does an athlete have an advantage when grows up in a ... · web viewnepal central african...
TRANSCRIPT

Master’s thesisErasmus University RotterdamDepartment of EconomicsEconomics of Markets, Organizations and Policy
How many and which Olympic medals does a country win? “An empirical investigation”.Name: R.F.P. Stuber Student number: 319949Supervisor: Dr. J. Emami NaminiPlace and date: Rotterdam, January 2013

Abstract
In this paper the number of medals a country will win in Olympic games is predicted. Also the
number of medals a country will win in a certain category is examined. With the help of data
from the summer Olympics of 1960 until 2008 regressions are made. The first basic model is
made with GDP per capita and population as explanatory variables. This model is extended with
some other variables such as Soviet Union, Planned economy, Host of the Olympics and lagged
medal share.
Also in this paper two extensions are made. The first extension is whether a superstar has a
motivational effect on the rest of the team. The other extension is to check whether it is true that
the more developed a country is, the more medals it will get in more expensive sports.
Overall one could say that the variables used to predict the 2012 Olympic results are good, but
the fit of the model becomes better, the smaller the country is. The superstar motivational effect
is positive and significant, but due to the restricted number of observations further research is
needed in order to check for the robustness of these results. The last extension shows that the
more developed countries win more medals overall, and score better in expensive sports than less
developed countries.
Keywords: sports economics, Olympics, medals, superstar motivational effect, cost of doing a
sport, developed and developing countries.
JEL–codes: J8, O47
2

Preface
This thesis was written in order to obtain a Master degree in Economics of markets, organizations
and policy at the Erasmus School of Economics at Erasmus University of Rotterdam.
First of all I want to thank my supervisor professor Julian Emami Namini for pointing into the
direction of sports economics. This was a way to combine my fields of interest. I had fun working
on my thesis and thanks to all the support given by Julian Emami Namini I was able to succeed.
During the months I was working on my thesis I realized that writing was just a small part of all
the time invested in this final part of my study. The biggest part was collecting all the data and
performing the regressions. On forehand I didn’t expected this, but I learned a lot from it and
think I can be proud of the result. I gained a lot of knowledge and skills that can come in handy
during my professional career.
Finally, I would like to thank my parents, brother and friends for supporting me in writing this
thesis and helping me with brainstorming when I was struggling.
Rotterdam, January 2013
Rob Stuber
3

Table of contents
Abstract.............................................................................................................................................2
Preface..............................................................................................................................................3
Table of contents..............................................................................................................................4
1. Introduction...............................................................................................................................5
2. Literature overview...................................................................................................................7
3. Data.........................................................................................................................................10
4. Medal share models.................................................................................................................12
4.1 Basic model...........................................................................................................................12
4.2 Extended model....................................................................................................................15
4.3 Predicting medals for London 2012......................................................................................18
5. Extensions...............................................................................................................................19
5.1 Superstar effect.....................................................................................................................19
5.2 Material intensity of a sport..................................................................................................22
6. Conclusions.............................................................................................................................25
7. References...............................................................................................................................27
8. Appendix.................................................................................................................................29
Appendix 1, Forecast for 2012...................................................................................................29
Appendix 2, Superstar effect......................................................................................................32
Appendix 3, Countries income categories..................................................................................34
Appendix 4, Costs of doing a sport.............................................................................................36
Appendix 5, Z-test results...........................................................................................................40
4

5

1. Introduction
When the Olympic Games take place, all the eyes of the world are turned to that enormous event.
In 2008 there were 4.7 billion people who watched the Olympic Games on television1. In 2012
this place was London, there people could watch the greatest athletes battling for the gold medals
and supporting their country. The modern Olympic creed is “participating is more important
rather than winning”, said ones by one of the founders of the modern Olympic games; Baron
Pierre de Coubertin2. This is not in line with the national committees who spend millions of
dollars to create the optimal environment for the athletes, like training facilities, coaching,
medical care, etc. to make them win more medals3. The nations’ only look at the country medal
table at the end, and the athletes go to the Olympics with only one goal; to win gold in their
specialty. This means winning is more important than participating and this is in contradiction
with the Olympic slogan. The medal table from the Olympic Games of Beijing in 2008 shows
that from the 204 participating countries only 84 were able to win at least one medal. This raises
the question are some countries better than other counties when it comes to sport achievements?
Does it give an athlete an advantage when he or she grows up in a certain country?
This paper is about the factors that influence the success in the Olympics4. In general, talent can
be assumed to be normally distributed around the world, which implies that controlling for
population will give us a clear medal table. But why did India win only 6 medals in the last
Olympics, whilst having a population of more than a billion? So population is not the only factor
that influences the success countries have in the games. In this paper I will make an extension on
the paper of Bernard & Busse (2004). This means I will try to identify what factors influence the
success of nations during the Olympic Games. I renew their results through a tobit regression and
use the most recent Olympic data from 1960 until 2008. Another part of this paper will describe
1 TV viewers during the Olympics: http://www.statista.com/statistics/236692/total-number-of-tv-viewers-of-olympic-summer-games-worldwide/2 The Olympic motto: http://www.la84foundation.org/6oic/OlympicCurriculum/socialstudies5.pdf3 Olympic plan from The Netherlands with the goal to be part of the top 10 medal winning countries: NOC*NSF (2012) Nederland in de top 10, NOC*NCF.4 In the rest of the paper the term Olympics or games will refer to the Summer Olympics, in this paper the winter Olympics are not taken into account.
6

whether more developed countries score better in material intensive sports as oppose to less
developed countries. My last extension will be to check whether superstars in the national team
will increase the performance of the rest of the team, since their performance, motivation and
attention of the press could have a motivational effect.
The paper is organized using the following structure. Chapter 2 will give a literature overview of
other research that has been done about this topic. In chapter 3 there will be a description of the
data that is used for this paper. The 4th chapter gives the medal share model, first the base model
and secondly the extended model. The extensions made in chapter 5 are, whether a superstar has
an influence on the rest of the team’s performance and if there is a correlation between the
material-intensity of the sport and the number of medals a developing and developed country will
get on this particular discipline?’ At the end in chapter 6, a short conclusion is given and some
further research possibilities are given.
7

2. Literature overview
This paper is not the first paper written about this topic. A lot of previous research has been done.
There are two periods where there was a research about the Olympic Games. The first period was
in the early seventies. After the collapse of the Soviet Union in the nineties the research was
caught up again. In this literature overview only research from the last period is shown, since it
has more data and is therefore more complete.
One of the papers written earlier is the paper of Shughart and Tollison (1993) the hypothesis prior
to the downfall of the Soviet Union the Soviet Bloc’s Olympians were less successful in the 1992
Olympics. According to the paper the direct effect of this cannot be allocated directly on the fall
of the Soviet Union, but they found strong proof to believe it has a big impact. The empirical data
from the Olympics in 1952 until 1992 are used with an exception of the boycott year 1980 and
1984. The medals won in Barcelona in 1992 was three percentage points lower than the medals
won in Seoul 1988 and by six percentage points compared to Montreal in 1976. With the data the
indication is made that the medal share is significantly less than before the collapse on a 0.001
level. The main reason why the Olympians were less successful was that the collapse of socialism
in the Soviet Union and the incompleteness of the economic transition has diminished the
opportunities of the former Soviet Bloc’s Olympic athletes to appropriate benefits of medal
winning. The privileges given by the state, to rise above the crowd, was gone and therefore also
the extra motivational effect. This paper is a good tribute to the extended model that will be used
in this paper that support our Soviet dummy, that indicated that Soviet Union countries will do
better or worse in the Olympics.
One of the more accurate and recent papers in predicting medal shares for countries, is the
Bernard and Busse (2004) paper. This paper tries to find variables that have an influence on the
medal totals. With the data from 1960-1996 the empirical model is made. At first the basic model
only takes population and gross domestic product (GDP)per capita into account. A cobb-Douglas
production function is made with the population and GDP per capita variables as production
factors. Those variables are both highly significant in the tobit regression they made. Other
research shows that some other variables also have an effect on the medals won by countries, so
8

the model is extended. The variables Host, Planned economy, Former Soviet Union and lagged
medal share are added. The variable former Soviet Union is partly added by the work of Shughart
and Tollison (1993) mentioned above. Also in this paper the hypothesis is made that former
Olympic success has an influence on the success a country is going to get at the next Olympics.
For example new training facilities have an effect now but in the upcoming 4 years this facility is
still highly useable with the most modern technology. The results show that all the variables are
significant. The tobit regression formed a prediction for 36 countries at the 2000 Sydney
Olympics was made. Twenty-three of the 36 countries were predicted within 3 medals of the
actual medals won in Sydney. This indicated a decent model, especially when 35/36 countries
were within two times the standard error.
Johnson and Ali (2000) also wrote a paper about the performance of countries in the Olympics. In
their paper two models were presented. The following variables were taken into account; GDP
per capita, population, home advantage, geographical proximity to the hosting nation, political
system and former colonial links. The first model was calculating the participants of a country.
With the data from 1952 until 1996 they used a large number of observations and made some
conclusions based on the participation of athletes. The home country almost doubles the number
of participants and for the surrounding countries it increases with 25%. The political system also
has an influence on the number of participants the country sends. The former colonial links also
have an impact on the participants a country sends to the Olympics. The second model looks at
the Olympic success instead of participation. In the paper significant proof is found that the home
advantage adds twelve percent chance of success and also communist countries outperform other
countries with 12 medals.
Another paper, ‘Why Do Some Countries Win More Olympic Medals? Lessons for Social
Mobility and Poverty Reduction’ written by Krishna and Haglund (2008) tried to answer two
important questions when it comes to Olympic success with the help of OLS and Probit
regressions. The first question is what factors contribute to a country’s ability to take home a
greater share of the available medals? The other question is “what factors seem to determine the
likelihood that a country will win at least one medal?” To answer these questions the data from
1992 until 2004 is used. The basic model used variables population and GDP per capita and both
9

have a significant positive effect on the medalshare. The extended model also has the variables
Health, Education, Public information, per cent urban, roads and host.
The health variable is measured by the life expectancy at birth, since healthier people have a
higher probability to be successful in sport. The education variable is taken into account since it
can have an effect in two ways. First the possibility to gain literacy, numeracy and exposure to
ideas and stimulate a young athlete to become ambitious in sport. Secondly a talented athlete is
easier discovered in school by a coach or trainer and can get better training. Public information
measures the number of radio receivers per 1.000 residents to determine the public information
available in a country about the Olympics. The idea behind it is that a child who gets more
information about the Olympics will be inspired to become an athlete as well. The other variables
per cent urban and roads are measured by the percentage of the population living in an urban
area and by the kilometer of roads per 1.000 hectares of land. This would contribute to bring
potential talents together to train, compete, etc. The host variable is a dummy assigned the value
of one when the county is the hosting country.
A large population, greater public information and lack of urbanization contribute to win a larger
share of the Olympic medals. The other variables are not significant in both models, however
GDP per capita is not consistently significant. Therefore this paper concluded that being rich on
average as country is not enough to win a large share of the Olympic medals. The likelihood that
a country will win one medal is increasing when the country has a larger population, greater
wealth and more public information.
The paper ‘Predicting Olympic medal counts: the effect of economic development on Olympic
Performance’ written by Bian in 2005 gives an empirical analysis of different variables used to
predict the medals a county will win. The paper uses basic models from Bernard and Busse
(2004) and Johnson and Ali (2000) and the data from the Olympics of 1988, 1992, 1996 and
2000. The results are almost the same just like similar papers. The socialist background (political
system), the hosting country, GDP per capita and population have a significant impact on the
medals won by the countries.
10

3. Data
The data for this thesis is gathered from different sources. The Olympic medal count data was
obtained from the International Olympic Committee (IOC) website5. All the country
socioeconomic indicators were a bit harder to gather from 1960 until present. Our primary source
of data for Population and GDP per capita in constant dollars (2000) data is the World bank
national accounts data files, but not all data was provided so some other sources are used; the
OECD national accounts data files6, CIA-factbook7 and the United Nations statistics division8.
Still some GDP per capita data was missing and the data from Bernard & Busse (2004) was used
to nearly complete the dataset9. However their data is in US dollars 1995 and in this paper US
dollars 2000 is used. The data from Bernard & Busse is adjusted to US dollars 2000 with the help
of consumer price index from the Worldbank.
In the paper there are some dummies that are taken into account. For the dummy variable ‘Soviet’
the following countries are marked as former part of the Soviet Union: Armenia, Azerbaijan,
Belarus, Estonia, Georgia, Kazakhstan, Kyrgyzstan, Latvia, Lithuania, Moldova, Russia, Soviet
Union, Tajikistan, Turkmenistan, Ukraine and Uzbekistan.
For the dummy variable planned the following countries are marked: Albania, Bulgaria, China,
Cuba, Czechoslovakia, East Germany, Hungary, Myanmar, North Korea, Poland, Romania, and
Yugoslavia. This dummy is for all countries who were not in the Soviet Union, but were of are
also a planned economy.
All the above variables are already been used in previous literature as can be read in the literature
overview. In the previous literature all the variables were significant. In this paper it is expected
that the variables still have a significant effect on the medal shares.
The variables that are used in chapter 5 are extensions to the existing model and therefore a
contribution to the research topic.
5 http://www.olympic.org/olympic-results6 http://www.oecd.org/statistics/7 https://www.cia.gov/library/publications/the-world-factbook/8 http://unstats.un.org/unsd/databases.htm9 http://mba.tuck.dartmouth.edu/pages/faculty/andrew.bernard/RESTAT%20Olympic%20Data.xls
11

In chapter 5 the possibility of a superstar having motivational effect on the rest of his team will
be checked. This is done, because in previous research outside the sport sector you see that
leaders inspire the other team members. In this paper will be checked if this also holds for teams
in the Olympics. The Olympic games from 1992-2008 are taken into account within this
extension. A superstar is defined in this paper as an athlete in one of the five biggest disciplines
who wins in two consecutive Olympic games at least one gold medal. The five biggest disciplines
from the Olympic games are determined by its popularity. To check the popularity of a sport the
internet traffic is measured by IOC. In a Report of the IOC10 from the Olympic games of 2004
they counted the number of hits on a particular sports discipline of the IOC website during the
Olympics in Athens. In this paper the popularity of a sport is shown and the assumption is made
in this paper that this is the same for the whole period (1992-2008). These sports are Aquatics,
Gymnastics, Athletics, Football and Volleyball.
In the last extension of this paper the separation of material intensive and material non-intensive
sports is made. With this extension will be checked whether richer countries do it relatively better
at sports that cost more. To make a distinction between the material intensity of the sport the
most successful athletes of the disciplines in the London 2012 Olympics were picked and looked
at which equipment they used. Clothes were taken for granted so purely the equipment besides
clothes were taken into account. In this extension there will be four different categories used; $0-
100, $101-1.000, $1.000-10.000 and $10.000+. An example of the calculation is Table tennis
player Xiaoxia Li. She uses a Nittaku Lialox penhold with a different front and back rubber (DHS
hurricane 3 Neo, Nittaku refoma). On internet the prices of these items are respectively $89.9911,
$22.4912 and $4213 dollars. In total this is $154.48 dollar and therefore table tennis is a category 2
sport. In appendix 3 all the sport disciplines and calculated materials can be found along with the
athlete who uses it.
For all regressions in this paper a tobit regression is used, due to the fact that countries can’t have
a negative medal share. A tobit regression makes every negative outcome on forehand 0.
10 An IOC report that give the results from the media attention from the Olympics 2004: Olympic Programme Commission, Report to the 117th IOC Session from 24 May 200511 The price of a Nittaku Lialox penhold: http://www.paddlepalace.com/Lialox-Penhold/productinfo/PNLIAC/12 The price of a DHS hurricane 3 Neo: http://www.megaspin.net/store/default.asp?pid=dhs-h3-neo13 The price of a Nittaku reforma: http://www.tabletennisdb.com/rubber/nittaku-refoma.html
12

4. Medal share models
4.1 Basic modelIn this paper the Olympic Games from 1960 towards 2008 are taken into account. In the
litterateur overview other papers written about a similar topic are discussed. Examples of these
studies are Ball (1972), Grimes et al. (1974), Levine (1974) and more recent studies Bian (2005)
and Bernard & Busse (2004). This chapter will mostly be an update of the Bernard & Busse
(2004) paper. The data is extended and covers now the Olympics from 1960 until 2008.
In the papers above the first variable is population. Population is very important factor in the
chance to win a medal, since more inhabitants in a country increase the chance for potential
talented athletes to be born14. This variable is used in all previous research and always highly
significant. In the paper the equal distribution of talent is considered. This means the bigger the
country the more optional medal candidates a country has. In the simplest world this would mean
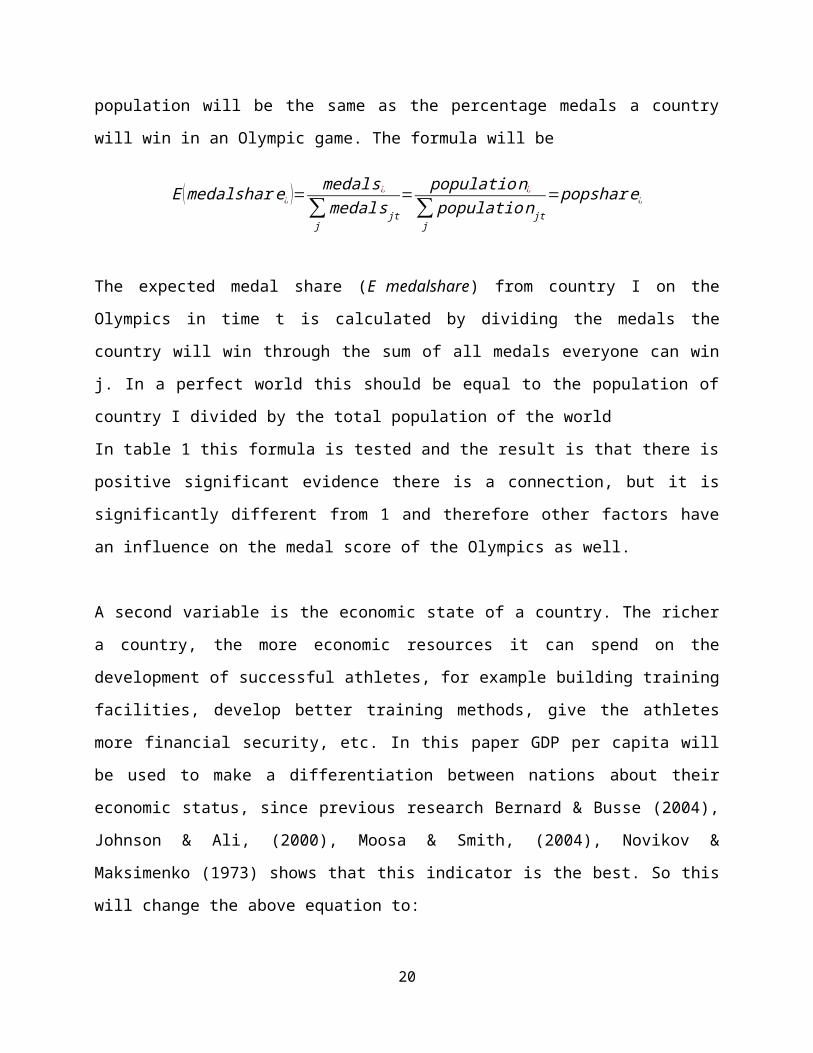
that the percentage of world population will be the same as the percentage medals a country will
win in an Olympic game. The formula will be
E (medalshar e¿)= medal s¿
∑j
medal s jt
=populatio n¿
∑j
population jt
=popshar e¿
The expected medal share (E medalshare) from country I on the Olympics in time t is calculated
by dividing the medals the country will win through the sum of all medals everyone can win j. In
a perfect world this should be equal to the population of country I divided by the total population
of the world
In table 1 this formula is tested and the result is that there is positive significant evidence there is
a connection, but it is significantly different from 1 and therefore other factors have an influence
on the medal score of the Olympics as well.
A second variable is the economic state of a country. The richer a country, the more economic
resources it can spend on the development of successful athletes, for example building training
facilities, develop better training methods, give the athletes more financial security, etc. In this
paper GDP per capita will be used to make a differentiation between nations about their
14 Source: Johnson & Ali (2000)
13
economic status, since previous research Bernard & Busse (2004), Johnson & Ali, (2000), Moosa
& Smith, (2004), Novikov & Maksimenko (1973) shows that this indicator is the best. So this
will change the above equation to:
E medal s¿
∑j
medal s jt
=M ¿¿= f ( N ¿ ,Y ¿ , A¿)
The medals a country earns (M ¿¿¿¿)¿ is explained by population (N ¿), GDP (Y ¿) and some
organizational ability of the country A¿¿. However this organizational ability is hard to express in
a variable or value, so in this paper this will be taken for granted and make it a constant factor.
Also a year dummy (dt), to take the changes in the number of nations participating i, number of
sports held and number of medals given and as final an error term(ε it) that is assumed to be
normally distributed are included.
From the variables GDP and population the log function is used to be able to translate this to
medal shares. GDP is a sum of all the per capita income of a country and therefore GDP per
capita will be used. The basic model will be:
M ¿=C+α log (N ¿)+β log( YN )
¿+d t+¿ ε¿¿
14
Table 1: Tobit regression of medal share on population and GDP per capita in dollarsModel 1 2 3 4
Independent
variable
Medal
share
Sig. Medal
share
Sig. Medal
share
Sig. Medal
share
Sig.
Population share 0.4873
(0.0377)
0.000
Log population 0.0318
(0.0015)
0.000 0.0341
(0.0014)
0.000
Log GDP per capita 0.0212
(0.0017)
0.000 0.0283
(0.0015)
0.000
LR test 11.92
(0.001)
Year dummies Yes Yes Yes Yes
Log likelihood 808.5519 1005.8700 810.8895 1202.366
Observations 1776 1776 1776 1776
The LR-test reports the test of the equality of the coefficients on log GDP per capita and Log population (and the p-value). The error term is
distributed chi-squared with 1 degree of freedom. The numbers between parentheses is the standard error.
As described by model 1 above, only population share have a significant effect but not even
close to 1, so other factors also have an influence on the medal share. In model 2 and 3
Population and GDP per capita is taken into account and the log likelihood of both models is
higher than model 1. Both variables are positive and significant on a 99% confidence interval. In
the 4th model both variables are included and also here significant on a 1% level. The
interpretation of the results is that if the GDP per capita of a country goes up with 1%, than the
medal share will simultaneously go up with 0.0283%.
The log likelihood of model 4 is the highest of all the basic models in table 1. The log likelihood
test rejects the hypotheses that the coefficients of log population and log GDP are the same on a
1% level.
15

4.2 Extended modelThis model can be extended with other dummy variables. The first dummy is host, this is 1 for
the host of the Olympic Games and 0 otherwise. In past research, Ball (1972), Bernard & Busse
(2004), Grimes, Kelly, & Rubin (1974), Johnson & Ali (2000), Levine (1974), proof has been
found for a positive effect with the host of the games on the medals they earn as a nation. The
hosting country delivers more public support, which increases the mental state of an athlete and
therefore will try to perform better. Also the hosting country always increases its sports budget
the years before the games are taking place.
Also two other dummy variables will be used, the Soviet and the planned (political system)
dummy. The dummy will be one if the nation was part of the Soviet Union or was/is a planned
economy and 0 otherwise. These dummies are included since Shughart & Tollison, (1993) found
proof that after the Soviet Union was split up, the countries that were formed were less ambitious
to spent money on Olympic gold than before in the Soviet Union. Also Johnson and Ali (2000)
found proof that communist countries outperform the other countries by 12 medals. This could be
explained through the highly ambitious pressure towards Olympic success from the Soviet Union
and other planned economy nations. There were more resources made available towards the
athletes and also the private privileges for an athlete after Olympic success were very motivating
for the individuals, because in planned economics individuals are equal and this was a way to
separate you from the rest.
In the papers of Krishna & Haglund (2008) and Lui & Suen (2008) other variables are also taken
into account; Life expectancy, primary school enrolment, percentage urban in a country and
education level. Those variables have no significant effect on the medals earned by countries
during the Olympics in their papers, so those variables will be ignored. Other things should be
taken into account as well, such as; a country cannot send as many athletes as their proportion in
the world population when looking for example at soccer every team can only enter to the
qualifications with one team, however this cannot be measured.
Taken the new dummies into account the model can be extended to:
M ¿=C+α log (N ¿)+β log( YN )
¿+Hos t ¿+Soviet ¿+Planne d¿+d t+¿ ε¿¿
16

Table 2: Tobit regression of medal share on expanded explanatory set in dollars Model 5 6 7Independent variable Medal share Sig. Medal share Sig. Medal share Sig.
Log population 0.0297 (0.0012)
0.000 0.0290 (0.0012)
0.000 0.0073 (0.0005)
0.000
Log GDP per capita 0.0289 (0.0013)
0.000 0.0283 (0.0013)
0.000 0.0068 (0.0006)
0.000
Host 0.0520 (0.0072)
0.000 0.0242 (0.0072)
0.001 0.0182 (0.0031)
0.000
Soviet 0.0524 (0.0034)
0.000 0.0481 (0.0032)
0.000 0.0108 (0.0016)
0.000
Planned (non-Soviet) 0.0337 (0.0027)
0.000 0.0306 (0.0027)
0.000 0.0088 (0.0012)
0.000
Lagged medal share 0.7671 (0.0143)
0.000
LR test 0.288 (0.59) 0.172 (0.68) 0.716 (0.40)Boycott years Yes No NoYear dummies Yes Yes YesLog likelihood 1388.928 1277.3230 1637.275Observations 1776 1559 1383The LR-test reports the test of the equality of the coefficients on log GDP per capita and Log population (and the p-value). The error term is
distributed chi-squared with 1 degree of freedom. The numbers between parentheses is the standard error.
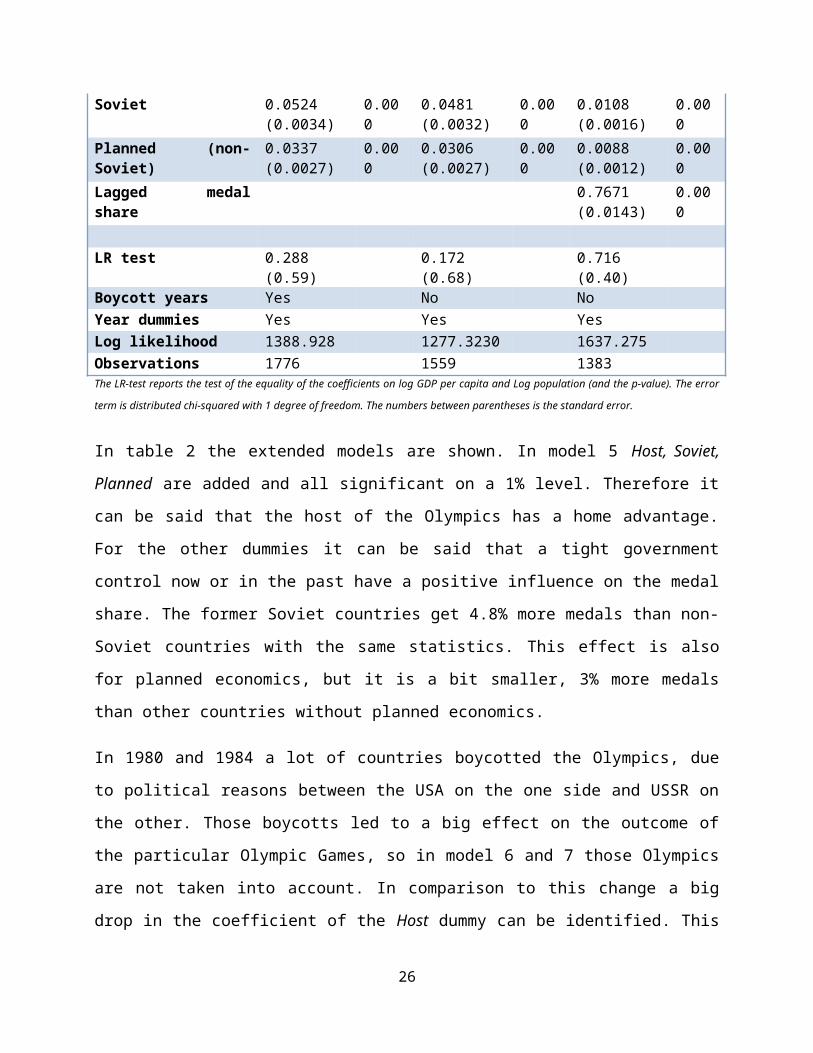
In table 2 the extended models are shown. In model 5 Host, Soviet, Planned are added and all
significant on a 1% level. Therefore it can be said that the host of the Olympics has a home
advantage. For the other dummies it can be said that a tight government control now or in the past
have a positive influence on the medal share. The former Soviet countries get 4.8% more medals
than non-Soviet countries with the same statistics. This effect is also for planned economics, but
it is a bit smaller, 3% more medals than other countries without planned economics.
In 1980 and 1984 a lot of countries boycotted the Olympics, due to political reasons between the
USA on the one side and USSR on the other. Those boycotts led to a big effect on the outcome of
the particular Olympic Games, so in model 6 and 7 those Olympics are not taken into account. In
comparison to this change a big drop in the coefficient of the Host dummy can be identified. This
17
is perfectly explainable, since in 1980 the Olympics were held in Moscow and in 1984 in Los
Angeles, due to lack of competition of other big counties they obtained enormous medal shares.
The coefficients from Population and GDP per capita remain highly significant and positive. The
coefficients are in all models almost equal to each other. The LR-test gives no significant proof
that the coefficients are not equal to each other. The null hypotheses are therefore not rejected.
In model 7 the variable lagged medal share is added. The variable is indicating that the medal
share a country gets during an Olympics, past success, will affect the medals the country wins on
the Olympics after, current success. If a country decides, for example, to build a highly
sophisticated training facility this can have a payoff during the Olympics right away, but also in
the subsequent Olympics it can still benefit the medal share. This makes the total model:
M ¿=C+α log (N ¿)+β log( YN )
¿+Hos t ¿+Soviet ¿+Planne d¿+(1−δ ) M¿−1+d t+¿ ε ¿¿
This variable is highly significant on a 99% confidence interval. Since 1960 is the first data used
in this paper there is no lagged medal share added for this year. In model 7 the coefficients all
previous variables have fallen, but are still significant on a 1% level. The log likelihood still has
risen to 1637 and therefore it is good to add lagged medal share.
18

4.3 Predicting medals for London 2012To illustrate the performance of the model in its current form, a forecast is made. In the summer
of 2012 the Olympics in London were held. GDP and population 2011 data from the World data
bank is used to make a forecast with the latest model estimated in this paper.
In Appendix 1 the outcome of the forecast is shown. For all countries which won at least 1 medal
in London, a forecast is made15. The model does quite well match the actual medals won by
countries. In our prediction 77 countries are taken into account.16 From those 77, 15 countries
were predicted right, 22 countries have a deviation of one medal of their actual medal score and
10 have a difference of 2. This means the model predicted 47 from the 74 countries within a ±2
medals interval. What is shown from the results is that it is harder to predict bigger countries,
than smaller. A possible explanation for this bigger difference for large medal share countries is
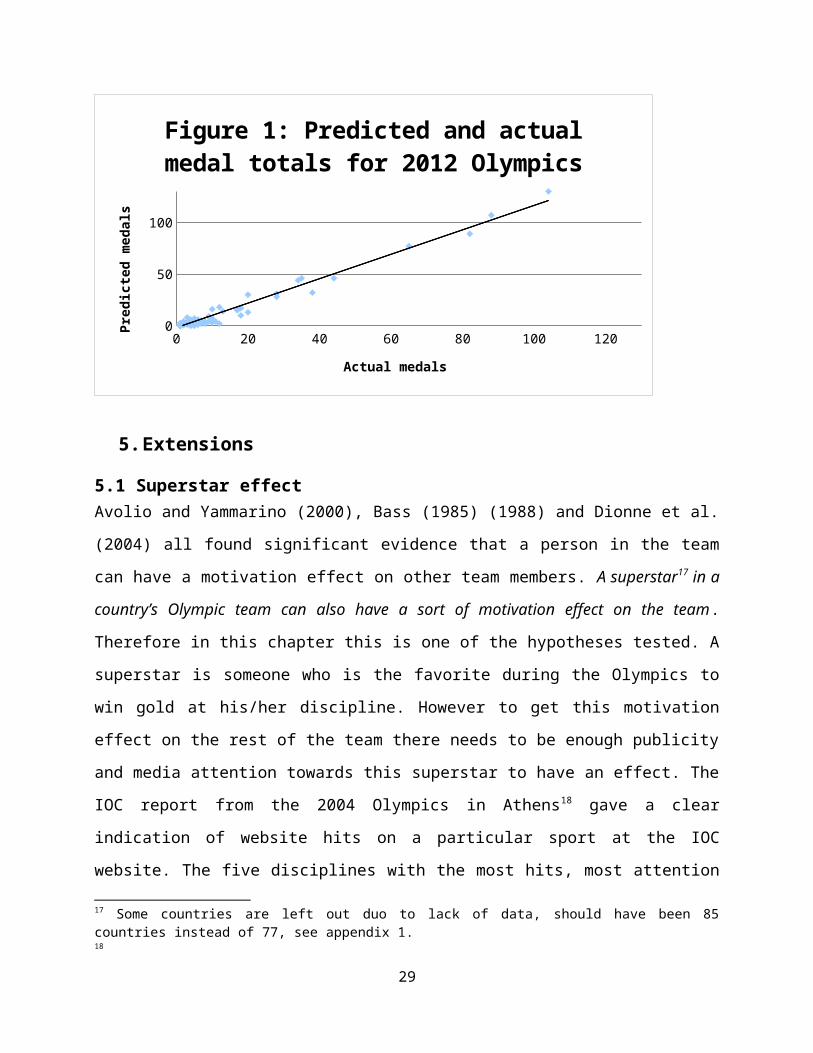
that they are harder to predict because of more variation in the Olympic results. In figure 1 a
visual graph shows the outcome of appendix 1. The vertical axis displays the predicted medals,
while the horizontal axis displays the actual medals. On a 100% accurate model the line should
have a slope of 45 degrees, however as can be concluded from figure 1 the model in this paper is
decent, but could be better.
0 20 40 60 80 100 1200
20
40
60
80
100
120
Figure 1: Predicted and actual medal totals for 2012 Olympics
Actual medals
Pred
icted
med
als
15 Source: Bernard & Busse (2004) 16 Source: Bernard & Busse (2004)
19
5. Extensions
5.1 Superstar effectAvolio and Yammarino (2000), Bass (1985) (1988) and Dionne et al. (2004) all found significant
evidence that a person in the team can have a motivation effect on other team members. A
superstar17 in a country’s Olympic team can also have a sort of motivation effect on the team .
Therefore in this chapter this is one of the hypotheses tested. A superstar is someone who is the
favorite during the Olympics to win gold at his/her discipline. However to get this motivation
effect on the rest of the team there needs to be enough publicity and media attention towards this
superstar to have an effect. The IOC report from the 2004 Olympics in Athens18 gave a clear
indication of website hits on a particular sport at the IOC website. The five disciplines with the
most hits, most attention from the public are aquatics, gymnastics, athletics, football, volleyball.
Those 5 sports are the most popular and therefore only superstars from those disciplines are
taken, because the assumption is made that in other disciplines the motivation effect will be non-
existing. All the superstars that are taken into account can be found in appendix 2.
The data used at this extension is from the Olympics of 1992 until 2008, because it is hard to get
all the data from all the superstars that go back to 1960 and further. Also the known doping use
from the eastern bloc will not be taken into account and give is a more precise effect. The
superstar dummy is divided into 3 categories. The first dummy is star1 this means the dummy is
equal to 1 if an athlete wins for example at least one gold medal in 1992 and 1996, then in 1996
the dummy is 1. This is done also for star2, but here the superstar wins at least 2 medals in both
Olympic Games. The last category is star3 and here a superstar wins 3 or more medals in two
Olympic Games in a row.
Our model is extended with this dummy and becomes:
M ¿=C+α log (N ¿)+β log( YN )
¿+Hos t ¿+Soviet ¿+Planne d¿+(1−δ ) M¿−1+star 1+star 2+star 3+d t+¿ε¿¿
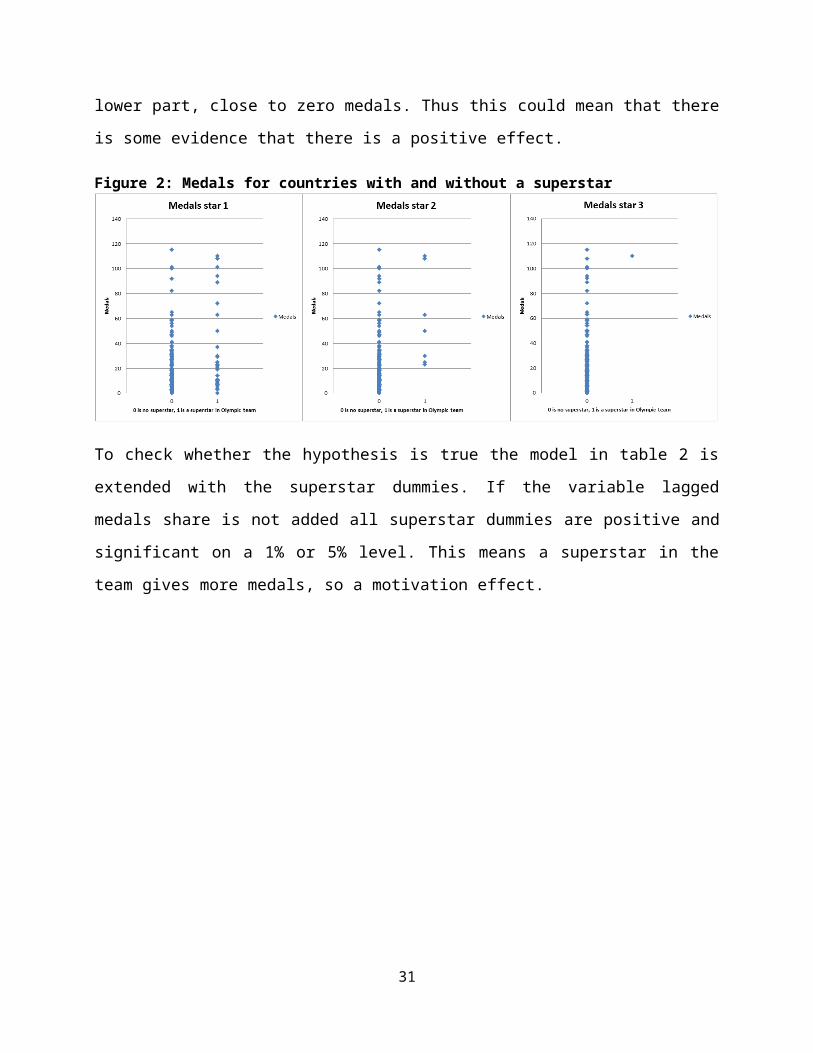
In figure 2 there is no clear indication to say that the hypotheses are true since the countries with
a superstar do not have a significant higher number of medals. But if looked closely the countries
17 Some countries are left out duo to lack of data, should have been 85 countries instead of 77, see appendix 1.18
20
without a superstar have more concentration in the lower part, close to zero medals. Thus this
could mean that there is some evidence that there is a positive effect.
Figure 2: Medals for countries with and without a superstar
To check whether the hypothesis is true the model in table 2 is extended with the superstar
dummies. If the variable lagged medals share is not added all superstar dummies are positive and
significant on a 1% or 5% level. This means a superstar in the team gives more medals, so a
motivation effect.
21

Table 3: Tobit regression of medal share on expanded explanatory set with superstar dummy in dollars Model 8 9Independent variable Medal share Sig. Medal share Sig.
Log population 0.0196 (0.0010) 0.000 0.0050 (0.0004) 0.000
Log GDP per capita 0.0187 (0.0011) 0.000 0.0046 (0.0004) 0.000
Host 0.0367 (0.0068) 0.000 0.0165 (0.0026) 0.000
Soviet 0.0256 (0.0022) 0.000 0.0067 (0.0001) 0.000
Planned (non-Soviet) 0.0197 (0.0026) 0.000 0.0032 (0.0010) 0.002
Lagged medal share 0.8315 (0.0173) 0.000
Star1 0.0162 (0.0033) 0.000 0.0012 (0.0013) 0.356
Star2 0.0139 (0.0070) 0.046 0.0013 (0.0028) 0.660
Star3 0.0438 (0.0162) 0.007 0.0129 (0.0062) 0.038
LR test 0.563 (0.45) 0.770 (0.38)Year dummies Yes YesLog likelihood 919.5697 1204.6000Observations 923 923The LR-test reports the test of the equality of the coefficients on log GDP per capita and Log population (and the p-value). It is distributed chi-
squared with 1 degree of freedom. The numbers between parentheses is the standard error.
However if the lagged medal share variable is added there can still be seen that there are positive
dummies for a superstar, but only the star3 dummy is significant on a 1% level. This means only
a superstar with 3 or more medals in 2 consecutive Olympic Games has a motivation effect.
The only remark by the dummy star3 is that it is only one observation. Michael Phelps is the only
person between 1992 and 2008 who won more than 3 gold medals in 2 Olympic Games. Another
counterargument can be that he won 8 gold medals in 2008, so that it is not a motivation effect,
but more the athlete’s medal input that makes that there is a positive effect.
With this paper it cannot be said with absolute certainty that there exists a motivation effect for
superstars. Further research is needed to make a more accurate statement about the superstar
dummy.
22

5.2 Material intensity of a sport Every sport has different costs to perform the sport. Some sports are almost do-able for free and
other sports cost thousands of dollars. The economic state of a country can tribute to the medals
earned on a particular sport given the material intensity of the sport. For example, for a country
where its population is on average beneath the poverty line it could be more difficult to score
good in rowing whereas the costs of doing such a sport are quite high and need a lot of facilities
to get the Olympic level. Countries that are highly developed have more resources to spend on
those ‘hobbies’ and do not have to put a lot of resources into the primary life needs of its
population. So in this section the hypothesis will be: ‘developed countries score more medals
than developing countries in material intensive sports’. All the Olympic data from 1960-2008 is
used.
First a distinction between countries is made with the help of the World Development indicators.
They divide countries into a category low income, lower middle income, upper middle income
and high income in their annually report19. In appendix 3 this classification is shown. The 2012
indication counts for the whole period (1960-2008) since countries hardly switch categories, the
assumption is made that the classification for 2012 holds for the entire period. Secondly the
sports are categorized into material intensive and material non intensive sports. In appendix 3,
table 8 shows the summary of the costs of doing a particular sport. As explained in the data
chapter every discipline is calculated on a gold medal(s) winner of the London 2012 Olympics
and their equipment costs is taken into account. However clothes are taken for granted.
Categories that will be used; $0-100, $101-1.000, $1.000-10.000 and $10.000+.
Table 4 coefficients mean that a country that is classified as low income has a negative effect on
the medal share in category 1 sports by -0.0744. Since these are dummies an increase in effect
cannot happen.
In table 4 states that only in category 2 and category 3 all coefficients are significant. In category
1 and 4 only a few are significant. However a certain trend is visible. At low income the
coefficient in category 1 is -0.0744 and this is rising over the different categories. In category 3
the coefficient is -0.2005. This means that low income has a negative rising effect on the number
19 A superstar is defined in this paper as an athlete in one of the five biggest disciplines who wins in two consecutive Olympic games at least one gold medal.
23

of medals a country gains if the costs of doing a sport rises. This trend is not spotted for the upper
incomes, so it cannot be said with the help of table 4 to reject or accept the hypothesis.
Table 4: Tobit regression of medal shares divided into categories on economic state of a countryModel
Independent
variable
Medal
share cat 1
Sig. Medal
share cat 2
Sig. Medal
share cat 3
Sig. Medal
share cat 4
Sig.
Low income -0.0744
(0.0077)
0.000 -0.0755
(0.0084)
0.000 -0.2005
(0.0254)
0.000 -0.5386
(12629)
1.000
Lower middle
income
-0.0550
(0.0059)
0.000 -0.0803
(0.0077)
0.000 -0.1585
(0.0158)
0.000 -0.1565
(0.0163)
0.000
Upper middle
income
-0.0200
(0.0052)
0.000 -0.0439
(0.0066)
0.000 -0.0889
(0.0116)
0.000 -0.0697
(0.0092)
0.000
High income -0.0064
(0.0048)
0.185 -0.0165
(0.0059)
0.005 -0.0347
(0.0098)
0.000 -0.0116
(0.0078)
0.134
It is distributed chi-squared with 1 degree of freedom. The numbers between parentheses is the standard error.
Since not all results in table 4 are significant another category classification can be used. Low
income and lower middle income combined will be developing countries and upper middle
income and high income are combined developed countries. So this classification is more
generalized and therefore the chance of finding better proof for the hypothesis is higher.
Table 5: Tobit regression of medal shares divided into developing and developed countriesModel
Independent
variable
Medal
share cat 1
Sig. Medal
share cat 2
Sig. Medal
share cat 3
Sig. Medal
share cat 4
Sig.
Developing
countries
-0.0509
(0.0038)
0.000 -0.0560
(0.0045)
0.000 -0.1252
(0.0111)
0.000 -0.1485
(0.0143)
0.000
Developed
countries
0.0267
(0.0029)
0.000 0.0239
(0.0034)
0.000 0.0344
(0.0056)
0.000 0.0415
(0.0049)
0.000
It is distributed chi-squared with 1 degree of freedom. The numbers between parentheses is the standard error.
24

In table 4 a certain trend for low income could be identified. Table 5 with more generalized
categories gives all significant data and the same trend for both developing and developed
countries. This should indicate that the hypothesis ‘developed countries score more medals than
developing countries in material intensive sports’ is true. To make this clear the coefficients of
developed countries in category 1 and category 4 should not be the same. It must also hold for all
the coefficients in developing and developed.
In Appendix 5, table 10 all the results of the z-test are given, but the hypothesis that the
coefficients are the same is rejected in almost all cases with a 99% confidence level. With
categories 1 and 2 in developing the coefficients are significantly different but on a 95%
confidence level. The coefficients of categories 1 and 2 in developed are not significant and
therefore it cannot be said that those coefficients are different from each other. So developed
countries perform on category 1 and 2 sports just as good, but on the more expensive sports, they
perform better. For the overall hypothesis in this section it makes no difference.
This gives the overall conclusion that the economic state of a country has an influence on the
success in different sports disciplines if looked at the costs of doing the sport. Richer countries
perform better in all the categories, but in the more expensive sports this effect is the greatest.
25
6. Conclusions
The Olympic summer games are hosted every four years and thousands of athletes compete with
each other to win a gold medal in their discipline. In this paper it is shown that is matters in what
country the athlete grows up and comes out for. Bernard & Busse (2004) made a regression to
predict the outcome of the medals won by every country and in this paper their data, results are
updated and extended.
First it was checked if only the population and the GDP per capita had an influence and if this
was enough to predict the medal table. Both variables have a significant effect on the number of
medals but these were not the only one. More research shown that there is a host effect and that
the political structure in the past, Soviet, and now, planned have also an effect on the outcome of
the Olympics. With the regression of the extended model all countries who won at least one
medal in London 2012 was calculated what, with these variables above, would be the outcome.
From those 77, 15 countries were predicted right, 22 countries have a deviation of one medal of
their actual medal score and 10 have a difference of 2. This means the model predicted 47 from
the 74 countries within 2 medals. This is almost 2/3 of the forecasting. It is nice to see this result,
but the prediction could be better. Particular on the big medal winning countries where can be
seen a big difference between predicted and actual medals. A possible explanation for this
difference could be the big variation in the results such a country wins. Further research could go
into this variance.
Secondly the dummy variable superstar was added to the extended model. This dummy seems at
first sight to have a significant positive effect. However when the lagged medal share variable is
added we still see positive dummies for superstar, but only the star3 dummy is significant on a
1% level. This means only a superstar with 3 or more medals in 2 consecutive Olympic Games
has a motivation effect. The only remark by the dummy star3 is that it exists of only one
observation. Another counterargument can be that he won 8 gold medals in 2008, so that it is not
a motivation effect, but more the athlete’s input that makes it significant. In this paper it cannot
be said with absolute certainty that there exists a motivation effect for superstars. Further research
is needed to make a more accurate statement about the superstar dummy.
26

Thirdly there was checked whether or not the economic state of a country does have an influence
on the medals they earn in different categories of sport if controlled for the costs of doing that
sport. First the categories low income, lower middle income, upper middle income and high
income were used, but not all the results were significant. So another classification was used,
developed and developing countries.
With this new categorization all the results were significant and when checked for difference in
coefficients it has shown that almost all coefficients are different from each other and the trend
that richer countries perform better on more costly sports is true. So the overall conclusion is that
the economic state of a country has an influence on the success in different sports disciplines if
looked at the costs of doing the sport. Richer countries perform better in all the categories, but in
the more expensive sports this effect is the greatest.
Overall it can be said that an athlete born in a particular country could have an advantage to win a
medal, since not only talent is a factor to success but also some country variables.
27

7. References
Avolio, B.J. and Yammarino, F.J. (2002), Transformational and Charismatic Leadership: The Road Ahead, Elsevier Science, Oxford.
Ball, D.W. (1972), Olympic Games competition: structural correlates of national success, International Journal of Comparative Sociology, 15, 186-200.
Balmer, N. J., Nevill, A. M. and Williams, A. M. (2003), Modelling home advantage in the Summer Olympic Games, Journal of Sports Sciences, 21, 469 – 478.
Bass, B.M. (1985), Leadership and Performance Beyond Expectations, Free Press, New York, NY.
Bass, B.M. (1988), The inspirational process of leadership, Journal of Management Development, Vol. 7, pp. 21-31.
Bernard, A. and Busse, M.R. (2004), Who wins the Olympic Games: Economic resources and medal totals, Review of Economics and Statistics, 86, 413-417.
Bian, X. (2005), Predicting Olympic Medal Counts: The Effects of Economic Development on Olympic Performance, The Park Place Economist, XIII, 37-44.
Dionne, S. D., Yammarino, F. J., Atwater, L. E. and Spangler, W. D. (2004), Transformational leadership and team performance, Journal of Organizational Change Management, 17, 177–193.
Greenleaf, C.A., Gould, D. and Dieffenbach, K. (2001), Factors influencing Olympic performance: Interviews with Atlanta and Nagano U.S. Olympians, Journal of Applied Sport Psychology, 13, 179-209.
Grimes, A.R., Kelly, W.J. and Rubin, P.H. (1974), A socioeconomic model of national Olympic performance, Social Science Quarterly, 55, 777-82.
Heji, C., de Boer, P., Franses, P.H., Kloek, T. and van Dijk, H.K. (2004), Econometric Methods with Applications in Business and Economics, Oxford University Press, Oxford, UK.
IOC - Olympic Programme Commission (2005), Report to the 117th IOC Session, 24 May 2005.
Johnson, D. K. N. and Ali, A. (2000), Coming to play or coming to win: Participation and success at the Olympic Games (Working paper). Department of Economics, Wellesley College, Wellesley, MA.
Krishna, A and Haglund, E. (2008), Why Do Some Countries Win More Olympic Medals? Lessons for Social Mobility and Poverty Reduction. Economic & Political WEEKLY , July 12, 2008.
Levine, N. (1974), Why do countries win Olympic medals? Some structural correlates of Olympic Games success: 1972, Sociology and Social Research, 58, 353-360.
Lui, H.K. and Suen, W.C. (2008), Men, money, and medals: An econometric analysis of the Olympic Games. Pacific Economic Review, 13(1), 1-16.
Moore, D. S., McCabe, G. P., Duckworth, W. M., and Sclove, S. L. (2008), The practice of business statistics: using data for decisions, W. H. Freeman and Co.
28
NOC*NSF (2012) Nederland in de top 10, NOC*NCF
Rathke, A. and Woitek, U. (2007), Economics and Olympics: An efficiency analysis. Institute for empirical research in economics, university of Zürich.
Shughart, W. F. and Tollison, R.D. (1993), Going for the Gold: Property Rights and Athletic Effort in Transitional Economies, Kyklos, v46 n2 1993, pp. 263-72.
Wallechinshy, D. and Loucky, J. (2012), The complete book of the Olympics, 2012 edition, Aurum press ltd, April 2012.
WDI (2012), World development indicators 2012, The world bank, 2012.
29

8. Appendix
Appendix 1, Forecast for 2012
Table 6, forecast for Olympics of 2012 with the extended model, countries who won at least 1 medal Countries Predicted medals Actual medals Difference
United States 130 104 26China 107 88 19Russia 89 82 7Great Britain 77 65 12Germany 46 44 2Japan 32 38 -6Australia 46 35 11France 44 34 10South Korea 31 28 3Italy 28 28 0Ukraine 30 20 10Netherlands 13 20 -7Canada 17 18 -1Hungary 10 18 -8Spain 16 17 -1Brazil 15 17 -2Kazakhstan 14 13 1Belarus 18 12 6Jamaica 2 12 -10Kenya 4 11 -7Poland 16 10 6Azerbaijan 7 10 -3Czech Republic 3 10 -7Romania 9 9 0Denmark 4 9 -5Sweden 4 8 -4Colombia 2 8 -6Mexico 5 7 -2Georgia 4 7 -3Ethiopia 2 7 -5India 6 6 0South Africa 2 6 -4Croatia 1 6 -5Turkey 7 5 2Lithuania 6 5 1
30
Ireland 2 5 -3Mongolia 0 5 -5Argentina 6 4 2Norway 5 4 1Switzerland 5 4 1Slovakia 2 4 -2Slovenia 1 4 -3Serbia 0 4 -4Trinidad and Tobago 0 4 -4Uzbekistan 8 3 5Armenia 3 3 0Belgium 3 3 0Finland 3 3 0Thailand 3 3 0Tunisia 1 3 -2Bulgaria 4 2 2Indonesia 4 2 2Latvia 4 2 2Estonia 3 2 1Greece 3 2 1Egypt 2 2 0Malaysia 2 2 0Portugal 2 2 0Singapore 2 2 0Dominican Republic 1 2 -1Moldova 1 2 -1Qatar 1 2 -1Algeria 2 1 1Hong Kong 2 1 1Saudi Arabia 2 1 1Venezuela 2 1 1Guatemala 1 1 0Kuwait 1 1 0Morocco 1 1 0Tajikistan 1 1 0Bahamas 0 1 -1Botswana 0 1 -1Cyprus 0 1 -1Gabon 0 1 -1Grenada 0 1 -1Montenegro 0 1 -1Uganda 0 1 -1
31

New Zealand, Cuba, Iran, North Korea, Puerto Rico, Chinese Taipei, Afghanistan and Bahrain are not taken into the forecasting, since there is a lack of data for 2011 GDP per capita or population.
32

Appendix 2, Superstar effect
Table 7: Athletes who are a ‘superstar’, category star1, star2 and star 3Superstar Discipline Athlete Country Olympic Superstar statusStar1 Athletics
Michael Johnson USA 1996 and 2000Haile Gebreselassie ETH 2000Kenenisa Bekele ETH 2008Robert Korzeniowski POL 2000 and 2004Carlton Lewis USA 1992 and 1996Virgilijus Alekna LIT 2004Jan Zelezny CZE 1996 and 2000Andreas Thorkildsen NOR 2008Gail Devers USA 1996Veronica Campbell Jam 2008Marie-José Pérec FRA 1996Yelena isinbayeva RUS 2008Francoise Mbango Etone CAM 2008
Football (soccer)Argentina ARG 2008USA USA 2008
GymnasticsGervasio Deferr Angel SPA 2004Svetlana Khorkina RUS 2000
SwimmingAleksandr Popov RUS 1996Pieter vd Hoogeband NLD 2004Ian Thorpe AUS 2004Grant Hacket AUS 2004Aaron Peirsol USA 2008Kosuke kitajima JPN 2008Michael Phelps USA 2008Tamas Darnyi HUN 1992Thomas Dolan USA 1992Inge de Bruijn NLD 2004Janet Evans USA 1992Natalie Coughlin USA 2008Krisztina Egerszegi HUN 1992 and 1996Kirsty Coventry ZIM 2008Yana Klockkova UKR 2004
VolleyballCuba CUB 1996 and 2000
33

Kerri Walsh USA 2008Star2 Athletics
Carlton Lewis USA 1992Swimming
Aleksandr Popov RUS 1996Ian Thorpe AUS 2004Aaron Peirsol USA 2008Kosuke kitajima JPN 2008Michael Phelps USA 2008Tamas Darnyi HUN 1992Yana Klockkova UKR 2004
Star 3 SwimmingMichael Phelps USA 2008
34

Appendix 3, Countries income categories
Table 8, countries categorized to income levelIncome level CountriesLow income Afghanistan Eritrea Madagascar Tajikistan
Bangladesh Ethiopia Malawi Tanzania
Benin Gambia, The Mali Togo
Burkina Faso Guinea Mozambique Uganda
Burundi Guinea-Bissau Myanmar Zimbabwe
Cambodia Haiti Nepal
Central African Republic
Kenya Niger
Chad Korea, Dem. Rep. Rwanda
Comoros Kyrgyz Republic Sierra Leone
Congo, Dem. Rep. Liberia Somalia
Lower middle income
Angola Guatemala Morocco Syrian Arab Republic
Armenia Guyana Nicaragua Timor-Leste
Belize Honduras Nigeria Tonga
Bhutan India Pakistan Turkmenistan
Bolivia Indonesia Papua New Guinea Tuvalu
Cameroon Iraq Paraguay Ukraine
Cape Verde Kiribati Philippines Uzbekistan
Congo, Rep. Kosovo Samoa Vanuatu
Côte d'Ivoire Lao PDR São Tomé and Príncipe Vietnam
Djibouti Lesotho Senegal West Bank and Gaza
Egypt, Arab Rep. Marshall Islands Solomon Islands Yemen, Rep.
El Salvador Mauritania Sri Lanka Zambia
Fiji Micronesia, Fed. Sts. South Sudan
Georgia Moldova Sudan
Ghana Mongolia Swaziland
Upper middle income
Albania Costa Rica Lithuania Serbia
Algeria Cuba Macedonia, FYR Seychelles
American Samoa Dominica Malaysia South Africa
Antigua and Barbuda Dominican Republic Maldives St. Kitts and Nevis
Argentina Ecuador Mauritius St. Lucia
Azerbaijan Gabon Mayotte St. Vincent & Grenadines
Belarus Grenada Mexico Suriname
Bosnia and Herzegovina
Iran, Islamic Rep. Montenegro Thailand
35

Botswana Jamaica Namibia Tunisia
Brazil Jordan Palau Turkey
Bulgaria Kazakhstan Panama Uruguay
Chile Latvia Peru Venezuela, RB
China Lebanon Romania
Colombia Libya Russian Federation
High income Andorra Equatorial Guinea Japan San Marino
Aruba Estonia Korea, Rep. Saudi Arabia
Australia Faeroe Islands Kuwait Singapore
Austria Finland Liechtenstein Sint Maarten
Bahamas, The France Luxembourg Slovak Republic
Bahrain French Polynesia Macao SAR, China Slovenia
Barbados Germany Malta Spain
Belgium Gibraltar Monaco St. Martin
Bermuda Greece Netherlands Sweden
Brunei Darussalam Greenland New Caledonia Switzerland
Canada Guam New Zealand Trinidad and Tobago
Cayman Islands Hong Kong SAR, China
Northern Mariana Islands
Turks and Caicos Islands
Channel Islands Hungary Norway United Arab Emirates
Croatia Iceland Oman United Kingdom
Curaçao Ireland Poland United States
Cyprus Isle of Man Portugal Virgin Islands (U.S.)
Czech Republic Israel Puerto Rico
Denmark Italy Qatar
36

Appendix 4, Costs of doing a sport
Table 9: Cost of doing a sport, Categories used; $0-100, $101-1.000, $1.000-10.000 and $10.000+Sport discipline Most successful athletes from London Price of doing the sport Category
Archery Ki Bo Bae $1438.33 3Athletics All gold medal winners of different
disciplines$179.91 2
Badminton Yunlei Zhao $140.00 2Basketball Carmelo Anthony $0.00 1Boxing Nicola Adems $0.00 1Canoeing Ed Mckeever $3655.00 3Cycling Chris Hoy $15000.00 4Diving Ruolin Chen $0.00 1Equestrian Charlotte Dujardin $10000000.00 4Fencing Elisa di Francisca $170.00 2Field Hockey Naomi van As $274.94 2Football Giovanni dos Santos $0.00 1Gymnastics Alexandra Raisman $0.00 1Handball Luc Abalo $0.00 1Judo An Kum Ae $0.00 1Modern pentathlon David Svoboda $892.00 2Rowing Filip Adamski $13470.00 4Sailing Ben Ainslie $20000.00 4Shooting Jin Jongoh $.000.00 3Swimming Micheal Phelps $0.00 1Synchronized swimming
Natalia Ishchenko $0.00 1
Table tennis Xiaoxia Li $153.49 2Taekwondo Joel Gonzalez Bonilla $0.00 1Tennis Serena Williams $149.00 2Triathlon Alistair Brownlee $8092.00 3Volleyball Danielle Lins $0.00 1Water polo Betsey Armstrong $0.00 1Weightlifting Xiaoiun Lu $0.00 1Wresting Jordan Ernest Burroughs $0.00 1
37

Calculations of table 9, cost of doing the sport, prices autumn 2012
Archery Equipment Price Source
Ki Bo Bae Samick master riser $699 http://www.lancasterarchery.com/samick-master-max-25-recurve-riser.html
Shibuya Ultima RC 520 Carbon Recurve Sight
$299.99 http://www.lancasterarchery.com/shibuya-ultimar-rc-520-carbon-recurve-sight.html
Beiter Insert Nock 10x$1.17 http://www.lancasterarchery.com/beiter-insert-nocks-12-1-12-2-19-1-19-2.html
Easton X10 Stainless Steel Break-off Point
10x$3.17 http://www.lancasterarchery.com/easton-x10-stainless-steel-break-off-points-100-120-gr.html
W&W HMC PLUS Extender $39.99 http://www.lancasterarchery.com/w-w-hmc-plus-extender.html
W&W HMC PLUS Side Rod $54.99 http://www.lancasterarchery.com/w-w-hmc-plus-side-rod.html
W&W HMC PLUS Carbon Stabilizer $109.99 http://www.lancasterarchery.com/w-w-hmc-plus-carbon-stabilizer.html
Beiter plunger button $159.99 http://www.pats-archery.com/Beiter?product_id=262
Beiter Clicker Silver Blade $14.99 http://www.lancasterarchery.com/beiter-clicker-silver-blade.html
Hoyt super rest $2.50 http://www.lancasterarchery.com/hoyt-super-rest.html
JVD Cordovan Finger Tab $13.49 http://www.lancasterarchery.com/jvd-cordovan-finger-tab.html
Total: $1438.33
Athletics Equipment Price Source
Renaud Lavillenie
Pole vault USC 5,20meter $629.99 http://www.clicksports.co.uk/products/vaultingpoles/
Pars Krisztian
Hammer throwing $199.99 https://www.stackhouseathletic.com/products/track-field/hammers/stainless-steel-hammer
Walcott Keshorn
Champion steel 800 javelin $914.00 https://www.stackhouseathletic.com/products/track-field/javelins/mens-elite/TJC90
Robert Harting
Canterbrian Black Olympia discus $179.00 https://www.stackhouseathletic.com/products/track-field/discus/cantabrian/cantabrian-black-olympia
Majewski Tomasz
Nishi Iron shot put $235.99 http://www.nishi.com/english/pdf/throwing-implements.pdf
Ashton Eaton
Decathlon $2158.97 All above equipment
Total: $179.91 (24 medal event, 6 with equipment 18 without) $4317.94/24 = $179.91
Badminton Equipment Price Source
Yunlei Zhao Li-Ning N60 Badminton Racket $140.00 http://www.li-ning-badminton.com/rackets/windstorm/li-ning-n60-badminton-racket-detail
Total: $140.00
38
Canoeing Equipment Price Source
Ed McKeever
Nelo k1 Quattro L $3250 http://www.mar-kayaks.pt/en/kayaks/details/k1_quattro_l/
Braca 1 pedals $405 http://www.kayakpro.com/kp/kayakpro2/wwwhtml/contents/bracas.htm
Total: $3655
Cycling Equipment Price Source
Chris Hoy Bike $15000 http://www.thesun.co.uk/sol/homepage/sport/olympics/4476286/Chris-Hoy-wonder-bike.html
Total: $15000
Equestrian Equipment Price Source
Charlotte Dujardin
Horse Valegro $10000000
http://sports.yahoo.com/news/olympics--great-britain-s-olympic-champion-equestrian-dressage-team-horses-valegro--uthopia-and-alf-put-up-for-sale.html
Total: $10000000
Fencing Equipment Price Source
Elisa di Francisca
BF Blue FIE Electric Foil w/French Grip
$170.00 http://shop.fencing.net/product_p/fdn-44500.htm
Total: $170.00
Field Hockey Equipment Price Source
Naomi van As
Adidas X24 compo 1 stick $274.94 http://www.longstreth.com/Adidas-X24-Compo-1-Composite-Field-Hockey-Stick/productinfo/AAX24C1/
Total: $274.94
Modern pentathlon
Equipment Price Source
David Svoboda
Eko aims laser pistol ELP-2011 L $699.00 www.eko-aims.com/binary/file/-/id/2/fid/65
BF Blue FIE Maraging Epee w/French Grip
$193.00 http://shop.fencing.net/product_p/fdn-31508.htm
Total: $892.00
39

Rowing Equipment Price Source
Filip Adamski
Hypercarbon K2 Shell $12.500 http://www.pocock.com/racing-shell-models/pocock-rowing-boats-pair-doubles/
Carbon seat $195 http://www.pocock.com/parts/seats/
Croker S4 Full carbon oars $775 http://www.crokerusa.com/pricing.php
Total: $13470
Sailing Equipment Price Source
Ben Ainslie Devoti Finn 2012 Model $20000 http://www.nbsailsports.com.au/store/product-info.php?pid923.html
Total: $20000
Shooting Equipment Price Source
Jin Jongoh Steyr LP 10E $2000 http://www.edinkillie.co.uk/ecatalog/steyr-lp10-air-pistol-p-390.html
Total: $2000
Table tennis Equipment Price Source
Xiaoxia Li Nittaku Lialox Penhold $89.99 http://www.paddlepalace.com/Lialox-Penhold/productinfo/PNLIAC/
DHS hurricane 3 Neo $22.49 http://www.megaspin.net/store/default.asp?pid=dhs-h3-neo
Nittaku refoma $42.00 http://www.tabletennisdb.com/rubber/nittaku-refoma.html
Total: $154.48
Tennis Equipment Price Source
Serena Williams
Wilson BLX Blade Team $149 http://www.tennis-warehouse.com/Wilson_BLX_Blade_Team/descpageRCWILSON-WBXBTE.html
Total: $149
Triathlon Equipment Price Source
Alistair Brownlee
AiR ultralight UD full carbon $8092 http://www.boardmanbikes.com/road/air98.html
Zipp 404 Firecrest tubularSRAM Red brakes, chainset, gearingRitchey Superlogic / WCS Carbon
Total: $8092
40

Appendix 5, Z-test results
The z-test, since n=1559, needs to check whether the coefficients of the developed and developing dummies are different between categories 1-4. The following formula is being used:
Ztest=X i – X j−(μ i−μ j)
√ σ i2
ni+
σ j2
n j
(ui – uj)= 0 because there is no reason to belief there is an expected difference between the coefficients. Where Xi and Xj are the observed coefficients and i and j the models 1-4. This gives us the following hypothesis:
H0: Xi = Xj
Ha: Xi ≠ Xj
From table 5 the coefficients are taken and this gives the following outcomes if all models are checked with each other for developed and developing.
Table 10, z-values for developing and developed modelsDeveloping z-value Developed z-valueModel 1 and 2 2.2103 Model 1 and 2 1.3929Model 1 and 3 24.0336 Model 1 and 3 -3.2976Model 1 and 4 28.6440 Model 1 and 4 -6.6166Model 2 and 3 21.8759 Model 2 and 3 -4.3701Model 2 and 4 26.6370 Model 2 and 4 -7.6278Model 3 and 4 5.7725 Model 3 and 4 -2.7358
For the z-test it means when the z-value*>2.58 a significant difference in coefficients on a 99%
confidence level is proofed and therefore rejects the H0 hypothesis. If looked at table 10 it can be
seen that this is the case for almost all coefficients. For the coefficients of model 1 and 2 in
developing and developed this is not the case. However the coefficients from model 1 and 2 in
developing are still significant but on a 95% confidence level, because 2.2103>1.96. The
coefficients of developed in model 1 and 2 are not significant and therefore it cannot be said that
those coefficients are different from each other.
41