region, progress report on yemen and sudan · asian ldcs: afghanistan, angladesh, hutan, ambodia,...
TRANSCRIPT
Distr.
LIMITED
E/ESCWA/ECRI/2015/WP.2
6 March 2015
ORIGINAL: ENGLISH
ECONOMIC AND SOCIAL COMMISSION FOR WESTERN ASIA (ESCWA)
ISTANBUL PLAN OF ACTION FOR LEAST DEVELOPED
COUNTRIES IN THE ESCWA REGION, PROGRESS
REPORT ON YEMEN AND SUDAN
EMERGING AND CONFLICT RELATED ISSUES DIVISION,
SOFIA PALLI
United Nations
2015
_______________
Note: This document has been reproduced in the form in which it was received, without formal editing. The views expressed are
those of the author and do not necessarily reflect the position of the United Nations secretariat
15-00180
Foreword
Least Developed Countries (LDCs) are highly representative of the most vulnerable and marginalized
countries in the world. Currently forty eight in total, LDCs are characterized by structural vulnerabilities
to growth such as low per capita income, low levels of social and human development and often at a
geographical disadvantageous position. LDC’s together constitute 12 per cent of global population and,
as of 2010, contribute only by 1 per cent to global trade, and economic activity1.
In 2011, in a high-level meeting hosted by Turkey, LDC’s and the international community resolved to a
vision, taking the form of a mutually agreed compact towards sustainable development by 2020. The
Istanbul Plan of Action, acknowledging the structural vulnerabilities of LDC’s has a strong focus on
boosting productive capacities, supported by special measures to effectively engage in trade, build
human capacities, attract investment and participate in global production networks and value chains.
Structural transformation through increasing productive capacity comes hand in hand with the objective
to work towards achieving equitable economic growth to at least a level of 7 percent annually. The
overall target is for half of the countries to graduate from LDCs status by 2020. This ten year partnership
is developed across eight key areas: productive capacity, agriculture, food security and rural
development, trade, commodities, human and social development, multiple crises and other emerging
challenges, mobilizing financial resources for development and capacity building and good governance
at all levels, each supported by commitments for the international community and LDC’s.
Looking back at four years of implementation, this study will analyze progress and challenges met in
LDC’s in the ESCWA region, Yemen and Sudan with a strong focus on the special vulnerabilities these
countries are experiencing due to conflict and political instability.
1 UN-OHRLLS (2013), Vision20/20, the Istanbul Program of Action for Least Developed Countries, 2011-2020.
3
List of Least Developed Countries and Criteria for Graduation
African LDCs and Haiti: Angola, Benin, Burkina Faso, Burundi, Central African Republic, Chad, Democratic Republic of the
Congo, Djibouti, Equatorial Guinea, Eritrea, Ethiopia, Gambia, Guinea, Guinea-Bissau, Haiti, Lesotho, Liberia, Madagascar,
Malawi, Mali, Mauritania, Mozambique, Niger, Rwanda, Senegal, Sierra Leone, Somalia, Sudan (former) or South Sudan
and Sudan, Togo, Uganda, United Republic of Tanzania, Zambia.
Asian LDCs: Afghanistan, Bangladesh, Bhutan, Cambodia, Lao People’s Democratic Republic, Myanmar, Nepal, Yemen.
Island LDCs: Comoros, Kiribati, Sao Tome and Principe, Solomon Islands, Timor-Leste, Tuvalu, Vanuatu.
The list of LDCs1 is revisited every three years by the United Nations Economic and Social Council (ECOSOC), following
recommendations of the Committee for Development Policy (CDP). The criteria for inclusion as per the 2012 review are:
(a) Per capita income, based on a three-year average estimate of the per capita gross national income (GNI),
with a threshold of $992 for candidate countries for addition to the list, and a threshold of $1,190 for
graduation from LDC status;
(b) Human assets, involving a composite index (the Human Assets Index) based on the following indicators: (i)
nutrition (percentage of the population that is undernourished); (ii) health (child mortality ratio); (iii) school
enrolment (gross secondary school enrolment ratio); and (iv) literacy (adult literacy ratio);
(c) Economic vulnerability, involving a composite index (the Economic Vulnerability Index) based on the
following indicators: (i) natural shocks (index of instability of agricultural production; and the percentage of
victims of natural disasters); (ii) trade-related shocks (index of instability of exports of goods and services); (iii)
physical exposure to shocks (proportion of population living in low-lying areas); (iv) economic exposure to
shocks (share of agriculture, forestry and fisheries in gross domestic product (GDP); index of merchandise
export concentration); (v) smallness (population in logarithm); and (vi) remoteness (index of remoteness). In all
three criteria, different thresholds are used for identifying countries to be added to the list of LDCs, and those
that should graduate from the list.
Each country’s eligibility as an LDC depends on meeting all three criteria while having a population no greater than 75
million. However, the inclusion of the country in the LDC’s category depends on its government accepting this status and
the measures that this entails. A country will normally qualify for graduation from LDC status if it has met graduation
thresholds under at least two of the three criteria in at least two consecutive triennial reviews of the list. However, if the
per capita GNI of an LDC has risen to a level at least double the graduation threshold, the country is eligible for
graduation regardless of its performance under the other two criteria.
Source: UN Department of Economic and Social Affairs, Committee for Development Policy accessed at:
http://www.un.org/en/development/desa/policy/cdp/ldc_info.shtml
4
I. Introduction
Sudan and Yemen, the conflict affected Least Developed Countries (LDC) in Western Asia, are expected
to significantly lag behind the IPoA graduation criteria from the LDC category. Despite positive
developments in other LDC’s, meaningful socio-economic changes are still slow and uneven for both
countries. While growth of LDC’s economies, in total will continue to surpass global averages, with an
expected acceleration from 5.3 per cent in 2014 to 5.7 per cent in 2015 and 5.9 per cent in 20162,
growth rates have contracted by almost half for both Sudan and Yemen following secession with South
Sudan and onset of conflict for Yemen3. Fiscal deficit for Yemen is still at about eight percent of Gross
Domestic Product (GDP) and its economy in overall, which contracted at about 12 percent in 20114, is
still to recover. Likewise, following the secession with South Sudan, Sudan’s economy contracted by
almost 7 percent during 2012-2013 and is slowly on the road to recovery. Repeated cycles of political
and criminal violence are also key factors for persistent poverty levels5 in both countries, despite rapid
progress in reducing poverty in other LDC’s, primarily in Asia.
The governments’ efforts towards establishing robust and responsive governance systems and
capacities that would sustain a resilient economy towards external and internal shocks have been
impaired by protracted internal conflict and emerging challenges such as the global financial, food and
oil price crises. Weak human, technological and institutional capacities, coupled with scarcity of
domestic resources and inequality induces a vicious cycle of low productivity and investment and limited
technology transfer. Poverty is deeply entrenched and primarily rural, which signals the need for
diversifying rural economies by raising labour productivity in agriculture but also expand livelihood
opportunities into non farm activities.
Depleting oil outputs6, against low oil prices has eroded other sectors of the economy, thus highlighting
the inherent vulnerabilities of overreliance on one sector. While Sudan and Yemen have different
development trajectories, both countries witness unpredictable and declining oil revenues, dependence
2 UN DESA (2015), World Economic Situation and Prospects, p. 7
3 Ibid, p.13 In Yemen, growth of GDP is estimated to have decreased by more than half to 2.1 per cent in 2014,
with a moderate acceleration in growth to 3.7 per cent expected in 2015.
4 Yemen, National Statistics Office, annual GDP growth,
5 Recent estimates for Yemen suggest that poverty rate stands at 42% in 20095 to 54.5% in 2012 (WB: Yemen
Country Overview, updated in September 2014). Poverty estimates for Sudan are equally alarming with 46.5%
living in poverty5.
5 Poverty rates increased according to the 2010 food poverty line (extreme poverty) from 12.46%
to 16.15% or about 30% compared to UNDP/World Bank/Government of Yemen, Poverty Assessment for 2005-
2006. Both the poverty gap and severity intensified by a more accelerated rate than that of the proportion of the
poor.
6 See section C and D; Political instability has led to severe declines in oil output, reducing oil revenues by about
one third in the first half of 2014.
5
on foreign Aid primarily in response to humanitarian needs, a weak service sector and a deteriorating
agricultural sector, unable to service livelihood needs for the growing number of rural households,
falling into poverty and food insecurity. The repercussions of overdependence on one sector and neglect
of agricultural development are also reflected in both countries’ increasing rates of rural and urban,
unemployment, - primarily among the youth -. In 2011, just in the aftermath of political turmoil, ten
million Yemenis, nearly half of the population were reported as food insecure. On the other hand,
Sudan’s unsustainable debt burden, in absence of common positioning with South Sudan, and US
imposed sanctions; fiscal deficits and protracted conflict in Darfur hinder the government’s capacity
towards sound planning for macroeconomic stability.
On the governance level, Yemen’s transitional Government is facing daunting challenges due to political
instability with the most recent scaling up of violence following Yemen's Houthi movement capturing
the presidential palace in January 21st, 2015. Encouraging trends following the National Dialogue
Outcomes through 2014 are again under risk, pending on a new agreement reached by the parties in
conflict.
Key Messages
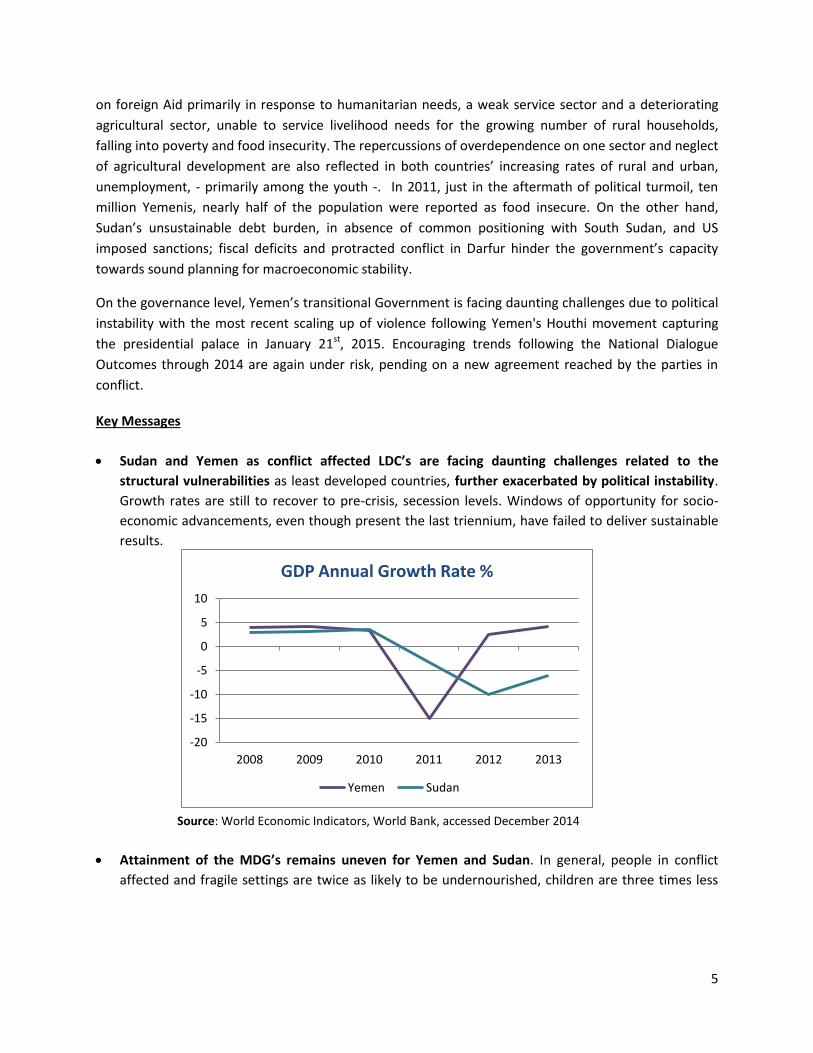
Sudan and Yemen as conflict affected LDC’s are facing daunting challenges related to the
structural vulnerabilities as least developed countries, further exacerbated by political instability.
Growth rates are still to recover to pre-crisis, secession levels. Windows of opportunity for socio-
economic advancements, even though present the last triennium, have failed to deliver sustainable
results.
Source: World Economic Indicators, World Bank, accessed December 2014
Attainment of the MDG’s remains uneven for Yemen and Sudan. In general, people in conflict
affected and fragile settings are twice as likely to be undernourished, children are three times less
-20
-15
-10
-5
0
5
10
2008 2009 2010 2011 2012 2013
GDP Annual Growth Rate %
Yemen Sudan
6
likely to attend school, while children under five are twice as likely to die before the age of five7.
Renewed predictable funding and political resolve are essential in the Post 2015 framework.
External stresses and shocks tend to heavily impact on conflict affected LDC’s capacities to absorb or
mitigate risks. Oil price volatility, climate change and spillover effects from neighboring conflicts are
important factors in increasing the likelihood of risk resulting into new cycles of violence. Conflict
prevention measures with adequate early warning and risk assessment tools can assist better
prepare and mitigate adverse impacts of shocks. Far more so than in stable LDC’s, addressing such
external stresses needs to be embedded in national strategies and translated into special support
measures to this effect by the international community.
Yemen and Sudan, will need to focus their efforts in diversifying the largely agrarian economies and
build their productive capacities by creating decent jobs for the alarming number of their
unemployed youth. This in public policy will mean that other reforms will need to be sequenced or
delayed on the road to recovery.
Both Yemen and Sudan, experience wide disparities in income and resource distribution across
governorates, in many cases triggering internal conflict. In Sudan, power and resources tend to be
restricted in and around Khartoum, whereas in Yemen resource distribution has favored certain
groups over others. However, while income inequality is a determinant of other non-income
outcomes of well being (health, education, nutrition), it is not the only factor encouraging
inequalities. Institutions have a critical role to play. Governance failures, public policy biases, and
inefficient or ineffective service delivery systems are key drivers of inequalities and social exclusion.
Hence, providing equal opportunities across the country should be supported by responsive
governance institutions able to absorb and effectively address grievances among different territories
and groups.
Interventions in the aftermath of conflict should be aware of the interactions between the
proposed action and the context and be implemented in a conflict sensitive manner. In the
immediate aftermath of conflict, development partners channel support primarily through ad-hoc
initiatives and often pre-mature investment in capacity building. This has in cases resulted in ‘more
harm’ through, for instance, overcrowded public sectors that disproportionately responded to needs
of one group over another, hence generating new tensions. The comprehensive implementation of
reforms in national institutions is a slow and lengthy process. It will often have to prioritize certain
reforms at the expense of others and may fall short of donors’ expectations.
7 World Development Report (2011), p.6, Washington D.C
UNDP (2014), ‘Humanity Divided: Confronting Inequality in Developing Countries’, Bureau for Development Policy,
New York.
7
International assistance and aid allocation mechanisms differ in fragile situations. Aid
disbursement for Sudan and Yemen is currently an important source of external finance when
measured as a percent of GNI, on a per capita basis or as a proportion of the government budget.
For Yemen, in particular, ODA has tripled over the last three years. However, aid allocation needs
differ for conflict affected and fragile states. Measures for rapid disbursements vis a vis, impaired
government capacities often result in delays, jeopardizing life saving financing needs but also
compromising the recipient country’s ownership over proposed policy mechanisms. In addition,
while external financing is important at the early stages of recovery, measures for aid management
need to be in place to improve public finance mechanisms which will later on capitalize on the
strengthened national capacities for domestic resource mobilization.
A. Productive capacity building
1. Infrastructure, Energy and ICT
Sudan
Sudan’s power generation capacity has gradually increased in the last years, rising from around 800
megawatts (MW) in 2005 to 3,187 MW in 20138, with a clear shift towards hydropower. Sudan has the
potential to become a key hydropower exporter, if relevant capacities and funding are strengthened and
integration with neighboring Nile Basin countries increased. However, accessibility and service coverage
remains challenging with the majority of rural population lacking access to reliable electric supply.
Infrastructure has been destroyed or severely damaged across the country with conflict affected areas
suffering the most. Children and women are particularly affected by insufficient and erratic service.
Infrastructure projects are among Asian and Arab investors’ top priorities in the country. In March 2011,
for instance the Kuwait-based Arab Fund for Economic and Social Development granted Sudan US$350
million in concessional loans for infrastructure projects9.
In ICT, Sudan has also made efforts in liberalizing the telecommunications sector (national Sudatel
privatized over a decade ago) and has managed to attract significant private capital mainly from Gulf
countries. Mobile penetration has also vastly expanded from coverage of less than 1 percent in 2000 to
33 percent in 2009 and 60.5% in 201210. The country enjoys a relatively well equipped
telecommunications infrastructure, including a national fibre optics backbone and international fibre
connections. Sudan declared the year 2015, as the e-Government year, during which numerous e-
8 UNIDO, (2013), World Small Hydropower Development Report 2013, Sudan, accessed at
http://www.smallhydroworld.org/fileadmin/user_upload/pdf/Africa_Northern/WSHPDR_2013_Sudan.pdf
9 United Nations Development Group, (2012), Sudan Country Analysis.
10 The subscriber base from 23,000 in 2000 to 27,657,875 in 2013, while the fixed telephone subscription shows a
moderate general decrease since 2004.
8
service initiatives will take place. Sudan has also established an African City for Technology to encourage
youth initiatives in ICT and Technology. Reducing youth unemployment could be addressed by
supporting technology incubators and promoting entrepreneurship among university graduates. Sudan
has established a national team to develop e-Learning strategy and in February 2015, the Ministry of
Science and Technology announced in Feb 2015, a plan to develop the first e-School in Sudan.
In the transport sector, even though the road network almost doubled in length to 6,200 kilometers
(km) between 2000 and 2008, large volumes of unpaved roads11 still exist12. Rural connectivity remains
challenging with only a few main road arteries operating. Road density is low while disruptions due to
conflict and low quality roads have a negative impact on traffic of transport routes. The Government of
Sudan, reports that a priority for the next five years would be to improve infrastructure to achieve
greater regional integration. Sudan has also great potential to benefit more from its natural sea road
through its Red Sea port. The main highway linking Khartoum to Port Sudan is at a distance of
approximately 630 miles. The GoS with support from the World Bank is currently constructing a new
highway at a shorter distance which will substantially reduce transportation costs13.
Yemen
Infrastructure in Yemen has been severely affected by the political turmoil in 2011, causing protracted
disruptions in power generation. In governorates in the highlands, which were already in isolation,
lacking even basic infrastructure, the conflict further exacerbated the situation by disrupting transport
routes, prohibiting access to markets and in many cases leaving communities without electricity for
extended periods. Damages on the pipelines, severely affected oil production and exports, Yemen’s
main contributor to growth.
Yemen has among the lowest ratings in terms of access to electricity in the region, with only 54% of the
population having access, out of which 42% live in rural areas. The country’s main Public Electricity
Company (PEC) grid is servicing primarily urban centers and has vastly excluded southern areas. On the
positive side, Yemen has a high potential on renewable sources, having one of the world’s highest levels
of solar radiation and wind. These resources are reported capable of providing necessary resources for
extending energy supplies of rural communities in the highlands while also advancing large-scale
commercial power development. The Government of Yemen (GoY) has prioritized renewable energy use
in its development plan; setting a target of 15-20 per cent increase of renewable energy share in total
electricity generation by 202514. However, its potential is highly dependent on external funding.
11
The total paved highway is only around 2, 250 miles.
12 No updated data for paved roads % in Sudan.
13 World Bank (2013), Khartoum - Road Sudan Rehabilitation Project:
http://www.worldbank.org/projects/P002626/khartoum-port-sudan-road-rehabilitation-project?lang=en
14 Sustainable Energy Regulation Network (SERN), Country Profile, Yemen, accessed at
http://www.reegle.info/policy-and-regulatory-overviews/YE
9
In terms of ICT maturity15, Yemen is among the lowest ranking countries in the ESCWA region, meaning
a) low ICT penetration rates and unfavorable market conditions, b) scarce international connectivity to
the Internet backbone, c) poor Internet infrastructure and low dissemination, especially for broadband,
inadequate national backbone and limited number of internet players. However, on the positive side,
connectivity has increased and so has the number of private sector companies involved in the sector.
This partly explains the number of mobile telephone subscribers increasing by 129 per cent, despite
political turmoil.
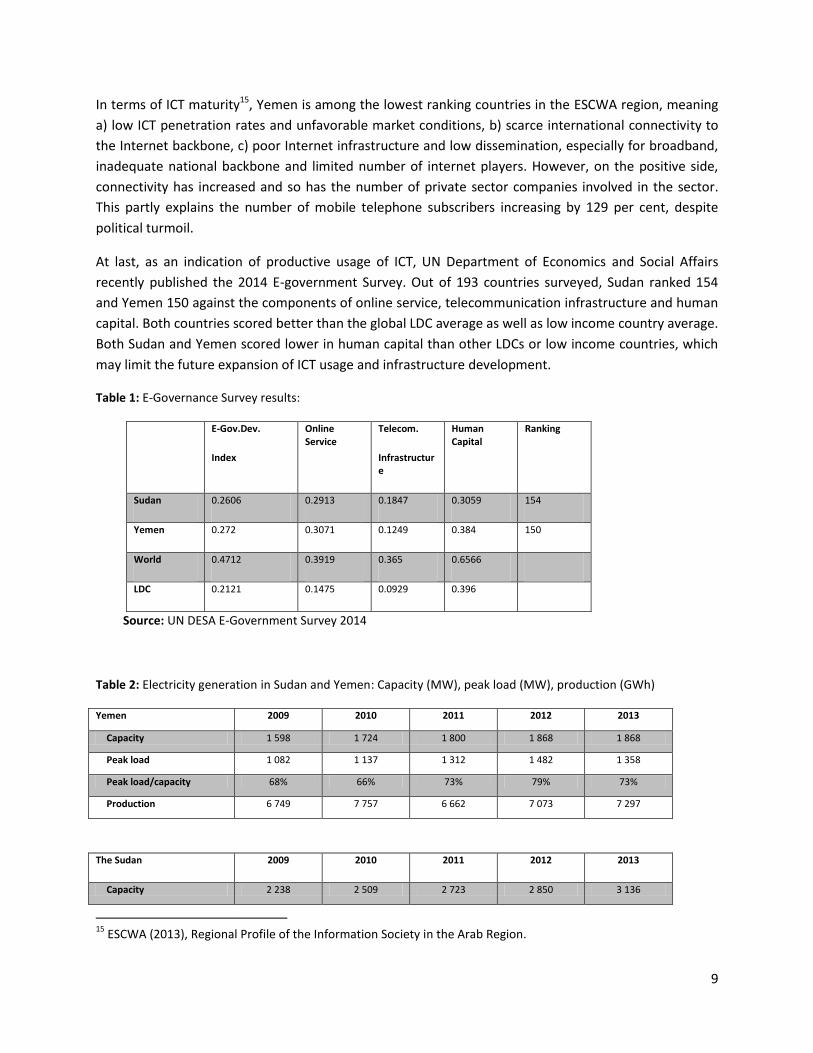
At last, as an indication of productive usage of ICT, UN Department of Economics and Social Affairs
recently published the 2014 E-government Survey. Out of 193 countries surveyed, Sudan ranked 154
and Yemen 150 against the components of online service, telecommunication infrastructure and human
capital. Both countries scored better than the global LDC average as well as low income country average.
Both Sudan and Yemen scored lower in human capital than other LDCs or low income countries, which
may limit the future expansion of ICT usage and infrastructure development.
Table 1: E-Governance Survey results:
E-Gov.Dev.
Index
Online Service
Telecom.
Infrastructure
Human Capital
Ranking
Sudan 0.2606 0.2913 0.1847 0.3059 154
Yemen 0.272 0.3071 0.1249 0.384 150
World 0.4712 0.3919 0.365 0.6566
LDC 0.2121 0.1475 0.0929 0.396
Source: UN DESA E-Government Survey 2014
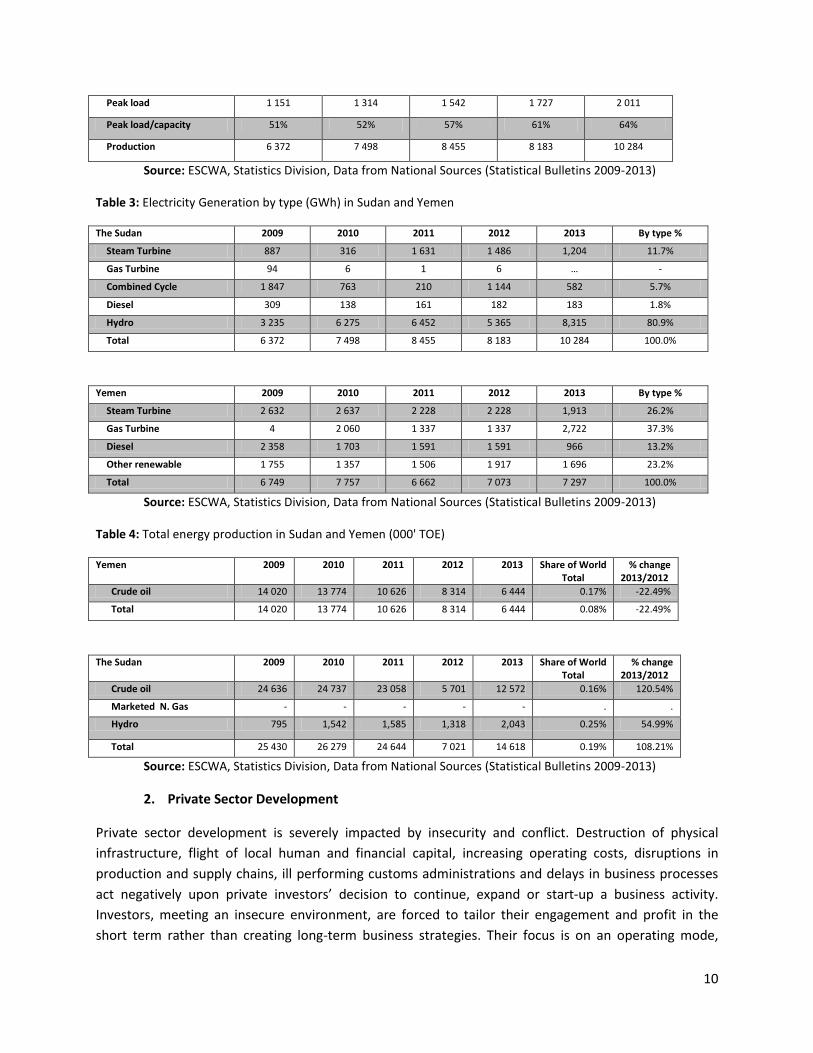
Table 2: Electricity generation in Sudan and Yemen: Capacity (MW), peak load (MW), production (GWh)
Yemen 2009 2010 2011 2012 2013
Capacity 1 598 1 724 1 800 1 868 1 868
Peak load 1 082 1 137 1 312 1 482 1 358
Peak load/capacity 68% 66% 73% 79% 73%
Production 6 749 7 757 6 662 7 073 7 297
The Sudan 2009 2010 2011 2012 2013
Capacity 2 238 2 509 2 723 2 850 3 136
15
ESCWA (2013), Regional Profile of the Information Society in the Arab Region.
10
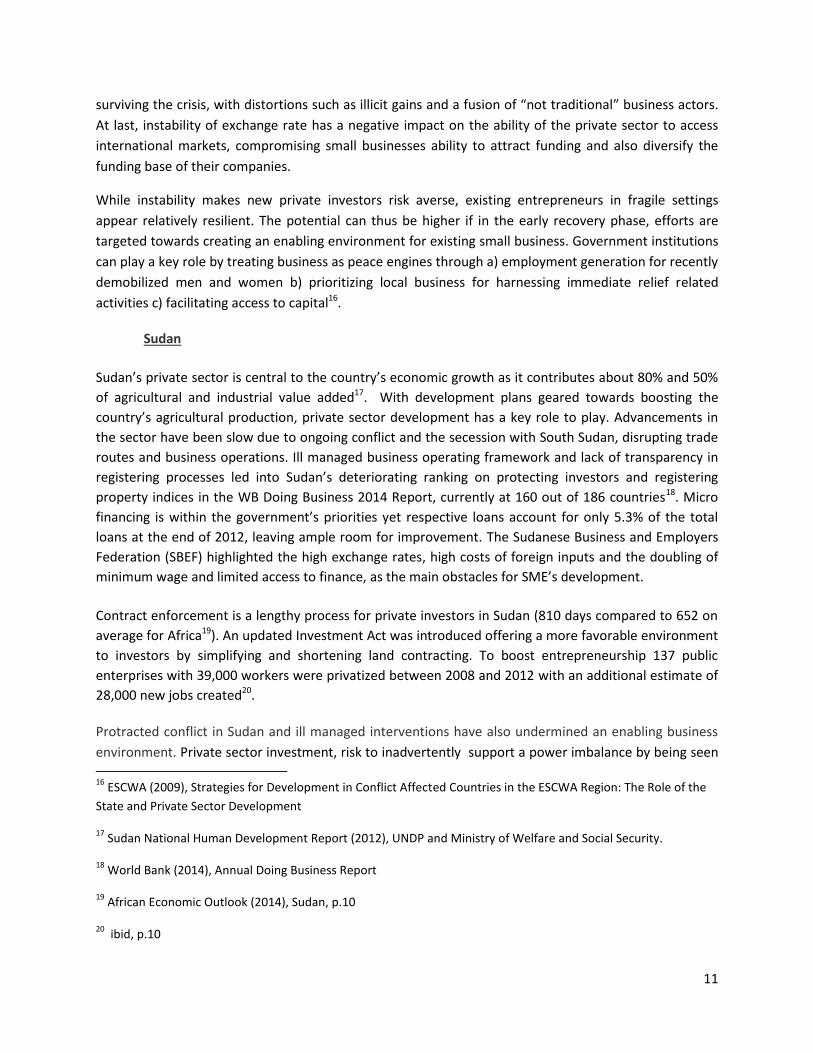
Peak load 1 151 1 314 1 542 1 727 2 011
Peak load/capacity 51% 52% 57% 61% 64%
Production 6 372 7 498 8 455 8 183 10 284
Source: ESCWA, Statistics Division, Data from National Sources (Statistical Bulletins 2009-2013)
Table 3: Electricity Generation by type (GWh) in Sudan and Yemen
The Sudan 2009 2010 2011 2012 2013 By type %
Steam Turbine 887 316 1 631 1 486 1,204 11.7%
Gas Turbine 94 6 1 6 … -
Combined Cycle 1 847 763 210 1 144 582 5.7%
Diesel 309 138 161 182 183 1.8%
Hydro 3 235 6 275 6 452 5 365 8,315 80.9%
Total 6 372 7 498 8 455 8 183 10 284 100.0%
Yemen 2009 2010 2011 2012 2013 By type %
Steam Turbine 2 632 2 637 2 228 2 228 1,913 26.2%
Gas Turbine 4 2 060 1 337 1 337 2,722 37.3%
Diesel 2 358 1 703 1 591 1 591 966 13.2%
Other renewable 1 755 1 357 1 506 1 917 1 696 23.2%
Total 6 749 7 757 6 662 7 073 7 297 100.0%
Source: ESCWA, Statistics Division, Data from National Sources (Statistical Bulletins 2009-2013)
Table 4: Total energy production in Sudan and Yemen (000' TOE)
Yemen 2009 2010 2011 2012 2013 Share of World Total
% change 2013/2012
Crude oil 14 020 13 774 10 626 8 314 6 444 0.17% -22.49%
Total 14 020 13 774 10 626 8 314 6 444 0.08% -22.49%
The Sudan 2009 2010 2011 2012 2013 Share of World Total
% change 2013/2012
Crude oil 24 636 24 737 23 058 5 701 12 572 0.16% 120.54%
Marketed N. Gas - - - - - . .
Hydro 795 1,542 1,585 1,318 2,043 0.25% 54.99%
Total 25 430 26 279 24 644 7 021 14 618 0.19% 108.21%
Source: ESCWA, Statistics Division, Data from National Sources (Statistical Bulletins 2009-2013)
2. Private Sector Development
Private sector development is severely impacted by insecurity and conflict. Destruction of physical
infrastructure, flight of local human and financial capital, increasing operating costs, disruptions in
production and supply chains, ill performing customs administrations and delays in business processes
act negatively upon private investors’ decision to continue, expand or start-up a business activity.
Investors, meeting an insecure environment, are forced to tailor their engagement and profit in the
short term rather than creating long-term business strategies. Their focus is on an operating mode,
11
surviving the crisis, with distortions such as illicit gains and a fusion of “not traditional” business actors.
At last, instability of exchange rate has a negative impact on the ability of the private sector to access
international markets, compromising small businesses ability to attract funding and also diversify the
funding base of their companies.
While instability makes new private investors risk averse, existing entrepreneurs in fragile settings
appear relatively resilient. The potential can thus be higher if in the early recovery phase, efforts are
targeted towards creating an enabling environment for existing small business. Government institutions
can play a key role by treating business as peace engines through a) employment generation for recently
demobilized men and women b) prioritizing local business for harnessing immediate relief related
activities c) facilitating access to capital16.
Sudan
Sudan’s private sector is central to the country’s economic growth as it contributes about 80% and 50%
of agricultural and industrial value added17. With development plans geared towards boosting the
country’s agricultural production, private sector development has a key role to play. Advancements in
the sector have been slow due to ongoing conflict and the secession with South Sudan, disrupting trade
routes and business operations. Ill managed business operating framework and lack of transparency in
registering processes led into Sudan’s deteriorating ranking on protecting investors and registering
property indices in the WB Doing Business 2014 Report, currently at 160 out of 186 countries18. Micro
financing is within the government’s priorities yet respective loans account for only 5.3% of the total
loans at the end of 2012, leaving ample room for improvement. The Sudanese Business and Employers
Federation (SBEF) highlighted the high exchange rates, high costs of foreign inputs and the doubling of
minimum wage and limited access to finance, as the main obstacles for SME’s development.
Contract enforcement is a lengthy process for private investors in Sudan (810 days compared to 652 on
average for Africa19). An updated Investment Act was introduced offering a more favorable environment
to investors by simplifying and shortening land contracting. To boost entrepreneurship 137 public
enterprises with 39,000 workers were privatized between 2008 and 2012 with an additional estimate of
28,000 new jobs created20.
Protracted conflict in Sudan and ill managed interventions have also undermined an enabling business
environment. Private sector investment, risk to inadvertently support a power imbalance by being seen 16
ESCWA (2009), Strategies for Development in Conflict Affected Countries in the ESCWA Region: The Role of the
State and Private Sector Development
17 Sudan National Human Development Report (2012), UNDP and Ministry of Welfare and Social Security.
18 World Bank (2014), Annual Doing Business Report
19 African Economic Outlook (2014), Sudan, p.10
20 ibid, p.10
12
as supporting one group over another, by employing communities from one region over another etc.
Conflict blind interventions often lead into an informal, highly distorted trade economy which has been,
to some extent, the case in Sudan. The international community, through the “New Deal” highlights
different ways of engagement in fragile states, including with the private sector. Becoming conflict-
sensitive, is one of them and it involves a deeper understanding of the interaction between the
operating environment and the intervention. Within this framework, (SBEF), the South Sudan Business
Union and Global Compact Organization signed in November 2014 a Declaration and committed to
promote ethical business practices for peace21. In addition, on the positive side, the GoS with support
from UNIDO is working on an Industrial Modernization Program which will help boost agro-industrial
value addition. The programme covers six sectors: leather and leather good manufactories; fisheries;
agriculture fertilizers; animal feed; food processing sector; fresh fruit and vegetables; groundnut and
edible oil products; and cotton lint and spinning/textile22.
Yemen
In Yemen, efforts yielding results in private sector and SMEs development from 2007 until 2012 have
been unfortunately compromised by political instability. Prior to political turmoil, the country’s central
bank with support from the donor community had set up and provided training through its Microfinance
Unit, while it also established two mincrofinance banks. Loan disbursement to SME’s were steadily
rising.
Private sector in Yemen, consists primarily of micro, small and medium enterprises (MSMEs) – over 97%
of firms (about 290,000) have less than 25 employees with total estimated employment of over 600,000
workers, including approximately 30,000 women23. The Transitional Plan for Security and Development
(TPSD) prioritizes job creation, linking MSME development not only to private sector development, as
well as to the social equity and protection agenda. The 2012 rapid assessment of the effects of the crisis
on businesses in Yemen, found that over 75% of firms surveyed identified electricity, macroeconomic
stability, political instability and corruption as major obstacles to their business, whilst over 40% of their
value sales decreased since the beginning of the crisis in 2011. The Social Fund for Development in
Yemen, reports that public lending to SMEs has steadily increased since 2003, reaching its pick at 2010.
In 2011, however, loan disbursed to MFIs dropped from about YR 1.2 billions to a little more than YR 860
millions, again, due to the 2011 crisis24.
21
SBEF and Global Compact (2014), Declaration on Promoting Business for Peace, accessed at :
https://www.unglobalcompact.org/docs/news_events/9.6/Sudan-SouthSudan_BusinessDeclaration.pdf
22 UNIDO (2013),’USD 11m programme for industrial modernization of Sudan presented by UNIDO ’accessed at
http://www.unido.org/news/press/usd-unido.html
23 Central Statistic Office of Yemen, data from 2004, extracted from Stimulating Business and Employment in
Yemen, Nabila Assad, World Bank, Middle East and North Africa Region.
24 Social Fund for Development, Yemen (2011) , Small and Micro Enterprises Development in Yemen and Future
Projects, p.62
13
Nevertheless, the GoY highlights the strengh of private sector in reviving the economy and it has in
November 2014 signed a Memorandum of Understanding (MOU) with the Yemeni private sector to
foster an enabling environment for business creation and youth employment25. The MOU introduces a
formal dialogue mechanism, the establishment of a Joint Committee on Small and Medium Enterprises
and private sector engagement in value chain development. It also touches upon legislative reforms to
combat corruption, protect private property and set up fundamentals of a favorable investment
environment.
At last, prior crisis, Yemen’s ratings in the World Bank's annual Doing Business reports, which compare
the business and investment climates of countries around the world, demonstrated a steady
improvement. From 2008 to 2011, Yemen's overall ranking improved from 123rd to 94th, while its rating
as a location to start a business jumped from 178th to 55th. From 2009 to 2011, the country rose 35
places in the 'getting credit' index, moving up from 174th to 139th. However the instability following the
years after 2011 have pushed the country back to pre 2007 ratings.
B. Agriculture, Food Security and Nutritional Scarcity and Rural Development
Productive capacity building relates to the structural transformation of LDC’s economies towards
economic sectors and activities with higher value added. This translates into changes in the composition
of employment and diversified production and exports. The quality of employment to support increased
productivity is at stake here. Productive and remunerative employment with focus on creating
incentives for self employment is necessary. In the absence of those, people living in poverty can result
into informal labour and small-scale family agriculture.
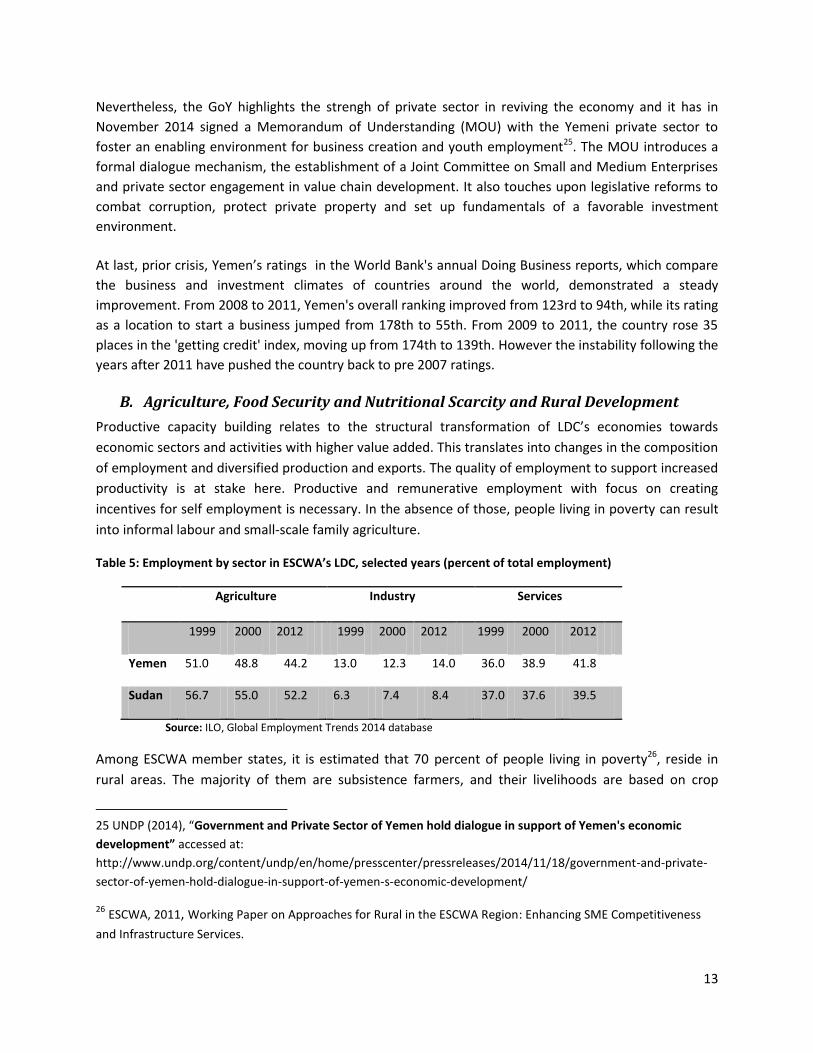
Table 5: Employment by sector in ESCWA’s LDC, selected years (percent of total employment)
Agriculture Industry Services
1999 2000 2012 1999 2000 2012 1999 2000 2012
Yemen 51.0 48.8 44.2 13.0 12.3 14.0 36.0 38.9 41.8
Sudan 56.7 55.0 52.2 6.3 7.4 8.4 37.0 37.6 39.5
Source: ILO, Global Employment Trends 2014 database
Among ESCWA member states, it is estimated that 70 percent of people living in poverty26, reside in
rural areas. The majority of them are subsistence farmers, and their livelihoods are based on crop
25 UNDP (2014), “Government and Private Sector of Yemen hold dialogue in support of Yemen's economic
development” accessed at:
http://www.undp.org/content/undp/en/home/presscenter/pressreleases/2014/11/18/government-and-private-
sector-of-yemen-hold-dialogue-in-support-of-yemen-s-economic-development/
26 ESCWA, 2011, Working Paper on Approaches for Rural in the ESCWA Region: Enhancing SME Competitiveness
and Infrastructure Services.
14
cultivation, herding and fishing. The limited availability of landholdings, water scarcity, caused by low
and declining groundwater levels, erratic weather conditions and low rates of productivity, severely
affect food production, food security and rural incomes. As in the great majority of LDC’s, the necessary
additional income which could lift people out of poverty is needed most by people living in rural areas.
Even against the current scenario of rapid urbanization growth, the possibility of poverty reduction by
industrial development alone is limited due to social and environmental considerations related to the
nature of urbanization. Renewed attention to rural development with measures to increase agricultural
productivity through non-agricultural activities and the generation of non-farm income sources is
essential.
Violent conflicts in both Yemen and Sudan have destroyed critical infrastructure, dwellings, farms and
forced people to flee their bases. They exacerbated poverty, forced people to food insecurity, disrupted
livelihoods and local economies while eroding development gains. Sustained political commitment
towards the sector hosting the largest share of world’s poor is a prerequisite for building resilient rural
communities and creating an enabling environment for improving food security through adequate
investments and effective service delivery.
1. Agriculture
Sudan
Sudan witnessed, as a result of the secession, the loss of significant human and land resources as well as
access to three quarters of the country’s oil. In particular, secession reduced the Sudan’s total area by
one quarter, with arid lands increasing from 65 to almost 90 per cent27. Despite this fact, 75 per cent of
previously classified as arable land is still within the borders of Sudan, out of which only 16.8 milion
hectares are reported as cultivated, leaving an ample space for improvement28. Moreover, decreases are
also evident in the livestock population, by 28 per cent to 104 million head, during 2012. The
government of Sudan has channeled funds towards large scale irrigation, yet it is still only covering 9
percent of the cultivated land.
Agriculture provides employment for approximately 70 per cent of the labour force in rural areas29. With
nearly two thirds of the country’s population depending on agriculture for food supplies and income,
this sector is critical in assisting households recovering post crisis. Agricultural productivity in the Sudan
is low and variable. Unstable rainfall levels and erratic climatic conditions, degraded soils, water
scarcity, limited access to rural credit facilities, protracted conflict and related displacement, increasing
food prices, are some of the challenges affecting farmers’ livelihoods. In addition, in the country’s acute
poverty areas, the rapidly increasing population (IDPs and returnees) puts the already fragile ecosystems
under pressure.
27
IFAD (2013), Republic of the Sudan, Country Strategic Opportunities Program.
28 ibid
29 Sudan Population and Housing Census 2008
15
Despite good harvest during 2011, and 2012 Sudan remains a food deficit country with poverty deeply
entrenched and predominantly rural, affecting primarily farmers practicing rainfed agriculture. The
traditional rainfed farming includes about 10 million hectares and consists of household landholdings of
2-50 hectares. Productivity is declining, but use of improved practices in several projects has
demonstrated potential for major improvements. Livestock is also an important component of the
agricultural sector, with production based on traditional pastoral systems.
During 2014, the lean season started earlier and levels of stressed and crisis levels of food security are
expected to rise. The World Food Program reports that while Sudan typically produces a cereal surplus
for export, in 2014, the country is likely to face a cereal deficit of one million metric tones30.
On the institutional framework, the government has intensified efforts to diversify its crops (cereals,
beans, sisal hemp, fodder crops, horticulture crops); yet cotton and gum dominate agriculture exports.
Irrigation and transportation systems are among the biggest challenges to a diversified and dynamic
agricultural economy. The Government of Sudan (GoS) has successfully engaged in partnerships with
domestic and foreign investors so as to increase agricultural exports and provide alternative
opportunities to substitute for losing oil revenues.
Yemen
Agriculture is an important pillar of Yemen’s national economy, accounting for 17.5% of GDP, by
livestock’s contribution at 20 per cent to this amount31. Agriculture, including transport, processing and
trading sectors employs about 54 per cent of the population.
The Yemeni Ministry of Agriculture was recording an average growth in production of value added
agriculture at about 7.5 per cent annually with all types of crops demonstrating positive growth and
largest gains in grain, coffee and honey. As in the Sudan, poverty is primarily rural, affecting subsistence
farming.
Political instability, civil conflict across the country and protracted displacement of population has had a
detrimental impact on agricultural livelihoods, resulting in extensive loss of livestock, crops and a
twofold increase in the number of food insecure households the last two years. Scarce water resources
alongside disputes over its management, limited arable land, and limited agricultural investment are
among the biggest challenges of the agricultural sector.
30
WFP (2014), 2014 Second Quarterly Operational Briefing, Sudan, accessed at:
http://documents.wfp.org/stellent/groups/public/documents/resources/wfp264433.pdf
31 Government of Yemen, (2012), National Agriculture Sector Strategy 2012-2016
16
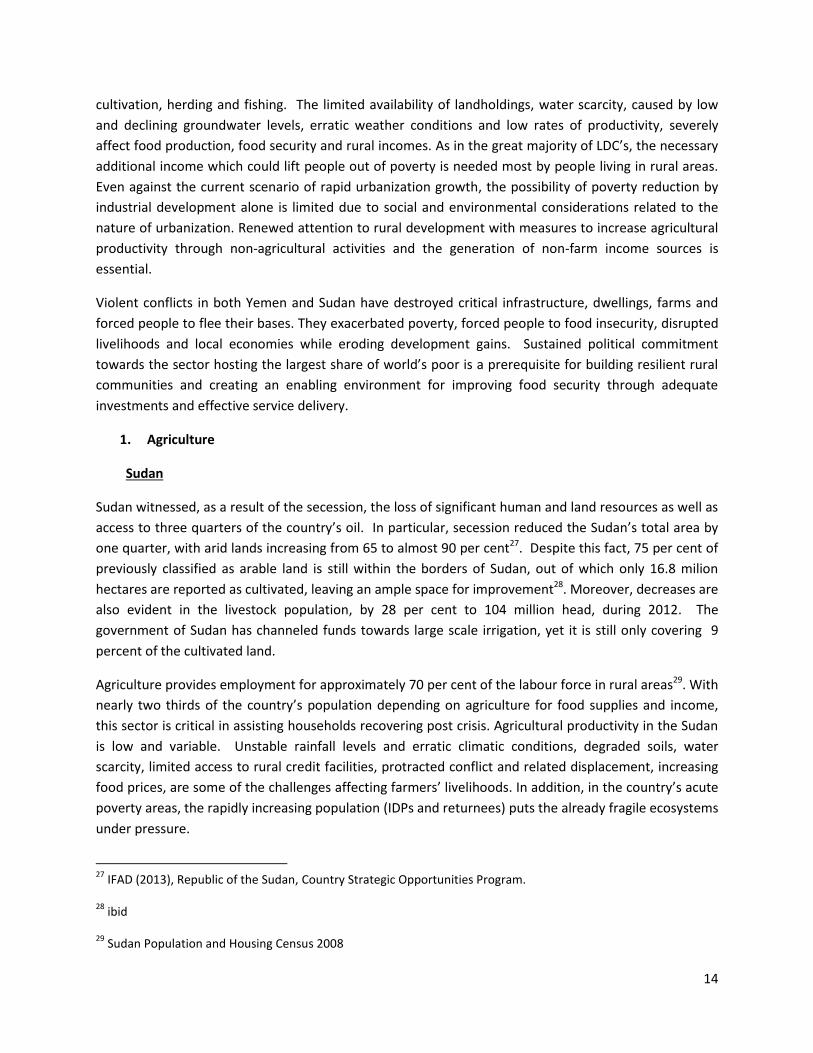
Yemen scores among the last in ESCWA region in regards to Credit to Agriculture…
Table 6: Share of Value Added in Agriculture, selected countries (2005 and 2010)
Source: FAO, Statistical Yearbook 2013, p.18
On behalf of the government, a new Strategy was drafted in 201232 covering the period up to 2016 and
is treating agriculture as the primary way to raise rural incomes and provide decent employment, while
making efficient use of natural resources and protecting the environment33.
2. Food Security
Sudan
Food security, since 2011, has slightly improved in the Sudan, primarily due to a good harvest during
2012/13, but the situation remains fragile. The total amount of food insecure population is recorded at
960,000 while 2.5 million people remain vulnerable. Protracted conflict in Darfur, entering its 11th year
32
Government of Yemen, (2012), National Agriculture Sector Strategy 2012-2016.
33 The Strategy’s objectives are to Raise domestic food production through improvement in input supply, increased
farmer awareness, and greater availability of agricultural credit; lead efforts to fight poverty in the rural
community through higher income to farmers and increased rural employment; preservation of the environment
and natural resources, and activating the role of community participation to ensure sustainability; improve
marketing efficiency and decrease post harvest losses and development of exporting capacities; donor efforts are
geared towards boosting food production through sharecropping, providing displaced and host community
farmers with agricultural inputs and tools to improve water harvesting and storage.
17
in 2015 has left around 2.9 million people in urgent need of food assistance, according to recent
estimates from OCHA34. North Darfur continues to be among the worst hit (17 percent) while East and
Central witnessed the highest improvements.
Projections for 2015 are also not promising as the combined impact of conflict in South Kordofan, Blue
Nile and Darfur states, a low 2014 crop production and increasing food prices can raise the number of
food insecure population up to 4 million.
At household level, food insecure households are usually confronted with multiple deprivations in terms
of geography and livelihoods opportunities. As in Yemen the profile of food insecure households
includes female headed households, lower educated and IDPs. Furthermore, young children are
reported to be among the most vulnerable with thirty five percent of children 6 to 59 months stunted,
16 percent waster and 32 underweight35. Primary shocks for households include price volatility, political
insecurity, quantity and distribution of rainfall.
Yemen
Since 2011, Yemen has witnessed a “sweeping decline in food security”36. In 2011, just in the aftermath
of political turmoil, ten million Yemenis, nearly half of the population were reported as food insecure.
These numbers represent an 87% increase, from 2009, on the population who has limited or no access
to sufficient, nutritious food or is eating a poor or borderline diet according to agreed international
standards. The situation has marginally improved in the course of 2013, with 42.5% of the population
remaining food insecure. Yemen is now the world’s eighth most food-insecure country37 . In 2012–14,
25.7 percent of the population was undernourished – just 3 percent less than in 1990–92 (28.9 percent).
According to the World Food Programme monitoring, out of 19 governorates, 4 are in an emergency
state, meaning severely food insecure and unable to produce or buy food on a daily basis, 9 in crisis and
2 as stressed38. Nearly two-thirds of the country’s people depend on agriculture, and more than
90 percent of water is used for irrigation. The narcotic leaf, qat, is recorded as the preferred cash crop as
due to its high price on local markets; and apparently up to 40–50 percent of water for agriculture is
used to irrigate qat39.
Political instability, stagnant growth levels and price volatility of food and critical commodities, inflation,
decreased remittances are reported as the main determinants of peoples’ hindered access to food.
34
OCHA (2013), Humanitarian Bulleting Sudan, Issue 47
35 For detailed data on child malnutrition refer to Annex
36 WFP (2012), Comprehensive Food Security Survey
37 Global Hunger Index (GHI), IFPRI 2014. http://www.ifpri.org/publication/2014-global-hunger-index
38 WFP, UNICEF and Government of Yemen (2014), Comprehensive Food Security Survey CFSS
39 World Bank (2000): ‘Qat in Yemen, Towards a Policy and Action Plan’
18
In regards to the Yemeni food security profile, there are big discrepancies between rural (with over half
percent of the population as insecure) and urban areas and between ethnic groups (with al Bayda and
Mareb populations reported as severely impacted). Smaller households (with less than 7.3 people of
the national average), female headed households and lower educated ones are among those lacking
behind. High food and fuel prices are the predominant shocks, elevating the cost of living well beyond
the means of affected households, while urban households also list insecurity as a major obstacle in
comparison to lower levels observed in rural areas.
To support the restoration of stability, the National Food Security Strategy’s (NFSS) objective is to
reduce the prevalence of food insecurity by one-third by 2015 and make 90 percent of the population
food-secure by 2020; to reduce child malnutrition by at least one percentage point per year. The
roadmap to achieving these goals focuses on measures to decrease qat production and consumption,
reduce Yemen’s vulnerability to global food price shocks and natural disasters, promote the sustainable
use of water, increase public investment, and improve the provision of services.
Central to the implementation of NFSS are the National Agriculture Sector Strategy and Investment Plan
2012–2016 and the National Water Sector Strategy and Investment Programme, dating back in 2004. In
addition to reducing the cultivation of qat and increasing investments, the National Agriculture Sector
Strategy and Investment Plan aims to enhance growth in domestic food productivity. To reduce the
country’s vulnerability to international food price shocks, the government is considering establishing a
strategic grain reserve. Such a reserve would be vital for Yemen, currently depends primarily on food
imports for its consumption needs. The Food and Agriculture Organization recommends that a strategic
grain reserve linked to social protection and early warning systems can facilitate the capacity to cope
with food emergencies and protect the vulnerable.
Social safety nets have also been critical reserves for tackling food insecurity. Yemen’s primary bodies in
this regards are the Social Welfare Fund and the Social Fund for Development serving as the main
mechanism for social protection. The Social Welfare Fund is an unconditional cash transfer programme
funded largely by the government with international donor support. Coverage has increased from
100,000 beneficiary households in 1996 to more than 1 million in 2010, providing cash to half the
country’s poor. However, the lack of resources significantly limits the capacity of these two programmes
to expand their coverage; the Social Welfare Fund, for instance has not made any payments to
beneficiaries since January 201440.
The adoption of innovative approaches and best practices that have yielded results elsewhere can also
be a promising way forward. For example, households and community-level stocks could be developed
as a buffer from shocks, while subsidies and tax incentives could be tried to increase productive
capacity. The use of cash programmes and vouchers could also serve as a means to revive local
markets41.
40
FAO, (2014), The State of Food Security in the World, Yemen Country Profile, p. 38.
41 OXFAM, (2011), Briefing Paper, Yemen: Fragile Lives in Hungry Times.
19
C. Trade
In total, the fuel-exporting LDCs continued to record growth rates below those of other groups and they
tend to be more volatile. Their over-dependence on just one export product exacerbates their
vulnerability to external shocks, meaning that any disruption of production or international price
fluctuation has a disproportionate impact on the performance of the economy as a whole.
Sudan
In 2012, the value of merchandise exports of the Sudan decreased substantially by 62.3 percent to reach
3.4 bln US$, while its merchandise imports also decreased by 31.1 percent to reach 6.6 bln US$. The
merchandise trade balance recorded a relatively large deficit of 3.2 bln US$. Merchandise exports in the
Sudan were highly concentrated amongst partners with over 80% in three partners (Herfindahl Index =
0.344); imports were more diversified. In 2012, the value of exports of services of the Sudan increased
by 39.1 percent, reaching 1.2 bln US$, while its imports of services decreased moderately by 6.4 percent
and reached 2.0 bln US$. There was a moderate trade in services deficit of 848.1 mln US$42.
Sudan enjoys preferential access to major industrial markets and is a member of several important
regional free trade agreements, such as the Greater Arab Free Trade Area (GAFTA) and the Common
Market for Eastern and Southern Africa (COMESA) free trade agreement (FTA).
However, the country’s import tariff regime continues to be restrictive. Sudan’s average, is well above
levels imposed by most other developing countries, creating disincentives for exporting and hinders
ability of agricultural producers to integrate into global supply chains.
Lastly, Yemen and Sudan are on the lowest rank of ease of doing business index at 137/189 and 160/
189 respectively, testifying to ample room for improvement. Accordingly, on the Index of Trade
Logistics43 both countries are scoring low, with Yemen falling from 63 down to 151 over the last couple
of years.
Yemen
Yemen became member of the World Trade Organization in June 2014. Yemen has pledged to fully
apply WTO provisions in the areas of rules of origin, preshipment inspection, anti-dumping,
countervailing and safeguard measures, export restrictions, subsidies, trade-related investment
measures, free zones and preferential trade under bilateral, regional and other agreements. The country
did also bind its agricultural export subsidies at zero upon accession (WTO, Accession Protocal 2014).
Yemen’s main destination of goods exports: China (41.0%), Thailand (19.2%), India (11.4%), Korea,
42
UN Comtrade, Sudan Country Profile 2013
43 The LPI measures the on-theground efficiency of trade supply chains, or logistics performance. This year’s
edition covers 160 countries. Supply chains are the backbone of international trade and commerce. Their logistics
encompasses freight transportation, warehousing, border clearance, payment systems, and increasingly many
other functions outsourced by producers and merchants to dedicated service providers.
20
Republic of (4.4%) and Saudi Arabia, Kingdom of (3.5%) and main origin of goods imports: European
Union (27%), United Arab Emirates (9.8%), Switzerland (8.8%), China (7.4%) and India (5.8%). The mostly
exported and imported services are transportation and travel.
As an LDC country, Yemen will benefit from technical assistance and other beneficial treatments such as
the special and different treatment provisions. However, concerns over its accession due to Yemen
being a net importer, relying heavily on agriculture. Hence, international products may compromise
“healthy competitiveness” as the Yemeni economy’s capacity to deal with the accession remains under
question44.
In 2012, the value of merchandise exports of Yemen increased marginally by 1.6 percent to reach 7.1 bln
US$, while its merchandise imports increased substantially by 12.2 percent to reach 11.3 bln US$ The
merchandise trade balance recorded a moderate deficit of 4.2 bln US$ (see graph below) Merchandise
exports in Yemen were moderately concentrated amongst partners; imports were diversified. 80% of
the country’s exports are concentrated in just six countries (Herfindahl Index = 0.224) in 2013, making
the country extremely vulnerable in external shocks. Imports were more diversified with 18 partners
accounted for 80 percent or more of imports ((Herfindahl Index = 0.049)45).
Regional Integration in regards to Trade:
Based on the Leage of Arab States (LAS) import structure during 2006-2010, a weighted average of 0.4
tariff duty was applied to all LAS members. Non-LAS members trade with tariffs in the range of 5-6%.
Sudan and Yemen due to their status as least developed countries, still benefit from a longer phasing-
out of applied tariffs under Greater Arab Free Trade Area at the range of 1 to 2 percent.46 Yemen is also
one of the Member States of the Economic and Social Commission for Western Asia (ESCWA) adopting
the Integrated Transport System in the Arab Mashreq (ITSAM). ITSAM aims to facilitate trade and
transport between the countries of the region, in order to enhance regional integration and trade flows.
Sudan and Yemen are also benefitting from the EU Generalized System of Preferences, allowing
developing country exporters to pay less or no duties on their exports to the EU.
44
UN (2014), Support Measures Portal for Least Developed Countries, Yemen becomes 160th
member of WTO,
http://esango.un.org/ldcportal/trade/news/-/blogs/yemen-becomes-160th-member-of-wto?
45 United Nations, COMtrade Yemen Profile
46International Trade Center (2013), Leage of Arab States’ Regional Integration, Opportunities for Trade and
Employment (http://legacy.intracen.org/marketanalysis/docs/Newsletters/LAS-
Opportunities_for_Trade_and_Employment_Executive_Summary.pdf
21
However, regional architecture of trade is very likely to change vastly over the next two years due to
the decision of the Third Summit of Arab Economic and Social Development to create a customs union
and a free trade area by 2015.
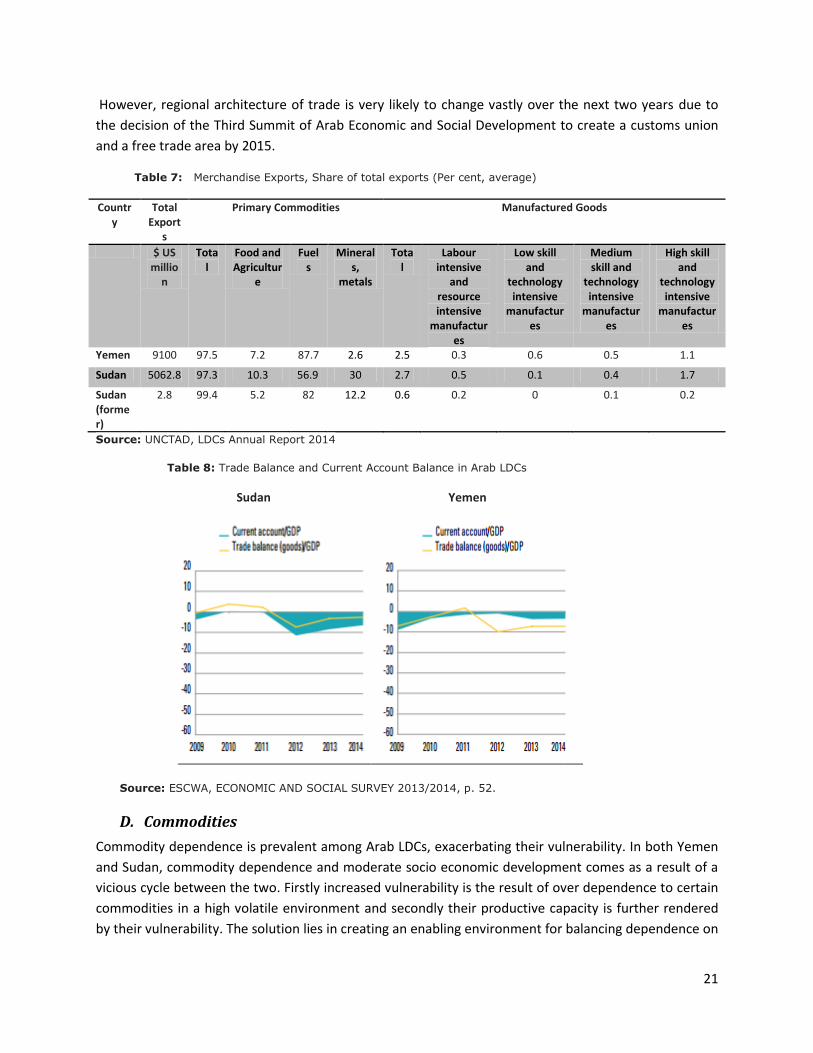
Table 7: Merchandise Exports, Share of total exports (Per cent, average)
Country
Total Export
s
Primary Commodities Manufactured Goods
$ US millio
n
Total
Food and Agricultur
e
Fuels
Minerals,
metals
Total
Labour intensive
and resource intensive
manufactures
Low skill and
technology intensive
manufactures
Medium skill and
technology intensive
manufactures
High skill and
technology intensive
manufactures
Yemen 9100 97.5 7.2 87.7 2.6 2.5 0.3 0.6 0.5 1.1
Sudan 5062.8 97.3 10.3 56.9 30 2.7 0.5 0.1 0.4 1.7
Sudan (former)
2.8 99.4 5.2 82 12.2 0.6 0.2 0 0.1 0.2
Source: UNCTAD, LDCs Annual Report 2014
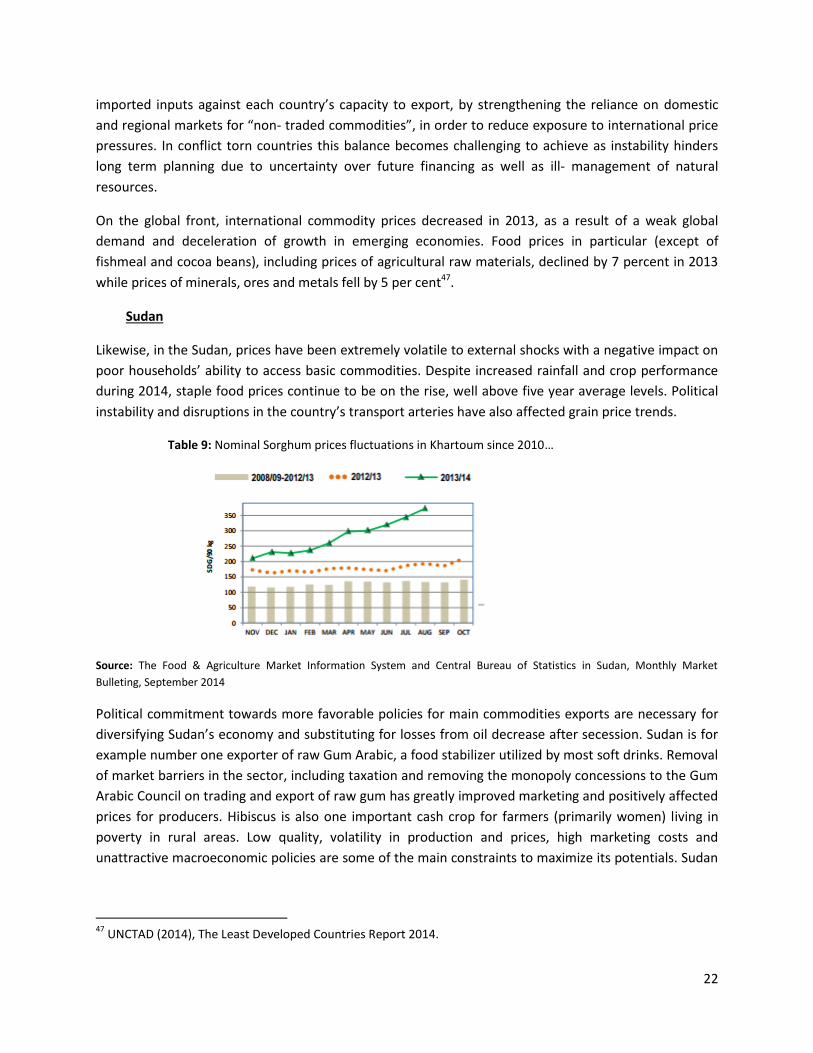
Table 8: Trade Balance and Current Account Balance in Arab LDCs
Sudan Yemen
Source: ESCWA, ECONOMIC AND SOCIAL SURVEY 2013/2014, p. 52.
D. Commodities
Commodity dependence is prevalent among Arab LDCs, exacerbating their vulnerability. In both Yemen
and Sudan, commodity dependence and moderate socio economic development comes as a result of a
vicious cycle between the two. Firstly increased vulnerability is the result of over dependence to certain
commodities in a high volatile environment and secondly their productive capacity is further rendered
by their vulnerability. The solution lies in creating an enabling environment for balancing dependence on
22
imported inputs against each country’s capacity to export, by strengthening the reliance on domestic
and regional markets for “non- traded commodities”, in order to reduce exposure to international price
pressures. In conflict torn countries this balance becomes challenging to achieve as instability hinders
long term planning due to uncertainty over future financing as well as ill- management of natural
resources.
On the global front, international commodity prices decreased in 2013, as a result of a weak global
demand and deceleration of growth in emerging economies. Food prices in particular (except of
fishmeal and cocoa beans), including prices of agricultural raw materials, declined by 7 percent in 2013
while prices of minerals, ores and metals fell by 5 per cent47.
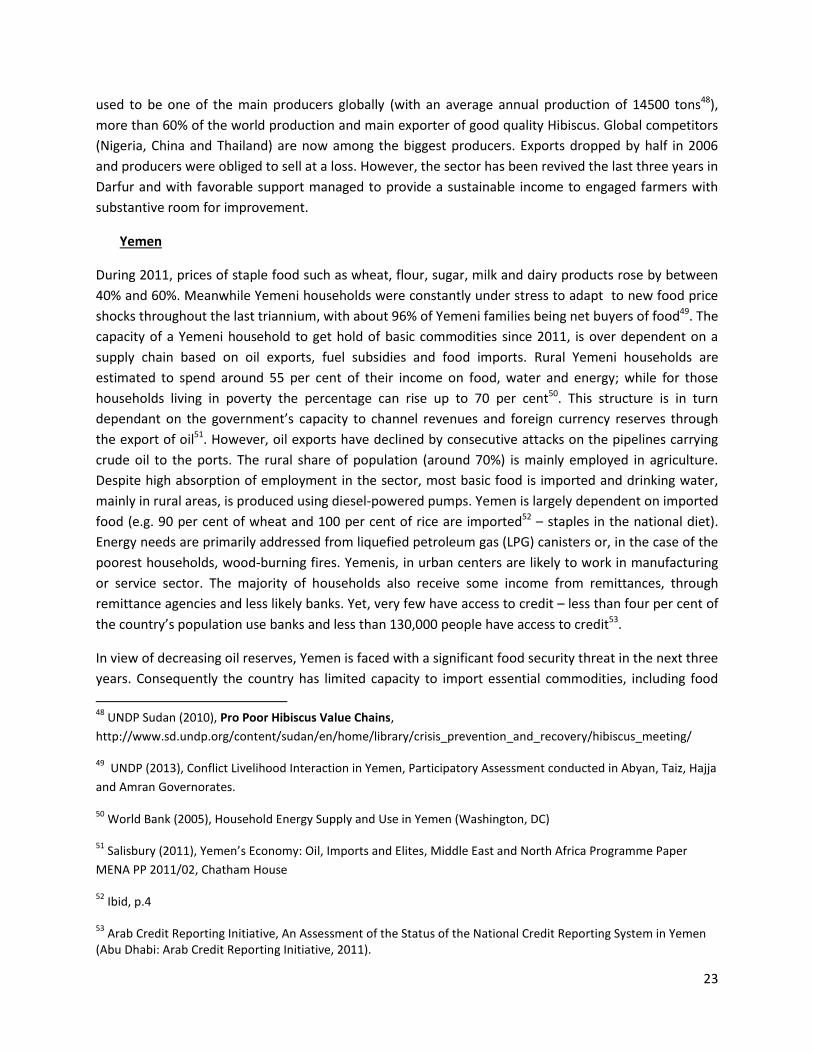
Sudan
Likewise, in the Sudan, prices have been extremely volatile to external shocks with a negative impact on
poor households’ ability to access basic commodities. Despite increased rainfall and crop performance
during 2014, staple food prices continue to be on the rise, well above five year average levels. Political
instability and disruptions in the country’s transport arteries have also affected grain price trends.
Table 9: Nominal Sorghum prices fluctuations in Khartoum since 2010…
Source: The Food & Agriculture Market Information System and Central Bureau of Statistics in Sudan, Monthly Market
Bulleting, September 2014
Political commitment towards more favorable policies for main commodities exports are necessary for
diversifying Sudan’s economy and substituting for losses from oil decrease after secession. Sudan is for
example number one exporter of raw Gum Arabic, a food stabilizer utilized by most soft drinks. Removal
of market barriers in the sector, including taxation and removing the monopoly concessions to the Gum
Arabic Council on trading and export of raw gum has greatly improved marketing and positively affected
prices for producers. Hibiscus is also one important cash crop for farmers (primarily women) living in
poverty in rural areas. Low quality, volatility in production and prices, high marketing costs and
unattractive macroeconomic policies are some of the main constraints to maximize its potentials. Sudan
47
UNCTAD (2014), The Least Developed Countries Report 2014.
23
used to be one of the main producers globally (with an average annual production of 14500 tons48),
more than 60% of the world production and main exporter of good quality Hibiscus. Global competitors
(Nigeria, China and Thailand) are now among the biggest producers. Exports dropped by half in 2006
and producers were obliged to sell at a loss. However, the sector has been revived the last three years in
Darfur and with favorable support managed to provide a sustainable income to engaged farmers with
substantive room for improvement.
Yemen
During 2011, prices of staple food such as wheat, flour, sugar, milk and dairy products rose by between
40% and 60%. Meanwhile Yemeni households were constantly under stress to adapt to new food price
shocks throughout the last triannium, with about 96% of Yemeni families being net buyers of food49. The
capacity of a Yemeni household to get hold of basic commodities since 2011, is over dependent on a
supply chain based on oil exports, fuel subsidies and food imports. Rural Yemeni households are
estimated to spend around 55 per cent of their income on food, water and energy; while for those
households living in poverty the percentage can rise up to 70 per cent50. This structure is in turn
dependant on the government’s capacity to channel revenues and foreign currency reserves through
the export of oil51. However, oil exports have declined by consecutive attacks on the pipelines carrying
crude oil to the ports. The rural share of population (around 70%) is mainly employed in agriculture.
Despite high absorption of employment in the sector, most basic food is imported and drinking water,
mainly in rural areas, is produced using diesel-powered pumps. Yemen is largely dependent on imported
food (e.g. 90 per cent of wheat and 100 per cent of rice are imported52 – staples in the national diet).
Energy needs are primarily addressed from liquefied petroleum gas (LPG) canisters or, in the case of the
poorest households, wood-burning fires. Yemenis, in urban centers are likely to work in manufacturing
or service sector. The majority of households also receive some income from remittances, through
remittance agencies and less likely banks. Yet, very few have access to credit – less than four per cent of
the country’s population use banks and less than 130,000 people have access to credit53.
In view of decreasing oil reserves, Yemen is faced with a significant food security threat in the next three
years. Consequently the country has limited capacity to import essential commodities, including food
48
UNDP Sudan (2010), Pro Poor Hibiscus Value Chains,
http://www.sd.undp.org/content/sudan/en/home/library/crisis_prevention_and_recovery/hibiscus_meeting/
49 UNDP (2013), Conflict Livelihood Interaction in Yemen, Participatory Assessment conducted in Abyan, Taiz, Hajja
and Amran Governorates.
50 World Bank (2005), Household Energy Supply and Use in Yemen (Washington, DC)
51 Salisbury (2011), Yemen’s Economy: Oil, Imports and Elites, Middle East and North Africa Programme Paper
MENA PP 2011/02, Chatham House
52 Ibid, p.4
53 Arab Credit Reporting Initiative, An Assessment of the Status of the National Credit Reporting System in Yemen
(Abu Dhabi: Arab Credit Reporting Initiative, 2011).
24
and fuel. The Government of Yemen has recognized the importance of diversifying its economic
structure to expand manufacturing and exports of non-oil commodities. However, implementation of
supporting policies has been slow due to political instability.
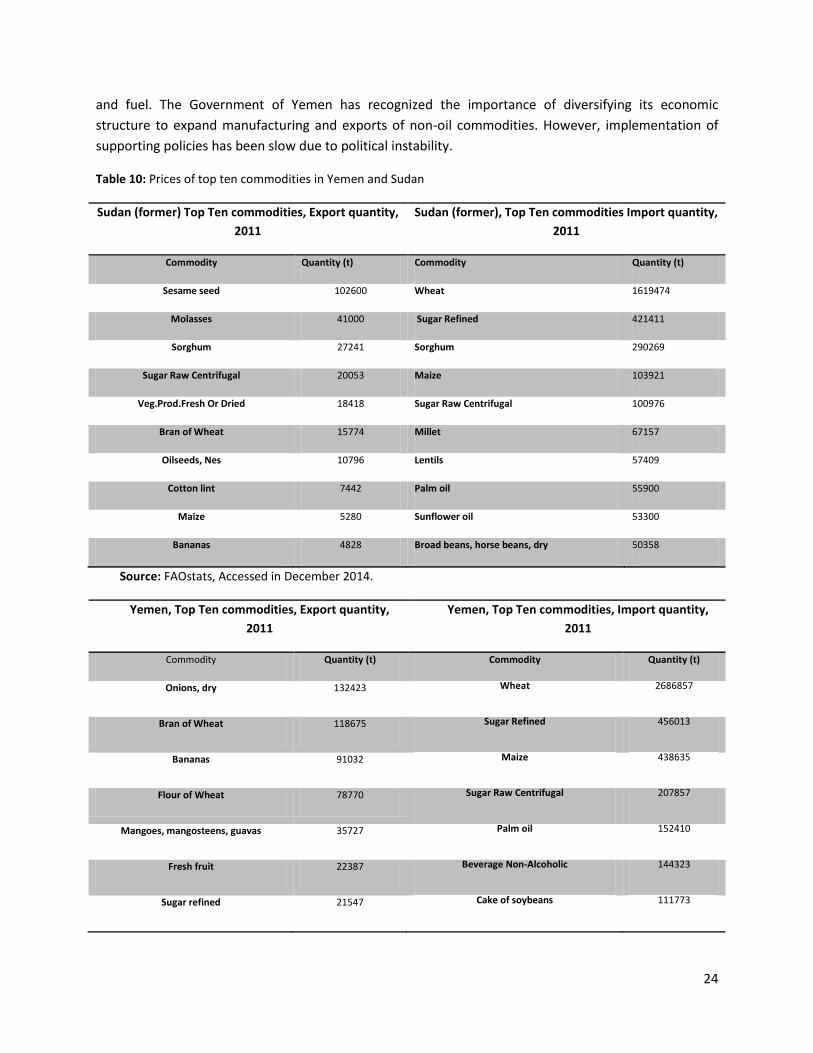
Table 10: Prices of top ten commodities in Yemen and Sudan
Sudan (former) Top Ten commodities, Export quantity,
2011
Sudan (former), Top Ten commodities Import quantity,
2011
Commodity Quantity (t) Commodity Quantity (t)
Sesame seed 102600 Wheat 1619474
Molasses 41000 Sugar Refined 421411
Sorghum 27241 Sorghum 290269
Sugar Raw Centrifugal 20053 Maize 103921
Veg.Prod.Fresh Or Dried 18418 Sugar Raw Centrifugal 100976
Bran of Wheat 15774 Millet 67157
Oilseeds, Nes 10796 Lentils 57409
Cotton lint 7442 Palm oil 55900
Maize 5280 Sunflower oil 53300
Bananas 4828 Broad beans, horse beans, dry 50358
Source: FAOstats, Accessed in December 2014.
Yemen, Top Ten commodities, Export quantity,
2011
Yemen, Top Ten commodities, Import quantity,
2011
Commodity Quantity (t) Commodity Quantity (t)
Onions, dry 132423 Wheat 2686857
Bran of Wheat 118675 Sugar Refined 456013
Bananas 91032 Maize 438635
Flour of Wheat 78770 Sugar Raw Centrifugal 207857
Mangoes, mangosteens, guavas 35727 Palm oil 152410
Fresh fruit 22387 Beverage Non-Alcoholic 144323
Sugar refined 21547 Cake of soybeans 111773
25
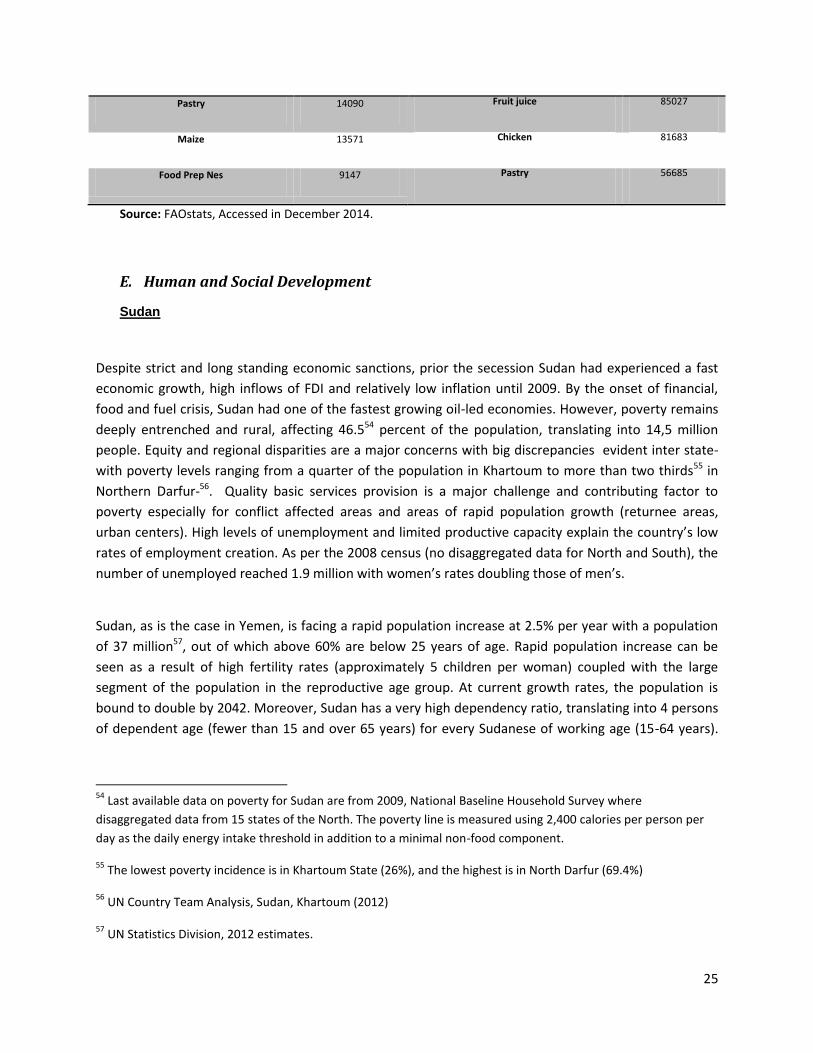
Pastry 14090 Fruit juice 85027
Maize 13571 Chicken 81683
Food Prep Nes 9147 Pastry 56685
Source: FAOstats, Accessed in December 2014.
E. Human and Social Development
Sudan
Despite strict and long standing economic sanctions, prior the secession Sudan had experienced a fast
economic growth, high inflows of FDI and relatively low inflation until 2009. By the onset of financial,
food and fuel crisis, Sudan had one of the fastest growing oil-led economies. However, poverty remains
deeply entrenched and rural, affecting 46.554 percent of the population, translating into 14,5 million
people. Equity and regional disparities are a major concerns with big discrepancies evident inter state-
with poverty levels ranging from a quarter of the population in Khartoum to more than two thirds55 in
Northern Darfur-56. Quality basic services provision is a major challenge and contributing factor to
poverty especially for conflict affected areas and areas of rapid population growth (returnee areas,
urban centers). High levels of unemployment and limited productive capacity explain the country’s low
rates of employment creation. As per the 2008 census (no disaggregated data for North and South), the
number of unemployed reached 1.9 million with women’s rates doubling those of men’s.
Sudan, as is the case in Yemen, is facing a rapid population increase at 2.5% per year with a population
of 37 million57, out of which above 60% are below 25 years of age. Rapid population increase can be
seen as a result of high fertility rates (approximately 5 children per woman) coupled with the large
segment of the population in the reproductive age group. At current growth rates, the population is
bound to double by 2042. Moreover, Sudan has a very high dependency ratio, translating into 4 persons
of dependent age (fewer than 15 and over 65 years) for every Sudanese of working age (15-64 years).
54
Last available data on poverty for Sudan are from 2009, National Baseline Household Survey where
disaggregated data from 15 states of the North. The poverty line is measured using 2,400 calories per person per
day as the daily energy intake threshold in addition to a minimal non-food component.
55 The lowest poverty incidence is in Khartoum State (26%), and the highest is in North Darfur (69.4%)
56 UN Country Team Analysis, Sudan, Khartoum (2012)
57 UN Statistics Division, 2012 estimates.
26
According to the Labour Survey (2011)58, 8.9 million people aged 15 years and above were registered as
active in the labour market, with paid employment accounting for 42,0%, own account work 39.2% and
18% as unemployed. Growing rates of unemployment among youth between 15-24 years of age is a
concern, especially in absence of social protection schemes.
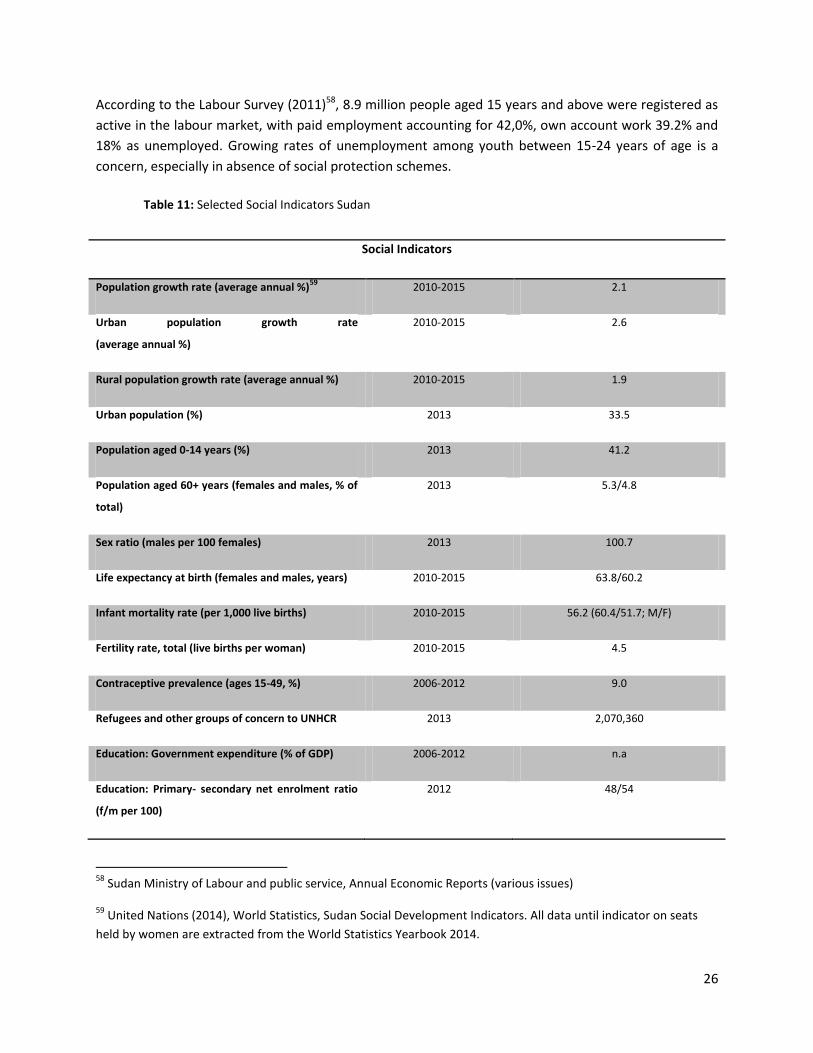
Table 11: Selected Social Indicators Sudan
Social Indicators
Population growth rate (average annual %)59
2010-2015 2.1
Urban population growth rate
(average annual %)
2010-2015 2.6
Rural population growth rate (average annual %) 2010-2015 1.9
Urban population (%) 2013 33.5
Population aged 0-14 years (%) 2013 41.2
Population aged 60+ years (females and males, % of
total)
2013 5.3/4.8
Sex ratio (males per 100 females) 2013 100.7
Life expectancy at birth (females and males, years) 2010-2015 63.8/60.2
Infant mortality rate (per 1,000 live births) 2010-2015 56.2 (60.4/51.7; M/F)
Fertility rate, total (live births per woman) 2010-2015 4.5
Contraceptive prevalence (ages 15-49, %) 2006-2012 9.0
Refugees and other groups of concern to UNHCR 2013 2,070,360
Education: Government expenditure (% of GDP) 2006-2012 n.a
Education: Primary- secondary net enrolment ratio
(f/m per 100)
2012 48/54
58
Sudan Ministry of Labour and public service, Annual Economic Reports (various issues)
59 United Nations (2014), World Statistics, Sudan Social Development Indicators. All data until indicator on seats
held by women are extracted from the World Statistics Yearbook 2014.
27
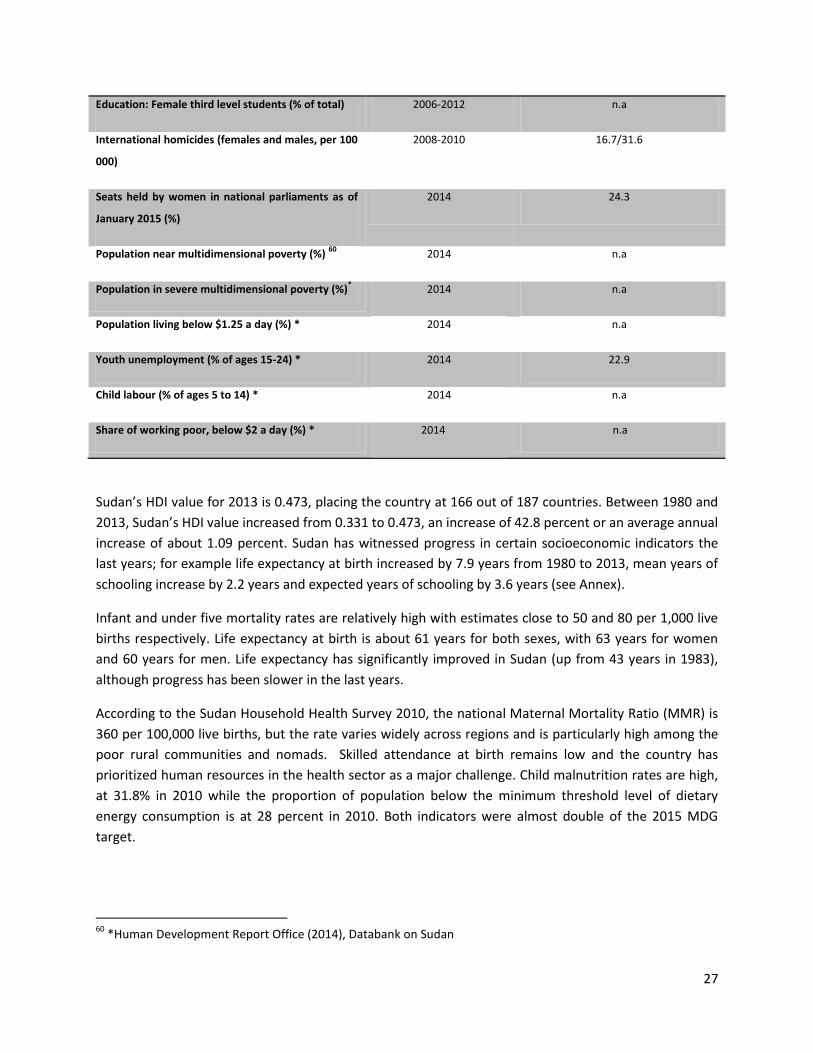
Education: Female third level students (% of total) 2006-2012 n.a
International homicides (females and males, per 100
000)
2008-2010 16.7/31.6
Seats held by women in national parliaments as of
January 2015 (%)
2014 24.3
Population near multidimensional poverty (%) 60
2014 n.a
Population in severe multidimensional poverty (%)*
2014 n.a
Population living below $1.25 a day (%) * 2014 n.a
Youth unemployment (% of ages 15-24) * 2014 22.9
Child labour (% of ages 5 to 14) * 2014 n.a
Share of working poor, below $2 a day (%) * 2014 n.a
Sudan’s HDI value for 2013 is 0.473, placing the country at 166 out of 187 countries. Between 1980 and
2013, Sudan’s HDI value increased from 0.331 to 0.473, an increase of 42.8 percent or an average annual
increase of about 1.09 percent. Sudan has witnessed progress in certain socioeconomic indicators the
last years; for example life expectancy at birth increased by 7.9 years from 1980 to 2013, mean years of
schooling increase by 2.2 years and expected years of schooling by 3.6 years (see Annex).
Infant and under five mortality rates are relatively high with estimates close to 50 and 80 per 1,000 live
births respectively. Life expectancy at birth is about 61 years for both sexes, with 63 years for women
and 60 years for men. Life expectancy has significantly improved in Sudan (up from 43 years in 1983),
although progress has been slower in the last years.
According to the Sudan Household Health Survey 2010, the national Maternal Mortality Ratio (MMR) is
360 per 100,000 live births, but the rate varies widely across regions and is particularly high among the
poor rural communities and nomads. Skilled attendance at birth remains low and the country has
prioritized human resources in the health sector as a major challenge. Child malnutrition rates are high,
at 31.8% in 2010 while the proportion of population below the minimum threshold level of dietary
energy consumption is at 28 percent in 2010. Both indicators were almost double of the 2015 MDG
target.
60
*Human Development Report Office (2014), Databank on Sudan
28
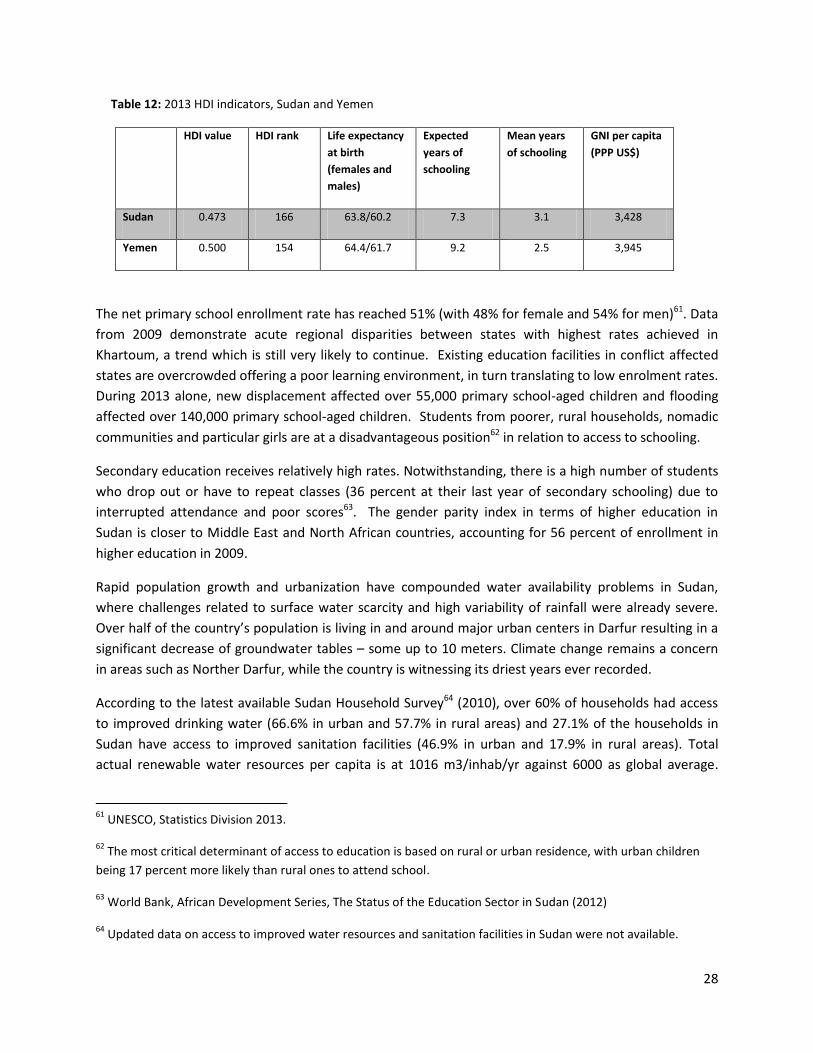
Table 12: 2013 HDI indicators, Sudan and Yemen
HDI value HDI rank Life expectancy
at birth
(females and
males)
Expected
years of
schooling
Mean years
of schooling
GNI per capita
(PPP US$)
Sudan 0.473 166 63.8/60.2 7.3 3.1 3,428
Yemen 0.500 154 64.4/61.7 9.2 2.5 3,945
The net primary school enrollment rate has reached 51% (with 48% for female and 54% for men)61. Data
from 2009 demonstrate acute regional disparities between states with highest rates achieved in
Khartoum, a trend which is still very likely to continue. Existing education facilities in conflict affected
states are overcrowded offering a poor learning environment, in turn translating to low enrolment rates.
During 2013 alone, new displacement affected over 55,000 primary school-aged children and flooding
affected over 140,000 primary school-aged children. Students from poorer, rural households, nomadic
communities and particular girls are at a disadvantageous position62 in relation to access to schooling.
Secondary education receives relatively high rates. Notwithstanding, there is a high number of students
who drop out or have to repeat classes (36 percent at their last year of secondary schooling) due to
interrupted attendance and poor scores63. The gender parity index in terms of higher education in
Sudan is closer to Middle East and North African countries, accounting for 56 percent of enrollment in
higher education in 2009.
Rapid population growth and urbanization have compounded water availability problems in Sudan,
where challenges related to surface water scarcity and high variability of rainfall were already severe.
Over half of the country’s population is living in and around major urban centers in Darfur resulting in a
significant decrease of groundwater tables – some up to 10 meters. Climate change remains a concern
in areas such as Norther Darfur, while the country is witnessing its driest years ever recorded.
According to the latest available Sudan Household Survey64 (2010), over 60% of households had access
to improved drinking water (66.6% in urban and 57.7% in rural areas) and 27.1% of the households in
Sudan have access to improved sanitation facilities (46.9% in urban and 17.9% in rural areas). Total
actual renewable water resources per capita is at 1016 m3/inhab/yr against 6000 as global average.
61
UNESCO, Statistics Division 2013.
62 The most critical determinant of access to education is based on rural or urban residence, with urban children
being 17 percent more likely than rural ones to attend school.
63 World Bank, African Development Series, The Status of the Education Sector in Sudan (2012)
64 Updated data on access to improved water resources and sanitation facilities in Sudan were not available.
29
Sustainable management of depleting water resources can be treated as both a consequence and a
major driver of conflict for Sudan. Development strategies tackling water resources should go beyond
issues of access and and consider broader, more equitable management in a conflict sensitive manner.
Gender equality is among the key priorities for socioeconomic advancement in Sudan. Women enjoy a
quota of at least 25 percent representation in national or state parliaments in the 2008 Electoral Law,
which is also reflected in the real political representation of women in the National Assembly. Sudan has
also with assistance from UN Women inserted 20 gender related questions in the 2014 Household
Survey which will generate the nation’s first gender national data on this matter. According to the 2010
MDGs Report, women occupy 28% of the seats in the parliament in 2010. As per the UNDP Sudan
Human Development Report GNI per capita was higher for men than for women, 5,153 and 1,692
respectively while the Gini coefficient demonstrated gender discrepancies across all human
development indicators except longevity. Sudan ranks 140th out of 187 countries in the Gender
Inequality Index65. Nation-wise 65.5 percent of women and girls have undergone FGM/C as per the
Sudan Household Survey of 2010 with rates particularly high in the North. Even more alarming is the fact
of 48 percent of married women surveyed, testified that they intended to circumcise their daughters66.
At last, it is worth noting that Sudan is one of the very few countries that have not ratified the treaty on
Convention on Elimination of All Forms of Discrimination Against Women (CEDAW).
Displacement and Shelter: The humanitarian situation is reported as deteriorating since 2012 with new,
conflict induced displacement present in Darfur. The current number of IDPs is estimated at 3.4 million;
a decrease of 2010 numbers of five million. However this is only due to the movement of South
Sudanese and the fact that former southern Sudanese IDPs, especially around Khartoum, were no longer
counted as IDPs. In reality, IDPs have been gradually increasing throughout the last four years. About 6.9
million people are reported by UNHCR as in need of humanitarian assistance67. This represents a 40%
increase compared to last year. The 2014 Strategic Response Plan targets 4.7 million people (78% of the
total in need of enhanced resilience) composed of IDPs, refugees and asylum seekers, IDP and refugee
returnees, South Sudanese, flood and mine affected communities, and non displaced food insecure and
severely affected by conflict, distributed across 113 localities in Sudan68.
In terms of HIV/AIDS, the understanding of the epidemic context in Sudan has substantially increased.
Evidence from the 2011 integrated bio-behavioral survey (IBBS) among key populations, ‘2010 ANC
surveillance rounds and routine programmatic data from VCT and PMTCT sites indicate a two to seven
fold higher HIV prevalence among key populations notably in states in the eastern region’69 e.g. Red Sea,
65
HDRO, Statistics, 2014
66 UNDG. Sudan Country Analysis 2012
67UNHCR (2015), Country Operations Profile Sudan accessed at: http://www.unhcr.org/pages/49e483b76.html
68 Sudan, Strategic Response Plan 2014.
69 UNAids (2013), Sudan National AIDS Control Programme - UNAids
30
Kassala, Blue Nile compared to the HIV prevalence among general population. In view of challenging
socio-economic conditions in the post secession era, UNAIDS expects an increase in population’s HIV
vulnerability and transmission rates70.
Social protection: Overall pro-poor spending was gradually increasing from 2004 to 2009 and fell again
in 2009 to 10.27 percent71. The Zakat Fund, a proportion of wealth paid yearly for the benefit of the
poor is also widely employed. In terms of social protection schemes, the biggest initiative is the
Community Development Fund (CDF) whose objective is to respond to urgent early recovery needs in
conflict affected areas. Since 2006, CDF has supported above 1000 community initiatives, including
Noth and South Kordofan, Blue Nile and Kassala states and the Abyei area72.
Yemen
Yemen is among the poorest countries in the Arab region, with poverty rates rising from 34% in 2006 to
54%73 in 2012. It has one of the highest population growth rates in the world, and the combination of
the population food demands, the crisis and rising food prices has placed the country among the world’s
most food insecure nations. The population was estimated at 23.8 million in 201274, which at the current
growth rate of 3% per annum will bring the country to a twofold increase by year 2033. With such rapid
population growth, depleting water resources, and insufficient health care and education capacities,
poverty rates are projected to increase and socio-economic development indicators are likely to
deteriorate.
Yemen’s Human Development Index value for 2013 was 0.500— placing the country in the low human
development category—with rank at 154 out of 187 countries. Between 1990 and 2013, Yemen’s HDI
value increased substantially from 0.390 to 0.500, an increase of 28.2 percent or an average annual
increase of about 1.08 percent; however after 2011 the situation has changed. Yemen’s 2013 HDI of
0.500 is above the average of 0.493 for countries in the low human development group, yet far below
the average of 0.682 for countries in the Arab States. From the Arab States, countries similar to Yemen
70
UNAIDS, 2014, Sudan Country Progress Report, accessed at
http://www.unaids.org/en/dataanalysis/knowyourresponse/countryprogressreports/2014countries/SDN_narrativ
e_report_2014.pdf.
71 MDG’s Report Sudan 2010, accessed at http://www.sd.undp.org/content/sudan/en/home/library/mdg/sudan-
millennium-development-goals-progress-report-2010/
72 African Development Bank (2014), African Economic Outlook, Sudan
73Joint Social and Economic Assessment for the Republic of Yemen (2012), Government of Yemen, World Bank,
Islamic Development Bank and European Union
74 UN Stats, World Statistics Yearbook 2014
31
in 2013 HDI rank and to some extent relevant to its population size are Djibouti and Sudan, which have
HDIs ranked 170 and 166 respectively75.
The 2011 political crisis in Yemen devastated the socio economic situation and resulted in slowing down
or even halting progress made towards the MDGs achievement. Last available data on MDGs Progress,
demonstrate that Yemen, is unlikely to reach any of the MDGs by 201576.
Food insecurity is among the major concerns with over five million people, found to be severely food
insecure77. Malnourishment and in particular underweight indicator for children under five years of age
deteriorated with almost half of all children under five, chronically malnourished 47% out of which 13%
suffering from acute malnutrition78. The combination of several and moderate food insecurity has
exacerbated the hunger indicators further to the level of 10 million people, which represent almost
44.5% of the population of 2012.
In terms of education, the progress both in primary and secondary education has been slow. The Gross
Enrollment Ratio (GER) in Yemen is at 81.5% in basic education and 42.5% in secondary. The GER in
Yemen reaches 81.5% in basic education and 42.5% in secondary education. This is low compared to
regional averages (Middle East and North African countries), where the average of GER in primary and
secondary education reached 106% and 70.2% in 2011, respectively, according to the World Bank
Indicators. In particular, girls residing in rural areas are among the most vulnerable groups being
deprived of access to education facilities. The National Social Protection Monitoring Survey (2012) 79discloses disaggregated indicators of the urban/rural residences, testifying to girls in rural areas being
consistently less likely to attend basic education than urban girls (61 per cent in rural and 86 per cent in
urban areas). For boys, the difference is smaller: 84 per cent in urban and 76 per cent in rural areas. In
addition, as Yemen provisions separate secondary education facilities for boys and girls, the school
availability for boys is greater than for girls.
75
HDRO, Human Development Report, 2014, Yemen Country Analysis.
76 National Millennium Development Goals Report, (2010), Yemen, accessed at
http://www.ye.undp.org/content/yemen/en/home/library/mdg/yemen---national-millennium-development-
goals-report-/
77 WFP 2012 Comprehensive Food Security Survey
78 See detailed data on malnutrition in Annex
79 GoY (2012), National Social Protection Monitoring Survey, accessed at https://
yemennutritioncluster/documents/-nspms-national-social-protection-monitoring-survey
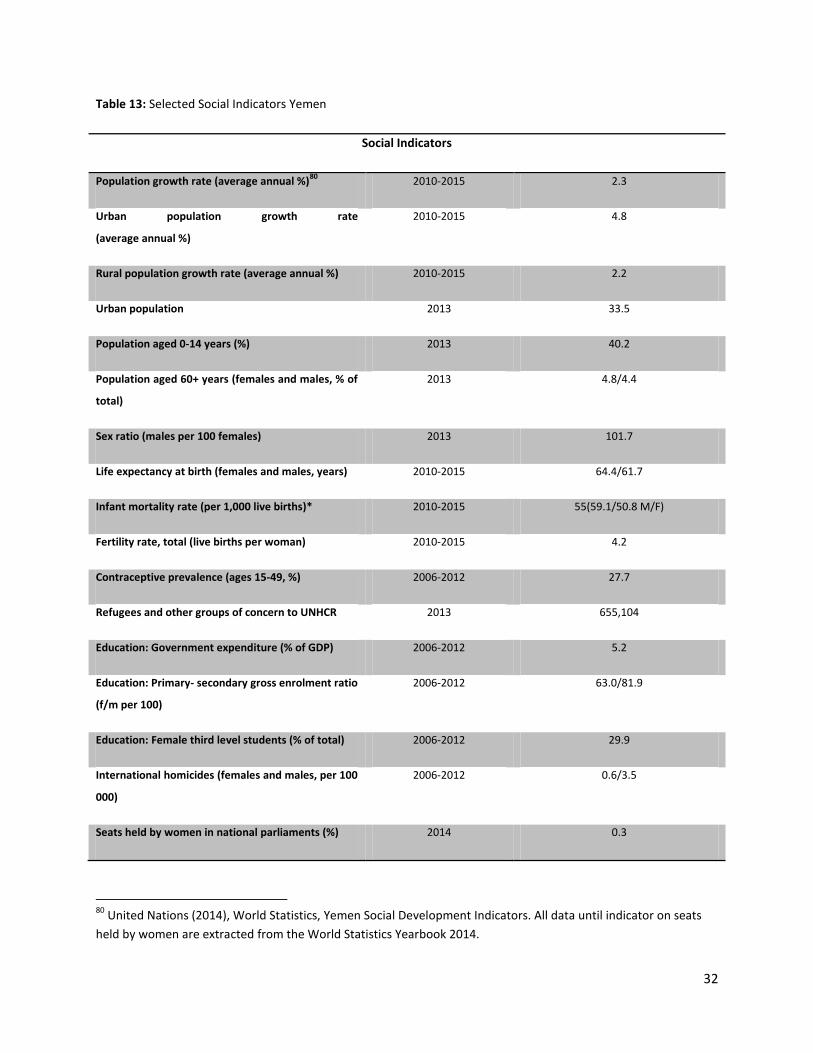
32
Table 13: Selected Social Indicators Yemen
Social Indicators
Population growth rate (average annual %)80
2010-2015 2.3
Urban population growth rate
(average annual %)
2010-2015 4.8
Rural population growth rate (average annual %) 2010-2015 2.2
Urban population 2013 33.5
Population aged 0-14 years (%) 2013 40.2
Population aged 60+ years (females and males, % of
total)
2013 4.8/4.4
Sex ratio (males per 100 females) 2013 101.7
Life expectancy at birth (females and males, years) 2010-2015 64.4/61.7
Infant mortality rate (per 1,000 live births)* 2010-2015 55(59.1/50.8 M/F)
Fertility rate, total (live births per woman) 2010-2015 4.2
Contraceptive prevalence (ages 15-49, %) 2006-2012 27.7
Refugees and other groups of concern to UNHCR 2013 655,104
Education: Government expenditure (% of GDP) 2006-2012 5.2
Education: Primary- secondary gross enrolment ratio
(f/m per 100)
2006-2012 63.0/81.9
Education: Female third level students (% of total) 2006-2012 29.9
International homicides (females and males, per 100
000)
2006-2012 0.6/3.5
Seats held by women in national parliaments (%) 2014 0.3
80
United Nations (2014), World Statistics, Yemen Social Development Indicators. All data until indicator on seats
held by women are extracted from the World Statistics Yearbook 2014.
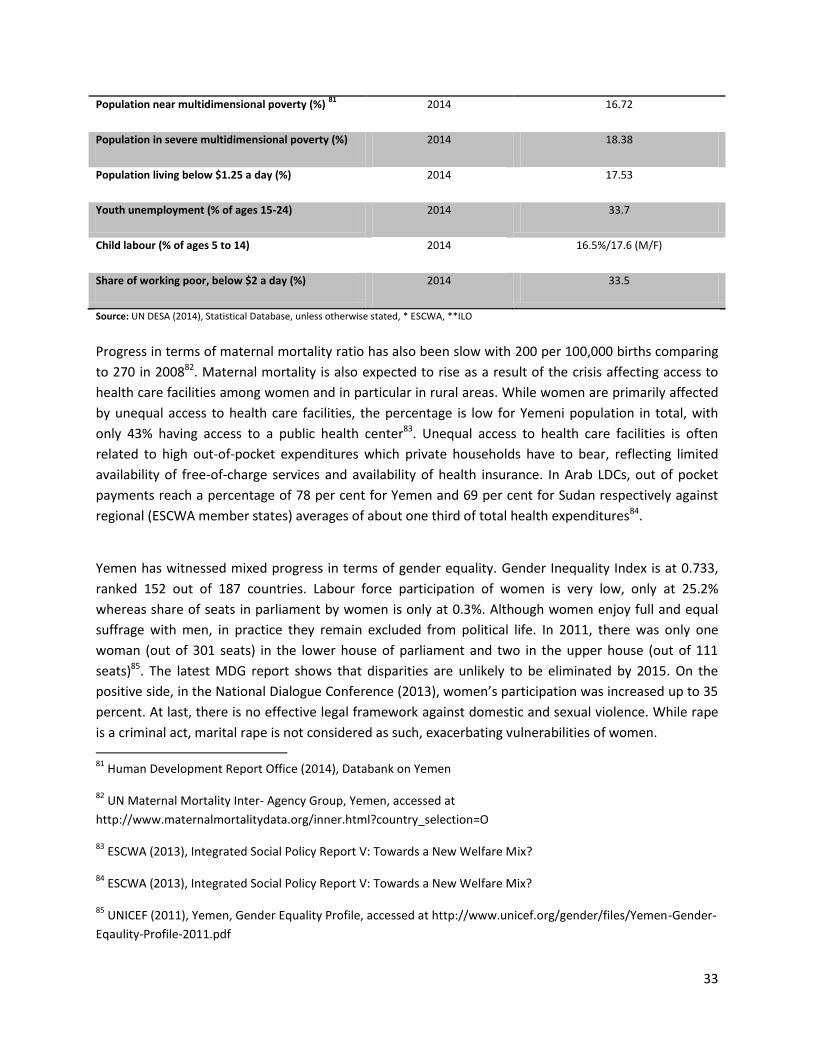
33
Population near multidimensional poverty (%) 81
2014 16.72
Population in severe multidimensional poverty (%) 2014 18.38
Population living below $1.25 a day (%) 2014 17.53
Youth unemployment (% of ages 15-24) 2014 33.7
Child labour (% of ages 5 to 14) 2014 16.5%/17.6 (M/F)
Share of working poor, below $2 a day (%) 2014 33.5
Source: UN DESA (2014), Statistical Database, unless otherwise stated, * ESCWA, **ILO
Progress in terms of maternal mortality ratio has also been slow with 200 per 100,000 births comparing
to 270 in 200882. Maternal mortality is also expected to rise as a result of the crisis affecting access to
health care facilities among women and in particular in rural areas. While women are primarily affected
by unequal access to health care facilities, the percentage is low for Yemeni population in total, with
only 43% having access to a public health center83. Unequal access to health care facilities is often
related to high out-of-pocket expenditures which private households have to bear, reflecting limited
availability of free-of-charge services and availability of health insurance. In Arab LDCs, out of pocket
payments reach a percentage of 78 per cent for Yemen and 69 per cent for Sudan respectively against
regional (ESCWA member states) averages of about one third of total health expenditures84.
Yemen has witnessed mixed progress in terms of gender equality. Gender Inequality Index is at 0.733,
ranked 152 out of 187 countries. Labour force participation of women is very low, only at 25.2%
whereas share of seats in parliament by women is only at 0.3%. Although women enjoy full and equal
suffrage with men, in practice they remain excluded from political life. In 2011, there was only one
woman (out of 301 seats) in the lower house of parliament and two in the upper house (out of 111
seats)85. The latest MDG report shows that disparities are unlikely to be eliminated by 2015. On the
positive side, in the National Dialogue Conference (2013), women’s participation was increased up to 35
percent. At last, there is no effective legal framework against domestic and sexual violence. While rape
is a criminal act, marital rape is not considered as such, exacerbating vulnerabilities of women.
81
Human Development Report Office (2014), Databank on Yemen
82 UN Maternal Mortality Inter- Agency Group, Yemen, accessed at
http://www.maternalmortalitydata.org/inner.html?country_selection=O
83 ESCWA (2013), Integrated Social Policy Report V: Towards a New Welfare Mix?
84 ESCWA (2013), Integrated Social Policy Report V: Towards a New Welfare Mix?
85 UNICEF (2011), Yemen, Gender Equality Profile, accessed at http://www.unicef.org/gender/files/Yemen-Gender-
Eqaulity-Profile-2011.pdf
34
Social protection: Limited and unequal access to social protection remains an obstacle to social justice
in Arab LDC’s. Yemen has an established social protection floor which includes the Social Welfare Fund,
the Social Fund for Development, the Public Works project, the Fund for Economic Opportunities, Fund
for Welfare and Rehabilitation for people with disabilities and the National Program for the
development of productive families and community. The Funds cover a wide range of activities from
public work projects and employment opportunities, to vocational training, micro-credit and direct cash
transfers to communities in need. Programs were scaled up in respond to the crisis, especially in relation
to food insecure population, yet they were unable and unprepared to provide a comprehensive and
effective solution. Coverage in Yemen is reaching only 8 per cent of people with other countries such as
Egypt, Lebanon, Morocco and Tunisia, covering up to 30-40 per cent86. Social protection schemes should
be revised and perform in line with the country’s development vision towards a diversified, resilient
economy translating into social transfers boosting the agriculture and fisheries sector with targeting
responding effectively to gender disparities across the country.
In terms of HIV/AIDS prevalence, Yemen has low incidences mainly concentrated in commercial sex
workers. However, lack of awareness and unregistered cases due to taboos indicate that rates may be
higher.
Unemployment: Previous economic recessions have demonstrated that youth employment conditions
recover at a slower pace than resumptions of economic growth87. In 90s, ‘countries required an average
of 11 years to restore pre-crisis levels of youth unemployment88’. Youth unemployment crises suggest
that youth employment challenges are likely to persist longer thereby despite fiscal difficulties and
strained budgets, attention should placed into not downsizing financial needs to critical socio-economic
sectors which would stimulate pro-poor growth.
The share of youth in Yemen that is neither in education, training or employment (NEET) is currently
estimated at 48%. Youth unemployment rates are more than three times higher than for adults while
significant gender discrepancies exist as the rate is three times higher for women. Sudan Employment-
to-population rate stood at 31.06% and unemployment rate stood at 17%. Youth (15-24) unemployment
rate stood at 25.4%89.
Decent employment90 involves among other, opportunities for work that are productive and deliver a
fair income, security in the workplace and social protection for families and better prospects for
86
ESCWA (2014), ‘Participation and Social Protection in the Arab Region’
87 UN, World Youth Report 2013, accessed at: http://issuu.com/unpublications/docs/12iv6isbn9789210558662/35
88 ibid
89 No updated data for Sudan exist, Figures are from 2010 SUDAN, MDGs report, accessed at
http://www.undp.org/content/sudan/en/home/mdgoverview/overview/mdg1/
90 ILO definition
35
personal development and social integration. Sudan and Yemen, have pre crisis followed jobless growth
policies, encouraging a shortage of productive employment, which deepened existing inequalities and
eroded social cohesion. Informal work, underemployment and casual work are prime characteristics of
the employment scene in those countries. Stimulating the creation of productive employment and
tackling long-term systemic labour market problems will require both political resolve as well as
structural changes in the employment policies for both countries with a focus on agricultural outputs
and diversifying rural incomes. Youth-led business creation and support through access to finance, long
term labour intensive public work programs, informal sector support and women’s economic
empowerment are some of the supporting activities for structural reform.
Water resources: Groundwater depletion has become a critical issue in Yemen since 1980s with articles
portraying the country as the globe’s first candidate for running out of water91. Water scarcity is more
acute in the western part of the country, where the majority of the population resides (over 90%).
Demand is rising with rapid population growth and increased per capita demand, exacerbating water
scarcity. Water resources in Yemen, have declined due to overpumping of aquifers and an unsustainable
water management practice called aquifer mining. Over 90% of water goes to service agriculture92
purposes which in turn contributes just over 6% of GDP. The percent of total freshwater resources
withdrawn is 168.6%, demonstrating the high pressure on renewable water resources withdrawal.
Annual water deficit currently accounts for 1065 MCM93. Total actual renewable water resources per
capita is at 88.04 m3/inhab/yr94 against 6000 as global average95 , while the percent of population with
access to improved water sources is 55% and improved sanitation at 53% which has slowly but steadily
improved since 1994. However, there is a still wide gap between rural and urban areas.
91
Euractiv (2014), UN official: Yemen could be 'first country to run out of water', accessed at
http://www.euractiv.com/sections/development-policy/un-official-yemen-could-be-first-country-run-out-water-
303678; IRIN (2014), Time running out for solution to Water Crisis, accessed at
http://www.irinnews.org/report/96093/yemen-time-running-out-for-solution-to-water-crisis
92 FAO, AQUASTAT, Last available data from 2005, accessed in November 2014
93 Ministry of Water and Environment, Yemen (2009), accessed at
http://www.un.org/esa/dsd/dsd_aofw_wat/wat_pdfs/meetings/ws0109/2_Yemen_Salem.pdf
94 The government provides estimates of each Yemeni’s average share of renewable water resource at 125 cubic
metres per year is 1/10 of the average in most Middle Eastern countries and 1/15 of world average, figure slightly
different than UN- Water estimates, yet still far lower than regional and global averages.
95 FAO, AQUASTAT, Accessed in November 2014
36
F. Multiple Crises and Other Emerging Challenges
Climate Change, Displacement and Conflict
Frequent natural disasters, accelerated desertification, rising sea levels and scarce water resources
have led Sudan becoming one of the hotspots of key future climate impacts and vulnerabilities in
Africa. Sudan is characterized by arid and semi-arid ecosystems, with desert and semi-desert areas in
the northern part of the county. Along the borders with South Sudan, in the east and west alike, climatic
conditions are more favorable with low rainfall savannah and Montana vegetation. Air temperatures
have been increasing the last fifty years with a frequency of extreme weather conditions, particularly
draughts, on the rise. Mean annual temperature is reported at 26 to 32 degrees Celsius while in the
north it can reach high forties resulting in stresses and heat related diseases96.
Erratic rainfall conditions, coupled with its concentration during short growing periods, exacerbate the
vulnerability of rain-fed agricultural systems. The country’s inherent vulnerability is related to the fact
that food security is determined by rainfall, in rural areas, where the majority of the population resides.
Sudan’s Ministry of Environment reports a trend of decreasing annual rainfall in the last 60 years (0.5%)
and increased rainfall variability as determinants to draughts across the country. Prolonged drought
episodes between 1978 to 1987 resulted in widespread human and livestock fatalities and forced
migration and displacement of millions Sudanese citizens.
An estimated 50 to 200 km shift on the south of the boundaries between semi desert and desert land
has occurred since the establishment of rainfall and vegetation records in 1930s. Estimates of future
droughts post a threat to about 19 million hectares of rain-fed mechanized and traditional farms, as well
as livelihoods of nomadic and pastoral communities – particularly in Kordofan and Darfur- . This scenario
would lead to an approximate 20 percent drop on the country’s food production97. Sudan is also
suffering from severe floods98. At last, dust storms, thunderstorms and heat waves have similarly
compromised livelihood opportunities. Climate change is adding on the pressure of an already strained
economy. Diversification of economic activities could be one measure to strengthen the country’s
resilience and adverse climate effects.
96
UNEP (2010), Data on Average Annual Temperatures accessed at
http://www.grid.unep.ch/index.php?option=com_content&view=article&id=73&Itemid=400&lang=en&project_id
=27B4A862
97 A WB study (2008) suggests that for each degree in temperature increase, the agriculture will decrease by 10%.
The IFAD (2013) Environmental and Climate Change Assessment, showed that the average temperature increase
across the country will be around 1.5 to 2,5oC, resulting in a decrease of agricultural output by 15 50 25% percent
respectively by 2050.
98 Two specific types of draughts are evident, during the past decades. The first, during torrential rain when high
levels of water overflow the River Nile and its tributaries, usually due to above normal rainy seasons in the
Ethiopian Plateau. Such floods occured in 1946, 1988, 1994, 1998 and 2001. The second type of flood occurs as a
result of heavy localized rainfall during the rainy summer season and such incidents were reported in 1952, 1962,
1965, 1978-1979, 1988 and 1997.
37
Conflict and climate change
Sudan
During recurrent drought events conflicts are likely to occur due to competition over strained natural
resources. In addition, food shortages can result into famine, followed by displacement. With over 6
million of displaced people and refugees today, Sudan is housing the largest populations of displaced
persons globally. The scale of displacement and particular vulnerabilities of affected communities have
caused great human suffering and in many cases fueled new conflict over stressed resources.
In Darfur, research on displaced communities has shown that in addition to environmental and
economic challenges, there is a strong political element inherent to their vulnerability. The lack of
alternative livelihood opportunities has over the years created powerful economic forces that placed
individuals into livelihood paths that served themselves as drivers of conflict. Young et al. (2005)99
highlight local governance patterns and the politicization of the tribal administration as major conflict
drivers, rather than the lack of resources. In essence, the administration ‘became aligned with group
interests and with interests of particular livelihood types’…while ‘conflicts disrupt livelihood options
they generate others which can potentially fuel the conflict’. Inequalities in terms of access to services
and financial support were evident between Darfur and other states and within different livelihood
groups in Darfur. The 2014 Strategic Response Plan of Darfur has pledged a substantive amount of
resources on generating livelihood opportunities and provision of resources. However, Darfur’s past
shows that resources, if allocated through non conflict sensitive means are likely to fuel grievances
rather than averting them100.
Yemen
Yemen is also high vulnerable to climate related challenges; drought, water scarcity, flooding and sea
level rise. As in the Sudan, Yemen has a semi arid to arid climate, with erratic rainfalls severely impacting
rain-fed agriculture, which account for more than half of the country’s total. Yemen reported that
natural disasters have resulted in a loss of $ 200 million, which cumulative from 2008 amounted to 6 per
cent of the country’s GDP101. Mortalities from natural disasters are high in remote rural communities.
Yemen witnesses pockets of severe rural poverty where communities are affected by the cumulative
effect of flash floods and drought, further deteriorating already unsafe living conditions. For small rural
households, even a minor drought episode can lead to yield losses and can have a devastating impact on
food security. Across the country, Yemen faces both extremely dry and wet conditions which together
99
Young, H. et. Al (2005) Darfur: Livelihoods under Siege. Omdurman: Feinstein International Famine Center, Tufts
University, and Afhad University for Women.
100 Overseas Development Institute (2014), Levine, S. et al. Conflict, climate change and politics: why a
technocratic approach fails the resilience challenge, HPG Working Paper.
101 Yemen Official Statement in Second Preparatory Committee on the Post 2015 framework for Disaster Risk
Reduction in November 2014 in New York.
38
with ground water scarcity, intensify risk in water related mortalities and destruct livelihood
opportunities, health and education services. The average annual flood related loss for example in
Sana’a and its hinterlands is estimated at US $ 3 million.
Acute weather conditions and limited livelihood opportunities, together with population growth have
led to rapid, unorganized urbanization. Food insecurity and unemployment have caused increasing
migration to Yemen’s hinterlands. In lack of sufficient urban infrastructure, the informal settlements
being formed around Sana’a have compromised sanitary conditions, exacerbating vulnerabilities to
future risks while also compounding risks from rock and landslides. In particular, the country’s urban
coastal zones are growing at a rate of 3% surpassing the territories carrying capacity by informal
settlements 102– considered illegal by the government- and thus being excluded from social protection
schemes.
G. Domestic Resource Mobilization for Development and Capacity Building
Domestic Resource Mobilization (DRM) has a great potential for development. It is a necessary step for
financing critical service delivery functions, socio-economic development and a sustainable pathway out
from aid dependency. In the international framework, DRM was recognized as a top priority by the
Monterrey Consensus on Financing for Development in 2002, and was revisited afresh as an alternative
way to finance development on the G20 agenda in 2013. Moreover, in the High Level Meeting for
Effective Development Cooperation in Mexico in spring 2014, developing nations called upon donors to
increase the amount of aid towards DRM from 1 to 2 percent per year.
Declining foreign aid levels will be insufficient to drive development and stability in these countries and
in particular in fragile LDCs. The development community is encouraged to look at taxation as a
potential source of development finance and a means of simultaneously strengthening state-citizen
relationships. Restructuring the tax system in order to raise revenues can positively affect the social
contract between a state and its citizenry. An effective and accountable tax system is not only an
economic prerequisite for transitioning in a post conflict environment. In fragile settings, it can be
treated as a trust building avenue, forming the rules of “bargaining” between citizenry and leadership
over mutual responsibilities and obligations.
The economic vulnerability profile of Sudan and Yemen is determined by limited domestic resources,
indebtedness and large deficits in the current and trade accounts, financed mainly by loans and grants.
Domestic resource mobilization (DRM) can form the foundation for self-sustaining development first by
focusing on domestic resources but also by building the bases for attracting and effectively using
international investment and assistance103. It can strengthen the country’s capacity to exercise full
102
GFDRR and WB (2011) , “Vulnerability, Risk Reduction and Adaptation to Climate Change, Yemen”
103 Di John, J. (2010), “Taxation, Resource Mobilisation, and State Performance,” Crisis States Research Centre,
Working Paper no. 84, London School of Economics, London,
www2.lse.ac.uk/internationalDevelopment/research/crisisStates/download/Policy%20Directions/Taxation.pdf.
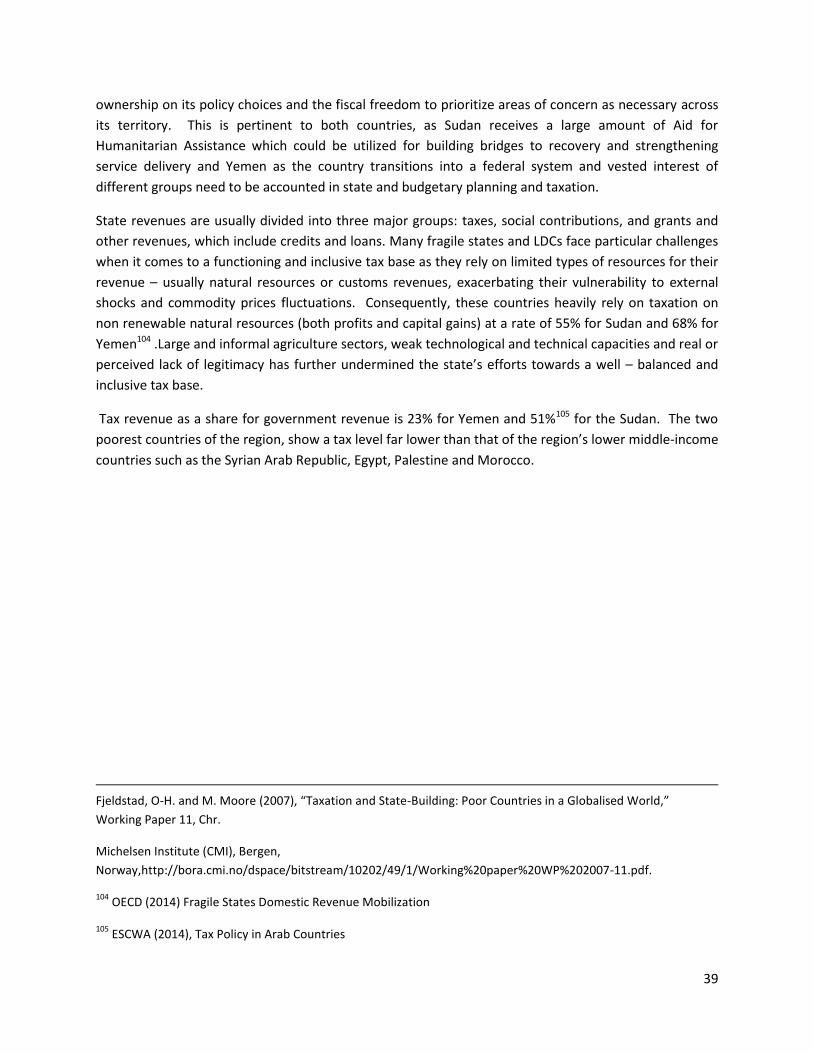
39
ownership on its policy choices and the fiscal freedom to prioritize areas of concern as necessary across
its territory. This is pertinent to both countries, as Sudan receives a large amount of Aid for
Humanitarian Assistance which could be utilized for building bridges to recovery and strengthening
service delivery and Yemen as the country transitions into a federal system and vested interest of
different groups need to be accounted in state and budgetary planning and taxation.
State revenues are usually divided into three major groups: taxes, social contributions, and grants and
other revenues, which include credits and loans. Many fragile states and LDCs face particular challenges
when it comes to a functioning and inclusive tax base as they rely on limited types of resources for their
revenue – usually natural resources or customs revenues, exacerbating their vulnerability to external
shocks and commodity prices fluctuations. Consequently, these countries heavily rely on taxation on
non renewable natural resources (both profits and capital gains) at a rate of 55% for Sudan and 68% for
Yemen104 .Large and informal agriculture sectors, weak technological and technical capacities and real or
perceived lack of legitimacy has further undermined the state’s efforts towards a well – balanced and
inclusive tax base.
Tax revenue as a share for government revenue is 23% for Yemen and 51%105 for the Sudan. The two
poorest countries of the region, show a tax level far lower than that of the region’s lower middle-income
countries such as the Syrian Arab Republic, Egypt, Palestine and Morocco.
Fjeldstad, O-H. and M. Moore (2007), “Taxation and State-Building: Poor Countries in a Globalised World,”
Working Paper 11, Chr.
Michelsen Institute (CMI), Bergen,
Norway,http://bora.cmi.no/dspace/bitstream/10202/49/1/Working%20paper%20WP%202007-11.pdf.
104 OECD (2014) Fragile States Domestic Revenue Mobilization
105 ESCWA (2014), Tax Policy in Arab Countries
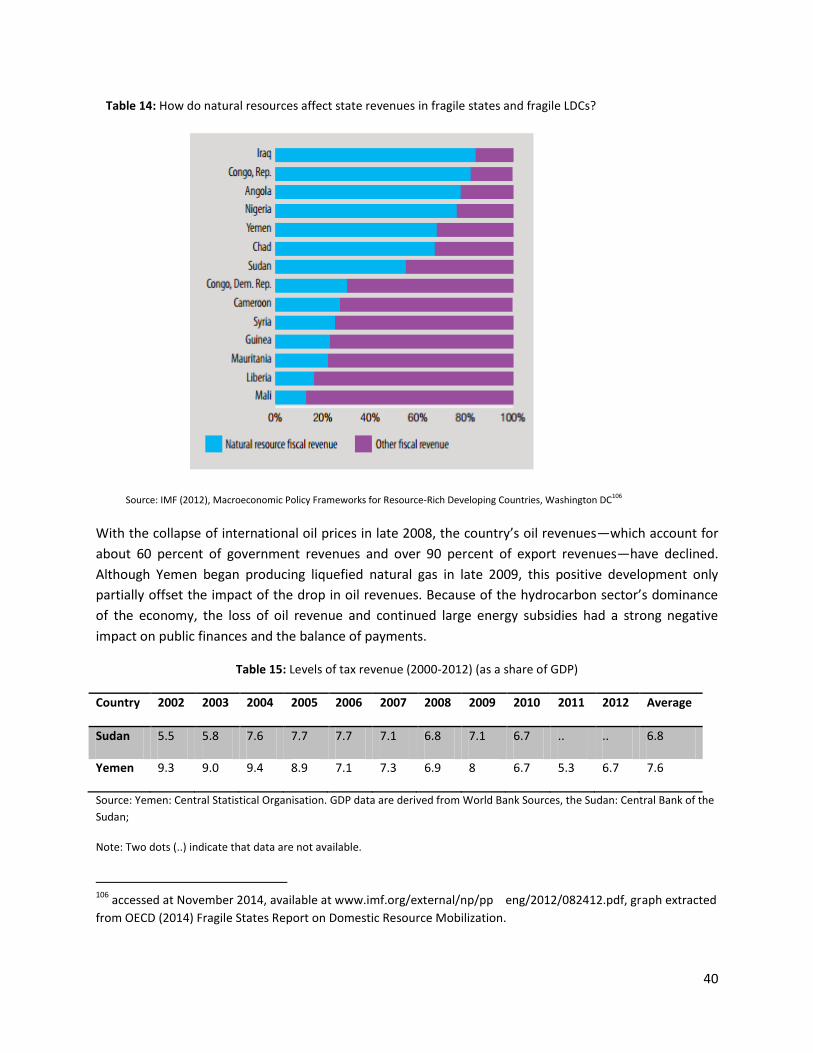
40
Table 14: How do natural resources affect state revenues in fragile states and fragile LDCs?
Source: IMF (2012), Macroeconomic Policy Frameworks for Resource-Rich Developing Countries, Washington DC106
With the collapse of international oil prices in late 2008, the country’s oil revenues—which account for
about 60 percent of government revenues and over 90 percent of export revenues—have declined.
Although Yemen began producing liquefied natural gas in late 2009, this positive development only
partially offset the impact of the drop in oil revenues. Because of the hydrocarbon sector’s dominance
of the economy, the loss of oil revenue and continued large energy subsidies had a strong negative
impact on public finances and the balance of payments.
Table 15: Levels of tax revenue (2000-2012) (as a share of GDP)
Country 2002 2003 2004 2005 2006 2007 2008 2009 2010 2011 2012 Average
Sudan 5.5 5.8 7.6 7.7 7.7 7.1 6.8 7.1 6.7 .. .. 6.8
Yemen 9.3 9.0 9.4 8.9 7.1 7.3 6.9 8 6.7 5.3 6.7 7.6
Source: Yemen: Central Statistical Organisation. GDP data are derived from World Bank Sources, the Sudan: Central Bank of the
Sudan;
Note: Two dots (..) indicate that data are not available.
106
accessed at November 2014, available at www.imf.org/external/np/pp eng/2012/082412.pdf, graph extracted
from OECD (2014) Fragile States Report on Domestic Resource Mobilization.
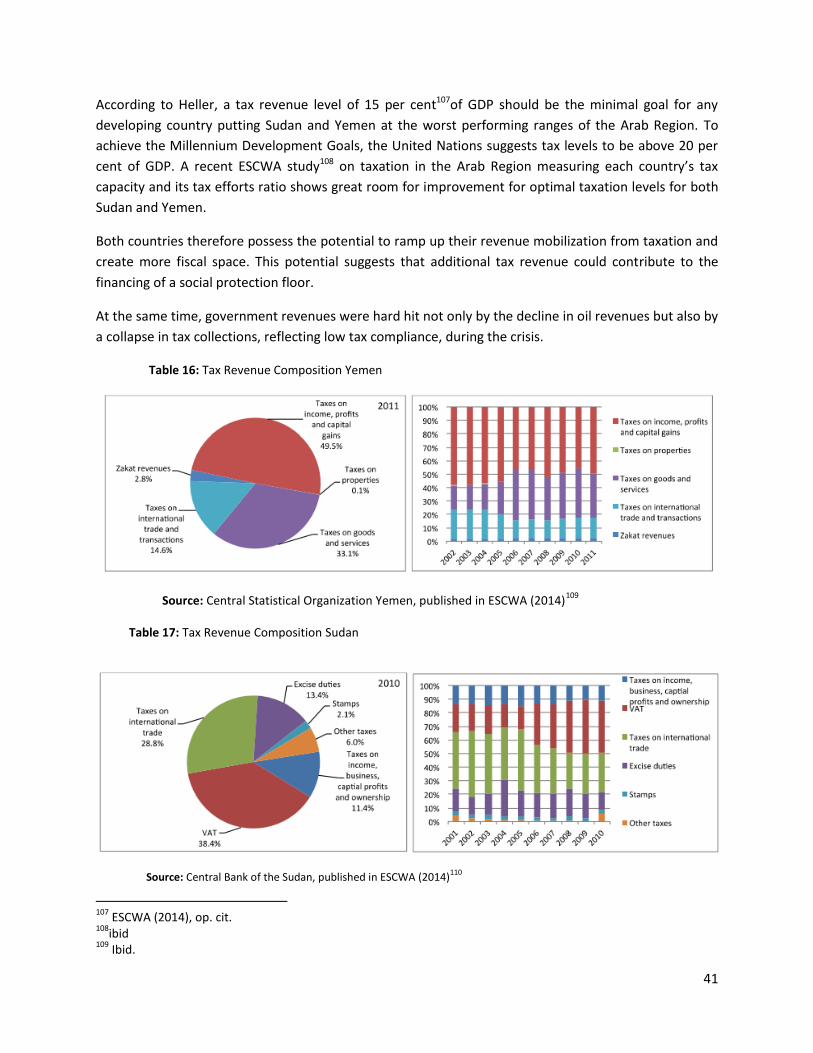
41
According to Heller, a tax revenue level of 15 per cent107of GDP should be the minimal goal for any
developing country putting Sudan and Yemen at the worst performing ranges of the Arab Region. To
achieve the Millennium Development Goals, the United Nations suggests tax levels to be above 20 per
cent of GDP. A recent ESCWA study108 on taxation in the Arab Region measuring each country’s tax
capacity and its tax efforts ratio shows great room for improvement for optimal taxation levels for both
Sudan and Yemen.
Both countries therefore possess the potential to ramp up their revenue mobilization from taxation and
create more fiscal space. This potential suggests that additional tax revenue could contribute to the
financing of a social protection floor.
At the same time, government revenues were hard hit not only by the decline in oil revenues but also by
a collapse in tax collections, reflecting low tax compliance, during the crisis.
Table 16: Tax Revenue Composition Yemen
Source: Central Statistical Organization Yemen, published in ESCWA (2014)109
Table 17: Tax Revenue Composition Sudan
Source: Central Bank of the Sudan, published in ESCWA (2014)110
107
ESCWA (2014), op. cit. 108
ibid 109
Ibid.
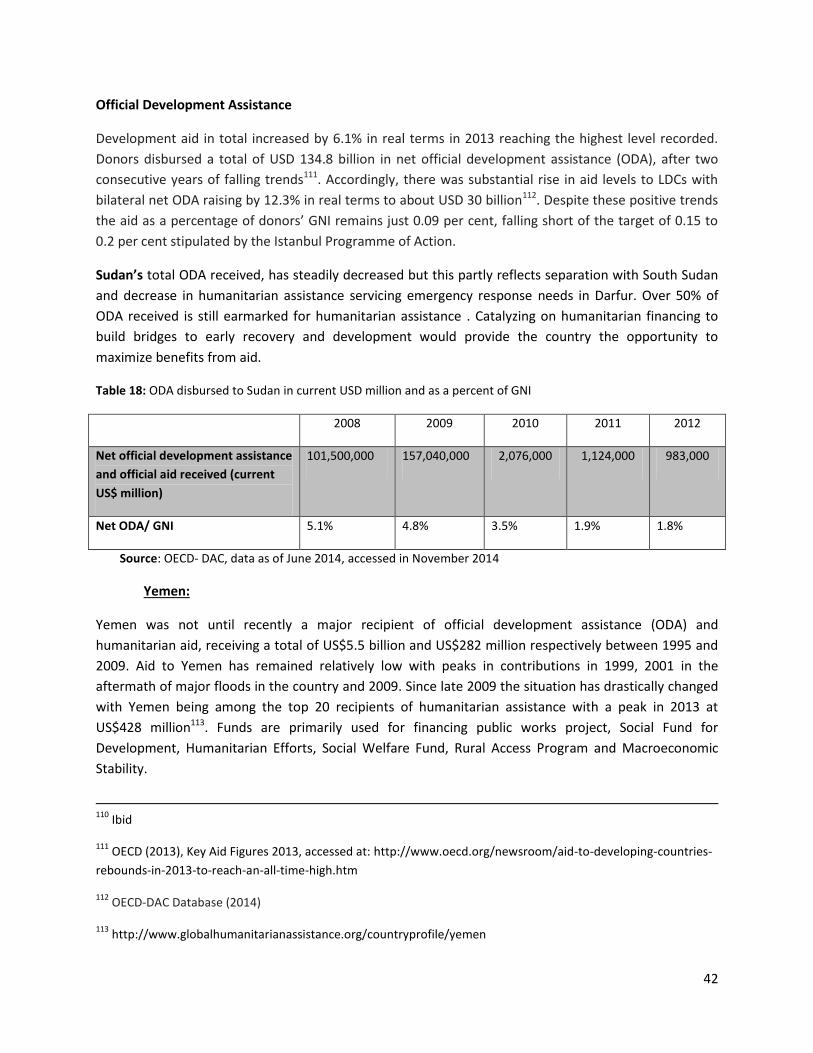
42
Official Development Assistance
Development aid in total increased by 6.1% in real terms in 2013 reaching the highest level recorded.
Donors disbursed a total of USD 134.8 billion in net official development assistance (ODA), after two
consecutive years of falling trends111. Accordingly, there was substantial rise in aid levels to LDCs with
bilateral net ODA raising by 12.3% in real terms to about USD 30 billion112. Despite these positive trends
the aid as a percentage of donors’ GNI remains just 0.09 per cent, falling short of the target of 0.15 to
0.2 per cent stipulated by the Istanbul Programme of Action.
Sudan’s total ODA received, has steadily decreased but this partly reflects separation with South Sudan
and decrease in humanitarian assistance servicing emergency response needs in Darfur. Over 50% of
ODA received is still earmarked for humanitarian assistance . Catalyzing on humanitarian financing to
build bridges to early recovery and development would provide the country the opportunity to
maximize benefits from aid.
Table 18: ODA disbursed to Sudan in current USD million and as a percent of GNI
2008 2009 2010 2011 2012
Net official development assistance
and official aid received (current
US$ million)
101,500,000 157,040,000 2,076,000 1,124,000 983,000
Net ODA/ GNI 5.1% 4.8% 3.5% 1.9% 1.8%
Source: OECD- DAC, data as of June 2014, accessed in November 2014
Yemen:
Yemen was not until recently a major recipient of official development assistance (ODA) and
humanitarian aid, receiving a total of US$5.5 billion and US$282 million respectively between 1995 and
2009. Aid to Yemen has remained relatively low with peaks in contributions in 1999, 2001 in the
aftermath of major floods in the country and 2009. Since late 2009 the situation has drastically changed
with Yemen being among the top 20 recipients of humanitarian assistance with a peak in 2013 at
US$428 million113. Funds are primarily used for financing public works project, Social Fund for
Development, Humanitarian Efforts, Social Welfare Fund, Rural Access Program and Macroeconomic
Stability.
110
Ibid
111 OECD (2013), Key Aid Figures 2013, accessed at: http://www.oecd.org/newsroom/aid-to-developing-countries-
rebounds-in-2013-to-reach-an-all-time-high.htm
112 OECD-DAC Database (2014)
113 http://www.globalhumanitarianassistance.org/countryprofile/yemen
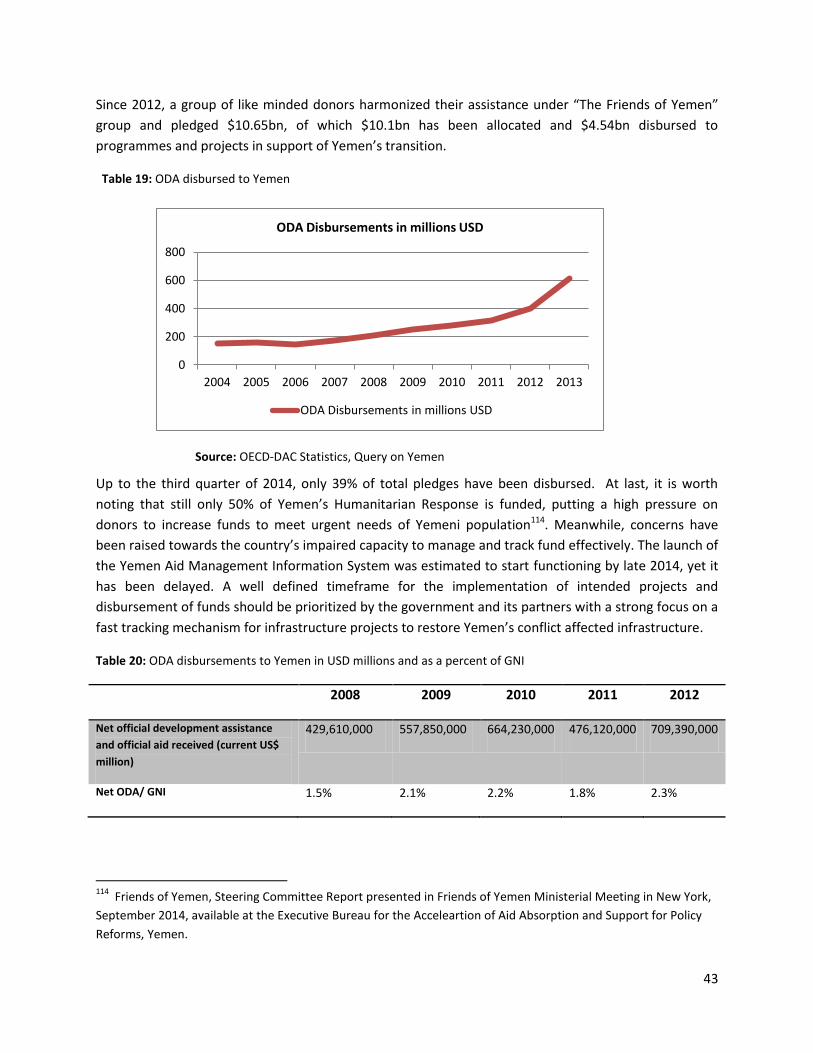
43
Since 2012, a group of like minded donors harmonized their assistance under “The Friends of Yemen”
group and pledged $10.65bn, of which $10.1bn has been allocated and $4.54bn disbursed to
programmes and projects in support of Yemen’s transition.
Table 19: ODA disbursed to Yemen
Source: OECD-DAC Statistics, Query on Yemen
Up to the third quarter of 2014, only 39% of total pledges have been disbursed. At last, it is worth
noting that still only 50% of Yemen’s Humanitarian Response is funded, putting a high pressure on
donors to increase funds to meet urgent needs of Yemeni population114. Meanwhile, concerns have
been raised towards the country’s impaired capacity to manage and track fund effectively. The launch of
the Yemen Aid Management Information System was estimated to start functioning by late 2014, yet it
has been delayed. A well defined timeframe for the implementation of intended projects and
disbursement of funds should be prioritized by the government and its partners with a strong focus on a
fast tracking mechanism for infrastructure projects to restore Yemen’s conflict affected infrastructure.
Table 20: ODA disbursements to Yemen in USD millions and as a percent of GNI
2008 2009 2010 2011 2012
Net official development assistance
and official aid received (current US$
million)
429,610,000 557,850,000 664,230,000 476,120,000 709,390,000
Net ODA/ GNI 1.5% 2.1% 2.2% 1.8% 2.3%
114
Friends of Yemen, Steering Committee Report presented in Friends of Yemen Ministerial Meeting in New York,
September 2014, available at the Executive Bureau for the Acceleartion of Aid Absorption and Support for Policy
Reforms, Yemen.
0
200
400
600
800
2004 2005 2006 2007 2008 2009 2010 2011 2012 2013
ODA Disbursements in millions USD
ODA Disbursements in millions USD
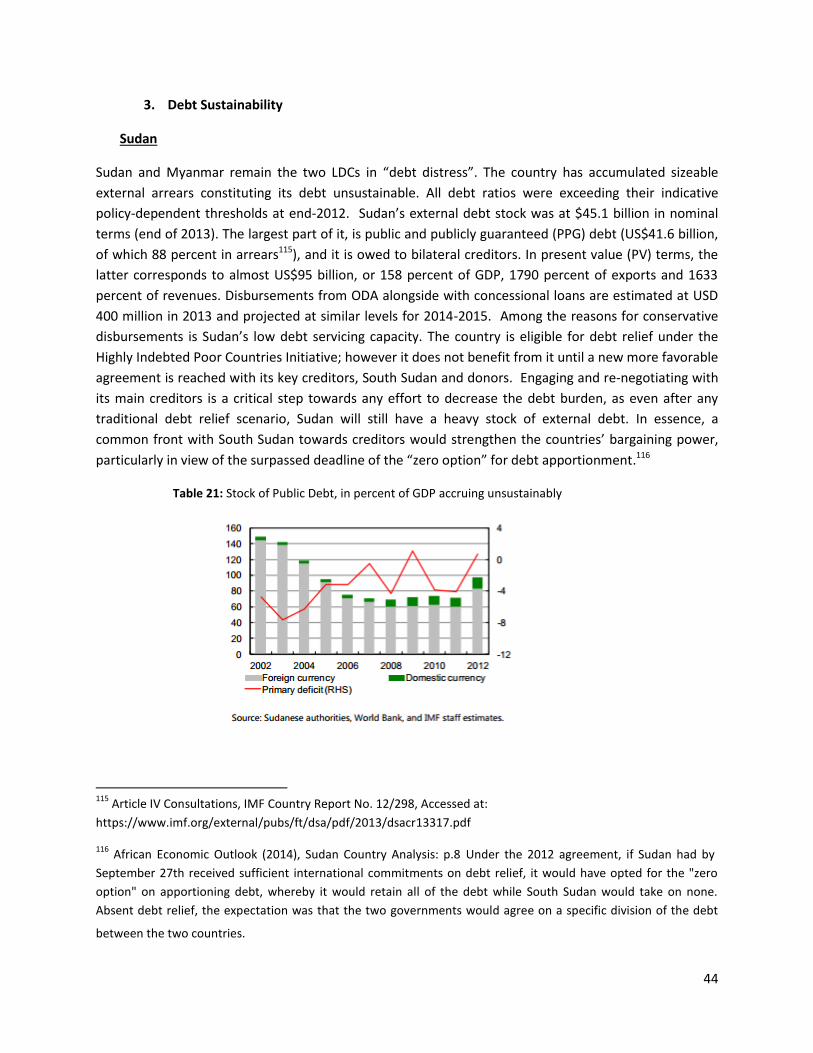
44
3. Debt Sustainability
Sudan
Sudan and Myanmar remain the two LDCs in “debt distress”. The country has accumulated sizeable
external arrears constituting its debt unsustainable. All debt ratios were exceeding their indicative
policy-dependent thresholds at end-2012. Sudan’s external debt stock was at $45.1 billion in nominal
terms (end of 2013). The largest part of it, is public and publicly guaranteed (PPG) debt (US$41.6 billion,
of which 88 percent in arrears115), and it is owed to bilateral creditors. In present value (PV) terms, the
latter corresponds to almost US$95 billion, or 158 percent of GDP, 1790 percent of exports and 1633
percent of revenues. Disbursements from ODA alongside with concessional loans are estimated at USD
400 million in 2013 and projected at similar levels for 2014-2015. Among the reasons for conservative
disbursements is Sudan’s low debt servicing capacity. The country is eligible for debt relief under the
Highly Indebted Poor Countries Initiative; however it does not benefit from it until a new more favorable
agreement is reached with its key creditors, South Sudan and donors. Engaging and re-negotiating with
its main creditors is a critical step towards any effort to decrease the debt burden, as even after any
traditional debt relief scenario, Sudan will still have a heavy stock of external debt. In essence, a
common front with South Sudan towards creditors would strengthen the countries’ bargaining power,
particularly in view of the surpassed deadline of the “zero option” for debt apportionment.116
Table 21: Stock of Public Debt, in percent of GDP accruing unsustainably
115
Article IV Consultations, IMF Country Report No. 12/298, Accessed at:
https://www.imf.org/external/pubs/ft/dsa/pdf/2013/dsacr13317.pdf
116 African Economic Outlook (2014), Sudan Country Analysis: p.8 Under the 2012 agreement, if Sudan had by
September 27th received sufficient international commitments on debt relief, it would have opted for the "zero
option" on apportioning debt, whereby it would retain all of the debt while South Sudan would take on none.
Absent debt relief, the expectation was that the two governments would agree on a specific division of the debt
between the two countries.
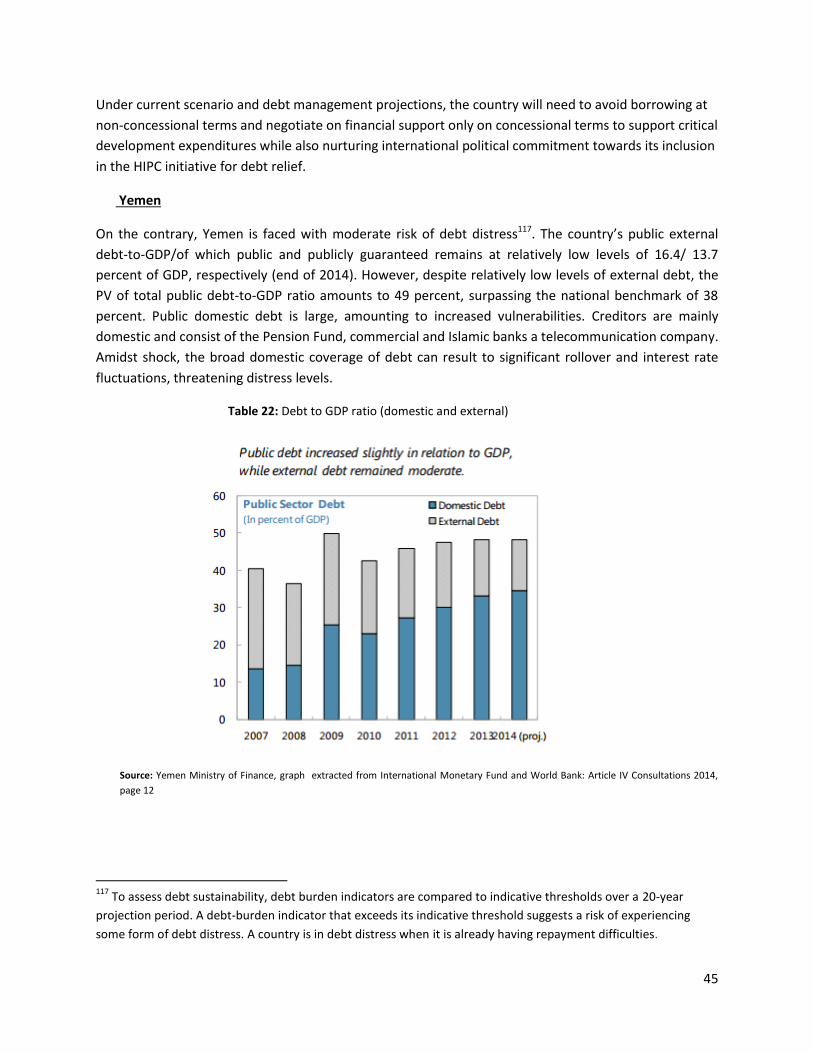
45
Under current scenario and debt management projections, the country will need to avoid borrowing at
non-concessional terms and negotiate on financial support only on concessional terms to support critical
development expenditures while also nurturing international political commitment towards its inclusion
in the HIPC initiative for debt relief.
Yemen
On the contrary, Yemen is faced with moderate risk of debt distress117. The country’s public external
debt-to-GDP/of which public and publicly guaranteed remains at relatively low levels of 16.4/ 13.7
percent of GDP, respectively (end of 2014). However, despite relatively low levels of external debt, the
PV of total public debt-to-GDP ratio amounts to 49 percent, surpassing the national benchmark of 38
percent. Public domestic debt is large, amounting to increased vulnerabilities. Creditors are mainly
domestic and consist of the Pension Fund, commercial and Islamic banks a telecommunication company.
Amidst shock, the broad domestic coverage of debt can result to significant rollover and interest rate
fluctuations, threatening distress levels.
Table 22: Debt to GDP ratio (domestic and external)
Source: Yemen Ministry of Finance, graph extracted from International Monetary Fund and World Bank: Article IV Consultations 2014,
page 12
117
To assess debt sustainability, debt burden indicators are compared to indicative thresholds over a 20-year
projection period. A debt-burden indicator that exceeds its indicative threshold suggests a risk of experiencing
some form of debt distress. A country is in debt distress when it is already having repayment difficulties.
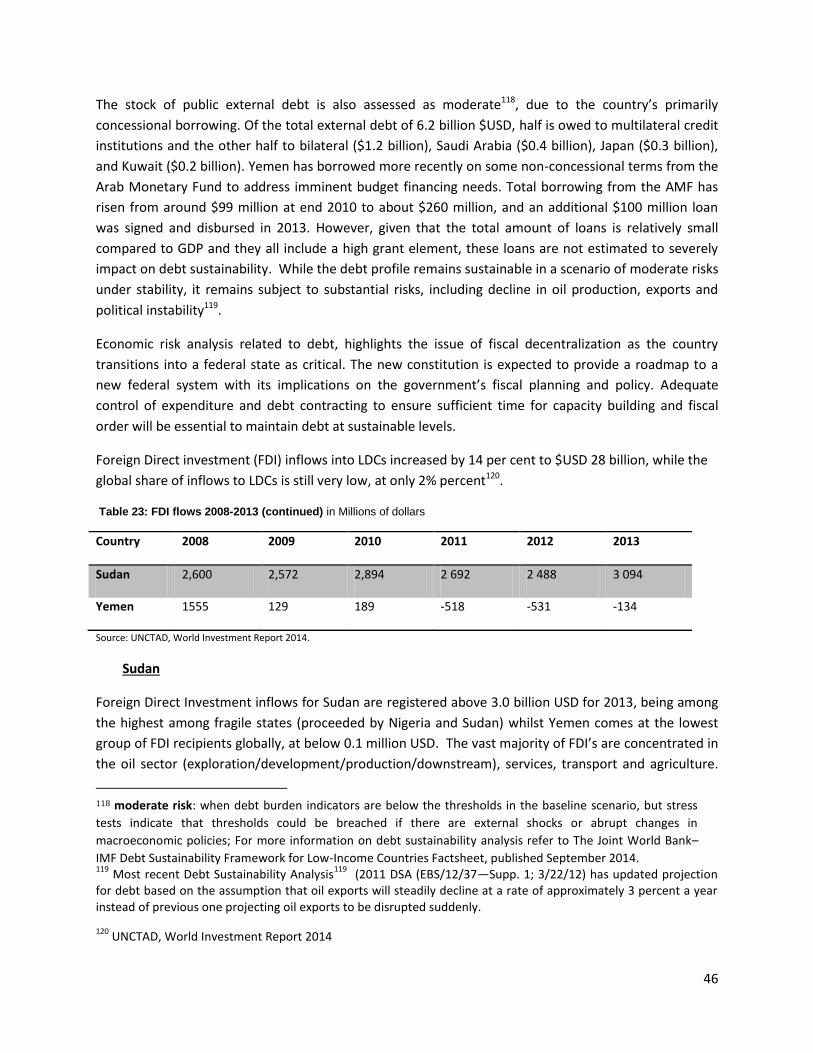
46
The stock of public external debt is also assessed as moderate118, due to the country’s primarily
concessional borrowing. Of the total external debt of 6.2 billion $USD, half is owed to multilateral credit
institutions and the other half to bilateral ($1.2 billion), Saudi Arabia ($0.4 billion), Japan ($0.3 billion),
and Kuwait ($0.2 billion). Yemen has borrowed more recently on some non-concessional terms from the
Arab Monetary Fund to address imminent budget financing needs. Total borrowing from the AMF has
risen from around $99 million at end 2010 to about $260 million, and an additional $100 million loan
was signed and disbursed in 2013. However, given that the total amount of loans is relatively small
compared to GDP and they all include a high grant element, these loans are not estimated to severely
impact on debt sustainability. While the debt profile remains sustainable in a scenario of moderate risks
under stability, it remains subject to substantial risks, including decline in oil production, exports and
political instability119.
Economic risk analysis related to debt, highlights the issue of fiscal decentralization as the country
transitions into a federal state as critical. The new constitution is expected to provide a roadmap to a
new federal system with its implications on the government’s fiscal planning and policy. Adequate
control of expenditure and debt contracting to ensure sufficient time for capacity building and fiscal
order will be essential to maintain debt at sustainable levels.
Foreign Direct investment (FDI) inflows into LDCs increased by 14 per cent to $USD 28 billion, while the
global share of inflows to LDCs is still very low, at only 2% percent120.
Table 23: FDI flows 2008-2013 (continued) in Millions of dollars
Country 2008 2009 2010 2011 2012 2013
Sudan 2,600 2,572 2,894 2 692 2 488 3 094
Yemen 1555 129 189 -518 -531 -134
Source: UNCTAD, World Investment Report 2014.
Sudan
Foreign Direct Investment inflows for Sudan are registered above 3.0 billion USD for 2013, being among
the highest among fragile states (proceeded by Nigeria and Sudan) whilst Yemen comes at the lowest
group of FDI recipients globally, at below 0.1 million USD. The vast majority of FDI’s are concentrated in
the oil sector (exploration/development/production/downstream), services, transport and agriculture.
118 moderate risk: when debt burden indicators are below the thresholds in the baseline scenario, but stress
tests indicate that thresholds could be breached if there are external shocks or abrupt changes in
macroeconomic policies; For more information on debt sustainability analysis refer to The Joint World Bank–
IMF Debt Sustainability Framework for Low-Income Countries Factsheet, published September 2014. 119
Most recent Debt Sustainability Analysis119
(2011 DSA (EBS/12/37—Supp. 1; 3/22/12) has updated projection for debt based on the assumption that oil exports will steadily decline at a rate of approximately 3 percent a year instead of previous one projecting oil exports to be disrupted suddenly.
120 UNCTAD, World Investment Report 2014
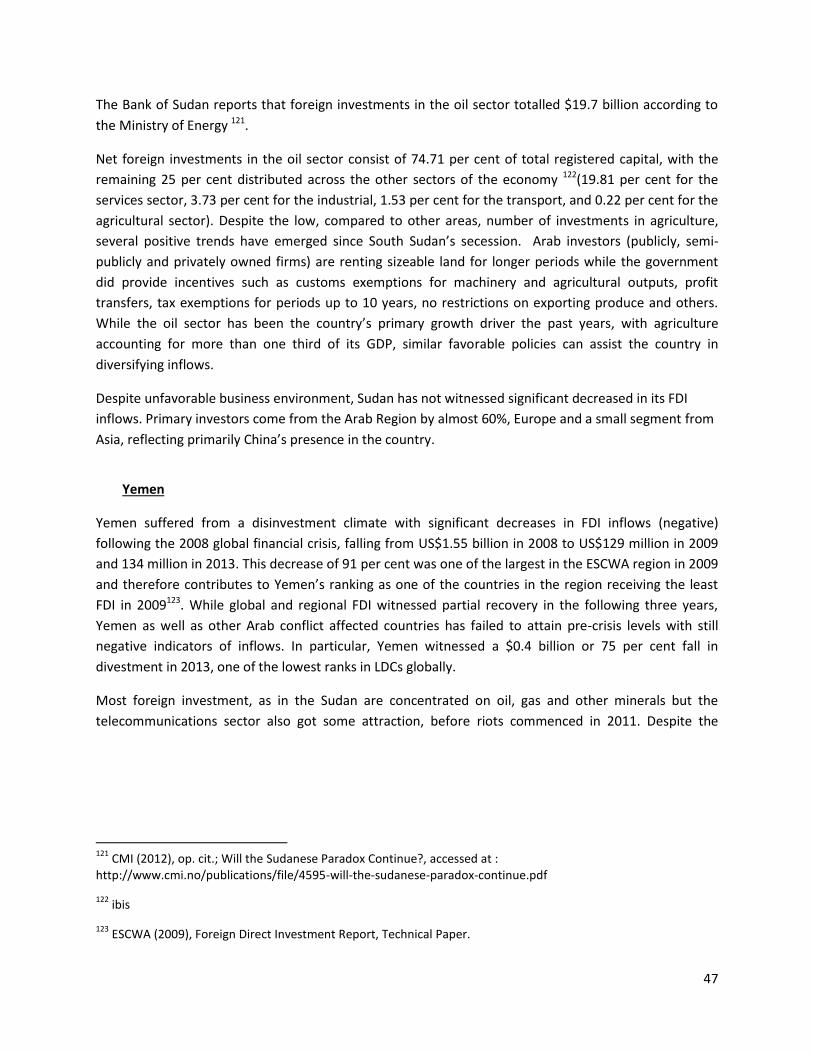
47
The Bank of Sudan reports that foreign investments in the oil sector totalled $19.7 billion according to
the Ministry of Energy 121.
Net foreign investments in the oil sector consist of 74.71 per cent of total registered capital, with the
remaining 25 per cent distributed across the other sectors of the economy 122(19.81 per cent for the
services sector, 3.73 per cent for the industrial, 1.53 per cent for the transport, and 0.22 per cent for the
agricultural sector). Despite the low, compared to other areas, number of investments in agriculture,
several positive trends have emerged since South Sudan’s secession. Arab investors (publicly, semi-
publicly and privately owned firms) are renting sizeable land for longer periods while the government
did provide incentives such as customs exemptions for machinery and agricultural outputs, profit
transfers, tax exemptions for periods up to 10 years, no restrictions on exporting produce and others.
While the oil sector has been the country’s primary growth driver the past years, with agriculture
accounting for more than one third of its GDP, similar favorable policies can assist the country in
diversifying inflows.
Despite unfavorable business environment, Sudan has not witnessed significant decreased in its FDI
inflows. Primary investors come from the Arab Region by almost 60%, Europe and a small segment from
Asia, reflecting primarily China’s presence in the country.
Yemen
Yemen suffered from a disinvestment climate with significant decreases in FDI inflows (negative)
following the 2008 global financial crisis, falling from US$1.55 billion in 2008 to US$129 million in 2009
and 134 million in 2013. This decrease of 91 per cent was one of the largest in the ESCWA region in 2009
and therefore contributes to Yemen’s ranking as one of the countries in the region receiving the least
FDI in 2009123. While global and regional FDI witnessed partial recovery in the following three years,
Yemen as well as other Arab conflict affected countries has failed to attain pre-crisis levels with still
negative indicators of inflows. In particular, Yemen witnessed a $0.4 billion or 75 per cent fall in
divestment in 2013, one of the lowest ranks in LDCs globally.
Most foreign investment, as in the Sudan are concentrated on oil, gas and other minerals but the
telecommunications sector also got some attraction, before riots commenced in 2011. Despite the
121
CMI (2012), op. cit.; Will the Sudanese Paradox Continue?, accessed at : http://www.cmi.no/publications/file/4595-will-the-sudanese-paradox-continue.pdf
122 ibis
123 ESCWA (2009), Foreign Direct Investment Report, Technical Paper.
48
abundant investment opportunities in the country, until political circumstances permit a more stable
environment, investors are most likely to continue being deterred124.
On the institutional framework, Yemen has made some efforts to enhance its attractiveness as a
business destination. The establishment of the General Investment Authority (GIA) is for example
Yemen’s primary agency tasked with promoting investment and coordinating government’s efforts to
this end. Promoted areas include industries, mining, transport, touring, housing, fishery and marine
biology sector. The geological diversity characterizing Yemen has led to a significant variety in mineral
wealth, largely unexplored. The Government of Yemen reports the existence of economically viable
quantities of gold, zinc, silver as well as copper and nickel as a means to diversify its investments.
While investors come primarily from the Arab region, Yemen has during 2014 succeeded, despite
unfavorable environment, to attract financing and technical support on electricity and energy sectors
from emerging economies such as Brazil.
4. Remittances
Sudan
Table 24: Remittances flows in Sudan
Published in ESCWA (2015), forthcoming study on Remmittances in Sudan
124
FDI Intelligencey Unit, Yemen Country update accessed at
http://www.fdiintelligence.com/Locations/Middle-East-Africa/Yemen/Political-instability-steers-
investors-from-Yemen)
0
10
20
30
40
50
60
70
0
500
1000
1500
2000
2500
3000
3500
19
77
19
78
19
79
19
80
19
81
19
82
19
83
19
84
19
85
19
86
19
87
19
88
19
89
19
90
19
91
19
92
19
93
19
94
19
95
19
96
19
97
19
98
19
99
20
00
20
01
20
02
20
03
20
04
20
05
20
06
20
07
20
08
20
09
20
10
20
11
20
12
20
13
Mil
lio
n U
SD
, cu
rren
t
Mil
lio
n U
SD
Sources: Central Bank of Sudan and the World Bank development indicators
The flows of remittances in Sudan
Remittance inflows (LHS) Net remittances Remittance outflows (RHS)
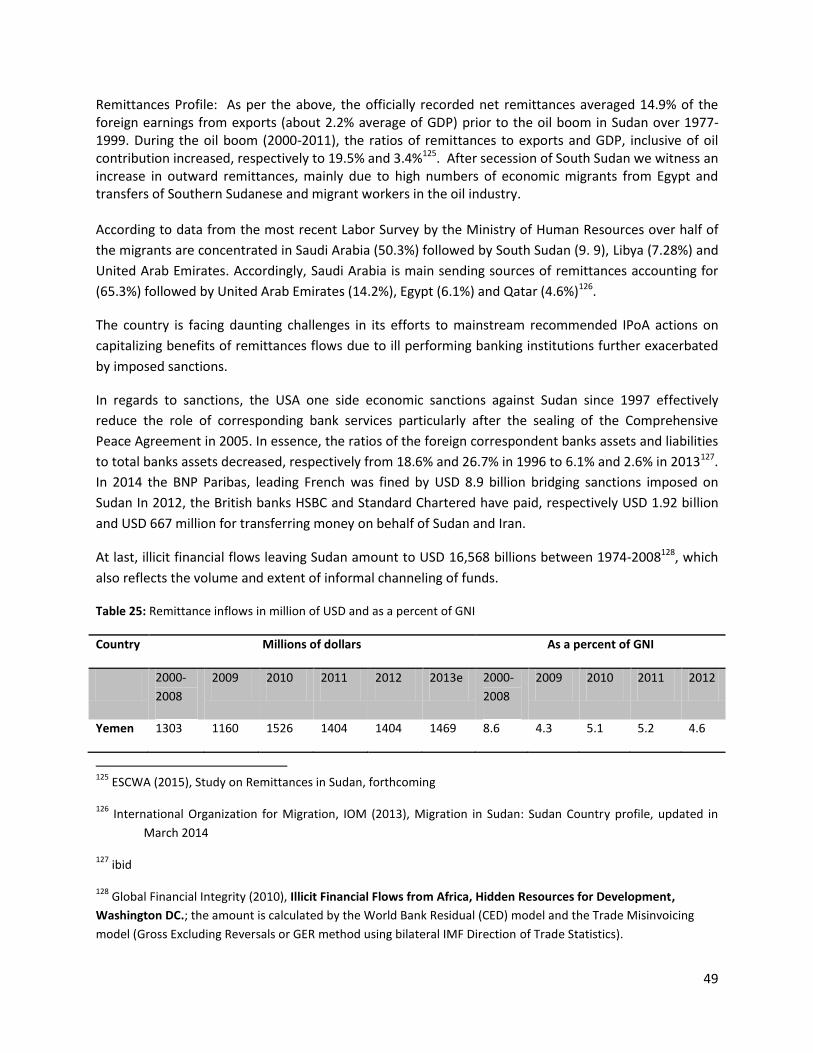
49
Remittances Profile: As per the above, the officially recorded net remittances averaged 14.9% of the foreign earnings from exports (about 2.2% average of GDP) prior to the oil boom in Sudan over 1977-1999. During the oil boom (2000-2011), the ratios of remittances to exports and GDP, inclusive of oil contribution increased, respectively to 19.5% and 3.4%125. After secession of South Sudan we witness an increase in outward remittances, mainly due to high numbers of economic migrants from Egypt and transfers of Southern Sudanese and migrant workers in the oil industry. According to data from the most recent Labor Survey by the Ministry of Human Resources over half of
the migrants are concentrated in Saudi Arabia (50.3%) followed by South Sudan (9. 9), Libya (7.28%) and
United Arab Emirates. Accordingly, Saudi Arabia is main sending sources of remittances accounting for
(65.3%) followed by United Arab Emirates (14.2%), Egypt (6.1%) and Qatar (4.6%)126.
The country is facing daunting challenges in its efforts to mainstream recommended IPoA actions on
capitalizing benefits of remittances flows due to ill performing banking institutions further exacerbated
by imposed sanctions.
In regards to sanctions, the USA one side economic sanctions against Sudan since 1997 effectively
reduce the role of corresponding bank services particularly after the sealing of the Comprehensive
Peace Agreement in 2005. In essence, the ratios of the foreign correspondent banks assets and liabilities
to total banks assets decreased, respectively from 18.6% and 26.7% in 1996 to 6.1% and 2.6% in 2013127.
In 2014 the BNP Paribas, leading French was fined by USD 8.9 billion bridging sanctions imposed on
Sudan In 2012, the British banks HSBC and Standard Chartered have paid, respectively USD 1.92 billion
and USD 667 million for transferring money on behalf of Sudan and Iran.
At last, illicit financial flows leaving Sudan amount to USD 16,568 billions between 1974-2008128, which
also reflects the volume and extent of informal channeling of funds.
Table 25: Remittance inflows in million of USD and as a percent of GNI
Country Millions of dollars As a percent of GNI
2000-
2008
2009 2010 2011 2012 2013e 2000-
2008
2009 2010 2011 2012
Yemen 1303 1160 1526 1404 1404 1469 8.6 4.3 5.1 5.2 4.6
125
ESCWA (2015), Study on Remittances in Sudan, forthcoming
126 International Organization for Migration, IOM (2013), Migration in Sudan: Sudan Country profile, updated in
March 2014
127 ibid
128 Global Financial Integrity (2010), Illicit Financial Flows from Africa, Hidden Resources for Development,
Washington DC.; the amount is calculated by the World Bank Residual (CED) model and the Trade Misinvoicing
model (Gross Excluding Reversals or GER method using bilateral IMF Direction of Trade Statistics).
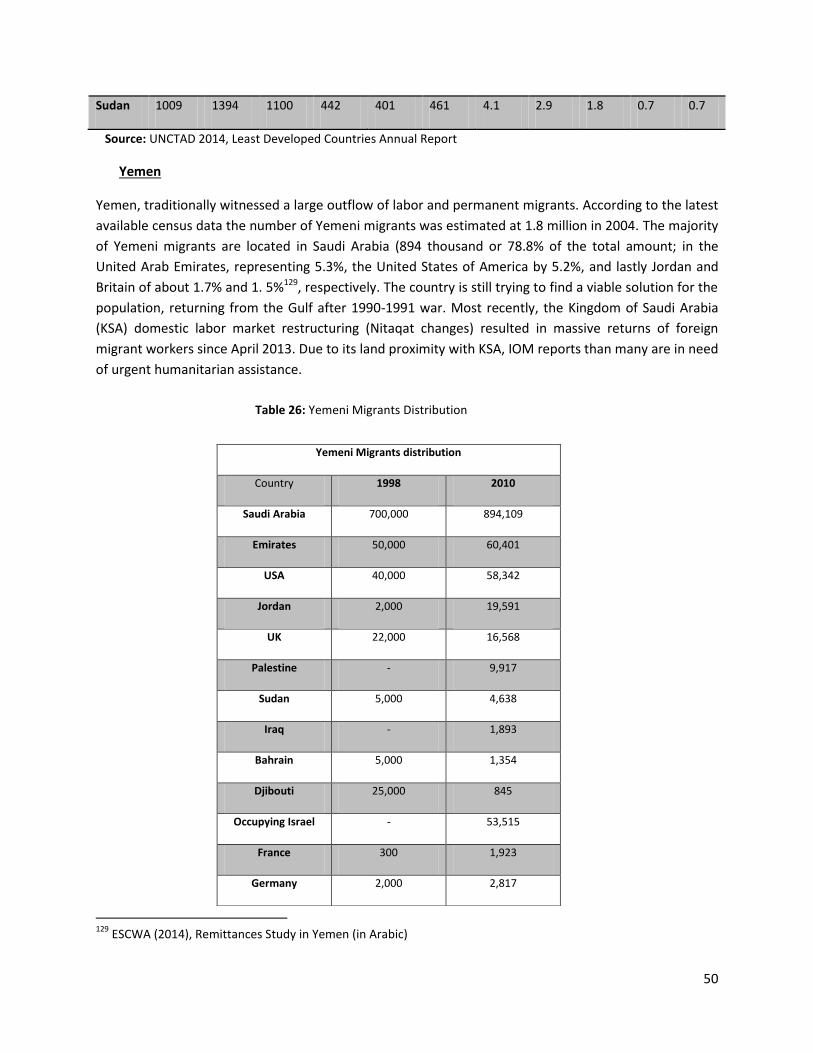
50
Sudan 1009 1394 1100 442 401 461 4.1 2.9 1.8 0.7 0.7
Source: UNCTAD 2014, Least Developed Countries Annual Report
Yemen
Yemen, traditionally witnessed a large outflow of labor and permanent migrants. According to the latest
available census data the number of Yemeni migrants was estimated at 1.8 million in 2004. The majority
of Yemeni migrants are located in Saudi Arabia (894 thousand or 78.8% of the total amount; in the
United Arab Emirates, representing 5.3%, the United States of America by 5.2%, and lastly Jordan and
Britain of about 1.7% and 1. 5%129, respectively. The country is still trying to find a viable solution for the
population, returning from the Gulf after 1990-1991 war. Most recently, the Kingdom of Saudi Arabia
(KSA) domestic labor market restructuring (Nitaqat changes) resulted in massive returns of foreign
migrant workers since April 2013. Due to its land proximity with KSA, IOM reports than many are in need
of urgent humanitarian assistance.
Table 26: Yemeni Migrants Distribution
129
ESCWA (2014), Remittances Study in Yemen (in Arabic)
Yemeni Migrants distribution
Country 1998 2010
Saudi Arabia 700,000 894,109
Emirates 50,000 60,401
USA 40,000 58,342
Jordan 2,000 19,591
UK 22,000 16,568
Palestine - 9,917
Sudan 5,000 4,638
Iraq - 1,893
Bahrain 5,000 1,354
Djibouti 25,000 845
Occupying Israel - 53,515
France 300 1,923
Germany 2,000 2,817
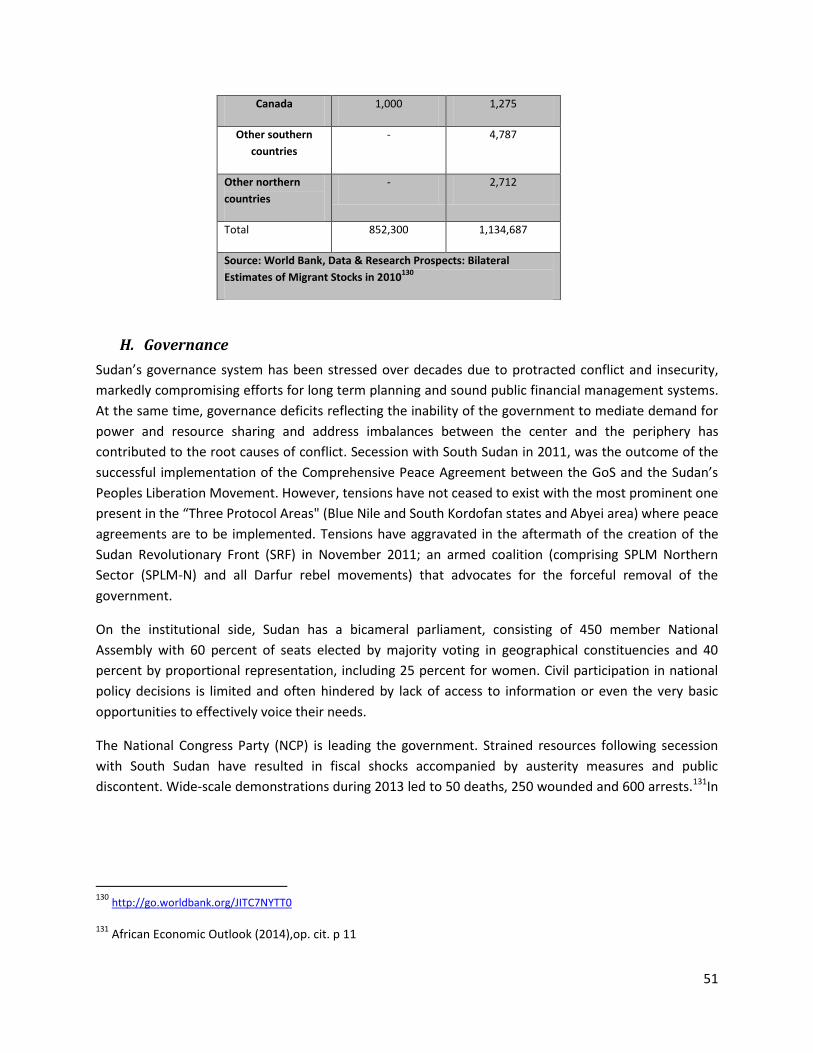
51
H. Governance
Sudan’s governance system has been stressed over decades due to protracted conflict and insecurity,
markedly compromising efforts for long term planning and sound public financial management systems.
At the same time, governance deficits reflecting the inability of the government to mediate demand for
power and resource sharing and address imbalances between the center and the periphery has
contributed to the root causes of conflict. Secession with South Sudan in 2011, was the outcome of the
successful implementation of the Comprehensive Peace Agreement between the GoS and the Sudan’s
Peoples Liberation Movement. However, tensions have not ceased to exist with the most prominent one
present in the “Three Protocol Areas" (Blue Nile and South Kordofan states and Abyei area) where peace
agreements are to be implemented. Tensions have aggravated in the aftermath of the creation of the
Sudan Revolutionary Front (SRF) in November 2011; an armed coalition (comprising SPLM Northern
Sector (SPLM-N) and all Darfur rebel movements) that advocates for the forceful removal of the
government.
On the institutional side, Sudan has a bicameral parliament, consisting of 450 member National
Assembly with 60 percent of seats elected by majority voting in geographical constituencies and 40
percent by proportional representation, including 25 percent for women. Civil participation in national
policy decisions is limited and often hindered by lack of access to information or even the very basic
opportunities to effectively voice their needs.
The National Congress Party (NCP) is leading the government. Strained resources following secession
with South Sudan have resulted in fiscal shocks accompanied by austerity measures and public
discontent. Wide-scale demonstrations during 2013 led to 50 deaths, 250 wounded and 600 arrests.131In
130
http://go.worldbank.org/JITC7NYTT0
131 African Economic Outlook (2014),op. cit. p 11
Canada 1,000 1,275
Other southern
countries
- 4,787
Other northern
countries
- 2,712
Total 852,300 1,134,687
Source: World Bank, Data & Research Prospects: Bilateral
Estimates of Migrant Stocks in 2010130
52
2013, the country came at 170th place out of 179 countries by Reporters without Borders due to the
government’s control of public media132.
Despite advances on the judicial sector, challenges remain and primarily relate to transparent and
accessible to all judicial institutions as well as critical human and financial capital to increase coverage of
all regions. Conflict affected areas, such as North Darfur, only three out of seven criminal courts are
operational, all in El Fasher in addition to 39 over 72 functioning rural courts. Participation and resolve
into justice is low with only 16 percent of the population indicating confidence in fair treatment if they
are arrested or file a complaint with local law and order institutions.
Among the major challenges for the government include a) its capacity to ensure security, rule of law
and exert legitimate authority by responding to diverse needs of communities across its territory and b)
increase its performance in effective and equal service delivery and natural resource management in a
manner that addresses the political and social division within and among communities.
In terms of Human Rights, Sudan has made advancements including the mainstreaming of human rights
provision in its constitutional and legal framework, including the establishment of the Advisory Council
on Human Rights and the proposed Human Rights Commission, provisions on the rights and protection
of women and children, freedom of beliefs and protection of the freedom of expression. However,
Sudan has not yet ratified key international human rights treaties, such as the Convention against
Torture and Other Cruel, Inhuman and Degrading Treatment, and the Convention on the Elimination of
All Forms of Discrimination against Women. The universal periodic review (UPR) of the Human Rights
Council in May 2011 highlighted continuing discriminatory laws against women and the prevalence of
sexual and gender-based violence in Darfur as major concerns. In addition, effective implementation of
the human rights policies on the ground remain slow and uneven across governorates. Most recently,
on January 29th 2015 the Sudanese Writers Union announced that the government had ordered
its closure, which is only one of many unions and independent think tanks that the GoS has
outlawed. A result oriented framework that sets out a timeline for tangible realization of human rights
policies across the respective institutions was among key recommendations to the GoS133. This would
enable a more equal access to justice which mean that all people stand to benefit from improved and
fair access to judicial institutions.
In terms of corruption the government faces challenges common in conflict affected and resource rich
states, severely undermining stability. According to the 2013 Global Corruption Barometer, over 70%
percent of respondents thought that state institutions, including NGOs are corrupt. The country also
132 Reporters without Borders (2014), ‘ELEVEN NEWSPAPERS SEIZED IN LESS THAN A WEEK’
http://en.rsf.org/sudan-eleven-newspapers-seized-in-less-10-03-2014,45967.html
133 OHCHR, Sudan (2013): Report of the Independent Expert on the situation of human rights in the Sudan
(A/HRC/27/69)
53
performs poor in the World Bank’s Worldwide Governance Indicators134. However, the GoS has
demonstrated commitment towards fighting corruption and is benefiting from regional initiatives such
as the “Arab Anti-Corruption and Integrity Network” (ACINET), an Arab regional mechanism that brings
together governmental and non-governmental entities for consultation and cooperation on anti-
corruption issues in the Arab Region135.
Yemen
In Yemen, as in the Sudan, the quality of governance systems and service provision has been put into
test following the popular uprising and socio-economic and political tensions in 2011. After 33 years in
power, Yemen’s president Ali Abdallah Saleh resigned in May 2011, and the country began its political
transformation which has continued to present day. Underlying institutional weaknesses have been
unable to address root causes of conflict evident in four separate fronts: the Houthis in the North,
grievances in the south, the presence of Al-Qaeda in the Arabian Peninsula (AQAB) and public discontent
with the government across the capital Sana’a. The socio-economic and political tensions in Yemen led
the country to the verge of civil war, which was partly defused, with the mediation and support of the
GCC countries following by a transition agreement in November 2011 which established a Government
of National Unity; a Military Committee for Establishing Safety and Security; election of a new president,
constitutional and electoral reform and a National Dialogue.
The National Dialogue Conference (NDC) was formed to formulate and guide the country’s transition
process. The NDC comprised of eleven working groups - 565 members - concluded its work in January
2014. The NDC resolutions guarantee freedom of religion; recommended formation of nonsectarian
government; prohibited illegal financial or military support from foreign powers; made restrictions on
ownership of weapons; proposed a cap on military spending and called for addressing the feuds which
contributed to the conflict136. The NDC recommendations also included extending the presidency for
another year in order to implement certain reforms and oversee transition process, and restructuring of
parliament and the Shura Council in order to ensure more equitable representation. These
recommendations were incorporated into a draft new constitution which was submitted before the
Parliament in January 2015.
The governance and administrative division of Yemen has been as complex as the country’s history and
social fabric. The country has been administratively divided into 22 governorates and into 333 districts
which are further subdivided into 2210 sub-districts and then into 38,284 villages137. At the local level,
134
For more information on the WB
135 More information on the Arab Anti-Corruption and Integrity Network can be found at:
http://www.arabacinet.org/
136 Holzpfel, P. B. (2014). Yemen’s Transition Process: Between Fragmentation and Transformation. Peaceworks 95.
Washington, D.C. United States Institute of Peace.
137 Mitchell, R. (2012). What the Social Sciences Can Tell Policy-Makers in Yemen. Middle East Journal, 66(2), 304.
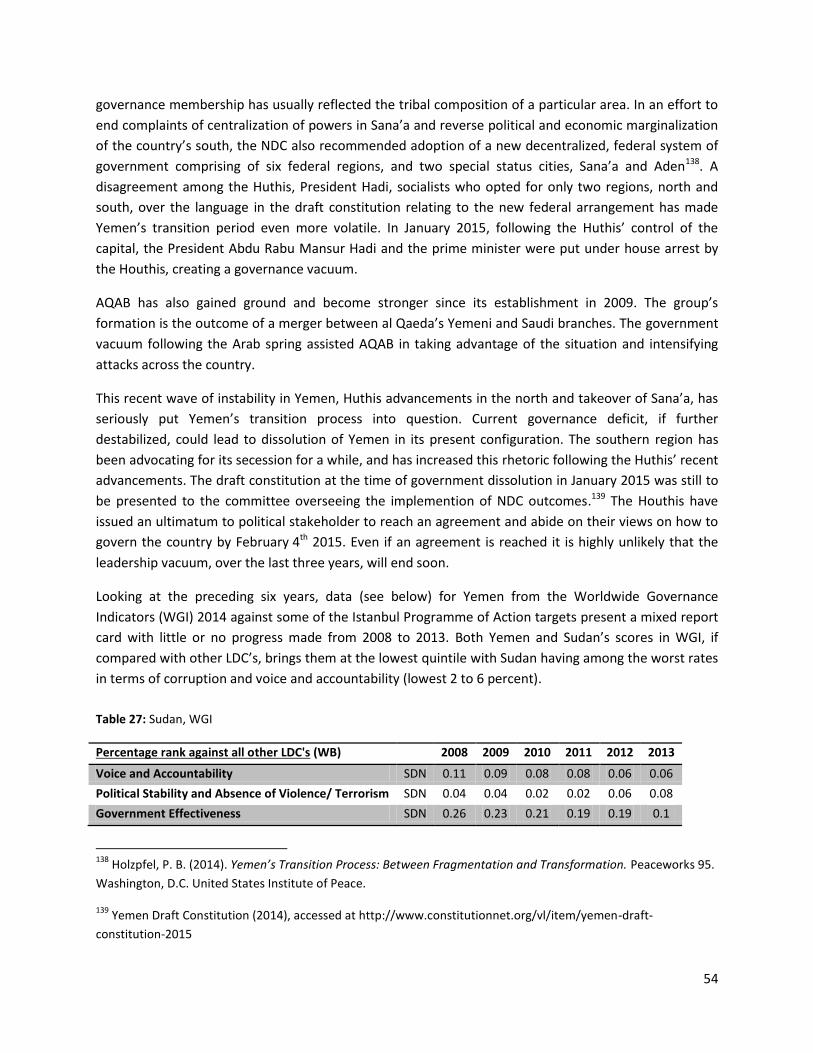
54
governance membership has usually reflected the tribal composition of a particular area. In an effort to
end complaints of centralization of powers in Sana’a and reverse political and economic marginalization
of the country’s south, the NDC also recommended adoption of a new decentralized, federal system of
government comprising of six federal regions, and two special status cities, Sana’a and Aden138. A
disagreement among the Huthis, President Hadi, socialists who opted for only two regions, north and
south, over the language in the draft constitution relating to the new federal arrangement has made
Yemen’s transition period even more volatile. In January 2015, following the Huthis’ control of the
capital, the President Abdu Rabu Mansur Hadi and the prime minister were put under house arrest by
the Houthis, creating a governance vacuum.
AQAB has also gained ground and become stronger since its establishment in 2009. The group’s
formation is the outcome of a merger between al Qaeda’s Yemeni and Saudi branches. The government
vacuum following the Arab spring assisted AQAB in taking advantage of the situation and intensifying
attacks across the country.
This recent wave of instability in Yemen, Huthis advancements in the north and takeover of Sana’a, has
seriously put Yemen’s transition process into question. Current governance deficit, if further
destabilized, could lead to dissolution of Yemen in its present configuration. The southern region has
been advocating for its secession for a while, and has increased this rhetoric following the Huthis’ recent
advancements. The draft constitution at the time of government dissolution in January 2015 was still to
be presented to the committee overseeing the implemention of NDC outcomes.139 The Houthis have
issued an ultimatum to political stakeholder to reach an agreement and abide on their views on how to
govern the country by February 4th 2015. Even if an agreement is reached it is highly unlikely that the
leadership vacuum, over the last three years, will end soon.
Looking at the preceding six years, data (see below) for Yemen from the Worldwide Governance
Indicators (WGI) 2014 against some of the Istanbul Programme of Action targets present a mixed report
card with little or no progress made from 2008 to 2013. Both Yemen and Sudan’s scores in WGI, if
compared with other LDC’s, brings them at the lowest quintile with Sudan having among the worst rates
in terms of corruption and voice and accountability (lowest 2 to 6 percent).
Table 27: Sudan, WGI
Percentage rank against all other LDC's (WB) 2008 2009 2010 2011 2012 2013
Voice and Accountability SDN 0.11 0.09 0.08 0.08 0.06 0.06
Political Stability and Absence of Violence/ Terrorism SDN 0.04 0.04 0.02 0.02 0.06 0.08
Government Effectiveness SDN 0.26 0.23 0.21 0.19 0.19 0.1
138
Holzpfel, P. B. (2014). Yemen’s Transition Process: Between Fragmentation and Transformation. Peaceworks 95.
Washington, D.C. United States Institute of Peace.
139 Yemen Draft Constitution (2014), accessed at http://www.constitutionnet.org/vl/item/yemen-draft-
constitution-2015
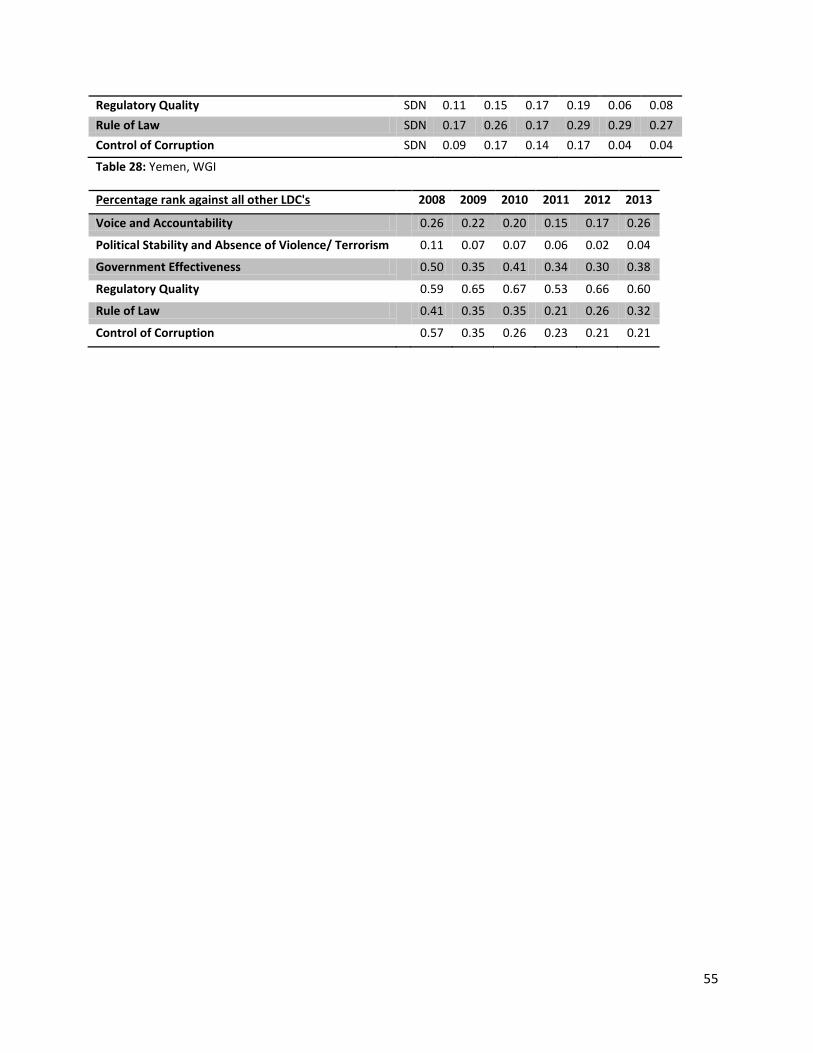
55
Regulatory Quality SDN 0.11 0.15 0.17 0.19 0.06 0.08
Rule of Law SDN 0.17 0.26 0.17 0.29 0.29 0.27
Control of Corruption SDN 0.09 0.17 0.14 0.17 0.04 0.04
Table 28: Yemen, WGI
Percentage rank against all other LDC's 2008 2009 2010 2011 2012 2013
Voice and Accountability 0.26 0.22 0.20 0.15 0.17 0.26
Political Stability and Absence of Violence/ Terrorism 0.11 0.07 0.07 0.06 0.02 0.04
Government Effectiveness 0.50 0.35 0.41 0.34 0.30 0.38
Regulatory Quality 0.59 0.65 0.67 0.53 0.66 0.60
Rule of Law 0.41 0.35 0.35 0.21 0.26 0.32
Control of Corruption 0.57 0.35 0.26 0.23 0.21 0.21
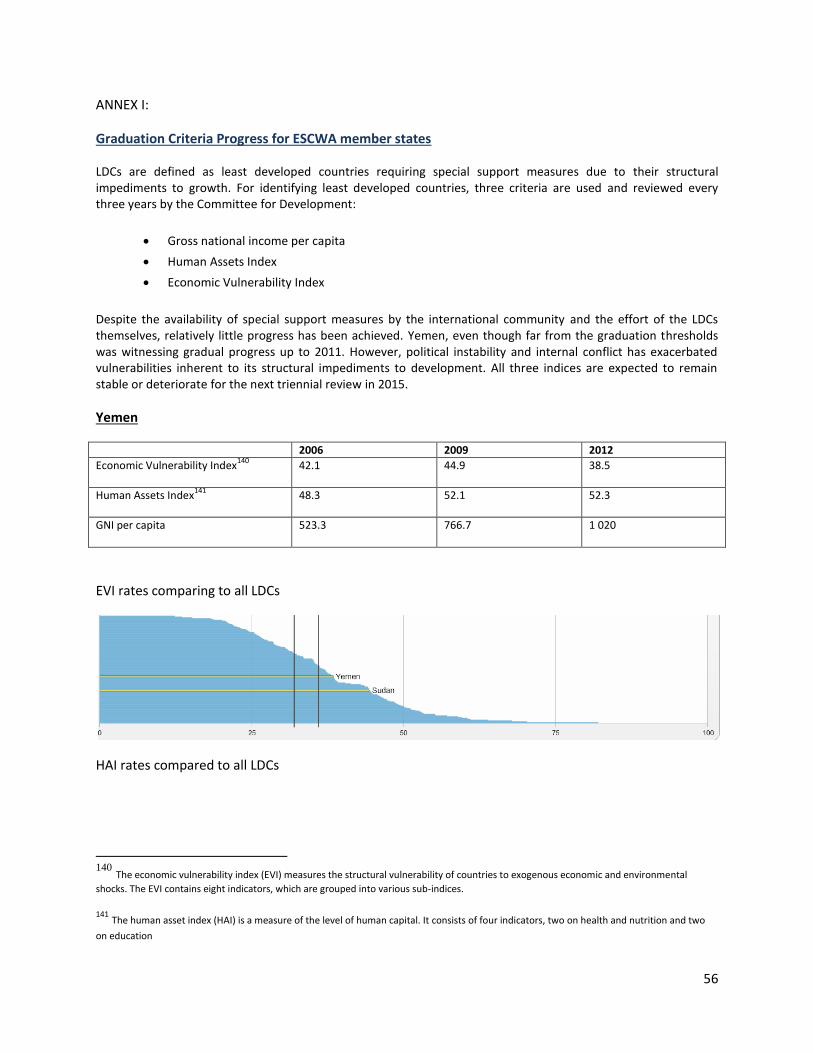
56
ANNEX I:
Graduation Criteria Progress for ESCWA member states
LDCs are defined as least developed countries requiring special support measures due to their structural impediments to growth. For identifying least developed countries, three criteria are used and reviewed every three years by the Committee for Development:
Gross national income per capita
Human Assets Index
Economic Vulnerability Index
Despite the availability of special support measures by the international community and the effort of the LDCs themselves, relatively little progress has been achieved. Yemen, even though far from the graduation thresholds was witnessing gradual progress up to 2011. However, political instability and internal conflict has exacerbated vulnerabilities inherent to its structural impediments to development. All three indices are expected to remain stable or deteriorate for the next triennial review in 2015.
Yemen
2006 2009 2012
Economic Vulnerability Index140
42.1
44.9
38.5
Human Assets Index141
48.3
52.1
52.3
GNI per capita 523.3
766.7
1 020
EVI rates comparing to all LDCs
HAI rates compared to all LDCs
140
The economic vulnerability index (EVI) measures the structural vulnerability of countries to exogenous economic and environmental
shocks. The EVI contains eight indicators, which are grouped into various sub-indices.
141 The human asset index (HAI) is a measure of the level of human capital. It consists of four indicators, two on health and nutrition and two
on education
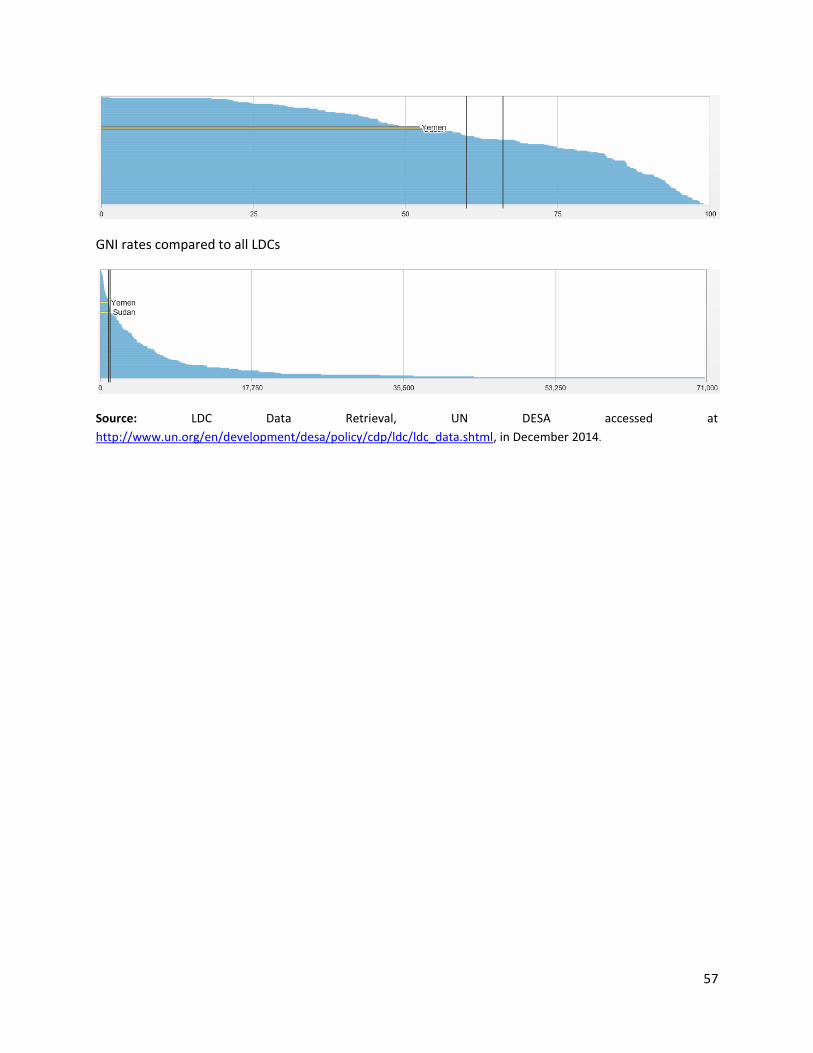
57
GNI rates compared to all LDCs
Source: LDC Data Retrieval, UN DESA accessed at
http://www.un.org/en/development/desa/policy/cdp/ldc/ldc_data.shtml, in December 2014.
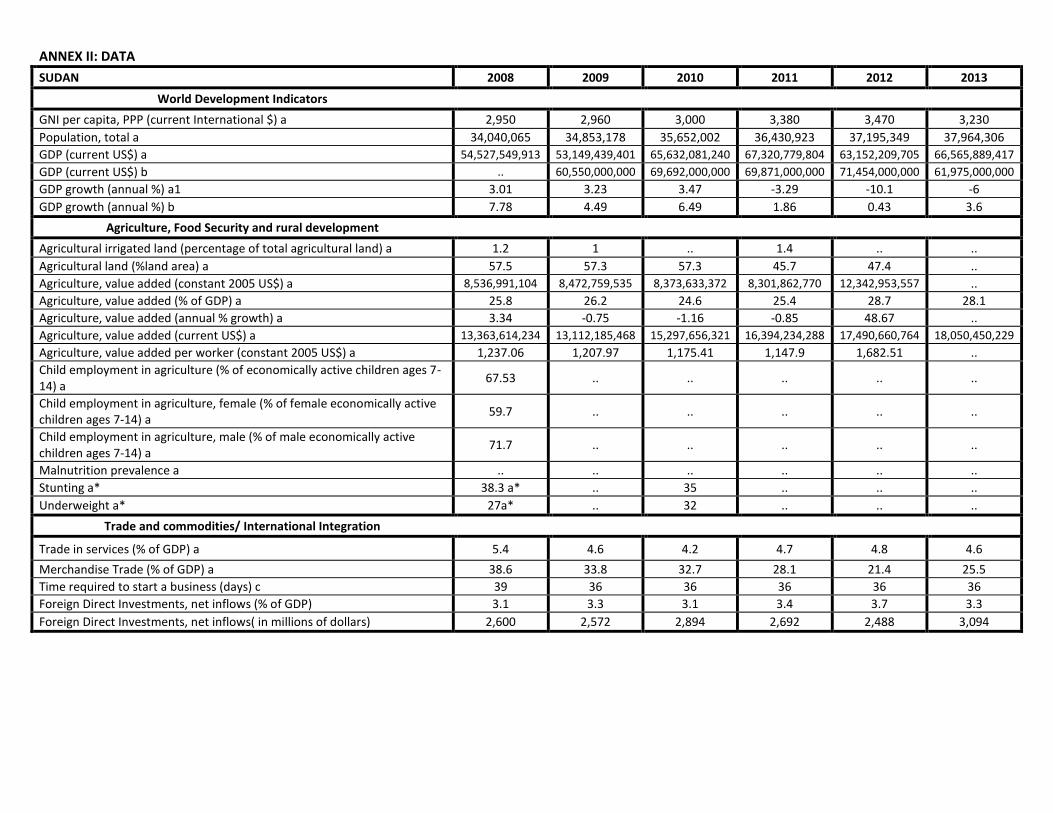
ANNEX II: DATA
SUDAN 2008 2009 2010 2011 2012 2013
World Development Indicators
GNI per capita, PPP (current International $) a 2,950 2,960 3,000 3,380 3,470 3,230
Population, total a 34,040,065 34,853,178 35,652,002 36,430,923 37,195,349 37,964,306
GDP (current US$) a 54,527,549,913 53,149,439,401 65,632,081,240 67,320,779,804 63,152,209,705 66,565,889,417
GDP (current US$) b .. 60,550,000,000 69,692,000,000 69,871,000,000 71,454,000,000 61,975,000,000
GDP growth (annual %) a1 3.01 3.23 3.47 -3.29 -10.1 -6
GDP growth (annual %) b 7.78 4.49 6.49 1.86 0.43 3.6
Agriculture, Food Security and rural development
Agricultural irrigated land (percentage of total agricultural land) a 1.2 1 .. 1.4 .. ..
Agricultural land (%land area) a 57.5 57.3 57.3 45.7 47.4 ..
Agriculture, value added (constant 2005 US$) a 8,536,991,104 8,472,759,535 8,373,633,372 8,301,862,770 12,342,953,557 ..
Agriculture, value added (% of GDP) a 25.8 26.2 24.6 25.4 28.7 28.1
Agriculture, value added (annual % growth) a 3.34 -0.75 -1.16 -0.85 48.67 ..
Agriculture, value added (current US$) a 13,363,614,234 13,112,185,468 15,297,656,321 16,394,234,288 17,490,660,764 18,050,450,229
Agriculture, value added per worker (constant 2005 US$) a 1,237.06 1,207.97 1,175.41 1,147.9 1,682.51 ..
Child employment in agriculture (% of economically active children ages 7-14) a
67.53 .. .. .. .. ..
Child employment in agriculture, female (% of female economically active children ages 7-14) a
59.7 .. .. .. .. ..
Child employment in agriculture, male (% of male economically active children ages 7-14) a
71.7 .. .. .. .. ..
Malnutrition prevalence a .. .. .. .. .. ..
Stunting a* 38.3 a* .. 35 .. .. ..
Underweight a* 27a* .. 32 .. .. ..
Trade and commodities/ International Integration
Trade in services (% of GDP) a 5.4 4.6 4.2 4.7 4.8 4.6
Merchandise Trade (% of GDP) a 38.6 33.8 32.7 28.1 21.4 25.5
Time required to start a business (days) c 39 36 36 36 36 36
Foreign Direct Investments, net inflows (% of GDP) 3.1 3.3 3.1 3.4 3.7 3.3
Foreign Direct Investments, net inflows( in millions of dollars) 2,600 2,572 2,894 2,692 2,488 3,094
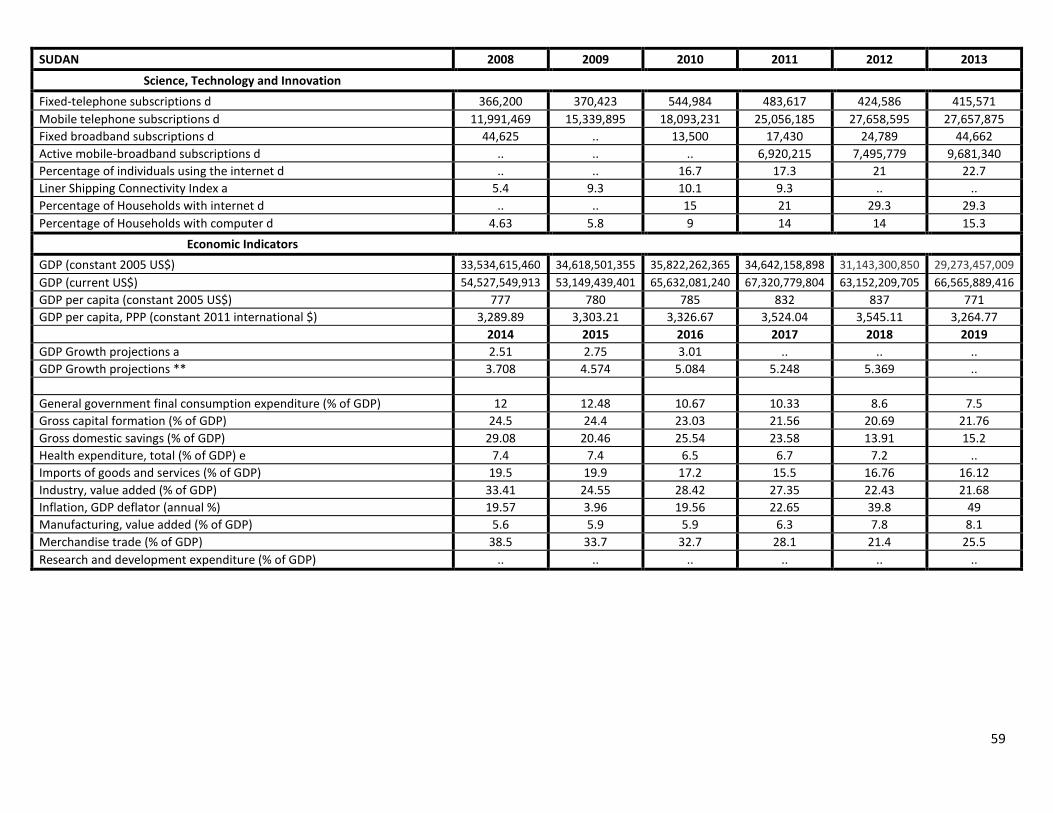
59
SUDAN 2008 2009 2010 2011 2012 2013
Science, Technology and Innovation
Fixed-telephone subscriptions d 366,200 370,423 544,984 483,617 424,586 415,571
Mobile telephone subscriptions d 11,991,469 15,339,895 18,093,231 25,056,185 27,658,595 27,657,875
Fixed broadband subscriptions d 44,625 .. 13,500 17,430 24,789 44,662
Active mobile-broadband subscriptions d .. .. .. 6,920,215 7,495,779 9,681,340
Percentage of individuals using the internet d .. .. 16.7 17.3 21 22.7
Liner Shipping Connectivity Index a 5.4 9.3 10.1 9.3 .. ..
Percentage of Households with internet d .. .. 15 21 29.3 29.3
Percentage of Households with computer d 4.63 5.8 9 14 14 15.3
Economic Indicators
GDP (constant 2005 US$) 33,534,615,460 34,618,501,355 35,822,262,365 34,642,158,898 31,143,300,850 29,273,457,009
GDP (current US$) 54,527,549,913 53,149,439,401 65,632,081,240 67,320,779,804 63,152,209,705 66,565,889,416
GDP per capita (constant 2005 US$) 777 780 785 832 837 771
GDP per capita, PPP (constant 2011 international $) 3,289.89 3,303.21 3,326.67 3,524.04 3,545.11 3,264.77
2014 2015 2016 2017 2018 2019
GDP Growth projections a 2.51 2.75 3.01 .. .. ..
GDP Growth projections ** 3.708 4.574 5.084 5.248 5.369 ..
General government final consumption expenditure (% of GDP) 12 12.48 10.67 10.33 8.6 7.5
Gross capital formation (% of GDP) 24.5 24.4 23.03 21.56 20.69 21.76
Gross domestic savings (% of GDP) 29.08 20.46 25.54 23.58 13.91 15.2
Health expenditure, total (% of GDP) e 7.4 7.4 6.5 6.7 7.2 ..
Imports of goods and services (% of GDP) 19.5 19.9 17.2 15.5 16.76 16.12
Industry, value added (% of GDP) 33.41 24.55 28.42 27.35 22.43 21.68
Inflation, GDP deflator (annual %) 19.57 3.96 19.56 22.65 39.8 49
Manufacturing, value added (% of GDP) 5.6 5.9 5.9 6.3 7.8 8.1
Merchandise trade (% of GDP) 38.5 33.7 32.7 28.1 21.4 25.5
Research and development expenditure (% of GDP) .. .. .. .. .. ..
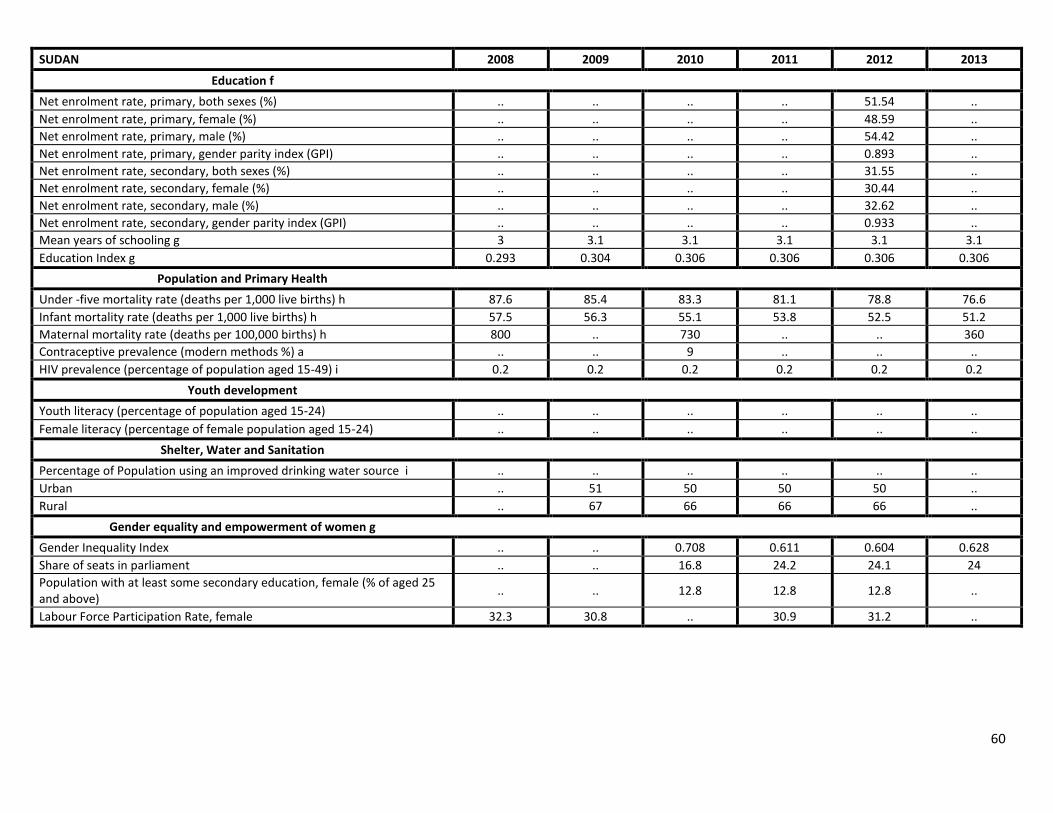
60
SUDAN 2008 2009 2010 2011 2012 2013
Education f
Net enrolment rate, primary, both sexes (%) .. .. .. .. 51.54 ..
Net enrolment rate, primary, female (%) .. .. .. .. 48.59 ..
Net enrolment rate, primary, male (%) .. .. .. .. 54.42 ..
Net enrolment rate, primary, gender parity index (GPI) .. .. .. .. 0.893 ..
Net enrolment rate, secondary, both sexes (%) .. .. .. .. 31.55 ..
Net enrolment rate, secondary, female (%) .. .. .. .. 30.44 ..
Net enrolment rate, secondary, male (%) .. .. .. .. 32.62 ..
Net enrolment rate, secondary, gender parity index (GPI) .. .. .. .. 0.933 ..
Mean years of schooling g 3 3.1 3.1 3.1 3.1 3.1
Education Index g 0.293 0.304 0.306 0.306 0.306 0.306
Population and Primary Health
Under -five mortality rate (deaths per 1,000 live births) h 87.6 85.4 83.3 81.1 78.8 76.6
Infant mortality rate (deaths per 1,000 live births) h 57.5 56.3 55.1 53.8 52.5 51.2
Maternal mortality rate (deaths per 100,000 births) h 800 .. 730 .. .. 360
Contraceptive prevalence (modern methods %) a .. .. 9 .. .. ..
HIV prevalence (percentage of population aged 15-49) i 0.2 0.2 0.2 0.2 0.2 0.2
Youth development
Youth literacy (percentage of population aged 15-24) .. .. .. .. .. ..
Female literacy (percentage of female population aged 15-24) .. .. .. .. .. ..
Shelter, Water and Sanitation
Percentage of Population using an improved drinking water source i .. .. .. .. .. ..
Urban .. 51 50 50 50 ..
Rural .. 67 66 66 66 ..
Gender equality and empowerment of women g
Gender Inequality Index .. .. 0.708 0.611 0.604 0.628
Share of seats in parliament .. .. 16.8 24.2 24.1 24
Population with at least some secondary education, female (% of aged 25 and above)
.. .. 12.8 12.8 12.8 ..
Labour Force Participation Rate, female 32.3 30.8 .. 30.9 31.2 ..
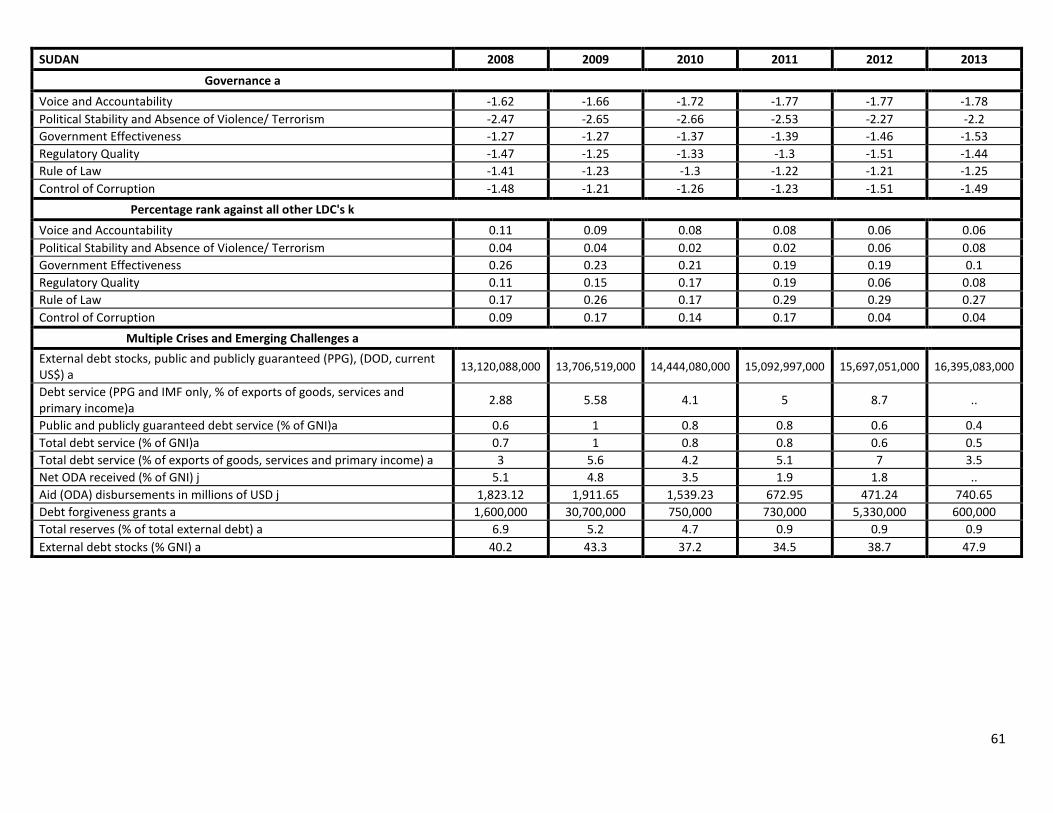
61
SUDAN 2008 2009 2010 2011 2012 2013
Governance a
Voice and Accountability -1.62 -1.66 -1.72 -1.77 -1.77 -1.78
Political Stability and Absence of Violence/ Terrorism -2.47 -2.65 -2.66 -2.53 -2.27 -2.2
Government Effectiveness -1.27 -1.27 -1.37 -1.39 -1.46 -1.53
Regulatory Quality -1.47 -1.25 -1.33 -1.3 -1.51 -1.44
Rule of Law -1.41 -1.23 -1.3 -1.22 -1.21 -1.25
Control of Corruption -1.48 -1.21 -1.26 -1.23 -1.51 -1.49
Percentage rank against all other LDC's k
Voice and Accountability 0.11 0.09 0.08 0.08 0.06 0.06
Political Stability and Absence of Violence/ Terrorism 0.04 0.04 0.02 0.02 0.06 0.08
Government Effectiveness 0.26 0.23 0.21 0.19 0.19 0.1
Regulatory Quality 0.11 0.15 0.17 0.19 0.06 0.08
Rule of Law 0.17 0.26 0.17 0.29 0.29 0.27
Control of Corruption 0.09 0.17 0.14 0.17 0.04 0.04
Multiple Crises and Emerging Challenges a
External debt stocks, public and publicly guaranteed (PPG), (DOD, current US$) a
13,120,088,000 13,706,519,000 14,444,080,000 15,092,997,000 15,697,051,000 16,395,083,000
Debt service (PPG and IMF only, % of exports of goods, services and primary income)a
2.88 5.58 4.1 5 8.7 ..
Public and publicly guaranteed debt service (% of GNI)a 0.6 1 0.8 0.8 0.6 0.4
Total debt service (% of GNI)a 0.7 1 0.8 0.8 0.6 0.5
Total debt service (% of exports of goods, services and primary income) a 3 5.6 4.2 5.1 7 3.5
Net ODA received (% of GNI) j 5.1 4.8 3.5 1.9 1.8 ..
Aid (ODA) disbursements in millions of USD j 1,823.12 1,911.65 1,539.23 672.95 471.24 740.65
Debt forgiveness grants a 1,600,000 30,700,000 750,000 730,000 5,330,000 600,000
Total reserves (% of total external debt) a 6.9 5.2 4.7 0.9 0.9 0.9
External debt stocks (% GNI) a 40.2 43.3 37.2 34.5 38.7 47.9
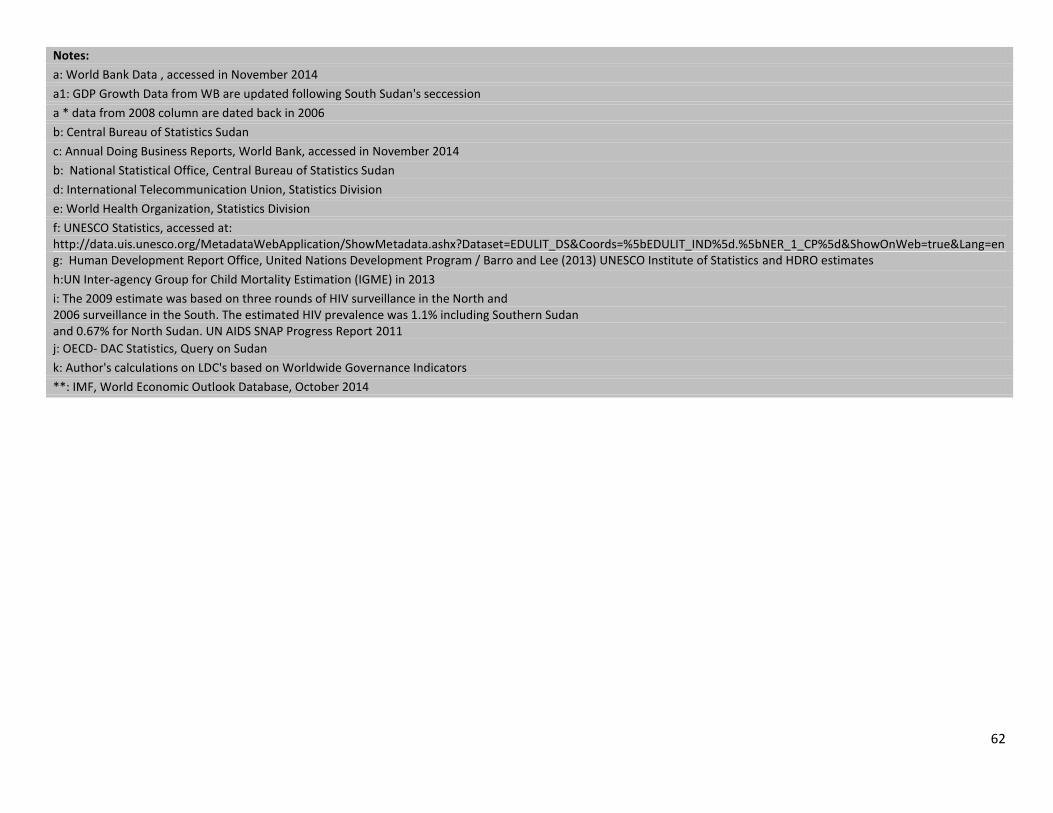
62
Notes:
a: World Bank Data , accessed in November 2014
a1: GDP Growth Data from WB are updated following South Sudan's seccession
a * data from 2008 column are dated back in 2006
b: Central Bureau of Statistics Sudan
c: Annual Doing Business Reports, World Bank, accessed in November 2014
b: National Statistical Office, Central Bureau of Statistics Sudan
d: International Telecommunication Union, Statistics Division
e: World Health Organization, Statistics Division
f: UNESCO Statistics, accessed at: http://data.uis.unesco.org/MetadataWebApplication/ShowMetadata.ashx?Dataset=EDULIT_DS&Coords=%5bEDULIT_IND%5d.%5bNER_1_CP%5d&ShowOnWeb=true&Lang=en g: Human Development Report Office, United Nations Development Program / Barro and Lee (2013) UNESCO Institute of Statistics and HDRO estimates
h:UN Inter-agency Group for Child Mortality Estimation (IGME) in 2013
i: The 2009 estimate was based on three rounds of HIV surveillance in the North and 2006 surveillance in the South. The estimated HIV prevalence was 1.1% including Southern Sudan and 0.67% for North Sudan. UN AIDS SNAP Progress Report 2011
j: OECD- DAC Statistics, Query on Sudan
k: Author's calculations on LDC's based on Worldwide Governance Indicators
**: IMF, World Economic Outlook Database, October 2014
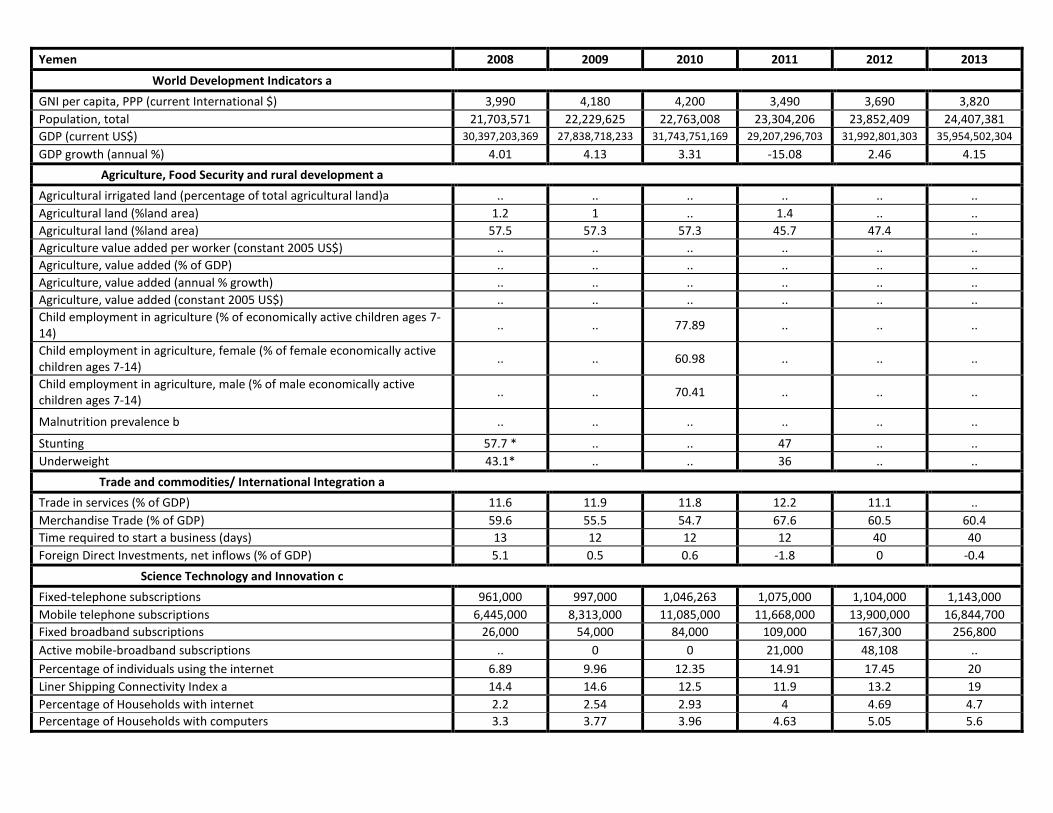
Yemen 2008 2009 2010 2011 2012 2013
World Development Indicators a
GNI per capita, PPP (current International $) 3,990 4,180 4,200 3,490 3,690 3,820
Population, total 21,703,571 22,229,625 22,763,008 23,304,206 23,852,409 24,407,381
GDP (current US$) 30,397,203,369 27,838,718,233 31,743,751,169 29,207,296,703 31,992,801,303 35,954,502,304
GDP growth (annual %) 4.01 4.13 3.31 -15.08 2.46 4.15
Agriculture, Food Security and rural development a
Agricultural irrigated land (percentage of total agricultural land)a .. .. .. .. .. ..
Agricultural land (%land area) 1.2 1 .. 1.4 .. ..
Agricultural land (%land area) 57.5 57.3 57.3 45.7 47.4 ..
Agriculture value added per worker (constant 2005 US$) .. .. .. .. .. ..
Agriculture, value added (% of GDP) .. .. .. .. .. ..
Agriculture, value added (annual % growth) .. .. .. .. .. ..
Agriculture, value added (constant 2005 US$) .. .. .. .. .. ..
Child employment in agriculture (% of economically active children ages 7-14)
.. .. 77.89 .. .. ..
Child employment in agriculture, female (% of female economically active children ages 7-14)
.. .. 60.98 .. .. ..
Child employment in agriculture, male (% of male economically active children ages 7-14)
.. .. 70.41 .. .. ..
Malnutrition prevalence b .. .. .. .. .. ..
Stunting 57.7 * .. .. 47 .. ..
Underweight 43.1* .. .. 36 .. ..
Trade and commodities/ International Integration a
Trade in services (% of GDP) 11.6 11.9 11.8 12.2 11.1 ..
Merchandise Trade (% of GDP) 59.6 55.5 54.7 67.6 60.5 60.4
Time required to start a business (days) 13 12 12 12 40 40
Foreign Direct Investments, net inflows (% of GDP) 5.1 0.5 0.6 -1.8 0 -0.4
Science Technology and Innovation c
Fixed-telephone subscriptions 961,000 997,000 1,046,263 1,075,000 1,104,000 1,143,000
Mobile telephone subscriptions 6,445,000 8,313,000 11,085,000 11,668,000 13,900,000 16,844,700
Fixed broadband subscriptions 26,000 54,000 84,000 109,000 167,300 256,800
Active mobile-broadband subscriptions .. 0 0 21,000 48,108 ..
Percentage of individuals using the internet 6.89 9.96 12.35 14.91 17.45 20
Liner Shipping Connectivity Index a 14.4 14.6 12.5 11.9 13.2 19
Percentage of Households with internet 2.2 2.54 2.93 4 4.69 4.7
Percentage of Households with computers 3.3 3.77 3.96 4.63 5.05 5.6
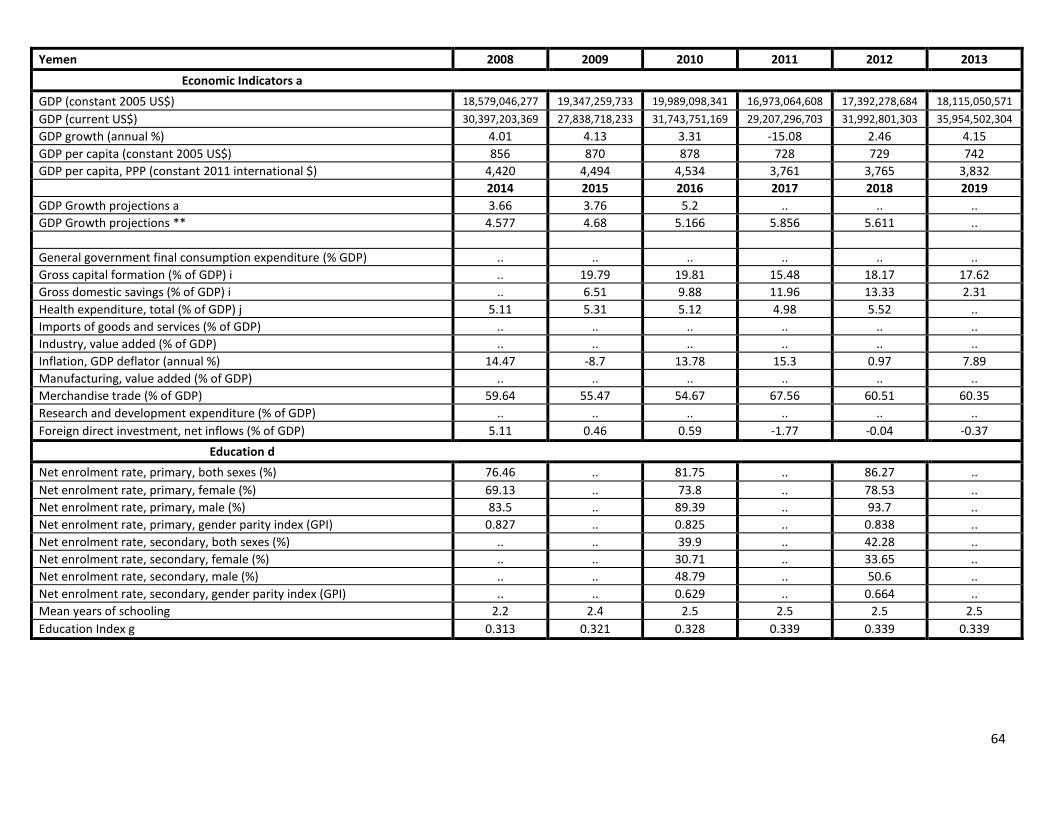
64
Yemen 2008 2009 2010 2011 2012 2013
Economic Indicators a
GDP (constant 2005 US$) 18,579,046,277 19,347,259,733 19,989,098,341 16,973,064,608 17,392,278,684 18,115,050,571
GDP (current US$) 30,397,203,369 27,838,718,233 31,743,751,169 29,207,296,703 31,992,801,303 35,954,502,304
GDP growth (annual %) 4.01 4.13 3.31 -15.08 2.46 4.15
GDP per capita (constant 2005 US$) 856 870 878 728 729 742
GDP per capita, PPP (constant 2011 international $) 4,420 4,494 4,534 3,761 3,765 3,832
2014 2015 2016 2017 2018 2019
GDP Growth projections a 3.66 3.76 5.2 .. .. ..
GDP Growth projections ** 4.577 4.68 5.166 5.856 5.611 ..
General government final consumption expenditure (% GDP) .. .. .. .. .. ..
Gross capital formation (% of GDP) i .. 19.79 19.81 15.48 18.17 17.62
Gross domestic savings (% of GDP) i .. 6.51 9.88 11.96 13.33 2.31
Health expenditure, total (% of GDP) j 5.11 5.31 5.12 4.98 5.52 ..
Imports of goods and services (% of GDP) .. .. .. .. .. ..
Industry, value added (% of GDP) .. .. .. .. .. ..
Inflation, GDP deflator (annual %) 14.47 -8.7 13.78 15.3 0.97 7.89
Manufacturing, value added (% of GDP) .. .. .. .. .. ..
Merchandise trade (% of GDP) 59.64 55.47 54.67 67.56 60.51 60.35
Research and development expenditure (% of GDP) .. .. .. .. .. ..
Foreign direct investment, net inflows (% of GDP) 5.11 0.46 0.59 -1.77 -0.04 -0.37
Education d
Net enrolment rate, primary, both sexes (%) 76.46 .. 81.75 .. 86.27 ..
Net enrolment rate, primary, female (%) 69.13 .. 73.8 .. 78.53 ..
Net enrolment rate, primary, male (%) 83.5 .. 89.39 .. 93.7 ..
Net enrolment rate, primary, gender parity index (GPI) 0.827 .. 0.825 .. 0.838 ..
Net enrolment rate, secondary, both sexes (%) .. .. 39.9 .. 42.28 ..
Net enrolment rate, secondary, female (%) .. .. 30.71 .. 33.65 ..
Net enrolment rate, secondary, male (%) .. .. 48.79 .. 50.6 ..
Net enrolment rate, secondary, gender parity index (GPI) .. .. 0.629 .. 0.664 ..
Mean years of schooling 2.2 2.4 2.5 2.5 2.5 2.5
Education Index g 0.313 0.321 0.328 0.339 0.339 0.339
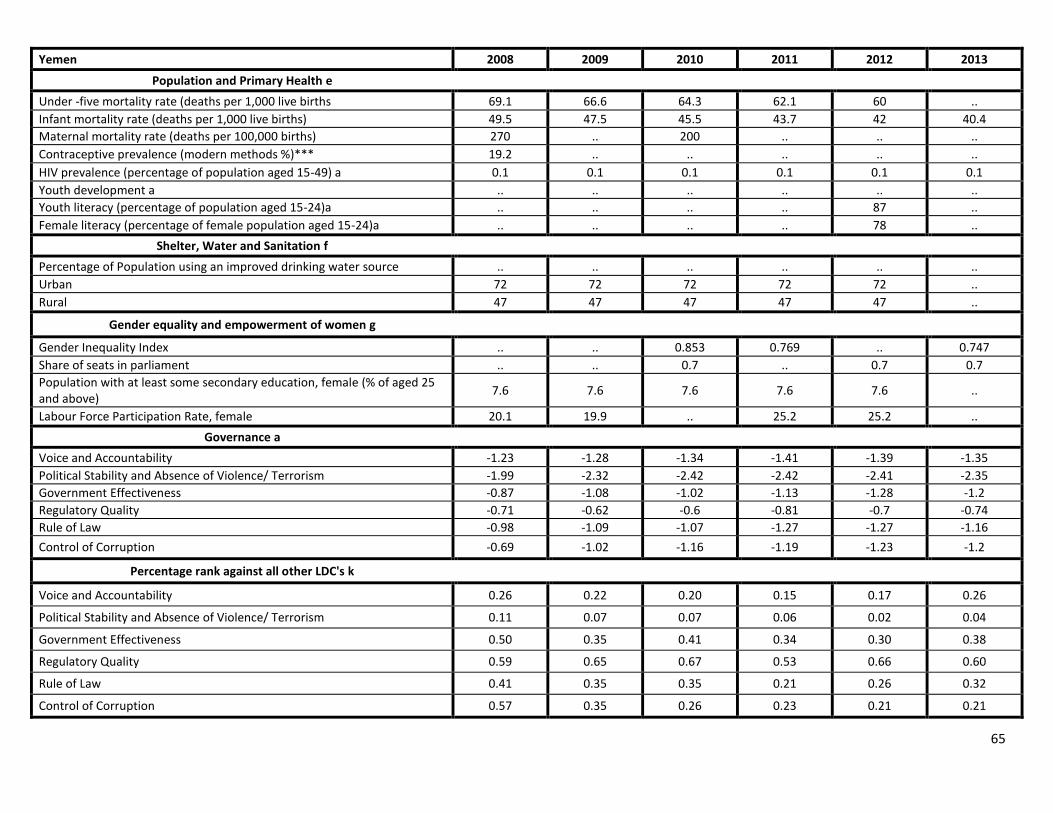
65
Yemen 2008 2009 2010 2011 2012 2013
Population and Primary Health e
Under -five mortality rate (deaths per 1,000 live births 69.1 66.6 64.3 62.1 60 ..
Infant mortality rate (deaths per 1,000 live births) 49.5 47.5 45.5 43.7 42 40.4
Maternal mortality rate (deaths per 100,000 births) 270 .. 200 .. .. ..
Contraceptive prevalence (modern methods %)*** 19.2 .. .. .. .. ..
HIV prevalence (percentage of population aged 15-49) a 0.1 0.1 0.1 0.1 0.1 0.1
Youth development a .. .. .. .. .. ..
Youth literacy (percentage of population aged 15-24)a .. .. .. .. 87 ..
Female literacy (percentage of female population aged 15-24)a .. .. .. .. 78 ..
Shelter, Water and Sanitation f
Percentage of Population using an improved drinking water source .. .. .. .. .. ..
Urban 72 72 72 72 72 ..
Rural 47 47 47 47 47 ..
Gender equality and empowerment of women g
Gender Inequality Index .. .. 0.853 0.769 .. 0.747
Share of seats in parliament .. .. 0.7 .. 0.7 0.7
Population with at least some secondary education, female (% of aged 25 and above)
7.6 7.6 7.6 7.6 7.6 ..
Labour Force Participation Rate, female 20.1 19.9 .. 25.2 25.2 ..
Governance a
Voice and Accountability -1.23 -1.28 -1.34 -1.41 -1.39 -1.35
Political Stability and Absence of Violence/ Terrorism -1.99 -2.32 -2.42 -2.42 -2.41 -2.35
Government Effectiveness -0.87 -1.08 -1.02 -1.13 -1.28 -1.2
Regulatory Quality -0.71 -0.62 -0.6 -0.81 -0.7 -0.74
Rule of Law -0.98 -1.09 -1.07 -1.27 -1.27 -1.16
Control of Corruption -0.69 -1.02 -1.16 -1.19 -1.23 -1.2
Percentage rank against all other LDC's k
Voice and Accountability 0.26 0.22 0.20 0.15 0.17 0.26
Political Stability and Absence of Violence/ Terrorism 0.11 0.07 0.07 0.06 0.02 0.04
Government Effectiveness 0.50 0.35 0.41 0.34 0.30 0.38
Regulatory Quality 0.59 0.65 0.67 0.53 0.66 0.60
Rule of Law 0.41 0.35 0.35 0.21 0.26 0.32
Control of Corruption 0.57 0.35 0.26 0.23 0.21 0.21
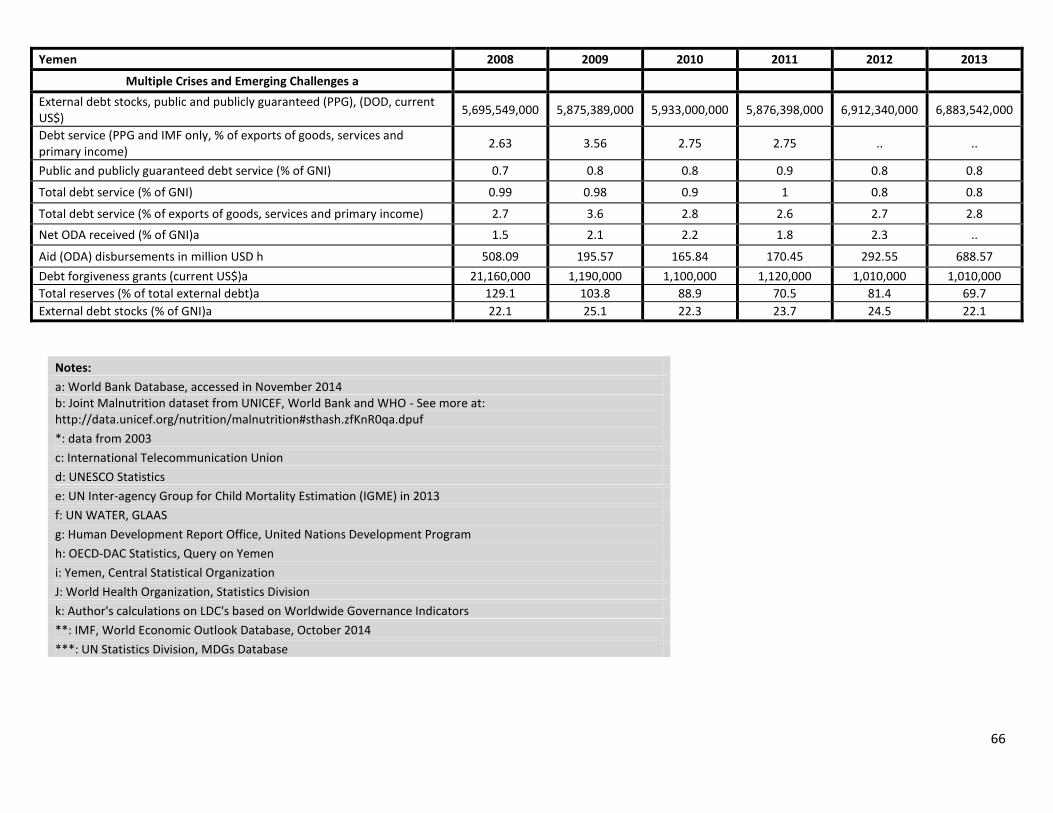
66
Yemen 2008 2009 2010 2011 2012 2013
Multiple Crises and Emerging Challenges a
External debt stocks, public and publicly guaranteed (PPG), (DOD, current US$)
5,695,549,000 5,875,389,000 5,933,000,000 5,876,398,000 6,912,340,000 6,883,542,000
Debt service (PPG and IMF only, % of exports of goods, services and primary income)
2.63 3.56 2.75 2.75 .. ..
Public and publicly guaranteed debt service (% of GNI) 0.7 0.8 0.8 0.9 0.8 0.8
Total debt service (% of GNI) 0.99 0.98 0.9 1 0.8 0.8
Total debt service (% of exports of goods, services and primary income) 2.7 3.6 2.8 2.6 2.7 2.8
Net ODA received (% of GNI)a 1.5 2.1 2.2 1.8 2.3 ..
Aid (ODA) disbursements in million USD h 508.09 195.57 165.84 170.45 292.55 688.57
Debt forgiveness grants (current US$)a 21,160,000 1,190,000 1,100,000 1,120,000 1,010,000 1,010,000
Total reserves (% of total external debt)a 129.1 103.8 88.9 70.5 81.4 69.7
External debt stocks (% of GNI)a 22.1 25.1 22.3 23.7 24.5 22.1
Notes:
a: World Bank Database, accessed in November 2014 b: Joint Malnutrition dataset from UNICEF, World Bank and WHO - See more at: http://data.unicef.org/nutrition/malnutrition#sthash.zfKnR0qa.dpuf
*: data from 2003
c: International Telecommunication Union
d: UNESCO Statistics
e: UN Inter-agency Group for Child Mortality Estimation (IGME) in 2013
f: UN WATER, GLAAS
g: Human Development Report Office, United Nations Development Program
h: OECD-DAC Statistics, Query on Yemen
i: Yemen, Central Statistical Organization
J: World Health Organization, Statistics Division
k: Author's calculations on LDC's based on Worldwide Governance Indicators
**: IMF, World Economic Outlook Database, October 2014
***: UN Statistics Division, MDGs Database