doe review release 02/14/2013 - centers for disease ... review release 02/14/2013 . ... 5.3.3 notes...
TRANSCRIPT

ORAU TEAM Dose Reconstruction Project for NIOSH
Oak Ridge Associated Universities I Dade Moeller I MJW Technical Services
Page 1 of 73
DOE Review Release 02/14/2013
Document Title:
Oak Ridge National Laboratory – Occupational Internal Dose
Document Number: ORAUT-TKBS-0012-5
Revision: 02
Effective Date: 02/08/2013
Type of Document: TBD
Supersedes: Revision 01
Subject Expert(s): Robert E. Burns
Approval: Signature on File Approval Date: 01/28/2013
Keith W. Varnado, Document Owner Concurrence: Signature on File Concurrence Date: 01/29/2013 John M. Byrne, Objective 1 Manager
Concurrence: Scott R. Siebert Signature on File for Concurrence Date: 01/28/2013
Edward F. Maher, Objective 3 Manager
Concurrence: Vickie S. Short Signature on File for Concurrence Date: 01/28/2013
Kate Kimpan, Project Director
Approval: Signature on File Approval Date: 02/08/2013
James W. Neton, Associate Director for Science
New Total Rewrite Revision Page Change
FOR DOCUMENTS MARKED AS A TOTAL REWRITE, REVISION, OR PAGE CHANGE, REPLACE THE PRIOR REVISION AND DISCARD / DESTROY ALL COPIES OF THE PRIOR REVISION.

Document No. ORAUT-TKBS-0012-5 Revision No. 02 Effective Date: 02/08/2013 Page 2 of 73
PUBLICATION RECORD
EFFECTIVE DATE
REVISION NUMBER DESCRIPTION
06/29/2004 00 New technical basis document for the Oak Ridge National Laboratory – Occupational Internal Dose. First approved issue. Initiated by Robert E. Burns, Jr.
05/30/2006 00 PC-1 Page change revision to update required language in the Introduction on page 8 in Section 5.1. Adds Section 5.4 on pages 28 and 29 on using air monitoring data to assign best estimates of internal dose for unmonitored ORNL workers during the 1944-1947 period. Makes reference changes on pages 30 and 32 in the Reference Section. Adds Attachment B, on pages 67, 68, 69, and 70, which gives the technical justification for this protocol. No changes occurred as a result of internal formal review. Incorporates NIOSH formal review comments. No sections were deleted. This revision results in no change to the assigned dose and no PER is required. Training required: As determined by the Task Manager. Initiated by Elizabeth M. Brackett and Thomas R. La Bone. Approval:
Signature on File 05/22/2006 John M. Byrne, Document Owner
Signature on File 05/22/2006 John M. Byrne, Task 3 Manager
Keith McCartney Signature on File for 05/22/2006 Edward F. Maher, Task 5 Manager
Signature on File 05/22/2006 Kate Kimpan, Project Director
Signature on File 05/30/2006 James W. Neton, Associate Director for Science
10/01/2007 01 Approved Revision 01 initiated to include Attributions and Annotations, Purpose and Scope sections. Revised Section 5.4. Made editorial changes. No further changes occurred as a result of formal internal review. Incorporates formal NIOSH review comments. Training required: As determined by the Task Manager. Initiated by Robert E. Burns, Jr.
02/08/2013 02 Revision initiated to add new SEC designation to Section 5.1.3 and to incorporate definitions and directions for dose reconstruction for claims that are excluded from the 1943 through July 31, 1955, Special Exposure Cohort. Removed Section 5.4 and Attachment B from the text and Table of Contents. Incorporates formal internal and NIOSH review comments. Training required: As determined by the Objective Manager. Initiated by Keith W. Varnado.
TRADEMARK INFORMATION
Microsoft® and Word® are registered trademarks of the Microsoft Corporation in the United States and/or other countries.
All other trademarks are the property of their respective owners.

Document No. ORAUT-TKBS-0012-5 Revision No. 02 Effective Date: 02/08/2013 Page 3 of 73
TABLE OF CONTENTS
SECTION TITLE PAGE
Acronyms and Abbreviations ............................................................................................................... 6
5.1 Introduction .............................................................................................................................. 8 5.1.1 Purpose ........................................................................................................................ 9 5.1.2 Scope ........................................................................................................................... 9 5.1.3 Special Exposure Cohort Class .................................................................................... 9
5.2 Radionuclides of Concern ...................................................................................................... 10 5.2.1 Solubility Classes ....................................................................................................... 11 5.2.2 Route of Intake and Particle Sizes .............................................................................. 12 5.2.3 Bioassay Programs .................................................................................................... 12
5.2.3.1 In Vitro Monitoring Program .......................................................................... 12 5.2.3.2 In Vivo Monitoring Program............................................................................ 13
5.2.4 Recordkeeping ........................................................................................................... 13 5.2.4.1 Division Codes ............................................................................................... 13 5.2.4.2 Radioanalytical Abbreviations and Codes ...................................................... 14 5.2.4.3 Whole-Body Counting Results Codes ............................................................ 16
5.3 In Vitro Minimum Detectable Activities, Counting Methods, and Reporting Practices ............. 18 5.3.1 In Vitro Minimum Detectable Activities ........................................................................ 18
5.3.1.1 Minimum Detectable Activities between 1945 and 1989 ................................ 18 5.3.1.2 Minimum Detectable Activities after 1989 ....................................................... 18
5.3.2 Counting Methods for In Vitro Samples ...................................................................... 18 5.3.2.1 Alpha Spectrometry ....................................................................................... 19 5.3.2.2 Liquid Scintillation .......................................................................................... 19 5.3.2.3 Zinc-Sulfide Scintillation ................................................................................. 19 5.3.2.4 Gamma Spectrometry .................................................................................... 19 5.3.2.5 Gas Flow Proportional Counter (Beta Counting) ............................................. 19
5.3.3 Notes on Measurements of Alpha Emitters ................................................................. 19 5.3.3.1 Trivalent Alpha Actinides ................................................................................ 19 5.3.3.2 Plutonium ....................................................................................................... 20 5.3.3.3 Environmental Uranium .................................................................................. 20
5.4 In Vivo Minimum Detectable Activities, Counting Methods, and Reporting Practices .............. 20 5.4.1 Shielded Counting Room ............................................................................................ 20 5.4.2 Detectors, Geometries, and Techniques ..................................................................... 22 5.4.3 Cesium Counting Artifact ............................................................................................ 27 5.4.4 Minimum Detectable Activity ....................................................................................... 27
5.5 Attributions and Annotations .................................................................................................. 30
References ........................................................................................................................................ 32
Glossary ............................................................................................................................................ 35
ATTACHMENT A, CALCULATION OF MDAs FROM HISTORICAL DATA ........................................ 38

Document No. ORAUT-TKBS-0012-5 Revision No. 02 Effective Date: 02/08/2013 Page 4 of 73
LIST OF TABLES
TABLE TITLE PAGE
5-1 Radioanaytical results between 1945 and 1988 ..................................................................... 11 5-2 Solubility classifications used by ORNL for reevaluation of historical bioassay results ........... 11 5-3 Routine bioassay monitoring methods and frequencies from 1973 to 1982 ............................ 12 5-4 Historical division codes ......................................................................................................... 14 5-5 New division codes ................................................................................................................ 15 5-6 Urinalysis abbreviations and codes ........................................................................................ 15 5-7 Fecal analysis codes .............................................................................................................. 16 5-8 Result codes for whole-body counting .................................................................................... 16 5-9 Recommended in vitro MDAs for radionuclides from 1947 to 1989 ........................................ 17 5-10 MDAs for in vitro samples after 1989...................................................................................... 18 5-11 Construction history of the counting room .............................................................................. 21 5-12 1965 selection criteria for whole-body counting ...................................................................... 22 5-13 Qualitative information concerning radioactive material detected using the WBC facility
from 1966 to 1983 .................................................................................................................. 23 5-14 Qualitative information concerning radioactive material detected using the WBC facility
through 1978 .......................................................................................................................... 24 5-15 Maximum measured in vivo activity from 1961 to 1966 .......................................................... 25 5-16 Mean body burdens of 137Cs from fallout in the United States ................................................ 27 5-17 MDA values for six-detector HPGe array ................................................................................ 28 5-18 Current MDA values for ORNL scanning bed counter (NaI/Ge) .............................................. 28 5-19 Current MDA values for ORNL germanium thyroid counter .................................................... 28 5-20 Current MDA values for ORNL fixed bed counter ................................................................... 28 5-21 Frequency of in vivo monitoring.............................................................................................. 30 A-1 Data used to determine historical MDAs for radionuclides in urine and feces ......................... 41 A-2 MDAs calculated from recovered data for radionuclides ......................................................... 46

Document No. ORAUT-TKBS-0012-5 Revision No. 02 Effective Date: 02/08/2013 Page 5 of 73
LIST OF FIGURES
FIGURE TITLE PAGE
5-1 Current MDA values for ORNL germanium lung counter versus chest-wall thickness ............ 29 5-2 Current MDA values for ORNL phoswich lung counter versus chest-wall thickness for
241Am and 238Pu ...................................................................................................................... 29 A-1 MDA data for 241Am in urine ................................................................................................... 47 A-2 MDA data for 244Cm in urine ................................................................................................... 48 A-3 MDA data for 137Cs in urine .................................................................................................... 50 A-4 MDA data for gross alpha in urine .......................................................................................... 51 A-5 MDA data for gross beta in urine ............................................................................................ 53 A-6 MDA data for 3H in urine ........................................................................................................ 54 A-7 MDA data for 147Pm in urine ................................................................................................... 56 A-8 MDA data for 238Pu in urine .................................................................................................... 57 A-9 MDA data for 239Pu in urine .................................................................................................... 59 A-10 MDA data for 241Pu in urine .................................................................................................... 60 A-11 MDA data for rare earths in urine ........................................................................................... 62 A-12 MDA data for 90Sr in urine ...................................................................................................... 63 A-13 MDA data for 233U in urine ...................................................................................................... 65 A-14 MDA data for 238U in urine ...................................................................................................... 66 A-15 MDA data for 241Am in feces ................................................................................................... 68 A-16 MDA data for gross alpha in feces ......................................................................................... 69 A-17 MDA data for 239Pu in feces .................................................................................................... 71 A-18 MDA data for 232Th in feces .................................................................................................... 72

Document No. ORAUT-TKBS-0012-5 Revision No. 02 Effective Date: 02/08/2013 Page 6 of 73 ACRONYMS AND ABBREVIATIONS
AEC U.S. Atomic Energy Commission
CFR Code of Federal Regulations
cm centimeter
d day DOE U.S. Department of Energy DOL U.S. Department of Labor dpm disintegrations per minute
EEOICPA Energy Employee Occupational Illness Compensation Program Act of 2000
ft feet
g gram
HPGe hyper-pure, intrinsic germanium hr hour
ICRP International Commission on Radiological Protection in. inch
keV kiloelectron-volt, 1,000 electron-volts
L liter
m meter MDA minimum detectable activity mL milliliter min minute mo month MPBB maximum permissible body burden MPOB maximum permissible organ burden mrem millirem
NaI sodium iodide NaI-CsI sodium iodide-cesium iodide phoswich detector NaI(Tl) thallium drifted sodium iodide NaI/Ge sodium iodide/germanium nCi nanocurie NCRP National Council on Radiation Protection and Measurements NIOSH National Institute for Occupational Safety and Health
ORAU Oak Ridge Associated Universities ORNL Oak Ridge National Laboratory
pCi picocurie POC probability of causation
SEC Special Exposure Cohort SBC scanning bed counter
Document No. ORAUT-TKBS-0012-5 Revision No. 02 Effective Date: 02/08/2013 Page 7 of 73 SRDB Ref ID Site Research Database Reference Identification (number)
TBD technical basis document
U.S.C. United States Code
WBC Whole-Body Counting (Facility) wk week
µCi microcurie µm micrometer
§ section or sections

Document No. ORAUT-TKBS-0012-5 Revision No. 02 Effective Date: 02/08/2013 Page 8 of 73 5.1 INTRODUCTION
Technical basis documents and site profile documents are not official determinations made by the National Institute for Occupational Safety and Health (NIOSH) but are rather general working documents that provide historical background information and guidance to assist in the preparation of dose reconstructions at particular sites or categories of sites. They will be revised in the event additional relevant information is obtained about the affected site(s). These documents may be used to assist NIOSH staff in the completion of the individual work required for each dose reconstruction.
In this document the word “facility” is used as a general term for an area, building, or group of buildings that served a specific purpose at a site. It does not necessarily connote an “atomic weapons employer facility” or a “Department of Energy [DOE] facility” as defined in the Energy Employees Occupational Illness Compensation Program Act [EEOICPA; 42 U.S.C. § 7384l(5) and (12)]. EEOICPA defines a DOE facility as “any building, structure, or premise, including the grounds upon which such building, structure, or premise is located … in which operations are, or have been, conducted by, or on behalf of, the Department of Energy (except for buildings, structures, premises, grounds, or operations … pertaining to the Naval Nuclear Propulsion Program)” [42 U.S.C. § 7384l(12)]. Accordingly, except for the exclusion for the Naval Nuclear Propulsion Program noted above, any facility that performs or performed DOE operations of any nature whatsoever is a DOE facility encompassed by EEOICPA.
For employees of DOE or its contractors with cancer, the DOE facility definition only determines eligibility for a dose reconstruction, which is a prerequisite to a compensation decision (except for members of the Special Exposure Cohort). The compensation decision for cancer claimants is based on a section of the statute entitled “Exposure in the Performance of Duty.” That provision [42 U.S.C. § 7384n(b)] says that an individual with cancer “shall be determined to have sustained that cancer in the performance of duty for purposes of the compensation program if, and only if, the cancer … was at least as likely as not related to employment at the facility [where the employee worked], as determined in accordance with the POC [probability of causation1] guidelines established under subsection (c) …” [42 U.S.C. § 7384n(b)]. Neither the statute nor the probability of causation guidelines (nor the dose reconstruction regulation, 42 C.F.R. Pt. 82) restrict the “performance of duty” referred to in 42 U.S.C. § 7384n(b) to nuclear weapons work (NIOSH 2010).
The statute also includes a definition of a DOE facility that excludes “buildings, structures, premises, grounds, or operations covered by Executive Order No. 12344, dated February 1, 1982 (42 U.S.C. 7158 note), pertaining to the Naval Nuclear Propulsion Program” [42 U.S.C. § 7384l(12)]. While this definition excludes Naval Nuclear Propulsion Facilities from being covered under the Act, the section of EEOICPA that deals with the compensation decision for covered employees with cancer [i.e., 42 U.S.C. § 7384n(b), entitled “Exposure in the Performance of Duty”] does not contain such an exclusion. Therefore, the statute requires NIOSH to include all occupationally-derived radiation exposures at covered facilities in its dose reconstructions for employees at DOE facilities, including radiation exposures related to the Naval Nuclear Propulsion Program. As a result, all internal and external occupational radiation exposures are considered valid for inclusion in a dose reconstruction. No efforts are made to determine the eligibility of any fraction of total measured exposure for inclusion in dose reconstruction. NIOSH, however, does not consider the following exposures to be occupationally derived (NIOSH 2010):
• Background radiation, including radiation from naturally occurring radon present in conventional structures
• Radiation from X-rays received in the diagnosis of injuries or illnesses or for therapeutic reasons
1 The U.S. Department of Labor (DOL) is ultimately responsible under the EEOICPA for determining the POC.

Document No. ORAUT-TKBS-0012-5 Revision No. 02 Effective Date: 02/08/2013 Page 9 of 73 5.1.1 Purpose
The purpose of this technical basis document (TBD) is to describe internal dosimetry systems and practices at Oak Ridge National Laboratory (ORNL) from late 1943 to the present. It discusses historical and current practices for use in the evaluation of internal radiation exposure of monitored and unmonitored workers. This TBD can serve as a supplement to, or substitute for, individual monitoring data.
5.1.2 Scope
ORNL began operations in early 1943. The startup of the Graphite Reactor and plutonium separation activities in late 1943 introduced the potential for personnel exposures from intakes of radioactive material. Laboratory operations involving radioactive materials increased over subsequent years as ORNL expanded its roles in radionuclide production and development of chemical separations processes.
Development of methods and techniques for internal monitoring (bioassay) was one of the many priorities at ORNL in its early years of operation because such methods simply did not exist. Although ORNL used air sampling and radiological contamination monitoring programs as qualitative indicators of internal exposure, urinalyses for various internal contaminants did not begin at the site until about 1945. (A limited number of in vivo measurements appear to have begun at ORNL in 1959.) ORNL maintained early tolerance levels for airborne contamination based on “product” (i.e., 239Pu) concentrations in the air (Cox 1944). [These early tolerance levels for alpha and beta-gamma contaminants were 3 × 10-11 and 1 × 10⁻⁷ µCi/cm3, respectively, during the mid-1940s.] In addition, the Laboratory later established tolerance levels for materials such as 131I and noble gases.
Attributions and annotations, indicated by bracketed callouts and used to identify the source, justification, or clarification of the associated information, are presented in Section 5.4.
5.1.3 Special Exposure Cohort Class
June 17, 1943, through July 31, 1955 In its evaluation of SEC-00189, NIOSH determined, and the Advisory Board on Radiation and Worker Health concurred, that NIOSH lacks adequate information with which to perform sufficiently accurate dose reconstructions for the following worker class recommended for addition to the SEC (NIOSH 2012):
All employees of the Department of Energy, its predecessor agencies, and their contractors and subcontractors who worked in any area at the Oak Ridge National Laboratory (X-10) in Oak Ridge, Tennessee, from June 17, 1943 through July 31, 1955, for a number of work days aggregating at least 250 work days, occurring either solely under this employment, or in combination with work days within the parameters established for one or more other classes of employees in the Special Exposure Cohort.
Dose reconstruction guidance in this document for periods before August 1, 1955, is presented to provide a technical basis for partial dose reconstructions for claims not covered within the SEC class through July 31, 1955. NIOSH found that it was infeasible to reconstruct doses for inadequately monitored radionuclides such as uranium, thorium, and fission products. Although NIOSH found that it is not possible to completely reconstruct radiation doses for the proposed class, NIOSH intends to use any internal and external monitoring data that might become available for an individual claim (and that can be interpreted using existing NIOSH dose reconstruction processes or procedures). Therefore, dose reconstructions for individuals who were employed at the ORNL site during the period
Document No. ORAUT-TKBS-0012-5 Revision No. 02 Effective Date: 02/08/2013 Page 10 of 73 from June 17, 1943, through July 31, 1955, but who do not qualify for inclusion in the SEC, may be performed using these data as appropriate.
For periods within the SEC period, partial dose reconstructions can be performed based on personal monitoring information and/or available coworker intake rates.
5.2 RADIONUCLIDES OF CONCERN
Because of the many diverse processes and experiments that took place there, a complete list of radionuclides workers encountered at ORNL would be difficult to assemble. Radionuclides likely to produce a measureable internal dose include uranium, activation products, fission products, and transuranic elements [1]. The earliest urine sample results that were provided by ORNL were for 239Pu and 90Sr. The electronic data that were provided by ORNL for use in estimating isotopic MDAs came from a project performed in the early to mid-1990s to convert hard-copy data to a dBase IV database. Funding ran out on the conversion project in the mid-1990s; the entire set of site data was never completely converted, but a significant number of results were made available for Project use. In addition, captured information for 1945 indicated 164 urine bioassay samples for plutonium (Wirth 1945). Table 5-1 lists radionuclides that were included in in vitro bioassay results from ORNL for the period from 1945 to 1988. The results were provided for estimating minimum detectable activities (MDAs) for various analyses. The source of these data was an electronic database that was created by ORNL in the early 1990s from hard-copy bioassay records and the 1945 plutonium samples. The sample size values in Table 5-1 are the numbers of analyses for that nuclide in the data ORNL provided and the 1945 plutonium samples. These values do not reflect the total number of in vitro bioassays that were performed by ORNL in this period because not all hard-copy records are in the database.
Isotope-specific analyses for in vitro samples did not become routine until 1989. Before that time, chemical methods were used to separate radioelements as well as practicable, and the materials were assayed in terms of total activity. The measured activity would later be assigned to a predominant nuclide. Therefore, a result from the early years might indicate 90Sr, when in reality it includes 89Sr. The same is true for early plutonium results and results for transuranic materials. Therefore, ”associated” radionuclides are inherently included in such results. Process knowledge of radionuclides present in various work areas was used to assign nuclides to sample results. The present ORNL internal dosimetry program uses a limited number of radionuclides for screening purposes. Positive results are followed up with additional bioassays.

Document No. ORAUT-TKBS-0012-5 Revision No. 02 Effective Date: 02/08/2013 Page 11 of 73 Table 5-1. Radioanalytical results between 1945 and 1988 [2, 6].
Nuclide Sample size Nuclide Sample size Nuclide Sample size Am-241 5,670 I-131 41 S-35 10 Am-243 12 Mn-54 2 Sb-125 1 As-74 7 Mo-99 1 Sm-151 11 BG 2 Na-24 3 Sr-85 1 Bk-249 14 Nb-95 3 Sr-89 37 Br-82 2 Np-237 55 Sr-90 12,893 Br-83 2 P-32 166 Tc-99 20 C-14 11 Pa-231 55 Th-232 1,125 Ca-45 4 Pa-233 16 Tl-201 1 Ce-144 37 Pa-234 1 Tl-204 1 Cf-249 3 Pb-210 2 Tm-170 6 Cf-252 14 Pm-147 80 U-232 1 Cl-36 1 Po-210 66 U-233 829 Cm-242 12 Pu-238 65 U-235 3 Cm-244 299 Pu-239 15642 U-238 11,434 Co-60 83 Pu-241 112 U-239 11 Cs-134 1 Pu-242 41 Y-88 5 Cs-137 3,561 Ra-226 333 Y-90 31 Fe-59 9 Ra-228 1 Zn-65 7 Gross alpha 4,875 Rare earths 1,098 Zr-95 20 Gross beta 324 Ru-103 1 H-3 2,070 Ru-106 65
5.2.1 Solubility Classes
Internal dosimetrists at ORNL provided a list of assumed intake modes and clearance class information for 73 radionuclides. These assumptions, given in Table 5-2, are those used by ORNL when reevaluating historical bioassay results. They are provided as a reference for dose reconstructors, with the caveat that the assumed solubility classes are not known to be based on any specific studies. In general, they merely reflect conservative choices for dose assessment in terms of committed effective dose equivalent. Dose reconstructors therefore should not assume that these classes, which are in terms of the system promulgated in (ICRP 1966), represent choices that are favorable to claimants for tissue-specific dose evaluations. Dose reconstructors should instead make a choice for the radionuclide and tissue(s) of interest using the system of solubility classes in International Commission on Radiological Protection (ICRP) Publication 66 (ICRP 1994) [3].
Table 5-2. Solubility classifications used by ORNL for reevaluation of historical bioassay results (McLaughlin 2002).
Material class
Intake mode Radionuclides
V (Very soluble) Ingestion H-3 L (Labeled organic) Inhalation C-14 D (Days) Inhalation Na-22, P-32, P-33, S-35, Rb-86, Sr-85, Sr-89, Sr-90, I-125, I-129, I-131,
Ba-133, Cs-134, Cs-137, Eu-152, Eu-154, W-188 W (Weeks) Inhalation Ca-45, Cr-51, Mn-54, Fe-55, Fe-59, Ni-63, Ge-68, Sc-75, Tc-99, Gd-153,
Hg-203, Bi-207, Po-210, Ra-226, Np-237, Am-241, Am-243, Cm-242, Cm-244, Cm-248
Y (Years) Inhalation Sc-46, Co-57, Co-58, Co-60, Cu-64, Zn-65, Cu-67, Y-88, Y-90, Pd-103, Ru-106, Cd-109, Ag-110m, Pm-147, Ir-192, Os-191, Th-228, Th-229, Th–230, Th-232, Pa-231, U-232, U-233, U-234, U-235, U-236, U-238, Pu-238, Pu-239, Pu-240, Pu-241, Pu-242, Cf-249, Cf-252
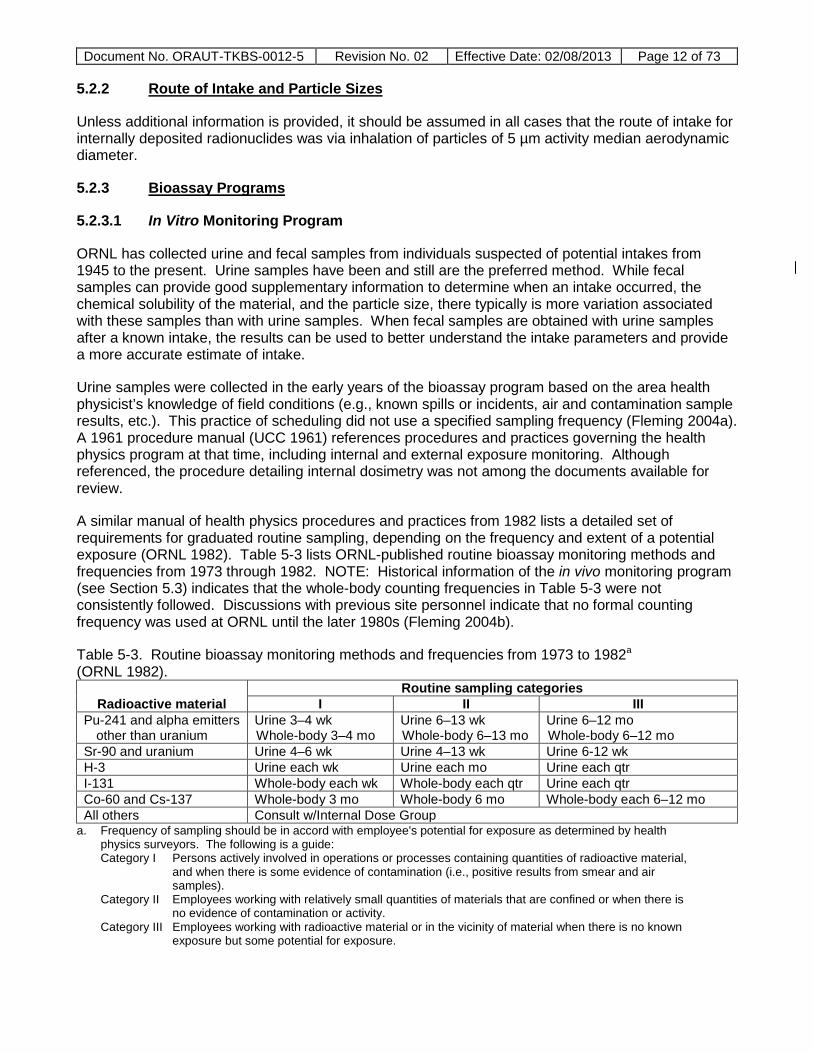
Document No. ORAUT-TKBS-0012-5 Revision No. 02 Effective Date: 02/08/2013 Page 12 of 73 5.2.2 Route of Intake and Particle Sizes
Unless additional information is provided, it should be assumed in all cases that the route of intake for internally deposited radionuclides was via inhalation of particles of 5 µm activity median aerodynamic diameter.
5.2.3 Bioassay Programs
5.2.3.1 In Vitro Monitoring Program
ORNL has collected urine and fecal samples from individuals suspected of potential intakes from 1945 to the present. Urine samples have been and still are the preferred method. While fecal samples can provide good supplementary information to determine when an intake occurred, the chemical solubility of the material, and the particle size, there typically is more variation associated with these samples than with urine samples. When fecal samples are obtained with urine samples after a known intake, the results can be used to better understand the intake parameters and provide a more accurate estimate of intake.
Urine samples were collected in the early years of the bioassay program based on the area health physicist’s knowledge of field conditions (e.g., known spills or incidents, air and contamination sample results, etc.). This practice of scheduling did not use a specified sampling frequency (Fleming 2004a). A 1961 procedure manual (UCC 1961) references procedures and practices governing the health physics program at that time, including internal and external exposure monitoring. Although referenced, the procedure detailing internal dosimetry was not among the documents available for review.
A similar manual of health physics procedures and practices from 1982 lists a detailed set of requirements for graduated routine sampling, depending on the frequency and extent of a potential exposure (ORNL 1982). Table 5-3 lists ORNL-published routine bioassay monitoring methods and frequencies from 1973 through 1982. NOTE: Historical information of the in vivo monitoring program (see Section 5.3) indicates that the whole-body counting frequencies in Table 5-3 were not consistently followed. Discussions with previous site personnel indicate that no formal counting frequency was used at ORNL until the later 1980s (Fleming 2004b).
Table 5-3. Routine bioassay monitoring methods and frequencies from 1973 to 1982a (ORNL 1982).
Radioactive material Routine sampling categories
I II III Pu-241 and alpha emitters
other than uranium Urine 3–4 wk Whole-body 3–4 mo
Urine 6–13 wk Whole-body 6–13 mo
Urine 6–12 mo Whole-body 6–12 mo
Sr-90 and uranium Urine 4–6 wk Urine 4–13 wk Urine 6-12 wk H-3 Urine each wk Urine each mo Urine each qtr I-131 Whole-body each wk Whole-body each qtr Urine each qtr Co-60 and Cs-137 Whole-body 3 mo Whole-body 6 mo Whole-body each 6–12 mo All others Consult w/Internal Dose Group
a. Frequency of sampling should be in accord with employee's potential for exposure as determined by health physics surveyors. The following is a guide: Category I Persons actively involved in operations or processes containing quantities of radioactive material,
and when there is some evidence of contamination (i.e., positive results from smear and air samples).
Category II Employees working with relatively small quantities of materials that are confined or when there is no evidence of contamination or activity.
Category III Employees working with radioactive material or in the vicinity of material when there is no known exposure but some potential for exposure.

Document No. ORAUT-TKBS-0012-5 Revision No. 02 Effective Date: 02/08/2013 Page 13 of 73 Section 5.3 discusses the in vitro monitoring program and the data it produced.
5.2.3.2 In Vivo Monitoring Program
ORNL has collected whole-body, lung-, and wound-counting data for employees since 1959. For the most part, in vivo counting was used until the late 1980s to confirm potential intakes from known incidents or identified by the in vitro monitoring program. Although Morgan, Snyder, and Struxness (1965) indicated that routine in vivo monitoring for all site radiological workers began in 1965, it appears that a formal program did not begin until the mid- to late 1980s. Section 5.4 discusses the in vivo monitoring program and the data it produced.
5.2.4 Recordkeeping
ORNL used various formats on paper records to record bioassay results through most of the period of interest. In addition, ORNL has entered much historical in vitro monitoring data into a database. These data were used to estimate MDAs as described in this document (see Attachment A). These records will be used by dose reconstructors in estimating intakes.
It is not practicable for this document to provide examples of all record formats ORNL used in the past six decades; MMES (1995) contains a guide to historical record formats. Most bioassay records share the following information: name, badge or other identification number, division code, health physics area, date, analysis code, results (in disintegrations per minute per 24-hr sample), and a reason for the analysis. A review of ORNL claim files indicated that many bioassay forms had slight revisions throughout their use but that the information they contain is similar from one revision to the next and should be easily interpreted.
5.2.4.1 Division Codes
The division code sometimes provides information on individual locations and job assignments. Table 5-4 lists historical division codes, and Table 5-5 lists more recent codes.

Document No. ORAUT-TKBS-0012-5 Revision No. 02 Effective Date: 02/08/2013 Page 14 of 73
Table 5-4. Historical division codes (MMES 1995). Codes DIVNUM Departments Division name
AC 01 3390 Analytical Chemistry BI 02 4455 Biology CH 04 Chemistry CT 03 3370 Chemical Technology DI 20 3200 Directors EC, GE 38 3060 Gen. Engr. and Construc. ED 06 3480 Education EL 07 3320 Electronuclear FM 22 Finance and Materials HE 23 3090 Health HP 08 3810, 4193, 3193, 3490 Health Physics IC 09 3341, 3075 Instrumentation and Controls IE 24 Inspection Engineering IS 25 3369, 3650, 4362, 3360 Isotopes LP 26 3094 Laboratory Protection MA 10 3166, 3516, 3152 Mathematics MC 11 3470 Metals and Ceramics MET Metallurgy NP 12 3410 Neutron Physics OP 28 3639 Operations PE 21 3016, 3078, 3003, 3004, 3062 Plant and Equipment PH 13 3405 Physics PI 30 3173 Public Information PR 29 3107, 3141 Personnel RC 14 3430, 4430 Reactor Chemistry RE 16 4435, 3435 Reactor RP 17 Research Participation SS 18 3475 Solid State TH 19 4460 Thermonuclear TI 31 3072, 3148 Technical Information
5.2.4.2 Radioanalytical Abbreviations and Codes
Paper records contain abbreviation codes for recording analytes. These codes were often based on the initials of the analysis or the isotopic abbreviation of the radionuclide. Tables 5-6 and 5-7 list the codes for measured radionuclides in urine and fecal samples, respectively (Mani 1983) (MMES 1995).

Document No. ORAUT-TKBS-0012-5 Revision No. 02 Effective Date: 02/08/2013 Page 15 of 73
Table 5-5. New division codes (MMES 1995). Code DIVNUM Division Code DIVNUM Division
AC 01 Analytical Chemistry HS 08 Health & Safety RSRH AS 70 Administrative Services IC 09 Instrmt & Controls AT 07 Applied Technology IF Isotopes BI 02 Biology IR 43 Info. Resource Org. BS 95 Business Systems IS 72 Isotopes Division CH 04 Chemistry LP 26 Lab Prot. CM 20 Central Management MC 11 Metals and Ceramics CS 63 Computing and Telecom OC 62 Controller Office CT 03 Chemical Technology OP 27, 32 Operations EA 93 ESA OS 22 Operational Safety EC 35 Environmental Compliance PC 64 Procurement EH 36 Env. & Health Prot. PE 21 Plant & Equipment EN 15 Energy PH 13 Physics EP 12 Eng. Physics & Math PU 73 Publications ER 29 Employee Relations QA 24 Quality ES 42 Env. Sciences RE 87 Env. Restoration ET 16 Eng. Technology RP 14 Robotics EX 90 Executive Offices RR 06 Research Reactors FE 19 Fusion Energy RU Rust FM 37 Finance and Materials SS 18 Solid State FR 14 Fuel Recycle TR 60 Treasurer Office GE 69 ORNL Engineering VI Visitor GR 71 Graphics WM 27 Waste Management HE 23 Health
Table 5-6. Urinalysis abbreviations and codes (Mani 1983; MMES 1995). Alphanumeric code Numeric code Alphanumeric code Numeric code
CM0 Cm-244 000 Other PA3 Pa-233 beta 017 Np-237 CO0 Co-60 001 S-35 PH2 P-32 018 Ag-110m CS0 Cesium B (Cs-137) 002 Co-60 PM7 Pm-147 CS7 Cs-137 003 Pb-210 PO0 Po-210 EU Eu-154 004 Na-24 PU0, PU Pu-239 alpha FP0, FP Fission products (Cs-
137) 005 Zr-95/Nb-95 PU1 Pu-241
FU0 Total rare earths () 006 Tc-99 PU9 Pu-239 GA0, GA Gross alpha (Pu-239) 007 As-74 RA0 Ra-226 GB0, GB Gross beta (Sr-90) 008 Br-82/Br-83 RU6 Ru-106 GD0 Gd-153 009 Fe-59 SR0 Sr-90 GG0 Gross gamma (Cs-137) 010 Mn-54 SR5 Sr-85 GU0 Gross alpha (Pu-239) 011 I-131 SR9 Sr-89 HY3 H-3 012 Cs-132 TA0 Ta-180 I25 I-125 013 Gross beta TH Th-232 I31 I-131 014 Ba-140 TP0 Trans plutonium
alpha (Am-241)
NP0 Np-237 015 Sb-125 TRE Total rare earths () PA0 Pa-230 alpha 016 Tl-204 URO U-234 alpha
The ORNL database contains values for isotopic activities during times when isotope-specific analyses were not possible or routinely performed. In earlier years, the element of concern was extracted chemically from the biological sample and the total radioactivity of the element in the extract was measured. At some point after the extraction and sample count, the total sample activity was attributed to a specific radionuclide. Many of the isotopic assignments were based on process knowledge.

Document No. ORAUT-TKBS-0012-5 Revision No. 02 Effective Date: 02/08/2013 Page 16 of 73
Table 5-7. Fecal analysis codes (Mani 1983; MMES 1995).
Alphanumeric code GF0 Pu-239 gross alpha (includes Th) PF0 Pu-239 RF0 Rare earths () SF0 Sr-90 SF9 Sr-89 TF0 Trans plutonium (Am-241) UF0 U-234 OF0 Other
5.2.4.3 Whole-Body Counting Results Codes
Table 5-8 lists codes used on some older cards and forms for documenting whole-body counting results. Many hard-copy records have been consolidated into individual personal records folders. However, this compilation is incomplete, with records only for employees with last names beginning with A through G.
Table 5-8. Result codes for whole-body counting [4]. Before 1971 1971–1978
Code Descriptiona Code Descriptiona 1 Normal human spectrum 0 = <15% MPOB 2 Less than 10% MPBB 2 = <25% MPOB 3 Less than 25% MPBB 4 = <50% MPOB 4 Less than 50% MPBB 6 = <100% MPOB 5 Greater than 50% MPBB 8 >100% MPOB N Insignificant & indeterminate S Significant & indeterminate
a. MPBB = maximum permissible body burden; MPOB = maximum permissible organ burden.
Recovered data show that analytical MDAs tended to remain fairly consistent for a number of years. Abrupt changes in MDAs can be identified for groups of radionuclides during specific years. After these changes, the MDAs remain generally consistent in subsequent years. This “step-wise” pattern allowed MDAs from several years to be grouped to obtain a single, representative MDA. Table A-2 in Attachment A provides annual averages for periods when bioassay data were available.
To reflect the performance of the instrumentation and analytical methods more accurately during the period before 1990, Table 5-9 assigns MDAs for some isotopes to their corresponding radioelement rather than the specific radionuclide. For example, routine separation of the alpha emitters 238Pu and 239Pu did not occur until alpha spectrometric analyses became routine in 1989, but the recovered database reports both separately. They have been combined in this document as “Plutonium.” NOTE: Plutonium-241 is reported separately because it is a beta emitter that can be assayed separately from the alpha-emitting isotopes of plutonium.

Docum
ent No. O
RA
UT-TK
BS-0012-5 R
evision No. 02
Effective Date: 02/08/2013
Page 17 of 73
Table 5-9. Recommended in vitro MDAs (dpm/24-hr sample) for radionuclides from 1947 to 1989.
Year
Urine MDAs (dpm/24h sample) Fecal MDAs (dpm/24h sample) Gross alpha
Gross beta
Am- 241
Cm- 244
Cs- 137 H-3
I- 131
Np- 237
Pm- 147 Plutonium Polonium
Pu- 241
Ra- 226
Rare earths
Ru- 106
Sr-89 + Sr-90 Uranium
Gross alpha
Am- 241
Cm- 244 Plutonium
Th- 232
1943 1944 1945 3.1 1946 1947 0.38 1948 0.38 1.4 1949 0.38 1.4 1950 33 0.21 34 1.4 0.53 1951 0.33 33 0.21 129 0.30 34 6.3 0.53 1952 0.26 0.33 33 0.21 31 129 0.30 34 6.3 0.53 1953 0.26 0.33 33 0.21 58 31 129 0.30 34 6.3 0.53 1954 0.26 1,135 0.33 33 0.21 58 1.3 129 0.30 34 6.3 0.53 1955 0.26 1,135 0.33 197 0.21 58 1.3 129 0.30 34 6.3 0.53 1956 0.26 1,135 0.33 197 0.21 58 1.3 129 0.30 34 6.3 0.64 0.53 1957 0.26 1,135 0.33 197 1.1 0.21 58 1.3 129 0.30 34 6.3 0.64 0.34 0.53 1958 0.26 1,135 0.33 197 1.1 0.21 58 1.3 129 0.30 34 6.3 0.64 0.34 0.53 1959 0.26 1,135 0.33 197 1.1 396 0.21 58 1.3 129 0.30 34 6.3 0.64 0.34 0.53 1960 0.26 1,135 0.33 197 1.1 396 0.21 58 1.3 129 53 34 6.3 0.64 0.34 0.53 1961 0.26 288 0.33 197 320,282 1.1 396 0.21 17 1.3 129 53 6.3 6.3 0.64 0.34 0.53 1962 0.26 288 0.33 197 320,282 1.1 396 0.21 17 1.3 129 53 6.3 6.3 0.64 0.34 0.53 1963 0.26 288 0.33 197 320,282 1.1 396 0.21 17 1.3 129 53 6.3 6.3 0.64 0.34 0.53 1964 0.26 288 0.33 0.22 197 320,282 0.09 396 0.21 17 1.3 129 53 6.3 1.1 0.64 0.34 0.53 1965 0.26 288 0.33 0.22 197 320,282 10,358 0.09 396 0.21 17 1.3 129 53 6.3 1.1 0.64 0.46 1.05 0.34 0.53 1966 0.26 288 0.33 0.22 197 320,282 10,358 0.09 396 0.21 17 1.3 129 53 6.3 1.1 0.64 0.46 1.05 0.34 0.53 1967 0.26 288 0.33 0.22 197 320,282 10,358 0.09 396 0.21 17 1.3 129 53 6.3 1.1 0.64 0.46 1.05 0.34 0.53 1968 0.09 39.8 0.08 0.10 51 55,681 10,358 0.09 396 0.06 17 9.2 1.3 129 53 6.3 0.09 0.64 0.46 1.05 0.34 0.53 1969 0.09 39.8 0.08 0.10 51 55,681 10,358 0.09 396 0.06 17 9.2 1.3 129 53 6.3 0.09 0.64 0.46 1.05 0.34 0.53 1970 0.09 39.8 0.08 0.10 51 55,681 10,358 0.09 396 0.06 17 9.2 1.3 129 53 6.3 0.09 0.64 0.46 1.05 0.34 0.53 1971 0.09 39.8 0.08 0.10 51 55,681 10,358 0.09 396 0.06 17 9.2 0.07 5.4 53 4.0 0.09 0.64 0.46 1.05 0.34 0.53 1972 0.09 39.8 0.08 0.10 51 55,681 10,358 0.09 396 0.06 17 9.2 0.07 5.4 53 4.0 0.09 0.64 0.46 1.05 0.34 0.53 1973 0.09 39.8 0.05 0.10 51 55,681 10,358 0.09 396 0.04 17 9.2 0.07 5.4 53 4.0 0.06 0.64 0.46 1.05 0.34 0.53 1974 0.09 39.8 0.05 0.10 51 55,681 10,358 0.09 396 0.04 17 9.2 0.07 5.4 53 4.0 0.06 0.64 0.46 1.05 0.34 0.53 1975 0.09 39.8 0.05 0.10 51 55,681 10,358 0.09 396 0.04 0.52 9.2 0.07 5.4 53 4.0 0.06 0.64 0.46 1.05 0.34 0.53 1976 0.09 39.8 0.05 0.10 51 55,681 10,358 0.09 396 0.04 0.52 9.2 0.07 5.4 53 4.0 0.06 0.64 0.46 1.05 0.34 0.53 1977 0.09 39.8 0.05 0.10 51 55,681 10,358 0.09 396 0.04 0.52 9.2 0.07 5.4 53 4.0 0.06 0.64 0.46 1.05 0.34 0.53 1978 0.09 39.8 0.05 0.10 51 55,681 10,358 0.09 396 0.04 0.52 9.2 0.07 5.4 53 4.0 0.06 0.64 0.46 1.05 0.34 0.53 1979 0.09 39.8 0.05 0.10 51 55,681 10,358 0.09 396 0.04 0.52 9.2 0.07 5.4 53 4.0 0.06 0.64 0.46 1.05 0.34 0.53 1980 0.09 39.8 0.05 0.10 51 55,681 10,358 0.09 396 0.04 0.52 9.2 0.07 5.4 53 4.0 0.06 0.64 0.46 1.05 0.34 0.53 1981 0.09 39.8 0.05 0.10 51 55,681 10,358 0.09 396 0.04 0.52 9.2 0.07 5.4 53 4.0 0.06 0.64 0.46 1.05 0.34 0.53 1982 0.09 39.8 0.05 0.10 51 55,681 10,358 0.09 396 0.04 0.52 9.2 0.07 5.4 53 4.0 0.06 0.64 0.46 1.05 0.34 0.53 1983 0.09 39.8 0.05 0.10 51 55,681 10,358 0.09 396 0.04 0.52 9.2 0.07 5.4 53 4.0 0.06 0.64 0.46 1.05 0.34 0.53 1984 0.09 39.8 0.05 0.10 51 55,681 10,358 0.09 396 0.04 0.52 9.2 0.07 5.4 53 4.0 0.06 0.64 0.46 1.05 0.34 0.53 1985 0.09 39.8 0.05 0.10 51 55,681 10,358 0.09 396 0.04 0.52 9.2 0.07 5.4 53 4.0 0.06 0.64 0.46 1.05 0.34 0.53 1986 0.09 39.8 0.05 0.10 51 55,681 10,358 0.09 396 0.04 0.52 9.2 0.07 5.4 53 4.0 0.06 0.64 0.46 1.05 0.34 0.53 1987 0.09 39.8 0.05 0.10 51 55,681 10,358 0.09 396 0.04 0.52 9.2 0.07 5.4 53 4.0 0.06 0.64 0.46 1.05 0.34 0.53 1988 0.09 39.8 0.05 0.10 51 55,681 10,358 0.09 396 0.04 0.52 9.2 0.07 5.4 53 4.0 0.06 0.64 0.46 1.05 0.34 0.53 1989 0.09 39.8 0.05 0.10 51 55,681 10,358 0.09 396 0.04 0.52 9.2 0.07 5.4 53 4.0 0.06 0.64 0.46 1.05 0.34 0.53
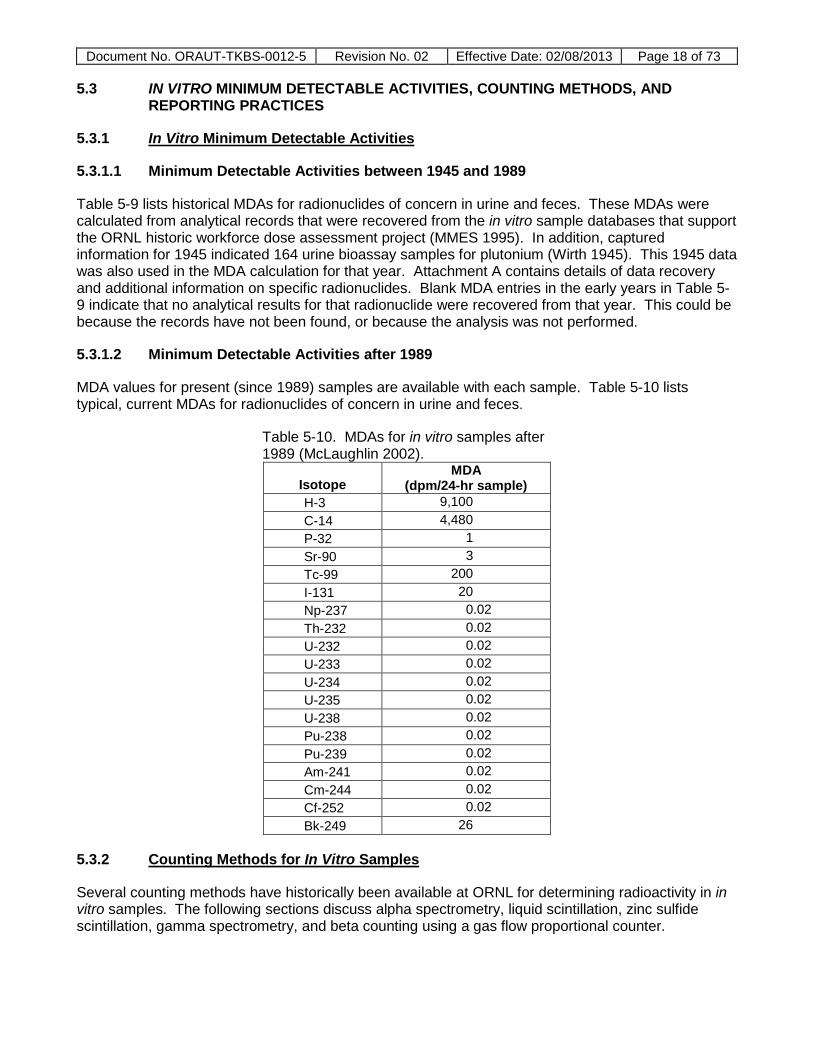
Document No. ORAUT-TKBS-0012-5 Revision No. 02 Effective Date: 02/08/2013 Page 18 of 73 5.3 IN VITRO MINIMUM DETECTABLE ACTIVITIES, COUNTING METHODS, AND
REPORTING PRACTICES
5.3.1 In Vitro Minimum Detectable Activities
5.3.1.1 Minimum Detectable Activities between 1945 and 1989
Table 5-9 lists historical MDAs for radionuclides of concern in urine and feces. These MDAs were calculated from analytical records that were recovered from the in vitro sample databases that support the ORNL historic workforce dose assessment project (MMES 1995). In addition, captured information for 1945 indicated 164 urine bioassay samples for plutonium (Wirth 1945). This 1945 data was also used in the MDA calculation for that year. Attachment A contains details of data recovery and additional information on specific radionuclides. Blank MDA entries in the early years in Table 5-9 indicate that no analytical results for that radionuclide were recovered from that year. This could be because the records have not been found, or because the analysis was not performed.
5.3.1.2 Minimum Detectable Activities after 1989
MDA values for present (since 1989) samples are available with each sample. Table 5-10 lists typical, current MDAs for radionuclides of concern in urine and feces.
Table 5-10. MDAs for in vitro samples after 1989 (McLaughlin 2002).
Isotope MDA
(dpm/24-hr sample) H-3 9,100 C-14 4,480 P-32 1 Sr-90 3 Tc-99 200 I-131 20 Np-237 0.02 Th-232 0.02 U-232 0.02 U-233 0.02 U-234 0.02 U-235 0.02 U-238 0.02 Pu-238 0.02 Pu-239 0.02 Am-241 0.02 Cm-244 0.02 Cf-252 0.02 Bk-249 26
5.3.2 Counting Methods for In Vitro Samples
Several counting methods have historically been available at ORNL for determining radioactivity in in vitro samples. The following sections discuss alpha spectrometry, liquid scintillation, zinc sulfide scintillation, gamma spectrometry, and beta counting using a gas flow proportional counter.

Document No. ORAUT-TKBS-0012-5 Revision No. 02 Effective Date: 02/08/2013 Page 19 of 73 5.3.2.1 Alpha Spectrometry
ORNL uses alpha spectrometry in the analysis of nuclides that decay primarily by alpha emission, with only very low-energy photons or none at all. A tracer is added to the bioassay sample before analysis begins to determine the chemical yield of the process. The radioelements are chemically separated from the sample and electrodeposited on stainless-steel disks. Plutonium and the other transuranic elements can be analyzed sequentially; uranium analysis requires a separate sample.
5.3.2.2 Liquid Scintillation
Liquid scintillation is used for the analysis of low-energy pure beta emitters, specifically 3H and 14C. One milliliter of a urine sample is mixed with a scintillation cocktail for analysis.
5.3.2.3 Zinc-Sulfide Scintillation
ORNL used zinc-sulfide scintillation counting to count alpha emitters such as the trivalent alpha actinides (see Sections 5.3.3.1 and 5.3.3.2).
5.3.2.4 Gamma Spectrometry
ORNL uses gamma spectrometry to identify and quantify radionuclides that emit photons with energies greater than 60 keV. A high-resolution, hyper-pure, intrinsic germanium (HPGe) detector with a beryllium end-window is used. Urine samples are placed in a 1-L MarineIli beaker, which is placed over the detector for counting. If the total sample volume is less than 1 L, distilled or deionized water is added to bring the volume up to 1 L. Fecal samples were counted directly in the sample counter for screening purposes, and they might have been ashed and placed into a 2-in. Petri dish for quantitative results.
5.3.2.5 Gas Flow Proportional Counter (Beta Counting)
ORNL uses the gas flow proportional counter system for the analysis of strontium. Strontium is chemically separated from the sample and filtered onto a glass fiber filter. The filter is placed on a planchet for insertion into the counter. The counting system does not distinguish between beta energies, so the reported result is total strontium (89Sr plus 90Sr).
5.3.3 Notes on Measurements of Alpha Emitters
5.3.3.1 Trivalent Alpha Actinides
Before 1989, ORNL did not perform radionuclide-specific analyses for americium, curium, and other high atomic number elements beyond plutonium. [These radionuclides were typically recorded on the HP Body Fluids Analysis Request cards as transplutonium (TPO or TPL).] Rather, the Laboratory separated trivalent alpha actinides as a group and analyzed by zinc-sulfide scintillation counting. Therefore, monitoring of transplutonium elements was unable to differentiate between such nuclides as 241Am and 244Cm. The default radionuclide to use with measurements involving trivalent alpha actinides is 241Am. The detection sensitivity of the transplutonium analysis technique is not well documented for samples processed before 1985. However, laboratory records suggest that the transplutonium detection level was about 0.2 dpm through 1985.
For analyses after 1985, an estimate of the sample-specific MDA is generally reported. Alpha spectroscopy analysis for transuranic elements in bioassay samples began in the early to mid-1980s. Differentiation by alpha energy separation for isotopes such as 234U, 235U, 238U, 238Pu, 239Pu, 241Am, and 244Cm became possible.
Document No. ORAUT-TKBS-0012-5 Revision No. 02 Effective Date: 02/08/2013 Page 20 of 73 5.3.3.2 Plutonium
Before 1989, ORNL did not routinely perform isotope-specific analyses for plutonium. Rather, the Laboratory separated plutonium as an element and analyzed it by zinc-sulfide scintillation counting. Therefore, the historic plutonium analysis technique was unable to differentiate among the alpha-emitting 238Pu, 239Pu, and 240Pu. Site analytical personnel assert that in the early 1980s, positive total plutonium measurements were recounted on the limited number of alpha spectrometers that were available at the site. Although many HP Body Fluids Analysis Request cards in the claims files gave results for 238Pu and 239Pu, this was not consistently observed. The default isotope for positive, total plutonium measurements should be 239Pu [5].
5.3.3.3 Environmental Uranium
The following paragraphs were taken entirely from the Oak Ridge National Laboratory Internal Dosimetry Program Technical Basis Document (McLaughlin 2002). They are included as an aid to dose reconstructors in the interpretation of uranium bioassay results for ORNL workers.
Environmental levels of naturally-occurring uranium are found throughout eastern Tennessee. The environmental activity levels in the immediate area surrounding Oak Ridge are sufficiently high such that dietary intake of uranium is detectable with 24-hour urine samples. A urinary uranium background study was conducted in the mid 1990's using non-occupationally exposed employees to quantify the range of typical background uranium excretion. Based upon the results of that study, a discrimination level (set at the 99th percentile level) of 0.14 dpm/day was established for both U-234 and U-238 to differentiate between environmental and occupational exposure to uranium. A value of 0.25 dpm/day is applied to total uranium results. Plots of the observed uranium excretion distributions for U-234, U-238, and total uranium are provided below.
An activity ratio of U-234 to U-238 of approximately 2 to 1 has been observed within the analyzed local potable water samples. Activity ratios in this range have been reported for various aquifers (Osmond). Though U-234 and U-238 should be in secular equilibrium within nature, the observed enrichment of the isotope U-234 is believed to be caused by several factors which include the direct transfer of U-238 decay products across a solid/liquid phase boundary by alpha recoil and differences in solubility between uranium decay chain members. Recognizing this trend, uranium bioassay results that are less than 0.2 dpm/day that do not exhibit a U-234 to U-238 activity ratio of 2:1 should be considered suspect and investigated.
5.4 IN VIVO MINIMUM DETECTABLE ACTIVITIES, COUNTING METHODS, AND REPORTING PRACTICES
5.4.1 Shielded Counting Room
The ORNL Whole-Body Counting (WBC) facility, sometimes referred to as the In Vivo Gamma-Ray Spectrometer), is in Building 2008 in the northwest corner of the Main Plant area. Several Health Physics Division annual progress reports (Morgan 1961; Morgan, Snyder, and Struxness 1963, 1966) indicate that the WBC facility began operation in June 1960 and another report (Brown, Patterson, and Abee 1971) indicates a May 1960 date; a more recent document (Watts et al. 1995) indicates several counts occurred earlier. Therefore, it is likely that the WBC facility began limited operations in 1959.

Document No. ORAUT-TKBS-0012-5 Revision No. 02 Effective Date: 02/08/2013 Page 21 of 73 The main counting room has inner dimensions of 10 by 10 by 10 ft. Its walls consist of four layers of pre-World War II steel with a total thickness of 14 in. Some documents called it the iron or big room. The first recorded count in the WBC facility occurred on July 13, 1959, and, “was a background count [conducted] in the corner of the steel room with the door not in place and the roof incomplete” (Watts et al. 1995). The room was completed on July 24, 1959 (with the exception of a 0.125-in. layer of “special low-radioactivity lead” added to all inner surfaces in 1960 to reduce background radiation levels) and was used for a time to conduct background studies of paint and interior samples and to count biological samples such as milk, grass, and cow thyroids. The first recorded lung count of an employee occurred on May 19, 1960. Almost immediately after (May 19 to 20, 1960), it was used to conduct lung counts of three employees involved in an onsite contamination incident. The original counting facility used a 4- by 4-in. NaI (Tl) crystal, but it is not clear what the counting geometry was. There is a photograph of an individual laying on a nylon-strapped, aluminum beach chair, but it was not clear whether that was the geometry initially employed in the facility. The “Argonne Chair” counting geometry was set up for whole body counting on February 27, 1961 (Morgan 1961, p. 240). The tubular steel chair was tilted so the individual’s body was in a V position with the detector placed approximately 50 cm directly over the hips (Morgan 1961, p. 241).
Before construction of the WBC facility, health physicists realized that there could be problems with siting a low-level radiation counting facility in the plant environment, with radioactive effluents from operations being generated immediately adjacent to the facility. Therefore, ORNL designed and installed a recirculating air treatment system that pumped air from inside the counting room through charcoal traps, cooling coils, and heaters to remove radon, odors, and excess moisture (Brown, Patterson, and Abee 1971; Morgan 1961). A slight positive pressure was maintained in the counting room by using cylinders of “aged” breathing air to make up for leakage from the system.
To improve the detection sensitivity, additional layers of material were applied to the floor in the WBC facility counting room over the years. Morgan, Snyder, and Struxness (1963) indicates that 0.04-in.-thick layers of tin and cadmium were laid over the interior surface of the lead, only on the floor, with a 0.01-in.-thick layer of copper over the tin and cadmium. The original vinyl tile was placed over the copper. These materials were installed to reduce background radiation emitted from the lead shield as a graduating shield to minimize the contribution of low-energy X-rays. In the mid-1990s, the vinyl tile surface was removed and a 0.03-in.-thick layer of stainless steel was placed directly over the other metal layers. Site personnel indicated that the stainless-steel layer was primarily for aesthetic purposes to cover the oxidized copper layer. With the addition of frictional surfaces for slip reduction, this was the latest form of the floor. Table 5-11 lists the construction history of the counting room.
Table 5-11. Construction history of the counting room. Installation date Material Thickness (in.)
1959 (entire facility) Pre-WW II steel 14 1960 (entire facility) Special low-radioactivity lead 0.125 1963 (floor only) Tin 0.04 1963 (floor only) Cadmium 0.04 1963 (floor only) Copper 0.01 Mid-1990s Stainless steel 0.03
Subsequent improvements to the shielded counting room, detectors, and counting geometries are described below. The shielded room was used to conduct all in vivo measurements at ORNL until 1992, when a Canberra scanning bed counter (SBC) was installed in Room 16 of Building 2008.
A discussion with Berger (Fleming 2004b), who was responsible for the facility from the mid-1970s until the early 1980s, indicated that although the facility was in operation, a formal in vivo monitoring program was not in place until the late 1980s. Before that time, the WBC facility was used almost exclusively to either confirm known or suspected intakes of radioisotopes or for research purposes.

Document No. ORAUT-TKBS-0012-5 Revision No. 02 Effective Date: 02/08/2013 Page 22 of 73 Selection of individuals for counting was performed by field health physics personnel based on expected contaminants of concern and the probability of exposure until the early 1990s, when the selection of individuals for in vivo monitoring became the responsibility of the Internal Dosimetry staff.
5.4.2 Detectors, Geometries, and Techniques
As described above, the initial in vivo counter at ORNL used a 4- by 4-in. NaI(Tl) crystal and a tilted chair counting arrangement (Morgan 1961). In July 1961, counting activities in the WBC facility were suspended to modify the detector arrangement with the installation of an 8- by 4-in. NaI(Tl) crystal to replace the smaller detector to increase efficiency and reduce counting times. In 1962, several thin (5-in.-diameter by 0.0625-in.) NaI(Tl) crystals were installed in the facility to quantify low-energy photons (e.g., mainly isotopes of plutonium). Also in that year, calibration studies were conducted using an arc-shaped geometry. This geometry was expected to result in less variation in counting efficiency than the chair geometry. (The arc geometry placed an individual laying in an arced position with the anterior portion of the body facing the detector at a distance of about 1 m, so each portion of the body was approximately the same distance from the detector (Mani 1983).
Morgan, Snyder, and Struxness (1963) indicated that the thin crystal detectors could see approximately 40 nCi of 238Pu if there was a preexposure chest count. If there was no preexposure count, the detection capability was approximately 80 nCi. In 1963, an SBC replaced the chair geometry using the 8- by 4-in. NaI(Tl) crystal for whole-body counting. The bed and individual were moved under the stationary detector. This geometry was used to determine roughly the part of the body in which the gamma-emitting radioisotopes were located. The detection efficiency was approximately equivalent to that of the chair geometry (Morgan, Snyder, and Struxness 1963). Morgan, Snyder, and Struxness (1963) noted that the computer output provided a “gross” spectrum as well as having the ability to “strip the 40K and 137Cs background counts.” Several spectra observed during that period indicated a large portion of the “net” spectra with negative values. Morgan, Snyder, and Struxness (1964) noted that in March 1963 “written weekly reports of in vivo counting activities and results was begun.” The research to generate this document did not find any of these weekly reports.
Morgan, Snyder, and Struxness (1965) reported that “Baseline counts on essentially every person with a potential for future exposure was completed in May 1965.” By the third week of May 1965, a prioritizing system for selecting individuals for whole-body counting was initiated. Table 5-12 describes this system. Although several located documents stated that baseline and specified monitoring frequencies were used to make in vivo measurements, Fleming (2004b) indicated that a full in vivo monitoring program did not exist at ORNL until approximately 1994, when site internal dosimetrists became responsible for identifying personnel for counting. Before that time, the area health physicists selected individuals for in vivo monitoring. The area health physicists were responsible for determining radioisotopes to which the worker could have been exposed and counting frequencies. This led to inconsistent approaches to the selection of individuals for monitoring.
Table 5-12. 1965 selection criteria for whole-body counting. Priority Selection criteria
1 Persons suspected of having sustained exposure 2 Persons being recounted as follow-up to initial elevated in vivo results 3 Persons who work directly with radioactive material (once every 3 mo) 4 Persons who work in areas where radioactive materials are handled, but do not work directly with
the material (once every 6 mo) 5 New hires or other persons requiring a baseline count and a limited number of persons prior to
termination
Morgan, Snyder, and Struxness (1966) indicated that the “job of determining which employees should be counted, the frequency with which they should be recounted, and preparing the necessary

Document No. ORAUT-TKBS-0012-5 Revision No. 02 Effective Date: 02/08/2013 Page 23 of 73 schedule cards and lists is requiring more time than had been anticipated.” For this reason, the WBC facility was still being used to verify if intakes had taken place rather than for routine monitoring of site personnel. A new Health Physics Division Report (Morgan, Snyder, and Davis 1967) begun in 1966 included data on numbers of in vivo counts and basic statistics for in vivo monitoring. It included numbers of individuals whose results exceeded the U.S. Atomic Energy Commission (AEC) reporting level (50% of the permissible body burden averaged over the year) or some other specified amount. Table 5-13 summarizes this information. NOTE: The use of annual averages could be misleading in cases involving short-lived or rapidly cleared materials. Mani (1983, Table 15) provided similar data but reported all in vivo counts that exceeded specified levels rather than annual averages. Table 5-14 lists this information.
Table 5-13. Qualitative information concerning radioactive material detected using the WBC facility from 1966 to 1983.
Year Number of persons exceeding the permissible body burden
(based upon in vivo measurements) 1966a 0 persons exceeded 50% of permissible body burden 1967a 0 persons exceeded 50% of permissible body burden 1968a 0 persons exceeded 50% of permissible body burden 1969a 0 persons exceeded 50% of permissible body burden 1970b 0 persons exceeded 25% of permissible body burden 1971b 0 persons exceeded 25% of permissible body burden 1972b 0 persons exceeded 25% of permissible body burden 1973b 0 persons exceeded 25% of permissible body burden 1974b 2 (employees inhaled Cm-244 believed to range from 20 (15 pCi) to 40% (30 pCi) of organ (lung)
burden) 1975b 4 (1 - Cm-244 of ~50%, 1 – U-238 of <15%, 1 – Zn-65 and Co-57 of <15%, and 1 – Co-60 of <15% of
lung burden) 1976b 6 (all six appear to have had detectable amounts of Cm-244 of <15% of the lung burden) 1977b 20 (8 – 239Pu and 241Am of <25%, 8 – 137Cs, 60Co, 153Gd, and 109Cd of <15%, and 4 – 125I and 123Te
<25% of the lung burden) 1978b 6 (1 - Pu-241 and Am-241 of ~70% (lung), 1 – 131I-131 minor amount that could not be quantified
(thyroid), and 4 – Co-60 of <25% (lung) 1979b 0 persons exceeded 25% of permissible lung burden 1980b 0 persons exceeded 10% of permissible lung burden 1981b 0 persons exceeded 10% of permissible lung burden 1982b 0 persons exceeded 10% of permissible lung burden 1983b 0 persons exceeded 10% of permissible lung burden
a. The AEC permissible level was 50% of the permissible body burden from 1966 through 1969. b. From 1970, ORNL indicated in reports that in vivo measurements did not exceed specified amounts.
Table 5-15 summarizes the maximum activity measured through in vivo monitoring for various nuclides for the period from 1961 to 1966.
The results for a given in vivo analysis contained the following information: name, badge number (or equivalent), division code, health physics area, date, analysis code, and results code. Table 5-8 lists result codes for the period before 1978. The reason for the analysis was given. The ORNL Division codes are the same as those listed in Tables 5-4 and 5-5. [NOTE: The ICRP Publication 2 methodology of reporting percentages of body or lung burdens (ICRP 1959) was used at ORNL through 1983.] AEC Manual Chapter 0502 required “an evaluation of the radiation exposure status of an employee when monitoring techniques indicated that a body burden equaled or exceeded 50% of a maximum permissible limit”.

Docum
ent No. O
RA
UT-TK
BS-0012-5 R
evision No. 02
Effective Date: 02/08/2013
Page 24 of 73
Table 5-14. Qualitative information concerning radioactive material detected using the WBC facility through 1978 (Mani 1983).
Count year
Insignificant and
indeterminate Significant and indeterminate
<15% of MPOB
Normal spectrum
<10/25% of MPOBa
<25% of MPOB
<50% of MPOB
>50% of MPOB
<100% of MPOB
>100% of MPOB
Total counts
1962 59 9 3 71 1963 906 15 921 1964 1,485 6 20 13 31 1,555 1965 1,111 16 8 23 11 1,169 1966 632 11 12 28 13 696 1967 918 13 6 25 4 966 1968 815 135 12 6 968 1969 905 126 8 18 1,057 1970 499 14 2 1 2 518 1971 310 4 9 1 324 1972 255 4 259 1973 321 1 3 325 1974 246 2 8 3 6 7 6 278 1975 297 23 5 4 1 330 1976 215 6 29 3 1 254 1977 256 14 15 5 1 291 1978 257 12 30 3 3 1 306 Total 2,157 62 103 7,330 360 71 128 62 8 7 10,288
a. 10% before 1971 and 25% from 1971 to 1978.

Document No. ORAUT-TKBS-0012-5 Revision No. 02 Effective Date: 02/08/2013 Page 25 of 73
Table 5-15. Maximum measured in vivo activity (nCi) from 1961 to 1966.
Isotope 1961 1962 1963 1964 1965 1966 Na-24 140 Sc-46 4 Cr-51 320 42 Tracea Co-56 15 Co-57 65 Co-58 20 38 Trace Fe-59 40 15 Co-60 80 13 2 220 5 12 Co-64 <5 Zn-65 40 3 16 Trace Se-75 250 Sr-90 40 4,500 800 626 Zr-95/Nb-95 30 11 14 47 18 39 Ru-106/Rh-106 131 47 200 30 Sb-125 162 6 18 I-131 12 200 28b 73 54 6 Cs-137 440 360 570 310 104 92 Ce-144/Pr-144 30 <7 75 50 Eu-155 Trace Au-198 Hg-203 800 0.0005 169 22 Ra-226 <5 <0.5c Pa-233 2,800 U (enriched) Trace Trace a. Trace is not defined within any of the annual reports, but is provided here to
give a qualitative “feel” for the amount present. b. Thyroid. c. Micrograms.
Since 1989, each in vivo measurement showing a positive result has been assessed, including making estimates of intake and dose. The Oak Ridge National Laboratory Internal Dosimetry Program Technical Basis Document (McLaughlin 2002) states that dose estimates of less than 1 mrem were reported as zero. The overwhelming number of in vivo measurements obtained at the facility indicate no elevated activity.
Mani (1983) indicated that a NaI-CsI phoswich detector was installed and operational in 1967, although Brown, Patterson, and Abee (1971) state, “The several detectors used for measuring gamma radiation from the human body are all NaI(Tl) crystals.” The 1974 annual report of the Health Physics Division (Auxier, Davis, and Turner 1975) stated that a phoswich detector was in place and apparently was installed between 1971 and 1974, but no other information was found stating when the detector was placed in the WBC facility. A 9- by 9-in. NaI(Tl) crystal was installed in the WBC facility in 1974 (Auxier, Davis, and Turner 1975) and placed under the chest area of the counting bed. This detector was used for stationary chest counts. [A statement in Brown, Patterson, and Abee (1971) indicated that a distortion of the spectrum occurred if the large detector was used with the bed moving. Thus, it was not used for whole-body scans.] The whole-body scans performed during this period used the 8- by 4-in. detector at a distance of 12 in. from the bed surface and an elapsed counting time of 20 minutes. (If transuranic isotopes were suspected, the thin crystal assembly was used.) Stationary chest counts used either the 8- by 4-in. or thin crystal assembly in contact with the chest depending on what contaminants were expected. When the 9- by 9-in. NaI(Tl) crystal was used the individual was positioned either face-up or -down on the bed and the bed was lowered just shy of contact with the face of the large detector. The time to conduct stationary chest counts typically ranged from 10 to 40 minutes and sometimes longer to ensure “better counting statistics” (Brown,

Document No. ORAUT-TKBS-0012-5 Revision No. 02 Effective Date: 02/08/2013 Page 26 of 73
Patterson, and Abee 1971). The arc-counting geometry was described in Brown, Patterson, and Abee (1971) with the 8- by 4-in. detector positioned 6 ft above the center point of the counting bed. This geometry differs from that described in Mani’s assessment of ORNL internal dosimetry data (Mani 1983). The counting bed was placed on the floor with the ends supported to give the proper curvature. This geometry was intended for use only when the count rate was too high for the scanning or stationary chest counting methods. (No evidence of the arc-counting geometry actually being used was noted in the references reviewed in the generation of this document.)
In addition to the NaI(Tl) detectors described above, Brown, Patterson, and Abee (1971) indicated that three other detectors were in use in the counting room in 1971. A 3- by 3-in. NaI crystal was used to measure radiation emanating from specific organs (e.g., mainly for the thyroid, kidneys, liver, and spleen). Because of its smaller size, it could be placed directly over the organ of interest. Two other NaI crystals were employed in the WBC Facility as wound probes: 2 by 2 in. and 1 by 0.03125 in., with the latter used to measure low-energy photons less than about 200 keV.
The next bulk sources of information describing instruments and procedures in the WBC Facility were provided by Berger and Goans (1981), Berger and Lane (1981, 1982, 1984), and Fleming (2004b). Fleming (2004b) indicated that use of the phoswich detector began in late 1976 to early 1977. Until that time, the three thin NaI(Tl) crystal detector assembly was in use for detection of low-energy photons. The phoswich detector had the following dimensions: 5.25 by 0.0625 in. NaI - 2 in. CsI. Mani (1983) indicates that in 1978, an 80-cm2 HPGe counting array was in the WBC facility, but it was not fully operational until May 1980 (Berger and Lane 1981). The array consisted of six separate detectors in an aluminum block in a close-packed rectangular array (e.g., a six-die pattern) designed to cover one lung (Berger and Lane 1981). The phoswich and HPGe detectors were used together from the early 1980s to obtain lung count data; they were positioned over the right and left lungs, respectively. Berger and Lane (1984) indicated that there were problems with getting all the HPGe detectors positioned close to the chest surface due to the construction of the aluminum block. Detectors on the chest surface were almost a factor of 3 more sensitive than those farther away from the chest. This lung count geometry was used until approximately 1987, when problems developed with the HPGe/liquid nitrogen feed system. At that time, the HPGe detector array was taken out of service, and the phoswich detector was the only device used for routine chest counts until 1994.
In 1992, a Nuclear Data SBC was put in service, primarily to measure mixed fission and activation products ranging in energy between 100 and 2,000 keV; it is in use today. This counter is in Room 16 of Building 2008, and is the only in vivo monitoring device outside the shielded counting room (Watts et al. 1995). It has three germanium detectors facing downward and two NaI detectors on the sides of the bed. As described below, it can also be used as a backup chest counter, if necessary, due to its 3%- to 50% efficient germanium detectors (Watts et al. 1995). The detectors are in a solid center shield. The shield is designed so there is a minimum of 4 in. of lead around each detector.
During this time, the 5.25- by 0.0625-in. NaI - 2-in. CsI phoswich detector was used to conduct chest counts. Sometime between 1977 and 1994, another phoswich detector with similar dimensions was procured and used until three 70% efficient germanium detectors were installed in the counting room in 1994. A chair counting geometry was reinitiated at that time, with the individual reclined 45 degrees from the vertical. The three germanium detectors are positioned with two detectors over the right lung (one over the upper portion and the other over the lower portion) and one over the left lung. The third detector is over the upper portion of the left lung.
In addition to the above, there are three other detector arrangements in the WBC facility. A germanium thyroid counter can be set up using one of the detectors used for lung counting. The individual is in the same chair used for lung counting, but the chair is inclined at a 25-degree angle. Other organ-specific geometries can be used as necessary (skull, liver, hand, etc.). The 5.25- by

Document No. ORAUT-TKBS-0012-5 Revision No. 02 Effective Date: 02/08/2013 Page 27 of 73
0.0625-in. NaI - 2-in. CsI phoswich and the SBC (in a fixed-bed position) are backup systems that can be used for lung counts if needed.
Until 1994, field health physicists selected individuals for in vivo monitoring. At that time, the internal dosimetry group became responsible for the selection of personnel for in vivo monitoring with guidance from field health physicists. Fleming (2004b) indicated that the in vivo monitoring program might not have been effective for monitoring ORNL personnel until the late 1980s because of reliance on field health physicists to determine the individuals to be monitored.
5.4.3 Cesium Counting Artifact
Many ORNL workers had measured body burdens from intakes of 137Cs from nonoccupational sources (e.g., fallout and consumption of local venison). At present, ORNL uses a value of 20 nCi 137Cs in a whole-body count for consumers of venison as the decision level to follow up or conduct a dose assessment (McLaughlin 2002). However, the Laboratory has never used it to negate an individual’s occupational dose that was received on the site.
Fallout affects everyone in North America, and body burdens of 137Cs measurable in whole-body counters were common in the 1960s and 1970s. National Council on Radiological Protection and Measurements (NCRP) Report 94 provides mean body burdens of 137Cs for the United States for the years most likely to produce interference with occupational whole-body count results (NCRP 1988). Table 5-16 lists these values.
Table 5-16. Mean body burdens of 137Cs from fallout in the United States (NCRP 1988).
Year Body burden (nCi) Year Body burden (nCi) 1953 0.27 1966 9.7 1954 1.1 1967 5.6 1955 2.2 1968 3.5 1956 4.3 1969 2.7 1957 5.1 1970 2.7 1958 6.5 1971 2.7 1959 8.1 1972 2.7 1960 6.8 1973 2.7 1961 4.6 1974 1.6 1962 6 1975 1.1 1963 11 1976 1.6 1964 19 1977 1.1 1965 16
5.4.4 Minimum Detectable Activity
As stated above, the thin (5-in.-diameter by 0.0625-in.) NaI(Tl) crystal array used in 1963 to detect low-energy photons emitted primarily from transuranic elements could detect approximately 40 nCi of 238Pu, if there had been a preexposure chest count. If there was no preexposure count, the detection capability was approximately 80 nCi (Morgan, Snyder, and Struxness 1963).
Table 5-17 lists MDAs for the HPGe array of six individual detectors in the aluminum block (used around early- to mid-1980s).
Tables 5-18, 5-19, and 5-20 list MDA values for the ORNL SBC, germanium thyroid counter, and fixed bed counter, respectively (Watts et al. 1995). MDA values were calculated for each individual measurement made using the germanium lung counter, SBC, and fixed bed counter. Figure 5-1 is a

Document No. ORAUT-TKBS-0012-5 Revision No. 02 Effective Date: 02/08/2013 Page 28 of 73
Table 5-17. MDA values for six-detector HPGe array (Berger and Lane 1981).
Nuclide Organ MDA (nCi) Pu-239 Lung 21.5 Am-241 Lung 1.1 I-125 Thyroid 0.04 Cs-137 Lung 16.4 Gd-153 Lung 0.87 Eu-152 Lung 0.71 U-233 Lung 1.42 Co-57 Lung 0.94
Table 5-18. Current MDA values for ORNL scanning bed counter (NaI/Ge) (Watts et al. 1995).
Isotope MDA (nCi) Isotope MDA (nCi) Isotope MDA (nCi) Cr-51 24/30 Mn-54 2.1/2.4 Co-57 4.9/5.9 Fe-59 3.9/4.5 Co-60 2.2/1.9 Zn-65 4.3/6.0 Rb-88 12/15 Y-88 1.8/1.9 Nb-95 2.1/2.7 Zr-95 3.7/4.1 Tc-99m 4.4/5.3 Ru-103 2.6/2.9 Ru-106 21/30 Cd-109 NG/224* Sn-113 3.4/4.0 Sb-124 2.2/3.1 I-131 2.7/3.1 Ba-133 3.7/4.5 I-133 2.7/2.9 Cs-134 2.2/3.0 Cs-137 2.4/2.8 Ce-139 4.3/4.6 Ba-140 9.2/9.1 La-140 2.3/2.4 Ce-141 7.7/8.4 Ce-144 36/43 Eu-152 8.5/9.7 Gd-153 21/21 Eu-154 6.1/7.2 Pb-212 6.3/7.6 Bi-214 5.8/9.8 U-235 5.9/6.1
*NG = not given.
Table 5-19. Current MDA values for ORNL germanium thyroid counter.
Isotope MDA (nCi) I-125 0.06 I-131 0.12
Table 5-20. Current MDA values for ORNL fixed bed counter.
Isotope MDA (nCi) Co-60 0.31 Ce-144 6.28
plot of MDA values for different nuclides for the ORNL germanium lung counter as a function of chest wall thickness. Figure 5-2 shows MDA values for 238Pu and 241Am for the ORNL phoswich lung counter as a function of chest wall thickness. Table 5-21 lists the frequencies of in vivo counting since 1960 and, for the various detectors, a summary of the best estimates of the applicable periods of use.

Document No. ORAUT-TKBS-0012-5 Revision No. 02 Effective Date: 02/08/2013 Page 29 of 73
Figure 5-1. Current MDA values (nCi) for ORNL germanium lung counter versus chest-wall thickness (cm) (Watts et al. 1995).
241Am 238Pu Figure 5-2. Current MDA values (nCi) for ORNL phoswich lung counter versus chest-wall thickness (cm) for 241Am and 238Pu (Watts et al. 1995).

Document No. ORAUT-TKBS-0012-5 Revision No. 02 Effective Date: 02/08/2013 Page 30 of 73
Table 5-21. Frequency of in vivo monitoring. Monitoring type Applicable period Frequency
Lung counting
1960–1961 4- × 4-in. NaI(Tl)
No set frequency. (Period of facility development – limited routine human counting, typically of incidents.)
1961–1962 8- × 4-in. NaI(Tl)
No set frequency. (Development activities to change over to larger detector – typically incidents.)
1962 to ca. 1967–1971 8- × 4-in. NaI(Tl)
No set frequency. (Period spent obtaining baseline counts onsite employees and incident counts)
1965–?? 8- × 4-in. NaI(Tl)
Frequency stated in Annual Report (see Table 5-12), but discussions with site personnel indicate that it was not consistently implemented.
ca. 1967–1971 to 1976 8- × 4-in. NaI(Tl) and 9- × 9-in. NaI(Tl)
Large detector was added below counting table and used when conducting stationary lung counts only.
1962–1976 5-in.-diameter × 1/16-in. NaI(Tl)
No set frequency. (Thin NaI crystals used to quantify low energy photons.)
Lung counting (cont’d.)
1976–1994 5.25- × 1/16-in. NaI - 2- CsI phoswich
Monitoring frequency was not effectively implemented. This phoswich detector was used to monitor for low energy photons.
1980–1987 Germanium array and phoswich
Monitoring frequency was not effectively implemented. Detectors used together.
1992–present combination germanium and NaI
Fixed Bed Counter is SBC in fixed position. Used only to measure fission and activation products (e.g., 60Co and 144Ce) immediately after assimilation.
1994–present Germanium system
Varies from annual to semiannual depending on exposure potential set by Internal Dosimetrist.
1994–present 5.25- × 1/16-in. NaI - 2- CsI phoswich
Phoswich detector can be used, but germanium detection system noted above is routinely used.
Whole-body counting
1960–1961 4- × 4-in. NaI(Tl)
No set frequency. (Period of facility development –limited routine human counting, typically incidents.)
1961–1962 8- × 4-in. NaI(Tl)
No set frequency. (Development activities to change to larger detector – typically incidents.)
1963–1976 8- × 4-in. NaI(Tl)
Table 5-12 selection criteria used in 1965 for WBC.
1992–present combination germanium and NaI
SBC. Monitoring frequency implemented in 1994 to include annual and semiannual counts depending on exposure potential set by Internal Dosimetrist.
Thyroid counter (and other organs)
1963–?? 3- × 3-in. NaI(Tl)
Incident counting and research. May have been used for frequent monitoring of workers potentially exposed to iodine, but this information was not found.
1994–present germanium (uses one of three germanium detectors used for lung counting)
Typically, site research personnel would be placed on this program and monitored on semiannual frequency, as well as persons involved in known or potential iodine intake.
5.5 ATTRIBUTIONS AND ANNOTATIONS
Where appropriate in this document, bracketed callouts have been inserted to indicate information, conclusions, and recommendations provided to assist in the process of worker dose reconstruction. These callouts are listed here in the Attributions and Annotations section, with information to identify the source and justification for each associated item. Conventional References, which are provided in the next section of this document, link data, quotations, and other information to documents available for review on the Project’s Site Research Database (SRDB).

Document No. ORAUT-TKBS-0012-5 Revision No. 02 Effective Date: 02/08/2013 Page 31 of 73
[1] Burns, Robert E. ORAU Team. Senior Health Physicist. April 2007. Section 2 of this Site Profile (ORAUT 2007) provides a more detailed discussion of the key radionuclides workers encountered.
[2] Burns, Robert E. ORAU Team. Senior Health Physicist. April 2007. This list was compiled from queries of the database of in vitro bioassay results provided by ORNL.
[3] Burns, Robert E. ORAU Team. Senior Health Physicist. April 2007. The system of absorption types promulgated in ICRP Publication 66 (ICRP 1994) is used for all inhalation dose reconstructions under EEOICPA, as this represents use of the best available science. Use of older solubility class information or assumptions to maximize committed dose could result in organ dose assessments that would not be favorable to the claimant.
[4] Burns, Robert E. ORAU Team. Senior Health Physicist. April 2007. These codes are from worker dosimetry records.
[5] Burns, Robert E. ORAU Team. Senior Health Physicist. April 2007. The selection of 239Pu as the default radionuclide, when the true isotopic mix is not known from measurement, is made to ensure assessments favorable to claimants.
[6] Varnado, Keith W. ORAU Team. Senior Health Physicist. October 2012. Captured documents indicated 164 urine samples for plutonium in 1945. Calculations of 1945 plutonium MDA performed by Tom LaBone. Table 5-9 updated to incorporate a 1945 plutonium MDA value of 3.1 dpm/d.

Document No. ORAUT-TKBS-0012-5 Revision No. 02 Effective Date: 02/08/2013 Page 32 of 73
REFERENCES
Auxier, J. A., D. M. Davis, and J. E. Turner, 1975, Applied Health Physics and Safety Annual Report for 1974, ORNL-5055, Union Carbide Corporation, Oak Ridge National Laboratory, Oak Ridge, Tennessee, August. [SRDB Ref ID: 11555]
Berger, C. D., and R. E. Goans, 1981, “A Comparison of the NaI-CsI Phoswich and a Hyperpure Germanium Array for the In Vivo Detection of the Actinides,” Health Physics, volume 40, number 4, pp. 535–542.
Berger, C. D., and B. H. Lane, 1981, Performance of a Large Hyperpure Germanium Detector Array for In-Vivo Detection of Low-Energy Photon and X-Ray Emitters: Analytical Procedure and Current Capabilities, ORNL/TM-7925, Union Carbide Corporation, Oak Ridge National Laboratory, Oak Ridge, Tennessee, October. [SRDB Ref ID: 10104]
Berger, C. D. and B. H. Lane 1982, The Oak Ridge National Laboratory Whole Body Counter: Internal Operation Procedure Manual, ORNL/TM-8423, Union Carbide Corporation, Oak Ridge National Laboratory, Oak Ridge, Tennessee, August. [SRDB Ref ID: 10109]
Berger, C. D., and B. H. Lane, 1984, Calibration of a Large Hyperpure Germanium Detector Array for Actinide Lung Counting with a Tissue-Equivalent Torso Phantom, ORNL/TM-8723, Martin Marietta Energy Systems, Oak Ridge National Laboratory, Oak Ridge, Tennessee, July. [SRDB Ref ID: 10081]
Brodsky, A., 1992, “Exact Calculation of Probabilities of False Positives and False Negatives for Low Background Counting,” Health Physics, volume 63, number 2, pp.198–204.
Brown, P. E., G. R. Patterson, and H. H. Abee, 1971, The ORNL Whole Body Counter, CF 71-1-71, Union Carbide Corporation, Oak Ridge National Laboratory, Oak Ridge, Tennessee, January 1. [SRDB Ref ID: 8513]
Cox, A. C., 1944, Progress Report, First Nine Months Operation of Separations Plant, December, 1943 to September 1944, CN-1879, Clinton Laboratories, Oak Ridge, Tennessee, October 9. [SRDB Ref ID: 99656, p. 2]
Evans, R. D., 1955, The Atomic Nucleus, McGraw-Hill, New York, New York.
Fleming, K., 2004a, “Acceptance of Personal Communication Information in ORNL Technical Basis Document,” e-mail to J. Auxier, Oak Ridge Associated Universities Team, Oak Ridge, Tennessee, April 9. [SRDB Ref ID: 121046]
Fleming, K., 2004b, “Acceptance of Personal Communication Information in ORNL Technical Basis Document,” e-mail to C. Berger, Oak Ridge Associated Universities Team, Oak Ridge, Tennessee, April 9. [SRDB Ref ID: 121048]
ICRP (International Commission on Radiological Protection), 1959, Report of Committee II on Permissible Dose for Internal Radiation, ICRP Publication 2, Pergamon Press, London, England. [SRDB Ref ID: 64410]
ICRP (International Commission on Radiological Protection), 1966, “Deposition and Retention Models for Internal Dosimetry of the Human Respiratory Tract,” ICRP Committee II, Task Group on Lung Dynamics, Health Physics, volume 12, pp. 173–207. [SRDB Ref ID: 29276]

Document No. ORAUT-TKBS-0012-5 Revision No. 02 Effective Date: 02/08/2013 Page 33 of 73
ICRP (International Commission on Radiological Protection), 1975, Report of the Task Group on Reference Man, Publication 23, Pergamon Press, Oxford, England. [SRDB Ref ID: 22735]
ICRP (International Commission on Radiological Protection), 1994, Human Respiratory Tract Model for Radiological Protection, Publication 66, Pergamon Press, Oxford, England. [SRDB Ref ID: 22732]
LaBone, T. R., 2012, “Estimation of Process MDA for Pu Urine Bioassay at X10 in 1945.” [SRDB: Ref ID: 120655]
Mani, K. V., 1983, Assessment of Oak Ridge National Laboratory Internal Dosimetry Data for DOE Health and Mortality Study, master’s thesis, Chapel Hill, North Carolina. [SRDB Ref ID: 870]
McLaughlin, D. A., 2002, Oak Ridge National Laboratory Internal Dosimetry Program Technical Basis Document, Rev. 4, UT-Battelle, Oak Ridge National Laboratory, Oak Ridge, Tennessee, January 1. [SRDB Ref ID: 10096]
MMES (Martin Marietta Energy Systems), 1995, Documentation of the dBase IV In Vitro Sample Databases Supporting the ORNL Historic Work Force Dose Assessment Project, Rev. 0, September 2. [SRDB Ref ID: 8516]
Morgan, K. Z., 1961, Health Physics Division Annual Progress Report for Period Ending July 31, 1961, ORNL-3189, Union Carbide Corporation, Oak Ridge National Laboratory, Oak Ridge, Tennessee, October 24. [SRDB Ref ID: 11564]
Morgan, K. Z., W. S. Snyder, and E. G. Struxness, 1963, Health Physics Division Annual Progress Report for Period Ending June 30, 1963, ORNL-3492, Union Carbide Corporation, Oak Ridge National Laboratory, Oak Ridge, Tennessee, September 23. [SRDB Ref ID: 11565]
Morgan, K. Z., W. S. Snyder, and E. G. Struxness, 1964, Health Physics Division Annual Progress Report for Period Ending July 31, 1964, ORNL-3697, Union Carbide Corporation, Oak Ridge National Laboratory, Oak Ridge, Tennessee, October. [SRDB Ref ID: 11566]
Morgan, K. Z., W. S. Snyder, and E. G. Struxness, 1965, Health Physics Division Annual Progress Report for Period Ending July 31, 1965, ORNL-3849, Union Carbide Corporation, Oak Ridge National Laboratory, Oak Ridge, Tennessee, October. [SRDB Ref ID: 11567]
Morgan, K. Z., W. S. Snyder, and E. G. Struxness, 1966, Health Physics Division Annual Progress Report for Period Ending July 31, 1966, ORNL-4007, Union Carbide Corporation, Oak Ridge National Laboratory, Oak Ridge, Tennessee, October. [SRDB Ref ID: 11561]
Morgan, K. Z., W. S, Snyder, and D. M. Davis, 1967, Health Physics and Safety Annual Report for 1966, ORNL-4146, Union Carbide Corporation, Oak Ridge National Laboratory, Oak Ridge, Tennessee, August. [SRDB Ref ID: 11558]
NCRP (National Committee on Radiological Protection and Measurements), 1988, Exposure of the Population in the United States and Canada from Natural Background Radiation, Report 94, Bethesda, Maryland. [SRDB Ref ID: 22736]
NIOSH (National Institute for Occupational Safety and Health), 2010, Radiation Exposures Covered for Dose Reconstructions Under Part B of the Energy Employees Occupational Illness Compensation Program Act, DCAS-IG-003, Rev. 1, Division of Compensation Analysis and Support, Cincinnati, Ohio, October 5. [SRDB Ref ID: 88929]

Document No. ORAUT-TKBS-0012-5 Revision No. 02 Effective Date: 02/08/2013 Page 34 of 73
NIOSH (National Institute for Occupational Safety and Health), 2012, Special Exposure Cohort, Petition Evaluation Report Petition SEC-00189, Division of Compensation Analysis and Support, Cincinnati, Ohio. [SRDB Ref ID: 119537]
ORAUT (Oak Ridge Associated Universities Team), 2007, Oak Ridge National Laboratory – Site Description, ORAUT-TKBS-0012-2, Rev. 02, Oak Ridge, Tennessee, August 17. [SRDB Ref ID: 34367]
ORNL (Oak Ridge National Laboratory), 1982, Guides for Internal Exposure Monitoring, Procedure A-12, in Procedures and Practices for Radiation Protection, Health Physics Manual, revised May 15, Oak Ridge, Tennessee. [SRDB Ref ID: 12322]
UCC (Union Carbide Corporation), 1961, Procedures and Practices for Radiation Protection, Health Physics Manual, Oak Ridge National Laboratory, Oak Ridge, Tennessee, August 4. [SRDB Ref ID: 12323]
Watts, J. R., J. M. Barber, J. A. Biggerstaff, and G. R. Rao, 1995, Oak Ridge National Laboratory Internal Dosimetry Group In Vivo Monitoring Technical Basis Document, TB/IDG/WBCL-95-R0, Oak Ridge National Laboratory, Oak Ridge, Tennessee, August 30. [SRDB Ref ID: 11500]
Wirth, J. E., 1945, “Urine Specimens - Results from [name redacted],” memorandum to S. G. English, Clinton Laboratories, Oak Ridge, Tennessee, April 19. [SRDB Ref ID: 114346]

Document No. ORAUT-TKBS-0012-5 Revision No. 02 Effective Date: 02/08/2013 Page 35 of 73
GLOSSARY
absorption type Categories for materials according to their rate of absorption from the respiratory tract to the blood, which replaced the earlier inhalation clearance classes. Defined by the International Commission on Radiological Protection, the absorption types are F: deposited materials that are readily absorbed into blood from the respiratory tract (fast solubilization), M: deposited materials that have intermediate rates of absorption into blood from the respiratory tract (moderate rate of solubilization), and S: deposited materials that are relatively in the respiratory tract (slow solubilization). Also called solubility type.
activation Creation of a different isotope by bombarding the parent isotope with neutrons, protons, or other types of radiation that results in the formation of a different isotope or element.
alpha radiation Positively charged particle emitted from the nuclei of some radioactive elements. An alpha particle consists of two neutrons and two protons (a helium nucleus) and has an electrostatic charge of +2.
beta radiation Charged particle emitted from some radioactive elements with a mass equal to 1/1,837 that of a proton. A negatively charged beta particle is identical to an electron. A positively charged beta particle is a positron.
contamination Radioactive material in an undesired location including air, soil, buildings, animals, and persons.
curie Traditional unit of radioactivity equal to 37 billion (3.7 × 10¹⁰) becquerels, which is approximately equal to the activity of 1 gram of pure 226Ra.
dosimeter Device that measures the quantity of received radiation, usually a holder with radiation-absorbing filters and radiation-sensitive inserts packaged to provide a record of absorbed dose received by an individual.
dosimetry Measurement and calculation of internal and external radiation doses.
fission Splitting of the nucleus of an atom (usually of a heavy element) into at least two other nuclei and the release of a relatively large amount of energy. This transformation usually releases two or three neutrons.
fission product (1) Radionuclides produced by fission or by the subsequent radioactive decay of radionuclides. (2) Fragments other than neutrons that result from the splitting of an atomic nucleus.

Document No. ORAUT-TKBS-0012-5 Revision No. 02 Effective Date: 02/08/2013 Page 36 of 73
gamma radiation Electromagnetic radiation (photons) of short wavelength and high energy (10 kiloelectron-volts to 9 megaelectron-volts) that originates in atomic nuclei and accompanies many nuclear reactions (e.g., fission, radioactive decay, and neutron capture). Gamma photons are identical to X-ray photons of high energy; the difference is that X-rays do not originate in the nucleus.
in vitro bioassay Measurements to determine the presence of or to estimate the amount of radioactive material in the excreta or in other biological materials removed from the body.
in vivo bioassay Measurements of radioactive material in the human body utilizing instrumentation that detects radiation emitted from the radioactive material in the body.
ionizing radiation Radiation of high enough energy to remove an electron from a struck atom and leave behind a positively charged ion. High enough doses of ionizing radiation can cause cellular damage. Ionizing particles include alpha particles, beta particles, gamma rays, X-rays, neutrons, high-speed electrons, high-speed protons, photoelectrons, Compton electrons, positron/negatron pairs from photon radiation, and scattered nuclei from fast neutrons.
isotope One of two or more atoms of a particular element that have the same number of protons (atomic number) but different numbers of neutrons in their nuclei (e.g., 234U, 235U, and 238U). Isotopes have very nearly the same chemical properties.
neutron Basic nucleic particle that is electrically neutral with mass slightly greater than that of a proton. There are neutrons in the nuclei of every atom heavier than normal hydrogen.
nucleus Central core of an atom, which consists of positively charged protons and, with the exception of ordinary hydrogen, electrically neutral neutrons. The number of protons (atomic number) uniquely defines a chemical element, and the number of protons and neutrons is the mass number of a nuclide. The plural is nuclei.
nuclide Stable or unstable isotope of any element. Nuclide relates to the atomic mass, which is the sum of the number of protons and neutrons in the nucleus of an atom. A radionuclide is an unstable nuclide.
radiation Subatomic particles and electromagnetic rays (photons) with kinetic energy that interact with matter through various mechanisms that involve energy transfer.
radioactivity Property possessed by some elements (e.g., uranium) or isotopes (e.g., 14C) of spontaneously emitting energetic particles (electrons or alpha particles) by the disintegration of their atomic nuclei.
radionuclide Radioactive nuclide. See radioactivity and nuclide.

Document No. ORAUT-TKBS-0012-5 Revision No. 02 Effective Date: 02/08/2013 Page 37 of 73
rem Traditional unit of radiation dose equivalent that indicates the biological damage caused by radiation equivalent to that caused by 1 rad of high-penetration X-rays multiplied by a quality factor. The sievert is the International System unit; 1 rem equals 0.01 sievert. The word derives from roentgen equivalent in man; rem is also the plural.
U.S. Atomic Energy Commission (AEC) Federal agency created in 1946 to assume the responsibilities of the Manhattan Engineer District (nuclear weapons) and to manage the development, use, and control of nuclear energy for military and civilian applications. The U.S. Energy Research and Development Administration and the U.S. Nuclear Regulatory Commission assumed separate duties from the AEC in 1974. The U.S. Department of Energy succeeded the U.S. Energy Research and Development Administration in 1979.

Document No. ORAUT-TKBS-0012-5 Revision No. 02 Effective Date: 02/08/2013 Page 38 of 73
TABLE OF CONTENTS
SECTION TITLE PAGE
A.1 Recovery of Historical Data ................................................................................................... 39 A.1.1 Data Description ......................................................................................................... 39 A.1.2 Data Classification ...................................................................................................... 40 A.1.3 Synopsis of Recovered Data ...................................................................................... 40
A.2 Calculation Method for Sample MDAs .................................................................................... 41 A.2.1 Standard Deviation of Background Counts ................................................................. 43 A.2.2 Background Count Time ............................................................................................. 43 A.2.3 Instrument Efficiency .................................................................................................. 43 A.2.4 Yield ........................................................................................................................... 44 A.2.5 Volume of Aliquot Analyzed ........................................................................................ 44 A.2.6 Volume of 24-Hour Sample ........................................................................................ 44
A.3 Calculation Method for MDAs for Various Periods Between 1945 and 1988 .......................... 44
A.4 Additional Considerations....................................................................................................... 45
A.5 Calculation Method for Sample MDAs – 1945 Plutonium ....................................................... 45
LIST OF TABLES
TABLE TITLE PAGE
A-1 Data used to determine historical MDAs for radionuclides in urine and feces ......................... 41 A-2 MDAs calculated from recovered data for radionuclides ......................................................... 46
ATTACHMENT A CALCULATION OF MDAs FROM HISTORICAL DATA
Page 1 of 36

Document No. ORAUT-TKBS-0012-5 Revision No. 02 Effective Date: 02/08/2013 Page 39 of 73
LIST OF FIGURES
FIGURE TITLE PAGE
A-1 MDA data for 241Am in urine ................................................................................................... 47 A-2 MDA data for 244Cm in urine ................................................................................................... 48 A-3 MDA data for 137Cs in urine .................................................................................................... 50 A-4 MDA data for gross alpha in urine .......................................................................................... 51 A-5 MDA data for gross beta in urine ............................................................................................ 53 A-6 MDA data for 3H in urine ........................................................................................................ 54 A-7 MDA data for 147Pm in urine ................................................................................................... 56 A-8 MDA data for 238Puin urine ..................................................................................................... 57 A-9 MDA data for 239Pu in urine .................................................................................................... 59 A-10 MDA data for 241Pu in urine .................................................................................................... 60 A-11 MDA data for rare earths in urine ........................................................................................... 62 A-12 MDA data for 90Sr in urine ...................................................................................................... 63 A-13 MDA data for 233U in urine ...................................................................................................... 65 A-14 MDA data for 238U in urine ...................................................................................................... 66 A-15 MDA data for 241Am in feces ................................................................................................... 68 A-16 MDA data for gross alpha in feces ......................................................................................... 69 A-17 MDA data for 239Pu in feces .................................................................................................... 71 A-18 MDA data for 232Th in feces .................................................................................................... 72
A.1 RECOVERY OF HISTORICAL DATA
A large amount of raw bioassay data exists at the ORNL complex. A portion of these data was transcribed into an electronic database hosted on ORNL equipment and maintained by ORNL personnel.
As part of this dose reconstruction effort, this database was queried for historical urinalysis records on October 30, 2003. A supplemental query was performed on December 12, 2003. These queries requested information on the samples and the instrumentation used in the analysis. No personal information or individual dose results were requested or received.
These database queries generated 66,204 records from the period between 1945 and 1988. These records were compiled into a single database. A data validation and comment field was added to each record. Then the records were examined and classified according to usability.
Further NIOSH data capture identified 164 plutonium urine samples taken from February 1945 through May 28, 1945, and include some control samples (Wirth 1945). These 1945 plutonium samples were not identified within the electronic database records. These records were also evaluated separately [3] using the MDA calculational methods described in LaBone (2012) and are not included in Attachment A with the exception of Section A.5.
A.1.1 Data Description
The database queries retrieved 17 parameters from the ORNL internal dosimetry database:
ATTACHMENT A CALCULATION OF MDAs FROM HISTORICAL DATA
Page 2 of 36

Document No. ORAUT-TKBS-0012-5 Revision No. 02 Effective Date: 02/08/2013 Page 40 of 73
• NUCLIDE – A unique abbreviated identifier for specific nuclides. • SAMPLEID – A unique identifier for individual samples. • SAMPLETYPE – A one-character identifier designating the type of sample (urine, fecal, etc.). • ALIQUOTVOL – The volume or mass of the sample analyzed. • SAMPLEVOL – The sample volume or mass collected. • COUNTDATE – The date the aliquot was counted. • STARTEDATE – The date sample processing began. • STOPDATE – The date sample processing ended. • RECOVERY – The chemical yield, in percent. • EFFICIENCY – The detector’s counting efficiency, in percent. • EFF_FACTOR – The reciprocal of the detector’s counting efficiency. • COUNTMIN – The sample count time, in minutes. • T_BKG_RATE – The total background count rate, in counts per minute. • BKG_MIN – The background count time, in minutes. • BKG_RGNT_R – The count rate of any reagent used. • BKG_COUNTS – The number of background counts. • MDA – The minimum detectable activity.
A.1.2 Data Classification
The 66,204 individual records in the database were classified into one of four categories:
• Duplicate Records - 272 duplicate records were found. These were marked with a “D” in the record’s validation field.
• Usable without Modification - 58,972 of the records collected (89%) were usable without qualification.
• Usable with Modification - Some of the records collected contained input errors that were easily identified. Examples include a nuclide entry of C-137, instrument efficiencies listed in fractions instead of percent, and dates from the turn of the century. Other information in the database enabled correction of some of these records. Such modifications were designated by placing an “M” in the records validation field and entering the reason for the change in the comment field. These records comprise 3% (2,193) of the database.
• Unusable Records - 4,767 of the records recovered (7%) were determined to be unusable in their present form. Most of these records are incomplete or contain gross errors. These were marked with an “R” in the validation field. An explanation for a record’s rejection was entered in the comment field.
The resulting database provided all the raw data used to determine the MDAs of radionuclides in urinalysis calculated in this attachment.
A.1.3 Synopsis of Recovered Data
The database queries recovered 61,165 usable records. Of these, 59,288 are clearly records of urinalyses and 1,859 are records of fecal analyses. Special analyses made up the remaining 18 records. Seventy-five different analyte labels are listed, although some are clearly different names for
ATTACHMENT A CALCULATION OF MDAs FROM HISTORICAL DATA
Page 3 of 36
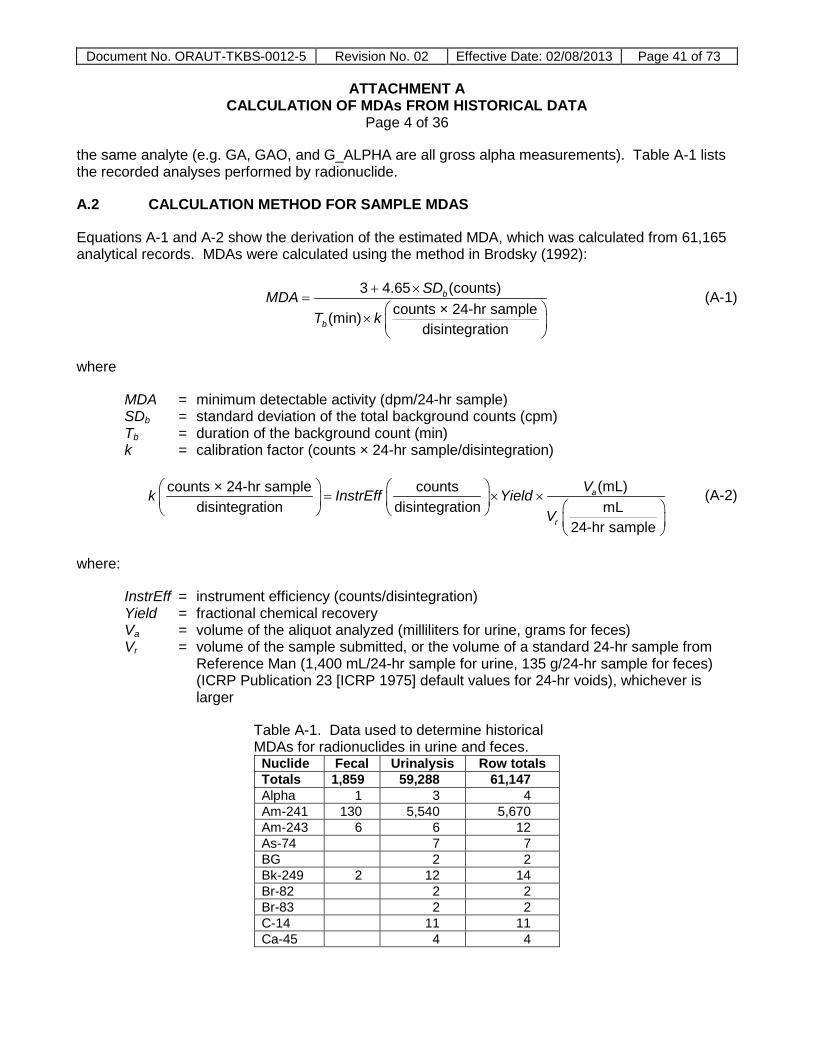
Document No. ORAUT-TKBS-0012-5 Revision No. 02 Effective Date: 02/08/2013 Page 41 of 73
the same analyte (e.g. GA, GAO, and G_ALPHA are all gross alpha measurements). Table A-1 lists the recorded analyses performed by radionuclide.
A.2 CALCULATION METHOD FOR SAMPLE MDAS
Equations A-1 and A-2 show the derivation of the estimated MDA, which was calculated from 61,165 analytical records. MDAs were calculated using the method in Brodsky (1992):
+ ×=
×
3 4.65 (counts)counts × 24-hr sample(min)
disintegration
b
b
SDMDAT k
(A-1)
where
MDA = minimum detectable activity (dpm/24-hr sample) SDb = standard deviation of the total background counts (cpm) Tb = duration of the background count (min) k = calibration factor (counts × 24-hr sample/disintegration)
= × ×
(mL)counts × 24-hr sample countsdisintegration disintegration mL
24-hr sample
a
r
Vk InstrEff YieldV
(A-2)
where:
InstrEff = instrument efficiency (counts/disintegration) Yield = fractional chemical recovery Va = volume of the aliquot analyzed (milliliters for urine, grams for feces) Vr = volume of the sample submitted, or the volume of a standard 24-hr sample from
Reference Man (1,400 mL/24-hr sample for urine, 135 g/24-hr sample for feces) (ICRP Publication 23 [ICRP 1975] default values for 24-hr voids), whichever is larger
Table A-1. Data used to determine historical MDAs for radionuclides in urine and feces.
Nuclide Fecal Urinalysis Row totals Totals 1,859 59,288 61,147 Alpha 1 3 4 Am-241 130 5,540 5,670 Am-243 6 6 12 As-74 7 7 BG 2 2 Bk-249 2 12 14 Br-82 2 2 Br-83 2 2 C-14 11 11 Ca-45 4 4
ATTACHMENT A CALCULATION OF MDAs FROM HISTORICAL DATA
Page 4 of 36

Document No. ORAUT-TKBS-0012-5 Revision No. 02 Effective Date: 02/08/2013 Page 42 of 73
Nuclide Fecal Urinalysis Row totals Ce-144 4 33 37 Cf-249 2 1 3 Cf-252 3 11 14 Cl-36 1 1 Cm-242 1 11 12 Cm-244 26 273 299 Co-60 2 81 83 Cs-134 1 1 Cs-137 4 3,557 3,561 Fe-59 1 8 9 GA 69 1,875 1,944 G-alpha 6 6 GAO 154 2,771 2,925 GB 278 278 GBO 46 46 H-3 2,070 2,070 I-131 41 41 Mn-54 2 2 Mo-99 1 1 Na-24 3 3 Nb-95 3 3 Np-237 1 54 55 P-32 166 166 Pa-231 1 54 55 Pa-233 3 13 16 Pa-234 1 1 Pb-210 2 2 Pm-147 16 64 80 Po-210 9 57 66 Pu-238 4 61 65 Pu-239 124 15,352 15,476 Pu-241 1 111 112 Pu-242 41 41 Ra-226 1 332 333 Ra-228 1 1 RE 39 698 737 Ru-103 1 1 Ru-106 65 65 S-35 10 10 Sb-125 1 1 Sm-151 11 11 Sr-85 1 1 Sr-89 37 37 Sr-90 142 12,751 12,893 T 1 1 Tc-99 19 19 Th-232 1,079 46 1,125 Tl-201 1 1 Tl-204 1 1
ATTACHMENT A CALCULATION OF MDAs FROM HISTORICAL DATA
Page 5 of 36

Document No. ORAUT-TKBS-0012-5 Revision No. 02 Effective Date: 02/08/2013 Page 43 of 73
Nuclide Fecal Urinalysis Row totals Tm-170 1 5 6 TPU 1 1 TRE 2 197 199 TRE B 1 1 Nuclide Fecal Urinalysis Row totals TRE-B 4 4 U-232 1 1 U-233 3 826 829 U-235 3 3 U-238 25 11,409 11,434 U-239 11 11 Y+RE 157 157 Y-88 5 5 Y-90 31 31 Zn-65 7 7 Zr-95 1 19 20
To use this equation one must know, or be able to calculate, the standard deviation of background counts, the duration of the count, the yield of any chemical extractions used, the efficiency of the detector used, and the amount of the sample analyzed. The method of recovering this information from the historical database is discussed in the following sections.
A.2.1 Standard Deviation of Background Counts
The data field BKG_COUNTS contained recorded background counts for a sample and was the preferred source of background count information. When a record’s BKG_COUNTS field was blank, the background count information was calculated as the product of the T_BKG_RATE and BKG_MIN fields. If the BKG_MIN field was blank, but the T_BKG_RATE field contained a value, the background count information was calculated as the product of the T_BKG_RATE and COUNTMIN fields.
The variability in repeat counts, such as background counts, follows the Poisson distribution (Evans 1955, Chapter 26). It is a property of the Poisson distribution that its standard deviation is the square root of its mean value. Therefore, in this analysis, the standard deviation of the total background counts was calculated as the square root of the total background counts.
A.2.2 Background Count Time
The data field BKG_MIN contained the recorded background count time for a sample and was the preferred source of background count time information. If the BKG_MIN field was blank, the time in the COUNTMIN field was used. This last method of estimating the background count time is likely to be favorable to claimants because in almost all cases where there is paired data, the COUNTMIN value is less than the BKG_MIN value. This produces a higher MDA when substituted into Equation 1.
A.2.3 Instrument Efficiency
Information on instrument efficiencies was contained in two fields. The EFFICIENCY field contained the percent of disintegrations detected by the instrument. The EFF_FACTOR field contained the reciprocal of the EFFICIENCY field.
ATTACHMENT A CALCULATION OF MDAs FROM HISTORICAL DATA
Page 6 of 36

Document No. ORAUT-TKBS-0012-5 Revision No. 02 Effective Date: 02/08/2013 Page 44 of 73
A.2.4 Yield
The chemical yield for a given radiochemical analysis was contained in the RECOVERY data field. This value was given in percent recovery.
Many of the records had blank recovery fields. However, due to the repetitive nature of the chemical extractions used, application of an average, radionuclide-specific, chemical recovery to records with no recovery value was judged to be acceptable. This approach is supported further by the lack of variability observed in daily runs on known standards recorded in laboratory logbooks recovered from the late-1950s through the mid-1970s.
A.2.5 Volume of Aliquot Analyzed
The ALIQUOTVOL field usually contained a value for the amount of material subjected to radioanalysis. When this field was blank, it was assumed that the entire sample provided was used in the analysis. The amount of the sample was recorded in the SAMPLEVOL field.
A.2.6 Volume of 24-Hour Sample
Excretion rates and concentrations vary greatly within a 24-hr period and between individuals. The models developed for calculating intakes from in vitro analyses are based on 24-hr samples. The daily urine excretion rate is 1,400 mL/24-hr sample; for feces, this value is 135 g/24-hr sample.
Often, the volume analyzed (Va) was less than the reference excretion rate from Reference Man. When this was observed, the calculated activity in the sample was normalized to the Reference Man volume to compensate. This adjustment increased the MDA and, therefore, would be favorable to claimants.
A.3 CALCULATION METHOD FOR MDAS FOR VARIOUS PERIODS BETWEEN 1945 AND 1988
Once the MDAs were calculated for individual samples, they were segregated by radionuclide and imported into Microsoft Excel spreadsheets. Using Excel, the values were plotted for visual inspection. Figures A-1 through A-18 at the end of this attachment show plots of data the was obtained and calculated for the following radioisotopes: (urine) 241Am, 244Cu, 137Cs, gross alpha, gross beta, 3H, 147Pm, 238Pu, 239Pu, 241Pu, rare earths, 90Sr, 233U, 238U, and (feces) 241Am, gross alpha, 239Pu, 232Th. In the first plot, the MDA values were plotted against the date of their analysis. This provided a visual representation of individual MDAs over time. The density of the available data and a gross approximation of typical sample MDAs for a given period were quickly observed using this format.
Two bar charts were created for each radionuclide. One shows the annual average MDAs between 1945 and 1988. The other shows the number of analytical results recovered for each year in the same period. These two charts provide additional information on gross trends exhibited by sample MDAs, and on the temporal distribution of the data.
These visual aids were used to establish general periods during which sample MDAs were similar. The sample MDAs in these periods were grouped as similar populations. Using Excel’s statistical functions, the following statistical parameters for each group of samples were determined:
ATTACHMENT A CALCULATION OF MDAs FROM HISTORICAL DATA
Page 7 of 36

Document No. ORAUT-TKBS-0012-5 Revision No. 02 Effective Date: 02/08/2013 Page 45 of 73
• The population size, • The 50th-percentile value of the population, • The population’s arithmetic mean, • The arithmetic standard deviation of the population, and • The 95% confidence level on the mean.
The 95% confidence levels on the mean for each radionuclide are the recommended MDAs for that radionuclide during the period evaluated.
A.4 ADDITIONAL CONSIDERATIONS
The recovered data indicate the analytical MDAs tended to remain fairly consistent for years. Abrupt changes in the MDAs were identified for groups of radionuclides during specific years. After the change, the MDAs remained generally consistent in the several succeeding years. This “step-wise” pattern allowed MDAs from several years to be grouped as one MDA for a specified period. Table 5-9 highlights these groupings by enclosing similar MDAs in a box.
Some MDAs changed frequently, creating a pattern of similar MDAs in short adjacent periods. When this occurred, the largest estimated MDA from that period was selected to be the representative MDA for the entire period. The tritium (3H) MDA listed between 1968 and 1981 in Table 5-9 is an example of this adjustment.
Most recovered data contained isotope-specific entries in the NUCLIDE field. However, the ability to differentiate routinely between isotopes of the same radioelement did not always exist before 1989. Many of the isotopic assignments were based on process knowledge. Therefore, during the period before 1989, the MDAs for some isotopes are reported as the MDAs for the radioelement instead of the radionuclide. For example, the alpha emitters 238Pu and 239Pu are reported separately in the database. They have been combined in this TBD as plutonium. NOTE: Plutonium-241 is reported separately because it is a beta emitter that can be measured separately from the alpha-emitting isotopes of plutonium. If the recovered data did not extend to 1989, the MDA calculated from the last known data was extrapolated forward (see Table 5-9).
A.5 CALCULATION METHOD FOR SAMPLE MDAS – 1945 PLUTONIUM
NIOSH data capture identified 164 plutonium urine samples taken from February 1945 through May 28, 1945, including some control samples (Wirth 1945). The records were examined and classified according to usability.
The 1945 plutonium MDAs were calculated using the method described by LaBone (2012).
ATTACHMENT A CALCULATION OF MDAs FROM HISTORICAL DATA
Page 8 of 36

Docum
ent No. O
RA
UT-TK
BS-0012-5 R
evision No. 02
Effective Date: 02/08/2013
Page 46 of 73
Table A-2. MDAs (dpm/24-hr sample) calculated from recovered data for radionuclides.
Year
Urine MDAs (dpm/24-hr sample) Fecal MDAs (dpm/24-hr sample) Gross alpha
Gross beta
Am- 241
Cm- 244
Cs- 137 H-3
I- 131
Np- 237
Pm- 147 Plutonium Polonium
Pu- 241
Ra- 226
Rare earths
Ru- 106
Sr-89 + Sr-90 Uranium
Gross alpha
Am- 241
Cm- 244 Plutonium
Th- 232
1943 1944 1945 1946 1947 0.33 1948 0.40 0.965 1949 0.34 0.998 1950 24.34 0.19 53.95 1.401 0.176 1951 29.54 0.18 33.34 0.036 22.34 3.600 1952 74.44 0.27 34.93 0.23 25.44 31.41 27.50 5.988 1953 0.17 29.49 0.19 2.98 30.45 27.01 6.196 1954 0.25 351.14 32.90 0.17 9.42 0.32 41.97 29.00 6.296 1955 0.22 960.93 26.52 0.19 33.32 0.87 0.142 26.76 6.810 1956 0.23 889.95 0.25 32.05 0.22 57.11 0.16 0.238 32.75 7.651 1957 0.69 998.73 0.44 30.61 1.07 0.39 0.80 0.272 28.08 5.257 0.055 0.072 0.226 1958 0.35 1385.09 0.42 38.61 0.26 0.19 0.34 0.255 47.99 7.423 0.728 0.537 1959 0.31 1321.55 0.35 312.8 0.10 587 0.23 0.29 331.74 0.359 36.83 5.636 0.647 0.303 1960 0.19 938.01 0.11 147.3 0.27 196 0.18 10.67 0.17 167.87 61.85 19.60 5.740 0.568 0.573 1961 0.21 290.98 42.62 71382 0.18 12.74 0.29 50.04 5.86 5.686 0.512 0.424 1962 0.32 252.50 641672 0.14 54.69 8.88 8.687 0.422 1963 0.45 146.59 72.18 393539 0.49 25.81 0.10 87.30 14.79 7.747 1.075 0.789 0.633 1964 0.24 198.28 0.57 62.09 214873 0.19 78.91 12.26 2.561 0.118 1.052 1965 0.46 140.95 0.21 0.17 55.66 124229 353.2 0.08 0.14 63.41 13.78 0.992 0.848 0.208 0.172 0.163 0.112 1966 0.12 0.16 52.71 153077 0.08 6.58 0.128 0.447 0.268 1967 0.082 0.099 75.55 150699 35718 0.08 7.30 0.405 0.769 1968 0.056 36.17 0.073 0.080 55.59 54872 1131 0.07 0.07 2.55 25.76 15.70 49.40 6.68 0.112 0.079 1.059 0.349 1969 0.066 38.82 0.099 0.082 50.80 53036 1281 0.09 23.10 0.07 31.75 7.66 56.96 46.95 4.73 0.094 0.768 0.306 0.536 1970 0.038 32.31 0.074 0.096 44.32 48763 1140 0.05 0.05 5.67 4.05 0.071 0.097 0.271 0.097 1971 37.06 0.072 49037 0.06 677 0.06 6.00 2.82 4.33 0.076 0.230 0.351 1972 0.18 0.046 75.05 45882 0.04 24.06 0.05 9.18 5.00 3.95 0.061 0.093 0.035 0.033 1973 0.10 0.039 50535 6.44 0.04 6.94 5.44 4.14 0.071 0.105 0.060 1974 0.093 46154 5.72 0.04 4.53 4.86 4.80 0.054 0.543 1.073 1.040 1975 0.040 0.032 44192 0.04 0.46 1.49 3.26 0.054 0.047 0.129 0.073 0.046 1976 0.050 0.080 46.12 45554 0.04 1.84 0.014 2.24 3.58 0.057 0.173 0.053 1977 0.037 36984 2.82 0.04 9.65 0.049 3.62 0.053 0.121 0.100 1978 0.032 0.016 31838 0.14 0.03 8.16 3.39 3.30 1979 0.030 0.046 35406 0.03 0.03 0.23 12.40 3.06 0.029 0.032 1980 0.032 0.036 48449 3.05 1981 0.015 1982 1983 1984 0.026 1985 1986 0.07 1987 0.07 1988 0.028
ATTACHMENT A CALCULATION OF MDAs FROM HISTORICAL DATA
Page 9 of 36

Document No. ORAUT-TKBS-0012-5 Revision No. 02 Effective Date: 02/08/2013 Page 47 of 73
Figure A-1. MDA data for 241Am in urine (part 1 of 3).
Figure A-1. MDA data for 241Am in urine (part 2 of 3).
Visual Comparison of Data to Estimated Am-241 MDAs in Urine
1 E-3
1 E-2
1 E-1
1 E+0
1 E+1
1945 1950 1955 1960 1965 1970 1975 1980 1985 1990Year
Act
ivity
(dpm
/24
h sa
mpl
e)
Sample MDAEst. MDA (95%CL on Mean)50th Percentile
Annual Average MDAs for Am-241 in Urine Calculated from Recovered Data Between 1945 and 1990
0
0.05
0.1
0.15
0.2
0.25
0.3
0.35
0.4
0.45
0.5
1945
1946
1947
1948
1949
1950
1951
1952
1953
1954
1955
1956
1957
1958
1959
1960
1961
1962
1963
1964
1965
1966
1967
1968
1969
1970
1971
1972
1973
1974
1975
1976
1977
1978
1979
1980
1981
1982
1983
1984
1985
1986
1987
1988
1989
1990
Year
MD
A (d
pm/2
4 h)
ATTACHMENT A CALCULATION OF MDAs FROM HISTORICAL DATA
Page 10 of 36

Document No. ORAUT-TKBS-0012-5 Revision No. 02 Effective Date: 02/08/2013 Page 48 of 73
Figure A-1. MDA data for 241Am in urine (part 3 of 3).
Figure A-2. MDA data for 244Cm in urine (part 1 of 3) (some later tables are “in feces”).
Number of Sample Results Recovered per Year Between 1945 and 1990 for Am-241 in Urine
0
100
200
300
400
500
600
70019
4519
4619
4719
4819
4919
5019
5119
5219
5319
5419
5519
5619
5719
5819
5919
6019
6119
6219
6319
6419
6519
6619
6719
6819
6919
7019
7119
7219
7319
7419
7519
7619
7719
7819
7919
8019
8119
8219
8319
8419
8519
8619
8719
8819
8919
90
Year
Num
ber
of S
ampl
es (N
)
Visual Comparison of Data to Estimated Cm-244 MDAs in Urine
1 E-3
1 E-2
1 E-1
1 E+0
1 E+1
1945 1950 1955 1960 1965 1970 1975 1980 1985 1990Year
Act
ivity
(dpm
/24
h sa
mpl
e)
Sample MDAEst. MDA of 0.2 (95%CL on Mean)50th Percentile of 0.1
ATTACHMENT A CALCULATION OF MDAs FROM HISTORICAL DATA
Page 11 of 36

Document No. ORAUT-TKBS-0012-5 Revision No. 02 Effective Date: 02/08/2013 Page 49 of 73
Figure A-2. MDA data for 244Cm in urine (part 2 of 3).
Figure A-2. MDA data for 244Cm in urine (part 3 of 3).
Annual Average MDAs for Cm-244 in Urine Calculated from Recovered Data Between 1945 and 1990
0
0.1
0.2
0.3
0.4
0.5
0.619
4519
4619
4719
4819
4919
5019
5119
5219
5319
5419
5519
5619
5719
5819
5919
6019
6119
6219
6319
6419
6519
6619
6719
6819
6919
7019
7119
7219
7319
7419
7519
7619
7719
7819
7919
8019
8119
8219
8319
8419
8519
8619
8719
8819
8919
90
Year
MD
A (d
pm/2
4 h)
Number of Sample Results Recovered per Year Between 1945 and 1990 for Cm-244 in Urine
0
10
20
30
40
50
60
70
80
90
100
1945
1946
1947
1948
1949
1950
1951
1952
1953
1954
1955
1956
1957
1958
1959
1960
1961
1962
1963
1964
1965
1966
1967
1968
1969
1970
1971
1972
1973
1974
1975
1976
1977
1978
1979
1980
1981
1982
1983
1984
1985
1986
1987
1988
1989
1990
Year
Num
ber
of S
ampl
es (N
)
ATTACHMENT A CALCULATION OF MDAs FROM HISTORICAL DATA
Page 12 of 36

Document No. ORAUT-TKBS-0012-5 Revision No. 02 Effective Date: 02/08/2013 Page 50 of 73
Figure A-3. MDA data for 137Cs in urine (part 1 of 3).
Figure A-3. MDA data for 137Cs in urine (part 2 of 3).
Visual Comparison of Data to Estimated Cs-137 MDAs in Urine
1 E+0
1 E+1
1 E+2
1 E+3
1945 1950 1955 1960 1965 1970 1975 1980 1985 1990Year
Act
ivity
(dpm
/24
h sa
mpl
e)MDA (dpm/24 h)Estimated MDA For the Period50th Percentile
Annual Average MDAs for Cs-137 in Urine Calculated from Recovered Data Between 1945 and 1990
0
50
100
150
200
250
300
350
1945
1946
1947
1948
1949
1950
1951
1952
1953
1954
1955
1956
1957
1958
1959
1960
1961
1962
1963
1964
1965
1966
1967
1968
1969
1970
1971
1972
1973
1974
1975
1976
1977
1978
1979
1980
1981
1982
1983
1984
1985
1986
1987
1988
1989
1990
Year
MD
A (d
pm/2
4 h)
ATTACHMENT A CALCULATION OF MDAs FROM HISTORICAL DATA
Page 13 of 36

Document No. ORAUT-TKBS-0012-5 Revision No. 02 Effective Date: 02/08/2013 Page 51 of 73
Figure A-3. MDA data for 137Cs in urine (part 3 of 3).
Figure A-4. MDA data for gross alpha in urine (part 1 of 3).
Number of Sample Results Recovered per Year Between 1945 and 1990 for Cs-137 in Urine
0
100
200
300
400
500
600
700
800
90019
4519
4619
4719
4819
4919
5019
5119
5219
5319
5419
5519
5619
5719
5819
5919
6019
6119
6219
6319
6419
6519
6619
6719
6819
6919
7019
7119
7219
7319
7419
7519
7619
7719
7819
7919
8019
8119
8219
8319
8419
8519
8619
8719
8819
8919
90
Year
Num
ber
of S
ampl
es (N
)
Visual Comparison of Data to Estimated Gross Alpha MDAs in Urine
1 E-2
1 E-1
1 E+0
1 E+1
1945 1950 1955 1960 1965 1970 1975 1980 1985 1990Year
Act
ivity
(dpm
/24
h sa
mpl
e)
Sample MDAEst. MDA (95%CL on Mean)50th Percentile
ATTACHMENT A CALCULATION OF MDAs FROM HISTORICAL DATA
Page 14 of 36

Document No. ORAUT-TKBS-0012-5 Revision No. 02 Effective Date: 02/08/2013 Page 52 of 73
Figure A-4. MDA data for gross alpha in urine (part 2 of 3).
Figure A-4. MDA data for gross alpha in urine (part 3 of 3).
Annual Average MDAs for Gross Alpha in Urine Calculated from Recovered Data Between 1945 and 1990
0
0.1
0.2
0.3
0.4
0.5
0.6
0.7
0.819
4519
4619
4719
4819
4919
5019
5119
5219
5319
5419
5519
5619
5719
5819
5919
6019
6119
6219
6319
6419
6519
6619
6719
6819
6919
7019
7119
7219
7319
7419
7519
7619
7719
7819
7919
8019
8119
8219
8319
8419
8519
8619
8719
8819
8919
90
Year
MD
A (d
pm/2
4 h)
Number of Sample Results Recovered per Year Between 1945 and 1990 for Gross Alpha in Urine
0
500
1000
1500
2000
2500
1945
1946
1947
1948
1949
1950
1951
1952
1953
1954
1955
1956
1957
1958
1959
1960
1961
1962
1963
1964
1965
1966
1967
1968
1969
1970
1971
1972
1973
1974
1975
1976
1977
1978
1979
1980
1981
1982
1983
1984
1985
1986
1987
1988
1989
1990
Year
Num
ber
of S
ampl
es (N
)
ATTACHMENT A CALCULATION OF MDAs FROM HISTORICAL DATA
Page 15 of 36

Document No. ORAUT-TKBS-0012-5 Revision No. 02 Effective Date: 02/08/2013 Page 53 of 73
Figure A-5. MDA data for gross beta in urine (part 1 of 3).
Figure A-5. MDA data for gross beta in urine (part 2 of 3).
Visual Comparison of Data to Estimated Gross Beta MDAs in Urine
1 E+1
1 E+2
1 E+3
1 E+4
1945 1950 1955 1960 1965 1970 1975 1980 1985 1990Year
Act
ivity
(dpm
/24
h sa
mpl
e)Sample MDAEst. MDA (95%CL on Mean)50th Percentile
Annual Average MDAs for Gross Beta in Urine Calculated from Recovered Data Between 1945 and 1990
0
200
400
600
800
1000
1200
1400
1600
1945
1946
1947
1948
1949
1950
1951
1952
1953
1954
1955
1956
1957
1958
1959
1960
1961
1962
1963
1964
1965
1966
1967
1968
1969
1970
1971
1972
1973
1974
1975
1976
1977
1978
1979
1980
1981
1982
1983
1984
1985
1986
1987
1988
1989
1990
Year
MD
A (d
pm/2
4 h)
ATTACHMENT A CALCULATION OF MDAs FROM HISTORICAL DATA
Page 16 of 36

Document No. ORAUT-TKBS-0012-5 Revision No. 02 Effective Date: 02/08/2013 Page 54 of 73
Figure A-5. MDA data for gross beta in urine (part 3 of 3).
Figure A-6. MDA data for 3H in urine (part 1 of 3).
Number of Sample Results Recovered per Year Between 1945 and 1990 for Gross Beta in Urine
0
10
20
30
40
50
60
70
80
9019
4519
4619
4719
4819
4919
5019
5119
5219
5319
5419
5519
5619
5719
5819
5919
6019
6119
6219
6319
6419
6519
6619
6719
6819
6919
7019
7119
7219
7319
7419
7519
7619
7719
7819
7919
8019
8119
8219
8319
8419
8519
8619
8719
8819
8919
90
Year
Num
ber
of S
ampl
es (N
)
Visual Comparison of Data to Estimated H-3 MDAs in Urine
1 E+3
1 E+4
1 E+5
1 E+6
1945 1950 1955 1960 1965 1970 1975 1980 1985 1990Year
Act
ivity
(dpm
/24
h sa
mpl
e)
Sample MDAEst. MDA (95%CL on Mean)50th Percentile
ATTACHMENT A CALCULATION OF MDAs FROM HISTORICAL DATA
Page 17 of 36

Document No. ORAUT-TKBS-0012-5 Revision No. 02 Effective Date: 02/08/2013 Page 55 of 73
Figure A-6. MDA data for 3H in urine (part 2 of 3).
Figure A-6. MDA data for 3H in urine (part 3 of 3).
Annual Average MDAs for H-3 in Urine Calculated from Recovered Data Between 1945 and 1990
0
100000
200000
300000
400000
500000
600000
70000019
4519
4619
4719
4819
4919
5019
5119
5219
5319
5419
5519
5619
5719
5819
5919
6019
6119
6219
6319
6419
6519
6619
6719
6819
6919
7019
7119
7219
7319
7419
7519
7619
7719
7819
7919
8019
8119
8219
8319
8419
8519
8619
8719
8819
8919
90
Year
MD
A (d
pm/2
4 h)
Number of Sample Results Recovered per Year Between 1945 and 1990 for H-3 in Urine
0
50
100
150
200
250
300
350
400
450
1945
1946
1947
1948
1949
1950
1951
1952
1953
1954
1955
1956
1957
1958
1959
1960
1961
1962
1963
1964
1965
1966
1967
1968
1969
1970
1971
1972
1973
1974
1975
1976
1977
1978
1979
1980
1981
1982
1983
1984
1985
1986
1987
1988
1989
1990
Year
Num
ber
of S
ampl
es (N
)
ATTACHMENT A CALCULATION OF MDAs FROM HISTORICAL DATA
Page 18 of 36

Document No. ORAUT-TKBS-0012-5 Revision No. 02 Effective Date: 02/08/2013 Page 56 of 73
Figure A-7. MDA data for 147Pm in urine (part 1 of 3).
Figure A-7. MDA data for 147Pm in urine (part 2 of 3).
Visual Comparison of Data to Estimated Pm-147 MDAs in Urine
1 E+0
1 E+1
1 E+2
1 E+3
1 E+4
1945 1950 1955 1960 1965 1970 1975 1980 1985 1990Year
Act
ivity
(dpm
/24
h sa
mpl
e)Sample MDAEst. MDA of 396 (95%CL on Mean)50th Percentile of 40
Annual Average MDAs for Pm-147 in Urine Calculated from Recovered Data Between 1945 and 1990
0
100
200
300
400
500
600
700
800
1945
1946
1947
1948
1949
1950
1951
1952
1953
1954
1955
1956
1957
1958
1959
1960
1961
1962
1963
1964
1965
1966
1967
1968
1969
1970
1971
1972
1973
1974
1975
1976
1977
1978
1979
1980
1981
1982
1983
1984
1985
1986
1987
1988
1989
1990
Year
MD
A (d
pm/2
4 h)
ATTACHMENT A CALCULATION OF MDAs FROM HISTORICAL DATA
Page 19 of 36

Document No. ORAUT-TKBS-0012-5 Revision No. 02 Effective Date: 02/08/2013 Page 57 of 73
Figure A-7. MDA data for 147Pm in urine (part 3 of 3).
Figure A-8. MDA data for 238Pu in urine (part 1 of 3).
Number of Sample Results Recovered per Year Between 1945 and 1990 for Pm-147 in Urine
0
2
4
6
8
10
12
14
1619
4519
4619
4719
4819
4919
5019
5119
5219
5319
5419
5519
5619
5719
5819
5919
6019
6119
6219
6319
6419
6519
6619
6719
6819
6919
7019
7119
7219
7319
7419
7519
7619
7719
7819
7919
8019
8119
8219
8319
8419
8519
8619
8719
8819
8919
90
Year
Num
ber
of S
ampl
es (N
)
Visual Comparison of Data to Estimated Pu-238 MDAs in Urine
1 E-3
1 E-2
1 E-1
1 E+0
1 E+1
1945 1950 1955 1960 1965 1970 1975 1980 1985 1990Year
Act
ivity
(dpm
/24
h sa
mpl
e)
Sample MDAEst. MDA (95%CL on Mean)50th Percentile
ATTACHMENT A CALCULATION OF MDAs FROM HISTORICAL DATA
Page 20 of 36

Document No. ORAUT-TKBS-0012-5 Revision No. 02 Effective Date: 02/08/2013 Page 58 of 73
Figure A-8. MDA data for 238Puin urine (part 2 of 3).
Figure A-8. MDA data for 238Pu in urine (part 3 of 3).
Annual Average MDAs for Pu-238 in Urine Calculated from Recovered Data Between 1945 and 1990
0
0.1
0.2
0.3
0.4
0.5
0.619
4519
4619
4719
4819
4919
5019
5119
5219
5319
5419
5519
5619
5719
5819
5919
6019
6119
6219
6319
6419
6519
6619
6719
6819
6919
7019
7119
7219
7319
7419
7519
7619
7719
7819
7919
8019
8119
8219
8319
8419
8519
8619
8719
8819
8919
90
Year
MD
A (d
pm/2
4 h)
Number of Sample Results Recovered per Year Between 1945 and 1990 for Pu-238 in Urine
0
1
2
3
4
5
6
7
8
9
1945
1946
1947
1948
1949
1950
1951
1952
1953
1954
1955
1956
1957
1958
1959
1960
1961
1962
1963
1964
1965
1966
1967
1968
1969
1970
1971
1972
1973
1974
1975
1976
1977
1978
1979
1980
1981
1982
1983
1984
1985
1986
1987
1988
1989
1990
Year
Num
ber
of S
ampl
es (N
)
ATTACHMENT A CALCULATION OF MDAs FROM HISTORICAL DATA
Page 21 of 36
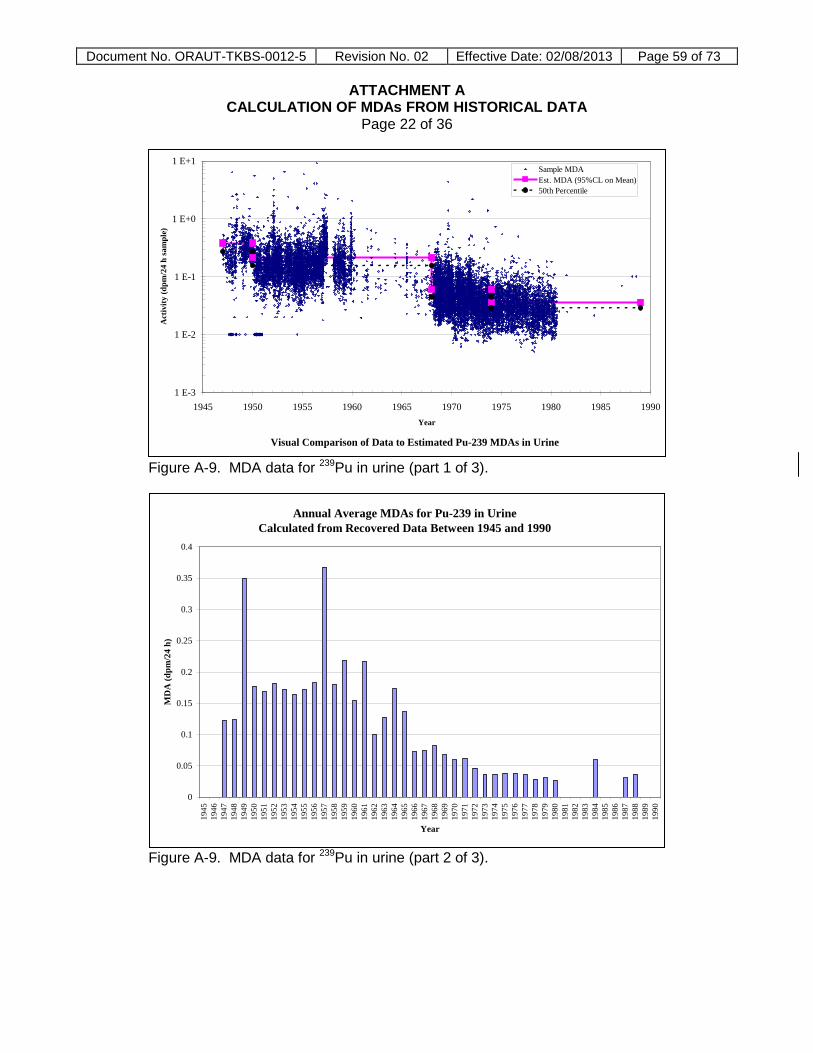
Document No. ORAUT-TKBS-0012-5 Revision No. 02 Effective Date: 02/08/2013 Page 59 of 73
Figure A-9. MDA data for 239Pu in urine (part 1 of 3).
Figure A-9. MDA data for 239Pu in urine (part 2 of 3).
Visual Comparison of Data to Estimated Pu-239 MDAs in Urine
1 E-3
1 E-2
1 E-1
1 E+0
1 E+1
1945 1950 1955 1960 1965 1970 1975 1980 1985 1990Year
Act
ivity
(dpm
/24
h sa
mpl
e)Sample MDAEst. MDA (95%CL on Mean)50th Percentile
Annual Average MDAs for Pu-239 in Urine Calculated from Recovered Data Between 1945 and 1990
0
0.05
0.1
0.15
0.2
0.25
0.3
0.35
0.4
1945
1946
1947
1948
1949
1950
1951
1952
1953
1954
1955
1956
1957
1958
1959
1960
1961
1962
1963
1964
1965
1966
1967
1968
1969
1970
1971
1972
1973
1974
1975
1976
1977
1978
1979
1980
1981
1982
1983
1984
1985
1986
1987
1988
1989
1990
Year
MD
A (d
pm/2
4 h)
ATTACHMENT A CALCULATION OF MDAs FROM HISTORICAL DATA
Page 22 of 36

Document No. ORAUT-TKBS-0012-5 Revision No. 02 Effective Date: 02/08/2013 Page 60 of 73
Figure A-9. MDA data for 239Pu in urine (part 3 of 3).
Figure A-10. MDA data for 241Pu in urine (part 1 of 3).
Number of Sample Results Recovered per Year Between 1945 and 1990 for Pu-239 in Urine
0
200
400
600
800
1000
1200
140019
4519
4619
4719
4819
4919
5019
5119
5219
5319
5419
5519
5619
5719
5819
5919
6019
6119
6219
6319
6419
6519
6619
6719
6819
6919
7019
7119
7219
7319
7419
7519
7619
7719
7819
7919
8019
8119
8219
8319
8419
8519
8619
8719
8819
8919
90
Year
Num
ber
of S
ampl
es (N
)
Visual Comparison of Data to Estimated Pu-241 MDAs in Urine
1 E-1
1 E+0
1 E+1
1 E+2
1945 1950 1955 1960 1965 1970 1975 1980 1985 1990Year
Act
ivity
(dpm
/24
h sa
mpl
e)
Sample MDAEst. MDA of 9.2 (95%CL on Mean)50th Percentile of 6.7
ATTACHMENT A CALCULATION OF MDAs FROM HISTORICAL DATA
Page 23 of 36

Document No. ORAUT-TKBS-0012-5 Revision No. 02 Effective Date: 02/08/2013 Page 61 of 73
Figure A-10. MDA data for 241Pu in urine (part 2 of 3).
Figure A-10. MDA data for 241Pu in urine (part 3 of 3).
Annual Average MDAs for Pu-241 in Urine Calculated from Recovered Data Between 1945 and 1990
0
5
10
15
20
25
3019
4519
4619
4719
4819
4919
5019
5119
5219
5319
5419
5519
5619
5719
5819
5919
6019
6119
6219
6319
6419
6519
6619
6719
6819
6919
7019
7119
7219
7319
7419
7519
7619
7719
7819
7919
8019
8119
8219
8319
8419
8519
8619
8719
8819
8919
90
Year
MD
A (d
pm/2
4 h)
Number of Sample Results Recovered per Year Between 1945 and 1990 for Pu-241 in Urine
0
5
10
15
20
25
30
35
40
1945
1946
1947
1948
1949
1950
1951
1952
1953
1954
1955
1956
1957
1958
1959
1960
1961
1962
1963
1964
1965
1966
1967
1968
1969
1970
1971
1972
1973
1974
1975
1976
1977
1978
1979
1980
1981
1982
1983
1984
1985
1986
1987
1988
1989
1990
Year
Num
ber
of S
ampl
es (N
)
ATTACHMENT A CALCULATION OF MDAs FROM HISTORICAL DATA
Page 24 of 36

Document No. ORAUT-TKBS-0012-5 Revision No. 02 Effective Date: 02/08/2013 Page 62 of 73
Figure A-11. MDA data for rare earths in urine (part 1 of 3).
Figure A-11. MDA data for rare earths in urine (part 2 of 3).
Visual Comparison of Data to Estimated Rare Earth MDAs in Urine
1 E-1
1 E+0
1 E+1
1 E+2
1 E+3
1 E+4
1945 1950 1955 1960 1965 1970 1975 1980 1985 1990Year
Act
ivity
(dpm
/24
h sa
mpl
e)
Sample MDAEst. MDA (95%CL on Mean)50th Percentile
Annual Average MDAs for Rare Earths in Urine Calculated from Recovered Data Between 1945 and 1990
0
50
100
150
200
250
300
350
1945
1946
1947
1948
1949
1950
1951
1952
1953
1954
1955
1956
1957
1958
1959
1960
1961
1962
1963
1964
1965
1966
1967
1968
1969
1970
1971
1972
1973
1974
1975
1976
1977
1978
1979
1980
1981
1982
1983
1984
1985
1986
1987
1988
1989
1990
Year
MD
A (d
pm/2
4 h)
ATTACHMENT A CALCULATION OF MDAs FROM HISTORICAL DATA
Page 25 of 36

Document No. ORAUT-TKBS-0012-5 Revision No. 02 Effective Date: 02/08/2013 Page 63 of 73
Figure A-11. MDA data for rare earths in urine (part 3 of 3).
Figure A-12. MDA data for 90Sr in urine (part 1 of 3).
Number of Sample Results Recovered per Year Between 1945 and 1990 for Rare Earths in Urine
0
100
200
300
400
500
600
1945
1946
1947
1948
1949
1950
1951
1952
1953
1954
1955
1956
1957
1958
1959
1960
1961
1962
1963
1964
1965
1966
1967
1968
1969
1970
1971
1972
1973
1974
1975
1976
1977
1978
1979
1980
1981
1982
1983
1984
1985
1986
1987
1988
1989
1990
Year
Num
ber
of S
ampl
es (N
)
Visual Comparison of Data to Estimated Sr-90 MDAs in Urine
1 E-1
1 E+0
1 E+1
1 E+2
1 E+3
1945 1950 1955 1960 1965 1970 1975 1980 1985 1990Year
Act
ivity
(dpm
/24
h sa
mpl
e)
Sample MDAEst. MDA (95%CL on Mean)50th Percentile
ATTACHMENT A CALCULATION OF MDAs FROM HISTORICAL DATA
Page 26 of 36

Document No. ORAUT-TKBS-0012-5 Revision No. 02 Effective Date: 02/08/2013 Page 64 of 73
Figure A-12. MDA data for 90Sr in urine (part 2 of 3).
Figure A-12. MDA data for 90Sr in urine (part 3 of 3).
Annual Average MDAs for Sr-90 in Urine Calculated from Recovered Data Between 1945 and 1990
0
10
20
30
40
50
60
70
1945
1946
1947
1948
1949
1950
1951
1952
1953
1954
1955
1956
1957
1958
1959
1960
1961
1962
1963
1964
1965
1966
1967
1968
1969
1970
1971
1972
1973
1974
1975
1976
1977
1978
1979
1980
1981
1982
1983
1984
1985
1986
1987
1988
1989
1990
Year
MD
A (d
pm/2
4 h)
Number of Sample Results Recovered per Year Between 1945 and 1990 for Sr-90 in Urine
0
200
400
600
800
1000
1200
1400
1945
1946
1947
1948
1949
1950
1951
1952
1953
1954
1955
1956
1957
1958
1959
1960
1961
1962
1963
1964
1965
1966
1967
1968
1969
1970
1971
1972
1973
1974
1975
1976
1977
1978
1979
1980
1981
1982
1983
1984
1985
1986
1987
1988
1989
1990
Year
Num
ber
of S
ampl
es (N
)
ATTACHMENT A CALCULATION OF MDAs FROM HISTORICAL DATA
Page 27 of 36

Document No. ORAUT-TKBS-0012-5 Revision No. 02 Effective Date: 02/08/2013 Page 65 of 73
Figure A-13. MDA data for 233U in urine (part 1 of 3).
Figure A-13. MDA data for 233U in urine (part 2 of 3).
Visual Comparison of Data to Estimated U-233 MDAs in Urine
1 E-2
1 E-1
1 E+0
1 E+1
1 E+2
1945 1950 1955 1960 1965 1970 1975 1980 1985 1990Year
Act
ivity
(dpm
/24
h sa
mpl
e)
Sample MDAEst. MDA (95%CL on Mean)50th Percentile
Annual Average MDAs for U-233 in Urine Calculated from Recovered Data Between 1945 and 1990
0
1
2
3
4
5
6
7
8
9
10
1945
1946
1947
1948
1949
1950
1951
1952
1953
1954
1955
1956
1957
1958
1959
1960
1961
1962
1963
1964
1965
1966
1967
1968
1969
1970
1971
1972
1973
1974
1975
1976
1977
1978
1979
1980
1981
1982
1983
1984
1985
1986
1987
1988
1989
1990
Year
MD
A (d
pm/2
4 h)
ATTACHMENT A CALCULATION OF MDAs FROM HISTORICAL DATA
Page 28 of 36

Document No. ORAUT-TKBS-0012-5 Revision No. 02 Effective Date: 02/08/2013 Page 66 of 73
Figure A-13. MDA data for 233U in urine (part 3 of 3).
Figure A-14. MDA data for 238U in urine (part 1 of 3).
Number of Sample Results Recovered per Year Between 1945 and 1990 for U-233 in Urine
0
50
100
150
200
250
300
350
400
45019
4519
4619
4719
4819
4919
5019
5119
5219
5319
5419
5519
5619
5719
5819
5919
6019
6119
6219
6319
6419
6519
6619
6719
6819
6919
7019
7119
7219
7319
7419
7519
7619
7719
7819
7919
8019
8119
8219
8319
8419
8519
8619
8719
8819
8919
90
Year
Num
ber
of S
ampl
es (N
)
Visual Comparison of Data to Estimated U-238 MDAs in Urine
1 E-3
1 E-2
1 E-1
1 E+0
1 E+1
1 E+2
1945 1950 1955 1960 1965 1970 1975 1980 1985 1990Year
Act
ivity
(dpm
/24
h sa
mpl
e)
Sample MDAEstimated MDA For the Period50th Percentile
ATTACHMENT A CALCULATION OF MDAs FROM HISTORICAL DATA
Page 29 of 36

Document No. ORAUT-TKBS-0012-5 Revision No. 02 Effective Date: 02/08/2013 Page 67 of 73
Figure A-14. MDA data for 238U in urine (part 2 of 3).
Figure A-14. MDA data for 238U in urine (part 3 of 3).
Annual Average MDAs for U-238 in Urine Calculated from Recovered Data Between 1945 and 1990
0
1
2
3
4
5
6
7
8
9
1019
4519
4619
4719
4819
4919
5019
5119
5219
5319
5419
5519
5619
5719
5819
5919
6019
6119
6219
6319
6419
6519
6619
6719
6819
6919
7019
7119
7219
7319
7419
7519
7619
7719
7819
7919
8019
8119
8219
8319
8419
8519
8619
8719
8819
8919
90
Year
MD
A (d
pm/2
4 h)
Number of Sample Results Recovered per Year Between 1945 and 1990 for U-238 in Urine
0
100
200
300
400
500
600
700
800
900
1000
1945
1946
1947
1948
1949
1950
1951
1952
1953
1954
1955
1956
1957
1958
1959
1960
1961
1962
1963
1964
1965
1966
1967
1968
1969
1970
1971
1972
1973
1974
1975
1976
1977
1978
1979
1980
1981
1982
1983
1984
1985
1986
1987
1988
1989
1990
Year
Num
ber
of S
ampl
es (N
)
ATTACHMENT A CALCULATION OF MDAs FROM HISTORICAL DATA
Page 30 of 36

Document No. ORAUT-TKBS-0012-5 Revision No. 02 Effective Date: 02/08/2013 Page 68 of 73
Figure A-15. MDA data for 241Am in feces (part 1 of 3).
Figure A-15. MDA data for 241Am in feces (part 2 of 3).
Visual Comparison of Data to Estimated Am-241 MDAs in Feces
1 E-2
1 E-1
1 E+0
1 E+1
1945 1950 1955 1960 1965 1970 1975 1980 1985 1990Year
Act
ivity
(dpm
/24
h sa
mpl
e)Sample MDAEst. MDA of 0.5 (95%CL on Mean)50th Percentile of 0.2
Annual Average MDAs for Am-241 in Feces Calculated from Recovered Data Between 1945 and 1990
0
0.1
0.2
0.3
0.4
0.5
0.6
0.7
0.8
0.9
1945
1946
1947
1948
1949
1950
1951
1952
1953
1954
1955
1956
1957
1958
1959
1960
1961
1962
1963
1964
1965
1966
1967
1968
1969
1970
1971
1972
1973
1974
1975
1976
1977
1978
1979
1980
1981
1982
1983
1984
1985
1986
1987
1988
1989
1990
Year
MD
A (d
pm/2
4 h)
ATTACHMENT A CALCULATION OF MDAs FROM HISTORICAL DATA
Page 31 of 36

Document No. ORAUT-TKBS-0012-5 Revision No. 02 Effective Date: 02/08/2013 Page 69 of 73
Figure A-15. MDA data for 241Am in feces (part 3 of 3).
Figure A-16. MDA data for gross alpha in feces (part 1 of 3).
Number of Sample Results Recovered per Year Between 1945 and 1990 for Am-241 in Feces
0
5
10
15
20
25
30
3519
4519
4619
4719
4819
4919
5019
5119
5219
5319
5419
5519
5619
5719
5819
5919
6019
6119
6219
6319
6419
6519
6619
6719
6819
6919
7019
7119
7219
7319
7419
7519
7619
7719
7819
7919
8019
8119
8219
8319
8419
8519
8619
8719
8819
8919
90
Year
Num
ber
of S
ampl
es (N
)
Visual Comparison of Data to Estimated Gross Alpha MDAs in Feces
1 E-2
1 E-1
1 E+0
1 E+1
1945 1950 1955 1960 1965 1970 1975 1980 1985 1990Year
Act
ivity
(dpm
/24
h sa
mpl
e)
Sample MDAEst. MDA of 0.6 (95%CL on Mean)50th Percentile of 0.4
ATTACHMENT A CALCULATION OF MDAs FROM HISTORICAL DATA
Page 32 of 36

Document No. ORAUT-TKBS-0012-5 Revision No. 02 Effective Date: 02/08/2013 Page 70 of 73
Figure A-16. MDA data for gross alpha in feces (part 2 of 3).
Figure A-16. MDA data for gross alpha in feces (part 3 of 3).
Annual Average MDAs for Gross Alpha in FecesCalculated from Recovered Data Between 1945 and 1990
0
0.2
0.4
0.6
0.8
1
1.219
4519
4619
4719
4819
4919
5019
5119
5219
5319
5419
5519
5619
5719
5819
5919
6019
6119
6219
6319
6419
6519
6619
6719
6819
6919
7019
7119
7219
7319
7419
7519
7619
7719
7819
7919
8019
8119
8219
8319
8419
8519
8619
8719
8819
8919
90
Year
MD
A (d
pm/2
4 h)
Number of Sample Results Recovered per Year Between 1945 and 1990 for Gross Alpha in Feces
0
20
40
60
80
100
120
140
1945
1946
1947
1948
1949
1950
1951
1952
1953
1954
1955
1956
1957
1958
1959
1960
1961
1962
1963
1964
1965
1966
1967
1968
1969
1970
1971
1972
1973
1974
1975
1976
1977
1978
1979
1980
1981
1982
1983
1984
1985
1986
1987
1988
1989
1990
Year
Num
ber
of S
ampl
es (N
)
ATTACHMENT A CALCULATION OF MDAs FROM HISTORICAL DATA
Page 33 of 36

Document No. ORAUT-TKBS-0012-5 Revision No. 02 Effective Date: 02/08/2013 Page 71 of 73
Figure A-17. MDA data for 239Pu in feces (part 1 of 3).
Figure A-17. MDA data for 239Pu in feces (part 2 of 3).
Visual Comparison of Data to Estimated Pu-239 MDA in Feces
1 E-3
1 E-2
1 E-1
1 E+0
1 E+1
1945 1950 1955 1960 1965 1970 1975 1980 1985 1990Year
Act
ivity
(dpm
/24
h sa
mpl
e)Sample MDAEst. MDA of 0.4 (95%CL on Mean)50th Percentile of 0.1
Annual Average MDAs for Pu-239 in FecesCalculated from Recovered Data Between 1945 and 1990
0
0.2
0.4
0.6
0.8
1
1.2
1945
1946
1947
1948
1949
1950
1951
1952
1953
1954
1955
1956
1957
1958
1959
1960
1961
1962
1963
1964
1965
1966
1967
1968
1969
1970
1971
1972
1973
1974
1975
1976
1977
1978
1979
1980
1981
1982
1983
1984
1985
1986
1987
1988
1989
1990
Year
MD
A (d
pm/2
4 h)
ATTACHMENT A CALCULATION OF MDAs FROM HISTORICAL DATA
Page 34 of 36

Document No. ORAUT-TKBS-0012-5 Revision No. 02 Effective Date: 02/08/2013 Page 72 of 73
Figure A-17. MDA data for 239Pu in feces (part 3 of 3).
Figure A-18. MDA data for 232Th in feces (part 1 of 3).
Number of Sample Results Recovered per Year Between 1945 and 1990 for Pu-239 in Feces
0
5
10
15
20
25
30
35
1945
1946
1947
1948
1949
1950
1951
1952
1953
1954
1955
1956
1957
1958
1959
1960
1961
1962
1963
1964
1965
1966
1967
1968
1969
1970
1971
1972
1973
1974
1975
1976
1977
1978
1979
1980
1981
1982
1983
1984
1985
1986
1987
1988
1989
1990
Year
Num
ber
of S
ampl
es (N
)
Visual Comparison of Data to Estimated Th-232 MDAs in Feces
1 E-2
1 E-1
1 E+0
1 E+1
1945 1950 1955 1960 1965 1970 1975 1980 1985 1990Year
Act
ivity
(dpm
/24
h sa
mpl
e)
Sample MDAEst. MDA of 0.5 (95%CL on Mean)50th Percentile of 0.3
ATTACHMENT A CALCULATION OF MDAs FROM HISTORICAL DATA
Page 35 of 36

Document No. ORAUT-TKBS-0012-5 Revision No. 02 Effective Date: 02/08/2013 Page 73 of 73
Figure A-18. MDA data for 232Th in feces (part 2 of 3).
Figure A-18. MDA data for 232Th in feces (part 3 of 3).
Annual Average MDAs for Th-232 in FecesCalculated from Recovered Data Between 1945 and 1990
0
0.2
0.4
0.6
0.8
1
1.2
1945
1946
1947
1948
1949
1950
1951
1952
1953
1954
1955
1956
1957
1958
1959
1960
1961
1962
1963
1964
1965
1966
1967
1968
1969
1970
1971
1972
1973
1974
1975
1976
1977
1978
1979
1980
1981
1982
1983
1984
1985
1986
1987
1988
1989
1990
Year
MD
A (d
pm/2
4 h)
Number of Sample Results Recovered per Year Between 1945 and 1990 for Th-232 in Feces
0
100
200
300
400
500
600
700
800
1945
1946
1947
1948
1949
1950
1951
1952
1953
1954
1955
1956
1957
1958
1959
1960
1961
1962
1963
1964
1965
1966
1967
1968
1969
1970
1971
1972
1973
1974
1975
1976
1977
1978
1979
1980
1981
1982
1983
1984
1985
1986
1987
1988
1989
1990
Year
Num
ber
of S
ampl
es (N
)
ATTACHMENT A CALCULATION OF MDAs FROM HISTORICAL DATA
Page 36 of 36