dodge & cox income fund annual report dated december 31, 2019 · dodge &cox funds® 2019...
TRANSCRIPT

D O D G E & C O X F U N D S®
2019
Annual ReportDecember 31, 2019
Income FundE S T A B L I S H E D 1 9 8 9
T I C K E R : D O D I X
Important Notice:
Beginning on January 1, 2021, we intend to discontinue mailing paper copies of the Fund’s shareholder reports as permitted by newregulations adopted by the Securities and Exchange Commission, unless you specifically request paper copies from Dodge & Cox Funds orfrom your financial intermediary, such as a broker-dealer or bank. The reports will remain available to you on the Dodge & Cox Fundswebsite (dodgeandcox.com), and you will be notified by mail each time a report is posted and provided with a link to access the report.
If you have already elected to receive shareholder reports electronically, you will not be affected by this change and do not need to take anyaction. If you have not done so already, you may elect to receive shareholder reports and other communications electronically by enrollingin e-delivery on the Funds website, or, if you are invested through a financial intermediary, by updating your mailing preferences throughthe intermediary.
If you wish to continue receiving paper copies of all future shareholder reports, please contact us at (800) 621-3979. Reports will be providedto you free of charge. If you are invested through a financial intermediary, you may contact your financial intermediary to request to receivepaper copies. Your election to receive reports in paper form will apply to all funds held with Dodge & Cox Funds or through your financialintermediary, as applicable.
12/19 IF AR Printed on recycled paper

TO OUR SHAREHOLDERS
The Dodge & Cox Income Fund had a total return of 9.7% for theyear ended December 31, 2019, compared to a total return of 8.7%for the Bloomberg Barclays U.S. Aggregate Bond Index (BloombergBarclays U.S. Agg).
MARKET COMMENTARY
The U.S. investment-grade fixed income market posted a robust8.7% return in 2019, fueled by the combination of falling U.S.Treasury yields and strong performance from the Corporate bondsector.
U.S. Treasury rates declined for much of the year amid asubstantial pivot toward easing monetary policy by the FederalReserve as well as rising trade tensions and concerns about slowingglobal growth. It wasn’t until the fourth quarter that long-termTreasury yields rose from multi-year lows, following a series ofpositive U.S. economic reports, encouraging developments inU.S.-China trade negotiations, and more clarity on Brexit.
The Fed reversed course from its path of steadily raising ratesin 2017-2018 and carried out a “mid-cycle adjustment” of threequarter-point rate cuts in 2019. Moreover, Fed Chairman JeromePowell signaled that the central bank is likely to keep rates onhold through 2020 amid low inflation. Although the pace of U.S.economic growth slowed last year, the economy continued toexpand. For example, labor market reports released during the yearwere better than expected, as employers added an average of175,000 jobs per month, and the unemployment rate declined to a50-year low of 3.5%. Other data was mixed: robust consumerspending was offset by manufacturing sector weakness.
The investment-grade Corporate sector returned 14.5%a forthe year, outperforming comparable-duration Treasuries by 6.8percentage points. Credit yield premiumsb on corporate bondsended the year near their tightest level since the global financialcrisis. Meanwhile, Agencyc mortgage-backed securities (MBS)returned 6.4% and outperformed comparable-durationd Treasuriesby a modest 0.6 percentage points.
INVESTMENT STRATEGY
The Fund’s strong year—in terms of both absolute and relativeperformance—was driven by outperformance from a wide varietyof individual credite holdings and a significant overweight to thestrong-performing Credit sector.
Over the year, we made a number of adjustments to theFund’s portfolio positioning in light of higher credit marketvaluations and slightly less constructive economic fundamentals.Most notably, we trimmed multiple credit issuers and invested theproceeds in U.S. Treasuries.
We also made other modest adjustments in the portfolio, butit retains the same general themes. The Fund maintains sizeableexposures to corporate securities (34%)f and Agency MBS (35%),both of which represent modest overweights relative to the Index.The Fund also features smaller positions in asset-backed securities(6%) and government-related securities (5%). The Fund’s
weighting in U.S. Treasuries (18%) and net cash (2%) represents“dry powder” we can deploy as we uncover compelling investmentopportunities in the future. We continue to maintain the Fund’soverall defensive position with respect to interest rate risk, with aportfolio duration of 4.3 years (compared to 5.9 years for theIndex).
The Credit Sector: Reduced Overal l Exposure, but Sti l lFinding Select Opportunit iesThe most meaningful change to positioning throughout 2019 wasan eight percentage point reduction in the Fund’s credit weighting.This selective pruning leaves the Fund’s credit weighting at itspost-global financial crisis low and represents the reversal ofadditions made amid the broad credit sell-off in late 2018/early2019.
Reductions were achieved through a combination ofmaturities, relative value-driven trims, and participation in tendersrelated to corporate liability management exercises. For example,we trimmed certain Verizong bonds, which performed well as thecompany made progress towards its deleveraging targets. We alsorecently exited Anheuser-Busch InBev, a position established atthe beginning of 2019 during a time of heightened credit marketanxiety and issuer volatility driven by ratings downgrades. It isimportant to note that 2019 trims were, by and large, driven by aless attractive risk-reward tradeoff following strong performanceand subsequently higher valuations, rather than a deterioratingview of the issuers’ creditworthiness.
Despite reducing the Fund’s credit exposure generally, weremain on the lookout for individual opportunities in credit,highlighted by the additions of AbbVie, Occidental Petroleum,UniCredit, and Vodafone Group over the course of the year.
AbbVie, a biopharmaceutical company that issued debt inNovember to help fund its acquisition of Allergan, meritshighlighting. AbbVie’s business has been dominated by Humira, aprescription drug that will come off patent as early as 2022 and willlikely face increased competition over the next few years. In ourview, the acquisition of Allergan makes strategic sense as a meansof bolstering free cash flow and increasing product diversification.We believe investors are adequately compensated with anattractive yield spread for the fundamental risks facing AbbVie,including its new, higher leverage and the potential for integrationchallenges, legislative changes to the U.S. drug pricing model, andunexpected product liabilities. In the coming years, we expect thecompany to pay down the incremental debt it incurred to financethe Allergan acquisition, leading to a much improved creditprofile.
While we believe the credit market is fairly valued, the long-term total return prospects for a well-curated, thoroughlyresearched, and stress-tested credit portfolio remain attractive.Thus, we are comfortable with the Fund’s credit overweight, butwe continue to be vigilant, taking into account the strongperformance of credit in 2019.
P A G E 2 ▪ D O D G E & C O X I N C O M E F U N D

The Securit ized Sector: Adding Liquidity andIncremental Yield at a Compell ing ValuationThe Fund’s holdings in the Securitized sector consist predominantlyof Agency MBS, with a smaller weighting in AAA-rated asset-backed securities (ABS). As a group, these securities can provideattractive total-return potential in the front to intermediate part ofthe yield curve, and they continue to play an important role in theoverall portfolio because of their generally substantial liquidity andhigh credit quality.
Within MBS, the Fund features a large position in 30-year4.5% coupon securities. This segment underperformed in 2019 asborrowers faced greater refinancing incentives because of thedecline in interest rates. Through our bottom-up, fundamentalresearch we attempt to measure—and assess whether investors arebeing appropriately compensated for—prepayment risk. Given ouranalysis, we believe this risk is manageable for these securitiesgoing forward, and their favorable starting valuations make themattractive, especially relative to credit alternatives. There are alsosignificant differences in prepayment behavior across servicers andorigination channels, creating opportunities to benefit from astutesecurity selection. Overall, we believe the risk-reward equation inAgency MBS continues to look compelling given modest dollarprices and relatively wide spreads.
Within ABS, we sold securities backed by credit card debt andauto loans because we concluded their high relative valuations nolonger presented a compelling risk-reward dynamic, and wereinvested the proceeds in Agency MBS. The Fund continues tohold floating rate ABS backed by 97% federally guaranteedstudent loans. These short-duration securities trade at favorablelevels relative to ABS and MBS alternatives, and their floatingrate coupon adds a defensive duration element to the portfolio.
Defensive Duration: Mitigat ing the Risk of RisingRates over TimeAlthough we have lowered our expectations for the future path ofinterest rates, the portfolio’s defensive duration position reflectsour longer-term view that interest rates are still likely to exceedcurrent market expectations.
The portfolio’s relative interest rate positioning is underpinnedby two key factors. First, we believe recession risk is low and theU.S. economy is on solid footing. While we expect the economy toslow toward trend growth (2% real GDP) as the fiscal stimulusfades, the strengths of the consumer sector and the labor marketshould help it avoid a recession. In our view, U.S. Treasuryvaluations have swung too far in attempting to price in a period oflow or negative growth. Second, the significant reduction inunemployment and the ensuing labor market tightening have raisedthe prospect of more rapid wage growth and somewhat higherinflation than what many indicators are forecasting. While weexpect the Fed to keep short-term rates steady, we believe the longend of the curve will move higher over time. Given these factorsand low starting yields, we believe it is important to remaindefensive in order to mitigate the negative effect of any bondmarket price declines that could stem from potential increases ininterest rates over time.
Inflat ion Expectat ions: An Addit ional Valuation-Driven OpportunityIn developing our economic forecasts, our team of analysts andtraders is constantly on the lookout for segments of the marketthat appear undervalued. One example is Treasury InflationProtected Securities (TIPS), where we recently established a smallposition in three-year securities. These securities look attractiverelative to other investment opportunities due to the low level ofinflation required to generate a competitive total return. Webelieve that underlying inflation (excluding energy prices) alreadylooks strong relative to market expectations, and that acontinuation of the economic expansion should support this levelof inflation. Additionally, while inflation has remained below theFederal Reserve’s 2% target according to their preferred measure,TIPS returns are based off a different measure of inflation (CPI)that has been running significantly higher.
IN CLOSING
While we are pleased with the Fund’s 2019 results, we cautionshareholders to temper their expectations for future returns. Thelow level of interest rates increases the risk of quite modest (oreven negative) returns if yields rise substantially from currentlevels. In addition, because of current narrow credit yieldpremiums, credit markets are unlikely to provide the performancetailwind of the past year.
That said, we believe bonds continue to serve a vital defensiverole in a diversified portfolio, providing liquidity, income generation,downside protection, and low correlation to riskier asset classes. Wehave positioned the Fund defensively from a duration standpoint, andwe will continue to seek opportunities to build portfolio yield throughour bottom-up, research-driven investment approach.
Thank you for your continued confidence in our firm. Asalways, we welcome your comments and questions.
For the Board of Trustees,
Charles F. Pohl,Chairman
Dana M. Emery,President
January 31, 2020
a Sector returns as calculated and reported by Bloomberg.b Yield premiums are one way to measure a security’s valuation. Narrowing
yield premiums result in a higher valuation. Widening yield premiums resultin a lower valuation.
c The U.S. Government does not guarantee the Fund’s shares, yield, or netasset value. The agency guarantee (by, for example, Ginnie Mae, FannieMae, or Freddie Mac) does not eliminate market risk.
d Duration is a measure of a bond’s (or a bond portfolio’s) price sensitivity tochanges in interest rates.
e Credit securities refers to corporate bonds and government-related securities,as classified by Bloomberg.
f Unless otherwise specified, all weightings and characteristics are as ofDecember 31, 2019.
g The use of specific examples does not imply that they are more or lessattractive investments than the Fund’s other holdings.
D O D G E & C O X I N C O M E F U N D ▪ P A G E 3

2019 PERFORMANCE REVIEWThe Fund outperformed the Bloomberg Barclays U.S. Agg by1.0 percentage point in 2019.
Key Contributors To Relat ive Results▪ Security selection within credit was positive as several issuers
performed well, including Citigroup capital securities, Enel,Pemex, Petrobras, Rio Oil Finance Trust, TC Energy, andTelecom Italia.
▪ The Fund’s overweight to corporate bonds and underweightto U.S. Treasuries added to relative returns given thesignificant outperformance of credit.
Key Detractors from Relat ive Results▪ The Fund’s below-benchmark duration position (74%* of
the Bloomberg Barclays U.S. Agg’s duration) hamperedrelative returns as Treasury yields declined.
▪ The Fund’s Agency MBS holdings slightly underperformedthe MBS in the Bloomberg Barclays U.S. Agg after adjustingfor duration differences.
* Denotes Fund positioning at the beginning of the period.
KEY CHARACTERISTICS OF DODGE & COXIndependent Organizat ionDodge & Cox is one of the largest privately owned investmentmanagers in the world. We remain committed to independence,with a goal of providing the highest quality investmentmanagement service to our existing clients.
90 Years of Investment ExperienceDodge & Cox was founded in 1930. We have a stable and well-qualified team of investment professionals, most of whom havespent their entire careers at Dodge & Cox.
Experienced Investment TeamThe U.S. Fixed Income Investment Committee, which is thedecision-making body for the Income Fund, is a nine-membercommittee with an average tenure at Dodge & Cox of 20 years.
One Business with a Single Research OfficeDodge & Cox manages equity (domestic, international, andglobal), fixed income (domestic and global), and balancedinvestments, operating from one office in San Francisco.
Consistent Investment ApproachOur team decision-making process involves thorough, bottom-up fundamental analysis of each investment.
Long-Term Focus and Low ExpensesWe invest with a three- to five-year investment horizon, whichhas historically resulted in low turnover relative to our peers.We manage Funds that maintain low expense ratios.
Risks: The Fund invests in individual bonds whose yields andmarket values fluctuate, so that an investment may be worthmore or less than its original cost. Debt securities are subject tointerest rate risk, credit risk, and prepayment and call risk, all ofwhich could have adverse effects on the value of the Fund. Alow interest rate environment creates an elevated risk of futurenegative returns. Financial intermediaries may restrict theirmarket making activities for certain debt securities, which mayreduce the liquidity and increase the volatility of such securities.Please read the prospectus and summary prospectus for specificdetails regarding the Fund’s risk profile.
P A G E 4 ▪ D O D G E & C O X I N C O M E F U N D

GROWTH OF $10,000 OVER 10 YEARSFOR AN INVESTMENT MADE ON DECEMBER 31, 2009
Dodge & Cox Income Fund $15,424
Bloomberg Barclays U.S. Agg $14,445
12/31/09 12/31/11 12/31/13 12/31/15 12/31/17 12/31/195,000
10,000
$30,000
20,000
AVERAGE ANNUAL TOTAL RETURNFOR PERIODS ENDED DECEMBER 31, 2019
1 Year 5 Years 10 Years 20 Years
Dodge & Cox Income Fund 9.73% 3.69% 4.43% 5.61%Bloomberg Barclays U.S. Aggregate
Bond Index (Bloomberg BarclaysU.S. Agg) 8.72 3.05 3.75 5.03
Returns represent past performance and do not guarantee futureresults. Investment return and share price will fluctuate withmarket conditions, and investors may have a gain or loss whenshares are sold. Fund performance changes over time andcurrently may be significantly lower than stated. Performance isupdated and published monthly. Visit the Fund’s website atdodgeandcox.com or call 800-621-3979 for current performancefigures.
The Fund’s total returns include the reinvestment of dividend andcapital gain distributions, but have not been adjusted for anyincome taxes payable by shareholders on these distributions or onFund share redemptions. Index returns include interest incomebut, unlike Fund returns, do not reflect fees or expenses. TheBloomberg Barclays U.S. Aggregate Bond Index (BloombergBarclays U.S. Agg) is a widely recognized, unmanaged index ofU.S. dollar-denominated, investment-grade, taxable debtsecurities.
Bloomberg is a registered trademark of Bloomberg Finance L.P. and itsaffiliates. Barclays® is a trademark of Barclays Bank PLC.
FUND EXPENSE EXAMPLEAs a Fund shareholder, you incur ongoing Fund costs, including management fees and other Fund expenses. All mutual funds have ongoingcosts, sometimes referred to as operating expenses. The following example shows ongoing costs of investing in the Fund and can help youunderstand these costs and compare them with those of other mutual funds. The example assumes a $1,000 investment held for the sixmonths indicated.
ACTUAL EXPENSES
The first line of the table below provides information about actual account values and expenses based on the Fund’s actual returns. You mayuse the information in this line, together with your account balance, to estimate the expenses that you paid over the period. Simply divideyour account value by $1,000 (for example, an $8,600 account value divided by $1,000 = 8.6), then multiply the result by the number in thefirst line under the heading “Expenses Paid During Period” to estimate the expenses you paid on your account during this period.
HYPOTHETICAL EXAMPLE FOR COMPARISON WITH OTHER MUTUAL FUNDS
Information on the second line of the table can help you compare ongoing costs of investing in the Fund with those of other mutual funds.This information may not be used to estimate the actual ending account balance or expenses you paid during the period. The hypothetical“Ending Account Value” is based on the actual expense ratio of the Fund and an assumed 5% annual rate of return before expenses (not theFund’s actual return). The amount under the heading “Expenses Paid During Period” shows the hypothetical expenses your account wouldhave incurred under this scenario. You can compare this figure with the 5% hypothetical examples that appear in shareholder reports ofother mutual funds.
Six Months EndedDecember 31, 2019
Beginning Account Value7/1/2019
Ending Account Value12/31/2019
Expenses PaidDuring Period*
Based on Actual Fund Return $1,000.00 $1,029.50 $2.15Based on Hypothetical 5% Yearly Return 1,000.00 1,023.08 2.15* Expenses are equal to the Fund’s annualized expense ratio of 0.42%, multiplied by the average account value over the period, multiplied by 184/365 (to reflect the
one-half year period).
The expenses shown in the table highlight ongoing costs only and do not reflect any transactional fees or account maintenance fees.Though other mutual funds may charge such fees, please note that the Fund does not charge transaction fees (e.g., redemption fees, salesloads) or universal account maintenance fees (e.g., small account fees).
D O D G E & C O X I N C O M E F U N D ▪ P A G E 5

PORTFOLIO INFORMATION December 31, 2019
SECTOR DIVERSIFICATION (%) % of Net Assets
U.S. Treasury 17.5Government-Related 5.1Securitized 41.5Corporate 34.0Net Cash & Other(a) 1.9
(a) Net Cash & Other includes cash, short-term investments, derivatives, receivables, and payables.
P A G E 6 ▪ D O D G E & C O X I N C O M E F U N D

PORTFOLIO OF INVESTMENTS December 31, 2019
DEBT SECURITIES: 98.1%
PAR VALUE VALUE
U.S. TREASURY: 17.5%U.S. Treasury Inflation Indexed
0.125%, 1/15/22(g) $ 133,806,429 $ 133,730,9620.125%, 4/15/22(g) 689,475,057 688,434,9980.625%, 4/15/23(g) 138,374,513 140,509,698
U.S. Treasury Note/Bond1.50%, 10/31/21 890,000,000 888,539,3851.50%, 11/30/21 2,214,048,000 2,210,449,2421.50%, 8/15/22 420,000,000 418,877,8271.50%, 9/15/22 1,000,000,000 997,187,4701.625%, 11/15/22 37,899,000 37,906,0981.75%, 7/31/24 90,000,000 90,204,4801.25%, 8/31/24 29,555,000 28,962,5541.50%, 10/31/24 300,000,000 297,213,3361.50%, 11/30/24 600,000,000 594,559,9023.00%, 10/31/25 561,940,000 599,976,1792.50%, 2/28/26 700,000,000 728,708,6032.375%, 4/30/26 600,000,000 620,448,2222.375%, 5/15/29 1,085,000,000 1,126,854,5691.625%, 8/15/29 764,000,000 743,693,7812.875%, 5/15/49 661,390,000 728,180,8992.25%, 8/15/49 47,135,000 45,669,394
11,120,107,599GOVERNMENT-RELATED: 5.1%FOREIGN AGENCY: 2.3%Petroleo Brasileiro SA (Brazil)
5.093%, 1/15/30(b) 253,092,000 271,190,6097.25%, 3/17/44 10,705,000 12,985,1656.90%, 3/19/49 12,355,000 14,492,415
Petroleos Mexicanos (Mexico)6.875%, 8/4/26 120,490,000 132,304,0446.50%, 3/13/27 227,365,000 241,397,9686.84%, 1/23/30(b) 125,987,000 134,344,9786.625%, 6/15/35 112,290,000 115,041,1056.375%, 1/23/45 166,156,000 159,825,4566.75%, 9/21/47 191,366,000 191,725,7686.35%, 2/12/48 192,270,000 185,540,550
1,458,848,058LOCAL AUTHORITY: 2.8%L.A. Unified School District GO
5.75%, 7/1/34 6,075,000 7,779,7066.758%, 7/1/34 185,585,000 255,851,193
New Jersey Turnpike Authority RB7.414%, 1/1/40 41,065,000 64,417,0237.102%, 1/1/41 148,277,000 226,128,356
New Valley Generation4.929%, 1/15/21 146,348 149,434
State of California GO7.50%, 4/1/34 162,016,000 243,970,1737.55%, 4/1/39 106,975,000 171,590,0407.30%, 10/1/39 202,095,000 308,603,1077.625%, 3/1/40 115,675,000 185,222,280
State of Illinois GO5.10%, 6/1/33 306,400,000 330,308,392
1,794,019,704
3,252,867,762SECURITIZED: 41.5%ASSET-BACKED: 6.5%Federal Agency: 0.0%(h)
Small Business Admin. — 504 ProgramSeries 2000-20C 1, 7.625%, 3/1/20 391 391Series 2000-20G 1, 7.39%, 7/1/20 518 520Series 2001-20G 1, 6.625%, 7/1/21 201,419 204,208Series 2001-20L 1, 5.78%, 12/1/21 498,696 510,851Series 2002-20A 1, 6.14%, 1/1/22 3,959 4,034
PAR VALUE VALUE
Series 2002-20L 1, 5.10%, 12/1/22 $ 152,422 $ 157,188Series 2003-20G 1, 4.35%, 7/1/23 13,820 14,207Series 2004-20L 1, 4.87%, 12/1/24 369,042 386,121Series 2005-20B 1, 4.625%, 2/1/25 754,534 785,454Series 2005-20D 1, 5.11%, 4/1/25 25,029 26,125Series 2005-20E 1, 4.84%, 5/1/25 1,087,940 1,137,317Series 2005-20G 1, 4.75%, 7/1/25 1,314,205 1,366,751Series 2005-20H 1, 5.11%, 8/1/25 13,986 14,659Series 2005-20I 1, 4.76%, 9/1/25 1,515,269 1,573,771Series 2006-20A 1, 5.21%, 1/1/26 1,305,553 1,368,469Series 2006-20B 1, 5.35%, 2/1/26 439,124 464,564Series 2006-20C 1, 5.57%, 3/1/26 1,850,256 1,950,012Series 2006-20G 1, 6.07%, 7/1/26 3,582,586 3,775,196Series 2006-20H 1, 5.70%, 8/1/26 29,074 30,916Series 2006-20I 1, 5.54%, 9/1/26 46,253 48,848Series 2006-20J 1, 5.37%, 10/1/26 1,308,562 1,383,197Series 2006-20L 1, 5.12%, 12/1/26 1,238,236 1,308,267Series 2007-20A 1, 5.32%, 1/1/27 2,665,770 2,806,840Series 2007-20C 1, 5.23%, 3/1/27 4,074,794 4,294,590Series 2007-20D 1, 5.32%, 4/1/27 3,934,228 4,145,569Series 2007-20G 1, 5.82%, 7/1/27 2,711,915 2,875,804
30,633,869Other: 1.2%Rio Oil Finance Trust (Brazil)
9.25%, 7/6/24(b) 365,457,313 409,315,8469.75%, 1/6/27(b) 221,176,382 260,990,3428.20%, 4/6/28(b) 67,600,000 78,078,676
748,384,864Student Loan: 5.3%Navient Student Loan Trust
USD LIBOR 1-Month+1.25%, 3.042%, 6/25/65(b) 279,041,159 281,748,974+1.15%, 2.955%, 3/25/66(b) 231,008,174 230,311,245+1.30%, 3.092%, 3/25/66(b) 152,006,000 153,098,756+0.80%, 2.592%, 7/26/66(b) 300,085,460 294,921,709+1.05%, 2.842%, 7/26/66(b) 323,668,000 321,134,586+1.15%, 2.942%, 7/26/66(b) 234,752,000 234,912,265+1.00%, 2.792%, 9/27/66(b) 114,564,000 113,081,576+1.05%, 2.842%, 12/27/66(b) 188,816,197 187,672,745+0.72%, 2.512%, 3/25/67(b) 97,760,000 95,740,611+0.80%, 2.592%, 3/25/67(b) 183,798,000 180,086,016+0.68%, 2.472%, 6/27/67(b) 225,000,000 221,201,303+1.00%, 2.792%, 2/27/68(b) 62,078,000 61,916,690+0.70%, 2.505%, 2/25/70(b) 252,630,963 248,832,682
Navient Student Loan Trust (PrivateLoans)Series 2014-AA A2A,
2.74%, 2/15/29(b) 14,026,593 14,086,402Series 2017-A A2A,
2.88%, 12/16/58(b) 31,000,000 31,069,260SLM Student Loan Trust
USD LIBOR 1-Month+1.20%, 2.992%, 10/25/34 27,721,000 28,067,881+1.10%, 2.892%, 8/27/40 25,924,630 25,931,518
USD LIBOR 3-Month+0.63%, 2.57%, 1/25/40(b) 142,597,151 138,999,482+0.17%, 2.11%, 7/25/40 13,626,000 12,667,561+0.75%, 2.69%, 10/25/40 80,889,000 78,542,135+0.60%, 2.54%, 1/25/41 122,299,910 118,721,501+0.55%, 2.49%, 10/25/64(b) 32,458,000 31,889,449+0.55%, 2.49%, 10/25/64(b) 72,950,000 71,672,171
SMB Private Education Loan Trust(Private Loans)Series 2017-A A2A, 2.88%, 9/15/34(b) 20,963,943 21,038,417Series 2017-B A2A, 2.82%, 10/15/35(b) 23,915,878 23,952,706Series 2018-A A2A, 3.50%, 2/15/36(b) 50,000,000 51,797,335
See accompanying Notes to Financial Statements D O D G E & C O X I N C O M E F U N D ▪ P A G E 7

PORTFOLIO OF INVESTMENTS December 31, 2019
DEBT SECURITIES (continued)
PAR VALUE VALUE
Series 2018-B A2A, 3.60%, 1/15/37(b) $ 68,386,000 $ 70,245,368
3,343,340,344
4,122,359,077CMBS: 0.8%Agency CMBS: 0.8%Fannie Mae Multifamily DUS
Pool AL6455, 2.765%, 11/1/21 8,966,822 8,953,204Freddie Mac Multifamily Interest Only
Series K055 X1, 1.365%, 3/25/26(e) 118,242,286 8,479,982Series K056 X1, 1.264%, 5/25/26(e) 40,948,036 2,760,889Series K057 X1, 1.191%, 7/25/26(e) 245,523,370 15,623,511Series K062 X1, 0.307%, 12/25/26(e) 323,166,613 6,439,095Series K064 X1, 0.607%, 3/25/27(e) 411,951,783 15,792,172Series K065 X1, 0.673%, 4/25/27(e) 477,687,514 20,641,021Series K066 X1, 0.752%, 6/25/27(e) 380,591,929 18,413,228Series K067 X1, 0.578%, 7/25/27(e) 479,520,539 18,675,071Series K069 X1, 0.365%, 9/25/27(e) 99,189,122 2,571,865Series K071 X1, 0.291%, 11/25/27(e) 258,407,781 5,398,940Series K070 X1, 0.327%, 11/25/27(e) 201,183,845 4,798,617Series K089 X1, 0.542%, 1/25/29(e) 524,580,673 23,101,903Series K091 X1, 0.559%, 3/25/29(e) 263,547,557 12,158,318Series K092 X1, 0.709%, 4/25/29(e) 490,719,752 28,286,166Series K093 X1, 0.952%, 5/25/29(e) 234,892,621 17,715,648Series K094 X1, 0.881%, 6/25/29(e) 325,011,821 23,046,523Series K095 X1, 0.949%, 6/25/29(e) 226,438,157 16,717,318Series K097 X1, 1.09%, 7/25/29(e) 246,688,818 21,964,260Series K096 X1, 1.257%, 7/25/29(e) 550,107,708 49,654,427Series K098 X1, 1.271%, 8/25/29(e) 478,278,689 44,327,730Series K099 X1, 1.006%, 9/25/29(e) 520,693,890 37,769,312Series K101 X1, 0.837%, 10/25/29(e) 199,972,762 13,835,715Series K102 X1, 0.947%, 10/25/29(e) 555,442,759 37,938,351Series K152 X1, 0.956%, 1/25/31(e) 42,680,140 3,384,108Series K154 X1, 0.308%, 11/25/32(e) 389,165,345 11,834,752Series K1511 X1, 0.778%, 3/25/34(e) 177,744,388 14,438,905
484,721,031MORTGAGE-RELATED: 34.2%Federal Agency CMO & REMIC: 5.1%Dept. of Veterans Affairs
Series 1995-2D 4A, 9.293%, 5/15/25 52,896 59,454Series 1997-2 Z, 7.50%, 6/15/27 4,642,447 5,172,855Series 1998-2 2A, 8.505%, 8/15/27(e) 10,415 11,621Series 1998-1 1A, 8.293%, 3/15/28(e) 81,841 89,377
Fannie MaeTrust 1998-58 PX, 6.50%, 9/25/28 163,137 180,309Trust 1998-58 PC, 6.50%, 10/25/28 981,102 1,086,572Trust 2001-69 PQ, 6.00%, 12/25/31 1,157,273 1,305,838Trust 2002-33 A1, 7.00%, 6/25/32 1,487,283 1,725,644Trust 2002-69 Z, 5.50%, 10/25/32 162,545 176,994Trust 2008-24 GD, 6.50%, 3/25/37 557,681 621,139Trust 2007-47 PE, 5.00%, 5/25/37 1,958,627 2,137,861Trust 2009-53 QM, 5.50%, 5/25/39 533,557 552,563Trust 2009-30 AG, 6.50%, 5/25/39 5,528,241 6,121,405Trust 2009-40 TB, 6.00%, 6/25/39 2,249,837 2,465,681Trust 2010-123 WT, 7.00%, 11/25/40 22,576,306 26,327,404Trust 2001-T3 A1, 7.50%, 11/25/40 78,643 86,579Trust 2001-T7 A1, 7.50%, 2/25/41 47,432 54,998Trust 2001-T5 A2, 6.979%, 6/19/41(e) 31,883 36,058Trust 2001-T5 A3, 7.50%, 6/19/41(e) 166,546 193,084Trust 2011-58 AT, 4.00%, 7/25/41 6,180,258 6,585,358Trust 2001-T4 A1, 7.50%, 7/25/41 1,365,975 1,593,311Trust 2001-T10 A1, 7.00%, 12/25/41 1,456,013 1,665,054Trust 2013-106 MA, 4.00%, 2/25/42 14,707,170 15,580,803Trust 2002-90 A1, 6.50%, 6/25/42 3,352,237 3,832,226Trust 2002-W6 2A1, 7.00%, 6/25/42(e) 1,803,515 1,996,843Trust 2002-W8 A2, 7.00%, 6/25/42 1,059,279 1,236,770
PAR VALUE VALUE
Trust 2003-W2 1A2, 7.00%, 7/25/42 $ 5,181,104 $ 6,034,098Trust 2002-T16 A3, 7.50%, 7/25/42 2,590,569 3,076,336Trust 2003-W4 3A,
5.676%, 10/25/42(e) 1,595,428 1,786,894Trust 2012-121 NB, 7.00%, 11/25/42 744,416 872,649Trust 2003-W1 2A,
5.808%, 12/25/42(e) 1,979,564 2,133,799Trust 2003-7 A1, 6.50%, 12/25/42 2,698,237 3,039,371Trust 2004-T1 1A2, 6.50%, 1/25/44 1,223,093 1,394,644Trust 2004-W2 2A2, 7.00%, 2/25/44 64,427 73,601Trust 2004-W2 5A, 7.50%, 3/25/44 2,752,705 3,129,050Trust 2004-W8 3A, 7.50%, 6/25/44 2,160,152 2,512,407Trust 2004-W15 1A2, 6.50%, 8/25/44 543,065 618,762Trust 2005-W1 1A3, 7.00%, 10/25/44 4,575,982 5,341,094Trust 2001-79 BA, 7.00%, 3/25/45 174,884 198,951Trust 2006-W1 1A1, 6.50%, 12/25/45 259,539 296,774Trust 2006-W1 1A2, 7.00%, 12/25/45 1,904,247 2,205,224Trust 2006-W1 1A3, 7.50%, 12/25/45 32,103 37,475Trust 2006-W1 1A4, 8.00%, 12/25/45 2,187,089 2,561,275Trust 2007-W10 1A, 6.26%, 8/25/47(e) 6,365,346 7,085,622Trust 2007-W10 2A,
6.316%, 8/25/47(e) 1,959,147 2,175,172USD LIBOR 1-Month
+0.55%, 2.342%, 9/25/43 26,432,450 26,617,466+0.40%, 2.192%, 7/25/44 1,064,071 1,053,026
Freddie MacSeries 3312 AB, 6.50%, 6/15/32 1,982,608 2,253,712Series 2456 CJ, 6.50%, 6/15/32 108,617 123,896Series T-41 2A, 5.276%, 7/25/32(e) 185,232 196,046Series 2587 ZU, 5.50%, 3/15/33 2,824,763 3,107,980Series 2610 UA, 4.00%, 5/15/33 1,184,088 1,244,871Series T-48 1A, 4.899%, 7/25/33(e) 2,046,123 2,195,895Series 2708 ZD, 5.50%, 11/15/33 10,839,146 11,929,927Series 3204 ZM, 5.00%, 8/15/34 5,076,932 5,555,540Series 3330 GZ, 5.50%, 6/15/37 486,190 513,006Series 3427 Z, 5.00%, 3/15/38 2,224,644 2,441,834Series T-51 1A, 6.50%, 9/25/43(e) 47,288 55,599Series 4283 DW, 4.50%, 12/15/43(e) 59,089,573 64,046,904Series 4283 EW, 4.50%, 12/15/43(e) 35,119,155 38,161,394Series 4281 BC, 4.50%, 12/15/43(e) 99,135,465 106,296,455Series 4319 MA, 4.50%, 3/15/44(e) 19,437,903 20,785,494
Ginnie MaeUSD LIBOR 1-Month
+0.65%, 2.424%, 10/20/64 7,325,847 7,327,838+0.63%, 2.404%, 4/20/65 10,773,591 10,768,995+0.60%, 2.374%, 7/20/65 7,287,678 7,277,014+0.60%, 2.374%, 8/20/65 7,145,487 7,134,901+0.62%, 2.394%, 9/20/65 1,547,315 1,546,075+0.75%, 2.524%, 11/20/65 28,641,728 28,749,730+0.90%, 2.674%, 3/20/66 18,079,918 18,248,260+0.90%, 2.674%, 4/20/66 19,898,374 20,084,287+0.78%, 2.554%, 9/20/66 10,690,613 10,743,469+0.75%, 2.524%, 10/20/66 51,194,211 51,404,378+0.80%, 2.574%, 11/20/66 22,274,923 22,410,650+0.81%, 2.584%, 12/20/66 12,853,998 12,939,094+0.57%, 2.344%, 9/20/67 28,775,981 28,796,332+0.60%, 2.374%, 9/20/69 44,330,404 44,184,043+0.60%, 2.374%, 11/20/69 30,418,113 30,175,016+0.65%, 2.424%, 11/20/69 39,828,269 39,629,852+0.65%, 2.424%, 11/20/69 120,004,752 119,402,690
USD LIBOR 12-Month+0.30%, 2.416%, 9/20/66 18,462,022 18,406,145+0.28%, 2.205%, 12/20/66 35,322,642 35,029,510+0.30%, 3.42%, 1/20/67 93,002,433 92,351,537+0.30%, 3.42%, 1/20/67 100,640,273 99,941,135+0.31%, 3.43%, 1/20/67 37,155,321 36,914,209
P A G E 8 ▪ D O D G E & C O X I N C O M E F U N D See accompanying Notes to Financial Statements

PORTFOLIO OF INVESTMENTS December 31, 2019
DEBT SECURITIES (continued)
PAR VALUE VALUE
+0.25%, 3.271%, 2/20/67 $ 19,474,805 $ 19,327,450+0.20%, 3.221%, 3/20/67 3,257,860 3,227,344+0.30%, 3.179%, 4/20/67 23,066,985 22,950,734+0.20%, 2.93%, 5/20/67 45,232,702 44,773,305+0.30%, 3.03%, 5/20/67 19,742,465 19,632,480+0.20%, 2.937%, 6/20/67 98,866,019 97,871,575+0.30%, 3.037%, 6/20/67 23,527,397 23,405,099+0.20%, 2.403%, 8/20/67 21,975,571 21,715,523+0.25%, 2.366%, 9/20/67 22,721,217 22,500,730+0.27%, 2.386%, 9/20/67 68,861,066 68,182,495+0.22%, 2.194%, 10/20/67 32,855,249 32,463,056+0.23%, 2.204%, 10/20/67 157,005,662 154,925,274+0.23%, 2.204%, 10/20/67 72,934,083 72,006,011+0.25%, 2.224%, 10/20/67 47,997,422 47,416,505+0.20%, 2.158%, 11/20/67 16,836,315 16,611,673+0.22%, 2.178%, 11/20/67 22,837,593 22,551,209+0.22%, 2.178%, 11/20/67 130,572,907 128,772,895+0.18%, 2.105%, 12/20/67 33,984,699 33,436,304+0.06%, 3.062%, 12/20/67 55,674,382 54,578,510+0.06%, 3.062%, 1/20/68 101,971,595 99,986,096+0.08%, 3.082%, 1/20/68 45,084,760 44,344,243+0.15%, 3.27%, 1/20/68 15,890,033 15,620,028+0.05%, 2.56%, 2/20/68 24,688,109 24,293,092+0.04%, 3.061%, 2/20/68 52,753,517 51,739,368+0.05%, 3.071%, 2/20/68 3,635,749 3,568,424+0.07%, 3.091%, 2/20/68 47,685,390 46,815,084+0.10%, 3.102%, 2/20/68 92,443,103 90,395,350+0.10%, 3.102%, 2/20/68 46,166,788 45,243,304+0.15%, 3.152%, 2/20/68 33,010,622 32,470,175+0.03%, 2.909%, 3/20/68 17,975,119 17,608,976+0.05%, 2.929%, 3/20/68 43,416,549 42,689,226+0.04%, 3.061%, 3/20/68 84,949,986 83,356,494+0.04%, 3.061%, 3/20/68 34,848,319 33,987,628+0.06%, 3.081%, 3/20/68 13,765,003 13,435,430+0.02%, 2.899%, 4/20/68 23,901,949 23,280,078+0.05%, 2.929%, 4/20/68 45,083,144 44,009,056+0.05%, 2.929%, 4/20/68 39,566,921 38,618,221+0.04%, 2.77%, 5/20/68 46,429,685 45,277,050+0.15%, 2.887%, 6/20/68 44,444,397 43,645,558+0.25%, 2.76%, 7/20/68 41,089,848 40,541,800+0.12%, 2.236%, 8/20/68 33,732,386 33,169,952+0.10%, 2.074%, 10/20/68 62,250,920 60,555,647+0.22%, 2.178%, 11/20/68 34,131,204 33,513,392+0.30%, 2.258%, 11/20/68 35,268,295 34,932,597+0.40%, 3.30%, 2/20/69 30,357,179 30,266,900+0.50%, 2.506%, 11/20/69 71,456,059 71,450,484
3,206,675,029Federal Agency Mortgage Pass-Through: 29.1%Fannie Mae, 15 Year
6.00%, 12/1/19-3/1/23 7,962,898 8,156,5175.50%, 1/1/21-7/1/25 39,829,314 41,296,9404.00%, 9/1/25 562,878 573,1744.00%, 11/1/33 329,699,991 353,142,2255.00%, 9/1/25 17,968,894 18,669,3633.50%, 10/1/25-9/1/33 585,541,438 607,322,3613.50%, 6/1/34 356,938,488 370,070,5374.50%, 3/1/29 12,968,508 13,629,494
Fannie Mae, 20 Year4.50%, 3/1/29-1/1/34 295,730,706 316,376,9554.00%, 9/1/30-3/1/37 1,419,057,843 1,511,054,6633.50%, 11/1/35-10/1/39 379,156,608 394,227,841
Fannie Mae, 30 Year6.00%, 11/1/28-2/1/39 76,596,738 87,645,0297.00%, 4/1/32-2/1/39 6,629,734 7,632,6406.50%, 12/1/32-8/1/39 31,189,238 35,530,4085.50%, 2/1/33-11/1/39 115,200,902 128,341,764
PAR VALUE VALUE
4.50%, 11/1/35-3/1/49 $ 4,300,822,654 $ 4,568,055,4454.50%, 6/1/48 379,214,830 400,449,8674.50%, 6/1/48 547,804,438 578,577,2594.50%, 7/1/48 261,402,264 275,299,9594.50%, 7/1/48 248,842,681 262,851,1134.50%, 1/1/49 557,880,311 586,593,3844.50%, 3/1/49 536,082,543 563,857,8485.00%, 7/1/37-3/1/49 157,763,453 169,245,7094.00%, 10/1/40-2/1/47 464,167,554 491,943,655
Fannie Mae, 40 Year4.50%, 1/1/52-6/1/56 131,717,117 142,569,632
Fannie Mae, Hybrid ARM(e)
1-Year U.S. Treasury CMT+2.14%, 4.357%, 10/1/33 873,666 919,694+2.14%, 4.544%, 8/1/34 241,556 254,473+1.95%, 3.953%, 9/1/34 1,127,447 1,181,921+2.29%, 4.72%, 1/1/36 6,998,707 7,377,108+2.12%, 4.496%, 7/1/36 60,031 63,335+2.12%, 4.58%, 12/1/36 1,032,346 1,083,968
USD LIBOR 12-Month+1.68%, 4.482%, 7/1/34 1,279,452 1,337,351+1.37%, 3.247%, 10/1/34 608,464 627,761+1.94%, 4.117%, 1/1/35 646,610 683,801+1.39%, 4.379%, 4/1/35 1,184,289 1,226,363+1.75%, 4.625%, 6/1/35 361,143 379,604+1.45%, 4.148%, 7/1/35 342,994 354,760+1.45%, 4.176%, 7/1/35 329,174 342,587+1.52%, 4.291%, 7/1/35 519,888 539,691+1.75%, 4.524%, 7/1/35 1,023,914 1,077,235+1.31%, 3.667%, 8/1/35 629,454 648,826+1.36%, 3.739%, 8/1/35 2,193,793 2,298,993+1.75%, 4.125%, 8/1/35 1,043,621 1,094,127+1.77%, 4.085%, 9/1/35 949,039 984,550+1.55%, 3.854%, 10/1/35 1,149,984 1,193,858+1.75%, 3.998%, 10/1/35 784,951 820,149+1.62%, 3.698%, 12/1/35 321,875 333,583+1.62%, 3.696%, 1/1/36 1,500,446 1,565,743+1.69%, 4.087%, 1/1/36 2,180,447 2,283,835+1.71%, 4.205%, 11/1/36 800,890 839,332+1.74%, 3.753%, 12/1/36 753,280 788,960+1.59%, 3.863%, 1/1/37 925,542 966,922+1.98%, 4.516%, 2/1/37 1,632,833 1,731,131+1.93%, 4.803%, 4/1/37 333,777 355,040+1.74%, 4.523%, 8/1/37 1,077,235 1,133,862+1.48%, 4.042%, 11/1/37 450,738 467,510+1.73%, 4.357%, 5/1/38 71,189,926 74,581,437+1.93%, 4.801%, 5/1/38 1,473,300 1,561,331+1.88%, 4.285%, 9/1/38 114,511 119,111+1.71%, 3.881%, 10/1/38 938,378 981,745+1.59%, 3.981%, 10/1/38 2,301,971 2,397,633+1.73%, 4.269%, 10/1/38 542,664 570,328+1.71%, 4.277%, 6/1/39 403,776 424,597+1.77%, 3.744%, 12/1/39 655,697 677,329+1.71%, 4.608%, 4/1/42 3,617,060 3,757,467+1.67%, 3.979%, 9/1/42 2,570,651 2,656,616+1.68%, 3.598%, 11/1/42 3,063,014 3,173,583+1.57%, 2.284%, 12/1/42 11,778,537 11,885,532+1.57%, 3.407%, 2/1/43 6,875,552 7,069,547+1.82%, 4.115%, 2/1/43 1,439,575 1,501,538+1.56%, 2.317%, 5/1/43 2,471,722 2,492,978+1.47%, 4.306%, 6/1/43 666,130 674,241+1.56%, 2.955%, 9/1/43 2,953,575 3,035,342+1.56%, 3.257%, 9/1/43 2,019,037 2,061,380+1.46%, 4.045%, 9/1/43 1,493,422 1,533,988+1.60%, 2.887%, 10/1/43 20,269,514 20,834,678+1.55%, 2.649%, 11/1/43 8,585,056 8,817,378+1.60%, 2.883%, 11/1/43 10,950,875 11,117,094
See accompanying Notes to Financial Statements D O D G E & C O X I N C O M E F U N D ▪ P A G E 9
PORTFOLIO OF INVESTMENTS December 31, 2019
DEBT SECURITIES (continued)
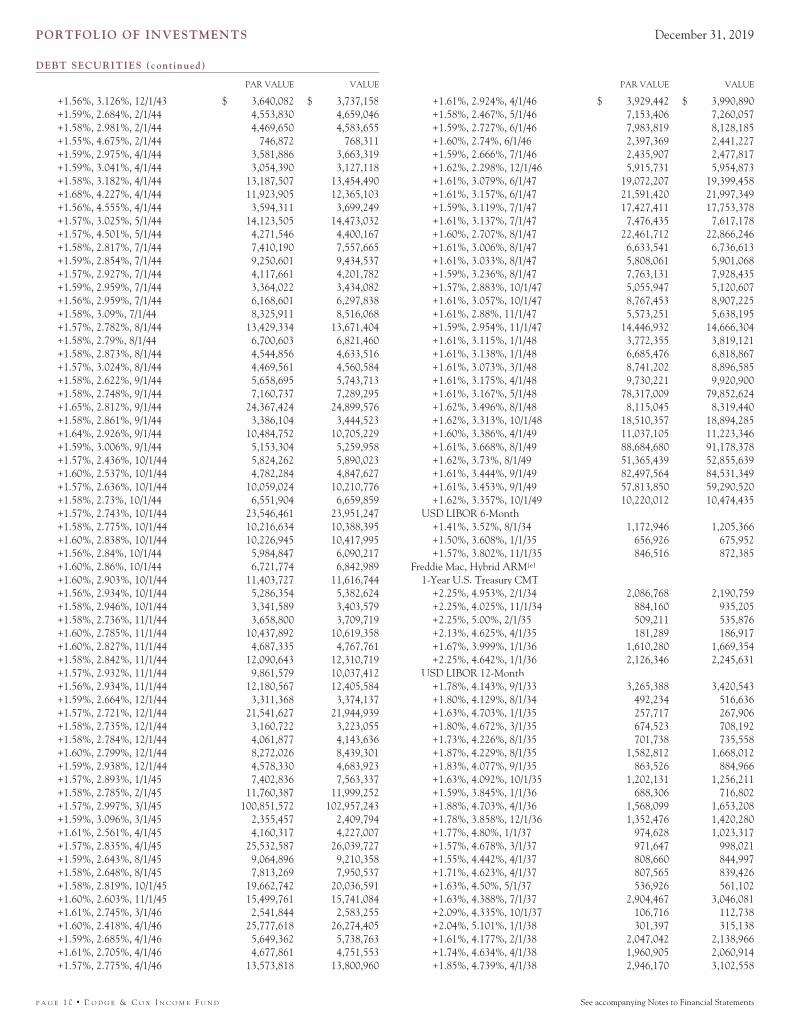
PAR VALUE VALUE
+1.56%, 3.126%, 12/1/43 $ 3,640,082 $ 3,737,158+1.59%, 2.684%, 2/1/44 4,553,830 4,659,046+1.58%, 2.981%, 2/1/44 4,469,650 4,583,655+1.55%, 4.675%, 2/1/44 746,872 768,311+1.59%, 2.975%, 4/1/44 3,581,886 3,663,319+1.59%, 3.041%, 4/1/44 3,054,390 3,127,118+1.58%, 3.182%, 4/1/44 13,187,507 13,454,490+1.68%, 4.227%, 4/1/44 11,923,905 12,365,103+1.56%, 4.555%, 4/1/44 3,594,311 3,699,249+1.57%, 3.025%, 5/1/44 14,123,505 14,473,032+1.57%, 4.501%, 5/1/44 4,271,546 4,400,167+1.58%, 2.817%, 7/1/44 7,410,190 7,557,665+1.59%, 2.854%, 7/1/44 9,250,601 9,434,537+1.57%, 2.927%, 7/1/44 4,117,661 4,201,782+1.59%, 2.959%, 7/1/44 3,364,022 3,434,082+1.56%, 2.959%, 7/1/44 6,168,601 6,297,838+1.58%, 3.09%, 7/1/44 8,325,911 8,516,068+1.57%, 2.782%, 8/1/44 13,429,334 13,671,404+1.58%, 2.79%, 8/1/44 6,700,603 6,821,460+1.58%, 2.873%, 8/1/44 4,544,856 4,633,516+1.57%, 3.024%, 8/1/44 4,469,561 4,560,584+1.58%, 2.622%, 9/1/44 5,658,695 5,743,713+1.58%, 2.748%, 9/1/44 7,160,737 7,289,295+1.65%, 2.812%, 9/1/44 24,367,424 24,899,576+1.58%, 2.861%, 9/1/44 3,386,104 3,444,523+1.64%, 2.926%, 9/1/44 10,484,752 10,705,229+1.59%, 3.006%, 9/1/44 5,153,304 5,259,958+1.57%, 2.436%, 10/1/44 5,824,262 5,890,023+1.60%, 2.537%, 10/1/44 4,782,284 4,847,627+1.57%, 2.636%, 10/1/44 10,059,024 10,210,776+1.58%, 2.73%, 10/1/44 6,551,904 6,659,859+1.57%, 2.743%, 10/1/44 23,546,461 23,951,247+1.58%, 2.775%, 10/1/44 10,216,634 10,388,395+1.60%, 2.838%, 10/1/44 10,226,945 10,417,995+1.56%, 2.84%, 10/1/44 5,984,847 6,090,217+1.60%, 2.86%, 10/1/44 6,721,774 6,842,989+1.60%, 2.903%, 10/1/44 11,403,727 11,616,744+1.56%, 2.934%, 10/1/44 5,286,354 5,382,624+1.58%, 2.946%, 10/1/44 3,341,589 3,403,579+1.58%, 2.736%, 11/1/44 3,658,800 3,709,719+1.60%, 2.785%, 11/1/44 10,437,892 10,619,358+1.60%, 2.827%, 11/1/44 4,687,335 4,767,761+1.58%, 2.842%, 11/1/44 12,090,643 12,310,719+1.57%, 2.932%, 11/1/44 9,861,579 10,037,412+1.56%, 2.934%, 11/1/44 12,180,567 12,405,584+1.59%, 2.664%, 12/1/44 3,311,368 3,374,137+1.57%, 2.721%, 12/1/44 21,541,627 21,944,939+1.58%, 2.735%, 12/1/44 3,160,722 3,223,055+1.58%, 2.784%, 12/1/44 4,061,877 4,143,636+1.60%, 2.799%, 12/1/44 8,272,026 8,439,301+1.59%, 2.938%, 12/1/44 4,578,330 4,683,923+1.57%, 2.893%, 1/1/45 7,402,836 7,563,337+1.58%, 2.785%, 2/1/45 11,760,387 11,999,252+1.57%, 2.997%, 3/1/45 100,851,572 102,957,243+1.59%, 3.096%, 3/1/45 2,355,457 2,409,794+1.61%, 2.561%, 4/1/45 4,160,317 4,227,007+1.57%, 2.835%, 4/1/45 25,532,587 26,039,727+1.59%, 2.643%, 8/1/45 9,064,896 9,210,358+1.58%, 2.648%, 8/1/45 7,813,269 7,950,537+1.58%, 2.819%, 10/1/45 19,662,742 20,036,591+1.60%, 2.603%, 11/1/45 15,499,761 15,741,084+1.61%, 2.745%, 3/1/46 2,541,844 2,583,255+1.60%, 2.418%, 4/1/46 25,777,618 26,274,405+1.59%, 2.685%, 4/1/46 5,649,362 5,738,763+1.61%, 2.705%, 4/1/46 4,677,861 4,751,553+1.57%, 2.775%, 4/1/46 13,573,818 13,800,960
PAR VALUE VALUE
+1.61%, 2.924%, 4/1/46 $ 3,929,442 $ 3,990,890+1.58%, 2.467%, 5/1/46 7,153,406 7,260,057+1.59%, 2.727%, 6/1/46 7,983,819 8,128,185+1.60%, 2.74%, 6/1/46 2,397,369 2,441,227+1.59%, 2.666%, 7/1/46 2,435,907 2,477,817+1.62%, 2.298%, 12/1/46 5,915,731 5,954,873+1.61%, 3.079%, 6/1/47 19,072,207 19,399,458+1.61%, 3.157%, 6/1/47 21,591,420 21,997,349+1.59%, 3.119%, 7/1/47 17,427,411 17,753,378+1.61%, 3.137%, 7/1/47 7,476,435 7,617,178+1.60%, 2.707%, 8/1/47 22,461,712 22,866,246+1.61%, 3.006%, 8/1/47 6,633,541 6,736,613+1.61%, 3.033%, 8/1/47 5,808,061 5,901,068+1.59%, 3.236%, 8/1/47 7,763,131 7,928,435+1.57%, 2.883%, 10/1/47 5,055,947 5,120,607+1.61%, 3.057%, 10/1/47 8,767,453 8,907,225+1.61%, 2.88%, 11/1/47 5,573,251 5,638,195+1.59%, 2.954%, 11/1/47 14,446,932 14,666,304+1.61%, 3.115%, 1/1/48 3,772,355 3,819,121+1.61%, 3.138%, 1/1/48 6,685,476 6,818,867+1.61%, 3.073%, 3/1/48 8,741,202 8,896,585+1.61%, 3.175%, 4/1/48 9,730,221 9,920,900+1.61%, 3.167%, 5/1/48 78,317,009 79,852,624+1.62%, 3.496%, 8/1/48 8,115,045 8,319,440+1.62%, 3.313%, 10/1/48 18,510,357 18,894,285+1.60%, 3.386%, 4/1/49 11,037,105 11,223,346+1.61%, 3.668%, 8/1/49 88,684,680 91,178,378+1.62%, 3.73%, 8/1/49 51,365,439 52,855,639+1.61%, 3.444%, 9/1/49 82,497,564 84,531,349+1.61%, 3.453%, 9/1/49 57,813,850 59,290,520+1.62%, 3.357%, 10/1/49 10,220,012 10,474,435
USD LIBOR 6-Month+1.41%, 3.52%, 8/1/34 1,172,946 1,205,366+1.50%, 3.608%, 1/1/35 656,926 675,952+1.57%, 3.802%, 11/1/35 846,516 872,385
Freddie Mac, Hybrid ARM(e)
1-Year U.S. Treasury CMT+2.25%, 4.953%, 2/1/34 2,086,768 2,190,759+2.25%, 4.025%, 11/1/34 884,160 935,205+2.25%, 5.00%, 2/1/35 509,211 535,876+2.13%, 4.625%, 4/1/35 181,289 186,917+1.67%, 3.999%, 1/1/36 1,610,280 1,669,354+2.25%, 4.642%, 1/1/36 2,126,346 2,245,631
USD LIBOR 12-Month+1.78%, 4.143%, 9/1/33 3,265,388 3,420,543+1.80%, 4.129%, 8/1/34 492,234 516,636+1.63%, 4.703%, 1/1/35 257,717 267,906+1.80%, 4.672%, 3/1/35 674,523 708,192+1.73%, 4.226%, 8/1/35 701,738 735,558+1.87%, 4.229%, 8/1/35 1,582,812 1,668,012+1.83%, 4.077%, 9/1/35 863,526 884,966+1.63%, 4.092%, 10/1/35 1,202,131 1,256,211+1.59%, 3.845%, 1/1/36 688,306 716,802+1.88%, 4.703%, 4/1/36 1,568,099 1,653,208+1.78%, 3.858%, 12/1/36 1,352,476 1,420,280+1.77%, 4.80%, 1/1/37 974,628 1,023,317+1.57%, 4.678%, 3/1/37 971,647 998,021+1.55%, 4.442%, 4/1/37 808,660 844,997+1.71%, 4.623%, 4/1/37 807,565 839,426+1.63%, 4.50%, 5/1/37 536,926 561,102+1.63%, 4.388%, 7/1/37 2,904,467 3,046,081+2.09%, 4.335%, 10/1/37 106,716 112,738+2.04%, 5.101%, 1/1/38 301,397 315,138+1.61%, 4.177%, 2/1/38 2,047,042 2,138,966+1.74%, 4.634%, 4/1/38 1,960,905 2,060,914+1.85%, 4.739%, 4/1/38 2,946,170 3,102,558
P A G E 1 0 ▪ D O D G E & C O X I N C O M E F U N D See accompanying Notes to Financial Statements

PORTFOLIO OF INVESTMENTS December 31, 2019
DEBT SECURITIES (continued)
PAR VALUE VALUE
+1.89%, 4.767%, 5/1/38 $ 590,741 $ 611,767+1.67%, 4.414%, 6/1/38 1,620,170 1,698,870+1.73%, 4.294%, 10/1/38 233,852 243,008+1.74%, 4.344%, 10/1/38 1,726,299 1,812,396+1.78%, 4.528%, 11/1/39 876,476 923,139+1.85%, 4.437%, 7/1/43 1,067,846 1,115,345+1.71%, 4.375%, 8/1/43 12,610,119 13,096,596+1.64%, 2.781%, 10/1/43 1,413,258 1,451,501+1.58%, 2.856%, 1/1/44 2,281,091 2,334,064+1.61%, 3.083%, 1/1/44 2,683,387 2,748,207+1.62%, 2.837%, 2/1/44 7,531,884 7,694,543+1.64%, 3.123%, 4/1/44 2,157,768 2,208,509+1.63%, 3.148%, 4/1/44 4,662,609 4,772,478+1.63%, 2.998%, 5/1/44 66,108,780 67,694,769+1.62%, 2.854%, 6/1/44 4,021,466 4,099,211+1.62%, 3.096%, 6/1/44 13,122,167 13,430,796+1.62%, 3.062%, 7/1/44 4,639,325 4,740,665+1.63%, 3.076%, 7/1/44 3,386,596 3,458,002+1.61%, 2.848%, 8/1/44 5,457,372 5,552,113+1.62%, 3.023%, 8/1/44 6,647,292 6,783,499+1.63%, 3.075%, 8/1/44 6,543,327 6,680,338+1.62%, 2.682%, 9/1/44 6,426,794 6,520,761+1.62%, 2.781%, 9/1/44 6,821,495 6,918,109+1.62%, 2.841%, 9/1/44 5,901,532 6,008,602+1.62%, 2.821%, 10/1/44 3,583,914 3,642,227+1.62%, 2.881%, 10/1/44 11,019,662 11,244,406+1.61%, 2.913%, 10/1/44 8,301,234 8,448,106+1.63%, 2.913%, 10/1/44 9,864,105 10,069,690+1.63%, 3.025%, 10/1/44 10,011,848 10,209,830+1.60%, 2.693%, 11/1/44 12,705,462 12,933,896+1.63%, 2.737%, 11/1/44 6,097,664 6,209,042+1.63%, 2.803%, 11/1/44 9,513,569 9,670,399+1.61%, 2.887%, 11/1/44 6,414,981 6,547,426+1.61%, 2.901%, 11/1/44 17,285,430 17,587,068+1.61%, 2.904%, 11/1/44 5,033,350 5,125,908+1.62%, 2.924%, 11/1/44 9,993,717 10,209,603+1.62%, 2.934%, 11/1/44 8,421,782 8,596,454+1.63%, 2.936%, 11/1/44 13,501,113 13,752,431+1.63%, 2.941%, 11/1/44 8,122,119 8,294,596+1.60%, 3.005%, 11/1/44 4,507,970 4,612,990+1.63%, 2.71%, 12/1/44 2,698,689 2,746,672+1.63%, 2.83%, 12/1/44 13,825,550 14,102,120+1.62%, 2.893%, 12/1/44 8,254,394 8,431,057+1.63%, 2.901%, 12/1/44 11,435,327 11,677,631+1.62%, 2.938%, 12/1/44 5,862,532 5,989,687+1.62%, 2.64%, 1/1/45 8,895,931 9,048,811+1.63%, 2.836%, 1/1/45 7,457,417 7,610,366+1.62%, 2.837%, 1/1/45 7,247,568 7,386,598+1.62%, 2.922%, 1/1/45 12,989,448 13,261,288+1.63%, 3.071%, 1/1/45 16,279,116 16,613,100+1.62%, 2.876%, 2/1/45 10,684,287 10,899,588+1.62%, 2.588%, 4/1/45 4,889,852 4,970,076+1.63%, 2.60%, 5/1/45 33,654,644 34,183,218+1.63%, 2.755%, 6/1/45 3,760,184 3,825,330+1.63%, 2.651%, 8/1/45 9,536,895 9,682,162+1.64%, 2.74%, 8/1/45 26,710,853 27,162,801+1.61%, 2.816%, 8/1/45 6,439,688 6,553,157+1.63%, 2.803%, 9/1/45 7,901,967 8,042,387+1.63%, 2.724%, 5/1/46 170,596,151 173,510,392+1.62%, 2.751%, 5/1/46 11,588,725 11,767,969+1.62%, 2.605%, 7/1/46 18,209,491 18,477,821+1.63%, 2.533%, 9/1/46 33,983,483 34,336,715+1.63%, 3.167%, 6/1/47 8,606,124 8,751,787+1.63%, 3.182%, 8/1/47 5,129,759 5,219,066+1.64%, 3.099%, 10/1/47 6,707,398 6,816,870+1.64%, 3.146%, 11/1/47 3,447,430 3,507,572+1.64%, 3.573%, 2/1/49 27,545,963 28,243,574
PAR VALUE VALUE
USD LIBOR 6-Month+1.60%, 3.794%, 8/1/36 $ 1,578,173 $ 1,636,011
Freddie Mac Gold, 15 Year5.50%, 10/1/20-12/1/24 608,142 617,2296.00%, 8/1/21-11/1/23 3,749,546 3,874,5644.50%, 3/1/25-6/1/26 6,734,087 7,027,359
Freddie Mac Gold, 20 Year6.50%, 10/1/26 1,514,886 1,682,6244.50%, 5/1/30-1/1/34 74,673,212 80,148,9984.00%, 9/1/31-10/1/35 356,767,188 380,027,1463.50%, 7/1/35-1/1/36 139,531,193 145,877,262
Freddie Mac Gold, 30 Year7.90%, 2/17/21 437 4377.00%, 4/1/31-11/1/38 2,317,031 2,607,1866.50%, 12/1/32-10/1/38 7,718,824 8,763,9946.00%, 12/1/33-2/1/39 13,507,839 15,411,3815.50%, 3/1/34-12/1/38 38,522,067 43,241,9454.50%, 3/1/39-2/1/49 1,778,001,815 1,899,385,0474.50%, 3/1/49 251,339,762 264,914,3644.00%, 11/1/45-11/1/47 634,871,625 671,900,928
Freddie Mac Pool, 15 Year6.00%, 10/1/21 1,940 1,980
Freddie Mac Pool, 20 Year3.50%, 8/1/39 241,531,740 251,490,758
Freddie Mac Pool, 30 Year7.00%, 11/1/37 8,302 9,6384.50%, 7/1/42-4/1/49 438,001,453 461,445,775
Ginnie Mae, 20 Year4.00%, 1/20/35 6,325,044 6,535,341
Ginnie Mae, 30 Year7.80%, 7/15/20-1/15/21 6,250 6,2697.85%, 1/15/21 1,221 1,2237.50%, 12/15/23-5/15/25 460,296 493,8757.00%, 5/15/28 165,177 179,592
18,511,561,803PRIVATE LABEL CMO & REMIC: 0.0%(h)
GSMPS Mortgage Loan TrustSeries 2004-4 1A4, 8.50%, 6/25/34(b) 2,785,084 3,065,982
Seasoned Credit Risk Transfer TrustSeries 2017-4 M45T, 4.50%, 6/25/57 24,534,699 26,218,197
29,284,179
21,747,521,011
26,354,601,119CORPORATE: 34.0%FINANCIALS: 11.6%Bank of America Corp.
3.004%, 12/20/23(f) 422,916,000 433,107,6844.20%, 8/26/24 163,140,000 175,112,0314.25%, 10/22/26 185,082,000 201,695,256
Barclays PLC (United Kingdom)4.375%, 9/11/24 239,204,000 251,098,5384.836%, 5/9/28 77,975,000 83,995,812
BNP Paribas SA (France)4.25%, 10/15/24 381,716,000 409,184,9974.375%, 9/28/25(b) 70,131,000 75,479,4534.375%, 5/12/26(b) 102,019,000 109,441,1274.625%, 3/13/27(b) 232,400,000 253,937,256
Boston Properties, Inc.4.125%, 5/15/21 52,852,000 54,082,6323.85%, 2/1/23 76,031,000 79,627,3893.125%, 9/1/23 19,500,000 20,111,7113.80%, 2/1/24 64,024,000 67,677,868
See accompanying Notes to Financial Statements D O D G E & C O X I N C O M E F U N D ▪ P A G E 1 1

PORTFOLIO OF INVESTMENTS December 31, 2019
DEBT SECURITIES (continued)
PAR VALUE VALUE
3.20%, 1/15/25 $ 47,075,000 $ 48,823,1653.65%, 2/1/26 19,580,000 20,728,5604.50%, 12/1/28 101,325,000 114,752,952
Capital One Financial Corp.3.50%, 6/15/23 129,377,000 134,366,4853.75%, 4/24/24 14,640,000 15,406,3973.20%, 2/5/25 45,901,000 47,506,2344.20%, 10/29/25 121,149,000 130,644,392
Citigroup, Inc.3.50%, 5/15/23 72,730,000 75,659,1574.00%, 8/5/24 31,300,000 33,495,673USD LIBOR 3-Month
+6.37%, 8.306%, 10/30/40(a) 427,488,075 474,511,763Equity Residential
4.625%, 12/15/21 108,687,000 113,526,8323.00%, 4/15/23 47,300,000 48,685,5363.375%, 6/1/25 77,890,000 81,787,465
HSBC Holdings PLC (United Kingdom)5.10%, 4/5/21 85,935,000 89,105,8379.30%, 6/1/21 100,000 109,3542.65%, 1/5/22 32,865,000 33,214,5403.262%, 3/13/23(f) 13,570,000 13,874,3473.60%, 5/25/23 63,550,000 66,256,7423.95%, 5/18/24(f) 133,680,000 140,565,8704.30%, 3/8/26 116,100,000 126,316,7166.50%, 5/2/36 218,122,000 297,540,3906.50%, 9/15/37 230,191,000 316,577,7816.80%, 6/1/38 20,025,000 28,475,318
JPMorgan Chase & Co.3.375%, 5/1/23 92,238,000 95,801,2734.125%, 12/15/26 119,864,000 131,173,3044.25%, 10/1/27 125,244,000 138,500,9688.75%, 9/1/30(a) 81,412,000 118,601,343
Lloyds Banking Group PLC(United Kingdom)4.05%, 8/16/23 131,150,000 138,969,8034.50%, 11/4/24 218,317,000 233,289,0954.65%, 3/24/26 92,232,000 100,215,530
Royal Bank of Scotland Group PLC(United Kingdom)6.125%, 12/15/22 340,311,000 372,298,4616.10%, 6/10/23 19,737,000 21,717,7516.00%, 12/19/23 350,211,000 389,225,0205.125%, 5/28/24 28,169,000 30,497,239
UniCredit SPA (Italy)7.296%, 4/2/34(b)(f) 292,266,000 335,823,004
Unum Group7.25%, 3/15/28 18,838,000 23,276,1666.75%, 12/15/28 8,107,000 10,065,018
Wells Fargo & Co.3.55%, 8/14/23 244,815,000 256,501,0604.10%, 6/3/26 130,170,000 140,257,8604.30%, 7/22/27 159,265,000 174,354,336
7,377,050,491INDUSTRIALS: 20.8%AbbVie, Inc. 3.20%, 11/21/29(b) 239,530,000 243,524,019
4.05%, 11/21/39(b) 99,360,000 105,004,5624.25%, 11/21/49(b) 121,960,000 128,355,980
AT&T, Inc. 8.75%, 11/15/31 100,978,000 143,356,1565.35%, 9/1/40 59,744,000 71,929,5804.75%, 5/15/46 78,945,000 89,084,9885.65%, 2/15/47 122,520,000 155,860,8085.45%, 3/1/47 140,205,000 173,671,507
Bayer AG (Germany)3.875%, 12/15/23(b) 301,635,000 316,414,2734.25%, 12/15/25(b) 133,965,000 144,427,227
PAR VALUE VALUE
4.375%, 12/15/28(b) $ 170,210,000 $ 185,558,117BHP Billiton, Ltd. (Australia)
6.75%, 10/19/75(a)(b)(f) 55,286,000 64,915,163Burlington Northern Santa Fe LLC(d)
8.251%, 1/15/21 978,256 1,004,1843.05%, 9/1/22 39,535,000 40,619,9735.943%, 1/15/23 8,173 8,3143.85%, 9/1/23 79,525,000 84,452,2175.72%, 1/15/24 9,702,747 10,339,8665.342%, 4/1/24 2,751,962 2,887,8285.629%, 4/1/24 11,937,632 12,632,8765.996%, 4/1/24 26,189,768 28,535,0483.442%, 6/16/28(b) 75,389,733 79,687,829
Cemex SAB de CV (Mexico)6.00%, 4/1/24(b) 72,394,000 74,421,7565.70%, 1/11/25(b) 225,456,000 231,658,2956.125%, 5/5/25(b) 113,075,000 117,316,4437.75%, 4/16/26(b) 138,048,000 150,127,200
Charter Communications, Inc.5.00%, 2/1/20 20,700,000 20,738,7654.125%, 2/15/21 33,095,000 33,624,6284.00%, 9/1/21 40,609,000 41,546,6554.908%, 7/23/25 109,110,000 120,103,5986.55%, 5/1/37 46,188,000 56,543,2756.75%, 6/15/39 112,072,000 142,012,8376.484%, 10/23/45 450,292,000 561,550,2875.375%, 5/1/47 57,310,000 64,117,1295.75%, 4/1/48 195,865,000 228,118,497
Cigna Corp.4.00%, 2/15/22(b) 62,964,000 64,983,7807.65%, 3/1/23(b) 7,217,000 8,279,6323.75%, 7/15/23 244,625,000 256,385,5724.125%, 11/15/25 47,550,000 51,548,6407.875%, 5/15/27(b) 26,720,000 34,638,0904.375%, 10/15/28 154,300,000 170,728,326
Cox Enterprises, Inc.3.25%, 12/15/22(b) 94,333,000 96,986,3802.95%, 6/30/23(b) 251,295,000 255,878,6713.85%, 2/1/25(b) 231,475,000 245,137,5483.35%, 9/15/26(b) 139,412,000 143,876,1413.50%, 8/15/27(b) 48,562,000 50,728,118
CRH PLC (Ireland)3.875%, 5/18/25(b) 181,839,000 194,118,868
CSX Corp.9.75%, 6/15/20 10,067,000 10,402,4136.251%, 1/15/23 10,784,691 11,740,485
CVS Health Corp.4.10%, 3/25/25 42,500,000 45,587,2794.30%, 3/25/28 153,100,000 167,068,1374.78%, 3/25/38 89,275,000 101,189,390
Dell Technologies, Inc.5.45%, 6/15/23(b) 90,089,000 97,661,767
Dillard’s, Inc.7.875%, 1/1/23 275,000 297,0647.75%, 7/15/26 21,016,000 23,713,8507.75%, 5/15/27 12,848,000 14,684,4087.00%, 12/1/28 28,225,000 31,338,538
Dow, Inc.7.375%, 11/1/29 69,100,000 91,536,0699.40%, 5/15/39 153,811,000 251,915,3075.25%, 11/15/41 39,918,000 46,586,258
Elanco Animal Health, Inc.3.912%, 8/27/21 32,870,000 33,713,7174.272%, 8/28/23 32,775,000 34,599,4544.90%, 8/28/28 46,519,000 50,560,547
Ford Motor Credit Co. LLC(d)
5.75%, 2/1/21 192,923,000 199,117,981
P A G E 1 2 ▪ D O D G E & C O X I N C O M E F U N D See accompanying Notes to Financial Statements

PORTFOLIO OF INVESTMENTS December 31, 2019
DEBT SECURITIES (continued)
PAR VALUE VALUE
5.875%, 8/2/21 $ 169,660,000 $ 177,577,6423.813%, 10/12/21 194,775,000 198,330,1685.596%, 1/7/22 105,725,000 111,378,9733.219%, 1/9/22 30,125,000 30,335,6984.25%, 9/20/22 3,142,000 3,248,6974.14%, 2/15/23 127,081,000 130,672,3974.375%, 8/6/23 49,659,000 51,604,9044.063%, 11/1/24 39,570,000 40,356,163
HCA Healthcare, Inc.4.125%, 6/15/29 73,620,000 78,009,9455.125%, 6/15/39 39,000,000 43,041,1395.25%, 6/15/49 43,600,000 48,599,149
Imperial Brands PLC (United Kingdom)4.25%, 7/21/25(b) 580,620,000 612,176,8193.875%, 7/26/29(b) 195,925,000 197,371,888
Kinder Morgan, Inc.6.50%, 2/1/37 50,861,000 63,419,9166.95%, 1/15/38 92,139,000 121,813,1816.50%, 9/1/39 72,546,000 91,962,7825.00%, 8/15/42 78,782,000 86,175,8395.00%, 3/1/43 86,308,000 94,879,7685.50%, 3/1/44 96,910,000 113,147,8295.40%, 9/1/44 69,297,000 80,044,046
Macy’s, Inc.6.70%, 7/15/34 77,960,000 87,721,0704.50%, 12/15/34 95,617,000 90,828,3906.375%, 3/15/37 21,354,000 22,689,761
Nordstrom, Inc.6.95%, 3/15/28 20,107,000 24,164,260
Occidental Petroleum Corp.2.90%, 8/15/24 107,365,000 109,023,3683.20%, 8/15/26 38,905,000 39,364,1083.50%, 8/15/29 91,530,000 93,307,992
Prosus NV (Netherlands)6.00%, 7/18/20(b) 220,010,000 223,550,4015.50%, 7/21/25(b) 347,931,000 386,236,8114.85%, 7/6/27(b) 140,217,000 152,752,119
RELX PLC (United Kingdom)3.125%, 10/15/22 146,687,000 151,083,6263.50%, 3/16/23 64,115,000 66,627,7744.00%, 3/18/29 59,330,000 64,355,634
TC Energy Corp. (Canada)5.625%, 5/20/75(a)(f) 237,639,000 247,738,6575.875%, 8/15/76(a)(f) 84,536,000 90,986,0975.30%, 3/15/77(a)(f) 282,129,000 289,735,1985.50%, 9/15/79(a)(f) 138,575,000 145,434,462
Telecom Italia SPA (Italy)5.303%, 5/30/24(b) 241,154,000 259,240,5507.20%, 7/18/36 61,253,000 72,572,5547.721%, 6/4/38 166,317,000 204,569,910
The Walt Disney Co.6.20%, 12/15/34 14,795,000 20,736,9336.65%, 11/15/37 79,075,000 117,221,763
Ultrapar Participacoes SA (Brazil)5.25%, 10/6/26(b) 151,950,000 163,157,8325.25%, 6/6/29(b) 137,300,000 144,782,850
Union Pacific Corp.6.061%, 1/17/23 1,939,227 2,116,9644.698%, 1/2/24 1,514,664 1,580,5435.082%, 1/2/29 4,539,555 4,873,5795.866%, 7/2/30 27,919,074 31,313,3736.176%, 1/2/31 24,386,051 28,033,312
Verizon Communications, Inc.4.272%, 1/15/36 166,472,000 187,965,405
Vodafone Group PLC (United Kingdom)7.00%, 4/4/79(a)(f) 201,235,000 236,118,431
PAR VALUE VALUE
Xerox Holdings Corp.2.75%, 9/1/20 $ 22,690,000 $ 22,620,6824.50%, 5/15/21 100,501,000 103,212,5174.07%, 3/17/22 2,349,000 2,401,852
Zoetis, Inc.3.45%, 11/13/20 39,377,000 39,800,0024.50%, 11/13/25 166,139,000 183,837,610
13,195,055,643UTILITIES: 1.6%Dominion Energy, Inc.
2.579%, 7/1/20 32,099,000 32,165,2614.104%, 4/1/21 97,451,000 99,854,6475.75%, 10/1/54(a)(f) 232,036,000 250,088,408
Enel SPA (Italy)4.25%, 9/14/23(b) 30,675,000 32,458,1244.625%, 9/14/25(b) 120,488,000 131,349,3993.625%, 5/25/27(b) 38,125,000 39,457,7146.80%, 9/15/37(b) 174,509,000 231,841,1896.00%, 10/7/39(b) 161,224,000 202,669,368
1,019,884,110
21,591,990,244TOTAL DEBT SECURITIES
(Cost $59,889,761,215) $62,319,566,724
See accompanying Notes to Financial Statements D O D G E & C O X I N C O M E F U N D ▪ P A G E 1 3

PORTFOLIO OF INVESTMENTS December 31, 2019
SHORT-TERM INVESTMENTS: 1.4%
PAR VALUE/SHARES VALUE
REPURCHASE AGREEMENTS: 1.0%Bank of Montreal(c)
1.48%, dated 12/31/19, due 1/2/20,maturity value $156,712,884 $ 156,700,000 $ 156,700,000
Fixed Income Clearing Corporation(c)
1.00%, dated 12/31/19, due 1/2/20,maturity value $194,326,795 194,316,000 194,316,000
Royal Bank of Canada(c)
1.53%, dated 12/31/19, due 1/2/20,maturity value $313,326,631 313,300,000 313,300,000
664,316,000
MONEY MARKET FUND: 0.4%State Street Institutional U.S.
Government Money Market Fund 254,584,447 254,584,447
TOTAL SHORT-TERMINVESTMENTS(Cost $918,900,447) $ 918,900,447
TOTAL INVESTMENTS INSECURITIES(Cost $60,808,661,662) 99.5% $63,238,467,171
OTHER ASSETS LESS LIABILITIES 0.5% 307,094,384
NET ASSETS 100.0% $63,545,561,555
(a) Hybrid security has characteristics of both a debt and equity security.(b) Security exempt from registration under Rule 144A of the Securities Act of
1933. The security may be resold in transactions exempt from registration,normally to qualified institutional buyers.
(c) Repurchase agreements are collateralized by:
Bank of Montreal: U.S. Treasury Notes 1.125%-2.875%, 7/31/20-5/15/46 andU.S. Treasury Inflation Indexed Notes 0.125%-1.375%, 7/15/24-2/15/45. Totalcollateral value is $159,847,229.
Fixed Income Clearing Corporation: U.S. Treasury Note 1.50%, 8/31/21.Total collateral value is $198,206,175.
Royal Bank of Canada: U.S. Treasury Notes 2.125%-2.875%, 9/30/23-5/15/27and U.S. Treasury Inflation Indexed Notes 3.375%-3.875%, 4/15/29-4/15/32.Total collateral value is $319,593,355.
(d) Subsidiary (see below)(e) Variable rate security: interest rate is determined by the interest rates of
underlying pool of assets that collateralize the security. The interest rate ofthe security may change due to a change in the interest rates or thecomposition of underlying pool of assets. The interest rate shown is the rateas of period end.
(f) Variable rate security: fixed-to-float security pays an initial fixed interestrate and will pay a floating interest rate established at a predetermined timein the future. The interest rate shown is the rate as of period end.
(g) Inflation-linked(h) Rounds to 0.0%.
Debt securities are grouped by parent company unless otherwise noted.Actual securities may be issued by the listed parent company or one of itssubsidiaries. In determining a parent company’s country designation, theFund generally references the country of incorporation.
Debt securities with floating interest rates are linked to the referencedbenchmark; the interest rate shown is the rate as of period end.
ARM: Adjustable Rate MortgageCMBS: Commercial Mortgage-Backed SecurityCMO: Collateralized Mortgage ObligationCMT: Constant Maturity TreasuryDUS: Delegated Underwriting and ServicingGO: General ObligationRB: Revenue BondREMIC: Real Estate Mortgage Investment Conduit
P A G E 1 4 ▪ D O D G E & C O X I N C O M E F U N D See accompanying Notes to Financial Statements

STATEMENT OF ASSETS AND LIABILITIES
December 31, 2019ASSETS:Investments in securities, at value (cost $60,808,661,662) $63,238,467,171Cash 1,182,783Receivable for investments sold 17,460,944Receivable for Fund shares sold 79,554,791Interest receivable 411,467,061Prepaid expenses and other assets 304,550
63,748,437,300
LIABILITIES:Payable for Fund shares redeemed 177,678,190Management fees payable 21,521,249Accrued expenses 3,676,306
202,875,745
NET ASSETS $63,545,561,555
NET ASSETS CONSIST OF:Paid in capital $60,964,832,308Distributable earnings 2,580,729,247
$63,545,561,555
Fund shares outstanding (par value $0.01 each, unlimitedshares authorized) 4,530,761,843
Net asset value per share $ 14.03
STATEMENT OF OPERATIONSYear Ended
December 31, 2019INVESTMENT INCOME:Dividends $ 38,568,317Interest 2,062,523,768
2,101,092,085
EXPENSES:Management fees 237,350,192Custody and fund accounting fees 740,839Transfer agent fees 7,919,343Professional services 240,391Shareholder reports 1,954,008Registration fees 1,202,626Trustees’ fees 341,667Miscellaneous 678,673
250,427,739
NET INVESTMENT INCOME 1,850,664,346
REALIZED AND UNREALIZED GAIN (LOSS):Net realized gain (loss)
Investments in securities 640,367,179Futures contracts (65,402,334)
Net change in unrealized appreciation/depreciationInvestments in securities 2,943,215,105Futures contracts 27,176,840
Net realized and unrealized gain 3,545,356,790
NET CHANGE IN NET ASSETS FROMOPERATIONS $ 5,396,021,136
STATEMENT OF CHANGES IN NET ASSETS
Year EndedDecember 31, 2019
Year EndedDecember 31, 2018
OPERATIONS:Net investment income $ 1,850,664,346 $ 1,688,153,909Net realized gain (loss) 574,964,845 67,886,229Net change in unrealized appreciation/
depreciation 2,970,391,945 (1,942,972,195)
5,396,021,136 (186,932,057)
DISTRIBUTIONS TOSHAREHOLDERS:
Total distributions (2,203,565,377) (1,887,086,223)
FUND SHARETRANSACTIONS:
Proceeds from sale of shares 15,958,728,359 14,058,784,954Reinvestment of distributions 1,912,882,574 1,568,832,950Cost of shares redeemed (11,832,125,919) (13,526,739,100)
Net change from Fund share transactions 6,039,485,014 2,100,878,804
Total change in net assets 9,231,940,773 26,860,524
NET ASSETS:Beginning of year 54,313,620,782 54,286,760,258
End of year $ 63,545,561,555 $ 54,313,620,782
SHARE INFORMATION:Shares sold 1,153,948,397 1,043,147,794Distributions reinvested 137,478,496 117,588,178Shares redeemed (857,254,896) (1,008,309,102)
Net change in shares outstanding 434,171,997 152,426,870
See accompanying Notes to Financial Statements D O D G E & C O X I N C O M E F U N D ▪ P A G E 1 5

NOTES TO FINANCIAL STATEMENTS
NOTE 1—ORGANIZATION AND SIGNIFICANT
ACCOUNTING POLICIES
Dodge & Cox Income Fund (the “Fund”) is one of the seriesconstituting the Dodge & Cox Funds (the “Trust” or the “Funds”).The Trust is organized as a Delaware statutory trust and isregistered under the Investment Company Act of 1940, asamended, as an open-end management investment company. TheFund commenced operations on January 3, 1989, and seeks highand stable current income consistent with long-term preservationof capital. Risk considerations and investment strategies of theFund are discussed in the Fund’s Prospectus.
The Fund is an investment company and follows the accountingand reporting guidance issued in Topic 946 by the FinancialAccounting Standards Board. The financial statements have beenprepared in conformity with accounting principles generallyaccepted in the United States of America, which require the use ofestimates and assumptions by management. Actual results may differfrom those estimates. Significant accounting policies are as follows:
Security valuation The Fund’s net assets are normallyvalued as of the scheduled close of trading on the New York StockExchange (“NYSE”), generally 4 p.m. Eastern Time, each day thatthe NYSE is open for business.
Debt securities and derivatives traded over the counter arevalued using prices received from independent pricing serviceswhich utilize dealer quotes, recent transaction data, pricingmodels, and other inputs to arrive at market-based valuations.Pricing models may consider quoted prices for similar securities,interest rates, cash flows (including prepayment speeds), and creditrisk. Exchange-traded derivatives are valued at the settlementprice determined by the relevant exchange. Short-term securitiesless than 60 days to maturity may be valued at amortized cost ifamortized cost approximates current value. Mutual funds arevalued at their respective net asset values. Security values are notdiscounted based on the size of the Fund’s position and may differfrom the value the Fund receives upon sale of the securities. Allsecurities held by the Fund are denominated in U.S. dollars.
If market quotations are not readily available or if normalvaluation procedures produce valuations that are deemed unreliableor inappropriate under the circumstances existing at the time, theinvestment will be valued at fair value as determined in good faithby or under the direction of the Fund’s Board of Trustees. The Boardof Trustees has appointed Dodge & Cox, the Fund’s investmentmanager, to make fair value determinations in accordance with theDodge & Cox Funds Valuation Policies (“Valuation Policies”),subject to Board oversight. Dodge & Cox has established a PricingCommittee that is comprised of representatives from Treasury,Legal, Compliance, and Operations. The Pricing Committee isresponsible for implementing the Valuation Policies, includingdetermining the fair value of securities and other investments whennecessary. The Pricing Committee considers relevant indications ofvalue that are reasonably available to it in determining the fair valueassigned to a particular security, such as the value of similarfinancial instruments, trading volumes, contractual restrictions ondisposition, related corporate actions, and changes in economic
conditions. In doing so, the Pricing Committee employs variousmethods for calibrating fair valuation approaches, including aregular review of key inputs and assumptions, back-testing, andreview of any related market activity.
Valuing securities through a fair value determination involvesgreater reliance on judgment than valuation of securities based onreadily available market quotations. In some instances, lack ofinformation and uncertainty as to the significance of informationmay lead to a conclusion that a prior valuation is the best indicationof a security’s value. When fair value pricing is employed, the pricesof securities used by the Fund to calculate its net asset value maydiffer from quoted or published prices for the same securities.
Security transactions, investment income, expenses,and distributions Security transactions are recorded on the tradedate. Realized gains and losses on securities sold are determined onthe basis of identified cost.
Interest income is recorded on the accrual basis. Interestincome includes coupon interest, amortization of premium andaccretion of discount on debt securities, and gain/loss onpaydowns. The ability of the issuers of the debt securities held bythe Fund to meet their obligations may be affected by economicdevelopments in a specific industry, state, or region. Debtobligations may be placed on non-accrual status and relatedinterest income may be reduced by ceasing current accruals andwriting off interest receivables when the collection of all or aportion of interest has become doubtful. A debt obligation isremoved from non-accrual status when the issuer resumes interestpayments or when collectibility of interest is reasonably assured.Dividend income is recorded on the ex-dividend date.
Expenses are recorded on the accrual basis. Some expenses of theTrust can be directly attributed to a specific series. Expenses whichcannot be directly attributed are allocated among the Funds in theTrust using methodologies determined by the nature of the expense.
Distributions to shareholders are recorded on the ex-dividenddate.
Repurchase agreements Repurchase agreements aretransactions under which a Fund purchases a security from a dealercounterparty and agrees to resell the security to that counterparty ona specified future date at the same price, plus a specified interest rate.The Fund’s repurchase agreements are secured by U.S. government oragency securities, the fair value of which exceeds the principalamount of the repurchase transaction, including accrued interest, atall times. The Fund maintains custody of the underlying collateralsecurities, either through its regular custodian or through a third partycustodian that maintains separate accounts for both the Fund and itscounterparties. In the event of default by the counterparty, the Fundhas the contractual right to liquidate the securities and to apply theproceeds in satisfaction of the obligation.
To-Be-Announced securities The Fund may purchasemortgage-related securities on a to-be-announced (“TBA”) basis at afixed price, with payment and delivery on a scheduled future datebeyond the customary settlement period for such securities. The Fundmay choose to extend the settlement through a “dollar roll”
P A G E 1 6 ▪ D O D G E & C O X I N C O M E F U N D

NOTES TO FINANCIAL STATEMENTS
transaction in which it sells the mortgage-related securities to a dealerand simultaneously agrees to purchase similar securities for futuredelivery at a predetermined price. The Fund accounts for TBA dollarrolls as purchase and sale transactions.
Indemnification Under the Trust’s organizational documents,its officers and trustees are indemnified against certain liabilitiesarising out of the performance of their duties to the Trust. Inaddition, in the normal course of business the Trust enters intocontracts that provide general indemnities to other parties. TheTrust’s maximum exposure under these arrangements is unknown asthis would involve future claims that may be made against the Trustthat have not yet occurred.
NOTE 2—VALUATION MEASUREMENTS
Various inputs are used in determining the value of the Fund’sinvestments. These inputs are summarized in the three broad levelslisted below.▪ Level 1: Quoted prices in active markets for identical securities▪ Level 2: Other significant observable inputs (including quoted
prices for similar securities, market indices, interest rates, creditrisk, forward exchange rates, etc.)
▪ Level 3: Significant unobservable inputs (including Fundmanagement’s assumptions in determining the fair valueof investments)
The inputs or methodology used for valuing securities are notnecessarily an indication of the risk associated with investing inthose securities.
The following is a summary of the inputs used to value theFund’s holdings at December 31, 2019:
ClassificationLEVEL 1
(Quoted Prices)
LEVEL 2(Other Significant
Observable Inputs)
SecuritiesDebt Securities
U.S. Treasury $ — $ 11,120,107,599Government-Related — 3,252,867,762Securitized — 26,354,601,119Corporate — 21,591,990,244
Short-term InvestmentsRepurchase Agreements — 664,316,000Money Market Fund 254,584,447 —
Total Securities $ 254,584,447 $ 62,983,882,724
NOTE 3—DERIVATIVE INSTRUMENTS
The Fund may use derivatives either to minimize the impact ofcertain risks to one or more of its investments (as a “hedgingtechnique”) or to implement its investment strategy. A derivativeis a financial instrument whose value is derived from a security,currency, interest rate, index, or other financial instrument.
Futures contracts Futures contracts involve an obligation topurchase or sell (depending on whether the Fund has entered a longor short futures contract, respectively) an asset at a future date, at aprice set at the time of the contract. Futures contracts are exchange-traded. Upon entering into a futures contract, the Fund is required to
deposit an amount of cash or liquid assets (referred to as “initialmargin”) in a segregated account with the clearing broker.Subsequent payments (referred to as “variation margin”) to and fromthe clearing broker are made on a daily basis based on changes in themarket value of the contract. Changes in the market value of openfutures contracts are recorded as unrealized appreciation ordepreciation in the Statement of Operations. Realized gains andlosses on futures contracts are recorded in the Statement ofOperations at the closing or expiration of the contracts. Cashdeposited with a broker as initial margin is recorded in the Statementof Assets and Liabilities. A receivable and/or payable to brokers fordaily variation margin is also recorded in the Statement of Assets andLiabilities.
Investments in futures contracts may include certain risks,which may be different from, and potentially greater than, those ofthe underlying assets. To the extent the Fund uses futures, it isexposed to additional volatility and potential losses resulting fromleverage.
The Fund did not have open futures contracts at December 31,2019.
Additional derivative information The following summarizesthe effect of derivative instruments on the Statement of Operations.
Interest RateDerivatives
Net realized gain (loss)Futures contracts $(65,402,334)
Net change in unrealized appreciation/depreciationFutures contracts $ 27,176,840
The following summarizes the range of volume in the Fund’sderivative instruments during the year ended December 31, 2019.
Derivative % of Net Assets
Futures contracts USD notional value 0-1%
NOTE 4—RELATED PARTY TRANSACTIONS
Management fees Under a written agreement approved by aunanimous vote of the Board of Trustees, the Fund pays amanagement fee monthly at an annual rate of 0.50% of the Fund’saverage daily net assets up to $100 million and 0.40% of the Fund’saverage daily net assets in excess of $100 million to Dodge & Cox,investment manager of the Fund. The agreement further providesthat Dodge & Cox shall waive its fee to the extent that such feeplus all other ordinary operating expenses of the Fund exceed 1%of the average daily net assets for the year.
Fund officers and trustees All officers and two of thetrustees of the Trust are officers or employees of Dodge & Cox.The Trust pays a fee only to those trustees who are not affiliatedwith Dodge & Cox.
D O D G E & C O X I N C O M E F U N D ▪ P A G E 1 7

NOTES TO FINANCIAL STATEMENTS
NOTE 5—INCOME TAX INFORMATION AND
DISTRIBUTIONS TO SHAREHOLDERS
A provision for federal income taxes is not required since the Fundintends to continue to qualify as a regulated investment companyunder Subchapter M of the Internal Revenue Code and distribute allof its taxable income to shareholders. Distributions are determined inaccordance with income tax regulations, and such amounts may differfrom net investment income and realized gains for financial reportingpurposes. The Fund may also designate a portion of the amount paidto redeeming shareholders as a distribution for tax purposes. Financialreporting records are adjusted for permanent book to tax differences atyear end to reflect tax character. Book to tax differences are primarilydue to differing treatments of wash sales, net short-term realizedgain (loss), derivatives, and distributions.
Distributions during the years noted below were characterized asfollows for federal income tax purposes:
Year EndedDecember 31, 2019
Year EndedDecember 31, 2018
Ordinary income $ 1,993,518,195 $ 1,653,646,376($ 0.462 per share) ($ 0.398 per share)
Long-term capital gain $ 210,047,182 $ 233,439,847($ 0.047 per share) ($ 0.057 per share)
At December 31, 2019, the tax basis components of distributableearnings were as follows:
Undistributed ordinary income $ 35,103,885Undistributed long-term capital gain 115,979,668
At December 31, 2019, unrealized appreciation and depreciationfor investments and derivatives based on cost for federal income taxpurposes were as follows:
Tax cost $60,808,821,477
Unrealized appreciation 2,623,673,988Unrealized depreciation (194,028,294)
Net unrealized appreciation 2,429,645,694
Fund management has reviewed the tax positions for openperiods (three years and four years, respectively, from filing theFund’s Federal and State tax returns) as applicable to the Fund,and has determined that no provision for income tax is required inthe Fund’s financial statements.
NOTE 6—LOAN FACILITIES
Pursuant to an exemptive order issued by the Securities andExchange Commission (“SEC”), the Fund may participate in aninterfund lending facility (“Facility”). The Facility allows the Fundto borrow money from or loan money to the Funds. Loans underthe Facility are made for temporary or emergency purposes, such asto fund shareholder redemption requests. Interest on borrowings isthe average of the current repurchase agreement rate and the bankloan rate. There was no activity in the Facility during the year.
All Funds in the Trust participate in a $500 millioncommitted credit facility (“Line of Credit”) with State Street Bankand Trust Company, to be utilized for temporary or emergencypurposes to fund shareholder redemptions or for other short-termliquidity purposes. The maximum amount available to the Fund is$250 million. Each Fund pays an annual commitment fee on itspro-rata portion of the Line of Credit. For the year endedDecember 31, 2019, the Fund’s commitment fee amounted to$381,795 and is reflected as a Miscellaneous Expense in theStatement of Operations. Interest on borrowings is charged at theprevailing rate. There were no borrowings on the Line of Creditduring the year.
NOTE 7—PURCHASES AND SALES OF INVESTMENTS
For the year ended December 31, 2019, purchases and sales ofsecurities, other than short-term securities and U.S. governmentsecurities, aggregated $3,453,152,078 and $7,691,881,822 respectively.For the year ended December 31, 2019, purchases and sales of U.S.government securities aggregated $30,295,157,112 and$20,868,219,196 respectively.
NOTE 8—NEW ACCOUNTING GUIDANCE
In March 2017, the Financial Accounting Standards Board issuedan update to amend the amortization period for certain purchasedcallable debt securities held at a premium. The amendmentsshorten the amortization period for premiums to the earliest calldate, but do not require an accounting change for securities held ata discount. The amendments are effective for financial statementsfor fiscal years beginning after December 15, 2018, and interimperiods within those fiscal years. The Fund’s adoption of theupdated accounting standards on January 1, 2019 did not have amaterial impact on the Fund’s financial statements.
NOTE 9—SUBSEQUENT EVENTS
Fund management has determined that no material events ortransactions occurred subsequent to December 31, 2019, and throughthe date of the Fund’s financial statements issuance, which requireadditional disclosure in the Fund’s financial statements.
P A G E 1 8 ▪ D O D G E & C O X I N C O M E F U N D

FINANCIAL HIGHLIGHTS
SELECTED DATA AND RATIOS(for a share outstanding throughout each year) Year Ended December 31,
2019 2018 2017 2016 2015
Net asset value, beginning of year $13.26 $13.76 $13.59 $13.29 $13.78Income from investment operations:
Net investment income 0.44 0.41 0.38 0.42 0.40Net realized and unrealized gain (loss) 0.84 (0.45) 0.21 0.32 (0.48)
Total from investment operations 1.28 (0.04) 0.59 0.74 (0.08)
Distributions to shareholders from:Net investment income (0.43) (0.40) (0.38) (0.42) (0.40)Net realized gain (0.08) (0.06) (0.04) (0.02) (0.01)
Total distributions (0.51) (0.46) (0.42) (0.44) (0.41)
Net asset value, end of year $14.03 $ 13.26 $ 13.76 $ 13.59 $ 13.29
Total return 9.73% (0.31)% 4.36% 5.62% (0.59)%Ratios/supplemental data:
Net assets, end of year (millions) $63,546 $54,314 $54,287 $46,632 $43,125Ratio of expenses to average net assets 0.42% 0.42% 0.43% 0.43% 0.43%Ratio of net investment income to average net assets 3.12% 3.02% 2.80% 3.11% 2.97%Portfolio turnover rate 49% 37% 19% 27% 24%
See accompanying Notes to Financial Statements
D O D G E & C O X I N C O M E F U N D ▪ P A G E 1 9

REPORT OF INDEPENDENT REGISTERED PUBLIC ACCOUNTING FIRM
To the Board of Trustees of the Dodge & Cox Funds and Shareholders of Dodge & Cox Income Fund
Opinion on the Financial Statements
We have audited the accompanying statement of assets and liabilities, including the portfolio of investments, of Dodge & Cox Income Fund(one of the funds constituting Dodge & Cox Funds, referred to hereafter as the “Fund”) as of December 31, 2019, the related statement ofoperations for the year ended December 31, 2019, the statement of changes in net assets for each of the two years in the period endedDecember 31, 2019, including the related notes, and the financial highlights for each of the five years in the period ended December 31, 2019(collectively referred to as the “financial statements”). In our opinion, the financial statements present fairly, in all material respects, thefinancial position of the Fund as of December 31, 2019, the results of its operations for the year then ended, the changes in its net assets foreach of the two years in the period ended December 31, 2019 and the financial highlights for each of the five years in the period endedDecember 31, 2019 in conformity with accounting principles generally accepted in the United States of America.
Basis for Opinion
These financial statements are the responsibility of the Fund’s management. Our responsibility is to express an opinion on the Fund’sfinancial statements based on our audits. We are a public accounting firm registered with the Public Company Accounting Oversight Board(United States) (PCAOB) and are required to be independent with respect to the Fund in accordance with the U.S. federal securities lawsand the applicable rules and regulations of the Securities and Exchange Commission and the PCAOB.
We conducted our audits of these financial statements in accordance with the standards of the PCAOB. Those standards require that weplan and perform the audit to obtain reasonable assurance about whether the financial statements are free of material misstatement, whetherdue to error or fraud.
Our audits included performing procedures to assess the risks of material misstatement of the financial statements, whether due to error orfraud, and performing procedures that respond to those risks. Such procedures included examining, on a test basis, evidence regarding theamounts and disclosures in the financial statements. Our audits also included evaluating the accounting principles used and significantestimates made by management, as well as evaluating the overall presentation of the financial statements. Our procedures includedconfirmation of securities owned as of December 31, 2019 by correspondence with the custodian, transfer agent and brokers. We believethat our audits provide a reasonable basis for our opinion.
PricewaterhouseCoopers LLPSan Francisco, CaliforniaFebruary 20, 2020
We have served as the auditor of one or more investment companies in the Dodge & Cox Funds since 1931.
P A G E 2 0 ▪ D O D G E & C O X I N C O M E F U N D

SPECIAL 2019 TAX INFORMATION(unaudited)The following information is provided pursuant to provisions ofthe Internal Revenue Code:
The Fund designates $210,047,182 as long-term capital gaindistributions in 2019.
FUNDS’ LIQUIDITY RISK MANAGEMENTPROGRAM(unaudited)The Funds have adopted and implemented a written liquidity riskmanagement program as required by Rule 22e-4 under theInvestment Company Act. The program is reasonably designed toassess and manage each Fund’s liquidity risk, taking intoconsideration the Fund’s investment strategy and the liquidity ofits portfolio investments during normal and reasonably foreseeablestressed conditions; its short and long-term cash flow projections;and its cash holdings and access to other funding sources includingthe Funds’ interfund lending facility and line of credit. The Funds’Board of Trustees approved the appointment of a Liquidity RiskManagement Committee including representatives from Dodge &Cox’s legal, compliance, treasury, operations, trading, and portfoliomanagement departments, which is responsible for the program’sadministration and oversight and for reporting to the Board on atleast an annual basis regarding the program’s operation andeffectiveness. The Liquidity Risk Management Committeerefreshed its assessment of the Fund’s liquidity risk profile,considering additional data gathered in the 12 months endedSeptember 30, 2019 and the adequacy and effectiveness of theliquidity risk management program’s operations since its inceptionin February, 2019 (the “covered period”) in order to prepare awritten report to the Board of Trustees for consideration at itsmeeting held on December 12, 2019. The report concluded that(i) the Fund did not experience significant liquidity challengesduring the covered period (ii) the Fund’s investment strategy isappropriate for an open-end fund; and (iii) the Fund’s liquidity riskmanagement program is reasonably designed to assess and manageits liquidity risk.
BOARD APPROVAL OF FUNDS’ INVESTMENTMANAGEMENT AGREEMENTS ANDMANAGEMENT FEES(unaudited)The Board of Trustees is responsible for overseeing the performanceof the Dodge & Cox Funds’ investment manager and determiningwhether to continue the Investment Management Agreementsbetween the Funds and Dodge & Cox each year (the “Agreements”).At a meeting of the Board of Trustees of the Trust held onDecember 12, 2019, the Trustees, by a unanimous vote (including aseparate vote of those Trustees who are not “interested persons” (asdefined in the Investment Company Act of 1940) (the “IndependentTrustees”)), approved the renewal of the Agreements for anadditional one-year term through December 31, 2020 with respect toeach Fund. During the course of the year, the Board receivedextensive information and materials relating to the investmentmanagement and administrative services provided by Dodge & Coxand the performance of each of the Funds.
INFORMATION RECEIVED
Over the past several years, the Board has requested, received, anddiscussed a number of special presentations on topics relevant totheir annual consideration of the proposed renewal of the Funds’Agreements. In addition to the foregoing and in advance of themeetings referred to below, the Board, including the IndependentTrustees, requested, received, and reviewed materials relating tothe Agreements and the services provided by Dodge & Cox. TheIndependent Trustees retained Broadridge to prepare anindependent expense and performance summary for each Fund andcomparable funds managed by other advisers identified byBroadridge. The Broadridge materials included informationregarding advisory and administrative fee rates, expense ratios, andtransfer agency, custodial, and distribution expenses, as well asperformance comparisons to each Fund’s peer group and to abroad-based securities index or combination of indices. TheBroadridge materials also included a comparison of expenses ofvarious share classes offered by comparable funds. The materialsreviewed by the Board contained information concerning, amongother things, Dodge & Cox’s profitability, financial results andcondition, management fee revenue, and separate account feeschedules. The Board additionally considered the Funds’ brokeragecommissions, turnover rates, sales and redemption data, and theinvestment that Dodge & Cox makes in research used in managingthe Funds. The Board received and reviewed memoranda andrelated materials addressing, among other things, Dodge & Cox’sservices to the Funds; how Dodge & Cox Funds’ fees compare tofees of peer group funds; the different fees, services, costs, and risksassociated with other accounts managed by Dodge & Cox ascompared to the Dodge & Cox Funds; and the ways in which theFunds realize economies of scale. Throughout the process ofreviewing the services provided by Dodge & Cox and preparing forthe meeting, the Independent Trustees found Dodge & Cox to beopen, forthright, detailed, and helpful in answering questionsabout all issues. The Board received copies of the Agreements anda memorandum from the independent legal counsel to theIndependent Trustees discussing the factors generally regarded asappropriate to consider in evaluating mutual fund managementarrangements. The Trust’s Contract Review Committee, consistingsolely of Independent Trustees, met with the independent legalcounsel on November 7, 2019 and again on December 12, 2019 todiscuss whether to renew the Agreements. The Board, includingthe Independent Trustees, subsequently concluded that theexisting Agreements are fair and reasonable and voted to approvethe Agreements. In considering the Agreements, the Board,including the Independent Trustees, did not identify any singlefactor or particular information as all-important or controlling. Inreaching the decision to approve the Agreements, the Boardconsidered several factors, discussed below, to be key factors andreached the conclusions described below.
NATURE, QUALITY, AND EXTENT OF THE SERVICES
The Board considered that Dodge & Cox provides a range ofservices to the Funds in addition to portfolio management,including regulatory compliance, trading desks, proxy voting,transfer agent and custodian oversight, administration, regulatory
D O D G E & C O X I N C O M E F U N D ▪ P A G E 2 1

filings, tax compliance and filings, website, and anti-moneylaundering. The nature of services provided by Dodge & Cox hasbeen documented in materials provided to the Board and inpresentations made to the Board throughout the year. Inparticular, the Board considered the nature, quality, and extent ofportfolio management, administrative, and shareholder servicesperformed by Dodge & Cox. With regard to portfolio managementservices, the Board considered Dodge & Cox’s established long-term history of care in the management of the Funds; itsconsistency in investment approach and depth; the backgroundand experience of the Dodge & Cox U.S. Equity InvestmentCommittee, International Equity Investment Committee, GlobalEquity Investment Committee, U.S. Fixed Income InvestmentCommittee, and Global Fixed Income Investment Committee, andresearch analysts responsible for managing the Funds;Dodge & Cox’s methods for assessing the regulatory andinvestment climate in various jurisdictions; its overall level ofattention to its core investment management function; and itscommitment to the Funds and their shareholders. The Boardreviewed information from Dodge & Cox regarding any materialconflicts of interest between the Funds and Dodge & Cox or itsother clients, and regarding how Dodge & Cox addresses thoseconflicts. The Board noted Dodge & Cox’s record of favorablepress and industry coverage, as well as its good compliance record,and its reputation as a trusted, shareholder-friendly mutual fundfamily. In addition, the Board considered that Dodge & Coxmanages approximately $211 billion in Fund assets with fewerprofessionals than most comparable funds, and that on averagethese professionals have more experience and longer tenure thaninvestment professionals at comparable funds. The Board alsonoted that Dodge & Cox is an investment research-oriented firmwith no other business endeavors to distract management’sattention from its research efforts, that its investment professionalsadhere to a consistent investment approach across the Funds, andthat due to its deliberate strategy with respect to new products,Dodge & Cox has had stability in its mutual fund product offeringsover the course of many years and has the fewest funds of any ofthe 25 largest mutual fund families by assets. The Board furtherconsidered the “Gold” analyst rating awarded by Morningstar to allof the Funds (other than the Global Bond Fund, which has a“Silver” rating). The Board concluded that it was satisfied with thenature, extent, and quality of investment management and otherservices provided to the Funds by Dodge & Cox.
INVESTMENT PERFORMANCE
The Board reviewed each Fund’s recent and long-term investmentperformance (including periods of outperformance andunderperformance), as compared to relevant indices and theperformance of such Fund’s peer group and broader Morningstarcategory. In assessing the performance of the Funds, the Boardconsidered the Funds’ investment returns over various periods andthe volatility thereof and concluded that the levels experiencedwere consistent with Dodge & Cox’s long-term approach andactive investment style. The Board also compared the short- andlong-term investment performance of the equity funds to value-oriented indices, in recognition of the significant performance
divergence between value and growth stocks over the past severalyears. It was noted that equity performance has been consistentwith the value oriented investment strategy employed byDodge & Cox. The Board concluded that Dodge & Cox’s historic,long-term, team-oriented, bottom-up investment approachremains consistent and that Dodge & Cox continues to bedistinguished by its integrity, transparency, and independence.The Board considered that the performance of the Funds is theresult of a value-oriented investment management process thatemphasizes a long-term investment horizon, independent research,a team approach, price discipline, low cost, and low portfolioturnover. The Board concluded that Dodge & Cox has deliveredlong-term performance for Fund investors consistent with thelong-term investment strategies being pursued by the Funds.
COSTS AND ANCILLARY BENEFITS
Costs of Services to Funds: Fees and Expenses The Boardconsidered each Fund’s management fee rate and net expense ratiorelative to (1) a broad category of other mutual funds with similarportfolio characteristics and share class and expense structures and(2) a smaller group of peers selected by Broadridge based oninvestment style, share class characteristics, and asset levels. TheBoard also considered the management fees charged by Dodge & Coxto other clients. In particular, the Board considered that the Fundscontinue to be below their peer group medians in net expense ratios.The Board also evaluated the operating structures of the Funds andDodge & Cox, noting that the Funds do not charge front-end salescommissions or distribution fees, and Dodge & Cox bears, amongother things, the cost of most third-party research, reimbursement forshareholder recordkeeping and administrative costs to third-partyretirement plan administrators, and administrative and officeoverhead. The Board noted that the Broadridge report shows that thenet expense ratio of every Dodge & Cox Fund is in the leastexpensive quartile compared to its broad Morningstar category. TheBoard noted the Funds’ unusual single-share-class structure andreviewed Broadridge data (including asset-weighted average expenseratios) showing that most of the peer group funds offer severaldifferent classes of shares, with different expense ratios, to differentcategories of investors, and that the Broadridge expense comparisonsdescribed above generally compare the net expense ratio of eachDodge & Cox Fund’s single share class to one of the least expensiveshare classes of the peer fund, even though those share classes areoften not available to retail investors. The Board noted that theFunds provide access for small investors to high quality investmentmanagement at a relatively low cost. The Board also considered thatthe Funds are priced to scale, i.e., management fee rates begin atrelatively low levels. Even without breakpoints, the Funds’management fee rates are lower than those of many peer funds whosefee schedules include breakpoints. With respect to non-U.S. fundssponsored and managed by Dodge & Cox that are comparable to theFunds in many respects, the Board noted that the fee rates charged byDodge & Cox are the same as or higher than the fee rates charged tothe Funds. The Board reviewed information regarding the fee ratesDodge & Cox charges to separate accounts that have investmentprograms similar to those of the Funds, including instances where
P A G E 2 2 ▪ D O D G E & C O X I N C O M E F U N D

separate account fees are lower than Fund fees. The Board consideredthe differences in the nature and scope of services Dodge & Coxprovides to the Funds as compared to other client accounts, as well asmaterial differences in regulatory, litigation, and other risks asbetween Dodge & Cox Funds and other types of clients. The Boardnoted that different markets exist for mutual fund and institutionalseparate account management services and that a comparison of Fundfee rates and separate account fee rates must consider the fact thatseparate account clients bear additional costs and responsibilities thatare included in the cost of a Fund. After consideration of thesematters, the Board concluded that the overall costs incurred by theFunds for the services they receive (including the management feepaid to Dodge & Cox) are reasonable and that the fees are acceptablebased upon the qualifications, experience, reputation, andperformance of Dodge & Cox and the low overall expense ratios ofthe Funds.
Profitability and Costs of Services to Dodge & Cox;“Fall-out” Benefits The Board reviewed reports of Dodge & Cox’sfinancial position, profitability, and estimated overall value andconsidered Dodge & Cox’s overall profitability within its context as aprivate, employee-owned S-Corporation and relative to the scope andquality of the services provided. The Board noted in particular thatDodge & Cox’s profits are not generated by high fee rates, but reflect afocused business approach toward investment management. The Boardrecognized the importance of Dodge & Cox’s profitability—which isderived solely from management fees and does not include otherbusiness ventures—to maintain its independence, stability, companyculture and ethics, and management continuity. The Board alsoconsidered that the compensation/profit structure at Dodge & Coxincludes a return on shareholder employees’ investment in the firm,which is vital for remaining independent and facilitating retention ofmanagement and investment professionals. The Board also consideredthat Dodge & Cox has in the past closed some of the Funds to newinvestors to proactively manage growth in those Funds. While theseactions are intended to benefit existing Fund shareholders, the effect isto reduce potential revenues to Dodge & Cox from new shareholders.The Board also considered potential “fall-out” benefits (including thereceipt of research from unaffiliated brokers and reputational benefitsto non-U.S. funds sponsored and managed by Dodge & Cox) thatDodge & Cox might receive as a result of its association with theFunds and determined that they are acceptable. The Board also notedthat Dodge & Cox continues to invest in its business to provideenhanced services, systems, and research capabilities, all of whichbenefit the Funds. The Board concluded that Dodge & Cox’sprofitability is the keystone of its independence, stability, and long-term investment performance and that the profitability ofDodge & Cox’s relationship with the Funds (including fall-outbenefits) is fair and reasonable.
ECONOMIES OF SCALE
The Board considered whether there have been economies of scalewith respect to the management of each Fund, whether the Fundshave appropriately benefited from any economies of scale, andwhether the management fee rate is reasonable in relation to the levelof Fund assets and any economies of scale that may exist. In the
Board’s view, any consideration of economies of scale must takeaccount of the Funds’ low fee and expense structure and the fact thatthe Dodge & Cox Funds build economies of scale into their feestructures by charging low fees from a fund’s inception and keepingoverall expenses down as a Fund grows, as compared to other fundcomplexes that employ fee “breakpoints” only after a fund reaches acertain scale. An assessment of economies of scale must also take intoaccount that Dodge & Cox invests time and resources in each newFund for months (and sometimes years) prior to launch; in addition,in a Fund’s early periods of operations, expenses are capped, whichmeans that Dodge & Cox subsidizes the operations of a new Fund fora period of time until it reaches scale. The Board also observed that,while total Fund assets have grown over the long term, this growthhas not been continuous or evenly distributed across all of the Funds.In addition, the Board noted that Dodge & Cox has shared thebenefits of economies of scale with the Funds by adding services to theFunds over time, and that Dodge & Cox’s internal costs of providinginvestment management, technology, administrative, legal, andcompliance services to the Funds continue to increase. For example,Dodge & Cox has increased its global research staff and investmentresources over the years to add new capabilities for the benefit of Fundshareholders and to address the increased complexity of investingglobally. In addition, Dodge & Cox has made expenditures in otherstaff, technology, and infrastructure to enable it to integrate credit andequity analyses and to implement its strategy in a more effectivemanner. Over the last ten years, Dodge & Cox has increased itsspending on research, investment management, client servicing,cybersecurity, technology, third-party research, data services, andcomputer systems for trading, operations, compliance, accounting,and communications at a rate that has outpaced the Funds’ growthrate during the same period. The Board also observed that, evenwithout fee breakpoints, the Funds are competitively priced in acompetitive market and that having a low fee from inception is betterfor shareholders than starting with a higher fee and addingbreakpoints. The Board also noted that there are certain diseconomiesof scale associated with managing large funds, insofar as certain of thecosts and risks associated with portfolio management increasedisproportionately as assets grow. The Board concluded that thecurrent Dodge & Cox fee structure is fair and reasonable andadequately shares economies of scale that may exist.
CONCLUSION
Based on their evaluation of all material factors and assisted by theadvice of independent legal counsel to the Independent Trustees,the Board, including the Independent Trustees, concluded that themanagement fee structure was fair and reasonable, that each Fundwas paying a competitive fee for the services provided, thatDodge & Cox’s services have provided value for Fund shareholdersover the long term, and that approval of the Agreements was inthe best interests of each Fund and its shareholders.
D O D G E & C O X I N C O M E F U N D ▪ P A G E 2 3

FUND HOLDINGSThe Fund provides a complete list of its holdings on a quarterly basisby filing the lists with the SEC on Form N-CSR (as of the end of thesecond and fourth quarters) and on Part F of Form N-PORT (as ofthe end of the first and third quarters). Shareholders may view theFund’s Form N-CSR and Part F of Form N-PORT on the SEC’swebsite at sec.gov. A list of the Fund’s quarter-end holdings is alsoavailable at dodgeandcox.com on or about the 15th day followingeach quarter end and remains available on the website until the list isupdated for the subsequent quarter.
PROXY VOTINGFor a free copy of the Fund’s proxy voting policies and procedures,please call 800-621-3979, visit the Fund’s website atdodgeandcox.com, or visit the SEC’s website at sec.gov. Informationregarding how the Fund voted proxies relating to portfolio securitiesduring the most recent 12-month period ending June 30 is alsoavailable at dodgeandcox.com or at sec.gov.
HOUSEHOLD MAILINGSThe Fund routinely mails shareholder reports and summaryprospectuses to shareholders and, on occasion, proxy statements.In order to reduce the volume of mail, when possible, only onecopy of these documents will be sent to shareholders who are partof the same family and share the same residential address.
If you have a direct account with the Funds and you do not wantthe mailing of shareholder reports and summary prospectusescombined with other members in your household, contact the Fundsat 800-621-3979. Your request will be implemented within 30 days.
P A G E 2 4 ▪ D O D G E & C O X I N C O M E F U N D

THIS PAGE INTENTIONALLY LEFT BLANK
D O D G E & C O X I N C O M E F U N D ▪ P A G E 2 5

THIS PAGE INTENTIONALLY LEFT BLANK
P A G E 2 6 ▪ D O D G E & C O X I N C O M E F U N D

DODGE & COX FUNDS—EXECUTIVE OFFICER & TRUSTEE INFORMATION
Name (Age) andAddress*
Position with Trust(Year of Election orAppointment)**
Principal Occupation During Past Five Years and Other RelevantExperience**
Other Directorships of Public Companies Heldby Trustees
INTERESTED TRUSTEES AND EXECUTIVE OFFICERSCharles F. Pohl (61) Chairman and Trustee
(since 2014)Chairman and Director of Dodge & Cox; Chief Investment Officer andmember of U.S. Equity Investment Committee (USEIC), Global EquityInvestment Committee (GEIC), and International Equity InvestmentCommittee (IEIC)
—
Dana M. Emery (58) President(since 2014) andTrustee (since 1993)
Chief Executive Officer, President, and Director of Dodge & Cox;Co-Director of Fixed Income (until January 2020) and member of U.S.Fixed Income Investment Committee (USFIIC) and Global FixedIncome Investment Committee (GFIIC)
—
Diana S. Strandberg(60)
Senior Vice President(since 2006)
Senior Vice President and Director of Dodge & Cox; Director ofInternational Equity and member of GEIC, IEIC, and GFIIC; member ofUSEIC (until January 2020)
—
Roberta R.W. Kameda(59)
Chief Legal Officer(since 2019) andSecretary (since 2017)
Vice President, General Counsel, and Secretary (since 2017) ofDodge & Cox
—
David H. Longhurst(62)
Treasurer(since 2006)
Vice President and Assistant Treasurer of Dodge & Cox —
Katherine M. Primas(45)
Chief ComplianceOfficer(since 2010)
Vice President and Chief Compliance Officer of Dodge & Cox —
INDEPENDENT TRUSTEESCaroline M. Hoxby(53)
Trustee(since 2017)
Professor of Economics, Stanford University; Director of the Economicsof Education Program, National Bureau of Economic Research; SeniorFellow, Hoover Institution and Stanford Institute for Economic PolicyResearch
—
Thomas A. Larsen (70) Trustee(since 2002)
Senior Counsel of Arnold & Porter (law firm) (2015-2018); Partner ofArnold & Porter (until 2015); Director of Howard, Rice, Nemerovski,Canady, Falk & Rabkin (1977-2011)
—
Ann Mather (59) Trustee(since 2011)
CFO, Pixar Animation Studios (1999-2004) Director, Alphabet Inc. (internet informationservices) (since 2005); Director, Glu Mobile,Inc. (multimedia software) (since 2004);Director, Netflix, Inc. (internet television)(since 2010); Director, Arista Networks (cloudnetworking) (since 2013)
Robert B. Morris III(67)
Trustee(since 2011)
Advisory Director, The Presidio Group (2005-2016); Partner andManaging Director—Global Investment Research at Goldman Sachs(until 2001)
—
Gabriela FrancoParcella (51)
Trustee(since 2020)
Managing Partner of Merlone Geier Partners (since 2018); Chairman,President, and CEO, Mellon Capital (2011 to 2017); COO, MellonCapital (1997 to 2011).
Director, Terreno Realty Corporation(since 2018)
Gary Roughead (68) Trustee(since 2013)
Robert and Marion Oster Distinguished Military Fellow, HooverInstitution (since 2012); Admiral, United States Navy (Ret.); U.S. NavyChief of Naval Operations (2008-2011)
Director, Northrop Grumman Corp. (globalsecurity) (since 2012); Director, Maersk Line,Limited (shipping and transportation)(since 2016)
Mark E. Smith (68) Trustee(since 2014)
Executive Vice President, Managing Director—Fixed Income at LoomisSayles & Company, L.P. (2003-2011)
—
John B. Taylor (73) Trustee(since 2005)(and 1995-2001)
Professor of Economics, Stanford University (since 1984); Senior Fellow,Hoover Institution (since 1996); Under Secretary for InternationalAffairs, United States Treasury (2001-2005)
—
* The address for each Officer and Trustee is 555 California Street, 40th Floor, San Francisco, California 94104. Each Officer and Trusteeoversees all six series in the Dodge & Cox Funds complex and serves for an indefinite term.
** Information as of January 15, 2020.Additional information about the Trust’s Trustees and Officers is available in the Trust’s Statement of Additional Information (SAI).You can get a free copy of the SAI by visiting the Funds’ website at dodgeandcox.com or calling 800-621-3979.
D O D G E & C O X I N C O M E F U N D ▪ P A G E 2 7

Income Fund
dodgeandcox.com
For Fund literature, transactions, and accountinformation, please visit the Funds’ website.
or write or call:
DODGE & COX FUNDS
c/o DST Asset Manager Solutions, Inc.P.O. Box 219502Kansas City, Missouri 64121-9502(800) 621-3979
INVESTMENT MANAGER
Dodge & Cox555 California Street, 40th FloorSan Francisco, California 94104(415) 981-1710
This report is submitted for the general information of the shareholders of the Fund. The report is not authorized fordistribution to prospective investors in the Fund unless it is accompanied by a current prospectus.
This report reflects our views, opinions, and portfolio holdings as of December 31, 2019, the end of the reporting period.Any such views are subject to change at any time based upon market or other conditions and Dodge & Cox disclaims anyresponsibility to update such views. These views may not be relied on as investment advice and, because investment decisionsfor a Dodge & Cox Fund are based on numerous factors, may not be relied on as an indication of trading intent on behalf ofany Dodge & Cox Fund.