dodge & cox worldwide funds annual report for the period
TRANSCRIPT
Annual ReportFOR THE YEAR ENDED 31 DECEMBER 2020
Dodge & Cox Worldwide Funds plc -
Global Stock FundU.S. Stock FundGlobal Bond Fund
An umbrella fund with segregated liability between sub-funds
12/20 UCITS AR
Page
Background to the Company 3
Directors’ Report 4
Independent Auditors’ Report 6
Depositary Report 9
Investment Manager’s Report
Global Stock Fund 10
U.S. Stock Fund 13
Global Bond Fund 16
Portfolio of Investments
Global Stock Fund 19
U.S. Stock Fund 24
Global Bond Fund 27
Statement of Financial Position 32
Statement of Comprehensive Income 33
Statement of Changes in Net Assets Attributable to Redeemable Shareholders 34
Statement of Cash Flows 35
Notes to the Financial Statements 36
Portfolio Purchases and Sales (unaudited)
Global Stock Fund 49
U.S. Stock Fund 50
Global Bond Fund 51
Total Expense Ratios (unaudited) 52
Remuneration Policy (unaudited) 53
Securities Financing Transactions (unaudited) 54
Administration of the Company (unaudited) 55
This annual report may be translated into other languages. Any such translation shall be a direct translation of the English text. In theevent of any inconsistency or ambiguity in relation to the meaning of any word or phrase in the translation, the English text will prevail.Any disputes as to the terms thereof shall be governed by, and construed in accordance with, the law of Ireland.
Contents
Dodge & Cox Worldwide Funds plc (the “Company”) was incorporated in Ireland on 25 September 2009 as a public limited company withregistration number 475691 and is operating under the Companies Act 2014 (the “Companies Act”). Unless otherwise provided for in this report,all capitalised terms shall have the same meaning herein as in the prospectus of the Company dated 8 March 2021 (the “Prospectus”).
The Company is an open-ended investment company with variable capital and is authorised and regulated by the Central Bank of Ireland (the“Central Bank”) under the European Communities (Undertakings for Collective Investment in Transferable Securities) Regulations 2011, asamended (the “UCITS Regulations”). The Company is organised in the form of an umbrella fund with segregated liability between sub-funds. Asat 31 December 2020, the Company had three* constituent sub-funds (each a “Fund” and collectively the “Funds”) as listed below, along with theshare classes of each Fund in issue during the year:
Fund Name and Active Share Classes Commencement of Operations
Dodge & Cox Worldwide Funds plc – Global Stock Fund (“Global Stock Fund”)USD Accumulating Class 1 December 2009USD Distributing Class 3 February 2020GBP Accumulating Class 1 December 2009GBP Distributing Class 13 February 2013GBP Distributing Class (H)** 3 January 2017EUR Accumulating Class 1 December 2009CAD Accumulating Class 1 October 2010
Dodge & Cox Worldwide Funds plc – U.S. Stock Fund (“U.S. Stock Fund”)USD Accumulating Class 1 December 2010USD Distributing Class 2 March 2020GBP Accumulating Class 1 December 2010GBP Distributing Class 2 December 2013GBP Distributing Class (H)** 3 January 2017EUR Accumulating Class 1 December 2010
Dodge & Cox Worldwide Funds plc – Global Bond Fund (“Global Bond Fund”)USD Accumulating Class 1 May 2014GBP Distributing Class 1 May 2014GBP Distributing Class (H)** 1 May 2014EUR Accumulating Class 1 May 2014EUR Accumulating Class (H)** 1 May 2014EUR Distributing Class 1 May 2014EUR Distributing Class (H)** 1 May 2014
* An additional sub-fund of the Company, the Dodge & Cox Worldwide Funds plc - Emerging Markets Stock Fund, was authorised by the Central Bank on 17 February 2021.** “(H)” denotes hedged share class
Investment Objectives and PoliciesThe Company provides investors with a choice of Funds. Each Fund aims to achieve its investment objective, as set out below, while spreadinginvestment risks through investment in transferable securities, liquid financial assets, and other permitted investments in accordance with theUCITS Regulations.
Global Stock FundThe Fund’s objective is to provide shareholders with an opportunity for long-term growth of principal and income. The Fund seeks to achieve itsobjective by investing primarily in a diversified portfolio of equity securities issued by companies from at least three different countries locatedanywhere in the world, which may include Emerging Market Countries.
U.S. Stock FundThe Fund’s primary objective is to provide shareholders with an opportunity for long-term growth of principal and income. A secondary objectiveis to seek to achieve a reasonable current income. The Fund seeks to achieve its objective by investing primarily in a diversified portfolio ofU.S. equity securities.
Global Bond FundThe Fund’s objective is to provide shareholders with a high rate of total return, consistent with long-term preservation of capital. The Fund seeksto achieve its objective by investing in a diversified portfolio of bonds and other debt instruments of issuers from at least three different countrieslocated anywhere in the world, which may include Emerging Markets Countries.
Full details of the investment objectives and policies of the Global Stock Fund, U.S. Stock Fund, and Global Bond Fund are set out in theProspectus.
Background to the Company
DODGE & COX WORLDWIDE FUNDS PLC � PAGE 3
The directors of the Company (the “Directors”, together the “Board of Directors”) present herewith their report together with the audited financialstatements for the year ended 31 December 2020.
DirectorsThe name and nationality of persons who were Directors during the year ended 31 December 2020 are:
Éilish Finan (Irish) (independent)Stephen Haswell (American)1
Carl O’Sullivan (Irish) (independent)Rosemary Quinlan (Irish) (independent)Diana Strandberg (American)William Strickland (American)Steven Voorhis (American)1 Stephen Haswell was appointed as a director of the Company with effect from 30 October 2020.
Directors’ and Secretary’s Interests in SharesAt 31 December 2020, the following Director held shares (all USD Accumulating Class Shares) in the Funds: Diana Strandberg held500,000 (2019: 500,000) shares in the Global Stock Fund and 309,587 (2019: 309,587) shares in the U.S. Stock Fund. The secretary had nointerest in the shares of the Funds.
Directors’ ResponsibilitiesThe Directors are responsible for preparing the directors’ report and the financial statements in accordance with applicable Irish law.
Irish company law requires the Directors to prepare the financial statements for each financial year that give a true and fair view of theCompany’s assets, liabilities and financial position as at the end of the financial year and the profit or loss and cash flows of the Company for thefinancial year. The Directors have prepared the financial statements in accordance with International Financial Reporting Standards as adopted bythe European Union.
Under Irish company law, the Directors shall not approve the financial statements unless they are satisfied that they give a true and fair viewof the Company’s assets, liabilities and financial position as at the end of the financial year and the profit or loss and cash flows of the Companyfor the financial year.
In preparing the financial statements, the Directors are required to:
� select suitable accounting policies and then apply them consistently;� make judgments and estimates that are reasonable and prudent;� state whether the financial statements have been prepared in accordance with applicable accounting standards and identify the standards in
question, subject to any material departures from those standards being disclosed and explained in the notes to the financial statements; and� prepare the financial statements on the going concern basis unless it is inappropriate to presume that the Company will continue in business.
The Directors are responsible for ensuring that adequate accounting records are kept that are sufficient to:
� correctly record and explain the transactions of the Company;� enable, at any time, the assets, liabilities, financial position and profit or loss of the Company to be determined with reasonable accuracy; and� enable the Directors to ensure that the financial statements comply with the requirements of the Companies Act and enable those financial
statements to be audited.
To achieve this, the Directors have appointed an experienced administrator, State Street Fund Services (Ireland) Limited (the “Administrator”), tomaintain the accounting records of the Company and perform additional administrative duties.
The Directors are also responsible for safeguarding the assets of the Company. In fulfillment of this responsibility, they have appointed StateStreet Custodial Services (Ireland) Limited (the “Depositary”) to safekeep the Company’s assets in accordance with the constitution of theCompany (the “Constitution”). In addition, the Directors are responsible for taking reasonable steps for the prevention and detection of fraud andother irregularities.
The Directors are responsible for the maintenance and integrity of the financial statements included on the Company’s website. Legislationin Ireland governing the preparation and dissemination of financial statements may differ from legislation in other jurisdictions.
Directors’ Compliance StatementIt is the policy of the Company to comply with its relevant obligations (as defined in the Companies Act). As required by Section 225(2) of theCompanies Act, the Directors acknowledge that they are responsible for securing the Company’s compliance with the relevant obligations. TheDirectors have drawn up a compliance policy statement as defined in Section 225(3)(a) of the Companies Act and a compliance policy which refersto the arrangements and structures that are in place and which are, in the Directors’ opinion, designed to secure material compliance with theCompany’s relevant obligations. These arrangements and structures were reviewed by the Directors during the financial year. In discharging theirresponsibilities under Section 225, the Directors relied upon, among other things, the services provided, advice and/or representations from thirdparties whom the Directors believe have the requisite knowledge and experience in order to secure material compliance with the Company’srelevant obligations.
Directors’ Report
DODGE & COX WORLDWIDE FUNDS PLC � PAGE 4
Corporate Governance CodeThe Board of Directors assessed all measures included in the Irish Funds voluntary Corporate Governance Code for Collective InvestmentSchemes and Management Companies published in December 2011 (the “Code”). The Board of Directors has adopted all corporate governancepractices and procedures in the Code, which can be obtained at: http://www.irishfunds.ie.
Audit CommitteeThe Board of Directors decided it was not necessary to constitute an audit committee given the frequency of the meetings of the Board ofDirectors throughout the year and the size of the Board of Directors.
Relevant Audit InformationSo far as the Directors are aware, there is no relevant audit information of which the Company’s auditors are unaware and the Directors have takenall the steps that ought to have been taken as Directors in order to make themselves aware of any relevant audit information and to establish thatthe Company’s auditors are aware of that information.
RisksAn analysis of principal risks facing the Company arising from its use of financial instruments is included in Note 13 to the financial statements. Inaddition, risks associated with COVID-19 and Brexit are included in Note 15 and Note 16 to the financial statements. Other risk considerations areset forth in the Prospectus.
Review of the Business and Future DevelopmentsA review of each Fund’s performance can be found in the Investment Manager’s Report.
Results and DistributionsThe results of operations and distributions for the year are set out in the Statement of Comprehensive Income, and the Company’s distributionpolicy is set forth in Note 14 to the financial statements.
Significant Events During the YearThe details of any significant events affecting the Company during the year are set forth in Note 15 to the financial statements, includingdiscussion of COVID-19 and Brexit.
Significant Events Since Year EndThe details of any significant events affecting the Company since the year end are set forth in Note 16 to the financial statements, includingdiscussion of COVID-19 and Brexit.
Accounting RecordsTo ensure that adequate accounting records are kept, the Directors have employed the Administrator to serve as administrator, registrar, andtransfer agent to the Company. The accounting records are located at the offices of the Administrator at 78 Sir John Rogerson’s Quay, Dublin 2,Ireland.
Independent AuditorsThe auditors, PricewaterhouseCoopers, have indicated their willingness to continue in office, and a resolution that they be re-appointed will beproposed at the annual general meeting.
Transactions with Connected PersonsRegulation 43(1) of the Central Bank (Supervision and Enforcement) Act 2013 (Section 48(1)) (Undertakings for Collective Investment inTransferable Securities) Regulations 2019, as amended (the “Central Bank UCITS Regulations”) states that “a responsible person shall ensure thatany transaction between a UCITS and a connected person is (a) conducted at arm’s length; and (b) in the best interests of the unit-holders of theUCITS”.
As required under Regulation 81(4) of the Central Bank UCITS Regulations, the Board of Directors is satisfied that (a) there are in placearrangements, evidenced by written procedures, to ensure that the obligations that are prescribed by Regulation 43(1) are applied to alltransactions with connected persons; and (b) all transactions with connected persons that were entered into during the year complied with theobligations that are prescribed by Regulation 43(1).
On behalf of the Board of Directors
25 March 2021
Directors’ Report
DODGE & COX WORLDWIDE FUNDS PLC � PAGE 5
Independent auditors’ report to the members of Dodge & Cox Worldwide Funds plc
Report on the audit of the financial statements
Opinion
In our opinion, Dodge & Cox Worldwide Funds plc’s financial statements:
give a true and fair view of the Company’s and Funds’ assets, liabilities and financial position as at 31 December 2020 and of their results and cash flows for the year then ended;
have been properly prepared in accordance with International Financial Reporting Standards (“IFRSs”) as adopted by the European Union; and
have been properly prepared in accordance with the requirements of the Companies Act 2014 and the European Communities (Undertakings for Collective Investment in Transferable Securities) Regulations 2011 (as amended).
We have audited the financial statements, included within the Annual Report, which comprise:
the Statement of Financial Position as at 31 December 2020;
the Statement of Comprehensive Income for the year then ended;
the Statement of Cash Flows for the year then ended;
the Statement of Changes in Net Assets Attributable to Redeemable Shareholders for the year then ended;
the Portfolio of Investments for each of the Funds as at 31 December 2020; and
the notes to the financial statements for the Company and for each of its Funds, which include a description of the significant accounting policies.
Basis for opinion
We conducted our audit in accordance with International Standards on Auditing (Ireland) (“ISAs (Ireland)”) and applicable law.
Our responsibilities under ISAs (Ireland) are further described in the Auditors’ responsibilities for the audit of the financial statements section of our report. We believe that the audit evidence we have obtained is sufficient and appropriate to provide a basis for our opinion.
Independence
We remained independent of the Company in accordance with the ethical requirements that are relevant to our audit of the financial statements in Ireland, which includes IAASA’s Ethical Standard, and we have fulfilled our other ethical responsibilities in accordance with these requirements.
Conclusions relating to going concern
Based on the work we have performed, we have not identified any material uncertainties relating to events or conditions that, individually or collectively, may cast significant doubt on the Company’s and Funds’ ability to continue as a going concern for a period of at least twelve months from the date on which the financial statements are authorised for issue.
In auditing the financial statements, we have concluded that the directors’ use of the going concern basis of accounting in the preparation of the financial statements is appropriate.
However, because not all future events or conditions can be predicted, this conclusion is not a guarantee as to the Company’s and Funds’ ability to continue as a going concern.
Our responsibilities and the responsibilities of the directors with respect to going concern are described in the relevant sections of this report.
Reporting on other information
The other information comprises all of the information in the Annual Report other than the financial statements and our auditors’ report thereon. The directors are responsible for the other information. Our opinion on the financial statements does not cover the other information and, accordingly, we do not express an audit opinion or, except to the extent otherwise explicitly stated in this report, any form of assurance thereon. In connection with our audit of the financial statements, our responsibility is to read the other information and, in doing so, consider whether the other information is materially inconsistent with the financial statements or our knowledge obtained in the audit, or otherwise appears to be materially misstated. If we identify an apparent material inconsistency or material misstatement, we are required to perform procedures to conclude whether there is a material misstatement of the financial statements or a material misstatement of the other information. If, based on the work we have performed, we conclude that there is a material misstatement of this other information, we are required to report that fact. We have nothing to report based on these responsibilities.
With respect to the Directors’ Report, we also considered whether the disclosures required by the Companies Act 2014 have been included.
Based on the responsibilities described above and our work undertaken in the course of the audit, ISAs (Ireland) and the Companies Act 2014 require us to also report certain opinions and matters as described below:
In our opinion, based on the work undertaken in the course of the audit, the information given in the Directors’ Report for the year ended 31 December 2020 is consistent with the financial statements and has been prepared in accordance with applicable legal requirements.
Based on our knowledge and understanding of the Company and its environment obtained in the course of the audit, we have not identified any material misstatements in the Directors’ Report.
Responsibilities for the financial statements and the audit
Responsibilities of the directors for the financial statements
As explained more fully in the Directors’ Responsibilities set out on page 4, the directors are responsible for the preparation of the financial statements in accordance with the applicable framework and for being satisfied that they give a true and fair view.
The directors are also responsible for such internal control as they determine is necessary to enable the preparation of financial statements that are free from material misstatement, whether due to fraud or error.
In preparing the financial statements, the directors are responsible for assessing the Company’s and Funds’ ability to continue as going concerns, disclosing as applicable, matters related to going concern and using the going concern basis of accounting unless the directors either intend to liquidate the Company or to cease operations, or have no realistic alternative but to do so.
Auditors’ responsibilities for the audit of the financial statements
Our objectives are to obtain reasonable assurance about whether the financial statements as a whole are free from material misstatement, whether due to fraud or error, and to issue an auditors’ report that includes our opinion. Reasonable assurance is a high level of assurance, but is not a guarantee that an audit conducted in accordance with ISAs (Ireland) will always detect a material misstatement when it exists. Misstatements can arise from fraud or error and are considered material if, individually or in the aggregate, they could reasonably be expected to influence the economic decisions of users taken on the basis of these financial statements.
Our audit testing might include testing complete populations of certain transactions and balances, possibly using data auditing techniques. However, it typically involves selecting a limited number of items for testing, rather than testing complete populations. We will often seek to target particular items for testing based on their size or risk characteristics. In other cases, we will use audit sampling to enable us to draw a conclusion about the population from which the sample is selected.
A further description of our responsibilities for the audit of the financial statements is located on the IAASA website at:
https://www.iaasa.ie/getmedia/b2389013-1cf6-458b-9b8f-a98202dc9c3a/Description_of_auditors_responsibilities_for_audit.pdf.
This description forms part of our auditors’ report.
Use of this report
This report, including the opinions, has been prepared for and only for the Company’s members as a body in accordance with section 391 of the Companies Act 2014 and for no other purpose. We do not, in giving these opinions, accept or assume responsibility for any other purpose or to any other person to whom this report is shown or into whose hands it may come save where expressly agreed by our prior consent in writing.
Other required reporting
Companies Act 2014 opinions on other matters
We have obtained all the information and explanations which we consider necessary for the purposes of our audit.
In our opinion the accounting records of the Company were sufficient to permit the financial statements to be readily and properly audited.
The financial statements are in agreement with the accounting records.
Companies Act 2014 exception reporting
Directors’ remuneration and transactions
Under the Companies Act 2014 we are required to report to you if, in our opinion, the disclosures of directors’ remuneration and transactions specified by sections 305 to 312 of that Act have not been made. We have no exceptions to report arising from this responsibility.
Jonathan O'Connell for and on behalf of PricewaterhouseCoopers Chartered Accountants and Statutory Audit Firm Dublin 31 March 2021
We have enquired into the conduct of Dodge & Cox Worldwide Funds plc (the “Company”), for the year from 1 January 2020 to 31 December2020, in our capacity as Depositary to the Company.
This report including the opinion has been prepared for and solely for the shareholders in the Company as a body, in accordance withRegulation 34, (1), (3) and (4) in Part 5 of the European Communities (Undertakings for Collective Investment in Transferable Securities)Regulations 2011, as amended (the “UCITS Regulations”), and for no other purpose. We do not, in giving this opinion, accept or assumeresponsibility for any other purpose or to any other person to whom this report is shown.
Responsibilities of the DepositaryOur duties and responsibilities are outlined in Regulation 34, (1), (3) and (4) in Part 5 of the UCITS Regulations. One of those duties is to enquire intothe conduct of the Company in each annual accounting period and report thereon to the shareholders.
Our report shall state whether, in our opinion, the Company has been managed in that period in accordance with the provisions of theCompany’s constitution (the “Constitution”) and the UCITS Regulations. It is the overall responsibility of the Company to comply with theseprovisions. If the Company has not so complied, we, as Depositary, must state why this is the case and outline the steps which we have taken torectify the situation.
Basis of Depositary OpinionThe Depositary conducts such reviews as it, in its reasonable opinion, considers necessary in order to comply with its duties as outlined inRegulation 34, (1), (3) and (4) in Part 5 of the UCITS Regulations and to ensure that, in all material respects, the Company has been managed (i) inaccordance with the limitations imposed on its investment and borrowing powers by the provisions of the Constitution and the UCITS Regulationsand (ii) otherwise in accordance with the Constitution and the UCITS Regulations.
OpinionIn our opinion, the Company has been managed during the year, in all material respects:
(i) in accordance with the limitations imposed on the investment and borrowing powers of the Company by the Constitution, the UCITSRegulations and the Central Bank (Supervision and Enforcement) Act 2013 (Section 48(1))(Undertakings for Collective Investment inTransferable Securities) Regulations 2019, as amended (the “Central Bank UCITS Regulations”); and
(ii) otherwise in accordance with the provisions of the Constitution, the UCITS Regulations and the Central Bank UCITS Regulations.
State Street Custodial Services (Ireland) Limited78 Sir John Rogerson’s QuayDublin 2Ireland25 March 2021
Depositary Report
DODGE & COX WORLDWIDE FUNDS PLC � PAGE 9
Market CommentaryIn 2020, global equity markets were extremely volatile. Global stocks fell sharply in the spring as the coronavirus (COVID-19) pandemic evolved,then rebounded quickly off March lows and performed well during the second and third quarters. After the successful development of effectiveCOVID-19 vaccines, markets rebounded sharply again in November as investors looked forward to the potential for an economic recovery in2021. The sudden market reversals this year illustrate the importance of having a long-term view and staying the course with one’s convictions.Markets can turn quickly, and history shows us that major market moves are episodic and unpredictable. Thus, missing even a few days in themarket can make a big difference to overall returns.
The fourth quarter saw a change in fortunes for value stocks,a with the MSCI World Value Index up 16%, outperforming the MSCI WorldGrowth Index, up 13%. The Fund is overweight value sectors such as Energy and Financials, market laggards that later became market leadersduring the quarter as global equities surged. Given its value-oriented positioning, the Fund significantly outperformed the MSCI World and theMSCI World Value.
While value outperformed growth in the fourth quarter, value stocks still lagged growth significantly for the year—MSCI World Value wasdown 1% versus up 34% for the MSCI World Growth—and underperformed growth stocks by 142 percentage points over the last decade.b
Investment StrategyWe believe we are still in the early innings of a reversal between value and growth performance, and a strong case can be made for investing invalue stocks going forward.
First, starting valuations matter, and the valuation differential between value and growth stocks remains wide by historical standards, whichcreates ample opportunities for value-oriented investors like Dodge & Cox. The Fund trades at a significant discount to the broad-basedmarket: 13.2 times forward earnings compared to 21.0 times for the MSCI World.c Historically, lower starting valuations have produced moreattractive long-term returns.
Second, we are encouraged by the approval of COVID-19 vaccines. The areas of the market impacted by COVID should continue to recoveras more of the population becomes vaccinated. There is also the possibility that interest rates increase as the economy recovers, which wouldfurther benefit many of the Fund’s holdings.
Third, history has indicated it is hard to stay a market leader. Several very large, high-valuation technology companies have had a largeinfluence on market returns. We believe many of them are overvalued and face significant challenges, not only in justifying their valuations but alsobecause of mounting competitive and regulatory threats. In addition, they would be disadvantaged by higher interest rates.
We have strong conviction in our portfolio positioning. The portfolio is composed mainly of companies with strong franchises that benefitfrom long-term economic growth. About half the portfolio is invested in innovation-driven businesses in areas such as Internet & Direct MarketingRetail, Media, Communication Services, and Health Care. Given wide valuation gaps, the Fund also continues to have notable overweightpositions in value parts of the market. Many stocks that were hit hard by the economic consequences of the pandemic—notably in the Financials,Energy, and Industrials sectors—were down significantly for the year, even after the fourth quarter rebound.
We continue to assess relative valuation opportunities, weighing long-term fundamentals against current prices. For example, while weadded to Financials and other cyclicals earlier in the year, in the fourth quarter we trimmed Financials modestly on relative performance and addedto Health Care. We discuss Financials and Health Care in more detail below.
FinancialsAfter a rocky start, declining 32% in the first quarter, the MSCI World Financials sector appreciated in the second, third, and fourth quarters.Financials were especially strong in the fourth quarter, finishing up 24% and enabling the sector to end the year down just 3%. However,Financials had one of the lowest returns in the market for the year, amid concerns of a weak economy, high credit losses, and low interest ratesdriven by the pandemic. Additionally, regulators and central banks either explicitly or implicitly caused financial services companies to suspenddividends and share buyback programs that were expected to occur in 2020. In contrast to previous downturns, banks are in a much strongerposition this time. In large part due to the effects of the 2008-09 financial crisis, banks entered the current crisis with low leverage, restrained risktaking, and well-diversified sources of revenue. Moreover, in anticipation of a sudden, pandemic driven downturn, many banks quickly set asidesignificant provisions for expected loan losses and remain broadly reserved for higher levels of joblessness than economies are currentlyexperiencing. Finally, governments have provided unprecedented support to the economy to blunt the impact of potential credit losses. Despitethis, valuations for Financials are near historic lows compared to the stock market as a whole. The MSCI World Banks industry trades at 12.8 timesforward estimated earnings compared to 21.0 times for the broader MSCI World.
During the first part of the year, we added to the Fund’s Financials holdings, which traded at exceptionally low valuations in light of thepandemic. With the resolution of the health crisis, we see potential for a return to higher economic activity, unwinding of provisions, and stronglevels of capital return. The Federal Reserve, for example, has allowed the large banks to resume dividend payments and share repurchases. TheFund remains overweight Financials: 27.9% of the Fund compared to 12.8% of the MSCI World and 21.5% of the MSCI World Value.
Capital Oned is an example of a stock we added to opportunistically in 2020. A leading financial services company trading at an attractivevaluation, Capital One represents exceptional long-term value in our opinion. The bank’s most profitable business—credit cards—felt the impactof weaker consumer spending as the pandemic took its toll on the economy. Yet, like many other Financials, it is well positioned to benefit froma healthier economy that we believe should emerge once vaccinations become widespread. The company has a number of strengths: scale incredit cards and auto lending, robust deposits, an advanced digital banking platform, and a legacy of heavy investment in technology.Management is focused on the long term, committed to improving the bank’s expense efficiency, and has a track record of earning higherrisk-adjusted margins than its peers. At 10.9 times forward earnings, Capital One is trading at a substantial discount to the overall market.
Health CareAs markets plunged earlier in the year and subsequently rebounded, we adjusted the Fund’s positioning in the Health Care sector based on itsrelative attractiveness. The Fund’s holdings in Health Care are largely comprised of pharmaceutical companies, whose earnings are generallystable and not sensitive to swings in the economy. Those defensive characteristics provided relative strength in the first quarter as pandemicworries hurt other areas of the market—such as Financials, Energy, Industrials, and Materials—much more. Companies in those sectors becameexceptionally attractive, so we added to them by meaningfully trimming the Fund’s Health Care holdings. The Fund’s weighting in Health Caredeclined from 18.9% on 31 March to 14.7% on 30 September.
Investment Manager’s ReportGlobal Stock Fund
DODGE & COX WORLDWIDE FUNDS PLC � PAGE 10
However, while all sectors posted positive returns in the fourth quarter, Health Care underperformed the overall market by 7.2 percentagepoints. The Fund added back to Health Care, in particular in the Pharmaceuticals industry that now trades at an attractive 14.9 times estimatedearnings. While an average valuation relative to history, it is in the bottom decile of its valuation relative to the market. We recognise concerns overdrug pricing and uncertainty regarding the new Biden Administration’s policies in the United States. However, we believe the Fund’sPharmaceuticals holdings have impressive innovation potential, global customer bases, and highly attractive valuations. In the fourth quarter, thecombination of attractive fundamentals and valuations led us to begin to add back to many of the Fund’s holdings, including Sanofi andGlaxoSmithKline.
Sanofi is a French pharmaceutical company with particular expertise in rare diseases. In recent years the company has rebuilt itsmanagement team, replacing its Chief Executive Officer, Chief Financial Officer, and Head of Research and Development with executives thathave a demonstrable track record of success. Moreover, while the company’s new drug pipeline shows promise, we believe the stock price onlyreflects the discounted value of the current portfolio of approved drugs, with little or no value ascribed to the new drug pipeline.
GlaxoSmithKline, a UK-based pharmaceutical company, is a leader in the attractive vaccines and consumer health care markets, but its corepharmaceuticals business has struggled. A new management team joined in 2017-18 and has undertaken a turnaround plan, which includesdivesting non-core businesses and rebuilding the company’s new drug pipeline, particularly around immunology and oncology. The implied valueof its pharmaceutical business is low, indicating that investors are giving little credit for better prospects in the future.
In Closing2020 was a difficult year for value investors. However, the tide started to turn dramatically in the fourth quarter, as the previouslaggards—specifically Energy, Financials, and Industrials—became the market leaders. Going forward, we continue to believe this is anopportune time to invest in value stocks.
We have strong conviction in the Fund’s value-oriented portfolio, which is comprised mostly of companies with strong businesses that webelieve would benefit from sustained economic growth. We remain optimistic about the outlook for the Fund and confident in our activeinvestment approach. Since changes in valuations and share prices can happen swiftly and without warning, we encourage our shareholders totake a long-term view.
Thank you for your continued confidence in our firm. As always, we welcome your comments and questions.
On behalf of the Board of Directors of Dodge & Cox,
Charles F. Pohl,Chairman andChief Investment Officer, Dodge & Cox
Dana M. Emery,President andChief Executive Officer, Dodge & Cox
1 February 2021
a Value stocks are the lower valuation portion of the equity market, and growth stocks are the higher valuation portion.b The MSCI World Value Index had a total return of 92.4% from 31 December 2010 through 31 December 2020 compared to 234.2% for the MSCI World Growth Index.c Unless otherwise specified, all weightings and characteristics are as of 31 December 2020.d The use of specific examples does not imply that they are more or less attractive investments than the portfolio’s other holdings.
Investment Manager’s ReportGlobal Stock Fund
DODGE & COX WORLDWIDE FUNDS PLC � PAGE 11
Average Annual Total Return
For periods ended 31 December 2020 1 Year % 3 Years % 5 Years % 10 Years %Since
Inception %
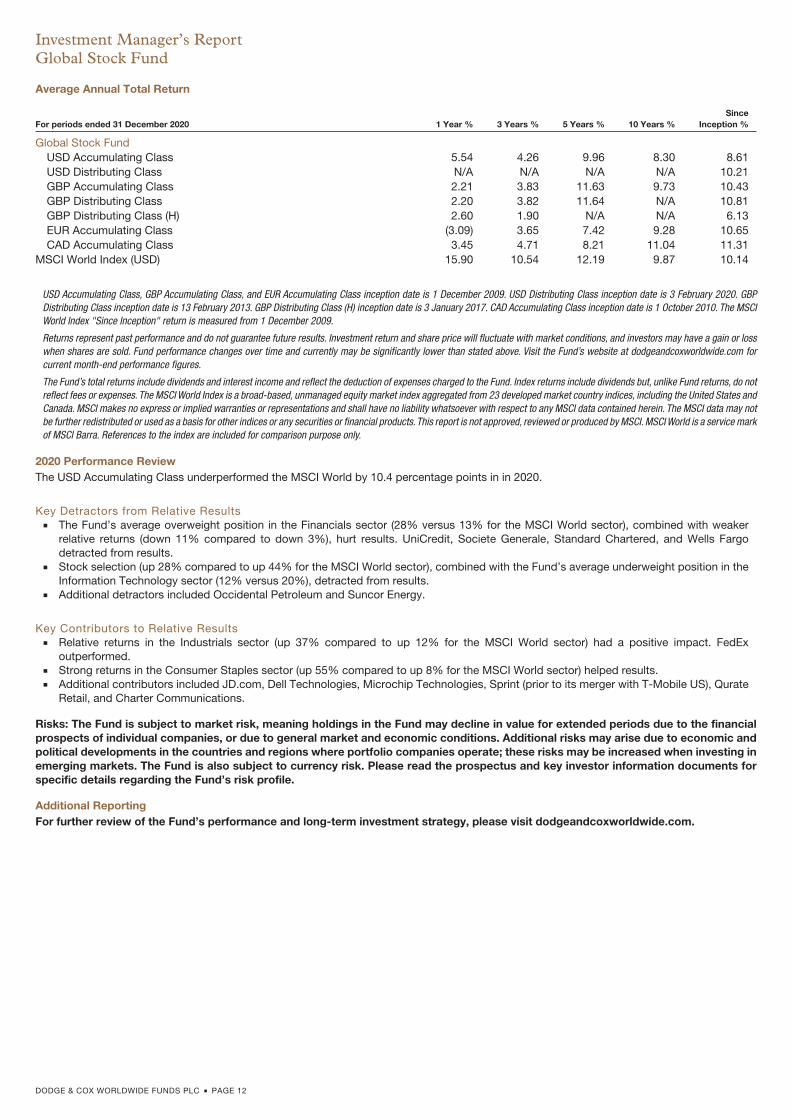
Global Stock FundUSD Accumulating Class 5.54 4.26 9.96 8.30 8.61USD Distributing Class N/A N/A N/A N/A 10.21GBP Accumulating Class 2.21 3.83 11.63 9.73 10.43GBP Distributing Class 2.20 3.82 11.64 N/A 10.81GBP Distributing Class (H) 2.60 1.90 N/A N/A 6.13EUR Accumulating Class (3.09) 3.65 7.42 9.28 10.65CAD Accumulating Class 3.45 4.71 8.21 11.04 11.31
MSCI World Index (USD) 15.90 10.54 12.19 9.87 10.14
USD Accumulating Class, GBP Accumulating Class, and EUR Accumulating Class inception date is 1 December 2009. USD Distributing Class inception date is 3 February 2020. GBPDistributing Class inception date is 13 February 2013. GBP Distributing Class (H) inception date is 3 January 2017. CAD Accumulating Class inception date is 1 October 2010. The MSCIWorld Index "Since Inception" return is measured from 1 December 2009.
Returns represent past performance and do not guarantee future results. Investment return and share price will fluctuate with market conditions, and investors may have a gain or losswhen shares are sold. Fund performance changes over time and currently may be significantly lower than stated above. Visit the Fund’s website at dodgeandcoxworldwide.com forcurrent month-end performance figures.
The Fund’s total returns include dividends and interest income and reflect the deduction of expenses charged to the Fund. Index returns include dividends but, unlike Fund returns, do notreflect fees or expenses. The MSCI World Index is a broad-based, unmanaged equity market index aggregated from 23 developed market country indices, including the United States andCanada. MSCI makes no express or implied warranties or representations and shall have no liability whatsoever with respect to any MSCI data contained herein. The MSCI data may notbe further redistributed or used as a basis for other indices or any securities or financial products.This report is not approved, reviewed or produced by MSCI. MSCI World is a service markof MSCI Barra. References to the index are included for comparison purpose only.
2020 Performance ReviewThe USD Accumulating Class underperformed the MSCI World by 10.4 percentage points in in 2020.
Key Detractors from Relative Results� The Fund’s average overweight position in the Financials sector (28% versus 13% for the MSCI World sector), combined with weaker
relative returns (down 11% compared to down 3%), hurt results. UniCredit, Societe Generale, Standard Chartered, and Wells Fargodetracted from results.
� Stock selection (up 28% compared to up 44% for the MSCI World sector), combined with the Fund’s average underweight position in theInformation Technology sector (12% versus 20%), detracted from results.
� Additional detractors included Occidental Petroleum and Suncor Energy.
Key Contributors to Relative Results� Relative returns in the Industrials sector (up 37% compared to up 12% for the MSCI World sector) had a positive impact. FedEx
outperformed.� Strong returns in the Consumer Staples sector (up 55% compared to up 8% for the MSCI World sector) helped results.� Additional contributors included JD.com, Dell Technologies, Microchip Technologies, Sprint (prior to its merger with T-Mobile US), Qurate
Retail, and Charter Communications.
Risks: The Fund is subject to market risk, meaning holdings in the Fund may decline in value for extended periods due to the financialprospects of individual companies, or due to general market and economic conditions. Additional risks may arise due to economic andpolitical developments in the countries and regions where portfolio companies operate; these risks may be increased when investing inemerging markets. The Fund is also subject to currency risk. Please read the prospectus and key investor information documents forspecific details regarding the Fund’s risk profile.
Additional ReportingFor further review of the Fund’s performance and long-term investment strategy, please visit dodgeandcoxworldwide.com.
Investment Manager’s ReportGlobal Stock Fund
DODGE & COX WORLDWIDE FUNDS PLC � PAGE 12
Market CommentaryThe U.S. equity market was extremely volatile in 2020. In the first quarter, the coronavirus (COVID-19) evolved into a global pandemic, disruptingmajor economies around the world and abruptly ending the longest stock market bull run in U.S. history. U.S. equities fell sharply, then quicklyrebounded off their March lows and performed strongly for the remainder of the year. A combination of depressed valuations, substantial fiscaland monetary stimulus, and a robust recovery in corporate earnings buoyed the U.S. equity market. After the successful development of effectiveCOVID-19 vaccines in the fourth quarter, segments of the market that had previously lagged—such as Energy, Financials, andIndustrials—outperformed as the U.S. stock market surged to an all-time high in December. This rapid and dramatic reversal illustrates theimportance of having a long-term view and staying the course with one’s convictions because markets can turn quickly.
Looking back on 2020, companies have fallen into two groups: businesses largely immune to the economic impact of the pandemic (wedescribe them as “COVID defensive”) and those hit hard by the economic consequences of the pandemic (“COVID cyclical”). Approximately70%a of the S&P 500 is in COVID-defensive businesses, mainly those in the Information Technology, Health Care, Consumer Staples, and Utilitiessectors. Large technology-related companies have surged, especially the FAANGM stocks—Facebook, Amazon, Apple, Netflix, Google(Alphabet), and Microsoft. In contrast, the other 30% of the S&P 500 is comprised of COVID-cyclical companies—largely in the Financials, Energy,Industrials, and Real Estate sectors—that have not fared well. For example, Energy (down 34%) was the worst-performing sector of the S&P500 in 2020, reflecting an unprecedented decline in demand due to worldwide stay-at-home orders and the global economic slowdown.
Investment StrategyOver the past decade, U.S. value stocksb underperformed growth stocks by 218 percentage points.c In September 2020, however, the marketstarted to shift in value’s favour, but it is too soon to know whether this could be the beginning of a major reversal in market leadership.Increasingly, we believe a strong case can be made for investing in value stocks going forward.
First, the valuation differential between value and growth stocks remains wide by historical standards, which creates ample opportunities forvalue-oriented investors like Dodge & Cox. The Fund trades at a significant discount to the broad-based market: 13.6 times forward earningscompared to 23.7 times for the S&P 500. Historically, lower starting valuations have produced more attractive long-term returns.
Second, we are encouraged by the approval of effective COVID-19 vaccines. The COVID-cyclical areas of the market should continue torecover as more of the population becomes vaccinated and economic activity accelerates. In addition, as supply and demand move toward abetter balance in the oil markets, Energy could outperform. Moreover, U.S. interest rates may increase as the economy recovers fully, which wouldfurther benefit many of the Fund’s holdings.
Third, history has indicated it is hard to remain a market leader. Several very large, high-valuation technology companies have had asubstantial impact on overall market returns. We believe many of them are overvalued and face significant challenges, not only in justifying theirvaluations but also because of mounting competitive and regulatory threats. In addition, they would be disadvantaged by higher interest rates.
The Fund leans heavily toward COVID-cyclical and value sectors, with notable overweight positions in Financials and Energy. We continue tolook for opportunities to optimise in the portfolio based on our long-term outlook for each company and assessment of the valuation and market’sexpectations. During 2020, we added significantly to various financial services, energy, and low-valuation technology companies.
In Energy, oil prices have started to recover from a low of about $20/barrel in the spring to $49/barrel on 31 December. We believe there is anopportunity for further price increases as demand continues to recover and supply is impacted by the low investment in oil exploration andproduction. While Energy led market returns in the fourth quarter, the valuations are still quite depressed in our opinion. Our views on two othersectors, Financials and Information Technology, are highlighted in more detail below.
FinancialsIn 2020, Financials was one of the worst-performing sectors of the market amid concerns that a weaker economy would lead to increases in creditlosses for U.S. banks and lower interest rates would reduce profit margins. However, we believe the large U.S. banks are in a much strongerposition compared to past downturns. During the 2008-09 global financial crisis, U.S. banks were at the epicenter of the downturn because oftheir heavy exposure to the troubled housing market. In contrast, the COVID-19 pandemic is a health crisis that has led to a sudden decline ineconomic activity. Most U.S. banks entered the current crisis with low leverage, restrained risk taking, and well-diversified sources of revenue.Moreover, in anticipation of a sharper downturn, many banks have set aside significant provisions for expected loan losses and remain broadlyreserved for higher levels of economic distress than the United States is currently experiencing.
U.S. Financials’ valuations are near historic lows compared to the stock market as a whole. Specifically, the S&P 500 Banks industry tradesat 13.4 times forward estimated earnings compared to 23.7 times for the broader S&P 500. This sizeable discount does not fully reflect the banks’underlying strength, in our opinion. Looking ahead, we believe large banks are well positioned to benefit from the vaccine rollout and anticipatedeconomic rebound, which should lead to better growth and lower credit costs in 2021. We expect capital returns to increase, as the U.S. FederalReserve has allowed all the large banks to resume paying dividends and buying back their shares, with certain restrictions.
On 31 December, the Fund had significant exposure to Financials: 27.8% compared to 10.4% for the S&P 500. Capital One Financiald (a4.1% position) was the Fund’s largest holding at year end.
Capital One FinancialCapital One is a leading financial services company trading at an attractive valuation and, in our opinion, it represents exceptional long-term value.The bank’s most profitable business—credit cards—felt the impact of weaker consumer spending as the pandemic took its toll on the economy.Yet, like many other Financials, it is well positioned to benefit from a healthier economy that we believe should emerge once vaccinations becomewidespread. The company has a number of strengths: scale in credit cards and auto lending, robust deposits, advanced digital banking platform,and a legacy of heavy investment in technology. Management is focused on the long term, committed to improving the bank’s expense efficiency,and has a track record of earning higher risk-adjusted margins than its peers. At 10.9 times forward earnings, Capital One is trading at asubstantial discount to the overall market, and we opportunistically added to the Fund’s position in this stock during 2020.
Information TechnologyMany of the U.S. growth stocks are expensive technology-related companies. Especially after their strong 2020 performance, InformationTechnology sector valuations are approaching year 2000-type levels by some measures, and unprofitable technology stocks now account for32% of total technology stocks, which is close to the March 2000 level of 36%.
Given such stretched valuations, the Fund remains underweight the overall Information Technology sector and is primarily invested in lower-valuation technology stocks. The Fund’s technology holdings trade at a significant discount to the overall Information Technology sector on
Investment Manager’s ReportU.S. Stock Fund
DODGE & COX WORLDWIDE FUNDS PLC � PAGE 13
various metrics, including 1.3 times sales (compared to 6.9 times for the S&P 500 sector) as well as 13.2 times estimated earnings, compared to29.4 times for the S&P 500 sector. In 2020, we added to Cisco and VMware and also started a new position in Fiserv, which increased the Fund’sexposure to IT Services.
FiservFiserv is a diversified provider of financial technology and payment processing services to banks and merchants. Decreased merchant activityduring the COVID-19 pandemic, combined with a sooner-than-expected CEO transition and partial sale of KKR’s stake in the company, weighedon Fiserv’s stock price and created an opportunity for us to start a position during the fourth quarter. Fiserv has a strong business franchise withdominant market positions in several major business lines, including global merchant transaction processing, U.S. issuer processing, andU.S. core banking processing. The company has a shareholder-focused management team and trades at an attractive valuation given its growthprospects. It also offers significant margin expansion potential from revenue synergies and cross-selling opportunities. On 31 December, Fiservwas a 0.6% position in the Fund.
In Closing2020 was a difficult year for value investors. However, the tide started to turn dramatically in the fourth quarter, as the previouslaggards—specifically Energy, Financials, and Industrials—became the market leaders that quarter. Going forward, we continue to believe this isan opportune time to invest in value stocks.
We have strong conviction in the Fund’s value-oriented portfolio, which is comprised mostly of companies with strong businesses that webelieve would benefit from sustained economic growth. We remain optimistic about the outlook for the Fund and confident in our activeinvestment approach. Since changes in valuations and share prices can happen swiftly and without warning, we encourage our shareholders totake a long-term view.
Thank you for your continued confidence in our firm. As always, we welcome your comments and questions.
On behalf of the Board of Directors of Dodge & Cox,
Charles F. Pohl,Chairman andChief Investment Officer, Dodge & Cox
Dana M. Emery,President andChief Executive Officer, Dodge & Cox
1 February 2021
a Unless otherwise specified, all weightings and characteristics are as of 31 December 2020.b Value stocks are the lower valuation portion of the equity market, and growth stocks are the higher valuation portion.c The Russell 1000 Value Index had a total return of 171.3% from 31 December 2010 through 31 December 2020 compared to 389.3% for the Russell 1000 Growth Index.d The use of specific examples does not imply that they are more or less attractive investments than the portfolio’s other holdings.
Investment Manager’s ReportU.S. Stock Fund
DODGE & COX WORLDWIDE FUNDS PLC � PAGE 14
Average Annual Total Return
For periods ended 31 December 2020 1 Year % 3 Years % 5 Years % 10 Years %Since
Inception %
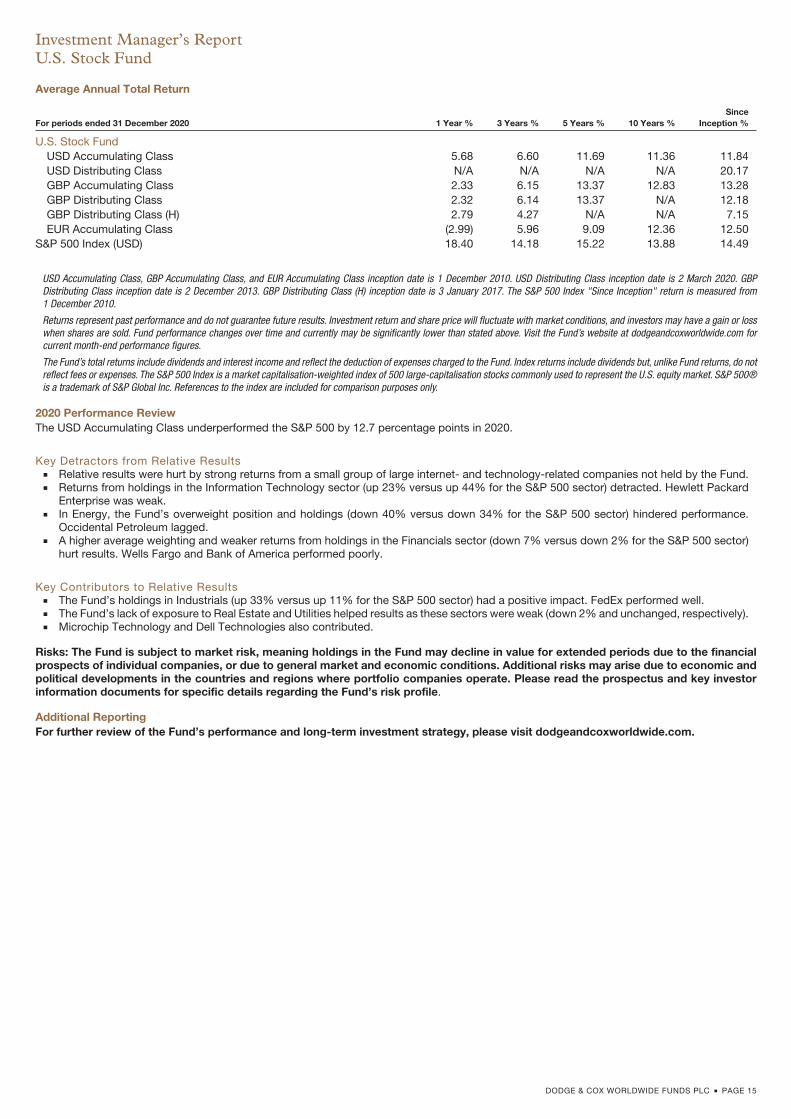
U.S. Stock FundUSD Accumulating Class 5.68 6.60 11.69 11.36 11.84USD Distributing Class N/A N/A N/A N/A 20.17GBP Accumulating Class 2.33 6.15 13.37 12.83 13.28GBP Distributing Class 2.32 6.14 13.37 N/A 12.18GBP Distributing Class (H) 2.79 4.27 N/A N/A 7.15EUR Accumulating Class (2.99) 5.96 9.09 12.36 12.50
S&P 500 Index (USD) 18.40 14.18 15.22 13.88 14.49
USD Accumulating Class, GBP Accumulating Class, and EUR Accumulating Class inception date is 1 December 2010. USD Distributing Class inception date is 2 March 2020. GBPDistributing Class inception date is 2 December 2013. GBP Distributing Class (H) inception date is 3 January 2017. The S&P 500 Index "Since Inception" return is measured from1 December 2010.
Returns represent past performance and do not guarantee future results. Investment return and share price will fluctuate with market conditions, and investors may have a gain or losswhen shares are sold. Fund performance changes over time and currently may be significantly lower than stated above. Visit the Fund’s website at dodgeandcoxworldwide.com forcurrent month-end performance figures.
The Fund’s total returns include dividends and interest income and reflect the deduction of expenses charged to the Fund. Index returns include dividends but, unlike Fund returns, do notreflect fees or expenses. The S&P 500 Index is a market capitalisation-weighted index of 500 large-capitalisation stocks commonly used to represent the U.S. equity market. S&P 500®is a trademark of S&P Global Inc. References to the index are included for comparison purposes only.
2020 Performance ReviewThe USD Accumulating Class underperformed the S&P 500 by 12.7 percentage points in 2020.
Key Detractors from Relative Results� Relative results were hurt by strong returns from a small group of large internet- and technology-related companies not held by the Fund.� Returns from holdings in the Information Technology sector (up 23% versus up 44% for the S&P 500 sector) detracted. Hewlett Packard
Enterprise was weak.� In Energy, the Fund’s overweight position and holdings (down 40% versus down 34% for the S&P 500 sector) hindered performance.
Occidental Petroleum lagged.� A higher average weighting and weaker returns from holdings in the Financials sector (down 7% versus down 2% for the S&P 500 sector)
hurt results. Wells Fargo and Bank of America performed poorly.
Key Contributors to Relative Results� The Fund’s holdings in Industrials (up 33% versus up 11% for the S&P 500 sector) had a positive impact. FedEx performed well.� The Fund’s lack of exposure to Real Estate and Utilities helped results as these sectors were weak (down 2% and unchanged, respectively).� Microchip Technology and Dell Technologies also contributed.
Risks: The Fund is subject to market risk, meaning holdings in the Fund may decline in value for extended periods due to the financialprospects of individual companies, or due to general market and economic conditions. Additional risks may arise due to economic andpolitical developments in the countries and regions where portfolio companies operate. Please read the prospectus and key investorinformation documents for specific details regarding the Fund’s risk profile.
Additional ReportingFor further review of the Fund’s performance and long-term investment strategy, please visit dodgeandcoxworldwide.com.
Investment Manager’s ReportU.S. Stock Fund
DODGE & COX WORLDWIDE FUNDS PLC � PAGE 15
Market CommentaryThe financial markets were volatile over the course of 2020. The coronavirus (COVID-19) pandemic hit in the spring, causing a rapid and largesell-off in risk assets, such as corporate bonds, equities, and commodities, and a flight to safe-haven assets, such as U.S. Treasuries. To bolsterthe economy and markets, global policymakers swiftly took actions—cutting interest rates, expanding asset purchase programs, and enactingsubstantial fiscal stimulus packages. The markets rebounded rapidly, and continued to strengthen throughout the second half of the year,bolstered by improved prospects for a COVID-19 vaccine and hope for a revival of economic activity in 2021. Bond market returns were strong inthis environment, driven primarily by price gains from falling interest rates.
Despite the vibrant mood of the market, the economic and human toll of the pandemic remains severe. The IMF projects that world outputdeclined by more than 4% in 2020, with negative growth from virtually all major countries (except China). Given this backdrop and the fragility ofthe economic recovery, global policymakers have been exceptionally active. Since cutting the policy rate to effectively zero in March andexpanding its asset purchase program (including corporate bond purchases), the U.S. Federal Reserve (Fed) has signaled that it does not plan toincrease the policy rate until at least 2024. The European Central Bank initiated and subsequently expanded its Pandemic Emergency PurchaseProgram, while the Bank of England cut rates and expanded its quantitative easing measures too. On the fiscal front, U.S. and European Unionpolicymakers put in place significant stimulus measures. Notably, the extraordinary policy support was not restricted to developed countries.Emerging market policymakers also embraced such programs, cutting rates to historic lows, launching quantitative easing programs, andboosting government spending.
The tepid outlook for economic growth and inflation, coupled with extremely accommodative monetary policies, have left global interest ratesquite low. At year end, 10-year yields of all G-10 countries were under 1%, and there was nearly $18 trillion of negative-yielding debt outstandingglobally. During the year, U.S. and Canadian 10-year rates fell the most (around 100 basis pointsa each) among developed markets. In emergingmarkets, 10-year rates in economies like Peru, the Philippines, Indonesia, and Mexico declined even more. However, interest rates for a handfulof countries with more challenged political and economic environments (e.g., Brazil, Turkey, South Africa) actually rose slightly. This dichotomyreflects the wide differentials in economic fundamentals and pandemic responses across countries, and underscores the importance of countryselection in managing a global portfolio.
The moves in creditb markets during the early part of the year were extraordinary. During the first quarter, investment-grade yield premiumsc
tripled in less than a month, a pace that exceeded that of the 2008-09 financial crisis. However, the tide turned starting in April, and corporate yieldpremiums went on to recover to near pre-pandemic levels. Corporate bond issuance hit record-highs, enabling many companies to improve theirliquidity positions and balance sheets. Furthermore, central banks also remain committed to supporting fixed income markets through a suite ofcorporate credit and liquidity facilities.
Currency markets also fluctuated significantly. In the depth of the market panic, investors flocked to safe havens like the U.S. dollar, whilecurrencies of economies with weak fundamentals or those dependent on commodity exports fell dramatically. However, as investor sentimentimproved, these trends generally reversed course. After peaking in March, the U.S. dollar fell nearly 12% through year end, closing at levels notseen since early 2018. From a regional standpoint, European and Asian currencies tended to appreciate to a greater extent, while Latin Americancurrencies lagged. Given the significant fall in oil prices during the year (down 20%), the currencies of oil exporters like Russia and Colombiadepreciated. In addition, the Turkish lira and Brazilian real both fell over 20% as these countries contended with unique political, economic, andpandemic-related challenges.
Investment StrategyThe significant volatility and uncertainty that characterised 2020 provided a fertile environment for Dodge & Cox’s active and price-disciplinedapproach to investing in global bonds. All three of the primary return levers that we use in the Fund—credit, rates, and currencies—contributed tothe Fund’s strong performance. During the year, as asset prices/valuations shifted, we made several changes to portfoliopositioning—significantly increasing the Fund’s credit holdings during the market sell-off in the spring (and subsequently trimming some of them),moderately increasing the Fund’s non-U.S. currency exposure, and incrementally increasing the Fund’s duration.d
Credit: Don’t Sit StillWhile credit valuations started and ended the year at similar levels, the journey between those two points was a wild one, in which our valuationdiscipline and security selection skills added significant value. The Fund’s credit holdings were the largest contributors to the Fund’s overallreturn. We came into the year having reduced the Fund’s credit exposure by 19 percentage points in 2019 and continued trimming early in 2020.In March and April, when valuations fell to exceptional levels, we purchased the bonds of a number of strong, highly rated companies that weretrading at valuations typically associated with high-yield issuers. Examples include Coca-Cola, Exxon, State of California, Exelon, and WellsFargo.e Overall, these purchases performed phenomenally, in a surprisingly brief timeframe. As valuations recovered, we unwound many of theseadditions, reducing the Fund’s credit holdings from a peak of 62%f in June, to 50% at year end. These sales were based primarily on valuationconsiderations, rather than concerns about the issuers’ fundamentals. Overall corporate fundamentals are fairly healthy, as many companies haverecently boosted liquidity, increased focus on reducing debt, and benefited from low debt costs. Although valuations are less attractive than theywere in the spring, we continue to have conviction in the Fund’s carefully researched 58 credit issuers, which offer significantly more yield than“risk-free” government securities.
One issuer that we added to during the year was Prosus, a global consumer internet group with equity stakes in several technologycompanies, including an approximately $200 billion investment in Tencent, a dominant Chinese internet company. Though subject to bouts ofvolatility because of its China and emerging markets exposure, we believe Prosus is a sound credit, with an asset value that more than adequatelycovers its ~$6 billion of debt. Further, Prosus bonds offer substantial incremental yield relative to comparably rated corporate bonds. In additionto purchasing more bonds in the midst of the March sell-off, we replaced some of the Fund’s U.S. dollar bonds with euro-denominated debtduring the fourth quarter. This swap allowed us to pick up additional yield premium.
We reinvested proceeds from credit sales primarily into attractively priced generic Agencyg-guaranteed mortgage securities, which are highlyliquid and highly rated (with negligible credit risk), and offer an attractive risk/return profile. If credit or other areas of the market become morecompelling, we will be ready to redeploy this capital, just as we did when the crisis unfolded in 2020.
Currency: The Winds Are ChangingSince the Fund’s inception in 2014 the U.S. dollar has generally been strong, creating a headwind to the returns of the Fund’s non-dollar holdings.That tide may have started to turn in 2020. As mentioned above, while the U.S. dollar surged in the midst of the market panic in March, it has sincedeclined nearly 12%. Our expectation is that it will continue to weaken, albeit more modestly. This view is driven by several factors includingovervaluation (based on metrics like purchasing power parity), sizable and growing U.S. fiscal and current account deficits, diminished growth andinterest rate differentials between the United States and other countries, and the global recovery from COVID-19. In aggregate, the Fund’s
Investment Manager’s ReportGlobal Bond Fund
DODGE & COX WORLDWIDE FUNDS PLC � PAGE 16
non-U.S. dollar holdings contributed modestly to 2020 performance. In a low-yield world, especially one in which the dollar may be weakening, wesee value in having currency as an additional and diverse source of return in a global bond portfolio.
During the year, we added approximately two percentage points in non-U.S. currency exposure, bringing the aggregate exposure to 19% ofthe Fund. Employing our fundamentals-based, long-term, and selective approach to currency management, we established new positions inbonds denominated in four currencies—the Swedish krona, Norwegian krone, Russian ruble, and Malaysian ringgit. The investment thesis foreach of these currencies is a unique combination of valuation and fundamentals. For example, our investment in Malaysia hinges on a positiveoutlook for both the currency and interest rates. The ringgit has lagged the recovery in other Asian currencies, despite Malaysia’s diversified andfundamentally sound economy and resilient export sector. While ongoing uncertainty over the nation’s political leadership has weighed on thecurrency, we believe risks of material changes in economic policy are limited and the currency valuation is attractive.
Rates: Low For a WhileThe significant move lower in interest rates, especially in the United States, Mexico, and Indonesia, boosted performance. Looking ahead, we arebroadly aligned with consensus in expecting the Fed and other major central banks to refrain from raising policy rates until at least 2024. In theUnited States, we believe long-term rates will rise modestly more than what is priced in, based on hope for successful vaccine rollouts, sizablepolicy support, prospects for additional fiscal stimulus, and stronger growth and inflation outlooks. We lengthened the duration of the portfoliofrom 3.3 to 4.1 years over the course of the year, primarily by extending U.S. duration.
Outside of the United States, we continue to avoid certain markets, such as Germany, Japan, and the United Kingdom, with negative orhistorically low yield levels. In these markets, even a tiny rise in interest rates could lead to negative returns. Instead, we have invested in carefullyselected emerging markets bonds (e.g., Indonesia, Mexico, India) to add non-U.S. interest rate exposure to the Fund. Indonesia is one of theFund’s larger government-bond exposures (4%), and performed strongly this year. As of year end, the Fund’s holding in Indonesia bondsmaturing in 2036 yielded 7% (4% on an inflation-adjusted basis), significantly higher than what is available in the majority of the bond market. Webelieve this valuation level, combined with Indonesia’s fundamental strengths—strong growth prospects, prudent fiscal and monetarypolicy—make it an attractive investment.
In ClosingWe are extremely pleased with the Fund’s performance this year. On the heels of a 12% return in 2019 for the USD Accumulating Class, we cameinto 2020 cautiously optimistic about return prospects in a low-yield environment. However, in navigating markets through the pandemic, weidentified numerous pockets of opportunity to again generate a double-digit return for the USD Accumulating Class. We believe this highlights thebenefit of applying a flexible investment approach to a broad global investment universe—something that benchmark-oriented and/or domestic-oriented strategies cannot do.
As we look ahead, we are cognisant of the challenging aspects of the outlook. Broadly speaking, interest rates and credit yield premiums arelow, and this tempers our return expectations. In addition, we are in uncharted territory with the pandemic and the expansive set of policies inplace, which brings a wide range of potential risks. Mutations in the virus or challenges with vaccine distribution could derail the global recovery.Moreover, the unprecedented monetary and fiscal measures taken by governments and central banks around the world have provided vitalsupport for financial markets and the real economy, but these may have longer-term negative consequences.
Nonetheless, we are confident that our experienced investment team is well positioned to deal with these challenges and seize onopportunities. Our broad investment universe enables us to search for promising investments across global credit, currency, and rate markets. Wehave constructed a diverse portfolio that is not overly exposed to any particular outcome and with sufficient “dry powder” to capitalise onattractive investments that we may identify. Above all, we retain conviction in our long-term, disciplined investment approach.
Thank you for your continued confidence in our firm. As always, we welcome your comments and questions.
On behalf of the Board of Directors of Dodge & Cox,
Charles F. Pohl,Chairman andChief Investment Officer, Dodge & Cox
Dana M. Emery,President andChief Executive Officer, Dodge & Cox
1 February 2021
a One basis point is equal to 1/100th of 1%.b Credit securities refers to corporate bonds and government-related securities, as classified by Bloomberg.c Yield premiums are one way to measure a security’s valuation. Narrowing yield premiums result in a higher valuation. Widening yield premiums result in a lower valuation.d Duration is a measure of a bond’s (or a bond portfolio’s) price sensitivity to changes in interest rates.e The use of specific examples does not imply that they are more or less attractive investments than the Fund’s other holdings.f Unless otherwise specified, all weightings include accrued interest and all weightings and characteristics are as of 31 December 2020.g The U.S. Government does not guarantee the Fund’s shares, yield, or net asset value.The agency guarantee (by, for example, Ginnie Mae, Fannie Mae, or Freddie Mac) does not eliminate
market risk.
Investment Manager’s ReportGlobal Bond Fund
DODGE & COX WORLDWIDE FUNDS PLC � PAGE 17
Average Annual Total Return
For periods ended 31 December 2020 1 Year % 3 Years % 5 Years %Since
Inception %
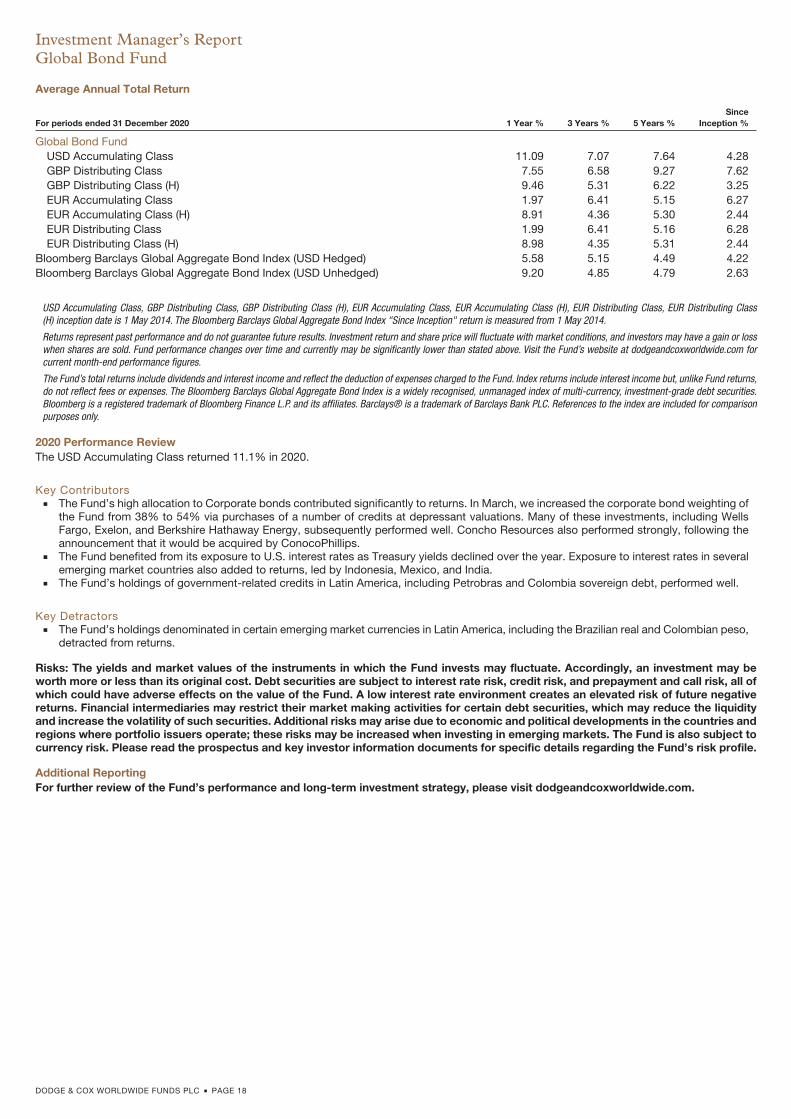
Global Bond FundUSD Accumulating Class 11.09 7.07 7.64 4.28GBP Distributing Class 7.55 6.58 9.27 7.62GBP Distributing Class (H) 9.46 5.31 6.22 3.25EUR Accumulating Class 1.97 6.41 5.15 6.27EUR Accumulating Class (H) 8.91 4.36 5.30 2.44EUR Distributing Class 1.99 6.41 5.16 6.28EUR Distributing Class (H) 8.98 4.35 5.31 2.44
Bloomberg Barclays Global Aggregate Bond Index (USD Hedged) 5.58 5.15 4.49 4.22Bloomberg Barclays Global Aggregate Bond Index (USD Unhedged) 9.20 4.85 4.79 2.63
USD Accumulating Class, GBP Distributing Class, GBP Distributing Class (H), EUR Accumulating Class, EUR Accumulating Class (H), EUR Distributing Class, EUR Distributing Class(H) inception date is 1 May 2014. The Bloomberg Barclays Global Aggregate Bond Index "Since Inception" return is measured from 1 May 2014.
Returns represent past performance and do not guarantee future results. Investment return and share price will fluctuate with market conditions, and investors may have a gain or losswhen shares are sold. Fund performance changes over time and currently may be significantly lower than stated above. Visit the Fund’s website at dodgeandcoxworldwide.com forcurrent month-end performance figures.
The Fund’s total returns include dividends and interest income and reflect the deduction of expenses charged to the Fund. Index returns include interest income but, unlike Fund returns,do not reflect fees or expenses. The Bloomberg Barclays Global Aggregate Bond Index is a widely recognised, unmanaged index of multi-currency, investment-grade debt securities.Bloomberg is a registered trademark of Bloomberg Finance L.P. and its affiliates. Barclays® is a trademark of Barclays Bank PLC. References to the index are included for comparisonpurposes only.
2020 Performance ReviewThe USD Accumulating Class returned 11.1% in 2020.
Key Contributors� The Fund’s high allocation to Corporate bonds contributed significantly to returns. In March, we increased the corporate bond weighting of
the Fund from 38% to 54% via purchases of a number of credits at depressant valuations. Many of these investments, including WellsFargo, Exelon, and Berkshire Hathaway Energy, subsequently performed well. Concho Resources also performed strongly, following theannouncement that it would be acquired by ConocoPhillips.
� The Fund benefited from its exposure to U.S. interest rates as Treasury yields declined over the year. Exposure to interest rates in severalemerging market countries also added to returns, led by Indonesia, Mexico, and India.
� The Fund’s holdings of government-related credits in Latin America, including Petrobras and Colombia sovereign debt, performed well.
Key Detractors� The Fund’s holdings denominated in certain emerging market currencies in Latin America, including the Brazilian real and Colombian peso,
detracted from returns.
Risks: The yields and market values of the instruments in which the Fund invests may fluctuate. Accordingly, an investment may beworth more or less than its original cost. Debt securities are subject to interest rate risk, credit risk, and prepayment and call risk, all ofwhich could have adverse effects on the value of the Fund. A low interest rate environment creates an elevated risk of future negativereturns. Financial intermediaries may restrict their market making activities for certain debt securities, which may reduce the liquidityand increase the volatility of such securities. Additional risks may arise due to economic and political developments in the countries andregions where portfolio issuers operate; these risks may be increased when investing in emerging markets. The Fund is also subject tocurrency risk. Please read the prospectus and key investor information documents for specific details regarding the Fund’s risk profile.
Additional ReportingFor further review of the Fund’s performance and long-term investment strategy, please visit dodgeandcoxworldwide.com.
Investment Manager’s ReportGlobal Bond Fund
DODGE & COX WORLDWIDE FUNDS PLC � PAGE 18
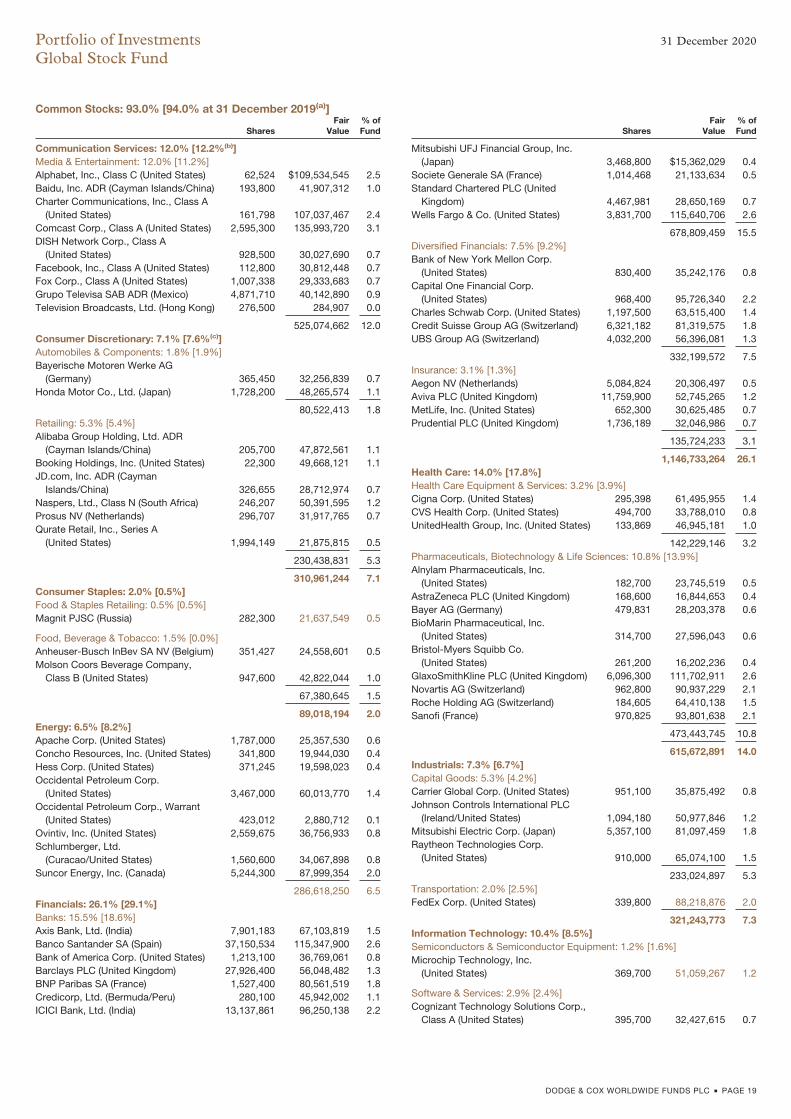
Common Stocks: 93.0% [94.0% at 31 December 2019(a)]
SharesFair
Value% ofFund
Communication Services: 12.0% [12.2%(b)]Media & Entertainment: 12.0% [11.2%]Alphabet, Inc., Class C (United States) 62,524 $109,534,545 2.5Baidu, Inc. ADR (Cayman Islands/China) 193,800 41,907,312 1.0Charter Communications, Inc., Class A
(United States) 161,798 107,037,467 2.4Comcast Corp., Class A (United States) 2,595,300 135,993,720 3.1DISH Network Corp., Class A
(United States) 928,500 30,027,690 0.7Facebook, Inc., Class A (United States) 112,800 30,812,448 0.7Fox Corp., Class A (United States) 1,007,338 29,333,683 0.7Grupo Televisa SAB ADR (Mexico) 4,871,710 40,142,890 0.9Television Broadcasts, Ltd. (Hong Kong) 276,500 284,907 0.0
525,074,662 12.0Consumer Discretionary: 7.1% [7.6%(c)]Automobiles & Components: 1.8% [1.9%]Bayerische Motoren Werke AG
(Germany) 365,450 32,256,839 0.7Honda Motor Co., Ltd. (Japan) 1,728,200 48,265,574 1.1
80,522,413 1.8Retailing: 5.3% [5.4%]Alibaba Group Holding, Ltd. ADR
(Cayman Islands/China) 205,700 47,872,561 1.1Booking Holdings, Inc. (United States) 22,300 49,668,121 1.1JD.com, Inc. ADR (Cayman
Islands/China) 326,655 28,712,974 0.7Naspers, Ltd., Class N (South Africa) 246,207 50,391,595 1.2Prosus NV (Netherlands) 296,707 31,917,765 0.7Qurate Retail, Inc., Series A
(United States) 1,994,149 21,875,815 0.5
230,438,831 5.3
310,961,244 7.1Consumer Staples: 2.0% [0.5%]Food & Staples Retailing: 0.5% [0.5%]Magnit PJSC (Russia) 282,300 21,637,549 0.5
Food, Beverage & Tobacco: 1.5% [0.0%]Anheuser-Busch InBev SA NV (Belgium) 351,427 24,558,601 0.5Molson Coors Beverage Company,
Class B (United States) 947,600 42,822,044 1.0
67,380,645 1.5
89,018,194 2.0Energy: 6.5% [8.2%]Apache Corp. (United States) 1,787,000 25,357,530 0.6Concho Resources, Inc. (United States) 341,800 19,944,030 0.4Hess Corp. (United States) 371,245 19,598,023 0.4Occidental Petroleum Corp.
(United States) 3,467,000 60,013,770 1.4Occidental Petroleum Corp., Warrant
(United States) 423,012 2,880,712 0.1Ovintiv, Inc. (United States) 2,559,675 36,756,933 0.8Schlumberger, Ltd.
(Curacao/United States) 1,560,600 34,067,898 0.8Suncor Energy, Inc. (Canada) 5,244,300 87,999,354 2.0
286,618,250 6.5Financials: 26.1% [29.1%]Banks: 15.5% [18.6%]Axis Bank, Ltd. (India) 7,901,183 67,103,819 1.5Banco Santander SA (Spain) 37,150,534 115,347,900 2.6Bank of America Corp. (United States) 1,213,100 36,769,061 0.8Barclays PLC (United Kingdom) 27,926,400 56,048,482 1.3BNP Paribas SA (France) 1,527,400 80,561,519 1.8Credicorp, Ltd. (Bermuda/Peru) 280,100 45,942,002 1.1ICICI Bank, Ltd. (India) 13,137,861 96,250,138 2.2
SharesFair
Value% ofFund
Mitsubishi UFJ Financial Group, Inc.(Japan) 3,468,800 $15,362,029 0.4
Societe Generale SA (France) 1,014,468 21,133,634 0.5Standard Chartered PLC (United
Kingdom) 4,467,981 28,650,169 0.7Wells Fargo & Co. (United States) 3,831,700 115,640,706 2.6
678,809,459 15.5Diversified Financials: 7.5% [9.2%]Bank of New York Mellon Corp.
(United States) 830,400 35,242,176 0.8Capital One Financial Corp.
(United States) 968,400 95,726,340 2.2Charles Schwab Corp. (United States) 1,197,500 63,515,400 1.4Credit Suisse Group AG (Switzerland) 6,321,182 81,319,575 1.8UBS Group AG (Switzerland) 4,032,200 56,396,081 1.3
332,199,572 7.5Insurance: 3.1% [1.3%]Aegon NV (Netherlands) 5,084,824 20,306,497 0.5Aviva PLC (United Kingdom) 11,759,900 52,745,265 1.2MetLife, Inc. (United States) 652,300 30,625,485 0.7Prudential PLC (United Kingdom) 1,736,189 32,046,986 0.7
135,724,233 3.1
1,146,733,264 26.1Health Care: 14.0% [17.8%]Health Care Equipment & Services: 3.2% [3.9%]Cigna Corp. (United States) 295,398 61,495,955 1.4CVS Health Corp. (United States) 494,700 33,788,010 0.8UnitedHealth Group, Inc. (United States) 133,869 46,945,181 1.0
142,229,146 3.2Pharmaceuticals, Biotechnology & Life Sciences: 10.8% [13.9%]Alnylam Pharmaceuticals, Inc.
(United States) 182,700 23,745,519 0.5AstraZeneca PLC (United Kingdom) 168,600 16,844,653 0.4Bayer AG (Germany) 479,831 28,203,378 0.6BioMarin Pharmaceutical, Inc.
(United States) 314,700 27,596,043 0.6Bristol-Myers Squibb Co.
(United States) 261,200 16,202,236 0.4GlaxoSmithKline PLC (United Kingdom) 6,096,300 111,702,911 2.6Novartis AG (Switzerland) 962,800 90,937,229 2.1Roche Holding AG (Switzerland) 184,605 64,410,138 1.5Sanofi (France) 970,825 93,801,638 2.1
473,443,745 10.8
615,672,891 14.0Industrials: 7.3% [6.7%]Capital Goods: 5.3% [4.2%]Carrier Global Corp. (United States) 951,100 35,875,492 0.8Johnson Controls International PLC
(Ireland/United States) 1,094,180 50,977,846 1.2Mitsubishi Electric Corp. (Japan) 5,357,100 81,097,459 1.8Raytheon Technologies Corp.
(United States) 910,000 65,074,100 1.5
233,024,897 5.3Transportation: 2.0% [2.5%]FedEx Corp. (United States) 339,800 88,218,876 2.0
321,243,773 7.3Information Technology: 10.4% [8.5%]Semiconductors & Semiconductor Equipment: 1.2% [1.6%]Microchip Technology, Inc.
(United States) 369,700 51,059,267 1.2
Software & Services: 2.9% [2.4%]Cognizant Technology Solutions Corp.,
Class A (United States) 395,700 32,427,615 0.7
Portfolio of Investments 31 December 2020
Global Stock Fund
DODGE & COX WORLDWIDE FUNDS PLC � PAGE 19
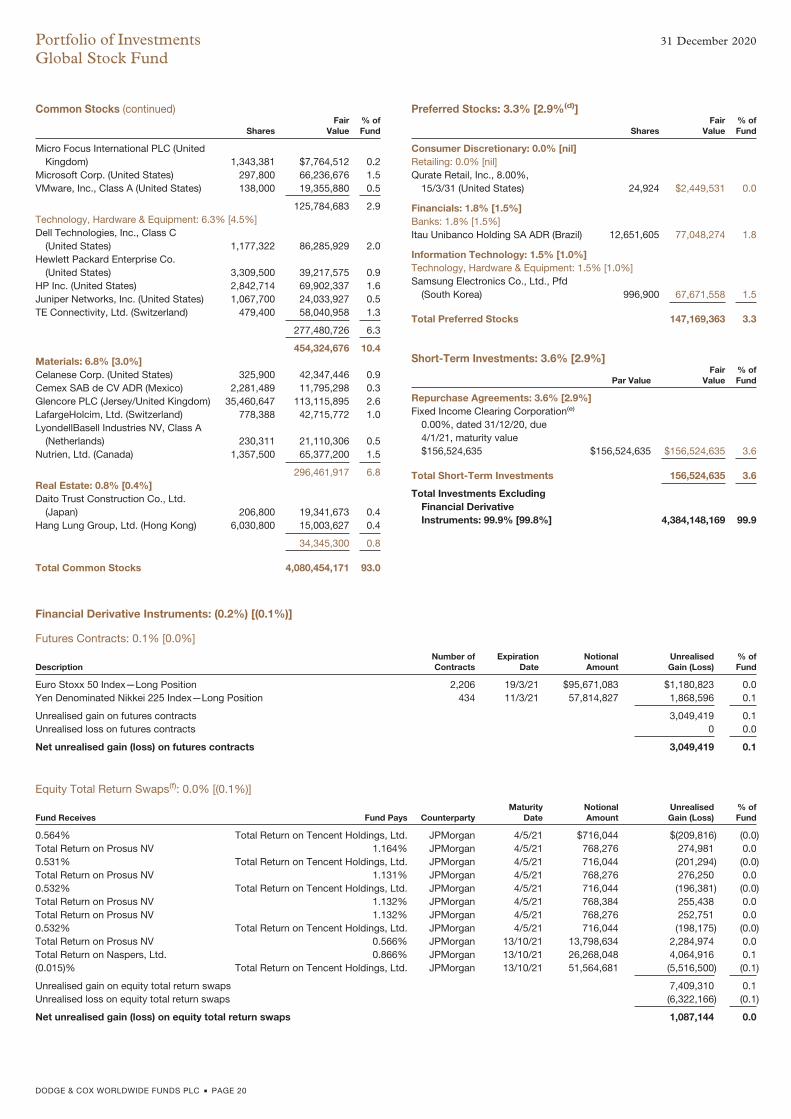
Common Stocks (continued)
SharesFair
Value% ofFund
Micro Focus International PLC (UnitedKingdom) 1,343,381 $7,764,512 0.2
Microsoft Corp. (United States) 297,800 66,236,676 1.5VMware, Inc., Class A (United States) 138,000 19,355,880 0.5
125,784,683 2.9Technology, Hardware & Equipment: 6.3% [4.5%]Dell Technologies, Inc., Class C
(United States) 1,177,322 86,285,929 2.0Hewlett Packard Enterprise Co.
(United States) 3,309,500 39,217,575 0.9HP Inc. (United States) 2,842,714 69,902,337 1.6Juniper Networks, Inc. (United States) 1,067,700 24,033,927 0.5TE Connectivity, Ltd. (Switzerland) 479,400 58,040,958 1.3
277,480,726 6.3
454,324,676 10.4Materials: 6.8% [3.0%]Celanese Corp. (United States) 325,900 42,347,446 0.9Cemex SAB de CV ADR (Mexico) 2,281,489 11,795,298 0.3Glencore PLC (Jersey/United Kingdom) 35,460,647 113,115,895 2.6LafargeHolcim, Ltd. (Switzerland) 778,388 42,715,772 1.0LyondellBasell Industries NV, Class A
(Netherlands) 230,311 21,110,306 0.5Nutrien, Ltd. (Canada) 1,357,500 65,377,200 1.5
296,461,917 6.8Real Estate: 0.8% [0.4%]Daito Trust Construction Co., Ltd.
(Japan) 206,800 19,341,673 0.4Hang Lung Group, Ltd. (Hong Kong) 6,030,800 15,003,627 0.4
34,345,300 0.8
Total Common Stocks 4,080,454,171 93.0
Preferred Stocks: 3.3% [2.9%(d)]
SharesFair
Value% ofFund
Consumer Discretionary: 0.0% [nil]Retailing: 0.0% [nil]Qurate Retail, Inc., 8.00%,
15/3/31 (United States) 24,924 $2,449,531 0.0
Financials: 1.8% [1.5%]Banks: 1.8% [1.5%]Itau Unibanco Holding SA ADR (Brazil) 12,651,605 77,048,274 1.8
Information Technology: 1.5% [1.0%]Technology, Hardware & Equipment: 1.5% [1.0%]Samsung Electronics Co., Ltd., Pfd
(South Korea) 996,900 67,671,558 1.5
Total Preferred Stocks 147,169,363 3.3
Short-Term Investments: 3.6% [2.9%]
Par ValueFair
Value% ofFund
Repurchase Agreements: 3.6% [2.9%]Fixed Income Clearing Corporation(e)
0.00%, dated 31/12/20, due4/1/21, maturity value$156,524,635 $156,524,635 $156,524,635 3.6
Total Short-Term Investments 156,524,635 3.6
Total Investments ExcludingFinancial DerivativeInstruments: 99.9% [99.8%] 4,384,148,169 99.9
Financial Derivative Instruments: (0.2%) [(0.1%)]
Futures Contracts: 0.1% [0.0%]
DescriptionNumber ofContracts
ExpirationDate
NotionalAmount
UnrealisedGain (Loss)
% ofFund
Euro Stoxx 50 Index—Long Position 2,206 19/3/21 $95,671,083 $1,180,823 0.0Yen Denominated Nikkei 225 Index—Long Position 434 11/3/21 57,814,827 1,868,596 0.1
Unrealised gain on futures contracts 3,049,419 0.1Unrealised loss on futures contracts 0 0.0
Net unrealised gain (loss) on futures contracts 3,049,419 0.1
Equity Total Return Swaps(f): 0.0% [(0.1%)]
Fund Receives Fund Pays CounterpartyMaturity
DateNotionalAmount
UnrealisedGain (Loss)
% ofFund
0.564% Total Return on Tencent Holdings, Ltd. JPMorgan 4/5/21 $716,044 $(209,816) (0.0)Total Return on Prosus NV 1.164% JPMorgan 4/5/21 768,276 274,981 0.00.531% Total Return on Tencent Holdings, Ltd. JPMorgan 4/5/21 716,044 (201,294) (0.0)Total Return on Prosus NV 1.131% JPMorgan 4/5/21 768,276 276,250 0.00.532% Total Return on Tencent Holdings, Ltd. JPMorgan 4/5/21 716,044 (196,381) (0.0)Total Return on Prosus NV 1.132% JPMorgan 4/5/21 768,384 255,438 0.0Total Return on Prosus NV 1.132% JPMorgan 4/5/21 768,276 252,751 0.00.532% Total Return on Tencent Holdings, Ltd. JPMorgan 4/5/21 716,044 (198,175) (0.0)Total Return on Prosus NV 0.566% JPMorgan 13/10/21 13,798,634 2,284,974 0.0Total Return on Naspers, Ltd. 0.866% JPMorgan 13/10/21 26,268,048 4,064,916 0.1(0.015)% Total Return on Tencent Holdings, Ltd. JPMorgan 13/10/21 51,564,681 (5,516,500) (0.1)
Unrealised gain on equity total return swaps 7,409,310 0.1Unrealised loss on equity total return swaps (6,322,166) (0.1)
Net unrealised gain (loss) on equity total return swaps 1,087,144 0.0
Portfolio of Investments 31 December 2020
Global Stock Fund
DODGE & COX WORLDWIDE FUNDS PLC � PAGE 20
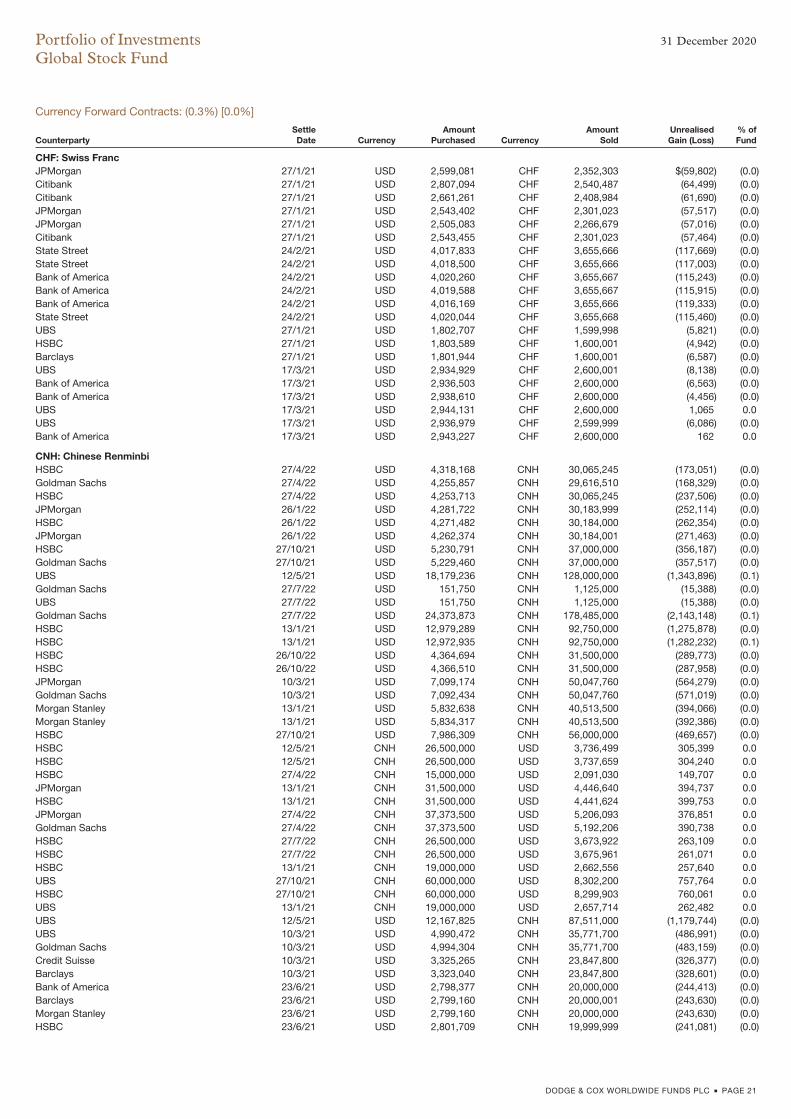
Currency Forward Contracts: (0.3%) [0.0%]
CounterpartySettleDate Currency
AmountPurchased Currency
AmountSold
UnrealisedGain (Loss)
% ofFund
CHF: Swiss FrancJPMorgan 27/1/21 USD 2,599,081 CHF 2,352,303 $(59,802) (0.0)Citibank 27/1/21 USD 2,807,094 CHF 2,540,487 (64,499) (0.0)Citibank 27/1/21 USD 2,661,261 CHF 2,408,984 (61,690) (0.0)JPMorgan 27/1/21 USD 2,543,402 CHF 2,301,023 (57,517) (0.0)JPMorgan 27/1/21 USD 2,505,083 CHF 2,266,679 (57,016) (0.0)Citibank 27/1/21 USD 2,543,455 CHF 2,301,023 (57,464) (0.0)State Street 24/2/21 USD 4,017,833 CHF 3,655,666 (117,669) (0.0)State Street 24/2/21 USD 4,018,500 CHF 3,655,666 (117,003) (0.0)Bank of America 24/2/21 USD 4,020,260 CHF 3,655,667 (115,243) (0.0)Bank of America 24/2/21 USD 4,019,588 CHF 3,655,667 (115,915) (0.0)Bank of America 24/2/21 USD 4,016,169 CHF 3,655,666 (119,333) (0.0)State Street 24/2/21 USD 4,020,044 CHF 3,655,668 (115,460) (0.0)UBS 27/1/21 USD 1,802,707 CHF 1,599,998 (5,821) (0.0)HSBC 27/1/21 USD 1,803,589 CHF 1,600,001 (4,942) (0.0)Barclays 27/1/21 USD 1,801,944 CHF 1,600,001 (6,587) (0.0)UBS 17/3/21 USD 2,934,929 CHF 2,600,001 (8,138) (0.0)Bank of America 17/3/21 USD 2,936,503 CHF 2,600,000 (6,563) (0.0)Bank of America 17/3/21 USD 2,938,610 CHF 2,600,000 (4,456) (0.0)UBS 17/3/21 USD 2,944,131 CHF 2,600,000 1,065 0.0UBS 17/3/21 USD 2,936,979 CHF 2,599,999 (6,086) (0.0)Bank of America 17/3/21 USD 2,943,227 CHF 2,600,000 162 0.0
CNH: Chinese RenminbiHSBC 27/4/22 USD 4,318,168 CNH 30,065,245 (173,051) (0.0)Goldman Sachs 27/4/22 USD 4,255,857 CNH 29,616,510 (168,329) (0.0)HSBC 27/4/22 USD 4,253,713 CNH 30,065,245 (237,506) (0.0)JPMorgan 26/1/22 USD 4,281,722 CNH 30,183,999 (252,114) (0.0)HSBC 26/1/22 USD 4,271,482 CNH 30,184,000 (262,354) (0.0)JPMorgan 26/1/22 USD 4,262,374 CNH 30,184,001 (271,463) (0.0)HSBC 27/10/21 USD 5,230,791 CNH 37,000,000 (356,187) (0.0)Goldman Sachs 27/10/21 USD 5,229,460 CNH 37,000,000 (357,517) (0.0)UBS 12/5/21 USD 18,179,236 CNH 128,000,000 (1,343,896) (0.1)Goldman Sachs 27/7/22 USD 151,750 CNH 1,125,000 (15,388) (0.0)UBS 27/7/22 USD 151,750 CNH 1,125,000 (15,388) (0.0)Goldman Sachs 27/7/22 USD 24,373,873 CNH 178,485,000 (2,143,148) (0.1)HSBC 13/1/21 USD 12,979,289 CNH 92,750,000 (1,275,878) (0.0)HSBC 13/1/21 USD 12,972,935 CNH 92,750,000 (1,282,232) (0.1)HSBC 26/10/22 USD 4,364,694 CNH 31,500,000 (289,773) (0.0)HSBC 26/10/22 USD 4,366,510 CNH 31,500,000 (287,958) (0.0)JPMorgan 10/3/21 USD 7,099,174 CNH 50,047,760 (564,279) (0.0)Goldman Sachs 10/3/21 USD 7,092,434 CNH 50,047,760 (571,019) (0.0)Morgan Stanley 13/1/21 USD 5,832,638 CNH 40,513,500 (394,066) (0.0)Morgan Stanley 13/1/21 USD 5,834,317 CNH 40,513,500 (392,386) (0.0)HSBC 27/10/21 USD 7,986,309 CNH 56,000,000 (469,657) (0.0)HSBC 12/5/21 CNH 26,500,000 USD 3,736,499 305,399 0.0HSBC 12/5/21 CNH 26,500,000 USD 3,737,659 304,240 0.0HSBC 27/4/22 CNH 15,000,000 USD 2,091,030 149,707 0.0JPMorgan 13/1/21 CNH 31,500,000 USD 4,446,640 394,737 0.0HSBC 13/1/21 CNH 31,500,000 USD 4,441,624 399,753 0.0JPMorgan 27/4/22 CNH 37,373,500 USD 5,206,093 376,851 0.0Goldman Sachs 27/4/22 CNH 37,373,500 USD 5,192,206 390,738 0.0HSBC 27/7/22 CNH 26,500,000 USD 3,673,922 263,109 0.0HSBC 27/7/22 CNH 26,500,000 USD 3,675,961 261,071 0.0HSBC 13/1/21 CNH 19,000,000 USD 2,662,556 257,640 0.0UBS 27/10/21 CNH 60,000,000 USD 8,302,200 757,764 0.0HSBC 27/10/21 CNH 60,000,000 USD 8,299,903 760,061 0.0UBS 13/1/21 CNH 19,000,000 USD 2,657,714 262,482 0.0UBS 12/5/21 USD 12,167,825 CNH 87,511,000 (1,179,744) (0.0)UBS 10/3/21 USD 4,990,472 CNH 35,771,700 (486,991) (0.0)Goldman Sachs 10/3/21 USD 4,994,304 CNH 35,771,700 (483,159) (0.0)Credit Suisse 10/3/21 USD 3,325,265 CNH 23,847,800 (326,377) (0.0)Barclays 10/3/21 USD 3,323,040 CNH 23,847,800 (328,601) (0.0)Bank of America 23/6/21 USD 2,798,377 CNH 20,000,000 (244,413) (0.0)Barclays 23/6/21 USD 2,799,160 CNH 20,000,001 (243,630) (0.0)Morgan Stanley 23/6/21 USD 2,799,160 CNH 20,000,000 (243,630) (0.0)HSBC 23/6/21 USD 2,801,709 CNH 19,999,999 (241,081) (0.0)
Portfolio of Investments 31 December 2020
Global Stock Fund
DODGE & COX WORLDWIDE FUNDS PLC � PAGE 21
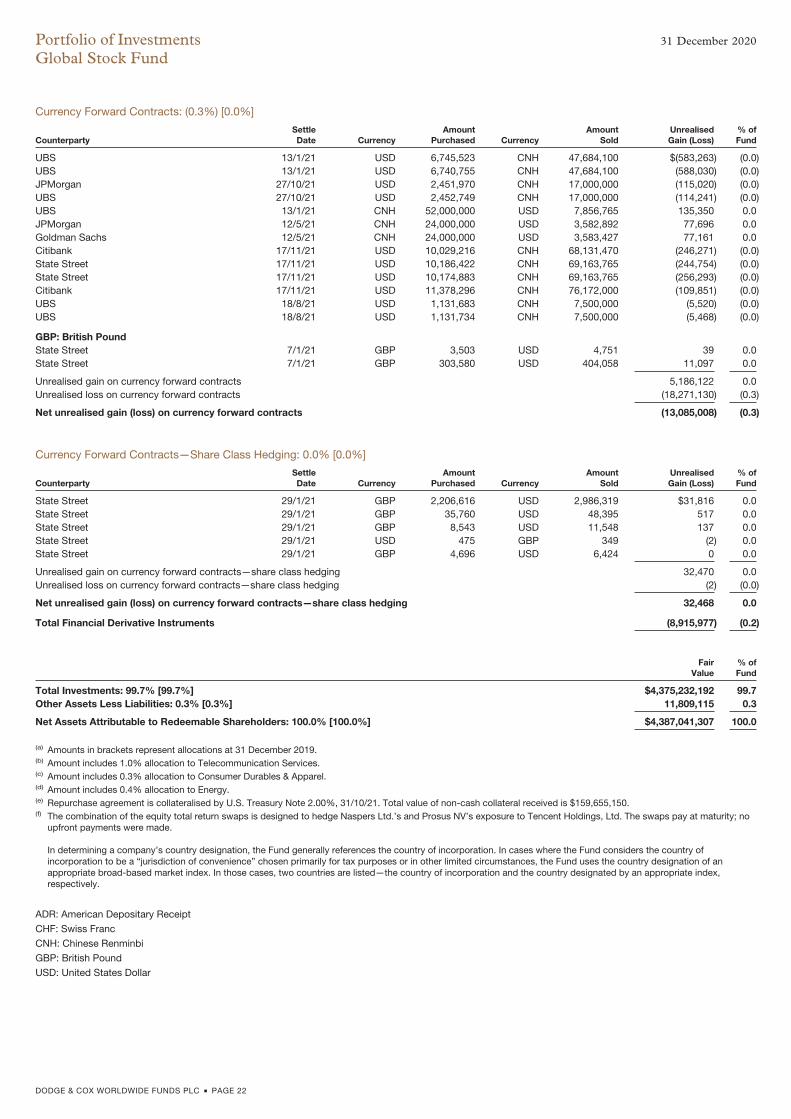
Currency Forward Contracts: (0.3%) [0.0%]
CounterpartySettleDate Currency
AmountPurchased Currency
AmountSold
UnrealisedGain (Loss)
% ofFund
UBS 13/1/21 USD 6,745,523 CNH 47,684,100 $(583,263) (0.0)UBS 13/1/21 USD 6,740,755 CNH 47,684,100 (588,030) (0.0)JPMorgan 27/10/21 USD 2,451,970 CNH 17,000,000 (115,020) (0.0)UBS 27/10/21 USD 2,452,749 CNH 17,000,000 (114,241) (0.0)UBS 13/1/21 CNH 52,000,000 USD 7,856,765 135,350 0.0JPMorgan 12/5/21 CNH 24,000,000 USD 3,582,892 77,696 0.0Goldman Sachs 12/5/21 CNH 24,000,000 USD 3,583,427 77,161 0.0Citibank 17/11/21 USD 10,029,216 CNH 68,131,470 (246,271) (0.0)State Street 17/11/21 USD 10,186,422 CNH 69,163,765 (244,754) (0.0)State Street 17/11/21 USD 10,174,883 CNH 69,163,765 (256,293) (0.0)Citibank 17/11/21 USD 11,378,296 CNH 76,172,000 (109,851) (0.0)UBS 18/8/21 USD 1,131,683 CNH 7,500,000 (5,520) (0.0)UBS 18/8/21 USD 1,131,734 CNH 7,500,000 (5,468) (0.0)
GBP: British PoundState Street 7/1/21 GBP 3,503 USD 4,751 39 0.0State Street 7/1/21 GBP 303,580 USD 404,058 11,097 0.0
Unrealised gain on currency forward contracts 5,186,122 0.0Unrealised loss on currency forward contracts (18,271,130) (0.3)
Net unrealised gain (loss) on currency forward contracts (13,085,008) (0.3)
Currency Forward Contracts—Share Class Hedging: 0.0% [0.0%]
CounterpartySettleDate Currency
AmountPurchased Currency
AmountSold
UnrealisedGain (Loss)
% ofFund
State Street 29/1/21 GBP 2,206,616 USD 2,986,319 $31,816 0.0State Street 29/1/21 GBP 35,760 USD 48,395 517 0.0State Street 29/1/21 GBP 8,543 USD 11,548 137 0.0State Street 29/1/21 USD 475 GBP 349 (2) 0.0State Street 29/1/21 GBP 4,696 USD 6,424 0 0.0
Unrealised gain on currency forward contracts—share class hedging 32,470 0.0Unrealised loss on currency forward contracts—share class hedging (2) (0.0)
Net unrealised gain (loss) on currency forward contracts—share class hedging 32,468 0.0
Total Financial Derivative Instruments (8,915,977) (0.2)
FairValue
% ofFund
Total Investments: 99.7% [99.7%] $4,375,232,192 99.7Other Assets Less Liabilities: 0.3% [0.3%] 11,809,115 0.3
Net Assets Attributable to Redeemable Shareholders: 100.0% [100.0%] $4,387,041,307 100.0
(a) Amounts in brackets represent allocations at 31 December 2019.(b) Amount includes 1.0% allocation to Telecommunication Services.(c) Amount includes 0.3% allocation to Consumer Durables & Apparel.(d) Amount includes 0.4% allocation to Energy.(e) Repurchase agreement is collateralised by U.S. Treasury Note 2.00%, 31/10/21. Total value of non-cash collateral received is $159,655,150.(f) The combination of the equity total return swaps is designed to hedge Naspers Ltd.’s and Prosus NV’s exposure to Tencent Holdings, Ltd. The swaps pay at maturity; no
upfront payments were made.
In determining a company’s country designation, the Fund generally references the country of incorporation. In cases where the Fund considers the country ofincorporation to be a “jurisdiction of convenience” chosen primarily for tax purposes or in other limited circumstances, the Fund uses the country designation of anappropriate broad-based market index. In those cases, two countries are listed—the country of incorporation and the country designated by an appropriate index,respectively.
ADR: American Depositary Receipt
CHF: Swiss Franc
CNH: Chinese Renminbi
GBP: British Pound
USD: United States Dollar
Portfolio of Investments 31 December 2020
Global Stock Fund
DODGE & COX WORLDWIDE FUNDS PLC � PAGE 22
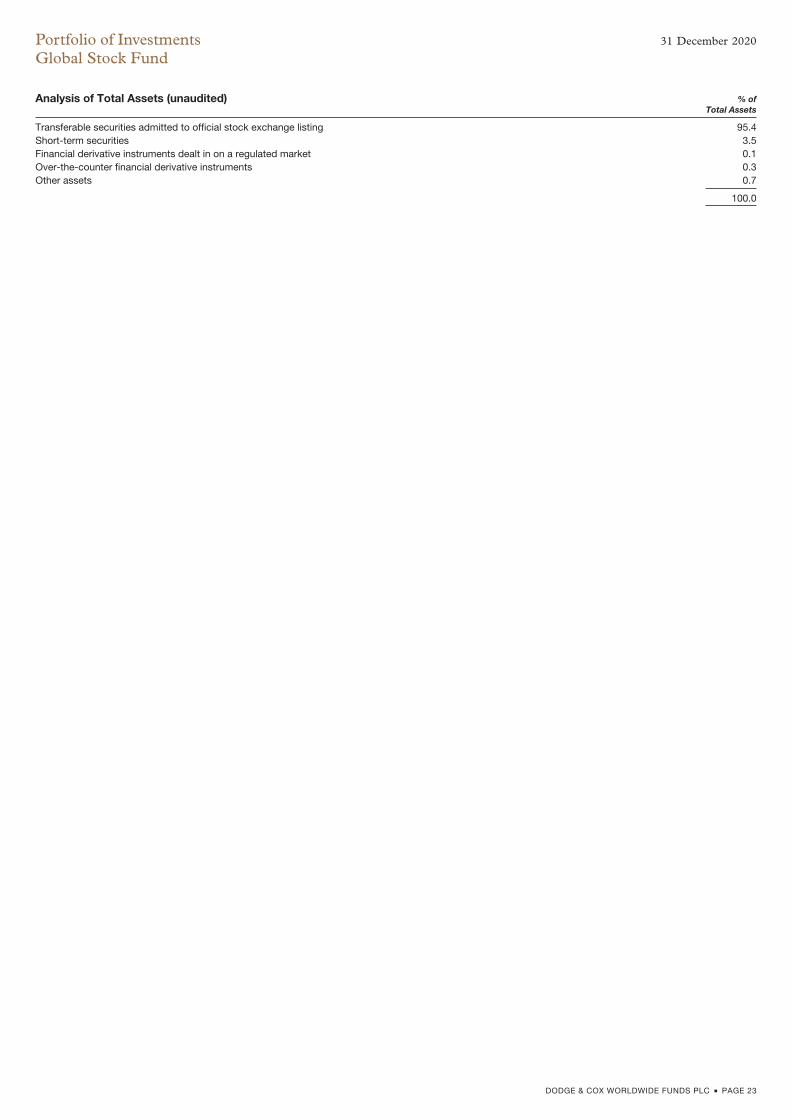
Analysis of Total Assets (unaudited) % ofTotal Assets
Transferable securities admitted to official stock exchange listing 95.4Short-term securities 3.5Financial derivative instruments dealt in on a regulated market 0.1Over-the-counter financial derivative instruments 0.3Other assets 0.7
100.0
Portfolio of Investments 31 December 2020
Global Stock Fund
DODGE & COX WORLDWIDE FUNDS PLC � PAGE 23
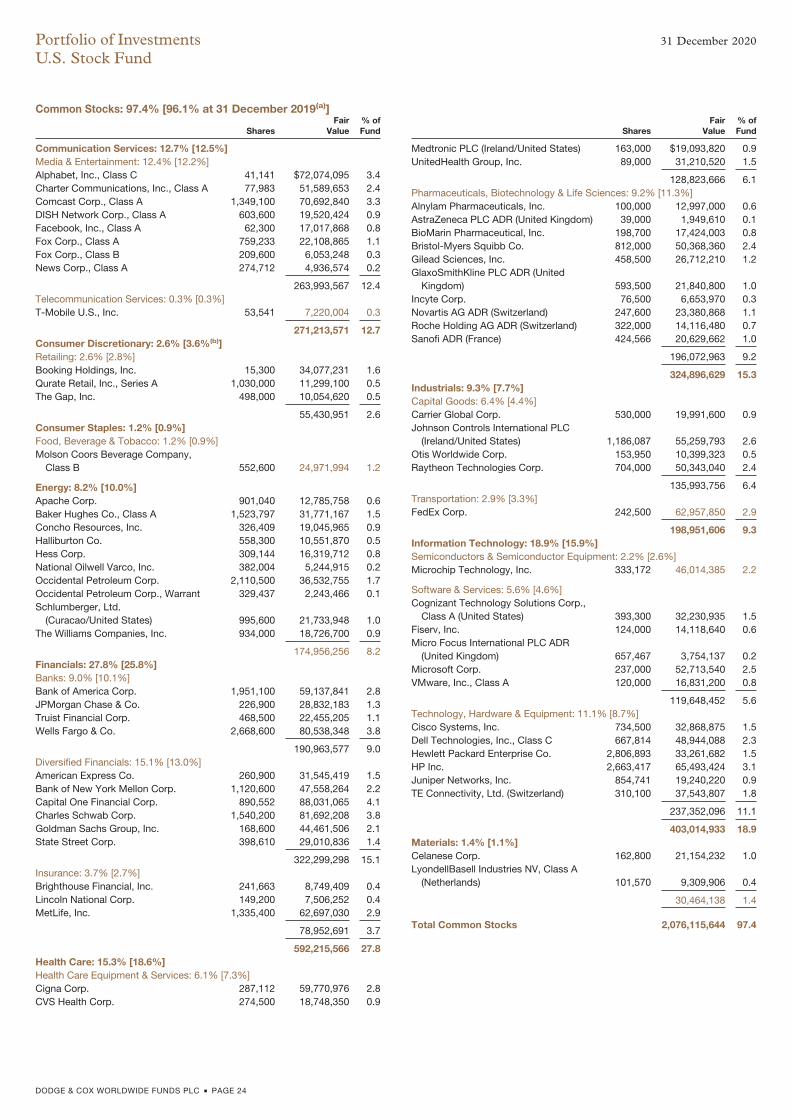
Common Stocks: 97.4% [96.1% at 31 December 2019(a)]
SharesFair
Value% ofFund
Communication Services: 12.7% [12.5%]Media & Entertainment: 12.4% [12.2%]Alphabet, Inc., Class C 41,141 $72,074,095 3.4Charter Communications, Inc., Class A 77,983 51,589,653 2.4Comcast Corp., Class A 1,349,100 70,692,840 3.3DISH Network Corp., Class A 603,600 19,520,424 0.9Facebook, Inc., Class A 62,300 17,017,868 0.8Fox Corp., Class A 759,233 22,108,865 1.1Fox Corp., Class B 209,600 6,053,248 0.3News Corp., Class A 274,712 4,936,574 0.2
263,993,567 12.4Telecommunication Services: 0.3% [0.3%]T-Mobile U.S., Inc. 53,541 7,220,004 0.3
271,213,571 12.7Consumer Discretionary: 2.6% [3.6%(b)]Retailing: 2.6% [2.8%]Booking Holdings, Inc. 15,300 34,077,231 1.6Qurate Retail, Inc., Series A 1,030,000 11,299,100 0.5The Gap, Inc. 498,000 10,054,620 0.5
55,430,951 2.6Consumer Staples: 1.2% [0.9%]Food, Beverage & Tobacco: 1.2% [0.9%]Molson Coors Beverage Company,
Class B 552,600 24,971,994 1.2
Energy: 8.2% [10.0%]Apache Corp. 901,040 12,785,758 0.6Baker Hughes Co., Class A 1,523,797 31,771,167 1.5Concho Resources, Inc. 326,409 19,045,965 0.9Halliburton Co. 558,300 10,551,870 0.5Hess Corp. 309,144 16,319,712 0.8National Oilwell Varco, Inc. 382,004 5,244,915 0.2Occidental Petroleum Corp. 2,110,500 36,532,755 1.7Occidental Petroleum Corp., Warrant 329,437 2,243,466 0.1Schlumberger, Ltd.
(Curacao/United States) 995,600 21,733,948 1.0The Williams Companies, Inc. 934,000 18,726,700 0.9
174,956,256 8.2Financials: 27.8% [25.8%]Banks: 9.0% [10.1%]Bank of America Corp. 1,951,100 59,137,841 2.8JPMorgan Chase & Co. 226,900 28,832,183 1.3Truist Financial Corp. 468,500 22,455,205 1.1Wells Fargo & Co. 2,668,600 80,538,348 3.8
190,963,577 9.0Diversified Financials: 15.1% [13.0%]American Express Co. 260,900 31,545,419 1.5Bank of New York Mellon Corp. 1,120,600 47,558,264 2.2Capital One Financial Corp. 890,552 88,031,065 4.1Charles Schwab Corp. 1,540,200 81,692,208 3.8Goldman Sachs Group, Inc. 168,600 44,461,506 2.1State Street Corp. 398,610 29,010,836 1.4
322,299,298 15.1Insurance: 3.7% [2.7%]Brighthouse Financial, Inc. 241,663 8,749,409 0.4Lincoln National Corp. 149,200 7,506,252 0.4MetLife, Inc. 1,335,400 62,697,030 2.9
78,952,691 3.7
592,215,566 27.8Health Care: 15.3% [18.6%]Health Care Equipment & Services: 6.1% [7.3%]Cigna Corp. 287,112 59,770,976 2.8CVS Health Corp. 274,500 18,748,350 0.9
SharesFair
Value% ofFund
Medtronic PLC (Ireland/United States) 163,000 $19,093,820 0.9UnitedHealth Group, Inc. 89,000 31,210,520 1.5
128,823,666 6.1Pharmaceuticals, Biotechnology & Life Sciences: 9.2% [11.3%]Alnylam Pharmaceuticals, Inc. 100,000 12,997,000 0.6AstraZeneca PLC ADR (United Kingdom) 39,000 1,949,610 0.1BioMarin Pharmaceutical, Inc. 198,700 17,424,003 0.8Bristol-Myers Squibb Co. 812,000 50,368,360 2.4Gilead Sciences, Inc. 458,500 26,712,210 1.2GlaxoSmithKline PLC ADR (United
Kingdom) 593,500 21,840,800 1.0Incyte Corp. 76,500 6,653,970 0.3Novartis AG ADR (Switzerland) 247,600 23,380,868 1.1Roche Holding AG ADR (Switzerland) 322,000 14,116,480 0.7Sanofi ADR (France) 424,566 20,629,662 1.0
196,072,963 9.2
324,896,629 15.3Industrials: 9.3% [7.7%]Capital Goods: 6.4% [4.4%]Carrier Global Corp. 530,000 19,991,600 0.9Johnson Controls International PLC
(Ireland/United States) 1,186,087 55,259,793 2.6Otis Worldwide Corp. 153,950 10,399,323 0.5Raytheon Technologies Corp. 704,000 50,343,040 2.4
135,993,756 6.4Transportation: 2.9% [3.3%]FedEx Corp. 242,500 62,957,850 2.9
198,951,606 9.3Information Technology: 18.9% [15.9%]Semiconductors & Semiconductor Equipment: 2.2% [2.6%]Microchip Technology, Inc. 333,172 46,014,385 2.2
Software & Services: 5.6% [4.6%]Cognizant Technology Solutions Corp.,
Class A (United States) 393,300 32,230,935 1.5Fiserv, Inc. 124,000 14,118,640 0.6Micro Focus International PLC ADR
(United Kingdom) 657,467 3,754,137 0.2Microsoft Corp. 237,000 52,713,540 2.5VMware, Inc., Class A 120,000 16,831,200 0.8
119,648,452 5.6Technology, Hardware & Equipment: 11.1% [8.7%]Cisco Systems, Inc. 734,500 32,868,875 1.5Dell Technologies, Inc., Class C 667,814 48,944,088 2.3Hewlett Packard Enterprise Co. 2,806,893 33,261,682 1.5HP Inc. 2,663,417 65,493,424 3.1Juniper Networks, Inc. 854,741 19,240,220 0.9TE Connectivity, Ltd. (Switzerland) 310,100 37,543,807 1.8
237,352,096 11.1
403,014,933 18.9Materials: 1.4% [1.1%]Celanese Corp. 162,800 21,154,232 1.0LyondellBasell Industries NV, Class A
(Netherlands) 101,570 9,309,906 0.4
30,464,138 1.4
Total Common Stocks 2,076,115,644 97.4
Portfolio of Investments 31 December 2020
U.S. Stock Fund
DODGE & COX WORLDWIDE FUNDS PLC � PAGE 24
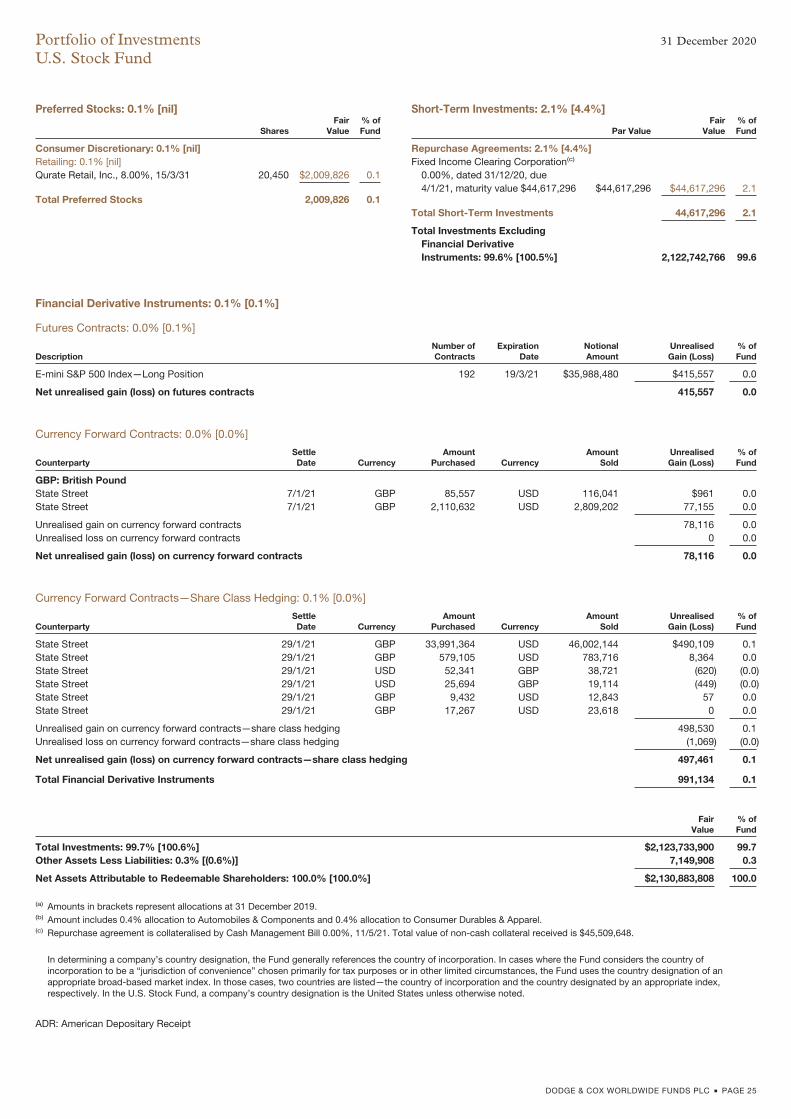
Preferred Stocks: 0.1% [nil]
SharesFair
Value% ofFund
Consumer Discretionary: 0.1% [nil]Retailing: 0.1% [nil]Qurate Retail, Inc., 8.00%, 15/3/31 20,450 $2,009,826 0.1
Total Preferred Stocks 2,009,826 0.1
Short-Term Investments: 2.1% [4.4%]
Par ValueFair
Value% ofFund
Repurchase Agreements: 2.1% [4.4%]Fixed Income Clearing Corporation(c)
0.00%, dated 31/12/20, due4/1/21, maturity value $44,617,296 $44,617,296 $44,617,296 2.1
Total Short-Term Investments 44,617,296 2.1
Total Investments ExcludingFinancial DerivativeInstruments: 99.6% [100.5%] 2,122,742,766 99.6
Financial Derivative Instruments: 0.1% [0.1%]
Futures Contracts: 0.0% [0.1%]
DescriptionNumber ofContracts
ExpirationDate
NotionalAmount
UnrealisedGain (Loss)
% ofFund
E-mini S&P 500 Index—Long Position 192 19/3/21 $35,988,480 $415,557 0.0
Net unrealised gain (loss) on futures contracts 415,557 0.0
Currency Forward Contracts: 0.0% [0.0%]
CounterpartySettleDate Currency
AmountPurchased Currency
AmountSold
UnrealisedGain (Loss)
% ofFund
GBP: British PoundState Street 7/1/21 GBP 85,557 USD 116,041 $961 0.0State Street 7/1/21 GBP 2,110,632 USD 2,809,202 77,155 0.0
Unrealised gain on currency forward contracts 78,116 0.0Unrealised loss on currency forward contracts 0 0.0
Net unrealised gain (loss) on currency forward contracts 78,116 0.0
Currency Forward Contracts—Share Class Hedging: 0.1% [0.0%]
CounterpartySettleDate Currency
AmountPurchased Currency
AmountSold
UnrealisedGain (Loss)
% ofFund
State Street 29/1/21 GBP 33,991,364 USD 46,002,144 $490,109 0.1State Street 29/1/21 GBP 579,105 USD 783,716 8,364 0.0State Street 29/1/21 USD 52,341 GBP 38,721 (620) (0.0)State Street 29/1/21 USD 25,694 GBP 19,114 (449) (0.0)State Street 29/1/21 GBP 9,432 USD 12,843 57 0.0State Street 29/1/21 GBP 17,267 USD 23,618 0 0.0
Unrealised gain on currency forward contracts—share class hedging 498,530 0.1Unrealised loss on currency forward contracts—share class hedging (1,069) (0.0)
Net unrealised gain (loss) on currency forward contracts—share class hedging 497,461 0.1
Total Financial Derivative Instruments 991,134 0.1
FairValue
% ofFund
Total Investments: 99.7% [100.6%] $2,123,733,900 99.7Other Assets Less Liabilities: 0.3% [(0.6%)] 7,149,908 0.3
Net Assets Attributable to Redeemable Shareholders: 100.0% [100.0%] $2,130,883,808 100.0
(a) Amounts in brackets represent allocations at 31 December 2019.(b) Amount includes 0.4% allocation to Automobiles & Components and 0.4% allocation to Consumer Durables & Apparel.(c) Repurchase agreement is collateralised by Cash Management Bill 0.00%, 11/5/21. Total value of non-cash collateral received is $45,509,648.
In determining a company’s country designation, the Fund generally references the country of incorporation. In cases where the Fund considers the country ofincorporation to be a “jurisdiction of convenience” chosen primarily for tax purposes or in other limited circumstances, the Fund uses the country designation of anappropriate broad-based market index. In those cases, two countries are listed—the country of incorporation and the country designated by an appropriate index,respectively. In the U.S. Stock Fund, a company’s country designation is the United States unless otherwise noted.
ADR: American Depositary Receipt
Portfolio of Investments 31 December 2020
U.S. Stock Fund
DODGE & COX WORLDWIDE FUNDS PLC � PAGE 25
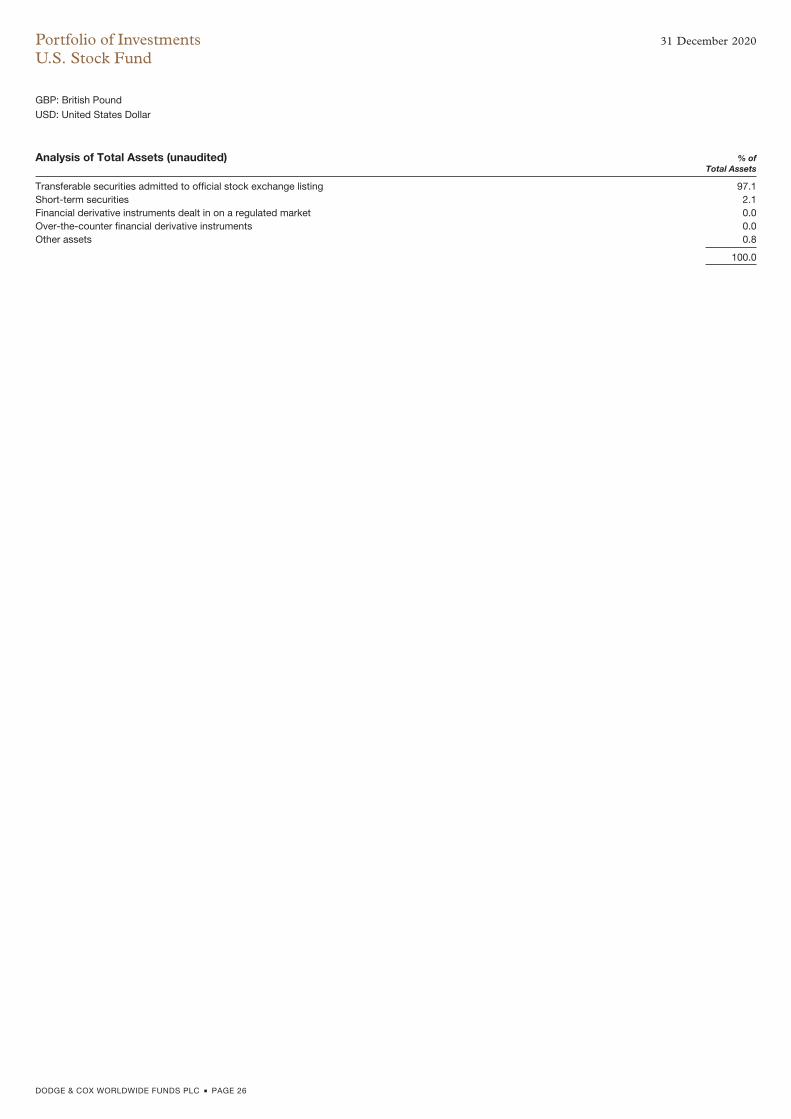
GBP: British Pound
USD: United States Dollar
Analysis of Total Assets (unaudited) % ofTotal Assets
Transferable securities admitted to official stock exchange listing 97.1Short-term securities 2.1Financial derivative instruments dealt in on a regulated market 0.0Over-the-counter financial derivative instruments 0.0Other assets 0.8
100.0
Portfolio of Investments 31 December 2020
U.S. Stock Fund
DODGE & COX WORLDWIDE FUNDS PLC � PAGE 26
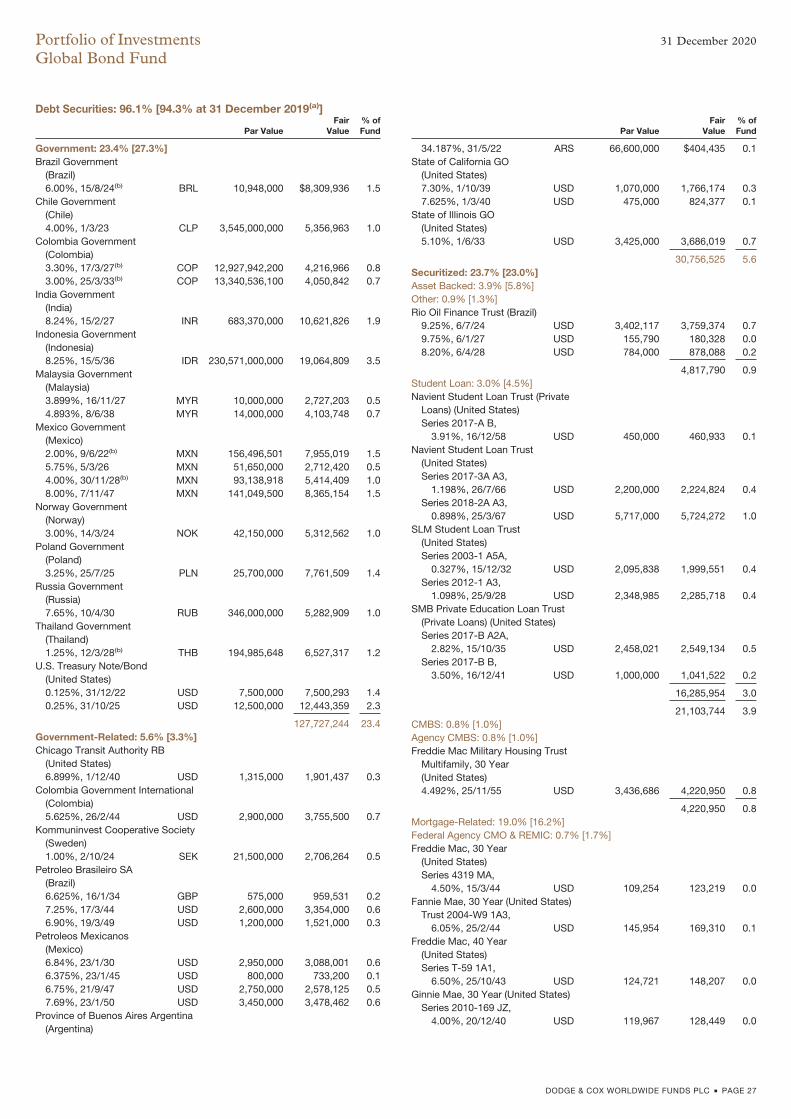
Debt Securities: 96.1% [94.3% at 31 December 2019(a)]
Par ValueFair
Value% ofFund
Government: 23.4% [27.3%]Brazil Government
(Brazil)6.00%, 15/8/24(b) BRL 10,948,000 $8,309,936 1.5
Chile Government(Chile)4.00%, 1/3/23 CLP 3,545,000,000 5,356,963 1.0
Colombia Government(Colombia)3.30%, 17/3/27(b) COP 12,927,942,200 4,216,966 0.83.00%, 25/3/33(b) COP 13,340,536,100 4,050,842 0.7
India Government(India)8.24%, 15/2/27 INR 683,370,000 10,621,826 1.9
Indonesia Government(Indonesia)8.25%, 15/5/36 IDR 230,571,000,000 19,064,809 3.5
Malaysia Government(Malaysia)3.899%, 16/11/27 MYR 10,000,000 2,727,203 0.54.893%, 8/6/38 MYR 14,000,000 4,103,748 0.7
Mexico Government(Mexico)2.00%, 9/6/22(b) MXN 156,496,501 7,955,019 1.55.75%, 5/3/26 MXN 51,650,000 2,712,420 0.54.00%, 30/11/28(b) MXN 93,138,918 5,414,409 1.08.00%, 7/11/47 MXN 141,049,500 8,365,154 1.5
Norway Government(Norway)3.00%, 14/3/24 NOK 42,150,000 5,312,562 1.0
Poland Government(Poland)3.25%, 25/7/25 PLN 25,700,000 7,761,509 1.4
Russia Government(Russia)7.65%, 10/4/30 RUB 346,000,000 5,282,909 1.0
Thailand Government(Thailand)1.25%, 12/3/28(b) THB 194,985,648 6,527,317 1.2
U.S. Treasury Note/Bond(United States)0.125%, 31/12/22 USD 7,500,000 7,500,293 1.40.25%, 31/10/25 USD 12,500,000 12,443,359 2.3
127,727,244 23.4Government-Related: 5.6% [3.3%]Chicago Transit Authority RB
(United States)6.899%, 1/12/40 USD 1,315,000 1,901,437 0.3
Colombia Government International(Colombia)5.625%, 26/2/44 USD 2,900,000 3,755,500 0.7
Kommuninvest Cooperative Society(Sweden)1.00%, 2/10/24 SEK 21,500,000 2,706,264 0.5
Petroleo Brasileiro SA(Brazil)6.625%, 16/1/34 GBP 575,000 959,531 0.27.25%, 17/3/44 USD 2,600,000 3,354,000 0.66.90%, 19/3/49 USD 1,200,000 1,521,000 0.3
Petroleos Mexicanos(Mexico)6.84%, 23/1/30 USD 2,950,000 3,088,001 0.66.375%, 23/1/45 USD 800,000 733,200 0.16.75%, 21/9/47 USD 2,750,000 2,578,125 0.57.69%, 23/1/50 USD 3,450,000 3,478,462 0.6
Province of Buenos Aires Argentina(Argentina)
Par ValueFair
Value% ofFund
34.187%, 31/5/22 ARS 66,600,000 $404,435 0.1State of California GO
(United States)7.30%, 1/10/39 USD 1,070,000 1,766,174 0.37.625%, 1/3/40 USD 475,000 824,377 0.1
State of Illinois GO(United States)5.10%, 1/6/33 USD 3,425,000 3,686,019 0.7
30,756,525 5.6Securitized: 23.7% [23.0%]Asset Backed: 3.9% [5.8%]Other: 0.9% [1.3%]Rio Oil Finance Trust (Brazil)
9.25%, 6/7/24 USD 3,402,117 3,759,374 0.79.75%, 6/1/27 USD 155,790 180,328 0.08.20%, 6/4/28 USD 784,000 878,088 0.2
4,817,790 0.9Student Loan: 3.0% [4.5%]Navient Student Loan Trust (Private
Loans) (United States)Series 2017-A B,
3.91%, 16/12/58 USD 450,000 460,933 0.1Navient Student Loan Trust
(United States)Series 2017-3A A3,
1.198%, 26/7/66 USD 2,200,000 2,224,824 0.4Series 2018-2A A3,
0.898%, 25/3/67 USD 5,717,000 5,724,272 1.0SLM Student Loan Trust
(United States)Series 2003-1 A5A,
0.327%, 15/12/32 USD 2,095,838 1,999,551 0.4Series 2012-1 A3,
1.098%, 25/9/28 USD 2,348,985 2,285,718 0.4SMB Private Education Loan Trust
(Private Loans) (United States)Series 2017-B A2A,
2.82%, 15/10/35 USD 2,458,021 2,549,134 0.5Series 2017-B B,
3.50%, 16/12/41 USD 1,000,000 1,041,522 0.2
16,285,954 3.0
21,103,744 3.9CMBS: 0.8% [1.0%]Agency CMBS: 0.8% [1.0%]Freddie Mac Military Housing Trust
Multifamily, 30 Year(United States)4.492%, 25/11/55 USD 3,436,686 4,220,950 0.8
4,220,950 0.8Mortgage-Related: 19.0% [16.2%]Federal Agency CMO & REMIC: 0.7% [1.7%]Freddie Mac, 30 Year
(United States)Series 4319 MA,
4.50%, 15/3/44 USD 109,254 123,219 0.0Fannie Mae, 30 Year (United States)
Trust 2004-W9 1A3,6.05%, 25/2/44 USD 145,954 169,310 0.1
Freddie Mac, 40 Year(United States)Series T-59 1A1,
6.50%, 25/10/43 USD 124,721 148,207 0.0Ginnie Mae, 30 Year (United States)
Series 2010-169 JZ,4.00%, 20/12/40 USD 119,967 128,449 0.0
Portfolio of Investments 31 December 2020
Global Bond Fund
DODGE & COX WORLDWIDE FUNDS PLC � PAGE 27
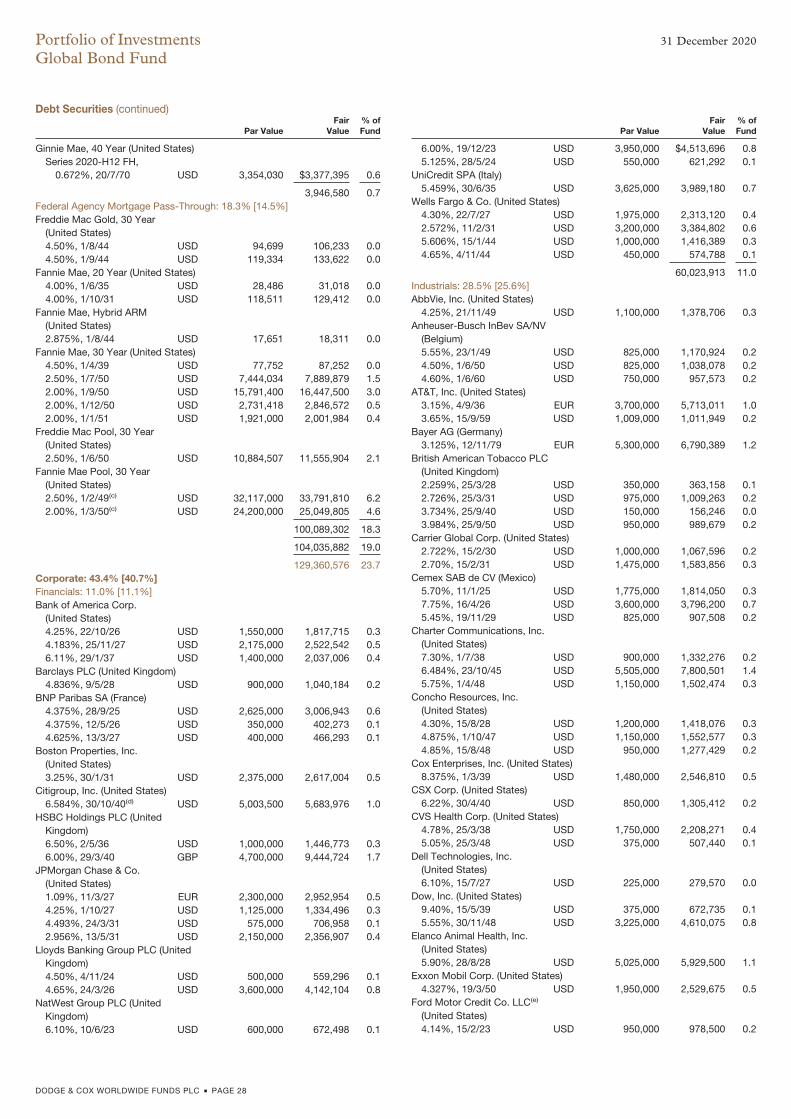
Debt Securities (continued)
Par ValueFair
Value% ofFund
Ginnie Mae, 40 Year (United States)Series 2020-H12 FH,
0.672%, 20/7/70 USD 3,354,030 $3,377,395 0.6
3,946,580 0.7Federal Agency Mortgage Pass-Through: 18.3% [14.5%]Freddie Mac Gold, 30 Year
(United States)4.50%, 1/8/44 USD 94,699 106,233 0.04.50%, 1/9/44 USD 119,334 133,622 0.0
Fannie Mae, 20 Year (United States)4.00%, 1/6/35 USD 28,486 31,018 0.04.00%, 1/10/31 USD 118,511 129,412 0.0
Fannie Mae, Hybrid ARM(United States)2.875%, 1/8/44 USD 17,651 18,311 0.0
Fannie Mae, 30 Year (United States)4.50%, 1/4/39 USD 77,752 87,252 0.02.50%, 1/7/50 USD 7,444,034 7,889,879 1.52.00%, 1/9/50 USD 15,791,400 16,447,500 3.02.00%, 1/12/50 USD 2,731,418 2,846,572 0.52.00%, 1/1/51 USD 1,921,000 2,001,984 0.4
Freddie Mac Pool, 30 Year(United States)2.50%, 1/6/50 USD 10,884,507 11,555,904 2.1
Fannie Mae Pool, 30 Year(United States)2.50%, 1/2/49(c) USD 32,117,000 33,791,810 6.22.00%, 1/3/50(c) USD 24,200,000 25,049,805 4.6
100,089,302 18.3
104,035,882 19.0
129,360,576 23.7Corporate: 43.4% [40.7%]Financials: 11.0% [11.1%]Bank of America Corp.
(United States)4.25%, 22/10/26 USD 1,550,000 1,817,715 0.34.183%, 25/11/27 USD 2,175,000 2,522,542 0.56.11%, 29/1/37 USD 1,400,000 2,037,006 0.4
Barclays PLC (United Kingdom)4.836%, 9/5/28 USD 900,000 1,040,184 0.2
BNP Paribas SA (France)4.375%, 28/9/25 USD 2,625,000 3,006,943 0.64.375%, 12/5/26 USD 350,000 402,273 0.14.625%, 13/3/27 USD 400,000 466,293 0.1
Boston Properties, Inc.(United States)3.25%, 30/1/31 USD 2,375,000 2,617,004 0.5
Citigroup, Inc. (United States)6.584%, 30/10/40(d) USD 5,003,500 5,683,976 1.0
HSBC Holdings PLC (UnitedKingdom)6.50%, 2/5/36 USD 1,000,000 1,446,773 0.36.00%, 29/3/40 GBP 4,700,000 9,444,724 1.7
JPMorgan Chase & Co.(United States)1.09%, 11/3/27 EUR 2,300,000 2,952,954 0.54.25%, 1/10/27 USD 1,125,000 1,334,496 0.34.493%, 24/3/31 USD 575,000 706,958 0.12.956%, 13/5/31 USD 2,150,000 2,356,907 0.4
Lloyds Banking Group PLC (UnitedKingdom)4.50%, 4/11/24 USD 500,000 559,296 0.14.65%, 24/3/26 USD 3,600,000 4,142,104 0.8
NatWest Group PLC (UnitedKingdom)6.10%, 10/6/23 USD 600,000 672,498 0.1
Par ValueFair
Value% ofFund
6.00%, 19/12/23 USD 3,950,000 $4,513,696 0.85.125%, 28/5/24 USD 550,000 621,292 0.1
UniCredit SPA (Italy)5.459%, 30/6/35 USD 3,625,000 3,989,180 0.7
Wells Fargo & Co. (United States)4.30%, 22/7/27 USD 1,975,000 2,313,120 0.42.572%, 11/2/31 USD 3,200,000 3,384,802 0.65.606%, 15/1/44 USD 1,000,000 1,416,389 0.34.65%, 4/11/44 USD 450,000 574,788 0.1
60,023,913 11.0Industrials: 28.5% [25.6%]AbbVie, Inc. (United States)
4.25%, 21/11/49 USD 1,100,000 1,378,706 0.3Anheuser-Busch InBev SA/NV
(Belgium)5.55%, 23/1/49 USD 825,000 1,170,924 0.24.50%, 1/6/50 USD 825,000 1,038,078 0.24.60%, 1/6/60 USD 750,000 957,573 0.2
AT&T, Inc. (United States)3.15%, 4/9/36 EUR 3,700,000 5,713,011 1.03.65%, 15/9/59 USD 1,009,000 1,011,949 0.2
Bayer AG (Germany)3.125%, 12/11/79 EUR 5,300,000 6,790,389 1.2
British American Tobacco PLC(United Kingdom)2.259%, 25/3/28 USD 350,000 363,158 0.12.726%, 25/3/31 USD 975,000 1,009,263 0.23.734%, 25/9/40 USD 150,000 156,246 0.03.984%, 25/9/50 USD 950,000 989,679 0.2
Carrier Global Corp. (United States)2.722%, 15/2/30 USD 1,000,000 1,067,596 0.22.70%, 15/2/31 USD 1,475,000 1,583,856 0.3
Cemex SAB de CV (Mexico)5.70%, 11/1/25 USD 1,775,000 1,814,050 0.37.75%, 16/4/26 USD 3,600,000 3,796,200 0.75.45%, 19/11/29 USD 825,000 907,508 0.2
Charter Communications, Inc.(United States)7.30%, 1/7/38 USD 900,000 1,332,276 0.26.484%, 23/10/45 USD 5,505,000 7,800,501 1.45.75%, 1/4/48 USD 1,150,000 1,502,474 0.3
Concho Resources, Inc.(United States)4.30%, 15/8/28 USD 1,200,000 1,418,076 0.34.875%, 1/10/47 USD 1,150,000 1,552,577 0.34.85%, 15/8/48 USD 950,000 1,277,429 0.2
Cox Enterprises, Inc. (United States)8.375%, 1/3/39 USD 1,480,000 2,546,810 0.5
CSX Corp. (United States)6.22%, 30/4/40 USD 850,000 1,305,412 0.2
CVS Health Corp. (United States)4.78%, 25/3/38 USD 1,750,000 2,208,271 0.45.05%, 25/3/48 USD 375,000 507,440 0.1
Dell Technologies, Inc.(United States)6.10%, 15/7/27 USD 225,000 279,570 0.0
Dow, Inc. (United States)9.40%, 15/5/39 USD 375,000 672,735 0.15.55%, 30/11/48 USD 3,225,000 4,610,075 0.8
Elanco Animal Health, Inc.(United States)5.90%, 28/8/28 USD 5,025,000 5,929,500 1.1
Exxon Mobil Corp. (United States)4.327%, 19/3/50 USD 1,950,000 2,529,675 0.5
Ford Motor Credit Co. LLC(e)
(United States)4.14%, 15/2/23 USD 950,000 978,500 0.2
Portfolio of Investments 31 December 2020
Global Bond Fund
DODGE & COX WORLDWIDE FUNDS PLC � PAGE 28
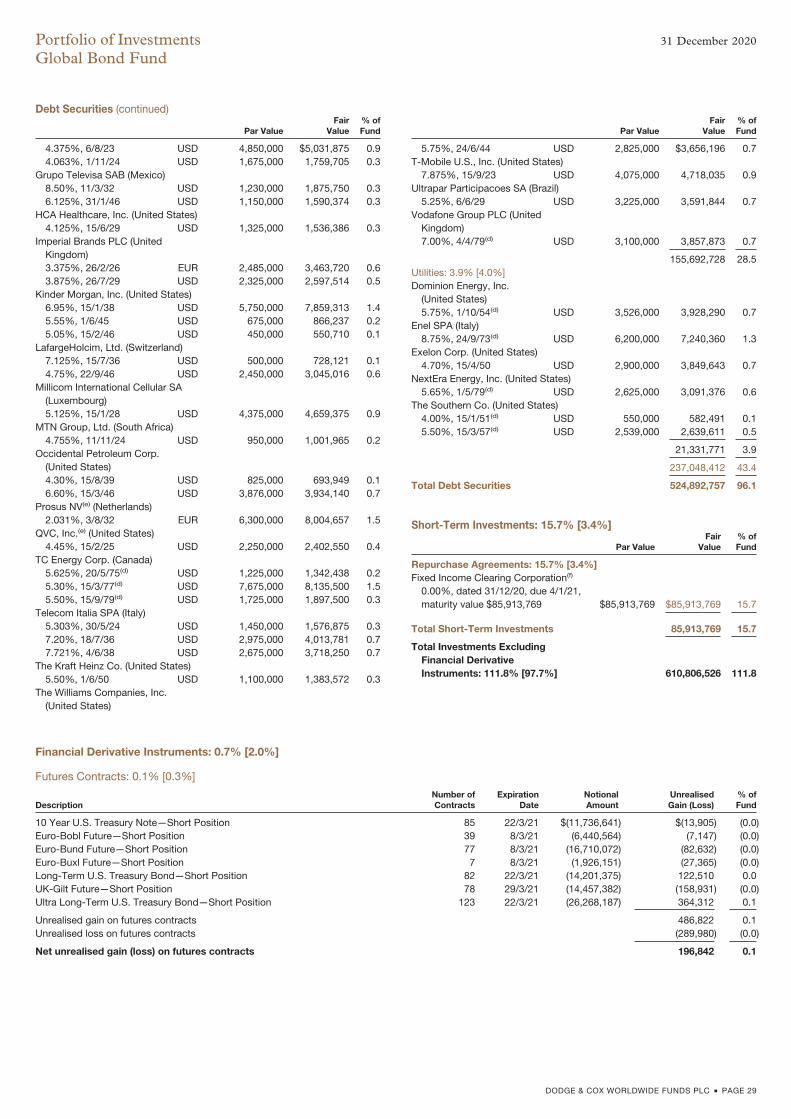
Debt Securities (continued)
Par ValueFair
Value% ofFund
4.375%, 6/8/23 USD 4,850,000 $5,031,875 0.94.063%, 1/11/24 USD 1,675,000 1,759,705 0.3
Grupo Televisa SAB (Mexico)8.50%, 11/3/32 USD 1,230,000 1,875,750 0.36.125%, 31/1/46 USD 1,150,000 1,590,374 0.3
HCA Healthcare, Inc. (United States)4.125%, 15/6/29 USD 1,325,000 1,536,386 0.3
Imperial Brands PLC (UnitedKingdom)3.375%, 26/2/26 EUR 2,485,000 3,463,720 0.63.875%, 26/7/29 USD 2,325,000 2,597,514 0.5
Kinder Morgan, Inc. (United States)6.95%, 15/1/38 USD 5,750,000 7,859,313 1.45.55%, 1/6/45 USD 675,000 866,237 0.25.05%, 15/2/46 USD 450,000 550,710 0.1
LafargeHolcim, Ltd. (Switzerland)7.125%, 15/7/36 USD 500,000 728,121 0.14.75%, 22/9/46 USD 2,450,000 3,045,016 0.6
Millicom International Cellular SA(Luxembourg)5.125%, 15/1/28 USD 4,375,000 4,659,375 0.9
MTN Group, Ltd. (South Africa)4.755%, 11/11/24 USD 950,000 1,001,965 0.2
Occidental Petroleum Corp.(United States)4.30%, 15/8/39 USD 825,000 693,949 0.16.60%, 15/3/46 USD 3,876,000 3,934,140 0.7
Prosus NV(e) (Netherlands)2.031%, 3/8/32 EUR 6,300,000 8,004,657 1.5
QVC, Inc.(e) (United States)4.45%, 15/2/25 USD 2,250,000 2,402,550 0.4
TC Energy Corp. (Canada)5.625%, 20/5/75(d) USD 1,225,000 1,342,438 0.25.30%, 15/3/77(d) USD 7,675,000 8,135,500 1.55.50%, 15/9/79(d) USD 1,725,000 1,897,500 0.3
Telecom Italia SPA (Italy)5.303%, 30/5/24 USD 1,450,000 1,576,875 0.37.20%, 18/7/36 USD 2,975,000 4,013,781 0.77.721%, 4/6/38 USD 2,675,000 3,718,250 0.7
The Kraft Heinz Co. (United States)5.50%, 1/6/50 USD 1,100,000 1,383,572 0.3
The Williams Companies, Inc.(United States)
Par ValueFair
Value% ofFund
5.75%, 24/6/44 USD 2,825,000 $3,656,196 0.7T-Mobile U.S., Inc. (United States)
7.875%, 15/9/23 USD 4,075,000 4,718,035 0.9Ultrapar Participacoes SA (Brazil)
5.25%, 6/6/29 USD 3,225,000 3,591,844 0.7Vodafone Group PLC (United
Kingdom)7.00%, 4/4/79(d) USD 3,100,000 3,857,873 0.7
155,692,728 28.5Utilities: 3.9% [4.0%]Dominion Energy, Inc.
(United States)5.75%, 1/10/54(d) USD 3,526,000 3,928,290 0.7
Enel SPA (Italy)8.75%, 24/9/73(d) USD 6,200,000 7,240,360 1.3
Exelon Corp. (United States)4.70%, 15/4/50 USD 2,900,000 3,849,643 0.7
NextEra Energy, Inc. (United States)5.65%, 1/5/79(d) USD 2,625,000 3,091,376 0.6
The Southern Co. (United States)4.00%, 15/1/51(d) USD 550,000 582,491 0.15.50%, 15/3/57(d) USD 2,539,000 2,639,611 0.5
21,331,771 3.9
237,048,412 43.4
Total Debt Securities 524,892,757 96.1
Short-Term Investments: 15.7% [3.4%]
Par ValueFair
Value% ofFund
Repurchase Agreements: 15.7% [3.4%]Fixed Income Clearing Corporation(f)
0.00%, dated 31/12/20, due 4/1/21,maturity value $85,913,769 $85,913,769 $85,913,769 15.7
Total Short-Term Investments 85,913,769 15.7
Total Investments ExcludingFinancial DerivativeInstruments: 111.8% [97.7%] 610,806,526 111.8
Financial Derivative Instruments: 0.7% [2.0%]
Futures Contracts: 0.1% [0.3%]
DescriptionNumber ofContracts
ExpirationDate
NotionalAmount
UnrealisedGain (Loss)
% ofFund
10 Year U.S. Treasury Note—Short Position 85 22/3/21 $(11,736,641) $(13,905) (0.0)Euro-Bobl Future—Short Position 39 8/3/21 (6,440,564) (7,147) (0.0)Euro-Bund Future—Short Position 77 8/3/21 (16,710,072) (82,632) (0.0)Euro-Buxl Future—Short Position 7 8/3/21 (1,926,151) (27,365) (0.0)Long-Term U.S. Treasury Bond—Short Position 82 22/3/21 (14,201,375) 122,510 0.0UK-Gilt Future—Short Position 78 29/3/21 (14,457,382) (158,931) (0.0)Ultra Long-Term U.S. Treasury Bond—Short Position 123 22/3/21 (26,268,187) 364,312 0.1
Unrealised gain on futures contracts 486,822 0.1Unrealised loss on futures contracts (289,980) (0.0)
Net unrealised gain (loss) on futures contracts 196,842 0.1
Portfolio of Investments 31 December 2020
Global Bond Fund
DODGE & COX WORLDWIDE FUNDS PLC � PAGE 29
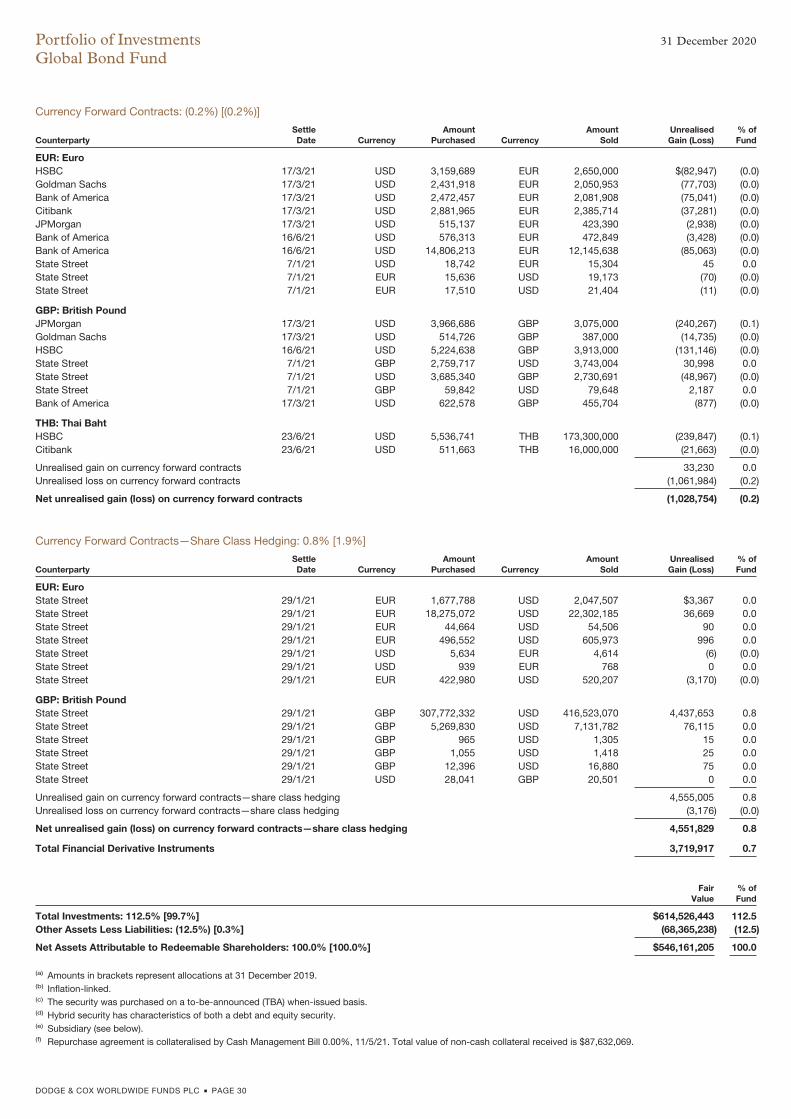
Currency Forward Contracts: (0.2%) [(0.2%)]
CounterpartySettleDate Currency
AmountPurchased Currency
AmountSold
UnrealisedGain (Loss)
% ofFund
EUR: EuroHSBC 17/3/21 USD 3,159,689 EUR 2,650,000 $(82,947) (0.0)Goldman Sachs 17/3/21 USD 2,431,918 EUR 2,050,953 (77,703) (0.0)Bank of America 17/3/21 USD 2,472,457 EUR 2,081,908 (75,041) (0.0)Citibank 17/3/21 USD 2,881,965 EUR 2,385,714 (37,281) (0.0)JPMorgan 17/3/21 USD 515,137 EUR 423,390 (2,938) (0.0)Bank of America 16/6/21 USD 576,313 EUR 472,849 (3,428) (0.0)Bank of America 16/6/21 USD 14,806,213 EUR 12,145,638 (85,063) (0.0)State Street 7/1/21 USD 18,742 EUR 15,304 45 0.0State Street 7/1/21 EUR 15,636 USD 19,173 (70) (0.0)State Street 7/1/21 EUR 17,510 USD 21,404 (11) (0.0)
GBP: British PoundJPMorgan 17/3/21 USD 3,966,686 GBP 3,075,000 (240,267) (0.1)Goldman Sachs 17/3/21 USD 514,726 GBP 387,000 (14,735) (0.0)HSBC 16/6/21 USD 5,224,638 GBP 3,913,000 (131,146) (0.0)State Street 7/1/21 GBP 2,759,717 USD 3,743,004 30,998 0.0State Street 7/1/21 USD 3,685,340 GBP 2,730,691 (48,967) (0.0)State Street 7/1/21 GBP 59,842 USD 79,648 2,187 0.0Bank of America 17/3/21 USD 622,578 GBP 455,704 (877) (0.0)
THB: Thai BahtHSBC 23/6/21 USD 5,536,741 THB 173,300,000 (239,847) (0.1)Citibank 23/6/21 USD 511,663 THB 16,000,000 (21,663) (0.0)
Unrealised gain on currency forward contracts 33,230 0.0Unrealised loss on currency forward contracts (1,061,984) (0.2)
Net unrealised gain (loss) on currency forward contracts (1,028,754) (0.2)
Currency Forward Contracts—Share Class Hedging: 0.8% [1.9%]
CounterpartySettleDate Currency
AmountPurchased Currency
AmountSold
UnrealisedGain (Loss)
% ofFund
EUR: EuroState Street 29/1/21 EUR 1,677,788 USD 2,047,507 $3,367 0.0State Street 29/1/21 EUR 18,275,072 USD 22,302,185 36,669 0.0State Street 29/1/21 EUR 44,664 USD 54,506 90 0.0State Street 29/1/21 EUR 496,552 USD 605,973 996 0.0State Street 29/1/21 USD 5,634 EUR 4,614 (6) (0.0)State Street 29/1/21 USD 939 EUR 768 0 0.0State Street 29/1/21 EUR 422,980 USD 520,207 (3,170) (0.0)
GBP: British PoundState Street 29/1/21 GBP 307,772,332 USD 416,523,070 4,437,653 0.8State Street 29/1/21 GBP 5,269,830 USD 7,131,782 76,115 0.0State Street 29/1/21 GBP 965 USD 1,305 15 0.0State Street 29/1/21 GBP 1,055 USD 1,418 25 0.0State Street 29/1/21 GBP 12,396 USD 16,880 75 0.0State Street 29/1/21 USD 28,041 GBP 20,501 0 0.0
Unrealised gain on currency forward contracts—share class hedging 4,555,005 0.8Unrealised loss on currency forward contracts—share class hedging (3,176) (0.0)
Net unrealised gain (loss) on currency forward contracts—share class hedging 4,551,829 0.8
Total Financial Derivative Instruments 3,719,917 0.7
FairValue
% ofFund
Total Investments: 112.5% [99.7%] $614,526,443 112.5Other Assets Less Liabilities: (12.5%) [0.3%] (68,365,238) (12.5)
Net Assets Attributable to Redeemable Shareholders: 100.0% [100.0%] $546,161,205 100.0
(a) Amounts in brackets represent allocations at 31 December 2019.(b) Inflation-linked.(c) The security was purchased on a to-be-announced (TBA) when-issued basis.(d) Hybrid security has characteristics of both a debt and equity security.(e) Subsidiary (see below).(f) Repurchase agreement is collateralised by Cash Management Bill 0.00%, 11/5/21. Total value of non-cash collateral received is $87,632,069.
Portfolio of Investments 31 December 2020
Global Bond Fund
DODGE & COX WORLDWIDE FUNDS PLC � PAGE 30
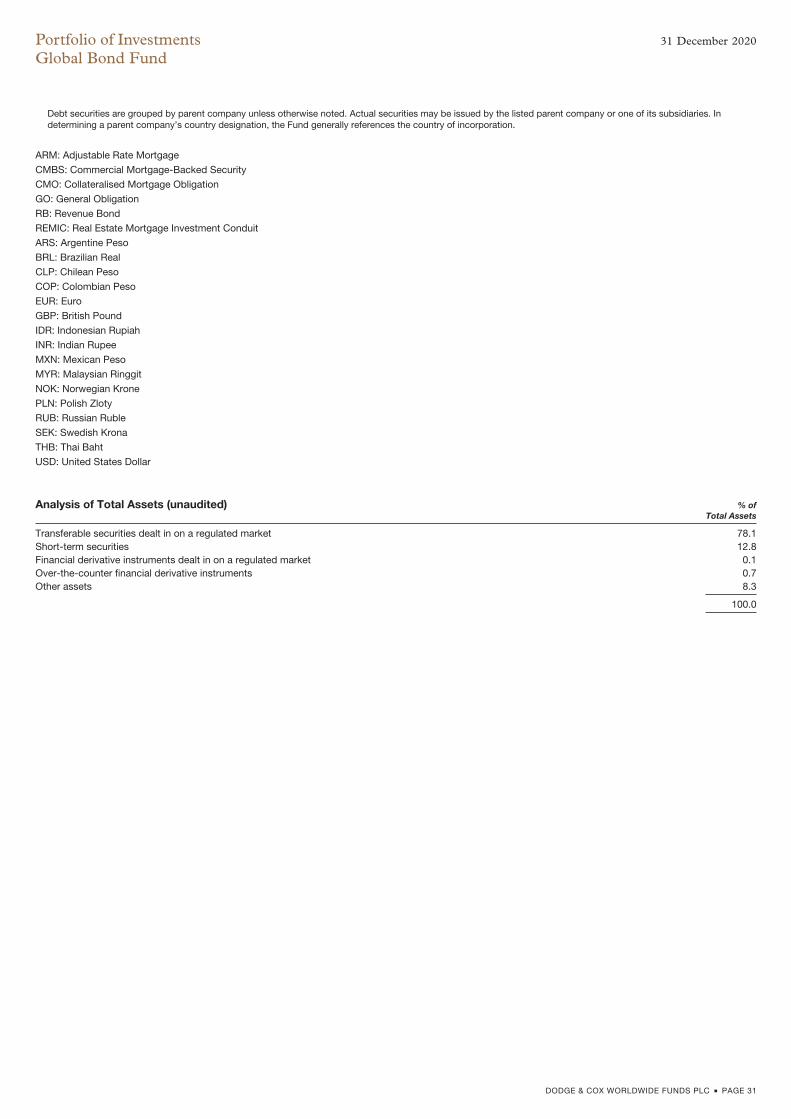
Debt securities are grouped by parent company unless otherwise noted. Actual securities may be issued by the listed parent company or one of its subsidiaries. Indetermining a parent company’s country designation, the Fund generally references the country of incorporation.
ARM: Adjustable Rate Mortgage
CMBS: Commercial Mortgage-Backed Security
CMO: Collateralised Mortgage Obligation
GO: General Obligation
RB: Revenue Bond
REMIC: Real Estate Mortgage Investment Conduit
ARS: Argentine Peso
BRL: Brazilian Real
CLP: Chilean Peso
COP: Colombian Peso
EUR: Euro
GBP: British Pound
IDR: Indonesian Rupiah
INR: Indian Rupee
MXN: Mexican Peso
MYR: Malaysian Ringgit
NOK: Norwegian Krone
PLN: Polish Zloty
RUB: Russian Ruble
SEK: Swedish Krona
THB: Thai Baht
USD: United States Dollar
Analysis of Total Assets (unaudited) % ofTotal Assets
Transferable securities dealt in on a regulated market 78.1Short-term securities 12.8Financial derivative instruments dealt in on a regulated market 0.1Over-the-counter financial derivative instruments 0.7Other assets 8.3
100.0
Portfolio of Investments 31 December 2020
Global Bond Fund
DODGE & COX WORLDWIDE FUNDS PLC � PAGE 31
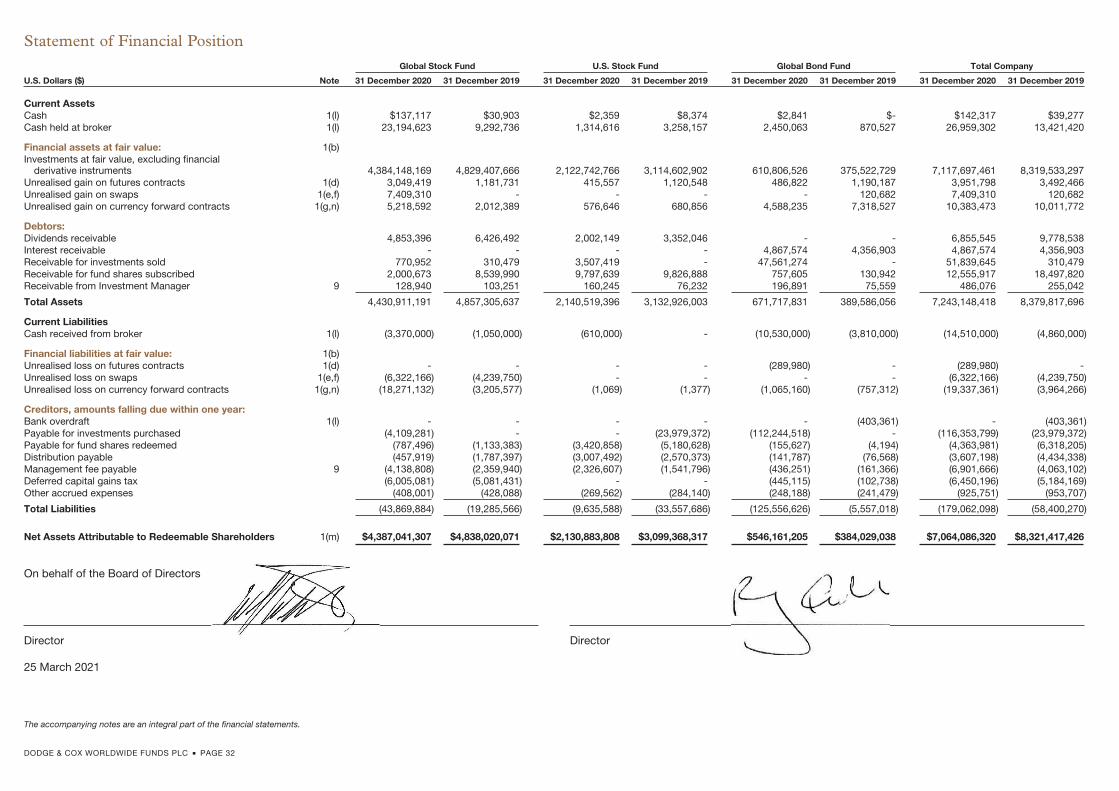
Global Stock Fund U.S. Stock Fund Global Bond Fund Total Company
U.S. Dollars ($) Note 31 December 2020 31 December 2019 31 December 2020 31 December 2019 31 December 2020 31 December 2019 31 December 2020 31 December 2019
Current AssetsCash 1(l) $137,117 $30,903 $2,359 $8,374 $2,841 $- $142,317 $39,277Cash held at broker 1(l) 23,194,623 9,292,736 1,314,616 3,258,157 2,450,063 870,527 26,959,302 13,421,420
Financial assets at fair value: 1(b)Investments at fair value, excluding financial
derivative instruments 4,384,148,169 4,829,407,666 2,122,742,766 3,114,602,902 610,806,526 375,522,729 7,117,697,461 8,319,533,297Unrealised gain on futures contracts 1(d) 3,049,419 1,181,731 415,557 1,120,548 486,822 1,190,187 3,951,798 3,492,466Unrealised gain on swaps 1(e,f) 7,409,310 - - - - 120,682 7,409,310 120,682Unrealised gain on currency forward contracts 1(g,n) 5,218,592 2,012,389 576,646 680,856 4,588,235 7,318,527 10,383,473 10,011,772
Debtors:Dividends receivable 4,853,396 6,426,492 2,002,149 3,352,046 - - 6,855,545 9,778,538Interest receivable - - - - 4,867,574 4,356,903 4,867,574 4,356,903Receivable for investments sold 770,952 310,479 3,507,419 - 47,561,274 - 51,839,645 310,479Receivable for fund shares subscribed 2,000,673 8,539,990 9,797,639 9,826,888 757,605 130,942 12,555,917 18,497,820Receivable from Investment Manager 9 128,940 103,251 160,245 76,232 196,891 75,559 486,076 255,042
Total Assets 4,430,911,191 4,857,305,637 2,140,519,396 3,132,926,003 671,717,831 389,586,056 7,243,148,418 8,379,817,696
Current LiabilitiesCash received from broker 1(l) (3,370,000) (1,050,000) (610,000) - (10,530,000) (3,810,000) (14,510,000) (4,860,000)
Financial liabilities at fair value: 1(b)Unrealised loss on futures contracts 1(d) - - - - (289,980) - (289,980) -Unrealised loss on swaps 1(e,f) (6,322,166) (4,239,750) - - - - (6,322,166) (4,239,750)Unrealised loss on currency forward contracts 1(g,n) (18,271,132) (3,205,577) (1,069) (1,377) (1,065,160) (757,312) (19,337,361) (3,964,266)
Creditors, amounts falling due within one year:Bank overdraft 1(l) - - - - - (403,361) - (403,361)Payable for investments purchased (4,109,281) - - (23,979,372) (112,244,518) - (116,353,799) (23,979,372)Payable for fund shares redeemed (787,496) (1,133,383) (3,420,858) (5,180,628) (155,627) (4,194) (4,363,981) (6,318,205)Distribution payable (457,919) (1,787,397) (3,007,492) (2,570,373) (141,787) (76,568) (3,607,198) (4,434,338)Management fee payable 9 (4,138,808) (2,359,940) (2,326,607) (1,541,796) (436,251) (161,366) (6,901,666) (4,063,102)Deferred capital gains tax (6,005,081) (5,081,431) - - (445,115) (102,738) (6,450,196) (5,184,169)Other accrued expenses (408,001) (428,088) (269,562) (284,140) (248,188) (241,479) (925,751) (953,707)
Total Liabilities (43,869,884) (19,285,566) (9,635,588) (33,557,686) (125,556,626) (5,557,018) (179,062,098) (58,400,270)
Net Assets Attributable to Redeemable Shareholders 1(m) $4,387,041,307 $4,838,020,071 $2,130,883,808 $3,099,368,317 $546,161,205 $384,029,038 $7,064,086,320 $8,321,417,426
On behalf of the Board of Directors
Director Director
25 March 2021
Statement of Financial Position
The accompanying notes are an integral part of the financial statements.
DODGE & COX WORLDWIDE FUNDS PLC � PAGE 32
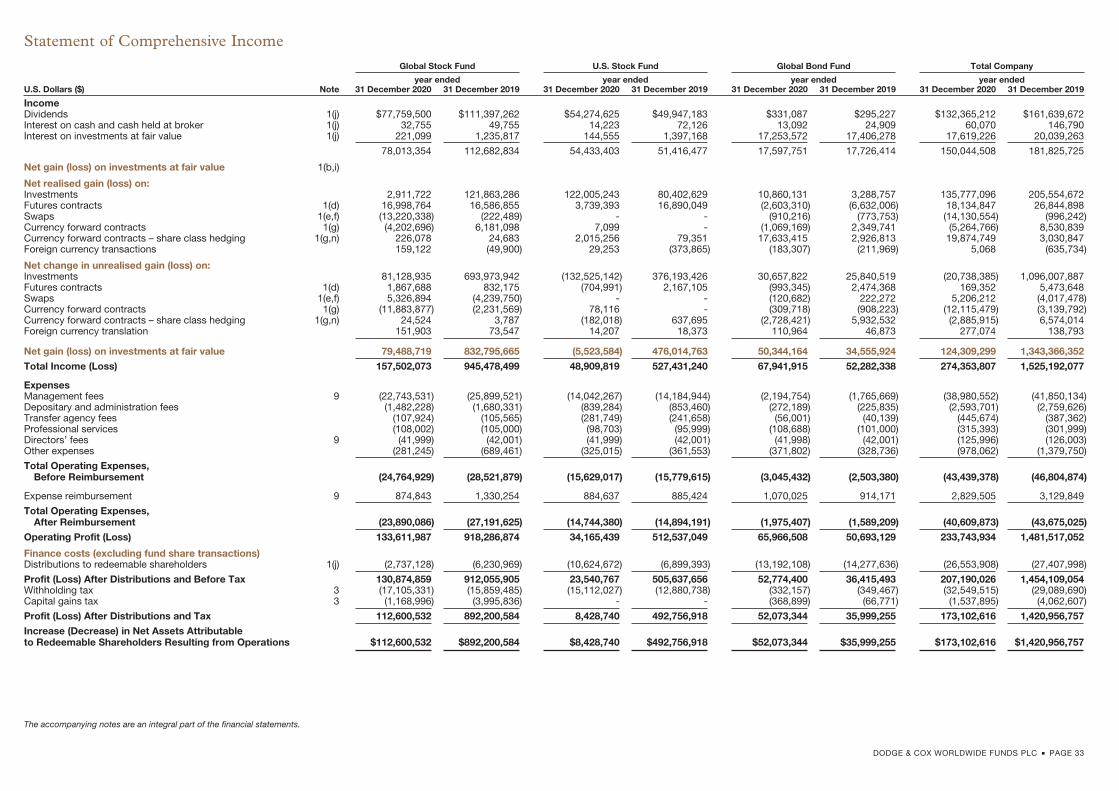
Global Stock Fund U.S. Stock Fund Global Bond Fund Total Company
year ended year ended year ended year endedU.S. Dollars ($) Note 31 December 2020 31 December 2019 31 December 2020 31 December 2019 31 December 2020 31 December 2019 31 December 2020 31 December 2019
IncomeDividends 1(j) $77,759,500 $111,397,262 $54,274,625 $49,947,183 $331,087 $295,227 $132,365,212 $161,639,672Interest on cash and cash held at broker 1(j) 32,755 49,755 14,223 72,126 13,092 24,909 60,070 146,790Interest on investments at fair value 1(j) 221,099 1,235,817 144,555 1,397,168 17,253,572 17,406,278 17,619,226 20,039,263
78,013,354 112,682,834 54,433,403 51,416,477 17,597,751 17,726,414 150,044,508 181,825,725
Net gain (loss) on investments at fair value 1(b,i)
Net realised gain (loss) on:Investments 2,911,722 121,863,286 122,005,243 80,402,629 10,860,131 3,288,757 135,777,096 205,554,672Futures contracts 1(d) 16,998,764 16,586,855 3,739,393 16,890,049 (2,603,310) (6,632,006) 18,134,847 26,844,898Swaps 1(e,f) (13,220,338) (222,489) - - (910,216) (773,753) (14,130,554) (996,242)Currency forward contracts 1(g) (4,202,696) 6,181,098 7,099 - (1,069,169) 2,349,741 (5,264,766) 8,530,839Currency forward contracts – share class hedging 1(g,n) 226,078 24,683 2,015,256 79,351 17,633,415 2,926,813 19,874,749 3,030,847Foreign currency transactions 159,122 (49,900) 29,253 (373,865) (183,307) (211,969) 5,068 (635,734)
Net change in unrealised gain (loss) on:Investments 81,128,935 693,973,942 (132,525,142) 376,193,426 30,657,822 25,840,519 (20,738,385) 1,096,007,887Futures contracts 1(d) 1,867,688 832,175 (704,991) 2,167,105 (993,345) 2,474,368 169,352 5,473,648Swaps 1(e,f) 5,326,894 (4,239,750) - - (120,682) 222,272 5,206,212 (4,017,478)Currency forward contracts 1(g) (11,883,877) (2,231,569) 78,116 - (309,718) (908,223) (12,115,479) (3,139,792)Currency forward contracts – share class hedging 1(g,n) 24,524 3,787 (182,018) 637,695 (2,728,421) 5,932,532 (2,885,915) 6,574,014Foreign currency translation 151,903 73,547 14,207 18,373 110,964 46,873 277,074 138,793
Net gain (loss) on investments at fair value 79,488,719 832,795,665 (5,523,584) 476,014,763 50,344,164 34,555,924 124,309,299 1,343,366,352
Total Income (Loss) 157,502,073 945,478,499 48,909,819 527,431,240 67,941,915 52,282,338 274,353,807 1,525,192,077
ExpensesManagement fees 9 (22,743,531) (25,899,521) (14,042,267) (14,184,944) (2,194,754) (1,765,669) (38,980,552) (41,850,134)Depositary and administration fees (1,482,228) (1,680,331) (839,284) (853,460) (272,189) (225,835) (2,593,701) (2,759,626)Transfer agency fees (107,924) (105,565) (281,749) (241,658) (56,001) (40,139) (445,674) (387,362)Professional services (108,002) (105,000) (98,703) (95,999) (108,688) (101,000) (315,393) (301,999)Directors’ fees 9 (41,999) (42,001) (41,999) (42,001) (41,998) (42,001) (125,996) (126,003)Other expenses (281,245) (689,461) (325,015) (361,553) (371,802) (328,736) (978,062) (1,379,750)
Total Operating Expenses,Before Reimbursement (24,764,929) (28,521,879) (15,629,017) (15,779,615) (3,045,432) (2,503,380) (43,439,378) (46,804,874)
Expense reimbursement 9 874,843 1,330,254 884,637 885,424 1,070,025 914,171 2,829,505 3,129,849
Total Operating Expenses,After Reimbursement (23,890,086) (27,191,625) (14,744,380) (14,894,191) (1,975,407) (1,589,209) (40,609,873) (43,675,025)
Operating Profit (Loss) 133,611,987 918,286,874 34,165,439 512,537,049 65,966,508 50,693,129 233,743,934 1,481,517,052
Finance costs (excluding fund share transactions)Distributions to redeemable shareholders 1(j) (2,737,128) (6,230,969) (10,624,672) (6,899,393) (13,192,108) (14,277,636) (26,553,908) (27,407,998)
Profit (Loss) After Distributions and Before Tax 130,874,859 912,055,905 23,540,767 505,637,656 52,774,400 36,415,493 207,190,026 1,454,109,054Withholding tax 3 (17,105,331) (15,859,485) (15,112,027) (12,880,738) (332,157) (349,467) (32,549,515) (29,089,690)Capital gains tax 3 (1,168,996) (3,995,836) - - (368,899) (66,771) (1,537,895) (4,062,607)
Profit (Loss) After Distributions and Tax 112,600,532 892,200,584 8,428,740 492,756,918 52,073,344 35,999,255 173,102,616 1,420,956,757
Increase (Decrease) in Net Assets Attributableto Redeemable Shareholders Resulting from Operations $112,600,532 $892,200,584 $8,428,740 $492,756,918 $52,073,344 $35,999,255 $173,102,616 $1,420,956,757
Statement of Comprehensive Income
The accompanying notes are an integral part of the financial statements.
DODGE & COX WORLDWIDE FUNDS PLC � PAGE 33
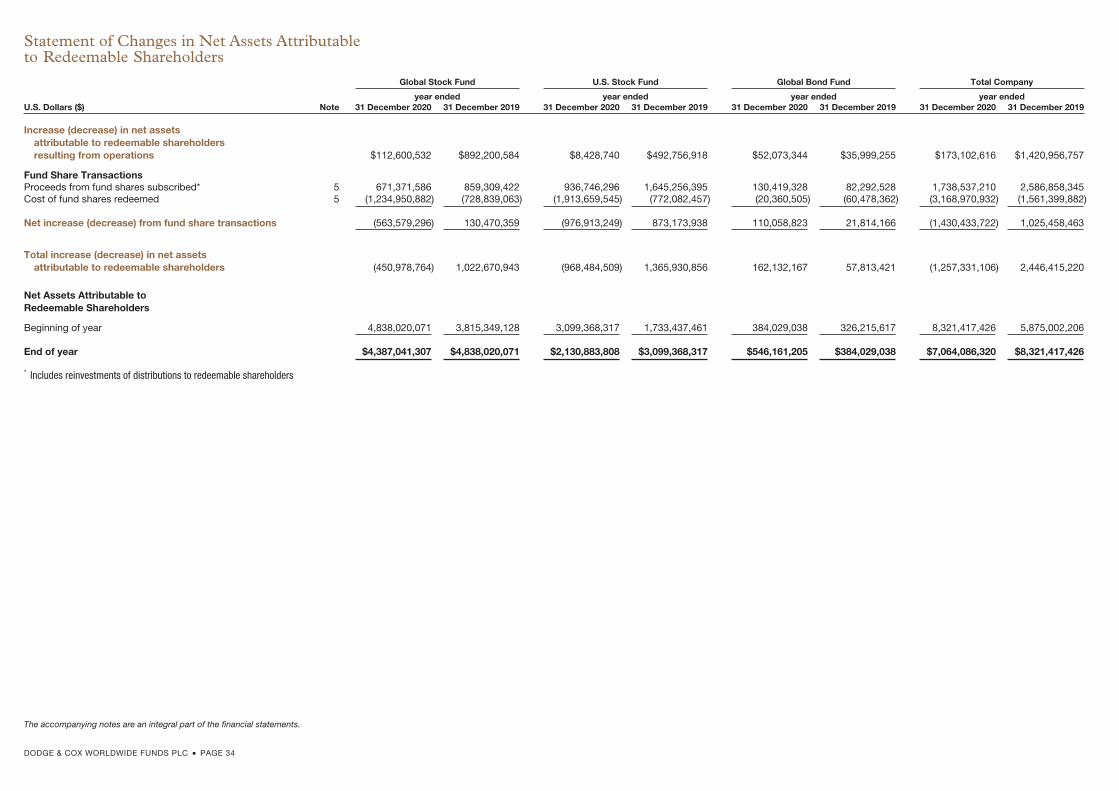
Global Stock Fund U.S. Stock Fund Global Bond Fund Total Company
year ended year ended year ended year endedU.S. Dollars ($) Note 31 December 2020 31 December 2019 31 December 2020 31 December 2019 31 December 2020 31 December 2019 31 December 2020 31 December 2019
Increase (decrease) in net assetsattributable to redeemable shareholdersresulting from operations $112,600,532 $892,200,584 $8,428,740 $492,756,918 $52,073,344 $35,999,255 $173,102,616 $1,420,956,757
Fund Share TransactionsProceeds from fund shares subscribed* 5 671,371,586 859,309,422 936,746,296 1,645,256,395 130,419,328 82,292,528 1,738,537,210 2,586,858,345Cost of fund shares redeemed 5 (1,234,950,882) (728,839,063) (1,913,659,545) (772,082,457) (20,360,505) (60,478,362) (3,168,970,932) (1,561,399,882)
Net increase (decrease) from fund share transactions (563,579,296) 130,470,359 (976,913,249) 873,173,938 110,058,823 21,814,166 (1,430,433,722) 1,025,458,463
Total increase (decrease) in net assetsattributable to redeemable shareholders (450,978,764) 1,022,670,943 (968,484,509) 1,365,930,856 162,132,167 57,813,421 (1,257,331,106) 2,446,415,220
Net Assets Attributable toRedeemable Shareholders
Beginning of year 4,838,020,071 3,815,349,128 3,099,368,317 1,733,437,461 384,029,038 326,215,617 8,321,417,426 5,875,002,206
End of year $4,387,041,307 $4,838,020,071 $2,130,883,808 $3,099,368,317 $546,161,205 $384,029,038 $7,064,086,320 $8,321,417,426
* Includes reinvestments of distributions to redeemable shareholders
Statement of Changes in Net Assets Attributableto Redeemable Shareholders
The accompanying notes are an integral part of the financial statements.
DODGE & COX WORLDWIDE FUNDS PLC � PAGE 34
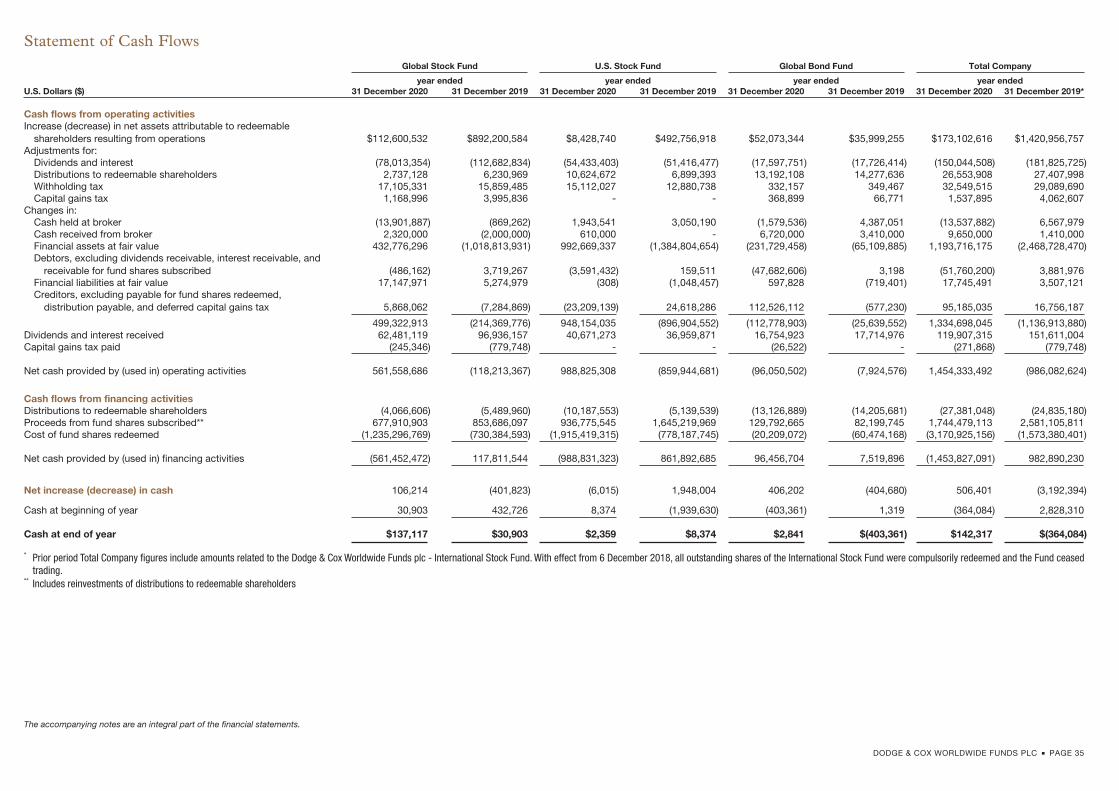
Global Stock Fund U.S. Stock Fund Global Bond Fund Total Company
year ended year ended year ended year endedU.S. Dollars ($) 31 December 2020 31 December 2019 31 December 2020 31 December 2019 31 December 2020 31 December 2019 31 December 2020 31 December 2019*
Cash flows from operating activitiesIncrease (decrease) in net assets attributable to redeemable
shareholders resulting from operations $112,600,532 $892,200,584 $8,428,740 $492,756,918 $52,073,344 $35,999,255 $173,102,616 $1,420,956,757Adjustments for:
Dividends and interest (78,013,354) (112,682,834) (54,433,403) (51,416,477) (17,597,751) (17,726,414) (150,044,508) (181,825,725)Distributions to redeemable shareholders 2,737,128 6,230,969 10,624,672 6,899,393 13,192,108 14,277,636 26,553,908 27,407,998Withholding tax 17,105,331 15,859,485 15,112,027 12,880,738 332,157 349,467 32,549,515 29,089,690Capital gains tax 1,168,996 3,995,836 - - 368,899 66,771 1,537,895 4,062,607
Changes in:Cash held at broker (13,901,887) (869,262) 1,943,541 3,050,190 (1,579,536) 4,387,051 (13,537,882) 6,567,979Cash received from broker 2,320,000 (2,000,000) 610,000 - 6,720,000 3,410,000 9,650,000 1,410,000Financial assets at fair value 432,776,296 (1,018,813,931) 992,669,337 (1,384,804,654) (231,729,458) (65,109,885) 1,193,716,175 (2,468,728,470)Debtors, excluding dividends receivable, interest receivable, and
receivable for fund shares subscribed (486,162) 3,719,267 (3,591,432) 159,511 (47,682,606) 3,198 (51,760,200) 3,881,976Financial liabilities at fair value 17,147,971 5,274,979 (308) (1,048,457) 597,828 (719,401) 17,745,491 3,507,121Creditors, excluding payable for fund shares redeemed,
distribution payable, and deferred capital gains tax 5,868,062 (7,284,869) (23,209,139) 24,618,286 112,526,112 (577,230) 95,185,035 16,756,187
499,322,913 (214,369,776) 948,154,035 (896,904,552) (112,778,903) (25,639,552) 1,334,698,045 (1,136,913,880)Dividends and interest received 62,481,119 96,936,157 40,671,273 36,959,871 16,754,923 17,714,976 119,907,315 151,611,004Capital gains tax paid (245,346) (779,748) - - (26,522) - (271,868) (779,748)
Net cash provided by (used in) operating activities 561,558,686 (118,213,367) 988,825,308 (859,944,681) (96,050,502) (7,924,576) 1,454,333,492 (986,082,624)
Cash flows from financing activitiesDistributions to redeemable shareholders (4,066,606) (5,489,960) (10,187,553) (5,139,539) (13,126,889) (14,205,681) (27,381,048) (24,835,180)Proceeds from fund shares subscribed** 677,910,903 853,686,097 936,775,545 1,645,219,969 129,792,665 82,199,745 1,744,479,113 2,581,105,811Cost of fund shares redeemed (1,235,296,769) (730,384,593) (1,915,419,315) (778,187,745) (20,209,072) (60,474,168) (3,170,925,156) (1,573,380,401)
Net cash provided by (used in) financing activities (561,452,472) 117,811,544 (988,831,323) 861,892,685 96,456,704 7,519,896 (1,453,827,091) 982,890,230
Net increase (decrease) in cash 106,214 (401,823) (6,015) 1,948,004 406,202 (404,680) 506,401 (3,192,394)
Cash at beginning of year 30,903 432,726 8,374 (1,939,630) (403,361) 1,319 (364,084) 2,828,310
Cash at end of year $137,117 $30,903 $2,359 $8,374 $2,841 $(403,361) $142,317 $(364,084)
* Prior period Total Company figures include amounts related to the Dodge & Cox Worldwide Funds plc - International Stock Fund. With effect from 6 December 2018, all outstanding shares of the International Stock Fund were compulsorily redeemed and the Fund ceasedtrading.
** Includes reinvestments of distributions to redeemable shareholders
Statement of Cash Flows
The accompanying notes are an integral part of the financial statements.
DODGE & COX WORLDWIDE FUNDS PLC � PAGE 35
1. Significant Accounting Policies
The principal accounting policies applied in the preparation of thesefinancial statements are set out below. These policies have beenconsistently applied to all years presented unless otherwise stated.
(a) Basis of PreparationThe financial statements have been prepared in accordance withInternational Financial Reporting Standards (“IFRSs”) as adopted bythe European Union, the provisions of the Companies Act, the UCITSRegulations, and the Central Bank UCITS Regulations. They havebeen prepared under the historical cost convention as modified bythe revaluation of financial assets and financial liabilities at fair valuethrough profit or loss.
The financial statements have also been prepared on a goingconcern basis as the Directors have a reasonable expectation that theFunds comprising the Company have adequate resources tocontinue in operational existence for the foreseeable future.
The preparation of financial statements in conformity with IFRSsrequires the Directors and their delegates to make certain accountingestimates and assumptions. Actual results may differ from thoseestimates and assumptions. It also requires the Directors and theirdelegates to exercise judgment in the process of applying theCompany’s accounting policies. Critical accounting estimates andjudgments are set forth in Note 2.
(i) Standards, amendments, and interpretations effective1 January 2020There are no new standards, amendments or interpretationsissued and effective for the financial year beginning 1 January2020 that have a significant impact on the Company’s financialstatements.
(ii) Standards, amendments, and interpretations effective after1 January 2020 and not early adoptedA number of new standards, amendments, and interpretationsare effective for financial years beginning after 1 January 2020,and have not been early adopted. None of these are expected tohave a significant impact on the Company’s financialstatements.
(b) Financial Instruments at Fair Value(i) ClassificationAll of the Company’s financial instruments are either managedand evaluated on a fair value basis and/or held for trading.Consequently, they are classified as financial assets or financialliabilities at fair value.
(ii) Recognition/Derecognition of InvestmentsPurchases and sales of investments are recognised on tradedate, the date on which a Fund commits to purchase or sell theinvestment. Investments are initially recognised at fair value.Subsequent to initial recognition, all investments continue to beclassified at fair value, and the changes in fair value arerecognised as unrealised gain (loss) on investments in theStatement of Comprehensive Income.
Investments are derecognised when the rights to receivecash flows from the investments have expired or a Fund hastransferred substantially all risks and rewards of ownership.Realised gains and losses on sales of investments are calculatedbased on the average cost of the investment in local currencyand are recognised as realised gain (loss) on investments in theStatement of Comprehensive Income.
(iii) Determination of Net Asset ValueFor the purpose of determining dealing prices, the net assetvalue of each Fund and/or each share class is calculated as ofthe scheduled close of trading on the New York Stock Exchange(“NYSE”), usually 4 p.m. Eastern Time, on each Dealing Day asset out in the Prospectus.
(iv) Fair Value EstimationFair value is the price that would be received to sell an asset orpaid to transfer a liability in an orderly transaction betweenmarket participants. The fair value of financial assets andliabilities traded in active markets is generally based on quotedmarket prices at the close of trading on the reporting date. Incircumstances where a price is not within the bid-ask spread,Dodge & Cox (the “Investment Manager”) will determine thepoint within the bid-ask spread that is most representative of fairvalue. The fair value of financial assets and liabilities that are nottraded in active markets is determined using valuationtechniques.
Listed securities are generally valued using the officialquoted close price or the last sale price on the exchange that isdetermined to be the primary market for the security. Debtsecurities and non-exchange traded derivatives are valued usingprices received from independent pricing services which utilisedealer quotes, recent transaction data, pricing models, and otherinputs to arrive at market-based valuations. Pricing models mayconsider quoted prices for similar securities, interest rates, cashflows (including prepayment speeds), and credit risk. Exchange-traded derivatives are valued at the settlement price determinedby the relevant exchange. Currency forward contracts are valuedbased on the prevailing forward exchange rates of the underlyingcurrencies. Other financial instruments for which market quotesare readily available are valued at fair value.
If market quotations or market-based valuations are notreadily available or if normal valuation procedures producevaluations that are deemed unreliable or inappropriate under thecircumstances existing at the time, the investment will be valuedat such value as is certified with care and good faith as theprobable realisable value of the investment by a competentprofessional person appointed by the Directors and approved forsuch purpose by the Depositary, which may include theInvestment Manager. The Investment Manager has established apricing committee (the “Pricing Committee”) that is comprised ofrepresentatives from Treasury, Legal, Compliance, andOperations. The Pricing Committee oversees the InvestmentManager’s valuation process, including determining the fairvalue of securities and other investments when necessary. ThePricing Committee considers relevant indications of value thatare reasonably available to it in determining the fair valueassigned to a particular security, such as the value of similarfinancial instruments, trading volumes, contractual restrictionson disposition, related corporate actions, and changes ineconomic conditions. In doing so, the Pricing Committeeemploys various methods for calibrating fair valuationapproaches, including a regular review of key inputs andassumptions, backtesting, and review of any related marketactivity.
As trading in securities on most non-U.S. exchanges isnormally completed before the close of the NYSE, the value ofmany non-U.S. securities can change by the time a Fund’ssecurities are valued. To address these changes, the Funds mayutilise adjustment factors provided by an independent pricingservice to systematically value non-U.S. securities at fair value.These adjustment factors are based on statistical analyses ofsubsequent movements and changes in U.S. markets andfinancial instruments trading in U.S. markets that represent non-U.S. securities or baskets of securities.
Valuing securities through a fair value determinationinvolves greater reliance on judgment than valuation of securitiesbased on readily available market quotations. In some instances,lack of information and uncertainty as to the significance ofinformation may lead to a conclusion that a prior valuation is thebest indication of a security’s value. When fair value pricing isemployed, a Fund’s value for a security may differ from quoted orpublished prices for the same security.
Notes to the Financial Statements
DODGE & COX WORLDWIDE FUNDS PLC � PAGE 36
(c) Repurchase AgreementsEach Fund enters into repurchase agreements, which involve thepurchase of securities from a counterparty. As part of the transaction,the counterparty agrees to repurchase the underlying securities at thesame price, plus specified interest, and at an agreed-upon date.Repurchase agreements are secured by collateral, typicallyU.S. government or agency securities, as disclosed in each Fund’sPortfolio of Investments. Repurchase agreements are used as short-term cash management vehicles.
(d) Futures ContractsFutures contracts involve an obligation to purchase or sell (dependingon whether a Fund has entered a long or short futures contract,respectively) an asset at a future date, at a price set at the time of thecontract. Upon entering into a futures contract, a Fund is required todeposit an amount of cash or liquid assets (referred to as initialmargin) in a segregated account with the clearing broker. Subsequentpayments (referred to as variation margin) to and from the clearingbroker are made on a daily basis based on changes in the marketvalue of each futures contract. Changes in the market value of openfutures contracts are recorded as unrealised gain (loss) in theStatement of Comprehensive Income. Realised gains and losses onfutures contracts are recorded in the Statement of ComprehensiveIncome at the closing or expiration of the contracts. Cash depositedwith a clearing broker is recorded as cash held at broker in theStatement of Financial Position. Investments in futures contracts mayinvolve certain risks, which may be different from, and potentiallygreater than, those of the underlying securities. To the extent a Funduses futures contracts, it is exposed to additional volatility andpotential losses resulting from leverage. U.S. Treasury, eurogovernment bond, and UK-Gilt futures contracts are used inconnection with the management of portfolio interest rate exposure.Equity index futures contracts are used to help maintain a more fullyinvested portfolio.
(e) Interest Rate SwapsInterest rate swaps are agreements that obligate two parties toexchange a series of cash flows at specified payment datescalculated by reference to specified interest rates, such as anexchange of floating rate payments for fixed rate payments. Uponentering into a centrally cleared interest rate swap, a Fund is requiredto post an amount of cash or liquid assets (referred to as initial margin)in a segregated account with the clearing broker. Subsequentpayments (referred to as variation margin) to and from the clearingbroker are made on a daily basis based on changes in the marketvalue of each interest rate swap. Changes in the market value of openinterest rate swaps are recorded as unrealised gain (loss) in theStatement of Comprehensive Income. Realised gains and losses oninterest rate swaps are recorded in the Statement of ComprehensiveIncome, both upon the exchange of cash flows on each specifiedpayment date and upon the closing or expiration of the swaps. Cashdeposited with a clearing broker is recorded as cash held at broker inthe Statement of Financial Position. Investments in interest rateswaps may involve certain risks including unfavorable changes ininterest rates, or a default or failure by the clearing broker orclearinghouse. Interest rate swaps are used in connection with themanagement of portfolio interest rate exposure.
(f) Equity Total Return SwapsEquity total return swaps, over-the-counter derivatives (“OTCDerivatives”), are contracts that can create long or short economicexposure to an underlying equity security. Under such a contract, oneparty agrees to make payments to another based on the total return ofa notional amount of the underlying security (including dividends andchanges in market value), in return for periodic payments from theother party based on a fixed or variable interest rate applied to thesame notional amount. Equity total return swaps can also be used tohedge against exposure to specific risks associated with a particularissuer or the underlying assets of a particular issuer. The value ofequity total return swaps changes daily based on the value of theunderlying equity security. Changes in the market value of equity total
return swaps are recorded as unrealised gain (loss) in the Statementof Comprehensive Income. Realised gains and losses on equity totalreturn swaps are recorded in the Statement of ComprehensiveIncome upon exchange of cash flows for periodic payments and uponthe closing or expiration of the swaps. Cash collateral pledged or heldby the Funds for equity total return swaps is recorded as cash heldat/(received from) broker in the Statement of Financial Position.Investments in equity total return swaps may include certain risksincluding unfavorable price movements in the underlying referenceinstrument(s), or a default or failure by the counterparty.
(g) Currency Forward ContractsCurrency forward contracts, OTC Derivatives, represent an obligationto purchase or sell a specific currency at a future date at a price set atthe time of the contract. Changes in the value of open contracts arerecorded as unrealised gain (loss) in the Statement of ComprehensiveIncome. When a currency forward contract is closed, a Fund recordsa realised gain (loss) in the Statement of Comprehensive Incomeequal to the difference between the value at the time the contract wasopened and the value at the time it was closed. Losses from thesetransactions may arise from unfavorable changes in currency valuesor if the counterparties do not perform under a contract’s terms. Cashcollateral pledged or held by the Funds for currency forward contractsis recorded as cash held at/(received from) broker in the Statement ofFinancial Position. Currency forward contracts are used to hedgedirect and/or indirect currency exposure associated with certainportfolio positions, or as a substitute for direct investment in a market.In addition, currency forward contracts are used for share classhedging purposes.
(h) To-Be-Announced SecuritiesThe Global Bond Fund may purchase mortgage-related securities ona to-be-announced (“TBA”) basis at a fixed price, with payment anddelivery on a scheduled future date beyond the customary settlementperiod for such securities. The Global Bond Fund may choose toextend the settlement through a “dollar roll” transaction in which itsells the mortgage related securities to a dealer and simultaneouslyagrees to purchase similar securities for future delivery at apredetermined price. The Global Bond Fund accounts for TBA dollarrolls as purchase and sale transactions.
(i) Foreign Currency TranslationEach Fund’s (and the Company’s) functional and presentationcurrency is the U.S. dollar. Foreign currency transactions aretranslated into the functional currency using the exchange ratesprevailing at the dates of the transactions. Foreign currency assetsand liabilities, including investments at fair value, are translated intothe functional currency at the prevailing exchange rates as of thevaluation date. Reported realised and unrealised gain (loss) oninvestments in the Statement of Comprehensive Income includesforeign currency gain (loss) related to investment transactions.Reported realised and unrealised gain (loss) on foreign currencytransactions and translation in the Statement of ComprehensiveIncome include the following: disposing/holding of foreign currency,the difference between the trade and settlement dates on securitiestransactions and fund share transactions, the difference between theaccrual and payment dates on dividends and interest, and currencylosses on the purchase of foreign currency in certain countries thatimpose taxes on such transactions.
(j) Income, Expenses, and DistributionsDividend income and corporate action transactions are typicallyrecorded on the ex-dividend date. Dividends characterised as returnof capital are recorded as a reduction to the cost of investmentsand/or realised gain. Interest income is recognised using the effectiveinterest method. Interest on cash and cash held at broker includesinterest from cash balances. Interest on investments at fair valueincludes interest from debt securities and repurchase agreements.
Expenses are recorded on an accrual basis, with the exceptionof transaction costs relating to the purchase or sale of financialinstruments which are charged as incurred. Certain expenses of the
Notes to the Financial Statements
DODGE & COX WORLDWIDE FUNDS PLC � PAGE 37
Company can be directly attributed to a specific Fund. Expenseswhich cannot be directly attributed are allocated among the Fundsusing methodologies determined by the nature of the expense.
Distributions from Distributing Share Classes are recorded onthe ex-dividend date and reported as a finance cost in the Statementof Comprehensive Income. Details of the Company’s distributionpolicy are set forth in Note 14.
(k) Transaction CostsTransaction costs are incremental costs that are directly attributableto the acquisition, issue or disposal of a financial asset or financialliability. An incremental cost is one that would not have been incurredif the entity had not acquired, issued or disposed of the financialinstrument. When a financial asset or financial liability is recognisedinitially, the Company measures it at its fair value through profit orloss, plus costs that are directly attributable to the acquisition or issueof the financial asset or financial liability.
Transaction costs on the purchase or sale of financial assets orfinancial liabilities are expensed as incurred and included in net gain(loss) on investments at fair value in the Statement of ComprehensiveIncome. Separately identifiable transaction costs are disclosed inNote 12. Custody and subcustody transaction costs are included indepositary and administration fees in the Statement ofComprehensive Income and are not separately disclosed.
(l) Cash and Bank BalancesCash and bank balances are stated at face value and generally heldwith State Street Bank and Trust Company (United States). Bankoverdrafts, if any, are classified as liabilities.
Cash held at broker includes margin cash and cash collateralposted or pledged by the Funds with respect to derivatives. Cashreceived from broker includes cash collateral held by the Funds withrespect to derivatives. Further information on cash held at broker andcash received from broker is set forth in Note 1(d)-(g).
(m) Redeemable SharesRedeemable shares can be redeemed at a shareholder’s option andare classified as financial liabilities. Redeemable shares can be putback to a Fund on any Dealing Day for cash equal to a proportionateshare of the net asset value of the relevant share class. The liability forredeemable shares is presented in the Statement of Financial Positionas “net assets attributable to redeemable shareholders”.
(n) Hedged Share ClassesHedged share classes, indicated by the inclusion of “(H)” in the nameof the share class, seek to provide shareholders with performancereturns similar to the share class denominated in a Fund’s BaseCurrency. The Investment Manager may employ techniques,generally currency forward contracts, to minimise these shareclasses’ exposure to changes in exchange rates between a Fund’sBase Currency and the share class currency. While the InvestmentManager may attempt to hedge against such currency exposure,there can be no guarantee that the value of the hedged share classeswill not be affected by the value of a Fund’s Base Currency relative tothe share class currency. Any costs and gains or losses related toshare class hedging transactions are borne by the relevant hedgedshare classes. The use of share class hedging strategies maysubstantially limit shareholders in hedged share classes frombenefiting if the share class currency falls against a Fund’s BaseCurrency. The costs of administering class-level hedging are includedin other expenses in the Statement of Comprehensive Income.
(o) Offsetting Financial InstrumentsFinancial assets and liabilities are offset and the net amount isreported in the Statement of Financial Position when there is a legallyenforceable right to offset the recognised amounts and there is anintention to settle on a net basis or realise the asset and settle theliability simultaneously.
2. Critical Accounting Estimates and Judgments
ValuationValuation procedures may involve certain estimation methods andvaluation models when market quotations or market-basedvaluations are not available or are unrepresentative. Detailedinformation on valuation procedures is set forth in Note 1(b)(iv).
Functional CurrencyThe Directors consider the U.S. dollar the currency that most faithfullyrepresents the economic effect of the underlying transactions,events, and conditions of each Fund. The U.S. dollar is the currency inwhich each Fund (and the Company) measures its performance andreports its results.
3. Taxation
Under current Irish law and practice, the Company qualifies as aninvestment undertaking as defined in Section 739B of the TaxesConsolidation Act, 1997, as amended. Accordingly, it is not generallychargeable to Irish tax on its income or capital gains. However, Irishtax can arise on the happening of a chargeable event in the Company.A chargeable event includes any distribution payment toshareholders, any encashment, repurchase, redemption, transfer, orcancellation of shares, and the holding of shares at the end of eacheight-year period beginning with the acquisition of such shares. NoIrish tax will arise in respect of chargeable events in respect of ashareholder who is an Exempt Irish Resident or who is neitherresident nor ordinarily resident in Ireland for tax purposes at the timeof the chargeable event, provided, in each case, that an appropriatevalid declaration in accordance with the provisions of the TaxesConsolidation Act, 1997 (as amended) is held by the Company.
The Funds are subject to taxes which may be imposed by certaincountries in which the Funds invest. The Funds endeavor to recordsuch taxes based on applicable tax law. Withholding taxes areincurred on certain dividends or receipts and are accrued at the timethe associated dividend or interest income is recorded. Capital gainstaxes are incurred upon the disposition of certain appreciatedsecurities and accrued based on unrealised gains in those securities.The Funds file withholding tax reclaims in certain jurisdictions torecover a portion of amounts previously withheld. The Funds record areclaim receivable based on, among other things, a jurisdiction’s legalobligation to pay reclaims as well as payment history and marketconvention.
4. Exchange Rates
The exchange rates used by the Funds for conversion to U.S. dollars,the functional currency, at 31 December were:
31 December 2020 31 December 2019
Argentine Peso 141.3000 59.8718Brazilian Real 5.1942 N/ABritish Pound 0.7313 0.7549Canadian Dollar 1.2729 1.2986Chilean Peso 710.5000 751.9500Chinese Renminbi 6.5029 6.9615Colombian Peso 3,415.5000 3,287.2300Euro 0.8186 0.8915Hong Kong Dollar 7.7525 7.7923Indian Rupee 73.0675 71.3782Indonesian Rupiah 14,050.0000 13,882.5000Japanese Yen 103.2550 108.6550Malaysian Ringgit 4.0225 N/AMexican Peso 19.8995 18.9075Norwegian Krone 8.5743 N/APolish Zloty 3.7357 3.7939Russian Ruble 73.9463 62.0663South African Rand 14.6950 14.0060South Korean Won 1,086.3000 1,156.4500Swedish Krona 8.2276 9.3664Swiss Franc 0.8853 0.9678Thai Baht 29.9600 29.9538
Notes to the Financial Statements
DODGE & COX WORLDWIDE FUNDS PLC � PAGE 38
5. Share Capital
Redeemable SharesThe Directors are empowered to issue up to 500 billion shares of nopar value in the Company at the net asset value per share on suchterms as they see fit.
Each of the shares entitles the holder to participate equally on apro rata basis in the net assets and dividends of a Fund attributable tosuch shares and to attend and vote at meetings of the Company andof the Fund represented by those shares except in cases where adividend is declared prior to the holder’s subscription into a Fund. Noclass of shares confers on the holder thereof any preferential orpreemptive rights or any rights to participate in the profits anddividends of any other class of shares or any voting rights in relationto matters relating solely to any other class of shares.
The Company has a minimum capital requirement of€300,000. The Administrator monitors the Company’s capital on adaily basis, under the oversight of the Directors. The Company hasobtained from the Investment Manager an undertaking in writing toprovide additional capital in the event the Company’s capital fallsbelow the required minimum.
The share capital of the Company is at all times equal to the netasset value of the Company. Net assets attributable to redeemableshareholders represent a liability carried at the redemption amountsthat would be payable at the date of the Statement of FinancialPosition if the shareholders exercised the right to redeem the sharesin a Fund. Net assets attributable to redeemable shareholders wereas follows:
31 December 2020 31 December 2019 31 December 2018
Net Asset Value NAV per Share Net Asset Value NAV per Share Net Asset Value NAV per Share
Global Stock FundUSD Accumulating Class $897,187,668 $24.97 $1,110,791,945 $23.66 $867,968,065 $19.17USD Distributing Class $35,673,767 $10.92 $- $- $- $-GBP Accumulating Class £1,942,330,404 £30.04 £2,131,625,422 £29.39 £1,826,890,667 £24.74GBP Distributing Class £123,183,017 £20.68 £257,598,937 £20.46 £183,929,349 £17.50GBP Distributing Class (H) £2,287,741 £12.12 £259,648 £11.88 £692,244 £10.05EUR Accumulating Class €454,770,393 €30.70 €441,190,659 €31.68 €290,423,237 €25.12CAD Accumulating Class C$90,235,688 C$30.00 C$87,307,402 C$29.00 C$69,291,627 C$24.69
U.S. Stock FundUSD Accumulating Class $581,581,353 $30.90 $899,033,091 $29.24 $613,817,180 $23.55USD Distributing Class $3,839,787 $11.79 $- $- $- $-GBP Accumulating Class £646,881,758 £35.15 £806,181,942 £34.35 £576,988,266 £28.75GBP Distributing Class £412,945,559 £21.35 £803,996,019 £21.15 £251,834,936 £17.86GBP Distributing Class (H) £35,240,617 £12.76 £22,111,695 £12.56 £7,004,476 £10.41EUR Accumulating Class €39,255,426 €32.80 €34,059,615 €33.81 €47,370,303 €26.65
Global Bond FundUSD Accumulating Class $67,565,035 $13.22 $55,728,033 $11.90 $55,332,648 $10.58GBP Distributing Class £8,782,597 £12.74 £4,494,043 £12.26 £1,037,681 £11.79GBP Distributing Class (H) £314,155,642 £9.59 £236,278,465 £9.09 £207,257,175 £8.63EUR Accumulating Class €5,748,633 €15.00 €3,568,557 €14.71 €938,758 €12.80EUR Accumulating Class (H) €19,569,354 €11.74 €1,553,467 €10.78 €1,421,552 €9.86EUR Distributing Class €3,221,623 €11.68 €1,681,092 €11.86 €922,740 €10.78EUR Distributing Class (H) €1,729,181 €9.10 €1,553,654 €8.66 €1,421,635 €8.30
The movements in the number of shares during the years ended 31 December 2020 and 31 December 2019 were as follows:
Balance at31 December 2019
SharesIssued*
SharesRedeemed
Balance at31 December 2020
Global Stock FundUSD Accumulating Class 46,947,993 13,378,222 (24,396,798) 35,929,417USD Distributing Class - 3,490,012 (222,792) 3,267,220GBP Accumulating Class 72,538,653 4,237,420 (12,115,445) 64,660,628GBP Distributing Class 12,590,887 1,290,017 (7,925,060) 5,955,844GBP Distributing Class (H) 21,863 292,982 (126,160) 188,685EUR Accumulating Class 13,927,014 5,588,840 (4,700,835) 14,815,019CAD Accumulating Class 3,011,020 25,954 (28,663) 3,008,311
U.S. Stock FundUSD Accumulating Class 30,742,937 8,977,391 (20,898,517) 18,821,811USD Distributing Class - 2,285,946 (1,960,138) 325,808GBP Accumulating Class 23,473,015 9,541,921 (14,611,032) 18,403,904GBP Distributing Class 38,015,567 9,151,762 (27,828,508) 19,338,821GBP Distributing Class (H) 1,760,090 2,741,222 (1,739,032) 2,762,280EUR Accumulating Class 1,007,369 1,072,639 (883,196) 1,196,812* Includes reinvestments of distributions to redeemable shareholders
Notes to the Financial Statements
DODGE & COX WORLDWIDE FUNDS PLC � PAGE 39
Balance at31 December 2019
SharesIssued*
SharesRedeemed
Balance at31 December 2020
Global Bond FundUSD Accumulating Class 4,681,541 1,226,214 (796,006) 5,111,749GBP Distributing Class 366,666 471,116 (148,208) 689,574GBP Distributing Class (H) 25,997,751 6,784,914 (29,596) 32,753,069EUR Accumulating Class 242,566 208,913 (68,164) 383,315EUR Accumulating Class (H) 144,160 2,065,588 (543,293) 1,666,455EUR Distributing Class 141,718 152,482 (18,315) 275,885EUR Distributing Class (H) 179,411 18,057 (7,395) 190,073* Includes reinvestments of distributions to redeemable shareholders
Balance at31 December 2018
SharesIssued*
SharesRedeemed
Balance at31 December 2019
Global Stock FundUSD Accumulating Class 45,288,377 7,788,948 (6,129,332) 46,947,993GBP Accumulating Class 73,850,133 8,997,558 (10,309,038) 72,538,653GBP Distributing Class 10,511,273 10,586,223 (8,506,609) 12,590,887GBP Distributing Class (H) 68,885 3,968 (50,990) 21,863EUR Accumulating Class 11,560,469 2,990,454 (623,909) 13,927,014CAD Accumulating Class 2,806,100 204,920 - 3,011,020
U.S. Stock FundUSD Accumulating Class 26,061,711 11,499,047 (6,817,821) 30,742,937GBP Accumulating Class 20,071,702 13,975,023 (10,573,710) 23,473,015GBP Distributing Class 14,097,108 27,634,243 (3,715,784) 38,015,567GBP Distributing Class (H) 672,623 1,325,450 (237,983) 1,760,090EUR Accumulating Class 1,777,168 869,047 (1,638,846) 1,007,369
Global Bond FundUSD Accumulating Class 5,231,800 564,848 (1,115,107) 4,681,541GBP Distributing Class 87,989 291,856 (13,179) 366,666GBP Distributing Class (H) 24,008,333 6,004,212 (4,014,794) 25,997,751EUR Accumulating Class 73,352 176,223 (7,009) 242,566EUR Accumulating Class (H) 144,160 - - 144,160EUR Distributing Class 85,570 56,618 (470) 141,718EUR Distributing Class (H) 171,304 8,107 - 179,411* Includes reinvestments of distributions to redeemable shareholders
The U.S. dollar equivalent amounts associated with the above share movements during the years ended 31 December 2020 and 31 December2019 were as follows:
Year ended31 December 2020
Year ended31 December 2019
Subscriptions* Redemptions Subscriptions* Redemptions
Global Stock FundUSD Accumulating Class $293,063,782 $(480,597,795) $168,414,510 $(129,949,913)USD Distributing Class 35,925,695 (2,409,068) - -GBP Accumulating Class 124,556,189 (413,149,038) 328,844,366 (362,175,947)GBP Distributing Class 29,398,738 (186,771,038) 260,020,250 (215,302,140)GBP Distributing Class (H) 3,330,895 (1,506,997) 57,169 (746,549)EUR Accumulating Class 184,652,637 (149,934,143) 97,824,635 (20,664,514)CAD Accumulating Class 443,650 (582,803) 4,148,492 -
U.S. Stock FundUSD Accumulating Class 242,503,837 (511,874,560) 312,725,352 (178,483,855)USD Distributing Class 19,629,902 (22,714,675) - -GBP Accumulating Class 378,456,601 (565,459,652) 571,568,025 (439,367,827)GBP Distributing Class 223,740,462 (761,432,900) 710,795,434 (95,334,982)GBP Distributing Class (H) 33,763,706 (21,684,479) 19,552,542 (3,604,674)EUR Accumulating Class 38,651,788 (30,493,279) 30,615,042 (55,291,119)
Global Bond FundUSD Accumulating Class 15,145,361 (9,087,390) 6,533,312 (12,846,767)GBP Distributing Class 7,862,586 (2,377,958) 4,666,192 (210,934)GBP Distributing Class (H) 76,701,348 (362,865) 67,495,502 (47,300,933)EUR Accumulating Class 3,522,716 (1,131,771) 2,775,362 (113,627)EUR Accumulating Class (H) 24,946,945 (7,096,663) - -EUR Distributing Class 2,061,818 (226,897) 744,260 (6,101)EUR Distributing Class (H) 178,554 (76,961) 77,900 -* Includes reinvestments of distributions to redeemable shareholders
Notes to the Financial Statements
DODGE & COX WORLDWIDE FUNDS PLC � PAGE 40
Subscriber SharesThe subscriber share capital of the Company is €2 divided into2 subscriber shares of no par value. The subscriber shares do notparticipate in the assets of any Fund nor do they form part of the netasset value of the Company. Holders of subscriber shares are notentitled to dividends or any surplus of assets over liabilities upon thewinding-up of the Company. They are disclosed in the financialstatements by way of this note only.
6. Soft Commission Arrangements
The Investment Manager’s objective in selecting broker-dealers andeffecting portfolio transactions in securities is to seek best execution.The Investment Manager may receive research and brokerageservices from broker-dealers with which it effects transactions. Theresearch services received may be produced by the broker-dealereffecting the trade (“proprietary research”), or by a third party that isnot involved in effecting the trade (“third party research”). The receiptof broker-dealer or third party research and information and relatedservices permits the Investment Manager to supplement its ownresearch and analysis and provides access to the views andinformation of individuals and the research staffs of other firms. TheInvestment Manager believes that the research and brokerageservices provided by broker-dealers and their ability to achievequality execution are important for, and assist the InvestmentManager in fulfilling its overall responsibilities to, its clients, includingthe Company.
7. Cross Liability
The Company is an umbrella fund with segregated liability betweensub-funds, and under Irish law the Company generally will not beliable as a whole to third parties and there generally will not be thepotential for cross liability between the Funds. Notwithstanding theforegoing, there can be no assurance that, should an action bebrought against the Company in the courts of another jurisdiction, thesegregated nature of the Funds would necessarily be upheld. Inaddition, whether or not there is a cross-liability between Funds,proceedings involving a Fund could involve the Company as a whole,which could potentially affect the operations of all Funds.
8. Efficient Portfolio Management
The Funds may employ investment techniques and instruments forefficient portfolio management purposes, subject to the conditionsand within the limits laid down by the Central Bank and theProspectus. Such investment techniques and instruments are usedwhen the Investment Manager considers them to be economicallyappropriate in order to seek to reduce risk, reduce costs, or generateadditional capital or income for the Funds with an appropriate level ofrisk. The Funds enter into repurchase agreements for efficientportfolio management purposes. During the year ended 31 December2020, the Global Stock Fund, U.S. Stock Fund, and Global BondFund earned interest income arising from repurchase agreements inthe amounts of $221,099, $144,555, and $27,776, respectively (2019:$1,235,805, $1,397,166, and $165,044, respectively). Transactioncosts are embedded in the price of the instruments and are notseparately identifiable.
9. Transations with Related Parties
Investment ManagerDodge & Cox has been appointed to act as investment manager ofthe Company and the Funds. The Company, on behalf of and out ofthe assets of each Fund, pays investment management fees, which
are accrued daily and paid monthly in arrears at the annual rates setout below:
Fund% of average daily net asset value
of each class of each Fund
Global Stock Fund 0.60%U.S. Stock Fund 0.60%Global Bond Fund 0.50%
At 31 December 2020, the Funds had payables to the InvestmentManager for accrued management fees, which are reflected asmanagement fee payable in the Statement of Financial Position.
During the year ended 31 December 2020, the InvestmentManager voluntarily agreed to limit aggregate annual ordinaryexpenses of the Funds to the rates set out below:
Fund% of average daily net asset value
of each class of each Fund
Global Stock Fund 0.63%U.S. Stock Fund 0.63%Global Bond Fund 0.45%
As a result, during the year ended 31 December 2020, the InvestmentManager reimbursed expenses to the Funds in the amounts disclosedin the Statement of Comprehensive Income. At 31 December 2020,the Funds had receivables from the Investment Manager forreimbursed expenses, which are reflected as receivable from theInvestment Manager in the Statement of Financial Position.
At 31 December 2020, the Investment Manager owned 8%(31 December 2019: 10%) of the outstanding shares of the GlobalBond Fund.
DirectorsThe Constitution provides that the Directors shall be entitled to a feeby way of remuneration for their services at a rate to be determinedfrom time to time by the Directors. It is expected that the aggregateamount of Directors’ remuneration in any one year shall not exceed€130,000. In addition, all of the Directors are entitled to bereimbursed out of the assets of each Fund for their reasonable out-of-pocket expenses incurred in discharging their duties as Directors.
The Company pays each non-affiliated Director an annual fee inconsideration of agreeing to act as a director of the Company. Theamounts earned by the non-affiliated Directors are reflected asdirectors’ fees in the Statement of Comprehensive Income, of which$0 (31 December 2019: $0) was outstanding at 31 December 2020.The Directors affiliated with the Investment Manager do not receiveDirectors’ fees.
The following Director held shares (all USD AccumulatingClass Shares) in the Funds at 31 December 2020: Diana Strandbergheld 500,000 (2019: 500,000) shares in the Global Stock Fund and309,587 (2019: 309,587) shares in the U.S. Stock Fund.
10. Significant Agreements
Auditors’ RemunerationFor the year ended 31 December 2020, remuneration for all workcarried out for the Company by the statutory audit firm in relation tothe audit of the Company’s financial statements amounted to$99,004 (2019: $89,998), including out-of-pocket expenses. For thesame period, remuneration for all non-audit work carried out for theCompany by the statutory audit firm amounted to $69,779 (2019:$67,257). There were no other fees paid/payable to the statutory auditfirm.
11. Line of Credit
The Company has a committed credit facility (“Line of Credit”) withState Street Bank and Trust Company, to be utilised on a temporarybasis in order to fund shareholder redemptions or for other short-termliquidity purposes. The maximum amount available on the Line ofCredit is $45,000,000, and the amount utilised by a Fund may notexceed 10% of the Fund’s net assets. Each Fund pays an annualcommitment fee on its pro-rata portion of the Line of Credit, which is
Notes to the Financial Statements
DODGE & COX WORLDWIDE FUNDS PLC � PAGE 41
included in other expenses in the Statement of ComprehensiveIncome. Interest on borrowings is charged at the prevailing rate.There were no borrowings on the Line of Credit during the year ended31 December 2020 or 31 December 2019.
12. Transaction Costs
In order to achieve its investment objective, a Fund incurs transactioncosts in relation to trading activity on its portfolio. These costs mayinclude broker commissions, settlement fees, stamp duties, andfinancial transaction taxes. During the year ended 31 December 2020,the Global Stock Fund, U.S. Stock Fund, and Global Bond Fundincurred separately identifiable transaction costs in the amounts of$2,225,863 (2019: $1,796,129), $538,063 (2019: $346,688), and$10,633 (2019: $8,796), respectively. For some financial instruments,such as debt securities, repurchase agreements, and currencyforward contracts, transaction costs are embedded in the price of theinstruments and are not separately identifiable.
13. Risk Management Policies and Procedures
In accordance with IFRS 7, the following is a description of how theCompany manages risks associated with the use of financialinstruments.
Policies and ProceduresThe Board of Directors has put in place procedures designed toidentify, monitor, and manage applicable risks pertaining to theFunds. As part of the Company’s permanent risk managementfunction, the conduct of certain risk functions and the implementationof the Company’s risk management policy have been delegated tothe Investment Manager’s Risk Management Committee (the“Committee”). The Committee is composed of management from keyfunctions across the Investment Manager. The objective of theCommittee is not to eliminate risk, but rather to seek to evaluate therisks faced by the Investment Manager. The Committee’s purpose isto:
� evaluate the key risks of the Investment Manager and themanner in which the risks are identified, measured, monitored,and communicated including setting escalation points requiringcommunication to senior management and/or the InvestmentManager’s board of directors;
� validate that adequate policies and procedures are in place tounderstand and, where appropriate, mitigate the risks to whichthe Investment Manager’s affiliates and clients are exposed,including but not limited to portfolio management, liquidity,valuation, operational, IT, legal, regulatory, and reputationalrisks; and
� assess from multiple perspectives the risks associated with newinvestment instruments, strategies, and products.
The Committee (acting as a whole and/or through its designees, asapplicable) is responsible for ensuring that each Fund is managedwithin the guidelines set out by the Directors, each Fund’s investmentobjective, and the provisions of the Prospectus. On a quarterly basis,and more frequently as required, the Directors receive reports andpresentations from the Investment Manager detailing each Fund’srisk profile and investment performance.
The main risks arising from the Company’s use of financialinstruments are market risk, liquidity risk, and credit risk. These risksare discussed in the following notes and qualitative and quantitativeanalyses are provided where relevant. Other risk considerations areset forth in the Prospectus.
Global ExposureUnder the UCITS Regulations, the Investment Manager is required toemploy a risk management process which enables it to accuratelymonitor and manage the global exposure of the Funds to financialderivative instruments (“FDI”) (which are a subset of the financialinstruments in which the Funds invest). The Investment Manager usesthe commitment approach to measure the global exposure of theFunds. The commitment approach is a methodology that aggregates
the underlying market or notional values of FDI. In accordance withthe UCITS Regulations, global exposure of a Fund to FDI must notexceed 100% of a Fund’s net asset value.
Market RiskMarket risk is the risk that the fair value or future cash flows of aFund’s financial instruments will decline due to changes in marketprices, and includes price risk, currency risk, and interest rate risk.The Investment Manager’s strategy for managing market risk is drivenby the investment objectives and policies of the Funds.
(i) Price RiskPrice risk is the risk that the fair value or future cash flows of aFund’s financial instruments will decline due to changes inmarket prices (other than those arising from currency risk orinterest rate risk), whether those changes are caused by factorsspecific to the individual financial instruments or their issuers orby factors affecting all similar financial instruments traded in themarket. The Funds are exposed to price risk arising from theirinvestments in financial instruments.
The Investment Manager’s risk management efforts arefocused on mitigating the risk of a permanent loss of capital,rather than trying to mitigate the impact of shorter-term pricemovements. Indeed, short-term volatility can provide theopportunity to purchase or sell a security at attractive valuations.The Investment Manager attempts to mitigate the risk of apermanent loss of capital at both the individual security level andthe portfolio level. At the individual security level, the InvestmentManager follows a disciplined approach to security selection,involving:
� a strict price discipline. We seek to invest in companieswith valuations that do not fully reflect prospects for thecompany and where our analysis suggests the possibility ofmore positive developments. We constantly weigh valuationagainst company fundamentals and re-evaluate our thinkingas prices change.
� independent research. Each security is selected based onextensive bottom-up research and fundamental analysis.
� long-term investment horizon. Investments are selectedbased on their return potential over a three- to five-year timehorizon. A longer time horizon focuses the research processon the investment’s underlying fundamentals.
� collective judgment. Each Fund is managed by aninvestment committee which makes investment decisionsafter a thorough review process. A group decision-makingprocess allows for the discussion, evaluation, and vetting ofa broad set of issues and ideas, and reduces the reliance onany one person.
� ongoing review. Fund holdings are reviewed on an ongoingbasis. Individual security positions are discussed weekly atinvestment committee meetings. An investment committeemay decide to gradually increase or decrease positionsbased on new information or price changes.
At the portfolio level, the Investment Manager mitigates riskthrough diversification by investing in a portfolio of securitiesacross various industry sectors and/or regions. The InvestmentManager monitors compliance with investment restrictions,including restrictions on investment concentrations, as set forthin the Prospectus. Individual security and sector concentrationsare disclosed in each Fund’s Portfolio of Investments.
The Funds are actively managed using a bottom-upapproach to security selection and do not intend to closely tracka benchmark. However, the Investment Manager periodicallyreviews each Fund’s performance, characteristics, and sectorand/or regional diversification relative to its relevant benchmarkindex (the “Index”), and reports such information to theDirectors. The regional diversification of each Fund compared tothe Index was as follows:
Notes to the Financial Statements
DODGE & COX WORLDWIDE FUNDS PLC � PAGE 42
Global Stock Fund 31 December 2020 31 December 2019
Region Diversification* (%) Global Stock Fund MSCI World Index Global Stock Fund MSCI World Index
United States 46.0 66.1 43.8 63.3Europe (excluding United Kingdom) 20.2 14.9 26.4 15.5United Kingdom 9.5 4.3 8.0 5.5Asia Pacific (excluding Japan) 8.3 3.6 8.2 3.9Latin America 4.0 0.0 3.7 0.0Japan 3.7 7.8 3.5 8.2Canada 3.5 3.1 2.3 3.4Africa 1.1 0.0 1.1 0.0Middle East 0.0 0.2 0.0 0.2
U.S. Stock Fund 31 December 2020 31 December 2019
Non-U.S. Securities* (%) U.S. Stock Fund S&P 500 Index U.S. Stock Fund S&P 500 Index
Non-U.S. securities not in theS&P 500 Index 4.0 0.0 4.5 0.0
Global Bond Fund 31 December 2020 31 December 2019
Region Diversification* (%) Global Bond Fund
BloombergBarclays Global
AggregateBond Index Global Bond Fund
BloombergBarclays Global
AggregateBond Index
United States 51.2 35.9 48.5 39.1Latin America 15.7 1.1 15.4 1.1Europe (excluding United Kingdom) 13.3 24.8 12.3 24.4Asia Pacific (excluding Japan) 8.0 12.1 9.9 8.3United Kingdom 6.5 5.5 5.9 5.1Canada 2.1 3.4 1.9 3.3Africa 0.2 0.0 0.5 0.0Japan 0.0 14.3 0.0 16.0Supranational 0.0 2.1 0.0 2.0Middle East 0.0 0.7 0.0 0.7
* The Funds may classify a company or an issuer in a different category than the Index. The Funds generally classify a company or a corporate issuer based on country of incorporation,but may designate a different country in certain circumstances.
The table below summarises the sensitivity of each Fund’s net assets to price movements at 31 December. The analysis is based on thelargest percentage decrease in day-over-day price levels of the Index during the years presented and assumes the Index movement is areasonable proxy for a Fund’s movement. An increase in day-over-day price levels of the Index of the same magnitude would have resultedin an equal but opposite effect on each Fund’s net assets.
Global Stock Fund Year ended31 December 2020
Year ended31 December 2019
Largest day-over-day decrease in the MSCI World Index (9.9%) (2.5%)Effect on the Fund’s net assets** $(434,317,089) $(120,950,502)
U.S. Stock Fund Year ended31 December 2020
Year ended31 December 2019
Largest day-over-day decrease in the S&P 500 Index (12.0%) (3.0%)Effect on the Fund’s net assets** $(255,706,057) $(92,981,050)
Global Bond Fund Year ended31 December 2020
Year ended31 December 2019
Largest day-over-day decrease in the Bloomberg Barclays Global Aggregate Bond Index (USD Hedged) (1.5%) (0.5%)Effect on the Fund’s net assets** $(8,192,418) $(1,920,145)
** This sensitivity analysis has limitations. It represents a hypothetical outcome that is not intended to be predictive. The effect on Fund net assets is calculated by applying the largestday-over-day decrease in the Index to Fund net assets at 31 December.
(ii) Currency RiskCurrency risk is the risk that the fair value or future cash flows of a Fund’s financial instruments will decline due to changes in exchange rates.The Funds are exposed to currency risk to the extent that their assets and liabilities are not denominated in U.S. dollars, each Fund’s BaseCurrency. The Funds have indirect exposure to currency risk to the extent they invest in securities of issuers exposed to currency risk.Monetary assets and liabilities of a Fund include cash, receivable and payable balances, unrealised gain (loss) on currency forward contractsused for share class hedging, currency forward contracts used for investment purposes, and debt securities. Non-monetary assets of a Fundinclude equity securities.
Notes to the Financial Statements
DODGE & COX WORLDWIDE FUNDS PLC � PAGE 43
The direct non-U.S. dollar currency exposures for the monetary and non-monetary assets and liabilities (net of any currency forwardcontracts used for hedging purposes) of each Fund were as follows:
Global Stock Fund 31 December 2020 31 December 2019
Currency
NetMonetaryExposure
NetNon-Monetary
Exposure
TotalNet
Exposure
% ofNet
Assets
NetMonetaryExposure
NetNon-Monetary
Exposure
TotalNet
Exposure
% ofNet
Assets
Euro $9,341,591 $448,087,771 $457,429,362 10.4% $867,060 $788,871,737 $789,738,797 16.3%British Pound 2,441,668 419,338,820 421,780,488 9.6% 1,088,448 350,219,142 351,307,590 7.3%Swiss Franc - 271,864,429 271,864,429 6.2% 646 339,151,634 339,152,280 7.0%Chinese Renminbi - (188,760,096) (188,760,096) (4.3)% - (234,485,063) (234,485,063) (4.8)%Other (non-USD) 4,393,255 476,404,845 480,798,100 11.0% 761,876 486,957,817 487,719,693 10.1%
Total $16,176,514 $1,426,935,769 $1,443,112,283 32.9% $2,718,030 $1,730,715,267 $1,733,433,297 35.9%
Global Bond Fund 31 December 2020 31 December 2019
Currency
NetMonetaryExposure
NetNon-Monetary
Exposure
TotalNet
Exposure
% ofNet
Assets
NetMonetaryExposure
NetNon-Monetary
Exposure
TotalNet
Exposure
% ofNet
Assets
Mexican Peso $24,549,550 $- $24,549,550 4.5% $19,427,975 $- $19,427,975 5.1%Indonesian Rupiah 18,793,258 - 18,793,258 3.4% 13,845,241 - 13,845,241 3.6%Indian Rupee 10,898,441 - 10,898,441 2.0% 13,298,330 13,298,330 3.5%Brazilian Real 8,426,790 - 8,426,790 1.5% - - - -Other (non-USD) 47,810,276 - 47,810,276 8.8% 31,172,547 - 31,172,547 8.1%
Total $110,478,315 $- $110,478,315 20.2% $77,744,093 $- $77,744,093 20.3%
The U.S. Stock Fund invests only in U.S. dollar denominatedsecurities, most of which are issued by U.S. corporations, andtherefore has limited direct exposure to currency risk withrespect to its monetary and non-monetary assets.
Unlike the Global Stock Fund and U.S. Stock Fund, theGlobal Bond Fund has significant monetary exposure to non-U.S. dollar currencies. The following table summarises thesensitivity of the Global Bond Fund’s net assets to changes inexchange rates at 31 December. The analysis is based on areasonably possible strengthening of the U.S. dollar against allother currencies to which the Fund is directly exposed. Aweakening of the U.S. dollar of the same magnitude would haveresulted in an equal but opposite effect on the Fund’s net assets.
Global Bond FundYear ended
31 December 2020Year ended
31 December 2019
Reasonably possible strengthening ofthe U.S. dollar 10% 10%
Effect on the Fund’s net assets* $(11,047,832) $(7,774,409)
* This sensitivity analysis has limitations. It represents a hypothetical outcome that is notintended to be predictive.
The Global Stock Fund maintained currency forward contracts tohedge direct and/or indirect currency exposure to the Britishpound, Chinese renminbi, and Swiss franc. During the year
ended 31 December 2020, these currency forward contracts hadU.S. dollar total values ranging from 5% to 7% (2019: 5% to 7%)of the Fund’s net assets.
The Global Bond Fund maintained currency forwardcontracts to hedge direct and/or indirect currency exposure tothe British pound, euro, South Korean won, and Thai baht.During the year ended 31 December 2020, these currencyforward contracts had U.S. dollar total values ranging from 7% to14% (2019: 12% to 15%) of the Fund’s net assets.
Currency exposure arises as a consequence of investmentdecisions made for each Fund and is monitored by theInvestment Manager. Other than as described above, theInvestment Manager did not actively hedge currency exposuresarising from each Fund’s investments.
(iii) Interest Rate RiskInterest rate risk is the risk that the fair value or future cash flowsof a Fund’s financial instruments will decline due to changes inmarket interest rates. The Global Bond Fund is exposed tointerest rate risk through its investments in debt securities. OtherFunds may have indirect exposure to interest rate risk to theextent they invest in securities of issuers exposed to interest raterisk. The following table summarises the Global Bond Fund’sassets and liabilities by maturity date:
Global Bond Fund 31 December 2020
Maturity DateLess than 1 Year
Maturity Date1 - 5 Years
Maturity DateOver 5 Years
Non-InterestBearing Total
Financial assets at fair value $- $90,166,994 $429,041,787 $96,672,802 $615,881,583Financial liabilities at fair value - - - (1,355,140) (1,355,140)Other assets less other liabilities - - - (68,365,238) (68,365,238)
Total $- $90,166,994 $429,041,787 $26,952,424 $546,161,205
31 December 2019
Maturity DateLess than 1 Year
Maturity Date1 - 5 Years
Maturity DateOver 5 Years
Non-InterestBearing Total
Financial assets at fair value $2,940,411 $61,186,953 $294,535,915 $25,488,846 $384,152,125Financial liabilities at fair value - - - (757,312) (757,312)Other assets less other liabilities - - - 634,225 634,225
Total $2,940,411 $61,186,953 $294,535,915 $25,365,759 $384,029,038
Notes to the Financial Statements
DODGE & COX WORLDWIDE FUNDS PLC � PAGE 44
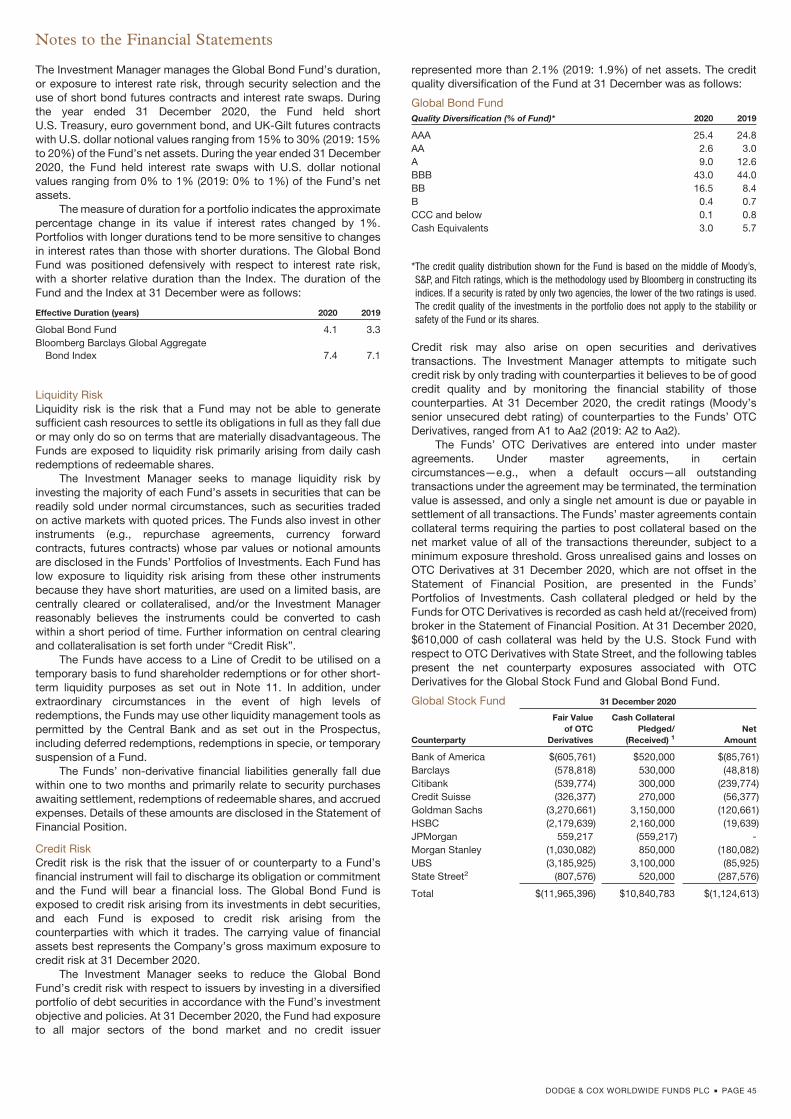
The Investment Manager manages the Global Bond Fund’s duration,or exposure to interest rate risk, through security selection and theuse of short bond futures contracts and interest rate swaps. Duringthe year ended 31 December 2020, the Fund held shortU.S. Treasury, euro government bond, and UK-Gilt futures contractswith U.S. dollar notional values ranging from 15% to 30% (2019: 15%to 20%) of the Fund’s net assets. During the year ended 31 December2020, the Fund held interest rate swaps with U.S. dollar notionalvalues ranging from 0% to 1% (2019: 0% to 1%) of the Fund’s netassets.
The measure of duration for a portfolio indicates the approximatepercentage change in its value if interest rates changed by 1%.Portfolios with longer durations tend to be more sensitive to changesin interest rates than those with shorter durations. The Global BondFund was positioned defensively with respect to interest rate risk,with a shorter relative duration than the Index. The duration of theFund and the Index at 31 December were as follows:
Effective Duration (years) 2020 2019
Global Bond Fund 4.1 3.3Bloomberg Barclays Global Aggregate
Bond Index 7.4 7.1
Liquidity RiskLiquidity risk is the risk that a Fund may not be able to generatesufficient cash resources to settle its obligations in full as they fall dueor may only do so on terms that are materially disadvantageous. TheFunds are exposed to liquidity risk primarily arising from daily cashredemptions of redeemable shares.
The Investment Manager seeks to manage liquidity risk byinvesting the majority of each Fund’s assets in securities that can bereadily sold under normal circumstances, such as securities tradedon active markets with quoted prices. The Funds also invest in otherinstruments (e.g., repurchase agreements, currency forwardcontracts, futures contracts) whose par values or notional amountsare disclosed in the Funds’ Portfolios of Investments. Each Fund haslow exposure to liquidity risk arising from these other instrumentsbecause they have short maturities, are used on a limited basis, arecentrally cleared or collateralised, and/or the Investment Managerreasonably believes the instruments could be converted to cashwithin a short period of time. Further information on central clearingand collateralisation is set forth under “Credit Risk”.
The Funds have access to a Line of Credit to be utilised on atemporary basis to fund shareholder redemptions or for other short-term liquidity purposes as set out in Note 11. In addition, underextraordinary circumstances in the event of high levels ofredemptions, the Funds may use other liquidity management tools aspermitted by the Central Bank and as set out in the Prospectus,including deferred redemptions, redemptions in specie, or temporarysuspension of a Fund.
The Funds’ non-derivative financial liabilities generally fall duewithin one to two months and primarily relate to security purchasesawaiting settlement, redemptions of redeemable shares, and accruedexpenses. Details of these amounts are disclosed in the Statement ofFinancial Position.
Credit RiskCredit risk is the risk that the issuer of or counterparty to a Fund’sfinancial instrument will fail to discharge its obligation or commitmentand the Fund will bear a financial loss. The Global Bond Fund isexposed to credit risk arising from its investments in debt securities,and each Fund is exposed to credit risk arising from thecounterparties with which it trades. The carrying value of financialassets best represents the Company’s gross maximum exposure tocredit risk at 31 December 2020.
The Investment Manager seeks to reduce the Global BondFund’s credit risk with respect to issuers by investing in a diversifiedportfolio of debt securities in accordance with the Fund’s investmentobjective and policies. At 31 December 2020, the Fund had exposureto all major sectors of the bond market and no credit issuer
represented more than 2.1% (2019: 1.9%) of net assets. The creditquality diversification of the Fund at 31 December was as follows:
Global Bond FundQuality Diversification (% of Fund)* 2020 2019
AAA 25.4 24.8AA 2.6 3.0A 9.0 12.6BBB 43.0 44.0BB 16.5 8.4B 0.4 0.7CCC and below 0.1 0.8Cash Equivalents 3.0 5.7
*The credit quality distribution shown for the Fund is based on the middle of Moody’s,S&P, and Fitch ratings, which is the methodology used by Bloomberg in constructing itsindices. If a security is rated by only two agencies, the lower of the two ratings is used.The credit quality of the investments in the portfolio does not apply to the stability orsafety of the Fund or its shares.
Credit risk may also arise on open securities and derivativestransactions. The Investment Manager attempts to mitigate suchcredit risk by only trading with counterparties it believes to be of goodcredit quality and by monitoring the financial stability of thosecounterparties. At 31 December 2020, the credit ratings (Moody’ssenior unsecured debt rating) of counterparties to the Funds’ OTCDerivatives, ranged from A1 to Aa2 (2019: A2 to Aa2).
The Funds’ OTC Derivatives are entered into under masteragreements. Under master agreements, in certaincircumstances—e.g., when a default occurs—all outstandingtransactions under the agreement may be terminated, the terminationvalue is assessed, and only a single net amount is due or payable insettlement of all transactions. The Funds’ master agreements containcollateral terms requiring the parties to post collateral based on thenet market value of all of the transactions thereunder, subject to aminimum exposure threshold. Gross unrealised gains and losses onOTC Derivatives at 31 December 2020, which are not offset in theStatement of Financial Position, are presented in the Funds’Portfolios of Investments. Cash collateral pledged or held by theFunds for OTC Derivatives is recorded as cash held at/(received from)broker in the Statement of Financial Position. At 31 December 2020,$610,000 of cash collateral was held by the U.S. Stock Fund withrespect to OTC Derivatives with State Street, and the following tablespresent the net counterparty exposures associated with OTCDerivatives for the Global Stock Fund and Global Bond Fund.
Global Stock Fund 31 December 2020
Counterparty
Fair Valueof OTC
Derivatives
Cash CollateralPledged/
(Received) 1Net
Amount
Bank of America $(605,761) $520,000 $(85,761)Barclays (578,818) 530,000 (48,818)Citibank (539,774) 300,000 (239,774)Credit Suisse (326,377) 270,000 (56,377)Goldman Sachs (3,270,661) 3,150,000 (120,661)HSBC (2,179,639) 2,160,000 (19,639)JPMorgan 559,217 (559,217) -Morgan Stanley (1,030,082) 850,000 (180,082)UBS (3,185,925) 3,100,000 (85,925)State Street2 (807,576) 520,000 (287,576)
Total $(11,965,396) $10,840,783 $(1,124,613)
Notes to the Financial Statements
DODGE & COX WORLDWIDE FUNDS PLC � PAGE 45
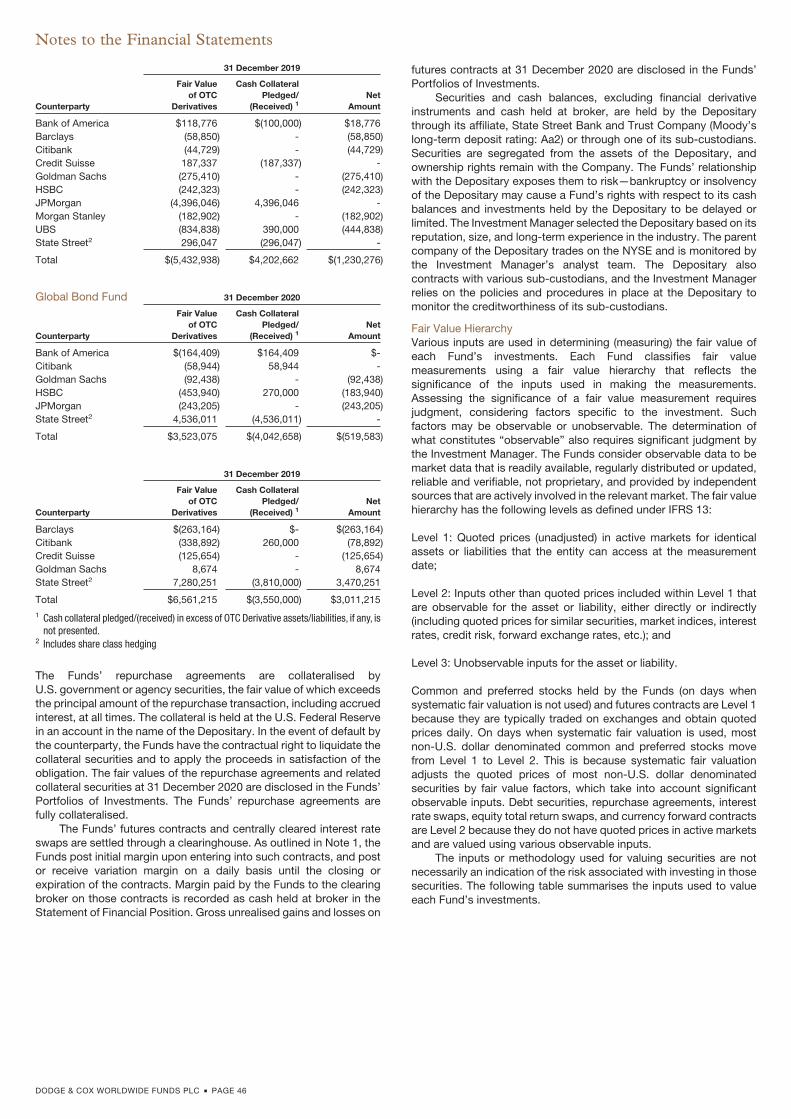
31 December 2019
Counterparty
Fair Valueof OTC
Derivatives
Cash CollateralPledged/
(Received) 1Net
Amount
Bank of America $118,776 $(100,000) $18,776Barclays (58,850) - (58,850)Citibank (44,729) - (44,729)Credit Suisse 187,337 (187,337) -Goldman Sachs (275,410) - (275,410)HSBC (242,323) - (242,323)JPMorgan (4,396,046) 4,396,046 -Morgan Stanley (182,902) - (182,902)UBS (834,838) 390,000 (444,838)State Street2 296,047 (296,047) -
Total $(5,432,938) $4,202,662 $(1,230,276)
Global Bond Fund 31 December 2020
Counterparty
Fair Valueof OTC
Derivatives
Cash CollateralPledged/
(Received) 1Net
Amount
Bank of America $(164,409) $164,409 $-Citibank (58,944) 58,944 -Goldman Sachs (92,438) - (92,438)HSBC (453,940) 270,000 (183,940)JPMorgan (243,205) - (243,205)State Street2 4,536,011 (4,536,011) -
Total $3,523,075 $(4,042,658) $(519,583)
31 December 2019
Counterparty
Fair Valueof OTC
Derivatives
Cash CollateralPledged/
(Received) 1Net
Amount
Barclays $(263,164) $- $(263,164)Citibank (338,892) 260,000 (78,892)Credit Suisse (125,654) - (125,654)Goldman Sachs 8,674 - 8,674State Street2 7,280,251 (3,810,000) 3,470,251
Total $6,561,215 $(3,550,000) $3,011,2151 Cash collateral pledged/(received) in excess of OTC Derivative assets/liabilities, if any, is
not presented.2 Includes share class hedging
The Funds’ repurchase agreements are collateralised byU.S. government or agency securities, the fair value of which exceedsthe principal amount of the repurchase transaction, including accruedinterest, at all times. The collateral is held at the U.S. Federal Reservein an account in the name of the Depositary. In the event of default bythe counterparty, the Funds have the contractual right to liquidate thecollateral securities and to apply the proceeds in satisfaction of theobligation. The fair values of the repurchase agreements and relatedcollateral securities at 31 December 2020 are disclosed in the Funds’Portfolios of Investments. The Funds’ repurchase agreements arefully collateralised.
The Funds’ futures contracts and centrally cleared interest rateswaps are settled through a clearinghouse. As outlined in Note 1, theFunds post initial margin upon entering into such contracts, and postor receive variation margin on a daily basis until the closing orexpiration of the contracts. Margin paid by the Funds to the clearingbroker on those contracts is recorded as cash held at broker in theStatement of Financial Position. Gross unrealised gains and losses on
futures contracts at 31 December 2020 are disclosed in the Funds’Portfolios of Investments.
Securities and cash balances, excluding financial derivativeinstruments and cash held at broker, are held by the Depositarythrough its affiliate, State Street Bank and Trust Company (Moody’slong-term deposit rating: Aa2) or through one of its sub-custodians.Securities are segregated from the assets of the Depositary, andownership rights remain with the Company. The Funds’ relationshipwith the Depositary exposes them to risk—bankruptcy or insolvencyof the Depositary may cause a Fund’s rights with respect to its cashbalances and investments held by the Depositary to be delayed orlimited. The Investment Manager selected the Depositary based on itsreputation, size, and long-term experience in the industry. The parentcompany of the Depositary trades on the NYSE and is monitored bythe Investment Manager’s analyst team. The Depositary alsocontracts with various sub-custodians, and the Investment Managerrelies on the policies and procedures in place at the Depositary tomonitor the creditworthiness of its sub-custodians.
Fair Value HierarchyVarious inputs are used in determining (measuring) the fair value ofeach Fund’s investments. Each Fund classifies fair valuemeasurements using a fair value hierarchy that reflects thesignificance of the inputs used in making the measurements.Assessing the significance of a fair value measurement requiresjudgment, considering factors specific to the investment. Suchfactors may be observable or unobservable. The determination ofwhat constitutes “observable” also requires significant judgment bythe Investment Manager. The Funds consider observable data to bemarket data that is readily available, regularly distributed or updated,reliable and verifiable, not proprietary, and provided by independentsources that are actively involved in the relevant market. The fair valuehierarchy has the following levels as defined under IFRS 13:
Level 1: Quoted prices (unadjusted) in active markets for identicalassets or liabilities that the entity can access at the measurementdate;
Level 2: Inputs other than quoted prices included within Level 1 thatare observable for the asset or liability, either directly or indirectly(including quoted prices for similar securities, market indices, interestrates, credit risk, forward exchange rates, etc.); and
Level 3: Unobservable inputs for the asset or liability.
Common and preferred stocks held by the Funds (on days whensystematic fair valuation is not used) and futures contracts are Level 1because they are typically traded on exchanges and obtain quotedprices daily. On days when systematic fair valuation is used, mostnon-U.S. dollar denominated common and preferred stocks movefrom Level 1 to Level 2. This is because systematic fair valuationadjusts the quoted prices of most non-U.S. dollar denominatedsecurities by fair value factors, which take into account significantobservable inputs. Debt securities, repurchase agreements, interestrate swaps, equity total return swaps, and currency forward contractsare Level 2 because they do not have quoted prices in active marketsand are valued using various observable inputs.
The inputs or methodology used for valuing securities are notnecessarily an indication of the risk associated with investing in thosesecurities. The following table summarises the inputs used to valueeach Fund’s investments.
Notes to the Financial Statements
DODGE & COX WORLDWIDE FUNDS PLC � PAGE 46
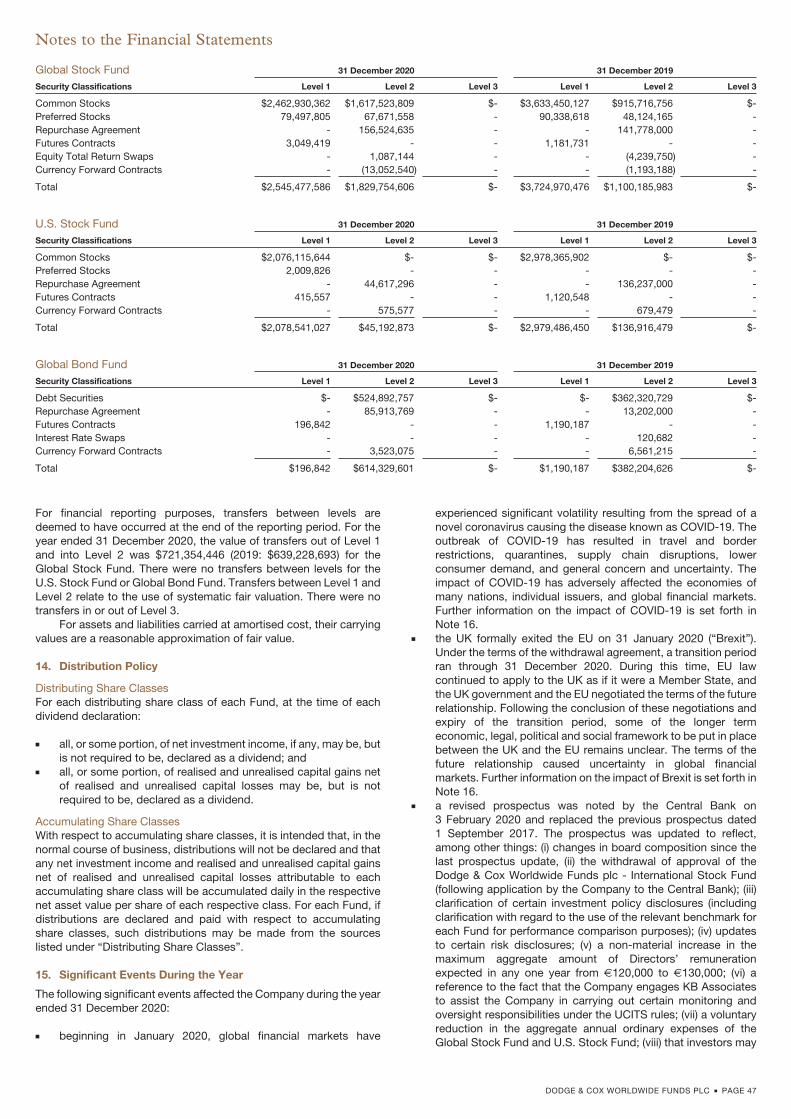
Global Stock Fund 31 December 2020 31 December 2019
Security Classifications Level 1 Level 2 Level 3 Level 1 Level 2 Level 3
Common Stocks $2,462,930,362 $1,617,523,809 $- $3,633,450,127 $915,716,756 $-Preferred Stocks 79,497,805 67,671,558 - 90,338,618 48,124,165 -Repurchase Agreement - 156,524,635 - - 141,778,000 -Futures Contracts 3,049,419 - - 1,181,731 - -Equity Total Return Swaps - 1,087,144 - - (4,239,750) -Currency Forward Contracts - (13,052,540) - - (1,193,188) -
Total $2,545,477,586 $1,829,754,606 $- $3,724,970,476 $1,100,185,983 $-
U.S. Stock Fund 31 December 2020 31 December 2019
Security Classifications Level 1 Level 2 Level 3 Level 1 Level 2 Level 3
Common Stocks $2,076,115,644 $- $- $2,978,365,902 $- $-Preferred Stocks 2,009,826 - - - - -Repurchase Agreement - 44,617,296 - - 136,237,000 -Futures Contracts 415,557 - - 1,120,548 - -Currency Forward Contracts - 575,577 - - 679,479 -
Total $2,078,541,027 $45,192,873 $- $2,979,486,450 $136,916,479 $-
Global Bond Fund 31 December 2020 31 December 2019
Security Classifications Level 1 Level 2 Level 3 Level 1 Level 2 Level 3
Debt Securities $- $524,892,757 $- $- $362,320,729 $-Repurchase Agreement - 85,913,769 - - 13,202,000 -Futures Contracts 196,842 - - 1,190,187 - -Interest Rate Swaps - - - - 120,682 -Currency Forward Contracts - 3,523,075 - - 6,561,215 -
Total $196,842 $614,329,601 $- $1,190,187 $382,204,626 $-
For financial reporting purposes, transfers between levels aredeemed to have occurred at the end of the reporting period. For theyear ended 31 December 2020, the value of transfers out of Level 1and into Level 2 was $721,354,446 (2019: $639,228,693) for theGlobal Stock Fund. There were no transfers between levels for theU.S. Stock Fund or Global Bond Fund. Transfers between Level 1 andLevel 2 relate to the use of systematic fair valuation. There were notransfers in or out of Level 3.
For assets and liabilities carried at amortised cost, their carryingvalues are a reasonable approximation of fair value.
14. Distribution Policy
Distributing Share ClassesFor each distributing share class of each Fund, at the time of eachdividend declaration:
� all, or some portion, of net investment income, if any, may be, butis not required to be, declared as a dividend; and
� all, or some portion, of realised and unrealised capital gains netof realised and unrealised capital losses may be, but is notrequired to be, declared as a dividend.
Accumulating Share ClassesWith respect to accumulating share classes, it is intended that, in thenormal course of business, distributions will not be declared and thatany net investment income and realised and unrealised capital gainsnet of realised and unrealised capital losses attributable to eachaccumulating share class will be accumulated daily in the respectivenet asset value per share of each respective class. For each Fund, ifdistributions are declared and paid with respect to accumulatingshare classes, such distributions may be made from the sourceslisted under “Distributing Share Classes”.
15. Significant Events During the Year
The following significant events affected the Company during the yearended 31 December 2020:
� beginning in January 2020, global financial markets have
experienced significant volatility resulting from the spread of anovel coronavirus causing the disease known as COVID-19. Theoutbreak of COVID-19 has resulted in travel and borderrestrictions, quarantines, supply chain disruptions, lowerconsumer demand, and general concern and uncertainty. Theimpact of COVID-19 has adversely affected the economies ofmany nations, individual issuers, and global financial markets.Further information on the impact of COVID-19 is set forth inNote 16.
� the UK formally exited the EU on 31 January 2020 (“Brexit”).Under the terms of the withdrawal agreement, a transition periodran through 31 December 2020. During this time, EU lawcontinued to apply to the UK as if it were a Member State, andthe UK government and the EU negotiated the terms of the futurerelationship. Following the conclusion of these negotiations andexpiry of the transition period, some of the longer termeconomic, legal, political and social framework to be put in placebetween the UK and the EU remains unclear. The terms of thefuture relationship caused uncertainty in global financialmarkets. Further information on the impact of Brexit is set forth inNote 16.
� a revised prospectus was noted by the Central Bank on3 February 2020 and replaced the previous prospectus dated1 September 2017. The prospectus was updated to reflect,among other things: (i) changes in board composition since thelast prospectus update, (ii) the withdrawal of approval of theDodge & Cox Worldwide Funds plc - International Stock Fund(following application by the Company to the Central Bank); (iii)clarification of certain investment policy disclosures (includingclarification with regard to the use of the relevant benchmark foreach Fund for performance comparison purposes); (iv) updatesto certain risk disclosures; (v) a non-material increase in themaximum aggregate amount of Directors’ remunerationexpected in any one year from €120,000 to €130,000; (vi) areference to the fact that the Company engages KB Associatesto assist the Company in carrying out certain monitoring andoversight responsibilities under the UCITS rules; (vii) a voluntaryreduction in the aggregate annual ordinary expenses of theGlobal Stock Fund and U.S. Stock Fund; (viii) that investors may
Notes to the Financial Statements
DODGE & COX WORLDWIDE FUNDS PLC � PAGE 47
subscribe for shares only in the named currency of the relevantshare class; and (ix) clarification that dealing applications oncereceived are irrevocable and binding on the investor. Certainchanges referenced above were, where appropriate, notified toshareholders prior to the filing of the revised prospectus on3 February 2020.
� the USD Distributing Class of the Global Stock Fundcommenced operations on 3 February 2020.
� the USD Distributing Class of the U.S. Stock Fund commencedoperations on 2 March 2020.
� Stephen Haswell was appointed as a director of the Companywith effect from 30 October 2020.
16. Significant Events Since Year End
The following significant events have affected the Company since31 December 2020:
� the impact of COVID-19 may continue to adversely affect theeconomies of many nations, individual issuers, and globalfinancial markets. The nature and extent of the impact is difficultto predict but may adversely affect the return on each Fund andits investments.
� the impact of Brexit and the terms of the future relationshipbetween the UK and EU may continue to cause uncertainty inglobal financial markets. Volatility resulting from this uncertaintymay adversely affect the return on each Fund and itsinvestments through market movements, potential decline in thevalue of the British pound and/or euro, and any downgrading ofUK sovereign credit ratings. It is also possible there will be moredivergence between UK and EU regulations post-Brexit, limitingwhat cross-border activities can take place. This may affect theCompany’s ability to market the Funds to UK investors in themedium to longer term. However, the Company has beengranted permission under the UK government’s temporarypermissions regime, which will allow the Company to continue touse its passport to market the Funds into the UK for a limitedperiod while the Company seeks authorisation from the UKregulators.
� a revised prospectus was noted by the Central Bank on17 February 2021 and replaced the previous prospectus dated3 February 2020. The prospectus was updated to reflect theapproval by the Central Bank of the Dodge & Cox WorldwideFunds plc – Emerging Markets Stock Fund.
� a revised prospectus was noted by the Central Bank on 8 March2021 and replaced the previous prospectus dated 17 February2021. The prospectus was updated to comply with certaindisclosure requirements of the EU Sustainable FinanceDisclosure Regulation applicable from 10 March 2021.
17. Approval of the Financial Statements
The financial statements were approved by the Directors on 25 March2021 for filing with the Central Bank and circulation to shareholders.
Notes to the Financial Statements
DODGE & COX WORLDWIDE FUNDS PLC � PAGE 48
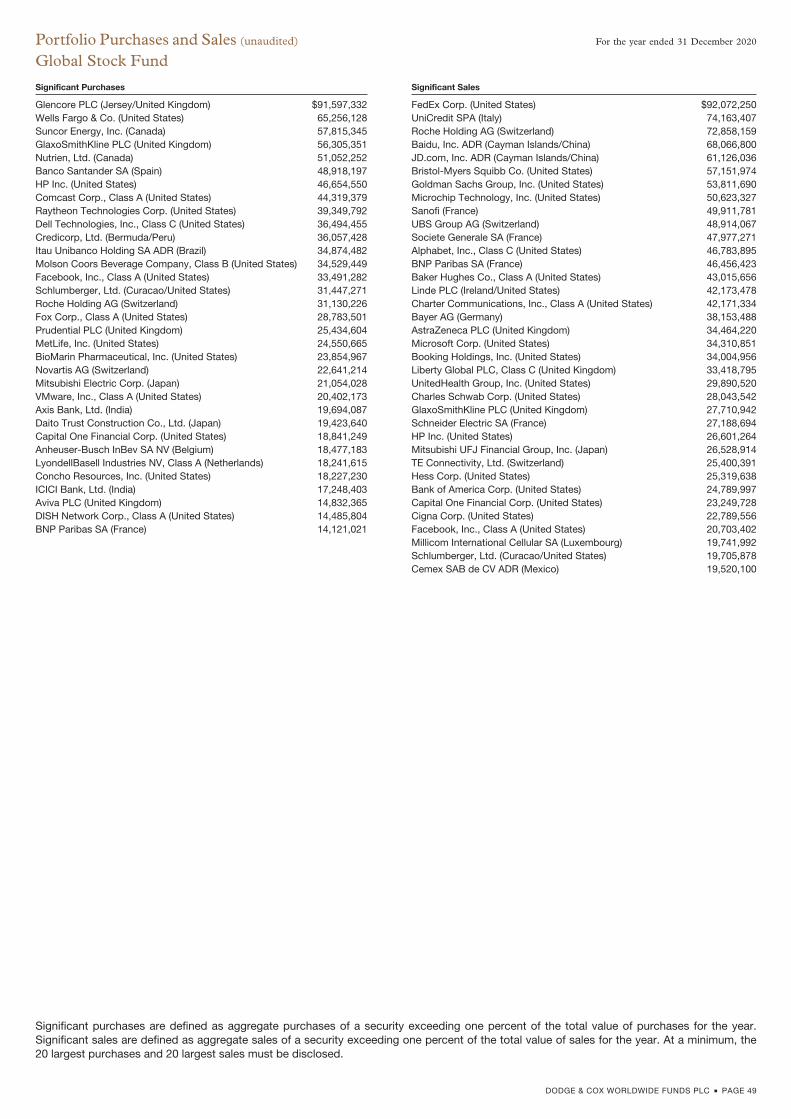
Significant Sales
FedEx Corp. (United States) $92,072,250UniCredit SPA (Italy) 74,163,407Roche Holding AG (Switzerland) 72,858,159Baidu, Inc. ADR (Cayman Islands/China) 68,066,800JD.com, Inc. ADR (Cayman Islands/China) 61,126,036Bristol-Myers Squibb Co. (United States) 57,151,974Goldman Sachs Group, Inc. (United States) 53,811,690Microchip Technology, Inc. (United States) 50,623,327Sanofi (France) 49,911,781UBS Group AG (Switzerland) 48,914,067Societe Generale SA (France) 47,977,271Alphabet, Inc., Class C (United States) 46,783,895BNP Paribas SA (France) 46,456,423Baker Hughes Co., Class A (United States) 43,015,656Linde PLC (Ireland/United States) 42,173,478Charter Communications, Inc., Class A (United States) 42,171,334Bayer AG (Germany) 38,153,488AstraZeneca PLC (United Kingdom) 34,464,220Microsoft Corp. (United States) 34,310,851Booking Holdings, Inc. (United States) 34,004,956Liberty Global PLC, Class C (United Kingdom) 33,418,795UnitedHealth Group, Inc. (United States) 29,890,520Charles Schwab Corp. (United States) 28,043,542GlaxoSmithKline PLC (United Kingdom) 27,710,942Schneider Electric SA (France) 27,188,694HP Inc. (United States) 26,601,264Mitsubishi UFJ Financial Group, Inc. (Japan) 26,528,914TE Connectivity, Ltd. (Switzerland) 25,400,391Hess Corp. (United States) 25,319,638Bank of America Corp. (United States) 24,789,997Capital One Financial Corp. (United States) 23,249,728Cigna Corp. (United States) 22,789,556Facebook, Inc., Class A (United States) 20,703,402Millicom International Cellular SA (Luxembourg) 19,741,992Schlumberger, Ltd. (Curacao/United States) 19,705,878Cemex SAB de CV ADR (Mexico) 19,520,100
Significant Purchases
Glencore PLC (Jersey/United Kingdom) $91,597,332Wells Fargo & Co. (United States) 65,256,128Suncor Energy, Inc. (Canada) 57,815,345GlaxoSmithKline PLC (United Kingdom) 56,305,351Nutrien, Ltd. (Canada) 51,052,252Banco Santander SA (Spain) 48,918,197HP Inc. (United States) 46,654,550Comcast Corp., Class A (United States) 44,319,379Raytheon Technologies Corp. (United States) 39,349,792Dell Technologies, Inc., Class C (United States) 36,494,455Credicorp, Ltd. (Bermuda/Peru) 36,057,428Itau Unibanco Holding SA ADR (Brazil) 34,874,482Molson Coors Beverage Company, Class B (United States) 34,529,449Facebook, Inc., Class A (United States) 33,491,282Schlumberger, Ltd. (Curacao/United States) 31,447,271Roche Holding AG (Switzerland) 31,130,226Fox Corp., Class A (United States) 28,783,501Prudential PLC (United Kingdom) 25,434,604MetLife, Inc. (United States) 24,550,665BioMarin Pharmaceutical, Inc. (United States) 23,854,967Novartis AG (Switzerland) 22,641,214Mitsubishi Electric Corp. (Japan) 21,054,028VMware, Inc., Class A (United States) 20,402,173Axis Bank, Ltd. (India) 19,694,087Daito Trust Construction Co., Ltd. (Japan) 19,423,640Capital One Financial Corp. (United States) 18,841,249Anheuser-Busch InBev SA NV (Belgium) 18,477,183LyondellBasell Industries NV, Class A (Netherlands) 18,241,615Concho Resources, Inc. (United States) 18,227,230ICICI Bank, Ltd. (India) 17,248,403Aviva PLC (United Kingdom) 14,832,365DISH Network Corp., Class A (United States) 14,485,804BNP Paribas SA (France) 14,121,021
Portfolio Purchases and Sales (unaudited) For the year ended 31 December 2020
Global Stock Fund
Significant purchases are defined as aggregate purchases of a security exceeding one percent of the total value of purchases for the year.Significant sales are defined as aggregate sales of a security exceeding one percent of the total value of sales for the year. At a minimum, the20 largest purchases and 20 largest sales must be disclosed.
DODGE & COX WORLDWIDE FUNDS PLC � PAGE 49
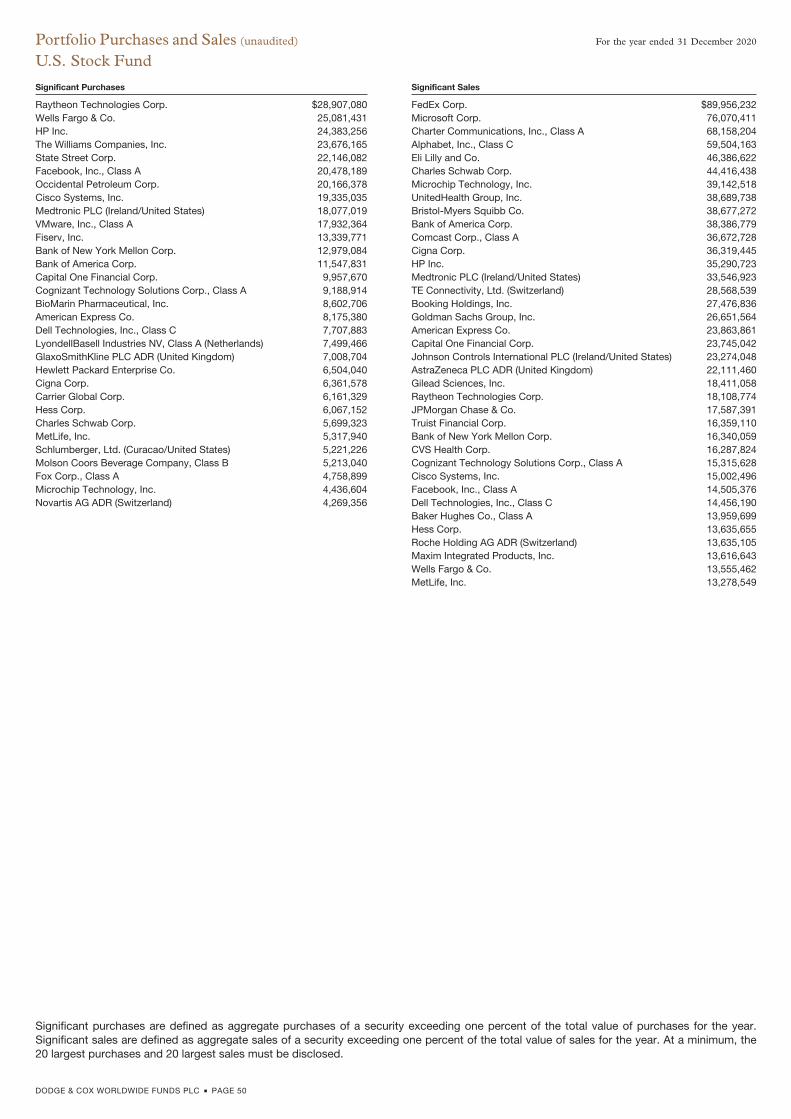
Significant Sales
FedEx Corp. $89,956,232Microsoft Corp. 76,070,411Charter Communications, Inc., Class A 68,158,204Alphabet, Inc., Class C 59,504,163Eli Lilly and Co. 46,386,622Charles Schwab Corp. 44,416,438Microchip Technology, Inc. 39,142,518UnitedHealth Group, Inc. 38,689,738Bristol-Myers Squibb Co. 38,677,272Bank of America Corp. 38,386,779Comcast Corp., Class A 36,672,728Cigna Corp. 36,319,445HP Inc. 35,290,723Medtronic PLC (Ireland/United States) 33,546,923TE Connectivity, Ltd. (Switzerland) 28,568,539Booking Holdings, Inc. 27,476,836Goldman Sachs Group, Inc. 26,651,564American Express Co. 23,863,861Capital One Financial Corp. 23,745,042Johnson Controls International PLC (Ireland/United States) 23,274,048AstraZeneca PLC ADR (United Kingdom) 22,111,460Gilead Sciences, Inc. 18,411,058Raytheon Technologies Corp. 18,108,774JPMorgan Chase & Co. 17,587,391Truist Financial Corp. 16,359,110Bank of New York Mellon Corp. 16,340,059CVS Health Corp. 16,287,824Cognizant Technology Solutions Corp., Class A 15,315,628Cisco Systems, Inc. 15,002,496Facebook, Inc., Class A 14,505,376Dell Technologies, Inc., Class C 14,456,190Baker Hughes Co., Class A 13,959,699Hess Corp. 13,635,655Roche Holding AG ADR (Switzerland) 13,635,105Maxim Integrated Products, Inc. 13,616,643Wells Fargo & Co. 13,555,462MetLife, Inc. 13,278,549
Significant Purchases
Raytheon Technologies Corp. $28,907,080Wells Fargo & Co. 25,081,431HP Inc. 24,383,256The Williams Companies, Inc. 23,676,165State Street Corp. 22,146,082Facebook, Inc., Class A 20,478,189Occidental Petroleum Corp. 20,166,378Cisco Systems, Inc. 19,335,035Medtronic PLC (Ireland/United States) 18,077,019VMware, Inc., Class A 17,932,364Fiserv, Inc. 13,339,771Bank of New York Mellon Corp. 12,979,084Bank of America Corp. 11,547,831Capital One Financial Corp. 9,957,670Cognizant Technology Solutions Corp., Class A 9,188,914BioMarin Pharmaceutical, Inc. 8,602,706American Express Co. 8,175,380Dell Technologies, Inc., Class C 7,707,883LyondellBasell Industries NV, Class A (Netherlands) 7,499,466GlaxoSmithKline PLC ADR (United Kingdom) 7,008,704Hewlett Packard Enterprise Co. 6,504,040Cigna Corp. 6,361,578Carrier Global Corp. 6,161,329Hess Corp. 6,067,152Charles Schwab Corp. 5,699,323MetLife, Inc. 5,317,940Schlumberger, Ltd. (Curacao/United States) 5,221,226Molson Coors Beverage Company, Class B 5,213,040Fox Corp., Class A 4,758,899Microchip Technology, Inc. 4,436,604Novartis AG ADR (Switzerland) 4,269,356
Portfolio Purchases and Sales (unaudited) For the year ended 31 December 2020
U.S. Stock Fund
Significant purchases are defined as aggregate purchases of a security exceeding one percent of the total value of purchases for the year.Significant sales are defined as aggregate sales of a security exceeding one percent of the total value of sales for the year. At a minimum, the20 largest purchases and 20 largest sales must be disclosed.
DODGE & COX WORLDWIDE FUNDS PLC � PAGE 50
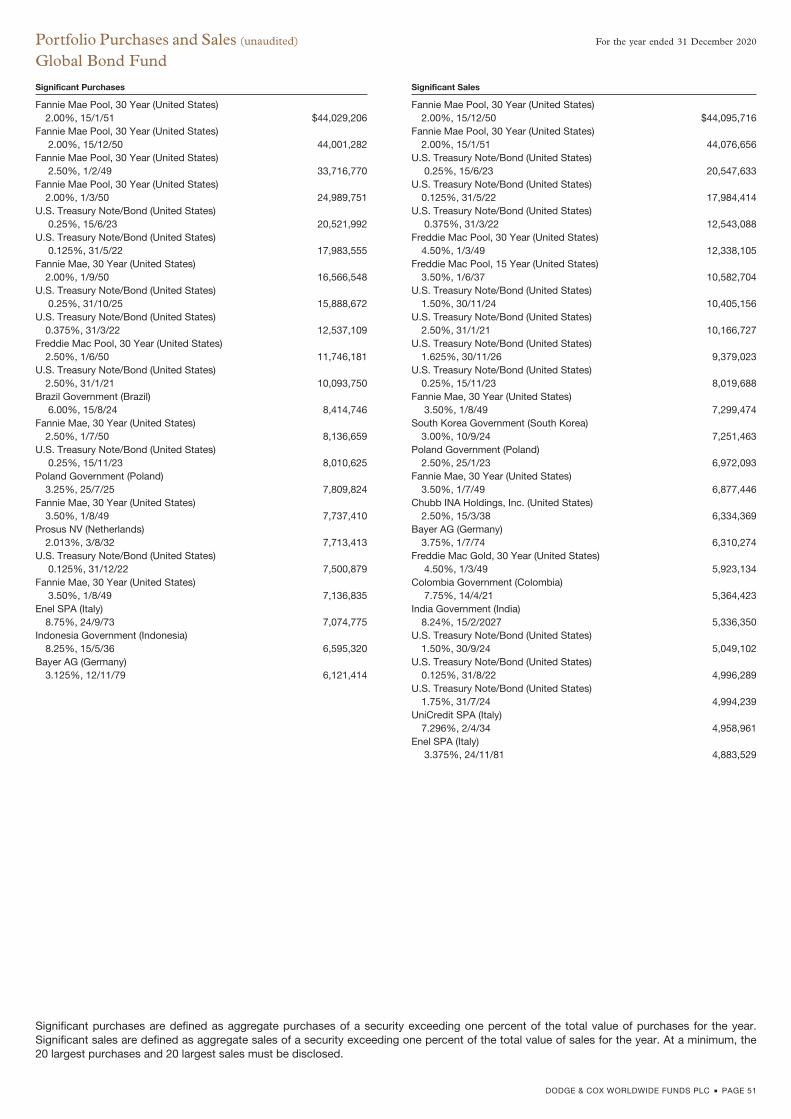
Significant Sales
Fannie Mae Pool, 30 Year (United States)2.00%, 15/12/50 $44,095,716
Fannie Mae Pool, 30 Year (United States)2.00%, 15/1/51 44,076,656
U.S. Treasury Note/Bond (United States)0.25%, 15/6/23 20,547,633
U.S. Treasury Note/Bond (United States)0.125%, 31/5/22 17,984,414
U.S. Treasury Note/Bond (United States)0.375%, 31/3/22 12,543,088
Freddie Mac Pool, 30 Year (United States)4.50%, 1/3/49 12,338,105
Freddie Mac Pool, 15 Year (United States)3.50%, 1/6/37 10,582,704
U.S. Treasury Note/Bond (United States)1.50%, 30/11/24 10,405,156
U.S. Treasury Note/Bond (United States)2.50%, 31/1/21 10,166,727
U.S. Treasury Note/Bond (United States)1.625%, 30/11/26 9,379,023
U.S. Treasury Note/Bond (United States)0.25%, 15/11/23 8,019,688
Fannie Mae, 30 Year (United States)3.50%, 1/8/49 7,299,474
South Korea Government (South Korea)3.00%, 10/9/24 7,251,463
Poland Government (Poland)2.50%, 25/1/23 6,972,093
Fannie Mae, 30 Year (United States)3.50%, 1/7/49 6,877,446
Chubb INA Holdings, Inc. (United States)2.50%, 15/3/38 6,334,369
Bayer AG (Germany)3.75%, 1/7/74 6,310,274
Freddie Mac Gold, 30 Year (United States)4.50%, 1/3/49 5,923,134
Colombia Government (Colombia)7.75%, 14/4/21 5,364,423
India Government (India)8.24%, 15/2/2027 5,336,350
U.S. Treasury Note/Bond (United States)1.50%, 30/9/24 5,049,102
U.S. Treasury Note/Bond (United States)0.125%, 31/8/22 4,996,289
U.S. Treasury Note/Bond (United States)1.75%, 31/7/24 4,994,239
UniCredit SPA (Italy)7.296%, 2/4/34 4,958,961
Enel SPA (Italy)3.375%, 24/11/81 4,883,529
Significant Purchases
Fannie Mae Pool, 30 Year (United States)2.00%, 15/1/51 $44,029,206
Fannie Mae Pool, 30 Year (United States)2.00%, 15/12/50 44,001,282
Fannie Mae Pool, 30 Year (United States)2.50%, 1/2/49 33,716,770
Fannie Mae Pool, 30 Year (United States)2.00%, 1/3/50 24,989,751
U.S. Treasury Note/Bond (United States)0.25%, 15/6/23 20,521,992
U.S. Treasury Note/Bond (United States)0.125%, 31/5/22 17,983,555
Fannie Mae, 30 Year (United States)2.00%, 1/9/50 16,566,548
U.S. Treasury Note/Bond (United States)0.25%, 31/10/25 15,888,672
U.S. Treasury Note/Bond (United States)0.375%, 31/3/22 12,537,109
Freddie Mac Pool, 30 Year (United States)2.50%, 1/6/50 11,746,181
U.S. Treasury Note/Bond (United States)2.50%, 31/1/21 10,093,750
Brazil Government (Brazil)6.00%, 15/8/24 8,414,746
Fannie Mae, 30 Year (United States)2.50%, 1/7/50 8,136,659
U.S. Treasury Note/Bond (United States)0.25%, 15/11/23 8,010,625
Poland Government (Poland)3.25%, 25/7/25 7,809,824
Fannie Mae, 30 Year (United States)3.50%, 1/8/49 7,737,410
Prosus NV (Netherlands)2.013%, 3/8/32 7,713,413
U.S. Treasury Note/Bond (United States)0.125%, 31/12/22 7,500,879
Fannie Mae, 30 Year (United States)3.50%, 1/8/49 7,136,835
Enel SPA (Italy)8.75%, 24/9/73 7,074,775
Indonesia Government (Indonesia)8.25%, 15/5/36 6,595,320
Bayer AG (Germany)3.125%, 12/11/79 6,121,414
Portfolio Purchases and Sales (unaudited) For the year ended 31 December 2020
Global Bond Fund
Significant purchases are defined as aggregate purchases of a security exceeding one percent of the total value of purchases for the year.Significant sales are defined as aggregate sales of a security exceeding one percent of the total value of sales for the year. At a minimum, the20 largest purchases and 20 largest sales must be disclosed.
DODGE & COX WORLDWIDE FUNDS PLC � PAGE 51
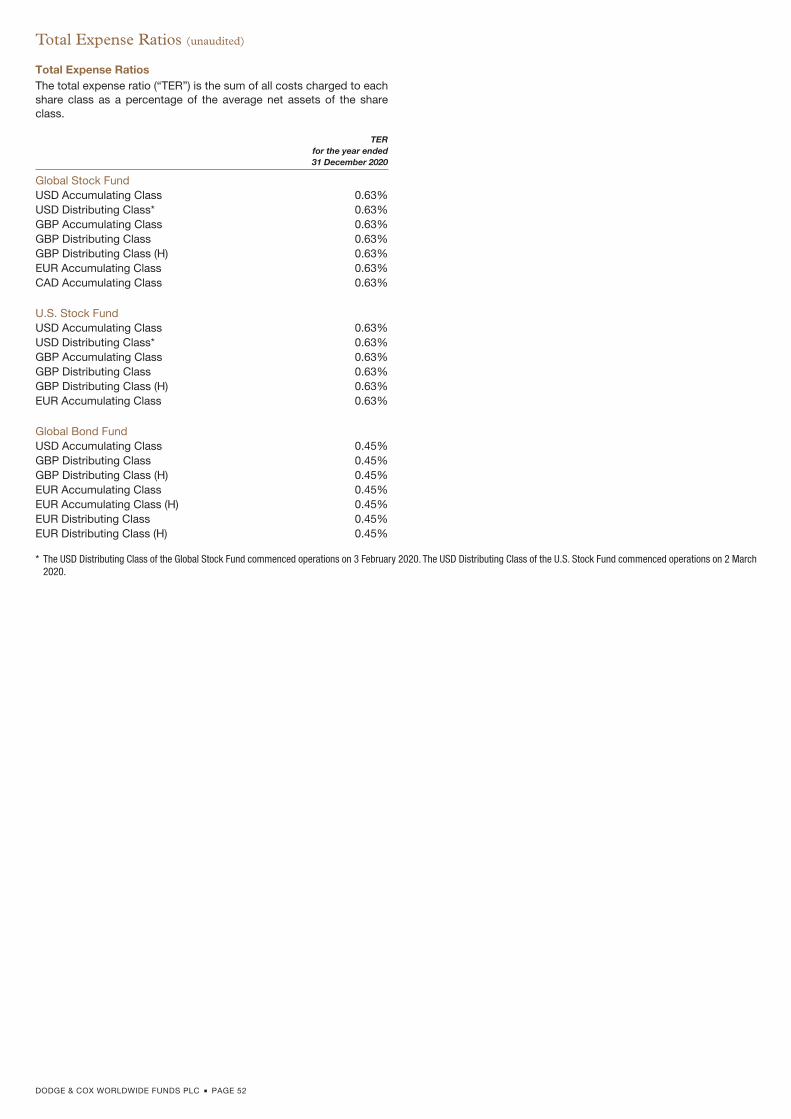
Total Expense RatiosThe total expense ratio (“TER”) is the sum of all costs charged to eachshare class as a percentage of the average net assets of the shareclass.
TERfor the year ended31 December 2020
Global Stock FundUSD Accumulating Class 0.63%USD Distributing Class* 0.63%GBP Accumulating Class 0.63%GBP Distributing Class 0.63%GBP Distributing Class (H) 0.63%EUR Accumulating Class 0.63%CAD Accumulating Class 0.63%
U.S. Stock FundUSD Accumulating Class 0.63%USD Distributing Class* 0.63%GBP Accumulating Class 0.63%GBP Distributing Class 0.63%GBP Distributing Class (H) 0.63%EUR Accumulating Class 0.63%
Global Bond FundUSD Accumulating Class 0.45%GBP Distributing Class 0.45%GBP Distributing Class (H) 0.45%EUR Accumulating Class 0.45%EUR Accumulating Class (H) 0.45%EUR Distributing Class 0.45%EUR Distributing Class (H) 0.45%
* The USD Distributing Class of the Global Stock Fund commenced operations on 3 February 2020. The USD Distributing Class of the U.S. Stock Fund commenced operations on 2 March2020.
Total Expense Ratios (unaudited)
DODGE & COX WORLDWIDE FUNDS PLC � PAGE 52
In line with the requirements of the UCITS Regulations, the Company has adopted a remuneration policy which is consistent with the principlesoutlined in the ESMA guidelines on sound remuneration policies under the UCITS Directive (the “Remuneration Guidelines”). The remunerationpolicy is appropriate to the Company’s size, internal organisation and the nature, scope and complexity of its activities.
The Company’s remuneration policy applies to certain identified staff whose professional activities have a material impact on the risk profileof the Company. As at 31 December 2020, the Company did not have any employees and the Company’s remuneration policy applies only tomembers of the Company’s management body (i.e. the Board of Directors and designated persons). The Directors not affiliated with theInvestment Manager receive a fixed annual fee which is in line with the fees paid by other Irish funds and compensates these directors for theirtasks, expertise and responsibilities. Directors that are employees of the Investment Manager (or an affiliate) are not paid any fees for their servicesas directors.
For the year ended 31 December 2020, only the Directors not affiliated with the Investment Manager received a fixed annual fee from theCompany in their roles as directors, which was in aggregate €114,250. None of the Directors are entitled to receive any variable remunerationfrom the Company. The Company also pays to Clifton Fund Consulting Limited (trading as KB Associates) a fixed fee at normal commercial ratesfor the provision of the designated persons to the Company.
In accordance with Regulation 24B(1) (b), (c), and (d) of the UCITS Regulations, the remuneration policy and its implementation is reviewed atleast annually and it is confirmed that no material changes have been made to the remuneration policy during the year ended 31 December 2020.
The Company has delegated investment management to the Investment Manager. The Company has put in place contractual arrangementswith the Investment Manager to receive and disclose information regarding the remuneration of the Investment Manager’s identified staff inaccordance with the Remuneration Guidelines. No remuneration has been paid to staff of the Investment Manager by the Company. Instead, theCompany pays a management fee to the Investment Manager as disclosed in Note 9 of the financial statements. The Investment Manager paysremuneration to its staff in accordance with the policies, procedures and processes applicable to it.
Remuneration Policy (unaudited)
DODGE & COX WORLDWIDE FUNDS PLC � PAGE 53
Article 13 of Regulation (EU) 2015/2365 on transparency of securities financing transactions (“SFTs”) and of reuse and amending Regulation(EU) No 648/2012 requires UCITS investment companies to provide the following information on the use made of SFTs and total return swaps. At31 December 2020, the SFTs and total return swaps held by the Funds consisted of the following instruments:
Repurchase Agreements
Global Stock FundMarket Value $156,524,635% of Net Assets 3.6%Counterparty Name Fixed Income Clearing CorporationCounterparty Country of Establishment United StatesMaturity Date 4/1/21Settlement BilateralCollateral Description Repurchase agreement is collateralised by U.S. Treasury Note 2.00%, 31/10/21. Total value of non-
cash collateral received is $159,655,150. The collateral is rated Aaa (Moody’s long-term rating).
U.S. Stock FundMarket Value $44,617,296% of Net Assets 2.1%Counterparty Name Fixed Income Clearing CorporationCounterparty Country of Establishment United StatesMaturity Date 4/1/21Settlement BilateralCollateral Description Repurchase agreement is collateralised by Cash Management Bill 0.00%, 11/5/21. Total value of non-
cash collateral received is $45,509,648. The collateral is rated Aaa (Moody’s long-term rating).
Global Bond FundMarket Value $85,913,769% of Net Assets 15.7%Counterparty Name Fixed Income Clearing CorporationCounterparty Country of Establishment United StatesMaturity Date 4/1/21Settlement BilateralCollateral Description Repurchase agreement is collateralised by Cash Management Bill 0.00%, 11/5/21. Total value of non-
cash collateral received is $87,632,069. The collateral is rated Aaa (Moody’s long-term rating).
Total Return Swaps
Global Stock FundMarket Value $1,087,144% of Net Assets 0.0%Counterparty Name JPMorganCounterparty Country of Establishment United StatesMaturity Date 4/5/21 to 13/10/21Settlement BilateralCollateral Description Cash collateral is pledged or received based on the net fair value of all over-the-counter derivative
contracts under the same master agreement. Total value of cash collateral received under the masteragreement is $3,370,000.
Safekeeping & Reuse of CollateralState Street Custodial Services (Ireland) Limited, depositary of the Company, is responsible for the safekeeping of collateral received. The Fundsdo not reuse non-cash collateral received. The Funds may reinvest cash collateral received in accordance with their investment objectives andpolicies. JPMorgan, counterparty to the total return swaps, is responsible for the safekeeping of cash collateral pledged with respect to totalreturn swaps, which is held in a pooled account.
Returns & CostsThe interest income arising from repurchase agreements during the period is disclosed in Note 8. The net losses arising from total return swapsduring the period were $7,893,444. Transaction costs for repurchase agreements and total return swaps are embedded in the price of theinstruments and are not separately disclosed. All returns generated by repurchase agreements and total return swaps are returned to the Funds.
Securities Financing Transactions (unaudited)
DODGE & COX WORLDWIDE FUNDS PLC � PAGE 54
Board of DirectorsÉilish Finan (Irish) (independent)Stephen Haswell (American)1
Carl O’Sullivan (Irish) (independent)Rosemary Quinlan (Irish) (independent)Diana Strandberg (American)William Strickland (American)Steven Voorhis (American)
Registered Office of the Company78 Sir John Rogerson’s QuayDublin 2Ireland
Investment ManagerDodge & Cox555 California Street40th FloorSan FranciscoCalifornia 94104United States
DistributorDodge & Cox Worldwide Investments Ltd.48-49 Pall MallLondon SW1Y 5JGUnited Kingdom
Administrator, Registrar and Transfer AgentState Street Fund Services (Ireland) Limited78 Sir John Rogerson’s QuayDublin 2Ireland
DepositaryState Street Custodial Services (Ireland) Limited78 Sir John Rogerson’s QuayDublin 2Ireland
Global Sub-CustodianState Street Bank and Trust CompanyState Street Financial CenterOne Lincoln StreetBostonMassachusetts 02111United States
Legal Advisors in IrelandArthur CoxTen Earlsfort TerraceDublin 2Ireland
Independent AuditorsPricewaterhouseCoopersChartered Accountants and Statutory Audit FirmOne Spencer DockNorth Wall QuayDublin 1Ireland
Company SecretaryBradwell LimitedTen Earlsfort TerraceDublin 2Ireland
Representative in Switzerland2
First Independent Fund Services AGKlausstrasse 338008 ZurichSwitzerland
Paying Agent in SwitzerlandNPB Neue Privat Bank AGLimmatquai 18024 ZurichSwitzerland1 Stephen Haswell was appointed as a director of the Company with effect from
30 October 2020.2 For Swiss investors, the consolidated Swiss prospectus, constitution, key investor
information documents, annual and semi-annual reports, as well as a list containing allpurchases and sales which have been made during the reporting period can be obtainedfree of charge at the office of the Swiss representative.
Administration of the Company (unaudited)
DODGE & COX WORLDWIDE FUNDS PLC � PAGE 55
