yingjiao xu ting chi jin su editors
TRANSCRIPT
Springer Series in Fashion Business
Yingjiao XuTing Chi Jin Su Editors
Chinese Consumers and the Fashion Market
Springer Series in Fashion Business
Series editor
Tsan-Ming Choi, The Hong Kong Polytechnic University, Hung Hom, Hong Kong

More information about this series at http://www.springer.com/series/15202
Yingjiao Xu • Ting Chi • Jin SuEditors
Chinese Consumers andthe Fashion Market
123
EditorsYingjiao XuNorth Carolina State UniversityRaleigh, NCUSA
Ting ChiWashington State UniversityPullman, WAUSA
Jin SuThe University of North CarolinaGreensboro, NCUSA
ISSN 2366-8776 ISSN 2366-8784 (electronic)Springer Series in Fashion BusinessISBN 978-981-10-8428-7 ISBN 978-981-10-8429-4 (eBook)https://doi.org/10.1007/978-981-10-8429-4
Library of Congress Control Number: 2018931923
© Springer Nature Singapore Pte Ltd. 2018This work is subject to copyright. All rights are reserved by the Publisher, whether the whole or partof the material is concerned, specifically the rights of translation, reprinting, reuse of illustrations,recitation, broadcasting, reproduction on microfilms or in any other physical way, and transmissionor information storage and retrieval, electronic adaptation, computer software, or by similar or dissimilarmethodology now known or hereafter developed.The use of general descriptive names, registered names, trademarks, service marks, etc. in thispublication does not imply, even in the absence of a specific statement, that such names are exempt fromthe relevant protective laws and regulations and therefore free for general use.The publisher, the authors and the editors are safe to assume that the advice and information in thisbook are believed to be true and accurate at the date of publication. Neither the publisher nor theauthors or the editors give a warranty, express or implied, with respect to the material contained herein orfor any errors or omissions that may have been made. The publisher remains neutral with regard tojurisdictional claims in published maps and institutional affiliations.
Printed on acid-free paper
This Springer imprint is published by Springer NatureThe registered company is Springer Nature Singapore Pte Ltd.The registered company address is: 152 Beach Road, #21-01/04 Gateway East, Singapore 189721, Singapore
Preface
China has experienced a great economic boom in the past two decades, leading to avery dynamic consumer market in the country. Urbanization is happening at ahistorical high rate. The post-80s one-child generation has been entering theworkforce. A larger percentage of the huge Chinese population has joined themiddle class, with significantly increasing purchasing power. The upper middleclass and the globally minded young consumers are exerting disproportionateinfluence in the market. Significant shifts have been witnessed in consumptiondynamics in the Chinese consumer market.
Fashion products, with the symbolic and social communication function, havebeen playing a significant role in Chinese consumers’ lives. Deeply rooted in theChinese culture, face consciousness plays an important role in consumers’ fashionconsumption. Chinese consumers have been strongly associated with a high level ofbrand consciousness and brand loyalty. The recent years have witnessed anexplosion of Chinese consumers’ craving for luxury fashion products. Chineseconsumers have been found to hold a discriminant preference of global brands overChinese domestic brands. With the fact that many global brands manufactured inChina and at the same time Chinese companies shifting from the export orientationto focusing on branding in the domestic market, will Chinese consumers’ pursuit ofglobal brands shift accordingly? Winning the Chinese consumers is rewarding butchallenging for both global and domestic brands.
The consumption dynamics is also spurred by the advancement of technology inproduct design and production, marketing, and retailing. Online shopping, partic-ularly mobile shopping, has brought revolutionary changes to the retail industry inChina. E-tailers such as Taobao, T-mall, and several others have become the mainproviders of young consumers’ daily needs, including fashion products. However,coming together with the convenience and low prices provided by online shoppingis the concern of low quality and counterfeits. However, this challenge facingonline shopping provides opportunities for the in-store retailers to attract and retaintheir customers. Another major implication of technology advancement in theChinese fashion market is consumers’ brand behavior via social media. Onlineproduct reviews, brand community, new shopping platforms enabled by social
v
media such as the most powerful WeChat as well as group shopping all bringadditional dynamics to the Chinese consumer market.
Changes in consumers’ lifestyles and values leave a strong impact in the Chineseconsumer market. The severe pollution in the country not only stimulates a highlevel of consciousness of health and accordingly exercise, but also brings awarenessand concern for environmental protection. Consumption of sportswear, athleisureapparel and footwear products, green products, as well as secondhand clothingattracts great attention from the marketers. Another impact is from the real estatemarket. As housing getting extremely expensive in China, young adults eitherbecome very thrift in spending to save for future housing needs or choose to give upthe motivation to buy a house but instead focus on current gratification.
Lastly, the dynamics of the Chinese market is also manifested in the form ofbipolar coexistence. Globalization has produced a hybrid of modern and traditionalconsumers coexisting in the Chinese fashion market. Also coexisting in the Chinesemarket are the mass low-income consumer segment and the superrich. Imbalance isobserved also between consumers living in the inner land and those in the coastal.
With no intention to cover all the aforementioned aspects, this edited book aimedto provide an insight into consumer behaviors in the growing and dynamic Chinesefashion market. We hope this book can provide an inspiration to peer scholars andpractitioners in their endeavors to investigate and understand the Chinese fashionmarket.
Raleigh, USA Yingjiao XuPullman, USA Ting ChiGreensboro, USA Jin Su
vi Preface
Contents
Part I Apparel Customization and Luxury Fashion in China
Facing the Rising Consumer Sophistication: Identifying theFactors that Influence Chinese Consumers’ Intention to PurchaseCustomized Apparel . . . . . . . . . . . . . . . . . . . . . . . . . . . . . . . . . . . . . . . . 3Chunmin Lang, Ruirui Zhang and Li Zhao
What Will Trigger a Non-buyer to Become a Buyer in China’sLuxury Goods Market? Cultural and Demographic Influences . . . . . . . 25Dong Shen, Jingxi Qian and Ying Jiang
Part II Digital Retailing in China
How Web site Quality Affects Apparel Mobile CommerceConsumer Satisfaction and Intent to Purchase? A Studyof Chinese Consumers . . . . . . . . . . . . . . . . . . . . . . . . . . . . . . . . . . . . . . 49Ting Chi and Quinn Sullivan
Attitudes Toward Technology, Digital Activities, and Useof Internet Shopping Features Among Chinese and US CollegeStudents . . . . . . . . . . . . . . . . . . . . . . . . . . . . . . . . . . . . . . . . . . . . . . . . . 73Jane E. Workman and Seung-Hee Lee
Part III Sustainable Fashion in China
Young Consumers’ Perceptions of Sustainable Clothing: EmpiricalInsights from Chinese Post-90s’ College Students . . . . . . . . . . . . . . . . . . 97Jin Su, Kittichai (Tu) Watchravesringkan and Jianheng Zhou
Application of Motivation-Opportunity-Ability Theory in theConsumption of Eco-fashion Products: Were Chinese ConsumersUnderestimated? . . . . . . . . . . . . . . . . . . . . . . . . . . . . . . . . . . . . . . . . . . . 119Ruirui Zhang and Chunmin Lang
vii
Part IV Fashion Branding in China
Licensing or not Licensing? A Pilot Study on Examining theApparel Extension of Auto Brands Ford and Jeepin China Market . . . . . . . . . . . . . . . . . . . . . . . . . . . . . . . . . . . . . . . . . . . 145Chuanlan Liu, Yao Wei and Langchao Zhang
Part V Select Fashion Market Segments in China
Chinese Male Consumers’ High-End Shirt Consumption:A Perspective of Fabric Attributes . . . . . . . . . . . . . . . . . . . . . . . . . . . . . 171Yanwen Ruan, Yingjiao Xu, Jun Li and Xiaogang Liu
Chinese Consumers and the Knitwear Fashion Market . . . . . . . . . . . . . 193Xin Zhang, Colin Gale and Claudia Eckert
viii Contents

Part IApparel Customization and Luxury
Fashion in China
Facing the Rising ConsumerSophistication: Identifying the Factorsthat Influence Chinese Consumers’Intention to Purchase Customized Apparel
Chunmin Lang, Ruirui Zhang and Li Zhao
Abstract Consumers’ desire for novelty and uniqueness drives consumers to con-sistently seek new products that differentiate them from others. New goods arepurchased frequently and disposed of quickly by consumers, which provide ashort-term experience of novelty and newness but increase landfill wastes. Apparelcustomization provides consumers with an option to create their own personalizedclothing items, which can increase product longevity because it results in personalattachment from customized styles and well-fitted garments. The study investigatedthe influence of shopping motivations and perceived enjoyment on consumerintention to purchase customized apparel for Chinese consumers. By applying thetheory of planned behavior (TPB), this study considers that engaging in customiza-tion is not only from an individual’s values and self-interest, but also from socialvalues. An online survey was conducted with 321 Chinese consumers. The SEManalysis results indicate the three shopping values (adventure shopping, idea shop-ping, and achievement shopping) significantly influence the intention to purchasecustomized apparel products in an indirect way, and the significant effect of perceivedenjoyment on the intention toward apparel customization is also confirmed. Further,the mediating effects of TPB components were also confirmed among Chinese par-ticipants. This study highlights the role of shopping values and perceived enjoymenton the adoption of apparel customization and provides guidance for the retailers andmarketers who provide apparel customization services in the Chinese market.
C. Lang (&)Department of Textiles, Apparel Design, & Merchandising, College of Agriculture,Louisiana State University, 143 Human Ecology, Baton Rouge, LA 70803, USAe-mail: [email protected]
R. ZhangDepartment of Fashion Design and Retailing, Framingham State University,234A Hemenway Annex, Framingham, MA 01701, USAe-mail: [email protected]
L. ZhaoTextile and Apparel Management, University of Missouri, 137 Stanley Hall,Columbia, MO 65211, USAe-mail: [email protected]
© Springer Nature Singapore Pte Ltd. 2018Y. Xu et al. (eds.), Chinese Consumers and the Fashion Market, Springer Seriesin Fashion Business, https://doi.org/10.1007/978-981-10-8429-4_1
3
Keywords Apparel customization � Chinese consumers � Shopping motivationsPerceived enjoyment � Theory of planned behavior
Introduction
Notably, consumers’ desire for novelty and uniqueness has a great impact on theeconomic vividness of the fashion industry (Kawamura, 2005). These needs driveconsumers to constantly seek new products that differentiate them from others. Newgoods are purchased frequently and disposed of quickly by consumers, whichprovide a short-term experience of novelty and newness (Birtwistle & Moore,2007), but increase landfill waste. This is the case especially in China, the countrywith the largest population in the world, which produces much of the material thatends up in landfills. Approximately 26 million tons of textile waste is generated inChina annually, which makes up about 3.5–4% of the world’s waste materials(Ravenhall, 2012; Xue, Zhang, & Wang, 2014). Pressure on the environmentrequires a radical change among consumers and the fashion industry to developcreative solutions in garment production and consumption (Lawless & Medvedev,2016). Apparel customization provides consumers with an option to create theirown personalized clothing items, which can increase product longevity because itresults in personal attachment to customized styles and well-fitted garments(Armstrong, Niinimäki, Kujala, Karell, & Lang, 2015; Flynn & Vencat, 2012).Participating in the process will create a deeper emotional connection between theconsumer and the product that he/she creates (Lee & DeLong, 2017); thus, theproduct may be kept for a longer period of time (Armstrong et al., 2015).Furthermore, this creative and innovative marketing campaign has also become asignificant marketing strategy to develop and maintain loyal customers (Cho &Fiorito, 2009).
Although apparel customization may hold substantial benefits for businesses andsocieties and is continuing to expand and gain more attention, not all consumershave been engaged in the transactions (Boer, Pedrazzoli, Bettoni, & Sorlini, 2013;Sherman, 2014), especially in China (Kesari & Atulkar, 2016; Ou, 2011), whichindicates the need to understand what influences those consumers’ intention topurchase customized apparel products. Shopping values are critical psychologicalvariables that encourage consumers to behave in a particular manner (Solomon &Rabolt, 2006). They affect the way consumers respond to different market strategiesand how they consume particular products or services. Despite the growing prac-tical importance of apparel customization, there is a lack of knowledge in the effectof shopping values on consumers’ attitudes and intentions of purchasing cus-tomized apparel products (Cho & Fiorito, 2009). Therefore, studying how shoppingvalues influence the engagement in apparel customization may aid in identifyingapproaches to increase consumers’ purchase intention of customized apparel.
The majority of previous research has been focused on customization strategy,technology, supply chain management, and operation systems (McKinney, Gill,
4 C. Lang et al.
Dorie, & Roth, 2017; Sanders & Stappers, 2015; Senanayake & Little, 2010). Inregard to consumers’ perception of apparel customization, some exploratoryqualitative studies have focused on consumer preferences and motivations, but mostof the research was conducted in the US or European countries. For example,Armstrong et al. (2015) conducted focus groups in the US and Finland to uncoverconsumers’ preferences in regard to the participatory design of apparel products.Niinimäki and Hassi (2011) conducted a qualitative study with two online ques-tionnaires in Finland to investigate consumers’ interest in co-creation of textileproducts. Challenges to adoption, such as uncertainty about personal style(Armstrong et al., 2015), unfamiliarity with technology involved in the cus-tomization process (Lee & Chang, 2011), concerns of waiting for a long time(Armstrong et al., 2015; Kim & Hong, 2011), and lack of trust in the provider(Armstrong et al., 2015; Ou, 2011) have been identified previously. For instance,some consumers were concerned about the lack of guarantee of a successful result ifthey participate in the design process. Some quantitative studies conducted in theUS have confirmed the positive influences of attitude, ease of use, perceivedenjoyment, exciting experience, as well as perceived security for mass cus-tomization (Cho & Fiorito, 2009; Fiore, Lee, & Kunz, 2004; Lee & Chang, 2011).But studies focusing on Chinese consumers’ apparel customization behavior arelacking. Ou (2011) carried out in-depth interviews to explore young Chineseconsumers’ perceptions of mass apparel customization. However, to date, the roleof shopping values in the adoption of customized apparel for Chinese consumershas not been investigated.
McKinsey & Company’s report (Atsmon, Magni, Li, & Liao, 2012) suggestedthat China’s consumer sophistication is on the rise. By the year of 2020, half ofChina’s urban households’ income will catapult into the upper middle class. Asincome level rises, Chinese consumers tend to be more rational about fashion andbegin to pay more attention to clothing that reflects their personal style (Atsmonet al., 2012). These consumers have indicated higher demand for innovative andpersonalized products. These rising expectations among Chinese consumers requirethe market to provide products with good quality and the ability to cater to theirindividualized needs. However, many fashion companies still do not have adequatecapabilities to process the customized products to meet consumers’ personalizedrequirements due to lack of understanding of these consumers. Although a varietyof studies have been done on customization in developed countries (Kim & Hong,2011; Lee & Chang, 2011; Niinimäki & Hassi, 2011; Sanders & Stappers, 2015;Senanayake & Little, 2010), understanding of Chinese consumers’ motivationstoward apparel customization is lacking.
The purpose of this study is to determine the factors that influence Chineseconsumers’ intention to purchase customized apparel. The study results areexpected to contribute to the broader literature that focuses on customization in theapparel industry and to lay the foundation for the development of strategies thatencourage apparel customization. In addition, by applying Ajzen’s (1991) theory ofplanned behavior (TPB), this study considers that engaging in customization is notonly of an individual’s values and self-interest, such as attitude and perceived
Facing the Rising Consumer Sophistication … 5
behavior control, but also of social values, like subjective norms. Specifically,personal values are considered to be external variables and assumed to influenceintention indirectly mediated by the components of TPB (Ajzen & Fishbein, 1980).This study explores the influence of shopping values and perceived enjoyment onthe components of TPB, as well as consumers’ intention to purchase customizedapparel. This research is the first attempt to examine the relationship of shoppingvalues and the intention to purchase customized apparel. The results of this researchwill provide managerial insights for the promotion of apparel customization.
Literature Review and Hypotheses Development
Apparel Customization
Customization is defined as delivering products and services with enough varietyand uniqueness that best meet an individual’s needs (Cho & Fiorito, 2009; Pine,1993). Product customization assumes that the market is heterogeneous andconsumer-driven. It highlights a consumer-centered design approach. In order tomeet the consumer’s specific requirements effectively, consumers’ involvementduring the product development cycle is crucial. The essence of customization is totransform a consumer into a co-designer (Tseng & Piller, 2003). Co-design is acollaborative process between the consumer and the retailer, through which theconsumer gets involved in the design process and a product is customized to fulfillthe consumer’s individual requirements (Peterson, 2016). Therefore, to enhance theinteraction with consumers, the co-design process needs to trigger the hedonicmotivation among consumers and improve the enjoyment of the process (Piller &Tseng, 2010).
Apparel customization is an important competitive advantage in the fashionindustry (Salvador, De Holan, & Piller, 2009). It has become a significant mar-keting strategy in the development and maintenance of loyal customers and to fulfillconsumers’ demands more precisely (Steen, Manschot, & Koning, 2011), therefore,to increase consumers’ satisfaction with the product. In addition, Pine (1993) alsodescribed customization as an effective approach to eliminate excessive inventory,since products are made with consumers’ specifications, therefore, to reduce waste.Consumers also benefit from customization. Involvement in customization allowsconsumers to specify unique requirements and apply personal preferences anduniqueness into the design (Ou, 2011; Schreier, 2006). In addition, the customdesign provides the consumer with increased product satisfaction by designing aproduct that is more personalized in fit, style, comfort, as well as functionality(Piller & Müller, 2004; Schreier, 2006). Consumers also experience entertainmentand enjoyment during the process of co-design (Schreier, 2006; Steen et al., 2011)and the pride of authorship (Schreier, 2006). Where environmental sustainability isconcerned, product customization may bring great benefits as well, such as
6 C. Lang et al.
maximizing usage by increasing consumer satisfaction and improving the fitbetween the product’s properties and the consumer’s needs (Bruno, Nielsen, Taps,& Jorgensen, 2013). Customization is considered as environmentally sustainable(Medini, Da Cunha, & Bernard, 2015). To make customized products, efforts andpride have been involved in the process, and the process of customization might bean unforgettable experience; therefore, consumers tend to build a solid emotionalbond with the customized products and keep the items for a longer time.Consumers’ involvement in the design process can result in a deeper relationshipand personal attachment to the garment, due to customized styles and well-fittedpieces, therefore, increasing the use frequency and potential life span of the productand a reduction in landfill waste (Armstrong et al., 2015; Chapman, 2009;Niinimäki & Hassi, 2011).
Short use time of garments is related to dissatisfaction that can be caused by lowquality and poor fit (Armstrong et al., 2015; Niinimäki, 2014). To improve the fitand to meet individual specifications and requirements, customized apparel hasbecome increasingly popular among consumers (Senanayake & Little, 2010). Theapparel industry has built popular customization services, which allow consumersto participate in product development in different ways. For example, consumerscan get involved in the design stage by selecting colors, fabrics, trims, and sil-houette (Kamali & Loker, 2002). Some prominent examples that exist in theindustry include: NikeiD studio, a digital customization platform that providesservices for customers to configure their own sneakers by choosing different colorsand materials (Abnett, 2015); Blank Label, an online male clothing customizationretailer that offers a variety options of fabrics, styles, and colors for consumers tobuild the apparel that looks and fits the way they want; eShakti provides consumerswith options of different styles and designs to customize their dresses, skirts, andtops for better fits; Vans provides consumers the chance to design their own skateshoes by combining any colors or patterns for the different parts of the shoes.Besides participating in the co-design, consumers can also participate in patternmaking to get custom fit clothing (Fiore, Lee, & Kunz, 2003); Nomo Jeans, forexample, is a fashion company that utilizes 3D body scanning to createmade-to-measure jeans and to improve personal fit. In the process of customization,the consumer is able to apply their own creativity, preferences, narratives, and evenmemories to the product design (Armstrong et al., 2015). It provides consumerswith a choice of obtaining unique and better fitting products.
China has become a profitable apparel market due to its large population andrapid economic growth (Atsmon et al., 2012). Despite the growing importance ofapparel customization and the development of the Chinese market, the concept ofcustomization is rather new to most people in China and not many people have beenengaged in the transaction (Ou, 2011), and the acceptance of apparel customizationamong Chinese consumers is still low (Kesari & Atulkar, 2016). Therefore, there isa critical need to examine the personal factors influencing the intention to purchasecustomized apparel among Chinese consumers.
Facing the Rising Consumer Sophistication … 7
Shopping Values
Shopping values are critical psychological variables that encourage consumers tobehave in a certain manner (Solomon & Rabolt, 2006). Consumers are motivatednot only by the utilitarian value, but also the feeling obtained during the shoppingprocess. Shopping values are mainly categorized as utilitarian and hedonic drives(Arnold & Reynolds, 2003). Two dimensions, achievement shopping and efficiencyshopping, were included in utilitarian shopping values (Kim, 2006). Efficiencyshopping value states that consumers want to be time-savers during the shoppingprocess, while achievement shopping value refers to task-oriented shopping moti-vation where getting things done is critical (Kim, 2006). Hedonic shopping valuecontains six dimensions, which reflects the joy, entertainment, and pleasure derivedfrom the experience (Arnold & Reynolds, 2003). Among the six dimensions,adventure shopping refers to shopping for stimulation, adventure, excitement, andthe feeling of being in another world. Social shopping reveals shopping as a part ofconsumers’ social life. Gratification views shopping as a special treat for consumersto alleviate a negative mood for stress relief. Idea shopping refers to the process ofconsumers’ trying to gather information, to keep up with the new fashion trends,and to see new products with innovations. Role shopping reflects the enjoyment andexcitement that consumers feel when shopping for others. Value shoppingemphasizes the joy of looking for discounted projects and the best deals.
A previous study conducted by Merle, Chandon, Roux, and Alizon (2010) hasacknowledged that customization provides both utilitarian and hedonic benefits.According to Xu and McGehee (2012), Chinese consumers pursue novelty and newtrends during their shopping experience to satisfy hedonic value. The co-designprocess in customization, in itself, conveys adventure and provides fun andenjoyable experiences (Ou, 2011). For some consumers, getting involved in theprocess is also an approach to obtain new fashion skills, and those consumers mayfeel fulfillment and pleasure by wearing clothing they created themselves (Ou,2011). Therefore, by carefully reviewing the features of each dimension of bothutilitarian and hedonic shopping values, as well as the characteristics of apparelcustomization, only adventure shopping value, idea shopping value, and achieve-ment shopping value were investigated in the context of purchase intention towardapparel customization among Chinese consumers. These three shopping values arebelieved to be highly relevant to the experience of apparel customization andhaving the greatest potential for providing insights into consumer intentions topurchase customized apparel. As personal values, these variables are taken asexternal factors and assumed to influence intention indirectly through the compo-nents of TPB (Ajzen & Fishbein, 1980).
Adventure shopping refers to shopping for the purpose of experiencing excite-ment and adventure (Arnold & Reynolds, 2003) and describes how consumers seekfreshness and need stimulations in order to escape from the feeling of boredom(McGuire, 1974). Apparel customization provides consumers with visual stimula-tion and exciting experiences in the design and fashion-making process. In addition,
8 C. Lang et al.
customized services could offer unique and fresh suggestions to consumers. Hence,consumers may enjoy shopping in such an atmosphere and develop a positiveattitude toward the process of customization. A previous study has confirmed thathedonic shopping values have an influence on attitude (Chung, 2015). Furthermore,consumers with adventure shopping values always seek excitement and adventurein their shopping process and they may establish strong positive beliefs about theirability of apparel customization, for which special skills may be needed. In addi-tion, a previous study has confirmed the significant positive relationship betweenthe preference of having an exciting experience and the willingness to accept masscustomization (Fiore et al., 2004). In the context of Chinese consumers, a previousstudy has found that adventure shopping value positively influences purchaseintention among Chinese consumers (Xu, Chen, Burman, & Zhao, 2014). Lau, Sin,and Chan (2005) have also confirmed that Chinese consumers’ cross-bordershopping behavior is positively impacted by adventure shopping. Therefore, thefollowing hypothesis was proposed:
H1: Adventure shopping value positively influences (a) attitude toward, (b) sub-jective norms of, (c) perceived behavior control of, and (d) perceived enjoyment ofapparel customization.
Idea shopping refers to shopping to gather information about new trends,fashion, and products (Kim & Hong, 2011), in order to update the knowledge ofnew style and innovations (Arnold & Reynolds, 2003). Consumers’ gathering ofinformation for a specific purchase need represents a leisure pursuit as a final goal.Nowadays, consumers, especially younger generations, constantly seek new ideasand fashion items to fuel their desire for novelty and uniqueness. Taking part incustomization for fashion products could provide a means for those consumers whoare seeking unique, stylish, and fashionable items. Getting involved in cus-tomization to make one’s own one-of-a-kind fashion product might be an excitingapproach to gain ideas about new fashion and show their pioneering role in thehistory of acceptance of new ideas. Therefore, they may have a more positiveattitude toward apparel customization and tend to enjoy the process of co-design.Additionally, the activity of apparel customization can be seen as a way of col-lecting information of creativity. People with idea shopping values are usuallyfashion leaders (Kim & Hong, 2011), who tend to adopt new trends earlier thanothers; they would be more confident about their creativity and enjoy the experienceof the customization process. Therefore, it is hypothesized that:
H2: Idea shopping value positively influences (a) attitude toward, (b) subjectivenorms of, (c) perceived behavior control of, and (d) perceived enjoyment of apparelcustomization.
Achievement shopping refers to a goal-related shopping experience whereconsumers feel is important to accomplish what they had planned on a particularshopping trip (Kim, 2006). As a utilitarian value, achievement shopping valueemphasizes the efficiency and functional benefits obtained during the process
Facing the Rising Consumer Sophistication … 9
(Irani & Hanzaee, 2011). Product specifications and quality of customized productscan fulfill consumers’ basic needs and assist consumers in enjoying thedecision-making process (Kesari & Atulkar, 2016; To, Liao, & Lin, 2007).Utilitarian has been perceived as one benefit for customized products (Merle et al.,2010), which integrates both aesthetic and functional fit (Schreier, 2006). Frankeand Schreier (2008) have confirmed that a positive relationship exists between theutilitarian benefit and the willingness to pay more for customized products.Through apparel customization, consumers’ specific need for a unique style orbetter fit can be achieved. For instance, for consumers who have some specialneeds, such as plus-size clothing, it is crucial to accomplishing their shopping goalsof obtaining better fit through apparel customization. By participating in the processof customizing products, consumers may also feel a sense of accomplishment.Therefore, they may enjoy more throughout the process of co-design. Furthermore,individuals with achievement shopping value are usually functional shoppers (Kim,2006); they tend to be goal-oriented and have strong beliefs about their ability andare concerned about others’ opinion on their achievement. In addition, achievementvalue has also been found to positively influence consumers’ attitude(Jayawardhena, 2004). Thus, the following hypothesis is proposed:
H3: Achievement shopping value positively influences (a) attitude toward,(b) subjective norms of, (c) perceived behavior control of, and (d) perceivedenjoyment of apparel customization.
Perceived Enjoyment
Perceived enjoyment is an intrinsic motivation (Teo, Lim, & Lai, 1999) andinterprets the extent to which performing a certain activity is perceived to beenjoyable in itself, regardless of the performance consequences (Davis, Bagozzi, &Warshaw, 1992). As the intrinsic motivation factor, perceived enjoyment indicatesthe pleasure and satisfaction gained from performing a certain behavior. It is asalient factor affecting consumer attitudes and intentions toward the behavior.Attitude represents an individual’s general evaluation of performing a certainbehavior (Ajzen, 1991), while perceived enjoyment focuses on how fun the processof apparel customization is. The positive influence of perceived enjoyment onattitude has been confirmed by several studies (Childers, Carr, Peck, & Carson,2001; Lee & Chang, 2011), indicating that when the activity is perceived to beenjoyable, a positive attitude toward the behavior is developed. In addition, con-sumers who engage in designing their own products will experience positive ornegative emotions during the interaction. When consumers enjoy and feel interestedin the co-design process of apparel customization, they may perceive positivebeliefs about their own ability and develop confidence in the control of behaviorthroughout the interaction.
10 C. Lang et al.
Enjoying the process is an important motivator for people to engage in a certainactivity. Individuals may get involved in a particular behavior if it yields fun andpleasure. The co-design process in apparel customization delivers interactive fea-tures, which requires consumers to communicate and interact with the professionaldesigner, retailer, or technological tool. Especially for apparel products, in order toachieve the particular style they anticipate, consumers may need to try differentchoices provided by retailers. Not feeling comfortable and enjoying the processmay discourage their intention. The positive influence of perceived enjoyment onmass customization has been confirmed by a variety of research (Franke & Schreier,2010; Lee & Chang, 2011). Given that co-design process of apparel products is aform of a hedonic system, perceived enjoyment is expected to have a salientinfluence on purchase intention toward apparel customization. Therefore, the fol-lowing hypotheses were generated:
H4: Perceived enjoyment of apparel customization is positively associated with(a) attitude, (b) subjective norms, and (c) perceived behavior control.H5: Perceived enjoyment of apparel customization is positively associated withconsumers’ intention to purchase customized apparel products.
The Theory of Planned Behavior
The framework of the theory of planned behavior (TPB) indicates that an indi-vidual’s intention toward a certain behavior is affected by attitude, subjectivenorms, and perceived behavior control. Attitude represents an individual’s evalu-ation of performing certain behaviors and is regarded as a major determinant of thebehavior (Ajzen, 1991). A positive attitude toward a given behavior indicates thatan individual is more likely to participate in the behavior. For example, research hasshown that consumers’ attitudes toward mass customization positively influencetheir responses, which includes the intention to purchase and to recommend cus-tomized products to others (Lee & Chang, 2011). The customization processcontains interactive features between consumers and retailers; therefore, it would becrucial to examine consumers’ attitudes and its effects on their responses.
Subjective norms refer to the perception of how important reference groups’expectations of exhibiting a certain behavior are. An individual’s behavior is notonly influenced by personal values, but it is also influenced by social groups,especially by specific reference groups. The opinions regarding certain behaviorsfrom those people who are important to an individual play a crucial role in con-sumers’ response to the behavior, which was also confirmed (Salazar, Oerlemans, &van Stroe-Biezen, 2013). China especially has been identified as a country with acollectivist culture (Hofstede, 1980), which indicates that family, friends, andcommunity play an important role in an individual’s attitude toward a certainbehavior.
Facing the Rising Consumer Sophistication … 11
Perceived behavioral control refers to an individual’s perception of his or herability to perform a certain behavior. Previous research has illustrated the positiveinfluence of perceived behavior control on people’s feelings about the behavior andtheir expected outcomes (Lee & Chang, 2011). The co-design process of apparelcustomization requires the consumer to have certain skills and ideas regarding thestyle they expect and to interact and communicate with the retailer or designer. Theperception of inability to have control over the co-design process may discouragepeople’s intention toward participating in apparel customization (Piller, Schubert,Koch, & Moslein, 2005). A strong perception of the ability to perform co-designpoints to a higher intention. Therefore, the research hypotheses are stated below:
H6: Consumers’ (a) attitude, (b) subjective norms, (c) perceived behavior controlpositively influence consumers’ intention to purchase customized apparel products.
Research Method
Sample and Data Collection
Data were collected in China with a convenient sampling strategy. An online surveywas set up on a Chinese online market research Web site called Wenjuanxing.Participants were recruited via WeChat, which is a popular Chinese social mediaapp having over 889 million active users in 2016 (CIW Team, 2016). Threeresearchers sent the invitation with the survey link to their contacts throughWeChatand requested them to complete the survey, as well as to share the survey link withtheir contacts on WeChat. In total, CNY 240.00 (US$36.42) Red Envelope wasdistributed to the contacts; individuals who completed the survey received a randomamount as an incentive. Each respondent was given a brief description of the study,explaining Institutional Review Board approval and the implications of his or herparticipation. In total, the survey link was sent to 878 WeChat users fromSeptember to November 2016. A total of 321 usable responses were collected andused in the data analysis, with a response rate of 36.6%.
Instrument Development
Three sections were included in the questionnaire. The first section contains a seriesof multi-item scales to measure the constructs including adventure shopping value,idea shopping value, achievement shopping value, perceived enjoyment, attitude,subjective norms, and perceived behavior control. All of these constructs weremeasured on five-point Likert scales with 1 = strongly disagree to 5 = stronglyagree. The items used to measure adventure shopping value, idea shopping value,
12 C. Lang et al.
and achievement shopping value were borrowed from Arnold and Reynolds (2003)and Kim (2006). Perceived enjoyment was measured by five items modified fromMerle et al. (2010). A semantic differential scale was employed to measure attitude(Ajzen, 2002). An incomplete statement regarding apparel customization wasdeveloped, followed by five groups of semantic differential adjectives. Based on thefive-point scale, participants were requested to select the corresponding adjectivefrom each group to complete the statement. Subjective norms were measured usinga three-item scale modified from Ajzen (2002). Perceived behavioral control wasmeasured by four items modified from Kidwell and Jewell (2003).
The second section measures consumers’ purchase intention toward apparelcustomization. To better explain the idea of apparel customization, one hypotheticalscenario statement was developed based on existing industry customizationexamples. Participants were requested to rate the level of willingness to purchasecustomized apparel products by responding to the question, “I intend to purchasecustomized apparel products during the next 12 months?” The scenario wasdescribed as following:
A fashion retailer provides consumers with customization services: consumers can choosetheir favorite style, color, fabric, pattern, size, and image, etc. and design their favorite,one-of-kind style of clothing with the assistance of professional designers and place theorder. The retailer will make the clothing according to consumers’ design; in the meantime,this retailer also provides relative consumer services as needed.
The third section measures consumers’ demographics. The questionnairedesigned for this study was originally developed in English because all theinstruments adopted in this study were written in English. Then, the questionnairewas first translated into Chinese by one bilingual scholar who has a Ph.D. degree inapparel merchandising, and then the Chinese version was back-translated to Englishby a different bilingual scholar to ensure an accurate translation.
Results
Profile of the Participants
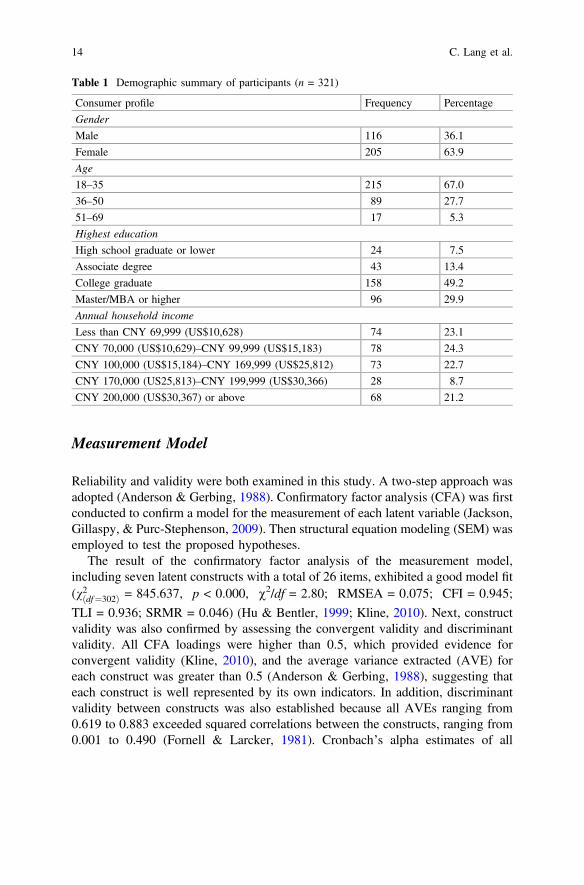
Of the total 321 participants, the majority of them (63.9%) were female. Participantsaged 18–35 made up 67% of the sample, followed by 36–50 with 27.7%. Almosthalf (49.2%) of the participants had a college degree, and there were also 29.9%participants reported having a master’s/MBA or higher degree. With regard toannual household income, 31.2% of the participants reported annual income beingmore than CNY 200,000 (US$30,367); 31.4 and 47.4% of participants had annualincome between CNY 100,000 (US$15,184) and CNY 199,999 (US$30,366) andless than CNY 99,999 (US$15,183), respectively. Table 1 presents the demo-graphic summary of participants.
Facing the Rising Consumer Sophistication … 13
Measurement Model
Reliability and validity were both examined in this study. A two-step approach wasadopted (Anderson & Gerbing, 1988). Confirmatory factor analysis (CFA) was firstconducted to confirm a model for the measurement of each latent variable (Jackson,Gillaspy, & Purc-Stephenson, 2009). Then structural equation modeling (SEM) wasemployed to test the proposed hypotheses.
The result of the confirmatory factor analysis of the measurement model,including seven latent constructs with a total of 26 items, exhibited a good model fit(v2ðdf¼302Þ = 845.637, p < 0.000, v2/df = 2.80; RMSEA = 0.075; CFI = 0.945;
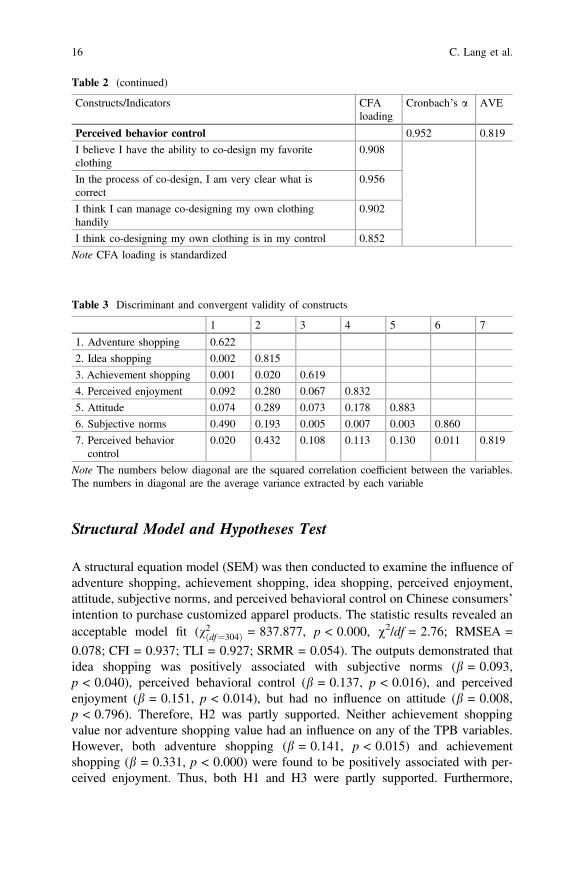
TLI = 0.936; SRMR = 0.046) (Hu & Bentler, 1999; Kline, 2010). Next, constructvalidity was also confirmed by assessing the convergent validity and discriminantvalidity. All CFA loadings were higher than 0.5, which provided evidence forconvergent validity (Kline, 2010), and the average variance extracted (AVE) foreach construct was greater than 0.5 (Anderson & Gerbing, 1988), suggesting thateach construct is well represented by its own indicators. In addition, discriminantvalidity between constructs was also established because all AVEs ranging from0.619 to 0.883 exceeded squared correlations between the constructs, ranging from0.001 to 0.490 (Fornell & Larcker, 1981). Cronbach’s alpha estimates of all
Table 1 Demographic summary of participants (n = 321)
Consumer profile Frequency Percentage
Gender
Male 116 36.1
Female 205 63.9
Age
18–35 215 67.0
36–50 89 27.7
51–69 17 5.3
Highest education
High school graduate or lower 24 7.5
Associate degree 43 13.4
College graduate 158 49.2
Master/MBA or higher 96 29.9
Annual household income
Less than CNY 69,999 (US$10,628) 74 23.1
CNY 70,000 (US$10,629)–CNY 99,999 (US$15,183) 78 24.3
CNY 100,000 (US$15,184)–CNY 169,999 (US$25,812) 73 22.7
CNY 170,000 (US25,813)–CNY 199,999 (US$30,366) 28 8.7
CNY 200,000 (US$30,367) or above 68 21.2
14 C. Lang et al.
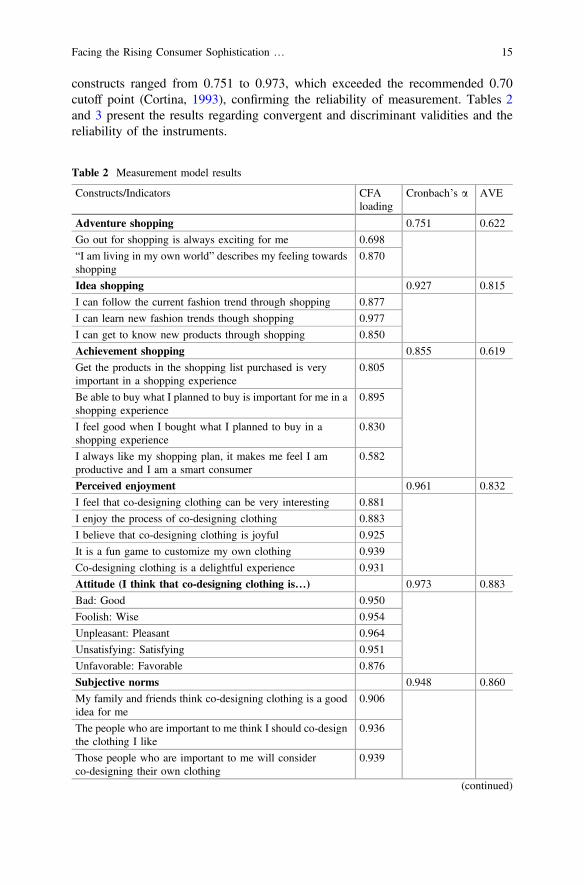
constructs ranged from 0.751 to 0.973, which exceeded the recommended 0.70cutoff point (Cortina, 1993), confirming the reliability of measurement. Tables 2and 3 present the results regarding convergent and discriminant validities and thereliability of the instruments.
Table 2 Measurement model results
Constructs/Indicators CFAloading
Cronbach’s a AVE
Adventure shopping 0.751 0.622
Go out for shopping is always exciting for me 0.698
“I am living in my own world” describes my feeling towardsshopping
0.870
Idea shopping 0.927 0.815
I can follow the current fashion trend through shopping 0.877
I can learn new fashion trends though shopping 0.977
I can get to know new products through shopping 0.850
Achievement shopping 0.855 0.619
Get the products in the shopping list purchased is veryimportant in a shopping experience
0.805
Be able to buy what I planned to buy is important for me in ashopping experience
0.895
I feel good when I bought what I planned to buy in ashopping experience
0.830
I always like my shopping plan, it makes me feel I amproductive and I am a smart consumer
0.582
Perceived enjoyment 0.961 0.832
I feel that co-designing clothing can be very interesting 0.881
I enjoy the process of co-designing clothing 0.883
I believe that co-designing clothing is joyful 0.925
It is a fun game to customize my own clothing 0.939
Co-designing clothing is a delightful experience 0.931
Attitude (I think that co-designing clothing is…) 0.973 0.883
Bad: Good 0.950
Foolish: Wise 0.954
Unpleasant: Pleasant 0.964
Unsatisfying: Satisfying 0.951
Unfavorable: Favorable 0.876
Subjective norms 0.948 0.860
My family and friends think co-designing clothing is a goodidea for me
0.906
The people who are important to me think I should co-designthe clothing I like
0.936
Those people who are important to me will considerco-designing their own clothing
0.939
(continued)
Facing the Rising Consumer Sophistication … 15
Structural Model and Hypotheses Test
A structural equation model (SEM) was then conducted to examine the influence ofadventure shopping, achievement shopping, idea shopping, perceived enjoyment,attitude, subjective norms, and perceived behavioral control on Chinese consumers’intention to purchase customized apparel products. The statistic results revealed anacceptable model fit (v2ðdf¼304Þ = 837.877, p < 0.000, v2/df = 2.76; RMSEA =
0.078; CFI = 0.937; TLI = 0.927; SRMR = 0.054). The outputs demonstrated thatidea shopping was positively associated with subjective norms (b = 0.093,p < 0.040), perceived behavioral control (b = 0.137, p < 0.016), and perceivedenjoyment (b = 0.151, p < 0.014), but had no influence on attitude (b = 0.008,p < 0.796). Therefore, H2 was partly supported. Neither achievement shoppingvalue nor adventure shopping value had an influence on any of the TPB variables.However, both adventure shopping (b = 0.141, p < 0.015) and achievementshopping (b = 0.331, p < 0.000) were found to be positively associated with per-ceived enjoyment. Thus, both H1 and H3 were partly supported. Furthermore,
Table 2 (continued)
Constructs/Indicators CFAloading
Cronbach’s a AVE
Perceived behavior control 0.952 0.819
I believe I have the ability to co-design my favoriteclothing
0.908
In the process of co-design, I am very clear what iscorrect
0.956
I think I can manage co-designing my own clothinghandily
0.902
I think co-designing my own clothing is in my control 0.852
Note CFA loading is standardized
Table 3 Discriminant and convergent validity of constructs
1 2 3 4 5 6 7
1. Adventure shopping 0.622
2. Idea shopping 0.002 0.815
3. Achievement shopping 0.001 0.020 0.619
4. Perceived enjoyment 0.092 0.280 0.067 0.832
5. Attitude 0.074 0.289 0.073 0.178 0.883
6. Subjective norms 0.490 0.193 0.005 0.007 0.003 0.860
7. Perceived behaviorcontrol
0.020 0.432 0.108 0.113 0.130 0.011 0.819
Note The numbers below diagonal are the squared correlation coefficient between the variables.The numbers in diagonal are the average variance extracted by each variable
16 C. Lang et al.
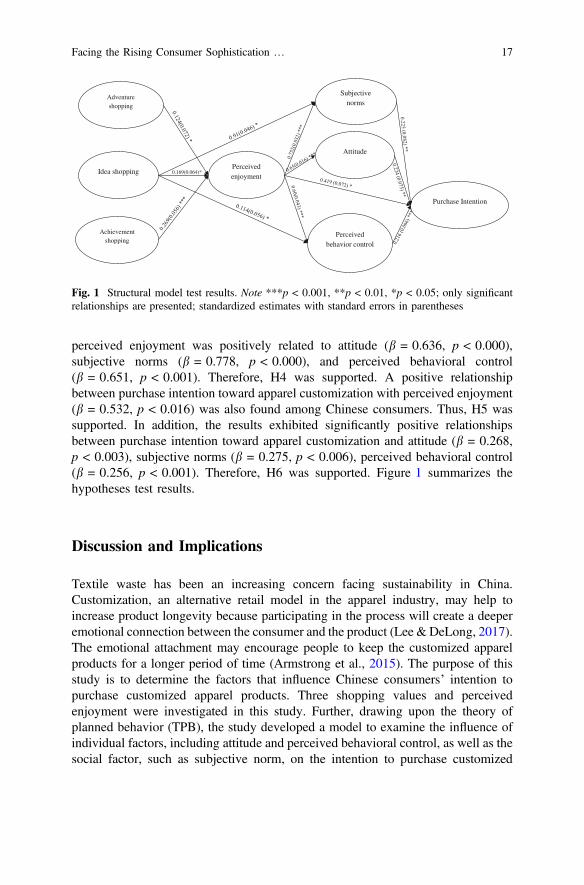
perceived enjoyment was positively related to attitude (b = 0.636, p < 0.000),subjective norms (b = 0.778, p < 0.000), and perceived behavioral control(b = 0.651, p < 0.001). Therefore, H4 was supported. A positive relationshipbetween purchase intention toward apparel customization with perceived enjoyment(b = 0.532, p < 0.016) was also found among Chinese consumers. Thus, H5 wassupported. In addition, the results exhibited significantly positive relationshipsbetween purchase intention toward apparel customization and attitude (b = 0.268,p < 0.003), subjective norms (b = 0.275, p < 0.006), perceived behavioral control(b = 0.256, p < 0.001). Therefore, H6 was supported. Figure 1 summarizes thehypotheses test results.
Discussion and Implications
Textile waste has been an increasing concern facing sustainability in China.Customization, an alternative retail model in the apparel industry, may help toincrease product longevity because participating in the process will create a deeperemotional connection between the consumer and the product (Lee & DeLong, 2017).The emotional attachment may encourage people to keep the customized apparelproducts for a longer period of time (Armstrong et al., 2015). The purpose of thisstudy is to determine the factors that influence Chinese consumers’ intention topurchase customized apparel products. Three shopping values and perceivedenjoyment were investigated in this study. Further, drawing upon the theory ofplanned behavior (TPB), the study developed a model to examine the influence ofindividual factors, including attitude and perceived behavioral control, as well as thesocial factor, such as subjective norm, on the intention to purchase customized
Achievement shopping
Adventureshopping
Idea shopping
Attitude
Purchase Intention
Perceived enjoyment
Subjective norms
Perceived behavior control
0.169(0.064)*
Fig. 1 Structural model test results. Note ***p < 0.001, **p < 0.01, *p < 0.05; only significantrelationships are presented; standardized estimates with standard errors in parentheses
Facing the Rising Consumer Sophistication … 17
apparel. The results point out the positive influence of shopping values and perceivedenjoyment on Chinese consumers’ purchase intention toward apparel customization.
Specifically, study results illustrate that perceived enjoyment of apparel cus-tomization is positively influenced by adventure shopping, idea shopping, andachievement shopping. Shopping values are critical psychological factors thatencourage consumers to adopt a certain behavior (Solomon & Rabolt, 2006).Consumers are motivated not only by the utilitarian value but also for the emotionalsatisfaction obtained during the shopping process. People with adventure shoppingvalue would like to seek freshness and excitement in order to escape from theaversive state of boredom (McGuire, 1974). Apparel customization requires con-sumers to participate in the co-design process, which may bring excitement to thoseconsumers with adventure shopping value; therefore, they may perceive the processenjoyable. Similarly, individuals with idea shopping value tend to go shopping tokeep up with new fashion trends, new products, and innovations (Arnold &Reynolds, 2003). Apparel customization requires that consumers be innovative andhave creative ideas. In addition, the co-design process in customization requiresconsumers to communicate and interact with the professional designer or retailer,which may provide consumers with a chance to gain knowledge about new styleand fashion ideas and fuel consumers’ enjoyment of the process. Achievementshopping values reflect the importance of accomplishment in what had beenplanned on a particular shopping trip (Kim, 2006). Apparel customization providesconsumers with an opportunity to get involved in the process of designing andmaking one-of-a-kind apparel products for themselves. Through apparel cus-tomization, consumers’ specific need for a unique style or better fit can be achieved.A feeling of accomplishment may convey an excitement to those consumers withachievement shopping values. To encourage more apparel customization amongChinese consumers, enhancing the entertainment aspect of co-design and empha-sizing the enjoyment and benefits of learning new fashion ideas would be beneficialfor the development of customization businesses. In order to stimulate Chineseconsumers to participate in apparel customization, marketers and retailers need tohighlight that the process of customization is going to be an adventurous andexciting experience. By participating in the process, consumers will not only learnnew fashion trends and style but also be able to get apparel products with better fitand unique style. Consumers will also feel a sense of achievement by learning newtrends and being productive in the shopping journey. In addition, retailers alsocould highlight the benefit of gaining pride of authorship through apparel cus-tomization, which may increase the perceived enjoyment of customization processand attract those consumers who put a high value on the shopping achievement.
As predicted, the positive relationship between perceived enjoyment andintention to purchase customized apparel products was confirmed, indicating thatthe perceived enjoyment of customization or co-design process increases con-sumers’ intention to participate in apparel customization, and they would be morelikely to get involved in customizing their own apparel products. This result isconsistent with previous research (Childers et al., 2001; Lee & Chang, 2011),confirming the positive influence of perceived enjoyment. In addition, the positive
18 C. Lang et al.
influences of perceived enjoyment on subjective norms, attitude, and perceivedbehavior control were also confirmed. Enjoyable feeling is an important motivatorfor people to get involved in a certain behavior. Individuals may engage in aparticular behavior and be more confident about their behavior if it yields fun andenjoyment. Customization requires the participation of consumers in the process ofco-design. In order to achieve the particular style they anticipate, consumers mayneed to try different choices provided by retailers. Not enjoying the activity ofcustomization may discourage consumers’ engagement in the process. Marketingfor apparel customization could highlight the benefit of self-design and the rewardsobtained from the co-design process, which might add value to apparel cus-tomization. In addition, retailers also can emphasize that necessary assistance fromprofessional designers will be available during the customization process, which isfun, creative, and interesting.
As stated earlier, consumers’ intention to purchase customized apparel productsneeds to be understood and explained by associating both personal shopping valuesand social factors. The theory of planned behavior (TPB), taking into account bothindividual and social factors, was adopted as the theoretical framework to analyzethe determinants of Chinese consumers’ intention toward purchasing customizedapparel products. Drawing upon TPB, the intention to purchase customized apparelwas proposed to be related to attitudes, subjective norms, and perceived behavioralcontrol. As predicted, the results confirmed that the three factors in the TPB modelcontribute significantly to the prediction of consumers’ intentions to purchasecustomized apparel products. The results suggest that the decision to get involved inapparel customization is a rational process wherein consumers take into accounttheir attitudes and abilities. Getting involved in the process of apparel customizationrequires consumers to be creative and to be confident about their personal style andabilities. Some technology skills may also be needed if they customize apparelproducts online. Individuals who have more positive beliefs about their abilities andskills in the process of apparel customization would be more confident in theirbehaviors; therefore, they would be more likely to participate in apparel cus-tomization in the future. The positive influence of subjective norms also correlateswith the collectivism core cultural value of Chinese consumers who tend to beinterdependent and are conformists (Hofstede, 1980). Shaping attitudes andreducing perceived difficulties of performing apparel customization are crucial asthey may help consumers develop a sense of personal confidence regarding apparelcustomization. For example, retailers can highlight that professional assistance fromdesigners will help to make the co-design process easy and fun.
Unexpectedly, although both adventure shopping and achievement shoppinghave no influence on any of the TPB variables, the influence of idea shopping onsubjective norms and perceived behavior control turned out to be significantlypositive. This result indicates that individuals who tend to gather information aboutnew trends through shopping usually have strong beliefs about their behaviors andare concerned with social pressure from others with regard to apparel customiza-tion. With the positive influence of subjective norms and perceived behavioralcontrol on the purchase intention toward apparel customization, the indirect
Facing the Rising Consumer Sophistication … 19
influence of idea shopping on the intention was confirmed. One suggestion forfashion retailers who provide customization services would be to offer videotapeservices by taking a video for consumers during the co-design process that capturesa memorable moment. This may encourage more consumers to participate inapparel customization and enhance the entertainment aspect of co-design, as well asthe value of learning new ideas. In addition, customization retailers also canemphasize the enjoyment and benefits of learning new fashion ideas in their mar-keting strategy, which will be beneficial for the promotion of apparel customizationbusinesses.
Conclusion and Limitations
Apparel customization may present a solution to reduce excessive textile waste byincreasing product longevity through building a solid emotional bond between theconsumer and customized products (Medini et al., 2015), because it results inpersonal attachment to customized styles and well-fitted garments (Armstrong et al.,2015), which might be kept for a longer period of time. Although customization hasgenerated much interest in the fashion industry, not many Chinese consumers getinvolved in the process of apparel customization. This research adds a uniquecontribution to the body of knowledge about Chinese consumers’ purchase inten-tion toward apparel customization by identifying the positive role of three shoppingvalues in the process of customization. The results also highlight the positiveinfluence of perceived enjoyment, attitude, perceived ability, and subjective normson the intention to purchase customized apparel products, as well as on the rela-tionships between shopping values and the intention.
In addition, the study successfully extended the TPB model by taking shoppingvalues and perceived enjoyment as the external factor in this model. Through astructural equation estimation, idea shopping value and perceived enjoyment wereproved to play an important role in the development of consumer attitude andsubjective norm, thereby influencing Chinese consumers’ intention to purchasecustomized apparel products.
Moreover, apparel customization serves to increase the longevity of the con-sumer–product relationship. It encourages consumers to be more sustainable byincreasing product longevity without requiring a pro-environmental attitude, whichmay also provide marketers and retailers with new directions in which to supportsustainability and simultaneously offer a new and innovative business model formeeting fashion needs while balancing the environmental costs.
This study has several limitations, and further study may be needed in future.Firstly, a convenience sample and online survey method were used to collect data inChina, which might limit the generalizability of the results. Second, the retailconcept of apparel customization was explained in one sentence; participants mayhave different interpretations as they pertain to understanding apparel customiza-tion, and this interpretation may have an influence on their response to the
20 C. Lang et al.
willingness to purchase customized products and generate bias. Third, althoughbehavioral intention has been used to measure behavior, the results are based onconsumers’ intention, rather than behavior. Longitudinal research, which traces themodel in association with behavior, would complement the findings of this study.
References
Abnett, K. (2015). Will mass customization works for fashion? Retrieved from https://www.businessoffashion.com/articles/intelligence/mass-customisation-fashion-nike-converse-burberry.
Ajzen, I. (1991). The theory of planned behavior. Organizational Behavior and Human DecisionProcesses, 50(2), 179–211.
Ajzen, I. (2002). Constructing a TpB questionnaire: Conceptual and methodological consider-ations. Retrieved from http://www.uni-bielefeld.de/ikg/zick/ajzen%20construction%20a%20tpb%20questionnaire.pdf.
Ajzen, I., & Fishbein, M. (1980). Understanding attitudes and predicting social behavior.Englewood Cliffs, NJ: Prentice-Hall.
Anderson, J. C., & Gerbing, D. W. (1988). Structural equation modeling in practice: A review andrecommended two-step approach. Psychological Bulletin, 103(3), 411–423.
Armstrong, C. M., Niinimäki, K., Kujala, S., Karell, E., & Lang, C. (2015). Sustainable fashionproduct service systems: An exploration in consumer acceptance of new consumption models.Journal of Cleaner Production, 97(15), 30–39.
Arnold, M. J., & Reynolds, K. E. (2003). Hedonic shopping motivations. Journal of Retailing,79(2), 77–95.
Atsmon, Y., Magni, M., Li, L., & Liao, W. (2012). Meet the 2020 Chinese consumer. Retrievedfrom http://www.mckinsey.com/global-themes/asia-pacific/meet-the-chinese-consumer-of-2020.
Birtwistle, G., & Moore, C. M. (2007). Fashion clothing-where does it all end up? InternationalJournal of Retail & Distribution Management, 35(3), 210–216.
Boer, C. R., Pedrazzoli, P., Bettoni, A., & Sorlini, M. (2013). Mass customization andsustainability: An assessment of framework and industrial implementation. London, UK:Springer.
Bruno, T. D., Nielsen, K., Taps, S. B., & Jorgensen, K. A. (2013). Sustainability evaluation ofmass customization. International Federation for Information Processing, 414, 175–182.
Chapman, J. (2009). Design for (emotional) durability. Design Issues, 25(4), 29–35.Childers, T. L., Carr, C. L., Peck, J., & Carson, S. (2001). Hedonic and utilitarian motivations for
online retail shopping behavior. Journal of Retailing, 77(4), 511–535.Cho, H., & Fiorito, S. S. (2009). Acceptance of online customization for apparel shopping.
International Journal of Retail & Distribution Management, 37(5), 389–407.Chung, Y. S. (2015). Hedonic and utilitarian shopping values in airport shopping behavior.
Journal of Air Transport Management, 49, 28–34.CIW Team. (December 29, 2016). Top WeChat stats and trends 2016. Retrieved from https://
www.chinainternetwatch.com/19524/wechat-data-report-2016/.Cortina, J. M. (1993). What is coefficient alpha? An examination of theory and applications.
Journal of Applied Psychology, 78(1), 98–104.Davis, F. D., Bagozzi, R. P., & Warshaw, P. R. (1992). Extrinsic and intrinsic motivation to use
computers in the workplace. Journal of Applied Social Psychology, 22(14), 1111–1132.Fiore, A. M., Lee, S., & Kunz, G. (2003). Psychographic variables affecting willingness to use
body-scanning. Journal of Business and Management, 9(3), 271–287.Fiore, A. M., Lee, S.-E., & Kunz, G. (2004). Individual differences, motivations, and willingness
to use a mass customization option for fashion products. European Journal of Marketing,38(7), 835–849.
Facing the Rising Consumer Sophistication … 21
Flynn, A., & Vencat, E. F. (2012). Custom nation: Why customization is the future of business andhow to profit from it. Dallas, TX: BenBella Books.
Fornell, C., & Larcker, D. F. (1981). Evaluating structural equation models with unobservablevariables and measurement error. Journal of Marketing Research, 18(1), 39–50.
Franke, N., & Schreier, M. (2008). Product uniqueness as a driver of customer utility in masscustomization. Market Lett, 19, 93–107.
Franke, N., & Schreier, M. (2010). Why customers value self-designed products: The importanceof process effort and enjoyment. Journal of Product Innovation Management, 27(7), 1020–1031.
Hofstede, G. (1980). Culture’s consequences. Beverly Hills, CA: Sage.Hu, L.-T., & Bentler, P. M. (1999). Cutoff criteria for fit indexes in covariance structure analysis:
Conventional criteria versus new alternatives. Structural Equation Modeling, 6(1), 1–31.Irani, N., & Hanzaee, K. H. (2011). The effects of variety-seeking buying tendency and price
sensitivity on utilitarian and hedonic value in apparel shopping satisfaction. InternationalJournal of Marketing Studies, 3(3), 89–103.
Jackson, D. L., Gillaspy, J. A. J., & Purc-Stephenson, R. (2009). Reporting practices inconfirmatory factor analysis: An overview and some recommendations. PsychologicalMethods, 14(1), 6–23.
Jayawardhena, C. (2004). Personal values’ influence on e-shopping attitude and behavior. InternetResearch, 14(2), 127–138.
Kamali, N., & Loker, S. (2002). Mass customization: On-line consumer involvement in productdesign. Journal of Computer-Mediated Communication, 7(4). Retrieved from http://onlinelibrary.wiley.com.fscproxy.framingham.edu/doi/10.1111/j.1083.
Kawamura, Y. (2005). Fashionology: An introduction to fashion studies. Oxford, England: Berg.Kesari, B., & Atulkar, S. (2016). Satisfaction of mall shoppers: A study on perceived utilitarian
and hedonic shopping values. Journal of Retailing and Consumer Services, 31, 22–31.Kidwell, B., & Jewell, R. D. (2003). An examination of perceived behavioral control: Internal and
external influences on intention. Psychology & Marketing, 20(7), 625–642.Kim, H.-S. (2006). Using hedonic and utilitarian shopping motivations to profile inner city
consumers. Journal of Shopping Center Research, 13(1), 57–79.Kim, H.-S., & Hong, H. (2011). Fashion leadership and hedonic shopping motivations of female
consumers. Clothing and Textiles Research Journal, 29(4), 314–330.Kline, R. B. (2010). Principles and practice of structural equation modeling (3rd ed.). New York,
NY: The Guilford Press.Lau, H. F., Sin, L. Y. M., & Chan, K. K. C. (2005). Chinese cross-border shopping: An empirical
study. Journal of Hospitality & Tourism Research, 29(1), 110–133.Lawless, E., & Medvedev, K. (2016). Assessment of sustainable design practices in the fashion
industry: Experiences of eight small sustainable design companies in the Northeastern andSoutheastern United States. International Journal of Fashion Design, Technology andEducation, 9(1), 41–50.
Lee, H.-H., & Chang, E. (2011). Consumer attitudes toward online mass customization: Anapplication of extended technology acceptance model. Journal of Computer-MediatedCommunication, 16, 171–200.
Lee, Y. K., & DeLong, M. (2017). American and Korean youths’ attachment to handcraft appareland its relation to sustainability. Clothing and Textiles Research Journal, 35(2), 67–80.
McGuire, W. J. (1974). Psychological motives and communication gratification. In J. G. Blumler& E. Katz (Eds.), The uses of mass communications: Current perspectives on gratificationsresearch. Beverly Hills, CA and London: Sage.
McKinney, E., Gill, S., Dorie, A., & Roth, S. (2017). Body-to-pattern relationships in women’strouser drafting methods: Implications for apparel mass customization. Clothing and TextilesResearch Journal, 35(1), 16–32.
Medini, K., Da Cunha, C., & Bernard, A. (2015). Tailoring performance evaluation to specificindustrial contexts—Application to sustainable mass customization enterprises. InternationalJournal of Production Research, 53(8), 2439–2456.
22 C. Lang et al.
Merle, A., Chandon, J.-L., Roux, E., & Alizon, F. (2010). Perceived value of the mass-customizedproduct and mass customization experience for individual consumers. Production andOperation Management, 19(5), 503–514.
Niinimäki, K. (2014). Sustainable consumer satisfaction in the context of clothing. In C. Vezzoli,C. Kohtala, & A. Srinivasan (Eds.), Product-service system design for sustainability. Sheffield:Greenleaf.
Niinimäki, K., & Hassi, L. (2011). Emerging design strategies in sustainable production andconsumption of textile and clothing. Journal of Cleaner Production, 19, 1876–1883.
Ou, Y. (2011). Apparel mass customization: Perceptions of young Chinese consumers. MasterThesis, the University of North Carolina at Greensboro.
Peterson, J. (2016). The co-design process in mass customization of complete garment knittedfashion products. Journal of Textile Science & Engineering, 6(4), 270–278.
Piller, F. T., & Müller, M. (2004). A new marketing approach to mass customization. InternationalJournal of Computer Integrated Manufacturing, 17(7), 583–593.
Piller, F. T., Schubert, P., Koch, M., & Moslein, K. (2005). Overcoming mass confusion:Collaborative customer co-design in online communities. Journal of Computer-MediatedCommunication, 10(4). https://doi.org/10.1111/j.1083-6101.2005.tb00271.x.
Piller, F. T., & Tseng, M. M. (2010). Handbook of research in mass customization andpersonalization. Singapore: World Scientific.
Pine, B. J. I. I. I. (1993). Mass customization: The new frontier in business competition. Boston,MA: Harvard Business School Press.
Ravenhall, L. (2012). Fast fashion and the destruction of developing countries. Retrieved fromhttp://www.ecooutfitters.co.uk/blog/fast-fashion-the-destruction-of-developing-countries/.
Salazar, H. A., Oerlemans, L., & van Stroe-Biezen, S. (2013). Social influence on sustainableconsumption: Evidence from a behavioral experiment. International Journal of ConsumerStudies, 37(2), 172–180.
Salvador, F., De Holan, P. M., & Piller, F. (2009). Cracking the code of mass customization. MITSloan Management Review, 50(3), 71–78.
Sanders, E. B. N., & Stappers, P. J. (2015). Probes, toolkits and prototypes: Three approaches tomaking in codesigning. CoDesign: International Journal of CoCreation in Design and theArts, 10(1), 5–14.
Schreier, M. (2006). The value increment of mass-customized products: An empirical assessment.Journal of Consumer Behavior, 5, 317–327.
Senanayake, M. M., & Little, T. J. (2010). Mass customization: Points and extent of apparelcustomization. Journal of Fashion Marketing and Management, 14(2), 282–299.
Sherman, L. (2014). Customizable fashion is on the rise. Retrieved from http://fashionista.com/2014/06/customization-apparel-fashion.
Solomon, M. R., & Rabolt, N. J. (2006). Consumer behavior in fashion. Upper Saddle River, NJ:Prentice-Hall.
Steen, M., Manschot, M., & Koning, N. D. (2011). Benefits of co-design in service design project.International Journal of Design, 5(2), 53–60.
Teo, T. S. H., Lim, V. K. G., & Lai, R. Y. C. (1999). Intrinsic and extrinsic motivation in internetusage. International Journal of Management Science, 27, 25–37.
To, P. L., Liao, C., & Lin, T. H. (2007). Shopping motivations on Internet: A study based onutilitarian and hedonic value. Technovation, 27(12), 774–787.
Tseng, M. M., & Piller, F. (2003). The customer centric enterprise: Advances in masscustomization and personalization. New York, NY: Springer.
Xu, Y., Chen, Y., Burman, R., & Zhao, H. (2014). Second-hand clothing consumption: Across-cultural comparison between American and Chinese young consumers. InternationalJournal of Consumer Studies, 38(6), 670–677.
Xu, Y., & McGehee, N. G. (2012). Shopping behavior of Chinese tourists visiting the UnitedStates: Letting the shoppers do the talking. Tourism Management, 33(2), 427–430.
Xue, H. Y., Zhang, X. J., & Wang, Y. Q. (2014). Research on the disposal strategy of wastetextiles. Applied Mechanics and Materials, 522, 817–820.
Facing the Rising Consumer Sophistication … 23
What Will Trigger a Non-buyerto Become a Buyer in China’s LuxuryGoods Market? Culturaland Demographic Influences
Dong Shen, Jingxi Qian and Ying Jiang
Abstract The purpose of this study is to identify what triggers Chinese consumersto become a luxury goods buyer from a non-buyer. The objectives of this study are:(1) to compare Chinese luxury goods buyers and non-buyers by examining theirkey differences; (2) to identify potential cultural and demographic determinants ofChinese consumers’ final purchase of luxury goods; and (3) to explore the effectivestrategies of how to trigger more consumers to purchase luxury goods in China.A survey was conducted in summer 2016 in China through WeChat, a social mediaapp, and a total of 1,549 returned questionnaires were useful. Factor analysis,MANOVA, and logistic regression were chosen for data analyses. The results showthat Chinese luxury goods buyers and non-buyers are significantly different in bothcultural orientation and demographics. Chinese luxury goods buyers are short-termoriented, individualism focused, and power/status focused, whereas non-buyers aremore long-term oriented, collectivism focused, and less power/status focused. Theyshow significant differences in education level, family income, and location ofresidence. Chinese luxury goods buyers are more likely to be consumers who havehigher family income, have higher education level, and live in more advanced anddeveloped cities. Non-buyers have strong interest in luxury goods and show strongpurchase intention. The high price point is the main issue. When they are ready tomake the first purchase, they are more likely to buy luxury watches, clothing,
D. Shen (&)Fashion Merchandising and Design, Department of Family and Consumer Sciences,College of Social Science and Interdisciplinary Studies, California State University,MS 6053, 6000 J Street, Sacramento, CA 95819, USAe-mail: [email protected]
J. QianSchool of Fashion Communication, Beijing Institute of Fashion Technology,Beijing, People’s Republic of Chinae-mail: [email protected]
Y. JiangSchool of Business, Beijing Institute of Fashion Technology, Beijing,People’s Republic of Chinae-mail: [email protected]
© Springer Nature Singapore Pte Ltd. 2018Y. Xu et al. (eds.), Chinese Consumers and the Fashion Market, Springer Seriesin Fashion Business, https://doi.org/10.1007/978-981-10-8429-4_2
25
cosmetics, or accessories in mainland China off-line. Implications and limitationsare addressed.
Keywords Consumers � China � Luxury � Culture � Demographics
Introduction
Luxury goods is defined in different ways, such as a philosophical–sociologicalapproach, a micro-economic approach, or a managerial approach. Wiedmann,Hennigs, and Siebels (2007) define luxury as a multidimensional construct,including value perception of financial dimension (price value), functional dimen-sion (usability, quality, uniqueness), individual dimension (self-identity, hedonicvalue, materialistic value), and social dimension (conspicuousness, prestige). Heineand Phan (2011) address the current lack of consumer-oriented approach anddevelop a comprehensive definition of luxury goods—“luxury goods have morethan necessary and ordinary characteristics compared to other products of theircategory, which include their relatively high level of price, quality, aesthetics,rarity, extraordinarity, and symbolic meaning.”
After slowing sales due to factors such as fears of terrorist attacks and currencyfluctuations that kept many tourists away from cities including Paris, the luxurygoods market will return to growth with an estimate of a global personal luxurygoods market of close to $300 billion in 2017 (Bain & Company, 2017). Being arelatively new comer to the world luxury goods market at the beginning of thetwenty-first century, China has taken a more leading role recently. In 2012, Chinaofficially overtook the USA as the world’s biggest consumer nation of luxury goodsfor the first time (Doran, 2013). China’s luxury spending in 2015 was at$16.8 billion (Horton, 2016). Chinese consumers account for the largest portion ofluxury goods purchases (31%), followed by Americans (24%) and Europeans(18%) (D’Arpizio, Levato, Zito, & Montgolfier, 2015). It is estimated that over thenext five years, Chinese luxury consumers will continue to drive growth as theymaintain the biggest bloc of luxury shoppers globally, and by 2020, Chineseshoppers will make 34% of the total sale (Flora, 2016).
Even though China has become a key player in the global luxury market, muchattention in both academics and business practices has been paid to the Chineseconsumers who have purchased luxury goods. The luxury goods buyers have beenresearched immensely on their purchase motivation, attitudes, purchase intention,determinants of their purchase, and profiling (Black, 2007; Prendergast & Wong,2003; Roll, 2017; Wang, 2008). In contrast, little has been studied on thenon-buyers. However, the ones who have not purchased luxury goods in China mayhave an enormous potential and they might become new buyers quickly. In 2009,33% of the total luxury market in China came from existing customers, whereas67% came from first-time buyers. In 2010, 37% of the sales came from existingcustomers compared to 63% came from new buyers (Bain Co., 2011). If about two
26 D. Shen et al.
out of three Chinese luxury goods consumers are first-time buyers, studying thenon-buyers and identifying their potentials are critical and necessary. In 2013, about2% of Chinese population bought 30% of all luxury goods worldwide (Said, 2013).Looking at China’s market with close to 1.4 billion population, it is obvious thatnot everyone is or will be a luxury goods consumer. However, studying the 98% of1.4 billion population to explore their potentials, especially to identify what kind ofnon-buyers in this group are more likely to become luxury goods buyers, will betremendously valuable. Therefore, this study puts focus on the comparison betweenthe buyers and non-buyers of luxury goods. Furthermore, this study goes beyond asimple comparison between the buyers and non-buyers by taking a step further witha purpose of identifying what can trigger the non-buyers to become luxury goodsbuyers. The objectives of this study are: (1) to compare Chinese luxury goodsbuyers and non-buyers and examine their key differences; (2) to identify potentialcultural and demographic determinants of Chinese consumers’ final purchase ofluxury goods; and (3) to explore effective strategies of how to trigger more con-sumers to purchase luxury goods in China.
This project is unique and significant. First, by focusing on luxury goodsnon-buyers rather than buyers, this study can bring an important addition to thecurrent literature by filling a missing component to the research on luxury market.This contribution to the academic world can not only add the missing part to thecurrent literature, but enrich the research on luxury goods consumers through amore complete angle from both buyers and non-buyers. Second, the results of thisproject can be of great interest to luxury goods companies. Since China’s luxurygoods market has become a major target for many luxury brands, it is undeniablyimportant to have a thorough understanding of that market, especially the potentialmarket given the fact that two-thirds of the luxury goods buyers are first-timebuyers in China. Specifically, this study focuses on Chinese consumers’ culturalorientation and demographics, and examines whether the buyers and non-buyersshow differences in these dimensions. Examining the key differences between thebuyers and non-buyers and identifying the determinants which can trigger thenon-buyers to become buyers will be significant contributions to the businesspractitioners.
Literature Review and Conceptual Framework
Purchase Intention Versus Actual Purchase
Among research on consumer behavior, purchase intention is often chosen ratherthan actual purchase mainly because it is a more feasible measurement. A similarpattern exists in the research on Chinese luxury goods consumers as well. Zhangand Kim (2013) examined factors that affected Chinese consumers’ attitude towardpurchasing luxury fashion goods and purchase intention. When a cross-cultural
What Will Trigger a Non-buyer to Become a Buyer … 27
study was conducted by Bian and Forsythe (2012) to examine American andChinese consumers, again, purchase intention was investigated rather than actualpurchase. Li, Li, and Kambele (2012) tried a more realistic approach by examiningChinese consumers’ willingness to pay for luxury fashion brands related to theirfashion lifestyle and perceived value. But willingness to pay is still very differentfrom the final actual purchasing behavior.
Compared to purchase intention, actual purchase behavior is more valuable andreliable. Even though research has approved that there is a correlation betweenpurchase intention and final purchase (Bemmaor, 1995; Newberry, Kleinz, &Boshoff, 2003), these are still two different concepts. It is not unusual to seeconsumers who have a higher purchase intention end up not making the finalpurchase due to various reasons. It is also not surprising to see consumers who havea lower purchase intention eventually make the final purchase. Purchase intention isa strong, but imperfect, predictor of purchasing. The strength of this relationshipcan vary quite a bit. Sheppard, Hartwick, and Warshaw (1988) found that theaverage correlation for the intention–behavior relationship was 0.53 ranging from0.15 to 0.92. Morwitz, Steckel, and Gupta (2007) took a further look at the factorswhich had impact on the correlation between purchase intention and actual pur-chase, and they found that intentions were more correlated with purchases forexisting products than for new ones; and more correlated when consumers wereasked to provide intentions to purchase specific brands than when they were askedto provide intentions to buy at the product category level. Even though luxurygoods have been existing in the Western market for many decades, it is still rela-tively new in China. For many Chinese consumers, luxury brands, luxury products,and luxury lifestyle are still new concepts. In addition, this study was to examinethe overall luxury goods market in China rather than a specific brand. Therefore, arelatively low correlation between purchase intention and actual purchase isunavoidable. Thus, by asking their actual purchase behavior rather than their pur-chase intention, this study identified whether a Chinese consumer was a luxurygoods buyer or non-buyer by using two versions of questionnaires assignedaccordingly. With two sets of data collected, comparing the buyers and non-buyersand investigating what can trigger the non-buyers to become buyers of luxurygoods become possible and significant.
Cultural Influence
Culture has an important influence on human behavior, with the assumption that anindividual’s behavior usually reflects their cultural value system. Adler (1997)developed a cultural–behavior model showing a chain effect starting from culturalinfluence on human attitude, then from attitude to final behavior. It is inevitable thatsuch a pervasive force will influence how individuals act in a consumer context,because consumers often see things through the lens of culture (Teimourpour &Hanzaee, 2011). One of the most recognized cultural frameworks is established by
28 D. Shen et al.
Hofstede (2001), who introduced cultural framework based on five dimensions:power distance, individualism/collectivism, masculinity/femininity, uncertaintyavoidance, and long-term orientation/short-term orientation. The framework pro-vides scales from 0 to 100 for 76 countries for each dimension, and each countryhas a position on each scale. Although the country scores were originally producedin the early 1970s, over 200 external comparative studies and replications haveproved that country ranking in his data is still valid (Hofstede, 2001). In addition,Hofstede’s cultural dimensions not only have been validated by many studies forexplaining national differences, but have been also used for examining culturaldifferences at the individual levels. His work has been cited over 85,000 timesshowing its popularity and impact (Tung & Verbeke, 2010).
According to Hofstede (2001), power distance index (PDI) refers to theacceptance degree of unequally distributed power in organizations or families.Power and inequality are extremely fundamental facts of any society. Even thoughall societies are unequal, some are more unequal than others. Cultures with a highPDI tend to be more accepting of social hierarchies and authority. The countrieswith the highest PDI are mostly Eastern countries, whereas the counties with thelowest PDI are mostly Western countries (Hofstede, 2001). In Hofstede’s model(2001), China scored 80 out of 100 compared to the USA with a score of 40. Thisindicates that Chinese expect and accept a high degree of social inequality andauthority, and in turn, they strive for higher social status and authority to gain andmaintain more power (Lau, 1988). The social dimension of luxury goods putsspecific emphases on conspicuousness and prestige (Jung & Shen, 2011). Theassociation with the upper social class remains an important aspect of luxury today(Kapferer, 1997; Nueno & Quelch, 1998). Research has shown that in the newemerging sociological dynamics of China, status plays a much higher role than inmore stable and mature societies (Khairullah & Khairullah, 2013). Therefore,Chinese consumers look for means to show off or boost their status. Among thesuper-rich, conspicuous consumption is common to show off their wealth; andamong the middle-class, buying and wearing luxury goods is seen as a passport forentering elite social circles (Lin & Wang, 2010). Buying and consuming luxurygoods is one of the effective tools because luxury goods symbolize high social classand prestigious social elite which are all associated with high income, highauthority, and more power. Therefore,
H1a. There is a significant difference of PDI between the luxury goods buyers andnon-buyers in China.
H1b. The higher PDI, the more likely for Chinese consumers to purchase luxurygoods.
Collectivism refers to the degree of which individuals are integrated into groupsand individualism (IDV) is on the opposite side (Hofstede, 2001). In collectivistsocieties where the group orientation is emphasized, individuals are likely to feelpressured to conform to group norms. On the individualist side, when the tiesbetween individuals are loose, everybody is expected to focus on themselves—theirown success, their own benefit, their own needs and wants, and their own goals.
What Will Trigger a Non-buyer to Become a Buyer … 29
People who can show their own uniqueness are often looked up to; thus, everyonewants to be unique including a unique appearance and wardrobe. Most Westernsocieties such as the USA are known to be individualistic while most Easternsocieties such as China are collectivistic as groups’ objectives and success are moreimportant than individual achievement. China only scores 20 out of 100 inHofstede’s cultural dimensions in contrast with the USA’s score of 91 (Hofstede,2001). Therefore, China is a society with a strong collectivism influence. Eventoday when Chinese younger generations are more influenced by the Westernculture, their ways of expressing individualism remains understated within thecontext of the social barriers of a Confucian society. It is observed that becauseChina is not a truly individual culture, even ambitious Chinese youth show off in anunderstated way so that the tone and the manner of these independent attitudes aresubtle and slight (Keller, Wang, Cooney, Erstad, & Lu, 2015). Since luxury alwayshas a high premium price which is not affordable by the vast majority of thepopulation, this high price contributes to the exclusivity and rarity of the offer(Chen & Lamberti, 2015). Luxury goods are closely tied with uniqueness andindividualism because the individual dimension of luxury goods focuses onself-identity, hedonic value, materialistic value, self-satisfaction, andself-accomplishment (Jung & Shen, 2011). Therefore,
H2a. There is significant difference of IDV between the luxury goods buyers andnon-buyers in China.
H2b. The higher IDV, the more likely for Chinese consumers to buy luxurygoods.
Masculinity (MAS) versus its opposite, femininity, refers to the distribution ofroles between the genders (Hofstede, 2001). The women in feminine countries havethe same modest, caring values as the men. In the masculine countries, they aresomewhat assertive and competitive, but not as much as the men, so that thesecountries show a gap between men’s values and women’s values (Teimourpour &Hanzaee, 2011). The gender gap can be often reflected in many aspects of a society,such as employment opportunities, salary ranges, professional choices, and familyroles. Another very visible aspect is through appearance in that women would dressmore feminine whereas man would look more masculine. China’s score in thisdimension is 66 out of 100 compared to the USA with a score of 62 (Hofstede,2001), which does not show a sizable gap, especially when compared to otherdimensions (Shi & Wang, 2011). More importantly, luxury goods as a whole isneither masculine nor feminine. There are certain brands or certain product linesemphasizing masculinity and others emphasizing femininity. But no gender ten-dency exists in the luxury market as a whole. Because this study focuses on theluxury goods market as a whole rather than a particular luxury brand or productcategory, there should be no high correlation between MAS and luxury goodspurchase. Therefore,
30 D. Shen et al.
H3. There is no significant difference of MAS between the luxury goods buyersand non-buyers in China.
Uncertainty avoidance (UAI) deals with a society’s tolerance for uncertainty andambiguity (Hofstede, 2001). UAI is defined as the extent of feeling “threatened byuncertain or unknown situations” (Hofstede, 1980, p. 113) as members of a societymay be more or less tolerant of uncertain and ambiguous than those of othersocieties. Unstructured situations are novel, unknown, surprising, and different fromusual. Uncertainty-avoiding cultures try to minimize the possibility of such situa-tions through strict laws and rules, safety and security measures, and any othermeans. The opposite type, uncertainty-accepting cultures try to have as few rules aspossible and they are relativist and allow many currents to flow side by side(Teimourpour & Hanzaee, 2011). The Chinese culture scores 40 compared to theUS score of 46 on this UAI dimension (Hofstede, 1980).
Luxury goods are new products to many Chinese, especially the non-buyers.However, what defines luxury goods is its highest-ranked quality. Buying luxurygoods can warrant consumers the best quality, which can lower any purchasinguncertainty. Therefore,
H4a. There is a significant difference of UAI between the luxury goods buyers andnon-buyers in China.
H4b. The higher UAI, the more likely for Chinese consumers to purchase luxurygoods.
Long-term orientation (LTO) is the fifth dimension of Hofstede’s framework.LTO stands for the fostering of virtues oriented toward future rewards, in particularperseverance and thrift. Its opposite pole, short-term orientation, stands for thefostering of virtues related to the present (Hofstede, 2001). Some characteristics oflong-term orientation include persistence, leisure time not too important, save, andbe thrifty, whereas short-term orientation emphasizes quick results, leisure timeimportance, and spending. China scored 118 in this dimension compared to the USscore of 29 (Hofstede, 1980), showing that Chinese culture is extremely long-termorientated (Shi & Wang, 2011). Given the characteristics of luxury goods andluxury goods consumption, the extremely high price is definitely against the basicfocus of long-term orientation on being thrifty. For consumers who live more forthe present than for the future, big spending on luxury goods is more likely tohappen than long-term oriented consumers. Therefore,
H5a. There is significant difference of LTO between the luxury goods buyers andnon-buyers in China.
H5b. The higher LTO, the less likely for Chinese consumers to buy luxury goods.
What Will Trigger a Non-buyer to Become a Buyer … 31
Demographics
The current literature has consistently shown consumer demographic impact onpurchase behavior. Individual consumer’s age, gender, income, education, maritalstatus, location of residence, and other demographic variables can influence con-sumers on different levels and in different ways. Similarly, luxury goods purchasebehavior can also be influenced by consumer demographics. When China’s luxurygoods market is studied, research has been mainly done by focusing on Chineseconsumers who have bought luxury goods, such as Black (2007) and Wang (2008).Do non-buyers show significant differences in demographic variables when they arecompared to the luxury goods buyers? Are there specific demographic variables thathold Chinese non-buyers back from making the final purchase of luxury goods?Here, the most common six demographic variables, income, education, age, gender,marital status, and location of residence, are discussed and examined.
Since luxury goods always have a high price point, consumers’ income level isoften associated with luxury goods purchase. In contrast with necessity goods,luxury goods are more expensive and are often bought by individuals who have ahigher disposable income or greater accumulated wealth than the average (Heine &Phan, 2011). In China, the luxury goods buyers of the past were the ultra-rich(Ben-Shabat, 2015). The super-rich who have accumulated enormous amounts ofwealth emerged in the last couple of decades created by the soaring Chineseeconomy. They could be coal mine owners from Shanxi Province or companyowners from Wenzhou in Zhejiang Province, known for its tradition of runningsmall businesses. They could also be real-estate developers who have made millionsin big city property deals, or prominent factory owners from the Pearl River deltaarea, where many international brands have been manufacturing since the “opendoor” policy allowed them into the country (Anonymous, 2007). Therefore,
H6a. There is significant difference of income between the luxury goods buyersand non-buyers in China.
H6b. The higher the income, the more likely for Chinese consumers to buy luxurygoods.
Education is often highly correlated with income level. Gregorio and Lee (2002)present empirical evidence on how education is related to income distribution in apanel data set covering a broad range of countries for the period between 1960 and1990 by finding that a higher educational attainment plays a significant role in ahigher income level. In China, education is seen as the most important tool byChinese parents for their kids’ future, because investing in education is consideredto be an important strategy to promote higher standards of living in China(Heckman, 2003). Wang (2011) found that in China, education indeed reducesearnings inequality while increasing individuals’ earnings. Also, Chinese who havehigher education level tend to have more exposure to Western culture by travelingabroad, receiving Western education, accessing to Western social media, andthrough other channels. Therefore,
32 D. Shen et al.
H7a. There is significant difference of education level between the luxury goodsbuyers and non-buyers in China.
H7b. The higher the education level, the more likely for Chinese consumers tobuy luxury goods.
The global luxury market used to be dominated by relatively older consumers,and today they are still part of the picture (Ben-Shabat, 2015). In China, consumersaged 35–50 have formed their dominating role in the luxury market. Individualsaged 30–34 in China made the highest average gross income in 2015; however, theage segment 45–49 represented the largest proportion among Chinese in the topincome segment (Roberts, 2016). According to the forecast, by 2030 the age groupof 40–44 in China will become the most prominent among the country’s top incomeearners, representing opportunities for luxury goods (Roberts, 2016).
Meanwhile, younger consumers, especially Millennials, have started to make upan increasingly large share of the luxury market in China. The popular nickname forthis Millennials generation is the little emperors and empresses, referring to theirstatus as the only child in their families. While older generations may be moreprice-conscious and less brand oriented, China’s youngsters do not share the sameviews (Wassner, 2009). They are more likely to be compulsive in their spendingdue to the desire to seek power and prestige (Li, Jiang, An, Shen, & Jin, 2009).They tend to engage in conspicuous consumption such as purchasing luxury goods.Also, due to the family and competitive pressure, it is important for them to pur-chase products and brands to impress their peers (Zhao & Belk, 2007). Overall,China’s younger generation has far more inclination to spend than to save. Withgreat potentials in both older generation who have higher earnings and youngergeneration who has higher desire for luxury goods in China, the followinghypothesis is developed:
H8. There is no significant age difference between the luxury goods buyers andnon-buyers in China.
In the global luxury market, female consumers have outperformed male con-sumers (Stokburger-Sauer & Teichmann, 2013). However, rapid global growth inmale apparel and grooming categories is helping to balance the scales (Ben-Shabat,2015). In contrast, an opposite pattern is observed in China. Chinese luxury markethas been mainly male-driven because it has been the only market in the worldwhere men consume many more luxury goods than women (Olivier, 2013). Menaccount for at least 55% of China’s luxury market, well above the global average of40% (O’Connell, 2013). However, recently, due to the impact of the government’santi-corruption measures, Chinese male consumers’ dominating role in luxuryspending due to their culture of sealing deal through gifting has changed. In 2013,female consumers accounted for around half of all Chinese luxury buyers, repre-senting an enormous growth from 1995 when 90% of luxury buyers were male, andthis trend has kept going (Dawson, 2014). Today, women in China are gainingeconomic independence and are reaching a point of having their own money tospend on luxury items. Each year, 76% of China’s female college graduates aspire
What Will Trigger a Non-buyer to Become a Buyer … 33
to management positions, compared with 52% of their US counterparts. And Chinais home to 11 of the world’s 20 richest self-made women, and it boasts 153 femaleyuan billionaires (around $150 million) (Burkitt, 2011). In a market where maleconsumers used to be the more dominating buyers of luxury goods, and femaleconsumers have gradually caught up in the recent years, the following hypothesis isdeveloped:
H9. There is no significant gender difference between the luxury goods buyers andnon-buyers in China.
Singles might have more disposable income to invest in themselves than infamily and children. However, due to the traditional Chinese cultural influence,most Chinese get married before they turn 30. Single Chinese are often youngerthan married ones, which means that their annual incomes are lower as well.However, even though married Chinese are more likely to make more money, theyhave more responsibilities to their family and children, which may lead to lessdisposable income.
In addition, singles often pay more attention to their public image and are moreself-focused, which makes them being more interested in luxury goods due to thesocial dimension and individual dimension of luxury goods. However, becausemarried consumers in China tend to be older than singles and as a result, they aremore likely to have a better-established career than singles, the work-settingpressure for successful and prestigious looks may push the married consumers tomake purchases of luxury goods. Therefore, when both married Chinese and singleChinese have their desires for luxury goods, the following hypothesis is developed:
H10. There is no significant difference of marital status between the luxury goodsbuyers and non-buyers in China.
Location of residence can directly relate to consumer behavior due to a variety ofreasons such as living standard, climate, regional culture. Given luxury goodscharacteristics such as premium price point, uniqueness, and rareness, Chineseconsumers living in different parts of the country have shown visible differences inluxury goods consumption. Being the tier-one cities, Shanghai, Beijing,Guangzhou, and Shenzhen account for 30% of wealthy Chinese (McKinsey, 2011).Meanwhile, growing wealth beyond tier-one cities has been creating several geo-graphic markets with sizable pools of luxury goods consumers. Many of theChina’s tier-two cities, such as Hangzhou and Nanjing, even smaller tier-two cities,such as Qingdao and Wuxi, have become large enough to justify the presence ofluxury stores catering to them (Atsmon, Dixit, & Wu, 2011). The luxury goodsmarket will remain concentrated in the top 36 major cities in China mainly due totheir economic development, which will account for 74% of the market’s growthand 76% of total luxury sales by 2015 (Atsmon et al., 2011). Therefore,
34 D. Shen et al.
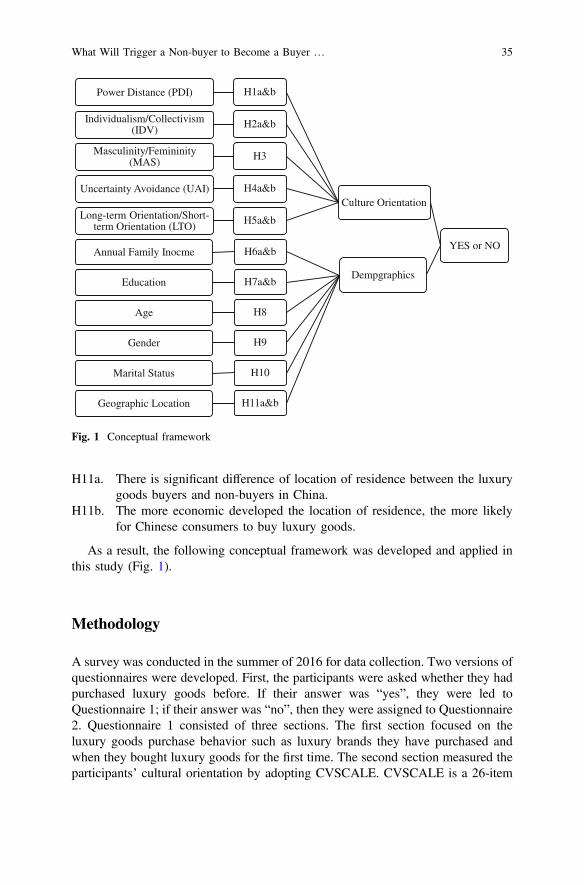
H11a. There is significant difference of location of residence between the luxurygoods buyers and non-buyers in China.
H11b. The more economic developed the location of residence, the more likelyfor Chinese consumers to buy luxury goods.
As a result, the following conceptual framework was developed and applied inthis study (Fig. 1).
Methodology
A survey was conducted in the summer of 2016 for data collection. Two versions ofquestionnaires were developed. First, the participants were asked whether they hadpurchased luxury goods before. If their answer was “yes”, they were led toQuestionnaire 1; if their answer was “no”, then they were assigned to Questionnaire2. Questionnaire 1 consisted of three sections. The first section focused on theluxury goods purchase behavior such as luxury brands they have purchased andwhen they bought luxury goods for the first time. The second section measured theparticipants’ cultural orientation by adopting CVSCALE. CVSCALE is a 26-item
YES or NO
Culture Orientation
H1a&bPower Distance (PDI)
H2a&bIndividualism/Collectivism (IDV)
H3Masculinity/Femininity (MAS)
H4a&bUncertainty Avoidance (UAI)
H5a&bLong-term Orientation/Short-term Orientation (LTO)
Dempgraphics
H6a&bAnnual Family Inocme
H7a&bEducation
H8Age
H9Gender
H10Marital Status
H11a&bGeographic Location
Fig. 1 Conceptual framework
What Will Trigger a Non-buyer to Become a Buyer … 35
five-dimensional scale of individual cultural values that assesses Hofstede’s culturaldimensions at the individual level, which has shown adequate reliability, validity,and across-sample and across-national generalizability (Yoo, Donthu, &Lenartowicz, 2011). “People in higher positions should make most decisionswithout consulting people in lower positions” and “People in higher positionsshould avoid social interaction with people in lower positions” are examples of PDIitems. “Individuals should sacrifice self-interest for the group” and “Group successis more important than individual success” are examples of IDV items. “It is moreimportant for men to have a professional career than it is for women” and “Thereare some jobs that a man can always do better than a woman” are examples of MASitems. “Standardized work procedures are helpful” and “Instructions for operationsare important” are examples of UAI items. “Personal steadiness and stability” and“Giving up today’s fun for success in the future” are examples of LTO items. Thelast section focused on demographics. In Questionnaire 2, the participants who havenot purchased luxury goods before were measured on their possible behavior onluxury goods purchase, such as their willingness to purchase luxury goods, and thereasons why they have not made a purchase yet. Then the second section measuredthe participants’ cultural orientation by using CVSCALE. The last section focusedon demographics.
Both versions of questionnaire were originally written in English and thentranslated into Chinese by one of the researchers. Another two bilingual Chineseresearchers confirmed the translation accuracy. The Chinese version of the ques-tionnaire was then pre-tested by two groups of Chinese college students with 20 ofeach, one group for Questionnaire 1 and the other group for Questionnaire 2, forclarity and accuracy. Based on the feedback from the respondents, the question-naires were slightly modified to make it clear and understandable. The answersfrom the pretest were not included in the main data analysis.
Because the main goal of this research is to study the potential luxury goodsmarket in China, reaching out to Chinese consumers in various regions and places iscritical. Therefore, an online survey became a better option. Specifically, WeChat, asocial media app, was selected to distribute the questionnaire. WeChat, which issimilar to Facebook, is a cross-platform instant messaging service developed inChina in 2011. Being one of the largest stand-alone messaging apps, it has over abillion accounts and 700 million active users from all over China in 2016(Wikipedia, 2016). College students and staff members at a university in Beijingwere involved in the final data collection in the summer of 2016. On WeChat, eachof them has their groups of friends, who reside all over the country in different citiesand regions. They sent the survey link to each friend on WeChat and based on howthe participant answered the first question, “whether you have purchased luxurygoods before?”, the app led the participant to the right version of the questionnaires.Total 55 students and staff were participants who sent the survey link to theirWeChat groups, which generated a pool with potential 2,498 subjects. Eventually,1,549 useful questionnaires were returned with a 62% return rate.
36 D. Shen et al.
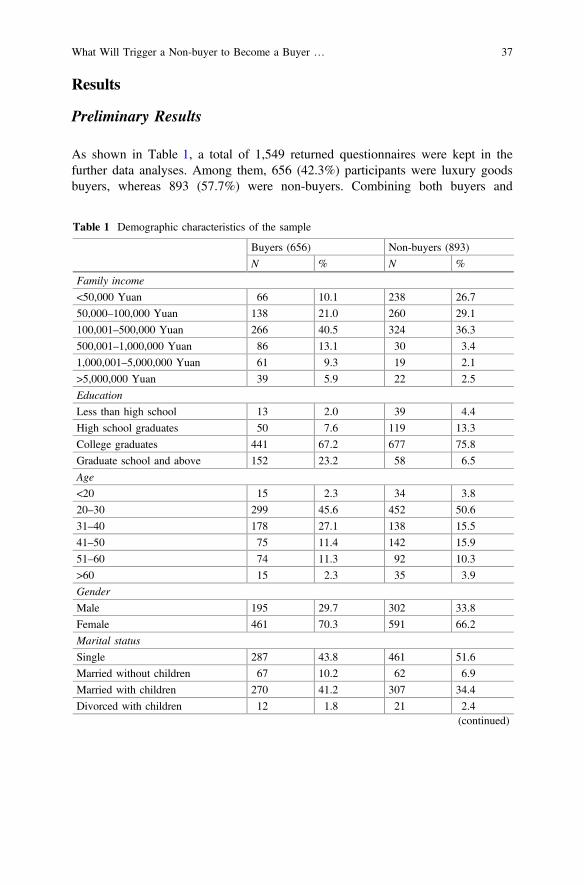
Results
Preliminary Results
As shown in Table 1, a total of 1,549 returned questionnaires were kept in thefurther data analyses. Among them, 656 (42.3%) participants were luxury goodsbuyers, whereas 893 (57.7%) were non-buyers. Combining both buyers and
Table 1 Demographic characteristics of the sample
Buyers (656) Non-buyers (893)
N % N %
Family income
<50,000 Yuan 66 10.1 238 26.7
50,000–100,000 Yuan 138 21.0 260 29.1
100,001–500,000 Yuan 266 40.5 324 36.3
500,001–1,000,000 Yuan 86 13.1 30 3.4
1,000,001–5,000,000 Yuan 61 9.3 19 2.1
>5,000,000 Yuan 39 5.9 22 2.5
Education
Less than high school 13 2.0 39 4.4
High school graduates 50 7.6 119 13.3
College graduates 441 67.2 677 75.8
Graduate school and above 152 23.2 58 6.5
Age
<20 15 2.3 34 3.8
20–30 299 45.6 452 50.6
31–40 178 27.1 138 15.5
41–50 75 11.4 142 15.9
51–60 74 11.3 92 10.3
>60 15 2.3 35 3.9
Gender
Male 195 29.7 302 33.8
Female 461 70.3 591 66.2
Marital status
Single 287 43.8 461 51.6
Married without children 67 10.2 62 6.9
Married with children 270 41.2 307 34.4
Divorced with children 12 1.8 21 2.4(continued)
What Will Trigger a Non-buyer to Become a Buyer … 37
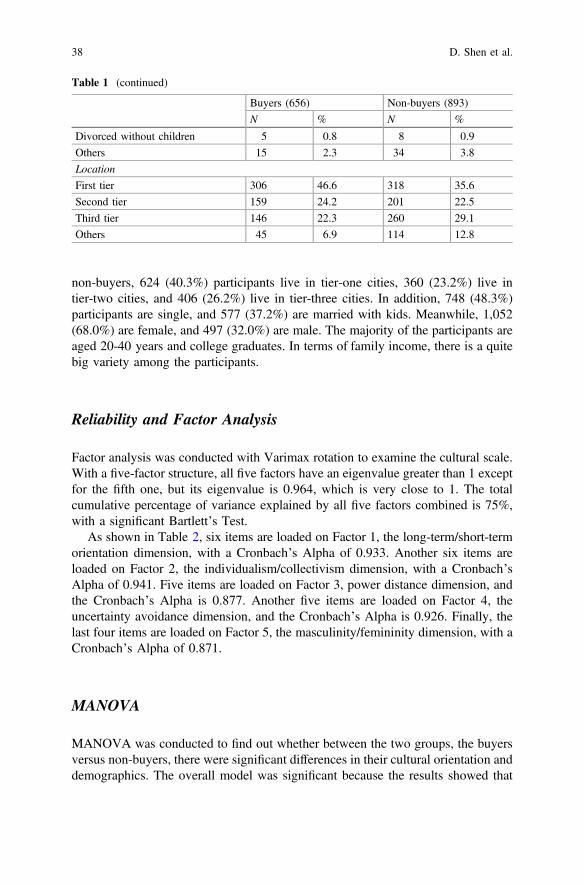
non-buyers, 624 (40.3%) participants live in tier-one cities, 360 (23.2%) live intier-two cities, and 406 (26.2%) live in tier-three cities. In addition, 748 (48.3%)participants are single, and 577 (37.2%) are married with kids. Meanwhile, 1,052(68.0%) are female, and 497 (32.0%) are male. The majority of the participants areaged 20-40 years and college graduates. In terms of family income, there is a quitebig variety among the participants.
Reliability and Factor Analysis
Factor analysis was conducted with Varimax rotation to examine the cultural scale.With a five-factor structure, all five factors have an eigenvalue greater than 1 exceptfor the fifth one, but its eigenvalue is 0.964, which is very close to 1. The totalcumulative percentage of variance explained by all five factors combined is 75%,with a significant Bartlett’s Test.
As shown in Table 2, six items are loaded on Factor 1, the long-term/short-termorientation dimension, with a Cronbach’s Alpha of 0.933. Another six items areloaded on Factor 2, the individualism/collectivism dimension, with a Cronbach’sAlpha of 0.941. Five items are loaded on Factor 3, power distance dimension, andthe Cronbach’s Alpha is 0.877. Another five items are loaded on Factor 4, theuncertainty avoidance dimension, and the Cronbach’s Alpha is 0.926. Finally, thelast four items are loaded on Factor 5, the masculinity/femininity dimension, with aCronbach’s Alpha of 0.871.
MANOVA
MANOVA was conducted to find out whether between the two groups, the buyersversus non-buyers, there were significant differences in their cultural orientation anddemographics. The overall model was significant because the results showed that
Table 1 (continued)
Buyers (656) Non-buyers (893)
N % N %
Divorced without children 5 0.8 8 0.9
Others 15 2.3 34 3.8
Location
First tier 306 46.6 318 35.6
Second tier 159 24.2 201 22.5
Third tier 146 22.3 260 29.1
Others 45 6.9 114 12.8
38 D. Shen et al.
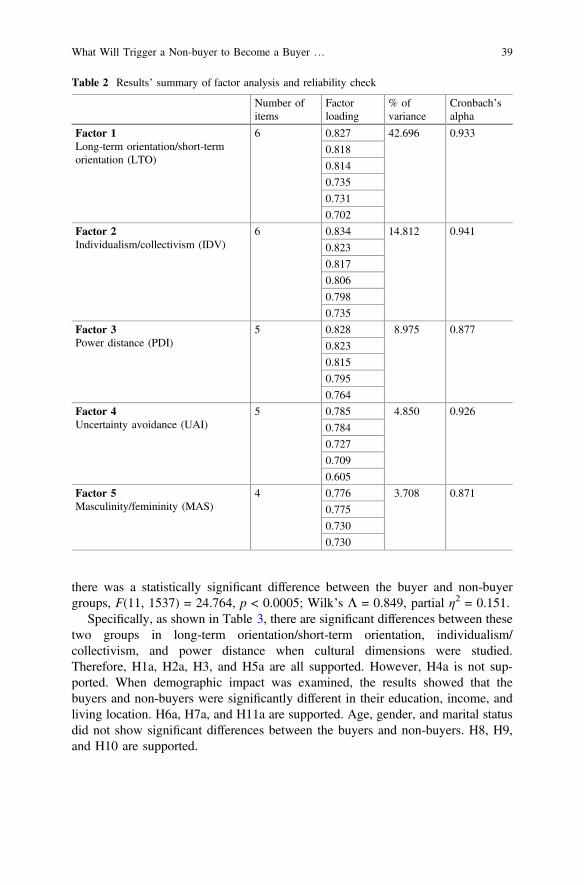
there was a statistically significant difference between the buyer and non-buyergroups, F(11, 1537) = 24.764, p < 0.0005; Wilk’s K = 0.849, partial η2 = 0.151.
Specifically, as shown in Table 3, there are significant differences between thesetwo groups in long-term orientation/short-term orientation, individualism/collectivism, and power distance when cultural dimensions were studied.Therefore, H1a, H2a, H3, and H5a are all supported. However, H4a is not sup-ported. When demographic impact was examined, the results showed that thebuyers and non-buyers were significantly different in their education, income, andliving location. H6a, H7a, and H11a are supported. Age, gender, and marital statusdid not show significant differences between the buyers and non-buyers. H8, H9,and H10 are supported.
Table 2 Results’ summary of factor analysis and reliability check
Number ofitems
Factorloading
% ofvariance
Cronbach’salpha
Factor 1Long-term orientation/short-termorientation (LTO)
6 0.827 42.696 0.933
0.818
0.814
0.735
0.731
0.702
Factor 2Individualism/collectivism (IDV)
6 0.834 14.812 0.941
0.823
0.817
0.806
0.798
0.735
Factor 3Power distance (PDI)
5 0.828 8.975 0.877
0.823
0.815
0.795
0.764
Factor 4Uncertainty avoidance (UAI)
5 0.785 4.850 0.926
0.784
0.727
0.709
0.605
Factor 5Masculinity/femininity (MAS)
4 0.776 3.708 0.871
0.775
0.730
0.730
What Will Trigger a Non-buyer to Become a Buyer … 39
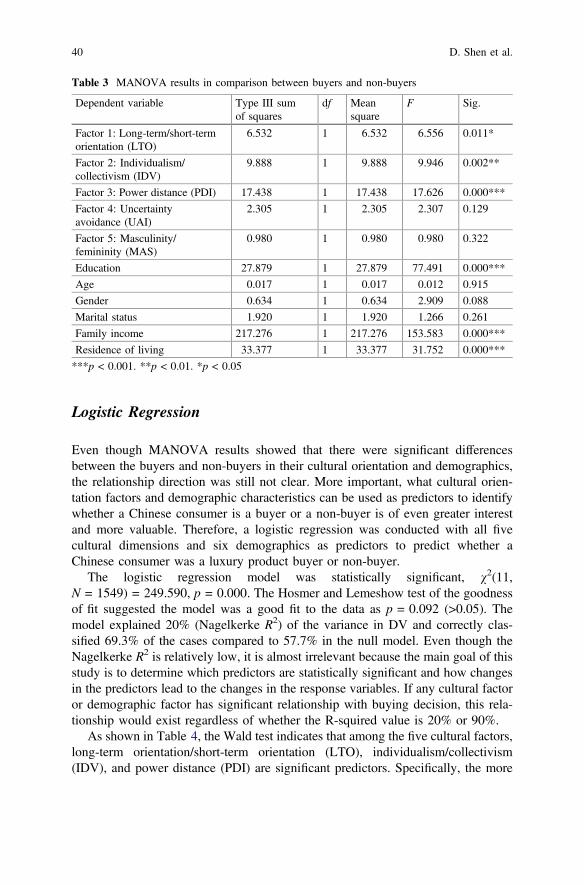
Logistic Regression
Even though MANOVA results showed that there were significant differencesbetween the buyers and non-buyers in their cultural orientation and demographics,the relationship direction was still not clear. More important, what cultural orien-tation factors and demographic characteristics can be used as predictors to identifywhether a Chinese consumer is a buyer or a non-buyer is of even greater interestand more valuable. Therefore, a logistic regression was conducted with all fivecultural dimensions and six demographics as predictors to predict whether aChinese consumer was a luxury product buyer or non-buyer.
The logistic regression model was statistically significant, v2(11,N = 1549) = 249.590, p = 0.000. The Hosmer and Lemeshow test of the goodnessof fit suggested the model was a good fit to the data as p = 0.092 (>0.05). Themodel explained 20% (Nagelkerke R2) of the variance in DV and correctly clas-sified 69.3% of the cases compared to 57.7% in the null model. Even though theNagelkerke R2 is relatively low, it is almost irrelevant because the main goal of thisstudy is to determine which predictors are statistically significant and how changesin the predictors lead to the changes in the response variables. If any cultural factoror demographic factor has significant relationship with buying decision, this rela-tionship would exist regardless of whether the R-squired value is 20% or 90%.
As shown in Table 4, the Wald test indicates that among the five cultural factors,long-term orientation/short-term orientation (LTO), individualism/collectivism(IDV), and power distance (PDI) are significant predictors. Specifically, the more
Table 3 MANOVA results in comparison between buyers and non-buyers
Dependent variable Type III sumof squares
df Meansquare
F Sig.
Factor 1: Long-term/short-termorientation (LTO)
6.532 1 6.532 6.556 0.011*
Factor 2: Individualism/collectivism (IDV)
9.888 1 9.888 9.946 0.002**
Factor 3: Power distance (PDI) 17.438 1 17.438 17.626 0.000***
Factor 4: Uncertaintyavoidance (UAI)
2.305 1 2.305 2.307 0.129
Factor 5: Masculinity/femininity (MAS)
0.980 1 0.980 0.980 0.322
Education 27.879 1 27.879 77.491 0.000***
Age 0.017 1 0.017 0.012 0.915
Gender 0.634 1 0.634 2.909 0.088
Marital status 1.920 1 1.920 1.266 0.261
Family income 217.276 1 217.276 153.583 0.000***
Residence of living 33.377 1 33.377 31.752 0.000***
***p < 0.001. **p < 0.01. *p < 0.05
40 D. Shen et al.
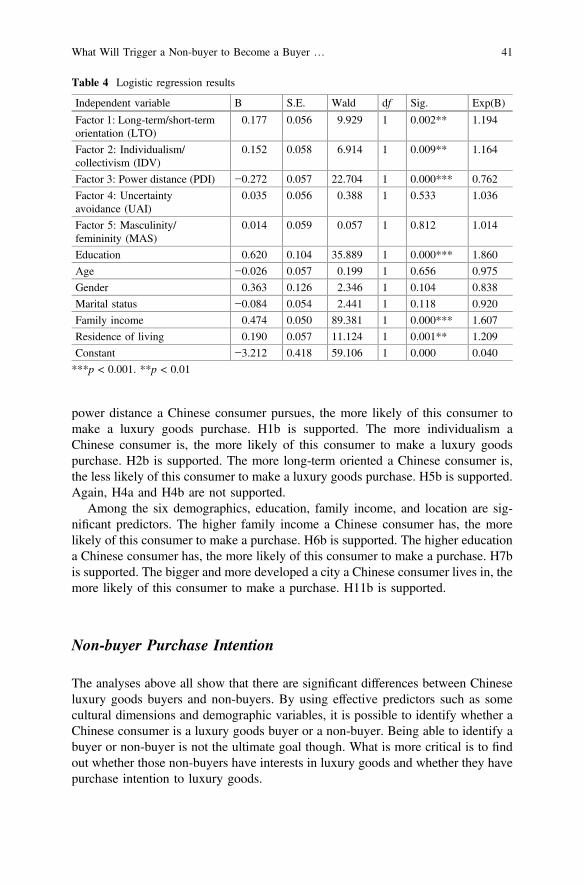
power distance a Chinese consumer pursues, the more likely of this consumer tomake a luxury goods purchase. H1b is supported. The more individualism aChinese consumer is, the more likely of this consumer to make a luxury goodspurchase. H2b is supported. The more long-term oriented a Chinese consumer is,the less likely of this consumer to make a luxury goods purchase. H5b is supported.Again, H4a and H4b are not supported.
Among the six demographics, education, family income, and location are sig-nificant predictors. The higher family income a Chinese consumer has, the morelikely of this consumer to make a purchase. H6b is supported. The higher educationa Chinese consumer has, the more likely of this consumer to make a purchase. H7bis supported. The bigger and more developed a city a Chinese consumer lives in, themore likely of this consumer to make a purchase. H11b is supported.
Non-buyer Purchase Intention
The analyses above all show that there are significant differences between Chineseluxury goods buyers and non-buyers. By using effective predictors such as somecultural dimensions and demographic variables, it is possible to identify whether aChinese consumer is a luxury goods buyer or a non-buyer. Being able to identify abuyer or non-buyer is not the ultimate goal though. What is more critical is to findout whether those non-buyers have interests in luxury goods and whether they havepurchase intention to luxury goods.
Table 4 Logistic regression results
Independent variable B S.E. Wald df Sig. Exp(B)
Factor 1: Long-term/short-termorientation (LTO)
0.177 0.056 9.929 1 0.002** 1.194
Factor 2: Individualism/collectivism (IDV)
0.152 0.058 6.914 1 0.009** 1.164
Factor 3: Power distance (PDI) −0.272 0.057 22.704 1 0.000*** 0.762
Factor 4: Uncertaintyavoidance (UAI)
0.035 0.056 0.388 1 0.533 1.036
Factor 5: Masculinity/femininity (MAS)
0.014 0.059 0.057 1 0.812 1.014
Education 0.620 0.104 35.889 1 0.000*** 1.860
Age −0.026 0.057 0.199 1 0.656 0.975
Gender 0.363 0.126 2.346 1 0.104 0.838
Marital status −0.084 0.054 2.441 1 0.118 0.920
Family income 0.474 0.050 89.381 1 0.000*** 1.607
Residence of living 0.190 0.057 11.124 1 0.001** 1.209
Constant −3.212 0.418 59.106 1 0.000 0.040
***p < 0.001. **p < 0.01
What Will Trigger a Non-buyer to Become a Buyer … 41
The results show that among all the non-buyers, close to half of them (46.5%)chose “yes” when they were asked whether they would like to purchase luxuryproducts, which shows strong purchase intention among the Chinese luxury goodsnon-buyers. Close to half of them (44.2%) would like to buy luxury goods as giftsfor others and for themselves. Regarding product category, the non-buyers are mostinterested in buying luxury watches (46.4%), followed by clothing (44.7%), cos-metics (39.8%), and accessories (shoes, scarves, sunglasses, and belts) (37.4%).Regarding purchasing location, the non-buyers chose mainland China first (58.7%),followed by Hong Kong, Macau, and Taiwan (40.4%), and EU (26.4%) and USA(24.6%). And 43.1% of them chose to buy off-line rather than online.
Conclusions, Discussions, and Implications
The purpose of this study is to identify what triggers Chinese consumers to becomea luxury goods buyer from a non-buyer. The objectives of this study are: (1) tocompare Chinese luxury goods buyers and non-buyers by examining their keydifferences; (2) to identify potential cultural and demographic determinants ofChinese consumers’ final purchase of luxury goods; and (3) to explore the effectivestrategies of how to trigger more consumers to purchase luxury goods in China. Theresults show that Chinese luxury goods buyers and non-buyers are significantlydifferent in both cultural orientation and demographics. Specifically, they showsignificant differences in education level, family income, and location of residence.When cultural orientation is studied, they are different in long-term/short-termorientation, individualism/collectivism, and power distance. Chinese luxury goodsbuyers are often short-term oriented, individualism focused, and power/statusfocused, whereas non-buyers are more long-term oriented, collectivism focused,and less power/status focused. In addition, Chinese luxury products buyers are morelikely to have higher family income, have higher education level, and live in moreadvanced and developed cities. Chinese luxury goods non-buyers have stronginterest in luxury goods and show strong purchase intention as well. The high pricepoint is the main reason why they have not made a purchase yet. When they areready to make their first purchase, they are more likely to buy luxury watches,clothing, cosmetics, or accessories in mainland China off-line. All the hypothesesare supported by the data except for H4a and H4b on UAI. On one hand, it is truethat the high price of luxury goods does provide a guarantee of high quality toconsumers to avoid any uncertainty. On the other hand, however, without enoughprevious purchase experience and lacking the needed knowledge of luxury goodssince luxury goods and brands are still relatively new to the China’s market,especially for non-buyers, Chinese consumers who are high on UAI might be lesslikely to buy luxury goods to avoid uncertainty. With both possibilities mixed andcombined, as a result, no significant difference of UAI was found between theluxury goods buyers and non-buyers in China.
42 D. Shen et al.
Looking at China’s market with close to 1.4 billion population, about 2% ofChinese population bought 30% of all luxury goods worldwide in 2013 (Said,2013), then what about the rest 98%? In 2015, 35% of luxury goods sales camefrom Chinese consumers, followed by 15% from Americans and 10% fromJapanese. It is estimated that in 2025, Chinese consumers will generate 50% of thesales (Rambourg, 2015). Therefore, a big portion of the 50% of the sales will comefrom first-time buyers. What set the luxury goods non-buyers apart from the buy-ers? Who are more likely to become the first-time buyers? This study shows thatChinese luxury goods non-buyers tend to have lower family income, have lowerlevel of education, and live in less developed cities and regions in China. This is nota surprise because luxury goods are often associated with high premium price, highsocial status, and class. Therefore, further economic development and continuousincrease of income, education, and living standard will be critical to trigger morenon-buyers to become first-time buyers in China. Research has shown that in China,the share of urban households’ annual income with $6,000–15,999 in 2000 was63%, followed by a big increase to 82% in 2010. However, the share is estimated todrop to 36% in 2020 because 51% of the unban households will make annualincome of $16,000–34,000, a level higher (Atsmon & Magni, 2012). This economicforecast provides the needed financial prerequisite to more Chinese consumers ifthey want to become luxury goods buyers. When more and more Chinese can earnhigher income according to the forecast, with their strong willingness to purchaseluxury goods, it is clear that many first-time buyers will emerge in China’s luxurygoods market in the next five years, which will eventually further expand China’sluxury goods market greatly.
However, a higher level of income, a better education, and a higher level ofliving standard combined do not guarantee a non-buyer to become a buyer for sure.This study further proves that beyond the demographic differences, luxury goodsnon-buyers also differ from buyers in cultural orientations. Non-buyers are morelong-term oriented, more collectivism focused, and less power/social status sensi-tive than luxury goods buyers. These findings clearly show the strategic directionsto luxury goods companies in term of how to trigger more non-buyers to becomebuyers. Through advertising campaigns, selection of spokespersons, store concept,visual presentation, and media effects, luxury goods companies need to focus onsearching for effective strategies to convert those long-term oriented, collectivismfocused, and power/social status less sensitive non-buyers to the opposite. Becausewithout these changes on cultural orientation, those non-buyers will not becomebuyers even if financially they can afford luxury goods. The two driving forces,cultural orientation and demographics, are both needed in order to triggernon-buyers to become buyers in China’s luxury goods market.
What Will Trigger a Non-buyer to Become a Buyer … 43
Limitations and Future Studies
Despite key contributions research can bring, all studies have limitations includingthis one. First, an online survey through WeChat was conducted for data collectionin order to reach out potential participants living in different regions and cities inChina in a time-efficient and economic-efficient way. However, this survey strategylimits the age range of participants because older Chinese do not use WeChat asmuch as younger Chinese do. The result showed that more than 50% of returnedquestionnaires were completed by consumers between 20 and 30 years old. In2016, the biggest two age-groups in China population are 20- to 30-year-old groupand 40- to 50-year-old group (China 2016, 2016). The future studies may put morefocus on the older group of Chinese consumers, especially the 40- to 50-year-oldgroup, which are more career-established with a higher annual income compared tothe younger groups.
Second, due to a small sample size (there are total 893 non-buyer questionnairescollected in this study), it is inappropriate to run a cluster analysis on the non-buyergroup. However, segmenting and profiling the non-buyers will be invaluable forluxury goods businesses to market in China. Research (Black, 2007; Wang, 2008)has been done on categorizing Chinese luxury goods buyers for the development ofdifferent business strategies in order to target each segment more effectively.Similarly, it will be more beneficial and valuable if a cluster analysis can beconducted to segment all Chinese non-buyers into different groups. Future studiesfocusing on this direction will be needed.
References
Adler, N. J. (1997). International dimensions of organizational behavior. Cincinnati, OH:Shout-Western College Publishing.
Anonymous. (2007). Branding in China: Luxury looks east. Brand Strategy, June 12, 56.Atsmon, Y., Dixit, V., & Wu, C. (April 2011). Tapping China’s luxury-goods market. Retrieved
from http://www.mckinsey.com/business-functions/marketing-and-sales/our-insights/tapping-chinas-luxury-goods-market.
Atsmon, Y., & Magni, M. (2012). Meet the Chinese consumer of 2020. Retrieved from http://www.mckinsey.com/global-themes/asia-pacific/meet-the-chinese-consumer-of-2020.
Bain & Company. (2017). 2017 Global luxury market report. Retrieved from http://www.bain.com/about/press/press-releases/global-personal-luxury-goods-market-expected-to-grow-by-2-4-percent.aspx.
Bain Co. (2011). 2011 China luxury market study. Retrieved from http://www.bain.com/Images/2011%20Bain%20China%20Luxury%20Market%20Study.pdf.
Bemmaor, A. C. (1995). Predicting behavior from intention-to-buy measures: The parametric case.Journal of Marketing Research, 32, 176–191.
Ben-Shabat, H. (2015). The new luxury consumer? Think: Multiple consumers. Retrieved fromhttp://www.therobinreport.com/the-new-luxury-consumer-think-multiple-consumers/.
Bian, Q., & Forsythe, S. (2012). Purchase intention for luxury brands: A cross culturalcomparison. Journal of Business Research, 65(10), 1443–1451.
44 D. Shen et al.
Black, P. T. (2007). Luxury market in China is fast-growing and confusing. Advertising Age,78(43), 46.
Burkitt, L. (2011). In China, women begin splurging. Retrieved from http://www.wsj.com/articles/SB10001424052748703864204576315291406475666.
Chen, S., & Lamberti, L. (2015). Entering the dragon’s nest: Exploring Chinese upper-classconsumers’ perception of luxury. Qualitative Market Research, 18(1), 4–29.
China 2016. (2016). Population pyramids of the word from 1950-2100. Retrieved from https://populationpyramid.net/china/2016/.
Dawson, K. C. (2014). Women are now taking over luxury shopping in China. Retrieved fromhttp://usa.chinadaily.com.cn/opinion/2014-02/04/content_17268466.htm.
D’Arpizio, C., Levato, F., Zito, D., & Montgolfier, J. (2015). Luxury goods worldwide marketstudy. Retrieved from http://www.bain.com/Images/BAIN_REPORT_Global_Luxury_2015.pdf.
Doran, S. (2013). 2013 luxury industry predictions from the experts. Retrieved from http://luxurysociety.com/articles/2013/01/2013-luxury-industry-predictions-from-the-experts.
Flora, L. (2016). Bain: China’s luxury market reverses decline with 2% growth. Retrieved fromhttps://jingdaily.com/bain-chinas-luxury-market-reverses-decline-2-growth/.
Gregorio, J. D., & Lee, J. (2002). Education and income inequality: New evidence fromcross-country data. The Review of Income and Wealth, 48(3), 395–416.
Heckman, J. J. (2003). China’s investment in human capital. Economic Development and CulturalChange, 51, 795–804.
Heine, K., & Phan, M. (2011). Trading-up mass-market goods to luxury products. AustralasianMarketing Journal, 19(2), 108–114.
Hofstede, G. (1980). Culture’s consequences: International differences in work-related values.Beverly Hills, CA: Sage Publications.
Hofstede, G. (2001). Culture’s consequences. Thousand Oaks, CA: Sage Publications.Horton, C. (2016). When it comes to luxury, China still leads. Retrieved from http://www.nytimes.
com/2016/04/05/fashion/china-luxury-goods-retail.html?_r=0.Jung, J., & Shen, D. (2011). Brand equity of luxury fashion brands among Chinese and U.S. young
female consumers. Journal of East-West Business, 17(1), 48–69.Kapferer, J. N. (1997). Managing luxury brands. Journal of Brand Management, 4(4), 251–260.Keller, J., Wang, Y., Cooney, J., Erstad, A., & Lu, C. (2015). Cultural dimensions: A comparative
analysis of aviation students in China and the U.S. International Journal of Aviation,Aeronautics, and Aerospace, 2(3). Retrieved from http://commons.erau.edu/ijaaa/vol2/iss3/3.
Khairullah, D. H. Z., & Khairullah, Z. Y. (2013). Cultural values and decision-making in China.International Journal of Business, Humanities and Technology, 3(2), 1–12.
Lau, S. (1988). The value orientations of Chinese university students in Hong Kong. InternationalJournal of Psychology, 23(5), 583–596.
Li, D., Jiang, Y., An, S., Shen, Z., & Jin, W. (2009). The influence of money attitudes on youngconsumers’ compulsive buying. Young Consumers, 10(2), 98–109.
Li, G., Li, G., & Kambele, Z. (2012). Luxury fashion brand consumers in China: Perceived value,fashion lifestyle, and willingness to pay. Journal of Business Research, 65(10), 1516–1522.
Lin, X., & Wang, C. L. (2010). The heterogeneity of Chinese consumer values: A dual structureExplanation. Cross Cultural Management: An International Journal, 17(3), 244–256.
Morwitz, V. G., Steckel, J., & Gupta, A. (2007). When do purchase intentions predict sales?International Journal of Forecasting, 23(3), 347–364.
McKinsey. (2011). From ‘Made in China’ to ‘Sold in China’, the Rise of the Chinese UrbanConsumer. McKinsey Global Institute, McKinsey & Company.
Nueno, J. L., & Quelch, J. A. (1998). The mass marketing of luxury. Business Horizons, 41(6),61–68.
Newberry, C. R., Kleinz, B. R., & Boshoff, C. (2003). Managerial implications of predictingpurchase behavior from purchase intentions: A retail patronage case study. Journal of ServicesMarketing, 17, 609–618.
What Will Trigger a Non-buyer to Become a Buyer … 45
Olivier. (2013). Chinese men buy more luxury goods than Chinese women. Retrieved from http://marketingtochina.com/chinese-men-buy-more-luxury-goods-than-chinese-women/.
O’Connell, S. (2013). Why men are so important to China’s luxury market? Retrieved from http://luxurysociety.com/articles/2013/02/why-men-are-so-important-to-chinas-luxury-market.
Prendergast, G., & Wong, C. (2003). Parental influence on the purchase of luxury brands of infantapparel: An exploratory study in Hong Kong. The Journal of Consumer Marketing, 20(2/3),157–169.
Rambourg, E. (2015). Meet the Chinese luxury shoppers who are taking over the world. Retrievedfrom http://www.businessinsider.com/chinese-luxury-shoppers-are-taking-over-2015-1.
Roberts, E. (2016). The latest facts and figures about the Chinese luxury market. Retrieved fromhttp://www.luxurysociety.com/en/articles/2016/08/the-latest-facts-and-figures-about-the-chinese-luxury-market/.
Roll, M. (2017). Chinese luxury consumers—Trends and challenges for luxury brands. Retrievedfrom https://martinroll.com/resources/articles/asia/chinese-luxury-consumers-trends-and-challenges-for-luxury-brands/.
Said, S. (2013). 2% of Chinese population buy 30% of all luxury goods. Retrieved from http://www.therichest.com/business/economy/2-of-chinese-buy-30-of-all-luxury-goods/.
Sheppard, B. H., Hartwick, J., & Warshaw, P. R. (1988). The theory of reasoned action: Ameta-analysis of past research with recommendations for modifications and future research.Journal of Consumer Research, 15, 325–343.
Shi, X., & Wang, J. (2011). Cultural distance between China and US across GLOBE Model andHofstede Model. International Business and Management, 2(1), 11–17.
Stokburger-Sauer, N. E., & Teichmann, K. (2013). Is luxury just a female thing? The role ofgender in luxury brand consumption. Journal of Business Research, 66(7), 889–896.
Teimourpour, B., & Hanzaee, K. H. (2011). The impact of culture on luxury consumptionbehaviour among Iranian consumers. Journal of Islamic Marketing, 2(3), 309–328.
Tung, R. L., & Verbeke, A. (2010). Beyond Hofstede and GLOBE: Improving the quality ofcross-cultural research. Journal of International Business Studies, 41(8), 1259–1274.
Wassner, B. (2009). Young buyers challenge luxury retailers inAsia.NewYork Times, November 17.Wang, J. (2008). Viewpoint: The language of chopsticks. Journal of Advertising Research, 48(4),
481–484.Wang, L. (2011). How does education affect the earnings distribution in urban China? Retrieved
from http://anon-ftp.iza.org/dp6173.pdf.Wiedmann, K. P., Hennigs, N., & Siebels, A. (2007). Measuring consumers’ luxury value
perception: A cross-cultural framework. Academy of Marketing Science Review, 11, 1–21.Wikipedia. (2016). WeChat. Retrieved from https://en.wikipedia.org/wiki/WeChat.Yoo, B., Donthu, N., & Lenartowicz, T. (2011). Measuring Hofstede’s five dimensions of cultural
values at the individual level: Development and Validation of CVSCALE. Journal ofInternational Consumer Marketing, 23(3–4), 193–210.
Zhang, B., & Kim, J. (2013). Luxury fashion consumption in China: Factors affecting attitude andpurchase intent. Journal of Retailing and Consumer Services, 20, 68–79.
Zhao, X., & Belk, R. W. (2007). Live from shopping malls: Blogs and Chinese consumer desire.Advances in Consumer Research, 34, 131–137.
46 D. Shen et al.

Part IIDigital Retailing in China
How Web site Quality Affects ApparelMobile Commerce Consumer Satisfactionand Intent to Purchase? A Studyof Chinese Consumers
Ting Chi and Quinn Sullivan
Abstract In recent years, apparel mobile commerce has experienced a rapiddevelopment in China, which is largely fueled by proliferation of smartphones,decreased cost of mobile data, increasing number of m-tailers, and shift of con-sumer shopping style toward mobility and time flexibility. Some apparel m-tailerscan attract millions of visitors to their web sites everyday while others seem notappealing to consumers. Thus, this study aims to identify the effects of key featuresof mobile web site quality on the Chinese consumer satisfaction that in turn affectstheir intent to shop apparel via mobile web sites. Six dimensions of mobile web sitequality, including web site visual appeal, apparel visual appeal, brand trust, web siteinformativeness, web site response time, and web site security, were investigated.Using the primary data collected via an online survey, multiple regression analysiswas applied to test the proposed relationships. Results reveal that web site infor-mativeness, web site visual appeal, apparel visual appeal, and web site securitypositively affect consumer satisfaction toward apparel m-commerce web site whileweb site response time and brand trust show insignificant impacts on consumersatisfaction. With higher satisfaction on apparel m-commerce web site, consumersare more likely to purchase apparel through the web site.
Keywords M-commerce � Web site quality � Purchase intention
T. Chi (&) � Q. SullivanDepartment of Apparel, Merchandising, Design & Textiles,Washington State University, Pullman WA 99164, USAe-mail: [email protected]
Q. Sullivane-mail: [email protected]
© Springer Nature Singapore Pte Ltd. 2018Y. Xu et al. (eds.), Chinese Consumers and the Fashion Market, Springer Seriesin Fashion Business, https://doi.org/10.1007/978-981-10-8429-4_3
49
Introduction
China is the world’s largest smartphone market, accounting for approximately 30%of the global smartphone market. Chinese smartphone users are expected to jumpfrom 527 million in 2015 to 640 million in 2018, according to eMarketer, (2016). Ithas been witnessed that Chinese consumers are quickly getting used to use theirgadgets to snap up a wide array of products and services via the Internet. In 2016,nearly half of all China’s e-commerce sales, totaling $650 billion, were made withmobile devices (Fung Business Intelligence, 2017). It is projected that by 2019,mobile users in China will spend approximately $1.4 trillion on m-commerce,which will account for 71.5% of the country’s total e-commerce sales and nearly aquarter of the country’s entire retail market (eMarketer, 2016).
Proliferation of inexpensive smartphones, decreased cost of mobile data, andsophisticated mobile payment apps are fueling the m-commerce boom in China.The Chinese government sees the development of m-commerce as the new enginefor the next wave of economic growth and has imposed light policy restraints onretailing and payment on the m-commerce platform (Sun & Chi, 2017).
As one of most popular consumer products, more than 20% of apparel sales inChina were made through the online channel in 2015. The online appetite forapparel in China has grown exponentially. Euromonitor International (2016) pre-dicts this trend will continue in the next few years with China contributing half ofthe world’s value growth for online apparel purchases. According to EuromonitorInternational’s 2016 Global Consumer Trends Survey, majority of Chinese con-sumers preferred the online channel to the in-person experience for both researchand purchase of apparel. Owing to the increasingly rapid pace of working andliving, digitally savvy Chinese consumers have been seeking more efficient, con-venient, and inexpensive ways of shopping, which has resulted in a boost to onlinepurchases.
Apparel m-commerce is a division of the m-commerce channel with a specialfocus on apparel and related accessories. The trends in apparel online shoppingindicate substantial growth in the amount of time spent on retail mobile platformsand overall retail spending on mobile channel (Fulgoni, 2014; Bilgihan,Kandampully, & Zhang, 2016). Apparel retailers are offering greater productacquisition options, competitive prices, and user-friendly shopping experience viatheir mobile platforms to attract more consumers with the purpose of m-commercerevenue generation. However, the outcomes do not always turn out as expected.According to Fung Business Intelligence (2017), less than 30% of apparel retailersare currently making profits from their m-commerce channel in China. The popu-larity contrast among apparel mobile retailers (m-tailers) is distinct. Some apparelm-tailers can attract millions of visitors to their web sites everyday while othersseem not appealing to consumers.
Park, Jeon, and Sullivan (2015) state that in brick-and-mortar channel, storeimage and interior quality have an enormous impact on consumer apparel buyingdecisions, and apparel online retail web sites are similarly important as web site
50 T. Chi and Q. Sullivan
quality affects consumer satisfaction and consequently purchase intention. Despiteits importance, extant research has yet to focus on apparel mobile web site qualityand its effect on positive consumer shopping experience and future purchasestimulus (Sanakulov & Karjaluoto, 2015). Thus, in order to gain a better under-standing of these critical issues regarding apparel m-commerce, this study aims toempirically determine the effects of key features of apparel mobile web site on theChinese consumer satisfaction that in turn affects their intentions to shop apparel viamobile web sites. Specifically, the objectives of this study are threefold: first,through identifying the key features of apparel mobile web site, this study proposesa research model illustrating the relationships between apparel web site quality,consumer satisfaction, and consumer purchase intention; second, the psychometricproperties of the developed model are examined using the primary consumer surveydata gathered in China. The significant factors influencing Chinese consumer sat-isfaction and further intent to use apparel m-commerce are statistically determined.Finally, based on the results, some managerial implications for marketers andcompanies are provided.
The remainder of this article is organized as follows. The next section reviewsthe relevant literature and proposes the hypotheses. The research model is thenintroduced with the corresponding measures and scales for each construct in themodel. In the methodology section, the survey subjects, data sets, and statisticalmethods are described, respectively. The results and discussion follow thereafter.Next, the conclusions are drawn based on the findings, and the implications for bothacademic researchers and industrial practitioners are presented. Finally, somelimitations of this study are addressed, and some directions for future research areoffered.
Literature Review and Hypothesis Development
In this section, we review the relevant literature on the theory of self-regulatoryprocess (Bagozzi, 1992) justifying the relationship between m-commerce web sitequality, consumer satisfaction, and purchase intention. The measures of mobile website quality include web site visual appeal, apparel visual appeal, brand trust, website informativeness, web site response time, and web site security. The hypothesesare proposed based on the review of the literature.
The Theory of Self-Regulatory Process
Theory of self-regulatory process proposed by Bagozzi (1992) explains the rela-tionship between consumer attitude and behavioral intention. Previous attitudetheories, such as the theory of reasoned action (Ajzen & Fishbein, 1977) and thetheory of planned behavior (Ajzen, 1991), suggested that consumer attitudes could
How Web site Quality Affects Apparel Mobile Commerce … 51
influence their intentions directly. However, Bagozzi (1992) argued that attitudesdid not determine intentions sufficiently. He suggested that self-regulatory pro-cesses were needed to predict intention.
Bagozzi (1992) defines attitude as an appraisal of the consequences of acting orsimply as an appraisal process. He argues that the appraisal process would stimulateemotional reactions, which, in turn, lead to coping response of intention. Therefore,attitude does not influence intention directly. Emotion could mediate the relation-ship between consumer attitude and behavioral intention. Appraisal would lead toparticular emotion, such as satisfaction. In this situation, this emotion will lead tospecific intentions, such as to maintaining or increasing satisfaction (Tsai &Bagozzi, 2014). In contrast, if a consumer experiences an unpleasant event or failsto achieve a desired goal, an outcome-desire conflict will occur. Particular emotion,such as dissatisfaction, results. This emotion, in turn, stimulates the intention ofavoidance.
Self-regulatory process has been widely applied in consumer behavior researchin the context of e-commerce or m-commerce. Barnes and Vidgen (2001), DeLoneand McLean (2003), Loiacono, Watson, and Goodhue (2007), and Shin, Chung, Ohand Lee (2013) identified a wide array of web site features that could affect con-sumers’ evaluation of web site quality and result in positive or negative emotion.These investigated web site quality features include informational fit-to-task; tai-lored communications; trust; response time; ease of understanding; intuitive oper-ations; visual appeal; innovativeness; emotional appeal; consistent image; onlinecompleteness. Polites, Williams, Karahanna, and Seligman (2012) used the theoryof self-regulatory process as a framework to explore the antecedents ofe-satisfaction and the relationship between e-satisfaction and web site loyalty. Theresult showed that satisfaction mediated the relationship between web site stickinessand consumer’s appraisal of information quality, system quality, usefulness, andperceived value of the web site.
Measure of Web site Quality
Web site quality is defined as a multi-dimensional interface, stimulating positive ornegative user attitude that results from the interaction between user and web site(Gao & Bai, 2014; Kim & Niehm, 2009). Variables to determine overallm-commerce web site quality were recently introduced to research through thedevelopment of the WebQual scale (Loiacono, 2000). Expanding from theTechnology Acceptance Model (TAM), WebQual offers an applicable scale thatallows researchers to systematically assess the quality of m-commerce web site(Chang & Wang, 2011; Loiacono et al., 2007). TAM was established to measureconsumer acceptance of new technology through examination of two primaryvariables, namely the perceived ease of use and perceived usefulness (Davis, 1989).TAM provides a useful tool to help understand the general consumer perception ofnew technology and future intent to use the technology. The WebQual scale has
52 T. Chi and Q. Sullivan
expanded the TAM consumer measurements through introducing new constructs tomore accurately identify the effects of web site quality on consumer reuse intention.The constructs originally introduced include ease of understanding and intuitiveoperations related to ease of use, information quality and tailored communicationsrelated to gathering information, functional fit-to-task, trust, response time, con-sistent image, online completeness, relative advantage, and customer service relatedto carrying out transactions, and visual appeal, innovativeness, and emotionalappeal related to entertainment (Loiacono, 2000; Loiacono et al., 2007).
The WebQual constructs measuring web site quality have been applied to theanalysis of business-to-consumer (B2C) web sites, which represent the major onlineinteraction between apparel retailers and consumers. Kim and Niehm (2009)indicated among the original WebQual constructs, higher correlations betweencertain constructs suggested a need for a number of second-order constructs. In astudy examining the dimensionality of web site quality for apparel retailers, usingthe WebQual scale, Kim and Stoel (2004) identified that six constructs of web sitequality were highly related to consumer reuse intention. They are web appearance,entertainment, informational fit-to-task, transaction capability, response time, andtrust. The second-order constructs often measure the key features of a web sitequality (Loiacono et al., 2007) and provide an updated empirical support form-commerce consumer research (Hasanov & Khalid, 2015).
Entertainment: Web site Visual Appeal and ApparelVisual Appeal
Visual cues are a significant influence among consumers within the apparelindustry. Consumers pursuing apparel products perceive desire through the visualdisplays of clothing and store layout, and make consumption decisions based onthese visual sensory details (Khakimdjanova & Park, 2005; Ji & Pang, 2006). Priorstudies on apparel online shopping indicate that visual appeal is an importantinfluencing factor and can determine the business success that companies mayachieve (Ha & Lennon, 2010). In online shopping, this appeal is described by website balance, aesthetics, consistency, and response (Gao & Bai, 2014). Visualaspects are powerful in dictating consumer satisfaction and intent to purchase whenelicited and experienced by the consumer. In a study by Cyr, Head, Larios, and Pan(2006), mobile web site interface design significantly affected whether a personstays to continue shopping or not. Visual displays on a mobile apparel web sitetherefore must entice the visitors who integrate visual web site appeal with per-ceived web site quality.
The apparel industry also relies heavily on imagery to promote the quality ofgoods produced for sale. While visual merchandising plays a significant role inbrick-and-mortar shopping, the effect of visual merchandising in mobile apparelshopping is often overlooked. Moayery, Zamani, and Vazifehdoost (2014) proved
How Web site Quality Affects Apparel Mobile Commerce … 53
that visual merchandising in brick-and-mortar shopping influenced impulsivebuying behaviors among female consumers while younger consumers were moreresponsive to visual merchandising techniques. Visual merchandising in onlineapparel shopping was revealed to influence consumer pleasure and arousal, amongboth online shoppers and browsers (Ha & Lennon, 2010).
An empirical study by Khakimdjanova and Park (2005) proved a need forimproved visual merchandising of apparel in online commerce applications.Researching the variables of apparel presentation and aesthetics online, the studyfound that online retailers needed to create a setting similar to brick-and-mortarapparel shopping to achieve the best shopping results. In another study, Flavianet al. (2009) affirmed that web site design is a key factor for apparel retailers toobtain positive outcomes as it significantly affects users’ perceptions and behaviors.In order to improve the online shopping experience, apparel visual display and website structure and design were two important areas that demand attention anddevelopment. Therefore, we propose the following hypotheses 1 and 2.
H1: Mobile web site visual appeal positively affects Chinese consumers’ web sitesatisfaction.H2: Apparel visual appeal positively affects Chinese consumers’ web sitesatisfaction.
Ease of Use: Perceived Information Quality
Online shopping provides new channels for consumers to experience visual andinformation stimuli, which supports or discourages consumption intentions throughproduct search. One main disadvantage of m-commerce channel is the lack ofinformation quality sought by consumers. Maity and Dass (2014) explored theretailer to consumer communication process across the three shopping channels(i.e., brick-and-mortar stores, e-commerce, and m-commerce). Low media richnesswas observed among m-commerce web sites, which included limitation in screensize and communication, and influenced the superiority of desktop computer-basede-commerce shopping channel over the m-commerce alternative.
In a study by Kim and Stoel (2004), research asserted that informativeness of anm-commerce web site was a notable factor of predicting consumer satisfaction.Design quality of a mobile web site was said to influence consumer traffic, whereasinformation quality encouraged purchase (Kim & Stoel, 2004). According toHausman and Siekpe (2009), acceptance of a web site depends on informativeness,which is viewed as a human factor influencing overall purchase intention. Perceivedvalue of a mobile web site is also a result of provided product information (Kim &Niehm, 2009). Thus, the following hypothesis is proposed.
H3: Information quality on mobile web site positively affects Chinese consumers’web site satisfaction.
54 T. Chi and Q. Sullivan
Response Time: Response Time of Web site Applications
In order for consumers to perceive a web site useful in making transactions, responsetime must be factored as a variable for web site quality. Web site response time isdefined as the delay a consumer experiences during the attempt to observe onlineinformation (Galletta, Henry, McCoy, & Polak, 2006). In the study examining theimpact of web site delay on consumer satisfaction, Galletta et al. (2006) asserted thatweb site response delay and unfamiliarity with a web site had a greater impact ondecreasing consumer patience and intent to return. Response time was applied toapparel m-commerce through the study by Kim and Stoel (2004), where responsetime was proven to significantly affect the consumer perception of transaction-relatedweb site qualities. In this study, satisfaction with an apparel m-commerce web site wasrelated to transaction capabilities. Therefore, we propose the following hypothesis.
H4: Response time positively affects Chinese consumers’ web site satisfaction.
Web site Security
Web site security involves protecting consumers from fraud and monetary losses(Bressolles et al., 2014). Loiacono et al. (2007) related consumer transactions totrust regarding the web site processes that influence reuse intention. The concept oftrust was developed to reflect the outcome from consumers’ perceived safety andprivacy of web site processes. Web site security has become one of the mostimportant values desired by consumers during online shopping due to the recentlack of protective measures concerning retail customer security and privacy.
In a study conducted by Chen and Kao (2010), web site security and privacymeasures were indicated to be most influential among online consumers in Taiwan.To demonstrate acceptable security and privacy protection, individuals in the studynoted that control over the transaction process can improve perceived security andprivacy. Complex online interactions were suggested to maximize feelings ofsecurity when shopping online, which provided security as a main influence ononline shopping satisfaction (Chen & Kao, 2010).
In December 2013, Target, a big box retailer and one of the current leaders inonline shopping, was hacked by outside sources (Isidore, 2014). During this event,Target lost details regarding monetary (credit card) and personal information ofconsumers who shopped during the holiday season. Shortly after the Target creditcard breach, security hacks hit other major retailers, including Neiman Marcus,Michaels, and the Home Depot. The security hacks were made public through newsreleases, instilling fear among consumers regarding online and in-store securitymeasures (Smith, 2014). Following these events and based on the findings fromprior studies, we suggest that security features among apparel m-commerce retailersgained importance among consumers. This leads to the hypothesis below.
How Web site Quality Affects Apparel Mobile Commerce … 55
H5: Security features of mobile web site positively affect Chinese consumers’ website satisfaction.
Brand Trust: Previously Established Consumer Brand Trust
Brand trust is described as the relationship developed between consumers andretailers as a result of learned expectations the consumer relates to the brand (Jones& Kim, 2010). This relationship is often associated with visual cues the consumerinterprets when shopping online, and affects the consumer’s intention to shop at aparticular retailer’s web site (Loiacono, 2000). The WebQual scale most closelyrelates brand trust to consistent image; however, research has proven a need fordeeper perspective than given by the WebQual scale. As digital-only stores becomemore prevalent in online shopping, developing brand trust can be problematic forconsumers. Brick-and-mortar stores have a greater chance at developing brand trustin person, transitioning this consumer connection through a well-built onlinechannel. Hahn and Kim (2009) claimed that consumers, who had previouslydeveloped trust through a brick-and-mortar retailer experience, could more easilyaccept the retailer’s online shopping channel to meet their needs. Whilebrick-and-mortar stores have greater ability to develop brand trust in their stores,online retailers face problems developing trust.
To influence shopping perceptions, retailers depend on the development of brandtrust. According to Shiue and Li (2013), consumers who perceived a brand posi-tively through levels of previous commitment were more likely to show positiveattitude and reuse the web site. Ling, Chai and Piew (2010) studied brand orien-tation and discovered that stronger brand names and images led to greater levels ofconsumer satisfaction with his/her purchase decisions. Higher levels of comfortassociated with brand trust can therefore influence consumer perceptions of web sitequality, leading to the hypothesis proposed below.
H6: Previously developed brand trust positively affects Chinese consumers’ website satisfaction.
Consumer Web site Satisfaction and Intent to Use
Web site satisfaction can be the result of different determining factors with changesof web site application (Schaupp, 2010). In a study of impact of web site satis-faction on consumer web site reuse intention, Schaupp (2010) found that web sitesatisfaction must be met before consumers intended to return.
Based on the theory of self-regulatory process, Cristobal, Flavián and Guinaliu(2007) identified a wide array of web site features including ease of use,
56 T. Chi and Q. Sullivan
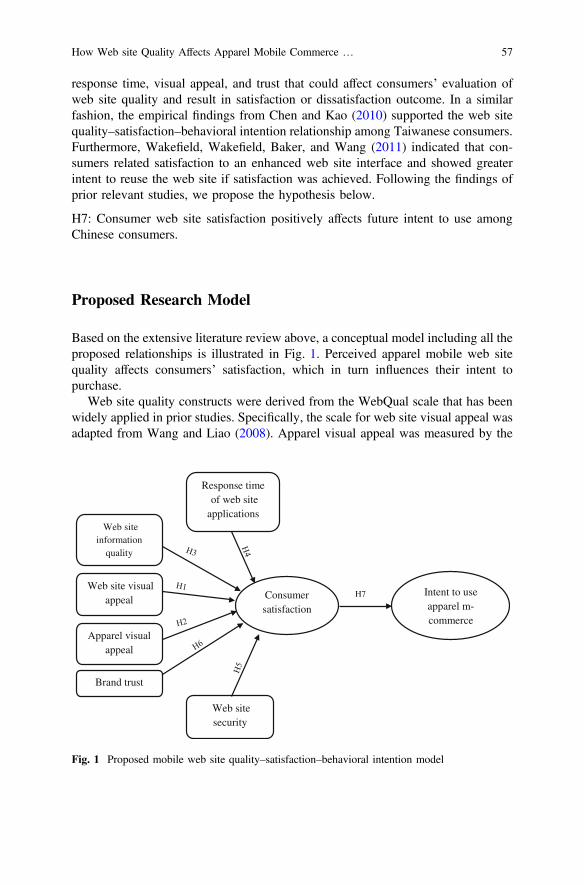
response time, visual appeal, and trust that could affect consumers’ evaluation ofweb site quality and result in satisfaction or dissatisfaction outcome. In a similarfashion, the empirical findings from Chen and Kao (2010) supported the web sitequality–satisfaction–behavioral intention relationship among Taiwanese consumers.Furthermore, Wakefield, Wakefield, Baker, and Wang (2011) indicated that con-sumers related satisfaction to an enhanced web site interface and showed greaterintent to reuse the web site if satisfaction was achieved. Following the findings ofprior relevant studies, we propose the hypothesis below.
H7: Consumer web site satisfaction positively affects future intent to use amongChinese consumers.
Proposed Research Model
Based on the extensive literature review above, a conceptual model including all theproposed relationships is illustrated in Fig. 1. Perceived apparel mobile web sitequality affects consumers’ satisfaction, which in turn influences their intent topurchase.
Web site quality constructs were derived from the WebQual scale that has beenwidely applied in prior studies. Specifically, the scale for web site visual appeal wasadapted from Wang and Liao (2008). Apparel visual appeal was measured by the
Web siteinformation
quality
Web site visual appeal
Response time of web site
applications
Web site security
Brand trust
Apparel visual appeal
Consumer satisfaction
Intent to useapparel m-commerce
H7
Fig. 1 Proposed mobile web site quality–satisfaction–behavioral intention model
How Web site Quality Affects Apparel Mobile Commerce … 57
scale developed by Khakimdjanova and Park (2005). The scale for web siteresponse time was adapted from Kim and Stoel (2004). The scale for web siteinformativeness was adapted from Kim and Niehm (2009). Web site security wascaptured by the scale from Bressolles, Durrieu, and Giraud (2007). The scale forbrand trust was adapted from Jones and Kim (2010). The scale for consumersatisfaction was adapted from Zhou (2011). The scale for intent to use apparelm-commerce was adapted from Hausman and Siekpe (2009). Appendix 1 lists allthe constructs and their corresponding measurement scales.
Methodology
Survey Instrument Development and Data Collection
The survey instrument was initially developed in English and reviewed by fourprofessors who were familiar with research topic and survey techniques. Then, theinstrument was translated into Chinese by a bilingual graduate student. The Chineseversion was back-translated into English by another bilingual graduate student toensure translation equivalence. The Chinese version of survey instrument wastested through a pilot study with eight Chinese consumers who have made pur-chases through apparel mobile web sites. The suggestions from the participantswere used to refine the instrument with regard to arrangement, wording accuracy,and relevance (Chi, Kilduff, & Gargeya, 2009). This process helped to make thefinal survey instrument more valid and clearer (Mariadoss, Chi, Tansuhaj, &Pomirleanu, 2016).
The primary data was collected via an online survey of Chinese consumers inJanuary 2017. The professional survey web site used is Sojump (http://www.sojump.com/, similar to Amazon Mechanical Turk https://www.mturk.com/mturk/),which owns a national consumer database in China. A total of 296 eligibleresponses were received. The profile of survey respondents is presented in Table 1.
Of 296 respondents, 40.3% were female and 59.7% were male. The ages of therespondents varied from 18 years old to over 50 years old, mainly distributing(91.7%) in the range from 18 to 40 years old. Most of the respondents had bach-elor’s degree (52.3%), followed by some college (29.5%), high school (10.5%),master’s degree (6.4%), and doctorate (1.3%). 45.2% of the respondents’ personalpre-tax income ranged from ¥50,001 to ¥100,000 (approximately US$7,300–$14,599), followed by ¥20,001 to ¥50,000 at 21.6% (approximately US$2,920–$7,299), ¥100,001 to ¥150,000 at 17.6% (approximately US$14,600–$21,898),¥150,001 to ¥200,000 at 10.8% (approximately US$21,899–$29,197), less than¥20,000 (US$2,919) at 3.8%, and more than ¥200,000 (US$29,198) at 2.5%.
58 T. Chi and Q. Sullivan
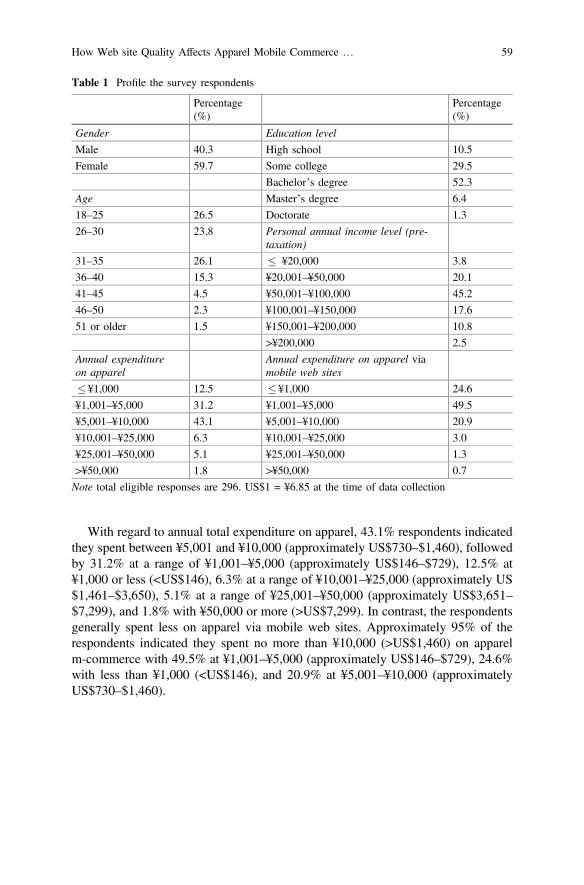
With regard to annual total expenditure on apparel, 43.1% respondents indicatedthey spent between ¥5,001 and ¥10,000 (approximately US$730–$1,460), followedby 31.2% at a range of ¥1,001–¥5,000 (approximately US$146–$729), 12.5% at¥1,000 or less (<US$146), 6.3% at a range of ¥10,001–¥25,000 (approximately US$1,461–$3,650), 5.1% at a range of ¥25,001–¥50,000 (approximately US$3,651–$7,299), and 1.8% with ¥50,000 or more (>US$7,299). In contrast, the respondentsgenerally spent less on apparel via mobile web sites. Approximately 95% of therespondents indicated they spent no more than ¥10,000 (>US$1,460) on apparelm-commerce with 49.5% at ¥1,001–¥5,000 (approximately US$146–$729), 24.6%with less than ¥1,000 (<US$146), and 20.9% at ¥5,001–¥10,000 (approximatelyUS$730–$1,460).
Table 1 Profile the survey respondents
Percentage(%)
Percentage(%)
Gender Education level
Male 40.3 High school 10.5
Female 59.7 Some college 29.5
Bachelor’s degree 52.3
Age Master’s degree 6.4
18–25 26.5 Doctorate 1.3
26–30 23.8 Personal annual income level (pre-taxation)
31–35 26.1 � ¥20,000 3.8
36–40 15.3 ¥20,001–¥50,000 20.1
41–45 4.5 ¥50,001–¥100,000 45.2
46–50 2.3 ¥100,001–¥150,000 17.6
51 or older 1.5 ¥150,001–¥200,000 10.8
>¥200,000 2.5
Annual expenditureon apparel
Annual expenditure on apparel viamobile web sites
� ¥1,000 12.5 � ¥1,000 24.6
¥1,001–¥5,000 31.2 ¥1,001–¥5,000 49.5
¥5,001–¥10,000 43.1 ¥5,001–¥10,000 20.9
¥10,001–¥25,000 6.3 ¥10,001–¥25,000 3.0
¥25,001–¥50,000 5.1 ¥25,001–¥50,000 1.3
>¥50,000 1.8 >¥50,000 0.7
Note total eligible responses are 296. US$1 = ¥6.85 at the time of data collection
How Web site Quality Affects Apparel Mobile Commerce … 59
Data Analysis Methods
The statistical assumptions including multivariate normality, multicollinearity, andcorrelations were first examined. Multivariate normality is when each variableunder consideration is normally distributed with respect to each other variable.Multivariate normality can be assessed through calculating skewness and kurtosisfor each variable. There is a violation of normality assumption, if the results aregreater than +1.0 or smaller than −1.0. Multicollinearity is a statistical phenomenonin which two or more predictor variables in a multiple regression model are highlycorrelated, meaning that one can be linearly predicted from the others with anon-trivial degree of accuracy. In order to test for multicollinearity among thepredictor variables, variance-inflation factor (VIFj) and tolerance were applied. Themulticollinearity statistics show that the tolerance indicator should be all greaterthan 0.2, and their VIFj values should be less than 5.0 to indicate that no multi-collinearity problem occurs (Ott, Longnecker, & Ott, 2001). Since each constructwas measured by multiple items, the average score of the multi-items for a constructwas computed and used in further analysis such as correlation analysis and multipleregression analysis (Chi & Sun, 2013). Pearson’s correlation analysis was appliedto examine the relationship between the constructs. The correlation coefficient value(r), range from 0.10 to 0.29, is considered weak, from 0.30 to 0.49 is consideredmedium, and from 0.50 to 1.0 is considered strong (Chi & Zheng, 2016). Accordingto Field (2009), correlation coefficient should not go beyond 0.8 to avoid multi-collinearity. Exploratory factor analysis (EFA) and confirmatory factor analysis(CFA) were employed to test the constructs in the proposed model in terms ofreliability, unidimensionality, and construct validity including both convergentvalidity and discriminant validity.
For factor analysis, the extraction criterion is set as eigenvalue above 1.0. Itemswith low factor loadings (less than 0.50) are dropped (Yoo & Donthu, 2001). Thededuction of certain measurement variables requires the re-examination of factorloadings, coefficient alpha, item-to-total correlations, and factor structure (Chi et al.,2009). This iterative procedure is repeated until all requirements are met.
Unidimensionality, reliability, convergent validity, and discriminant validitywere tested for proving model adequacy. First, unidimensionality refers to theexistence of one underlying measurement construct that accounts for variation inexaminee responses. Second, Cronbach’s alpha is a coefficient of internal consis-tency. It is commonly used as an estimate of the reliability of a psychometric test fora sample of examinees. Third, convergent validity refers to the extent to whichindicators of a specific construct “converge” or share a high proportion of variancein common. Convergent validity is valid when average variance extracted(AVE) scores for all latent constructs are above the desired threshold of 0.50. AVEis a summary measure of convergence among a set of items representing a con-struct. It is the average percent of variation explained among the items. Fourth,discriminant validity refers to the extent to which a construct is truly distinct fromother constructs. Comparing the AVEs to the squared correlation between the two
60 T. Chi and Q. Sullivan
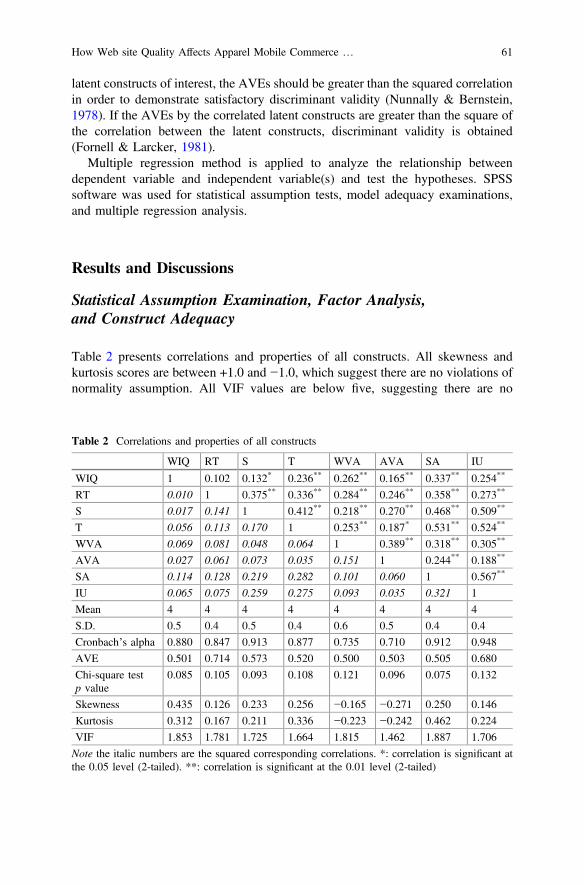
latent constructs of interest, the AVEs should be greater than the squared correlationin order to demonstrate satisfactory discriminant validity (Nunnally & Bernstein,1978). If the AVEs by the correlated latent constructs are greater than the square ofthe correlation between the latent constructs, discriminant validity is obtained(Fornell & Larcker, 1981).
Multiple regression method is applied to analyze the relationship betweendependent variable and independent variable(s) and test the hypotheses. SPSSsoftware was used for statistical assumption tests, model adequacy examinations,and multiple regression analysis.
Results and Discussions
Statistical Assumption Examination, Factor Analysis,and Construct Adequacy
Table 2 presents correlations and properties of all constructs. All skewness andkurtosis scores are between +1.0 and −1.0, which suggest there are no violations ofnormality assumption. All VIF values are below five, suggesting there are no
Table 2 Correlations and properties of all constructs
WIQ RT S T WVA AVA SA IU
WIQ 1 0.102 0.132* 0.236** 0.262** 0.165** 0.337** 0.254**
RT 0.010 1 0.375** 0.336** 0.284** 0.246** 0.358** 0.273**
S 0.017 0.141 1 0.412** 0.218** 0.270** 0.468** 0.509**
T 0.056 0.113 0.170 1 0.253** 0.187* 0.531** 0.524**
WVA 0.069 0.081 0.048 0.064 1 0.389** 0.318** 0.305**
AVA 0.027 0.061 0.073 0.035 0.151 1 0.244** 0.188**
SA 0.114 0.128 0.219 0.282 0.101 0.060 1 0.567**
IU 0.065 0.075 0.259 0.275 0.093 0.035 0.321 1
Mean 4 4 4 4 4 4 4 4
S.D. 0.5 0.4 0.5 0.4 0.6 0.5 0.4 0.4
Cronbach’s alpha 0.880 0.847 0.913 0.877 0.735 0.710 0.912 0.948
AVE 0.501 0.714 0.573 0.520 0.500 0.503 0.505 0.680
Chi-square testp value
0.085 0.105 0.093 0.108 0.121 0.096 0.075 0.132
Skewness 0.435 0.126 0.233 0.256 −0.165 −0.271 0.250 0.146
Kurtosis 0.312 0.167 0.211 0.336 −0.223 −0.242 0.462 0.224
VIF 1.853 1.781 1.725 1.664 1.815 1.462 1.887 1.706
Note the italic numbers are the squared corresponding correlations. *: correlation is significant atthe 0.05 level (2-tailed). **: correlation is significant at the 0.01 level (2-tailed)
How Web site Quality Affects Apparel Mobile Commerce … 61
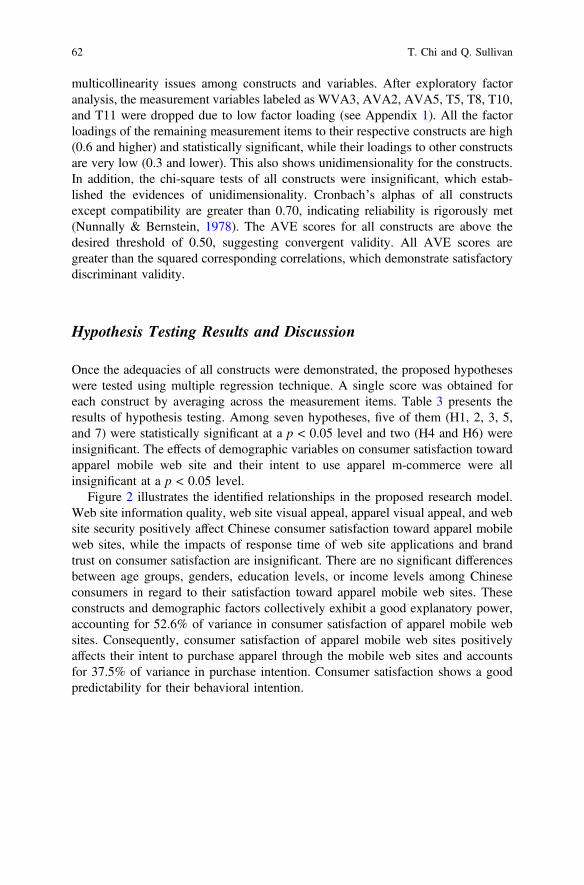
multicollinearity issues among constructs and variables. After exploratory factoranalysis, the measurement variables labeled as WVA3, AVA2, AVA5, T5, T8, T10,and T11 were dropped due to low factor loading (see Appendix 1). All the factorloadings of the remaining measurement items to their respective constructs are high(0.6 and higher) and statistically significant, while their loadings to other constructsare very low (0.3 and lower). This also shows unidimensionality for the constructs.In addition, the chi-square tests of all constructs were insignificant, which estab-lished the evidences of unidimensionality. Cronbach’s alphas of all constructsexcept compatibility are greater than 0.70, indicating reliability is rigorously met(Nunnally & Bernstein, 1978). The AVE scores for all constructs are above thedesired threshold of 0.50, suggesting convergent validity. All AVE scores aregreater than the squared corresponding correlations, which demonstrate satisfactorydiscriminant validity.
Hypothesis Testing Results and Discussion
Once the adequacies of all constructs were demonstrated, the proposed hypotheseswere tested using multiple regression technique. A single score was obtained foreach construct by averaging across the measurement items. Table 3 presents theresults of hypothesis testing. Among seven hypotheses, five of them (H1, 2, 3, 5,and 7) were statistically significant at a p < 0.05 level and two (H4 and H6) wereinsignificant. The effects of demographic variables on consumer satisfaction towardapparel mobile web site and their intent to use apparel m-commerce were allinsignificant at a p < 0.05 level.
Figure 2 illustrates the identified relationships in the proposed research model.Web site information quality, web site visual appeal, apparel visual appeal, and website security positively affect Chinese consumer satisfaction toward apparel mobileweb sites, while the impacts of response time of web site applications and brandtrust on consumer satisfaction are insignificant. There are no significant differencesbetween age groups, genders, education levels, or income levels among Chineseconsumers in regard to their satisfaction toward apparel mobile web sites. Theseconstructs and demographic factors collectively exhibit a good explanatory power,accounting for 52.6% of variance in consumer satisfaction of apparel mobile websites. Consequently, consumer satisfaction of apparel mobile web sites positivelyaffects their intent to purchase apparel through the mobile web sites and accountsfor 37.5% of variance in purchase intention. Consumer satisfaction shows a goodpredictability for their behavioral intention.
62 T. Chi and Q. Sullivan
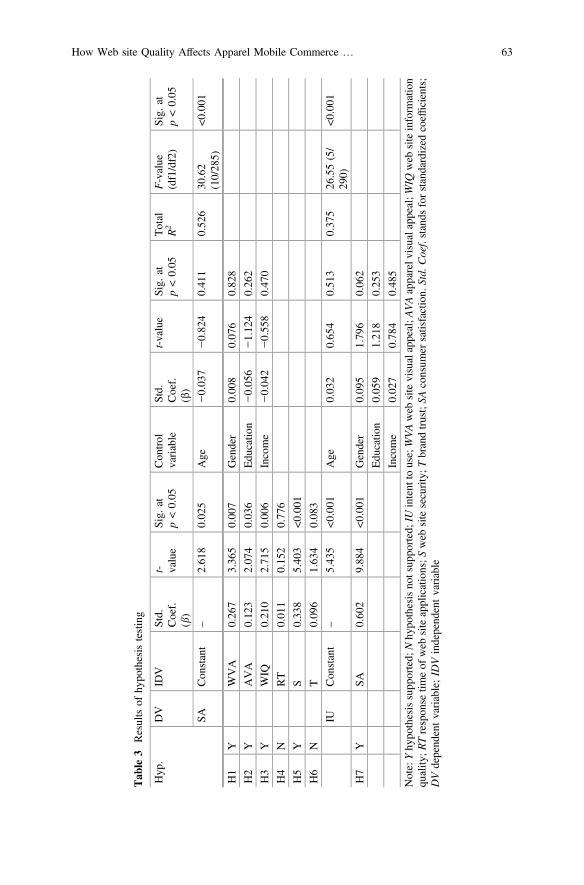
Tab
le3
Resultsof
hypo
thesistesting
Hyp
.DV
IDV
Std.
Coef.
(b)
t- value
Sig.
atp<0.05
Con
trol
variable
Std.
Coef.
(b)
t-value
Sig.
atp<0.05
Total
R2
F-value
(df1/df2)
Sig.
atp<0.05
SACon
stant
–2.61
80.02
5Age
−0.03
7−0.82
40.41
10.52
630
.62
(10/28
5)<0
.001
H1
YWVA
0.26
73.36
50.00
7Gender
0.00
80.07
60.82
8
H2
YAVA
0.12
32.07
40.03
6Edu
catio
n−0.05
6−1.12
40.26
2
H3
YWIQ
0.21
02.71
50.00
6Income
−0.04
2−0.55
80.47
0
H4
NRT
0.01
10.15
20.77
6
H5
YS
0.33
85.40
3<0
.001
H6
NT
0.09
61.63
40.08
3
IUCon
stant
–5.43
5<0
.001
Age
0.03
20.65
40.51
30.37
526
.55(5/
290)
<0.001
H7
YSA
0.60
29.88
4<0
.001
Gender
0.09
51.79
60.06
2
Edu
catio
n0.05
91.21
80.25
3
Income
0.02
70.78
40.48
5
Note:Yhy
pothesissupp
orted;
Nhy
pothesisno
tsup
ported;IUintent
touse;WVAweb
sitevisualappeal;A
VAapparelv
isualapp
eal;WIQ
web
siteinform
ation
quality
;RTrespon
setim
eof
web
siteapplications;S
web
sitesecurity;T
brandtrust;SA
consum
ersatisfaction.
Std.
Coef.stands
forstandardized
coefficients;
DVdepend
entvariable;ID
Vindepend
entvariable
How Web site Quality Affects Apparel Mobile Commerce … 63
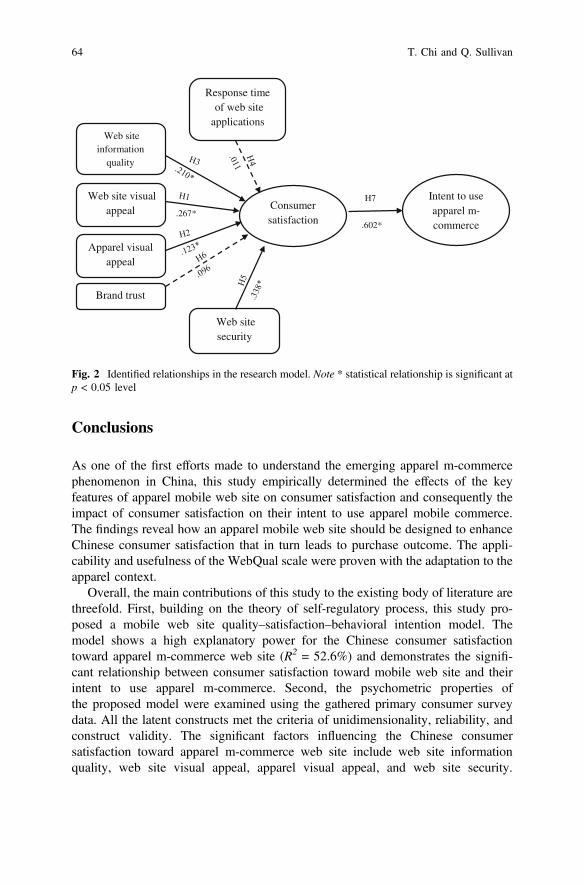
Conclusions
As one of the first efforts made to understand the emerging apparel m-commercephenomenon in China, this study empirically determined the effects of the keyfeatures of apparel mobile web site on consumer satisfaction and consequently theimpact of consumer satisfaction on their intent to use apparel mobile commerce.The findings reveal how an apparel mobile web site should be designed to enhanceChinese consumer satisfaction that in turn leads to purchase outcome. The appli-cability and usefulness of the WebQual scale were proven with the adaptation to theapparel context.
Overall, the main contributions of this study to the existing body of literature arethreefold. First, building on the theory of self-regulatory process, this study pro-posed a mobile web site quality–satisfaction–behavioral intention model. Themodel shows a high explanatory power for the Chinese consumer satisfactiontoward apparel m-commerce web site (R2 = 52.6%) and demonstrates the signifi-cant relationship between consumer satisfaction toward mobile web site and theirintent to use apparel m-commerce. Second, the psychometric properties ofthe proposed model were examined using the gathered primary consumer surveydata. All the latent constructs met the criteria of unidimensionality, reliability, andconstruct validity. The significant factors influencing the Chinese consumersatisfaction toward apparel m-commerce web site include web site informationquality, web site visual appeal, apparel visual appeal, and web site security.
.267*
Web site information
quality
Web site visual appeal
Response time of web site
applications
Web site security
Brand trust
Apparel visual appeal
Consumer satisfaction
Intent to useapparel m-commerce
H7
.602*
Fig. 2 Identified relationships in the research model. Note * statistical relationship is significant atp < 0.05 level
64 T. Chi and Q. Sullivan

Finally, although the investigated demographic factors did not impose statisticallysignificant impacts on Chinese consumer satisfaction toward apparel m-commerce website, some noteworthy patterns between consumer segments emerged. Chinese con-sumers with younger age, male, lower education level, or lower income level tend toshow a higher satisfaction toward apparel m-commerce web site. Meanwhile, amongChinese consumers who show a higher satisfaction toward apparel m-commerceweb site, those who are older, male, higher education level or higher income levelare more likely to make actual purchases via apparel m-commerce web site.
Implications
This study also imparted some managerial implications. Given the acceleratingcompetition facing apparel m-tailers in China, attracting more consumers to visittheir web sites and enhancing their satisfaction toward the web sites that leads touse and reuse have become crucial. Based on the consumer desired features of anapparel m-commerce web site identified in this study, apparel m-tailers can create ormodify their web sites with clear direction and targeted outcomes. Investmentdecision may be made in a more effective manner.
Mobile web site interface design with balance, aesthetics, and consistencyappeals to Chinese consumers. Given the characteristics of apparel, visual mer-chandising plays a significant role in apparel online shopping, which influencesconsumer pleasure and arousal. M-tailers need to create a setting similar tobrick-and-mortar apparel shopping to achieve the best shopping results. Apparelpresentation and aesthetics on the mobile web site should promote the quality ofgoods. Compared to desktop computer-based e-commerce channel, low mediarichness has been one of prominent disadvantages for m-commerce web sites due tothe limitation in screen size, although recent popularity of big screen smartphonespartially addresses the issue. Providing relatively simple but sufficient product andservice information for consumers to make purchase decision is the principle forany m-commerce web design. Consumer trust is the outcome from consumers’perceived safety and privacy of web site processes. Web site security has becomeone of the most important values desired by consumers during online shopping dueto the recent lack of protective measures concerning retail customer security andprivacy. As lack of web site security is fatal for any m-tailers, investment in website security should always be one of top priorities.
With the rapid proliferations of 4G network and decreased cost of mobile data inChina, web site response time is no longer a concern to Chinese consumers. Thecontinuous upgrading of mobile Internet infrastructure is one of the major factorsfor the recent boom of m-commerce in China. According to a recent study fromFung Business Intelligence (2017), most of m-commerce users in China are satis-fied with the speed of mobile Internet connection and business transaction.Compared to the popularity of selling through their own mobile web sites byapparel brands and retailers in other major countries such as USA, a majority of
How Web site Quality Affects Apparel Mobile Commerce … 65
apparel companies in China, particularly small- and medium-sized enterprises(SMEs), sell through some national reputable digital online platforms such asTmall.com and JD.com. A great percentage of Chinese m-commerce users are usedto search and find what they want through these popular platforms. These platformsusually provide additional product quality warranty to shoppers through theiragreements with the product suppliers. This may explain that brand trust does notsignificantly affect Chinese consumer satisfaction toward apparel m-commerce websites, which lowers the m-commerce entry barrier for SMEs.
Moreover, based on the findings of this study, certain types of consumers areworth more attention from companies or should be weighed more in company’sm-commerce marketing strategies or investment. First of all, younger, male, lowereducation level, or lower income Chinese consumers tend to be more receptive tothe new shopping channel—m-commerce that is innovative, private/personal,convenient, price-competitive and requires less resources compared to othershopping channels. Apparel m-tailers can rapidly expand customer base throughattracting these consumers. Second, for apparel m-tailers to develop long-termcustomer base, older, male, higher education level or higher income consumersseem to be more loyal and are more likely to make actual purchases once they aresatisfied with their experiences with apparel m-commerce web sites. Finally, withthe rapid development of m-commerce in China, the market is becoming saturated.Targeting those consumers who are more challenging to be pleased and have higherexpectation on shopping experience could help apparel m-tailers gain market shareand create unique market niche.
Limitations and Future Studies
Although this study has provided a better understanding on the effects of the keyfeatures of apparel m-commerce web site on consumer satisfaction and the impactof consumer satisfaction on their intent to use apparel m-commerce in China, thereare some limitations that should be mentioned and could be addressed in the futurestudies. First, this study used a quantitative research method. Although the quan-titative approach allows the examination of the casual relationships betweenindependent factors and consumer satisfaction and consequently intent to useapparel m-commerce, it is considered weak in discovering the underlying reasons tothe phenomenon. Qualitative methods used in future studies might provide a moredetailed reasoning about the relationships identified in the quantitative analysis.Second, additional factors could be added to the model in the future studies toachieve a higher explanatory power on consumer intent to use apparelm-commerce. Finally, although the technique is valid and has been appliedextensively in the prior studies, the use of a single indicant for multi-item latentconstruct in data analysis could lose certain information about the construct. In thefuture, other methods such as structural equation modeling could be applied for dataanalysis.
66 T. Chi and Q. Sullivan
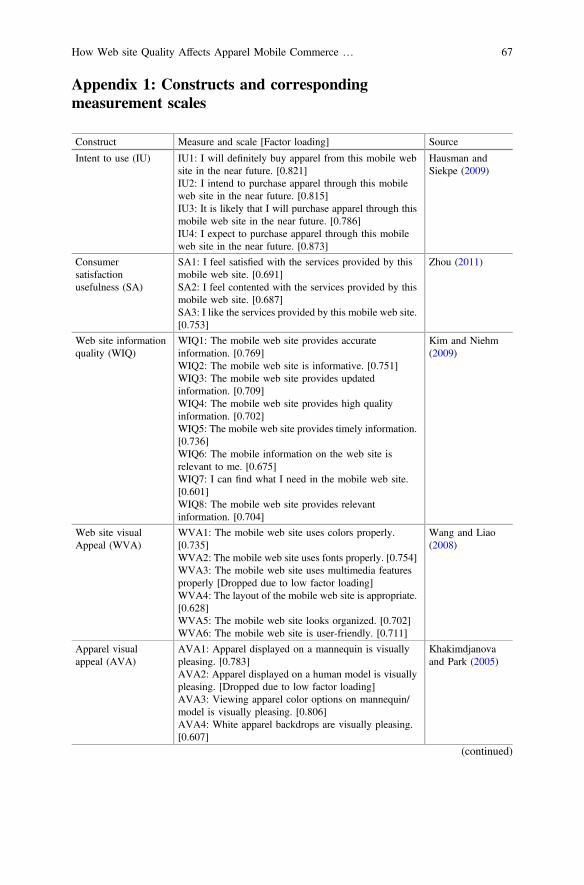
Appendix 1: Constructs and correspondingmeasurement scales
Construct Measure and scale [Factor loading] Source
Intent to use (IU) IU1: I will definitely buy apparel from this mobile website in the near future. [0.821]IU2: I intend to purchase apparel through this mobileweb site in the near future. [0.815]IU3: It is likely that I will purchase apparel through thismobile web site in the near future. [0.786]IU4: I expect to purchase apparel through this mobileweb site in the near future. [0.873]
Hausman andSiekpe (2009)
Consumersatisfactionusefulness (SA)
SA1: I feel satisfied with the services provided by thismobile web site. [0.691]SA2: I feel contented with the services provided by thismobile web site. [0.687]SA3: I like the services provided by this mobile web site.[0.753]
Zhou (2011)
Web site informationquality (WIQ)
WIQ1: The mobile web site provides accurateinformation. [0.769]WIQ2: The mobile web site is informative. [0.751]WIQ3: The mobile web site provides updatedinformation. [0.709]WIQ4: The mobile web site provides high qualityinformation. [0.702]WIQ5: The mobile web site provides timely information.[0.736]WIQ6: The mobile information on the web site isrelevant to me. [0.675]WIQ7: I can find what I need in the mobile web site.[0.601]WIQ8: The mobile web site provides relevantinformation. [0.704]
Kim and Niehm(2009)
Web site visualAppeal (WVA)
WVA1: The mobile web site uses colors properly.[0.735]WVA2: The mobile web site uses fonts properly. [0.754]WVA3: The mobile web site uses multimedia featuresproperly [Dropped due to low factor loading]WVA4: The layout of the mobile web site is appropriate.[0.628]WVA5: The mobile web site looks organized. [0.702]WVA6: The mobile web site is user-friendly. [0.711]
Wang and Liao(2008)
Apparel visualappeal (AVA)
AVA1: Apparel displayed on a mannequin is visuallypleasing. [0.783]AVA2: Apparel displayed on a human model is visuallypleasing. [Dropped due to low factor loading]AVA3: Viewing apparel color options on mannequin/model is visually pleasing. [0.806]AVA4: White apparel backdrops are visually pleasing.[0.607]
Khakimdjanovaand Park (2005)
(continued)
How Web site Quality Affects Apparel Mobile Commerce … 67
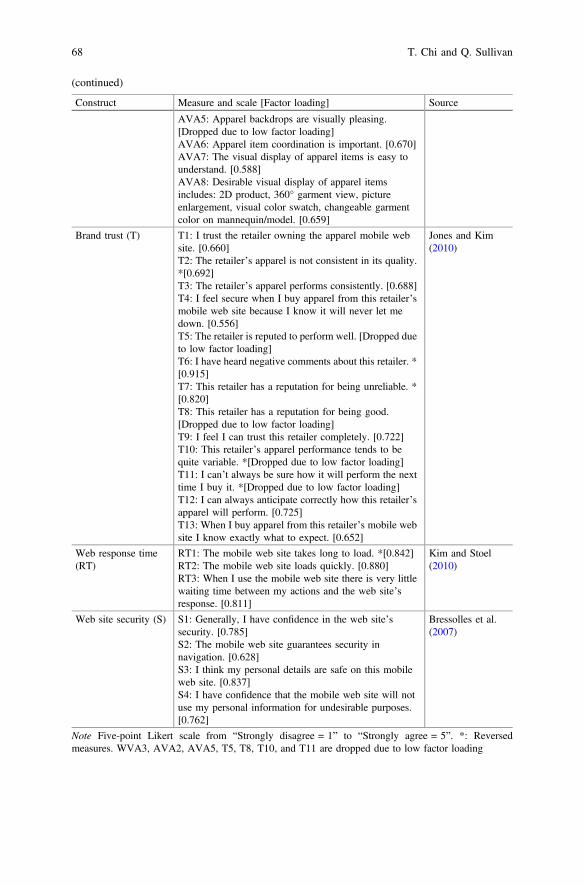
(continued)
Construct Measure and scale [Factor loading] Source
AVA5: Apparel backdrops are visually pleasing.[Dropped due to low factor loading]AVA6: Apparel item coordination is important. [0.670]AVA7: The visual display of apparel items is easy tounderstand. [0.588]AVA8: Desirable visual display of apparel itemsincludes: 2D product, 360° garment view, pictureenlargement, visual color swatch, changeable garmentcolor on mannequin/model. [0.659]
Brand trust (T) T1: I trust the retailer owning the apparel mobile website. [0.660]T2: The retailer’s apparel is not consistent in its quality.*[0.692]T3: The retailer’s apparel performs consistently. [0.688]T4: I feel secure when I buy apparel from this retailer’smobile web site because I know it will never let medown. [0.556]T5: The retailer is reputed to perform well. [Dropped dueto low factor loading]T6: I have heard negative comments about this retailer. *[0.915]T7: This retailer has a reputation for being unreliable. *[0.820]T8: This retailer has a reputation for being good.[Dropped due to low factor loading]T9: I feel I can trust this retailer completely. [0.722]T10: This retailer’s apparel performance tends to bequite variable. *[Dropped due to low factor loading]T11: I can’t always be sure how it will perform the nexttime I buy it. *[Dropped due to low factor loading]T12: I can always anticipate correctly how this retailer’sapparel will perform. [0.725]T13: When I buy apparel from this retailer’s mobile website I know exactly what to expect. [0.652]
Jones and Kim(2010)
Web response time(RT)
RT1: The mobile web site takes long to load. *[0.842]RT2: The mobile web site loads quickly. [0.880]RT3: When I use the mobile web site there is very littlewaiting time between my actions and the web site’sresponse. [0.811]
Kim and Stoel(2010)
Web site security (S) S1: Generally, I have confidence in the web site’ssecurity. [0.785]S2: The mobile web site guarantees security innavigation. [0.628]S3: I think my personal details are safe on this mobileweb site. [0.837]S4: I have confidence that the mobile web site will notuse my personal information for undesirable purposes.[0.762]
Bressolles et al.(2007)
Note Five-point Likert scale from “Strongly disagree = 1” to “Strongly agree = 5”. *: Reversedmeasures. WVA3, AVA2, AVA5, T5, T8, T10, and T11 are dropped due to low factor loading
68 T. Chi and Q. Sullivan
References
Ajzen, I. (1991). The theory of planned behavior. Organizational Behavior and Human DecisionProcesses, 50(2), 179–211.
Ajzen, I., & Fishbein, M. (1977). Attitude-behavior relations: A theoretical analysis and review ofempirical research. Psychological Bulletin, 84(5), 888.
Bagozzi, R. P. (1992). The self-regulation of attitudes, intentions, and behavior. Social PsychologyQuarterly, 55(2), 178–204.
Barnes, S., & Vidgen, R. (2001). An evaluation of cyber-bookshops: The WebQual method.International Journal of Electronic Commerce, 6(1), 11–30.
Bilgihan, A., Kandampully, J., & Zhang, T. (2016). Towards a unified customer experience inonline shopping environments: Antecedents and outcomes. International Journal of Qualityand Service Sciences, 8(1), 102–119.
Bressolles, G., Durrieu, F., & Giraud, M. (2007). The impact of electronic service quality’sdimensions on customer satisfaction and buying impulse. Journal of Customer Behaviour,6(1), 37–56.
Bressolles, G., Durrieu, F., & Senecal, S. (2014). A consumer typology based on e-service qualityand e-satisfaction. Journal of Retailing and Consumer Services, 21(6), 889–896.
Chang, H., & Wang, H. W. (2011). The moderating effect of customer perceived value on onlineshopping behaviour. Online Information Review, 35(3), 333–359.
Chen, C. F., & Kao, Y. L. (2010). Relationships between process quality, outcome quality,satisfaction, and behavioural intentions for online travel agencies–evidence from Taiwan. TheService Industries Journal, 30(12), 2081–2092.
Chi, T., Kilduff, P. P., & Gargeya, V. B. (2009). Alignment between business environmentcharacteristics, competitive priorities, supply chain structures, and firm business performance.International Journal of Productivity and Performance Management, 58(7), 645–669.
Chi, T., & Sun, Y. (2013). Development of firm export market oriented behavior: Evidence froman emerging economy. International Business Review, 22(1), 339–350.
Chi, T., & Zheng, Y. (2016). Understanding environmentally friendly apparel consumption:An empirical study of Chinese consumers. International Journal of Sustainable Society, 8(3),206–227.
Cristobal, E., Flavián, C., & Guinaliu, M. (2007). Perceived e-service quality (PeSQ) measurementvalidation and effects on consumer satisfaction and web site loyalty. Managing ServiceQuality: An International Journal, 17(3), 317–340.
Cyr, D., Head, M., Larios, H., & Pan, B. (2006). Design aesthetics leading to m-loyalty in mobilecommerce. Information & Management, 43(8), 950–963.
Davis, F. D. (1989). Perceived usefulness, perceived ease of use and user acceptance ofinformation technology. MIS Quarterly, 13(3), 319–340.
DeLone, W. H., & McLean, E. (2003). The DeLone and McLean model of information systemssuccess: A ten-year update. Journal of Management Information Systems, 19(4), 9–30.
eMarketer (2016). Ecommerce turns into Mcommerce in China. Retrieved from https://www.emarketer.com/Article/Ecommerce-Turns-Mcommerce-China/1013736 on April 10, 2017.
Euromonitor. (2016). Apparel category to drive product-based digital commerce growth: Thinkwith google partnership. Retrieved from http://blog.euromonitor.com/2016/09/apparel-category-drive-product-based-digital-commerce-growth.html on May 1, 2017.
Field, A. (2009). Discovering statistics using SPSS. Sage publications.Flavian, C., Gurrea, R., & Orús, C. (2009). Web design: A key factor for the website success.
Journal of Systems and Information Technology, 11(2), 168–184.Fornell, C., & Larcker, D. F. (1981). Structural equation models with unobservable variables and
measurement error: Algebra and statistics. Journal of Marketing Research, 18(3), 382–388.Fulgoni, G. M. (2014). Omni-channel retail insights and the consumer’s path-to-purchase. Journal
of Advertising Research, 54(4), 377–380.
How Web site Quality Affects Apparel Mobile Commerce … 69
Fung Business Intelligence. (2017). China retail & e-commerce quarterly Issue 1. Retrieved fromhttps://www.fbicgroup.com/sites/default/files/CREQ_01.pdf on May 15, 2017.
Fung Business Intelligence. (2017). China retail & e-commerce quarterly Issue 04. Retrieved fromhttps://www.fbicgroup.com/sites/default/files/CREQ_04.pdf. on December 10th, 2017.
Galletta, D., Henry, R., McCoy, S., & Polak, P. (2006). When the wait isn’t so bad: The interactingeffects of website delay, familiarity, and breadth. Information Systems Research, 17(1), 20–37.
Gao, L., & Bai, X. (2014). Online consumer behaviour and its relationship to website atmosphericinduced flow: Insights into online travel agencies in China. Journal of Retailing and ConsumerServices, 21(4), 653–665.
Ha, Y., & Lennon, S.J. (2010). Effects of site design on consumer emotions: role of productinvolvement. Journal of Research in Interactive Marketing, 4(2), 80-96.
Hahn, K., & Kim, J. (2009). The effect of offline brand trust and perceived internet confidence ononline shopping intention in the integrated multichannel context. International Journal ofRetail & Distribution Management, 37(2), 126–141.
Kim, J., & Stoel, L. (2010). Factors contributing to rural consumers’ in shopping behavior: effects ofinstitutional environment and social capital. Marketing Intelligence & Planning, 28(1), 70–87.
Hasanov, J., & Khalid, H. (2015). The impact of website quality on online purchase intentionof organic food in Malaysia: A WebQual model approach. Procedia Computer Science, 72,382–389.
Hausman, A. V., & Siekpe, J. S. (2009). The effect of web interface features on consumer onlinepurchase intentions. Journal of Business Research, 62(1), 5–13.
Isidore, C. (2014). Target: Hacking hit up to 110 million customers. Retrieved from http://money.cnn.com/2014/01/10/news/companies/target-hacking/index.html on May 25, 2017.
Ji, X., & Pang, C. (2006). Online visual merchandising of apparel e-retailers. In 2006 IEEEInternational Conference on Engineering Management (pp. 307–311).
Jones, C., & Kim, S. (2010). Influences of retail brand trust, off-line patronage, clothinginvolvement and website quality on online apparel shopping intention. International Journal ofConsumer Studies, 34(6), 627–637.
Khakimdjanova, L., & Park, J. (2005). Online visual merchandising practice of apparele-merchants. Journal of Retailing and Consumer Services, 12(5), 307–318.
Kim, S., & Stoel, L. (2004). Apparel retailers: Website quality dimensions and satisfaction.Journal of Retailing and Consumer Services, 11(2), 109–117.
Kim, H., & Niehm, L.S. (2009). The impact of website quality on information quality, value, andloyalty intentions in apparel retailing. Journal of interactive marketing, 23(3), 221–233.
Ling, K., Chai, L., & Piew, T. (2010). The effects of shopping orientations, online trust and prioronline purchase experience toward customers’ online purchase intention. InternationalBusiness Research, 3(3), 63–76.
Loiacono, E. T. (2000). Webqual (tm): A web site quality instrument. University of Georgia.Loiacono, E., Watson, R., & Goodhue, D. (2007). WebQual: An instrument for consumer
evaluation of web sites. International Journal of Electronic Commerce, 11(3), 51–87.Mariadoss, B. J., Chi, T., Tansuhaj, P., & Pomirleanu, N. (2016). Influences of firm orientations on
sustainable supply chain management. Journal of Business Research, 69(9), 3406–3414.Maity, M., & Dass, M. (2014). Consumer decision-making across modern and traditional
channels: e-commerce, m-commerce, in-store. Decision Support Systems, 61(1), 34–46.Moayery, M., Zamani, S., & Vazifehdoost, H. (2014). Effect of visual merchandising on apparel
impulse buying behaviors among Iranian young adult females. Indian Journal of Science andTechnology, 7(3), 360–366.
Nunnally, J., & Bernstein, I. (1978). Psychometric theory. New York: McGraw-Hill.Ott, L., Longnecker, M., & Ott, R. L. (2001). An introduction to statistical methods and data
analysis. CA: Duxbury Pacific Grove.Park, H. H., Jeon, J. O., & Sullivan, P. (2015). How does visual merchandising in fashion retail
stores affect consumers’ brand attitude and purchase intention? The International Review ofRetail, Distribution and Consumer Research, 25(1), 87–104.
70 T. Chi and Q. Sullivan
Polites, G. L., Williams, C. K., Karahanna, E., & Seligman, L. (2012). A theoretical framework forconsumer e-satisfaction and site stickiness: An evaluation in the context of online hotelreservations. Journal of Organizational Computing and Electronic Commerce, 22(1), 1–37.
Sanakulov, N., & Karjaluoto, H. (2015). Consumer adoption of mobile technologies: A literaturereview. International Journal of Mobile Communications, 13(3), 244–275.
Schaupp, L. (2010). Web site success: Antecedents of web site satisfaction and re-use. Journal ofInternet Commerce, 9(1), 42–64.
Shin, J. I., Chung, K. H., Oh, J. S., & Lee, C. W. (2013). The effect of site quality on repurchaseintention in Internet shopping through mediating variables: The case of university students inSouth Korea. International Journal of Information Management, 33(3), 453–463.
Shiue, Y. C., & Li, S. H. (2013). Brand involvement in retaining customers despite dissatisfaction.Social Behavior and Personality: An International Journal, 41(4), 643–650.
Smitch, C. (2014). Confirmed: Home Depot credit card hack significantly bigger than Target’s.Retrieved from http://bgr.com/2014/09/19/home-depot-vs-target/ on May 15, 2017.
Tsai, H. T., & Bagozzi, R. P. (2014). Contribution behavior in virtual communities: Cogntiive,emotional, and social influences. MIS Quarterly, 38(1), 143–163.
Wakefield, R. L., Wakefield, K. L., Baker, J., & Wang, L. C. (2011). How website socialness leadsto website use. European Journal of Information Systems, 20(1), 118–132.
Wang, Y. S., & Liao, Y. W. (2008). Assessing eGovernment systems success: A validation of theDeLone and McLean model of information systems success. Government InformationQuarterly, 25(4), 717–733.
Yoo, B., & Donthu, N. (2001). Developing and validating a multidimensional consumer-basedbrand equity scale. Journal of Business Research, 52(1), 1–14.
Zhou, T. (2011). Examining the critical success factors of mobile website adoption. OnlineInformation Review, 35(4), 636–652.
How Web site Quality Affects Apparel Mobile Commerce … 71
Attitudes Toward Technology,Digital Activities, and Use of InternetShopping Features Among Chineseand US College Students
Jane E. Workman and Seung-Hee Lee
Abstract The purpose of this study was to examine how attitudes toward tech-nology (ATT), habitual use of digital activities, and frequency of use of internetshopping features differ among male and female Chinese and US college students.Participants were 114 male, 92 female students from a Midwestern US universityand 100 male, 93 female students from Lanzhou University in China. Resultsrevealed that US and Chinese students shared some attitudes and behaviors (pos-itive ATT, use of internet shopping features) but differed in others (negative andanxious/dependent ATT, habitual use of digital activities). US (vs. Chinese) stu-dents indicated more habitual use of all digital activities. Men and women did notdiffer in positive or negative ATT but women indicated greater anxiety/dependenceon technology than men did. Women indicated more habitual use of total digitalactivities, social media, and smartphone than men. Implications for Chinese con-sumers and the fashion market are provided.
Keywords Attitudes toward technology � Digital activities � Internet shoppingfeatures
Given the investment of companies in e-commerce, understanding the conditionsthat must exist for consumers to make use of available technology is an importantresearch topic with economic ramifications for both consumers and online stores.There are many interrelated factors that can affect whether a consumer uses, or doesnot use, available technology to purchase products online: (a) culture, (b) gender,(c) information processing, (d) motivations, (e) attitudes toward technology, and(f) habit. For example, culture and gender affect the way individuals have learned toprocess information. Cultural values regarding egalitarianism may lead to gender
J. E. Workman (&) � S.-H. LeeFashion Design and Merchandising, Southern Illinois University,311 Quigley Hall, Carbondale, IL 62901, USAe-mail: [email protected]
S.-H. Leee-mail: [email protected]
© Springer Nature Singapore Pte Ltd. 2018Y. Xu et al. (eds.), Chinese Consumers and the Fashion Market, Springer Seriesin Fashion Business, https://doi.org/10.1007/978-981-10-8429-4_4
73
differences in use of technology. Culture and gender may interact to affect tech-nology use. Gender affects acceptance and use of technology; therefore, it isimportant to understand the gender differences in hedonic and utilitarian motiva-tions underlying use of internet shopping features. Established attitudes towardtechnology and habit, or behavior exhibited in the past, are other variables that canhelp to explain and predict technology use. China and the USA differ considerablyin five of six cultural values: individualism, indulgence, long-term orientation,power distance, and uncertainty avoidance but not in masculinity. Therefore,because of these cultural differences, attitudes toward technology, habitual use ofdigital activities, and use of internet shopping features may differ among a sampleof male and female Chinese and US college student consumers.
The unified theory of acceptance and use of technology (UTAUT) confirms acritical need to examine acceptance and use of consumer technologies—a “multi-billion dollar industry given the number of technology devices, applications, andservices targeted at consumers” (Venkatesh, Thong, & Xu, 2012, p. 158).Consumer services include internet shopping features. If, or how often, consumersuse technology services may depend on their culture, gender, attitudes towardtechnology, habitual use of digital activities, and characteristics of the internetshopping features. The purpose of this study was to examine how attitudes towardtechnology, habitual use of digital activities, and frequency of use of internetshopping features differ among a sample of male and female Chinese and UScollege student consumers.
China has shown rapid technology adoption trends. The statistics in this para-graph were gleaned from the Statistical Report (July 2016) provided by ChinaInternet Network Information Center. In June of 2016, China had 710 millioninternet users—an increase of 21.32 million from December 2015. Among internetusers, the number of mobile internet users in China reached 92.5% (656 million)making the mobile phone the most important device for internet access. AmongChinese internet users, the ratio of males to females is 53% to 47%. AmongChinese internet users, 20.1% are in the age group of 10–19; 30.4% are in the agegroup of 20–29; and 24.2% are in the age group of 30–39 for a total of 74.7% in theage group of 10–39. Chinese internet users stayed online for an average of 26.5 h aweek. Part of that time was spent shopping; in 2016, there were nearly 448 milliononline shoppers in China, 63% of those with internet access engaged in onlineshopping—up to 8.3% from 2015. Mobile devices were used to engage in onlineshopping by 401 million consumers—61% of those with internet access and anincrease of 18% from 2015. With these many online shoppers, China’s online retailbusiness has shown continuous growth. Yet China, with an internet penetration rate(i.e., percentage of population using the internet) of 51.7% in 2016, has yet to reachits potential online population.
“The rise of China to become the largest e-commerce importer can be attributedin part to growing health concerns, a rise in disposable income, as well as a growingappetite for overseas luxury and fashion items” (Lee, Gillai, Chen, & Rammohan,2016, p. 4). China was the world’s largest online retail market in 2015 with anincrease of 33.3% in online sales compared to 2014 (Tong, 2016) and projected to
74 J. E. Workman and S.-H. Lee
reach a transaction value of $1.56 trillion by 2018 (E-commerce Drives RetailSales, 2015). China has been transitioning toward a consumption-driven economyand has experienced several cultural trends, technological innovations, andimproved logistics networks that have encouraged the growth of e-commerce. Forexample, China’s large and growing middle class becomes more aware of brandnames and more loyal to particular brands plus an increasing tendency to purchasehigh-quality and/or discretionary products (Lee et al., 2016). Many products theylook for are easier to find and cheaper online. Further, the prevalence of mobiledevices and product reviews posted on social media sites are strong forcesinfluencing e-commerce (E-commerce in China, 2014).
In comparison, the US has an internet penetration rate of 88.5% (Internet Usersby Country, 2016). Internet use in the USA is nearly equal among men and women.With nearly 290 million internet users as of 2016, the USA is among the largestonline markets worldwide. Online sales in the USA in 2015 were nearly $342billion (US Census Bureau News, 2016). About 92% of internet users access anonline retail store each month (Bose, 2016). Plus, the Internet influenced in-storesales via in-store Web browsing, reading reviews online before making a purchase,checking what items a store has in stock, checking store hours, reserving an item forin-store pickup, scanning items for a quick price check, and allowing the store tomatch a lower price elsewhere (Martin, 2016; Sterling, 2017). Indeed, 55% ofshoppers acknowledged that customer reviews affect their buying decisions; nearly40% of in-store customers read online reviews before buying a product or service(Internet Trends, 2017). Offline spending influenced by the Internet has beenestimated between $1 and $2+ trillion. According to a Forrester research report,$1.26 trillion of local retail sales were affected in some way by digital media in2016 (Sterling, 2017).
Theoretical Framework
UTAUT evolved from a synthesis of eight technology use theories (Venkateshet al., 2012). There are four key constructs in UTAUT that are predicted to influ-ence technology adoption and use: performance expectancy (i.e., degree to whichusing a technology will be beneficial—utilitarian value or extrinsic motivation),effort expectancy (i.e., ease of use), social influence (i.e., importance of the opinionsof important others), and facilitating conditions (i.e., perceptions of resources andsupport available). Further, individual difference variables (e.g., gender, age,experience, and voluntariness of use) are theorized to moderate various UTAUTrelationships.
UTAUT has been applied beyond its first use in organizational contexts to othercontexts such as new technology, user populations, consumers, and cultural set-tings. In addition, new constructs have expanded the range of dependent andindependent variables. However, there remains a need for examination of factorsthat apply to consumer technology use, particularly considering the growth of
Attitudes Toward Technology, Digital Activities, and Use … 75
e-commerce. In the theory, the strongest predictor of technology use and acceptancehas been its utilitarian benefits or usefulness. Use of technology for its hedonic orrecreational benefits has received scant research attention (Venkatesh et al., 2012).The original UTAUT was revised to integrate three new constructs into UTAUT2,namely (a) intrinsic motivation (hedonic value); (b) price as an explanation forconsumer behavior; and (c) habit—a critical factor predicting technology use butnot initial acceptance.
Straub, Loch, and Hill (2001) suggested that cultural beliefs were a strongpredictor of acceptance of technology. Hofstede’s (2001) theory of culturaldimensions was used to explore similarities and differences between US andChinese students in terms of cultural differences that may affect attitudes towardtechnology, digital activities, and use of internet shopping features.
Review of the Literature
Use and Acceptance of Technology
The emergence of transportable technology (e.g., small, pocket-size devices such assmartphones and other wireless mobile devices) transformed how individuals per-form activities formerly limited to a desktop or laptop computer (Rosen et al.,2013a). Individuals now have 24/7 access to the Internet, e-mail, text messaging,and other applications with a Wi-Fi-enabled mobile device. A national study of7,446 US smartphone users (18- to 44-year-olds) revealed that eight in ten adultsand nine in ten young adults checked their phone within 15 min of awakening(IDC, 2013). Oulasvirta, Rattenbury, Ma, and Raita (2012) found that adults, onaverage, access their smartphones daily for 34 episodes of short duration (less than30 s). Other research found that, among US smartphone users, 58% check theirphones at least hourly and 73% feel anxious if their phone is misplaced (MobileMindset, 2012). Almost half of Japanese student respondents felt insecure, anxious,and perceived they were being ignored when they did not receive a response to theirtext messages (Kamibeppu & Sugiura, 2005). Rosen et al. (2013b) comparedparticipants with five or more signs of Internet addiction to those with fewer thanfive signs. Those who were more addicted to the Internet more often used internetsearching, shared media, and played video games. Those addicted to the Internetwere more anxious about being without technology and more dependent on tech-nology than those not addicted. Anxiety and dependency reflect items on theInternet Addiction Test.
76 J. E. Workman and S.-H. Lee
Hedonic and Utilitarian Motivations and Use of Technology
Two main stimuli underlying consumer behavior are hedonic (sensory, experiential)and utilitarian (functional, practical, instrumental) motivations (Babin, Darden, &Griffin, 1994). “Motivation is the energizing force that activates behavior andprovides purpose and direction to that behavior” (Hawkins & Mothersbaugh, 2013,p. 352). Motivation can come from physical, emotional, cognitive, or social stimulithat activate and direct behavior. A utilitarian perspective emphasizes efficiency andsensible disbursement of resources, whereas a hedonic perspective emphasizes theshopping experience itself as enjoyable and entertaining (Childers, Carr, Peck, &Carson, 2001). The theory of consumer motivation posits that to satisfy hedonicmotives, subjective, psychological information will be used to make decisions butto satisfy utilitarian motives, objective, tangible information will be used (Babinet al., 1994; Hirschman & Stern, 1999; Holbrook & Hirschman, 1982). Hirschmanand Stern (1999) found that positive emotions such as pleasure and enjoyment oftenaccompanied experiential shopping and hedonic consumption. Venkatesh et al.(2012, p. 161) defined hedonic motivation related to technology use as the “fun orpleasure derived from using a technology.” Hedonic motivation plays an importantrole in influencing use of consumer technology services (Brown & Venkatesh,2005; Childers et al., 2001), for example use of recreational shopping featuresassociated with online stores (e.g., e-mail alerts of new products, e-mail alerts ofspecial offers, list of new items, list of best-selling items).
Habit and Use of Technology
“Habit refers to the non-deliberate, automatically inculcated response that indi-viduals may bring to IS usage” (Limayem & Hirt, 2003, p. 66). Habit has beenhypothesized to be stored intention (Ajzen, 2002). Fishbein and Ajzen’s (1975)theory of reasoned action states that an individual’s behavior can be predicted by anintention to behave in a particular way. Further, the theory holds that intentions areshaped by attitudes toward the behavior and by social norms which, in turn, arebased on relevant beliefs regarding the behavior in question (Limayem & Hirt,2003). Habits reveal automatic behavior established during the past, such that aparticular cue calls forth the behavior even when an individual does not consciouslyintend to react. Habit is an important variable in explaining and predicting tech-nology use (Limayem & Hirt, 2003; Limayem, Hirt, & Cheung, 2007).
“Recent work has challenged the role of behavioral intention as the key predictorof technology use and introduced a new theoretical construct (i.e., habit) as anothercritical predictor of technology use” (Venkatesh et al., 2012, p. 158). Habit has beenoperationalized as prior behavior (Kim & Malhotra, 2005) and as the extent towhich an individual believes the behavior to be automatic (Limayem et al., 2007).
Attitudes Toward Technology, Digital Activities, and Use … 77
Gender and Use of Technology
The selectivity model (Meyers-Levy, 1989; Meyers-Levy & Maheswaran, 1991;Meyers-Levy & Sternthal, 1991) asserts that women are comprehensive informa-tion processors. Women not only react to subtle cues and exhibit greater sensitivityto relevant information but evaluate subjective and objective product attributes in anattempt to assimilate all available cues. In contrast, men are selective informationprocessors; that is, men ignore subtle cues in an attempt to be efficient. Men useprior experience or informal methods such as trial and error repetition relying onreadily available salient cues. If the selectivity model is correct, then men may beless likely to use recreational shopping features than women and women may useall internet shopping features more frequently than men.
Gender may be a key variable in acceptance and use of technological services. Ifgender processing differences do exist, it is important for Web site developers tounderstand the differences in order to produce shopping features that will be used.A tendency for women to notice subtle cues becomes important when these cuescontain relevant information. For example, the implicit level of risk (e.g., financial,product quality) associated with a product could serve as a subtle information cuewhich men may ignore and women notice.
Computer anxiety has been defined as “aversion, fear or apprehension towardsinteracting with computers or thinking about computers, intimidation by, resistanceto, hostility, or aggression towards computers” (Beckers & Schmidt, 2001, p. 35).Women displayed higher levels of computer anxiety than men (e.g., Bozionelos,2001; Igbaria & Chakrabarti, 1990). Attitudes (e.g., computer anxiety) are deter-minants of intention and subsequent behavior.
Perceived ease of use has been an obstacle to user acceptance (Venkatesh &Davis, 2000). Ease of use was more relevant to women in making decisionsregarding technology use but usefulness was more relevant to men; ease of use wasnot important to men at any point in decision making (Venkatesh & Morris, 2000).Rosen et al. (2013a) found that men (vs. women) more often played video games,had more online friends, did more media sharing, and experienced more anxietyabout not having access to technology.
Kimbrough, Guadagno, Muscanell, and Dill (2013) used an online survey tocollect data about experiences with multiple forms of technology-mediated com-munication, that is, social networking sites, e-mail, video calls, instant messaging,texting, and phone calls. They found that women, compared to men, preferred andmore frequently used technology-mediated communication such as text messaging,social media, and online video calls.
Given the extensive role of technology in e-commerce and the increasingpresence of women in online shopping domains, understanding gender differencesin technology use decisions is an important issue with economic ramifications foronline stores. Gender differences may be more pronounced for some product types(e.g., clothing compared to books; identity-expressive compared to functionalproducts).
78 J. E. Workman and S.-H. Lee
Culture and Use of Technology
Loch, Straub, and Kamel (2003) applied the model of cultural influence to look atculture-specific facilitators and barriers to adoption and use of the internet in theArab world. Both social norms and extent of technological acculturation affectedindividual acceptance and use of the internet (Straub, Keil, & Brenner, 1997).
Hofstede’s (2001) theory of cultural dimensions helps explain how culturaldifferences may influence technology acceptance and use (Itim International, 2017).Hofstede’s six cultural dimensions are individualism (China—20; US—91),indulgence (China—24, US—68), long-term orientation (China—87; US—26),masculinity (China—66; US—62), power distance (China—80; US—40), anduncertainty avoidance (China—30; US—46).
The power distance dimension (PDI) reveals attitudes toward inequality amongmembers of a culture (Itim International, 2017). PDI is defined by Hofstede (2001)as the extent to which less powerful members within a country expect and acceptunequal distribution of power. China at 80/100 ranks high in PDI, meaning thatinequalities among people are expected and considered acceptable. Formalauthority and sanctions influence people’s behavior. The USA at 40/100 ranks lowin PDI, meaning that citizens accept the uniqueness of each person and, therefore,the inequality, but not the idea of wielding power over others to influence theirideas and behavior.
Individualism (IND) refers to the degree of interdependence among society’smembers (Hofstede, 2001; Hofstede, Hofstede, & Minkov, 2010; Itim International,2017). In collectivist (COL) societies, “in-groups” take care of members inexchange for loyalty. In individualist societies, people only look after themselvesand their direct family. Self-image is defined in terms of “I” (IND) or “We” (COL).China at 20/100 is a highly collectivist culture where interests of the group are moreimportant than individual interests. The USA at 91/100 is a highly individualistculture as shown by an emphasis on equal rights for all citizens.
A high score on the Masculine (MAS) dimension indicates a society driven bycompetition, achievement, and success, whereas a low score (Feminine) indicates asociety that values caring for others and quality of life (Hofstede, 2001; Hofstedeet al., 2010; Itim International, 2017). In a Feminine society, quality of life is a signof success and standing out from the crowd is disgraceful. China at 66/100 is aMasculine society—competitive and success-oriented to the point that citizens willsacrifice family and leisure priorities to work. Chinese students are concerned abouttheir exam scores and ranking as these criteria are the means to achieve success.The USA at 62/100 is also a Masculine society, sharing values that individualsshould “strive to be the best they can be” and a tendency to display and talk freelyabout their achievements.
Uncertainty Avoidance (UA) refers to the extent to which members of a culturecreate beliefs and institutions to reduce anxiety and perceived threats caused byambiguous or unknown situations (Hofstede, 2001; Hofstede et al., 2010; ItimInternational, 2017). China at 30/100 has a low score on Uncertainty Avoidance
Attitudes Toward Technology, Digital Activities, and Use … 79
meaning that Chinese citizens are adaptable, entrepreneurial, and comfortable withambiguity. The USA at 46 also has a low score on UA, meaning there is a will-ingness to try something new or different, acceptance of new ideas and innovativeproducts, and tolerance for freedom of expression.
Long-Term Orientation (LTO) describes a society’s links with its past whilecoping with present and future challenges (Hofstede, 2001; Hofstede et al., 2010;Itim International, 2017). Low scores on LTO indicate normative societies thatmaintain time-honored traditions and norms and view societal change with suspi-cion. High scores indicate cultures that take a pragmatic approach and encouragethrift and education as ways to prepare for the future. China at 87/100 scores highon LTO indicating that Chinese adapt traditions to changed conditions, save andinvest, practice thriftiness, and persevere in accomplishing results. The USA at 26/100 is a normative society whose citizens have strong opinions about social andgovernmental issues. Performance is evaluated on a short-term basis, leading to anemphasis on quick results.
Indulgence is defined as the extent to which individuals are socialized to controltheir desires and impulses (Hofstede, 2001; Hofstede et al., 2010; Itim International,2017): indulgent (relatively weak control) or restrained (relatively strong control).The relatively weak control of desires and impulses may lead to an enhancedvulnerability to addictive behaviors. China at 24/100 is a restrained society with atendency to cynicism and pessimism, delayed gratification, and de-emphasis onleisure time. Social norms restrain their behavior, and indulging themselves isconsidered wrong. The USA at 68/100 is an indulgent society with an interest inimmediate gratification, citizens who work hard and play hard, and a high rate ofaddictive behaviors.
Compared with the USA, China ranks much lower in individualism and indul-gence, much higher in long-term orientation and power distance, about the same inmasculinity, and lower in uncertainty avoidance. Because members of both culturesare competitive and success-oriented, it is unlikely the Masculine dimension willaccount for any differences. The two cultures differ greatly in individualism andindulgence suggesting that Chinese students may have less frequent use of digitalactivities and internet shopping features because these activities are individual andindulgent. US students may lack self-control with regard to digital activitiesresulting in anxiety about losing access to technology. The two cultures also dif-fered greatly in power distance (inequalities among people) suggesting that genderdifferences in use of technology may exist or that there may be interactions betweenculture and gender on technology use. The two cultures also differed greatly inLong-Term Orientation (past, present, and future concerns) suggesting that strongopinions among US citizens about social issues may lead to more negative attitudestoward technology. China scored lower on Uncertainly Avoidance (they are morewilling to try something new or different) than the USA, suggesting they may haveslightly more positive, and less negative, attitudes toward technology. How indi-viduals obtain, consolidate, and use information depends on how they have learnedto process information (de Mooij & Hofstede, 2011). Members of collectivisticcultures such as China are used to symbols, signs, and tacit communication and
80 J. E. Workman and S.-H. Lee
have learned a different way of processing information than members of individ-ualistic cultures, who have adapted to verbal communication, explanations, andspeech (de Mooij & Hofstede, 2011, p. 187). Therefore, because of these culturaldifferences, attitudes toward technology, habitual use of digital activities, and use ofinternet shopping features may differ among a sample of male and female Chineseand US college student consumers.
Purpose of the Study and Hypotheses
The purpose of this study was to examine how attitudes toward technology (ATT),habitual use of digital activities, and frequency of use of internet shopping featuresdiffer among a sample of male and female Chinese and US college student con-sumers. The current research measured attitudes toward technology, habit, and bothutilitarian and hedonic values. The following variables were held constant in thisresearch: price (use of internet shopping features is provided free of charge to Website users); voluntariness (use of internet shopping features is voluntary); and age(the college student sample had little variance in age). Understanding the conditionsunder which convenience and recreational shopping features are or are not used isan important issue given the investment of companies in e-commerce and the effectthese shopping features may have on a consumer’s decision to purchase productsonline.
Research has documented the importance of ATT to consumer behavior, but hasnot compared ATT, habitual use of digital activities, and use of internet shoppingfeatures in combination with gender and culture. The following hypotheses wereproposed:
• H1a–e: Male and female college students will differ in (a) positive ATT,(b) negative ATT, (c) anxious ATT, (d) use of recreational internet shoppingfeatures, and (e) use of convenience internet shopping features.
• H2a–e: Chinese and US college students will differ in (a) positive ATT,(b) negative ATT, (c) anxious ATT, (d) use of recreational internet shoppingfeatures, and (e) use of convenience internet shopping features.
• H3a–e: Male and female college students will differ in habitual use of (a) totaldigital activities, (b) social media, (c) smartphone, (d) e-mail, and(e) entertainment.
• H4a–e: Chinese and US college students will differ in habitual use of (a) totaldigital activities, (b) social media, (c) smartphone, (d) e-mail, and(e) entertainment.
Attitudes Toward Technology, Digital Activities, and Use … 81
Method
A questionnaire was compiled that contained demographic items and scales mea-suring internet shopping features (Kim & LaRose, 2004), ATT, and habitual use ofdigital activities (Rosen et al., 2013a). The questionnaire was translated intoChinese by the widely used back-translation method.
Instruments. ATT includes items that measure positive attitudes (six items),negative attitudes (three items), anxious and dependent attitudes (three items; Rosenet al., 2013a). A five-point scale (5 = strongly agree; 1 = strongly disagree) mea-sured level of agreement with each item. Following are example items measuringpositive attitudes (“I feel it is important to be able to find any information wheneverI want online”), anxious attitudes (“I get anxious when I don’t have my cellphone”), and negative attitudes (“New technology makes people more isolated”).The scales measure attitudes toward technology in general rather than any specifictechnology. The items in anxious ATT assess anxiety related to dependence oraddiction to technology; not anxiety caused by aversion or fear of computers. Itemsin each subscale were summed to create a score for that subscale.
Habit was operationally defined as frequency of use. The original scale formeasuring use of digital activities (Rosen et al., 2013a) included 44 items. In theinterest of shortening the scale, representative items were selected: e-mail (twoitems), smartphone (four items), entertainment (three items), and social media (twoitems). Frequency of using digital activities used a 10-point scale (1 = never;2 = once a month; 3 = several times a month; 4 = once a week; 5 = several times aweek; 6 = once a day; 7 = several times a day; 8 = once an hour; 9 = several timesan hour; 10 = all the time). Items were summed to create a score for each digitalactivity and an overall score; higher scores indicate more habitual use and greateraddiction to these digital activities. Participants indicated how often they do each ofthe following activities: Check personal e-mail; check work or school e-mail; send,receive, and check text messages on a mobile phone (for personal use); send,receive, and check text messages on a mobile phone (during work or class); browsethe Web on a mobile phone (for personal use); browse the Web on a mobile phone(during work or class); watch TV shows, movies, other media on a TV set; searchthe internet for information on any device; play games on a computer, video gameconsole, or smartphone; general social media usage (check Facebook page or othersocial networks at work or school; check Facebook page or other social networksoutside work or school).
Internet shopping features include both convenience (five items) and recreational(four items) features (Kim & LaRose, 2004). Frequency of use of internet shoppingfeatures was measured with a five-point scale (1 = never; 2 = rarely; 3 = some-times; 4 = often; 5 = very often) indicating how often these features are used whenshopping online. Items measuring use of convenience features are: search enginefor finding products I want; product price information; price comparison with otherWeb sites; product-related articles or reviews written by experts; reviews written byother shoppers. Items measuring use of recreational shopping features are: e-mail
82 J. E. Workman and S.-H. Lee
alerts of new products; e-mail alerts of special offers; list of new items, and list ofbest-selling items. Items in each subscale were summed to create a score for thatscale.
Procedure. The research was approved by the Institutional Review Board at theUS university. The questionnaire was distributed and collected in large lectureclasses and took about 20 min to complete. Participants in this study were studentsfrom a university in the Midwestern United States and from Lanzhou University inChina. In the USA, in 2014, there were 21.6 million college students with anestimated $163 billion in discretionary income (US College Explorer, 2014). In2015, in China, there were about 26.25 million college students (Number of stu-dents…, 2017). Eight million students will graduate from Chinese higher educationinstitutions in 2017, ten times higher than in 1997, and more than twice the numbergraduating in the USA (Montgomery, 2017; Stapleton, 2017). Therefore, US andChinese male and female college students were considered an important sample foran investigation of attitudes toward technology, habitual use of digital activities,and use of internet shopping features.
Results
Participants were 209 US and 193 Chinese college students—185 women; 215men; mean age = 21.13; range 17–32—from a variety of majors (e.g., engineering,sports management, fashion, architecture, business). In the US sample, there were144 (68.9%) Caucasian, 38 (18.2%) African-American, 12 (5.74%) Hispanic/Latino, 11 (5.25%) Asian/Asian-American, and 4 (2.0%) otherwise classified.
Descriptive statistics and Cronbach’s alpha reliability for attitudes towardtechnology, internet shopping features, and digital activities are displayed inTable 1. Reliability was acceptable for all scales for both countries; Cronbach’salpha ranged from 0.67 to 0.88.
MANOVA, with country and gender as independent variables and positive ATT,negative ATT, anxious/dependent ATT, use of convenience and recreationalshopping features as dependent variables, was significant for country [F(5,391) = 8.33, p < 0.000], gender [F(5, 391) = 6.19, p < 0.000], and the country/gender interaction [F(5, 391) = 5.40, p < 0.000]. ANOVA (see Table 2) revealedthat men and women did not differ in positive ATT or negative ATT. Men andwomen differed in anxious/dependent ATT, use of recreational and convenienceshopping features. Women indicated greater anxiety/dependence on technology andmore often used both convenience and recreational shopping features than men.
The interaction between country and gender revealed that Chinese men andChinese women did not differ in use of recreational shopping features but USwomen, compared with US men, more often used recreational shopping features.US men expressed less anxiety/dependence on technology than v women butChinese men and women did not differ in anxiety/dependence about technology.H1a and H1b were not supported; H1c, H1d, and H1e were supported.
Attitudes Toward Technology, Digital Activities, and Use … 83
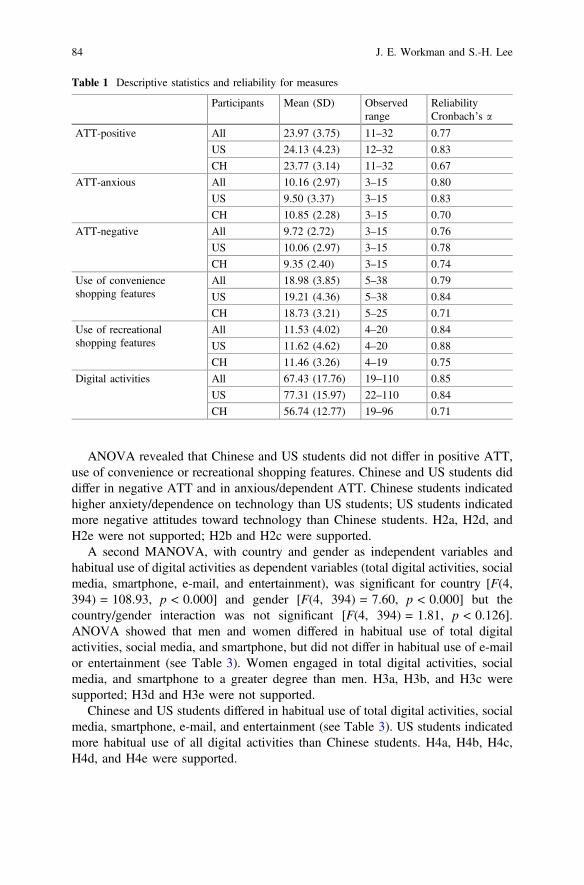
ANOVA revealed that Chinese and US students did not differ in positive ATT,use of convenience or recreational shopping features. Chinese and US students diddiffer in negative ATT and in anxious/dependent ATT. Chinese students indicatedhigher anxiety/dependence on technology than US students; US students indicatedmore negative attitudes toward technology than Chinese students. H2a, H2d, andH2e were not supported; H2b and H2c were supported.
A second MANOVA, with country and gender as independent variables andhabitual use of digital activities as dependent variables (total digital activities, socialmedia, smartphone, e-mail, and entertainment), was significant for country [F(4,394) = 108.93, p < 0.000] and gender [F(4, 394) = 7.60, p < 0.000] but thecountry/gender interaction was not significant [F(4, 394) = 1.81, p < 0.126].ANOVA showed that men and women differed in habitual use of total digitalactivities, social media, and smartphone, but did not differ in habitual use of e-mailor entertainment (see Table 3). Women engaged in total digital activities, socialmedia, and smartphone to a greater degree than men. H3a, H3b, and H3c weresupported; H3d and H3e were not supported.
Chinese and US students differed in habitual use of total digital activities, socialmedia, smartphone, e-mail, and entertainment (see Table 3). US students indicatedmore habitual use of all digital activities than Chinese students. H4a, H4b, H4c,H4d, and H4e were supported.
Table 1 Descriptive statistics and reliability for measures
Participants Mean (SD) Observedrange
ReliabilityCronbach’s a
ATT-positive All 23.97 (3.75) 11–32 0.77
US 24.13 (4.23) 12–32 0.83
CH 23.77 (3.14) 11–32 0.67
ATT-anxious All 10.16 (2.97) 3–15 0.80
US 9.50 (3.37) 3–15 0.83
CH 10.85 (2.28) 3–15 0.70
ATT-negative All 9.72 (2.72) 3–15 0.76
US 10.06 (2.97) 3–15 0.78
CH 9.35 (2.40) 3–15 0.74
Use of convenienceshopping features
All 18.98 (3.85) 5–38 0.79
US 19.21 (4.36) 5–38 0.84
CH 18.73 (3.21) 5–25 0.71
Use of recreationalshopping features
All 11.53 (4.02) 4–20 0.84
US 11.62 (4.62) 4–20 0.88
CH 11.46 (3.26) 4–19 0.75
Digital activities All 67.43 (17.76) 19–110 0.85
US 77.31 (15.97) 22–110 0.84
CH 56.74 (12.77) 19–96 0.71
84 J. E. Workman and S.-H. Lee
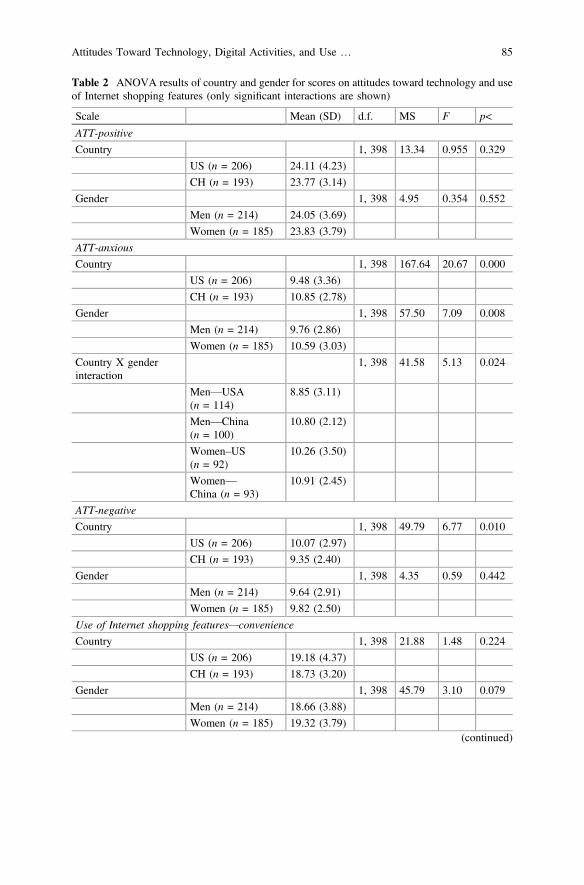
Table 2 ANOVA results of country and gender for scores on attitudes toward technology and useof Internet shopping features (only significant interactions are shown)
Scale Mean (SD) d.f. MS F p<
ATT-positive
Country 1, 398 13.34 0.955 0.329
US (n = 206) 24.11 (4.23)
CH (n = 193) 23.77 (3.14)
Gender 1, 398 4.95 0.354 0.552
Men (n = 214) 24.05 (3.69)
Women (n = 185) 23.83 (3.79)
ATT-anxious
Country 1, 398 167.64 20.67 0.000
US (n = 206) 9.48 (3.36)
CH (n = 193) 10.85 (2.78)
Gender 1, 398 57.50 7.09 0.008
Men (n = 214) 9.76 (2.86)
Women (n = 185) 10.59 (3.03)
Country X genderinteraction
1, 398 41.58 5.13 0.024
Men—USA(n = 114)
8.85 (3.11)
Men—China(n = 100)
10.80 (2.12)
Women–US(n = 92)
10.26 (3.50)
Women—China (n = 93)
10.91 (2.45)
ATT-negative
Country 1, 398 49.79 6.77 0.010
US (n = 206) 10.07 (2.97)
CH (n = 193) 9.35 (2.40)
Gender 1, 398 4.35 0.59 0.442
Men (n = 214) 9.64 (2.91)
Women (n = 185) 9.82 (2.50)
Use of Internet shopping features—convenience
Country 1, 398 21.88 1.48 0.224
US (n = 206) 19.18 (4.37)
CH (n = 193) 18.73 (3.20)
Gender 1, 398 45.79 3.10 0.079
Men (n = 214) 18.66 (3.88)
Women (n = 185) 19.32 (3.79)(continued)
Attitudes Toward Technology, Digital Activities, and Use … 85
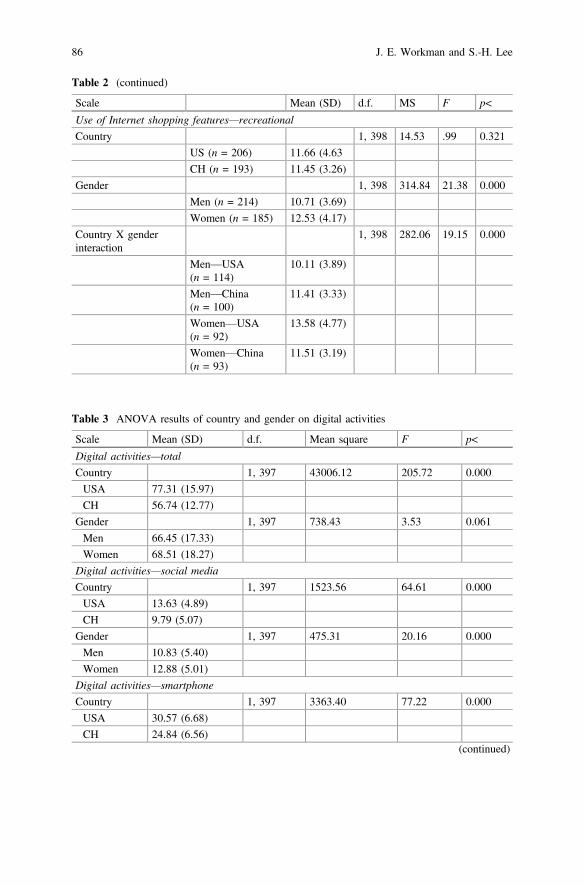
Table 2 (continued)
Scale Mean (SD) d.f. MS F p<
Use of Internet shopping features—recreational
Country 1, 398 14.53 .99 0.321
US (n = 206) 11.66 (4.63
CH (n = 193) 11.45 (3.26)
Gender 1, 398 314.84 21.38 0.000
Men (n = 214) 10.71 (3.69)
Women (n = 185) 12.53 (4.17)
Country X genderinteraction
1, 398 282.06 19.15 0.000
Men—USA(n = 114)
10.11 (3.89)
Men—China(n = 100)
11.41 (3.33)
Women—USA(n = 92)
13.58 (4.77)
Women—China(n = 93)
11.51 (3.19)
Table 3 ANOVA results of country and gender on digital activities
Scale Mean (SD) d.f. Mean square F p<
Digital activities—total
Country 1, 397 43006.12 205.72 0.000
USA 77.31 (15.97)
CH 56.74 (12.77)
Gender 1, 397 738.43 3.53 0.061
Men 66.45 (17.33)
Women 68.51 (18.27)
Digital activities—social media
Country 1, 397 1523.56 64.61 0.000
USA 13.63 (4.89)
CH 9.79 (5.07)
Gender 1, 397 475.31 20.16 0.000
Men 10.83 (5.40)
Women 12.88 (5.01)
Digital activities—smartphone
Country 1, 397 3363.40 77.22 0.000
USA 30.57 (6.68)
CH 24.84 (6.56)(continued)
86 J. E. Workman and S.-H. Lee
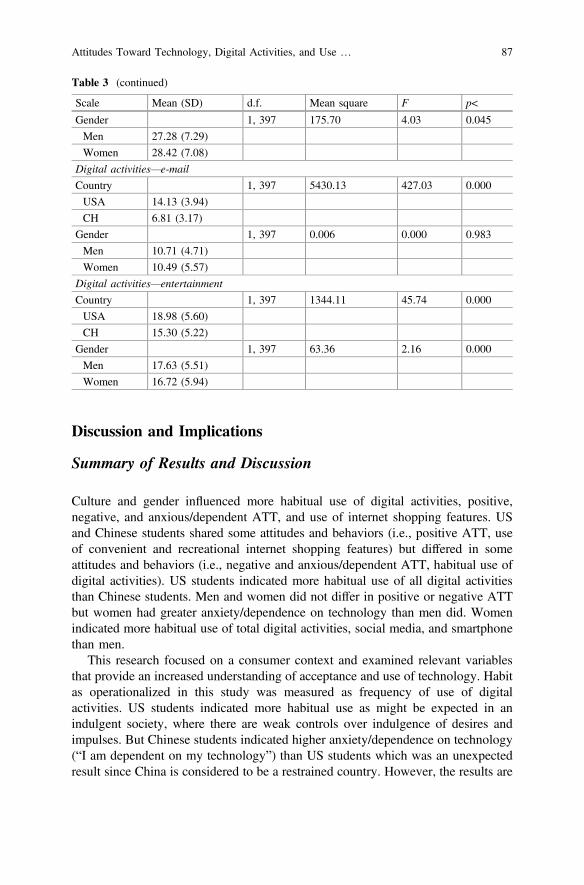
Discussion and Implications
Summary of Results and Discussion
Culture and gender influenced more habitual use of digital activities, positive,negative, and anxious/dependent ATT, and use of internet shopping features. USand Chinese students shared some attitudes and behaviors (i.e., positive ATT, useof convenient and recreational internet shopping features) but differed in someattitudes and behaviors (i.e., negative and anxious/dependent ATT, habitual use ofdigital activities). US students indicated more habitual use of all digital activitiesthan Chinese students. Men and women did not differ in positive or negative ATTbut women had greater anxiety/dependence on technology than men did. Womenindicated more habitual use of total digital activities, social media, and smartphonethan men.
This research focused on a consumer context and examined relevant variablesthat provide an increased understanding of acceptance and use of technology. Habitas operationalized in this study was measured as frequency of use of digitalactivities. US students indicated more habitual use as might be expected in anindulgent society, where there are weak controls over indulgence of desires andimpulses. But Chinese students indicated higher anxiety/dependence on technology(“I am dependent on my technology”) than US students which was an unexpectedresult since China is considered to be a restrained country. However, the results are
Table 3 (continued)
Scale Mean (SD) d.f. Mean square F p<
Gender 1, 397 175.70 4.03 0.045
Men 27.28 (7.29)
Women 28.42 (7.08)
Digital activities—e-mail
Country 1, 397 5430.13 427.03 0.000
USA 14.13 (3.94)
CH 6.81 (3.17)
Gender 1, 397 0.006 0.000 0.983
Men 10.71 (4.71)
Women 10.49 (5.57)
Digital activities—entertainment
Country 1, 397 1344.11 45.74 0.000
USA 18.98 (5.60)
CH 15.30 (5.22)
Gender 1, 397 63.36 2.16 0.000
Men 17.63 (5.51)
Women 16.72 (5.94)
Attitudes Toward Technology, Digital Activities, and Use … 87
consistent with Ni, Yan, Chen, and Liu (2009) who surveyed first-year students at auniversity in China and found that more than 6% were addicted to the Internet.Internet-addicted students (vs. non-internet addicted) had higher scores on anxiety;internet addiction was positively correlated with anxiety. Men (6.6%) were slightlymore likely to be internet addicted than women (6.1%).
US women indicated more habitual use of total digital activities, social media,and smartphone than men and indicated greater anxiety/dependence on technologythan men. These findings may reflect the results of socialization in an indulgentsociety where there is increased vulnerability to addictive behavior, especially forwomen. Women, compared to men, have been found to engage in several types ofaddictive behavior such as compulsive shopping (Lee & Workman, 2015), eatingdisorders (Cook et al., 2014; Woodside et al., 2001; Yates, 2013), and otheraddictive disorders (Cook et al., 2014; Fattore, Melis, Fadda, & Fratta, 2014; Yates,2013).
US students indicated more negative attitudes toward technology than Chinesestudents which may be partially explained by differences in Long-Term Orientation.The USA had low scores on LTO indicating a normative culture with suspiciousattitudes toward societal changes and expression of strong opinions about socialissues such as addressed in the measure of negative attitudes toward technology(e.g., new technology makes people waste too much time, makes life more com-plicated, and makes people more isolated). However, China’s high score on LTOplus a low score on Uncertainty Avoidance indicates that Chinese students arelikely to be receptive to, and adapt readily to, changes in technology.
US and Chinese students did not differ in use of convenience and recreationalinternet shopping features. Chinese men and women did not differ in use of con-venience and recreational internet shopping features. Information gathering is oftenthe first step in a purchase decision. “Whereas in individualistic cultures of lowpower distance, people will actively acquire information via the media and friendsto prepare for purchases, in collectivistic and/or high power distance cultures,people will acquire information more via implicit, interpersonal communication andbase their buying decisions on feelings and trust in the company”(de Mooij &Hofstede, 2011, p. 188). Zheng, Favier, Huang, and Coat (2012) concluded thatChinese consumers reduced risk by searching for information about the product andprice or by visiting a store to look at the product. Online reviews were not preferredas a means of risk reduction because consumers either enjoyed searching forinformation on the internet or believed online reviews were not trustworthy.Consistent with Zheng et al.’s study, in the current study, Chinese men and womenused both convenience and recreational internet shopping features to search forinformation.
US women more frequently used both convenience and recreational shoppingfeatures than men did. The selectivity model (Meyers-Levy, 1989; Meyers-Levy &Maheswaran, 1991; Meyers-Levy & Sternthal, 1991) may partially explain thesefindings; that is, the model asserts that women assimilate all available cues con-taining relevant information but men rely on readily available salient cues and useprior experience or informal methods such as trial and error to make purchase
88 J. E. Workman and S.-H. Lee
decisions. The selectivity model was developed in the USA and may not explaindifferences in use of internet shopping features among men and women in othercultures.
Theoretical Implications
Venkatesh et al. (2012) observed that use of technology for its hedonic or recre-ational benefits has not received much research attention. Therefore, they revisedthe original Unified Theory of Acceptance and Use of Technology to integrate threenew constructs: (a) intrinsic motivation (hedonic value); (b) price as an explanationfor consumer behavior; and (c) habit—a factor predicting technology use but notinitial acceptance. The current study included measures of intrinsic motivation andhabit (but not price) and found support for these variables as influences on tech-nology use between two cultures and between men and women.
Based on Hofstede’s (2001) theory of cultural dimensions, differences werepredicted among a sample of male and female Chinese and US consumers regardingattitudes toward technology, habitual use of digital activities, and frequency of useof internet shopping features. Partial or full support was found for all four majorhypotheses formulated based on cultural differences in the values of individualism,indulgence, long-term orientation, power distance, and uncertainty avoidance.Results confirmed the influence of culture on attitudes toward technology, habitualuse of digital activities, and frequency of use of internet shopping features. Noprevious research has explored the relationships among these three variablesbetween participants from the USA and China. These findings can contribute to thebody of research using Hofstede’s theory to investigate cultural differences.
Implications for Chinese Consumers and the Fashion Market
Results of this study revealed that Chinese male and female college students did notdiffer in their anxiety/dependence on technology, use of internet shopping features,and habitual use of total digital activities, social media, and smartphone. Theseresults can provide useful information for e-retailers or virtual store managers anddevelopers as they plan selective marketing strategies to serve their young targetmarket in China. For example, Chinese men and women used both convenience andrecreational internet shopping features to search for information. Because Chineseconsumers are a key group in a global fashion market, their use of internet shoppingfeatures in online shopping malls will greatly impact growth of the online fashionmarket. What additional internet shopping features would appeal to Chinese con-sumers? Perhaps a consumer survey would produce an answer to that question.
Attitudes Toward Technology, Digital Activities, and Use … 89
In the current study, Chinese students indicated some degree of addiction todigital activities as measured by frequency of use. Based on a 2015 iResearchreport, the four top reasons Chinese consumers engaged in online shopping werequality assurance, price, brand preference, and unavailability of product locally(iResearch, 2015). Popular categories that reveal an attraction to luxury and fashionitems include clothes, shoes, accessories, perfume, jewelry, and watches—cate-gories that may be hard to find locally and may be cheaper online (Fu, 2014; Rapp,2016). The growing desire for foreign luxury and fashion items has potential to leadto addictive internet shopping behaviors.
Because Chinese score is low on uncertainty avoidance, indicating a willingnessto try something new or innovative, the Chinese fashion market might be a goodtesting ground for design and deployment challenges associated with new types ofwearable and immersive technology (Saleem et al., 2017). Chinese consumers mayfavorably receive an expansion of the online shopping network to digital fashion asa space for creation, access, and social sharing.
Public Policy Implications
Given the increasing availability and affordability of transportable technology (e.g.,smartphones and other wireless mobile devices), technology addiction may becomemore prevalent. Digital over-engagement can have negative effects on daily livesincluding compulsive buying and diminishing participation in civic activities(Montag & Walla, 2016). Public policy intervention can address how digitaladdiction and online shopping behaviors are related.
There are policy issues regarding the digital divide across regions, education,income, generations, and gender that influence accessibility to digital tools andactivities. How can the digital gap be reduced? Public policy is required to explorewhere the digital divide of technology acceptance and use among different groupsoriginates. Internet exclusion is closely related to marketing issues regarding whocan or cannot conveniently participate in online shopping behaviors. Further, publicpolicy issues related to privacy, freedom of expression, and human rights may beraised in regard to digital activities of marketing.
Limitations and Implications for Further Research
This study was limited to data from Chinese and US college students. LanzhouUniversity in China is located in Gansu Province which is an inland location and,thus, not a representative area of China for examining technology use. Collegestudents, in general, cannot be considered representative of the general population.College students are an important target market for many businesses; however, ageneral population survey would provide a more complete picture of variables
90 J. E. Workman and S.-H. Lee

affecting technology acceptance and use. Another limitation is the scale, publishedin 2004, used to measure frequency of use of internet shopping features;undoubtedly both convenience and recreational internet shopping features havebeen added to internet shopping sites in the last 13 years, for example links tofashion bloggers. To shorten the original 44-item scale measuring use of digitalactivities, 11 representative items were selected. Shortening the scale may haveaffected its effectiveness in measuring habitual use of digital activities.
Another limitation relates to external factors present in different cultures such asa country’s particular situation, government regulations, or business competitionthat could influence consumers’ perception about adopting technology. This studydid not include these factors so further study can be examined with these externalissues. Also, we did not measure if the variables used in the study (e.g., attitudestoward technology, Internet shopping features, digital activities) affect consumers’purchasing intention or behavior regarding fashion items. Further research is rec-ommended to expand this study to other countries examining cultural differences intechnology acceptance and use.
There are three promising research areas regarding digital technology and cul-tural differences in internet shopping. First, there are research questions about howattitude toward digital tools and activities influences internet shopping behavior andhow these attitudes vary across developed and developing countries. Second,longitudinal data may help explain how individual preferences and digital activitiesduring childhood influence consumer behavior in both offline and online venuesduring adulthood. Third, wearable technology provides a continuous connectionbetween business and consumer but when does this connection become anannoyance or an intrusion into personal lives?
References
Ajzen, I. (2002). Residual effects of past on later behavior: Habituation and reasoned actionperspectives. Personality & Social Psychology Review, 6(2), 107–122.
Babin, B. J., Darden, W. R., & Griffin, M. (1994). Work and/or fun: Measuring hedonic andutilitarian shopping value. Journal of Consumer Research, 20(4), 644–656.
Beckers, J. J., & Schmidt, H. G. (2001). The structure of computer anxiety: A six-factor model.Computers in Human Behavior, 17(1), 35–49.
Bose, S. (2016, December 6). 8 in 10 US internet users now buy online, says GlobalWebIndex.Retrieved from https://smallbiztrends.com/2016/12/2016-online-shopping-statistics.html.
Bozionelos, N. (2001). Computer anxiety: Relationship with computer experience and prevalence.Computers in Human Behavior, 17(2), 213–224.
Brown, S. A., & Venkatesh, V. (2005). Model of adoption of technology in the household: Abaseline model test and extension incorporating household life cycle. MIS Quarterly, 29(4),399–426.
Childers, T. L., Carr, C. L., Peck, J., & Carson, S. (2001). Hedonic and utilitarian motivations foronline retail shopping behavior. Journal of Retailing, 77, 511–535.
Cook, B., Engel, S., Crosby, R., Hausenblas, H., Wonderlich, S., & Mitchell, J. (2014).Pathological motivations for exercise and eating disorder specific health-related quality of life.International Journal of Eating Disorders, 47(3), 268–272.
Attitudes Toward Technology, Digital Activities, and Use … 91
de Mooij, M., & Hofstede, G. (2011). Cross-cultural consumer behavior: A review of researchfindings. Journal of International Consumer Marketing, 23, 181–192.
E-commerce drives retail sales growth in China. (2015, September 25). eMarketer.E-commerce in China: Driving a new consumer culture. (2014, January). KPMG Global China
Practice.Fattore, L., Melis, M., Fadda, P., & Fratta, W. (2014). Sex differences in addictive disorders.
Frontiers in Neuroendocrinology, 35(3), 272–284.Fishbein, M., & Ajzen, I. (1975). Belief, attitude, intention and behavior. Reading, MA:
Addison-Wesley.Fu, R. (2014, September 4). Chinese cross-border online Shoppers insights. China Internet Watch.Hawkins, D., & Mothersbaugh, D. (2013). Consumer behavior: Building marketing strategy (12th
ed.). New York: McGraw Hill/Irwin.Hirschman, E. C., & Stern, B. B. (1999). The roles of emotion in consumer research. Advances in
Consumer Research, 26, 4–11.Hofstede, G. (2001). Culture’s consequences: Comparing values, behaviors, institutions and
organizations across nations. Newbury Park, CA: Sage.Hofstede, G., Hofstede, G. J., & Minkov, M. (2010). Cultures and organizations: Software of the
mind (Revised and Expanded 3rd ed.). New York: McGraw-Hill.Holbrook, M. B., & Hirschman, E. C. (1982). The experiential aspects of consumption: Consumer
fantasies, feelings, and fun. Journal of Consumer Research, 9(2), 132–140.IDC. (2013). Always connected: How smartphones and social media keep us engaged. IDC
Research. Retrieved http://www.scribd.com/doc/133393152/IDC-Facebook-Always-Connected.
Igbaria, M., & Chakrabarti, A. (1990). Computer anxiety and attitudes towards microcomputeruse. Behaviour & Information Technology, 9(3), 229–241.
Internet Trends. (2017). Stats & Facts in the US and Worldwide. Retrieved from https://www.vpnmentor.com/blog/vital-internet-trends/.
Internet Users by Country. (2016). Internet Live Stats. Retrieved from www.internetlivestats.com/internet-users-by-country/.
iResearch. (2015). 2015 China cross-border online shoppers report. Retrieved from www.iresearchchina.com/content/details8_19346.html.
Itim International. (2017). Geert Hofstede cultural dimensions. Retrieved from http://www.geert-hofstede.com.
Kamibeppu, K., & Sugiura, H. (2005). Impact of the mobile phone on junior high-school students’friendships in the Tokyo metropolitan area. Cyberpsychology & Behavior, 8(2), 121–130.
Kim, J., & LaRose, R. (2004). Interactive e‐commerce: Promoting consumer efficiency orimpulsivity? Journal of Computer‐Mediated Communication, 10(1), 00–00.
Kim, S. S., & Malhotra, N. K. (2005). A longitudinal model of continued IS use: An integrativeview of four mechanisms underlying post-adoption phenomena. Management Science, 51(5),741–755.
Kimbrough, A. M., Guadagno, R. E., Muscanell, N. L., & Dill, J. (2013). Gender differences inmediated communication: Women connect more than do men. Computers in Human Behavior,29, 896–900.
Lee, H., Gillai, B., Chen, Y., & Rammohan, S. (2016). US-to-China B2C E-commerce: Improvinglogistics to grow trade. Stanford Value Chain Innovation Initiative White Paper. Retrievedfrom https://www.gsb.stanford.edu/sites/gsb/files/publication-pdf/vcii-white-paper-us-china-ecommerce-imrpove-logistics-grow-trade.pdf.
Lee, S.-H., & Workman, J. (2015). Compulsive buying and branding phenomena. Journal of OpenInnovation: Technology, Market, and Complexity, 1, 3. https://doi.org/10.1186/s40852-015-0004-x.
Limayem, M., & Hirt, S. G. (2003). Force of habit and information systems usage: Theory andinitial validation. Journal of the Association for Information Systems, 4(1), 65–97.
Limayem, M., Hirt, S. G., & Cheung, C. M. (2007). How habit limits the predictive power ofintention: The case of information systems continuance. MIS Quarterly, 31(4), 705–737.
92 J. E. Workman and S.-H. Lee
Loch, K., Straub, D., & Kamel, S. (2003). Diffusing the Internet in the Arab world: The role ofsocial norms and technological culturation. IEEE Transactions on Engineering Management,50, 45–63.
Martin, C. (2016, February 3). Mobile influence on store sales tops $1 trillion. Retrieved fromhttps://www.mediapost.com/publications/article/268210/mobile-influence-on-store-sales-tops-1-trillion.html.
Meyers-Levy, J. (1989). Gender differences in information processing: A selectivity interpretation.In P. Caferata & A. Tybout (Eds.), Cognitive and affective responses to advertising (pp. 219–260). Lexington, MA: Lexington.
Meyers-Levy, J., & Maheswaran, D. (1991). Exploring differences in males’ and females’processing strategy. Journal of Consumer Research, 18(1), 63–70.
Meyers-Levy, J., & Sternthal, B. (1991). Gender differences in the use of message cues andjudgments. Journal of Marketing Research, 28(February), 84–96.
Mobile mindset. (2012). Retrieved from https://www.mylookout.com/resources/reports/mobile-mindset
Montag, C., & Walla, P. (2016). Carpe diem instead of losing your social mind: Beyond digitaladdiction and why we all suffer from digital overuse. Cogent Psychology, 3(1). https://doi.org/10.1080/23311908.2016.1157281.
Montgomery, C. (2017, May 26). China’s higher education megaproject. University World News,461. Retrieved from http://www.universityworldnews.com/article.php?story=20170523001225119.
Ni, X., Yan, H., Chen, S., & Liu, Z. (2009). Factors influencing internet addiction in a sample offreshmen university students in China. Cyberpsychology & Behavior, 12(3), 327–330.
Number of students at universities in China between 2005 and 2015 (in millions). Retrieved fromhttps://www.statista.com/statistics/227028/number-of-students-at-universities-in-china/.
Oulasvirta, A., Rattenbury, T., Ma, L., & Raita, E. (2012). Habits make smartphone use morepervasive. Personal and Ubiquitous Computing, 16(1), 105–114.
Rapp, J. (2016, June 22). Revolve CEO: ‘The Consumer Came to Us’ in China’s FashionE-Commerce Market. Jing Daily.
Rosen, L., Whaling, K., Carrier, L., Cheever, N., & Rokkum, J. (2013a). The media andtechnology usage and attitudes scale: An empirical investigation. Computers in HumanBehavior, 29, 2501–2511.
Rosen, L. D., Whaling, K., Rab, S., Carrier, L. M., & Cheever, N. A. (2013b). Is FacebookCreating “iDisorders”? The link between clinical symptoms of psychiatric disorders andtechnology use, attitudes and anxiety. Computers in Human Behavior, 29, 1243–1254.
Saleem, K., Shahzad, B., Orgun, M. A., Al-Muhtadi, J., Rodrigues, J. J., & Zakariah, M. (2017).Design and deployment challenges in immersive and wearable technologies. Behaviour &Information Technology, 1–12.
Stapleton, K. (2017, April 10). Inside the world’s largest higher education boom. TheConversation. Retrieved from http://theconversation.com/inside-the-worlds-largest-higher-education-boom-74789.
Statistical Report on Internet Development in China. (2016, July). Retrieved from: http://cnnic.com.cn/IDR/ReportDownloads/201611/P020161114573409551742.pdf.
Sterling, G. (2017, February 17). Reports: Digital, especially mobile, driving trillions in offlineretail spending. Retrieved from https://marketingland.com/reports-digital-especially-mobile-driving-trillions-offline-retail-spending-207037.
Straub, D. W., Keil, M., & Brenner, W. (1997). Testing the technology acceptance model acrosscultures: A three country study. Information & Management, 33, 1–11.
Straub, D. W., Loch, K., & Hill, C. (2001). Transfer of information technology to the Arab world:A test of cultural influence modeling. Journal of Global Information Management, 9, 6–28.
Tong, F. (2016, Jan 27). China’s online retail sales grow a third to $589 billion in 2015. InternetRetailer.
US Census Bureau News. (2016, May 17). Retrieved from www.census.gov/retail/mrts/www/data/pdf/ec_current.pdf.
Attitudes Toward Technology, Digital Activities, and Use … 93
US College Explorer (2014). Retrieved from http://www.refuelagency.com/wp-content/themes/refuelagency/college_explorer/college_explorer_2014_high_level_review.pdf.
Venkatesh, V., & Davis, F. D. (2000). A theoretical extension of the technology acceptance model:Four longitudinal field studies. Management Science, 46(2), 186–204.
Venkatesh, V., & Morris, M. G. (2000). Why don’t men ever stop to ask for directions? Gender,social influence, and their role in technology acceptance and usage behavior.MIS Quarterly, 24(1), 115–139.
Venkatesh, V., Thong, J., & Xu, X. (2012). Consumer acceptance and use of informationtechnology: Extending the unified theory of acceptance and use of technology. MIS Quarterly,36(1), 157–178.
Woodside, D. B., Garfinkel, P. E., Lin, E., Goering, P., Kaplan, A. S., Goldbloom, D. S., et al.(2001). Comparisons of men with full or partial eating disorders, men without eating disorders,and women with eating disorders in the community. American Journal of Psychiatry, 158(4),570–574.
Yates, A. (2013). Compulsive exercise and the eating disorders: Toward an integrated theory ofactivity. London, UK: Routledge.
Zheng, L., Favier, M., Huang, P., & Coat, F. (2012). Chinese consumer perceived risk and riskrelievers in e-shopping for clothing. Journal of Electronic Commerce Research, 13(3), 255.
94 J. E. Workman and S.-H. Lee

Part IIISustainable Fashion in China
Young Consumers’ Perceptionsof Sustainable Clothing: EmpiricalInsights from Chinese Post-90s’ CollegeStudents
Jin Su, Kittichai (Tu) Watchravesringkan and Jianheng Zhou
Abstract The scale of environmental and social impacts from global apparelproduction and consumption makes sustainability increasingly important in thecontemporary business environment. This study explores the Chinese young con-sumers’ perceptions of and attitudes toward sustainable clothing. Specifically, thestudy aims to answer the following two research questions: (1) How Chinesecollege students view and feel about sustainable clothing in terms of their perceivedrisks, and (2) How their sustainability knowledge, their personal values, and per-ceived risks impact their attitude toward and willingness to buy sustainable apparelproducts. The study results based on data collected from 381 Chinese post-90s’college students demonstrate that apparel sustainability knowledge strongly andpositively predicts consumer attitude and willingness to buy. The study also revealsthat consumer attitude and willingness to buy are significantly predicted by personalvalues and consumer perceived risks toward sustainable clothing. The study pro-vides valuable baseline information for the Chinese textile and apparel industry andglobal sustainable textile and apparel marketers.
Keywords Sustainable clothing � Sustainability knowledge � ValueAttitude � College student � Millennial generation � China
J. Su (&) � K. (Tu) WatchravesringkanDepartment of Consumer, Apparel, and Retail Studies, Bryan Schoolof Business and Economics, The University of North Carolina at Greensboro,Greensboro, NC 27402, USAe-mail: [email protected]
K. (Tu) Watchravesringkane-mail: [email protected]
J. ZhouGlorious Sun School of Business & Management, Donghua University,Shanghai 200051, Chinae-mail: [email protected]
© Springer Nature Singapore Pte Ltd. 2018Y. Xu et al. (eds.), Chinese Consumers and the Fashion Market, Springer Seriesin Fashion Business, https://doi.org/10.1007/978-981-10-8429-4_5
97
Introduction
As the industry supplying and marketing one of the major consumer product cat-egories—clothing, the apparel industry has specific negative impacts on the envi-ronment through all stages of the apparel product life cycle, from fiber growth andmanufacturing, fabric and garment dyeing and printing, transportation to stores andselling, to disposal at the end of garment life (Hill & Lee, 2012). Some of the keysocial and environmental sustainability issues in the clothing industry include theincreased volume of clothing consumption fueled by “fast fashion”; employeeworking conditions and wages; pesticide use, excessive chemical usage, and dis-posal of used garments (Goworek, Fisher, Cooper, Woodward, & Hiller, 2012).
There is an increasing public demand that corporations take responsibility forenvironmental and societal problems (Dickson, 2000). The literature suggests aconsumer-centered approach to sustainability, in which companies present a holisticapplication of sustainability strategies, well integrated into company policies andproduct offerings (Hill & Lee, 2012). Textile and apparel firms have been imple-menting a variety of eco-conscious initiatives throughout their supply chains(Dickson, Loker, & Eckman, 2009; Hiller Connell, 2011). However, as the industryworks toward being more environmentally and socially conscious, it is equallyimportant to involve consumers in the process and encourage sustainable con-sumption of apparel products. Sustainable consumption is also called as ethicalconsumption, described as making purchase decisions not only on the basis ofpersonal interests but also on the basis of the interests of society and the envi-ronment; therefore, it is closely connected with social and environmental sustain-ability (Goworek et al., 2012). Ethical consumerism has resulted in a market forethical fashion which is a new approach of “fashion with conscience” (Joergens,2006).
With the significant achievements of economic development from over 30 yearsof rapid urbanization and industrialization, China is facing serious environmentaldeterioration. As China is a major powerhouse of global apparel production, it isundeniable that awareness of environmental and social problems, including pollu-tion, and labor issues and working condition, has grown in recent years in China.Interest in sustainable clothing production and consumption is growing, as evi-denced by more and more designers and businesses promote sustainable lifestyle inChina (Cerini, March 14, 2016; Song, April 24, 2017). The rapid increase in thesize of the sustainable clothing market implies consumers’ increasing concern aboutsustainability. However, most research on sustainable consumption has originatedfrom, and focused on, Western countries; academic research attention to consumersustainable consumption behavior in China has been very limited so far (Kolk,Hong, & Van Dolen, 2010). In addition, young Chinese consumers’ perceptions ofand attitudes toward sustainable clothing in China have hardly been studied so far.Thus, this study aims to fill the literature gap by examining Chinese post-90s’college students’ perceptions of and consumer behavior toward sustainableclothing.
98 J. Su et al.
Previous research consistently indicates that knowledge is a determinant ofeco-conscious consumer behaviors (Hill & Lee, 2012; Hiller Connell, 2010;Hwang, Lee, & Diddi, 2015). The literature also reveals the negative effect ofperceived risk on consumers’ attitudes (Beneke, Flynn, Greig, & Mukaiwa, 2013;Kang & Kim, 2013; Sweeney, Soutar, & Johnson, 1999). Furthermore, the litera-ture maintains that consumers’ personal values are associated with the formation ofbeliefs and attitudes, and often influence intentions to behave in a certain way(Ajzen & Fishbein, 1980). Previous studies explored personal values and sociallyresponsible consumption in the USA and UK (Ma & Lee, 2012). However, littleresearch examined Chinese young consumers’ sustainability knowledge, theirpersonal values, and their attitudes toward sustainable consumption. Consideringthe huge social and cultural impacts that Chinese young generation plays in theChinese society and their market potential in Chinese apparel retail industry, builtupon previous studies, it is crucial to explore the Chinese young consumers’ per-ceptions of and attitudes toward sustainable clothing. Specifically, this study aimsto answer the following two research questions: (1) How Chinese college studentsview and feel about sustainable clothing in terms of their perceived risks, and(2) How their sustainability knowledge, personal values, and perceived risks impacttheir attitudes toward and willingness to buy sustainable apparel products.
In the following section, the relevant literature is reviewed. Next, the researchmethod employed to investigate the research questions is described. The empiricalresults of the survey are then presented. The concluding section discusses theimplications of the findings, notes the limitations of the study, and offers sugges-tions for future research.
Literature Review
Chinese Post-90s: Emerging Consumers for SustainableApparel Products
Previous research indicates that young consumer segment is a main target consumergroup for companies with corporate social responsibility (CSR) attributes, and theseyoung consumers represent a large and powerful consumer segment (Hill & Lee,2012; Hwang et al., 2015). Young consumers are only now entering their youngadulthood; thus, their consumer purchase decisions will impact fashion retailindustry for a long time. There are three reasons that motivate us to study Chinesepost-90s’ college students’ perspective. First, given the current vibrant retailenvironment in China, young consumers are considered one of the most importantmarket segments for apparel products (O’Cass & Choy, 2008; O’Cass & Siahtiri,2014). Retailers have been attracted to this consumer segment due to its size andconsumer spending power. In 2016, the total population in China is 1.37 billionpeople; however, noticeably the population count in the age group of 17–26 (born
Young Consumers’ Perceptions of Sustainable Clothing: Empirical … 99
between 1990 and 1999) is about 202.1 million people, constituting about 14.7% ofChina’s total population (U.S. Census Bureau, 2017). To put the power of thisconsumer segment into perspective, the head count of China’s post-90s alone isabout 62.4% of the entire US population (U.S. Census Bureau, 2017).
Second, the current Chinese post-90s have been growing up with China’s rapideconomic growth, a fact which affects their daily lives. Most Chinese post-90s arethe only child in their family; as such, they represent a generation of young adultswhose lifestyle is quite different from the previous generations. They are techno-logically connected to the global marketplace. They highly regard the power ofeconomic freedom, even social freedom, and are aware of emerging global issues.This generation appreciates sustainable lifestyle and is interested in health andwell-being issues in China (Rapp, 2016). Third, over the past decade, the Chinesegovernment has realized the importance of educating young students about sus-tainability for China’s sustainable development (Simões, 2016). Sustainability isheavily promoted in China through all different news and media channels (Kolket al., 2010; Simões, 2016). As such, understanding Chinese post-90s’ perspectivesof sustainable clothing offers valuable insights to global sustainable apparelmarketers.
Apparel Sustainability Knowledge
McDonald et al. (2009) found consumers process sustainability issues in decisionmaking differently among product categories. General environmental concern maynot carry over to the apparel industry specifically (Gam, 2011; Hiller Connell,2010). Even with an increasing universal awareness of environmental and ethicalissues, consumers who purchase apparel are often confused by the meaning ofsustainability (Hiller Connell, 2010). Previous studies found that consumers havemerely a broad awareness of environmental issues and lack knowledge specific tothe apparel industry (Gam & Banning, 2011; Hiller Connell, 2010). Even con-sumers who are environmentally conscious have little knowledge of the environ-mental impact of apparel purchases (Hiller Connell, 2010). The notion of ethicalclothing is complex as reflected by the use of various terms such as eco, organic,fair-trade, or recycled apparel. In addition, inclusion of sustainability in apparelpurchasing decisions may be especially complicated due to additional evaluativecriteria such as fit and aesthetic preferences (Gam, 2011; Hiller Connell, 2010).
Hill and Lee (2012) stated that specific understanding of the sustainable issues ofthe apparel industry is important, as the production and retailing of apparel productsrepresents a large industry with great adverse environmental impacts. Students whowere more knowledgeable about textile and apparel environmental issues perceivedthemselves to have more impact on the problems (Dickson, 2000; Hill & Lee, 2012;Hwang et al., 2015; Hyllegard, Ogle, & Yan, 2014). Additionally, some demo-graphics, including age, gender, and education, have been associated with a varietyof environmentally and socially responsible apparel consumption behaviors (Butler
100 J. Su et al.
& Francis, 1997; Dickson, 2000; Gam, Cao, Farr, & Kang, 2010; Hill & Lee,2012). Young consumers hold more favorable attitudes toward environmentalregulation and about conserving the environment with sustainable clothing con-sumption practices (Butler & Francis, 1997; Dickson, 2000; Hill & Lee, 2012;Hyllegard et al., 2014).
Knowledge shapes an individual’s beliefs, and attitude is derived from a groupof beliefs that one holds about the object of the behavior (Ajzen & Fishbein, 1980).Consumer knowledge of environmental and social issues may play a role in theirenvironmentally and socially responsible apparel consumption as well (Dickson,2000; Hwang et al., 2015). Knowledge is frequently a prerequisite for consumers toengage in pro-environmental and prosocial behaviors, and a lack of knowledge is aconstraint. Consumers with knowledge and concerns regarding environmental andsocietal issues would be motivated to purchase green and fair-trade products(Hwang et al., 2015). Chen and Burns (2006) maintained that consumer decisionsin product purchasing play a vital role in making the textile industry move toward“green” or environmentally responsible production. Previous studies have reportedthat consumers’ higher level of awareness of company’s CSR attributes had posi-tive effects on their purchase intentions (Bhaduri & Ha-Brookshire, 2011; Hwanget al., 2015; Smith, 2003). Different levels of consumers’ knowledge about sus-tainability issues in the textile and apparel industry would result in different con-sumer behaviors, and consumers’ apparel sustainability knowledge is the key tohelp consumers make the right choice. Therefore, based on the previous studies, thefollowing hypothesis was proposed:
H1: There is a positive influence of consumers’ apparel sustainability knowledge on(a) consumer attitude toward and (b) willingness to buy sustainable clothing.
Perceived Risks of Purchasing Sustainable Clothing
The issues surrounding consumers’ decisions to try new brands and adopt inno-vative products are of both theoretical interest and pragmatic importance. Onefactor that research has identified as a critical determinant of consumers’ willing-ness to buy a new item is the perceived risks associated with the purchase (Grewal,Gotlieb, & Marmorstein, 1994). Risk is a consumer’s perception of the uncertaintyand adverse consequences of engaging in an activity (Chang & Tseng, 2013;Dowling & Staelin, 1994). Perceived risk is commonly thought of as felt uncer-tainty regarding possible negative consequences of using a product or service.Dowling (1986) defined perceived risk as the uncertainty of a desired performancethat customers experience when making purchasing decisions. When consumersperceive higher risks, it is less likely that they will buy the product. Past studiesshow that perceived risk is an important factor, which influences a consumer’s
Young Consumers’ Perceptions of Sustainable Clothing: Empirical … 101
purchase intention (Chang & Tseng, 2013; Grewal et al., 1994; Sweeney et al.,1999).
Mitchell (1999) contended that perceived risk is actually a “multidimensionalphenomenon” which can be segmented into various risk components. A rich streamof consumer behavior literature supports the usage of these risk facets to understandconsumer product and service evaluations and purchases. Reviews of perceived riskillustrate a variety of conceptualizations of perceived risk (Dowling, 1986; Dowling& Staelin, 1994). The more common components of perceived risk include per-formance, financial, social and psychological risks (Beneke et al., 2013; Chang &Tseng, 2013; Featherman & Pavlou, 2003; Jacoby & Kaplan, 1972). Financial riskis the potential monetary loss and is defined as the potential monetary outlayassociated with the initial purchase price as well as the subsequent maintenance costof the product (Chang & Tseng, 2013; Grewal et al., 1994; Lim, 2003).Performance risk means the possibility that a purchased product fails to provide thedesired benefits or does not function properly (Bauer, 1960; Crespo, del Bosque, &de los Salmones Sánchez, 2009; Grewal et al., 1994; Lim, 2003). Performance riskis considered to be a quality risk (Kang & Kim, 2013) and is similar to the use-fulness or functionality of products. Social risk is a consumer’s concern about howother people perceive their shopping behavior and about the potential loss of status(Crespo et al., 2009; Kang & Kim, 2013; Lim, 2003). Consumers contemplatewhether purchasing and wearing an apparel product may damage or reduce theirimage in the eyes of others (Kang & Kim, 2013). It is the possibility that con-sumers’ shopping behavior is not accepted by other society members (Lim, 2003).Psychological risk refers to mental stress a consumer suffers due to shoppingbehavior, and it will have a negative effect on the consumer’s peace of mind orself-perception (Crespo et al., 2009; Lim, 2003). Psychological risk could possiblydamage one’s self-image and cause potential loss of self-esteem (ego loss) from thefrustration of not achieving a buying goal (Kang & Kim, 2013).
Shopping and purchasing is a way for young consumers to define themselvesand to create their identity of their own decision making. Young consumers useapparel products to develop, maintain, or reinforce their self-concept and self-image(Belk, 1988; Chaplin & John, 2005; Sirgy, 1982). For apparel products, oneimportant factor influencing college students’ purchasing decision is whether theproduct is fashionable or in style. Hiller Connell’s (2010) study showed that therewas a general perception among consumers that environmentally preferable apparelis less stylish when compared with mainstream apparel. Chen and Burns (2006)indicated that consumers may not want to sacrifice fashion or colors (e.g., organicfibers are available only in earth tone, off-white colors) for the sake of the envi-ronment when making decisions about the purchases of textiles and clothing.Therefore, fashion risk is an important risk dimension for clothing products. In thepresent study, we included fashion risk as one component of consumer perceivedrisk toward sustainable clothing.
The intentions to switch to products made by more socially responsible manu-facturers may be contingent on the product’s quality, style, and price equaling thatof other available products (Dickson, 2000). It is highly likely that when a person
102 J. Su et al.
contemplates the purchase of sustainable clothing, the individual has feelings of“uncertainty,” “discomfort,” and/or “anxiety.” This type of feeling is the result ofthe consumer’s perception of risk. Findings from previous studies reveal that theperception of higher prices is a major barrier to purchasing environmentally friendlyapparel (Gam, 2011; Hill & Lee, 2012; Hiller Connell, 2010). Chen and Burns(2006) reported that although consumers say that environmental aspects of textilesare important to them, some retailers found it is more difficult to sell organic andrecycled textile products because of their higher prices over regular items. HillerConnell (2010) also found that society’s expectation for individual’s appearance isanother external barrier to eco-conscious apparel acquisition. Therefore, based onprevious literature research, we generate the following hypotheses to examine theinfluence of perceived risks on consumer attitude and purchase intention.
H2: There is a negative influence of (a) financial risk, (b) performance risk,(c) psychological risk, (d) social risk, and (e) fashion risk on consumers’ attitudetoward sustainable clothing.H3: There is a negative influence of (a) financial risk, (b) performance risk,(c) psychological risk, (d) social risk, and (e) fashion risk on consumers’ willing-ness to buy sustainable clothing.
Schwartz Values
Schwartz defined a value as a belief pertaining to desirable end states or modes ofconduct, that transcends specific situations, guides selection or evaluation ofbehavior, people, and events, and is ordered by importance relative to other valuesto form a system of value priorities (Schwartz, 1992, 1994; Schwartz & Bilsky,1987). Based on universal requirements of human existence, Schwartz and Bilsky(1987) identified 56 values, and specified a set of dynamic relations among themotivational types of values in an integrated manner. Forty-five of the value itemshave demonstrated nearly equivalent meaning across over 60 countries around theworld (Schwartz, 1992, 1994; Schwartz & Sagiv, 1995). The Schwartz’s (1992)value theory defines ten broad value types according to the motivation thatunderlies each of them. These ten value types include power, achievement, hedo-nism, stimulation, self-direction, universalism, benevolence, tradition, conformity,and security (see Table 1). Studies with samples from many countries haveestablished that these indexes have adequate internal reliability, temporal stability,and external validity and that scores are not contaminated by social desirability(Bardi & Schwartz, 2003). The pursuit of each value has psychological, practical,and social consequences that may conflict or may be congruent with the pursuit ofother values (Bardi & Schwartz, 2003).
Values are abstract principles that are central to an individual’s self-concept(Dickson, 2000; Smith, 1982). They act as guides for assessing situations anddetermining an individual’s social and ideological positions (Rokeach, 1979; Smith,
Young Consumers’ Perceptions of Sustainable Clothing: Empirical … 103
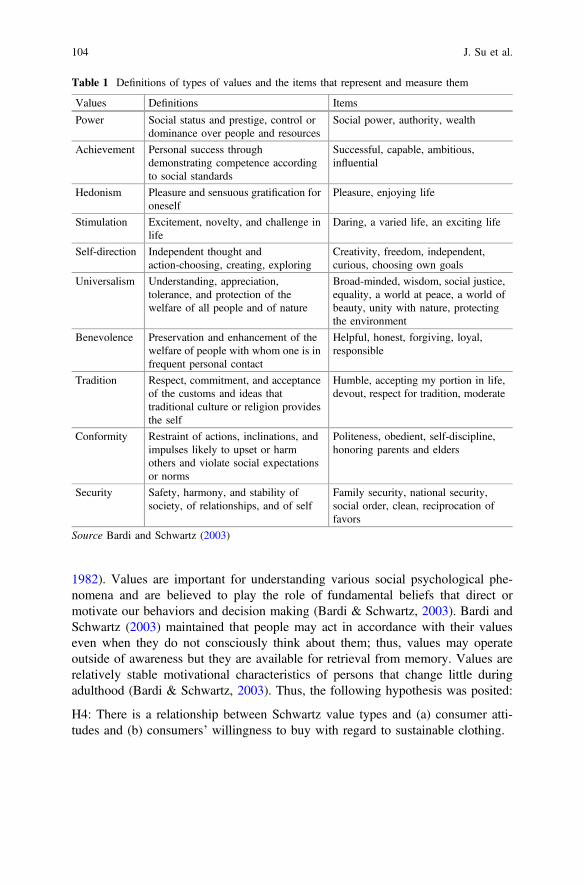
1982). Values are important for understanding various social psychological phe-nomena and are believed to play the role of fundamental beliefs that direct ormotivate our behaviors and decision making (Bardi & Schwartz, 2003). Bardi andSchwartz (2003) maintained that people may act in accordance with their valueseven when they do not consciously think about them; thus, values may operateoutside of awareness but they are available for retrieval from memory. Values arerelatively stable motivational characteristics of persons that change little duringadulthood (Bardi & Schwartz, 2003). Thus, the following hypothesis was posited:
H4: There is a relationship between Schwartz value types and (a) consumer atti-tudes and (b) consumers’ willingness to buy with regard to sustainable clothing.
Table 1 Definitions of types of values and the items that represent and measure them
Values Definitions Items
Power Social status and prestige, control ordominance over people and resources
Social power, authority, wealth
Achievement Personal success throughdemonstrating competence accordingto social standards
Successful, capable, ambitious,influential
Hedonism Pleasure and sensuous gratification foroneself
Pleasure, enjoying life
Stimulation Excitement, novelty, and challenge inlife
Daring, a varied life, an exciting life
Self-direction Independent thought andaction-choosing, creating, exploring
Creativity, freedom, independent,curious, choosing own goals
Universalism Understanding, appreciation,tolerance, and protection of thewelfare of all people and of nature
Broad-minded, wisdom, social justice,equality, a world at peace, a world ofbeauty, unity with nature, protectingthe environment
Benevolence Preservation and enhancement of thewelfare of people with whom one is infrequent personal contact
Helpful, honest, forgiving, loyal,responsible
Tradition Respect, commitment, and acceptanceof the customs and ideas thattraditional culture or religion providesthe self
Humble, accepting my portion in life,devout, respect for tradition, moderate
Conformity Restraint of actions, inclinations, andimpulses likely to upset or harmothers and violate social expectationsor norms
Politeness, obedient, self-discipline,honoring parents and elders
Security Safety, harmony, and stability ofsociety, of relationships, and of self
Family security, national security,social order, clean, reciprocation offavors
Source Bardi and Schwartz (2003)
104 J. Su et al.
Research Method
A structured questionnaire was designed based on a careful review of pertinentliterature. Sustainable clothing, which is also called environmentally and sociallyresponsible apparel products (Goworek et al., 2012; Harris, Roby, & Dibb, 2015),was defined at the beginning of the questionnaire, and examples of sustainableclothing products were provided. The survey was first developed in English.A translation and a back translation of the questionnaire were performed by tworesearchers who are fluent in both Chinese and English to ensure translationequivalence.
In terms of the measures of the variables, specifically, six items measuringconsumers’ sustainability knowledge about apparel products were obtained fromPark and Kim (2016). Measures of perceived risks were compiled from the liter-ature (Dickson, 2000; Kang & Kim, 2013). These items were measured using afive-point Likert-type scale (1 = “strongly disagree” to 5 = “strongly agree”). Wemeasured values with the Schwartz Value Survey (1992). The survey listed 56value items, each followed by a short definition in parentheses. Participants ratedeach value as a guiding principle in their own life on a five-point scale from 1 (notat all important) to 5 (extremely important). The forty-five value items in the surveythat have demonstrated nearly equivalent meaning across over 60 nations aroundthe world were used to index the ten values. Indexes are computed by averaging theimportance ratings of the value items that represent each value, listed in Table 1.Four items of measuring consumer attitude were adapted from Chan (2001) on afive-point semantic differential scale. Three items adopted from Sweeney et al.(1999) were used to measure consumers’ willingness to purchase sustainableclothing products on a five-point scale after modification to the research specificcontext. A sample of current college students from a large Chinese university inShanghai, China, was recruited during March 2017.
Data Analysis and Results
Sample Characteristics
A total of 430 responses were received, and a total of 381 valid responses were usedfor this study. Table 2 includes the sample characteristics information. Around 83%of the responses were from sophomore or juniors. The participants ranged in agefrom 18 to 26 years (45.4% were 18–20, 45.9% were 21–23, and 6.3% were 24–26). About 75% were female, and about 94% of the valid responses were fromstudents majored in the School of Business. In terms of the discretionary spendingper month, 11.0% of the respondents spent less than 500 CNY (approximately US$73.5), 52.0% spent 500–1,499 CNY (approximately US$73.5–220.4), and 28.6%
Young Consumers’ Perceptions of Sustainable Clothing: Empirical … 105
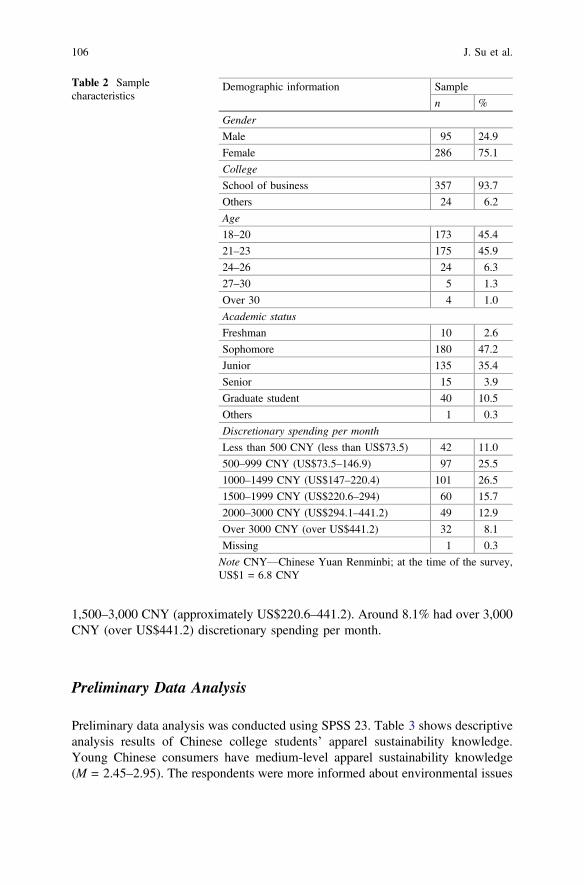
1,500–3,000 CNY (approximately US$220.6–441.2). Around 8.1% had over 3,000CNY (over US$441.2) discretionary spending per month.
Preliminary Data Analysis
Preliminary data analysis was conducted using SPSS 23. Table 3 shows descriptiveanalysis results of Chinese college students’ apparel sustainability knowledge.Young Chinese consumers have medium-level apparel sustainability knowledge(M = 2.45–2.95). The respondents were more informed about environmental issues
Table 2 Samplecharacteristics
Demographic information Sample
n %
Gender
Male 95 24.9
Female 286 75.1
College
School of business 357 93.7
Others 24 6.2
Age
18–20 173 45.4
21–23 175 45.9
24–26 24 6.3
27–30 5 1.3
Over 30 4 1.0
Academic status
Freshman 10 2.6
Sophomore 180 47.2
Junior 135 35.4
Senior 15 3.9
Graduate student 40 10.5
Others 1 0.3
Discretionary spending per month
Less than 500 CNY (less than US$73.5) 42 11.0
500–999 CNY (US$73.5–146.9) 97 25.5
1000–1499 CNY (US$147–220.4) 101 26.5
1500–1999 CNY (US$220.6–294) 60 15.7
2000–3000 CNY (US$294.1–441.2) 49 12.9
Over 3000 CNY (over US$441.2) 32 8.1
Missing 1 0.3
Note CNY—Chinese Yuan Renminbi; at the time of the survey,US$1 = 6.8 CNY
106 J. Su et al.
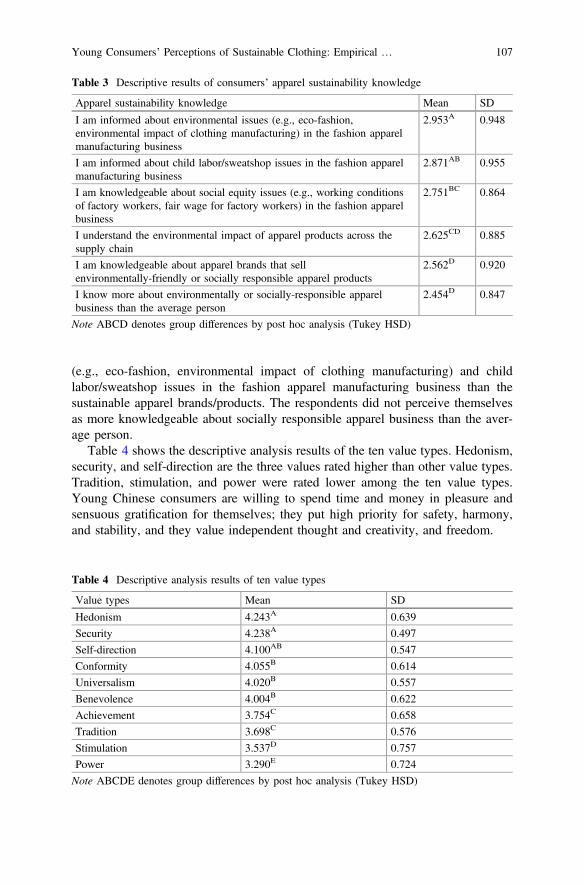
(e.g., eco-fashion, environmental impact of clothing manufacturing) and childlabor/sweatshop issues in the fashion apparel manufacturing business than thesustainable apparel brands/products. The respondents did not perceive themselvesas more knowledgeable about socially responsible apparel business than the aver-age person.
Table 4 shows the descriptive analysis results of the ten value types. Hedonism,security, and self-direction are the three values rated higher than other value types.Tradition, stimulation, and power were rated lower among the ten value types.Young Chinese consumers are willing to spend time and money in pleasure andsensuous gratification for themselves; they put high priority for safety, harmony,and stability, and they value independent thought and creativity, and freedom.
Table 3 Descriptive results of consumers’ apparel sustainability knowledge
Apparel sustainability knowledge Mean SD
I am informed about environmental issues (e.g., eco-fashion,environmental impact of clothing manufacturing) in the fashion apparelmanufacturing business
2.953A 0.948
I am informed about child labor/sweatshop issues in the fashion apparelmanufacturing business
2.871AB 0.955
I am knowledgeable about social equity issues (e.g., working conditionsof factory workers, fair wage for factory workers) in the fashion apparelbusiness
2.751BC 0.864
I understand the environmental impact of apparel products across thesupply chain
2.625CD 0.885
I am knowledgeable about apparel brands that sellenvironmentally-friendly or socially responsible apparel products
2.562D 0.920
I know more about environmentally or socially-responsible apparelbusiness than the average person
2.454D 0.847
Note ABCD denotes group differences by post hoc analysis (Tukey HSD)
Table 4 Descriptive analysis results of ten value types
Value types Mean SD
Hedonism 4.243A 0.639
Security 4.238A 0.497
Self-direction 4.100AB 0.547
Conformity 4.055B 0.614
Universalism 4.020B 0.557
Benevolence 4.004B 0.622
Achievement 3.754C 0.658
Tradition 3.698C 0.576
Stimulation 3.537D 0.757
Power 3.290E 0.724
Note ABCDE denotes group differences by post hoc analysis (Tukey HSD)
Young Consumers’ Perceptions of Sustainable Clothing: Empirical … 107
Due to the multidimensional nature of perceived risk, exploratory factor analysis(EFA) was first conducted for perceived risk to investigate the dimensional struc-ture of the variable. The KMO measure of 0.816 and the Bartlett’s test statistic(p < 0.000) indicate that the data is appropriate for factor analysis. The EFAsolution was determined using the following criteria: eigenvalue (>1), varianceexplained by each component, scree plot, loading score for each factor (⩾0.5), andmeaningfulness of each dimension. Items were eliminated if they showed lowcommunalities (<0.30), low factor loadings (<0.40), and/or high cross-loadings(>0.40). As a result, one item of the financial risk factor and one item of theperformance risk factor were eliminated. After the eliminations, the final EFAresulted in a five-factor model with 14 items, including 3 items of social risk, 3items of fashion risk, 3 items of performance risk, 3 items of psychological risk, and2 items of financial risk. Table 5 includes the EFA results. The result is consistentwith previous studies on multidimensional nature of perceived risk. Since theinternal reliability Cronbach’s alpha values for social risk (alpha = 0.890), fashionrisk (alpha = 0.858), performance risk (alpha = 0.853), and psychological risk(alpha = 0.842) are satisfactory, the study calculated the averages from therespective items for social risk, fashion risk, performance risk, and psychologicalrisk in the further analysis. The internal reliability Cronbach’s alpha for financialrisk is low (alpha = 0.450) although the two items form one factor. This resultindicates that the present study does not confirm Kang and Kim (2013)’s financialrisk scale. In the further regression analysis, we included all the three items relatedto financial risk, reflecting consumer’s perception of purchasing cost, maintenancecost, and risk of wasting money.
EFA was also conducted on apparel sustainability knowledge, consumer atti-tudes, and willingness to buy. The results revealed unidimensionality in sustain-ability knowledge (internal reliability Cronbach’s alpha = 0.832), consumerattitude (internal reliability Cronbach’s alpha = 0.855), and willingness to buy(internal reliability Cronbach’s alpha = 0.825).
Effects of Apparel Sustainability Knowledge and PerceivedRisk on Consumer Attitude and Willingness to Buy
To examine the effects of apparel sustainability knowledge and perceived risk onconsumer attitude and willingness to buy, standard multiple regression analyseswere performed with consumer attitude and willingness to buy as the dependentvariables and consumer apparel sustainability knowledge and perceived risks as theindependent variables. We created composite variables by averaging the respectiveitems for apparel sustainability knowledge, social risk, fashion risk, performancerisk, psychological risk, and included those composite variables and the three itemsrelated to the financial risk (purchasing cost, maintenance cost, and risk of wastingmoney) as the independent variables in the regression analysis. The average of the
108 J. Su et al.
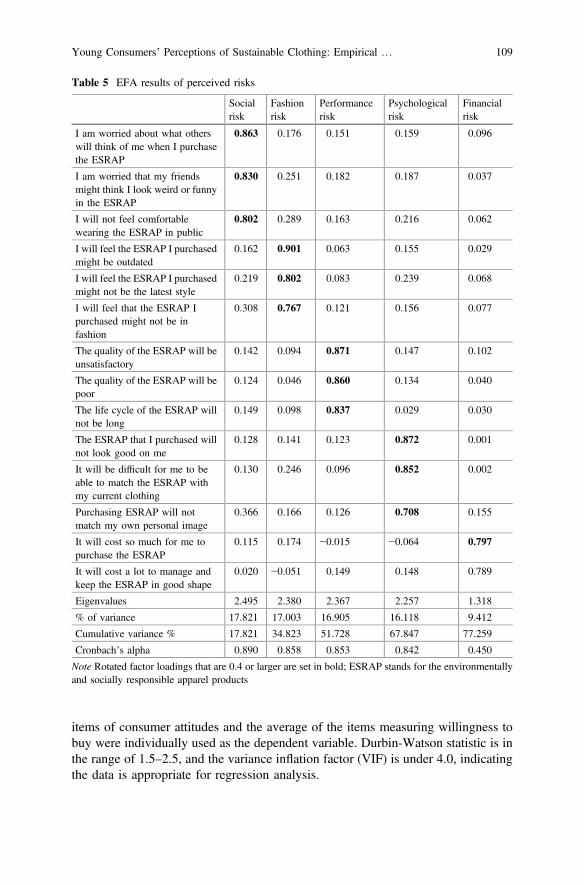
items of consumer attitudes and the average of the items measuring willingness tobuy were individually used as the dependent variable. Durbin-Watson statistic is inthe range of 1.5–2.5, and the variance inflation factor (VIF) is under 4.0, indicatingthe data is appropriate for regression analysis.
Table 5 EFA results of perceived risks
Socialrisk
Fashionrisk
Performancerisk
Psychologicalrisk
Financialrisk
I am worried about what otherswill think of me when I purchasethe ESRAP
0.863 0.176 0.151 0.159 0.096
I am worried that my friendsmight think I look weird or funnyin the ESRAP
0.830 0.251 0.182 0.187 0.037
I will not feel comfortablewearing the ESRAP in public
0.802 0.289 0.163 0.216 0.062
I will feel the ESRAP I purchasedmight be outdated
0.162 0.901 0.063 0.155 0.029
I will feel the ESRAP I purchasedmight not be the latest style
0.219 0.802 0.083 0.239 0.068
I will feel that the ESRAP Ipurchased might not be infashion
0.308 0.767 0.121 0.156 0.077
The quality of the ESRAP will beunsatisfactory
0.142 0.094 0.871 0.147 0.102
The quality of the ESRAP will bepoor
0.124 0.046 0.860 0.134 0.040
The life cycle of the ESRAP willnot be long
0.149 0.098 0.837 0.029 0.030
The ESRAP that I purchased willnot look good on me
0.128 0.141 0.123 0.872 0.001
It will be difficult for me to beable to match the ESRAP withmy current clothing
0.130 0.246 0.096 0.852 0.002
Purchasing ESRAP will notmatch my own personal image
0.366 0.166 0.126 0.708 0.155
It will cost so much for me topurchase the ESRAP
0.115 0.174 −0.015 −0.064 0.797
It will cost a lot to manage andkeep the ESRAP in good shape
0.020 −0.051 0.149 0.148 0.789
Eigenvalues 2.495 2.380 2.367 2.257 1.318
% of variance 17.821 17.003 16.905 16.118 9.412
Cumulative variance % 17.821 34.823 51.728 67.847 77.259
Cronbach’s alpha 0.890 0.858 0.853 0.842 0.450
Note Rotated factor loadings that are 0.4 or larger are set in bold; ESRAP stands for the environmentallyand socially responsible apparel products
Young Consumers’ Perceptions of Sustainable Clothing: Empirical … 109
As shown in Table 6, regression analysis results revealed that consumer attitudeand willingness to buy were significantly predicted by the regression models.Consumer apparel sustainability knowledge positively and significantly predictsboth consumer attitude and willingness to buy. Therefore, H1 (a) and H1 (b) weresupported. Performance risk, risk of wasting money, and fashion risk negativelyand significantly predict consumer attitude, which means when consumer perceiveshigher level of performance risk, risk of wasting money, and fashion risk withregard to purchasing sustainable clothing, they will have more negative attitudetoward sustainable clothing. Other aspects of perceived risk such as psychologicalrisk, social risk, and purchasing cost do not have a strong relationship with con-sumer attitude. Performance risk, risk of wasting money, and social risk negativelyand significantly predict consumer willingness to buy, which shows when consumerperceives higher level of performance risk, social risk, and risk of wasting money,they are less willing to buy sustainable clothing. Other aspects of perceived risksuch as psychological risk, fashion risk, and purchasing cost do not have a strongrelationship with consumer purchase intention. Thus, H2 and H3 were partiallysupported.
Effect of Values on Consumer Attitudeand Willingness to Buy
The ten value types from Schwartz’s value model were used for the regressionanalyses. We created composite variables by averaging the respective items foreach variable: ten value types, consumer attitudes, and willingness to buy. Standardmultiple regression analyses were performed with consumer attitude and willing-ness to buy individually as the dependent variable and the ten value types as theindependent variables (power, achievement, hedonism, stimulation, self-direction,universalism, benevolence, tradition, conformity, and security). Regression analysisresults show the Durbin-Watson statistic is in the range of 1.5–2.5 and the varianceinflation factor (VIF) is under 4.0, indicating the data is appropriate for regressionanalysis. As shown in Table 7, regression analysis results revealed that consumerattitude and willingness to buy are significantly predicted by their personal value.Specifically, the value type benevolence significantly and positively predicts con-sumer attitude. Benevolence strongly and positively predicts consumer willingnessto buy, while the value type achievement significantly and negatively predictsconsumer willingness to buy. Thus, H4 was partially supported.
110 J. Su et al.

Tab
le6
Resultsof
multip
leregression
Dependent
variables
Independentvariables
Durbin-Watsonstatistic
Adj.R2
FStandardized
beta
t-value
Consumer
attitude
1.822
0.131
8.134
Sustainabilityknow
ledge
0.117
2.388**
Performance
risk
−0.179
−3.226*
**
Psychologicalrisk
−0.068
−1.172
Social
risk
−0.037
−0.586
Fashionrisk
−0.120
−1.994*
*
Purchasing
cost
0.060
1.132
The
risk
ofwastin
gmon
ey−0.136
−2.467*
*
Maintenance
cost
0.122
2.374*
*
Willingn
essto
buy
1.797
0.204
13.206
Sustainabilityknow
ledge
0.188
3.994****
Performance
risk
−0.106
−1.994*
*
Psychologicalrisk
−0.062
−1.119
Social
risk
−0.181
−2.995*
**
Fashionrisk
−0.070
−1.219
Purchasing
cost
0.054
1.064
The
risk
ofwastin
gmon
ey−0.209
−3.967*
***
Maintenance
cost
0.085
1.728*
*P<0.10;**P<0.05;**
*P<0.01
;**
**P<0.001
Young Consumers’ Perceptions of Sustainable Clothing: Empirical … 111
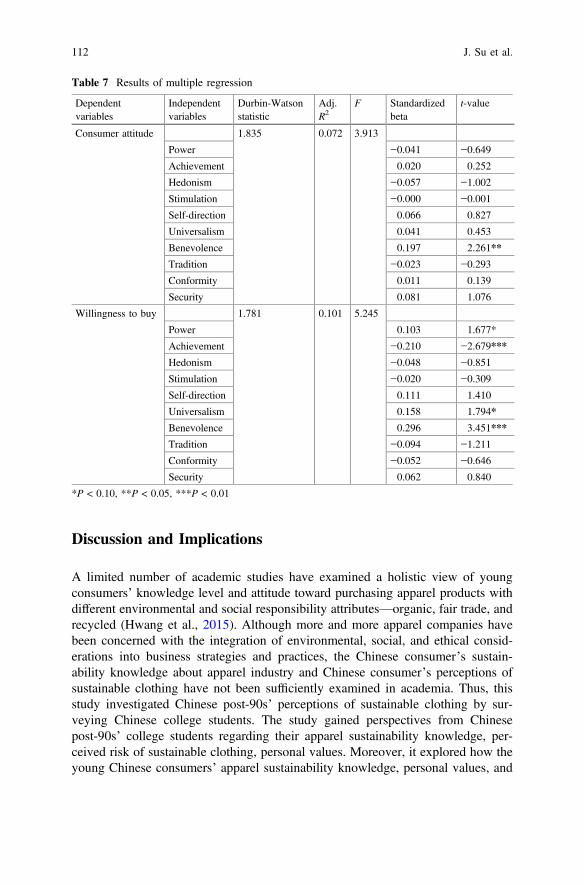
Discussion and Implications
A limited number of academic studies have examined a holistic view of youngconsumers’ knowledge level and attitude toward purchasing apparel products withdifferent environmental and social responsibility attributes—organic, fair trade, andrecycled (Hwang et al., 2015). Although more and more apparel companies havebeen concerned with the integration of environmental, social, and ethical consid-erations into business strategies and practices, the Chinese consumer’s sustain-ability knowledge about apparel industry and Chinese consumer’s perceptions ofsustainable clothing have not been sufficiently examined in academia. Thus, thisstudy investigated Chinese post-90s’ perceptions of sustainable clothing by sur-veying Chinese college students. The study gained perspectives from Chinesepost-90s’ college students regarding their apparel sustainability knowledge, per-ceived risk of sustainable clothing, personal values. Moreover, it explored how theyoung Chinese consumers’ apparel sustainability knowledge, personal values, and
Table 7 Results of multiple regression
Dependentvariables
Independentvariables
Durbin-Watsonstatistic
Adj.R2
F Standardizedbeta
t-value
Consumer attitude 1.835 0.072 3.913
Power −0.041 −0.649
Achievement 0.020 0.252
Hedonism −0.057 −1.002
Stimulation −0.000 −0.001
Self-direction 0.066 0.827
Universalism 0.041 0.453
Benevolence 0.197 2.261**
Tradition −0.023 −0.293
Conformity 0.011 0.139
Security 0.081 1.076
Willingness to buy 1.781 0.101 5.245
Power 0.103 1.677*
Achievement −0.210 −2.679***
Hedonism −0.048 −0.851
Stimulation −0.020 −0.309
Self-direction 0.111 1.410
Universalism 0.158 1.794*
Benevolence 0.296 3.451***
Tradition −0.094 −1.211
Conformity −0.052 −0.646
Security 0.062 0.840
*P < 0.10, **P < 0.05, ***P < 0.01
112 J. Su et al.
perceived risks impact their attitude toward and willingness to buy sustainableclothing products. This study provides valuable baseline information for the textileand apparel industry.
Previous studies suggested that consumers expressed positive sentiments towardsustainability in general but they lacked knowledge on social responsible practicesin the apparel industry (Gam & Banning, 2011; Hill & Lee, 2012; Hiller Connell,2010; Hwang et al., 2015). Dickson (2000) suggested that greater knowledge aboutindustry issues leads to greater concern for industry workers, and when consumershave greater knowledge and concern, their support for socially responsible businessgoals increases. In the present study, Chinese young consumers may have insuffi-cient knowledge of sustainability issues in the apparel industry and they slightlydisagree that they have much knowledge. This confirms previous research statingthat environmentally and socially responsible consumer behavior may not becatching on because educating consumers has not been a priority of industry(Dickson, 2000). Since the environmental and social issues in the apparel industryhave only recently reached prominence in the media in China, the typical clothingconsumer may feel inadequately informed or confused about actual industry con-ditions. Among all the sustainability issues in the apparel industry, young con-sumers are more aware of environmental impact and child labor issues thansustainable clothing brands or business, indicating the need for strengthening andexpanding marketing promotion for sustainable apparel brands and business inChina. The study results show apparel sustainability knowledge strongly andpositively predicts consumer attitude and willingness to buy, confirming previousresearch on the importance of sustainability knowledge (Dickson, 2000; Hill & Lee,2012; Hwang et al., 2015). Thus, knowledge underlies attitudes consumers formabout sustainable apparel business. If greater levels of knowledge can be achieved,support for socially and environmentally responsible businesses will increase to apoint that more directly affects purchase behavior. Firms in the textile and apparelindustry may need to focus on providing information to consumers in hopes ofstrengthening their support for eco-friendly and socially responsible business.Chinese apparel firms and retailers could develop some educational strategies intheir marketing and branding effort for sustainable apparel products. For example,the literature provided ideas such as using hangtags on garments in retail stores andextensive editorial space in catalogs to inform consumers about desired productattributes as well as company engagement in prosocial initiatives (Dickson, 2000;Hyllegard et al., 2014).
Sustainable clothing is still a new concept for many Chinese young consumers,and sustainable clothing business is an emerging market in China. Identified as acritical determinant of consumers’ willingness to buy a new item, such as sus-tainable clothing product, is the perceived risk associated with the purchase (Grewalet al., 1994). The study findings reveal that performance risk, maintenance risk, andrisk of wasting money significantly influence consumer attitude, and fashion riskimpacts attitude to some extent. Performance risk, social risk, and risk of wastingmoney significantly impact consumer willingness to buy sustainable clothing, andmaintenance cost impacts willingness to buy to some extent. Psychological risk and
Young Consumers’ Perceptions of Sustainable Clothing: Empirical … 113
purchasing cost are not influential predictors for consumer attitude and willingnessto buy. The results indicate that consumers are not concerned about the purchasingcost or psychological uncertainty of sustainable clothing; however, the consumersare more concerned about whether a purchased sustainable apparel product fails toprovide the desired benefits or does not function properly, and whether there is apotential cost for maintaining sustainable clothing, and whether there is feeling ofwasting money for purchasing sustainable clothing. On the other hand, consumersmay not feel restricted by the products offered by environmentally and sociallyresponsible businesses; they may simply be overwhelmed by the complexity ofproduct attributes that can be used in decisions to purchase clothing. Consideringthe fact that sustainable clothing products are relatively new product category,consumer may not fully understand the attributes of sustainable clothing; they arenot sure about sustainable clothing’s quality and performance and may merely thinkpurchasing sustainable clothing needs extra maintenance cost or there is highpossibility of wasting money.
Educating consumers seems to be an essential component for directing theirpurchases toward environmentally and socially responsible businesses. However,education alone will unlikely command changes in consumer behavior (Dickson,2000). Manufacturers and retailers will have to supply the products consumerswant, along with the assurance the business behaves responsibly. Purchasing sus-tainable clothing involves a variety of possible risks, including performance risk,psychological risk, social risk, fashion risk, higher purchase cost, maintenance cost,and risk of wasting money. Consumer’s perception of the uncertainty and adverseconsequences of engaging in sustainable purchasing influences their purchaseintention. Moreover, it is necessary to know what types of perceived risk impactconsumer attitude and purchase intention most.
In terms of the relationship between values and consumer attitude and willing-ness to buy sustainable clothing products, benevolence value significantly andpositively impacts consumer attitude and purchase intention; achievement valuesignificantly and negatively impacts consumer willingness to buy. Universalismimpacts consumer willingness to buy to some extent. These results indicate thatconsumers who value benevolence more will have more favorable attitude towardsustainable clothing and more willing to buy sustainable clothing.
Limitations and Future Research Directions
There are several limitations in the study which provide opportunities for futureresearch. First, generalization of the research findings is limited because of the useof a convenience sample (current college students) within a limited geographicallocation. Caution should be used in generalizing the findings of this study to theChinese post-90s’ population as a whole. The sample is also biased in that it reflectsa more highly educated portion of the Chinese post-90s. Less-educated Chinesepost-90s’ thoughts on environmental and social responsibility may not be
114 J. Su et al.
represented here. Future research may use a random sample that is more hetero-geneous in terms of geographic location and educational level to confirm thefindings. Second, this study examined Chinese young consumers’ sustainableclothing consumer behaviors. Future study could be extended to other countries toinvestigate how young consumers in other countries perceive sustainable clothing.Cross-cultural research is desirable for research in sustainable consumer behavior.Third, this study surveyed post-90s; however, future research should be conductedwith other generational cohorts too (e.g., post-70s and post-80s) to understand theway different generational cohorts perceive sustainable apparel products and tofurther investigate the systematic relationships among beliefs, attitudes, and pur-chase intentions. Fourth, financial risk in this study needs future scale developmentand the three items used in the study do not represent the financial risk well. Thus,more future research is needed for the financial risk scale. Finally, in order to obtainmore in-depth reasoning behind Chinese post-90s’ consumer behavior for thesustainable products, focus group interviews would be alternative approaches toexplore in future research.
References
Ajzen, I., & Fishbein, M. (1980). Understanding attitudes and predicting social behavior.Englewood Cliffs, NJ: Prentice-Hall.
Bardi, A., & Schwartz, S. H. (2003). Values and behavior: Strength and structure of relations.Personality and Social Psychology Bulletin, 29(10), 1207–1220.
Bauer, R. A. (1960). Consumer behavior as risk taking. In R. S. Hancock (Ed.), Dynamicmarketing for a changing world (pp. 389–398). Chicago: American Marketing Association.
Belk, R. W. (1988). Possessions and the extended self. Journal of Consumer Research, 15(2),139–168.
Beneke, J., Flynn, R., Greig, T., & Mukaiwa, M. (2013). The influence of perceived productquality, relative price and risk on customer value and willingness to buy: A study of privatelabel merchandise. Journal of Product & Brand Management, 22(3), 218–228.
Bhaduri, G., & Ha-Brookshire, J. E. (2011). Do transparent business practices pay? Exploration oftransparency and consumer purchase intention. Clothing and Textiles Research Journal, 29(2),135–149.
Butler, S. M., & Francis, S. (1997). The effects of environmental attitudes on apparel purchasingbehavior. Clothing and Textiles Research Journal, 15(2), 76–85.
Cerini, M. (March 14, 2016). Shanghai startup sets an eco-friendly model for China’s clothingwholesalers. Retrieved from https://www.forbes.com/sites/mariannacerini/2016/03/14/shanghai-start-up-sets-an-eco-friendly-model-for-chinas-clothing-wholesalers/#2aaffdc71db8.
Chan, R. Y. K. (2001). Determinants of Chinese consumers’ green purchase behavior. Psychologyand Marketing, 18(4), 389–413.
Chang, E.-C., & Tseng, Y.-F. (2013). Research note: E-store image, perceived value and perceivedrisk. Journal of Business Research, 66(7), 864–870.
Chaplin, L. N., & John, D. R. (2005). The development of self-brand connections in children andadolescents. Journal of Consumer Research, 32(1), 119–129.
Chen, H.-L., & Burns, L. D. (2006). Environmental analysis of textile products. Clothing andTextiles Research Journal, 24(3), 248–261.
Young Consumers’ Perceptions of Sustainable Clothing: Empirical … 115
Crespo, Á. H., del Bosque, I. R., & de los Salmones Sánchez, M. M. G. (2009). The influence ofperceived risk on Internet shopping behavior: A multidimensional perspective. Journal of RiskResearch, 12(2), 259–277.
Dickson, M. A. (2000). Personal values, beliefs, knowledge, and attitudes relating to intentions topurchase apparel from socially responsible businesses. Clothing and Textiles ResearchJournal, 18(1), 19–30.
Dickson, M. A., Loker, S., & Eckman, M. (2009). Social responsibility in the global apparelindustry. New York: Fairchild Books.
Dowling, G. R. (1986). Perceived risk: The concept and its measurement. Psychology andMarketing, 3(3), 193–210.
Dowling, G. R., & Staelin, R. (1994). A model of perceived risk and intended risk handlingactivity. Journal of Consumer Research, 21(1), 119–134.
Featherman, M. S., & Pavlou, P. A. (2003). Predicting e-services adoption: A perceived risk facetsperspective. International Journal of Human-Computer Studies, 59(4), 451–474.
Gam, H. J. (2011). Are fashion-conscious consumers more likely to adopt eco-friendly clothing?Journal of Fashion Marketing and Management: An International Journal, 15(2), 178–193.
Gam, H. J., & Banning, J. (2011). Addressing sustainable apparel design challenges withproblem-based learning. Clothing and Textiles Research Journal, 29(3), 202–215.
Gam, H. J., Cao, H., Farr, C., & Kang, M. (2010). Quest for the eco-apparel market: A study ofmothers’ willingness to purchase organic cotton clothing for their children. InternationalJournal of Consumer Studies, 34(6), 648–656.
Goworek, H., Fisher, T., Cooper, T., Woodward, S., & Hiller, A. (2012). The sustainable clothingmarket: An evaluation of potential strategies for UK retailers. International Journal of Retail &Distribution Management, 40(12), 935–955.
Grewal, D., Gotlieb, J., & Marmorstein, H. (1994). The moderating effects of message framing andsource credibility on the price-perceived risk relationship. Journal of Consumer Research,21(1), 145–153.
Harris, F., Roby, H., & Dibb, S. (2015). Sustainable clothing: challenges, barriers andinterventions for encouraging more sustainable consumer behaviour. International Journalof Consumer Studies, 40, 309–318.
Hill, J., & Lee, H. H. (2012). Young Generation Y consumers’ perceptions of sustainability in theapparel industry. Journal of Fashion Marketing and Management: An International Journal,16(4), 477–491.
Hiller Connell, K. Y. (2010). Internal and external barriers to eco-conscious apparel acquisition.International Journal of Consumer Studies, 34(3), 279–286.
Hiller Connell, K. Y. (2011). Exploring consumers’ perceptions of eco-conscious apparelacquisition behaviors. Social Responsibility Journal, 7(1), 61–73.
Hwang, C. G., Lee, Y.-A., & Diddi, S. (2015). Generation Y’s moral obligation and purchaseintentions for organic, fair-trade, and recycled apparel products. International Journal ofFashion Design, Technology and Education, 8(2), 97–107.
Hyllegard, K. H., Ogle, J. P., & Yan, R.-N. (2014). College students’ responses to prosocialmarketing claims on apparel hang tags. Journal of Fashion Marketing and Management: AnInternational Journal, 18(3), 269–283.
Jacoby, J., & Kaplan, L. B. (1972). The components of perceived risk. Paper Presented at theProceedings of the Third Annual Conference of the Association for Consumer Research.
Joergens, C. (2006). Ethical fashion: Myth or future trend? Journal of Fashion Marketing andManagement, 10(3), 360–371.
Kang, J., & Kim, S.-H. (2013). What are consumers afraid of? Understanding perceived risktoward the consumption of environmentally sustainable apparel. Family and ConsumerSciences Research Journal, 41(3), 267–283.
Kolk, A., Hong, P., & Van Dolen, W. (2010). Corporate social responsibility in China: An analysisof domestic and foreign retailers’ sustainability dimensions. Business Strategy and theEnvironment, 19(5), 289–303.
116 J. Su et al.
Lim, N. (2003). Consumers’ perceived risk: Sources versus consequences. Electronic CommerceResearch and Applications, 2(3), 216–228.
Ma, Y. J., & Lee, H.-H. (2012). Understanding consumption behaviours for fair trade non-foodproducts: Focusing on self-transcendence and openness to change values. InternationalJournal of Consumer Studies, 36(6), 622–634.
McDonald, S., Oates, C., Thyne, M., Alevizou, P., & McMorland, L.-A. (2009). Comparingsustainable consumption patterns across product sectors. International Journal of ConsumerStudies, 33(2), 137–145.
Mitchell, V. W. (1999). Consumer perceived risk: Conceptualisations and models. EuropeanJournal of Marketing, 33(1/2), 163–195.
O’Cass, A., & Choy, E. (2008). Studying Chinese generation Y consumers’ involvement infashion clothing and perceived brand status. Journal of Product & Brand Management, 17(5),341–352.
O’Cass, A., & Siahtiri, V. (2014). Are young adult Chinese status and fashion clothing brandconscious? Journal of Fashion Marketing and Management: An International Journal, 18(3),284–300.
Park, H., & Kim, Y.-K. (2016). Proactive versus reactive apparel brands in sustainability:Influences on brand loyalty. Journal of Retailing and Consumer Services, 29, 114–122.
Peter, J. P., & Ryan, M. J. (1976). An investigation of perceived risk at the brand level. Journal ofMarketing Research, 13(2), 184–188.
Rapp, J. (2016). Eco-fashion gets hip for China’s ‘light green’ consumers. Retrieved from https://jingdaily.com/eco-fashion-gets-hip-for-chinas-light-green-consumers/.
Rokeach, M. (1979). Understanding human values: Individual and societal. New York: FreePress.
Schwartz, S. H. (1992). Universals in the content and structure of values: Theoretical advances andempirical tests in 20 countries. In P. Z. Mark (Ed.), Advances in experimental socialpsychology (Vol. 25, pp. 1–65). New York: Academic Press.
Schwartz, S. H. (1994). Are there universal aspects in the structure and contents of human values?Journal of Social Issues, 50(4), 19–45.
Schwartz, S. H., & Bilsky, W. (1987). Toward a universal psychological structure of humanvalues. Journal of Personality and Social Psychology, 53(3), 550.
Schwartz, S. H., & Sagiv, L. (1995). Identifying culture-specifics in the content and structure ofvalues. Journal of Cross-cultural Psychology, 26(1), 92–116.
Simões, F. (2016). Consumer behavior and sustainable development in China: The role ofbehavioral sciences in environmental policymaking. Sustainability, 8(9), 897.
Sirgy, M. J. (1982). Self-concept in consumer behavior: A critical review. Journal of ConsumerResearch, 9(3), 287–300.
Smith, M. J. (1982). Persuasion and human action: A review and critique of social influencetheories. Belmont, CA: Wadsworth Publishing Company.
Smith, N. C. (2003). Corporate social responsibility: Whether or how? California ManagementReview, 45(4), 52–76.
Song, M. (April 24, 2017). In China, making a fashion statement. Retrieved from http://blogs.ei.columbia.edu/2017/04/24/in-china-making-a-fashion-statement/.
Sweeney, J. C., Soutar, G. N., & Johnson, L. W. (1999). The role of perceived risk in thequality-value relationship: A study in a retail environment. Journal of Retailing, 75(1), 77–105.
U.S. Census Bureau. (2017). International Data Base. Retrieved July 3, 2017 https://www.census.gov/population/international/data/idb/informationGateway.php.
Young Consumers’ Perceptions of Sustainable Clothing: Empirical … 117
Application of Motivation-Opportunity-Ability Theory in the Consumptionof Eco-fashion Products: Were ChineseConsumers Underestimated?
Ruirui Zhang and Chunmin Lang
Abstract Fueled by increased affluence and modernization process, China isexperiencing dramatic changes in its culture, social value, and consumption values.For Chinese people, the satisfaction of functional needs has been taken place bysocial, emotional, and experiential needs in apparel consumption. This transfor-mation indicates that Chinese consumers’ attitude and products selection aremoving toward health, happiness, and self-satisfaction. In general, Chinese have astronger financial incentive to live sustainably and they have more flexibility tochange. Therefore, the purpose of the study is to determine the factors that influenceChinese consumers’ intention to pursue eco-fashion consumption. The Motivation-Opportunity-Ability theory was applied as the theoretical foundation in this study.The data were collected in China through an online survey. Participants (n = 410)were recruited through email survey link and the social media app (WeChat).The SEM analysis results indicated that self-identity, environment consciousness,environmental apparel knowledge, and attitude significantly determine Chineseconsumers’ intention to pursue eco-fashion consumption. In addition, the perceivedopportunity was found to have a direct effect on the intention toward eco-fashionconsumption, as well as mediate the relationship between perceived ability andintention toward eco-fashion consumption.
Keywords Eco-fashion consumption � Motivation-Opportunity-Ability theorySelf-identity � Environmental consciousness � Environmental apparel knowledge
R. Zhang (&)Department of Fashion Design and Retailing, Framingham State University,234A Hemenway Annex, Framingham, MA 01701, USAe-mail: [email protected]
C. LangDepartment of Textiles, Apparel Design, & Merchandising, College of Agriculture,Louisiana State University, 143 Human Ecology, Baton Rouge, LA 70803, USAe-mail: [email protected]
© Springer Nature Singapore Pte Ltd. 2018Y. Xu et al. (eds.), Chinese Consumers and the Fashion Market, Springer Seriesin Fashion Business, https://doi.org/10.1007/978-981-10-8429-4_6
119
Introduction
Fueled by increased affluence and modernization processes, China is experiencingdramatic changes in its culture, social values, and consumption practices. Xiao andKim (2009) revealed that, for Chinese people, the satisfaction of functional needs hasbeen replaced by social, emotional, and experiential needs in apparel consumption.This transformation indicates that Chinese consumers’ attitude and product selectionare moving toward health, happiness, and self-satisfaction. In addition, due to highereducational levels, more disposable income, increasing social responsibility andenvironmental awareness, Chinese consumers are evolving in their behaviors andpractices and are beginning to promote sustainable consumption. Brodwin (2015)found that Chinese consumers have shown more willingness to buy environmentallyfriendly products when compared to US consumers. In general, the Chinese have astrongerfinancial incentive to live sustainably and theyhavemoreflexibility to change.
Although a variety of studies have been done on sustainable consumption indeveloped countries, a deeper understanding of Chinese consumers’ sustainableconsumption is lacking. Environmental consciousness was not a central theme inChina since the Chinese government’s highest priority unquestionably was eco-nomic development in the past thirty years. Even though the widespread environ-mental problems, such as water pollution, air pollution, and toxic waste releasing,have been inevitably discerned, economic growth and wealth creation are still themost valuable goals and are always given a higher level of importance (Harris,2006). Due to a lack of knowledge in ecology and education regarding environ-mental issues during the rapid economic development period from 1979 to 2000,Chinese consumers’ environmental consciousness has been insufficient; especiallythose Chinese who were living outside the major urban areas.
The aim of this study is to address existing research gaps in addition to deliv-ering practical formation for sustainable development and consumption in thecontext of fashion business in China. The purpose of this study is also to (1) de-velop a conceptual model based on Motivation-Opportunity-Ability (MOA) theoryto examine Chinese eco-fashion consumption behaviors; (2) identify antecedents,such as Chinese consumers’ man–nature-oriented environmental consciousness andattitude, the level of environmental knowledge, and green self-identity effects oneco-fashion consumption; (3) to determine the two external factors, opportunitiesand ability, and their effects on eco-fashion consumption.
Literature Review and Hypotheses Development
Eco-fashion Consumption
Eco-fashion, one of the green versions of consumer goods, is defined as the type ofclothing that is designed and produced to maximize benefits for people and societyand to minimize environmental impacts (Claudio, 2007; Joergens, 2006; Ochoa,
120 R. Zhang and C. Lang
2011). The clothing is made of biodegradable and recycled materials and/or pro-duced through environmentally friendly sourcing, production, and distribution and/or is involved with corporate socially responsible practices. This is what is con-sidered eco-fashion (Chan & Wong, 2012; Claudio, 2007; Young, Hwang,McDonald, & Oates, 2010). Therefore, eco-fashion emphasizes the environmentallyresponsible aspect instead of the socially responsible aspect of a business.
Many green versions of consumer products are now widely available in China.Ye (2000) mentioned that over 75% of Chinese consumers have strongly expressedtheir intention toward buying green products. Chan (2000) discovered that Chineseconsumers are very familiar with green consumer products such as eco-friendlydetergents and batteries. He also found that one-third of participants in his studybought at least one of those products in the past six months. Shen, Wang, Lo andShum (2012) found that Chinese consumers are willing to pay a premium price forclothing which is made in an environmentally and socially responsible way.Previous studies (Chan & Wong, 2012; Niinimäki, 2010) found that product-relatedattributes (e.g., product design, quality, and price) of eco-fashion and store-relatedattributes (e.g., store design, environment, ethical practices, and shop convenience)of eco-fashion are two important predictors of eco-fashion consumption behaviors.Chan and Wong (2012) specifically claimed that among Chinese consumers,store-related attributes determine Chinese consumers’ attitude, which in turninfluences their eco-fashion consumption behaviors. They also suggested that theprice of eco-fashion, as a critical factor, had a major effect on Chinese consumers’eco-fashion consumption and moderated the relationship between store-relatedattributes and eco-fashion consumption. The price factor should not be underesti-mated in further Chinese consumer behavioral studies.
In addition to those external influences motivating environmental consciousness,the internal traditional Chinese cultural values may also help to explain whyeco-fashion consumption behaviors are progressively becoming remarkable amongChinese consumers. Chan, Wong, and Leung (2008) bring a unique perspective toexplain Chinese ethical behaviors. They used the terminology “man–nature orien-tation” that Kluckhohn and Strodtbeck created in 1961 in explaining Chineseethical consumption behaviors. They pointed out that the “man–nature orientation”is similar to “Chinese place great emphasis on living in harmony with Nature”(Chan, 2000; Chan et al., 2008; Yau, 1988). This philosophy was funded by thethought of Lao Tzu. This great philosopher, who lived long before the time ofConfucius, taught that in order to achieve a “man–nature unity,” the human beings,as a part of nature, should not master but should adapt to or integrate with thenatural world. This Chinese “Man–nature orientation” is akin to Western literature’seco-centric orientation (Dunlap et al., 2000; Dunlap & Jones, 2002). Therefore, ifChinese consumers in the current society adhere to this traditional cultural value,they are more likely to adopt environmentally responsible consumption behaviorsdue to this genetic and inherent righteousness (Chan et al., 2008).
Application of Motivation-Opportunity-Ability Theory … 121
Motivation-Opportunity-Ability (MOA) Theory
Motivation-Opportunity-Ability (MOA) theory was proposed by MacInnis andJaworski in 1989 and it has been widely employed to explain consumer behaviorsand knowledge management practices (MacInnis, Moorman, & Jaworski, 1991;Siemsenm, Roth, & Balasubramanian, 2008; Argote, McEvily, & Reagans, 2003).This theory suggests that motivation, opportunity, and ability determine the degreeto which individuals process information. It also particularly highlights theimportance of the motivation factor that acts as a driver of behaviors. In general,motivation is a force that directs individuals toward goals and determines theindividuals’ willingness and readiness to act. Marketing research usually investi-gates ways which can be used to motivate consumers’ engagement in theirdecision-making journeys (Gruen, Osmonbekov, & Czaplewski, 2006).Opportunity shows the contextual or environmental mechanisms which are con-ducive to achieving desired goals or behavioral outcomes. There are several situ-ational factors, such as time, opportunity, availability, attention paid, and a numberof repetitions which will trigger or deter the desired goals and behavioral outcomes(MacInnis & Jaworski, 1989). In the MOA theory, ability represents a person’s skillor proficiencies in certain behaviors. In marketing and consumer studies, theaccessibility and availability of situational factors provide the foundation for pro-cessing ability. Taking the position that (1) Chinese consumers’ eco-fashion con-sumption intention as a behavioral outcome, (2) environmental consciousness,self-identity, consumers’ attitude, and environmental apparel knowledge are pro-posed to be motivational factors, and (3) perceived opportunity and ability areconducive to eco-fashion consumption intention, we propose that the MOA theorycan serve as an explanatory theoretical framework in the context of this study.
Motivations in the MOA Theory
In behavioral science studies, motivation is usually considered as a force whichleads people toward goals and behavioral action. In marketing studies, companiesdevelop different psychological and physical cues through which consumers can bemotivated to engage in processing information and/or buying intention and/orbehavior (Gruen et al., 2006). Motivation has been defined as goal-directed arousal(Park & Mittal, 1985). In this study, the goal of arousal is classified as willingnessto protect the environment for the future (environmental sustainability and con-sciousness); awareness of the harmful effects of apparel production processes(environmental apparel knowledge); having positive attitudes toward buyingeco-fashion (attitude), and a desire to be an “environmental consumer”(self-identity). High motivation in those aspects implies that Chinese consumers arewilling to buy eco-fashion. Previous studies found that green self-identificationmotivates consumers’ eco-fashion consumption (Chan & Wong, 2012; Niinimäki,
122 R. Zhang and C. Lang
2010). Consumers’ high level of environmental apparel knowledge and greenattitude predicts their eco-fashion consumption behaviors (Hiller Connell & Kozar,2012; Johe & Bhullar, 2016). This study identifies four variables, including envi-ronmental consciousness, self-identity, environmental apparel knowledge, andattitudes, as motivational variables in the proposed eco-fashion consumption con-ceptual model.
Environmental Consciousness
Environmental consciousness is a multi-dimensional construct which comprisescognitive, attitudinal, and behavioral components (Schelgelmilch, Bohlen, &Diamontopoulos, 1996). It is defined as a psychological tendency of performing inpro-environmental behaviors. Individuals’ value judgments, recognition, andbehavioral intention toward environmental issues are often reflected in the level ofone’s environmental consciousness (Chang, 2012; Schlegelmilch et al., 1996;Zelezny & Schultz, 2000; Zheng, 2010). Pro-environmental behaviors, such assigning a petition to support stricter environmental laws, participating in a protestagainst a company that is harming the environment, writing a letter to publicofficials to increase their support of environmental protection efforts, etc., are highlycorrelated with environmental consciousness (Cordano, Welcomer, & Scherer,2003). Eco-consumption behaviors, such as using a product that is durable and safefor the environment, or buying clothing with recycled content, are psychologicallyengaged with the level of one’s environmental consciousness. Consumers who havea low level of environmental consciousness are less likely to buy environmentalproducts because they do not consider environmental issues as critical factors intheir decision-making process. On the contrary, those with a high awareness ofenvironmental consciousness are more likely to adopt a wider range of environ-mentally conscious behaviors (Schlegelmilch et al., 1996).
Unfortunately, due to the holding of traditional views regarding Chinese’ social,economic, and political structure, many people maintain that the Chinese have farless environmental consciousness than Western consumers. However, Chan (1999)found that not only have Chinese residents shown their actual commitment towardeco-friendly activities, but they are also more emotionally attached to many envi-ronmental issues. This awareness of environmental consciousness generates awillingness to adopt eco-consumption behaviors among Chinese consumers (Chan,1999; Chan & Lau, 2002; Chan & Wong, 2012).
Consumers with a high awareness of environmental consciousness are morelikely to pay attention to and process environmental information, such as greencampaigns and advertisements. Kim, Littrell, and Paff Ogle (1999) reported thatsince consumers who reside in developing countries exhibit environmental con-sciousness toward living conditions than developed countries, they are more likelyto support apparel companies’ sustainable development or missions moving towardsocial responsibility. Therefore, the following hypothesis was developed:
Application of Motivation-Opportunity-Ability Theory … 123
H1a: Consumers’ environmental consciousness influences their intention towardeco-fashion consumption.
Environmental consciousness has been dramatically increasing its awarenessamong Chinese in recent years (Xue, Zhang, & Wang, 2014). Not only was thischanging generated by the constant education campaigns from schools, NGOs, andpopular media, but it has also been generated through real and painful conditionsthat the Chinese are suffering on a daily basis, such as breathing heavy smog whichhas blanketed many parts of China, especially in winter seasons. The Chinese havefirmly realized that rapid economic development through mass production has comeabout at the cost of the domestic environment (Harris, 2006). However, the biggestmicro-perspective upgrading among Chinese, especially those who are more edu-cated and are living in the urban and suburb areas, is the recognition that theirbehaviors are causing environmental harm. The current study hypothesizes thatChinese consumers are more likely to identify themselves as green consumers andhave a positive attitude toward eco-fashion product since their environmentalconsciousness has been increased. Oliver and Lee (2010) posited that based onself-image congruity theory, consumers’ self-identity reflects their green ideology.According to Hunt and Vitell’s (1986) theory of ethics, an individual’s moralphilosophy, such as environmental consciousness, forms their attitudes in situationsrelating to ethical issues. Therefore, the following two hypotheses were developed.
H1b: Consumers’ environmental consciousness affects consumers’ self-identity.H1c: Consumers’ environmental consciousness affects consumers’ attitude towardeco-fashion consumption.H1d: Consumers’ environmental consciousness affects consumers’ environmentalapparel knowledge.
Environmental Apparel Knowledge
Consumer decision-making processes are associated with a constructive and cog-nitive route, and consumer knowledge reflects a cognitive aspect in one’s mind. Inconsumer and behavioral studies, consumer knowledge has been examined as acritical factor or an antecedent in one’s decision-making process. The theoreticaldefinition of consumer knowledge consists of two dimensions: familiarity andproduct knowledge. Familiarity states the accumulated consumption experiences.Product knowledge refers to the sum of product information stored in one’smemory (Philippe & Ngobo, 1999). Environmental knowledge, as one of theoperational concepts built upon consumer knowledge, specifically emphasizesconsumers’ awareness of relevant environmental and ecological knowledge (Kang,Liu, & Kim, 2013). Therefore, the environmental apparel knowledge in the contextof this study emphasizes consumers’ awareness of relevant environmental andecological knowledge and of apparel products and manufacturing processes.
124 R. Zhang and C. Lang
Kim and Damhorst (1998) developed the environmental apparel knowledge scalewhich includes 11 statements concerning the processing of fibers, recycling, andbiodegradability of apparel goods, chemical pollutants produced in the manufactureof apparel goods and regulations for clean air and water imposed on apparel andtextile manufacturers. Chang (2012) posited that Chinese consumers have sufficientenvironmental apparel knowledge to perform more eco-consumption behaviorsthan those who do not possess such knowledge.
The findings from previous research regarding the relationship between envi-ronmental apparel knowledge, attitude, and eco-fashion consumption are incon-clusive (Kang et al., 2013). For example, consumers who are more knowledgeableabout environmental issues associated with apparel products are more likely to buysecondhand clothing or to purchase more classic styles for long-term usage.Hustvedt and Dickson (2009) concluded that apparel consumption behaviors wereusually influenced by the awareness of environmental apparel knowledge. Thoseconsumers who have a higher level of environmental apparel knowledge tend toevaluate environmental impacts of clothing products before buying. Kozar andHiller Connell (2013) found that environmental apparel knowledge and consumerattitude toward apparel social responsibility issues were positively correlated.Consumers’ environmental apparel knowledge was a significant predictor ofeco-fashion purchasing behavior.
However, an earlier study of Kim and Damhorst (1998) found that environ-mental apparel knowledge had a limited relationship with one’s environmentalconcern. It also has a weak effect on responsible apparel consumption behaviors.Based on participants’ responses in Carrigan and Attalla (2001)’s study, it showedthat consumers’ apparel purchasing decisions were less likely to be influenced byapparel companies’ environmental responsibility reputations. Noticing the results ofenvironmental apparel knowledge’s influence on apparel consumption behaviorsand consumers’ attitude, this study proposes the following two hypotheses:
H2a: Consumers’ environmental apparel knowledge is positively associated withconsumer attitude toward eco-fashion consumption.H2b: Consumers’ environmental apparel knowledge determines intention towardeco-fashion consumption.
Self-identity and Attitude
Self-identity is defined as the “relatively enduring characteristics that peopledescribe themselves” (Sparks & Guthrie, 1998, p. 1396) and is synonymous withself-concept or self-perception. An individuals’ self-identity is influenced by per-sonal motivations (such as self-esteem, self-enhancement, and self-understanding)and social interaction demands, expectations of others, and different roles thatpeople perform (Whitmarsh & O’Neill, 2010). Self-identity is noted as a potentialrelevant determinant of one’s behavior within sociology and psychological
Application of Motivation-Opportunity-Ability Theory … 125
literature. In environmental science studies, researchers (Whitmarsh & O’Neill,2010) have found that self-identity usually determines and affectspro-environmental attitudes and behaviors. Self-identity has been viewed as apredictor of behavioral intention (Granberg & Holmberg, 1990), which can beconsidered as a primary motive of pro-environmental behavior.
Based on the self-congruity theory (Sirgy, 1986), individuals who perceivethemselves as green consumers are more likely to buy green products. Self-identityis found as a common motivational value which guides people’s differenteco-friendly behaviors, such as recycling (Manetti, Pierro, & Livi, 2004); usingtheir own bags while shopping (Chan et al., 2008); buying organic products (Johe& Bhullar, 2016); and adopting the use of electric cars (Barbarossa, Beckmann, dePelsmacker, Moons, & Gwozdz, 2015). Sparks and Shepherd (1992) applied thetheory of planned behavior in examining the role of self-identity in green con-sumerism. They claimed that one’s self-identity invokes some moral imperative orethical-orientated behaviors.
Shaw, Shiu, and Clarke (2000) used the theory of planned behavior as a theo-retical foundation to examine its predictability in purchasing fair trade groceries.They claimed that consumers who are driven by a sense of ethical obligation orgreen self-identification are more likely to buy fair trade products. A study con-ducted by Hustvedt and Dickson (2009) examined the effects of consumers’environmental attitude and self-identity on the intention of buying organic cottonapparel. The findings showed that consumers whose self-identity is environmental,organic, and socially responsible were more likely to have positive attitudes towardorganic and sustainable agriculture. They are also more likely to buy locally madeapparel items. Oliver and Lee (2010) found that consumers’ self-identity has adirect effect on consumers’ attitude toward green products. Barbarossa et al. (2015)proposed a self-identity-based eco-friendly intention conceptual model to evaluatethe effects of self-identity and motivation’s effect on electric car adoption intention.
The study posited that consumers’ green self-identify and attitude are ante-cedents of eco-friendly conceptual intention and behavior, such as the adoption ofeco-friendly cars. The model suggests that green self-identify and consumer attitudehave a significant direct influence on the intention to adopt the use of electric cars.This study investigates the effects of consumers’ identify in adoptinghigh-involvement products, such as electric cars, while previous studies mainlyfocused on low-involvement products, such as fair trade groceries (Shaw & Shiu,2003) and organic vegetables (Johe & Bhullar, 2016). Apparel products are oftenconsidered as high-involvement products which are more likely to be engaged withan individual’s personal factors and self-values. Therefore, the followinghypotheses were developed:
H3a: Consumers’ self-identity is positively associated with consumer attitudetoward eco-fashion consumption.H3b: Consumers’ self-identity directly influences consumers’ intention towardeco-fashion consumption.
126 R. Zhang and C. Lang
H4: Consumers’ attitude directly influences consumers’ intention towardeco-fashion consumption.
Gruen et al. (2006) applied the MOA theory in examining thecustomer-to-customer (C2C) e-communities’ know-how exchanges. They foundthat in e-communities, the opportunity will be affected by individuals’ level ofattention and willingness of devotion to the C2C exchange. This finding can beleveraged to the context of this study since perceived opportunity in eco-fashionconsumption can be influenced by one’s attention and willingness of devotion ineco-fashion consumption. In addition, based on self-identify congruency theory, thewillingness of devotion in eco-fashion consumption can be determined by one’sgreen self-identity. Perceived ability in this study is defined as the perceived skillsor proficiencies to engage in pro-environmental behaviors. It is also considered asone of the consequences of self-identity (Stets & Biga, 2003). Therefore, the fol-lowing two hypotheses were developed:
H5a: Consumers’ self-identity is positively associated with perceived opportunity.H5b: Consumers’ self-identity is positively associated with perceived ability.
Perceived Opportunity
Opportunity is the contextual or environmental mechanisms that are conducive toachieving desired goals or behavioral outcomes. Several variables, such as time,money availability, attention paid, and numbers of repetitions of availability, canenhance or impede the desired outcome. For example, Gruen et al. (2006) foundthat the level of opportunity determines customer-to-customer know-how exchangein Internet communities. MacInnis and Jaworski (1989) claimed that using somecues in ads, such as humor, celebrity, and incongruent stimuli, will increaseopportunities for consumers to process brand information.
Opportunity in this research context is defined as the availability of resourceswhich consumers can find eco-fashion products. Chan and Lau (2002) mentionedthat Chinese consumers are very familiar with green consumer goods and have amore emotional attachment toward eco-friendly activities. Although there is a rel-atively limited availability of green products compared to Western countries,Chinese consumers still express their green concern freely as well as their will-ingness to acquire those green products. Chan (2000) revealed that even thoughChinese consumers have a significant demand of green purchase intention, theiractual purchase behavior is relatively insignificant. This low correspondence can beexplained by the unavailability of green products in China. With increasing afflu-ence derived from rapid economic growth in the past ten years, the fashion markethas been abundantly developed. This development has triggered more diversifiedand niche fashion markets in China, such as secondhand, renting fashion stores, andhandmade clothes. The following hypothesis was developed:
Application of Motivation-Opportunity-Ability Theory … 127
H6: The opportunity of shopping for eco-fashion influences Chinese consumers’intention toward eco-fashion consumption.
Perceived Ability
Ability implies some necessary resources such as money, intelligence, andknowledge that individuals have to make an outcome happen (Hoyer & MacInnis,1997). We refer to ability under the MOA theory as consumers’ skill or profi-ciencies in environmental behaviors. Cumming and Schwab (1973) mentioned thatwithout ability and opportunity, motivation alone cannot lead to behaviors.Therefore, ability plays one of the complementary roles in influencing behaviors.Perceived ability in this study is reflected by being able to read the labeling onproduct packages to verify if the contents are environmentally friendly, to reducewater usage, and to save electricity. Previous studies (Chan & Lau, 2002; Kanget al., 2013; Ramasamy & Yeung, 2009) have found that Chinese consumers havebecome aware of the content of apparel products they buy. Some well-educatedconsumers even investigate whether the fashion supply chain they will shop at isethical and transparent (Chan & Wong, 2012). Hence, the following hypothesis wasdeveloped:
H7: Perceived ability influences Chinese consumers’ intention toward eco-fashionconsumption.
In the process of developing the theoretical model in this study, researchersfound that many MOA theory-related behavioral studies focused on examiningmotivation, opportunity, and ability’s individual effects on behaviors. For example,MacInnis et al. (1991) identified internal and external factors which enhancedprocessing motivation, opportunity, and ability in brand information from adver-tisements. Gruen et al. (2006) identified individual effects of motivational variables,opportunity, and ability in C2C know-how exchanges. Most studies claim thatopportunity and ability either directly determine or have moderating effects onindividuals’ behaviors. None of the current research has explored the relationshipbetween opportunity and ability under the MOA theory. Chan and Lau (2002)mentioned that inadequate availability of eco-fashion products (lack of opportunity)may discourage Chinese consumers’ eco-fashion consumption, even though theyhave the ability to perform relevant pro-environmental behaviors (Chan & Lau,2002). Therefore, providing eco-fashion products to acquire opportunity (providingopportunity) might trigger people’s perception of the ease of performingeco-fashion consumption (the perceived ability). Thus, the following hypothesiswas developed:
H8: Consumers’ perceived opportunity influences perceived ability.
128 R. Zhang and C. Lang
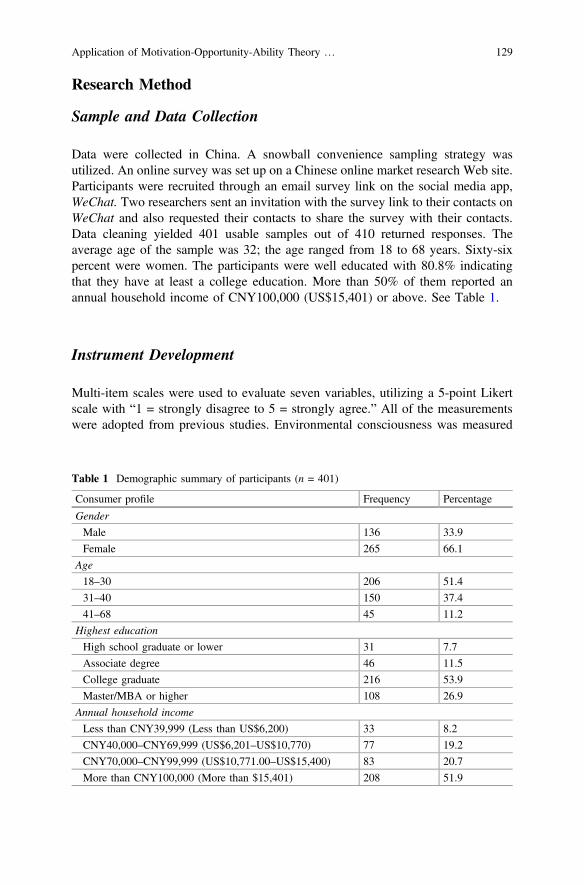
Research Method
Sample and Data Collection
Data were collected in China. A snowball convenience sampling strategy wasutilized. An online survey was set up on a Chinese online market research Web site.Participants were recruited through an email survey link on the social media app,WeChat. Two researchers sent an invitation with the survey link to their contacts onWeChat and also requested their contacts to share the survey with their contacts.Data cleaning yielded 401 usable samples out of 410 returned responses. Theaverage age of the sample was 32; the age ranged from 18 to 68 years. Sixty-sixpercent were women. The participants were well educated with 80.8% indicatingthat they have at least a college education. More than 50% of them reported anannual household income of CNY100,000 (US$15,401) or above. See Table 1.
Instrument Development
Multi-item scales were used to evaluate seven variables, utilizing a 5-point Likertscale with “1 = strongly disagree to 5 = strongly agree.” All of the measurementswere adopted from previous studies. Environmental consciousness was measured
Table 1 Demographic summary of participants (n = 401)
Consumer profile Frequency Percentage
Gender
Male 136 33.9
Female 265 66.1
Age
18–30 206 51.4
31–40 150 37.4
41–68 45 11.2
Highest education
High school graduate or lower 31 7.7
Associate degree 46 11.5
College graduate 216 53.9
Master/MBA or higher 108 26.9
Annual household income
Less than CNY39,999 (Less than US$6,200) 33 8.2
CNY40,000–CNY69,999 (US$6,201–US$10,770) 77 19.2
CNY70,000–CNY99,999 (US$10,771.00–US$15,400) 83 20.7
More than CNY100,000 (More than $15,401) 208 51.9
Application of Motivation-Opportunity-Ability Theory … 129
by three items adopted from Gam (2011). Four items modified from Kim andDamhorst (1999) were utilized to measure environmental apparel knowledge, and athree-item scale for self-identify was adopted from Hustvedt and Dickson (2009).The semantic differential scale containing four groups of semantic differentialadjectives was applied to measure attitude. In addition, perceived opportunity wasmeasured by three items adopted and modified from Zhang (2014). Perceivedability was measured by three items developed by researchers for the current study.Finally, intention toward eco-fashion consumption was measured by a three-itemscale modified from Chan and Wong (2012).
Data Analysis
SPSS 20.0 and Stata were used to perform statistical analysis. Reliability andvalidity were both examined in this study. A two-step approach was adopted(Anderson & Gerbing, 1988). Confirmatory factor analysis (CFA) was first con-ducted to find a better model for the measurement of each latent variable (Jackson,Gillaspy, & Purc-Stephenson, 2009). Then structural equation modeling (SEM) wasemployed to test the proposed hypotheses. The goodness-of-fit (GFI) indices usedin this study include the conventional cut off � 0.90 for acceptable fit for CFI andTIL, and � 0.95 for good fit (Hu & Bentler, 1999). RMSEA and SRMR valuesbetween 0.05 and 0.08 represent acceptable fit, and values <0.05 indicate good fit(Kline, 2010; Hu & Bentler, 1999).
Results
Measurement Model
An exploratory factor analysis was performed first to examine the factor structureusing a principal component analysis with varimax rotation. As expected, the screenplot examination confirmed the seven factors. All factor loadings ranged from 0.578to 0.954 were satisfactory. Then a confirmatory factor analysis was conducted totest the measurement model using Stata. The result of the measurement model,including seven latent constructs with a total of 23 items, exhibited an excellentmodel fit (v2ðdf¼209Þ = 381.243, p = 0.000, v2/df = 1.82; RMSEA = 0.045;
CFI = 0.962; TLI = 0.954; SRMR = 0.041)Next, construct validity was confirmed by assessing convergent validity and
discriminant validity. All CFA loadings were higher than 0.5, which providedevidence for convergent validity (Kline, 2010); and the average variance extracted(AVE) for each construct was greater than 0.5 (Anderson & Gerbing, 1988),suggesting that each construct is well represented by its own indicators. In addition,
130 R. Zhang and C. Lang
discriminant validity between constructs was also established because all AVEsranging from 0.510 to 0.679 exceeded squared correlations between the constructs,ranging from 0.008 to 0.286 (Fornell & Larcker, 1981). Cronbach’s alpha estimatesof all constructs ranged from 0.755 to 0.885, which exceeded the recommended0.70 cut off point (Cortina, 1993), confirming the reliability of measurement.Tables 2 and 3 represent the results regarding convergent and discriminantvalidities and the reliability of the instruments.
Structural Model and Hypotheses Test
Structural equation modeling (SEM) was employed to examine the influence of envi-ronmental consciousness, environmental apparel knowledge, attitude, opportunity,ability, and self-identity on Chinese consumers’ intention to buy eco-fashion products.The statistic results revealed an excellent model fit (v2ðdf¼210Þ = 396.48, p < 0.000,
v2/df = 1.888; RMSEA = 0.047; CFI = 0.959; TLI = 0.951; SRMR = 0.049).The outputs demonstrated that environmental consciousness was positively
associated with self-identity (b = 0.541, p < 0.000), environmental apparelknowledge (b = 0.530, p < 0.000), attitude (b = 0.236, p < 0.001), andeco-fashion consumption (b = 0.229, p < 0.000). Therefore, H1a, H1b, H1c, andH1d were all supported. The results indicate that Chinese consumers with higherenvironmental consciousness tend to have more environmental apparel knowledge,are more likely identify themselves as environmental consumers, feel positivetoward purchasing and are more likely to purchase eco-fashion products. In addi-tion, both environmental apparel knowledge (b = 0.199, p < 0.001) andself-identity (b = 0.214, p < 0.001) were found to be positively related to attitude,therefore, H2a and H3a were supported. Self-identity was also found to signifi-cantly impact perceived opportunity to sustainable consumption (b = 0.503,p < 0.000) and perceived ability to conduct sustainable consumption (b = 0.403,p < 0.000); therefore, H5a and H15b were supported. Furthermore, significantlypositive relationships were also exhibited between eco-fashion consumption andself-identity (b = 0.168, p < 0.046), environmental apparel knowledge (b = 0.145,p < 0.015), perceived opportunity (b = 0.165, p < 0.012), and attitude (b = 0.165,p < 0.01). Therefore, H2b, H3b, H4, and H6 were all supported. There was nosignificant relationship between ability and eco-fashion consumption (b = 0.152,p > 0.05). Therefore, H7 was not supported. Additionally, the significant rela-tionship between opportunity and ability was also confirmed (b = 0.362,p < 0.000), so H8 was supported. Figure 1 summarizes the hypothesis test results.
Application of Motivation-Opportunity-Ability Theory … 131
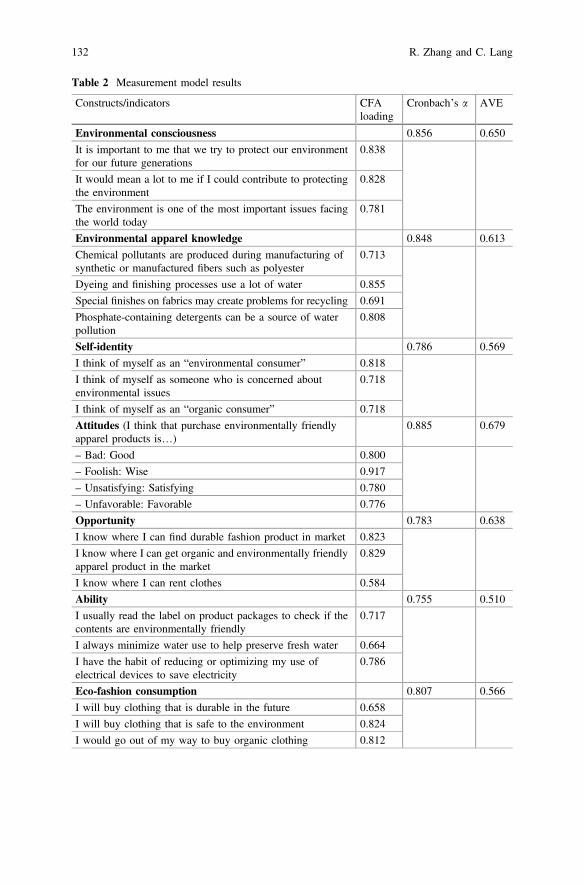
Table 2 Measurement model results
Constructs/indicators CFAloading
Cronbach’s a AVE
Environmental consciousness 0.856 0.650
It is important to me that we try to protect our environmentfor our future generations
0.838
It would mean a lot to me if I could contribute to protectingthe environment
0.828
The environment is one of the most important issues facingthe world today
0.781
Environmental apparel knowledge 0.848 0.613
Chemical pollutants are produced during manufacturing ofsynthetic or manufactured fibers such as polyester
0.713
Dyeing and finishing processes use a lot of water 0.855
Special finishes on fabrics may create problems for recycling 0.691
Phosphate-containing detergents can be a source of waterpollution
0.808
Self-identity 0.786 0.569
I think of myself as an “environmental consumer” 0.818
I think of myself as someone who is concerned aboutenvironmental issues
0.718
I think of myself as an “organic consumer” 0.718
Attitudes (I think that purchase environmentally friendlyapparel products is…)
0.885 0.679
– Bad: Good 0.800
– Foolish: Wise 0.917
– Unsatisfying: Satisfying 0.780
– Unfavorable: Favorable 0.776
Opportunity 0.783 0.638
I know where I can find durable fashion product in market 0.823
I know where I can get organic and environmentally friendlyapparel product in the market
0.829
I know where I can rent clothes 0.584
Ability 0.755 0.510
I usually read the label on product packages to check if thecontents are environmentally friendly
0.717
I always minimize water use to help preserve fresh water 0.664
I have the habit of reducing or optimizing my use ofelectrical devices to save electricity
0.786
Eco-fashion consumption 0.807 0.566
I will buy clothing that is durable in the future 0.658
I will buy clothing that is safe to the environment 0.824
I would go out of my way to buy organic clothing 0.812
132 R. Zhang and C. Lang
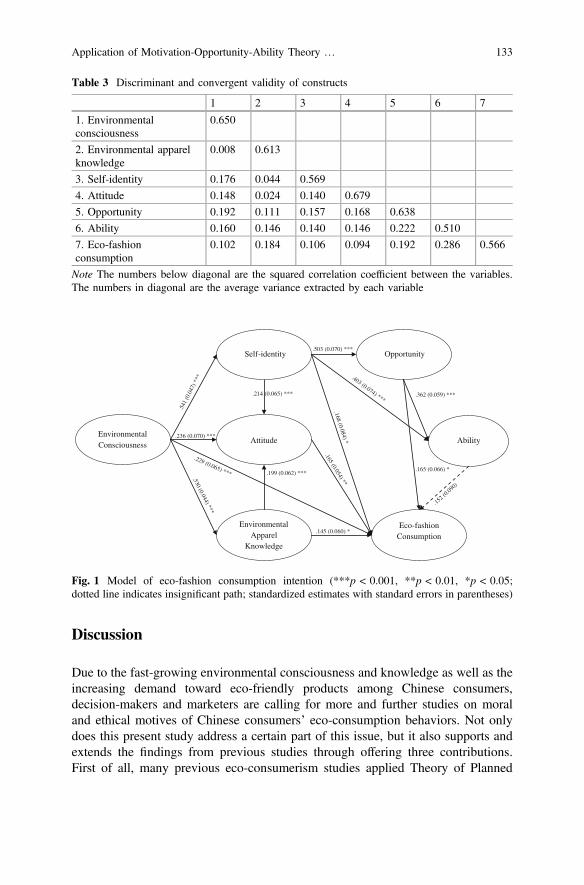
Discussion
Due to the fast-growing environmental consciousness and knowledge as well as theincreasing demand toward eco-friendly products among Chinese consumers,decision-makers and marketers are calling for more and further studies on moraland ethical motives of Chinese consumers’ eco-consumption behaviors. Not onlydoes this present study address a certain part of this issue, but it also supports andextends the findings from previous studies through offering three contributions.First of all, many previous eco-consumerism studies applied Theory of Planned
Table 3 Discriminant and convergent validity of constructs
1 2 3 4 5 6 7
1. Environmentalconsciousness
0.650
2. Environmental apparelknowledge
0.008 0.613
3. Self-identity 0.176 0.044 0.569
4. Attitude 0.148 0.024 0.140 0.679
5. Opportunity 0.192 0.111 0.157 0.168 0.638
6. Ability 0.160 0.146 0.140 0.146 0.222 0.510
7. Eco-fashionconsumption
0.102 0.184 0.106 0.094 0.192 0.286 0.566
Note The numbers below diagonal are the squared correlation coefficient between the variables.The numbers in diagonal are the average variance extracted by each variable
Environmental Consciousness
Environmental Apparel
Knowledge
Self-identity
Attitude Ability
Opportunity
Eco-fashion Consumption
.236 (0.070) ***
.530 (0.044) ***
.214 (0.065) ***
.199 (0.062) ***
.145 (0.060) *
.168 (0.084) *
.503 (0.070) ***
.165 (0.066) *
.362 (0.059) ***
.541
(0.0
47) *
** .403 (0.074) ***
.152 (0.
090)
.165 (0.054) **
.229 (0.065) ***
Fig. 1 Model of eco-fashion consumption intention (***p < 0.001, **p < 0.01, *p < 0.05;dotted line indicates insignificant path; standardized estimates with standard errors in parentheses)
Application of Motivation-Opportunity-Ability Theory … 133
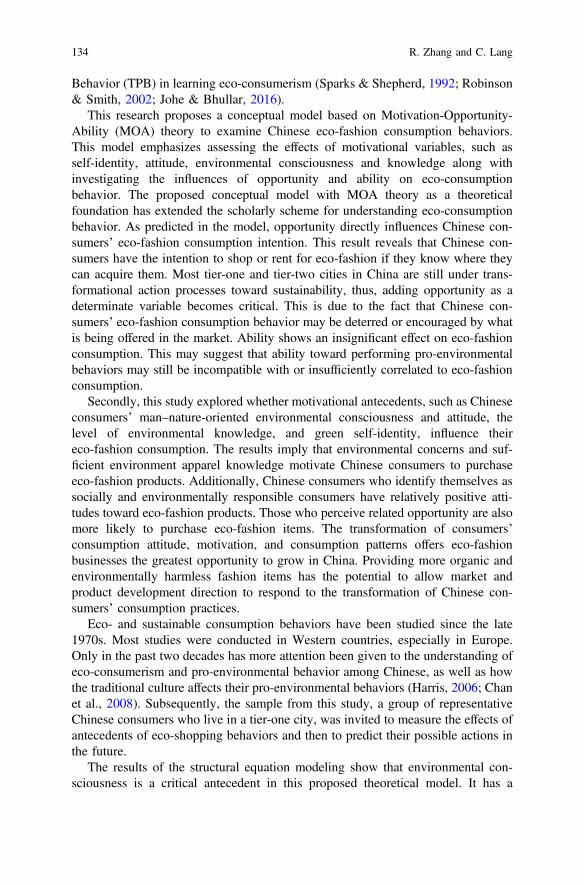
Behavior (TPB) in learning eco-consumerism (Sparks & Shepherd, 1992; Robinson& Smith, 2002; Johe & Bhullar, 2016).
This research proposes a conceptual model based on Motivation-Opportunity-Ability (MOA) theory to examine Chinese eco-fashion consumption behaviors.This model emphasizes assessing the effects of motivational variables, such asself-identity, attitude, environmental consciousness and knowledge along withinvestigating the influences of opportunity and ability on eco-consumptionbehavior. The proposed conceptual model with MOA theory as a theoreticalfoundation has extended the scholarly scheme for understanding eco-consumptionbehavior. As predicted in the model, opportunity directly influences Chinese con-sumers’ eco-fashion consumption intention. This result reveals that Chinese con-sumers have the intention to shop or rent for eco-fashion if they know where theycan acquire them. Most tier-one and tier-two cities in China are still under trans-formational action processes toward sustainability, thus, adding opportunity as adeterminate variable becomes critical. This is due to the fact that Chinese con-sumers’ eco-fashion consumption behavior may be deterred or encouraged by whatis being offered in the market. Ability shows an insignificant effect on eco-fashionconsumption. This may suggest that ability toward performing pro-environmentalbehaviors may still be incompatible with or insufficiently correlated to eco-fashionconsumption.
Secondly, this study explored whether motivational antecedents, such as Chineseconsumers’ man–nature-oriented environmental consciousness and attitude, thelevel of environmental knowledge, and green self-identity, influence theireco-fashion consumption. The results imply that environmental concerns and suf-ficient environment apparel knowledge motivate Chinese consumers to purchaseeco-fashion products. Additionally, Chinese consumers who identify themselves associally and environmentally responsible consumers have relatively positive atti-tudes toward eco-fashion products. Those who perceive related opportunity are alsomore likely to purchase eco-fashion items. The transformation of consumers’consumption attitude, motivation, and consumption patterns offers eco-fashionbusinesses the greatest opportunity to grow in China. Providing more organic andenvironmentally harmless fashion items has the potential to allow market andproduct development direction to respond to the transformation of Chinese con-sumers’ consumption practices.
Eco- and sustainable consumption behaviors have been studied since the late1970s. Most studies were conducted in Western countries, especially in Europe.Only in the past two decades has more attention been given to the understanding ofeco-consumerism and pro-environmental behavior among Chinese, as well as howthe traditional culture affects their pro-environmental behaviors (Harris, 2006; Chanet al., 2008). Subsequently, the sample from this study, a group of representativeChinese consumers who live in a tier-one city, was invited to measure the effects ofantecedents of eco-shopping behaviors and then to predict their possible actions inthe future.
The results of the structural equation modeling show that environmental con-sciousness is a critical antecedent in this proposed theoretical model. It has a
134 R. Zhang and C. Lang
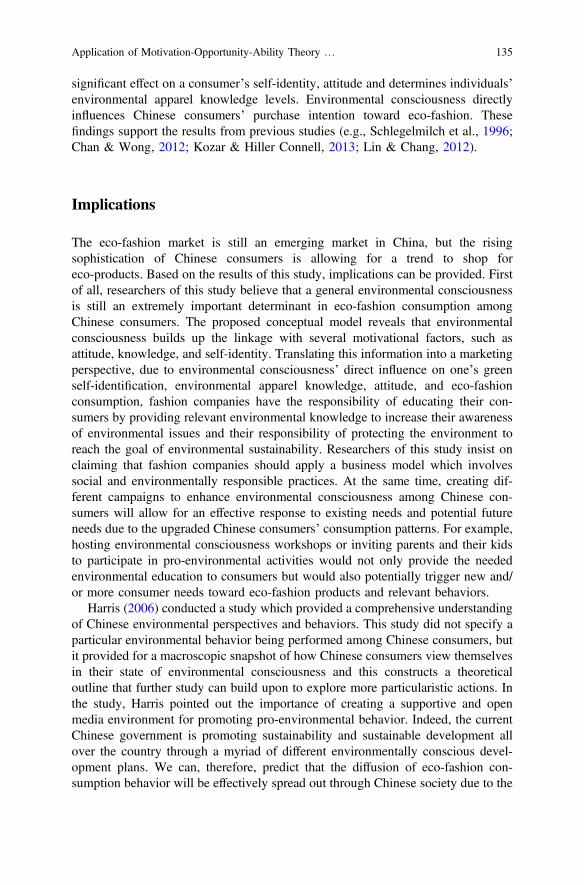
significant effect on a consumer’s self-identity, attitude and determines individuals’environmental apparel knowledge levels. Environmental consciousness directlyinfluences Chinese consumers’ purchase intention toward eco-fashion. Thesefindings support the results from previous studies (e.g., Schlegelmilch et al., 1996;Chan & Wong, 2012; Kozar & Hiller Connell, 2013; Lin & Chang, 2012).
Implications
The eco-fashion market is still an emerging market in China, but the risingsophistication of Chinese consumers is allowing for a trend to shop foreco-products. Based on the results of this study, implications can be provided. Firstof all, researchers of this study believe that a general environmental consciousnessis still an extremely important determinant in eco-fashion consumption amongChinese consumers. The proposed conceptual model reveals that environmentalconsciousness builds up the linkage with several motivational factors, such asattitude, knowledge, and self-identity. Translating this information into a marketingperspective, due to environmental consciousness’ direct influence on one’s greenself-identification, environmental apparel knowledge, attitude, and eco-fashionconsumption, fashion companies have the responsibility of educating their con-sumers by providing relevant environmental knowledge to increase their awarenessof environmental issues and their responsibility of protecting the environment toreach the goal of environmental sustainability. Researchers of this study insist onclaiming that fashion companies should apply a business model which involvessocial and environmentally responsible practices. At the same time, creating dif-ferent campaigns to enhance environmental consciousness among Chinese con-sumers will allow for an effective response to existing needs and potential futureneeds due to the upgraded Chinese consumers’ consumption patterns. For example,hosting environmental consciousness workshops or inviting parents and their kidsto participate in pro-environmental activities would not only provide the neededenvironmental education to consumers but would also potentially trigger new and/or more consumer needs toward eco-fashion products and relevant behaviors.
Harris (2006) conducted a study which provided a comprehensive understandingof Chinese environmental perspectives and behaviors. This study did not specify aparticular environmental behavior being performed among Chinese consumers, butit provided for a macroscopic snapshot of how Chinese consumers view themselvesin their state of environmental consciousness and this constructs a theoreticaloutline that further study can build upon to explore more particularistic actions. Inthe study, Harris pointed out the importance of creating a supportive and openmedia environment for promoting pro-environmental behavior. Indeed, the currentChinese government is promoting sustainability and sustainable development allover the country through a myriad of different environmentally conscious devel-opment plans. We can, therefore, predict that the diffusion of eco-fashion con-sumption behavior will be effectively spread out through Chinese society due to the
Application of Motivation-Opportunity-Ability Theory … 135
consistency with the government’s current sustainability goals. The vigorouspotential market and the supportive political environment in China are providinggreat business opportunities for fashion companies who want to expand theireco-fashion lines and products. In addition, for marketers and fashion companies, itwould be more effective to promote eco-fashion products through content mar-keting. For example, they could employ educational storytelling strategies: Tellconsumers why they need to protect the environment and what possible positiveresults could be brought about by adopting these practices.
Even though the young generations, particularly Generation Y (born from 1980to 1995) and Z (born from 1995), are performing with a relatively highself-awareness factor and individualism, they still possess traditional Chinese col-lectivism and cultural orientation rooted inside of them since they were raised byboomers (born from 1946 to 1960) and Generation X (born from 1961 to 1979whose lifestyles and personalities were heavily influenced by the Chinesemacro-social/political environment in 1950s–1980s. This means that the dominantshopping powers in China’s current society (Gen X, Y, and Z) are still greatlyinfluenced by collective selections. In another word, peers and community influ-ences still play a major role in their decision-making process. In addition to pro-viding continuing education regarding environmental knowledge to consumers, oneof the most critical strategies for stimulating more eco-fashion consumption anddeveloping a sustainable eco-environment is to place socially responsible pressureon social elites, such as celebrities, opinion leaders, decision-makers, pop stars, etc.,due to the fact that consumers’ decisions are often guided by those authorities.According to the diffusion of innovation theory, once the innovation of eco-fashionconsumption is in place and has reached 20% of the population (innovators andearly adopters), further innovation will rapidly occur involving the rest of thepopulation (the majority, late adopters, and the laggards).
Another implication for the fashion industry and markets is that the currentconceptual model shows that eco-fashion consumption can be achieved throughseveral internal and external factors which companies may employ to trigger cus-tomers’ needs. Some internal factors, such as consumers’ environmental con-sciousness, self-identity, knowledge, and attitude, positively and directly influenceeco-fashion consumption. Therefore, theoretically speaking, eco-fashion con-sumption may be achieved once an individual’s environmental cognitive level,determined by those internal factors, reaches a certain point. A market and itsconsumers have a push and pull relationship. In another word, a market influencesconsumers by creating different potential needs which consumers are initially notaware of. Meanwhile, consumers also have power over markets due to the fact thatconsumer preferences vary and can be fast changing. So for fashion companies, it isimportant to create various and appealing campaigns to promote eco-fashion con-sumption, while at the same time facilitating sustainable development in the fashionindustry to maintain their potential needs.
136 R. Zhang and C. Lang
Conclusion
This study investigated motivational factors, including environmental conscious-ness, self-identity, attitude, and environmental apparel knowledge, and two externalfactors, including opportunity and ability’s effect on eco-fashion consumption.Results show that with the exception of ability, all motivational factors andopportunity significantly and directly influence eco-fashion consumption.Participants in this study have sufficient ability in performing pro-environmentalbehaviors, such as reading the labeling on product packages to check if the contentsare environmentally friendly, minimizing water use to help preserve fresh water andhaving the habit of reducing or optimizing the use of electrical devices to saveelectricity. Pro-environmental behavioral ability does not directly lead Chineseconsumers to perform eco-fashion consumption behaviors. It is not until Chineseconsumers are aware of the availability of eco-fashion products or they have solidinformation about where to acquire these products that eco-fashion consumption isfully adopted.
It is interesting to note that pro-environmental behavioral ability did not have asignificant effect on eco-fashion consumption in either direct or indirect way. Thismay suggest that eco-fashion consumption is still a new shopping pattern amongChinese consumers. The ability to perform pro-environmental behaviors is com-patible with eco-fashion consumption or is insufficiently linked to buying clothingthat is durable and/or organic and/or safe to the environment.
Limitations and Suggestions for Further Study
There are several limitations that should be addressed in future research. Eventhough the sample size (n = 401) of this study was sufficient for conductingstructural equation modeling as well as other statistical analysis methods, a con-venience sampling, instead of a random selection, was used through an onlinesurvey system. Participants were recruited through email survey links and a socialmedia app. All participants are current residents living in tier-one cities. This mayresult in a homogenous sample group. For further studies, recruiting randomsamples from cites in different tiers, such as consumers from less developedregions, may provide for a more comprehensive understanding of how Chineseeco-consumerism, as a whole, optimally functions. The boundless potential pos-sibilities and diversity in the Chinese eco-fashion market are still insufficientlystudied. A further in-depth study into consumption behaviors among cities in dif-ferent tiers in China may prove to be valuable. Another limitation of this study isthe dependent variable that was employed. Only eco-fashion consumption intentionwas measured in the proposed conceptual model. Consumers’ actual eco-fashionconsumption behaviors may also be tested, along with internal and external factorsto increase the external validity of this study.
Application of Motivation-Opportunity-Ability Theory … 137
Further studies may benefit by examining which moral principle is employed,teleology or deontology, which Chinese consumers use when they are facing ethicalsituations. Chan et al. (2008) found that Chinese consumers were highly influencedby teleological considerations when engaged in moral obligations. For example, intheir study, one of the Chinese consumer’s pro-environmental behaviors is that theybring their own shopping bags when visiting markets and this behavior was sig-nificantly influenced by teleological evaluation, rather than ethical judgment.However, the cognitive decision-making process of deciding to bring consumersown shopping bags might be different from shopping for an eco-fashion product.Therefore, researchers who are interested in this topic and are using collectivism-dominated consumer cohorts as target research groups may want to examine whichmoral principle would better describe eco-fashion consumption behaviors.
References
Anderson, J. C., & Gerbing, D. W. (1988). Structural equation modeling in practice: A review andrecommended two-step approach. Psychooigical Bulletin, 103(3), 411–423.
Argote, L., McEvily, B., & Reagans, R. (2003). Managing knowledge in organizations: Anintegrative framework and review of emerging rhemes. Management Science, 49(4), 571–582.
Barbarossa, C., Beckmann, S. C., de Pelsmacker, P., Moons, I., & Gwozdz, W. (2015).A self-identity based model of electric car adoption intention: A cross-cultural comparativestudy. Journal of Environmental Psychology, 42, 149–160.
Brodwin, D. (March 15, 2015). Unsustainable America. Retrieved from http://www.usnews.com/opinion/economic-intelligence/2015/03/23/china-and-india-ready-to-lead-in-consumer-sustainability.
Carrigan, M., & Attalla, A. (2001). The myth of the ethical consumer—do ethics matter inpurchase behaviour? Journal of Consumer Marketing, 18(7), 560–578.
Chan, R. Y. K. (1999). Environmental attitudes and behavior of consumers in China: Surveyfindings and implications. Journal of International Consumer Marketing, 11(4), 25–51.
Chan, R. Y. K. (2000). An emerging green market in China: Myth or reality? Business Horizons,2, 55–60.
Chan, R. Y. K., & Lau, L. B. Y. (2002). Explaining green purchasing behavior: A cross-culturalstudy on American and Chinese consumers. Journal of International Consumer Marketing,14(2/3), 9–41.
Chan, T. Y., & Wong, C. W. Y. (2012). The consumption side of sustainable fashion supply chainUnderstanding fashion consumer eco-fashion consumption decision. Journal of FashionMarketing and Management, 16(2), 193–215.
Chan, R. Y. K., Wong, Y. H., & Leung, T. K. P. (2008). Applying ethical concepts to the study of“green” consumer behavior: An analysis of Chinese consumers’ intentions to bring their ownshopping bags. Journal of Business Ethics, 79(4), 469–481.
Chang, C.-T. (2012). Are guilt appeals a panacea in green advertising? The right formula of issueproximity and enviornmental consciousness. International Journal of Advertising, 31(4), 741–771.
Claudio, L. (2007). Waste couture: Environmental impact of the clothing industry. EnvironmentalHealth Perspectives, 115(9), 449–454.
Cordano, M., Welcomer, S. A., & Scherer, R. F. (2003). An analysis of the predictive validity ofthe new ecological paradigm scale. Journal of Environmental Education, 34(3), 22–28.
Cortina, J. M. (1993). What is coefficient alpha? An examination of theory and applications.Journal of Applied Psychology, 78(1), 98–104.
138 R. Zhang and C. Lang
Cummings, L. L., & Schwab, D. P. (1973). Performance in organizations: Determinants &Appraisal. Glenview, III: Scott, Foresman.
Dunlap, R., Van Liere, K., Mertig, A., & Jones, R. E. (2000). Measuring endorsement of the newecological paradigm: A revised NEP scale. Journal of Social Issues, 56, 425–442.
Dunlap, R. E., & Jones, R. E. (2002). Environmental concern: Conceptual and measurementissues. CT: Greenwood Press.
Fornell, C., & Larcker, D. F. (1981). Evaluating structural equation models with unobservablevariables and measurement error. Journal of Marketing Research, 18(1), 39–50.
Gam, H. J. (2011). Are fashion-conscious consumers more likely to adopt eco-friendly clothing?Journal of Fashion Marketing and Management, 15(2), 78–193.
Graberg, D., & Holmberg, S. (1990). The intention-behavior relationship among U.S. and SwedishVoters. Social Psychology Quarterly, 53(1), 44–54.
Gruen, T. W., Osmonbekov, T., & Czaplewski, A. J. (2006). eWOM: The impact ofcustomer-to-customer online know-how exchange on customer value and loyalty. Journal ofBusiness Research, 59(4), 449–456.
Harris, P. G. (2006). Environmental perspectives and behavior in China. Environment andbehavior, 38(1), 5–21.
Hiller Connell, K. Y., & Kozar, J. M. (2012). Social normative influence: An exploratory studyinvestigating its effectiveness in increasing engagement in sustainable apparel-purchasingbehaviors. Journal of Global Fashion Market, 3(4), 172–179.
Hoyer, W. D., & MacInnis, D. J. (1997). Consumer behavior. Boston: Houghton MifflinCompany.
Hu, L.-T., & Bentler, P. M. (1999). Cutoff criteria for fit indexes in covariance structure analysis:Conventional criteria versus new alternatives. Structural Equation Modeling, 6(1), 1–31.
Hunt, S. D., & Vitell, S. (1986). A general theory of marketing ethics. Journal of Macromarketing,6(1), 5–16.
Hustvedt, G., & Dickson, M. A. (2009). Consumer likelihood of purchasing organic cottonapparel: Influences of attitudes and self-identity. Journal of Fashion Marketing andManagement, 13(1), 49–65.
Jackson, D. L., Gillaspy, J. A. J., & Purc-Stephenson, R. (2009). Reporting practices inconfirmatory factor analysis: An overview and some recommendations. PsychologicalMethods, 14(1), 6–23.
Joergens, C. (2006). Ethical fashion: Myth or future trend? Journal of Fashion Marketing andManagement, 10, 360–371.
Johe, M. H., & Bhullar, N. (2016). To buy or not to buy: The roles of self-identity, attitudes,perceived behavioral control and norms in organic consumerism. Ecological Economics, 128,99–105.
Kang, J., Liu, C., & Kim, S.-H. (2013). Environmentally sustainable textile and apparelconsumption: The role of consumer knowledge, percieved consumer effectiveness andperceived personal relevance. International Journal of Consumer Studies, 37, 442–452.
Kim, H.-S., & Damhorst, M. L. (1998). Environmental concern and apparel consumption.Clothing and Textiles Research Journal, 16(3), 126–133.
Kim, H.-S., & Damhorst, M. L. (1999). Environmental attitude and commitment in relation to admessage credibility. Journal of Fashion Marketing and Management, 3(1), 18–30.
Kim, S., Littrell, M. A., & Paff Ogle, J. L. (1999). The relative important of social responsibility asa predictor of purchase intentions for clothing. Journal of Fashion Marketing andManagement, 3(3), 207–218.
Kline, R. B. (2010). Principles and practice of structural equation modeling (3rd ed.). New York:The Guilford Press.
Kluckhohn, F. R., & Strodtbeck, F. L. (1961). Variations in value orientations. Evanston, Illinois:Row, Peterson.
Kozar, J. M., & Hiller Connell, K. Y. (2013). Socially and environmentally responsible apparelconsumption: Knowledge, attitudes, and behaviors. Social Responsibility Journal, 9(2).1747-1117.
Application of Motivation-Opportunity-Ability Theory … 139
Lin, Y.-C., & Chang, C. A. (2012). Double standard: The role of environmental consciousness ingreen product usage. Journal of Marketing, 76, 125–134.
MacInnis, D. J., & Jaworski, B. (1989). Information processing from advertisements: Toward anintegrative framework. Journal of Marketing, 53, 1–23.
MacInnis, D. J., Moorman, C., & Jaworski, B. J. (1991). Enhancing and measuring consumers’motivation, opportunity, and ability to process brand information from ads. Journal ofMarketing, 55(4), 32–53.
Mannetti, L., Pierro, A., & Livi, S. (2004). Recycling: Planned and self-expressive behaviour.Journal of Environmental Psychology, 24, 227–236.
Niinimäki, K. (2010). Eco-clothing, consumer identity, and ideology. Journal of SustainableDevelopment, 18(3), 150–162.
Oliver, J. D., & Lee, S. H. (2010). Hybrid car purchase intentions: A cross-cultural analysis.Journal of Consumer Marketing, 27(2), 96–103.
Ochoa, L. M. C. (2011). Will ‘eco-fashion’ take off? A survey of potential customers of organiccotton clothes in London. Retrieved from http://publicaciones.eafit.edu.co/index.php/administer/article/view/188#.U5JZMdhmSbU.
Park, C. W., & Mittal, B. (1985). A theory of involvement in consumer behavior: Problems andissues. In J. N. Seth (Ed.), Research in consumer behavior (Vol. 1, pp. 201–231). Greenwich:JAI Press.
Philippe, A., & Ngobo, P. V. (1999). Assessment of consumer knowledge and its consequences: Amulti-component approach. Advances in Consumer Research, 26, 569–575.
Ramasamy, B., & Yeung, M. (2009). Chinese consumers’ perception of corporate socialresponsibility (CSR). Journal of Business Ethics, 88(1), 119–132.
Robinson, R., & Smith, C. (2002). Psychosocial and demographic variables associated withconsumer intention to purchase sustainably produced foods as defined by the Midwest foodalliance. Journal of Nutrition Education and Behavior, 34(6), 316–325.
Schlegelmilch, B. B., Bohlen, G. M., & Diamantopoulos, A. (1996). The link between greenpurchasing decisions and measures of environmental consciousness. European Journal ofMarketing, 30(5), 35–55. https://doi.org/10.1108/03090569610118740.
Siemsen, E., Roth, A. V., & Balasubramanian, S. (2008). How motivation, opportunity, and abilitydrive knowledge sharing: The constraining-factor model. Journal of Operations Management,26(3), 426–445.
Stets, J. E., & Biga, C. F. (2003). Bringing identity theory into environmental sociology.Sociological Theory, 21(4), 398–423.
Sirgy, M. J. (1986). Self-Congruity: Toward a Theory of Personality and Cybernetics. OraegerPublisher: Greenwood Publishing Group.
Shaw, D., Shiu, E., & Clarke, I. (2000). The contribution of ethical obligation and self-identity tothe theory of planned behavior: An exploration of ethical consumers. Journal of MarketingManagement, 16(8), 879–894.
Shaw, D., & Shiu, E. (2003). Ethics in consumer choice: A multivariate modeling approach.European Journal of Marketing, 37(10), 1485–1498.
Shen, B., Wang, Y., Lo, C. K. Y., & Shum, M. (2012). The impact of ethical fashion on consumerpurchase behavior. Journal of Fashion Marketing and Management, 16(2), 234–245.
Sparks, P., & Guthrie, C. A. (1998). Self-identify and the theory of planned behavior: A usefuladdition or A unhelp artifice. Journal of Applied Social Psychology, 28(15), 1393–1410.
Sparks, P., & Shepherd, R. (1992). Self-identity and the theory of planned behavior: Assessing therole of identification with “green consumerism”. Social Psychology Quarterly, 55, 388–399.
Whitmarsh, L., & O’Neill, S. (2010). Green identity, green living? The role of pro-environmentalself-identity in determining consistency across diverse pro-environmental behaviors. Journal ofEnvironmental Psychology, 30(4), 335–344.
Xiao, G., & Kim, J.-O. (2009). The investigation of Chinese consumer values, consumptionvalues, life satisfaction, and consumption behaviors. Psychology & Marketing, 26(7), 610–624.https://doi.org/10.1002/mar.20291.
140 R. Zhang and C. Lang
Xue, H. Y., Zhang, X. J., & Wang, Y. Q. (2014). Research on the disposal strategy of wastetextiles. Applied Mechanics and Materials, 522, 817–820.
Yau, O. H. M. (1988). Chinese cultural values: Their dimensions and marketing implications.European Journal of Marketing, 22(5), 44–57.
Ye, Q. (2000). Green marketing. Wuhan: Hubei People’s Publication.Young, W., Hwang, K., McDonald, S., & Oates, C. J. (2010). Sustainable consumption: Green
consumer behavior when purchasing products. Sustainable Development, 18(1), 20–31.Zelezny, L. C., & Schultz, P. W. (2000). Promoting environmentalism. Journal of Social Issues,
56(3), 365–371.Zhang, R. (2014). Sustainable apparel consumption: Scale development and validation
(Unpublished doctoral dissertation). Oregon State University, Corvallis, OR.Zheng, Y. (2010). Association analysis on pro-environmental behaviors and environmental
consciousness in main cities of East Asia. Behaviormetrika, 37(1), 55–69.
Application of Motivation-Opportunity-Ability Theory … 141

Part IVFashion Branding in China
Licensing or not Licensing? A Pilot Studyon Examining the Apparel Extensionof Auto Brands Ford and Jeep in ChinaMarket
Chuanlan Liu, Yao Wei and Langchao Zhang
Abstract This study intends to shed some light on understanding how consumersevaluate and accept global brands’ apparel extension in the world largest consumermarket to provide practical directions for apparel manufactures to make licensingdecisions. Specifically, this study applied the brand concept mapping(BCM) approach to evaluate an auto brand’s fashion clothing extension. Snowballsampling was used to collect data in major cities in China. Sixty participants wererecruited and divided into four groups to collect responses toward two auto brandsand the two auto brands’ apparel extensions, respectively. Consensus maps weregenerated based on individual maps. The comparison of BCMs showed that strongbrand associations from the parent brand transferred well to the apparel extension,even when the “fit” between the parent brand and its apparel extension was poor. Inthe category of apparel, country of origin can be leveraged for manufacturelicensees to compete for a market share. However, brand personality plays a moreimportant role in consumers’ acceptance of such a long-distance brand stretching.In addition, the level of individual consumer’s brand engagement can be a goodindicator for identifying target customer segment.
Keywords Licensing � Brand extension � Brand concept mapping (BCM)Auto brand extension � Brand engagement
Introduction
Because of marketers’ aggressive branding efforts, today’s consumers are bom-barded daily with numerous ads (Zhuang, Wang, Zhou, & Zhou, 2008). To avoidthe high cost and difficulty of introducing a new product to the market, many firms
C. Liu (&) � Y. Wei � L. ZhangLouisiana State University, 145 Human Ecology Building, Baton Rouge, USAe-mail: [email protected]
© Springer Nature Singapore Pte Ltd. 2018Y. Xu et al. (eds.), Chinese Consumers and the Fashion Market, Springer Seriesin Fashion Business, https://doi.org/10.1007/978-981-10-8429-4_7
145
choose to take advantage of established brands to launch new products lines orcategories (Aaker & Keller, 1990). One such approach is brand extension, which isdefined as “using a current brand name to enter a completely different productclass” (Aaker & Keller, 1990, p. 27). As stated by Morein (1975), leveraging awell-established brand name could reduce the risk of product failure significantly,as consumers are already familiar with the brand and have gained enough knowl-edge about it for decision making. Brand extension has become a marketingstrategy used widely to maximize firm success by gaining a larger market share, at asignificantly lower cost.
While brand extensions and licensing are used to be considered as two distinctbranding strategies, extant literature suggests that licensing be treated as an “ex-ternal” brand extension (Walsh, Rhenwrick, Williams, & Waldburger, 2014). Brandlicensing refers to a process of creating and managing contracts for a brand owner(a licensor) to give another firm (a licensee) the rights to produce and sell a productwith the brand on it (Jayachandran, Kaufman, Kumar, & Hewett, 2013). Manyautomobile and machinery brands have been involved actively in brand licensing.For example, both Jeep and Ferrari have launched an infant stroller line throughlicensing. Caterpillar, a brand of earthmoving equipment, has gained huge successby creating a line of CAT work boots and expanding to a whole casual/workfootwear collection in markets in more than 150 countries. John Deere, anotherbrand of machinery, now offers a selection of goods ranging from toys, strollers,and travel mugs to clothing, accessories, and iPhone cases.
The economic downturn in particular has provoked more automobile brands toseek licensing and brand extension opportunities. Meanwhile, Chinese apparelmanufacturers have been working as contractors for many global brands developedin North America and Europe for the last three decades. With China’s economicgrowth gradually going down, cost of production increasing, Chinese apparelindustry has to upgrade and move more toward the downstream of apparel supplychain with more focus on the domestic consumer market. Brand is the coreselection factor for consumers to make choices on apparel. Some of the manu-factures take a shortcut for branding their products by obtaining a license from aglobal brand. Taking the advantages of high brand awareness of global brands andlow consumer brand knowledge among Chinese consumers, many licensed globalbrands’ fashion extension succeeded in China’s fashion market. However, with thediffusion of information technology and globalization of Chinese consumers, thelandscape of branding products through licensing has been changing. Just having abrand name or label is far from successfully attracting and maintaining customers. Itis critical to understand how to develop products which can better leverage the paidbrand license.
Consumers develop attitudes toward a certain brand based on their previousexperiences with the brand (Priluck & Till, 2010). These experiences often form anetwork structure that consists of linked fragments of information, such as productpackaging, slogan, and advertising. Hence, understanding attitudes toward a brandand brand extension requires identifying the underlying structure of brand associ-ations. The existing techniques available for eliciting consumers’ brand associations
146 C. Liu et al.
include both qualitative and quantitative approaches, such as collages, focusgroups, and brand personality inventories (John, Loken, Kim, & Monga, 2006).However, these existing techniques lack the ability to show the structure of theassociation network. The “brand concept map” (BCM) is a relatively new method,which provides a map of the association networks that consumers form in theirminds (John et al., 2006). It pinpoints the most important associations, identifieshow consumers connect them to the brand, and reveals the structure of thoseinterconnections. By obtaining a BCM from each consumer and then aggregatingthe individual data to produce a consensus map, a clear picture of how consumersperceive a brand and its extension can be obtained to facilitate brand decisions.
The fashion industry is readily associated with branding. Given the nature andcompetitiveness of fashion markets, many researchers have discussed the need touse symbolic cues to create distinctive brand images and associations in this par-ticular industry (Carroll, 2009; Susan & Richard, 1998). Research has suggestedthat the key factors, in the success of brand extension, are the fit between the parentbrand and the extension, and how well the brand equity of the parent brand transfersto the extension (Hem, De Chernatony, & Iversen, 2003; Völckner & Sattler, 2006).However, many successful fashion brand extensions seem to have a relatively weakfit, with respect to product features, e.g., Caterpillar (CAT) brand boots, Jeep brandapparel, and so forth. The transfer of favorable brand associations may play a moreimportant role in the success of a new category. However, there has been littleresearch that explores how favorable parent brand associations are transferred toextensions and affect consumers’ acceptance of brand extensions. Applying BCMto brand extension studies in fashion categories will help us understand consumers’perceptions of apparel and fashion extensions. It will also help track how and whichassociations of the parent brand are transferred to facilitate the success ofextensions.
Sprott, Czellar, and Spangenberg (2009) proposed the concept of brandengagement in self-concept (BESC), which is defined as, “an individual differencerepresenting consumers’ propensity to include important brands as part of how theyview themselves” (p. 92). According to their research, a higher BESC level can leadto better brand recall, more brand awareness and greater favorable brand attitudes.Considering the effect of BESC on consumers’ evaluations of brand extensions, it isnecessary to examine its effect on consumers’ formation of brand associations andtheir evaluations of brand extension.
Although BCM has already been introduced in general fashion brandingresearch (Shin, 2011), it has not yet used to evaluate brand extension, particularly infashion clothing categories. Our study intended to shed some light on understandingconsumer evaluations of fashion clothing brand extension using the BCM approachto provide direction for manufactures to made licensing decision. Specifically, theobjectives were to (1) identify consumer associations with Ford and Jeep auto-mobiles and apparel using BCM; (2) categorize those associations; and (3) comparethe brand associations and brand images of Ford and Jeep apparel in the Chinesemarket.
Licensing or not Licensing? A Pilot Study on Examining … 147
Ford and Jeep apparel were selected because they are both extensions of iconicAmerican automobile brands. In 2002, an apparel line that targets male consumersfrom 18 to 45 years old was launched in China as an extension to the automobilebrand of Jeep. In the last 10 years, Jeep apparel has experienced great success inChina. Ford apparel is a relatively new brand compared to Jeep. Ford licensed itsapparel and accessory lines in China in 2012. Ford menswear also targets maleconsumers in the same age range as Jeep, so comparisons between a new brandextension and a successful extension will be useful for business practitioners andresearchers.
Literature Review
Brand Extension
Previous research has demonstrated that the “fit” between the parent brand and theextension and the perceived quality of the parent brand are crucial factors in thesuccess of extensions (Bottomley & Holden, 2001). According to Völckner andSattler (2006), approximately 15 determinants of the success of extensions weresignificant (p < 0.10) in at least one empirical study. Previous research has alsofound that the psychological process consumers experience in evaluating anextension plays an important role (Klink & Smith, 2001). According to Martinez(2011), two psychological paths have been used to explain consumers’ decisionprocess: categorical and piecemeal evaluation. As stated by Fiske (1982), “cate-gorical evaluation” refers to the situation in which individuals evaluate a newinstance by comparing the new information with that stored in memory. In contrast,“piecemeal evaluation” (Fiske, 1982; Martinez, 2011) is based on specific attributes(Bristol, 1996). These two evaluation processes are not exclusive, as consumersmight activate a categorical evaluation process when they identify a good fitbetween the parent brand and extended product categories (Boush & Loken, 1991).Meanwhile, knowledge and attitudes associated with the parent brand are trans-ferred to the extension (Martinez, 2011; Romeo, 1991). However, when the fit ispoor, a piecemeal process is developed as consumers evaluate the extension byassessing its individual attributes (Fiske & Pavelchak, 1986). Hence, a two-stageprocess is used commonly as consumers go through the evaluation process. At thefirst stage, they try to transfer existing associations and attitudes to the extension toassist the evaluation; if unsuccessful, a second stage will be initiated in which ananalytical evaluation is established (Fiske & Pavelchak, 1986; Martinez, 2011).
The decomposition of consumers’ psychological processes has revealed theimportance of brand associations in the success of brand extensions. Consumers’evaluation process could be seen as a brand association transfer process. Brands thathold strong, favorable, and unique brand associations that transfer well from theparent brand to the extension are more likely to extend successfully (Keller, 1993).
148 C. Liu et al.
Particularly, when the fit is poor, emphasizing strong brand associations becomesmore important, as the similar characteristics, personalities, and features may helpshift consumers’ attention from the poor fit to shared associations, and thus smooththe acceptance process. Leveraging strong, favorable, and unique brand associa-tions could successfully transfer intangible components of the brand stored in theconsumers’ mind to the new products.
Brand Associations and Brand Association Categories
According to Dew and Kwon (2010), a consumer’s perceptions about a brand existin his/her mind as a brand association network that reflects the brand image. Asstated by Aaker (1991), brand association refers to anything that is linked to thebrand in a consumer’s mind. It could be any opinion, though, impression orexperience consumers hold about a particular brand (Aaker, 1991; Keller, 1993).These associations vary in form. They may be tangible or intangible, reflectingproduct-related, functional associations, or non-product-related, experiential asso-ciations (Shocker, Srivastava, & Ruekert, 1994). Aaker (1991) also discussedclassification and dimensionality of brand associations and categorized 11 dimen-sions of brand associations. Korchia, 1999 (p. 15) examined the weakness ofexisting classifications further and proposed 15 categories of associations includingthe company, other organizations, brand personality, celebrities and events, typicalusers, typical usage situations, product category, price, communication, distribu-tion, product-related attributes, functional benefits, experiential benefits, symbolicbenefits, and attitudes. Compared to previous brand association dimensions,Korchia’s 15 categories are more specific and better suited for the fashion industry(Shin, 2011).
Most existing research explains the formation and operation of brand associationnetworks using human associative memory (HAM) theory derived from cognitivepsychology (Anderson & Bower, 1980; French & Smith, 2013; Wyer, Budesheim,Lambert, & Swan, 1994). According to HAM theory, brand knowledge is stored ina consumer’s mind as small pieces of information connected to each other to form acomplicated brand information network (Anderson, 1983). The brand recall processis an “activation-spreading” process. When one information node of the brand isactivated, it evokes another node linked to it and “spreads” to all the nodes in thenetwork to complete the brand recall (Anderson, 1983). According to Keller (1993),associations are different in terms of how relevant they are to consumers, how wellthey are connected to the brand, and how unique they are compared to competitors’associations.
Licensing or not Licensing? A Pilot Study on Examining … 149
Measuring Brand Associations
Keller (2008) suggested that qualitative techniques, such as free association, can beused to identify possible associations. The free association method asks an indi-vidual or small group of respondents to describe what comes to mind when theythink of a brand. Normally, it is used as a first step by which researchers ormarketers determine a basic idea of the range of possible associations and thefavorability, strength, and uniqueness of the associations identified. Keller (2008)also introduced other useful techniques, such as projective techniques and theZaltman Metaphor Elicitation Technique (ZMET). Projective techniques (Levy,1981, 1985) may involve asking respondents to complete sentences or interpretpictures about a brand to reveal their real feelings and thoughts on certain aspects ofthe brand. The method is largely oriented toward experience and feelings. It focusesprimarily on brand users, and their decision processes and perspectives. The ZMETis a more complicated technique that uncovers the association networks in con-sumers’ minds with a series of qualitative methods, such as taking photos, col-lecting pictures, drawing images, and giving interviews. Another example,perceptual mapping (Henderson, Iacobucci, & Calder, 1998), is a technique thatmakes pairwise comparisons of brand attributes. Respondents are provided with aset of brands and asked to compare all given attributes of every two brands.
Although the techniques discussed above elicit brand associations from differentperspectives, they all have obvious weaknesses. Most of them cannot identify therelationships among associations. Some techniques, such as ZMET and perceptualmapping, are very labor-intensive.
Brand Concept Mapping (BCM)
BCM is a standardized brand mapping technique that identifies the structure ofconsumers’ brand association networks by eliciting an aggregated BCM from asample of individually-produced maps. Although the procedure for data collectionand map aggregation sounds similar to the other mapping techniques describedabove, BCM is less labor-intensive, easier to administer and more accessible.According to John et al. (2006), BCM not only identifies important brand associ-ations but also conveys the connections among associations. Further, it may be usedon large samples or to compare consumer segments. Moreover, it does not requirespecially trained interviewers or complex analytical techniques.
BCM is a three-stage mapping technique. The first stage is elicitation in whichsalient associations are selected based on a set of criteria. The second stage ismapping, in which participants are asked to create a map. The third stage isaggregation, in which a consensus map is created based on aggregation rules.Table 1 shows the aggregation rules (John et al., 2006; Shin, 2011). Frequencycounts are the main determinant of whether or not an association is included in the
150 C. Liu et al.
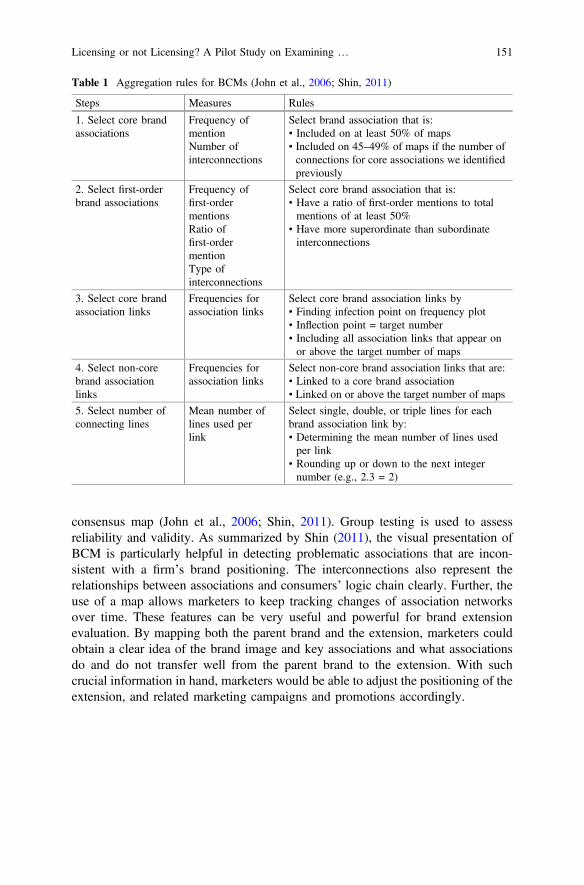
consensus map (John et al., 2006; Shin, 2011). Group testing is used to assessreliability and validity. As summarized by Shin (2011), the visual presentation ofBCM is particularly helpful in detecting problematic associations that are incon-sistent with a firm’s brand positioning. The interconnections also represent therelationships between associations and consumers’ logic chain clearly. Further, theuse of a map allows marketers to keep tracking changes of association networksover time. These features can be very useful and powerful for brand extensionevaluation. By mapping both the parent brand and the extension, marketers couldobtain a clear idea of the brand image and key associations and what associationsdo and do not transfer well from the parent brand to the extension. With suchcrucial information in hand, marketers would be able to adjust the positioning of theextension, and related marketing campaigns and promotions accordingly.
Table 1 Aggregation rules for BCMs (John et al., 2006; Shin, 2011)
Steps Measures Rules
1. Select core brandassociations
Frequency ofmentionNumber ofinterconnections
Select brand association that is:• Included on at least 50% of maps• Included on 45–49% of maps if the number ofconnections for core associations we identifiedpreviously
2. Select first-orderbrand associations
Frequency offirst-ordermentionsRatio offirst-ordermentionType ofinterconnections
Select core brand association that is:• Have a ratio of first-order mentions to totalmentions of at least 50%
• Have more superordinate than subordinateinterconnections
3. Select core brandassociation links
Frequencies forassociation links
Select core brand association links by• Finding infection point on frequency plot• Inflection point = target number• Including all association links that appear onor above the target number of maps
4. Select non-corebrand associationlinks
Frequencies forassociation links
Select non-core brand association links that are:• Linked to a core brand association• Linked on or above the target number of maps
5. Select number ofconnecting lines
Mean number oflines used perlink
Select single, double, or triple lines for eachbrand association link by:• Determining the mean number of lines usedper link
• Rounding up or down to the next integernumber (e.g., 2.3 = 2)
Licensing or not Licensing? A Pilot Study on Examining … 151
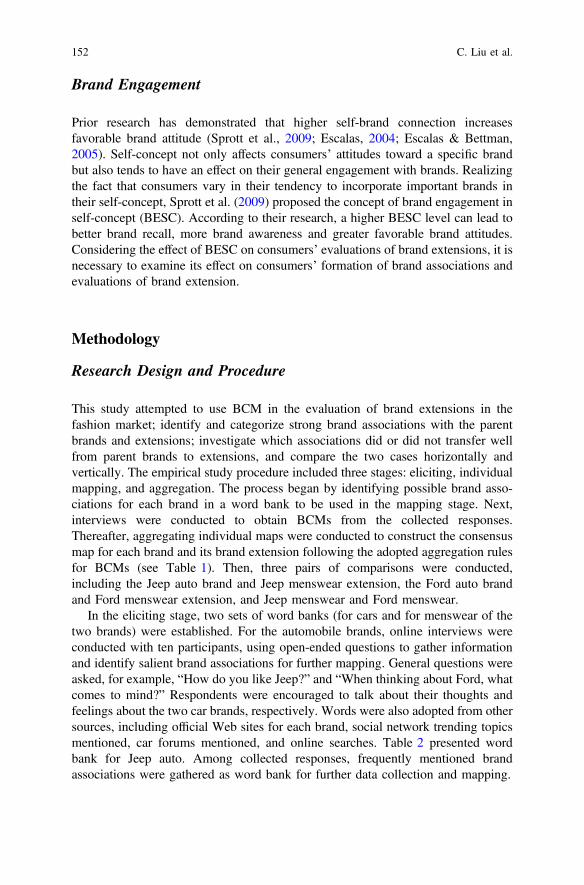
Brand Engagement
Prior research has demonstrated that higher self-brand connection increasesfavorable brand attitude (Sprott et al., 2009; Escalas, 2004; Escalas & Bettman,2005). Self-concept not only affects consumers’ attitudes toward a specific brandbut also tends to have an effect on their general engagement with brands. Realizingthe fact that consumers vary in their tendency to incorporate important brands intheir self-concept, Sprott et al. (2009) proposed the concept of brand engagement inself-concept (BESC). According to their research, a higher BESC level can lead tobetter brand recall, more brand awareness and greater favorable brand attitudes.Considering the effect of BESC on consumers’ evaluations of brand extensions, it isnecessary to examine its effect on consumers’ formation of brand associations andevaluations of brand extension.
Methodology
Research Design and Procedure
This study attempted to use BCM in the evaluation of brand extensions in thefashion market; identify and categorize strong brand associations with the parentbrands and extensions; investigate which associations did or did not transfer wellfrom parent brands to extensions, and compare the two cases horizontally andvertically. The empirical study procedure included three stages: eliciting, individualmapping, and aggregation. The process began by identifying possible brand asso-ciations for each brand in a word bank to be used in the mapping stage. Next,interviews were conducted to obtain BCMs from the collected responses.Thereafter, aggregating individual maps were conducted to construct the consensusmap for each brand and its brand extension following the adopted aggregation rulesfor BCMs (see Table 1). Then, three pairs of comparisons were conducted,including the Jeep auto brand and Jeep menswear extension, the Ford auto brandand Ford menswear extension, and Jeep menswear and Ford menswear.
In the eliciting stage, two sets of word banks (for cars and for menswear of thetwo brands) were established. For the automobile brands, online interviews wereconducted with ten participants, using open-ended questions to gather informationand identify salient brand associations for further mapping. General questions wereasked, for example, “How do you like Jeep?” and “When thinking about Ford, whatcomes to mind?” Respondents were encouraged to talk about their thoughts andfeelings about the two car brands, respectively. Words were also adopted from othersources, including official Web sites for each brand, social network trending topicsmentioned, car forums mentioned, and online searches. Table 2 presented wordbank for Jeep auto. Among collected responses, frequently mentioned brandassociations were gathered as word bank for further data collection and mapping.
152 C. Liu et al.
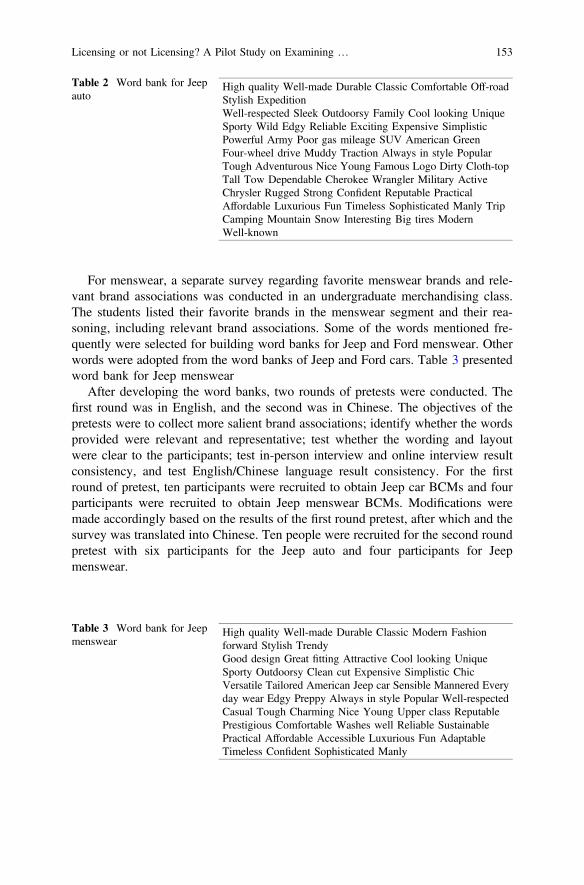
For menswear, a separate survey regarding favorite menswear brands and rele-vant brand associations was conducted in an undergraduate merchandising class.The students listed their favorite brands in the menswear segment and their rea-soning, including relevant brand associations. Some of the words mentioned fre-quently were selected for building word banks for Jeep and Ford menswear. Otherwords were adopted from the word banks of Jeep and Ford cars. Table 3 presentedword bank for Jeep menswear
After developing the word banks, two rounds of pretests were conducted. Thefirst round was in English, and the second was in Chinese. The objectives of thepretests were to collect more salient brand associations; identify whether the wordsprovided were relevant and representative; test whether the wording and layoutwere clear to the participants; test in-person interview and online interview resultconsistency, and test English/Chinese language result consistency. For the firstround of pretest, ten participants were recruited to obtain Jeep car BCMs and fourparticipants were recruited to obtain Jeep menswear BCMs. Modifications weremade accordingly based on the results of the first round pretest, after which and thesurvey was translated into Chinese. Ten people were recruited for the second roundpretest with six participants for the Jeep auto and four participants for Jeepmenswear.
Table 2 Word bank for Jeepauto
High quality Well-made Durable Classic Comfortable Off-roadStylish ExpeditionWell-respected Sleek Outdoorsy Family Cool looking UniqueSporty Wild Edgy Reliable Exciting Expensive SimplisticPowerful Army Poor gas mileage SUV American GreenFour-wheel drive Muddy Traction Always in style PopularTough Adventurous Nice Young Famous Logo Dirty Cloth-topTall Tow Dependable Cherokee Wrangler Military ActiveChrysler Rugged Strong Confident Reputable PracticalAffordable Luxurious Fun Timeless Sophisticated Manly TripCamping Mountain Snow Interesting Big tires ModernWell-known
Table 3 Word bank for Jeepmenswear
High quality Well-made Durable Classic Modern Fashionforward Stylish TrendyGood design Great fitting Attractive Cool looking UniqueSporty Outdoorsy Clean cut Expensive Simplistic ChicVersatile Tailored American Jeep car Sensible Mannered Everyday wear Edgy Preppy Always in style Popular Well-respectedCasual Tough Charming Nice Young Upper class ReputablePrestigious Comfortable Washes well Reliable SustainablePractical Affordable Accessible Luxurious Fun AdaptableTimeless Confident Sophisticated Manly
Licensing or not Licensing? A Pilot Study on Examining … 153
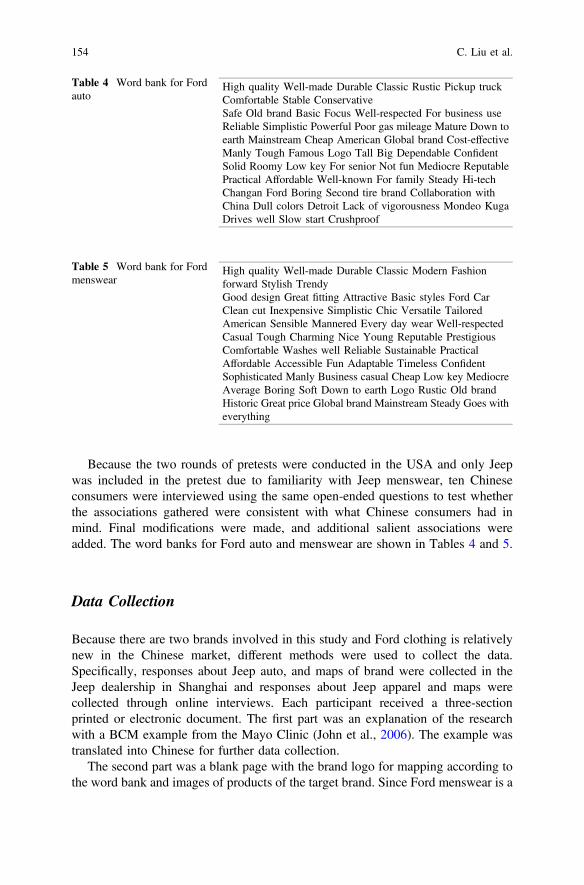
Because the two rounds of pretests were conducted in the USA and only Jeepwas included in the pretest due to familiarity with Jeep menswear, ten Chineseconsumers were interviewed using the same open-ended questions to test whetherthe associations gathered were consistent with what Chinese consumers had inmind. Final modifications were made, and additional salient associations wereadded. The word banks for Ford auto and menswear are shown in Tables 4 and 5.
Data Collection
Because there are two brands involved in this study and Ford clothing is relativelynew in the Chinese market, different methods were used to collect the data.Specifically, responses about Jeep auto, and maps of brand were collected in theJeep dealership in Shanghai and responses about Jeep apparel and maps werecollected through online interviews. Each participant received a three-sectionprinted or electronic document. The first part was an explanation of the researchwith a BCM example from the Mayo Clinic (John et al., 2006). The example wastranslated into Chinese for further data collection.
The second part was a blank page with the brand logo for mapping according tothe word bank and images of products of the target brand. Since Ford menswear is a
Table 4 Word bank for Fordauto
High quality Well-made Durable Classic Rustic Pickup truckComfortable Stable ConservativeSafe Old brand Basic Focus Well-respected For business useReliable Simplistic Powerful Poor gas mileage Mature Down toearth Mainstream Cheap American Global brand Cost-effectiveManly Tough Famous Logo Tall Big Dependable ConfidentSolid Roomy Low key For senior Not fun Mediocre ReputablePractical Affordable Well-known For family Steady Hi-techChangan Ford Boring Second tire brand Collaboration withChina Dull colors Detroit Lack of vigorousness Mondeo KugaDrives well Slow start Crushproof
Table 5 Word bank for Fordmenswear
High quality Well-made Durable Classic Modern Fashionforward Stylish TrendyGood design Great fitting Attractive Basic styles Ford CarClean cut Inexpensive Simplistic Chic Versatile TailoredAmerican Sensible Mannered Every day wear Well-respectedCasual Tough Charming Nice Young Reputable PrestigiousComfortable Washes well Reliable Sustainable PracticalAffordable Accessible Fun Adaptable Timeless ConfidentSophisticated Manly Business casual Cheap Low key MediocreAverage Boring Soft Down to earth Logo Rustic Old brandHistoric Great price Global brand Mainstream Steady Goes witheverything
154 C. Liu et al.
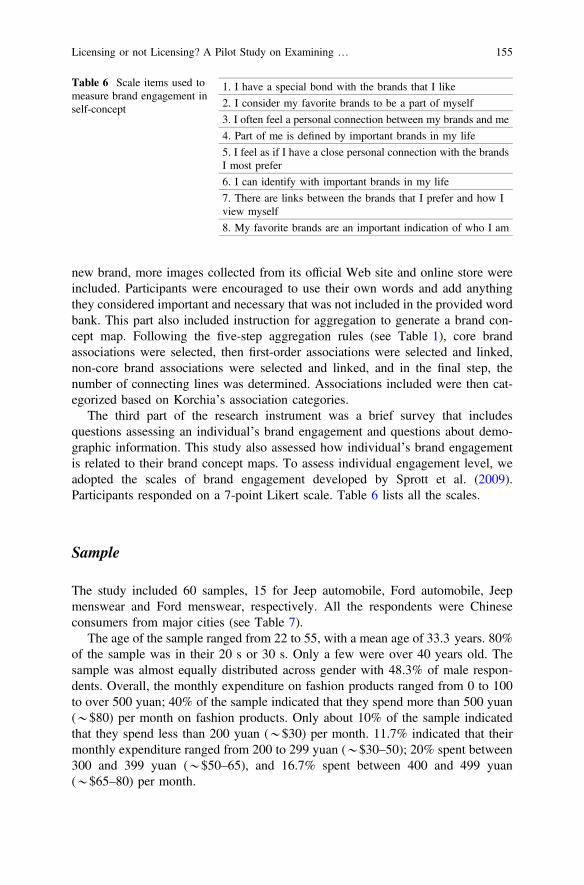
new brand, more images collected from its official Web site and online store wereincluded. Participants were encouraged to use their own words and add anythingthey considered important and necessary that was not included in the provided wordbank. This part also included instruction for aggregation to generate a brand con-cept map. Following the five-step aggregation rules (see Table 1), core brandassociations were selected, then first-order associations were selected and linked,non-core brand associations were selected and linked, and in the final step, thenumber of connecting lines was determined. Associations included were then cat-egorized based on Korchia’s association categories.
The third part of the research instrument was a brief survey that includesquestions assessing an individual’s brand engagement and questions about demo-graphic information. This study also assessed how individual’s brand engagementis related to their brand concept maps. To assess individual engagement level, weadopted the scales of brand engagement developed by Sprott et al. (2009).Participants responded on a 7-point Likert scale. Table 6 lists all the scales.
Sample
The study included 60 samples, 15 for Jeep automobile, Ford automobile, Jeepmenswear and Ford menswear, respectively. All the respondents were Chineseconsumers from major cities (see Table 7).
The age of the sample ranged from 22 to 55, with a mean age of 33.3 years. 80%of the sample was in their 20 s or 30 s. Only a few were over 40 years old. Thesample was almost equally distributed across gender with 48.3% of male respon-dents. Overall, the monthly expenditure on fashion products ranged from 0 to 100to over 500 yuan; 40% of the sample indicated that they spend more than 500 yuan(*$80) per month on fashion products. Only about 10% of the sample indicatedthat they spend less than 200 yuan (*$30) per month. 11.7% indicated that theirmonthly expenditure ranged from 200 to 299 yuan (*$30–50); 20% spent between300 and 399 yuan (*$50–65), and 16.7% spent between 400 and 499 yuan(*$65–80) per month.
Table 6 Scale items used tomeasure brand engagement inself-concept
1. I have a special bond with the brands that I like
2. I consider my favorite brands to be a part of myself
3. I often feel a personal connection between my brands and me
4. Part of me is defined by important brands in my life
5. I feel as if I have a close personal connection with the brandsI most prefer
6. I can identify with important brands in my life
7. There are links between the brands that I prefer and how Iview myself
8. My favorite brands are an important indication of who I am
Licensing or not Licensing? A Pilot Study on Examining … 155
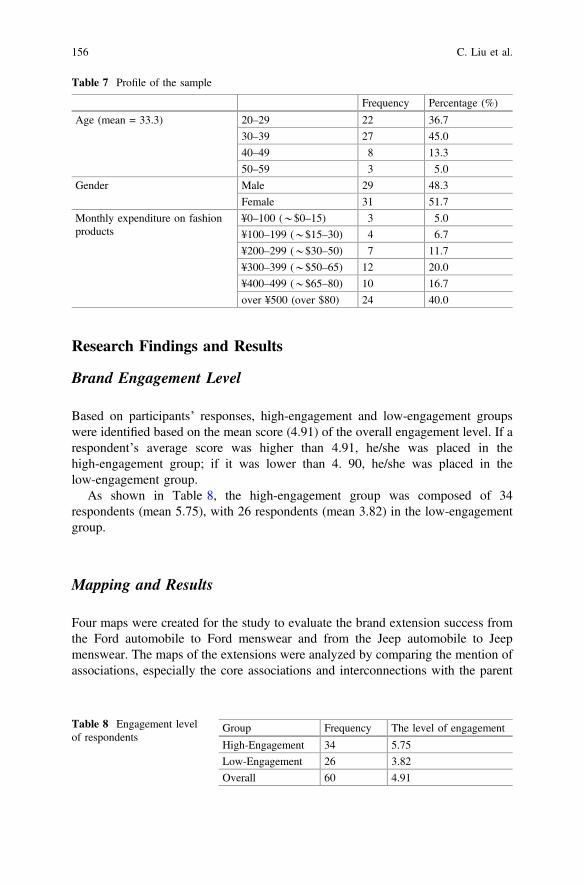
Research Findings and Results
Brand Engagement Level
Based on participants’ responses, high-engagement and low-engagement groupswere identified based on the mean score (4.91) of the overall engagement level. If arespondent’s average score was higher than 4.91, he/she was placed in thehigh-engagement group; if it was lower than 4. 90, he/she was placed in thelow-engagement group.
As shown in Table 8, the high-engagement group was composed of 34respondents (mean 5.75), with 26 respondents (mean 3.82) in the low-engagementgroup.
Mapping and Results
Four maps were created for the study to evaluate the brand extension success fromthe Ford automobile to Ford menswear and from the Jeep automobile to Jeepmenswear. The maps of the extensions were analyzed by comparing the mention ofassociations, especially the core associations and interconnections with the parent
Table 7 Profile of the sample
Frequency Percentage (%)
Age (mean = 33.3) 20–29 22 36.7
30–39 27 45.0
40–49 8 13.3
50–59 3 5.0
Gender Male 29 48.3
Female 31 51.7
Monthly expenditure on fashionproducts
¥0–100 (*$0–15) 3 5.0
¥100–199 (*$15–30) 4 6.7
¥200–299 (*$30–50) 7 11.7
¥300–399 (*$50–65) 12 20.0
¥400–499 (*$65–80) 10 16.7
over ¥500 (over $80) 24 40.0
Table 8 Engagement levelof respondents
Group Frequency The level of engagement
High-Engagement 34 5.75
Low-Engagement 26 3.82
Overall 60 4.91
156 C. Liu et al.
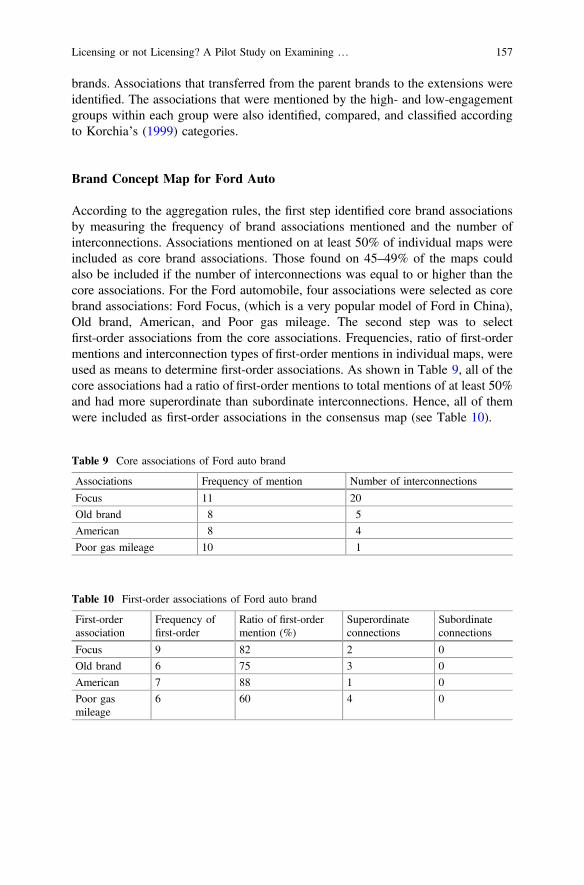
brands. Associations that transferred from the parent brands to the extensions wereidentified. The associations that were mentioned by the high- and low-engagementgroups within each group were also identified, compared, and classified accordingto Korchia’s (1999) categories.
Brand Concept Map for Ford Auto
According to the aggregation rules, the first step identified core brand associationsby measuring the frequency of brand associations mentioned and the number ofinterconnections. Associations mentioned on at least 50% of individual maps wereincluded as core brand associations. Those found on 45–49% of the maps couldalso be included if the number of interconnections was equal to or higher than thecore associations. For the Ford automobile, four associations were selected as corebrand associations: Ford Focus, (which is a very popular model of Ford in China),Old brand, American, and Poor gas mileage. The second step was to selectfirst-order associations from the core associations. Frequencies, ratio of first-ordermentions and interconnection types of first-order mentions in individual maps, wereused as means to determine first-order associations. As shown in Table 9, all of thecore associations had a ratio of first-order mentions to total mentions of at least 50%and had more superordinate than subordinate interconnections. Hence, all of themwere included as first-order associations in the consensus map (see Table 10).
Table 9 Core associations of Ford auto brand
Associations Frequency of mention Number of interconnections
Focus 11 20
Old brand 8 5
American 8 4
Poor gas mileage 10 1
Table 10 First-order associations of Ford auto brand
First-orderassociation
Frequency offirst-order
Ratio of first-ordermention (%)
Superordinateconnections
Subordinateconnections
Focus 9 82 2 0
Old brand 6 75 3 0
American 7 88 1 0
Poor gasmileage
6 60 4 0
Licensing or not Licensing? A Pilot Study on Examining … 157
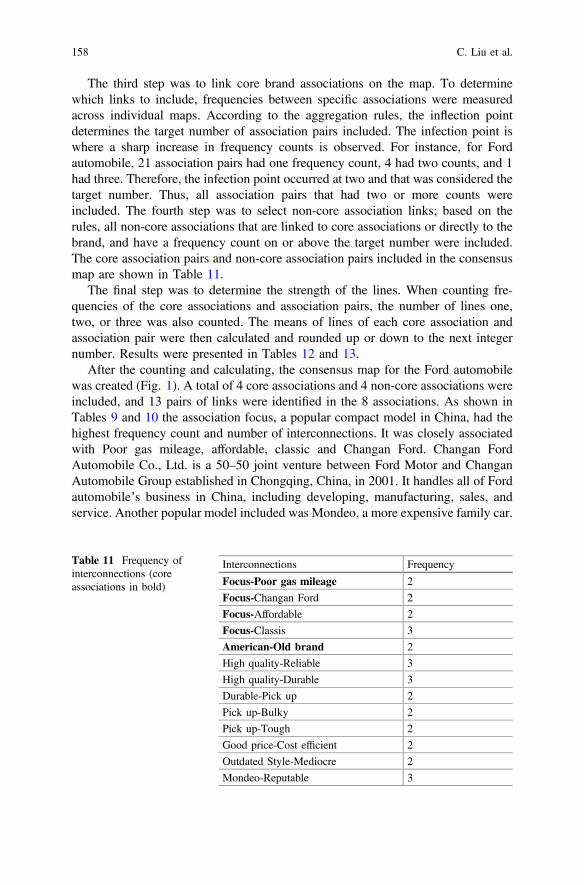
The third step was to link core brand associations on the map. To determinewhich links to include, frequencies between specific associations were measuredacross individual maps. According to the aggregation rules, the inflection pointdetermines the target number of association pairs included. The infection point iswhere a sharp increase in frequency counts is observed. For instance, for Fordautomobile, 21 association pairs had one frequency count, 4 had two counts, and 1had three. Therefore, the infection point occurred at two and that was considered thetarget number. Thus, all association pairs that had two or more counts wereincluded. The fourth step was to select non-core association links; based on therules, all non-core associations that are linked to core associations or directly to thebrand, and have a frequency count on or above the target number were included.The core association pairs and non-core association pairs included in the consensusmap are shown in Table 11.
The final step was to determine the strength of the lines. When counting fre-quencies of the core associations and association pairs, the number of lines one,two, or three was also counted. The means of lines of each core association andassociation pair were then calculated and rounded up or down to the next integernumber. Results were presented in Tables 12 and 13.
After the counting and calculating, the consensus map for the Ford automobilewas created (Fig. 1). A total of 4 core associations and 4 non-core associations wereincluded, and 13 pairs of links were identified in the 8 associations. As shown inTables 9 and 10 the association focus, a popular compact model in China, had thehighest frequency count and number of interconnections. It was closely associatedwith Poor gas mileage, affordable, classic and Changan Ford. Changan FordAutomobile Co., Ltd. is a 50–50 joint venture between Ford Motor and ChanganAutomobile Group established in Chongqing, China, in 2001. It handles all of Fordautomobile’s business in China, including developing, manufacturing, sales, andservice. Another popular model included was Mondeo, a more expensive family car.
Table 11 Frequency ofinterconnections (coreassociations in bold)
Interconnections Frequency
Focus-Poor gas mileage 2
Focus-Changan Ford 2
Focus-Affordable 2
Focus-Classis 3
American-Old brand 2
High quality-Reliable 3
High quality-Durable 3
Durable-Pick up 2
Pick up-Bulky 2
Pick up-Tough 2
Good price-Cost efficient 2
Outdated Style-Mediocre 2
Mondeo-Reputable 3
158 C. Liu et al.
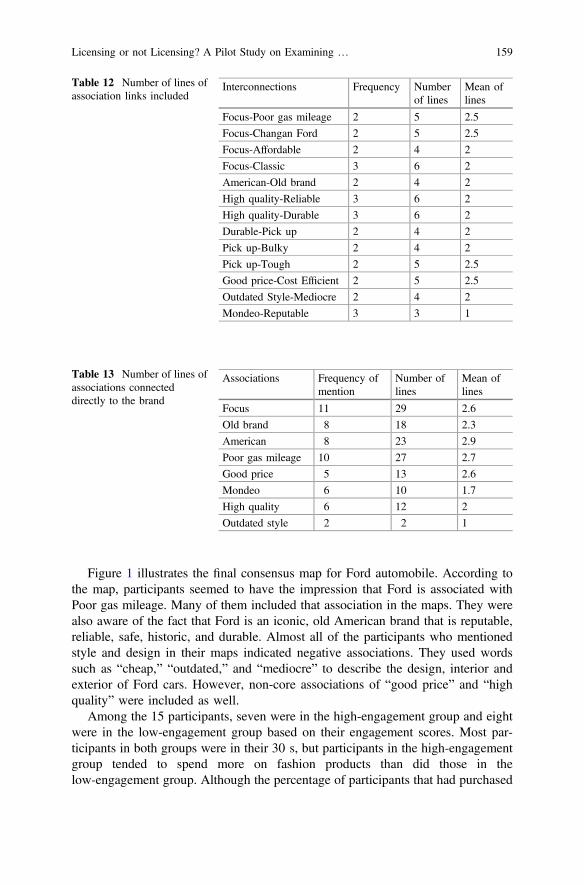
Figure 1 illustrates the final consensus map for Ford automobile. According tothe map, participants seemed to have the impression that Ford is associated withPoor gas mileage. Many of them included that association in the maps. They werealso aware of the fact that Ford is an iconic, old American brand that is reputable,reliable, safe, historic, and durable. Almost all of the participants who mentionedstyle and design in their maps indicated negative associations. They used wordssuch as “cheap,” “outdated,” and “mediocre” to describe the design, interior andexterior of Ford cars. However, non-core associations of “good price” and “highquality” were included as well.
Among the 15 participants, seven were in the high-engagement group and eightwere in the low-engagement group based on their engagement scores. Most par-ticipants in both groups were in their 30 s, but participants in the high-engagementgroup tended to spend more on fashion products than did those in thelow-engagement group. Although the percentage of participants that had purchased
Table 12 Number of lines ofassociation links included
Interconnections Frequency Numberof lines
Mean oflines
Focus-Poor gas mileage 2 5 2.5
Focus-Changan Ford 2 5 2.5
Focus-Affordable 2 4 2
Focus-Classic 3 6 2
American-Old brand 2 4 2
High quality-Reliable 3 6 2
High quality-Durable 3 6 2
Durable-Pick up 2 4 2
Pick up-Bulky 2 4 2
Pick up-Tough 2 5 2.5
Good price-Cost Efficient 2 5 2.5
Outdated Style-Mediocre 2 4 2
Mondeo-Reputable 3 3 1
Table 13 Number of lines ofassociations connecteddirectly to the brand
Associations Frequency ofmention
Number oflines
Mean oflines
Focus 11 29 2.6
Old brand 8 18 2.3
American 8 23 2.9
Poor gas mileage 10 27 2.7
Good price 5 13 2.6
Mondeo 6 10 1.7
High quality 6 12 2
Outdated style 2 2 1
Licensing or not Licensing? A Pilot Study on Examining … 159
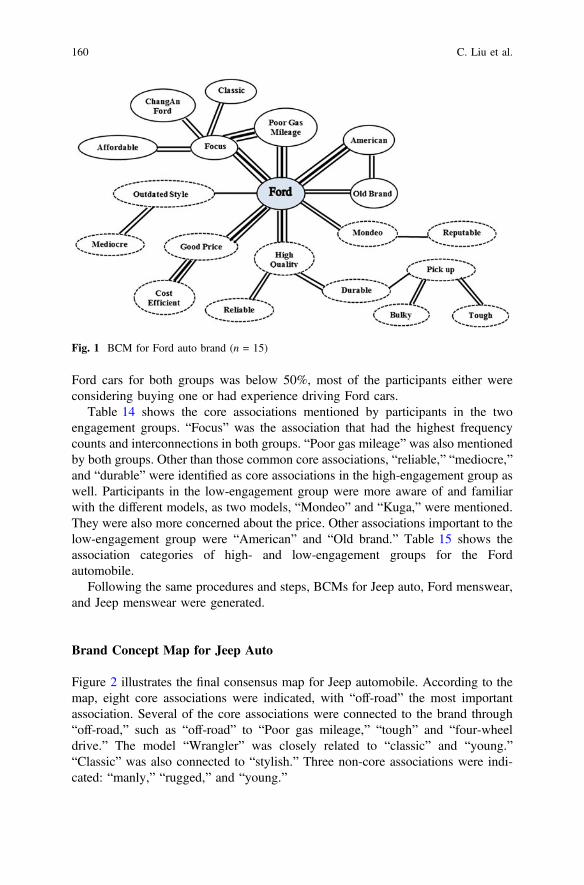
Ford cars for both groups was below 50%, most of the participants either wereconsidering buying one or had experience driving Ford cars.
Table 14 shows the core associations mentioned by participants in the twoengagement groups. “Focus” was the association that had the highest frequencycounts and interconnections in both groups. “Poor gas mileage” was also mentionedby both groups. Other than those common core associations, “reliable,” “mediocre,”and “durable” were identified as core associations in the high-engagement group aswell. Participants in the low-engagement group were more aware of and familiarwith the different models, as two models, “Mondeo” and “Kuga,” were mentioned.They were also more concerned about the price. Other associations important to thelow-engagement group were “American” and “Old brand.” Table 15 shows theassociation categories of high- and low-engagement groups for the Fordautomobile.
Following the same procedures and steps, BCMs for Jeep auto, Ford menswear,and Jeep menswear were generated.
Brand Concept Map for Jeep Auto
Figure 2 illustrates the final consensus map for Jeep automobile. According to themap, eight core associations were indicated, with “off-road” the most importantassociation. Several of the core associations were connected to the brand through“off-road,” such as “off-road” to “Poor gas mileage,” “tough” and “four-wheeldrive.” The model “Wrangler” was closely related to “classic” and “young.”“Classic” was also connected to “stylish.” Three non-core associations were indi-cated: “manly,” “rugged,” and “young.”
Fig. 1 BCM for Ford auto brand (n = 15)
160 C. Liu et al.
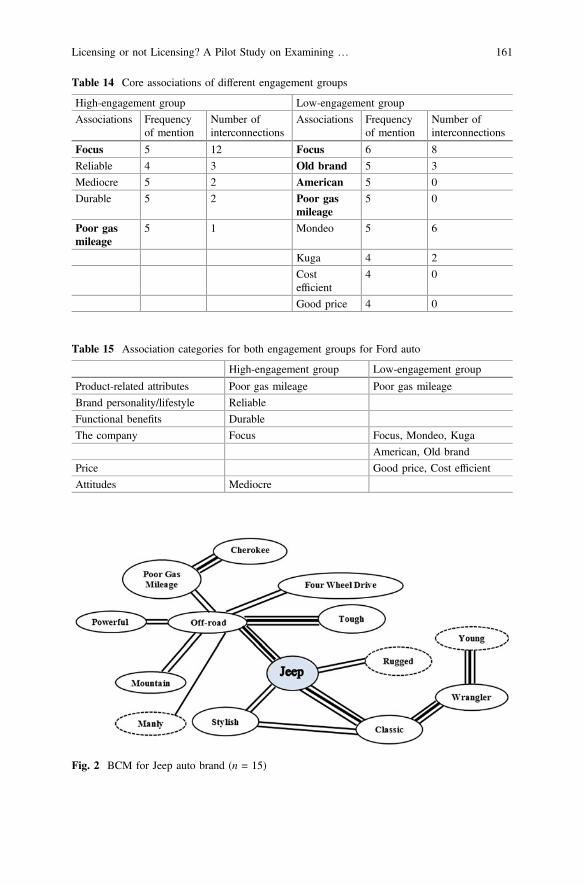
Table 14 Core associations of different engagement groups
High-engagement group Low-engagement group
Associations Frequencyof mention
Number ofinterconnections
Associations Frequencyof mention
Number ofinterconnections
Focus 5 12 Focus 6 8
Reliable 4 3 Old brand 5 3
Mediocre 5 2 American 5 0
Durable 5 2 Poor gasmileage
5 0
Poor gasmileage
5 1 Mondeo 5 6
Kuga 4 2
Costefficient
4 0
Good price 4 0
Table 15 Association categories for both engagement groups for Ford auto
High-engagement group Low-engagement group
Product-related attributes Poor gas mileage Poor gas mileage
Brand personality/lifestyle Reliable
Functional benefits Durable
The company Focus Focus, Mondeo, Kuga
American, Old brand
Price Good price, Cost efficient
Attitudes Mediocre
Fig. 2 BCM for Jeep auto brand (n = 15)
Licensing or not Licensing? A Pilot Study on Examining … 161
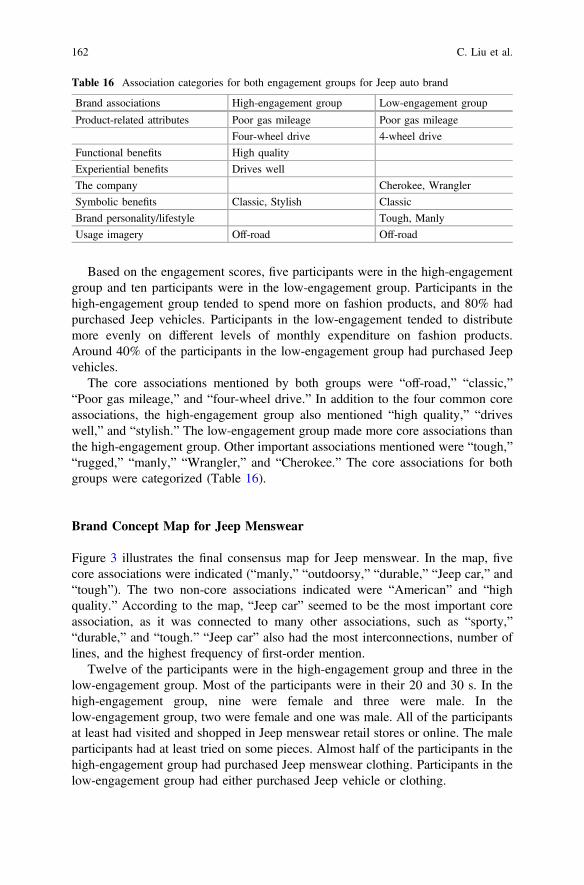
Based on the engagement scores, five participants were in the high-engagementgroup and ten participants were in the low-engagement group. Participants in thehigh-engagement group tended to spend more on fashion products, and 80% hadpurchased Jeep vehicles. Participants in the low-engagement tended to distributemore evenly on different levels of monthly expenditure on fashion products.Around 40% of the participants in the low-engagement group had purchased Jeepvehicles.
The core associations mentioned by both groups were “off-road,” “classic,”“Poor gas mileage,” and “four-wheel drive.” In addition to the four common coreassociations, the high-engagement group also mentioned “high quality,” “driveswell,” and “stylish.” The low-engagement group made more core associations thanthe high-engagement group. Other important associations mentioned were “tough,”“rugged,” “manly,” “Wrangler,” and “Cherokee.” The core associations for bothgroups were categorized (Table 16).
Brand Concept Map for Jeep Menswear
Figure 3 illustrates the final consensus map for Jeep menswear. In the map, fivecore associations were indicated (“manly,” “outdoorsy,” “durable,” “Jeep car,” and“tough”). The two non-core associations indicated were “American” and “highquality.” According to the map, “Jeep car” seemed to be the most important coreassociation, as it was connected to many other associations, such as “sporty,”“durable,” and “tough.” “Jeep car” also had the most interconnections, number oflines, and the highest frequency of first-order mention.
Twelve of the participants were in the high-engagement group and three in thelow-engagement group. Most of the participants were in their 20 and 30 s. In thehigh-engagement group, nine were female and three were male. In thelow-engagement group, two were female and one was male. All of the participantsat least had visited and shopped in Jeep menswear retail stores or online. The maleparticipants had at least tried on some pieces. Almost half of the participants in thehigh-engagement group had purchased Jeep menswear clothing. Participants in thelow-engagement group had either purchased Jeep vehicle or clothing.
Table 16 Association categories for both engagement groups for Jeep auto brand
Brand associations High-engagement group Low-engagement group
Product-related attributes Poor gas mileage Poor gas mileage
Four-wheel drive 4-wheel drive
Functional benefits High quality
Experiential benefits Drives well
The company Cherokee, Wrangler
Symbolic benefits Classic, Stylish Classic
Brand personality/lifestyle Tough, Manly
Usage imagery Off-road Off-road
162 C. Liu et al.
Four associations were mentioned by both groups: “durable,” “manly,” “out-doorsy,” and “tough.” These four associations were also identified as core associ-ations in the final consensus map. Among those, “tough” and “manly” were cited ascore associations in both the Jeep automobile and Jeep menswear maps. The coreassociation in the high-engagement group that had the highest frequency count andthe number of interconnections was “Jeep Car,” whereas in the low-engagementgroup, participants rated other associations such as “everyday wear,” “sporty,” and“American” higher. Table 17 illustrates the association categories of bothengagement groups.
Brand Concept Map for Ford Menswear
Figure 4 shows the final consensus map for Ford menswear. According to the map,Ford menswear was associated closely with “Ford car” and “American.” These twocore associations were linked to other positive associations such as “reputable,”“global brand,” and “high quality.” Other associations addressed the pricing,design, and cut of the line.
Ten participants were in the high-engagement group, and five were in thelow-engagement group. Most of the participants in both engagement groups were intheir 20 s. Half of the participants in the high-engagement group were male and the
Fig. 3 BCM for Jeep menswear brand (n = 15)
Table 17 Association categories for both engagement groups for Jeep menswear
Brand Associations High-engagement group Low-engagement group
Functional benefits Durable Durable, High quality
The company Jeep Car American
Brand personality/lifestyle Tough, Manly Tough, Manly
Usage imagery Outdoorsy Outdoorsy, Sporty, Everyday Wear
Licensing or not Licensing? A Pilot Study on Examining … 163

rest were female. In the low-engagement group, only one was male and four werefemale. Monthly expenditure on fashion products in the high-engagement grouptended to evenly distribute from approximately 0–100 yuan (*$0–15) to over 500yuan (*$80). Participants in the low-engagement group spent at least 200 yuan (*$30) monthly on fashion products.
None of the participants owned a Ford vehicle. Also, as the clothing line wasnewly launched in selective cities, none of the participants had a chance to makeany purchase yet. However, all of the participants were familiar with the Fordbrand, and all had experience driving or riding in a Ford car.
Both groups cited “mediocre” and “American.” The low-engagement group alsomentioned “Old brand.” “Ford car” had the greatest number of interconnections andhigh-frequency counts in the high-engagement group. Table 18 shows associationcategories for both engagement groups.
Fig. 4 BCM for Ford menswear brand (n = 15)
Table 18 Association categories for both engagement groups for Ford menswear
Brand associations High-engagement group Low-engagement group
Price Affordable
The company Ford car, American American, Old brand
Attitudes Mediocre Mediocre
Brand personality/lifestyle Simplistic
164 C. Liu et al.
Brand Extension Evaluation and Mapping Comparison
According to the maps and Korshia’s (1999) association categories, participantsconnected the Jeep automobile to Jeep menswear easily. Many unique and positiveassociations with the Jeep automobile transferred to the menswear extension suc-cessfully and smoothly. In particular, associations of categories such as brandpersonality/lifestyle, user imagery, the company and functional benefits transferredcompletely from the parent brand to the extension.
Similar to the case with Jeep, associations with the Ford motor company andcountry of origin transferred well from the parent brand to the extension. Otherassociation categories that transferred successfully were the price and attitudes.Although as an iconic American brand, Ford was considered “reputable,” “highquality,” and “durable,” some consumers used “mediocre” to describe both the Fordautomobile and its menswear. Compared to the case with Jeep, as a parent brand,Ford lacked a positive and unique brand personality. Hence, the extension lackedidentity as well. Product-related association and functional benefits did not transferto the extension at all. The affordable price of the menswear line was associateddirectly with the negative attitude of “mediocre.”
Discussion and Implications
This study demonstrated that BCM is an effective and powerful tool in the eval-uation of brand extension, as it offers a clear picture of consumers’ associationnetworks for both parent brands and extensions. The visual format enablesresearchers and practitioners to trace which and how associations transfer fromparent brands to extensions and make comparisons easily. Such market research canhelp manufactures who are searching global brands for licensing to select correctbrands. For those licensors, such type of research can help them react quickly andadjust strategically according to the mapping results.
The generated BCMs revealed that, in the case that fit between automobile andfashion is poor, strong associations, both positive and negative, still transferred wellfrom the parent brands to their extensions. Thus, it is clear that associations with theparent brand have a great influence on the extension, even between distant productcategories. For instance, the associations of “good price,” “affordable,” and “me-diocre” were identified in the Ford automobile map and then as core associations inthe Ford menswear map.
The results showed that brand personality could be a key factor in the success ofa fashion brand extension. For instance, associations with the Jeep automobile, suchas “tough” and “manly,” transferred successfully to the menswear line and becamethe core associations. Compared to Jeep, the new Ford menswear line lacked thestrong brand personality-related associations that need to be leveraged in order tocreate a strong brand positioning for Ford menswear. However, as shown in the
Licensing or not Licensing? A Pilot Study on Examining … 165
Ford menswear map, “simplistic” and “clean cut” offer a hint to marketers withrespect to how they might change consumers’ overall perceptions of the brand Fordas being “mediocre.”
As shown in the maps, in both the automobile and fashion categories, thecountry of origin effect played an important role in brand evaluation and the successof the extension; “American” was mentioned in three of the four maps as a coreassociation, especially in the extensions, although neither was made or designed inthe USA. “American” was linked to positive associations, such as “high quality”, sofirms should capitalize on the country of origin effect when promoting theirextensions. This effect may be particularly powerful in emerging markets.
In addition, the results showed that the level of brand engagement had a positiveassociation with consumer’s expenditure on fashion products. Firms should locatethe group of consumers in the high-engagement level, analyze their associationmaps, and tailor their products to those consumers’ needs. As the results suggest,firms that are considering extending their business into the fashion category shouldexamine the brand association networks of the parent brand thoroughly anddetermine on which associations they should capitalize. The results revealed thatthe success of Jeep was not a coincidence, as so many positive key associationstransferred from the parent brand to the extension. In contrast, Ford needs to createmore positive associations regarding brand personality and functional benefits tochange consumers’ negative attitudes.
Another important implication for manufactures from emerging markets toleverage a global brand is that the country of origin effect should always beassessed. Consumers in emerging markets are more aware of brand names thatoriginate in developed market and are more likely to generate positive associationsaccordingly. Both the case of Jeep and Ford supported this assertion. Particularly, inthe Ford menswear map, the association “American” was linked directly to “highquality.” Therefore, we suggest that a new extension with a relatively weak brandimage should take advantage of the country of origin effect when first entering themarket. Meanwhile, when making licensing decision, apparel manufactures shouldevaluate a brand’s personality and identity and to what degree the brand’ apparelextension can express consumers’ self, identity, and personality.
Limitations and Future Studies
The study has several limitations, primarily that it cannot be generalized well due tothe sample size (15 for each map), and the fact that convenient/snowball samplingwas used. Thus, the samples do not represent Chinese consumers in Shanghai,Beijing, Tianjin, and Shenzhen adequately. In particular, in the case of Fordmenswear, the sample may be biased because Ford menswear has no retail stores inthose cities. The results also cannot be generalized to the fashion industry, as onlytwo brands of menswear were selected and they may not represent the entirecategory. Wording problems also occurred, as participants were encouraged
166 C. Liu et al.
strongly to use their own words. The various ways in which participants expressedthe ideas and thoughts in their minds, added difficulty in the aggregation state. Thisgenerated a large number of association links with low-frequency counts.Accordingly, these maps might not be as representative as desired. Further, researchshould continue to apply BCM to evaluate extensions in other industries.Cross-cultural analysis would also be a good direction for comparison. The role thatbrand engagement plays in brand extension should be studied further as well.
References
Aaker, D. A. (1991). Managing brand equity: Capitalizing on the value of a brand name. NewYork/Toronto/New York: Free Press/Maxwell Macmillan Canada/Maxwell MacmillanInternational.
Aaker, D. A., & Keller, K. L. (1990). Consumer evaluations of brand extensions. Journal ofMarketing, 54(1), 27–41.
Anderson, J. R. (1983). The architecture of cognition (p. 1983). Cambridge, Mass.: HarvardUniversity Press.
Anderson, J. R., & Bower, G. H. (1980). Human associative memory: A brief edition. Hillsdale, N.J.: L. Erlbaum Associates.
Bottomley, P. A., & Holden, S. J. S. (2001). Do we really know how consumers evaluate brandextensions? Empirical generalizations based on secondary analysis of eight studies. Journal ofMarketing Research, 38(4), 494–500.
Boush, D. M., & Loken, B. (1991). A process-tracing study of brand extension evaluation. Journalof Marketing Research, 28(1), 16–28. https://doi.org/10.2307/3172723.
Bristol, T. (1996). Consumers’ beliefs resulting from conceptual combinations: Conjunctiveinferences about brand extensions. Psychology & Marketing, 13(6), 571–589.
Carroll, A. (2009). Brand communications in fashion categories using celebrity endorsement.Journal of Brand Management, 17(2), 146–158. https://doi.org/10.1057/bm.2008.42.
Dew, L., & Kwon, W.-S. (2010). Exploration of apparel brand knowledge: Brand awareness,brand association, and brand category structure. Clothing & Textiles Research Journal, 28(1),3–18. https://doi.org/10.1177/0887302X09341877.
Escalas, J. E. (2004). Narrative processing: Building consumer connections to brands. Journal ofConsumer Psychology, 14(1/2), 168–180.
Escalas, J. E., & Bettman, J. R. (2005). Self-construal, reference groups, and brand meaning.Journal of Consumer Research, 32(3), 378–389.
Fiske, S. T. (1982). Schema-triggered affect: Applications to social perception. Paper presented atthe Affect and cognition: 17th Annual Carnegie Mellon symposium on cognition.
Fiske, S. T., & Pavelchak, M. A. (1986). Category-based versus piecemeal-based affectiveresponses: Developments in schema-triggered affect. In R. M. Sorrentino, E. T. Higgins, R.M. Sorrentino, & E. T. Higgins (Eds.), Handbook of motivation and cognition: Foundations ofsocial behavior (pp. 167–203). New York, NY, US: Guilford Press.
French, A., & Smith, G. (2013). Measuring brand association strength: A consumer based brandequity approach. European Journal of Marketing, 47(8), 1356–1367. https://doi.org/10.1108/03090561311324363.
Hem, L. E., De Chernatony, L., & Iversen, N. M. (2003). Factors influencing successful brandextensions. Journal of Marketing Management, 19(7–8), 781–806.
Henderson, G. R., Iacobucci, D., & Calder, B. J. (1998). Brand diagnostics: Mapping brandingeffects using consumer associative networks. European Journal of Operational Research, 111(2), 306–327.
Licensing or not Licensing? A Pilot Study on Examining … 167
Jayachandran, S., Kaufman, P., Kumar, V., & Hewett, K. (2013). Brand licensing: What drivesroyalty rates? Journal of Marketing, 77(5), 108–122.
John, D. R., Loken, B., Kim, K., & Monga, A. B. (2006). Brand concept maps: A methodology foridentifying brand association networks. Journal of Marketing Research, 43(4), 549–563.
Keller, K. L. (1993). Conceptualizing, measuring, and managing customer-based brand equity.Journal of Marketing, 57(1), 1–22.
Keller, K. L. (2008). Strategic brand management: Building, measuring, and managing brandequity. Harlow: Pearson.
Klink, R. R., & Smith, D. C. (2001). Threats to the external validity of brand extension research.Journal of Marketing Research, 38(3), 326–335. https://doi.org/10.2307/1558527.
Korchia, M. (1999). A new typology of brand image. ACR European Advances, 4, 147–154.Levy, S. J. (1981). Interpreting consumer mythology: A structural approach to consumer behavior.
Journal of Marketing, 45(3), 49–61.Levy, S. J. (1985). Dreams, fairy tales, animals, and cars. Psychology & Marketing, 2(2), 67–81.Martinez, A. (2011). Consumer evaluations of brand extensions: Can online brands be extended to
offline markets? (MS), The Heriot-Watt University, Edinburgh, United Kingdom.Morein, J. A. (1975). Shift from brand to product line marketing. Harvard Business Review, 53(5),
56–64.Priluck, R., & Till, B. D. (2010). Comparing a customer-based brand equity scale with the implicit
association test in examining consumer responses to brands. Journal of Brand Management, 17(6), 413–428. https://doi.org/10.1057/bm.2009.32.
Romeo, J. B. (1991). The effects of negative information on the evaluations of brand extensionsand the family brand. Advances in Consumer Research, 18(1), 399–406.
Shin, S. (2011). Application of brand concept maps to GAP Inc. (MS), University of Georgia.Shocker, A. D., Srivastava, R. K., & Ruekert, R. W. (1994). Challenges and opportunities facing
brand management: An introduction to the special issue. Journal of Marketing Research, 31(2),149–158.
Sprott, D., Czellar, S., & Spangenberg, E. (2009). The importance of a general measure of brandengagement on market behavior: Development and validation of a scale. Journal of MarketingResearch, 46(1), 92–104.
Susan, A., & Richard, E. (1998). Fashion involvement, self-monitoring and the meaning of brands.Journal of Product & Brand Management, 7(2), 109–123. https://doi.org/10.1108/10610429810216874.
Völckner, F., & Sattler, H. (2006). Drivers of brand extension success. Journal of Marketing, 70(2), 18–34.
Walsh, P., Rhenwrick, I., Williams, A., & Waldburger, A. (2014). Team brand extension orlicensed product? Examining consumer awareness of two distinct brand strategies. SBM Sport,Business and Management: An International Journal, 4(2), 96–108.
Wyer, R. S., Budesheim, T. L., Lambert, A. J., & Swan, S. (1994). Person memory and judgment:Pragmatic influences on impressions formed in a social context. Journal of Personality andSocial Psychology, 66(2), 254–267. https://doi.org/10.1037/0022-3514.66.2.254.
Zhuang, G., Wang, X., Zhou, L., & Zhou, N. (2008). Asymmetric effects of brand origin confusionevidence from the emerging market of China. International Marketing Review, 25(4), 441–457.
168 C. Liu et al.
Part VSelect Fashion Market Segments
in China
Chinese Male Consumers’ High-End ShirtConsumption: A Perspective of FabricAttributes
Yanwen Ruan, Yingjiao Xu, Jun Li and Xiaogang Liu
Abstract With rising disposable incomes and male consumers’ increasing interestin personal grooming products, the Chinese menswear market is growing tremen-dously. Shirt is one of the most popular menswear items chosen by Chinese maleconsumers. While the shirt market is growing and many Chinese fabric manufac-turers possess great capacity in producing high-end fabrics and supply to globallyknown upscale shirt brands, no fabric brand is in existence in China for high-endshirts. Appreciating the additional value from the branded ingredient (fabric),especially for upscale products (shirts), it might be to the great benefits of thecurrent large fabric enterprises to brand their fabric products. To meet the increasingdemand for high-end men’s shirts in the Chinese market and to help Chinese textileindustry establishing high-end shirt brands, it is important to understand Chinesemale consumers’ shirt consumption behavior for high-end shirts. Focusing onconsumers’ preference of fabric attributes, this study conducted a two-step clusteranalysis with a survey of 170 Chinese male consumers. As a result, three distinctclusters in the Chinese men’s shirts market were identified: premium consumers,pragmatic consumers, and economic consumers. Results of this study will not onlyprovide implications to the practitioners in the industry in their efforts to better meetthe Chinese male consumers’ needs for high-end shirts, but also contribute to theliterature on male consumers’ shirt consumption behaviors.
Keywords Male consumers � High-end shirts � Fabric features � Cluster
Y. Ruan (&) � J. Li � X. LiuDonghua University, Shanghai, Chinae-mail: [email protected]
Y. XuNorth Carolina State University, Raleigh, USA
© Springer Nature Singapore Pte Ltd. 2018Y. Xu et al. (eds.), Chinese Consumers and the Fashion Market, Springer Seriesin Fashion Business, https://doi.org/10.1007/978-981-10-8429-4_8
171
Introduction
In the global apparel and footwear market, Asia Pacific, North America, andWestern Europe represent the three largest markets (Euro Monitor, 2017a;Prnewswire, 2016). In 2016, the Asia Pacific menswear market had exceeded theother two markets. Meanwhile, from 2002 to 2016, Western Europe had showed adeclined tendency in menswear market (Euro Monitor, 2017b; Mintel, 2017).Representing the largest part of the menswear market in Asia Pacific, China’smenswear industry grew much faster than the womenswear industry. In the men-swear market, the shirt segment would continue to grow in the years to come(Bizvibe, 2015; China Luxury Advisors, 2015; Edited, 2016; Euro Monitor,2017d). As a commonly utilized item, shirts play a very important role in maleconsumers’ daily life and are the second largest category among allmade-to-measure categories (China Business Industry Research, 2017a).
In the category of menswear shirts, high-end shirts such as ready-to-wear ormade-to-measure formal shirts and dress shirts traditionally take the main part inmale consumers’ wardrobe (Storey, 2008). Although there is not a common defi-nition for high-end shirts, this category can be identified from three aspects. Fromthe view of price level, a high-end shirt is usually priced over USD150 in the USA(Gentleman’s Gazette, 2013). From the view of dress occasion, high-end shirts areusually dressed in formal occasions (Storey, 2008), such as wedding, evening ball,or job interviews. From the view of resource and craftsmanship, high-end shirtsusually made by good quality fabric, long staple cotton, such as GIZA cotton fromEgypt. Some high-end shirts have logo of the high-end fabric brand on their shirtsto display their luxury taste (Gentleman’s Gazette, 2010). Not only the fabric, butalso the high-quality accessories, the exact fit tailor, and the excellent craftsmanshipare all important to a high-end shirt (Guokr, 2014).
A national survey indicated that 61% of US male Internet users aged over 18have purchased dress shirts in 2016, just followed common casual wear T-shirts,jeans, pants, shorts, and polo shirts (Mintel, 2016). In China, the formal dress shirtsand the made-to-measure shirts markets will continue to develop (Pinpai China,2017).
While the demand for men’s high-end shirts is strong, no Chinese high-end shirtfabric brand is in existence. In comparison, the manufacturing of high-end shirtfabrics in China is very well developed, but their production is mainly to supply tothe global fashion brands. The well-known high-end shirt fabric brands around theworld are mainly owned by European companies, including Albini Group, Canclini,Testa, Monti, Alumo, Soktas, and Getzner. To meet the demand for high-end men’sshirts in the Chinese market, it is important for the industry to understand Chinesemale consumers’ shirt consumption behaviors, particularly their preference of fabricattributes.
This current study is designed to provide an insight of Chinese male consumers’high-end shirt consumption. Specifically, it aims to investigate Chinese maleconsumers’ preference of fabric attributes for high-end shirts. A two-step cluster
172 Y. Ruan et al.
analysis was conducted to further segment the Chinese high-end shirt market.Results of this study not only provide implication to the practitioners in the industryin their efforts to better meet the Chinese male consumers’ needs for high-endshirts, but also contribute to the literature on male consumers’ shirt consumptionbehaviors.
In the following sections, an overview of the global and Chinese menswearmarket was first provided and followed by an introduction and analysis of theglobal high-end men’s shirt fabric brands. The literature review section ends with areview of male consumers’ shirt consumption. Following the literature review, theresearch methodology is explained in detail. Finally, the findings of this study arepresented in the results section, and conclusions and implications are provided atthe end of the paper.
Literature Review
Global Menswear Market
The global menswear market sized around USD414.2 billion in 2016, and thevolume of the market will reach around USD450 billion in 2021 (Euro Monitor,2017a). The Asia Pacific represents the largest menswear market in the world,followed by North American and Western Europe. As male consumers continue toplace a greater emphasis on their appearance, menswear is expected to outpacewomenswear in terms of growth (Business of Fashion, 2014; Euro Monitor, 2017b;Fashion United, 2016; Rinallo, 2007).
North America was the second largest menswear market in the world, and theUSA was the major market in this region with USD87.5 billion sales volume in2016. Shirts and jumpers were the second largest category in the US menswearmarket in 2016 (Euro Monitor, 2017c). The US menswear industry was expected toslightly increase in the future (Euro Monitor, 2017c), so was the men’s shirt cat-egory, which enjoyed a 12.5% volume growth over the period of 2011–2016 (EuroMonitor, 2017c).
Germany, UK, France, and Italy were the leading menswear markets in WesternEurope, accounting for 63% of the region’s sales of USD90.1 billion in 2016.However, the general menswear in Western Europe has shown a sign of decline(Euro Monitor, 2017b). On the contrast, the shirts market enjoyed an absolutegrowth of 575 million dollars (Euro Monitor, 2017b). Turkey, Sweden, andNorway were the three largest shirt markets in Western Europe, with Italy,Germany, and France having the smallest shirt markets in this region (EuroMonitor, 2017b).
Chinese Male Consumers’ High-End Shirt Consumption … 173
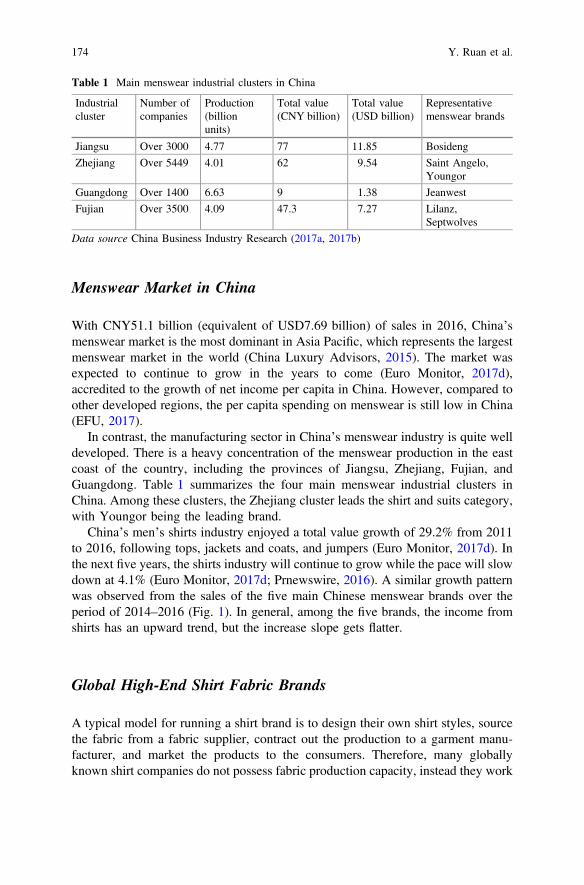
Menswear Market in China
With CNY51.1 billion (equivalent of USD7.69 billion) of sales in 2016, China’smenswear market is the most dominant in Asia Pacific, which represents the largestmenswear market in the world (China Luxury Advisors, 2015). The market wasexpected to continue to grow in the years to come (Euro Monitor, 2017d),accredited to the growth of net income per capita in China. However, compared toother developed regions, the per capita spending on menswear is still low in China(EFU, 2017).
In contrast, the manufacturing sector in China’s menswear industry is quite welldeveloped. There is a heavy concentration of the menswear production in the eastcoast of the country, including the provinces of Jiangsu, Zhejiang, Fujian, andGuangdong. Table 1 summarizes the four main menswear industrial clusters inChina. Among these clusters, the Zhejiang cluster leads the shirt and suits category,with Youngor being the leading brand.
China’s men’s shirts industry enjoyed a total value growth of 29.2% from 2011to 2016, following tops, jackets and coats, and jumpers (Euro Monitor, 2017d). Inthe next five years, the shirts industry will continue to grow while the pace will slowdown at 4.1% (Euro Monitor, 2017d; Prnewswire, 2016). A similar growth patternwas observed from the sales of the five main Chinese menswear brands over theperiod of 2014–2016 (Fig. 1). In general, among the five brands, the income fromshirts has an upward trend, but the increase slope gets flatter.
Global High-End Shirt Fabric Brands
A typical model for running a shirt brand is to design their own shirt styles, sourcethe fabric from a fabric supplier, contract out the production to a garment manu-facturer, and market the products to the consumers. Therefore, many globallyknown shirt companies do not possess fabric production capacity, instead they work
Table 1 Main menswear industrial clusters in China
Industrialcluster
Number ofcompanies
Production(billionunits)
Total value(CNY billion)
Total value(USD billion)
Representativemenswear brands
Jiangsu Over 3000 4.77 77 11.85 Bosideng
Zhejiang Over 5449 4.01 62 9.54 Saint Angelo,Youngor
Guangdong Over 1400 6.63 9 1.38 Jeanwest
Fujian Over 3500 4.09 47.3 7.27 Lilanz,Septwolves
Data source China Business Industry Research (2017a, 2017b)
174 Y. Ruan et al.
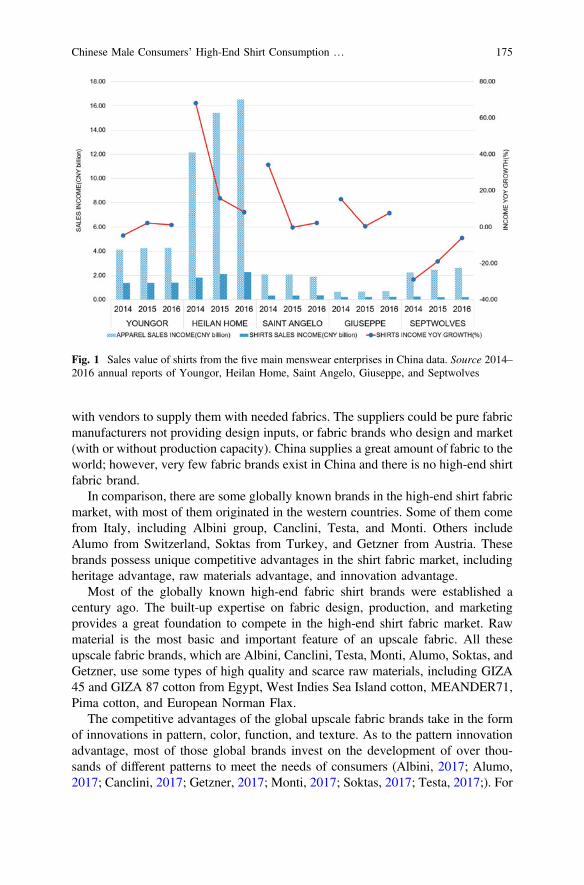
with vendors to supply them with needed fabrics. The suppliers could be pure fabricmanufacturers not providing design inputs, or fabric brands who design and market(with or without production capacity). China supplies a great amount of fabric to theworld; however, very few fabric brands exist in China and there is no high-end shirtfabric brand.
In comparison, there are some globally known brands in the high-end shirt fabricmarket, with most of them originated in the western countries. Some of them comefrom Italy, including Albini group, Canclini, Testa, and Monti. Others includeAlumo from Switzerland, Soktas from Turkey, and Getzner from Austria. Thesebrands possess unique competitive advantages in the shirt fabric market, includingheritage advantage, raw materials advantage, and innovation advantage.
Most of the globally known high-end fabric shirt brands were established acentury ago. The built-up expertise on fabric design, production, and marketingprovides a great foundation to compete in the high-end shirt fabric market. Rawmaterial is the most basic and important feature of an upscale fabric. All theseupscale fabric brands, which are Albini, Canclini, Testa, Monti, Alumo, Soktas, andGetzner, use some types of high quality and scarce raw materials, including GIZA45 and GIZA 87 cotton from Egypt, West Indies Sea Island cotton, MEANDER71,Pima cotton, and European Norman Flax.
The competitive advantages of the global upscale fabric brands take in the formof innovations in pattern, color, function, and texture. As to the pattern innovationadvantage, most of those global brands invest on the development of over thou-sands of different patterns to meet the needs of consumers (Albini, 2017; Alumo,2017; Canclini, 2017; Getzner, 2017; Monti, 2017; Soktas, 2017; Testa, 2017;). For
Fig. 1 Sales value of shirts from the five main menswear enterprises in China data. Source 2014–2016 annual reports of Youngor, Heilan Home, Saint Angelo, Giuseppe, and Septwolves
Chinese Male Consumers’ High-End Shirt Consumption … 175
example, Getzner develops over 5000 different patterns every year, and Cancliniprovides over 3500 new pattern designs in every six months in its innovationlaboratory ( Canclini, 2017; Getzner, 2017). The color innovation advantage refersto the ability to create great amount of color every year. Most of the upscale fabricbrands not only pay close attention to the color trend, but also develop their ownunique colors to meet their customers’ needs (Monti, 2017). The functionalityinnovation advantage usually refers to the finishing effect of the fabric. In additionto the function of permanent press, new functions include self-decontamination,temperature control. (Albini, 2017; Alumo, 2017; Canclini, 2017; Getzner, 2017;Soktas, 2017). The texture advantage refers to the use of high-count fabric. Thehighest count of fabric is 400/2, which is currently offered by Getzner. With thehigh count comes with new fabric features, such as hand and feel (Getzner, 2017).
While there are some large-scale textile enterprises in China, such as Lutai andLianfa, and most of them have great innovation capacity, according to the analysisof eight major Chinese cotton textile corporates (China Textile Planning ResearchAssociation, 2014), there is no upscale shirt fabric brand in China. With the strongdemand for high-end shirts for male consumers, there is also a market for high-endfabric brands. These large enterprises have the great potential to develop their ownfabric brands in terms of access to high-quality raw materials (enabled by the greatfinancial resources available), innovation ability, and historic heritage. A criticalstep in developing a successful brand is to understand consumers’ needs as well astheir preferred product attributes.
Male Consumers and Shirts
In the West, the commercial representations of masculinity have shifted from hardwork, thrift, and production to personal pleasure, stylistic expression, and com-modity consumption (Osgerby, 2003; Shaw & Tan, 2014). In menswear, shirts are apopular item for hundred years. Among all kinds of shirts, the white formal shirtsused to symbolize power, responsibility, success, wealth, and reliability. Althoughdress shirts are not as popular as in the past, they are still the must-have items closeto men’s personal life and professional life today and still a symbol of masculinity.
According to the analysis by Mintel, men want more flexibility in work hours,especially young male adults (Mintel, 2017), and not many companies strictlyrequire formal wears in workplaces now (Euro Monitor, 2017b). Therefore, casualshirts and jeans are accepted by more male consumers in workplaces. Shirts otherthan in white color are more accepted by male consumers also.
In terms of materials, according to the qualitative research on the twenty-firstcentury fashion tailors by Ross (2007), most fashion tailors claimed thatmade-to-measure customers still prefer suits made in natural fibers. There is ademand for lighter fabrics with more creative colors and patterns, and with naturalblended fibers (Ross, 2007). Although Ross’ research was based on suits, the
176 Y. Ruan et al.
preference for upscale shirts is expected to be similar. Additionally, compositionand pattern are another two features that should be considered in future research.
Male consumers in China showed a stronger interest in buying personalgrooming products and had been spending more time shopping for themselves,especially shopping for apparel products (Bakewell, Mitchell, & Rothwell, 2006).Shirt is the most popular item chosen by Chinese male consumers for both casualand formal occasions (China Business Industry Research, 2017a, 2017b). Amongall apparel categories, the consumers of shirts are the youngest, with 65% under24 years of age (China Business Industry Research, 2017a, 2017b). Young men ofage under 24 pay more attention to apparel products with both formal style and popelements, and shirts and suits are their top choices (China Business IndustryResearch, 2017a, 2017b; Euro Monitor, 2017a, 2017b, 2017c, 2017d).
Men were found putting more emphasis on convenience when shopping andshowed a higher level of loyalty to brands than their female counterparts (Hart,Farrel, Stachow, Reed & Cadogan, 2007). Most of male consumers regardedfunctionality and practicability as the most important factors for their apparelpurchases (Frith & Gleeson, 2004). The menswear industry puts ongoing emphasison developing functional shirts to meet male consumers’ needs for function as wellas convenience. For example, durable press (DP) shirts account for 55.5% of wholevolume of shirts at Youngor (2014, 2015, 2016). Similar observations were madefrom other menswear companies in China.
With the growth of personal income and shirt consumers getting younger, thefunctionality of shirts seemed no longer to be the only feature that menswearcompanies should improve (EFU, 2017). With more male consumers payingattention to unique custom service, branding, material, design, and cut, cus-tomization need is on the rise for menswear (China Business Industry Research,2017a). Among all made-to-measure categories, shirt is the second most popularitem, only after the most popular one—suit (China Business Industry Research,2017a). With the rise of the need to have unique styles on top of functionality, it isimportant for the Chinese menswear industry to examine Chinese male consumers’shopping decision for menswear, particular for shirts (EFU, 2017).
Methodology
Data for this study were collected via an online survey. The survey was distributedthrough a survey distribution agent in China named SOJUMP. A conveniencesampling method was used to recruit male consumers from the large nationalconsumer panel that SOJUPM maintains. Consumers must be 18 years of age orolder to participate. The online survey took place in June, 2016, and lasted for aboutfour weeks. The data collection process was terminated when the responses seemedsporadic. Extending the survey duration would not increase the response rategreatly. A total of 170 complete questionnaires were received at the end of the datacollection period.
Chinese Male Consumers’ High-End Shirt Consumption … 177
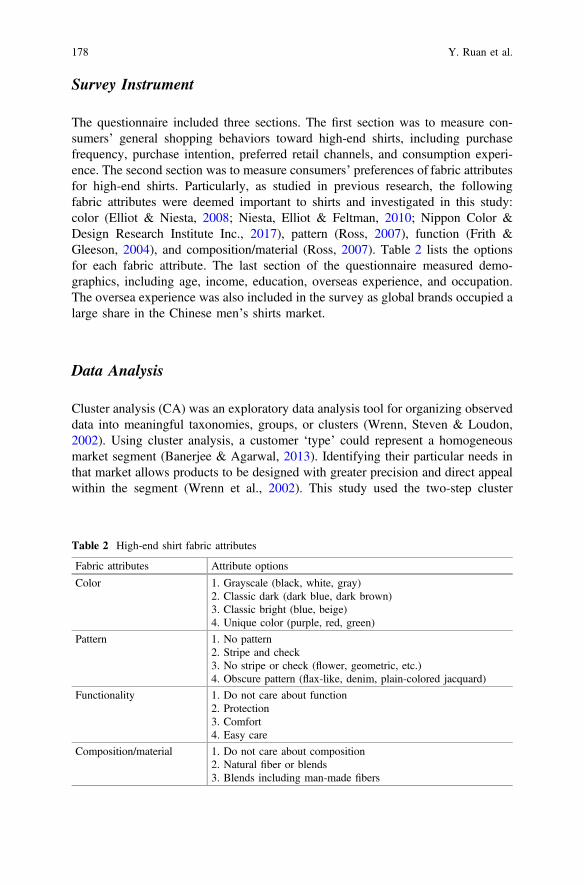
Survey Instrument
The questionnaire included three sections. The first section was to measure con-sumers’ general shopping behaviors toward high-end shirts, including purchasefrequency, purchase intention, preferred retail channels, and consumption experi-ence. The second section was to measure consumers’ preferences of fabric attributesfor high-end shirts. Particularly, as studied in previous research, the followingfabric attributes were deemed important to shirts and investigated in this study:color (Elliot & Niesta, 2008; Niesta, Elliot & Feltman, 2010; Nippon Color &Design Research Institute Inc., 2017), pattern (Ross, 2007), function (Frith &Gleeson, 2004), and composition/material (Ross, 2007). Table 2 lists the optionsfor each fabric attribute. The last section of the questionnaire measured demo-graphics, including age, income, education, overseas experience, and occupation.The oversea experience was also included in the survey as global brands occupied alarge share in the Chinese men’s shirts market.
Data Analysis
Cluster analysis (CA) was an exploratory data analysis tool for organizing observeddata into meaningful taxonomies, groups, or clusters (Wrenn, Steven & Loudon,2002). Using cluster analysis, a customer ‘type’ could represent a homogeneousmarket segment (Banerjee & Agarwal, 2013). Identifying their particular needs inthat market allows products to be designed with greater precision and direct appealwithin the segment (Wrenn et al., 2002). This study used the two-step cluster
Table 2 High-end shirt fabric attributes
Fabric attributes Attribute options
Color 1. Grayscale (black, white, gray)2. Classic dark (dark blue, dark brown)3. Classic bright (blue, beige)4. Unique color (purple, red, green)
Pattern 1. No pattern2. Stripe and check3. No stripe or check (flower, geometric, etc.)4. Obscure pattern (flax-like, denim, plain-colored jacquard)
Functionality 1. Do not care about function2. Protection3. Comfort4. Easy care
Composition/material 1. Do not care about composition2. Natural fiber or blends3. Blends including man-made fibers
178 Y. Ruan et al.
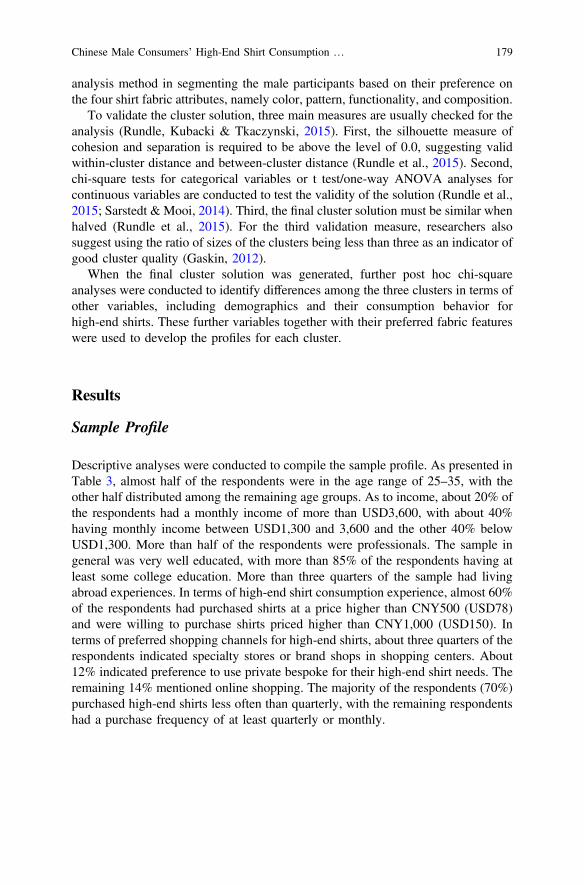
analysis method in segmenting the male participants based on their preference onthe four shirt fabric attributes, namely color, pattern, functionality, and composition.
To validate the cluster solution, three main measures are usually checked for theanalysis (Rundle, Kubacki & Tkaczynski, 2015). First, the silhouette measure ofcohesion and separation is required to be above the level of 0.0, suggesting validwithin-cluster distance and between-cluster distance (Rundle et al., 2015). Second,chi-square tests for categorical variables or t test/one-way ANOVA analyses forcontinuous variables are conducted to test the validity of the solution (Rundle et al.,2015; Sarstedt & Mooi, 2014). Third, the final cluster solution must be similar whenhalved (Rundle et al., 2015). For the third validation measure, researchers alsosuggest using the ratio of sizes of the clusters being less than three as an indicator ofgood cluster quality (Gaskin, 2012).
When the final cluster solution was generated, further post hoc chi-squareanalyses were conducted to identify differences among the three clusters in terms ofother variables, including demographics and their consumption behavior forhigh-end shirts. These further variables together with their preferred fabric featureswere used to develop the profiles for each cluster.
Results
Sample Profile
Descriptive analyses were conducted to compile the sample profile. As presented inTable 3, almost half of the respondents were in the age range of 25–35, with theother half distributed among the remaining age groups. As to income, about 20% ofthe respondents had a monthly income of more than USD3,600, with about 40%having monthly income between USD1,300 and 3,600 and the other 40% belowUSD1,300. More than half of the respondents were professionals. The sample ingeneral was very well educated, with more than 85% of the respondents having atleast some college education. More than three quarters of the sample had livingabroad experiences. In terms of high-end shirt consumption experience, almost 60%of the respondents had purchased shirts at a price higher than CNY500 (USD78)and were willing to purchase shirts priced higher than CNY1,000 (USD150). Interms of preferred shopping channels for high-end shirts, about three quarters of therespondents indicated specialty stores or brand shops in shopping centers. About12% indicated preference to use private bespoke for their high-end shirt needs. Theremaining 14% mentioned online shopping. The majority of the respondents (70%)purchased high-end shirts less often than quarterly, with the remaining respondentshad a purchase frequency of at least quarterly or monthly.
Chinese Male Consumers’ High-End Shirt Consumption … 179
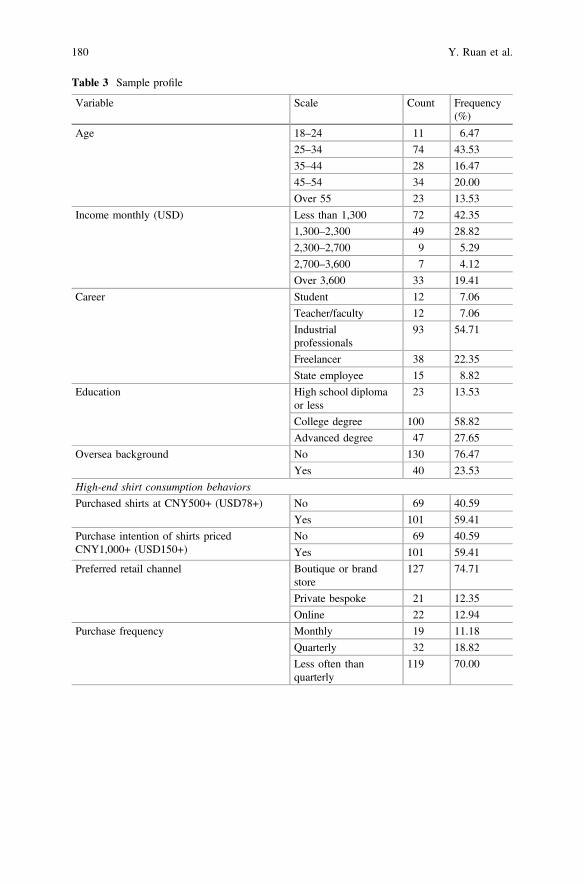
Table 3 Sample profile
Variable Scale Count Frequency(%)
Age 18–24 11 6.47
25–34 74 43.53
35–44 28 16.47
45–54 34 20.00
Over 55 23 13.53
Income monthly (USD) Less than 1,300 72 42.35
1,300–2,300 49 28.82
2,300–2,700 9 5.29
2,700–3,600 7 4.12
Over 3,600 33 19.41
Career Student 12 7.06
Teacher/faculty 12 7.06
Industrialprofessionals
93 54.71
Freelancer 38 22.35
State employee 15 8.82
Education High school diplomaor less
23 13.53
College degree 100 58.82
Advanced degree 47 27.65
Oversea background No 130 76.47
Yes 40 23.53
High-end shirt consumption behaviors
Purchased shirts at CNY500+ (USD78+) No 69 40.59
Yes 101 59.41
Purchase intention of shirts pricedCNY1,000+ (USD150+)
No 69 40.59
Yes 101 59.41
Preferred retail channel Boutique or brandstore
127 74.71
Private bespoke 21 12.35
Online 22 12.94
Purchase frequency Monthly 19 11.18
Quarterly 32 18.82
Less often thanquarterly
119 70.00
180 Y. Ruan et al.
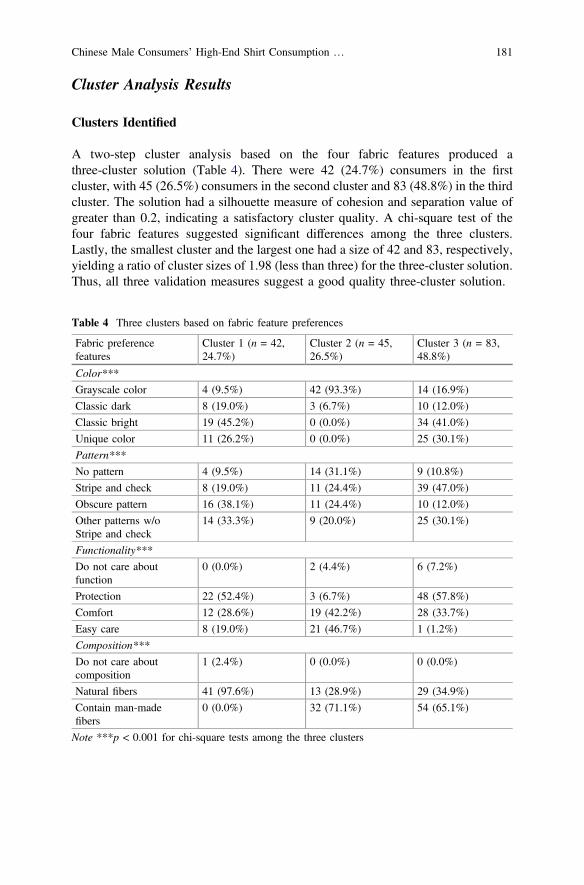
Cluster Analysis Results
Clusters Identified
A two-step cluster analysis based on the four fabric features produced athree-cluster solution (Table 4). There were 42 (24.7%) consumers in the firstcluster, with 45 (26.5%) consumers in the second cluster and 83 (48.8%) in the thirdcluster. The solution had a silhouette measure of cohesion and separation value ofgreater than 0.2, indicating a satisfactory cluster quality. A chi-square test of thefour fabric features suggested significant differences among the three clusters.Lastly, the smallest cluster and the largest one had a size of 42 and 83, respectively,yielding a ratio of cluster sizes of 1.98 (less than three) for the three-cluster solution.Thus, all three validation measures suggest a good quality three-cluster solution.
Table 4 Three clusters based on fabric feature preferences
Fabric preferencefeatures
Cluster 1 (n = 42,24.7%)
Cluster 2 (n = 45,26.5%)
Cluster 3 (n = 83,48.8%)
Color***
Grayscale color 4 (9.5%) 42 (93.3%) 14 (16.9%)
Classic dark 8 (19.0%) 3 (6.7%) 10 (12.0%)
Classic bright 19 (45.2%) 0 (0.0%) 34 (41.0%)
Unique color 11 (26.2%) 0 (0.0%) 25 (30.1%)
Pattern***
No pattern 4 (9.5%) 14 (31.1%) 9 (10.8%)
Stripe and check 8 (19.0%) 11 (24.4%) 39 (47.0%)
Obscure pattern 16 (38.1%) 11 (24.4%) 10 (12.0%)
Other patterns w/oStripe and check
14 (33.3%) 9 (20.0%) 25 (30.1%)
Functionality***
Do not care aboutfunction
0 (0.0%) 2 (4.4%) 6 (7.2%)
Protection 22 (52.4%) 3 (6.7%) 48 (57.8%)
Comfort 12 (28.6%) 19 (42.2%) 28 (33.7%)
Easy care 8 (19.0%) 21 (46.7%) 1 (1.2%)
Composition***
Do not care aboutcomposition
1 (2.4%) 0 (0.0%) 0 (0.0%)
Natural fibers 41 (97.6%) 13 (28.9%) 29 (34.9%)
Contain man-madefibers
0 (0.0%) 32 (71.1%) 54 (65.1%)
Note ***p < 0.001 for chi-square tests among the three clusters
Chinese Male Consumers’ High-End Shirt Consumption … 181
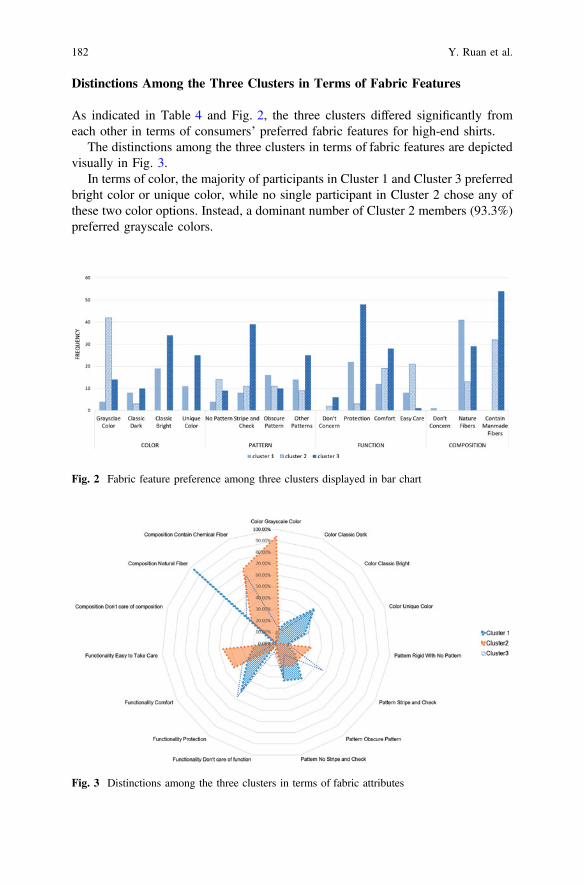
Distinctions Among the Three Clusters in Terms of Fabric Features
As indicated in Table 4 and Fig. 2, the three clusters differed significantly fromeach other in terms of consumers’ preferred fabric features for high-end shirts.
The distinctions among the three clusters in terms of fabric features are depictedvisually in Fig. 3.
In terms of color, the majority of participants in Cluster 1 and Cluster 3 preferredbright color or unique color, while no single participant in Cluster 2 chose any ofthese two color options. Instead, a dominant number of Cluster 2 members (93.3%)preferred grayscale colors.
Fig. 2 Fabric feature preference among three clusters displayed in bar chart
Fig. 3 Distinctions among the three clusters in terms of fabric attributes
182 Y. Ruan et al.
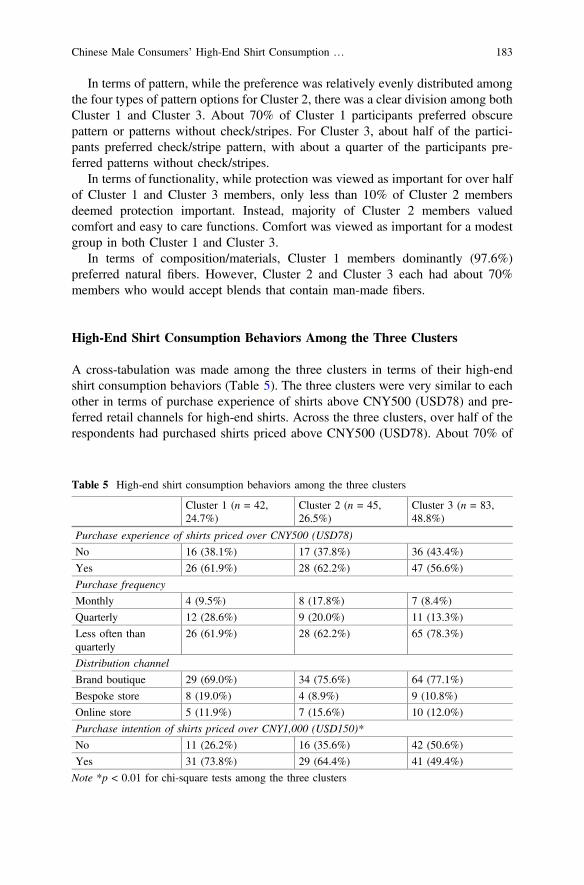
In terms of pattern, while the preference was relatively evenly distributed amongthe four types of pattern options for Cluster 2, there was a clear division among bothCluster 1 and Cluster 3. About 70% of Cluster 1 participants preferred obscurepattern or patterns without check/stripes. For Cluster 3, about half of the partici-pants preferred check/stripe pattern, with about a quarter of the participants pre-ferred patterns without check/stripes.
In terms of functionality, while protection was viewed as important for over halfof Cluster 1 and Cluster 3 members, only less than 10% of Cluster 2 membersdeemed protection important. Instead, majority of Cluster 2 members valuedcomfort and easy to care functions. Comfort was viewed as important for a modestgroup in both Cluster 1 and Cluster 3.
In terms of composition/materials, Cluster 1 members dominantly (97.6%)preferred natural fibers. However, Cluster 2 and Cluster 3 each had about 70%members who would accept blends that contain man-made fibers.
High-End Shirt Consumption Behaviors Among the Three Clusters
A cross-tabulation was made among the three clusters in terms of their high-endshirt consumption behaviors (Table 5). The three clusters were very similar to eachother in terms of purchase experience of shirts above CNY500 (USD78) and pre-ferred retail channels for high-end shirts. Across the three clusters, over half of therespondents had purchased shirts priced above CNY500 (USD78). About 70% of
Table 5 High-end shirt consumption behaviors among the three clusters
Cluster 1 (n = 42,24.7%)
Cluster 2 (n = 45,26.5%)
Cluster 3 (n = 83,48.8%)
Purchase experience of shirts priced over CNY500 (USD78)
No 16 (38.1%) 17 (37.8%) 36 (43.4%)
Yes 26 (61.9%) 28 (62.2%) 47 (56.6%)
Purchase frequency
Monthly 4 (9.5%) 8 (17.8%) 7 (8.4%)
Quarterly 12 (28.6%) 9 (20.0%) 11 (13.3%)
Less often thanquarterly
26 (61.9%) 28 (62.2%) 65 (78.3%)
Distribution channel
Brand boutique 29 (69.0%) 34 (75.6%) 64 (77.1%)
Bespoke store 8 (19.0%) 4 (8.9%) 9 (10.8%)
Online store 5 (11.9%) 7 (15.6%) 10 (12.0%)
Purchase intention of shirts priced over CNY1,000 (USD150)*
No 11 (26.2%) 16 (35.6%) 42 (50.6%)
Yes 31 (73.8%) 29 (64.4%) 41 (49.4%)
Note *p < 0.01 for chi-square tests among the three clusters
Chinese Male Consumers’ High-End Shirt Consumption … 183
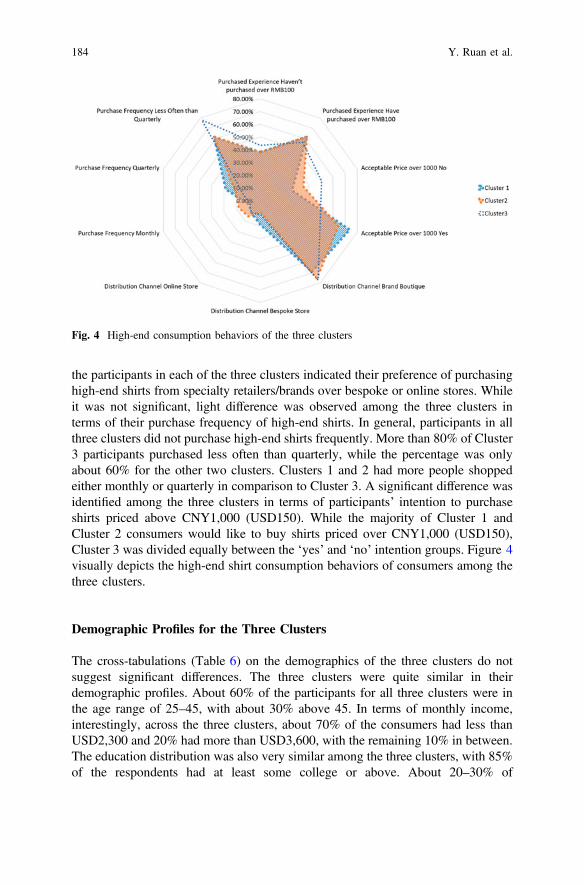
the participants in each of the three clusters indicated their preference of purchasinghigh-end shirts from specialty retailers/brands over bespoke or online stores. Whileit was not significant, light difference was observed among the three clusters interms of their purchase frequency of high-end shirts. In general, participants in allthree clusters did not purchase high-end shirts frequently. More than 80% of Cluster3 participants purchased less often than quarterly, while the percentage was onlyabout 60% for the other two clusters. Clusters 1 and 2 had more people shoppedeither monthly or quarterly in comparison to Cluster 3. A significant difference wasidentified among the three clusters in terms of participants’ intention to purchaseshirts priced above CNY1,000 (USD150). While the majority of Cluster 1 andCluster 2 consumers would like to buy shirts priced over CNY1,000 (USD150),Cluster 3 was divided equally between the ‘yes’ and ‘no’ intention groups. Figure 4visually depicts the high-end shirt consumption behaviors of consumers among thethree clusters.
Demographic Profiles for the Three Clusters
The cross-tabulations (Table 6) on the demographics of the three clusters do notsuggest significant differences. The three clusters were quite similar in theirdemographic profiles. About 60% of the participants for all three clusters were inthe age range of 25–45, with about 30% above 45. In terms of monthly income,interestingly, across the three clusters, about 70% of the consumers had less thanUSD2,300 and 20% had more than USD3,600, with the remaining 10% in between.The education distribution was also very similar among the three clusters, with 85%of the respondents had at least some college or above. About 20–30% of
Fig. 4 High-end consumption behaviors of the three clusters
184 Y. Ruan et al.
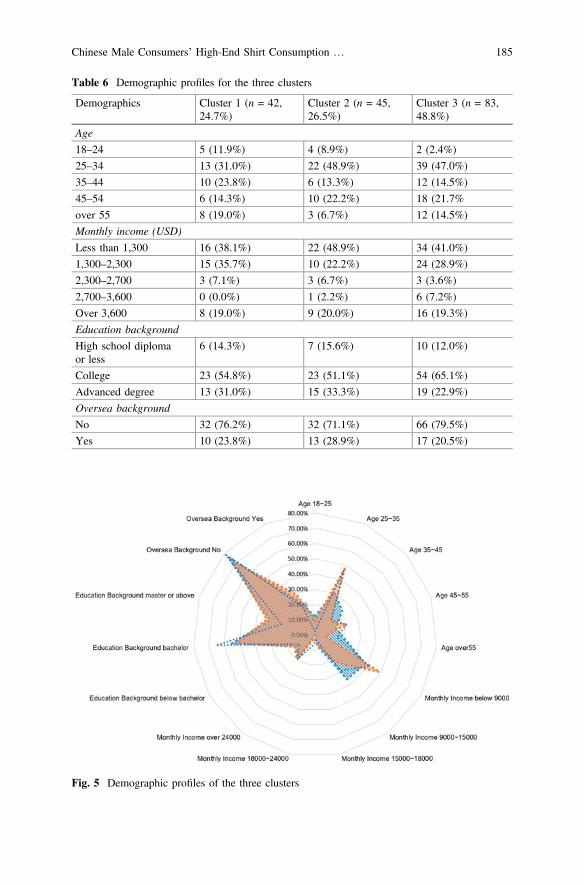
Table 6 Demographic profiles for the three clusters
Demographics Cluster 1 (n = 42,24.7%)
Cluster 2 (n = 45,26.5%)
Cluster 3 (n = 83,48.8%)
Age
18–24 5 (11.9%) 4 (8.9%) 2 (2.4%)
25–34 13 (31.0%) 22 (48.9%) 39 (47.0%)
35–44 10 (23.8%) 6 (13.3%) 12 (14.5%)
45–54 6 (14.3%) 10 (22.2%) 18 (21.7%
over 55 8 (19.0%) 3 (6.7%) 12 (14.5%)
Monthly income (USD)
Less than 1,300 16 (38.1%) 22 (48.9%) 34 (41.0%)
1,300–2,300 15 (35.7%) 10 (22.2%) 24 (28.9%)
2,300–2,700 3 (7.1%) 3 (6.7%) 3 (3.6%)
2,700–3,600 0 (0.0%) 1 (2.2%) 6 (7.2%)
Over 3,600 8 (19.0%) 9 (20.0%) 16 (19.3%)
Education background
High school diplomaor less
6 (14.3%) 7 (15.6%) 10 (12.0%)
College 23 (54.8%) 23 (51.1%) 54 (65.1%)
Advanced degree 13 (31.0%) 15 (33.3%) 19 (22.9%)
Oversea background
No 32 (76.2%) 32 (71.1%) 66 (79.5%)
Yes 10 (23.8%) 13 (28.9%) 17 (20.5%)
Fig. 5 Demographic profiles of the three clusters
Chinese Male Consumers’ High-End Shirt Consumption … 185
respondents in each cluster had overseas experiences. Figure 5 depicts the demo-graphic profiles of the three clusters.
Conclusions
With rising disposable incomes and male consumers’ increasing interest in personalgrooming products, the Chinese menswear market is growing tremendously. Shirt isone of the most popular menswear items chosen by Chinese male consumers forboth casual and formal occasions. While the shirt market is growing, there are fewshirt fabric brands in the Chinese market. At the same time, while many Chinesefabric manufacturers possess great capacity in producing high-end fabrics andsupply to globally known upscale shirt brands, no fabric brand is in existence inChina for high-end shirts. Realizing that ingredient (fabric) branding can bringadditional value to the final product (shirts), especially for upscale products, itmight be to the great benefits of the current fabric enterprises to brand their fabricproducts. Consumer insights of the high-end men’s shirt market in China are verycritical, but lacking. The current study was designed to fulfill this gap.
Based on consumers’ preference of fabric features for high-end shirts, threedistinctive clusters were identified in this study. Consumers in Cluster 1 had a highintention to purchase high-end shirts and developed a taste and an appreciation offashion in their high-end shirt consumption. Consumers in Cluster 2 exhibited apragmatic orientation by focusing on the easy-care function of the shirts andchoosing online shopping. Fashion seemed not so important to these pragmaticconsumers as they favored grayscale colors and plain no-pattern fabric. Man-madefibers were most accepted by these consumers. Consumers in Cluster 3, like thosepremium consumers in Cluster 1, displayed a strong taste and appreciation offashion through their preference in fabric features. However, these consumers didnot have the same purchase frequency and purchase intention for high-end shirtscompared to the premium consumers. The following is a detailed characterizationfor each cluster identified in the study.
Cluster 1: Premium Consumers
About a quarter of the respondents belonged to this cluster of premium consumers.The members of this cluster shared a similar preference of high-end shirts in termsof color, pattern, materials, and functions. Fashion seemed to be valued by thesepremium consumers. They preferred bright and unique colors and more sophisti-cated patterns such as obscure patterns and patterns without traditional stripe andcheck components. Natural fibers were extremely important to these consumers. Interms of function, they preferred protection and comfort. But, in contrast, theattribute of easy care seemed not important for these consumers. These consumers
186 Y. Ruan et al.
also had a significantly much higher intention in purchasing high-end shirts pricedabove CNY1,000 (USD150). Similar to the other two clusters, consumers in thiscluster mainly shopped at special stores for high-end shirts. While the differencewas not significant, a relatively higher percentage of consumers in this cluster usedbespoke to fulfill their needs for high-end shirts than consumers in the other twoclusters. In terms of demographics, this cluster had a high percentage of membersholding a more advanced degree. Also, this cluster seemed having a relativelyheavier concentration on the age groups of 35–45 and over 55. While the incomedistributions seemed not so different among the three clusters, this cluster relativelyhad a heavier concentration of high-income consumers.
Cluster 2: Pragmatic Consumers
This cluster took up another quarter of the sample. The consumers in this clustermanifested a high pragmatic orientation. Fashion was not viewed as important tothese consumers as to the premium consumers. A dominant percentage of theseconsumers preferred grayscale colors with no one showing interest in bright orunique colors. Worth noting, a high percentage of consumers in this cluster pre-ferred no-pattern plain shirts. The preference for other patterns was equally dis-tributed among the members. Another manifestation of these consumers’ pragmaticorientation was their strong attention to comfort and the easy-care function of theshirts. And relevantly, these consumers were agreeable to have their shirts made ofman-made fibers. While not as many as in the first cluster, over 60% of consumersin this cluster indicated interests in purchasing high-end shirts priced aboveCNY1,000 (USD150). The retail channels used to high-end shirts were prettysimilar to the other two clusters, but with a relatively heavier usage of online stores.Comparing to the other two clusters, consumers in this cluster purchased high-endshirts more frequently. In terms of demographic, the education level was prettysimilar to the first cluster with a high percentage of consumers holding an advanceddegree.
Cluster 3: Economic Consumers
Around half of the respondents fell into Cluster 3. These consumers indicated theweakest intention to purchase high-end shirts priced above CNY1,000 (USD150)and purchased high-end shirts least frequently. A high percentage of consumers inthis cluster could accept man-made fiber materials for high-end shirts. While beingeconomic, these consumers paid similar attention to fashion as the premium con-sumers did, in that they favored bright or unique colors and functions of protectionand comfort. However, these consumers either loved or hated the traditional stripeand/or check patterns. They had similar preference to consumers in the other two
Chinese Male Consumers’ High-End Shirt Consumption … 187
clusters in terms of shopping channels for high-end shirts, but with relatively morepatronage at special stores. In terms of demographics, again no significant differ-ence was identified among the groups. However, this cluster had a relatively heavierconcentration on college education, while the other two clusters had more membersholding a more advanced degree.
Among the three clusters, the economic consumers cluster represented the largestgroup including about half of the respondents. These consumers had a keen interestin and taste for high-end shirts, but their purchase intention was the lowest for shirtspriced above CNY1,000 (USD150) and their high-end shirt purchase was the leastfrequent. In comparison, the premium consumers and pragmatic consumers weremore likely to be the target market for high-end shirts in terms of their purchaseexperience and intention. However, much difference was found between these twogroups in their shirt consumptions with one fashion oriented and the other utilitarianoriented reflected by their fabric attribute preference. These findings can providegreat consumer insights for the high-end shirt brands as well as fabric brands in theirproduct development and marketing endeavors serving the Chinese market.
Limitations and Future Research
While very insightful, the study bears several limitations. First limitation comesfrom the small convenience sample. Therefore, the results need to be generalizedwith caution. Secondly, the three clusters did not distinguish from each other sig-nificantly in terms of demographics. The limitation from the convenience samplemight have partially contributed to the insignificance. But, future research couldalso explore the possibility of difference among the segments in terms of othervariables, such as lifestyle, personality, social class. Also, future studies couldinvestigate Chinese male consumers’ high-end shirt consumption behaviors fromother perspectives, such as brand loyalty, country of origin influence, fit/stylepreference, and consumption motivations.
References
Albini. (2017). Albini official website. Accessed October, 2017 online at: https://www.albinigroup.com/.
Alumo. (2017). Alumo official website. Accessed October, 2017 online at: https://www.alumo.ch/en.
Bakewell, C., Mitchell, V. W., & Rothwell, M. (2006). UK generation Y male fashionconsciousness. Journal of Fashion Marketing and Management: An International Journal, 10(2), 169–180.
Banerjee, S., & Agarwal, N. (2013). Cluster and conjoint analysis of the entry level brands incasual wear market in India w.r.t. product attributes. Journal of Marketing & Communication,8(4).
188 Y. Ruan et al.
Bizvibe. (2015). Global menswear market growth shows no signs of slowing. Accessed October,2017 online at: http://www.bizvibe.com/blog/global-menswear-market-growth-shows-no-signs-slowing/.
Business of Fashion. (2014). No signs of slowing in the global menswear market. AccessedOctober, 2017 online at: http://www.businessoffashion.com/articles/fashion-show-review/signs-slowing-global-menswear-market.
Canclini. (2017). Canclini official website. Accessed October, 2017 online at: https://www.canclini.it/.
China Business Industry Research. (2016). Prospect report of 2017 China formal menswearmarket size. Accessed October, 2017 online at: http://www.askci.com/news/chanye/20161216/10335783176.shtml (in Chinese).
China Business Industry Research. (2017a). Analysis report of 2017 China menswear industry.Accessed October, 2017 online at: www.askci.com/news/chanye/20170802/103450104420.shtml (in Chinese).
China Business Industry Research. (2017b). The size and development prospect of China’smenswear market in 2017. Accessed October, 2017 online at: www.askci.com/news/life/20161216/10225283169.shtml (in Chinese).
China Luxury Advisors. (2015). China luxury advisor’s thought leadership. Accessed October,2017 online at: http://chinaluxuryadvisors.com/chinas-menswear-market-shifts-into-high-gear/.
China Textile Planning Research Association. (2014). Analysis on the overall characteristics ofChina’s textile and apparel listed companies and their investment value. Accessed November,2017 online at: http://www.ctpra.com/hyzx/hyxw/201409/t20140926_1844699.html (inChinese).
Edited. (2016). Spring 2017 menswear: Market growth & trends. Accessed October, 2017 onlineat: http://edited.com/blog/2016/06/menswears-magic-moment/.
Elliot, A. J., & Niesta, D. (2008). Romantic red: Red enhances men’s attraction to women. Journalof Personality and Social Psychology, 95(5), 1150.
EFU. (2017). “2017 China men’s wear industry development report” released, which showedgreater competition. Accessed October, 2017 online at: http://news.efu.com.cn/newsview-1234248-1.html.
Euro Monitor. (2017a). Apparel and footwear global industry overview. Accessed October, 2017online at: http://www.portal.euromonitor.com.prox.lib.ncsu.edu/portal/analysis/tab.
Euro Monitor. (2017b). Menswear in Western Europe. Accessed October, 2017 online at: http://www.portal.euromonitor.com.prox.lib.ncsu.edu/portal/analysis/tab.
Euro Monitor. (2017c).Menswear in the US. Accessed October, 2017 online at: http://www.portal.euromonitor.com.prox.lib.ncsu.edu/portal/analysis/tab.
Euro Monitor. (2017d). Menswear in China. Accessed October, 2017 online at: http://www.portal.euromonitor.com.prox.lib.ncsu.edu/portal/analysis/tab.
Fashion United. (2016). Menswear will “spearhead” growth in clothing market. AccessedOctober, 2017 online at: http://fashionunited.uk/news/retail/menswear-will-spearhead-growth-in-clothing-market/2016072721202.
Frith, H., & Gleeson, K. (2004). Clothing and embodiment: Men managing body image andappearance. Psychology of men and masculinity, 5(1), 40–48.
Gentleman’s Gazette. (2010). Shirt basics guide: Material & fabric. Accessed October, 2017online at: https://www.gentlemansgazette.com/shirt-guide-basics-weaves.
Gentleman’s Gazette. (2013). The dress shirt guide-making & hallmarks of a quality shirt.Accessed October, 2017 online at: https://www.gentlemansgazette.com/dress-shirt-guide-making-hallmarks-quality.
Getzner. (2017). Getzner official website. Accessed October, 2017 online at: https://www.getzner.at/en/.
Giuseppe. (2014). Annual financial report. Accessed October, 2017 online at: http://money.finance.sina.com.cn/corp/view/vCB_AllBulletinDetail.php?stockid=002687&id=1691805 (inChinese).
Chinese Male Consumers’ High-End Shirt Consumption … 189

Giuseppe. (2015). Annual financial report. Accessed October, 2017 online at: http://money.finance.sina.com.cn/corp/view/vCB_AllBulletinDetail.php?stockid=002687&id=2284193 (inChinese).
Giuseppe. (2016). Annual financial report. Accessed October, 2017 online at: http://money.finance.sina.com.cn/corp/view/vCB_AllBulletinDetail.php?stockid=002687&id=3246362 (inChinese).
Guokr. (2014). Standard of high quality shirts. Accessed October, 2017 online at: https://www.guokr.com/post/562905 (in Chinese).
Hart, C., Farrell, A. M., Stachow, G., Reed, G., & Cadogan, J. W. (2007). Enjoyment of theshopping experience: Impact on customers’ repatronage intentions and gender influence. TheService Industries Journal, 27(5), 583–604.
Heilan Home. (2014). Annual financial report. Accessed October, 2017 online at: http://money.finance.sina.com.cn/corp/view/vCB_AllBulletinDetail.php?stockid=600398&id=1639492 (inChinese).
Heilan Home. (2015). Annual financial report. Accessed October, 2017 online at: http://money.finance.sina.com.cn/corp/view/vCB_AllBulletinDetail.php?stockid=600398&id=2406054 (inChinese).
Heilan Home. (2016). Annual financial report. Accessed October, 2017 online at: http://money.finance.sina.com.cn/corp/view/vCB_AllBulletinDetail.php?stockid=600398&id=3102059 (inChinese).
Gaskin, J. (2012). Two step cluster analysis in SPSS. Accessed October, 2017 online at: https://www.youtube.com/watch?v=DpucueFsigA.
Mintel. (2016). Men’s clothing. Accessed October, 2017 online at: http://reports.mintel.com/display/747672/.
Mintel. (2017). Menswear market becomes more competitive. Accessed October, 2017 online at:http://academic.mintel.com/Sinatra/oxygen/print/id=840853.
Monti. (2017). Monti official website. Accessed October, 2017 online at: https://www.monti.it/.Niesta Kayser, D., Elliot, A. J., & Feltman, R. (2010). Red and romantic behavior in men viewing
women. European Journal of Social Psychology, 40(6), 901–908.Nippon Color & Design Research Institute Inc. (2017). Image scale system. Accessed October,
2017 online at: http://www.ncd-ri.co.jp/english/main_0104.html.Osgerby, B. (2003). A pedigree of the consuming male: masculinity, consumption and the
American ‘leisure class’. The Sociological Review, 51(S1), 57–85.Pinpai China. (2017). R&D of private customized system to promote the transformation of
enterprise. Accessed October, 2017 online at: http://pinpai.china.com.cn/yxl/2017-04/18/content_9440894.htm (in Chinese).
Prnewswire. (2016). Global menswear market to grow at a CAGR of 4.51% till 2020. AccessedOctober, 2017 online at: http://www.prnewswire.com/news-releases/global-menswear-market-to-grow-at-a-cagr-of-451-till-2020-300329086.html.
Rinallo, D. (2007). Metro/fashion/tribes of men: Negotiating the boundaries of men’s legitimateconsumption. Consumer tribes, 76–92.
Ross, F. (2007). Refashioning London’s bespoke and demi-bespoke tailors: New textiles,technology and design in contemporary menswear. Journal of the Textile Institute, 98(3),281–288.
Rundle-Thiele, S., Kubacki, K., Tkaczynski, A., & Parkinson, J. (2015). Using two-step clusteranalysis to identify homogeneous physical activity groups. Marketing Intelligence & Planning,33(4), 522–537.
Saint Angelo. (2014). Annual financial report. Accessed October, 2017 online at: http://finance.sina.com.cn/corp/view/vCB_AllBulletinDetail.php?stockid=002154&id=1680304 (in Chinese).
Saint Angelo. (2015). Annual financial report. Accessed October, 2017 online at: http://money.finance.sina.com.cn/corp/view/vCB_AllBulletinDetail.php?stockid=002154&id=2389108 (inChinese).
190 Y. Ruan et al.
Saint Angelo. (2016). Annual financial report. Accessed October, 2017 online at: http://money.finance.sina.com.cn/corp/view/vCB_AllBulletinDetail.php?stockid=002154&id=3335442 (inChinese).
Sarstedt, M., & Mooi, E. (2014). Cluster analysis. In A concise guide to market research (pp. 273–324). Berlin, Heidelberg: Springer. Retrieved from: http://www.bookmetrix.com/detail/chapter/0a55d9dc-a197-4ffa-ba79-362a8db95023#downloads.
Septwolves. (2014). Annual financial report. Accessed October, 2017 online at: http://money.finance.sina.com.cn/corp/view/vCB_AllBulletinDetail.php?stockid=002029&id=1692878 (inChinese).
Septwolves. (2015). Annual financial report. Accessed October, 2017 online at: http://money.finance.sina.com.cn/corp/view/vCB_AllBulletinDetail.php?stockid=002029&id=2312955 (inChinese).
Septwolves. (2016). Annual financial report. Accessed October, 2017 online at: http://money.finance.sina.com.cn/corp/view/vCB_AllBulletinDetail.php?stockid=002029&id=3177240 (inChinese).
Shaw, P., & Tan, Y. (2014). Race and masculinity: A comparison of Asian and Western models inmen’s lifestyle magazine advertisements. Journalism & Mass Communication Quarterly,91(1), 118–138.
Soktas. (2017). Soktas official website. Accessed October, 2017 online at: https://www.soktas.com.tr/.
Storey, N. (2008). History of men’s fashion (pp. 99–104). South Yorkshire, Great Britain:Remember When Publishing.
Testa. (2017). Testa official website. Accessed October, 2017 online at: https://www.testaspa.com/site/.
Wrenn, B., Steven, R. E., & Loudon, D. L. (2002). Text and cases (2nd ed.). New York: TheHaworth Press. Retrieved from: https://zh.scribd.com/doc/102616412/Marketing-Research-Text-and-Cases.
Youngor. (2014). Annual financial report. Accessed October, 2017 online at: http://money.finance.sina.com.cn/corp/view/vCB_AllBulletinDetail.php?stockid=600177&id=1769289 (inChinese).
Youngor. (2015). Annual financial report. Accessed October, 2017 online at: http://money.finance.sina.com.cn/corp/view/vCB_AllBulletinDetail.php?stockid=600177&id=2439244 (inChinese).
Youngor. (2016). Annual financial report. Accessed October, 2017 online at: http://money.finance.sina.com.cn/corp/view/vCB_AllBulletinDetail.php?stockid=600177&id=3367452 (inChinese).
Chinese Male Consumers’ High-End Shirt Consumption … 191
Chinese Consumers and the KnitwearFashion Market
Xin Zhang, Colin Gale and Claudia Eckert
Abstract The Chinese knitwear industry is in crisis and needs to adapt to survive.Chinese knitwear brands face the problems of a shrinking domestic market, anaging consumer base, and lack of appeal to new generations. Meanwhile, productscreated by the industry are becoming more homogeneous. Influenced by global-ization, Chinese consumers have a wide choice of products with different styles andbrands in the fashion market. As more and more international brands enter into theChinese market, offering clothes that appeal to younger consumers, the challengefor many established Chinese fashion brands, especially in knitwear, is increasing.This paper reports on research into creative design in Chinese knitwear brands,which revealed that the Chinese knitwear industry is lacking a creative culture. Inmany knitwear companies in China, the lack of understanding of the value of designstems from a number of factors: restricted creative freedom for designers in com-panies and an absence of practice in the design education system for creativeprocesses to develop. This results in companies lacking confidence in theirdesigners’ creative abilities. This paper introduces the Chinese knitwear market andfashion consumers in China. It discusses why many Chinese consumers preferluxury or international brands rather than domestic brands and analyses the gaps increative design between Chinese and successful international brands. This is basedon research into consumer behavior for knitwear. It concludes by making recom-mendations on how the industry can turn things around.
Keywords Chinese fashion market � Knitwear design � Consumer behaviorsDesign culture � Consumption trend
X. Zhang (&) � C. GaleBirmingham City University, Birmingham, UKe-mail: [email protected]
C. Galee-mail: [email protected]
C. EckertOpen University, Milton Keynes, UKe-mail: [email protected]
© Springer Nature Singapore Pte Ltd. 2018Y. Xu et al. (eds.), Chinese Consumers and the Fashion Market, Springer Seriesin Fashion Business, https://doi.org/10.1007/978-981-10-8429-4_9
193
Introduction
China has grown into an important market after the reforms and opening policies,which began in the 1980s. Income, quality of life, and consumption power of Chinesepeople have rapidly improved with the growing Chinese economy. Many interna-tional fashion brands, including numerous luxury and fast fashion brands such asGucci, Louis Vuitton, and Zara, have opened stores in China with local Chinesebrands also becoming established. In the knitwear industry, two types of knitwearbrands play an important role in the Chinese retail market: Merino wool garments,mostly located in Zhejiang province, and cashmere knitwear and related productsfrom Inner Mongolia, Zhejiang Province and Shenzhen city. Chinese knitwear hastraditionally occupied large-sale areas in department stores in China with strong salesperformances. Since their peak around the year 2000, many Chinese knitwear brandsfaced a shrinking market and aging consumers (Anon, 2008). While cashmereknitwear brands are still represented in many department stores, it has become almostimpossible to find merino knitwear brands in department stores in China. But, wherethere are knitwear products, they have traditional and conservative styles and thedesigns are very similar to each other. This undermines competitiveness and does notattract a new generation of customers. This research focuses on the problems inChinese knitwear design culture and brand strategies and aims to identify ways tosupport the knitwear companies to improve their brands and bring back their marketshare. The findings are based the first author’s experience as an industrial knitweardesigner in China from the late 1990s to the present, as well as interviews with otherdesigners and managers in knitwear companies.
In the first part of Section “Background”, the problems of the Chinese knitwearsector are examined by reviewing the past and current state of the industry and thechanges that have occurred. This then explains how consumers attitudes havechanged and the rise in lifestyle and consumption has affected traditional retailsystems, including counterfeiting. Different types of company behaviors areintroduced in the final part of this section. Section “Methodology” introduces theresearch methodology. Due to the issues, the knitwear industry needs to respond,but faces its own challenges, particularly in brand identity, poor market structureand weak design culture which is explained in Section “The Challenges of theChinese Knitwear Industry”. This is in part caused by limitations in design edu-cation in China. The recommendations and suggestions will be discussed inSection “Recommendation for Changing the Situation”. Finally, it is concluded thatthe Chinese knitwear industry is in crisis and needs to adapt to survive.
Background
Knitwear must be seen in the wider context of fashion in China. This requiresunderstanding both the brands and the Chinese customers.
194 X. Zhang et al.
Knitwear Industry in China
China has become a more dynamic and significant market in the last few decades.The continually growing economy has increased income for a significant number ofpeople. In particular, middle class spending on luxury goods has been expanding.For example, Chinese consumers spent around $116.8 billion on luxury goods in2015, which represents 46% of luxury consumption worldwide (Anon, 2016). Onaverage, this market increased by around $6 billion per year between 2009 and2015 (Li, Li, & Kambele, 2012).
Global Versus Domestic Brands
Many famous global brands have their own flagship stores in China, occupying theprime locations in commercial centers in the more economically developed cities. Forinstance, in Guangzhou, the third largest Chinese city, more than ten shopping centerswith the best positions given to famous high-class international brands, to attractcustomers into shopping areas or shopping malls. Although the first Chinese fashioncompany was founded in 1917 in Shanghai (Tsui, 2010), it was not until the reform inthe 1980s that domestic brands grew and expanded. After this opening up of China,national brands gradually developed through the 1980s and 1990s (Li, 2004). Manybrands developed quality products leading to success in the Chinesemarket back then.Interestingly, there were over 5000 knitwear companies and around 180 brands inChina in the 1990s (Yang, 2009). Most knitwear companies were running theirbusinesses as knitwear suppliers (5000) rather than brands (180). After that, more andmore knitwear companies began to run their own labels. Some of them developed andbecame large businesses by the early 2000s, covering most Chinese provinces. Somebrands such as the cashmere brand Erdos had over 1500 stores at their peak time.However, there is now a different trend in the Chinese fashion market.
Brand Proliferation in the Market
There are thousands of clothing brands in the Chinese retail system, and new brandsappear in the market every year, while others disappear. For example, the authorsfound that some knitwear brands had hundreds of millions US$ annual volumesales, but profits were low, just covering their costs. This was due to a highpercentage of discounted products. The situation even resulted in setting up a newbusiness for selling inventory goods. In 2012, the annual business sales in theChinese biggest inventory market from Yiwu city Zhejiang province were over5 billion US$ (Chen, 2013).
Some famous Chinese brands have recently closed most of their retail stores.These companies used to be developing quickly and expanded in a short periodwithout analyzing their market demand. They did not have enough experience to
Chinese Consumers and the Knitwear Fashion Market 195

run a successful brand, which resulted in too many stores with high expenditure andmany unpopular clothes to sell. The companies also compete with other brands withvery similar product offerings. For example, to occupy a greater market share, somecashmere companies were running three or four brands with slightly different yarns,but similar designs. However, most of these brands did not further develop as theyexpected. In fact, too many indistinctive brands proved unattractive as consumersbecome exposed to global brands. Unsold stock is kept in the stores at the end of theseason and discounted, leaving many Chinese brands with surprisingly large stocks(Chen, 2013). Most knitwear brands try to relieve their inventory pressure bykeeping discounted products on sale throughout the year rather than discounting atcertain time of the year. This points to a lack of good system for both marketforecast and management of their products.
Decline of Chinese Brands
Chinese fashion brands have developed quickly over the past four decades. Many ofthem have developed from small factories with a few employees to big companieswith hundreds of chain stores during their peak time. However, there has been adecline in sale performance facing the domestic brands in recent years in the Chinesefashion market. Since 2012, many large Chinese brands have had to close largenumbers of their shops (Zhang, 2016). For example, Chinese sports brands closedover 3000 stores between 2012 and 2014, and Bosideng closed around 5000 stores upto 2015, which all reflect the problems arising both from economic slowdown and anunsustainable rapid expansion. Chinese knitwear brands that are specialized in asingle type of product suffered more than diversified fashion brands. Chinese woolknitwear brands almost disappeared in most big cities, and many small- andmiddle-scale cashmere brands went out of business between 2000 and 2010. Forinstance, in 2008, there were 718 Merino woolen knitwear brands with 2.6% ofsalerooms and 295 cashmere knitwear brands with 8% of salerooms in Beijing’sfashion market (Anon, 2009). Now, there are only around 10 big cashmere knitwearbrands left in Beijing. Most of the declining knitwear brands do not have clear andstrong brand personalities; their products are easily replaced by other similar productswith cheaper prices. The situation reflects a trend for oversupply in the Chinesefashion market leading to increased competition and brand failure (Liu, 2007).
Fashion Consumers in China
Lifestyle and Value Changes
China is attracting the world’s attention with its rapid economic growth. The qualityof life is rising universally across the country with improvements in the standard ofliving and lifestyle changes (Xu, 2013). Chinese people were used to buying clothes
196 X. Zhang et al.
just to satisfy their basic needs, such as keeping warm. After consumers’ incomeincreased in the last few decades their consumption style has changed. People useclothes to express their style and individuality as well as their status and positions intheir social life (Xu, 2013). According to statistics, by the end of 2013, China hasbecome the world’s largest consumer market for luxury goods (Sun, 2014). “Faceconsciousness” is an important cultural aspiration for the Chinese society. The“face” means personal need of sense of social values reflecting from other membersin society, which is also reflected by people’s fashion consumptions and shoppingbehaviors nowadays (Chen, 2011). Face culture is part of traditional Chinese shameculture, which is influenced by Confucianism; people are keen on “seekingself-perfection” and “fear of loosing face,” and “the feeling state after one’s face hasbeen lost” (Zhang, 2015). Therefore, many people care about the feelings othershave toward them and the feedback they get on their appearance including theirclothes, because this is related to their “face.” This influences their personal image,social status, wealth, and social networks (Chen, 2011). Thus, most Chinese con-sumers look for social identities through their clothes and quality of life, which ledto many pursuing famous brands and comparing themselves to others in theChinese society (Chen, 2011). Chinese people, especially those living in largecities, adore luxury lifestyles and prefer showing their success to others by wearingor using high-price products. Influenced by this “face” culture, many people useexpensive products not because of the products’ function but to meet a psycho-logical need, conform to peer pressure, or sometimes just to draw other people’sattention. This is particularly true for young people (Zhao, 2009). For example, inrecent years, many college students are using parents’ money to buy luxury goods.Some of them are not from rich families but still ask money from their parents, andsome students even borrow money from others just to satisfy their consumptiondesires (Anon, 2017).
Consumer Groups and Consumption Preferences
Many Chinese fashion brands are keen to segment target consumers by age, as eachgeneration has grown up in a totally different situation and has different educationalbackgrounds. According to Euromonitor International (2017) “young adults”(people born from 1980s to 2000s) care about individual identity; the “middleyouth” (1960s–1990s) care more about balancing their lives and jobs; the“mid-lifers” (1940s–1970s) have strong purchasing power and like luxury brands;and the “later-lifers” (1920s–1960s) make health and healthcare a big priority forthem. Wang (2014) divided the main Chinese fashion consumers into three agegroups, which includes people born during 1970s or 1980s or 1990s.“Most of 70sconsumers have temperance and cherish what comes to them”; Chinese of the 80sreceived better education and high-quality culture, along with globalization anddevelopment of the Internet, and they have formed their own characteristic ofpursuing personality and innovation without being restrained by traditions; “For the90s, they are a fast-growing consuming group; they are not just individuals
Chinese Consumers and the Knitwear Fashion Market 197
consuming, but also have a great influence on family purchasing” (Wang, 2014).Chinese born in the “80s and 90s are becoming the core consumer group, whilemost of 70s have been the backbone force of the society” (Wang, 2014). Comparedwith young consumer fashion brands, there are few brands designed formiddle-aged consumers. Normally, there are two opposite types of brands formiddle age groups; one offering old-fashioned clothes with low qualities and prices,and another offering higher quality with expensive prices. This does not leaveenough choices for middle-aged consumers for fashionable clothes with reasonableprices in Chinese fashion markets (Yu, 2015). Based on different income andpersonal background Yu (2015) identified the following five types of consumptiontypes: free and simple; indifferent; following fashion; style conscious; and con-servative. The elderly are keen to buy clothes for their basic physiological needs,but care about the price of the clothes (Lao, 2013). Consumers can also be dividedby cities and areas. There are four tiers of cities with different development levels inChina. Generally, people living in the first-tier cities are more influenced by culturalglobalization and are quicker to follow international trends, while people inthird-tier cities or remote areas are more conservative. For example, many Shanghaipeople prefer to buy fashion products when they travel to other countries (Ye,2013), which mean their fashion tastes are closer to international brands.
China is a large country with 56 different ethnic groups in different regions. Thedifferent ethnic groups or areas have their own fashion cultures and aestheticalstandards. This reflects their lifestyles and different preferences in clothes styles andcolors. For example, one knitwear brand has always sold clothes with differentcolors to different provinces in China. Thus, if knitwear brands want to meetconsumers’ expectations, they have to build clear brand and market positioning.
Traditional In-store Retailers
The traditional in-store retailers face many challenges from changes in the Chinesemarket. Many Chinese city people, with busy jobs or care duties, do not haveenough time to go to shops after work or on weekends. Many Chinese people arenow buying goods in online stores, because they are offered at cheaper prices withfast delivery and convenience. Thus, over 97% of city consumers think about onlineshopping first when they need to buy something (Anon, 2013). This puts traditionalretailers under pressure, especially the traditional department stores. During 2012 to2014, over 200 department stores were closed in China (Situ, 2015). Firstly, fewerpeople now visit traditional department stores, because customers prefer shoppingmalls with entertainment and leisure facilities as it has become popular to mergeshopping and leisure activities. Secondly, traditional department stores offer manybrands with similar products without distinguishing characteristics. For example,many department stores in China used to devote an entire floor to knitwear brands,but have now changed to shopping mall style arrangements where all the items ofone brand are kept together. These changes have caused many Chinese knitwearbrands to disappear from many cities, because of their single product structure and
198 X. Zhang et al.
old-fashion styles. At the same time, the increase in rental and staff costs has alsocaused the profits of department stores to decline from around 7–8% per year to 2and 3% (Lin, 2012).
Over Consumption
Over consumption refers to people buying (much) more than they need. Largenumbers of Chinese consumers over consume fashion products (Xu, 2015). This isinfluenced by Chinese shame culture, “shame is a group rather than an individualconcern in China: people almost always belong to a closely integrated group onwhich their honor or shame is reflected” (Zhang, 2015). Thus, many people sub-consciously compare themselves to others clothes and lifestyles within social orfriendship groups. In a social group someone might feel shame, if their clothes orappearance are not as good as that of their social peers. Therefore, many Chinesepeople buy luxury goods although their incomes are not high enough. For example,it is common for a young woman to spend a few months’ salary on a luxury bag. InChinese culture, many people believe that paying attention to pomp and luxury isseen as a symbol of success and status (Liang & Wang, 2007). There is a clear trendtoward luxury consumption among younger people, although they do not haveenough income to afford the luxury products in China. The average monthly incomeof a Chinese luxury consumer was 5288 Chinese Yuan (around $768) in 2011.However, the average age of Chinese consumers for the global luxury brands is15 years younger than in Europe and 25 years less than the US (Qin, 2012). On theother hand, after the fast fashion brands have become popular in China, manypeople’s consumption patterns have changed, because fast fashion brands encour-age people to keep following fashion trends by buying fast-changing consumergoods. Consumers buy many clothes to ensure they appear fashionable; however,many garments can just be used for one season because of bad quality and easilyoutdated designs. Considering these consumption trends, traditional knitwearbrands may meet big challenge in the markets, when consumers have many clothesat home for their basic needs. Consumers have high aesthetic requirements whenthey decide to buy a new item. Therefore, it is opinion of the author that for most ofthe Chinese knitwear brands, valuable raw materials and functionality are still theselling points rather than design and brand.
Counterfeits
Counterfeit goods refer to a class of illegal goods, which are a complete imitation ofbrand products in terms of brand name, trademark, function, appearance, and otheraspects (Lai & Zaichkowsky, 1999). Compared with the brand products, counterfeitgoods can be of inferior quality, but are much cheaper (Lai & Zaichkowsky, 1999).There is a large group of people in China, who aspire to luxury goods, but cannotafford them, which leaves a gap in the market for cheap imitation-luxury goods.
Chinese Consumers and the Knitwear Fashion Market 199
While being illegal in China, some people take the risk and sell counterfeit goods incovert ways because it is a quick way to make money. On the other hand, manyconsumers do not have the ability to distinguish which products are original or fake(Lai & Zaichkowsky, 1999). In addition, many people are not aware of copyrightand buy counterfeits products without being aware that they use an illegal product.
There is little cultural awareness in general of intellectual property rights. Infashion, even if designs are not direct counterfeit they can be very similar in termsof colors, patterns, and details to the designs of other brands. Most Chinese fashionbrands prefer to copy parts of designs from famous brands rather than use newdesigns created by their own design teams. In the knitwear industry, the situation iseven more extreme, because a limited number of yarns are used by most knitwearbrands leading to greater homogenizations than with fashion products with manykinds of fabric. Knitwear brands also prefer to copy each other to reduce the marketrisks, despite furious competition and price wars in knitwear markets.
The Behavior of Different Types of Companies
Tradition Knitwear Brands
Traditional Chinese knitwear brands must look for new ways to keep or increasetheir market shares. For example, one medium-scale cashmere brand that wasinterviewed in Inner Mongolia in 2015, had over 100 retail stores in China duringits peak time, but was now down to just a few. The boss indicated that her companyintended to start a new cashmere brand at the end of 2015. Subsequently, thecompany turned its main business to cashmere goat wool farming. It gave up oncashmere knitwear production, because the brand had lost its market share. Theirproblems were typical for the Chinese cashmere industry. Despite the quality,knitwear is not designed in collections with a consistent style. Their designs typi-cally fall into two problematic categories:
• Designs with over complicated decorations, that do not match other clothes;• Designs with too basic old-fashion styles that do not attract buyers.
The Chinese designs stagnate and consumers’ aesthetics have developed,influenced by international fashion trends and brands.
Knitwear in Luxury Brands
Chinese consumers prefer luxury clothing and the enjoyment they get out ofowning products from international brands with high visibility and reputation(Wang, 2010). Many people believe that it is an outstanding outcome from careersuccess if people can afford luxury products (Wang, 2010). In addition, to attract
200 X. Zhang et al.
Chinese consumers, many luxury brands created new products with specificChinese cultural elements.
Luxury knitwear can mean knitwear from luxury brands or knitwear made ofluxury materials, such as cashmere. Over 75% of the world’s cashmere products aremanufactured in China. Most luxury knitwear made in China is made by the samecompanies, who are unsuccessful in maintaining their own brand. However, evenwith similar quality knitwear made with the same material, there is a total dis-connection between luxury international brands and Chinese brands both in termsof price and consumer acceptation. For example, the price range of 100% cashmereknitwear is from $100 to $300 for many Chinese well-known knitwear brands.However, for international luxury brands, similar products double in price.Consumers choose these higher-priced international luxury brands as they show ahigher social status. Thus, compared to international luxury brands, Chinese knit-wear brands have a long way to go for their brand equity enhancement due to thelack of understanding and strategies for branding and designing.
Methodology
This section reports on a practice-based research study that focused on the problemsof design creativity in the Chinese knitwear market. The main observation is thatthere is a lack of creative culture in the Chinese knitwear industry, including designculture and understanding, branding strategy, and a lack of design education inChina. To gain a deep understanding of the situations of the Chinese knitwearbrands and find ways for dealing with the problems in knitwear design for thesebrands, the research methodology was based on a combination of qualitative andquantitative research (see Table 1). This included face-to-face interviews, a casestudy, design practice research, and online surveys. It also included a comparisonbetween advanced western countries and China in terms of the fashion industriesand design education systems to analyze the gap in design education, designers’abilities, and industry environments.
Between 2014 and 2017, face-to-face interviews were conducted with 46 people.The first group of 22 interviewees was from the Chinese and British knitwearindustry, and the second group of 24 interviewees was fashion and textile designstudents and faculty in China, Italy, and the UK. The first author visited fiveChinese knitwear companies, comprising two large, two medium-scale, and onesmall-scale knitwear brands, to talk with their owners and staff during 2015 and2016. The first author also contacted another big Chinese knitwear brand and talkedwith the company owner and interviewed a designer from the brand by email in2016. One British knitwear designer was interviewed in 2016, who had beenworking for over ten years both in UK and Hong Kong for a British designer studio.A case study, with practice research, was conducted with a Chinese knitwear brandin 2016. The practice research involved designing a knitwear collection for theyoung Chinese market. It was a good opportunity to closely observe a
Chinese Consumers and the Knitwear Fashion Market 201
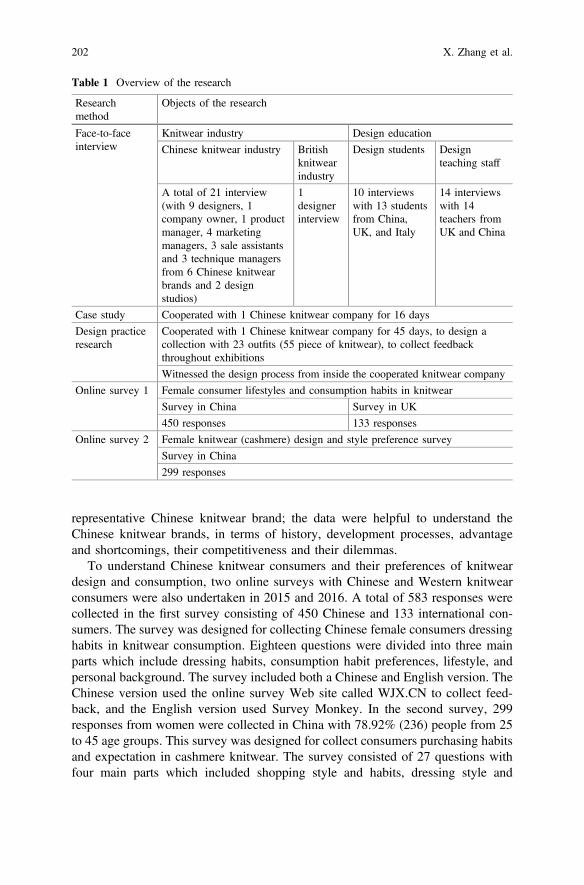
representative Chinese knitwear brand; the data were helpful to understand theChinese knitwear brands, in terms of history, development processes, advantageand shortcomings, their competitiveness and their dilemmas.
To understand Chinese knitwear consumers and their preferences of knitweardesign and consumption, two online surveys with Chinese and Western knitwearconsumers were also undertaken in 2015 and 2016. A total of 583 responses werecollected in the first survey consisting of 450 Chinese and 133 international con-sumers. The survey was designed for collecting Chinese female consumers dressinghabits in knitwear consumption. Eighteen questions were divided into three mainparts which include dressing habits, consumption habit preferences, lifestyle, andpersonal background. The survey included both a Chinese and English version. TheChinese version used the online survey Web site called WJX.CN to collect feed-back, and the English version used Survey Monkey. In the second survey, 299responses from women were collected in China with 78.92% (236) people from 25to 45 age groups. This survey was designed for collect consumers purchasing habitsand expectation in cashmere knitwear. The survey consisted of 27 questions withfour main parts which included shopping style and habits, dressing style and
Table 1 Overview of the research
Researchmethod
Objects of the research
Face-to-faceinterview
Knitwear industry Design education
Chinese knitwear industry Britishknitwearindustry
Design students Designteaching staff
A total of 21 interview(with 9 designers, 1company owner, 1 productmanager, 4 marketingmanagers, 3 sale assistantsand 3 technique managersfrom 6 Chinese knitwearbrands and 2 designstudios)
1designerinterview
10 interviewswith 13 studentsfrom China,UK, and Italy
14 interviewswith 14teachers fromUK and China
Case study Cooperated with 1 Chinese knitwear company for 16 days
Design practiceresearch
Cooperated with 1 Chinese knitwear company for 45 days, to design acollection with 23 outfits (55 piece of knitwear), to collect feedbackthroughout exhibitions
Witnessed the design process from inside the cooperated knitwear company
Online survey 1 Female consumer lifestyles and consumption habits in knitwear
Survey in China Survey in UK
450 responses 133 responses
Online survey 2 Female knitwear (cashmere) design and style preference survey
Survey in China
299 responses
202 X. Zhang et al.
preferences, cashmere knowledge and brand preferences, and personal backgroundand lifestyles. It used a same WJX.CN Web site as the first survey for Chineseconsumers’ responses. Both of these two Chinese surveys were linked to the socialmedia WeChat to help with the response rate. Limited by the diffusion path andsocial circle, 93.34% of responders were young female urban residents whichconsisted of 21.11% under 25 years old, 41.56% from 25 to 35 age group, and30.67% from 35 to 45 age group. The English version was linked with Facebook toask people helping to fill in the survey. Both of the surveys used the online surveyWeb sites’ tools for the result data analysis. These two online surveys helped tounderstand the different habits between Chinese consumers and international con-sumers in knitwear purchasing. In the second survey, the data helped to understandwhat Chinese female consumers expected in cashmere knitwear products.
Design practice research was a significant part for the whole research. Based onthe first author’s personal work experiences in the Chinese knitwear industry andmaking use of the research data of the market problems, a knitwear collection forthe Chinese market was designed. To explore a way for Chinese knitwear brands towork in design and production, 21 outfits (55 pieces) which combined modernwestern styles with traditional Chinese themes were designed. Feedback on thedesigns from the knitwear industry, academics, and other groups in both the Westand China was collected. The design practice research was a cooperation projectwith the case study company, a Chinese knitwear brand. The first author stayedover two months in the company to create the collection in late 2016. In the processof making the collection, she could observe the whole design process both of herdesign project and the other designers in the company. This provided useful insightsinto the company’s design culture and management. The design collection wasdisplayed in the cooperating company after completion. The knitwear was modeledat an art and design fashion show in Shenzhen with Tsinghua University at the endof 2016. The collection was exhibited at the designer fashion show in BirminghamFashion Festival (UK). Finally, a three-day exhibition was held in Birmingham CityUniversity in 2017. The research data collected from the methodology was ana-lyzed using statistical methods for quantitative data interpretation as well as qual-itative analysis of interviews and feedback.
The Challenges of the Chinese Knitwear Industry
Most Chinese knitwear companies began their businesses as knitting manufacturers,but now also operate as suppliers for international brands. Many Chinese knitwearcompanies offer top quality knitwear for luxury brands, but are unable to run theirown brands. For example, during the design practice period, the case study com-pany made beautiful high-quality cashmere knitwear for Japanese and Europeanluxury brands. However, its own knitwear brand looks less attractive although it hasthe same high qualities as the luxury brands. This shows that Chinese knitwear
Chinese Consumers and the Knitwear Fashion Market 203
brands do not lack good manufacturing capabilities. Their problems lie with theirbranding and design.
Based on the research and the observations, it showed that the gap betweensuccessful international brands and Chinese local brands lies in the followingaspects:
• A clear brand identity;• Fashionable designs and images;• Comprehensiveness of the product range;• Bigger shopping areas;• Better locations of the stores;• More influences on young people;• Clear brand positioning.
Successful international brands tend to have a clear brand identity with new andappealing products every season. Luxury brands have products with uniquedesigns, good materials and qualities and offer good after-sale services with shopsin the best locations. Most luxury brands offer “life warranties, flexible returnpolices, free adjustments and alterations, free delivery, personalization of products,customization, VIP loyalty programs, personal shopping assistance in stores, spe-cial collection viewing and updates” (Hameide, 2011). Many luxury brands suc-cessfully build their fashionable and ideal lifestyles to meet consumers’ needs.According to Hameide (2011) “a lifestyle brand successfully identifies itself with alifestyle and a marketing segment to the point that its name or image is mentallytriggered when the segment is mentioned.” Many global successful fashion brandsoffer comprehensive product ranges for their consumers, which not only includesclothes, and many types of fashion accessories as well as cosmetics and perfume.This makes the brands attractive for many people, although not everybody canafford the products. In fact, for many young people, aspirational luxury brands notonly offer beautiful products, they also become a symbol of success.
While a small percentage of Chinese brands have been successful in the Chinesemarket, most Chinese brands are not competitive enough with international brandsin China. The following observations were made through face-to-face interviews,visits and observations of fashion markets in Beijing, Guangzhou, Hohhot andBaotou cities. While domestic brands aimed for lower price point than luxurybrands, they are still affected by international competition. Most global brandsoccupied better locations with bigger stores than the domestic brands. However,most Chinese brands prefer to follow the market of existing designs. For example,to copy European brands, so that it is difficult for them to build up distinct identitiesand unique brand personalities. This applied to knitwear brands. In Chineseshopping malls, brands with similar market positioning are clustered and the bestpositions are given to the most popular brands. For instance, in many shoppingmalls and department stores, the ground floors (or first floors) are given to inter-national famous brands. The bigger and well-known Chinese womenswear brandsare located on the second and third floors, and then the menswear brands on the
204 X. Zhang et al.
higher floors. The knitwear brands are always found with other items, such asluggage, outdoor products, and other non-fashion items on the top floors. Mostconsumers can find clothes they like on the lower levels and do not go to the higherlevels. Compared to fashion brands, most knitwear brands have fewer opportunitiesto be visited by shoppers. In addition, most knitwear brands just offer knitwear forautumn and winter and rarely have a range of matching products. In spring andsummer, most of them just sell discounted winter clothes, which does not incen-tivize the shopping malls to give them prominent locations.
Reasons for the Problems of the Chinese Knitwear Brands
The results of this study suggested the following reasons for the current status of theChinese knitwear industry. Firstly, the designs from Chinese knitwear brands arenot strong enough to support the brands’ continual development and survival. Thequantity of discounted or unsold stock from these knitwear brands clearly showsthat their knitwear designs are not attractive enough for their targeted consumers.Secondly, the competition in the Chinese retail markets, after thousands of localbrands and international brands (because most of fashion brands offer knitwear aswell) established themselves, is heating up. The third important aspect is Chineseconsumers’ expectation are evolving quickly, which is influenced by globalizationand Internet access. Most Chinese consumers follow the leading fashion trendswhen they are shopping (Euromonitor International, 2013).
Missing Brand Distinction
The stock of Chinese knitwear brands in retail stores looks the same from year toyear and between brands. It is hard to distinguish between brands without looking attheir trademarks. For most Chinese knitwear brands, there is no clear differentiationinto different markets. The products lack distinctive styles for markets, and thecompanies do not have clear approaches to build up their brands. For example, thecase study brand did not have clear themes and color tones for their autumn andwinter products in 2016. There were over 200 knitwear tops with common styles inmultiple colors without a clear structure to the product offering in their showroomduring a June 2016 visit. Through discussions with the company marketing man-agers and designers, it became clear that their commercial agents and clients justorder products following their preferences. The company did not offer guidance forproduct structure and order lists of their products in the seasonal purchasingmeetings. Thus, it is hard to show distinctive styles and brand images to consumersin retail shops when the company lacks clear design plans and brand strategies.
According to Hameide (2011), “a successful brand has a strong identity (men-tally and physically), is innovative, consistent, competitively positioned, and holdsa matching positive image in the consumer’s mind.” Successful western fashion
Chinese Consumers and the Knitwear Fashion Market 205
brands offer creative collections with new themes and colors with their brands’DNA every season. Normally, different brands have their own product structuresbased on the brand positioning and features. Before they begin a new collection,design directors need to make a design plan with themes, colors, and the purpose ofthe design details to guild their design teams in the product development processes.“A collection is not a random selection of great items. It must have an overalldirection, and the piece should work together as a group” (Gehlhar, 2008). In thecollection, “the pieces should be able to be worn together or fit in as accent itemsthat can be sold alone” (Gehlhar, 2008).
Dynamic Market Structure in China
The Chinese market is dynamic and the purchasing power is still strong, especiallyin the first- and second-tier cities. There are some unavoidable challenges, whichaffects all brands, whether luxury or cheap, international or local, fast fashion orslow fashion:
• Internet shopping: Many people no longer go to shops to buy products,including clothing and fashion items. Online shopping is the first choice formany Chinese consumers.
• Discounts: Knitwear brands keep discount areas in their retail stores throughoutthe year, and consumers do not pay the full price for the products.
• Copies: Due to the immature intellectual property protection system and socialenvironment, original designs and smaller brands are losing out because ofcounterfeiting. In the knitwear market, small manufacturers copy designers’ andbig brands’ designs, offering a lower price, and wholesale brands can offer thesame products with lower prices for the consumers.
Missing Design Culture in Companies
“Design culture as engaging the inter-relationships of domains of designers, pro-duction, consumption with the design object, image, or space,” consists of value,circulation, and practice (Julier, 2006). “Design culture was to explore how each ofthese nodes affected the other—how these relationships were materialized throughpractices in the design profession and of production and consumption” (Julier,2006). From another position, “Design culture is located in communication, it isboth something designers do, but also is something that is all around” (Julier, 2006).Similarly, design culture for the Chinese knitwear brands, should include: designthinking, the comprehension of how designers think and work (Cross, 2011), designunderstanding, design process and management, which relates to the “designer’srole in the creation of value” (Julier, 2006), design education, and design abilities.There is an absence of a creative design culture and design understanding in theChinese knitwear industry. Generally, there is a lack of “value creation” and “less
206 X. Zhang et al.
focus on innovation” in many companies in China (Roll, 2005). For most Chineseknitwear brands, their design culture is missing the following aspects: clearlydefined design processes, valuing designer, thought through product structure anddesign understanding. In the research processes, the author found many companiesdid not make clear design plans for their new collection. The designers take theirnew design inspiration from existing market design samples or photographs fromfashion magazines rather than developing a design plan with themes based onfashion trends analysis. Most designers are not encouraged to make innovativeproducts. In most companies, the designers are assessed by how many of theirdesigns are ordered. Many company leaders do not really think designers shouldplay a key role for their brands, so designers are managed in the same way asproduction line factory workers. Thus, less attractive products cause many woollenknitwear brands to lose their market share. While the cashmere knitwear brandshave similar problems to the woolen brands in designing and branding, they benefitfrom the fact that cashmere is too expensive to use in many fashion brands.Therefore, some big cashmere brands still have space in the market for good-qualitycashmere products.
Many knitwear companies pay little attention to developing their design abilitiesand brand strategies. This has led to some of them going out of business. Forexample, 5 of 9 Chinese knitwear brands contacted for this research no longer hadtheir own designers. They had given up on creating and producing new products fortheir own brands by replacing them with purchasing finished knitwear garments inwholesale markets and then inserting their own label into the product. This reflects alack of understanding of what design should do for a brand, and a belief that designis not important for the competitiveness of a brand. Another reason for not havingtheir own design team is the lack of well-trained knitwear designers. For example,when the author interviewed a knitwear company owner in 2016, he explained thatdesigners were too expensive to employ for his brand. In the late 1990s, hiscompany had designers and around 60 retail stores, but he gradually lost thisbusiness and closed all stores until only two were left in Hohhot city in 2016. Hebelieved buying knitwear to put in his stores from wholesale market was aneffective way to reduce market risks and inventory pressure. In his experience, thedesigners who were working for his company were not helpful to in developing thebusiness.
Missing Design Education in Chinese Universities
The ability to design knitwear is related to design education and training at uni-versities and in companies. Compared to fashion design in British higher education,China has completely different teaching methods and concepts. Fashion courses aimto teach systematic knowledge in fashion and textiles to their students. For example,they cover basic courses such as pattern cutting, sewing skills, fashion illustrator,and so on. They have a strong basis in theory with little practice. Students must
Chinese Consumers and the Knitwear Fashion Market 207
study and pass around 30 subjects, such as fashion history, fashion technique skills,color printing, sketch, color composition, in their first three years, before under-taking a project in their last year of degree study. In contrast, the western fashioneducation system trains their students to build a design approach with research anddevelopment, which enables them to develop inspirational design ideas for clothes.For example, in many universities in the UK, students are required to do manydifferent projects in their three years of study, so that students can develop apersonal system for their own styles and preferences. Many British designers havereally strong design abilities when they graduate. However, the majority of newChinese designers require a long time to adapt to the design processes and systemsin their first employment position. Many companies are skeptical of the professionalskills of new designers, and do not give them enough space and freedom as part ofthe design processes. On the other hand, the knitwear companies do not train newdesigners themselves. This makes it difficult for many designers to develop theirdesign abilities once they work for companies. Most designers in Chinese knitwearbrands do not have the skill or confidence to create innovative designs. Therefore,they follow existing markets rather than creating different products with distinctivedesigns for their brands.
Lack of Understanding of the Knitwear Consumers
Knitwear occupies a significant share of the fashion market. Most fashion brandsoffer knitwear to match their other clothing ranges and to improve their sale per-formances. In recent years, living conditions and personal transportations haveimproved in China, so that many consumers no longer have to rely on knitwear tokeep warm in winter. Thus, the knitwear market had to respond to the customers’demands for aesthetically appealing, rather than simply warming, clothing.According to the online surveys of Chinese female consumers on knitwear con-sumption and preferences of cashmere knitwear design, almost half (49.56%) of450 respondents claimed to make purchasing decisions based on design and styleswhen buying knitwear, 38.44% of responders bought knitwear for the materials andqualities and another 12% consumers make decisions based on knitwear colors (seeFig. 1).
Furthermore, in a second survey (299 participants), where customers were askedto rank their preferences, design also occupied the first place among the aspects thatinfluence the purchasing decisions for cashmere knitwear (see Fig. 2).
Recommendation for Changing the Situation
In order to help Chinese knitwear brands to deal with their problems, it is stronglyrecommended that the following seven points are addressed:
208 X. Zhang et al.
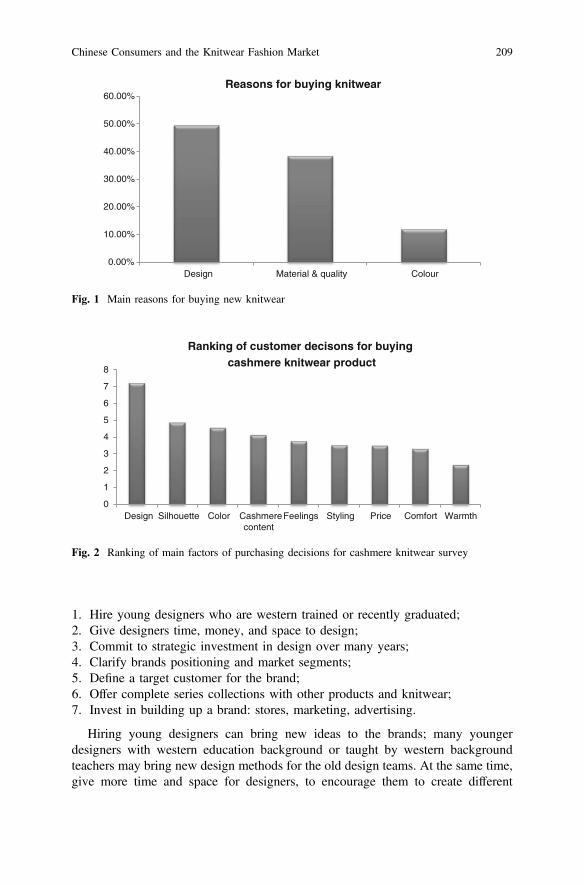
1. Hire young designers who are western trained or recently graduated;2. Give designers time, money, and space to design;3. Commit to strategic investment in design over many years;4. Clarify brands positioning and market segments;5. Define a target customer for the brand;6. Offer complete series collections with other products and knitwear;7. Invest in building up a brand: stores, marketing, advertising.
Hiring young designers can bring new ideas to the brands; many youngerdesigners with western education background or taught by western backgroundteachers may bring new design methods for the old design teams. At the same time,give more time and space for designers, to encourage them to create different
0.00%
10.00%
20.00%
30.00%
40.00%
50.00%
60.00%
Design Material & quality Colour
Reasons for buying knitwear
Fig. 1 Main reasons for buying new knitwear
0
1
2
3
4
5
6
7
8
Design Silhouette Color Cashmerecontent
Feelings Styling Price Comfort Warmth
Ranking of customer decisons for buying cashmere knitwear product
Fig. 2 Ranking of main factors of purchasing decisions for cashmere knitwear survey
Chinese Consumers and the Knitwear Fashion Market 209
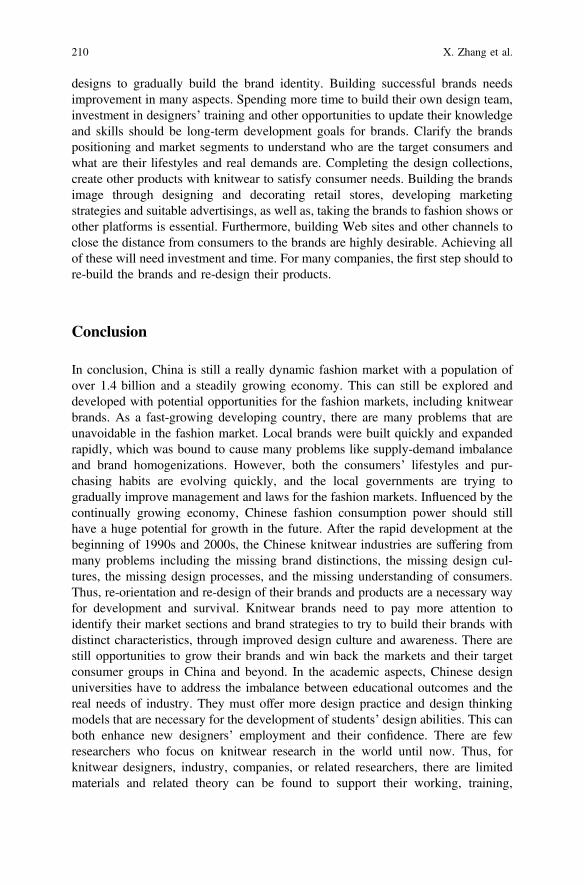
designs to gradually build the brand identity. Building successful brands needsimprovement in many aspects. Spending more time to build their own design team,investment in designers’ training and other opportunities to update their knowledgeand skills should be long-term development goals for brands. Clarify the brandspositioning and market segments to understand who are the target consumers andwhat are their lifestyles and real demands are. Completing the design collections,create other products with knitwear to satisfy consumer needs. Building the brandsimage through designing and decorating retail stores, developing marketingstrategies and suitable advertisings, as well as, taking the brands to fashion shows orother platforms is essential. Furthermore, building Web sites and other channels toclose the distance from consumers to the brands are highly desirable. Achieving allof these will need investment and time. For many companies, the first step should tore-build the brands and re-design their products.
Conclusion
In conclusion, China is still a really dynamic fashion market with a population ofover 1.4 billion and a steadily growing economy. This can still be explored anddeveloped with potential opportunities for the fashion markets, including knitwearbrands. As a fast-growing developing country, there are many problems that areunavoidable in the fashion market. Local brands were built quickly and expandedrapidly, which was bound to cause many problems like supply-demand imbalanceand brand homogenizations. However, both the consumers’ lifestyles and pur-chasing habits are evolving quickly, and the local governments are trying togradually improve management and laws for the fashion markets. Influenced by thecontinually growing economy, Chinese fashion consumption power should stillhave a huge potential for growth in the future. After the rapid development at thebeginning of 1990s and 2000s, the Chinese knitwear industries are suffering frommany problems including the missing brand distinctions, the missing design cul-tures, the missing design processes, and the missing understanding of consumers.Thus, re-orientation and re-design of their brands and products are a necessary wayfor development and survival. Knitwear brands need to pay more attention toidentify their market sections and brand strategies to try to build their brands withdistinct characteristics, through improved design culture and awareness. There arestill opportunities to grow their brands and win back the markets and their targetconsumer groups in China and beyond. In the academic aspects, Chinese designuniversities have to address the imbalance between educational outcomes and thereal needs of industry. They must offer more design practice and design thinkingmodels that are necessary for the development of students’ design abilities. This canboth enhance new designers’ employment and their confidence. There are fewresearchers who focus on knitwear research in the world until now. Thus, forknitwear designers, industry, companies, or related researchers, there are limitedmaterials and related theory can be found to support their working, training,
210 X. Zhang et al.
studying, and researching. The methodology and findings of this research provide arigorous approach to fill the gaps between Chinese knitwear, design, and con-sumers. The work offers fundamental research, based on sound theoretical methods,to provide future framework opportunities to improve the status of the Chineseknitwear sector.
References
Anon. (2008, June 23). Chinese cashmere brands white paper. Textile Apparel Weekly, pp. 50–53.Anon. (2009). Survey about fashion brands’ market share in Beijing city in 2008. Commercial
Medal (pp. 62–67). China: Beijing Business Information Center.Anon. (2013). The road of transformation of the department stores. China Business Trade, 9, 6–8.Anon. (2016). Statistics. Journal of Chinese Costume, 3, 13.Anon. (2017). 39 college students were sued college students bear high loans to buy luxury good
break faith, whose fault? Retrieved from: http://jiangsu.china.com.cn/html/jsnews/society/10509391_1.html.
Chen, T. H. (2011). Face consciousness and female brand clothing consumer marketing strategy.International Conference on Engineering Business Management, 22–24 Mar 2011, Wuhan,China.
Chen, W. W. (2013). There is excess in the stock street. Zhejiang Daily, 16(9), 9.Cross, N. (2011). Design Thinking. Oxford, Berg Publishers.Euromonitor International. (2013). Consumer lifestyles in China. Retrieved from: www.
euromonitor.com.Euromonitor International. (2017). Consumer lifestyles in China. Retrieved from: http://www.
euromonitor.com/consumer-lifestyles-in-china/report.Gehlhar, M. (2008). The fashion designer survival guide. New York: Kaplan Publishing.Hameide, K. K. (2011). Fashion branding unraveled. New York: Fairchild Books, A Division of
Conde Nast Publication.Julier, G. (2006). From visual culture to design culture. Design Issues, 22(1), 64–76.Lao, Y. M. (2013). Research on clothing consumption habits of older consumer-a case study of
Shaoxing Region. China Textile Leader, 12, 89–91.Li, X. Y. (2004). A study of the basic Development of fashion marketing in China. M.A. Thesis,
Dong Huan University, China.Lia, K. K., & Zaichkowsky, J. L. (1999). Brand imitation: Do the Chinese have different views?
Asia Pacific Journal of Management, 16, 179–192.Liang, J., & Wang, Y. (2007). Reflection on excessive consumption. Science Technology and
Industry, 7(5), 36–38.Lin, L. (2012). Traditional department store industry in their cold current. Economic Life, 11, 272.Li, G. X., Li, G. F., & Kambele, Z. (2012). Luxury fashion brand consumers in China: Perceived
value, fashion lifestyle, and willingness to pay. Journal of Business Research, 65, 1516–1522.Liu, B. R. (2007, January 19). Demonic market is surplus and clothing brands with aggravate
competition. Information Daily, p. the 2nd section, 1.Qin. (2012, December 18). Popular youth consumption trend in Chinese luxury market. China
Industrial and Commercial Daily, p. B04.Roll, M. (2005). Asian brand strategy: How Asia builds strong brands. New York, NY: Palgrave
Macmillan.Situ, W. C. (2015). The department stores continually are closing: The in-stores future. Economy,
6, 58–61.Sun, J. H. (2014). A research on brand effect of luxury brand and Chinese luxury consumers. M.I.
B. Thesis, Nanjing University, China.
Chinese Consumers and the Knitwear Fashion Market 211

Tsui, C. (2010). China fashion: Conversations with designers. Oxford: Berg Publisher.Wang, L. (2010). Psychoanalysis for consumption of luxury clothing products. Garment Art, 12
(04), 90–91.Wang, R. R. (2014). Empirical Research between consumers’ lifestyles and clothing purchase
behaviors of “after 70s-80s-90s”. M.A. Thesis, Zhejiang Sci-Tech University, China.Xu, F. L. (2015). Excessive consumption and happiness alienation. Journal of Shenyang Normal
University (social science edition), 39(187), 26–28.Xu, Y. Y. (2013). The influence of Chinese female consumers lifestyles on Korean fashion brands
attitudes and loyalty. Eighteenth Industrial Design Annual Conference Collected Papers,pp. 437–442.
Yang, D. J. (2009). “Soft gold” big brands rise in the time: thoughts and suggestions for Chinesecashmere industry. Textile and Apparel Weekly, 2009(2), 70–71.
Ye, J. L. (2013). Research on overseas consumption in the dress of Shanghai consumers. M.A.Thesis, Donghua University, China.
Yu, S. Y. (2015). The study of clothing consumption and dressing collection about middle-agedwomen. M.A. Thesis, Shanxi University of Science and Technology, China.
Zhao, J. R. (2009). Contemporary university students’ consumption behaviors. ContemporaryEconomic, 1(2), 114–116.
Zhang, J. (2015). Understanding the concept of shame in the Chinese culture. NYS Child Welfare/Child Protective Services Training Institute, 4.
Zhang, Z. (2016). The greatest powers needed for China’s garment industry development. ChinaFiber Inspection, 11, 118–119.
212 X. Zhang et al.