yield and nitrogen-use efficiency of aromatic rice cultivars in response to nitrogen fertilizer
TRANSCRIPT
PLEASE SCROLL DOWN FOR ARTICLE
This article was downloaded by: [Consortium for e-Resources in Agriculture]On: 6 December 2010Access details: Access Details: [subscription number 923464531]Publisher Taylor & FrancisInforma Ltd Registered in England and Wales Registered Number: 1072954 Registered office: Mortimer House, 37-41 Mortimer Street, London W1T 3JH, UK
Journal of New SeedsPublication details, including instructions for authors and subscription information:http://www.informaworld.com/smpp/title~content=t792306908
Yield and Nitrogen-Use Efficiency of Aromatic Rice Cultivars in Responseto Nitrogen FertilizerG. Mahajana; N. K. Sekhonb; N. Singha; R. Kaura; A. S. Sidhub
a Rice Section, Punjab Agricultural University, Ludhiana, India b Department of Soils, PunjabAgricultural University, Ludhiana, India
Online publication date: 03 December 2010
To cite this Article Mahajan, G. , Sekhon, N. K. , Singh, N. , Kaur, R. and Sidhu, A. S.(2010) 'Yield and Nitrogen-UseEfficiency of Aromatic Rice Cultivars in Response to Nitrogen Fertilizer', Journal of New Seeds, 11: 4, 356 — 368To link to this Article: DOI: 10.1080/1522886X.2010.520145URL: http://dx.doi.org/10.1080/1522886X.2010.520145
Full terms and conditions of use: http://www.informaworld.com/terms-and-conditions-of-access.pdf
This article may be used for research, teaching and private study purposes. Any substantial orsystematic reproduction, re-distribution, re-selling, loan or sub-licensing, systematic supply ordistribution in any form to anyone is expressly forbidden.
The publisher does not give any warranty express or implied or make any representation that the contentswill be complete or accurate or up to date. The accuracy of any instructions, formulae and drug dosesshould be independently verified with primary sources. The publisher shall not be liable for any loss,actions, claims, proceedings, demand or costs or damages whatsoever or howsoever caused arising directlyor indirectly in connection with or arising out of the use of this material.
Journal of New Seeds, 11:356–368, 2010Copyright © Taylor & Francis Group, LLCISSN: 1522-886X print/1522-9025 onlineDOI: 10.1080/1522886X.2010.520145
Yield and Nitrogen-Use Efficiencyof Aromatic Rice Cultivars in Response
to Nitrogen Fertilizer
G. MAHAJAN1, N. K. SEKHON2, N. SINGH1, R. KAUR1, andA. S. SIDHU2
1Rice Section, Punjab Agricultural University, Ludhiana, India2Department of Soils, Punjab Agricultural University, Ludhiana, India
Aromatic cultivars of rice respond differently to nitrogen applica-tion as compared to nonaromatic rice. Most of the aromatic ricecultivars are susceptible to disease and insect pest attack, and aremore prone to lodging. Therefore, nitrogen is the key input forincreasing the productivity of aromatic rice. Research analyzingthe effects of N level on yield and nitrogen-use efficiency (NUE) ofmodern aromatic cultivars is not well documented. Therefore, thepresent study was conducted to optimize N levels for higher yieldand NUE of modern aromatic rice cultivars. Across all genotypes,the mean nitrogen-fertilizer response was highest at 40 kg N/haas compared to other N levels (0, 20, and 60 kg N/ha), indi-cating that further increase in N level had no effect on cropresponse to fertilizer. The mean grain yield increased by 64.2%when plots were supplemented with 40 kg N/ha as compared tocontrol (unfertilized). Among cultivars, ‘Punjab Mehak 1’ regis-tered highest yield (4.3 t/ha), followed by ‘Pusa 1121’ (4.0 t/ha)and ‘Punjab Basmati 2’ (3.9 t/ha). Interactive effect between Nlevels and cultivars revealed that ‘Punjab Mehak 1’ responded sig-nificantly up to 60 kg N/ha due to more NUE and higher N uptakeas compared to ‘Pusa 1121’ and ‘Punjab Basmati 2’. Results fromthis study indicate that genotype differences in NUE existed in aro-matic rice cultivars; therefore, NUE of different cultivars could be auseful tool to adopt the appropriate cultural practices for achievinghigh yield and N response exploration.
Address correspondence to G. Mahajan, Rice Section, Punjab Agricultural University,Ludhiana, 141-004, India. E-mail: [email protected]
356
Downloaded By: [Consortium for e-Resources in Agriculture] At: 06:54 6 December 2010
Yield and Nitrogen-Use Efficiency of Aromatic Rice 357
KEYWORDS aromatic rice cultivars, nitrogen-use efficiency,lodging (%), partial factor productivity
INTRODUCTION
Rice (Oryza sativa L.), the staple food of nearly one-half of world’s pop-ulation, contributes >20% of the total calorie intake in humans. In Asia,where 95% of the world’s rice is produced and consumed, rice accounts for40%–80% of the calories in the Asian diet. India is one of the largest rice-growing countries of the world, second only to China, growing rice on 43million hectares annually, which is about one-third of the world area underrice (Timsina and Connor 2001). India has >5,000 varieties of rice that dif-fer with respect to grain size, texture, glutinous nature, aroma, and cookingquality (Vachhani, Butany, and Nair 1962).
Aromatic rice—especially Basmati—occupies a prime position in Indianculture, not only because of its high organoleptic quality, but also becauseit is considered an auspicious food. India had an immense wealth of aro-matic rices, much of which has been lost during the last three decades inthe aftermath of the Green Revolution, where emphasis was on yield ratherthan quality. These highly valued rices are collectively called Basmati (basaroma) and are popular not only throughout Asia but also in Europe andthe United States. The definition of Basmati now includes its other fine-grain qualities. Basmati rice is traditionally grown in the Himalayan foothillsof India and Pakistan, and the name is traditionally associated with thisgeographical origin (Bligh 2000). It is generally accepted that good qualityBasmati rice is characterized by extra-long, super-fine, slender grains withchalky endosperm and a shape comparable with a Turkish dagger; pleas-ant and exquisite aroma, sweet taste, dry, and soft texture when cooked;delicate curvature; low amylase content; medium to low gelatinization tem-perature; and one-and-a-half to twofold length-wise elongation, with leastbreadth-wise expansion on cooking and tenderness of cooked rice (Siddiq,Muralidharan, and Shobha-Rani 1997). Because of these properties, Basmatirice commands a premium price in the world market.
Mostly, yields of Basmati are lower than those of semi-dwarf varietiespossessing coarse to fine grains (FAOSTAT 2009; Siddiq, Muralidharan, andShobha-Rani 1997; Mahajan, Sharma, and Bharaj 2009). Basmati varieties donot withstand high rates of N fertilizer to increase yields; high rates of Nmake rice prone to lodging, disease, and insect pest attacks. Therefore it isnecessary to know the best N application rate for each variety, as well asits influence on components of yield and other agronomic parameters, suchas life cycle, plant height, and lodging, to obtain better knowledge of saidproductive response. Chaturvedi (2005) showed that plant height in rice is
Downloaded By: [Consortium for e-Resources in Agriculture] At: 06:54 6 December 2010
358 G. Mahajan et al.
positively correlated to the length of maturation cycle. A taller plant is moresusceptible to lodging and responds less well to nitrogen (Yoshida 1978).The panicles with a low percentage of sterile flowers permit the applicationof higher doses of N and produce better yield (Yoshida 1981). Sidhu, Sikka,and Singh (2004) reported that a relatively high dose of N (60 kg/ha) resultedin increased incidence of insect pest attack and lodging, which lowered yieldand quality of Basmati rice. Conry (1995) also reported that increased rateof N fertilizer could increase yield but reduced the quality of grains. Soilslow in N generally produce aromatic rice grain of better quality, but applica-tions of N rates higher than those required to produce maximum yield gavelow quality grain. Further, the extremely low use efficiency of applied N inlowland rice field (Vlek and Byrnes 1986) and the environmental hazardscaused by loss of N from rice field (Bohlool et al. 1992; Cassman et al. 1998)posed a great challenge to develop new rice varieties with enhanced N-useefficiency. The highest yield potential of a plant could be achieved onlywith the combined effect of its inherent genetic potential, good soil fertil-ity, and favorable environment to which it is exposed during the growingperiod. Although it is not possible to modify entirely the plant environmentunder field conditions to suit the need of a particular plant type, the judi-cious organization of controllable factors like selection of variety, optimumnutrient supply, and other management practices can provide a favorableenvironment to a considerable extent to achieve high productivity.
India has a large number of rice cultivars (>740 cultivars released so farby the Directorate of Rice Research), therefore the question of varietal differ-ences in the use of indigenous and applied nutrients for improved nutrientmanagement warrants more attention than it has received. Genotypic differ-ences in nutrient-use efficiency have been reported for common cultivars(Broadbent, De Datta, and Laureles 1987; Ladha et al. 1998). The presentinvestigation was planned to determine the most optimum economic doseof N at which new aromatic rice cultivars may give maximum yield andN-use efficiency.
MATERIALS AND METHODS
Experimental Site
An experiment was conducted at the experimental farm of the Rice Section,Punjab Agricultural University (30◦56′ N, 75◦52′ E, and 247 m a.s.l), India,during the 2007 and 2008 kharif season to assess genotypic differences inN-use efficiency and yield of aromatic rice at varied levels of N. The climateof the area is characterized as semi-arid, with an average annual rainfall of400–700 mm (75%–80% received during July-September), lowest temperatureranging from 0◦C to 4◦C in January, and highest maximum temperature being
Downloaded By: [Consortium for e-Resources in Agriculture] At: 06:54 6 December 2010
Yield and Nitrogen-Use Efficiency of Aromatic Rice 359
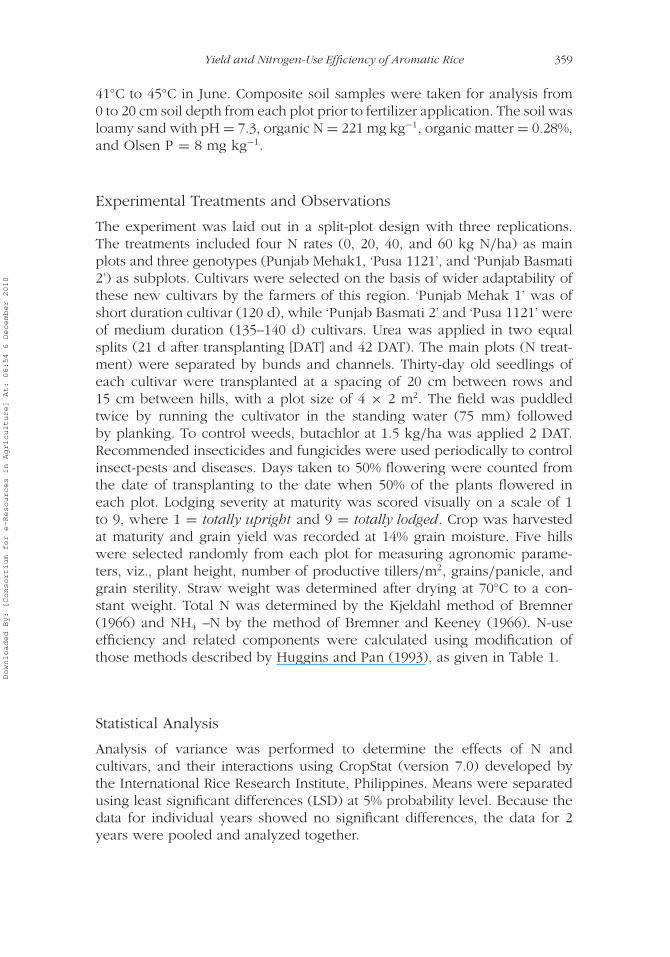
41◦C to 45◦C in June. Composite soil samples were taken for analysis from0 to 20 cm soil depth from each plot prior to fertilizer application. The soil wasloamy sand with pH = 7.3, organic N = 221 mg kg−1, organic matter = 0.28%,and Olsen P = 8 mg kg−1.
Experimental Treatments and Observations
The experiment was laid out in a split-plot design with three replications.The treatments included four N rates (0, 20, 40, and 60 kg N/ha) as mainplots and three genotypes (Punjab Mehak1, ‘Pusa 1121’, and ‘Punjab Basmati2’) as subplots. Cultivars were selected on the basis of wider adaptability ofthese new cultivars by the farmers of this region. ‘Punjab Mehak 1’ was ofshort duration cultivar (120 d), while ‘Punjab Basmati 2’ and ‘Pusa 1121’ wereof medium duration (135–140 d) cultivars. Urea was applied in two equalsplits (21 d after transplanting [DAT] and 42 DAT). The main plots (N treat-ment) were separated by bunds and channels. Thirty-day old seedlings ofeach cultivar were transplanted at a spacing of 20 cm between rows and15 cm between hills, with a plot size of 4 × 2 m2. The field was puddledtwice by running the cultivator in the standing water (75 mm) followedby planking. To control weeds, butachlor at 1.5 kg/ha was applied 2 DAT.Recommended insecticides and fungicides were used periodically to controlinsect-pests and diseases. Days taken to 50% flowering were counted fromthe date of transplanting to the date when 50% of the plants flowered ineach plot. Lodging severity at maturity was scored visually on a scale of 1to 9, where 1 = totally upright and 9 = totally lodged. Crop was harvestedat maturity and grain yield was recorded at 14% grain moisture. Five hillswere selected randomly from each plot for measuring agronomic parame-ters, viz., plant height, number of productive tillers/m2, grains/panicle, andgrain sterility. Straw weight was determined after drying at 70◦C to a con-stant weight. Total N was determined by the Kjeldahl method of Bremner(1966) and NH4 –N by the method of Bremner and Keeney (1966). N-useefficiency and related components were calculated using modification ofthose methods described by Huggins and Pan (1993), as given in Table 1.
Statistical Analysis
Analysis of variance was performed to determine the effects of N andcultivars, and their interactions using CropStat (version 7.0) developed bythe International Rice Research Institute, Philippines. Means were separatedusing least significant differences (LSD) at 5% probability level. Because thedata for individual years showed no significant differences, the data for 2years were pooled and analyzed together.
Downloaded By: [Consortium for e-Resources in Agriculture] At: 06:54 6 December 2010
360 G. Mahajan et al.
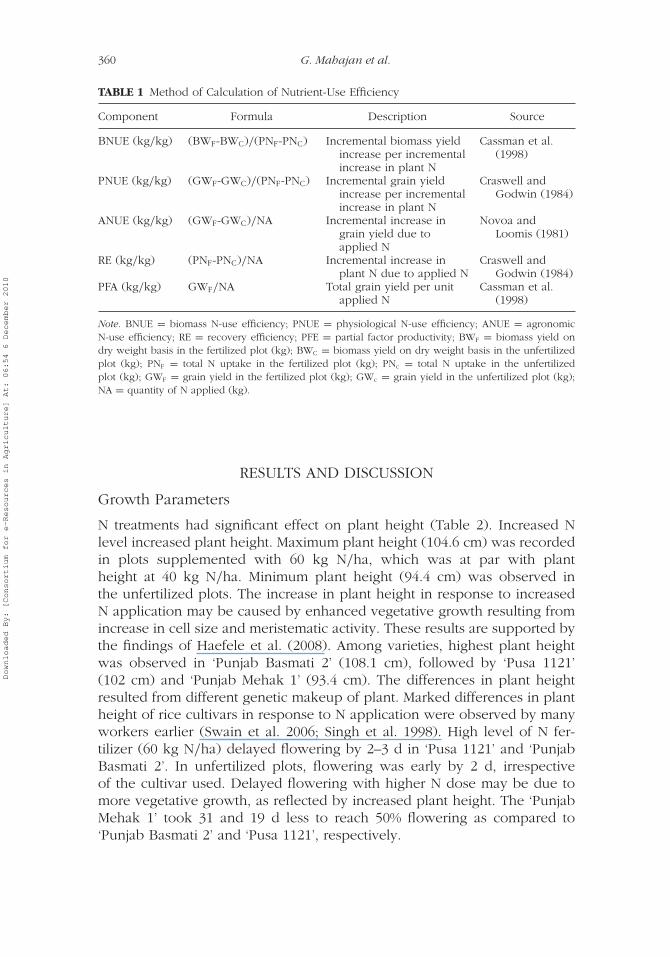
TABLE 1 Method of Calculation of Nutrient-Use Efficiency
Component Formula Description Source
BNUE (kg/kg) (BWF-BWC)/(PNF-PNC) Incremental biomass yieldincrease per incrementalincrease in plant N
Cassman et al.(1998)
PNUE (kg/kg) (GWF-GWC)/(PNF-PNC) Incremental grain yieldincrease per incrementalincrease in plant N
Craswell andGodwin (1984)
ANUE (kg/kg) (GWF-GWC)/NA Incremental increase ingrain yield due toapplied N
Novoa andLoomis (1981)
RE (kg/kg) (PNF-PNC)/NA Incremental increase inplant N due to applied N
Craswell andGodwin (1984)
PFA (kg/kg) GWF/NA Total grain yield per unitapplied N
Cassman et al.(1998)
Note. BNUE = biomass N-use efficiency; PNUE = physiological N-use efficiency; ANUE = agronomicN-use efficiency; RE = recovery efficiency; PFE = partial factor productivity; BWF = biomass yield ondry weight basis in the fertilized plot (kg); BWC = biomass yield on dry weight basis in the unfertilizedplot (kg); PNF = total N uptake in the fertilized plot (kg); PNc = total N uptake in the unfertilizedplot (kg); GWF = grain yield in the fertilized plot (kg); GWc = grain yield in the unfertilized plot (kg);NA = quantity of N applied (kg).
RESULTS AND DISCUSSION
Growth Parameters
N treatments had significant effect on plant height (Table 2). Increased Nlevel increased plant height. Maximum plant height (104.6 cm) was recordedin plots supplemented with 60 kg N/ha, which was at par with plantheight at 40 kg N/ha. Minimum plant height (94.4 cm) was observed inthe unfertilized plots. The increase in plant height in response to increasedN application may be caused by enhanced vegetative growth resulting fromincrease in cell size and meristematic activity. These results are supported bythe findings of Haefele et al. (2008). Among varieties, highest plant heightwas observed in ‘Punjab Basmati 2’ (108.1 cm), followed by ‘Pusa 1121’(102 cm) and ‘Punjab Mehak 1’ (93.4 cm). The differences in plant heightresulted from different genetic makeup of plant. Marked differences in plantheight of rice cultivars in response to N application were observed by manyworkers earlier (Swain et al. 2006; Singh et al. 1998). High level of N fer-tilizer (60 kg N/ha) delayed flowering by 2–3 d in ‘Pusa 1121’ and ‘PunjabBasmati 2’. In unfertilized plots, flowering was early by 2 d, irrespectiveof the cultivar used. Delayed flowering with higher N dose may be due tomore vegetative growth, as reflected by increased plant height. The ‘PunjabMehak 1’ took 31 and 19 d less to reach 50% flowering as compared to‘Punjab Basmati 2’ and ‘Pusa 1121’, respectively.
Downloaded By: [Consortium for e-Resources in Agriculture] At: 06:54 6 December 2010

Yield and Nitrogen-Use Efficiency of Aromatic Rice 361
TABLE 2 Effect of Varying N Levels on Plant Height (cm), d to 50% Flowering, and LodgingScore in Different Scented Rice Cultivars (2 yrs. Pooled Data)
‘Punjab Mehak 1’ ‘Pusa 1121’ ‘Punjab Basmati 2’ M
Plant height (cm)N0 85.2 97.9 100.2 94.4N20 93.5 101.7 108.8 101.3N40 97.4 103.7 111.8 104.3N60 97.5 104.7 111.7 104.6M 93.4 102.0 108.1LSD (0.05) N levels: 3.1; Cultivars: 2.0; N levels × Cultivars: NS
Days to 50% floweringN0 60 78 91 76N20 63 81 93 79N40 62 82 92 79N60 62 84 96 81M 62 81 93LSD (0.05) N levels: 0.8; Cultivars: 0.5; N levels × Cultivars: 1.1
Lodging score (0–9 scale)N0 0 0 0 0N20 0 0 0.7 0.4N40 0 4.3 3.7 2.7N60 0 5 5 3.3M 0 2.5 2.3LSD (0.05) N levels: 0.6; Cultivars: 0.4; N levels × Cultivars: 0.8
Note. N0 = without nitrogen; N20 = 20 kg/ha N supplied; N40 = 40 kg/ha N supplied; N60 = 60 kg/ha Nsupplied.
Yield Response
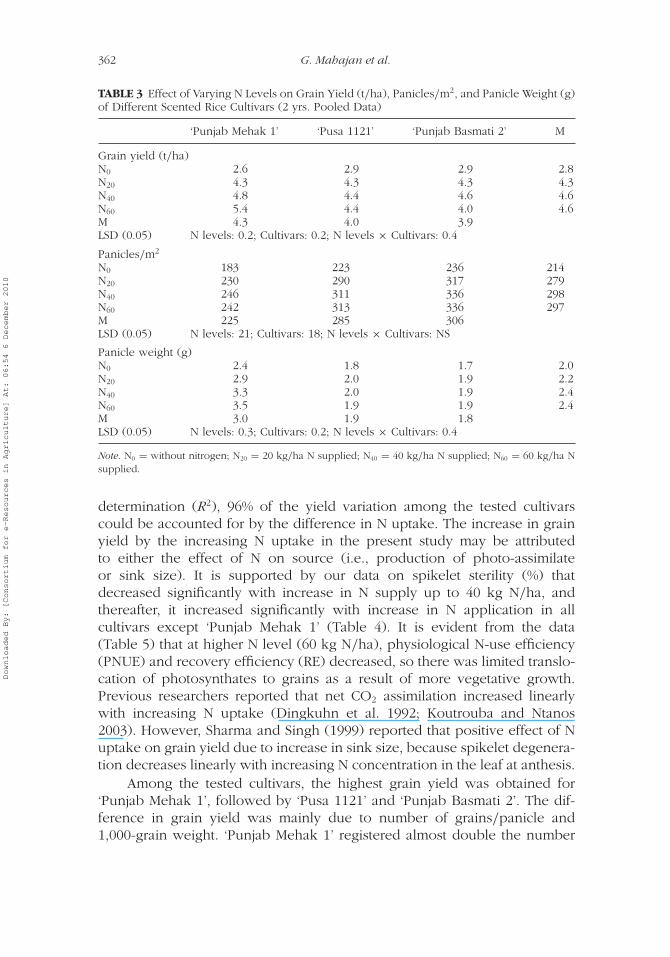
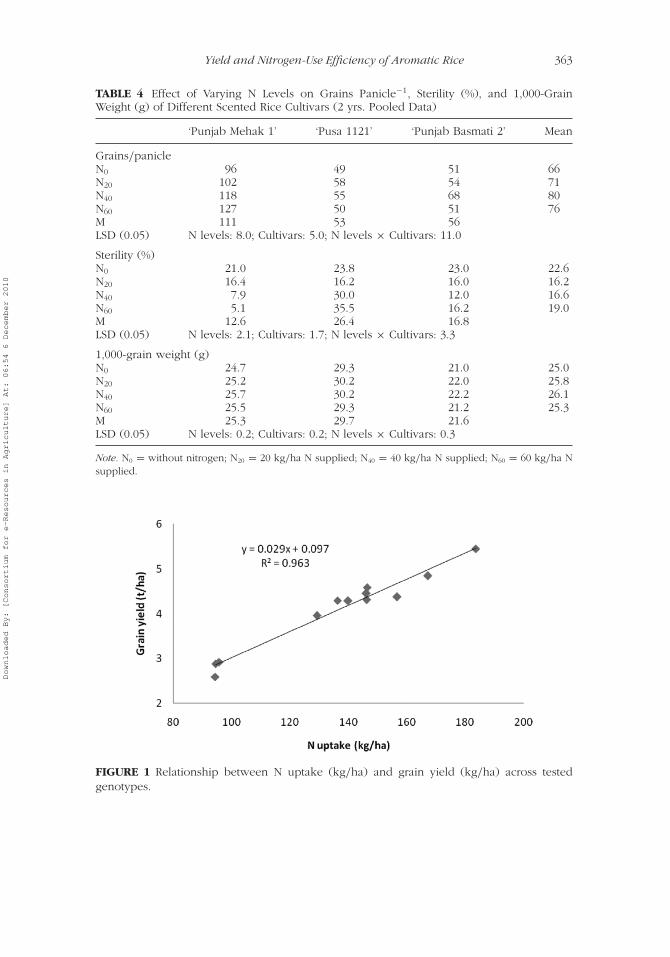
There was a significant effect of N level on grain yield of each cultivar(Table 3). Mean grain yield of all cultivars increased significantly up to40 kg N/ha and thereafter remained statistically same with increased Nlevel. Grain yield increased by 64.2% when plots were supplemented with40 kg N/ha as compared with control (unfertilized). Earlier, Chopra andChopra (2000) and Sidhu, Sikka, and Singh (2004) reported that basmatiseed yield increased with 40 kg N/ha, and thereafter, it decreased with anincrease in N dose. This increase in grain yield was associated with moreproductive tillers/m2, panicle weight, and grains/panicle; and with increased1,000-grain weight and low lodging percentage in response to N application(Tables 2, 3, and 4). Panicles/m2 and grains/panicle increased significantlywith increase in N level up to 40 kg/ha. The crop fertilized with 40 kg N/harecorded 39.2% more productive tillers m−2 and 21.2% more grains/panicleas compared with the control (Tables 3 and 4). Increased N applicationensured better availability of N to plants at active tillering and panicle-growth stage, which might have resulted in more productive tillers andgrains. Figure 1 clearly shows the linear relationship between N uptakeand grain yield across tested genotypes. As indicated by the coefficient of
Downloaded By: [Consortium for e-Resources in Agriculture] At: 06:54 6 December 2010
362 G. Mahajan et al.
TABLE 3 Effect of Varying N Levels on Grain Yield (t/ha), Panicles/m2, and Panicle Weight (g)of Different Scented Rice Cultivars (2 yrs. Pooled Data)
‘Punjab Mehak 1’ ‘Pusa 1121’ ‘Punjab Basmati 2’ M
Grain yield (t/ha)N0 2.6 2.9 2.9 2.8N20 4.3 4.3 4.3 4.3N40 4.8 4.4 4.6 4.6N60 5.4 4.4 4.0 4.6M 4.3 4.0 3.9LSD (0.05) N levels: 0.2; Cultivars: 0.2; N levels × Cultivars: 0.4
Panicles/m2
N0 183 223 236 214N20 230 290 317 279N40 246 311 336 298N60 242 313 336 297M 225 285 306LSD (0.05) N levels: 21; Cultivars: 18; N levels × Cultivars: NS
Panicle weight (g)N0 2.4 1.8 1.7 2.0N20 2.9 2.0 1.9 2.2N40 3.3 2.0 1.9 2.4N60 3.5 1.9 1.9 2.4M 3.0 1.9 1.8LSD (0.05) N levels: 0.3; Cultivars: 0.2; N levels × Cultivars: 0.4
Note. N0 = without nitrogen; N20 = 20 kg/ha N supplied; N40 = 40 kg/ha N supplied; N60 = 60 kg/ha Nsupplied.
determination (R2), 96% of the yield variation among the tested cultivarscould be accounted for by the difference in N uptake. The increase in grainyield by the increasing N uptake in the present study may be attributedto either the effect of N on source (i.e., production of photo-assimilateor sink size). It is supported by our data on spikelet sterility (%) thatdecreased significantly with increase in N supply up to 40 kg N/ha, andthereafter, it increased significantly with increase in N application in allcultivars except ‘Punjab Mehak 1’ (Table 4). It is evident from the data(Table 5) that at higher N level (60 kg N/ha), physiological N-use efficiency(PNUE) and recovery efficiency (RE) decreased, so there was limited translo-cation of photosynthates to grains as a result of more vegetative growth.Previous researchers reported that net CO2 assimilation increased linearlywith increasing N uptake (Dingkuhn et al. 1992; Koutrouba and Ntanos2003). However, Sharma and Singh (1999) reported that positive effect of Nuptake on grain yield due to increase in sink size, because spikelet degenera-tion decreases linearly with increasing N concentration in the leaf at anthesis.
Among the tested cultivars, the highest grain yield was obtained for‘Punjab Mehak 1’, followed by ‘Pusa 1121’ and ‘Punjab Basmati 2’. The dif-ference in grain yield was mainly due to number of grains/panicle and1,000-grain weight. ‘Punjab Mehak 1’ registered almost double the number
Downloaded By: [Consortium for e-Resources in Agriculture] At: 06:54 6 December 2010
Yield and Nitrogen-Use Efficiency of Aromatic Rice 363
TABLE 4 Effect of Varying N Levels on Grains Panicle−1, Sterility (%), and 1,000-GrainWeight (g) of Different Scented Rice Cultivars (2 yrs. Pooled Data)
‘Punjab Mehak 1’ ‘Pusa 1121’ ‘Punjab Basmati 2’ Mean
Grains/panicleN0 96 49 51 66N20 102 58 54 71N40 118 55 68 80N60 127 50 51 76M 111 53 56LSD (0.05) N levels: 8.0; Cultivars: 5.0; N levels × Cultivars: 11.0
Sterility (%)N0 21.0 23.8 23.0 22.6N20 16.4 16.2 16.0 16.2N40 7.9 30.0 12.0 16.6N60 5.1 35.5 16.2 19.0M 12.6 26.4 16.8LSD (0.05) N levels: 2.1; Cultivars: 1.7; N levels × Cultivars: 3.3
1,000-grain weight (g)N0 24.7 29.3 21.0 25.0N20 25.2 30.2 22.0 25.8N40 25.7 30.2 22.2 26.1N60 25.5 29.3 21.2 25.3M 25.3 29.7 21.6LSD (0.05) N levels: 0.2; Cultivars: 0.2; N levels × Cultivars: 0.3
Note. N0 = without nitrogen; N20 = 20 kg/ha N supplied; N40 = 40 kg/ha N supplied; N60 = 60 kg/ha Nsupplied.
FIGURE 1 Relationship between N uptake (kg/ha) and grain yield (kg/ha) across testedgenotypes.
Downloaded By: [Consortium for e-Resources in Agriculture] At: 06:54 6 December 2010
364 G. Mahajan et al.
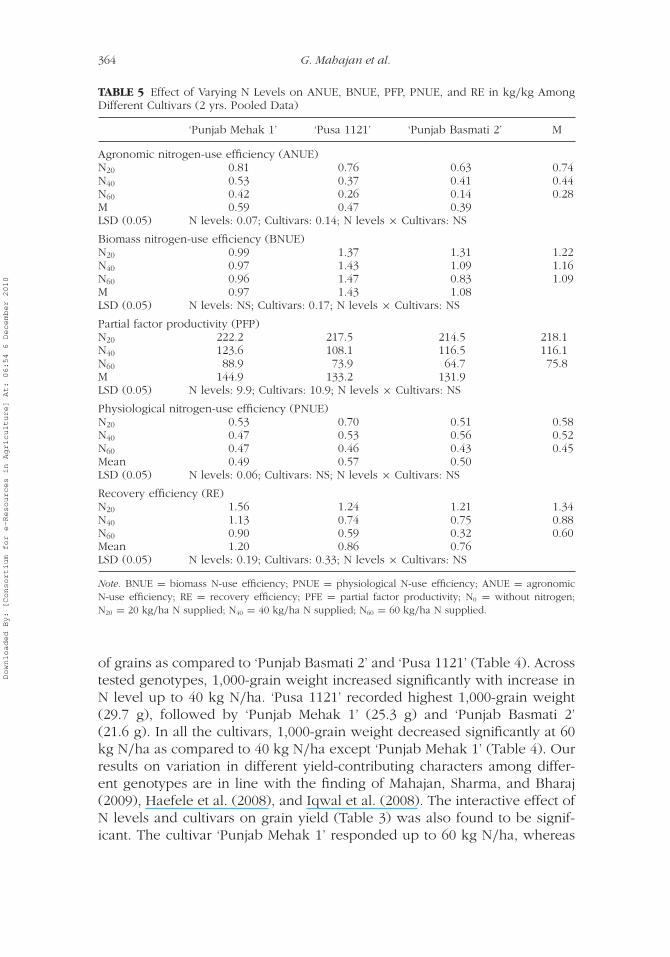
TABLE 5 Effect of Varying N Levels on ANUE, BNUE, PFP, PNUE, and RE in kg/kg AmongDifferent Cultivars (2 yrs. Pooled Data)
‘Punjab Mehak 1’ ‘Pusa 1121’ ‘Punjab Basmati 2’ M
Agronomic nitrogen-use efficiency (ANUE)N20 0.81 0.76 0.63 0.74N40 0.53 0.37 0.41 0.44N60 0.42 0.26 0.14 0.28M 0.59 0.47 0.39LSD (0.05) N levels: 0.07; Cultivars: 0.14; N levels × Cultivars: NS
Biomass nitrogen-use efficiency (BNUE)N20 0.99 1.37 1.31 1.22N40 0.97 1.43 1.09 1.16N60 0.96 1.47 0.83 1.09M 0.97 1.43 1.08LSD (0.05) N levels: NS; Cultivars: 0.17; N levels × Cultivars: NS
Partial factor productivity (PFP)N20 222.2 217.5 214.5 218.1N40 123.6 108.1 116.5 116.1N60 88.9 73.9 64.7 75.8M 144.9 133.2 131.9LSD (0.05) N levels: 9.9; Cultivars: 10.9; N levels × Cultivars: NS
Physiological nitrogen-use efficiency (PNUE)N20 0.53 0.70 0.51 0.58N40 0.47 0.53 0.56 0.52N60 0.47 0.46 0.43 0.45Mean 0.49 0.57 0.50LSD (0.05) N levels: 0.06; Cultivars: NS; N levels × Cultivars: NS
Recovery efficiency (RE)N20 1.56 1.24 1.21 1.34N40 1.13 0.74 0.75 0.88N60 0.90 0.59 0.32 0.60Mean 1.20 0.86 0.76LSD (0.05) N levels: 0.19; Cultivars: 0.33; N levels × Cultivars: NS
Note. BNUE = biomass N-use efficiency; PNUE = physiological N-use efficiency; ANUE = agronomicN-use efficiency; RE = recovery efficiency; PFE = partial factor productivity; N0 = without nitrogen;N20 = 20 kg/ha N supplied; N40 = 40 kg/ha N supplied; N60 = 60 kg/ha N supplied.
of grains as compared to ‘Punjab Basmati 2’ and ‘Pusa 1121’ (Table 4). Acrosstested genotypes, 1,000-grain weight increased significantly with increase inN level up to 40 kg N/ha. ‘Pusa 1121’ recorded highest 1,000-grain weight(29.7 g), followed by ‘Punjab Mehak 1’ (25.3 g) and ‘Punjab Basmati 2’(21.6 g). In all the cultivars, 1,000-grain weight decreased significantly at 60kg N/ha as compared to 40 kg N/ha except ‘Punjab Mehak 1’ (Table 4). Ourresults on variation in different yield-contributing characters among differ-ent genotypes are in line with the finding of Mahajan, Sharma, and Bharaj(2009), Haefele et al. (2008), and Iqwal et al. (2008). The interactive effect ofN levels and cultivars on grain yield (Table 3) was also found to be signif-icant. The cultivar ‘Punjab Mehak 1’ responded up to 60 kg N/ha, whereas
Downloaded By: [Consortium for e-Resources in Agriculture] At: 06:54 6 December 2010
Yield and Nitrogen-Use Efficiency of Aromatic Rice 365
‘Punjab Basmati 2’ and ‘Pusa 1121’ responded only up to 40 kg N/ha. It wasinteresting that at 20 kg N/ha, all the three cultivars gave equal yield.
N-Use Efficiency
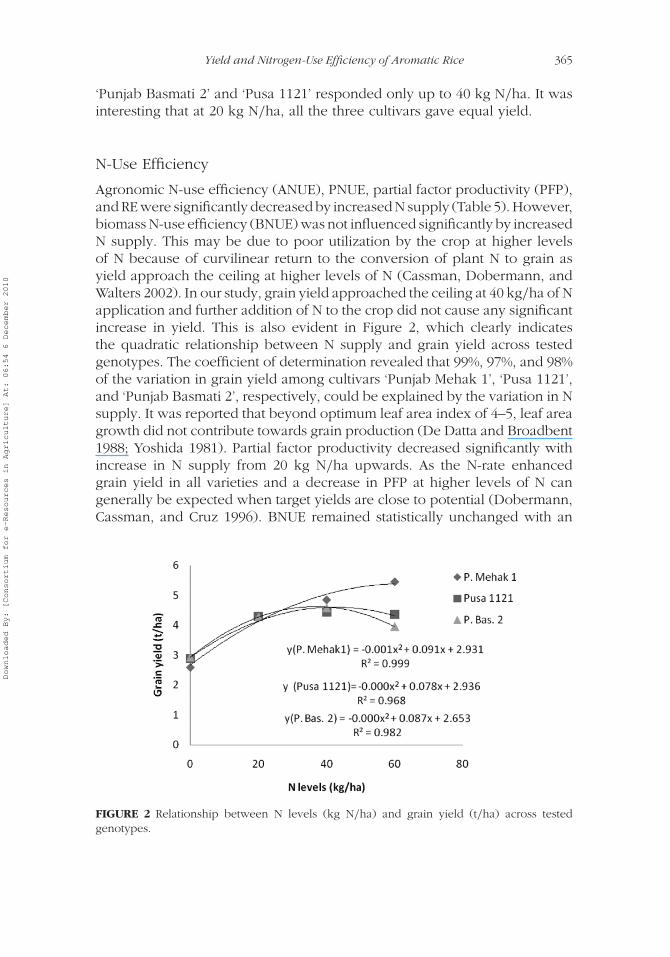
Agronomic N-use efficiency (ANUE), PNUE, partial factor productivity (PFP),and RE were significantly decreased by increased N supply (Table 5). However,biomass N-use efficiency (BNUE) was not influenced significantly by increasedN supply. This may be due to poor utilization by the crop at higher levelsof N because of curvilinear return to the conversion of plant N to grain asyield approach the ceiling at higher levels of N (Cassman, Dobermann, andWalters 2002). In our study, grain yield approached the ceiling at 40 kg/ha of Napplication and further addition of N to the crop did not cause any significantincrease in yield. This is also evident in Figure 2, which clearly indicatesthe quadratic relationship between N supply and grain yield across testedgenotypes. The coefficient of determination revealed that 99%, 97%, and 98%of the variation in grain yield among cultivars ‘Punjab Mehak 1’, ‘Pusa 1121’,and ‘Punjab Basmati 2’, respectively, could be explained by the variation in Nsupply. It was reported that beyond optimum leaf area index of 4–5, leaf areagrowth did not contribute towards grain production (De Datta and Broadbent1988; Yoshida 1981). Partial factor productivity decreased significantly withincrease in N supply from 20 kg N/ha upwards. As the N-rate enhancedgrain yield in all varieties and a decrease in PFP at higher levels of N cangenerally be expected when target yields are close to potential (Dobermann,Cassman, and Cruz 1996). BNUE remained statistically unchanged with an
FIGURE 2 Relationship between N levels (kg N/ha) and grain yield (t/ha) across testedgenotypes.
Downloaded By: [Consortium for e-Resources in Agriculture] At: 06:54 6 December 2010
366 G. Mahajan et al.
increase in N level from 20 kg N/ha to 60 kg N/ha (Table 5). This meansthat at higher N levels, N absorbed by the plants was used for vegetativegrowth, as reflected by an increase in plant height with an increase in Nsupply (Table 2), but absorbed N remained in the vegetative parts and wasnot utilized for improving grain yield, as is evident from lower values of PNUEand ANUE at higher N doses. The PNUE at 60 kg N/ha decreased by 22.4%as compared with 20 kg N/ha (Table 5). Similarly, ANUE also decreased by62.2% when 60 kg N/ha was applied to the crop as compared to 20 kg N/ha.The PNUE remained statistically same in all the cultivars, whereas ANUE,RE, PFP, and BNUE were influenced significantly by cultivars. The cultivar‘Punjab Mehak 1’ registered the highest ANUE, RE, and PFP as compared to‘Pusa 1121’ and ‘Punjab Basmati 2’; however, maximum BNUE was found incultivar ‘Pusa 1121’.
CONCLUSIONS
Our study demonstrated that beneficial response to N application in aro-matic rice varied across cultivars. Grain yield of ‘Punjab Basmati 2’ and‘Pusa 1121’ increased significantly with increased N supply up to 40 kg/ha,whereas in ‘Punjab Mehak 1’, significant increase in grain yield was observedwith increased N supply up to 60 kg N/ha. The cultivar ‘Punjab Mehak 1’registered the highest ANUE, RE, and PFP followed by ‘Pusa 1121’ and‘Punjab Basmati 2’; however, maximum BNUE was found in cultivar ‘Pusa1121’. The study concluded that the cultivars with high uptake efficiencycould be used for environment-friendly farming systems. The cultivars withhigh N-uptake efficiency had higher N contents than cultivars with lowN-uptake efficiency. ‘Punjab Mehak 1’ at 60 kg N/ha achieved 22.7% and25.9% more yield compared to ‘Pusa 1121’ and ‘Punjab Basmati 2’, respec-tively, due to N-use efficiency differences. Therefore, NUE of differentcultivars could be a useful tool to adopt the appropriate cultural practicesfor achieving high yield and optimizing N application rate.
REFERENCES
Bligh, H. F. J. 2000. Detection of adulteration of Basmati rice with non-premium long-grain rice. International Journal of Food Science and Technology35:257–65.
Bohlool, B. B., J. K. Ladha, D. P. Garrity, and T. George. 1992. Biological nitrogenfixation for sustainable agriculture: A perspective. In Biological nitrogen fixa-tion for sustainable agriculture, ed. J. K. Ladha, T. George, and B. B. Bohlool,1–12. Dorchect, The Netherlands: Kluwer Academic Publisher in Cooperationwith the International Rice Research Institute.
Bremner, J. M. 1966. Total nitrogen. In Methods of soil analysis, Part 2, ed.C. A. Black, 1149–78. Madison, WI: American Society of Agronomy.
Downloaded By: [Consortium for e-Resources in Agriculture] At: 06:54 6 December 2010
Yield and Nitrogen-Use Efficiency of Aromatic Rice 367
Bremner, J. M., and D. R. Keeney. 1966. Determination and isotope-ratio analysisof different forms of Nitrogen in soils: 3. Exchangeable ammonium, nitrate,and nitrite by extraction distillation methods. Soil Science Society of AmericaProceedings 30:577–82.
Broadbent, F. E., S. K. De Datta, and E. V. Laureles. 1987. Measurement of nitrogenuse efficiency in rice genotypes. Agron. J . 79:786–91.
Cassman, K. G., A. Dobermann, and D. T. Walters. 2002. Agroecosytems, Nitrogenuse efficiency and nitrogen management. AMBIO: A Journal of the HumanEnvironment 31:132–140.
Cassman, K. G., S. Peng, D. C. Olek, J. K. Ladha, W. Reichhardt, A. Dobermann,and U. Singh. 1998. Opportunities for increased nitrogen use efficiency fromimproved resource management in irrigated rice systems. Field Crops Res.56:7–19.
Chaturvedi, I. 2005. Effect of nitrogen fertilization on growth, yield and quality ofhybrid rice. J. Cent. Eur. Agric. 6:611–18.
Chopra N. K., and Chopra, N. 2000. Effect of row spacing and nitrogen level ongrowth, yield and seed quality of scented rice under transplanted conditions.Indian J. Agron. 45:304–08.
Conry, M. J. 1995. Comparisons of early, normal and late sowing at three ratesof nitrogen on the yield, grain nitrogen and screening contents of Blenheimspring malting barley in Ireland. Journal of Agricultural Science, Cambridge125:183–88.
Craswell, T., and D. C. Godwin, 1984. The efficiency of N fertilizers applied tocereals in different climates. In Advances in plant nutrition, ed. P. B. Tnker,and A. Lauchli, 1–55. New York: Praeger.
Dingkuhn, M., S. De Datta, C. Javellana, R. Pamplona, and H. F. Schnier 1992.Effect of late season N fertilization on photosynthesis and yield of transplantedand direct-seeded tropical flooded rice. I. Growth dynamics. Field Crops Res.28:223–24.
De Datta S. K., and E. E. Broadbent 1988. Methodology for evaluating nitrogen useefficiency by rice genotypes. Agron J . 80:793–98.
Dobermann, A., K. G. Cassman, and P. C. Sta. Cruz 1996. Fertilizer inputs, nutrientbalance and soil nutrient supplying power in intensive, irrigated rice ecosystems.II. Effective soil K supplying capacity. Nutr. Cyc. Agroecosyst. 46:11–21.
FAOSTAT. 2009. FAOSTAT database. Rome: Food and Agricultural Organization ofthe United Nations.
Haefele, S. M., S. M. A. Jabbar, J. D. L. C. Siopongco, A. Tirol-Padre, S. T. Amarante,P. C. Sta Cruz and W. C. Cosici. 2008. Nitrogen use efficiency in selectedrice genotypes under different water regimes and nitrogen levels. Field CropsResearch 107:137–46
Huggins, D. R., and B. L. Pan 1993. Nitrogen use efficiency component analysis: Anevaluation of cropping differences in productivity. Agron J . 85:898–905.
Iqwal, S., A. Ahmad, A. Hussain, M. A. Ali, T. Khaliq, and S. F.Wajid, 2008. Influenceof transplanting date and nitrogen management on productivity of paddycultivars under variable environments. Int. J. Agri. Biol. 10:288–92.
Koutrouba, S. D., and D. A. Ntanos. 2003. Genotypic differences for grain yield andnitrogen utilization in Indica and Japonica rice under Mediterranean conditions.Field Crops Res. 83:251–60.
Downloaded By: [Consortium for e-Resources in Agriculture] At: 06:54 6 December 2010
368 G. Mahajan et al.
Ladha, J. K., G. J. D. Kirk, J. Bennett, S. Peng, C. K. Reddy, P. M. Reddy,and U. Singh 1998. Opportunities for increased nitrogen use efficiency fromimproved lowland rice germplasm. Field Crops Res. 56:41–71.
Mahajan, G., N. Sharma, and T. S. Bharaj. 2009. Grain yield, water productivity andquality characteristics of basmati rice in response to cultivars and transplantingdates. International J. Plant Breeding 3:46–51.
Novoa, R., and R. S. Loomis 1981. Nitrogen and plant production. Plant Soil58:177–204.
Sharma, A. R., and D. P. Singh. 1999. Rice. In Crop yield, physiology and processes,ed. D. L. Smith and C. Mamel, 109–68. Berlin: Springer.
Siddiq, F. A., K. Muralidharan, and Shobha-Rani, N. 1997. Basmati rice. New Delhi:Directorate of Rice Research, Indian Council of Agricultural Research.
Sidhu, M. S., R. Sikka, and T. Singh 2004. Performance of transplanted basmati ricein different cropping systems as affected by N application. IRRN 29:63–65.
Singh, U., J. K. Ladha, E. G. Castillo, G. Punzalan, A. Tirol-Padre, and M. Duqueza,1998. Genotypic variation in nitrogen use efficiency in medium-and long-duration rice. Field Crops Res. 58:35–53.
Swain, D. K., B. C. Bhaskar, P. Krishnan, K. S. Rao, K. Srinivasa, K. N. Sangram, andR. N. Dash. 2006. Variation in yield, N uptake and N use efficiency of mediumand late duration rice varieties. Journal of Agricultural Science Cambridge144:69–83.
Timsina, J., and D. J. Connor. 2001. Productivity and management of rice-wheatcropping systems: Issues and challenges. Field Crop Res. 69:93–132.
Vachhani, M. V., W. T. Butany, and C. P. K. Nair 1962. A tentative commercialclassification of rice. Rice Newsletter 10:15.
Vlek, P. L. G., and B. H. Byrnes. 1986. The efficacy and loss of fertilizer N in lowlandrice. Fertilizer Res. 9:131–47.
Yoshida, S. 1978. Tropical climate and its influence on rice. Research Paper No. 20.International Rice Research Institute. Los Banos, Philippines.
Yoshida, S. 1981. Fundamental of rice crop science. International Rice ResearchInstitute. Los Banos, Philippines.
Downloaded By: [Consortium for e-Resources in Agriculture] At: 06:54 6 December 2010