wyndham worldwide corporation
TRANSCRIPT
Table of Contents
UNITED STATESSECURITIES AND EXCHANGE COMMISSION
WASHINGTON, D.C. 20549FORM 10-K
(Mark One)þ ANNUAL REPORT PURSUANT TO SECTION 13 OR 15(d) OF THE SECURITIES EXCHANGE ACT OF
1934For the fiscal year ended December 31, 2014
or
¨ TRANSITION REPORT PURSUANT TO SECTION 13 OR 15(d) OF THE SECURITIES EXCHANGE ACTOF 1934
For the transition period from to COMMISSION FILE NO. 001-32876
WYNDHAM WORLDWIDE CORPORATION(Exact name of registrant as specified in its charter)
DELAWARE 20-0052541(State or other jurisdiction
of incorporation or organization) (I.R.S. Employer
Identification No.)
22 SYLVAN WAY 07054PARSIPPANY, NEW JERSEY (Zip Code)
(Address of principal executive offices) (973) 753-6000
(Registrant’s telephone number, including area code)Securities registered pursuant to Section 12(b) of the Act:
Name of each exchangeTitle of each Class on which registered
Common Stock, Par Value $0.01 per share New York Stock ExchangeSecurities registered pursuant to Section 12(g) of the Act:
None(Title of Class)
Indicate by check mark if the registrant is a well-known seasoned issuer, as defined in Rule 405 of the Securities Act. Yes þ No ¨Indicate by check mark if the registrant is not required to file reports pursuant to Section 13 or Section 15(d) of the Act. Yes ¨ No þIndicate by check mark whether the registrant (1) has filed all reports required to be filed by Section 13 or 15(d) of the Securities Exchange Act of 1934 during the preceding 12months (or for such shorter period that the registrant was required to file such reports), and (2) has been subject to such filing requirements for the past 90 days. Yes þ No ¨Indicate by check mark whether the registrant has submitted electronically and posted on its corporate Web site, if any, every Interactive Data File required to be submitted andposted pursuant to Rule 405 of Regulation S-T (§ 232.405 of this chapter) during the preceding 12 months (or for such shorter period that the registrant was required to submit andpost such files). Yes þ No ¨Indicate by check mark if disclosure of delinquent filers pursuant to Item 405 of Regulation S-K (§ 229.405) is not contained herein, and will not be contained, to the best ofregistrant’s knowledge, in definitive proxy or information statements incorporated by reference in Part III of this Form 10-K or any amendment to this Form 10-K. þIndicate by check mark whether the registrant is a large accelerated filer, an accelerated filer, a non-accelerated filer, or a smaller reporting company. See the definitions of “largeaccelerated filer,” “accelerated filer” and “smaller reporting company” in Rule 12b-2 of the Exchange Act. (Check one):
Large accelerated filer þ Accelerated filer ¨ Non-accelerated filer ¨ Smaller reporting company ¨
(Do not check if a smaller
reporting company) Indicate by check mark whether the registrant is a shell company (as defined in Rule 12b-2 of the Act). Yes ¨ No þThe aggregate market value of the registrant’s common stock held by non-affiliates of the registrant as of June 30, 2014, was $9,402,262,649. All executive officers and directors ofthe registrant have been deemed, solely for the purpose of the foregoing calculation, to be “affiliates” of the registrant.As of January 31, 2015, the registrant had outstanding 120,558,066 shares of common stock.
DOCUMENTS INCORPORATED BY REFERENCEPortions of the Proxy Statement prepared for the 2015 Annual Meeting of Shareholders are incorporated by reference into Part III of this report.
Table of Contents
TABLE OF CONTENTS
Page PART I Item 1. Business 2Item 1A. Risk Factors 23Item 1B. Unresolved Staff Comments 31Item 2. Properties 31Item 3. Legal Proceedings 32Item 4. Mine Safety Disclosures 32 PART II Item 5. Market for Registrant’s Common Equity, Related Stockholder Matters and Issuer Purchases of Equity Securities 33Item 6. Selected Financial Data 35Item 7. Management’s Discussion and Analysis of Financial Condition and Results of Operations 37Item 7A. Quantitative and Qualitative Disclosures about Market Risk 62Item 8. Financial Statements and Supplementary Data 64Item 9. Changes in and Disagreements with Accountants on Accounting and Financial Disclosure 64Item 9A. Controls and Procedures 64Item 9B. Other Information 64 PART III Item 10. Directors, Executive Officers and Corporate Governance 65Item 11. Executive Compensation 66Item 12. Security Ownership of Certain Beneficial Owners and Management and Related Stockholder Matters 66Item 13. Certain Relationships and Related Transactions, and Director Independence 66Item 14. Principal Accounting Fees and Services 66 PART IV Item 15. Exhibits and Financial Statement Schedules 67 Signatures 68
Table of Contents
PART I
Forward Looking Statements
This report includes “forward-looking” statements, as that term is defined by the Securities and Exchange Commission (“SEC”) in its rules, regulationsand releases. Forward-looking statements are any statements other than statements of historical fact including statements regarding our expectations, beliefs,hopes, intentions or strategies regarding the future. In some cases forward-looking statements can be identified by the use of words such as “may,” “expects,”“should,” “believes,” “plans,” “anticipates,” “estimates,” “predicts,” “potential,” “continue” or other words of similar meaning. Forward-looking statementsare subject to risks and uncertainties that could cause actual results to differ materially from those discussed in or implied by the forward-looking statements.Factors that might cause such a difference include but are not limited to general economic conditions, our financial and business prospects, our capitalrequirements, our financing prospects, our relationships with associates and those disclosed as risks under “Risk Factors” in Part I, Item 1A of this report. Wecaution readers that any such statements are based on currently available operational, financial and competitive information and they should not place unduereliance on these forward-looking statements, which reflect management’s opinion only as of the date on which they were made. Except as required by law,we disclaim any obligation to review or update these forward-looking statements to reflect events or circumstances as they occur.
Where You Can Find More Information
We file annual, quarterly and current reports, proxy statements, reports filed or furnished pursuant to Section 13(a) or 15(d) of the Securities ExchangeAct of 1934 and other information with the SEC. Our SEC filings are available free of charge to the public over the Internet at the SEC’s website athttp://www.sec.gov. Our SEC filings are also available on our website at http://www.WyndhamWorldwide.com as soon as reasonably practicable after theyare filed with or furnished to the SEC. You may also read and copy any filed document at the SEC’s public reference room in Washington, D.C. at100 F Street, N.E., Washington, D.C. 20549. Please call the SEC at 1-800-SEC-0330 for further information about public reference rooms.
We maintain an internet site at http://www.WyndhamWorldwide.com. Our website and the information contained on or connected to that site are notincorporated into this Annual Report.
ITEM 1. BUSINESS
OVERVIEW
Wyndham Worldwide
As one of the world’s largest hospitality companies, we offer individual consumers and business customers a wide range of hospitality services andproducts through our global portfolio of world-renowned brands. The hospitality industry is a major component of the travel industry, which is one of thelargest retail industry segments of the global economy. Through our 25 primary brands, we have built a significant presence in most major hospitalitymarkets in the United States and throughout the world. Our brands include: Wyndham Hotels and Resorts, Ramada, Days Inn, Super 8, Howard Johnson,Wingate by Wyndham, Microtel Inns & Suites, Tryp by Wyndham, RCI, Landal GreenParks, Novasol, Hoseasons, cottages4you, James Villa Holidays,Wyndham Vacation Rentals, Wyndham Vacation Resorts, Shell Vacations Club and WorldMark by Wyndham. Our operations are grouped into threesegments: lodging, vacation exchange and rentals and vacation ownership.
• Wyndham Hotel Group is the world’s largest hotel company based on the number of properties, with 7,645 hotels and over 660,800 hotel roomsworldwide. We franchise in the upscale, upper midscale, midscale, economy and extended stay segments with a concentration in economy brands.We also provide property management services for full-service and select limited-service hotels. This is predominantly a fee-for-service business thatproduces recurring revenue streams with steady cash flow and low capital investment requirements.
• Wyndham Exchange and Rentals includes the world’s largest vacation exchange network based on the number of members (3.8 million) andaffiliated vacation ownership resorts (approximately 4,500) providing vacation exchange services and products to timeshare developers and owners.We are also the world’s largest professional manager of vacation rental properties based on the number of properties (approximately 103,000), whichwe market on behalf of independent owners. In total, we provide access to over 107,000 vacation properties in more than 100 countries, includingvacation ownership condominiums, traditional hotel rooms, villas, cottages, chalets, city apartments, second homes, fractional resorts, privateresidence clubs and yachts. This is primarily a fee-for-service business that provides stable revenue streams and produces strong cash flow.
2
Table of Contents
• Wyndham Vacation Ownership is the world’s largest timeshare (also known as vacation ownership) business based on the number of resorts, units,owners and revenues, with 203 resorts and approximately 904,000 owners. We develop and market Vacation Ownership Interests (“VOIs”) toindividual consumers, provide consumer financing in connection with the sale of VOIs and provide property management services at resorts.
Our business segments generate a diversified revenue stream and high free cash flow. Approximately 63% of our revenues are generated from our fee-for-service businesses. We receive fees (i) in the form of royalties for use of our brand names, (ii) for providing property management services to hotels andvacation ownership resorts, (iii) for providing vacation exchange and rentals services and (iv) for providing services under our Wyndham Asset AffiliationModels (“WAAM”) in our timeshare business. The remainder of our revenue comes primarily from the sale of VOIs and related financing.
How we create value for our shareholders
Our mission is to increase shareholder value by being the leader in travel accommodations and welcoming our guests to iconic brands and vacationdestinations through our signature “Count On Me!” service. Our strategies to achieve these objectives are to:
• Strategically allocate capital to expand our fee-for-service business models;
• Increase cash flow and profit through superior execution;
• Develop innovative services and products to meet the evolving needs of customers;
• Further develop our world class capabilities by strengthening our brands, attracting and developing the best talent and investing intechnology; and
• Support and promote Wyndham Green and Wyndham Diversity initiatives.
We provide value-added services and products intended to enhance the travel experience of the individual consumer and to drive revenues to ourbusiness customers. We have a strong presence in many different segments of the hospitality industry. This allows us to leverage our relationships with ourexisting customers by offering them services and products from other segments.
All of our businesses have both domestic and international operations. During 2014, we derived 74% of our revenues in the U.S. and 26% internationally(approximately 16% in Europe and 10% in all other international regions). For a discussion of our segment revenues, profits, assets and geographicaloperations, see Note 21 to the Consolidated Financial Statements included in this Annual Report.
History and Development
Our corporate history can be traced back to the formation of Hospitality Franchise Systems (“HFS”) in 1990. HFS initially began as a hotel franchisor thatlater expanded to include the addition of the vacation exchange business. In December 1997, HFS merged with CUC International, Inc. to form CendantCorporation, which then further expanded with the addition of the vacation rentals and vacation ownership businesses. On July 31, 2006, Cendantdistributed all of the shares of its subsidiary, Wyndham Worldwide Corporation, to the holders of Cendant common stock issued and outstanding as ofJuly 21, 2006 (the record date for the distribution). The separation was effective on July 31, 2006. On August 1, 2006, we commenced “regular way” tradingon the New York Stock Exchange under the symbol “WYN.”
We have many widely recognized and well-established brands. Our Howard Johnson and Ramada brands opened their first hotels in 1954. RCI, ourvacation exchange business, was established in 1974. Hoseasons, Landal GreenParks and Novasol, some of Europe’s most renowned vacation rental brands,were established in 1944, 1954 and 1968, respectively. Our vacation ownership brands began operations in 1978 with Shell Vacations Club, followed byWyndham Vacation Resorts (formally known as Fairfield Resorts) in 1980 and WorldMark by Wyndham (formally known as Trendwest Resorts) in 1989.
3
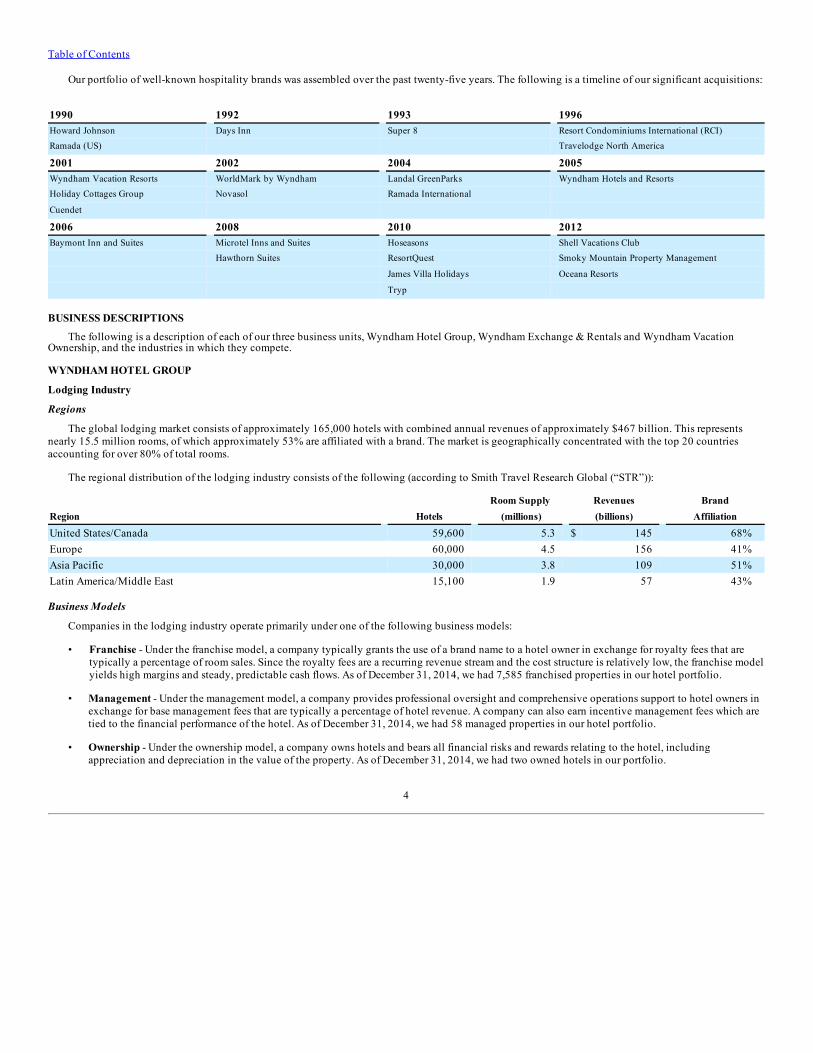
Table of Contents
Our portfolio of well-known hospitality brands was assembled over the past twenty-five years. The following is a timeline of our significant acquisitions:
1990 1992 1993 1996Howard Johnson Days Inn Super 8 Resort Condominiums International (RCI)Ramada (US) Travelodge North America
2001 2002 2004 2005Wyndham Vacation Resorts WorldMark by Wyndham Landal GreenParks Wyndham Hotels and ResortsHoliday Cottages Group Novasol Ramada International Cuendet 2006 2008 2010 2012Baymont Inn and Suites Microtel Inns and Suites Hoseasons Shell Vacations Club
Hawthorn Suites ResortQuest Smoky Mountain Property Management
James Villa Holidays Oceana Resorts
Tryp
BUSINESS DESCRIPTIONS
The following is a description of each of our three business units, Wyndham Hotel Group, Wyndham Exchange & Rentals and Wyndham VacationOwnership, and the industries in which they compete.
WYNDHAM HOTEL GROUP
Lodging Industry
Regions
The global lodging market consists of approximately 165,000 hotels with combined annual revenues of approximately $467 billion. This representsnearly 15.5 million rooms, of which approximately 53% are affiliated with a brand. The market is geographically concentrated with the top 20 countriesaccounting for over 80% of total rooms.
The regional distribution of the lodging industry consists of the following (according to Smith Travel Research Global (“STR”)):
Room Supply Revenues BrandRegion Hotels (millions) (billions) Affiliation
United States/Canada 59,600 5.3 $ 145 68%Europe 60,000 4.5 156 41%Asia Pacific 30,000 3.8 109 51%Latin America/Middle East 15,100 1.9 57 43%
Business Models
Companies in the lodging industry operate primarily under one of the following business models:
• Franchise - Under the franchise model, a company typically grants the use of a brand name to a hotel owner in exchange for royalty fees that aretypically a percentage of room sales. Since the royalty fees are a recurring revenue stream and the cost structure is relatively low, the franchise modelyields high margins and steady, predictable cash flows. As of December 31, 2014, we had 7,585 franchised properties in our hotel portfolio.
• Management - Under the management model, a company provides professional oversight and comprehensive operations support to hotel owners inexchange for base management fees that are typically a percentage of hotel revenue. A company can also earn incentive management fees which aretied to the financial performance of the hotel. As of December 31, 2014, we had 58 managed properties in our hotel portfolio.
• Ownership - Under the ownership model, a company owns hotels and bears all financial risks and rewards relating to the hotel, includingappreciation and depreciation in the value of the property. As of December 31, 2014, we had two owned hotels in our portfolio.
4
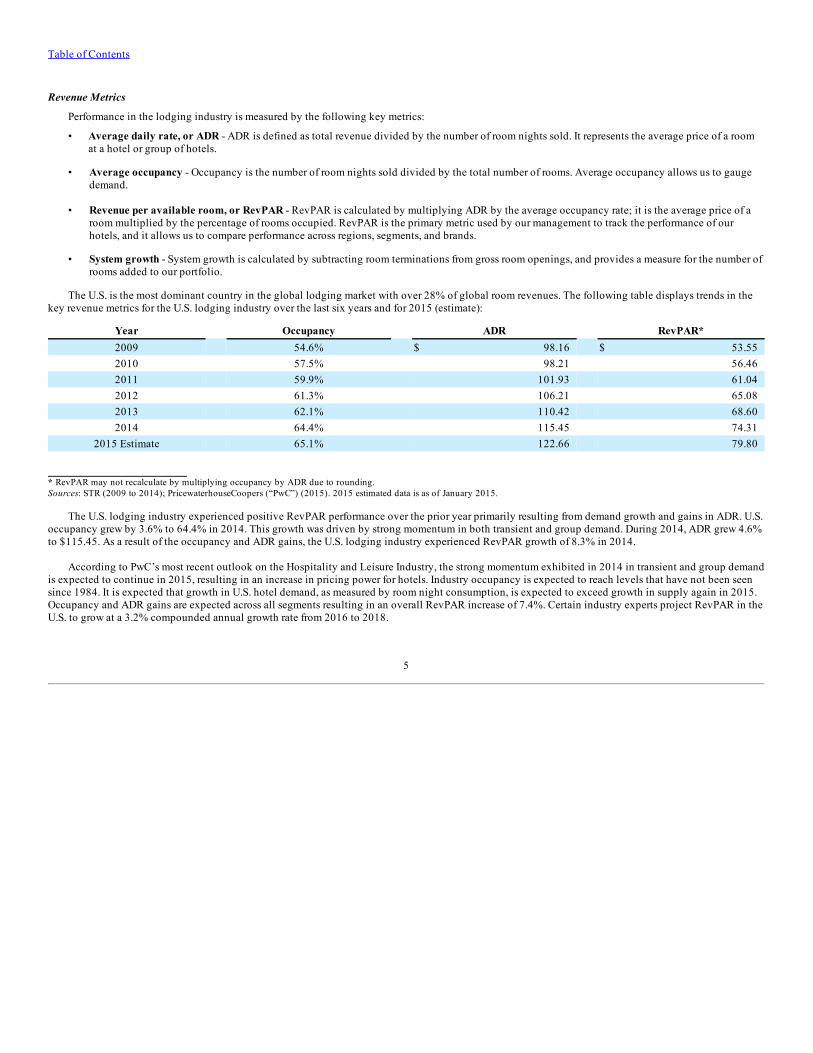
Table of Contents
Revenue Metrics
Performance in the lodging industry is measured by the following key metrics:
• Average daily rate, or ADR - ADR is defined as total revenue divided by the number of room nights sold. It represents the average price of a roomat a hotel or group of hotels.
• Average occupancy - Occupancy is the number of room nights sold divided by the total number of rooms. Average occupancy allows us to gaugedemand.
• Revenue per available room, or RevPAR - RevPAR is calculated by multiplying ADR by the average occupancy rate; it is the average price of aroom multiplied by the percentage of rooms occupied. RevPAR is the primary metric used by our management to track the performance of ourhotels, and it allows us to compare performance across regions, segments, and brands.
• System growth - System growth is calculated by subtracting room terminations from gross room openings, and provides a measure for the number ofrooms added to our portfolio.
The U.S. is the most dominant country in the global lodging market with over 28% of global room revenues. The following table displays trends in thekey revenue metrics for the U.S. lodging industry over the last six years and for 2015 (estimate):
Year Occupancy ADR RevPAR*2009 54.6% $ 98.16 $ 53.552010 57.5% 98.21 56.462011 59.9% 101.93 61.042012 61.3% 106.21 65.082013 62.1% 110.42 68.602014 64.4% 115.45 74.31
2015 Estimate 65.1% 122.66 79.80
* RevPAR may not recalculate by multiplying occupancy by ADR due to rounding.Sources: STR (2009 to 2014); PricewaterhouseCoopers (“PwC”) (2015). 2015 estimated data is as of January 2015.
The U.S. lodging industry experienced positive RevPAR performance over the prior year primarily resulting from demand growth and gains in ADR. U.S.occupancy grew by 3.6% to 64.4% in 2014. This growth was driven by strong momentum in both transient and group demand. During 2014, ADR grew 4.6%to $115.45. As a result of the occupancy and ADR gains, the U.S. lodging industry experienced RevPAR growth of 8.3% in 2014.
According to PwC’s most recent outlook on the Hospitality and Leisure Industry, the strong momentum exhibited in 2014 in transient and group demandis expected to continue in 2015, resulting in an increase in pricing power for hotels. Industry occupancy is expected to reach levels that have not been seensince 1984. It is expected that growth in U.S. hotel demand, as measured by room night consumption, is expected to exceed growth in supply again in 2015.Occupancy and ADR gains are expected across all segments resulting in an overall RevPAR increase of 7.4%. Certain industry experts project RevPAR in theU.S. to grow at a 3.2% compounded annual growth rate from 2016 to 2018.
5
Table of Contents
Segment Descriptions
Performance in the U.S. lodging industry is evaluated based upon chain scale segments, which are generally defined as follows:
• Luxury - typically offers first class accommodations and an extensive range of on-property amenities and services, including restaurants, spas,recreational facilities, business centers, concierges, room service and local transportation (shuttle service to airport and/or local attractions). ADR isnormally greater than $210 for hotels in this category.
• Upper Upscale - typically offers accommodations with a full range of on-property amenities and services, including restaurants, spas, recreationalfacilities, business centers, concierges, room service and local transportation (shuttle service to airport and/or local attractions). ADR normally fallsin the range of $145 to $210 for hotels in this category.
• Upscale - typically offers a full range of on-property amenities and services, including restaurants, spas, recreational facilities, business centers,concierges, room service, and local transportation (shuttle service to airport and/or local attractions). ADR normally falls in the range of $110 to$145 for hotels in this category.
• Upper Midscale - typically offers restaurants, vending, selected business services, partial recreational facilities (either a pool or fitness equipment),and limited transportation (airport shuttle). ADR normally falls in the range of $90 to $110 for hotels in this category.
• Midscale - typically offers limited breakfast, selected business services, limited recreational facilities (either a pool or fitness equipment), andlimited transportation (airport shuttle). ADR normally falls in the range of $65 to $90 for hotels in this category.
• Economy - typically offers basic amenities and a limited breakfast. ADR is normally less than $65 for hotels in this category.
Wyndham Hotel Group Overview
Wyndham Hotel Group is the world’s largest hotel franchisor based on number of properties, with 7,585 franchised hotels and over 660,800 hotel roomsworldwide, and is a leader in the economy segment. Our franchise business is easily adaptable to changing economic environments due to low operating coststructures. This, in combination with recurring fee streams, yields high margins and predictable cash flows. Ongoing capital requirements are relatively lowand mostly limited to technology expenditures which support core capabilities. We may employ incentives to generate new business, such as key money,development advance notes, and other forms of financial support to assist franchisees and hotel owners in converting to one of our brands or building newhotels under a Wyndham Hotel Group brand.
Our owned hotel portfolio currently consists of the Wyndham Grand Rio Mar Beach Resort and Spa in Puerto Rico (“Rio Mar hotel”) and the WyndhamGrand Orlando Bonnet Creek (“Bonnet Creek hotel”). Both hotels represent mixed-use opportunities which allow us to introduce our hotel guests to thevacation ownership product.
6
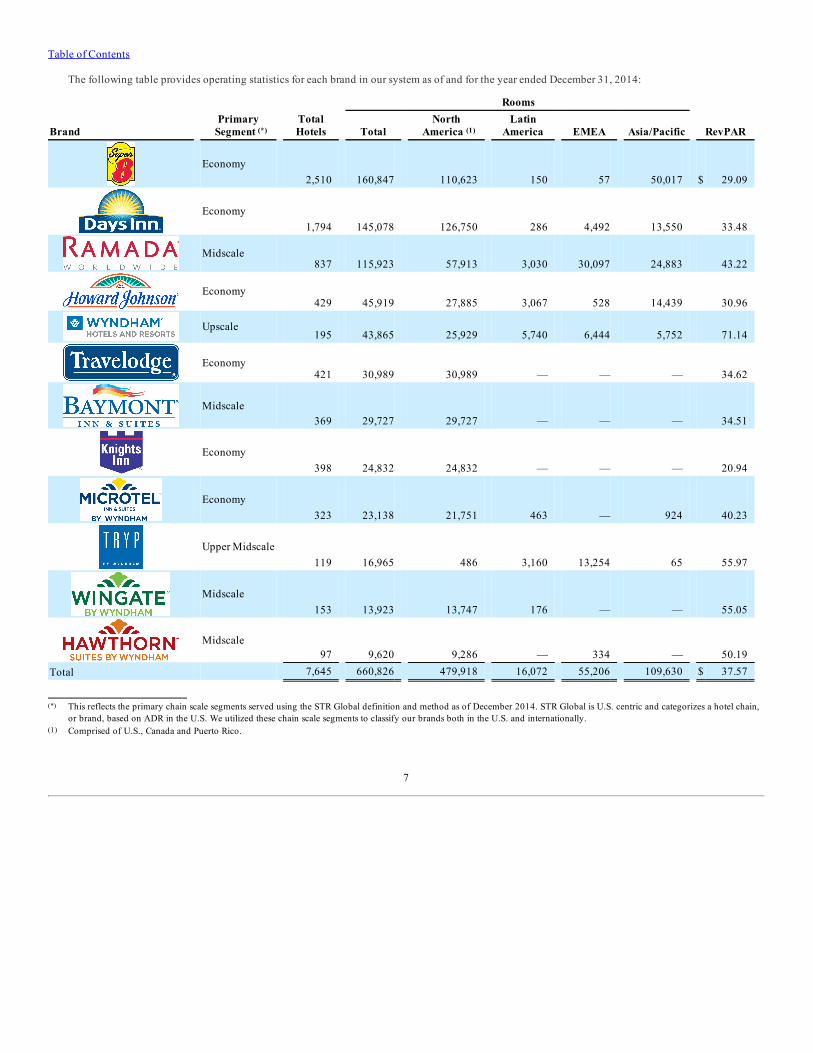
Table of Contents
The following table provides operating statistics for each brand in our system as of and for the year ended December 31, 2014:
Brand
Primary
Segment (*)
TotalHotels
Rooms
Total North
America (1) Latin
America EMEA Asia/Pacific RevPAR
Economy
2,510 160,847 110,623 150 57 50,017 $ 29.09
Economy
1,794 145,078 126,750 286 4,492 13,550 33.48
Midscale
837 115,923 57,913 3,030 30,097 24,883 43.22
Economy
429 45,919 27,885 3,067 528 14,439 30.96
Upscale
195 43,865 25,929 5,740 6,444 5,752 71.14
Economy
421 30,989 30,989 — — — 34.62
Midscale
369 29,727 29,727 — — — 34.51
Economy
398 24,832 24,832 — — — 20.94
Economy
323 23,138 21,751 463 — 924 40.23
Upper Midscale
119 16,965 486 3,160 13,254 65 55.97
Midscale
153 13,923 13,747 176 — — 55.05
Midscale
97 9,620 9,286 — 334 — 50.19Total 7,645 660,826 479,918 16,072 55,206 109,630 $ 37.57
(*) This reflects the primary chain scale segments served using the STR Global definition and method as of December 2014. STR Global is U.S. centric and categorizes a hotel chain,or brand, based on ADR in the U.S. We utilized these chain scale segments to classify our brands both in the U.S. and internationally.
(1) Comprised of U.S., Canada and Puerto Rico.
7
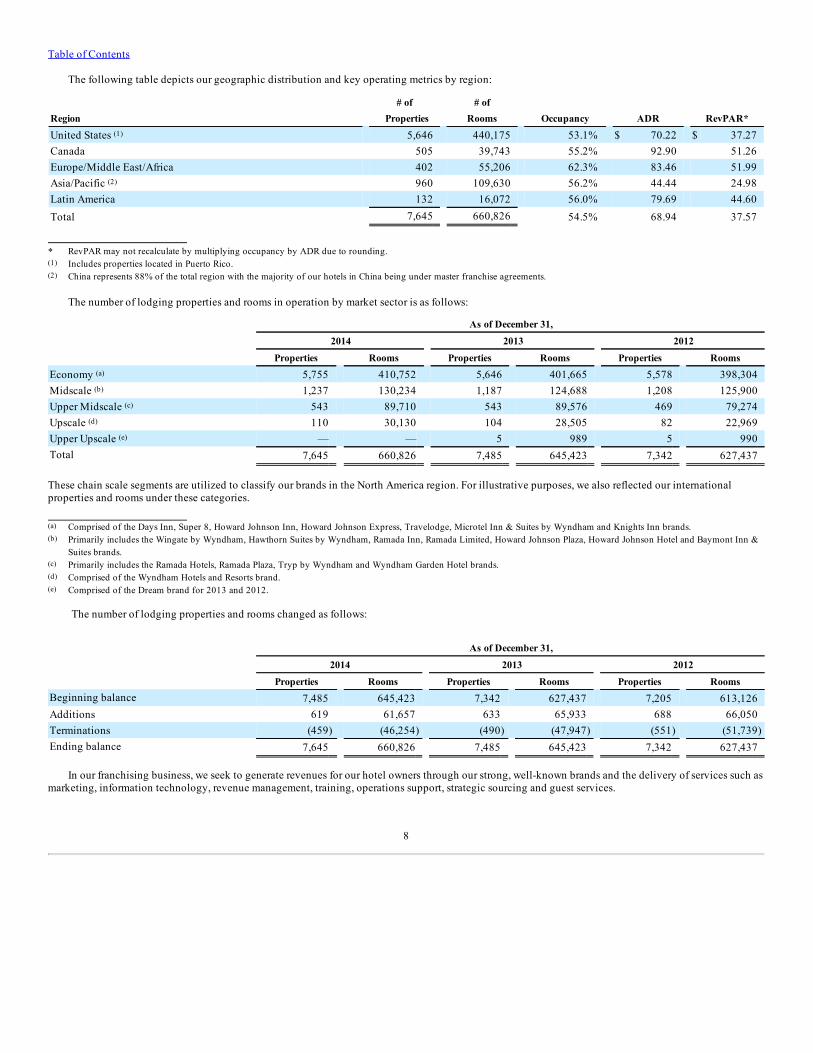
Table of Contents
The following table depicts our geographic distribution and key operating metrics by region:
# of # of Region Properties Rooms Occupancy ADR RevPAR*
United States (1) 5,646 440,175 53.1% $ 70.22 $ 37.27Canada 505 39,743 55.2% 92.90 51.26Europe/Middle East/Africa 402 55,206 62.3% 83.46 51.99Asia/Pacific (2) 960 109,630 56.2% 44.44 24.98Latin America 132 16,072 56.0% 79.69 44.60Total 7,645 660,826 54.5% 68.94 37.57
* RevPAR may not recalculate by multiplying occupancy by ADR due to rounding.(1) Includes properties located in Puerto Rico.(2) China represents 88% of the total region with the majority of our hotels in China being under master franchise agreements.
The number of lodging properties and rooms in operation by market sector is as follows:
As of December 31,
2014 2013 2012
Properties Rooms Properties Rooms Properties Rooms
Economy (a) 5,755 410,752 5,646 401,665 5,578 398,304Midscale (b) 1,237 130,234 1,187 124,688 1,208 125,900Upper Midscale (c) 543 89,710 543 89,576 469 79,274Upscale (d) 110 30,130 104 28,505 82 22,969Upper Upscale (e) — — 5 989 5 990Total 7,645 660,826 7,485 645,423 7,342 627,437
These chain scale segments are utilized to classify our brands in the North America region. For illustrative purposes, we also reflected our internationalproperties and rooms under these categories.
(a) Comprised of the Days Inn, Super 8, Howard Johnson Inn, Howard Johnson Express, Travelodge, Microtel Inn & Suites by Wyndham and Knights Inn brands.(b) Primarily includes the Wingate by Wyndham, Hawthorn Suites by Wyndham, Ramada Inn, Ramada Limited, Howard Johnson Plaza, Howard Johnson Hotel and Baymont Inn &
Suites brands.(c) Primarily includes the Ramada Hotels, Ramada Plaza, Tryp by Wyndham and Wyndham Garden Hotel brands.(d) Comprised of the Wyndham Hotels and Resorts brand.(e) Comprised of the Dream brand for 2013 and 2012.
The number of lodging properties and rooms changed as follows:
As of December 31,
2014 2013 2012
Properties Rooms Properties Rooms Properties RoomsBeginning balance 7,485 645,423 7,342 627,437 7,205 613,126Additions 619 61,657 633 65,933 688 66,050Terminations (459) (46,254) (490) (47,947) (551) (51,739)Ending balance 7,645 660,826 7,485 645,423 7,342 627,437
In our franchising business, we seek to generate revenues for our hotel owners through our strong, well-known brands and the delivery of services such asmarketing, information technology, revenue management, training, operations support, strategic sourcing and guest services.
8
Table of Contents
The sources of our revenues from franchising hotels include (i) ongoing franchise fees, which are comprised of royalty, marketing and reservation fees,(ii) initial franchise fees which relate to services provided to assist a franchised hotel to open for business under one of our brands and (iii) other service fees.Royalty fees are intended to cover the use of our trademarks. Marketing and reservation fees are intended to reimburse us for expenses associated withoperating reservations systems, e-commerce channels including our brand.com websites and access to third-party distribution channels, such as online travelagents (“OTAs”), advertising and marketing programs, global sales efforts, operations support, training and other related services. Other service fees includefees derived from providing ancillary services, and are generally intended to reimburse us for direct expenses associated with providing these services.
Our management business offers hotel owners the benefits of a global brand and a full range of management, marketing and reservation services. Inaddition to the standard franchise services, our hotel management business provides hotel owners with professional oversight and comprehensive operationssupport, including hiring, training and supervising the hotel managers and employees, annual budget preparation, local sales and marketing efforts, financialanalysis, and food and beverage services. Revenues earned from our management business include management and service fees. Management fees arecomprised of (i) base fees, which are typically a specified percentage of gross revenues from hotel operations, and potentially (ii) incentive fees, which aretypically a specified percentage of a hotel’s gross operating profit. Service fees include fees derived from accounting, design, construction and purchasingservices and technical assistance provided to managed hotels. We are also required to recognize fees relating to reimbursable payroll costs for operationalemployees who work at some of our managed hotels as revenue. Although these costs are funded by hotel owners, accounting guidance requires us to reportthese fees on a gross basis as both revenues and expenses. As such, there is no effect on our operating income.
Our ownership portfolio is limited to two hotels in locations where we have developed or intend to develop timeshare units. Revenues earned from ourowned hotels are comprised of (i) gross room nights, (ii) food and beverage services, and (iii) on-site spa, casino, golf and shop revenues. We are responsiblefor all operations and recognize all revenues and expenses associated with the hotels.
We also earn revenues from the Wyndham Rewards loyalty program when a member stays at a participating hotel. Revenues are derived from a fee wecharge based upon a percentage of room revenues generated from such member stays. These fees are intended to reimburse us for expenses associated withadministering and marketing the loyalty program.
Reservation Booking Channels
A majority of our economy and midscale hotels are located on highway roadsides for convenience of travelers; therefore, a significant portion of roomnights sold are on a walk in or direct to hotel basis. We believe their choice of hotel is attributable to the reputation and general recognition of our brandnames.
Another significant component of our value proposition to a hotel owner is access to our reservation booking channels, which we also refer to as ourdistribution platform. These channels include our proprietary brand web and mobile sites, our mobile apps, our call center facilities, our Wyndham Rewardsloyalty program, our global sales team, global distribution partners such as Sabre and Amadeus, OTAs and other third-party internet referral or bookingsources, such as Kayak, TripAdvisor and Google. Over half of our reservation delivery comes from online sources, including our proprietary and mobilewebsites.
For guests who choose to book their hotel stay in advance through our distribution platform, we booked a total of 53 million room nights in 2014 onbehalf of hotels within our system (including all bookings under our global sales agreements). This represents 41% of total bookings at these hotels, up 10%from last year.
A key strategy for reservation delivery is the continual investment in our e-commerce capabilities (websites, mobile and other online channels), as wellas the deployment of advertising spend to drive online traffic to our proprietary e-commerce channels. This strategy also encompasses marketing agreementswe have with travel related search websites and affiliate networks, and other initiatives to drive business directly to our online channels. In addition, to ensureour franchisees receive bookings from OTAs and other third-party internet sources, we provide direct connections between our central reservations systemand strategic third-party internet booking sources. These direct connections allow us to deliver more accurate and consistent rates and inventory, sendbookings directly to our central reservation systems without interference or delay and reduce our franchisee distribution costs.
9
Table of Contents
Loyalty Program
Building a robust loyalty program is critical to delivering our value proposition to our hotel owners, and we have embarked on a multi-year plan toenhance our program. The Wyndham Rewards program was introduced in 2003 and has grown steadily since its inception. The diversity of our brands andsignificant footprint uniquely enables us to meet our members’ leisure and business travel needs across a variety of locations, and a wide range of pricepoints. Over 39 million members in 70 countries have enrolled in the program since its inception. These members stay at our brands more frequently anddrive incremental room nights, higher ADR and a longer length of stay than non-members. On an annualized basis, a Wyndham Rewards member spends 70%more than a non-member.
Wyndham Rewards is the largest lodging loyalty program as measured by number of participating hotels in the lodging industry. Members earn pointsby staying in one of our participating branded hotels or by purchasing everyday services and products using a co-branded Wyndham Rewards credit card.The points may be redeemed for a variety of reward options, including airline travel, resort vacations, event tickets, gift certificates for leading retailers andrestaurants, and more. During 2014, 74% of all points redeemed were for free nights, a 39% increase over prior years. This demonstrates the impact of theprogram in driving additional stays to our hotel owners.
Marketing, Sales and Revenue Management Services
Our brand and field marketing teams develop and implement global marketing strategies for each of our hotel brands. While brand positioning andstrategy is generated from our U.S. headquarters, we have seasoned marketing professionals positioned around the globe to modify and implement thesestrategies on a local market level. Our marketing efforts communicate the unique value proposition of each of our individual brands, and are designed tobuild consumer awareness and drive business to our hotels, either directly or through our own reservation channels.
We deploy a variety of marketing strategies and tactics depending on the needs of the specific brand and local market, including online advertising,social media marketing, traditional media planning and buying (radio, television and print), creative development, promotions, sponsorships and highlytargeted direct marketing. In May 2014, we launched an umbrella marketing strategy which featured all 12 of our brands on television and in other forms ofmedia, with a goal of driving more consumers to our proprietary websites and into our loyalty program. Our Best Available Rate guarantee gives consumersconfidence to book directly with us by guaranteeing the same rates regardless of whether they book through our call centers, websites or other third-partychannels. In addition, we leverage the strength of our Wyndham Rewards loyalty program to develop meaningful marketing promotions and campaigns todrive new and repeat business to hotels in our system. Our Wyndham Rewards marketing efforts drive tens of millions of consumer impressions through theprogram’s channels and its partners’ channels.
Our global sales organization leverages the size and diversification of our portfolio to gain a larger share of business for each of our hotels throughrelationship-based selling to a broad range of hotel guests. With over 7,640 hotels throughout the world, we are able to find more complete solutions for aclient/company whose travel needs range from economy to upscale brands. In order to leverage multidimensional customer needs for our hotels, the salesteam is deployed globally in key markets within Europe, Mexico, Canada, Latin America, China, Hong Kong, the Middle East and the U.S.
We also offer revenue management subscription services, with professionals deployed in key markets globally, to help maximize the revenues of ourfranchisees by advising them on strategies for their consideration intended to optimize rate and inventory management. These services also coordinate allrecommended revenue programs delivered to our franchisees in tandem with e-commerce and brand marketing strategies.
Property Services
Our worldwide teams of industry veterans continually collaborate with franchisees on all aspects of their operations, and create detailed andindividualized strategies for success. We are able to make meaningful contributions to hotel operations, which result in higher profits for our hotel owners byproviding key services including system integration, operations support, training, strategic sourcing, and development planning and construction.
We also provide hotel owners with property management system software that synchronizes each hotel’s inventory with our central reservations platform.These systems assist franchisees with managing their room inventory (room nights), rates (ADR) and reservations, which leads to greater profits for our hotelowners and enhances our ability to deliver reservations at the right price to guests for our hotel owners.
10
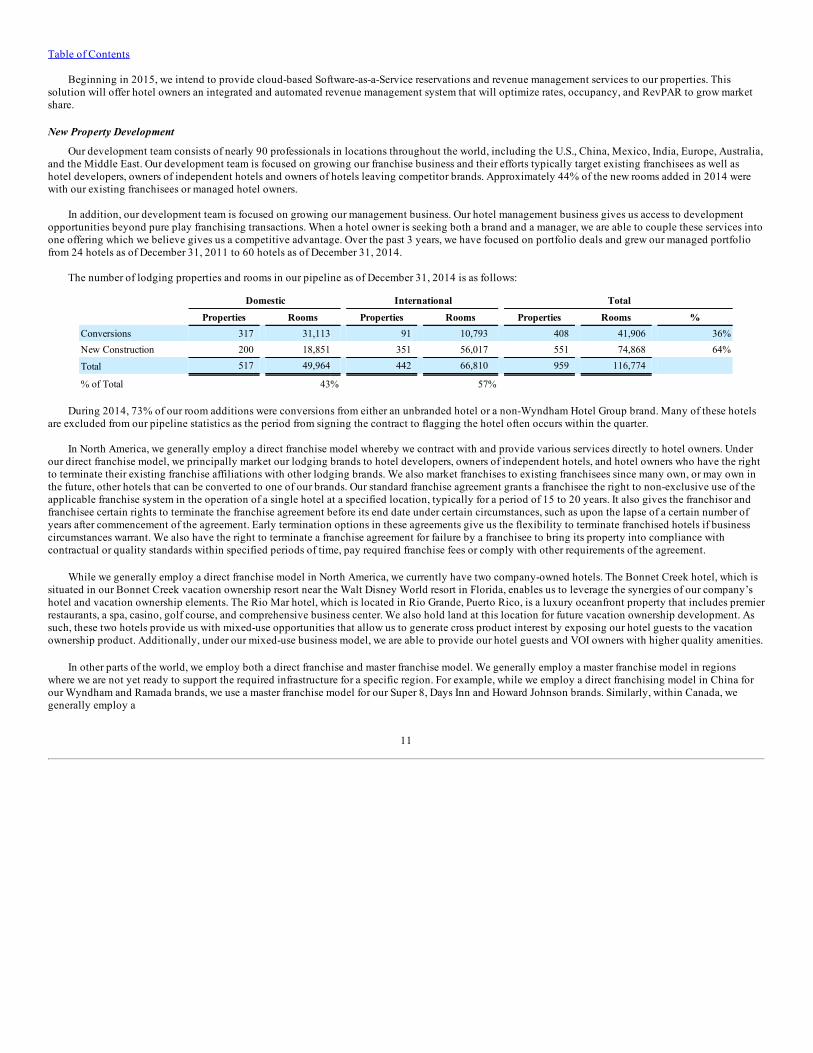
Table of Contents
Beginning in 2015, we intend to provide cloud-based Software-as-a-Service reservations and revenue management services to our properties. Thissolution will offer hotel owners an integrated and automated revenue management system that will optimize rates, occupancy, and RevPAR to grow marketshare.
New Property Development
Our development team consists of nearly 90 professionals in locations throughout the world, including the U.S., China, Mexico, India, Europe, Australia,and the Middle East. Our development team is focused on growing our franchise business and their efforts typically target existing franchisees as well ashotel developers, owners of independent hotels and owners of hotels leaving competitor brands. Approximately 44% of the new rooms added in 2014 werewith our existing franchisees or managed hotel owners.
In addition, our development team is focused on growing our management business. Our hotel management business gives us access to developmentopportunities beyond pure play franchising transactions. When a hotel owner is seeking both a brand and a manager, we are able to couple these services intoone offering which we believe gives us a competitive advantage. Over the past 3 years, we have focused on portfolio deals and grew our managed portfoliofrom 24 hotels as of December 31, 2011 to 60 hotels as of December 31, 2014.
The number of lodging properties and rooms in our pipeline as of December 31, 2014 is as follows:
Domestic International Total
Properties Rooms Properties Rooms Properties Rooms %Conversions 317 31,113 91 10,793 408 41,906 36%New Construction 200 18,851 351 56,017 551 74,868 64%
Total 517 49,964 442 66,810 959 116,774 % of Total 43% 57%
During 2014, 73% of our room additions were conversions from either an unbranded hotel or a non-Wyndham Hotel Group brand. Many of these hotelsare excluded from our pipeline statistics as the period from signing the contract to flagging the hotel often occurs within the quarter.
In North America, we generally employ a direct franchise model whereby we contract with and provide various services directly to hotel owners. Underour direct franchise model, we principally market our lodging brands to hotel developers, owners of independent hotels, and hotel owners who have the rightto terminate their existing franchise affiliations with other lodging brands. We also market franchises to existing franchisees since many own, or may own inthe future, other hotels that can be converted to one of our brands. Our standard franchise agreement grants a franchisee the right to non-exclusive use of theapplicable franchise system in the operation of a single hotel at a specified location, typically for a period of 15 to 20 years. It also gives the franchisor andfranchisee certain rights to terminate the franchise agreement before its end date under certain circumstances, such as upon the lapse of a certain number ofyears after commencement of the agreement. Early termination options in these agreements give us the flexibility to terminate franchised hotels if businesscircumstances warrant. We also have the right to terminate a franchise agreement for failure by a franchisee to bring its property into compliance withcontractual or quality standards within specified periods of time, pay required franchise fees or comply with other requirements of the agreement.
While we generally employ a direct franchise model in North America, we currently have two company-owned hotels. The Bonnet Creek hotel, which issituated in our Bonnet Creek vacation ownership resort near the Walt Disney World resort in Florida, enables us to leverage the synergies of our company’shotel and vacation ownership elements. The Rio Mar hotel, which is located in Rio Grande, Puerto Rico, is a luxury oceanfront property that includes premierrestaurants, a spa, casino, golf course, and comprehensive business center. We also hold land at this location for future vacation ownership development. Assuch, these two hotels provide us with mixed-use opportunities that allow us to generate cross product interest by exposing our hotel guests to the vacationownership product. Additionally, under our mixed-use business model, we are able to provide our hotel guests and VOI owners with higher quality amenities.
In other parts of the world, we employ both a direct franchise and master franchise model. We generally employ a master franchise model in regionswhere we are not yet ready to support the required infrastructure for a specific region. For example, while we employ a direct franchising model in China forour Wyndham and Ramada brands, we use a master franchise model for our Super 8, Days Inn and Howard Johnson brands. Similarly, within Canada, wegenerally employ a
11
Table of Contents
direct franchising model for our brands with the exception of our Days Inn and Travelodge brands, for which we use a master license model.
Franchise agreements in regions outside of North America may carry a lower fee structure based on the services we are prepared to provide in thatparticular region. Under our master franchise model we typically market our lodging brands to third parties that assume the principal role of franchisor, whichinvolves selling individual franchise agreements and providing quality assurance, marketing assistance, and reservations support to franchisees. Since weprovide only limited services to master franchisors, the fees we receive in connection with these agreements are typically lower than the fees we receive undera direct franchising model. Master franchise agreements, which are individually negotiated and vary among our brands, typically contain provisions thatpermit us to terminate the agreement if the other party fails to meet specified development schedules.
Strategies
We are strategically focused on leveraging our strength to deliver an enhanced value proposition to our franchisees and owners, and to create long-termshareholder value.
We expect to deploy the following tactics in pursuit of these goals:
• grow our iconic brands globally;
• deliver value-added operational support that improves hotel performance;
• expand and enhance our Wyndham Rewards loyalty program;
• align connectivity, systems and support to increase contribution for our franchisees; and
• increase marketing effectiveness and scale to drive revenue.
Seasonality
Franchise and management fees are generally higher in the second and third quarters than in the first or fourth quarters of any calendar year. This is dueto increased leisure travel and the related ability to charge higher ADRs during these months.
Competition
Competition is robust among the lodging brand franchisors to grow their franchise systems and retain their existing franchisees. We believe franchiseesmake decisions based principally upon the perceived value and quality of the brand and the services offered. We further believe that the perceived value of abrand name is partially a function of the success of the existing hotels franchised under the brand.
The ability of an individual franchisee to compete may be affected by the location and quality of its property, the number of competitors in the vicinity,community reputation and other factors. A franchisee’s success may also be affected by general, regional and local economic conditions. The potentialnegative effect of these conditions on our performance is substantially reduced by virtue of the diverse locations of our franchised hotels and by the scale ofour franchisee base. Our franchise system is dispersed among approximately 5,495 franchisees, which reduces our exposure from any one franchisee. No onefranchisee accounts for more than 9% of our franchised hotels or total segment revenues.
WYNDHAM EXCHANGE & RENTALS
Vacation Exchange and Rentals Industries
The vacation exchange and rentals industries offer leisure travelers access to a range of unique, non-traditional lodging accommodations, such asprivately-owned vacation homes, villas, cottages, apartments, condominiums and vacation ownership resorts, as well as flexibility in time of travel andlodging options.
Vacation exchange is a fee-for-service business that offers services and products to timeshare developers and owners. To participate in a vacationexchange, a timeshare owner provides his or her interval to an exchange company’s network and receives the opportunity to use another owner’s interval at adifferent location. The exchange company assigns a value to the owner’s interval based upon a number of factors, including location and size of thetimeshare unit, dates of the interval, and the amenities at the resort. Exchange companies generally derive revenues by charging fees for facilitatingexchanges and through annual membership dues. In 2013, 30% of global timeshare owners (or 6.0 million) were vacation exchange members and theycompleted approximately 2.9 million exchanges.
12
Table of Contents
Timeshare private label clubs, such as Club Wyndham, WorldMark by Wyndham and Disney Vacation Club, give members the option to exchange bothinternally or through external exchange channels. Private label clubs have been the largest driver of timeshare industry growth over the past several years.This long term trend has a positive impact on the average number of members, but a negative effect on the number of exchange transactions per member andrevenue per member as members exchange more within their private label club.
The over $80 billion global vacation rentals industry is largely a fee-for-service business that offers vacation property owners the opportunity to renttheir properties to leisure travelers. The industry is broadly divided into two segments. The first is the professionally managed rental segment, where thehomeowner provides their property to an agent to rent, generally on an exclusive basis, and pays the agent a commission for marketing the property,managing bookings and providing quality assurance to the renter. The agent may also offer services such as daily housekeeping, on-site check-in, in-unitmaintenance, and in-room guest amenities. The other segment of the industry is the rent-by-owner model where the property owner pays a fixed fee for anonline listing or a minimal commission percentage for each booking. The agreement to list the owner’s property is usually not exclusive and typicallyincludes minimal additional services. The rent-by-owner segment generally does not offer any quality assurance or direct booking ability for renters, and anyfixed listing fee is usually charged regardless of whether the unit is rented. Conversely, professionally managed vacation rental companies collect rent inadvance and generally offer accounting, housekeeping, maintenance and other services. After deducting the applicable commissions, professional managersremit the net amount due to the property owners. In addition to commissions, professionally managed vacation rental companies may earn revenues fromrental customers through fees that are incidental to the rental of the properties, such as for travel services, local transportation, on-site services and insuranceor similar types of products.
The global supply of vacation rental inventory is less organized than the lodging industry and is highly fragmented with much of it being madeavailable by individual property owners. We believe that as of December 31, 2014, there were approximately 1.3 million properties in the U.S. and 4.3million properties in Europe available for vacation rentals. In the U.S., vacation properties available for rental are primarily condominiums or stand-alonehouses, whereas in Europe, rental offerings are more diverse, including individual homes, apartments and holiday park chalets.
The global demand for vacation rentals is approximately 76 million vacation weeks per year, 57 million of which are rented by leisure travelers inEurope. We believe this demand has been growing for the following reasons: (i) the consumer value of renting a unit for an entire family, (ii) the increased useof the internet as a tool for facilitating vacation rental transactions and (iii) increased consumer awareness of vacation rental options. Demand for vacationrental properties is often regional since many leisure travelers rent properties within driving distance of their home.
Wyndham Exchange & Rentals Overview
Wyndham Exchange & Rentals connects vacation suppliers, including timeshare affiliates, individual homeowners, and vacation park operators withvacationers. Our mission is to send people on the vacation of their dreams. We have a diverse portfolio of trusted brands to meet the needs of virtually everytraveler. Through our industry-leading tools, expertise and brands, we bring outstanding value to both suppliers and guests to maximize supplier utilizationand guest experience. We have the world’s largest vacation exchange network based on the number of members and affiliated vacation ownership resorts, andare the world’s largest professional manager of vacation rental properties based on the number of professionally managed properties. We are largely a fee-for-service business with strong and predictable cash flows.
Our vacation exchange business, RCI, derives a majority of its revenues from annual membership dues and fees for facilitating exchanges. Our vacationexchange business also derives revenues from ancillary services including additional services provided to transacting members, programs with affiliatedresorts, club servicing and loyalty programs.
Our vacation rentals business, Wyndham Vacation Rentals, primarily derives its revenues from fees, which generally average between 20% and 50% ofthe gross booking fees. For properties which we own, manage or operate under long-term capital and operating leases (which represent less than 10% of ourportfolio), we receive 100% of the revenues. Our vacation rentals business also derives revenues from ancillary services delivered to property owners,vacation rental guests and homeowner associations.
Our vacation exchange and rentals business has access to over 107,000 unique, non-traditional vacation properties in more than 100 countries forspecified periods, predominantly on an exclusive basis. Each year, our vacation exchange and rentals business provides more than 5 million families withvacation exchange and rentals services and products. The properties available to travelers include vacation ownership condominiums, traditional hotelrooms, villas, cottages, chalets, city apartments, second homes, fractional resorts, private residence clubs, and yachts. We offer travelers flexibility as to timeof travel and a choice of lodging options. This flexibility also helps our timeshare developer affiliates, as it provides additional
13
Table of Contents
benefit to the timeshare product. We offer property owners marketing, booking and quality control services. Some of our rental brands also offer propertymanagement services ranging from key-holding to full property maintenance. We market our services and products using our nine primary consumer brandsand other related brands in almost 200 offices worldwide. No one external customer, developer or group accounts for more than 2% of our vacation exchangeand rentals revenues.
As the largest provider of vacation exchange and professionally managed vacation rentals, we leverage our inventory across our brands and businesslines to maximize value for affiliates, exchange members, vacation rental property owners and guests. We also leverage our scale and global marketingexpertise to enhance demand and drive occupancy across our portfolio. A prime example of this capability is the Wyndham Home Exchange program. Thisprogram generates unprecedented reach in the industry and provides our vacation rental property owners with the ability to deposit up to five weeks perproperty annually in exchange for intervals from within RCI’s portfolio of affiliated vacation ownership resorts. It allows exchange members the opportunityto access a wider variety of vacation properties, while also providing outstanding value to the vacation rental property owner.
We also provide industry-leading technology and revenue management expertise to optimize our exchange and vacation rental inventory throughautomated tools and sophisticated yield management techniques. Over the past several years, we have implemented these new tools and techniques tooptimize pricing and occupancy in our vacation rental businesses, adopting best practices developed from years of investment and experience at RCI. Thesetools allow for automated price changes based on demand and other factors. In the end, we believe it’s more revenue for homeowners, more commissions forus, and a fair market-based price for the consumer. We will continue to expand revenue management capabilities across our brands in the coming years.
Vacation Exchange
Through our vacation exchange business, RCI, we have relationships with approximately 4,500 vacation ownership resorts in over 100 countries,located in North America, Europe, Latin America, Caribbean, Southern Africa, Asia Pacific and the Middle East regions. We tailor our strategies andoperating plans for each region where RCI has or seeks to develop a substantial member base.
We have 3.8 million vacation exchange members and generally retain approximately 90% of such members each year. We generate fees from membersfor both annual membership subscriptions and transaction based services. In substantially all cases, we acquire new members when an affiliated resortdeveloper buys the initial term of an RCI membership on behalf of a timeshare owner as part of the vacation ownership purchase process. Generally, thisinitial membership is for either a 1 or 2 year term, after which these new members can choose to renew at their own expense. In certain circumstances, renewalsare paid for by the developer. Members are entitled to receive periodicals published by RCI and, for additional fees, to use the applicable exchange programand other services.
RCI operates three worldwide exchange programs that serve a member base of timeshare owners who want flexibility and variety in their travel planseach year. Our three vacation exchange programs are RCI Weeks, RCI Points and The Registry Collection. Participants in these programs pay annualmembership dues, and for additional fees are entitled to exchange intervals for intervals at other properties affiliated with our vacation exchange business. Inaddition, certain members may exchange intervals for other leisure-related services and products which enable us to generate additional fees.
• The RCI Weeks exchange program is the world's largest vacation ownership weeks-based exchange network and provides members with the abilityto exchange week-long intervals in units at their original resorts for intervals at comparable resorts.
• The RCI Points exchange program is the world’s largest vacation ownership points-based exchange network. Such program allocates points tointervals that members cede to the exchange program. Members may redeem their points for the use of vacation properties in our exchange programor for discounts on other services and products which may change from time to time, such as airfare, car rentals, cruises, hotels and otheraccommodations. When points are redeemed for these other services and products, our vacation exchange business obtains the right to thatmember’s points and may rent vacation properties backed by these points in order to recoup the expense of providing discounts on other servicesand products.
14
Table of Contents
• We believe that The Registry Collection exchange program is the industry’s largest and first global exchange network of luxury vacationaccommodations. The luxury vacation accommodations in our network include fractional ownership resorts, higher-end vacation ownership resorts,condo-hotels and yachts. The Registry Collection program allows members to exchange their intervals for the use of other luxury vacationproperties within the network for a fee and also offers access to other services and products, such as cruises, yachts, adventure travel, hotels and otheraccommodations.
Through innovation, RCI has developed a variety of value enhancing services and products for its members and affiliates. We introduced the use oftrading power transparency, which allows RCI Weeks members to deposit their vacation intervals with RCI and obtain a specific trading power that they canthen use to exchange for another interval within the program. Trading power transparency also allows members to combine deposited timeshare intervals foran additional fee, which enables them to exchange into higher-demanded vacations or receive a deposit credit if the value of their interval is greater than theinterval into which they have exchanged. For an additional fee, we also offer trading power protection to members if they need to change or cancel anexchange transaction. RCI also offers Platinum level memberships, which provide exclusive exchange and lifestyle benefits to Weeks and Points members.
Vacation Rentals
Wyndham Vacation Rentals professionally manages unique, non-traditional vacation rental properties including privately-owned villas, homes,cottages, chalets, apartments and condominiums in over 550 destinations. The variety, location and quality of properties in our portfolio, in addition to themany benefits and services that we offer, provides consumers the opportunity to vacation in various parts of the world in properties with conveniences similarto their homes. In addition to these properties, we market inventory from our vacation exchange business and other sources. We generate fee income frommarketing and renting these properties to consumers. We currently book approximately 1.6 million vacation rental weeks per year. Our vacation rentalsbusiness has approximately 103,000 properties with approximately 94,000 properties in Europe and over 9,000 properties in the U.S. The following is adescription of some of our major proprietary vacation rental brands:
• Wyndham Vacation Rentals U.K. has 70 years of industry experience and operates a number of well-recognized and established brands within thevacation rental market, including Hoseasons, cottages4you, and James Villa Holidays, and offers access to approximately 42,000 properties acrossthe U.K. and Europe.
• Novasol is one of continental Europe’s largest rental companies with over 45 years of industry experience, featuring properties in nearly 30European countries including holiday homes in Denmark, Croatia, France, Italy, Sweden and Norway, with approximately 39,000 exclusive holidayhomes available for rent through established brands such as Novasol, Dansommer and Cuendet.
• Landal GreenParks is one of the Netherlands’ leading holiday park companies, with 60 years of industry experience. We have over 70 holiday parksoffering over 12,000 holiday park chalets, as well as campsites with over 1,300 pitches in the Netherlands, Germany, Austria, the Czech Republic,Belgium, Switzerland and Hungary. Every year more than 2 million guests visit Landal’s parks, many of which offer dining, shopping and wellnessfacilities.
• Wyndham Vacation Rentals N.A. offers over 9,000 rental properties, in beach, ski, mountain, theme park, golf and tennis resort destinations such asFlorida, South Carolina, Colorado, Delaware, North Carolina, Alabama, Tennessee and Utah. We provide vacation rentals to travelers throughacquired brands and have more than 35 years of industry experience.
Most of the rental activity under our brands occurs in Europe and the United States. Our vacation rentals business provides access to select inventory toour 3.8 million vacation exchange members and our vacation exchange and rentals business has the ability to source and rent inventory in over 100countries.
Our vacation rentals business currently has relationships with over 61,000 independent property owners in 33 countries, including the United Kingdom,Denmark, the United States, Netherlands, Croatia, France, Italy, Sweden, Norway, Germany, Spain, Austria, Belgium, Ireland, Greece, Portugal and certaincountries in Eastern Europe. Property owners typically enter into annual contracts with us to professionally manage the rental of their properties. Ourvacation rentals business also has an ownership interest or capital leases under our Landal GreenParks brand in approximately 5% of the properties in ourrental portfolio.
15
Table of Contents
Customer Development
In our vacation exchange business, we affiliate with vacation ownership developers directly through our in-house sales teams. Affiliated developers signlong-term agreements that have an average duration of approximately five years. Our members are acquired primarily through our affiliated developers as partof the vacation ownership purchase process. We also acquire a small percentage of our members directly online from the secondary vacation ownershipmarket.
In our vacation rentals business, we primarily enter into exclusive annual rental agreements with property owners. We market these rental propertiesonline and offline to large databases of customers. Additional customers are sourced through bookable websites and offline advertising and promotions, andthrough the use of third-party travel agencies, tour operators and online distribution channels to drive additional occupancy. We have a number of specificbranded websites to promote, sell and inform new customers about vacation rentals.
Loyalty Program
Our U.S. vacation exchange business’s member loyalty program, RCI Elite Rewards, offers a co-branded credit card. The card allows members to earnreward points that can be redeemed for items related to our exchange programs, including annual membership dues, exchange fees for transactions, and otherservices and products offered by our vacation exchange business or certain third parties, including airlines and retailers.
Online Distribution
We will continue to invest in cutting edge technology and online capabilities to ensure that our members and rental customers have the best experience,with access to similar information and services that we provide through our call centers. We have several major initiatives ongoing to enhance our websitesand e-commerce performance across our exchange and vacation rental brands. Enhancements include improved search and mobile functionality, enhancedsite content and personalization for our members, vacation rental guests and property owners.
Through our comprehensive RCI.com initiatives which began in 2008, we launched enhanced vacation search, filtering and recommendationcapabilities that greatly simplify our search process, making it easier for a member to find a desired vacation. We have also greatly expanded our onlinecontent, including multiple resort pictures and high-definition videos to help educate members about their vacation options. Additionally, through thisinitiative, we released a significant series of technology enhancements to our members. We have also enhanced our ability to merchandise offers through webonly channels and have launched mobile technologies such as applications for smartphones and tablets to access RCI.com functionality.
Part of our strategy has been to improve our online distribution channels so that members and rental customers transact business online instead ofthrough our call centers, which generates cost savings for us. Our RCI.com initiatives have increased our web penetration to 49% at the end of 2014 (up from13% in 2008 when we launched these initiatives). As a result of enhancements made over the last several years, we have improved our web penetration for ourvacation rentals business to over 60% by the end of 2014.
Call Centers
Our vacation exchange and rentals business also services its members and rental customers through global call centers. The requests we receive at ourglobal call centers are handled by our vacation guides, who are trained to fulfill requests for exchanges and rentals. Call centers remain an importantdistribution channel for us and therefore we continue to invest resources to ensure that members and rental customers receive a high level of personalizedcustomer service.
Marketing
We market to our members and rental customers through several marketing channels including direct mail, email, telemarketing, online distributionchannels, brochures, magazines and travel agencies. Our vacation exchange business has a comprehensive social and mobile media platform including appsfor smartphones and tablets, a Facebook fan page, several Twitter accounts and YouTube channels, an online video content network, and two onlinemagazines. Our vacation exchange and rentals’ brands have approximately 95 publications involved in the marketing of the business, including variousresort directories and periodicals related to the vacation industry. We use our publications for marketing as well as for member and rental customer retentionand loyalty. Additionally, we promote our offerings to owners of resorts and vacation homes through trade shows, online and other marketing efforts thatinclude direct mail and telemarketing.
16
Table of Contents
Strategies
Our strategy to grow our vacation exchange and rentals business profitability includes the following:
• Inspire world-class associate engagement and “Count On Me!” service;
• Invest in technology to improve the customer experience, grow market share and reduce costs;
• Offer more options through market and product expansion, and by leveraging the scale of our inventory across brands;
• Leverage analytics to maximize yield across our portfolio and improve key business processes; and
• Promote the benefits of timeshare and vacation rentals to new and existing customer segments.
Our plans generally focus on pursuing these strategies organically. However, in appropriate circumstances, we will consider opportunities to acquirebusinesses, both domestic and international.
Seasonality
Vacation exchange revenues are normally highest in the first quarter, which is generally when members of RCI plan and book their vacations for the year.Rental transaction revenues earned are usually highest in the third quarter, when vacation arrivals are highest, combined with a compressed booking window,i.e., a reduction of the time between the booking date and the arrival date. Almost 60% of our European vacation rental customers book their reservationswithin 11 weeks of arrival dates and over 75% within 20 weeks of arrival dates. More than 60% of our North American vacation rental customers book theirreservations within 7 weeks and almost 75% within 11 weeks of arrival dates.
Competition
The vacation exchange and rentals business faces competition throughout the world. Our vacation exchange business competes with a third-partyinternational exchange company, with regional and local vacation exchange companies and with internet-only limited service exchanges. In addition,certain developers offer exchanges through internal networks of properties, which can be operated by us or by the developer, that offer owners of intervalsaccess to exchanges other than those offered by our vacation exchange business. The vacation rentals business faces competition from a broad variety ofprofessional vacation rental managers and rent-by-owner channels that collectively use brokerage services, direct marketing and the internet to market andrent vacation properties.
WYNDHAM VACATION OWNERSHIP
Vacation Ownership (Timeshare) Industry
The vacation ownership industry, also referred to as the timeshare industry, enables consumers to share ownership of a fully-furnished vacationaccommodation. Typically, the consumer purchases either a title to a fraction of a unit or a right to use a property for a specific period of time. This is referredto as a VOI. For many purchasers, vacation ownership is an attractive alternative to traditional lodging accommodations at hotels. Unlike lodging customers,timeshare owners are immune to variability in room rates. Also, vacation ownership units are, on average, more than twice the size and typically have moreamenities than traditional hotel rooms, such as kitchens or in-unit laundry.
VOIs are generally sold through weekly intervals or points-based systems. Under the weekly intervals system, owners can use a specific unit at a specificresort often during a specific week of the year. Under the points-based system, owners often have advanced reservation rights for a particular destination, butare free to redeem their points for various unit types and/or locations. In addition, points owners can vary the length and frequency of product utilization.Once point values are established for particular units, they generally cannot be changed, ensuring that the value of owner’s points never diminishes. Saleswere equally divided between intervals and points in 2013 according to the American Resort Development Association (or “ARDA”, a trade associationrepresenting the vacation ownership and resort development industries).
The vacation ownership concept originated in Europe during the late 1960s and spread to the U.S. shortly thereafter. The industry expanded slowly inthe U.S. until the mid-1980s. From the mid-1980s through 2007, it grew at a double-digit rate. Sales declined by approximately 8% in 2008 and experiencedeven greater declines in 2009 due to the global recession and a significant disruption in the credit markets. More recently, according to a 2014 report issuedby ARDA, domestic vacation ownership sales were approximately $7.6 billion in 2013, compared to $6.9 billion in 2012.
17
Table of Contents
Based on published industry data, we believe that the following factors have contributed to the strength and stability, particularly in North America, ofthe vacation ownership industry:
• strengthened consumer value proposition as timeshare resorts often provide superior accommodations compared with a hotel stay;
• improved quality of resorts and resort management and servicing;
• increased flexibility for timeshare owners made possible through affiliations with vacation ownership exchange companies and vacation ownershipcompanies’ internal point exchange programs;
• improved product perception resulting from the participation of widely known lodging and entertainment brands into the industry; and
• increased consumer confidence in the industry based on enhanced consumer protection regulation of the industry.
Demographic factors explain, in part, the continued appeal of vacation ownership. A 2014 study of recent U.S. vacation ownership purchasers indicatedthat the median new purchaser was 51 years of age and had a median household income of $89,500. This, along with other industry data, suggests that thetypical purchaser in the U.S. has disposable income and is interested in purchasing vacation products. We believe that baby boomers will continue to beactive participants in the vacation ownership industry.
According to a 2014 ARDA study, nearly 83% of timeshare owners expressed satisfaction with the product. Most owners can exchange their timeshareunit through exchange companies, and through the applicable vacation ownership company’s internal network of properties.
Wyndham Vacation Ownership Overview
Wyndham Vacation Ownership is the largest vacation ownership business in the world as measured by revenues and the number of vacation ownershipresorts, units and owners. We develop and acquire vacation ownership resorts, market and sell VOIs, provide consumer financing for the majority of the sales,and provide property management services to property owners’ associations. As of December 31, 2014, we had 203 vacation ownership resorts in the U.S.,Canada, Mexico, the Caribbean and the South Pacific that represent approximately 24,000 individual vacation ownership units and approximately 904,000owners of VOIs.
Our brands operate points-based vacation ownership programs through which VOIs can be redeemed for vacations that provide owners with flexibility asto resort location, length of stay, number of stays, unit type, and time of year. Our programs allow us to market and sell our vacation ownership products invariable quantities and to offer existing owners “upgrade” sales to supplement such owners’ existing VOIs. This contrasts with the fixed quantity of thetraditional fixed-week vacation ownership, which is primarily sold on a weekly interval basis.
Our vacation ownership business derives a majority of its revenues from timeshare sales, with the remainder coming from consumer financing andproperty management. Property management revenues are partly dependent on the number of units we manage.
Although we operate separate brands, we have integrated substantially all of the business functions, including consumer finance, informationtechnology, staff functions, product development and marketing activities.
In recent years, we have transformed the business through major initiatives such as tightening our lending standards, refining and enhancing ourmarketing channels and creating more capital efficient inventory sourcing models. These strategies have led to increased margins, improved cash flow anddeveloping the WAAM concept which is discussed below.
Our Vacation Ownership Brands
Club Wyndham
As of December 31, 2014, over 524,000 owners held interests in Club Wyndham resort properties which are located primarily in the U.S. and consisted of94 resorts (22 of which are shared with WorldMark by Wyndham and one of which is shared with Shell) that represented approximately 13,700 units.
18
Table of Contents
The majority of the resorts in which Club Wyndham markets and sells vacation ownership and other real estate interests are destination resorts located ator near attractions such as the Walt Disney World Resort in Florida; the Las Vegas Strip in Nevada; Myrtle Beach in South Carolina; Colonial Williamsburgin Virginia; and the Hawaiian Islands.
WorldMark by Wyndham
WorldMark by Wyndham is a club that offers an innovative credit-based system that gives owners greater flexibility and choice. The club consists of 83resorts (22 of which are shared with Club Wyndham, one of which is shared with Wyndham Vacation Resorts Asia Pacific and one of which is shared withShell), representing over 6,500 units which are located primarily in the Western U.S., Canada and Mexico. As of December 31, 2014, approximately 234,000owners held vacation credits in the club. The resorts in which WorldMark by Wyndham markets and sells vacation credits are primarily drive-to resorts.
Wyndham Vacation Resorts Asia Pacific
As of December 31, 2014 approximately 50,000 owners held vacation credits for Wyndham Vacation Resorts Asia Pacific, which consists of 26 resorts(one of which is shared with WorldMark by Wyndham) representing over 1,200 units that are located primarily in the South Pacific.
Shell Vacations Club
We expanded our fee-for-service property management business with our acquisition of Shell Vacations Club in 2012. We assumed the propertymanagement operations at 25 Shell Vacations Club resorts (one of which is shared with Club Wyndham and one of which is shared with WorldMark byWyndham), representing over 2,200 units as of December 31, 2014, which are primarily located in Hawaii, California, Arizona, Texas, Nevada, Oregon, NewHampshire, North Carolina, Wisconsin and Canada. Additionally, Shell Vacations Club sells VOIs and provides consumer financing to owners through itsShell Vacations Club brand. As of December 31, 2014, over 96,000 owners held vacation points in the Shell Vacations Club.
Maintenance Fees
Timeshare owners pay annual maintenance fees to the property owners’ associations responsible for managing the applicable resorts or to the Clubs. Theannual maintenance fee associated with the average VOIs purchased ranges from approximately $400 to $1,000. These fees generally are used to renovateand replace furnishings, pay operating, maintenance and cleaning costs, pay management fees and expenses, and cover taxes in some states, insurance andother related costs. As the owner of unsold inventory at resorts or unsold interests in the Clubs, we also pay maintenance fees in accordance with the legalrequirements of the jurisdictions in which the resorts are located. In addition, at certain newly-developed resorts, we sometimes enter into subsidy agreementswith the property owners’ associations to cover costs that otherwise would be covered by annual maintenance fees payable with respect to VOIs that have notyet been sold.
Sales and Marketing
We employ a variety of marketing channels to encourage prospective owners of VOIs to tour our properties and attend sales presentations at off-site salesoffices. Our resort-based sales centers also enable us to actively solicit upgrade sales to existing owners of VOIs while they vacation at our resort properties.We also operate a telesales program designed to market upgrade sales to existing owners of our products. Sales of VOIs relating to upgrades representedapproximately 67%, 70%, and 70% of our net sales revenue of VOIs during 2014, 2013 and 2012, respectively.
We use a variety of marketing programs to attract prospective owners, including sponsored contests that offer vacation packages or gifts, targetedmailings, outbound and inbound telemarketing efforts, and in association with Wyndham Worldwide hotel brands, other co-branded marketing programs andevents. We also partner with Wyndham Hotel Group by utilizing the Wyndham Rewards loyalty program to offer Wyndham Rewards points as an incentiveto prospective VOI purchasers, and by providing additional redemption options to Wyndham Rewards members. Additionally, we offer purchasers of VOIsthe opportunity to use the Wyndham Rewards co-branded credit card to earn additional Wyndham Rewards points and to partially finance their purchase. Wealso co-sponsor sweepstakes, giveaways, and promotional programs with professional teams at major sporting events and with other third parties at otherhigh-traffic consumer events. Where permissible under state law, we offer existing owners cash awards or other incentives for referrals of new owners.
New owner acquisition is an important strategy for us as this will continue to maintain our pool of “lifetime” buyers of vacation ownership that willenable us to solicit upgrade sales in the future. We believe the market for VOI sales is under-penetrated, and we estimate that there are 53 million U.S.households that are potential purchasers of VOIs. We added approximately 30,000, 29,000 and 28,000 new owners during 2014, 2013 and 2012,respectively.
19
Table of Contents
Our marketing and sales activities are often facilitated through marketing alliances with other travel, hospitality, entertainment, gaming and retailcompanies that provide access to such companies’ customers through a variety of co-branded marketing offers. Our resort-based sales centers, which arelocated in popular travel destinations throughout the U.S., generate substantial tour flow by enabling us to market to tourists already visiting thesedestination areas. Our marketing agents (who often operate on the premises of the hospitality, entertainment, gaming and retail companies with which wehave alliances) solicit tourists with offers relating to activities and entertainment in exchange for the tourists visiting the local resorts and attending salespresentations.
An example of a marketing alliance through which we market to tourists visiting destination areas is our current arrangement with Caesars Entertainmentin Las Vegas, Nevada. This arrangement enables us to operate concierge-style marketing kiosks throughout select casinos and permits us to solicit patrons toattend sales presentations with casino-related rewards and entertainment offers, such as gaming chips, show tickets and dining certificates. We also operateour primary Las Vegas sales center within Harrah’s Casino and regularly shuttle prospective owners targeted by such sales centers to and from our nearbyresort property.
Other marketing alliances provide us with the opportunity to align our marketing and sales programs with well-known lifestyle brands that appeal toconsumers with similar demographics to our current purchasers. One such example is our alliance with Margaritaville, a lifestyle brand popularized bymusician/entertainer Jimmy Buffett, where we market to patrons of various Margaritaville product lines via multiple channels, including on-site marketing atMargaritaville restaurants, affiliated venues and events, as well as co-branded vacation ownership offerings.
We offer a variety of entry-level programs and products as part of our sales strategy. For example, we have a program that allows prospective owners aone-time allotment of points or credits with no further obligations and a biennial product that provides for vacations every other year. As part of our salesstrategies, we rely on our points/credits-based programs, which provide prospective owners with the flexibility to buy relatively small packages of points orcredits which can then be upgraded at a later date. To facilitate upgrade sales among existing owners, we market opportunities for owners to purchaseadditional points or credits through periodic marketing campaigns and promotions while those owners vacation at our resort properties.
Purchaser Financing
We offer financing to purchasers of VOIs which attracts additional customers and generates substantial incremental revenues and profits. We fund andservice loans extended by Club Wyndham and WorldMark by Wyndham through our consumer financing subsidiary, Wyndham Consumer Finance, a whollyowned subsidiary of Wyndham Vacation Resorts based in Las Vegas, Nevada. Wyndham Consumer Finance performs loan financing, servicing and relatedadministrative functions. We have funded Shell Vacations Club loans since the date of acquisition through our consumer finance subsidiary, and servicethem through a third-party.
We typically perform a credit investigation or other inquiry into every purchaser’s credit history before offering to finance a portion of the purchase priceof the VOIs. The interest rate offered to participating purchasers is determined by an automated underwriting process based upon the purchaser’s credit score,the amount of the down payment, and the size of purchase. We use a FICO score which is a branded version of a consumer credit score widely used within theU.S. by the largest banks and lending institutions. FICO scores range from 300 - 850 and are calculated based on information obtained from one or more ofthe three major U.S. credit reporting agencies that compile and report on a consumer’s credit history. For purchasers with large loan balances, we maintainhigher credit standards for new loan originations. Our weighted average FICO score on new originations for 2014, 2013 and 2012 was approximately 725.
During 2014, we generated new receivables of approximately $1.0 billion on gross vacation ownership sales, net of WAAM Fee-for-Service sales, of $1.8billion, which amounts to 56% of our vacation ownership sales being financed. This level of financing is prior to the receipt of addenda cash. Addenda cashrepresents the cash received for full payment of a loan within 15 to 60 days of origination. After the application of addenda cash, we finance approximately49% of vacation ownership sales.
We generally require a minimum down payment of 10% of the purchase price on all sales of VOIs and offer consumer financing for the remaining balancefor up to 10 years. While the minimum is generally 10%, in 2014, our average down payment was approximately 30% for financed sales of VOIs. These loansare structured with equal monthly installments that fully amortize the principal by the final due date. We offer third-party credit lines (Bill Me Later and aWyndham Rewards co-branded credit card) to assist owners with financing their down payments.
20
Table of Contents
Similar to many other companies that provide consumer financing, we have historically securitized a majority of the receivables originated inconnection with the sales of VOIs. We initially place the financed contracts into a revolving warehouse securitization facility, generally within 30 to 90 daysafter origination. Many of the receivables are subsequently transferred from the warehouse securitization facility and placed into term securitization facilities.
Our consumer financing subsidiary is responsible for the maintenance of contract receivables files as well as all customer service, billing and collectionactivities related to the domestic loans we extend (except for loans associated with Shell Vacations Club). We assess the performance of our loan portfolio bymonitoring numerous metrics including collections rates, defaults by state of residency and bankruptcies. Our consumer financing subsidiary also managesthe selection and processing of loans pledged or to be pledged in our warehouse and term securitization facilities. As of December 31, 2014, our loanportfolio was 96% current (i.e., not more than 30 days past due).
Property Management
On behalf of each of the property owners’ associations, we or our affiliates generally provide day-to-day management for vacation ownership resorts,which includes oversight of housekeeping services, maintenance and refurbishment of the units, and provides certain accounting and administrative servicesto property owners’ associations. The terms of the property management agreements vary, however, the vast majority of the agreements provide a mechanismfor automatic renewal upon expiration of the terms. In connection with these property management services, we receive fees which are generally based upontotal costs to operate such resorts. Fees for property management services typically approximate 10% of budgeted operating expenses.
Wyndham Vacation Resorts, itself or through a Wyndham Vacation Resorts affiliate, manages Club Wyndham Plus, the majority of property owners’associations at resorts developed by Wyndham Vacation Resorts and property owners’ associations at resorts developed by third parties. Wyndham VacationResorts (or its affiliate) manages the reservation system, and provides owner services, and billing and collections services on behalf of the Club WyndhamPlus trust. The agreement under which we manage the Club Wyndham Plus program has a five-year term and it is automatically renewed for successive termsof five years, provided the trustee under the program does not serve notice of termination to us at the end of any calendar year.
WorldMark by Wyndham, itself or through a WorldMark by Wyndham affiliate, serves as the exclusive property manager and servicing agent ofWorldMark, the Club and WorldMark, South Pacific Club, as well as all resort units owned or operated by these Clubs. WorldMark by Wyndham or itsaffiliate also manages the reservation system for the Clubs, and provides owner services and billing and collections services. The initial term of themanagement agreement is for three years and is automatically renewed annually thereafter, provided the trustee under the program does not serve notice oftermination to WorldMark by Wyndham prior to expiration of the then current term.
SVC Hospitality, LLC, a direct subsidiary of Shell Vacations LLC, itself or through its affiliates, serves as the exclusive manager of Shell Owners ClubsAmerican, Hawaii, Pacific and West (collectively, the “Shell Vacations Club”), and as the managing agent for many of the affiliated property owners’associations. The management agreements for the Shell Vacations Club are subject to auto-renewal every three to five years, provided that Shell VacationsClub does not serve notice of termination prior to expiration of the then current term. Such notice requires the affirmative vote of the members in theassociation.
Inventory Sourcing
We sell inventory sourced primarily through four channels:1. Self-developed inventory,2. WAAM,3. Consumer loan defaults, and4. Inventory reclaimed from owners’ associations or owners.
Following are descriptions of these inventory sources:
1. Self-developed inventory: Under the traditional timeshare industry development model, we finance and develop inventory specifically for ourtimeshare sales. The process often begins with the purchase of raw land which we then develop. Depending on the size and complexity of the project, thisprocess can take several years. Such inventory can include mixed-use inventory developed in conjunction with one of our hotel brands, where a portion ofthe property is devoted to the timeshare product.
21
Table of Contents
2. WAAM: In 2010, we introduced the first of our WAAM models, WAAM Fee-for Service (formerly known as WAAM 1.0). This timeshare sourcingmodel was designed to capitalize upon the large quantities of newly developed, nearly completed or recently finished condominium or hotel inventory in thereal estate market without assuming the significant risk that accompanies property acquisition or new construction. This business model offers turn-keysolutions for developers or banks in possession of newly developed inventory, which we sell for a fee through our extensive sales and marketing channels.WAAM Fee-for-Service enables us to expand our resort portfolio with little or no capital deployment, while providing additional channels for new owneracquisition and growth for our fee-for-service property management business.
In addition to the WAAM Fee-for-Service business model, in 2012, we introduced WAAM Just-in-Time (formerly known as WAAM 2.0), which is aninventory acquisition model. This strategy enables us to acquire and own completed units close to the timing of their sale and significantly reduces theperiod between the deployment of capital to acquire inventory and the subsequent return on investment which occurs at the time of its sale to a timesharepurchaser. For the most part, inventory is recorded on our balance sheet at the time we are committed to purchase such inventory, which generally coincideswith the time of registration.
3. Consumer loan defaults: As discussed in the “Purchaser Financing” section, we offer financing to purchasers of VOIs. In the event of a default, we areable to recover the inventory and resell it at full current value. We are responsible for the payment of maintenance fees to the property owners’ associationsuntil the product is sold. As of December 31, 2014, inventory on the Consolidated Balance Sheet included assumed recoveries of loan defaults in the amountof $235 million.
4. Inventory reclaimed from owners’ associations or owners: We have entered into agreements with a majority of the property associations representingour developments where we may acquire properties from the associations, provided there is no outstanding debt on such properties related to owners whohave defaulted on their maintenance fees. In addition, we frequently work with owners to acquire their properties, provided they have no outstanding debt onsuch properties, prior to them defaulting on their maintenance fees. This provides the owner a graceful exit from a property that is no longer utilized due tolifestyle changes.
Strategies
We are focused on the following strategic objectives:
• driving free cash flow through efficient inventory procurement, optimizing our consumer loan portfolio and increasing operating efficiencies;
• adding new members efficiently through new inventory locations, new tour sources and enhanced third-party alliances; and
• pursuing expansion into new markets.
Seasonality
We rely, in part, upon tour flow to generate sales of VOIs; consequently, sales volume tends to increase in the spring and summer months as a result ofgreater tour flow from spring and summer travelers. Therefore, revenues from sales of VOIs are generally higher in the second and third quarters than in otherquarters. We cannot predict whether these seasonal trends will continue in the future.
Competition
The vacation ownership industry is highly competitive and is comprised of a number of companies specializing primarily in sales and marketing,consumer financing, property management and development of vacation ownership properties.
TRADEMARKS
Our brand names and related trademarks, service marks, logos and trade names are very important to the businesses that make up our Wyndham HotelGroup, Wyndham Exchange & Rentals and Wyndham Vacation Ownership business units. Our subsidiaries actively use or license for use all significantmarks, and we own or have exclusive licenses to use these marks. We register the marks that we own in the United States Patent and Trademark Office, as wellas with other relevant authorities where we deem appropriate, and seek to protect our marks from unauthorized use as permitted by law.
22
Table of Contents
EMPLOYEES
As of December 31, 2014, we had approximately 34,400 employees, including approximately 9,000 employees outside of the U.S. As of December 31,2014, our lodging business had approximately 6,400 employees, our vacation exchange and rentals business had approximately 10,100 employees, ourvacation ownership business had approximately 17,200 employees and our corporate group had approximately 700 employees. Approximately 3% of ouremployees are subject to collective bargaining agreements governing their employment with our company.
ENVIRONMENTAL COMPLIANCE
Our compliance with laws and regulations relating to environmental protection and discharge of hazardous materials has not had a material impact onour capital expenditures, earnings or competitive position and we do not anticipate any material impact from such compliance in the future.
SUSTAINABILITY
We have made a commitment to be at the forefront of sustainability and green business practices. We have set goals of reducing our carbon emissionsand water usage by 20% per square foot by the year 2020 using 2010 as our baseline. We also have a goal to ensure that 30% of our qualified supply chain by2020 is spent with suppliers who meet our Wyndham Green criteria. We continue to meet or surpass all environmental regulations in areas where we dobusiness. Our sustainability efforts have enabled us to not only conserve resources but also contribute to our bottom line through cost savings.
ITEM 1A. RISK FACTORS
Before you invest in our securities you should carefully consider each of the following risk factors and all of the other information provided in thisreport. We believe that the following information identifies the most significant risks that may impact us. However, the risks and uncertainties we face are notlimited to those set forth in the risk factors described below. Additional risks and uncertainties not presently known to us or that we currently believe to beimmaterial may also adversely affect our business. In addition, past financial performance may not be a reliable indicator of future performance and historicaltrends should not be used to anticipate results or trends in future periods. If any of the following risks and uncertainties develops into an actual event, theevent could have a material adverse effect on our business, financial condition or results of operations. In such case the market price of our common stockcould decline.
The hospitality industry is highly competitive and we are subject to risks relating to competition that may adversely affect our performance.
We will be adversely impacted if we cannot compete effectively in the highly competitive hospitality industry. Our continued success depends upon ourability to compete effectively in markets that contain numerous competitors, some of which may have significantly greater financial, marketing and otherresources than we have. Competition may reduce fee structures, potentially causing us to lower our fees or prices, which may adversely impact our profits.New competition or existing competition that uses a business model that is different from our business model may put pressure on us to change our model sothat we can remain competitive.
We may not be able to achieve our growth and performance objectives.
We may not be able to achieve our growth and performance objectives for increasing our earnings and cash flows, the number of franchised and/ormanaged properties in our lodging business, the number of vacation exchange members in our vacation exchange business and related transactions, thenumber of rental weeks sold by and the number of units in our vacation rentals businesses and the number of tours and new owners generated and vacationownership interests sold by our vacation ownership business.
Acquisitions and other strategic transactions may not prove successful and could result in operating difficulties and failure to realize anticipatedbenefits.
We regularly consider a wide array of acquisitions and other potential strategic transactions, including acquisitions of businesses, property acquisitions,joint ventures, business combinations, strategic investments and dispositions. Any of these transactions could be material to our business. We often competefor these opportunities with third parties, which may cause us to lose potential opportunities or to pay more than we might otherwise have paid absent suchcompetition. We cannot assure you that we will be able to identify and consummate strategic transactions and opportunities on favorable terms or that anysuch strategic transactions or opportunities, if consummated, will be successful. Acquisitions and other strategic transactions involve significant risk and theprocess of integrating and assimilating any strategic transaction may create unforeseen operating
23
Table of Contents
difficulties and costs and we may not realize the anticipated benefits of any of these strategic transactions or opportunities. Pursuing and consummatingstrategic transactions and opportunities may require us to obtain significant additional debt or equity financing, spend existing cash or incur liabilities andother expenses including amortization of acquired intangible assets or write-offs of goodwill. Strategic transactions may be entered into by us or by one ormore of our subsidiaries. With respect to those transactions entered into by a subsidiary, we may from time to time provide a performance guaranty of thesubsidiary’s obligations, which may expose us to litigation risks in the event of a dispute between transaction parties.
We are dependent on our senior management.
We believe that our future growth depends in part on the continued services of our senior management team. Losing the services of any members of oursenior management team could adversely affect our strategic and customer relationships and impede our ability to execute our business strategies.
Our revenues are highly dependent on the travel industry and declines in or disruptions to the travel industry such as those caused by economicslowdown, terrorism, political strife, pandemics or threats of pandemics, acts of God and war may adversely affect us.
Declines in or disruptions to the travel industry may adversely impact us. Risks affecting the travel industry include: economic slowdown and recession;economic factors such as increased costs of living and reduced discretionary income adversely impacting consumers’ and businesses’ decisions to use andconsume travel services and products; terrorist incidents and threats and associated heightened travel security measures; political and geographical strife;acts of God such as earthquakes, hurricanes, fires, floods, volcanoes and other natural disasters; war; concerns with or threats of pandemics or contagiousdiseases or health epidemics; environmental disasters such as the Gulf of Mexico oil spill; increased pricing, financial instability and capacity constraints ofair carriers; airline job actions and strikes; and increases in gasoline and other fuel prices.
We are subject to operating or other risks common to the hospitality industry.
Our business is subject to numerous operating or other risks common to the hospitality industry including:• changes in operating costs including inflation, energy, labor costs such as minimum wage increases and unionization, workers’ compensation and
health-care related costs and insurance;• increases in travel costs including air travel would likely impact consumer preferences with respect to certain of our vacation and resort destinations
and vacation ownership preferences and, if such conditions were to be sustained, the desirability of our vacation, resort and hotel products andofferings could be adversely impacted;
• changes in desirability of geographic regions of the hotels or resorts in our business;• changes in the supply and demand for hotel rooms, vacation exchange and rental services and products and vacation ownership services and
products;• evolving changes in consumer travel and vacation patterns and consumer preferences;• seasonality in our businesses, which may cause fluctuations in our operating results;• geographic concentrations of our operations and customers;• increases in costs due to inflation that may not be fully offset by price and fee increases in our business;• availability of acceptable financing and cost of capital as they apply to us, our customers, current and potential hotel franchisees and developers,
owners of hotels with which we have hotel management contracts, our RCI affiliates and other developers of vacation ownership resorts;• the quality of the services provided by franchisees, affiliated resorts in our vacation exchange business, properties in our vacation rentals business or
resorts in which we sell vacation ownership interests may adversely affect our image, reputation and brand value;• our ability to generate sufficient cash to buy from third-party suppliers the products that we need to provide to the participants in our points
programs who want to redeem points for such products;• overbuilding or excess capacity in one or more segments of the hospitality industry or in one or more geographic regions;• our ability to develop and maintain positive relations and contractual arrangements with current and potential franchisees, hotel owners, vacation
exchange members, vacation ownership interest owners, resorts with units that are exchanged through our vacation exchange business and/or ownersof vacation properties that our vacation rentals business markets for rental;
• our ability to adjust our business model to generate greater cash flow and require less capital expenditures;• organized labor activities and associated litigation;• maintenance and infringement of our intellectual property;• the bankruptcy or insolvency of any one of our customers, which could impair our ability to collect outstanding fees or other amounts due or
otherwise exercise our contractual rights;• our insurance coverage may not be adequate to cover catastrophic or other losses to our properties or other assets;
24
Table of Contents
• our failure to keep pace with technological developments could impair our competitive position;• increases in the use of third-party and competitor internet services to book hotel reservations, secure short-term lodging accommodations and market
vacation rental properties;• disruptions in relationships with third parties including marketing alliances and affiliations with e-commerce channels;• changes in the number, occupancy and room rates of hotels operating under franchise and management agreements;• revenues from our lodging business are indirectly affected by our franchisees’ pricing decisions;• franchisees that have development advance notes with us may experience financial difficulties;• consolidation of developers could adversely affect our vacation exchange business;• significant decrease in the supply of available vacation rental accommodations due to ongoing property renovations could adversely affect our
vacation rental business;• our continued management of homeowners associations depends on their ability to collect sufficient maintenance fees;• our ability to securitize the receivables that we originate in connection with sales of vacation ownership interests;• the sale of vacation ownership interests in the secondary market could negatively impact our sales;• unlawful or deceptive third-party vacation ownership interest resale schemes could damage our reputation and brand value;• the availability of and competition for desirable sites for the development of vacation ownership properties; difficulties associated with obtaining
entitlements to develop vacation ownership properties; liability under state and local laws with respect to any construction defects in the vacationownership properties we develop; our ability to adjust our pace of completion of resort development relative to the pace of our sales of theunderlying vacation ownership interests; and risks related to real estate project development costs and completion; and
• private resale of vacation ownership interests could adversely affect our vacation ownership resorts and vacation exchange businesses.
Third-party Internet reservation systems may adversely impact us.
Consumers increasingly use third-party Internet travel intermediaries to search for and book their hotel, resort and other travel accommodations. As theuse of these third-party Internet reservation channels increases, consumers may rely upon these third-party Internet systems to the detriment of thereservations systems provided by our own lodging and rental brands, which may impact consumer preferences for lodging choices outside of our own brandsand adversely impact our bookings and rates.
The continued success of our hotel business relies upon continued growth in the number of hotel properties under our brands and the performance ofour franchisees.
We have been historically successful in growing the number of our brands and franchised hotels in our hotel business and our revenues and profitabilityin our hotel segment relies upon our achieving continued growth objectives for franchised hotels in this segment. We are subject to many challenges ingrowing and sustaining our growth in the number of our franchised hotels including maintaining the quality of our service, operational support andreservation systems to support our franchisees, our ability to compete with other hotel owners for existing and future hotel franchisees, our ability to continueand enhance consumer acceptance of our brands and the quality of our managers and entire organization in supporting our hotel business. We also are subjectto the risk of entering into franchise relationships with owners and operators who do not achieve or maintain the quality standards we set, which if notappropriately and timely addressed could adversely impact our brand image and our ability to attract quality franchisee operators.
Our hotel business depends in part on our management arrangements with third parties.
Our hotel business is a party to management arrangements with certain of our hotel owners and franchisees, under which we typically are required tosatisfy certain financial and performance criteria and standards. Our ability to satisfy these financial and other performance criteria is subject to many of therisks common to the hotel industry as described in this report including factors and circumstances outside of our control such as economic conditions andconsumer travel and lodging preferences, as well as risks within our control such as the efforts and quality of our managers overseeing these managementarrangements and our operating performance generally. Should any significant number of these arrangements be terminated by reason of our failure to satisfyfinancial or performance criteria, it may have an adverse impact on our operating performance and profitability. We may provide a parent guaranty of oursubsidiaries’ performance under the guaranty which could expose us to litigation risks in the event of a dispute. We cannot assure you that all of our currentand future management arrangements will continue or that we will be able to enter into new management arrangements in the future on favorable terms.
25
Table of Contents
We are subject to risks related to our vacation ownership receivables portfolio.
We are subject to risks that purchasers of vacation ownership interests who finance a portion of the purchase price default on their loans due to adversemacro or personal economic conditions or otherwise, which would increase loan loss reserves and adversely affect loan portfolio performance; that if suchdefaults occur during the early part of the loan amortization period we will not have recovered the marketing, selling, administrative and other costsassociated with such vacation ownership interests; such costs will be incurred again in connection with the resale of the repossessed vacation ownershipinterest; and the value we recover in a default is not in all instances sufficient to cover the outstanding debt.
Our international operations are subject to risks not generally applicable to our domestic operations.
Our international operations are subject to numerous risks including exposure to local economic conditions; potential adverse changes in the diplomaticrelations of foreign countries with the U.S.; hostility from local populations; political instability; threats or acts of terrorism; restrictions and taxes on thewithdrawal of foreign investment and earnings; government policies against businesses owned by foreigners; investment restrictions or requirements;diminished ability to legally enforce our contractual rights in foreign countries; foreign exchange restrictions; fluctuations in foreign currency exchangerates; conflicts between local laws and U.S. laws including laws that impact our rights to protect our intellectual property; withholding and other taxes onremittances and other payments by subsidiaries; and changes in and application of foreign taxation structures including value added taxes. Any adverseoutcome resulting from the financial instability or performance of European economies, the instability of the Euro currency and the related volatility onforeign exchange and interest rates could have an effect on our results of operations, financial position or cash flows.
We are subject to certain risks related to our indebtedness, hedging transactions, securitization of certain of our assets, surety bond requirements, thecost and availability of capital and the extension of credit by us.
We are a borrower of funds under our credit facilities, credit lines, senior notes, commercial paper programs and securitization financings. We extendcredit when we finance purchases of vacation ownership interests and in instances when we provide key money, development advance notes and mezzanineor other forms of subordinated financing to assist franchisees and hotel owners in converting to or building a new hotel branded under one of our hotelbrands. We use financial instruments to reduce or hedge our financial exposure to the effects of currency and interest rate fluctuations. We are required to postsurety bonds in connection with our development and sales activities. In connection with our debt obligations, hedging transactions, securitization of certainof our assets, surety bond requirements, the cost and availability of capital and the extension of credit by us, we are subject to numerous risks including:
• our cash flows from operations or available lines of credit may be insufficient to meet required payments of principal and interest, which could resultin a default and acceleration of the underlying debt and under other debt instruments that contain cross-default provisions;
• if we are unable to comply with the terms of the financial covenants under our revolving credit facility or other debt, including a breach of thefinancial ratios or tests, such non-compliance could result in a default and acceleration of the underlying revolver debt and under other debtinstruments that contain cross-default provisions;
• our leverage may adversely affect our ability to obtain additional financing;• our leverage may require the dedication of a significant portion of our cash flows to the payment of principal and interest thus reducing the
availability of cash flows to fund working capital, capital expenditures, dividends, share repurchases or other operating needs;• increases in interest rates;• rating agency downgrades for our debt that could increase our borrowing costs and prevent us from obtaining additional financing;• failure or non-performance of counterparties to foreign exchange and interest rate hedging transactions;• we may not be able to securitize our vacation ownership contract receivables on terms acceptable to us because of, among other factors, the
performance of the vacation ownership contract receivables, adverse conditions in the market for vacation ownership loan-backed notes and asset-backed notes in general and the risk that the actual amount of uncollectible accounts on our securitized vacation ownership contract receivables andother credit we extend is greater than expected;
• our securitizations contain portfolio performance triggers which if violated may result in a disruption or loss of cash flow from such transactions;• a reduction in commitments from surety bond providers which may impair our vacation ownership business by requiring us to escrow cash in order
to meet regulatory requirements of certain states;• prohibitive cost and inadequate availability of capital could restrict the development or acquisition of vacation ownership resorts by us and the
financing of purchases of vacation ownership interests;• the inability of hotel owners that have received mezzanine and other loans from us to pay back such loans; and
26
Table of Contents
• if interest rates increase significantly, we may not be able to increase the interest rate offered to finance purchases of vacation ownership interests bythe same amount of the increase or such higher interest rates could reduce the desirability or demand of our customers for acquiring or financing ourvacation ownership interests.
Economic conditions affecting the hospitality industry, the global economy and credit markets generally may adversely affect our business and resultsof operations, our ability to obtain financing or securitize our receivables on reasonable and acceptable terms, the performance of our loan portfolioand the market price of our common stock.
The future economic environment for the hospitality industry and the global economy may continue to be challenged. The hospitality industry hasexperienced and may continue to experience significant downturns in connection with or in anticipation of declines in general economic conditions. Thecurrent economy has been characterized by higher unemployment, lower family income, lower business investment and lower consumer spending, leading tolower demand for hospitality services and products. Declines in consumer and commercial spending may adversely affect our revenues and profits.
Our access to credit and capital also depends in large measure on market liquidity factors, which we do not control. Our ability to access the credit andcapital markets may be restricted at times when we require or would like access to those credit and capital markets, which could impact our business plansand operating model. Uncertainty or volatility in the equity and credit markets may also negatively affect our ability to access short-term and long-termfinancing on reasonable terms or at all, which would negatively impact our liquidity and financial condition. In addition, if one or more of the financialinstitutions that support our existing credit facilities fails we may not be able to find a replacement, which would negatively impact our ability to borrowunder the credit facilities. Disruptions in the financial markets may adversely affect our credit rating and the market value of our common stock. If we areunable to refinance or repay our outstanding debt when due, our results of operations and financial condition will be materially and adversely affected.
While we believe we have adequate sources of liquidity to meet our anticipated requirements for working capital, debt service and capital expendituresfor the foreseeable future, if our cash flow or capital resources prove inadequate we could face liquidity problems that could materially and adversely affectour results of operations and financial condition.
Our liquidity as it relates to our vacation ownership contract receivables securitization program could be adversely affected if we were to fail to renew orreplace our securitization warehouse conduit facility on its renewal date or if a particular receivables pool were to fail to meet certain ratios, which couldoccur in certain instances if the default rates or other credit metrics of the underlying vacation ownership contract receivables deteriorate. Our ability to sellsecurities backed by our vacation ownership contract receivables depends on the continued ability and willingness of capital market participants to invest insuch securities.
It is possible that asset-backed securities issued pursuant to our securitization programs could in the future be downgraded by credit agencies. If adowngrade occurs our ability to complete other securitization transactions on acceptable terms or at all could be jeopardized. We could be forced to rely onother potentially more expensive and less attractive funding sources to the extent available which would decrease our profitability and may require us toadjust our business operations accordingly including reducing or suspending our financing to purchasers of vacation ownership interests.
If for any reason our sources of liquidity, including our securitization programs, were to decrease such that we were required to reduce or suspend ourfinancing for any significant number of purchases of our vacation ownership contracts, our sales of vacation ownership interests would likely decrease, whichwould adversely impact our revenues, cash flows and profitability.
An increase in interest rates would increase our financing costs and could adversely impact the demand for our vacation ownership interests.
Rising interest rates would increase the interest rates we pay in connection with our indebtedness, which would reduce our profitability and our cash flowavailable for other corporate purposes. While we may enter into interest rate hedging arrangements to reduce the impact of increased interest rates, the cost ofsuch hedging arrangements can be significant. In addition, if the cost of consumer financing to our customers and prospective customers for our vacationownership interests were to rise, the demand for these products may decline, which could adversely impact our revenues and profitability.
We are subject to risks related to litigation.
We are subject to a number of legal actions and the risk of future litigation as described in this report. We cannot predict with certainty the ultimateoutcome and related damages and costs of litigation and other proceedings filed by or against us. Adverse results in litigation and other proceedings mayharm our business.
27
Table of Contents
Our businesses are subject to extensive regulation and the cost of compliance or failure to comply with such regulations may adversely affect us.
Our businesses are heavily regulated by federal, state and local governments in the countries in which our operations are conducted. In addition,domestic and foreign federal, state and local regulators may enact new laws and regulations that may reduce our revenues, cause our expenses to increase orrequire us to modify substantially our business practices. If we are not in compliance with applicable laws and regulations including among others thosegoverning franchising, timeshare, consumer financing and other lending, information security and data privacy, marketing and sales, unfair and deceptivetrade practices, telemarketing including “do not call” legislation, data protection, licensing, labor, employment, health care, health and safety, accessibility,immigration, gaming, environmental including climate change, securities, stock exchange listing, accounting, tax and regulations applicable under theDodd-Frank Act, Office of Foreign Asset Control and the Foreign Corrupt Practices Act and local equivalents in international jurisdictions, we may be subjectto regulatory investigations or actions, fines, penalties, injunctions and potential criminal prosecution. In addition, increases in the cost and administrativeburden of compliance with such laws and regulations would impact our business operations and would adversely impact our operating performanceincluding our profitability.
We have substantial business operations outside the U.S. and we are subject to compliance with significant laws and regulations governing fraud,bribery and other anti-corruption laws.
Legislation such as the Foreign Corrupt Practices Act, The United Kingdom Bribery Act and other similar fraud, bribery and anti-corruption laws prohibitcompanies and their intermediaries from making improper payments to public and/or private officials for the purposes of obtaining or retaining business. Wehave policies and processes in place for the purpose of monitoring compliance with these laws. We provide training to our employees as part of ourcompliance programs in order to protect against noncompliance or violations of these laws. However, there can be no assurance that our policies, processes,and training will always protect us against any noncompliance with these laws and regulations. Should we violate or not comply with any of these fraud,bribery or other anti-corruption laws or regulations, either intentionally or unintentionally, or through the acts of intermediaries, we could incur significantcivil and criminal penalties, which could have a material adverse effect on our business, brands, financial condition and results of operations.
We are subject to extensive federal, state and local environmental laws and regulations.
Our operations, as well as the operations of our hotel and other property owners, are subject to a significant array of environmental laws and regulations,including those relating to discharges into water, emissions to air, releases of hazardous and toxic substances and remediation of contaminated sites. Pursuantto such laws and regulations we could be liable for the cost of cleaning up or removing hazardous substances at or in connection with our currently orformerly owned or operated properties, often whether or not the owner or operator knew of or was responsible for the presence, discharge or transfer of suchhazardous or toxic substances. The cost of investigation, remediation and other requirements for the clean-up, treatment or remediation of contaminated sitescould be substantial. Further, contamination on or from any of our currently or formerly owned or operated properties could subject us to liability to thirdparties or governmental authorities for remediation costs and injuries to persons, property or natural resources. Although we do not typically arrange for thetreatment or disposal of large quantities of hazardous or toxic substances, we could also be held liable for the clean-up of third-party disposal sites where wehave arranged for the disposal of our wastes.
Our ability to successfully market our services and products may be adversely impacted by continued changes in privacy laws and regulations.
Our operating model relies on a broad array of marketing programs to our customers and prospective customers, including telemarketing, emails, socialmedia and other marketing techniques and programs. These marketing programs are subject to extensive laws and regulations in the U.S. and internationalmarkets regulating consumer marketing and solicitation as well as data protection. While we continue to monitor all such laws and regulations, the cost ofcompliance impacts our operating costs. In addition, these laws require us to regularly adjust our marketing programs and techniques, and compliance withall of these laws and regulations may impact and restrict the success of our marketing programs, which could lead to less frequent or less impactful marketingto our customers and our prospective customers.
28
Table of Contents
Failure to maintain the security of personally identifiable and other information, non-compliance with our contractual or other legal obligationsregarding such information or a violation of our privacy and security policies with respect to such information could adversely affect us.
On June 26, 2012, the U.S. Federal Trade Commission (“FTC”) filed a lawsuit in Federal District Court for the District of Arizona against us and oursubsidiaries, Wyndham Hotel Group, LLC, Wyndham Hotels & Resorts Inc. and Wyndham Hotel Management Inc., alleging unfairness and deception-basedviolations of Section 5 of the FTC Act in connection with three prior data breach incidents involving a group of Wyndham brand hotels. We dispute theallegations in the lawsuit and are defending this lawsuit vigorously. We do not believe that the data breach incidents were or expect that the outcome of theFTC litigation will be material to us.
In connection with our business, we and our service providers collect and retain large volumes of certain types of personal and proprietary informationpertaining to our customers, stockholders and employees. Such information includes but is not limited to large volumes of customer credit and payment cardinformation. The legal, regulatory and contractual environment surrounding information security and privacy is constantly evolving and the hospitalityindustry is under increasing attack by cyber-criminals operating on a global basis. Our information technology infrastructure and information systems mayalso be vulnerable to system failures, computer hacking, cyber-terrorism, computer viruses, and other intentional or unintentional interference, negligence,fraud, misuse and other unauthorized attempts to access or interfere with these systems and our personal and proprietary information. The increased scope andcomplexity of our information technology infrastructure and systems could contribute to the potential risk of security breaches or breakdown. While wemaintain what we believe are reasonable security controls over proprietary information as well as the personal information of our customers, stockholders andemployees, any breach of or breakdown in our systems that results in the unauthorized release of proprietary or personal information could nevertheless occurand have a material adverse effect on our brands, reputation, business, financial condition and results of operations, as well as subject us to significantregulatory actions and fines, litigation, loss, third-party damages and other liabilities. Such a breach or a breakdown could also materially increase our coststo protect such information and to protect against such risks. A failure on our part to comply with information security, privacy and other similar laws andregulations with respect to the protection and privacy of personal or proprietary information could subject us to significant fines and other regulatorysanctions.
The insurance that we carry may not at all times cover our potential liabilities, losses or replacement costs.
We carry insurance for general liability, property, business interruption and other insurable risks with respect to our business and properties. We also self-insure for certain risks for up to certain monetary limits. The terms and conditions or the amounts of coverage of our insurance may not at all times besufficient to pay or reimburse us for the amount of our liabilities, losses or replacement costs, and there may also be risks for which we do not obtain insurancein the full amount concerning a potential loss or liability, or at all, due to the cost or availability of such insurance. As a result, we may incur liabilities orlosses in the operation of our business, which may be substantial, which are not sufficiently covered by the insurance we maintain, or at all, which could havea material adverse effect on our business, financial condition and results of operations.
Our inability to adequately protect and maintain our intellectual property could adversely affect our business.
Our inability to adequately protect and maintain our trademarks, trade dress and other intellectual property rights could adversely affect our business. Wegenerate, maintain, utilize and enforce a substantial portfolio of trademarks, trade dress and other intellectual property that are fundamental to the brands thatwe use in all of our businesses. There can be no assurance that the steps we take to protect our intellectual property will be adequate. Any event thatmaterially damages the reputation of one or more of our brands could have an adverse impact on the value of that brand and subsequent revenues from thatbrand. The value of any brand is influenced by a number of factors including consumer preference and perception and our failure to ensure compliance withbrand standards.
Disasters, disruptions and other impairment of our information technologies and systems and service facilities could adversely affect our business.
Any disaster, disruption or other impairment in our technology capabilities and service facilities could harm our business. Our businesses depend uponthe use of sophisticated information technologies and systems, including technology and systems utilized for reservation systems, vacation exchangesystems, hotel/property management, communications, procurement, member record databases, call centers, operation of our loyalty programs andadministrative systems. We also maintain physical facilities to support these systems and related services. The operation, maintenance and updating of thesetechnologies, systems and facilities are dependent upon internal and third-party technologies, systems, services and support and are subject to naturaldisasters and other disruptions for which there are no assurances of uninterrupted availability or adequate protection.
29
Table of Contents
We are subject to risks related to corporate responsibility.
Many factors influence our reputation and the value of our brands including perceptions of us held by our key stakeholders and the communities inwhich we do business. Businesses face increasing scrutiny of the social and environmental impact of their actions and there is a risk of damage to ourreputation and the value of our brands if we fail to act responsibly or comply with regulatory requirements in a number of areas such as safety and security,sustainability, responsible tourism, environmental management, human rights, climate change or availability of resources and support for local communities.
The market price of our shares may fluctuate.
The market price of our common stock may fluctuate depending upon many factors some of which may be beyond our control including our quarterly orannual earnings or those of other companies in our industry; actual or anticipated fluctuations in our operating results due to seasonality and other factorsrelated to our business; changes in accounting principles or rules; announcements by us or our competitors of significant acquisitions or dispositions; thefailure of securities analysts to cover our common stock; changes in earnings estimates by securities analysts or our ability to meet those estimates; theoperating and stock price performance of comparable companies; overall market fluctuations; and general economic conditions. Stock markets in generalhave experienced volatility that has often been unrelated to the operating performance of a particular company. These broad market fluctuations mayadversely affect the trading price of our common stock.
Your percentage ownership in Wyndham Worldwide may be diluted in the future.
Your percentage ownership in Wyndham Worldwide may be diluted in the future because of equity awards that we have and expect will be granted overtime to our Directors and employees. In addition, our Board may issue shares of our common and preferred stock and debt securities convertible into shares ofour common and preferred stock up to certain regulatory thresholds without shareholder approval.
Provisions in our certificate of incorporation and by-laws and under Delaware law may prevent or delay an acquisition of Wyndham Worldwide whichcould impact the trading price of our common stock.
Our certificate of incorporation and by-laws and Delaware law contain provisions that are intended to deter coercive takeover practices and inadequatetakeover bids by making such practices or bids unacceptably expensive and to encourage prospective acquirers to negotiate with our Board rather than toattempt a hostile takeover. These provisions include that stockholders do not have the right to act by written consent, rules regarding how stockholders maypresent proposals or nominate directors for election at stockholder meetings, the right of our Board to issue preferred stock without stockholder approval andlimitations on the right of stockholders to remove directors. Delaware law also imposes restrictions on mergers and other business combinations between usand any holder of 15% or more of our outstanding shares of common stock.
We cannot provide assurance that we will continue to pay dividends or purchase shares of our common stock under our stock repurchase program.
There can be no assurance that we will have sufficient surplus under Delaware law to be able to continue to pay dividends or purchase shares of ourcommon stock under our stock repurchase program. This may result from extraordinary cash expenses, actual expenses exceeding contemplated costs,funding of capital expenditures, increases in reserves or lack of available capital. Our Board of Directors may also suspend the payment of dividends or ourstock repurchase program if the Board deems such action to be in our best interests or those of our stockholders. If we do not pay dividends, the price of ourcommon stock must appreciate for you to realize a gain on your investment in Wyndham Worldwide. This appreciation may not occur and our stock may infact depreciate in value.
We are responsible for certain of Cendant’s contingent and other corporate liabilities.
Under the separation agreement and the tax sharing agreement that we executed with Cendant (now Avis Budget Group) and former Cendant units,Realogy and Travelport, we and Realogy generally are responsible for 37.5% and 62.5%, respectively, of certain of Cendant’s contingent and other corporateliabilities and associated costs including certain contingent and other corporate liabilities of Cendant and/or its subsidiaries to the extent incurred on or priorto August 23, 2006. These liabilities include those relating to certain of Cendant’s terminated or divested businesses, the Travelport sale, certain Cendant-related litigation, actions with respect to the separation plan and payments under certain contracts that were not allocated to any specific party in connectionwith the separation.
30
Table of Contents
If any party responsible for the liabilities described above were to default on its obligations, each non-defaulting party including Avis Budget would berequired to pay an equal portion of the amounts in default. Accordingly, we could under certain circumstances be obligated to pay amounts in excess of ourshare of the assumed obligations related to such liabilities including associated costs. In accordance with the terms of the separation agreement, Realogyposted a letter of credit in April 2007 for our and Cendant’s benefit to cover its estimated share of the assumed liabilities discussed above although there canbe no assurance that such letter of credit will be sufficient to cover Realogy’s actual obligations if and when they arise.
We may be required to write-off all or a portion of the remaining value of our goodwill or other intangibles of companies we have acquired.
Under generally accepted accounting principles we review our intangible assets, including goodwill, for impairment at least annually or when events orchanges in circumstances indicate the carrying value may not be recoverable. Factors that may be considered a change in circumstances indicating that thecarrying value of our goodwill or other intangible assets may not be recoverable include a sustained decline in our stock price and market capitalization,reduced future cash flow estimates and slower growth rates in our industry. We may be required to record a significant non-cash impairment charge in ourfinancial statements during the period in which any impairment of our goodwill or other intangible assets is determined, negatively impacting our results ofoperations and stockholders’ equity.
ITEM 1B. UNRESOLVED STAFF COMMENTS
None.
ITEM 2. PROPERTIES
Our corporate headquarters is located in a leased office at 22 Sylvan Way in Parsippany, New Jersey, which lease expires in 2029. We also have a leasedoffice in Virginia Beach, Virginia for our Associate Service Center, which lease expires in 2019.
Wyndham Hotel Group
The main corporate operations of our lodging business share office space in our corporate headquarters leased by Wyndham in Parsippany, New Jersey.Our lodging business also leases space for its reservations centers and/or data warehouses in Aberdeen, South Dakota; Phoenix, Arizona; and Saint John, NewBrunswick, Canada pursuant to leases that expire in 2016, 2017 and 2020, respectively. In addition, our lodging business has eight leases for office space invarious countries outside the U.S. with varying expiration dates ranging between 2015 and 2021. Our lodging business also has four leases for office spacewithin the U.S. with varying expiration dates ranging between 2015 and 2020 and a storage facility located in Parsippany, New Jersey that expires in 2017.All leases that are due to expire in 2015 are presently under review related to our ongoing requirements.
Wyndham Exchange & Rentals
Our vacation exchange and rentals business has its main corporate operations at a leased office in Parsippany, New Jersey, which lease expires in 2029.Our vacation exchange business also owns five properties located in the U.S., Ireland, United Kingdom, Mexico and Portugal. Our vacation exchangebusiness also has one other leased office located within the U.S. pursuant to a lease that expires in 2019 and 20 additional leased spaces in various countriesoutside the U.S. pursuant to leases that expire generally between 2015 through 2017 except for one lease that expires in 2020. Our vacation rentals business’soperations are managed in 28 owned locations (of which 19 are located in the U.S., five are located in Denmark, three are located in the United Kingdom andone is located in Italy), four main leased locations (of which two are located in the U.S., one is located in Denmark and one is located in the Netherlands) and138 smaller leased offices throughout Europe and the U.S.. The vacation exchange and rentals business also occupies space in London, United Kingdompursuant to a lease that expires in 2021. All leases that are due to expire in 2015 are presently under review related to our ongoing requirements.
Wyndham Vacation Ownership
Our vacation ownership business has its main corporate operations in Orlando, Florida pursuant to several leases, which begin to expire in 2025. Ourvacation ownership business also owns a contact center facility in Redmond, Washington as well as leased space in Springfield, Missouri; Chicago, Illinois;and Las Vegas, Nevada with various expiration dates. Our vacation ownership business leases space for administrative functions in Las Vegas, Nevada thatexpires in 2018 and in Northbrook, Illinois that expires in 2020. In addition, the vacation ownership business leases approximately 95 marketing and salesoffices, of which approximately 93 are located throughout the U.S. with varying expiration dates, and eight offices located in Australia that expire between2015 and 2019, with the exception of the main corporate operations in Bundall, Australia which expires in 2021.
31

Table of Contents
ITEM 3. LEGAL PROCEEDINGS
We are involved in various claims and lawsuits arising in the ordinary course of business, none of which, in the opinion of management, is expected tohave a material adverse effect on our results of operations or financial condition. See Note 17 to the Consolidated Financial Statements for a description ofclaims and legal actions arising in the ordinary course of our business and Note 23 to the Consolidated Financial Statements for a description of ourobligations regarding Cendant contingent litigation.
ITEM 4. MINE SAFETY DISCLOSURES
None.
32
Table of Contents
PART II
ITEM 5. MARKET FOR REGISTRANT’S COMMON EQUITY, RELATED STOCKHOLDER MATTERS AND ISSUER PURCHASES OFEQUITY SECURITIES
Market Price of Common Stock
Our common stock is listed on the New York Stock Exchange (“NYSE”) under the symbol “WYN”. As of January 31, 2015, the number of stockholdersof record was 6,085. The following table sets forth the quarterly high and low closing sales prices per share of WYN common stock as reported by the NYSEfor the years ended December 31, 2014 and 2013.
2014 High Low
First Quarter $ 75.74 $ 68.62Second Quarter 75.72 69.43Third Quarter 82.39 74.82Fourth Quarter 86.77 71.83
2013 High Low
First Quarter $ 64.48 $ 55.14Second Quarter 65.26 54.85Third Quarter 63.71 56.83Fourth Quarter 73.69 59.36
Dividend Policy
During 2014 and 2013, we paid a quarterly dividend of $0.35 and $0.29, respectively, per share of common stock issued and outstanding on the recorddate for the applicable dividend. During February 2015, our Board of Directors (“Board”) authorized an increase of quarterly dividends to $0.42 per sharebeginning with the dividend expected to be declared during the first quarter of 2015. Our dividend payout ratio is now approximately 34% of the midpointof the range of our estimated 2015 net income after certain adjustments. Our dividend policy for the future is to grow our dividend at least at the rate ofgrowth of our earnings. The declaration and payment of future dividends to holders of our common stock are at the discretion of our Board and depend uponmany factors, including our financial condition, earnings, capital requirements of our business, covenants associated with certain debt obligations, legalrequirements, regulatory constraints, industry practice and other factors that our Board deems relevant. There can be no assurance that a payment of adividend will occur in the future.
Issuer Purchases of Equity Securities
Below is a summary of our Wyndham Worldwide common stock repurchases by month for the quarter ended December 31, 2014:
ISSUER PURCHASES OF EQUITY SECURITIES
Period
Total Numberof Shares
PurchasedAverage Price
Paid per Share
Total Number ofShares
Purchased asPart of Publicly
Announced Plan
Approximate DollarValue of Shares that
May Yet Be PurchasedUnder the PubliclyAnnounced Plan
October 1 – 31, 2014 943,529 $ 77.15 943,529 $ 1,113,833,572November 1 – 30, 2014 501,111 78.79 501,111 1,074,351,825December 1 – 31, 2014 (*) 694,717 84.18 694,717 1,015,968,890Total 2,139,357 $ 79.82 2,139,357 $ 1,015,968,890
(*) Includes 86,695 shares purchased for which the trade date occurred during December 2014 while settlement occurred during January 2015.
On August 20, 2007, our Board authorized our current stock repurchase program that enables us to purchase our common stock. The Board has sinceincreased the capacity of the program six times, most recently on October 22, 2014 by $1.0 billion, bringing the total authorization under the program to $4.0billion. Under our current and prior stock repurchase plans, the total authorization is $4.8 billion.
33
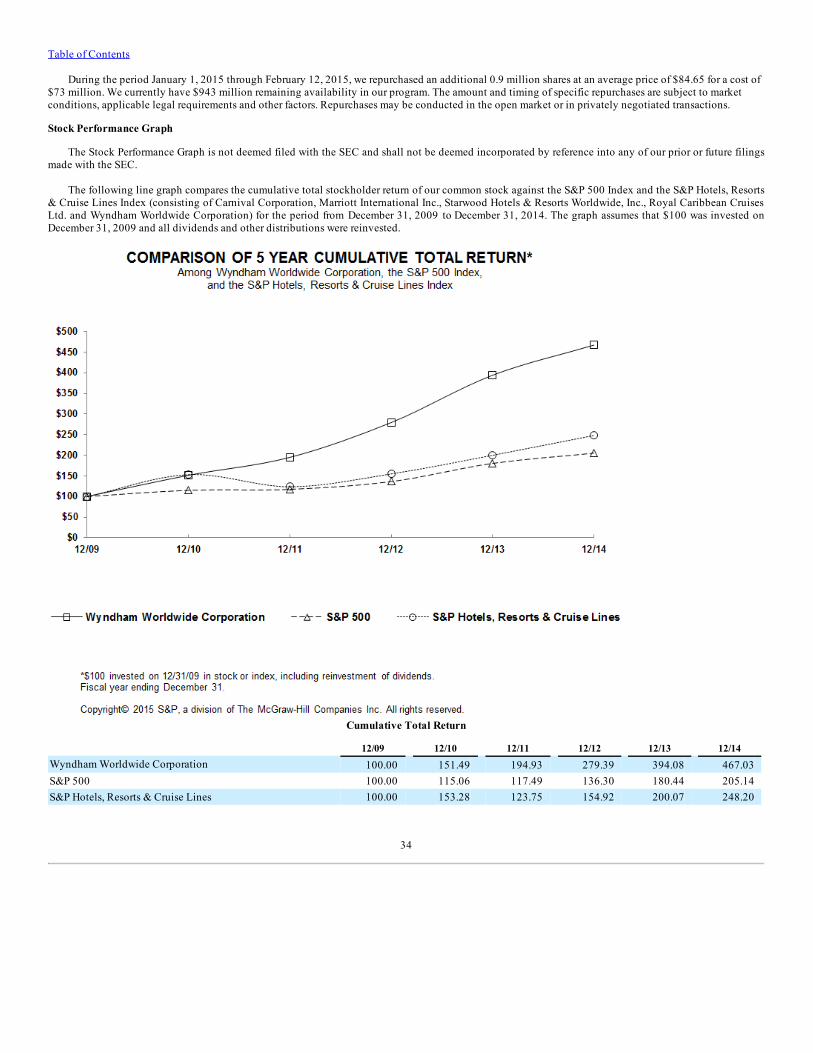
Table of Contents
During the period January 1, 2015 through February 12, 2015, we repurchased an additional 0.9 million shares at an average price of $84.65 for a cost of$73 million. We currently have $943 million remaining availability in our program. The amount and timing of specific repurchases are subject to marketconditions, applicable legal requirements and other factors. Repurchases may be conducted in the open market or in privately negotiated transactions.
Stock Performance Graph
The Stock Performance Graph is not deemed filed with the SEC and shall not be deemed incorporated by reference into any of our prior or future filingsmade with the SEC.
The following line graph compares the cumulative total stockholder return of our common stock against the S&P 500 Index and the S&P Hotels, Resorts& Cruise Lines Index (consisting of Carnival Corporation, Marriott International Inc., Starwood Hotels & Resorts Worldwide, Inc., Royal Caribbean CruisesLtd. and Wyndham Worldwide Corporation) for the period from December 31, 2009 to December 31, 2014. The graph assumes that $100 was invested onDecember 31, 2009 and all dividends and other distributions were reinvested.
Cumulative Total Return
12/09 12/10 12/11 12/12 12/13 12/14Wyndham Worldwide Corporation 100.00 151.49 194.93 279.39 394.08 467.03S&P 500 100.00 115.06 117.49 136.30 180.44 205.14S&P Hotels, Resorts & Cruise Lines 100.00 153.28 123.75 154.92 200.07 248.20
34
Table of Contents
ITEM 6. SELECTED FINANCIAL DATA
As of or For the Year Ended December 31,
2014 2013 2012 2011 2010Statement of Income Data (in millions): Net revenues $ 5,281 $ 5,009 $ 4,534 $ 4,254 $ 3,851Expenses:
Operating and other (a) 4,061 3,865 3,482 3,246 2,947Loss on sale and asset impairments 35 8 8 57 4Restructuring 11 10 7 6 9Depreciation and amortization 233 216 185 178 173
Operating income 941 910 852 767 718Other income, net (7) (6) (8) (11) (7)Interest expense 113 131 132 140 137Early extinguishment of debt — 111 108 12 30Interest income (10) (9) (8) (24) (5)Income before income taxes 845 683 628 650 563Provision for income taxes 316 250 229 233 184Net income 529 433 399 417 379Net (income)/loss attributable to noncontrolling interest — (1) 1 — —Net income attributable to Wyndham shareholders $ 529 $ 432 $ 400 $ 417 $ 379
Per Share Data Basic
Net income attributable to Wyndham shareholders $ 4.22 $ 3.25 $ 2.80 $ 2.57 $ 2.13Weighted average shares outstanding 125 133 143 162 178
Diluted Net income attributable to Wyndham shareholders $ 4.18 $ 3.21 $ 2.75 $ 2.51 $ 2.05Weighted average shares outstanding 127 135 145 166 185
Dividends Cash dividends declared per share $ 1.40 $ 1.16 $ 0.92 $ 0.60 $ 0.48
Balance Sheet Data (in millions): Securitized assets (b) $ 2,629 $ 2,314 $ 2,543 $ 2,638 $ 2,865Total assets 9,679 9,741 9,463 9,023 9,416Securitized debt 2,165 1,910 1,960 1,862 1,650Long-term debt 2,888 2,931 2,602 2,153 2,094Total equity 1,257 1,625 1,931 2,232 2,917Operating Statistics: (c) Lodging
Number of rooms 660,800 645,400 627,400 613,100 612,700RevPAR $ 37.57 $ 36.00 $ 34.80 $ 33.34 $ 31.14
Vacation Exchange and Rentals Average number of members (in 000s) 3,765 3,698 3,674 3,750 3,753Exchange revenue per member $ 177.12 $ 181.02 $ 179.68 $ 179.59 $ 177.53Vacation rental transactions (in 000s) 1,552 1,483 1,392 1,347 1,163Average net price per vacation rental $ 558.95 $ 532.11 $ 504.55 $ 530.78 $ 425.38
Vacation Ownership Gross Vacation Ownership Interest (“VOI”)sales (in 000s) $ 1,889,000 $ 1,889,000 $ 1,781,000 $ 1,595,000 $ 1,464,000Tours (in 000s) 794 789 724 685 634Volume Per Guest (“VPG”) $ 2,257 $ 2,281 $ 2,324 $ 2,229 $ 2,183
35
Table of Contents
(a) Includes operating, cost of VOIs, consumer financing interest, marketing and reservation and general and administrative expenses.(b) Represents the portion of gross vacation ownership contract receivables, securitization restricted cash and related assets that collateralize our securitized debt. Refer to Note 14 —
Variable Interest Entities.(c) The impact from acquired businesses have been included from their acquisition dates forward (see acquisition list below).
In presenting the financial data above in conformity with generally accepted accounting principles, we are required to make estimates and assumptionsthat affect the amounts reported. See “Management’s Discussion and Analysis of Financial Condition and Results of Operations — Financial Condition,Liquidity and Capital Resources — Critical Accounting Policies,” for a detailed discussion of the accounting policies that we believe require subjective andcomplex judgments that could potentially affect reported results.
ACQUISITIONS (2010 – 2014)
Between January 1, 2010 and December 31, 2014, we completed a number of acquisitions. The results of operations and financial position of suchacquisitions have been included beginning from the relevant acquisition dates. Below is a list of our primary acquisitions during that period (not intended tobe a complete list):
• Midtown 45, NYC Property (January 2013)• Oceana Resorts (December 2012)• Wyndham Grand Rio Mar Hotel (October 2012)• Shell Vacations Club (September 2012)• Smoky Mountain Property Management Group (August 2012)• James Villa Holdings Ltd. (November 2010)• ResortQuest International, LLC (September 2010)• Tryp hotel brand (June 2010)• Hoseasons Holdings Ltd. (March 2010)
See Note 4 to the Consolidated Financial Statements for a discussion of the acquisitions completed during 2014 and 2013.
LOSS ON SALE
During 2014, we sold our U.K.-based camping business at our vacation exchange and rentals business resulting in a $20 million loss. As a result of thistransaction, we received $1 million of cash, net, reduced our net assets by $11 million, wrote-off $6 million of foreign currency translation adjustments andrecorded a $4 million indemnification liability. Such loss is recorded within loss on sale and asset impairments on the Consolidated Statement of Income.
IMPAIRMENT & RESTRUCTURING CHARGES
During 2014, we recorded $12 million of restructuring costs at our vacation exchange and rentals and lodging businesses targeted at improving thealignment of the organizational structure of each business with their strategic objectives. In addition, we reversed $1 million of previously recorded contracttermination costs related to our 2013 organizational realignment initiative.
Additionally in 2014, we recorded a $7 million non-cash charge at our vacation exchange and rentals business related to the write-down of an equityinvestment which was the result of a reduction in the fair value of an entity in which we have a minority ownership position. We also recorded an $8 millionnon-cash charge at our lodging business related to the write-down of an investment in a joint venture, which was the result of the joint venture’s recurringlosses and negative operating cash flows.
During 2013, we recorded $10 million of restructuring costs, of which $9 million related to an organizational realignment initiative committed to at ourlodging business, primarily focused on optimizing its marketing structure. In addition, we recorded $8 million of non-cash impairment charges at our lodgingbusiness primarily related to a partial write-down of our Hawthorn trademark due to lower than anticipated growth in the brand.
During 2012, we recorded an $8 million non-cash asset impairment charge at our vacation exchange and rentals business resulting from the decision torebrand the ResortQuest and Steamboat Resorts trade names to the Wyndham Vacation Rentals brand. In addition, we recorded restructuring costs of $7million related to organizational realignment initiatives commenced during 2012 at our vacation exchange and rentals and vacation ownership businesses.
36
Table of Contents
During 2011, we recorded non-cash asset impairment charges at our lodging business which consisted of a write-down of $44 million of franchise andmanagement agreements, development advance notes and other receivables and a $13 million investment in an international joint venture. In addition, werecorded $6 million of restructuring costs primarily related to a strategic realignment initiative committed to during 2010 at our vacation exchange andrentals business.
During 2010, we recorded $9 million of restructuring costs related to a strategic realignment initiative committed to during 2010 at our vacationexchange and rentals business. In addition, we recorded a $4 million charge to reduce the value of certain vacation ownership properties and related assetsthat were no longer consistent with our development plans.
ITEM 7. MANAGEMENT’S DISCUSSION AND ANALYSIS OF FINANCIAL CONDITION AND RESULTS OF OPERATIONS
BUSINESS AND OVERVIEW
We are a global provider of hospitality services and products and operate our business in the following three segments:
• Lodging—primarily franchises hotels in the upscale, upper midscale, midscale, economy and extended stay segments and provides hotelmanagement services for full-service and select limited-service hotels.
• Vacation Exchange and Rentals—provides vacation exchange services and products to owners of intervals of vacation ownership interests(“VOIs”) and markets vacation rental properties primarily on behalf of independent owners.
• Vacation Ownership—develops, markets and sells VOIs to individual consumers, provides consumer financing in connection with the sale of VOIsand provides property management services at resorts.
Separation from Cendant
On July 31, 2006, Cendant Corporation, currently known as Avis Budget Group, Inc. (or “former Parent”), distributed all of the shares of Wyndhamcommon stock to the holders of Cendant common stock issued and outstanding on July 21, 2006, the record date for the distribution. On August 1, 2006, wecommenced “regular way” trading on the New York Stock Exchange under the symbol “WYN.”
Before our separation from Cendant (“Separation”), we entered into separation, transition services and several other agreements with Cendant, Realogyand Travelport to effect the separation and distribution, govern the relationships among the parties after the separation and allocate among the partiesCendant’s assets, liabilities and obligations attributable to periods prior to the separation. Under the Separation and Distribution Agreement, we assumed37.5% of certain contingent and other corporate liabilities of Cendant or its subsidiaries which were not primarily related to our business or the businesses ofRealogy, Travelport or Avis Budget Group, and Realogy assumed 62.5% of these contingent and other corporate liabilities. These include liabilities relatingto Cendant’s terminated or divested businesses, the Travelport sale on August 22, 2006, taxes of Travelport for taxable periods through the date of theTravelport sale, certain litigation matters, generally any actions relating to the separation plan and payments under certain contracts that were not allocatedto any specific party in connection with the Separation.
37
Table of Contents
RESULTS OF OPERATIONSLodging
In our franchising business, we seek to generate revenues for our hotel owners through our strong, well-known brands and the delivery of services such asmarketing, information technology, revenue management, training, operations support, strategic sourcing and guest services.
We enter into agreements to franchise our lodging brands to independent hotel owners. Our standard franchise agreement typically has a term of 15 to 20years and provides a franchisee with certain rights to terminate the franchise agreement before the end of the agreement under certain circumstances. Theprincipal source of revenues from franchising hotels is ongoing franchise fees, which are primarily comprised of royalty, marketing and reservation fees.Royalty, marketing and reservation fees are typically a percentage of gross room revenues of each franchised hotel. Royalty fees are intended to cover the useof our trademarks and our operating expenses, such as expenses incurred for franchise services, including quality assurance and administrative support, and toprovide us with operating profits. These fees are recognized as revenue upon becoming due from the franchisee. An estimate of uncollectible ongoing royaltyfees is charged to bad debt expense and included in operating expenses on the Consolidated Statements of Income. Lodging revenues also include initialfranchise fees, which are recognized as revenues when all material services or conditions have been substantially performed, which is either when a franchisedhotel opens for business or when a franchise agreement is terminated after it has been determined that the franchised hotel will not open.
Our franchise agreements also require the payment of marketing and reservation fees, which are intended to reimburse us for expenses associated withoperating an international, centralized, brand-specific reservations system, e-commerce channels such as our brand.com websites, as well as access to third-party distribution channels, such as online travel agents, advertising and marketing programs, global sales efforts, operations support, training and otherrelated services. These fees are recognized as revenue upon becoming due from the franchisee. An estimate of uncollectible ongoing marketing andreservation fees is charged to bad debt expense and included in marketing and reservation expenses on the Consolidated Statements of Income.
We are contractually obligated to expend the marketing and reservation fees we collect from franchisees in accordance with the franchise agreements; assuch, revenues earned in excess of costs incurred are accrued as a liability for future marketing or reservation costs. Costs incurred in excess of revenuesearned are expensed as incurred. In accordance with our franchise agreements, we include an allocation of costs required to carry out marketing andreservation activities within marketing and reservation expenses.
We also earn revenues from the Wyndham Rewards loyalty program when a member stays at a participating hotel. These revenues are derived from a feewe charge based upon a percentage of room revenues generated from such member stays. These fees are intended to reimburse us for expenses associated withadministering and marketing the loyalty program. These fees are recognized as revenue upon becoming due from the franchisee. Since we are obligated toexpend the fees we collect from franchisees, revenues earned in excess of costs incurred are accrued as a liability for future costs to support the program.
Other service fees we derive from providing ancillary services to franchisees are primarily recognized as revenue upon completion of services. Themajority of these fees are intended to reimburse us for direct expenses associated with providing these services.
38
Table of Contents
We also provide management services for hotels under management contracts, which offer all the benefits of a global brand and a full range ofmanagement, marketing and reservation services. In addition to the standard franchise services described above, our hotel management business provideshotel owners with professional oversight and comprehensive operations support services such as hiring, training and supervising the managers andemployees that operate the hotels as well as annual budget preparation, financial analysis and extensive food and beverage services. Our standardmanagement agreement typically has a term of up to 25 years. Our management fees are comprised of base fees, which are typically a specified percentage ofgross revenues from hotel operations, and incentive fees, which are typically a specified percentage of a hotel’s gross operating profit. Management feerevenues are recognized when earned in accordance with the terms of the contract and recorded as a component of franchise fee revenues on the ConsolidatedStatements of Income. We incur certain reimbursable costs on behalf of managed hotel properties and report reimbursements received from managed hotels asrevenues and the costs incurred on their behalf as expenses. Such reimbursable revenues are recorded as a component of service and membership fees on theConsolidated Statements of Income. The reimbursable costs, which principally relate to payroll costs for operational employees at the managed hotels, arereflected as a component of operating expenses on the Consolidated Statements of Income. The reimbursements from hotel owners are based upon the costsincurred with no added margin. As a result, these reimbursable costs have no effect on our operating income. Management fee revenues and reimbursablerevenues were $11 million and $148 million, respectively, during 2014, $8 million and $129 million, respectively, during 2013 and $7 million and $91million, respectively, during 2012.
We currently own two hotels in locations where we have developed or intend to develop timeshare units. Revenues earned from our owned hotels arecomprised of (i) gross room nights, (ii) food and beverage services and (iii) on-site spa, casino, golf and shop revenues. We are responsible for all theoperations of the hotels and recognize all revenues and expenses of these hotels.
Within our Lodging segment, we measure operating performance using the following key operating statistics: (i) number of rooms, which represents thenumber of rooms at lodging properties at the end of the year and (ii) revenue per available room (RevPAR), which is calculated by multiplying the percentageof available rooms occupied during the year by the average rate charged for renting a lodging room for one day.
Vacation Exchange and Rentals
As a provider of vacation exchange services, we enter into affiliation agreements with developers of vacation ownership properties to allow owners ofintervals of VOIs to trade their intervals for intervals at other properties affiliated with our vacation exchange business and, for some members, for otherleisure-related services and products. Additionally, as a marketer of vacation rental properties, generally we enter into contracts for exclusive periods of timewith property owners to market the rental of such properties to rental customers.
Our vacation exchange business derives a majority of its revenues from annual membership dues and exchange fees from members trading their intervals.Revenues from annual membership dues represent the annual fees from members who participate in our vacation exchange business and, for additional fees,have the right to exchange their intervals for intervals at other properties affiliated within our vacation exchange business and, for certain members, for otherleisure-related services and products. We recognize revenues from annual membership dues on a straight-line basis over the membership period during whichdelivery of publications, if applicable, and other services are provided to the members. Exchange fees are generated when members exchange their intervalsfor intervals at other properties affiliated with our vacation exchange business or for other leisure-related services and products. Exchange fees are recognizedas revenues, net of expected cancellations, when the exchange requests have been confirmed to the member.
Our vacation rentals business primarily derives its revenues from fees, which generally average between 20% and 50% of the gross booking fees. Forproperties which we own, manage or operate under long-term capital and operating leases (which represent less than 10% of our portfolio), we receive 100%of the revenues. The majority of the time, we act on behalf of the owners of the rental properties to generate our fees. We provide reservation services to theindependent property owners and receive the agreed-upon fee for the services provided. We remit the gross rental fee received from the renter to theindependent property owner, net of our agreed-upon fee. Revenues from such fees that are recognized in the period that the rental reservation is made arerecorded, net of expected cancellations.
39
Table of Contents
Cancellations for 2014, 2013 and 2012 each totaled less than 5% of rental transactions booked. Upon confirmation of the rental reservation, the rentalcustomer and property owner generally have a direct relationship for additional services to be performed. We also earn rental fees in connection withproperties which we own, manage or operate and such fees are recognized ratably over the rental customer’s stay, as this is the point at which the service isrendered. Our revenues are earned when evidence of an arrangement exists, delivery has occurred or the services have been rendered, the seller’s price to thebuyer is fixed or determinable, and collectability is reasonably assured.
Within our Vacation Exchange and Rentals segment, we measure operating performance using the following key operating statistics: (i) average numberof vacation exchange members, which represents members in our vacation exchange programs who pay annual membership dues and are entitled, foradditional fees, to exchange their intervals for intervals at other properties affiliated within our vacation exchange business and, for certain members, forother leisure-related services and products, (ii) exchange revenue per member, which represents total revenue from fees associated with memberships,exchange transactions, member-related rentals and other services for the year divided by the average number of vacation exchange members during the year,(iii) vacation rental transactions, which represents the number of standard one-week rental transactions that are generated in connection with customersbooking their vacation rental stays through us and (iv) average net price per vacation rental, which represents the net rental price generated from rentingvacation properties to customers and other related rental servicing fees divided by the number of vacation rental transactions.
Vacation OwnershipOur vacation ownership business develops, markets and sells VOIs to individual consumers, provides property management services at resorts and
provides consumer financing in connection with the sale of VOIs. It derives the majority of its revenues from sales of VOIs and derives other revenues fromconsumer financing and property management. Our sales of VOIs are either cash sales or developer-financed sales. In order for us to recognize revenues fromVOI sales under the full accrual method of accounting as prescribed in the guidance for sales of real estate for fully constructed inventory, a binding salescontract must have been executed, the statutory rescission period must have expired (after which time the purchasers are not entitled to a refund except fornon-delivery by us), receivables must have been deemed collectible and the remainder of our obligations must have been substantially completed. Inaddition, before we recognize any revenues from VOI sales, the purchaser of the VOI must have met the initial investment criteria and, as applicable, thecontinuing investment criteria, by executing a legally binding financing contract. A purchaser has met the initial investment criteria when a minimum downpayment of 10% is received by us. In accordance with the guidance for accounting for real estate time-sharing transactions, we must also take intoconsideration the fair value of certain incentives provided to the purchaser when assessing the adequacy of the purchaser’s initial investment. In those caseswhere financing is provided to the purchaser by us, the purchaser is obligated to remit monthly payments under financing contracts that represent thepurchaser’s continuing investment. If all of the criteria for a VOI sale to qualify under the full accrual method of accounting have been met, as discussedabove, except that construction of the VOI purchased is not complete, we recognize revenues using the percentage-of-completion (“POC”) method ofaccounting provided that the preliminary construction phase is complete and that a minimum sales level has been met (to assure that the property will notrevert to a rental property). The preliminary stage of development is deemed to be complete when the engineering and design work is complete, theconstruction contracts have been executed, the site has been cleared, prepared and excavated, and the building foundation is complete. The completionpercentage is determined by the proportion of real estate inventory costs incurred to total estimated costs. These estimated costs are based upon historicalexperience and the related contractual terms. The remaining revenues and related costs of sales, including commissions and direct expenses, are deferred andrecognized as the remaining costs are incurred.
We offer consumer financing as an option to customers purchasing VOIs, which are typically collateralized by the underlying VOI. The contractual termsof Company-provided financing agreements require that the contractual level of annual principal payments be sufficient to amortize the loan over acustomary period for the VOI being financed, which is generally 10 years, and payments under the financing contracts begin within 45 days of the sale andreceipt of the minimum down payment of 10%. An estimate of uncollectible amounts is recorded at the time of the sale with a charge to the provision for loanlosses, which is classified as a reduction of VOI sales on the Consolidated Statements of Income. The interest income earned from the financing arrangementsis earned on the principal balance outstanding over the life of the arrangement and is recorded within consumer financing on the Consolidated Statements ofIncome.
We also provide day-to-day-management services, including oversight of housekeeping services, maintenance and certain accounting andadministrative services for property owners’ associations and clubs. In some cases, our employees serve as officers and/or directors of these associations andclubs in accordance with their by-laws and associated regulations. We receive fees for such property management services which are generally based upontotal costs to operate such resorts. Fees for property management services typically approximate 10% of budgeted operating expenses. Property managementfee revenues are recognized when earned in accordance with the terms of the contract and are recorded as a component of service and
40
Table of Contents
membership fees on the Consolidated Statements of Income. Property management revenues, which are comprised of management fee revenue andreimbursable revenue, were $581 million, $567 million and $460 million during 2014, 2013 and 2012, respectively. Management fee revenues were $288million, $290 million and $225 million during 2014, 2013 and 2012, respectively. Reimbursable revenues, which are based upon certain reimbursable costswith no added margin, were $293 million, $277 million and $235 million during 2014, 2013 and 2012, respectively. These reimbursable costs principallyrelate to the payroll costs for management of the associations, club and resort properties where we are the employer and are reflected as a component ofoperating expenses on the Consolidated Statements of Income. During each of 2014, 2013 and 2012, one of the associations that we manage paid WyndhamExchange & Rentals $19 million for exchange services.
Within our Vacation Ownership segment, we measure operating performance using the following key metrics: (i) gross VOI sales (including tele-salesupgrades, which are a component of upgrade sales) before the net effect of POC accounting and loan loss provisions, (ii) tours, which represents the number oftours taken by guests in our efforts to sell VOIs and (iii) volume per guest, or VPG, which represents revenue per guest and is calculated by dividing the grossVOI sales (excluding tele-sales upgrades, which are a component of upgrade sales) by the number of tours.
Other ItemsWe record marketing and reservation revenues, Wyndham Rewards revenues, RCI Elite Rewards revenues and hotel/property management services
revenues for our Lodging, Vacation Ownership and Vacation Exchange and Rentals segments, in accordance with the guidance for reporting revenues grossas a principal versus net as an agent, which requires that these revenues be recorded on a gross basis.
Discussed below are our consolidated results of operations and the results of operations for each of our reportable segments. The reportable segmentspresented below represent our operating segments for which separate financial information is available and which is utilized on a regular basis by our chiefoperating decision maker to assess performance and to allocate resources. In identifying our reportable segments, we also consider the nature of servicesprovided by our operating segments. Management evaluates the operating results of each of our reportable segments based upon revenues and “EBITDA,”which is defined as net income before depreciation and amortization, interest expense (excluding consumer financing interest), early extinguishment of debt,interest income (excluding consumer financing interest) and income taxes, each of which is presented on the Consolidated Statements of Income. We believethat EBITDA is a useful measure of performance for our industry segments and, when considered with GAAP measures, gives a more complete understandingof our operating performance. Our presentation of EBITDA may not be comparable to similarly-titled measures used by other companies.
41
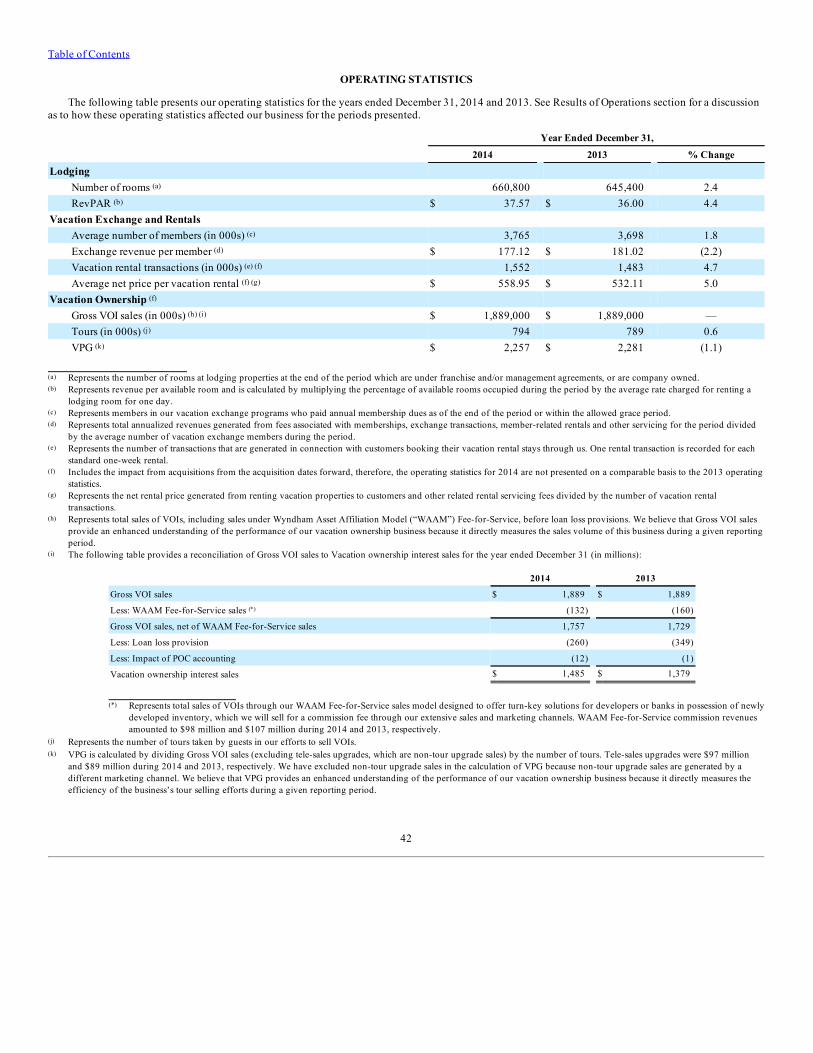
Table of Contents
OPERATING STATISTICS
The following table presents our operating statistics for the years ended December 31, 2014 and 2013. See Results of Operations section for a discussionas to how these operating statistics affected our business for the periods presented.
Year Ended December 31,
2014 2013 % Change
Lodging Number of rooms (a) 660,800 645,400 2.4RevPAR (b) $ 37.57 $ 36.00 4.4
Vacation Exchange and Rentals Average number of members (in 000s) (c) 3,765 3,698 1.8Exchange revenue per member (d) $ 177.12 $ 181.02 (2.2)Vacation rental transactions (in 000s) (e) (f) 1,552 1,483 4.7Average net price per vacation rental (f) (g) $ 558.95 $ 532.11 5.0
Vacation Ownership (f) Gross VOI sales (in 000s) (h) (i) $ 1,889,000 $ 1,889,000 —Tours (in 000s) (j) 794 789 0.6VPG (k) $ 2,257 $ 2,281 (1.1)
(a) Represents the number of rooms at lodging properties at the end of the period which are under franchise and/or management agreements, or are company owned.(b) Represents revenue per available room and is calculated by multiplying the percentage of available rooms occupied during the period by the average rate charged for renting a
lodging room for one day.(c) Represents members in our vacation exchange programs who paid annual membership dues as of the end of the period or within the allowed grace period.(d) Represents total annualized revenues generated from fees associated with memberships, exchange transactions, member-related rentals and other servicing for the period divided
by the average number of vacation exchange members during the period.(e) Represents the number of transactions that are generated in connection with customers booking their vacation rental stays through us. One rental transaction is recorded for each
standard one-week rental.(f) Includes the impact from acquisitions from the acquisition dates forward, therefore, the operating statistics for 2014 are not presented on a comparable basis to the 2013 operating
statistics.(g) Represents the net rental price generated from renting vacation properties to customers and other related rental servicing fees divided by the number of vacation rental
transactions.(h) Represents total sales of VOIs, including sales under Wyndham Asset Affiliation Model (“WAAM”) Fee-for-Service, before loan loss provisions. We believe that Gross VOI sales
provide an enhanced understanding of the performance of our vacation ownership business because it directly measures the sales volume of this business during a given reportingperiod.
(i) The following table provides a reconciliation of Gross VOI sales to Vacation ownership interest sales for the year ended December 31 (in millions):
2014 2013
Gross VOI sales $ 1,889 $ 1,889
Less: WAAM Fee-for-Service sales (*) (132) (160)
Gross VOI sales, net of WAAM Fee-for-Service sales 1,757 1,729
Less: Loan loss provision (260) (349)
Less: Impact of POC accounting (12) (1)
Vacation ownership interest sales $ 1,485 $ 1,379
(*) Represents total sales of VOIs through our WAAM Fee-for-Service sales model designed to offer turn-key solutions for developers or banks in possession of newlydeveloped inventory, which we will sell for a commission fee through our extensive sales and marketing channels. WAAM Fee-for-Service commission revenuesamounted to $98 million and $107 million during 2014 and 2013, respectively.
(j) Represents the number of tours taken by guests in our efforts to sell VOIs.(k) VPG is calculated by dividing Gross VOI sales (excluding tele-sales upgrades, which are non-tour upgrade sales) by the number of tours. Tele-sales upgrades were $97 million
and $89 million during 2014 and 2013, respectively. We have excluded non-tour upgrade sales in the calculation of VPG because non-tour upgrade sales are generated by adifferent marketing channel. We believe that VPG provides an enhanced understanding of the performance of our vacation ownership business because it directly measures theefficiency of the business’s tour selling efforts during a given reporting period.
42
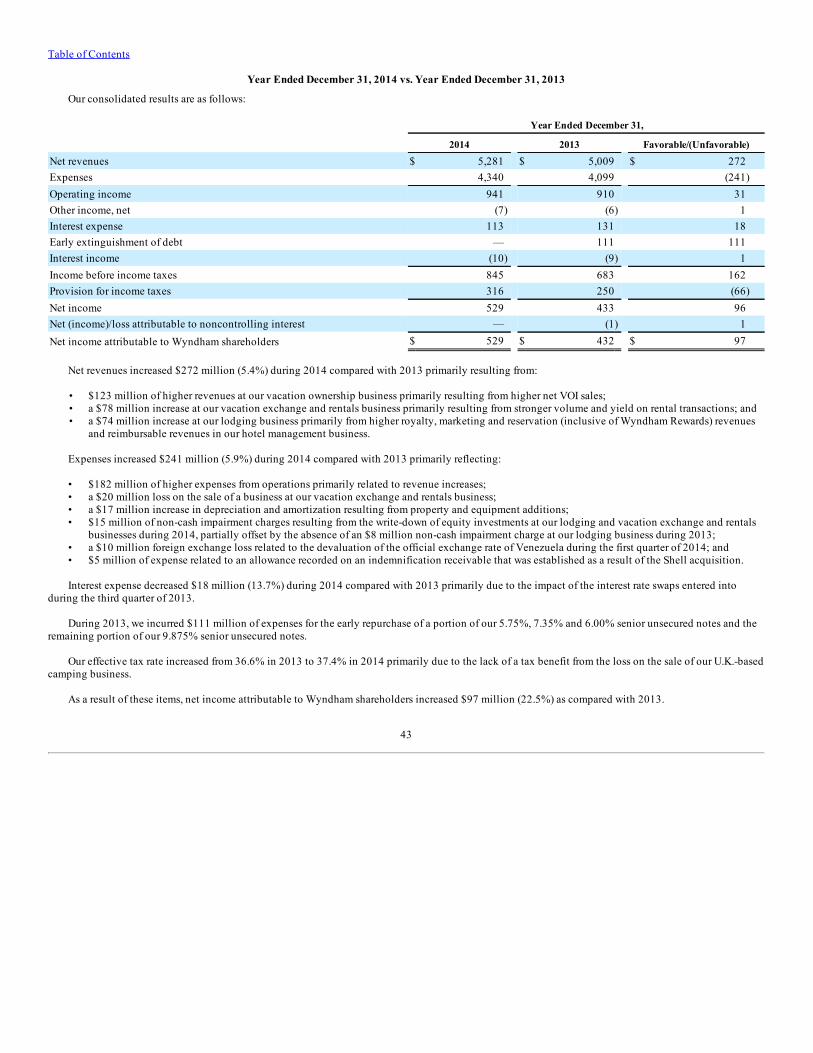
Table of Contents
Year Ended December 31, 2014 vs. Year Ended December 31, 2013
Our consolidated results are as follows:
Year Ended December 31,
2014 2013 Favorable/(Unfavorable)
Net revenues $ 5,281 $ 5,009 $ 272Expenses 4,340 4,099 (241)Operating income 941 910 31Other income, net (7) (6) 1Interest expense 113 131 18Early extinguishment of debt — 111 111Interest income (10) (9) 1Income before income taxes 845 683 162Provision for income taxes 316 250 (66)Net income 529 433 96Net (income)/loss attributable to noncontrolling interest — (1) 1Net income attributable to Wyndham shareholders $ 529 $ 432 $ 97
Net revenues increased $272 million (5.4%) during 2014 compared with 2013 primarily resulting from:
• $123 million of higher revenues at our vacation ownership business primarily resulting from higher net VOI sales;• a $78 million increase at our vacation exchange and rentals business primarily resulting from stronger volume and yield on rental transactions; and• a $74 million increase at our lodging business primarily from higher royalty, marketing and reservation (inclusive of Wyndham Rewards) revenues
and reimbursable revenues in our hotel management business.
Expenses increased $241 million (5.9%) during 2014 compared with 2013 primarily reflecting:
• $182 million of higher expenses from operations primarily related to revenue increases;• a $20 million loss on the sale of a business at our vacation exchange and rentals business;• a $17 million increase in depreciation and amortization resulting from property and equipment additions;• $15 million of non-cash impairment charges resulting from the write-down of equity investments at our lodging and vacation exchange and rentals
businesses during 2014, partially offset by the absence of an $8 million non-cash impairment charge at our lodging business during 2013;• a $10 million foreign exchange loss related to the devaluation of the official exchange rate of Venezuela during the first quarter of 2014; and• $5 million of expense related to an allowance recorded on an indemnification receivable that was established as a result of the Shell acquisition.
Interest expense decreased $18 million (13.7%) during 2014 compared with 2013 primarily due to the impact of the interest rate swaps entered intoduring the third quarter of 2013.
During 2013, we incurred $111 million of expenses for the early repurchase of a portion of our 5.75%, 7.35% and 6.00% senior unsecured notes and theremaining portion of our 9.875% senior unsecured notes.
Our effective tax rate increased from 36.6% in 2013 to 37.4% in 2014 primarily due to the lack of a tax benefit from the loss on the sale of our U.K.-basedcamping business.
As a result of these items, net income attributable to Wyndham shareholders increased $97 million (22.5%) as compared with 2013.
43
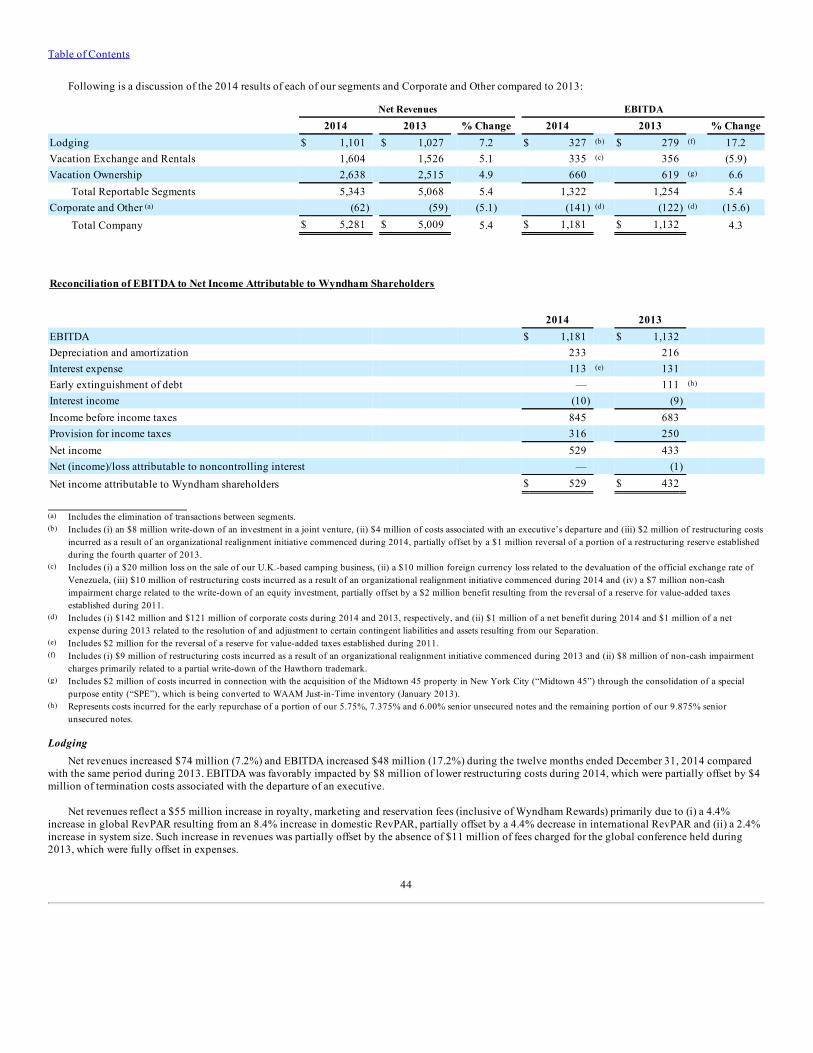
Table of Contents
Following is a discussion of the 2014 results of each of our segments and Corporate and Other compared to 2013:
Net Revenues EBITDA
2014 2013 % Change 2014 2013 % ChangeLodging $ 1,101 $ 1,027 7.2 $ 327 (b) $ 279 (f) 17.2Vacation Exchange and Rentals 1,604 1,526 5.1 335 (c) 356 (5.9)Vacation Ownership 2,638 2,515 4.9 660 619 (g) 6.6
Total Reportable Segments 5,343 5,068 5.4 1,322 1,254 5.4Corporate and Other (a) (62) (59) (5.1) (141) (d) (122) (d) (15.6)
Total Company $ 5,281 $ 5,009 5.4 $ 1,181 $ 1,132 4.3
Reconciliation of EBITDA to Net Income Attributable to Wyndham Shareholders
2014 2013 EBITDA $ 1,181 $ 1,132 Depreciation and amortization 233 216 Interest expense 113 (e) 131 Early extinguishment of debt — 111 (h) Interest income (10) (9) Income before income taxes 845 683 Provision for income taxes 316 250 Net income 529 433 Net (income)/loss attributable to noncontrolling interest — (1) Net income attributable to Wyndham shareholders $ 529 $ 432
(a) Includes the elimination of transactions between segments.(b) Includes (i) an $8 million write-down of an investment in a joint venture, (ii) $4 million of costs associated with an executive’s departure and (iii) $2 million of restructuring costs
incurred as a result of an organizational realignment initiative commenced during 2014, partially offset by a $1 million reversal of a portion of a restructuring reserve establishedduring the fourth quarter of 2013.
(c) Includes (i) a $20 million loss on the sale of our U.K.-based camping business, (ii) a $10 million foreign currency loss related to the devaluation of the official exchange rate ofVenezuela, (iii) $10 million of restructuring costs incurred as a result of an organizational realignment initiative commenced during 2014 and (iv) a $7 million non-cashimpairment charge related to the write-down of an equity investment, partially offset by a $2 million benefit resulting from the reversal of a reserve for value-added taxesestablished during 2011.
(d) Includes (i) $142 million and $121 million of corporate costs during 2014 and 2013, respectively, and (ii) $1 million of a net benefit during 2014 and $1 million of a netexpense during 2013 related to the resolution of and adjustment to certain contingent liabilities and assets resulting from our Separation.
(e) Includes $2 million for the reversal of a reserve for value-added taxes established during 2011.(f) Includes (i) $9 million of restructuring costs incurred as a result of an organizational realignment initiative commenced during 2013 and (ii) $8 million of non-cash impairment
charges primarily related to a partial write-down of the Hawthorn trademark.(g) Includes $2 million of costs incurred in connection with the acquisition of the Midtown 45 property in New York City (“Midtown 45”) through the consolidation of a special
purpose entity (“SPE”), which is being converted to WAAM Just-in-Time inventory (January 2013).(h) Represents costs incurred for the early repurchase of a portion of our 5.75%, 7.375% and 6.00% senior unsecured notes and the remaining portion of our 9.875% senior
unsecured notes.
LodgingNet revenues increased $74 million (7.2%) and EBITDA increased $48 million (17.2%) during the twelve months ended December 31, 2014 compared
with the same period during 2013. EBITDA was favorably impacted by $8 million of lower restructuring costs during 2014, which were partially offset by $4million of termination costs associated with the departure of an executive.
Net revenues reflect a $55 million increase in royalty, marketing and reservation fees (inclusive of Wyndham Rewards) primarily due to (i) a 4.4%increase in global RevPAR resulting from an 8.4% increase in domestic RevPAR, partially offset by a 4.4% decrease in international RevPAR and (ii) a 2.4%increase in system size. Such increase in revenues was partially offset by the absence of $11 million of fees charged for the global conference held during2013, which were fully offset in expenses.
44
Table of Contents
Other franchise fees and ancillary services increased revenues and EBITDA by $12 million and $15 million, respectively, resulting primarily from our co-branded credit card program.
The increase in net revenues also reflects $19 million of higher reimbursable revenues in our hotel management business which had no impact onEBITDA. Such increase was primarily the result of new management agreements executed during 2014.
Net revenues decreased $3 million and EBITDA was flat from our owned hotels compared to the same period last year due to the impact of renovations atthe Rio Mar Hotel.
EBITDA was unfavorably impacted primarily by $29 million of higher marketing, reservation and Wyndham Rewards expenses resulting from theimpact of the marketing and reservation revenue increases as we are obligated to spend such revenues on behalf of our franchisees.
As of December 31, 2014, we had approximately 7,650 properties and over 660,800 rooms in our system. Additionally, our hotel development pipelineincluded approximately 960 hotels and over 116,700 rooms, of which 57% were international and 64% were new construction as of December 31, 2014.
Vacation Exchange and RentalsNet revenues increased $78 million (5.1%) and EBITDA decreased $21 million (5.9%) during 2014 compared with 2013. Foreign currency translation
favorably impacted net revenues and EBITDA by $13 million and $5 million, respectively. EBITDA also reflects (i) a $20 million loss on the sale of our U.K.-based camping business, (ii) a $10 million foreign exchange loss related to the devaluation of the official exchange rate of Venezuela during the first quarterof 2014, (iii) $10 million of restructuring charges primarily targeted at improving the alignment of our organizational structure with our strategic objectives,and (iv) a $7 million non-cash impairment charge related to a write-down of an equity investment. Such unfavorability was partially offset by a $2 millionbenefit resulting from the reversal of a reserve for value-added taxes established during 2011.
Our acquisition of a vacation rental business contributed $9 million of incremental revenues (inclusive of $2 million of ancillary revenues) and $3million of incremental EBITDA during 2014.
Net revenues generated from rental transactions and related services increased $79 million. Excluding a favorable foreign currency translation impact of$20 million and $7 million of incremental vacation rental revenues from acquisitions, net revenues generated from rental transactions and related servicesincreased $52 million due to (i) a 3.9% increase in rental transaction volume primarily at our Denmark-based Novasol and Netherlands-based LandalGreenParks businesses and (ii) a 2.6% increase in average net price per vacation rental driven by strength in higher priced accommodations at LandalGreenParks and our U.K.-based James Villa Holidays business, partially offset by lower yield at Novasol. Our U.K.-based camping business, which was soldduring the fourth quarter, contributed rental transaction and related service revenue of $34 million and $31 million during 2014 and 2013, respectively.
Exchange and related service revenues, which principally consist of fees generated from memberships, exchange transactions, member-related rentals andother member servicing, decreased $2 million. Excluding an unfavorable foreign currency translation impact of $6 million, exchange and related servicerevenues increased $4 million primarily due to a 1.8% increase in the average number of members principally resulting from improved retention and growthin new members in North America and Latin America. Such impact was partially offset by a 1.3% reduction in exchange revenue per member primarilyresulting from the impact of macroeconomic factors related to Venezuela and Brazil and the impact of growth in club memberships in North America wherethere is a lower propensity to transact, partially offset by higher exchange yield in North America.
In addition, EBITDA was unfavorably impacted by $36 million of higher costs resulting from revenue increases in our vacation rentals businesses.
45
Table of Contents
Vacation Ownership
Net revenues and EBITDA increased $123 million (4.9%) and $41 million (6.6%), respectively, during the year ended 2014 compared with 2013.Foreign currency translation unfavorably impacted net revenues and EBITDA by $15 million and $4 million, respectively.
Net VOI revenue increased $106 million compared to the prior year. Excluding an unfavorable foreign currency translation impact of $10 million, netVOI revenue increased $116 million primarily due to an $89 million decrease in the provision for loan losses resulting from favorable default trends inconnection with a tightening of our credit standards. Gross VOI sales were flat compared to the prior period resulting from a 0.6% increase in tours offset by a1.1% decline in VPG. The increase in tour flow reflects our continued focus on marketing programs directed to new owner generation. The decrease in VPGresulted from an increase in the percentage of new owners tours which generally have lower VPG than tours to existing owners. In addition, revenues andEBITDA increased $9 million and $3 million, respectively, related to ancillary marketing activities.
Commission revenues generated by WAAM Fee-for-Service decreased $9 million compared to the prior year as a $28 million reduction in gross VOIsales under WAAM Fee-for-Service was partially offset by higher commission rates earned on such VOI sales. EBITDA increased $1 million primarily due tothe higher commission earned on such VOI sales.
Consumer financing revenues increased $1 million. Excluding an unfavorable foreign currency translation impact of $3 million, consumer financingrevenues increased $4 million. The increase was attributable to higher weighted average interest rates earned on contract receivables partially offset by alower average portfolio balance. EBITDA increased $8 million primarily reflecting lower interest expense as a result of a reduction in the weighted averageinterest rate on our securitized debt to 3.7% from 4.2%, partially offset by $54 million of increased average borrowings on our securitized debt facilities. As aresult, our net interest income margin increased to 83% compared to 82% during 2013.
Property management revenues increased $14 million. Excluding an unfavorable foreign currency translation impact of $2 million, propertymanagement revenues increased $16 million primarily from higher reimbursable revenues. EBITDA increased $6 million due to lower operating expenses.
In addition, EBITDA was unfavorably impacted by:
• $69 million of higher sales and marketing expenses primarily due to an increase in costs for tours targeting new owner generation;• a $16 million increase in the cost of VOI sales primarily due to the impact on estimated inventory recoveries resulting from a reduction in the
provision for loan losses; and• a $5 million expense related to a reserve recorded on an indemnification receivable established in 2012 as a result of the Shell acquisition.
Such decreases in EBITDA were partially offset by a $4 million reversal of a reserve established from an acquisition made in a previous year and $3million of lower acquisition costs.
Corporate and OtherCorporate expenses increased $19 million during 2014 compared to the prior year. Corporate expenses reflected a $1 million net benefit during 2014
and a $1 million net expense during 2013 related to the resolution of and adjustment to certain liabilities and assets resulting from our Separation. Excludingthe impact of these items, Corporate expenses increased $21 million primarily due to higher employee related costs, professional fees and informationtechnology expenses.
Corporate and Other revenues, which represents the elimination of intersegment revenues charged principally between our vacation ownership andlodging businesses, decreased $3 million during 2014 compared to 2013.
46
Table of Contents
OPERATING STATISTICS
The following table presents our operating statistics for the years ended December 31, 2013 and 2012. See Results of Operations section for a discussionas to how these operating statistics affected our business for the periods presented.
Year Ended December 31,
2013 2012 % ChangeLodging
Number of rooms (a) 645,400 627,400 2.9RevPAR (b) $ 36.00 $ 34.80 3.4
Vacation Exchange and Rentals Average number of members (in 000s) (c) 3,698 3,674 0.7Exchange revenue per member (d) $ 181.02 $ 179.68 0.7Vacation rental transactions (in 000s) (e) (f) 1,483 1,392 6.5Average net price per vacation rental (f) (g) $ 532.11 $ 504.55 5.5
Vacation Ownership (f) Gross VOI sales (in 000s) (h) (i) $ 1,889,000 $ 1,781,000 6.1Tours (in 000s) (j) 789 724 9.0VPG (k) $ 2,281 $ 2,324 (1.9)
(a) Represents the number of rooms at lodging properties at the end of the period which are under franchise and/or management agreements, or are company owned.(b) Represents revenue per available room and is calculated by multiplying the percentage of available rooms occupied during the period by the average rate charged for renting a
lodging room for one day.(c) Represents members in our vacation exchange programs who paid annual membership dues as of the end of the period or within the allowed grace period.(d) Represents total annualized revenues generated from fees associated with memberships, exchange transactions, member-related rentals and other servicing for the period divided
by the average number of vacation exchange members during the period.(e) Represents the number of transactions that are generated in connection with customers booking their vacation rental stays through us. One rental transaction is recorded for each
standard one-week rental.(f) Includes the impact from acquisitions from the acquisition dates forward, therefore, the operating statistics for 2013 are not presented on a comparable basis to the 2012 operating
statistics.(g) Represents the net rental price generated from renting vacation properties to customers and other related rental servicing fees divided by the number of vacation rental
transactions.(h) Represents total sales of VOIs, including sales under the WAAM Fee-for-Service, before loan loss provisions. We believe that Gross VOI sales provide an enhanced understanding
of the performance of our vacation ownership business because it directly measures the sales volume of this business during a given reporting period.(i) The following table provides a reconciliation of Gross VOI sales to Vacation ownership interest sales for the year ended December 31 (in millions):
2013 2012
Gross VOI sales (1) $ 1,889 $ 1,781
Less: WAAM Fee-for-Service sales (2) (160) (49)
Gross VOI sales, net of WAAM Fee-for-Service sales 1,729 1,732
Less: Loan loss provision (349) (409)
Less: Impact of POC accounting (1) —
Vacation ownership interest sales $ 1,379 $ 1,323
(1) For the years ended December 31, 2013 and 2012, included $14 million and $99 million, respectively, of Gross VOI sales under our WAAM Just-in-Timeinventory acquisition model which enables us to acquire and own completed timeshare units close to the timing of the sales of such units and to offer financing tothe purchaser. This significantly reduces the period between the deployment of capital to acquire inventory and the subsequent return on investment which occursat the time of its sale to a timeshare purchaser. We implemented this model during the second quarter of 2012.
(2) Represents total sales of VOIs through our WAAM Fee-for-Service sales model designed to offer turn-key solutions for developers or banks in possession of newlydeveloped inventory, which we will sell for a commission fee through our extensive sales and marketing channels. WAAM Fee-for-Service commission revenuesamounted to $107 million and $33 million during 2013 and 2012, respectively.
(j) Represents the number of tours taken by guests in our efforts to sell VOIs.(k) VPG is calculated by dividing Gross VOI sales (excluding tele-sales upgrades, which are non-tour upgrade sales) by the number of tours. Tele-sales upgrades were $89 million
and $97 million during 2013 and 2012, respectively. We have excluded non-tour upgrade sales in the calculation of VPG because non-tour upgrade sales are generated by adifferent marketing channel. We believe that VPG provides an enhanced understanding of the performance of our vacation ownership business because it directly measures theefficiency of the business’s tour selling efforts during a given reporting period.
47
Table of Contents
Year Ended December 31, 2013 vs. Year Ended December 31, 2012Our consolidated results comprised the following:
Year Ended December 31, 2013 2012 Favorable/(Unfavorable)Net revenues $ 5,009 $ 4,534 $ 475Expenses 4,099 3,682 (417)Operating income 910 852 58Other income, net (6) (8) (2)Interest expense 131 132 1Early extinguishment of debt 111 108 (3)Interest income (9) (8) 1Income before income taxes 683 628 55Provision for income taxes 250 229 (21)Net income 433 399 34Net (income)/loss attributable to noncontrolling interest (1) 1 (2)Net income attributable to Wyndham shareholders $ 432 $ 400 $ 32
Net revenues increased $475 million (10.5%) during 2013 compared with 2012 primarily resulting from:
• $196 million of incremental revenues from acquisitions across all our businesses;• $138 million of higher revenues at our vacation ownership business primarily resulting from higher WAAM Fee-for-Service commissions and
property management fees;• an $84 million increase at our lodging business primarily from higher reimbursable revenues in our hotel management business and higher royalty
and marketing and reservation (inclusive of Wyndham Rewards) revenues; and• $56 million of higher revenues at our vacation exchange and rentals business primarily from stronger revenue on rental transactions and new
product offerings.
Expenses increased $417 million (11.3%) during 2013 compared with the same period last year principally reflecting:
• $208 million of higher expenses from operations primarily related to the revenue increases (excluding acquisitions);• $170 million of incremental expenses from acquisitions; and• a $31 million increase in depreciation and amortization resulting from the impact of acquisitions and property and equipment additions made
during 2012.
Early extinguishment of debt increased $3 million due to $111 million of expenses incurred for the early repurchase of a portion of our 5.75%, 7.375%and 6.00% senior unsecured notes and the remaining portion of our 9.875% senior unsecured notes during 2013, partially offset by $108 million of expensesincurred for the early repurchase of a portion of our 9.875% and 6.00% senior unsecured notes during 2012.
As a result of these items, net income attributable to Wyndham shareholders increased $32 million (8.0%) as compared with 2012.
48
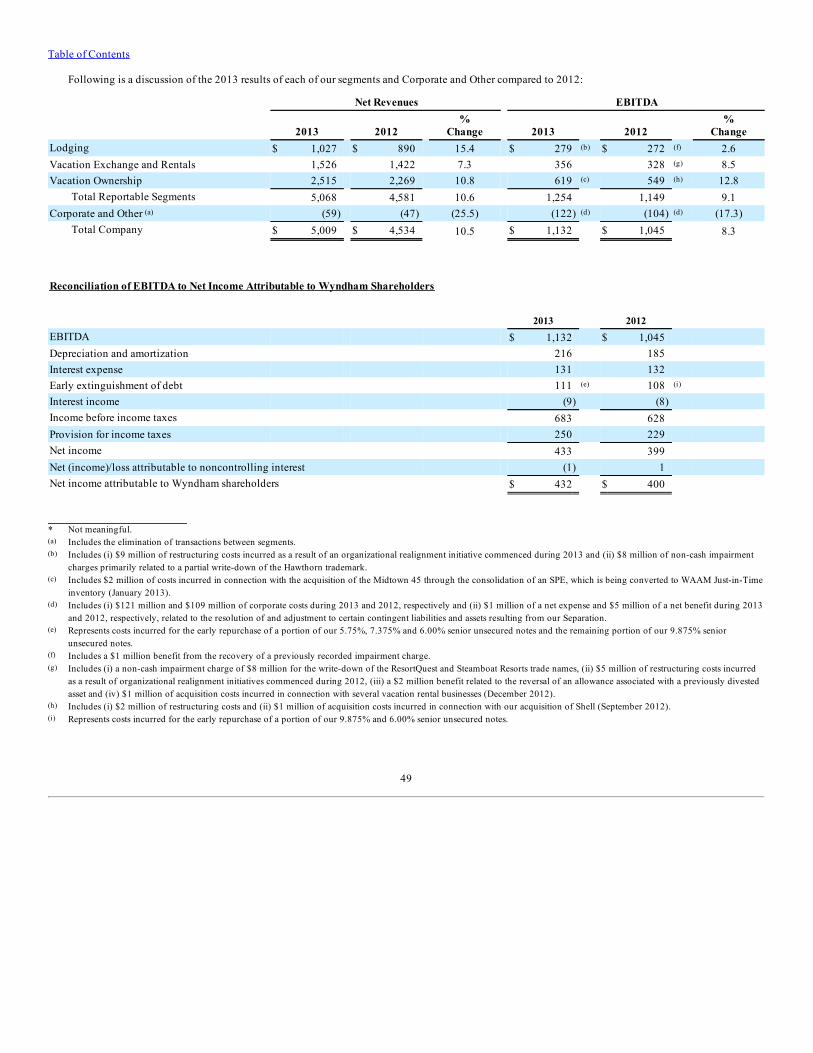
Table of Contents
Following is a discussion of the 2013 results of each of our segments and Corporate and Other compared to 2012:
Net Revenues EBITDA
2013 2012 %
Change 2013 2012 %
ChangeLodging $ 1,027 $ 890 15.4 $ 279 (b) $ 272 (f) 2.6Vacation Exchange and Rentals 1,526 1,422 7.3 356 328 (g) 8.5Vacation Ownership 2,515 2,269 10.8 619 (c) 549 (h) 12.8
Total Reportable Segments 5,068 4,581 10.6 1,254 1,149 9.1Corporate and Other (a) (59) (47) (25.5) (122) (d) (104) (d) (17.3)
Total Company $ 5,009 $ 4,534 10.5 $ 1,132 $ 1,045 8.3
Reconciliation of EBITDA to Net Income Attributable to Wyndham Shareholders
2013 2012 EBITDA $ 1,132 $ 1,045 Depreciation and amortization 216 185 Interest expense 131 132 Early extinguishment of debt 111 (e) 108 (i) Interest income (9) (8) Income before income taxes 683 628 Provision for income taxes 250 229 Net income 433 399 Net (income)/loss attributable to noncontrolling interest (1) 1 Net income attributable to Wyndham shareholders $ 432 $ 400
* Not meaningful.(a) Includes the elimination of transactions between segments.(b) Includes (i) $9 million of restructuring costs incurred as a result of an organizational realignment initiative commenced during 2013 and (ii) $8 million of non-cash impairment
charges primarily related to a partial write-down of the Hawthorn trademark.(c) Includes $2 million of costs incurred in connection with the acquisition of the Midtown 45 through the consolidation of an SPE, which is being converted to WAAM Just-in-Time
inventory (January 2013).(d) Includes (i) $121 million and $109 million of corporate costs during 2013 and 2012, respectively and (ii) $1 million of a net expense and $5 million of a net benefit during 2013
and 2012, respectively, related to the resolution of and adjustment to certain contingent liabilities and assets resulting from our Separation.(e) Represents costs incurred for the early repurchase of a portion of our 5.75%, 7.375% and 6.00% senior unsecured notes and the remaining portion of our 9.875% senior
unsecured notes.(f) Includes a $1 million benefit from the recovery of a previously recorded impairment charge.(g) Includes (i) a non-cash impairment charge of $8 million for the write-down of the ResortQuest and Steamboat Resorts trade names, (ii) $5 million of restructuring costs incurred
as a result of organizational realignment initiatives commenced during 2012, (iii) a $2 million benefit related to the reversal of an allowance associated with a previously divestedasset and (iv) $1 million of acquisition costs incurred in connection with several vacation rental businesses (December 2012).
(h) Includes (i) $2 million of restructuring costs and (ii) $1 million of acquisition costs incurred in connection with our acquisition of Shell (September 2012).(i) Represents costs incurred for the early repurchase of a portion of our 9.875% and 6.00% senior unsecured notes.
49
Table of Contents
Lodging
Net revenues increased $137 million (15.4%) and EBITDA increased $7 million (2.6%) during 2013 compared with 2012. EBITDA was unfavorablyimpacted by a $9 million restructuring charge and $8 million of non-cash impairment charges during the fourth quarter of 2013. EBITDA also reflects theabsence of a $1 million benefit from the recovery of a previously recorded impairment charge during 2012.
Net revenues reflected a $28 million increase in royalty and marketing and reservation fees (inclusive of Wyndham Rewards) primarily due to a 3.4%increase in RevPAR resulting from stronger occupancy and average daily rates, as well as a 2.9% increase in system size. In addition, net revenues andEBITDA were also favorably impacted by $4 million of higher intersegment licensing fees charged primarily to our vacation ownership business for the useof the Wyndham trade name. Ancillary revenues contributed an additional $17 million and $6 million of net revenues and EBITDA, respectively, principallyfrom growth in our co-branded credit card program and higher property management systems sales.
Net revenues and EBITDA increased $44 million and $6 million, respectively, from our owned hotels. Excluding $40 million and $3 million ofincremental revenues and EBITDA, respectively, related to our acquisition of the Rio Mar hotel during the fourth quarter of 2012, revenues and EBITDAincreased $4 million and $3 million, respectively, due to improved operating performance.
The increase in net revenues also reflects $44 million of higher reimbursable revenues (inclusive of $6 million of intersegment revenues) in our hotelmanagement business which had no impact on EBITDA. Such increase was primarily the result of new management agreements executed during the currentyear and the latter half of 2012.
EBITDA was also impacted by $22 million of higher marketing, reservation and Wyndham Rewards expenses primarily due to higher expensesassociated with the marketing revenue increases resulting from the growth of the business. We are committed to spend such marketing and reservationrevenues on behalf of our franchisees.
As of December 31, 2013, we had approximately 7,490 properties and 645,400 rooms in our system. Additionally, our hotel development pipelineincluded over 970 hotels and approximately 114,000 rooms, of which 58% were international and 68% were new construction as of December 31, 2013.
Vacation Exchange and Rentals
Net revenues and EBITDA increased $104 million (7.3%) and $28 million (8.5%), respectively, during 2013 compared with 2012. Foreign currencytranslation favorably impacted net revenues by $4 million and unfavorably impacted EBITDA by $2 million. EBITDA also reflects the absence of an $8million fourth quarter 2012 non-cash impairment charge resulting from Wyndham Vacation Rentals’ rebranding initiative and $5 million of fourth quarter2012 restructuring costs, partially offset by a $4 million settlement of a business disruption claim received during the second quarter of 2012 related to theGulf of Mexico oil spill in 2010.
Our acquisitions of vacation rentals businesses contributed $48 million of incremental net revenues (inclusive of $10 million of ancillary revenues) and$10 million of incremental EBITDA during 2013.
Net revenues generated from rental transactions and related services increased $87 million. Excluding the impact of $38 million of incremental vacationrental revenues from acquisitions and a favorable foreign currency translation impact of $10 million, net revenues generated from rental transactions andrelated services increased $39 million. This was primarily due to a 6.1% increase in average net price per vacation rental driven by the impact of yieldmanagement strategies especially in our James Villa Holidays and Landal GreenParks businesses.
Exchange and related service revenues, which principally consist of fees generated from memberships, exchange transactions, member-related rentals andother member servicing, increased $9 million. Excluding an unfavorable foreign currency translation impact of $6 million, exchange and related servicerevenues increased $15 million due to the impact of (i) a 1.6% increase in exchange revenue per member primarily resulting from an increase in revenuesderived from new products, growth in member rentals, as well as incremental revenues from new affiliate club servicing programs and (ii) a 0.7% increase inthe average number of members principally resulting from an increase in the member base in Latin America and North America due to the benefits of memberretention efforts and new affiliations.
50
Table of Contents
In addition to the items discussed above, EBITDA was unfavorably impacted by:
• $36 million of higher product and service-related costs resulting from the revenue increases in our vacation rentals businesses;• the absence of a $4 million favorable adjustment for value-added taxes recorded during the first quarter of 2012;• a $4 million foreign exchange loss related to the devaluation of the official exchange rate of Venezuela during the first quarter of 2013; and• the absence of a $2 million benefit recorded during the first quarter of 2012 related to the reversal of an allowance associated with a previously
divested asset.
Such decreases to EBITDA were partially offset by the favorable impact of $7 million from foreign exchange transactions and foreign exchangecontracts.
Vacation Ownership
Net revenues and EBITDA increased $246 million (10.8%) and $70 million (12.8%), respectively, during 2013 compared with 2012. The acquisition ofShell completed during the third quarter of 2012 contributed an incremental $108 million and $13 million of net revenues and EBITDA, respectively.
Gross VOI sales increased $108 million (6.1%) compared to the prior year principally due to a 9.0% increase in tour flow partially offset by a 1.9%decrease in VPG. The change in VPG was primarily attributable to the unfavorable impact of the expiration of an upgrade marketing program during thefourth quarter of 2012 and the mix impact of lower VPG from Shell sales. The increase in tour flow reflected our continued focus on marketing programsdirected towards new owner generation as well as the impact of the Shell acquisition.
Net VOI revenue increased $56 million compared to the same period last year resulting primarily from a $60 million decrease in our provision for loanlosses due to a lower provision rate resulting from favorable default trends from lower cease and desist activity.
Commission revenues and EBITDA generated by WAAM Fee-for-Service increased by $74 million and $18 million, respectively, compared to the prioryear, resulting from $111 million of higher VOI sales under WAAM Fee-for-Service.
Property management revenues and EBITDA increased $107 million and $12 million, respectively. The revenue and EBITDA increases were primarilythe result of $70 million and $13 million of incremental revenues and EBITDA, respectively, from the Shell acquisition. In addition, revenues were favorablyimpacted by higher reimbursable revenues resulting from increased operating expenses at our resorts which had no impact on EBITDA.
Consumer financing revenues and EBITDA increased $5 million and $18 million, respectively. Excluding $9 million of incremental revenues andEBITDA contributed from the Shell acquisition, revenues decreased $4 million and EBITDA increased $9 million. The revenue decrease was principally dueto a lower average portfolio balance of contract receivables partially offset by a higher weighted average interest rate earned on such receivables. Theincrease in EBITDA reflected lower interest expense as a result of a reduction in the weighted average interest rate on our securitized debt to 4.2% from 4.8%and lower average borrowings on our securitized debt facilities. As a result, our net interest income margin increased to 82% compared to 79% during 2012.
In addition to the items discussed above, EBITDA reflects an increase in expenses primarily resulting from (i) $29 million of higher sales and marketingexpenses due to increased tours for new owner generation and (ii) $14 million of increased general and administrative expenses primarily from higherinformation technology costs.
Such increases in expenses were partially offset by a $7 million reduction in the cost of VOI sales resulting from lower VOI product costs.
51
Table of Contents
Corporate and Other
Corporate and Other revenues decreased $12 million during 2013 compared with 2012 primarily due to the elimination of intersegment revenuescharged primarily between our vacation ownership and lodging businesses.
Corporate expenses (excluding intercompany expense eliminations) increased $18 million during 2013 compared with 2012. Corporate expensesreflected a $1 million net expense during 2013 and the absence of a $5 million net benefit during 2012 related to the resolution of and adjustment to certaincontingent liabilities and assets resulting from our Separation. Excluding the impact of these items, corporate expenses increased $12 million primarily dueto continued investments in information technology and information systems security enhancements, as well as higher employee related costs.
RESTRUCTURING PLANS
2014 Restructuring Plans
During 2014, we committed to restructuring initiatives at our vacation exchange and rentals and lodging businesses, primarily focused on improving thealignment of the organizational structure of each business with their strategic objectives. In connection with these initiatives, we recorded $6 million ofpersonnel-related costs, a $5 million non-cash charge to write-off information technology assets and $1 million of costs related to contract terminations. As ofDecember 31, 2014, we had a liability of $7 million, which is expected to be paid in cash primarily by the end of 2015. We anticipate annual net savingsfrom such initiatives to be $7 million.
2013 Restructuring Plan
During 2013, we committed to an organizational realignment initiative at our lodging business, primarily focused on optimizing its marketing structure.In connection with this initiative, we recorded $8 million of personnel-related costs and $1 million of costs related to contract terminations, of which $2million was paid in cash and $1 million was non-cash. During 2014, we reduced our liability with $5 million of cash payments and reversed $1 million ofpreviously recorded contract termination costs. We anticipate annual net savings from such initiatives to be insignificant as such cost reductions wereredeployed to support other marketing initiatives.
2012 Restructuring Plans
During 2012, we committed to an organizational realignment initiative at our vacation exchange and rentals business, primarily focused onconsolidating existing processes and optimizing its structure. Also during 2012, we implemented an organizational realignment initiative at our vacationownership business, targeting the elimination of business function redundancies resulting from the Shell acquisition. During 2012, we incurred costs of $7million and reduced our liability with cash payments of $1 million. During 2013, we (i) reduced our liability with $5 million of cash payments, (ii) recorded$2 million of additional facility-related expenses, (iii) increased our liability with $1 million of a non-cash adjustment associated with a facility closure and(iv) reversed $1 million of previously recorded personnel costs. During 2014, we reduced our liability with cash payments of $1 million. As of December 31,2014, we had a liability of $2 million, which is expected to be paid in cash by January 2017. From the commencement of the 2012 restructuring plansthrough December 31, 2014, we have incurred a total of $8 million of expenses in connection with such plans.
As of December 31, 2014, we had a remaining liability of $2 million related to our 2010 restructuring plan, all of which is facility-related.
52
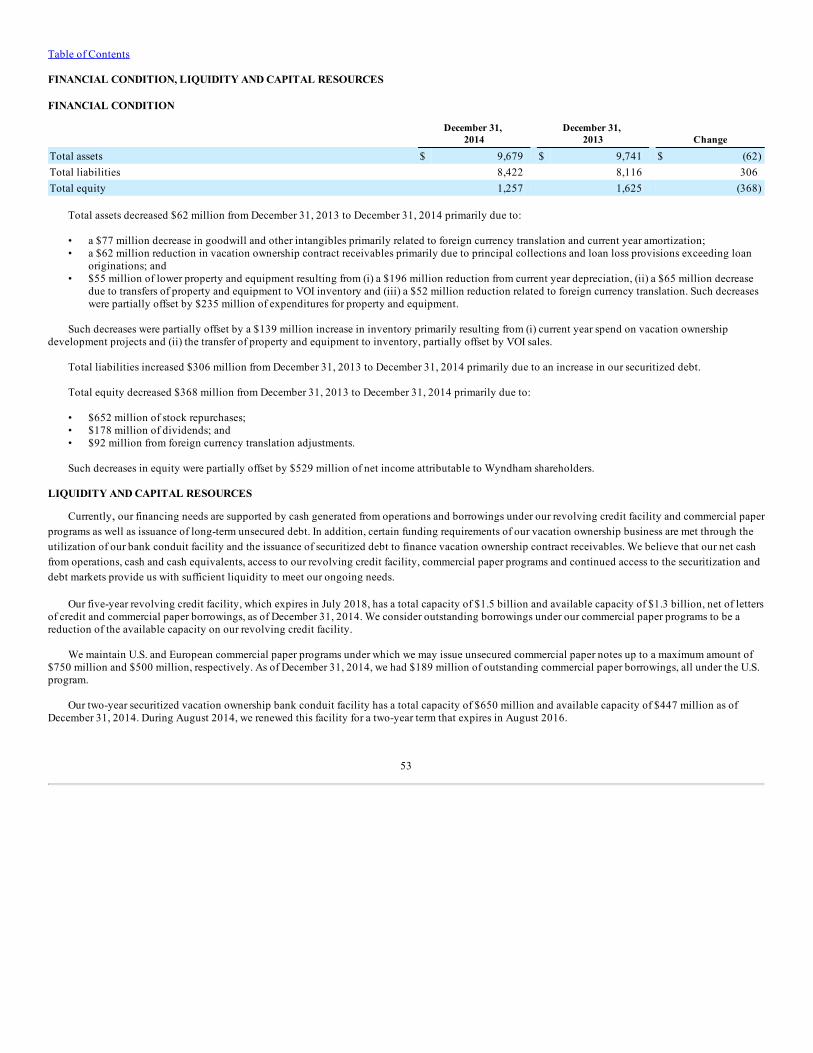
Table of Contents
FINANCIAL CONDITION, LIQUIDITY AND CAPITAL RESOURCES
FINANCIAL CONDITION
December 31,
2014 December 31,
2013 Change
Total assets $ 9,679 $ 9,741 $ (62)Total liabilities 8,422 8,116 306Total equity 1,257 1,625 (368)
Total assets decreased $62 million from December 31, 2013 to December 31, 2014 primarily due to:
• a $77 million decrease in goodwill and other intangibles primarily related to foreign currency translation and current year amortization;• a $62 million reduction in vacation ownership contract receivables primarily due to principal collections and loan loss provisions exceeding loan
originations; and• $55 million of lower property and equipment resulting from (i) a $196 million reduction from current year depreciation, (ii) a $65 million decrease
due to transfers of property and equipment to VOI inventory and (iii) a $52 million reduction related to foreign currency translation. Such decreaseswere partially offset by $235 million of expenditures for property and equipment.
Such decreases were partially offset by a $139 million increase in inventory primarily resulting from (i) current year spend on vacation ownershipdevelopment projects and (ii) the transfer of property and equipment to inventory, partially offset by VOI sales.
Total liabilities increased $306 million from December 31, 2013 to December 31, 2014 primarily due to an increase in our securitized debt.
Total equity decreased $368 million from December 31, 2013 to December 31, 2014 primarily due to:
• $652 million of stock repurchases;• $178 million of dividends; and• $92 million from foreign currency translation adjustments.
Such decreases in equity were partially offset by $529 million of net income attributable to Wyndham shareholders.
LIQUIDITY AND CAPITAL RESOURCES
Currently, our financing needs are supported by cash generated from operations and borrowings under our revolving credit facility and commercial paperprograms as well as issuance of long-term unsecured debt. In addition, certain funding requirements of our vacation ownership business are met through theutilization of our bank conduit facility and the issuance of securitized debt to finance vacation ownership contract receivables. We believe that our net cashfrom operations, cash and cash equivalents, access to our revolving credit facility, commercial paper programs and continued access to the securitization anddebt markets provide us with sufficient liquidity to meet our ongoing needs.
Our five-year revolving credit facility, which expires in July 2018, has a total capacity of $1.5 billion and available capacity of $1.3 billion, net of lettersof credit and commercial paper borrowings, as of December 31, 2014. We consider outstanding borrowings under our commercial paper programs to be areduction of the available capacity on our revolving credit facility.
We maintain U.S. and European commercial paper programs under which we may issue unsecured commercial paper notes up to a maximum amount of$750 million and $500 million, respectively. As of December 31, 2014, we had $189 million of outstanding commercial paper borrowings, all under the U.S.program.
Our two-year securitized vacation ownership bank conduit facility has a total capacity of $650 million and available capacity of $447 million as ofDecember 31, 2014. During August 2014, we renewed this facility for a two-year term that expires in August 2016.
53
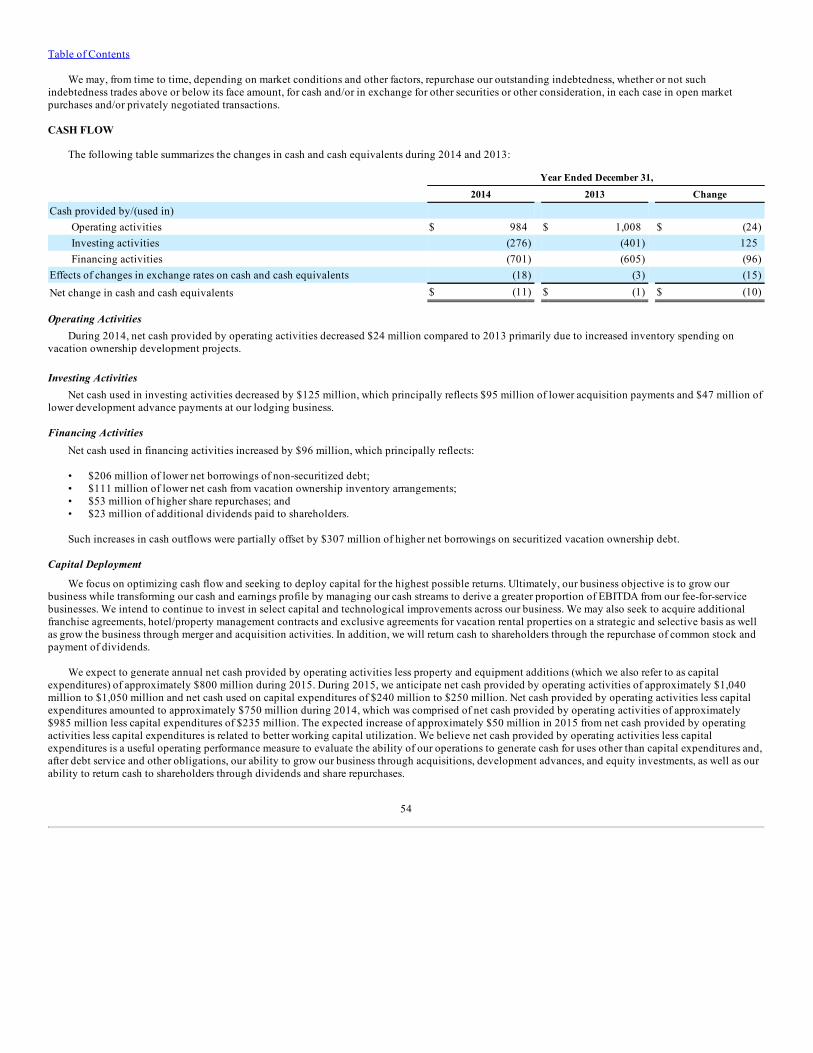
Table of Contents
We may, from time to time, depending on market conditions and other factors, repurchase our outstanding indebtedness, whether or not suchindebtedness trades above or below its face amount, for cash and/or in exchange for other securities or other consideration, in each case in open marketpurchases and/or privately negotiated transactions.
CASH FLOW
The following table summarizes the changes in cash and cash equivalents during 2014 and 2013:
Year Ended December 31,
2014 2013 Change
Cash provided by/(used in) Operating activities $ 984 $ 1,008 $ (24)Investing activities (276) (401) 125Financing activities (701) (605) (96)
Effects of changes in exchange rates on cash and cash equivalents (18) (3) (15)Net change in cash and cash equivalents $ (11) $ (1) $ (10)
Operating ActivitiesDuring 2014, net cash provided by operating activities decreased $24 million compared to 2013 primarily due to increased inventory spending on
vacation ownership development projects.
Investing ActivitiesNet cash used in investing activities decreased by $125 million, which principally reflects $95 million of lower acquisition payments and $47 million of
lower development advance payments at our lodging business.
Financing ActivitiesNet cash used in financing activities increased by $96 million, which principally reflects:
• $206 million of lower net borrowings of non-securitized debt;• $111 million of lower net cash from vacation ownership inventory arrangements;• $53 million of higher share repurchases; and• $23 million of additional dividends paid to shareholders.
Such increases in cash outflows were partially offset by $307 million of higher net borrowings on securitized vacation ownership debt.
Capital Deployment
We focus on optimizing cash flow and seeking to deploy capital for the highest possible returns. Ultimately, our business objective is to grow ourbusiness while transforming our cash and earnings profile by managing our cash streams to derive a greater proportion of EBITDA from our fee-for-servicebusinesses. We intend to continue to invest in select capital and technological improvements across our business. We may also seek to acquire additionalfranchise agreements, hotel/property management contracts and exclusive agreements for vacation rental properties on a strategic and selective basis as wellas grow the business through merger and acquisition activities. In addition, we will return cash to shareholders through the repurchase of common stock andpayment of dividends.
We expect to generate annual net cash provided by operating activities less property and equipment additions (which we also refer to as capitalexpenditures) of approximately $800 million during 2015. During 2015, we anticipate net cash provided by operating activities of approximately $1,040million to $1,050 million and net cash used on capital expenditures of $240 million to $250 million. Net cash provided by operating activities less capitalexpenditures amounted to approximately $750 million during 2014, which was comprised of net cash provided by operating activities of approximately$985 million less capital expenditures of $235 million. The expected increase of approximately $50 million in 2015 from net cash provided by operatingactivities less capital expenditures is related to better working capital utilization. We believe net cash provided by operating activities less capitalexpenditures is a useful operating performance measure to evaluate the ability of our operations to generate cash for uses other than capital expenditures and,after debt service and other obligations, our ability to grow our business through acquisitions, development advances, and equity investments, as well as ourability to return cash to shareholders through dividends and share repurchases.
54
Table of Contents
During 2014, we spent $196 million related to vacation ownership development projects (inventory). We believe that our vacation ownership businesscurrently has adequate finished inventory on our balance sheet to support vacation ownership sales for at least the next year. During 2015, we anticipatespending approximately $195 million to $205 million on vacation ownership development projects. The average inventory spend on vacation ownershipdevelopment projects for the 5 year period from 2014 through 2018 is expected to be approximately $215 million annually. After factoring in the anticipatedadditional average annual spending, we expect to have adequate inventory to support vacation ownership sales through at least the next 4 to 5 years.
We spent $235 million on capital expenditures during 2014, primarily on information technology enhancement projects throughout the Company andrenovations at our owned Rio Mar hotel and chalets at our Landal GreenParks business.
In addition, during 2014, we utilized $18 million of our net cash provided by operating activities less capital expenditures on development advancesprimarily at our lodging business related to acquiring new franchise and management agreements. In an effort to support growth in our lodging business, wewill continue to provide development advances which may include agreements with multi-unit owners. We will also continue to provide other forms offinancial support.
In connection with our focus on optimizing cash flow, we are expanding our approach to our asset-light efforts in vacation ownership by seekingopportunities with financial partners whereby they make strategic investments to develop assets on our behalf. We refer to this as WAAM Just-in-Time. Thepartner may invest in new ground-up development projects or purchase from us, for cash, existing in-process inventory which currently resides on our balancesheet. The partner will complete the development of the project and we may purchase the finished inventory at a future date as needed or as obligated underthe agreement.
We expect that the majority of the expenditures that will be required to pursue our capital spending programs, strategic investments and vacationownership development projects will be financed with cash flow generated through operations. Additional expenditures are financed with general unsecuredcorporate borrowings, including through the use of available capacity under our revolving credit facility and commercial paper programs.
Stock Repurchase Program
On August 20, 2007, our Board authorized a stock repurchase program that enables us to purchase our common stock. The Board has since increased thecapacity of the program six times, most recently on October 22, 2014 by $1.0 billion, bringing the total authorization under the program to $4.0 billion.
Under our current stock repurchase program, we repurchased 8.6 million shares at an average price of $75.79 for a cost of $652 million during the twelvemonths ended December 31, 2014. From August 20, 2007 through December 31, 2014, we repurchased 71.3 million shares at an average price of $42.94 for acost of $3.1 billion and repurchase capacity increased $78 million from proceeds received from stock option exercises.
As of December 31, 2014, we have repurchased under our current and prior stock repurchase programs, a total of 96.4 million shares at an average price of$40.17 for a cost of $3.9 billion since our Separation.
During the period January 1, 2015 through February 12, 2015, we repurchased an additional 0.9 million shares at an average price of $84.65 for a cost of$73 million. We currently have $943 million remaining availability in our program. The amount and timing of specific repurchases are subject to marketconditions, applicable legal requirements and other factors. Repurchases may be conducted in the open market or in privately negotiated transactions.
Foreign Earnings
As of December 31, 2014, we have determined that accumulated and undistributed net earnings of $760 million of certain foreign subsidiaries would beindefinitely reinvested in operations outside the United States. These earnings could become subject to additional taxes if remitted as dividends; theresulting U.S. income tax liabilities could be offset, in whole or in part, by credits allowable for taxes paid to foreign jurisdictions.
55
Table of Contents
LONG-TERM DEBT COVENANTS
The revolving credit facility is subject to covenants including the maintenance of specific financial ratios. The financial ratio covenants consist of aminimum consolidated interest coverage ratio of at least 2.5 to 1.0 as of the measurement date and a maximum consolidated leverage ratio not to exceed 4.0to 1.0 as of the measurement date (provided that the consolidated leverage ratio may be increased for a limited period to 5.0 to 1.0 in connection with amaterial acquisition). The consolidated interest coverage ratio is calculated by dividing consolidated EBITDA (as defined in the credit agreement) byconsolidated interest expense (as defined in the credit agreement), both as measured on a trailing 12 month basis preceding the measurement date. As ofDecember 31, 2014, our consolidated interest coverage ratio was 11.9 times. Consolidated interest expense excludes, among other things, interest expense onany securitization indebtedness (as defined in the credit agreement). The consolidated leverage ratio is calculated by dividing consolidated totalindebtedness (as defined in the credit agreement and which excludes, among other things, securitization indebtedness) as of the measurement date byconsolidated EBITDA as measured on a trailing 12 month basis preceding the measurement date. As of December 31, 2014, our consolidated leverage ratiowas 2.3 times. Covenants in this credit facility also include limitations on indebtedness of material subsidiaries; liens; mergers, consolidations, liquidationsand dissolutions; and the sale of all or substantially all of our assets. Events of default in this credit facility include failure to pay interest, principal and feeswhen due; breach of a covenant or warranty; acceleration of or failure to pay other debt in excess of $50 million (excluding securitization indebtedness);insolvency matters; and a change of control.
All of our senior unsecured notes contain various covenants including limitations on liens, limitations on potential sale and leaseback transactions andchange of control restrictions. In addition, there are limitations on mergers, consolidations and potential sale of all or substantially all of our assets. Events ofdefault in the notes include failure to pay interest and principal when due, breach of a covenant or warranty, acceleration of other debt in excess of $50million and insolvency matters.
As of December 31, 2014, we were in compliance with all of the financial covenants described above.
Each of our non-recourse, securitized term notes and the bank conduit facility contain various triggers relating to the performance of the applicable loanpools. If the vacation ownership contract receivables pool that collateralizes one of our securitization notes fails to perform within the parameters establishedby the contractual triggers (such as higher default or delinquency rates), there are provisions pursuant to which the cash flows for that pool will be maintainedin the securitization as extra collateral for the note holders or applied to accelerate the repayment of outstanding principal to the note holders. As ofDecember 31, 2014, all of our securitized loan pools were in compliance with applicable contractual triggers.
LIQUIDITY
Our vacation ownership business finances certain of its receivables through (i) an asset-backed bank conduit facility and (ii) periodically accessing thecapital markets by issuing asset-backed securities. None of the currently outstanding asset-backed securities contain any recourse provisions to us other thaninterest rate risk related to swap counterparties (solely to the extent that the amount outstanding on our notes differs from the forecasted amortizationschedule at the time of issuance).
We believe that our bank conduit facility, with a term through August 2016 and a total capacity of $650 million, combined with our ability to issue termasset-backed securities, should provide sufficient liquidity for our expected sales pace and we expect to have available liquidity to finance the sale of VOIs.
As of December 31, 2014, we had $447 million of availability under our asset-backed bank conduit facility. Any disruption to the asset-backed securitiesmarket could adversely impact our ability to obtain such financings.
We maintain commercial paper programs under which we may issue unsecured commercial paper notes up to a maximum amount of $1.25 billion. Weallocate a portion of our available capacity under our revolving credit facility to repay outstanding commercial paper borrowings in the event that thecommercial paper market is not available to us for any reason when outstanding borrowings mature. As of December 31, 2014, we had $189 million ofoutstanding borrowings and the total available capacity was $1.1 billion under these programs.
56
Table of Contents
We primarily utilize surety bonds at our vacation ownership business for sales and development transactions in order to meet regulatory requirements ofcertain states. In the ordinary course of our business, we have assembled commitments from 13 surety providers in the amount of $1.3 billion, of which $406million was outstanding as of December 31, 2014. The availability, terms and conditions and pricing of such bonding capacity are dependent on, amongother things, continued financial strength and stability of the insurance company affiliates providing the bonding capacity, general availability of suchcapacity and our corporate credit rating. If bonding capacity is unavailable, or alternatively, if the terms and conditions and pricing of such bonding capacityare unacceptable to us, our vacation ownership business could be negatively impacted.
Our liquidity position may also be negatively affected by unfavorable conditions in the capital markets in which we operate or if our vacation ownershipcontract receivables portfolios do not meet specified portfolio credit parameters. Our liquidity as it relates to our vacation ownership contract receivablessecuritization program could be adversely affected if we were to fail to renew or replace our conduit facility on its expiration date, or if a particularreceivables pool were to fail to meet certain ratios, which could occur in certain instances if the default rates or other credit metrics of the underlying vacationownership contract receivables deteriorate. Our ability to sell securities backed by our vacation ownership contract receivables depends on the continuedability and willingness of capital market participants to invest in such securities.
Our senior unsecured debt is rated Baa3 with a “stable outlook” by Moody’s Investors Service and BBB- with a “stable outlook” by both Standard andPoor’s and Fitch Rating Agency. A security rating is not a recommendation to buy, sell or hold securities and is subject to revision or withdrawal by theassigning rating organization. Reference in this report to any such credit rating is intended for the limited purpose of discussing or referring to aspects of ourliquidity and of our costs of funds. Any reference to a credit rating is not intended to be any guarantee or assurance of, nor should there be any undue relianceupon, any credit rating or change in credit rating, nor is any such reference intended as any inference concerning future performance, future liquidity or anyfuture credit rating.
SEASONALITY
We experience seasonal fluctuations in our net revenues and net income from our franchise and management fees, commission income earned fromrenting vacation properties, annual membership fees, exchange and member-related transaction fees and sales of VOIs. Revenues from franchise andmanagement fees are generally higher in the second and third quarters than in the first or fourth quarters due to increased leisure travel during the spring andsummer months. Revenues from vacation rentals are generally highest in the third quarter, when vacation arrivals are highest, combined with a compressedbooking window. Revenues from vacation exchange fees are generally highest in the first quarter, which is generally when members of our vacationexchange business plan and book their vacations for the year. Revenues from sales of VOIs are generally higher in the third quarter than in other quarters dueto increased leisure travel. The seasonality of our business may cause fluctuations in our quarterly operating results. As we expand into new markets andgeographical locations, we may experience increased or different seasonality dynamics that create fluctuations in operating results different from thefluctuations we have experienced in the past.
COMMITMENTS AND CONTINGENCIES
We are involved in claims, legal and regulatory proceedings and governmental inquiries related to our business. Litigation is inherently unpredictableand, although we believe that our accruals are adequate and/or that we have valid defenses in these matters, unfavorable results could occur. As such, anadverse outcome from such proceedings for which claims are awarded in excess of the amounts accrued, if any, could be material to us with respect toearnings or cash flows in any given reporting period. As of December 31, 2014, the potential exposure resulting from adverse outcomes of such legalproceedings could, in the aggregate, range up to approximately $22 million in excess of recorded accruals. However, we do not believe that the impact ofsuch litigation should result in a material liability to us in relation to our consolidated financial position or liquidity.
57
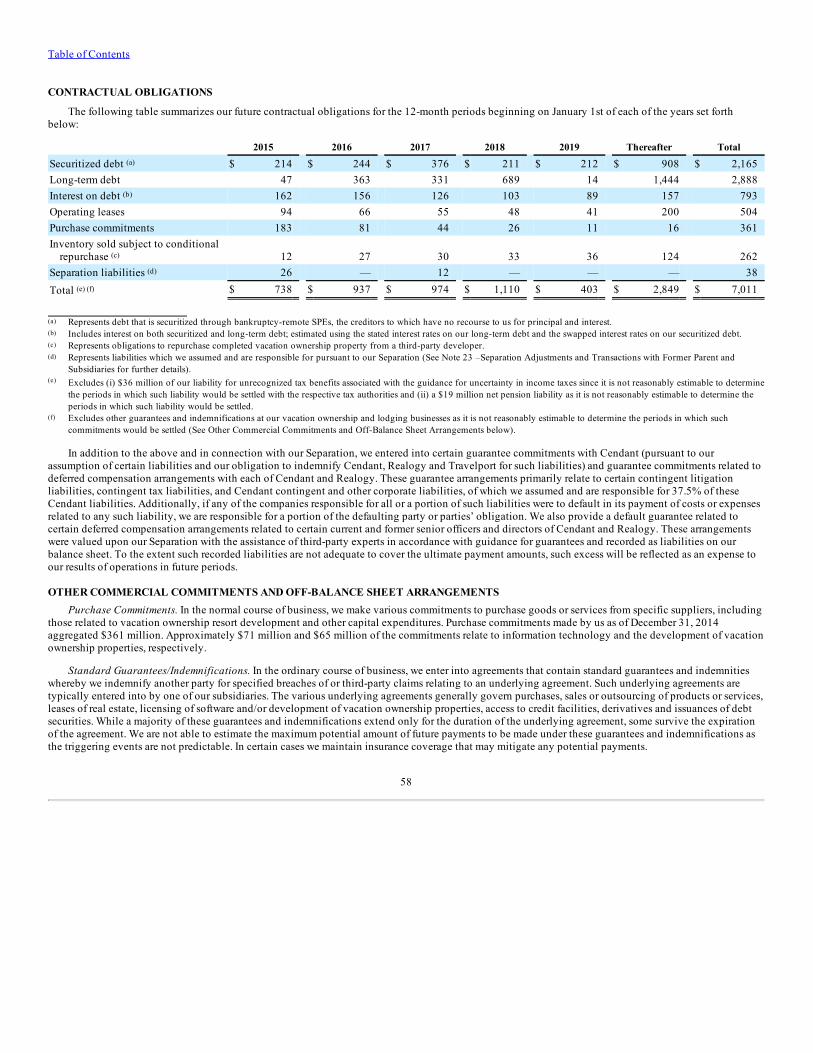
Table of Contents
CONTRACTUAL OBLIGATIONS
The following table summarizes our future contractual obligations for the 12-month periods beginning on January 1st of each of the years set forthbelow:
2015 2016 2017 2018 2019 Thereafter Total
Securitized debt (a) $ 214 $ 244 $ 376 $ 211 $ 212 $ 908 $ 2,165Long-term debt 47 363 331 689 14 1,444 2,888Interest on debt (b) 162 156 126 103 89 157 793Operating leases 94 66 55 48 41 200 504Purchase commitments 183 81 44 26 11 16 361Inventory sold subject to conditional
repurchase (c) 12 27 30 33 36 124 262Separation liabilities (d) 26 — 12 — — — 38Total (e) (f) $ 738 $ 937 $ 974 $ 1,110 $ 403 $ 2,849 $ 7,011
(a) Represents debt that is securitized through bankruptcy-remote SPEs, the creditors to which have no recourse to us for principal and interest.(b) Includes interest on both securitized and long-term debt; estimated using the stated interest rates on our long-term debt and the swapped interest rates on our securitized debt.(c) Represents obligations to repurchase completed vacation ownership property from a third-party developer.(d) Represents liabilities which we assumed and are responsible for pursuant to our Separation (See Note 23 –Separation Adjustments and Transactions with Former Parent and
Subsidiaries for further details).(e) Excludes (i) $36 million of our liability for unrecognized tax benefits associated with the guidance for uncertainty in income taxes since it is not reasonably estimable to determine
the periods in which such liability would be settled with the respective tax authorities and (ii) a $19 million net pension liability as it is not reasonably estimable to determine theperiods in which such liability would be settled.
(f) Excludes other guarantees and indemnifications at our vacation ownership and lodging businesses as it is not reasonably estimable to determine the periods in which suchcommitments would be settled (See Other Commercial Commitments and Off-Balance Sheet Arrangements below).
In addition to the above and in connection with our Separation, we entered into certain guarantee commitments with Cendant (pursuant to ourassumption of certain liabilities and our obligation to indemnify Cendant, Realogy and Travelport for such liabilities) and guarantee commitments related todeferred compensation arrangements with each of Cendant and Realogy. These guarantee arrangements primarily relate to certain contingent litigationliabilities, contingent tax liabilities, and Cendant contingent and other corporate liabilities, of which we assumed and are responsible for 37.5% of theseCendant liabilities. Additionally, if any of the companies responsible for all or a portion of such liabilities were to default in its payment of costs or expensesrelated to any such liability, we are responsible for a portion of the defaulting party or parties’ obligation. We also provide a default guarantee related tocertain deferred compensation arrangements related to certain current and former senior officers and directors of Cendant and Realogy. These arrangementswere valued upon our Separation with the assistance of third-party experts in accordance with guidance for guarantees and recorded as liabilities on ourbalance sheet. To the extent such recorded liabilities are not adequate to cover the ultimate payment amounts, such excess will be reflected as an expense toour results of operations in future periods.
OTHER COMMERCIAL COMMITMENTS AND OFF-BALANCE SHEET ARRANGEMENTSPurchase Commitments. In the normal course of business, we make various commitments to purchase goods or services from specific suppliers, including
those related to vacation ownership resort development and other capital expenditures. Purchase commitments made by us as of December 31, 2014aggregated $361 million. Approximately $71 million and $65 million of the commitments relate to information technology and the development of vacationownership properties, respectively.
Standard Guarantees/Indemnifications. In the ordinary course of business, we enter into agreements that contain standard guarantees and indemnitieswhereby we indemnify another party for specified breaches of or third-party claims relating to an underlying agreement. Such underlying agreements aretypically entered into by one of our subsidiaries. The various underlying agreements generally govern purchases, sales or outsourcing of products or services,leases of real estate, licensing of software and/or development of vacation ownership properties, access to credit facilities, derivatives and issuances of debtsecurities. While a majority of these guarantees and indemnifications extend only for the duration of the underlying agreement, some survive the expirationof the agreement. We are not able to estimate the maximum potential amount of future payments to be made under these guarantees and indemnifications asthe triggering events are not predictable. In certain cases we maintain insurance coverage that may mitigate any potential payments.
58
Table of Contents
Other Guarantees/Indemnifications. In the ordinary course of business, our vacation ownership business provides guarantees to certain owners’associations for funds required to operate and maintain vacation ownership properties in excess of assessments collected from owners of the VOIs. We may berequired to fund such excess as a result of unsold Company-owned VOIs or failure by owners to pay such assessments. In addition, from time to time, we willagree to reimburse certain owner associations up to 75% of their uncollected assessments. These guarantees extend for the duration of the underlying subsidyor similar agreement (which generally approximate one year and are renewable at our discretion on an annual basis). The maximum potential future paymentsthat we could be required to make under these guarantees was approximately $328 million as of December 31, 2014. We would only be required to pay thismaximum amount if none of the assessed owners paid their assessments. Any assessments collected from the owners of the VOIs would reduce the maximumpotential amount of future payments to be made by us. Additionally, should we be required to fund the deficit through the payment of any owners’assessments under these guarantees, we would be permitted access to the property for our own use and may use that property to engage in revenue-producingactivities, such as rentals. During 2014, 2013 and 2012, we made payments related to these guarantees of $17 million, $18 million and $18 million,respectively. As of December 31, 2014 and 2013, we maintained a liability in connection with these guarantees of $25 million and $30 million, respectively,on our Consolidated Balance Sheets.
We guarantee our vacation ownership subsidiary’s obligation to repurchase completed property in Las Vegas, Nevada from a third-party developersubject to the properties meeting our vacation ownership resort standards and provided that the third-party developer has not sold the property to anotherparty. The maximum potential future payments that we could be required to make under this commitment was $262 million as of December 31, 2014.
Our vacation ownership business entered into a management agreement that provides for a guarantee of a certain level of profitability based uponvarious metrics. As of December 31, 2014, the maximum potential amount of future payments that may be made under this guarantee was $10 million with anannual cap of $1 million.
As part of WAAM Fee-for-Service, we may guarantee to reimburse the developer a certain payment or to purchase from the developer, inventoryassociated with the developer’s resort property for a percentage of the original sale price if certain future conditions exist. The maximum potential futurepayments that we could be required to make under these guarantees was approximately $49 million as of December 31, 2014. As of both December 31, 2014and 2013, we had no recognized liabilities in connection with these guarantees.
From time to time, we may enter into a hotel management agreement that provides the hotel owner with a guarantee of a certain level of profitabilitybased upon various metrics. Under such an agreement, we would be required to compensate the hotel owner for any shortfall over the life of the managementagreement up to a specified aggregate amount. For certain agreements, we may be able to recapture a portion or all of the shortfall payments in the event thatfuture operating results exceed targets. As of December 31, 2014, the maximum potential amount of future payments to be made under these guarantees was$136 million with an annual cap of $39 million. We had an additional guarantee of $30 million with a $3 million cap for 2014 with no annual cap thereafter.As of December 31, 2014, we maintained a liability in connection with these guarantees of $32 million, on our Consolidated Balance Sheet (see Note 17 -Commitments and Contingencies).
Securitizations. We pool qualifying vacation ownership contract receivables and sell them to bankruptcy-remote entities all of which are consolidatedinto the accompanying Consolidated Balance Sheet as of December 31, 2014.
Letters of Credit. As of December 31, 2014, we had $69 million of irrevocable standby letters of credit outstanding, of which $2 million were under ourrevolving credit facility. As of December 31, 2013, we had $55 million of irrevocable standby letters of credit outstanding, of which $9 million were underour revolving credit facility. Such letters of credit issued during 2014 and 2013 primarily supported the securitization of vacation ownership contractreceivables fundings, certain insurance policies and development activity at our vacation ownership business.
Surety Bonds. As of December 31, 2014, we had assembled commitments from 13 surety providers in the amount of $1.3 billion, of which $406 millionwas outstanding (See Note 17- Commitments and Contingencies).
59
Table of Contents
CRITICAL ACCOUNTING POLICIESIn presenting our financial statements in conformity with generally accepted accounting principles, we are required to make estimates and assumptions
that affect the amounts reported therein. Several of the estimates and assumptions we are required to make relate to matters that are inherently uncertain asthey pertain to future events. However, events that are outside of our control cannot be predicted and, as such, they cannot be contemplated in evaluatingsuch estimates and assumptions. If there is a significant unfavorable change to current conditions, it could result in a material impact to our consolidatedresults of operations, financial position and liquidity. We believe that the estimates and assumptions we used when preparing our financial statements werethe most appropriate at that time. Presented below are those accounting policies that we believe require subjective and complex judgments that couldpotentially affect reported results. However, the majority of our businesses operate in environments where we are paid a fee for a service performed, andtherefore the results of the majority of our recurring operations are recorded in our financial statements using accounting policies that are not particularlysubjective, nor complex.
Vacation Ownership Revenue Recognition. Our sales of VOIs are either cash sales or seller-financed sales. In order for us to recognize revenues of VOIsales under the full accrual method of accounting as prescribed in the guidance for sales of real estate for fully constructed inventory, a binding sales contractmust have been executed, the statutory rescission period must have expired (after which time the purchasers are not entitled to a refund except for non-delivery by us), receivables must have been deemed collectible and the remainder of our obligations must have been substantially completed. In addition,before we recognize any revenues on VOI sales, the purchaser of the VOI must have met the initial investment criteria and, as applicable, the continuinginvestment criteria, by executing a legally binding financing contract. A purchaser has met the initial investment criteria when a minimum down payment of10% is received by us. In accordance with the requirements of the guidance for real estate time-sharing transactions, we must also take into consideration thefair value of certain incentives provided to the purchaser when assessing the adequacy of the purchaser’s initial investment. In those cases where financing isprovided to the purchaser by us, the purchaser is obligated to remit monthly payments under financing contracts that represent the purchaser’s continuinginvestment. The contractual terms of seller-provided financing arrangements require that the contractual level of annual principal payments be sufficient toamortize the loan over a customary period for the VOI being financed, which is generally ten years, and payments under the financing contracts begin within45 days of the sale and receipt of the minimum down payment of 10%.
If all of the criteria for a VOI sale to qualify under the full accrual method of accounting have been met, as discussed above, except that construction ofthe VOI purchased is not complete, we recognize revenues using the POC method of accounting provided that the preliminary construction phase is completeand that a minimum sales level has been met (to assure that the property will not revert to a rental property). The preliminary stage of development is deemedto be complete when the engineering and design work is complete, the construction contracts have been executed, the site has been cleared, prepared andexcavated, and the building foundation is complete. The completion percentage is determined by the proportion of real estate inventory costs incurred tototal estimated costs. These estimated costs are based upon historical experience and the related contractual terms. The remaining revenues and related costsof sales, including commissions and direct expenses, are deferred and recognized as the remaining costs are incurred. Until a contract for sale qualifies forrevenue recognition, all payments received are accounted for as restricted cash and deposits within other current assets and deferred income, respectively, onthe Consolidated Balance Sheets. Commissions and other direct costs related to the sale are deferred until the sale is recorded. If a contract is cancelled beforequalifying as a sale, non-recoverable expenses are charged to the current period as part of operating expenses on the Consolidated Statements of Income.Changes in costs could lead to adjustments to the POC status of a project, which may result in differences in the timing and amount of revenues recognizedfrom the construction of vacation ownership properties. This policy is discussed in greater detail in Note 2 to the Consolidated Financial Statements.
Allowance for Loan Losses. In our Vacation Ownership segment, we provide for estimated vacation ownership contract receivable defaults at the time ofVOI sales by recording a provision for loan losses as a reduction of VOI sales on the Consolidated Statements of Income. We assess the adequacy of theallowance for loan losses based on the historical performance of similar vacation ownership contract receivables. We use a technique referred to as static poolanalysis, which tracks defaults for each year’s sales over the entire life of those contract receivables. We consider current defaults, past due aging, historicalwrite-offs of contracts and consumer credit scores (FICO scores) in the assessment of borrower’s credit strength, down payment amount and expected loanperformance. We also consider whether the historical economic conditions are comparable to current economic conditions. If current conditions differ fromthe conditions in effect when the historical experience was generated, we adjust the allowance for loan losses to reflect the expected effects of the currentenvironment on the collectability of our vacation ownership contract receivables.
60
Table of Contents
Impairment of Long-Lived Assets. With regard to the goodwill and other indefinite-lived intangible assets recorded in connection with businesscombinations, we annually (during the fourth quarter of each year subsequent to completing our annual forecasting process), or more frequently ifcircumstances indicate that the value of goodwill may be impaired, review the reporting units’ carrying values as required by the guidance for goodwill andother intangible assets. For goodwill impairment testing, we have the option to first assess qualitative factors to determine whether the existence of events orcircumstances leads to a determination that it is more likely than not that the fair value of a reporting unit is less than its carrying amount. If, after assessingthe totality of events or circumstances, we determine it is not more likely than not that the fair value of a reporting unit is less than its carrying amount, thenperforming the two-step impairment test per the accounting guidance is unnecessary. The qualitative factors evaluated include macroeconomic conditions,industry and market considerations, cost factors, overall financial performance, our historical share price as well as other industry specific considerations.However, if we conclude otherwise, then we are required to perform the first step of the two-step impairment test by calculating the fair value of the reportingunit and comparing the fair value with the carrying amount of the reporting unit. To the extent estimated market-based valuation multiples and/or discountedcash flows are revised downward, we may be required to write-down all or a portion of goodwill, which would adversely impact earnings. Based on the resultsof our qualitative assessment performed during the fourth quarter of 2014, we determined that no impairment existed, nor do we believe there is a materialrisk of it being impaired in the near term at our lodging, vacation exchange and rentals and vacation ownership reporting units.
We also determine whether the carrying value of other indefinite-lived intangible assets is impaired on an annual basis or more frequently if indicators ofpotential impairment exist. Application of the other indefinite-lived intangible assets impairment test requires judgment in the assumptions underlying theapproach used to determine fair value. The fair value of each other indefinite-lived intangible asset is estimated using a discounted cash flow methodology.This analysis requires significant judgments, including anticipated market conditions, operating expense trends, estimation of future cash flows, which aredependent on internal forecasts, and estimation of long-term rate of growth. The estimates used to calculate the fair value of an other indefinite-livedintangible asset change from year to year based on operating results and market conditions. Changes in these estimates and assumptions could materiallyaffect the determination of fair value and the other indefinite-lived intangible assets impairment.
We also evaluate the recoverability of our other long-lived assets, including property and equipment and amortizable intangible assets, if circumstancesindicate impairment may have occurred, pursuant to guidance for impairment or disposal of long-lived assets. This analysis is performed by comparing therespective carrying values of the assets to the current and expected future cash flows, on an undiscounted basis, to be generated from such assets. Property andequipment is evaluated separately within each segment. If such analysis indicates that the carrying value of these assets is not recoverable, the carrying valueof such assets is reduced to fair value.
Business Combinations. A component of our growth strategy has been to acquire and integrate businesses that complement our existing operations. Weaccount for business combinations in accordance with the guidance for business combinations and related literature. Accordingly, we allocate the purchaseprice of acquired companies to the tangible and intangible assets acquired and liabilities assumed based upon their estimated fair values at the date ofpurchase. The difference between the purchase price and the fair value of the net assets acquired is recorded as goodwill.
In determining the fair values of assets acquired and liabilities assumed in a business combination, we use various recognized valuation methodsincluding present value modeling and referenced market values (where available). Further, we make assumptions within certain valuation techniquesincluding discount rates and timing of future cash flows. Valuations are performed by management or independent valuation specialists under management’ssupervision, where appropriate. We believe that the estimated fair values assigned to the assets acquired and liabilities assumed are based on reasonableassumptions that marketplace participants would use. However, such assumptions are inherently uncertain and actual results could differ from thoseestimates.
Accounting for Restructuring Activities. Restructuring actions require us to make significant estimates in several areas including (i) expenses forseverance and related benefit costs, (ii) the ability to generate sublease income, as well as our ability to terminate lease obligations and (iii) contractterminations. The amount that we have accrued as of December 31, 2014 represents our best estimate of the obligations that we incurred in connection withthese actions, but could be subject to change due to various factors including market conditions and the outcome of negotiations with third parties.
61
Table of Contents
Income Taxes. We recognize deferred tax assets and liabilities based on the differences between the financial statement carrying amounts and the taxbasis of assets and liabilities using currently enacted tax rates. We regularly review our deferred tax assets to assess their potential realization and establish avaluation allowance for portions of such assets that we believe will not be ultimately realized. In performing this review, we make estimates and assumptionsregarding projected future taxable income, the expected timing of the reversals of existing temporary differences and the implementation of tax planningstrategies. A change in these assumptions may increase or decrease our valuation allowance resulting in an increase or decrease in our effective tax rate,which could materially impact our results of operations.
For tax positions we have taken or expect to take in our tax return, we apply a more likely than not threshold, under which we must conclude a taxposition is more likely than not to be sustained, assuming that the position will be examined by the appropriate taxing authority that has full knowledge ofall relevant information, in order to recognize or continue to recognize the benefit. In determining our provision for income taxes, we use judgment,reflecting our estimates and assumptions, in applying the more likely than not threshold.
Adoption of Accounting PronouncementsDuring 2012, we adopted guidance related to the testing of goodwill for impairment, testing of indefinite-lived intangible assets for impairment and fair
value measurement. During 2013, we adopted guidance related to the reporting of amounts reclassified out of accumulated other comprehensive income.During 2014, we adopted guidance related to the reporting for the cumulative translation adjustment upon derecognition of a subsidiary or group of assetswithin a foreign entity. For detailed information regarding these standards and the impact thereof on our financial statements, see Note 2 to our ConsolidatedFinancial Statements.
62
Table of Contents
ITEM 7A. QUANTITATIVE AND QUALITATIVE DISCLOSURES ABOUT MARKET RISKWe use various financial instruments, particularly swap contracts and interest rate caps, to manage and reduce the interest rate risk related to our debt.
Foreign currency forwards and options are also used to manage and reduce the foreign currency exchange rate risk associated with our foreign currencydenominated receivables and payables, and forecasted royalties, forecasted earnings and cash flows of foreign subsidiaries and other transactions.
We are exclusively an end user of these instruments, which are commonly referred to as derivatives. We do not engage in trading, market making or otherspeculative activities in the derivatives markets. More detailed information about these financial instruments is provided in Note 16 to the ConsolidatedFinancial Statements. Our principal market exposures are interest and foreign currency rate risks.
• Our primary interest rate exposure as of December 31, 2014 was to interest rate fluctuations in the United States, specifically LIBOR and asset-backed commercial paper interest rates due to their impact on variable rate borrowings and other interest rate sensitive liabilities. In addition,interest rate movements in one country, as well as relative interest rate movements between countries can impact us. We anticipate that LIBOR andasset-backed commercial paper rates will remain a primary market risk exposure for the foreseeable future.
• We have foreign currency rate exposure to exchange rate fluctuations worldwide particularly with respect to the British pound, Euro, Canadian andAustralian dollar. We anticipate that such foreign currency exchange rate risk will remain a market risk exposure for the foreseeable future.
We assess our market risk based on changes in interest and foreign currency exchange rates utilizing a sensitivity analysis. The sensitivity analysismeasures the potential impact in earnings, fair values and cash flows based on a hypothetical 10% change (increase and decrease) in interest and foreigncurrency exchange rates. We have approximately $5.1 billion of debt outstanding as of December 31, 2014. Of that total, $928 million was variable rate debt($510 million has been synthetically converted to variable rate debt via an interest rate swap). A hypothetical 10% change in our effective weighted averageinterest rate would not generate a material change in interest expense.
The fair values of cash and cash equivalents, trade receivables, accounts payable and accrued expenses and other current liabilities approximate carryingvalues due to the short-term nature of these assets and liabilities. We use a discounted cash flow model in determining the fair values of vacation ownershipcontract receivables. The primary assumptions used in determining fair value are prepayment speeds, estimated loss rates and discount rates. We use aduration-based model in determining the impact of interest rate shifts on our debt and interest rate derivatives. The primary assumption used in these modelsis that a 10% increase or decrease in the benchmark interest rate produces a parallel shift in the yield curve across all maturities.
We use a current market pricing model to assess the changes in the value of our foreign currency derivatives used by us to hedge underlying exposurethat primarily consist of the non-functional current assets and liabilities of us and our subsidiaries. The primary assumption used in these models is ahypothetical 10% weakening or strengthening of the U.S. dollar against all our currency exposures as of December 31, 2014. The gains and losses on thehedging instruments are largely offset by the gains and losses on the underlying assets, liabilities or expected cash flows. As of December 31, 2014, theabsolute notional amount of our outstanding foreign exchange hedging instruments was $306 million. A hypothetical 10% change in the foreign currencyexchange rates would result in an immaterial change in the fair value of the hedging instrument as of December 31, 2014. Such a change would be largelyoffset by an opposite effect on the underlying assets, liabilities and expected cash flows.
Our total market risk is influenced by a wide variety of factors including the volatility present within the markets and the liquidity of the markets. Thereare certain limitations inherent in the sensitivity analyses presented. While probably the most meaningful analysis, these “shock tests” are constrained byseveral factors, including the necessity to conduct the analysis based on a single point in time and the inability to include the complex market reactions thatnormally would arise from the market shifts modeled.
We used December 31, 2014 market rates on outstanding financial instruments to perform the sensitivity analysis separately for each of our market riskexposures — interest and foreign currency rate instruments. The estimates are based on the market risk sensitive portfolios described in the precedingparagraphs and assume instantaneous, parallel shifts in interest rate yield curves and exchange rates.
63
Table of Contents
ITEM 8. FINANCIAL STATEMENTS AND SUPPLEMENTARY DATASee Financial Statements and Financial Statement Index commencing on page F-1 hereof.
ITEM 9. CHANGE IN AND DISAGREEMENTS WITH ACCOUNTANTS ON ACCOUNTING AND FINANCIAL DISCLOSURENone.
ITEM 9A. CONTROLS AND PROCEDURES
Disclosure Controls and Procedures. Our management, with the participation of our principal executive and principal financial officers have evaluatedthe effectiveness of our disclosure controls and procedures (as such term is defined in Rule 13a-15(e) under the Securities Exchange Act of 1934, as amended(the “Exchange Act”)) as of the end of the period covered by this report. Based on such evaluation, our principal executive and principal financial officershave concluded that, as of the end of such period, our disclosure controls and procedures were effective and operating to provide reasonable assurance thatinformation required to be disclosed by us in the reports that we file or submit under the Exchange Act is recorded, processed, summarized and reportedwithin the time periods specified in the rules and forms of the SEC, and to provide reasonable assurance that such information is accumulated andcommunicated to our management, including our principal executive and principal financial officers, as appropriate, to allow timely decisions regardingrequired disclosure.
Management’s Report on Internal Control over Financial Reporting. Our management is responsible for establishing and maintaining adequate internalcontrol over financial reporting, as defined in Rule 13a-15(f) under the Exchange Act. Our management assessed the effectiveness of our internal control overfinancial reporting as of December 31, 2014. In making this assessment, management used the criteria established in Internal Control - Integrated Framework(2013) issued by the Committee of Sponsoring Organizations (COSO) of the Treadway Commission. Based on this assessment, our management believes that,as of December 31, 2014, our internal control over financial reporting is effective. Our independent registered public accounting firm has issued anattestation report on the effectiveness of our internal control over financial reporting, which is included within their audit opinion on page [F-2].
There have been no changes in our internal control over financial reporting (as such term is defined in Rule 13a-15(f) under the Exchange Act) duringthe period to which this report relates that have materially affected or are reasonably likely to materially affect our internal control over financial reporting.
ITEM 9B. OTHER INFORMATIONNone
64
Table of Contents
PART III
ITEM 10. DIRECTORS, EXECUTIVE OFFICERS AND CORPORATE GOVERNANCEExcept as otherwise disclosed, the information required by this item is included in the Proxy Statement for our 2015 Annual Meeting of Shareholders
and is incorporated by reference in this report.
Identification of Executive Officers.The following provides information for each of our executive officers.
Stephen P. Holmes, 58, has served as our Chairman, Chief Executive Officer and a Director since July 2006. Mr. Holmes was Vice Chairman and directorof Cendant Corporation and Chairman and Chief Executive Officer of Cendant’s Travel Content Division from December 1997 to July 2006. Mr. Holmes wasVice Chairman of HFS Incorporated from September 1996 to December 1997, a director of HFS from June 1994 to December 1997 and Executive VicePresident, Treasurer and Chief Financial Officer of HFS from July 1990 to September 1996.
Thomas G. Conforti, 56, has served as our Executive Vice President and Chief Financial Officer since September 2009. From December 2002 toSeptember 2008, Mr. Conforti was Chief Financial Officer of DineEquity, Inc. Earlier in his career, Mr. Conforti held a number of general management,financial and strategic roles over a ten-year period in the Consumer Products Division of the Walt Disney Company. Mr. Conforti also held numerous financeand strategy roles within the College Textbook Publishing Division of CBS and the Soft Drink Division of PepsiCo.
Geoffrey A. Ballotti, 53, has served as President and Chief Executive Officer of Wyndham Hotel Group since March 2014. Mr. Ballotti served as ChiefExecutive Officer, Wyndham Exchange & Rentals, from March 2008 to March 2014. From October 2003 to March 2008, Mr. Ballotti was President, NorthAmerica Division of Starwood Hotels and Resorts Worldwide. From 1989 to 2003, Mr. Ballotti held leadership positions of increasing responsibility atStarwood Hotels and Resorts Worldwide including President of Starwood North America, Executive Vice President, Operations, Senior Vice President,Southern Europe and Managing Director, Ciga Spa, Italy. Prior to Starwood Hotels and Resorts Worldwide, Mr. Ballotti was a Banking Officer in theCommercial Real Estate Group at the Bank of New England.
Gail Mandel, 46, has served as President and Chief Executive Officer of Wyndham Exchange & Rentals since November 2014. Ms. Mandel was ChiefOperating Officer and Chief Financial Officer, Wyndham Exchange & Rentals, from March 2014 to November 2014 and Chief Financial Officer, WyndhamExchange & Rentals, from January 2010 to March 2014. From August 2006 to January 2010, Ms. Mandel was Senior Vice President, Financial Planning &Analysis, for Wyndham Worldwide. From February 1999 to August 2006, Ms. Mandel was Division Controller, Cendant Hospitality Services. From October1997 to February 1999, Ms. Mandel was Controller, Cendant Mobility. From September 1993 to October 1997, Ms. Mandel served in finance positions forHFS including Director, Business Development, Director, Corporate Audit and Manager, Internal Audit.
Franz S. Hanning, 61, has served as President and Chief Executive Officer, Wyndham Vacation Ownership, since July 2006. Mr. Hanning was the ChiefExecutive Officer of Cendant’s Timeshare Resort Group from March 2005 to July 2006. Mr. Hanning served as President and Chief Executive Officer ofWyndham Vacation Resorts, Inc. from April 2001 to March 2005 and as President and Chief Executive Officer of Wyndham Resort Development Corporationfrom August 2004 to March 2005. Mr. Hanning held several key leadership positions with Fairfield Resorts, Inc. from 1982 to 2001, including Regional VicePresident, Executive Vice President of Sales and Chief Operating Officer.
Thomas F. Anderson, 50, has served as our Executive Vice President and Chief Real Estate Development Officer since July 2006. From April 2003 toJuly 2006, Mr. Anderson was Executive Vice President, Strategic Acquisitions and Development of Cendant’s Timeshare Resort Group. From January 2000to February 2003, Mr. Anderson was Senior Vice President, Corporate Real Estate for Cendant. From November 1998 to December 1999, Mr. Anderson wasVice President of Real Estate Services, Coldwell Banker Commercial. From March 1995 to October 1998, Mr. Anderson was General Manager of AmericanAsset Corporation and from June 1990 to February 1995, Vice President of Commercial Lending for BB&T Corporation.
Mary R. Falvey, 54, has served as our Executive Vice President and Chief Human Resources Officer since July 2006. Ms. Falvey was Executive VicePresident, Global Human Resources for Cendant’s Vacation Network Group from April 2005 to July 2006. From March 2000 to April 2005, Ms. Falveyserved as Executive Vice President, Human Resources for RCI. From January 1998 to March 2000, Ms. Falvey was Vice President of Human Resources forCendant’s Hotel Division and Corporate Contact Center group. Prior to joining Cendant, Ms. Falvey held various leadership positions in the humanresources division of Nabisco Foods Company.
65
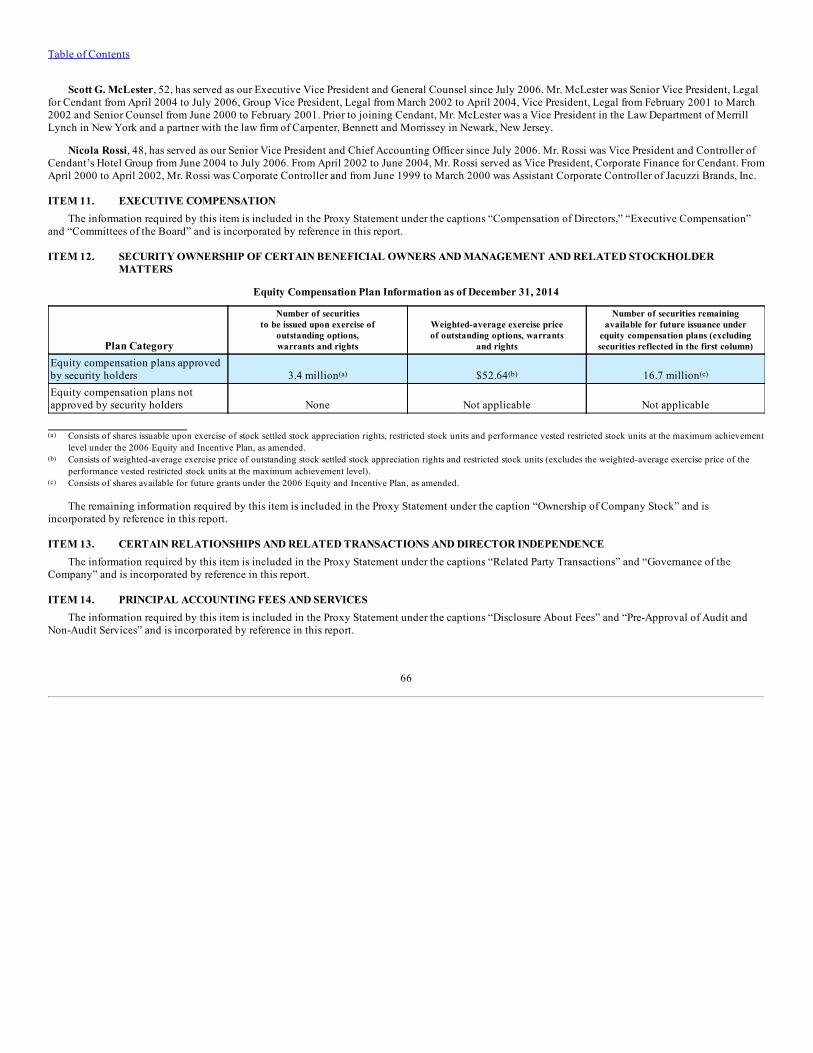
Table of Contents
Scott G. McLester, 52, has served as our Executive Vice President and General Counsel since July 2006. Mr. McLester was Senior Vice President, Legalfor Cendant from April 2004 to July 2006, Group Vice President, Legal from March 2002 to April 2004, Vice President, Legal from February 2001 to March2002 and Senior Counsel from June 2000 to February 2001. Prior to joining Cendant, Mr. McLester was a Vice President in the Law Department of MerrillLynch in New York and a partner with the law firm of Carpenter, Bennett and Morrissey in Newark, New Jersey.
Nicola Rossi, 48, has served as our Senior Vice President and Chief Accounting Officer since July 2006. Mr. Rossi was Vice President and Controller ofCendant’s Hotel Group from June 2004 to July 2006. From April 2002 to June 2004, Mr. Rossi served as Vice President, Corporate Finance for Cendant. FromApril 2000 to April 2002, Mr. Rossi was Corporate Controller and from June 1999 to March 2000 was Assistant Corporate Controller of Jacuzzi Brands, Inc.
ITEM 11. EXECUTIVE COMPENSATIONThe information required by this item is included in the Proxy Statement under the captions “Compensation of Directors,” “Executive Compensation”
and “Committees of the Board” and is incorporated by reference in this report.
ITEM 12. SECURITY OWNERSHIP OF CERTAIN BENEFICIAL OWNERS AND MANAGEMENT AND RELATED STOCKHOLDERMATTERS
Equity Compensation Plan Information as of December 31, 2014
Plan Category
Number of securitiesto be issued upon exercise of
outstanding options,warrants and rights
Weighted-average exercise priceof outstanding options, warrants
and rights
Number of securities remainingavailable for future issuance under
equity compensation plans (excludingsecurities reflected in the first column)
Equity compensation plans approvedby security holders 3.4 million(a) $52.64(b) 16.7 million(c)
Equity compensation plans notapproved by security holders None Not applicable Not applicable
(a) Consists of shares issuable upon exercise of stock settled stock appreciation rights, restricted stock units and performance vested restricted stock units at the maximum achievementlevel under the 2006 Equity and Incentive Plan, as amended.
(b) Consists of weighted-average exercise price of outstanding stock settled stock appreciation rights and restricted stock units (excludes the weighted-average exercise price of theperformance vested restricted stock units at the maximum achievement level).
(c) Consists of shares available for future grants under the 2006 Equity and Incentive Plan, as amended.
The remaining information required by this item is included in the Proxy Statement under the caption “Ownership of Company Stock” and isincorporated by reference in this report.
ITEM 13. CERTAIN RELATIONSHIPS AND RELATED TRANSACTIONS AND DIRECTOR INDEPENDENCEThe information required by this item is included in the Proxy Statement under the captions “Related Party Transactions” and “Governance of the
Company” and is incorporated by reference in this report.
ITEM 14. PRINCIPAL ACCOUNTING FEES AND SERVICESThe information required by this item is included in the Proxy Statement under the captions “Disclosure About Fees” and “Pre-Approval of Audit and
Non-Audit Services” and is incorporated by reference in this report.
66
Table of Contents
PART IV
ITEM 15. EXHIBITS AND FINANCIAL STATEMENT SCHEDULES
ITEM 15 (a)(1) FINANCIAL STATEMENTSSee Financial Statements and Financial Statements Index commencing on page F-1 hereof.
ITEM 15 (a)(3) EXHIBITSSee Exhibit Index commencing on page G-1 hereof.
The agreements included or incorporated by reference as exhibits to this report contain representations and warranties by each of the parties to theapplicable agreement. These representations and warranties were made solely for the benefit of the other parties to the applicable agreement and (i) were notintended to be treated as categorical statements of fact, but rather as a way of allocating the risk to one of the parties if those statements prove to beinaccurate, (ii) may have been qualified in such agreement by disclosures that were made to the other party in connection with the negotiation of theapplicable agreement, (iii) may apply contract standards of “materiality” that are different from “materiality” under the applicable securities laws and(iv) were made only as of the date of the applicable agreement or such other date or dates as may be specified in the agreement. We acknowledge that,notwithstanding the inclusion of the foregoing cautionary statements, we are responsible for considering whether additional specific disclosures of materialinformation regarding material contractual provisions are required to make the statements in this report not misleading.
67
Table of Contents
SIGNATURES
Pursuant to the requirements of Section 13 or 15(d) of the Securities Exchange Act of 1934, the registrant has duly caused this report to be signed on itsbehalf by the undersigned, thereunto duly authorized.
WYNDHAM WORLDWIDE CORPORATION
By: /s/ STEPHEN P. HOLMES
Stephen P. Holmes Chairman and Chief Executive Officer Date: February 13, 2015
Pursuant to the requirements of the Securities Exchange Act of 1934, this report has been signed below by the following persons on behalf of theRegistrant and in the capacities and on the dates indicated.
Name Title Date
Chairman and Chief Executive February 13, 2015/s/ STEPHEN P. HOLMES Officer
Stephen P. Holmes (Principal Executive Officer)
/s/ THOMAS G. CONFORTI Chief Financial Officer February 13, 2015Thomas G. Conforti (Principal Financial Officer)
/s/ NICOLA ROSSI Chief Accounting Officer February 13, 2015Nicola Rossi (Principal Accounting Officer)
/s/ MYRA J. BIBLOWIT Director February 13, 2015Myra J. Biblowit
/s/ JAMES E. BUCKMAN Director February 13, 2015James E. Buckman
/s/ GEORGE HERRERA Director February 13, 2015George Herrera
/s/ THE RIGHT HONOURABLE BRIAN MULRONEY Director February 13, 2015The Right Honourable Brian Mulroney
/s/ PAULINE D.E. RICHARDS Director February 13, 2015Pauline D.E. Richards
/s/ MICHAEL H. WARGOTZ Director February 13, 2015Michael H. Wargotz
68
INDEX TO ANNUAL CONSOLIDATED FINANCIAL STATEMENTS
PageReport of Independent Registered Public Accounting Firm F-2Consolidated Statements of Income for the years ended December 31, 2014, 2013 and 2012 F-3Consolidated Statements of Comprehensive Income for the years ended December 31, 2014, 2013 and 2012 F-4Consolidated Balance Sheets as of December 31, 2014 and 2013 F-5Consolidated Statements of Cash Flows for the years ended December 31, 2014, 2013 and 2012 F-6Consolidated Statements of Equity for the years ended December 31, 2014, 2013 and 2012 F-7Notes to Consolidated Financial Statements F-8
F-1
Table of Contents
REPORT OF INDEPENDENT REGISTERED PUBLIC ACCOUNTING FIRM
To the Board of Directors and Stockholders ofWyndham Worldwide CorporationParsippany, New Jersey
We have audited the accompanying consolidated balance sheets of Wyndham Worldwide Corporation and subsidiaries (the "Company") as of December 31,2014 and 2013, and the related consolidated statements of income, comprehensive income, cash flows, and equity for each of the three years in the periodended December 31, 2014. We also have audited the Company's internal control over financial reporting as of December 31, 2014, based on criteriaestablished in Internal Control - Integrated Framework (2013) issued by the Committee of Sponsoring Organizations of the Treadway Commission. TheCompany's management is responsible for these financial statements, for maintaining effective internal control over financial reporting, and for its assessmentof the effectiveness of internal control over financial reporting, included in the accompanying Management’s Report on Internal Control over FinancialReporting. Our responsibility is to express an opinion on these financial statements and an opinion on the Company's internal control over financialreporting based on our audits.
We conducted our audits in accordance with the standards of the Public Company Accounting Oversight Board (United States). Those standards require thatwe plan and perform the audit to obtain reasonable assurance about whether the financial statements are free of material misstatement and whether effectiveinternal control over financial reporting was maintained in all material respects. Our audits of the financial statements included examining, on a test basis,evidence supporting the amounts and disclosures in the financial statements, assessing the accounting principles used and significant estimates made bymanagement, and evaluating the overall financial statement presentation. Our audit of internal control over financial reporting included obtaining anunderstanding of internal control over financial reporting, assessing the risk that a material weakness exists, and testing and evaluating the design andoperating effectiveness of internal control based on the assessed risk. Our audits also included performing such other procedures as we considered necessaryin the circumstances. We believe that our audits provide a reasonable basis for our opinions.
A company's internal control over financial reporting is a process designed by, or under the supervision of, the company's principal executive and principalfinancial officers, or persons performing similar functions, and effected by the company's board of directors, management, and other personnel to providereasonable assurance regarding the reliability of financial reporting and the preparation of financial statements for external purposes in accordance withgenerally accepted accounting principles. A company's internal control over financial reporting includes those policies and procedures that (1) pertain to themaintenance of records that, in reasonable detail, accurately and fairly reflect the transactions and dispositions of the assets of the company; (2) providereasonable assurance that transactions are recorded as necessary to permit preparation of financial statements in accordance with generally acceptedaccounting principles, and that receipts and expenditures of the company are being made only in accordance with authorizations of management anddirectors of the company; and (3) provide reasonable assurance regarding prevention or timely detection of unauthorized acquisition, use, or disposition ofthe company's assets that could have a material effect on the financial statements.
Because of the inherent limitations of internal control over financial reporting, including the possibility of collusion or improper management override ofcontrols, material misstatements due to error or fraud may not be prevented or detected on a timely basis. Also, projections of any evaluation of theeffectiveness of the internal control over financial reporting to future periods are subject to the risk that the controls may become inadequate because ofchanges in conditions, or that the degree of compliance with the policies or procedures may deteriorate.
In our opinion, the consolidated financial statements referred to above present fairly, in all material respects, the financial position of Wyndham WorldwideCorporation and subsidiaries as of December 31, 2014 and 2013, and the results of their operations and their cash flows for each of the three years in theperiod ended December 31, 2014, in conformity with accounting principles generally accepted in the United States of America. Also, in our opinion, theCompany maintained, in all material respects, effective internal control over financial reporting as of December 31, 2014, based on the criteria established inInternal Control - Integrated Framework (2013) issued by the Committee of Sponsoring Organizations of the Treadway Commission.
/s/ Deloitte & Touche LLPParsippany, New JerseyFebruary 13, 2015
F-2
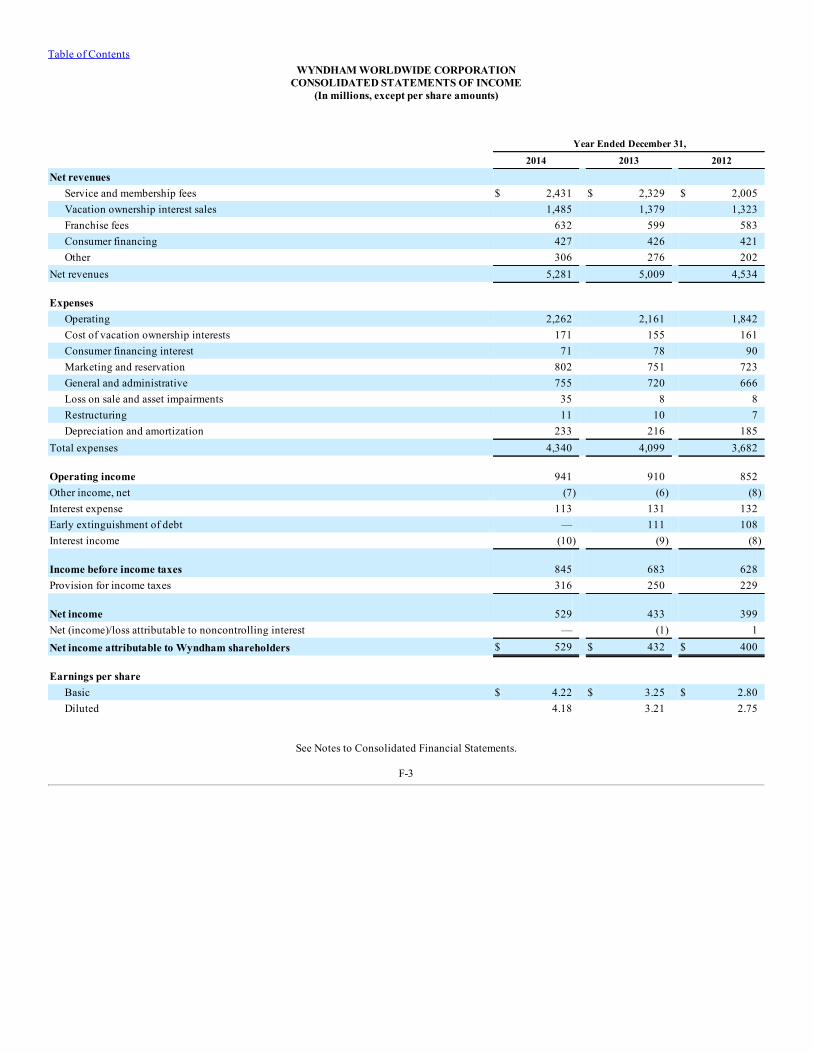
Table of ContentsWYNDHAM WORLDWIDE CORPORATION
CONSOLIDATED STATEMENTS OF INCOME(In millions, except per share amounts)
Year Ended December 31,
2014 2013 2012
Net revenues Service and membership fees $ 2,431 $ 2,329 $ 2,005Vacation ownership interest sales 1,485 1,379 1,323Franchise fees 632 599 583Consumer financing 427 426 421Other 306 276 202
Net revenues 5,281 5,009 4,534
Expenses Operating 2,262 2,161 1,842Cost of vacation ownership interests 171 155 161Consumer financing interest 71 78 90Marketing and reservation 802 751 723General and administrative 755 720 666Loss on sale and asset impairments 35 8 8Restructuring 11 10 7Depreciation and amortization 233 216 185
Total expenses 4,340 4,099 3,682
Operating income 941 910 852Other income, net (7) (6) (8)Interest expense 113 131 132Early extinguishment of debt — 111 108Interest income (10) (9) (8)
Income before income taxes 845 683 628Provision for income taxes 316 250 229
Net income 529 433 399Net (income)/loss attributable to noncontrolling interest — (1) 1Net income attributable to Wyndham shareholders $ 529 $ 432 $ 400
Earnings per share Basic $ 4.22 $ 3.25 $ 2.80Diluted 4.18 3.21 2.75
See Notes to Consolidated Financial Statements.
F-3
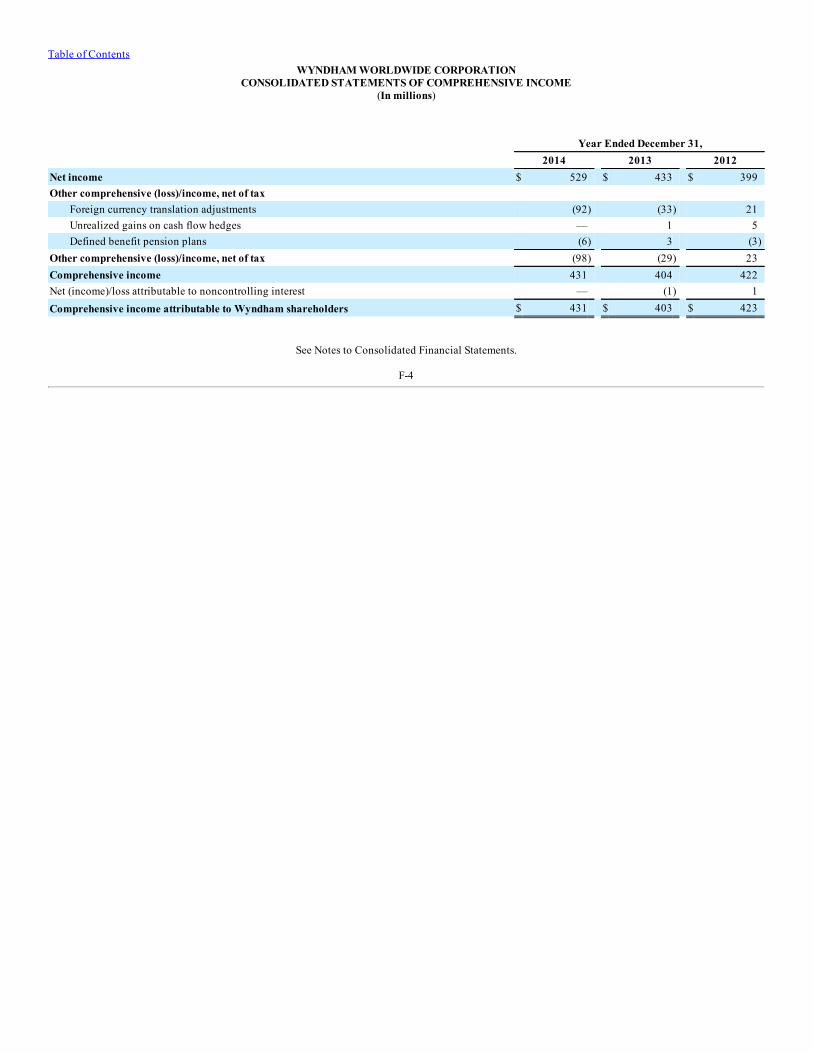
Table of ContentsWYNDHAM WORLDWIDE CORPORATION
CONSOLIDATED STATEMENTS OF COMPREHENSIVE INCOME(In millions)
Year Ended December 31, 2014 2013 2012Net income $ 529 $ 433 $ 399Other comprehensive (loss)/income, net of tax
Foreign currency translation adjustments (92) (33) 21Unrealized gains on cash flow hedges — 1 5Defined benefit pension plans (6) 3 (3)
Other comprehensive (loss)/income, net of tax (98) (29) 23Comprehensive income 431 404 422Net (income)/loss attributable to noncontrolling interest — (1) 1Comprehensive income attributable to Wyndham shareholders $ 431 $ 403 $ 423
See Notes to Consolidated Financial Statements.
F-4
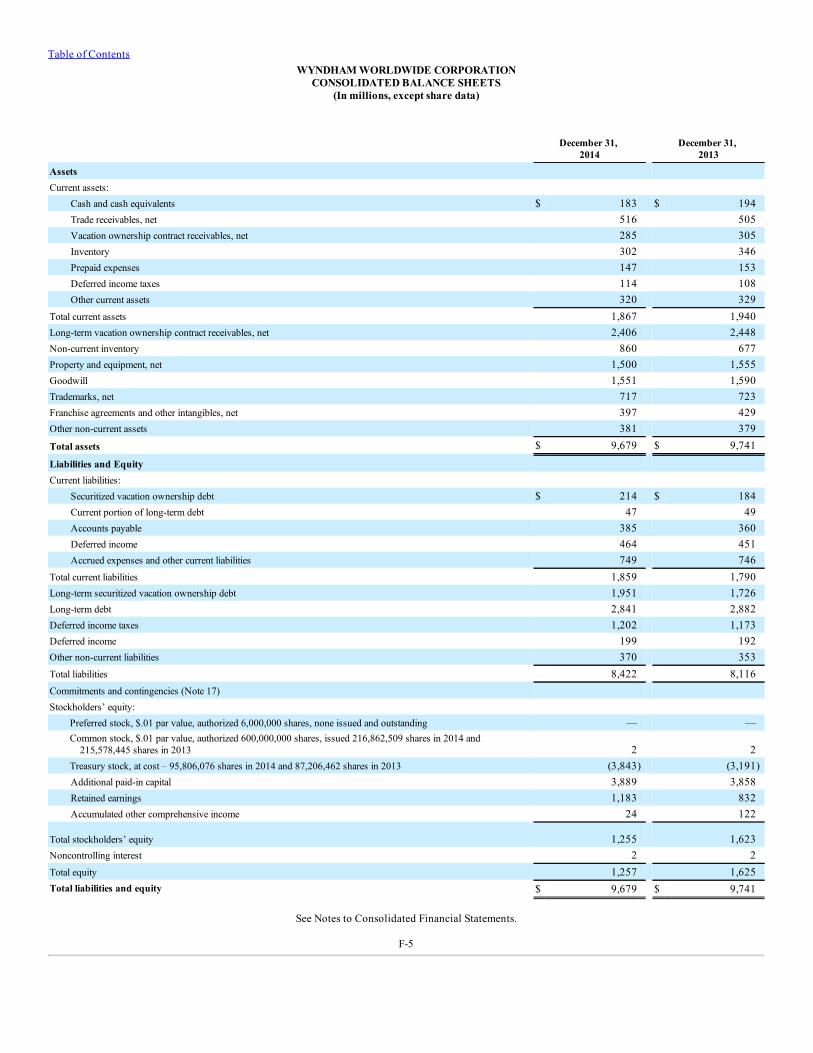
Table of ContentsWYNDHAM WORLDWIDE CORPORATION
CONSOLIDATED BALANCE SHEETS(In millions, except share data)
December 31,
2014 December 31,
2013
Assets Current assets:
Cash and cash equivalents $ 183 $ 194Trade receivables, net 516 505Vacation ownership contract receivables, net 285 305Inventory 302 346Prepaid expenses 147 153Deferred income taxes 114 108Other current assets 320 329
Total current assets 1,867 1,940Long-term vacation ownership contract receivables, net 2,406 2,448Non-current inventory 860 677Property and equipment, net 1,500 1,555Goodwill 1,551 1,590Trademarks, net 717 723Franchise agreements and other intangibles, net 397 429Other non-current assets 381 379Total assets $ 9,679 $ 9,741
Liabilities and Equity Current liabilities:
Securitized vacation ownership debt $ 214 $ 184Current portion of long-term debt 47 49Accounts payable 385 360Deferred income 464 451Accrued expenses and other current liabilities 749 746
Total current liabilities 1,859 1,790Long-term securitized vacation ownership debt 1,951 1,726Long-term debt 2,841 2,882Deferred income taxes 1,202 1,173Deferred income 199 192Other non-current liabilities 370 353Total liabilities 8,422 8,116Commitments and contingencies (Note 17) Stockholders’ equity:
Preferred stock, $.01 par value, authorized 6,000,000 shares, none issued and outstanding — —Common stock, $.01 par value, authorized 600,000,000 shares, issued 216,862,509 shares in 2014 and
215,578,445 shares in 2013 2 2Treasury stock, at cost – 95,806,076 shares in 2014 and 87,206,462 shares in 2013 (3,843) (3,191)Additional paid-in capital 3,889 3,858Retained earnings 1,183 832Accumulated other comprehensive income 24 122
Total stockholders’ equity 1,255 1,623Noncontrolling interest 2 2Total equity 1,257 1,625Total liabilities and equity $ 9,679 $ 9,741
See Notes to Consolidated Financial Statements.
F-5
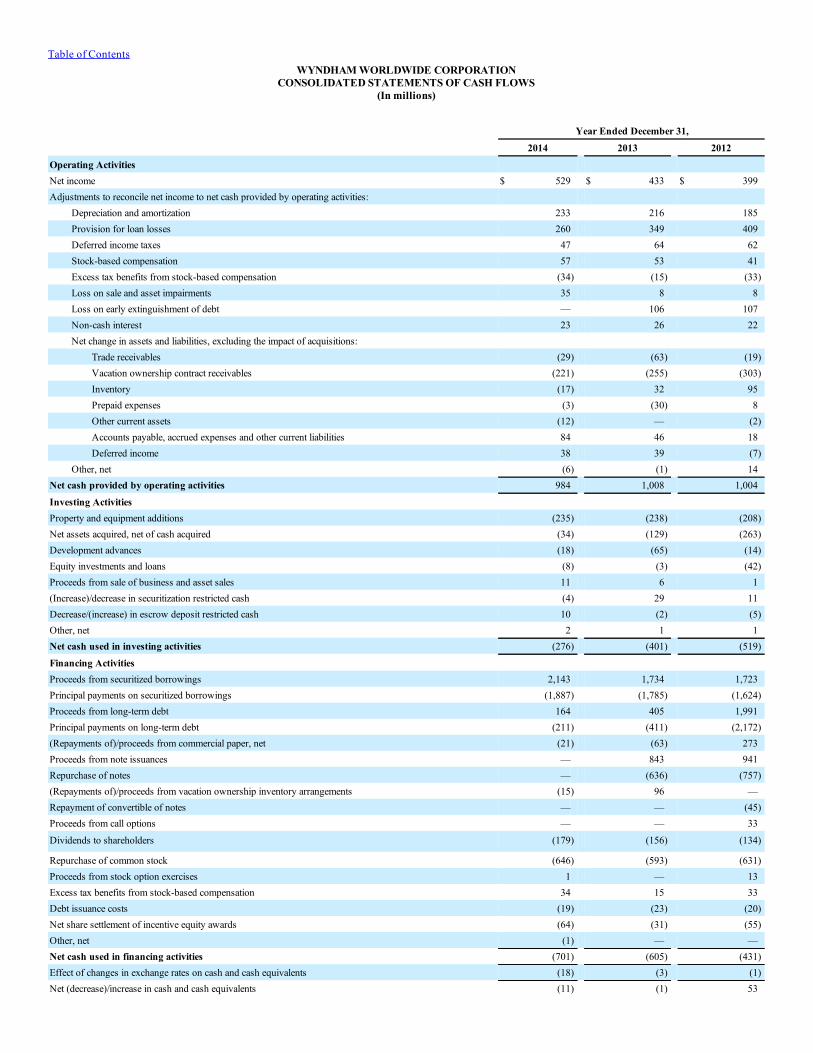
Table of ContentsWYNDHAM WORLDWIDE CORPORATION
CONSOLIDATED STATEMENTS OF CASH FLOWS(In millions)
Year Ended December 31,
2014 2013 2012
Operating Activities Net income $ 529 $ 433 $ 399Adjustments to reconcile net income to net cash provided by operating activities:
Depreciation and amortization 233 216 185Provision for loan losses 260 349 409Deferred income taxes 47 64 62Stock-based compensation 57 53 41Excess tax benefits from stock-based compensation (34) (15) (33)Loss on sale and asset impairments 35 8 8Loss on early extinguishment of debt — 106 107Non-cash interest 23 26 22Net change in assets and liabilities, excluding the impact of acquisitions:
Trade receivables (29) (63) (19)Vacation ownership contract receivables (221) (255) (303)Inventory (17) 32 95Prepaid expenses (3) (30) 8Other current assets (12) — (2)Accounts payable, accrued expenses and other current liabilities 84 46 18Deferred income 38 39 (7)
Other, net (6) (1) 14Net cash provided by operating activities 984 1,008 1,004
Investing Activities Property and equipment additions (235) (238) (208)Net assets acquired, net of cash acquired (34) (129) (263)Development advances (18) (65) (14)Equity investments and loans (8) (3) (42)Proceeds from sale of business and asset sales 11 6 1(Increase)/decrease in securitization restricted cash (4) 29 11Decrease/(increase) in escrow deposit restricted cash 10 (2) (5)Other, net 2 1 1Net cash used in investing activities (276) (401) (519)
Financing Activities Proceeds from securitized borrowings 2,143 1,734 1,723Principal payments on securitized borrowings (1,887) (1,785) (1,624)Proceeds from long-term debt 164 405 1,991Principal payments on long-term debt (211) (411) (2,172)(Repayments of)/proceeds from commercial paper, net (21) (63) 273Proceeds from note issuances — 843 941Repurchase of notes — (636) (757)(Repayments of)/proceeds from vacation ownership inventory arrangements (15) 96 —Repayment of convertible of notes — — (45)Proceeds from call options — — 33
Dividends to shareholders (179) (156) (134)
Repurchase of common stock (646) (593) (631)Proceeds from stock option exercises 1 — 13Excess tax benefits from stock-based compensation 34 15 33Debt issuance costs (19) (23) (20)Net share settlement of incentive equity awards (64) (31) (55)Other, net (1) — —Net cash used in financing activities (701) (605) (431)Effect of changes in exchange rates on cash and cash equivalents (18) (3) (1)Net (decrease)/increase in cash and cash equivalents (11) (1) 53

Cash and cash equivalents, beginning of period 194 195 142
Cash and cash equivalents, end of period $ 183 $ 194 $ 195
See Notes to Consolidated Financial Statements.
F-6
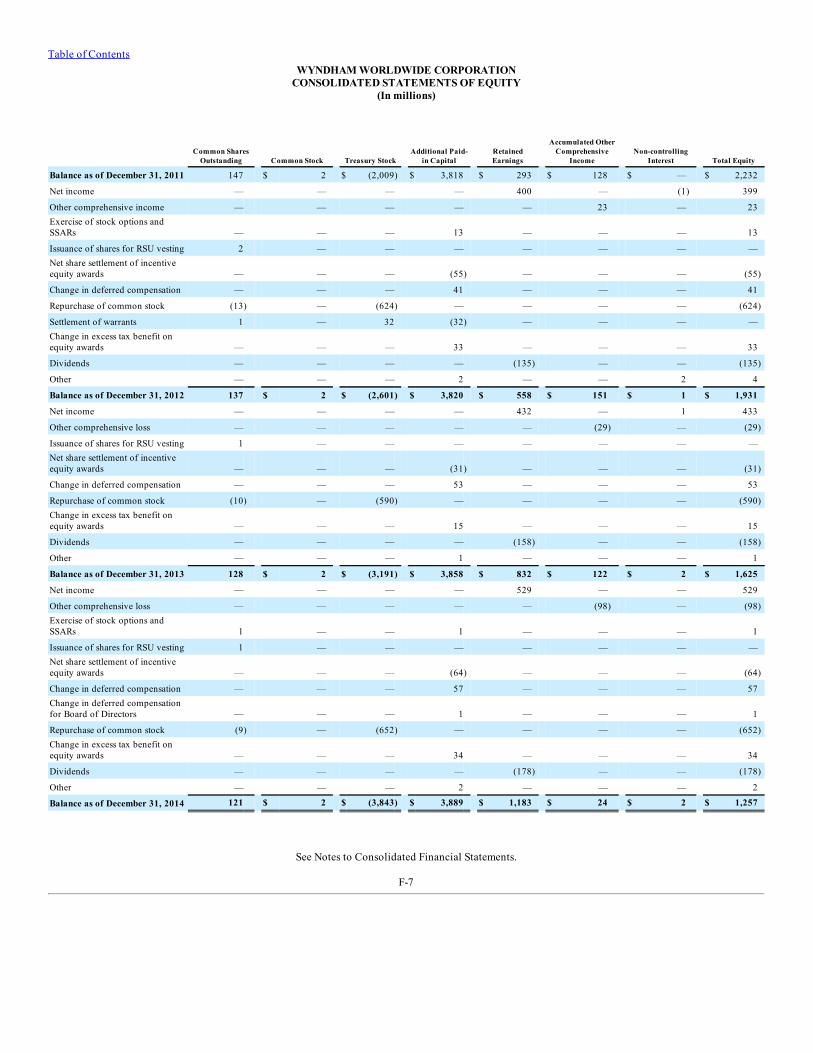
Table of ContentsWYNDHAM WORLDWIDE CORPORATION
CONSOLIDATED STATEMENTS OF EQUITY(In millions)
Common Shares
Outstanding Common Stock Treasury Stock Additional Paid-
in Capital RetainedEarnings
Accumulated OtherComprehensive
Income Non-controlling
Interest Total Equity
Balance as of December 31, 2011 147 $ 2 $ (2,009) $ 3,818 $ 293 $ 128 $ — $ 2,232
Net income — — — — 400 — (1) 399
Other comprehensive income — — — — — 23 — 23Exercise of stock options andSSARs — — — 13 — — — 13
Issuance of shares for RSU vesting 2 — — — — — — —Net share settlement of incentiveequity awards — — — (55) — — — (55)
Change in deferred compensation — — — 41 — — — 41
Repurchase of common stock (13) — (624) — — — — (624)
Settlement of warrants 1 — 32 (32) — — — —Change in excess tax benefit onequity awards — — — 33 — — — 33
Dividends — — — — (135) — — (135)
Other — — — 2 — — 2 4
Balance as of December 31, 2012 137 $ 2 $ (2,601) $ 3,820 $ 558 $ 151 $ 1 $ 1,931
Net income — — — — 432 — 1 433
Other comprehensive loss — — — — — (29) — (29)
Issuance of shares for RSU vesting 1 — — — — — — —Net share settlement of incentiveequity awards — — — (31) — — — (31)
Change in deferred compensation — — — 53 — — — 53
Repurchase of common stock (10) — (590) — — — — (590)Change in excess tax benefit onequity awards — — — 15 — — — 15
Dividends — — — — (158) — — (158)
Other — — — 1 — — — 1
Balance as of December 31, 2013 128 $ 2 $ (3,191) $ 3,858 $ 832 $ 122 $ 2 $ 1,625
Net income — — — — 529 — — 529
Other comprehensive loss — — — — — (98) — (98)Exercise of stock options andSSARs 1 — — 1 — — — 1
Issuance of shares for RSU vesting 1 — — — — — — —Net share settlement of incentiveequity awards — — — (64) — — — (64)
Change in deferred compensation — — — 57 — — — 57Change in deferred compensationfor Board of Directors — — — 1 — — — 1
Repurchase of common stock (9) — (652) — — — — (652)Change in excess tax benefit onequity awards — — — 34 — — — 34
Dividends — — — — (178) — — (178)
Other — — — 2 — — — 2
Balance as of December 31, 2014 121 $ 2 $ (3,843) $ 3,889 $ 1,183 $ 24 $ 2 $ 1,257
See Notes to Consolidated Financial Statements.
F-7
Table of Contents
WYNDHAM WORLDWIDE CORPORATIONNOTES TO CONSOLIDATED FINANCIAL STATEMENTS
(Unless otherwise noted, all amounts are in millions, except share and per share amounts)
1. Basis of Presentation
Wyndham Worldwide Corporation (“Wyndham” or the “Company”) is a global provider of hospitality services and products. The accompanyingConsolidated Financial Statements include the accounts and transactions of Wyndham, as well as the entities in which Wyndham directly or indirectly has acontrolling financial interest. The accompanying Consolidated Financial Statements have been prepared in accordance with accounting principles generallyaccepted in the United States of America. All intercompany balances and transactions have been eliminated in the Consolidated Financial Statements.
In presenting the Consolidated Financial Statements, management makes estimates and assumptions that affect the amounts reported and relateddisclosures. Estimates, by their nature, are based on judgment and available information. Accordingly, actual results could differ from those estimates. Inmanagement’s opinion, the Consolidated Financial Statements contain all normal recurring adjustments necessary for a fair presentation of annual resultsreported.
Business Description
The Company operates in the following business segments:
• Lodging—primarily franchises hotels in the upscale, upper midscale, midscale, economy and extended stay segments and provides hotelmanagement services for full-service and select limited-service hotels.
• Vacation Exchange and Rentals—provides vacation exchange services and products to owners of intervals of vacation ownership interests(“VOIs”) and markets vacation rental properties primarily on behalf of independent owners.
• Vacation Ownership—develops, markets and sells VOIs to individual consumers, provides consumer financing in connection with the sale of VOIsand provides property management services at resorts.
F-8
Table of Contents
2. Summary of Significant Accounting Policies
PRINCIPLES OF CONSOLIDATION
When evaluating an entity for consolidation, the Company first determines whether an entity is within the scope of the guidance for consolidation ofvariable interest entities (“VIE”) and if it is deemed to be a VIE. If the entity is considered to be a VIE, the Company determines whether it would beconsidered the entity’s primary beneficiary. The Company consolidates those VIEs for which it has determined that it is the primary beneficiary. TheCompany will consolidate an entity not deemed a VIE upon a determination that it has a controlling financial interest. For entities where the Company doesnot have a controlling financial interest, the investments in such entities are classified as available-for-sale securities or accounted for using the equity or costmethod, as appropriate.
REVENUE RECOGNITION
Lodging
The principal source of revenues from franchising hotels is ongoing franchise fees, which are primarily comprised of royalty, marketing and reservationfees. Royalty, marketing and reservation fees are typically a percentage of gross room revenues of each franchised hotel and are recognized as revenue uponbecoming due from the franchisee. An estimate of uncollectible ongoing royalty fees is charged to bad debt expense and included in operating expenses onthe Consolidated Statements of Income. Lodging revenues also include initial franchise fees, which are recognized as revenues when all material services orconditions have been substantially performed, which is either when a franchised hotel opens for business or when a franchise agreement is terminated after ithas been determined that the franchised hotel will not open.
The Company’s franchise agreements also require the payment of marketing and reservation fees, which are intended to reimburse the Company forexpenses associated with operating an international, centralized, brand-specific reservations system, e-commerce channels such as the Company’s brand.comwebsites, as well as access to third-party distribution channels, such as online travel agents, advertising and marketing programs, global sales efforts,operations support, training and other related services. Marketing and reservation fees are recognized as revenue upon becoming due from the franchisee. Anestimate of uncollectible ongoing marketing and reservation fees is charged to bad debt expense and included in marketing and reservation expenses in theConsolidated Statements of Income.
The Company is contractually obligated to expend the marketing and reservation fees it collects from franchisees in accordance with the franchiseagreements; as such, revenues earned in excess of costs incurred are accrued as a liability for future marketing or reservation costs. Costs incurred in excess ofrevenues earned are expensed as incurred. In accordance with its franchise agreements, the Company includes an allocation of costs required to carry outmarketing and reservation activities within marketing and reservation expenses.
The Company also earns revenues from its Wyndham Rewards loyalty program when a member stays at a participating hotel. These revenues are derivedfrom a fee the Company charges as a percentage of room revenues generated from such stay. This fee is recognized as revenue upon becoming due from thefranchisee. Since the Company is obligated to expend the fees it collects from franchisees, revenues earned in excess of costs incurred are accrued as aliability for future costs to support the program.
The Company also provides management services for hotels under management contracts, which offer all the benefits of a global brand and a full rangeof management, marketing and reservation services. In addition to the standard franchise services described above, the Company’s hotel managementbusiness provides hotel owners with professional oversight and comprehensive operations support services such as hiring, training and supervising themanagers and employees that operate the hotels as well as annual budget preparation, financial analysis and extensive food and beverage services. TheCompany’s standard management agreement typically has a term of up to 25 years. The Company’s management fees are comprised of base fees, which aretypically a specified percentage of gross revenues from hotel operations, and incentive fees, which are typically a specified percentage of a hotel’s grossoperating profit. Management fee revenues are recognized when earned in accordance with the terms of the contract and recorded as a component of franchisefee revenues on the Consolidated Statements of Income. Management fee revenues were $11 million, $8 million and $7 million during 2014, 2013 and 2012,respectively. The Company also recognizes as revenue reimbursable payroll costs for operational employees at certain of the Company’s managedhotels. Although these costs are funded by hotel owners, accounting guidance requires the Company to report these fees on a gross basis as both revenues andexpenses. The revenues are recorded as a component of service and membership fees while the offsetting expenses are reflected as a component of operatingexpenses on the Consolidated Statements of Income. As such, there is no effect on the Company’s operating income. Revenues related to these payroll costswere $148 million, $129 million and $91 million in 2014, 2013 and 2012, respectively.
F-9
Table of Contents
The Company also earns revenues from hotel ownership. The Company’s ownership portfolio is limited to two hotels in locations where we havedeveloped or intend to develop timeshare units. Revenues earned from the Company’s owned hotels consist primarily of (i) gross room revenues, (ii) food andbeverage services and (iii) on-site spa, casino, golf and shop revenues. These revenues are recognized upon the completion of services to its guests.
Vacation Exchange and Rentals
As a provider of vacation exchange services, the Company enters into affiliation agreements with developers of vacation ownership properties to allowowners of intervals of VOIs to trade their intervals for intervals at other properties affiliated with the Company’s vacation exchange business and, for somemembers, for other leisure-related services and products. Additionally, as a marketer of vacation rental properties, generally the Company enters intocontracts for exclusive periods of time with property owners to market the rental of such properties to rental customers.
The Company’s vacation exchange business derives a majority of its revenues from annual membership dues and exchange fees from members tradingtheir intervals. Revenues from annual membership dues represent the annual fees from members who participate in the Company’s vacation exchangebusiness and, for additional fees, have the right to exchange their intervals for intervals at other properties affiliated with the Company’s vacation exchangebusiness and, for certain members, for other leisure-related services and products. The Company recognizes revenues from annual membership dues on astraight-line basis over the membership period during which delivery of publications, if applicable, and other services are provided to the members.Exchange fees are generated when members exchange their intervals for intervals at other properties affiliated with the Company’s vacation exchangebusiness or for other leisure-related services and products. Exchange fees are recognized as revenues, net of expected cancellations, when the exchangerequests have been confirmed to the member.
The Company’s vacation rentals business primarily derives its revenues from fees, which generally average between 20% and 50% of the gross bookingfees. For properties which the Company owns, manages or operates under long-term capital and operating leases (which represent less than 10% of theCompany’s portfolio), the Company receives 100% of the revenues. The majority of the time, the Company acts on behalf of the owners of the rentalproperties to generate the Company’s fees. The Company provides reservation services to the independent property owners and receives the agreed-upon feefor the services provided. The Company remits the gross rental fee received from the renter to the independent property owner, net of the Company’s agreed-upon fee. Revenues from such fees that are recognized in the period that the rental reservation is made, are recorded net of expected cancellations.
Cancellations for 2014, 2013 and 2012 each totaled less than 5% of rental transactions booked. Upon confirmation of the rental reservation, the rentalcustomer and property owner generally have a direct relationship for additional services to be performed. The Company also earns rental fees in connectionwith properties which it owns, manages or operates and such fees are recognized ratably over the rental customer’s stay, as this is the point at which theservice is rendered. The Company’s revenues are earned when evidence of an arrangement exists, delivery has occurred or the services have been rendered,the seller’s price to the buyer is fixed or determinable, and collectability is reasonably assured.
Vacation Ownership
The Company develops, markets and sells VOIs to individual consumers, provides property management services at resorts and provides consumerfinancing in connection with the sale of VOIs. The Company’s vacation ownership business derives the majority of its revenues from sales of VOIs andderives other revenues from consumer financing and property management. The Company’s sales of VOIs are either cash sales or developer-financed sales. Inorder for the Company to recognize revenues from VOI sales under the full accrual method of accounting described in the guidance for sales of real estate forfully constructed inventory, a binding sales contract must have been executed, the statutory rescission period must have expired (after which time thepurchasers are not entitled to a refund except for non-delivery by the Company), receivables must have been deemed collectible and the remainder of theCompany’s obligations must have been substantially completed. In addition, before the Company recognizes any revenues from VOI sales, the purchaser ofthe VOI must have met the initial investment criteria and, as applicable, the continuing investment criteria, by executing a legally binding financingcontract. A purchaser has met the initial investment criteria when a minimum down payment of 10% is received by the Company.
In accordance with the guidance for accounting for real estate time-sharing transactions, the Company must also take into consideration the fair value ofcertain incentives provided to the purchaser when assessing the adequacy of the purchaser’s initial investment. In those cases where financing is provided tothe purchaser by the Company, the purchaser is obligated to remit monthly payments under financing contracts that represent the purchaser’s continuinginvestment.
F-10
Table of Contents
If all of the criteria for a VOI sale to qualify under the full accrual method of accounting have been met, as discussed above, except that construction ofthe VOI purchased is not complete, the Company recognizes revenues using the percentage-of-completion (“POC”) method of accounting provided that thepreliminary construction phase is complete and that a minimum sales level has been met (to assure that the property will not revert to a rental property). Thepreliminary stage of development is deemed to be complete when the engineering and design work is complete, the construction contracts have beenexecuted, the site has been cleared, prepared and excavated, and the building foundation is complete. The completion percentage is determined by theproportion of real estate inventory costs incurred to total estimated costs. These estimated costs are based upon historical experience and the relatedcontractual terms. The remaining revenues and related costs of sales, including commissions and direct expenses, are deferred and recognized as theremaining costs are incurred. During 2014, $12 million of revenues were deferred under the POC method of accounting. During 2013, an immaterial amountof revenues were deferred under the POC method of accounting.
The Company also offers consumer financing as an option to customers purchasing VOIs, which are typically collateralized by the underlying VOI. Thecontractual terms of Company-provided financing agreements require that the contractual level of annual principal payments be sufficient to amortize theloan over a customary period for the VOI being financed, which is generally 10 years and payments under the financing contracts begin within 45 days of thesale and receipt of the minimum down payment of 10%. An estimate of uncollectible amounts is recorded at the time of the sale with a charge to the provisionfor loan losses, which is classified as a reduction of VOI sales on the Consolidated Statements of Income. The interest income earned from the financingarrangements is earned on the principal balance outstanding over the life of the arrangement and is recorded within consumer financing on the ConsolidatedStatements of Income.
The Company also provides day-to-day-management services, including oversight of housekeeping services, maintenance and certain accounting andadministrative services for property owners’ associations and clubs. In some cases, the Company’s employees serve as officers and/or directors of theseassociations and clubs in accordance with their by-laws and associated regulations. The Company receives fees for such property management services whichare generally based upon total costs to operate such resorts. Fees for property management services typically approximate 10% of budgeted operatingexpenses. Property management fee revenues are recognized when earned in accordance with the terms of the contract and are recorded as a component ofservice and membership fees on the Consolidated Statements of Income. Property management revenues, which are comprised of management fee revenueand reimbursable revenue, were $581 million, $567 million and $460 million during 2014, 2013 and 2012, respectively. Management fee revenues were$288 million, $290 million and $225 million during 2014, 2013 and 2012, respectively. Reimbursable revenues, which are based upon certain reimbursablecosts with no added margin, were $293 million, $277 million and $235 million during 2014, 2013 and 2012, respectively. These reimbursable costsprincipally relate to the payroll costs for management of the associations, club and resort properties where the Company is the employer and are reflected as acomponent of operating expenses on the Consolidated Statements of Income. During each of 2014, 2013 and 2012, one of the associations that the Companymanages paid Wyndham Exchange & Rentals $19 million for exchange services.
Other Items
The Company records marketing and reservation revenues, Wyndham Rewards revenues, RCI Elite Rewards revenues and hotel/property managementservices revenues for its Lodging, Vacation Ownership and Vacation Exchange and Rentals segments, in accordance with the guidance for reporting revenuesgross as a principal versus net as an agent, which requires that these revenues be recorded on a gross basis.
Deferred Income
Deferred income, as of December 31, consisted of:
2014 2013Membership and exchange fees $ 275 $ 298VOI trial and incentive fees 160 149Vacation rental fees 104 109Initial franchise fees 49 42Other fees 75 45Total deferred income 663 643Less: Current deferred income 464 451Non-current deferred income $ 199 $ 192
F-11
Table of Contents
Deferred membership and exchange fees consist primarily of payments made in advance for annual memberships that are recognized over the term of themembership period, which is typically one to three years. Deferred VOI trial fees are payments received in advance for a trial VOI, which allows customers toutilize a VOI typically within one year of purchase. Deferred incentive fees represent payments received in advance for additional travel related services andproducts at the time of a VOI sale. Revenue is recognized when a customer utilizes the additional services and products, which is typically within two yearsof a VOI sale. Deferred vacation rental fees represent payments received in advance of a rental customer’s stay that are recognized as revenue when the rentalstay occurs, which is typically within six months of the confirmation date. Deferred initial franchise fees are recognized when all material services orconditions have been performed which is typically within two years.
INCOME TAXES
The Company recognizes deferred tax assets and liabilities using the asset and liability method, under which deferred tax assets and liabilities arecalculated based upon the temporary differences between the financial statement and income tax bases of assets and liabilities using currently enacted taxrates. These differences are based upon estimated differences between the book and tax basis of the assets and liabilities for the Company as of December 31,2014 and 2013.
The Company’s deferred tax assets are recorded net of a valuation allowance when, based on the weight of available evidence, it is more likely than notthat some portion or all of the recorded deferred tax assets will not be realized in future periods. Decreases to the valuation allowance are recorded asreductions to the Company’s provision for income taxes and increases to the valuation allowance result in additional provision for income taxes. Therealization of the Company’s deferred tax assets, net of the valuation allowance, is primarily dependent on estimated future taxable income. A change in theCompany’s estimate of future taxable income may require an addition to or reduction from the valuation allowance.
For tax positions the Company has taken or expects to take in a tax return, the Company applies a more likely than not threshold, under which theCompany must conclude a tax position is more likely than not to be sustained, assuming that the position will be examined by the appropriate taxingauthority that has full knowledge of all relevant information, in order to recognize or continue to recognize the benefit. In determining the Company’sprovision for income taxes, the Company uses judgment, reflecting its estimates and assumptions, in applying the more likely than not threshold.
CASH AND CASH EQUIVALENTS
The Company considers highly-liquid investments purchased with an original maturity of three months or less to be cash equivalents.
RESTRICTED CASH
The largest portion of the Company’s restricted cash relates to securitizations. The remaining portion is comprised of cash held in escrow accountsprimarily related to the Company’s vacation ownership business.
Securitizations: In accordance with the contractual requirements of the Company’s various vacation ownership contract receivable securitizations, adedicated lockbox account, subject to a blocked control agreement, is established for each securitization. At each month end, the total cash in the collectionaccount from the previous month is analyzed and a monthly servicer report is prepared by the Company, which details how much cash should be remitted tothe note holders for principal and interest payments, and any cash remaining is transferred by the trustee back to the Company. Additionally, as required byvarious securitizations, the Company holds an agreed-upon percentage of the aggregate outstanding principal balances of the VOI contract receivablescollateralizing the asset-backed notes in a segregated trust (or reserve) account as credit enhancement. Each time a securitization closes and the Companyreceives cash from the note holders, a portion of the cash is deposited in the reserve account. Such amounts were $96 million and $92 million, of which $75million and $64 million is recorded within other current assets and $21 million and $28 million is recorded within other non-current assets as ofDecember 31, 2014 and 2013, respectively, on the Consolidated Balance Sheets.
Escrow Deposits: Laws in most U.S. states require the escrow of down payments on VOI sales, with the typical requirement mandating that the funds beheld in escrow until the rescission period expires. As sales transactions are consummated, down payments are collected and are subsequently placed in escrowuntil the rescission period has expired. Depending on the state, the rescission period can be as short as 3 calendar days or as long as 15 calendar days. Incertain states, the escrow laws require that 100% of VOI purchaser funds (excluding interest payments, if any), be held in escrow until the deeding process iscomplete. Where possible, the Company utilizes surety bonds in lieu of escrow deposits. Escrow deposit amounts were $51 million and $57 million as ofDecember 31, 2014 and 2013, respectively, which is recorded within other current assets on the Consolidated Balance Sheets.
F-12
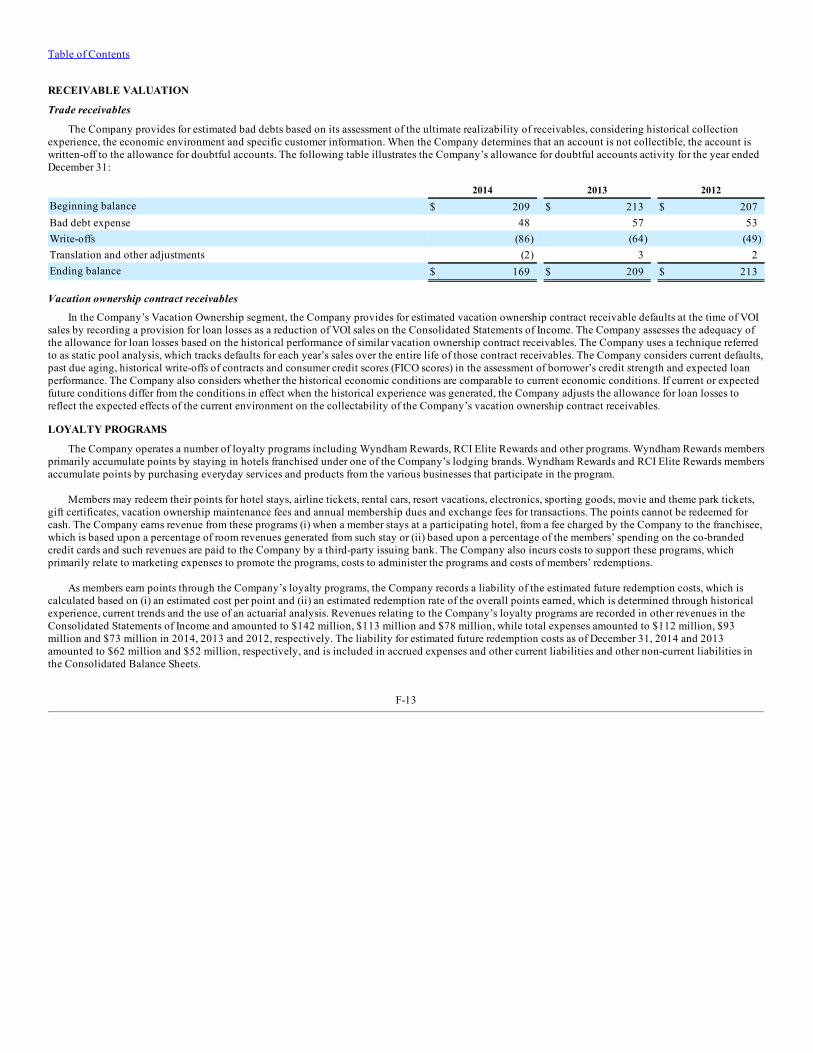
Table of Contents
RECEIVABLE VALUATION
Trade receivables
The Company provides for estimated bad debts based on its assessment of the ultimate realizability of receivables, considering historical collectionexperience, the economic environment and specific customer information. When the Company determines that an account is not collectible, the account iswritten-off to the allowance for doubtful accounts. The following table illustrates the Company’s allowance for doubtful accounts activity for the year endedDecember 31:
2014 2013 2012Beginning balance $ 209 $ 213 $ 207Bad debt expense 48 57 53Write-offs (86) (64) (49)Translation and other adjustments (2) 3 2Ending balance $ 169 $ 209 $ 213
Vacation ownership contract receivables
In the Company’s Vacation Ownership segment, the Company provides for estimated vacation ownership contract receivable defaults at the time of VOIsales by recording a provision for loan losses as a reduction of VOI sales on the Consolidated Statements of Income. The Company assesses the adequacy ofthe allowance for loan losses based on the historical performance of similar vacation ownership contract receivables. The Company uses a technique referredto as static pool analysis, which tracks defaults for each year’s sales over the entire life of those contract receivables. The Company considers current defaults,past due aging, historical write-offs of contracts and consumer credit scores (FICO scores) in the assessment of borrower’s credit strength and expected loanperformance. The Company also considers whether the historical economic conditions are comparable to current economic conditions. If current or expectedfuture conditions differ from the conditions in effect when the historical experience was generated, the Company adjusts the allowance for loan losses toreflect the expected effects of the current environment on the collectability of the Company’s vacation ownership contract receivables.
LOYALTY PROGRAMS
The Company operates a number of loyalty programs including Wyndham Rewards, RCI Elite Rewards and other programs. Wyndham Rewards membersprimarily accumulate points by staying in hotels franchised under one of the Company’s lodging brands. Wyndham Rewards and RCI Elite Rewards membersaccumulate points by purchasing everyday services and products from the various businesses that participate in the program.
Members may redeem their points for hotel stays, airline tickets, rental cars, resort vacations, electronics, sporting goods, movie and theme park tickets,gift certificates, vacation ownership maintenance fees and annual membership dues and exchange fees for transactions. The points cannot be redeemed forcash. The Company earns revenue from these programs (i) when a member stays at a participating hotel, from a fee charged by the Company to the franchisee,which is based upon a percentage of room revenues generated from such stay or (ii) based upon a percentage of the members’ spending on the co-brandedcredit cards and such revenues are paid to the Company by a third-party issuing bank. The Company also incurs costs to support these programs, whichprimarily relate to marketing expenses to promote the programs, costs to administer the programs and costs of members’ redemptions.
As members earn points through the Company’s loyalty programs, the Company records a liability of the estimated future redemption costs, which iscalculated based on (i) an estimated cost per point and (ii) an estimated redemption rate of the overall points earned, which is determined through historicalexperience, current trends and the use of an actuarial analysis. Revenues relating to the Company’s loyalty programs are recorded in other revenues in theConsolidated Statements of Income and amounted to $142 million, $113 million and $78 million, while total expenses amounted to $112 million, $93million and $73 million in 2014, 2013 and 2012, respectively. The liability for estimated future redemption costs as of December 31, 2014 and 2013amounted to $62 million and $52 million, respectively, and is included in accrued expenses and other current liabilities and other non-current liabilities inthe Consolidated Balance Sheets.
F-13
Table of Contents
INVENTORY
Inventory primarily consists of real estate and development costs of completed VOIs, VOIs under construction, land held for future VOI development,vacation ownership properties, vacation credits and inventory sold subject to conditional repurchase. The Company applies the relative sales value methodfor relieving VOI inventory and recording the related cost of sales. Under the relative sales value method, cost of sales is calculated as a percentage of netsales using a cost-of-sales percentage ratio of total estimated development cost to total estimated VOI revenue, including estimated future revenue andincorporating factors such as changes in prices and the recovery of VOIs generally as a result of contract receivable defaults. The effect of such changes inestimates under the relative sales value method is accounted for on a retrospective basis through corresponding current-period adjustments to inventory andcost of sales. Inventory is stated at the lower of cost, including capitalized interest, property taxes and certain other carrying costs incurred during theconstruction process, or net realizable value. Capitalized interest was $2 million, less than $1 million and $1 million in 2014, 2013 and 2012, respectively.
ADVERTISING EXPENSE
Advertising costs are generally expensed in the period incurred. Advertising expenses, which are primarily recorded within marketing and reservationexpenses on the Consolidated Statements of Income, were $170 million, $146 million and $105 million in 2014, 2013 and 2012, respectively.
USE OF ESTIMATES AND ASSUMPTIONS
The preparation of the Consolidated Financial Statements requires the Company to make estimates and assumptions that affect the reported amounts ofassets, liabilities, revenues and expenses and the disclosure of contingent assets and liabilities in the Consolidated Financial Statements and accompanyingnotes. Although these estimates and assumptions are based on the Company’s knowledge of current events and actions the Company may undertake in thefuture, actual results may ultimately differ from estimates and assumptions.
DERIVATIVE INSTRUMENTSThe Company uses derivative instruments as part of its overall strategy to manage its exposure to market risks primarily associated with fluctuations in
foreign currency exchange rates and interest rates. As a matter of policy, the Company does not use derivatives for trading or speculative purposes. Allderivatives are recorded at fair value either as assets or liabilities. Changes in fair value of derivatives not designated as hedging instruments and ofderivatives designated as fair value hedging instruments are recognized currently in operating income and net interest expense, based upon the nature of thehedged item, in the Consolidated Statements of Income. The effective portion of changes in fair value of derivatives designated as cash flow hedginginstruments is recorded as a component of other comprehensive income. The ineffective portion is reported immediately in earnings as a component ofoperating expense, based upon the nature of the hedged item. Amounts included in other comprehensive income are reclassified into earnings in the sameperiod during which the hedged item affects earnings.
PROPERTY AND EQUIPMENT
Property and equipment (including leasehold improvements) are recorded at cost, and presented net of accumulated depreciation and amortization.Depreciation, recorded as a component of depreciation and amortization on the Consolidated Statements of Income, is computed utilizing the straight-linemethod over the lesser of the lease terms or estimated useful lives of the related assets. Amortization of leasehold improvements, also recorded as acomponent of depreciation and amortization, is computed utilizing the straight-line method over the lesser of the estimated benefit period of the relatedassets or the lease terms. Useful lives are generally 30 years for buildings, up to 20 years for leasehold improvements, from 15 to 30 years for vacation rentalproperties and from 3 to 7 years for furniture, fixtures and equipment.
The Company capitalizes the costs of software developed for internal use in accordance with the guidance for accounting for costs of computer softwaredeveloped or obtained for internal use. Capitalization of software developed for internal use commences during the development phase of the project. TheCompany generally amortizes software developed or obtained for internal use on a straight-line basis, from 3 to 5 years, commencing when such software issubstantially ready for use. The net carrying value of software developed or obtained for internal use was $190 million and $158 million as of December 31,2014 and 2013, respectively. Capitalized interest was $4 million, $5 million and $4 million in 2014, 2013 and 2012, respectively.
F-14
Table of Contents
IMPAIRMENT OF LONG-LIVED ASSETS
The Company has goodwill and other indefinite-lived intangible assets recorded in connection with business combinations. The Company annually(during the fourth quarter of each year subsequent to completing the Company’s annual forecasting process), or more frequently if circumstances indicate thatthe value of goodwill may be impaired, reviews the reporting units’ carrying values as required by the guidance for goodwill and other indefinite-livedintangible assets. In accordance with the guidance, the Company has determined that its reporting units are the same as its reportable segments.
Under current accounting guidance, goodwill and other intangible assets with indefinite lives are not subject to amortization. However, goodwill andother intangibles with indefinite lives are subject to fair value-based rules for measuring impairment, and resulting write-downs, if any, are reflected inoperating expense. The Company has goodwill recorded at its lodging, vacation exchange and rentals and vacation ownership reporting units. The Companycompleted its annual goodwill impairment test by performing a qualitative analysis for each of its reporting units as of October 1, 2014 and determined thatno impairment exists.
The Company also evaluates the recoverability of its other long-lived assets, including property and equipment and amortizable intangible assets, ifcircumstances indicate impairment may have occurred, pursuant to guidance for impairment or disposal of long-lived assets. This analysis is performed bycomparing the respective carrying values of the assets to the current and expected future cash flows, on an undiscounted basis, to be generated from suchassets. Property and equipment is evaluated separately within each segment. If such analysis indicates that the carrying value of these assets is notrecoverable, the carrying value of such assets is reduced to fair value.
ACCOUNTING FOR RESTRUCTURING ACTIVITIES
The Company’s restructuring actions require it to make significant estimates in several areas including (i) expenses for severance and related benefitcosts, (ii) the ability to generate sublease income, as well as its ability to terminate lease obligations and (iii) contract terminations. The amount that theCompany has accrued as of December 31, 2014 represents its best estimate of the obligations incurred in connection with these actions, but could be subjectto change due to various factors including market conditions and the outcome of negotiations with third parties.
ACCUMULATED OTHER COMPREHENSIVE INCOME
Accumulated other comprehensive income (“AOCI”) consists of accumulated foreign currency translation adjustments, accumulated unrealized gainsand losses on derivative instruments designated as cash flow hedges and pension related costs. Foreign currency translation adjustments exclude incometaxes related to indefinite investments in foreign subsidiaries. Assets and liabilities of foreign subsidiaries having non-U.S.-dollar functional currencies aretranslated at exchange rates at the Consolidated Balance Sheet dates. Revenues and expenses are translated at average exchange rates during the periodspresented. The gains or losses resulting from translating foreign currency financial statements into U.S. dollars, net of hedging gains or losses and taxes, areincluded in AOCI on the Consolidated Balance Sheets. Gains or losses resulting from foreign currency transactions are included in the ConsolidatedStatements of Income.
STOCK-BASED COMPENSATION
In accordance with the guidance for stock-based compensation, the Company measures all employee stock-based compensation awards using a fair valuemethod and records the related expense in its Consolidated Statements of Income.
EQUITY EARNINGS AND OTHER INCOME
The Company applies the equity method of accounting when it has the ability to exercise significant influence over operating and financial policies ofan investee. The Company recorded $2 million, $3 million and $0 of net earnings from such investments during 2014, 2013 and 2012, respectively, in otherincome, net on the Consolidated Statements of Income.
During 2014, the Company recorded $5 million of income primarily related to the sale of non-strategic assets and other miscellaneous royalties at itsvacation ownership business. During 2013, the Company recorded $3 million of income primarily related to other miscellaneous royalties at its vacationownership business. In addition, during 2012, the Company recorded $8 million of income primarily related to the settlement of a business disruption claimrelated to the Gulf of Mexico spill in 2010 and the reversal of allowance associated with previously divested asset.
F-15
Table of Contents
RECENTLY ISSUED ACCOUNTING PRONOUNCEMENTS
Intangibles - Goodwill and Other. In July 2012, the Financial Accounting Standards Board (the “FASB”) issued guidance on the testing of indefinite-lived intangible assets for impairment, which is intended to reduce the cost and complexity of the impairment test for indefinite-lived intangible assets byproviding an entity with the option to first assess qualitatively whether it is necessary to perform the impairment test that is currently in place. An entitywould not be required to quantitatively calculate the fair value of an indefinite-lived intangible asset unless the entity determines that it is more likely thannot that its fair value is less than its carrying amount. This guidance was effective for interim and annual impairment tests beginning after September 15,2012, with early adoption permitted. The Company adopted the guidance on October 1, 2012, as required. There was no material impact on the ConsolidatedFinancial Statements resulting from the adoption.
Comprehensive Income. In February 2013, the FASB issued guidance to improve the reporting of amounts reclassified out of AOCI. The guidanceamends the presentation of changes in AOCI and requires an entity to disaggregate the total change of each component of other comprehensive income eitheron the face of the statement of income or as a separate disclosure in the notes. This guidance is effective prospectively for fiscal years beginning afterDecember 15, 2012. The Company adopted the guidance on January 1, 2013, as required. There was no material impact on its Consolidated FinancialStatements resulting from the adoption.
Foreign Currency Matters. In March 2013, the FASB issued guidance on a parent’s accounting for the cumulative translation adjustment uponderecognition of a subsidiary or group of assets within a foreign entity. The guidance requires that the parent release any related cumulative translationadjustment into net income only if the sale or transfer results in the complete or substantially complete liquidation of the foreign entity in which thesubsidiary or group of assets had resided. This guidance is effective prospectively for fiscal years beginning after December 15, 2013 and for interim periodswithin those fiscal years. The Company adopted the guidance on January 1, 2014, as required. There was no material impact on the Consolidated FinancialStatements resulting from the adoption.
Reporting Discontinued Operations and Disclosures of Disposals of Components of an Entity. In April 2014, the FASB issued guidance on reportingdiscontinued operations and disclosures of disposals of components of an entity. This guidance changes the criteria for determining which disposals can bepresented as discontinued operations and enhances the related disclosure requirements. This guidance is effective for fiscal years beginning after December15, 2014 and for interim periods within those fiscal years, with early adoption permitted. The Company will adopt this guidance on January 1, 2015, and itbelieves the adoption of this guidance will not have a material impact on the Consolidated Financial Statements.
Revenue from Contracts with Customers. In May 2014, the FASB issued guidance on revenue from contracts with customers. The guidance outlines asingle comprehensive model for entities to use in accounting for revenue arising from contracts with customers. This guidance is effective for fiscal yearsbeginning after December 15, 2016 and for interim periods within those fiscal years. The Company is currently evaluating the impact of the adoption of thisguidance on the Consolidated Financial Statements.
Disclosure of Uncertainties About an Entity’s Ability to Continue as a Going Concern. In August 2014, the FASB issued guidance on disclosure ofuncertainties about an entity’s ability to continue as a going concern. This guidance addresses management’s responsibility in evaluating whether there issubstantial doubt about a company’s ability to continue as a going concern and to provide related footnote disclosures. Management’s evaluation should bebased on relevant conditions and events that are known and reasonably knowable at the date that the financial statements are issued. The guidance iseffective for fiscal years ending after December 15, 2016 and for interim periods within those fiscal years, with early adoption permitted. The Company willadopt this guidance on January 1, 2015, and it believes the adoption of this guidance will not have an impact on the Consolidated Financial Statements.
F-16
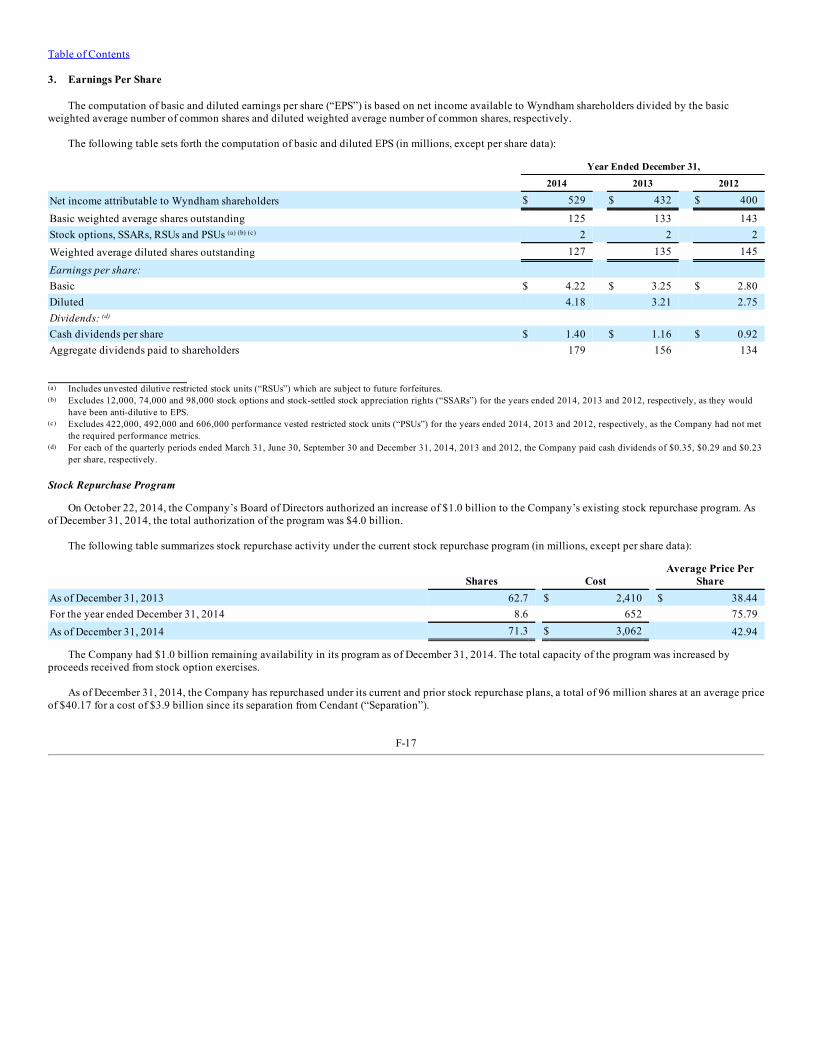
Table of Contents
3. Earnings Per Share
The computation of basic and diluted earnings per share (“EPS”) is based on net income available to Wyndham shareholders divided by the basicweighted average number of common shares and diluted weighted average number of common shares, respectively.
The following table sets forth the computation of basic and diluted EPS (in millions, except per share data):
Year Ended December 31,
2014 2013 2012
Net income attributable to Wyndham shareholders $ 529 $ 432 $ 400
Basic weighted average shares outstanding 125 133 143Stock options, SSARs, RSUs and PSUs (a) (b) (c) 2 2 2Weighted average diluted shares outstanding 127 135 145
Earnings per share: Basic $ 4.22 $ 3.25 $ 2.80Diluted 4.18 3.21 2.75Dividends: (d) Cash dividends per share $ 1.40 $ 1.16 $ 0.92Aggregate dividends paid to shareholders 179 156 134
(a) Includes unvested dilutive restricted stock units (“RSUs”) which are subject to future forfeitures.(b) Excludes 12,000, 74,000 and 98,000 stock options and stock-settled stock appreciation rights (“SSARs”) for the years ended 2014, 2013 and 2012, respectively, as they would
have been anti-dilutive to EPS.(c) Excludes 422,000, 492,000 and 606,000 performance vested restricted stock units (“PSUs”) for the years ended 2014, 2013 and 2012, respectively, as the Company had not met
the required performance metrics.(d) For each of the quarterly periods ended March 31, June 30, September 30 and December 31, 2014, 2013 and 2012, the Company paid cash dividends of $0.35, $0.29 and $0.23
per share, respectively.
Stock Repurchase Program
On October 22, 2014, the Company’s Board of Directors authorized an increase of $1.0 billion to the Company’s existing stock repurchase program. Asof December 31, 2014, the total authorization of the program was $4.0 billion.
The following table summarizes stock repurchase activity under the current stock repurchase program (in millions, except per share data):
Shares Cost Average Price Per
ShareAs of December 31, 2013 62.7 $ 2,410 $ 38.44For the year ended December 31, 2014 8.6 652 75.79As of December 31, 2014 71.3 $ 3,062 42.94
The Company had $1.0 billion remaining availability in its program as of December 31, 2014. The total capacity of the program was increased byproceeds received from stock option exercises.
As of December 31, 2014, the Company has repurchased under its current and prior stock repurchase plans, a total of 96 million shares at an average priceof $40.17 for a cost of $3.9 billion since its separation from Cendant (“Separation”).
F-17
Table of Contents
4. Acquisitions
Assets acquired and liabilities assumed in business combinations were recorded on the Consolidated Balance Sheets as of the respective acquisitiondates based upon their estimated fair values at such dates. The results of operations of businesses acquired by the Company have been included in theConsolidated Statements of Income since their respective dates of acquisition. The excess of the purchase price over the estimated fair values of theunderlying assets acquired and liabilities assumed was allocated to goodwill. In certain circumstances, the allocations of the excess purchase price are basedupon preliminary estimates and assumptions. Accordingly, the allocations may be subject to revision when the Company receives final information,including appraisals and other analyses. Any revisions to the fair values during the allocation period will be recorded by the Company as further adjustmentsto the purchase price allocations. Although, in certain circumstances, the Company has substantially integrated the operations of its acquired businesses,additional future costs relating to such integration may occur. These costs may result from integrating operating systems, relocating employees, closingfacilities, reducing duplicative efforts and exiting and consolidating other activities. These costs will be recorded on the Consolidated Statements of Incomeas expenses.
2014 ACQUISITIONS
During 2014, the Company completed four acquisitions for $32 million in cash, net of cash acquired, and paid an additional $2 million of contingentconsideration related to prior year acquisitions. The preliminary purchase price allocations resulted in the recognition of $14 million of property, $9million of inventory and $3 million of definite-lived intangible assets with a weighted average life of 13 years, all of which were allocated to the Company’sVacation Ownership segment. In addition, the Company recognized $2 million of goodwill, none of which is expected to be deductible for tax purposes,and $3 million of definite-lived intangible assets with a weighted average life of 12 years, both of which were allocated to the Company’s VacationExchange and Rentals segment. These acquisitions were not material to the Company’s results of operations, financial position or cash flows.
2013 ACQUISITIONS
Midtown 45, NYC Property. During January 2013, the Company entered into an agreement with a third-party partner whereby the partner acquired theMidtown 45 property in New York City (“Midtown 45”) for $115 million through a special purpose entity (“SPE”). The Company is considered to be theprimary beneficiary of the SPE and therefore the Company consolidates the SPE within its financial statements. The Company is managing and operating theproperty for rental purposes while the Company converts it into VOI inventory. The SPE’s purchase price allocation for this property resulted in therecognition of $115 million of property and equipment, all of which was assigned to the Company’s Vacation Ownership segment. Acquisition-related costsof $2 million are included in operating expenses in the accompanying Consolidated Statement of Income for 2013. This SPE transaction is consistent withthe Company’s strategy to replenish VOI inventory utilizing Wyndham Asset Affiliation Models (“WAAM”) Just-in-Time. The consolidation of the SPE wasnot material to the Company’s results of operations, financial position or cash flows (see Note 14 - Variable Interest Entities for more detailed information).
In addition, during 2013, the Company completed two other acquisitions for $14 million in cash, net of cash acquired. The preliminary purchase priceallocations resulted in the recognition of $12 million of goodwill, none of which is expected to be deductible for tax purposes, $8 million of definite-livedintangible assets with a weighted average life of 10 years and $1 million of trademarks, all of which were assigned to the Company’s Vacation Exchange andRentals segment. These acquisitions were not material to the Company’s results of operations, financial position or cash flows.
F-18
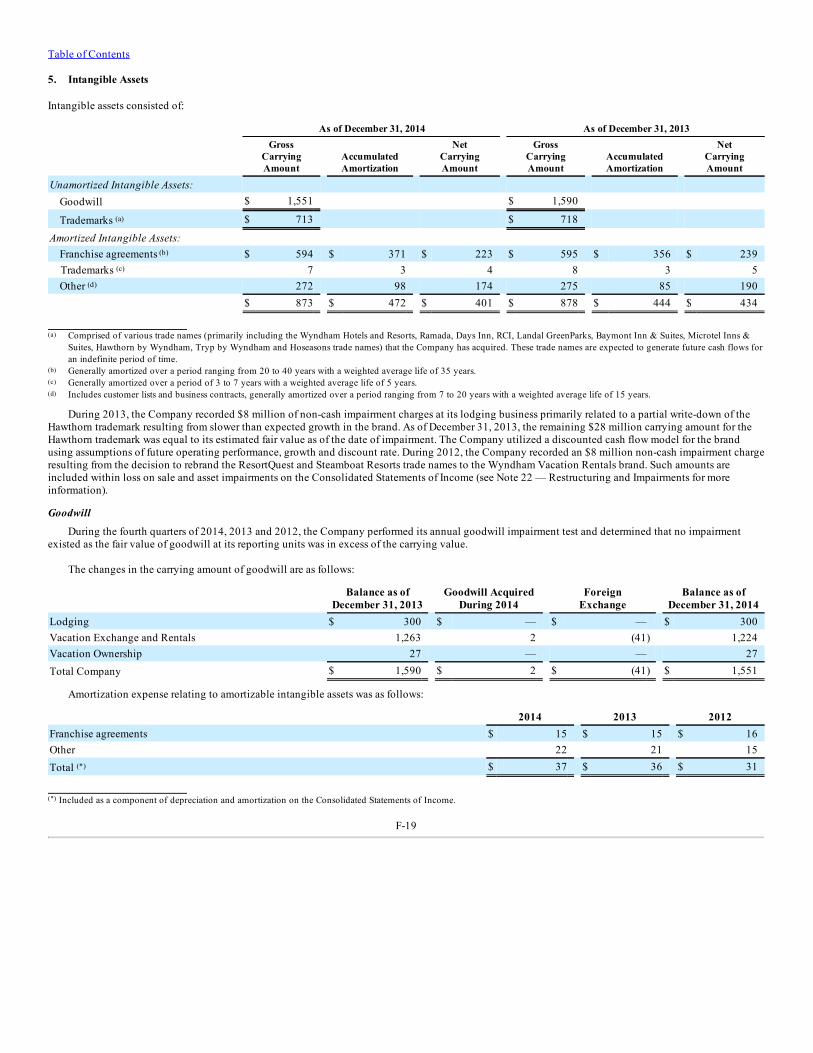
Table of Contents
5. Intangible Assets
Intangible assets consisted of:
As of December 31, 2014 As of December 31, 2013
GrossCarryingAmount
AccumulatedAmortization
NetCarryingAmount
GrossCarryingAmount
AccumulatedAmortization
NetCarryingAmount
Unamortized Intangible Assets: Goodwill $ 1,551 $ 1,590
Trademarks (a) $ 713 $ 718 Amortized Intangible Assets:
Franchise agreements (b) $ 594 $ 371 $ 223 $ 595 $ 356 $ 239 Trademarks (c) 7 3 4 8 3 5Other (d) 272 98 174 275 85 190
$ 873 $ 472 $ 401 $ 878 $ 444 $ 434
(a) Comprised of various trade names (primarily including the Wyndham Hotels and Resorts, Ramada, Days Inn, RCI, Landal GreenParks, Baymont Inn & Suites, Microtel Inns &Suites, Hawthorn by Wyndham, Tryp by Wyndham and Hoseasons trade names) that the Company has acquired. These trade names are expected to generate future cash flows foran indefinite period of time.
(b) Generally amortized over a period ranging from 20 to 40 years with a weighted average life of 35 years.(c) Generally amortized over a period of 3 to 7 years with a weighted average life of 5 years.(d) Includes customer lists and business contracts, generally amortized over a period ranging from 7 to 20 years with a weighted average life of 15 years.
During 2013, the Company recorded $8 million of non-cash impairment charges at its lodging business primarily related to a partial write-down of theHawthorn trademark resulting from slower than expected growth in the brand. As of December 31, 2013, the remaining $28 million carrying amount for theHawthorn trademark was equal to its estimated fair value as of the date of impairment. The Company utilized a discounted cash flow model for the brandusing assumptions of future operating performance, growth and discount rate. During 2012, the Company recorded an $8 million non-cash impairment chargeresulting from the decision to rebrand the ResortQuest and Steamboat Resorts trade names to the Wyndham Vacation Rentals brand. Such amounts areincluded within loss on sale and asset impairments on the Consolidated Statements of Income (see Note 22 — Restructuring and Impairments for moreinformation).
Goodwill
During the fourth quarters of 2014, 2013 and 2012, the Company performed its annual goodwill impairment test and determined that no impairmentexisted as the fair value of goodwill at its reporting units was in excess of the carrying value.
The changes in the carrying amount of goodwill are as follows:
Balance as of
December 31, 2013 Goodwill Acquired
During 2014 Foreign
Exchange Balance as of
December 31, 2014Lodging $ 300 $ — $ — $ 300Vacation Exchange and Rentals 1,263 2 (41) 1,224Vacation Ownership 27 — — 27Total Company $ 1,590 $ 2 $ (41) $ 1,551
Amortization expense relating to amortizable intangible assets was as follows:
2014 2013 2012Franchise agreements $ 15 $ 15 $ 16Other 22 21 15Total (*) $ 37 $ 36 $ 31
(*) Included as a component of depreciation and amortization on the Consolidated Statements of Income.
F-19
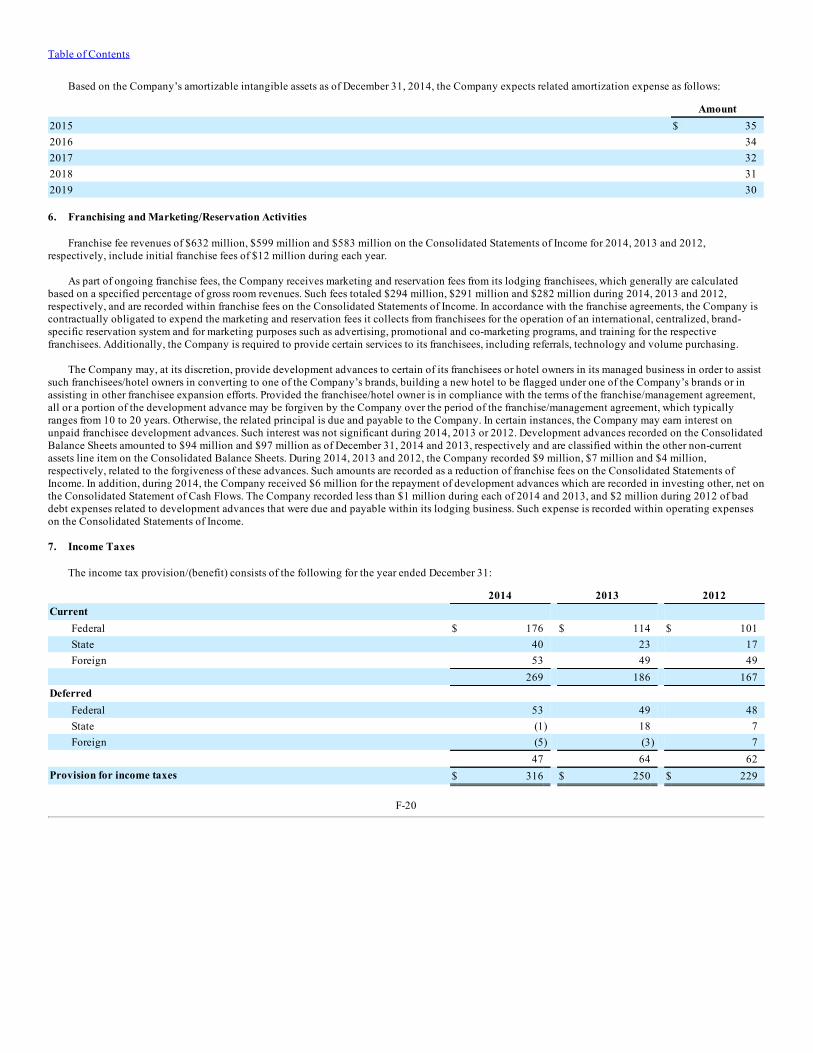
Table of Contents
Based on the Company’s amortizable intangible assets as of December 31, 2014, the Company expects related amortization expense as follows:
Amount2015 $ 352016 342017 322018 312019 30
6. Franchising and Marketing/Reservation Activities
Franchise fee revenues of $632 million, $599 million and $583 million on the Consolidated Statements of Income for 2014, 2013 and 2012,respectively, include initial franchise fees of $12 million during each year.
As part of ongoing franchise fees, the Company receives marketing and reservation fees from its lodging franchisees, which generally are calculatedbased on a specified percentage of gross room revenues. Such fees totaled $294 million, $291 million and $282 million during 2014, 2013 and 2012,respectively, and are recorded within franchise fees on the Consolidated Statements of Income. In accordance with the franchise agreements, the Company iscontractually obligated to expend the marketing and reservation fees it collects from franchisees for the operation of an international, centralized, brand-specific reservation system and for marketing purposes such as advertising, promotional and co-marketing programs, and training for the respectivefranchisees. Additionally, the Company is required to provide certain services to its franchisees, including referrals, technology and volume purchasing.
The Company may, at its discretion, provide development advances to certain of its franchisees or hotel owners in its managed business in order to assistsuch franchisees/hotel owners in converting to one of the Company’s brands, building a new hotel to be flagged under one of the Company’s brands or inassisting in other franchisee expansion efforts. Provided the franchisee/hotel owner is in compliance with the terms of the franchise/management agreement,all or a portion of the development advance may be forgiven by the Company over the period of the franchise/management agreement, which typicallyranges from 10 to 20 years. Otherwise, the related principal is due and payable to the Company. In certain instances, the Company may earn interest onunpaid franchisee development advances. Such interest was not significant during 2014, 2013 or 2012. Development advances recorded on the ConsolidatedBalance Sheets amounted to $94 million and $97 million as of December 31, 2014 and 2013, respectively and are classified within the other non-currentassets line item on the Consolidated Balance Sheets. During 2014, 2013 and 2012, the Company recorded $9 million, $7 million and $4 million,respectively, related to the forgiveness of these advances. Such amounts are recorded as a reduction of franchise fees on the Consolidated Statements ofIncome. In addition, during 2014, the Company received $6 million for the repayment of development advances which are recorded in investing other, net onthe Consolidated Statement of Cash Flows. The Company recorded less than $1 million during each of 2014 and 2013, and $2 million during 2012 of baddebt expenses related to development advances that were due and payable within its lodging business. Such expense is recorded within operating expenseson the Consolidated Statements of Income.
7. Income Taxes
The income tax provision/(benefit) consists of the following for the year ended December 31:
2014 2013 2012Current
Federal $ 176 $ 114 $ 101State 40 23 17Foreign 53 49 49
269 186 167Deferred
Federal 53 49 48State (1) 18 7Foreign (5) (3) 7
47 64 62Provision for income taxes $ 316 $ 250 $ 229
F-20
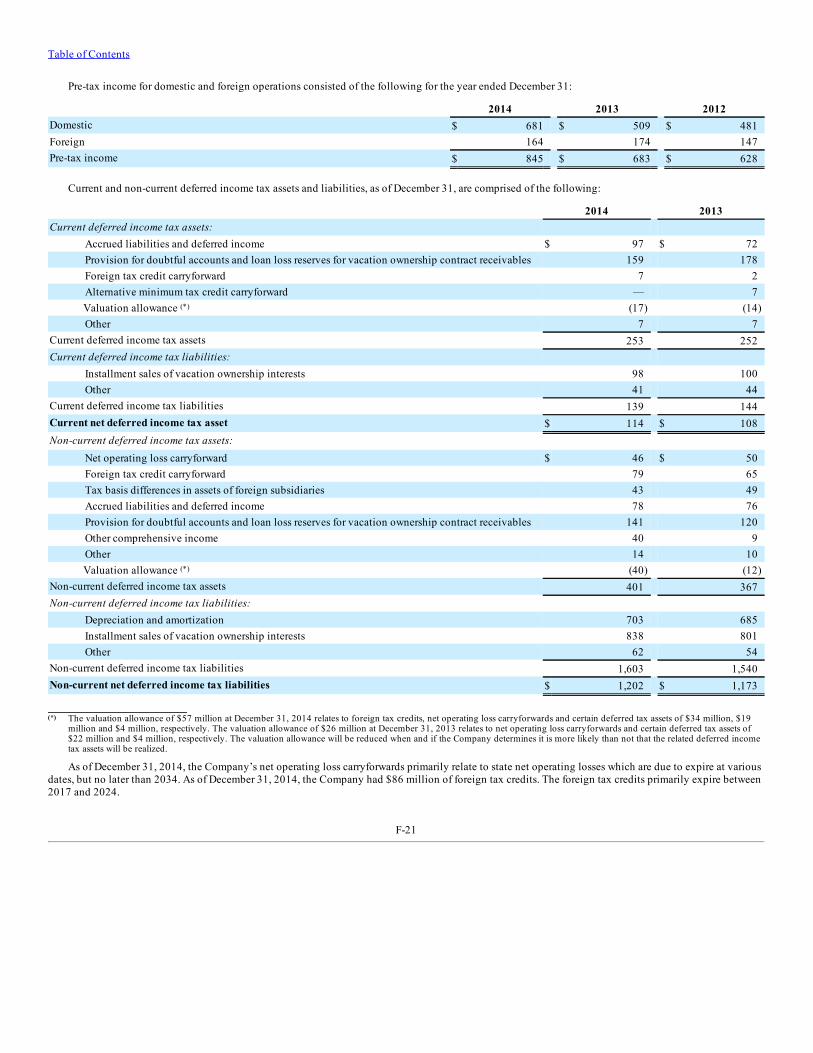
Table of Contents
Pre-tax income for domestic and foreign operations consisted of the following for the year ended December 31:
2014 2013 2012Domestic $ 681 $ 509 $ 481Foreign 164 174 147Pre-tax income $ 845 $ 683 $ 628
Current and non-current deferred income tax assets and liabilities, as of December 31, are comprised of the following:
2014 2013Current deferred income tax assets:
Accrued liabilities and deferred income $ 97 $ 72Provision for doubtful accounts and loan loss reserves for vacation ownership contract receivables 159 178Foreign tax credit carryforward 7 2Alternative minimum tax credit carryforward — 7Valuation allowance (*) (17) (14)Other 7 7
Current deferred income tax assets 253 252Current deferred income tax liabilities:
Installment sales of vacation ownership interests 98 100Other 41 44
Current deferred income tax liabilities 139 144Current net deferred income tax asset $ 114 $ 108Non-current deferred income tax assets:
Net operating loss carryforward $ 46 $ 50Foreign tax credit carryforward 79 65Tax basis differences in assets of foreign subsidiaries 43 49Accrued liabilities and deferred income 78 76Provision for doubtful accounts and loan loss reserves for vacation ownership contract receivables 141 120Other comprehensive income 40 9Other 14 10Valuation allowance (*) (40) (12)
Non-current deferred income tax assets 401 367Non-current deferred income tax liabilities:
Depreciation and amortization 703 685Installment sales of vacation ownership interests 838 801Other 62 54
Non-current deferred income tax liabilities 1,603 1,540Non-current net deferred income tax liabilities $ 1,202 $ 1,173
(*) The valuation allowance of $57 million at December 31, 2014 relates to foreign tax credits, net operating loss carryforwards and certain deferred tax assets of $34 million, $19million and $4 million, respectively. The valuation allowance of $26 million at December 31, 2013 relates to net operating loss carryforwards and certain deferred tax assets of$22 million and $4 million, respectively. The valuation allowance will be reduced when and if the Company determines it is more likely than not that the related deferred incometax assets will be realized.
As of December 31, 2014, the Company’s net operating loss carryforwards primarily relate to state net operating losses which are due to expire at variousdates, but no later than 2034. As of December 31, 2014, the Company had $86 million of foreign tax credits. The foreign tax credits primarily expire between2017 and 2024.
F-21
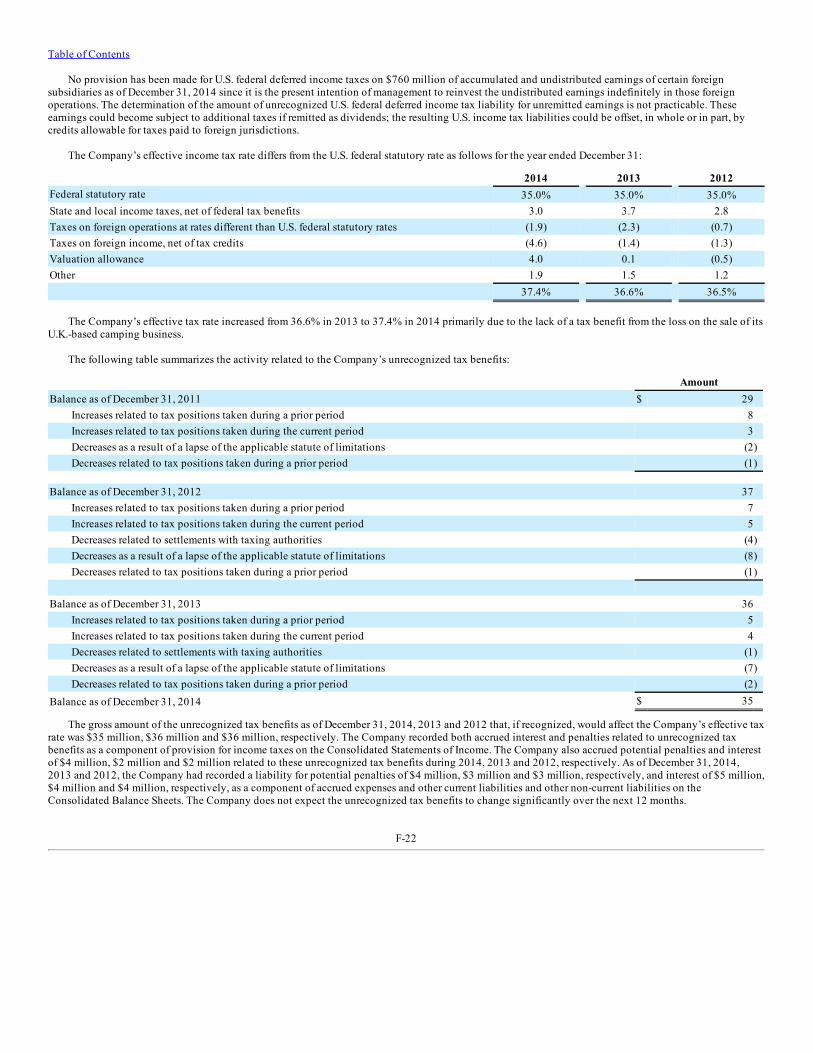
Table of Contents
No provision has been made for U.S. federal deferred income taxes on $760 million of accumulated and undistributed earnings of certain foreignsubsidiaries as of December 31, 2014 since it is the present intention of management to reinvest the undistributed earnings indefinitely in those foreignoperations. The determination of the amount of unrecognized U.S. federal deferred income tax liability for unremitted earnings is not practicable. Theseearnings could become subject to additional taxes if remitted as dividends; the resulting U.S. income tax liabilities could be offset, in whole or in part, bycredits allowable for taxes paid to foreign jurisdictions.
The Company’s effective income tax rate differs from the U.S. federal statutory rate as follows for the year ended December 31:
2014 2013 2012Federal statutory rate 35.0% 35.0% 35.0%State and local income taxes, net of federal tax benefits 3.0 3.7 2.8Taxes on foreign operations at rates different than U.S. federal statutory rates (1.9) (2.3) (0.7)Taxes on foreign income, net of tax credits (4.6) (1.4) (1.3)Valuation allowance 4.0 0.1 (0.5)Other 1.9 1.5 1.2 37.4% 36.6% 36.5%
The Company’s effective tax rate increased from 36.6% in 2013 to 37.4% in 2014 primarily due to the lack of a tax benefit from the loss on the sale of itsU.K.-based camping business.
The following table summarizes the activity related to the Company’s unrecognized tax benefits:
AmountBalance as of December 31, 2011 $ 29
Increases related to tax positions taken during a prior period 8Increases related to tax positions taken during the current period 3Decreases as a result of a lapse of the applicable statute of limitations (2)Decreases related to tax positions taken during a prior period (1)
Balance as of December 31, 2012 37
Increases related to tax positions taken during a prior period 7Increases related to tax positions taken during the current period 5Decreases related to settlements with taxing authorities (4)Decreases as a result of a lapse of the applicable statute of limitations (8)Decreases related to tax positions taken during a prior period (1)
Balance as of December 31, 2013 36
Increases related to tax positions taken during a prior period 5Increases related to tax positions taken during the current period 4Decreases related to settlements with taxing authorities (1)Decreases as a result of a lapse of the applicable statute of limitations (7)Decreases related to tax positions taken during a prior period (2)
Balance as of December 31, 2014 $ 35
The gross amount of the unrecognized tax benefits as of December 31, 2014, 2013 and 2012 that, if recognized, would affect the Company’s effective taxrate was $35 million, $36 million and $36 million, respectively. The Company recorded both accrued interest and penalties related to unrecognized taxbenefits as a component of provision for income taxes on the Consolidated Statements of Income. The Company also accrued potential penalties and interestof $4 million, $2 million and $2 million related to these unrecognized tax benefits during 2014, 2013 and 2012, respectively. As of December 31, 2014,2013 and 2012, the Company had recorded a liability for potential penalties of $4 million, $3 million and $3 million, respectively, and interest of $5 million,$4 million and $4 million, respectively, as a component of accrued expenses and other current liabilities and other non-current liabilities on theConsolidated Balance Sheets. The Company does not expect the unrecognized tax benefits to change significantly over the next 12 months.
F-22
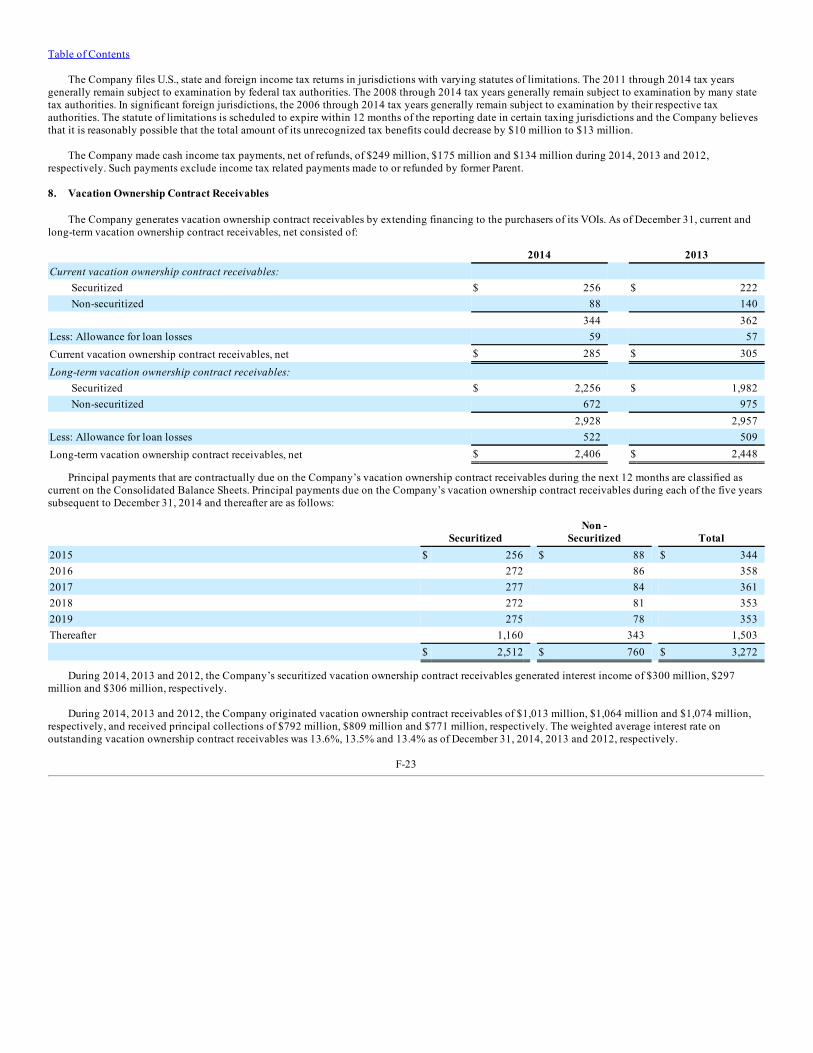
Table of Contents
The Company files U.S., state and foreign income tax returns in jurisdictions with varying statutes of limitations. The 2011 through 2014 tax yearsgenerally remain subject to examination by federal tax authorities. The 2008 through 2014 tax years generally remain subject to examination by many statetax authorities. In significant foreign jurisdictions, the 2006 through 2014 tax years generally remain subject to examination by their respective taxauthorities. The statute of limitations is scheduled to expire within 12 months of the reporting date in certain taxing jurisdictions and the Company believesthat it is reasonably possible that the total amount of its unrecognized tax benefits could decrease by $10 million to $13 million.
The Company made cash income tax payments, net of refunds, of $249 million, $175 million and $134 million during 2014, 2013 and 2012,respectively. Such payments exclude income tax related payments made to or refunded by former Parent.
8. Vacation Ownership Contract Receivables
The Company generates vacation ownership contract receivables by extending financing to the purchasers of its VOIs. As of December 31, current andlong-term vacation ownership contract receivables, net consisted of:
2014 2013Current vacation ownership contract receivables:
Securitized $ 256 $ 222Non-securitized 88 140
344 362Less: Allowance for loan losses 59 57Current vacation ownership contract receivables, net $ 285 $ 305
Long-term vacation ownership contract receivables: Securitized $ 2,256 $ 1,982Non-securitized 672 975
2,928 2,957Less: Allowance for loan losses 522 509Long-term vacation ownership contract receivables, net $ 2,406 $ 2,448
Principal payments that are contractually due on the Company’s vacation ownership contract receivables during the next 12 months are classified ascurrent on the Consolidated Balance Sheets. Principal payments due on the Company’s vacation ownership contract receivables during each of the five yearssubsequent to December 31, 2014 and thereafter are as follows:
Securitized Non -
Securitized Total2015 $ 256 $ 88 $ 3442016 272 86 3582017 277 84 3612018 272 81 3532019 275 78 353Thereafter 1,160 343 1,503 $ 2,512 $ 760 $ 3,272
During 2014, 2013 and 2012, the Company’s securitized vacation ownership contract receivables generated interest income of $300 million, $297million and $306 million, respectively.
During 2014, 2013 and 2012, the Company originated vacation ownership contract receivables of $1,013 million, $1,064 million and $1,074 million,respectively, and received principal collections of $792 million, $809 million and $771 million, respectively. The weighted average interest rate onoutstanding vacation ownership contract receivables was 13.6%, 13.5% and 13.4% as of December 31, 2014, 2013 and 2012, respectively.
F-23
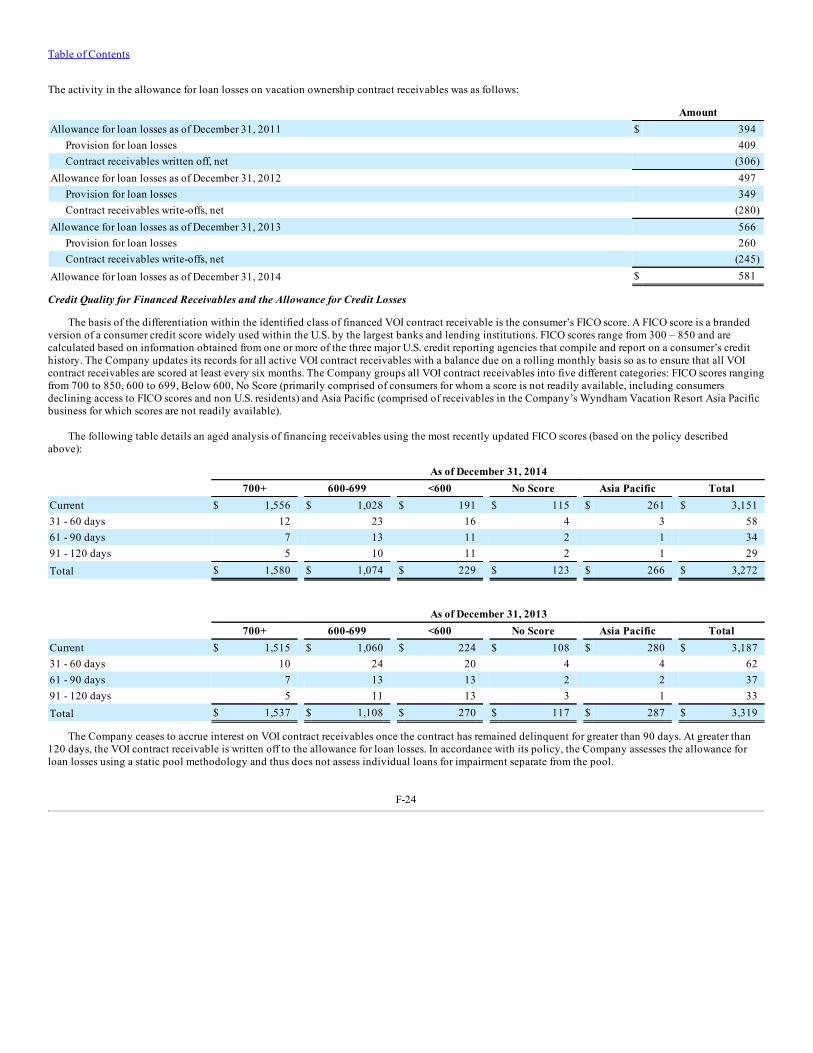
Table of Contents
The activity in the allowance for loan losses on vacation ownership contract receivables was as follows:
AmountAllowance for loan losses as of December 31, 2011 $ 394
Provision for loan losses 409Contract receivables written off, net (306)
Allowance for loan losses as of December 31, 2012 497Provision for loan losses 349Contract receivables write-offs, net (280)
Allowance for loan losses as of December 31, 2013 566Provision for loan losses 260Contract receivables write-offs, net (245)
Allowance for loan losses as of December 31, 2014 $ 581
Credit Quality for Financed Receivables and the Allowance for Credit Losses
The basis of the differentiation within the identified class of financed VOI contract receivable is the consumer’s FICO score. A FICO score is a brandedversion of a consumer credit score widely used within the U.S. by the largest banks and lending institutions. FICO scores range from 300 – 850 and arecalculated based on information obtained from one or more of the three major U.S. credit reporting agencies that compile and report on a consumer’s credithistory. The Company updates its records for all active VOI contract receivables with a balance due on a rolling monthly basis so as to ensure that all VOIcontract receivables are scored at least every six months. The Company groups all VOI contract receivables into five different categories: FICO scores rangingfrom 700 to 850, 600 to 699, Below 600, No Score (primarily comprised of consumers for whom a score is not readily available, including consumersdeclining access to FICO scores and non U.S. residents) and Asia Pacific (comprised of receivables in the Company’s Wyndham Vacation Resort Asia Pacificbusiness for which scores are not readily available).
The following table details an aged analysis of financing receivables using the most recently updated FICO scores (based on the policy describedabove):
As of December 31, 2014 700+ 600-699 <600 No Score Asia Pacific TotalCurrent $ 1,556 $ 1,028 $ 191 $ 115 $ 261 $ 3,15131 - 60 days 12 23 16 4 3 5861 - 90 days 7 13 11 2 1 3491 - 120 days 5 10 11 2 1 29Total $ 1,580 $ 1,074 $ 229 $ 123 $ 266 $ 3,272
As of December 31, 2013 700+ 600-699 <600 No Score Asia Pacific TotalCurrent $ 1,515 $ 1,060 $ 224 $ 108 $ 280 $ 3,18731 - 60 days 10 24 20 4 4 6261 - 90 days 7 13 13 2 2 3791 - 120 days 5 11 13 3 1 33Total $ 1,537 $ 1,108 $ 270 $ 117 $ 287 $ 3,319
The Company ceases to accrue interest on VOI contract receivables once the contract has remained delinquent for greater than 90 days. At greater than120 days, the VOI contract receivable is written off to the allowance for loan losses. In accordance with its policy, the Company assesses the allowance forloan losses using a static pool methodology and thus does not assess individual loans for impairment separate from the pool.
F-24
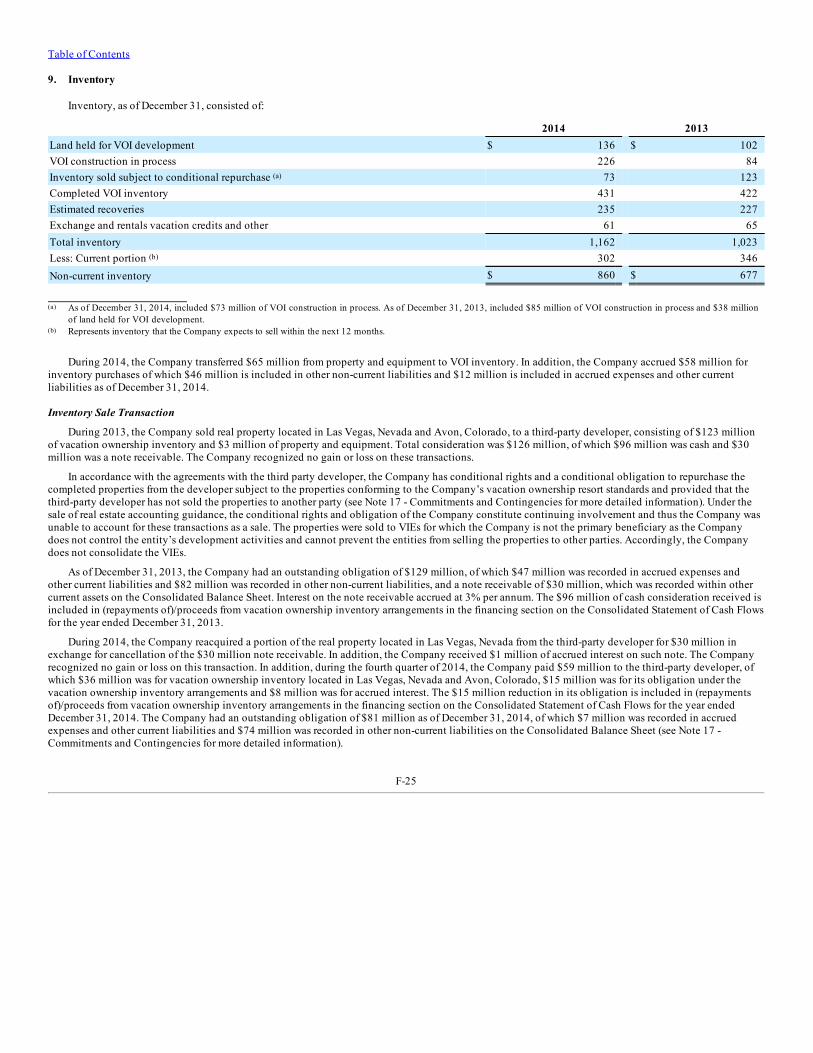
Table of Contents
9. Inventory
Inventory, as of December 31, consisted of:
2014 2013Land held for VOI development $ 136 $ 102VOI construction in process 226 84Inventory sold subject to conditional repurchase (a) 73 123Completed VOI inventory 431 422Estimated recoveries 235 227Exchange and rentals vacation credits and other 61 65Total inventory 1,162 1,023Less: Current portion (b) 302 346Non-current inventory $ 860 $ 677
(a) As of December 31, 2014, included $73 million of VOI construction in process. As of December 31, 2013, included $85 million of VOI construction in process and $38 millionof land held for VOI development.
(b) Represents inventory that the Company expects to sell within the next 12 months.
During 2014, the Company transferred $65 million from property and equipment to VOI inventory. In addition, the Company accrued $58 million forinventory purchases of which $46 million is included in other non-current liabilities and $12 million is included in accrued expenses and other currentliabilities as of December 31, 2014.
Inventory Sale Transaction
During 2013, the Company sold real property located in Las Vegas, Nevada and Avon, Colorado, to a third-party developer, consisting of $123 millionof vacation ownership inventory and $3 million of property and equipment. Total consideration was $126 million, of which $96 million was cash and $30million was a note receivable. The Company recognized no gain or loss on these transactions.
In accordance with the agreements with the third party developer, the Company has conditional rights and a conditional obligation to repurchase thecompleted properties from the developer subject to the properties conforming to the Company’s vacation ownership resort standards and provided that thethird-party developer has not sold the properties to another party (see Note 17 - Commitments and Contingencies for more detailed information). Under thesale of real estate accounting guidance, the conditional rights and obligation of the Company constitute continuing involvement and thus the Company wasunable to account for these transactions as a sale. The properties were sold to VIEs for which the Company is not the primary beneficiary as the Companydoes not control the entity’s development activities and cannot prevent the entities from selling the properties to other parties. Accordingly, the Companydoes not consolidate the VIEs.
As of December 31, 2013, the Company had an outstanding obligation of $129 million, of which $47 million was recorded in accrued expenses andother current liabilities and $82 million was recorded in other non-current liabilities, and a note receivable of $30 million, which was recorded within othercurrent assets on the Consolidated Balance Sheet. Interest on the note receivable accrued at 3% per annum. The $96 million of cash consideration received isincluded in (repayments of)/proceeds from vacation ownership inventory arrangements in the financing section on the Consolidated Statement of Cash Flowsfor the year ended December 31, 2013.
During 2014, the Company reacquired a portion of the real property located in Las Vegas, Nevada from the third-party developer for $30 million inexchange for cancellation of the $30 million note receivable. In addition, the Company received $1 million of accrued interest on such note. The Companyrecognized no gain or loss on this transaction. In addition, during the fourth quarter of 2014, the Company paid $59 million to the third-party developer, ofwhich $36 million was for vacation ownership inventory located in Las Vegas, Nevada and Avon, Colorado, $15 million was for its obligation under thevacation ownership inventory arrangements and $8 million was for accrued interest. The $15 million reduction in its obligation is included in (repaymentsof)/proceeds from vacation ownership inventory arrangements in the financing section on the Consolidated Statement of Cash Flows for the year endedDecember 31, 2014. The Company had an outstanding obligation of $81 million as of December 31, 2014, of which $7 million was recorded in accruedexpenses and other current liabilities and $74 million was recorded in other non-current liabilities on the Consolidated Balance Sheet (see Note 17 -Commitments and Contingencies for more detailed information).
F-25
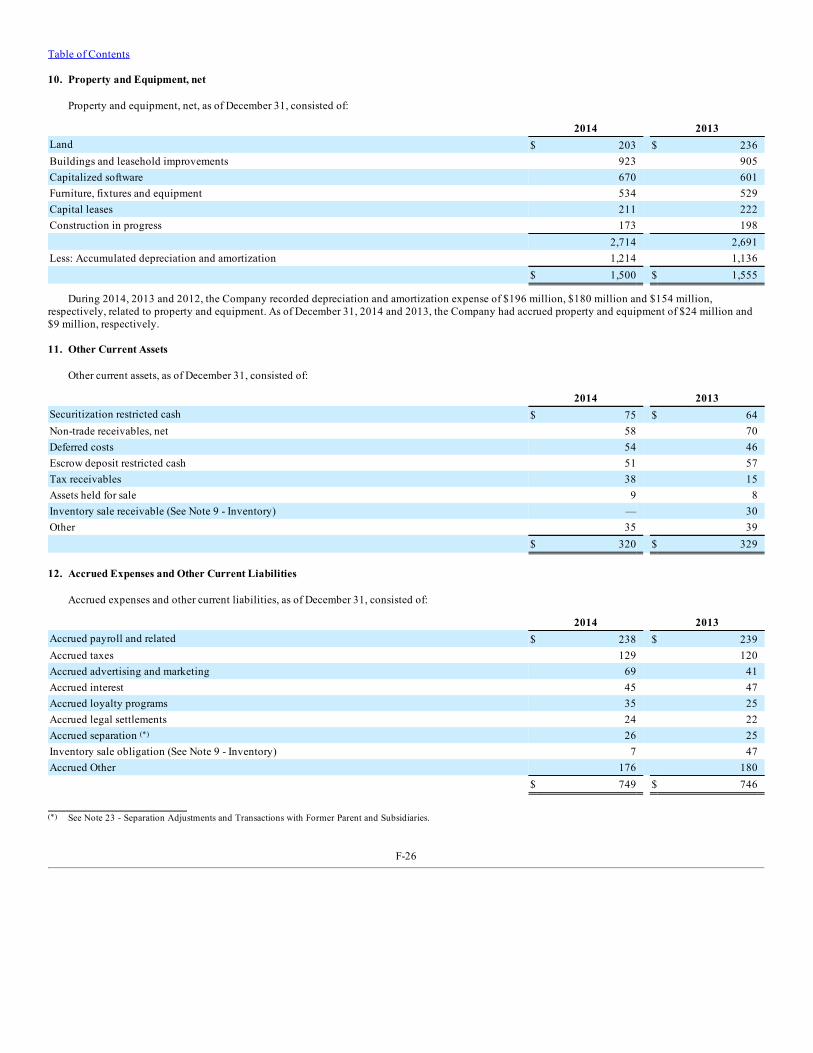
Table of Contents
10. Property and Equipment, net
Property and equipment, net, as of December 31, consisted of:
2014 2013Land $ 203 $ 236Buildings and leasehold improvements 923 905Capitalized software 670 601Furniture, fixtures and equipment 534 529Capital leases 211 222Construction in progress 173 198 2,714 2,691Less: Accumulated depreciation and amortization 1,214 1,136 $ 1,500 $ 1,555
During 2014, 2013 and 2012, the Company recorded depreciation and amortization expense of $196 million, $180 million and $154 million,respectively, related to property and equipment. As of December 31, 2014 and 2013, the Company had accrued property and equipment of $24 million and$9 million, respectively.
11. Other Current Assets
Other current assets, as of December 31, consisted of:
2014 2013Securitization restricted cash $ 75 $ 64Non-trade receivables, net 58 70Deferred costs 54 46Escrow deposit restricted cash 51 57Tax receivables 38 15Assets held for sale 9 8Inventory sale receivable (See Note 9 - Inventory) — 30Other 35 39 $ 320 $ 329
12. Accrued Expenses and Other Current Liabilities
Accrued expenses and other current liabilities, as of December 31, consisted of:
2014 2013Accrued payroll and related $ 238 $ 239Accrued taxes 129 120Accrued advertising and marketing 69 41Accrued interest 45 47Accrued loyalty programs 35 25Accrued legal settlements 24 22Accrued separation (*) 26 25Inventory sale obligation (See Note 9 - Inventory) 7 47Accrued Other 176 180 $ 749 $ 746
(*) See Note 23 - Separation Adjustments and Transactions with Former Parent and Subsidiaries.
F-26
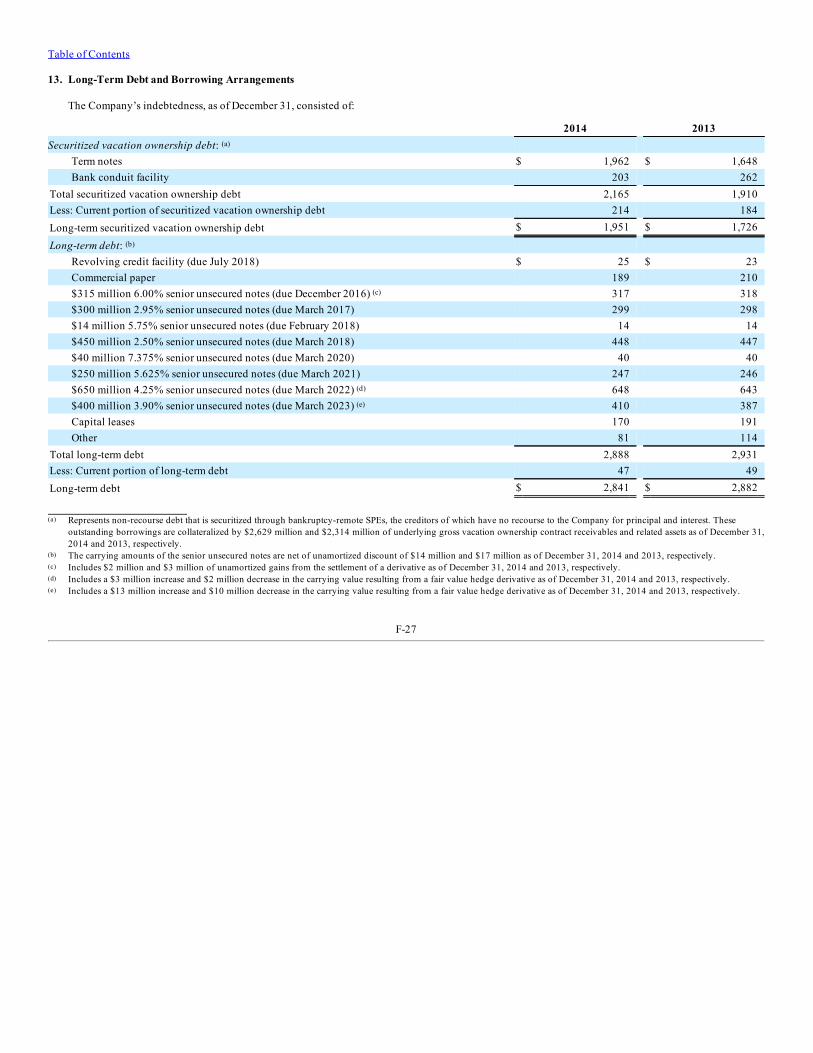
Table of Contents
13. Long-Term Debt and Borrowing Arrangements
The Company’s indebtedness, as of December 31, consisted of:
2014 2013Securitized vacation ownership debt: (a)
Term notes $ 1,962 $ 1,648Bank conduit facility 203 262
Total securitized vacation ownership debt 2,165 1,910Less: Current portion of securitized vacation ownership debt 214 184Long-term securitized vacation ownership debt $ 1,951 $ 1,726
Long-term debt: (b) Revolving credit facility (due July 2018) $ 25 $ 23Commercial paper 189 210$315 million 6.00% senior unsecured notes (due December 2016) (c) 317 318$300 million 2.95% senior unsecured notes (due March 2017) 299 298$14 million 5.75% senior unsecured notes (due February 2018) 14 14$450 million 2.50% senior unsecured notes (due March 2018) 448 447$40 million 7.375% senior unsecured notes (due March 2020) 40 40$250 million 5.625% senior unsecured notes (due March 2021) 247 246$650 million 4.25% senior unsecured notes (due March 2022) (d) 648 643$400 million 3.90% senior unsecured notes (due March 2023) (e) 410 387Capital leases 170 191Other 81 114
Total long-term debt 2,888 2,931Less: Current portion of long-term debt 47 49Long-term debt $ 2,841 $ 2,882
(a) Represents non-recourse debt that is securitized through bankruptcy-remote SPEs, the creditors of which have no recourse to the Company for principal and interest. Theseoutstanding borrowings are collateralized by $2,629 million and $2,314 million of underlying gross vacation ownership contract receivables and related assets as of December 31,2014 and 2013, respectively.
(b) The carrying amounts of the senior unsecured notes are net of unamortized discount of $14 million and $17 million as of December 31, 2014 and 2013, respectively.(c) Includes $2 million and $3 million of unamortized gains from the settlement of a derivative as of December 31, 2014 and 2013, respectively.(d) Includes a $3 million increase and $2 million decrease in the carrying value resulting from a fair value hedge derivative as of December 31, 2014 and 2013, respectively.(e) Includes a $13 million increase and $10 million decrease in the carrying value resulting from a fair value hedge derivative as of December 31, 2014 and 2013, respectively.
F-27
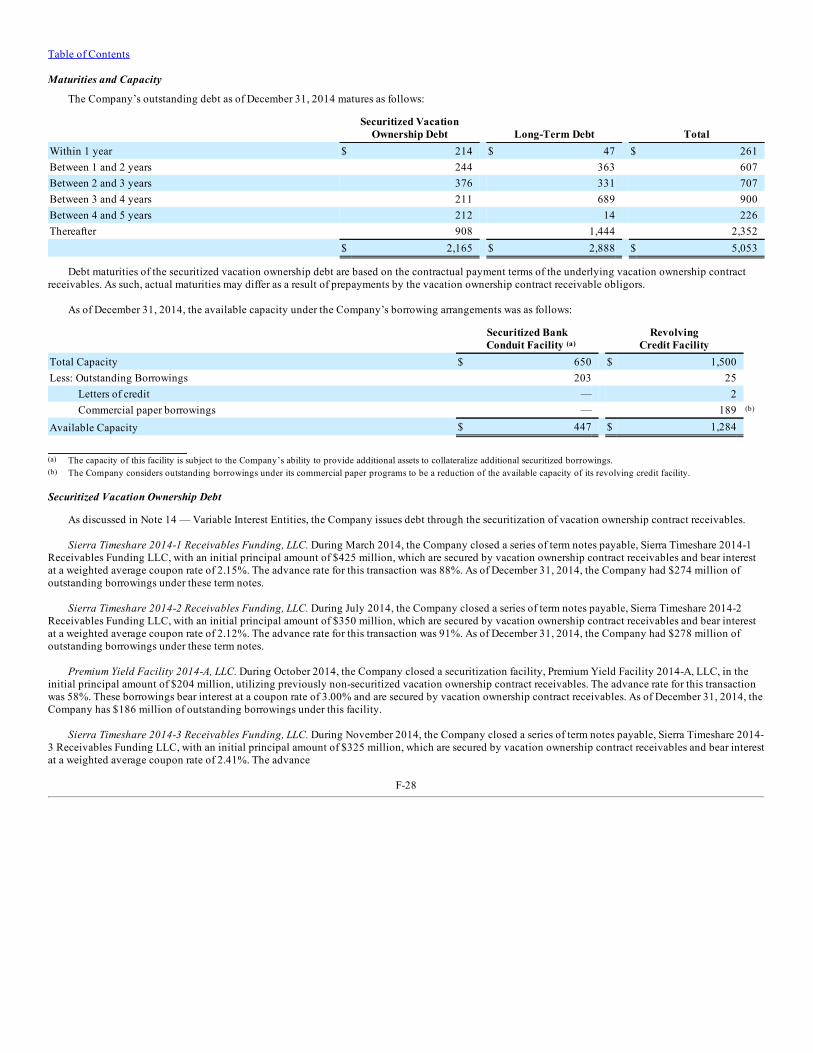
Table of Contents
Maturities and Capacity
The Company’s outstanding debt as of December 31, 2014 matures as follows:
Securitized Vacation
Ownership Debt Long-Term Debt TotalWithin 1 year $ 214 $ 47 $ 261Between 1 and 2 years 244 363 607Between 2 and 3 years 376 331 707Between 3 and 4 years 211 689 900Between 4 and 5 years 212 14 226Thereafter 908 1,444 2,352 $ 2,165 $ 2,888 $ 5,053
Debt maturities of the securitized vacation ownership debt are based on the contractual payment terms of the underlying vacation ownership contractreceivables. As such, actual maturities may differ as a result of prepayments by the vacation ownership contract receivable obligors.
As of December 31, 2014, the available capacity under the Company’s borrowing arrangements was as follows:
Securitized Bank
Conduit Facility (a) Revolving
Credit Facility Total Capacity $ 650 $ 1,500 Less: Outstanding Borrowings 203 25
Letters of credit — 2 Commercial paper borrowings — 189 (b)
Available Capacity $ 447 $ 1,284
(a) The capacity of this facility is subject to the Company’s ability to provide additional assets to collateralize additional securitized borrowings.(b) The Company considers outstanding borrowings under its commercial paper programs to be a reduction of the available capacity of its revolving credit facility.
Securitized Vacation Ownership Debt
As discussed in Note 14 — Variable Interest Entities, the Company issues debt through the securitization of vacation ownership contract receivables.
Sierra Timeshare 2014-1 Receivables Funding, LLC. During March 2014, the Company closed a series of term notes payable, Sierra Timeshare 2014-1Receivables Funding LLC, with an initial principal amount of $425 million, which are secured by vacation ownership contract receivables and bear interestat a weighted average coupon rate of 2.15%. The advance rate for this transaction was 88%. As of December 31, 2014, the Company had $274 million ofoutstanding borrowings under these term notes.
Sierra Timeshare 2014-2 Receivables Funding, LLC. During July 2014, the Company closed a series of term notes payable, Sierra Timeshare 2014-2Receivables Funding LLC, with an initial principal amount of $350 million, which are secured by vacation ownership contract receivables and bear interestat a weighted average coupon rate of 2.12%. The advance rate for this transaction was 91%. As of December 31, 2014, the Company had $278 million ofoutstanding borrowings under these term notes.
Premium Yield Facility 2014-A, LLC. During October 2014, the Company closed a securitization facility, Premium Yield Facility 2014-A, LLC, in theinitial principal amount of $204 million, utilizing previously non-securitized vacation ownership contract receivables. The advance rate for this transactionwas 58%. These borrowings bear interest at a coupon rate of 3.00% and are secured by vacation ownership contract receivables. As of December 31, 2014, theCompany has $186 million of outstanding borrowings under this facility.
Sierra Timeshare 2014-3 Receivables Funding, LLC. During November 2014, the Company closed a series of term notes payable, Sierra Timeshare 2014-3 Receivables Funding LLC, with an initial principal amount of $325 million, which are secured by vacation ownership contract receivables and bear interestat a weighted average coupon rate of 2.41%. The advance
F-28
Table of Contents
rate for this transaction was 88.5%. As of December 31, 2014, the Company had $302 million of outstanding borrowings under these term notes.
As of December 31, 2014, the Company had $922 million of outstanding borrowings under term notes entered into prior to December 31, 2013.
The Company’s securitized term notes include fixed and floating rate term notes for which the weighted average interest rate was 3.7%, 4.2% and 4.9%during 2014, 2013 and 2012, respectively.
Sierra Timeshare Conduit Receivables Funding II, LLC. During August 2014, the Company renewed its securitized timeshare receivables conduitfacility for a two-year period through August 2016. The facility has a total capacity of $650 million and bears interest at variable rates based on commercialpaper rates and LIBOR rates plus a spread. The bank conduit facility had a weighted average interest rate of 3.4%, 3.9% and 3.8% during 2014, 2013 and2012, respectively.
As of December 31, 2014, the Company’s securitized vacation ownership debt of $2,165 million is collateralized by $2,629 million of underlying grossvacation ownership contract receivables and related assets. Additional usage of the capacity of the Company’s bank conduit facility is subject to theCompany’s ability to provide additional assets to collateralize such facility. The combined weighted average interest rate on the Company’s total securitizedvacation ownership debt was 3.7%, 4.2% and 4.8% during 2014, 2013 and 2012, respectively.
Long-Term Debt
Revolving Credit Facility. During May 2013, the Company replaced its $1.0 billion revolving credit facility with a $1.5 billion five-year revolvingcredit facility that expires on July 15, 2018. This facility is subject to a fee of 20 basis points based on total capacity and bears interest at LIBOR plus 130basis points on outstanding borrowings. The facility fee and interest rate are dependent on the Company’s credit ratings. The available capacity of the facilityalso supports the Company’s commercial paper programs.
Commercial Paper. The Company maintains U.S. and European commercial paper programs with a total capacity of $750 million and $500 million,respectively. The maturities of U.S. and European commercial paper notes will vary, but may not exceed 366 days and 364 days, respectively, from the dateof issue. As of December 31, 2014, the Company had outstanding borrowings of $189 million at a weighted average rate of 0.89%, all of which was under itsU.S. commercial paper program. As of December 31, 2013, the Company had $210 million of outstanding borrowings at a weighted average interest rate of0.74% under its commercial paper programs. The Company considers outstanding borrowings under its commercial paper programs to be a reduction ofavailable capacity on its revolving credit facility.
The commercial paper notes are sold at a discount from par or will bear interest at a negotiated rate. While outstanding commercial paper borrowingsgenerally have short-term maturities, the Company classifies the outstanding borrowings as long-term debt based on its intent and ability to refinance theoutstanding borrowings on a long-term basis with its revolving credit facility.
As of December 31, 2014, the Company had $2,423 million of outstanding senior unsecured notes issued prior to December 31, 2013. Interest is payablesemi-annually in arrears on the notes. The notes are redeemable at the Company’s option at any time, in whole or in part, at the stated redemption prices plusaccrued interest through the redemption dates. These notes rank equally in right of payment with all of the Company’s other senior unsecured indebtedness.
Vacation Rental Capital Leases. The Company leases vacation homes located in European holiday parks as part of its vacation exchange and rentalsbusiness. The majority of these leases are recorded as capital lease obligations with corresponding assets classified within property and equipment, net on theConsolidated Balance Sheets. Such capital lease obligations had a weighted average interest rate of 4.5% during each of 2014, 2013 and 2012.
Capital Lease. During the first quarter of 2013, the Company extended the lease on its Corporate headquarters. As a result of this extension, theCompany classified the lease as a capital lease and recorded a capital lease obligation of $85 million with a corresponding capital lease asset which wasrecorded net of deferred rent. Such transaction was non-cash and as such, is excluded from both investing and financing activities within the Company’sConsolidated Statement of Cash Flows. Such capital lease had an interest rate of 4.5% during both 2014 and 2013.
Other. During January 2013, the Company entered into an agreement with a third-party partner whereby the partner acquired Midtown 45 through anSPE. The SPE financed the purchase with a $115 million four-year mortgage note, provided
F-29
Table of Contents
by related parties of such partner. The note accrues interest at 4.5% and the principal and interest are payable semi-annually, commencing on July 24, 2013.In addition, $9 million of mandatorily redeemable equity of the SPE was classified as long-term debt. As of December 31, 2014, $71 million of the four-yearmortgage note and $6 million of mandatorily redeemable equity were outstanding. As of December 31, 2013, $99 million of the four-year mortgage note and$8 million of mandatorily redeemable equity were outstanding. See Note 14 - Variable Interest Entities for more detailed information.
Fair Value Hedges. The Company has pay-variable/receive-fixed interest rate swap agreements on its 3.90% and 4.25% senior unsecured notes withnotional amounts of $400 million and $100 million, respectively. The fixed interest rates on these notes were effectively modified to a variable LIBOR-basedindex. As of December 31, 2014, the variable interest rates on the notional portion of the 3.90% and 4.25% senior unsecured notes were 2.38% and 2.29%,respectively. The aggregate fair value of these interest rate swap agreements resulted in $18 million of assets and $12 million of liabilities as of December 31,2014 and 2013, respectively. Such assets and liabilities are included in other non-current assets and in other non-current liabilities, respectively, on theConsolidated Balance Sheets.
3.50% Convertible Notes. During May 2009, the Company issued convertible notes (“Convertible Notes”) with face value of $230 million and bearinginterest at a rate of 3.50%, for net proceeds of $224 million. The Company accounted for the conversion feature as a derivative instrument under the guidancefor derivatives and bifurcated such conversion feature from the Convertible Notes for accounting purposes. The fair value of the Bifurcated ConversionFeature on the issuance date of the Convertible Notes was recorded as original issue discount for purposes of accounting for the debt component of theConvertible Notes. Therefore, interest expense greater than the coupon rate of 3.50% was recognized by the Company primarily resulting from the accretionof the discounted carrying value of the Convertible Notes to their face amount over the term of the Convertible Notes. Concurrent with the issuance of theConvertible Notes, the Company entered into convertible note hedge and warrant transactions with certain counterparties. During 2012, the Company repaidupon maturity, its remaining Convertible Notes with a carrying value of $45 million ($12 million for the Convertible Notes and $33 million for a relatedBifurcated Conversion Feature). Concurrent with the repayment, the Company settled the Call Options for proceeds of $33 million. As a result of thesetransactions, the Company made a net payment of $12 million.
Early Extinguishment of Debt
During 2013, the Company repurchased a portion of its 5.75% and 7.375% senior unsecured notes totaling $446 million through tender offers,repurchased $42 million of its 6.00% senior unsecured notes on the open market and executed a redemption option for the remaining $43 millionoutstanding on its 9.875% senior unsecured notes. As a result, during 2013, the Company repurchased a total of $531 million of its outstanding seniorunsecured notes and incurred expenses of $111 million which is included within early extinguishment of debt on the Consolidated Statement of Income.
During 2012, the Company repurchased $443 million of its 6.00% and $207 million of its 9.875% senior unsecured notes totaling $650 million throughtender offers. In connection with these tender offers, the Company incurred a loss of $108 million, which is included within early extinguishment of debt onthe Consolidated Statement of Income.
Interest Expense
The Company incurred non-securitized interest expense of $113 million during 2014. Such amount consisted primarily of interest on long-term debt,partially offset by $6 million of capitalized interest and $2 million of gains resulting from the ineffectiveness of the fair value hedges. Such amounts areincluded within interest expense on the Consolidated Statement of Income. Cash paid related to interest on the Company’s non-securitized debt was $119million.
The Company incurred non-securitized interest expense of $131 million during 2013. Such amount consisted primarily of interest on long-term debt,partially offset by $5 million of capitalized interest and is recorded within interest expense on the Consolidated Statement of Income. Cash paid related tointerest on the Company’s non-securitized debt was $127 million.
The Company incurred non-securitized interest expense of $132 million during 2012. Such amount consisted primarily of interest on long-term debt,partially offset by $5 million of capitalized interest and is recorded within interest expense on the Consolidated Statement of Income. Cash paid related tointerest on the Company’s non-securitized debt was $120 million.
Interest expense incurred in connection with the Company’s securitized vacation ownership debt was $71 million, $78 million and $90 million during2014, 2013 and 2012, respectively, and is recorded within consumer financing interest on the Consolidated Statements of Income. Cash paid related to suchinterest was $53 million, $61 million and $73 million during 2014, 2013 and 2012, respectively.
F-30
Table of Contents
14. Variable Interest Entities
The Company pools qualifying vacation ownership contract receivables and sells them to bankruptcy-remote entities. Vacation ownership contractreceivables qualify for securitization based primarily on the credit strength of the VOI purchaser to whom financing has been extended. Vacation ownershipcontract receivables are securitized through bankruptcy-remote SPEs that are consolidated within the Consolidated Financial Statements. As a result, theCompany does not recognize gains or losses resulting from these securitizations at the time of sale to the SPEs. Interest income is recognized when earnedover the contractual life of the vacation ownership contract receivables. The Company services the securitized vacation ownership contract receivablespursuant to servicing agreements negotiated on an arms-length basis based on market conditions. The activities of these SPEs are limited to (i) purchasingvacation ownership contract receivables from the Company’s vacation ownership subsidiaries, (ii) issuing debt securities and/or borrowing under a conduitfacility to fund such purchases and (iii) entering into derivatives to hedge interest rate exposure. The bankruptcy-remote SPEs are legally separate from theCompany. The receivables held by the bankruptcy-remote SPEs are not available to creditors of the Company and legally are not assets of the Company.Additionally, the creditors of these SPEs have no recourse to the Company for principal and interest.
The assets and liabilities of these vacation ownership SPEs are as follows:
December 31,
2014 December 31,
2013Securitized contract receivables, gross (a) $ 2,512 $ 2,204Securitized restricted cash (b) 96 92Interest receivables on securitized contract receivables (c) 20 17Other assets (d) 1 1Total SPE assets (e) 2,629 2,314Securitized term notes (f) 1,962 1,648Securitized conduit facilities (f) 203 262Other liabilities (g) 1 2Total SPE liabilities 2,166 1,912SPE assets in excess of SPE liabilities $ 463 $ 402
(a) Included in current ($256 million and $222 million as of December 31, 2014 and 2013, respectively) and non-current ($2,256 million and $1,982 million as of December 31,2014 and 2013, respectively) vacation ownership contract receivables on the Consolidated Balance Sheets.
(b) Included in other current assets ($75 million and $64 million as of December 31, 2014 and 2013, respectively) and other non-current assets ($21 million and $28 million as ofDecember 31, 2014 and 2013, respectively) on the Consolidated Balance Sheets.
(c) Included in trade receivables, net on the Consolidated Balance Sheets.(d) Includes interest rate derivative contracts and related assets; included in other non-current assets on the Consolidated Balance Sheets.(e) Excludes deferred financing costs of $30 million and $28 million as of December 31, 2014 and 2013, respectively, related to securitized debt.(f) Included in current ($214 million and $184 million as of December 31, 2014 and 2013, respectively) and long-term ($1,951 million and $1,726 million as of December 31,
2014 and 2013, respectively) securitized vacation ownership debt on the Consolidated Balance Sheets.(g) Primarily includes accrued interest on securitized debt ($1 million and $2 million as of December 31, 2014 and 2013, respectively) which is included in accrued expenses and
other current liabilities on the Consolidated Balance Sheets.
In addition, the Company has vacation ownership contract receivables that have not been securitized through bankruptcy-remote SPEs. Such grossreceivables were $760 million and $1,115 million as of December 31, 2014 and 2013, respectively. A summary of total vacation ownership receivables andother securitized assets, net of securitized liabilities and the allowance for loan losses, is as follows:
December 31,
2014 December 31,
2013SPE assets in excess of SPE liabilities $ 463 $ 402Non-securitized contract receivables 760 1,115Less: Allowance for loan losses 581 566Total, net $ 642 $ 951
F-31
Table of Contents
Midtown 45, NYC Property
During January 2013, the Company entered into an agreement with a third-party partner whereby the partner acquired Midtown 45 through an SPE. TheCompany is managing and operating the property for rental purposes while the Company converts it into VOI inventory. The SPE financed the acquisitionand planned renovations with a $115 million four-year mortgage note and $9 million of mandatorily redeemable equity provided by related parties of suchpartner. At the time of the agreement, the Company committed to purchase such VOI inventory from the SPE over a four-year period in the amount of $146million, of which $124 million will be used to repay the four-year mortgage note and the mandatorily redeemable equity of the SPE. The Company isconsidered to be the primary beneficiary of the SPE and therefore, the Company consolidated the SPE within its financial statements.
The assets and liabilities of the SPE are as follows:
December 31,
2014 December 31,
2013Cash $ — $ 4Property and equipment, net 64 111Total SPE assets 64 115Accrued expenses and other current liabilities 1 2Long-term debt (*) 77 107Total SPE liabilities 78 109SPE (deficit)/equity $ (14) $ 6
(*) As of December 31, 2014, included $71 million for a four-year mortgage note and $6 million of mandatorily redeemable equity, of which $31 million was included in currentportion of long-term debt on the Consolidated Balance Sheet. As of December 31, 2013, included $99 million for a four-year mortgage note and $8 million of mandatorilyredeemable equity, of which $30 million was included in current portion of long-term debt on the Consolidated Balance Sheet.
During 2014, the SPE conveyed $51 million of property and equipment to the Company, of which $24 million was subsequently transferred to VOIinventory.
15. Fair Value
The following table presents information about the Company’s financial assets and liabilities that are measured at fair value on a recurring basis andindicates the fair value hierarchy of the valuation techniques utilized by the Company to determine such fair values. Financial assets and liabilities carried atfair value are classified and disclosed in one of the following three categories:
Level 1: Quoted prices for identical instruments in active markets.
Level 2: Quoted prices for similar instruments in active markets; quoted prices for identical or similar instruments in markets that are not active; andmodel-derived valuations whose inputs are observable or whose significant value driver is observable.
Level 3: Unobservable inputs used when little or no market data is available.
In certain cases, the inputs used to measure fair value may fall into different levels of the fair value hierarchy. In such cases, the level in the fair valuehierarchy within which the fair value measurement falls has been determined based on the lowest level input (closest to Level 3) that is significant to the fairvalue measurement. The Company’s assessment of the significance of a particular input to the fair value measurement in its entirety requires judgment, andconsiders factors specific to the asset or liability.
F-32
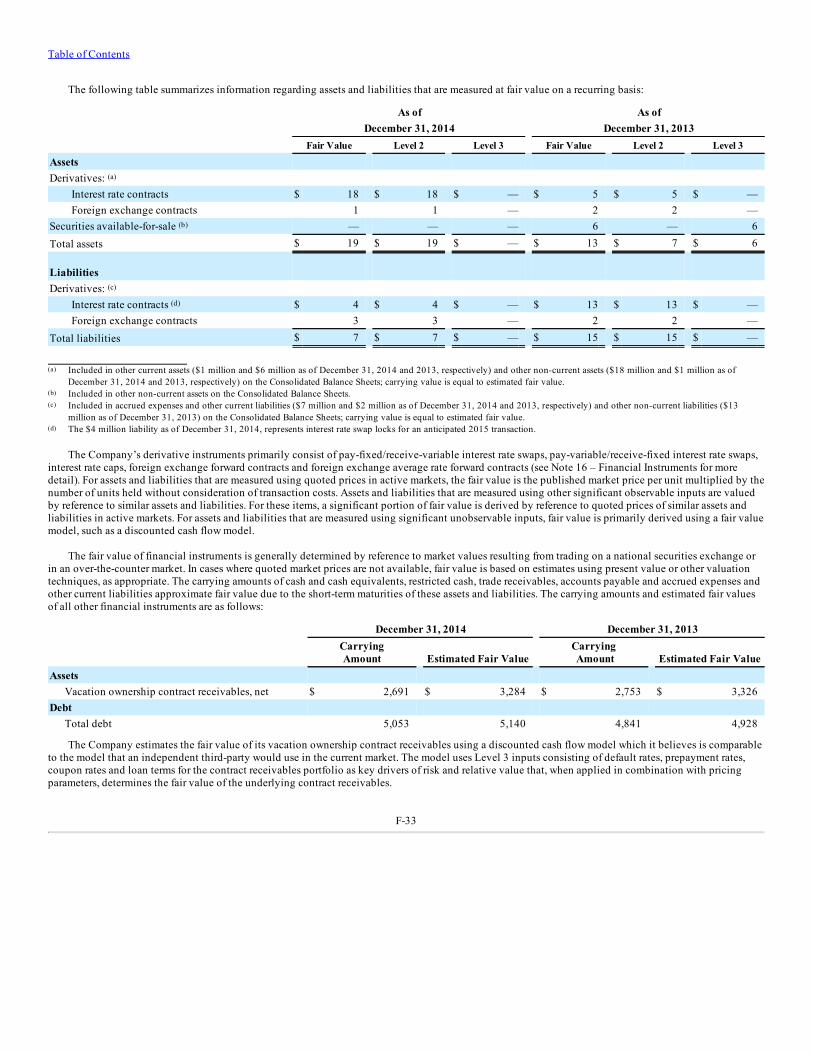
Table of Contents
The following table summarizes information regarding assets and liabilities that are measured at fair value on a recurring basis:
As of As of December 31, 2014 December 31, 2013 Fair Value Level 2 Level 3 Fair Value Level 2 Level 3
Assets Derivatives: (a)
Interest rate contracts $ 18 $ 18 $ — $ 5 $ 5 $ —Foreign exchange contracts 1 1 — 2 2 —
Securities available-for-sale (b) — — — 6 — 6Total assets $ 19 $ 19 $ — $ 13 $ 7 $ 6
Liabilities Derivatives: (c)
Interest rate contracts (d) $ 4 $ 4 $ — $ 13 $ 13 $ —Foreign exchange contracts 3 3 — 2 2 —
Total liabilities $ 7 $ 7 $ — $ 15 $ 15 $ —
(a) Included in other current assets ($1 million and $6 million as of December 31, 2014 and 2013, respectively) and other non-current assets ($18 million and $1 million as ofDecember 31, 2014 and 2013, respectively) on the Consolidated Balance Sheets; carrying value is equal to estimated fair value.
(b) Included in other non-current assets on the Consolidated Balance Sheets.(c) Included in accrued expenses and other current liabilities ($7 million and $2 million as of December 31, 2014 and 2013, respectively) and other non-current liabilities ($13
million as of December 31, 2013) on the Consolidated Balance Sheets; carrying value is equal to estimated fair value.(d) The $4 million liability as of December 31, 2014, represents interest rate swap locks for an anticipated 2015 transaction.
The Company’s derivative instruments primarily consist of pay-fixed/receive-variable interest rate swaps, pay-variable/receive-fixed interest rate swaps,interest rate caps, foreign exchange forward contracts and foreign exchange average rate forward contracts (see Note 16 – Financial Instruments for moredetail). For assets and liabilities that are measured using quoted prices in active markets, the fair value is the published market price per unit multiplied by thenumber of units held without consideration of transaction costs. Assets and liabilities that are measured using other significant observable inputs are valuedby reference to similar assets and liabilities. For these items, a significant portion of fair value is derived by reference to quoted prices of similar assets andliabilities in active markets. For assets and liabilities that are measured using significant unobservable inputs, fair value is primarily derived using a fair valuemodel, such as a discounted cash flow model.
The fair value of financial instruments is generally determined by reference to market values resulting from trading on a national securities exchange orin an over-the-counter market. In cases where quoted market prices are not available, fair value is based on estimates using present value or other valuationtechniques, as appropriate. The carrying amounts of cash and cash equivalents, restricted cash, trade receivables, accounts payable and accrued expenses andother current liabilities approximate fair value due to the short-term maturities of these assets and liabilities. The carrying amounts and estimated fair valuesof all other financial instruments are as follows:
December 31, 2014 December 31, 2013
CarryingAmount Estimated Fair Value
Carrying Amount Estimated Fair Value
Assets Vacation ownership contract receivables, net $ 2,691 $ 3,284 $ 2,753 $ 3,326
Debt Total debt 5,053 5,140 4,841 4,928
The Company estimates the fair value of its vacation ownership contract receivables using a discounted cash flow model which it believes is comparableto the model that an independent third-party would use in the current market. The model uses Level 3 inputs consisting of default rates, prepayment rates,coupon rates and loan terms for the contract receivables portfolio as key drivers of risk and relative value that, when applied in combination with pricingparameters, determines the fair value of the underlying contract receivables.
F-33
Table of Contents
The Company estimates the fair value of its securitized vacation ownership debt by obtaining Level 2 inputs comprised of indicative bids frominvestment banks that actively issue and facilitate the secondary market for timeshare securities. The Company estimates the fair value of its other long-termdebt, excluding capital leases, using Level 2 inputs based on indicative bids from investment banks and determines the fair value of its senior notes usingquoted market prices (such senior notes are not actively traded).
16. Financial Instruments
The designation of a derivative instrument as a hedge and its ability to meet the hedge accounting criteria determine how the change in fair value of thederivative instrument will be reflected in the Consolidated Financial Statements. A derivative qualifies for hedge accounting if, at inception, the derivative isexpected to be highly effective in offsetting the underlying hedged cash flows or fair value and the hedge documentation standards are fulfilled at the timethe Company enters into the derivative contract. A hedge is designated as a cash flow hedge based on the exposure being hedged. The asset or liability valueof the derivative will change in tandem with its fair value. Changes in fair value, for the effective portion of qualifying hedges, are recorded in AOCI. Thederivative’s gain or loss is released from AOCI to match the timing of the underlying hedged cash flows effect on earnings.
The Company reviews the effectiveness of its hedging instruments on an ongoing basis, recognizes current period hedge ineffectiveness immediately inearnings and discontinues hedge accounting for any hedge that it no longer considers to be highly effective. The Company recognizes changes in fair valuefor derivatives not designated as hedges or those not qualifying for hedge accounting in current period earnings. Upon termination of cash flow hedges, theCompany releases gains and losses from AOCI based on the timing of the underlying cash flows, unless the termination results from the failure of theintended transaction to occur in the expected time frame. Such untimely transactions require the Company to immediately recognize in earnings gains andlosses previously recorded in AOCI.
Changes in interest rates and foreign exchange rates expose the Company to market risk. The Company also uses cash flow hedges as part of its overallstrategy to manage its exposure to market risks associated with fluctuations in interest rates and foreign currency exchange rates. As a matter of policy, theCompany only enters into transactions that it believes will be highly effective at offsetting the underlying risk and it does not use derivatives for trading orspeculative purposes.
The Company uses the following derivative instruments to mitigate its foreign currency exchange rate and interest rate risks:
Foreign Currency Risk
The Company has foreign currency rate exposure to exchange rate fluctuations worldwide with particular exposure to the British pound, Euro, Canadianand Australian dollar. The Company uses freestanding foreign currency forward contracts to manage a portion of its exposure to changes in foreign currencyexchange rates associated with its foreign currency denominated receivables and forecasted earnings of foreign subsidiaries. Additionally, the Company usesforeign currency forward contracts designated as cash flow hedges to manage a portion of its exposure to changes in forecasted foreign currency denominatedvendor payments. The amount of gains or losses relating to contracts designated as cash flow hedges that the Company expects to reclassify from AOCI toearnings over the next 12 months is not material.
Interest Rate Risk
A portion of the debt used to finance the Company’s operations is exposed to interest rate fluctuations. The Company uses various hedging strategiesand derivative financial instruments to create a desired mix of fixed and floating rate assets and liabilities. Derivative instruments currently used in thesehedging strategies include swaps and interest rate caps. The derivatives used to manage the risk associated with the Company’s floating rate debt includefreestanding derivatives and derivatives designated as cash flow hedges. The Company also uses swaps to convert specific fixed-rate debt into variable-ratedebt (i.e., fair value hedges) to manage the overall interest cost. For relationships designated as fair value hedges, changes in fair value of the derivatives arerecorded in income with offsetting adjustments to the carrying amount of the hedged debt. The amount of gains or losses that the Company expects toreclassify from AOCI to earnings during the next 12 months is not material.
F-34
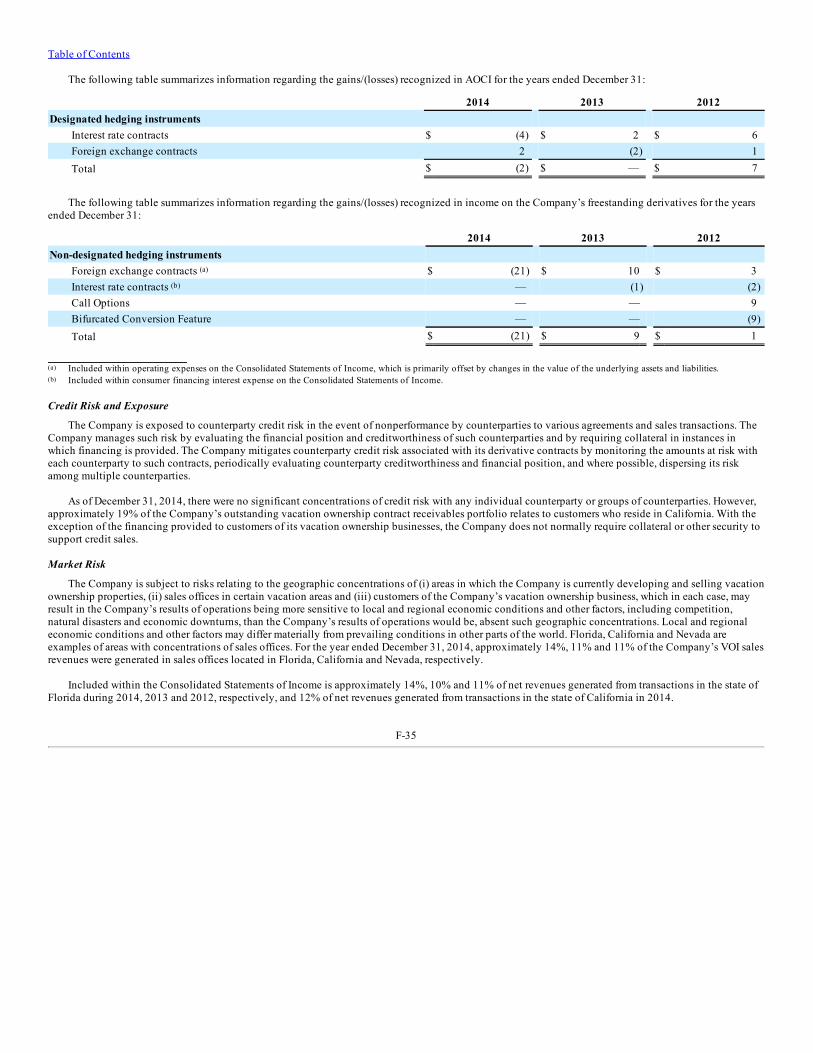
Table of Contents
The following table summarizes information regarding the gains/(losses) recognized in AOCI for the years ended December 31:
2014 2013 2012Designated hedging instruments
Interest rate contracts $ (4) $ 2 $ 6Foreign exchange contracts 2 (2) 1Total $ (2) $ — $ 7
The following table summarizes information regarding the gains/(losses) recognized in income on the Company’s freestanding derivatives for the yearsended December 31:
2014 2013 2012Non-designated hedging instruments
Foreign exchange contracts (a) $ (21) $ 10 $ 3Interest rate contracts (b) — (1) (2)Call Options — — 9Bifurcated Conversion Feature — — (9)Total $ (21) $ 9 $ 1
(a) Included within operating expenses on the Consolidated Statements of Income, which is primarily offset by changes in the value of the underlying assets and liabilities.(b) Included within consumer financing interest expense on the Consolidated Statements of Income.
Credit Risk and Exposure
The Company is exposed to counterparty credit risk in the event of nonperformance by counterparties to various agreements and sales transactions. TheCompany manages such risk by evaluating the financial position and creditworthiness of such counterparties and by requiring collateral in instances inwhich financing is provided. The Company mitigates counterparty credit risk associated with its derivative contracts by monitoring the amounts at risk witheach counterparty to such contracts, periodically evaluating counterparty creditworthiness and financial position, and where possible, dispersing its riskamong multiple counterparties.
As of December 31, 2014, there were no significant concentrations of credit risk with any individual counterparty or groups of counterparties. However,approximately 19% of the Company’s outstanding vacation ownership contract receivables portfolio relates to customers who reside in California. With theexception of the financing provided to customers of its vacation ownership businesses, the Company does not normally require collateral or other security tosupport credit sales.
Market Risk
The Company is subject to risks relating to the geographic concentrations of (i) areas in which the Company is currently developing and selling vacationownership properties, (ii) sales offices in certain vacation areas and (iii) customers of the Company’s vacation ownership business, which in each case, mayresult in the Company’s results of operations being more sensitive to local and regional economic conditions and other factors, including competition,natural disasters and economic downturns, than the Company’s results of operations would be, absent such geographic concentrations. Local and regionaleconomic conditions and other factors may differ materially from prevailing conditions in other parts of the world. Florida, California and Nevada areexamples of areas with concentrations of sales offices. For the year ended December 31, 2014, approximately 14%, 11% and 11% of the Company’s VOI salesrevenues were generated in sales offices located in Florida, California and Nevada, respectively.
Included within the Consolidated Statements of Income is approximately 14%, 10% and 11% of net revenues generated from transactions in the state ofFlorida during 2014, 2013 and 2012, respectively, and 12% of net revenues generated from transactions in the state of California in 2014.
F-35
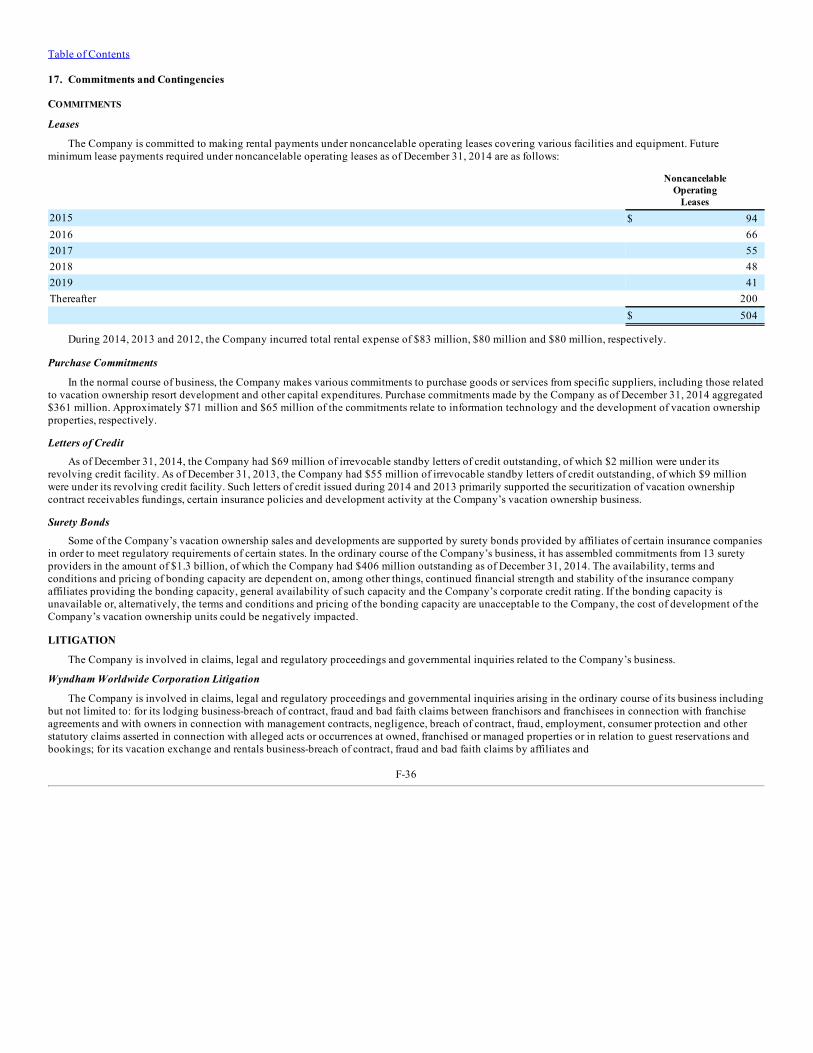
Table of Contents
17. Commitments and Contingencies
COMMITMENTS
Leases
The Company is committed to making rental payments under noncancelable operating leases covering various facilities and equipment. Futureminimum lease payments required under noncancelable operating leases as of December 31, 2014 are as follows:
NoncancelableOperating
Leases2015 $ 942016 662017 552018 482019 41Thereafter 200 $ 504
During 2014, 2013 and 2012, the Company incurred total rental expense of $83 million, $80 million and $80 million, respectively.
Purchase Commitments
In the normal course of business, the Company makes various commitments to purchase goods or services from specific suppliers, including those relatedto vacation ownership resort development and other capital expenditures. Purchase commitments made by the Company as of December 31, 2014 aggregated$361 million. Approximately $71 million and $65 million of the commitments relate to information technology and the development of vacation ownershipproperties, respectively.
Letters of Credit
As of December 31, 2014, the Company had $69 million of irrevocable standby letters of credit outstanding, of which $2 million were under itsrevolving credit facility. As of December 31, 2013, the Company had $55 million of irrevocable standby letters of credit outstanding, of which $9 millionwere under its revolving credit facility. Such letters of credit issued during 2014 and 2013 primarily supported the securitization of vacation ownershipcontract receivables fundings, certain insurance policies and development activity at the Company’s vacation ownership business.
Surety Bonds
Some of the Company’s vacation ownership sales and developments are supported by surety bonds provided by affiliates of certain insurance companiesin order to meet regulatory requirements of certain states. In the ordinary course of the Company’s business, it has assembled commitments from 13 suretyproviders in the amount of $1.3 billion, of which the Company had $406 million outstanding as of December 31, 2014. The availability, terms andconditions and pricing of bonding capacity are dependent on, among other things, continued financial strength and stability of the insurance companyaffiliates providing the bonding capacity, general availability of such capacity and the Company’s corporate credit rating. If the bonding capacity isunavailable or, alternatively, the terms and conditions and pricing of the bonding capacity are unacceptable to the Company, the cost of development of theCompany’s vacation ownership units could be negatively impacted.
LITIGATION
The Company is involved in claims, legal and regulatory proceedings and governmental inquiries related to the Company’s business.
Wyndham Worldwide Corporation Litigation
The Company is involved in claims, legal and regulatory proceedings and governmental inquiries arising in the ordinary course of its business includingbut not limited to: for its lodging business-breach of contract, fraud and bad faith claims between franchisors and franchisees in connection with franchiseagreements and with owners in connection with management contracts, negligence, breach of contract, fraud, employment, consumer protection and otherstatutory claims asserted in connection with alleged acts or occurrences at owned, franchised or managed properties or in relation to guest reservations andbookings; for its vacation exchange and rentals business-breach of contract, fraud and bad faith claims by affiliates and
F-36
Table of Contents
customers in connection with their respective agreements, negligence, breach of contract, fraud, consumer protection and other statutory claims asserted bymembers and guests for alleged injuries sustained at affiliated resorts and vacation rental properties and consumer protection and other statutory claimsasserted by consumers; for its vacation ownership business-breach of contract, bad faith, conflict of interest, fraud, consumer protection and other statutoryclaims by property owners’ associations, owners and prospective owners in connection with the sale or use of VOIs or land, or the management of vacationownership resorts, construction defect claims relating to vacation ownership units or resorts, and negligence, breach of contract, fraud, consumer protectionand other statutory claims by guests for alleged injuries sustained at vacation ownership units or resorts; and for each of its businesses, bankruptcyproceedings involving efforts to collect receivables from a debtor in bankruptcy, employment matters which may include claims of retaliation,discrimination, harassment and wage and hour claims, claims of infringement upon third parties’ intellectual property rights, claims relating to informationsecurity, privacy and consumer protection, tax claims and environmental claims.
On June 26, 2012, the U.S. Federal Trade Commission (“FTC”) filed a lawsuit in Federal District Court for the District of Arizona against the Companyand its subsidiaries, Wyndham Hotel Group, LLC (“WHG”), Wyndham Hotels & Resorts Inc. (“WHR”) and Wyndham Hotel Management Inc. (“WHM”),alleging unfairness and deception-based violations of Section 5 of the FTC Act in connection with three prior data breach incidents involving a group ofWyndham brand hotels. The Company, WHG, WHR and WHM dispute the allegations in the lawsuit and are defending this lawsuit vigorously. TheCompany does not believe that the data breach incidents were material, nor does it expect that the outcome of the FTC litigation will have a material effecton the Company’s results of operations, financial position or cash flows. On March 26, 2013, the Company’s, WHG’s, WHR’s and WHM’s motion to transfervenue of the lawsuit from Arizona to the Federal District Court for the District of New Jersey was granted. WHR’s motion to dismiss the lawsuit was denied onApril 7, 2014. The Court granted WHR’s motion to certify its order denying WHR’s motion to dismiss for interlocutory appeal on June 23, 2014. The motionto dismiss filed by the Company, WHG and WHM was denied on June 23, 2014. On July 29, 2014, the Third Circuit Court of Appeals granted WHR’s requestto file an interlocutory appeal of the District Court’s denial of its motion to dismiss. WHR filed its brief in support of its interlocutory appeal on October 6,2014. The FTC filed its opposition brief on November 5, 2014, and WHR filed its reply brief on December 8, 2014. The Company is unable at this time toestimate any loss or range of reasonably possible loss.
The Company records an accrual for legal contingencies when it determines, after consultation with outside counsel, that it is probable that a liabilityhas been incurred and the amount of the loss can be reasonably estimated. In making such determinations, the Company evaluates, among other things, thedegree of probability of an unfavorable outcome and, when it is probable that a liability has been incurred, the Company’s ability to make a reasonableestimate of loss. The Company reviews these accruals each reporting period and makes revisions based on changes in facts and circumstances includingchanges to its strategy in dealing with these matters.
The Company believes that it has adequately accrued for such matters with reserves of $24 million and $22 million as of December 31, 2014 and 2013,respectively. Such reserves are exclusive of matters relating to the Separation. For matters not requiring accrual, the Company believes that such matters willnot have a material effect on its results of operations, financial position or cash flows based on information currently available. However, litigation isinherently unpredictable and, although the Company believes that its accruals are adequate and/or that it has valid defenses in these matters, unfavorableresults could occur. As such, an adverse outcome from such proceedings for which claims are awarded in excess of the amounts accrued, if any, could bematerial to the Company with respect to earnings and/or cash flows in any given reporting period. As of December 31, 2014, the potential exposure resultingfrom adverse outcomes of such legal proceedings could, in the aggregate, range up to approximately $22 million in excess of recorded accruals. However, theCompany does not believe that the impact of such litigation should result in a material liability to the Company in relation to its consolidated financialposition or liquidity.
Cendant Litigation
Under the Separation agreement, the Company agreed to be responsible for 37.5% of certain of Cendant’s contingent and other corporate liabilities andassociated costs, including certain contingent litigation. Since the Separation, Cendant settled the majority of the lawsuits pending on the date of theSeparation. See also Note 23 - Separation Adjustments and Transactions with Former Parent and Subsidiaries regarding contingent litigation liabilitiesresulting from the Separation.
GUARANTEES/INDEMNIFICATIONS
Standard Guarantees/Indemnifications
In the ordinary course of business, the Company enters into agreements that contain standard guarantees and indemnities whereby the Companyindemnifies another party for specified breaches of or third-party claims relating to an underlying
F-37
Table of Contents
agreement. Such underlying agreements are typically entered into by one of the Company’s subsidiaries. The various underlying agreements generallygovern purchases, sales or outsourcing of products or services, leases of real estate, licensing of software and/or development of vacation ownershipproperties, access to credit facilities, derivatives and issuances of debt securities. While a majority of these guarantees and indemnifications extend only forthe duration of the underlying agreement, some survive the expiration of the agreement. The Company is not able to estimate the maximum potential amountof future payments to be made under these guarantees and indemnifications as the triggering events are not predictable. In certain cases, the Companymaintains insurance coverage that may mitigate any potential payments.
Other Guarantees/Indemnifications
Lodging
From time to time, the Company may enter into a hotel management agreement that provides the hotel owner with a guarantee of a certain level ofprofitability based upon various metrics. Under such an agreement, the Company would be required to compensate such hotel owner for any profitabilityshortfall over the life of the management agreement up to a specified aggregate amount. For certain agreements, the Company may be able to recapture all ora portion of the shortfall payments in the event that future operating results exceed targets. The terms of such guarantees generally range from 7 to 10 yearsand certain agreements may provide for early termination provisions under certain circumstances. As of December 31, 2014, the maximum potential amountof future payments that may be made under these guarantees was $136 million with a combined annual cap of $39 million. The Company had an additionalguarantee of $30 million with a $3 million cap for 2014 with no annual cap thereafter.
In connection with such performance guarantees, as of December 31, 2014, the Company maintained a liability of $32 million, of which $31 million wasincluded in other non-current liabilities and $1 million was included in accrued expenses and other current liabilities on its Consolidated Balance Sheet. Asof December 31, 2014, the Company also had a corresponding $39 million asset related to these guarantees, of which $35 million was included in other non-current assets and $4 million was included in other current assets on its Consolidated Balance Sheet. As of December 31, 2013, the Company maintained aliability of $45 million, of which $37 million was included in other non-current liabilities and $8 million was included in accrued expenses and other currentliabilities on its Consolidated Balance Sheet. As of December 31, 2013, the Company also had a corresponding $43 million asset related to the guarantees, ofwhich $39 million was included in other non-current assets and $4 million was included in other current assets on its Consolidated Balance Sheet. Suchassets are being amortized on a straight-line basis over the life of the agreements. The amortization expense for the performance guarantees noted above was$4 million and $3 million for the years ended December 31, 2014 and 2013, respectively.
For guarantees subject to recapture provisions, the Company had a receivable of $26 million and $24 million which was included in other non-currentassets on the Company’s Consolidated Balance Sheets for the years ended December 31, 2014 and 2013, respectively. Such receivables were the result ofpayments made to date which are subject to recapture and which the Company believes will be recoverable from future operating performance.
Vacation Ownership
In the ordinary course of business, the Company’s vacation ownership business provides guarantees to certain owners’ associations for funds required tooperate and maintain vacation ownership properties in excess of assessments collected from owners of the VOIs. The Company may be required to fund suchexcess as a result of unsold Company-owned VOIs or failure by owners to pay such assessments. In addition, from time to time, the Company will agree toreimburse certain owner associations up to 75% of their uncollected assessments. These guarantees extend for the duration of the underlying subsidy orsimilar agreement (which generally approximate one year and are renewable at the discretion of the Company on an annual basis). The maximum potentialfuture payments that the Company could be required to make under these guarantees were approximately $328 million as of December 31, 2014. TheCompany would only be required to pay this maximum amount if none of the assessed owners paid their assessments. Any assessments collected from theowners of the VOIs would reduce the maximum potential amount of future payments to be made by the Company. Additionally, should the Company berequired to fund the deficit through the payment of any owners’ assessments under these guarantees, the Company would be permitted access to the propertyfor its own use and may use that property to engage in revenue-producing activities, such as rentals. During 2014, 2013 and 2012, the Company madepayments related to these guarantees of $17 million, $18 million and $18 million, respectively. As of December 31, 2014 and 2013, the Company maintaineda liability in connection with these guarantees of $25 million and $30 million, respectively, on its Consolidated Balance Sheets.
The Company guarantees its vacation ownership subsidiary’s obligation to repurchase completed property in Las Vegas, Nevada from a third-partydeveloper subject to the property meeting the Company’s vacation ownership resort standards and provided that the third-party developer has not sold theproperty to another party. The maximum potential future payments that the Company could be required to make under these commitments was $262 millionas of December 31, 2014.
F-38
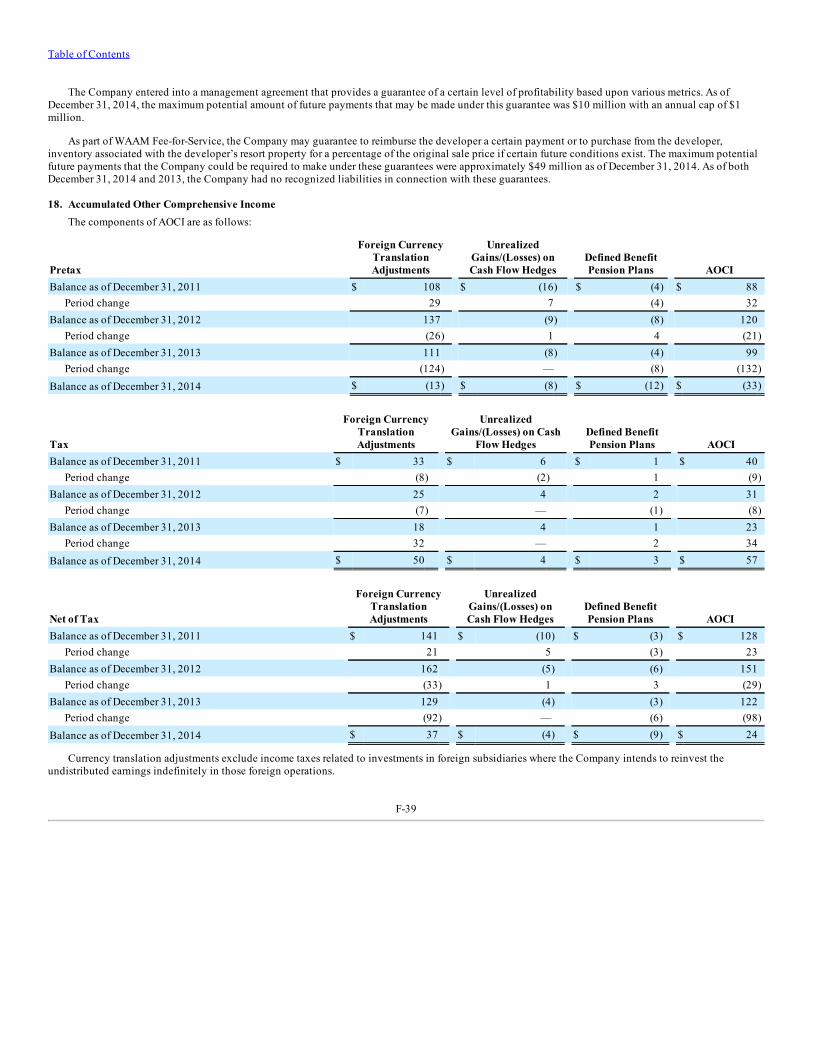
Table of Contents
The Company entered into a management agreement that provides a guarantee of a certain level of profitability based upon various metrics. As ofDecember 31, 2014, the maximum potential amount of future payments that may be made under this guarantee was $10 million with an annual cap of $1million.
As part of WAAM Fee-for-Service, the Company may guarantee to reimburse the developer a certain payment or to purchase from the developer,inventory associated with the developer’s resort property for a percentage of the original sale price if certain future conditions exist. The maximum potentialfuture payments that the Company could be required to make under these guarantees were approximately $49 million as of December 31, 2014. As of bothDecember 31, 2014 and 2013, the Company had no recognized liabilities in connection with these guarantees.
18. Accumulated Other Comprehensive IncomeThe components of AOCI are as follows:
Pretax
Foreign CurrencyTranslationAdjustments
UnrealizedGains/(Losses) onCash Flow Hedges
Defined BenefitPension Plans AOCI
Balance as of December 31, 2011 $ 108 $ (16) $ (4) $ 88Period change 29 7 (4) 32
Balance as of December 31, 2012 137 (9) (8) 120Period change (26) 1 4 (21)
Balance as of December 31, 2013 111 (8) (4) 99Period change (124) — (8) (132)
Balance as of December 31, 2014 $ (13) $ (8) $ (12) $ (33)
Tax
Foreign CurrencyTranslationAdjustments
UnrealizedGains/(Losses) on Cash
Flow Hedges Defined BenefitPension Plans AOCI
Balance as of December 31, 2011 $ 33 $ 6 $ 1 $ 40Period change (8) (2) 1 (9)
Balance as of December 31, 2012 25 4 2 31Period change (7) — (1) (8)
Balance as of December 31, 2013 18 4 1 23Period change 32 — 2 34
Balance as of December 31, 2014 $ 50 $ 4 $ 3 $ 57
Net of Tax
Foreign CurrencyTranslationAdjustments
UnrealizedGains/(Losses) onCash Flow Hedges
Defined BenefitPension Plans AOCI
Balance as of December 31, 2011 $ 141 $ (10) $ (3) $ 128Period change 21 5 (3) 23
Balance as of December 31, 2012 162 (5) (6) 151Period change (33) 1 3 (29)
Balance as of December 31, 2013 129 (4) (3) 122Period change (92) — (6) (98)
Balance as of December 31, 2014 $ 37 $ (4) $ (9) $ 24
Currency translation adjustments exclude income taxes related to investments in foreign subsidiaries where the Company intends to reinvest theundistributed earnings indefinitely in those foreign operations.
F-39
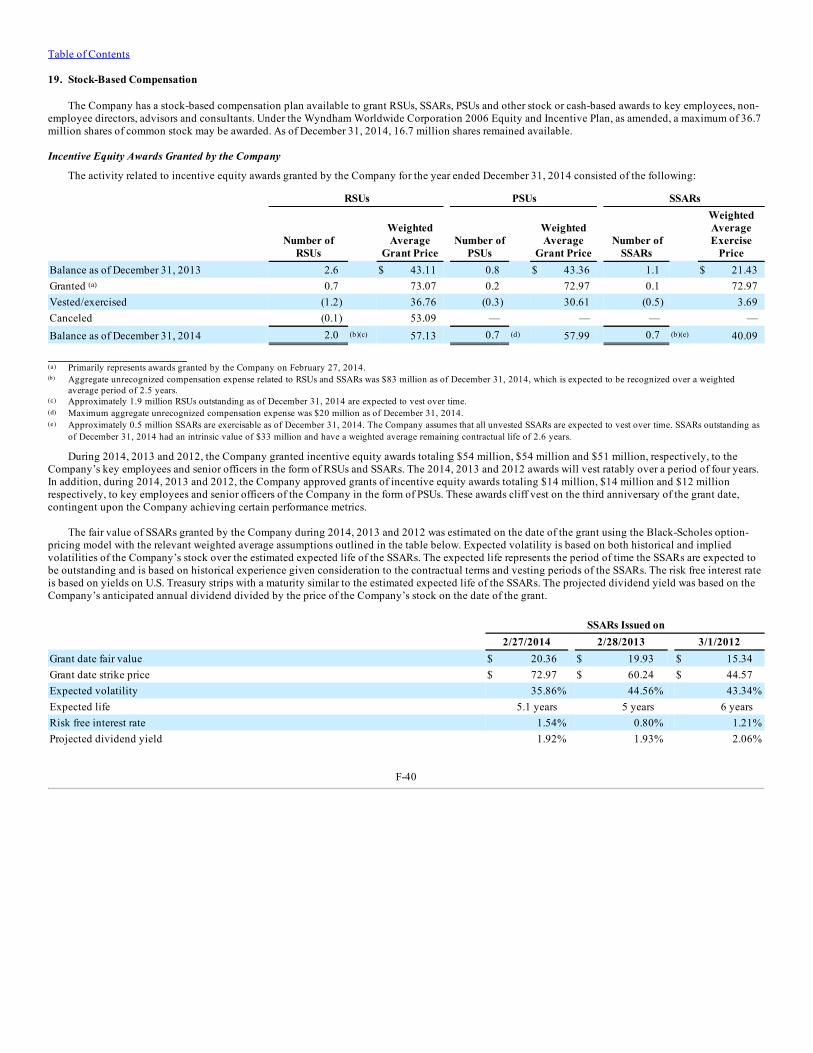
Table of Contents
19. Stock-Based Compensation
The Company has a stock-based compensation plan available to grant RSUs, SSARs, PSUs and other stock or cash-based awards to key employees, non-employee directors, advisors and consultants. Under the Wyndham Worldwide Corporation 2006 Equity and Incentive Plan, as amended, a maximum of 36.7million shares of common stock may be awarded. As of December 31, 2014, 16.7 million shares remained available.
Incentive Equity Awards Granted by the Company
The activity related to incentive equity awards granted by the Company for the year ended December 31, 2014 consisted of the following:
RSUs PSUs SSARs
Number of
RSUs
WeightedAverage
Grant Price Number of
PSUs
WeightedAverage
Grant Price Number of
SSARs
WeightedAverageExercise
PriceBalance as of December 31, 2013 2.6 $ 43.11 0.8 $ 43.36 1.1 $ 21.43Granted (a) 0.7 73.07 0.2 72.97 0.1 72.97Vested/exercised (1.2) 36.76 (0.3) 30.61 (0.5) 3.69Canceled (0.1) 53.09 — — — —Balance as of December 31, 2014 2.0 (b)(c) 57.13 0.7 (d) 57.99 0.7 (b)(e) 40.09
(a) Primarily represents awards granted by the Company on February 27, 2014.(b) Aggregate unrecognized compensation expense related to RSUs and SSARs was $83 million as of December 31, 2014, which is expected to be recognized over a weighted
average period of 2.5 years.(c) Approximately 1.9 million RSUs outstanding as of December 31, 2014 are expected to vest over time.(d) Maximum aggregate unrecognized compensation expense was $20 million as of December 31, 2014.(e) Approximately 0.5 million SSARs are exercisable as of December 31, 2014. The Company assumes that all unvested SSARs are expected to vest over time. SSARs outstanding as
of December 31, 2014 had an intrinsic value of $33 million and have a weighted average remaining contractual life of 2.6 years.
During 2014, 2013 and 2012, the Company granted incentive equity awards totaling $54 million, $54 million and $51 million, respectively, to theCompany’s key employees and senior officers in the form of RSUs and SSARs. The 2014, 2013 and 2012 awards will vest ratably over a period of four years.In addition, during 2014, 2013 and 2012, the Company approved grants of incentive equity awards totaling $14 million, $14 million and $12 millionrespectively, to key employees and senior officers of the Company in the form of PSUs. These awards cliff vest on the third anniversary of the grant date,contingent upon the Company achieving certain performance metrics.
The fair value of SSARs granted by the Company during 2014, 2013 and 2012 was estimated on the date of the grant using the Black-Scholes option-pricing model with the relevant weighted average assumptions outlined in the table below. Expected volatility is based on both historical and impliedvolatilities of the Company’s stock over the estimated expected life of the SSARs. The expected life represents the period of time the SSARs are expected tobe outstanding and is based on historical experience given consideration to the contractual terms and vesting periods of the SSARs. The risk free interest rateis based on yields on U.S. Treasury strips with a maturity similar to the estimated expected life of the SSARs. The projected dividend yield was based on theCompany’s anticipated annual dividend divided by the price of the Company’s stock on the date of the grant.
SSARs Issued on 2/27/2014 2/28/2013 3/1/2012Grant date fair value $ 20.36 $ 19.93 $ 15.34Grant date strike price $ 72.97 $ 60.24 $ 44.57Expected volatility 35.86% 44.56% 43.34%Expected life 5.1 years 5 years 6 yearsRisk free interest rate 1.54% 0.80% 1.21%Projected dividend yield 1.92% 1.93% 2.06%
F-40
Table of Contents
Stock-Based Compensation Expense
The Company recorded stock-based compensation expense of $57 million, $53 million and $41 million during 2014, 2013 and 2012, respectively,related to the incentive equity awards granted to employees by the Company. The Company recognized a net tax benefit of $23 million, $21 million and $16million during 2014, 2013 and 2012, respectively, for stock-based compensation arrangements on the Consolidated Statements of Income. During 2014,2013 and 2012, the Company increased its pool of excess tax benefits available to absorb tax deficiencies (“APIC Pool”) by $34 million, $15 million and$33 million, respectively, due to the vesting of RSUs, PSUs and SSARs. As of December 31, 2014, the Company’s APIC Pool balance was $112 million.
The Company paid $64 million, $31 million and $55 million of taxes for the net share settlement of incentive equity awards during 2014, 2013 and2012, respectively. Such amounts are included within financing activities on the Consolidated Statements of Cash Flows.
20. Employee Benefit Plans
Defined Contribution Benefit Plans
Wyndham sponsors a domestic defined contribution savings plan and a domestic deferred compensation plan that provide certain eligible employees ofthe Company an opportunity to accumulate funds for retirement. The Company matches the contributions of participating employees on the basis specifiedby each plan. The Company’s cost for these plans was $31 million, $28 million and $27 million during 2014, 2013 and 2012, respectively.
In addition, the Company contributes to several foreign employee benefit contributory plans which also provide eligible employees with an opportunityto accumulate funds for retirement. The Company’s contributory cost for these plans was $21 million, $22 million and $19 million during 2014, 2013 and2012, respectively.
Defined Benefit Pension Plans
The Company sponsors defined benefit pension plans for certain foreign subsidiaries. Under these plans, benefits are based on an employee’s years ofcredited service and a percentage of final average compensation or as otherwise described by the plan. As of December 31, 2014 and 2013, the Company’snet pension liability of $19 million and $15 million, respectively, is reported as other non-current liabilities on the Consolidated Balance Sheets. As ofDecember 31, 2014, the Company recorded $2 million and $13 million, within AOCI on the Consolidated Balance Sheet as an unrecognized prior servicecredit and unrecognized loss, respectively. As of December 31, 2013, the Company recorded $2 million and $7 million within AOCI on the ConsolidatedBalance Sheet as an unrecognized prior service credit and unrecognized loss, respectively.
The Company’s policy is to contribute amounts sufficient to meet minimum funding requirements as set forth in employee benefit and tax laws plus suchadditional amounts that the Company determines to be appropriate. During 2014, 2013 and 2012, the Company recorded pension expense of $3 million, $4million and $3 million, respectively.
21. Segment Information
The reportable segments presented below represent the Company’s operating segments for which separate financial information is available and which isutilized on a regular basis by its chief operating decision maker to assess performance and to allocate resources. In identifying its reportable segments, theCompany also considers the nature of services provided by its operating segments. Management evaluates the operating results of each of its reportablesegments based upon net revenues and “EBITDA”, which is defined as net income before depreciation and amortization, interest expense (excludingconsumer financing interest), early extinguishment of debt, interest income (excluding consumer financing interest) and income taxes, each of which ispresented on the Consolidated Statements of Income. The Company believes that EBITDA is a useful measure of performance for its industry segmentswhich, when considered with GAAP measures, the Company believes gives a more complete understanding of its operating performance. The Company’spresentation of EBITDA may not be comparable to similarly-titled measures used by other companies.
F-41
Table of Contents
YEAR ENDED OR AS OF DECEMBER 31, 2014
Lodging
VacationExchange
and Rentals Vacation
Ownership
Corporateand
Other (c) TotalNet revenues (a) (b) $ 1,101 $ 1,604 $ 2,638 $ (62) $ 5,281EBITDA 327 335 660 (141) 1,181Depreciation and amortization 61 96 47 29 233Segment assets 1,835 2,703 4,856 285 9,679Capital expenditures 55 74 85 21 235
YEAR ENDED OR AS OF DECEMBER 31, 2013
Lodging
VacationExchange
and Rentals Vacation
Ownership
Corporateand
Other (c) TotalNet revenues (a) (b) $ 1,027 $ 1,526 $ 2,515 $ (59) $ 5,009EBITDA 279 356 619 (122) 1,132Depreciation and amortization 54 87 47 28 216Segment assets 1,843 2,878 4,812 208 9,741Capital expenditures 51 81 66 40 238
YEAR ENDED OR AS OF DECEMBER 31, 2012
Lodging
VacationExchange
and Rentals Vacation
Ownership
Corporateand
Other (c) TotalNet revenues (a) $ 890 $ 1,422 $ 2,269 $ (47) $ 4,534EBITDA 272 328 549 (104) 1,045Depreciation and amortization 47 80 38 20 185Segment assets 1,757 2,703 4,853 150 9,463Capital expenditures 40 77 69 22 208
(a) Includes $41 million, $39 million and $34 million of intersegment trademark fees within the Company’s Lodging segment during 2014, 2013 and 2012, respectively, which areeliminated in Corporate and Other. Such fees are offset in expenses primarily at the Company’s Vacation Ownership segment
(b) Includes $7 million and $6 million of hotel management reimbursable revenues which were charged to the Company’s Vacation Ownership segment during 2014 and 2013,respectively, and are eliminated in Corporate and Other.
(c) Includes the elimination of transactions between segments.
Provided below is a reconciliation of EBITDA to net income attributable to Wyndham shareholders.
Year Ended December 31, 2014 2013 2012EBITDA $ 1,181 $ 1,132 $ 1,045Depreciation and amortization 233 216 185Interest expense 113 131 132Early extinguishment of debt — 111 108Interest income (10) (9) (8)Income before income taxes 845 683 628Provision for income taxes 316 250 229Net income 529 433 399Net (income)/loss attributable to noncontrolling interest — (1) 1Net income attributable to Wyndham shareholders $ 529 $ 432 $ 400
F-42
Table of Contents
The geographic segment information provided below is classified based on the geographic location of the Company’s subsidiaries.
UnitedStates
UnitedKingdom Netherlands
All OtherCountries Total
Year Ended or As of December 31, 2014 Net revenues $ 3,892 $ 298 $ 276 $ 815 $ 5,281Net long-lived assets 3,011 433 317 404 4,165Year Ended or As of December 31, 2013 Net revenues $ 3,765 $ 266 $ 250 $ 728 $ 5,009Net long-lived assets 3,066 459 372 400 4,297Year Ended or As of December 31, 2012 Net revenues $ 3,340 $ 258 $ 255 $ 681 $ 4,534Net long-lived assets 2,873 435 351 388 4,047
22. Restructuring and Impairments
2014 Restructuring Plans
During 2014, the Company committed to restructuring initiatives at its vacation exchange and rentals and lodging businesses, primarily focused onimproving the alignment of the organizational structure of each business with their strategic objectives. In connection with these initiatives, the Companyrecorded $6 million of personnel-related costs, a $5 million non-cash charge to write-off information technology assets and $1 million of costs related tocontract terminations. As of December 31, 2014, the Company had a liability of $7 million, which is expected to be paid in cash primarily by the end of2015.
2013 Restructuring Plan
During 2013, the Company committed to an organizational realignment initiative at its lodging business, primarily focused on optimizing its marketingstructure. In connection with this initiative, the Company recorded $8 million of personnel-related costs and $1 million of costs related to contractterminations, of which $2 million was paid in cash and $1 million was non-cash. During 2014, the Company reduced its liability with $5 million of cashpayments and reversed $1 million of previously recorded contract termination costs.
2012 Restructuring Plans
During 2012, the Company committed to an organizational realignment initiative at its vacation exchange and rentals business, primarily focused onconsolidating existing processes and optimizing its structure. Also during 2012, the Company implemented an organizational realignment initiative at itsvacation ownership business, targeting the elimination of business function redundancies resulting from the Shell acquisition. During 2012, the Companyincurred costs of $7 million and reduced its liability with cash payments of $1 million. During 2013, the Company (i) reduced its liability with $5 million ofcash payments, (ii) recorded $2 million of additional facility-related expenses, (iii) increased its liability with $1 million of a non-cash adjustment associatedwith a facility closure and (iv) reversed $1 million of previously recorded personnel costs. During 2014, the Company reduced its liability with cashpayments of $1 million. As of December 31, 2014, the Company had a liability of $2 million, which is expected to be paid in cash by January 2017. From thecommencement of the 2012 restructuring plans through December 31, 2014, the Company has incurred a total of $8 million of expenses in connection withsuch plans.
As of December 31, 2014, the Company had a remaining liability of $2 million related to its 2010 restructuring plan, all of which is facility-related.
F-43
Table of Contents
The table below includes activity for prior restructuring plans that are immaterial to the Company. The activity related to costs associated with therestructuring plans is summarized by category as follows:
Liability as ofDecember 31,
2011 Costs
Recognized Cash
Payments Other
Liability as ofDecember 31,
2012Personnel-Related $ 1 $ 7 (a) $ (2) $ — $ 6Facility-Related 9 — (4) — 5 $ 10 $ 7 $ (6) $ — $ 11
Liability as ofDecember 31,
2012 Costs
Recognized Cash
Payments Other
Liability as ofDecember 31,
2013Personnel-Related $ 6 $ 8 (b) $ (6) $ (2) (e) $ 6Facility-Related 5 2 (4) 1 (f) 4Contract Terminations — 1 — — 1 $ 11 $ 11 $ (10) $ (1) $ 11
Liability as ofDecember 31,
2013 Costs
Recognized Cash
Payments Other
Liability as ofDecember 31,
2014Personnel-Related $ 6 $ 6 (c) $ (6) $ — $ 6Facility-Related 4 — — — 4Contract Terminations 1 1 — (1) (g) 1Asset Impairment — 5 (d) — (5) (d) — $ 11 $ 12 $ (6) $ (6) $ 11
(a) Represents severance costs of $5 million and $2 million at the Company’s vacation exchange and rentals and vacation ownership businesses, respectively, resulting from areduction of 380 employees.
(b) Represents severance costs incurred at the Company’s lodging business resulting from a reduction of 105 employees.(c) Represents severance costs of $4 million and $2 million at the Company’s vacation exchange and rentals and lodging businesses, respectively, resulting from a reduction of 122
employees.(d) Represents the non-cash write-off of assets related to an information technology project at the Company’s vacation exchange and rentals business.(e) Includes $1 million of a reversal of previously recorded expenses at the Company’s vacation exchange and rentals business and $1 million of a non-cash settlement at the
Company’s lodging business.(f) Represents a non-cash adjustment to the liability at the Company’s vacation ownership business.(g) Represents a reversal of previously recorded expenses at the Company’s lodging business.
Loss on Sale
During 2014, the Company sold its U.K.-based camping business at its vacation exchange and rentals business resulting in a $20 million loss. As a resultof this transaction, the Company received $1 million of cash, net, reduced its net assets by $11 million, wrote-off $6 million of foreign currency translationadjustments and recorded a $4 million indemnification liability. Such loss is recorded within loss on sale and asset impairments on the ConsolidatedStatement of Income.
Impairments
During 2014, the Company recorded a $7 million non-cash impairment charge related to the write-down of an equity investment at its vacation exchangeand rentals business which was the result of a reduction in the fair value of the entity in which the Company has a minority ownership position. In addition,the Company recorded an $8 million non-cash impairment charge at its lodging business related to the write-down of an investment in a joint venture, whichwas the result of the joint venture’s recurring losses and negative operating cash flows. Such amounts are recorded within loss on sale and asset impairmentson the Consolidated Statement of Income.
During 2013, the Company recorded $8 million of non-cash impairment charges at its lodging business primarily related to a partial write-down of itsHawthorn trademark due to lower than anticipated growth in the brand. Such amount is recorded within loss on sale and asset impairments on theConsolidated Statement of Income.
F-44
Table of Contents
During 2012, the Company recorded an $8 million non-cash impairment charge at its vacation exchange and rentals business resulting from the decisionto rebrand the ResortQuest and Steamboat Resorts trade names to the Wyndham Vacation Rentals brand. Such amount is recorded within loss on sale andasset impairments on the Consolidated Statement of Income.
23. Separation Adjustments and Transactions with Former Parent and Subsidiaries
Transfer of Cendant Corporate Liabilities and Issuance of Guarantees to Cendant and Affiliates
Pursuant to the Separation and Distribution Agreement, upon the distribution of the Company’s common stock to Cendant shareholders, the Companyentered into certain guarantee commitments with Cendant (pursuant to the assumption of certain liabilities and the obligation to indemnify Cendant andRealogy and travel distribution services (“Travelport”) for such liabilities) and guarantee commitments related to deferred compensation arrangements witheach of Cendant and Realogy. These guarantee arrangements primarily relate to contingent litigation liabilities, contingent tax liabilities, and Cendantcontingent and other corporate liabilities, of which the Company assumed and is responsible for 37.5% while Realogy is responsible for the remaining62.5%. The remaining amount of liabilities which were assumed by the Company in connection with the Separation was $38 million and $39 million as ofDecember 31, 2014 and 2013, respectively. These amounts were comprised of Cendant corporate liabilities which were recorded on the books of Cendant aswell as additional liabilities which were established for guarantees issued at the date of Separation, related to unresolved contingent matters and others thatcould arise during the guarantee period. Regarding the guarantees, if any of the companies responsible for all or a portion of such liabilities were to default inits payment of costs or expenses related to any such liability, the Company would be responsible for a portion of the defaulting party or parties’ obligation(s).The Company also provided a default guarantee related to deferred compensation arrangements related to current and former senior officers and directors ofCendant, Realogy and Travelport. These arrangements were valued upon the Separation in accordance with the guidance for guarantees and recorded asliabilities on the Consolidated Balance Sheets. To the extent such recorded liabilities are not adequate to cover the ultimate payment amounts, such excesswill be reflected as an expense to the results of operations in future periods.
As a result of the sale of Realogy on April 10, 2007, Realogy was required to post a letter of credit in an amount acceptable to the Company and AvisBudget Group (formerly known as Cendant) to satisfy its obligations for the Cendant legacy contingent liabilities. As of December 31, 2014, the letter ofcredit was $53 million.
As of December 31, 2014, the $38 million of Separation related liabilities is comprised of $34 million for tax liabilities, $1 million for liabilities ofpreviously sold businesses of Cendant, $1 million for other contingent and corporate liabilities and $2 million of liabilities where the calculated guaranteeamount exceeded the contingent liability assumed at the Separation Date. In connection with these liabilities, as of December 31, 2014, $26 million isrecorded in accrued expenses and other current liabilities and $12 million is recorded in other non-current liabilities on the Consolidated Balance Sheet. TheCompany will indemnify Cendant for these contingent liabilities and therefore any payments made to the third-party would be through the former Parent.The actual timing of payments relating to these liabilities is dependent on a variety of factors beyond the Company’s control. In addition, the Company had$1 million of receivables due from former Parent and subsidiaries primarily relating to income taxes, as of both December 31, 2014 and 2013, which isrecorded in other current assets on the Consolidated Balance Sheets.
Prior to the Separation, the Company and Realogy were included in the consolidated federal and state income tax returns of Cendant through theSeparation date for the 2006 period then ended. The Company is generally liable for 37.5% of certain contingent tax liabilities. In addition, each of theCompany, Cendant and Realogy may be responsible for 100% of certain of Cendant’s tax liabilities that will provide the responsible party with a future,offsetting tax benefit.
F-45
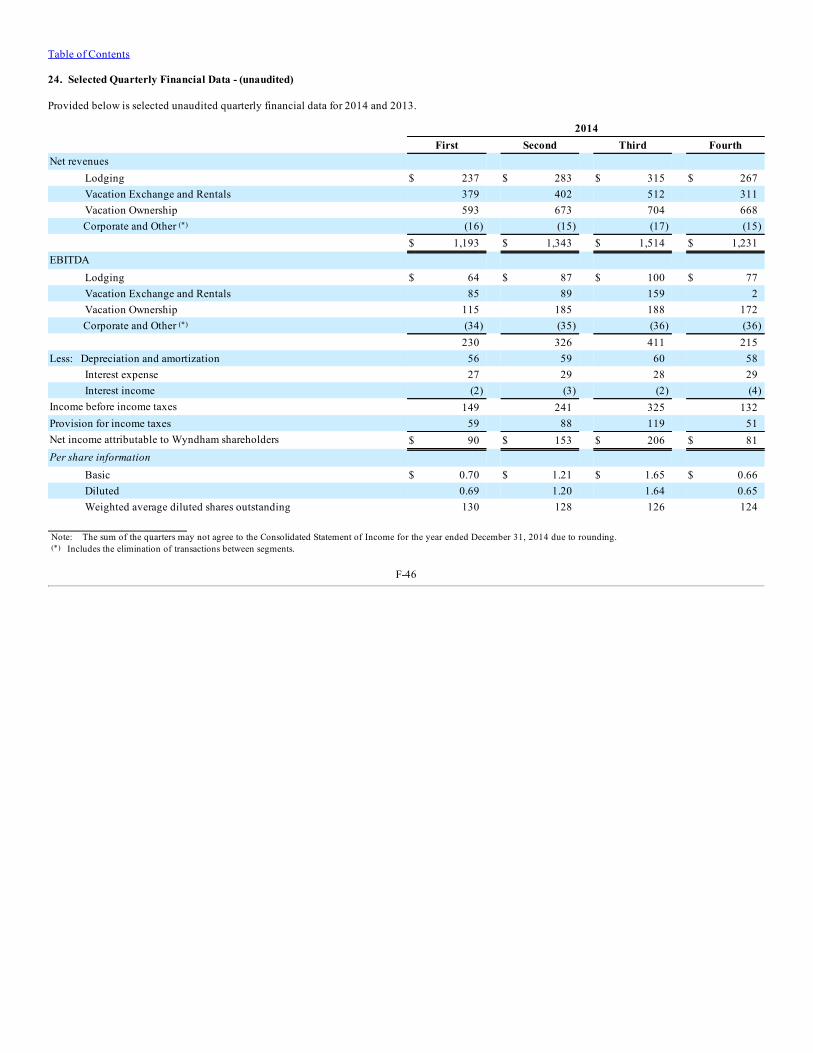
Table of Contents
24. Selected Quarterly Financial Data - (unaudited)
Provided below is selected unaudited quarterly financial data for 2014 and 2013.
2014 First Second Third FourthNet revenues
Lodging $ 237 $ 283 $ 315 $ 267Vacation Exchange and Rentals 379 402 512 311Vacation Ownership 593 673 704 668Corporate and Other (*) (16) (15) (17) (15)
$ 1,193 $ 1,343 $ 1,514 $ 1,231EBITDA
Lodging $ 64 $ 87 $ 100 $ 77Vacation Exchange and Rentals 85 89 159 2Vacation Ownership 115 185 188 172Corporate and Other (*) (34) (35) (36) (36)
230 326 411 215Less: Depreciation and amortization 56 59 60 58
Interest expense 27 29 28 29Interest income (2) (3) (2) (4)
Income before income taxes 149 241 325 132Provision for income taxes 59 88 119 51Net income attributable to Wyndham shareholders $ 90 $ 153 $ 206 $ 81Per share information
Basic $ 0.70 $ 1.21 $ 1.65 $ 0.66Diluted 0.69 1.20 1.64 0.65Weighted average diluted shares outstanding 130 128 126 124
Note: The sum of the quarters may not agree to the Consolidated Statement of Income for the year ended December 31, 2014 due to rounding.(*) Includes the elimination of transactions between segments.
F-46
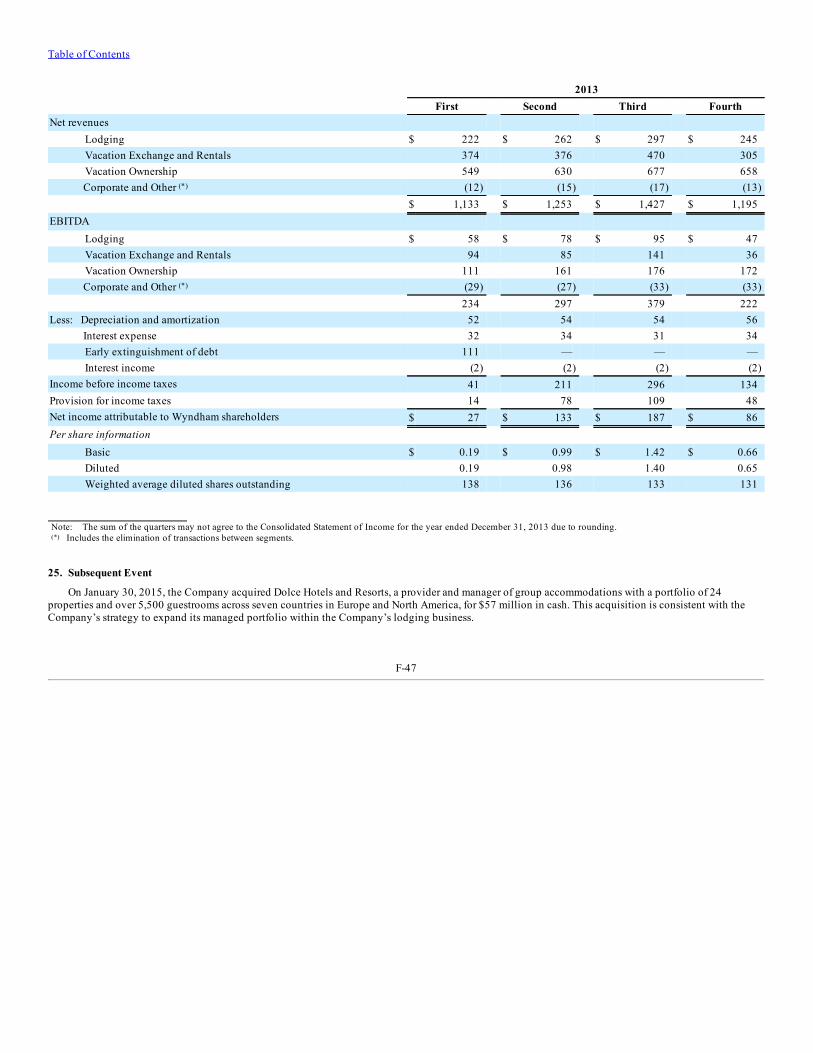
Table of Contents
2013 First Second Third FourthNet revenues
Lodging $ 222 $ 262 $ 297 $ 245Vacation Exchange and Rentals 374 376 470 305Vacation Ownership 549 630 677 658Corporate and Other (*) (12) (15) (17) (13)
$ 1,133 $ 1,253 $ 1,427 $ 1,195EBITDA
Lodging $ 58 $ 78 $ 95 $ 47Vacation Exchange and Rentals 94 85 141 36Vacation Ownership 111 161 176 172Corporate and Other (*) (29) (27) (33) (33)
234 297 379 222Less: Depreciation and amortization 52 54 54 56
Interest expense 32 34 31 34Early extinguishment of debt 111 — — —Interest income (2) (2) (2) (2)
Income before income taxes 41 211 296 134Provision for income taxes 14 78 109 48Net income attributable to Wyndham shareholders $ 27 $ 133 $ 187 $ 86Per share information
Basic $ 0.19 $ 0.99 $ 1.42 $ 0.66Diluted 0.19 0.98 1.40 0.65Weighted average diluted shares outstanding 138 136 133 131
Note: The sum of the quarters may not agree to the Consolidated Statement of Income for the year ended December 31, 2013 due to rounding.(*) Includes the elimination of transactions between segments.
25. Subsequent Event
On January 30, 2015, the Company acquired Dolce Hotels and Resorts, a provider and manager of group accommodations with a portfolio of 24properties and over 5,500 guestrooms across seven countries in Europe and North America, for $57 million in cash. This acquisition is consistent with theCompany’s strategy to expand its managed portfolio within the Company’s lodging business.
F-47
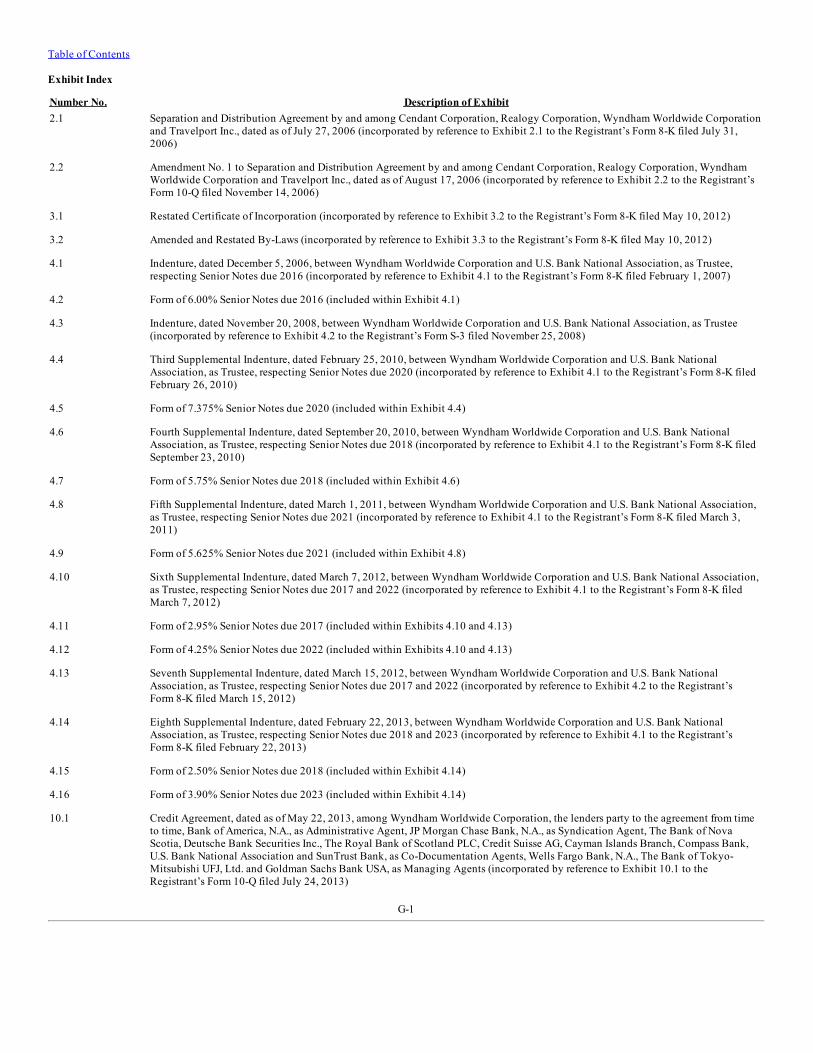
Table of Contents
Exhibit Index
Number No. Description of Exhibit2.1 Separation and Distribution Agreement by and among Cendant Corporation, Realogy Corporation, Wyndham Worldwide Corporation
and Travelport Inc., dated as of July 27, 2006 (incorporated by reference to Exhibit 2.1 to the Registrant’s Form 8-K filed July 31,2006)
2.2 Amendment No. 1 to Separation and Distribution Agreement by and among Cendant Corporation, Realogy Corporation, Wyndham
Worldwide Corporation and Travelport Inc., dated as of August 17, 2006 (incorporated by reference to Exhibit 2.2 to the Registrant’sForm 10-Q filed November 14, 2006)
3.1 Restated Certificate of Incorporation (incorporated by reference to Exhibit 3.2 to the Registrant’s Form 8-K filed May 10, 2012) 3.2 Amended and Restated By-Laws (incorporated by reference to Exhibit 3.3 to the Registrant’s Form 8-K filed May 10, 2012) 4.1 Indenture, dated December 5, 2006, between Wyndham Worldwide Corporation and U.S. Bank National Association, as Trustee,
respecting Senior Notes due 2016 (incorporated by reference to Exhibit 4.1 to the Registrant’s Form 8-K filed February 1, 2007) 4.2 Form of 6.00% Senior Notes due 2016 (included within Exhibit 4.1) 4.3 Indenture, dated November 20, 2008, between Wyndham Worldwide Corporation and U.S. Bank National Association, as Trustee
(incorporated by reference to Exhibit 4.2 to the Registrant’s Form S-3 filed November 25, 2008) 4.4 Third Supplemental Indenture, dated February 25, 2010, between Wyndham Worldwide Corporation and U.S. Bank National
Association, as Trustee, respecting Senior Notes due 2020 (incorporated by reference to Exhibit 4.1 to the Registrant’s Form 8-K filedFebruary 26, 2010)
4.5 Form of 7.375% Senior Notes due 2020 (included within Exhibit 4.4) 4.6 Fourth Supplemental Indenture, dated September 20, 2010, between Wyndham Worldwide Corporation and U.S. Bank National
Association, as Trustee, respecting Senior Notes due 2018 (incorporated by reference to Exhibit 4.1 to the Registrant’s Form 8-K filedSeptember 23, 2010)
4.7 Form of 5.75% Senior Notes due 2018 (included within Exhibit 4.6) 4.8 Fifth Supplemental Indenture, dated March 1, 2011, between Wyndham Worldwide Corporation and U.S. Bank National Association,
as Trustee, respecting Senior Notes due 2021 (incorporated by reference to Exhibit 4.1 to the Registrant’s Form 8-K filed March 3,2011)
4.9 Form of 5.625% Senior Notes due 2021 (included within Exhibit 4.8) 4.10 Sixth Supplemental Indenture, dated March 7, 2012, between Wyndham Worldwide Corporation and U.S. Bank National Association,
as Trustee, respecting Senior Notes due 2017 and 2022 (incorporated by reference to Exhibit 4.1 to the Registrant’s Form 8-K filedMarch 7, 2012)
4.11 Form of 2.95% Senior Notes due 2017 (included within Exhibits 4.10 and 4.13) 4.12 Form of 4.25% Senior Notes due 2022 (included within Exhibits 4.10 and 4.13) 4.13 Seventh Supplemental Indenture, dated March 15, 2012, between Wyndham Worldwide Corporation and U.S. Bank National
Association, as Trustee, respecting Senior Notes due 2017 and 2022 (incorporated by reference to Exhibit 4.2 to the Registrant’sForm 8-K filed March 15, 2012)
4.14 Eighth Supplemental Indenture, dated February 22, 2013, between Wyndham Worldwide Corporation and U.S. Bank National
Association, as Trustee, respecting Senior Notes due 2018 and 2023 (incorporated by reference to Exhibit 4.1 to the Registrant’sForm 8-K filed February 22, 2013)
4.15 Form of 2.50% Senior Notes due 2018 (included within Exhibit 4.14) 4.16 Form of 3.90% Senior Notes due 2023 (included within Exhibit 4.14) 10.1 Credit Agreement, dated as of May 22, 2013, among Wyndham Worldwide Corporation, the lenders party to the agreement from time
to time, Bank of America, N.A., as Administrative Agent, JP Morgan Chase Bank, N.A., as Syndication Agent, The Bank of NovaScotia, Deutsche Bank Securities Inc., The Royal Bank of Scotland PLC, Credit Suisse AG, Cayman Islands Branch, Compass Bank,U.S. Bank National Association and SunTrust Bank, as Co-Documentation Agents, Wells Fargo Bank, N.A., The Bank of Tokyo-Mitsubishi UFJ, Ltd. and Goldman Sachs Bank USA, as Managing Agents (incorporated by reference to Exhibit 10.1 to theRegistrant’s Form 10-Q filed July 24, 2013)
G-1
Table of Contents
10.2 Amended and Restated Indenture and Servicing Agreement, dated as of October 1, 2010, by and among Sierra Timeshare ConduitReceivables Funding II, LLC, as Issuer, Wyndham Consumer Finance, Inc., as Servicer, Wells Fargo Bank, National Association, asTrustee and U.S. Bank National Association, as Collateral Agent (incorporated by reference to Exhibit 99.1 to the Registrant’s Form 8-K filed October 5, 2010)
10.3 First Amendment, dated as of June 28, 2011, to the Amended and Restated Indenture and Servicing Agreement, dated as of October 1,
2010, by and among Sierra Timeshare Conduit Receivables Funding II, LLC, as Issuer, Wyndham Consumer Finance, Inc., as Servicer,Wells Fargo Bank, National Association, as Trustee and U.S. Bank National Association, as Collateral Agent (incorporated byreference to Exhibit 10.1 to the Registrant’s Form 10-Q filed August 1, 2011)
10.4 Third Amendment, dated as of August 30, 2012, to the Amended and Restated Indenture and Servicing Agreement, dated as of
October 1, 2010, by and among Sierra Timeshare Conduit Receivables Funding II, LLC, as Issuer, Wyndham Consumer Finance, Inc.,as Servicer, Wells Fargo Bank, National Association, as Trustee and U.S. Bank National Association, as Collateral Agent (incorporatedby reference to Exhibit 10.1 to the Registrant’s Form 10-Q filed October 24, 2012)
10.5 Fourth Amendment, dated as of August 29, 2013, to the Amended and Restated Indenture and Servicing Agreement, dated as of
October 1, 2010, by and among Sierra Timeshare Conduit Receivables Funding II, LLC, as Issuer, Wyndham Consumer Finance, Inc.,as Servicer, Wells Fargo Bank, National Association, as Trustee and U.S. Bank National Association, as Collateral Agent (incorporatedby reference to Exhibit 10.1 to the Registrant’s Form 10-Q filed October 23, 2013)
10.6 Fifth Amendment, dated as of August 28, 2014, to the Amended and Restated Indenture and Servicing Agreement, dated as of October
1, 2010, by and among Sierra Timeshare Conduit Receivables Funding II, LLC, as Issuer, Wyndham Consumer Finance, Inc., asServicer, Wells Fargo Bank, National Association, as Trustee and U.S. Bank National Association, as Collateral Agent (incorporated byreference to Exhibit 10.1 to the Registrant’s Form 10-Q filed October 24, 2014)
10.7 Employment Agreement with Stephen P. Holmes, dated as of July 31, 2006 (incorporated by reference to Exhibit 10.4 to the
Registrant’s Form 10-12B/A filed July 7, 2006) 10.8 Amendment No. 1 to Employment Agreement with Stephen P. Holmes, dated December 31, 2008 (incorporated by reference to
Exhibit 10.2 to the Registrant’s Form 10-K filed February 27, 2009) 10.9 Amendment No. 2 to Employment Agreement with Stephen P. Holmes, dated as of November 19, 2009 (incorporated by reference to
Exhibit 10.3 to the Registrant’s Form 10-K filed February 19, 2010) 10.10 Amendment No. 3 to Employment Agreement with Stephen P. Holmes, dated December 31, 2012 (incorporated by reference to
Exhibit 10.8 to the Registrant’s Form 10-K filed February 15, 2013) 10.11 Amendment No. 4 to Employment Agreement with Stephen P. Holmes, dated May 16, 2013 (incorporated by reference to Exhibit 10.2
to the Registrant’s Form 10-Q filed July 24, 2013) 10.12 Employment Agreement with Geoffrey A. Ballotti, dated as of March 31, 2008 (incorporated by reference to Exhibit 10.5 to the
Registrant’s Form 10-K filed February 27, 2009) 10.13 Amendment No. 1 to Employment Agreement with Geoffrey A. Ballotti, dated December 31, 2008 (incorporated by reference to
Exhibit 10.6 to the Registrant’s Form 10-K filed February 27, 2009) 10.14 Amendment No. 2 to Employment Agreement with Geoffrey A. Ballotti, dated December 16, 2009 (incorporated by reference to
Exhibit 10.7 to the Registrant’s Form 10-K filed February 19, 2010) 10.15 Amendment No. 3 to Employment Agreement with Geoffrey A. Ballotti, dated March 1, 2011 (incorporated by reference to Exhibit
10.4 to the Registrant’s Form 10-Q filed April 29, 2011) 10.16 Amendment No. 4 to Employment Agreement with Geoffrey A. Ballotti, dated March 28, 2014 (incorporated by reference to Exhibit
10.2 to the Registrant’s Form 10-Q filed April 24, 2014) 10.17* Employment Agreement with Gail Mandel, dated as of November 13, 201410.18 Employment Agreement with Franz S. Hanning, dated as of November 19, 2009 (incorporated by reference to Exhibit 10.4 to the
Registrant’s Form 10-K filed February 19, 2010) 10.19 Amendment No. 1 to Employment Agreement with Franz S. Hanning, dated March 1, 2011 (incorporated by reference to Exhibit 10.3
to the Registrant’s Form 10-Q filed April 29, 2011) 10.20 Amendment No. 2 to Employment Agreement with Franz S. Hanning, dated March 15, 2013 (incorporated by reference to Exhibit 10.1
to the Registrant’s Form 10-Q/A (Amendment No. 1) filed April 29, 2013) 10.21 Amendment No. 3 to Employment Agreement with Franz S. Hanning, dated February 28, 2014 (incorporated by reference to Exhibit
10.1 to the Registrant’s Form 10-Q filed April 24, 2014)
G-2
Table of Contents
10.22 Amendment No. 4 to Employment Agreement with Franz S. Hanning, dated May 15, 2014 (incorporated by reference to Exhibit 10.1to the Registrant’s Form 10-Q filed July 24, 2014)
10.23 Employment Agreement with Thomas G. Conforti, dated as of September 8, 2009 (incorporated by reference to Exhibit 10.1 to the
Registrant’s Form 10-Q filed November 5, 2009) 10.24 Amendment No. 1 to Employment Agreement with Thomas G. Conforti, dated May 11, 2012 (incorporated by reference to Exhibit
10.1 to the Registrant’s Form 10-Q filed July 25, 2012) 10.25 Employment Letter Agreement with Thomas Anderson, dated March 24, 2008 (incorporated by reference to Exhibit 10.9 to the
Registrant’s Form 10-K filed February 27, 2009) 10.26 Addendum No. 1 to Employment Letter Agreement with Thomas F. Anderson, dated December 31, 2008 (incorporated by reference to
Exhibit 10.10 to the Registrant’s Form 10-K filed February 27, 2009) 10.27* Addendum No. 2 to Employment Letter Agreement with Thomas F. Anderson, dated March 23, 2009 10.28* Addendum No. 3 to Employment Letter Agreement with Thomas F. Anderson, dated December 16, 2009 10.29* Addendum No. 4 to Employment Letter Agreement with Thomas F. Anderson, dated November 8, 2012 10.30 Employment Agreement with Eric A. Danziger, dated as of November 17, 2008 (incorporated by reference to Exhibit 10.8 to the
Registrant’s Form 10-K filed February 19, 2010) 10.31 Letter Agreement with Eric A. Danziger, dated December 1, 2008 (incorporated by reference to Exhibit 10.9 to the Registrant’s Form
10-K filed February 19, 2010) 10.32 Amendment No. 1 to Employment Agreement with Eric A. Danziger, dated December 16, 2009 (incorporated by reference to Exhibit
10.10 to the Registrant’s Form 10-K filed February 19, 2010) 10.33 Amendment No. 2 to Employment Agreement with Eric A. Danziger, dated March 1, 2011 (incorporated by reference to Exhibit 10.5
to the Registrant’s Form 10-Q filed April 29, 2011) 10.34 Amendment No. 3 to Employment Agreement with Eric A. Danziger, dated March 15, 2013 (incorporated by reference to Exhibit 10.2
to the Registrant’s Form 10-Q/A (Amendment No. 1) filed April 29, 2013) 10.35 Termination and Release Agreement with Eric A. Danziger, dated February 28, 2014 (incorporated by reference to Exhibit 10.3 to the
Registrant’s Form 10-Q filed April 24, 2014) 10.36 Wyndham Worldwide Corporation 2006 Equity and Incentive Plan (Amended and Restated as of May 12, 2009) (incorporated by
reference to Exhibit 10.1 to the Registrant’s Form 8-K filed May 18, 2009) 10.37 Amendment to the Wyndham Worldwide Corporation 2006 Equity and Incentive Plan (Amended and Restated as of February 27,
2014) (incorporated by reference to Appendix A of the Company’s Definitive Proxy Statement on Schedule 14A filed on April 4,2014)
10.38 Form of Award Agreement for Restricted Stock Units (incorporated by reference to Exhibit 10.17 to the Registrant’s Form 10-K filed
February 17, 2012) 10.39 Form of Award Agreement for Stock Appreciation Rights (incorporated by reference to Exhibit 10.18 to the Registrant’s Form 10-K
filed February 17, 2012) 10.40 Wyndham Worldwide Corporation Savings Restoration Plan (incorporated by reference to Exhibit 10.7 to the Registrant’s Form 8-K
filed July 19, 2006) 10.41 Amendment Number One to Wyndham Worldwide Corporation Savings Restoration Plan, dated December 31, 2008 (incorporated by
reference to Exhibit 10.17 to the Registrant’s Form 10-K filed February 27, 2009) 10.42 Wyndham Worldwide Corporation Non-Employee Directors Deferred Compensation Plan (incorporated by reference to Exhibit 10.6 to
the Registrant’s Form 8-K filed July 19, 2006) 10.43 First Amendment to Wyndham Worldwide Corporation Non-Employee Directors Deferred Compensation Plan (incorporated by
reference to Exhibit 10.48 to the Registrant’s Form 10-K filed March 7, 2007)
G-3
Table of Contents
10.44 Amendment Number Two to the Wyndham Worldwide Corporation Non-Employee Directors Deferred Compensation Plan, datedDecember 31, 2008 (incorporated by reference to Exhibit 10.20 to the Registrant’s Form 10-K filed February 27, 2009)
10.45 Wyndham Worldwide Corporation Officer Deferred Compensation Plan (incorporated by reference to Exhibit 10.8 to the Registrant’s
Form 8-K filed July 19, 2006) 10.46 Amendment Number One to Wyndham Worldwide Corporation Officer Deferred Compensation Plan, dated December 31, 2008
(incorporated by reference to Exhibit 10.22 to the Registrant’s Form 10-K filed February 27, 2009) 10.47 Amendment No. 2 to Wyndham Worldwide Corporation Officer Deferred Compensation Plan, dated December 31, 2012 (incorporated
by reference to Exhibit 10.32 to the Registrant’s Form 10-K filed February 15, 2013) 10.48 Transition Services Agreement among Cendant Corporation, Realogy Corporation, Wyndham Worldwide Corporation and Travelport
Inc., dated as of July 27, 2006 (incorporated by reference to Exhibit 10.1 to the Registrant’s Form 8-K filed July 31, 2006) 10.49 Tax Sharing Agreement among Cendant Corporation, Realogy Corporation, Wyndham Worldwide Corporation and Travelport Inc.,
dated as of July 28, 2006 (incorporated by reference to Exhibit 10.2 to the Registrant’s Form 8-K filed July 31, 2006) 10.50 Amendment, executed July 8, 2008 and effective as of July 28, 2006 to Tax Sharing Agreement, entered into as of July 28, 2006, by
and among Avis Budget Group, Inc., Realogy Corporation and Wyndham Worldwide Corporation (incorporated by Reference toExhibit 10.1 to the Registrant’s Form 10-Q filed August 8, 2008)
10.51 Agreement, dated as of July 15, 2010, between Wyndham Worldwide Corporation and Realogy Corporation clarifying Tax Sharing
Agreement, dated as of July 28, 2006, among Realogy Corporation, Cendant Corporation, Wyndham Worldwide Corporation andTravelport, Inc. (incorporated by reference to Exhibit 10.1 to the Registrant’s Form 8-K filed July 21, 2010)
12* Computation of Ratio of Earnings to Fixed Charges 21.1* Subsidiaries of the Registrant 23.1* Consent of Independent Registered Public Accounting Firm 31.1* Certification of Chairman and Chief Executive Officer Pursuant to Rule 13a-14(a) Under the Securities Exchange Act of 1934 31.2* Certification of Chief Financial Officer Pursuant to Rule 13a-14(a) Under the Securities Exchange Act of 1934 32** Certification of Chairman and Chief Executive Officer and Chief Financial Officer pursuant to 18 U.S.C. Section 1350 101.INS* XBRL Instance Document 101.SCH* XBRL Taxonomy Extension Schema Document 101.CAL* XBRL Taxonomy Extension Calculation Linkbase Document 101.DEF* XBRL Taxonomy Extension Definition Linkbase Document 101.LAB* XBRL Taxonomy Extension Label Linkbase Document 101.PRE* XBRL Taxonomy Extension Presentation Linkbase Document
* Filed with this report** Furnished with this report
G-4
Exhibit 10.17
EMPLOYMENT AGREEMENT
This Employment Agreement (this “Agreement”), dated as of November 13, 2014, is hereby made by and between WyndhamWorldwide Corporation, a Delaware corporation (the “Company”), and Gail Mandel (the “Executive”).
WHEREAS, the Company desires to employ the Executive, and the Executive desires to serve the Company, in accordancewith the terms and conditions of this Agreement.
NOW THEREFORE, in consideration of the foregoing and other good and valuable consideration, the receipt and sufficiencyof which are hereby acknowledged, the parties hereby agree as follows:
SECTION I
EFFECTIVENESS
This Agreement will be deemed effective and enforceable by the parties hereto as of the Effective Date (as defined below).
SECTION II
EMPLOYMENT; POSITION AND RESPONSIBILITIES
During the Period of Employment (as defined in Section III below) the Company agrees to employ the Executive and theExecutive agrees to be employed by the Company in accordance with the terms and conditions set forth in this Agreement.
During the Period of Employment, the Executive will serve as the Chief Executive Officer of the Company’s exchange andrentals business (“WER”) and will report to, and be subject to the direction of, the Chief Executive Officer of the Company (the“Supervising Officer”). The Executive will perform such duties and exercise such supervision with regard to the business of theCompany as are associated with her position, such as exercising responsibility for the exchange and rentals segment results, as well assuch reasonable additional duties as may be prescribed from time to time by the Supervising Officer. The Executive will, during thePeriod of Employment, devote substantially all of her time and attention during normal business hours to the performance of servicesfor the Company, or as otherwise directed by the Supervising Officer from time to time. The Executive will maintain a primary officeand generally conduct her business in Parsippany, New Jersey, except for customary business travel in connection with her dutieshereunder.
-1-
SECTION III
PERIOD OF EMPLOYMENT
The period of the Executive’s employment under this Agreement (the “Period of Employment”) will begin on November 13,2014 (the “Effective Date”) and will end on November 13, 2017, subject to earlier termination as provided in this Agreement. No laterthan 180 days prior to the expiration of the Period of Employment, the Company and the Executive will commence a good faithnegotiation regarding extending the Period of Employment; provided, that neither party hereto will have any obligation hereunder orotherwise to consummate any such extension or enter into any new agreement relating to the Executive’s employment with theCompany. For the avoidance of doubt, the Executive will not be entitled to payments pursuant to Section VI of this Agreement byreason of the Company electing to not extend this Agreement or enter into a new agreement with the Executive to extend the Period ofEmployment.
SECTION IV
COMPENSATION AND BENEFITS
For all services rendered by the Executive pursuant to this Agreement during the Period of Employment, including services asan executive officer, director or committee member of the Company or any subsidiary or affiliate of the Company, the Executive willbe compensated as follows:
A. Base Salary.
During the Period of Employment, the Company will pay the Executive base salary at an annual rate equal to five hundred andtwenty thousand dollars ($520,000) commencing effective on the Effective Date, subject to annual increases as the CompensationCommittee (the “Committee”) of the Company’s Board of Directors (the “Board”), deems appropriate in its sole discretion (“BaseSalary”). Base Salary will be payable according to the customary payroll practices of the Company.
B. Annual Incentive Awards.
The Executive will be eligible to earn an annual incentive compensation award in respect of each fiscal year of the Companyduring the Period of Employment, subject to the Committee’s discretion to grant such awards, based upon a target award opportunityequal to 100% of Base Salary earned during each such year, effective March 28, 2014 (and 50% prior to that date, with any AnnualIncentive Award paid for fiscal 2014 to be prorated), and subject to the terms and conditions of the annual incentive plan coveringemployees of the Company, and further subject to attainment by the Company and/or the WER segment of such performance goals,criteria or targets established and certified by the Committee in its sole discretion in respect of each such fiscal year (each such annualincentive, an “Incentive Compensation Award ”), provided that the Executive’s bonus targets relating to Incentive CompensationAwards will be based upon targets substantially equivalent to those applicable to other comparable senior executive officers (excludingthe Supervising Officer).
-2-
Solely for purposes of Section 162(m) of the Internal Revenue Code of 1986, as amended (the “Code”), the Executive will continue toparticipate in the Global Annual Incentive Plan as a non-SEL level participant until the commencement of the performance period forany annual incentive plan that may be established for the 2015 fiscal year. Any earned Incentive Compensation Award will be paid tothe Executive at such time as will be determined by the Committee, but in no event later than the last day of the calendar yearfollowing the calendar year with respect to which the performance targets relate.
C. Long Term Incentive Awards.
The Executive will be eligible for long term incentive awards as determined by the Committee, and the Executive willparticipate in such grants at a level commensurate with her position as a senior executive officer of the Company. For purposes of thisAgreement, awards described in this paragraph are referred to as “Long Term Incentive Awards .” Any Long Term IncentiveAwards will vest as determined by the Committee, including with respect to any performance-based conditions applicable to vesting, inits sole and absolute discretion, and will be subject to the terms and conditions of the Company’s 2006 Equity and Incentive Plan(restated as of February 27, 2014) and any amended or successor plan thereto (the “Equity Plan”) and the applicable agreementevidencing such award as determined by the Committee.
During the first quarter of 2015, the Executive will be awarded, subject to Committee approval, the following equity awardsconstituting her Long Term Incentive Awards for the 2015 fiscal year: (i) time-based restricted stock units (“ RSU 2015 AnnualGrant”), with the number of such units determined by dividing a grant value of no less than $1,500,000 by the closing market price ofthe Company’s common stock on the date of grant and (ii) an LTIP modifier award consisting of performance-vested restricted stockunits, with the number of such units determined by dividing an amount equal to 50% of the grant value of her 2015 RSU Annual Grantby the closing market price of the Company’s stock on the date of grant, the vesting of which will be subject to attainment by theCompany over the specified performance period of performance goals established and certified by the Committee in its sole discretion.Each such award will be subject to the terms and conditions of the Equity Plan and the applicable agreement evidencing such award asdetermined by the Committee.
D. Employee Benefits.
During the Period of Employment, the Company will provide the Executive with employee benefits generally offered to alleligible full-time employees of WER, and with perquisites generally offered to similarly situated senior executive officers of theCompany, subject to the terms of the applicable employee benefit plans or policies of WER and/or the Company.
E. Expenses.
During the Period of Employment, the Company will reimburse the Executive for reasonable business expenses incurred by theExecutive in connection with the performance of her duties and obligations under this Agreement, subject to Executive’s compliancewith such limitations and reporting requirements with respect to expenses as may be established by the Company from time
-3-
to time. The Company will reimburse all taxable business expenses to the Executive promptly following submission but in no eventlater than the last day of the Executive’s taxable year following the taxable year in which the expenses are incurred.
SECTION V
DEATH AND DISABILITY
The Period of Employment will end upon the Executive’s death. If the Executive becomes Disabled (as defined below) duringthe Period of Employment, the Period of Employment may be terminated at the option of the Executive upon notice of resignation tothe Company, or at the option of the Company upon notice of termination to the Executive. For purposes of this Agreement,“Disability” will have the meaning set forth in Section 409A of the Code, and the rules and regulations promulgated thereunder(“Code Section 409A”). The Company’s obligation to make payments to the Executive under this Agreement will cease as of suchdate of termination due to death or Disability, except for Base Salary earned but unpaid and any Incentive Compensation Awardsearned but unpaid for a prior completed fiscal year, if any, as of the date of such termination, which will be paid in accordance with theterms set forth in Sections IV-A and IV-B, respectively. Notwithstanding the foregoing, the Company will not take any action withrespect to the Executive’s employment status pursuant to this Section V earlier than the date on which the Executive becomes eligiblefor long-term disability benefits under the terms of the Company’s long-term disability plan in effect from time to time.
SECTION VI
EFFECT OF TERMINATION OF EMPLOYMENT
A . Without Cause Termination and Constructive Discharge . If the Executive’s employment terminates during the Period ofEmployment due to either a Without Cause Termination or a Constructive Discharge (each as defined below), the Company will payor provide the Executive, as applicable (or her surviving spouse, estate or personal representative, as applicable), subject to SectionXIX:
i a lump sum payment equal to 200% multiplied by the sum of (x) the Executive’s then current Base Salary, plus (y)an amount equal to the highest Incentive Compensation Award paid to the Executive with respect to the three fiscal years of theCompany immediately preceding the fiscal year in which Executive’s termination of employment occurs, but in no event will theamount set forth in this subsection (y) exceed 100% of the Executive’s then current Base Salary;
ii. subject to Section VI-D below, (x) all time-based Long Term Incentive Awards (including all stock options andstock appreciation rights) granted on or after the Effective Date which would have otherwise vested within one (1) year following theExecutive’s termination of employment, will vest upon the Executive’s termination of employment; and (y) any performance-basedLong Term Incentive Awards (including restricted stock units but excluding stock options and stock appreciation rights) granted on orafter the Effective Date, will vest and be paid on a pro
-4-
rata basis (to the extent that the performance goals applicable to the Long Term Incentive Award are achieved), with such proration tobe determined based upon the portion of the full performance period during which the Executive was employed by the Company plus12 months (or, if less, assuming employment for the entire performance period), with the payment of any such vested performance-based Long Term Incentive Awards to occur at the time that the awards vest and are paid to employees generally. The provisionsrelating to Long Term Incentive Awards set forth in this Section will not supersede or replace any provision or right of the Executiverelating to the acceleration of the vesting of such awards in the event of a change in control of the Company or the Executive’s death ordisability, whether pursuant to an applicable stock plan document or award agreement;
iii. a two year post-termination exercise period (but in no event beyond the original expiration date) for all vested andoutstanding stock appreciation rights and options held by the Executive on the date of termination; and
iv. any of the following amounts that are earned but unpaid through the date of such termination: (x) IncentiveCompensation Award for a prior completed fiscal year and (y) Base Salary.
B . Termination for Cause; Resignation. If the Executive’s employment terminates due to a Termination for Cause or aResignation, Base Salary earned but unpaid as of the date of such termination will be paid to the Executive in accordance with SectionVI-D below. Outstanding stock options and other equity awards held by the Executive as of the date of termination will be treated inaccordance with their terms.
C. For purposes of this Agreement, the following terms have the following meanings:i. “Termination for Cause” means a termination of the Executive’s employment by the Company due to (a) the
Executive’s willful failure to substantially perform her duties as an employee of the Company or any of its subsidiaries (other than anysuch failure resulting from incapacity due to physical or mental illness) or material breach of the Company’s Code of Conduct, (b) anyact of fraud, misappropriation, dishonesty, embezzlement or similar conduct against the Company or any of its subsidiaries, (c) theExecutive’s conviction or plea of nolo contendere for a felony (or its state law equivalent) or any crime involving moral turpitude ordishonesty (which conviction, due to the passage of time or otherwise, is not subject to further appeal), (d) the Executive’s grossnegligence in the performance of her duties or (e) the Executive purposely or negligently makes a false certification regarding theCompany’s financial statements. The Company will provide written notice to the Executive of its intention to terminate the Executive’semployment and that such termination is a Termination for Cause, along with a description of the Executive’s conduct that theCompany believes gives rise to the Termination for Cause, and provide the Executive with a period of fifteen (15) days to cure suchconduct (unless the Company reasonably determines in its sole discretion that the Executive’s conduct is not subject to cure) and/orchallenge the Company’s determination that such termination was a Termination for Cause; provided, however, that (i) thedetermination of whether such conduct has been cured and/or gives rise to a Termination for Cause will be made by the Company inits sole discretion and (ii) the Company will be entitled
-5-
to immediately and unilaterally restrict or suspend the Executive’s duties during such fifteen (15) day period pending suchdetermination.
ii. “Constructive Discharge” means, without the consent of the Executive, (a) any material breach by the Companyof the terms of this Agreement, (b) a material diminution in Base Salary, (c) a material diminution in the Executive’s authority, duties orresponsibilities, (d) a relocation of the Executive’s primary office to a location more than fifty (50) miles from her then current primarybusiness office or (e) in connection with a transaction described in Section XII below, the failure of the acquiring company to assumethis Agreement for any reason. The Executive will provide the Company a written notice that describes the circumstances being reliedon for such termination with respect to this Agreement within thirty (30) days after the event, circumstance or condition giving rise tothe notice. The Company will have thirty (30) days after receipt of such notice to remedy the situation prior to the termination forConstructive Discharge.
iii. “Without Cause Termination” or “Terminated Without Cause” means termination of the Executive’semployment by the Company other than due to death, Disability, or Termination for Cause.
iv. “Resignation” means a termination of the Executive’s employment by the Executive, other than in connectionwith a Constructive Discharge.
D. Conditions to Payment and Acceleration. In the event of a termination under this Section VI, any earned but unpaid BaseSalary as of the date of such termination will be paid in accordance with Section IV-A, and in the event of a Termination WithoutCause or a Constructive Discharge, any earned but unpaid Incentive Compensation Award for a prior completed fiscal year as of thedate of such termination will be paid in accordance with Section IV-B. All payments due to the Executive under Sections VI-A(i) willbe made to the Executive in a lump sum no later than the 60th day following the date of termination; provided however, that (i) allpayments and benefits under Sections VI-A(i) - (iii) will be subject to, and contingent upon, the execution by the Executive (or herbeneficiary or estate) of a release of claims against the Company and its affiliates in such reasonable form determined by the Companyin its sole discretion and (ii) in the event that the period during which the Executive is entitled to consider the general release (and torevoke the release, if applicable) spans two calendar years, then any payment that otherwise would have been payable during the firstcalendar year will in no case be made until the later of (A) the end of the revocation period (assuming that the Executive does notrevoke), or (B) the first business day of the second calendar year (regardless of whether the Executive used the full time period allowedfor consideration), all as required for purposes of Code Section 409A. The payments due to the Executive under Section VI-A will bein lieu of any other severance benefits otherwise payable to the Executive under any severance plan of the Company or its affiliates.
SECTION VII
OTHER DUTIES OF THE EXECUTIVEDURING AND AFTER THE PERIOD OF EMPLOYMENT
-6-
A. The Executive will, with reasonable notice during or after the Period of Employment, furnish information as may be in herpossession and fully cooperate with the Company and its affiliates as may be requested in connection with any claims or legal action inwhich the Company or any of its affiliates is or may become a party. After the Period of Employment, the Executive will cooperate asreasonably requested with the Company and its affiliates in connection with any claims or legal actions in which the Company or anyof its affiliates is or may become a party. The Company agrees to reimburse the Executive for any reasonable out-of-pocket expensesincurred by Executive by reason of such cooperation, including any loss of salary due, and the Company will make reasonable effortsto minimize interruption of the Executive’s life in connection with her cooperation in such matters as provided for in this Section VII-A.
B. The Executive recognizes and acknowledges that all information pertaining to this Agreement or to the affairs; business;results of operations; accounting methods, practices and procedures; members; acquisition candidates; financial condition; clients;customers or other relationships of the Company or any of its affiliates (“Information”) is confidential and is a unique and valuableasset of the Company or any of its affiliates. Access to and knowledge of certain of the Information is essential to the performance ofthe Executive’s duties under this Agreement. The Executive will not during the Period of Employment or thereafter, except to theextent reasonably necessary in performance of her duties under this Agreement, give to any person, firm, association, corporation, orgovernmental agency any Information, except as may be required by law. The Executive will not make use of the Information for herown purposes or for the benefit of any person or organization other than the Company or any of its affiliates. The Executive will alsouse her best efforts to prevent the disclosure of this Information by others. All records, memoranda, etc. relating to the business of theCompany or its affiliates, whether made by the Executive or otherwise coming into her possession, are confidential and will remain theproperty of the Company or its affiliates.
C.
i. During the Period of Employment (as may be extended from time to time) and the Post Employment Period (asdefined below and, together with the Period of Employment, the “Restricted Period”), irrespective of the cause, manner or time ofany termination, the Executive will not use her status with the Company or any of its affiliates to obtain loans, goods or services fromanother organization on terms that would not be available to her in the absence of her relationship to the Company or any of itsaffiliates.
ii. During the Restricted Period, the Executive will not make any statements intended to or which reasonably couldhave the effect of in any way injuring the interests of the Company or any of its affiliates. During the Restricted Period, the Executive,will not, without the express prior written consent of the Company which may be withheld in the Company’s sole and absolutediscretion, engage in, or directly or indirectly (whether for compensation or otherwise), own or hold any proprietary interest in,manage, operate, or control, or join or participate in the ownership, management, operation or control of, or furnish any capital to or beconnected in any manner with, any party or business which competes with the business of the Company or any of its affiliates, as suchbusiness or businesses may be conducted from time to time, either as a general or limited partner, proprietor, common or preferredshareholder, officer, director, agent, employee,
-7-
consultant, trustee, affiliate, or otherwise. The Executive acknowledges that the Company’s and its affiliates’ businesses are conductednationally and internationally and agrees that the provisions in the foregoing sentence will operate throughout the United States and theworld.
iii. During the Restricted Period, the Executive will not, without the express prior written consent of the Companywhich may be withheld in the Company’s sole and absolute discretion, directly or indirectly, request or advise any then current client,customer or supplier of the Company to withdraw, curtail or cancel its business with the Company or any of its affiliates, or solicit orcontact any such client, customer or supplier with a view to inducing or encouraging such client, customer or supplier to discontinue orcurtail any business relationship with the Company or any of its affiliates. The Executive will not have discussions with any employeeof the Company or any of its affiliates regarding information or plans for any business intended to compete with the Company or anyof its affiliates.
iv. During the Restricted Period, the Executive will not, without the express prior written consent of the Companywhich may be withheld in the Company’s sole and absolute discretion, interfere directly or indirectly with the employees or affairs ofthe Company or any of its affiliates, or directly or indirectly cause, solicit, entice or induce (or endeavor to cause, solicit, entice orinduce) any present or future employee or independent contractor of the Company or any of its affiliates to leave the employ of, orotherwise terminate its relationship with, the Company or any of its affiliates or to accept employment with, provide services to orreceive compensation from the Executive or any person, firm, company, association or other entity with which the Executive is now ormay hereafter become associated. The Executive hereby represents and warrants that the Executive has not entered into any agreement,understanding or arrangement with any employee of the Company or any of its subsidiaries or affiliates pertaining to any business inwhich the Executive has participated or plans to participate, or to the employment, engagement or compensation of any such employee.
v. For the purposes of this Agreement, the term “proprietary interest” means legal or equitable ownership, whetherthrough stock holding or otherwise, of an equity interest in a business, firm or entity, or ownership of any class of equity interest in apublicly-held company (unless such ownership of a publicly-held company is 5% or less); the term “affiliate” includes withoutlimitation all subsidiaries and licensees of the Company; and the term, “Post Employment Period” means either (1) if the Executive’semployment terminates for any reason at such time following the expiration of the Period of Employment hereunder, a period of oneyear following the Executive’s termination of employment; or (2) if the Executive’s employment terminates during the Period ofEmployment hereunder, a period of two years following the Executive’s termination of employment.
D. The Executive hereby acknowledges that damages at law may be an insufficient remedy to the Company if the Executiveviolates the terms of this Agreement and that the Company will be entitled, upon making the requisite showing, to preliminary and/orpermanent injunctive relief in any court of competent jurisdiction to restrain the breach of or otherwise to specifically enforce any of thecovenants contained in this Section VII without the necessity of posting any bond or showing any actual damage or that monetarydamages would not provide an adequate remedy.
-8-
Such right to an injunction will be in addition to, and not in limitation of, any other rights or remedies the Company may have. Withoutlimiting the generality of the foregoing, neither party will oppose any motion the other party may make for any expedited discovery orhearing in connection with any alleged breach of this Section VII.
E. The period of time during which the provisions of this Section VII will be in effect will be extended by the length of timeduring which the Executive is in breach of the terms hereof as determined by any court of competent jurisdiction on the Company’sapplication for injunctive relief.
F. The Executive agrees that the restrictions contained in this Section VII are an essential element of the compensation theExecutive is granted hereunder and but for the Executive’s agreement to comply with such restrictions, the Company would not haveentered into this Agreement.
SECTION VIII
INDEMNIFICATION
The Company will indemnify the Executive to the fullest extent permitted by the laws of the state of the Company’sincorporation in effect at that time, or the certificate of incorporation and by-laws of the Company, whichever affords the greaterprotection to the Executive (including payment of expenses in advance of final disposition of a proceeding as permitted by such laws,certificate of incorporation or by-laws).
SECTION IX
MITIGATION
The Executive will not be required to mitigate the amount of any payment provided for hereunder by seeking otheremployment or otherwise, nor will the amount of any such payment be reduced by any compensation earned by the Executive as theresult of employment by another employer after the date the Executive’s employment hereunder terminates.
SECTION X
WITHHOLDING TAXES
The Executive acknowledges and agrees that the Company may directly or indirectly withhold from applicable payments underthis Agreement all federal, state, city or other taxes that will be required pursuant to any law or governmental regulation.
SECTION XI
EFFECT OF PRIOR AGREEMENTS
-9-
Upon the Effective Date, this Agreement will be deemed to have superseded and replaced each prior employment or consultantagreement between the Company (and/or its affiliates, including without limitation, Cendant and its respective predecessors) and theExecutive.
SECTION XII
CONSOLIDATION, MERGER OR SALE OF ASSETS
Nothing in this Agreement will preclude the Company from consolidating or merging into or with, or transferring all orsubstantially all of its assets to, another corporation.
SECTION XIII
MODIFICATION
This Agreement may not be modified or amended except in writing signed by the parties. No term or condition of thisAgreement will be deemed to have been waived except in writing by the party charged with waiver. A waiver will operate only as tothe specific term or condition waived and will not constitute a waiver for the future or act as a waiver of anything other than that whichis specifically waived.
SECTION XIV
GOVERNING LAW
This Agreement has been executed and delivered in the State of New Jersey and its validity, interpretation, performance andenforcement will be governed by the internal laws of that state.
SECTION XV
ARBITRATION
A. Any controversy, dispute or claim arising out of or relating to this Agreement or the breach hereof (other than with respectto the matters covered by Section VII for which the Company may, but will not be required to, seek injunctive relief) will be finallysettled by binding arbitration in accordance with the Federal Arbitration Act (or if not applicable, the applicable state arbitration law) asfollows: Any party who is aggrieved will deliver a notice to the other party setting forth the specific points in dispute. Any pointsremaining in dispute twenty (20) days after the giving of such notice may be submitted to arbitration in New Jersey, to the AmericanArbitration Association, before a single arbitrator appointed in accordance with the arbitration rules of the American ArbitrationAssociation, modified only as herein expressly provided. After the aforesaid twenty (20) days, either party, upon ten (10) days noticeto the other, may so submit the points in dispute to arbitration. The arbitrator may enter a default decision against any party who fails toparticipate in the arbitration proceedings.
B. The decision of the arbitrator on the points in dispute will be final and binding, and judgment on the award may be enteredin any court having jurisdiction thereof.
-10-
C. Except as otherwise provided in this Agreement, the arbitrator will be authorized to apportion its fees and expenses andthe reasonable attorneys’ fees and expenses of any such party as the arbitrator deems appropriate. In the absence of any suchapportionment, the fees and expenses of the arbitrator will be borne equally by each party, and each party will bear the fees andexpenses of its own attorney.
D. The parties agree that this Section XV has been included to rapidly and inexpensively resolve any disputes between themwith respect to this Agreement, and that this Section XV will be grounds for dismissal of any court action commenced by either partywith respect to this Agreement, other than post-arbitration actions seeking to enforce an arbitration award. In the event that any courtdetermines that this arbitration procedure is not binding, or otherwise allows any litigation regarding a dispute, claim, or controversycovered by this Agreement to proceed, the parties hereto hereby waive any and all right to a trial by jury in or with respect to suchlitigation.
E. The parties will keep confidential, and will not disclose to any person, except as may be required by law, the existence ofany controversy hereunder, the referral of any such controversy to arbitration or the status or resolution thereof.
SECTION XVI
SURVIVAL
Sections VII, VIII, IX, XI, XII, XIII, XIV, XV, XVI will continue in full force in accordance with their respective termsnotwithstanding any termination of the Period of Employment.
SECTION XVII
SEPARABILITY
All provisions of this Agreement are intended to be severable. In the event any provision or restriction contained herein is heldto be invalid or unenforceable in any respect, in whole or in part, such finding will in no way affect the validity or enforceability of anyother provision of this Agreement. The parties hereto further agree that any such invalid or unenforceable provision will be deemedmodified so that it will be enforced to the greatest extent permissible under law, and to the extent that any court of competentjurisdiction determines any restriction herein to be unreasonable in any respect, such court may limit this Agreement to render itreasonable in the light of the circumstances in which it was entered into and specifically enforce this Agreement as limited.
SECTION XVIII
NO CONFLICTS
The Executive represents and warrants to the Company that she is not a party to or otherwise bound by any agreement orarrangement (including, without limitation, any license, covenant, or commitment of any nature), or subject to any judgment, decree, ororder of any court or administrative agency, that would conflict with or will be in conflict with or in any way preclude,
-11-
limit or inhibit the Executive’s ability to execute this Agreement or to carry out her duties and responsibilities hereunder.
SECTION XIX
SECTION 409A OF THE CODE
A . Section 409A. Although the Company does not guarantee to the Executive any particular tax treatment relating to thepayments and benefits under this Agreement, it is intended that such payments and benefits be exempt from, or comply with, CodeSection 409A and this Agreement will be construed in a manner consistent with the requirements for avoiding taxes or penalties underCode Section 409A.
B . Separation From Service. A termination of employment will not be deemed to have occurred for purposes of anyprovision of this Agreement providing for the payment of amounts or benefits subject to Code Section 409A upon or following atermination of employment unless such termination is also a “Separation from Service” within the meaning of Code Section 409A and,for purposes of any such provision of this Agreement, references to a “resignation,” “termination,” “termination of employment” or liketerms will mean Separation from Service.
C . Reimbursement. With regard to any provision herein that provides for reimbursement of costs and expenses or in-kindbenefits, except as permitted by Code Section 409A, (i) the right to reimbursement or in-kind benefits will not be subject to liquidationor exchange for another benefit and (ii) the amount of expenses eligible for reimbursement, or in-kind benefits, provided during anytaxable year will not affect the expenses eligible for reimbursement, or in-kind benefits to be provided, in any other taxable year,provided, that the foregoing clause will not be violated with regard to expenses reimbursed under any arrangement covered by Section105(b) of the Code solely because such expenses are subject to a limit related to the period the arrangement is in effect.
D . Specified Employee. If the Executive is deemed on the date of termination of employment to be a “specified employee”within the meaning of that term under Section 409A(a)(2)(B) of the Code and using the identification methodology selected by theCompany from time to time, or if none, the default methodology, then:
i. With regard to any payment, the providing of any benefit or any distribution of equity that constitutes “deferredcompensation” subject to Code Section 409A, payable upon separation from service, such payment, benefit or distribution will not bemade or provided prior to the earlier of (x) the expiration of the six-month period measured from the date of the Executive’s Separationfrom Service or (y) the date of the Executive’s death; and
ii. On the first day of the seventh month following the date of the Executive’s Separation from Service or, if earlier,on the date of death, (x) all payments delayed pursuant to this Section XVIII will be paid or reimbursed to the Executive in a lumpsum, and any remaining payments and benefits due under this Agreement will be paid or provided in accordance with the normal datesspecified for them herein and (y) all distributions of equity delayed pursuant to this Section XVIII will be made to the Executive.
-12-
E . Company Discretion. Whenever a payment under this Agreement specifies a payment period with reference to a numberof days (e.g., “payment will be made within 60 days following the date of termination”), the actual date of payment within thespecified period will be within the sole discretion of the Company and the number of days referenced will refer to the number ofcalendar days.
F . Compliance. Notwithstanding anything herein to the contrary, in no event whatsoever will the Company or any of itsaffiliates be liable for any additional tax, interest or penalties that may be imposed on the Executive by Code Section 409A or anydamages for failing to comply with Code Section 409A.
[Signature Page Follows]
-13-
IN WITNESS WHEREOF, the undersigned have executed this Agreement as of the date first set forth above.
WYNDHAM WORLDWIDE CORPORATION
By: /s/ Mary R. Falvey Name: Mary R. Falvey
Title: Executive VicePresident and
Chief HumanResources Officer
/s/ Gail Mandel Gail Mandel
Exhibit 10.27
March 23, 2009
Thomas Anderson4 Arrowhead TrailSparta, NJ 07871
Dear Tom:
Reference is made to the letter regarding your employment with Wyndham Worldwide Corporation (the “ Company”), dated March 24,2008 (the “Original Letter”), and the addendum letter dated December 31, 2008, regarding the clarification of certain terms in theOriginal Letter (together with the Original Letter, the “Offer Letter”).
This addendum letter hereby confirms that, effective as of January 1, 2009, notwithstanding anything to the contrary in the Offer Letter,you will not be eligible for a bonus modifier in 2009 or any subsequent year. Except as provided herein, all terms and conditions setforth in the Offer Letter shall remain in effect.
Regards,
WYNDHAM WORLDWIDE CORPORATION
By: /s/ Stephen P. Holmes Name: Stephen P. HolmesTitle: Chairman and Chief Executive Officer
Understood, accepted and agreed to as of March 23, 2009
/s/ Thomas Anderson Thomas Anderson
Exhibit 10.28
December 16, 2009
Thomas Anderson4 Arrowhead TrailSparta, NJ 07871
Dear Tom:
Reference is made to the letter regarding your employment with Wyndham Worldwide Corporation (“Wyndham Worldwide”),dated March 24, 2008 (the “Original Letter”), and the addendum letters dated December 31, 2008 and March 23, 2009 (together withthe Original Letter, the “Offer Letter”). Wyndham Worldwide would like to further clarify certain terms regarding the amount of yourseverance benefit set forth in the Offer Letter in order to address Section 162(m) of the Internal Revenue Code of 1986, as amended.
Effective as of December 16, 2009, this addendum letter hereby amends the Offer Letter to provide that, in the event you
become entitled to severance pay under the circumstances described in the Offer Letter, in lieu of the amount of severance payspecified in the Offer Letter, your severance pay will equal 200% multiplied by the sum of: (i) your then current base salary; plus (ii) anamount equal to the highest annual bonus (excluding bonus modifier) paid to you with respect to the three fiscal years of WyndhamWorldwide immediately preceding the fiscal year in which your termination of employment occurs, but in no event shall the amountunder (ii) exceed 100% of your then current base salary.
Except as provided herein, all terms and conditions set forth in the Offer Letter shall remain in effect.
/s/ Thomas Anderson Thomas Anderson
WYNDHAM WORLDWIDE CORPORATION
By: /s/ Mary Falvey Name: Mary FalveyTitle: Executive Vice President
Chief Human Resources Officer
cc: S. Holmes
Exhibit 10.29
November 8, 2012
Thomas Anderson4 Arrowhead TrailSparta, NJ 07871
Dear Tom:
Reference is made to the letter regarding your employment with Wyndham Worldwide Corporation ("Wyndham Worldwide") dated March24, 2008 ("Original Letter"), and the addendum letters dated December 31, 2008, March 23, 2009 and December 16, 2009 (together with theOriginal Letter, the "Offer Letter"). Wyndham Worldwide would like to amend your Offer Letter for purposes of compliance with the requirementsof Section 409A of the Internal Revenue Code of 1986, as amended, and the regulations and guidance issued thereunder ("Code Section 409A"), todefine the circumstances constituting cause under the Offer Letter, and to clarify certain terms regarding your performance-based Long TermIncentive Awards.
In the event (i) you become entitled to severance pay or benefits under the Offer Letter due to your termination of employment byWyndham Worldwide other than for cause ("Qualifying Termination"), and other than in connection with your disability which prevents you fromperforming services for Wyndham Worldwide for a period of 6 months, subject to the terms and conditions of the Offer Letter, and (ii) the periodduring which you are entitled to consider any release of claims required under the Offer Letter (and to revoke such release, if applicable) spans twocalendar years, then any payment that otherwise would have been payable during the first calendar year will in no case be made until the later of (A)the end of the revocation period (assuming that you do not revoke) or (B) the first business day of the second calendar year (regardless of whetheryou used the full time period allowed for consideration), as and to the extent required for purposes of Code Section 409A. For all purposes underthe Offer Letter and notwithstanding anything to the contrary therein, termination for cause has the meaning set forth in the Appendix attachedhereto.
Further, upon a Qualifying Termination, you will vest in any performance-based Long Term Incentive Award (excluding stock options andstock appreciation rights) that you may hold at the time of such termination and will be paid a pro-rata portion of any such performance-based LongTerm Incentive Awards, provided that the performance goals applicable to the performance-based Long Term Incentive Award are achieved, withsuch pro-ration based upon the portion of the full performance period during which you were employed by Wyndham Worldwide plus 12 months(or, if less, assuming employment for the entire performance period remaining after your termination), with the payment of any such vestedperformance-based Long Term Incentive Award to occur at the time that the awards are paid to employees generally. This paragraph shall notsupersede or replace any provision or right relating to the acceleration of the vesting of such performance-based Long Term Incentive Awards in theevent of a change in control of Wyndham Worldwide or your death or disability, whether pursuant to an applicable stock plan document or awardagreement.
Except as provided herein, all termsand conditions set forth in the Offer Letter shall remain in effect.
Regards,
WYNDHAM WORLDWIDE CORPORATION
By: /s/ Mary R. Falvey Name: Mary R. FalveyTitle: Executive Vice President, Chief Human Resources Officer
Understood, accepted and agreed to as of November 8, 2012
/s/ Thomas Anderson Thomas Anderson
Appendix
Termination for cause is defined as: (a) the Executive’s willful failure to substantially perform his duties as an employee of Wyndham Worldwide orany subsidiary (other than any such failure resulting from incapacity due to physical or mental illness), (b) any act of fraud, misappropriation,dishonesty, embezzlement or similar conduct against Wyndham Worldwide or any subsidiary, (c) the Executive’s conviction of a felony or any crimeinvolving moral turpitude (which conviction, due to the passage of time or otherwise, is not subject to further appeal), (d) the Executive’s grossnegligence in the performance of his duties or (e) the Executive purposefully or negligently makes (or has been found to have made) a falsecertification to Wyndham Worldwide pertaining to its financial statements. Unless Wyndham Worldwide reasonably determines in its sole discretionthat the Executive’s conduct is not subject to cure, then Wyndham Worldwide will provide notice to the Executive of its intention to terminate theExecutive’s employment for Cause hereunder, along with a description of the Executive’s conduct which Wyndham Worldwide believes gives rise toCause, and provide the Executive with a period of 15 days to cure such conduct and/or challenge Wyndham Worldwide’ s determination that Causeexists hereunder; provided, however, that (i) the determination of whether such conduct has been cured and/or gives rise to Cause shall be made byWyndham Worldwide in its sole discretion and (ii) Wyndham Worldwide shall be entitled to immediately and unilaterally restrict or suspend theExecutive’s duties during such 15 day period pending such determination.
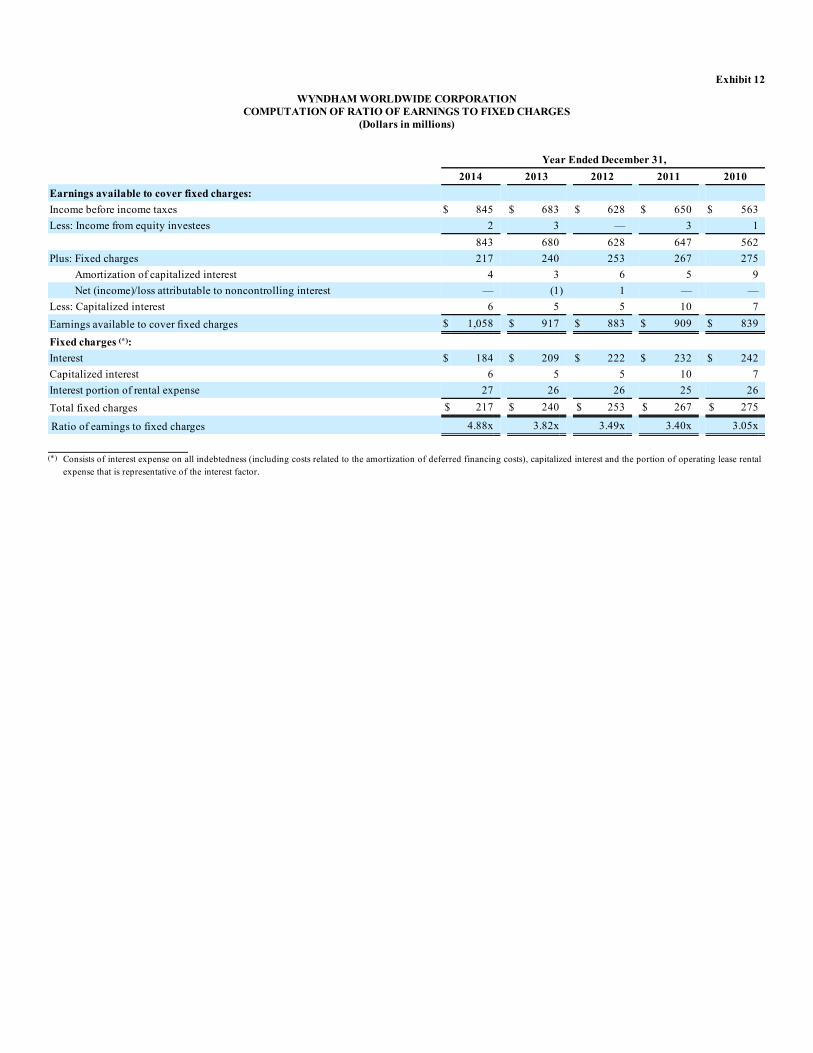
Exhibit 12
WYNDHAM WORLDWIDE CORPORATIONCOMPUTATION OF RATIO OF EARNINGS TO FIXED CHARGES
(Dollars in millions)
Year Ended December 31, 2014 2013 2012 2011 2010Earnings available to cover fixed charges: Income before income taxes $ 845 $ 683 $ 628 $ 650 $ 563Less: Income from equity investees 2 3 — 3 1 843 680 628 647 562Plus: Fixed charges 217 240 253 267 275
Amortization of capitalized interest 4 3 6 5 9Net (income)/loss attributable to noncontrolling interest — (1) 1 — —
Less: Capitalized interest 6 5 5 10 7Earnings available to cover fixed charges $ 1,058 $ 917 $ 883 $ 909 $ 839
Fixed charges (*): Interest $ 184 $ 209 $ 222 $ 232 $ 242Capitalized interest 6 5 5 10 7Interest portion of rental expense 27 26 26 25 26Total fixed charges $ 217 $ 240 $ 253 $ 267 $ 275
Ratio of earnings to fixed charges 4.88x 3.82x 3.49x 3.40x 3.05x
(*) Consists of interest expense on all indebtedness (including costs related to the amortization of deferred financing costs), capitalized interest and the portion of operating lease rentalexpense that is representative of the interest factor.
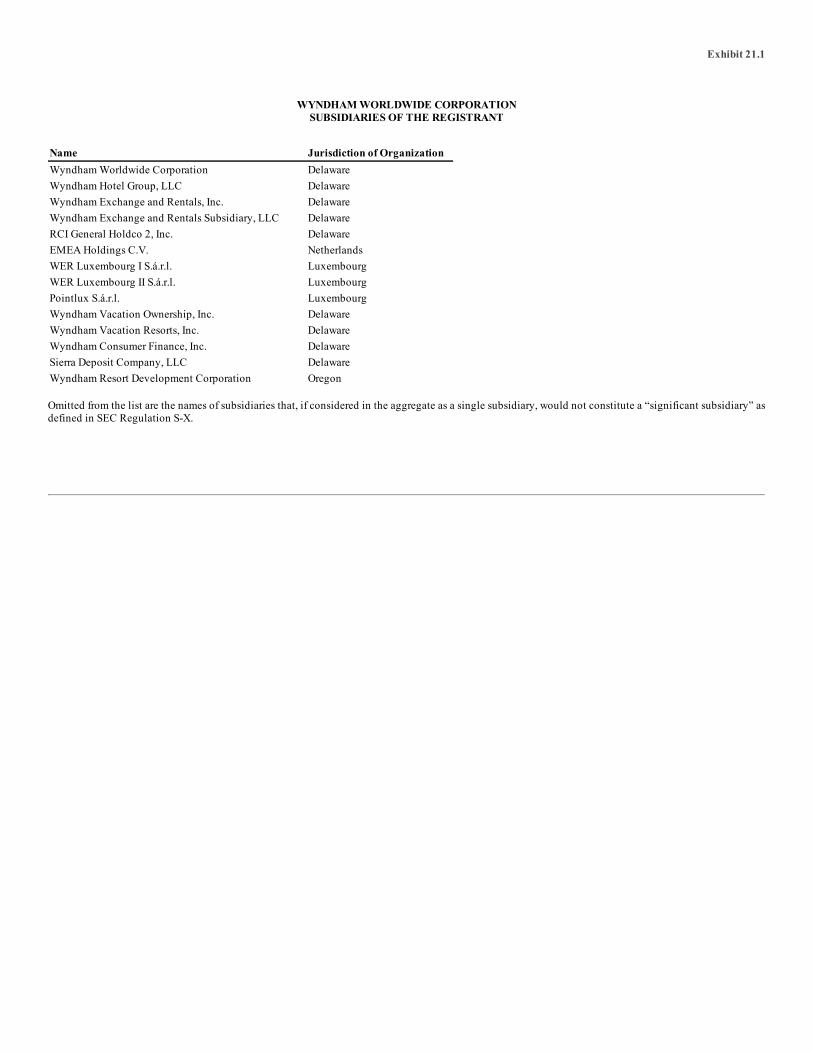
Exhibit 21.1
WYNDHAM WORLDWIDE CORPORATIONSUBSIDIARIES OF THE REGISTRANT
Name Jurisdiction of OrganizationWyndham Worldwide Corporation DelawareWyndham Hotel Group, LLC DelawareWyndham Exchange and Rentals, Inc. DelawareWyndham Exchange and Rentals Subsidiary, LLC DelawareRCI General Holdco 2, Inc. DelawareEMEA Holdings C.V. NetherlandsWER Luxembourg I S.á.r.l. LuxembourgWER Luxembourg II S.á.r.l. LuxembourgPointlux S.á.r.l. LuxembourgWyndham Vacation Ownership, Inc. DelawareWyndham Vacation Resorts, Inc. DelawareWyndham Consumer Finance, Inc. DelawareSierra Deposit Company, LLC DelawareWyndham Resort Development Corporation Oregon
Omitted from the list are the names of subsidiaries that, if considered in the aggregate as a single subsidiary, would not constitute a “significant subsidiary” asdefined in SEC Regulation S-X.
Exhibit 21.1(continued)
WYNDHAM WORLDWIDECORPORATION ASSUMED NAMES REPORT
Entity Name Assumed Name
Wyndham Consumer Finance, Inc. Assessment Recovery Group Wyndham Hotel Group, LLC Cendant Hotel Group Wyndham Resort Development Corporation Resort at Grand Lake Seasons Seasons at the Inn of Seventh Mountain Seasons at Seventh Mountain Seasons Restaurant Seventh Mountain Seventh Mountain Rafting Company Seventh Mountain Resort Seventh Mountain River Company The Lazy River Market Trendwest (Colorado) Trendwest Resorts WorldMark by Wyndham WorldMark by Wyndham Travel Wyndham Vacation Resorts, Inc. Club Wyndham Travel Fairfield Branson (Colorado) Fairfield Durango Fairfield Homes Fairfield Land Company Fairfield Resorts Fairfield Vacation Club Fairfield Vacation Club (Georgia) Glade Realty Harbour Realty Harbor Timeshare Sales Mountains Realty Ocean Breeze Market Pagosa Lakes Realty Red Rock Discount Adventures Red Rock West Discount Adventures Resort Financial Services Sapphire Realty Select Timeshare Realty Select Vacation Club (North Carolina) Sharp Realty

Exhibit 23.1
CONSENT OF INDEPENDENT REGISTERED PUBLIC ACCOUNTING FIRM
We consent to the incorporation by reference in Registration Statement No. 333-179710 on Form S-3 and in Registration Statement No. 333-136090 on FormS-8 of our report dated February 13, 2015, relating to the consolidated financial statements of Wyndham Worldwide Corporation and subsidiaries (the“Company”), and the effectiveness of the Company’s internal control over financial reporting, appearing in this Annual Report on Form 10-K of WyndhamWorldwide Corporation for the year ended December 31, 2014.
/s/ Deloitte & Touche LLPParsippany, New JerseyFebruary 13, 2015

Exhibit 31.1
CERTIFICATION
I, Stephen P. Holmes, certify that:
1. I have reviewed this Annual Report on Form 10-K of Wyndham Worldwide Corporation;
2. Based on my knowledge, this report does not contain any untrue statement of a material fact or omit to state a material fact necessary to make thestatements made, in light of the circumstances under which such statements were made, not misleading with respect to the period covered by thisreport;
3. Based on my knowledge, the financial statements, and other financial information included in this report, fairly present in all material respects thefinancial condition, results of operations and cash flows of the registrant as of, and for, the periods presented in this report;
4. The registrant’s other certifying officer(s) and I are responsible for establishing and maintaining disclosure controls and procedures (as defined inExchange Act Rules 13a-15(e) and 15d-15(e)) and internal control over financial reporting (as defined in Exchange Act Rules 13a-15(f) and 15d-15(f)) for the registrant and have:
a) Designed such disclosure controls and procedures, or caused such disclosure controls and procedures to be designed under our supervision,to ensure that material information relating to the registrant, including its consolidated subsidiaries, is made known to us by others withinthose entities, particularly during the period in which this report is being prepared;
b) Designed such internal control over financial reporting, or caused such internal control over financial reporting to be designed under oursupervision, to provide reasonable assurance regarding the reliability of financial reporting and the preparation of financial statements forexternal purposes in accordance with generally accepted accounting principles;
c) Evaluated the effectiveness of the registrant’s disclosure controls and procedures and presented in this report our conclusions about theeffectiveness of the disclosure controls and procedures, as of the end of the period covered by this report based on such evaluation; and
d) Disclosed in this report any change in the registrant’s internal control over financial reporting that occurred during the registrant’s mostrecent fiscal quarter (the registrant’s fourth fiscal quarter in the case of an annual report) that has materially affected, or is reasonably likelyto materially affect, the registrant’s internal control over financial reporting; and
5. The registrant’s other certifying officer(s) and I have disclosed, based on our most recent evaluation of internal control over financial reporting, tothe registrant’s auditors and the audit committee of the registrant’s Board of Directors (or persons performing the equivalent functions):
a) All significant deficiencies and material weaknesses in the design or operation of internal control over financial reporting which arereasonably likely to adversely affect the registrant’s ability to record, process, summarize and report financial information; and
b) Any fraud, whether or not material, that involves management or other employees who have a significant role in the registrant’s internalcontrol over financial reporting.
Date: February 13, 2015 /S/ STEPHEN P. HOLMES CHAIRMAN AND CHIEF EXECUTIVE OFFICER
Exhibit 31.2
CERTIFICATION
I, Thomas G. Conforti, certify that:
1. I have reviewed this Annual Report on Form 10-K of Wyndham Worldwide Corporation;
2. Based on my knowledge, this report does not contain any untrue statement of a material fact or omit to state a material fact necessary to make thestatements made, in light of the circumstances under which such statements were made, not misleading with respect to the period covered by thisreport;
3. Based on my knowledge, the financial statements, and other financial information included in this report, fairly present in all material respects thefinancial condition, results of operations and cash flows of the registrant as of, and for, the periods presented in this report;
4. The registrant’s other certifying officer(s) and I are responsible for establishing and maintaining disclosure controls and procedures (as defined inExchange Act Rules 13a-15(e) and 15d-15(e)) and internal control over financial reporting (as defined in Exchange Act Rules 13a-15(f) and 15d-15(f)) for the registrant and have:
a) Designed such disclosure controls and procedures, or caused such disclosure controls and procedures to be designed under our supervision,to ensure that material information relating to the registrant, including its consolidated subsidiaries, is made known to us by others withinthose entities, particularly during the period in which this report is being prepared;
b) Designed such internal control over financial reporting, or caused such internal control over financial reporting to be designed under oursupervision, to provide reasonable assurance regarding the reliability of financial reporting and the preparation of financial statements forexternal purposes in accordance with generally accepted accounting principles;
c) Evaluated the effectiveness of the registrant’s disclosure controls and procedures and presented in this report our conclusions about theeffectiveness of the disclosure controls and procedures, as of the end of the period covered by this report based on such evaluation; and
d) Disclosed in this report any change in the registrant’s internal control over financial reporting that occurred during the registrant’s mostrecent fiscal quarter (the registrant’s fourth fiscal quarter in the case of an annual report) that has materially affected, or is reasonably likelyto materially affect, the registrant’s internal control over financial reporting; and
5. The registrant’s other certifying officer(s) and I have disclosed, based on our most recent evaluation of internal control over financial reporting, tothe registrant’s auditors and the audit committee of the registrant’s Board of Directors (or persons performing the equivalent functions):
a) All significant deficiencies and material weaknesses in the design or operation of internal control over financial reporting which arereasonably likely to adversely affect the registrant’s ability to record, process, summarize and report financial information; and
b) Any fraud, whether or not material, that involves management or other employees who have a significant role in the registrant’s internalcontrol over financial reporting.
Date: February 13, 2015 /S/ THOMAS G. CONFORTI CHIEF FINANCIAL OFFICER
Exhibit 32
CERTIFICATION OF CHAIRMAN AND CEO AND CFO PURSUANT TO18 U.S.C. SECTION 1350
In connection with the Annual Report of Wyndham Worldwide Corporation (the “Company”) on Form 10-K for the period ended December 31, 2014, as filedwith the Securities and Exchange Commission on the date hereof (the “Report”), Stephen P. Holmes, as Chairman and Chief Executive Officer of theCompany, and Thomas G. Conforti, as Chief Financial Officer of the Company, each hereby certify, pursuant to 18 U.S.C. Section 1350, as adopted pursuantto Section 906 of the Sarbanes-Oxley Act of 2002, that, to the best of his knowledge:
1. The Report fully complies with the requirements of Section 13(a) or 15(d) of the Securities Exchange Act of 1934; and
2. The information contained in the Report fairly presents, in all material respects, the financial condition and results of operations of the Company.
/S/ STEPHEN P. HOLMESSTEPHEN P. HOLMESCHAIRMAN AND CHIEF EXECUTIVE OFFICERFEBRUARY 13, 2015
/S/ THOMAS G. CONFORTITHOMAS G. CONFORTICHIEF FINANCIAL OFFICERFEBRUARY 13, 2015
