workshop on recommendation utility evaluation
TRANSCRIPT

Proceedings of the
Workshop on Recommendation Utility
Evaluation: Beyond RMSE (RUE 2011)
held at the
6th
ACM International Conference
on Recommender Systems (RecSys 2012)
9 September 2012
Dublin, Ireland
Edited by
Xavier Amatriain1, Pablo Castells2, Arjen de Vries3, Christian Posse4, Harald Steck1
1 Netflix, USA 2 Universidad Autónoma de Madrid, Spain
3 Centrum Wiskunde & Informatica, Netherlands 4 Linkedin, USA


i
Preface
Introduction
Measuring the error in predicting held-out user rating values has been by far the dominant offline evaluation
methodology in the Recommender Systems (RS) literature. Yet there seems to be a general consensus in the
community that this criterion alone is far from being enough or even adequate to assess the practical effectiveness
of a recommender system in matching user needs. The end users of recommendations receive lists of items rather
than rating values, whereby recommendation accuracy metrics –as surrogates of the evaluated task– should target
the quality of the item selection, rather than the numeric system scores that determine this selection. Furthermore,
as far as the order of recommended items determines the set of elements that the user will actually consider for
consumption, effectiveness assessment methodologies should target item rankings. For this reason, metrics and
methodologies from the Information Retrieval (IR) field –where ranking evaluation has been studied and stand-
ardized for decades– have started to be adopted by the RS community. Gaps remain between the methodological
formalization of tasks in both fields though, which result in divergences in the adoption of IR methodologies for
RS, hindering the interpretation and comparability of empirical observations by different authors.
On the other hand, there is a growing realization that accuracy is only one among several relevant dimensions of
recommendation effectiveness. The value of novelty, for instance, has been recognized as a key dimension of
recommendation utility for users in real scenarios, in-as-much as the purpose of recommendation is inherently
linked to discovery in many application domains. Closely related to novelty, diversity is also a desirable quality to
enrich the user’s experience and enhance his array of relevant choices. Novelty and diversity are generally posi-
tive for businesses as well, by favoring the diversity of sales and helping leverage revenues from market niches.
As a matter of business performance enhancement, the value added by recommendation can be measured more
directly in terms of on-line click-through rate, conversion rate, sales order size increase, returning customers, in-
creased revenue, etc. On the other hand, web portals and social networks commonly face multiple objective opti-
mization problems related to user engagement, requiring appropriate evaluation methodologies for optimizing
along the entire recommendation funnel, from the initial click to the real user engagement in subsequent down-
stream utilities. Other potentially relevant dimensions of effective recommendations for consumers and providers
may include confidence, coverage, risk, cost, robustness, etc.
While the need for further extension, formalization, clarification and standardization of evaluation methodologies
is recognized in the community, this need is still unmet to a large extent. When engaging in evaluation work, re-
searchers and practitioners are still often faced with experimental design questions for which there are currently
not always precise and consensual answers. Room re-mains for further methodological development and conver-
gence, which motivated the RUE 2012 workshop
The ACM RecSys 2012 International Workshop on “Recommendation Utility Evaluation: Beyond RMSE” (RUE
2012) gathered researchers and practitioners interested in developing better, clearer, and/or more complete evalua-
tion methodologies for recommender systems –or just seeking clear guidelines for their experimental needs. The
workshop provided an informal setting for exchanging and discussing ideas, sharing experiences and viewpoints.
RUE sought to identify and better understand the current gaps in recommender system evaluation methodologies,
help lay directions for progress in addressing them, and contribute to the consolidation and convergence of exper-
imental methods and practice.

ii
Scope and topics
The accepted papers and the discussions held at the workshop addressed, among others, the following topics:
Recommendation quality dimensions.
Effective accuracy, ranking quality.
Novelty, diversity, unexpectedness, serendipity.
Utility, gain, cost, risk, benefit.
Robustness, confidence, coverage, usability, etc.
Matching metrics to tasks, needs, and goals.
User satisfaction, user perception, human factors.
Business-oriented evaluation.
Multiple objective optimization, user engagement.
Quality of service, quality of experience.
Evaluation methodology and experimental design.
Definition and evaluation of new metrics, studies of existing ones.
Adaptation of methodologies from related fields: IR, Machine Learning, HCI, etc.
Evaluation theory.
Practical aspects of evaluation.
Offline and online experimental approaches.
Simulation-based evaluation.
Datasets and benchmarks.
Validation of metrics.
Specific questions raised and addressed by the workshop included, among others, the following:
What are the unmet needs and challenges for evaluation in the RS field? What changes would we like to
see? How could we speed up progress?
What relevant recommendation utility and quality dimensions should be cared for? How can they be cap-
tured and measured?
How can metrics be more clearly and/or formally related to the task, contexts and goals for which a rec-
ommender application is deployed?
How should IR metrics be applied to recommendation tasks? What aspects require adjustment or further
clarification? What further disciplines should we draw from (HCI, Machine Learning, etc.)?
What biases and noise should experimental design typically watch for?
Can we predict the success of a recommendation algorithm with our offline experiments? What offline met-
rics correlate better and under which conditions?
What are the outreach and limitations of offline evaluation? How can online and offline experiments com-
plement each other?
What type of public datasets and benchmarks would we want to have available, and how can they be built?
How can the recommendation effect be traced on business outcomes?
How should the academic evaluation methodologies improve their relevance and usefulness for industrial
settings?
How do we envision the evaluation of recommender systems in the future?

iii
Submissions and Programme
The workshop received 18 submissions, of which 11 were accepted (61%), including 3 full technical papers, 4
position papers, and 4 technical papers presented as posters. The workshop opened with a keynote talk by Carlos
Gómez-Uribe, from Netflix, and included several open discussion sessions. We briefly summarize here the pre-
sented works and held discussions.
The keynote talk, entitled “Challenges and Limitations in the Offline and Online Evaluation of Recommender
Systems: A Netflix Case Study”, provided a comprehensive, inside view of the evaluation of recommendation
technologies in one of the major players in the recommender system industry. Gómez-Uribe explained and dis-
cussed how offline and online (A/B testing) phases, business metrics (cancellation rate, subscriber streaming),
long-term vs. short-term performance measures are handled in an online businesses heavily relying on recom-
mendation technologies.
The papers presented after this cover a wide spectrum of topics, encompassing most of the aspects put forward in
the intended workshop scope. In the full technical papers section, G. Adomavicius and J. Zhang address a new
quality dimension, namely recommendation stability, defined as the consistency of recommendations over small
incremental changes in the input data. A method is proposed to enhance the stability (at the same time as the accu-
racy) of an arbitrary recommender by means of an iterative approach where the system is fed back samples of its
output. F. Meyer et al. propose the distinction of four functions in user activity where a recommender system may
assist: decision, comparison, discovery, and exploration. The authors suggest associating a specific evaluation
metric to each of these dimensions, and a structured evaluation procedure (including the metrics computation) in
offline experiments. M. Habibi and A. Popescu-Belis present a crowdsourcing approach to evaluate the accuracy
of a filtering system which automatically links documents to human speech. The study addresses such issues as
worker’s reliability assessment, inter-worker agreement, and evaluation stability.
In the position papers section, A. Said, D. Tikk et al. present a conceptual framework where evaluation considers
three dimensions: the business model, the user requirements, and technical constraints, corresponding to the view
of the three broad types of stakeholders involved in a recommender application, respectively: vendors, consumers,
and service providers. S. Clerger-Tamayo, J. M. Fernández-Luna and J. F. Huete propose a generalization of
MAE where the error in rating predictions can be weighted in order to focus the evaluation on specific cases of
the user-item space, and identify conditions where recommendation is suboptimal. O. Başkaya and T. Aytekin
study the correspondence between rating-based and content-based inter-item similarity, which is a relevant issue
for metrics that are based on a generic item similarity function (such as the average intra-list dissimilarity for di-
versity evaluation). B. Kille considers the fact that different users may not be equally easy to provide accurate
recommendations for, and proposes measures to assess user difficulty in this perspective.
In the posters section, W. L. De Mello Neto and A. Nowé contrast offline and online evaluation in the context of
recommendation approaches leveraging social network information, considering such issues as transparency and
computational complexity, besides recommendation accuracy. K. Oku and F. Hattori present an approach to en-
hance recommendation serendipity by mixing features from different items as a seed to produce new recommen-
dations. C. E. Seminario and D. C. Wilson report a wide empirical study with the Mahout open source library,
focusing on accuracy and coverage, the tradeoffs between such dimensions, and the variations resulting from
functional enhancements introduced by the authors. L. Peska and P. Vojtas present an experimental study on a
travel agency website, where the extended use of implicit evidence from user interaction as input for recommen-
dation is tested, using clickthrough rate and conversion rate as the primary recommendation performance metrics.

iv
Different issues were addressed in the open discussion sessions during the workshop. A prominently recurrent one
was the gap between offline and online evaluation. Academic research is strongly focused on offline experiments
using rating prediction error or IR metrics, whereas businesses rely on live A/B testing with real customers using
business metrics such as CTR, conversion rate, cancellation rate (equivalently, returning customers), or revenue
increase (in its different measurable forms). With sales and profitability as the obvious common baseline denomi-
nator, the designation of specific core metrics among these seems use-case dependent. Some businesses, such as
Netflix, nonetheless report using offline testing as well, as a preliminary phase prior to online experimentation.
Business-oriented evaluation goals typically require longer-term evaluation cycles, where the effects of a feature
(e.g. on customer loyalty) can only be measured over an extended period of time (several months). Short-term
indicators (such as CTR) are commonly used nonetheless to complement these to some extent.
Some of the pointed out hurdles hindering the connection between academia and industry in this area include the
often discussed difficulty for academic researchers to access real-world large-scale datasets, or the availability of
a feasible procedure where algorithms from academia and data from vendors might get in contact, while meeting
the requirements and constraints of the involved stakeholders (data and algorithm ownership, end-user’s privacy,
etc.). Public evaluation campaigns such as the Netflix Prize, the CAMRa challenges, the plista Contest, were dis-
cussed as very positive moves in this direction, each with their own limitations. Further alternatives were dis-
cussed for setting up some form of evaluation platform where systems could be compared not just for accuracy,
but for scalability (response time). Paolo Cremonesi discussed also an initiative, currently in perspective, which is
aiming in this direction. The open API provided by Mendeley to its data was also described as an available oppor-
tunity for researchers to test their algorithms on massive data. Crowdsourcing approaches were furthermore men-
tioned as an intermediate option, available to researchers, between offline evaluation and full-scale experiments
on real application data.
There seemed to be a general consensus on the inadequacy of RMSE as a proxy for user satisfaction, or any prop-
er view on recommendation utility in general. This was expressed from many perspectives: from conceptual ra-
tionales (the recommender’s task, the user’s goals and interaction paradigm with recommendations in real applica-
tions) to experiences –offline and online evidence in formal or informal case studies– shared by many participants
in the workshop. Several other general concerns were identified regarding the adequacy of different metrics, such
as the fact that different contexts may require different metrics, e.g. navigational recommendation may focus on
accuracy and diversity, whereas discovery-oriented recommendation may emphasize novelty and serendipity. It is
also a common case in industrial contexts that technical requirements and business constraints may have to be
traded off with evaluation needs and may override other concerns and observations in A/B testing. Beyond
RMSE, the general opinion seemed yet to be that researchers in academia should still focus on generic metrics
rather than too specific business-oriented metrics and constraints.
The interest of the workshop theme was underlined, beyond the RUE workshop itself, by the pervading presence
of evaluation as an explicit object of research and discussion in the RecSys conference programme, clearly identi-
fied as an open area where further work is needed.

v
Acknowledgments
The organizers would like to thank the Program Committee members for their high-quality and timely evaluation of the submissions; the RecSys 2012 organizers (Neil J. Hurley and his team) and workshop chairs (Jill Freyne and Pearl Pu) for their support in the organization of this workshop; the keynote speaker (Carlos Gómez-Uribe), all the authors and presenters, for their contribution to a high-quality workshop program; and all participants for such fruitful discussions and valuable ideas as were exchanged during the workshop. Thanks are due to all such contributions which made RUE 2012 a successful venue. Xavier Amatriain
Pablo Castells
Arjen de Vries
Christian Posse
Harald Steck

vi

vii
Organizing Committee
Xavier Amatriain Netflix, USA Pablo Castells Universidad Autónoma de Madrid, Spain Arjen de Vries Centrum Wiskunde & Informatica, Netherlands Christian Posse Linkedin, USA Harald Steck Netflix, USA
Program Committee
Gediminas Adomavicius University of Minnesota, USA Alejandro Bellogín Universidad Autónoma de Madrid, Spain Iván Cantador Universidad Autónoma de Madrid, Spain Licia Capra University College London, UK Òscar Celma Gracenote, USA Charles Clarke University of Waterloo, Canada Paolo Cremonesi Politecnico di Milano, Italy Juan Manuel Fernández-Luna Universidad de Granada, Spain Pankaj Gupta Twitter, USA Juan F. Huete Universidad de Granada, Spain Dietmar Jannach University of Dortmund, Germany Jaap Kamps University of Amsterdam, Netherlands Neal Lathia University College London, UK Jérôme Picault Bell Labs, Alcatel-Lucent, France Filip Radlinski Microsoft, Canada Francesco Ricci Free University of Bozen-Bolzano, Italy Fabrizio Silvestri Consiglio Nazionale delle Ricerche, Italy David Vallet Universidad Autónoma de Madrid, Spain Paulo Villegas Telefónica R&D, Spain Jun Wang University College London, UK Yi Zhang University of California, Santa Cruz, USA

viii

ix
Table of Contents
Keynote talk
Carlos Gómez-Uribe Challenges and Limitations in the Offline and Online Evaluation of Recommender Systems: A Netflix Case
Study ................................................................................................................................................................... 1
Full technical papers
Gediminas Adomavicius and Jingjing Zhang Iterative Smoothing Technique for Improving the Stability of Recommender Systems ....................................... 3
Frank Meyer, Françoise Fessant, Fabrice Clérot and Eric Gaussier Toward a New Protocol to Evaluate Recommender Systems .............................................................................. 9
Maryam Habibi and Andrei Popescu-Belis Using Crowdsourcing to Compare Document Recommendation Strategies for Conversations........................ 15
Position papers
Alan Said, Domonkos Tikk, Klara Stumpf, Yue Shi, Martha Larson and Paolo Cremonesi Recommender Systems Evaluation: A 3D Benchmark ...................................................................................... 21
Sergio Cleger-Tamayo, Juan M. Fernández-Luna and Juan F. Huete On the Use of Weighted Mean Absolute Error in Recommender Systems ........................................................ 24
Osman Başkaya and Tevfik Aytekin How Similar is Rating Similarity to Content Similarity? .................................................................................. 27
Benjamin Kille Modeling Difficulty in Recommender Systems.................................................................................................. 30
Posters
Wolney Leal De Mello Neto and Ann Nowé Insights on Social Recommender Systems ........................................................................................................ 33
Kenta Oku and Fumio Hattori User Evaluation of Fusion-based Recommender Systems for Serendipity-oriented Recommendation ............. 39
Carlos E. Seminario and David C. Wilson Case Study Evaluation of Mahout as a Recommender Platform ...................................................................... 45
Ladislav Peska and Peter Vojtas Evaluating the Importance of Various Implicit Factors in E-commerce .......................................................... 51

x

1
Challenges and Limitations in the Offline and Online
Evaluation of Recommender Systems:
A Netflix Case Study
Carlos Gomez-Uribe Netflix, USA
ABSTRACT The typical use case of recommendation systems is suggesting items such as videos, songs or articles to users. Evaluating a recommender system is critical to the process of improving it. In theory the best judges of the quality and effectiveness of a recommender system are the users themselves, e.g., ideal metrics can describe the intensity and frequency of a user's interaction with the system over the long term. In practice, however, despite the wide adoption of consumer science based on online A/B testing for the evaluation and comparison of differ-ent recommender systems, user-derived measurements are often noisy, slow, non-repeatable, and sensitive to a myriad of potential con-founders. Furthermore, conducting large-scale user experiments for researchers in academia is often impossible. A complementary offline approach can be used to quickly evaluate and optimize new recommender systems on historical user-generated data. Yet these offline measurements need not translate directly onto the sought-after online results, such as increases in user engagement. This talk will describe the blend of offline and online experimentation we use at Netflix to improve upon our recommendation systems, and will discuss some key challenges and limitations of these approaches that are broadly relevant to the recommender systems field.

2

Iterative Smoothing Technique for Improving Stability of Recommender Systems
Gediminas Adomavicius University of Minnesota
Jingjing Zhang Indiana University
ABSTRACT We focus on the measure of recommendation stability, which reflects the consistency of recommender system predictions. Stability is a desired property of recommendation algorithms and has important implications on users' trust and acceptance of recommendations. Prior research has reported that some popular recommendation algorithms can suffer from a high degree of instability. In this study we propose a scalable, general-purpose iterative smoothing approach that can be used in conjunction with different traditional recommendation algorithms to improve their stability. Our experimental results on real-world rating data demonstrate that the proposed approach can achieve substantially higher stability as compared to the original recommendation algorithms. Importantly, the proposed approach not only does not sacrifice the predictive accuracy in order to improve recommendation stability, but is actually able to provide additional accuracy improvements at the same time.
1. INTRODUCTION Recommender systems represent technologies that assist users in finding a set of interesting or relevant items [1]. In order to provide good recommendations, recommender systems employ users’ feedback on consumed items. This input can include explicitly provided feedback in the form of ratings or tags, as well as feedback that can be implicitly inferred by monitoring users’ behavior such as browsing, linking, or buying patterns. The most common approach to modeling users’ preferences for items is via numeric ratings. The recommendation algorithm then analyzes patterns of users’ past ratings and predicts users’ preference ratings for new, not yet consumed items. Once ratings for the new items are estimated, the item(s) with the highest estimated rating(s) can be recommended to the user.
In the recommender systems literature, evaluating performance of recommendation algorithms has always been a key issue, and recommendation accuracy has been the major focus in developing evaluation metrics [11,23]. As a result, much of the research in the recommender systems area has focused on proposing new techniques to enhance the accuracy of recommendation algorithms in predicting what users will like, as exemplified by the recent $1M Netflix prize competition. Prediction accuracy metrics typically compare the rating values estimated by a recommendation algorithm against the actual rating values and reflect the closeness of the system’s predictions to users’ true ratings. In addition to recommendation accuracy, researchers have proposed a number of alternative types of measures, including recommendation coverage, diversity, novelty, serendipity, and several others, to evaluate the performance of recommender systems [11,23]. Of special interest to us is the recently introduced measure of recommendation stability [2], which reflects the level of consistency among the predictions
made by the system.
According to the definition, stability is the consistent agreement of predictions made on the same items by the same algorithm, when any new incoming ratings are in complete agreement to system’s prior estimations [2]. As has been discussed in prior work, stability is an important and desired property of recommender systems, and has a number of potential implications related to users’ trust and acceptance of such systems [2].
While providing stable and consistent recommendations is important in many contexts, prior research has demonstrated that some popular collaborative filtering recommendation algorithms can suffer from high degree of instability [2]. This is particularly true for the widely used item- and user-based nearest-neighbor collaborative filtering approaches. It has also been shown that stability does not necessarily correlate with predictive accuracy [2], i.e., different recommendation algorithms can exhibit different levels of stability, even though they may have similar prediction accuracy. Thus, maximizing accuracy may not necessarily help to improve stability, and vice versa. For instance, a simple heuristic that predicts any unknown user rating as an average of all known ratings of that user is perfectly stable [2]; however, in most real-world settings this heuristic is outperformed by more sophisticated recommendation algorithms in terms of predictive accuracy. Therefore, the main objective of this study is to develop an approach that can improve stability of recommendation algorithms without sacrificing their accuracy.
In this paper, we propose a general iterative smoothing approach to improve stability of any given recommendation technique. The approach serves as a meta-algorithm, i.e., it can be used in conjunction with any traditional recommendation technique. Accordingly, the paper evaluates the performance of the proposed approach in conjunction with a number of popular and widely-used recommendation algorithms in terms of their stability as well as accuracy on several real-world movie rating datasets. The results show that this meta-algorithmic approach provides substantial improvements in recommendation stability as compared to the original recommendation algorithms, while providing some additional accuracy benefits as well.
2. RELATED WORK Based on how unknown ratings are predicted, recommendation techniques can be classified into three general categories: content-based, collaborative filtering, and hybrid [1,3]. Among different recommendation approaches, collaborative filtering techniques have been most widely used, largely because they are domain independent, require minimal, if any, information about user and item features, yet can still achieve accurate predictions [13,19].
In a typical setting of collaborative filtering recommender systems, users’ preferences for items are modeled via numeric ratings. Thus, the recommendation problem is reduced to the problem of estimating ratings for the items that have not been seen by a user, and this estimation is usually based on the other available ratings given by this and/or other users. More formally, given a set of users U and a set of items I, the entire user-item
Copyright is held by the author/owner(s). Workshop on Recommendation Utility Evaluation: Beyond RMSE (RUE 2012), held in conjunction with ACM RecSys 2012. September 9, 2012, Dublin, Ireland.
3

sgsrr(
Ainpmrgmsimfm
RaeaRptoTinpinorocthr
Sthsinatwsppatorptempiss
wrthc
space is denoted gave to item i, wsubset of all poatings, and S\Decommendationu,i)S\D pairs, g
As mentioned ean recommender
predictive accurmean squared ereport the recom
growing understamay not give usesystems, and thamportant in eva
focus in this pameasures, recom
Recommendationamong the differexample where tand i2, for user R*(u,i1) and R*precisely accurato the system as
The recommendan light of the ne
prediction, R*(uncoming rating
other words, twecommender sy
other, if adding changes the othehe change in ecommendation
Specifically, the he extent to wh
stay the same/sincoming rating
agreement with swo-phase appro
stability of a recprior literature [2predictive modelare made. Then,o the original seatings. In Phas
predictive modeechnique, and
made. Stability predictions to cos called root me
similar fashion a
RMSS
where P1 and Pespectively, i.e.,he same recomm
complete agreem
as S = U × I. Lwhere Rui is typ
ossible (u,i) pairD be the set of un task is to estimgiven U, I, and k
arlier, predictivesystems literatu
racy metrics forrror (RMSE), w
mmendation accuanding that gooders a satisfying eat some other (coluating the effecaper is one of
mmendation stabi
n stability mearent predictions mthe system maku. Let’s deno
(u,i2). Let’s aste and, after userpart of the knowation algorithm
ew data. Would ,i2), and to whadata was exactlyo predictions R
ystem can be vieone of them to
er prediction. Apredictions re
n algorithm.
stability of a rehich the system’imilar (i.e., are gs submitted tosystem’s prior poach (illustratedcommendation a2]. In Phase 1,l is built, and pr a random subse
et of known ratinse 2, based on eel is built uspredictions on is then measur
ompute their rooean squared shifs RMSE:
, ∈ ∩
P2 are the predi, RMSS capturemendation algor
ment with algorith
Let Rui representpically known ors. Let D be tunknown ratingmate unknown known R(u,i) val
accuracy has bure. One of the r recommender
which we will usuracy results. Hd recommendatioexperience usingomplementary) ctiveness of the
these importanility [2].
asures the inhemade by the sys
kes predictions fote the two ratissume that predr u consumes itewn ratings, i.e., re-computes allthis change the
at extent, even ty as predicted b
R*(u,i1) and R*(ewed as “incons the training da
As discussed in eflects the (in
ecommender sys’s predictions fo
stable), when o the system predictions. Basd in Figure 1algorithm has b, given a set of redictions for allet of system’s prngs as hypothetiexpanded trainining the same remaining unkned by comparint mean squared
ift (RMSS), and
, ,
ictions made ins the shift in pre
rithm with new rhm’s own prior e
t rating that useronly for a limitethe set of knows. Therefore, thRui values for alues for (u,i) D
een a major focmost widely use
r systems is rose in this paper owever, there ison accuracy alon the recommendmeasures are alsystem [23]. O
nt complementa
erent consistencstem. Consider afor two movies, ng predictions
diction R*(u,i1) m i1, it gets addeR(u,i1) = R*(u,i
l other predictiovalue of the oththough the new
by the system? (u,i2) of the samsistent” with eacata for the syste[2], the degree
n)stability of th
stem is definedor the same itemany and all neare in comple
sed on this idea,) for computineen introduced
f known ratings,l unknown ratinredictions is addeical new incominng data, a secon
recommendationown ratings a
ng the two sets difference, whicis computed in
| ∩ |
n Phase 1 and edictions made bratings that are estimations.
r u ed
wn he all D.
us ed
oot to
s a ne
der so
Our ary
cy an i1 as is
ed 1). ns
her wly
In me ch
em of he
as ms ew ete , a ng in a gs ed ng nd on are of ch
n a
2, by in
Figure
Providiusers’ tpsychoagents less inopinionis conInconsia resulperceptcontextrecommaccepta
Prior restabilitythat soexamplcollaboNetflixpredicteafter aidenticasignificscale foThus, tpaper, that crecomm
3. IT3.1 GHigh ineach otinvolveadjustinbased oimproviterativcurrentratings
Figuresmoothof the where rfirst estThese psmoothrating iboth knconsiste
More sfor eacbased ocontain
e 1. Illustration
ing consistent ptrust and accepta
ology literature, iwith greater flu
nformative than ns [9], and advicnsidered less istent recommenlt, the decreasetions of the recots where consmender system iance and, thus, h
esearch has provy of popular re
ome widely usedle, it has beorative filtering x movie rating ed rating will sh
adding to the tal to the systemcant shift in predfor the dataset istechniques for swe propose a g
can be used mendation algori
TERATIVEGeneral Idenstability resultsther. We propoes multiple iteng the rating pron its other pre
ving consistencyve smoothing is tt iteration will bin subsequent it
2 provides ahing algorithm, aoverall process.ratings are knowtimated using sopredictions are
hing then starts in S\D based onnown as well asency between di
specifically, durich unknown useron training data
n all known ratin
of stability com
predictions has ance of recommit has been showuctuations in pa
n those with a ce inconsistent helpful than
ndations may be e in users’ trusommender systemsistency is vits likely to have
harm the success
vided a comprehecommendation d algorithms caen shown thaapproach can b
g data, meaninhift by 0.47 startraining data so
m’s current preddiction, considers only 4 stars (i.stability improvgeneral-purpose
to improve ithms.
E SMOOTHea s from predictionose an iterative serations for reredictions of a edictions and, ty of predicted that the rating pbe fed back intterations.
an overview oand Figure 3 gi. Given rating wn, predictions oome standard redenoted as P0. to iteratively a
n all other ratings predicted) in oifferent predicted
ing the k-th iterar-item pair (u,i)aset Dk,u,i. Things combined w
mputation, adapte
important implmendations. In thwn that online adast opinions are
more uniformwith past recomconsistent advdiscredited by ut will further rm’s competencetal, the instaba negative impa
s of the system.
ensive investigaalgorithms [2] a
an be highly unat RMSS for be as high as 0
ng that on avers (i.e., by aboutome new ratin
dictions [2]. Thring the length o.e., ratings go fr
vement are needmeta-algorithm
stability of
HING APPR
ns that are inconsmoothing appro
epeatedly and recommendatio
thus, is explicitratings. The k
predictions compto the data to p
of the proposeves a high-levelspace S and tra
on unknown raticommendation a The procedureadjust estimatio
gs in the rating srder to proactivd ratings.
ation (for any k)S\D, a model is dataset is conwith all predictio
ed from [2].
lications on he consumer dvice-giving e considered
m pattern of mmendations vice [7,24]. users and, as reduce their e [12,17]. In bility of a act on users’
ation into the and showed
nstable. For user-based
0.47 on the erage every t a half-star)
ngs that are his is a very of the rating rom 1 to 5). ded. In this
mic approach traditional
ROACH
nsistent with oach, which collectively
on algorithm ly aimed at key idea of puted during predict other
ed iterative l illustration aining set D ings S\D are algorithm T. of iterative ns for each
space S (i.e., ely improve
= 1, 2, …), fk,u,i is built
nstructed to ons on user-
4

itfth(
Hailsititinsw
Bun|Sbrit
InpTeitthddm(ittorTbovss
tem pairs in S\Dfor the predictionhe k-th iterationu,i) that is stored
,
Here R(u,i) repreand fk,u,i is the pllustrates the p
smoothing approteration is comteration to compn root mean squ
stops either afterwhen predictions
By definition, in user-item pair wineed to be constrS|–1 ratings as build a predictecommendationterative smoothi
Iterative SmooInputs: knownProcess: 1. Build modelrecommendation2. Apply moderatings S\D, i.e.,3. For each itera
For each unka. Construc
and all pexcept fo
b. Build mo
c. Make pre
4. Output predicOutput: PK
Fig
n other words, thproportional to tThis computatioexpensive for mtem rating spacehe Movielens 1
dataset [10], whdataset contains movies. Thus, thi.e., 1682 x 94terative smoothiotal 1.5 millionatings) would
Therefore, applybe feasible even overcome this covariation of thsignificant scalabstability benefits
D computed in thn on (u,i) as indin, each model fk
d as Pk(u,i), i.e.:
,
, , ,
esents the knowprediction modeprocess within oach. The set ompared with prepute the deviatiouared difference)r a fixed, pre-des on unknown ra
each iteration, aith unknown ratiructed over the a training datastive model on n algorithm T, ting approach is O
thing Algorithmn ratings data D
l f0 on known n algorithm T, i.el f0 to compu, P0(u,i) = f0(u,i)ation k {1, …,known rating pact dataset Dk,u,i bpredicted ratingsor rating Pk-1(u,i)
Dk,u,i = D ∪ Podel fk,u,i on data
fk,u,i ediction on (u, i)
Pk(u, i) =ctions made in th
ure 2. Iterative s
he complexity othe size of unknonal requiremen
many real-world e is large and ra00K dataset is a
hich is consider100,000 movie
he total number 43), of which 1ing algorithm onn predictive moneed to be coing the full iterafor datasets tha
omplexity issue,he iterative smbility improvem(as will be show
he previous (k-1cated in Figure 2
k,u,i produces a n
, ,, ,
wn rating that usel built based on
each iteration of predictions maedictions made n between the tw. The iterative s
etermined numbatings do not cha
a separate modeling. Thus, in totcourse of K iter
set. If t(x) is thdata sample
then the time cO(|S\D|Kt(|S|)).
m: , # of iterations K
ratings D usinge., f0T(D)
ute predictions P) for (u,i)S\D K}
air (u, i)S\D by including all Pk-1 from the pr), i.e.,
Pk-1\ {Pk-1(u,i)} aset Dk,u,i using TT (Dk,u,i) ) and store in P k
= fk,u,i(u, i) he final iteration
smoothing appro
of iterative smoonown ratings innt is likely to scenarios, i.e.,
ating data is spara publicly availred to be relativ
ratings from 9of possible ratin
1.5M is unknown the Movielensodels (each buionstructed withiative smoothing at are not very l in the next sect
moothing algoriments while retawn in the Results
) iteration, exce2. As the result new prediction f
∈∈ \
ser u gave item n Dk,u,i. Figure
of the iterativade in the curre
in the previouwo sets (measuresmoothing proceer of iterations
ange.
l is built for evetal, |S\D|K moderations, each usinhe time needed of size x usin
complexity of th.
K, algorithm T
g some standard
P0 for unknown
known ratings Drevious iteration
T, i.e.,
k, i.e.,
n PK
oach.
othing algorithm the rating spacbe prohibitive
anytime the userse. For examplable movie ratinvely small. Th43 users on 168ngs is about 1.6
wn. If we apps 100K dataset, lt on 1.6 millioin each iteratioapproach may nlarge. In order tion we proposeithm that offeining most of ths section).
ept of
for
i, 4
ve ent us ed
ess or
ery els ng to ng he
d
n
D n,
is ce. ely er-le, ng his 82 M
ply in on on. not
to e a ers he
Figur
3.2 SWe prsubstanreduces
Figure smoothsmoothmultiplunknowone moupon al
Specifibuilt bratings S\D copredicteinferen
Here RAs the produceSimilarwith prends eion unkn
The keoriginamodelsa separorder to
re 3. Illustration
Figure 4. Illus
Scalable Iteropose a variatintially simplifies its computation
5 provides an ohing algorithm.hing approach, thle iterations forwn rating. Howodel for each unkll known ratings
ically, during k-tbased on trainin
D combined wiomputed in theed rating for (
nce approach, def
,
R(u,i) represents result of the k-thes a new predrly to the originredictions made ither after a fixenown ratings co
ey difference bal iterative smoos built within eacrate model for evo properly adjus
of the general it
stration of one sm
rative Smooion of iterative
es the original nal requirements
overview of the . Similarly the proposed sca
repeatedly adjuwever, in each itknown rating, ons and predicted r
th iteration (for ang dataset Dk with all prediction
e previous itera(u,i) in the k fined as follows
, ,, ,
the known ratith iteration, for ediction for (u,i)al approach, newin the previous
ed number of itenverge (i.e., do n
between this simthing algorithm ch iteration k. Tvery unknown rst the predicted r
terative smoothin
moothing iterati
othing e smoothing apapproach and ss.
proposed scalato the origin
alable version alusting estimatioteration, instead nly one single matings in previou
any k = 1, 2, …)which contains ns Pk-1 on user-iation. Pk(u,i) iteration by the:
, ∈ , ∈ \
ing that user u geach (u,i)S\D, ) that is storedw predictions ariteration and th
erations or whennot change).
mplified variatiis the number o
The original algorating in the ratinrating Pk(u,i) usi
ng process.
ion.
pproach that significantly
able iterative al iterative lso involves
ons for each of building
model is built us iteration.
), model fk is all known tem pairs in denotes the e collective
gave item i. the model fk
d as Pk(u,i). re compared he procedure n predictions
ion and the of predictive rithm builds ng space, in ing all other
5

ratings from previous iteration, i.e., all ratings from D as well all ratings Pk-1(u',i') where (u',i') (u,i).
Scalable Iterative Smoothing Algorithm: Inputs: known ratings data D, # of iterations K, algorithm T Process: 1. Build model f0 on known ratings D using some standard recommendation algorithm T, i.e., f0T(D) 2. Apply model f0 to compute predictions P0 for unknown ratings S\D, i.e., P0(u,i) = f0(u,i) for (u,i)S\D 3. For each iteration k {1, …, K}
a. Construct dataset Dk by including all known ratings D and all predicted ratings Pk-1 from the previous iteration, i.e.,
Dk = D ∪ Pk-1 b. Build model fk on dataset Dk using T, i.e.,
fk T(Dk) c. For each unknown rating pair (u, i)S\D , make
prediction on (u, i) and store in Pk, i.e., Pk(u, i) = fk(u, i)
4. Output predictions made in the final iteration PK
Output: PK Figure 5. Overview of scalable iterative smoothing approach.
In contrast, the simplified algorithm builds only one predictive model in each iteration, based on the entire rating matrix. In other words, predicted rating Pk(u,i) is adjusted using all ratings from previous iteration, i.e., all ratings from D as well as from Pk-1, including Pk-1(u,i). Thus, in the simplified algorithm, for any given rating prediction P1(u,i) in the first iteration, the predictive model is built on a rating data (i.e., D1) that only differs from the rating data used in the original algorithm by one additional rating (i.e., D1\{P0(u,i)}). Because the influence of one additional rating is often subtle, especially when entire rating space is large (i.e., in settings with large numbers of users and items), the single overall model build in the simplified algorithm should produce outcomes similar to the ones produced by individual models built in the original algorithm, especially in the first iteration. While the difference between the original and simplified versions of the iterative smoothing may slowly increase as the number of iterations grows, the simplified approach still provides significant performance improvements (both in stability and accuracy), as demonstrated by the experimental results later in the paper.
Moreover, the runtime complexity of the simplified algorithm is much lower, making it much more practical from the scalability perspective. In particular, as only one overall model is built on all available ratings (i.e., dataset of size |S|) within each iteration, in total K models are constructed over the course of K iterations. Thus, the time complexity of the simplified variation is O(Kt(|S|)). Comparing this to the complexity of the original algorithm, O(|S\D|Kt(|S|)), the scalable heuristic offers huge computational improvements (i.e., by roughly |S\D| times). In this paper, we use scalable iterative smoothing in our experiments.
4. EXPERIMENTAL RESULTS 4.1 Overall Process Our experiments test the stability improvements achieved by the proposed meta-algorithmic approach in conjunction with several popular collaborative filtering techniques.
The experiments follow the two-phase stability computation from prior literature [2], discussed in Section 2. We used the standard train-test data splitting approach and divided known ratings data D into two sets: training data DT (80%) and validation data DV (20%), where D = DT DV and DT DV = . Training set DT
was used for building rating prediction models, while validation set DV was reserved exclusively for evaluating the predictive accuracy of the final predictions. Similarly, a randomly chosen half of the unknown rating space ET was dedicated for the stability evaluation of rating prediction models during the training phase, and the other half of the unknown rating space EV was reserved exclusively for proper evaluation of the stability of the final predictions. Here, S\D = ET EV and ET EV = .
Step 0: Create training and test datasets, i.e., DT, DV, ET, EV. Step 1: Find the best model parameters:
i. Use a portion (e.g., 75%) of training set DT to build rating prediction models using iterative smoothing.
ii. Compute model accuracy on other portion (25%) of DT. iii. Compute model stability on predictions made on ET. iv. Repeat steps i-iii with various parameter settings for
iterative smoothing (i.e., number of iterations). v. Find the best parameters for iterative smoothing, i.e., the
specifications that result in best stability and accuracy. Step 2: Evaluate accuracy and stability of the final predictions
i. Use the best parameter settings for iterative smoothing. ii. Train the system on the entire training set DT using
iterative smoothing. iii. Evaluate predictive accuracy on the reserved validation
rating set DV. iv. Evaluate recommendation stability on the reserved
unknown rating space EV. Step 3: Report parameter setting(s) as well as the accuracy and stability of the final predictions.
Figure 6. Overall experimental process.
Additionally, the process of iterative smoothing involves multiple iterations to adjust the predictions of unknown ratings. One of the goals in this study is to find whether predictions converge during the process of iterative smoothing and, if so, when. In addition, there is possibility that iterative smoothing models can “over-adjust” rating predictions after a number of iterations, in their attempt to maximize the performance on training data. Over-fitting is a well-known phenomenon which occurs when a predictive model is fine-tuned to fit the training data (including the random errors, outliers, and noise in the data) too well, which typically leads to diminished predictive performance on test data.
Therefore, for a given algorithm, it is necessary to find the best number of iterations to use on a given dataset in the final iterative smoothing procedure. In order to find the optimal parameter settings, we further used the standard train-test data splitting approach internally within the training data to identify the best parameter values for the proposed approach, i.e., that result in best accuracy and stability. The overall experiment process is summarized in Figure 6.
4.2 Recommendation Algorithms In our experiments, we test the proposed approach in conjunction with four popular recommendation algorithms: the simple baseline method, classic user- and item-based variations of neighborhood-based CF approaches, and the matrix factorization technique. A brief overview of each technique is provided below.
Baseline. In real-world settings, some users may systematically tend to give higher ratings than others, and some universally liked items might receive higher ratings than others. Without normalization, such user and item effects could bias system’s predictions. Hence, recommender systems often involve a pre-processing step to remove these “global effects”. One common practice is to estimate and remove three effects: the overall mean, the main effect of an item, and the main effect of a user [4]. Such
6

“global effects” can serve as a baseline estimate for unknown rating of corresponding user and item, i.e.,
bui = µ + bu + bi ,
where µ is the overall average rating, bu is the average observed deviation from µ on ratings provided by user u, and bi is the average observed deviation from µ on ratings given to item i. Note that, in all of our experiments (i.e., with all other recommendation algorithms), the ratings data were normalized by removing these global effects. Moreover, this estimate is often used as a baseline recommendation technique for comparison with other recommendation algorithms, i.e., R*(u,i) = bui, and we investigate its performance in our experiments as well.
User-Based Collaborative Filtering (CF_User). The user-based nearest-neighbor collaborative filtering approach is a heuristic that makes predictions of unknown ratings for a user based on the ratings previously rated by this user’s “nearest neighbors”, i.e., other users who have similar rating patterns [6,20]. That is, the value of the unknown rating for user u and item i is usually computed as an aggregate of the neighbors’ ratings for the same item i. The most common aggregation approach is the weighted sum of the neighbors’ ratings, where the similarity of two users is used as a weight. I.e., the more similar user u' and target user u are, the more weight will be carried by the rating provided by user u' on item i in the weighted sum when computing the prediction. Predicted rating for user u on item i is computed as:
∗ , ∑ ∗ ,∈ ,
∑ | |∈ ,
where N(u,i) is a set of “neighbors” with similar rating patterns to user u and that have provided ratings for item i, simuv is the similarity between users u and v, and bui is the baseline estimate for user u on item i. In our implementation, two users must have rated at least 3 items in common to allow computation of similarity between them. The similarity between two users is calculated as Pearson correlation between rating vectors (based on the commonly rated items) of the two users. Prediction of each unknown rating is formulated by combining the preferences of 20 most similar users who have rated the same item.
Item-Based Collaborative Filtering (CF_Item). The user-based collaborative filtering technique also has an analogous item-based version, where the ratings of the nearest-neighbor items are used to predict unknown ratings for a given item. Several studies have presented empirical evidence that item-based algorithms often provide better predictive accuracy than user-based methods (e.g., [22]). Thus, our experiments also test the standard item-based collaborative filtering in conjunction with the proposed approach. Similarly to the settings employed in user-based CF, in our experiments, two items are required to have been rated by 3 common users to allow similarity evaluation between them, and 20 nearest-neighbor items are used to formulate a prediction.
Matrix factorization (SVD). Matrix factorization technique is a model-based (as opposed to heuristic-based) collaborative filtering approach that characterizes items and users via a number of latent factors inferred from known ratings [8,15]. This technique models the U×I rating space as a product of two sub-matrices: user preference matrix (U×L) and item feature matrix (L×I). Each user and item is described by a vector of L latent variables. In our experiments L is set to be 20. The user vector indicates the preference of the user for several latent features, and the item vector represents an item’s importance weights for the same latent features. Singular value decomposition (SVD) techniques are used to decompose original rating matrix into the two sub-matrices in an optimal way that minimizes the resulting
approximation error. After the two sub-matrices are learned using known ratings, each unknown rating is estimated as a dot-product of the corresponding user- and item-factors vectors. Many variations of matrix factorization techniques have been developed during the recent Netflix Prize competition (e.g., [14,15,18,21]). Our experiments focus on the basic underlying version of the matrix factorization [8]; however, the proposed meta-algorithmic approach can be applied with any variation of this technique.
4.3 Results: Comparing Iterative Smoothing with Standard Recommendation Techniques The objective of the experiment is to compare the performance of the proposed iterative smoothing approach with standard single-model recommendation techniques on several real world datasets.
The first dataset we used is the Movielens 100K dataset [10], which contains 100,000 known ratings on 1682 movies from 943 users (6.3% data density). Our second dataset is a sample extracted from the Movielens 1M dataset. The original Movielens 1M dataset consists of 1,000,000 ratings for 6040 movies by 3952 users (4.2% data density) [10]. From this dataset we extracted a random sample of 3000 users and 3000 movies. Resulted dataset contains 400,627 known ratings (i.e., 4.45% data density). Our third dataset is sampled from the Netflix 100M dataset used in the recent Netflix Prize competition [5]. Similarly to the second dataset, we sub-sampled 3000 random users and 3000 random movies from the original data file. The result data sample consists of 105,256 known ratings (i.e., 1.17% data density). The three datasets used in our experiments come from different sources and have different data characteristics (i.e., size and sparsity). All movie ratings in the Movielens and Netflix datasets are integer values between 1 and 5, where 1 represents the least liked movies, and 5 represents the most liked movies. The datasets used in this experiment are summarized in Table 1.
Table 1. Summary of Experimental Datasets.
DataSet Description Users Items Density Movielens
100K Movie ratings from Movielens movie
recommender system.
943 1682 6.30%
Movielens 1M
3000 3000 4.45%
Netflix Movie ratings
distributed by Netflix company.
3000 3000 1.17%
The procedure of this experiment followed the general experimental process described in Figure 6. We examined the prediction accuracy and stability of the final predictions on the reserved validation datasets (as described in Figure 6, Step 2). For each recommendation algorithm used in our study, we compare two approaches: the standard (original) single-model approach and the scalable version of iterative smoothing approach. Accuracy and stability numbers (measured by RMSE and RMSS) of the two approaches on real-world movie rating datasets are provided in Table 2.
Experimental results are consistent across different datasets. On all three datasets, our proposed meta-algorithmic iterative smoothing approach outperformed the original recommendation techniques in both stability and accuracy in the vast majority of cases. In particular, on average (i.e., across all datasets), iterative smoothing provided a dramatic 55% improvement over the original recommendation algorithms in stability (as measured by RMSS) for CF_User and CF_Item algorithms. Even for the fairly stable SVD and baseline techniques, on average, iterative smoothing was able to further improve RMSS by 14%. In terms of predictive accuracy, on average, iterative smoothing provided
7
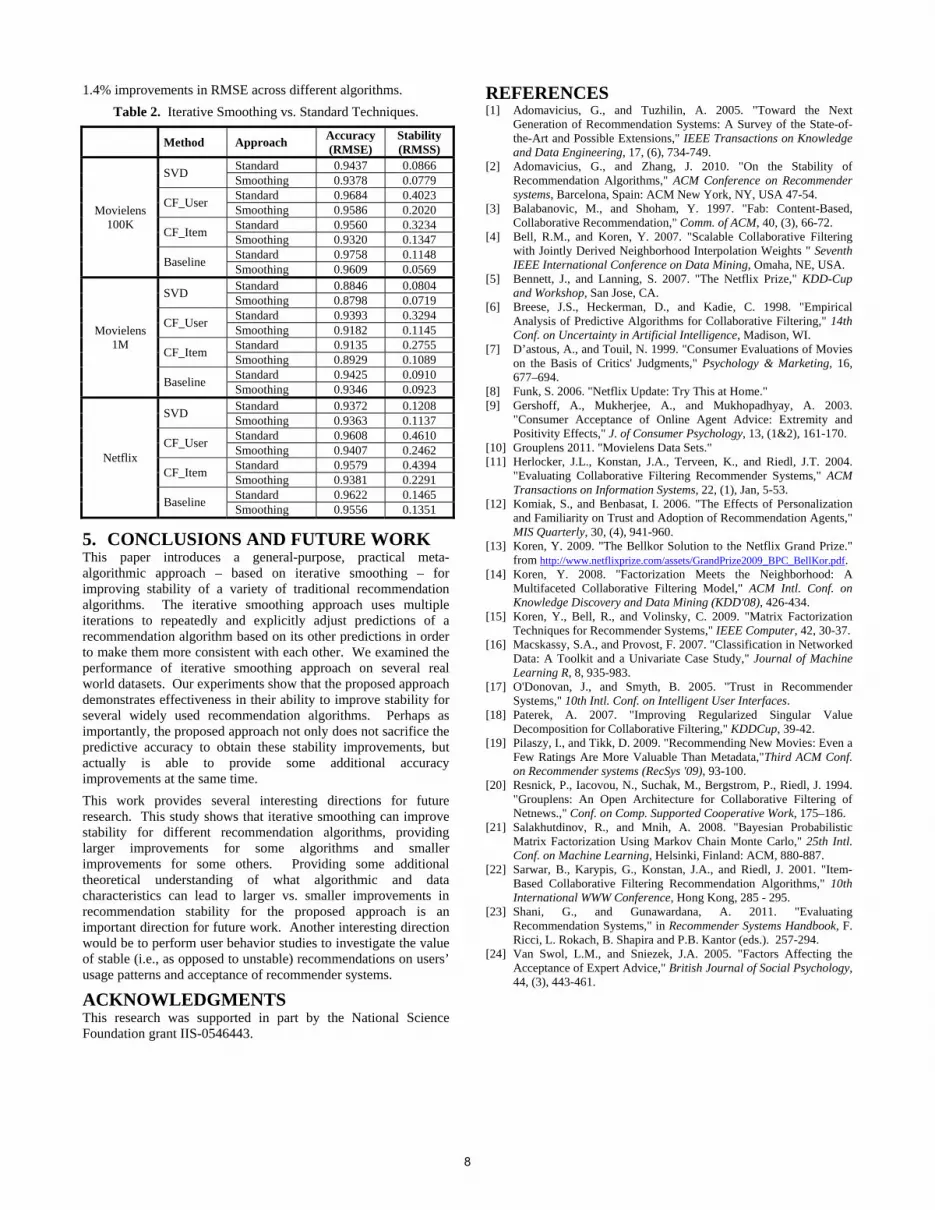
1.4% improvements in RMSE across different algorithms.
Table 2. Iterative Smoothing vs. Standard Techniques.
Method Approach Accuracy (RMSE)
Stability (RMSS)
Movielens 100K
SVD Standard 0.9437 0.0866 Smoothing 0.9378 0.0779
CF_User Standard 0.9684 0.4023 Smoothing 0.9586 0.2020
CF_Item Standard 0.9560 0.3234 Smoothing 0.9320 0.1347
Baseline Standard 0.9758 0.1148 Smoothing 0.9609 0.0569
Movielens 1M
SVD Standard 0.8846 0.0804 Smoothing 0.8798 0.0719
CF_User Standard 0.9393 0.3294 Smoothing 0.9182 0.1145
CF_Item Standard 0.9135 0.2755 Smoothing 0.8929 0.1089
Baseline Standard 0.9425 0.0910 Smoothing 0.9346 0.0923
Netflix
SVD Standard 0.9372 0.1208 Smoothing 0.9363 0.1137
CF_User Standard 0.9608 0.4610 Smoothing 0.9407 0.2462
CF_Item Standard 0.9579 0.4394 Smoothing 0.9381 0.2291
Baseline Standard 0.9622 0.1465 Smoothing 0.9556 0.1351
5. CONCLUSIONS AND FUTURE WORK This paper introduces a general-purpose, practical meta-algorithmic approach – based on iterative smoothing – for improving stability of a variety of traditional recommendation algorithms. The iterative smoothing approach uses multiple iterations to repeatedly and explicitly adjust predictions of a recommendation algorithm based on its other predictions in order to make them more consistent with each other. We examined the performance of iterative smoothing approach on several real world datasets. Our experiments show that the proposed approach demonstrates effectiveness in their ability to improve stability for several widely used recommendation algorithms. Perhaps as importantly, the proposed approach not only does not sacrifice the predictive accuracy to obtain these stability improvements, but actually is able to provide some additional accuracy improvements at the same time.
This work provides several interesting directions for future research. This study shows that iterative smoothing can improve stability for different recommendation algorithms, providing larger improvements for some algorithms and smaller improvements for some others. Providing some additional theoretical understanding of what algorithmic and data characteristics can lead to larger vs. smaller improvements in recommendation stability for the proposed approach is an important direction for future work. Another interesting direction would be to perform user behavior studies to investigate the value of stable (i.e., as opposed to unstable) recommendations on users’ usage patterns and acceptance of recommender systems.
ACKNOWLEDGMENTS This research was supported in part by the National Science Foundation grant IIS-0546443.
REFERENCES [1] Adomavicius, G., and Tuzhilin, A. 2005. "Toward the Next
Generation of Recommendation Systems: A Survey of the State-of-the-Art and Possible Extensions," IEEE Transactions on Knowledge and Data Engineering, 17, (6), 734-749.
[2] Adomavicius, G., and Zhang, J. 2010. "On the Stability of Recommendation Algorithms," ACM Conference on Recommender systems, Barcelona, Spain: ACM New York, NY, USA 47-54.
[3] Balabanovic, M., and Shoham, Y. 1997. "Fab: Content-Based, Collaborative Recommendation," Comm. of ACM, 40, (3), 66-72.
[4] Bell, R.M., and Koren, Y. 2007. "Scalable Collaborative Filtering with Jointly Derived Neighborhood Interpolation Weights " Seventh IEEE International Conference on Data Mining, Omaha, NE, USA.
[5] Bennett, J., and Lanning, S. 2007. "The Netflix Prize," KDD-Cup and Workshop, San Jose, CA.
[6] Breese, J.S., Heckerman, D., and Kadie, C. 1998. "Empirical Analysis of Predictive Algorithms for Collaborative Filtering," 14th Conf. on Uncertainty in Artificial Intelligence, Madison, WI.
[7] D’astous, A., and Touil, N. 1999. "Consumer Evaluations of Movies on the Basis of Critics' Judgments," Psychology & Marketing, 16, 677–694.
[8] Funk, S. 2006. "Netflix Update: Try This at Home." [9] Gershoff, A., Mukherjee, A., and Mukhopadhyay, A. 2003.
"Consumer Acceptance of Online Agent Advice: Extremity and Positivity Effects," J. of Consumer Psychology, 13, (1&2), 161-170.
[10] Grouplens 2011. "Movielens Data Sets." [11] Herlocker, J.L., Konstan, J.A., Terveen, K., and Riedl, J.T. 2004.
"Evaluating Collaborative Filtering Recommender Systems," ACM Transactions on Information Systems, 22, (1), Jan, 5-53.
[12] Komiak, S., and Benbasat, I. 2006. "The Effects of Personalization and Familiarity on Trust and Adoption of Recommendation Agents," MIS Quarterly, 30, (4), 941-960.
[13] Koren, Y. 2009. "The Bellkor Solution to the Netflix Grand Prize." from http://www.netflixprize.com/assets/GrandPrize2009_BPC_BellKor.pdf.
[14] Koren, Y. 2008. "Factorization Meets the Neighborhood: A Multifaceted Collaborative Filtering Model," ACM Intl. Conf. on Knowledge Discovery and Data Mining (KDD'08), 426-434.
[15] Koren, Y., Bell, R., and Volinsky, C. 2009. "Matrix Factorization Techniques for Recommender Systems," IEEE Computer, 42, 30-37.
[16] Macskassy, S.A., and Provost, F. 2007. "Classification in Networked Data: A Toolkit and a Univariate Case Study," Journal of Machine Learning R, 8, 935-983.
[17] O'Donovan, J., and Smyth, B. 2005. "Trust in Recommender Systems," 10th Intl. Conf. on Intelligent User Interfaces.
[18] Paterek, A. 2007. "Improving Regularized Singular Value Decomposition for Collaborative Filtering," KDDCup, 39-42.
[19] Pilaszy, I., and Tikk, D. 2009. "Recommending New Movies: Even a Few Ratings Are More Valuable Than Metadata,"Third ACM Conf. on Recommender systems (RecSys '09), 93-100.
[20] Resnick, P., Iacovou, N., Suchak, M., Bergstrom, P., Riedl, J. 1994. "Grouplens: An Open Architecture for Collaborative Filtering of Netnews.," Conf. on Comp. Supported Cooperative Work, 175–186.
[21] Salakhutdinov, R., and Mnih, A. 2008. "Bayesian Probabilistic Matrix Factorization Using Markov Chain Monte Carlo," 25th Intl. Conf. on Machine Learning, Helsinki, Finland: ACM, 880-887.
[22] Sarwar, B., Karypis, G., Konstan, J.A., and Riedl, J. 2001. "Item-Based Collaborative Filtering Recommendation Algorithms," 10th International WWW Conference, Hong Kong, 285 - 295.
[23] Shani, G., and Gunawardana, A. 2011. "Evaluating Recommendation Systems," in Recommender Systems Handbook, F. Ricci, L. Rokach, B. Shapira and P.B. Kantor (eds.). 257-294.
[24] Van Swol, L.M., and Sniezek, J.A. 2005. "Factors Affecting the Acceptance of Expert Advice," British Journal of Social Psychology, 44, (3), 443-461.
8

Toward a New Protocol to Evaluate Recommender Systems
Frank Meyer, Françoise Fessant, Fabrice Clérot Orange Labs
av. Pierre Marzin 22307 Lannion cedex
France
{franck.meyer,francoise.fessant,fabrice.clerot}@orange.com
Eric Gaussier University of Grenoble - LIG
UFR IM2AG - LIG/AMA Grenoble Cedex 9
France
ABSTRACT In this paper, we propose an approach to analyze the performance and the added value of automatic recommender systems in an industrial context. We show that recommender systems are multifaceted and can be organized around 4 structuring functions: help users to decide, help users to compare, help users to discover, help users to explore. A global off line protocol is then proposed to evaluate recommender systems. This protocol is based on the definition of appropriate evaluation measures for each aforementioned function. The evaluation protocol is discussed from the perspective of the usefulness and trust of the recommendation. A new measure called Average Measure of Impact is introduced. This measure evaluates the impact of the personalized recommendation. We experiment with two classical methods, K-Nearest Neighbors (KNN) and Matrix Factorization (MF), using the well known dataset: Netflix. A segmentation of both users and items is proposed to finely analyze where the algorithms perform well or badly. We show that the performance is strongly dependent on the segments and that there is no clear correlation between the RMSE and the quality of the recommendation.
Categories and Subject Descriptors H.3.3 [Information Search and Retrieval]: Information filtering – collaborative filtering, recommender system; H.3.4 [Systems
and Software]: Performance evaluation (efficiency and effectiveness) – performance measures, usefulness of
recommendation.
General Terms Algorithms, Measurement, Performance, Experimentation.
Keywords
Recommender systems, Industrial context, evaluation, Compare, Explore, Decide, Discover, RMSE, utility of recommendation
1. INTRODUCTION The aim of recommender systems is to help users to find items that should interest them, from large catalogs. One frequently adopted measure of the quality of a recommender system is accuracy (for the prediction of ratings of users on items) [1,14]. Yet in many implementations of recommender system services, the rating prediction function is either not provided, or not
highlighted when it is provided (in industrial contexts, the generated recommendations themselves and their utility are more important than the rating predictions). There is increasing consensus in the community that accuracy alone is not enough to assess the practical effectiveness and added-value of recommendations [8,13]. Recommender systems in industrial context are multifaceted and we propose to consider them around the definition of 4 key recommendation functions which meet the needs of users facing a huge catalog of items: how to decide, how to compare, how to explore and how to discover. Once the main functions are defined, the next question is how to evaluate a recommender system on its various facets? We will review for each function the key points for their evaluation and the available measures if they exist. In particular, we will introduce a dedicated measure for the function "help to discover". This function raises the question of the evaluation from the point of view of the usefulness of the recommendation. We will also present a global evaluation protocol able to deal with the multifaceted aspect of recommender systems, which requires at least a simple segmentation of users and items. The remainder of the paper is organized as follow: the next section introduces the four core functions of an industrial recommender system. Then the appropriate measures for each core function are presented as well as the global evaluation protocol. The last part of the paper is dedicated to experimental results and conclusion.
2. MAIN FEATURES OF
RECOMMENDER SYSTEMS Automatic recommender systems are often used on e-commerce websites. These systems work in conjunction with a search engine for assistance in catalog browsing to help users find relevant content. As many users of e-commerce websites are anonymous, a very important feature is the contextual recommendation of item, for anonymous users. The purpose of these systems being also to increase usage (the audience of a site) or sales, the recommendation itself is more important than the rating predicted. Moreover, prioritizing a list of items on a display page is a more important functionality than the prediction of a rating. These observations, completed with interviews with marketers and project managers of Orange about their requirements relatively to recommender systems and an overview of recommender systems both in the academic and in the industrial fields [10] has led us to organize the recommender systems' functionalities into 4 main features: Help to Decide. Given an item, a user wants to know if he will appreciate the item. This feature consists of the prediction of a rating for a user and an item and is today mainstream in academic literature [14].
Copyright is held by the author/owner(s). Workshop on Recommendation Utility Evaluation: Beyond RMSE (RUE 2012), held in conjunction with ACM RecSys 2012. September 9, 2012, Dublin, Ireland.
9

Help to Compare. Given several items, a user wants to know what item to chose. This feature corresponds to a ranking function. It can be used to provide recommendation lists [5] or to provide personalized sorting results of requests on a catalog. Help to Discover. Given a huge catalog of items, a user wants to find a short list of new interesting items. This feature is usually called item-based top-N recommendation in the academic literature [6]. It corresponds to personalized recommendation. Note that the prediction of the highest rated item is not necessarily the most useful recommendation [5]. For instance the item with the highest predicted rating will most likely be already known by the user. Help to Explore (or Navigate). Given one item, an (anonymous) user wants to know what the related items are. This feature corresponds to the classical item-to-item recommendation to anonymous users popularized by the e-commerce website Amazon [9] during catalog browsing. This function is widely used in the industry because it can make recommendations for anonymous users, based on the items she consults. It requires a similarity function between items.
3. EVALUATION OF INDUSTRIAL
RECOMMENDER SYSTEMS In this section we discuss the appropriate measures for each core function and a global protocol for the evaluation of the recommender system. The evaluation is viewed from the standpoint of the utility of the recommendation for each user and each item.
3.1 Utility of the recommendation A good recommender system should avoid bad and trivial recommendations. The fact that a user likes an item and the fact that an item is already known by the user have to be distinguished [7]. A good recommendation corresponds to an item that would probably be well rated by the user but also an item that the user does not know. For instance it is worthless recommending to all users the blockbuster of the year: it should be a good rated movie on the average, but it is not a useful recommendation as most of people may have already seen it.
3.2 Item segmentation and user segmentation Another important issue for an industrial application is to fully exploit the available catalog, including its long tail, consisting of items rarely purchased [2]. A system’s ability to make a recommendation, in a relevant way, for all items in the catalog is therefore important. However Tan and Netessine [16] have observed on the Netflix dataset for instance, that the long tail effect is not so obvious. There's more of a Pareto distribution (20% of the most rated items represents 80% of the global ratings) in the Netflix data than a long tail distribution as proposed by Anderson [2] (where infrequent items globally represent more ratings). They also noticed that the behavior of the users and the type of items they purchase are linked. In particular, customers who watched items in the long tail are in fact heavy users, light users tend to focus only on popular items. These observations lead us to the introduction of the notion of segments of items and users. The definition of the segment thresholds must be relative and catalog dependant. We will use the terms of light/heavy users segment and of unpopular/popular item segment instead of using long tail and short head concepts. In a first step we will use this simple segmentation to analyze how an industrial recommender system can help all users both heavy and light and how it can recommend all items, both popular and unpopular.
3.3 Measures of performance For our protocol we use a classic train/test split of the data. The train set will be used to compute statistics and thresholds and to build a predictive model. The test set will be used to compute the performance measures. The predictive model should at least be able to provide a rating prediction function for any couple of user and item. We will see that to provide the "Help to Explore" functionality the predictive model also must be able, in some way, to produce an item-item similarity matrix allowing it to select, for each item i, its most similar items (the related items). We first detail the performance measures we use for our protocol, according to the 4 core functions. Help to Decide. The main use case is a user watching an item description on a screen and wondering if he would enjoy it. Giving a good personalized rating prediction will help the user to choose. The "help to decide" function can be given by the rating prediction function and must be measured by an accuracy measure which penalizes extreme errors. The Root Mean Squared Error (RMSE) is the natural candidate [14]. Help to Compare. The main use case here is a user getting an intermediate short list of items after having given her preferences. This user then wants to compare the items of this short list, in order to choose the one she will enjoy most. The function needs a ranking mechanism with a homogeneous quality of ranking over the catalog. A simple measure is the percentage of compatible rank indexes. After modeling, for each user u and for each couple of item (i, j) in the test set rated by u with ru,i≠ru,j, the preference given by u is compared with the predicted preference given by the recommender method, using the predicted ratings and . The percentage of compatible preferences is given by:
(3-1)
with , where
is 1 if has the same sign as and 0 otherwise, and
is the number of elements of
Help to Discover. The main use case here is a user getting recommended items: these recommendations must be relevant and useful. For relevancy our approach is the following: an item i recommended for the user u - is considered relevant if u has rated i in the test set with a rating greater than or equal to u's mean of ratings, - is considered irrelevant if u has rated i in the test set with a rating lower than u's mean of ratings - is not evaluated if not present for u (not rated by u) in the test set. The classical measure to evaluate recommendation list is the precision measure (recall being difficult to apply in the context of recommendation, as in huge catalogs one does not know all the items relevant for each user). For each user u:
(3-2)
Hu stands for the subset of evaluable recommendations in the test set for u, that is to say the set of couples (u,i), i being the recommended item to the user u. |Hu| is the size of Hu, in number of couples (u, i).
10

However the precision is not able to measure the usefulness of the recommendations: recommending well-known blockbusters, already known by the user will lead to a very high precision although this is of very low utility. To account for this, we introduce here the concept of recommendation impact. The basic idea is that, the more frequent a recommended item is, the less impact the recommendation has. This is summarized in Table 1:
Table 1. The notion of recommendation Impact Impact of the recommendation
Impact if the user likes the item
Impact if the user dislikes the item
Recommending a popular item
Low: the item is likely to be already known at least by name by the user.
Low: even if the user dislikes this item he can understand that as a popular item this recommendation is likely to appear... at least at the beginning
Recommending an unpopular (infrequent) item
High: the service provided by the recommender system is efficient. The rarest the item was, the less likely the user would have found it alone.
High: not only the item was unknown and did not inspire confidence, but it also was not good.
We then define the Average Measure of Impact (AMI) for the performance evaluation of the function "Help user to Discover". The AMI of a recommendation list Z for a user u with an average of rating is given by:
(3-3)
Where Hu denotes the subset of the evaluable recommendations in the test set, Z denotes the set of couples (user, item), representing a set of recommendations, count(i) the number of logs in the train set related to the item i, and |I| the size of the catalog of items. The rarer an item i (rarity being estimated in the train set), the greater the AMI if i is both recommended and relevant for a user u. The greater the AMI, the better the positive impact of the recommendations on u. The AMI will have to be calibrated as we do not know yet what is a "good AMI". But we can already compare different algorithms, or different recommendation strategies (such as post filtering methods to add serendipity) with this measure. Help to Explore. The main case here is the item-to-item recommendation for an anonymous user who is watching an item description on a screen: the recommender system should propose items similar to that being watched. We can try to evaluate the performance of this functionality by associating, with each context item i, the KNN of i, using an overall precision measure for the recommended items. But, we will have an issue: it can be more effective to associate each context item i with N items optimized only for precision, rather than N items similar to the context item i. It may be more efficient, to optimize precision, to associate blockbusters for each source item. In fact we want to assess the quality of the Help to Explore (navigate) function: we want a good semantic, meaningful similarity for each associated item. But only an experiment with real users can assess this semantic similarity.
Our solution is to use the underlying item-item similarity matrix for this evaluation. We can assess the overall quality of the pairs of similar items by an indirect method: 1. given a predictive model, find a way to compute similarities between any pair of items, building an item-item similarity matrix. 2. use an item-item K-Nearest Neighbors (KNN) model [12] using this matrix. The assumption is that a good similarity matrix must lead to good performances for other aspects of the recommendation when used into an item-item KNN model. This is the approach we take, using RMSE, precision, and ranking performance measures. For a KNN type algorithm, this analysis is straightforward and simple: the similarity matrix is already the kernel of the model. The algorithms that are not directly based on a similarity measure need a method for extracting the similarities between the items. For matrix-factorization-based algorithm, this can correspond to a method to compute similarities between the factors of the items.
3.4 Evaluation Protocol The evaluation protocol is then designed thanks to the mapping between the 4 core functions and the associated performance measures as summarized in Table 2.
Table 2. Adapted measures for each core function Functions Quality criterion Measure
Decide Accuracy of the rating prediction Penalization of extreme errors to minimize the risk of wrong decision
RMSE
Compare Good predicted ranking for every couple of items of the catalog
COMP % of compatible rank indexes
Discover Selection for a user the most preferred items in a list of items Identification of good/bad recommendations Precise, useful, trusted recommendation
(Precision, not recommended!) Average Measure of Impact (AMI)
Explore Precise recommendations Identification of good/bad recommendations
Similarity matrix leading to good performances, in accuracy, relevancy, usefulness and trust
The following notations are adopted: a log (u, i, r) corresponds to a user u who rated an item i with the rating r. U is the set of all the users, I is the set of all the items. Given a dataset D of logs and an algorithm A, the evaluation protocol we propose is as follow: Initialization
Randomly split the dataset into 2 datasets train and test
Use the train dataset to generate a model with the algorithm A.
Evaluation
1. For each log (u, i, r) of the test set: 1.1 compute the predicted rating of the model 1.2 compute the predicted rating error
2. Use the RMSE which gives an indicator of the performance of the Help to Decide function. 3. For each user u of U:
3.1 sort all u's logs of the test set by ratings 3.2 sort all u's logs of the test set by rating prediction 3.3 compute COMP comparing the indexes of u's logs and the indexes of the predicted ratings of he logs.
11

4. Use the averaged COMP as an indicator of the Help to Compare function.
5. For each item i of I, compute count(i) which is the number of logs in the train set referencing i. 6. For each user u of U:
6.1 compute the predicted rating of each item i of I. 6.2 select the top-N highest predicted rating items noted iu,1 to iu,N which are the Top-N recommended items.
6.3 compute the rating average of u, noted . 6.4 for each recommended item iu,j of u:
6.4.1 check if a corresponding log (u, iu,j,r) exists, If so the recommendation of iu,j is evaluable else skip the step 6.4.2.
6.4.2. If r≥ then the recommendation is considered relevant (and irrelevant in the other case).
6.5 compute the Precision and the AMI for the evaluable recommendations
7. Use the Precision and the AMI, averaged by users, as the indicators for the Help to Discover Function 8. Specify a way to compute efficiently, using the model of the algorithm A, the similarity between every couple of items (i,j). 9. Compute the similarity matrix of all the couple (i, j) for I×I. 10. Use this similarity matrix as the kernel of an item-item K-Nearest Neighbor model, then run the protocol for the steps 1 to 7 for RMSE, COMP, AMI and Precision to obtain a 4-dimensional indicator of the quality of the Help to Explore function.
4. EXPERIMENTS
4.1 Datasets and configuration Experiments are conducted on the widely used dataset Netflix [3]. This dataset has the advantage of being public and allows performance comparisons with many others techniques. Agnostic thresholds are used for segments of users and items, depending of datasets. We used simple thresholds based on the mean of the number of ratings to split items into popular items and unpopular (infrequent) items, and similarly to split users into heavy users and light users. For instance, on Netflix, using a Train Set of 90% of the total of logs, the mean of the number of rating for the users is 190 (heavy users are users who gave more than 190 ratings otherwise they are light users) and the mean of number of ratings for the items is 5089 (popular items are items with more than 5089 ratings otherwise they are unpopular items). The number of generated items for the Top-N recommendation is always N=10. All our tests are carried out on this configuration: Personal Computer with 12 GB Ram, processor IntelTM XeonTM W3530 64-bit-4-core processor running at 2.8 GHz, hard disk of 350 GB. All algorithms and the benchmark process are written in JavaTM.
4.2 Algorithms We chose to use 2 models: fast matrix factorization using the MF algorithm presented in [15] and an item-item KNN algorithm [12]. These algorithms are mainstream techniques for recommender systems. For MF we analyze the effect of the number of factors, for the KNN algorithm we analyze the effect of K, the number of Nearest Neighbor kept in the model. In addition, to compare the performances of these 2 algorithms, 2 baseline algorithms are also used: - a simple default predictor using the mean of items and the mean of the users (the sum of the two means if available, divided by 2). This algorithm is also used by the KNN algorithm when no KNN items are available for a given item to score.
- a random predictor, generating uniform ratings between [1..5] for each rating prediction. One industrial requirement of our system was that it could take into account new items and new users every 2 hours. Considering other process and I/O constraints, for all the algorithms the modeling time was then restricted to 1.5 hours. This has implications for the MF algorithm as on Netflix it always reaches an optimum between 16 and 32 factors: this is a constant for all our tests, for all the performances. Beyond 32 factors, MF does not have enough time to converge. Note that this convergence may be slow, longer than 24 hours for more than 100 factors on the Netflix dataset. Implementations details
Our implementation of MF is similar to those of the BRISMF implementation [15] with a learning rate of 0.030 and a regularization factor of 0.008, with early stopping. Learning process is stopped after 1.5 hours, or when the RMSE increases three consecutive times (the increase or decrease of the RMSE is controlled on a validation set consisting of 1.5% of the train set). We used an implementation of item-item KNN model as described in [11]. The similarity function is the Weighted Pearson similarity [4]. All details about implementations can be found in [10].
5. NUMERICAL RESULTS The following abbreviations are used for the segmentation of the performance: Huser: Heavy users, Luser: Light users, Pitem: Popular items and Uitem: Unpopular items (the meaning of unpopular is rather "rare", "infrequent"). For MF we analyzed the number of factors used and for KNN the number of NN kept. The full results of our experiments are available in [10].
5.1 “Help to Decide” performances The global default predictor has a RMSE of 0.964 and the global random predictor has a RMSE of 1.707. KNN's RMSE performances: Different sizes of neighborhoods (K) have been tested, compliant with our tasks in an industrial context. Increasing K generally increases the performances. However the associated similarity matrix weights must be kept in RAM for efficiency purposes, which is difficult, if not possible, with high values of K. For very large catalog applications, the size of the KNN matrix must be reasonable (up to 200 neighbors in our tests). The KNN method performs well except when K is small and except for the light-user-unpopular item segment (Luser Uitem). There is a significant gap between the RMSE for the LuserUitem segment (RMSE=1.05) and the RMSE of the heavy-user-popular-item segment (RMSE=0.8). Clearly, the KNN model is not adapted to the former, whereas it performs well on the later. Optimal number of neighbors is around K= 100.
MF's RMSE performances: Different numbers of factors have been tested. MF has difficulties modeling the Luser-Uitem segment: on this segment the RMSE never decreases under 0.96. On the contrary the RMSE for heavy-user-popular-item is close to 0.81, and the two symmetrical segments light-user-popular item and heavy-user-unpopular-item both have a good (low) RMSE (0.84 and 0.85). The RMSE decreases when number of the factor increases up to around 20 factors. After that number, the RMSE increases. It is a consequence of our time-constrained early stopping condition. This corresponds to about 140 passes on the train set. The optimal number of factors seems to be between 16 and 32.
12

5.2 “Help to Compare” performance The default global predictor has a percentage of compatible rank indexes (COMP) of 69% and the random global predictor has a performance of 49.99%. MF's and KNN’s ranking performances: The results are given for the time limited version of run for MF. MF outperforms the KNN model for the light user segments (with a COMP of 73.5% for MF and 66% for KNN). For the rest, the performances are similar to those of KNN. The maximum of ranking compatibility is around 77% for heavy users' segments.
5.3 “Help to Discover” performance
5.3.1 Analysis using the Precision The global default predictor has a precision of 92.86 % which is questionable: one can see that a simple Top-10 based on high rating average is sufficient to obtain good precision performance. The global random predictor has a precision of 53.04%. KNNs' precision performances: The precision increases as the number of K increases. But the results are not significantly better than that of the default predictor. The precision is better than the default predictor for only the Huser-Pitem segment and only for at least K=200. Under K=100, it seems better to use a default predictor than a KNN predictor for ranking tasks. Nevertheless the Huser-Pitem segment is well modeled: the precision for 10 generated items for the KNN model is greater than 97% for the model with 200 neighborhoods.
MF's precision performances: MF has a better behavior than the KNN model, especially for the light-user-unpopular-item segment (precision of 96% for F=32 factors, precision of 83% for the KNN with K>=100).
5.3.2 Analysis using the AMI The Average Measure of Impact gives slight negative performances for the random predictor and a small performance to the default predictor: the default predictor "wins" its impact values on Unpopular items. Note that the supports for the different evaluated segments are very different and the weights of the two popular item segments are significantly higher The KNN model behaves significantly better that the default predictor for the AMI. For MF, the behavior is much worse than that a KNN model. In general, the impact of MF is similar to, or lower than that of the default predictor. An analysis according to the segmentation gives a more detailed view of where are the impacts. Numerical results are summarized in Table 3.
Table 3. AMI according to the segmentation
Best model Huser Pitem
Luser Pitem
Huser Uitem
Luser Uitem
Global
MF F=32 0.38 0.26 8.93 10.61 0.5
KNN K=100 0.71 0.43 9.59 8.84 2.0
Default Pred 0.29 0.25 21.22 12.31 0.5
Random Pred
0.00 0.03 -5.13 -0.53 -0.6
Best algorithm
KNN KNN Default Predictor
Default Predictor
KNN
5.4 Summary for Decide, Compare, Discover Four models have been analyzed: a KNN model, a MF model, a random model and a default predictor model, on 3 tasks adapted to a rating-predictor-based recommender system: Decide,
Compare, Discover and on 4 user-item segments: heavy-user-popular-item, heavy-user-unpopular-item, light-user-popular-item and light-user-unpopular item. A summary of the results is given in Table 4. An analysis of the results by segments shows that globally, KNN is well adapted for the heavy-user segments and that MF, and the default predictor are well adapted to light-user segments. Globally, for the tasks "Help to Decide" and "Help to Compare", MF is the best-suited algorithm in our tests. For the task "Help to Discover" KNN is more appropriate. Note that a switch-based hybrid recommender [14], based on item and user segmentation could exploit this information to improve the global performances of the system. Finally 3 main facts will have to be considered:
1. Performances strongly vary according to the different segments of users and items.
2. MF, KNN and default methods are complementary as they perform differently across the different segments.
3. RMSE is not strictly linked to other performance measure, as mentioned for instance in [5].
Table 4. Global results, summary
Heavy
Users
Popular
items
Heavy
Users
Unpopular
items
Light
Users
Popular
Items
Light
Users
Unpopular
Items
Decide RMSE
KNN
MF
MF
MF
Compare %Compatible preferences
KNN
KNN
MF
MF
Discover Precision
KNN
MF
Default Predictor
MF
Discover Average Measure of Impact
KNN
Default Predictor
KNN
Default Predictor
When designing a recommender engine, we have to think about the impact of the recommender: recommending popular items to heavy users might be not so useful. On the other hand, it can be illusory to make personalized recommendations of unpopular (and unknown) items to light (and unknown) users. A possible simple strategy could be:
- rely on robust default predictors, for instance based on robust means of items to try to push unknown golden nuggets to unknown users,
- use personalized algorithms to recommend popular items to light users,
- finally, use personalized algorithms to recommend unpopular items of the long tail for heavy "connoisseurs".
5.5 “Help to Explore” performance To analyze the performance of the "Help to Explore" functionality we have to compare the quality of the similarities extracted from the models. We use the protocol defined before: a good similarity matrix for the task "Help to Explore" is a similarity matrix leading to global good performances, when used in a KNN model. We choose a similarity matrix with 100 neighbors for each item: this is largely enough for item-to-item tasks where generally a page displays 10 to 20 similar items. Results are presented in Table 5 for the KNN models with K=100, comparing KNN computed on
13

MF's items factors, native KNN and a Random KNN model used as baseline. As item-item similarity matrix is the kernel of a item-item KNN model, compute similarities in this case is straightforward. To compute similarities between items for MF, we use the MF-based representation of items (the vectors of the factor of the items), with a Pearson similarity. The KNN model computed on the MF's factors of the items can be viewed as a MF-emulated KNN model. Note that as the default predictor model based on items’ means and users’ means cannot itself produce a similarity matrix, it is disqualified for this task. For the RMSE, the MF-Emulated KNN model looses 0.025 point going from 0.844 to 0.870. Compared with other models, it still performs correctly.
Table 5. Quality of an item-item similarity matrix according
to 4 measures: results on Netflix
Native KNN
K=100
KNN computed on MF's items factors
K=100, number of factors=16
RMSE 0.8440 0.8691 Ranking: % compatible
77.03% 75.67%
Precision 91.90% 86.39%
AMI 2.043 2.025
(Global time of the modeling task)
(5290 seconds) (3758 seconds)
For the global ranking, the difference between the MF-Emulated model and the native KNN model is still low, whereas a random KNN model performs very badly. For the precision, for a Top-10 ranking, the MF-Emulated KNN model performs significantly worse than a native KNN model. For the Average Measure of Impact, the MF-emulated KNN model and the native KNN model perform almost identically. These results show that MF could be used to implement a similarity function between items to support the "Help to Explore" function, and that MF could be used as a component for faster KNN search.
6. CONCLUSION We have proposed a new approach to analyze the performance and the added value of automatic Recommender Systems in an industrial context. First, we have defined 4 core functions for these systems, which are: Help users to Decide, Help users to Compare, Help users to Discover, Help users to Explore. Then we proposed a general off-line protocol crossing our 4 core functions with a simple 4 users×items segments to evaluate a recommender system according to the industrial and marketing requirements. We compared two major state of the art methods, item-item KNN and MF, with 2 baselines methods used as reference. We showed that the two major methods are complementary as they perform differently across the different segments. We proposed a new measure, the Average Measure of Impact, to deal with the usefulness and the trust of the recommendations. Using the precision measure, and the AMI, we showed that there is no clear evidence of correlation between the RMSE and the quality of the recommendation. We have demonstrated the utility of our protocol as it may change
- the classical vision of the recommendation evaluation, often focused on the RMSE/MAE measures as they are assumed correlated with the system overall performances,
- and the way to improve the recommender systems to achieve their tasks.
7. REFERENCES [1] Adomavicius, G. and Tuzhilin, A. 2005. Toward the Next
Generation of Recommender Systems: A Survey of the State-of-the-Art and Possible Extensions, IEEE Trans. Knowl.
Data Eng, 17 (6), 2005, pp. 734-749. [2] Anderson, C. 2006. The Long Tail. Why the future of
business is selling less of more. Hyperion Verlag. [3] Bennet, J and Lanning, S. 2007. The Netflix Prize, KDD Cup
and Workshop. 2007. www.netflixprize.com. [4] Candillier, L., Meyer, F., Fessant, F. 2008. Designing
Specific Weighted Similarity Measures to Improve Collaborative Filtering Systems. ICDM 2008: 242-255.
[5] Cremonesi, P., Koren, Y., and Turrin, R. 2010. Performance of recommender algorithms on Top-N recommender tasks. RecSys 2010.
[6] Deshpande, M., and Karypis, G. 2004. Item-based top-N recommendation algorithms. In ACM Transactions on Information Systems, 22(1), 143–177.
[7] Herlocker, J. L., Konstan, J. A., Terveen, L.G. and Riedl, J. 2004. Evaluating collaborative filtering recommender systems. In ACM Transactions on Information Systems 22 (1), 5–53.
[8] Knijnenburg, B. P., Willemsen, M.C., Kobsa, A. 2011: A pragmatic procedure to support the user-centric evaluation of recommender systems.RECSYS 2011, 321-324
[9] Linden, G. Smith,.B, and York, J. 2003. Amazon.com Recommendations: Item-to-Item Collaborative Filtering. IEEE Internet Computing, 7 (1), 2003, pp. 76-80.
[10] Meyer, F. 2012. Recommender systems in industrial contexts. ArXiv e-prints. http://arxiv.org/abs/1203.4487.
[11] Meyer; F., Fessant, F. 2011. Reperio: a generic and flexible recommender system. IEEE/WIC/ACM Conference on Web Intelligence, 2011.
[12] Sarwar, B., Karypis, G., Konstan, J., and Reidl, J. 2001. Item-based collaborative filtering recommendation algorithms. In WWW’01: Proceedings of 10th International Conference on World Wide Web, pages 285–295.
[13] Schroder, G., Thiele, M. and Lehner, W. 2011. Setting Goals and Choosing Metrics for Recommender System Evaluation. UCERSTI 2 -RECSYS 2011
[14] Su, X., and Khoshgoftaar, T.M. 2009. A survey of collaborative filtering techniques. In Advances in Artificial Intelligence, 2009.
[15] Takács, G., Pilászy, I., Németh, B., Tikk, D. 2009. Scalable Collaborative Filtering Approaches for Large Recommender Systems. Journal of Machine Learning Research 10: 623-656 2009.
[16] Tan, T.F. and Netessine, S. 2011, Is Tom Cruise Threatened? An Empirical Study of the Impact of Product Variety on Demand Concentration. ICIS 2011.
14

Using Crowdsourcing to Compare DocumentRecommendation Strategies for Conversations
Maryam HabibiIdiap Research Institute and EPFL
Rue Marconi 19, CP 5921920 Martigny, Switzerland
Andrei Popescu-BelisIdiap Research InstituteRue Marconi 19, CP 592
1920 Martigny, [email protected]
ABSTRACTThis paper explores a crowdsourcing approach to the evalua-tion of a document recommender system intended for use inmeetings. The system uses words from the conversation toperform just-in-time document retrieval. We compare sev-eral versions of the system, including the use of keywords,retrieval using semantic similarity, and the possibility foruser initiative. The system’s results are submitted for com-parative evaluations to workers recruited via a crowdsour-cing platform, Amazon’s Mechanical Turk. We introducea new method, Pearson Correlation Coefficient-InformationEntropy (PCC-H), to abstract over the quality of the work-ers’ judgments and produce system-level scores. We measurethe workers’ reliability by the inter-rater agreement of eachof them against the others, and use entropy to weight thedifficulty of each comparison task. The proposed evaluationmethod is shown to be reliable, and the results show thatadding user initiative improves the relevance of recommen-dations.
Categories and Subject DescriptorsH.3.3 [Information Storage and Retrieval]: InformationSearch and Retrieval—Query formulation, Retrieval models;H.3.4 [Information Storage and Retrieval]: Systemsand Software—Performance evaluation
General TermsEvaluation, Uncertainty, Reliability, Metric
KeywordsDocument recommender system, user initiative, crowdsourc-ing, Amazon Mechanical Turk, comparative evaluation
1. INTRODUCTIONA document recommender system for conversations pro-
vides suggestions for potentially relevant documents within
Permission to make digital or hard copies of all or part of this work forpersonal or classroom use is granted without fee provided that copies arenot made or distributed for profit or commercial advantage and that copiesbear this notice and the full citation on the first page. To copy otherwise, torepublish, to post on servers or to redistribute to lists, requires prior specificpermission and/or a fee.Copyright is held by the author/owner(s). Workshop on RecommendationUtility Evaluation: Beyond RMSE (RUE 2012), held in conjunction withACM RecSys 2012, September 9, 2012, Dublin, Ireland..
a conversation, such as a business meeting. Used as a vir-tual secretary, the system constantly retrieves documentsthat are related to the words of the conversation, using au-tomatic speech recognition, but users could also be allowedto make explicit queries. Such a system builds upon pre-vious approaches known as implicit queries, just-in-time re-trieval, or zero query terms, which were recently confirmedas a promising research avenue [1].
Evaluating the relevance of recommendations produced bysuch a system is a challenging task. Evaluation in use re-quires the full deployment of the system and the setup ofnumerous evaluation sessions with realistic meetings. Thatis why alternative solutions based on simulations are impor-tant to find. In this paper, we propose to run the documentrecommender system over a corpus of conversations and touse crowdsourcing to compare the relevance of results in var-ious configurations of the system.
A crowdsourcing platform, here Amazon’s Mechanical Turk,is helpful for several reasons. First, we can evaluate a largeamount of data in a fast and inexpensive manner. Second,workers are sampled from the general public, which mightrepresent a more realistic user model than the system de-velopers, and have no contact with each other. However, inorder to use workers’ judgments for relevance evaluation, wehave to circumvent the difficulties of measuring the qualityof their evaluations, and factor out the biases of individualcontributions.
We will define an evaluation protocol using crowdsourcing,which estimates the quality of the workers’ judgments bypredicting task difficulty and workers’ reliability, even if noground truth to validate the judgments is available. This ap-proach, named Pearson Correlation Coefficient-InformationEntropy (PCC-H), is inspired by previous studies of inter-rater agreement as well as by information theory.
This paper is organized as follows. Section 2 describesthe document recommender system and the different ver-sions which will be compared. Section 3 reviews previousresearch on measuring the quality of workers’ judgments forrelevance evaluation and labeling tasks using crowdsourcing.Section 4 presents our design of the evaluation micro-tasks– “Human Intelligence Tasks” for the Amazon’s MechanicalTurk. In Section 5, the proposed PCC-H method for measur-ing the quality of judgments is explained. Section 6 presentsthe results of our evaluation experiments, which on the onehand validate the proposed method, and on the other handindicate the comparative relevance of the different versionsof the recommender system.
15

2. OUTLINE OF THE DOCUMENTRECOMMENDER SYSTEM
The document recommender system under study is theAutomatic Content Linking Device (ACLD [15, 16]), whichuses real-time automatic speech recognition [8] to extractwords from a conversation in a group meeting. The ACLDfilters and aggregates the words to prepare queries at regu-lar time intervals. The queries can be addressed to a lo-cal database of meeting-related documents, including alsotranscripts of past meetings if available, but also to a websearch engine. The results are then displayed in an unobtru-sive manner to the meeting participants, which can consultthem if they find them relevant and purposeful.
Since it is difficult to assess the utility of recommendeddocuments from an absolute perspective, we aim instead atcomparing variants of the ACLD, in order to assess the im-provement (or lack thereof) due to various designs. Here, wewill compare four different approaches to the recommenda-tion problem – which is in all cases a cold-start problem, aswe don’t assume knowledge about participants. Rather, in apure content-based manner, the ACLD simply aims to findthe closest documents to a given stretch of conversation.
The four compared versions are the following ones. Two“standard”versions as in [15] differ by the filtering procedurefor the conversation words. One of them (noted AW) usesall the words (except stop words) spoken by users during aspecific period (typically, 15 s) to retrieve related documents.The other one (noted KW) filters the words, keeping onlykeywords from a pre-defined list related to the topic of themeeting.
Two other methods depart from the initial system. Oneof them implements semantic search (noted SS [16]), whichuses a graph-based semantic relatedness measure to per-form retrieval. The most recent version allows user initiative(noted UI), that is, it can answer explicit queries addressedby users to the system, with results replacing spontaneousrecommendations for one time period. These are processedby the same ASR component, with participants using a spe-cific name for the system (“John”) to solve the addressingproblem.
In the evaluation experiments presented here, we only usehuman transcriptions of meetings, to focus on the evalu-ation of the retrieval strategy itself. We use one meeting(ES2008b) from the AMI Meeting Corpus [6] in which thedesign of a new remote control for a TV set is discussed.The explicit users’ requests for the UI version are simulatedby modifying the transcript at 24 different locations wherewe believe that users are likely to ask explicit queries – amore principled approach for this simulation is currently un-der study. We restrict the search to the Wikipedia website,mainly because the semantic search system is adapted tothis data, using a local copy of it (WEX) that is semanti-cally indexed. Wikipedia is one of the most popular generalreference works on the Internet, and recommendations overit are clearly of high potential interest. But alternatively,all our systems (except the semantic one) could also be runwith non-restricted web searches via Google, or limited toother web domains or websites.
The 24 fragments of the meeting containing the explicitqueries are submitted for comparison. That is, we want toknow which of the results displayed by the various versionsat the moment following the explicit query are considered
most relevant by external judges. As the method allowsonly binary comparisons, as we will now describe, we willcompare UI with the AW and KW versions, and then SSwith KW.
3. RELATED WORKRelevance evaluation is a difficult task because it is subjec-
tive and expensive to be performed. Two well-known meth-ods for relevance evaluation are the use of a click-data cor-pus, or the use of human experts [18]. However, in our case,producing click data or hiring professional workers for rele-vance evaluation would both be overly expensive. Moreover,it is not clear that evaluation results provided by a narrowrange of experts would be generalizable to a broader rangeof end users. In contrast, crowdsourcing, or peer collabora-tive annotation, is relatively easy to prototype and to testexperimentally, and provides a cheap and fast approach toexplicit evaluation. However, it is necessary to consider someproblems which are associated to this approach, mainly thereliability of the workers’ judgments (including spammers)and the intrinsic knowledge of the workers [3].
Recently, many studies have considered the effect of thetask design on relevance evaluation, and proposed designsolutions to decrease time and cost of evaluation and to in-crease the accuracy of results. In [9], several human factorsare considered: query design, terminology and pay, withtheir impact on cost, time and accuracy of annotations.To collect proper results, the effect of user interface guide-lines, inter-rater agreement metrics and justification analysiswere examined [2], showing e.g. that asking workers to writea short explanation in exchange of a bonus is an efficientmethod for detecting spammers. In addition, in [11], dif-ferent batches of tasks were designed to measure the effectof pay, required effort and worker qualifications on the ac-curacy of resulting labels. Another paper [13] has studiedhow the distribution of correct answers in the training dataaffects worker responses, and suggested to use a uniformdistribution to avoid biases from unethical workers.
The Technique for Evaluating Relevance by Crowdsourc-ing (TERC, see [4]) emphasizes the importance of qualifica-tion control, e.g. by creating qualification tests that must bepassed before performing the actual task. However, anotherstudy [2] showed that workers may still perform tasks ran-domly even after passing qualification tests. Therefore, itis important to perform partial validation of each worker’stasks, and weight the judgments of several workers to pro-duce aggregate scores [4].
Several other studies have focused on Amazon’s Mechan-ical Turk crowdsourcing platform and have proposed tech-niques to measure the quality of workers’ judgments whenthere is no ground truth to verify them directly [17, 19, 7,10, 12]. For instance, in [5], the quality of judgments fora labeling task is measured using the inter-rater agreementand majority voting. Expectation maximization (EM) hassometimes been used to estimate true labels in the absenceof ground truth, e.g. in [17] for an image labeling task. Inorder to improve EM-based estimation of the reliability ofworkers, the confidence of workers in each of their judg-ments has been used in [7] as an additional feature – thetask being dominance level estimation for participants in aconversation. As the performance of the EM algorithm isnot guaranteed, a new method [10] was introduced to esti-mate reliability based on low-rank matrix approximation.
16

All of the above-mentioned studies assume that tasks sharethe same level of difficulty. To model both task difficultyand user reliability, an EM-based method named GLAD wasproposed by [19] for an image labeling task. However, thismethod is sensitive to the initialization value, hence a goodestimation of labels requires a small amount of data withground truth annotation [12].
4. SETUP OF THE EXPERIMENTAmazon’s Mechanical Turk (AMT) is a crowdsourcing
platform which gives access to a vast pool of online work-ers paid by requesters to complete human intelligence tasks(HITs). Once designed and published, registered workersthat fulfill the requesters’ selection criteria are invited byAMT service to work on HITs in exchange for a small amountof money per HIT [3].
As it is difficult to find an absolute relevance score foreach version of the ACLD recommender system, we onlyaim for comparative relevance evaluation between versions.For each pair of versions, a batch of HITs was designed withtheir results. Each HIT (see example in Fig. 1) contains afragment of conversation transcript with the two lists of doc-ument recommendations to be compared. Only the first sixrecommendations are kept for each version. The lists fromthe two compared versions are placed in random positions(first or second) across HITs, to avoid biases from a constantposition.
We experimented with two different HIT designs. Thefirst one offers evaluators a binary choice: either the first listis considered more relevant than the second, or vice-versa.In other words, workers are obliged to express a preferencefor one of the two recommendation sets. This encourages de-cisions, but of course may be inappropriate when the two an-swers are of comparable quality, though this may be evenedout when averaging over workers. The second design givesworkers four choices (as in Figure 1): in addition to the pre-vious two options, they can indicate either that both listsseem equally relevant, or equally irrelevant. In both designs,workers must select exactly one option.
To assign a value to each worker’s judgment, a binary cod-ing scheme will be used in the computations below, assigninga value of 1 to the selected option and 0 to all others. Therelevance value RV of each recommendation list for a meet-ing fragment is computed by giving a weight to each workerjudgment and averaging them. The Percentage of RelevanceValue, noted PRV , shows the relevance value of each com-pared system, and is computed by assigning a weight to eachpart of the meeting and averaging the relevance values RVfor all meeting fragments.
There are 24 meeting fragments, hence 24 HITs in eachbatch for comparing pairs of systems, for UI vs. AW andUI vs. KW. As user queries are not needed for comparingSS vs. KW, we designed 36 HITs, with 30-second fragmentsfor each. There are 10 workers per HIT, so there are 240total assignments for UI-vs-KW and for UI-vs-AW (with a2-choice and 4-choice design for each), and 360 for SS-KW.As workers are paid 0.02 USD per HIT, the cost for the fiveseparate experiments was 33 USD, with an apparent averagehourly rate of 1.60 USD. The average time per assignmentis almost 50 seconds. All five tasks took only 17 hours to beperformed by workers via AMT. For qualification control weallow workers with greater than 95% approval rate or withmore than 1000 approved HITs.
5. THE PCC-H METHODMajority voting is frequently used to aggregate multiple
sources of comparative relevance evaluation. However, thisassumes that all HITs share the same difficulty and all theworkers are equally reliable. We will take here into accountthe task difficulty Wq and the workers’ reliability rw, as itwas shown that they have a significant impact on the qual-ity of the aggregated judgments. We thus introduce a newcomputation method called PCC-H, for Pearson CorrelationCoefficient-Information Entropy.
5.1 Estimating Worker ReliabilityThe PCC-H method computes the Wq and rw values in
two steps. In a first step, PCC-H estimates the reliabilityof each worker rw based on the Pearson correlation of eachworker’s judgment with the average of all the other workersjudgments (see Eq. 1).
rw =
∑Aa=1
∑Qq=1(Xqwa − ¯Xwa)(Yqa − Ya)
(Q− 1)SXwaSYa
(1)
In Equation 1, Q is number of meeting fragments, Xwqa
is the value that worker w assigned to option a of fragmentq, Xwqa has value 1 if that option a is selected by workerw, otherwise it is 0. Xwa and SXwa are the expected valueand standard deviation of variable Xwqa respectively. Yqa
is the average value which all other workers assign to theoption a of fragment q. Ya and SYa are the expected valueand standard deviation of variable Yqa.
The value of rw computed above is used as a weight forcomputing RVqa, the relevance value of option a of eachfragment q, according to Eq. 2 below:
RVqa =
∑Ww=1 rwXwqa∑W
w=1 rw(2)
For HIT designs with two options, RVqa shows the rel-evance value of each answer list a. However, for the fouroption HIT designs, RVql for each answer list l is formu-lated as Eq. 3 below:
RVql = RVql +RVqb
2− RVqn
2(3)
In this equation, half of the relevance value of the casein which both lists are relevant RVqb is added as a reward,and half of the relevance value of the case in which bothlists are irrelevant RVqn is subtracted as a penalty from therelevance value of each answer list RVql.
5.2 Estimating Task DifficultyIn a second step, PCC-H considers the task difficulty for
each fragment of the meeting. The goal is to reduce the ef-fect of some fragments of the meeting, in which there is anuncertainty in the workers judgments, e.g. because there areno relevant search results in Wikipedia for the current frag-ment. To lessen the effect of uncertainty in our judgments,the entropy of answers for each fragment of the meeting iscomputed and a function of it is used as a weight for eachfragment. This weight is used for computing the percentageof relevance value PRV . Entropy, weight and PRV are de-fined in Eqs. 4–6, where A is the number of options, and Hq
and Wq are the entropy and weight of fragment q.
17

Figure 1: Snapshot of a 4-choice HIT: workers read the conversation transcript, examine the two answerlists (with recommended documents for the respective conversation fragment) and select one of the fourcomparative choices (#1 better than #2, #2 better than #1, both equally good, both equally poor). A shortcomment can be added.
Hq = −A∑
a=1
RVqalog(RVqa) (4)
Wq = 1 −Hq (5)
PRV a =
∑Qq=1 WqRVqa∑Q
q=1 Wq
(6)
6. RESULTS OF THE EXPERIMENTSTwo sets of experiments were performed. First, we at-
tempt to validate the PCC-H method. Then, we apply thePCC-H method to compute PRV for each answer list to con-clude which version of the system outperforms the others.
In order to make an initial validation of the workers judg-ments, we compare the judgments of individual workers withthose of an expert. For each worker, the number of frag-ments for which the answer is the same as the expert’s an-swer is counted, and the total is divided by the numberof fragments to compute accuracy. Then we compare thisvalue with rw, which is estimated as the reliability mea-surement for each worker’s judgment. The percentage ofagreement between each worker vs. the expert ew and therw for each worker for one of the batches is shown in Table 1,with an overall agreement between these two values for eachworker. In other words, workers who have more similaritywith our expert also have more inter-rater agreement withother workers. Since in the general case there is no groundtruth (expert) to verify workers judgments, we rely on theinter-rater agreement for the other experiments.
Firstly, equal weights for all the user evaluations and frag-ments are assigned to compute PRV s for two answer lists ofour experiments, which are shown in Table 2.
Table 1: Percentage of agreement between a singleworker and the expert, and a single worker and theother workers, for the KW system and 4-choice HITs
Worker # ew rw
1 0.66 0.812 0.54 0.653 0.54 0.644 0.50 0.715 0.50 0.606 0.50 0.357 0.41 0.248 0.39 0.339 0.36 0.3410 0.31 0.12
In this approach, it is assumed that all the workers arereliable and all the fragments share the same difficulty. Tohandle workers’ reliability, we consider workers with lowerrw as outliers. One approach is to remove all the outliers.For instance, the four workers with lowest rw are consideredoutliers and are deleted, and the same weight is given to theremaining six workers. The result of comparative evaluationbased on removing outliers is shown in Table 3.
In the computation above, an arbitrary border was definedbetween outliers and other workers as a decision boundaryfor removing outliers. However, instead of deleting work-ers with lower rw, which might still have potentially usefulinsights on relevance, it is rational to give a weight to allworkers’ judgments based on a confidence value. The PRVfor each answer list of four experiments based on assigningweight rw to each worker’s evaluation, and equal weights toall meeting fragments are shown in Table 4.
18

Table 2: PRV s for AW-vs-UI and KW-vs-UI pairsAll workers andfragments withequal weights
2-choiceHITs
4-choiceHITs
AW-vs-UIPRV AW 30% 26%PRV UI 70% 74%
KW-vs-UIPRV KW 45% 35%PRV UI 55% 65%
Table 3: PRV s for AW-vs-UI and KW-vs-UI pairsSix workers andfragments withequal weights
2-choiceHITs
4-choiceHITs
AW-vs-UIPRV AW 24% 13%PRV UI 76% 86%
KW-vs-UIPRV KW 46% 33%PRV UI 54% 67%
In order to show that our method is stable on differentHIT designs, we used two different HIT designs for eachpair as mentioned in Section 4. We show that PRV con-verges to the same value for each pair with different HITdesigns. As observed in Table 4, PRV s of AW-vs-UI pairare not quite similar for two different HIT designs, althoughthe answer lists are the same. In fact, we observed that, inseveral cases, there was no strong agreement among workersto decide which answer list is more relevant to that meetingfragment, and we consider that these are “difficult” frag-ments. Since the source of uncertainty is undefined, we canreduce the effect of that fragment on the comparison by giv-ing a weight to each fragment in proportion of the difficultyof assigning RVql. The PRV values thus obtained for all ex-periments are represented in Table 5. As shown there, thePRV s of AW-vs-UI pair are now very similar for 2-HIT and4-HIT tasks. Moreover, the difference between the systemversions is emphasized, which indicates that the sensitivityof the comparison method has increased.
Moreover, we compare the PCC-H method with the ma-jority voting method and the GLAD method (Generativemodel of Labels, Abilities, and Difficulties [19]) for estimat-ing comparative relevance value through considering taskdifficulty and worker reliability parameters. We run theGLAD algorithm with the same initial values for all fourexperiments. The PRV s which are computed by majorityvoting, GLAD and PCC-H are shown in Table 6.
As shown in Table 6, PRV s which are computed by thePCC-H method for both HIT designs are very close to thoseof GLAD for the 4-choice HIT design. Moreover, the PRVvalues obtained by the PCC-H method for the two differentHIT designs are very similar, which is less the case for ma-jority voting and GLAD. This means that PCC-H methodis able to calculate the PRV s independent of the exact HITdesign. Moreover, the PRV values calculated using PCC-Hare more robust since the proposed method is not dependenton initialization values, as GLAD is. Therefore, using PCC-H for measuring the reliability of workers judgments is alsoan appropriate method for qualification control of workersfrom crowdsourcing platforms.
The proposed method is also applied for comparative eval-uation of SS-vs-KW search results (semantic search vs. key-
Table 4: PRV s for AW-vs-UI and KW-vs-UI pairsAll workers withdifferent weightsand parts withequal weights
2 choicesHIT design
4 choicesHIT design
AW-vs-UIPRV AW 24% 18%PRV UI 76% 82%
KW-vs-UIPRV KW 33% 34%PRV UI 67% 66%
Table 5: PRV s for AW-vs-UI and KW-vs-UI pairsAll workers withdifferent weightsand fragmentswith differentweights(PCC-H method)
2-choiceHITs
4-choiceHITs
AW-vs-UIPRV AW 19% 15%PRV UI 81% 85%
KW-vs-UIPRV KW 23% 26%PRV UI 77% 74%
word-based search). The PRV s are calculated by three dif-ferent methods as shown in Table 7. The first method is themajority voting method which considers all the workers andfragments with the same weight. The second method assignsweights computed by PCC-H method to measure PRV s, thethird one is the GLAD method. Therefore the SS versionoutperforms the KW version according to all three scores.
7. CONCLUSION AND PERSPECTIVESIn all the evaluation steps, the UI system appeared to pro-
duce more relevant recommendations than AW or KW. Us-ing KW instead of AW improved PRV by 10 percent. Thismeans that using UI, i.e. when users ask explicit queries inconversation, improves over AW or KW versions, i.e. withspontaneous recommendations. Nevertheless, KW can beused as an assistant which suggests documents based on thecontext of the meeting along with the UI version, that is,spontaneous recommendations can be made when no userinitiates a search. Moreover, the SS version works betterthan the KW version, which shows the advantage of seman-tic search.
As for the evaluation method, PCC-H outperformed theGLAD method proposed earlier for estimating task difficultyand reliability of workers in the absence of ground truth.Based on the evaluation results, the PCC-H method is ac-ceptable for qualification control of AMT workers or judg-ments, because it provides a more stable PRV score acrossdifferent HIT designs. Moreover, PCC-H does not requireany initialization.
The comparative nature of PCC-H imposes some restric-tions on the evaluations that can be carried out. For in-stance, if N versions must be compared, this calls in theoryfor N ∗ (N − 1)/2 comparisons, which is clearly impracti-cal when N grows. This can be solved if a priori knowl-edge about the quality of the systems is available, to avoidredundant comparisons. Moreover, an approach to reducethe number of pairwise comparisons required from humanraters proposed in [14] could be ported to our context. For
19

Table 6: PRV s computed by the majority voting, theGLAD, and the PCC-H methods
Methods Majority voting, GLAD, PCC-Hpairs 2-choice HITs 4-choice HITs
AW-vs-UIPRV AW 30%, 23%, 19% 26%, 13%, 15%PRV UI 70%, 77%, 81% 74%, 87%, 85%
KW-vs-UIPRV KW 45%, 47%, 23% 35%, 23%, 26%PRV UI 55%, 53%, 77% 65%, 77%, 74%
Table 7: PRV s for SS-vs-KWMethod Majority voting, GLAD, PCC-H
pair 4-choice HITs
SS-vs-KWPRV SS 88%, 88%, 93%
PRV KW 12%, 12%, 7%
progress evaluation, a new version must be compared withthe best performing previous version, looking for measur-able improvement, in which case PCC-H fully answers theevaluation needs.
There are instances in which the search results of bothversions are irrelevant. The goal of future work will be toreduce the number of such uncertain instances, to deal withambiguous questions, and to improve the processing of user-directed queries by recognizing the context of the conver-sation. Another experiment should improve the design ofsimulated user queries, in order to make them more realis-tic.
8. ACKNOWLEDGMENTSThe authors are grateful to the Swiss National Science
Foundation for its financial support under the IM2 NCCRon Interactive Multimodal Information Management (seewww.im2.ch).
9. REFERENCES[1] J. Allan, B. Croft, A. Moffat, and M. Sanderson.
Frontiers, challenges and opportunities for informationretrieval: Report from SWIRL 2012. SIGIR Forum,46(1):2–32, 2012.
[2] O. Alonso and R. A. Baeza-Yates. Design andimplementation of relevance assessments usingcrowdsourcing. In Proceedings of the EuropeanConference on Information Retrieval (ECIR), pages153–164, 2011.
[3] O. Alonso and M. Lease. Crowdsourcing 101: Puttingthe “wisdom of the crowd” to work for you. WSDMTutorial, 2011.
[4] O. Alonso, D. Rose, and B. Stewart. Crowdsourcingfor relevance evaluation. SIGIR Forum, 42:9–15, 2008.
[5] J. Carletta. Assessing agreement on classificationtasks: The kappa statistic. Computational Linguistics,22:249–254, 1996.
[6] J. Carletta. Unleashing the killer corpus: experiencesin creating the multi-everything AMI Meeting Corpus.Language Resources and Evaluation Journal,41(2):181–190, 2007.
[7] G. Chittaranjan, O. Aran, and D. Gatica-Perez.Exploiting observers’ judgments for nonverbal groupinteraction analysis. In Proceedings of the IEEE
Conference on Automatic Face and GestureRecognition (FG), 2011.
[8] P. N. Garner, J. Dines, T. Hain, A. El Hannani,M. Karafiat, D. Korchagin, M. Lincoln, V. Wan, andL. Zhang. Real-time ASR from meetings. InProceedings of Interspeech, pages 2119–2122, 2009.
[9] C. Grady and M. Lease. Crowdsourcing documentrelevance assessment with mechanical turk. InProceedings of the NAACL-HLT 2010 Workshop onCreating Speech and Language Data with Amazon’sMechanical Turk, pages 172–179, 2010.
[10] D. R. Karger, S. Oh, and D. Shah. Budget-optimalcrowdsourcing using lowrank matrix approximations.In Proceedings of the Allerton Conference onCommunication, Control and Computing, 2011.
[11] G. Kazai. In search of quality in crowdsourcing forsearch engine evaluation. In Proceedings of theEuropean Conference on Information Retrieval(ECIR), pages 165–176, 2011.
[12] F. K. Khattak and A. Salleb-Aouissi. Quality controlof crowd labeling through expert evaluation. InProceedings of the NIPS 2nd Workshop onComputational Social Science and the Wisdom ofCrowds, 2011.
[13] J. Le, A. Edmonds, V. Hester, and L. Biewald.Ensuring quality in crowdsourced search relevanceevaluation : The effects of training questiondistribution. In Proceedings of the SIGIR 2010Workshop on Crowdsourcing for Search Evaluation,pages 17–20, 2010.
[14] X. Llora, K. Sastry, D.E. Goldberg, A. Gupta, andL. Lakshmi. Combating user fatigue in iGAs: Partialordering, support vector machines, and syntheticfitness. In Proceedings of the Conference on Geneticand Evolutionary Computation (GECCO ’05), pages1363–1370, 2005.
[15] A. Popescu-Belis, E. Boertjes, J. Kilgour, P. Poller,S. Castronovo, T. Wilson, A. Jaimes, and J. Carletta.The AMIDA automatic content linking device:Just-in-time document retrieval in meetings. InProceedings of Machine Learning for MultimodalInteraction (MLMI), pages 272–283, 2008.
[16] A. Popescu-Belis, M. Yazdani, A. Nanchen, andP. Garner. A speech-based just-in-time retrievalsystem using semantic search. In Proceedings of the49th Annual Meeting of the ACL, pages 80–85, 2011.
[17] P. Smyth, U. M. Fayyad, M. C. Burl, P. Perona, andP. Baldi. Inferring ground truth from subjectivelabeling of venus images. In Advances in NeuralInformation Processing Systems (NIPS), pages1085–1092, 1994.
[18] P. Thomas and D. Hawking. Evaluation by comparingresult sets in context. In Proceedings of the 15th ACMInternational Conference on Information andKnowledge Management (CIKM), pages 94–101, 2006.
[19] J. Whitehill, P. Ruvolo, T.-F. Wu, J. Bergsma, andJ. Movellan. Whose vote should count more: Optimalintegration of labels from labelers of unknownexpertise. In Advances in Neural InformationProcessing Systems (NIPS), pages 2035–2043. 2009.
20

Recommender Systems Evaluation: A 3D Benchmark
Alan SaidTU Berlin
Domonkos TikkGravity R&D
Yue ShiTU-Delft
Martha LarsonTU-Delft
Klara StumpfGravity R&D
Paolo CremonesiPolitecnico di Milano
ABSTRACTRecommender systems add value to vast content resourcesby matching users with items of interest. In recent years,immense progress has been made in recommendation tech-niques. The evaluation of these has however not been matchedand is threatening to impede the further development of rec-ommender systems. In this paper we propose an approachthat addresses this impasse by formulating a novel evalua-tion concept adopting aspects from recommender systemsresearch and industry. Our model can express the qualityof a recommender algorithm from three perspectives, theend consumer (user), the service provider and the vendor(business and technique for both). We review current bench-marking activities and point out their shortcomings, whichare addressed by our model. We also explain how our 3Dbenchmarking framework would apply to a specific use case.
Categories and Subject DescriptorsH.3.3 [Information Storage and Retrieval]: InformationSearch and Retrieval - Retrieval models
1. INTRODUCTION & MOTIVATIONRecommender systems identify items suitable for specific
users in large content collections. Despite recent commer-cial and research efforts, a systematic evaluation model thataddresses and considers all aspects and participants of therecommender system is still missing. In this paper we proposea 3D Recommender System Benchmarking Model that coversall dimensions that impact the effectiveness of recommendersystems in real-world settings. The concept builds on a studyof benchmarking settings from research and industry andprovides a common comparison of recommender systems,independent of setting, data and purpose. Our benchmarkingconcept captures three evaluation aspects which are sharedin all recommender systems, independent of whether theyare research systems or industrial products. As three mainevaluation dimensions we identify user requirements, businessrequirements and technological constraints, each representedby a set of qualities which ensure the general applicability ofthese procedures. For each particular recommendation prob-lem, the instantiation and relevance of these requirementsshould be specified.
The motivation behind this framework is the growing im-portance of recommender systems. Users cannot be assumedto have the necessary overview to specify their information
Copyright is held by the author/owner(s).Workshop on Recommendation Utility Evaluation: Beyond RMSE (RUE2012), held in conjunction with ACM RecSys 2012 September 9, 2012,Dublin, Ireland
needs in vast content collections. However, with a varietyof data and the recommendation task, the comparison ofalgorithms, approaches and general concepts becomes infea-sible due to the inherent differences in requirements, designchoices, etc. This calls for a comprehensive benchmarkingframework that sets data- and task-specific requirementsdriven by particular real-world applications.
The benefits of benchmarking. Benchmarks formulatestandardized tasks making it possible to compare the perfor-mance of algorithms. They have been highly successful in theareas of information retrieval, e.g. Text Retrieval Conference(TREC) [12] and the multimedia retrieval ImageCLEF [7],TRECVid [9] and MediaEval [6]. Benchmarks yield two typesof benefits; (1) they serve to support the development of newtechnologies in the research community [9,11] and (2) theycreate economic impact by bringing research closer to themarket [8].
Existing recommendation benchmarks. Today’sbenchmarks are limited by their simplified views of users andof data. The problem setting of the Netflix Prize1, ground-breaking at its time, was focused on a single functional re-quirement : the qualitative assessment of recommendationwas simplified to the root mean squared error of predictedratings. Its simplified view treated users as needing no fur-ther output from the recommender system than a ratingon individual items. The data set was equally restricted touser ratings, additional information available in a real-worldrecommender system environment were not considered. Fur-thermore, the Prize did not take non-functional requirementsinto account, which arise from business goals and technicalparameters of the recommendation service, though aspectsas scalability, reactivity, robustness and adaptability are keyfor the productive operation of recommender systems.
The series of context-aware movie recommendation(CAMRa) challenges explored the usefulness of contextualdata in recommendations. The 2010 challenge2 provided spe-cial features on the movie mood, movie location, and intendedaudience (Moviepilot track), as well as social relationship be-tween users and user activities on a movie-related social site(Filmtipset track). The time of the recommendation was alsoconsidered as context (Week track). Although the challengesexpanded the data sources used, the evaluation translatedreal-world user needs into the classification accuracy metricsto evaluate the system in the contest, and non-functionalrequirements of the solutions were not investigated.
The limitations of the Netflix Prize and CAMRa series arecharacteristics of currently existing benchmarks and datasets. The concept presented in this paper approaches this
1http://www.netflixprize.com
2http://www.dai-labor.de/camra2010/challenge/
21

Bus
ines
s M
odel
s
User Requirements
Tech
nical
Constr
aints
Figure 1: The three proposed evaluation axes.
challenge by placing central focus on real-world user needs;large, heterogeneous, multi-source data sets and evaluatingboth functional (quality-related) and non-functional (tech-nical and business goals-related) requirements.
2. 3D RECOMMENDATION EVALUATIONIn order to extend the state of the art of evaluation, we
propose a concept for evaluation metrics that incorporates theneeds from all perspectives in the recommendation spectrum.The concept defines a set of benchmarking techniques thatselect the correct combination of (i) data sets, (ii) evaluationmethods and (iii) metrics according to a three dimensionalrequirement space: business models, user requirements andtechnical constraints, see Fig. 1.
Business models allow a company to generate revenue.Different models lead to different requirements in terms ofthe expected value from a recommender system. For instance,in a pay-per-view video-on-demand business model, the goalof the recommender system is to increase sales to allow thecompany to maximize revenues. However, in subscriber-basedvideo-on-demand business models, the driving forces may beto get users to return to the service in the future (a typicalshowcase where recommender systems help [1]). Businessmodels may be influenced by the choice of the objectivefunction in the recommender algorithm; prediction-based orranking-based functions reflect different business metrics.
User requirements reflect users’ perspectives. Recom-menders are assets for user satisfaction and persuasion, i.e.,they try to influence a user’s attitude or behavior [4], theusability of the systems affect the user’s perception of the sys-tem. Recommendations may have different goals, e.g. reduceinformation overload, facilitate search, and find interestingitems increasing the quality and decreasing the time of thedecision-making process.
Technical constraints. Recommender systems in real-life must take into account a number of technical requirementsand constraints. These can be classified as data and systemconstraints, scalability and robustness requirements. Dataconstraints relate to the service architecture, e.g. satelliteTV lacks a return channel for feedback, hindering the useof collaborative filtering algorithms. System constraintsderive from hardware and/or software limitations, e.g. in amobile TV scenario, the processing power in the hand-helddevice is limited; excluding resource-heavy algorithms onthe client side. Scalability requirements derive from theneed of instant recommendations to all users on all items.These requirements are particularly strict in linear TV, whereviewers are used to quick responsiveness. Robustness re-quirements are needed to create good services, able to workin case of data or component failure in distributed systems.
3. EVALUATION SETTING
3.1 Current evaluation methodologiesExisting evaluation methods for recommender systems can
be classified into system-oriented evaluation, user-orientedevaluation or a combination of both [3].
In system-oriented evaluation (off-line) users are notinvolved in the evaluation, instead, a data set is partitionedinto training and test sets. Using the training set, data pointsin the test set are predicted. In user-oriented evaluation(on-line) feedback from users interacting with the system iscollected by explicit questions or implicit observing.
Competitions and challenges built around recommendersystems are mostly organized to find the most accurate mod-els. As described in Table 1, recommender systems are mostlyevaluated off-line and often, the business value of the tech-nologies is not examined. Even though the accuracy mayinfluence user satisfaction and revenue increase indirectly,there exists no way to evaluate the dimensions of user require-ments and business models. In most of the cases, the off-lineevaluation scheme is chosen. Algorithms are often evalu-ated by error, ranking or classification accuracy measures.Many challenges (e.g. Netflix Prize) use explicit ratings toprofile users, other recommender scenarios (e.g. item-2-itemrecommendation) are not addressed. Technical constraintsare uncommon in contests, the exception being the RecLabPrize3. If a certain method performs well on a data set, theintegrability in a real-world system is still not addressed.This deficiency is partially solved by online testing methods(as seen in CAMRa): recommender systems were tested in areal environment, but an objective metric to show the realapplicability of the tested system is missing. In the RecLabPrize, the evaluated metric is revenue increase generatedby the system. The organizers also specified non-functionalrequirements to be eligible for the semi-final (top 10 teams),but user requirements are not considered. These approachesall contain metrics and methods moving towards our 3Dmodel, but none of them provide a comprehensive model.
3.2 Currently existing metricsOn-line evaluation is the only technique able to measure
the true user satisfaction; conducting such evaluations ishowever time consuming, and cannot be generally applied,rather only to limited scenarios [2]. Contrary, off-line testinghas the advantage to be immediate, and easy to performon several data sets with multiple algorithms. The questionis whether differences between the off-line performance ofalgorithms can be carried over to differentiate their onlineperformance in various recommendation situations.
Classification metrics measure how well a system is ableto classify items correctly, e.g. precision and recall. Predic-tive metrics measure to what extent a system can predictratings of users. As rated items have an order, predictiveaccuracy metrics can be used to measure the item rankingability. Coverage metrics measure the percentage of itemsfor which the system can make recommendations [13]. Con-fidence metrics measure how certain the system is of theaccuracy of the recommendations. Additionally, many rec-ommender systems algorithms use learning rate metricsin order to gradually increase quality.
A recommender system can recommend accurate items,have good coverage and diversity and still not satisfy a user,if they are trivial [10]. The state-of-the-art of the evalua-tion metrics of recommendation reflects different recommen-dation tasks. Diversity, novelty, serendipity and user
3http://overstockreclabprize.com/
22
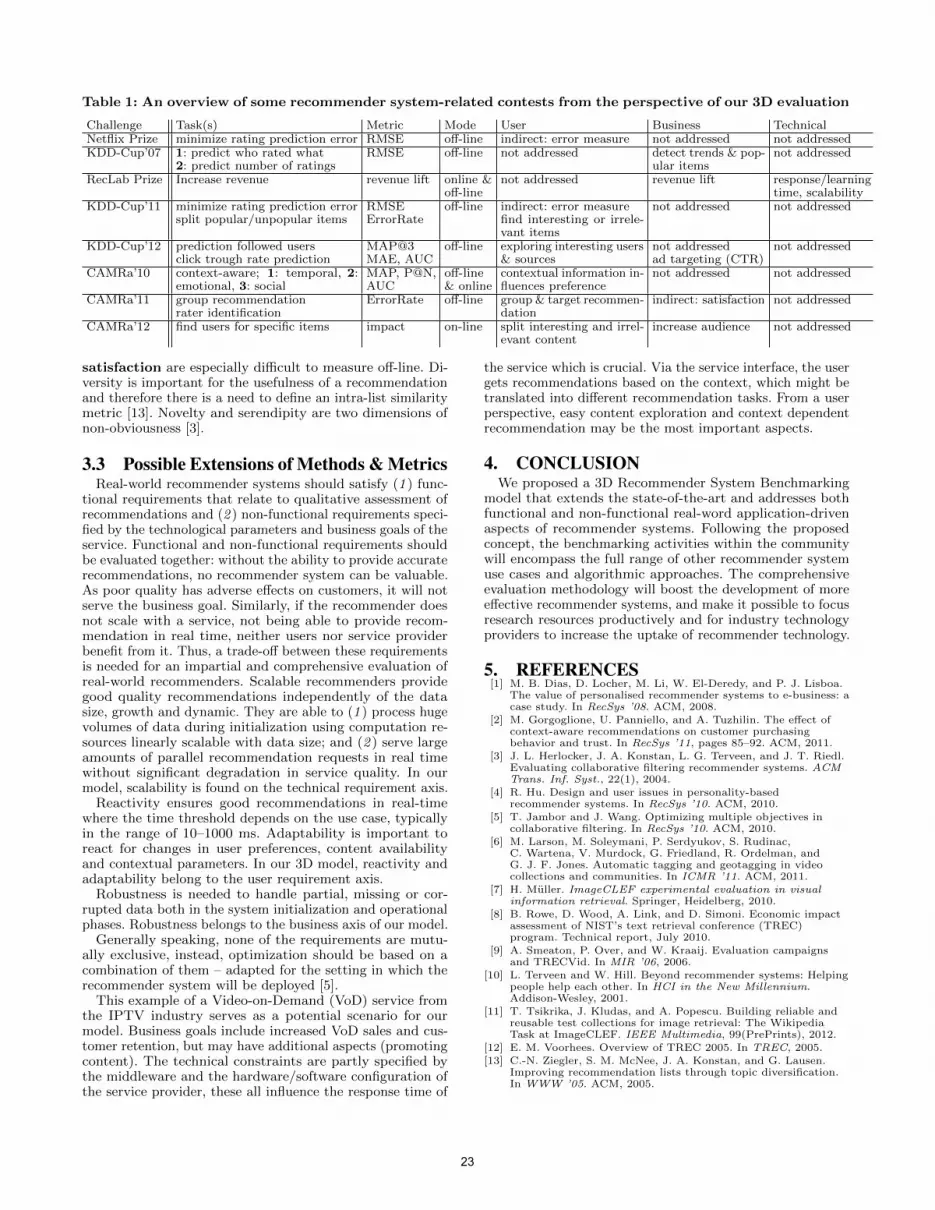
Table 1: An overview of some recommender system-related contests from the perspective of our 3D evaluation
Challenge Task(s) Metric Mode User Business TechnicalNetflix Prize minimize rating prediction error RMSE off-line indirect: error measure not addressed not addressedKDD-Cup’07 1: predict who rated what
2: predict number of ratingsRMSE off-line not addressed detect trends & pop-
ular itemsnot addressed
RecLab Prize Increase revenue revenue lift online &off-line
not addressed revenue lift response/learningtime, scalability
KDD-Cup’11 minimize rating prediction errorsplit popular/unpopular items
RMSEErrorRate
off-line indirect: error measurefind interesting or irrele-vant items
not addressed not addressed
KDD-Cup’12 prediction followed usersclick trough rate prediction
MAP@3MAE, AUC
off-line exploring interesting users& sources
not addressedad targeting (CTR)
not addressed
CAMRa’10 context-aware; 1: temporal, 2:emotional, 3: social
MAP, P@N,AUC
off-line& online
contextual information in-fluences preference
not addressed not addressed
CAMRa’11 group recommendationrater identification
ErrorRate off-line group & target recommen-dation
indirect: satisfaction not addressed
CAMRa’12 find users for specific items impact on-line split interesting and irrel-evant content
increase audience not addressed
satisfaction are especially difficult to measure off-line. Di-versity is important for the usefulness of a recommendationand therefore there is a need to define an intra-list similaritymetric [13]. Novelty and serendipity are two dimensions ofnon-obviousness [3].
3.3 Possible Extensions of Methods & MetricsReal-world recommender systems should satisfy (1 ) func-
tional requirements that relate to qualitative assessment ofrecommendations and (2 ) non-functional requirements speci-fied by the technological parameters and business goals of theservice. Functional and non-functional requirements shouldbe evaluated together: without the ability to provide accuraterecommendations, no recommender system can be valuable.As poor quality has adverse effects on customers, it will notserve the business goal. Similarly, if the recommender doesnot scale with a service, not being able to provide recom-mendation in real time, neither users nor service providerbenefit from it. Thus, a trade-off between these requirementsis needed for an impartial and comprehensive evaluation ofreal-world recommenders. Scalable recommenders providegood quality recommendations independently of the datasize, growth and dynamic. They are able to (1 ) process hugevolumes of data during initialization using computation re-sources linearly scalable with data size; and (2 ) serve largeamounts of parallel recommendation requests in real timewithout significant degradation in service quality. In ourmodel, scalability is found on the technical requirement axis.
Reactivity ensures good recommendations in real-timewhere the time threshold depends on the use case, typicallyin the range of 10–1000 ms. Adaptability is important toreact for changes in user preferences, content availabilityand contextual parameters. In our 3D model, reactivity andadaptability belong to the user requirement axis.
Robustness is needed to handle partial, missing or cor-rupted data both in the system initialization and operationalphases. Robustness belongs to the business axis of our model.
Generally speaking, none of the requirements are mutu-ally exclusive, instead, optimization should be based on acombination of them – adapted for the setting in which therecommender system will be deployed [5].
This example of a Video-on-Demand (VoD) service fromthe IPTV industry serves as a potential scenario for ourmodel. Business goals include increased VoD sales and cus-tomer retention, but may have additional aspects (promotingcontent). The technical constraints are partly specified bythe middleware and the hardware/software configuration ofthe service provider, these all influence the response time of
the service which is crucial. Via the service interface, the usergets recommendations based on the context, which might betranslated into different recommendation tasks. From a userperspective, easy content exploration and context dependentrecommendation may be the most important aspects.
4. CONCLUSIONWe proposed a 3D Recommender System Benchmarking
model that extends the state-of-the-art and addresses bothfunctional and non-functional real-word application-drivenaspects of recommender systems. Following the proposedconcept, the benchmarking activities within the communitywill encompass the full range of other recommender systemuse cases and algorithmic approaches. The comprehensiveevaluation methodology will boost the development of moreeffective recommender systems, and make it possible to focusresearch resources productively and for industry technologyproviders to increase the uptake of recommender technology.
5. REFERENCES[1] M. B. Dias, D. Locher, M. Li, W. El-Deredy, and P. J. Lisboa.
The value of personalised recommender systems to e-business: acase study. In RecSys ’08. ACM, 2008.
[2] M. Gorgoglione, U. Panniello, and A. Tuzhilin. The effect ofcontext-aware recommendations on customer purchasingbehavior and trust. In RecSys ’11, pages 85–92. ACM, 2011.
[3] J. L. Herlocker, J. A. Konstan, L. G. Terveen, and J. T. Riedl.Evaluating collaborative filtering recommender systems. ACMTrans. Inf. Syst., 22(1), 2004.
[4] R. Hu. Design and user issues in personality-basedrecommender systems. In RecSys ’10. ACM, 2010.
[5] T. Jambor and J. Wang. Optimizing multiple objectives incollaborative filtering. In RecSys ’10. ACM, 2010.
[6] M. Larson, M. Soleymani, P. Serdyukov, S. Rudinac,C. Wartena, V. Murdock, G. Friedland, R. Ordelman, andG. J. F. Jones. Automatic tagging and geotagging in videocollections and communities. In ICMR ’11. ACM, 2011.
[7] H. Muller. ImageCLEF experimental evaluation in visualinformation retrieval. Springer, Heidelberg, 2010.
[8] B. Rowe, D. Wood, A. Link, and D. Simoni. Economic impactassessment of NIST’s text retrieval conference (TREC)program. Technical report, July 2010.
[9] A. Smeaton, P. Over, and W. Kraaij. Evaluation campaignsand TRECVid. In MIR ’06, 2006.
[10] L. Terveen and W. Hill. Beyond recommender systems: Helpingpeople help each other. In HCI in the New Millennium.Addison-Wesley, 2001.
[11] T. Tsikrika, J. Kludas, and A. Popescu. Building reliable andreusable test collections for image retrieval: The WikipediaTask at ImageCLEF. IEEE Multimedia, 99(PrePrints), 2012.
[12] E. M. Voorhees. Overview of TREC 2005. In TREC, 2005.[13] C.-N. Ziegler, S. M. McNee, J. A. Konstan, and G. Lausen.
Improving recommendation lists through topic diversification.In WWW ’05. ACM, 2005.
23

On the use of Weighted Mean Absolute Error inRecommender Systems
S. Cleger-TamayoDpto. de Informática.
Universidad de Holguín, [email protected]
J.M. Fernández-Luna & J.F. HueteDpto. de Ciencias de la Computación e I.A.
CITIC – UGR Universidad de Granada, Spain{jmfluna,jhg}@decsai.ugr.es
ABSTRACTThe classical strategy to evaluate the performance of a Rec-ommender System is to measure the error in rating predic-tions. But when focusing on a particular dimension in arecommending process it is reasonable to assume that ev-ery prediction should not be treated equally, its importancedepends on the degree to which the predicted item matchesthe deemed dimension or feature. In this paper we shall ex-plore the use of weighted Mean Average Error (wMAE) asan alternative to capture and measure their effects on therecommendations. In order to illustrate our approach twodifferent dimensions are considered, one item-dependent andthe other that depends on the user preferences.
1. INTRODUCTIONSeveral algorithms based on different ideas and concepts
have been developed to compute recommendations and, asa consequence, several metrics can be used to measure theperformance of the system. In the last years, increasing ef-forts have been devoted to the research of RecommenderSystem (RS) evaluation. According to [2], “the decision onthe proper evaluation metric is often critical, as each met-ric may favor a different algorithm”. The selected metricdepends on the particular recommendation tasks to be an-alyzed. Two main tasks might be considered: the first one,with the objective of measuring the capability of a RS topredict the rating that a user should give to an unobserveditem, and the second one is related to the ability of an RSto rank a set of unobserved items, in such a way that thoseitems more relevant to the user have to be placed in toppositions of the ranking. Our interest in this paper is themeasurement of the capability of a system to predict userinterest in an unobserved item, so we focus on rating predic-tion.
For this purpose, two standard metrics [3, 2] have beentraditionally considered: the Mean Absolute Error (MAE)and the Root Mean Squared Error (RMSE). Both metricstry to measure which might be the expected error of the
Acknowledgements: This work was jointly supported by theSpanish Ministerio de Educación y Ciencia and Junta de Andalucía, underprojects TIN2011-28538-C02-02 and Excellence Project TIC-04526,respectively, as well as the Spanish AECID fellowship program.
Copyright is held by the author/owner(s). Workshop on RecommendationUtility Evaluation: Beyond RMSE (RUE 2012), held in conjunction withACM RecSys 2012. September 9, 2012, Dublin, Ireland. .
system, RMSE being more sensitive to the occasional largeerror: the squaring process gives higher weight to very largeerrors. A valuable property of both metrics is that they taketheir values in the same range as the error being estimated,so they can be easily understood by the users.
But, these metrics consider that the standard deviation ofthe error term is constant over all the predictions, i.e. eachprediction provides equally precise information about the er-ror variation. This assumption, however, does not hold, evenapproximately, in every recommending application. In thispaper we will focus on the weighted Mean Absolute Error,wMAE, as an alternative to measure the impact of a givenfeature in the recommendations1. Two are the main pur-poses for using this metric: On the one hand, as an enhancedevaluation tool for better assessing the RS performance withrespect to the goals of the application. For example, in thecase of recommending books or movies it could be possiblethat the accuracy of the predictions varies when focusing onpast or recent products. In this situation, it is not reason-able that every error were treated equally, so more stressshould be put in recent items. On the other hand, it canbe also useful as a diagnosis tool that, using a “magnifyinglens”, can help to identify those cases where an algorithm ishaving trouble with. For both purposes, different featuresshall be considered which might depend on the items, asfor example, in the case of a movie-based RS the genre, therelease date, price, etc. But also, the dimension might beuser-dependent considering, for example, the location of theuser, the users’ rating distribution, etc.
This metric has been widely used for evaluation of modelperformance in several fields as meteorology or economicforecasting [8]. But, few have been discussed about its usein the recommending field; isolately several papers use smalltweaks on error metrics in order to explore different aspectsof RS [5, 7]. Next section presents the weighted mean abso-lute error, illustrating its performance considering two differ-ent features, user and item-dependent, respectively. Lastlywe present the concluding remarks.
2. WEIGHTED MEAN ABSOLUTE ERRORThe objective of this paper is to study the use of a weight-
ing factor in the average error. In order to illustrate its func-tionality we will consider simple examples obtained usingfour different collaborative-based RS (using Mahout imple-mentations): i) Means, that predicts using the average rat-
1A similar reasoning can be used when considering squarederror, which yields to the weighted Mean Root Squared Er-ror, wRMSE.
24

ings for each user; ii) LM [1], following a nearest neighborsapproach; iii) SlopeOne [4], predicting based on the averagedifference between preferences and iv) SVD [6], based on amatrix factorization technique. The metric performance isshowed using an empirical evaluation based on the classicMovieLens 100K data set.
A weighting factor would indicate the subjective impor-tance we wish to place on each prediction, relating the errorto any feature that might be relevant from both, the user orthe seller point of view. For instance, considering the releasedate, we can assign weights in such a way that the higher theweight, the higher importance we are placing on more recentdata. In this case we could observe that even when the MAEis under reasonable threshold, the performance of a systemmight be inadequate when analyzing this particular feature.
The weighted Mean Absolute Error can be computed as
wMAE =
PUi=1
PNij=1 wi,j × abs(pi,j − ri,j)PU
i=1
PNij=1 wi,j
, (1)
where U represents the number of users; Ni, the numberof items predicted for the ith-user; ri,j , the rating given bythe ith-user to the item Ij ; pi,j , the rating predicted bythe model and wi,j represents the weight associated to thisprediction. Note that when all the individual differences areweighted equally wMAE coincides with MAE.
In order to illustrate our approach, we shall consider twofactors, assuming that wi,j ∈ [0, 1].• Item popularity: we would like to investigate whetherthe error in the predictions depends on the number of userswho rated the items. Two alternatives will be considered:
i+ The weights will put more of a penalty on bad pre-dictions when an item has been rated quite frequently(the items has a high number of ratings). We still pe-nalize bad predictions when it has a small number ofratings, but we do not penalize as much as when wehave more samples, since it may just be that the lim-ited number of ratings do not provide much informa-tion about the latent factors which influence the usersratings. Particularly, for each item Ii we shall considerits weight as the probability that this item were ratedin the training set, i.e. wi = pr(Ii).
i– This is the inverse of the previous criterion, where weput more emphasis on the predictions over those itemswith fewer ratings. So the weights are wi = 1− pr(Ii).
• Rating distribution: It is well known that the usersdoes not rate the items uniformly, they tend to use high-valued ratings. By means of this feature we can measurewhether the error depends on the ratings distribution or not.Particularly, we shall consider four different alternatives:
rS+ Considering the overall rating distribution in the sys-tem, putting more emphasis on the error in the pre-dictions on those common ratings. So the weights arewi = prS(ri), ri being the rating given by the user tothe item Ii.
rS– Inversely, we assess more weight to the less commonratings, i.e. wi = 1− prS(ri).
rU+ Different users can use a different pattern of rating, sowe consider the rating distribution of the user, in such
a way that those common ratings for a particular userwill have greater weights, i.e. wi = prU (ri).
rU– The last one assigns more weight to the less frequentrating, i.e. wi = 1− prU (ri).
Figures 1-A and 1-B present the absolute values of theMAE and wMAE error for the four RSs considered in thispaper. Figure 1-A shows the results where the weightsare positively correlated to the feature distribution, whereasFigure 1-B presents the results when they are negatively cor-related. In this case, we can observe that by using wMAE wecan determine that error is highly dependent on the users’pattern of ratings, and weaker when considering item pop-ularity. Moreover, if we compare the two figures we canobserve that all the models perform better when predictingthe most common ratings. In this sense, they are able tolearn the most frequent preferences and greater errors (badperformance) are obtained when focusing on less frequentrating values. Related to item popularity these differencesare less conclusive. In some sense, the way in which the userrates an item does not depend of how popular the item is.
2.1 Relative Weights vs. Relative ErrorAnother different alternative to explore the benefits of us-
ing the wMAE metric is to consider the ratio between wMAEand MAE. In this sense, denoting as ei,j = abs(pi,j − ri,j),we have that wMAE/MAE is equal to
wMAE/MAE =
Pi,j wi,jei,j/
Pi,j ei,jP
i,j wi,j/N.
Taking into account that we restrict the weights to take itsvalue in the [0, 1] interval, the denominator might representthe average percentage of mass of the items that is relatedto the dimension under consideration whereas the numeratorrepresents the average percentage of the error coming fromthis feature. So, when wMAE > MAE we have that thepercentage of error coming from the feature is greater thanits associated mass, so the the system is not able to predictproperly such dimension. When both metrics are equal thisimplies that the expected error is independent of the feature.
In Figure 1-C we present the values of the wMAE/MAEwhere, again, we can see that there exists a dependence be-tween the rating and the error. The error associated to thecommon ratings are less than the relative importance of thisfeature in the system whereas for less common ratings thesystem is not able to perform good predictions, being greaterthe relative error than its associated weights. This situationdoes not hold when considering item popularity.
Figures 1-D and 1-E present an scatter plot that relatesthe relative weights (horizontal axis) to the relative error(vertical axis) for each user in the system and for each RSused2. Particularly, in Figure 1-D we are considering rU+as weighting factor. Note that, since there are 5 possibleratings, the relative weight is equal to 0.2 when all the rat-ings are equally probable and its value increases with theimportance of the most used ratings. In this figure we cansee that both percentage of mass and the percentage of er-ror are positively correlated, being wMAE/MAE < 1 formost of the users. Moreover, there is a trend to improve thepredictions for those users with higher relative mass (for ex-ample, we can see how the regression line for the LM model2We have included all the users with at least 10 predictions.
25

Figure 1: Using wMAE in recommendations: absolute and relative values.
Means LM Slope One SVD0,50
0,55
0,60
0,65
0,70
0,75
0,80
0,85
0,90
0,95
MAE ru+ rS+ iS+ A
Means LM Slope One SVD0,60
0,65
0,70
0,75
0,80
0,85
0,90
0,95MAE rU- rS- iS-
B
rU+ rU- rS+ rS- i+ i-0,600
0,650
0,700
0,750
0,800
0,850
0,900
0,950
1,000
1,050
1,100
Means LM Slope One SVD C
0,1 0,2 0,3 0,4 0,5 0,6 0,70,1
0,2
0,3
0,4
0,5
0,6
0,7
relative weight
rela
tive
erro
r
LM Lineal (LM ) SO SVD D
0,0005 0,0010 0,0015 0,0020 0,0025 0,0030 0,00350,0005
0,0010
0,0015
0,0020
0,0025
0,0030
0,0035
0,0040
relative weight
rela
tive
erro
rE
rU+ rU- rS+ rS- i+ i-0,80
0,82
0,84
0,86
0,88
0,90
0,92
0,94
0,96
0,98
LM Slope One SVDF
gets further away3 from the line y=x). In some way we canconclude that recommendation usefulness of the rating dis-tribution is consistent for all the users and RS models. Onthe other hand, Figure 1-E considers i+ as weights. In thiscase, although weights and error are positively correlated,there exists significant differences between different users.This result is hidden in the global measures.
2.2 Relative Comparison Among ModelsAlthough wMAE might give some information about how
the error has been obtained, there is no criterion about whata good prediction is. In order to tackle this situation we pro-pose the use of the relative rather than the absolute error,i.e. the weighted Mean Absolute Percentage Error, wMAPE.Then, given two models, M1 and M2, the relative metric isdefined as wMAEM1/wMAEM2. In this metric, the lessthe value, the greater the improvements. Thus, if we fix themodel M2 to be a simple model (as the average rating) weobtain the wMAE values in Figure 1-F. From these values,we can obtain some conclusions as for instance that LM fitsbetter the common user’s preferences (rU+), whereas SlopeOne and SVD are more biased toward the overall rating dis-tribution in the system (rS+). Similarly, we found that bet-ter improvements, with respect to the average ratings, areobtained when focusing on less frequent ratings. Finally,with respect to item popularity all the models obtain bet-ter improvements when considering the most popular items,although these differences are less significant.
3. CONCLUSIONSIn this paper we have explored the use of weighted Mean
Average Error as a means to measure the RS’s performanceby focusing on a given dimension or feature, being able to
3The other models perform similarly, but we have decidedto not include these regression lines due to clarity reasons.
uncover specific cases where a recommendation algorithmmay be having suboptimal performance. This is a very use-ful way to know the origin of the errors found in the rec-ommendations and therefore useful for improving the RSs,although its main problem is that it is not absolute as MAE.
4. REFERENCES[1] S. Cleger-Tamayo, J.M. Fernandez-Luna and J.F.
Huete. A New Criteria for Selecting Neighborhood inMemory-Based Recommender Systems. Proc. of 14thCAEPIA’11, pp. 423-432. 2011.
[2] A. Gunawardana and G. Shani. A Survey of AccuracyEvaluation Metrics of Recommendation Tasks. Journalof Machine Learning Research 10, pp. 2935-2962. 2009.
[3] J.L. Herlocker, J.A. Konstan, L.G. Terveen and J.T.Riedl. Evaluating collaborative filtering recommendersystems. ACM Trans. Inf. Syst. 22, 1. 2004, pp. 5-53.
[4] D. Lemire and A. Maclachlan. Slope One Predictors forOnline Rating-Based Collaborative Filtering. Proc. ofSIAM Data Mining (SDM’05), 2005
[5] P. Massa and P. Avesani. Trust metrics inrecommender systems. Computing with Social Trust,pp. 259-285 Springer 2009.
[6] B.M. Sarwar, G. Karypis, J. Konstan and J. Riedl.Incremental SVD-Based Algorithms for HighlyScaleable Recommender Systems. 5th InternationalConf. on Computer and Information Technology. 2002.
[7] T. Jambor and J. Wang. Goal-driven collaborativefiltering: A directional error based approach. In Proc.ECIR’2010. pp. 407-419. 2010.
[8] C.J. Willmot. Statistics for the Evaluation andComparison of Models. Journal of GeophysicalResearch, 90. pp. 8995-9005, 1985.
26

How Similar is Rating Similarity to Content Similarity?
Osman BaskayaDepartment of Computer Engineering
Bahçesehir UniversityIstanbul, Turkey
Tevfik AytekinDepartment of Computer Engineering
Bahçesehir UniversityIstanbul, Turkey
ABSTRACTThe success of a recommendation algorithm is typically mea-sured by its ability to predict rating values of items. Al-though accuracy in rating value prediction is an importantproperty of a recommendation algorithm there are otherproperties of recommendation algorithms which are impor-tant for user satisfaction. One such property is the diversityof recommendations. It has been recognized that being ableto recommend a diverse set of items plays an important rolein user satisfaction. One convenient approach for diversifi-cation is to use the rating patterns of items. However, inwhat sense the resulting lists will be diversified is not clear.In order to assess this we explore the relationship betweenrating similarity and content similarity of items. We discussthe experimental results and the possible implications of ourfindings.
Categories and Subject DescriptorsH.3.3 [Information Storage and Retrieval]: InformationSearch and Retrieval
General TermsExperimentation, Measurement
Keywordsdiversity, recommender systems, collaborative filtering
1. INTRODUCTIONRecommender systems help users to pick items of interest
based on explicit or implicit information that users provideto the system. One of the most successful and widely usedtechnique in recommender systems is called collaborative fil-tering (CF) [7]. CF algorithms try to predict the ratings ofa user based on the ratings of that user and the ratings ofother users in the system. The performance of collabora-tive filtering algorithms is typically measured by the error
Permission to make digital or hard copies of all or part of this work forpersonal or classroom use is granted without fee provided that copies arenot made or distributed for profit or commercial advantage and that copiesbear this notice and the full citation on the first page. To copy otherwise, torepublish, to post on servers or to redistribute to lists, requires prior specificpermission and/or a fee.Copyright is held by the author/owner(s). Workshop on RecommendationUtility Evaluation: Beyond RMSE (RUE 2012), held in conjunction withACM RecSys 2012. September 9, 2012, Dublin, Ireland.
they make in predicting the ratings of users for items. Al-though accuracy of predictions is an important aspect ofrecommender systems, it is not the only one. Recently, in-creasing the diversity of recommendation lists have gainedattention among researchers in the field [8, 2]. To be ableto recommend a diverse set of items to a user is importantwith respect to user satisfiability because a recommendationlist consisting of one type of item (e.g., movies only from thesame genre) might not be very satisfactory even if the ac-curacy of rating prediction is high. But here there is oneissue. We need to define a metric for measuring the diver-sity of a recommendation list. Then we can try to optimizethe recommendation list based on this metric. One possiblemetric for measuring the diversity of a recommendation listof a particular user is described in [2]. This metric measuresthe diversity as the average dissimilarity of all pairs of itemsin a user’s recommendation list. Formally, it can be definedas follows:
D(R) =1
N(N − 1)
∑i∈R
∑j∈R,j 6=i
d(i, j), (1)
where R is the recommendation list of a user and N = |R|.d(i, j) is the dissimilarity of items i and j which is definedas one minus the similarity of items i and j.
We think that average dissimilarity is a reasonable way tomeasure the diversity of a list of items. However, the impor-tant part is how to define d(i, j), i.e., the dissimilarity of twoitems which is unspecified in equation (1). The problem isnot to choose a similarity metric such as Pearson or cosine.The problem is whether we can use the rating patterns (vec-tors) of items in order to measure their similarity. And if weuse these rating patterns, in what respect the recommenda-tion lists will be diversified? For example, if it is a movierecommender system, will the recommendation lists containmore movies from different genres or will the content of themovies get diversified?
In order to answer these questions we will compare ratingsimilarity with two types of content similarities which wewill define below. We hope that the results we discuss willshed some light on these types of questions and stimulatediscussion on diversification.
2. RELATED WORKSIn hybrid recommendations content information is used in
order to increase the accuracy of rating predictions especiallyfor items whose ratings are too sparse. For example [3, 5,6] use content information collected from sources such as
27

Wikipedia and IMDB in order to improve the accuracy ofrating predictions. These works indirectly show that there isindeed some positive relationship between rating similarityand content similarity. Otherwise, it was not possible toincrease the prediction accuracy using content information.Another paper which comes close to our concerns is [1]
Here, the authors propose a new algorithm for diversifyingrecommendation lists. Their algorithm uses rating patternsof movies for diversification. They evaluate the results bylooking at how well the recommendation lists are diversifiedwith respect to genre and movie series they belong. Theyreport that the resulting lists’ diversity increase in both re-spects (genre and series). However, to the best of our knowl-edge there are no direct comparisons between rating andcontent similarity. In this paper we examine directly thesetwo types of similarities.
3. ITEM CONTENT GENERATIONIn our experiments we use Movielens1 (1M) data set. In
order to compare movies’ rating patterns to their contentswe first need to generate movie content information. We usetwo sources of information to this end. One source of contentinformation comes from Wikipedia articles corresponding tomovies in the Movielens dataset. The other source of con-tent information comes from genre information which areprovided in the dataset. Details of content generation aregiven below.
3.1 Content Generation from WikipediaThe Movielens dataset contains 3883 distinct movies and
6040 users. Some of these movies are not rated by any user.Also some of the movies have no corresponding entries inWikipedia. After discarding these movies we are able tofetch 3417 (approximately 88% of all movies) movie articlesfrom Wikipedia.In this work we only use the text of each Wikipedia article
(we do not use link structure or category information ofarticles). The text of a Wikipedia article consists of partssuch as “Plot”, “Cast”, and “Release”. We do not include“References” and “See also” parts of the text since they maycontain information which is unrelated to the content of themovies. After extracting the text of each document we applysome basic preprocessing steps such as stemming and stop-words removal. We use a vector space model to representtext documents.
3.2 Genre InformationAs a second source of content we use the genre keywords
(such as adventure, action, comedy, etc.) provided by theMovielens dataset. Each movie in the dataset is associatedwith one or more genre keywords. We define the genre sim-ilarity between two movies using the Jaccard metric givenbelow:
J(i, j) =|Gi ∩Gj ||Gi ∪Gj |
(2)
where Gi and Gj are genre sets of items i and j.
4. EXPERIMENTSIn the first set of experiments we try to understand the
relation between movie rating patterns and content gener-ated from the corresponding Wikipedia articles. We have1http://www.grouplens.org/node/73
two matrices: one is the Movie-User matrix which holdsthe ratings of users on movies and the other is the Movie-TFIDF matrix which holds the tf-idf weights for each docu-ment. For evaluation we use the following methodology. Foreach movie we find the most similar 100 movies using theMovie-User matrix (rating neighborhood) and the most sim-ilar 100 movies using Movie-TFIDF matrix (content neigh-borhood). We then find the number of common items inthese two neighborhoods. It turns out that on average thereare 14.74 common movies in the two neighborhoods. If wegenerate the neighborhoods randomly this value turns outto be around 2.80. Randomization tests show that this dif-ference is significant (p < 0.01).
We run the same experiment with different neighborhoodsizes (20 and 50) but the percentages of the number of com-mon items in the rating and content neighborhoods turnout to be similar to the percentages we get when we use aneighborhood of size 100.
We also test whether there is a relationship between thenumber of ratings and the correspondence between ratingand content similarity. To see this we find the rating andcontent neighborhoods of those movies which have similarnumber of ratings. To do this we divide the movies into rat-ing intervals according to the number of ratings they have:movies which have ratings between 1-100, between 101-200,and so on. If an interval has less than 20 movies, we mergeit with the previous one in order to increase the significanceof the results. Figure 1 shows the average number of com-mon items in the rating and content neighborhood sets ofmovies as a function of rating intervals. Interestingly, Fig-ure 1 shows a clear linear correlation, i.e., as the number ofratings increases the number of common items in the con-tent and rating neighborhood of movies also increases. Onepossible explanation of this positive linear correlation mightbe this. Generally, there is a positive relationship betweenthe number of ratings and the popularity of a movie. Thismeans that popular movies receive ratings from many dif-ferent people with different tastes. Hence the rating pat-terns of popular movies reflect a diverse set of characteris-tics. Wikipedia movie articles also have rich contents reflect-ing different characteristics of movies. This might explainwhy a movie’s rating neighborhood approaches to its contentneighborhood as the number of ratings increase.
In the next set of experiments our aim is to understandthe relationship between movie rating patterns and moviegenres provided in the Movielens dataset. Genre keywordsprovide limited information compared to Wikipedia articles.Because Wikipedia articles contain terms that give informa-tion not only about the genre of a movie but also about thedirector, starring, musical composition, etc.
In order to measure the relationship between movie ratingpatterns and genres we applied a similar methodology. Foreach movie m we find the most similar 100 movies usingthe Movie-User matrix (that is the rating neighborhood)and find the Jaccard similarity (as defined in equation 2)between movie m and movies in its rating neighborhood.The average Jaccard similarity value turns out to be 0.43.If we generate the rating neighborhood randomly we find aJaccard value around 0.17. Randomization tests show thatthis difference is significant (p < 0.01).
We also test whether there is a relationship between thenumber of ratings and genre similarity. Similar to the ex-periment we described above we divided the movies into rat-
28

Figure 1: Average number of common movies as afunction of rating intervals.
Figure 2: Average Jaccard index as a function ofrating intervals.
ing intervals according to the number of ratings they have.Then for each movie m in a rating interval we calculate theJaccard similarity value between the movie m and its rat-ing neighborhood of 100 movies then calculate the averagesper rating interval. Figure 2 shows these average values asa function of rating intervals. Here, we again have an in-teresting case. There is a negative linear correlation whichmeans that the more a movie has ratings the more its ratingsimilarity diverges from its genre similarity.The reason underlying these results might be this. Movies
which have limited number of ratings (unpopular movies)are generally watched by the fans of that genre. For exam-ple, a fan of sci-fi movies may also watch an unpopular sci-fi movie. So, unpopular movies generally get ratings fromthe same set of users who are fans of that movie’s genre.And this makes the rating vectors of those movies (samegenre movies) similar to each other. On the other hand ifa movie is popular than it gets ratings from a diverse set ofusers which causes their rating neighborhoods diverge fromits genre.
5. CONCLUSIONWe should note at the outset that the conclusions pre-
sented here are not conclusive. Different experiments ondifferent datasets and with different item types need to bedone in order to drive more firm conclusions. However, wehope that these experiments and results will stimulate dis-cussion and further research.
In this work we examined the relationship between ratingsimilarity and content similarity of movies in the Movielensdataset. We examined two kinds of content: one of themis the tf-idf weights of movie articles in Wikipedia and theother is the genre keywords of movies provided by the Movie-lens dataset.
We found that to a certain degree there is a similarity be-tween rating similarity and Wikipedia content similarity andalso between rating similarity and genre similarity. However,we leave open to discussion the magnitude of these similari-ties. We also found that as the number of ratings of a movieincreases its rating similarity approaches to its Wikipediacontent similarity whereas its rating similarity diverges awayfrom its genre similarity.
According to these results if diversification is done basedon the rating patterns of movies then the recommendationlists will likely be diversified with respect to the contentof movies to some extent. So, if no content information isavailable or it is difficult to get it, it might be useful to userating patterns to diversify the recommendation lists.
To this analysis we plan to add latent characteristics ofitems generated by matrix factorization methods [4]. Weplan to explore the correspondences among similarities de-fined over rating patterns, contents, and latent characteris-tics of items.
6. REFERENCES[1] R. Boim, T. Milo, and S. Novgorodov. Diversification
and refinement in collaborative filtering recommender.In CIKM, pages 739–744, 2011.
[2] N. Hurley and M. Zhang. Novelty and diversity intop-N recommendation - analysis and evaluation. ACMTrans. Internet Techn, 10(4):14, 2011.
[3] G. Katz, N. Ofek, B. Shapira, L. Rokach, and G. Shani.Using wikipedia to boost collaborative filteringtechniques. In RecSys, pages 285–288, 2011.
[4] Y. Koren, R. M. Bell, and C. Volinsky. Matrixfactorization techniques for recommender systems.IEEE Computer, 42(8):30–37, 2009.
[5] A. Loizou and S. Dasmahapatra. Using Wikipedia toalleviate data sparsity issues in Recommender Systems,pages 104–111. IEEE, 2010.
[6] P. Melville, R. J. Mooney, and R. Nagarajan.Content-boosted collaborative filtering for improvedrecommendations. In AAAI/IAAI, pages 187–192, 2002.
[7] J. B. Schafer, D. Frankowski, J. L. Herlocker, andS. Sen. Collaborative filtering recommender systems. InThe Adaptive Web, pages 291–324, 2007.
[8] M. Zhang and N. Hurley. Avoiding monotony:improving the diversity of recommendation lists. InRecSys, pages 123–130, 2008.
29
Modeling Difficulty in Recommender Systems
Benjamin Kille, Sahin AlbayrakDAI-Lab
Technische Universitat Berlin{kille,sahin}@dai-lab.de
ABSTRACTRecommender systems have frequently been evaluated withrespect to their average performance for all users. However,optimizing such recommender systems regarding those eval-uation measures might provide worse results for a subset ofusers. Defining a difficulty measure allows us to evaluate andoptimize recommender systems in a personalized fashion.We introduce an experimental setup to evaluate the eligibil-ity of such a difficulty score. We formulate the hypothesisthat provided a difficulty score recommender systems can beoptimized regarding costs and performance simultaneously.
Categories and Subject DescriptorsH.3.3 [Information Storage and Retrieval]: InformationSearch and Retrieval - Information filtering, Retrieval mod-els, Search process, Selection process; H.3.4 [InformationTechnology and Systems Applications]: Decision sup-port
General TermsAlgorithms, Design, Experimentation, Measurement, Hu-man factors
Keywordsdifficulty, recommender systems, user modeling, evaluation
1. INTRODUCTIONEvaluating a recommender system’s performance repre-
sents a non-trivial task. The choice of evaluation measureand methodology depends on various factors. Modeling therecommendation task as rating prediction problem favorsmeasures such as root mean squared error (RMSE) andmean absolute error (MAE) [7]. In contrast, mean aver-age precision (MAP) and normalized discounted cumulativegain (NDCG) qualify as evaluation measures for an itemranking scenario [12]. In either case, two recommendation
Copyright is held by the authors/owner(s).Workshop on Recommendation Utitlity Evaluation: Beyond RMSE (RUE2012), held in conjunction with ACM RecSys 2012 September 9, 2012,Dublin, Ireland..
algorithms are compared with respect to their average per-formance on the full set of users. This entails that all usersare treated equally. However, we argue that the difficulty ofrecommending items to users varies. Suppose we consider arecommender system with two users, Alice and Bob. Alicehas rated a large number of items. Bob has recently startedusing the system and rated a few items. The system rec-ommends a number of items to both of them. Alice andBob rate the recommended items. Suppose we attempt toevaluate two recommender algorithms based on those rat-ings, denoted as R1 and R2. Assume that R1 predicts Al-ice’s ratings with an error of 0.8 and Bob’s ratings with anerror of 0.9. On the other hand, we observe R2 to devi-ate 1.0 for Alice and 0.8 for Bob, respectively. Averagingthe errors, we obtain 0.85 for R1 and 0.9 for R2. Still, R2
predicts Bob’s ratings better even though his preferences ex-hibit higher sparsity compared to Alice’s. Besides the num-ber of ratings, there are further factors discriminating howwell an recommendation algorithm perform for a given user.We introduce the notion of difficulty in the context of rec-ommender systems. Each user is assigned a difficulty valuereflecting her expected evaluation outcome. Users with higherrors or disordered item rankings receive a high difficultyvalue. Contrarily, we assign low difficulty values to usersexhibiting low errors and well ordered item rankings. Rec-ommender systems benefit from those difficulty value two-fold. First, optimization can target difficult users who re-quire such efforts. On the other hand, the recommendersystem can provide users with low difficulty values with rec-ommendations generated by more trivial methods. Recom-mending most popular items represents such an approach.Second, difficulty values enable the system to estimate howlikely a specific user will perceive the recommendations asadequate. Thereby, the system can control interactions withusers, e.g. by asking for additional ratings to provide betterrecommendations for particularly difficult users.
2. RELATED WORKAdomavicius and Tuzhilin reveal possible extensions to
recommender systems [1]. They mention an enhanced un-derstanding of the user as one such extension. Our workattempts to contribute to this by defining a user’s difficulty.Hereby, the system estimates a user’s likely perception ofthe recommendations. The methods performing best on thewell-known Netflix Prize Challenge had applied ensembletechniques to further improve their rating prediction accu-racy [3, 11]. Both do not state an explicit modeling of rec-ommendation difficulty on the user-level. However, ensem-
30

ble techniques involve an implicit presence of such a con-cept. Combining the outcome of several recommendationalgorithms does make sense in case a single recommenda-tion algorithm fails for a subset of users. Such an effect isconsequently compensated by including other recommenda-tion algorithms’ outcomes. Bellogin presents an approachto predict a recommender systems performance [4]. How-ever, the evaluation is reported on the system level aver-aging evaluation measures over the full set of users. Ourapproach focuses on predicting the user-level difficulty. Ko-ren and Sill introduced a recommendation algorithms thatoutputs confidence values [8]. Those confidence values couldbe regarded as difficulty. However, the confidence values arealgorithm specific. We require the difficulty score’s valid-ity to generally hold. The concept of evaluation consideringdifficulty has been introduced in other domains. Aslam andPavlu investigated estimation of a query’s difficulty in thecontext of information retrieval [2]. Their approach baseson the diversity of retrieved lists of documents by severalIR systems. Strong agreement with respect to the docu-ment ranking indicates a low level of difficulty. In contrast,highly diverse rankings suggest a high level of difficulty. Heet al. describe another approach to estimate a query’s dif-ficulty [6]. Their method compares the content of retrieveddocuments and computes a coherence score. They assumethat in case highly coherent documents are retrieved thequery is clear and thus less difficult than a query resulting inminor coherency. Genetic Algorithms represent another do-main where difficulty has received the research community’sattention. However, the difficulty is determined by the fit-ness landscape of the respective problem [5, 6]. Kunchevaand Whitaker investigated diversity in the context of a clas-sification scenario [9]. Concerning a query’s difficulty, di-versity has been found an appropriate measure [2]. We willadapt two diversity measures applied in the classificationscenario for determining the difficulty to recommend a useritems.
3. METHODWe strive to determine the difficulty of the recommenda-
tion task for a given user. Formally, we are looking for amap δ(u) : U 7→ [0; 1] that assigns each user u ∈ U a realnumber between 0 and 1 corresponding to the level of diffi-culty. For one recommendation algorithm the difficulty fora given user could be simply determined by a (normalized)evaluation measure, e.g. RMSE. However, such a difficultywould not be valid for other recommendation algorithms.In addition, recommender systems optimized with respectto the item ranking would likely end up with different dif-ficulty values. We adapt the idea of measuring difficultyin terms of diversity to overcome those issues. We assumethe recommender systems comprises several recommenda-tions methods, denoted A = {A1, A2, . . . , An}. Each suchAn generates rating predictions along with item rankingsfor a given user u. We choose RMSE to evaluate the rat-ing predictions and NDCG to assess the item ranking, re-spectively. We measure a user’s difficulty by means of thediversity of those rating predictions and item rankings. Forthat purpose, we adjusted two diversity metrics introducedby Kuncheva and Whitaker for classification ensembles [9].We alter the pair-wise Q statistics to fit the item rankingscenario. Regarding the rating prediction we adapt the dif-ficulty measure θ.
3.1 Q statisticsApplied to the classification ensemble setting, theQ statis-
tics base on a confusion matrix. The confusion matrix con-fronts two classifiers in a binary manner - correctly classifiedversus incorrectly classified. We need to adjust this set-ting to fit the item ranking scenario. Table 1 illustrates theadjusted confusion matrix. We count all correctly rankeditems as well as all incorrectly ranked items for both recom-mendations algorithms. Subsequently, the confusion matrixdisplays the overlap of those items sets. Equation 1 rep-resents the Q statistic derived from the confusion matrix.Note that the Q statistic measures diversity in between tworecommender algorithms. Hence, we need to average the Qstatistic values obtained for all comparisons in between theavailable algorithms. Equation 2 computes the final diver-sity measure.
Qij(u) =N11N00 −N01N10
N11N00 +N10N01(1)
QA(u) =
(|A|2
)−1 ∑Ai,Aj∈A
Qij (2)
3.2 Difficutly measure θ
Kuncheva and Whitaker introduce the difficulty measureθ as a non-pairwise measure [9]. θ allows us to considerseveral recommendation algorithms simultaneously. We it-erate over the set of withhold items for the given user. Ateach step we compute the RMSE for all recommendationalgorithms at hand. Thereby, we observe the variance inbetween all recommender algorithms’ RMSE values. Theaverage variance displays how diverse the user is perceivedby the set of recommendation algorithms. Equation 3 cal-culates θ. I denotes the set of items in the target user’s testset. The σ(i) function computes the variances in betweenthe recommendation algorithms’ RMSE values for the givenitem.
θ(u) =1
|I|∑i∈I
σ(i) (3)
3.3 Difficulty measure δ
We attempt to formulate a robust difficulty measure forrecommender systems. Therefore, we propose a combinationof the Q statistic and θ. As a result, both RMSE and NDCGare considered. The more recommendation algorithms weinclude the more robust the final difficulty value will be.Equation 4 displays a linear combination of both measures.The parameter λ ∈ [0; 1] controls the weighting. λ = 1allows to focus on the ranking task. The absence of ratingvalues might require such a setting.
δ(u|A) = λ ·QA(u) + (1− λ) · θ(u) (4)
4. EXPERIMENTAL SETTINGWe will evaluate the proposed difficulty measure δ and
subsequently outline the intended experimental protocol. Sev-eral data sets, such as Movielens 10M, Netflix and Last.fmprovide the required data. We will implement item-based
31

Ai: rank(k) ≤ rank(l) Ai: rank(k) > rank(l)
Aj : rank(k) ≤ rank(l) N11 N10
Aj : rank(k) > rank(l) N01 N00
Where rank(k) ≤ rank(l) is true.
Table 1: Adjusted confusion matrix
and user-based neighborhood recommenders, matrix factor-ization recommenders along with slope-one recommenders.All those recommendation methods do not require data ex-cept user preferences. As a first step, we split each data setsin three partitions. The first partition will be used for train-ing and the second partition to assign each user a difficultyscore according to Equation 4. Finally, the third partitionwill be used as evaluation data set. The subset of userswith comparably low difficulty score will receive recommen-dations based on a non-optimized recommendation methodsuch as the most popular recommender. The subset of userswith medium difficulty score will receive recommendationsgenerated by slightly optimized recommender algorithms.Finally, the particularly hard users will receive recommenda-tions generated by highly optimized recommenders. We willcompare both required efforts and recommendation qualityagainst approaches dealing with all users in the same ways.Such approaches will include optimizing recommenders toperform well averaged over the full set of users and recom-mending all users with trivial recommenders, for instancemost popular recommendations. Our hypothesis is that thedifficulty score will allow us to achieve lower costs along witha comparably high recommendation quality by selecting anappropriate recommendation algorithm for a given user. Inaddition, we will observe what user characteristics determineher difficulty.
5. CONCLUSION AND FUTURE WORKWe introduced the notion of difficulty in the context of
recommending items to users. Measuring that task’s dif-ficulty on user-level allows a more personalized optimiza-tion of recommender systems. Users with comparably lowdifficulty scores receive adequate recommendations withoutmuch efforts. On the other hand, users with a compara-bly high difficulty score may be asked to provide additionaldata to improve the system’s individual perception. A com-bination of the Q statistic and the difficulty measure θ -both adjusted to fit the recommendation scenario - allowsus to measure the difficulty for a given user. The calculationrequires a sufficiently large data set containing user prefer-ences on items along with a set of implemented recommen-dation algorithms. We introduced an experimental settingthat we will use to evaluate the presented methodology insection 4. In addition, we intend to apply pattern recog-nition techniques to find correlations between the difficultyscore and user characteristics. For instance, the numberof ratings is known to correlate with the difficulty for newusers (”cold-start problem”) and users with a large numberof items (”power-users”) [10].
6. ACKNOWLEDGEMENTSThis work is funded by the DFG (Deutsche Forschungs-
gemeinschaft) in the scope of the LSR project.
7. REFERENCES[1] G. Adomavicius and A. Tuzhilin. Toward the next
generation of recommender systems: A survey of thestate-of-the-art and possible extensions. IEEETransaction on Knowledge and Data Engineering,17(6):734–749, 2005.
[2] J. A. Aslam and V. Pavlu. Query hardness estimationusing jensen-shannon divergence among multiplescoring functions. In Proceedings of the 29th Europeanconference on IR research, ECIR’07, pages 198–209,2007.
[3] R. M. Bell and Y. Koren. Lessons from the netflixprize challenge. SIGKDD Explor. Newsl., 9(2):75–79,2007.
[4] A. Bellogin. Predicting performance in recommendersystems. In Proceedings of the fifth ACM conferenceon Recommender systems, pages 371–374. ACM, 2011.
[5] M. Hauschild and M. Pelikan. Advancedneighborhoods and problem difficulty measures. InProceedings of the 13th annual conference on Geneticand evolutionary computation, GECCO ’11, pages625–632, 2011.
[6] J. He, M. Larson, and M. De Rijke. Usingcoherence-based measures to predict query difficulty.In Proceedings of the IR research, 30th Europeanconference on Advances in information retrieval,ECIR’08, pages 689–694, 2008.
[7] J. Herlocker, J. Konstan, L. Terveen, and J. Riedl.Evaluating collaborative filtering recommendersystems. ACM Transactions on Information Systems,22(1):5–53, 2004.
[8] Y. Koren and J. Sill. Ordrec: an ordinal model forpredicting personalized item rating distributions. InProceedings of the fifth ACM conference onRecommender systems, RecSys ’11, pages 117–124,New York, NY, USA, 2011. ACM.
[9] L. Kuncheva and C. Whitaker. Measures of diversityin classifier ensembles and their relationship with theensemble accuracy. Machine Learning, 51:181–207,2003.
[10] A. Said, B. Jain, and S. Albayrak. Analyzingweighting schemes in collaborative filtering: Coldstart, post cold start and power users. In 27th ACMSymposium On Applied Computing (SAC ’12), NewYork, NY, USA, 2012. ACM.
[11] G. Takacs, I. Pilaszy, B. Nemeth, and D. Tikk. Majorcomponents of the gravity recommendation system.SIGKDD Explorations, 9(2), 2007.
[12] S. Vargas and P. Castells. Rank and relevance innovelty and diversity metrics for recommendersystems. In Proceedings of the fifth ACM conferenceon Recommender systems, RecSys ’11, pages 109–116,New York, NY, USA, 2011. ACM.
32

Insights on Social Recommender System
Wolney L. de Mello NetoVrije Universiteit Brussel
CoMo LabBrussels, Belgium
Ann NowéVrije Universiteit Brussel
CoMo LabBrussels, Belgium
ABSTRACTRecommender Systems (RS) algorithms are growing moreand more complex to follow requirements from real-worldapplications. Nevertheless, the slight improvement they of-ten bring may not compensate the considerable increase inalgorithmic complexity and decrease in computational per-formance. Contrarily, context aspects such as social aware-ness are still not much explored. In view of that, this paperproposes insights on how to possibly achieve more efficientand accurate predictions for recommendations by exploringmultiple dimensions of a RS architecture. A framework isdesigned, comprised of a Facebook application called My-PopCorn and some scenarios of user neighborhood RSs areproposed. The first one investigates how to recommendmovies based on a narrowed subset of collaborative data,extracted from the social connections of the active user.Secondly, connections between users enable a solution forthe cold-start problem. Preferences from social connectionsare aggregated, producing a temporary profile of the newuser. Finally, a third dimension is explored regarding evalu-ation metrics. Results from traditional evaluation by offlinecross-validation are compared to measuring prediction ac-curacy of online feedback data. These insights propose howcommunity-based RS designs might take advantage of so-cial context features. Results show that all three proposedsolutions perform better assuming some conditions. Socialneighborhoods can often provide representative data for col-laborative filtering user-neighborhood techniques, improvinga lot the RS performance in terms of computational com-plexity metric without compromising prediction accuracy.Assuming a user has a dense social network, the cold-startproblem can be easily tackled. Finally, rating prediction ac-curacy performs better when evaluated online than by offlinecross-validation.
Categories and Subject DescriptorsH.4 [Information Systems Applications]: Miscellaneous;H.3.3 [Information Search and Retrieval]: Collabora-
Permission to make digital or hard copies of all or part of this work forpersonal or classroom use is granted without fee provided that copies arenot made or distributed for profit or commercial advantage and that copiesbear this notice and the full citation on the first page. To copy otherwise, torepublish, to post on servers or to redistribute to lists, requires prior specificpermission and/or a fee.Copyright is held by the author/owner(s). Workshop on RecommendationUtility Evaluation: Beyond RMSE (RUE 2012), held in conjunction withACM RecSys 2012. September 9, 2012, Dublin, Ireland..
tive Filtering; D.2.8 [Software Engineering]: Metrics—complexity measures, performance measures
KeywordsRecommender System, Collaborative Filtering, Social Rec-ommenders, Cold-Start Problem, Evaluation Metrics
1. INTRODUCTIONOur generation faces several tough challenges within the
current peta-, exa- or even zettabyte information era. Everyday we deal with huge amounts of information whose ma-nipulation and storage struggles even on high-end computertechnologies. Shifting from the point of view of computercapacity to an average single person, the problem gets evenworse due to human being limitations. Online services areexamples of big data resources with increasing importance inour lives. About two years ago, Google’s search engine usedto process approximately half of the entire written works ofmankind per day [6]. Nowadays, it is impossible to avoidsuch reality while working, studying, and entertaining your-self. Perhaps this information overload comes with high cost,nevertheless, high benefit as well.
Movie domain is a great context where information over-load is a high potential pain point to be explored. Moreover,Netflix movie streaming service is a good motivation for thiswork due to two main reasons. Firstly, figures disclosed in[1] mention 75% of their sales come from recommendations.Secondly, [1] reveals the decision of not implementing com-mercially the algorithm with around 10% improvement inprediction accuracy, winner of US$ 1 million prize[8]. Tak-ing these facts into account, what would be the most poten-tial path to explore within the field of RSs? Is accuracy themost important metric to take into account? What aboutcomputational complexity and transparency? What aboutonline instead of offline evaluation methods?
Rather than building upon complex RS methods, this pa-per investigates a social framework for developing state-of-the-art RS. Aiming at current main challenges, this paperproposes contributions on how to tackle some of its most rel-evant issues based on possibilities enabled by social contextinformation. The three explored RS challenges are: (i) per-formance issues related to scalability of recommender sys-tems; (ii) lack of knowledge about new users, known as coldstart problem; and (iii) definition of good evaluation meth-ods.
Some insights are discussed based on how social-graphdata enable a good implementation of a user neighborhoodRS algorithm, focusing not only on prediction accuracy but
33

also on other metrics such as scalability, computational com-plexity and transparency. These insights lead to 3 hypothe-ses listed below:
i. A user’s social neighborhood is sufficiently representa-tive to provide efficient, in the sense of computationalcomplexity, and effective recommendations, in termsof prediction accuracy;
ii. Social neighborhood connections can derive assump-tions about new users taste, avoiding the cold-startproblem;
iii. Online evaluation of transparent recommendations shouldbe a valid metric within social RSs.
2. RELATED WORKIn the introduction of the latest survey in RS field, [15]
highlights current challenges for RSs. Some of them areinvestigated hereby, such as follows:
Scalability In real-world applications, the number of in-stances might often steeply increase in multiple dimensionssuch as number of users, items and, in turn, user-item pref-erence signals. Despite being a good scenario for some RSalgorithms to achieve better accuracy, bigger datasets maylead to a great increase in computational complexity.
[7] proposes an evaluation of top-N recommendation algo-rithms. Item-based RS is proposed as an alternative for non-scalable user-based recommenders, since it performs bet-ter when there are many more users than items. Someother item-based RSs avoiding scalability problems withinmemory-based CF algorithms are compared in [16].
Regarding model-based CF techniques, [17] follows a rea-soning that is similar to the solution presented in Section4.1, since both look for a narrowed neighborhood whichdoes not to compromise general performance. Whereas thecited papers are based on clustering techniques, our heuris-tic consists of narrowing the database to a subset of usersocial-graph connections. Although scalability is an intrin-sic disadvantage to user-based RS, the proposition of a localneighborhood might overcome this drawback. User-basedRS is adopted since it enables some features related to thesocial RSs, such as transparent explanations for each recom-mendation;
Data Sparsity It is among the main bottlenecks for RSs.The lack of information is a big problem, especially duringfirst interactions of a new user. This scenario is defined asthe cold start or new user problem, which is traditionallysolved by requiring initial user information before any rec-ommendation is given. Nevertheless, this interaction is timeconsuming, since the user has to look for a couple of itemsto rate. To improve that, [14] has compared 6 techniquesto generate this first list of items, aiming to maximize thepercentage of rated items out of all items presented to a newuser.
Besides requiring this first interaction with the RS, onecould think of a temporary user profile in order to enableinitial recommendations. [11] explores trust networks andpropose the incorporation of preferences from trusted users.Nevertheless, the new user still has to explicitly provide in-formation about who are his/her trusted users. Our workretrieves implicit information from social networks, regard-less trust measurements. The method consists of retrieving
social connections and building a virtual profile based on ag-gregation methods, originally proposed for group RSs. [13]describes 10 aggregation methods and empirically concludesthat social-based think is the best basis for generating anartificial preference profile. The author claims that LeastMisery, Average and Average without Misery are the mosthuman-like reasoning techniques, achieving very good re-sults.
Transparency Users eventually question themselves aboutthe reasoning behind a recommendation. They are more in-clined to accept and evaluate better once they understandhow an item has been suggested to him or her. Neverthe-less, it is not always possible to provide such a transpar-ent explanation. [9] presents a survey on content-based RSand compares them to CF techniques also in terms of trans-parency. The authors claim CF techniques are a black box,and it is indeed the truth for most cases. In the case ofuser-neighborhood RSs, although RSs could tell to the ac-tive user about people with close taste that influenced therecommendation, privacy issues may not allow such trans-parency. In view of this challenge, this paper counteractsthe affirmation made by the previously cited survey. It ispossible to give explanation on user-based collaborative fil-tering technique once one assumes not having privacy issues,a tractable scenario within social networks, where connec-tions previously agree on sharing some information. Besidesthis proposal, some solutions to tackle CF limitations relatedto transparency are proposed in [4].
Evaluation One of the main modules of a RS design,evaluation strategy is a critical and subjective aspect to beshaped throughout the whole process of building and main-taining a RS. Even though most papers adopt accuracy asthe most important metric, one should consider many otherevaluation criteria, as presented in [5]. Computational com-plexity is one metric highlighted in the insight presented inSection 4.1. Transparency is enabled by social context, asdiscussed in Section 3.1.3. Besides exploring metrics, thispaper also focus on questioning methods (see Section 4.3).Offline and online methods should be compared while mea-suring rating prediction accuracy.
2.1 Social RecommendersIn view of all issues previously listed and the fact some
state-of-the-art architectures might not be that attractivefor commercial purposes, this paper dives into a RS de-sign that is gaining special attention: Social RSs. Alsocalled community-based recommenders, the basic architec-ture embeds context data into either collaborative filteringor content-based algorithms, improving the RS performance.According to [15], community-based paradigm is still a hottopic and it is not possible to find a consensus about whethersocial recommenders have better performance. [19] presentsa broad survey on social recommenders. One could see so-cial data in two ways: (i) unweighted social graph; (ii) or amore complex weighted social-graph. The former has beenselected for this paper experiments based on empirical con-clusions made by [2] while comparing CF and Social Filter-ing. Similarities between friends were in average higher thanthe same correlation measurement between non-connectedusers. Moreover, both weighted and basic social RSs per-formed the same or better than pure collaborative filteringRSs for the referred case.
Further than looking at social connections, the latter is
34

Table 1: MyPopCorn and GroupLens datasets.Users Ratings Movies
MyPopCorn 129 14k 3kGroupLens 72k 10M 10k
a trust-based RS that focuses on weighted relationships. Aclear comparison between social RS and trust-based RS isdefined in [10]. Moreover, [3] highlights the possibility of ex-plaining recommendations based on social connections andthe fact active users rate better the RS in case of existingsuch transparency. Finally, the social RS described herebyprofits from an unweighted social graph.
3. FRAMEWORKAs claimed in [15, pg 15], the context in which a RS is
developed and its expected features determine the optimalalgorithm to be adopted. Parameters such as movie do-main, social community context, rating strategy and sparsedata were definitely crucial to come up with the final ar-chitecture described hereby. A Facebook application calledMyPopCorn1, the RS front-end, and a social based imple-mentation of user neighborhood CF algorithm compose thecurrent framework, to be presented in the two following sec-tions.
3.1 MyPopCorn, a Facebook app as Front-EndThe idea of building this movie recommender system and
making it available on a social network is due to the factsocial graph enables proposed recommendation experimentsbased on social neighborhoods. Moreover, the capability ofrecommending to an active user and receiving an online feed-back on rating prediction accuracy on recommended itemsis decisive to benchmark the implemented algorithms.
MyPopCorn is a web movie recommender system. Someof its interfaces are composed as follows:
First screen presents a brief description of the main fea-tures before the user joins the application. After that, anactive user can check statistics about top users and friends;
MyTaste is where a user can rate movies. Recommendation-wise, this is one of the main interactions with the user, inwhich RS collects data;
My Friends’ Taste presents a list of friends and theirrespective number of ratings. The more ratings each friendhas, the bigger his or her basket gets.
3.1.1 Social-Graph DataThe first collaborative data with ratings over movies were
taken from GroupLens 10M dataset. From that point, thedatabase was increased with ratings from users of MyPop-Corn. Information about users, friendships are also madepersistent into the same database. The dataset used for theexperiments is summarized in Table 1.
In a very short timeframe, the application was acceptedby a good number of users. Almost 130 active users havebeen exploring the application during 2 months time. Figure1 illustrates all users who contributed for the experimentscarried out into this paper. The more movies a user rates,the bigger the node is represented in the social graph. Theaverage degree of connections in this graph was 10.543.
1http://mypopcorn.info/
Figure 1: Social Graph representation of MyPop-Corn database.
3.1.2 Rating StrategyIn MyPopCorn, the user can choose a rating from 1 to
5 ‘stars’. Asymmetric labels were defined for each of the 5stars to achieve a more homogeneous judgment, namely Bad,Regular, Good, Great and Masterpiece. Test users reportedgood feedback on the proposed rating strategy claiming thisdiscrete labeled design is certainly more intelligible, whereusers can have a hint of what each rating value may rep-resent. While following such design, this research aims atreducing subjectivity that is intrinsic to rating process, thecore interaction responsible for obtaining the main input ofa Collaborative Filtering RS. This strategy also prevents thenecessity of the RS to normalize user ratings.
3.1.3 Recommendation StrategyRecommendations are generated from two implementa-
tions of user neighborhood recommenders, such as follows:
• Provided by a traditional user-based RS. The neigh-borhood calculated among all users in the database;
• Provided by a social-graph user-based RS. A socialneighborhood is based on the set of active user friends,to be described in more details in the next section.
A shuffled list of recommendations generated by both RSimplementations is presented to the user. Movie descriptionand a continuous predicted value is presented. Therefore,recommendations are seen as a regression and not a clas-sification problem within this framework. Finally, at thebottom of the frame one can see the explanation about eachrecommendation(see Figure 2). In the first example on lightblue background, a message informs the recommendationwas “Based on all MyPopCorn database“. Alternatively, thesecond message informs that is was “Based on friends withclosest taste“, followed by the list of users Friend X andFriend Y.
Figure 2: Recommendation strategy in MyPopCorn.
35

This system is designed to give the most transparent rec-ommendations possible. In view of that, the reasoning be-hind the RS can be better understood by presenting thereal number as predicted rating value. Furthermore, ex-plaining the recommendation with a list of users will trans-form a formerly impersonal recommendation into a socialpassive interaction between friends. Due to privacy issues,presenting this list is only possible for the social neighbor-hood approach, where content sharing among users is agreedin advance.
3.2 Movie RS Back-EndThe final architecture of the social-graph recommender
was developed on top of the user-based RS implementationprovided in Mahout2. User neighborhood CF paradigm hasclose reasoning to social user behavior, being the most rel-evant criterion that influenced this design choice. In pos-session of information about users taste, this user-centeredmethod focus on comparing similarity among users. Fur-thermore, friendship data will be essential to enable modifi-cations on the original algorithm. Insights on how to profitfrom social context information in different dimensions willbe addressed below.
4. INSIGHTS ON RS CHALLENGESAs the title suggests, solutions to the current RS chal-
lenges listed in Related Work are described in this section.Each of the following implemented scenarios tackle threemain challenges previously mentioned, namely computationalcomplexity issues of scalable user-neighborhood RSs; sparsedata about new users, known as cold start problem; anddefinition of optimal evaluation methods for transparent andnon-transparent recommendations.
4.1 Social NeighborhoodThe idea of narrowing the dataset to a subset of users
aims to tackle scalability constraints and increase real-timeperformance, two issues that are intrinsic to user-based RS[7]. Assuming that calculating an active user’s neighborhood(comprised of k similar users) among his or her social con-nections might be representative enough, good recommenda-tions could be achieved without the necessity of comparinga user preference vector with all other users in the database.This hypothesis is based on a related work comparing thecorrelation between users similarity and the binary fact ofbeing or not being friends[2]. It was observed that similar-ities between friends are in average higher than the samecorrelation measurement between non-connected users.
Experiments were performed in order to investigate thethree insights proposed above. A standard user-based neigh-borhood RS setup is incrementally modified from the currentinsight until the third one. This scenario focus on predict-ing ratings contained in a training set comprised of 5% of all14.367 ratings provided by MyPopCorn users. The reasonfor not adding any rating from GroupLens into the trainingset of the standard neighborhood is allow a fair comparisonbetween both neighborhoods. By applying two strategies,namely Standard full neighborhood and hereby proposedSocial one, some hypotheses are tested: (i) Real-time rec-ommendation performance will become much more efficientwhile adopting social neighborhood; (ii) Rating prediction
2Apache Mahout machine learning library
accuracy from social neighborhood recommendations will beas much precise as in the standard method.
For the proposed experiment methods, standard neighbor-hood RS performs around 70k calculations, the number of allusers in the merged dataset. In the case of social neighbor-hood, the number of comparisons is relative to the degree ofeach node (user) in the social graph, which varies from 0 to49 for MyPopCorn dataset with an average degree of 10.543.Concerning average runtime, whereas prediction process forone rating takes around 950.55 ms for standard neighbor-hood, after narrowing the search space to the set of socialconnections, it takes in average 69.975 ms, 92.63% lower.Regarding accuracy, Figure 3 presents prediction accuracyerror for this new neighborhood compared to the standardimplementation. Both implementations were compared byvarying the size of the neighborhood k while experimentingtwo values of threshold t=1 and t=2. This threshold definesthe minimum number users in the neighborhood that rateda same candidate item. When t=2, the items rated by onlyone user in the neighborhood are not taken into account.
Figure 3: Standard and Social Neighborhoods pre-diction accuracy (RMSE).
The minimum RMSE = 0.8385664 was obtained by Stan-dard neighborhood (k=3,t=2). Besides that, Social (k=2,t=2)achieved RMSE = 1.018598. Surprisingly, rating predictionaccuracy also improved. Except for values of k neighborsequal to 2 and 3, Social Neighborhood outperforms, in av-erage, the standard method, confirming the first hypothesisfor this scenario. Besides that, the value of threshold t=2performs better. The fact of accepting only items rated byat least two users might have increased the confidence onpreference data, achieving better accuracy results. On thecontrary, hypothesis 2 was surprisingly refuted. Instead ofperforming almost the same as in the original approach, So-cial Neighborhood can significantly outperform predictionaccuracy for k > 3. While increasing the value of k, such so-cial neighborhood enables a more accurate predictions and,probably, reaching higher serendipity.
Remark: This approach is not available for people withno or few friends, suffering from the cold start problem, tobe solved next.
36

4.2 Social Aggregation for Cold-start ProblemOne of the main issues related to RS, the cold-start prob-
lem or new-user problem prohibit some active users to re-ceive recommendations. In the dataset used for all experi-ments, 21 users out of 129 have rated less than 10 movies,while others more than a thousand. These users with fewratings are almost unable to receive any recommendation.
Instead of adopting the classic approaches such as content-based or presenting a list to be rated as from the first userinteraction, this paper proposes a solution based on social-graph information. It is based strategy from group RS basedon aggregating user profiles. One could see this problemfollowing the quote “Tell me who your friends are and I willtell you who you are“. This reasoning is also motivated bythe work carried out in [2], where social filtering is exploredand conclusions reinforce the suggested heuristic. Likewise,[?] developed a probabilistic RS and achieved good resultsin experiments where active users were recommended itemsbased on the preferences of his or her social connections.On the contrary, the idea presented in this paper followsthe same reasoning of absorbing social context data intothe system to solve the cold-start problem, nevertheless, bydifferent means (based on group RS) and in a different RSimplementation technique (user neighborhood RS).
Among some aggregation techniques mentioned in the Re-lated Work, Average without Misery is adopted, since it findsa balance between the Least Misery and Average. It pre-serves the main advantages of both aggregation strategiesoriginally applied to group RS and now reflected in the ag-gregated virtual profile to be considered by our single-userRS. It follows the human-like reasoning in which a group ofpeople tend to select items that please, in average, most per-sons involved. Moreover, it excludes items once rated belowa defined threshold, as described by [13]. The same authorproposed such aggregation for solving the cold-start problemin [12], although in a different RS paradigm. Experimentswere run in order to test the following hypothesis: (i) Rec-ommendation accuracy for aggregated virtual social profileperforms not much worse than cross-validation of real rat-ings. Hence, it would be a feasible solution to the cold-startproblem.
The social neighborhood method was adopted with pa-rameters k=4 and t=1, so that the most number of pre-dictions are enabled. The idea here is to investigate howmany active users had the cold-start problem, meaning theirneighborhoods were empty. While repeating the experi-ments from last section in 5% of MyPopCorn ratings dataset,around 103 users were in the testset. Nevertheless, RS couldnot estimate any rating for 13 users due to empty neighbor-hood issue. 6 users had no social connections, what cannot be solved by the method proposed here. The remaining7 users had their ratings predicted with accuracy error ofRMSE = 1.69588.
One should raise the question that this is not much data,referring to the tiny set of 7 users. In view of that, an-other experiment has been run on 50% of ratings in MyPop-Corn dataset. Ratings of 44 users experiencing the cold-start problem were hidden iteratively in order to be pre-dicted by the RS. Foreach of the 44 users, the RS generateda virtual profile based on aggregating all ratings from theirfriends, including those removed in order to artificially causethe cold-start problem. Only 8 new users(18%) could not behelped by this method of aggregation due to the fact of hav-
ing no social connections. Prediction accuracy error wasRMSE = 1.37461.
Compared to the accuracy evaluated in the experimentsof previous sections (RMSE = 1.173435 for k=4, t=1),this proposed solution to the cold-start problem has de-creased performance in around 20%, considering the RMSE= 1.37461. In view of that, the proposed solution is con-sidered to be a good alternative for social RSs. Besidesnot compromising the prediction accuracy significantly, thismethod should be considered in terms of how efficient the RScan deal with new users that are not interested in providingmany ratings as from the first interaction. Despite not be-ing an objective metric, the ability of solving the cold-startshould be incorporated into RS evaluation.
4.3 Comparison of Evaluation MethodsWhile the first insight focuses on the two objective evalua-
tion metrics, namely prediction accuracy and computationalcomplexity, this insight focuses on transparency, a subjectivemetric, and evaluation methods. The most popular evalua-tion metric throughout RS state-of-the-art, prediction accu-racy benchmark is often based on offline cross-validation anderror calculation over Root Mean Squared Error - RMSE. Inview of that, this third and last section compares offline andonline methods of calculating estimation accuracy togetherwith more transparent recommendations based on social ex-planation. One hypothesis is that this online method mightmake offline approach suboptimal for the context of socialrecommenders. Instead of cross-validation, one should con-sider the social factor involved within online evaluation. Dueto the strategy of recommending a list of movies whose pre-dicted ratings might not be always high and to make it moretransparent, the predicted value is presented to the activeuser. Assuming that not many people tend to converge withthe RS prediction, this strategy will not bias the compari-son. Actually, we believe there are people who also try todiverge from what has been predicted.
The current experiment intends to test the effect of ex-plained recommendations, as previously described in [18],but now in the context of social RSs, as defined in the fol-lowing hypothesis: (i) Assuming social RSs where recom-mendations based on social connections are explained, rat-ing estimation accuracy achieve better results if evaluatedonline, instead of offline.
Besides RMSE, metrics such as novelty or serendipity weretaken into account while choosing higher values of k otherthan the ones that reached minimum accuracy, shown inFigure 3. Although the same number of recommendationswith standard and social neighborhood were generated, ac-tive users gave more feedback on the social ones. 119 onlinefeedbacks were provided, as presented in Table 2 in compar-ison with the traditional offline method.
As Table 2 shows, Standard Neighborhood method achieveda prediction accuracy of 1.0646 and Social Neighborhood RSsetup achieved better rating prediction accuracy of RMSE= 0.9952. Both of them presented an improvement whenevaluated online other than offline. The decrease in RMSEwas of 14.16% and 6.64%.
Hypothesis was confirmed by the numbers shown in Table2. Surprisingly, online evaluation accuracy with StandardNeighborhood improved better (14.16%) than 6.64% gainachieved by Social Neighborhood strategy. Finally, resultshave shown that, in average, RSs tend to present better
37

Table 2: Online evaluation of social and standardneighborhood.
Std. N. Social N.Setup k=8, t=2 k=4, t=2OfflineRMSE 1.240429 1.066049OnlineRMSE 1.064686 0.995211Improvement 14.16% 6.64%
accuracy results in online evaluations than offline for bothexplained and non-explained recommendations.
5. CONCLUSIONSThis paper first discussed the computational requirements
intrinsic to user neighborhood RS, by nature a non-scalablealgorithm. Based on the two most important evaluationmetrics, state space reduction enabled a decrease of 92.63%in computational complexity, while not compromising accu-racy. Instead, the latter also improved.
Social graph was essential to enable a solution to the cold-start problem. Tested with success in group RS, Averagewithout Misery enabled creation of virtual profiles based onactive users network. Results confirmed the proposed hy-pothesis, indicating this solution as a good alternative tothis issue while presenting a decrease on prediction accu-racy of only 20% by cross-validation.
Another important achievement was caused by transpar-ent recommendations. Results from the third insight turnprediction accuracy by cross-validation an even more ques-tionable benchmark method. Both neighborhood formationmethods presented a considerable improvement of 6.64%and 14.12%. While choosing online evaluation methods, onecould have better conclusions about the RS quality.
6. ACKNOWLEDGMENTSThis research is part of a master studies sponsored by
Monesia: MObility Network Europe-Southamerica: an Insti-tutional Approach, an Erasmus Mundus External Coopera-tion Window.
Thanks Lucas Carvalho, researcher at Federal Universityof Sergipe - Brazil, for cooperating on the development ofthe Facebook application named MyPopCorn.
7. REFERENCES[1] X. Amatriain and J. Basilico. Netflix
recommendations: Beyond the 5 stars, 2012.
[2] G. Groh and C. Ehmig. Recommendations in tasterelated domains: collaborative filtering vs. socialfiltering. In Proceedings of the 2007 internationalACM conference on Supporting group work, pages127–136. Citeseer, 2007.
[3] I. Guy, N. Zwerdling, D. Carmel, I. Ronen, E. Uziel,S. Yogev, and S. Ofek-Koifman. Personalizedrecommendation of social software items based onsocial relations. In Proceedings of the third ACMconference on Recommender systems, pages 53–60.ACM, 2009.
[4] J. Herlocker and J. Konstan. Explaining collaborativefiltering recommendations. of the 2000 ACMconference on, pages 241–250, 2000.
[5] J. Herlocker, J. Konstan, L. Terveen, and J. Riedl.Evaluating collaborative filtering recommendersystems. ACM Transactions on Information Systems(TOIS), 22(1):5–53, 2004.
[6] D. Infographic. Visualizing the petabyte age, 2010.
[7] G. Karypis. Evaluation of item-based top-nrecommendation algorithms. In Proceedings of thetenth international conference on Information andknowledge management, pages 247–254. ACM, 2001.
[8] Y. Koren, R. Bell, and C. Volinsky. Matrixfactorization techniques for recommender systems.Computer, 42(8):30–37, 2009.
[9] P. Lops, M. Gemmis, and G. Semeraro. Content-basedrecommender systems: State of the art and trends.Recommender Systems Handbook, pages 73–105, 2011.
[10] H. Ma, D. Zhou, C. Liu, M. Lyu, and I. King.Recommender systems with social regularization. InProceedings of the fourth ACM internationalconference on Web search and data mining, pages287–296. ACM, 2011.
[11] P. Massa and P. Avesani. Trust-aware collaborativefiltering for recommender systems. On the Move toMeaningful Internet Systems 2004: CoopIS, DOA, andODBASE, pages 492–508, 2004.
[12] J. Masthoff. Modeling the multiple people that areme. User Modeling 2003, pages 146–146, 2003.
[13] J. Masthoff. Group modeling: Selecting a sequence oftelevision items to suit a group of viewers. UserModeling and User-Adapted Interaction, 14(1):37–85,2004.
[14] A. Rashid, I. Albert, D. Cosley, S. Lam, S. McNee,J. Konstan, and J. Riedl. Getting to know you:learning new user preferences in recommender systems.In Proceedings of the 7th international conference onIntelligent user interfaces, pages 127–134. ACM, 2002.
[15] F. Ricci, L. Rokach, and B. Shapira. Introduction torecommender systems handbook. RecommenderSystems Handbook, pages 1–35, 2011.
[16] B. Sarwar, G. Karypis, J. Konstan, and J. Reidl.Item-based collaborative filtering recommendationalgorithms. In Proceedings of the 10th internationalconference on World Wide Web, pages 285–295. ACM,2001.
[17] B. Sarwar, G. Karypis, J. Konstan, and J. Riedl.Recommender systems for large-scale e-commerce:Scalable neighborhood formation using clustering. InProceedings of the Fifth International Conference onComputer and Information Technology, pages158–167, 2002.
[18] N. Tintarev and J. Masthoff. Designing and evaluatingexplanations for recommender systems. RecommenderSystems Handbook, pages 479–510, 2011.
[19] P. Victor, M. Cock, and C. Cornelis. Trust andrecommendations. Recommender Systems Handbook,pages 645–675, 2011.
38

User Evaluation of Fusion-based Approach forSerendipity-oriented Recommender System
Kenta OkuCollege of Information Science and Engineering,
Ritsumeikan University1-1-1 Nojihigashi, Kusatsu City
Shiga, [email protected]
Fumio HattoriCollege of Information Science and Engineering,
Ritsumeikan University1-1-1 Nojihigashi, Kusatsu City
Shiga, [email protected]
ABSTRACTIn recent years, studies have focused on the development ofrecommender systems that consider measures that go be-yond simply the accuracy of the system. One such measure,serendipity, is de�ned as a measure that indicates how therecommender system can �nd unexpected and useful itemsfor users. We have previously proposed a fusion-based rec-ommender system as a serendipity-oriented recommendersystem. In this study, we improve upon this system by con-sidering the concept of serendipity. Our system possessesmechanisms that can cause extrinsic and intrinsic accidents,and it enables users to derive some value from such acci-dents through their sagacity. We consider that such mech-anisms are required for the development of the serendipity-oriented recommender system. The key idea of this system isthe fusion-based approach, through which the system mixestwo user-input items to �nd new items that have the mixedfeatures. The contributions of this paper are as follows:providing an improved fusion-based recommender systemthat adopts a fusion-based approach to improve serendip-ity; practically evaluating the recommender system throughuser tests using a real book data set from Rakuten Books;and showing the e�ectiveness of the system compared torecommender systems on websites such as Amazon from theviewpoint of serendipity.
Categories and Subject DescriptorsH.3.3 [Information Search and Retrieval]: Information Fil-tering
General TermsExperimentation
KeywordsRecommender systems, Serendipity-oriented recommendersystems, Serendipity
Copyright is held by the author/owner(s). Workshop on RecommendationUtility Evaluation: Beyond RMSE (RUE 2012), held in conjunction withACM RecSys 2012. September 9, 2012, Dublin, Ireland.
1. INTRODUCTIONIn recent years, several studies have focused on the de-
velopment of recommender systems that consider measuresbeyond simply the accuracy of the system, such as the nov-elty, diversity, and serendipity [1][2]. This is because thesestudies have found that users are not always satis�ed withrecommender systems with only high accuracy�they desirefor the systems to consider various other viewpoints, too.In an attempt to satisfy this need, in this study, we fo-
cus on the serendipity. Serendipity means "the ability tomake unexpected and valuable discoveries by accident." Wethus de�ne a serendipitous item as something unexpectedand valuable, and we believe that such an item can diver-sify users' interest regardless of their experiences, thus mak-ing their lives richer. This study therefore aims to developa serendipity-oriented recommender system that providesusers with serendipitous items.First, it is necessary to gain some insight into the origi-
nal meaning of the word "serendipity." The word "serendip-ity" originated from a story called "The Three Princes ofSerendip" [3], which tells the story of three princes. Theseprinces discovered a series of novel things during the courseof various and unexpected events on their journeys, whichthey attributed to their luck. Horace Walpole, who readthis story, stated that "the princes were always making dis-coveries, by accidents and sagacity," to describe which hecoined the word "serendipity," which means "the ability tomake unexpected discovery by accidents and sagacity" [4].In light of Walpole's de�nition, we believe that a serendipity-oriented recommender system should possess an interfacethat has mechanisms that output "unexpected discoveries"based on the input of "accidental events" experienced by theusers and the sagacity of the users.In addition, [4] states that accidents are of two types: "ex-
trinsic" and "intrinsic." For example, a well-known serendip-itous discovery is that of gravity�it is stated that "Newtonhad an inspiration of the notion of universal gravitation atthe sight of an apple that fell from a tree"[5]. In this event,the apple falling from the tree can be considered an "ex-trinsic accident," that is, one that occurs regardless of theaction of a person. Another example of a serendipitous dis-covery is that made by Koichi Tanaka, which won him theNobel Prize in Chemistry in 2002. Although he realizedthat he had accidentally used glycerin instead of acetoneas a sample, he continued his experiments in order to ob-serve the results. This led to him discovering an unknownphenomenon. In this event, the discovery of the unknown
39

phenomenon can be considered an "intrinsic accident," thatis, one that results from the action of a person with thepositive expectation of something. It is of great importanceto derive some value from these accidents. In this light, aperson's sagacity plays a crucial role.The above-described examples suggest that a serendipity-
oriented recommender system should have an interface con-sisting of the following mechanisms:
(a) A mechanism that causes extrinsic accidents.
(b) A mechanism that causes intrinsic accidents.
(c) A mechanism that enables users to derive some valuefrom accidents through their sagacity.
In this study, we have proposed a fusion-based recommendersystem to satisfy these requirements. The key idea of thissystem is adopting a fusion-based approach for discoveringserendipitous items by mixing two user-input items together.As described at the beginning of this section, we de�nea serendipitous item as an unexpected and valuable item.Speci�cally, the following items are relevant to serendipitousitems:
• Items that can excite the user's interest for the �rsttime although he/she does not know about them andhe/she would not be able to discover them by him-self/herself.
• Items that can excite the user's interest for the �rsttime although he/she thought that he/she was not in-terested in them.
• Items that can attract the user's interest after beingdisplayed by the system.
We also de�ne a high-serendipity recommender system thatcan recommend more serendipitous items to users.By using our proposed fusion-based recommender system,
a user can mix two items together in the system interface tocreate something new from something existing in a manneranalogous to mixing colors, ingredients, or sounds. The actof mixing also entails the following:
a) We can intuitively expect mixed results from a combi-nation of inputs. On the other hand, some combina-tions can yield unexpected results.
b) Because our curiosity may be aroused by the intu-itive comprehensibility and unexpectedness of the actof mixing, we might feel like being creative and mixingvarious combinations of inputs.
Characteristic (a) corresponds to the mechanism that causesintrinsic accidents because unexpected results may be pro-duced by mixing materials together with the expectation ofsome positive results. Characteristic (b) corresponds to themechanism that enables us to derive some value from ac-cidents through our sagacity in that we can select valuableinputs from among the given inputs.Figure 1 shows the interface of the fusion-based recom-
mender system for book recommendation. When the userclicks [Random], [Search], [Popular], and [New] buttons, thesystem randomly provides the user with corresponding booksfrom the book database. Randomly providing books corre-sponds to the mechanism that causes extrinsic accidents.
Figure 1: Interface of Fusion-based Recommender System.
The user can also select an interesting book as a materialfrom the displayed books based on his/her sagacity, and thendrag-and-drop it into a base book, which is also selected bythe user. The system then provides the user with books pos-sessing mixed features of the two books. Although the usercan select books to mix with some expectation, some bookcombinations may yield unexpected results. This may causeintrinsic accidents. The user can repeatedly and creativelyuse the system to see various mixing results until he/sheis satis�ed with the results. In this process, serendipitousitems are interactively provided to the user.We have already developed a predecessor to the proposed
fusion-based recommender system[6]. In this study, we haveimproved upon the system interface and internal process-ing based on the deeper idea of serendipity, and we haveevaluated this system from the viewpoint of practical use.The contributions of this study are as follows:
• developing the improved fusion-based recommender sys-tem that adopts a fusion-based approach for improvingthe serendipity;
• experimentally evaluating the practical usability of therecommender system using a real book data set fromRakuten Books;
• showing the e�ectiveness of the system compared torecommender systems on websites such as Amazonfrom the viewpoint of serendipity.
2. RELATED WORKHerlocker et al. [1] suggested that recommender systems
with high accuracy do not always satisfy users. Therefore,they suggested that recommender systems should be eval-uated not only by their accuracy but also by various othermetrics such as novelty, diversity, and serendipity.Several studies have already focused on serendipity in the
context of recommendation. Ziegler et al. [7][8] suggestedthat diversifying recommendation lists improves user satis-faction. Toward this end, they proposed topic diversi�cation
40
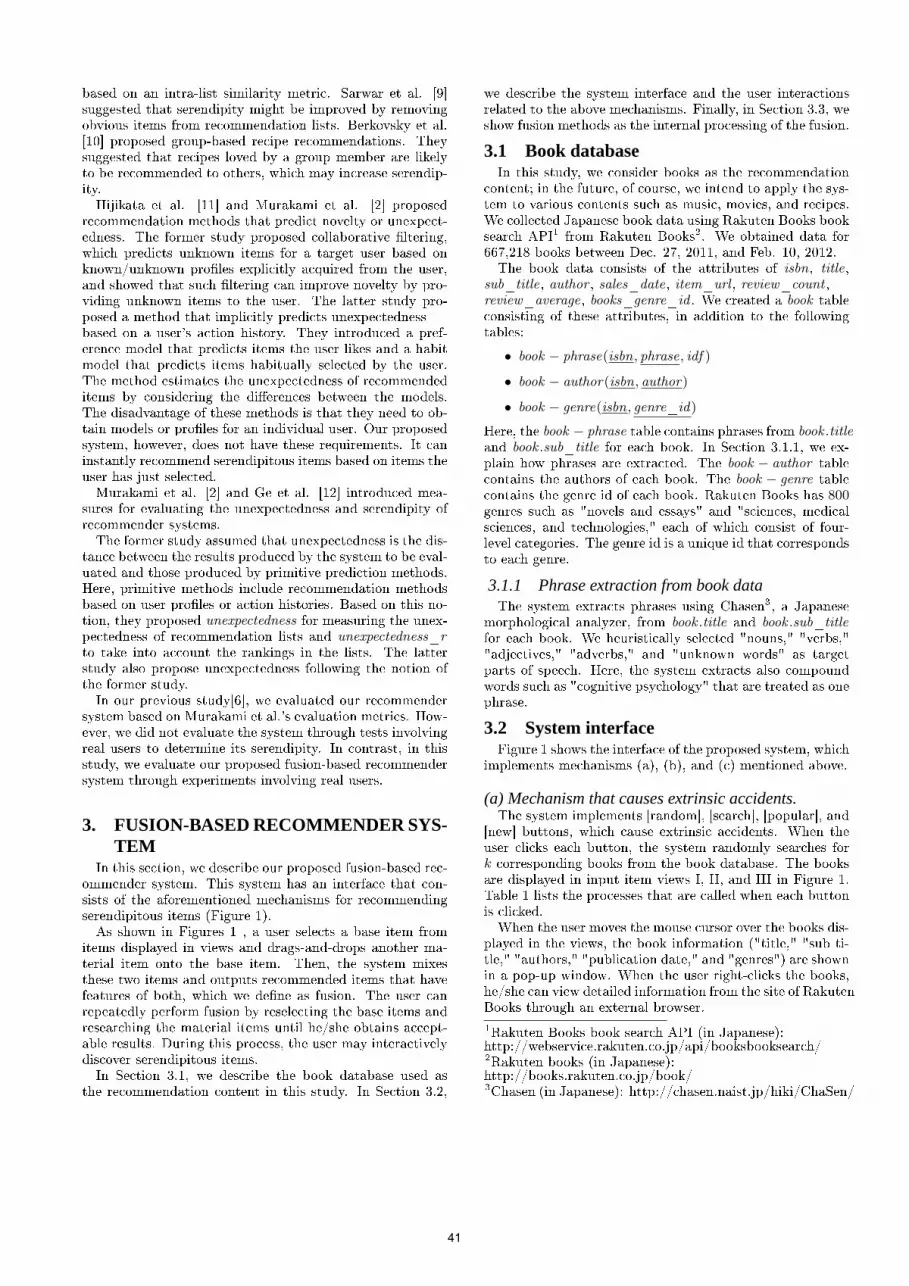
based on an intra-list similarity metric. Sarwar et al. [9]suggested that serendipity might be improved by removingobvious items from recommendation lists. Berkovsky et al.[10] proposed group-based recipe recommendations. Theysuggested that recipes loved by a group member are likelyto be recommended to others, which may increase serendip-ity.Hijikata et al. [11] and Murakami et al. [2] proposed
recommendation methods that predict novelty or unexpect-edness. The former study proposed collaborative �ltering,which predicts unknown items for a target user based onknown/unknown pro�les explicitly acquired from the user,and showed that such �ltering can improve novelty by pro-viding unknown items to the user. The latter study pro-posed a method that implicitly predicts unexpectednessbased on a user's action history. They introduced a pref-erence model that predicts items the user likes and a habitmodel that predicts items habitually selected by the user.The method estimates the unexpectedness of recommendeditems by considering the di�erences between the models.The disadvantage of these methods is that they need to ob-tain models or pro�les for an individual user. Our proposedsystem, however, does not have these requirements. It caninstantly recommend serendipitous items based on items theuser has just selected.Murakami et al. [2] and Ge et al. [12] introduced mea-
sures for evaluating the unexpectedness and serendipity ofrecommender systems.The former study assumed that unexpectedness is the dis-
tance between the results produced by the system to be eval-uated and those produced by primitive prediction methods.Here, primitive methods include recommendation methodsbased on user pro�les or action histories. Based on this no-tion, they proposed unexpectedness for measuring the unex-pectedness of recommendation lists and unexpectedness_rto take into account the rankings in the lists. The latterstudy also propose unexpectedness following the notion ofthe former study.In our previous study[6], we evaluated our recommender
system based on Murakami et al.'s evaluation metrics. How-ever, we did not evaluate the system through tests involvingreal users to determine its serendipity. In contrast, in thisstudy, we evaluate our proposed fusion-based recommendersystem through experiments involving real users.
3. FUSION-BASED RECOMMENDER SYS-TEM
In this section, we describe our proposed fusion-based rec-ommender system. This system has an interface that con-sists of the aforementioned mechanisms for recommendingserendipitous items (Figure 1).As shown in Figures 1 , a user selects a base item from
items displayed in views and drags-and-drops another ma-terial item onto the base item. Then, the system mixesthese two items and outputs recommended items that havefeatures of both, which we de�ne as fusion. The user canrepeatedly perform fusion by reselecting the base items andresearching the material items until he/she obtains accept-able results. During this process, the user may interactivelydiscover serendipitous items.In Section 3.1, we describe the book database used as
the recommendation content in this study. In Section 3.2,
we describe the system interface and the user interactionsrelated to the above mechanisms. Finally, in Section 3.3, weshow fusion methods as the internal processing of the fusion.
3.1 Book databaseIn this study, we consider books as the recommendation
content; in the future, of course, we intend to apply the sys-tem to various contents such as music, movies, and recipes.We collected Japanese book data using Rakuten Books booksearch API1 from Rakuten Books2. We obtained data for667,218 books between Dec. 27, 2011, and Feb. 10, 2012.The book data consists of the attributes of isbn, title,
sub_title, author , sales_date, item_url , review_count ,review_average, books_genre_id . We created a book tableconsisting of these attributes, in addition to the followingtables:
• book − phrase(isbn, phrase, idf )
• book − author(isbn, author)
• book − genre(isbn, genre_id)
Here, the book − phrase table contains phrases from book .titleand book .sub_title for each book. In Section 3.1.1, we ex-plain how phrases are extracted. The book − author tablecontains the authors of each book. The book − genre tablecontains the genre id of each book. Rakuten Books has 800genres such as "novels and essays" and "sciences, medicalsciences, and technologies," each of which consist of four-level categories. The genre id is a unique id that correspondsto each genre.
3.1.1 Phrase extraction from book dataThe system extracts phrases using Chasen3, a Japanese
morphological analyzer, from book .title and book .sub_titlefor each book. We heuristically selected "nouns," "verbs,""adjectives," "adverbs," and "unknown words" as targetparts of speech. Here, the system extracts also compoundwords such as "cognitive psychology" that are treated as onephrase.
3.2 System interfaceFigure 1 shows the interface of the proposed system, which
implements mechanisms (a), (b), and (c) mentioned above.
(a) Mechanism that causes extrinsic accidents.The system implements [random], [search], [popular], and
[new] buttons, which cause extrinsic accidents. When theuser clicks each button, the system randomly searches fork corresponding books from the book database. The booksare displayed in input item views I, II, and III in Figure 1.Table 1 lists the processes that are called when each buttonis clicked.When the user moves the mouse cursor over the books dis-
played in the views, the book information ("title," "sub ti-tle," "authors," "publication date," and "genres") are shownin a pop-up window. When the user right-clicks the books,he/she can view detailed information from the site of RakutenBooks through an external browser.
1Rakuten Books book search API (in Japanese):http://webservice.rakuten.co.jp/api/booksbooksearch/2Rakuten books (in Japanese):http://books.rakuten.co.jp/book/3Chasen (in Japanese): http://chasen.naist.jp/hiki/ChaSen/
41

Table 1: Search processing by each button.Button Processing Target viewRandom Searching k books from the book
database at random.Input itemview I
Search Searching k books at random frombooks whose title or sub_title includeskeywords input in the text box.
Input itemview II
New Searching k books at ran-dom from books satisfyingreview_count × review_average ≥ θ.
Input itemview III
Popular Searching k books at random frombooks saled last one month.
Input itemview III
(b) Mechanism that causes intrinsic accidents.The system implements a fusion mechanism as an inter-
face that causes intrinsic accidents.The user can select a base item by double-clicking a book
from among the books in the input item view or recommen-dation item view. The base item is considered as the basiswhen performing fusion.The user can select a material item from among the books
in the same two views. The material item is used for per-forming fusion with the base item. When the user drags-and-drops the material item onto the base item, fusion ofthe two items is performed. The system then displays theitems outputted by the fusion in the recommendation itemview. In Section 3.3, we de�ne three fusion methods. Thesystem displays items outputted by each fusion method inthe corresponding recommendation item view I, II, or III.
(c) Mechanism that enables users to derive some valuefrom accidents through their sagacity.In mechanism (b), the user can select a base item and a
material item from among the books deemed interesting inthe views. Such intuitive selection of books may correspondto his/her sagacity.Here, the type of book that can be selected depends on
the user. When performing fusion, the user can select itemsthat are suitable for his/her preferences as well as items thatare considered interesting.
3.3 Fusion methodAs shown in Section 3.2 (b), fusion is performed using
the base and the material item when the user drags-and-drops the material item onto the base item. We de�ne thefollowing three methods as fusion methods. In this section,bookA, bookB , and book denote the base item, material item,and recommended item, respectively.
phrase − phrase fusion.The phrase − phrase fusion method searches for a maxi-
mum of m books whose book .title or book .sub_title includesat least one phrase from the phrase list bookA.phraseList inbookA and at least one phrase from the phrase listbookB .phraseList in bookB . The searched books are shownin recommendation item view I. Figure 2 (a) shows an exam-ple of fusion for bookA�"Equation loved by a doctor"�andbookB�"Magic for cleaning up giving palpitations of life."In this case, the system displays "Magic doctor" based on"doctor" in bookA and "magic" in bookB .
phrase − genre fusion.The phrase−genre fusion method searches for a maximum
Figure 2: Example of each fusion method.
of m books whose book .title or book .sub_title includes atleast one phrase from the phrase list bookA.phraseList inbookA and whose book .genre_id corresponds to at least onegenre from the genre list bookB .genre_idList in bookB . Thesearched books are shown in recommendation item view II.Figure 2 (b) shows an example of the fusion of bookA�"Management"�and bookB�"Equation loved by a doctor."In this case, the system displays "If a female student who is amanager of high-school baseball team reads `Management',"whose book .title or book .sub_title includes "management"and whose book .genre_id corresponds to bookB .genre_id(i.e., "[novels and essays � Japanese novels]").
phrase − author fusion.The phrase − author fusion method searches for a maxi-
mum of m books whose book .title or book .sub_title includesat least one phrase from the phrase list bookA.phraseList inbookA and whose book .author corresponds to at least oneauthor from the author list bookB .authorList in bookB . Thesearched books are shown in recommendation item view III.Figure 2 (c) shows an example of the fusion of bookA�"Neuroscience of language"�and bookB�"Excitement ofscience by Kenichiro Mogi." In this case, the system displays"Neuroscience class we want to take the best in the world,"whose book .title or book .sub_title includes "neuroscience"and whose book .author corresponds to bookB .author (i.e.,"[Kenichiro Mogi]").
4. EXPERIMENTSIn this section, we show the experimental results of user
tests of our proposed fusion-based recommender system. We
42

implemented this system using Java and Processing as theevaluation system. In the experiments, we selected booksas recommendation contents and created the book databasedescribed in Section 3.1 using MySQL.
4.1 Experimental methodNine subjects (eight males and one female) participated
in our study. Their age is from 20 to 23. They had av-erage computer skills and used the Internet regularly (ev-ery day/nearly every day). They also used online shoppingwebsites such as Amazon very rarely (a few times so far) orrarely (a few times a month). They read books rarely (a fewtimes a month) or moderately (once to three times a week).The experimental procedure is as follows:
(1) We explain the recommender system to be used to eachsubject and provide them with the task "Find threebooks you want to read on holidays."
(2) Each subject carries out the task using the assignedsystem (without time limitation).
(3) If the subject �nds suitable books, he/she marks them(at most 3 books). We call these books the main rec-ommended books.
(4) If the subject �nds books that are not suitable but areinteresting, he/she marks them (any number of books).We call these books the sub-recommended books.
(5) The subject �nishes the task when he/she �nds threemain recommended books. However, he/she can �nishthe task if he/she is satis�ed or satiated with even lessthan three books.
(6) After the task is �nished, the subject answers all thequestions listed in Table 2 for each recommended book.
(7) The subject performs the same steps for each recom-mender system.
Section 4.2 discusses the recommender systems used in theexperiments. Each subject uses the various recommendersystems in a di�erent order to cancel any e�ect that mightotherwise be produced.Table 2 lists the questions about the recommended books.
Here, the subjects answered Q1 using a three-level scale{3:unknown, 2:known but never read, 1:have been ever read},and Q2 to Q4 using a �ve-level scale {5:strongly agree,4:agree, 3:neither agree nor disagree, 2:disagree, 1:stronglydisagree}. With regard to "by myself" in Q4, we explainedto the subjects that "if you think that you can easily �ndthe book by using existing search engines (e.g., Google, Ya-hoo!) or by using a genre or keyword search at online/realbook stores or libraries by yourself, the book is regarded as`�ndable book by myself'."After all tasks were �nished, the subjects answered ques-
tions, �this system excited my interest and enabled me todiscover somthing new,� which is related to serendipity ofthe recommender systems using the same �ve-level scale.
4.2 Comparative systemsWe choose Amazon4, a large online store with recom-
mender systems, for comparison with our proposed system.
4amazon.co.jp (Japanese site): http://www.amazon.co.jp/
Table 2: Questions for recommended books.No. QuestionQ1 I did not know this book.Q2 I have been interested in this book before the system
presented it to me.Q3 This book excited my interest for the �rst time.Q4 I think that I could not �nd this book by myself.
Figure 3: Separate evaluation of sub-recommended book.
We considered two types of systems�Amazon search andrecommend (A-RS) and Amazon ranking (A-Rank)�as base-line systems. In this section, we explain the utilization ofthe baseline systems and the proposed system.
Amazon search and recommend (A-RS).The subjects are allowed to only use keyword and genre
search method on the Amazon site, following which they canuse the recommendation list (a list shown under "CustomersWho Bought This Item Also Bought"). We encouraged thesubjects to refer to the entire recommendation list becausetoward the end, the list potentially includes unexpected butinteresting books. Amazon's recommendation method is im-plemented by item-based collaborative �ltering[13].
Amazon ranking (A-Rank).The subjects are allowed to only refer to the ranking of
"Best Sellers" and "New Releases." They are also allowedto refer to the ranking in each category.
Fusion-based recommender system (F-RS).We explained the system interface, described in Section
3.2, and how it is used to the subjects in advance. How-ever, we did not explain the details of the internal process-ing of the fusion method, described in Section 3.3, becausewe would like to observe whether the subjects can graduallyunderstand the same through trial and error.Here, we used k = 4, θ = 1000, and m = 3, as mentioned
in Section 3.2 and Section 3.3.
4.3 Results
4.3.1 Evaluation of sub-recommended booksWe analyzed what type of books were marked as sub-
recommended books. Figure 3 shows the overall results ofthe subjects' ratings for Q1�Q4 from Table 2 about sub-recommended books. The �gure shows the averages of theratings for each recommender system.
43

As described in Section 1, the �rst de�nition of serendip-itous items is "items that can excite the user's interest forthe �rst time although he/she does not know about themand he/she would not be able to discover them by him-self/herself." From this viewpoint, we evaluated the systemsbased on not only the discoverability but also whether therecommended items excited the users' interest. Therefore,from the viewpoint of serendipity, we analyzed how manyitems that satis�ed the conditions of books that "Q1: I didnot know this book," "Q4: I think that I could not �nd thisbook by myself," and "Q3: This book excited my interestfor the �rst time" could be found by each system. If therating of a book for Q1 = 3, Q4 ≥ 4, and Q3 ≥ 4, we assignit a score of "1," otherwise we assign a score of "0." Figure3 shows the averages. We found signi�cant di�erences be-tween the average of F-RS and those of A-RS and A-Rankby a t-test with a signi�cance level of 5%.The second de�nition of serendipitous items is "items that
can excite the user's interest for the �rst time althoughhe/she thought that he/she was not interested in them."From this viewpoint, we analyzed how many items that sat-is�ed the conditions of books that "Q2: I have not beeninterested in this book" and "Q3: This book excited my in-terest for the �rst time" could be found by each system. Ifthe rating of a book for Q2 ≤ 2 and Q3 ≥ 4, we assign ita score of "1," otherwise we assign a score of "0." Figure3 shows the averages. We found signi�cant di�erences be-tween the average of F-RS and that of A-RS by a t-test witha signi�cance level of 1%. In addition, we found signi�cantdi�erences between the average of F-RS and that of A-Rankwith a signi�cance level of 5%.Although A-RS recommends books related to the browsed
book through item-based collaborative �ltering, there is lit-tle possibility of the recommended book being largely againstthe user's interest because of its high accuracy. Meanwhile,because A-Rank recommends popular books, the user mayalready know the recommended books if they belong to gen-res the user is interested in. On the other hand, the fusion-based recommender system can recommend books that areoccasionally against the user's interest depending on the se-lection of the material item. This is why the system showedhigh discoverability, although this involves some risks. Inaddition, because the recommended books are still relevantto the base item, the user may be interested in them. Thisis why the fusion-based recommender system was superiorfrom the viewpoint of serendipity.
4.3.2 Evaluation of systemsWe focus on the question about serendipity, "this system
excited my interest and enabled me to discover somethingnew." The average of the subjects' ratings were 3.00 for A-RS, 2.67 for A-Rank, and 4.22 for F-RS. From this view-point, the proposed system signi�cantly outperformed A-RSand A-Rank with a signi�cance level of 5%. This result in-dicates that the proposed system can provide serendipitousitems related to "items that can attract the user's interestafter being displayed by the system," which is one of thede�nitions of serendipitous items.
5. CONCLUSIONIn this study, we improved upon our fusion-based rec-
ommender system based on the deeper idea of serendipity.This system possesses mechanisms that cause extrinsic and
intrinsic accidents and enables users to derive some valuefrom accidents through their sagacity. The key idea of thesystem is the fusion-based approach, through which the sys-tem mixes two user-input items to �nd new items that havethe mixed features.We experimentally evaluated the fusion-based
recommender system through user tests using a real bookdata set from Rakuten Books. The experimental resultsshowed the e�ectiveness of this system compared with therecommender systems used on the Amazon website from theviewpoint of serendipity. We would like to enhance its in-terfaces and make the fusion methods more intuitive andunderstandable for the users.
6. ACKNOWLEDGEMENTThis work was supported by a Grant-in-Aid for Young
Scientists (B) (23700132).
7. REFERENCES[1] J.L. Herlocker, J.A. Konstan, L.G. Terveen, and J.T. Riedl.
Evaluating collaborative �ltering recommender systems. ACMTransactions on Information Systems (TOIS), Vol. 22, No. 1,pp. 5�53, 2004.
[2] Tomoko Murakami, Koichiro Mori, and Ryohei Orihara.Metrics for evaluating the serendipity of recommendation lists.New Frontiers in Arti�cial Intelligence, pp. 40�46, 2008.
[3] Elizabeth Jamison Hodges. Three Princes of Serendip.Atheneum, 1964.
[4] Shigekazu Sawaizumi, Osamu Katai, Hiroshi Kawakami, andTakayuki Shiose. Use of serendipity power for discoveries andinventions. Intelligent and Evolutionary Systems, Studies inComputational Intelligence, Vol. 187, pp. 163�169, 2009.
[5] Royston M. Roberts. Serendipity: Accidental Discoveries inScience. Wiley, 1989.
[6] Kenta Oku and Fumio Hattori. Fusion-based recommendersystem for improving serendipity. In Proceedings of theWorkshop on Novelty and Diversity in Recommender Systems(DiveRS 2011), at the 5th ACM International Conference onRecommender Systems (RecSys 2011), pp. 19�26, 2011.
[7] Cai-Nicolas Ziegler, Georg Lausen, and Lars Schmidt-Thieme.Taxonomy-driven computation of product recommendations. InProceedings of the Thirteenth ACM conference on Informationand knowledge management - CIKM '04, p. 406, New York,New York, USA, 2004. ACM Press.
[8] C.N. Ziegler, S.M. McNee, J.A. Konstan, and Georg Lausen.Improving recommendation lists through topic diversi�cation.In Proceedings of the 14th international conference on WorldWide Web, pp. 22�32, New York, New York, USA, 2005. ACM.
[9] Badrul Sarwar, George Karypis, Joseph Konstan, and JohnReidl. Item-based collaborative �ltering recommendationalgorithms. In Proceedings of the 10th international conferenceon World Wide Web, pp. 285�295, New York, New York, USA,2001. ACM.
[10] Shlomo Berkovsky and Jill Freyne. Group-based reciperecommendations: analysis of data aggregation strategies. InProceedings of the fourth ACM conference on Recommendersystems, pp. 111�118. ACM, 2010.
[11] Y. Hijikata, T. Shimizu, and S. Nishida. Discovery-orientedcollaborative �ltering for improving user satisfaction. InProceedings of the 13th international conference on Intelligentuser interfaces, pp. 67�76. ACM, 2009.
[12] Mouzhi Ge, C. Delgado-Battenfeld, and D. Jannach. Beyondaccuracy: evaluating recommender systems by coverage andserendipity. In Proceedings of the fourth ACM conference onRecommender systems, pp. 257�260. ACM, 2010.
[13] G. Linden, B. Smith, and J. York. Amazon.comrecommendations: Item-to-item collaborative �ltering. IEEEInternet Computing, Vol. 7, No. 1, pp. 76�80, January 2003.
44

Case Study Evaluation of Mahout as a RecommenderPlatform
Carlos E. SeminarioSoftware and Information Systems Dept.
University of North Carolina [email protected]
David C. WilsonSoftware and Information Systems Dept.
University of North Carolina [email protected]
ABSTRACTVarious libraries have been released to support the devel-opment of recommender systems for some time, but it isonly relatively recently that larger scale, open-source plat-forms have become readily available. In the context of suchplatforms, evaluation tools are important both to verify andvalidate baseline platform functionality, as well as to pro-vide support for testing new techniques and approaches de-veloped on top of the platform. We have adopted ApacheMahout as an enabling platform for our research and havefaced both of these issues in employing it as part of ourwork in collaborative filtering. This paper presents a casestudy of evaluation focusing on accuracy and coverage eval-uation metrics in Apache Mahout, a recent platform toolthat provides support for recommender system applicationdevelopment. As part of this case study, we developed a newmetric combining accuracy and coverage in order to evaluatefunctional changes made to Mahout’s collaborative filteringalgorithms.
Categories and Subject DescriptorsH.3.3 [Information Storage and Retrieval]: InformationSearch and Retrieval–Information filtering
General TermsAlgorithms, Experimentation, Measurement
KeywordsRecommender systems, Evaluation, Mahout
1. INTRODUCTIONSelecting a foundational platform is an important step in
developing recommender systems for personal, research, orcommercial purposes. This can be done in many differentways: the platform may be developed from the ground up,an existing recommender engine may be contracted (e.g.,
Permission to make digital or hard copies of all or part of this work forpersonal or classroom use is granted without fee provided that copies arenot made or distributed for profit or commercial advantage and that copiesbear this notice and the full citation on the first page. To copy otherwise, torepublish, to post on servers or to redistribute to lists, requires prior specificpermission and/or a fee.
Copyright is held by the author/owner(s). Workshop on Recommen-dation Utility Evaluation: Beyond RMSE (RUE 2012), held in conjunctionwith ACM RecSys 2012. September 9, 2012, Dublin, Ireland.Copyright 2012 ...$10.00
OracleAS Personalization1), code libraries can be adapted,or a platform may be selected and tailored to suit (e.g.,LensKit2, MymediaLite3, Apache Mahout4, etc.). In somecases, a combination of these approaches will be employed.
For many projects, and particularly in the research con-text, the ideal situation is to find an open-source platformwith many active contributors that provides a rich and var-ied set of recommender system functions that meets all ormost of the baseline development requirements. Short offinding this ideal solution, some minor customization to analready existing system may be the best approach to meetthe specific development requirements. Various libraries havebeen released to support the development of recommendersystems for some time, but it is only relatively recentlythat larger scale, open-source platforms have become readilyavailable. In the context of such platforms, evaluation toolsare important both to verify and validate baseline platformfunctionality, as well as to provide support for testing newtechniques and approaches developed on top of the platform.We have adopted Apache Mahout as an enabling platformfor our research and have faced both of these issues in em-ploying it as part of our work in collaborative filtering rec-ommenders.
This paper presents a case study of evaluation for rec-ommender systems in Apache Mahout, focusing on metricsfor accuracy and coverage. We have developed functionalchanges to the baseline Mahout collaborative filtering algo-rithms to meet our research purposes, and this paper exam-ines evaluation both from the standpoint of tools for baselineplatform functionality, as well as for enhancements and newfunctionality. The objective of this case study is to evaluatethese functional changes made to the platform by comparingthe baseline collaborative filtering algorithms to the changedalgorithms using well known measures of accuracy and cov-erage [6]. Our goal is not to validate algorithms that havealready been tested previously, but to assess whether, andto what extent, the functional enhancements have improvedthe accuracy and coverage performance of the baseline out-of-the-box Mahout platform. Given the interplay betweenaccuracy and coverage in this context, we developed a uni-fied metric to assess accuracy vs. coverage trade-offs whenevaluating functional changes made to Mahout’s collabora-tive filtering algorithms.
1http://download.oracle.com/docs/cd/B10464 05/bi.904/b12102/1intro.htm2http://lenskit.grouplens.org/3http://www.ismll.uni-hildesheim.de/mymedialite/4http://mahout.apache.org
45

2. RELATED WORKRevisiting evaluation in the context of recommender plat-
forms has received recent attention in the thorough evalua-tion of the LensKit platform using previously tested collabo-rative filtering algorithms and metrics, as reported in [2]. Acomprehensive set of guidelines for evaluating recommendersystems was provided by Herlocker et al [6]; these guidelineshighlight the use of evaluation metrics such as accuracy andcoverage and suggest the need for an ideal “general cover-age metric” that would combine coverage with accuracy toyield an overall “practical accuracy” measure. Many of theseevaluation metrics and techniques have also been covered re-cently in [12].
Recommender system research has been primarily con-cerned with improving recommendation accuracy [7]; how-ever, other metrics such as coverage [10, 4] and also noveltyand serendipity [6, 3] have been deemed necessary becauseaccuracy alone is not sufficient to properly evaluate the sys-tem. Mcnee et al [7] states that recommendations that aremost accurate according to the standard metrics are some-times not the most useful to users and outlines a more user-centric approach to evaluation. The interplay between ac-curacy and other metrics such as coverage and serendipitycreates trade-offs for recommender system implementers andthis has been widely discussed in the literature, e.g., see [4,3] and our previous work discussing trade-offs between ac-curacy and robustness [11].
3. SELECTING APACHE MAHOUTTo support our research in collaborative filtering, sev-
eral recommender system platforms were surveyed, includ-ing LensKit, easyrec5, and MymediaLite. We selected Ma-hout because it provides many of the desired characteristicsrequired for a recommender development workbench plat-form. Mahout is a production-level, open-source, systemand consists of a wide range of applications that are usefulfor a recommender system developer: collaborative filteringalgorithms, data clustering, and data classification. Mahoutis also highly scalable and is able to support distributed pro-cessing of large data sets across clusters of computers usingHadoop6. Mahout recommenders support various similarityand neighborhood formation calculations, recommendationprediction algorithms include user-based, item-based, Slope-One and Singular Value Decomposition (SVD), and it alsoincorporates Root Mean Squared Error (RMSE) and MeanAbsolute Error (MAE) evaluation methods. Mahout is read-ily extensible and provides a wide range of Java classes forcustomization. As an open-source project, the Mahout de-veloper/contributor community is very active; the Mahoutwiki also provides a list of developers and a list of websitesthat have implemented Mahout7.
3.1 Uncovering Mahout DetailsAlthough Mahout is rich in documentation, there are im-
plementation details on how Mahout works that could onlybe understood by looking at the source code. Thus, for clar-ity in evaluation, we needed to verify the implementationof baseline platform functionality. The following describessome of these details for Mahout 0.4 ‘out-of-the-box’:
5http://easyrec.org/6http://hadoop.apache.org/7https://cwiki.apache.org/MAHOUT/mahout-wiki.html
Similarity Weighting: Mahout implements the classic Pear-son Correlation as described in [8, 5]. Similarity weighting issupported in Mahout and consists of the following method:
scaleFactor = 1.0 - count / (num + 1);if (result < 0.0)
result = -1.0 + scaleFactor * (1.0 + result);else
result = 1.0 - scaleFactor * (1.0 - result);
where count is the number of co-rated items between twousers, num is the number of items in the dataset, and resultis the calculated Pearson Correlation coefficient.
User-Based Prediction Algorithm: Mahout implements aWeighted Average prediction method similar to the approachdescribed in [1], except that Mahout does not take the abso-lute value of the individual similarities in the denominator,however, it does ensure that the predicted ratings are withinthe allowable range, e.g., between 1.0 and 5.0.
Item-Based Prediction Algorithm: Mahout implements aWeighted Average prediction method. This approach is sim-ilar to the algorithm in [9], except that Mahout does nottake the absolute value of the individual similarities in thedenominator, however, it does ensure that the predicted rat-ings are within the allowable range, e.g., between 1.0 and5.0. Also, Mahout does not provide support for neighbor-hood formation, e.g., similarity thresholding, for item-basedprediction.
Accuracy Evaluation calculation: Mahout executes therecommender system evaluator specified at run time (MAEor RMSE) and implements traditional techniques found in[6, 12]. For MAE, this would be,
MAE =
∑ni=1 | ActualRatingi − PredictedRatingi |
n(1)
where n is the total number of ratings predicted in the testrun.
3.2 Making Mahout Fit for PurposeThrough personal email communication with one of the
Mahout developers, we were informed that Mahout intendedto provide basic rating prediction and similarity weightingcapabilities for its recommenders and that it would be upto developers to provide more elaborate approaches. Sev-eral changes were made to the prediction algorithms andthe similarity weighting techniques for both the user-basedand item-based recommenders in order to meet our specificrequirements and to match the best practices found in theliterature, as follows:
Similarity weighting: Defined as Significance Weighting in[5], this consists of the following method:
scaleFactor = count/50.0;if (scaleFactor > 1.0) scaleFactor = 1.0;result = scaleFactor * result;
where count is the number of co-rated items between twousers, and result is the calculated Pearson Correlation co-efficient.
User-user mean-centered prediction: After identifying aneighborhood of similar users, a prediction, as documentedin [8, 5, 1], is computed for a target item i and target useru as follows:
pu,i = ru +
∑vεV simu,v(rv,i − rv)∑
vεV | simu,v |(2)
46

where V is the set of k similar users who have rated item i,rv,i is the rating of those users who have rated item i, ru isthe average rating for the target user u over all rated items,rv is the average rating for user v over all co-rated items,and simu,v is the Pearson correlation coefficient.
Item-item mean-centered prediction: A prediction, as doc-umented in [1], is computed for a target item i and targetuser u as follows:
pu,i = ri +
∑jεNu(i) simi,j(ru,j − rj)∑
jεNu(i) | simi,j |(3)
where Nu(i) is the set of items rated by user u most similarto item i, ru,j is u’s rating of item j, rj is the average ratingfor item j over all users who rated item j, ri is the averagerating for target item i, and simi,j is the Pearson correlationcoefficient.
Item-item similarity thresholding: This method was addedto Mahout and used in conjunction with the item-item mean-centered prediction described above. Similarity threshold-ing, as described in [5], defines a level of similarity that isrequired for two items to be considered similar for purposesof making a recommendation prediction; item-item similar-ities that are less than the threshold are not used in theprediction calculation.
Coverage and combined accuracy/coverage metric: As sug-gested in [6], the easiest way to measure coverage is to selecta random sample of user-item pairs, ask for a prediction foreach pair, and measure the percentage for which a predic-tion was provided. To calculate coverage, code changes weremade to Mahout to provide, for each test run, the total num-ber of rating predictions requested that were unable to becalculated as well as the total of number of rating predic-tions requested that were actually calculated; the sum ofthese two numbers is the total number of ratings requested.Coverage was calculated as follows:
Coverage =Total#RatingsCalculated
Total#RatingsRequested(4)
Code changes were also made to calculate a combined accu-racy and coverage metric as defined in Section 4.
4. ACCURACY AND COVERAGE METRICThe metrics selected for this case study, accuracy and cov-
erage, were chosen because they are fundamental to the util-ity of a recommender system [10, 6]. Although other metricssuch as novelty and serendipity can, and should, be used inconjunction with accuracy and coverage, our objective wasto evaluate the very basic requirements of a recommendersystem. Our implementation of coverage, referred to as pre-diction coverage in [6], measures the percentage of a datasetfor which the recommender system is able to provide predic-tions. High coverage would indicate that the recommendersystem is able to provide predictions for a large number ofitems and is considered to be a desirable characteristic ofthe recommender system [6]. A combination of high accu-racy (low error rate) and high coverage are indeed desirableby users and system operators because it improves the util-ity or usefulness of the system from a user standpoint [10,6].
What constitutes ‘good’ accuracy or coverage, however,has not been well defined in the literature: studies suchas [10, 4, 5] and many others, endeavor to maximize accu-racy (achieve lowest possible value) and/or coverage (achieve
highest possible value) and view these metrics on a rela-tive basis, i.e., how much the metric has increased or de-creased beyond a baseline value based on empirical results.Furthermore, the interplay between accuracy and coverage,i.e., coverage decreases as a function of accuracy [4, 3], cre-ates a trade-off for recommender system implementers thathas been discussed previously but not been developed thor-oughly. Inspired by the suggestion in [6] to combine the cov-erage and accuracy measures to yield an overall “practicalaccuracy” measure for the recommender system, we devel-oped a straightforward “AC Measure” that combines bothaccuracy and coverage into a single metric as follows:
ACi =AccuracyiCoveragei
, (5)
where i indicates the ith trial in an evaluation experiment.
Figure 1: Illustration of the AC Measure
The AC Measure simply adjusts (upward) the Accuracyaccording to the level of Coverage metrics found in an ex-perimental trial and is agnostic to the accuracy metric used,e.g., MAE or RMSE. Using a family of curves for the MeanAbsolute Error (MAE) accuracy metric, Figure 1 illustratesthe relationship between accuracy, coverage, and the ACMeasure. As an example, following the “MAE : 0.5’’ curvewe see that at 100% coverage, the AC Measure is 0.5, andat 10% coverage, the AC Measure has increased to 5. Theintuition behind this metric is that when the recommendersystem is able to provide predictions for a high percentageof items in the dataset, the accuracy metric more closelyindicates the level of system performance; conversely, whenthe coverage is low, the accuracy metric is “penalized” and isadjusted upwards. We believe that the major benefit of theAC Measure is that it formulates a solution for addressingthe trade-off between accuracy and coverage and can be usedto create a ranked list of results (low to high) from multipleexperimental trials to find the best (lowest) AC Measure foreach set of test conditions. The simplified visualization ofthe combined AC Measure shown in Figure 1 is an additionalbenefit. For our evaluation purposes, the use of a combinedmetric was ideal in addressing the inherent trade-offs be-tween accuracy and coverage, especially in the cases whereaccuracy is found to be high when coverage is low; we positthat the AC Measure will also be useful for other researchersperforming evaluations using accuracy and coverage.
47

5. EXPERIMENTAL DESIGNThe objective of this case study was to understand Ma-
hout’s baseline collaborative filtering algorithms and evalu-ate functional changes made to the platform using accuracyand coverage metrics. The main intent of making functionalchanges to Mahout recommender algorithms was to bringthe Mahout algorithms in line with best practices found inthe literature. Therefore, the overall hypothesis to be testedin this case study was that the modified algorithms improveMahout’s ‘out-of-the-box’ prediction accuracy for both user-based and item-based recommenders while maintaining rea-sonable coverage.
5.1 Datasets and AlgorithmsThe data used in this study were the MovieLens datasets
downloaded from GroupLens Research8: the 100K datasetwith 100,000 ratings for 1,682 movies and 943 users (re-ferred to as ML100K in this study) and the 10M datasetwith 10,000,000 ratings for 10,681 movies and 69,878 users(referred to as ML10M in this study). Ratings provided inthese datasets consist of integer values between 1 (did notlike) to 5 (liked very much).
For User-based (see §3.1), Mahout uses Pearson Corre-lation similarity (with and without similarity weighting),Neighborhood formation (similarity thresholding or kNN),and Weighted Average prediction. This was tested againsta modified algorithm (see §3.2) consisting of Pearson Cor-relation similarity (with and without similarity weighting),Neighborhood formation (similarity thresholding or kNN),and Mean-centered prediction. For Item-based (see §3.1),Mahout uses Pearson Correlation similarity (with and with-out similarity weighting), no Neighborhood formation, andWeighted Average prediction. This was tested against amodified algorithm (see §3.2) consisting of Pearson Corre-lation similarity (with and without similarity weighting),Neighborhood formation (similarity thresholding), and Mean-centered prediction.
5.1.1 Test CasesIn order to test the overall hypothesis, the following test
cases were developed and executed for both user-based anditem-based recommenders using the ML100K and ML10Mdatasets:
1. Mahout Prediction, No weighting2. Mahout Prediction, Mahout weighted3. Mahout Prediction, Significance weighted4. Mean-Centered Prediction, No weighting5. Mean-Centered Prediction, Mahout weighted6. Mean-Centered Prediction, Significance weighted
5.1.2 Accuracy and Coverage MetricsWe used Mahout’s MAE evaluator to measure the accu-
racy of the rating predictions. For prediction coverage, weused dataset training data to estimate the rating predictionsfor the test set; the random sample of user-item pairs in ourtesting was 30K pairs for ML100K and 25K pairs for ML10M(see §3.2). AC Measures were calculated for all test cases.
5.1.3 Dataset PartitioningThe Mahout evaluator creates holdout 9 partitions accord-
ing to a set of run-time parameters. For the tests using the8http://www.grouplens.org9Holdout is a method that splits a dataset into two parts, a
ML100K dataset, the training set was 70% of the data, thetest set was 30% of the data, and 100% of the user data wasused; a total 30K rating predictions from 943 users were re-quested for each test set. For the tests using the ML10Mdataset, the training set was 95% of the data, the test setwas 5% of the data, and 5% of the user data was used; atotal 25K rating predictions from 3180 users were requestedfor each test set.
5.1.4 Test VariationsVarious similarity thresholds and kNN neighborhood sizes
were executed for each test case in order to understand andevaluate the corresponding behavior of the recommenders.For User-based recommender testing, similarity thresholdsof 0.0, 0.1, 0.3, 0.5, and 0.7 and kNN neighborhood sizes of600, 400, 200, 100, 50, 20, 10, 5, and 2 were tested. ForItem-based recommender testing, in addition to using nosimilarity thresholding, similarity thresholds of 0.0, 0.1, 0.2,0.3, 0.4, 0.5, 0.6, and 0.7 were tested.
6. RESULTS AND DISCUSSION
6.1 ML10M ResultsFigures 2 and 3 show the results of test cases 1 through
6 for user and item-based algorithms, respectively10. Thekey results of the experiment, for both user-based and item-based algorithms unless otherwise noted, were as follows:
1. MAE for mean-centered prediction with significanceweighting is a significant improvement (p<0.01) over MAEfor Mahout prediction, regardless of weighting, across simi-larity thresholds (except item-based at similarity thresholdof 0.7) and kNN neighborhood sizes (except user-based atkNN of 2, not shown).
2. Mahout similarity weighting does not significantly im-prove (p<0.01) Mahout prediction MAE over prediction withno similarity weighting (except Mahout prediction for user-based and item-based at a similarity threshold of 0.4, notshown). This would indicate that Mahout similarity weight-ing is not very effective as a weighting technique, especiallyas compared to significance weighting.
6.2 ML100K ResultsThe results and trend lines for the ML100K experiment
are similar to ML10M. The key results, for both user-basedand item-based algorithms unless otherwise noted, were:
1. MAE for mean-centered prediction with significanceweighting is a significant improvement (p<0.01) over MAEfor Mahout prediction, regardless of weighting, across simi-larity thresholds and kNN neighborhood sizes (except user-based at kNN of 400).
2. Mahout similarity weighting does not significantly im-prove (p<0.01) Mahout prediction MAE over prediction with
training set and a test set, and the partitioning is performedby randomly selecting some ratings from all, or some, of theusers. The selected ratings constitute the test set, while theremaining ones are the training set.
10The following curves are superimposed over each other be-cause the values are very similar: MAE results for mean-centered prediction (no weighting and Mahout weighted),MAE results for Mahout prediction (No weighting andMahout weighted), Coverage results for Mahout predic-tion and mean-centered prediction (No weighting and Ma-hout weighted), Coverage results for Mahout prediction andmean-centered prediction (both Significance weighted).
48

Figure 2: User-based Mahout Recommender Re-sults for ML10M, Test cases 1 through 6
no similarity weighting (except Mahout prediction for user-based and item-based at a similarity threshold of 0.4).
6.3 DiscussionAs hypothesized, results for both of the ML100K and
ML10M experiments show significant improvements in MAEusing the mean-centered prediction algorithm with signifi-cance weighting compared to the Mahout baseline predic-tion algorithm. However, when coverage is considered, the“best” MAE results may need a second look. Can an MAEof 0.5 or less be considered “good” when the associated cov-erage is in the single digits? In this case, the recommendersystem may only be able to provide recommendations to avery small subset of its users and is a situation that mustbe avoided by system operators. To help address the ac-curacy vs. coverage trade-off, combined measures such asthe AC Measure (Section 4), can help by considering bothaccuracy and coverage simultaneously. For the ML10M ex-periment, we determined that the lowest MAE for the User-based algorithm using mean-centered prediction with sig-nificance weighting was 0.578 at a similarity threshold of0.7 and coverage of 0.833%; the AC Measure for this resultis calculated as 69.42. Similarly, the lowest MAE for theItem-based algorithm using mean-centered prediction withsignificance weighting was 0.371 at a similarity threshold of0.7 and coverage of 1.02%; the AC Measure for this result iscalculated as 36.32. In each of these cases, the exceedinglyhigh values for the AC Measure indicate that these resultsare not very desirable in a recommender system.
Figures 4 and 5 show the AC Measure results for user and
Figure 3: Item-based Mahout Recommender Re-sults for ML10M, Test cases 1 through 6
item-based algorithms using ML10M, respectively. Ratherthan show all 30 results for each algorithm (5 similaritythresholds x 2 prediction methods x 3 weighting types), weshow only the results with calculated AC Measure valuesless than 1.0; therefore, the lowest MAE results reportedabove for user-based and item-based algorithms are clearlybeyond the range of this chart. We found that the bestcombined accuracy/coverage results were found at higherlevels of coverage and lower levels of similarity threshold,i.e., the best (lowest) AC Measure for user-based was 0.688at a similarity threshold of 0.1 and for item-based was 0.665at a similarity threshold of 0.0, both using mean-centeredprediction and significance weighting. We can also see that,with few exceptions, mean-centered prediction is improvedover the Mahout prediction for the same similarity weight-ing and similarity threshold. We observed similar resultsusing the ML100K dataset where the best (lowest) AC Mea-sure for user-based was 0.765 and for item-based was 0.746,both at a similarity threshold of 0.0 and both using mean-centered prediction and significance weighting. These re-sults demonstrate that the “best” MAE may not always bethe lowest MAE, especially when coverage is also considered;furthermore, recommender system settings such as similarityweighting and neighborhood size also need to be consideredduring system evaluation.
Other observations of our experiments that match resultsreported in [5] and serve to validate our evaluation and in-crease our confidence in the results are: (a) In general, signif-icance weighting improves prediction MAE, as compared topredictions using Mahout similarity weighting or no similar-
49

Figure 4: AC Measure for selected User-based re-sults (lower is better)
Figure 5: AC Measure for selected Item-based re-sults (lower is better)
ity weighting; (b) As the similarity threshold increases, MAEfor mean-centered prediction with significance weighting im-proves and coverage degrades, whereas MAE and coverageboth degrade for Mahout prediction with Mahout weighting;(c) Coverage decreases as neighborhood size decreases.
7. CONCLUSIONOur case study of Mahout as a recommender system plat-
form highlights evaluation considerations for developers andalso shows how straightforward functional enhancements im-proves the performance of the baseline platform. We eval-uated our changes against current Mahout functionality us-ing accuracy and coverage metrics not only to assess base-line results, but also to provide a view of the trade-offs be-tween accuracy and coverage resulting from using differentrecommender algorithms. We reported cases where the low-est MAE accuracy results were not necessarily always the‘best’ when coverage results were also considered, and weinstrumented Mahout for a combined accuracy and cover-age metric (AC Measure) to evaluate these trade-offs moredirectly. We believe that this case study will provide use-ful guidance in using Mahout as a recommender platform,
and that our combined measure will prove useful in evalu-ating algorithm changes for the inherent trade-offs betweenaccuracy and coverage.
8. REFERENCES[1] C. Desrosiers and G. Karypis. A comprehensive survey
of neighborhood-based recommendations methods. InF. Ricci, L. Rokach, B. Shapira, and P. B. Kantor,editors, Recommender Systems Handbook. Springer,2011.
[2] M. D. Ekstrand, M. Ludwig, J. A. Konnstan, andJ. T. Riedl. Rethinking the recommender researchecosystem: Reproducibility, openness, and lenskit. InProceedings of the 5th ACM Recommender SystemsConference (RecSys ’11), October 2011.
[3] M. Ge, C. Delgado-Battenfeld, and D. Jannach.Beyond accuracy: Evaluating recommender systemsby coverage and serendipity. In Proceedings of the 4thACM Recommender Systems Conference (RecSys ’10),September 2010.
[4] N. Good, J. B. Schafer, J. A. Konstan, A. Borchers,B. Sarwar, J. Herlocker, and J. Riedl. Combiningcollaborative filtering with personal agents for betterrecommendations. In Proceedings of the 16th NationalConference on Artificial Intelligence (AAAI-99), July1999.
[5] J. L. Herlocker, J. A. Konstan, A. Borchers, andJ. Riedl. An algorithmic framework for performingcollaborative filtering. In Proceedings of the ACMSIGIR Conference, 1999.
[6] J. L. Herlocker, J. A. Konstan, L. G. Terveen, andJ. Riedl. Evaluating collaborative filteringrecommender systems. ACM Transactions onInformation Systems, 22(1):5–53, 2004.
[7] S. Mcnee, J. Riedl, and J. Konstan. Accurate is notalways good: How accuracy metrics have hurtrecommender systems. In Proceedings of theConference on Human Factors in ComputingSystems(CHI 2006), April 2006.
[8] P. Resnick, N. Iacovou, M. Suchak, P. Bergstrom, andJ. Riedl. GroupLens: an open architecture forcollaborative filtering of netnews. In Proceedings of theACM CSCW Conference, 1994.
[9] B. Sarwar, G. Karypis, J. Konstan, and J. Reidl.Item-based collaborative filtering recommendationalgorithms. In Proceedings of the World Wide WebConference, 2001.
[10] B. M. Sarwar, J. A. Konstan, A. Borchers,J. Herlocker, B. Miller, and J. Riedl. Using filteringagents to improve prediction quality in the grouplensresearch collaborative filtering system. In Proceedingsof the ACM 1998 Conference on Computer SupportedCooperative Work (CSCW ’98), November 1998.
[11] C. E. Seminario and D. C. Wilson. Robustness andaccuracy tradeoffs for recommender systems underattack. In Proceedings of the 25th Florida ArtificialIntelligence Research Society Conference(FLAIRS-25), May 2012.
[12] G. Shani and A. Gunawardana. Evaluatingrecommendation systems. In F. Ricci, L. Rokach,B. Shapira, and P. B. Kantor, editors, RecommenderSystems Handbook. Springer, 2011.
50

Evaluating Various Implicit Factors in E-commerceLadislav Peska
Department of software engineering Charles University in Prague
Malostranske namesti 25, Prague, Czech Republic
Peter Vojtas Department of software engineering
Charles University in Prague Malostranske namesti 25, Prague, Czech Republic
ABSTRACT In this paper, we focus on the situation of a typical e-commerce
portal employing personalized recommendation. Such website
could, in addition to the explicit feedback, monitor many different
patterns of implicit user behavior – implicit factors. The problem
arises while trying to infer connections between observed implicit
behavior and user preferences - while some connections are
obvious, others may not.
We have selected several often used implicit factors and
conducted online experiment on travel agency web site to find out
which implicit factors could replace explicit ratings and (if there
are more of them) how to combine their values. As utility
functions determining recommending efficiency was selected click
through rate and conversions rate.
Our experiments corroborate importance of considering more
implicit factors and their different weights. The best individual
results were achieved by means of the scrolling factor, the best
combination was Prior_to method (lexicographical ordering
based on factor values).
Categories and Subject Descriptors H.3.3 [Information Systems]: Information Search and Retrieval -
Information Filtering
General Terms Measurement, Human Factors.
Keywords Recommender systems, implicit factors, user feedback,
e-commerce success metrics
1. INTRODUCTION Recommending on the web is both an important commercial
application and popular research topic. The amount of data on the
web grows continuously and it is nearly impossible to process it
directly by a human. The keyword search engines were adopted to
cope with information overload but despite their undoubted
successes, they have certain limitations. Recommender systems
can complement onsite search engines especially when the user
does not know exactly what he/she wants. Many recommender
systems, algorithms or methods have been presented so far. We
can mention Amazon.com recommender [12] as one of the most
popular commercial examples. Recommender systems varies in
both type (Collaborative, Content-based, Context, hybrid, etc.),
input (user feedback types, object attributes, etc.) or output. We
suggest [17] for detailed recommender systems taxonomy.
The explicit feedback (given by the user consciously e.g. rating
objects with stars) is often used in research and also in some
commercial applications. Although it is quite easy to understand
and refers very well to the user’s preference, it also has
drawbacks. The biggest ones are its scarcity and unwillingness of
some users to provide any explicit feedback [7]. Contrary to the
explicit feedback, the implicit feedback (events triggered by a user
unconsciously) can provide abundant amount of data, but it is
much more difficult to understand the true meaning of such
feedback.
The rest of the paper is organized as follows: review of some
related work is in section 2. In section 3 we describe our model
of user preferences and in section 4 method how to learn it.
Section 5 contains results of our online experiment on a travel
agency website. Finally section 6 concludes our paper and points
to our future work.
1.1 Motivation In this paper we focus on an e-commerce website employing
personalized object recommendation – e.g. travel agency. On such
site we can record several types of user implicit feedback such as
page-view, actions or time spent on page, purchasing related
actions, click through or click stream, etc. Each of these factors is
believed to be related to the user’s preference on an object.
However this relation can be non-trivial, dependant on other
factors, etc. In this work, we focus on if and how such relations
could be compared against each another. Our second aim is how
to use or combine them in order to improve recommendations.
1.2 Contribution The main contributions of this paper are:
Evaluation of recommendation based on various
implicit factors using typical e-commerce success
metrics.
A generic model that combines various types of user
feedback.
Experiments with several combining methods (average,
weighted aggregation and prioritization).
Gathered data for possible future off-line experiments.
Copyright is held by the author/owner(s). Workshop on Recommendation
Utility Evaluation: Beyond RMSE (RUE 2012), held in conjunction with
ACM RecSys 2012. September 9, 2012, Dublin, Ireland.
51

2. RELATED WORK The area of recommender systems has been extensively studied
recently. Much effort has been made for creating different
recommendation algorithms e.g. [3], [4], [5] and designing whole
recommender systems e.g. [6], [15] and [16]. Our work is
prependable to some of those systems as we can supply them with
a single-value object rating based on more implicit factors instead
of using explicit user’s object rating or only single implicit factor.
A lot of recommendation algorithms aims to do decompose the
user’s preference on the object into the preference of the object’s
attributes [3], [4], [5] and [15], which can be a future extension
to our work.
Some authors employ context information while deciding about
true meaning of the user feedback e.g. Eckhardt et al. [2] proposes
that good rating of an object is more relevant when the object
appears among other good objects. Joachims et al. [8] proposes
“Search Engine Trust Bias” while observing that the first result of
a search engine search has higher click through rate than the
second one, even if the results were swapped – so the less relevant
result was shown at the first place.
Important for our research is the work of Kiessling et al. on the
Preference SQL system e.g. [10]. The Preference SQL is an
extension of SQL language allowing user to specify directly
preferences (or so called “soft constraints”) and to combine them
in order to receive best objects. We use three described
combination operators: Prior to (hierarchical), Ranking and
Pareto in our model of user preference.
Several authors studied various aspects of implicit feedback: quite
common are studies about comparing implicit and explicit
feedback e.g. Claypool et al. [1] using adapted web browser or
Jawaheer et al. [7] on an online music server. Using only an
implicit feedback based utility function is a common approach
when it is impossible to get explicit feedback [6], [14]. Lee and
Brusilovsky proposed job recommender directly employing
negative implicit feedback [11]. In our case we have focused on e-
commerce recommenders, so we have used two typical e-
commerce utility functions – Click Through Rate and user
Conversion Rate. In contrast to several studies e.g. [1] who
studied behavior of closed, small group of users (who installed
special browser) on the open web, we have focused on the single
website and all its users which in result let us to gather more
feedback data and introduce more various feedback factors.
For our experiments, we use the UPComp [13] recommender
deployable into the running e-commerce applications. Compared
to our previous work [14], we have conducted larger on-line
experiment, revised utility functions in our learning method and
introduced new model of user preference.
3. MODELS OF USER PREFERENCE We assume that any feedback is in the form Feedback(user,
object, feedback type, value). At this stage of our research, we do
not employ preference relations or feedback related to the object
groups (e.g. categories) and object attributes.
We based our models on work of Kiessling et al. and their model
of user preferences in Preference SQL [10]. The authors defined
several patterns on how to express preferences (soft conditions)
on a single attribute e.g. “prize around 2000” or “Highest
distance”, etc. Each soft condition assigns to each object value
from [0, 1] interval. Then they defined three types of operators
combining soft conditions together:
- Preferring Operator: preferring one (or more) condition against
others.
- Ranking Operator to combine conditions by a ranking function.
At this time we use weighted average as a ranking.
- Pareto Operator for combining equally important conditions, or
conditions where their relation is unknown. We plan to use this
operator in our future work.
In our research, we have replaced the soft conditions by the
implicit factors forming the Preference algebra model. Each
implicit factor value has assigned preference value from [0, 1]
interval – currently we simply linearly normalize the space
between highest and lowest factor values. Those preference values
can be then freely combined with the operators e.g.:
Scrolling PRIOR TO Avg(Time, MouseClicks) We will demonstrate behavior of our model on a small two-
dimensional example: Table 1 contains four sample objects and
their scrolling and time on page feedback for fixed user (data
already normalized into [0, 1]). They are visualized on Figure 1:
as it can be seen, we will receive different top-k for their various
combinations.
Table 1: example objects and their scrolling and time on page
implicit factor values.
Object Amount of scrolling Time on page
Object1 1.0 (e.g 10 times) 0.4 (e.g. 200sec)
Object2 0.7 (e.g 7 times) 1.0 (e.g. 500sec)
Object3 0.8 (e.g 8 times) 0.6 (e.g. 300sec)
Object4 0.4 (e.g 4 times) 0.3 (e.g. 150sec)
Figure 1: Combining single implicit factor values into the
preference for objects from Table 1.
4. LEARNING PREFERENCE MODEL The idea behind our learning model is following: If we use a fixed
recommendation methods supplied with various implicit factor
data and then compare the effectivity of the recommendations, we
can estimate how successful each implicit factor is.
For the purpose of our experiment, we have divided our learning
model into two phases: in the first phase, we have learned
successfulness of the considered implicit factors (see Table 2 for
their list and description). In the second phase we have
implemented several methods combining various implicit factors
together based on the Preference algebra model.
52

Table 2: Description of the considered implicit factors for
arbitrary fixed user and object
Factor Description
PageView Count( OnLoad() event on object detail page)
MouseActions Count( OnMouseOver() events on object detail
page)
Scroll Count( OnScroll() events on object detail page)
TimeOnPage Sum( time spent on object detail page)
Purchase Count(Object was purchased)
Open Count( Object detail page accessed via link from
recommending area)
Shown Count( Object shown in recommending area)
In both phases we have measured success of the recommendations
according to the two widely used e-commerce success metrics:
Conversion rate - #buyers / #users
Click through rate (CTR) - #click through / #shown
objects by the recommending method
As we stand on the side of the e-shop owner, we determine that
the main task for the recommender system is to increase the shop
owner’s profit. It is possible to measure the profit directly as an
utility function, however we did reject this method for now and
use only conversion rate measuring overall goal (purchase)
achievements. In this stage of our work we mainly focus on
convincing user to buy any product rather then convince him/her
to buy product B instead of A (see table 3 – the overall conversion
rates are rather low and need to be improved prior to the other
goals).
As the conversion rate should evaluate the overall success of the
whole system, the CTR refers directly to the success of the
recommendation itself.
5. EXPERIMENT We have conducted an online experiment on the SLAN tour travel
agency website1 to confirm our ideas. We have exchanged the
previous random recommendations on the category pages for our
methods. The experiment lasted for 2 months in February and
March 2012. We have collected data from in total 15610 unique
users (over 200 000 feedback events). We first describe in Figure
2 the simplified diagram of the travel agency e-shop. We
recognize four important states of user interaction with the e-shop:
User is creating conjunctive query Q (either implicitly e.g. by
viewing category pages or explicitly via search interface).
The (possibly very large) set of objects OQ is response to Q.
The objects are recommended at this state. We recommend
some objects from OQ to the user (membership in OQ set is
necessary condition, each recommended object from OR has
to fulfill).
User is viewing detail of the selected object o. We believe
that most of the interesting user feedback should be recorded
in this phase.
User purchased the object o, which is the criterion of success
for us.
1 http://www.slantour.cz
Figure 2: The simplified state diagram of an e-commerce site:
User enters the site in STATE I. or II. He/she can either navigate
through category or search result pages – updating query Q,
receiving new recommended objects OQ and OR (STATE I.) or
proceeds to the detail of an object (STATE II.). The object can be
eventually purchased (STATE III.).
The Figure 3 depicts the schema of our experiment.
Figure 3: General schema of our experiment. When user visits the
website for the first time, he receives userID, whenever he access
page with recommendations, the component selects the
recommending method according to the userID. The experiment
results for each method are computed from user feedback (Click
throughs, purchases).
5.1 UPComp recommender The UPComp (user preference component) is an independent e-
commerce recommender. It consists of a database layer storing
user feedback, server-side computing user preference and
recommendations and client-side which captures the user events
and shows recommended objects. Among UPComp main
advantages belong:
Easy deployable to a various e-commerce systems
regardless to the domain of objects.
Large (extendible) set of recorded user behavior.
Several recommending methods which can be
combined together.
In the current experimental setting, we have used only a small
portion of UPComp capabilities (ObjectRating and Collaborative
methods, recommending objects for known category). For more
complex description see [13].
53

5.2 Single implicit factors For the first learning phase we have created a total of seven
variants of ObjectRating recommending method, each based on
one implicit factor (PageView(), MouseActions(), Scrolling(),
TimeOnPage(), Purchases(), ClickThrough() and
ClickThrough()/Shown() rate). Each variant of ObjectRating
method used the same recommendation algorithm, but based on
only one feedback type data. We have also added Random()
method recommending random objects from the current category
as a baseline. Each unique user received recommendations based
only on one of these methods all the time he visited the website.
The method is determined as userID mod K, where K is number of
possible methods.
The ObjectRating method calculates for each object (o) the object
rating as the sum of feedback values of given type (f) from all
users U. The score is then normalized into [0, 1] (see pseudo SQL
code below).
SELECT (SUM(value) / MAX(SUM(value)) as ObjectRating FROM Feedback WHERE Object = o and FeedbackType = f
We have selected this simple method, because we wanted to avoid
the problems suffered by more complex methods (e.g. Cold Start
Problem). On the other hand, this decision decreases variability of
recommendations, so we want to use also other methods in our
future work.
Table 3. shows results of the first phase of our experiment. Anova
test proves statistically significant differences in Click through
rate (p-value < 0.001), but the differences in the Conversion rate
were not statistically significant (probably due to relatively small
number of purchases – 106 buyers in total).
Rather surprising is the supreme position of the Scrolling()
method comparing to the e.g. Claypool et al. [1]. However in
contrast to the Claypool et al. the most of our object detail pages
overflows typical browser visible area. However important
controls like purchase button are visible in top of the page,
scrolling is necessary to see some additional information like
accommodation details, all hotel pictures, trip program, etc. On
sites with bookmark-style design with no or a little scrolling
needs, opening an in-page bookmark should be considered as a
similar action to our scrolling event. Also time spent on page
seems to improve recommendations (despite the results of e.g.
Kelly and Belkin [9]).
Table 3. Results of the experiment’s first phase. * significant
improvement over Random() (TukeyHSD, 95% confidence).
Method Conversion rate Click through
rate (CTR)
Random() (baseline) 0.97% 3.02%
PageView() 1.34% 4.11%*
MouseActions() 0.96% 4.15%*
TimeOnPage() 1.71% 4.50%*
Scrolling() 1.98% 4.94%*
Purchases() 1.39% 4.06%
ClickThrough() 0.84% 4.32%*
ClickThrough/Shown() 1.70% 4.38%*
5.3 Combining implicit factors Following to the first phase, we have defined our three main tasks
and perform experiments to receive at least initial answers/results
for them:
T1. Measure whether combined methods produce better
recommendations than the single-factor ones.
T2. Measure whether various combination functions affect
recommendation effectivity.
T3. How to use our results in more complex recommending
methods.
Table 4: Results of combined methods: AVG stands for average,
in Weighted_AVG we use the factor’s placement in the CTR
results as weight, similarly Prior_to prioritize first factor against
second, etc. * significant improvement over Random()
(TukeyHSD). ** significant impr. over AVG(best 3 factors)
(TukeyHSD). *** significant impr. over Scrolling() (t-test).
Method Conversion
rate CTR
Random() (baseline1) 0.97% 3.19%
Scrolling() (baseline2) 1.07% 4.36% *
AVG(all factors) 1.41% 4.54% *
AVG(best 3 factors) 1.35% 3.95%
Weighted_AVG(best 3 factors) 1.49% 4.95% *,**
Prior_to(best 3 factors) 1.05% 5.12% *,**,***
Collaborative+ Weighted_AVG
(all factors) 0.95% 4.64% *
Again Conversion rate unfortunately did not provide us with any
significant results, so we have focused on the CTR. The combined
methods overall achieved better results than the Scrolling(), but
only the Prior_to() was significantly better. Almost every method
outperforms Random() recommendation.
For the Task 2, we have compared Weighted average, Priorization
and Average methods on the best three implicit factors, where
both Weighted average and Priorization methods receives
significantly better results than Average in Click through rate.
Both Prior_to and Weighted_AVG significantly outperformed
AVG method, from which can be concluded that there are
important differences in various single implicit factors
performance and that combination function should weight
somehow the single factors performance. However even though
the Prior_to CTR results were better than Weighted_AVG, the
difference was not significant enough, so we can not yet make a
conclusion about which combination method is the best.
For the third task, we have slightly changed our experiment
schema (see Figure 2), where we have exchanged the
ObjectRating() method for UserObjectRating(User, Object,
Feedback type) calculating object rating separately for each
relevant user (see pseudo SQL code below).
SELECT (SUM(value) / MAX(SUM(value)) as ObjectRating FROM Feedback WHERE User = u and Object = o and FeedbackType = f UPComp then calculated standard user-to-user collaborative
filtering. The method results (see Table 4, Collaborative+
Weighted_AVG) were though rather moderate. The method
outperforms AVG, Scrolling and Random in CTR, however the
difference was not significant enough and other simple methods
54

(e.g. Prior_to) achieved better results. One of the possible
problems was the higher computational complexity of this method
resulting in higher response time which could reduce the user's
interest in the objects presented in recommending area. This
method can be in future compared / replaced with e.g. object-to-
object collaborative filtering with precomputed similarity as
described in [12].
6. CONCLUSIONS AND FUTURE WORK In this paper, we have discussed the problem of using more
various implicit factors and how to formulate user’s preference
from them. We have adapted the Preference algebra model to this
task, selected several possibly good implicit factors and organized
a small online experiment to verify our ideas. The experiment
results showed that the most of our proposed factors outperforms
baseline recommendation and that it is important to use more
various implicit factors combined accordingly to their
performance.
The usage of e-commerce success metrics (especially CTR) to
determine success of recommendations provided us with
interesting results, so we plan to continue using Click through rate
as a success metrics (conversions due to the relatively small
number of purchases only in large scale experiments).
Our research on this field is in its early stage, so there is both
space for more experiments (e.g. with negative implicit feedback,
dependencies between various factors, temporal aspect of user’s
preference and behavior, etc.) and for possible improvements in
our experimental settings (e.g. replacing recommending methods,
extend the implicit factors set, etc.).
However our main task should be to move from such experiments
into a working recommender system based on implicit preferences
with various (dynamic) importances.
7. ACKNOWLEDGMENTS
The work on this paper was supported by Czech projects SVV-
2012-265312, MSM 0021620838 and GACR 202-10-0761.
REFERENCES [1] Mark Claypool, Phong Le, Makoto Wased, and David
Brown. 2001. Implicit interest indicators. In Proceedings of
the 6th international conference on Intelligent user
interfaces (IUI '01). ACM, New York, NY, USA, 33-40.
[2] Eckhardt A., Horváth T., Vojtáš P.: PHASES: A User Profile
Learning Approach for Web Search. In Proc. of WI 2007,
Silicon Valley, CA, IEEE Computer Society, pp. 780-783
[3] Alan Eckhardt, Peter Vojtáš: Combining Various Methods of
Automated User Decision and Preferences Modelling. MDAI
'09 172-181. Springer-Verlag Berlin, Heidelberg, 2009.
[4] Alan Eckhardt, Peter Vojtáš. 2009. How to learn fuzzy user
preferences with variable objectives. In proc. of
IFSA/EUSFLAT Conf. 2009: 938-943.
[5] Jill Freyne, Shlomo Berkovsky, and Gregory Smith. 2011.
Recipe recommendation: accuracy and reasoning. In
Proceedings of the 19th international conference on User
modeling, adaption, and personalization (UMAP'11).
Springer-Verlag, Berlin, Heidelberg, 99-110.
[6] Yifan Hu, Yehuda Koren, and Chris Volinsky. 2008.
Collaborative Filtering for Implicit Feedback Datasets. In
Proc. of ICDM '08. IEEE Computer Society, Washington,
DC, USA, 263-272.
[7] Gawesh Jawaheer, Martin Szomszor, and Patty Kostkova.
2010. Comparison of implicit and explicit feedback from an
online music recommendation service. In Proc. of
HetRec'10. ACM, New York, NY, USA, 47-51.
[8] Thorsten Joachims, Laura Granka, Bing Pan, Helene
Hembrooke, Filip Radlinski, and Geri Gay. 2007. Evaluating
the accuracy of implicit feedback from clicks and query
reformulations in Web search. ACM Trans. Inf. Syst. 25, 2,
Article 7 (April 2007). DOI=10.1145/1229179.1229181
[9] Kelly, D. & Belkin, N. J. Display time as implicit feedback:
understanding task effects Proceedings of the 27th ACM
SIGIR conference on Research and development in
information retrieval, ACM, 2004, 377-384
[10] Kießling, W.; Endres, M. & Wenzel, F. The Preference SQL
System - An Overview. IEEE Data Eng. Bull., 2011, 34, 11-
18
[11] Lee, D. H. & Brusilovsky, P. Reinforcing Recommendation
Using Implicit Negative Feedback In Proc. of UMAP 2009,
Springer, LNCS, 2009, 422-427
[12] Linden, G.; Smith, B. & York, J. Amazon.com
recommendations: item-to-item collaborative filtering
Internet Computing, IEEE, 2003, 7, 76 - 80
[13] Ladislav Peska, Alan Eckhardt, and Peter Vojtas. 2011.
UPComp - A PHP Component for Recommendation Based
on User Behaviour. In Proceedings of WI-IAT '11, IEEE
Computer Society, Washington, DC, USA, 306-309.
[14] Ladislav Peska and Peter Vojtas. 2012. Estimating
Importance of Implicit Factors in E-commerce. To appear on
WIMS 2012, http://ksi.mff.cuni.cz/~peska/wims12.pdf
[15] Pizzato, L.; Rej, T.; Chung, T.; Koprinska, I. & Kay, J.
RECON: a reciprocal recommender for online dating
Proc. of RecSys'10, ACM, 2010, 207-214
[16] Symeonidis, P.; Tiakas, E. & Manolopoulos, Y. Product
recommendation and rating prediction based on multi-modal
social network. Proc. of RecSys'11, ACM, 2011, 61-68
[17] Bo Xiao and Izak Benbasat. 2007. E-commerce product
recommendation agents: use, characteristics, and impact. MIS
Q. 31, 1 (March 2007), 137-209.
55