worksheet landmark analysis t=9
TRANSCRIPT
X LS RL-90-60 6 6
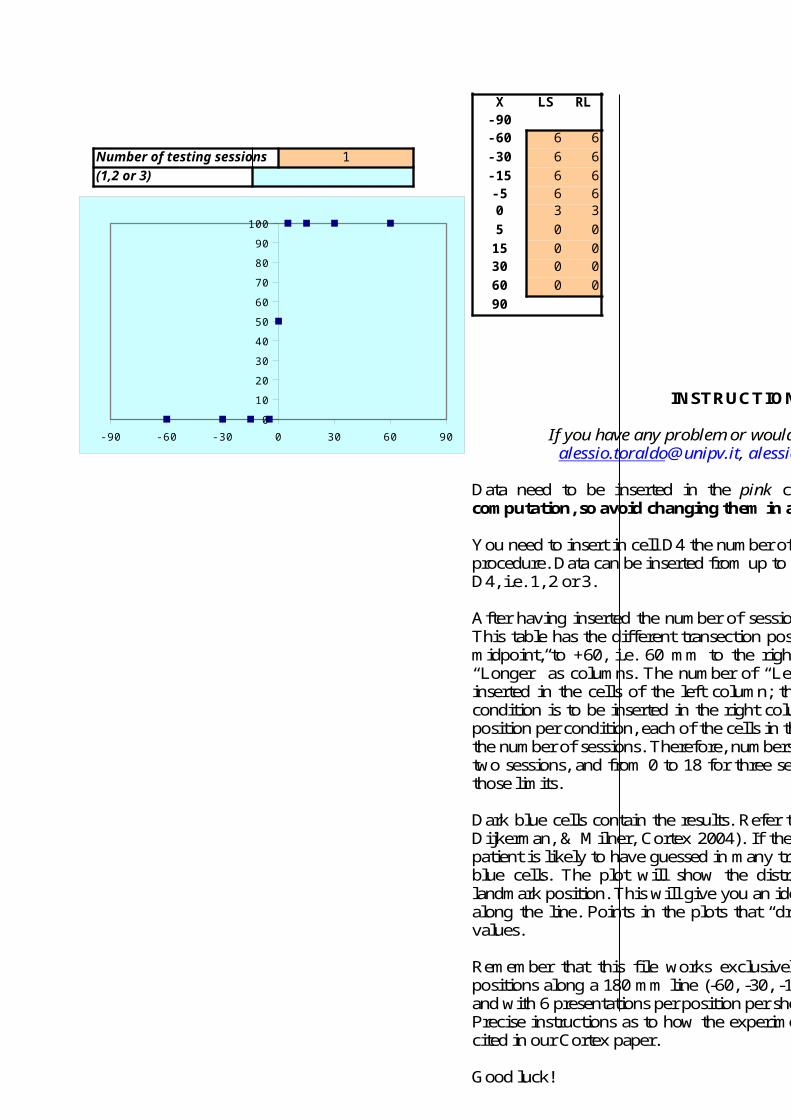
Number of testing sessions 1 -30 6 6(1,2 or 3) -15 6 6
-5 6 60 3 35 0 015 0 030 0 060 0 090
-90 -60 -30 0 30 60 900
102030405060708090
100
INSTRUCTIO NS FOR USING THE FILE
If you have any problem or would like to have more information please contact [email protected], [email protected], or [email protected]
Data need to be inserted in the pink cells. All the other cells contain form ulae for the com putation, so avoid changing them in any way. You need to insert in cell D4 the number of sessions carried out according to Bisiach et al.’s (1998) procedure. Data can be inserted from up to three sessions, so three only numbers are allowed in cell D4, i.e. 1, 2 or 3. After having inserted the number of sessions, you have to insert the data in the pink cells I3:J11. This table has the different transection positions as rows (from -60, i.e. 60 m m to the left of true m idpoint, to +60, i.e. 60 m m to the right of m idpoint) and the two conditions, “Shorter” and “Longer” as columns. The number of “Left” responses given in the “Shorter” condition is to be inserted in the cells of the left column; the num ber of “Right” responses given in the “Longer” condition is to be inserted in the right colum n. Since a single session has 6 stimuli per landmark position per condition, each of the cells in the pink table m ust have a number between 0 and 6 tim es the number of sessions. Therefore, num bers must vary from 0 to 6 for one session, from 0 to 12 for two sessions, and from 0 to 18 for three sessions. Be careful not to insert numbers that go beyond those lim its. Dark blue cells contain the results. Refer to the paper for their interpretation (Toraldo, M cIntosh, Dijkerman, & M ilner, Cortex 2004). If there are problem s with data insertion, or if the exam ined patient is likely to have guessed in m any trials, warning messages will pop out of some of the light blue cells. The plot will show the distribution of p-values, expressed as percentage, against landmark position. This will give you an idea of how shallow or displaced the norm al cum ulative is along the line. Points in the plots that “dropped” below the horizontal axis indicate unknown p-values. Rem em ber that this file works exclusively for the experim ent made with 9 precise landm ark positions along a 180 mm line (-60, -30, -15, -5, 0, 5, 15, 30, 60 mm from the objective midpoint) and with 6 presentations per position per sheet per session, with up to three sessions. Precise instructions as to how the experim ent should be m ade are detailed in Bisiach et al., 1998, cited in our Cortex paper. Good luck!
Alessio Toraldo
P1.96 1 0 ###5
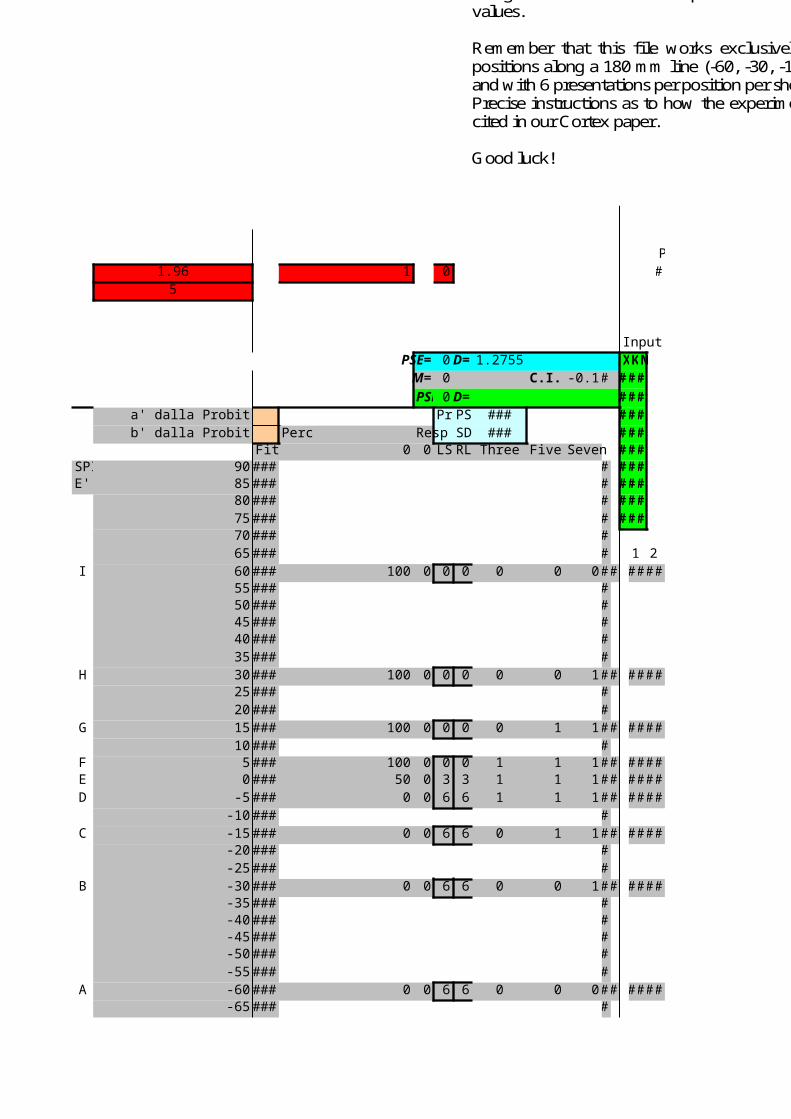
Input per ProbiPSE= 0D= 1.2755 XKN
M= 0 C.I. -0.1############PSE 0D= #########
a' dalla Probit Pr PS ### #########b' dalla Probit Perc Resp SD ### #########
Fit 0 0 LS RL Three Five Seven#########SPI 90### ############E' 85### ############
80### ############75### ############70### ###65### ### 1 2
I 60### 100 0 0 0 0 0 0##################55### ###50### ###45### ###40### ###35### ###
H 30### 100 0 0 0 0 0 1##################25### ###20### ###
G 15### 100 0 0 0 0 1 1##################10### ###
F 5### 100 0 0 0 1 1 1##################E 0### 50 0 3 3 1 1 1##################D -5### 0 0 6 6 1 1 1##################
-10### ###C -15### 0 0 6 6 0 1 1##################
-20### ###-25### ###
B -30### 0 0 6 6 0 0 1##################-35### ###-40### ###-45### ###-50### ###-55### ###
A -60### 0 0 6 6 0 0 0##################-65### ###
INSTRUCTIO NS FOR USING THE FILE
If you have any problem or would like to have more information please contact [email protected], [email protected], or [email protected]
Data need to be inserted in the pink cells. All the other cells contain form ulae for the com putation, so avoid changing them in any way. You need to insert in cell D4 the number of sessions carried out according to Bisiach et al.’s (1998) procedure. Data can be inserted from up to three sessions, so three only numbers are allowed in cell D4, i.e. 1, 2 or 3. After having inserted the number of sessions, you have to insert the data in the pink cells I3:J11. This table has the different transection positions as rows (from -60, i.e. 60 m m to the left of true m idpoint, to +60, i.e. 60 m m to the right of m idpoint) and the two conditions, “Shorter” and “Longer” as columns. The number of “Left” responses given in the “Shorter” condition is to be inserted in the cells of the left column; the num ber of “Right” responses given in the “Longer” condition is to be inserted in the right colum n. Since a single session has 6 stimuli per landmark position per condition, each of the cells in the pink table m ust have a number between 0 and 6 tim es the number of sessions. Therefore, num bers must vary from 0 to 6 for one session, from 0 to 12 for two sessions, and from 0 to 18 for three sessions. Be careful not to insert numbers that go beyond those lim its. Dark blue cells contain the results. Refer to the paper for their interpretation (Toraldo, M cIntosh, Dijkerman, & M ilner, Cortex 2004). If there are problem s with data insertion, or if the exam ined patient is likely to have guessed in m any trials, warning messages will pop out of some of the light blue cells. The plot will show the distribution of p-values, expressed as percentage, against landmark position. This will give you an idea of how shallow or displaced the norm al cum ulative is along the line. Points in the plots that “dropped” below the horizontal axis indicate unknown p-values. Rem em ber that this file works exclusively for the experim ent made with 9 precise landm ark positions along a 180 mm line (-60, -30, -15, -5, 0, 5, 15, 30, 60 mm from the objective midpoint) and with 6 presentations per position per sheet per session, with up to three sessions. Precise instructions as to how the experim ent should be m ade are detailed in Bisiach et al., 1998, cited in our Cortex paper. Good luck!
Alessio Toraldo
-70### ###-75### ###-80### ###-85### ###-90### ###
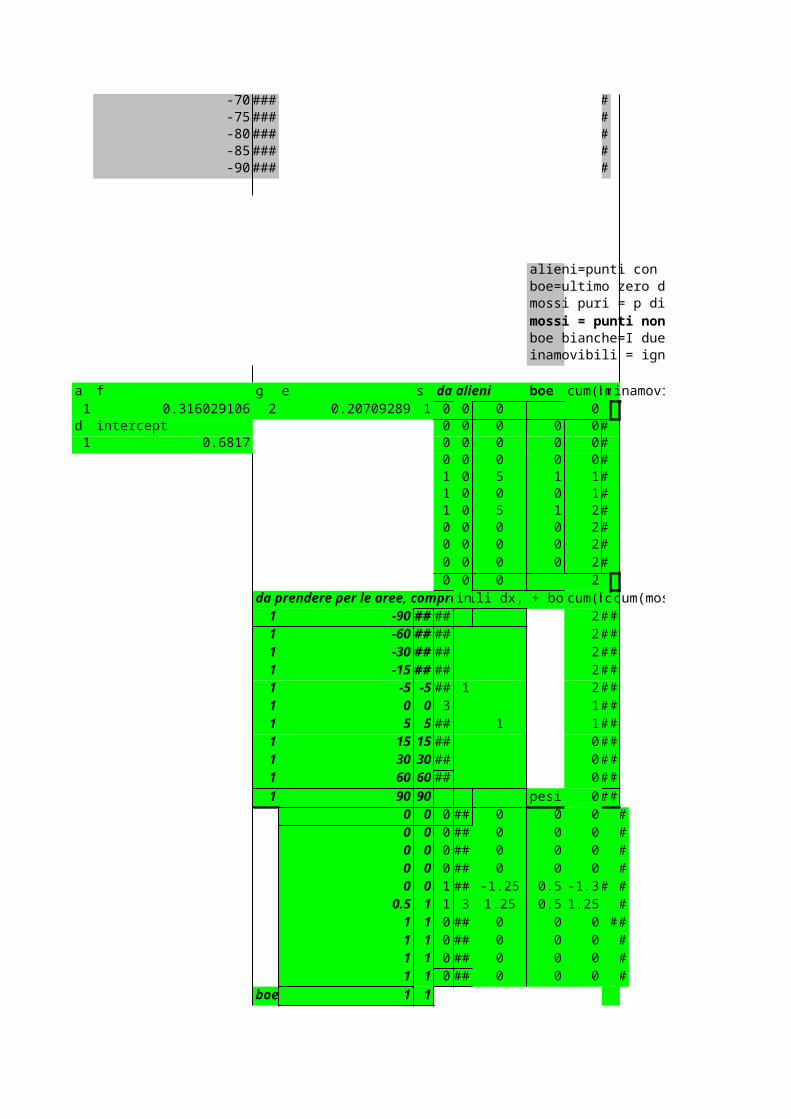
alieni=punti con p ignoto (0/0)boe=ultimo zero da sx a dx, ultimo 1 da dx a sxmossi puri = p diversi da 0 e da 1mossi = punti non ignoti compresi tra le due boe. Possono essere anche 0 ed 1.boe bianche=I due punti piu' interni, nell'insieme delle boe+alieni tra boe e mossi se almeno due mossiinamovibili = ignoti compresi tra una boa e un mosso, quando ci sono almeno due mossi
a f g e s da alieni boe cum(bminamovibili1 0.316029106 2 0.20709289 1 0 0 0 0
d intercept 0 0 0 0 0###1 0.6817 0 0 0 0 0###
0 0 0 0 0###1 0 5 1 1###1 0 0 0 1###1 0 5 1 2###0 0 0 0 2###0 0 0 0 2###0 0 0 0 2###0 0 0 2
da prendere per le aree, compresininamovibili dx, + boa dxcum(bccum(mossi)^-11 -90###### 2######1 -60###### 2######1 -30###### 2######1 -15###### 2######1 -5 -5### 1 2######1 0 0 3 1######1 5 5### 1 1######1 15 15### 0######1 30 30### 0######1 60 60### 0######1 90 90 pesi 0######
0 0 0### 0 0 0 ###0 0 0### 0 0 0 ###0 0 0### 0 0 0 ###0 0 0### 0 0 0 ###0 0 1### -1.25 0.5 -1.3######
0.5 1 1 3 1.25 0.5 1.25 ###1 1 0### 0 0 0######1 1 0### 0 0 0 ###1 1 0### 0 0 0 ###1 1 0### 0 0 0 ###
boe 1 1
1 0 Coi p 0######### G
1
1
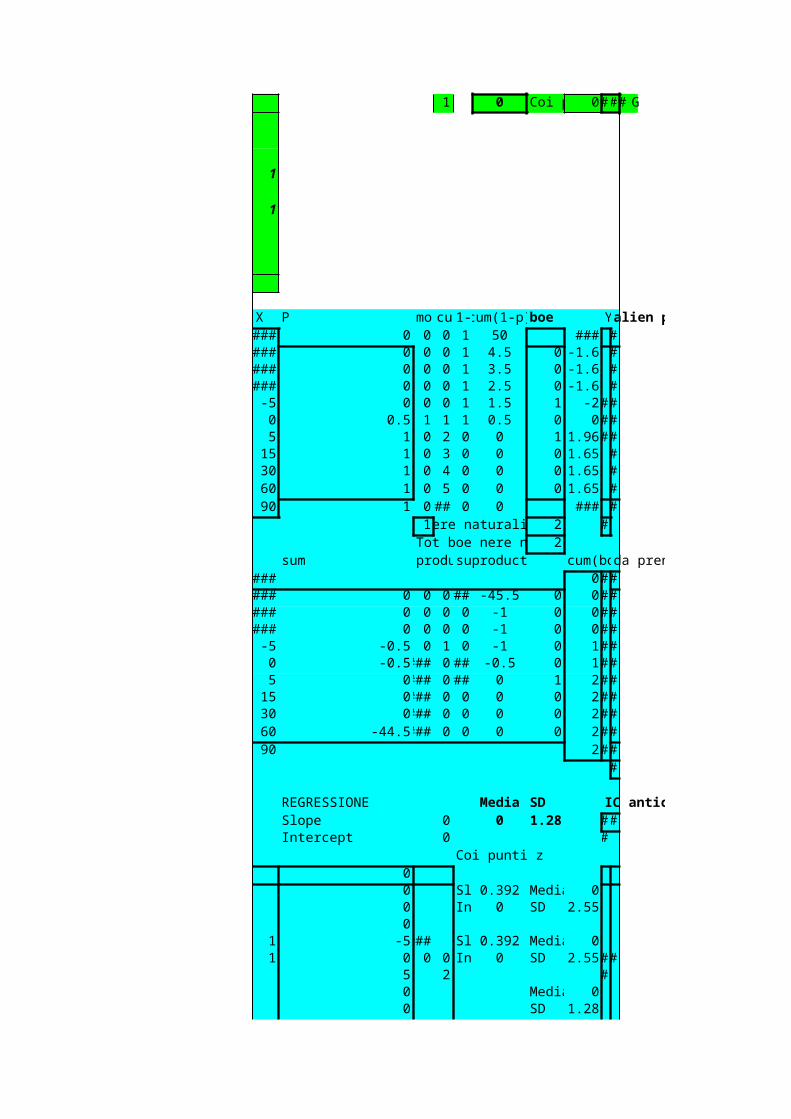
X P mo cu 1-cum(1-p)boe Yalien points### 0 0 0 1 50 ######### 0 0 0 1 4.5 0 -1.6###### 0 0 0 1 3.5 0 -1.6###### 0 0 0 1 2.5 0 -1.6###-5 0 0 0 1 1.5 1 -2######0 0.5 1 1 1 0.5 0 0######5 1 0 2 0 0 1 1.96######15 1 0 3 0 0 0 1.65###30 1 0 4 0 0 0 1.65###60 1 0 5 0 0 0 1.65###90 1 0### 0 0 ######
1Tot boe nere naturali e artificiali2 ###Tot boe nere naturali2
sum produsuproduct cum(boda prendere### 0######### 0 0 0### -45.5 0 0######### 0 0 0 0 -1 0 0######### 0 0 0 0 -1 0 0######-5 -0.5 0 1 0 -1 0 1######0 -0.5### 0### -0.5 0 1######5 0### 0### 0 1 2######15 0### 0 0 0 0 2######30 0### 0 0 0 0 2######60 -44.5### 0 0 0 0 2######90 2######
###
REGRESSIONE Media SD IC antico (errato?)che considerava l'errore attorno alla normale cumulativa.Slope 0 0 1.28 ######Intercept 0 ###
Coi punti z00 Sl 0.392 Media 00 In 0 SD 2.550
1 -5### Sl 0.392 Media 01 0 0 0 In 0 SD 2.55######
5 2 ###0 Media 00 SD 1.28
00
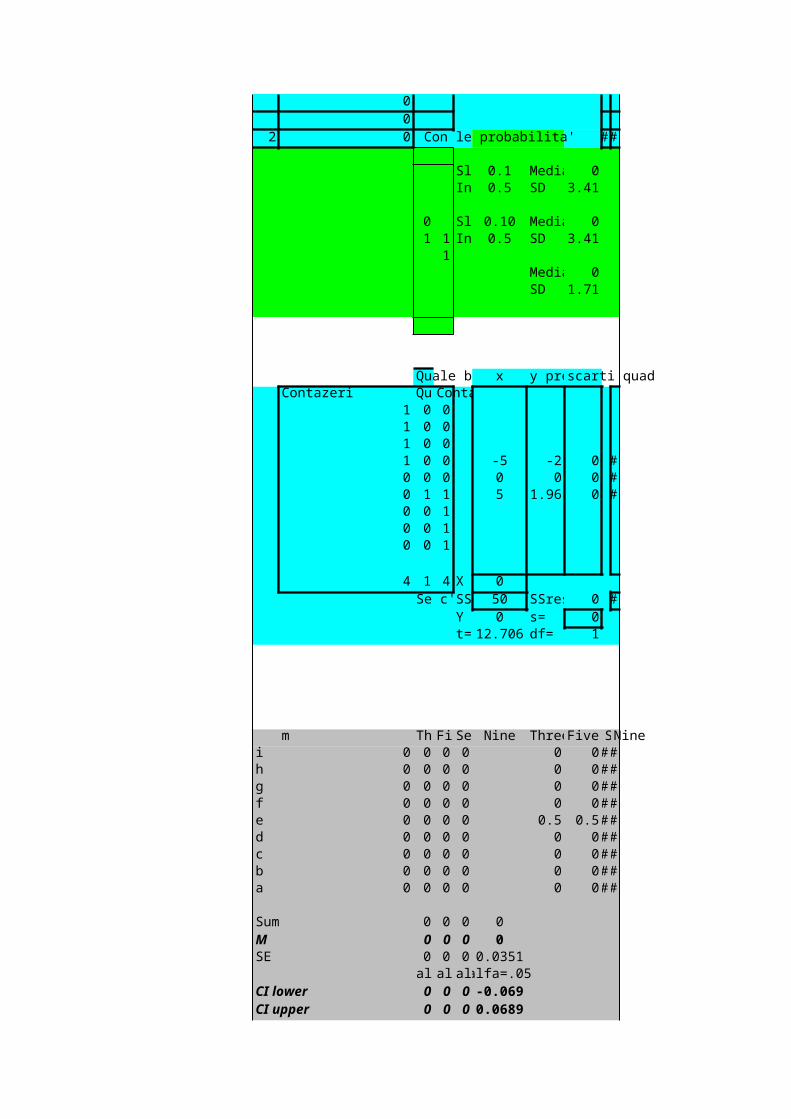
2 0 Con le probabilita' ######
Sl 0.1 Media 0In 0.5 SD 3.41
0 Sl 0.10 Media 01 1 In 0.5 SD 3.41
1Media 0SD 1.71
Quale b x y prescarti quadContazeri Qu Conta
1 0 01 0 01 0 01 0 0 -5 -2 0###0 0 0 0 0 0###0 1 1 5 1.96 0###0 0 10 0 10 0 1
4 1 4 X 0Se c'SS 50 SSres 0###
Y 0 s= 0t= 12.706 df= 1
m Th Fi Se Nine ThreeFive SNinei 0 0 0 0 0 0######h 0 0 0 0 0 0######g 0 0 0 0 0 0######f 0 0 0 0 0 0######e 0 0 0 0 0.5 0.5######d 0 0 0 0 0 0######c 0 0 0 0 0 0######b 0 0 0 0 0 0######a 0 0 0 0 0 0######
Sum 0 0 0 0M 0 0 0 0SE 0 0 0 0.0351
al al alalfa=.05CI lower 0 0 0 -0.069CI upper 0 0 0 0.0689

TM=transection mossaA=transection contigua alla mossa, con probabilita' piu' lontana.TM A0 5
p(Tp(A)01

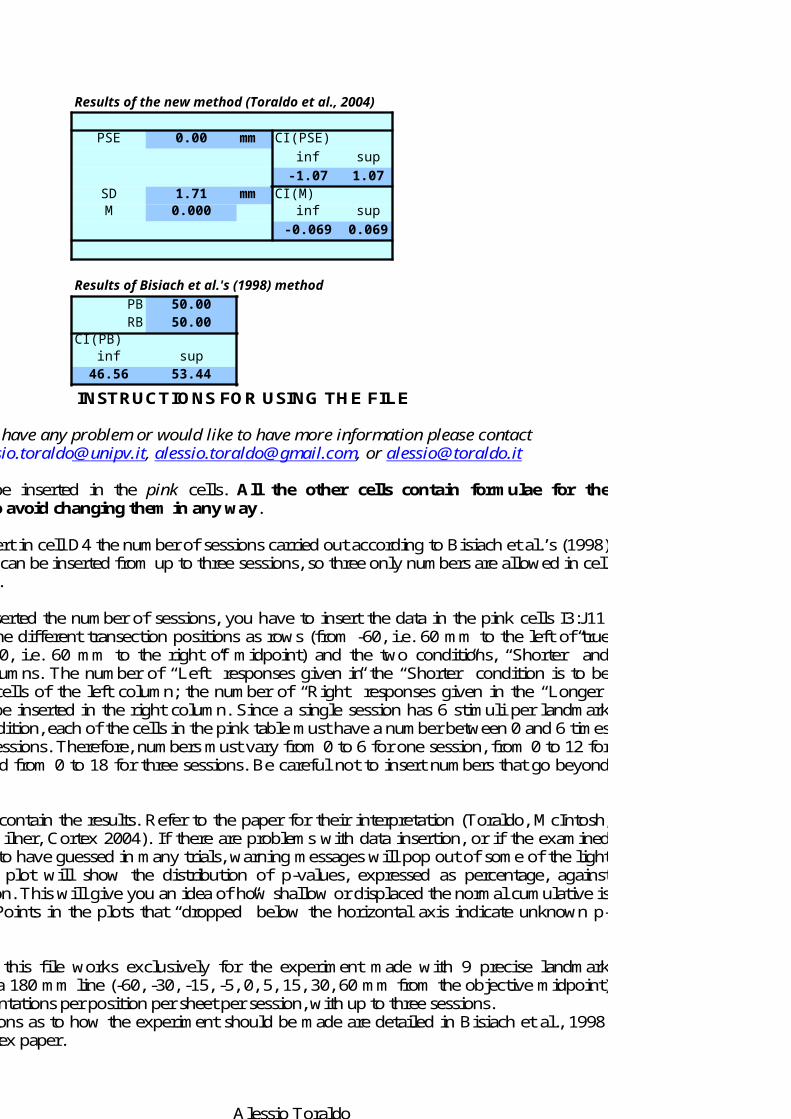
Results of the new method (Toraldo et al., 2004)
PSE 0.00 mm CI(PSE)inf sup-1.07 1.07
SD 1.71 mm CI(M)M 0.000 inf sup
-0.069 0.069
Results of Bisiach et al.'s (1998) methodPB 50.00RB 50.00
CI(PB)inf sup46.56 53.44
INSTRUCTIO NS FOR USING TH E FILE
If you have any problem or would like to have more information please contact [email protected], [email protected], or [email protected]
Data need to be inserted in the pink cells. All the other cells contain form ulae for the com putation, so avoid changing them in any way. You need to insert in cell D4 the num ber of sessions carried out according to Bisiach et al.’s (1998) procedure. Data can be inserted from up to three sessions, so three only num bers are allowed in cell D4, i.e. 1, 2 or 3. After having inserted the num ber of sessions, you have to insert the data in the pink cells I3:J11. This table has the different transection positions as rows (from -60, i.e. 60 mm to the left of true midpoint, to +60, i.e. 60 mm to the right of midpoint) and the two conditions, “Shorter” and “Longer” as colum ns. The number of “Left” responses given in the “Shorter” condition is to be inserted in the cells of the left column; the num ber of “Right” responses given in the “Longer” condition is to be inserted in the right colum n. Since a single session has 6 stimuli per landmark position per condition, each of the cells in the pink table m ust have a num ber between 0 and 6 tim es the number of sessions. Therefore, num bers m ust vary from 0 to 6 for one session, from 0 to 12 for two sessions, and from 0 to 18 for three sessions. Be careful not to insert numbers that go beyond those lim its. Dark blue cells contain the results. Refer to the paper for their interpretation (Toraldo, M cIntosh, Dijkerman, & M ilner, Cortex 2004). If there are problems with data insertion, or if the exam ined patient is likely to have guessed in many trials, warning messages will pop out of some of the light blue cells. The plot will show the distribution of p-values, expressed as percentage, against landm ark position. This will give you an idea of how shallow or displaced the norm al cum ulative is along the line. Points in the plots that “dropped” below the horizontal axis indicate unknown p-values. Remem ber that this file works exclusively for the experiment made with 9 precise landm ark positions along a 180 mm line (-60, -30, -15, -5, 0, 5, 15, 30, 60 mm from the objective midpoint) and with 6 presentations per position per sheet per session, with up to three sessions. Precise instructions as to how the experiment should be m ade are detailed in Bisiach et al., 1998, cited in our Cortex paper. Good luck!
Alessio Toraldo
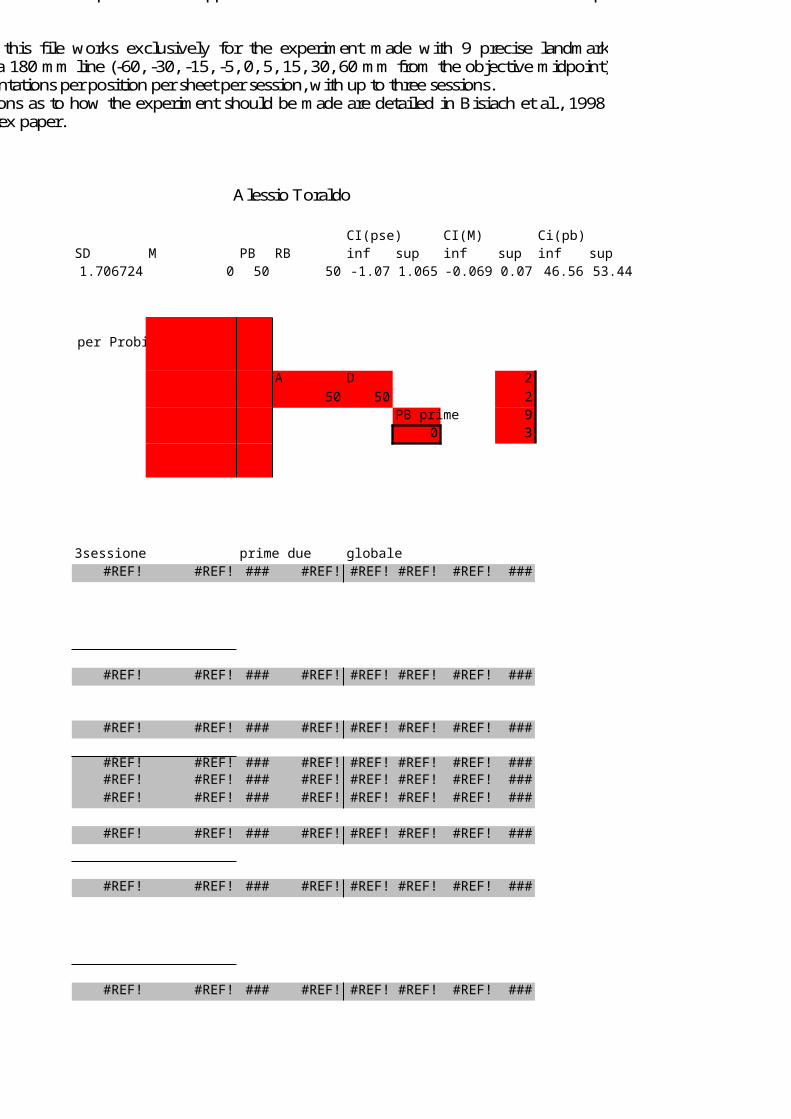
Ratio Se/rangeM 0.06886611PB 0.06886611
CI(pse) CI(M) Ci(pb)SD M PB RB inf sup inf sup inf sup1.706724 0 50 50 -1.07 1.065 -0.069 0.07 46.56 53.44
Input per Probi
A D 250 50 2
PB prime 90 3
3sessione prime due globale#REF! #REF! ### #REF! #REF! #REF! #REF! ###
#REF! #REF! ### #REF! #REF! #REF! #REF! ###
#REF! #REF! ### #REF! #REF! #REF! #REF! ###
#REF! #REF! ### #REF! #REF! #REF! #REF! ####REF! #REF! ### #REF! #REF! #REF! #REF! ####REF! #REF! ### #REF! #REF! #REF! #REF! ###
#REF! #REF! ### #REF! #REF! #REF! #REF! ###
#REF! #REF! ### #REF! #REF! #REF! #REF! ###
#REF! #REF! ### #REF! #REF! #REF! #REF! ###
INSTRUCTIO NS FOR USING TH E FILE
If you have any problem or would like to have more information please contact [email protected], [email protected], or [email protected]
Data need to be inserted in the pink cells. All the other cells contain form ulae for the com putation, so avoid changing them in any way. You need to insert in cell D4 the num ber of sessions carried out according to Bisiach et al.’s (1998) procedure. Data can be inserted from up to three sessions, so three only num bers are allowed in cell D4, i.e. 1, 2 or 3. After having inserted the num ber of sessions, you have to insert the data in the pink cells I3:J11. This table has the different transection positions as rows (from -60, i.e. 60 mm to the left of true midpoint, to +60, i.e. 60 mm to the right of midpoint) and the two conditions, “Shorter” and “Longer” as colum ns. The number of “Left” responses given in the “Shorter” condition is to be inserted in the cells of the left column; the num ber of “Right” responses given in the “Longer” condition is to be inserted in the right colum n. Since a single session has 6 stimuli per landmark position per condition, each of the cells in the pink table m ust have a num ber between 0 and 6 tim es the number of sessions. Therefore, num bers m ust vary from 0 to 6 for one session, from 0 to 12 for two sessions, and from 0 to 18 for three sessions. Be careful not to insert numbers that go beyond those lim its. Dark blue cells contain the results. Refer to the paper for their interpretation (Toraldo, M cIntosh, Dijkerman, & M ilner, Cortex 2004). If there are problems with data insertion, or if the exam ined patient is likely to have guessed in many trials, warning messages will pop out of some of the light blue cells. The plot will show the distribution of p-values, expressed as percentage, against landm ark position. This will give you an idea of how shallow or displaced the norm al cum ulative is along the line. Points in the plots that “dropped” below the horizontal axis indicate unknown p-values. Remem ber that this file works exclusively for the experiment made with 9 precise landm ark positions along a 180 mm line (-60, -30, -15, -5, 0, 5, 15, 30, 60 mm from the objective midpoint) and with 6 presentations per position per sheet per session, with up to three sessions. Precise instructions as to how the experiment should be m ade are detailed in Bisiach et al., 1998, cited in our Cortex paper. Good luck!
Alessio Toraldo

alieni=punti con p ignoto (0/0)boe=ultimo zero da sx a dx, ultimo 1 da dx a sxmossi puri = p diversi da 0 e da 1mossi = punti non ignoti compresi tra le due boe. Possono essere anche 0 ed 1.boe bianche=I due punti piu' interni, nell'insieme delle boe+alieni tra boe e mossi se almeno due mossiinamovibili = ignoti compresi tra una boa e un mosso, quando ci sono almeno due mossi
inamovibili
cum(mossi)^-1

alien points
da prendere
IC antico (errato?)che considerava l'errore attorno alla normale cumulativa.

A=transection contigua alla mossa, con probabilita' piu' lontana.
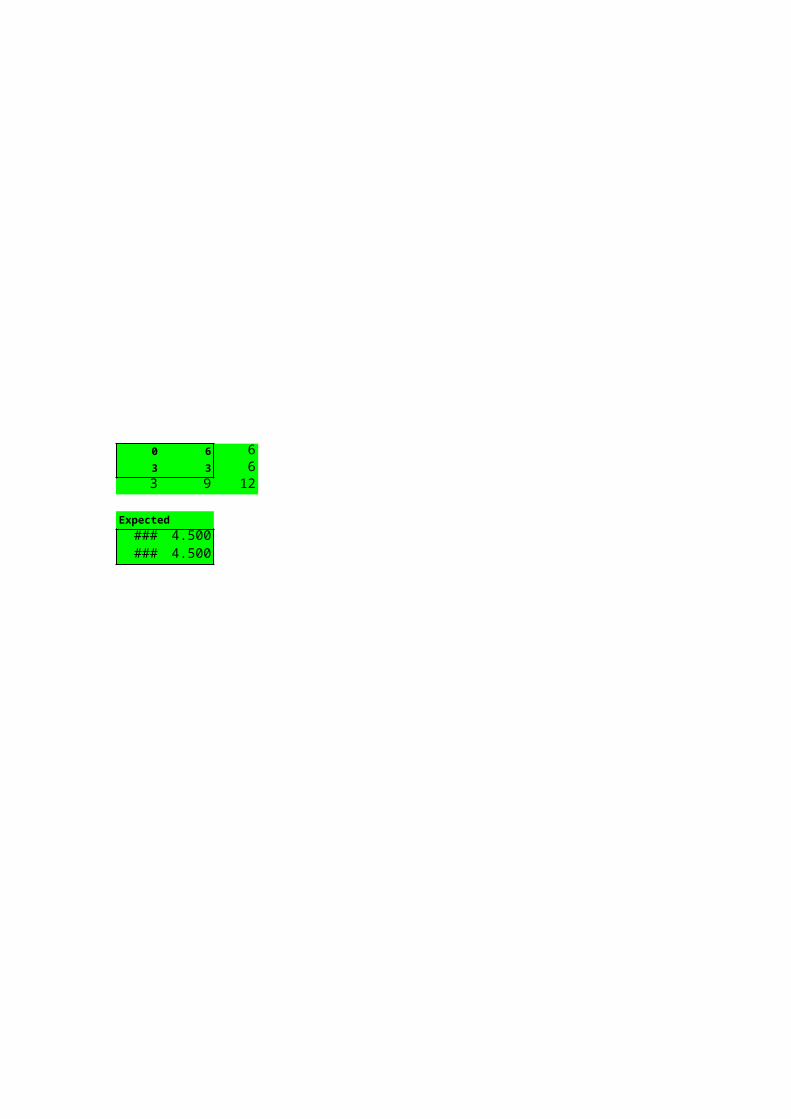
0 6 63 3 63 9 12
Expected### 4.500### 4.500

boe bianche=I due punti piu' interni, nell'insieme delle boe+alieni tra boe e mossi se almeno due mossi


16.315.712.512.5-0.1
2293