workforce-constrained preventive maintenance scheduling using evolution strategies
TRANSCRIPT

Decision Sciences Volume 31 Number 4 Fall 2000 Printed in the U.S.A.
Workforce-constrained Preventive Maintenance Scheduling Using Evolution Strategies Sanjay Ahire Department of MIS and Decision Sciences, School of Business Administration, University of Dayton, 300 College Park, Dayton, OH 45469-2130, email: [email protected]
Garrison Greenwood Department of Electrical and Computer Engineering, Portland State University, Portland, OR 97207-0751 ~ email: [email protected]
Ajay Gupta Department of Computer Science. Western Michigan University, 1903 W. Michigan Ave., Kalamazoo, MI 49008-5371, email: [email protected]
Mark Terwilliger Department of Mathematics and Computer Science, Lake Superior State University, MI 49783, email: [email protected]
ABSTRACT Heavy equipment overhaul facilities such as aircraft service centers and railroad yards face the challenge of minimizing the makespan for a set of preventive maintenance (PM) tasks, requiring single or multiple skills, within workforce availability constraints. In this paper, we examine the utility of evolution strategies to this problem. Comparison of the computational efforts of evolution strategies with exhaustive enumeration to reach optimal solutions for 60 small problems illustrates the ability of evolution strategies to yield optimal solutions increasingly efficiently with increasing problem size. A set of 852 large-scale problems was solved using evolution strategies to examine the effects of task-related problem characteristics, workforce-related variables, and evolution strate- gies population size (p) on CPU time. The results empirically supported practical utility of evolution strategies to solve large-scale, complex preventive maintenance problems involving single- and multiple-skilled workforce. Finally, comparison of evolution strat- egies and simulated annealing for the 852 experiments indicated much faster conver- gence to optimality with evolution strategies.
Subject Areas: Evolution Strategies, Preventive Maintenance, and Workforce Scheduling.
833

834 Evolution Strategies
INTRODUCTION In today’s competitive environment, the need for effective maintenance of opera- tional equipment can hardly be ignored. In the manufacturing sector, downtime of machines has been identified as one of the major causes of reduced productivity (Spencer & Guide, 1995; Vuppalapati, Ahire, & Gupta, 1995). Improved mainte- nance of manufacturing equipment has been recognized as a critical element of overall quality improvement efforts (Flynn, Schroeder, & Sakakibara, 1994; Saraph, Benson, & Schroeder, 1989). In the service sector also, the primary equip- ment used to provide service must be kept in good condition. This cannot only avoid major disasters, but also defer expensive capital investments. An excellent case in point is the maintenance of aircraft in the airline industry. It is estimated that the maintenance function of various airlines accounts for about 10% of their operating costs, about the same as the fuel costs (Lam, 1995). In June 2000, the U.S. Federal Aviation Administration threatened to shut down major aircraft over- haul maintenance at Alaska Airlines in the wake of several jet crashes linked to inept maintenance execution and reporting practices (Wald, 2000). In summary, competent and effective maintenance has a direct impact on the profitability and reputation of an airline and, in general, of any organization. Research into better methods of scheduling preventive maintenance (PM) certainly represents a worth- while contribution to enhancing operations management effectiveness.
In this paper, we study the PM scheduling problem faced by all major over- haul maintenance facilities where aircraft, ships, locomotives, or other heavy equipment need to be turned around as early as possible. However, the available time window is not the explicit restricting factor in scheduling, and the servicing of the unit must be completed in its entirety before the unit is returned to field usage. Thus, we consider the problem of assigning single- or multiple-skilled workers to a set of PM tasks requiring single or multiple skills. The objective is to compute the assignment, which will lead to a minimum makespan (time to complete all tasks). We examine the applicability of an evolution strategy (ES) algorithm to this NP- hard problem. The efficiency of the algorithm vis-8-vis exhaustive enumeration is illustrated for small problems. The computational efficiency of evolution strate- gies vis-h-vis simulated annealing (SA) is further confirmed through a large-scale experimental design covering 852 experiments.
The paper is organized as follows. First, we survey the past PM research, fol- lowed by a formal description of our PM problem. Then, evolution strategies (ES) are introduced and conceptually compared with genetic algorithms and simulated annealing (SA). The next section presents the mechanics of ES application to our specific PM problem. Computational efficacy of the ES approach is compared to exhaustive enumeration (EE). Computational performance of the ES approach for a systematic design of 852 large-scale PM problems is also analyzed. The results from the ES and SA approach are compared for the 852 problems in the next sec- tion. We conclude the paper with recommendations for further research.
PREVENTIVE MAINTENANCE RESEARCH REVIEW From a managerial perspective, different scheduling methodologies suit different contexts including system characteristics (continuous versus intermittent operations),

Ahire, Greenwood, Guptu, and Tenvilliger 835
scope of the problem (only maintenance schedules versus production and mainte- nance schedules), and goals (minimizing total expected maintenance costs versus maximizing total effectiveness in terms of breakdown avoidance). Over the last two decades, researchers have focused on various aspects of the PM function in different contexts (Table 1). Preventive maintenance research has been well doc- umented in various seminal surveys (McCall, 1965; Pierskalla & Voelker, 1975; Sherif & Smith, 1981; Valdez & Feldman, 1989). Some classics have also pio- neered mathematical treatment of the subject (Barlow & Hunter, 1960). Research- ers have adopted various approaches to model PM scheduling problems. For example, Comell, Lee, and Tagaras (1987) used the Markov chain approach to modeling deterioration of equipment, and analyzed the long-term performance of a combination of scheduled and on-demand maintenance policies. Ram and Olumolade (1987) fitted a Weibull distribution to time between failures on past equipment data, and used it to optimize the total expected maintenance (scheduled and breakdown) cost in the presence of a production plan.
Researchers have studied a wide range of PM scheduling contexts. Golabi, Kulkami, and Way (1982) discussed scheduling of pavement maintenance using a Markov approach. Recently, Golabi and Shepard (1997) presented a combination of Markovian state prediction and dynamic cost minimization approach for sched- uling maintenance/overhaul of road bridge networks. Various highway associa- tions in the U.S. have adopted both of these approaches.
A few recent research papers have developed models to maximize some measure of PM productivity or effectiveness in a limited maintenance resource context. For example, Dijkstra, Kroon, Salomon, Van Nunen, and Van Wassenhove (1994) described a decision support system (DSS) for scheduling aircraft mainte- nance for KLM Royal Dutch Airlines within a finite time window. The DSS was based on two integer programming models. The first model used workload esti- mates, shift times, the number of teams per shift, and desired service level as inputs to calculate the size and composition of the teams so that the total number of engi- neers was minimized, the service level constraint was satisfied, and jobs were matched with engineer skills. The second model assigned a given workforce (num- ber of engineers per team and their skill combinations, shift times, and workload estimates) to workload in an optimal manner so as to maximize the service level. The researchers limited the scope of the problem to single-skilled engineers within the specific organizational context.
Ulusoy, Or, and Soydan ( 1 992) presented an actual system of maintenance planning and control in a foundry setting. The heart of the system was a mainte- nance task priority function based on three factors: recommended task frequency (F), task criticality index (C) based on a composite of various machine-specific and production-relevance criteria, and actual maintenance delay beyond the rec- ommended frequency (D). The authors used the conventional utility function approach to develop the function for various groups of PM tasks of different fre- quencies incorporating these three factors. Finally, they presented a ratio-analysis- based set of performance measures to evaluate the PM effectiveness in terms of the ratios between breakdown maintenance and PM, among other indices.
Dekker and Smeitink ( 1 994) analyzed the problem of scheduling preventive replacement tasks at randomly occurring opportunities of restricted duration. They

836 Evolution Strategies
Table 1: Summary of preventive maintenance (PM) research.
Papers Methodology Contribution McCall(l965), Research Summaries of the state-of-the-art of PM Pierskalla and Voelker (1975). Sherif and Smith (1981), Valdez and Feldman ( 1989)
Cornell, Lee, and Tagaras (1987)
Ram and Olumolade ( 1987)
Golabi, Kulkami, and Way (1982) Golabi and Shepard (1997)
Ulusoy, Or, and Soydan ( 1992)
Dekker and Smeitink (1 994)
Dijkstra, Kroon, Salomon, Van Nunen, and Van Wassenhove ( 1994)
Gopalakrishnan, Ahire, and Miller ( 1997)
Ahire, Greenwood, Gupta, and Terwilliger (2000)
surveys
Markov-chain models
Stochastic optimization
Markov-chain model and dynamic programming
Case study, utility func- tions
Stochastic optimization in process industry PM
Case study in airline indus- try, determim- istic optimization
Logistic regression and integer pro- gramming, application in a newspaper firm
Evolution strategies and simulated annealing
research and prescriptions for future research.
Deterioration of equipment and combination of scheduled and breakdown maintenance modeled analytically using Markov chain. Analytical formulas developed for optimum PM policies.
Weibull distribution used for time-between- failures. Analytical model for optimizing total scheduled and breakdown maintenance costs for a production plan.
Combination of Markov chain and dynamic programming optimization for road mainte- nance PM models.
Utility functions used to develop priorities for various PM task groups, ratio-analysis perfor- mance measures for PM effectiveness.
Analytical block replacement model of ran- dom finite duration PM time-blocks and task- priorities, cost minimization of the stochastic PM schedule. Decision support system for between-flights inspection schedule using integer programming models to minimize single-skill workforce organized in teams within the shift time and desired task-completion service level targets.
Analytical models developed for maximizing the effectiveness of PM schedule subject to single- and multiple-skilled workforce avail- ability constraints. Logistic regression used to determine task priorities based on machine history and task importance. The optimal PM schedule maximizes the total task priority score for a PM schedule. PM problem of minimizing the makespan of a set of PM tasks within workforce and skills availability constraints studied. No restriction on PM time availability. Especially useful in overhaul maintenance heavy equipment, such as airplane or ship heavy maintenance. Detailed performance analysis of evolution strategies and comparison with simulated annealing algorithm.

Ahire, Greenwood, Gupto, and Ter-williger 837
presented an approach to determining the priorities of various replacement pack- ages (or sets of replacement tasks) based upon the cost of delaying the package beyond their optimal control limit for time since last execution. The scheduling criterion was based upon an opportunistic block replacement model as an underly- ing long-term cost optimization model.
Finally, Gopalakrishnan, Ahire, and Miller (1997) modeled PM task priori- ties using logistic regression to test past machine usage and breakdown. They fed these priorities to a task-scheduling (binary integer programming) model that incorporated workforce man-hours and skills-availability constraints. Determinis- tic heuristics were developed to provide good solutions to the task-scheduling problem. Note that, with the exception of Gopalakrishnan et al., most other models did not explicitly address scheduling of PM activities using a multiple-skilled workforce. Dijkstra et al. (1994) further specified that work teams with skills required for particular PM tasks constituted a unit of workforce. All of these recent studies assumed restricted time availability for conducting preventive mainte- nance.
THE WORKFORCE-CONSTRAINED PM PROBLEM
We consider the problem of scheduling a set of PM tasks with a given available workforce (see Table 1 ) . For each task, the skills required and number of persons with these skills needed to work on the task is known. The tasks are to be per- formed by the available workforce, defined by the number of persons with each skill or multiple skills. All of the skills required for the set of tasks to be performed must be available in the given workforce (i.e., there must be at least one person with each of the required skills). The objective is to determine the schedule (sequence in which the PM tasks should be executed) with the minimum makespan (the time of completion of the final task). This will be referred to as the workforce- constrained preventive maintenance problem. Note that the optimal solution to this problem will yield a PM schedule in which: (a) all PM tasks in the set will be per- formed, (b) the available workforce characteristics (number of persons, and single- versus multiple-skill availability) will be utilized in an efficient manner, and (c) the minimum possible maintenance window (time to perform PM between pro- duction or equipment usage) will be determined. Hence, a solution to this problem is critical to reducing maintenance downtimes in manufacturing/service produc- tion systems.
This problem differs from that addressed by Ulusoy et al. (1992), Dekker and Smeitink (1994), Dijkstra et al. (1994), and Gopalakrishnan et al. (1997) in terms of its focus and objective. Instead of executing those tasks that will maximize the total net savings in a specific time-bucket subject to workforce availability con- straints (skills, persons, and man-hours), our goal i-; to minimize the makespan of a set of PM tasks within the workforce availability constraints (skills and persons). Thus, we schedule all tasks. Because all tasks will be scheduled, the logic of assigning workers to tasks is not driven by previously determined priorities. Instead, our approach consists of matching the workers of required skills to tasks in an efficient manner so as to complete the tasks in the shortest possible makespan.

838 Evolution Strategies
In practice, this problem occurs routinely in large-scale, complex mainte- nance environments, such as aircraft heavy maintenance facilities, ship mainte- nance yards, and railroad yards. For example, while Dijkstra et al. (1994) modeled the time-constrained scheduling of inspection and PM activities for aircraft on ground between consecutive flights, aircraft heavy maintenance facilities receive aircraft for major overhauls at various phases in their life. Aircraft type and design dictates the intervals (in terms of mileage and/or age) for these overhauls. Although there is a realistic expectation about the maximum makespan within which the aircraft must be turned around to resume its flights, maintenance facili- ties always seek to minimize the turnaround time within their available workforce. All of the overhaul tasks must be completed before the aircraft can be returned to the field. Thus, the problem that we consider is not that of prioritizing tasks or maximizing service level (the number of tasks completed within the finite frame as a percentage of the total number of candidate tasks) within a finite time frame. Rather, the objective is to minimize the turnaround time or makespan.
Structurally, our PM problem differs from the earlier works as follows. The goal of the earlier problems (especially, Gopalakrishnan et al., 1997) was to max- imize some major facet of PM effectiveness (number of tasks, composite priority of tasks completed, etc.) within the constraints of the available time and work- force. While our problem does incorporate explicit workforce constraints, it does not have an explicit time constraint. Thus, the possible savings in our problem come from “faster completion of all candidate required tasks” instead of “comple- tion of a subset of the candidate tasks within the available limited time window.” While the common essence of the goals is to perform PM more efficiently, the con- text is different. The applicability of our research is to contexts (such as overhaul maintenance of heavy equipment) that are fundamentally different from those time-constrained contexts (such as machinery maintenance between production batches or aircraft routine maintenance between successive flights) where the ear- lier models could be useful.
Our problem could also be extended to the multiple aircraft overhaul case by aggregating the tasks to which PM workforce can be assigned so that the overall makespan for all of the aircraft is minimized. On the other hand, if aircraft are ser- viced on a first-come, first-served basis, the multiple aircraft situation is simply an extension in which the scheduling problem is solved for each aircraft sequentially, where each aircraft’s PM schedule is affected by the preceding aircrafts’ schedules in terms of workforce availability while those aircraft are being serviced (Lam, 1995). The same scheduling problems are inherent in ship and railroad yards.
Mathematically, this problem can be characterized as a variation of the n- jobs, rn-machines job shop problem where, (1) each job (PM task) has only one processing step, and (2) the job ties up one or more machines of different types (PM workers) for its processing duration. This problem is more complex than the n-jobs, rn-machines job shop due to simultaneous utilization of multiple machines by a job. Since the standard job shop scheduling problem has been known to be NP-hard (Adams, Balas, & Zawack, 1988), our problem is clearly NP-hard.
Traditionally, optimization algorithms have been tried on the standard job shop scheduling problem (Lageweg, Lenstra, & Rinnooy Kan, 1977; Carlier & Pinson, 1989), with some success, to smaller size problems. However, the NP-hard

Ahire, Greenwood, Gupta, and Tenvilliger 839
nature of the problem precludes the possibility of exact algorithms for large-size, real-world problems. For larger problems, deterministic heuristics have been tra- ditionally applied using some form of priority rules (e.g., Adams et al., 1988). Since the late 1980s, new approaches such as simulated annealing (SA) and evo- lution techniques such as genetic algorithms have been applied to the problem (Biegel & Davern, 1990; Looi, 1992; Van Laarhoven, Aarts, & Lenstra, 1992). Glover and Greenberg (1989) provided a good review of simulated annealing, genetic algorithms, neural networks, and other new approaches for heuristic search in combinatorial optimization problems.
Recently, a new paradigm called evolution strategies (ES) has attracted researchers’ attention for application to complex computational problems (Back & Schwefel, 1993; DeJong, 1993; Michalewicz, 1994). Evolution strategies have been applied very recently to a diverse set of domains including task scheduling in distributed systems (Greenwood, Gupta, & McSweeny, 1994) and maintenance scheduling (Greenwood, Ahire, Gupta, & Munnangi, 1995). However, none of these papers, including Greenwood et al. (1995), has applied ES algorithms to our complex resource-constrained PM problem. Evolution strategy algorithms, like genetic algorithms (GA), belong to the general class of algorithms called Evolu- tion Algorithms (EA).
EVOLUTION STRATEGIES
The 1990s have witnessed a growing interest in the use of evolution algorithms (EA) to solve computationally complex problems. Two major paradigms of EA, namely, genetic algorithms (GA) and evolution strategies (ES), have been applied in a wide range of domains. Both GA and ES emulate biological principles of adaptive selection found in nature. Both are capable of obtaining good solutions to computationally hard problems (Davis, 1991 ; Back, 1996). Each generation (iter- ation of an ES) takes a population of individuals (potential solutions) and modifies the genetic material (problem parameters) to produce a new offspring. Although both the parents and the offspring are evaluated, only the fittest individuals (better solutions) survive over multiple generations. This means an ES simultaneously investigates several regions of the search space, thus finding comparable solutions to those found by other heuristic techniques (such as simulated annealing) but in far less computation time. In addition, an ES can also directly incorporate deter- ministic heuristics leading to even better solutions (Michalewicz, 1994; Nissen, 1993). The particular genetic encoding for an individual is referred to as the gen- otype. New genotypes are created by special mutation operators that modify the genetic material. Decoding this genetic material gives observed characteristics of the individual, referred to as the phenotype. The fitness of the genotype quantifies how closely the observed characteristics meet a desired objective. Highly fit indi- viduals display highly desirable characteristics. The ES terminates after a fixed number of generations (r) have been produced and evaluated, or earlier if an acceptable solution is found.
Genetic algorithms and evolution strategies were developed independently. While each maintains a population of trial solutions, imposes random changes to these solutions, and incorporates selection to determine which solutions survive,

840 Evolution Strategies
there are a number of differences. The most critical difference is that GA are con- cerned with the genotype level and attempt to model genetic operators that exist in nature (such as crossover). Evolution strategies are more concerned with pheno- typic effects, and emphasize mutational transformations (Fogel, 1995a). Recent research has shown that macro-mutations such as crossovers are not always nec- essary to produce satisfactory performance of an evolution algorithm. Indeed, it has been suggested that overemphasizing low-level operators and components (which is done in GAS) causes the loss of the selection of good behaviors in evo- lutionary processes (Fogel, 1995b). Finally, GA has been found to be less efficient as compared to ES in solving problems with many constraints (Sumichrast, Oxen- rider, & Clayton, 2000).
Simulated Annealing (SA) has also been tried on several combinatorial optimi- zation problems (Eglese, 1990 Johnson, Aragon, & McGeoch, 1991; Van Laarhoven et al., 1992). Simulated annealing attempts to find out the global minimum of a cost functionfover a finite solution space S as follows. The method starts from a random initial solution, and a neighboring solution is examined. Better solutions are always selected while worse solutions may be accepted with an exponentially decreasing probability. The probability of accepting a move that causes an increase 6 infis called the acceptance function, and is normally set to exp(-G/T), where T is a control parameter corresponding to temperature in an annealing process. Thus, small increases infare more likely to be accepted than large increases, and when T is high most moves will be accepted. This helps to escape local optima (Eglese, 1990).
Simulated annealing can find good results in certain types of optimization problems, though its excessive computation time has been cited as a major disad- vantage (Bollinger & Midkiff, 1994). This has led some researchers to suggest par- allel SA algorithms. Unfortunately, even these can produce unsatisfactory results. Researchers have demonstrated that parallel random search can outperform paral- lel SA (Braschi, Ferreira, & Zerovnik, 1989).
In summary, the relative strengths of the ES approach over GA and SA have been demonstrated theoretically and empirically. Further discussion on these com- parisons can be found in Back (1996). Based on these comparisons, we use ES algorithms to solve the resource-constrained PM scheduling problem. We later provide a direct empirical comparison between SA and ES.
Generic Steps in the ES Algorithm The algorithm starts by randomly generating an initial population of p individuals, representing feasible PM schedules (step 1 ), From this initial population, each individual is mutated to generate one offspring. All of the offspring are added to the population (step 2). All of the 2p individuals are evaluated to determine their fitness (step 3). Of these individuals, the p fittest individuals are selected for sur- vival while others are discarded (step 4). Steps 2 through 4 are continued until an acceptable solution (per predetermined criteria) is found or r generations have been evaluated.
In step 2, each individual is mutated to produce an offspring. The mutation operator produces this offspring by making a small, random perturbation to the problem parameters encoded by the genotype. Exactly how a mutation operator
Ahire, Greenwood, Gupta, and Terwilliger 84 1
creates an offspring depends on the genotype data structure, thus, it is application dependent. It is also possible to have multiple mutation operators. In such cases, the kth mutation operator is applied to an individual with probability pk . Since Zpk = 1 .O, all individuals will be subjected to a mutation operator. In the next section, we discuss the mutation operators used for solving the workforce-constrained PM scheduling problem. Although mutation operators are stochastic in nature, ES is not merely a random search. It concentrates the search in those regions of the search space where good solutions have previously been found. Regions with little promise are pruned out, because individuals with high fitness survive over the weaker ones. Also, since only the fittest p individuals (parents and offspring) sur- vive after each generation, ES is able to converge monotonically over generations to an acceptable solution. As problem size increases, a higher number of genera- tions is required as more mutations are required for ES convergence. Generally, the quality of solutions is proportional to p and r.
APPLYING EVOLUTION STRATEGIES TO THE WORKFORCE- CONSTRAINED PREVENTIVE MAINTENANCE PROBLEM
The application of ES to the workforce-constrained PM problem is described in the following sections: identification of genotype (candidate sequence of tasks), computation of schedule and makespan (phenotype), and description of mutation operators.
PM Problem Genotype To apply ES to the workforce-constrained PM problem, we first specify the geno- type, that is, the data structure that encodes the problem parameters. Recall that for the PM problem, the N PM tasks (labeled I , ..., N) must be scheduled for execution. Each task has a known completion time and a known set of skills that technicians must possess to perform the task. For example, a PM task may require the assign- ment of an electrician for three hours and a mechanical technician for one hour. Given a set of technicians (with specific skills), the goal is to assign them to the N PM tasks such that all tasks can be completed in minimal time. Thus, the genotype for ES implementation is an N element ordered list of integers corresponding to the N tasks. The left-to-right order of the list specifies the sequence in which the tasks are to be assigned available maintenance personnel. The ordered list represents a candidate sequence.
Computation of Schedule and Makespan (Phenotype) L is the set of technicians available. Individual elements of this set represent indi- vidual technicians, who may have one or more of the skills required for executing the N tasks. Note that the cardinality of this set varies as PM tasks are executed because all personnel assigned to a task may not be needed for the entire task exe- cution time. For example, a mechanic could be required to work 5 time units while an electrician might be required to work for only 2 time units. Once a tech- nician has completed a PM task, (s)he is "returned" to L to await assignment to another task.

842 Evolution Strategies
The schedule for a specific genotype is computed as follows. The first task in the genotype task list is selected, and all needed personnel for this task are taken from L. If L is not empty, all remaining tasks are scanned (from left to right) to check if any other task could be started. Tasks cannot hoard resources. This means that all needed personnel must be available in L at the instant the task is scheduled to begin. Technicians are assigned to other PM tasks whenever they have com- pleted their current task. Thus, for the above example, we could reassign the elec- trician to another task after 2 time units while the mechanic could be assigned to another task after 5 time units. The process of assignment of PM personnel to the tasks in the list continues until all PM tasks are completed. The completion time for the last task determines the schedule length or makespan. The lower the makespan, the higher the fitness of the phenotype.
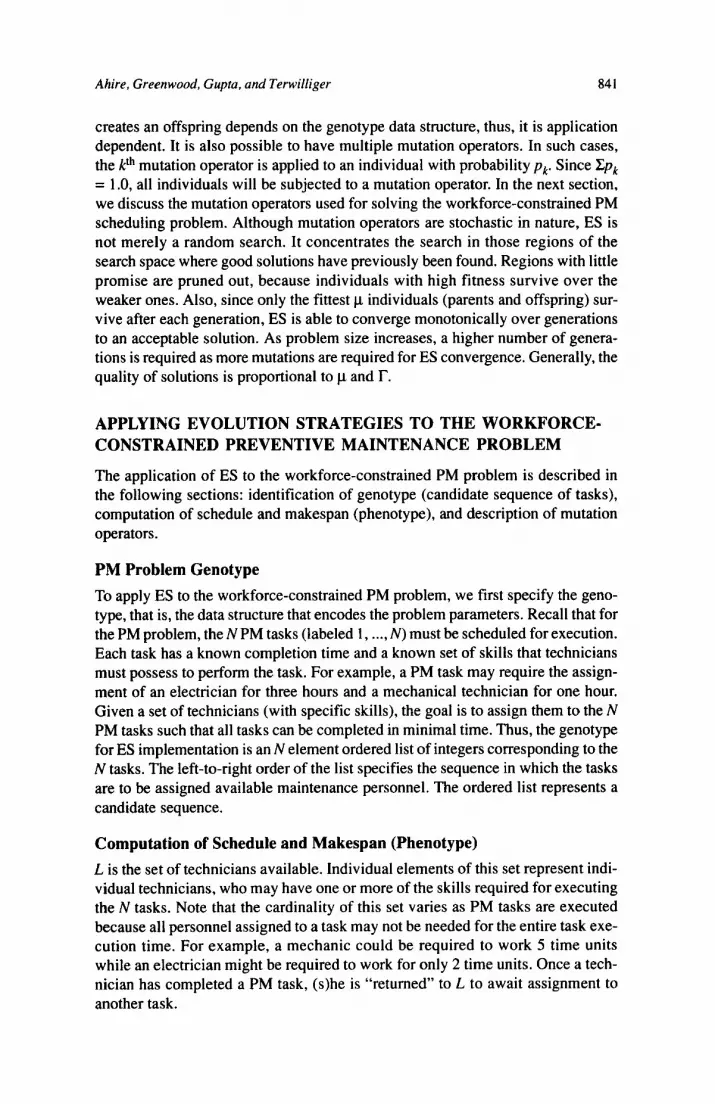
Mutation Operators The ES uses two genetic operators to produce an offspring from parents. The inser- tion operator selects a task from the task list and inserts it at some other randomly chosen position in the task list. This operator has the effect of either advancing or delaying (in time) the chosen task. The execution order of all other tasks remains unchanged. The recombination operator randomly selects two points in a task list and perturbs the execution order of tasks between these points. Again, the execu- tion order of all other tasks remains unchanged. A simple example of these opera- tors is shown in Figure 1. Part (a) demonstrates the insertion operator and Part (b) shows the recombination operator. Note that in a generation, the insertion operator was applied to a parent for producing offspring with a probability of .3, and the recombination operator was applied with a probability of .7.
COMPARISON OF THE EVOLUTION STRATEGY APPROACH WITH THE EXHAUSTIVE ENUMERATION APPROACH Evolutionary strategies represent an economical method of selectively examining solutions in the solution space of the PM problem. On the contrary, exhaustive enumeration (EE) examines each feasible solution in the solution space. Thus, for an N task problem, the EE approach needs to examine N! solutions. Hence, the ES approach should yield the optimal solution more efficiently than the EE approach in a majority of cases. The magnitude of the economy should increase significantly with an increase in problem size.
Experimental Design To validate this ES computational economy vis-h-vis the EE approach, a set of 60 problems was executed using both EE and ES. Of these, problems 1 through 20 entailed five tasks, problems 3 1 through 40 had 10 tasks, and problems 41 through 60 were 11 -task problems. The analysis was limited to smaller problems due to computational efforts required for EE. The notation and problem specification are explained below:
N = number of tasks, TS = total number of skills available in the workforce=2 (say,
a = mechanic and b = electrician),

Ahire, Greenwood, Gupta, and Tenvilliger 843
Figure 1: The ES mutation operators.
GENOTYPE BEFORE
GENOTYPE AFTER
(a) Insertion Operator
n I I I 11 51 41 21 71 8 ) 31 61 I I
(b) Recombination Operator
Wu
Wb
Wu&b = number of workers with both skills u and b,
W = total number of workers = Wu + Wb + Wu&b,
SPT = maximum number of skills required per task,
SPW = skills per worker ( I = single-skilled workers, 2 = double-skilled
Specifications for problems 1 - 10 and I 1-20 were identical except that 1 - 10 used single-skilled workers (Wu = 3 , Wb = 5 , Wu&b = 0) while 11-20 used double- skilled workers (Wu = 0, Wb = 0, Wu&b = 8). Similar distinction was designed between problems 2 1-30 and 3 1-40, and between 4 1-50 and 5 1-60. For each group of problems 1 through 10, 21 through 30, and 41 through 50, the specific task information was individually specified. For example, for problem 6 , the following data was specified:
= number of workers with skill a ,
= number of workers with skill b,
workers).
(A) General Problem Parameters
N = 5
TS
SPT = Maximum Number of Skills Required Per Task = 2
SPW = Skills per Worker = 1 (i.e., single-skilled workforce)
W
= 2 (i.e., skills u and b); where u = mechanic, b = electrician
= Number of Workers = 8 = Wu + Wb

844 Evolution Strategies
Wa = Number of Workers with skill a = 3 (i.e., persons a l , a2, a3)
W b = Number of Workers with skill b = 5 (i.e., persons b l , b2, b3, b4, b5 )
(B) Specific Task Skill Requirement Information
Task Task Time Number of Workers, Skill, and Duration Worked 1 6 hrs Two persons with skill b for 6 hours 2 Two persons with skill a for 5 hours; Three per-
sons with skill b for 15 hours 3 Two persons with skill a for 8 hours; One person
with skill b for 10 hours 4 One person with skill a for 20 hours; Four per-
sons with skill b for 10 hours 5 5 hrs Two persons with skill a for 5 hours; Three per-
sons with skill b for 4 hours
15 hrs
10 hrs
20 hrs
The worker assignment was determined using two rules. First, a task can’t be started unless all of the workers with requisite skills are available. Second, if a per- son is used for part of a task, he works from the start of the task for that amount of time, and is released for assignment to another job. For example, suppose a task starts at time 26 and requires 8 hours to complete. If it requires two persons with skill a for five hours and three persons with skill b for eight hours, then the two workers with skill a will work on the task from 26 to 3 1. They will be available for another task at the end of 31. The three workers with skill b will work for all 8 hours from 26 through 34.
Execution All of the 60 problems were run using EE first. The optimum solution makespan and CPU time (CPUEE) were noted. The number of solutions examined by EE (SOLNEE) corresponded to N ! . Next, each problem was run using ES to converge to optimal makespan, and the CPU time (CPUES) and number o f solutions required to attain the optimal makespan (SOLNES) were noted. The following two indices of ES efficiency (vis-84s EE) were computed for each problem:
CPUPARS = CPU parsimony index
= CPUES * 100 J CPUEE
COMPARS = Computational parsimony index
= SOLNES * 100 J N !
Results Tables 2, 3 , and 4 summarize the results of ES comparison with EE. For five-task problems, the ES approach had to screen 18.12% of the feasible solutions on aver- age to find the optimal solution. A maximum search effort corresponded to screen- ing of 75.00% of the feasible space of 120 solutions. The CPU time required was

Ahire, Greenwood, Gupta, and Terwilliger 845
Table 2: Comparison of evolutionary strategy with exhaustive enumeration for a five-task problem.
Optimum ESOPTGEN COMPARS 3 Experiment Makespan' (p = 5 ) (a)
1 37 2 8.333 2 3 4 5 6 7 8 9
10 11 12 13 14 15 16 17 18 19 20
35 33 36 40 29 40 40 48 50 27 25 30 30 50 25 35 35 40 40
2 2 2 1 4 2 1 2 1
17 16 2 1 1 1
10 1
18 1
8.333 8.333 8.333 4.166
16.666 8.333 4.166 8.333 4.166
70.833 66.666
8.333 4.166 4.166 4.166
4 1.666 4.166
75 .000 4.666
COMPARS Summary Average 18.125 Minimum 4.166 Maximum 75.000 Median 8.333
'The CPU time to attain optimum makespan for all experiments using both ES and EE was negligible.
2ESGENOPT = Number of generations required by ES (with p = 5) to reach the optimal makespan.
3COMPARS =Computational Parsimony Index (%) = Total number of solutions examined by ES to reach the optimum makespan * 100 I N ! = ESGENOPT * p * 100 I N ! .
negligible for both ES and EE. For 10-task problems, the computational efficiency from ES was much more significant. The ES approach had to screen only 0.45% of the feasible solutions on average to find the optimal solution. The CPU time required by ES to find the optimal solution was only 1.87% of that required by the EE approach. While the maximum search effort required by the ES corresponded to screening of 2.61% of the feasible space of 3,628,800 solutions, the CPU time

846 Evolution Strategies
Table 3: Comparison of evolutionary strategy with exhaustive enumeration for a 10-task problem.
Experiment Makespan (set) (set) (%I (%I 21 80 803 0 0 0.008 22 80 813 0 0 0.006 23 110 805 1 0.124 0.007 24 75 806 1 0.124 0.009 25 90 847 0 0 0.006 26 105 888 2 0.225 0.0 I5 27 93 858 62 7.226 1.830 28 87 818 1 0.122 0.013 29 76 839 79 9.416 2.150 30 90 811 0 0 0.006 31 70 782 12 1.535 0.292 32 69 783 20 2.554 0.790 33 90 772 0 0 0.007 34 70 784 1 0.127 0.006 35 78 812 3 0.370 0.086 36 90 845 21 2.485 0.78 1 37 85 808 9 1.114 0.27 1 38 80 790 93 1 1.772 2.610 39 73 826 1 0.121 0.010 40 85 779 1 0.128 0.02 1
Optimum CPUEE CPUES' CPUPARS2 COMPARS
Makespan CPUEE CPUES CPUPARS COMPARS Summary Summary Summary Summary Summary
Average 83.8 8 13.5 15.35 1.8726 0.446 Minimum 69 772 0 0 0.006 Maximum 110 888 93 11.772 2.610 Median 80 81 1 1 0.128 0.0 15 'CPUES = CPU time required by ES to reach optimal solution. 2CPUPARS = CPU Parsimony Index (%) = CPUES * 100 1 CPUEE. 'COMPARS = Computational Parsimony Index (%) = Total number of solutions examined
by ES to reach the optimum makespan * 100 / N!.
required was 1 1.77% of that required by the EE approach. For 1 1 -task problems, the computational efficiency from ES was even more significant. The ES approach had to screen only 0.091 % of the feasible solutions on average to find the optimal solution. The CPU time required by ES to find the optimal solution was only 0.12% of that required by the EE approach. While the maximum search effort required by the ES corresponded to screening of 0.35% of the feasible space of 39,916,800 solutions, the CPU time required was only 0.48% of that required by the EE approach. These results clearly demonstrate the practical utility of the ES

Ahire, Greenwood, Gupta, and Tenvilliger 847
Table 4: Comparison of evolutionary strategy with exhaustive enumeration for an Il-task problem.
Experiment Makespan (set) (set) (%I (%I Optimum CPUEE CPUES' CPUPMS COMPARS
41 86 947 1 0 0 0 42 43 44 45 46 47 48 49 50 51 52 53 54 55 56 57 58 59 60
80 118 75 95
111 96 90 76 96 76 73 93 12 80 93 88 83 73 91
11190 10850 11041 11580 10719 10383 9817
10163 10292 1030 1 10701 10408 10612 11085 10206 9805 9478 9845 9972
0 0 2 0 0
48 5 2 0 1 0 0
45 47 0 1
45 47 0
0 0 0.0 18 0 0 0.463 0.05 1 0.020 0 0.010 0 0 0.424 0.424 0 0.010 0.475 0.477 0
0 0 0.007 0 0 0.350 0.040 0.008 0 0.008 0.002 0 0.350 0.350 0.002 0.003 0.350 0.350 0
Makespan CPUEE CPUES CPUPARS COMPARS Summary Summary Summary Summary Summary
Average 87.25 10395 12.15 0.1 I9 0.09 I Minimum 72 947 1 0 0 0 Maximum 118 1 1580 48 0.477 0.350 Median 87 10342 0.500 0.005 0.002 ICPUES = CPU time required by ES to reach optimal solution. 2CPUPARS = CPU Parsimony Index (%) = CPUES * 100 / CPUEE. 3COMPARS = Computational Parsimony Index (%) = Total number of solutions examined
by ES to reach the optimum makespan * 100 I N ! .
approach even for relatively small practical problems, and its increasing relative efficiency vis-h-vis the EE approach with increasing problem size.
In addition, we solved a sample of PM problems of eight different sizes (N = 5 , 6 , 7 , 8, 9, 10, 11, 12, and 13) using the EE approach. The average CPU times (seconds) for these eight problem sizes with EE and ES execution were as follows: CPUEE = 0, CPUES = 0 (for N = 5); CPUEE = 0, CPUES = 0 (for N = 6); CPUEE = 1 .O, CPUES = 0 (for N = 7); CPUEE = 9.0, CPUES = 0 (for N = 8); CPUEE = 81 .O, CPUES = 0 (for N = 9), CPUEE = 810, CPUES = 0 (for N = 10); C P U E E = 10,000, CPUES = 1 (for N = 11); C P U E E = 130,000,

848 Evolution Strategies
CPUES = 3 (for N = 12); and CPUEE = 1,690,000, CPUES = 5 (for N = 13). The computational requirements indicate an exponential relationship between the number of tasks and CPU time for the EE approach. The corresponding CPU times for ES execution of the same problems demonstrates that the efficiency of the ES approach should increase tremendously as we approach real-world PM problems of the size and complexity experienced in heavy maintenance facilities for aircraft or railroad cars.
EVOLUTION STRATEGY PERFORMANCE FOR LARGE-SCALE PROBLEMS
To further demonstrate the utility of ES algorithms to the workforce-constrained PM problem, we analyzed the quality of solutions offered by ES under a wide range of problem settings and at different levels of ES parameters. A total of 852 experi- ments were conducted for various ranges of problem characteristics and ES execu- tion parameters. For each experiment, two critical solution quality measures, namely, CPU time (CPU) and makespan (MSPAN) were recorded. The results were analyzed to examine the effects of the task-related and workforce-related problem characteristics and the ES parameter p on the two solution quality measures. While problems described in literature can serve as a basis for experimental designs for well-documented problems such as assembly line balancing (Leu, Matheson, & Rees, 1994) or traditional job shop scheduling (Rachamadugu, Nandkeolyar, & Schriber, 1993), the problem addressed in this paper has not been studied in the past. Hence, the experimental design had to be developed from scratch. The PM problem parameters were chosen based on our prior knowledge of similar mainte- nance environments and discussions with operations research analysts at a commer- cial airline company. The ES parameters were based on considerations of reasonable computational efforts. We ran sample experiments with different param- eter settings and arrived at the chosen parameters upon the preliminary findings. This procedure is generally followed for new categories of algorithms that have not been applied in a particular context (e.g., Sumichrast et al., 2000).
Experimental Design Following the scheme used by Leu et al. (1994), we divided the factors for exper- imental design into two types: problem characteristics and ES parameters. Prob- lem characteristics were grouped into two types: task related and workforce related. These reflected problem size as well as complexity of scheduling. Five task-specific factors were identified: number of tasks to be scheduled (N), distri- bution of task times (Y), total skills required for all tasks (TS), skills required per task (SPT), and number of persons with a required skill needed to perform the task (WPT). Three levels of N were used (N = 100,500, and 1,000). For each of the N tasks, task times had to be generated. These were generated from binomial distri- butions following Lue et al. (1994) using two different levels of variance among task times (Binomial probability Y = 0.2 and 0.5). A total of 852 experiments were identified using the factors and levels presented in Tables 5a and 5b. For the sake of brevity, the derivation of these 852 experiments is detailed in the Appendix.

Ahire, Greenwood, Guptu, und Terwilliger 849
Table 5: Experimental design for large-scale PM problems.
a. The basic thirteen experiments
Run Skills per Person Required per Task Number W W ) (TS) (SPT)
1 1 2 1 2 1 2 2 3 1 S 1 4 1 S 2 5 1 5 3 6 2 2 1 7 2 2 2 8 2 S 1 9 2 5 2
10 2 5 3 I1 3 5 1 12 3 S 2 13 3 5 3
Number of Total Skills Skills Required
b. Other problem characteristics, ES parameters, and performance measures Factor Description Levels Problem-Characteristic Factors N Number of tasks 100 500 1,000 W Number of workers 10 30 so WPT Number of workers needed
of a specific skill per task 1 3 Y Binomial probability for task time
(hour) 0.2 0.5
Evolution Strategies Parameter‘ P ES Population
Performance Measures (Outcomes) CPU CPU Time
GEN Number of Generations
MSPAN Makespan
5 20
not not not applicable applicable applicable
not not not applicable applicable applicable
not not not applicable applicable applicable
SOLNES Number of Solutions Examined not not not by ES applicable applicable applicable
I Each experiment was executed using the stopping rule of “no improvement over the solu- tion at a generation for 10 subsequent generations.” Thus, the number of generations I- at which this occurs was noted as the required number of generations (GEN).

850 Evolution Strategies
Table 5b shows three measures of solution quality. Each of the 852 experi- ments was executed using the stopping rule of "no improvement over the solution at a generation for 10 subsequent generations." The solution at which computa- tions were stopped was denoted as the quasi-optimal solution from ES. The num- ber of generations required to attain the quasi-optimal solution was noted as the required number of generations (CEN). CPU execution time for each run (CPU) represented another direct measure of computational requirement. The makespan (MSPAN) corresponding to the final solution was also noted. For each experiment, the actual number of solutions examined by ES was also recorded.
Statistical Results Each of the 852 runs was executed on an Ultra Sparc I machine (167 Mhz, 128 MB RAM). Results obtained by applying the ES algorithm to the 852 runs were ana- lyzed statistically using SPSS statistical package (Norusis, 1994). The CPU time required varied between 0.02 and 3,248.00 seconds (mean = 86.02). Number of generations required for solution convergence (GEN) ranged from 10 to 172 (mean = 19.3). Schedule makespan (MSPAN) varied between 10.00 and 11,297 minutes (mean = 678). From these summary statistics of computational efforts, it is evident that ES approach can be easily implemented for real-life PM problems involving hundreds of tasks.
Regression analysis was used to estimate power expressions for the two out- come measures, CPU time and Makespan, as functions of the various task-related and workforce-related factors. These are summarized in Table 6. The estimations provide several interesting insights. First, Model 1 indicates that CPU time requirements using ES were proportional to N1.34 in contrast to the fact that the CPU time from EE varied exponentially with the number of tasks ($". This com- parison provides an empirical evidence of the computational efficiency and prac- tical utility of ES for real-world PM problems. The function also showed that CPU time was proportional to SP W P P U . ~ ~ , W'.5, and SPW-0.4. Thus, as the task complexity increases, the computational requirement increases. One explanation could be that with growing complexity of the problem, an existence of multiple optimal solutions may be less probable. Hence, the probability of rapidly reaching the optimal solution is reduced. CPU time proportionality to W1.s is attributable to an increase in the number of feasible solutions with increasing W. Finally, CPU time variation with S P W-".I indicates that as multifunctionality of a worker increases, the flexibility of assignment of workers to span a set of tasks increases. Thus, there is a higher probability of quickly finding an optimal assignment.
SP and WPT1.07, while i t varied with W-'.OS and SPW-'.'7. Thus, larger problem size (N) and higher complexity of tasks (SP T and WP T) should result in higher makespan, whereas the use of larger workforce ( W ) and multifunctionality (SPW) should reduce the makespan. Both these findings have practical implications for manage- ment of such a PM program.
Finally, the number of solutions examined to arrive at the final solution (SOLNES) was regressed on the task-related and workforce-related factors (Model 3). The number of solutions examined was found to vary with @ . ' I , S P p . 5 1 , and WPfl) .26 . Thus, the task complexity rather than the number of tasks seemed to
In Model 2, makespan was found to be proportional to

Ahire, Greenwood, Gupta, und Tenvilliger 85 1
Table 6: Results of multiplicative regressions for CPU time, makespan, and number of solutions examined by ES approach.'
Model 1 Model 2 Model 3 Dependent Variable (y) CPU MSPAN SOLNES Regression Coefficients (p) for Tasks-related Variables N SPT WPT
1.34* 0.97* 0.11* 0.96* 1.18* 0.51* 0.35* 1.07* 0.26*
Regression Coefficients @) for Workforce-related Variables
SP w -0.40* -0.17* -0.15* W 1.50* -1.05* -0.25*
Model Fit Adjusted R2 F-Statistic
0.68 0.88 0.11 302 1025 21 0, = .OO) (p = .OO) (p = .OO)
'All regressions are of the form: y = c x NO1 x WPTP2 x SPTP' x W @ x SPWp5. Estimated using logarithms of terms of both sides.
*Significant at p < .05.
affect the number of solutions examined. This computational effort measure was also proportional to W-0.24. It was not influenced by SPW in a statistically signifi- cant manner. However, these results should be interpreted with caution because the factors and the multiplicative form of the regression expression did not estimate SOLNES satisfactorily (R2 = 0.1 1).
EVOLUTION STRATEGY AND SIMULATED ANNEALING PERFORMANCE COMPARISON
The complexity in solving the PM problem necessitates use of heuristic search algorithms. It is therefore natural to ask if any one particular algorithm outper- forms others for the PM problem. The No Free Lunch (NFL) theorem (Wolpert & Macready, 1997) suggests that good performance of a particular search algorithm for a certain class of problems is no guarantee that it will perform equally well for any other class of problems. This means that one cannot prefer, for example, sim- ulated annealing (SA) over other algorithms for the PM problem just because it works well for, say, the traveling salesman problem.
Direct comparisons between algorithms are insightful. However, without a conscientious attempt to make the comparisons fair, the results may be inconclu- sive, or in the worst case, completely wrong (Greenwood, 1997). While the focus of our paper is on testing the performance of ES for a wide range of specifications for the particular PM problem under consideration, we also compared the relative performance of ES against SA for this problem.

852 Evolution Strategies
To compare the speed of convergence of the two algorithms under a wide spectrum of problem specifications, all of the 852 problem instances (described in the previous section) were again solved using SA. Specifically, the target makespan (quasi-optimal solution) attained from the prior ES run was noted for each problem. As mentioned before, this was the makespan obtained using the stopping rule of no improvement over 10 successive generations. Next, SA itera- tions were executed for each problem until either the exact target makespan or an even better value is obtained. For each SA experiment, the following scheme was used:
temp = 1 .O; // lower makespan represents higher solution fitness while exit criteria not met do I
zz = prob( ); // get random number between 0 and 1 pr = exp(-(chromosome[ l].fitness - chromosome[2].fitness)/temp); if (pr > zz)
chromosome[ 11 = chromosome[2]; //take the weaker chromosome temp = temp * 0.98;
I end do while
The variable “temp” is the cooling temperature that controls the annealing process in the SA algorithm. This temperature is reduced with each iteration by multiplication with a factor of 0.98, which was selected based on multiple SA runs conducted for sample problems. The number of SA iterations represent the number of solutions examined by SA to attain the target quasi-optimal solution and can be directly compared with the corresponding value of SOLNES (number of solutions examined by ES) to evaluate the relative convergence speeds of the two algo- rithms. The ratio of the number solutions examined by SA and ES (defined as p) was computed for each experiment. A comparative analysis across the 852 runs yielded an average p value of 11 39. Thus, SA had to examine almost “12 times” as many solutions as those examined by ES. These results clearly demonstrate the superiority of the ES approach over the SA approach for the specific class of PM problems.
CONCLUSIONS
In this paper, we considered the preventive maintenance (PM) scheduling problem faced by all major overhaul maintenance facilities where aircraft, ships, locomo- tives, or other heavy equipment need to be turned around as early as possible. However, available time window is not the explicit restricting factor in scheduling, and the servicing of the unit must be completed in its entirety before the unit is returned to field usage. Thus, we have considered the problem of assigning single- or multiple-skilled workers to a set of PM tasks requiring single or multiple skills. The objective is to compute the assignment, which will lead to a minimum makespan (time to complete all tasks). We examined the applicability of an evolu- tion strategy (ES) algorithm to this NP-hard problem. The efficiency of the algo- rithm vis-h-vis exhaustive enumeration was illustrated for 60 small problems. The

Ahire, Greenwood, Guptu, and Tenvilliger 853
computational efficiency of ES vis-A-vis exhaustive enumeration was further con- firmed through a large-scale experimental design covering 852 experiments. ES comparison to SA across the 852 experiments indicated that SA had to examine almost 12 times as many solutions as those examined by ES to reach the quasi- optimal solutions.
These results clearly demonstrate the utility of the ES approach to solve a large-scale complex PM scheduling problem faced by heavy maintenance facili- ties within realistic computing efforts, and the superiority of this approach over the SA approach for the specific class of PM problems. Various regression expressions also provided insights on the impact of task-related and workforce-related factors on computational efforts and makespan. The makespan expression indicated that makespan increases with increased problem size and task complexity while it decreases with a larger workforce and multiple-skilled workers. Also, CPU time increased with increased problem size and complexity while it decreased with multiple-skilled workforce.
The results reported in this paper are of direct relevance to the heavy main- tenance overhaul functions in aircraft service centers, shipyards, and railroad yards. The research could be extended in several directions. On one hand, the ES algorithms could be used for many operations management problems that have been known to be NP-hard. Many scheduling problems apart from the one consid- ered here fall into this class of problems (e.g., job shop scheduling). The basic ES paradigm is general enough to be applicable to these other problems. Of course, as illustrated in the previous section, the genotype must change to capture the new problem’s parameters, and the solution fitness measure must also be suitably altered. At the present time, no other researchers have addressed the type and size of problem discussed in this paper. Hence, we have no other results to compare against. The comprehensive experimentation implemented in this work should make it a good benchmark for comparing the performance of other algorithms. [Received: August 12, 1999. Accepted: October 23,2000.1
REFERENCES
Adams, J., Balas, E., & Zawack, D. (1988). The shifting bottleneck procedure for job shop scheduling. Management Science, 34(3), 391-401.
Back, T. ( 1996). Evolutionary algorithms in theory and practice. Oxford, England: Oxford University Press.
Back, T., & Schwefel, H. P. (1993). An overview of evolution algorithms for parameter optimization. Evolutionary Computation, 1 (l) , 1-23.
Barlow, R., & Hunter, L. (1960). Optimum preventive maintenance policies. Oper- ations Research, 8, 90-100.
Biegel, J. E., & Davern, J. J. (1990). Genetic algorithms and job shop scheduling. Computers and Industrial Engineering, 1 O( 1 -4), 8 1-9 I .
Bollinger, S., & Midkiff, S. (1994). Heuristic techniques for processor and link assignments in multicomputers. IEEE Transactions on Parallel and Distrib- uted Systems, 5(2), 1 13- 120.

854 Evolution Strategies
Braschi, A., Ferreira, A., & Zerovnik, J. (1989). On behavior of parallel simulated annealing. Parallel Computation, 263-268.
Carlier, J., & Pinson, E. (1989). An algorithm for solving the job-shop problem. Management Science, 35(2), 164-1 76.
Comell, P., Lee, H., & Tagaras, G. (1987). Warnings of malfunctions: The decision to inspect and maintain processes on schedule or on demand. Management Science, 33( lo), 1277- 1290.
Davis, L. (Ed.). (1991). Handbook of genetic algorithms. New York: Van Nostrand Reinhold.
DeJong, K. A. (1993). Evolutionary computation. Boston: MIT Press. Dekker, R., & Smeitink, E. (1994). Preventive maintenance at opportunities of
restricted duration. Naval Research Logistics, 41,335-353. Dijkstra, M. C., Kroon, L. G., Salomon, M., Van Nunen, J., & Van Wassenhove, L.
N. (1994). Planning the size and organization of KLM’s aircraft maintenance personnel. Interfaces, 24(6), 47-58.
Eglese, R. W. (1990). Simulated annealing: A tool for operational research. Euro- pean Journal of Operational Research, 46,27 1-28 1 .
Flynn, B. B., Schroeder, R. G., & Sakakibara, S. (1994). A framework for quality management research and an associated instrument. Journal of Operations Management, 11,339-366.
Fogel, D. (1995a). Evolutionary computation (2nd ed.). Piscataway, NJ: IEEE Press.
Fogel, D. ( 1995b). Phenotypes, genotypes, and operators in evolutionary compu- tation. Proceedings of the IEEE Conference on Evolutionary Computation,
Glover, F., & Greenberg, H. (1989). New approaches for heuristic search: A bilat- eral linkage with artificial intelligence. European Journal of Operational Research, 39, 1 19- 130.
Golabi, K., Kulkami, K. R., & Way, G. (1982). A statewide pavement management program. Interfaces, 12(6), 5-21.
Golabi, K., & Shepard, R. (1997). Pontis: A system for maintenance optimization and improvement of U.S. bridge networks. Interfaces, 27( I ) , 7 1-88.
Gopalakrishnan, M., Ahire, S., & Miller, D. (1997). Maximizing the effectiveness of a preventive maintenance system: An adaptive modeling approach. Man- agement Science, 43(6), 827-840.
Greenwood, G. (1997). So many algorithms: So little time. ACM Software Engi- neering Notes, 22,92-93.
Greenwood, G., Ahire, S., Gupta, A., & Munnangi, R. (1995). Parallel implemen- tation of evolutionary strategies. Proceedings of the International Confer- ence on High Performance Computing, 469-474.
Greenwood, G., Gupta, A., & McSweeney, K. (1994). Scheduling tasks in multiprocessor systems using evolutionary strategies. Proceedings of the IEEE Conference on Evolutionary Computation, 345-349.
193-198.

Ahire, Greenwood, Guptu, und Terwilliger. 855
Johnson, D. S., Aragon, C. R., & McGeoch, L. A. (1991). Optimization by simu- lated annealing: An experimental evaluation; Part 11, graph coloring and number partitioning. Operations Research, 39,378-406.
Lageweg, B. J., Lenstra, J. K., & Rinnooy Kan, A. H. G. (1977). Job shop sched- uling by implicit enumeration. Management Science, 24( lo), 441 -450.
Lam, M. (1995). An introduction to airline maintenance. In The Handbook ofAir- line Economics (1 st ed.), New York: McGraw-Hill, 397-406.
Leu, Y., Matheson, L., & Rees, L. (1994). Assembly line balancing using genetic algorithms with heuristic-generated initial populations and multiple evalua- tion criteria. Decision Sciences, 25(4), 58 1-606.
Looi, C. ( 1992). Neural network methods in combinatorial optimization. Comput- ers and Operations Research, 19(3/4), 19 1-208.
McCall, J. (1965). Maintenance policies for stochastically failing equipment: A survey. Management Science, 11 (3,493-524,
Michalewicz, Z. ( 1994). Genetic algorithms + Data structures = Evolutionary algorithms (2nd ed.). Berlin, Germany: Springer-Verlag.
Nissen, V. (1993). Evolutionary algorithms in management science: An overview and list of references. European study group for evolutionary economics.
Norusis, M. J. (1994). SPSS advanced statistics (Version 6.1). Chicago, IL: SPSS, Inc.
Pierskalla, W. P., & Voelker, J. A. (1976). A survey of maintenance models: The control and surveillance of deteriorating systems. Naval Research Logistics Quarterly, 23( 3), 35 3-388.
Rachamadugu, R., Nandkeolyar, U., & Schriber, T. (1993). Scheduling with sequencing flexibility. Decision Sciences, 24(2), 3 15-341.
Ram, B., & Olumolade, M. (1987). Preventive maintenance scheduling in the pres- ence of a production plan. Production and Inventory Management, I"' Quar- ter, 81-87.
Saraph, J. V., Benson, P. G., & Schroeder, R. G. (1989). An instrument for measur- ing the critical factors of quality management. Decision Sciences, 20(4),
Sherif, Y., & Smith, M. (1981). Optimal maintenance models for systems subject to failure-A review. Naval Research Logistics Quarterly, 28,47-74.
Spencer, M. S., & Guide, D.V. (1995). An exploration of the components of JIT: Case study and survey results. International Journal of Operations and Pro- duction Management, 15(5), 72-83.
Sumichrast, R. T., Oxenrider, K. A., & Clayton, E. R. (2000). An evolutionary algorithm for sequencing production on a paced assembly line. Decision Sci- ences, 31(1), 149-172.
Ulusoy, G., Or, I., & Soydan, N. (1992). Design and implementation of a mainte- nance planning and control system. International Journal of Production Economics, 24,263-272.
8 10-829.

856 Evolution Strategies
Valdez, F., & Feldman, R. (1989). A survey of preventive maintenance models for stochastically deteriorating single-unit systems. Naval Research Logistics Quarterly, 36,419-446.
Van Laarhoven, P. J. M., Aarts, E. H. L., & Lenstra, J. K. (1992). Job shop sched- uling by simulated annealing. Operations Research, 40( 1), 1 13- 125.
Vuppalapati, K., Ahire, S., & Gupta, T. (1995). JIT and TQM: A case for joint implementation. international Journal of Operations and Production Man- agement, 15(5), 84-94.
Wald, M. L. (2000). F.A.A. threatens action that could shut airline. New York Times, June 3 , A-20.
Wolpert, D. H., & Macready, W. G. (1997). No free lunch theorems for optimiza- tion. IEEE Transactions on Evolutionary Computation, 1,67-82.
APPENDIX
Design of Experiments for Large-scale PM Problems We divided the factors for experimental design into two types: problem character- istics and ES parameters. Problem characteristics were grouped into two types: task related and workforce related. These reflected problem size as well as com- plexity of scheduling.
Task-related factors Five task-specific factors were identified: number of tasks to be scheduled ( N ) , dis- tribution of task times (y>, total skills required for all tasks (TS), skills required per task (SPT), and number of persons with a required skill needed to perform the task (WPT). Three levels of N were used ( N = 100,500, and 1,000). For each of the N tasks, task times had to be generated. These were generated from binomial distri- butions following Lue et al. (1994) using two different levels of variance among task times (Binomial probability Y = 0.2 and 0.5).
Two levels of total skills required for performing all N tasks (TS) were con- sidered, namely, 2 and 5 . This means, when TS = 2, each of the N tasks may need either one or both of the skills from TS. Thus, the number of skills required per task (SPT) is another factor, which was set at three levels (SP T = 1,2, and 3). Note that when TS = 2, a value of SPT = 3 is not feasible. However, when TS = 5 , all three levels of SPT are possible. In fact, for an experiment with TS = 5 and SPT = 2, the specific two skills required for a task could be any combination of two tasks from the five tasks listed in TS. Similarly, when TS = 5 and SPT = 3, the three specific skills required for a task could be any combination of three tasks from the five tasks listed in TS. Finally, once the specific skills needed for a task are known, the number of persons needed of each skill required for the task (WPT) must also be specified. We assigned two practical levels of WPT, namely, 1 and 3 workers.
For example, let us say we have a PM system that needs either one or both of only two skills (mechanics and electricians) for performing any of a total of 100 tasks. Here, N = 100, and TS = 2 (skill 1 = mechanic, skill 2 = electrician). Thus,

Ahire, Greenwood, Gupta, and Terwilliger 857
if a task requires two mechanics and two electricians, it will have SPT = 2, and WPT = 2. For reasons of practicality of experimentation efforts, we did not con- sider the possibility of different numbers of persons required for each skill used in the task. Thus, for the current example, the possibility of a task requiring two mechanics and three electricians was not considered. Also, it was assumed that the persons working on a task would be busy for the entire duration of the task. Partial engagement of the workers skilled in a particular skill on a task was ruled out in the experimental design. However, this could be easily incorporated in the ES algo- rithm.
Workforce-related factors Two workforce-related factors were identified: number of workers available (W) and number of skills available per person (SPW). Three practical levels of W were chosen, namely, 10, 30, and 50 workers. Literature on quality management and maintenance scheduling indicates that cross-training PM technicians in multiple skills can be used as a strategy to improve maintenance productivity (Vuppalapati et al., 1995; Gopalakrishnan et al., 1997). Hence, we evaluated ES performance under three different skill levels. Thus, the factor SPW had three different levels, namely, single-skilled workers, double-skilled workers, and triple-skilled workers. It was assumed that in an experiment, only one of these three types of workers would be employed (i.e., all workers W will be either single-skilled, or double- skilled, or triple-skilled), though the algorithm accounted for this possibility in task scheduling.
ES Parameters Two ES parameters can affect the quality of the final solution, namely, population size (p) and number of generations (GEN). This is because the larger the popula- tion, the higher the number of solutions examined, and the higher the probability of finding a better solution. Likewise, the higher the number of generations, the more extensive the search and, thus, the higher the probability of finding a superior solution. However, if we specify a stopping rule, then for a given p, we can find out the value of GEN, after which the final solution will be recorded. Hence, we used two levels of the population size (p = 5,20), leaving r to be determined as a per- formance measure.
Experiments A basic set of 13 runs was designed using the three problem characteristic factors and their levels: SPT, TS, and SPW (Table 5a). For single-skilled workers (SPW = 1 ) , when the total number of skills required for performing a set of tasks is two (TS = 2), the skills required per task must be either one or two (SPT = 1 or 2). Thus, we identified two runs for SPW = 1 and TS = 2. Next, for single-skilled workers, when TS = 5 , we could identify three runs for the three different levels stated above for SPT (SPT = 1,2, or 3). Thus, there were five basic runs for SPW = 1 (Table 5a: runs 1 through 5 ) . Again, for double-skilled workers (SPW = 2), when TS = 2, SPT could have only two levels (SPT = 1 or 2). For TS = 5 , SPT could have three levels (SPT = 1, 2, or 3). Thus, there were five basic runs for SPW = 2 (Table 5a: runs 6

858 Evolution Strategies
through 10). Finally, for triple-skilled workers (SPW = 3), TS = 2 is not practical. That is, if only two skills at most are required for performing a set of tasks, it doesn’t make sense to have a triple-skilled workforce. Hence, for triple-skilled workers, only three basic runs were identified, corresponding to TS = 5 , and SPT = 1,2, and 3 (Table 5a: runs 11 through 13).
Table 5b shows the levels of the other problem-specific characteristics and ES parameters. Note that for the problem-specific factors, there are three levels of the problem size (N), three levels of the number of workers (W), two levels of bino- mial distribution probabilities for generating task times (Y), and two levels of num- ber of persons with each skill required for performing a specific task (WPT). This yields a total of 468 ( 1 3 x 3 x 3 x 2 x 2) experiments.
However, of these, 42 experiments are not feasible. They correspond to the specifications where more persons are required of a skill for a task than are avail- able for a specific setting. For example, for experiments with W = 10, SPW = 1, and TS = 5 , we assume that the five skills will be equally distributed among the 10 sin- gle-skilled workers. Thus, there will be two single-skilled workers possessing each one of the five skills. Hence, for this setting, experiments with WPT = 3 are not fea- sible for any level of SPT (1,2, or 3), any number of tasks ( N = 100,500, 1,0oO), or any level of Y (0.2,0.5). Thus, there are 18 (3 x 3 x 2) such infeasible experi- ments corresponding to single-skilled workers. Now let us consider those double- skilled workers (SPW = 2) experiments where W = 10 and TS = 5 . Within these, runs corresponding to the two levels of SPT (2 and 3) are not feasible for any level of N (100, 500, 1,000) or Y (0.2, 0.5). Thus, 12 (2 x 3 x 2) of the double-skilled workers experiments are not feasible. Finally, consider those triple-skilled workers experiments where W = 10 and TS = 5 . Again, within these, runs corresponding to the two levels of SPT(2 and 3) are not feasible for any level of N (100,500, 1,OOO) or Y (0.2, 0.5). Thus, 12 (2 x 3 x 2) of the triple-skilled workers experiments are also not feasible. Hence, of the total 468 experiments, 42 (1 8 for single-skilled workers, 12 for double-skilled workers, and 12 for triple-skilled workers) are not feasible and were not executed. This resulted in 426 feasible experiments for any specification of ES parameters. Since we considered two levels of the parameter p. the experimental design yielded a total of 852 experiments.
Sanjay L. Ahire is an associate professor in the Department of MIS and Decision Sciences at the University of Dayton. He received a PhD in management science from the University of Alabama in 1992. He also holds a master’s degree in management studies and a bachelor’s degree in chemical engineering, both from the University of Bombay. Dr. Ahire’s current research interests include evaluation of operations improvement approaches and assessment of information technology impact on operations. His research has been published in leading journals including Management Science, Decision Sciences, Journal of Operations Management, Production and Operations Management, European Journal of Operational Research, and Intevaces.

Ahire, Greenwood, Guptu, und Terwilliger 859
Garrison W. Greenwood has more than 15 years of industrial experience as an electronics engineer. After receiving a PhD in electrical engineering at the University of Washington in 1992, he entered academia where he is currently an assistant professor in the Department of Electrical & Computer Engineering at Portland State University. A recognized expert in evolutionary algorithms, he is currently an associate editor for the I E E E Transactions in Evolutionary Computation. Dr. Greenwood is a registered professional engineer in the State of California.
Ajay Gupta received his MS and PhD in computer science from Purdue University. He also holds an MS degree in mathematics from the University of Cincinnati and a BE degree in electrical and electronics engineering from the Birla Institute of Technology and Science, India. He is the chairman of the Department of Computer Science at Western Michigan University. Dr. Gupta’s current research interests include parallel processing and evolutionary computation, with numerous articles in computer science-related journals including Journal of Parallel and Distributed Computing, Journal of Supercomputing, International Journal of H i ph Speed Computing, Information Science, Parallel Computing Journal, and IEEE Transactions on Computers. His paper entitled “Adaptive Integration using Evolutionary Strategies” won the best paper award at I996 International Conference on High Performance Computing. Dr. Gupta is a member of the ACM and IEEE Computer Society.
Mark Terwilliger is an associate professor of computer science at Lake Superior State University, Michigan. He holds an MS degree in computer science from Michigan State University. His research interests include genetic algorithms, parallel processing, evolution strategies, and artificial intelligence.