word graphs in architectural design
TRANSCRIPT
AIE EDAMhttp://journals.cambridge.org/AIE
Additional services for AIE EDAM:
Email alerts: Click hereSubscriptions: Click hereCommercial reprints: Click hereTerms of use : Click here
Word graphs in architectural design
BAUKE DE VRIES, JORAN JESSURUN, NICOLE SEGERS and HENRI ACHTEN
AIE EDAM / Volume 19 / Issue 04 / November 2005, pp 277 - 288DOI: 10.1017/S0890060405050195, Published online: 02 November 2005
Link to this article: http://journals.cambridge.org/abstract_S0890060405050195
How to cite this article:BAUKE DE VRIES, JORAN JESSURUN, NICOLE SEGERS and HENRI ACHTEN (2005). Word graphs in architectural design.AIE EDAM, 19, pp 277-288 doi:10.1017/S0890060405050195
Request Permissions : Click here
Downloaded from http://journals.cambridge.org/AIE, IP address: 147.32.157.129 on 20 Feb 2015
Word graphs in architectural design
BAUKE DE VRIES, JORAN JESSURUN, NICOLE SEGERS, and HENRI ACHTENEindhoven University of Technology, 5600 MB Eindhoven, The Netherlands
(Received October 13, 2004; Accepted May 24, 2005!
Abstract
In computer-aided architectural design, words are an underemployed source of information. Through a series of casestudies, we deduced a design annotation data model. All entities in this model can be captured from the design draft,except one: the word relation. Therefore, a system was developed that generates word graphs using single words fromthe draft as input. The system searches for semantic relations between words and for new intermediate words that canconnect two existing words. The system has filters that select only those graphs that are considered interesting by thedesigners. The envisioned applications of word graphs in the context of computer-aided architectural design are tocontribute to the architect’s design and to enhance the fluency of the design. These expectations are met, but must beconsidered in relation to the architect’s drafting behavior.
Keywords: Computer-Aided Design; Design Semantics; Word Associations
1. INTRODUCTION
Words have not enjoyed the same amount of attention asthe support of graphic representations in research oncomputer-aided architectural design ~CAAD!. Research onCAAD has been focused since the introduction of the firstdrawing systems, mainly on the development of intelligentdrawing objects. CAAD is firmly established for the pro-duction of the final design, and is now moving toward sup-port of the early design phase, for example, in the area ofsketch recognition ~Do et al., 2000; Leclercq, 2001!. Theinput of words in CAAD is treated as graphical entity or atmost reinterpreted into the character format. In architec-tural design sketches, annotations are used for clarificationof, or commenting on, the design at hand. In our view, ifarchitects write in the act of designing, then words shouldbe considered as part of the design process just like sketches.Words complement the sketch and provide information aboutthe design ~Lawson & Loke, 1997!. Other research evendemonstrated that there is a relationship between the designquality and the use of words ~Wong & Kvan, 1999!. Jakob-sen et al. ~1991! propose verb–noun pairs in software designfor the formulation of functional requirements. Further, inthe field of psychology, it is suggested that showing seman-
tic associations causes people to come up with more seman-tic and episodic associations ~Silberman et al., 2001!. Wordsare a valuable, yet underemployed source of informationthat can help us better understand the design process andthereby provide better support for the designer.
Based on this observation, we have set out to develop amethod to interpret words while designing and process theminto a semantic representation. The form in which the useof words has been implemented in semantic representationsis by presenting the captured words in graphs to the designer.Relationships between annotated words are inferred, andnew words are generated that are associated to these cap-tured words. We have investigated what filtering and pre-sentation of generated graphs is necessary to produce outputin a format that can be readily interpreted by the designer.Using a test implementation, we explored the possibilitiesof word graphs in the context of architectural design. Thefindings show that it is possible to interpret annotated wordsand to positively stimulate the architect by structuring thesewords and by offering new related words.
The outline of the article is as follows. We briefly discussthe outcome of the design case studies. The outcome isorganized in a design annotation data model that includesthe design entities that make up a design. In the next sec-tion, the word graph system and the technologies used inthe implementation are described in detail. The feedbackfiltering section discusses which output of the word graph
Reprint requests to: Bauke de Vries, P.O. Box 513, 5600 MB Eind-hoven, The Netherlands. E-mail: [email protected]
Artificial Intelligence for Engineering Design, Analysis and Manufacturing ~2005!, 19, 277–288. Printed in the USA.Copyright © 2005 Cambridge University Press 0890-0604005 $16.00DOI: 10.10170S0890060405050195
277
system is considered interesting and how the filters operate.A list of typical examples demonstrates how word graphscan shift the interpretation of words. Finally, we report onsome results of the experiment and discuss the potential ofword graphs in the context of CAAD.
2. DESIGN ANNOTATIONS
2.1. Case studies
Although we had indications from our own experience andfrom other research ~Lawson & Loke, 1997; Wong & Kvan,1999! that words play an important role during the designprocess, we did not know what this role is, why it is impor-tant, and how it fits within the whole design process. There-fore, we organized a short series of case studies, that is, weobserved design sessions, introspective design sessions, andstudent assignments, to analyze the use of words in theearly phase of architectural design. The case studies areextensively reported in Segers ~2004!. Here, we only describethe results that contribute to the understanding of annotatedwords. From the case studies, we deduced the entities thatare used in design: words, sketches, images, and marks.
2.1.1. Words
Words are used for different purposes and in differentcombinations. Types of writing that were found are anno-tations, list of items ~with numbers or bullets!, diagram-likeplacement of keywords, and words that comprise completesentences. Annotations often clarify or comment on asketch, image, or mark. A list of items is used to make a listof attributes to an idea, while a diagram-like placement ofkeywords is often an abstraction. A statement consisting ofcomplete sentences explains ideas more thoroughly.
2.1.2. Sketches
In the studies we found that there are different types ofsketches: a small icon or diagram representation, an isomet-
ric or perspective representation, and a projection ~facade!,section ~vertical!, or plan ~horizontal section! representa-tion. Sketches never seem to be finished. Architects editthem in a later phase or use them as underlying sketch totrace some of the old lines and add new ones through trans-parent sheets.
2.1.3. Images
Images are pictorial examples that are retrieved from anoutside source. Some images are included in the assign-ment, such as photos from the site or maps, while otherimages are taken from books, magazines, or the Internet.Images are used to clarify or illustrate an idea, to give inspi-ration to the architect, or to trace over.
2.1.4. Marks
Marks are any graphic element that are not construed asa word, sketch, or image, but that indicate a relationshipbetween two entities or that single out a particular entity.The type of the mark varies from arrows, lines, and encir-cling to framings. Marks appear to have a different func-tion, depending on what they connect, and how and wherethey are placed. The arrow with a single arrowhead, forinstance, mostly points at conclusions, solutions, questions,or other important issues. In or near a sketch, this arrowindicates an entrance, a line of sight, or a movement.
Based on the design entities used in the design draft, weconstruct a data model in the next section to specify howthe design entities, including words, are related to each other.
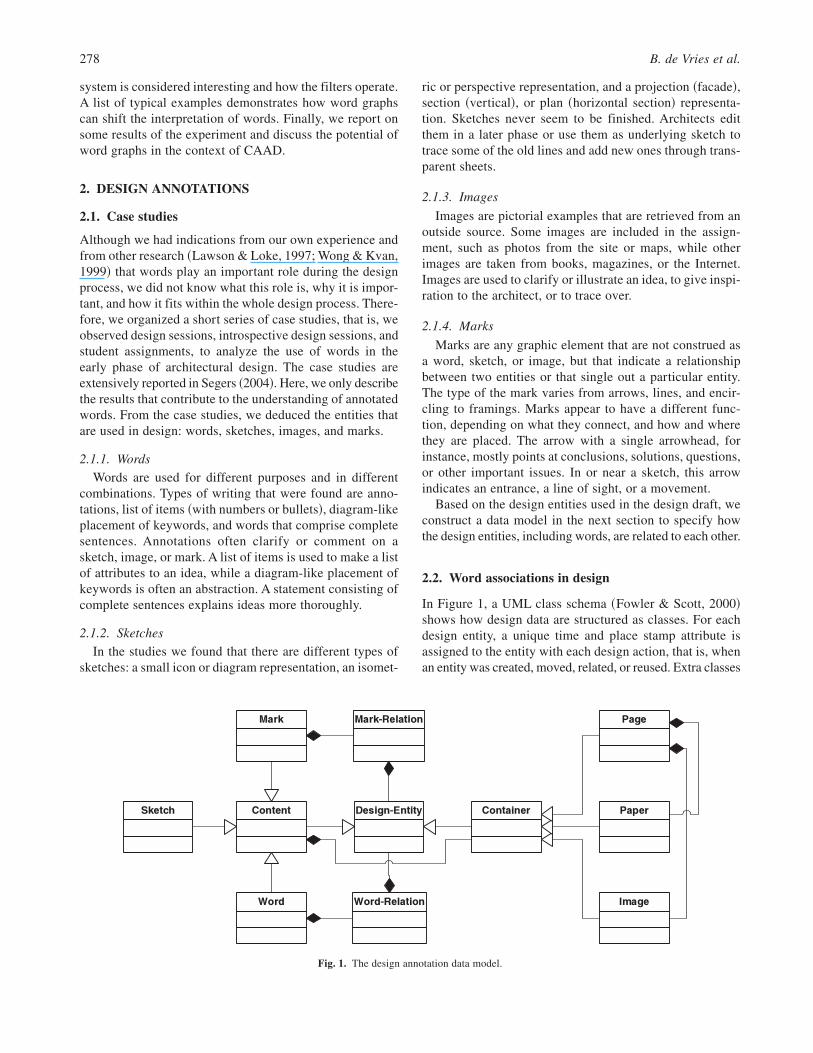
2.2. Word associations in design
In Figure 1, a UML class schema ~Fowler & Scott, 2000!shows how design data are structured as classes. For eachdesign entity, a unique time and place stamp attribute isassigned to the entity with each design action, that is, whenan entity was created, moved, related, or reused. Extra classes
Fig. 1. The design annotation data model.
278 B. de Vries et al.
are added to construct the complete design annotation model:paper, page, content, container, mark relation, and wordrelation. When an architect uses pen and paper to work, thepaper can be a roll of transparent paper, or a workbook withempty pages. Turning to a new page has several functions.A new empty sheet prevents the designer from being dis-tracted by an earlier design draft or provides more space fordrafting when continuing the design draft with the same ora new idea. On each page are multiple objects: containerssuch as papers and images, and contents such as words,marks, and sketches. A container is an abstract class forimages, pages and papers, which is a placeholder for ~new!content. Content is an abstract class for words, marks, andsketches. Content is generated during a design session,whereas a container is imported into the design. The mark-relation and the word-relation classes represent relationshiptypes. In case of the mark relation, the relationship type cansometimes be deduced from the mark, such as an arrowwith the meaning “leads to,” but architects do not have aunivocal symbol language. Word relations are often notexplicitly defined by the architect. Although implicit rela-tionships are inferred from the design by the designer dur-ing the design process, they do not become part of the designdata because they are not explicitly stated.
In this research project, we have focused on the role ofwords and we have investigated the possibility to inferrelationships between words. More specifically, we haveresearched lexical associations as a method to stimulatearchitectural design by associative reasoning. Silberman et al.~2001! describes two types of associations: semantic andepisodic. Semantic associations are theoretical: there is acommon understanding about the relationship. An exampleof a semantic association is for instance “mother” with“child.” A tree and a branch are related to one another intheory; it is a relation not depending on an individual’sperception. Episodic associations are associations that arenot theoretical, but exist because something happened intime or space: an episode. An example of an episodic asso-ciation is “yellow” with “submarine.” The relation existsbecause the Beatles made a song called “yellow submarine.”
3. WORD GRAPHS
Episodic associations occur through personal experience,and are therefore difficult to capture, and nearly impossible
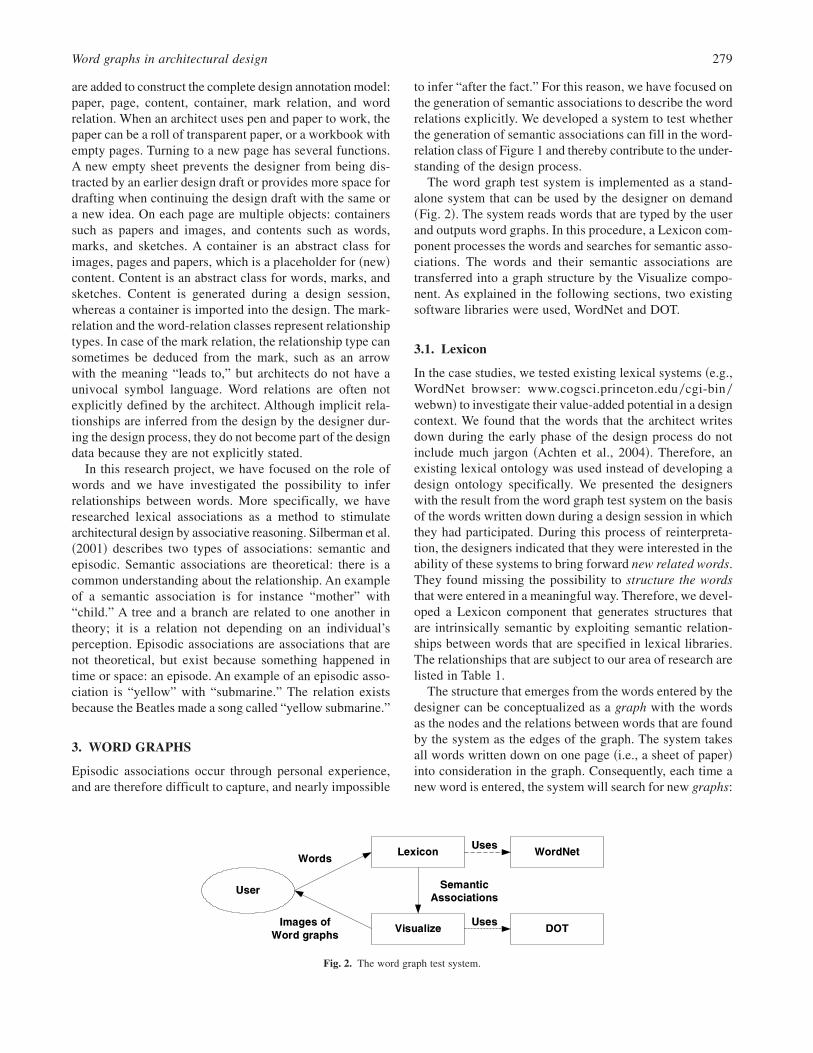
to infer “after the fact.” For this reason, we have focused onthe generation of semantic associations to describe the wordrelations explicitly. We developed a system to test whetherthe generation of semantic associations can fill in the word-relation class of Figure 1 and thereby contribute to the under-standing of the design process.
The word graph test system is implemented as a stand-alone system that can be used by the designer on demand~Fig. 2!. The system reads words that are typed by the userand outputs word graphs. In this procedure, a Lexicon com-ponent processes the words and searches for semantic asso-ciations. The words and their semantic associations aretransferred into a graph structure by the Visualize compo-nent. As explained in the following sections, two existingsoftware libraries were used, WordNet and DOT.
3.1. Lexicon
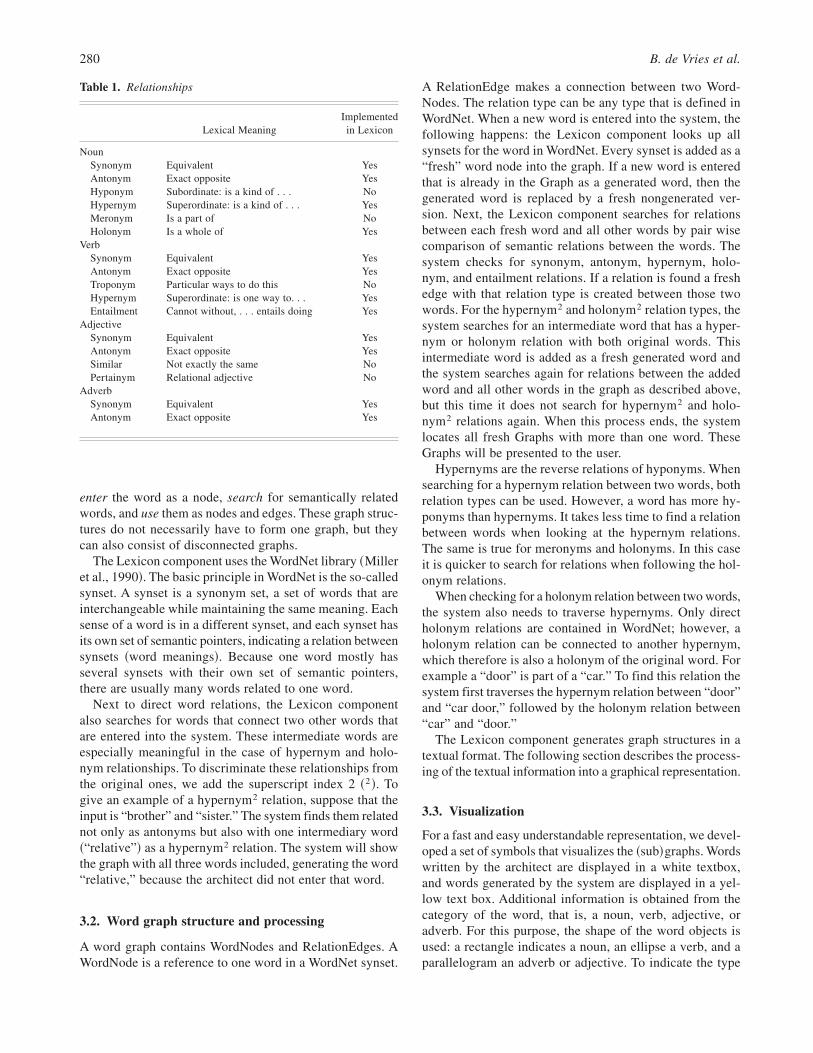
In the case studies, we tested existing lexical systems ~e.g.,WordNet browser: www.cogsci.princeton.edu0cgi-bin0webwn! to investigate their value-added potential in a designcontext. We found that the words that the architect writesdown during the early phase of the design process do notinclude much jargon ~Achten et al., 2004!. Therefore, anexisting lexical ontology was used instead of developing adesign ontology specifically. We presented the designerswith the result from the word graph test system on the basisof the words written down during a design session in whichthey had participated. During this process of reinterpreta-tion, the designers indicated that they were interested in theability of these systems to bring forward new related words.They found missing the possibility to structure the wordsthat were entered in a meaningful way. Therefore, we devel-oped a Lexicon component that generates structures thatare intrinsically semantic by exploiting semantic relation-ships between words that are specified in lexical libraries.The relationships that are subject to our area of research arelisted in Table 1.
The structure that emerges from the words entered by thedesigner can be conceptualized as a graph with the wordsas the nodes and the relations between words that are foundby the system as the edges of the graph. The system takesall words written down on one page ~i.e., a sheet of paper!into consideration in the graph. Consequently, each time anew word is entered, the system will search for new graphs:
Fig. 2. The word graph test system.
Word graphs in architectural design 279
enter the word as a node, search for semantically relatedwords, and use them as nodes and edges. These graph struc-tures do not necessarily have to form one graph, but theycan also consist of disconnected graphs.
The Lexicon component uses the WordNet library ~Milleret al., 1990!. The basic principle in WordNet is the so-calledsynset. A synset is a synonym set, a set of words that areinterchangeable while maintaining the same meaning. Eachsense of a word is in a different synset, and each synset hasits own set of semantic pointers, indicating a relation betweensynsets ~word meanings!. Because one word mostly hasseveral synsets with their own set of semantic pointers,there are usually many words related to one word.
Next to direct word relations, the Lexicon componentalso searches for words that connect two other words thatare entered into the system. These intermediate words areespecially meaningful in the case of hypernym and holo-nym relationships. To discriminate these relationships fromthe original ones, we add the superscript index 2 ~2!. Togive an example of a hypernym2 relation, suppose that theinput is “brother” and “sister.” The system finds them relatednot only as antonyms but also with one intermediary word~“relative”! as a hypernym2 relation. The system will showthe graph with all three words included, generating the word“relative,” because the architect did not enter that word.
3.2. Word graph structure and processing
A word graph contains WordNodes and RelationEdges. AWordNode is a reference to one word in a WordNet synset.
A RelationEdge makes a connection between two Word-Nodes. The relation type can be any type that is defined inWordNet. When a new word is entered into the system, thefollowing happens: the Lexicon component looks up allsynsets for the word in WordNet. Every synset is added as a“fresh” word node into the graph. If a new word is enteredthat is already in the Graph as a generated word, then thegenerated word is replaced by a fresh nongenerated ver-sion. Next, the Lexicon component searches for relationsbetween each fresh word and all other words by pair wisecomparison of semantic relations between the words. Thesystem checks for synonym, antonym, hypernym, holo-nym, and entailment relations. If a relation is found a freshedge with that relation type is created between those twowords. For the hypernym2 and holonym2 relation types, thesystem searches for an intermediate word that has a hyper-nym or holonym relation with both original words. Thisintermediate word is added as a fresh generated word andthe system searches again for relations between the addedword and all other words in the graph as described above,but this time it does not search for hypernym2 and holo-nym2 relations again. When this process ends, the systemlocates all fresh Graphs with more than one word. TheseGraphs will be presented to the user.
Hypernyms are the reverse relations of hyponyms. Whensearching for a hypernym relation between two words, bothrelation types can be used. However, a word has more hy-ponyms than hypernyms. It takes less time to find a relationbetween words when looking at the hypernym relations.The same is true for meronyms and holonyms. In this caseit is quicker to search for relations when following the hol-onym relations.
When checking for a holonym relation between two words,the system also needs to traverse hypernyms. Only directholonym relations are contained in WordNet; however, aholonym relation can be connected to another hypernym,which therefore is also a holonym of the original word. Forexample a “door” is part of a “car.” To find this relation thesystem first traverses the hypernym relation between “door”and “car door,” followed by the holonym relation between“car” and “door.”
The Lexicon component generates graph structures in atextual format. The following section describes the process-ing of the textual information into a graphical representation.
3.3. Visualization
For a fast and easy understandable representation, we devel-oped a set of symbols that visualizes the ~sub!graphs. Wordswritten by the architect are displayed in a white textbox,and words generated by the system are displayed in a yel-low text box. Additional information is obtained from thecategory of the word, that is, a noun, verb, adjective, oradverb. For this purpose, the shape of the word objects isused: a rectangle indicates a noun, an ellipse a verb, and aparallelogram an adverb or adjective. To indicate the type
Table 1. Relationships
Lexical MeaningImplementedin Lexicon
NounSynonym Equivalent YesAntonym Exact opposite YesHyponym Subordinate: is a kind of . . . NoHypernym Superordinate: is a kind of . . . YesMeronym Is a part of NoHolonym Is a whole of Yes
VerbSynonym Equivalent YesAntonym Exact opposite YesTroponym Particular ways to do this NoHypernym Superordinate: is one way to. . . YesEntailment Cannot without, . . . entails doing Yes
AdjectiveSynonym Equivalent YesAntonym Exact opposite YesSimilar Not exactly the same NoPertainym Relational adjective No
AdverbSynonym Equivalent YesAntonym Exact opposite Yes
280 B. de Vries et al.
of relation, the edges between the nodes are used. These aredisplayed as arrows: a black arrow type indicates whether itis a ~1! hypernym or hypernym2 or a ~2! hyponym or hy-ponym2. The position of the arrowhead discriminatesbetween relation type 1 and type 2. Color is used to denoteless frequently occurring relations: blue stands for entail-ment, red means antonym, and green means synonym. Forthe implementation of the visualization component we usedthe DOT library ~Koutsofios & North, 1993!. DOT createshierarchical layouts of directed graphs. A DOT languagefile specifies the objects in a directed graph and makes anoptimal output layout of the objects.
Figure 3 displays the interface of the word graph testsystem. At the bottom part is a field where words are enteredthat should be included in the word graph. The left columnshows the words that have been entered. In the main win-dow, the subgraphs are subsequently added each time a newword generates one or more new subgraphs. The horizontalscrollbar allows for browsing through the history of sub-graphs. Pushing the Complete Graph button displays a sheetwith all subgraphs that are generated from the complete listof words. The filters visible in the bottom left can be checkedon or off. These are discussed in the next section.
4. FEEDBACK FILTERING
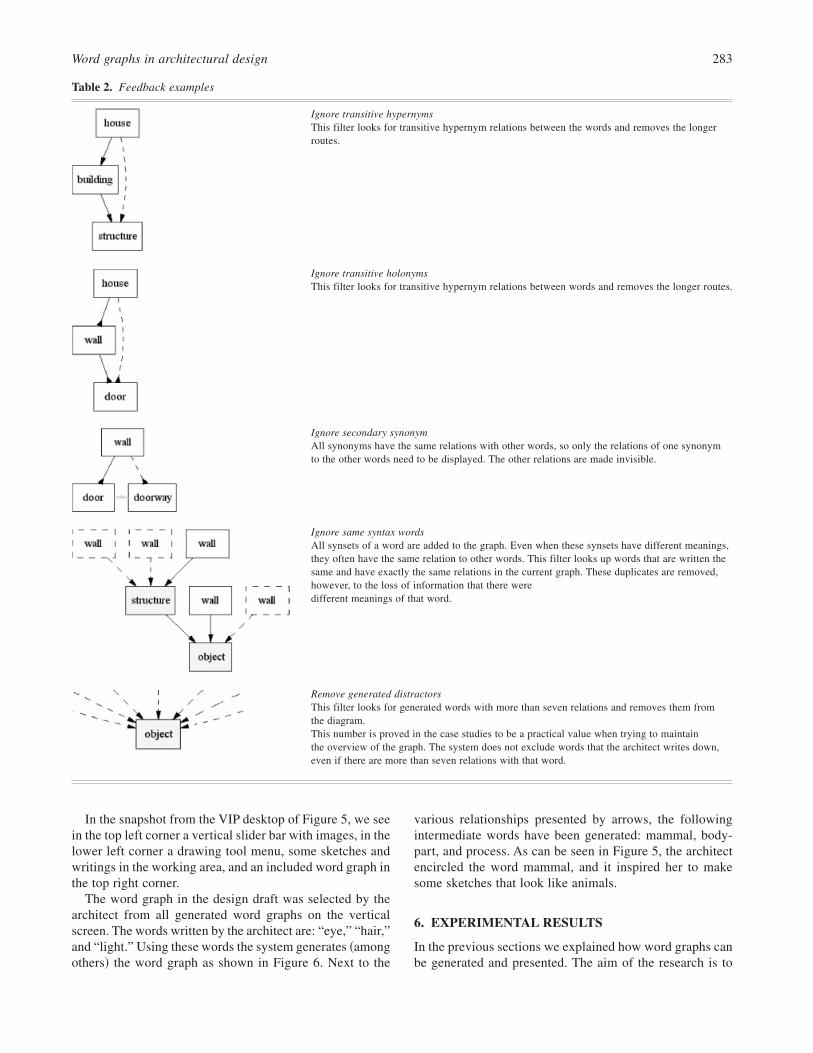
When words are added, the process described in the previ-ous section generates all possible semantic relations. Thedisplayed graphs become very large, which makes them toocomplicated to understand quickly. Some of these relationsare not interesting ~as stated by the interviewed architectsin Section 3.1! or can easily be deduced from other rela-tions. Therefore, we implemented filters that reduce thesize of the graph and that present only interesting relationsand new words. We can distinguish between two classes offilters: redundancy filters and relevance filters ~Table 2!.The redundancy filters called “ignore transitive hyper-nyms,” “ignore transitive holonyms,” and “ignore second-ary synonym” remove relations that can be deduced fromother relations. The relevance filters “remove generated dis-tracters” and “ignore same syntax words” remove relationsand words that are not interesting for the user.
5. WORD GRAPHS IN CAAD
To test our system in an architectural design environment,we integrated the word graph system in a design aid sys-tem. In the following sections, the technical aspects aredescribed including the user interface.
5.1. Platform
The Visual Interaction Platform ~VIP-3; Aliakseyeu, 2003!,is an augmented reality system developed for architects.VIP-3 preserves the naturalness of the traditional way of
designing with pen and paper while at the same time addingnew functionality. The system consists of a table with var-ious projectors. On the table are a digital drawing board andan electronic pen. The digital drawing board is a Wacomtablet, which is calibrated with the overhead projector.Strokes can be made with the electronic pen and are thenprojected on the drawing board immediately; as a conse-quence, it feels like working with a normal workbook. Theresolution is high enough for the architect to work withrather fine lines and to retain a sketchlike quality. The pencan also be used to manipulate items. The system offerstransparency of the virtual papers, which can also be rotated,scaled, and edited. Working with VIP-3, the architectsketches as usual, writes things down, makes marks, andperforms searches in an image database. Feedback from theword graph system is shown in real time on a separatevertical screen.
5.2. Word recognition and word graph presentation
For the generation of word graphs, the text that is writtendown during the design session must be captured by thesystem and recognized as words. Although handwriting rec-ognition software has improved rapidly over the last years,it fails for our purpose for the following reasons:
• The quality of text in design drafts is often very poor.
• Not just a specific set, but all words need to berecognized.
• Text in design drafts is written under various angles.
• Text must be isolated from other strokes such as marksand sketches.
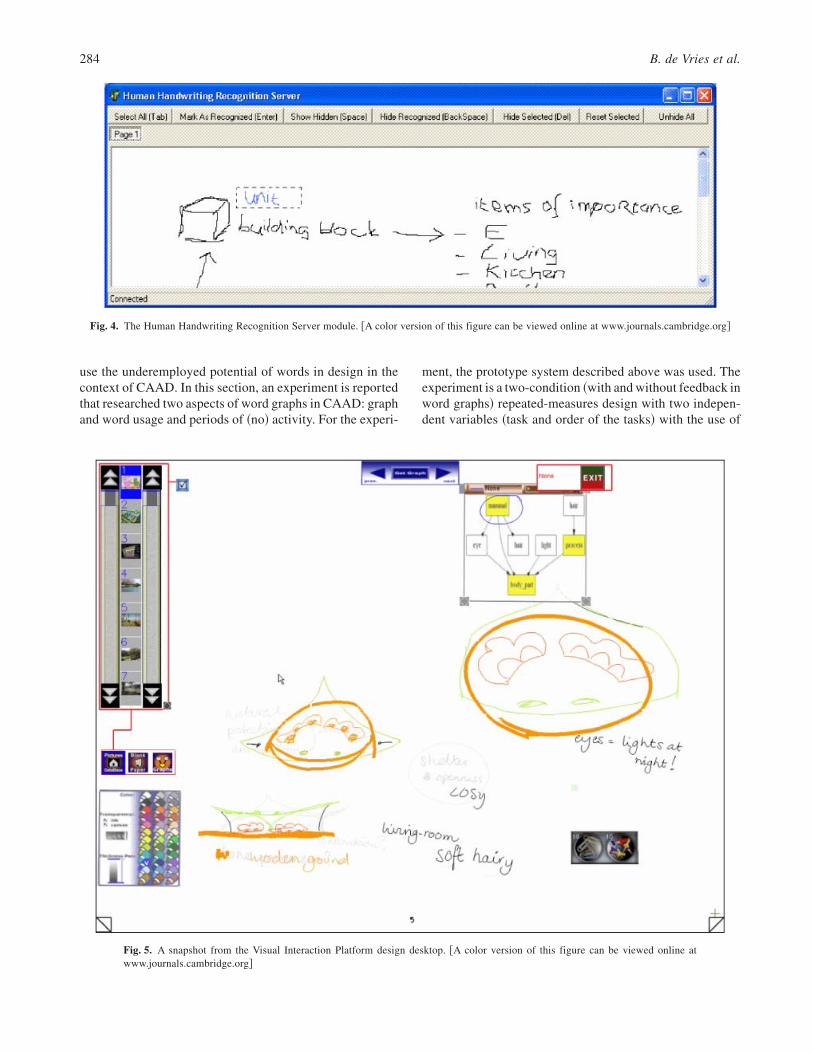
No sufficiently robust software was found available. Apragmatic solution to this problem of word recognition isthe Human Handwriting Recognition Server module. Thismodule basically functions as a “Wizard of Oz” by a humanobserver who recognizes the words that are made in thedesign draft. The observer is located in a different areafrom the design system. All strokes appear on the observer’smonitor. The observer selects the strokes that are part of aword, as displayed in Figure 4, and types in the word for theCAAD system.
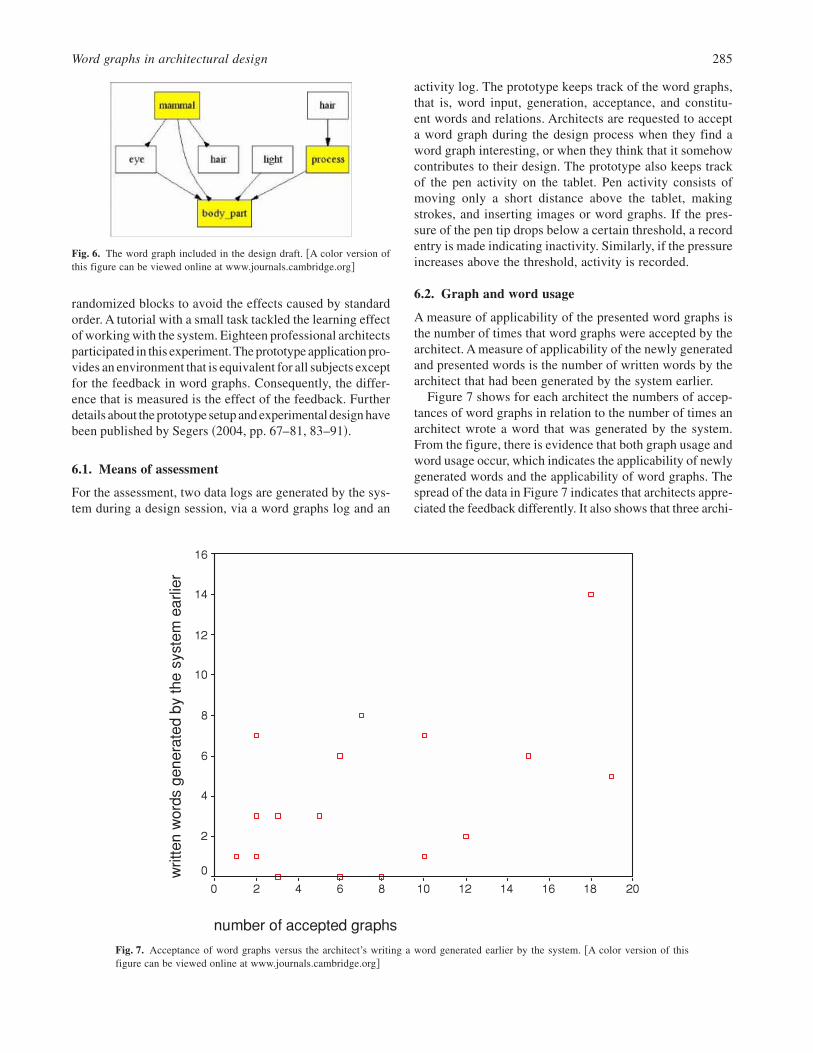
As soon as a new word is entered, new word graphs ~ifany! are generated and displayed to the system user on thevertical screen. Word graphs are displayed on the verticalscreen in a striplike manner. An average of five word graphsis visible on the vertical screen to prevent displaying toomuch information. New word graphs appear on the rightand the old ones “slide” to the left. With the word graphmenu, the architect can see all word graphs by scrollingback and forth through the strip of word graphs. One wordgraph from the strip is highlighted, indicating the selectedword graph. With the button Get Graph the selected wordgraph is copied to the horizontal work field to become partof the design draft ~Fig. 5!.
Word graphs in architectural design 281
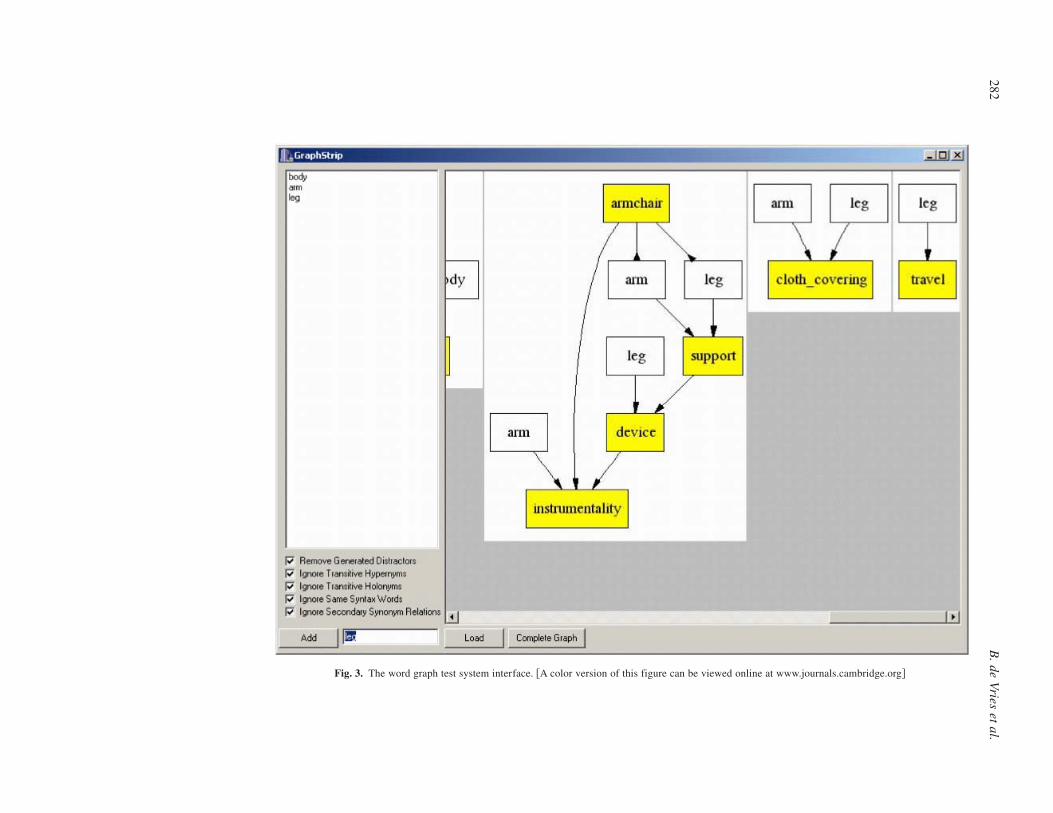
Fig. 3. The word graph test system interface. @A color version of this figure can be viewed online at www.journals.cambridge.org#
282B
.deVries
etal.
In the snapshot from the VIP desktop of Figure 5, we seein the top left corner a vertical slider bar with images, in thelower left corner a drawing tool menu, some sketches andwritings in the working area, and an included word graph inthe top right corner.
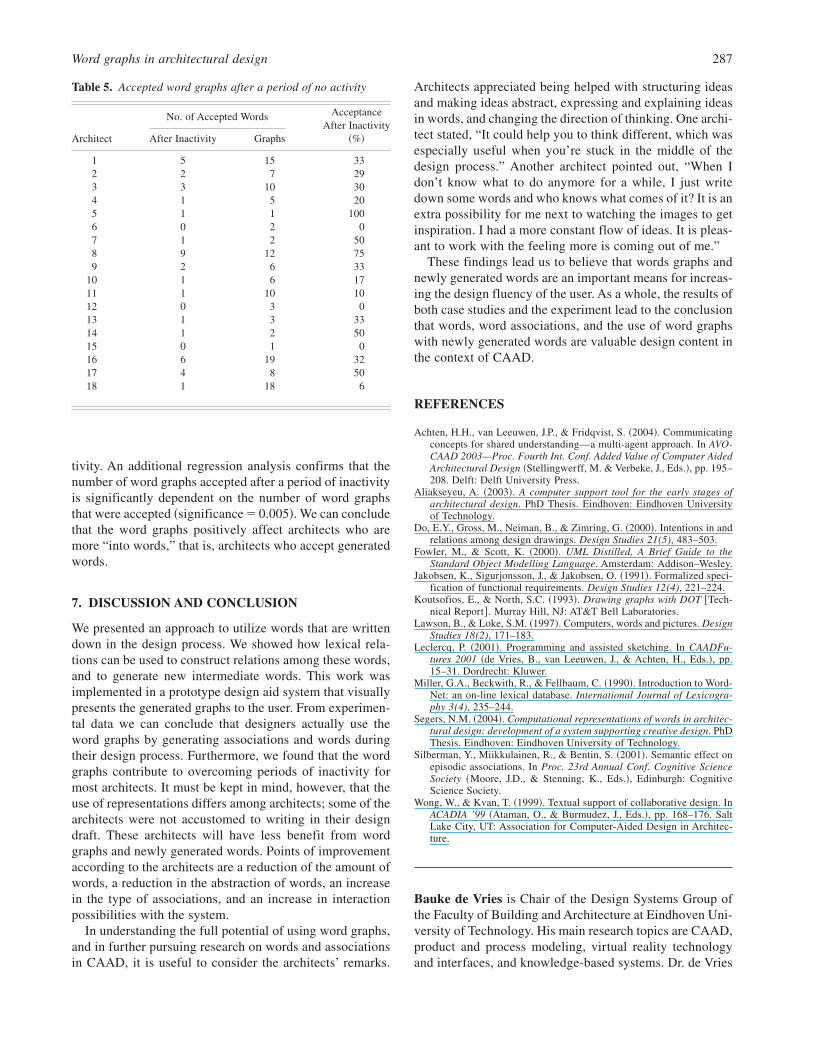
The word graph in the design draft was selected by thearchitect from all generated word graphs on the verticalscreen. The words written by the architect are: “eye,” “hair,”and “light.” Using these words the system generates ~amongothers! the word graph as shown in Figure 6. Next to the
various relationships presented by arrows, the followingintermediate words have been generated: mammal, body-part, and process. As can be seen in Figure 5, the architectencircled the word mammal, and it inspired her to makesome sketches that look like animals.
6. EXPERIMENTAL RESULTS
In the previous sections we explained how word graphs canbe generated and presented. The aim of the research is to
Table 2. Feedback examples
Ignore transitive hypernymsThis filter looks for transitive hypernym relations between the words and removes the longerroutes.
Ignore transitive holonymsThis filter looks for transitive hypernym relations between words and removes the longer routes.
Ignore secondary synonymAll synonyms have the same relations with other words, so only the relations of one synonymto the other words need to be displayed. The other relations are made invisible.
Ignore same syntax wordsAll synsets of a word are added to the graph. Even when these synsets have different meanings,they often have the same relation to other words. This filter looks up words that are written thesame and have exactly the same relations in the current graph. These duplicates are removed,however, to the loss of information that there weredifferent meanings of that word.
Remove generated distractorsThis filter looks for generated words with more than seven relations and removes them fromthe diagram.This number is proved in the case studies to be a practical value when trying to maintainthe overview of the graph. The system does not exclude words that the architect writes down,even if there are more than seven relations with that word.
Word graphs in architectural design 283
use the underemployed potential of words in design in thecontext of CAAD. In this section, an experiment is reportedthat researched two aspects of word graphs in CAAD: graphand word usage and periods of ~no! activity. For the experi-
ment, the prototype system described above was used. Theexperiment is a two-condition ~with and without feedback inword graphs! repeated-measures design with two indepen-dent variables ~task and order of the tasks! with the use of
Fig. 4. The Human Handwriting Recognition Server module. @A color version of this figure can be viewed online at www.journals.cambridge.org#
Fig. 5. A snapshot from the Visual Interaction Platform design desktop. @A color version of this figure can be viewed online atwww.journals.cambridge.org#
284 B. de Vries et al.
randomized blocks to avoid the effects caused by standardorder. A tutorial with a small task tackled the learning effectof working with the system. Eighteen professional architectsparticipated in this experiment.The prototype application pro-vides an environment that is equivalent for all subjects exceptfor the feedback in word graphs. Consequently, the differ-ence that is measured is the effect of the feedback. Furtherdetails about the prototype setup and experimental design havebeen published by Segers ~2004, pp. 67–81, 83–91!.
6.1. Means of assessment
For the assessment, two data logs are generated by the sys-tem during a design session, via a word graphs log and an
activity log. The prototype keeps track of the word graphs,that is, word input, generation, acceptance, and constitu-ent words and relations. Architects are requested to accepta word graph during the design process when they find aword graph interesting, or when they think that it somehowcontributes to their design. The prototype also keeps trackof the pen activity on the tablet. Pen activity consists ofmoving only a short distance above the tablet, makingstrokes, and inserting images or word graphs. If the pres-sure of the pen tip drops below a certain threshold, a recordentry is made indicating inactivity. Similarly, if the pressureincreases above the threshold, activity is recorded.
6.2. Graph and word usage
A measure of applicability of the presented word graphs isthe number of times that word graphs were accepted by thearchitect. A measure of applicability of the newly generatedand presented words is the number of written words by thearchitect that had been generated by the system earlier.
Figure 7 shows for each architect the numbers of accep-tances of word graphs in relation to the number of times anarchitect wrote a word that was generated by the system.From the figure, there is evidence that both graph usage andword usage occur, which indicates the applicability of newlygenerated words and the applicability of word graphs. Thespread of the data in Figure 7 indicates that architects appre-ciated the feedback differently. It also shows that three archi-
Fig. 6. The word graph included in the design draft. @A color version ofthis figure can be viewed online at www.journals.cambridge.org#
Fig. 7. Acceptance of word graphs versus the architect’s writing a word generated earlier by the system. @A color version of thisfigure can be viewed online at www.journals.cambridge.org#
Word graphs in architectural design 285
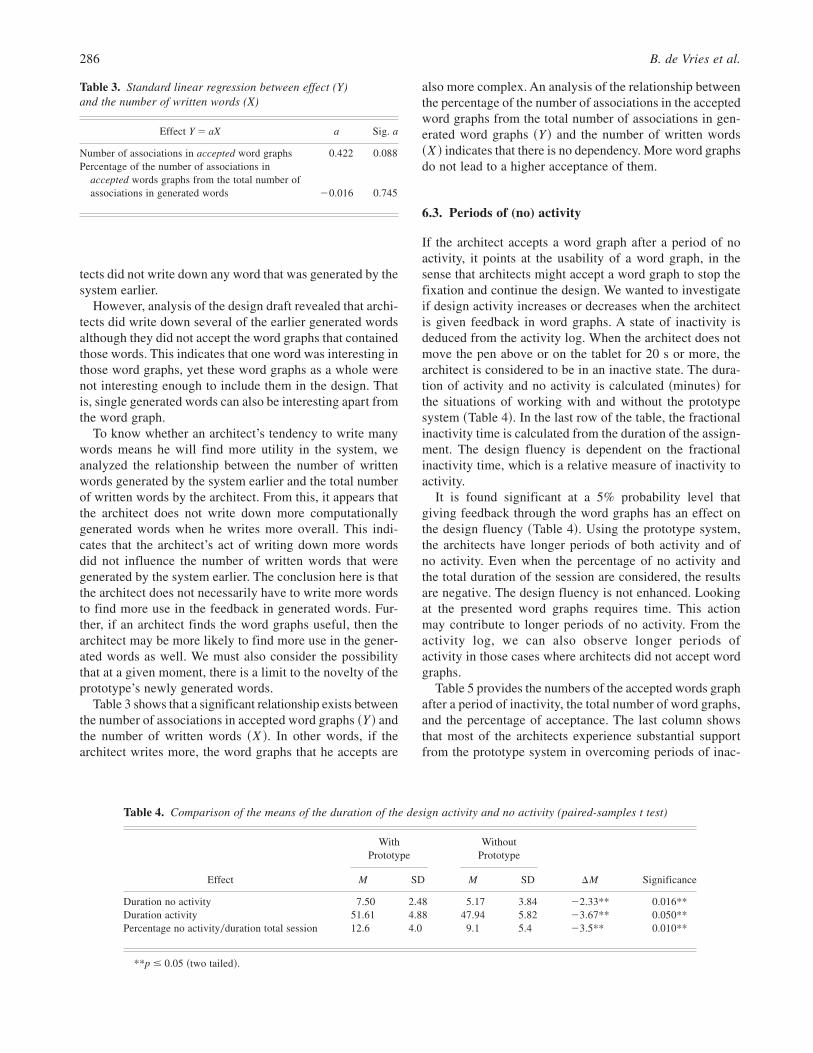
tects did not write down any word that was generated by thesystem earlier.
However, analysis of the design draft revealed that archi-tects did write down several of the earlier generated wordsalthough they did not accept the word graphs that containedthose words. This indicates that one word was interesting inthose word graphs, yet these word graphs as a whole werenot interesting enough to include them in the design. Thatis, single generated words can also be interesting apart fromthe word graph.
To know whether an architect’s tendency to write manywords means he will find more utility in the system, weanalyzed the relationship between the number of writtenwords generated by the system earlier and the total numberof written words by the architect. From this, it appears thatthe architect does not write down more computationallygenerated words when he writes more overall. This indi-cates that the architect’s act of writing down more wordsdid not influence the number of written words that weregenerated by the system earlier. The conclusion here is thatthe architect does not necessarily have to write more wordsto find more use in the feedback in generated words. Fur-ther, if an architect finds the word graphs useful, then thearchitect may be more likely to find more use in the gener-ated words as well. We must also consider the possibilitythat at a given moment, there is a limit to the novelty of theprototype’s newly generated words.
Table 3 shows that a significant relationship exists betweenthe number of associations in accepted word graphs ~Y ! andthe number of written words ~X !. In other words, if thearchitect writes more, the word graphs that he accepts are
also more complex. An analysis of the relationship betweenthe percentage of the number of associations in the acceptedword graphs from the total number of associations in gen-erated word graphs ~Y ! and the number of written words~X ! indicates that there is no dependency. More word graphsdo not lead to a higher acceptance of them.
6.3. Periods of (no) activity
If the architect accepts a word graph after a period of noactivity, it points at the usability of a word graph, in thesense that architects might accept a word graph to stop thefixation and continue the design. We wanted to investigateif design activity increases or decreases when the architectis given feedback in word graphs. A state of inactivity isdeduced from the activity log. When the architect does notmove the pen above or on the tablet for 20 s or more, thearchitect is considered to be in an inactive state. The dura-tion of activity and no activity is calculated ~minutes! forthe situations of working with and without the prototypesystem ~Table 4!. In the last row of the table, the fractionalinactivity time is calculated from the duration of the assign-ment. The design fluency is dependent on the fractionalinactivity time, which is a relative measure of inactivity toactivity.
It is found significant at a 5% probability level thatgiving feedback through the word graphs has an effect onthe design fluency ~Table 4!. Using the prototype system,the architects have longer periods of both activity and ofno activity. Even when the percentage of no activity andthe total duration of the session are considered, the resultsare negative. The design fluency is not enhanced. Lookingat the presented word graphs requires time. This actionmay contribute to longer periods of no activity. From theactivity log, we can also observe longer periods ofactivity in those cases where architects did not accept wordgraphs.
Table 5 provides the numbers of the accepted words graphafter a period of inactivity, the total number of word graphs,and the percentage of acceptance. The last column showsthat most of the architects experience substantial supportfrom the prototype system in overcoming periods of inac-
Table 3. Standard linear regression between effect (Y)and the number of written words (X)
Effect Y � aX a Sig. a
Number of associations in accepted word graphs 0.422 0.088Percentage of the number of associations in
accepted words graphs from the total number ofassociations in generated words �0.016 0.745
Table 4. Comparison of the means of the duration of the design activity and no activity (paired-samples t test)
WithPrototype
WithoutPrototype
Effect M SD M SD DM Significance
Duration no activity 7.50 2.48 5.17 3.84 �2.33** 0.016**Duration activity 51.61 4.88 47.94 5.82 �3.67** 0.050**Percentage no activity0duration total session 12.6 4.0 9.1 5.4 �3.5** 0.010**
**p � 0.05 ~two tailed!.
286 B. de Vries et al.
tivity. An additional regression analysis confirms that thenumber of word graphs accepted after a period of inactivityis significantly dependent on the number of word graphsthat were accepted ~significance � 0.005!. We can concludethat the word graphs positively affect architects who aremore “into words,” that is, architects who accept generatedwords.
7. DISCUSSION AND CONCLUSION
We presented an approach to utilize words that are writtendown in the design process. We showed how lexical rela-tions can be used to construct relations among these words,and to generate new intermediate words. This work wasimplemented in a prototype design aid system that visuallypresents the generated graphs to the user. From experimen-tal data we can conclude that designers actually use theword graphs by generating associations and words duringtheir design process. Furthermore, we found that the wordgraphs contribute to overcoming periods of inactivity formost architects. It must be kept in mind, however, that theuse of representations differs among architects; some of thearchitects were not accustomed to writing in their designdraft. These architects will have less benefit from wordgraphs and newly generated words. Points of improvementaccording to the architects are a reduction of the amount ofwords, a reduction in the abstraction of words, an increasein the type of associations, and an increase in interactionpossibilities with the system.
In understanding the full potential of using word graphs,and in further pursuing research on words and associationsin CAAD, it is useful to consider the architects’ remarks.
Architects appreciated being helped with structuring ideasand making ideas abstract, expressing and explaining ideasin words, and changing the direction of thinking. One archi-tect stated, “It could help you to think different, which wasespecially useful when you’re stuck in the middle of thedesign process.” Another architect pointed out, “When Idon’t know what to do anymore for a while, I just writedown some words and who knows what comes of it? It is anextra possibility for me next to watching the images to getinspiration. I had a more constant flow of ideas. It is pleas-ant to work with the feeling more is coming out of me.”
These findings lead us to believe that words graphs andnewly generated words are an important means for increas-ing the design fluency of the user. As a whole, the results ofboth case studies and the experiment lead to the conclusionthat words, word associations, and the use of word graphswith newly generated words are valuable design content inthe context of CAAD.
REFERENCES
Achten, H.H., van Leeuwen, J.P., & Fridqvist, S. ~2004!. Communicatingconcepts for shared understanding—a multi-agent approach. In AVO-CAAD 2003—Proc. Fourth Int. Conf. Added Value of Computer AidedArchitectural Design ~Stellingwerff, M. & Verbeke, J., Eds.!, pp. 195–208. Delft: Delft University Press.
Aliakseyeu, A. ~2003!. A computer support tool for the early stages ofarchitectural design. PhD Thesis. Eindhoven: Eindhoven Universityof Technology.
Do, E.Y., Gross, M., Neiman, B., & Zimring, G. ~2000!. Intentions in andrelations among design drawings. Design Studies 21(5), 483–503.
Fowler, M., & Scott, K. ~2000!. UML Distilled, A Brief Guide to theStandard Object Modelling Language. Amsterdam: Addison–Wesley.
Jakobsen, K., Sigurjonsson, J., & Jakobsen, O. ~1991!. Formalized speci-fication of functional requirements. Design Studies 12(4), 221–224.
Koutsofios, E., & North, S.C. ~1993!. Drawing graphs with DOT @Tech-nical Report# . Murray Hill, NJ: AT&T Bell Laboratories.
Lawson, B., & Loke, S.M. ~1997!. Computers, words and pictures. DesignStudies 18(2), 171–183.
Leclercq, P. ~2001!. Programming and assisted sketching. In CAADFu-tures 2001 ~de Vries, B., van Leeuwen, J., & Achten, H., Eds.!, pp.15–31. Dordrecht: Kluwer.
Miller, G.A., Beckwith, R., & Fellbaum, C. ~1990!. Introduction to Word-Net: an on-line lexical database. International Journal of Lexicogra-phy 3(4), 235–244.
Segers, N.M. ~2004!. Computational representations of words in architec-tural design: development of a system supporting creative design. PhDThesis. Eindhoven: Eindhoven University of Technology.
Silberman, Y., Miikkulainen, R., & Bentin, S. ~2001!. Semantic effect onepisodic associations. In Proc. 23rd Annual Conf. Cognitive ScienceSociety ~Moore, J.D., & Stenning, K., Eds.!, Edinburgh: CognitiveScience Society.
Wong, W., & Kvan, T. ~1999!. Textual support of collaborative design. InACADIA ’99 ~Ataman, O., & Burmudez, J., Eds.!, pp. 168–176. SaltLake City, UT: Association for Computer-Aided Design in Architec-ture.
Bauke de Vries is Chair of the Design Systems Group ofthe Faculty of Building and Architecture at Eindhoven Uni-versity of Technology. His main research topics are CAAD,product and process modeling, virtual reality technologyand interfaces, and knowledge-based systems. Dr. de Vries
Table 5. Accepted word graphs after a period of no activity
No. of Accepted Words
Architect After Inactivity Graphs
AcceptanceAfter Inactivity
~%!
1 5 15 332 2 7 293 3 10 304 1 5 205 1 1 1006 0 2 07 1 2 508 9 12 759 2 6 33
10 1 6 1711 1 10 1012 0 3 013 1 3 3314 1 2 5015 0 1 016 6 19 3217 4 8 5018 1 18 6
Word graphs in architectural design 287
is the author of publications that have been presented atinternational conferences and scientific articles that havebeen published in international journals. He has been a mem-ber of many PhD committees and Project Leader in Euro-pean research projects.
Joran Jessurun is a Software Engineer who supports otherresearchers with the development of prototype software sys-tems. The application domain is primarily in design supportsystems. His expertise areas are software development ~cod-ing!, software specification and design, computer graphics,virtual reality, databases, and computer networks.
Nicole Segers’ interest in art and science led to an MS inarchitectural design and a PhD in CAAD at the TechnischeUniversiteit Eindhoven. Her work focuses on the early stagesof the design process and especially on creativity and the
use of ~written! words by architects. This interest is devel-oped further at De Twee Snoeken, which is a Dutch firmthat combines an architectural office with software devel-opment. Dr. Segers is currently working on the participa-tion of inhabitants in architectural design and urban planning.The use of words and semantic relations plays an importantrole in this project as well.
Henri Achten is Assistant Professor of design theoryresearch and CAAD. His research work focuses on the archi-tectural knowledge content of graphic representations, waysof formalizing this knowledge, and development of auto-mated recognition and design support tools in this area. Dr.Achten’s second area of research is the connection betweendesign methodology, design theory, and CAAD, in particu-lar, how the use of computation informs and changes designprocesses and design thinking.
288 B. de Vries et al.