women's perceptions of safety and smart safety
TRANSCRIPT
SUPERVISORS:
Dr. J.A. Martinez (1st supervisor)
Dr. C. Richter (2nd supervisor)
WOMEN’S PERCEPTIONS
OF SAFETY AND SMART
SAFETY DEVICES IN SMART
CITY
JINWEI CHANG
March, 2019
WOMEN’S PERCEPTIONS OF
SAFETY AND SMART SAFETY
DEVICES IN SMART CITY
SUPERVISORS:
Dr. J.A. Martinez (1st supervisor)
Dr. C. Richter (2nd supervisor)
THESIS ASSESSMENT BOARD:
Prof. Dr. P.Y. Georgiadou (Chair)
Dr.O.Kounadi (External Examiner, University of Twente)
JINWEI CHANG
Enschede, the Netherlands, March, 2019
Thesis submitted to the Faculty of Geo-Information Science
and Earth Observation of the University of Twente in partial
fulfilment of the requirements for the degree of Master of
Science in Geo-information Science and Earth Observation.
Specialization: Land Administration Course

DISCLAIMER
This document describes work undertaken as part of a programme of study at the Faculty of Geo-Information Science and
Earth Observation of the University of Twente. All views and opinions expressed therein remain the sole responsibility of the
author and do not necessarily represent those of the Faculty
i
ABSTRACT
Smart cities could deliver people a better quality of life. There have been plenty of literatures reporting the
application of intelligent technology to various urban domains: economy, mobility, security, education,
living, environment, along with personal safety for urban residents. A number of smart devices have been
created and applied to these domains. For example, the smart safety devices fitted with Information and
Communication Technology (ICT) like smart surveillance devices, sensors in transport, smart streetlights
could protect people in case of emergency. As reported in plenty of news, female urban residents have a
greater tendency to encounter incidents than their male counterparts do, for which a city cannot be called
smart unless women feel safe. Many researchers have paid attention to Closed Circuit Television (CCTV)
intended for use in public spaces, and explored the effects it could have on deterring criminality and
improving public safety. Despite this, there is insufficient research into the perceptions women have towards
smart surveillance devices and some other smart safety devices. Without more detailed information about
the perception that women have about safety and smart safety devices, it is impossible to improve safety for
women effectively. Thus, it is necessary to perform research into how safe women feel and what their
perceptions are towards smart safety devices. What is important in this study is that consideration is given
to the socio-spatial context of urban settings, including land uses and crime patterns, which is primarily
because smart safety devices could not function in isolation to improve the safety of people or change their
perceptions thereof, but have the possibility to co-influence their perceptions of safety. The aim of this
study is to conduct research into the influence of smart safety devices on the perceptions held by women
towards safety in different public places of a Chinese city and taking into consideration the crime hotspots
and land uses of these places.
The city chosen for this research is Xi’an. As a smart city located in China, Xi’an was identified as a model
city for the construction of surveillance networks for public security purpose in October 2016. Furthermore,
there were some safety incidents occurring across different public spaces in Xi’an in the past, involving
railway stations and shopping streets in particular. Therefore, this study involves an investigation conducted
into how safe women feel and how they perceive smart surveillance devices in the two public spaces, namely
Xi’an station and Luomashi shopping street. The research applied a combination of quantitative and
qualitative methods to perform the study on the problems as mentioned above. Firstly, this research
investigated the crime hotspots in two districts where the two public spaces are located by using kernel
density analysis, which are indicative of the crime hotspots and identifying the type of land uses in crime
hotspots and two public spaces. Then, 80 semi-structured interviews were conducted to learn about the
perceptions held by women towards safety and smart safety devices in the two public spaces. Finally, several
types of associations were examined. Respectively: to what extent female perceptions towards safety match
the state of criminality around two public space; which types of land use are closely related to the crime
hotspots; and to what extent there is an association between awareness for smart surveillance devices and
improvement to women’s feeling about safety. These associations were analysed by conducting a Chi-Square
test as well as women’s perceptions towards other smart safety devices by performing text analysis.
The main results obtained from conducting this research include: (1) Luomashi shopping street is in crime
hotspots but not the Xi’an station. Besides, the crime rate in the Beilin district where the Luomashi shopping
street is located is comparatively lower than in the Xicheng district (Xi'an station located in) (2) Women feel
safer in Luomashi shopping street rather than at the Xi’an station. Thus, female perception towards safety
in these two public spaces proves inconsistent with the crime hotspots. (3) Crime hotspots tend to be
concentrated in residential land and commercial land. (4) According to the information provided by the
respondents, “traffic order”, “distribution of light” and “presence of police” are three key influencing factors

ii
in women perceptions towards safety in public spaces. (5) There is no significant association between
awareness of smart surveillance devices and improvement to women’s feeling about safety. (6) Participants
indicated raising the awareness of self-protection is more important than using smart safety devices.
According to all the results, this thesis could provide reference to assist with urban planning to improve safety in the urban areas. Keywords: Women perceptions on safety, Smart surveillance devices, Smart Safety devices, Land use
iii
ACKNOWLEDGEMENTS
I would like to take this opportunity to express my sincerest gratitude to the people offering me a lot of help
during my MSc period. First and foremost, I would like to express my greatest gratitude to my two supervisors, Dr. J.A. Martinez
and Dr. C. Richter. Without their valuable comments, precise thinking, and patient guidance, it’s impossible
for me to complete my thesis successfully. It is my great honor to work with and learn from my lovely
supervisors.
I also would like to express my gratitude to my beloved parents and families. They always encourage me to
confront challenges with bravery. I also have a massive gratitude to my dear friends for assisting me with
acquiring the research data and check my thesis English.
Special thanks to my Chair Prof. Dr. P.Y. Georgiadou. Her positive attitude towards my thesis makes me
confident and motivated to finish my thesis.
Finally I would like to extend my appreciation to all the LA lectures staff who taught me a lot of new
knowledge that will facilitate me to develop my career.
iv
TABLE OF CONTENTS
1. INTRODUCTION ······················································································································ 1
1.1. Background and justification ···································································································· 1
1.2. Research problem ················································································································· 2
1.3. Research objectives ·············································································································· 2
1.3.1. Sub-objectives and research questions: ············································································· 2
1.4. Conceptual Framework ·········································································································· 3
1.5. Structure of the research report ······························································································· 4
2. LITERATURE REVIEW ·············································································································· 5
2.1. Smart city ···························································································································· 5
2.2. Quality of life and safety ········································································································· 5
2.3. Smart devices ······················································································································ 6
2.4. The relation among safety, crime situation, and smart safety devices··············································· 6
2.4.1. Perception of safety and actual crime situation ···································································· 6
2.4.2. Women safety perception and smart safety devices ······························································ 7
2.4.3. Crime and smart safety devices ························································································ 8
2.5. Women’s safety in China ········································································································ 8
3. RESEARCH DESIGN AND METHODOLOGY ················································································ 9
3.1. General method ···················································································································· 9
3.2. Study area ··························································································································· 9
3.2.1. Xi’an city ······················································································································ 9
3.2.2. Selected public spaces: Xi’an railway station and Luomashi shopping street ····························· 10
3.3. Data collection methods ········································································································ 13
3.3.1. Collection of crime data·································································································· 13
3.3.2. Collection of women perceptions on safety and smart safety devices ······································ 13
3.4. Approach to data processing ·································································································· 15
3.4.1. Crime rate ··················································································································· 15
3.4.2. Geo-coding and export ·································································································· 15
3.4.3. Getting land use type of two districts ················································································· 16
3.4.4. Processing data on women perceptions ············································································ 16
v
3.5. Data analysis ······················································································································ 16
3.5.1. Crime situation analysis ································································································· 16
3.5.2. Women perceptions analysis··························································································· 17
3.6. Research design matrix ········································································································· 18
4. RESULTS ······························································································································ 20
4.1. Safety of two administrative districts by crime situation ································································ 20
4.1.1. Crime rates in two districts ······························································································ 20
4.1.2. Crime hotspots in two districts ························································································· 21
4.1.3. Land use type of criminal locations ··················································································· 22
4.2. Explanation of women perceptions on safety and smart safety devices ··········································· 23
4.2.1. Women perceptions on safety ························································································· 23
4.2.2. Women perceptions on smart safety devices ······································································ 27
4.3. Relationship between women’s perceptions of safety and crime situation as well as smart safety devices
30
4.3.1. Relationship between women’s perceptions of safety and crime situation ································· 30
4.3.2. Relationship between women’s perceptions of safety and smart safety devices ························· 32
5. DISCUSSION ························································································································· 34
5.1. Women perceptions on safety and crime situation ······································································ 34
5.2. Smart surveillance devices and the feeling of safety ···································································· 34
5.3. Smart safety devices: between reality and vision ········································································ 35
6. CONCLUSION ························································································································ 36
6.1. Major research findings ········································································································· 36
6.2. Limitation ··························································································································· 36
6.3. Recommendation ················································································································· 36
7. LIST OF REFERENCE ············································································································· 38
APPENDIX ···································································································································· 42
vi
LIST OF FIGURES
Figure 1 Conceptual framework .......................................................................................................................................... 4
Figure 2 The Locations of Beilin and Xincheng District in Xi’an.................................................................................... 10
Figure 3 The Locations and Layouts of Luomashis Sopping Street and Xi’an Station (left side) ...................................... 11
Figure 4 Locations of Smart Surveillance Devices in Xi’an Station. ................................................................................ 14
Figure 5 Locations of Smart Surveillance Devices in Luomashi Shopping Street. ............................................................. 15
Figure 6 The Principle of Kernel Function. ...................................................................................................................... 17
Figure 7 Crime Rates in Xincheng and Beilin District ......................................................................................... 20
Figure 8 Distribution of Criminal Locations in Xincheng and Beilin Districts................................................ 21
Figure 9 Hotspots Grid Density Map of Criminal Locations in Beilin and Xincheng Districts ................... 22
Figure 10 Land Use in Crime Hotspots .................................................................................................................. 23
Figure 11 Women’s Feeling of Safety and Reasons for the Extent of Feeling of Safety in Xi’an station ............................ 24
Figure 12 Women’s Feeling of Safety and Reasons for the Extent of Feeling of Safety in Luomashi Shopping
Street ............................................................................................................................................................................. 25
Figure 13 Type of Unsafe Incidents Experienced/Heard by Interviewees Xi’an ............................................................... 25
Figure 14 Type of Unsafe Incidents Experienced/Heard by Interviewees in Luomshi Shopping Street ... 26
Figure 15 Elements Selected by Participants Which Could Influent Women Feeling of Safety in Xi’an Station .............. 27
Figure 16 Elements Selected by Participants Which Could influent Women Feeling of Safety in Luomashi Shopping Street
....................................................................................................................................................................................... 27
Figure 17 The Influence of Surveillance Devices on Women Feeling of Safety in Two Public Spaces ................................ 28
Figure 18 Women Perceptions on Effects of Other Smart Safety Devices ......................................................................... 29
Figure 19 Types of functions of smart devices, which women consider would be helpful in emergencies: for attack (yellow), for
self-defence (blue), for help/assistance (green) .................................................................................................................... 30
Figure 20 Hotspots Grid Density Map of Theft in Beilin and Xincheng Districts .......................................................... 31
Figure 21 Figure 20 Hotspots Grid Density Map of Theft in Beilin and Xincheng Districts ........................................... 31
vii
LIST OF TABLES
Table 1 Contingency table................................................................................................................................................ 17
Table 2 All Data Which Are Used in the Research ....................................................................................................... 18
Table 3 Research Matrix ................................................................................................................................................ 19
Table 4 The Statistic of Crime Cases Type in Two Districts ............................................................................................ 21
Table 5 The Statistic of Extent of Women’s Feeling of Safety in Luomashi Shopping Street and Xi’an Station .............. 24
Table 6 Cross tabulation ................................................................................................................................................. 32
Table 7 Chi-Square Tests Result .................................................................................................................................... 33

1
1. INTRODUCTION
This chapter deals with the background of the study, prior to an introduction of the research problem,
research objectives and questions, along with the structure of this research.
1.1. Background and justification
Under the context of a modern society, a combination of fast-paced increase in the population and urban
migration contributes to an unprecedented scale of urbanization. The development of smart cities has
presented itself as an effective way of accommodating a substantial number of people. Nonetheless, as the
wealthy is the major beneficiary of smart cities across Asia and Africa, there are some commentators who
take the view that smart city is growing at a pace that is based on an unreasonable expectation (Lohrmann,
2016).
As claimed by Capdevila & Zarlenga (2015), smart city is defined as a city that is characterized by the
inventiveness and creativity of its citizens. From 2000 onwards, the focus of smart city has shifted away
from technology and structure to network-based sustainability integrated with the quality of life (Hall, 2000;
Kramers, 2014). Allowing for the different viewpoints on smart cities and changing visions, it is of a realistic
significance to conduct research into the impact made by the elements of smart city and its development on
the quality of life (QoL) of citizens.
As far as QoL is concerned, how QoL is defined involves two significant elements, one is associated with
the ways people perceive and assess their living environment while the other one relates to how the
environments where citizens live and work are reflected (Pacione, 2003). According to the definition by
WHO (1997), QoL represents an individual's perception of their position in life against the background of
the culture and value systems where they live and the perception is usually in comparison to their objectives,
expectations, standards and concerns. Based on an analysis conducted by Macke et al. (2018), there are four
crucial factors in assessing the perception of QoL, ranging from social-structural relations, environmental
well-being, material well-being to community integration, all of which require safety item to be integrated
into social-structural relations. As revealed by a report entitled Population and Social Conditions, economic
security and physical safety are regarded as a significant dimension of QoL (EU-QOLEG, 2017). There are
two major indicators selected to assess physical safety: homicide rate, and perception of crime, violence or
vandalism in the living area respectively (EU-QOLEG, 2017). An assessment was conducted by Kitchen
and Williams (2010) to assess the perception held by residents towards crime and safety in their city. The
assessment results indicated that the negative perceptions people had towards safety could make little impact
on their QoL, which was because people were conscious of it and took actions to mitigate the risk (e.g. by
avoiding certain public spaces and not going out in the dark). A few years later, however, Węziak-
Białowolska (2016) proposed that cities that make people feel safe tend to be where people have high levels
of satisfaction with the quality of their life.
In order to make a positive impact on people’s perception on safety, Information and Communication
Technology (ICT) have been extensively applied. For example, following a brutal gang-rape incident that
occurred in Delhi in December 2012, the Indian government made a rule that required all the phones sold
in India to be retrofitted with a panic button for the sake of women’s safety (Karusala & Kumar, 2017).
Furthermore, smart streetlights are effective in saving energy and reducing the cost required for maintenance
2
works, in addition to supplying real-time traffic information for efficient transport regulation, for which they
are of a great significance to improving personal safety and traffic safety (Meher, 2013).
In the past, men were reported to feel safer than women in many developed countries (Crabtree & Nsubuga,
2012) and plenty of news claimed that females were more likely to be subjected to harassment. It could
occur on various occasion such as streets, workspaces, schools and parks etc. (Blumenthal, 2014). As
revealed by Chinese Women's Safe Travel Report, hotels and shopping malls were the places where almost
all violent incidents against women occurred, which was despite the fact that these places were attended by
specific owners and managers (Yu, 2017). With the emergence of smart technologies aimed at raising the
quality of life for citizens, it is of significance to perform studies on female perceptions toward safety and
smart safety devices.
1.2. Research problem
Currently, despite the widespread application of smart technologies which are purposed to improve public
safety, like sensor monitoring traffic flow and security cameras (Mayarani Praharaj, 2015), there remains
little effort made on conducting research into women perception on safety and smart safety devices. In the
absence of a clear understanding of female experience and perceptions towards safety and smart safety
devices, it is unrealistic to make improvements to female feeling about of safety and smart safety devices.
In 2012, Xi’an city (China) was targeted to build a smart city by the National Ministry of Science and
Technology. For the most recent 6 years, Xi’an has made a substantial improvement on urban traffic through
the application of internet networks, e-government, industries with the Internet of Things, as well as mobile
payment (Zhao & Cai, 2017). However, smart measures for safety, women safety in particular, remains
inadequate.
At present, there are only limited types of smart technology found available for research, including all in one
smart safety system for women safety, “Safe bracelet”, “Roar siren” and “PaPa” (Recinos, 2016; Yang, 2018;
Monisha, Monisha, Pavithra, & Subhashini, 2016). It is difficult to search for the evidence required to
facilitate empirical research into various smart safety devices like smart surveillance devices, PaPa
application (providing immediate rescue when users suffer unsafe incidents) (Yang, 2018).
In this sense, the major concern about this research lie with the extent to which smart safety devices improve
women’s feeling towards safety and female perceptions towards safety in public spaces. Considering the
possibility that female perceptions of safety in public spaces are subjected to the influence by various factors
besides smart safety devices, the influences of land uses and crime hotspots are covered in this research.
Xi’an represents a model city for the construction of public security video surveillance networks(Xinhua
News Agency, 2018). Allowing for this, this research places its focus of attention on Xi’an for its networks
of smart surveillance devices.
1.3. Research objectives
In order to explore women’s perceptions on safety and smart safety devices, this research takes into account
land uses and crime hotspots, along with how women perceive smart safety devices in different public
spaces. Concerning this research, the public spaces involve Luomashi shopping street and Xi’an railway
station, which are located in Beilin and Xincheng districts respectively.
1.3.1. Sub-objectives and research questions:
A. To ascertain the state of safety within the two administrative districts by crime situation.
What is the crime rate of the two districts?
What are the hotspots of crime in the two districts?
Which are the types of land use at crime hotspots and around the two public spaces?
3
B. To establish female perceptions towards safety and smart safety devices, particularly the impact of smart
surveillance devices on women’s feeling of safety.
What are women’s perceptions on safety in the two public spaces?
How women perceive smart surveillance devices?
How women perceive other smart safety devices?
C. To perform an analysis of how women’s perceptions towards safety in two public spaces relate to the
crime hotspots in two districts, in addition to the association between women’s feeling about safety with
smart surveillance devices.
What is the association between crime hotspots and women’s perceptions on safety in two public
space?
What is the relationship between smart surveillance devices with women feeling of safety?
1.4. Conceptual Framework
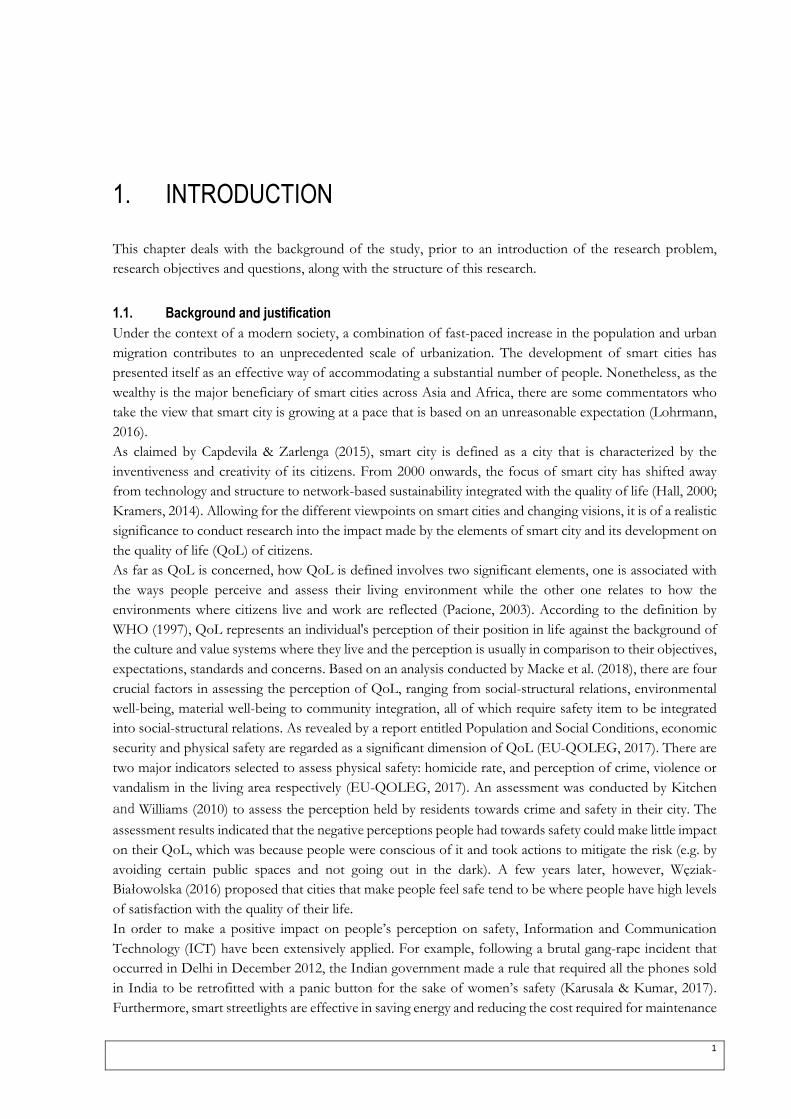
Figure 1 presents a conceptual framework as a summary of the major concepts for this research and their
relationships (see figure 1). An essential element of building a smart city lies in the improvement to the
quality of life, which encompass a range of indicators, of which safety is quite significant. Recently, more
public attention has been drawn to women safety in public spaces across the world. Besides, some measures
were suggested to improve public safety through a research into crime situation. Smart technology also is
regarded as the subject of study as it is sometimes promoted as way to improve QoL and safety in particular.
Therefore, this research is carried out by combining female perceptions towards safety and safety devices in
order to research women safety. In this research, safety is referred to through crime situation, which is
associated with crime rate, crime hotspots and relevant information like land use. Subsequently, smart safety
devices, which make up part of smart technology, are investigated through a study on female perceptions
towards them (smart surveillance devices and other smart safety devices). Finally, the explored relations are
identified.
4
Figure 1 Conceptual framework
1.5. Structure of the research report
In structure, this report consists of the following chapters:
Chapter 1: Introduction
Research background, research problem, research objectives and questions are covered in this chapter.
Chapter 2: Literature Review
This chapter includes the concepts of smart city and quality of life, the relation among smart city, quality of
life, safety and women safety, the correlation between crime situations with women perceptions on safety,
and the development of women perception about smart devices on safety in research area.
Chapter 3: Research Methodology
This chapter presents an introduction of the research area and an elaboration on the analysis method
regarding the relevant literature.
Chapter 4: Results
This chapter deals with result analysis with respect to research objectives.
Chapter 5: Discussion
The in depth research results are interpreted and discussed in this chapter.
Chapter 6: Conclusion
This chapter is primarily about the conclusions of the relevant research findings, in addition to the
limitations and recommendations.
Chapter 7: List of References
5
2. LITERATURE REVIEW
In this chapter, a review is undertaken of the literatures in relation to the research topic, thus providing a
reference to both the prior and existing research situations as well as understanding of how the context used
throughout this research is defined. These definitions range from smart city, quality of life, safety to smart
devices. Additionally, the relation among safety, crime situation and smart safety devices is also interpreted
to identify sub-objective.
2.1. Smart city
Urbanization has created a considerable impact on the world. Urban management and development thus
has become increasingly imperative owning to a variety of different urban problems like environmental
pollution, resources shortage, and congestions. The notion of smart city has been raised with an effective
approach in a bid to improve urban management and development (Wu, Zhang, Shen, Mo, & Peng, 2018).
Moreover, the combination of intangible elements (e.g. creativity of people and institutions) and tangible
elements (e.g. institutions and digital infrastructure) leads to the emergence of the smart city (Capdevila &
Zarlenga, 2015; Hall, 2000; Macke et al., 2018).
Practically, the notion “smart city” is quite ambiguous in the absence of consistent concept and structure,
which is exemplified by the fact that “smart” is also known as “intelligent” or “digital(Albino, Berardi, &
Dangelico, 2015). As argued by some researchers, the digital city is defined as an interconnected community
enabled by broadband communications infrastructure (Ishida, 2002). Intelligent city is characterized by the
application of information technology to transform lives with focus placed on the capability to deliver
support to technological development and innovation within the city (Komninos, 2011). As claimed by Nam
and Pardo (2011) “smart” is favoured over the term “intelligent” as “smart” is achieved only when smart
cities are capable of satisfying user needs, while “intelligent” is constricted to indicating a quick response to
feedback.
Different researchers tend to have different understandings of smart cities. Lombardi et al. (2012) took the
view that the notion of the smart city shall be demonstrated by the combination of information and
communications technology (ICT), human capital, social and relational capital, and environmental issues.
As claimed by Ramaprasad et al. (2017), “the smart city is representative of a mixed concept that encompass
the application of information technology infrastructure and the capability to process information and
resources with the aim to improve the quality of lives of its people”. This sort of concept bears some
similarity to Albino et al. (2015): smart city presents a platform where technology is applied to improve
quality of life.
The characteristics typical of smart cities are separated in multiple respects. The Centre of Regional Science
at the Vienna University of Technology launched a project where 6 dimensions of smart city were raised
based on 70 European middle size cities including: smart economy, smart mobility, smart environment,
smart people, smart living, and smart governance (Albino et al., 2015).
2.2. Quality of life and safety
Consistent with the foregoing concepts, the objective of a smart city lies with the development of a
sustainable economy and improvement to wellbeing and quality of life. In turn, the quality of life is regarded
as a major element to develop a smart city (Nam & Pardo, 2011; Thuzar, 2011). Pacione (2003) was
supportive of the definition of QoL being relevant to two fundamental elements: subjective elements that
are intended to depict the ways people perceive and assess their living environment (e.g. satisfaction, feeling
of safety ), and objective elements that are used to represent the environment where people live and work
6
(e.g. health care provision, crime, education, leisure facilities, and housing). Chui et al. (2018) concentrated
on seven different indicators of the quality of life to determine the influence exerted by the applications of
smart city on improving the quality of people’s life, ranging from safety, time and convenience, health,
environmental quality, social connectedness, and civic participation, jobs to living costs. The research results
revealed that smart city is conducive to raising the levels of quality in life by 10-30 percent.
According to a report entitled Population and Social Conditions (EU-QOLEG, 2017), a comprehensive
framework to assess the quality of life involves a total of nine different indicators: material conditions for
living, productive or other main activity, health, education, leisure and social interactions, natural and living
environment, governance and basic rights, overall experience of life, and economic security and physical
safety. As defined by the International Committee of the Red Cross (2015), economic security refers to the
ability people possess to afford satisfying their essential demands in a sustainable way. Physical safety is
defined as the protection of an individual person’s physical safety from any potentially harmful situation,
such as crime, accidents or natural disasters (EU-QOLEG, 2017).
In this research, the implication of safety is confined to physical safety. In the report (EU-QOLEG, 2017),
physical safety was split into two topics: crime and perception of physical safety. And the perception of
physical safety is referred to as the feeling about safety expressed in a percentage of the participants feeling
safe/unsafe. Objective indicators correspond to crime inclusive of crime and homicide rate; subjective
indicators correspond to the perception of physical safety involving the perception of crime, violence in
living area respectively (EU-QOLEG, 2017). In this circumstance, crime situation (crime rate and crime
hotspots) and land use are determined as objective indicators for this research, with female perceptions
towards safety and smart safety devices being selected as subjective indicators.
2.3. Smart devices
Smart devices include a wide variety of different electronic facilities with the capability of connecting, sharing
and interacting with its user and other similar smart devices (Technopedia, 2018). According to Rollnick
(2008), crime risk is subjected to the influence exerted by urban design choices and the organization of
public services. Chui et al. (2018) selected three separate indicators (fatalities, crime incidents, emergency
response time) and consolidated smart technologies to make assessment of safety. As indicated by the
assessment, smart technologies were capable of reducing fatalities by 8–10 percent and cutting back on
emergency response times by 20–35 percent. Besides, with the aim to offer smart solutions to improve
safety for citizens, especially for those vulnerable people like women, children and elderly, there are some
countries seeking to construct a smart city that applies smart technologies in some areas like smart transport
management systems and public safety. One classic example is China, where sensor monitoring traffic flows,
security cameras, and data are linked to the internet networks (Praharaj, 2015). Besides, in order to address
the issue of a declining police force, the police department in Surat of India launched “Smart City Project”
and developed intelligent surveillance involving a network of over 6000 closed circuit television (CCTV)
cameras to enforce law and public order. Following this move, the local crime rate decreased by 27%
(Nimish, 2017). Apart from that, a smart participatory tool and Women’s Safety Audits (WSA) are conducive
to searching for the safer places and identifying some obstacles to safety in the community (Praharaj, 2015).
In this research, the discussion is limited to smart safety devices that play a significant role in ensuring safety.
2.4. The relation among safety, crime situation, and smart safety devices
2.4.1. Perception of safety and actual crime situation
The feeling of safety in a specific area is closely associated with the actual crime situation in that area.
However, the correlation between crime and feeling of safety remains far from clear. As discovered by Curiel
and Bishop (2017), the perception of safety they held in a specific area is quite unstable and could change
7
instantly due to a small number of criminal cases occurring in that area. In addition, literature has made
emphasis that the sense of security bears a close association with actual crime locations (Ratnayake, 2017).
On the contrary, Karunananda, Rajapakse and Rathnayaka (2018) claimed that there is no link between
crime spots and sense of security, which is a similar view to the outcome of a survey conducted by Australian
Bureau of Statistic (2003). It indicated that people’s perceptions towards safety are not necessarily consistent
with recorded victimization rates or crime spots. In addition, a prior study indicated diverse land-uses have
the potential to boost perceived safety. For instance, the communities with a greater access to shops, parks,
and transit could minimize the sense of fear of crime (Foster, Giles-Corti, & Knuiman, 2010). A few years
later, Twinam (2017) also discovered that dense mixed-use areas are relatively safe as compared to typical
residential areas. Additionally, it was revealed that land use was a significant determinant of street crime
patterns. In 2013, Ludin et al. (2013) drew a similar conclusion that there existed a crucial relationship
between crimes and land uses patterns as crime showed a tendency of concentration in the residential and
commercial areas.
Beside, in multiple hotspots urban crime areas, it was reported that females were specifically targeted more
by offenders than males, which made women have a negative perceptions towards safety. In line with this
viewpoint, Tandogan and Ilhan (2016) argued that women tend to have more exposure to unsafe feeling as
a consequence of crime.
2.4.2. Women safety perception and smart safety devices
Across the world, female safety is uniformly viewed as a notable issue. “35% of women have experienced
either physical or sexual violence’’ (WHO, 2013,p.2). Public space is openly available and accessible to all
kinds of people (Soraganvi, 2017). Passing through public places such as market and crowded street could
make plenty of women and girls feel great anxiety, which owns to the experience that accidents are more
likely to occur in this sort of places (Soraganvi, 2017). This type of phenomenon leads to the emergence of
smart devices. As argued by some studies, smart safety devices are effective in making females feel safe to
some extent (Karusala & Kumar, 2017; Zurawski & Czerwinski, 2008). One typical example is the smart
foot device from Indonesia which is capable of providing aid to women in raising alarm with a sensor fitted
to the footwear. In operation, it sends a warning signal to an application on the victim’s phone after being
triggered by tapping one foot behind the other four times (Viswanath, Pakyala, & Muneeswari, 2016). In
addition, plenty of researches focused on making assessment of the effectiveness of CCTV and the
mechanism for CCTV to deter crime and safeguard women from risk (Monisha et al., 2016; Zurawski &
Czerwinski, 2008), there remains a lack of focus placed on women perceptions towards safety and smart
safety devices. As indicated by Zurawski et al. (2010), the perception held by people towards the safety bears
hardly any relation to the technology but it is associated with socio-relations, for which CCTVs appears to
have no effect on improving feelings of safety in public space. A short on-site interview was conducted by
Brands et al. (2016), to research people’s perceptions of CCTV when they stay outside at night in Utrecht
and Rotterdam. The result revealed that there is a potential that the awareness to CCTVs presence could
help enhance personal safety. Nonetheless, the capability CCTV systems have to improve people’s feeling
of safety is fairly restricted as it plays a part only after the occurrence of incidents rather than before or when
it happens (Brands et al., 2016). In addition, as discovered by other researchers, the number of CCTV
cameras had a negative association with men’s fear of crime and even no relation to women’s fear of crime.
Moreover, there was no apparent effect exhibited on the perceived risk of crime (Cho & Park, 2017).
Generically, the findings as to whether or not CCTV could exert a positive influence on improving the
public feeling about safety remain debatable (Taylor, 2012).
8
2.4.3. Crime and smart safety devices
Recently, some crime areas were provided with diverse smart safety devices. In the event of any security
threat in a specific environment, smart surveillance in Smart Transportation Safety (STS) could be utilized
to enable an automatic and accurate identification. For instance, some researchers use fog-framework (for
intelligent public safety in vehicular environment) to provide assistance with crime prevention by applying
it to computation in smart surveillance-based STS(Neto, Zhao, Rodrigues, Camboim, & Braun, 2018). Apart
from this, a combination of other facilities like crime-mapping platforms, gunshot-detection systems and
smart lights is utilized to improve the ability to detect crime in advance of its occurrence (Dearden, 2017).
As a significant smart safety device, smart surveillance devices are referred to in this research.
2.5. Women’s safety in China
In China, there is little effort made on conducting research into women’s safety. Of course, it does not imply
that all women feel safe in China. Recently, there was a surge in the violence committed against women in
public spaces, with young women in particular as the target of harassment (Yu, 2017). In accordance with
the definition set out by the United Nations, violence against women can be described as any act of gender-
based violence that leads to, or has a potential to lead to, physical, sexual or mental detriment or suffering
to women, including threats of such acts, coercion or arbitrary deprivation of individual freedom,
irrespective of where it occurs (World Health Organization, 2018). According to Chinese Women Travel
Safety Report (2017), of the 120 cases associated with violence committed against women, as many as 62
cases were related to sexual harassment or rape. As revealed by the public reports published within the
period from 2010 to 2018 on women travelling in public spaces of Xi’an, the major type of violence against
women is found out to be robbery with its proportion reaching 57%, which is followed by sexual harassment
accounting for 27% (Zhenguan, 2018). Over the recent years, some reports emerged regarding safety
incidents occurring to females. In August 2014, there were a minimum of 28 young women aged between
15 and 30 across China went missing. Additionally, of these disappeared young women, five ended up being
killed and 15 women remain not found (Wang, 2014). Besides, a woman was forcibly made hostage by a
complete stranger in a hotel, while some girls were subjected to sexual harassment when using online car-
hailing services (China Central Television, 2018). Aside from that, many visitors and local residents reported
that theft was so prevalent in Xi’an that the city was nicknamed by the press as “theft city” (Voice of Daqin,
2018). Therefore, it is imperative to resolve the issue.
Considering the particular context of Xi’an, a number of different types of crime is selected in this research,
ranging from theft, robbery, harassment to intentional injury, which is aimed at ascertaining whether or not
there is an association of local crime situations with women perception towards safety in the two public
spaces.
9
3. RESEARCH DESIGN AND METHODOLOGY
This chapter is to elaborate on the way the research is conducted, which involves general method, study
area, the methods of data collection, data processing and analysis, as well as research matrix.
3.1. General method
This research is approached with a combination of methods quantitative and qualitative analysis. It is widely
accepted that quantitative research prioritizes the collection and analysis of numerical data, whereas
qualitative research gives consideration to the words in the collection and analysis of data (Bryman, 2012;
Hayes, Bonner, & Douglas, 2013). Specifically, a qualitative method is applied in this research to devise a
semi-structured interview and scale items to obtain the information on women perceptions towards safety
and smart surveillance devices in the two public space (Xi’an station and Luomashi shopping street) along
with other smart safety devices that have been put into service. In addition, a combination of quantitative
analysis and qualitative analysis is applied in the research to illustrate crime situation and female perceptions
towards safety, which is purposed to enhance the integrity of the research results.
3.2. Study area
3.2.1. Xi’an city
Xi’an represents the capital city of Shaanxi Province covering 10752 Km2. It has a registered residential
population of 9.07 million and is located in the centre of the Guanzhong Plain in North-western China
(OECD Publishing, 2013; Office of the State Council, 2008).
In 2012, the local government and China Telecom Shaanxi Company signed up to a strategic cooperation
agreement on the construction of “smart city” with an aim at comprehensively facilitating three major
projects: smart government, smart industry, and smart livelihood (China Big Data and Smart City Research
Institute, 2016; China Social Sciences Press, 2015; Wang, 2017). By adopting the mode of Government
Investment-Private Operation, Xi’an started trialling the development of smart city, which involved various
projects like digital urban management, wireless video surveillance, and real-time traffic information (Li,
Lin, & Geertman, 2015). In October 2016, Xi’an was rated as a model city for building networks of public
security video surveillance (Xinhua News Agency, 2018). Subsequent to that, the local government carried
on to initiate the “Xueliang Project”, which was purposed specifically to achieve a complete coverage of
video surveillance across all public areas and those significant areas in Xi’an. Meanwhile, the project was
reliant on a wide variety of advanced technologies such as data mining, portrait comparison, license plate
recognition, intelligent early warning, and geographic information positioning to reinforce correlation
analysis of massive information and implement the preventative and control measures of public security in
Xi’an (Xinhua News Agency, 2018).
Despite the application of smart safety devices to the regulation of an individual city, there remained the
occurrence of some criminal incidents in different public spaces across Xi’an, with railway stations and
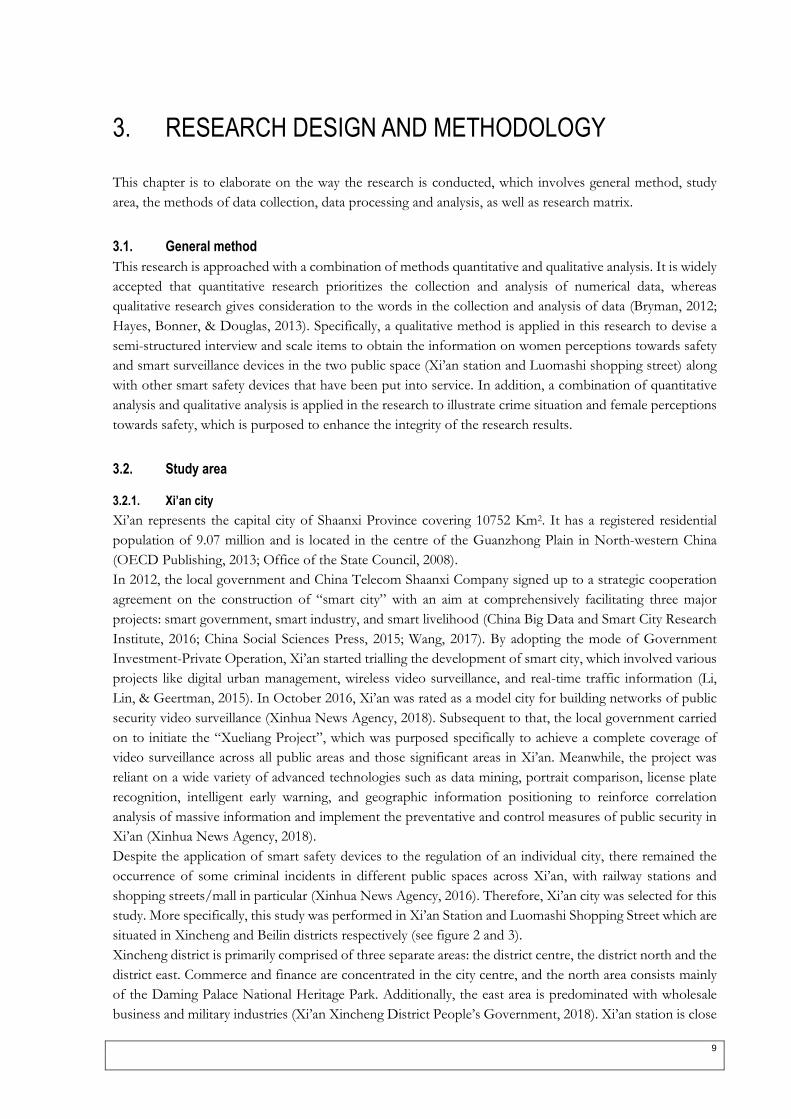
shopping streets/mall in particular (Xinhua News Agency, 2016). Therefore, Xi’an city was selected for this
study. More specifically, this study was performed in Xi’an Station and Luomashi Shopping Street which are
situated in Xincheng and Beilin districts respectively (see figure 2 and 3).
Xincheng district is primarily comprised of three separate areas: the district centre, the district north and the
district east. Commerce and finance are concentrated in the city centre, and the north area consists mainly
of the Daming Palace National Heritage Park. Additionally, the east area is predominated with wholesale
business and military industries (Xi’an Xincheng District People’s Government, 2018). Xi’an station is close
10
to the north area geographically and surrounded by residential, public management and service, and
commercial land.
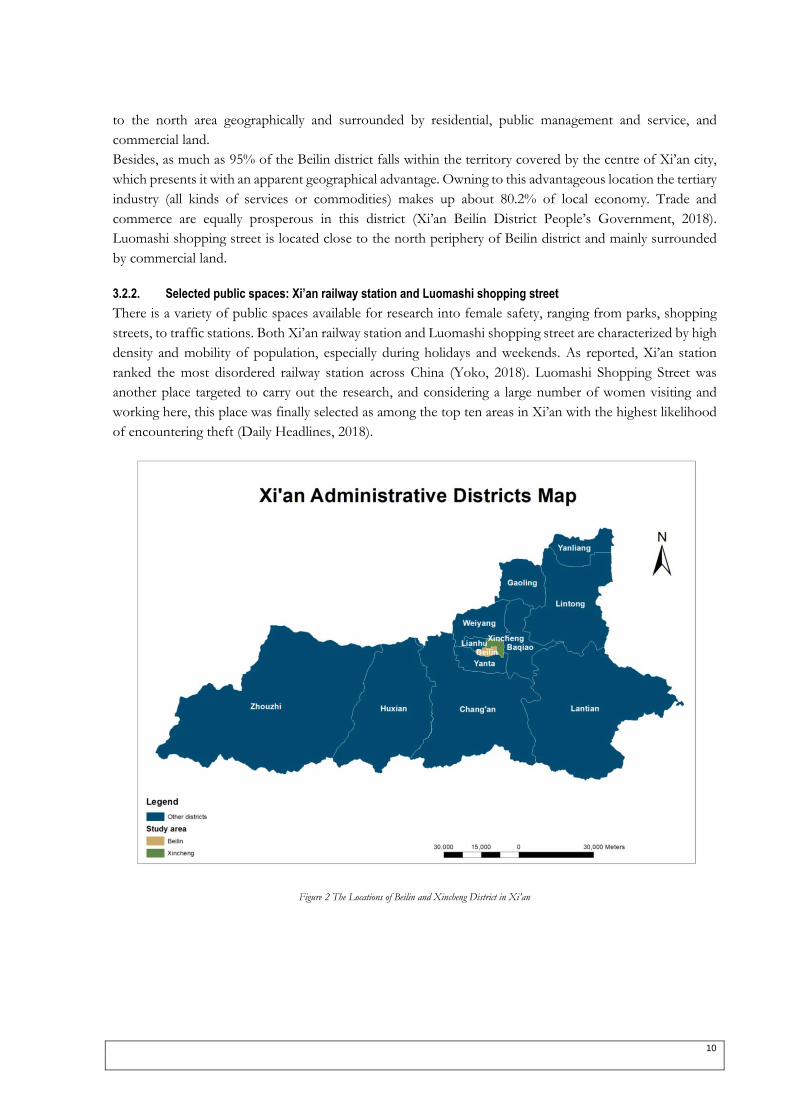
Besides, as much as 95% of the Beilin district falls within the territory covered by the centre of Xi’an city,
which presents it with an apparent geographical advantage. Owning to this advantageous location the tertiary
industry (all kinds of services or commodities) makes up about 80.2% of local economy. Trade and
commerce are equally prosperous in this district (Xi’an Beilin District People’s Government, 2018).
Luomashi shopping street is located close to the north periphery of Beilin district and mainly surrounded
by commercial land.
3.2.2. Selected public spaces: Xi’an railway station and Luomashi shopping street
There is a variety of public spaces available for research into female safety, ranging from parks, shopping
streets, to traffic stations. Both Xi’an railway station and Luomashi shopping street are characterized by high
density and mobility of population, especially during holidays and weekends. As reported, Xi’an station
ranked the most disordered railway station across China (Yoko, 2018). Luomashi Shopping Street was
another place targeted to carry out the research, and considering a large number of women visiting and
working here, this place was finally selected as among the top ten areas in Xi’an with the highest likelihood
of encountering theft (Daily Headlines, 2018).
Figure 2 The Locations of Beilin and Xincheng District in Xi’an
11
Figure 3 The Locations and Layouts of Luomashis Sopping Street (downside) and Xi’an Station (upside)

13
3.3. Data collection methods
Based on the research questions, the data involved in this research covers two major aspects. One is
associated with crime data for crime situations to indicate the state of public safety, and the other one relates
to women perceptions towards safety and smart safety devices.
3.3.1. Collection of crime data
The relevant data used in this research include population, locations of criminal incidents,the number of
criminal cases, and the types of land use in Beilin and Xincheng districts.
The objective of population collection is to determine crime rate, for which the data on 2015-2018
permanent population in Xi’an from Xi’an Statistical Yearbook was referenced (Limin & Hainan, 2015;
Minwei & Hainan, 2016; Minwei & Junhu, 2017; Minwei & Xianbao, 2018). In order to know about the
number of criminal cases on a different type, the open crime case information from 2015-2018 was reviewed
with the number sourced from the official website of Case Information Disclosure of The People’s
Procuratorate of the P. R. China calculated (People’s Procuratorate of the P.R.China, n.d.). The overall
number of criminal cases is 1338 for the two districts. Besides, the information on criminal locations was
also acquired from this website, which assisted with determining the crime spots. Because of the vagueness
and absence of some information about criminal locations, only 410 locations remained in this research and
these locations were distributed as discrete pattern. Consequently, some hotspots could not be presented by
this research. In respect to the types of land use, OpenStreetMap data in sub-region of China was accessed
by downloading from the Geofabrik Download Server ( Geofabrik Download Server, 2018)
3.3.2. Collection of women perceptions on safety and smart safety devices
In terms of women perceptions, semi-structured interview was applied in the research, thus requiring
researchers to provide interview guide designed on the research questions. However, there was a need for
them to work in a flexible way with the guide in addition to allowing respondents to narrate without any
thinking (Goldrick-Rab & Mewburn, 2017).
In this research, the interview guide consists of three separate parts: women perception towards safety,
women perceptions towards smart surveillance devices and women perceptions towards other smart safety
devices. The content of this interview guide is listed in Appendix. The sampling strategy shall be devised
prior to the preparation for this interview guide.
3.3.2.1. Sample time
As revealed by the Chinese Women Travel Safety Report (2017), the safety incidents tend to occur more
frequently during the periods like 8 am to 11 am and 6 pm to 8 pm. Besides, the number of cases of violence
occurring against women during daytime is the same as that occurring at night. Furthermore, given that the
National Day holiday lasts from October 1st to 7th, a higher number of people would choose to go on travel,
with young women in particularly, which results in more visitors turning up in the railway station and on
shopping streets. Consequently, the fieldwork was determined to take place from September 30th to October
28th in 2018. In addition, to maintain a similar environment for data collection, the variation in the number
of visitors to the two public spaces was kept equal, for which an assistant was employed to conduct the
interview in one public space while the researcher was conducting interview in another public space.
Previous to carrying out the interview, a period of 4 days was spent on preparation including familiarization
with the study area and testing of the interview guide, in addition to final revision of planning. Overall, the
interview was performed for the duration between 5th and 15th October from 9 am to 7 pm on a daily basis.
A total of 10 minutes were allotted to each interview.
14
3.3.2.2. Participants and sample size
As indicated by some research, young women aged 18-29 have a greater tendency to encounter violence
than other age groups (Duanmu, 2016; Yu, 2017; Zhang, 2017). Additionally, the public spaces like shopping
streets and railway stations attract more young people, especially during holidays and weekends. Therefore,
young females aged between 18 and 30 were involved as study participants, with 40 people required for each
public place. This sample size was established based on the sampling strategy developed by Brands (2016).
Because of the disruptions to the interviews for multiple times, a total of 86 young women were interviewed
at the end, with 42 respondents in Xi’an Station, and the remaining 44 respondents in Luomashi shopping
street).
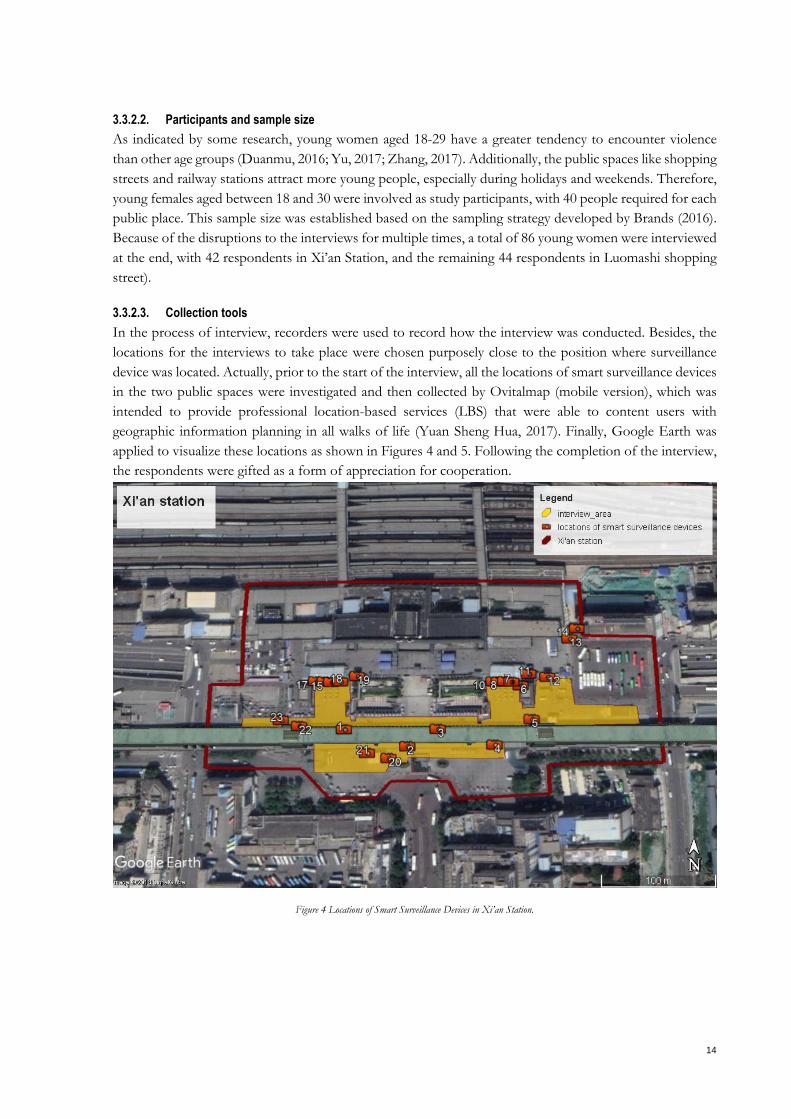
3.3.2.3. Collection tools
In the process of interview, recorders were used to record how the interview was conducted. Besides, the
locations for the interviews to take place were chosen purposely close to the position where surveillance
device was located. Actually, prior to the start of the interview, all the locations of smart surveillance devices
in the two public spaces were investigated and then collected by Ovitalmap (mobile version), which was
intended to provide professional location-based services (LBS) that were able to content users with
geographic information planning in all walks of life (Yuan Sheng Hua, 2017). Finally, Google Earth was
applied to visualize these locations as shown in Figures 4 and 5. Following the completion of the interview,
the respondents were gifted as a form of appreciation for cooperation.
Figure 4 Locations of Smart Surveillance Devices in Xi’an Station.
15
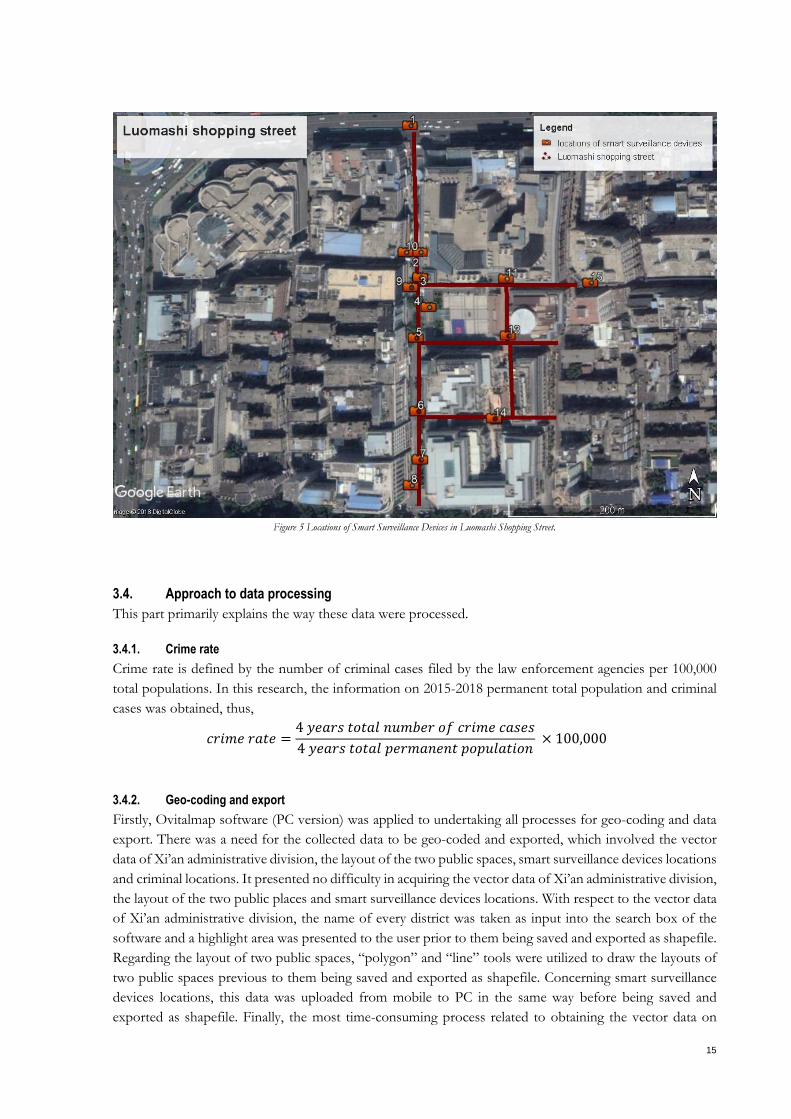
Figure 5 Locations of Smart Surveillance Devices in Luomashi Shopping Street.
3.4. Approach to data processing
This part primarily explains the way these data were processed.
3.4.1. Crime rate
Crime rate is defined by the number of criminal cases filed by the law enforcement agencies per 100,000
total populations. In this research, the information on 2015-2018 permanent total population and criminal
cases was obtained, thus,
𝑐𝑟𝑖𝑚𝑒 𝑟𝑎𝑡𝑒 =4 𝑦𝑒𝑎𝑟𝑠 𝑡𝑜𝑡𝑎𝑙 𝑛𝑢𝑚𝑏𝑒𝑟 𝑜𝑓 𝑐𝑟𝑖𝑚𝑒 𝑐𝑎𝑠𝑒𝑠
4 𝑦𝑒𝑎𝑟𝑠 𝑡𝑜𝑡𝑎𝑙 𝑝𝑒𝑟𝑚𝑎𝑛𝑒𝑛𝑡 𝑝𝑜𝑝𝑢𝑙𝑎𝑡𝑖𝑜𝑛 × 100,000
3.4.2. Geo-coding and export
Firstly, Ovitalmap software (PC version) was applied to undertaking all processes for geo-coding and data
export. There was a need for the collected data to be geo-coded and exported, which involved the vector
data of Xi’an administrative division, the layout of the two public spaces, smart surveillance devices locations
and criminal locations. It presented no difficulty in acquiring the vector data of Xi’an administrative division,
the layout of the two public places and smart surveillance devices locations. With respect to the vector data
of Xi’an administrative division, the name of every district was taken as input into the search box of the
software and a highlight area was presented to the user prior to them being saved and exported as shapefile.
Regarding the layout of two public spaces, “polygon” and “line” tools were utilized to draw the layouts of
two public spaces previous to them being saved and exported as shapefile. Concerning smart surveillance
devices locations, this data was uploaded from mobile to PC in the same way before being saved and
exported as shapefile. Finally, the most time-consuming process related to obtaining the vector data on
16
criminal locations. Text information on all the criminal locations in the two districts was entered into the
search box of the software (PC version) with the locations being marked one by one. Subsequently, they
were saved and exported as shapefile.
3.4.3. Getting land use type of two districts
Current Land Use Classification (Ministry of Natural Resource of the People’s Republic of China, 2017)
was applied in this study, for which 11 first classifications and 58 second classifications were involved. Thus,
five kinds of first classifications were used primarily ranging from commercial and service land, residential
land, public administration and service land, industrial, mining, warehousing land, to land for special use.
To be specific, commercial and service land is associated with seven “sub-categories” including retail
business, wholesale market, restaurant, hotel, commerce and finance, entertainment and others. Public
administration and service land includes ten sub-categories ranging from government agencies and
organizations, news publishing, education, scientific research, health care, social welfare, culture, sports,
municipal utilities, to park and grass. Lands for special use involves military installation,
embassies and consulates, prison, religious, funeral, scenic spot.
The land use data acquired from Geofabrik Download Server covers nearly the entirety of China, which
gives rise to the necessity to extract land use type of the two districts in Xi’an. The process was undertaken
in ArcGIS 10.6. “Analysis Tools” was utilized to facilitate shapefile of land use in China to be intersected
with administrative division vector of Xincheng and Beilin districts, prior to saving the output features class
which is land use type of two districts.
3.4.4. Processing data on women perceptions
Subsequent to the semi-structured interview, interview recode was transcribed in Word previous to being
taken as input into Atlas.ti to code keywords that match the interview questions. Following this, these
keywords were aggregated and calculated in Excel to proceed with data analysis.
3.5. Data analysis
3.5.1. Crime situation analysis
In the study, the crime situation was indicated by a combination of crime rate and crime hotspots.
Additionally, crime hotspots were performed with the application of exploratory spatial data analysis in
ArcGis10.6. In order to determine hotspots on accidents and identified problematic places, Kernel Density
Estimation (KDE) was used some years ago to perform traffic safety analysis (Erdogan, Yilmaz, Baybura,
& Gullu, 2008).
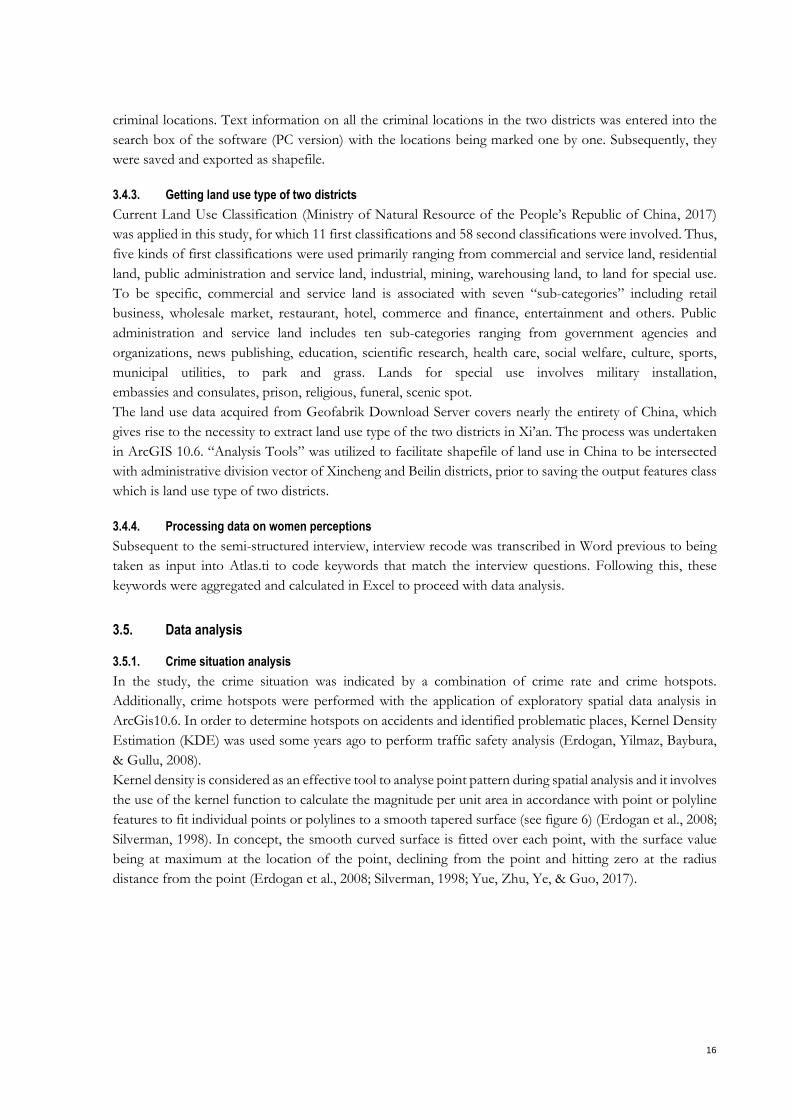
Kernel density is considered as an effective tool to analyse point pattern during spatial analysis and it involves
the use of the kernel function to calculate the magnitude per unit area in accordance with point or polyline
features to fit individual points or polylines to a smooth tapered surface (see figure 6) (Erdogan et al., 2008;
Silverman, 1998). In concept, the smooth curved surface is fitted over each point, with the surface value
being at maximum at the location of the point, declining from the point and hitting zero at the radius
distance from the point (Erdogan et al., 2008; Silverman, 1998; Yue, Zhu, Ye, & Guo, 2017).
17
Figure 6 The Principle of Kernel Function.
Reprinted from Geographical Information System Aided Traffic Accident Analysis System Case Study: City of Afyonkarahisar, by Erdogan, Yilmaz, Baybura, and
Gullu, May 4 2007, retrieved from https://www.sciencedirect.com/science/article/pii/S0001457507000863 Copyright © 2007 Elsevier Ltd.
The bandwidth (search radius) shall be ascertained prior to the use of kernel density estimation. A large
bandwidth extends over a relatively large area as compared to a small bandwidth, which results in the
tendency for the estimate of density surface to be smooth. Therefore, it is unlikely to present its details.
However, a small bandwidth has a potential to create many crime clusters. After multiple times of trial, 1km
of bandwidth was determined, with the result indicated in Results chapter.
3.5.2. Women perceptions analysis
The quantitative textual analysis was applied primarily in this part, which represents the method “researchers
used to explain the characteristics of a recorded or visual message” (Frey, Botan, & Kreps, 2000).
In the study, female perceptions consist of three parts: safety, smart surveillance devices and other smart
safety devices. Apart from this, there is a minor difference in the analysis of each perception. In respect to
female perceptions towards safety, the frequency of keywords corresponding to interview questions, and
how many women feel safe, unsafe or neutral were counted (see Results chapter). As for female perceptions
towards other smart safety devices, conclusions were drawn as to how many women are familiar with other
smart safety devices and what are their expectations in other smart safety devices. In terms of female
perceptions towards smart surveillance devices, two questions were raised to assist with the analysis: whether
or not there is an association between awareness of smart surveillance devices and improvement of feeling
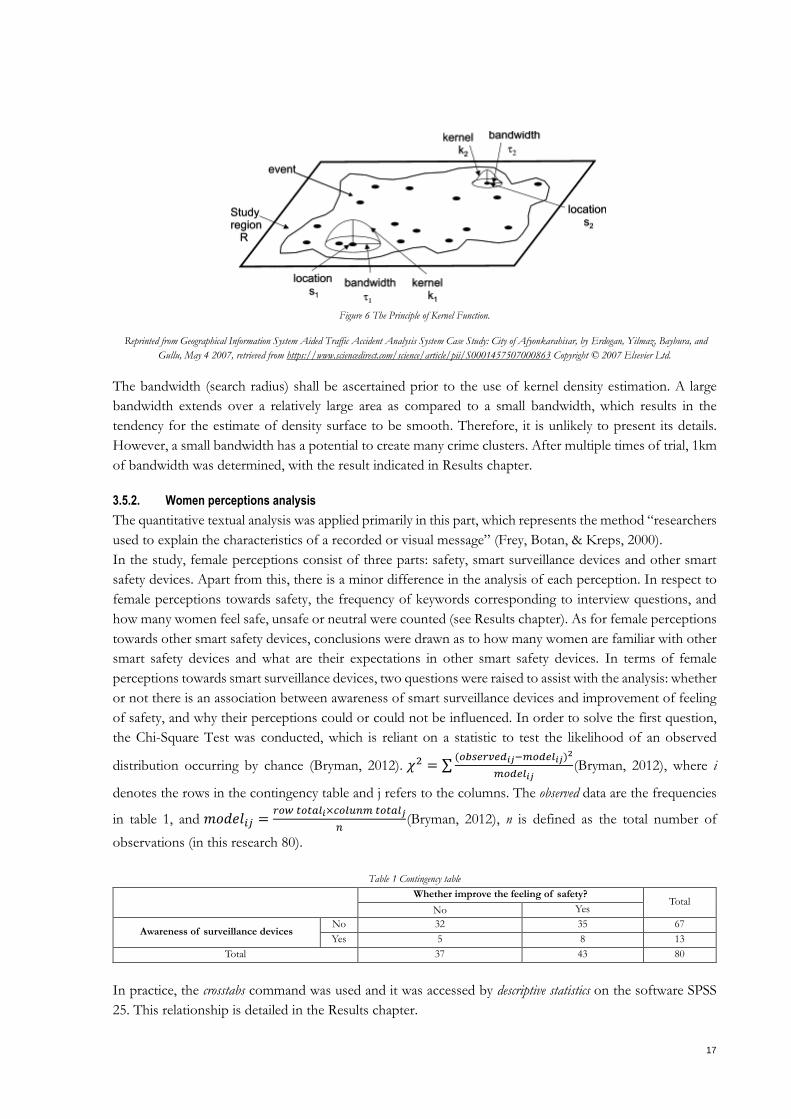
of safety, and why their perceptions could or could not be influenced. In order to solve the first question,
the Chi-Square Test was conducted, which is reliant on a statistic to test the likelihood of an observed
distribution occurring by chance (Bryman, 2012). 𝜒2 = ∑(𝑜𝑏𝑠𝑒𝑟𝑣𝑒𝑑𝑖𝑗−𝑚𝑜𝑑𝑒𝑙𝑖𝑗)2
𝑚𝑜𝑑𝑒𝑙𝑖𝑗(Bryman, 2012), where i
denotes the rows in the contingency table and j refers to the columns. The observed data are the frequencies
in table 1, and 𝑚𝑜𝑑𝑒𝑙𝑖𝑗 =𝑟𝑜𝑤 𝑡𝑜𝑡𝑎𝑙𝑖×𝑐𝑜𝑙𝑢𝑛𝑚 𝑡𝑜𝑡𝑎𝑙𝑗
𝑛(Bryman, 2012), n is defined as the total number of
observations (in this research 80).
Table 1 Contingency table
Whether improve the feeling of safety?
Total No Yes
Awareness of surveillance devices No 32 35 67
Yes 5 8 13
Total 37 43 80
In practice, the crosstabs command was used and it was accessed by descriptive statistics on the software SPSS
25. This relationship is detailed in the Results chapter.
18
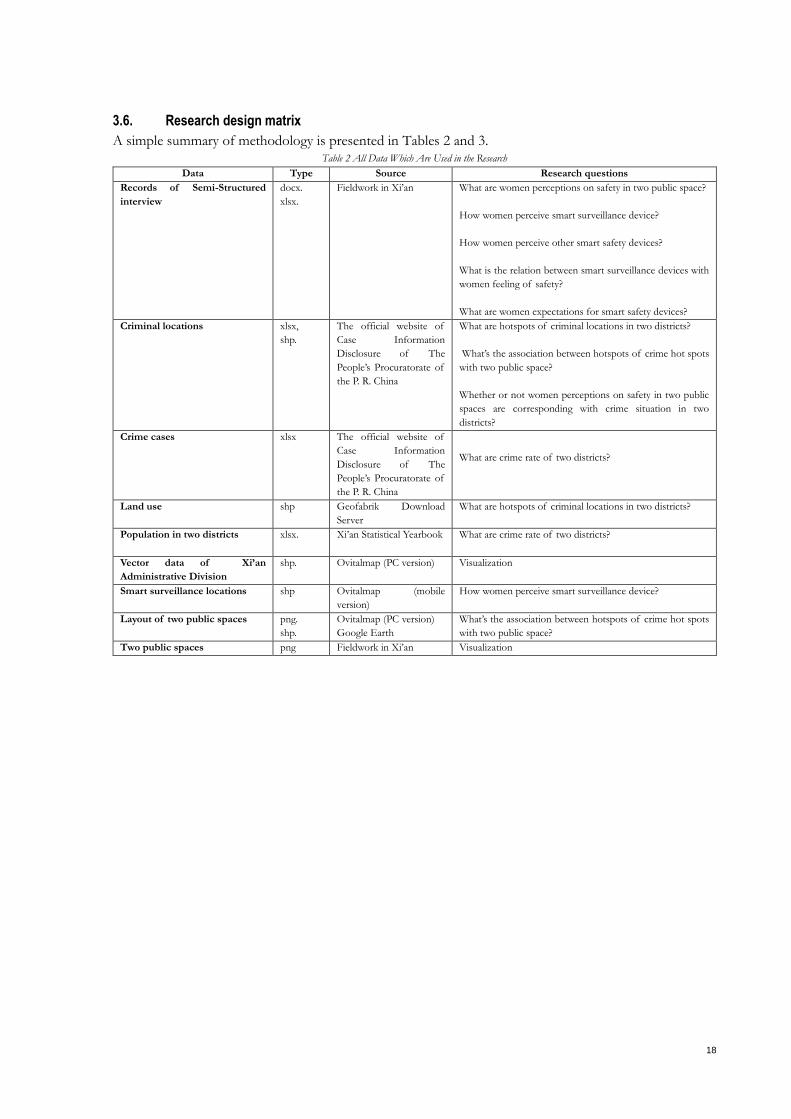
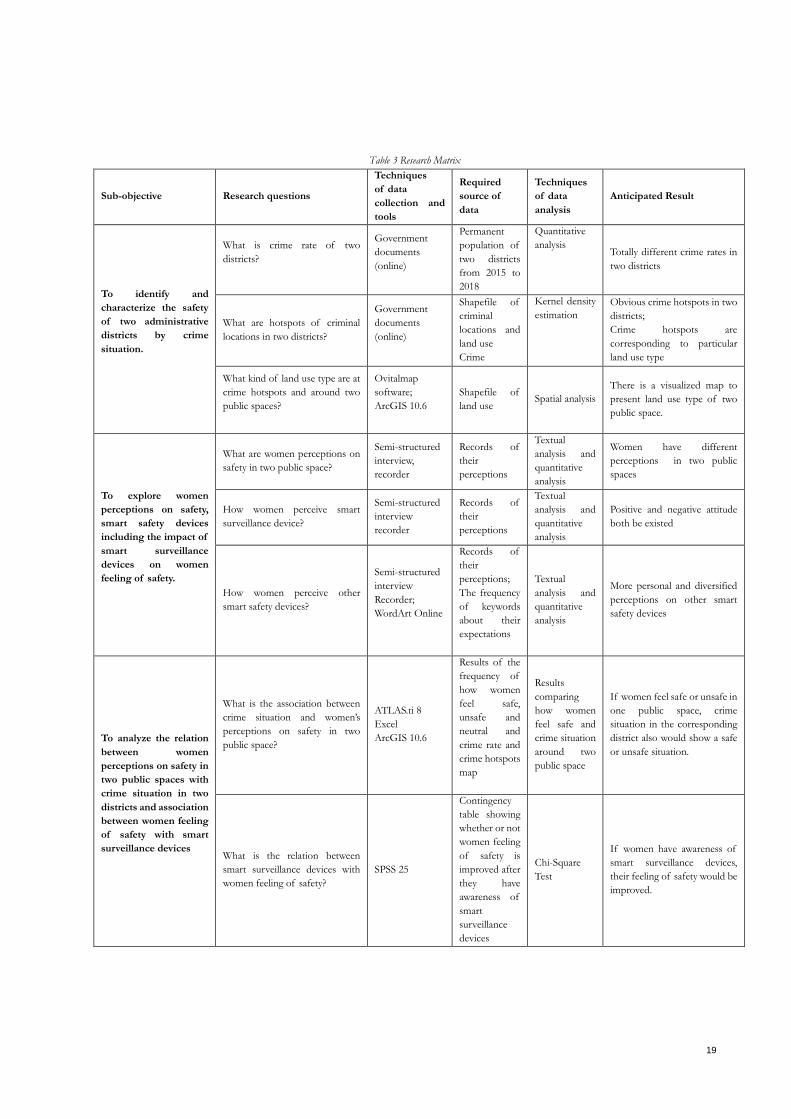
3.6. Research design matrix
A simple summary of methodology is presented in Tables 2 and 3. Table 2 All Data Which Are Used in the Research
Data Type Source Research questions
Records of Semi-Structured
interview
docx.
xlsx.
Fieldwork in Xi’an What are women perceptions on safety in two public space?
How women perceive smart surveillance device?
How women perceive other smart safety devices?
What is the relation between smart surveillance devices with
women feeling of safety?
What are women expectations for smart safety devices?
Criminal locations xlsx,
shp.
The official website of
Case Information
Disclosure of The
People’s Procuratorate of
the P. R. China
What are hotspots of criminal locations in two districts?
What’s the association between hotspots of crime hot spots
with two public space?
Whether or not women perceptions on safety in two public
spaces are corresponding with crime situation in two
districts?
Crime cases xlsx The official website of
Case Information
Disclosure of The
People’s Procuratorate of
the P. R. China
What are crime rate of two districts?
Land use shp
Geofabrik Download
Server
What are hotspots of criminal locations in two districts?
Population in two districts xlsx. Xi’an Statistical Yearbook What are crime rate of two districts?
Vector data of Xi’an
Administrative Division
shp. Ovitalmap (PC version) Visualization
Smart surveillance locations shp Ovitalmap (mobile
version)
How women perceive smart surveillance device?
Layout of two public spaces png.
shp.
Ovitalmap (PC version)
Google Earth
What’s the association between hotspots of crime hot spots
with two public space?
Two public spaces png Fieldwork in Xi’an Visualization
19
Table 3 Research Matrix
Sub-objective Research questions
Techniques
of data
collection and
tools
Required
source of
data
Techniques
of data
analysis
Anticipated Result
To identify and
characterize the safety
of two administrative
districts by crime
situation.
What is crime rate of two
districts?
Government
documents
(online)
Permanent
population of
two districts
from 2015 to
2018
Quantitative
analysis
Totally different crime rates in
two districts
What are hotspots of criminal
locations in two districts?
Government
documents
(online)
Shapefile of
criminal
locations and
land use
Crime
Kernel density
estimation
Obvious crime hotspots in two
districts;
Crime hotspots are
corresponding to particular
land use type
What kind of land use type are at
crime hotspots and around two
public spaces?
Ovitalmap
software;
ArcGIS 10.6
Shapefile of
land use Spatial analysis
There is a visualized map to
present land use type of two
public space.
To explore women
perceptions on safety,
smart safety devices
including the impact of
smart surveillance
devices on women
feeling of safety.
What are women perceptions on
safety in two public space?
Semi-structured
interview,
recorder
Records of
their
perceptions
Textual
analysis and
quantitative
analysis
Women have different
perceptions in two public
spaces
How women perceive smart
surveillance device?
Semi-structured
interview
recorder
Records of
their
perceptions
Textual
analysis and
quantitative
analysis
Positive and negative attitude
both be existed
How women perceive other
smart safety devices?
Semi-structured
interview
Recorder;
WordArt Online
Records of
their
perceptions;
The frequency
of keywords
about their
expectations
Textual
analysis and
quantitative
analysis
More personal and diversified
perceptions on other smart
safety devices
To analyze the relation
between women
perceptions on safety in
two public spaces with
crime situation in two
districts and association
between women feeling
of safety with smart
surveillance devices
What is the association between
crime situation and women’s
perceptions on safety in two
public space?
ATLAS.ti 8
Excel
ArcGIS 10.6
Results of the
frequency of
how women
feel safe,
unsafe and
neutral and
crime rate and
crime hotspots
map
Results
comparing
how women
feel safe and
crime situation
around two
public space
If women feel safe or unsafe in
one public space, crime
situation in the corresponding
district also would show a safe
or unsafe situation.
What is the relation between
smart surveillance devices with
women feeling of safety?
SPSS 25
Contingency
table showing
whether or not
women feeling
of safety is
improved after
they have
awareness of
smart
surveillance
devices
Chi-Square
Test
If women have awareness of
smart surveillance devices,
their feeling of safety would be
improved.
20
4. RESULTS
Based on the sub-objectives raised in this study, the findings results are presented. The first sub-objective is
to ascertain the state of safety within the two administrative districts by crime situation. The second one is
establish female perceptions towards safety and smart safety devices, particularly the impact of smart
surveillance devices on women’s feeling of safety. The last one is to perform an analysis of how female
perceptions towards safety in two public spaces relate to the crime hotspots in two districts, in addition to
the association between women’s feeling about safety with smart surveillance devices. In the following
sections, the research findings for each sub-objective are illustrated. Therefore, it is necessary to elaborate
on sub-objective 1 in the first place.
4.1. Safety of two administrative districts by crime situation
This part consists of two major aspects: crime rates in Beilin and Xincheng districts and the distribution
patterns of crime hotspots. In addition, land use of the crime locations is involved as well to give a full
understanding of safety and crime locations.
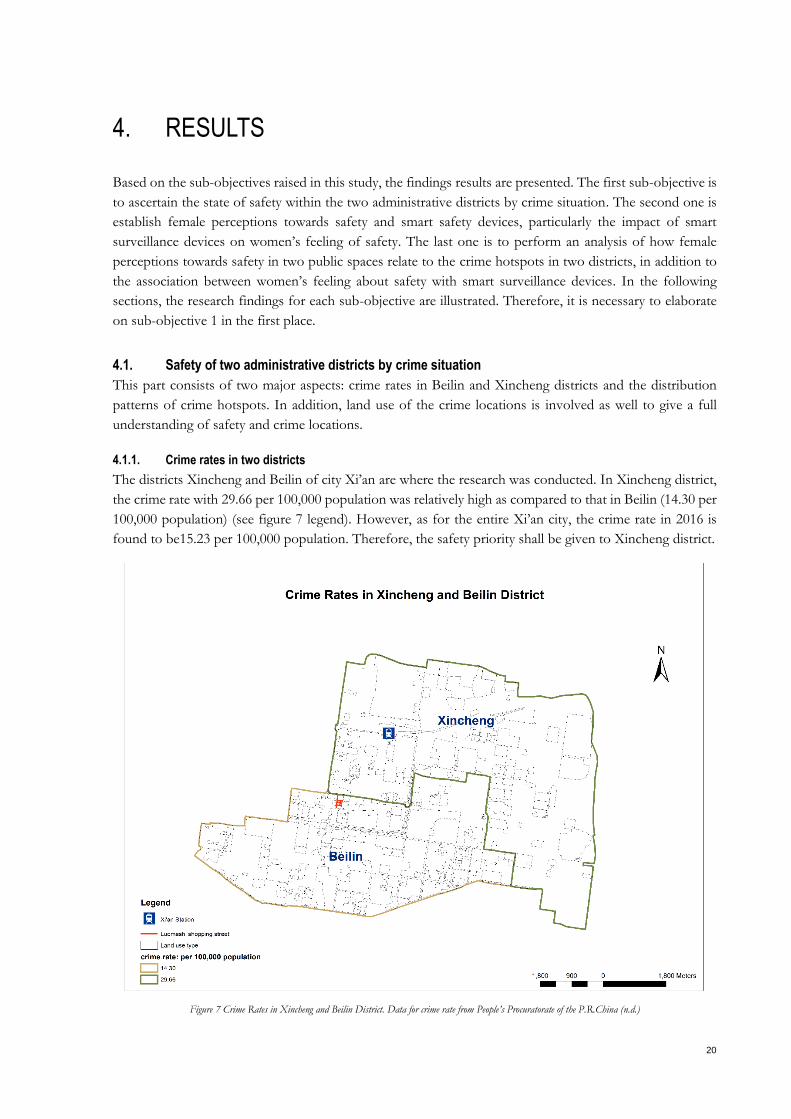
4.1.1. Crime rates in two districts
The districts Xincheng and Beilin of city Xi’an are where the research was conducted. In Xincheng district,
the crime rate with 29.66 per 100,000 population was relatively high as compared to that in Beilin (14.30 per
100,000 population) (see figure 7 legend). However, as for the entire Xi’an city, the crime rate in 2016 is
found to be15.23 per 100,000 population. Therefore, the safety priority shall be given to Xincheng district.
Figure 7 Crime Rates in Xincheng and Beilin District. Data for crime rate from People’s Procuratorate of the P.R.China (n.d.)
21
4.1.2. Crime hotspots in two districts
Of all the disclosed cases, a total of 410 criminal locations were collected, involving a range of different
crime cases like theft, robbery, harassment, intentional injury, fraud and traffic offense. Based on this, the
term “violent incidents” was applied in this research to represent “intentional injury”, “robbery”, and
“harassment” (see table 4), and the most criminal cases are theft, followed by violent incidents. Besides, the
number of traffic offense and fraud cases was unchanged in the study as the participants referred to traffic
and fraud that caused them anxiety, which was despite that the two types of cases are not mentioned in the
chapter of literature review and data collection.
Table 4 The Statistic of Crime Cases Type in Two Districts
Districts fraud Violent incidents Traffic offense Thefts Total
Beilin 3 41 35 131 210
Xincheng 3 61 26 110 200
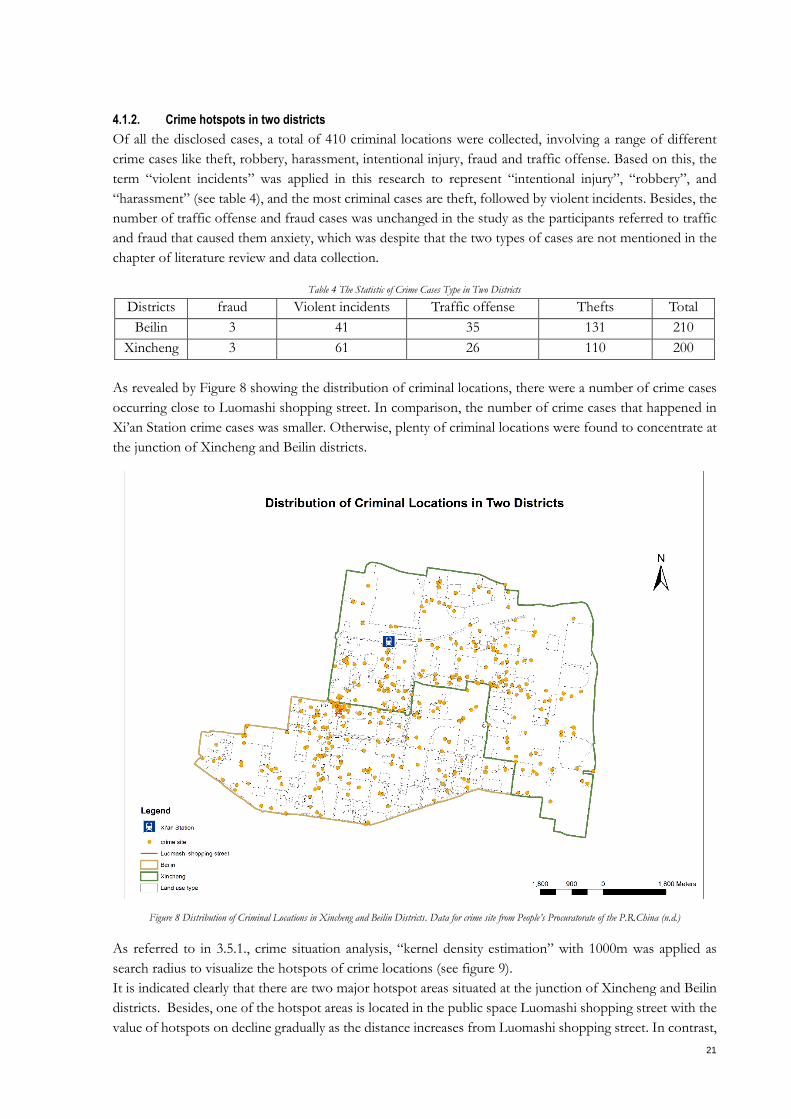
As revealed by Figure 8 showing the distribution of criminal locations, there were a number of crime cases
occurring close to Luomashi shopping street. In comparison, the number of crime cases that happened in
Xi’an Station crime cases was smaller. Otherwise, plenty of criminal locations were found to concentrate at
the junction of Xincheng and Beilin districts.
Figure 8 Distribution of Criminal Locations in Xincheng and Beilin Districts. Data for crime site from People’s Procuratorate of the P.R.China (n.d.)
As referred to in 3.5.1., crime situation analysis, “kernel density estimation” with 1000m was applied as
search radius to visualize the hotspots of crime locations (see figure 9).
It is indicated clearly that there are two major hotspot areas situated at the junction of Xincheng and Beilin
districts. Besides, one of the hotspot areas is located in the public space Luomashi shopping street with the
value of hotspots on decline gradually as the distance increases from Luomashi shopping street. In contrast,
22
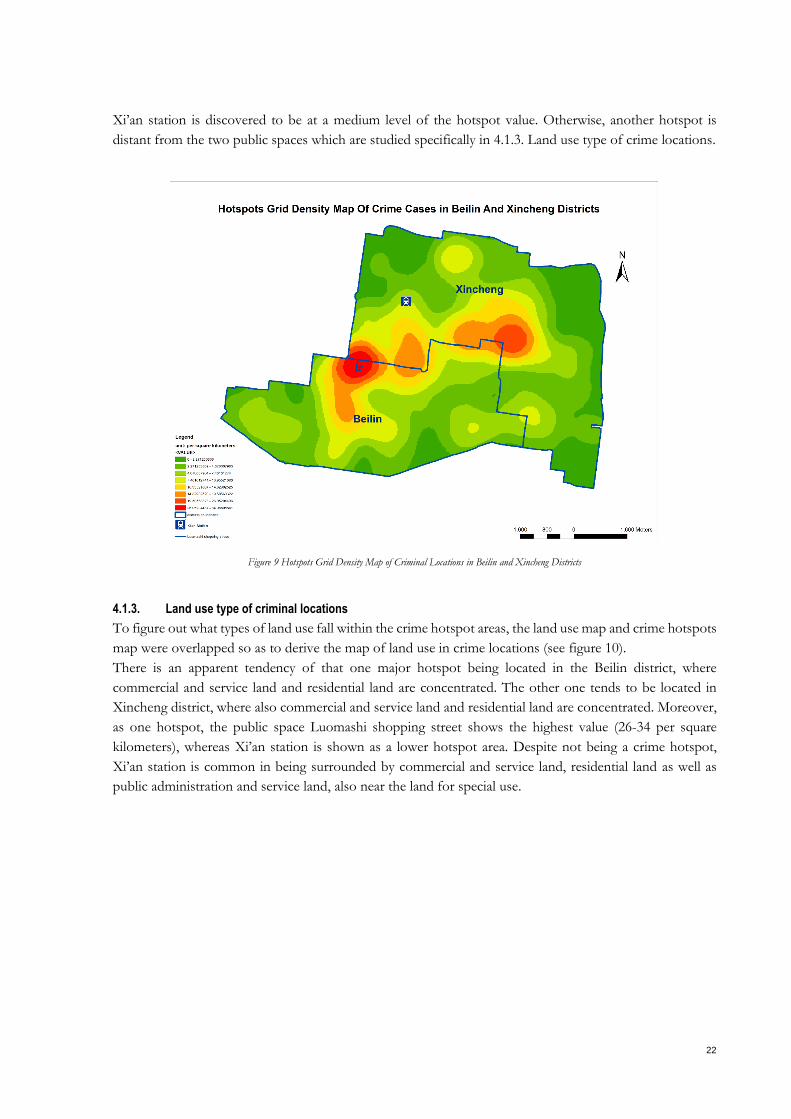
Xi’an station is discovered to be at a medium level of the hotspot value. Otherwise, another hotspot is
distant from the two public spaces which are studied specifically in 4.1.3. Land use type of crime locations.
Figure 9 Hotspots Grid Density Map of Criminal Locations in Beilin and Xincheng Districts
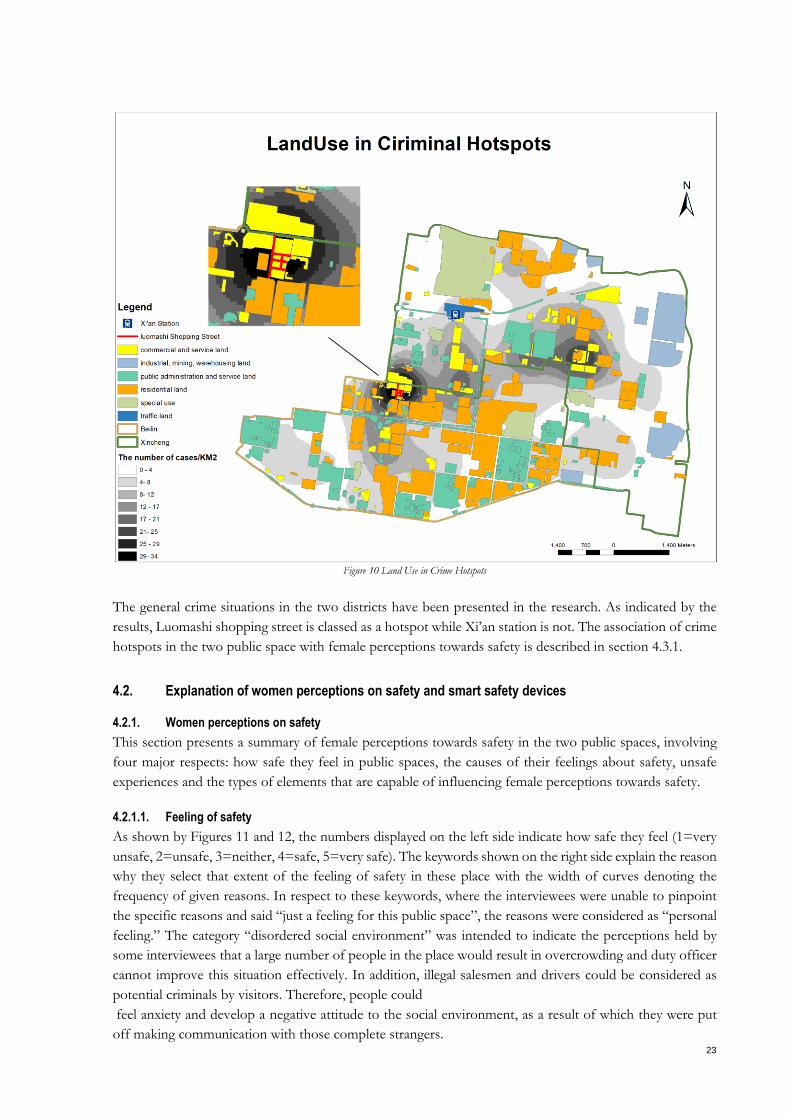
4.1.3. Land use type of criminal locations
To figure out what types of land use fall within the crime hotspot areas, the land use map and crime hotspots
map were overlapped so as to derive the map of land use in crime locations (see figure 10).
There is an apparent tendency of that one major hotspot being located in the Beilin district, where
commercial and service land and residential land are concentrated. The other one tends to be located in
Xincheng district, where also commercial and service land and residential land are concentrated. Moreover,
as one hotspot, the public space Luomashi shopping street shows the highest value (26-34 per square
kilometers), whereas Xi’an station is shown as a lower hotspot area. Despite not being a crime hotspot,
Xi’an station is common in being surrounded by commercial and service land, residential land as well as
public administration and service land, also near the land for special use.
23
Figure 10 Land Use in Crime Hotspots
The general crime situations in the two districts have been presented in the research. As indicated by the
results, Luomashi shopping street is classed as a hotspot while Xi’an station is not. The association of crime
hotspots in the two public space with female perceptions towards safety is described in section 4.3.1.
4.2. Explanation of women perceptions on safety and smart safety devices
4.2.1. Women perceptions on safety
This section presents a summary of female perceptions towards safety in the two public spaces, involving
four major respects: how safe they feel in public spaces, the causes of their feelings about safety, unsafe
experiences and the types of elements that are capable of influencing female perceptions towards safety.
4.2.1.1. Feeling of safety
As shown by Figures 11 and 12, the numbers displayed on the left side indicate how safe they feel (1=very
unsafe, 2=unsafe, 3=neither, 4=safe, 5=very safe). The keywords shown on the right side explain the reason
why they select that extent of the feeling of safety in these place with the width of curves denoting the
frequency of given reasons. In respect to these keywords, where the interviewees were unable to pinpoint
the specific reasons and said “just a feeling for this public space”, the reasons were considered as “personal
feeling.” The category “disordered social environment” was intended to indicate the perceptions held by
some interviewees that a large number of people in the place would result in overcrowding and duty officer
cannot improve this situation effectively. In addition, illegal salesmen and drivers could be considered as
potential criminals by visitors. Therefore, people could
feel anxiety and develop a negative attitude to the social environment, as a result of which they were put
off making communication with those complete strangers.
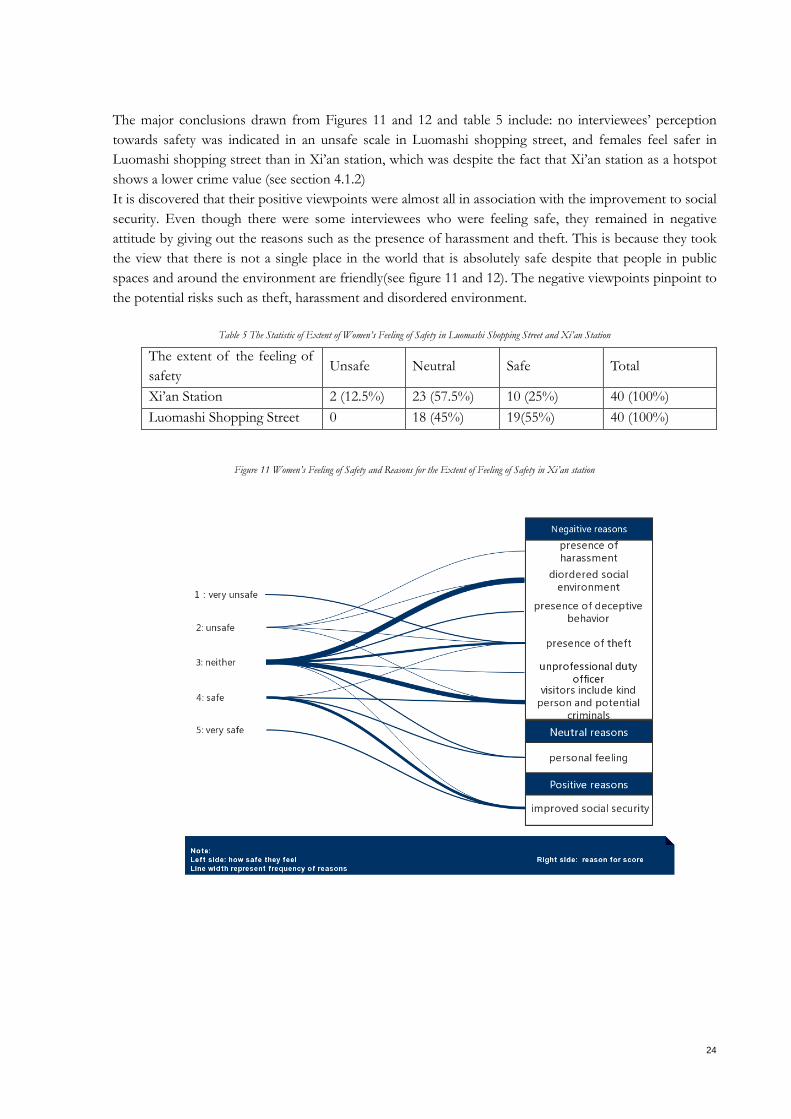
24
The major conclusions drawn from Figures 11 and 12 and table 5 include: no interviewees’ perception
towards safety was indicated in an unsafe scale in Luomashi shopping street, and females feel safer in
Luomashi shopping street than in Xi’an station, which was despite the fact that Xi’an station as a hotspot
shows a lower crime value (see section 4.1.2)
It is discovered that their positive viewpoints were almost all in association with the improvement to social
security. Even though there were some interviewees who were feeling safe, they remained in negative
attitude by giving out the reasons such as the presence of harassment and theft. This is because they took
the view that there is not a single place in the world that is absolutely safe despite that people in public
spaces and around the environment are friendly(see figure 11 and 12). The negative viewpoints pinpoint to
the potential risks such as theft, harassment and disordered environment.
Table 5 The Statistic of Extent of Women’s Feeling of Safety in Luomashi Shopping Street and Xi’an Station
Figure 11 Women’s Feeling of Safety and Reasons for the Extent of Feeling of Safety in Xi’an station
The extent of the feeling of
safety Unsafe Neutral Safe Total
Xi’an Station 2 (12.5%) 23 (57.5%) 10 (25%) 40 (100%)
Luomashi Shopping Street 0 18 (45%) 19(55%) 40 (100%)
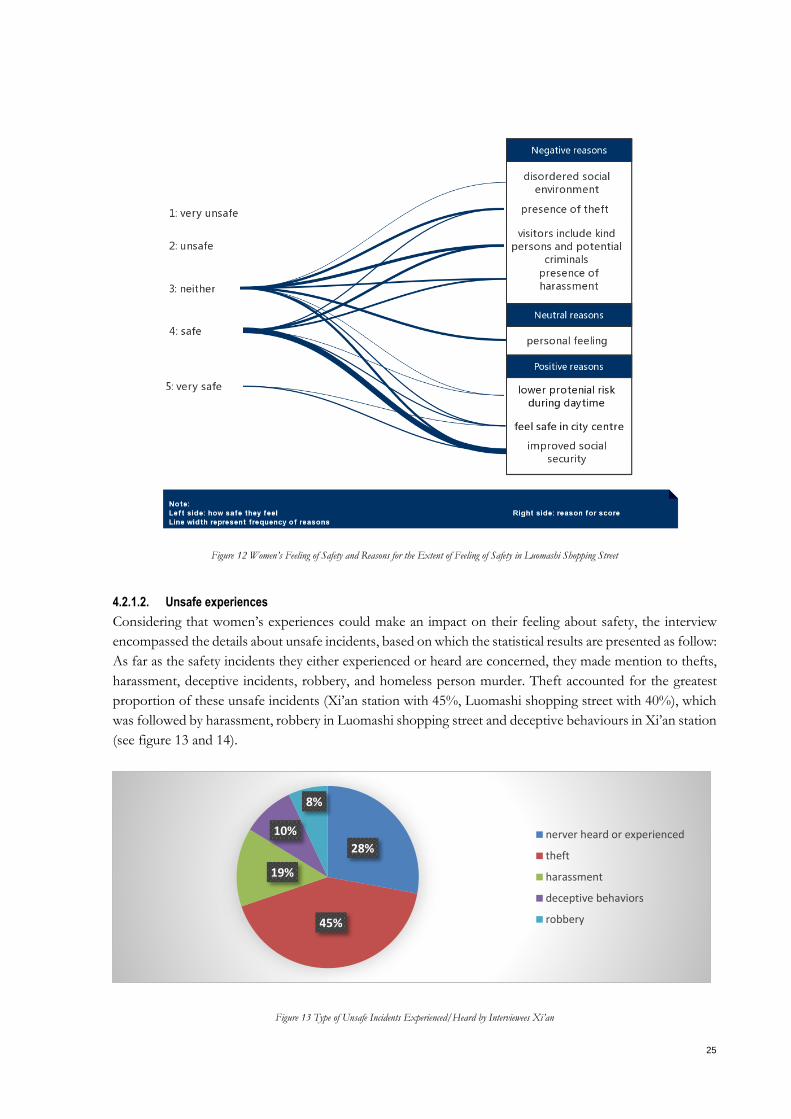
25
Figure 12 Women’s Feeling of Safety and Reasons for the Extent of Feeling of Safety in Luomashi Shopping Street
4.2.1.2. Unsafe experiences
Considering that women’s experiences could make an impact on their feeling about safety, the interview
encompassed the details about unsafe incidents, based on which the statistical results are presented as follow:
As far as the safety incidents they either experienced or heard are concerned, they made mention to thefts,
harassment, deceptive incidents, robbery, and homeless person murder. Theft accounted for the greatest
proportion of these unsafe incidents (Xi’an station with 45%, Luomashi shopping street with 40%), which
was followed by harassment, robbery in Luomashi shopping street and deceptive behaviours in Xi’an station
(see figure 13 and 14).
Figure 13 Type of Unsafe Incidents Experienced/Heard by Interviewees Xi’an
28%
45%
19%
10%
8%
nerver heard or experienced
theft
harassment
deceptive behaviors
robbery
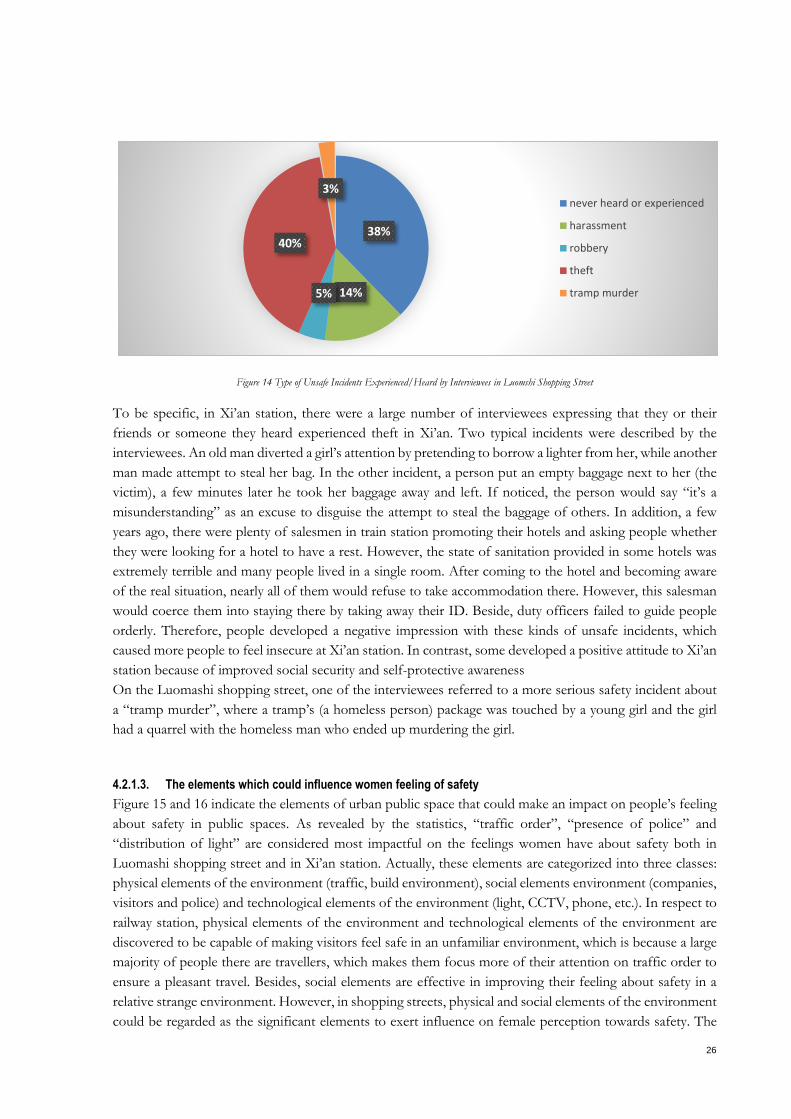
26
Figure 14 Type of Unsafe Incidents Experienced/Heard by Interviewees in Luomshi Shopping Street
To be specific, in Xi’an station, there were a large number of interviewees expressing that they or their
friends or someone they heard experienced theft in Xi’an. Two typical incidents were described by the
interviewees. An old man diverted a girl’s attention by pretending to borrow a lighter from her, while another
man made attempt to steal her bag. In the other incident, a person put an empty baggage next to her (the
victim), a few minutes later he took her baggage away and left. If noticed, the person would say “it’s a
misunderstanding” as an excuse to disguise the attempt to steal the baggage of others. In addition, a few
years ago, there were plenty of salesmen in train station promoting their hotels and asking people whether
they were looking for a hotel to have a rest. However, the state of sanitation provided in some hotels was
extremely terrible and many people lived in a single room. After coming to the hotel and becoming aware
of the real situation, nearly all of them would refuse to take accommodation there. However, this salesman
would coerce them into staying there by taking away their ID. Beside, duty officers failed to guide people
orderly. Therefore, people developed a negative impression with these kinds of unsafe incidents, which
caused more people to feel insecure at Xi’an station. In contrast, some developed a positive attitude to Xi’an
station because of improved social security and self-protective awareness
On the Luomashi shopping street, one of the interviewees referred to a more serious safety incident about
a “tramp murder”, where a tramp’s (a homeless person) package was touched by a young girl and the girl
had a quarrel with the homeless man who ended up murdering the girl.
4.2.1.3. The elements which could influence women feeling of safety
Figure 15 and 16 indicate the elements of urban public space that could make an impact on people’s feeling
about safety in public spaces. As revealed by the statistics, “traffic order”, “presence of police” and
“distribution of light” are considered most impactful on the feelings women have about safety both in
Luomashi shopping street and in Xi’an station. Actually, these elements are categorized into three classes:
physical elements of the environment (traffic, build environment), social elements environment (companies,
visitors and police) and technological elements of the environment (light, CCTV, phone, etc.). In respect to
railway station, physical elements of the environment and technological elements of the environment are
discovered to be capable of making visitors feel safe in an unfamiliar environment, which is because a large
majority of people there are travellers, which makes them focus more of their attention on traffic order to
ensure a pleasant travel. Besides, social elements are effective in improving their feeling about safety in a
relative strange environment. However, in shopping streets, physical and social elements of the environment
could be regarded as the significant elements to exert influence on female perception towards safety. The
38%
14%5%
40%
3%never heard or experienced
harassment
robbery
theft
tramp murder
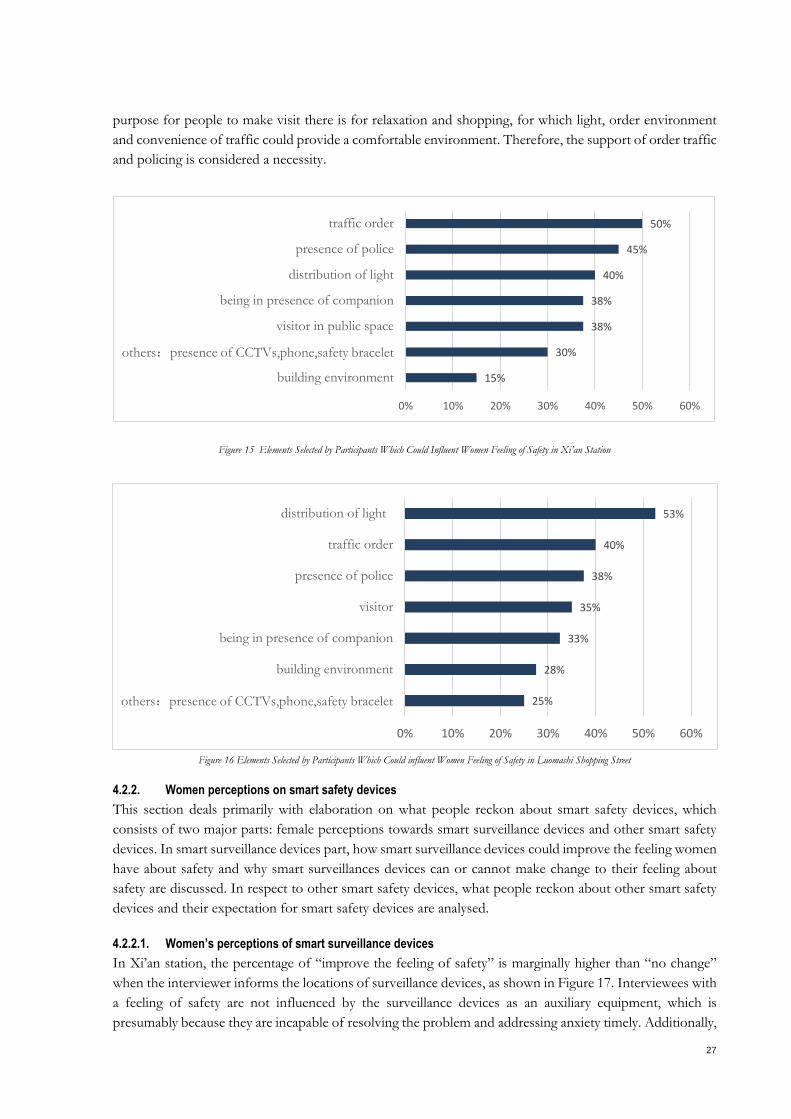
27
purpose for people to make visit there is for relaxation and shopping, for which light, order environment
and convenience of traffic could provide a comfortable environment. Therefore, the support of order traffic
and policing is considered a necessity.
Figure 15 Elements Selected by Participants Which Could Influent Women Feeling of Safety in Xi’an Station
Figure 16 Elements Selected by Participants Which Could influent Women Feeling of Safety in Luomashi Shopping Street
4.2.2. Women perceptions on smart safety devices
This section deals primarily with elaboration on what people reckon about smart safety devices, which
consists of two major parts: female perceptions towards smart surveillance devices and other smart safety
devices. In smart surveillance devices part, how smart surveillance devices could improve the feeling women
have about safety and why smart surveillances devices can or cannot make change to their feeling about
safety are discussed. In respect to other smart safety devices, what people reckon about other smart safety
devices and their expectation for smart safety devices are analysed.
4.2.2.1. Women’s perceptions of smart surveillance devices
In Xi’an station, the percentage of “improve the feeling of safety” is marginally higher than “no change”
when the interviewer informs the locations of surveillance devices, as shown in Figure 17. Interviewees with
a feeling of safety are not influenced by the surveillance devices as an auxiliary equipment, which is
presumably because they are incapable of resolving the problem and addressing anxiety timely. Additionally,
15%
30%
38%
38%
40%
45%
50%
0% 10% 20% 30% 40% 50% 60%
building environment
others:presence of CCTVs,phone,safety bracelet
visitor in public space
being in presence of companion
distribution of light
presence of police
traffic order
25%
28%
33%
35%
38%
40%
53%
0% 10% 20% 30% 40% 50% 60%
others:presence of CCTVs,phone,safety bracelet
building environment
being in presence of companion
visitor
presence of police
traffic order
distribution of light
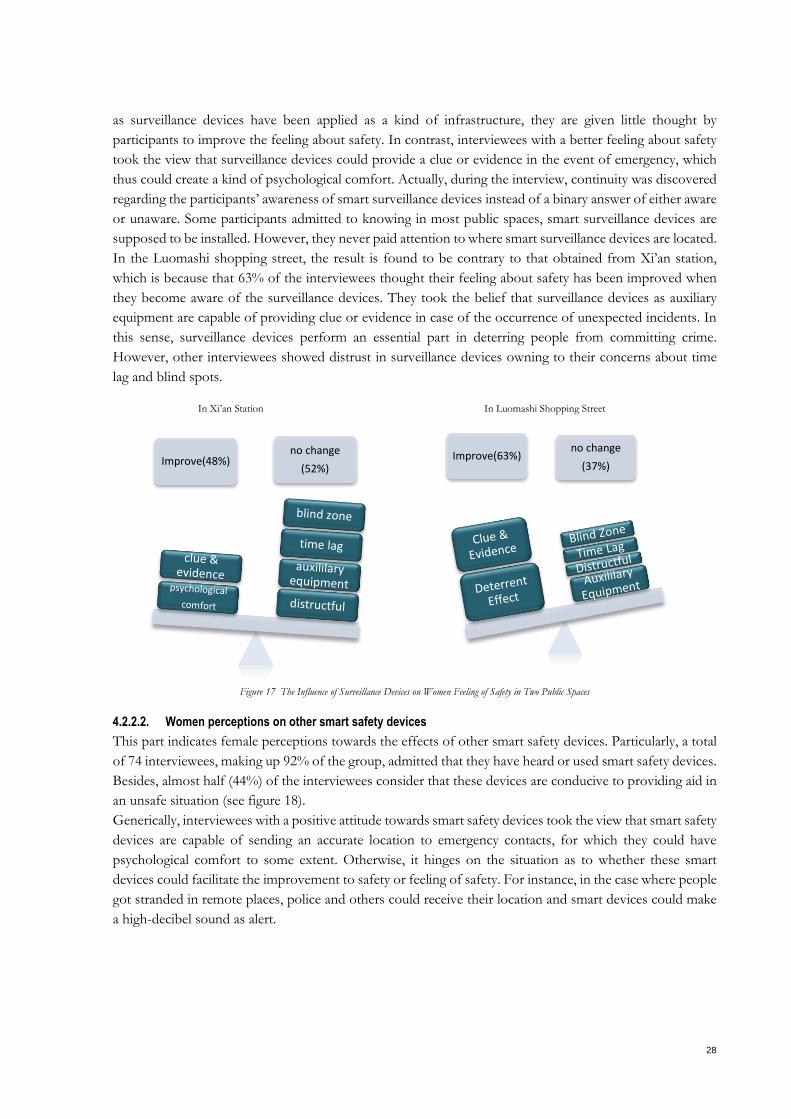
28
as surveillance devices have been applied as a kind of infrastructure, they are given little thought by
participants to improve the feeling about safety. In contrast, interviewees with a better feeling about safety
took the view that surveillance devices could provide a clue or evidence in the event of emergency, which
thus could create a kind of psychological comfort. Actually, during the interview, continuity was discovered
regarding the participants’ awareness of smart surveillance devices instead of a binary answer of either aware
or unaware. Some participants admitted to knowing in most public spaces, smart surveillance devices are
supposed to be installed. However, they never paid attention to where smart surveillance devices are located.
In the Luomashi shopping street, the result is found to be contrary to that obtained from Xi’an station,
which is because that 63% of the interviewees thought their feeling about safety has been improved when
they become aware of the surveillance devices. They took the belief that surveillance devices as auxiliary
equipment are capable of providing clue or evidence in case of the occurrence of unexpected incidents. In
this sense, surveillance devices perform an essential part in deterring people from committing crime.
However, other interviewees showed distrust in surveillance devices owning to their concerns about time
lag and blind spots.
In Xi’an Station In Luomashi Shopping Street
Figure 17 The Influence of Surveillance Devices on Women Feeling of Safety in Two Public Spaces
4.2.2.2. Women perceptions on other smart safety devices
This part indicates female perceptions towards the effects of other smart safety devices. Particularly, a total
of 74 interviewees, making up 92% of the group, admitted that they have heard or used smart safety devices.
Besides, almost half (44%) of the interviewees consider that these devices are conducive to providing aid in
an unsafe situation (see figure 18).
Generically, interviewees with a positive attitude towards smart safety devices took the view that smart safety
devices are capable of sending an accurate location to emergency contacts, for which they could have
psychological comfort to some extent. Otherwise, it hinges on the situation as to whether these smart
devices could facilitate the improvement to safety or feeling of safety. For instance, in the case where people
got stranded in remote places, police and others could receive their location and smart devices could make
a high-decibel sound as alert.
Improve(48%) no change
(52%)Improve(63%)
no change
(37%)
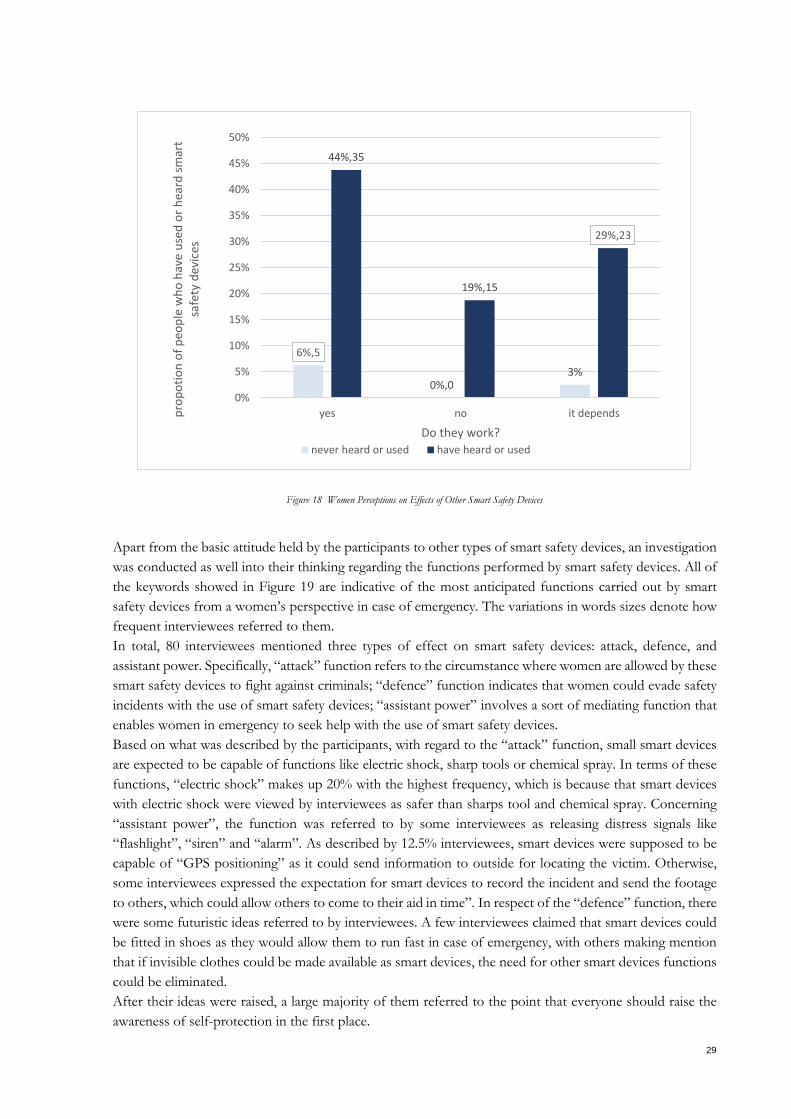
29
Figure 18 Women Perceptions on Effects of Other Smart Safety Devices
Apart from the basic attitude held by the participants to other types of smart safety devices, an investigation
was conducted as well into their thinking regarding the functions performed by smart safety devices. All of
the keywords showed in Figure 19 are indicative of the most anticipated functions carried out by smart
safety devices from a women’s perspective in case of emergency. The variations in words sizes denote how
frequent interviewees referred to them.
In total, 80 interviewees mentioned three types of effect on smart safety devices: attack, defence, and
assistant power. Specifically, “attack” function refers to the circumstance where women are allowed by these
smart safety devices to fight against criminals; “defence” function indicates that women could evade safety
incidents with the use of smart safety devices; “assistant power” involves a sort of mediating function that
enables women in emergency to seek help with the use of smart safety devices.
Based on what was described by the participants, with regard to the “attack” function, small smart devices
are expected to be capable of functions like electric shock, sharp tools or chemical spray. In terms of these
functions, “electric shock” makes up 20% with the highest frequency, which is because that smart devices
with electric shock were viewed by interviewees as safer than sharps tool and chemical spray. Concerning
“assistant power”, the function was referred to by some interviewees as releasing distress signals like
“flashlight”, “siren” and “alarm”. As described by 12.5% interviewees, smart devices were supposed to be
capable of “GPS positioning” as it could send information to outside for locating the victim. Otherwise,
some interviewees expressed the expectation for smart devices to record the incident and send the footage
to others, which could allow others to come to their aid in time”. In respect of the “defence” function, there
were some futuristic ideas referred to by interviewees. A few interviewees claimed that smart devices could
be fitted in shoes as they would allow them to run fast in case of emergency, with others making mention
that if invisible clothes could be made available as smart devices, the need for other smart devices functions
could be eliminated.
After their ideas were raised, a large majority of them referred to the point that everyone should raise the
awareness of self-protection in the first place.
6%,5
0%,03%
44%,35
19%,15
29%,23
0%
5%
10%
15%
20%
25%
30%
35%
40%
45%
50%
yes no it dependspro
po
tio
n o
f p
eop
le w
ho
hav
e u
sed
or
hea
rd s
mar
t sa
fety
dev
ices
Do they work?
never heard or used have heard or used
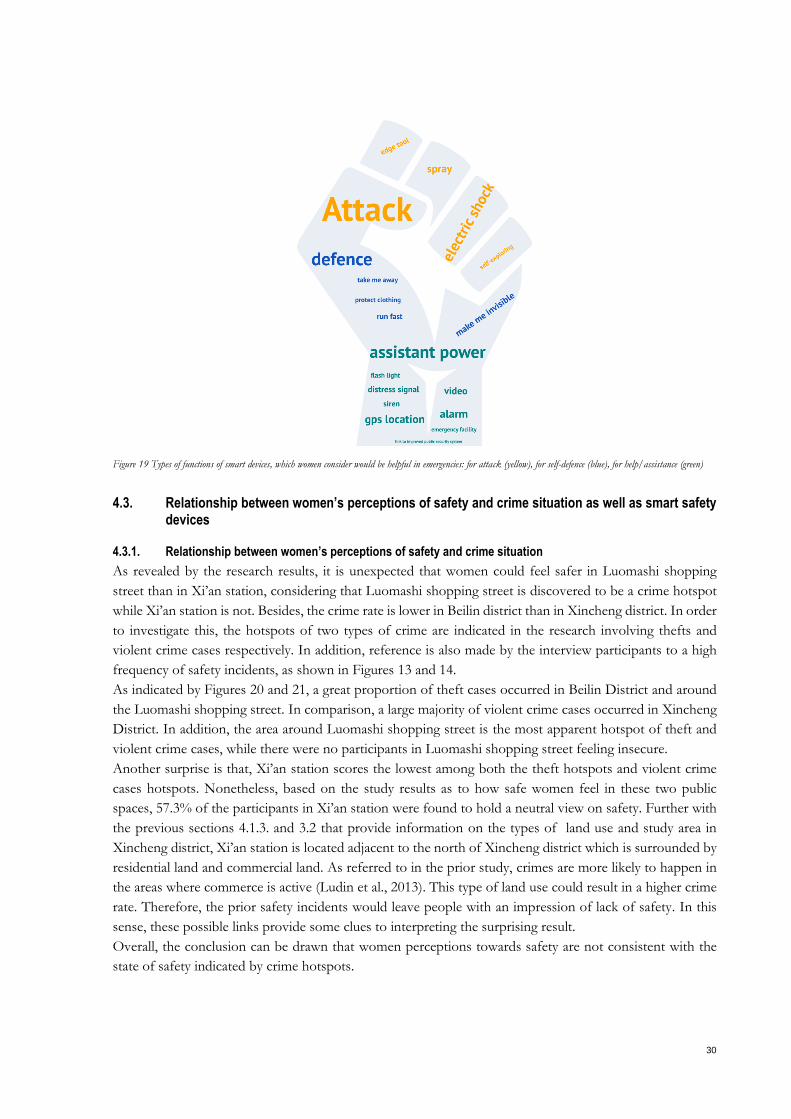
30
Figure 19 Types of functions of smart devices, which women consider would be helpful in emergencies: for attack (yellow), for self-defence (blue), for help/assistance (green)
4.3. Relationship between women’s perceptions of safety and crime situation as well as smart safety devices
4.3.1. Relationship between women’s perceptions of safety and crime situation
As revealed by the research results, it is unexpected that women could feel safer in Luomashi shopping
street than in Xi’an station, considering that Luomashi shopping street is discovered to be a crime hotspot
while Xi’an station is not. Besides, the crime rate is lower in Beilin district than in Xincheng district. In order
to investigate this, the hotspots of two types of crime are indicated in the research involving thefts and
violent crime cases respectively. In addition, reference is also made by the interview participants to a high
frequency of safety incidents, as shown in Figures 13 and 14.
As indicated by Figures 20 and 21, a great proportion of theft cases occurred in Beilin District and around
the Luomashi shopping street. In comparison, a large majority of violent crime cases occurred in Xincheng
District. In addition, the area around Luomashi shopping street is the most apparent hotspot of theft and
violent crime cases, while there were no participants in Luomashi shopping street feeling insecure.
Another surprise is that, Xi’an station scores the lowest among both the theft hotspots and violent crime
cases hotspots. Nonetheless, based on the study results as to how safe women feel in these two public
spaces, 57.3% of the participants in Xi’an station were found to hold a neutral view on safety. Further with
the previous sections 4.1.3. and 3.2 that provide information on the types of land use and study area in
Xincheng district, Xi’an station is located adjacent to the north of Xincheng district which is surrounded by
residential land and commercial land. As referred to in the prior study, crimes are more likely to happen in
the areas where commerce is active (Ludin et al., 2013). This type of land use could result in a higher crime
rate. Therefore, the prior safety incidents would leave people with an impression of lack of safety. In this
sense, these possible links provide some clues to interpreting the surprising result.
Overall, the conclusion can be drawn that women perceptions towards safety are not consistent with the
state of safety indicated by crime hotspots.
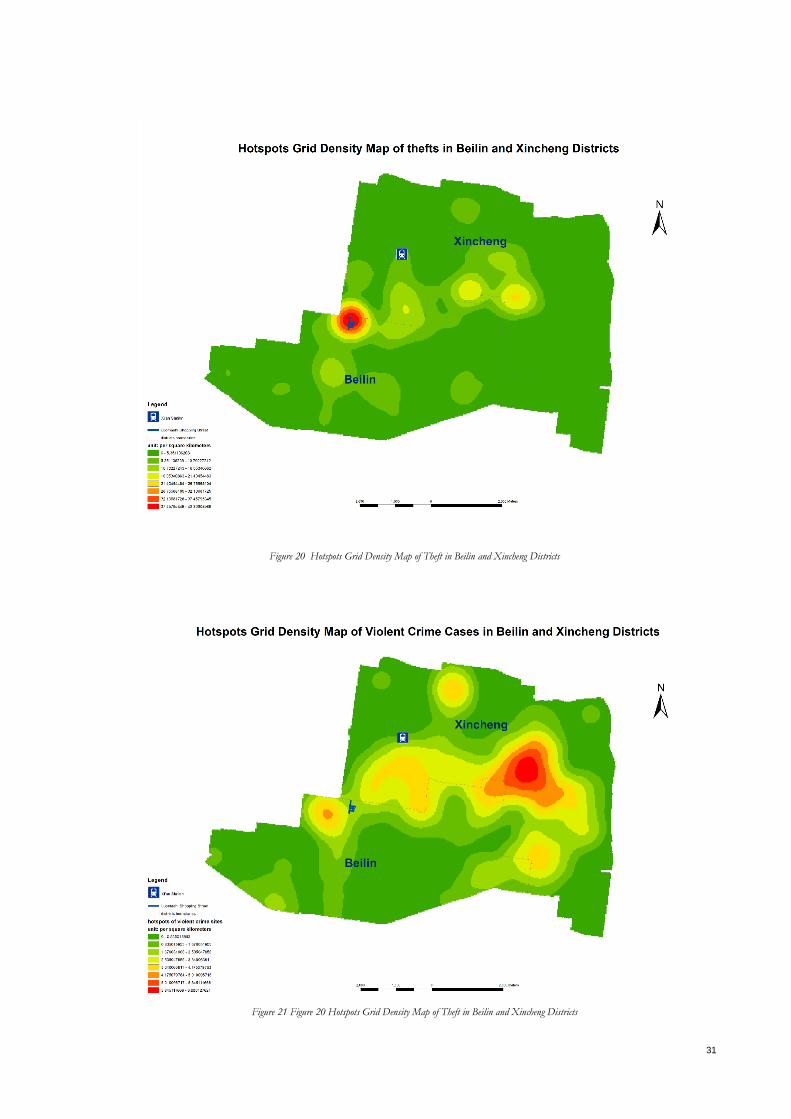
31
Figure 20 Hotspots Grid Density Map of Theft in Beilin and Xincheng Districts
Figure 21 Figure 20 Hotspots Grid Density Map of Theft in Beilin and Xincheng Districts
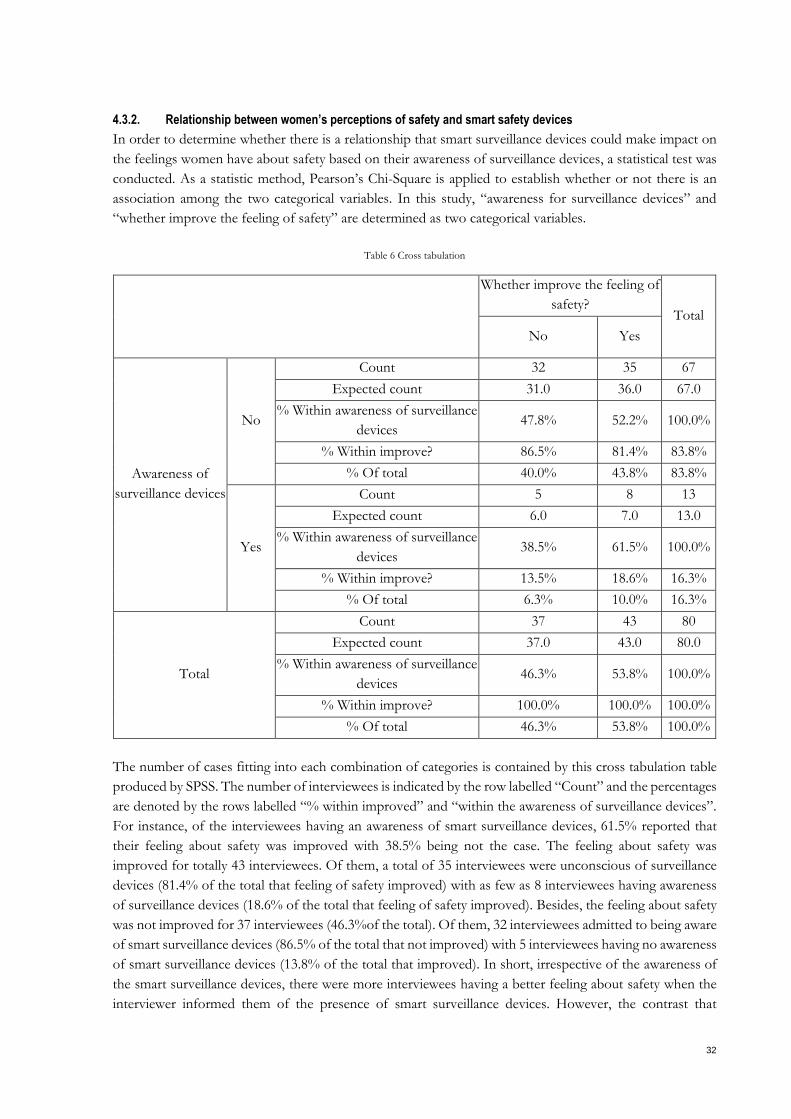
32
4.3.2. Relationship between women’s perceptions of safety and smart safety devices
In order to determine whether there is a relationship that smart surveillance devices could make impact on
the feelings women have about safety based on their awareness of surveillance devices, a statistical test was
conducted. As a statistic method, Pearson’s Chi-Square is applied to establish whether or not there is an
association among the two categorical variables. In this study, “awareness for surveillance devices” and
“whether improve the feeling of safety” are determined as two categorical variables.
Table 6 Cross tabulation
Whether improve the feeling of
safety? Total
No Yes
Awareness of
surveillance devices
No
Count 32 35 67
Expected count 31.0 36.0 67.0
% Within awareness of surveillance
devices 47.8% 52.2% 100.0%
% Within improve? 86.5% 81.4% 83.8%
% Of total 40.0% 43.8% 83.8%
Yes
Count 5 8 13
Expected count 6.0 7.0 13.0
% Within awareness of surveillance
devices 38.5% 61.5% 100.0%
% Within improve? 13.5% 18.6% 16.3%
% Of total 6.3% 10.0% 16.3%
Total
Count 37 43 80
Expected count 37.0 43.0 80.0
% Within awareness of surveillance
devices 46.3% 53.8% 100.0%
% Within improve? 100.0% 100.0% 100.0%
% Of total 46.3% 53.8% 100.0%
The number of cases fitting into each combination of categories is contained by this cross tabulation table
produced by SPSS. The number of interviewees is indicated by the row labelled “Count” and the percentages
are denoted by the rows labelled “% within improved” and “within the awareness of surveillance devices”.
For instance, of the interviewees having an awareness of smart surveillance devices, 61.5% reported that
their feeling about safety was improved with 38.5% being not the case. The feeling about safety was
improved for totally 43 interviewees. Of them, a total of 35 interviewees were unconscious of surveillance
devices (81.4% of the total that feeling of safety improved) with as few as 8 interviewees having awareness
of surveillance devices (18.6% of the total that feeling of safety improved). Besides, the feeling about safety
was not improved for 37 interviewees (46.3%of the total). Of them, 32 interviewees admitted to being aware
of smart surveillance devices (86.5% of the total that not improved) with 5 interviewees having no awareness
of smart surveillance devices (13.8% of the total that improved). In short, irrespective of the awareness of
the smart surveillance devices, there were more interviewees having a better feeling about safety when the
interviewer informed them of the presence of smart surveillance devices. However, the contrast that
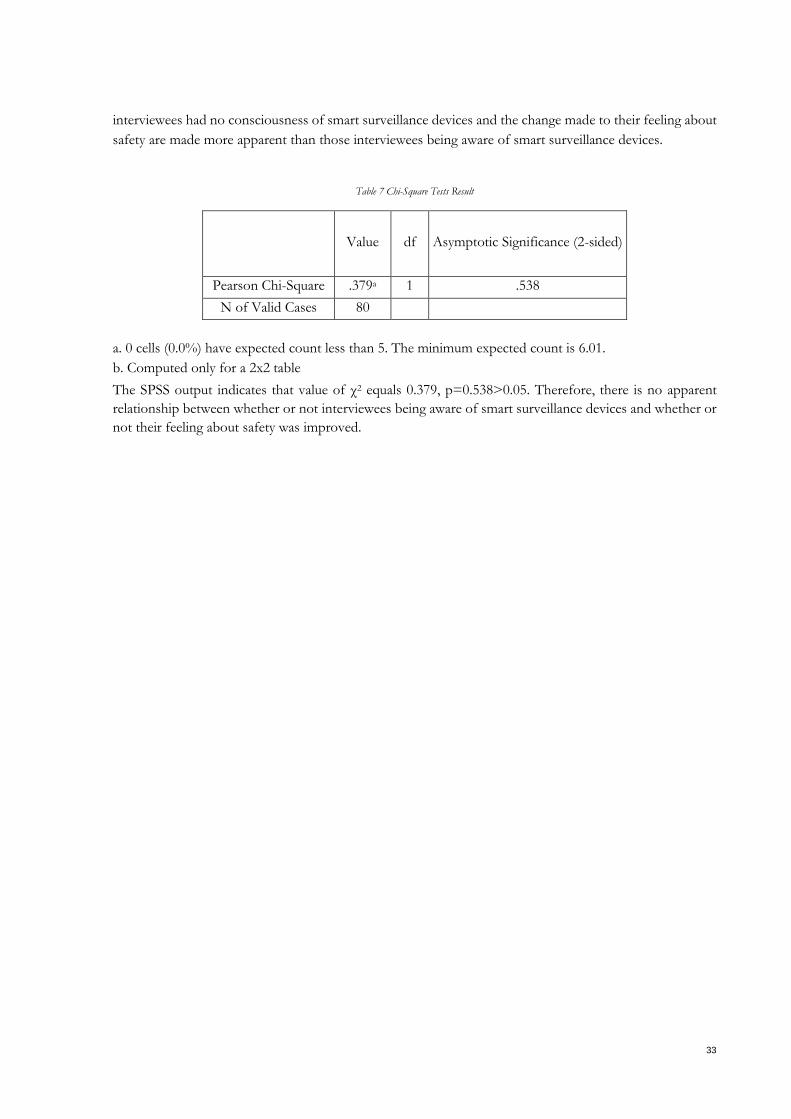
33
interviewees had no consciousness of smart surveillance devices and the change made to their feeling about
safety are made more apparent than those interviewees being aware of smart surveillance devices.
Table 7 Chi-Square Tests Result
Value df Asymptotic Significance (2-sided)
Pearson Chi-Square .379a 1 .538
N of Valid Cases 80
a. 0 cells (0.0%) have expected count less than 5. The minimum expected count is 6.01.
b. Computed only for a 2x2 table
The SPSS output indicates that value of χ2 equals 0.379, p=0.538>0.05. Therefore, there is no apparent
relationship between whether or not interviewees being aware of smart surveillance devices and whether or
not their feeling about safety was improved.
34
5. DISCUSSION
This chapter relates to a discussion about the research findings in detail based on their association and
impactions along with the findings made by others.
5.1. Women perceptions on safety and crime situation
Based on the foregoing research results, it is known that a majority of the participants held a neutral feeling
about safety in Xi’an station which is not classed as a crime hotspot, and women feel safe in Luomashi
shopping street which is a crime hotspot. In addition, nearly all types of land use around crime hotspots are
commercial land and residential land. Under this circumstance, this finding could be associated with land
use types. This assumption has been indicated indirectly by the prior researches reflected: they made attempt
to build up safe public spaces for women to reduce female fear of crime. Therefore, security measures shall
be made more stringent in urban spaces (Tandogan & Ilhan, 2016). In addition, diverse land-uses have the
potential to boost perceived safety which means the communities with a greater access to shops, parks, and
transit could minimize the sense of fear of crime (Foster et al., 2010).
As mentioned in the previous sections, Xi’an station is surrounded by residential buildings, commercial land,
near a national park, and public administration and service land. In comparison, Luomashi shopping street
is an appealing public space for its location in the centre city with surrounding commercial land and
residential land. It is obvious that land use type around Xi’an station is more diverse than around Luomashi
shopping street. Thus, the result of this thesis does not match with the research result of Foster et al.
However, as argued by some researchers, crime is likely to occur on the occasions where a combination of
opportunities and criminals are present (Adel, Salheen, & Mahmoud, 2016), crime rates bear an association
with different land uses that could be categorized into three types of districts (generating criminals, attracting
criminals, and mix both of them respectively). Based on the argument made by Adel et al., the districts of
“attracting criminals” pose higher risks of exposure to crimes and plenty of crimes happen within
overcrowded areas including commercial areas. Compared with Xi’an station (women keep neutral attitude
for safety), Luomashi shopping street (women keep positive attitude for safety) is characterized completely
by commercial land. Beside, Luomashi shopping street is more crowded than Xi’an station in normal days.
In consequence, these links could lead to women perceptions towards safety in the two public spaces are
inconsistent with crime hotspots around the two public spaces.
5.2. Smart surveillance devices and the feeling of safety
As revealed by the result from conducting Chi-square test, there was no apparent relationship between the
improved feeling about safety by smart surveillance devices and the consciousness of smart surveillance
devices. However, as revealed by the statistics on how many participants are made feel safer by their
awareness of smart surveillance devices, the result indicated that more participants feel safer than those who
have their feelings unchanged. Moreover, there is a significant gap between the policy discourse about smart
surveillance devices and the perceptions held by participants towards how smart surveillance devices work.
This suggests that the effect smart surveillance devices have is less effective than publicity of policy. In this
sense, to bridge the gap between policy discourses and participants’ perceptions, policy discourses are
supposed to shift from ensuring safety to offering assistance. These details of the result bear some similarity
to another research carried out by Brands et al. (2016): a better awareness of CCTV presence is conducive
to improving the perceptions of personal safety among the participants. In addition, Zurawski (2010)
performed regression analysis to conclude that there is no clear relationship between CCTV and the
35
participants’ feeling about safety. They argued that spatial setting play an essential role in influencing the
feeling about safety, for which feeling safe in a particular space cannot be simply attributed to the presence
of CCTV.
Generally, smart surveillance devices perform a crucial function following the occurrence of incidents, which
is considered as a significant evidence and clue. As for female feeling about safety, smart surveillance devices
are capable of giving them some psychological comfort. However, in case of emergency, smart surveillance
is ineffective in improving their security.
5.3. Smart safety devices: between reality and vision
In accordance with what was described by the participants as their expectation of smart safety devices, there
are various suggestions made to improve the functions of safety devices: automatically alarm, video and
voice record, GPS positioning, help signal like flashlight, electric shock etc.. Besides, these expectations were
categorized into three aspects: attack function, defence function, and assistant function. In reality, there are
more smart safety devices with assistant function than with attack and defence functions, with GPS
positioning in particular. As people could not make response swiftly to emergencies, some researchers
proposed wearable devices like “smart band” that integrates multiple functions and connect smart phone to
the internet. More specifically, it is capable of accessing GPS and messaging services in addition to sending
request for help and the location co-ordinates to the nearest Police station, relatives and the people nearby
(Harikiran, Menasinkai, & Shirol, 2016).
Personally, under the circumstance where people encounter safety incidents, the devices with assistant
function are hardly capable of providing aid, which is because plenty of things could happen during the time
waiting for others to offer help. In this interview, some of the interviewees referred to attack functions like
electric shock, spray with liquid chemical, which are more useful in the event of an emergency to save time.
However, it could hurt the victim as well by accident. Some ideas raised by the participants were impressive
regarding the self-defence function with superpower, like running fast, taking them away, with making users
invisible in emergency in particular. However, despite a range of smart features being installed in city with
the purpose to improve security and safety, the risks of smart safety devices remain debatable. For instance,
making users invisible seems possible to address both the surveillance and the safety problem. However,
new problem could arise from this function: if these solutions were exploited by criminals, there is no way
to know who are murder or thieves, let alone how to secure people.
36
6. CONCLUSION
This chapter represents a brief summary of the research findings, which is followed by research limitations.
In addition, it makes some suitable recommendations for urban planning.
6.1. Major research findings
This research is intended to explore the relationship among women’s perceptions of safety in public space,
crime situation combing land use, and smart safety devices. Then, providing information for urban planners
and others to improve women safety.
The results show that nearly all crime hotspots are surrounded by commercial and residential land. And
women feel safer even in crime hotspot, and this crime hotspot is mainly surrounded by commercial land.
Additionally, smart surveillance devices could be an influencing factor in female feelings about safety.
Despite this, there remains no significant relationship of it with female feeling about safety. Affected by
various factors like space setting, inherent cognition for a place to visit, there tends to be a lack of feeling
about safety for women.Finally, in some circumstances, smart safety device resembles a double-edged
sword, for which attention shall be drawn to emerging problems that arise from these smart devices.
6.2. Limitation
The limitation and weakness are discussed from the data quality and the integrity of research.
Considering that land use data collected cannot cover all corners of two districts, the research results are
unable to indicate all land use types in the two districts. Then, with the exception of observation and statistics
from mapping, there is an absence of mathematical model methods to validate the influence exerted by
different land use on crime distribution and female perceptions towards safety. Recently, local colocation
patterns were utilized in some researches to illustrate a significant association between commercial land and
crime, which could reflect to what extent crime points are attracted to land-use features points in a local
area.(Sypion-dutkowska & Leitner, 2017; Yue et al., 2017).
In addition, there is a possibility that potential biases in the sampling process result in the absence of a
significant association between whether or not interviewees are aware smart surveillance devices and
whether or not their feeling about safety was improved.
Moreover, Zurawski (2010) argued for a tendency that the feelings of safety are derived from familiarity
with a specific area. However, the extent of familiarity with the two public spaces and female perceptions
towards spatial setting were not involved in the interview guide of this study, which leads to a presumption
instead of a genuine evidence that women feel safer in Luomashi shopping street than Xi’an station due to
familiarity and space setting.
6.3. Recommendation
At present, it is known that safety is associated with land use, or the feeling about safety is related to both
space setting and full awareness of CCTV. It appears that striking a sensible balance between different land
use types or distributing equitably spatial setting is conducive to improving the perceptions towards safety.
However, how to achieve this objective and avoid the negative influence generated to economic
development shall be paid more attention to. Developing a local location theory is possibly necessary to
address the issue by combining people’s perceptions on safety, crime situation, and land use.
In respect to female perceptions towards elements that could have an effect on women’s feeling of safety,
“traffic order”, “presence of police” and “distribution of light” are considered as three elements that are
37
most impactful on women’s feeling of safety both in Luomashi shopping street and Xi’an station. This
finding provides a clue to improving women safety in terms of urban planning. It is possible that sensible
planning traffic environment and maintaining traffic order timely as well as increasing the number of patrol
officers could be implemented as an effective measure to improve women’s feeling of safety.
With these devices being applied to monitor our situation and improve quality of life, how to secure these
data to protect privacy shall be considered seriously. Therefore, when studying how to improve smart
technology to create a better quality of life, researchers are supposed to take into account emerging
challenges to deliver the best possible effect.
38
7. LIST OF REFERENCE
Adel, H., Salheen, M., & Mahmoud, R. A. (2016). Crime in relation to urban design. Case study: The Greater Cairo Region. Ain Shams Engineering Journal, 7(3), 925–938. https://doi.org/10.1016/j.asej.2015.08.009
Albino, V., Berardi, U., & Dangelico, R. M. (2015). Smart Cities: Definitions, Dimensions, Performance, and Initiatives. Journal of Urban Technology, 22(1), 3–21. https://doi.org/10.1080/10630732.2014.942092
Australian Bureau of Statistics. (2003). Crime and Justice: Crime victimisation and feelings of safety. Retrieved from http://www.abs.gov.au/AUSSTATS/[email protected]/7d12b0f6763c78caca257061001cc588/2b7af75e3fbf2272ca2570fe00198567!OpenDocument
Blumenthal, S. (2014). Creating Safe Spaces in Cities for Women: A Resolution for International Women’s Day 2014. The Huffington Post. Retrieved from https://www.huffingtonpost.com/susan-blumenthal/international-womens-day_b_4922218.html
Brands, J., Schwanen, T., & van Aalst, I. (2016). What are you looking at? Visitors’ perspectives on CCTV in the night-time economy. European Urban and Regional Studies, 23(1), 23–39. https://doi.org/10.1177/0969776413481369
Broomfield, M. (2004). International Committee of the Red Cross. TECHNICAL MANUAL Upper Limb Prosthetics, (324). Retrieved from https://www.icrc.org/en/document/introduction-economic-security
Bryman, A. (2012). Social Research Methods, 1–809. https://doi.org/10.15713/ins.mmj.3 Capdevila, I., & Zarlenga, M. I. (2015). Smart city or smart citizens? The Barcelona case. Journal of Strategy
and Management, 8(3), 266–282. https://doi.org/10.1108/JSMA-03-2015-0030 China Big Data and Smart City Research Institute. (2016). The Cooperation Signing for Construction
Strategy of Xi’An Smart City. Retrieved August 20, 2018, from http://dtecity.com/plus/view.php?aid=175
China Social Sciences Press. (2015). Chapter 1: Who discovered the Silk Road. Retrieved August 20, 2018, from http://www.cssn.cn/ts/dlz/rwsk/txdysbss/201504/t20150423_1599720.shtml
Cho, J. T., & Park, J. (2017). Exploring the effects of CCTV upon fear of crime: A multi-level approach in Seoul. International Journal of Law, Crime and Justice, 49, 35–45. https://doi.org/10.1016/j.ijlcj.2017.01.005
Chui, M., Lund, S., Madgavkar, A., Mischke, J., & Ramaswamy, S. (2018). Smart Cities: Digital Solutions for a More Livable Future, (June). Retrieved from https://www.mckinsey.com/~/media/McKinsey/Industries/Capital Projects and Infrastructure/Our Insights/Smart cities Digital solutions for a more livable future/MGI-Smart-Cities-Full-Report.ashx
Crabtree, S., & Nsubuga, F. (2012). Women Feel Less Safe Than Men in Many Developed Countries. GALLUP. Retrieved from https://news.gallup.com/poll/155402/women-feel-less-safe-men-developed-countries.aspx
Curiel, R. P., & Bishop, S. (2017). Modelling the fear of crime. Proceedings of the Royal Society A: Mathematical, Physical and Engineering Sciences, 473(2203). https://doi.org/10.1098/rspa.2017.0156
Daily Headlines. (2018). Xi’an Travel Guide— count the top ten areas in Xi’an that are most likely to encounter thieves. Retrieved January 9, 2019, from https://kknews.cc/zh-sg/travel/k98kx9p.html
Dearden, L. (2017). How technology is allowing police to predict where and when crime will happen. Independent. Retrieved from https://www.independent.co.uk/news/uk/home-news/police-big-data-technology-predict-crime-hotspot-mapping-rusi-report-research-minority-report-a7963706.html
Erdogan, S., Yilmaz, I., Baybura, T., & Gullu, M. (2008). Geographical information systems aided traffic accident analysis system case study: city of Afyonkarahisar. Accident Analysis and Prevention, 40(1), 174–181. https://doi.org/10.1016/j.aap.2007.05.004
EU-QOLEG. (2017). Final report of the expert group on quality of life indicators - EU Law and Publications. https://doi.org/10.2785/021270
Foster, S., Giles-Corti, B., & Knuiman, M. (2010). Neighbourhood design and fear of crime: A social-ecological examination of the correlates of residents’ fear in new suburban housing developments. Health & Place, 16(6), 1156–1165. https://doi.org/10.1016/J.HEALTHPLACE.2010.07.007
Frey, L. R., Botan, C. H., & Kreps, G. L. (2000). Investigating communication an introduction to research methods second edition allyn and bacon. Retrieved from
39
http://uurimismeetodid.pbworks.com/f/00+Investigating+Communication.+Contents+and+Preface.PDF
Geofabrik Download Server. (2018). Geofabrik Download Server. Retrieved January 10, 2019, from https://download.geofabrik.de/asia/china.html
Goldrick-Rab, S., & Mewburn, I. (2017). Interview. In The Digital Academic: Critical Perspectives on Digital Technologies in Higher Education (pp. 156–161). New York, NY: Springer New York. https://doi.org/10.4324/9781315473611
Hall, P. (2000). Creative cities and economic development. Urban Studies, 37(4), 639–649. https://doi.org/10.1080/00420980050003946
Yang, H. (2018). PaPa Software: Timing Guard,Immediate Rescue. Retrieved August 26, 2018, from http://www.lieyunwang.com/archives/166829
Harikiran, G. C., Menasinkai, K., & Shirol, S. (2016). Smart security solution for women based on Internet Of Things(IOT). In 2016 International Conference on Electrical, Electronics, and Optimization Techniques (ICEEOT) (pp. 3551–3554). IEEE. https://doi.org/10.1109/ICEEOT.2016.7755365
Hayes, B., Bonner, A., & Douglas, C. (2013). An introduction to mixed methods research for nephrology nurses. Renal Society of Australasia Journal, 9, 8–14.
Ishida, T. (2002). Digital city Kyoto. Communications of the ACM, 45(7), 76–81. https://doi.org/10.1145/514236.514238
Karunananda, S., Rajapakse, A., & Rathnayaka, R. (2018). Ascertaining the Sense of Safety in Urban Neighborhood Streets : The case of Kotahena , Sri Lanka, (February), 1–17. https://doi.org/10.20944/preprints201801.0282.v1
Karusala, N., & Kumar, N. (2017). Women ’ s Safety in Public Spaces : Examining the Efficacy of Panic Buttons in New Delhi. Acm Chi, 3340–3351. https://doi.org/10.1145/3025453.3025532
Kitchen, P., & Williams, A. (2010). Quality of life and perceptions of crime in Saskatoon, Canada. Social Indicators Research, 95(1), 33–61. https://doi.org/10.1007/s11205-009-9449-2
Komninos, N. (2011). Intelligent cities: Variable geometries of spatial intelligence. Intelligent Buildings International, 3(3), 172–188. https://doi.org/10.1080/17508975.2011.579339
Kramers A. (2014). Smart Cities and Climate Targets. Reducing cities’ energy use with ICT and travel information. Retrieved from http://www.diva-portal.org/smash/get/diva2:751909/FULLTEXT01.pdf
Li, Y., Lin, Y., & Geertman, S. (2015). The development of smart cities in China. International Conference on Computers in Urban Planning and Urban Management, 291-1–18.
Limin, L., & Hainan, L. (2015). Xi’an Statistical Yearbook in 2015. Xi’an: China Statistics Press. Retrieved from http://tjj.xa.gov.cn/ptl/def/def/2015/tjnj/indexch.htm
Lohrmann, D. (2016). Smart Cities: The Good, the Bad and the Ugly. Retrieved August 1, 2018, from http://www.govtech.com/blogs/lohrmann-on-cybersecurity/smart-cities-the-good-the-bad-and-the-ugly.html
Lombardi, P., Giordano, S., Farouh, H., & Yousef, W. (2012). Modelling the smart city performance. Innovation, 25(2), 137–149. https://doi.org/10.1080/13511610.2012.660325
Ludin, A. N. M., Aziz, N. A., Yusoff, N. H., & Razak, W. J. W. A. (2013). Impacts of urban land use on crime patterns through GIS application. Planning Malaysia, 11(December 2013), 1–22. https://doi.org/10.21837/pmjournal.v11.i2.113
Macke, J., Casagrande, R. M., Sarate, J. A. R., & Silva, K. A. (2018). Smart city and quality of life: Citizens’ perception in a Brazilian case study. Journal of Cleaner Production, 182, 717–726. https://doi.org/10.1016/j.jclepro.2018.02.078
Meher, S. (2013). Smart Street Light Business Case, 6. Retrieved from http://www.silverspringnet.com/wp-content/uploads/SilverSpring-Whitepaper-Smart-Street-Light-Bizcase.pdf
Ministry of Natural Resource of the People’s Republic of China. GB T 21010-2017 Current land use classification, Pub. L. No. A76, China National Standardization Administration (2017). Ministry of Natural Resource of the People’s Republic of China. Retrieved from http://www.gb688.cn/bzgk/gb/newGbInfo?hcno=224BF9DA69F053DA22AC758AAAADEEAA
Minwei, Z., & Hainan, L. (2016). Xi’an Statistical Yearbook in 2016. Xi’an: China Statistics Press. Retrieved from http://tjj.xa.gov.cn/ptl/def/def/2016/zk/indexch.htm
Minwei, Z., & Junhu, C. (2017). Xi’an Statistical Yearbook in 2017. Xi’an: China Statistics Press. Retrieved from http://tjj.xa.gov.cn/ptl/def/def/2017/zk/indexch.htm
Minwei, Z., & Xianbao, W. (2018). Xi’an Statistical Yearbook in 2018. Xi’an: China Statistics Press. Retrieved from http://tjj.xa.gov.cn/ptl/def/def/2018/zk/indexch.htm
Monisha, D. G., Monisha, M., Pavithra, G., & Subhashini, R. (2016). Women safety device and application-
40
FEMME. Indian Journal of Science and Technology, 9(10), 975–8887. https://doi.org/10.17485/ijst/2016/v9i10/88898
Nam, T., & Pardo, T. A. (2011). Conceptualizing smart city with dimensions of technology, people, and institutions. Proceedings of the 12th Annual International Digital Government Research Conference on Digital Government Innovation in Challenging Times - Dg.o ’11, 282. https://doi.org/10.1145/2037556.2037602
Neto, A. J. V., Zhao, Z., Rodrigues, J. J. P. C., Camboim, H. B., & Braun, T. (2018). Fog-based crime-assistance in smart IoT transportation system. IEEE Access, 6(February), 11101–11111. https://doi.org/10.1109/ACCESS.2018.2803439
Nimish, S. (2017). Smart City projects need CCTV video surveillance standards to ensure future stability of data, say experts- Technology News, Firstpost. Retrieved August 17, 2018, from https://www.firstpost.com/tech/news-analysis/smart-city-projects-need-cctv-video-surveillance-standards-to-ensure-future-stability-of-data-say-experts-4006067.html
OECD Publishing. (2013). The Chilean urban system and its challenges. In OECD Urban Policy Reviews: Chile 2013. OECD Publishing. https://doi.org/10.1787/9789264230040-en
Office of the State Council. (2008). Reply of the State Council on Xi’an City Master Plan. Retrieved August 17, 2018, from http://www.gov.cn/zwgk/2008-05/09/content_965572.htm
Pacione, M. (2003). Urban environmental quality and human wellbeing - A social geographical perspective. Landscape and Urban Planning, 65(1–2), 19–30. https://doi.org/10.1016/S0169-2046(02)00234-7
People’s Procuratorate of the P.R.China. (n.d.). Case Information Disclosure of The People’s Procuratorate of the P.R.China. Retrieved January 10, 2019, from http://www.ajxxgk.jcy.gov.cn/html/gj/sxb/
Praharaj, M. (2015). Smart City Bhubaneswar needs to be safe for women. Retrieved from https://www.dailypioneer.com/state-editions/bhubaneswar/smart-city-bhubaneswar-needs-to-be-safe-for-women.html
Ramaprasad, A., Sánchez-Ortiz, A., & Syn, T. (2017). A unified definition of a smart city. In Lecture Notes in Computer Science (including subseries Lecture Notes in Artificial Intelligence and Lecture Notes in Bioinformatics) (Vol. 10428 LNCS, pp. 13–24). Springer, Cham. https://doi.org/10.1007/978-3-319-64677-0_2
Ratnayake, R. (2017). Sense of safety in public spaces: university student safety experiences in an Australian regional city. Rural Society, 26(1), 69–84. https://doi.org/10.1080/10371656.2017.1284616
Recinos, E. (2016). 5 Great Gadgets That Are Made for Women Safety :: Tech :: Lists :: Gadgets :: Paste. Retrieved August 7, 2018, from https://www.pastemagazine.com/articles/2016/04/5-tech-products-that-are-made-for-womens-safety.html
Rollnick, R. (2008). The Global Assessment on Women’s Safety (Vol. HS/1230/09). Silverman, B. (1998). Density Estimation for Statistics and Data Analysis. New York. Soraganvi, S. (2017). Safe Public Places: Rethinking Design for Women Safety. Nternational Journal on Emerging
Technologies , 8(1), 5. https://doi.org/0975-8364 Sypion-dutkowska, N., & Leitner, M. (2017). Land Use Influencing the Spatial Distribution of Urban
Crime : A Case Study of Szczecin , Poland. https://doi.org/10.3390/ijgi6030074 Tandogan, O., & Ilhan, B. S. (2016). Fear of Crime in Public Spaces: From the View of Women Living in
Cities. Procedia Engineering, 161, 2011–2018. https://doi.org/10.1016/j.proeng.2016.08.795 Taylor, E. (2012). Awareness, understanding and experiences of CCTV amongst teachers and pupils in three
UK schools. Innovation and the Public Sector, 18, 1–16. https://doi.org/10.3233/978-1-61499-113-7-1 Technopedia. (2018). What is a Smart City? - Definition from Techopedia. Retrieved August 28, 2018, from
https://www.techopedia.com/definition/31463/smart-device Thuzar, M. (2011). URBANIZATION IN SOUTHEAST ASIA: DEVELOPING SMART CITIES FOR
THE FUTURE? In M. J. Montesano & P. O. Lee (Eds.), Regional Outlook (pp. 96–100). Singapore: ISEAS–Yusof Ishak Institute Singapore. https://doi.org/10.1355/9789814311694-022
Twinam, T. (2017). Danger zone : Land use and the geography of neighborhood crime. Journal of Urban Economics, 100, 104–119. https://doi.org/10.1016/j.jue.2017.05.006
Viswanath, N., Pakyala, N. V., & Muneeswari, G. (2016). Smart foot device for women safety. In Proceedings - 2016 IEEE Region 10 Symposium, TENSYMP 2016 (pp. 130–134). https://doi.org/10.1109/TENCONSpring.2016.7519391
Voice of Daqin. (2018). "broking small case" to solve the worry of the people’s livelihood and pick off the name of the thief city. Retrieved January 20, 2019, from http://www.cnr.cn/sxpd/dqzs/20180412/t20180412_524196092.shtml
Wang, D. (2017). GuoShengZhiKu Helps Xi’an Build the “Belt and Road” Core Area. Retrieved August 20, 2018, from http://www.china.com.cn/news/2017-08/03/content_41340362_2.htm
Wang, Q. (2014). At least 28 women lost contact in a month, 5 people have been killed and 15 people still lost. Retrieved September 8, 2018, from https://www.thepaper.cn/newsDetail_forward_1267229
41
Węziak-Białowolska, D. (2016). Quality of life in cities – Empirical evidence in comparative European perspective. Cities, 58, 87–96. https://doi.org/10.1016/J.CITIES.2016.05.016
WHO. (1997). Introducing the WHOQOL instruments Strengths of the WHOQOL instruments. World Health Organization, 1–15. Retrieved from http://www.who.int/mental_health/media/68.pdf
WHO. (2013). Global and regional estimates of violence against women: prevalence and health effects of intimate partner violence and non-partner sexual violence. 2013, 57. https://doi.org/10.1007/s13398-014-0173-7.2
Wu, Y., Zhang, W., Shen, J., Mo, Z., & Peng, Y. (2018). Smart city with Chinese characteristics against the background of big data: Idea, action and risk. Journal of Cleaner Production, 173, 60–66. https://doi.org/10.1016/j.jclepro.2017.01.047
Xi’an Beilin District People’s Government. (2018). The overview of Beilin District. Retrieved January 21, 2019, from http://www.beilin.gov.cn/ptl/def/def/index_4_550.html
Xi’an Xincheng District People’s Government. (2018). The Overview of Xincheng District. Retrieved January 21, 2019, from http://www.xincheng.gov.cn/zjxc/list/52.html
XiaoXu Zhao, & Jun Cai. (2017). Research on Xi’an Smart City Construction Based on Big Data Theory. Retrieved August 13, 2018, from http://www.urbanchina.org/n1/2017/1219/c410783-29715991.html
Xinhua News Agency. (2016). Reform of Xi’an Police Bureau. Retrieved August 26, 2018, from http://www.xinhuanet.com/mrdx/2016-08/19/c_135614517.htm
Xinhua News Agency. (2018). Xi’an: Video Surveillance in Public Areas and Key Areas Will Achieve Full Coverage. Retrieved August 20, 2018, from http://www.gov.cn/xinwen/2018-06/10/content_5297688.htm
Yang, H. (2018). PaPa Software: Timing Guard, Immediate Rescue. Retrieved August 26, 2018, from http://www.lieyunwang.com/archives/166829
Yi, D. (2016). Are you going to be spotted by traffickers? Retrieved August 28, 2018, from http://www.thepaper.cn/baidu.jsp?contid=1454499
Yoko. (2018). The most "chaotic" railway station in China. Retrieved January 9, 2019, from https://baijiahao.baidu.com/s?id=1609649634831145251&wfr=spider&for=pc
Yu, Z. (2017). Chinese Women Travel Safety Report. Retrieved from https://www.sohu.com/a/135196679_117416
Yuanshenghua Net. (2017). Ovitalmap-Product. Retrieved January 10, 2019, from http://www.ovital.com:8080/en/product/
Yue, H., Zhu, X., Ye, X., & Guo, W. (2017). The Local Colocation Patterns of Crime and Land-Use Features in Wuhan, China. ISPRS International Journal of Geo-Information, 6(10), 307. https://doi.org/10.3390/ijgi6100307
Zurawski, N. (2010). It is all about perceptions: Closed-circuit television, feelings of safety and perceptions of space - What the people say. Security Journal, 23(4), 259–275. https://doi.org/10.1057/sj.2008.20
Zurawski, N., & Czerwinski, S. (2008). Crime, maps and meaning: Views from a survey on safety and CCTV in Germany. Surveillance and Society, 5(1), 51–72.
42
APPENDIX
Women Perception on Safety and Smart Safety Devices Introduction :
This survey aim to women perception on safety, the impact of smart devices on safety in different public space,
surveillance devices in particular. The researcher will invite young women between 18 and 30 years old and who have
been Xi’an more than half year or have been come to Xi’an more than one time to do an interview and fill in a short
questionnaire one by one. Before starting this survey, researcher need to ask for consent of selects. Based on research
sub-objectives and questions, the interview will be promoted by following questions:
Part 1. Women perception on safety in two public space
1. Why are you visiting this public space?
2. Whether is the reason you select this public space and the time to visit here about safety?
3. How safe do you feel when you come to here?
A: 1 B: 2 C: 3 D: E: 5
Note: 1-5 represent the extent of feeling of safety respectively: very unsafe, unsafe, neither, safe, very safe.
4. Why do you select that extent of feeling of safety in this place?
5. Have you ever experienced or heard unsafe incidents with women in this place, including theft, robbery, and sexual
harassment?
6. Could you give me more details about that incident?
7. What kind of things will influence your feelings of safety in this public space? (multi-choice)
Light,
Traffic,
Visitor,
Police,
Building Environment
companion
Others:phones,surveillance devices, safety brace..
8. Why do you select those things?
Part 2. Women perception on the impact of surveillance device on safety
1. Are you aware of some surveillance devices in this public space? Note: If they do not know, the researcher will point surveillance device for respondents.
2. How safe do you feel when you are aware of surveillance devices? A: 1 B: 2 C: 3 D: 4 E: 5
Note: 1-5 represent the extent of feeling of safety respectively: very unsafe, unsafe, neither, safe, very safe.
3. Why do you think surveillance devices make you feel safe or cannot change your feeling of safety in this place?
Part 3. Women perception on smart devices in two public space
1. Have you used other smart devices could improve women safety in public space except surveillance devices, something like safety brace (Fig.1), phone emergency (Fig.2), PP safety (Fig.3)? Note: smart devices are kinds of electronic gadget that is able to connect, share and interact with its user and other smart devices. According to current safety products, almost smart devices could help you alarm and send
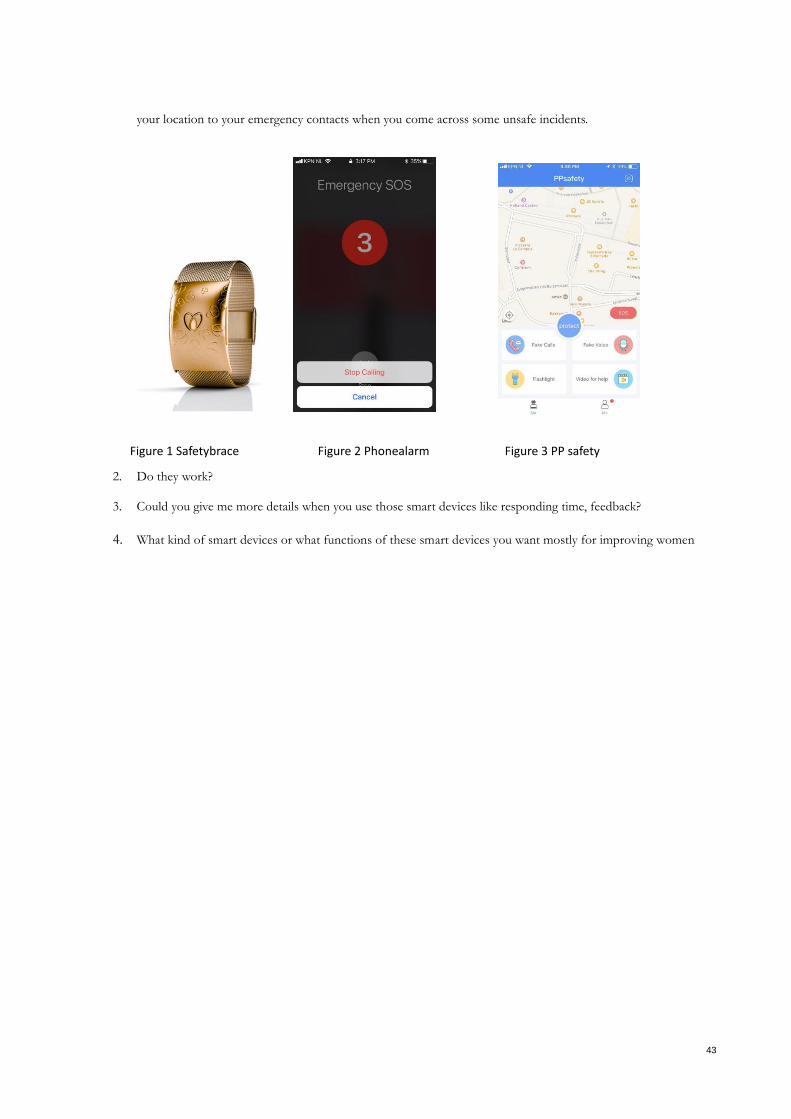
43
your location to your emergency contacts when you come across some unsafe incidents.
2. Do they work?
3. Could you give me more details when you use those smart devices like responding time, feedback?
4. What kind of smart devices or what functions of these smart devices you want mostly for improving women
Figure 1 Safetybrace Figure 2 Phonealarm Figure 3 PP safety