within-host selection is limited by an effective population of streptococcus pneumoniae during...
TRANSCRIPT

Within-Host Selection Is Limited by an Effective Population ofStreptococcus pneumoniae during Nasopharyngeal Colonization
Yuan Li,a Claudette M. Thompson,a Krzysztof Trzcinski,a,b Marc Lipsitcha
Department of Epidemiology and Department of Immunology and Infectious Diseases, Harvard School of Public Health, Boston, Massachusetts, USAa; Department ofPediatric Immunology and Infectious Diseases, UMC Utrecht, Utrecht, The Netherlandsb
Streptococcus pneumoniae (pneumococcus) is a significant pathogen that frequently colonizes the human nasopharynx. Envi-ronmental factors, including antimicrobial use and host immunity, exert selection on members of the nasopharyngeal popula-tion, and the dynamics of selection are influenced by the effective population size of the selected population, about which little isknown. We measured here the variance effective population size (Ne) of pneumococcus in a mouse colonization model by moni-toring the frequency change of two cocolonizing, competitively neutral pneumococcal strains over time. The point estimate of Ne
during nasal carriage in 16 BALB/c mice was 133 (95% confidence interval [CI] � 11 to 203). In contrast, the lower-bound censuspopulation exhibited a mean of 5768 (95% CI � 2,515 to 9,021). Therefore, pneumococcal Ne during nasal carriage is substan-tially smaller than the census population. The Ne during day 1 to day 4 of colonization was comparable to the Ne during day 4 today 8. Similarly, a low Ne was also evident for the colonization of pneumococcus in BALB/c mice exposed to cholera toxin 4weeks prior to challenge and in another mouse strain (DO11.10 RAG�/�). We developed a mathematical model of pneumococcalcolonization composed of two subpopulations with differential contribution to future generations. By stochastic simulation,this model can reproduce the pattern of observed pneumococcal Ne and predicts that the selection coefficients may be difficult tomeasure in vivo. We hypothesized that such a small Ne may reduce the effectiveness of within host selection for pneumococcus.
Studies of within-host competition between bacteria typicallymeasure selection by the mean change in the logarithm of the
ratio of a favored to a disfavored allele (1–4), sometimes called a“competitive index.” In animal experiments, there is often sub-stantial variation in the competition outcome among animal sub-jects (1–4), which necessitates the use of a large number of animalsto ensure reproducible results (5). Understanding the source ofthis variation is important for a number of purposes, includingsample size calculations in experimental design and results inter-pretation. For example, modern methods for identifying genesimportant for fitness in certain environments, such as transposonmutagenesis screens, rely on the ability of many members of alarge inoculum to establish infection, so that variations in mutantfrequency may be attributed to selection rather than chance. Fromthe opposite perspective, predictions of quantitative models ofselection within a host for immune escape or emergence of resis-tant variants depend not only on the strength of selection but alsoon the number of pathogen individuals available for selection (3,6, 7).
The variation in competitive index in experiments is rarelycommented on, as if the presence of noise in results was an inev-itable consequence of animal experiments. Stochasticity intro-duced by population bottlenecks and by small effective popula-tion size can also contribute to the observed variation. Since thefirst transposon mutagenesis study that relied on interpretation ofallele frequency change to infer fitness effects of gene knockouts(8), this has been an important issue that needs to be accountedfor implicitly or explicitly (9). In population genetics, stochasticityin the fate of alleles under selection (as well as that of neutralalleles) is explained by the concept of effective population size,which intuitively is related to the number of individuals in eachgeneration who contribute to the next (10), making allowance forthe fact that contributions may be uneven for many reasons. Moreprecisely, the effective size of a population (Ne) is defined by the
value that produces an observed distribution of changes in thefrequencies of unselected alleles due to stochasticity in the repro-duction of a finite population and can be estimated from thisdistribution, with a larger Ne corresponding to smaller stochasticfluctuations (10). Ne is an important parameter in understandingthe dynamics of population diversity since it controls, amongother genetic processes, the effectiveness of selection relative togenetic drift. A small Ne increases the relative weight of geneticdrift over selection in determining allele frequency, so that thedifference between the chance of fixing a favorable mutation andthe chance of fixing a neutral mutation in the population is re-duced (10). Because bacterial pathogens usually show large censuspopulations (i.e., the number of CFU per host), many experi-ments have been performed with the assumption that the medianor mean change in frequency of one variant compared to anotheris a good representation of the selective value of those variants invivo (1, 2, 11–15), although researchers may make allowance forthe noise involved when small numbers of each variant are presentin a small population, such as in transposon-mutant screens (13).Although little is known about the actual Ne of bacterial popula-tions within individual hosts, it is possible that Ne is smaller thanthe census population because of the observed subpopulation
Received 8 August 2013 Returned for modification 5 September 2013Accepted 22 September 2013
Published ahead of print 30 September 2013
Editor: A. Camilli
Address correspondence to Yuan Li, [email protected].
Supplemental material for this article may be found at http://dx.doi.org/10.1128/IAI.00527-13.
Copyright © 2013, American Society for Microbiology. All Rights Reserved.
doi:10.1128/IAI.00527-13
4534 iai.asm.org Infection and Immunity p. 4534 – 4543 December 2013 Volume 81 Number 12

structure (16), which may lead to heterogeneity in the reproduc-tive potential of members of the population. We therefore hy-pothesize that limited effective population sizes contribute to thevariability of competition outcome when the sizes are smallenough to make even a fully neutral marker drift significantly.
Streptococcus pneumoniae (pneumococcus) is an importantpathogen that frequently colonizes the human nasopharynx. Al-though nasopharyngeal colonization is usually asymptomatic, it isa critical step prior to invasive infections (17, 18). The nasopha-ryngeal carriage population serves as a reservoir of bacteria thatmay be transmitted to other hosts. In humans, an average carrierharbors at least 103 to 105 pneumococci (19), and the duration ofcolonization ranges from 1 week to several months (19). Moreimportantly, most transmission of pneumococci occurs fromhealthy carriers, making the nasopharyngeal colonization a keystage in the evolution and ecology of these organisms. The effect ofselection pressures imposed by host immunity, competition withother microflora, and antimicrobial treatment will depend on theeffective population size. This is both because a small Ne limits theamount of genetic variation (i.e., mutations and recombinationevents) available for selection and because, in simple population-genetic models, selection can be effective only if the product of theselection coefficient and Ne is substantially greater than 1; other-wise, selection will typically be overwhelmed by genetic drift. Anunderstanding of within host Ne would be valuable in understand-ing the population dynamics of pneumococcus in vivo.
We assessed here how much stochastic effects influence theoutcome of animal experiments by measuring the Ne of pneumo-coccus in a mouse colonization model and modeling its effects onwithin-host selection. We found that Ne was substantially smallerthan the carriage population size. It appeared that Ne did notchange over time during colonization. Simulation studies sug-gested that such a small Ne could reduce the efficiency of within-host selection for favored variants.
MATERIALS AND METHODSStrains and animals. The OVA and AVO stains were serotype 6B pneu-mococcal strain 603 derivatives that were described previously (3). Briefly,these were derivatives of clinical strain 603 with either OVA323-339 pep-tide (ISQAVHAAHAEINEAGR) or the reverse “AVO” peptide (RGAENIEAHAAHVAQSI) fused with two pneumococcal proteins: pneumococ-cal surface protein A (PspA) and pneumolysin (Ply). Wild-type BALB/c(BALB/c) mice and BALB/c DO11.10 RAG�/� (DO11.10) mice were ob-tained from the Jackson ImmunoResearch Laboratories, Bar Harbor, ME.All mice were female, 9 to 10 weeks old at the start of experiments, andkept in a BL2 facility. Some mice were intranasally administered 1 �g ofcholera toxin (CT; List Biological Laboratories, Compel, CA) 4 or 5 weeksprior to challenge, because these mice were controls in other experimentsin which the experimental mice received immunizations using CT as anadjuvant. The data analyzed in the present study are a combination ofnewly generated data (BALB/c and DO11.10 RAG�/� mice) and the fre-quencies from controls in experiments previously published for theBALB/c mice with CT (3). The mouse experiment protocols were ap-proved by Institutional Animal Care and Use Committee of Harvard Uni-versity.
Mouse carriage model and strain quantification. BALB/c or DO11.10RAG�/� mice were inoculated intranasally with a mix of the OVA and theAVO strains in 10 �l of phosphate-buffered saline containing approxi-mately 5 � 106 CFU of each strain. Nasal wash samples were collected upto 8 days after challenge according to a method described previously (3).Aliquots of each sample were titered to determine the CFU density insample. The remaining samples were cultured overnight on blood agar
plates supplemented with gentamicin to a final concentration of 2.5 mg/liter, and all bacterial growth was harvested for genomic DNA extraction.
Genomic DNA was purified from cultures of samples collected fromanimals using a DNeasy blood and tissue kit (Qiagen, Valencia, CA). OVAstrain- and AVO strain-specific primer sets were designed based on thenucleotide sequence difference in the pspA locus between the two strains.The quantity of strain-specific genomic DNA in a sample was determinedby real-time PCR as described previously (3). The AVO/OVA ratio foreach sample was calculated by using the absolute amount of OVA DNAand AVO DNA in the sample. The CFU counts for AVO and OVA bacteriain a sample were estimated from the total CFU and the AVO/OVA ratio(Table 1).
Bacterial growth curve. AVO and OVA strains were streaked ontoblood agar plates and cultured at 37°C in a 5% CO2 overnight. Fourcolonies from each strain were subcultured in Todd-Hewitt medium with0.5% yeast extract (THY; Becton Dickinson, Sparks, MD) until the opticaldensity at 620 nm (OD620) reached �0.4 and then diluted into THYmedium at a starting culture OD620 of �0.005. Growth was monitored insterile flat-bottom 96-well microtiter plates (Nunc, Denmark) containing200 �l of culture in each well every 30 min using a VERSAmax microplatereader (Molecular Devices, Sunnyvale, CA) over 6 h. The growth curveswere fitted to an exponential growth equation, and the doubling time wasestimated using Prism software (GraphPad Software, Inc., La Jolla, CA).
Estimation of variance effective population (Ne). MLNE software(20, 21) was used to estimate the maximum-likelihood Ne and its 95%confidence interval (CI). Essentially, the software uses the probability ofobserving the CFU count data (Table 1) in a sample at a given time as afunction of the CFU count data in a previous sample, the number ofgenerations during the sampling period, and the (harmonic) mean effec-tive size (Ne) of the population (22). The estimation procedure in MLNEfunction further accounted for the probability of observing the CFUcount data in a sample given a true ratio between the two strains in theunderlying population and thus explicitly accounted for sampling errorcaused by examining the allelic composition of a finite number of bacte-rial CFU. When the CFU count data in all time points are given, thesoftware will maximize the likelihood of the data by varying the Ne. Weassumed that Ne was the same for each mouse, and the frequency of AVOand OVA bacteria in different mice at each time point in a single experi-ment could be treated as if they were alleles at independently assortingloci. The likelihood maximized by the software in this way corresponds to
TABLE 1 CFU counts used for Ne estimation in the BALB/c mouseexperiment
Mouse
CFU count
Day 1 Day 4 Day 8
AVO OVA AVO OVA AVO OVA
1-1 1,510 2,468 877 971 643 2331-2 8 2 170 76 67 721-3 200 249 34 233 386 3,1631-4 378 370 52 364 9 121-5 4,432 8,623 676 8,248 2,472 7,5822-2 1,099 1,750 387 1,098 292 4772-3 22 42 77 115 759 1,3783-1 57 28 117 65 288 03-2 1,948 3,858 1,328 2,651 2,316 19,6283-3 3,107 2,484 1,124 1,241 4,448 6,8963-4 2,092 4,413 530 891 1,980 2,4293-5 283 294 150 95 10,254 5,5794-1 31 33 70 58 70 904-3 848 765 523 1,896 1,880 5,0554-4 1,775 1,988 247 234 765 1,1714-5 95 97 7 15 657 1,440
Pneumococcal Effective Population
December 2013 Volume 81 Number 12 iai.asm.org 4535

the assumption that Ne was the same in each mouse, so each mouse con-tributes independent data to the estimation of that single quantity. Toestimate the pneumococcal Ne during colonization in BALB/c mice, theCFU count data on days 1, 4, and 8 were used. To estimate the averagepneumococcal Ne during colonization in DO11.10 RAG�/� mice, theCFU count data on days 1, 3, and 7 were used. Allele frequency changefrom the time of inoculation (day 0) to day 1 was not considered in Ne
estimation to minimize the effect of colonization bottleneck. Any mousewith missing data on any of the three sampling time points was also ex-cluded from analysis. The input data for MLNE were prepared accordingto software instructions with each mouse replicate being treated as anindependent locus. The number of pneumococcal generations betweentwo sampling time points was calculated by dividing the length of timebetween two samplings by the average life span of pneumococcus. Weused (cells doubling time)/ln (2) as the average life span according to asimple exponential-growth/exponential-death model at its equilibrium.Due to the haploidy of pneumococcal genome, the Ne and 95% CI esti-mated by the MLNE software (designed for diploids) were scaled up by afactor of 2 (Jinliang Wang, unpublished data), a scaling that we validatedby preliminary simulation (data not shown).
Simulation of pneumococcal colonization population. A simplemodel of heterogeneity in bacterial reproduction that could generate asmall effective population size is one similar to that described by Balabanet al. (23) for “type 1 persisters.” This model represents the pneumococcalcolonization population as composed of two subpopulations, P1 and P2.P1 is a small subpopulation that actively replicates, while P2 represents alarge subpopulation where most bacterial death/removal occurs. Eachsubpopulation is composed of two strains, A and O, that satisfy P1'A1 �O1 and P2' A2 � O2. The dynamics of A1, O1, A2, and O2 is described byequations 1 to 4:
dA1
dt� �A1 �
�A1(A1 � O1)
K1� da A1 (1)
dO1
dt� �O1 �
�O1(A1 � O1)
K1� do O1 (2)
dA2
dt�
�A1(A1 � O1)
K1� �A2 �1 �
A2 � O2
K2� � da A2 (3)
dO2
dt�
�O1(A1 � O1)
K1� �O2 �1 �
A2 � O2
K2� � da O2 (4)
For competitively neutral strains to achieve stable carriage, we assumedthat da � do � d and that � � d. Essentially, strains in P1 follow exponen-tial growth and clearance, with the probability of the descendant cell’sremaining in P1 decreasing with the number of cells in P1; otherwise, itmigrates to P2 (equations 5 and 6), with the migration modeled as aseparate event. Strains in P2 grow logistically and are also subjected toexponential clearance.
dP1
dt� �P1 �
�P12
K1� dP1 (5)
dP2
dt�
�P12
K1� �P2 �1 �
P2
K2� � dP2 (6)
Equation 5 combines equations 1 and 2; equation 6 combines equations 3and 4. The stable equilibrium subpopulation size of P1 and P2 is given by:
P1� � A1
� � O1� �
� � d
�K1 (7)
P2� � A2
� � O2� �
(� � d)(1 ��1 �1 � 4K1
K2
2�K2 (8)
Note that when growth is blocked (� � 0), the total population (P1 � P2)follows an exponential decay: d(P1 � P2)/dt � �d(P1 � P2). In this situ-ation, the half-life (ln2/d) of pneumococcus during mouse nasal coloni-
zation has been estimated to be 161 min (13). Unless otherwise specified,the clearance rate d � 0.0043 min�1 (ln2/161 min�1) and the maximumgrowth rate � � 0.0231 min�1 were used. Varied K1 and K2 values wereused as indicated.
Our simulation was a stochastic version of the model described byequations 1 to 4. To generate simulation data of allele frequency, we usedthe “adaptivetau” package in R (24), which implements an adaptive tauleaping to approximate the trajectory of a continuous-time stochasticprocess. The instantaneous transition rate for each transition and its ef-fects are given in Table 2.
To initialize the simulation, A1 � O1 and A2 � O2 were first set to theirequilibrium size (P1* and P2* in equations 7 and 8, respectively). Tomimic the allele frequency distribution on day 1 of colonization, a value oflog10(a) was randomly drawn from a normal distribution estimated fromthe BALB/c colonization experiment (equation 9), where a is the ratiobetween the two strains in each subpopulation (a' Ai/Oi, i � 1,2). Thespecific initial state (A1, O1, A2, and O2) was then calculated according tothe value of a and equations 10 to 13.
log10 a � N�0, 0.232� (9)
On day 1:
A1 � P1* a
1 � a(10)
O1 � P1* 1
1 � a(11)
A2 � P2* a
1 � a(12)
O2 � P2* a
1 � a(13)
After initiation, the model was first simulated forward for t � 4,320 min (3days) by using the “ssa.adaptivetau” function in the “adaptivetau” R pack-age (24). The values of A1, O1, A2, and O2 at the end of the t � 4,320 minwere recorded as the day 4 output. Continuing from this state, the model
TABLE 2 Transition rates for simulation of the colonization population
Event Effects (A1, O1, A2, O2) Transition rate (0)a
BirthA1 1, 0, 0, 0 �A1
O1 0, 1, 0, 0 �O1
MigrationA1 –1, 0, 1, 0 �A1 (A1 � O1)/K1
O1 0, –1, 0, 1 �O1 (A1 � O1)/K1
ClearanceA1 –1, 0, 0, 0 daA1
O1 0, 1, 0, 0 doO1
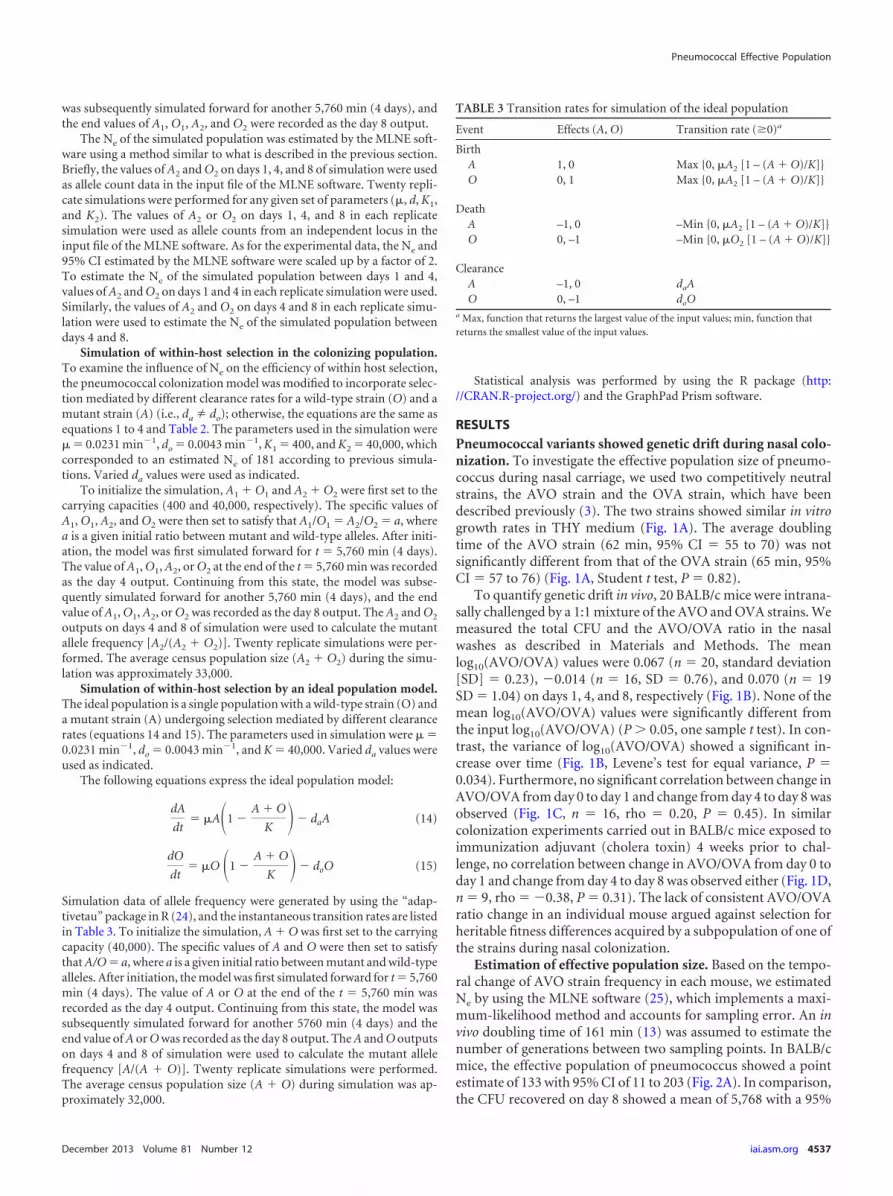
BirthA2 0, 0, 1, 0 Max {0, �A2 [1 – (A2 � O2)/K2]}O2 0, 0, 0, 1 Max {0, �A2 [1 – (A2 � O2)/K2]}
DeathA2 0, 0, –1, 0 –Min {0, �A2 [1 – (A2 � O2)/K2]}O2 0, 0, 0, –1 –Min {0, �O2 [1 – (A2 � O2)/K2]}
ClearanceA2 0, 0, –1, 0 daA2
O2 0, 0, 0, –1 doO2
a Max, function that returns the largest value of the input values; min, function thatreturns the smallest value of the input values.
Li et al.
4536 iai.asm.org Infection and Immunity
was subsequently simulated forward for another 5,760 min (4 days), andthe end values of A1, O1, A2, and O2 were recorded as the day 8 output.
The Ne of the simulated population was estimated by the MLNE soft-ware using a method similar to what is described in the previous section.Briefly, the values of A2 and O2 on days 1, 4, and 8 of simulation were usedas allele count data in the input file of the MLNE software. Twenty repli-cate simulations were performed for any given set of parameters (�, d, K1,and K2). The values of A2 or O2 on days 1, 4, and 8 in each replicatesimulation were used as allele counts from an independent locus in theinput file of the MLNE software. As for the experimental data, the Ne and95% CI estimated by the MLNE software were scaled up by a factor of 2.To estimate the Ne of the simulated population between days 1 and 4,values of A2 and O2 on days 1 and 4 in each replicate simulation were used.Similarly, the values of A2 and O2 on days 4 and 8 in each replicate simu-lation were used to estimate the Ne of the simulated population betweendays 4 and 8.
Simulation of within-host selection in the colonizing population.To examine the influence of Ne on the efficiency of within host selection,the pneumococcal colonization model was modified to incorporate selec-tion mediated by different clearance rates for a wild-type strain (O) and amutant strain (A) (i.e., da do); otherwise, the equations are the same asequations 1 to 4 and Table 2. The parameters used in the simulation were� � 0.0231 min�1, do � 0.0043 min�1, K1 � 400, and K2 � 40,000, whichcorresponded to an estimated Ne of 181 according to previous simula-tions. Varied da values were used as indicated.
To initialize the simulation, A1 � O1 and A2 � O2 were first set to thecarrying capacities (400 and 40,000, respectively). The specific values ofA1, O1, A2, and O2 were then set to satisfy that A1/O1 � A2/O2 � a, wherea is a given initial ratio between mutant and wild-type alleles. After initi-ation, the model was first simulated forward for t � 5,760 min (4 days).The value of A1, O1, A2, or O2 at the end of the t � 5,760 min was recordedas the day 4 output. Continuing from this state, the model was subse-quently simulated forward for another 5,760 min (4 days), and the endvalue of A1, O1, A2, or O2 was recorded as the day 8 output. The A2 and O2
outputs on days 4 and 8 of simulation were used to calculate the mutantallele frequency [A2/(A2 � O2)]. Twenty replicate simulations were per-formed. The average census population size (A2 � O2) during the simu-lation was approximately 33,000.
Simulation of within-host selection by an ideal population model.The ideal population is a single population with a wild-type strain (O) anda mutant strain (A) undergoing selection mediated by different clearancerates (equations 14 and 15). The parameters used in simulation were � �0.0231 min�1, do � 0.0043 min�1, and K � 40,000. Varied da values wereused as indicated.
The following equations express the ideal population model:
dA
dt� �A�1 �
A � O
K � � daA (14)
dO
dt� �O �1 �
A � O
K � � doO (15)
Simulation data of allele frequency were generated by using the “adap-tivetau” package in R (24), and the instantaneous transition rates are listedin Table 3. To initialize the simulation, A � O was first set to the carryingcapacity (40,000). The specific values of A and O were then set to satisfythat A/O � a, where a is a given initial ratio between mutant and wild-typealleles. After initiation, the model was first simulated forward for t � 5,760min (4 days). The value of A or O at the end of the t � 5,760 min wasrecorded as the day 4 output. Continuing from this state, the model wassubsequently simulated forward for another 5760 min (4 days) and theend value of A or O was recorded as the day 8 output. The A and O outputson days 4 and 8 of simulation were used to calculate the mutant allelefrequency [A/(A � O)]. Twenty replicate simulations were performed.The average census population size (A � O) during simulation was ap-proximately 32,000.
Statistical analysis was performed by using the R package (http://CRAN.R-project.org/) and the GraphPad Prism software.
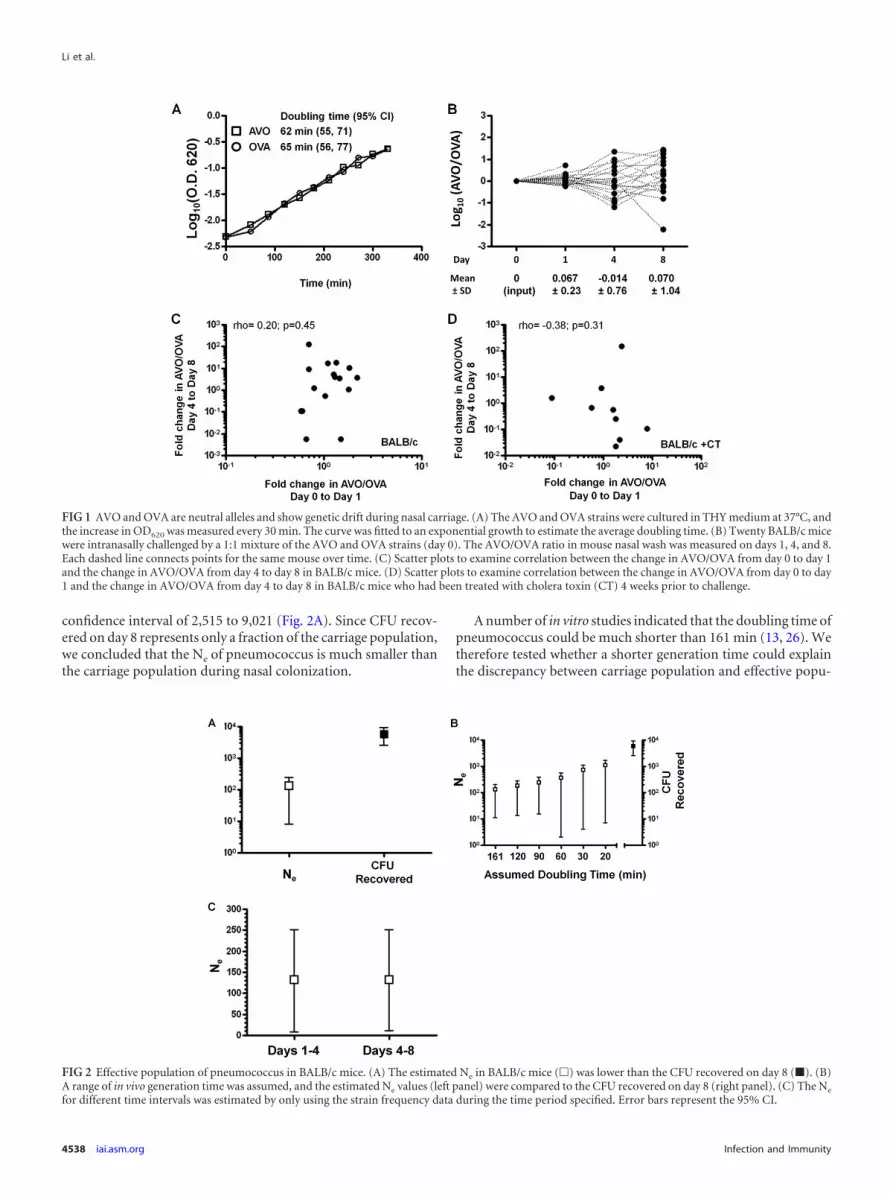
RESULTSPneumococcal variants showed genetic drift during nasal colo-nization. To investigate the effective population size of pneumo-coccus during nasal carriage, we used two competitively neutralstrains, the AVO strain and the OVA strain, which have beendescribed previously (3). The two strains showed similar in vitrogrowth rates in THY medium (Fig. 1A). The average doublingtime of the AVO strain (62 min, 95% CI � 55 to 70) was notsignificantly different from that of the OVA strain (65 min, 95%CI � 57 to 76) (Fig. 1A, Student t test, P � 0.82).
To quantify genetic drift in vivo, 20 BALB/c mice were intrana-sally challenged by a 1:1 mixture of the AVO and OVA strains. Wemeasured the total CFU and the AVO/OVA ratio in the nasalwashes as described in Materials and Methods. The meanlog10(AVO/OVA) values were 0.067 (n � 20, standard deviation[SD] � 0.23), �0.014 (n � 16, SD � 0.76), and 0.070 (n � 19SD � 1.04) on days 1, 4, and 8, respectively (Fig. 1B). None of themean log10(AVO/OVA) values were significantly different fromthe input log10(AVO/OVA) (P � 0.05, one sample t test). In con-trast, the variance of log10(AVO/OVA) showed a significant in-crease over time (Fig. 1B, Levene’s test for equal variance, P �0.034). Furthermore, no significant correlation between change inAVO/OVA from day 0 to day 1 and change from day 4 to day 8 wasobserved (Fig. 1C, n � 16, rho � 0.20, P � 0.45). In similarcolonization experiments carried out in BALB/c mice exposed toimmunization adjuvant (cholera toxin) 4 weeks prior to chal-lenge, no correlation between change in AVO/OVA from day 0 today 1 and change from day 4 to day 8 was observed either (Fig. 1D,n � 9, rho � �0.38, P � 0.31). The lack of consistent AVO/OVAratio change in an individual mouse argued against selection forheritable fitness differences acquired by a subpopulation of one ofthe strains during nasal colonization.
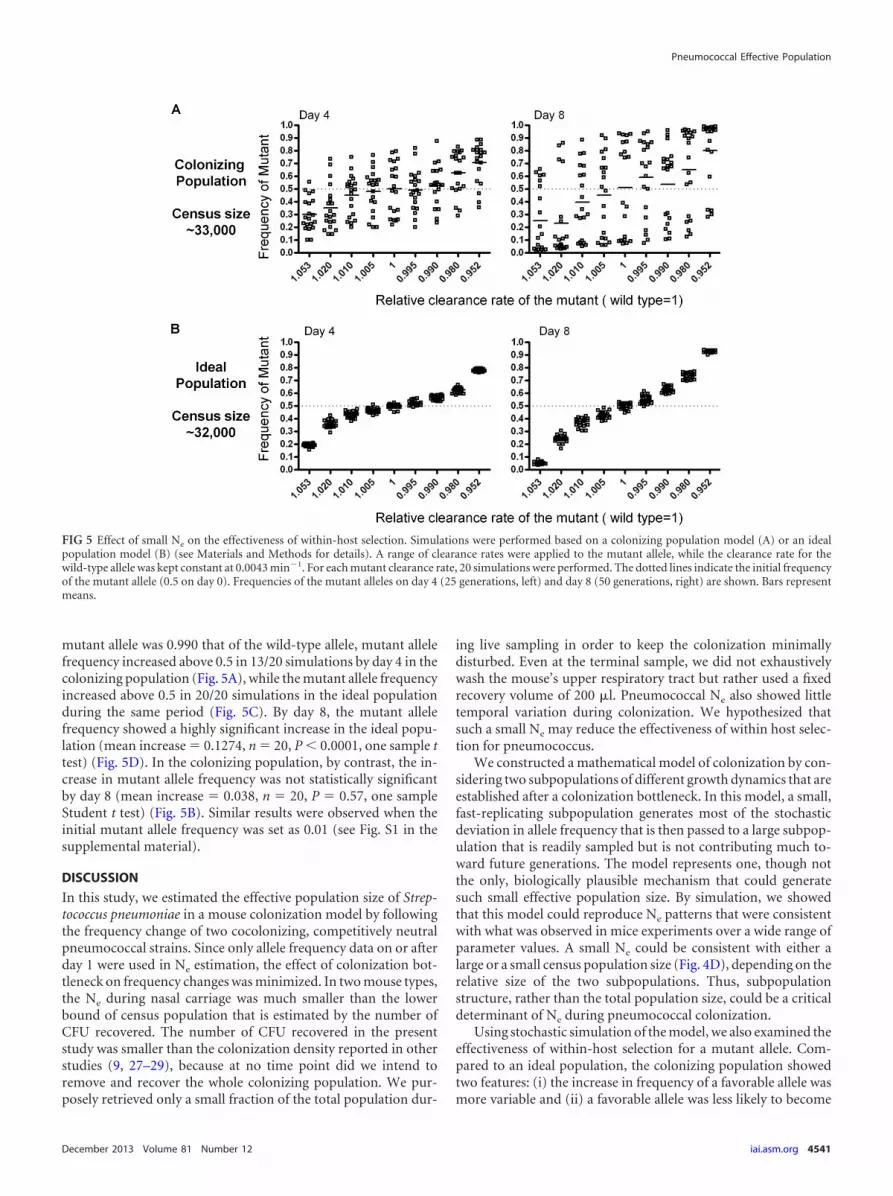
Estimation of effective population size. Based on the tempo-ral change of AVO strain frequency in each mouse, we estimatedNe by using the MLNE software (25), which implements a maxi-mum-likelihood method and accounts for sampling error. An invivo doubling time of 161 min (13) was assumed to estimate thenumber of generations between two sampling points. In BALB/cmice, the effective population of pneumococcus showed a pointestimate of 133 with 95% CI of 11 to 203 (Fig. 2A). In comparison,the CFU recovered on day 8 showed a mean of 5,768 with a 95%
TABLE 3 Transition rates for simulation of the ideal population
Event Effects (A, O) Transition rate (�0)a
BirthA 1, 0 Max {0, �A2 [1 – (A � O)/K]}O 0, 1 Max {0, �A2 [1 – (A � O)/K]}
DeathA –1, 0 –Min {0, �A2 [1 – (A � O)/K]}O 0, –1 –Min {0, �O2 [1 – (A � O)/K]}
ClearanceA –1, 0 daAO 0, –1 doO
a Max, function that returns the largest value of the input values; min, function thatreturns the smallest value of the input values.
Pneumococcal Effective Population
December 2013 Volume 81 Number 12 iai.asm.org 4537
confidence interval of 2,515 to 9,021 (Fig. 2A). Since CFU recov-ered on day 8 represents only a fraction of the carriage population,we concluded that the Ne of pneumococcus is much smaller thanthe carriage population during nasal colonization.
A number of in vitro studies indicated that the doubling time ofpneumococcus could be much shorter than 161 min (13, 26). Wetherefore tested whether a shorter generation time could explainthe discrepancy between carriage population and effective popu-
FIG 1 AVO and OVA are neutral alleles and show genetic drift during nasal carriage. (A) The AVO and OVA strains were cultured in THY medium at 37°C, andthe increase in OD620 was measured every 30 min. The curve was fitted to an exponential growth to estimate the average doubling time. (B) Twenty BALB/c micewere intranasally challenged by a 1:1 mixture of the AVO and OVA strains (day 0). The AVO/OVA ratio in mouse nasal wash was measured on days 1, 4, and 8.Each dashed line connects points for the same mouse over time. (C) Scatter plots to examine correlation between the change in AVO/OVA from day 0 to day 1and the change in AVO/OVA from day 4 to day 8 in BALB/c mice. (D) Scatter plots to examine correlation between the change in AVO/OVA from day 0 to day1 and the change in AVO/OVA from day 4 to day 8 in BALB/c mice who had been treated with cholera toxin (CT) 4 weeks prior to challenge.
FIG 2 Effective population of pneumococcus in BALB/c mice. (A) The estimated Ne in BALB/c mice (�) was lower than the CFU recovered on day 8 (�). (B)A range of in vivo generation time was assumed, and the estimated Ne values (left panel) were compared to the CFU recovered on day 8 (right panel). (C) The Ne
for different time intervals was estimated by only using the strain frequency data during the time period specified. Error bars represent the 95% CI.
Li et al.
4538 iai.asm.org Infection and Immunity

lation. A range of generation times was assumed and the corre-sponding effective population size was calculated (Fig. 2B). Asexpected, effective population size increased when generationtime became shorter (Fig. 2B). However, the effective populationsize was still substantially smaller than the CFU recovered even anunrealistically short generation time (20 min) was assumed (Fig.2B). Thus, a short generation time in vivo was unlikely to be themajor explanation for the small Ne.
We next examined whether there is temporal change in pneu-mococcal Ne during colonization. The average Ne from day 1 today 4 (days 1 to 4) was calculated by using the AVO allele fre-quency change between day 1 and day 4. The same strategy wasused to estimate average Ne during days 4 to 8. As shown in Fig.2C, the estimation of Ne for days 1 to 4 (point estimate, 132; 95%CI � 7 to 250) was very similar to the estimation of Ne for days 4to 8 (point estimate, 132; 95% CI � 11 to 250). The Ne estimatedfor the two time intervals were much lower than the CFU recov-ered on day 8, a finding consistent with the overall Ne.
Finally, the effective population size of pneumococcus duringnasal carriage in varied experimental conditions, as well as in adifferent mouse type, was investigated. Cholera toxin (CT) is acommonly used adjuvant in immunization experiments, and herewe examined its effect on Ne in BALB/c mice. In BALB/c miceexposed to CT (BALB/c � CT), the effective population of pneu-mococcus showed point estimate of 64 (95% CI � 6 to 65) (Fig.3A, n � 8). Similar to what was observed in naive BALB/c mice,the Ne was substantially smaller than the CFU recovered on day 8(mean, 14,641; 95% CI � 3,620 to 25,655) (Fig. 3A). The estima-tion of Ne for days 1 to 4 (point estimate, 62; 95% CI � 3 to 111)was similar to the estimation of Ne for days 4 to 8 (point estimate,69; 95% CI � 4 to 75) (Fig. 3B). It appeared that exposure to CTreduced pneumococcal Ne in BALB/c mice.
In DO11.10 RAG�/� mice (which lack adaptive B cell and Tcell immunity, except for CD4� T cells specific for a peptide ofovalbumin) exposed to CT (DO11.10 � CT), the effective popu-lation of pneumococcus showed point estimate of 87 (95% CI � 7to 181) (Fig. 3C, n � 7). Again, the Ne was much smaller than theCFU recovered on day 8 (mean, 9,931; 95% CI � 4,155 to 15,708)(Fig. 3C). The estimation of Ne for days 1 to 3 (point estimate, 86;95% CI � 5 to 245) was similar to the estimation of Ne for days 3to 7 (point estimate, 87; 95% CI � 7 to 206) (Fig. 3D). Thus, the Ne
of pneumococcus in DO11.10 RAG�/� mice showed qualitativelysimilar patterns as in BALB/c mice.
A mathematical model reproduced the Ne patterns. The largediscrepancy between Ne and carriage census population sizewould be most readily explained by heterogeneity in pneumococ-cal replication during nasopharyngeal colonization. Indeed, thenasal mucosa may support two populations of pneumococci,which can be primarily recovered from the outer surface and thenasal tissue, respectively (16). To examine whether the heteroge-neous nasal environment can explain the observed Ne patterns, wemodeled pneumococcal colonization by considering two sub-populations, P1 and P2 that are established 1 day after inoculation(Fig. 4A). Loosely based on the idea of the type I persister de-scribed by Balaban et al. (23), we hypothesized that a small sub-population of pneumococci (P1), perhaps tissue associated (16),actively replicates, while a larger population that is in the naso-pharyngeal lumen or mucosal surface (P2) may or may not repli-cate but does not contribute to the future generations which areseeded by the P1 population. Effectively, P2 is the major site ofbacterial death and removal. Note that this is a deliberate simpli-fication, in the absence of detailed information concerning theheterogeneity in dynamics of the colonizing population over time.
We simulated this model, tracking OVA and AVO strains sep-
FIG 3 Effective population of pneumococcus in BALB/c and DO11.10 RAG�/� mice. All mice had been exposed to CT 4 to 5 weeks prior to challenge. The pointestimate of Ne (�) and mean CFU recovered (�) are shown. The estimated Ne in BALB/c mice (A) or DO11.10 RAG�/� mice (C) was lower than the terminallyrecovered CFU. The Ne in different time intervals was calculated by only using the strain frequency data during the time period specified in BALB/c mice (B) andDO11.10 RAG�/� mice (D). Error bars represent the 95% CI.
Pneumococcal Effective Population
December 2013 Volume 81 Number 12 iai.asm.org 4539

arately, in a continuous-time stochastic process. Typical results of20 simulation outputs for a particular parameter combination(K1 � 400, K2 � 30000) are shown in Fig. 4B. Ne was estimatedbased on the simulated outputs and compared to the equilibriumsize of P2, which was treated as the census population since itrepresents the vast majority of P1 � P2 in our simulation. Asshown in Fig. 4C, the Ne estimated from the simulation outputs(163; 95% CI � 16 to 174) was similar to the Ne estimated forpneumococcus in BALB/c mice and was much smaller than theequilibrium size of P2 (24737) that was used to generate the sim-ulation outputs. For the simulated data, the estimation of Ne fordays 1 to 4 (point estimate, 169; 95% CI � 14 to 291) was alsosimilar to the estimation of Ne for days 4 to 8 (point estimate, 150;95% CI � 15 to 151) (Fig. 4D). In addition, we estimated Ne basedon simulation data generated from varied K1 and K2 to examineeffects of census population (P2*) on Ne (Fig. 4E). We found thata wide range of simulation census population ([4,226 to 48,993],Fig. 4E) that was consistent with the observed CFU recovered cangenerate similar Ne to those observed in the BALB/c mice experi-ment.
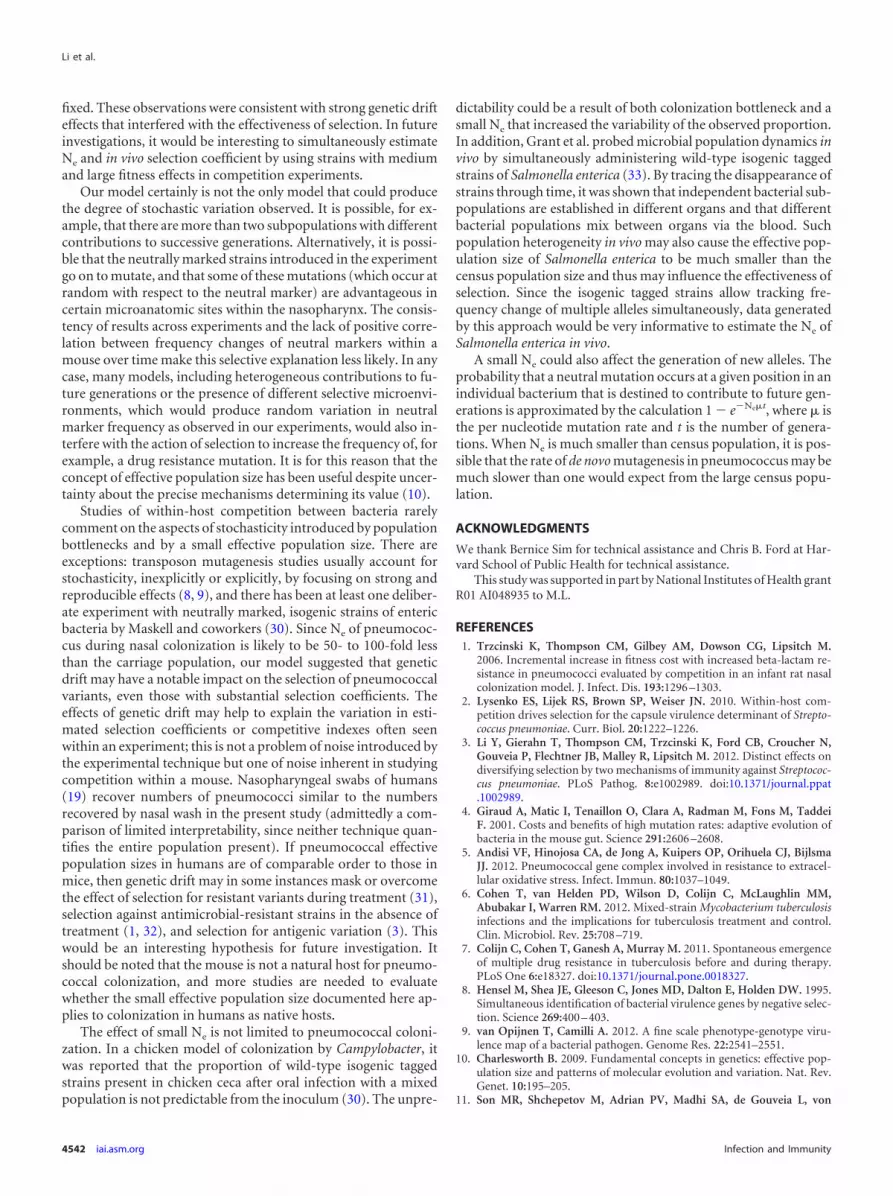
Facilitated by the pneumococcal colonization model, we fur-ther investigated the pattern of allele frequency change in the col-onizing population when the clearance rate of the A strain bacteriais different from that of the O strain bacteria, as might be the caseof under selection for escape from strain-specific immune re-sponses or antimicrobial agents. The results were compared tothose from an ideal population in which the census size and effec-tive size are nearly equal (Fig. 5). In both populations, the censussize was approximately 30,000 during simulation. Selection wouldbe expected to operate efficiently down to a selection coefficient oforder �10�4 if the effective population size were equal to theobserved census size. The colonizing population was parameter-ized such that Ne � 183, a finding consistent with Ne estimated inthe BALB/c mice. The initial mutant allele frequency was set as 0.5(1:1 ratio to the wild-type allele), and the mutant allele frequencywas monitored for up to 8 days. Clearance rate ratios ranging from0.952 to 1.053 were used for both the colonizing population andthe ideal population. The simulation results indicated that selec-tion was less efficient in the colonizing population than in the idealpopulation (Fig. 5). For example, when the clearance rate of the
FIG 4 Mathematical model of pneumococcal colonization dynamics. (A) Differential equations describing the dynamics of two strains (A and O) in twosubpopulations, P1 and P2. A stochastic version of this model was used in simulation. To initialize the simulation, P1 and P2 were set to their equilibrium size (P1*and P2*, respectively), and the ratio between the two strains in each subpopulation was set to follow a log-normal distribution as estimated from the day 1 resultsof the BALB/c colonization experiment. After initiation, the model was simulated forward for a total of t � 10,080 min (7 days), and the counts of the two strainsin each subpopulation on days 1, 4, and 8 were recorded as output. (B) Typical results from 20 simulations with the indicated parameter values. The log10(A2/O2)calculated from the simulation output is shown, and each dashed line connects data points from the same simulation. (C) Simulation of the model producedsmall Ne despite large census population size. The point estimate of Ne (�) calculated from output of 20 simulations in panel B is shown, which is substantiallysmaller than the census population size P2* (�) used in the simulation. Error bars indicate the 95% CI. (D) Simulation of the model showed little temporal changein Ne. Ne was calculated from output of 20 simulations shown in panel B and the Ne in different time intervals was estimated by only using the strain frequencydata during the time period specified. Error bars indicate the 95% CI. (E) Effects of P1* and P2* size on the estimated Ne. Simulation was performed with varyingK1 and K2 values such that the indicated P1* and P2* sizes were achieved. Twenty simulations were performed for each combination of P1* and P2*, and the pointestimate of Ne based on that 20 simulation output is shown. The shaded area represents where the simulated Ne values fall within the 95% CI of Ne estimated fromthe BALB/c colonization experiment, and the census population size used in the simulation (P2*) is no smaller than the census population size observed in theBALB/c colonization experiment (95% CI of mean CFU recovered, open bar).
Li et al.
4540 iai.asm.org Infection and Immunity
mutant allele was 0.990 that of the wild-type allele, mutant allelefrequency increased above 0.5 in 13/20 simulations by day 4 in thecolonizing population (Fig. 5A), while the mutant allele frequencyincreased above 0.5 in 20/20 simulations in the ideal populationduring the same period (Fig. 5C). By day 8, the mutant allelefrequency showed a highly significant increase in the ideal popu-lation (mean increase � 0.1274, n � 20, P 0.0001, one sample ttest) (Fig. 5D). In the colonizing population, by contrast, the in-crease in mutant allele frequency was not statistically significantby day 8 (mean increase � 0.038, n � 20, P � 0.57, one sampleStudent t test) (Fig. 5B). Similar results were observed when theinitial mutant allele frequency was set as 0.01 (see Fig. S1 in thesupplemental material).
DISCUSSION
In this study, we estimated the effective population size of Strep-tococcus pneumoniae in a mouse colonization model by followingthe frequency change of two cocolonizing, competitively neutralpneumococcal strains. Since only allele frequency data on or afterday 1 were used in Ne estimation, the effect of colonization bot-tleneck on frequency changes was minimized. In two mouse types,the Ne during nasal carriage was much smaller than the lowerbound of census population that is estimated by the number ofCFU recovered. The number of CFU recovered in the presentstudy was smaller than the colonization density reported in otherstudies (9, 27–29), because at no time point did we intend toremove and recover the whole colonizing population. We pur-posely retrieved only a small fraction of the total population dur-
ing live sampling in order to keep the colonization minimallydisturbed. Even at the terminal sample, we did not exhaustivelywash the mouse’s upper respiratory tract but rather used a fixedrecovery volume of 200 �l. Pneumococcal Ne also showed littletemporal variation during colonization. We hypothesized thatsuch a small Ne may reduce the effectiveness of within host selec-tion for pneumococcus.
We constructed a mathematical model of colonization by con-sidering two subpopulations of different growth dynamics that areestablished after a colonization bottleneck. In this model, a small,fast-replicating subpopulation generates most of the stochasticdeviation in allele frequency that is then passed to a large subpop-ulation that is readily sampled but is not contributing much to-ward future generations. The model represents one, though notthe only, biologically plausible mechanism that could generatesuch small effective population size. By simulation, we showedthat this model could reproduce Ne patterns that were consistentwith what was observed in mice experiments over a wide range ofparameter values. A small Ne could be consistent with either alarge or a small census population size (Fig. 4D), depending on therelative size of the two subpopulations. Thus, subpopulationstructure, rather than the total population size, could be a criticaldeterminant of Ne during pneumococcal colonization.
Using stochastic simulation of the model, we also examined theeffectiveness of within-host selection for a mutant allele. Com-pared to an ideal population, the colonizing population showedtwo features: (i) the increase in frequency of a favorable allele wasmore variable and (ii) a favorable allele was less likely to become
FIG 5 Effect of small Ne on the effectiveness of within-host selection. Simulations were performed based on a colonizing population model (A) or an idealpopulation model (B) (see Materials and Methods for details). A range of clearance rates were applied to the mutant allele, while the clearance rate for thewild-type allele was kept constant at 0.0043 min�1. For each mutant clearance rate, 20 simulations were performed. The dotted lines indicate the initial frequencyof the mutant allele (0.5 on day 0). Frequencies of the mutant alleles on day 4 (25 generations, left) and day 8 (50 generations, right) are shown. Bars representmeans.
Pneumococcal Effective Population
December 2013 Volume 81 Number 12 iai.asm.org 4541
fixed. These observations were consistent with strong genetic drifteffects that interfered with the effectiveness of selection. In futureinvestigations, it would be interesting to simultaneously estimateNe and in vivo selection coefficient by using strains with mediumand large fitness effects in competition experiments.
Our model certainly is not the only model that could producethe degree of stochastic variation observed. It is possible, for ex-ample, that there are more than two subpopulations with differentcontributions to successive generations. Alternatively, it is possi-ble that the neutrally marked strains introduced in the experimentgo on to mutate, and that some of these mutations (which occur atrandom with respect to the neutral marker) are advantageous incertain microanatomic sites within the nasopharynx. The consis-tency of results across experiments and the lack of positive corre-lation between frequency changes of neutral markers within amouse over time make this selective explanation less likely. In anycase, many models, including heterogeneous contributions to fu-ture generations or the presence of different selective microenvi-ronments, which would produce random variation in neutralmarker frequency as observed in our experiments, would also in-terfere with the action of selection to increase the frequency of, forexample, a drug resistance mutation. It is for this reason that theconcept of effective population size has been useful despite uncer-tainty about the precise mechanisms determining its value (10).
Studies of within-host competition between bacteria rarelycomment on the aspects of stochasticity introduced by populationbottlenecks and by a small effective population size. There areexceptions: transposon mutagenesis studies usually account forstochasticity, inexplicitly or explicitly, by focusing on strong andreproducible effects (8, 9), and there has been at least one deliber-ate experiment with neutrally marked, isogenic strains of entericbacteria by Maskell and coworkers (30). Since Ne of pneumococ-cus during nasal colonization is likely to be 50- to 100-fold lessthan the carriage population, our model suggested that geneticdrift may have a notable impact on the selection of pneumococcalvariants, even those with substantial selection coefficients. Theeffects of genetic drift may help to explain the variation in esti-mated selection coefficients or competitive indexes often seenwithin an experiment; this is not a problem of noise introduced bythe experimental technique but one of noise inherent in studyingcompetition within a mouse. Nasopharyngeal swabs of humans(19) recover numbers of pneumococci similar to the numbersrecovered by nasal wash in the present study (admittedly a com-parison of limited interpretability, since neither technique quan-tifies the entire population present). If pneumococcal effectivepopulation sizes in humans are of comparable order to those inmice, then genetic drift may in some instances mask or overcomethe effect of selection for resistant variants during treatment (31),selection against antimicrobial-resistant strains in the absence oftreatment (1, 32), and selection for antigenic variation (3). Thiswould be an interesting hypothesis for future investigation. Itshould be noted that the mouse is not a natural host for pneumo-coccal colonization, and more studies are needed to evaluatewhether the small effective population size documented here ap-plies to colonization in humans as native hosts.
The effect of small Ne is not limited to pneumococcal coloni-zation. In a chicken model of colonization by Campylobacter, itwas reported that the proportion of wild-type isogenic taggedstrains present in chicken ceca after oral infection with a mixedpopulation is not predictable from the inoculum (30). The unpre-
dictability could be a result of both colonization bottleneck and asmall Ne that increased the variability of the observed proportion.In addition, Grant et al. probed microbial population dynamics invivo by simultaneously administering wild-type isogenic taggedstrains of Salmonella enterica (33). By tracing the disappearance ofstrains through time, it was shown that independent bacterial sub-populations are established in different organs and that differentbacterial populations mix between organs via the blood. Suchpopulation heterogeneity in vivo may also cause the effective pop-ulation size of Salmonella enterica to be much smaller than thecensus population size and thus may influence the effectiveness ofselection. Since the isogenic tagged strains allow tracking fre-quency change of multiple alleles simultaneously, data generatedby this approach would be very informative to estimate the Ne ofSalmonella enterica in vivo.
A small Ne could also affect the generation of new alleles. Theprobability that a neutral mutation occurs at a given position in anindividual bacterium that is destined to contribute to future gen-erations is approximated by the calculation 1 � e�Ne�t, where � isthe per nucleotide mutation rate and t is the number of genera-tions. When Ne is much smaller than census population, it is pos-sible that the rate of de novo mutagenesis in pneumococcus may bemuch slower than one would expect from the large census popu-lation.
ACKNOWLEDGMENTS
We thank Bernice Sim for technical assistance and Chris B. Ford at Har-vard School of Public Health for technical assistance.
This study was supported in part by National Institutes of Health grantR01 AI048935 to M.L.
REFERENCES1. Trzcinski K, Thompson CM, Gilbey AM, Dowson CG, Lipsitch M.
2006. Incremental increase in fitness cost with increased beta-lactam re-sistance in pneumococci evaluated by competition in an infant rat nasalcolonization model. J. Infect. Dis. 193:1296 –1303.
2. Lysenko ES, Lijek RS, Brown SP, Weiser JN. 2010. Within-host com-petition drives selection for the capsule virulence determinant of Strepto-coccus pneumoniae. Curr. Biol. 20:1222–1226.
3. Li Y, Gierahn T, Thompson CM, Trzcinski K, Ford CB, Croucher N,Gouveia P, Flechtner JB, Malley R, Lipsitch M. 2012. Distinct effects ondiversifying selection by two mechanisms of immunity against Streptococ-cus pneumoniae. PLoS Pathog. 8:e1002989. doi:10.1371/journal.ppat.1002989.
4. Giraud A, Matic I, Tenaillon O, Clara A, Radman M, Fons M, TaddeiF. 2001. Costs and benefits of high mutation rates: adaptive evolution ofbacteria in the mouse gut. Science 291:2606 –2608.
5. Andisi VF, Hinojosa CA, de Jong A, Kuipers OP, Orihuela CJ, BijlsmaJJ. 2012. Pneumococcal gene complex involved in resistance to extracel-lular oxidative stress. Infect. Immun. 80:1037–1049.
6. Cohen T, van Helden PD, Wilson D, Colijn C, McLaughlin MM,Abubakar I, Warren RM. 2012. Mixed-strain Mycobacterium tuberculosisinfections and the implications for tuberculosis treatment and control.Clin. Microbiol. Rev. 25:708 –719.
7. Colijn C, Cohen T, Ganesh A, Murray M. 2011. Spontaneous emergenceof multiple drug resistance in tuberculosis before and during therapy.PLoS One 6:e18327. doi:10.1371/journal.pone.0018327.
8. Hensel M, Shea JE, Gleeson C, Jones MD, Dalton E, Holden DW. 1995.Simultaneous identification of bacterial virulence genes by negative selec-tion. Science 269:400 – 403.
9. van Opijnen T, Camilli A. 2012. A fine scale phenotype-genotype viru-lence map of a bacterial pathogen. Genome Res. 22:2541–2551.
10. Charlesworth B. 2009. Fundamental concepts in genetics: effective pop-ulation size and patterns of molecular evolution and variation. Nat. Rev.Genet. 10:195–205.
11. Son MR, Shchepetov M, Adrian PV, Madhi SA, de Gouveia L, von
Li et al.
4542 iai.asm.org Infection and Immunity

Gottberg A, Klugman KP, Weiser JN, Dawid S. 2011. Conserved muta-tions in the pneumococcal bacteriocin transporter gene, blpA, result in acomplex population consisting of producers and cheaters. mBio 2:00179 –11. doi:10.1128/mBio.00179-11.
12. Davis KM, Akinbi HT, Standish AJ, Weiser JN. 2008. Resistance tomucosal lysozyme compensates for the fitness deficit of peptidoglycanmodifications by Streptococcus pneumoniae. PLoS Pathog. 4:e1000241.doi:10.1371/journal.ppat.1000241.
13. van Opijnen T, Camilli A. 2012. A fine scale phenotype-genotype viru-lence map of a bacterial pathogen. Genome Res. doi:10.1101/gr.137430.112.
14. Mastroeni P, Grant A, Restif O, Maskell D. 2009. A dynamic view of thespread and intracellular distribution of Salmonella enterica. Nat. Rev. Mi-crobiol. 7:73– 80.
15. Giraud A, Fons M, Taddei F. 2003. Impact of mutation rate on theadaptation of gut bacteria. J. Soc. Biol. 197:389 –396. (In French.)
16. Briles DE, Novak L, Hotomi M, van Ginkel FW, King J. 2005. Nasalcolonization with Streptococcus pneumoniae includes subpopulations ofsurface and invasive pneumococci. Infect. Immun. 73:6945– 6951.
17. Bogaert D, De Groot R, Hermans PW. 2004. Streptococcus pneumoniaecolonisation: the key to pneumococcal disease. Lancet Infect. Dis. 4:144 –154.
18. Simell B, Auranen K, Kayhty H, Goldblatt D, Dagan R, O’Brien KL,Pneumococcal Carriage Group. 2012. The fundamental link betweenpneumococcal carriage and disease. Expert Rev. Vaccines 11:841– 855.
19. Albrich WC, Madhi SA, Adrian PV, van Niekerk N, Mareletsi T,Cutland C, Wong M, Khoosal M, Karstaedt A, Zhao P, Deatly A, SidhuM, Jansen KU, Klugman KP. 2012. Use of a rapid test of pneumococcalcolonization density to diagnose pneumococcal pneumonia. Clin. Infect.Dis. 54:601– 609.
20. Wang J. 2003. Maximum-likelihood estimation of admixture proportionsfrom genetic data. Genetics 164:747–765.
21. Wang J. 2001. A pseudo-likelihood method for estimating effective pop-ulation size from temporally spaced samples. Genet. Res. 78:243–257.
22. Williamson EG, Slatkin M. 1999. Using maximum likelihood to estimatepopulation size from temporal changes in allele frequencies. Genetics 152:755–761.
23. Balaban NQ, Merrin J, Chait R, Kowalik L, Leibler S. 2004. Bacterialpersistence as a phenotypic switch. Science 305:1622–1625.
24. Cao Y, Gillespie DT, Petzold LR. 2007. Adaptive explicit-implicit tau-leaping method with automatic tau selection. J. Chem. Physics 126:224101.
25. Wang J, Whitlock MC. 2003. Estimating effective population size andmigration rates from genetic samples over space and time. Genetics 163:429 – 446.
26. Hathaway LJ, Brugger SD, Morand B, Bangert M, Rotzetter JU, HauserC, Graber WA, Gore S, Kadioglu A, Muhlemann K. 2012. Capsule typeof Streptococcus pneumoniae determines growth phenotype. PLoS Pathog.8:e1002574. doi:10.1371/journal.ppat.1002574.
27. Rosch JW, Mann B, Thornton J, Sublett J, Tuomanen E. 2008. Con-vergence of regulatory networks on the pilus locus of Streptococcus pneu-moniae. Infect. Immun. 76:3187–3196.
28. Cron LE, Bootsma HJ, Noske N, Burghout P, Hammerschmidt S,Hermans PW. 2009. Surface-associated lipoprotein PpmA of Streptococ-cus pneumoniae is involved in colonization in a strain-specific manner.Microbiology 155:2401–2410.
29. Cron LE, Stol K, Burghout P, van Selm S, Simonetti ER, Bootsma HJ,Hermans PW. 2011. Two DHH subfamily 1 proteins contribute to pneu-mococcal virulence and confer protection against pneumococcal disease.Infect. Immun. 79:3697–3710.
30. Coward C, van Diemen PM, Conlan AJ, Gog JR, Stevens MP, Jones MA,Maskell DJ. 2008. Competing isogenic Campylobacter strains exhibit vari-able population structures in vivo. Appl. Environ. Microbiol. 74:3857–3867.
31. Anderson KB, Tan JS, File TM, Jr, DiPersio JR, Willey BM, Low DE.2003. Emergence of levofloxacin-resistant pneumococci in immunocom-promised adults after therapy for community-acquired pneumonia. Clin.Infect. Dis. 37:376 –381.
32. Andersson DI, Hughes D. 2010. Antibiotic resistance and its cost: is itpossible to reverse resistance? Nat. Rev. Microbiol. 8:260 –271.
33. Grant AJ, Restif O, McKinley TJ, Sheppard M, Maskell DJ, MastroeniP. 2008. Modeling within-host spatiotemporal dynamics of invasive bac-terial disease. PLoS Biol. 6:e74. doi:10.1371/journal.pbio.0060074.
Pneumococcal Effective Population
December 2013 Volume 81 Number 12 iai.asm.org 4543