with refanned jt8d engines
TRANSCRIPT

NASA CR-1348s REPORT MDCJ4519
WITH REFANNED JT8D ENGINES FINAL REPORT
VOLUME lli PERFORMANCE AND ANALYSIS
( N P S A - C F - 1 3 4 8 5 9 ) LC-S FLIGHT C L B C N S ' K E A I I O N ti7b- 1306 2
3: F E F F Q P E A S C E A E C AIALYSIS Fina l iiepcrt (Dcuqlas A i r c r a f t C c . , Inc.) 2 3 9 F H C $ @ . C C U n c l a s
FSCCFA)! WITH F E F A N N E C J78C ??IGINES. U C L U F E
C X L <IC G 3 / c ' 5 Cit74l:
Pnpared for Nnimrl Acronoutics and Space Administration
NASA Lewis bearch h t e r Contract NAS 317841
R&R W. Schroeder, Project Manager

2 Government Acarwon No. 1 RemrtNo.
NASA a-131859 4. Tttk rd Subtitle
DC-9 FLIGHT DWSSTRATIOh’ PROGRA?l U!TH REFANNED JTBD LYCIXES. FINAL REPORT. VOLLE 111. PBKFORW4XE .WD AKALYSIS
7. Author(S) I
3 Rccipmt’sC.ulopNo
5. Rcpdrc Date
July 1972 6. Rrfomtng Oqmiatlon codc
, --
8. Rrtwminq olcpnizatmn Report No I Ioc 54519
.
9 Ratwmu*i ~ I I r a t o n Nnr VKI we% 10. W o k Un~t No
Douglas A i K r a f t C-ny NcDonnell Doqlas Corporation Long 8each. Cal i fornlr 90801
,
%ational Aerorwutlcs and Space Adninistration L‘-shinr:on. O.C.
?5. S u p p l M n t * V Nom
I JT8D-109 engines.
Project Manager. Robert Y. Schroeder NASA lewis Research Center Cleveland, Ohio
16 Abstract During the period o f June 1973 t o July 1975. analytical data were produced t o support the design. fabrication, and ground and f l i g h t test ing o f OC-9 Refan airfrare/nacelle h a h a r e with prototype
The pmduction JT8D-109 engine has a sea level stat ic, standard day bare engine takeoff thrust o f 73 840 N (16.600 lb). In r ta l la t ion of the JT80-109 results i n an operational weight increase of 1 041 kg (2.291 lb ) and an a f t operational empty weight c.g. s h i f t o f 6 t o 7 percent W.A.C.. A t sea level standard day conditions the additional thrust of the 5180-109 results i n 2 040 kg (4500 l b ] additional takeoff gross weight capabilit-t fo r a given f i e l d length. Range loss o f the OC-9 Refan airplane fo r long range cruise a t 10 668 m (35.000 ft) and payloads i l l us t ra t i ng takeoff-gross-wight and fuel capacity l imi ted cases are 352 i n (190 n.ni.) and 54 km (29 n.ni.) respectively. Range loss for 0.78 Mach n e t cruise a t 9 1U m ([email protected] ft) and payloads sime as above are 326 km (176 n.mi.1 and 50 km (27 n.mi.) respectively. The Refan airplane dgonstrated s ta l l , s ta t i c lonqitudinal s tab i l i t y , longitudinal control, longi- tudinal t r i m , a i r and ground minium control speeds. and directional control characteristics that were similar t o the Dc-9-30 production a*rplane ana did canply with production airplane a imr th iness requirements. Cruise perfotmance, with prototype JT80-109 engines. showed the range factor 5 t o 7 percent lam t4an an equivalent JTSD-9 pawred production OC-9-30. C l i m b performance shows an 8 percent improveuent i n second segment and approach l im i t ing weights and a 5 percent improvement i n enroute ?imit ing w igh t . Thrust reverser performance was denonstrated a t speeds below the operationa cutback speed 30.87 m/s (60 knots) with acceptable engine operation. Structural and dynamic ground test, f l i g h t test and analytical results substantiate Refan Proqrm requirements that the nacelle, thrust reverser harbare. and the afrplane structural modifications are flightworthy and cer t i f iab le and that the airplane m e t f l u t t e r speed margins. Estimated un i t cost o f a DC-9 Refan retrofit p rog rn i s 1.338 mi l l ion i n mid-1975 dollars wi th about an equal s p l i t i n cost between air f rame and engine.
I I--- 17 Kcv WodS (Suggclted by Authork)) 18 Distrihutton Statement
‘11 ~ n a t o r ~ t N o
MS 3-17841
13. T n r of Rcpon .nd kid Covered
Contractor Report
14. Spaaring codt
StAbi l i ty and C o n t r o l , Retrof i t and Economics, Structural and Aerodynamic damping, 3C-9 Refan r l i g h t Test, JT80-109 Prototype Engines
Unclassi fied-Unliai ted
‘ For sale by (he National Techi i ic i l lnloririatiori Sciv icr Siiiiriglirlrl Vi iFi i i ! . i 22151

TABLE OF CONTENTS
SLmARY ................................................................ INTROWCTION ........................................................... AIRPLANE DESCRIPTION ................................................... ENGINE P E f f O ~ C E ..................................................... AIRPLANE P E R f O W W E ................................................... AIRPLANE STABILITY AND COHTlEOL .........................................
S t a l l Characteristics ............................................. Stat ic Longitudinal S t a b i l i t y ..................................... Longitudinal Control .............................................. Longitudinal Trim ................................................. M i n i m Control Speed .............................................
AIRPLANE/ENGINE PERFORMANCE ............................................ Two Engine Takeoff Acceleration ................................... Climb Perfonance ................................................. Cruise Performance ................................................ Drag Polars A l l Engine ............................................ Fuel Supply ....................................................... Engine S t a r t i n g ................................................... Fl ight Test Prototype Engine Perfollllance ..........................
Instal led engine cal ibrat ion ................................... Thrust lapse rate ............................................... Engine operation during MCL climb ............................... Engine performance during transients ............................ Engine characteristics during airplane maneuvers ................
1
3
5
9
21
37
39
43
47
51
57
61
63
65
67
71
73
77
81
81
100
100
104
112
iii

Engine Component Cooling .......................................... Constant Speed Drive O i l and Generator ~ l i ..................... Engine Fire Detector System ....................................... Engine Vibration Wsurement ...................................... Thrust Reverser ................................................... Ice Protection .................................................... Auxil iary Power Plant .............................................
AIRPLYNE STRUCTURAL INTEGRITY ATID DYNWICS ............................. Structural Analyses ...............................................
Pylon/Fuselage .................................................. !.acelle ......................................................... Thrust reverser .................................................
Flu t te r Analyses .................................................. Ground V i brat ion Test Modes and Frequencies ....................... Structural and Aerodynanfc Danpfng ................................
RETROFIT At4D ECONOMICS ANALYSIS ........................................ SWHARY OF RESULTS AND CONCLUSIOWS ..................................... Q'fi.ENCES ............................................................. SIYF1BOLS ................................................................
11 3
121
127
131
155
163
169
179
181
182
192
196
207
209
213
215
223
227
229
i v

S U W R Y
The purpose o f the DC-9 Refan Program was t o establ ish the technical and economic f e a s i b i l i t y o f reducing the noise o f ex i s t i ng JT8D powered DC-9 a i r c r a f t . The Refan Program was div ided i n t o two phases.
Phase I provided engine and nacel le la i rp lane in tegra t ion d e f i n i t i o n documents f o r i n s t a l l a t i o n o f the JT8D-109 engine on the DC-9 series airplane, prepared prel iminary design of nacel le and airplane modif icat ions, conducted model t es ts f o r design information, and prepared analyses f o r economic and retrofit considerations. Phase I1 included d e t a i l analyses, hardware design and fabr icat ion, and f l ight tes t i ng t o substantiate the design and obtain f l y o i e r noise data.
The JT8D-109 engine, a der iva t ive o f the basic P r a t t and Whitney JT8D-9 turbofan engine with the min inum treatment acoustic nacel le was selected i n Phase I f o r the design, analysis, construction, and f l i g h t t es t i ng during Phase 11.
The work described i n t h i s repor t documnts the performance and analysis e f f o r t car r ied out under Phase 11, Contract NAS 3-17841.
The sea leve l s ta t i c , standard day bare engine takeoff t h rus t f o r the p duction 3T80-109 i s 73 840 N (16,600 l b ) ; re?a t i ve t o the 3180-9 engine the takeoff t h rus t i s 14.5 percent higher, the cru ise TSFC a t 9 144 m (30,000 ft), M = 0.80 and 19 571 N (4,400 l b ) th rus t i s 1.5 percent lower, and the maximum cru ise th rus t avai lab le a t the sane tfach number and a l t i t u d e i s 4 percent higher .
The i n s t a l l a t i o n o f the JT8D-109 engine resu l t s i n an operational weight increase o f 1 041 kg (2,294 l b ) and an a f t operational empty weight center o f g rav i ty s h i f t o f 6 t o 7 percent M.A.C. A t sea leve l standard day condit ions the addi t ional t h rus t o f the JT8D-109 resu l ts i n 2 040 kg (4,500 l b ) addi- t i ona l takeof f gross weight capab i l i t y f o r a given f i e l d length.
The range change o f the DC-9 Refan r e l a t i v e to the production DC-9 airplane f o r long range cruise a t 10 668 m (35,090 ft) and payloads i l l u s t r a t - i n g takeoff-gross-weight and fue l capacity l i m i t e d cases are -352 km (-190 n.mf.) and -54 krn (-29 n.mi.) respectively. Also, the range changes fo r 0.78 Mach number cru ise a t 9 144 m (30,000 ft) and payloads same as above are -326 km (-176 n.mi .) and -50 km (-27 n.mi .) respectively.
Although the JT8D-109 engine has s l i g h t l y be t te r spec i f ic fue l consumption character is t ics , t h i s gain i s o f f s e t by the increased weight o f the engine, nacel le, and airframe modif icat ion hardware, and f o r t yp ica l stage lengths the actual fue l costs are about the same. A t longer stage lengths the Refan airplane would bum s l i g h t l y more fue l .
The Refan airplane demonstrated s t a l l , s t a t i c longi tud ina l s t a b i l i t y , longi tud ina l control , longi tud ina l t r i m , a i r and ground rninirmm control speeds, and d i rec t iona l control character is t ics s im i la r t o the production DC-9-30 and d i d comply w i th production airplane airworthiness requirements.

The c l i nb performance o f the OC-9 Refan airplane re la t i ve t o the production DC-9-30 shows an 8 percent i n p r o v e m t i n second segmnt and approach l i m i t i n g weights and a 5 percent inproverant i n enroute l i m i t i n g weight. The cruise performance data from the OC-9 airplane powered with JT8D-109 prototype engines shared the range factor f r o m 5 t o 7 percent lower than an equivalent 318D-9 powered DC-9-30 production airplane. The engine nacelle conpartmnt venti lat ion, subsystem component, qenerator, and constant speed drive cooling systems were demonstrated sa t i s fac to r i l y f o r ground and i n f l i g h t conditions.
Thrust reverser per fomnce was demonstrated a t speeds below the opera- t ional cutback speed o f 30.87 m/s (60 knots) with acceptable engine operation. The caw1 ice protection system f l i g h t evaluation shows that the system pro- vides ice protection performance which i s equal t o o r i n excess of predictions; and the aux i l iary power plant t e s t data indicated no unusual s ta r t i ng o r operating characteristics.
t o ground and f l i g h t tes t data substantiate! program requirements that the nacelle, thrust reverser hardware, and the airplane structural modifications are f l ightnorthy and c e r t i f i a b l e and that the Refan airplane m e t f l u t t e r speed margins.
The DC-9 Refan airplane structural and dynamic analyt ical results compared
The r e t r o f i t and economic analysis based on the r e t r o f i t o f 550 airplanes, indicate that the estimated u n i t cost o f the r e t r o f i t program i s 1.338 m i l l i o n i n mid-1975 dol lars wi th about an equal s p l i t i n cost between airframe and engine.

i NTRODUCTI ON
The continuing growth o f the a i r t ransportat ion industry w i th resu l t i ng i ncwased numbers o f operations f r o m es tab1 ished o r emerging a i rpor ts coup1 ed w i th increased populat ion density near a i rpor ts , has resul ted i n an e f fo r t t o contro l human exposure t o airplane noise. The government and indus t r i a l organizations have therefore agressively supported programs d i rected a t producing airplane and engine designs o f fe r i ng meaningful reductions i n a i r - po r t community noise.
During the l a t e 1960's research re la ted t o the noise w i th in the engine i t s e l f and research re la ted t o absorotive mater ia ls were s u f f i c i e n t l y re f ined t o have been applied t o the development o f the quieter high bypass r a t i o turbo- fan power plants f o r the new qeneration o f wide-body cocmercial airDlanes.
However, a la rge por t ion o f the ex i s t i ng and expanding f l e e t o f standard bodied transports are powered by the JT3D o r JT8D low bypass r a t i o engines. Since ear ly ret irement o f these airplanes o r re-engining w i t h a t o t a l l y new high-bypass r a t i o engine are no t competit ive i n terms o f t i ineliness o r economics, two approaches t o solve the noise problem o f these l w bypass r a t i o engines appear t o be feasible.
(SAM) t o nacel le treatment w i t h possibly a j e t noise suppressor. A number o f government and industry studies have considered t h i s approach (SAM) and stand- ard body transports being del ivered i n the mid-1970's include t h i s technology.
One approach would be t o apply the technology o f sound absorbing mater ia ls
A second approach would be t o incorporate the technology o f the high- bypass r a t i o engines i n t o the JT3D and JT8D family. This would require re- placement o f the present low bypass r a t i o engine fans w i th la rger fans whi le maintaining the hardware and general operating character is t ics o f the core engine. This would r e s u l t i n a substant ia l reduction i n j e t exhaust noise, of pa r t i cu la r i n te res t f o r the JT8D engine, w i th the p o s s i b i l i t y o f improved engine fue l consumption and a substant ia l improvement i n thrust .
I n August 1972, the NASA Lewis Research Center authorized the Douglas A i r c r a f t Company, The Boeing Company, and P r a t t and Whitney A i r c r a f t t o develop and establ ish the economic and technical f e a s i b i l i t y o f reducing noise by developing engine and airframe/nacelle modif icat ions. The program covered the JT3D engine and the DC-8 and B-707 !t powers and the JTSD engine and the DC-9, 8-727 and 8-737 i t powers. A t the end o f approximately four and one-half months a l l e f f o r t on the JT3D was terminated. A l l subsequent studies were performed on a der iva t ive of the P ra t t and Whitney JT8D-9 engine desig- nated the JT8D-109. The Douglas A i r c r a f t Company Phase I e f f o r t i s sumnarired i n reference 1.
On the basis of the resu l ts of the Phase I e f f o r t the Douglas A i r c r a f t Company was authorized on 30 June 1973 t o proceed w i th a Phase 11 study that would include the nacel le/airplane design and construction, k i t costs , ground compat ib i l i ty tests, f l i g h t worthiness, f l i g h t engine/airplane performance and f l yover noise tests .
3

This volume (Volune 111) o f the NASA Refan program Phase I1 f i n a l repcrt contains the fol lowing:
A comparison o f the performance and physical character is t ics o f the production JT8D-109 and JT8D-9 engines.
A comparison o f the performance o f the production DC-9-30 and the DC-9 Refan airplane with production JT8D-9 and JT8D-109 engines insta l led, respectively.
An evaluation o f the s t a b i l i t y and control character is t ics o f the DC-9 Refan airplane.
An evaluation o f the DC-9 Refan airplane/engine perfonnance w i th the two prototype JT8D-109 f l i g h t t e s t engines insta l led.
A surmary o f the s t ruc tu ra l and dynamic analysis.
An evaluation o f the resu l ts from ground tests t h a t were conducted p r i o r t o f l i g h t t e s t i n g and an evaluation and comparison o f f l i g h t t e s t data w i th ana ly t i ca l resul ts .
An evaluation o f the resu l ts from the s t ruc tu ra l and aerodynamic damping f l ight tests.
A summary o f the r e t r o f i t and economic analysis.
A sumnary o f the design and construction, performance and analysis, and f l yover noise t e s t resul ts for the DC-9 Refan f l i g h t demonstration airplane i s presented i n Volume I, reference 2.
s t r a t i o n conf igurat ion f o r the nacelle, pylon, thrust reverser, sub-system, and fuselage inc lud ing hardware construction i s reported i n Volume 11, reference 3.
The design e f f o r t t h a t establ ished the DC-9 Refan airplane f l i g h t demon-
FAR Part 36 noise levels, EPNL and dB(A) - distance maps, noise contours , spectral studies on ext ra ground attenuation, turbulence, ground re f lec t ion , noise source levels, s t a t i c - t o - f l i g h t predict ions, and the engine/nacelle acoustical character ist ics o f the DC-9 Refan airplane are reported i n Volume I V , reference 4.
This repor t contains both U.S. Customary and I n t e h a t i o n a l System ( S I ) Units; however, a l l calculat ions and measurements were made using the U.S. Customary Uni ts .
4

A I RPLAilE DESCRI PTIOfl
The DC-9 airplane i s a low wing , two-engine, T-tail, short-to-medium range, comnercial transport produced i n five basic Series (10, 23, 3 C , 40 and 50 plus derivatives of those series). The engines are located a t the rear of the airplane and mounted on pylons attached to the l e f t and riqht side of the fuselage. -31, 32, -32F, 40, -50, the Air Force C-9A and the Navy C-9B. These models vary widely i n takeoff gross weights, fuel t a n k arranqement, fuselage length, wing area and JT8D engine model (figure 1) .
Production models of the DC-9 are the -14/15, -15F, -20,
Figure 1 shows a simplified genealogy of the DC-9 family starting from the f i r s t model (Series 10) and showing the important chanqes made from model to model through the la tes t "stretched" versions. The most sianificant change i n the OC-9 model was introduced w i t h the initiation of the DC-9-30 Series. A t t h a t time, the fuselage was lengthened approximately 4.57 m (179 i n ) , the winq span was increased 1.22 m (48 i n ) and full span leadina edge s la ts were incorporated.
A production model DC-9-31 w i t h a structurally modified fuselage, a new shorter span pylon, a new larger long duct nacelle and thrust reverser w i t h the JT80-109 engine installed \vas used fo r the DC-9 Refan fl iqht demonstration (figure 2) . The Refan airplane was operated a t takeoff gross weights up t o 49 032 kq (108,000 l b ) , and landing gross weights o f 44 946 kg (99,000 lb).
5

c
6

? x
7


ENGIIJE PERFOfMANCE
The JT8D-109 engine i s a der ivat ive o f the basic P r a t t and Whitney A i r c r a f t JT8D-9 turbofan engine. w i t h a mechanically coupled s ing le stage far, and s i x low pressure compressor stages dr iven by a three stage turbine. The seven stage high pressure compressor i s dr iven by a sing;e stage turb ine through concentric shafting. The burner section consists of nine separate chambers i n an annular array. The turb ine i n temperature on a 15°C (59OF) day i s 975OC (1789OF).
It i s an a x i a l flow two spool ducted turbofan engine
The annular fan duct de l ivers the fan a i r rearward where i t i s combtned w i t h the main engine a i r and discharged through a comnon j e t nozzle. The compressor system generates a takeoff compression r a t i o o f 15.5 and a bypass r a t i o o f 2.12. A cross sect ion comparison of the JT8D-109 and JT8D-9 engine and nacel le i s depicted i n f i g u r e 3.
The performance and physical character is t ics o f a production JT8D-109 and JT8D-9 are compared i n tab le 1. The d i r e c t comparison o f bare engine perform- ance i s based on condit ions a t the Pra t t and Whitney A i rc ra f t reference nozzle using a f u e l lower heating value of 10 224 kg cal/kg (18,400 Btu/ lb) ( f igure 4 and 5).
Figures 6 and 7 show the Douglas A i r c r a f t Company nozzle performance coeff ic ients which were estimated by adjust ing the P r a t t and Whitney A i r c r a f t nozzle performance i n engine deck CCD 0287-01.0 w i t h actual t e s t data obtaine during the JT8D-109 engine/nacelle hardware compat ib i l i t y t e s t conducted by P r a t t and Whitney A i r c r a f t i n Hartford.
The Douglas A i r c r a f t Company nozzle ve loc i ty c o e f f i c i e n t f o r tho takeoff condi t ion i s 0.978 and f o r the max cruise condi t ion i s 0.98" a t 9 144 m (30,000 f t) and 0.80 M ( f i g u r e 6). The discharge coe f f i c i e t l t f o r the takeoff condi t ion i s 0.974 and f o r the max cruise condi t ion i s 0.989 a t 9 144 m (30,000 f t) and 0.80 M ( f igure 7).
The i n s t a l l e d engine performance o f the production JT8D-109 and JT8D-9 engine i s compared i n f igures 8 and 9. Performance comparisons betc-een the JT8D-9 and JT8D-109 engines are shown f o r takeoff and cruise conditions. A d i r e c t comparison can be made between the two engine i n s t a l l a t i o n s because of the ident ica l reference nozzles and charging s tat ions used by P r a t t and Whitney A i r c r a f t . The data presented include a l l i n s t a l l a t i o n e f fec ts f o r normal operation. The i n s t a l l a t i o n losses applied t o the JTBD-9 and JTBD-139 engines include the following: Douglas i n l e t , fan arid compressor bleeds, power ext ract lon. Douglas nozzle loss and nacel le draq .
data a t s t a t i c condit ions ( i n l e t reciprocal mass-flow r a t i o , A i / & = 9). experimental data are shown i n f i g u r e 10 f o r both the Doucllas i n l e t and the P r a t t and Whitney A i r c r a f t bellmouth and were obtained from i n l e t pressure measurements during the P r a t t and Whltney ground tests.
Figure 11 shows the i n l e t loss coef f i c ien t as a function o f reciprocal mass-flow r a t i o , A i /& . The loss coef f icent curve passes through the
The i n l e t total-pressure loss was based i n p a r t on avai lab le experimpntal ;he
9

FIGURE 3. JT8D ENGlNE/NACELLE COMPARISON
MAXIMUM AIRFLOW
TABLE 1 BARE ENGINE CHARACTERISTICS COMPARISON
Ibh 340 510 (kg/J (154) 12311
TAKEOFF THRUST (SEA LEVEL STATIC, 1 STANDAr ' 3 A Y ) 1 f: 1 1:: 1 (:iz$ 1 FAN TIP SPtED, SEA LEVEL STATIC TAKEOFF (m/d (432.81 (477.6)
FAN PRESSURE RATIO
MAXIMUM CRUISE THRUST -30,ooOft 19144ml,0.B0M
_ _ BYPASS RATIO 1 .ai 2.1 2
I 1 1 1.97 1.66
Ib 4.640 4.720 (N) (20 196) im m
FAN TIP DIAMETER
OVERALL BARE ENGINE LENGTH (LESS SPINNER)
in. lm)
in. 119.97 127.19 I m) (3.047) 13.231)
I CRUISE TSFC - 30,000h I9 144 m), Ib/hr/lb 0.793 0.781 I 0.80M.4.400lb119571 N) THRUST I (k&!hr/N) I 10.0809) I !3.0798)
BARE ENGINE WEIGHT Ib 3.21 7 3,822 ( t o ) I1 460) I 1 734)
10

- i ? r 10'
- tb
- 15
n - I b z a
- x c I- w
0 14
w 2 -I
c - a
z 2
a
I
13
-
12
11 0.0 0.1 0.2 0.3 0.4
MACH NUMBER - M
FIGURE 4. UC9 REFAN BARE ENGINE PERFORMANCE. PRATT AND WHITNEY NOZZLE, TAKEOFF, SEA LEVEL STANDARD DAY
11

am4-
-0.m
2 2
I
fn Y
0.076
0.072
-
-
- I I
D 3mo 44)o 4
UNINSTALLEO NET THRVST - Ib I I
0.W-
0.080 - ? 1 . a
I
fn
x - Y
0.076
0.07 2
> 4
-
9
-
I I I I I lzo00 14000 16ooo lao00 20000
UNINSTALLED NET THRUST - IN)
3200 3600 4ooo 4'30 5200 UNINSTALLED NET THRUST - tb
J I I I I 14OOO 16000 18OOO 20000 22000
UNINSTALLED NET THRUST - IN1
.
FIGURE 5. oC9 REFAN BARE ENGINE PERFORMANCE, PRATT AND WHITNEY NOZZLE, STANDARD DAY, CRUISE
12

P
m to 2 0
N
0 o!
t
13

c
t! a!! z
? N
R
19 r
? r
r c
N c
9 c
F: u) w
14

76r. lo3
72
68
z I
t- rn 3 U
-
I- w z 0 w A A
rn
I u Z
2 60
lA
56
52
48
17x lo3
16
e 15 I
5 a I I- t- w 2
2 14 A A U !i
' 5 I u z
lA
13
12
11 0.0
FIGURE 8.
0.1 0.2 0.3
MACH NUMBER - M
DCB REFAN INSTALLED ENGINE PERFORMANCE, SEA LEVEL, STANDARD DAY
0 4
TAKEOFF.
1 5

INSTALLATION EFFECTS
0 INLETLOSS 0 GENERATOR COOLING 0 AIR CONDITIONING BLEED 0 HORSEPOWER EXTRACTION 0 NACELLE AND PYLON DRAGS
DOUGLASNOZZLE I
M = 0.76. 35,000 h (10 668 m) STANDARD DAY
,/ JT8D-9
JT8D-109
I I
0.090
- z . L . I 01
5 0.086 I
V lL v)
2400 2800 3200 3600 4000 1 0.82
2an, 0.082 F - INSTALLED NET THRUST - Ib
I I NC j I I I 8000 1o.Ooo 12000 1 4 . m 16,000 18,000
- INSTALLED NET THRUST - (N)
0.096
0.092 I
2 z m -r I
v)
c . Y
0.088
0.084
0.96
0.92 P 2 3 .
I V LL In
0.88
0.84 2400 2800 3200 3800 4000 4400
F - INSTALLED NET THRUST - Ib 1 1 NC I I I 1
10.000 12.000 14,000 16.000 18.OOO 20,000
F - INSTALLED NET THRUST - IN) NC
FIGURE 9. DC9 REFAN INSTALLED CRUISE PERFROMANCE
16

REFERRED AIRFLOW, W h T /6 - Ib/s T 2 T2
I I I I I 1 0 50 100 150 200 250
REFERRED AIRFLOW, W ~ , ' ~ - - / h T - (kgls) T 2 2
u v) ln s
FIGURE 10. DC-9 REFAN INLET LOSS COEFFICIENT FROM GROUND TEST DATA
0 . 0 1 - ~ ~ 11.54ft2 (1.072rn2)
O FROM INLET GROUND-TEST DATA AT Al/A, 0
A FROM BELLMOUTH GROUND-TEST DATA AT A,/A,, 0
0 ESTIMATED LOSSCOEFFICIENT AT AI/A,, - 1.0
I 1
17

experimental leve l a t A i / b = 0 and through an ana ly t i ca l estimate leve l
at in terna Ai’? = drag loo* coef f i c i en t o f the i n l e t and then conversion o f the drag coe f f i c i en t i n t o an equivalent total-pressure loss coef f i c ien t . The decreasing l eve l o f loss-coeff ic ient w i th increasing Ai/&, i s due t o the diminishing l i p loss as the s ize o f the engine a i r f l o w streamtube a t f ree stream conditions, &, approaches the s ize of the i n l e t , A i . The e f f e c t I f var iables other than rec iprocal mass-flow r a t i o ( i n l e t angle o f attack ana etlgine a i r f low) on i n l e t loss coe f f i c i en t i s not s ign i f i can t f o r the DC-9 operating envelope
kre engine performance demonstrations are made w i th a bellmouth i n s t a l l e d and no correct ion i s made by the engine manufacturer f o r bellmouth loss. Therefore, on ly the d i f ference between the i n l e t and bellmouth loss leve ls shown i n f i gu re 11 i s appl ied f o r the ca lcu la t ion of i n s t a l l e d engine performance.
The ana ly t i ca l estimate was made by ca lcu la t ion o f the
Table 2 compares ( a t the same condi t ions) the production DC-9-30 engine i n s t a l l a t i o n losses f o r a t yp i ca l takeoff condi t ion o f Mach number 0.27, sea leve l standard day with the DC-9 Refan engine i n s t a l l a t i o n losses. The i n s t a l l a t i o n loss comparison f o r a t yp i ca l h igh speed cru ise i s shown i n tab le 3. The cru ise condit ions are as fo l lows: Mach number 0.78, a l t i t u d e o f 9 144 m (30,000 f t) and an i n s t a l l e d th rus t o f 16 014 N (3,600 l b ) per engi ne
18

w z c3 z w
M
- o\ 0 I tl a0 c 3
c a2 m 0 9
I
.. 5F _-
,I
w e - -!? j
n c
CCI c, 0 e
a + c Y
X
z L L
I1
V z LL
1 9

% Q n U L
E I c, v)
n E U U
0,
0"
m
c
Y . w e 0 0 0, a
a w
II
t-
0
0
w E
m n z U
0 a
c
c Y
c)
0 0
m w
c
'0,
l
1 n
mor hh I-. 0 . .
Y
B 0 0
I
- rD Ln 0 0
+ .
a0 0 0 0
I
- g I
n
w Y
5 u,
ou d
LL LL w
W
N 0 L v) e s 8 Y
pl 0
h V ) 4 0 0 , W h 0 0
+ + . . !
N w 0 0
I . - N 0, N 0
I .
20

AIRPLANE PERFORMANCE
The i n s t a l l a t i o n of the JT8D-109 engine resu l ts i n an operational weight increase of 1 041 kg (2,294 l b ) and an a f t Operational Empty Weight (OEW) center of g r a v i t y s h i f t o f 6 t o 7 percent M.A.C. A weight breakdown i s presented i n tab le 4 for the production DC-9-32 and the DC-9 Refan airplane. The weight increase i s s p l i t about equal ly between the airframe arid the engine. R e t r o f i t weights are approximately 91 kg (200 l b ) less than the f l i g h t t e s t weights because of the incorporation o f weight reduction items tha t were i d e n t i f i e d dur ing the hardware design and through analyses of the f l i g h t t e s t resul ts .
A review o f the production DC-9 Series 30 " inservice f l e e t " was made t o survey the l o a d a b i l i t y changes associated w i t h the DC-9 Kefan engine i n s t a l l - at ion. Figure 12 indicates a wide range i n OEW and center of g r a v i t y among basic customer configurations. These configurations include: s ing le and mixed class passenger, convert ib le f re ighter , rap id chanqe and a1 1 f re ighter . The b a l l a s t weight range and number o f airplanes i n each group i s also shown. Most operators w i l l avoid the use o f b a l l a s t by choosing other methods, which are technica l ly feasible, t o correct any adverse balance effect on the i r oper a t i ons .
During ground maintenance, some configurations may be subjected t o a t ip-over condi t ion by ground gusts, snow loads and towing. configurations several a1 ternat ive correct ions are read i l y ava i l able. One simple method, whicn i s used a t the Douglas A i r c r a f t Company, i s t o i n s t a l l water b a l l a s t drums a t hard points which e x i s t on the fuselage nose section.
For these airplane
A comparison o f the DC-9-32 FAA takeoff f i e l d length as a funct ion of takeoff gross weight i s shown i n f i g u r e 13 f o r the JT8D-109 and JT8D-9 englne ins ta l la t ions . A t sea leve l standard day condit ions the addi t ional th rus t o f the JT8D-109 engine resu l ts i n about 2 040 kg (4,500 l b ) addi t ional takeoff gross weight capab i l i t y foi- a given f i e l d length o f which about one half i s the increased OEW and one h a l f i s increased payload. Also, the airplane I s not second segment climb l i m i t e d (i.e,, no reduction i n f lap set t ing, with i t s resu l t ing greater f i e l d length, required t o meet the engine-out climb gradient requirement). The minimun f i e l d length, as l i m i t e d by airplane minimum contro l speed, i s indicated i n f i g u r e 13. The Refan confiquratfon has an increase i n ground minimm contro l speed o f 1.5 m/s (2.9 knots).
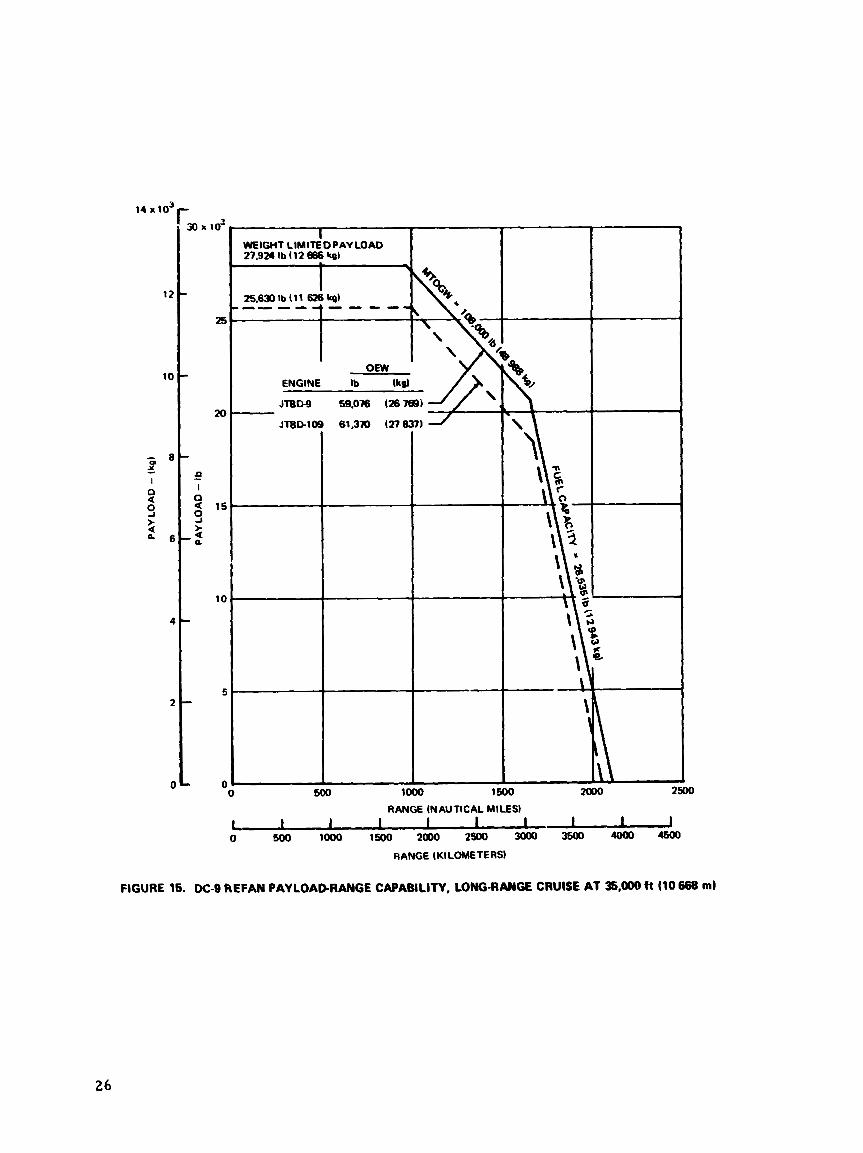
Comparisons o f the DC-9-32 payload range character is t ics fo r the JT80-9 and JT8D-109 engine i n s t a l l a t i o n s are presented i n f igures 14 through 17. High speed cruise i s f lown a t 0.78 Mach number. Long range cruise i s flown a t the speed a t which the spec i f i c range i s 99 percent of the max imun naut ical mi les per pound at ta inable a t the cru ise weight. Payload range character is t ics f o r hlgh speed cruise and long range cru ise a t 10 668 m (35,000 f t ) a l t i t u d e are presented i n f igures 14 and 15 respectively, The payload range character- i s t i c s f o r high speed and long range cruise a t 9 144 m (30,000 f t ) are shown I n f igures 16 and 17. High speed climb and descent schedules are used w i t h 0.78 Mach number cruise and long range cl imb and descent schedules are used w l t h long range cruise. Domestic reserves are used w i t h a l l cases. Maximum fuel capacity assumes the use o f the 2 195 l i t e r (580 g a l ) center l ine fuel tank.
21

s (u Y
0 c 0 .t Y
n eJ m Y
n h 0 N Y
n
3 Y
n
(u 8 Y
n 0 m Y
n OD (u r
Y
n m m cu Y
h
@ N v
n h CD d m Y
n
0
CD (u
8
Y
n h 2 h hl Y
n
3 m 0 Y
n
3 QI * Y
v) s 3 W v) 0 L
v) E W E W
m 2
22

23

\
-t-
il+ i3 z z E E I I I I
c
n)
E x a
m
x
(Y u!
R 9 c
9 0
m s?
24

14 x 10
12
10
- 8
a s a
rn x - 0
> a
6
4
2
0
30 x 1(
25
m
??
0
a 15 > 0, a n
10
5
0 5Go loo0 1500 3000 2500
RANGE (NAUTICAL MILES)
0 500 1000 1500 2000 2500 3000 3500 4000 4500 U' I I I I 1 1
RANGE (KI LOME TE RSI
FIGURE 14. DC-9 REFAN PAYLOADRANGE CAPABILITY,CRUlSE AT M 0.78 AND hp = 35,000 ft (10 668 m)
25
0 Mw) loo0 1500 2Ooo RANGE (NAUTICAL MILES)
I I I I I I 1- 0 500 loo0 19w 2000 2500 3OoO 3500 4wo -
RANGE (KILOMETERS)
FIGURE 15. OC-9 REFAN PAYLOADRANGE CAPABILITY, LONG-RANGE CRUISE AT 36,m ft (10 668 ml
26

14 x loJ
12
i o
- 2 8
2 2
I 0 a >
6
4
2
a
30 lo3
25
20
10
5
0 0
FIGURE 16.
RANGE (NAUTICAL MILES)
0 500 lo00 1500 2000 2500 3000 3500 4000 4500 1 I I i I I I I I J
RANGE (KILOMETERS)
D C 9 REFAN PAYLOAD-RANGE CAPABILITY, CRUISE AT M = 0.78 AND hp = 30,OOO ft (9144 ml
27

14 a lo3
12
10
- 8 2
n s
- I
4
> 2 6
4
2
0
FIGURE 17.
10
5
0
I WEIGHT LIM1;EDPAYLOAD 27.924 Ib (12 666 kp)
ENGINE Ib
JT80-9 59.076 (26788)
JT8D-109 61370 (27 83?)
1500 RANGE (NAUTICAL MILES)
I 1 I 1 I I I ! 1 0 500 lo00 1m Moo 2 m 3ooo 3500 4000 4600
RANGE (KILOMETERS)
Jo
DC-9 REFAN PAYLOAD-RANGE CAPABILITY, LONG-RANGE CRUISE AT 30.000 ft (9 144 m)
28

Breakdowns o f the maximum range increments due t o weight and SFC di f ferences between the JT8D-9 and JT8D-109 powered versions o f the DC-I .32 are shown i n tables 5 and 6 f o r long range cruise a t 10 668 m (35,000 ft) ,ni 0.78 Mach nulrrber cru ise a t 9 144 m (30,000 ft). The breakdowns are shown f o r two payloads, 10 433 kg (23,000 l b ) and 6 804 kg (15,000 lb ) , t o i l l u s t r a t e both takeoff-gross-weight l i m i t e d and fuel-capacity l i m i t e d cases. As shown, the SFC and drag changes between the engine i n s t a l l a t i o n s r e s u l t i n a small range gain f o r the DC-9 Refan; but the addi t ional OEW resu l ts i n a moderate range loss when the airplane i s fuel-capaci ty l i m i t e d and a substantial range loss when the airplane i s takeoff-gross -weight l imi ted.
gseful way o f presenting airplane c a p a b i l i t y i s by f i e i d length-ran;, A i c h shows how much range can be at ta ined out o f a giver? f ; z ld length. This approach t rea ts the f ie ld- length- l imi ted cases. FAA takeoff f i e l d length as a funct ion o f range f o r the DC-9-32 w i t h JT8D-109 and JT8D-9 engine i n s t a l l a t i o n s i s compared i n f i o u r e 18. The range has de t t r r ined using high speed cruise a t 9 144 m (30,000 f t ) and domestic reserves. The takeoff f i e l d lengths are f o r sea jevel, standard day condit ions. Data are shown fctr two payloads, 6 804 kg (15,000 l b ) and 10 433 kg (23,000 1 b) . A t a given f i e l d length the addi t ional takeoff th rus t o f the JT8D-109 engine i n s t a l l a - t i o n resu l ts i n about a 222 km (120 n.mi.) increase i n range f o r a 6 804 kg (15,000 l b ) payload and a 260 km (140 n.mi.) increase f o r a 10 433 kg (23,000 l b ) payload.
The changes i n s ign i f i can t performance parameters between tibe two configurations are presented i n tables 7 through 10. pavameters include fuel burned, takeoff gross weight, block speed, and takeoff f i e l d length. Each table shows the performance increments between the JT8D-4 and JT8D-109 conf igurat ions f o r the t yp i ca l mission 694 km (375 n.mi.), an intermediate mission 1 556 km (840 n.mi.), and the maximum range f o r the JT8D-109 conf igurat ion. The tables are f o r long range cruise a t 10 668 m (35,000 f t ) and 0.78 Mach number cru ise a t 9 144 m (30,000 ft) f o r a 6 804 kg (15,000 l b ) typ ica l mission payload and a 10 433 kg (23,000 l b ) space 1 i m i ted payload.
Tables 7 through 10 show a s l i g h t increase i n block f u e l f o r the JT8D-109 powered DC-9 airplane. the typ ica l 694 km (375 n.mi.), intermediate 1556 km (840 n.mi.), and mximm range missions, tables 7 and 3 show an increase i n block fue l o f less than 1 ocrcent fo r both lonq range cruise a t 10 668 m (35,000 ft) and 0.78 Mach number cruise a t 9 144 m (30,000 ft). 6 804 kg (15,000 l b ) and range 694 km (375 n.mi.), t a b l t s 9 and 10 show less than 1 percent increase i n block f u e l f o r both the long range cru ise and 0.78 Mach number cruise cases.
!.lhile payload-range shows the maximum capabi l i Ly o f the airplane, another
these performance
For the space l i m i t e d payload o f 10 433 kg (23,000 l b ) ,
For the t yp i ca l mission payload
29

W
9
n c, it en 4) L c
0 al c, E c c - Y
30

01
6 c - 3 E
Y S c -
A I
c
.p c Y
E
.r
.r c Y
E
31

X QD
c X 1 1 I I
9 Y x 0 R c c
WJ HION31 0 1 3 3 3JO3XVl VVd
32

b w m a I-
w E =
33

00 W A
c 8 '
n
$2
UBW *cD - + +-
n
r x n a
Nc +z
L
34

A
* E + 0 1 NU
OG;;
I
e- + €
83 c I I-
n n m
Y o moo O N
N O c u r Y
L
35

36

AIRPLANE STABILITY AND CONTRClL
The s t a b i l i t y and control character is t ics o f the DC-9 Defan airplane were evaluated t o determine the a f f e c t o f tk i n s t a l l a t i o n o f the larger diameter JT8D-109 engine aiid nacelle, the reduced span pylon and weight increases .
The Refan airplane demonstrated s t a l l character is t ics s imi la r t o the DC-9-30 production airplane w i t h no chanqe i n character is t ics due t o the i n s t a l l a t i o n o f the JT8D-109 engine.
The s t a t i c longi tud ina l s t a b i l i t y appears t o he s l i g h t l y less than t h a t o f the production DC-9-30. However, the s tab; l i ty o f the Refan conf igurat ion i s considered s u f f i c i e n t t o meet the requi remnts o f previous production airplane c e r t i f i c a t i o n tests and complies w i th airplane a i r - worthiness requirements,
The long1 tudinal control character is t ics o f the Refan airplane are no t s i g n i f i c a n t l y changed from tha t o f the production DC-9-30 and comply w i t h airplane a i rworthiness requi remen t s .
The Refan airplane longi tud ina l t r i m character is t ics are unchanged from t h a t o f the production DC-9-30 i n the landing conf igurat ion ard s l i g h t l y mre airplane nose-up i n the cruise c o n f i y r a t i o n . The Refan t r immabi l i ty does comply w i t h airworthiness requi remeat:
o r no s i g n i f i c a n t change from those o f the production DC-9-30; and the c o n t r o l l a b i l i t y w i t n both synmetrical and asymmetrical reverse thrust under a l l condit ions tested was acceptable.
The Refan airplane a i r and ground minimum control speeds ind icate l i t t l e
37


Stall Characteristics
The s ta l l characteristics of the Refan airplane were evaluated to obtain a quant-itative appreciation of the s t a l l speeds, particalarly a t the forward center of gravity.
forward and a f t center of gravity and "power on" s ta l l tests were conducted w i t h the airplane a t the forward center of gravity ir., the following configur- atrms:
" Id le power" stal; tests were conducted w i t h the airplane a t both the
0 Stall Characteristics - Idle Power
F 1 a ps/Sl ats Landing Gear
Up/ Retract UP
0" /Ex tend UP
0.436 rad (25 deg)/Extend .
0.873 rad (50 deg)/Extend lbwn
Down
0 Stall Characteristics - Power On
F1 aps/Sl ats Landing Ge
Up/ Retract UP
0.87: rad (50 deg)/Extend Down
The nwmal s ta l l speed tes t procedure, which i s to apply a pull force t o the elevator column to o b t a i n the required airplane s ta l l entry rate and maintain this cclumn pull force through three beeps on the Supplementary Stall Recognition Syqtem (SSRS) horn, was modified for the Hefan airplane. TCle Refan procedure was continued until the f i r s t beep of the SShS horn occurred, a t which time the nlevator column was released a3d the engines were ,lowly accelerated.
For the "idle power" s ta l l tests the airplane was trimmed a t the specified power settlng a t an airspeed of 1.4 V Thrust values set for the
required for level f l ight in the approach configuration a t an airspeed of 1.6 Vs and maximum land lng weight.
"power on" s ta l l tests were determined by trim 1 ng the airplane t o the thrust
During the "power on" s ta l l tests the EPR values varied from 1.34 a t higher speeds, to 1.41 a t the lowest speed. The airplane s ta l l characterfstics were acceptable.
39

Although the normal s t a l l speed tes t procedures (maintaining column pu l l force through three beeps on the SSRS horn) were not followed, s t a l l speeds have been evaluated and are shoun i n f igure 19. Stick shaker actuation speeds are shown i n f igure 20 wi th naninal l ines and tolerances based on the Product- ion F l igh t Procedures Manual. All data f a l l w i th in the tolerances.
S ta l l characteristics are s imi lar t o those o f the production DC-9-30 a i r c r a f t wi th no change i n characterist ics due to the ins ta l la t ion df the 3T80-109 engine. The fomard center of grav i ty r i r p l a m s t a l l speeds are wi th in production DC-9 tolerances,althougti the test procedure used was not designed t o detennine miniam s t a l l speeds. On the basis o f these data FAA c e r t i f i e d s t a l l speeds can be demonstrated using noma1 minimum s t a l l speed procedures.
40

a w
41

1 1 I 1 1 1 8 c 51 8 8 0
( S P )
NOl lVnL3V Y3XVHS X31l.S 1 V SVI S.NIVldV3
c x ( . I
?

S t a t i c Longitudinal S t a b i l i t y
The s t a t i c long i tud ina l s t a b i l i t y character is t ics o f the Refan a i rp lane were evaluated for high speed climb and during cruise. accomplished f o r the fo l lawing configurations and conditions:
F l i g h t tes ts were
Thrust
High Speed Climb 320 (165)
Crwise 1 TFLF I A f t 10.8 M
A1 t i t u d e F1 aps/ f t S1 ats
(m 1
23,000 Up/ Retract (7010)
The demonstrated s t i ck - f ree and s t i ck - f i xed s t a t i c long i tud ina l s t a b i l i t y character is t ics o f the DC-9-30 Refan and production DC-9-30 a r e presented i n f igures 21 and 22 f o r the climb and cru ise configurations, respectively. These data show comparative DC-9-30 Refan and production DC-9-30 s t i c k forces and elevator def lect ions required t o s t a b i l i z e the airplanes a t airspeeds above and below the designated t r i m speed. I n addition, f ree-return character is t ics are shown f o r both airplanes. These show the s tab i l i zed airspeeds, s t i c k forces, and elevator def lect ions resu l t i ng when the contro l column i s released a t speeds wel l above and below the t r i m speeds. The DC-9-30 production a i rp lane data were obtained from airp lane c e r t i f i c a t i o n tests.
The s t ick- f ree s t a b i l i t y data show the production DC-9-30 and Refan e levator column fo rce var ia t ions required w i th airspeed. The Refan column forces were obtained w i th an kaes hand-held fo rce gauge during the f l i g h t t es t , whi le the production DC-9-30 column forces were obtained from an instrunented e levator column. This would expla in some o f the scat ter shown i n the Refan force data. These data ind ica te comparable leve ls o f s t a b i l i t y f o r the two airplanes but, under the circumstances, they do no t provide the most r e l i a b l e comparison. A b e t t e r canparison can be made using the s t i ck - f i xed s t a b i l i t y plots.
The s t i ck - f i xed s t a b i l i t y da ta shows -30 production a i rp lane and Refan e levator def lect ions required w i th var ia t ions i n airspeed. These data ind ica te a very modest reduction i n s t a t i c longi tud ina l s t a b i l i t y f o r the Refan. I n the cl imb condit ion shown i n f i g u r e 21, the s t a b i l i t y ( a 6 e l a v ) i s essent ia l l y una1 tered. A t the high-speed cru ise condit ion shown i n f igure 22, the s t a b i l i t y o f the Refan i s shown t o be s l i g h t l y diminished (approximately 1/2 degree over a M = 0.15 speed range). However, i t i s not f e l t t h i s minor reduction i n s t a b i l i t y i s representative o f the Refan, since there i s no reascn t o bel ieve t h a t the comparison should be d i f f e r e n t than t h a t f o r the climb configuration.
I n e i t he r condition, the comparison i s considered good, ar,d the dif ferences i n s t a b i l i t y shown between the two airplanes are no worse than miqht be seen f o r the same a i rp lane on separate tests.
43

'H ALTITUDE ce GROSS WEIGHT
Dc-430 .Q 5230 0 591) 34.3 84.700 (J1419 MCT 0.1 (0.0017)ANU
DC-9-30 REFAN 6 6700 - 12.400 (2042 - 3780) 33.0 84.600 (38 374) MCT 0.2 (0.0035) ANU
(%MAC) Ib THRUST a (r.d) - - ( m) - tt - SYM - MODEL
NOTES: 1. CONTROL FORCES MEASURED W I T H HANDHELD AMESGAUGE
2. S H A M D SYMBOLS ARE FREE RETURN DATA
knots
130 140 150 160 im 180 190
( m/r) CALIBRATED AIRSPEED, Vc
FIGURE 21. DC9 REFAN STATIC LONGITUDINAL STABILITY - DURING CLIMB - FLAPSlSLATS; UP/RETRACT, GEAR UP
44

a LL
w 0
I
a s J 0 K I- z 0 0
0 I-
> w J w
a
a
a
a 0 + >
150-
100
50
(N)O
50
100-
'ti ALTITUDE cg GROSS WEIGHT
- Ib &it- (ml (X MAC) SYM - - ' 1 - MODEL
23.800 (7254) 34.1 86.300 (39 145) 0.4 10.007) A N D
22.000 (6706) 34.2 87.600 139735) 0.4 10.0071 A N 0
Dc-9-30
DC-9-30 REFAN
-
-
-
-
NOTES: 1. CONTROL FORCES MEASURED WITH HAND-HELD AMES GAUGE
2. SHADED SYMBOLS ARE FREE RETURN DATA
. . . . . .
!
. . . . . . i
. . _.. ,
I
. . . . . . . . . . !
__._ . . !.- ............. 1 I
. . . . . . . . .
. . . . . . . . . I . -. . . . . . . .
I
. . I . . . . .
PUSH . . . . .
, . . . .
._ .
. . . . . . . . !
. . . . .
.-- iu-
deg 11 .
. ;m 1 ;
0.65 0.70 0.75 0.80 0.85 TED 0.60
MACH NUMBER. M
FIGURE 22. DC-9 REFAN STATIC LONGITUDINAL STABILITY - HIGH-SPEED CRUISE - FLAPS/SLATS; UPIRETRACT, GEAR UP, TFLF
45

The freeweturn characteristics o f the two airplanes are comparable wi th in normal f l i g h t t e s t data accuracy.
The s t a t i c longitudinal s t a b i l i t y of the Dc-9-30 Refan appears t o be s l i g h t l y less than that o f the production DC-9-a. However, the s t a b i l i t y o f the Refan configuration i s suf f ic ient t o met the requirements of previous production airplane c e r t i f i c a t i o n tests and i s considered c e r t i f i a b l e a t the ex is t ing a f t c.g. l i m i t .
46

Longitudinal Control
The DC-9 Refan airplane longi tud ina l control system capabi 1 i t y t o control the airplane was evaluated during f l i g h t condi t ion changes such as (1) airspeed var ia t ion, (2 ) power appl icat ion and (3) f lap /s la t r e t r a c t i o n w i th simultaneous power appl icat ion. This evaluation was conducted t o demonstrate the one-hand longi tud ina l c o n t r o l l a b i l i t y of the Refan airplane urder c r i t i c a l trim-change conditions. One-hand c o n t r o l l a b i l i t y , f o r the purposes o f FAA c e r t i f i c a t i o n requirements, i s in terpreted as no more than 222.41 I4 (50 l b ) o f column force.
The t e s t resu l ts a r e shown i t 1 tabular form i n tab le 11. A l l DC-9-30 pro- duction a i rp lane data were obtained f r o m c e r t i f i c a t i o n tests. These data cover three d i f f e r e n t c o n t r o l l a b i l i t y tests: (1) airspeed var ia t ion (1.1 Vs t o 1.7 Vs @ forward c.g. and f u l l down flaps), (2) power appl icat ion a t both forward and a f t c.g., f laps/s lats; up/retract and landing gear down, and (3) power appl i - cat ion wi th simultaneous f l a p and s l a t r e t i a c t i o n a t f o m a r d and a f t c.g. The t a b l e shows deta i led t e s t condit ions and resu l ts i n terms of required incre- mental e levator def lect ion, colunn force, and a l t i t u d e changes where applicable.
Although c o n t r o l l a b i l i t y i n these tes ts i s n o m a l l y measured by required control forces, these forces were no t avai lable on the DC-3-30 Refan, because the elevator column was no t instrumented and a l l column force readings required the use o f a hand-held Ames gauge. The use o f the hand-held gauge was found t o be unsuitable f o r determining the t rans ien t - l i ke column forces t h a t occur during these tests. C o n t r o l l a b i l i t y was evaluated, however, by comparison o f the required elevator control def lect ions o f the Refan w i t h tha t o f the DC-9-30 production airplane.
0 Airspeed Var iat ion
ura t ion a t forward c.g. w i t h f laps /s la ts 0.873 rad (50 deg)/extend and landing gear down. One hand control was evaluated without changinc, t r i m , whi le airspeed was var ied from 1.1 t o 1.7 Vs. a 0.314 rad (18 deg) elevator de f lec t ion change between 1.1 Vs and 1.7 V, compared t o 0.262 rad (15 deg) f o r the production DC-3-30. The 0.262 rad (15 deg) elevator def lect ion on the DC-9-30 production airplane required 129 14 (29 l b ) o f column force. The 0.314 rad (18 deg) elevator def lect ion on the Refan was 20 percent higher and would y i e l d a column force on the order of 155.69 I4 (35 l b ) , wel l under the allowable 222.41 IJ (50 l b ) .
The airplane was trimned with i d le power a t 1.4 Vs i n the landing conf ig-
The Refan conf iqurat ion showed
0 Power Appl icat ion
uration. o f f th rus t and maintaining airspeed. C o n t r o l l a b i l i t y was evaluated a t both forward and a f t c.g., f laps/s lats; u p l r e t r a c t and landinq gear down. tes ts were conducted a t a constant speed (whi le the th rus t i s advanced from i d l e t o i n f l i g h t takeof f ) t o avoid the inf luence o f s t a t i c lonqi tud ina l s t a b i l i t y and confine the source o f the t r i m change t o th rus t ef fects only.
The airplane was trimned with i d l e power a t 1.4 V, i n the landing confiq- One hand control was evaluated whi le qu ick ly applying i n f l i q h t take-
These
47

L u
I-
I I
I I
t- o q
i5: w Lt
- L O oo c r
0 0 2z
w 6 w e At- At-
e? 00 c
(I

Control def lect ions were noted a t approximately 1.4 Vs before and a f t e r power application. The contro l data shown i n tab le 11 indicated t h a t the t r i m change i s eas i l y con t ro l lab le fo r a l l conditions tested and tha t the Refan c o n t r o l l a b i l i t y i s essent ia l l y the same as tha t o f the production DC-9-30. No elevator deflections qreater than 0.052 rad (3 deg) are required, and no column forces greater than 62.28 N (14 l b ) are required.
0 Power Appl icat ion w i t h Flap/Slat Retraction
The airplane was trimned a t 1.2 Vs wi th th rus t f o r leve l f l i q h t i n the landing configuration. The flaps and s l a t s were re t rac ted w i th simultaneous appl icat ion o f MCT power whi le maintaining the speed schedule and holding a l t i t u d e loss t o a mifiimum. C o n t r o l l a b i l i t y under "qo around" conditions was evaluated a t both for.rJrd and a f t c.g. f laps/s lats; 0.873 rad (50 deg)/extend and landing gear down.
The a l t i t u d e l o s t a f t e r i n i t i a t i o n o f t h i s maneuver i s of equal i n te res t w i th t h a t of the contro l requirements. I n the forward c.g. configuration, ne i ther the DC-9-30 production airplane no,r the Refan l o s t any s ign i f i can t a l t i t u d e during the maneuver. The production DC-9-30 showed an elevator def lect ion o f 0.070 rad (4 deq) required, y ie ld inq a column force of approxi- mately 75.62 N (17 l b ) push. The Refan configuration showed 0.087 rad ( 5 deg), which would y i e l d aporoximately 93.40 tI (21 l b ) .
I n the a f t c.g. conf igurat ion the DC-9-30 production a i rp lane aqain showed no a l t i t u d e loss whi le tne Refar: snowed an i n i t i a l a l t i t u d e loss o f approximately IC.67 m (35 f t ) . This a l t i t u d e loss can probably be a t t r ibu ted t o a descending f l i g h t path a t the i n i t i a t i o n o f the tes t . The control requir2d a t a f t c.g. was only 0.035 rad (2 deg) f o r the Refan as compared to 0.052 rad (3 deg) f o r the production DC-9-30. The DC-9-30 production airplane required only 8.90 N (2 l b ) o f column force, so t h a t the Refan would requi re s l i g h t l y less force.
The longi tud ina l control character is t ics o f the DC-9 Refan airplane are not s ign i f i can t l y changed from tha t of the production DC-9-30. A l l conditions are considered eas i l y cont ro l lab le.
Control def lect ions required f o r airspeed va r ia t i on (1.1 Vs t o 1.7 V s ) are approximately C~.052 rad ( 3 deg) more f o r the Refan airplane, cont ro l o f power appl icat ion ( i d l e th rus t t o i n f l i g h t takeof f t h rus t ) i s essent ia l l y the same f o r both airplanes and the Refan control def lect ions required during "go-around" ( f l a p / s l a t re t rac t i on + power appl icat ion) were w i th in 0.018 rad (1 deg) o f those f o r the DC-9-30 production airplane.
The DC-9 Refan airplane longi tud ina l cont ro l character is t ics comply w i th airplane a i wor th iness requirements.
49


Longitudinal T r i m
The longi tud ina l t r i m capab i l i t ies o f the DC-9 Refan airplane were eval-
The DC-9 Rk4-an airplane was trimmed hands-off during g l i d e w i t h both
uated during s t a h i l i z e d f l i g h t a t various airspeeds and airplane configurations.
engines a t :die, f laps/s lats, 0.873 rad (SO deg)/Extend, gear down, forward c.g., a t speeds varying from 1.2 V t o 1.8 VS and during leve l f l i g h t a t a f t c.g. and two a l t i tudes: t o 180 m/s (350 knots), V (180 knots) t o 154.3 n/s 800 knots) w i t h the gear extended; 2) 7925 m (26,000 f t ) a l t i t u d e f r o m Mach number 0.70 t o 410 (0.84) w i th the gear retracted.
1 ) 30#8 m (10,000 f t ) f r o m 128.6 m/s (250 knots) , with the landing qear re t racted and from 92.6 m/s
TLe 7ongitudinal t r i m character is t ics of the 3C-9-30 Refan and the DC-9-3” production airplanes are summarized i n f igures 23 through 26. These data show comparative Refan and production DC-9-30 t r i m character is t ics i n the 1 anding and cru ise configuration.
Longitudinal t r i m character is t ics i n the landing configuration ( f laps/ s l a t s ) 0.873 rad (50 deg)/Extended, gear down and i d l e th rus t ) are shown i n f i g u r e 23 f o r the Refan and the production DC-9-30. These data show the same character is t ics f o r both airplanes, ind icat ing a capab i l i t y t o t r i m a t speeds dcwn t o 1.3 V w i t h minus 0.21n rad (12 deg) o f hor lzontal s t a b i l i z e r incidence. The specff icat ions o f C h l 4b requi re t r i m a b i l i t y a t speeds down t o 1.4 V comply w i t h t h s requirement a t the e x i s t i n g forward c.g. l i m i t .
thus the Refan, l i k e the DC-9-30 production airplane w i l l
Longitudinal t r i m character is t ics i n the cruise configuration ( f laps/ s la t s : up/retract , gear up, th rus t f o r l eve l f l i g h t ) are shown i n f i g u r e 24 f o r the Refan and the production DC-9-30. requi r ing 0.004 rad (0.2 deg) t o 0.010 rad (0.6 deg) more airplane-nose-up t r i m . The dif ferences shown i n t r i m character is t ics are small, and l i k e those o f the s t a b i l i t y and c o n t r o l l a b i l i t y tests, f a l l rv i th in what i s considered normal f l i g h t t e s t data scatter.
These data show the Refan
An addi t ional t e s t was conducted i n the cruise conf igurat ion w i th the landing gear extended. The Refan data from t h i s tes t , presented i n f igurr t 25 showed inconsistencies i n landing gear effect:, \!hen these data are compared t o the gear-up data they ind icate an airplane-nose-down t r i m change resu l t ing from gear extension, whereas a l l previous Series 30 DC-9 airplanes show a character is t ics a i rplane-nose-up t r i m change. The gear-down t r i m data are believed t o be i n e r r o r since they are not consistent w i th the Refan character is t ics i n the landing conf igurat ion or wi th any previous production DC-9-30 data.
A t the higher cruise a l t i t u d e and speeds ( f i g u r e 26), the t r i m character is t ics w i t h landinq gear retracted are r e l a t i v e l y the same as a t the low a l t i tude . The required s t a b i l i z e r i s indicated s l i g h t l y higher f o r the Ref an,
5 1

8328 (25381 5.7 89.600 (40 642)
6510 (1984) 5.7 89,500 (40 597)
DC-930 0 4700 (14301 9.0 97,500 (44 250)
DC-9-30
DC-930
DC-930 A 7495 (22701 6.4 91,7m (41 600)
DC-9-30REFAN 0 6300 (19201 7.8 98.400 (446501
NOTE: THE OC-9-30 POINTS HAVE BEEN ADJUSTED TO REFLECT A CENTER OF GR4VITV POSITION OF 7.8% MAC
I 2 g -0.20
ii a K
-0.15
2 (rad) - 2
2 2 a -0.05 9
I- v)
-0.10
2 0
0
. I
I
I I
I 1
I
I
. . . i ; i ; i
! !
I
! " I 1 , ..i .
! i I j
I ' i
AND . 8 i i
1 . ; 1 I
I
! ! I
1
i I
, I
I
i -i
1 I
1 i ! ! I
I
101 I I I I I I 1 .o 1.2 1.4 1.6 1 .8 2.0
TED SPEED RATIO - VIVs
FIGURE 23. DG9 REFAN LONGITUDINAL TRIM - LANDING OONFIGURATION - FLAWSLATS 60 (0.873VEXT. GEAR DOWN, IDLE THRUST
52

ALTITUDE GROSS WEIGHT Ib - SYM - ft - (m) 06 MAC) - MODEL
I_-
10.000 (3050) 34.0 94,250 (42 750)
10,000 (3050) 34.1 84,300 138 2501
DC-930
DC-930 REFAN
-0.20-
I .- 2 0
-0.15 ii P K w t! -0.10
k a -0.06
::
rl 2 (red)
I- z
K
0.05
NOTE: THE DC-9-30 REFAN DATA POINTS HAVE BEEN ADJUSTEO TO REFL.ECT A GROSS WEIGHT OF 94.250 Ib (42 751 kg)
ANU
-
-
-
0 -
-
a -' 0 2
w n 0.1
knots
I 1 I I I 75 100 1 25 150 1 75
CALIBRATED AIRSPEED, Vc
DCQ REFAN LONGITUDINAL TRIM - CRUISE CONFIGURATION - FLAPS/SLATS: UP/RET, FIGURE 24. GEAR UP, TFLF
53

- 0.25
.- 1 -0.20 i E
-0.15 a a
i W N -
I 0.10 2 : g -0 .05 '
P
v, (rad) A
2 K
0 .
0.05
ALTITUDE cg GROSS WEIGHT SYM - (m) (KMACI - Ib MODEL - tl -I-
DC-S~O 0 1O.ooO (30.60) 34.6 92,900 (42 150) DC-SIOREFAN a 1O.OOO (3060) 34.2 74,500 (33 800)
-
8
NOTE: THE DC-9-30R DATA POINTS HAVE BEEN ADJUSTED TO REFLECT A GROSS WEIGHT OF 92,900 Ib (42 139 kg)
- ANU -
!
- A.N.D.
!
' . fEU
- 6
dw O[
6 TED
I. I I -2 160 2 w 260 300 350
CALIBRATED AIRSPEED, Vc (knots)
I I I - 75 100 125 150 175
CALIBRATED AIRSPEED, Vc ( rnls)
FIGURE 25. DG9 REFAN LONGITUDINAL TRIM - CRUISE CONFIGURATION FLAPSISLATS: UP/RET, GEAR DOWN, TFLF
54

ALTITUDE cg GROSS WEIGHT (kg1 - Ib - SYM - (mi 1% MAC) -- 't - MODE 1
Dc-930 @ .26.000 (79001 34.5 84.000 (38 1 0 )
DC-930REFAN a 26.000 (79001 34.2 89.100 (404M)I
N O T E THE DC-9-30 RFFAN DATA POINTS H 4 V E BEEN ADJUSTED TO REFLECT P. GROSS WEIGHT OF 84.000 Ib (38 102 k g ) AND A cg OF 34.596 MAC
MACH TRIM COMPENSATOR ON
0.8 0.9 MACH NUMBER. M
FIGURE 26. DG9 REFAN LONGITUDINAL TRIM - CRUISE CONFIGURATION - FLAPS/SLATS: OIRET, GEAR UP, TFLF
55

The DC-9 Refan airplane longi tud ina l t r i m character is t ics are shown t o be unchanged from that o f the E-9-30 production airplane i n the landing configuration and s l l g h t l y more ai rp lane nose-up i n the cruise configuration. A l l f l i g h t t e s t data comparisons are considered good and f a l l w i t h i n the normal range o f t e s t data scatter. The Refan t r i n m a b i l i t y complies w i th a i r p l ane a i rworthi ness requ i rements .
56

Minimum Control Speed
The minimum speed a t which the DC-9 Refan has s u f f i c i e n t cont ro l t o of fset the asymmetric t h rus t condi t ion of s ing le engine operation was evaluated fo r f l i g h t , takeoffs, and normal reverser landings and asymnetric reverse th rus t landings.
0 Vmca - A i r
The minimun contro l speed i n the a i r was evaluated w i t h one engine shut down and the other set a t i n f l i g h t takeoff thrust . The t e s t configuration was:aft cog. with f l aps /s l z t s se t a t 0.087 rad (5 deg)/Extend and a t 0.262 rad (15 deg)/Extend w i t h rudder power on.
The a i r minimun contro l speeds f o r the DC-9-30 Refan and OC-9-30 production airplane with 0.087 rad (5 deg) and 0.262 rad (15 deg) f laps are shown i n f igure 27. The f l i g h t data ind icate tha t no s ign i f i can t change has resu l ted from the Refan ins ta l l a t i on . With 0.087 rad (5 deg) f laps, these data show t h a t the Refan Vmca i s 1.03 m/s (2 knots) below the approved production DC-9-30 Vmca a t equal thrust . A t 0.262 rad (15 deg) f l aps these data show tha t the Refan Vmca i s approximately 0.257 m/s (1/2 knot) higher. It should be noted t h a t considerable data sca t te r i s normally encountered f n m the Vmca test . The Refan points f a l l w i th in t h i s sca t te r band.
0 Vmcg - Ground Takeoff
An operational check o f the minimun contro l speed on the ground during takeoff was evaluated by reducing one o f the engines t o i d l e during the takeoff r o l l . The speed a t which the engine cut occurred was reduced i n 2.57 m/s (5 knot) increments u n t i l a l a t e r a l dev iat ion o f 4.57 m (15 f t) occurred. This t e s t was accomplished w i t h the rudder pedal nose wheel steer ing disconnected t o simulate an i c y runway.
The ground minimum contro l speeds f o r the production DC-9-30 and the DC-9-30 Refan are shown i n f i ure 28. These data ind icate t h a t the Refan Vmcg i s 1.29 m/s (2-1/2 knots! higher than the approved production DC-9-30 speed a t equal thrust . An addi t ional f l i g h t point , obtained w i th an a l ternate DC-9-30 production airplane, i s included on t h i s p lo t , showing considerable d a h scatter. Again the Refan data are considered w i th in the normal sca t te r band f o r t h i s test , ind ica t ing l i t t l e o r no s ign i f i can t e i f ec t o f the Refan i n s t a l l a t i o n on Vmcg.
0 Vmcg - Ground Landing w i th Reverse Thrust
An operational check o f a i rp lane d i rec t iona l control was accomplished during normal reverser landings and during reverser landings where one engine was suddenly reduced t o i d l e from high reverser power.
The d i rec t iona l cont ro l t e s t was accomplished w i th rudder pedal nose wheel steer ing connected and disconnected and w i th nanual rudder and w i th rudder power on.
57

14 lo3-
13
12
11
Ib
10
’ 9 -
8 L 1 I I I I I
90 100 110 im 130 knots
-
-
-
-
1 I I I I 45 50 55 60 65
( 4 s )
EOUIVALENT AIRSPEED, Ve
FIGURE 27. DCB REFAN MINIMUM CONTROL SPEED - AIR - SLATS EXTENDED, RUDDER POWER ON
58

65 x lo3
60
t- 3
t,
E
a r 5E t-
2 w tN)
0 2 w 0
l-
ul
5(
5 a a b
45
4c
15 x 11
Ib
0
DG930 FAA APPROVED cg = 34.79hMAC SYMBOL SERIES -- 0 30
0 30
0 30REFAN
4 I I 1 I 90 100 110 120 130
knots
I 1 1 I 1 45 50 55 60 65
( d S )
EQUIVALENT AIRSPEED, Ve
FIGURE 28. DC9 REFAN MINIMUM CONTROL SPEED - GROUND - FIAPSISLATS; 5(0.087)/EXT, RUDDER POWER ON
5 9

C o n t r o l l a b i l i t y w i t h both s y m e t r i c a l and a s m t r i c a l reverse th rus t was also demnstrated. Although insu f f i c ien t data are avai lab le fo r quant i t - a t i ve analysis o f results, p i l o t s have ind icated t h a t f u l l c o n t r o l l a b i l i t y was avai lab le under a l l conditions tested, and t h a t the a i rp lane response charac ter is t i cs are essent ia l l y the sane as t h a t o f the DC-9-30 production a i rpl ane .
The Refan a i rp lane m i n i u oontrol speeds are essent ia l l y the same as those o f the production DC-9-30; and the a i rp lane c o n t m l l a b i l i t y w i th both s y m e t r i c a l and a s m t r i c a l reverse t h r u s t under a l l condit ions tested was acceptable.
60

AIRPLANE/ ENG INE PERFORHANCE
The DC-9 Refan airplane and ins ta l led JT8D-109 engine performance was evaluated w i t h respect t o the production (DC-9-30/JT8D-9) airplane t o determine the extent of the changes resul t ing fm the airplane, engine and nacel 1 e m d i f i c a t i ons.
Test f l i gh ts were conducted t o establ ish the performance levels o f the airplane and engine during takeoff, climb, cruise and landing. Engine performance was evaluated during suction fue l feeding, windmill and ground engine starts, snap t h m t t l e retards, jam accelerations, airplane s t a l l , high s ides l ip angles and abused takeoffs. Airplane/engine subsystem perform- ance and the aux i l ia ry power p lant (APU) performance and s ta r t ing character- i s t i c s (ground and f l i g h t ) were also evaluated.
production airplane data corrected f o r the dif ference i n thrust showed good ag wemen t .
Refan takeoff acceleration performance when compared wi th DC-9 Series 30
The climb performance o f the DC-9 Refan airplane re la t i ve t o the JT8D-9 powered DC-9-30 production airplane shows an 8 percent improvement i n second segment and apprcach l i m i t i n g weights and a 5 percent improvement i n enroute l i m i t i n g weight.
The cruise perfcmance test ing o f the DC-9 Refan airplane, wi th the two prototype JT8D-109 engines instal led, shohed the range factor f rom 5 t o 7 percent loner than an equivalent 3180-9 pc.wed DC-9-30 production airplane. While approximately 2 percent o f t h i s incret1,s. was due t o the drag increase of the larger nacelle, the balance was due t o the higher engine SFC o f the prototype JT8D-10S engines.
During the JT8D-109 engine performance tests no signs o f engine i n s t a b i l i t y were noted by the p i l o t s while the maximum climb thrust maneuver u t i l i z i n g fuel suction feed was being conducted. Engine ground star t ing characterist ics were sat isfactory wi th l i t t l e or no change f r o m other JT8D versions. The low speed i n f l i g h t s ta r t ing envelope was also ve r i f i ed t o be sat isfactor j . Overall, the engine operations were excellent wi th no major problems encountered and engine performance very close to predicted levels.
The a i rp l ane/engine subsystem performance tests showed tha t the JT8D-109 engine nacelle compartment vent i la t ion and component cooling requirements were sat isf ied for ground and i n f l i g h t conditions. The JT8D-109 engine generator and CSD cooling systems were demonstrated sa t i s fac to r i l y f o r the c r i t i c a l (100% load) ground i d l e condit ion and for a l l i n f l i g h t conditions.
operation was demonstrated a t speeds below the operational cutback speed of 30.87 m/s (60 knots) wi th acceptable engine operation; and the peak empennage temperatures remained below the maximun allowable 121OC (25OOF) f o r the aluminum skin.
During the thrust reverser performance evaluation normal reverse thrust
61

The auxiliary power plant (APU) tests showed no unusual starting or operating characteristics during ground starts; and electr ic and w i n h i l l airstarts with the mdi f ied exhaust were accomplished a t the extremes of the production APU cert i f ied a i rstar t envelope.
62

Two Engine Takeoff Acceleration
The DC-9 Refan two-engine takeoff accelerat ion performance was evaluated t o obta in i n s t a l l e d 3T8D-109 engine operating character is t ics and a i r c r a f t accelerat ion data during normal takeoffs, which i s requi red t o establ ish a l l -engine takeof f p r o f i l e s f o r the f lyover noise testing.
Takeoff accelerations were obtained f o r two takeoff configurations flaps/slats,O/Extend and 0.262 rad (15 deg)/Extend.
The DC-9 Refan a i rp lane measured accelerat ion was compared w i t h FAA approved DC-9 Series 30 production data corrected f o r the d i f ference I n th rus t between the JT8D-109 and JT80-9 engines. These data show good agreement f o r both takeof f f l a p configurations.
Because these data showed good agreement, the production DC-9-30 FAA approved data corrected for t h rus t d i f ferences were used t o establ ish a1 1- engine takeof f accelerat ion performance required t o ca lcu late the takeoff p ro f i l es f o r the f l yove r FAR P a r t 36 noise data.
6 3


C1 inib Performance
The climb performmce o f the DC-9 Refan a i rp lane was evaluated t o determine the incremental effect o f the JT8D-109 engines r e l a t i v e t o the JT8D-9 powered production DC-9-30.
The climb increments were obtained f o r the condi t ions l i s t e d below,
1) Second segment climb (engine-out, takeof f conf igurat ion)
2) Enroute climb (engine-out, clean wing conf igurat ion)
3) Approach cl imb (engine-out, go-around f l a p s )
since the a i r c r a f t can be l i m i t e d by any one o f these.
Several pa i r s o f reciprocal heading c l imbs were accompl i shed f o r each o f the condi t ions l i s t e d above. Reciprocal heading climbs were conducted, a t constant heading and airspeed, t o e l iminate wind shear e f fec ts . Speci f ied power was se t we l l below the ta rge t a l t i t u d e so t h a t approximately 3 minutes of s tab i l i zed climb data were obtained climbing through the ta rge t a l t i t u d e , whi le maintaining airspeed and power l eve l s constant. S u f f i c i e n t rudder was input t o maintain constant heading.
The f l i g h t measured Refan climb data have been compared t o ex i s t i ng production DC-9 Series 30 climb r e s u l t s and the incremental differences i n terms o f thrust-to-weight r a t i o are presented as a funct ion of climb gradient i n f i g u r e 29 f o r the various conditions tested.
The estimated incremental dcfference shown accounts f o r the increased nacel le sk in f r i c t i o n drag, increased windmil l inq engine drag, and decreased l a t e r a l t r i m drag resu l t ing from a smaller th rus t moment a r m f o r the JT8D-109 engine i ns ta l l a t i on . The flight-measured data shows good aqreement w i th the estimated incremental d i f ference fo r each o f the c l imb conditions.
The penalty associated w i t h the Refan i n s t a l l a t i o n i n terms of increased thrust-to-weight r a t i o (poorer L/D) i s from 1 t o 1-1/2 percent a t the second segment and approach cl imb l i m i t i n g gradients and about 4 percent a t the enroute condition.
The JT8D-109 engine has more th rus t ava i lab le a t the takeoff s e t t i n g than the JT8D-9 engine; thus, a t a given thrust-to-weight r a t i o , the DC-9 Refan airplane w i l l have a higher l i m i t i n g weight than the production DC-9-30.
The net r e s u l t o f climb performance associated w i th the Refan i n s t a l l a - t ion, inc lud ing the improvement due t o the increased th rus t ava i lab le and the penalty due t o the increased thrust-to-weight r a t i o required i s an 8 percent improvement i n second segment and approach l i m i t i n g weights and a 5 percent improvement i n enroute 1 i m i t i ng weight.
65

0 FLIGHT TEST JATA
5
0
-5
5
0
-5
5
-5
5
0
-5
FIGURE 29. DC-9 REFAN CLIMB PERFORMANCE
66

Cruise Performance
Cruise performance tes ts were conducted t o obta in a i rp lane drag information and overa l l a i rp lane performance i n the form o f range fac to r , which was used t o determine the incremental e f f e c t on spec i f i c range due t o the DC-9 Refan a i rp lane w i th JT6D-:09 engines r e l a t i v e t o the JT€!D-9 powered production DC-9-30.
The airplane was s tab i l i zed f o r leve l , unaccelerated f l i g h t a t the speci f ied airspeed. A l t i t ude and gross wei h t condi t ions were chosen t o obtain W/6 values o f 181 400 kg (400,000 l b 3 , 158 800 kg (350,000 l b ) , 136 100 kg (300,000 l b ) , and 90 700 kg (200,000 l b ) . The incremental a i rp lane performance data were determined i n the cru ise (clean wing) conf igurat ion.
The CI , i se performance increment f o r i n s t a l l i n g JT8D-109 Refan engines was evaluated based on drag and range fac to r increments. The JT80-9 powered DC-9-30 production airplane drag i s based on the composite drag p c three separate airplanes. The range factor i s a lso based on the average o f three separate a i r p l anes, a1 1 powered by JT8D-9 engines.
ing the JT8D-109 engine. The fou r W/b's tested are representat ive o f cruise operation a t a l t i t udes o f 6 096 m (20,000 f t ) , 8 839 m (29,000 f t) , 9 449 m (31,000 f t ) and 10 668 m (35,000 f t ) ( h i g h e r W/6 f o r higher a l t i t u d e ) . The data points ind icate t h a t the drag penalty i s about as est inated (sk in f r i c t i o n and form drag only) , about a 2 percent increase i n a i rp lane drag. This i s not Mach number dependent f o r W/6 = 90 700 kg (200,000 l b ) , 136 100 kg (300,000 l b ) , o r 158 800 kg (350,000 l b ) ; on ly a t N/6 = 181 400 kg (406,000 l b ) i s there any ind ica t ion o f the favorable interference ( e f f e c t o f engine stream tube reducing wing compress ib i l i ty drag) tha t was measured i n the wind tunnel.
Figure 30 shows the measured drag increase a t four W/6's due t o i n s t a l l -
Figure 31 shows the measured range fac to r reduct ion a t four W/6's f o r i ns ta l 1 ing 3T8D-109 engines. (MO = 0.75 - 0.78) the range fac to r i s reduced by about 5 t o 7 percent.
About 2 percent i s due t o the increased drag o f the l a rge r nacelle. The balance (3-5 percent) i s due t o the poorer SFC o f the prototype JT8D-109 engines. The SFC d i f ference i s i n agreement w i th the 3T8D-109 SFC measured during the engi3e ca l i b ra t i on tes ts and the t e s t data qenerated from the engine deck (CCD0281-00.0) b u i l t from the ground s t a t i c and NASA Lewis a l t i t u d e tests conducted on a P r a t t and Whitney t e s t engine ( S / f I P-667091). For comparison the deck data are used t o represent the average o f the two prototype f l i q h t t e s t engines. The range fac to r decrement i s about one percent o r so worse a t W/6 2 90 700 kg (200,000 l b ) due t o the poorer SFC of the JT8D-109 prototype engine a t the lower th rus t set t inqs.
For the important operating condi t ions
67

0 FLIGHT TEST DATA
1 O L
5 - (3
2 n
’” o r a 5 -5 -
w
3 0
W/6 _. .- = 350,000 Ib (158 800- kg EST IM ATC
10- 0 z !i 5 - w 0 a n 0 . Lu
- 5 p
- 5 L
W/6 = 300,000 Ib (136 100 k
m o a - ~ ~ - - Q & -
MACH NUMBER. M
1 o b
5 -
0
FIGURE 30. DCQ REFAN L9UISE DRAG CHARACTERISTICS
W/6 =- 200,OW .. Ib . (90 700 . - kg)! ..
6 8

0 FLIGHT TEST DATA
10
5 -
O i
P 1 -
Wlb = 400,000 Ib '(18' 400 kg) -
8 t a U
E z 0
E 2 w K
n
I
10
.W/b = 350,000 lb ~
'(158 800 kgl '
"F 5
Wlb . 300,000 lbj i(l36-100 kg) I
5 -
I I J 0.55 0.80 0.65 0.70 0.75
MACH NUMBER - M
0.80 0.85
FIGURE 31. DCB REFAN RANGE FACTOR CHARACTERISTICS
6 9


Drzg Polars - All-Engins
In order to accurately define the f l i g h t proff les and thrust require- ment for FAR Part 36 flyover noise level measurements, test f l i gh ts *re made! to detemfne the trimed drag of the DC-9 Refan airplane.
DC-9 Refan drag polars were evaluated a t an operational c.g. of about 19 percent M.A. C. for two configuratiofis: f laps/stats Oo/Extend for the takeoff noise p r o f i l e and 0,873 rad (50 @)/Extend f o r the approach nofse pro f i l e . Three minutes o f continuous data were recorded during stabi l ized level unacceleratct f l i g h t a t various airspeeds i n the takeoff and landing conffg- urations.
The f l i g h t measured resul ts are i n good agrement with an estimate based MI the prnduction OC-9 Series 30 drag polars. The estimate accounts for the increased nacelle skin f r i c t i o n drag of the JTBD-109 engine instal lat ion.
the takeoff f l i g h t paths and approach thrust requirements for the FAR Part 36 noise data.
The drag polars obtained for these two conftgurations were used t o deffne
71


Fuel Supply
The suct ion f u e l feed capab i l i t y of the JT8D-109 engine was evaluated iu r ing a cl imb t o a l t f tude.
A t approximately 488 m (1,600 ft), MCL t h rus t was set and the climb conducted t o the fo l lowing schedule.
129 m/s (250 KIAS) t o 3 048 m (10,000 ft)
165 m/s (320 KIAS) t o 0.74 MN
0.74 $ t o 9 144 m (30,000 ft) cru ise a l t i t u d e
The LH tank boost pumps were turned OFF a t about 1 524 m (5,000 f t) and the LH engine operated on suction f u e l feed f o r the remainder o f the clfmb t o 9 144 m (30,000 ft). The boost pumps were returned to normal conf igurat ion af ter the climb was completed.
The systems conf igurat ion f o r the t e s t was normal f o r climb except the LH fue l tank boost pump was OFF and f u e l crossfeed CLOSLD.
No signs of engine i n s t a b i l i t y were noted by the p i l o t s during the MCL clfmb u t i l i z i n g fue l suction feed. ( f i gu re 32 and 33), the fue l pmp i n l e t pressure was 172-207 kPa (25-30 ps ig) and interstage pressure was 538-607 kPa (78-88 psig). With the engine oper- a t ing on suction feed, the i n l e t pressure was -7 t o 0 kPa (-1 t o 0 psig) and interstage pressure was about 483 kPa-552 kPa (60-70 psig). Cockpit indicated fue l flows were normal f o r the engine power set t ings.
was demonstrated s a t i s f a c t o r i l y w i th no ind ica t ion o f engine i n s t a b i l i t y and no unusual c e r t i f i c a t i o n requirements anticipated.
P r io r t o turn ing o f f the boost pumps
The Refan engine suction fuel capab i l i t y during the cl imb t o a l t i t u d e
7 3

0 m 0 -1 0 m I c 0 N
m N
I I I I I 1 I I E b 0 0
I
ul 0 I. 0 :J 8 0, c
0 D l : m
N c x
w K , I
3 0
74

W K 3 v) v) W K
W n
0 U t v) K W I- 5 Q a A W
U 3
z 2 W K Q)
3 0
ci m W K 3 !2 U
75


Engine Start ing
The JT8D-109 engine s ta r t ing characterist ics were determined t o ve r i f y ground star t ing and the l o w speed port ion o f the windmill s t a r t envelope i n f l i g h t .
0 Engine Start inq - Ground
The ground s t a r t tests were conducted f o r a range o f ambient conditions and are considered satisfactory w i th l i t t l e change f r o m other JT8D versions f o r the conditions monitored.
0 Enqine Start inq - I n f l i q h t
I n f l i g h t s ta r ts were conducted using normal i n f l i gh t engine s t a r t procedure f o r windni l l start ing. The tes t engine was restarted a f te r a normal cool down and shutdown o f the tes t engine with N1 and NE stabi l ized.
Stabi l ized win&dl l data (N1 and N2) p r i o r t o i n i t i a t i o n o f the s t a r t i s presented i n f igure 34. A cDmparison t o read i l y avai lable JT8D-15 engine N2 data i s also shown. The a i r s t a r t s conducted are shown on a sumnary envelope s imi la r t o current JT8D engines i n f igure 35. A slow speed s ta r t outside the published envelope ( f igure 35) resulted i n a peak EGT of 523OC (973OF), l i m i t i s 520°C (968OF).
The low speed i n f l i g h t s ta r t ing envelope was ve r i f i ed t o be satisfactory.
7 7

SYM ENGINE SERIAL NUMBER
0 0
- 1 P666995 - LEFT HAND
2 p686996 - RIGHT HAND
35)
/ 30 - I JT8D-15 ENG N, WIM LINE
N,, HIGH PRESSURE COMPRESSOR
E 25- E I- 2
0
w
YI
a a 1
kW 20 - m . >
2 LOW PRESSURE COMPRESSOR. N,
r; w w In a
MACH NUMBER
FIGURE 34. D C 9 REFAN WINDMILL SPEED v t MACH NUMBER
78

m
X
3
? r
B r
- n . E P
r w a. v)
- g w
[L a
0 c c
8
i?
w Q 0 -l w > z w c a a 5 a a z W
0 z w z 2
30 w K Q)
ui rn w K 3 (3 - LL
79


Fl igh t Test Prototype Engine Performance
SYSTEM DESIGNATION
Engine performance das evaluated t o assess the compat ib i l i ty o f the JT80-109 engine wi th the airframe and subsystems on the ground and in f l igh t .
1
GENE RATOR HY DRWL I C s PNEUMATICS
Ins ta l led engine ca l ibrat ion data, thrust lapse ra te data, maximum climb thrust data, engine transient data a d effects o f airplane s t a l l on engine operations were evaluated during the tes t program.
encountered. Engine performance was very close t o the predicted levels.
Ins ta l led enoine cal ibrat ion. - The performance parameters o f the JT8D-109 engine ins ta l led i n the DC-9 Refan airplane were measured t o obtain s tab i l ized gas generator data a t varlous combinations o f power settings, f l i g h t conditions, bleed, and power extractions. These data were needed t o establ ish the ef fects o f normal and m a x i m (ground only) engine system configurations on engine performance.
shown i n tab le 12.
Overall, the engine operations were excel lent wi th no major problems
0 .
The engine system configurations f o r the i n f l i g h t and ground tests, are
~ ~
Normal On High One A/C Pack
Maximum On High Two A / C Pack , X-Feed Open
TABLE 12
The ins ta l led engine performance and the ef fects o f power extract ion and bleed a l r on engine performance was evaluated. Calculated net thrust and measured engine parameters are presented compared against Pra t t and Whi tney tes t data which has been adjusted t o Include the ins ta l led ef fects of the Douglas A i r c ra f t Company in le t , nozzle, subsystems and bleeds.
The Prat t and Whitney A i r c ra f t t es t data used was generated from an engine deck (CCD 0281-00.0) that was b u i l t by Prat t f r o m the experimental JT8D-109 Engine #3 (S/N P-667091) Ground Stat ic and NASA Lewis Al t i tude Test data. Data from t h i s source used herein i s referred t o dy the engine deck number CCD 0281.
0 Insta l led Enqlne Calibrat ion - Ground
Stahi l l ;?d data was obtained a t sea level , s ta t i c conditions from tes t runs on l e f t and r i g h t hand engines f o r power sett ings f r o m i d l e t o takeoff wi th engine system conflgurations o f minimum, normal and maximum.
81

Corrected measured and calculated engine performance parameters obtained from the sea leve l s t a t i c tes ts fo r minimum, normal and maximum engine system configurations were p lo t ted versus engine pressure r a t i o (EPR) f o r the l e f t and r i g h t hand engines, and are shown i n f igures 36 through 39. Data fm the CCD 0281 deck was generated fo r the normal system configuration and i s p lo t ted on the same figures.
The effects of bleed and power ext rac t ion are shown ( f i gu re 39) as percent de l ta change of the maximun and normal system configurations compared against the minimum condi t ion and p lo t ted versus EPR. The e f fec ts o f bleed and power ex t rac t ion on thrust , fan pressure r a t i o and low pressure r o t o r speed were small enough t o be considered i n s i g n i f i c a n t and were not plot ted.
0 I n s t a l l e d Enqine Cal ibrat ion - I n f l i s h t
engine system configurations a t the fo l lowing conditions: S tab i l i zed data from both englnes were obtained w i th minimum and normal
a ) 762 m (2,500 ft) a l t i tude , 0.23 M, i n f l i g h t takeoff t o minimum appmach power, normal system conf igurat ion only.
b) 7 620 m (25,000 ft) a l t i t ude , 0.72 M, MCT t o minimum power required f o r l eve l f l i g h t .
c ) 10 668 m (35,000 ft) a l t i tude , 0.80 M, MCT t o minimum power required f o r leve l f l i g h t , t e s t conducted on l e f t hand engine only.
Engine ca l i b ra t i on data were obtained ( f igures 40, 41, and 42) a t 762 m (2,500 ft) t o s a t i s f y the th rus t determination por t ion o f the f lyover noise tests. No bleed and power ex t rac t ion e f fec ts were evaluated.
Figures 43, 44, and 45 present engine ca l i b ra t i on data a t 7 620 m (25,000 ft) f o r the mlnimun and normal engine system conrigurations. The effects of system conf igurat ion changes on engine performance are shown i n f igure 46. The e f fec ts on thrust , fan pressure r a t i o and low pressurn m t o r were smal l (very s im i la r t o what was seen i n the sea leve l s t a t i c data) and were not plot ted.
Figure 47 presents corrected spec i f i c f ue l consumption versus corrected ne t t h rus t a t 7 620 m (25,000 ft), 0.72 M f o r the normal engine system config- urat ion. P ra t t and Whitney A i r c r a f t t e s t data generated fmm the CCD 0281 engine deck f o r the same condit ions are p lo t ted on the same f igure.
Engine ca l i b ra t l on data was obtained a t 10 668 m (35,000 f t ) * 0.80 M f o r the mlnimun and normal system conf igurat ions on the l e f t hand engine only. These data are shown i n f igures 48 through 51. Corrected spec i f i c f ue l consumptlon versus corrected net t h rus t i s shown i n f i gu re 52.
and P-666996) on Shlp No. 741 was accomplished w i th in the scope of normal and predictable procedures w l th no unusual problems.
I n s t a l l a t l o n and tes t ing o f tm, prototype f l i g h t t e s t engines (P-666995
82

75 x 102
70
65
6c-
55
50- - 1
3
I-
z 2 40-
$
t,
45-
I- o Lu a a 8 35-
l7
-
..
- P ' 3
f I-
z D Lu c u
ti
t,
a
IU
0 0
a a
. * ....... . _ _ 3 1 O r
25
20
15
1 oL
13 I
-
-
-
ENGINE PRESSURE RATIO - P,,/PT2
SEA LEVEL, STATIC, THRUST AND FUEL FLOW FIGURE 36. DC-9 REFAN - JT8D-109 INSTALLED ENGINE CALIBHATION
83

8 x 1
E e 1 a w w In n
8 5 K w U
ii w U 0
B
a
a a
s W I- o w
8
- -
-
-
. - -i.-
-1.6
-1.5
1.4
1.3
1.2
1.1
-1.0
1 1
! I . ' t : I +----+ i i
t
. . . .
. _ _ .. - . . . . i , ' -- .. -. . . . . .
..-. . . . . . . . . - . . .
. - - - I .
. . . . . .
+ i I
-
. . . . . . . . . .f .c
I /
i ... . . A * .~ . . . .
--P&WA TEST DATA (CCD 0281-00.0) NORMAL
' FLAGGED SYMBOLS ARE LEFT-HAND ENGINE SYSTEM CONFIGURATION.
AND UNFLAGGED SYMBOLS ARE RIGHT-HAND ENGINE.
. . . .
. -
1 . 1 I 1 I I I I I I .o 1.1 1.2 1.3 1.4 1.5 1.6 ?.7 1.8 1.9 2.0
ENGINE PRESSURE RATIO - PTf/PT2
FIGURE 37. DC-9 REFAN - JT8D-109 INSTALLED ENGINE CALIBRATION SEA LEVEL, STATIC, L.P. HOTOR SPEED AND FAN PRESSURE RATIO
84

115 Y
E Et
a
a e 0
1
. .
-_ . . 1 I
: ‘ I . .. -i
, , . . I . .
I . .
NORMAL
--PLWA TELT DATA (CCD 028.-00.0) NORMAL
FLAGGED SYMBOLS ARE LEFT-HAND ENGINE SYSTEM CONFIGU RAT1 ON.
AND UNFLAGGED SYMBOLS ARE RIGHT-HAND ENGINE.
’
x 102
a K 0
60 1 . 1 I , I I 1 I
1.0 1.1 1.2 1.3 1.4 1.5 1.6 17 1.8 ENGINE PRESSURE RATIO - P,,’PT2
FIGURE 38. DC-9 REFAN - JT8D-109 INSTALLED ENGINE CALIBRATION SEA LEVEL, STATIC, H.P. ROTOR SPEED AND L.P. DISCHARGE TEMP.
85

SYS CONFIG
NORMAL
v I MAXIMUM 1 ON 1 HIGH I TWOAICPACh XFEEDOPEN 1
GEN HYD PNEUMATICS
ON HIGH ONEAICPACK
- Y -
RELATIVE TO THEMINIMUM CONFIGURATION
4 0 t
30
20
10
0,
- -
-
a
8
, .
. -. I -
~. .-
0 lo-': s. . ' 6-8
Kc 6T2
RELATlVr TO THE MINIMUM COh FIG UR AT1 OiJ +z
I 1 1 I 1.5 1.6 1.7 1.8 1.9
[ ; ? ; ' , , +a
1.1 1.2 1.3 1.4
ENGINE PRESSURE R A T i O . 5
pT2
FIGURE 39. DC-9 REFAN - JT8D-109 INSTALLED ENGINE CALIBRATION SEA LEVEL, STATIC, EFFECTS OF BLEED AND POWER EXTRACTION
86


FIGURE 41. DC-9 REFAN - JTBD-109 INSTALLED ENGINE CALIBRATION 2 500 ft (762 m), 140 KNOTS (72 m/s) L.P. ROTOR SPEED AND FA’’ PRESSURE h A T l r ~
88

115
x lo2
0 g
E P
-85 x 10 UJ
f m a 3
-80 I-
a ZJ
UJ
- 7 5 s.
- 7 0 5
-66 ,"
8
- 0 8 :
n
a a
tu t
-60
.. ~. . . . . . . . .
1 - i 8-
85 - -P&WA TEST DATA (CCD 0281-00.0) NORMAL
FLAGGED SYMBOLS ARE LEFT-HAND ENGINE . . .a - SYSTEM CONFIGURATION.
. . Q . . AND UNFLAGGED SYMBOLS ARE RIGHT-HAND . I ~ ENGINE.
8 0 . 1 , l I I I 1 1 J 1.0 1.1 1.2 1.3 1.4 1.5 1.6 1.7 1.8
ENGINE PRESSURE RATIO - PT,IPT,
N I-
I-
.a . b
I-
I-
FIGURE 4 2 DC-9 REFAN - JT8D-109 INSTALLED ENGINE CALIBRATION 2,500 h (762 m), 140 KNOTS (72 i d s ) H.P. ROTOR SPEED AND L.P. TU-BINE DISCHARGE TEMP.
89

.. .. . 3 13 x 1 O F -+ . * ... . . . . ....., . ! I
lo3
-
-
-
-
55 x lo+
50 -
45 - 0 - z -
t 1 1-40- t- rn
a 3 a I I-
5 I c
L35- 2 2
0 w a I- 0
w c 0
a c: 0
15
-50 IO*
45
40
- L
-35 1 3
. 0 3 - s u.
-30 d. 3 U
E - 2 5
U a 0 V
- m
15
10
-5
.i 5
: ; : ; , ,
I ! '
. . . ! . . i . !
' ~ ~ , .. . . . . .. . ~ 1 . ' -t- --7 : . i
, . . . 12 --.; ~ ~ . - :.- . i ., .... - - ~ ~ . . . __ . . . . . . - - . . . - . . .. - . - . . .~ ..-- ,
~ , -. .L . . - . . .
i . ,
L
~. .
5-. .. . . . . . . .
_ - - . _ . . - . . .. . .- w k x a . - - 5 , 0 V
0 NORMAL ON HIGH ONEAICPACK - 3 ' 0
1- . --PLWA TFST DATA (CCD 0281-00.0) NORMAL 5YSTEM CONFIGURATION.
AND UNFLAGGED SYMBOLS ARE RIGHT-nAND . FLAGGED SYMBCLS ARE LEFT-HAND ENGINE - 2
. - . . . ENGINE.
;.1' I I I I I I - 1 1.0 1.1 1.2 1.3 1.4 1.5 1.6 1.7 18 1.9
ENGINE PRESSURE RATIO - P,,/PT,
FIGURE 43. DC-9 REFAN - JT8D-109 INSTALLED ENGINE CALIBRATION 25,OOO !t (7 620 m), 0.72 MACH NUMBER, THRUST AND FUEL -Low

' -1.1
. - 1.6 + h
n . LL . --1.5 a+
0 a
a
t-
0: . . - :.4
2 v) w - 1.3 a n 2 . . . i
. -1.2
I 1 .1
. . . -. ........ .+. ..
,bd ! '
' !
.................... 8 L.$p?/ -1:.
... -1 r__ .... : i .. 4.+'-..f... . . . m , .
. . . . . . . ...
. . . .
. . .
. - - ... - ~ . .
. . _. .
A _ . . . - .-..-
, . . . . . . . . . . . . . . ._ .........
. . . . . . . . . -~ -~
- . SYM. S"sC0NFIG GEN HYD PNEUMATICS .
A MINIMUM OFF OFF OFF
0 NORMAL ON HIGH ONEAICPACK , * . . _ .
-PLWA TEST DATA (CCD 0281-00.0) NORMAL . . . . . SVSTEM CONFIGURATION. . . FLAGGED SVMBDLS ARE LEFT-HAND ENGINE -.i . : .. .- ._ AND UNFLAGGED SYMBOLS ARE RIGHT-HAND
. . . . . .. ...... .~ ,.. ENGINE. -.
, . , . 1 : I , ! 1 I I I I I I , ,
1 9 2.0 1.0 1.1 1.2 1.3 1.4 1.5 1.6 1.7 1.8 ENGINE PRESSURE RATIO -. p,,/p,,
FIGURE 44. DC-9 REFAN - JT8D-109 INSTALLED ENGINF CALIBRATION 25,000 ft (7 620 NJ, 0.72 MACH NUMBER, L.P. ROTOR I. '€ED AND FAN PRESSURE RATIO
31

. . . .
120 E 9 /
G " y 115- v)
4 1 . . '
/ - . . . . .
. . . . . ,
.- . . . -. . . . . . .
/.%le.. . - . . . . . . .
e ?'.*.........I.
....... I .
I ' . . . ! & . , I I
, . . . . . . . : . .
. . . . . . . . . . .
. -.... . .
125 x 102
. . 1- 0
.- FLAGGED SYMP3LS ARE LEFT-HAND ENGINE AND UNFLAGGED SYMBOLS ARE RIGHT-HAltD ENGINE.
1 1 t I 1 90 L"' 10 1.1 1.2 1.3 1.4 1.5 1.6 1 7 1.8 1.9
ENGINE PRESSURE RATIO - PT7/PT2
- 85
- 80 - 75
- 70
- 65 a60
FIGURE 45. DC-9 REFAN -- JTID-109 INSTALLED ENGINF CALIBRATION 25,000 ft (7620 m), 0.72 MACH NUMBER. H.P. ROTOR SPEED AND L.P. TURBINE DISCHARGF TEMP
92

SYM
0 SYSCONFIG GEN H Y D PNEUMATICS
NORMAL ON HIGH ONEA/CPACK
I
. . . . . . . . .
+4-
+3 PERCENT CHANGE
t 2 2L
-2
RELATIVE TO THE MINIMUM CONFIGUHATIOh t 1
7 30
: - * . _ _ . , . .
. . --. i . . . -.. _ _ . . . . . . . . . _ _
- -1 . . . - L - .. . I
. 1 - . . . . . .
- . .... i . . .
A - _- . . . . . . . . . . v *r I T
O r . . . . . . . . . . - . . . .- . . . .
20
+8’
+6
+4
t2 , -
RELATIVE TO THE MINIMUM CONFIGURATION
-
- .
PERCENT CHANGE
Wf - Kc & T 2
RELATIVE TO THE MINIMUM CON F I GU R ATlON
2 i ...
p’
+O I 1 I I I 1 I I 1.4 1.5 1.6 1.7 1.8 1.9 1.1 1.9 1.3
ENGINE PRESSURE RATIO.- pT7
pT2
FIGURE 46. DC-9 REFAN - JT8D-109 INSTALLED ENGI:JF CALIBRATION 25,000 ft !7 620 m), 0.72 MACH - EFFECTS OF BLEED AND POWER EXTRACTION
93

m 0 c x
::
a
n 0
- 5 1 I-
a ;!3 I b- I- w z D w I-
$?: a a 0 0
3
n N
0 N
5
1 I 1 ti 0
8 E d 0 8 0
1 -1 -- 8 r
8 c

13 x
55 x 1 0 2
50
. 45-
. ~ i a -
t I- w a I- I- w z a
V
a 0 v ' 25-
3
x , 35-
p 30- w a
20
15
10-
-
' 1 I- fn 3 I I- I- w z 0 W
a
6
8
W a X
-
-
-
. / . /
.I P
x ~ ~ 3 -
L . S
& 1 E 2 U -1 w
U 3
E i- V w .. a a 0 V -
-
-P&WA TEST DATA (CCD 0281-00.0) NORMAL - SYSTEM CONFIGURATION.
# . LSV'IBOLS A>& -LEFT-HAN-0-E-NGINE ONLY. c
55 x 10,
- 5 0 L . .c 01 A -
- 4 5 1 3 2
-40 ii U
2
D w I-
U U 0 u
U
-35 i
30
25
.c - . ~.
. . f A
.. . ~.
. -12
.
7: - - 11
.. . .
6 - f -10
. - 9 5 -
4 - - 8
3 - - :7
2 - - 6
1, I 1 1 I 1 I 1 -5 1.: 1.3 1.4 1.5 1.6 1.7 1.8 1.9 2.0
ENGINE PRESSURE RATIO - PT,/PT,
FIGURE 48. DC-9 REFAN - JT8D-109 INSTALLED ENGINE CALIBRATION 35.000 ft (lC.668 m), 0.8 MACH NUMBER THRUST AND FUEL FLOW
,
95

9 x 1
O W c
4c. 1.. . I . . . . . .
-P&WA TEST DATA (CCD 0281-00.0) NORMAL SYSTEM CONFIGURATION. . - 'SVMBOLS ARE LEFT-HAND ENGINE ONLY.
I . I . I I , I , l . I . I I I l , l , l 1 .o 1.1 1.2 1.3 1.4 1.5 1.6 1.7 1.8 1.9 2.0
ENGINE PRESSURE RATIG - PT,/PT,
FIGURE 49- DC-9 REFAN - JT8D-109 INSTALLED ENGINE CALIBRATION 35,000 h (10.668 m), 0.8 MACH NUMBER, L.P. ROTOR SPEED AND FAN PRESSURE RATIO
96

125 x
E P
x lo2
a ? D
MINIMUM OFF OFF
NORMAL ON HIGH ONE AIC PACK 100-
--P&WA 1 EST DATA (CCD 281-00.0) NORMAL
'SYMBOLS ARF LEFT-HAND ENGINE ONLY. . SYSTEN CONFIGURATION.
. . .- . . . . . 95, I I I I 1 I I 1.3 1.4 1.5 1.6 1 7 1.8 1.9 2.0
ENGINE PRESSURE RATIO - P,,/PT2
FIGURE 50. OC-9 REFAN - JT8D 109 INSTALLED ENGlhi. CALIBRATION 35,000 ft (10.668 m) 0.8 MACH NUMBER, H.P. ROTOH SPEED AND L.P. TURBINE DISCHARGE TEMP.
97

SYM I SYS CONFIG I GEN 1 HYD I PNEUMATICS
0 I NORMAL I ON I HIGH I ONEA/CPACK
PERCENT CHANGE
-2 %2
RELATIVE TO THE MINIMCIM CONFIGURATION
PERCENT CHANGE
W f
K X RFLATIVE TO THE MINIMUM CCh F IGU RAT1 ON
O t
+e r
+4 +6 t I , : . L :
. .. _._- . . . . . . . a , I . - - - - . - . - I , '
. . . . . . . . . . . . , . . . . . . . . . . . . . . .
, .
i
1.1 1.2 1.3 1 4 1.5 1 8 1.9
P
P T 2
ENGINk r'RESSURE RATIO,
FIGURE 51. DC-9 REFAN - JT8D 109 INSTALLED ENGINE CALIBRATION 35,000 ft (10.668 m), 0.8 MACH NUMBER, EFFECTS OF BLEED AND POWER EXTRACTION I
98

m
3 2 r l
I- v) 3 (E I I- !-
” i a w I- V w K
0 0 x
-.
0
UJ
c
0 x 8 0 0
m E
99

Comparison of the f l i g h t t e s t data w i t h the t e s t data generated from the CCD 3281 engine deck, indicates t h a t the p2rformance and e f fec ts of t l e e d and power ext ract ion loads are reasonably predictable.
Generally, the f l i s h t engiIie perfornance was not modeled exact ly by the engine deck; however, parameter deviat ions appear t o be consiLtent, e.g., corrected n e t thrust , fan pressure r a t i o and corrected Low Pressure Rotor Speed a t the same EPR and other condit ions were higher t i a n the CCD 0281 data. The corrected Hlgh Pressure Rotor Speed and the corrected Low Pressure Turbine Discharge Temperature a t the same EPR and other conditions/were lower than the CCD 0281 data. The corrected fuel f low most inconsistent, a t various a l t i tudes and Mach
Thrust lapse rate. - Thrust lapse i n s t a l l e d i n the DC-9 Refan airplane were establ ished from r o l l i n g takeoffs. The th rus t lapse r a t e was recording data from takeoff t o a l t i tudes of
Figure 53 shows the EPR (Pt7/Pt2) lapse the prototype JT8D-109 f l i g h t t e s t engines.
f l i g h t resu l ts and a t other condit ions lower.
i n f l i g h t th rus t determination procedure was
be higher than
s t a t i c and
values along the f l i g h t path f o r both takeoff procedures described above.
The th rus t lapse r a t e w i t h speed demonstrated by the f l i g h t t e s t engines i s shown i n f i g u r e 54. Also sflow i s the lapse r a t e curve t h a t was generated from CCD 2b7-3.1 engine deck and used f o r Refan performance estimates.
A t the t y p i c a l production DC-9-30 second segment speeds, the thrust lapse ra te as demonstrated by the f l i g h t t e s t engines, i s approximately 2-1/2 percent b e t t e r than the predicted lapse rate.
En i n e operation during MCL climb. - The operation o f the JT8D-lG3 engine X i h - q C L climbs was evaluated t o determine che p i l o t workload and t o eva; .;$e the a b i l i t y ’ o f the JT8D-103 engine t o fo l low the maximum climb thrust power se t t ing schedule during climb t o a l t i tude .
Maximum climb th rus t was set and the climb star ted a t approximately 129 m/s (250 K I A S I and 988 m (1,600 f t ) , continued t o 6 096 m (20,OW f t ) and 165 m/s (32C K I K ] and terminated a t 9 144 IF (30,000 f t ) and M = 0.74 ( f igure 55).
During the climb several ambient temperature inversions made the P‘. EPR d i f f i c u l t t o maintain and t h r o t t l e resets were required ( f igure 55 .:id 56). The workload, i n each case, was sat is factory t o the p i l o t s .
Although p i l o t workload was acceptable, the reset c r i t e r i a o f 0.01 EPR used f o r the DC-9 Refan airplane tests are considered too r e s t r i c t i v e dnd should be 0.02 EPR un i ts as on other current JT8D engines. tes ts the t h r o t t l e s were reset when the indicated EPR d i f f e r e d from the t a r g e t dalue 0.01 EPR.
During the cl imb
100

1.01
1 .oo
LL 1+1
=a 0.99 a
a
W
It . u
0.96
0.97
-1 1 2 3 4 6 7
RAT - RAT OC
FIGURE 53. DC-9 REFAN EPR LAPSE RATE
f LIGHT TEST ENGINES
CCD 207-3.1 tNGINC DECK
0.80
I I
0.76 J
1 0.r 0 1 0 2 0 3 0 4 0 5 06 07 0 8
hl MACH N JMBE t3
FIGURE 54. 03-9 REFAN THRUST LAPSE RATE
101

(a) AIRPLANE ALTITUDE (hp)
I N I ~ I A L T H R ~ T T L E THRUST SET RESET
THR~TTLE THRO’TTLE EN^ OF RESET RESET CLIMB
TIME - sec
(b) ENGINE PRESSURE RATIO (EPR)
FIGURE 55. DC-9 REFAN THROTTLE RESET DURING MCL CLIMB
102

0
1 W E 3 t- a a n 5 w t- t- In
Lu
a
FIGURE 56. DC-9 HEFAN STATIC AIR TEMPERATURE DURING MCL CLIMB
103

Engine performance during transients. - Engine t rans ient tes ts were conducted t o dete rmine the JT retards and jam accelerations w i th normal and f u l l service bleed configurations f o r ground, i n f l i g h t and landlng-climb operations.
engine response character is t ics t o snap t h r o t t l e
Test data was obtained on both the l e f t hand engine S/N 666995 and the r i g h t hand engine S/N 666960 The bleed configuration was normal f o r ground transients and f o r i n f l i g h t accelerat ions and decelerations. Bleed system conf igurat ion f o r the landing cl imb accelerat ions are noted below. The a i r c r a f t conf igurat ion dur ing the landing cl imb accelerat ion t e s t was maximum landing weight, gear down and f laps/slats, 0.873 rad (50 deg)/Extend.
0 Enqine Transients - Ground and I n f l i q h t
I n i t i a l l y , the t e s t engine was stablqized a t id le . Then a slow accelerat ion t o takeoff pawer (1.74 EPR) was perfonned and the engine allowed t o s tab i l i ze . A slow decelerat ion followed. The t e s t was repeated f o r a moderate and r a p i d accelerat ion and deceleration. Then a ser ies o f bodie accelerat ions and decelerations were conducted (jam accelerat ions f r o m i d l e t o takeoff and snap decelerations f r o m takeof f power) i n rap id succession without al lowing the engine t o s tab i l i ze .
A ser ies o f accelerat ions and decelerat ions were conducted on each engine.
I n f l i g h t t rans ients were conducted for each engine where i n i t i a l l y the airplane was s tab i l i zed a t t e s t a l t i t u d e and airspeed (airspeed decreased during the tests) . From s tab i l i zed td le , the t e s t engine was accelerated t o MCT (1.88-1.77 EPR) a t a moderate rate. A f te r al lowing the engine t o s t a b i l i z e a t MCT (about 10 seconds), a moderate decelerat ion t o i d l e was conducted. The tes ts were repeated w i t h a rap id accelerat ion and deceleration.
Engine response t o t h r o t t l e inputs was acceptable f o r the ground and i n f l i g h t acceleration-deceleration t es ts w i t h normal bleeds. Typical response character is t ics o f the l e f t and r i g h t hand f l i g h t t e s t engines f o r the ground s t a t i c and i n f l i g h t tes ts are presented i n f igures 57, 58, 59 and 60 respect- ive ly .
a Landinq Climb Accelerations
the configuration noma1 f o r ic ing.
l i shed w i th both engines a t the power required t o maintain the r a t e of descent f o r the a l rp lane I n the landing conf igurat ion a t maximun gross weight. A t 2 865 m (9,400 ft), both engines were retarded t o 65 percent N2' simulat ing f l l g h t id le . Airspeed was targeted a t 66 m/s (128 knots). A t 2 621 m (8,600 ft), jam accelerations were conducted simultaneously on both engines attempting t o reach the ta rge t i n f l i g h t takeof f EPR. The t e s t was repeated f o r an I d l e power o f approximately 60% NE, and f o r ground i d l e power.
Addit ional tests were conducted f o r i d l e N2's o f 63%, 67%. 52.5% w i th the conf igurat ion and procedure the same.
Landing climb accelerations were conducted w i t h f u l l service bleeds and
An a i r l i n e type approach descent o f about 4 m/s (13 f t / sec ) was estab-
104

h
L o i -0
9 w
.--A 500 .. *- -- . . - 6 . .- . - .. . 'c
- - - - I I
100- .__... .. -..- .. _...'- . .* . . - . *- 2 80, - I 6 0 c
.. 40, y. ........ -*.- * * a .......
1 . o o t l x E a m m
~
2 1.60 a E 1.40 a
1.20
.
z Q: 1.50 / c C' c
\* 5-1.00 * .
J 8 '
20- ' 0.75 *
18 lo4
105

....... - 80, ae I 6 0 I
..... 40. mr ........................
106
...... ..... .... - ..... .".. . . .. .. . . .. ....... **.. -..

136
e
130
im
260
255
250
................. .................... -.- ............. --.. ..... ..+. .... ...... .-C-*'*.*. ~ ......................................
450 I- 00 400. w 0
350
300
.................... . ........ ......... *.. '.. *.........4-
.. ...............
107
2 5 k
20
15
10,
i 10
~ -

255
250
245
240
r
..... "W.....
.'.u. .. ..-..-.. ".* -.....-- .... *.--.*+.- .-**..... -.. *.5-,.
-... *.. -*..- *,.-.., wL..u+*-***-
'
1
L
I I -*... 500 ..*..I JI.. 9.. 450 I I /""""". 5.1 +*.- 1 I I I
' 5
- 2 0 'a 15
10
10
0 5 10 15 20 25 30 35 40 TIME - SEC
FIGURE 60. DC-9 REFAN RH ENGINE PEPFORMANCE DURING ACCELERATION AND DECELERAT13N - IN FLIGHT - RAM AIR TEMPERATURE 7OC
108

Jam accelerat ion tes ts were a lso conducted on the l e f t and r i g h t hand engines separately, with the i n i t i a l bleed configuration normal f o r landing. The a i r c r a f t was s tab i l i zed a t 2 621 m (8,600 ft) and 66 m/s (128 knots). The ground i d l e th rus t was set on the t e s t engine. Power on the remaining engine was as required t o maintain a l t i t u d e and airspeed. Maximum bleeds were then set on the t e s t engine with:
a) Engine and A i r f o i l Anti- Ice: ON (Test Engine Supplies Both Wings)
b ) Test Pneunatic Cross Feed: OPEN
c ) Non-Test Pneumatic Cross Feed: CLOSED
A jam acceleration, attempting i n f l i g h t takeoff power, was then per foned on the t e s t engine. The tes ts were repeated f o r the other engine. With maximun bleeds from each engine, a jam accelerat ion was then conducted simultaneously on both engines from ground i d l e t o an attempted target o f i n f l i g h t takeoff thrust , (pneumatic crossfeed open).
A sumnary o f per t inent engine powers and times f o r the landing-climb accelerat ions i s attached tab le 13. N measuring capab i l i t i es a t the time o f the tes ts were not s u f f i c i e n t t o p e d i t evaluation o f the time required fo r engine s t a b i l i z a t i o n a t i d l e a f te r re ta rd f rom approach powers.
A l l landing-climb engine accelerat ions from ground i d l e w i th maximum pneumatic bleeds f a i l e d t o reach i n f l i g h t takeoff power w i th in the 8 second time target.
A f l i g h t i d l e Ne caution l i g h t was i n s t a l l e d t o i l l u n i n a t e when N2 RPM dropped below 64.5%. This l i g h t se t t i ng resu l ts i n an estimated th rus t o f 6 717 N (1,510 l b ) per engine a t sea level, 72 m/s (140 knots) and was intended t o ensure the 8 second capab i l i t y from i d l e t o i n f l i g h t takeoff EPR a t 2 621 m (8,600 ft) w i th normal engine bleeds and power extract ion.
A s m a r y of i d l e Np's a t t h r o t t l e advance and EPR's a t 8 seconds are presented on f i gu re 61. A t rend was establ ished f o r the i d l e N2 and 8 second EPR except f o r the LH engine response data, which displayed noteably higher EPR than data from other accelerat ion at tem ts . The RH engine f a i l e d t o a t t a i n the target i n f l i g h t takeof f EPR during a c 1 of the accelerat ion attempts.
Landing-climb accelerations from ground i d l e t o i n f l i g h t takeoff power LH engine w i th an t i - i c i ng bleeds d i d not s a t i s f y the 8 second requirement.
character is t ics from higher i d l e N2's approximated the 8 second c r i t e r i o n o f other JT8D engines b e t because o f the s ign i f i can t di f ference between t h i s and the other JT8D-109 .:?ding close up climb data, the LH engine bleed conf igur- a t i on has been questioned.
To ensure reaching i n f l i g h t takeoff power w i th maximum bleed configur- a t ion a t 2 621 m (8,600 f t ) the i d l e N2 must be above 66% N2.
109

I-
2 &-3 r
1
C C F C C C C
< I- a n F? d
W
t $ c 3 m a I W
8
Y 2 5
LL LL 0
(3 J LL z z - z 2 & z O W
(3 z W W I I-
O
I- W
W J I-
0
z
a a a
W -I I- I- 0 I + W I- LL a
z 0 u
a
a
8
OD
z a z v) v) W J
W a
B s LL LL
a
5!
I- I- I
J LL z I- W 0
- a 2 W I c
W a 4 a
n
I
t 3
om 3 I I-
a 0 LL VI 0 W
$!!I
8 0 m m
o W
110

I 1 .a 6
1 .I
1 .€
1.5
1.4
1.3
1.2
1.1
1 .o
L
I
.
I
.
0
/ 0
I/ /
-4
8
0 ENGINE 1 SIN 6669%
0 ENG 2 SIN 686998 r FLAGGED POINTS LESS THAN 8 SOC TO TAKEOFF EPR
+ BLEED CONFIGURATION QUESTIONABLE . . - __
62 54 MI 68 60 62 64 SS HIGH PRESSURE COMPRESSOR ROlOR SPEED, N, - % rpm (AT INITIATION OF THROTTLE ADVANCE)
FIGURE 61. DC9 REFAN LANDING CLIMB ACCELERATION - JT’SDlOB ENGINE INFLIGHT IDLE Np DETERMINATION
111

nqine character is t ics durinq a i rp lane maneuvers. - A number of f l i g h t tests ;ere made t o evaluate the oDeration of the JT8D-109 enqine durinq a i r c r a f t s t a l l w i t h d i f ferent power sett ings, during s t a b i l i z e d - f l i g h t at"high angles o f at tack and high s i d e s l i p angles and t o ver i f y t h a t engine operation was sa t is fac to ry during an abused takeoff.
0 Engine Operating Character ist ics - Approach t o S t a l l s
The engines were a t i d l e o r low powers w i th continuous i g n i t i o n , the engine hydraul ic pumps a t h igh f low w i t h a u x i l i a r y hydraul ic pumps, a l te rna te hydraul ic pumps, yaw dampers and APU on.
During the approach t o s t a l l s tes t ing three compressor s t a l l s occurred on the R.H. engine during a moderate r e t a r d from about 1.77 EPR t o i d le . A 5OoC (122OF) r i s e i n EGT resulted. iio other unusual events were reported. The p i l o t s f e l t t h a t i n a l l cases accelerat ion was good above 1.1 EPR.
l e f t (SJN 666995 3 by the occurrence of occasional compressor s t a l l s during the approach t o o r recovery from a i r p l ie s t a l l s .
* The R.H. en i ne ( S / J 666996) appeared t o have less s t a l l margin than the
0 Engine Operating Character ist ics - Stal Is
S t a l l tes ts were performed w i t h symmetrical power and w i t h the system configuration the same as f o r the approach t o s t a l l s tests, except the yaw dampers were o f f . the r i g h t hand engine during engine accelerat ion a f t e r recovery from an airplane s t a l l w i t h f laps/s la ts , up/ret. Otherwise the engine operating character is t ics were regarded as good.
During the power ''on" s t a l l tes ts one compressor s t a l l was reported on
During the slowdown w i t h MCT s t a l l s the engine demonstrated no unusual operating character is t ics .
During the high angle o f attacl- evaluation tes t , the enqine operation was normal a t l o c a l angles of at tack up t o .576 rad (33 deg) ANU.
0 Engine Operating Character ist ics - Hinh Sides1 i p Angles
Engine operation was a lso evaluated a t various angles o f s i d e s l i p w i t h the L.H. engine se t a t MCT. The system conf igurat ion was normal fo r takeoff w i t h the pneumatic supply o f f on the l e f t engine f a r some f l i g h t s and on normal f o r other f l i g h t s .
angles o f s ides l ip evaluation. No abnormal engine operating character is t ics occurred during the high
0 Engine Operating Character ist ics - Abused Takeoff
The system conf igurat ion f o r the abused takeoff was normal (bleeds on)
The JT8D-109 Refan engine operatiIL., character is t ics and s t a b i l i t y during
f o r takeoff wi th f laps/s lats, .262 r a t (15 deg)/Extend.
the abused takeclff maneuver were sat isfactory.
112

Engine Component Cooling
This tes t was performed t o establ ish that the Refanned engine nacelle compartment vent i la t ion and component cooling configuration was wi th in allowable l i m i t s both on the ground and i n f l i gh t .
The system configuration for the ground and the f l i g h t t es t was engine hydraulic pumps on high, one a i r conditioning pack per engine was on and a l l i ce protection was o f f ; the generator load i s noted f o r each test.
f igures 62 thru 66. For a l l test ing a one t o one correction was added t o ambient temperatures t o adjust f o r a hot day. A hot day i s defined as an ambient temperature o f 5OoC up t o 2 591 m (8,500 ft) and standard +35OC above 2 591 m (8,500 ft).
Engine component cooling instrumentation locations are shown i n
During ground test ing, wi th normal takeoff power, a l l corrected temper- atures remained wi th in allowable 1 i m i t s .
During f l i g h t test ing a1 1 uncorrected engine component temperatures were satisfactory. However, when corrected t o a hot day the PRBC valve body was 8OC ( 1 5 O F ) over the l i m i t . Normal takeoff power was set f o r tes t ambient conditions, and a one t o one correction added t o a l l tenlFer;,tures t o adjust t o a hot day. This correction resulted i n cycle and component temperatures higher than would ex ls t on an actual hot day. A more r e a l i s t i c correction method was applied t o the PRBC valve body i n l i e u o f the one to one correction.
A mathematical thermal model was ta i lored f o r computer use to match t e s t day values o f engine case, bleed f l o w , ambient, nacelle wall, and PRBC valve temperatures. Hot day values f o r engine case, bleed flow, ambient and nacelle wall temperatures were then !nput and PRBC valve body temperatures calculated. This correction procedure resulted I n PRBC valve temperatures below 1 i m i t .
Maximum uncorrected and corrected values f o r engine component. temperatures during the ground and f l i g h t test are presented i n table 14. The'JT8D-109 engine nacelle compartment vent i la t ion and component cooling requirements were sa t is f ied f o r ground and i n f l i g h t conditions and could be expected t o meet FAA ce r t i f i ca t i on requirements .
113

NAMEPLATE J VIEW A
PLUG AND TIC PROBE ENGINE PRESSURE RATIO BLEED CONTROL VALVE
FUEL PRESSURE AND Dl MP VALVE LEFT-HAND SIDE - ENGINE NO. 1
7S1005 FUEUOIL HEAT EXCHANGER FUEL OUT TEMPEEATURE
FIGURE 6 2 DC9 R5FAN TEMPERATURE INSTRUMENTATION LOCATIONS OF ENGINE COMPONENTS
114

IGNITOR BOX
IGNITOR PLUG LEAD
IGNITOR PLUG LEAD TEMPERATURE 74-1003
CLAMP THEMOCOUPLE FOR 741002,74-10Q3
IGNITOR PLUG (RIGHT SIDE) T=?F 741 002 IGNITOR PLUG TEMPERATURE
NACELLE COMP AR TM EN T AMBIENT NEAR FUEL CONTROL W
PRODUCTION CLAMPS AND TUBING
AMBIENT NEAR FUEL
FIGURE 63. D C 9 REFAN TEMPERATURE INSTRUMENTATION LOCATIONS OF IGNITOR AND NACELLE COMPARTMENT AMBIENT
115

UPPER NACELLE
I
NACELLE COMPT EXIT AIR TEMP
EXISTING PROD BOLTS (REF)
EXIT OPENING IN NACELLE
VIEW A
NACELLE COMPT
INLET AIR
LOOKING INBOARD AT LEFT ENGINE
I I
AMBIENT AT HYDR
AIR TEMP AULIC PUMP
FIGURE 64. DC9 REFAN TEMPERATURE INSTRUMENTATION LOCATIONS OF NACELLE COMPARTMENT
116

z 0, h t- a n a a om z 0
0
3 w
- 5 s >
117

751 105 NACELLE SKIN TEMP NEAR 13TH STAGE AT SKIN LOCATED ABOVE 13TH STAGE DUCT IN CENTER OF PYLON SKIN
751 109 NACELLE SKIN TEMP NEAR 13TH STAGE AT RIB LOCATED APPROXIMATELY IN CENTER OF CLOSING RIB
13TH STAGE
VIEW LOOKING INBOARD AT LEFT PYLON
FIGURE 66. DC9 REFAN INSTRUMENTATION LOCATION OF NACELLE SKIN TEMPERATURE
118

TABLE 14
JT8D-109 ENGINE NACELLE COMPARTMENT COOLING
I PARAMETER 1 MAX
PARAM I NO.
I NAC COMPT EXIT AIR TEMP
NAC COMPT INLET AIR TEMP
AMB AIR AT HY OR PUMP TEMP
135 157) 60 I161 90 I 3 2 1
130 I541 105 141) 139 159)
135 1571 218 I1031 138 I581
212 I1001 152 167) 168 176)
188 I871 161 1721 238 1114) .**
281 1138) 212 1100)
WORR
INFLIGHT
75-1101 75-1103 75-1102
74-1002 -
74-1003 73-1002
73-1005 75-1501 77-1101
166 (741 107 142) 118 (48)
142 (61) 108 142) 190 (881
204 196) 235 1113) 157 169)
711104 75-1105 75-1116 751117
*CORR MAX TEMP F LTo
IC1
135 157) 97 (36)
160 171) 104 140)
230 (110)
188 I871
228 (1091 202 193) 228
140 (60)
299'*(149) 230 I l l O l
114 1461 78 (26)
155 168) 79 126)
215 1102) 143 162) 240 I1161 177 181)
~-
181 1109) 147 (64)
205 196) 149 165)
MAX ALLOW.
TEMP OF (oc1
225 1107)
450 1232) 450 (2321 275 I1351
300 1149) 275 11351 300 1149)
250 1121) 250 1121)
IGNITOR PLUG TEMP
IGNITOR PLUG LEAD TEMP
PRBC BODY TEMP
I (Cont) (15 min)
N1 TACH GEN BODY TEMP
NAC SKIN TEMP NR 13TH STG AT RIB
NAC SKIN TEMP NR 13TH STG AT SKIN PYLON AMB AFT OF 13TH STG TEMP NAC COMPT AMB NR FUEL CONTR
*THE FOLLOWING "ONE-TO-ONE" CORRECTION FOR HOT DAY WAS APPLIED TO ENGINE COMPONENT TEMPERATURES.
T j = T1 + (HOT - T2)
T j = CORRECTED TEMPERATURE OF COMPONENT. OF (OC)
T1 = TEMPERATURE OF COMPONENT DURING TEST. O F (OC)
T2 =
WHERE
oBIENT TEMPERATURE (SAT CALCULATED FROM TAT), OF (OC)
HOT = 122OF (5OoC) SL - 6500 ft (2591 m)
HDf = STD 95OF (35OC) 8500 ft (2591 m)
*'TEMPERATURE CORRECTED USING THERMAL MODEL.
"*AMBlEMT TEMPERATURE CORRECTION NOT APPLICABLE TO FLUID TEMPERATURE.
NOTE: CORRECTED TEMPERATURES USING ONE-TO-ONE CORRECTION ARE ESTIMATED TO BE HIGHER THAN WOULD EXIST FOR ACTUAL HOT DAY CONDITIONS.
119


Constant Speed Drive O i l and Generator Cooling
1 7 3 1 7 3 1 7 3 1 7 3
1 7 7 1 80 1 80 1 8 1 1 80
18. 1 8 7
1 88
1 5 5
1 5 5 1 4 9 1 4 8
1 38 1375
1 5 1
1535 1510
1607 1 64 1 W
This t e s t was performed (a) t o determine i f the constant speed dr ive (CSD) generator i s load l im i ted whenever 100% load i s applied; (b) t o determine if the Refan en ine i d l e power rpn i s compatible wi th the production CSD and generator; and (c 3 to evaluate the effectiveness of the CSD and generator cooling systems on the ground and during f l i g h t .
51 51 51 51 51 51 51
51 51 51
51
51
53 7
53 7
53 7
53 7
53 7
5.3 I 53 7
53 7
53 7
53 7 53 7
53 7 I
A CSD instrumented t o measure o i l - i n and o i l -out temperatures and an instrumented Westinghouse generator was ins ta l led on the LH engine. The engine and a i r f o i l ant i - ice was o f f , the engine hydraulic pumps were on high, air-condit ioning packs and aux i l ia ry hydraulic punps were on, the alternate hydraulic pumps o f f , and the pneunatic cross feed closed.
0 Constant Speed Drive
f o r the cooling tests. The r i s e i n o i l temperature across the CSD was ca? cu 1 ated.
The CSD o i l - i n temperatures and CSD oi l -out temperatures were measured
A set o f points over the takeoff and climb range was selected from the f l i g h t t es t data. Cases a t those tes t conditions, a l t i tude, airspeed, t rue a i r temperature, and engine pressure r a t i o (Set 1) were input i n t o the Prat t and Whitney A i r c ra f t JT8D-109 engine cycle deck. The same tes t a l t i tudes and airspeeds were also run i n the deck wi th hot day ambient temperatures and hot day power required (Set 2) , table 15.
CONFIGURATION
TABLE 15
REFAN ENGINE CYCLE DECK INPUT 1 I
ALTITUDE IAS I TAl OC
SET 1 ACTUAL TEST CONDITIONS
SET 2 HOT DAY CON 0 I T IONS
SL
SL SL
2,500 (7621 5.000 I15241 7,500 122861 8,500 125911
10.000 130481 12.500 I38101 15.000 145721 17.500 153341
20.000 160961
SL
SL 2.500 17623 5,000 115241
7.500 122861
8.500 I25911
8.500 1259li 10.000 130481 12.500 138101
15.000 145721 17.500 15334)
20.000 160961
-
0 0 0
210 1108)
210 11081 205 ll(jsl 205 11051 205 11051
?05 11051 205 I1051 205 11051
205 1105)
0
0
210 (1081 710 I1081 205 I1051 205 11051
205 llosl 205 11051 205 (105)
205 (1051 205 llosl 205 I1051
21 21 14
10 5 2 1
-2 3 3
-8 -12
50 50 57 2
57 9 5 8 2
58 5
41 2
38 6 3 4 4 30 1
25 7 21 5
121

CSD heat reject ion a t 100% generator load was determined from the cycle deck N output and a Sunstrand CSD performance curve. CSD o i l cooler heat reject?on was determined from the cycle deck fan performance data and a Jani t ro l heat exchanger performance curve. The o i l temperature out o f the CSD was calculated for t es t conditions and hot day conditions. The d i f f e m n t between the hot and tes t day o i l out temperatures i s the hot day correction factor. This factor was added t o the measured o i l out temperature obtained from the f l i g h t t es t data. A i rcraf t a l t i tude, airspeed, t rue a i r temperature, engine pressure r a t i o and CSD o i l out temp are shown on f igure 67.
an analyt ical solut ion was required. To reach an analyt ical solut ion the Prat t and Whitney Ai rcraf t CCD 281.0 cycle deck was run for three hot day cruise points. The CSD o i l out temperature was determined by the same pmcedure used f o r T.O. and climb.
Since no f l i g h t t es t information was avai lable on CSD cooling a t cruise,
, ALT . Mn TAT EPR CSD O i l Out CSD O i l Out
ft (m) "C Temp O C Temp "C Corrected Analytical To Hat Day
25,000 (7 620) 0.8 23.7 1.442 111 114 - 30,000 (9 144) 0.8 24.4 1.44 119 122
35,000 (10 668) 0.8 13.3 1.64 126 128
The highest CSD o i l out temperature was found a t 35,000 fee t Std day +3fi0C. That tmperature yas 12POC (262°F) which i s 5°C (9°F) below the continuous l i m i t temperature (table 16).
The measured CSD o i l out temperature, when corrected t o hot day ambient conditions and with 100% generator load resul ts i n temperatures below the transient l l m i t of 146OC (295OF) during takeoff and climb up t o 3 048 m (10,000 ft) and below the maxfmun continuous l i m i t o f 133°C (271°F) f o r climb above 3 048 m (10,000 ft). The cruise condit ion temperatures, based on analyt ical data related t o tes t data, are also below the maximum continuous l i m i t .
The CSD cooling system provides adequate cooling f o r the JT8D-109 engine i ns ta l l a t i on on the DC-9 Refan airplane. The system performance i s such tha t C'iD cooling could be expected t o meet FAA ce r t i f i ca t i on c r i t e r i a i f flown t o FAA f l i g h t t es t procedures.
0 Generator
The generator cooling system effectjveness was evaluated by using pressure and temperature data obtained during ground and f l i g h t tests along w i th generator a i r f low ca l ibrat ion data obtained during laboratory tests.
122

60
a a
-m 2.0-
1.8
g 1.6 w
1.4
1.2
1.0
--&--- -0 I I
- &Y--*
I--/ -
-
- I ! LEGEND
' I - 0-4 I
123
190-
I
c 1 7 0 -
L o -
2130-
a w
I k
w a 2 I-
5 + 110- J
5 8 90-
70
- 4 - T E S T CONDITION, 50 PERCENT GENERATOR LOAD
1-4- TEST CONDITION 100 PERCENT GENERATOR LOAD -HOT DAY CONDITION, P&WA DECK CCD 207-5.0 100 PERCENT LOAD
360 - oL I
I TRANSIENT LIMIT - 295OF (146OC)
CONTINUOUS LIMIT - 275OF (135OC)
' 320 - t 2 0 w a 3 280 - t
I
I ;I 1
I a Lu -1' 5 240 - I- A -e
zoo- ---d I r ~ o ~ - - - - 4 L - - o MCT 160 - - a

The instrumented production generator, cooling i n l e t and e x i t ducts were set up and operated i n the laboratory t o obtaln measured a i r f low versus generator pressure drop a t a constant generator rpn. The resul ts were p lo t ted and used wi th generator cooling f l i g h t tes t data t o determine the avai lable airf low. A curve of corrected generator air f low versus engine fan pressure r a t i o was constructed using the f l i g h t t es t pfF7/P, and the avai lable a i r f low ( f igure 68).
engine cycle deck a t the EPR, bleed airflow, power extraction, a l t i tude and airspeed a t t he production DC-9-30 cer t i f ied operating 1 i m i ts. These 1 i m i t s are 5OoC f o r i d l e and takeoff operation, sea level t o 2 591 m (8,500 f t) and standard temperature plus 35°C for a l l enroute cases. The fan pressure r a t i o and temperature data obtained from the cycle deck output was used i n conjunction wi th f igure 68 t o obtain the generator cooling c id low . Figure 69 presents the avai lable generator air f low and the required generator a i r f low versus the generator i n l e t temperature.
The maximum available a i r f low was determined by running the JT8D-109
The tes t data shows tha t the avai lable generator cooling air f low exceeds the hot day 100% load a i r f l ow requirements f o r id le, takeoff, climb and cruise. Therefore, the DC-9 Refan generator cooling system i s adequate for a1 1 operational cases.
124

2.6
2*2
n E a*
a-
. -- 1.8
1.4
1.0
60 70 1
ALTITUDE: 0 1 7.000 f t 10-51 82 m)
-AIRSPEED: . 00 knots (0-103 m h )
EPR: IDLE - 1.84
= dTt7,lTST,
= ptf7'pST0 -
- -
4 - ' c
,SEA LEVEL I MOO0 ft l1219m)-
I 16000 ft (1829 m)
,8500 ft (2591 m) I
-7-
1 110 1
GENERATOR AIR INLET TEMPERATURE (OC)
0
FIGURE 69. DC-9 REFAN GENERATOR AIRFLOW REOUIREMENTS e FAA CERTIFIED HOT DAY CONDITIONS
125


Engine Fire Detector System
The engine f i r e detector tes t was performed on the ground and in fl ight to determine i f the engine f i r e detector system alarm t r ip setting loop margin i s adequate (same as production) for the JT8D-109 engine installation on the DC-9 Refan airplane.
engine loop resistance versus time for the ground and f l ight tes t i s shown in figures 70 and 71. The pylon (apron) loop resistance values are shown i n figure 72.
Data was obtained on the pylon (apron) loop and the engine loop. The
The pylon and engine detector elements are wired in parallel t a the detector control u n i t , therefore the detector control u n i t is set t o t r i p the fire alarm when the parallel equivalent resistance lowers t o 400 ohms. Due t o the distance separating the engine and pylon elements, the analytical procedure used was to allow the engine loop or the pylon loop t o be heated individually until the parallel equivalent resistance of the system became 400 ohms.
An analysis was made t o correct the tes t data t o hot day conditions, 50°C ( 1 2 2 O F ) day for an altitude of sea level to 2 591 m (8,500 f t ) and r-td. +35"C (63OF) above 2 591 m (8,500 f t ) ; a f te r which, the minimum t r ip uaming margin was determined.
resulted i n a minimum trip margin of 101°C (182°F). T r i p margins are acceptable between 83-1 39°C (150-250°F).
101°C ( 1 8 2 O F ) margin and will assure freedom from false alarms.
The production f i r e detector loop control unit t r i p setting of 400 ohms
The minimum trip warning setting on the Refan installation results f n a
These results are comparable w i t h da t a previously accepted by the FAA as data conforming to regulations.
127

X
1 I 0
I
20 3 TIME - MINUTES
FIGURE 70. DC-9 REFAN FIRE DETECTOR LOOP RESISTANCE, ENGINE ELEMENT - GROUND STATIC
128

I !
\ \ \
\
-4
\
\ ' C IRECTED TO 1XoF (49'C) DAY \
15.060 ft (4572 m)
20,000 ft (609
'TAKEOF,F AND CLIMB CLIMB-
I I 30 40 50 TIME -MINUTES
i
FIGURE 71. DC-9 REFAN FIRE DETECTOR LOOP RESISTANCE, ENGINE ELEMENT - TAKEOFF, CLIMB AND LEVEL FLIGHT
129

10 i 0 1
00 1 BRAKE dELEASE
T r l o n o +
TAKEOFF ANDCLGB
4 )c STATIC
20
iROUND TESl
rAKEOFF EPF
TIME - MlNlWiS !
F LI GH T TEST
/
FIGURE 72. DC-9 REFAN FIRE DETECTOR LOOP PESISTANCE, PYLON APRON - GROUND STATIC AND FLIGHT
130

Engine V i brat ion Measurement
Locat ion
I n l e t Pickup
Rear Pickup
The engine vibrat ion tes t was conducted t o obtain ins ta l led JT8D-109 engine v ibrat ion measurements t o ver i fy tha t Engine Vibration Measurement (EVM) levels present are acceptable and t o compare levels w i th the Prat t and Whitney Aircraf t t es t stand results.
- O v e r a l l Low Rotor F req . High Rotor Freq.
m i 1 (mn) m i l (4 m i 1 (m 1 -- ---------..--.-_.__---I-
4.0 (0.102) 3.5 (0.089) 2.5 (0.064)
3.0 (0.076) 3.0 (0.076) 2.0 (0.051) ___--- I
Engine vibrat ion measurements were obtained throughout the normal f l i g h t envelope o f the airplane and included the following f l i g h t conditions.
Takeoff and normal climb t o 10 668 m (35,000 ft) with LH engine power scans a t 3 048 m (10,000 ft), 6 096 m (20,000 ft), 9 144 m (30,OOO ft) and 1(! 568 m (35,000 ft).
A i rc ra f t stal ls, a i r c r a f t slow down wi th MCT on the LH engine and operation a t high angle o f attack.
Cruise a t 6 096 m (20,000 ft) and 9 144 m (30,000 f t ) wi th a moderate accel/decel on the CH engine.
Normal descent wi th moderate LH power scans a t 9 144 m (30,000 ft) 6 096 m (20,000 ft), 3 048 m (10,000 ft) and 1 524 m (5,000 ft) (with the RH engine a t i d l e f o r scans).
Normal approach, landing and r o l l o u t wi th normal reverse thrust.
Ground operati in a t s tab i l ized power sett ings o f 1.12, 1.17, 1.215, 1.38, 1.56 and 1.72 EPR, and a power scan, i d l e t o takeoff t o id le.
The maximum safe operating v ibrat ion l i m i t s f o r the JT8D-109 engine are shown i n table 17. The engine v ibrat ion acceptance l i m i t s are l i s t e d i n table 18.
TABLE 17
* Pratt and Whitney Report PWE ‘114, 16 September 1974
131

TABLE 18
-_
Location
I n l e t Pickup -
- - Overall Low Rotor Freq. High Rotor Freq.
m i 1 (mm) m i 1 (4 m i 1 (d - - 1.5 (0.0381 ) - - -
* Prat t and Whitney Report PWA-5114, 16 September 1974
Rear Pickup - -
Recorded EVM levels d id not exceed .0254 mn (1.0 m i l ) during f l i g h t or ground test. A comparison o f the Douglas ground t e s t resul ts t o the P r a t t and Whitney tes t stand results, table 19 revealed no s ign i f icant difference between tes t stand values and ins ta l l ed readings.
1.2 (0.030) 1.1 (0.028)
The data fo r the acceleration, RMS and spectral analysis are presented i n figures 73 through 92 f o r engine #I. These data were recorded during power scans a t ground s t a t i c and i n f l i g h t a t 1 524 m (5,000 ft), 152 m/s (295 knots) and p lo t ted during the up-scan for the ground run and the down scan o f the i n f l i g h t power scan. power scans are presented i n f igure 73 and 74.
Spectral (3-D) time h is tory p lo ts were produced and are presented i n both 5-500 H t and 5-2000 Hz ranges, i n f igures 75 through 78 and 79 through 82 , respectively.
ranges and r e f l e c t the ro to r frequency Components shown on t h t hlgh speed ends o f the spectral (3-0) time h is tory plots, i n f igures 83 through 86 and 87 through 90 respectively.
Fan speed t i m e h is tor ies f o r the ground and f l i g h t
Acceleration spectra were p lo t ted f o r both the 5-500 Hz ar ’ 5-2000 Hr
The R;.IS acceleration versus fan speed data f r o m the ground tes t power
The RMS acceleration versus fan speed show no major peaks between i d l e
sciin are shown i n f igures 91 and 92.
and takeoff thrust, but the maximum v ibrat ion occurs a t the highest speed. The ins ta l led engine displacement values are sat isfactory f o r the airplane envelope and are comparable t o tes t stand values.
The spectral t i m e h is tor ies show the 5-500 Hz contains the contr ibuting frequency components making up the displacement magnitude while the 5-2000 Hz range shows that much o f the overal l v ibrat ion acceleration l i e s above 500 Hz. Low pressure (fan) and high pressure ro to r frequency components and t h e i r harmonics can be ident i f ied a t the high speed end of the scans a t approximately 123 Hz (86% N1) and 192 H t 142 fundamental frequency.
132

TABLE 19 JT80-109 ENGINE VIBRATION DISPLACEMENT MEASUREMENT
TEST CONDITION ~
ENGINE SIN 666995 1.776 EPR 1.73 1.71 1 1.70 1 .68 1.61 1 1.597 1.563 1.559 1.512 1.5 1.467 1.423 1.386 1.384 1.315 1.253 1.215 1.192 1.18 1.17 1.1 24 1.12 1.068
SLOW ACCE L - IDLE TO TAKEOFF SLOW DECEL - TAKEOFF TO IDLE ACCEL - IDLE TO TAKEOFF ENGINE SIN 666996
1.88 EPR : .746 1.72 1.700 1.68 1.640 1.63 1.628 1.62 1.600
1.547 1.515 1.427 1.385 1.310 1.27 1.246 1.190 1.02
ACCEL - IDLE TO TAKEOFF
TO IDLE
TO TAKEOFF
DECEL - TAKEOFF
ACCEL - IDLE
'FROM THE LOG OF **FROM INFLIGHT TE
P&WA TEST
INLET mil (mm)
1.1
1.2 -
- - 1.3 1.4
1.4 1 -5
1.5 1.4 1.5
0.5 0.8
0.9
-
-
-
-
- - - - 0.2
1.3-1.5 (0.033-0.0381
0.5-1.6 (0.0134.041)
1 .o (0.025)
-
0.8
0.8
0.8
0.5
0.9
0.9 0.9 0.8 0.7 0.7
0.8 0.8
0.8
0.0
0.7
-
-
-
-
-
-
- (0.020)
10.020) -
- (0.0201 - (0.013)
(0.023) (0.023) (0.023) (0.020) (0.0181 (0.01 8 I
(0.020) 10.020)
-
-
-
(o.orn1 10.0)
(0.018)
IGlNE ACCEPTANCE TI , OTHER DAC INSTALI
iTAND*
REAR mil (nun)
0.7
0.5 -
- - 0.5 0.6
0.5 0.5
-
- 0.4 0.7 0.3
0.3 0.4
0.9
-
-
- - - - 0.3
(0.01 8)
(0.013) -
- - (0.013) (0.015)
(0.013) (0.013)
(0.010) (0.018) (0.008)
(0.008) (0.010)
10.023)
-
-
-
-
I
- - - (0.0081
0.30.8 (0.0080.0201
0.44.6 (0.0104.0151
0.8 (0.020)
- 0.7
0.7
0.7
0.5
0.5 0.4 0.4 0.4 0.4 0 4
0.4 0.8
0.6
0.5
0.6
-
-
-
-
-
-
- (0.018)
(0.018)
(0.018)
(0.013)
(0.013)
(0.010) (0.010) (0.010) (0.010) (0.010)
10.01a 10.020)
10.015)
10.013)
(0.01 5)
-
-
-
-
-
-
DOUGLAS Ih
COWRESSOR mil (mm)
T DATA D TEST DATA FROM GROUND STATIC TESTS
'ALLED TEST
TURBINE mil (mml
- 0.34.6
- - - - -
0.39.8 - - - - - -
0.49.7 - -
0.24.5 - -
0.54.7 0.34.6
- -
0.2-1 .o
0.208 ~0.0050.020)
0.24.5" 10.0054.013)
094.5.' ~0.0054.013~
0.24.4 ~0.0054.010)
- -
- -
0.20.6" ~0.0054.015)
0.30.7'' (0.00843.018) - -
- -
0.20.6" (0.0080.015)
0.10.5" (0.0034.013)
0.20.7" ('3.0080.0181
0.20.5" (0.0084.01 3)
0.20.8.' ~0.0084.020l
- -
- -
I 133

0 5
8 c
0 P r
R c
In 2 a
00 0 % $ 1
r Lu
I-
8
8
0 0
0 N
0 0 a 0
P a0 u) 0
c P
0 z
2
a 2 w
K
134

8 N
0 m
0 2
s c
:: c
8 -
0 OD
0 W
0 0
0 0 8 8 9 0
N c -
I
I- a
d r*
1 3 5


R u? 0
8 u-
0 c *
8 N I I
> 0 2 w 3 CI W U IL
a c
' 0
144

P a t;;
I
d
0 @! 0 0
0 m '9 c 0 0
l& - NOllWH31333W
245

N I ! > 0 z w 3 2 a LI
146

N
I 1
a
2 G a z c (I
> w I m a 3 c F
rd W
147

148

0 a c c v)
h I
(L
N
2 i 0
a E 2 > w
a K 3 c
5
0 z
i 2 w K
149

I Y
0 e Y
H c a
d OD
- NOllVki31333V
150

m 0 m c c 0
H c
151

r (? N - w J 6 NOILWH31333V l l V H 3 A O
4 z I- 2 w u W a a
n !
W W 0 rn z 2
152

153


Thrus t Reverser
Thrust reverser performance testing was conducted to evaluate the DC-9 Refan airplane deceleration capability, t o determine the extent of thrust reverser reingestion, to monitor airplane control characteristics dur ing normal and abnormal reverse thrust landings and survey the empennage skin temperatures in the area of the thrust reverser during reverse thrust operation.
The thrust reverser system configuration was the same as the current
1) Larger thrust reverser buckets
2 ) Increased hydraulic system component sizes and volumes
3) Fail safe latch incorporated on the upper and lower doors
rotated production system except for the following changes.
4) Redesigned thrust reverser controls
5) Upper and lower bucket forward lips, 73.6 mm (2.90 i n ) tall
The airplane systems configuration for the reverse thrust landings were normal hydraulics, forward c.g. and f laps/slats 0.873 rad (50 deg)/Extend.
Thrust reverser thermocouples were installed as shown i n figures 93 and 94. The empennage peak temperatures were monitored by temp-plates located as shown in figure 95.
Symmetrical reverse thrust decelerations were evaluated during h i g h speed taxi tests and landings w i t h varying amounts of reverse thrust from idle t o takeoff. The airplane ground speed was obtained from laser t racking da ta and the airplane deceleration calculated and normalized t o a standard airplane gross weight. The normalized deceleration f o r a reverse thrust target EPR of MCT (1.6) i s presented i n figure 96 versus equivalent airspeed.
Figure 97 shows the measured airplane deceleration normalized to 45 359 kg (100,000 l b ) landing weight as a function of equivalent airspeed f o r nominal engine power settings from reverse idle (1.08) EPR t o MCT (1.6).
The test procedure was t o set EPR in reverse approximately 4 seconds after touchdown and hold this EPR t o as low a speed as practical before engine instability or reingestion precluded further operation. For normal airline operation of production DC-9's. 1.6 EPR is set i n reverse and cut back t o 1.2 EPR is initiated a t 30.87 m/s (60 knots). This procedure was established t o prevent foreign object damage (FOD) due t o kick up from the bottom reverser bucket j e t efflux.
The Refanned engine LP compressor discharge pressure, Ps3, was monitored for evidence of engine instability dur ing the tests; the JT8D-109 engine characteristics were normal for the thrust reverser operations w l t h no evidence o f instability or reingestion. The fact t h a t the JT8D-109 engine
PRECEDING PAGE BLANK NOT FILMED 1 5 5

EXHAUST NOZZLE SKIN (12 O'CLOCK) TEMPERATURE THERMOCOUPLE
'\ \
LEXHAUST NOZZLE SKIN 16 O'CLOCK) TEMPERATURE THE RM OCOU PL E
VIEW LOOKING FORWARD AT LEFT ENGINE
THRUST REVERSER ACTUATOR
THRUST REVERSER ACTUATOR COMPARTMENT AMBIENT rr TEMPERATURE THERMOCOUPLE
THRUST REVERSER ACTUATOR CYLINDER BODY TEMPERATURE THE RMOC OU PL E
VIEW LOOKING INBOARD AT OUTWARD ACTUATOR LEFT ENGINE
FIGURE 93. DC-9 REFAN THRUST REVERSER ACTUATOR AND EXHAUST NOZZLE THERMOCOUPLE LOCATIONS
156

THRUST REVERSER OVERCENTES LINK
‘ THRUST REVERSER IDLER LINK TEMPERATURE (ONE TlC INSTALLED ON EACH SIDE OF LINK)
THRUST REVERSER DOOR HOT GAS PATH AND BACK SKIN TEMP LOCATIONS
BUCKET AFT EDGE
LOOKING DOWN AT INSIDE OF LOWER REVERSER BUCKET
, < A .‘I
,I - T/R W O R ’ BACKSKIN L-& AMBIENT TEMP
E-B
FIGURE 94. DC-9 REFAN THRUST REVERSER IDLER LINK AND DOOR THERMOCOUPLE LOCATIONS
157

FWD 9 1.6-
1.4 - 1.2 -
3 i 1.0 - ,;
u1
Y P
0.4 -
0.2 -
0-
LEFT-HAND HEAT EXCHANGER COOLING AIR EXHAUST
0
@
i 0 0
i
60 Z? 210'F (sS°C) 200'F (93%) ltO°F (77OCI i
" I - - CENTER OF PYLON
10 - 8-8 21 @
m 10 I
1 I I 1 20 30 40 50 60 70 80 90
0 8, 10
RISTANCE - in
I I I I I I I I I I I 1 0 0.2 0.4 0.6 0.8 1 .o 1.2 1.4 1.6 t .d 2.0 2.2
DISTANCE -. (.nl 1. TEMPERATURES ARE LE= THAN &O0F C6S00 UNLESS NOTED 2. CIRCLED NUMBERS ARE APPROXIMATE LOCATIONS OF TEMPSLATES
DC-9 REFAN ENGINE NACELLE AND FUSELAGE TEMP-PLATEE
NOTES:
FJGURE 95. AFTER REVERSE THRUST LANDING
158

X
159

2.t
1.'
-, E ? 2
c
. E a a W
W a 1.'
s t a
a a a 2 u
0.
GROSS WEIGHT SYM Ib (k3
w EPR (%MAC) OF P C ) wmH
62 (16.9 1.4711 .a 0 96.600 (43817) 7.4 62 (16.5) 1.6111.60
0 0 A
FIGURE 97. DC-9 REFAN THRUST REVERSER PERFORMANCE - W, = 100,WO Ib (45 359 kg) = 50 dag (0.873 rad) (LANDING), SPOILERS UP, BRAKES OFF - ZERO WIND FLAPS
lob.^ (47%) , 9.9 58 (:4.5) 1 .0811.07
103.00 (47720) 9.1 i 60 (15.5) 1.201 1.1 9
ioi.600 (ami) 8.7 61 (16) 1.m11.28
160

does not appear t o experience i n s t a b i l i t y down t o speeds as lar as 15.4 m/s (30 knots) suggests that the 31 m/s (60 knots) cutback speed o f the production OC-9 f leet coold be retained for the JT80-109 engine instal lat ion.
The design of the JT80-109 reverser was based on obtaining the sane retarding force as the production DC-9-30/3180-9 (less reverser e f f iciency f o r the JT80-109 due t o i t s higher thrust rating). Figure 97 shows the performance handbook brakes-off deceleration capabil i ty o f the OC-9-30 with 3180-9 engines using the described operating procedure. To achieve the same deceleration capabi l i ty an EPR = 1.6 i s required with the 3180-109 engine. This i s a higher percentage o f MCT thrust than f o r the 3180-9 engine.
Empennage peak temperatures were recorded for n o m 1 thrust reverser landings and remained below the mxinnn allowable 121°C (250°F) f o r the aluninun skin. The instrunen?at!on was located on the LH side o f the airplane and was not affected by the APU exhaust. The fuselage skin i n the pylon region i s aluninun except f o r a t i t a n i r n area surrounding the pylon and extending outward about .762 nm (3 in.). Unless noted, the temperature a t the temp-plate locations was less than 66°C (150°F) ( f igure 95). The maximun temperature measured was 99°C (210°F) a t temp-plate location No. 7 (aluninun skin).
The Refan reverser tests indicated tha t i n order t o achieve the same a i r c r a f t deceleration wi th the JT80-109 engine reverse thrust as wi th the exist ing OC-9/JT80 handbook performance, an engine EPR of 1.6 i s required. Normal reverse thrust operation was d w n s t r a t e d a t speeds below the operational cutback speed of 60 knots wi th acceptable engine operation; and the peak empennage temperatures remained below the maximun allowable 121OC (250°F) f o r the aluninm skin.
161


Ice Protection
F l igh t test ing of the DC-9 Refan cowl i ce protection system was conducted t o obtain c lear a i r cowl i c e protection temperature and pressure data a t s tab i l ized and transient f l i g h t conditions and show that the system w i l l provide safe f l i g h t i n i c ing conditions.
The l e f t engine caul i c e protection system was instrumented t o provide measurements o f cowl l i p skin structure temperature and ant i - ic ing a i r temperatures and pressures. The location o f the cowl l i p outer surface temperature instrumentation i s shown i n f igure 98.
Data were recorded f o r trar.sient f l i g h t conditions of takeoff, climb, descent, approach and landing. Data were also recorded a t s tab i l ized a l t i tudes o f about 9 144 m (30,000 ft) and 4 572 m (15,000 ft) a t cruise airspeeds and about 1 524 m (5,000 ft) f o r a hold condition.
Evaluation o f the f l i g h t t e s t data as well as the cowl i ce protection design analysis which preceded the f l i g h t t es t program employed the standard heat t ransfer analysis techniques used f o r i ce protection system analysis. Comparisons o f the measured and analy t ica l ly derived surface temperatures show tha t the performance o f the nose cowl ant i - ic ing system w i l l meet o r exceed the performance level predicted by the analysis.
Plots c f the ant i - ic ing surface temperature pro f i les a t various a l t i tudes during clitro, cruise, descent and approacn are shown i n f igures 99, 100 and 101. The cowl ? i p outer surface themcouple locations ( f igure 98) are also p lo t ted on these figures.
The DC-9 Refan cowl l i p geometry, the ice pratection a i r supply system, and the ice protection heating rrquirements were based on the design config- urat ion and heating requirements o f the production DC-9 Series 30 cowl i ce protection system which i s c e r t i f i e d by the FAA. The clear a i r f l i g h t evalu- a t ion of the Refan cowl i c e protection system shows that the system provides ice protection perfonance which i s equal t o o r i n excess o f predictions.
demonstrated conservative nature o f the analyt ical method show that the DC-9 Refan cowl ice protection system can be operated without res t r i c t ions and i s suitable f o r unlimited dispatch i n to known Ic ing conditions.
System design s im i la r i t i es wi th the FAA c e r t i f i e d DC-9 system and the past
163

U.
164

1
I Ly- J
-hlC)otn 1
165

z 0 c
N
'0
w i
166

x F
I
c
a W
167


Auxi 1 i ary Power P1 ant
This tes t was conducted t o determine the effect of the redesigned APU exhaust def lector on the APU performance and s tar t ing characterist ics (ground and in f l i gh t ) ; and t o evaluate the effectiveness of the deflector i n preventing d i rec t impingement o f the APU exhaust on the larger and closer Refanned engine nacelle and thrust reverser surfaces during ground operation.
The APU i s the same type production u n i t current ly ins ta l led i n production DC-9's. The APU exhaust was redesigned (louvered) and ins ta l led as shown i n figures 102, 103, and 104.
Temp-plates were ins ta l led on the r i g h t hand nacelle and fuselage aluminum surfaces near the APU exhaust as shown i n f igures 105, 106 and 107. The temp-plates (used t o measure APU exhaust impingement) were read and recorded a t various surface winds f o r the ground s ta r ts and a f te r each f l i g h t . The winds noted i n tab le 20, were measured a t the Yuma Control Tower approximately 2.41 km (1.5 mi . ) from the Douglas f a c i l i t y .
E lec t r i c and windmill a i rs ta r ts were conducted throughout the production DC-9 APU a i r s t a r t envelope. Start ing EGT and RPM l i m i t s were observed for ground and airstarts.
0 Ground Starts
development personnel . 0 I n f l i q h t Starts
l ished a t the extremes o f the c e r t i f i e d a i r s t a r t envelope f o r the production APU. This comparison i s shown on f igure 108 and the a i rs ta r ts are tabulated i n t a t e 21. One unsuccessful e lec t r i c s t a r t attempt occurred a t 10 668 m (35,000 f t ) , 134 m/s (260 knots) a f t e r about 2-1/4 hours of cold soak (outside the APU a i r s t a r t envelope), but a second attempt was successful.
No unusual s ta r t ing o r operating characterist ics were noted by f l i g h t
E lec t r i c and windni l l a i rs ta r ts wi th the modified exhaust were accomp-
Although there i s some indicat ion tha t windni l l RPM's p r io r t o s tar ts are lower which might be expected from increased back pressure, the data indicate that the modified exhaust does not have a noticeably detrfmental e f fec t on a i rs tar ts . S t a r t times and maximum EGT's are comparable to the production APU. I n f l i g h t performance was noted as being normal by f l i g h t development personnel.
0 APU Exhaust Impingement
mapped on f igures 106, 107 and 108 and tabulated i n table 20. Considering the recorded surface temperatures and estlmated APU exhaust temperatures 31 5 O C -
427°C (600OF t o 8OO0F), i t appears t h e r e was no d i rec t Impingement of the exhaust core f low on the JT8D-109 engine nacelle.
A s m a r y o f the resul ts from the APU exhaust impingement tests are
PRECEDING PAGE BLANK NOT FILMED 169

LOUVER ASSEMBLY
2 = 41.178
FIGURE 102. DC-9 AEFAN - APU LOUVERED EXHAUST - VIEW LOOKING F0RWARD.Y - 1069.00
170

I L
3 9 X u
a 4 I

.*/tT
I! ,
i j I I
' It ' I
172

NOS
--
'E: Dl IS
Y STA = 1069
LESS THAN 1 50°F
LESS THAN 1 60°F (71 OC)
STANCE BETWEEN TEMPERATURE PLATES 10 in. (0.254 m)
FIGURE 705. DC-9 REFAN APU LOUVERED EXHAUST EFFLUX PATTERN SUMMARY (NACELLE AND PYLON 1
YN = 253 NACELLE STA YN = 204
\ -h BUCKET
I \ 7 STANG
13 I LESS THAN 15OoF (66OCI I
up\ 4 I I f
I *TEMP PLATES MOUNTED ON CENTER PF STANC '
FIGURE 106. DC-9 REFAN APLI LOUVERED EXHAUST EFFLUX PATTERN SUMMARY ISTANG FAIRING)
173

FIGURE 107. DC-9 REFAN APU LOUVERED EXHAUST EFFLUX PATTERN SUMMARY (FUSELAGE)
! 74

However, the top surface gf the thrust reverser bucke* was distinctly affected by i t s proximity t o the exhaust e f f lux. The surface teuperatures noted i n f igure 105 and table 20 appe2r s imi lar t o that o f the production ins ta l l a t i on w i knout the exhaust deflector.
None o f the surface temperatures exceeded the established maximun a1 low- able skin temperature o f 177°C (350OF). The data ind-Icates that under normal APU operating procedures and loading, the louvered exhaus, helps d i rec t the exhaust flow away from the larger and closer Refanned engine insta l la t ion.
The redesigned APU exhaust deflector had no detrimental e f fec t on ground star t ing or perfonnance characterist ics .
The a i r s t a r t envelope was ve r i f i ed f o r t h i s configuration wi th the exception o f one unsuccessful s tar t , which was outside the envel3pe.
Measured fuselage and nacel l e skin tcrrperatures resul t fng r o m APU exhaust impingement were acceptab;e fo r the non-load carrying aluminum skin 1 ocat ions.
175

TABLE 20 DCS REFAN A W EXHAUST IMPINGEMENT TEST
SUMMARY OF RECORDED SURFACE TEMPERATURES ~
FLIGHT NO.
WIND DIRECTION deg (rad)
WIND VELOCITY knotdmls)
A/P HEADING deglradl
A W CYCLES
REVERSER CYCLES
INFLIGHT START
TEMPTAB NO.
1
2
3
4
5
6
7
8
9
10
11
12
13
14
15
16
17
18A
18B
19
20
21
'LESS THAN !5OoF (66OC)
~~
6
Or) 10.524)
5 (2.6)
130 (3.269)
1
1
- OF (OC) .
210 1991
220 (1041
300 (149)
220(104
160 (71)
150 (66)
180 182)
170 177)
180 1821
250 (121,
300 (149)
160 (71)
~~
718
-
0
-
2
1
-
OF (OC! . .
350 (1661
220 (104)
300 (149
220(1041
160 (71)
150 (66)
180 (82)
170 (77)
180 (82)
350 (177)
300 (149)
160 (71)
9
350 (6.1091
1216.2)
NA
1
1
-
OF (OC) --
220 (104)
220 (104)
300 (149
200 1931
160 171)
150 (66)
180 (82)
170 (77)
180 (82)
220 (104)
300 (149
160 171)
10
50 ( 0.8731
5 (2.61
NA
1
1
-
O F (OC)
220 (104)
220 (104)
300 (149
220 (1041 .
160 (71)
150 (661
180 (82)
i r n ( 7 7 )
180 (82)
220 1104)
300 (149
160(71) --
11
40 ( 0.696)
4 (2.11
160 12.793)
1
1
-
O F (OCI
220 (104
220 (104)
300 (1490
220 (104)
180 (82)
1 6 0 0 1 )
250 (121)
220 (104)
170 (77)
220 (104)
220 (104)
300 (149)
160 (71)
12
140 (2.443)
lO(5.1)
im (2.234)
1
1
-
OF (OC)
220 (104
220 (104)
150 (66)
300 (149
220 (104)
200 (93)
170 (771
250 (121)
220 1104)
190 (88)
270 (104)
250 1121)
300 (149
160 (71)
14
NA
NA
NA
1
1
2
OF (OC)
220 (104)
220 (104)
150 (661
300 (149)
220 (104
200 (93)
170 (77)
250 (1211
220 (104)
190 188)
220 (104)
250 (121)
300 (149)
160!71)
ORIGINAL PAGE X8 OF POOR QUALITy
176

c c
177

u) t z w B 0
w n 2
> 2
Id
w w
cn t- 3 0
0
P a 0 E E *I- Ov)
u a t- V w 2 (II
0 U t- V W -I W
0 a I- V Ly A w
L I
t 2 -7 4'-
178

AIRPLANE STRUCTURAL INTEGRITY AND DYWMICS
Structural and dynamic analyses were p e r f o m d dur in Phase I 1 o f the Refan Program t o substantiate three basic requirements: 9 1) The new nacelle and th rus t reverser hardware and the modif icat ions t o the airplane s t ructure were required t o be f l igh twor thy and c e r t i f i a b l e t o the Federal Aviat ion Regulations; (2) The DC-9 wi th JT80-109 engine i n s t a l l e d would meet o r exceed required f l u t t e r speed margins; (3) The airplane i n the Refan f l i g h t t e s t con f igwat ion would q u a l i f y for an experimental f l i g h t t e s t penni t t o be issued by the FAA.
I n addi t ion t o the analyses performed i n Phase 11, ground tests were conducted p r i o r t o the f l i g h t t e s t f o r v e r i f i c a t i o n o f cer ta in ana ly t i ca l predictions. These tes ts included an airplane ground v ib ra t ion t e s t (GVT), th rus t reverser cyc l ing t o maximm reverse power, cabin pressurization and engine runup t o takeof f p a w . S t ra in gauges and accelerorneters were i n - s t a l l e d on primary s t ruc tu ra l components t o numitor load levels, deflect ions and accelerations during the ground tes ts and subsequent f l i q h t tests.
The GYT resu l ts v e r i f i e d tha t the airplane normal modes o f v ib ra t ion were not s i g n i f i c a n t l y changed due t o the Refan modifications. Likewise, the damping character is t ics compared w e l l w i th those o f the basic production a i rpl ane.
t o the extent t ha t s i g n i f i c a n t paramters were compared w i th ana ly t i ca l resul ts. A l l per t inen t data which were co l lected during the tests have been f i l e d f o r future reference i n the event a production program i s i n i t i a t e d . The primary ob ject ive w i l l be t o use the t e s t data t o optimize the s t ruc tu ra l weight o f the Refan hardware. Except f o r po ten t ia l weight savings, the t e s t resu l ts indicate tha t the s t ruc tu ra l configuration o f the Refan ha%lware i s sa t is fac to ry f o r use as a production r e t r o f i t o f DC-9 airplane.
Evaluation o f the data from the ground and f l i g h t t es ts was accomplished
Structural and aerodynamic damping f l i g h t tests were conducted t o sub-
t u l t s . The s tan t ia te the f l u t t e r i n t e g r i t y o f the Refan airplane and t o W a i n frequency and damping resoonse data t o show cor re la t ion w i th analyt ica? t e s t data shows tha t the DC-9-31 w i th JT80-109 engines exhibi s l i g h t l y improved damping character is t ics compared t o the produL.rion airplane. Likewise, there were no i n s t a b i l i t i e s o r excessive v ib ra t ion w i th in the demonstrated f 1 i gh t envel ope.
the same o r
179


Struc tura l Analysis
WEIGHT
I Ib 1 (kg) ANALYSIS M I G H T ANDc.b.
During Phase I of the Refan Program, preliminary s t ruc tu ra l analyses were performed t o determine the s t ruc tu ra l f e a s i b i l i t y of retrofitting DC-9 airplanes w i t h refanned JT80 engines (ref. 1) . I n Phase 11 the s t ruc tu ra l modifications which were identified i n Phase I were f ina l i zed and designed f o r incorporation i n t o the f l i g h t demonstration airplane. Design c r i t e r i a and s t ruc tu ra l analyses were documented during Phase I1 i n sufficient de ta i l t o meet the program object ives . Maximum advantage was taken of the s i m i l a r i t i e s between the s t ruc tu ra l arrangements of the Refan and production a i rp lane configurations. Likewise, se lec t ion of mater ia ls and material heat t r e a t s for the Refan hardware was limited t o those of proven qua l i t y and r e l i a b i l i t y . T h i s policy was intended t o minimize any risk associated w i t h a potent ia l h i g h r a t e of production of retrofit kits f o r the DC-9 fleet.
Design c r i t e r i a were es tab l i shed f o r the Refan modifications which meet o r exceed the production c e r t i f i c a t i o n basis. The DC-9 was certified t o the requirements of CAR 4b dated kcember 31, 1953, amendments 4b-1 t h r o u g h 4b-15. To provide s t ruc tu ra l c a n o n a l i t y of the r e t r o f i t hardware f o r a l l DC-9 a i r - plane models, the JT8D-117 engine was selected a s the bas is f o r the s t ruc tu ra l analyses since i t produced the most critical loadinqs. Detai ls of the ana lys is engine weight, c.g. and forward and reverse thrust a re qiven i n t ab l e 22.
Y (re.) in - I (ml
1
TABLE 22 DC-9 REFAN ENGINE WEIGHT AND THRUST FOR STRENGTH ANALYSIS
JT8D-17 (BASIC DEMOUNTABLE ENGINE PLUS NACELLE)
WEIGHT INCREMENT FOR REFAN WEIGHT INCREMENT FOR ACOUSTICALLY TREATED NACELLE
JTED-117 ENGINE AND NACELLE
5% FOR CONTINGENCIES
JTID-117 ANALYSIS WEIGHT AND C.g.
4,699
570 655
5.924
296
6.220
(2 133)
(259)
(297)
( 2 689)
(134) 128231
989
942 1.000
990
990 990
125.12)
(23.93) (25.401
(25.151 (25.15)
(25.151
ANALYSIS FORWARD AND REVERSE THRUST
JT8D-117 NET INSTALLED FORWARD THRUST FT 17,500 Ib (77.84 kN)
REVERSE THRUST PER ENGINE.
F~ = E F ~ + D R A ~ + D B A ~ ~ + ‘ R E V ~ ~ F R + D ~ n ~ E = 0.4 (ASSUMED EFFICIENCY FOR DESIGN)
D,,, = 4.470 Ib (19.88 kNIJ RAM DRAG AT 175 KEAS 189.95 m!s)
DBASE = 2,751 (12.24 kNIJ BASE DRAG AT 175 KEAS (89.95 r n l s )
PRE,,dAFR -460 Ib (-2.05 kNI j INDLCED PRESSURE FORCE
D,,, = 104 lb (462NI)NACELLE DRAG AT 175 KEAS (89.95 i d s )
1 F, = 13.865 Ih 161.67 kN)
PIWEDING PAGE BLANK NOT FILMED 181

f4ew hardware required to accommodate the JT8D-109 engine included the engine nacelle, thrust reverser and pylon. In addition, structural modifi- cations t o the fuselage structure which supports the pylon and the lower centerline keel were required due to the increased loads of the JT80-109 enqine. Design details of the Refan hardware are presented i n reference 3 .
Pylon/Fuselaqe. - The pylon attachment to the fuselage transmits enqine and nacelle inertia, thrust and aerodynamic loads. The structural conf iauration includes several redundant load paths. For this reason, an internal loads analysis employing a finite element model was performed to give load d i s t r i b - utions for the s t r e n g t h analyses.
An existing DC-9 airplane f in i te element analysis model was modified to include the structural configuration and geometry of the Refan pylon. The model which includes the pylon, fuselage, vertical stabilizer and winq stubs is shown i n figure 109.
The idealization details of the pylon/fuselage interface i n t h e analysis model are shown i n an enlargement of t h a t area i n figure 110. The model includes a simple representation of the engine since the engine mount system is also redundant. Engine bending and torsional stiffnesses were provided by Pratt and Whitney Aircraft. The loads were applied to the analysis model a t the centerline of the engine as shown i n figure 110. The external load conditions which were analyzed are given i n table 23. To expedite the design, an envelope of a rb i t ra ry load conditions was selected for the internal loads analysis. Subsequently an investigation of airplane f l i g h t and landing conditions was made to verify that the arbitrary conditions were i n fact representative of the actual critical loads. Table 23 gives the comparison of the arb i t ra ry and airplane conditions.
S t r a in gauges were installed on the pylon for the ground and f l i q b t tests to monitor data for comparison w i t h analytical predictions. A sumnary of analytical and strain gauge shear stresses for two loading conditions is given i n table 24. Generally the results show good correlation, however, the lower surface of the py?on appears to have substantially reduced shear stresses based on the test data. The internal loads analysis conservatively assumed t h a t the majority L f the lower surface shear would be reacted i n the forward section of the lower pylon since the a f t section contains a series o f access door cutouts. The framing around the access doors has shear carryinq capability and as shown by the tes t results, relieves the forward sectinn shear stresses.
A major design consideration regarding the pylon/fusel age interface was the amount of relative deflection which could be permitted between the pylon a n d the side of fuselaqr! i n the area of the fuselage pressure bulkhead. Figure 111 shows tne analytical deflections for the s ta t ic takeoff thrust load condition including the effects of fuselage pressurization and engine 1.0 g inertia. The pylon attachment t o the fuselage between the frames a t Y = 980 and Y = 1019 was designed as a flexible j o i n t which transmits shear only t o tbe fuselage skin. This arrangement was required to avoid lateral loadinq of the pressure bulkhead under engine loading conditions. As shown i n figure 111, the resulting relative deflection between the pylon and fuselaae as calculated by the internal loads analysis i s approximately 2.8 mm (0.11 i n ) . The flexible j o i n t concept, t o be practical and also exhibit adequate fatique life,required
132

A w n 0 E
2 a 1L ul K
I83


TABLE 23
DC-9 REFAN ENGINE MOUNT/PYLON DESIGN CONDITIONS
3.5 deg (0.061 rad)
r CONDITION DESCRIPTION
VERTICAL GUST
VERTICAL GUST
LATERAL GUST
LATERAL GUST
DYNAMIC LANDING
DYNAMIC LANDING
DYNAMIC LANDING
CRASH (ULTIMATE)
?ARY CONDITIONS T
Nt Ib I (Nl
(77 840)
- 3.33 (77 8401
- - .-
- - -
4.0 -16,000 (-71 168)
4.0 -16,000 (-71 1681
-2.0 -16.000 ( - 7 ? 168)
6.0 1 - 1 -
-0.04
-0.04
-0.08
-0.08
0.24
0.8
0.24
12 0 --
3E CONDITIONS
I T
NZ E- (Nl
(50 262)
(50 2621
(50 2621
150 2611
(-636061
(-63606)
(-63 6061
-
185

186
(44402)
(25 442)
(16410)
(6 6881
(9928)
PYLON LOCAT ION (SEE DIAGRAM;
6750
4330
2450
1060
1070
BOX UfPER SURFACE
QY = 973.5
@Y =996
@ Y -998.5
BOX LOWER SURFACE
@Y =973.3
FRONT SPAR
@SHEAR FITTING
@FUSELAGE FRAME
@PAR WEB
@FUSELAGE FRAME
REAR SPAR
CLOSING RIB
B Y - 1009
CONDITION: ENGINE INSTAL- LATION
WEIGHT = 4750 lb (2155 kpl
SHEAR STRESS
ANA1
PI
1160
254
390
900
6440
3680
2 380
970
1440 ---
ST
(k Pa1
(7 3771
(2 6201
(6 550)
(3 7921
(46 540)
(29 8541
(1 6 89?1
(7 308)
(7 377)
:ONDITION: STATIC TAKEOFF
UET THRUST, F, = 16266 Ib (72 351 N1
THRUST
SHEAR STRESS
ANA
PI
- - 4500
4650
8060
6280
0
210
1080
430
3440 --
YTICAL Ik Pal
(31 026)
(32 061 1
(55 5721
(43 2991
(0 )
(1 448)
( 7 446)
( 2 965"
(23 7181
1
Wl -
5220
5040
61 30
2030
820
280
1550
470
EST Ik Pel
(35991)
(34 750)
(42 2651
(13996)
(5 6541
(1 9311
t l i a ~ 4 7 1
I2 e961

I
W
U
X
B s 2
4 I - t 3
> I
W o
187

a r e l a t i v e def lect ion i n the order of 1.5 mm (0.06 in) . Previous experience w i th the fuselage shel l anal s i s model indicated tha t fo r the magnitude o f the
instrunentat ion was placed a t the f l e x i b l e j o i n t on the Refan airplane a t Stat ion Y = 996 t o monitor the actual deflect ions during the t e s t program. Figures 112, 113, and 114 show the t e s t def lect ions f o r riet thrust, engine i n e r t i a and cabin pressur izat ion respectively. U t i l i z i n g these data tab le 25 gives t o t a l def lect ions based on the t e s t resu l ts f o r the two c r i t i c a l f r t i g u e conditions: cabin pressurization; ( 2 ) takeoff th rus t and 1.0 g engine i r rer t ia. These r e s u l t s ind icate t h a t the f l e x i b l e j o i n t design based on a 1.5 mm (0.06 i n ) de f lec t ion c r i t e r i a f o r fat igue, should be s t r u c t u r a l l y adequate.
analy t ica l deflections, smal Z e r t e s t deflect ions could be expected. Therefore,
(1) cruise thrust, 2.0 g engine i n e r t i a due t o 3 v e r t i c a l gust and
Pylon t o Fuselage Relat ive Def lect ion
in. (m 1 0.0115 (0.292)
0.0283 (0.719)
- 0.0275 (0.698) 0.0673 (1.709)
0.0368 (0.935)
_e_ 0.0141 (0.358) 1
0.0509 (1 2 9 3 ) ---_ -
TABLE 25
Reference Figure No.
112
11 3
114
112
113
DC-9 REFAN FUSELAGE TO PYl
Fatigue Condition Descript ion
(1) 5000 l b (22 240 N) Cruise Thrust
2.0 9 Engine I n e r t i a
7.46 ps i (51.43 kPa) D i f f e r e n t i a l Cabin Pressure
TOTAL
(2) 16000 l b (72 351 N ) Takeoff
1.0 9 Engine I n e b t i a TOTAL
The e f f e c t o f the JT80-109 engines on the a f t fuselage c r i t i c a l v e r t i c a l bending condit ion f o r f l i g h t i s shown i n f i g u r e 115. Although the heavier refanned engines produce an increase i n the bending moments along the a f t fuselage, the increased moments do not exceed The o r i g i n a l production design bending moments. Revised production bending moments shown i n f igure 115 rqwesent a subsequent refinement of the production DC-9 external loads analysis. T'vse ref ined analysis nethods formed the basis f o r the ca lcu lat ion o f Refan fuselage loads.
Fuselage loads f o r the c r i t i c a l DC-9 landing condit ions w i th JT8D-109 enqines i n s t a l l e d exceeded the strength c a p a b i l i t y o f the fuselage lower center l ine keel i n the area o f the main landing gear wheel well. An add-on modif iLat ion t o the ex is t ing keel structure was desiqned t o accomnodate the higher loads. Figure 116 shows the e f f e c t the s t ructura l modif icat ions had on the fuselage stress leve ls a t Stat ion Y = 737 which i s a section throuqh the wheel wel l area a f t o f the wing rear spar.
188

NET 1 HRUST - Ib
I I I I I 0 20 40 60 80
NET THRUST (N) FIGURE 112. DC-9 REFAN FUSELAGE TO PYLON DEFLECTION VERSUS NET THRUST
FIGURE 113. DC-9 REFAN FUSELAGE TO PYLON DEFLECTION VERSUS FNGINE INERTIA

- 0 0
t -
190

FUSFLA-E STATION - Y FIGURE 115. 4 G T FIJSELAGE VERTICAL BENDING MOMENT
STRF.6 LEVEL (loo0 PSI)
I.' I I 1 1 J 500 400 3Go 200 1 0 0 0 1 0 0 200 300
STRESS LEVEL IMPaI FiGL'Gt '116. DC-9 FUSELAGE BENDING STRESS COMPARISON
1
191

Nacelle. - The nacelle canporaents (nose cowl, i n l e t bullCt. access doors, pylon apron and exhaust duct aeroaynamic fairincls) were designed to a loading envelope which included the following conditions:
1. Combined airplane pitching and dynamic pressure (+ q), yawing and dynamic pressure (+ (1) and maximum dynanic pressrre (9) f o r wind- m i l l i ng and maxim6 continuous thrust.
AIRPLANE VFLOCITY
(EOUIVALENT) CONDIT1m DESCRIPTION knots (mh)
MAXIMUM 425 1218.6)
MAXIMUM 273 (140.4)
MAXIMUM - c q 350 (1800)
MAXIMUM $q I 240 1123.5)
2. blaximum takeoff thrust a t sea level.
DYNAMIC PRESSURE PSI IkPd
610 (29 2)
252 (12 1)
414 (19.8)
195 (9.41
3. Rejected t,*eoff a t sea level.
4. High a l t i t ude corners o f the f l i q h t envelope.
I n addition, loads resc l t ing from a pneumatic duct f a i l u r e causing hiqh nacelle internal preswres was considered. The access doors and the i r supporting structure were also designed t o withstand a 33.4 m/sec (65 knots) qround oust while i n the open position. Table 26 gives a summary o f the loading conditions and the di f ferent ia l pressures f o r the access doors and the pylon apron. The loads imposed on the pylon apron by the access door f o r the ground gust condition and the pneumatic duct f a i l u r e condition are shown i n f igure 117.
f4BLL: 26 OC-9 REFAN ACCESS DOORS AND PYLON APRON LOAD CONDITIONS
65 KNOT 133.4 rnW GROUND GUST (DOORS OPEN) I I - I --
I - I - PNEUMATIC DUCT FA '19E
0 l o
LIMIT DIFFERENTIAL
PRESSURE psi IkR)
I 2.W (19.86) BURST
3.93 (27.10) BURST
-1.33 (-9.17) COLLAPsE
0.18 (1.24)
6 25 BURST (ULTIMATE)
149 (0.2601 0
-4.6 {-0.080) 0
The load conditions which produce maximun loads on the nose cowl are given i n table 27 i n the form o f t o t a l loadings sumned a t the enqine fomard flange. Also given f o r comparison are the P r a t t and Whitney A i rc ra f t allow- able forward flange loads. The Refan nose cowl structural arrangement and materials a re very sfmilar, except f o r length, t o the production DC-9 nose cowl. An important consideration i n the strength analysis o f the nose cowl was the effect of temperature and pressure imposed by thr ant i - ic ing system. Table 28 gives a comparison of temperat res and pressures f o r the nose cowl a*ld i n l e t b u l l e t f o r the c r iL ica l ant i - ic ing system design corldition. The prototype JT80-109 enqines are actual ly less c r i t i c a l than the JT8D production engine, therefore those components affected by tmperature and pressure,such as the leadinq edge I ' D " duct and the epoxy bonded acoustic sandwich i n the in1 et,were s a t i s f actory by cmpari son.
192

530 Ib I2 357 N)
(a) 65 knot (3.34 mls) LIMIT GROUND GUST WITH ACCESS DOORS OPEN
FIGURE 117. DC-9 REFAN PVI.ON APRON LOADS
193

TABLE 27
-1.270 (-3 649)
906 (4 030)
-3.595 (-159911
1.932 (8 594)
OC-9 REFAN NOSE CMNL AlTACHMENT LOADS LANGE N O . 2
P
418 (1 859)
252 I1 121)
421 (1 873)
370 I1 646)
CONDITION OESCRIPTION
'9,800 i t43 590)
f 14,700 ('65 386)
DAC APPL tED LOADS:
MAXIMUM q (LIMIT)
MAXIMUM oq (LIMIT)
MAXIMUM -aq (LIMIT)
CRASH (ULTIMPTEI
P&W ALLOWABLE LOADS:
LIMIT
ULTIMATE
1.740 (7 740)
2.610 (11 609)
6.887 (30 633)
842 (3 745)
1.972 (8 771)
3,860 (17 169)
Eng i ne Model
-
6.900 (30 691 I
10.350 146 037)
rioso Cowl
- "D" Duct A f t Cm P max T max P max
psi (kPa) O F ('C) psi (kPa)
ATTACH
LOAD in Ib IN m) I Ib (NI I BOLT Ib IN) -1 M
iartment . T max
O F ( O L )
480(248.9)
480( 248.9)
480(248.9)
40.165 (4 538)
66.716 (7 538)
-104,133 (-11 7651
63,650 17 191 I
P max
psi (kPa)
22.1 (152.4)
20.7( 142.7)
21,0(144.8)
233.ooO ( % 26 329)
t 349,500 I + 394 935)
TABLE 28
DC-9 NOSE COWL AND BULLET DESIGN PRESSURES AND TEMPERATURES -
JT8D-9 118.26125.5) ~~~ - ~~
JT8D-109117.8( 122.7)
JT8D-1171 1 8.0 ( 1 24.1 ) I 590 ( 31 0 . g i 5.0 ( 1 03.4) - -_-__
I n l e '1 : t h l l e t
T max OF ("C)
380( 193.3)
344 ( 1 73.3 ]
360( 182.2 ]
Design Condition: Takcoff Power, Mach No. = 0.484, h b i e n t A i r Temperature = --6OoF (-51.1OC) to 12OOF (48.9OC), Ant i - ic inq System Operstlng
The exhaust duct o f the refanned engine was designed t o withstand loads imposed by the thrust reverser, internal prec,cures, thernal effects and maximun i n e r t i a load factors. Figures 118 and 119 show the c r i t i c a l exhaust duct intet :a1 pressure and temperature distributions, respectively, f o r the JT8D production and JT8D-109 prototype engines. The two load cdnditions which gave maximum loads on the exhaust l i c t are qiven i n table 29. Thc loads are
194

120 L 180 190 'roo NACELLE STATION - YN
FIGURE 118. DC-9, JT8D EXHAUST DUCT PRESSURE DISTRIBUTION, MAX CONTINUOUS THRUST V, AT SEA LEVEL STANDARD DAY
3 5 0 r
- " w
3 0 0 - L
0 0 0 D
a 250-
U < a n
t- -1 -1
w - I
w
3 I-
R w P
3 k-
w
5 5 200-
rf 15& a
c -1 -I e 9
w Z
50
NACELLE STATION Y N
FIBURE 119. DC-9, JT8D EXHAUST DUCT TEMPERATURE DISTRIBUTION, MAX CONTINUOUS THRUST V, AT SEA LEVEL STANDARD DAV
195

TABLE 29 DC-9 REFAN EXHAUST DUCT ATTACHMENT LOADS
CONDITION DEXRlPTlON
DAC APPLIED LOADS:
REV€ RSE THRUST + MAXIMUM INERTIA (LIMIT)
CRASH (ULTIMATEI
P&WA ALLOWABLE LOP 3s. LIMIT
ULTIMATE
FLANGE NO. 3 (TAILPIPE)
ATTACH BOLT
P LOAD IbqN) Ib (NI
H M" Ib YNI in-lb (N.m)
2.870 (1 2 71x3 -196,OOO (-22 144) 19.400 (86 291) 700 (3 114)
3.260 (14 500) -202.475 (-22 876) 12.W (53 376) 110 (4891
t4.900 (t21 795) ~301.OOO (t34007) 45.700 (20.3 274) 1.740 (7 740)
t7.350 (t32693) t451.500 (t51 010) 68.550 (304910) 2.610 (11 609)
sunned a t the t a i l p i p e mounting f lange o f the engine. The f i r s t condi t ion cm- bines maximum reverse t h r u s t and exhaust system i n e r t i a i n ext ra loads correspond- i n g t o 3.9 g's during landing. The crash condi t ion i s a combination o f 12 g ' s forward and 6 g ' s down. Table 29 a lso gives the P r a t t and Nhitney A i r c r a f t t a i l p i p e mounting f lange allowable loads.
Thrust reverser. - The t h r u s t reverser fob the JT8D-109 engine i s s im i la r i n concept t o the production th rus t reverser. a system o f l inkaqes and dr iven by two hydraul ic actuators. The s t ructura l design c r i t e r i a f o r the th rus t reverser include the fol lowinq:
Basically, two doors are Support by
1.
2.
3.
4.
The th rus t reverser doors and l inkage shal l have the strenqth t o withstand the loads imposed from the stowed t o the f u l l y deployed pos i t ion due t o an airplane v e l o c i t y o f 92.6 m/sec (180 knots) and maximum takeoff power.
The actuator cy l inder and l inkage sha l l have the strenqth t o withstand the snubbing loads imposed durinq rejected takeoff a t 92.6 m/sec (180 knots) under engine power, and considering the e f fec ts o f the time fo r actual operation.
The actuator cy l inder shal l have operational stowing capab i l i t y a t an airplane v e l o c i t y of 87.4 m/sec (170 knots) w i th the engine a t i d l e power.
The th rus t reverser doors and l inkace shal l be designed t o remain stowed, indepcndent o f the l a t c b mechanism. thmugn VD (a i rp lane dive speed) w i t h maximum continuous thrust , i n the absence o f actuatlon t o deploy.
.
196

5. The th rus t reverser l a t ch mechanism sha l l withstand f a i l s a f e loads consist ing o f aerodynamic forces on the doors a t Vc (airplane cruise speed) with maximum continuous th rus t combined w i t h actuator hydraul ic opening forces due to 20 684 kPa (3,000 p s i ) maximum accumulator pressure.
I e 4 0 - U
0 3 ' 8 -
2 2 a 0 C
20
10
0 -
The th rus t reverser door force versus actuator stroke i s shown i n f igure 120 as a funct ion o f one, two and three second cnqine spooldown time f r o m maximum takeoff thrust . The rejected takeoff loads used f o r desiqn of the Refan th rus t reverser and actuators were conservatively based on the one second spooldown condition. The ant ic ipated normal deploy time was 2.0 t o 2.5 seconds.
I
$ a
c 0 x
-
-
70 lo3
50
FIGURE
16 lo3
14
12
10
8
6
4
2
0
0 20 30 60 80 100 120 140 160 180 200 220 240 2 6 0 280 300 STROKE (rnrn)
120- DC-9 REFAN THRUST REVERSER DOOR LOADS VERSUS ACTUATOR STROKE
Thrust reverser mechanism loads f o r the rejected takeoff design condi t ion are qiven i n tab le 30. The loads are given as a function of the d r i v e r arm deployment angle measured from i t s stowed posi t ion. Loads f 3 r a typ ica l operational condi t ion are given i n tab le 31. The enpine was assumed t o be a t i d l e power when the thrust reverser was deployed and the . i tp lane ve loc i ty was 56.6 m/sec (110 knots). These a r e character is t ics of
. , b r J v : ? X-9 landing condition. These predicted loads w i l l be used f o r . d t h t e s t resul ts. -. *.
. . :-d?cted actuator loads versus actuator stroke are shown i n 3 .: f;.r the two c r i t i c a l desiqn condit ions (rejected takeoff and
2 ) and the normal landinq condit ion.
197

0 CI W
m a I-
7 .l s
r, U w a.
rn
2
1
a -
-11
&
198
ORIGINAL PAGE I8 OF K)OR QUALITY

a yi P
X a n
w a
a 5 E

ACTUATOR STROKE - in.
I I I 1 I I 1 I I 1 I I 0 20 40 60 80 100 120 140 160 180 200 220 240
ACTUATOR STROKE - (mm)
FIGURE 121. DC-9 REFAN THRUST REVERSER ACTUATOR LOAD VERSUS STROKE
2,795 (31 6)
- -- 21.Ooo ( 2 -,- 6.560 (742)
-47,7’B( 5392)
I n addi t ion t o the loads imposed on the l inkage during t h r u s t reverser operation, preloading o f the l inkaqe i n the stowed pos i t ion was necessary t o meet the requirement tha t the doors remain closed a t the airplane divz speed. A summary o f the predicted c r i t i c a l l inkage loads i s given i n tab le 32 and includes the re jected takeoff (one second spooldown), l a t c h f a i l s a f e (system attempting to deploy i n f l i g h t w i th maximum hydraul ic pressure) and stowed (preloaded) design conditions.
TABLE 32 DC-9 REFAN SUMMARV OF CRITICAL THRUST REVERSER LINKAGE LOADS
6,970 (31 00;’ 5,043 ( 2 2 431)
2,935 f 13 OS51 641 ( 2 851)
6.400 I2E 467)
14,822 ( 65 0311
j .516 28 983) 71 7 ( 3 1891
3.21 1 (1 4 283) 11 2 (4%)
-3,W9( 13562) 1,630(7251)
CONDITION DESCRIPTION
IDLEH LATCH FAILSAFE REJECTED TAKEOFF i STOWED IPRELOADI
DRIVER LINK
dog (redP ANGLE 0
1 9 10.033)
136.21 (2.3771 0
LATCH FAILSAFE 1.9 (0.033)
1 9 (0 033)
0
BENDING MOMENl in4b (N.ml

The id le r , overcenter and d r i v e r l i n k s were load ca l ib ra ted p r i o r t o the ground and f l i g h t test ing. Test data recorded f o r the th rus t reverser i n the stowed pos i t ion and f u l l y deployzd during a normal landing are shown i n tab le 33 w i t h comparable ana ly t i ca l predict ions. No s t ruc tu ra l modif icat ions would appear l i k e l y f o r a production reverser based on the close agreement o f these loads.
TABLE 33 DC-9 REFAN THRUST REVERSER LINKAGE LOADS (ANALYTICAL vs TEST)
LINK
IDLER
OVER- CENTER
DRIVER
THRUST REVERSER STOWED
'AXIAL I
1
THRUST REVERSER STOWED
ANALYTICAL TEST
'AXIAL 'SHEAR 'AXIAL 'SHEAR Ib b b b
IN) IN) (NI IN)
2.9 36 836 2,900 700 (:30551 137191 (129001 13 1141
- 14.822 14,010
1. 66 931, 1-67 3191
3,048 1,630 -2.8 70 1,670 / (-135631 (72511 ( 127661 (742e)'
.- - /
r~~~~~ t
ANALYTICAL
'AXIAL 'SHEAR Ib Ib
(N) (NI
3,990 (17 7481
2.503
2,532 1 '?
(11 2611 (4981
THRUST REVERSER DEPLOYED
TEST
'AXIAL "WEAR Ib b
IN) (Nl
4.000 (17 7931
2,300 110 2311
2.142 125
('5561 - (9 52Rl
AXIAL ?
OVERCENTER t
- l T V O T LINK
-+-
P A S H E A R
FI VOT
- - STOP
PSHEAR
THHIJST REVERSER COMPONENT LOAD DIAGRAMS
201

Each hydraulic actuator clevis was calibrated for axial load t o provide comparison load versus stroke test data. Figure 122 shows tes t d a t a for l e f t side hydraulic actuator for several t es t conditions and the predicted load versus stroke for noma1 landing. Also included i n figure 122 is the load versus stroke calculated from differential hydraulic pressure data recorded fo r the actuator. The comparison of results indicates t h a t considerably reduced loads occur toward the end of the stroke for the tes t conditions. These results suggest t h a t potential exists for reducing the weight o f a prodi. tion actuator cy1 inder configuration.
Variation of actuator load and svercenter liok laad as a function of actuator stroke, w i t h deployment times indicated, are shown :n figures 123 and 124, respectively. The data shown are for the normal landing condition. Performance of the thrust reverser with respect to deployment characteristics was w i t h i n the sys%n design objectives.
202

I j I I - o o a I
-3 N
0 - x
- O N N
0 'ON
- 8 r
0 - E
- E
' - 8 ' .* c- -
w r w Y Y 0 0 e U t - t - b? v )
a o n
a 4
c a
z-: 9 3 3 t - k v V
-8 7
0 'a,
203

204

91 OOO1 - OW07 XNI1 kI31N33kl3hO I I I 1 I I I I I J
( 2 P 0 2 ? F f ? % 8 0 , I I I I
(N?) - O V O l MN17 t(MN33J33AO
a w v) K w >, % 7:
a
3 K
c z U U w a 9 0
e N
w K 3
c
(9 u.
205


F1 u t t e r Analyses
F lu t te r analyses of the DC-? Refan were performed and compared t o analyt ical resul ts for the production DC-9 airplane. The DC-9 i s required by the Federal Aviation Regulations t o be f ree from f l u t t e r and divergence a t speeds up t o 1.2 VD (design dive speed). The design dive speed p r o f i l e i s shown i n f igure 125. The c r i t i c a l f l u t t e r mode f o r a l l versions o f the production DC-9 i s the antisymnetric T- ta i l f l u t t e r mode. This mode i s comprised o f coupling between the r i g i d body modes, f i n f i r s t bending and f i n f i r s t torsion. Only the a n t i s m e t r i c cases are shown as the symnetric analyses resulted i n s ign i f i can t ly higher f l u t t e r speeds.
A l l f l u t t e r analyses were performed using a Douglas developed computer program. The method used i s the standard "required dampinq vs ve loc i ty method". k,tisynmetrSc analyses were performed with the Refan engine and the basic engine using orthogonal modes. Control surface rotat ion modes (8 Hz rudder and ai leron and elevator f ree) were also included i n the analyses.
coefficients based on a modified aerodynamic s t r i p theory. tiowever, the analyses performed f o r the Refan program used unsteady aerodynamic influence coeff ic ients (AIC's) based on the Doublet Lat t ice Method. Lat t ice Method i s a recent development i n unsteady l i f t i n g surface theory. The AIC's computed wi th t h i s method demonstrate good correlat ion wi th experimental data and NASA Kernel Function Method calculations. The AIC's used i n the f l u t t e r analysis were computed f o r 0.87 Mach llumber, which i s the c r i t i c a l Mach Number f o r DC-9 f l u t t e r .
Previous DC-9 f l u t t e r analyses were performed usinq unsteady aerodynamic
The Doublet
The increased JT8D-109 engine weiqht and shortened pylon do not s i y n i f i - cantly change the modes that couple t o produce the T - ta i l f l u t t e r mode. the c r i t i c a l f l u t t e r speeds and frequencies are not s ign i f icant ly changed from those o f the DC-9 production airplane.
The 3.0 Wz T-ta i l f l u t t e r mode exhibi ts a shallow damped f l u t t e r crossing resul t ing i n s ign i f icant var iat ion i n f l u t t e r speed with modal structural damping. Therefore, the f l u t t e r speeds were conservatively taken a t the g = 0 crossing.
Hence,
A comparison o f f l u t t e r resul ts i s also shown i n f igure 125. The Refan configuration resulted i n sl ight-ty higher f l u t t e r speeds a t a l l a l t i tudes compared t o the production OC-9 configuration. The f l u t t e r margin i s well i n excess o f the 1.2 VD requirement for FAA ce r t i f i ca t i on under CAR 4b, paragraph 4b.308.
207

MACH NUMBER
FIGURE 125. DC9 REFAN ANTISYMMETRIC FLUTTER BOUNDARY
208

Ground V i brat ion Test Modes and Frequencies
Ground v ibrat ion tests were conducted on the DC-9 Refan airplane, t o evaluate the effects of the pylon, fuselage, nacelle and engine st i f fness and weight changes on the normal modes o f vibrat ion. The normal modes were used t o val idate the basic structural stiffness and mass properties and t o evaluate f l u t t e r and structural dynamic characterist ics.
characterist ics o f the airplane between 2 and 20 tiz; and (2) t o measure the s ign i f icant low frequency symmetric and antisymmetric modes o f v ibrat ion together w i th the associated frequency and structural damping.
The tes t objectives were: (1) t o determine the frequency response
The GVT was performed i n a manner s imi lar t o those conducted on previous DC-9 airplanes. Vibration data were obtained f o r the zero fue l configuration. The airplane was s t ruc tu ra l l y complete, however, bal last ing was necessary t o simulate the passenger, i n t e r i o r and cargo distr ibut ions. The t o t a l airplane tes t weiqht was 34 714 kg (76,531 l b ) wi th the center o f grav i ty located a t 35.2 percent M.A.C. The airplane was supported on the main landing gear inboard t i r e s i n f l a ted t o 1 172 kPa (170 ps i ) and a s o f t bungee suspension system a t the nose landing gear.
Airplane modes o f v ibrat ion were excited by applying periodic forces with electromagnetic shakers and varying the frequency u n t i l resonance was attained. A t resonance, modal amplitudes, frequency and structural damping were measured.
Pr ior t o measuring modal v ibrat ion amplitudes, frequency response plots were taken using x-y plot ters. These response p lo ts were used as a guide for f ine tuning the mode t o the desired resonant conditions. Upon completion of each modal suwey, a d i rect-wr i te recorder was used to measure the s t i l l - a i r damping fol lowing sudden removal o f the exci tat ion force.
The antisymnetric and symmetric structural modes o f v ibrat ion measured on the Refan airplane are presented i n tables 34 and 35 along w i th those obtained e a r l i e r on a production DC-' The comparison shows that the weight and structural modifications t o the .*-fan airplane caused minor changes t o the modal frequencies. The modal dampi.15 also d id not vary s ign i f i can t ly f r o m values measured f o r the production DC-9.
209

TABLE 34
RESONANT FREQUENCY COMPARISON
ANTI SYMMETRI C MODES
CONFIGURATION : ZERO FUEL
SHIP NO.
MIDEL
GROSS WEIGHT
c.g. (% MAC)
Horn FREQUENCY
HZ
2.56
3.11
4.02
-- 6.80
MODAL DESCRIPTION MODAL
FREOUENCY ti2
2.576
3.1 5
3.98
5.95
6.86
F I N BENDING
F I N TORSION
HORIZONTAL STABILIZER YAW
FUSELAGE BENDING
WIiJG FIRST BENDING
1
35.2 1 34.9
210

TABLE 35
SHIP NO.
MODEL
GROSS WE lGHT
c.g.(X MAC)
RESONANT FREQUENCY COMPARISON
40
-31
76,531 l b (34 714 kg)
35.2
r I
-
WING FIRST BENDING
F I N P I T C H I S I N PHASE WITH FUSELAGE
HORIZONTAL STABILIZER FIRST BENDING AND PYLON BENDING
FUSELAGE BENDING
I CONFI6URhTION : ZERO FUEL
3.41
4.25
6.01
7.08
S Y W T R I C mDE:
-I
MOW DESCRIPTION
I -31 I
+I FREQUENCY
3.405
4.34
6.29
7.18
21 I


Structural and Aerodynamic Damping
F l ight tests were conducted t o obtain structural frequency response data t o demonstrate that the Refan airplane i s free from f l u t t e r and/or excessive vibrat ion wi th in an arb i t rary f l i g h t envelope defined as approximately h a l f way between the Vw/b (cruise) and V D / ~ (dive) speeds.
Previous tests on the DC-9-31 airplane indicated that c r i t i c a l empennage f l u t t e r modes were not sensitive t o fuel loading, therefore, the Refan tests were conducted over a range o f 100 percent t o 52 percent fuel. The airplane was ballasted to an a f t center o f gravity. The minimum zero fuel weight was 32 207 kg (71, 004 lb) , and the gross w i g h t s varied between 40 597 kg (89,500 l b ) and 37 195 kg (82,000 l b ) wi th in center o f gravi ty l i m i t s ranging from 32.8 percent t o 33.5 percent M.A.C.
The method o f test ing consisted o f exci t ing the structure with p i l o t induced control surface pulses. Tests on production DC-9 airplanes have shown that control surface inputs adequately excite the important modes. Control surface inputs were made f o r level f l i g h t , pushovers, p u l l ups and rudder power on and o f f conditions.
Instrumentation consisted o f acceleration and control surface posi t ion tranducers. The outputs o f these tranducers were recorded on airborne oscillographs. Selected outputs were telemetered t o a ground stat ion f o r monitoring. Structural response was monitored i n real-time t o assess the a i rpl ane damping characteri s t i cs as the speed envelope was expanded. This was accomplished by monitoring such characteristics as amplitude, damping and frequency o f the various responses.
The real-time data display u t i l i z e d two s t r i p charts and two cathode ray tube displays during the f l ights . Modal frequency and damping were plot ted against airspeed t o indicate trends as the airplane speed was increased .
Aerodynamic damping characteristics were evaluated wi th p i 1 o t induced control surface pulses about 3 axes (aileron, rudder and elevator) a t calibrated speeds o f 134 m/s (300 knots) t o 172 m/s (384 knots) a t 5 182 m (17,000 f t ) a l t i tude and up t o Mach - 0.87 a t 7 163 m (23,500 f t ) a l t i tude.
The c r i t i c a l antisyrmetric T - t a i l empennage mode responded a t 3.0 Hz. The damping i n t h i s mode was predominant on f i n la te ra l acceleration. I n general , the damping i n t h i s mode exceeded 4 percent c r i t i c a l damping (8 percent structural damping) up t o highest speeds tested with no rapid change i n damping.
For the f l i g h t conditions tested, the DC-9-31 Refan airplane displayed s i m i l a r o r s l i g h t l y improved damplng characteristics as conpared t o the production DC-9-31 airplane. Structural damping was i n excess o f 8 percent for the speeds tested with no rapid deteriorat ion I n damping. Turning the rudder hydraulic power o f f had no detectable e f fec t on structural damping.
21 3


RETROFIT AND ECOI.1014IC AilALYSIS
The economics, performance, and noise impact of retrofitting DC-9 airplanes w i t h JT80-100 series enaines are based on analyses of the nacelle, thrust reverser, and fuselage desian described i n reference 3. The analysis was performed specifically on the DC-9-30 Refan airplane w i t h JT8D-109 engines installed; however. i t i s applicable t o a l l DC-9 airplanes w i t h hardwall nacelles powered by existinq JT8D enqines.
The market for DC-9 Refan retrof i t airplanes was estimated a t between 525 and 550 aircraft depending, i n pa r t , upon the date of noise abatement rule making. During the early 1980's approximately 300 DC-9's are anticipated to be i n service worldwide. The retrofit market amounts t o approximately two- thirds of the total aircraft delivered. Of the 500 aircraft i t was estimated t h a t two-thirds would be retrofitted by domestic airlines.
The estimated u n i t cost o f the re t rof i t program i s 1.338 million i n mid-1975 dollars. While this estimate has increased subs t an t i a l ly from the 1972 levels the increase was almost solely due to price inflation and the lower aerospace industry operating levels currently being experienced. The t o t a l price i n millions of 1975 dollars, including 4 percent NASA royalty is as follows:
Non Recurring .08b Engine K i t .629 Nacelle Kit .400 Airframe Kit .OS6 Instal lation ,165
TOTAL Price 1.338
Retrofitting the DC-9 airplane w i t h the JT8D-109 engine modification could be accomplished i n about 16-1/2 days after some experience has been accumulated. Five major tasks would be required:
Task Description Elapsed Time - Days
Air1 ine Preparation and Delivery to Modification Center
1
Acceptance Inspection 1
Airplane Rework 11 1/2
Test and Acceptance 2 1/2
Return t o Customer 1 /2
TOTAL 16 1/2
The entire domestic and foreign retrof i t program t w l d be accomplished by early 1983 based upon assumed retrof i t program ATP i n mid-1976, figure 126.
PREZEDING PAGE BLANK NOT FJLMm 21 5

Direct operating costs are presented f o r the DC-9-30, JT80-9 and the JTflD-109 configurations f o r the typ ica l mission 4 572 kg (15,000 l b ) payload case, using both high speed cruise and long range cru ise a t 10 668 m (35,000 f t ) cruise a l t i tude . The m d i f i e d ATA methodology i s presented i n table 36. A t 740 km (400 n.mi.) the cost di f ference i s .09 cents per seat mile, 2.04 vs 1.95 cents per seat mi le i n 1975 dol lars, f igure 127. This di f ference amounts t o about $34 p r r t r i p i n t o t a l d i r e c t cost . However, only a f r a c t i o n of the $34, $6.67, can be traced t o an increase i n cash operating costs. This smaller amount i s due t o hiqher maintenance costs associated w i th the Refan configura- t ion. The f u e l burned and consequently, the costs are almost iden t ica l f o r equivalent condit ions as shown i n tables 7, 8, 9, and 10.
Although the JT8D-109 Refan engine has s l i g h t l y be t te r f ue l specif ics, the gain i s o f f s e t by the increased weight o f the airplane and actual f ue l costs are near ly a toss up. A t longer stage lengths the Refan airplane would burn s l i g h t l y more fue l , The t o t a l $6.67 cash cost d i f f e r e n t i a l f o r t yp i ca l missions would increase cash operating costs by about $18,000 per airplane per year o r about $6,700,000 f o r the estimated domestic f l e e t of 375 DC-9 Refan airplanes.
An i n i t i a l investment of s l i q h t l y over $600 m i l l i o n would be required t o r e t r o f i t the domestic f l e e t . A t the end o f 8 years the t o t a l cost of Refan r e t r o f i t and other in t roduct ion costs would amount t o a t o t a l o f $660 m i l l i c n plus in terest .
The noise generated by a s ingle f l i g h t f o r a given set of f l i g h t condi- t ions can be described by a representative set o f noise contours. Figures 128 and 129 present the 90 and 95 EPNdB, e f fec t i ve perceived noise leve l , noise contours f o r a production OC-9 powered w i th the JT8D-9 and the OC-9 Refan airplane f o r a t yp i ca l mission. S i m i l a r ccntours f o r other condit ions are presented i n reference 4.
Noise contour area comparisons provide a way t o compare the r e l a t i v e noise o f a1 ternat ive configurations under p a r a l l e l conditions. Another measure can b t obtained from the noise leve l dif ferences a t the FAR P a r t 36 measurement points. These dif ferences, derived from f lyover noise t e s t data obtained during the DC-9 Refan f l i g h t demonstration program, are tabulated i n table 37.
216

TABLE 36
1967 ATA AND REFAN INTERNATIONAL DOC FORMULAS
FORMULA,
4500 U - + 500
1 t l / (Tb + 0.30)
CREW PAY I$/BLK-HR)
2 MAN JET (SUBSONIC)
FORMULA.
4500 U - - + 500
1 t l / ( T b + 0.30)
FUEL ($/GAL 1 NONREVENUE FACT04 ON FUEL
AIRFRAME MAINTENANCE CYCLE
MATERIAL WCYC)
DIRECT LABOR (MHICYC)
AIRFRAME MAINTENANCE HOURLY MATERIAL ($IFHI
DIRECT LABOR (MHIFH)
ENGINE MAINTENANCE -CYCLE
MATERIAL ($/CYCI
DIRECT LABOR
ENGINE MAINlENANCE - HOURLY
MATERIAL ($/FHI DIRECT LABOR (MH/FH)
BURDEN MH/t>IRECT LABOR M H
MAINTENANCE LAFOR RATE WMH)
INSURANCE (PERCENT PRI?E’YR)
1967 ATA
0.05 (TOGW/lOM)) t100.00
0.11
1.02
6.24 (Ca/106)
630
(WdlOOo) t 120 0.05 (WdlOoO) t 6 -
3.08 (Ca/106)
UTI LlZATlON (HRIYEAR)
2aO (Ce/106) Ne
I0.6 + 0.027 (T/1 03)1 Ne
25.0 (Ce/106) Ne
[0.6 + 027 IT/lO3Il Ne
1.8
4.00
INVESTMENT SPARES RATIO (PERCENT)
A I RFR AM€
ENGINE DEPRECIATION SCHEDULE (YEARSIPERCENT RESIDUAL)
-I
2.0
10
40
12/0
I
ATA (1975 COEFFICIENT)
21.58 [Vcr (TOGWIlO’I 0‘3 t 51.76
0.30 INCLUDED IN FUEL PRICE
DOUGLAS EXPERI ENCE
1 .o
6 30
141!0
DEFINITION OF TERMS ANI) UNITS
TOGW MAXIMUM TAKEOFF GROSS WEIGHT (LB) Wa AIRFRAME WEIGHT (LB) Vcr CRUISE SPEED (MPH) M MACH NUMBER Ca AIRFRAME PRICE ($1 F H FLIGHTHOURS Ce ENGINE PRICE ( $ I MH MANHOURS Ne NUMBER OF ENGINES CYC CYCLE T SEA LEVEL STATIC THRUST (LE) T, BLOCK TIME (HR)
217

1
I
E 5 1 I I-
2 k
I - 0
rn . 0 0 In 2 w 0
1
I
i 1 2 c'
L
C
DC-S!JT8D-109 DC-9/JT8D-9 --
600 800 1000 1
NAUTICAL MILES 1 I 1 I I I I 8 10 12 14 16 18 20 22 x 10'
KILOMETERS (a) HIGH SPEED CRUISE
IO NAUTICAL MILES
I 1 I I I 1 I 8 10 12 14 16 18 20 j 2 x lo2
KILOMETERS (b) LONG RANGE CRUISE
FIGURE 127. DIRECT OPERATING CO:;T VERSUS STAGE LENGTH - CENTS PER SEAT MILE FOR A TYPICfii MISSION, 15,000 Ib (4 572 kg) PAYLOAD - 1975 ATA - Itt",DIFIED
218

3-DEGREE APPROACH - TAKEOFF WITHOUT CUTBACK
AIRCRAFT
HARDWALL
REFAN
REFAN - - HARDWALL
AREA WITHIN CONTOUR,
sqml (rq kml
4 7 (12 2)
3.8 (98)
AREA WtTHlN AIRCRAFT CONTOUR,
wml (IS kml
H AR DWA L L 11.2 (29 01 REFAN 7.4 119 21
AIRCRAFT
HARDWALL
REFAN
. .-
AREA WITHIN CONTOUR,
q m l (sq kml
1 11.0 12851 i
I 7.3 118 9)
3-DEGREE APPROACH - TAKEOFF WITH CUTBACK
p- HARDWALL RE FAN -
.- TWO-SEGMENT APPROACH - TAKEOFF WITHOUT CUTBACK
REFAN, 7 HARDWALL
TWO-SEGMENT APPROACH - TAKEOFF WITH CUTBACK
fl .t .1 I , , r , l
70 15 10 5 0 5 10 15 ?O ' ) 10 I!) 4 0 4!1 ' ) O r ~ 5
A I RCR AFT CONTOUR,
H ARQWALL 4.6 I11 9) REFAN 3.6 19.3)
60 lo3 1 I 1 L I I 1 1 1
I , , 1 , 1 , 1 , , , , , >(I i 5 ;5 b ;5 4, ti0 l/O 165 170 135 150 165 180 1 9 5 x 10'
1 1 1 1 ~ 1 1 ' 1 ,
DISTANCE FROM BRA..E RELFnSE
l l l l ' l l ' r \
DISTANCE TO THRESHOLD
l28. 90-EPNdB NOISE CONTOURS FOR HARDWALL AND REFAN DC-9% AIRCRAFT FOR TYPICAL MISSION OPEHATION
219

1 1 1 1 1 1 1 1 1 1 1 1 1 %DEGREE APPROACH - TAKEOFF WITHOUT CUTBACK
REFAN----\ r HAROWALL
10
5 0
0 :
10 fllllllllllllllll 3-DEGREE APPROACH - TAKEOFF WITH CUTBACK
R E F A N 7 r HARDWALL
TWO-SEGMEN f APPROACH - TAKEOFF WITHOUT CUTBACK
HARDWALL
c
' ' ' ' J
AIRCRAFT CONTOUR, sami (sa km)
H AR DWA L L
REFAN 2 7 ( 7 0 )
5 7 ( 1 3 5 )
AREA WITHIN CONTOUR, AI RCHAFT
H ARDWA L L 3 0 0 8 1
REFAN 2 1 ( 5 4 )
AIRCRAFT CONTOUR,
HARDWALL 2.1 (701
AHEAWlTHlN 1 I I AIRCRAFT 1 CONTOUR,
sqmi km)
TWO6EGMENT APPROACH - TAKEOFF WITH CUTBACK
feet fee!
&I io ;5 6 i s & d5 $0 i 5 sb 165 l i 0 lk l j0 165 160 1 6 5 ~ 10'
71) 15 10 5 0 5 10 15 20 25 30 35 40 45 50 55 60x lo3 , 1 1 1 I I I 1 1 1 1 1 L 1 1
1111'1 1'1 -. meters
I ill, I AN( I IO I t l l t t StlOL I) 4-L DISTANCE FHOM BRAKE RELEASE
FIGURE 129. 95.EPNdB NOISE CONTOUR FOR HARDWALL AND REFAN DC-9.39 AIRCRAFT FOR TYPICAL MISSION nPERATlON
220

TABLE 37
Ref an- Condition EPNdB
Takeoff with Cutback 87
Sideline 95
Approach 97
NOISE LEVEL DIFFERENCES AT THE FAR PART 36 WEASUREIENT POINTS
Refan vs Hardwall
10
5
9
-AEPNdB
221


SUMMARY OF RESULTS AND CONCLUSIONS
The purpose o f the Refan Program was t o determine the technical and economic feasi b i l i t y o f reducing a i rpor t comuni ty noise produced by 3180 powered airplanes through modifications o f exist ing engines and nacelles. This report presents an evaluation o f analytical, ground and f l i g h t tes t data obtained from studies and tests conducted during the DC-9 Refan Program.
The JT8D-109 engine, a derivative o f the basic P r a t t and Whitrtey JT8D-9 turbofan engine, was selected f o r ins ta l la t ion i n the DC-9 Refan f l i g h t demon- s t ra t ion airplane. The sea level stat ic, standard day bare engine takeoff thrust f o r the production JT8D-109 i s 73 840 N (16,600 lb).
The bare engine performance o f the production JT80-109 engine re la t i ve t o the JT8D-9 shorn that f o r sea level stat ic, standard day the takeoff thrust i s 14.5 percent higher, the cruise TSFC a t 9 144 m (30,000 ft), M = 0.80 and 19 571 N (4,400 lb ) thrust i s 1.5 percent lower, and the maxinum cruise thrust available a t the sane Mach number and a l t i tude i s 4 percent higher.
increase of 1 041 kg (2,294 lb ) and an a f t operational enpty weight (NU) center of gravi ty s h i f t o f 6 t o 7 percent M.A.C. The weight increase i s s p l i t about equally between the airframe and the engine. Ret ro f i t k i t weights w i l l be approximately 91 kg (200 lb ) less than the f l i g h t tes t weights because of weight reduction i t e m that were ident i f ied during hardware design and DC-9 Refan f l i g h t test data anclvsis.
The ins ta l la t ion o f the 3180-109 engine resul ts i n an operational weight
A conparison o f the DC-9-32 FAA takeoff f i e l d length as a function o f gross weight f o r the 3180-109 and JT8D-9 production engine insta l la t ions show tha t a t sea level standard day conditions the additional thrust o f the 3180-109 results i n 2 040 kg (4,500 l b ) additional takeoff gross weight capabi l i ty f o r a given f i e l d length.
The DC-9-32 payload range characterist ics wi th the JT8D-109 engine insta l led re la t ive t o the JT8D-9 indicate the range changes for long range cruise a t 1C 668 m (35,000 f t ) and payloads i l l u s t r a t i n takeoff-gross-weight and fuel capacity l imi ted cases are -352 km (-190 n.mi . 3 and -54 km (-29 n.mi .) respectively. Also, the range changes f o r 0.78 Mach number cruise a t 9 144 m (30,000 ft) and payloads same as above are -326 km (-176 n.mi.1 and -50 kn (-27 n.mi .) respectively.
Although the JT8D-109 Refan engine has s l i gh t l y better specif ic fue l consumption characteristics, th is gain i s o f fset by the increased weight o f the engine, nacelle, and a i r f rame modification hardware, and f o r typical stage lengths the actual fuel costs are about tk same. A t longer stage lengths the Refan airplane would burn s l i gh t l y more fuel.
The s t a b i l i t y and control characterist ics o f the DC-9 kefan airplane were evaluated to determine the af fect o f the ins ta l la t ion o f the larger diameter JT8D-109 engine and nacelle, the reduced span pylon, and weight increases, and t o v e r i f y airplane airworthiness.
223

The Refan airplane demonstrated s t a l l , s t a t i c longitudinal s tab i l i t y , longitudinal control, longitudinal t r i m , a i r and ground minimum control speeds, and direct ional control characteristics s imi lar t o the DC-9-30 production airplane and d id comply with production airplane aimorthiness requirements.
The DC-9 Refan airplane and ins ta l l ed JT8D-109 engine perfovmance was evaluated with respect t o the production (DC-9-301JT80-9) airplane t o deter- mine the af fect o f the airplane, engine and nacelle modifications.
Test f l ights were conducted t o establish the performance levels o f the afrplane and engine during takeoff, climb, cruise and landing. Engine per- formance was evaluated during suction fuel feeding, windmill and ground engine starts, snap t h r o t t l e retards, jam accelerations, airplane s t a l l , high side- s l i p angles and abused takeoffs. AiFplane/engine subsystem performance and the aux i l iary power p lant (AW) performance and s tar t ing characteristics (ground and f l i g h t ) were also evaluated.
production airplane data corrected f o r the difference i n thrust showed good agreemn t .
Refan takeoff acceleration performance when compared with DC-9 Series 30
The climb performance o f the DC-9 Refan airplane re la t ive t o the JT8D-9 panered DC-9-30 production airp;ane shws an 8 percent improvement i n second segnent and approach l i m i t i n g weights and a 5 percent improvement i n enroute l i m i t l n g weight.
The cruise performance test ing o f the DC-9 Refan airplane, wi th the two prototype JT8D-109 engines instal led, shoned the range factor from 5 t o 7 percent lower than an equivalent JT8D-9 ponered DC-9-30 production airplane. While approximately 2 percent o f t h i s increment was due t o the drag increase o f the larger nacelle, the balance was due t o the higher engine SFC o f the prototype JT8D-lo9 engines.
b i l i t y were noted by the p i l o t s while the maxinun climb thrust maneuver u t i l i z i n g fuel suction feed was being conducted. Engine ground star t ing characteristics were satisfactory wi th l i t t l e o r no change f r o m other JTsO versions. The low speed i n f l i g h t s tar t ing envelope was also ver i f ied t o be sat isfactor i . Overall, the engine operations were excellent wi th no major problems encountered and engine performance very close t o predicted levels.
engine nacelle compartment vent i lat ion m d component cooling requirements were sat is f ied fo r ground and i n f l i g h t conditions. The JT8D-109 engine generator and CSD cooling systems were demonstrated sa t i s fac to r i l y f o r the c r i t i c a l (100% load) ground i d l e condltion and f o r a l l i n f l i g h t conditions.
During the JT8D-109 engine performance tests no signs o f engine insta-
The airplane/engine subsystem performance tests showed that the JT80-109
During the thrust reverser performance evaluation normal reverse thrust operation was demonstrated a t speeds belaw the operational cutback speed of 30.87 m/s (60 knots) wi th acceptable engine operation; and the peak empennage temperatures remained below the maximum allowable 1 2 1 O C ( 2 5 O O F ) for the aluminum skin.
224

The Refan caw1 i c e protection system f l i g h t evaluation shws that the system provides i c e protection performance which i s equal t o or i n excess of predictions. System design s im i la r i t i es w i th the c e r t i f i e d production OC-9 system and the conservative n a t u n of the analyt ical method indicate that the DC-9 Refan c w l i ce protection system can be operated without restr ict ions.
The aux i l iary power plant (APU) tests shared no unusual s ta r t ing or operating characteristics during ground starts; and e lec t r i c and w inh i l l a i r s ta r t s wi th the modified exhaust were accarplished a t the extrenes o f the production APli c e r t i f i e d . i n t a r t envelope.
Structural and dynamic analyses, ground and f l igh t tests were perforned on the DC-9 Refan airplane to substantiate three basic program requirwrnts:
1) The nacelle, thrust reverser harchre, and the airplane structural modifications are t o be f l ightworthy and cer t i f iab le .
2) The Refan airplane w i l l Reet f l u t t e r speed margins,
3) The Refan airplane w i l l qua l i f y f o r an exper i lmta l f l i g h t tes t pernit,
Evaluation o f the results from the ground and f l i g h t tezts revealed that the structural configuration o f the Refan hardrrare i s sat isfactory f o r use i n production and/or retrofit k i t s for the OC-9 airplane.
The Refan airplane ground vibrat ion t e s t (GYT) results ve r i f i ed tha r the airplane normal modes o f vibrat ion are not s ign i f i can t ly changed; also, the darnping characteristics conpared well with those o f the DC-9 production a i r p l ane.
Structural and 8erodyf~~1iC d q i n g f l i g h t t e s t data sham tha t the Refan airplane exhibited the same or s l i g h t l y i r p r o w d daaping characteristics re la t i ve t o the production DC-9-30 and there were no i n s t a b i l i t i e s or ex- cessive vibrat ion w i th in the demonstrated f ? i g h t envelope,
The r e t r o f i t and economic analysis indicates that the estimated u n i t cost o f the retrofit program i s 1.338 A i l l i o n i n mid-1975 dol lars wi th about an equal s p l i t i n cost between a i r f r a m and engine. This estimate has increased substantially from the 1972 levels and i s almost solely the resul t o f pr ice i n f l a t i o n and the current lower aerospace industry operating levels.
225


1. Anon., "OC-9/3180 Refan Phase I Final raCport', Douglas Aircraft Company, NASA CU-121252, 1973.
2. Anon., "DC-9 Flight Omonstration Progrrr with Ikfamcd JT8D Engines', Volrrw I , Stnayry, Douglas Aircraft Company, NASA CR-131857, 1975.
3. Anon., "DC-9 Flight DcDnstratlon Progru with R e f d JT8D Engines', Volume 11, Design and Construction, Douglas AirCtaft Ctmpany, NASA CR-131858, 1975.
*;. hem. , "OC-9 Fl ight Dmnstratton Pragrr with Refanned JT8D Engines', Voltme I V , F l p v e r Noise, Douglas Aircraft Company, NAU CR-134860, 1975.
227


SYMBOLS
a
ADDS
a 9
AGL
ALT
AND
ANU
APU
ATA
BPR
BRGW
D
dB
OBASE
D~~~
D.P. o r P
DM DOC
E .4s
EPNL
EGT
EPR
E XT
FAR
Acceleration
Airborne D ig i ta l Data System
Ground Deceleration
Above Ground Level
A1 t i tude
Airplane Nose Down
Airplane rlose Up
Auxi l iary Power Unit
Acceleration Corrected t o Standard Conditions
A i r Transport Association
By-Pass Ratio
Brake Release Gross Weight
Drag
Decibel s
Base Drag
Nacelle Drag
D i f fe ren t ia l Pressure
Ram Drag
Direct Operatirag Cost
Equivalent Airspeed
Effect ive Perceived Noise Level
Exhaust Gas Temperature
Federal Aviation Regulations
229

FM:
Fe
FN
F~~
FNC
FPR
Fwd
9
G.W.
hP
hpn
hPr HUB
HZ
I A S
IGV
ih I n f l t
K o r K t
KCAS
KEAS
K IAS
L
L.E.
LH
L/H
L PT
F l ight Data Center
Elevator Colunn Force
Uninstal led Net Thrust
Insta l led Net Thrust
Total Airplane Net Tbrust
Fan Pressure Ratio
Fomard
Acceleration o f grav i ty
Gross Weight
Pressure A1 ti tude
Observed Pressure A1 ti tude Corrected f o r Instrunent Error
Observed Pressure A1 ti tude
Blade Hub
Hertz
Indicated Airspeed
I n l e t Guide Vanes
tior i zontal Stabi 1 i zer Ang l e
I n F l igh t
Knot
Knots Calibrated Airspeed
Knots Equivalent Airspeed
Knots Indicated Airspeed
Nozzle Length
Leading Edge
Lef t Hand
Nozzl e 1 eng th-to-he i g h t r a t i o
Law Pressure Turbine
230

M
M.A.C.
MALT
MART
MAX
M C l
MCT
MD
MEW
MFC
M I N
MMH
Mm MO
M~~~ MTC
M T W
Nl
N2 NEF
0 AT
OEW
ov rd
F l igh t Mach Nunber
Mean Aerodynamic Chord
Mobile Autanatic Laser Tracker
Mobile Atmospheric Recording Tower
Maximun
Maximun Climb Thrust
Maximun Continuous Thrust
Design Mach Number
!hnufacturer's Empty Weight
Maximum Mach Nunber f o r Stabi 1 i ty Characteristic\
Minimun
Local Mach Number
Maximun Design Landing Weight
Observed Mach Hunber Corrected f o r Instrument Error
Maintenance Man Hour
Maximun Operating Mach Nunber
Freestream Mach Nunber
Blade Row Relative I n l e t Mach Number
Mach T r i m Compensator
Maximum Takeoff Gross \*/eight
Maximun Design Taxi Weight
Engine Low Pressure Compressor Rotor Speed
Engine High Pressure Compressor Rotor Speed
Noise Exposure Forecast
Outside A i r Temperature
Operational Empty Weight
Override
231

'amb
pL PHdB
PNL
PNLT
PfiLTM
PRBC
ps i
psid
t o
t 2
P t 7
P t f 7
pT1 ox 9
qcm
Ref
RAT
HH
RPM
SAT
Se c
SFC
SL
SLS
Freestream Ambient Pressure
Local Stat ic Pressure
Units o f PNL i n Decibels
Perceived tloise Level
Tone Corrected Perceived Noise Level
Maximum Tone Corrected Perceived Noise Level
Freestream Stat ic Pressure
Pressure Ratio Bleed Control
Pounds Per Square Inch
Pounds fer Square Inch Di f ferent ia l
Freestream Total Pressure
Engine Compressor I n l e t Total Pressure
Enqine Turbine Discharge Total Pressure
Engine Fan Oischarge Total Pressure
Nozzle Total Mixed Discharge Pressure
Dynani c Pressure
Impact Pressure Corresponding t o V c
Impact Pressure Corresponding t o Vm
Ref e ren ce
Ram A i r Temperature
Right Hand
Revoluttans Per Minute
Stat ic A i r Temperature
Seconds
Specific Fuel Consumption
Sea Level
Sea Level Stat ic
232

SPL
T
TAT
Tan
TEU
TED
TFLF
TSFC
TO
TMT
TSFC
Ttf 7 TY P
V
"C
vD
"e
"ew
'FC
"FE
v~ E
vLo
vM
'mw
' m a
Ymcg
!l V
Sound Pressure Level
Temperature
Total A i r Temperature
hb i en t Temperature
T r a i l ing Edge Up
T r a i l i n n Edge Down
Thrust f o r Level F l igh t
Thrgst Speci f ic Fuel Consumption
Takeoff
Treatment
Thrust Specific Fuel Consumption
Engine Fan D i scharqe Total Temperature
Typical
Speed, knots
Cali brated A i rspeed
Desiqn Airspeed
Equivalent A i rspeed
Equivalent Airspeed Corrected t o Standard Ileight
Maximum Airspeed f o r S t a b i l i t y Character ist ics
Maximum Airspeed f o r Flap Extension
Airplane Ground Speed
Maximum Airspeed f o r Landinq Gear Extension
Airspeed a t L i f t - o f f
Observed Airspeed Corrected f o r Instrunent E r r o r
Vm Corrected t o Standard Weight
A i r Minimum Control Speed
Ground Mlnfmum Control Speed
233

'MO Maximum Operating A I rspeed
Airspeed f o r Rotation
Maximum Airppeed for Rotation
Sta l l Speed
Maximun Alrspeed f o r S lat Extension
Cr i t i ca l Engine Fai 1 ure Speed
Equfvalent Airspeed and Corrected t o Standard Weight
Takeoff Safety Speed
'RMaX
's
'1
'1,
'2
wR
us
'SE
W A l rp l ane Gross Weight
Airplane Gross Weight Ratio
Airplane Standard Gross Weight
W/M Windmi 11
X A i r c ra f t Inboard-Outboard Station
Y A I rcraf t Fore-Af t Stat ion
Z Alrcraf t Vert ical Stat ion
GREEK LETTERS
a Angl e-of-Attack
P 6 Re1 at ive Absolute Pressure
Angt e - o f 4 des 1 i p
Re1 at ive Absolute Total Pressure ST
72
BT
Y Fl igh t Path Angle
C1 lmb Gradient
e Relatlve Absolute Stat ic Temperature
Re1 at lve Absolute Total Temperature
4 Alrplane Att i tude i n Roll
0 Relatlve Dens1 ty
be
6F
Elevator Deflection - Poslt ive Tra l l lng Edge Down
Flap Deflection
2 34