wisdom marine lines co., limited
TRANSCRIPT

Stock Code:2637
Wisdom Marine Lines Co., Limited
2018 Annual Report
Notice to readers
This English-version annual report is a summary translation of the Chinese version and is not an
official document of the shareholders’ meeting. If there is any discrepancy between the English
and Chinese versions, the Chinese version shall prevail.
Taiwan Stock Exchange Market Observation Post System:
http://newmops.twse.com.tw
2018 Annual Report is available at: http://www.wisdomlines.com.tw
Printed on March 29, 2019

Spokesperson
Name: Bruce Hsueh
Title: Chief Financial Officer
Tel: 886-2-2755-2637
E-mail:[email protected]
Deputy Spokesperson
Name: Chao, Mike Tzu-Lung
Title: Chief Operating Officer
Tel: 886-2-2755-2637
E-mail: [email protected]
Headquarters
Wisdom Marine Lines Co., Limited Address: Clifton
House, 75 Fort Street, PO Box1350, Grand Cayman
Y1-1108, Cayman Islands
Subsidiaries
Wisdom Marine Lines S.A. (Panama)
Address: Paseo del Mar and Pacific Avenues,
Costa del Este, MMG Tower, 23rd Floor,
Panama City, Republic of Panama
Wisdom Marine International Inc.
Address: Rm.711, 7th Fl., No.237, Fu-Hsing S.
Rd. Sec. 2, Taipei
Tel: 886-2-2755-2637
Well Shipmanagement and Maritine Consultant
Co., Limited
Address: Rm.711, 7th Fl., No.237, Fu-Hsing S.
Rd. Sec. 2, Taipei
Tel: 886-2-2755-2637
Litigation/non-Litigation agent in the Republic of China
Name: Lan, Chun-Sheng
Title: Chairman
Tel:886-2-27552637
E-mail: [email protected]
Stock Transfer Agent
Sino Pac Securities Agency Division
Address: 3F, No.17,Bo’ai Rd., Taipei City
Tel: 886-2-2381-6288
Website: http://www.sinotrade.com.tw/stocktransfer
Auditors
Ernst & Young Accounting Firm
Auditors: Lin, Li-huang & Fu, Wen-fang
Address: 9F, No. 333, Sec.1, Keelung Road,, Taipei City
Tel.: 886-2-2757-8888
Website: http://www.ey.com
Overseas Securities Exchange
London Stock Exchange
Disclosed information can be found at http://www.londonstockexchange.com
Corporate Website:http://www.wisdomlines.com.tw

Board of Directors
Position Name Nationality Education and Career
Chairman Lan, Chun-Sheng TW
BA in Business Administration, Tamkang University
President, Shih Wei Navigation
President, First Steamship Group
Director Fukui Masayuki JP
BA in Business Administration, Chapman College (USA)
Tokyo Freighting, Ltd shipbroker
Yoko Senpaku Co. Partner
Director Chao, Mike
Tzu-Lung TW
BA in Economics & BS in Biology, University of Maryland (USA)
William Tan & Associates, CPA
Director
Jinzhou
Investment Co.,
Ltd. TW
BA in Eastern Linguistics, Chinese Culture University
Sales Manager, Jardine Matheson Representative:
Chen,
Ming-Shang
Independent
Director Chen, Po-Chih TW
PhD in Economics, National Taiwan University
National Policy Advisor to the President
Economic Advisor to the President
Chairman, Council for Economic Planning and Development,
Executive Yuan
Director, Central Bank
Chairman of Department of Economics, National Taiwan University
and President of Chung-Hua Institution Economic Research
Independent
Director Tu, Neng-Mo TW
J.S.D./LL.M., University of California, Berkeley, School of Law
LL. B. National Taiwan University
Co-Founder and Managing Partner, Elements Attorneys
Advisor, Taipei City Government International Affairs Advisory
Committee
Corporate Counsel, Media Tek Inc.
Corporate Counsel Asia Pacific, Foxconn Group
Attorney, Investment Department, Lee & Li Attorneys-at-Law
Independent
Director Lin, Tse-Chun TW
Ph.D in Finance, Finance Group, University of Amsterdam
M.Phil in Economics,Tinbergen Institute
MBA in International Business, National Chengchi University
BA in Economics, National Taiwan University
Associate Professor of Finance, Faculty of Business and Economics,
University of Hong Kong
Independent
Director Chiu, Yung-Ho TW
Ph.D in Economics, University of Mississippi (USA)
Master in Economics, Soochow University
BA in Economics, FengChia University
Vice Chairperson & Spokesman, Fair Trade Commission, ROC
Dean of Office of Academic Affairs, Soochow University
Director, First Commercial Bank
Member of Remuneration Committee, Teco Electric and Machinery
Independent Director, Chenfull International
Independent
Director Liu, Tsai-Ching TW
Ph.D in Economics, University of North Carolina at Chapel Hill
BA in Economics, National Chung Hsing University

Position Name Nationality Education and Career
Director, Taiwan Stock Exchange
Director, Taiwan Insurance Guaranty Fund
Director, Global Link Securities
Chairman and President, Department of Public Finance, National
Taipei University
Director, Public Finance and Finance Research Center

Content
1. Letter to Shareholders ................................................................................................................................ 6
Dear Shareholders, .......................................................................................................................................... 6
External Environment ..................................................................................................................................... 6
2. Company Overview ..................................................................................................................................... 9
2.1 Company and Group Profile ............................................................................................................................... 9
2.2 Organization ................................................................................................................................................... 10
3. Corporate Governance Report ................................................................................................................. 17
3.1 Organization ...................................................................................................................................................... 17
3.2 Profiles of Directors, Supervisors, President, Vice Presidents, Assistant Vice Presidents, and Managers of
Various Departments and Branch Offices ............................................................................................................... 19
3.3 Remunerations to Directors, Supervisors, President, and Vice Presidents in the past year ............................... 26
3.4 Corporate Governance Practices ....................................................................................................................... 33
3.5 Information Regarding to the Company’s Audit Fee and Independence ........................................................... 66
3.6 Replacement of CPA ......................................................................................................................................... 67
3.7 The Company’s Chairman, Chief Executive Officer, Chief Financial Officer, and managers in charge of its
finance and accounting operations did not hold any positions in the Company’s independent auditing firm or its
affiliates during 2018. ............................................................................................................................................. 67
3.8 Transfer & pledge of stock equity by directors, supervisors, managerial officers and holders of 10% or more
of company shares ................................................................................................................................................... 67
3.9 Information on relationships among the top ten shareholders ........................................................................... 69
3.10 Ownership of Shares in Affiliated Enterprises ................................................................................................ 70
4. Funding Activities ...................................................................................................................................... 74
4.1 Capital and Share Capital .................................................................................................................................. 74
4.2 Issuance of Corporate Bonds (Including Overseas Corporate Bonds) .............................................................. 81
4.3 Preferred Shares ................................................................................................................................................ 87
4.4 Global Depositary Receipts ............................................................................................................................... 87
4.5 Employee Stock Options ................................................................................................................................... 88
4.6 Restricted Stock Awards .................................................................................................................................... 88
4.7 New Share Issue for Merger or Acquisition of Another Company .................................................................... 88
4.8 Implementation of Capital Allocation Plan ....................................................................................................... 88
5. Business Overview ..................................................................................................................................... 89
5.1 Business Activities ............................................................................................................................................ 89
5.2 Market, production and sales............................................................................................................................. 92
5.3 Workforce Overview ......................................................................................................................................... 96
5.4 Environmental protection expenditure .............................................................................................................. 98
5.5 Employer-employee relations ............................................................................................................................ 99
5.6 Major Contracts ............................................................................................................................................... 100
6. Financial Information .............................................................................................................................. 111
6.1 Five-Year Financial Summary ........................................................................................................................ 111
6.2 Five-Year Financial Analysis .......................................................................................................................... 113
6.3 Audit Committee’s Report for the Most Recent Year ..................................................................................... 116
6.4 Consolidated Financial Statements for the Years Ended December 31, 2018, and Independent Auditors’
Report .................................................................................................................................................................... 116

7. Financial Conditions, Business Results and Risk Analysis ................................................................... 117
7.1 Financial Overview ......................................................................................................................................... 117
7.2 Business Results .............................................................................................................................................. 119
7.3 Cash Flow ....................................................................................................................................................... 121
7.4 Effect of Capital Expenditure on Financial Performance in Last Year ............................................................ 122
7.5 Investment Policy in Last Year, Profit/Loss Analysis, Improvement Plan, and Investment Plan for the Coming
Year ....................................................................................................................................................................... 122
7.6 Risk Assessment for Last Year Up To the Publication Date of this Report ..................................................... 123
7.7 Other Important Information ........................................................................................................................... 129
8. Special Disclosure .................................................................................................................................... 130
8.1 Information of Related Party ........................................................................................................................... 130
8.2 Status of private placement of securities in the last fiscal year and up to the date of annual report publication
............................................................................................................................................................................... 142
8.3 Holding or disposal of shares in the Company by subsidiaries in the last fiscal year and up to the date of
annual report publication ....................................................................................................................................... 142
8.4 Other supplemental information ...................................................................................................................... 143
8.5 Material deviation in protection of shareholders' rights .................................................................................. 143
8.6 Corporate events with material impact on shareholders' equity or stock prices set forth in Article 36, Paragraph
3, Subparagraph 2 of Securities and Exchange Act in the past year and up to the date of report should be listed
individually: .......................................................................................................................................................... 150
Statement on Internal Control ................................................................................................................... 151
Audit Committee’s Review Report ............................................................................................................ 152
Audit Report of Independent Auditors ...................................................................................................... 156

Letter to Shareholders 6
1. Letter to Shareholders
Dear Shareholders,
External Environment
The dry bulk shipping market remained stable in 2018. The decline in newbuilding investment led
to the recovery of equilibrium in dry bulk shipping capacity, where supply had exceeded demand
for years. Meanwhile, increasingly stringent environmental regulations and the cost of funds
continued to dampen shipowners' willingness to invest. As a result, the newbuilding and
secondhand markets did not rebound as strongly as the freight market. The supply of dry bulk
carriers is expected to continue to stagnate in the near future.
In particular, the upcoming Global Sulphur Cap 2020 creates a considerable degree of uncertainty
for the future of the shipping industry. There is still room for improvement in both scrubbers and
low-sulphur fuel in terms of supply, cost, and technology. The industry has so far been unable to
find optimal solutions in response to the new regulations. This uncertainty has a certain degree of
impact on long-term time charters and investment in newbuildings. On the other hand, the Ballast
Water Management Convention, entering into force in 2019, is expected to trigger accelerated
replacement of old vessels.
Another key in the dry bulk shipping market is the 2018 global economy. The generally positive
outlook helps hold freight rates stable in the market. However, the escalating US-China trade war is
having a certain degree of impact on the future of shipping. US-China trade accounts for 3% of the
global trade volume. Less than half US-China trade faces tariff changes due to the trade war, and
even a smaller portion involves goods shipped by dry bulk carriers. Nevertheless, the trade war may
initiate a chain reaction that includes the rise of protectionism and disruption of growth momentum
in the US and China economies. The shipping market will have to pay close attention to these issues
as they develop. However, based on the impact on the freight rates, trade uncertainties have not
caused greater pressure on dry bulk shipping.
2018 Business Results
In 2018, we had 8 newbuildings, hired 1 new bareboat, added 1 to ships under management,
disposed 2 ships of our own, and terminated management of 2 ships. The number of ships in our
fleet had a net increase of 6 from 124 at the beginning of the year to 130 at the end of the year. Old
ships were being replaced at a slower rate than expected due to adverse market conditions and the
relative lack of suitable opportunities for ship sale.

Letter to Shareholders 7
The shipping market had a clearly more positive outlook of the economy in 2018. Our newbuildings
generated on average a gross margin of 40% or higher on time charters. Recovering market
conditions at the beginning of the year had allowed contracts to be renewed at generally better terms.
The average hire after renewal was 20% higher. As a result, the operating profit margin had shown
significant improvement by rising from 17% in 2017 to 26% in 2018.
On the other hand, in terms of non-operating income, we only received US$6 million in dispute
settlement amid a stable market and the lack of speculative investment. Meanwhile, the Japanese
Yen was relatively stable in the foreign exchange market in 2018. The depreciated New Taiwan
Dollar had led to a small positive yield on the TWD denominated bonds we issued in 2018. The
total foreign exchange gain in the year was less than US$1 million. Interest expenses were
significantly higher, however, due to increased interest rates. Overall, our net operating profit was
US$115 million and net profit was US$60.01 million in the year.
2019 Business Plan
We expect to have 5 more newbuildings delivered in 2019. They include 3 supramax and 2
handysize vessels. Since a slow recovery can be expected this year, we plan to secure some
profitable long-term contracts in the year.
All our newbuildings in 2019 are Eco ships built by first class Japanese builders, such as Imabari,
Namura, and Kawasaki, and comply with the latest environmental regulations and requirements. We
have also started to deploy vessels in compliance with Tier III NOx emission standards. So far we
have contracted 6 vessels that comply with the new standards, and delivery is expected to take place
starting in 2020. Given the Tier III emission standards are the shipbuilding standards of the future,
by taking action promptly while the market is recovering and ship prices are still low, we will be
able to stay one step ahead of our competitors in securing a cost advantage for the Group.
In response to the Ballast Water Management Convention that is to come into force in 2019, we
have completed installation on 74 vessels, and have made plans to install the equipment on 11
existing and 5 new vessels in 2019.
Apart from market fluctuatoin, we shall also focus on the development of the shipping industry to
find a best way to meet the sulphur cap requirement. Our fleet is currently planning to comply with
the requirement by switching to low sulphur fuels. However, we will also invest time and resources
in the collaborative development of scubbers and the study of the effects of low sulphur fuels on the
vessels’ main engines.

Letter to Shareholders 8
With uncertainties remaining in international political and economic conditions in 2019, the capital
market continues to be stagnant with increased finance costs and the transactions in secondhand
market is still inactive. Nevertheless, given relatively stable freight rates, we aim to find suitable
opportunities to sell ships. Ship sales will not only facilitate replacement of old vessels, but also
reduce our exposure to interest rate volatility by improving our capital structure.
Chairman:Lan, Chun-Sheng

Company Overview 9
2. Company Overview
2.1 Company and Group Profile
2.1.1 Date of Establishment
Wisdom Marine Lines Co., Ltd. ("Company") is the parent company of Wisdom Marine Group ("Group"). A
holding company was created in Cayman Islands on October 21, 2008. The Company controls Wisdom
Marine Lines S.A., Wisdom Marine International Inc., and Well Shipmanagement and Maritime Consultant
Co., Ltd. In particular, the business entity Wisdom Marine Lines S.A. has been a specialized international
shipping company since it was established on March 15, 1999. The key operating activities of the Group
include marine transportation, vessel management and maintenance, and vessel chartering. A diverse fleet
and a flexible management model enable the Group to minimize market risks.
The Group was founded by its chairman James Lan ("Chairman Lan"). Chairman Lan was born to a family
of shipping experts. He had worked as shipowning partner, professional manager, and independent
shipowner; and served as the chairman of DNV GL Taiwan. With thirty years of experience in shipping,
Chairman Lan is well versed in ship procurement, business operations, and financial management. With
Chairman Lan at the helm, the management team deploys flexible business strategies and steers the business
to stay competitive in a volatile market. The Group grows in reputation, revenue, and profit as the size of its
fleet increases at a steady pace.
2.1.2 Addresses and Telephones of Headquarters, Offices, and Factories
2.1.2.1 Headquarters:Wisdom Marine Lines Co., Limited
Address: Clifton House, 75 Fort Street, PO Box 1350, Grand Cayman, KY1-1108, Cayman Islands
Telephone: (+886 2) 2755-2637
2.1.2.2 Wisdom Marine Lines Co., Limited (Singapore Branch)
Address:8 Eu Tong Sen Street, #15-98 The Central, Singapore 059818
Telephone: (+65) 6536-0377
2.1.2.3 Subsidiary:Wisdom Marine Lines S.A.
Address:Paseo del Mar and Pacific Avenues, Costa del Este, MMG Tower, 23rd Floor, Panama City,
Republic of Panama
Telephone: (+886 2) 2755-2637
2.1.2.4 Subsidiary:Wisdom Marine International Inc.
Address: 7F-11 No. 237, Sec. 2, Fuxing South Road, Taipei City, Taiwan
Telephone: (886 2)2755-2637

Company Overview 10
Wisdom Marine Lines Co., Limited
Wisdom Marine International Inc. Wisdom Marine Lines S.A.
Pescadores
Investment and
Development Inc.
Subsidiaries of Wisdom Marine Lines S.A.
(Note 1)
100% 100%
100% 100%
Well Shipmanagement
and Maritime
Consultant Co., Ltd.
40%
2.1.2.5 Sub-subsidiary in Taiwan:Well Shipmanagement and Maritime Consultant Co., Ltd.
Address: 7F-11 No. 237, Sec. 2, Fuxing South Road, Taipei City, Taiwan
Telephone: (+886 2) 2700-1158
2.2 Organization
2.2.1 Organization
Note 1: Subsidiaries of Wisdom Marine Lines S.A.:
FRATERNITY MARINE S.A.(100%)、UNICORN MARINE S.A.(100%)、ELITE STEAMSHIP S.A.(100%)、COSMIC WISDOM S.A.(100%)、
FOURSEAS MARITIME S.A. PANAMA(100%)、GENIUS MARINE S.A.(100%)、WINSOME WISDOM S.A.(100%)、HARMONY
PESCADORES S.A.(100%)、MOUNT WISDOM S.A.(100%)、GENIUS PRINCE S.A(100%)、MERCY MARINE LINE S.A.(100%)、INFINITE
WISDOM S.A.(100%)、UNICORN SUCCESSOR S.A.(100%)、GENIUS STAR CARRIERS S.A.(100%)、MAGNATE MARITIME S.A.(100%)、
BEAGLE WISDOM S.A.(100%)、GENIUS STAR NAVIGATION S.A.(100%)、FRATERNITY SHIP INVESTMENT S.A.(100%)、HARMONY
TRANSPORT S.A.(100%)、MIGHTY MARITIME S.A.(100%) 、EUROASIA INVESTMENT S.A.(100%)、WISDOM ACE S.A.(100%)、UNICORN
FORTUNE S.A.(100%)、UNICORN LOGGER S.A. (100%)、UNICORN BRAVO S.A.(100%)、TAOKAS WISDOM S.A.(100%)、SIRAYA WISDOM
S.A.(100%)、HOANYA WISDOM S.A.(100%)、PAPORA WISDOM S.A. (100%)、ARIKUN WISDOM S.A.(100%)、BEAGLE MARINE S.A.
(100%)、POAVOSA WISDOM S.A.(100%)、PAZEH WISDOM S.A.(100%)、BABUZA WISDOM S.A.(100%)、UNICORN LOGISTICS S.A.(100%)、
LOG WISDOM S.A.(100%)、RUKAI MARITIME S.A(100%)、TAROKO MARITIME S.A.(100%)、LUILANG WISDOM S.A.(100%)、TAROKO
WISDOM S.A.(100%)、UNICORN PESCADORES S.A.(100%)、PESCADORES INTERNATIONAL LINE S.A.(100%)、GSX MARITIME
S.A.(100%)、ATAYAL WISDOM S.A.(100%)、BUNUN WISDOM S.A(100%)、PAIWAN WISDOM S.A.(100%)、SAYSIAT WISDOM S.A.(100%)、
AMIS WISDOM S.A.(100%)、MAKATAO WISDOM S.A.(100%)、SAKIZAYA WISDOM S.A.(100%)、TAO MARINER S.A.(100%)、TAO BRAVE
S.A.(100%)、KAVALAN WISDOM S.A.(100%)、KATAGALAN WISDOM S.A.(100%)、TAIVOAN WISDOM S.A.(100%)、TROBIAN WISDOM
S.A.(100%)、FAVORAN WISDOM S.A.(100%)、TAOKAS NAVIGATION S.A.(100%)、TAOKAS MARINE S.A (100%)、DUMUN MARINE
S.A.(100%)、GUMA MARINE S.A.(100%)、LLOA WISDOM S.A.(100%)、MIMASAKA INVESTMENT S.A.(100%) 、SAO WISDOM S.A.(100%)、
TRIUMPH WISDOM S.A.(100%)、GUMA NAVIGATION S.A.(100%)、DUMUN NAVIGATION S.A.(100%)、TAO STAR S.A.(100%)、VAYI
WISDOM S.A.(100%)、ADIXI WISDOM S.A.(100%)、LIGULAO WISDOM S.A.(100%)、ATAYAL STAR S.A.(100%) 、ATAYAL BRAVE

Company Overview 11
S.A.(100%)、ATAYAL MARINER SA.(100%)、KATAGALAN MARINE S.A.(100%)、AMIS NAVIGATIONS.A.(100%)、BUNUN NAVIGATION
S.A.(100%)、BUNUN MARINE S.A.(100%)、GS NAVIGATION S.A.(100%)、GS GLOBAL S.A.(100%)、KATAGALAN LINE S.A.(100%)、
POAVOSA INTERNATIONAL S.A.(100%)、POAVOSA MARITIME S.A.(100%)、SAKIZAYA MARINE S.A.(100%)、SAKIZAYA NAVIGATION
S.A.(100%)、TAO ACE S.A.(100%)、TAO TREASURER S.A.(100%)、AMIS STAR S.A. (100%)、AMIS INTERNATIONAL S.A.(100%)、
SAKIZAYA LINE S.A.(100%)、POAVOSA NAVIGATION S.A.(100%)、AMIS CARRIERS S.A.(100%)、AMIS MARINER S.A.(100%)、
KATAGALAN NAVIGATION S.A.(100%)、KATAGALAN STAR S.A.(100%)、KATAGALAN CARRIERS S.A.(100%)、BUNUN FORTUNE
S.A.(100%)、AMIS ELEGANCE S.A.(100%)、DAIWAN CHAMPION S.A.(100%)、DAIWAN DOLPHIN S.A.(100%)、DAIWAN ELEGANCE
S.A.(100%)、DAIWAN FORTUNE S.A.(100%)、DAIWAN GLORY S.A.(100%)、SAKIZAYA DIAMOND S.A.(100%)、AMIS FORTUNE
S.A.(100%)、BUNUN HERO S.A.(100%)、SAKIZAYA FORTUNE S.A.(100%)、SAKIZAYA GLORY S.A.(100%)、DAIWAN HERO S.A.(100%) 、
DAIWAN INFINITY S.A.(100%) 、SAKIZAYA HERO S.A.(100%)、BUNUN INFINITY S.A.(100%)、SAKIZAYA INTEGRITY S.A.(100%)、
DAIWAN JUSTICE S.A.(100%)、DAIWAN KALON S.A.(100%)、SAKIAYA JUSTICE S.A.(100%)、SAKIZAYA KALON S.A.(100%)、SAKIZAYA
LEADER S.A.(100%)、BUNUN JUSTICE S.A.(100%)、AMIS HERO S.A.(100%)、SAKIZAYA MIRACLE S.A.(100%)、AMIS INTEGRITY
S.A.(100%)、DAIWAN LEADER S.A.(100%)、DAIWAN MIRACLE S.A.(100%)、SAKIZAYA QUEEN S.A.(100%)、SAKIZAYA RESPECT
S.A.(100%)、SAKIZAYA POWER S.A.(100%)、SAKIZAYA ORCHID S.A.(100%)、AMIS JUSTICE S.A.(100%)、AMIS MIRACLE S.A.(100%)、
BUNUN BRAVE S.A.(100%)、BUNUN CHAMPION S.A.(100%)、BUMUM DYNASTY S.A.(100%)、BUNUN ELEGANCE S.A.(100%)、AMIS
NATURE INC.(100%)。
Note 2: The organization and subsidiaries are as of March 29, 2019.
2.2.2 Group history
Year Important events
1999 1. Established Wisdom Marine Lines S.A. with a registered capital of US$10,000 in March.
2. Purchased M/V "Global Wisdom" to sail the Asia routes and carry steel and timber.
2000
1. Completed newbuildings "Fraternity Wisdom" and "Mount Wisdom" (later renamed
"Genius Mariner").
2. Purchased "Tien Wei", "Unicorn No.1", "Ever Elite" (later renamed "Genius Trader"),
"Kitty" and "Blue Seaway".
3. The number of vessels owned reached a total of 8.
2001
1. Wisdom Marine Lines S.A. sold "Global Wisdom" in March, and leased 3 container ships
"Unicorn Joy", "Unicorn Express", and "Unicorn Mariner", from Fortis Bank Nederland in
October. Completed newbuildings "Mega Wisdom" and "Winsome Wisdom". Purchased
"Jaw Wei". Sold "Tien Wei".
2. The number of vessels reached a total of 12.
3. Established Well Shipmanagement and Maritime Consultant Co., Ltd. with a registered
capital of NT$3,000,000 in the Republic of China.
2002
1. Purchased "Benefit Wisdom" and "Asia 21st Century". Leased "Asia Crusader". Sold "Blue
Seaway" and "Jaw Wei".
2. The number of vessels operated (including owned, leased, and managed) reached a total of
13.
2003
1. Completed newbuildings "Infinite Wisdom" and "Mercy Wisdom". Purchased "Tanjung
Priok" and "New Luckly VI". Leased "Unicorn Brave". Sold "Kitty".
2. The number of vessels operated (including owned, leased, and managed) reached a total of
17.
3. Well Shipmanagement and Maritime Consultant Co., Ltd. received the Panama DOC
(Document of Compliance) from Bureau Veritas.

Company Overview 12
Year Important events
2004
1. Leased "Genius Star I". Completed newbuildings "Genius Star" and "Magnate".
2. Sold "Unicorn Joy", "Unicorn Mariner", "Genius Trader", and "Asia Crusader".
3. The number of vessels operated (including owned, leased, and managed) reached a total of
16.
2005
1. Wisdom Marine Lines S.A. leased "Genius Star II", and invested a 40% stake in Harmony
Success S.A. and acquired management of "Golden Kiku".
2. Completed newbuilding "Beagle I". Purchased "Pacific Venus". Sold "Unicorn Express".
3. The number of vessels operated (including owned, leased, and managed) reached a total of
19.
2006
1. Wisdom Marine Lines S.A. capitalized profits and reported a registered capital of
US$16,260,000 in June.
2. Wisdom Marine Lines S.A. capitalized profits and reported a registered capital of
US$30,000,000 at the end of August.
3. Completed newbuilding "Genius Star III". Purchased "Beagle VI", "Mol Grace" and
"Unicorn Ace".
4. The number of vessels operated (including owned, leased, and managed) reached a total of
23.
2007
1. Completed newbuildings "Beagle VII", "Beagle II", "Genius Stra VII", "Siraya Wisdom",
"Genius Star VIII", "Unicorn Bravo", "Arikun", and "Bingo". Purchased "Izumo" and
"Dumai Express". Sold "Mega Wisdom", "Tanjung Priok", "New Lucky VI", "Benefit
Wisdom".
2. "Unicorn Ace" sank in Philippine waters on March 20. Started managing "Indian
Challenger".
3. The number of vessels operated (including owned, leased, and managed) reached a total of
29.
2008
1. Wisdom Marine Lines S.A. capitalized profits and reported a registered capital of
US$60,000,000.
2. Invested a 50% stake in Rich Containership S.A. and acquired management of "Ital
Massima".
3. Completed newbuilding "Taokas Wisdom", "Hoanya Wisdom", and "Unicorn Logger".
Sold "Winsome Wisdom" and purchased "Iris".
4. The number of vessels operated (including owned, leased, and managed) reached a total of
33.
5. Established the holding company Wisdom Marine Lines Co., Ltd. in Cayman Islands on
October 21.
6. Established Wisdom Marine International Inc. with a registered capital of NT$10,000,000 in
the Republic of China in December.

Company Overview 13
Year Important events
2009
1. Wisdom Marine Lines Co., Ltd. on June 15 with a registered capital of NT$2,200,000,000.
2. Well Shipmanagement and Maritime Consultant Co., Ltd. received the H.K. DOC
(Document of Compliance) from Bureau Veritas.
3. Acquired management of "Ital Melodia" and leased "Mermaid Star" on a time charter to be
returned at the end of same year.
4. Completed newbuilding "Pazeh Wisdom" and purchased "Bizen" in February. Completed
newbuildings "Beagle III" and "Papora Wisdom", and purchased "Rukai" in March.
Purchased "Luilang Wisdom" and "Itami" in May. Completed newbuildings "Babuza
Wisdom" and "Poavosa Wisdom" and purchased "Taroko" in June. Purchased "Meta" and
leased "African Challenger" and "Strait Challenger" on a time charter in July. Completed
newbuilding "Genius Star IX" and sold "Rukai" in August. Purchased "Mino" and "Jasmine
Ace" in October. Purchased "Tao Triumph" and sold the 50% stake in Rich Containership
S.A. in November, and leasebacked "Meta" and "Luilang". Purchased "Coral Hero" in
December.
5. The number of vessels operated (including owned, leased, and managed) reached a total of
51.
2010
1. Wisdom Marine became listed under the stock code 2637 on TWSE on December 1.
2. Purchased "Mimasaka" in January. Purchased "Global Faith" and sold and leasebacked
"MOL Grace" and "Taroko" in February. Merged the wholly owned subsidiaries Pescadores
Navigation S.A. and Taroko Wisdom S.A. in March, with Pescadores Navigation S.A. being
the merged company and Taroko Wisdom S.A. the surviving company. Completed
newbuilding "Paiwan Wisdom" in April. Purchased "Unicorn Dolphin" in May. Completed
newbuilding "Daiwan Wisdom" in June. Completed newbuilding "Genius Star X" in July.
Completed newbuilding "Amis Wisdom I", purchased "Unicorn Emerald", and leased "Tao
Star" in August. Completed newbuilding "Amis Wisdom II" and sold and leasebacked
"Unicorn Emerald" in September. Completed newbuildings "Tao Mariner", "Naluhu", and
"Frontier Bonanza" in October. Completed newbuildings "Ligulao" and "Guma" in
November. Completed newbuilding "Dumun" in December.
3. Started managing "Alaw" on behalf of third party.
4. The number of vessels operated (including owned, leased, and managed) reached a total of
67.
2011
1. Wisdom Marine Lines Co., Ltd. capitalized capital surplus and reported a paid-in capital of
NT$3,355,000,000 on August 31.
2. Wisdom Marine Lines Co., Ltd. launched a cash capital increase and reported a paid-in
capital of NT$3,580,000,00 on November 1.
3. Completed newbuildings "AMIS WISDOM III" and "Tao Brave", and sold "Iris" in
January. Leased "Del Sol" on a bareboat charter, and sold "Unicorn No.1" in March.
Completed newbuilding "Poavosa Wisdom III" in April. Sold and leasebacked "Fraternity
Wisdom" in June, and sold "Unicorn Brave" and leased "Ocean Victory" on a bareboat
charter in July. Completed newbuilding "Amis Wisdom VI" and "Sakizaya Wisdom" in
September. Completed newbuildings "Poavosa Wisdom VI" and "LBC Energy" in October.
Purchased "Taikli" and "Hibiscus" in November.
4. The number of vessels operated (including owned, leased, and managed) reached a total of
75.

Company Overview 14
Year Important events
2012
1. Made the first issue of international unsecured convertible corporate bond for a total of
NT$600,000,000 on March 29.
2. Wisdom Marine Lines Co., Ltd. capitalized capital surplus and reported a paid-in capital of
NT$3,938,000,000 on August 31.
3. Completed new building "Katagalan Wisdom" in January. Completed new building "Atayal
Star" in February. Sold "Strait Challenger" in March. Completed new building "Atayal
Mariner", sold "Genius Star", and sold and leasebacked "Mercy Wisdom" in April.
Completed new building "Katagalan Wisdom III" in May. Purchased "Blue Horizon", and
completed newbuilding "Atayal Brave" in June. Purchased "Clear Horizon" in July.
Completed newbuilding "Genius Star XI" in September. Completed newbuilding "Bunun
Wisdom" in October. Completed newbuilding "Poavosa Wisdom VII", and terminated third
party management contract for "Indian Fortune" in November. Purchased "Bering ID", and
leased "ID North Sea" on a bareboat charter in December.
4. The number of vessels operated (including owned, leased, and managed) reached a total of
84.
2013
1. Wisdom Marine Lines Co., Ltd. capitalized capital surplus and reported a paid-in capital of
NT$4,149,624,640 on September 11.
2. Launched a capital increase by cash to participate in an issue of global depositary receipts
for a total of US$39,312,000.
3. Made the first overseas issue of unsecured convertible corporate bond for a total of
US$60,000,000 on November 12.
4. Sold "Infinite Wisdom", and completed newbuildings "Poavosa Wisdom VIII" and "Atayal
Ace" in January. Sold and leasebacked "Genius Mariner" in February. Completed
newbuilding "Genius Star XII" in March. Completed newbuilding "Sakizaya Ace" in April.
Completed newbuilding "Tao Ace", and leased "Caribbean ID" on a bareboat charter in
May. Completed newbuilding "Sakizaya Brave" in June, sold "Meta" in July, and completed
newbuilding "Amis Ace" and "Tao Treasure" in August. Sold "Luilang Wisdom", and
completed newbuilding "Poavosa Ace" in September. Lost contact with "Bingo" in Indian
waters during a cyclone in October. Completed newbuildings "Copenship Wisdom" and
"Bunun Ace" in November.
5. The number of vessels operated (including owned, leased, and managed) reached a total of
92.
2014
1. Sold "Dumai Express" and "Tao Triumph" in January. Sold "Fraternity Wisdom", and
"Beagle III" collided with South Korean carrier Pegasus Prime outside Tokyo Bay and sank
in March. Completed newbuildings "Sakizaya Champion", "Daiwan Ace", "Daiwan Brave",
and "Scarlet Falcon", and sold "Taroko" in April. Sold "Asia 21st Century" in June.
Completed newbuilding "Bunun Brave" in July. Sold "Bering ID", and completed
newbuilding "Amis Champion". Completed newbuildings "Bunun Champion" and "Scarlet
Eagle". Completed newbuilding "Bunun Dynasty" in October. Completed newbuilding
"Bunun Elegance" in November. Sold "Genius Mariner" in December.
2. The number of vessels operated (including owned, leased, and managed) reached a total of
94.

Company Overview 15
Year Important events
2015
1. Completed newbuildings "Bunun Fortune", "Amis Dolphin", "Amis Elegance", and
"Daiwan Elegance", and completed and sold newbuilding "Imabari 1680" in January.
Completed newbuilding "Daiwan Champion" in February. Completed newbuilding "Daiwan
Dolphin" in March. Completed newbuildings "Scarlet Rosella", "Bunun Glory", "Daiwan
Fortune", and "Sakizaya Diamond" in April. Completed newbuildings "Daiwan Glory" and
"Amis Fortune" in June. Sold "Unicorn Emerald", and completed newbuilding "Bunun
Hero", and added "Pescadores" in July. Completed and sold newbuilding "Imabari 1681" in
August. Completed and sold newbuilding "Tsuneishi 164" in September. Completed
newbuilding "Sakizaya Elegance", and terminated third party management agreement for
"Alaw" in October. Sold "Coral Hero" in December.
2. Made the second overseas issue of unsecured convertible corporate bond for a total of
US$60,000,000 on April 10, and exercise the upsize option for US$20,000,000 in May.
3. The number of vessels operated (including owned, leased, and managed) reached a total of
106.
2016
1. Completed newbuilding "Sakizaya Future" in January. Completed newbuildings "Daiwan
Justice", "Daiwan Kalon", "Sakizaya Glory", and "Amis Glory" in March. Sold "Itami" in
May. Sold "Mercy Wisdom" in June. Purchased "Ocean Victory" in July. Completed
newbuildings "Daiwan Hero", "Sakizaya Hero", and "Daiwan Infinity in August. Completed
newbuilding "Bunun Infinity", sold and leased "Jasmine Ace" on a bareboat charter, and
sold and leased "Wisdom Grace" on a bareboat charter in September. Completed
newbuilding "Sakizaya Integrity" in October.
2. Wisdom Marine Lines Co., Ltd. launched a cash capital increase to raise a total of
NT$400,000,000 and reported a paid-in capital of NT$5,549,706,300 on November 2.
3. Wisdom Marine International Inc. purchased a stake in Pescadores Investment and
Development Inc. in April.
4. The number of vessels operated (including owned, leased, and managed) reached a total of
114.
2017
1. Sold "Poavosa Champion" in February. Completed newbuilding "Sakizaya Justice" in
March. Completed newbuildings "Sakizaya Miracle" and "Bunun Justice" in April.
Completed newbuilding "Amis Hero", sold "Unicorn Dolphin", and sold a 40% stake in
"Golden Kiku" and turned it into a ship under management in May. Completed newbuilding
"Sakizaya Kalon" in June. Completed newbuildings "Sakizaya Leader" and "Amis
Integrity", and leased "Amis Orchid" on a bareboat charter in July. Completed newbuilding
"Sakizaya Power" in September. Completed newbuildings "Sakizaya Noble", "Sakizaya
Orchid", and "Amis Justice" in October.
2. Made the second issue of domestic secured convertible corporate bond for a total of
NT$400,000,000 on September 30.
3. Made the third issue of domestic unsecured convertible corporate bond for a total of
NT$800,000,000 on October 2.
4. Wisdom Marine Lines Co., Ltd. launched a cash capital increase to raise a total of
NT$320,000,000 and reported a paid-in capital of NT$6,167,075,660 on November 8.
5. The number of vessels operated (including owned, leased, and managed) reached a total of
124.

Company Overview 16
Year Important events
2018
1. Completed newbuildings "Amis Miracle", "Bunun Kalon", and "Sakizaya Queen", and
added "Mega Benefit" to ships under management in January.
2. Completed newbuilding "Sakizaya Respect", and terminated the commercial lease on
"Jasmine Ace" in April.
3. Completed newbuilding "Joseph Wisdom" in June.
4. Completed newbuilding "Amis Nature" in August.
5. Completed newbuilding "Amis Power", added "Saysiat Benefit" to ships under
management on behalf of third party, and sold "Genius Star ll" in September.
6. Terminated third party management of "Del Sol", and completed newbuilding "Daiwan
Leader" in November.
7. Terminated third party management of "Golden Kiku" in December.
8. The number of vessels operated (including owned, leased, and managed) reached a total of
130.
2019
1. Terminated management and leased "Mega Benefit" on a bareboat charter in January.
2. Sold "Genius Star I" in March.
3. The number of vessels operated (including owned, leased, and managed) reached a total of
129.
2.2.3 Risks
Please refer to Section 7.6 Risk Assessment of the Annual Report for information on the risks and response measures.

Corporate Governance Report 17
3. Corporate Governance Report
3.1 Organization
Company Department Responsibilities
Wisdom Marine Lines
Co., Ltd.
Board of Directors
Formulation of financial policies for the Group
Internal control and business performance audits for the Group
Approval of important transactions and investments for the Group
Providing endorsements and guarantees for subsidiaries applying for
loans
Approval of key person appointments for the Group
Funding in Taiwan and compliance related matters
Chairman Chairing meetings of the Board of Directors
Overseeing operations of the Group
President Approval of important operational and business plans
Cross-department management and coordination
Spokesperson Important company announcements and media and investor relations
Auditing Office Supervision of audits of internal control system and business
operations and recommendations for modification
Singapore Branch Operation of the Group business
Company Department Responsibilities
Wisdom Marine Lines
S.A.
Board of Directors
Allocation of funds for the Group
Acquisition and disposal of key assets (ships)
Signing long term lease agreements
Providing endorsements and guarantees for subsidiaries applying for
loans
Auditing Office Supervision of audits of internal control system and business
operations and recommendations for modification
Company Department Responsibilities
Wisdom Marine
International Inc.
Administration
Department
Document storage and administration for the Group
Shareholder affair administration and business registration for the
Group
Management of human resources in Taiwan for the Group
IT software/hardware management
General affair administration
Seaman Affairs
Department
Seaman hiring, evaluation, and recruitment for ships under
management
Finance
Department
Performing accounting, financial, tax, budgeting, and account
processing activities and providing accurate and up-to-date financial
information for the Group.
Business and
Operation
Department
Brokerage of ship leasing, operation, and sale for other companies
Routine operations and insurance claim administration for ships under
management

Corporate Governance Report 18
Company Department Responsibilities
Well Shipmanagement
and Maritime
Consultant Co., Ltd.
ISM Department Safety management training and supervision for ships under
management Technical
Department
Arrangements of ship maintenance and inspection for ships under
management Supply
Department
Procurement and supply of supplies, parts, and lubricants for ships
under management

Corporate Governance Report 19
3.2 Profiles of Directors, Supervisors, President, Vice Presidents, Assistant Vice
Presidents, and Managers of Various Departments and Branch Offices
3.2.1 Director
3.2.1.1 Basic information
Unit: 000 shares, %; As of March 19, 2019
Title
Name
Natio
nality
Gen
der
First d
ate elected
Date elected
Term
Shareholding
when elected
Current
shareholding
Curren
t shareh
old
ings b
y sp
ouse an
d
min
or ch
ildren
Shareh
old
ing b
y n
om
inee arran
gem
ent
Education and work
experience
Other current
positions within
the Company
and in other
companies
Spouse o
r relatives w
ithin
the seco
nd
deg
ree of k
insh
ip actin
g as D
irectors,
Superv
isors, o
r oth
er dep
artmen
t head
s
Nu
mb
er of sh
ares
Sh
areho
ldin
g (%
)
Nu
mb
er of sh
ares
Sh
areho
ldin
g (%
)
Nu
mb
er of sh
ares
Sh
areho
ldin
g (%
)
Nu
mb
er of sh
ares
Sh
areho
ldin
g (%
)
Title
Nam
e
Relatio
nsh
ip
Ch
airman
Lan,
Chun-
Sheng
Taiw
an
Male
2008.
12.25
2018.
05.25
3 y
ears
197,793 32.07 197,793 31.09 2,789 0.45 0 0
BA in Business
Administration, Tamkang
University
President, Shih Wei
Navigation
President, First Steamship
Group
Chairman,
Penghu First
Credit
Cooperative
Chairman,
Wisdom Marine
Lines
Chairman,
Brave Line
Advisor, Shih
Wei Navigation
- - -
Directo
r
Fukui
Masayuki
Japan
Male
2008.
12.25
2018.
05.25
3 y
ears
1,471 0.24 1,471 0.23 0 0 0 0
BA in Business
Administration, Chapman
College (USA)
Tokyo Freighting, Ltd
shipbroker
Yoko Senpaku Co. Partner
Yoko Co., Ltd.
Founder and
President
- - - D
irector
Chao,
Mike
Tzu-Lung
Taiw
an
Male
2008.
12.25
2018.
05.25
3 y
ears
604 0.10 604 0.09 649 0.11 0 0
BA in Economics & BS in
Biology, University of
Maryland (USA)
William Tan & Associates,
CPA
COO, Wisdom
Marine Lines - - -
Directo
r
Jinzhou
Investme
nt Taiw
an
Male
2012.
06.29
2018.
05.25
3 y
ears
1,473 0.24 1,473 0.23 0 0 0 0
BA in Eastern Linguistics,
Chinese Culture University
Sales Manager, Jardine
Matheson
President,
Prime Maritime
Agency
- - -
Represent
ed by
Chen,
Ming-Sha
ng
558 0.09 558 0.09 0 0 0 0 - - -
Indep
enden
t Directo
r
Yasuhisa
Iwanaga
(Note 1)
Japan
Male
2008.
12.25
2015.
05.29
3 y
ears
0 0 0 0 0 0 0 0
BA in Political Science and
Economics, Waseda
University (Japan)
Lecturer, Waseda University
Corporate Officer, Sumitomo
Corporation
President, Sumitomo
Corporation Taiwan
N/A - - -
Corporate Governance Report 20
Title
Name
Natio
nality
Gen
der
First d
ate elected
Date elected
Term
Shareholding
when elected
Current
shareholding
Curren
t shareh
old
ings b
y sp
ouse an
d
min
or ch
ildren
Shareh
old
ing b
y n
om
inee arran
gem
ent
Education and work
experience
Other current
positions within
the Company
and in other
companies
Spouse o
r relatives w
ithin
the seco
nd
deg
ree of k
insh
ip actin
g as D
irectors,
Superv
isors, o
r oth
er dep
artmen
t head
s
Num
ber o
f shares
Shareh
old
ing (%
)
Num
ber o
f shares
Shareh
old
ing (%
)
Num
ber o
f shares
Shareh
old
ing (%
)
Num
ber o
f shares
Shareh
old
ing (%
)
Title
Nam
e
Relatio
nsh
ip
Chairman, Japanese
Chamber of Commerce &
Industry Taipei
Ind
epen
den
t Directo
r
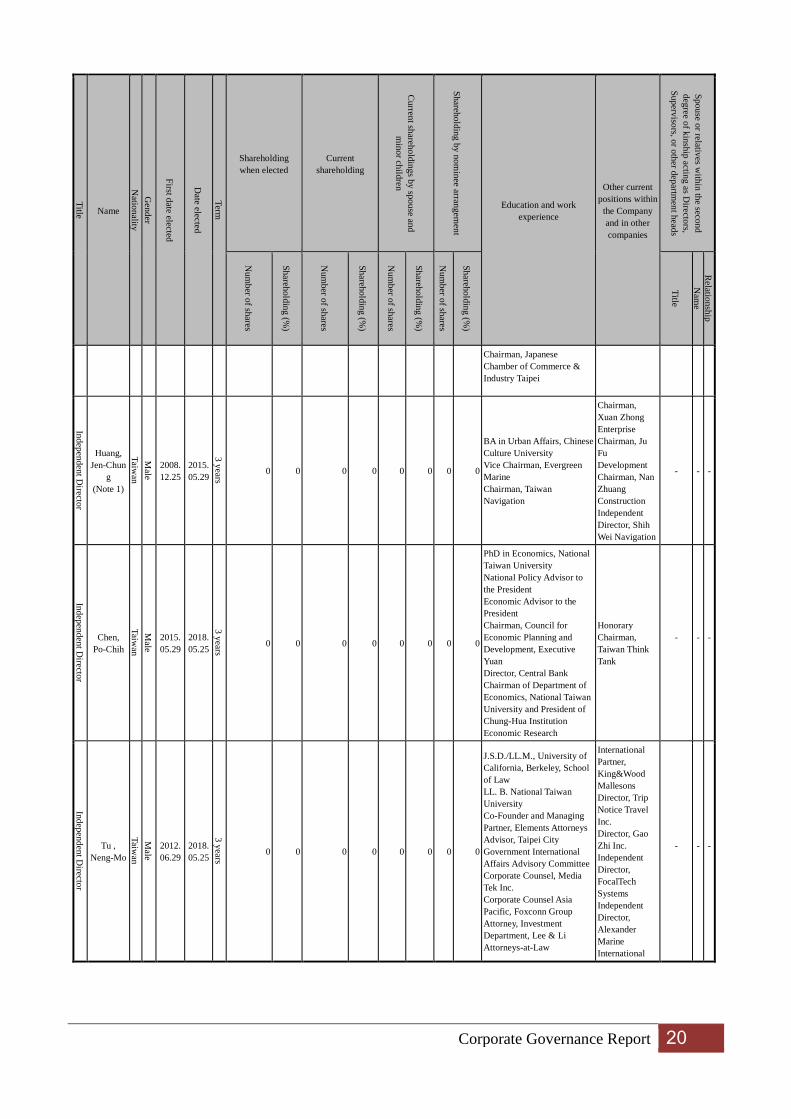
Huang,
Jen-Chun
g
(Note 1)
Taiw
an
Male
2008.
12.25
2015.
05.29
3 y
ears
0 0 0 0 0 0 0 0
BA in Urban Affairs, Chinese
Culture University
Vice Chairman, Evergreen
Marine
Chairman, Taiwan
Navigation
Chairman,
Xuan Zhong
Enterprise
Chairman, Ju
Fu
Development
Chairman, Nan
Zhuang
Construction
Independent
Director, Shih
Wei Navigation
- - -
Ind
epen
den
t Directo
r
Chen,
Po-Chih T
aiwan
Male
2015.
05.29
2018.
05.25
3 y
ears
0 0 0 0 0 0 0 0
PhD in Economics, National
Taiwan University
National Policy Advisor to
the President
Economic Advisor to the
President
Chairman, Council for
Economic Planning and
Development, Executive
Yuan
Director, Central Bank
Chairman of Department of
Economics, National Taiwan
University and President of
Chung-Hua Institution
Economic Research
Honorary
Chairman,
Taiwan Think
Tank
-
-
-
Indep
end
ent D
irector
Tu ,
Neng-Mo
Taiw
an
Male
2012.
06.29
2018.
05.25
3 y
ears
0 0 0 0 0 0 0 0
J.S.D./LL.M., University of
California, Berkeley, School
of Law
LL. B. National Taiwan
University
Co-Founder and Managing
Partner, Elements Attorneys
Advisor, Taipei City
Government International
Affairs Advisory Committee
Corporate Counsel, Media
Tek Inc.
Corporate Counsel Asia
Pacific, Foxconn Group
Attorney, Investment
Department, Lee & Li
Attorneys-at-Law
International
Partner,
King&Wood
Mallesons
Director, Trip
Notice Travel
Inc.
Director, Gao
Zhi Inc.
Independent
Director,
FocalTech
Systems
Independent
Director,
Alexander
Marine
International
-
-
-

Corporate Governance Report 21
Title
Name
Natio
nality
Gen
der
First d
ate elected
Date elected
Term
Shareholding
when elected
Current
shareholding
Curren
t shareh
old
ings b
y sp
ouse an
d
min
or ch
ildren
Shareh
old
ing b
y n
om
inee arran
gem
ent
Education and work
experience
Other current
positions within
the Company
and in other
companies
Spouse o
r relatives w
ithin
the seco
nd
deg
ree of k
insh
ip actin
g as D
irectors,
Superv
isors, o
r oth
er dep
artmen
t head
s
Num
ber o
f shares
Shareh
old
ing (%
)
Num
ber o
f shares
Shareh
old
ing (%
)
Num
ber o
f shares
Shareh
old
ing (%
)
Num
ber o
f shares
Shareh
old
ing (%
)
Title
Nam
e
Relatio
nsh
ip
Indep
enden
t Directo
r
Lin,
Tse-Chun
(Note 2)
Taiw
an
Male
2018.
05.25
2018.
05.25
3 y
ears
0 0 0 0 0 0 0 0
Ph.D in Finance, Finance
Group, University of
Amsterdam
M.Phil in
Economics,Tinbergen
Institute
MBA in International
Business, National Chengchi
University
BA in Economics, National
Taiwan University
Associate Professor of
Finance, Faculty of Business
and Economics, University
of Hong Kong
Professor of
Finance,
Faculty of
Business and
Economics,
University of
Hong Kong
- - -
Ind
epen
den
t Directo
r
Chiu,
Yung-Ho
(Note 2) T
aiwan
Male
2018.
05.25
2018.
05.25
3 y
ears
0 0 0 0 0 0 0 0
Ph.D in Economics,
University of Mississippi
(USA)
Master in Economics,
Soochow University
BA in Economics, FengChia
University
Vice Chairperson &
Spokesman, Fair Trade
Commission, ROC
Dean of Office of Academic
Affairs, Soochow University
Director, First Commercial
Bank
Member of Remuneration
Committee, Teco Electric
and Machinery
Independent Director,
Chenfull International
Professor,
Department of
Economics,
Soochow
University
- - -
Indep
end
ent D
irector
Liu,
Tsai-
Ching
(Note 2)
Taiw
an
Fem
ale
2018.
05.25
2018.
05.25
3 y
ears
0 0 0 0 0 0 0 0
Ph.D in Economics,
University of North Carolina
at Chapel Hill
BA in Economics, National
Chung Hsing University
Director, Taiwan Stock
Exchange
Director, Taiwan Insurance
Guaranty Fund
Director, Global Link
Securities
Chairman and President,
Department of Public
Finance, National Taipei
University
Director, Public Finance and
Finance Research Center
Professor,
National Taipei
University
Director,
Taiwan Stock
Exchange
Director,
Taiwan
Insurance
Guaranty Fund
Vice Chairman,
Committee on
Taxation and
Financial
Policy, Chinese
National
Federation of
Industries
Note 1: Term ended after the election of Directors and Independent Directors on May 25, 2018.
Note 2: Elected Independent Director in the annual general meeting on May 25, 2018.

Corporate Governance Report 22
3.2.1.2 Supervisors: The Company does not appoint supervisors as the Independent Directors form the
Audit Committee as required by the Articles of Incorporation.
3.2.1.3 Large shareholders of institutional shareholder
Name of institutional shareholder Large shareholders of institutional shareholder
Jinzhou Investment Co., Ltd. Lan, Mei-Chou (90%), Lan, Wei-Chih (10%)
3.2.1.4 Professional knowledge and independence of Directors
Criteria
Name
Has at least 5 years of work experience
and professional qualifications below
Meets the independence criteria
(Note 1)
Number of
positions as
an
Independent
Director in
other public
companies
Lecturer (or
above) of commerce,
law,
finance, accounting,
or any
subject relevant to
the
Company's operations
in a public
or private junior
college,
college or
university
Certified judge,
prosecutor, lawyer, accountant, or
holder of
professional qualification
relevant to the
Company's operations
Work
experience in the area
of
commerce, law,
finance, or
accounting, or
otherwise
necessary for the
business of
the Company
1 2 3 4 5 6 7 8 9 10
Lan,
Chun-Sheng -
Fukui
Masayuki -
Chao, Mike
Tzu-Lung -
Jinzhou
Investment
Co., Ltd.
Represented by
Chen,
Ming-Shang
-
Yasuhisa
Iwanaga
(Note 2)
-
Huang,
Jen-Chung
(Note 2)
-

Corporate Governance Report 23
Criteria
Name
Has at least 5 years of work experience
and professional qualifications below
Meets the independence criteria
(Note 1)
Number of
positions as
an
Independent
Director in
other public
companies
Lecturer (or above) of
commerce,
law, finance,
accounting,
or any subject
relevant to
the Company's
operations
in a public or private
junior
college, college or
university
Certified judge, prosecutor, lawyer,
accountant, or
holder of professional
qualification
relevant to the Company's
operations
Work experience
in the area
of commerce,
law,
finance, or accounting,
or
otherwise necessary
for the
business of the
Company
1 2 3 4 5 6 7 8 9 10
Chen,
Po-Chih -
Tu,
Neng-Mo 2
Lin,
Tse-Chun
(Note 3)
-
Chiu,
Yung-Ho
(Note 3)
-
Liu,
Tsai-Ching
(Note 3)
-
Note 1: The symbol "v" marks where the Directors meet the criteria:
1. Not an employee of the Company or any of its affiliates.
2. Not a Director or Supervisor of the Company of any of its affiliates (excluding Independent Directors set up by the
Company, its parent company or subsidiaries in compliance of the local regulations).
3. Not a natural-person shareholder who holds shares, together with those held by the person's spouse, minor children, or
held by the person under others' names, in an aggregate amount of one percent or more of the total number of issued
shares of the Company or ranks as one of its top ten shareholders.
4. Not a spouse, relative within the second degree of kinship, or lineal relative within the third degree of kinship, of any of
the above persons in the preceding three subparagraphs.
5. Not a Director, Supervisor, or employee of a corporate/institutional shareholder that directly holds five percent or more of
the total number of issued shares of the Company or ranks as one of its top five shareholders.
6. Not a Director, Supervisor, managerial officer, or a shareholder that holds more than five percent of shares at a company or
institution that has financial or business exchanges with the Company.
7. Not a professional individual or owner, partner, director (member of the governing board), supervisor (member of the
supervising board), or managerial officer of a sole proprietorship, partnership, company, or institution that provides
commercial, legal, financial, accounting, or consultation services to the Company or any of its affiliates, or spouse thereof.
However, this restriction does not apply to a member of the remuneration committee who exercises power in accordance
with Article 7 of Regulations Governing the Appointment and Exercise of Powers by the Remuneration Committee of a
Company Whose Stock is Listed on the Stock Exchange or Traded Over the Counter.
8. Not having a marital relationship, or a relative within the second degree of kinship to any other Director of the Company.
9. Not been a person of any conditions defined in Article 30 of the Company Act.

Corporate Governance Report 24
10. Not elected as a government or corporate representative, as described in Article 27 of the Company Act.
Note 2: Term ended after the election of Directors and Independent Directors on May 25, 2018.
Note 3: Elected Independent Director in the annual general meeting on May 25, 2018.
3.2.2 Key Management Personnel
3.2.2.1 Basic Information
Unit: 000 shares, %; As of March 19, 2019
Title
Natio
nality
Nam
e
Gen
der
Date o
f appo
intm
ent(N
ote 1
)
Shareholding
Shareholdings
by spouse and
minor children
Shareholding
by
nominee
arrangement
Education and work
experience
Cu
rrent jo
b p
ositio
n in
oth
er com
pan
ies
Management
personnel who is
a spouse or a
relative within
second degree
Nu
mber o
f shares
Sh
areho
ldin
g p
ercentag
e
(%)
Nu
mber o
f shares
Sh
areho
ldin
g p
ercentag
e
(%)
Nu
mber o
f shares
Sh
areho
ldin
g p
ercentag
e
(%)
Title
Nam
e
Relatio
nsh
ip
President
Taiw
an
Cheng,
Chun-Sheng
Male
19
99
.12
.01
26
5,3
68
0.04%
12
3,7
96
0.02% - -
National Keelung
Maritime Vocational
High School
Captain
Manager, Honor Faith
Industrial Limited
Vice President, Wisdom
Marine Lines
- - - -
COO
Taiw
an
Chao, Mike
Tzu-Lung
Male
20
05.0
8.0
1
603,7
10
0.09%
649,2
84
0.11% - -
BA in Economics & BS
in Biology, University
of Maryland (USA)
William Tan &
Associates, CPA
- - - -
Assistant
Vice
President,
Business
and
Operation
Department
Taiw
an
SC
Fan
g
Male
20
04.0
5.1
0
51
,806
0.01%
14
6,8
32
0.02% - -
National Keelung
Maritime Vocational
High School
Captain
- - - -
CTO
Taiw
an
Tsau
r,
Sh
uan
g-C
hau
Male
2013.0
8.0
1
- -
- - - -
National Keelung
Maritime Vocational
High School
TMT
- - - -

Corporate Governance Report 25
Title
Natio
nality
Nam
e
Gen
der
Date o
f appo
intm
ent(N
ote 1
)
Shareholding
Shareholdings
by spouse and
minor children
Shareholding
by
nominee
arrangement
Education and work
experience
Cu
rrent jo
b p
ositio
n in
oth
er com
pan
ies
Management
personnel who is
a spouse or a
relative within
second degree
Nu
mber o
f shares
Sh
areho
ldin
g p
ercentag
e
(%)
Nu
mber o
f shares
Sh
areho
ldin
g p
ercentag
e
(%)
Nu
mber o
f shares
Sh
areho
ldin
g p
ercentag
e
(%)
Title
Nam
e
Relatio
nsh
ip
Assistant
Vice
President,
Seaman
Affairs
Department
Taiw
an
CY
Wen
Male
2005.1
1.0
1
114,3
55
0.02%
160,9
33
0.03% - -
Fu Hsing Kang College,
National Defense
University
Director, Office of
Business Relations, First
Steamship
- - - -
CFO
Taiw
an
Bruce
Hsueh
Male
20
07
.04
.02
33
8,3
62
0.05%
82
,71
9
0.01 - -
BA in Economics,
National Taiwan
University
Masters, University of
California, Berkeley
- - - -
Assistant
Vice
President,
Finance
Department
Taiw
an
Lina Hung
Fem
ale
19
99
.08
.01
26
0,6
14
0.04%
- - - -
Department of
Economics, Soochow
University
Accountant, National
Shipping Agency Corp
- - - -
Audit
Officer
Taiw
an
TT Ting
Fem
ale
20
17.0
2.1
3
10
,00
0
0.00%
-
- - -
Information
Management
Department, Tamkang
University
PricewaterhouseCoopers
Taiwan
- - - -
Note 1: The date of appointment is the start date of employment with Wisdom Marine Lines.

Corporate Governance Report 26
3.3 Remunerations to Directors, Supervisors, President, and Vice Presidents in
the past year
3.3.1 Remuneration to Directors (including Independent Directors)
Unit: NT$ 000;
Title
Nam
e
Director's remuneration
Ratio of total
compensation
(A+B+C+D) to
net profit after
tax (%)
(Note 8)
Pay received as an employee Ratio of
total
compensati
on
(A+B+C+
D+E+F+G
) to net
profit after
tax (%)
(Note 8)
Re
mu
ner
atio
n
fro
m
inv
est
me
nts
oth
er
tha
n
sub
sidi
arie
s(N
ote
1)
Remunerat
ion (A)
(Note 2)
Retirement
pension (B)
Director's
remuneration
(C) (Note 3)
Business
expenses (D)
(Note 4)
Salary,
bonuses and
allowances
(E) (Note 5)
Retirement
pension (F)
Employee's remuneration
(G) (Note 6)
The C
om
pan
y
All co
mpan
ies in th
e finan
cial
statemen
ts(Note 7
)
The C
om
pan
y
All co
mpan
ies in th
e finan
cial
statemen
ts(Note 7
)
The C
om
pan
y
All co
mpan
ies in th
e finan
cial
statemen
ts(Note 7
)
The C
om
pan
y
All co
mpan
ies in th
e finan
cial
statemen
ts(Note 7
)
The C
om
pan
y
All co
mpan
ies in th
e finan
cial
statemen
ts(Note 7
)
The C
om
pan
y
All co
mpan
ies in th
e finan
cial
statemen
ts(Note 7
)
The C
om
pan
y
All co
mpan
ies in th
e finan
cial
statemen
ts(Note 7
)
The
Company
All
companies
in the
financial
statements
(Note 7)
The C
om
pan
y
All co
mpan
ies in th
e finan
cial
statemen
ts (Note 7
) Cash
value
Share
value
Cash
value
Share
value
Ch
airman
Lan
,
Ch
un
-Sh
en
g
500 500 0 0 1,852 1,852 61 61 0.13 0.13 5,076 5,076 0 0 0 0 0 0 0.41 0.41
N/
A
Directo
r
Fu
ku
i
Masay
uk
i
500 500 0 0 300 300 56 56 0.05 0.05 0 0 0 0 0 0 0 0 0.05 0.05
N/
A
Directo
r
Ch
ao, M
ike
Tzu
-Lu
ng
500 500 0 0 300 300 50 50 0.05 0.05 0 2,869 0 0 0 0 0 0 0.05 0.21
N/
A
Directo
r
Jinzh
ou
Investm
ent
Co., L
td.
500 500 0 0 300 300 50 50 0.05 0.05 0
0
0
0
0
0
0
0
0.05 0.05
N/
A
Rep
resented
by C
hen
,
Min
g-S
han
g
Indep
enden
t
Directo
r
Hu
ang, Jen
-Chung
(No
te 9)
199 199 0 0 119 119 27 27 0.02 0.02 0 0 0 0 0 0 0 0 0.02 0.02
N/
A
Indep
end
ent
Directo
r
Yasu
hisa
Iwan
aga
(Note 9
)
199 199 0 0 119 119 27 27 0.02 0.02 0 0 0 0 0 0 0 0 0.02 0.02
N/
A

Corporate Governance Report 27
Title
Nam
e
Director's remuneration
Ratio of total
compensation
(A+B+C+D) to
net profit after
tax (%)
(Note 8)
Pay received as an employee Ratio of
total
compensati
on
(A+B+C+
D+E+F+G
) to net
profit after
tax (%)
(Note 8)
Re
mu
ner
atio
n
fro
m
inv
est
me
nts
oth
er
tha
n
sub
sidi
arie
s(N
ote
1)
Remunerat
ion (A)
(Note 2)
Retirement
pension (B)
Director's
remuneration
(C) (Note 3)
Business
expenses (D)
(Note 4)
Salary,
bonuses and
allowances
(E) (Note 5)
Retirement
pension (F)
Employee's remuneration
(G) (Note 6)
The C
om
pan
y
All co
mpan
ies in th
e finan
cial
statemen
ts(Note 7
)
The C
om
pan
y
All co
mpan
ies in th
e finan
cial
statemen
ts(Note 7
)
The C
om
pan
y
All co
mpan
ies in th
e finan
cial
statemen
ts(Note 7
)
The C
om
pan
y
All co
mpan
ies in th
e finan
cial
statemen
ts(Note 7
)
The C
om
pan
y
All co
mpan
ies in th
e finan
cial
statemen
ts(Note 7
)
The C
om
pan
y
All co
mpan
ies in th
e finan
cial
statemen
ts(Note 7
)
The C
om
pan
y
All co
mpan
ies in th
e finan
cial
statemen
ts(Note 7
)
The
Company
All
companies
in the
financial
statements
(Note 7)
The C
om
pan
y
All co
mpan
ies in th
e finan
cial
statemen
ts (Note 7
) Cash
value
Share
value
Cash
value
Share
value
Indep
enden
t
Directo
r
Tu, N
eng
-Mo
500 500 0 0 300 300 70 70 0.05 0.05 0 0 0 0 0 0 0 0 0.05 0.05
N/
A
Indep
end
ent
Directo
r
Chen
, Po
-Ch
ih
500 500 0 0 300 300 75 75 0.05 0.05 0 0 0 0 0 0 0 0 0.05 0.05
N/
A
Ind
epen
den
t
Directo
r
Lin
, Tse-C
hu
n
(No
te 10
)
303 303 0 0 182 182 43 43 0.03 0.03 0 0 0 0 0 0 0 0 0.03 0.03
N/
A
Ind
epen
den
t
Directo
r
Ch
iu, Y
un
g-H
o
(No
te 10
)
303 303 0 0 182 182 42 42 0.03 0.03 0 0 0 0 0 0 0 0 0.03 0.03
N/
A
Ind
epen
den
t
Directo
r
Liu
, Tsai-C
hin
g
(Note 1
0)
303 303 0 0 182 182 42 42 0.03 0.03 0 0 0 0 0 0 0 0 0.03 0.03 N/
A
Note 1: Amount of remuneration a director of the Company receives from investments other than subsidiaries of the Company.
Note 2: Remuneration to Directors in the most recent year (include Director salary, additional pay, severance pay, bonuses, and incentive payments).
Note 3: Amount of Director's remuneration as passed by the Board of Directors in the past year.
Note 4: Business expenses incurred by Directors in the past year (including transportation, special allowance, other allowances, housing, and company
car). Where housing, car and other forms of transport, or personal allowances are provided, the nature and cost of assets provided should be
disclosed and the rent, gas, and other expenses be paid as incurred or at fair market price. Where a driver is also provided, it should be specified
in the notes that the Company pays compensation to the driver but does not include the amount in remuneration.
Note 5: All payments to Directors who are also employees of the Company (including the position of President, Vice President, other management
personnel and staff), including salary, additional pay, severance pay, bonuses, incentive payments, transportation, special allowance, other
allowances, housing, and company car. Where housing, car and other forms of transport, or personal allowances are provided, the nature and
cost of assets provided should be disclosed and the rent, gas, and other expenses be paid as incurred or at fair market price. Where a driver is
also provided, it should be specified in the notes that the Company pays compensation to the driver but does not include the amount in
remuneration. Furthermore, compensation costs recognized under IFRS 2 "share-based payment transactions", including employee stock
options, restricted stock awards, and rights to cash issue, should also be included in remuneration.

Corporate Governance Report 28
Note 6: The amount of employee's remuneration as passed by the Board of Directors in the past year should be disclosed for Directors who are also
employees of the Company (including the position of President, Vice President, other management personnel and staff) and have received
employee remuneration (including stocks and cash).
Note 7: The total pay to Directors from all companies in the consolidated statements (including the Company) should be disclosed.
Note 8: Net profit after tax refers to the net profit after tax in the past year. Where IFRSs has been adopted, net profit after tax refers to the net profit
after tax in the individual and separate financial statements.
Note 9: Term ended after the election of Directors and Independent Directors on May 25, 2018.
Note 10: Elected Independent Director in the annual general meeting on May 25, 2018.
* The remuneration disclosed in the table does not follow the definition of income under the Income Tax Act. Hence, the table is compiled strictly
for disclosure and not for tax purposes.
3.3.2 Remuneration of supervisors Not applicable for the Company as it does not appoint
supervisors.

Corporate Governance Report 29
3.3.3 Remuneration of supervisors Not applicable for the Company as it does not appoint
supervisors.
Unit: NT$ 000
Title
(Note 1) Name
Salary
(A)
(Note 2)
Retirement
pension
(B)
(Note 10)
Bonuses
and
allowances
(C)
(Note 3)
Employee's remuneration
(D)
(Note 4)
Ratio of total
compensation
(A+B+C+D) to net
profit after tax (%)
(Note 8) Remuneration
from
investments
other than
subsidiaries
(Note 9)
Th
e Co
mp
any
All co
mp
anies in
the
finan
cial
statemen
ts(No
te 5)
Th
e Co
mp
any
All co
mp
anies in
the
finan
cial
statemen
ts(No
te 5)
Th
e Co
mp
any
All co
mp
anies in
the
finan
cial
statemen
ts(No
te 5)
The
Company
All companies
in the financial
statements
(Note 5) The
Company
All
companies
in the
financial
statements
(Note 5)
Cash
value
Share
value
Cash
value
Share
value
Wisdom
Marine
International
Inc.
President
Cheng,
Chun-Sheng
0 8,460 0 0 0 2,674 0 0 0 0 0 0.62 無
Wisdom
Marine
International
Inc.
COO
Chao, Mike
Tzu-Lung
Wisdom
Marine
International
Inc.
CTO
Tsaur,
Shuang-Chau
Wisdom
Marine
International
Inc.
CFO
Bruce Hsueh
*Regardless of title, all positions equivalent to President or Vice President (e.g. General Manager, CEO, Executive Director) are subject to the
disclosure requirements.
Range of remuneration table
Range of remuneration paid to Presidents
and Vice Presidents
Name of President and Vice Presidents
The
Company
(Note 6)
All companies in the financial statements
(Note 7) E
Below NT$2,000,000 - -
NT$2,000,000 (inclusive) to NT$5,000,000
(exclusive) -
Cheng, Chun-Sheng, Chao, Mike Tzu-Lung , Bruce
Hsueh, Tsaur, Shuang-Chau
NT$5,000,000 (inclusive) to NT$10,000,000
(exclusive) - -
NT$10,000,000 (inclusive) to
NT$15,000,000 (exclusive) - -
NT$15,000,000 (inclusive) to
NT$30,000,000 (exclusive) - -

Corporate Governance Report 30
Range of remuneration paid to Presidents
and Vice Presidents
Name of President and Vice Presidents
The
Company
(Note 6)
All companies in the financial statements
(Note 7) E
NT$30,000,000 (inclusive) to
NT$50,000,000 (exclusive) - -
NT$50,000,000 (inclusive) to
NT$100,000,000 (exclusive) - -
More than NT$100,000,000 - -
Total - 4 people
Note 1: The names of President and Vice Presidents should be listed individually and the amounts in summary by category. Directors who serve
concurrently as President or Vice President should be listed in this table and the table above.
Note 2: Salary, additional pay, and severance pay received by the President or Vice President in the past year.
Note 3: Bonus, incentive payment, transportation, special allowance, other allowances, housing, company car and other payments received by the
President or Vice President in the past year. Where housing, car and other forms of transport, or personal allowances are provided, the nature
and cost of assets provided should be disclosed and the rent, gas, and other expenses be paid as incurred or at fair market price. Where a driver
is also provided, it should be specified in the notes that the Company pays compensation to the driver but does not include the amount in
remuneration. Furthermore, compensation costs recognized under IFRS 2 "share-based payment transactions", including employee stock
options, restricted stock awards, and rights to cash issue, should also be included in remuneration.
Note 4: Amount of President's/Vice President's employee remuneration (including stocks and cash) as passed by the Board of Directors in the past
year.
Note 5: The total pay to the President and Vice Presidents of the Company from all companies in the consolidated statements (including the Company)
should be disclosed.
Note 6: The names of the President and Vice Presidents are disclosed in the appropriate ranges according to the total pay to each of the President and
Vice Presidents from the Company.
Note 7: The names of the President and Vice Presidents should be disclosed in the appropriate ranges according to the total pay to each of the President
and Vice Presidents from all companies in the consolidated statements (including the Company).
Note 8: Net profit after tax refers to the net profit after tax in the past year. Where IFRSs has been adopted, net profit after tax refers to the net profit
after tax in the individual and separate financial statements.
Note 9: Amount of remuneration the President or a vice president of the Company receives from investments other than subsidiaries of the Company.
Note 10: Amount of contributions.
* The remuneration disclosed in the table does not follow the definition of income under the Income Tax Act. Hence, the table is compiled strictly
for disclosure and not for tax purposes.
3.3.4 Manager's Name and Distribution of Employee Bonus N/A.
Unit: NT$ 000
Title Name Share
value Cash value Total
Ratio of total amount to net
profit after tax (%)
Management
personnel
President Cheng,
Chun-Sheng
- - - -
COO Chao, Mike
Tzu-Lung
Assistant Vice
President, Business
and Operation
Department
SC Fang
CTO Tsaur,

Corporate Governance Report 31
Title Name Share
value Cash value Total
Ratio of total amount to net
profit after tax (%)
Shuang-Chau
Assistant Vice
President, Seaman
Affairs Department
CY Wen
CFO Bruce Hsueh
Assistant Vice
President, Finance
Department
Lina Hung
3.3.5 Comparison and analysis of remunerations to Directors, Supervisors, President and Vice
Presidents as a percentage of net profit after tax in the last two years and description of the
policy, standards and packages of remunerations, procedure for making such decision and
relation to business performance:
Analysis of remunerations to Directors, Supervisors, President and Vice Presidents from the Company and all
companies in the consolidated financial statements as a percentage of net profit after tax in the last two years:
Unit: NT$ 000
Title
2016 2017 2018
Total amount
as a percentage of
net profit after tax
(%)
Total amount
as a percentage of
net profit after tax
(%)
Total amount
as a percentage of
net profit after tax
(%)
Th
e Co
mp
any
All co
mp
anies in
the
finan
cial statemen
ts
Th
e Co
mp
any
All co
mp
anies in
the
finan
cial statemen
ts
Th
e Co
mp
any
All co
mp
anies in
the
finan
cial statemen
ts
Th
e Co
mp
any
All co
mp
anies in
the
finan
cial statemen
ts
Th
e Co
mp
any
All co
mp
anies in
the
finan
cial statemen
ts
Th
e Co
mp
any
All co
mp
anies in
the
finan
cial statemen
ts
Directors
and
Supervisors
6,728 9,492 0.48 0.68 4,414 7,046 1.06 1.69 14,060 16,929 0.78 0.94
President,
Vice
Presidents
0 10,929 0 0.78 0 11,765 0 2.82 0 11,134 0 0.62
Description of the policy, standards and packages of remunerations, procedure for making such decision and
relation to business performance and future risks:
According to the Articles of Incorporation and the Director Remuneration Policy of the Company, the annual
base remuneration for a director is NT$500,000, which is to be adjusted by the Board of Directors to reflect
the business performance in the year and subject to a maximum limit of NT$1 million. The remuneration to
Directors has been passed by the Board of Directors on January 28, 2019 and March 29, 2019. The Company
is to pay the Chairman and Directors NT$500,000 each in base remuneration in the first quarter. After the

Corporate Governance Report 32
annual general meeting, a performance bonus of US$60,288 and NT$300,000(the actual bonus calculated by
days of employment)each will be paid to the Chairman and Directors. Monthly salaries and annual bonuses
to President and Vice Presidents are based on the average level of pay offered by competition for the same
position, the power and responsibility of the position, and the contribution to the Company's business targets.
In addition to the Company's overall business performance and future operating risks and trends in the
industry, the personal target completion rate and contribution to the Company' business performance are also
taken into consideration in the calculation of reasonable compensation. Performance evaluation and pay
reasonableness are reviewed by the Remuneration Committee and the Board of Directors. The remuneration
system is reviewed as needed to reflect actual business performance and regulations and to maintain the
balance between sustainable development and risk management.

Corporate Governance Report 33
3.4 Corporate Governance Practices
3.4.1 Operations of the Board of Directors
The board of directors met 12 times in last year (2018). The details of the attendance are as follows:
Title Name Attendances
in person
Attendances
by proxy
Attendance
rate
(%)
Notes
Chairman Lan, Chun-Sheng 12 0 100% None.
Director Fukui Masayuki 11 0 91.67% None
Director Chao, Mike
Tzu-Lung 9 1 75% None
Director
Jinzhou Investment
10 0 83.33% None Representative:
Chen, Ming-Shang
Independent director Yasuhisa Iwanaga 4 0 100%
Exited after the election in the
annual general meeting on
May 25, 2018.
Scheduled attendances: 4
Independent director Huang, Jen-Chung 4 0 100%
Exited after the election in the
annual general meeting on
May 25, 2018.
Scheduled attendances: 4
Independent director Tu, Neng-Mo 11 1 91.67% None
Independent director Chen, Po-Chih 12 0 100% None
Independent director Lin, Tse-Chun 6 1 75%
Elected for the first time in the
annual general meeting on
May 25, 2018.
Scheduled attendances: 8
Independent director Chiu, Yung-Ho 7 0 87.5%
Elected for the first time in the
annual general meeting on
May 25, 2018.
Scheduled attendances: 8
Independent director Liu, Tsai-Ching 7 0 87.5%
Elected for the first time in the
annual general meeting on
May 25, 2018.
Scheduled attendances: 8
Other important information:
1. Should any of the following take place in a board meeting, the date and number of the meeting, the content of proposal, independent
director's opinions and the Company's response to such opinions should be recorded:
Matters listed in Article 14-3 of the Securities and Exchange Act
Aside from the above matters, other resolutions adopted by the board of directors to which an independent director has made
objection or reservation on record or in writing

Corporate Governance Report 34
Date Term Agenda and follow-up
Matters under
Article 14-3 of
the Securities
and Exchange
Act
Objection or
reservation
from
independent
director
2018.01.23 33th meeting of the 4th
board of directors
Resolution to purchase two 37,800-ton Imabari
newbuild dry bulk carriers V
2018.02.23 34th meeting of the 4th
board of directors
Ratification of 2017 financial statements, and
resolution to purchase two 82,400-ton JMU
newbuild dry bulk carriers
V
2018.03.30 35th meeting of the 4th
board of directors Amendment of the internal control system V
2018.04.27 36th meeting of the 4th
board of directors
Ratification of 2018 Q1 financial statements, and
large loans between groups V
2018.06.22 2nd meeting of the 5th
board of directors
Resolution to purchase one 82,400-ton JMU
newbuild, and large loans between groups V
2018.07.20 3rd meeting of the 5th board
of directors
Ratification of 2018 Q2 financial statements, and
participation in the duty free tender for Taiwan
Taoyuan International Airport Terminal 2 Zone D
V
2018.08.24 4th meeting of the 5th board
of directors Resolution to cancel purchase of MV Amis Queen V
2018.09.27 5th meeting of the 5th board
of directors
Resolution to purchase one 82,400-ton JMU
newbuild, and large loans between groups V
2018.10.26 6th meeting of the 5th board
of directors
Resolution to purchase one 82,400-ton JMU
newbuild V
2018.11.30 7th meeting of the 5th board
of directors
Amendment of the internal control system,
resolution to purchase one 63,300-ton Tsuneishi
newbuild, and resolution to purchase one
61,000-ton Kawasaki newbuild.
V
2018.12.14 8th meeting of the 5th board
of directors
Resolution for capital increase for Wisdom
Marine International V
Independent director's opinion:
(1) 2017 financial statements were approved unanimously by the independent directors in the 34th meeting of the 4th board of
directors.
(2) 2018 Q2 financial statements were approved unanimously by the independent directors in the 3rd meeting of the 5th board of
directors.
(3) Regarding the proposal for participation in the duty free tender for Taiwan Taoyuan International Airport Terminal 2 Zone D in the
3rd meeting of the 5th board of directors, the independent directors, citing the Company's lack of related business experience and
the excessively large royalties, asked the chairman to explain in detail the advantages and disadvantages of the tender.
(4) The independent directors did not have other comments other than the above.
The Company's response to independent director's opinions: In the 3rd meeting of the 5th board of directors on July 20, 2018, Chairman

Corporate Governance Report 35
James Lan answered in detail the independent directors' questions regarding the proposal for participation in the duty free tender for
Taiwan Taoyuan International Airport Terminal 2 Zone D.
Results of resolutions: The proposal was passed by a unanimous vote of all directors present.
2. Details, including names of directors, proposals, reasons for conflict of interest, and voting results, of circumstances where directors
absented themselves due to conflict of interest: None.
3. Evaluation of targets to enhance the role of the board and performance in the current year and last year:
(1) The Group has the Audit Committee, the Remuneration Committee, and the Nomination Committee in place to meet the
targets to enhance the role of the board of directors. Moreover, the Group has implemented corporate governance and related
regulations and disclosed them on the Market Observation Post System.
4. The attendance records of independent directors by board meeting in 2018:
○: Attendance in person ;Δ: Attendance by proxy ;X: Absent
Date Term Huang,
Jen-Chung
Yasuhisa
Iwanaga
Tu,
Neng-Mo
Chen,
Po-Chih
Lin,
Tse-Chun
Chiu,
Yung-Ho
Liu,
Tsai-Ching
2018.01.23
33th meeting of
the 4th board of
directors
○ ○ ○ ○ N/A N/A N/A
2018.02.23
34th meeting of
the 4th board of
directors
○ ○ ○ ○ N/A N/A N/A
2018.03.30
35th meeting of
the 4th board of
directors
○ ○ ○ ○ N/A N/A N/A
2018.04.27
36th meeting of
the 4th board of
directors
○ ○ Δ ○ N/A N/A N/A
2018.05.25
1st meeting of
the 5th board of
directors
N/A N/A ○ ○ ○ X X
2018.06.22
2nd meeting of
the 5th board of
directors
N/A N/A ○ ○ Δ ○ ○
2018.07.20
3rd meeting of
the 5th board of
directors
N/A N/A ○ ○ ○ ○ ○
2018.08.24
4th meeting of
the 5th board of
directors
N/A N/A ○ ○ ○ ○ ○
2018.09.28
5th meeting of
the 5th board of
directors
N/A N/A ○ ○ ○ ○ ○
2018.10.26
6th meeting of
the 5th board of
directors
N/A N/A ○ ○ ○ ○ ○

Corporate Governance Report 36
2018.11.30
7th meeting of
the 5th board of
directors
N/A N/A ○ ○ ○ ○ ○
2018.12.14
8th meeting of
the 5th board of
directors
N/A N/A ○ ○ ○ ○ ○
3.4.2 Operations of the Audit Committee
The Audit Committee met 12 times in last year (2018). The details of the attendance are as follows:
Title Name Attendances in
person
Attendances
by proxy
Attendance rate
(%) Notes
Independent director Yasuhisa
Iwanaga 4 0 100%
Exited after the election in
the annual general meeting
on May 25, 2018.
Scheduled attendances: 4
Independent director Huang,
Jen-Chung 4 0 100%
Exited after the election in
the annual general meeting
on May 25, 2018.
Scheduled attendances: 4
Independent director Tu, Neng-Mo 11 1 91.67% None
Independent director Chen,
Po-Chih 12 0 100% None
Independent director Lin,
Tse-Chun 7 1 87.5%
Elected for the first time in
the annual general meeting
on May 25, 2018.
Scheduled attendances: 8
Independent director Chiu,
Yung-Ho 7 0 87.5%
Elected for the first time in
the annual general meeting
on May 25, 2018.
Scheduled attendances: 8
Independent director Liu,
Tsai-Ching 7 0 87.5%
Elected for the first time in
the annual general meeting
on May 25, 2018.
Scheduled attendances: 8
Other important information:
1. The primary responsibility of the Audit Committee is to assist the board of directors in performing its duty to oversee the
accounting, audit, and financial reporting processes in the Company and the quality of financial management.
Matters to be reviewed by the Audit Committee include:
Fair presentation of financial statements Appointment and removal of financial, accounting, or
internal audit officers
Effective enforcement of internal control Selection/Change of certificated public accountants and
their independence and performance

Corporate Governance Report 37
Adequacy of accounting policies Performance of Audit Committee's responsibilities
Management of existing or potential risks Audit Committee Performance Self-assessment
Questionnaire
Material asset or derivative transactions Securities offerings or issues
Material loans, endorsements, or
guarantees
Compliance with relevant laws and regulations
2. Should any of the following take place in an audit committee meeting, the date and number of the meeting, the content of
proposal, the Audit Committee's resolutions and the Company's response to the Audit Committee's opinions should be
recorded:
(1) Matters listed in Article 14-5 of the Securities and Exchange Act
(2) Aside from the above matters, other resolutions that are passed by a two-thirds majority or more of the board of
directors but without being passed by the Audit Committee
Date of the
Audit
Committee
Term Agenda and follow-up
Matters under
Article 14-5 of
the Securities
and Exchange
Act
Resolutions that
are passed by a
two-thirds
majority or
more of the
directors but
without being
passed by the
Audit
Committee
2018.01.23 33th meeting of the 4th Audit
Committee
Resolution to purchase two
37,800-ton Imabari newbuild dry bulk
carriers
V
2018.02.23 34th meeting of the 4th Audit
Committee
Ratification of 2017 financial
statements, and resolution to purchase
two 82,400-ton JMU newbuild dry
bulk carriers
V
2018.03.30 35th meeting of the 4th Audit
Committee
Amendment of the internal control
system V
2018.04.27 36th meeting of the 4th Audit
Committee
Ratification of 2018 Q1 financial
statements, and large loans between
groups
V
2018.06.22 2nd meeting of the 5th Audit
Committee
Resolution to purchase one 82,400-ton
JMU newbuild, and large loans
between groups
V
2018.07.20 3rd meeting of the 5th Audit
Committee
Ratification of 2018 Q2 financial
statements, and participation in the
duty free tender for Taiwan Taoyuan
International Airport Terminal 2 Zone
D
V

Corporate Governance Report 38
2018.08.24 4th meeting of the 5th Audit
Committee
Resolution to cancel purchase of MV
Amis Queen V
2018.09.27 5th meeting of the 5th Audit
Committee
Resolution to purchase one 82,400-ton
JMU newbuild, and large loans
between groups
V
2018.10.26 6th meeting of the 5th Audit
Committee
Resolution to purchase one 82,400-ton
JMU newbuild V
2018.11.30 7th meeting of the 5th Audit
Committee
Amendment of the internal control
system, resolution to purchase one
63,300-ton Tsuneishi newbuild, and
resolution to purchase one 61,000-ton
Kawasaki newbuild.
V
Independent director's opinion: Regarding the proposal for participation in the duty free tender for Taiwan Taoyuan International
Airport Terminal 2 Zone D in the 3rd meeting of the 5th board of directors, the independent directors, citing the Company's lack
of related business experience and the excessively large royalties, asked the chairman to explain in detail the advantages and
disadvantages of the tender.
The Company's response to independent director's opinions: In the 3rd meeting of the 5th board of directors on July 20, 2018,
Chairman James Lan answered in detail the independent directors' questions regarding the proposal for participation in the duty
free tender for Taiwan Taoyuan International Airport Terminal 2 Zone D.
Detailed results: The proposal was passed by a unanimous vote of all independent directors present.
3. The Independent Directors' avoidance of interest motion should indicate the names of the Independent Directors, content of
the motion and reasons of avoidance of interest as well as the involvement in voting: None
4. Communications between independent directors and internal audit officers and auditors (including communications regarding
important matters with respect to the Company's finance and business activities, means and results):
To enable independent directors to find out in a timely manner about the Company's operational risks and the status of
improvement, the Group has implemented an internal control system and related guidelines in compliance with the
Regulations Governing Establishment of Internal Control Systems by Public Companies. To reasonably ensure the internal
control system works effectively, the Company has created an audit unit directly under the board of directors and in charge of
preparing audit plans as required by the competent authority. The internal audit officer presents to the independent directors an
audit report and a list of errors and improvements after the monthly audit procedure is completed. The internal audit officer
also attends board meetings to report on the status of the operation.
The accountant audits and sends the financial statements and related reports to the independent directors for review. The
accountant attended the meeting on February 22, 2019, and discussed key audit items in the 2018 financial statements with the
independent directors.
3.4.3 Corporate governance practices and departure from Corporate Governance
Best-Practice Principles for TWSE/GTSM Listed Companies and reasons
Area of assessment Practices Departure
from

Corporate Governance Report 39
Yes No Summary
Corporate
Governance
Best-Practice
Principles
for
TWSE/TPEx
Listed
Companies
and reasons
1. Has the Company set and disclosed
principles for practicing corporate
governance according to the
"Corporate Governance Best-Practice
Principles for TWSE/TPEx Listed
Companies?"
V
The Company has established the corporate
governance principles pursuant to the "Corporate
Governance Best-Practice Principles for TWSE/TPEx
Listed Companies" and disclosed the principles on the
company website and the Market Observation Post
System.
No material
departure
2. The Company's shareholding structure
and shareholders' rights and interests
(1) Has the Company set internal
operations procedures for dealing
with shareholder proposals, doubts,
disputes, and litigation as well as
implemented those procedures
through the proper procedures?
(2) Does the Company have a list of
major shareholders of companies
over which the Company has actual
control and the list of ultimate
owners of those major shareholders?
(3) Has the Company established and
implemented risk
control/management and firewall
mechanisms between it and
affiliated corporations?
(4) Does the company have internal
regulations in place to prevent
insiders from trading securities on
information not yet public?
V
(1) The Company has hired a specialized
shareholder services agent in Taiwan to handle
shareholder services. A contact and email
address are also in place to respond promptly to
shareholders' suggestions or handle disputes.
(2) The Company has a shareholder services unit
and hires a shareholder services agent. It follows
up regularly on large shareholders with actual
control of the Company and the entities with the
ultimate control of such shareholders.
(3) The rules in the internal control system apply.
(4) The Company has implemented the Procedures
for Handling Material Nonpublic Information.
The procedures require that employees of the
Company adhere to the regulations against
insider trading. Trading of related securities is
prohibited if one is in possession of material
nonpublic information.
The Company provides a compliance handbook
for newly elected directors after they take office
and awareness orientation for new employees
when they receive training. The latest orientation
for new employees took place in August 2018.
The courses covered confidentiality of material
information and the elements of insider trading.
The presentations and video files used in the
courses were placed on internal discs that can be
accessed by all employees so that those who
missed the courses would be able to receive the
same information. Electronic announcements are
made every January to reiterate the rules to the
employees. Announcements on "insider trading
prevention training" were made on January 25,
2018 and January 14, 2019.
No material
departure
3. Board composition and responsibilities
(1) Has the board of directors devised
and enforced a diversity policy?
(2) In addition to the Remuneration
Committee and the Audit
V
(1) Board composition
a. The Company implemented the Corporate
Governance Principles after it was passed
in the 20th meeting of the 4th board of
directors on December 16, 2016. Chapter
No material
departure

Corporate Governance Report 40
Area of assessment
Practices Departure
from
Corporate
Governance
Best-Practice
Principles
for
TWSE/TPEx
Listed
Companies
and reasons
Yes No Summary
Committee required by law, is the
company willing to create on a
voluntary basis other functional
committees?
(3) Has the company established and
implemented the rules and methods
for board performance evaluation,
and been conducting performance
evaluation every year?
(4) Does the company periodically
evaluate the level of independence
of the CPA?
III "Reinforcing the role of the board of
directors" provides a comprehensive
policy. Nomination and election of board
members are governed by the Articles of
Incorporation and follow the nomination
rules. In addition to education and work
experience of each candidate, stakeholder
opinions will also be taken into
consideration. The process follows the
Director Election Guidelines and the
Corporate Governance Principles in order
to ensure diversity and independence of
the board.
b. Regarding the 9 directors on the 5th board
of directors, James Lan, Fukui Masayuki ,
Chao, Mike Tzu-Lung , and Chen,
Ming-Shang possess valuable skills in
leadership, business judgment, business
management, and crisis management as
well as knowledge of the industry and
international markets; and the five
independent directors, Tu, Neng-Mo,
Chen, Po-Chih, Chiu, Yung-Ho, Lin,
Tse-Chun, and Liu, Tsai-Ching, are
experts in law, accounting and financial
analysis, and international markets.
c. 56% of the board are independent
directors; 11% are also employees; and
11% are female. 3 independent directors
have served on the board for 3 years or
less; 1 for 4 to 6 years; and 1 for 6 to 9
years. 2 directors are aged 70 or above; 3
aged between 60 and 69; and 4 aged 60 or
under.
d. The board of directors implements a
board diversity policy and discloses the
policy on the company website and the
Market Observation Post System.
(2) In addition to the Remuneration Committee and
the Audit Committee, the Company has also
created the Nomination Committee as part of its
commitment to good corporate governance.
(3) The board of directors passed the Guidelines for
Performance Evaluation of Board of Directors
and Functional Committees on April 28, 2017.
The guidelines require that a self-assessment of
the board of directors be completed within three

Corporate Governance Report 41
Area of assessment
Practices Departure
from
Corporate
Governance
Best-Practice
Principles
for
TWSE/TPEx
Listed
Companies
and reasons
Yes No Summary
months after the end of a fiscal year.
The self-assessment of overall performance of
the board of directors cover the following five
aspects:
a. Director participation
b. Quality of meeting discussions and
decisions
c. Board composition and structure
d. Education and training completed by
directors
e. Corporate governance and culture
The self-assessment of overall performance of
the functional committees cover the following
four aspects:
a. Member participation
b. Quality of meeting discussions and
decisions
c. Committee composition and structure
d. Corporate governance and culture
Every year, when all questionnaires are
completed and collected, the Corporate
Governance Evaluation Task Force follows the
guidelines above to perform analysis, and
includes quantitative indicators before
presenting the report to the board of directors
and making recommendations for improvement
at the same time. The guidelines above and
evaluation results are disclosed on the company
website.
The results of last board performance evaluation
(2018) are as follows:
a. The average score of the board
self-assessment is 4.80 (out of 5.00).
b. The average score of the Audit
Committee self-assessment is 4.90 (out of
5.00).
c. The average score of the Remuneration
Committee self-assessment is 4.80 (out of
5.00).
d. The average score of the Nomination
Committee self-assessment is 4.90 (out of
5.00).
Recommendations for improvement: None
The report on performance evaluation of the
board and its members was approved in the
board meeting on March 29, 2019.

Corporate Governance Report 42
Area of assessment
Practices Departure
from
Corporate
Governance
Best-Practice
Principles
for
TWSE/TPEx
Listed
Companies
and reasons
Yes No Summary
On February 11, 2019, the Company hired EY
Advisory Services, an external party, to perform the
external board evaluation for the period between July
1, 2017 and December 31, 2018. EY Advisory
Services sent experts to perform the evaluation with
respect to structure, people, and process and
information. The evaluation process involved
document review, director self-assessment
questionnaires, and onsite interviews with 3 directors.
It covered eight items, which were board structure
and processes, board composition, institutional and
organizational structure, roles and responsibilities,
culture and conduct, director training and
development, risk management oversight, and filing,
disclosure, and performance monitoring.
EY Advisory Services presented an evaluation report
on March 22, 2019. For qualitative indicators, EY
Advisory Services performed further 3-tiered
evaluation, basic, advanced, and benchmark. The
comprehensive evaluation rated the Company's
performance in the three aspects as advanced. EY
Advisory Services also made recommendations for
further improvement. They were included in the
report to the board of directors on March 29, 2019.
The Company will use the recommendations as a
basis for ongoing reinforcement of the role of the
board.
EY Advisory Services made the following
recommendations:
a. Recommendation for Wisdom Marine Lines to
establish explicit proposal submission rules for
the board of directors and the Audit Committee
and to allow important operational plans to be
included in agendas for the Audit Committee
to the extent permitted under current
circumstances.
b. Recommendation to build a director talent
database via the Nomination Committee or
other units as appropriate in order to enable the
Company to assemble a board with the
experience and expertise needed to accomplish
the Company's development strategies and
goals at different stages of its business.
c. Recommendation for the board of directors to
include shipping related courses in education
and training for directors specializing in other

Corporate Governance Report 43
Area of assessment
Practices Departure
from
Corporate
Governance
Best-Practice
Principles
for
TWSE/TPEx
Listed
Companies
and reasons
Yes No Summary
fields and to continue to recruit experts from
outside the Company to provide group courses
for directors. In addition to corporate
governance, the courses may cover forward
looking topics, such as trade war, energy
efficiency and carbon reduction, and carbon
neutral vessels, to help members of the board
discussion strategies and exchange opinions on
an open communication platform.
d. Recommendation for the Company to identify
potential external risks, operational risks, and
financial and nonfinancial risks in medium-
and long-term sustainability, consider the
probability of such occurrences and the
potential impact on management of Wisdom
Marine Lines' business, and implement risk
management mechanisms accordingly. An
external party may be commissioned if needed
to perform third party evaluation as part of the
continuing effort to optimize corporate
governance and the internal control system.
The Company plans to follow EY Advisory Services'
recommendations and make plans for improvement
as part of the continuing effort to reinforce the role of
the board of directors.
(4) The Company evaluates the independence and
competence of CPAs at least once a year. The
evaluation covers the size and reputation of the
accounting firm, the number of consecutive
years of audit service, the nature and extent of
non-audit services, the audit and certification
fees, peer review, any lawsuit or warning or
investigation by the competent authority, the
quality of audit services, any training on a
regular basis, and the interaction with the
management team and internal audit officers.
The process is completed by the Accounting
Department. The results for the last two years
were presented to the board of directors on
December 15, 2017 and December 14, 2018.
4. Does the TWSE/TPEx listed company
have a corporate governance unit or
staff responsible for corporate
governance practices (including but
not limited to providing information
V
The Company has the Corporate Governance
Evaluation Task Force. The CFO serves concurrently
as the corporate governance officer and the contact for
the directors. The CFO has three years or more of
experience in managing finances for a listed company.
No material
departure

Corporate Governance Report 44
Area of assessment
Practices Departure
from
Corporate
Governance
Best-Practice
Principles
for
TWSE/TPEx
Listed
Companies
and reasons
Yes No Summary
necessary for directors and supervisors
to perform their duties, organizing
board meetings and annual general
meetings as required by law, handling
business registration and any change
of registration, and compiling minutes
of board meetings and annual general
meetings) on a full-time or part-time
basis?
There are four other members, who form the planning
unit for corporate governance and ethical corporate
management aimed to protect shareholder rights and
reinforce the role of the board of directors. The
responsibilities include supplying information
necessary for directors and independent directors to
perform their duties and the latest regulatory
development relevant to management of the business in
order to help directors and independent directors
comply with the law.
The Company made the following progress in the
business in 2018. A report was presented to the board
of directors on March 29, 2019.
(1) Enhanced the role of the board of directors
a. Provided training courses for directors:
i. September 28, 2018 [Board
competency and performance
evaluation] 3 hours
ii. October 26, 2018 [AML hotspot
analysis, a director's/supervisor's
duties, and a study of the latest
Company Act] 3 hours
b. A directors liability insurance policy for
US$5 million was purchased and
presented to the board of directors on
January 23, 2018.
c. The Company called a meeting with the
CPAs, independent directors, audit
officers, and financial and accounting
officers on December 14, 2018.
d. Performance evaluation of the board of
directors and functional committees was
completed, and the results were presented
to the board of directors on March 29,
2019.
(2) Increased transparency
a. Investor seminars:
i. Attended a TWSE presentation on
April 3, 2018
ii. Attended a TWSE presentation on
Monday, December 3, 2018
b. Created an investor services team and
installed a range of channels for investor
communications.
c. Started disclosing unaudited operating
profit and net profit for the previous
month at the beginning of each month (on

Corporate Governance Report 45
Area of assessment
Practices Departure
from
Corporate
Governance
Best-Practice
Principles
for
TWSE/TPEx
Listed
Companies
and reasons
Yes No Summary
the 5th business day or so) on a voluntary
basis.
d. The Chinese and English versions of the
2018 financial statements were uploaded
and disclosed early on February 25, 2019.
(3) Strengthened compliance
a. New rules and regulations include the
following:
i. Implemented the Human Rights
Policy on March 30, 2018 to raise
awareness of human rights in the
workforce.
ii. Created the Whistleblowing
System on March 30, 2018 to
ensure effective implementation of
compliance and ethical corporate
management and protect the legal
rights of whistleblowers and
relevant parties.
b. Amendments to rules and regulations
include the following:
i. The Guidelines for Performance
Evaluation of Board of Directors
were amended on February 23,
2018 to reflect the practical needs
of the business.
ii. The Corporate Governance
Principles were amended on June
22, 2018 to reflect the situation in
practice.
(4) Other
a. Published the 2017 Corporate Social
Responsibility Report on June 28, 2018.
b. The Company scored 83.54 and was rated
in the range of 21%-35% in the 2017
Corporate Governance Evaluation. The
Corporate Governance Evaluation is
released annually by the Corporate
Governance Center.
5. Has the company established channels
for communicating with stakeholders
(including but not limited to
shareholders, employees, customers
and suppliers), set up a dedicated
stakeholder area on the company
website, as well as responded
V
The Company respects the rights of its stakeholders.
By identifying stakeholders and utilizing the
appropriate channels with stakeholder participation, the
Company finds out the reasonable expectations and
needs of the stakeholders, and responds appropriately
to important CSR issues of concern to the stakeholders.
The departments work together in stakeholder
No material
departure

Corporate Governance Report 46
Area of assessment
Practices Departure
from
Corporate
Governance
Best-Practice
Principles
for
TWSE/TPEx
Listed
Companies
and reasons
Yes No Summary
appropriately to important corporate
social responsibility issues of concern
to stakeholders?
communications and report regularly to the board of
directors.
(1) Shareholders
Issues of concern: procurement of energy
efficient ships/economic performance/maritime
safety/fleet management and
planning/compliance/corporate governance
a. The annual general meeting is held by the
end of May every year. The proposals are
decided by voting on a case-by-case basis.
Shareholders are also able to exercise their
voting rights and participate in the voting
process by electronic means.
b. Annual general meeting reports and
business reports are released and made
available to investors every year.
c. Revenue and unaudited earnings for the
previous month are published on the
Market Observation Post System and the
company website every month.
d. Investor conference presentations are
uploaded to the Market Observation Post
System and the company website to be
available to investors.
(2) Employees
Issues of concern: economic
performance/maritime safety/talent recruitment
and retention/employer-employee
relations/starting salaries
a. The Company holds a management meeting
every month. The department heads report
and discuss activities in their respective
departments and other matters including
talent recruitment and retention. The
conclusions are made known to the staff in
relevant departments after the meetings.
b. Employer-employee meetings are held
every month to manage
employer-employee relations, facilitate
employer-employee collaboration, and
improve efficiency in the workplace.
(3) Suppliers
Issues of concern: maritime safety/risk
management/fleet management and
planning/compliance/shipping quality
a. In addition to paying or receiving visits
from time to time, the Company contacts

Corporate Governance Report 47
Area of assessment
Practices Departure
from
Corporate
Governance
Best-Practice
Principles
for
TWSE/TPEx
Listed
Companies
and reasons
Yes No Summary
suppliers directly via email or telephone to
conduct business or make improvement.
b. Dedicated contacts are assigned for
procurement projects, and suppliers are
reached directly by mail or telephone.
(4) Customers
Issues of concern: economic performance/risk
management/corporate governance/unauthorized
disclosure/customer satisfaction
a. The Company stays in constant contact
with customers by email or telephone on a
weekly or daily basis.
b. At least one visit is paid or received every
year.
In addition to the stakeholder communication channels
above, the company website has a dedicated
stakeholder section that displays the contact
information for stakeholders. The aim is to achieve
accessibility, transparency, timeliness, integrity, and
interactivity. It helps the Company understand issues of
concern to stakeholders and respond as appropriate. It
also enables the Company to receive feedback from
different directions and use them as a basis for ongoing
improvement. The Company published the 2017
Corporate Social Responsibility Report on June 28,
2018 and disclosed more details on CSR practices.
6. Has the company hired a professional
agency to handle matters related to the
annual general meeting?
V The Company has hired SinoPac Securities Co., Ltd. to
handle matters related to the annual general meeting.
No material
departure
7. Information disclosure
(1) Has the company established a
corporate website to disclose
information regarding the
company's financial, business and
corporate governance standings?
(2) Has the company adopted other
means of information disclosure
(e.g. creating a website in English,
appointing a dedicated staff to
gather and disclose company
information, implementing a
spokesperson system, and
disclosing the process of investor
conferences on the company
website)?
V
(1) The Company has a website to disclose
business, financial, and corporate governance
information in Chinese and English.
(2) Questions related to the Company are answered
by the spokesperson or deputy spokesperson.
Furthermore, information on the Company is to
be gathered and disclosed by the spokesperson
or deputy spokesperson and the investor
relations departments. It is disclosed on the
company website the investor conferences which
took place in the past or to which the Company
has been invited.
No material
departure

Corporate Governance Report 48
Area of assessment
Practices Departure
from
Corporate
Governance
Best-Practice
Principles
for
TWSE/TPEx
Listed
Companies
and reasons
Yes No Summary
8. Does the company have other
information that contributes to better
understanding of its corporate
governance standing (including but
not limited to employee rights,
employee care, investor relations,
supplier relations, stakeholder rights,
training completed by directors and
supervisors, implementation of risk
management policies and risk
evaluation criteria, implementation of
customer policies, liability insurance
policies purchased for directors and
supervisors)?
V
(1) The Company and its subsidiaries comply with
local laws and regulations and implement
employee benefit programs as required to
protect employee rights.
(2) The Company has the Management Department
in charge of employee rights and investor
relations. The department also provides training
for employees and courses for directors
regularly or as needed.
(3) The Company also has the Employee Welfare
Committee in charge of providing holiday gifts
and bonuses and other benefits for employees.
Employer-employee meetings are held every
quarter to maintain an open communication
channel between managers and employees.
(4) The Company has purchased liability insurance
policies for the directors and reported the
information to the board of directors.
No material
departure
9. Please describe improvements in terms of the results of the Corporate Governance Evaluation System in recent years and propose
areas and measures to be given priority where improvement is needed.
(1) The Company has implemented the Guidelines for Performance Evaluation of Board of Directors, and performs regular board
performance evaluation and discloses the results on the company website.
(2) The Company has prepared the Corporate Social Responsibility Report based on international reporting guidelines. The report
has been uploaded to the Market Observation Post System and the company website.
(3) The Company has created the Corporate Social Responsibility Committee, and discloses the committee's activities and
performance on the company website and in annual reports.
(4) The Company makes an active effort to develop a better complaint and whistleblowing system to give employees and external
parties an open communication channel.
(5) The Company makes an active effort to implement an anti-corruption policy and avoid unethical behaviors in business
activities that may cause damage to the community and other stakeholders.

Corporate Governance Report 49
3.4.4 Operations of the Remuneration Committee
3.4.4.1 Members of Remuneration Committee:
Type (Note
1)
Criteria
Name
5 years or more of work experience and
one of the following professional
qualifications
Independence criteria (Note 2) Number of
other public
companies in
which the
member is
also a
remuneration
committee
An
instructor
or higher
in a
department
of
commerce,
law,
finance,
accounting,
or other
academic
field
related to
the
business of
the
Company
in a public
or private
college or
university
A judge,
prosecutor,
lawyer,
certified
public
accountant,
or other
professional
or technical
specialist
who has
passed a
national
examination
and been
awarded a
certificate
in a
profession
related to
the business
of the
Company
Work
experience
in
commerce,
law,
finance,
accounting,
or other
field
related to
the
business of
the
Company
1 2 3 4 5 6 7 8
Independent
director
Huang,
Jen-Chung
(Note 3)
-
Independent
director
Yasuhisa
Iwanaga
(Note 3)
-
Independent
director
Chen,
Po-Chih -
Independent
director
Tu,
Neng-Mo 2
Independent
director
Lin,
Tse-Chun
(Note 4)
-
Independent
director
Chiu,
Yung-Ho
(Note 4)
-
Independent
director
Liu,
Tsai-Ching
(Note 4)
-
Note 1: Specify director, independent director, or other under Type.
Note 2: Place a check (✓) where the member meets the following conditions during the two years prior to election and at any time during service.
(1) Not an employee of the Company or any of its affiliates.
(2) Not a director or supervisor of the Company or any of its affiliates, except for an independent director established pursuant to the Securities
and Exchange Act or the applicable local regulations.
(3) Not a natural-person shareholder who, together with his/her spouse and minor children, holds or holds in the name of another person an
aggregate amount of 1% or more of the shares in the Company, and not one of the Company's top ten shareholders.
(4) Not a spouse, relative within the second degree of kinship, or lineal relative within the third degree of kinship or closer to anyone listed in the
three preceding items.
(5) Not a director, supervisor, or employee of an institutional shareholder that holds 5% or more of the shares in the Company, and not a director,
supervisor, or employee of any of the top five institutional shareholders.
(6) Not a director, supervisor, manager, or shareholder holding a 5% or larger stake of a company or institution that has a financial or business
relationship with the Company.
(7) Not a professional person or an owner, partner, director, supervisor, or manager of any proprietorship, partnership, company, or institution
providing commercial, legal, financial, or accounting services or consultation for the Company or any of its affiliates, and not a spouse of any
such person.

Corporate Governance Report 50
(8) Not been a person in any of the circumstances listed in Article 30 of the Company Act.
Note 3: Exited after the election of directors and independent directors on May 25, 2018.
Note 4: Elected an independent director for the first time in the annual general meeting on May 25, 2018.
3.4.4.2 Operations of the Remuneration Committee
The Remuneration Committee consists entirely of the independent directors of the Company. There are 5
members on the committee on the publication date of this annual report. The term of office for the 3rd
committee starts on May 29, 2015 and ends on May 28, 2018. The term of office for the current committee
starts on May 25, 2018 and ends on May 24, 2021. The Remuneration Committee met 3 times in last year
(2018). The details of the attendance are as follows:
Title Name Attendances in
person
Attendances by
proxy
Attendance rate
(%) Notes
Member Yasuhisa
Iwanaga 2 0 100%
Exited after the election in the
annual general meeting on May
25, 2018.
Scheduled attendances: 2
Member Huang,
Jen-Chung 2 0 100%
Exited after the election in the
annual general meeting on May
25, 2018.
Scheduled attendances: 2
Convener Chen,
Po-Chih 3 0 100%
Re-elected after the election in
the annual general meeting on
May 25, 2018.
Member Tu,
Neng-Mo 3 0 100%
Re-elected after the election in
the annual general meeting on
May 25, 2018.
Member Lin,
Tse-Chun 1 0 100%
Elected for the first time in the
annual general meeting on May
25, 2018.
Scheduled attendances: 1
Member Chiu,
Yung-Ho 0 0 0%
Elected for the first time in the
annual general meeting on May
25, 2018.
Scheduled attendances: 1
Member Liu,
Tsai-Ching 0 0 0%
Elected for the first time in the
annual general meeting on May
25, 2018.
Scheduled attendances: 1

Corporate Governance Report 51
Other important information:
1. Roles and responsibilities of the Remuneration Committee
Set and review regularly the annual and long-term performance targets for directors and managers and the remuneration
policies, systems, standards, and structures.
Assess regularly the progress of directors and managers toward their performance targets, and set the contents and
amounts of individual compensation packages.
2. Describe the date, term, agenda, and resolutions of the board meeting and the response to the Remuneration Committee's
recommendations where the board did not adopt or modify the Remuneration Committee's recommendations (e.g. describe the
difference and reasons where the board of directors approves a better compensation package than what is recommended by the
Remuneration Committee): None.
3. If a member opposes a resolution the Committee has adopted or has reservations with a written record or a statement, the date
and session of the meeting, the resolution, opinions of all the members, and the handling of their opinions shall be indicated:
None.
Remuneration
Committee
Date
Term Agenda and follow-up Resolutions
2018.01.23
6th meeting of the 3rd
Remuneration
Committee
Distribution of director compensation for 2017,
proposal for employee pay adjustment, and
distribution of year-end bonuses for 2017
The Remuneration
Committee passed
with a unanimous
vote.
2018.03.30
7th meeting of the 3rd
Remuneration
Committee
Distribution of director compensation for 2017,
amendment to director compensation distribution
guidelines, resolution of employee pay adjustment,
and resolution of manager pay adjustment
The Remuneration
Committee passed
with a unanimous vote.
2018.05.25
1st meeting of the 4th
Remuneration
Committee
Election of convener of 4th committee, review of the
Remuneration Committee Charter, and distribution of
director compensation for 2017
The Remuneration
Committee passed
with a unanimous vote.
3.4.5 Operations of the Nomination Committee
3.4.5.1 Composition and operations of the Nomination Committee
There are 5 members on the Nomination Committee on the publication date of this annual report. The term of office for
the 2nd committee starts on May 29, 2015 and ends on May 28, 2018. The term of office for the current committee
starts on June 22, 2018 and ends on May 24, 2021. The Nomination Committee met 2 times in last year (2018). The
details of the attendance are as follows:
Title Name Attendances in
person
Attendances by
proxy
Attendance
rate
(%)
Notes

Corporate Governance Report 52
Independent
director
Huang,
Jen-Chung 1 0 100%
Exited after the election in the
annual general meeting on May
25, 2018.
Scheduled attendances: 1
Independent
director
Yasuhisa
Iwanaga 1 0 100%
Exited after the election in the
annual general meeting on May
25, 2018.
Scheduled attendances: 1
Independent
director
Tu,
Neng-Mo 1 0 100%
Have not served on the
Nomination Committee again
after the election at the end of the
term on June 22, 2018.
Scheduled attendances: 1
Director Fukui
Masayuki 1 0 100%
Have not served on the
Nomination Committee again
after the election at the end of the
term on June 22, 2018.
Scheduled attendances: 1
Director James Lan 1 0 100% None.
Director Chao, Mike
Tzu-Lung 0 0 0%
Served on the Nomination
Committee for the first time after
the election at the end of the term
on June 22, 2018.
Scheduled attendances: 0
Independent
director
Chen,
Po-Chih 0 0 0%
Served on the Nomination
Committee for the first time after
the election at the end of the term
on June 22, 2018.
Scheduled attendances: 0
Independent
director
Chiu,
Yung-Ho 0 0 0%
Served on the Nomination
Committee for the first time after
the election at the end of the term
on June 22, 2018.
Scheduled attendances: 0
Independent
director
Liu,
Tsai-Ching 0 0 0%
Served on the Nomination
Committee for the first time after
the election at the end of the term
on June 22, 2018.
Scheduled attendances: 0

Corporate Governance Report 53
Other important information:
The Nomination Committee convenes at least once a year according to the committee charter and assists the board of directors in
the following matters:
1. Search for and review and nomination of director candidates.
2. Build and develop the organizational structure of the board of directors to ensure an appropriate board composition.
3. Review training programs for directors and succession plans for directors and executive officers.
(1) According to the Articles of Incorporation, members of the board of directors are to be elected by nomination and serve
a term of three years. The list of candidates, who are proposed during the nomination period pursuant to the Director
Election Guidelines, are to be reviewed and then submitted to the annual general meeting by the Nomination
Committee.
(2) The Nomination Committee Charter provides that the committee shall meet at least once a year. It also provides that,
depending on the size and scope of business of the Company and considering the professional knowledge, skills and
experience required of the directors and executive officers and their independence, the Nomination Committee sets and
reviews regularly the number of directors and that of executive officers and qualifications, and looks for suitable
executive officer candidates. In addition to exceptional capabilities, executive officers must share the Company's
values, and possess integrity and commitment as well as the courage to embrace innovation. The Company should
review candidates before presenting the results and a list of recommendations to the board of directors.
Nomination
Committee
Date
Term Agenda and follow-up Resolutions
2018.03.30 2nd meeting of the 1st
Nomination Committee
Candidate eligibility review for 5th board of
directors and independent directors
The Nomination
Committee passed with
a unanimous vote, and
submitted the list of
candidates to the
annual general
meeting.
3.4.6 Performance of Corporate Social Responsibility: Systems and measures taken by the
company regarding environmental protection, community involvement, social contribution,
social service, public interest, consumer rights, human rights, health and safety, and other
social responsibility activities and results.
Item
Practices Departure
from
Corporate
Social
Responsibilit
y Best
Practice
Principles
for
TWSE/TPEx
listed
companies
and reasons
Yes
No
Summary

Corporate Governance Report 54
Item
Practices Departure
from
Corporate
Social
Responsibilit
y Best
Practice
Principles
for
TWSE/TPEx
listed
companies
and reasons
Yes
No
Summary
1. Implementation of corporate governance
(1) Does the company have a corporate
social responsibility policy or system
in place? Is progress reviewed on a
regular basis?
(2) Does the company provide social
responsibility training on a regular
basis?
(3) Does the company have a unit that
supports CSR practices on a full-time
or part-time basis? Is the CSR unit
operated by senior managers as
authorized by the board of directors,
and does the CSR unit report to the
board of directors?
(4) Does the company have reasonable
remuneration policies in place? Does
the company incorporate employee
performance evaluation into the CSR
policy and establish effective reward
and punishment systems?
V
(1) The Company implemented the Corporate Social
Responsibility Best Practice Principles in April 2017
and included CSR policies in routine operations.
Targets and action plans are discussed every year to
set the benchmarks and conduct performance review.
(2) The Company conducts regular training courses and
campaigns. For example, corporate ethics, code of
conduct, and other business related courses are
provided for new employees during orientation.
(3) The Company has the Management Department in
charge of supporting CSR practices on a full-time
basis. The Corporate Social Responsibility Committee
was created in October 2017, and the chairperson was
appointed by the board of directors. It is an important
milestone in CSR implementation for the Company
on the path to sustainability. A systematic approach to
data collection has been taking shape in the company.
Activities related to environmental protection and
customer relations and subsequent followup and
results are reviewed regularly. Reports are submitted
to the board of directors on an annual basis.
(4) The Company approves employee pay based on
experience, skills, and intended position and not on
gender, age, nationality, or race. Employees complete
a self-assessment form at the end of each year.
Employee performance evaluation is made part of the
ethical corporate management and workplace unity
objectives in the CSR policy. Pay adjustment takes
into account market averages and economic trends.
The Remuneration Committee, consisting of
independent directors, assists in assessing and
overseeing the overall remuneration policy and
director and employee pay levels.
Given the Company is a primary listed company,
employee remuneration is required to comply with
local policies where workers are located. The Articles
of Incorporation of the subsidiaries, Wisdom Marine
International and Well Shipmanagement and Maritime
Consultant, state explicitly that "1% of the profit, if
any, in the current year shall be allocated to employee
compensation. However, a sum shall be set aside in
advance to pay down any outstanding cumulative
losses."
No material
departure

Corporate Governance Report 55
Item
Practices Departure
from
Corporate
Social
Responsibilit
y Best
Practice
Principles
for
TWSE/TPEx
listed
companies
and reasons
Yes
No
Summary
2. Creating a sustainable environment
(1) Does the company work to improve
resource utilization efficiency and use
recycled materials that have a low
impact on the environment?
(2) Does the company have in place a
suitable environmental management
system based on the characteristics of
the industry?
(3) Does the company pay attention to
the impact of climate change on its
business activities, and take
greenhouse gas inventories and
implement strategies to achieve
energy conservation and carbon
reduction and greenhouse gas
reduction?
V
(1) The Company has launched a paperless campaign that
makes electronic copies of files that have to be stored
in order to reduce paper use and achieve
environmental targets.
(2) The office buildings operated by the Company
follows government policies and implements a
recycling system. The Management Department is
responsible for environmental management related
matters, including daily office cleaning to maintain a
clean, healthy environment.
(3) The Company adjust temperature settings in the air
conditioning systems to reflect seasonal changes and
reduce unnecessary waste. Furthermore, the
Company's new energy efficient ships will be joining
the fleet over the next three years. The new ships are
expected to save fuel consumption by 15% to 20%,
thereby contributing to the energy conservation and
carbon reduction.
No material
departure
3. Protecting public interest
(1) Does the company have adequate
management policies and procedures
in place pursuant to the applicable
regulations and the International Bill
of Human Rights?
(2) Does the company have an employee
grievance mechanism or channel in
place to handle complaints as
appropriate?
(3) Does the company provide a safe and
healthy work environment and
organize regular health and safety
training for employees?
(4) Does the company have a channel for
regular employee communications,
and inform employees by reasonable
means of changes in the business that
may have a material impact on them?
(5) Does the company have in place
effective tools to help employees with
career planning and development?
(6) Does the company have policies and
complaint procedures in place to
protect consumer rights regarding
R&D, procurement, production,
operation, and service processes?
V
(1) Chapter IV of the Corporate Social Responsibility
Best Practice Principles states clearly the rules for
protecting public interest. Corporate governance,
employee remuneration, and bonus and performance
management guidelines in compliance with the
International Bill of Human Rights and other
applicable regulations are in place to ensure basic
employee rights are protected. The Company
implemented a human rights policy aligned to the
vision the International Bill of Human Rights and
consistent with practical considerations in the
shipping business, and disclosed it on the company
website on March 30, 2018.
The Wisdom Marine Lines Human Rights Policy
complies with the Universal Declaration of Human
Rights, the UN Global Compact, the ILO
Conventions and other human rights conventions. It
treats active employees and contract workers with
respect and dignity. The policy prohibits all forms of
discrimination; prohibits all forms of forced labor and
child labor; does not hinder employees' freedom of
association; and adheres strictly to the local labor
laws. Regarding the environment, the Company has
made a commitment to providing a safe and healthy
work environment for employees. It complies with
the regulations and improves health and safety in the
workplace on an ongoing basis to prevent accidents
No material
departure

Corporate Governance Report 56
Item
Practices Departure
from
Corporate
Social
Responsibilit
y Best
Practice
Principles
for
TWSE/TPEx
listed
companies
and reasons
Yes
No
Summary
(7) Does the company comply with the
applicable regulations and
international conventions regarding
marketing and labeling of products
and services?
(8) Before starting a business relationship
with a supplier, does the company
assess the supplier's record on its
impact on the environment and
society as a whole in the past?
(9) Does the company include in the
contracts with major suppliers a
clause that provides that the company
has the right to unilaterally cancel or
terminate the contract at any time
should the supplier violate its CSR
policy and cause a material impact on
the environment and society?
and reduce occupational hazards in order to protect
safety as well as mental and physical health of the
employees.
The Company ensures the recruitment policy is free
of any unfair practices in order to maintain fairness
and impartiality in recruitment, benefits and
compensation, training, performance evaluation and
promotion. The Company also provides adequate,
effective grievance mechanisms to address and
prevent infringement of employee rights. Meanwhile,
the Company works hard to create an equal
opportunity workplace free of discrimination and
harassment. It installs open communication channels
and holds regular employer-employee meetings to
protect the rights of both parties.
(2) In principle, the Company requires that it respond to
all complaints within a specific time frame. It also
requires that the identities of individuals who file
complaints and the contents of complaints be kept
confidential, and such individuals be protected from
inappropriate treatment as a result of their complaints.
The Company did not receive any employee
complaint in 2018.
(3) The Company takes the following actions to provide a
safe and healthy work environment for employees:
a. hold regular health and safety campaigns,
firefighting training, and emergency drills.
b. require ships undergo regular maintenance and
repair as required by law, and raise awareness
among the crew in order to create a safe
workplace and prevent occupational accidents.
c. post 24-hour security guards with supervision
and monitoring to protect company property
and employee safety.
d. raise awareness of the Sexual Harassment
Prevention Act, and install appropriate
reporting channels.
(4) The Company utilizes annual employee
self-assessments as a means for employees to
communicate with managers in the their departments
in writing or face-to-face in an interview. In addition,
the Company holds monthly meetings of the
department heads. The meetings help with gathering
employee feedback and formulating responses.
(5) The Company places great emphasis on employee

Corporate Governance Report 57
Item
Practices Departure
from
Corporate
Social
Responsibilit
y Best
Practice
Principles
for
TWSE/TPEx
listed
companies
and reasons
Yes
No
Summary
growth and development. It provides a wide range of
education and training courses for employees to
develop professional training and explore their
potential.
(6) There is a Stakeholders section on the company
website that is maintained by a dedicated staff. The
section provides a channel for users to send questions
and suggestions.
(7) The Company conducts its business activities in
compliance with all applicable laws and international
standards.
(8) The Company evaluates the condition of a supplier's
CSR practices and the risks therein and uses the
results as a basis for selecting quality suppliers in the
future.
(9) To ensure that products supplied by a supplier should
not have a negative impact on the environment and
society, the Company chooses only licensed or
qualified suppliers who products, materials, and
production processes meet the regulatory standards.
4. Enhancing information disclosure
(1) Does the company disclose relevant and
reliable CSR information on the
company website and the Market
Observation Post System?
V (1) The Company discloses CSR information on the
company website.
No material
departure
5. Describe the difference, if any, between actual practice and the corporate social responsibility principles, if the company has
implemented such principles based on the Corporate Social Responsibility Best Practice Principles for TWSE/TPEx Listed
Companies: No difference.
6. Other useful information for explaining the status of corporate social responsibility practices: The Company pays much
attention to its social and environmental responsibility. In addition to following the IMO (International Maritime Organization)
MARPOL and SOLAS Conventions, the Company has always chosen the most advanced facilities when it comes to onboard
equipment. All of the Company's ships comply with the latest NOx emission standards.
7. Provide accredited certifications of the company's corporate social responsibility report, if any: None.
3.4.7 Ethical corporate management and related measures:
Item Practices Departure
from Ethical

Corporate Governance Report 58
Yes No Summary
Corporate
Management
Best Practice
Principles
for
TWSE/TPEx
Listed
Companies
and reasons
1. Establishment of ethical corporate
management policy and plans
(1) Does the company state in internal
regulations and external
correspondence its ethical
corporate management policy and
practices and the commitment of
the board of directors and the
management to enforcement of the
ethical corporate management
policy?
(2) Does the company have measures
in place against unethical conduct?
Do these measures provide clearly
the operating procedures, code of
conduct, disciplinary actions, and
appeal procedures, and are they
enforced effectively?
(3) Does the company take preventive
measures in business activities
subject to a higher conduct risk as
listed under Article 7, Paragraph 2
of the Ethical Corporate
Management Best Practice
Principles for TWSE/TPEx Listed
Companies?
V
(1) The Company has the Employee Work Rules in
place and the Management Department
responsible for devising ethical corporate
management policies and preventive measures to
be implemented by other dedicated units. In
addition to the commitment of the board of
directors and management to enforce ethical
corporate management, the Company has in
place a set of well constructed management
system that covers accounting and internal
control practices. Internal management and
external business activities are conducted in strict
adherence to the rules.
(2) The Company places great emphasis on
employee work ethics and integrity. The
Employee Work Rules provide the rules to be
followed by all employees for effective
enforcement of ethical corporate management.
(3) The Employee Work Rules provides that
employees shall not accept hospitality, gifts,
kickbacks, or other illegal gains in the process of
performing their duties or in violation of their
obligations.
No material
departure
2. Enforcement of ethical corporate
management
(1) Does the company assess business
partners' records of integrity, and
include a moral clause in the
contracts with its business
partners?
(2) Does the company have a unit that
supports ethical corporate
management practices on a
full-time or part-time basis and
reports progress to the board of
directors on a regular basis?
(3) Does the company have a conflict
of interest management policy in
place, provides adequate reporting
channels, and enforce the rules
accordingly?
(4) Does the company have effective
accounting and internal control
systems in place to enforce ethical
corporate management? Are the
V
(1) The Company conducts business activities with
fairness and transparency. Before starting a
business relationship, the Company considers the
legality of a distributor, supplier, customer, or
other counterparty in a transaction and any record
of unethical conduct in the past in order to avoid
engaging with parties with a record of unethical
conduct.
(2) A dedicated unit in the Company is responsible
for publishing the Employee Work Rules on the
corporate bulletin board and presenting regularly
internal audit reports to the board of directors.
The board of directors should exercise due care
and diligence and oversees that the Company
stays from unethical conduct in order to maintain
ethical corporate management.
(3) The Company has the Employee Work Rules in
place. The rules provide that employees, without
the Company's written consent, shall not operate
a business identical or similar to the Company's
business for him/herself or any third party.
(4) To ensure effective enforcement of ethical
No material
departure

Corporate Governance Report 59
Item
Practices Departure
from Ethical
Corporate
Management
Best Practice
Principles
for
TWSE/TPEx
Listed
Companies
and reasons
Yes No Summary
systems audited regularly by the
internal audit unit or by outside
accountants?
(5) Does the company provide regular
internal and external training on
ethical corporate management?
corporate management, the Company has
effective accounting and internal control systems
in place. Internal auditors audit compliance in the
systems above on a regular basis.
(5) The Company provides training as needed, or
utilizes internal open communications,
department meetings, executive communications,
and other appropriate occasions to raise
awareness of the Company's commitment to
ethical corporate management.
3. Whistleblowing system
(1) Does the company have a well
established whistleblowing and
reward system and an accessible
reporting channel in place, and
appoint suitable representatives for
approaching accused individuals?
(2) Does the company have standard
operating procedures in place for
investigating reports and the
necessary confidentiality
measures?
(3) Does the company take measures
to protect whistleblowers from
inappropriate treatment or
retaliation?
V
(1) The Company has a reporting mailbox
([email protected]) in place. Only the
Audit Office is authorized to access the mailbox.
Auditors handle reports by following the
reporting procedures. No report has been made in
2018 up to the publication date of this annual
report.
(2) The Company sets specific time frames for
responding to and investigating reports as well as
confidentiality measures to protect details in the
reports.
(3) Whistleblowing reports are processed by a
dedicated staff in the Audit Office in order to
ensure whistleblowers do not receive
inappropriate treatment or retaliation as a result
of their reports.
No material
departure
4. Enhancing information disclosure
(1) Does the company disclose the
Ethical Corporate Management
Best Practice Principles and its
results on the company website
and the Market Observation Post
System?
V
(1) The Company discloses its business philosophy
and information on the management team on the
company website. Important rules and
regulations can be found in the dedicated
corporate governance section.
No material
departure
5. Describe the difference, if any, between actual practice and the ethical corporate management principles, if the company has
implemented such principles based on the Ethical Corporate Management Best Practice Principles for TWSE/TPEx Listed
Companies: No difference.
6. Other useful information for explaining the status of ethical corporate management practices: (e.g. review and amendment of
the company's ethical corporate management principles)
(1) The Board Meeting Procedures provide a recusal procedure for directors with a conflict of interest. Where a director or a
juristic person that the director represents is an interested party in an agenda item, the director shall state key aspects of
such interest in the meeting. When such interest is likely to prejudice the interest of the Company, the director shall not
participate in discussion or voting on the agenda item, and shall recuse him/herself from discussion or voting on the item.
In addition, the director shall not exercise voting right as proxy for another director.
(2) The Company has the Material Insider Information Procedures in place. The procedures require that directors, supervisors,
managers and employees who have knowledge of material information inside the Company not disclose said material

Corporate Governance Report 60
Item
Practices Departure
from Ethical
Corporate
Management
Best Practice
Principles
for
TWSE/TPEx
Listed
Companies
and reasons
Yes No Summary
insider information in their knowledge to third parties. The procedures also require that unpublished material insider
information acquired during performance of one's duties not be disclosed to third parties.
3.4.8 For inquiries regarding corporate governance principles and related guidelines:
Please visit http://mops.twse.com.tw or http://www.wisdomlines.com.tw/wisdom/php/contact_cg4.php.
3.4.9 Other useful information for explaining corporate governance practices
None.
3.4.10 Status of implementation of internal control system
Statement on Internal Control Please refer to page 152.
Provide reasons, audit opinions, improvements, and correction of errors where internal controls are audited by
outside accountants: None.
3.4.11 Disciplinary actions imposed by law on the company and its employees, disciplinary
actions imposed by the company on its employees for violation of internal control regulations,
and errors and improvements in last year and up to the publication date of this annual report
None.
3.4.12 Major Resolutions of Annual General Meeting and Board Meetings
3.4.12.1 Major Resolutions of Annual General Meeting
Date Major resolutions Resolutions
2018.05.25
1. 2017 Business Report -
2. 2017 Business Report -
3. The Audit Committee Report on the
Review of the 2017 Financial Report -
4. 2017 Directors’ Remuneration Report. -
5. Report on 2nd Secured Convertible Bonds
Received formal approval for the 2nd CB Issue from the Central
Bank of the Republic of China (Taiwan) and the Financial
Supervisory Commission R.O.C. on August 17, 2017 and

Corporate Governance Report 61
Date Major resolutions Resolutions
September 8, 2017 respectively.
The initial conversion price of the 2nd CB Issue was set on
September 22, 2017.
Total Amount of the 2nd CB Issue: NTD 400,000,000.
Funds raised from the 2nd CB Issue had been fully invested by
Q1 2018.
6. Report on 3rd Unsecured Convertible
Bonds
Received formal approval for the 3rd CB Issue from the Central
Bank of the Republic of China (Taiwan) and the Financial
Supervisory Commission R.O.C. on August 17, 2017 and
September 8, 2017 respectively.
The initial conversion price of the 3rd CB Issue was set on
September 25, 2017.
Total Amount of the 3rd CB Issue: NTD 800,000,000.
Funds raised from the 3rd CB Issue had been fully invested by
Q1 2018.
7. Amendments to the Rules of Board
Meetings -
8. Recognition of 2017 Financial Report Recognized and accepted.
9. Recognition of 2017 Dividend Proposal Recognized and accepted.
10. Distribution of Cash Dividends out of
Capital Reserve
Distributed at NT$1,000 per 1,000 shares, total are NT$
616,707,566.
According to the Board of Directors’ resolution on June 22,
2018, the Chairman was authorized to determine September 18,
2018 as the Record Date, and the date of distribution is October
8, 2018.
11. The Election for 5th Directors and
Independent Directors The Board works according to election results.
12. Waiver of Directors’ Non-Competition
Obligation Approved.

Corporate Governance Report 62
3.4.12.2 Major Resolutions of Board Meetings
Date Major resolutions
2018.01.23
1. The rectification of the 2017 Q4 audit follow-up of previous non-compliances be acknowledged
and approved.
2. 2018 Revised Budget Plan and Estimated Income Statement of 2018
3. Board of Directors Performance Self-Assessment Questionnaire
4. Approval of 2017 Basic Director Reward
5. Company-Wide Salary Adjustment
6. Approval of 2017 Annual Bonus
7. Convention of Annual General Meeting
8. Purchase Newbuilding: Two Imabari 37,800 DWT Bulk Carriers
9. Ratified of Intercompany Loan Facilities
10. Approval of Bank of Taiwan: Loan Facility
2018.02.23
1. Adoption of 2017 Financial Report
2. Amendment to Guidelines for Board Performance Evaluation
3. Proposed Agenda for Annual General Meeting
4. Purchase Newbuilding: Two JMU 82,400 DWT Bulk Carriers
5. Time Charter: MV Daiwan Glory, MV Sakizaya Respect
2018.03.30
1. Approval of execution of 2017 Internal Control Declaration
2. 2017 Business Report
3. Reported the impact of the introduction of IFRS 16 on the Group’s financial statements
4. Approval of 2017 Director Reward
5. 2017 Dividend Proposal
6. Candidates for Election of Directors
7. Waiver of Directors’ Non-Competition Obligation
8. Proposed Agenda for Annual General Meeting
9. Company-Wide Salary Adjustment
10. Manager Salary Adjustment
11. Extension of Appointment Beyond Retirement Age
12. 2017 Annual Corporate Governance Report
13. Adoption of Whistleblowing Policy
14. Adoption of Human Rights Policy
15. Amendment to the Procedures for Financing Cycle
16. Time Charter: MV Sakizaya Brave, MV Bunun Glory
17. Approval of Intercompany Loan Facilities
18. Approval of Samurai Investment S.A. Loan Facility
19. Loan: MV Sakizaya Respect
20. Jih Sun International Commercial Bank: Loan Facility
2018.04.27
1. The rectification of the 2018 Q1 audit follow-up of previous non-compliances be acknowledged
and approved.
2. Adoption of 2018 Q1 Financial Report
3. Extension of Appointment Beyond Retirement Age
4. Termination of Bareboat Charter: MV Jasmine Ace
5. Approval of Intercompany Loan Facilities
6. Approval of Benefit Transport S.A. Loan Facility
7. Approval of Extension: MV Daiwan Wisdom Loan

Corporate Governance Report 63
Date Major resolutions
8. Approval of Bank of Kaohsiung Loan Facility
2018.05.25
1. Election of Chairman of the Board of Directors
2. Election of Remuneration Committee Members
3. Extension of Appointment Beyond Retirement Age
4. Time Charters : MV Amis Nature and MV Naluhu
5. Approval of Intercompany Loan Facilities
6. Approval of Refinancing MV Amis Leader and MV Amis Kalon Loan Facility
7. Approval of Extension MV Daiwan Wisdom Loan
8. Approval of CTBC Bank Loan Facility
9. Approval of Hwatai Bank Loan Facility
2018.06.22
1. Election of Nominating Committee Memebers
2. Authorize the Chairman to set the Cash Dividend Declaration Schedule
3. Earnings Distribution of Wisdom Panama
4. Amendment to the Guidelines for Corporate Governance
5. Purchase Newbuilding: JMU 82,400 DWT Bulk Carrier
6. Time Charters : MV Amis Integrity, MV Amis Power and MV Amis Wisdom VI
7. Approval of MV Amis Nature Loan Facility
8. Approval of Intercompany Loan Facilities
9. Approval of Far Eastern International Bank Loan Facility
10. Approval of Taishin International Bank Loan Facility
11. Approval of Sunny Bank Loan Facility
12. Approval of Taishin International Bank: Authorized Limit for Financial Derivatives
2018.07.20
1. The rectification of the 2018 Q2 audit follow-up of previous non-compliances be acknowledged
and approved.
2. Adoption of 2018 Q2 Financial Report
3. Operation Bid to Taoyuan Airport Terminal 2 Zone D
4. Approval of MV Tao Star Loan Facility
5. Approval of Extension MV Global Faith Loan Facility
6. Approval of Intercompany Loan Facilities
7. Approval of First Commercial Bank Loan Facility
8. Approval of Far Eastern International Bank Authorized Limit for Financial Derivatives
2018.08.24
1. Ratify of sale of MV Genius Star II
2. Cancellation of Purchase and TC-in: MV Amis Queen
3. Approval of MV Amis Power Loan Facility
4. Approval of MV Daiwan Leader Loan Facility
5. Approval of MV Paiwan Wisdom BBHP Financing
6. Approval of MV Poavosa Brave BBHP Financing
7. Approval of Extension MV Global Faith Loan Facility
8. Approval of Chang Hwa Bank Loan Facility
9. Approval of Taichung Commercial Bank Loan Facility
10. Approval of Sunny Bank Loan Facility
11. Approval of Bank of Taiwan Loan Facility
12. Approval of Mega International Commercial Bank, Central Branch Loan Facility
13. Approval of Mega International Commercial Bank, Chung Shan Branch Loan Facility
14. Approval of Mega International Commercial Bank, Central Branch Authorized Limit for
Financial Derivatives

Corporate Governance Report 64
Date Major resolutions
15. Approval of Mega International Commercial Bank, Chung Shan Branch Authorized Limit for
Financial Derivatives
16. Approval of Taichung Commercial Bank Authorized Limit for Financial Derivatives
2018.09.28
1. Extension of Appointment Beyond Retirement Age
2. Time Charter MV Bunun Brave
3. Purchase Newbuilding: JMU 82,400 DWT Bulk Carrier
4. Approval of Intercompany Loan Facilities
5. Approval of Yoko Loan Facility
6. Approval of Taiwan Business Bank Loan Facility
7. Approval of Bank of Panhsin Loan Facility
2018.10.26
1. The rectification of the 2018 Q3 audit follow-up of previous non-compliances be acknowledged
and approved.
2. Adoption of 2018 Q3 Financial Report
3. Appointment of Convenor of the CSR Committee
4. Appointment of Convenor of the Safety Management Committee
5. Purchase Newbuilding: JMU 82,400 DWT Bulk Carrier
6. Time Charter MV Daiwan Leader / MV Amis Fortune / MV Bunun Wisdom
7. Approval of Extension MV Wisdom Grace Bareboat Charter
8. Approval of Benefit Transport S.A. Loan Facility to Genius Marine S.A.
9. Approval of Taiwan Business Bank Loan Facility
10. Approval of First Commercial Bank Loan Facility
2018.11.30
1. Assessment of External Auditor
2. Amendment to payroll Procedures
3. Amendment to Employee Work Rules
4. Purchase Newbuilding: Tsuneishi 63,300 DWT Bulk Carrier
5. Purchase Newbuilding: Kawasaki 61,000 DWT Bulk Carrier
6. Approval of Extension MV Ligulao Loan Facility
7. Approval of Extension Mega International Commercial Bank Loan Facility
8. Approval of Extension Chang Hwa Bank Loan Facility
2018.12.14
1. 2019 Operation Plan and Budget Plan
2. Capital Increase of Wisdom Marine International
3. Approval of MV Mega Benefit Bareboat Charter
4. Approval of Bank of Taiwan Loan Facility
5. Approval of EnTie Bank Loan Facility
6. Approval of Taiwan Business Bank Loan Facility
7. Approval of Intercompany Loan Facilities
2019.01.28
1. Insurance coverage for Directors and Officers Liability
2. The rectification of the 2018 Q4 audit follow-up of previous non-compliances be acknowledged
and approved.
3. Approval of 2018 Basic Director Reward
4. Company-Wide Salary Adjustment
5. Approval of 2018 Annual Bonus
6. Amendment to Procedures for Asset Acquisition and Disposal
7. Amendment to Guidelines for Corporate Governance
8. Amendment to Internal Control Procedures
9. Convention of 2019 Annual General Meeting

Corporate Governance Report 65
Date Major resolutions
10. Approval of Extension of MV Naluhu Loan Facility
11. Approval of Benefit Transport S.A. Loan Facility
12. Approval of Taiwan Cooperative Bank Loan Facility
13. Approval of E.Sun Bank Loan Facility
14. Approval of E.Sun Bank Authorized Limit for Financial Derivatives
15. Approval of Bank SinoPac Authorized Limit for Financial Derivatives
2019.02.22
1. Adoption of 2018 Financial Report
2. Amendment to Procedures for Loan to Others
3. Amendment to Rules of Board Meeting
4. Amendment to Articles of Association
5. Extension of Appointment Beyond Retirement Age
6. Approval of MV Daiwan Miracle Loan Facility
2019.03.29
1. 2018 Annual Corporate Governance Report
2. Approval of execution of 2018 Internal Control Declaration
3. Board of Directors Performance Self-Assessment Report
4. Amendment to Procedures for Loan to Others
5. Amendment to Procedures for Endorsement and Guarantee
6. Amendment to Articles of Association
7. 2018 Dividend Proposal
8. 2018 Director Reward
9. Earnings Distribution of Wisdom Panama
10. Issuance of Corporate Bonds
11. Capital Increase Issuance of New Shares
12. Proposed Agenda for Annual General Meeting
13. Appointment of Chief Corporate Governance Officer
14. Purchase of Office Space
15. Capital Increase of Wisdom Marine International Inc.
16. Newbuilding: Tsuneishi 63,300 DWT Bulk Carrier
17. Newbuilding: Namura 38,000 DWT Bulk Carrier
18. Approval of Intercompany Loan Facilities
19. Approval of Taichung Bank Leasing Co., Ltd. Loan Facility
20. Approval of Jih Sun International Commercial Bank Loan Facility
3.4.13 Major Issues of Record or Written Statements Made by Any Director or Supervisor
Dissenting to Important Resolutions Passed by the Board of Directors
None.
3.4.14 Resignation or Dismissal of the Company’s Key Individuals, Including the Chairman,
CEO, and Heads of Accounting, Finance, Internal Audit and R&D
None.

Corporate Governance Report 66
3.5 Information Regarding to the Company’s Audit Fee and Independence
3.5.1 Audit Fee
Accounting Firm Name of CPA Audit Period Remarks
Ernst & Young, Taiwan Lin, Li Huang Fuh, Wen Fun 2018.1.1-2018.12.31 Ernst & Young, Taiwan
Item
Expense
2018
Audit Fee Non-Audit Fee (Note
1) Total
1 Under NT$ 2,000,000 40 40
2 NT$2,000,001 ~ NT$4,000,000
3 NT$4,000,001 ~ NT$6,000,000 5,450 5,450
4 NT$6,000,001 ~ NT$8,000,000
5 Over NT$8,000,000
None1:The non-audit fee pay to Ernst & Young, Taiwan total NT$40,000 is the fee of registration of Wisdom Marine
Line Co., Ltd - Taiwan Office.
3.5.3 Assessment of External Auditor’s Independence
The Audit Committee evaluate external auditor’s independence once a year and report to the Board of Directors.
The evaluations are as the following:
Evaluate Result Independence
The CPA do not have financial advantage with the Company directly or
indirectly.
Yes Yes
The CPA do not have loan facility or loan guarantee with the Company’s
directors.
Yes Yes
The CPA do not have business relationship and potential employment
with the Company.
Yes Yes
The CPA and the audit team were not the Company’s directors, managers or
anyone can influence the audit engagement in recent two years.
Yes Yes
The CPA do not provide services that the non-audit services influence the
results of the audit services.
Yes Yes
The CPA do not have the Company’s issued stock or other securities. Yes Yes
The CPA is not the Company’s defender or representative of assisting
the third-parties’ conflicting.
Yes Yes
The CPA do not have relationship with the Company’s directors, managers
or anyone can influence the audit engagement.
Yes Yes
The CPA’s independence declaration. Yes Yes
Ensure the CPA rotates every seven years. Yes Yes

Corporate Governance Report 67
3.6 Replacement of CPA
None.
3.7 The Company’s Chairman, Chief Executive Officer, Chief Financial Officer,
and managers in charge of its finance and accounting operations did not hold
any positions in the Company’s independent auditing firm or its affiliates during
2018.
3.8 Transfer & pledge of stock equity by directors, supervisors, managerial
officers and holders of 10% or more of company shares
3.8.1 Changes in Shareholding of Directors, Supervisors, Managers and Major Shareholders
Units: Share
Title Name
2017 2018 2019 until to publish date
Shareholding Pledge Shareholding Shareholding Pledge Shareholding
Increase
(Decrease)
Increase
(Decrease)
Increase
(Decrease)
Increase
(Decrease)
Increase
(Decrease)
Increase
(Decrease)
Chairman Lan,
Chun-Sheng
13,879,298 31,500,000 0 9,346,000 0 0
Director Chao, Mike
Tzu-Lung
28,748 0 0 0 0 0
Director Fukui
Masayuki
128,796 0 0 0 0 0
Director
Jinzhou
Investment
Co., Ltd.
70,129 0 0 0 0 0
Independence
Director
Huang,
Jen-Chung
(Note 1)
0 0 0 0 0 0
Independence
Director
Iwanaga
Yasuhisa
(Note 1)
0 0 0 0 0 0
Independence
Director
Tu,
Neng-Mo
0 0 0 0 0 0
Independence
Director
Chen,
Po-Chih
0 0 0 0 0 0
Independence
Director
Lin,
Tse-Chun
(Note 2)
0 0 0 0 0 0

Corporate Governance Report 68
Title Name
2017 2018 2019 until to publish date
Shareholding Pledge Shareholding Shareholding Pledge Shareholding
Increase
(Decrease)
Increase
(Decrease)
Increase
(Decrease)
Increase
(Decrease)
Increase
(Decrease)
Increase
(Decrease)
Independence
Director
Chiu,
Yung-Ho
(Note 2)
0 0 0 0 0 0
Independence
Director
Liu,
Tsai-Ching
(Note 2)
0 0 0 0 0 0
President Cheng,
Chun-Sheng 23,237 0 0 0 0 0
Assistant
Vice
President of
Business and
Operation
Dept.
SC Fang 4,536 0 0 0 0 0
Chief
Technical
Officer
Tsaur,
Shuang-Chau 0 0 0 0 0 0
Assistant
Vice
President of
Seaman
Affairs Dept.
CY Wen (53,553) 0 (36,000) 0 0 0
Chief
Financial
Officer
Bruce Hsueh (209,372) (160,000) 0 0 0 0
Assistant
Vice
President of
Finance
Dept.
Lina Hung 22,820 0 0 0 0 0
Internal
Auditor TT Ting 50,000 0 (40,000) 0 0 0
Note 1:Term ended after the election of Directors and Independent Directors on May 25, 2018.
Note 2:Elected Independent Director in the annual general meeting on May 25, 2018.
3.8.1.1 Shares Trading with Related Parties
None.
3.8.1.2 Shares Pledge with Related Parties
None.

Corporate Governance Report 69
3.9 Information on relationships among the top ten shareholders
19 March 2019(Book Closing Date);Unit:share;%
Item Name Current Shareholding
Spouse’s/minor’s
Shareholding
Shareholding
by Nominee
Arrangement
Name and Relationship
Between the Company’s Top
Ten Shareholders, or Spouses
or Relatives Within Two
Degrees
Shares % Shares % Shares % Name Relationship
1 Lan, Chun-Sheng 197,793,456 31.09% 2,789,223 0.45% - -
Pescadores、
Hui Wen、
Jingui
Please refer to
the following.
2
Pescadores Merchandise
Co.,Ltd. 50,981,203 8.01% - - - -
Lan,
Chun-Sheng Director
Representative: Chen,
Huang-Ming 419,648 0.07% - - - - - -
3
Unicorn Marine Agency Co.,
Ltd. 34,311,126 5.39% - - - - - -
Representative: Liu, Han
Yang - - - - - - - -
4
Hui Wen Investment Co.,
Ltd. 23,293,059 3.66% - - - - - -
Representative: Lan,
Mei-Chou 3,435,245 0.54% - - - -
Lan,
Chun-Sheng
Second-degree
relatives
5
Song Ying Transportation
Co., Ltd 12,600,237 1.98% - - - - - -
Representative: Gao, Qin
Long - - - - - - - -
6 FUBON LIFE INSURANCE
CO.,LIMITED.-TWOTC-FFI 9,278,000 1.46% - - - - - -
7 Morgan Stanley & Co.
International Plc 7,274,667 1.14% - - - - - -
8
Jingui Investment Co., Ltd. 6,500,821 1.02% - - - - - -
Representative: Lan,
Mei-Chou 3,435,245 0.54% - - - -
Lan,
Chun-Sheng
Second-degree
relatives
9 Luo, Ming-Ren 5,460,447 0.86% - - - - - -
10
JPMorgan Chase Bank N.A.,
Taipei Branch in custody for
Vanguard Total International
Stock Index Fund, a series of
Vanguard Star Funds
5,022,102 0.79% - - - - - -

Corporate Governance Report 70
3.10 Ownership of Shares in Affiliated Enterprises
31 December 2018, Unit:share;%
Shift in investment
Investment by the
Company
Investment by directors,
supervisors, managers, direct
or indirect control groups
Combined investment
Shares % Shares % Shares %
Wisdom Marine International Inc. 54,800,000 100% - - 54,800,000 100%
Well Shipmanagement and Maritine
Consultant Co., Limited
2,300,000 100% - - 2,300,000 100%
Wisdom Marine Lines S.A. 454,139 100% - - 454,139 100%
Adixi Wisdom S.A. 100 100% - - 100 100%
Amis Carriers S.A. 100 100% - - 100 100%
Amis Elegance S.A. 100 100% - - 100 100%
Amis Fortune S.A. 100 100% - - 100 100%
Amis Hero S.A. 100 100% - - 100 100%
Amis Integrity S.A. 100 100% - - 100 100%
Amis International S.A. 100 100% - - 100 100%
Amis Justice S.A. 100 100% - - 100 100%
Amis Mariner S.A. 100 100% - - 100 100%
Amis Miracle S.A. 100 100% - - 100 100%
Amis Nature Inc. 100 100% - - 100 100%
Amis Navigation S.A. 100 100% - - 100 100%
Amis Star S.A. 100 100% - - 100 100%
Amis Wisdom S.A. 100 100% - - 100 100%
Arikun Wisdom S.A. 100 100% - - 100 100%
Atayal Brave S.A. 100 100% - - 100 100%
Atayal Mariner S.A. 100 100% - - 100 100%
Atayal Star S.A. 100 100% - - 100 100%
Atayal Wisdom S.A. 100 100% - - 100 100%
Babuza Wisdom S.A. 100 100% - - 100 100%
Beagle Marine S.A. 100 100% - - 100 100%
Beagle Wisdom S.A. 35,000 100% - - 35,000 100%
Bunun Brave S.A. 100 100% - - 100 100%
Bunun Champion S.A. 100 100% - - 100 100%
Bunun Dynasty S.A. 100 100% - - 100 100%
Bunun Elegance S.A. 100 100% - - 100 100%
Bunun Fortune S.A. 100 100% - - 100 100%
Bunun Hero S.A. 100 100% - - 100 100%
Bunun Infinity S.A. 100 100% - - 100 100%
Bunun Justice S.A. 100 100% - - 100 100%
Bunun Marine S.A. 100 100% - - 100 100%
Bunun Navigation S.A. 100 100% - - 100 100%
Bunun Wisdom S.A. 100 100% - - 100 100%
Cosmic Wisdom S.A. 100 100% - - 100 100%
Daiwan Champion S.A. 100 100% - - 100 100%
Daiwan Dolphin S.A. 100 100% - - 100 100%

Corporate Governance Report 71
Shift in investment
Investment by the
Company
Investment by directors,
supervisors, managers, direct
or indirect control groups
Combined investment
Shares % Shares % Shares %
Daiwan Elegance S.A. 100 100% - - 100 100%
Daiwan Fortune S.A. 100 100% - - 100 100%
Daiwan Glory S.A. 100 100% - - 100 100%
Daiwan Hero S.A. 100 100% - - 100 100%
Daiwan Infinity S.A. 100 100% - - 100 100%
Daiwan Justice S.A. 100 100% - - 100 100%
Daiwan Kalon S.A. 100 100% - - 100 100%
Daiwan Leader S.A. 100 100% - - 100 100%
Daiwan Miracle S.A. 100 100% - - 100 100%
Dumun Marine S.A. 100 100% - - 100 100%
Dumun Navigation S.A. 100 100% - - 100 100%
Elite Steamship S.A. 100 100% - - 100 100%
Euroasia Investment S.A. 100 100% - - 100 100%
Favoran Wisdom S.A. 100 100% - - 100 100%
Fourseas Maritime S.A. Panama 100 100% - - 100 100%
Fraternity Marine S.A. 100 100% - - 100 100%
Fraternity Ship Investment S.A. 100 100% - - 100 100%
Genius Marine S.A. 100 100% - - 100 100%
Genius Prince S.A. 100 100% - - 100 100%
Genius Star Carriers S.A. 100 100% - - 100 100%
Genius Star Navigation S.A. 100 100% - - 100 100%
GS Global S.A. 100 100% - - 100 100%
GS Navigation S.A. 100 100% - - 100 100%
GSX Maritime S.A. 100 100% - - 100 100%
Guma Marine S.A. 100 100% - - 100 100%
Guma Navigation S.A. 100 100% - - 100 100%
Harmony Pescadores S.A.(Panama) 100 100% - - 100 100%
Harmony Transport S.A. 100 100% - - 100 100%
Hoanya Wisdom S.A. 100 100% - - 100 100%
Infinite Wisdom S.A. 100 100% - - 100 100%
Katagalan Carriers S.A. 100 100% - - 100 100%
Katagalan Line S.A. 100 100% - - 100 100%
Katagalan Marine S.A. 100 100% - - 100 100%
Katagalan Navigation S.A. 100 100% - - 100 100%
Katagalan Star S.A. 100 100% - - 100 100%
Katagalan Wisdom S.A. 100 100% - - 100 100%
Kavalan Wisdom S.A. 100 100% - - 100 100%
Ligulao Wisdom S.A. 100 100% - - 100 100%
Lloa Wisdom S.A. 100 100% - - 100 100%
Log Wisdom S.A. 100 100% - - 100 100%
Luilang Wisdom S.A. 100 100% - - 100 100%
Magnate Maritime S.A. 100 100% - - 100 100%
Makatao Wisdom S.A. 100 100% - - 100 100%

Corporate Governance Report 72
Shift in investment
Investment by the
Company
Investment by directors,
supervisors, managers, direct
or indirect control groups
Combined investment
Shares % Shares % Shares %
Mercy Marine Line S.A. 100 100% - - 100 100%
Mighty Maritime S.A. 100 100% - - 100 100%
Mimasaka Investment S.A. 100 100% - - 100 100%
Mount Wisdom S.A. 100 100% - - 100 100%
Paiwan Wisdom S.A. 100 100% - - 100 100%
Papora Wisdom S.A. 100 100% - - 100 100%
Pazeh Wisdom S.A. 100 100% - - 100 100%
Pescadores International Line S.A. 100 100% - - 100 100%
Poavosa International S.A. 100 100% - - 100 100%
Poavosa Maritime S.A. 100 100% - - 100 100%
Poavosa Navigation S.A. 100 100% - - 100 100%
Poavosa Wisdom S.A. 100 100% - - 100 100%
Rukai Maritime S.A. 100 100% - - 100 100%
Sakizaya Diamond S.A. 100 100% - - 100 100%
Sakizaya Fortune S.A. 100 100% - - 100 100%
Sakizaya Glory S.A. 100 100% - - 100 100%
Sakizaya Hero S.A. 100 100% - - 100 100%
Sakizaya Integrity S.A. 100 100% - - 100 100%
Sakizaya Justice S.A. 100 100% - - 100 100%
Sakizaya Kalon S.A. 100 100% - - 100 100%
Sakizaya Leader S.A. 100 100% - - 100 100%
Sakizaya Line S.A. 100 100% - - 100 100%
Sakizaya Marine S.A. 100 100% - - 100 100%
Sakizaya Miracle S.A. 100 100% - - 100 100%
Sakizaya Navigation S.A. 100 100% - - 100 100%
Sakizaya Orchid S.A. 100 100% - - 100 100%
Sakizaya Power S.A. 100 100% - - 100 100%
Sakizaya Queen S.A. 100 100% - - 100 100%
Sakizaya Respect S.A. 100 100% - - 100 100%
Sakizaya Wisdom S.A. 100 100% - - 100 100%
Sao Wisdom S.A. 100 100% - - 100 100%
Saysiat Wisdom S.A. 100 100% - - 100 100%
Siraya Wisdom S.A. 100 100% - - 100 100%
Taivoan Wisdom S.A. 100 100% - - 100 100%
Tao Ace S.A. 100 100% - - 100 100%
Tao Brave S.A. 100 100% - - 100 100%
Tao Mariner S.A. 100 100% - - 100 100%
Tao Star S.A. 100 100% - - 100 100%
Tao Treasure S.A. 100 100% - - 100 100%
Taokas Marine S.A. 100 100% - - 100 100%
Taokas Navigation S.A. 100 100% - - 100 100%
Taokas Wisdom S.A. 100 100% - - 100 100%
Taroko Maritime S.A. 100 100% - - 100 100%

Corporate Governance Report 73
Shift in investment
Investment by the
Company
Investment by directors,
supervisors, managers, direct
or indirect control groups
Combined investment
Shares % Shares % Shares %
Taroko Wisdom S.A. 200 100% - - 200 100%
Triumph Wisdom S.A. 100 100% - - 100 100%
Trobian Wisdom S.A. 100 100% - - 100 100%
Unicorn Bravo S.A. 100 100% - - 100 100%
Unicorn Fortune S.A. 100 100% - - 100 100%
Unicorn Logger S.A. 100 100% - - 100 100%
Unicorn Logistics S.A. 100 100% - - 100 100%
Unicorn Marine S.A. 100 100% - - 100 100%
Unicorn Pescadores S.A. 100 100% - - 100 100%
Unicorn Successor S.A. 100 100% - - 100 100%
Vayi Wisdom S.A. 100 100% - - 100 100%
Winsome Wisdom S.A. 100 100% - - 100 100%
Wisdom Ace S.A. 100 100% - - 100 100%

Funding Activities 74
4. Funding Activities
4.1 Capital and Share Capital
4.1.1 Sources of Share Capital
Record date: Same as publication date for this annual report
Type of shares Authorized share capital (equity)
Notes Outstanding shares Unissued shares Total
Registered
common shares 636,194,168 243,805,832 880,000,000 N/A
Unit: TWD
Month/Year Issue
price
Authorized share capital Paid-in capital Notes
Number of
shares
(thousand
shares)
Amount
Number of
shares
(thousand
shares)
Amount Sources of Share
Capital
Shares
acquired by
non-cash
assets
Other
2008.10 10 330,000 3,300,000,000 1 10 Note 1 - -
2009.01 10 330,000 3,300,000,000 200,000 2,000,000,000
2 million shares
in transfer of
equity
- Note 2
2009.06 10 330,000 3,300,000,000 220,000 2,200,000,000
20 million shares
in capitalization
of capital surplus
- Note 3
2010.03 42.50 330,000 3,300,000,000 250,000 2,500,000,000 30 million shares
in cash issue - Note 4
2010.08 10 330,000 3,300,000,000 275,000 2,750,000,000
25 million shares
in capitalization
of profits
- Note 5
2010.12 38 330,000 3,300,000,000 305,000 3,050,000,000
30 million shares
in cash issue for
public listing
- Note 6
2011.02 10 500,000 5,000,000,000 305,000 3,050,000,000 Note 7 - -
2011.08 10 500,000 5,000,000,000 335,500 3,355,000,000
30.5 million
shares in
capitalization of
capital surplus
- Note 8
2011.11 37 500,000 5,000,000,000 358,000 3,580,000,000
22.5 million
shares in cash
issue
- Note 9
2012.08 40.36 500,000 5,000,000,000 368,661 3,686,605,170
10,661,000 shares
in capitalization
of first issue of
international
unsecured
- Note
10

Funding Activities 75
Month/Year Issue
price
Authorized share capital Paid-in capital Notes
Number of
shares
(thousand
shares)
Amount
Number of
shares
(thousand
shares)
Amount Sources of Share
Capital
Shares
acquired by
non-cash
assets
Other
convertible
corporate bond
2012.08 10 500,000 5,000,000,000 404,461 4,044,605,170
35.8 million
shares in
capitalization of
capital surplus
- Note
11
2013.03 10 600,000 6,000,000,000 404,461 4,044,605,170 Note 12 - -
2013.09 10 600,000 6,000,000,000 424,221 4,242,206,340
19,760,117 shares
in capitalization
of capital surplus
- Note
13
2013.11 32.12 600,000 6,000,000,000 460,221 4,602,206,340
36 million global
depository
receipts by cash
issue
- Note
14
2014.04 10 600,000 6,000,000,000 505,587 5,055,866,190
45,365,985 shares
in capitalization
of first overseas
issue of unsecured
convertible
corporate bond
- Note
15
2014.08 10 600,000 6,000,000,000 516,864 5,168,643,490
11,277,730 shares
in capitalization
of capital surplus
- Note
16
2015.05 10 880,000 8,800,000,000 516,864 5,168,643,490 Note 17 - -
2016.11 28 880,000 8,800,000,000 556,864 5,568,643,490 40 million shares
in cash issue -
Note
18
2017.08 10 880,000 8,800,000,000 584,708 5,847,075,660 27,843,217 shares
in capitalization
of capital surplus
Note
19
2017.11 23.5 880,000 8,800,000,000 616,708 6,167,075,660 32 million shares
in cash issue
Note
20
2018.08 10 880,000 8,800,000,000 616,711 6,167,109,780
3,412 shares in
capitalization of
third issue of
domestic unsecured
convertible
corporate bond in
the Republic of
China
Note
21
2018.10 10 880,000 8,800,000,000 618,174 6,181,737,830
1,462,805 shares in
2018 Q3
capitalization of
Note
22

Funding Activities 76
Month/Year Issue
price
Authorized share capital Paid-in capital Notes
Number of
shares
(thousand
shares)
Amount
Number of
shares
(thousand
shares)
Amount Sources of Share
Capital
Shares
acquired by
non-cash
assets
Other
First overseas issue
of unsecured
convertible
corporate bond and
third issue of
domestic unsecured
convertible
corporate bond in
the Republic of
China
2019.01 10 880,000 8,800,000,000 629,805 6,298,054,940
11,631,711 shares in
2018 Q4
capitalization of
First overseas issue
of unsecured
convertible
corporate bond and
third issue of
domestic unsecured
convertible
corporate bond in
the Republic of
China
Note
23
2019.03 10 880,000 8,800,000,000 636,194 6,361,941,680
6,388,674 shares in
2019 Q1
capitalization of
third issue of
domestic unsecured
convertible
corporate bond in
the Republic of
China
Note
24
Note 1: Share capital of the Company at establishment.
Note 2: In January 2009, the Company entered into a share transfer agreement with Chairman James Lan to transfer a 100% stake in Wisdom Marine
Lines S.A. to the Company in exchange for all shares in the Company.
Note 3: On June 15, 2009, the Board of Directors approved capitalization of capital surplus.
Note 4: On February 8, 2010, the annual general meeting passed a resolution for cash issue. The cash issue was approved by the Financial
Supervisory Commission of the Executive Yuan in the FSC Letter Jin-Guan-Zheng-Fa No.0990001895 dated January 27, 2010.
Note 5: On June 28, 2010, the annual general meeting passed a resolution for capitalization of profits. The transaction was approved by the GreTai
Securities Market in the Letter Gre-Tai-Shen No.0990020530 dated August 24, 2010.
Note 6: On December 1, 2010, the Company became listed and offered a cash issue. The cash issue was approved by the Financial Supervisory
Commission of the Executive Yuan in the FSC Letter Jin-Guan-Zheng-Fa No.0990060322 dated November 4, 2010.
Note 7: On February 14, 2011, the annual general meeting passed a resolution to increase the registered capital.
Note 8: On June 17, 2011, the annual general meeting passed a resolution for capitalization of capital surplus. The transaction was approved by the
Taiwan Stock Exchange in the Letter Taiwan-Stock-Shang-2-1000027556 dated August 24, 2011.

Funding Activities 77
Note 9: On June 17, 2011, the Board of Directors passed a resolution for cash issue to issue new shares on November 1, 2011. The cash issue was
approved by the Financial Supervisory Commission of the Executive Yuan in the FSC Letter Jin-Guan-Zheng-Fa No.1000034377 dated August
9, 2011.
Note 10: First conversion of convertible corporate bonds to common shares on August 20, 2012.
Note 11: On June 29, 2012, the annual general meeting passed a resolution for capitalization of capital surplus. The transaction was completed on
August 31, 2012 and approved by the Taiwan Stock Exchange in the Letter Taiwan-Stock-Shang-2-10100186331 dated August 23, 2012.
Note 12: On March 22, 2013, the annual general meeting passed a resolution to increase the registered capital.
Note 13: On June 21, 2013, the annual general meeting passed a resolution for capitalization of capital surplus. The transaction was completed on
September 11, 2013 and approved by the Taiwan Stock Exchange in the Letter Taiwan-Stock-Shang-2-1020017412 dated September 2, 2013.
Note 14: On July 26, 2013, the Board of Directors passed a resolution to issue global depository receipts by cash issue and to issue the new shares on
November 8, 2013. The cash issue was approved by the Financial Supervisory Commission of the Executive Yuan in the FSC Letter
Jin-Guan-Zheng-Fa No.1020016320 dated May 15, 2013.
Note 15: First conversion of overseas convertible corporate bonds to common shares on April 18, 2014.
Note 16: On June 27, 2014, the annual general meeting passed a resolution for capitalization of capital surplus. The transaction was completed on
August 21, 2014 and approved by the Taiwan Stock Exchange in the Letter Taiwan-Stock-Shang-2-1030016561 dated August 12, 2014.
Note 17: On May 29, 2015, the annual general meeting passed a resolution to increase the registered capital.
Note 18: On July 29, 2016, the Board of Directors passed a resolution for cash issue to issue new shares on November 2, 2016. The cash issue came
into effect by the Financial Supervisory Commission of the Executive Yuan in the FSC Letter Jin-Guan-Zheng-Fa No.1050035665 dated
September 8, 2016.
Note 19: On June 23, 2017, the annual general meeting passed a resolution for capitalization of capital surplus. The transaction was completed on
August 25, 2017 and approved by the Taiwan Stock Exchange on August 21, 2016.
Note 20: On July 28, 2017, the Board of Directors passed a resolution for cash issue to issue new shares on November 8, 2017. The cash issue came
into effect by the Financial Supervisory Commission of the Executive Yuan in the FSC Letter Jin-Guan-Zheng-Fa No.1060034373 dated
September 8, 2017.
Note 21: First conversion of third issue of domestic unsecured convertible corporate bond in the Republic of China to common shares on August 3,
2018.
Note 22: 2018 Q3 conversion of First overseas issue of unsecured convertible corporate bond in 2013 to 284,420 shares and third issue of domestic
unsecured convertible corporate bond in the Republic of China to 1,181,797 common shares (including 3,412 shares from first conversion on
August 3, 2018) on October 2, 2018.
Note 23: 2018 Q4 total conversion of First overseas issue of unsecured convertible corporate bond in 2013 and third issue of domestic unsecured
convertible corporate bond in the Republic of China to 11,631,711 common shares on January 2, 2019.
Note 24: 2019 Q1 conversion of third issue of domestic unsecured convertible corporate bond in the Republic of China to 6,388,674 common shares
on March 19, 2019.
4.1.2 Shelf Registration Information
N/A.
4.1.3 Shareholders
March 19, 2019 (book closure date)
Governme
nt agencies
Financial
institutions
Other
corporations Individuals
Foreign
institutions
and foreigners
Total
Number of people 1 13 148 15,686 140 15,988
Number of shares 1,005,111 11,524,525 150,105,038 405,641,456 67,918,038 636,194,168
Shareholding
percentage 0.16% 1.81% 23.59 63.76 10.68 100.00%
Note: The table is based on the numbers of shares recorded in the shareholder register on the last book closure date, on which there was a total of
636,194,168 outstanding shares. Shareholding by Chinese investors: Not applicable as no Chinese investors hold shares in the Company
Quantity
Shareholders

Funding Activities 78
4.1.4 Shareholding Distribution
March 19, 2019 (book closure date)
Shareholding range (shares) Number of
shareholders Number of shares
Shareholding
percentage
1 to 999 3,006 662,277 0.10%
1,000 to 5,000 7,716 16,325,572 2.57%
5,001 to 10,000 2,002 14,394,019 2.26%
10,001 to 15,000 957 11,623,145 1.83%
15,001 to 20,000 464 8,290,136 1.30%
20,001 to 30,000 551 13,592,735 2.14%
30,001 to 50,000 467 17,845,094 2.80%
50,001 to 100,000 387 26,902,448 4.23%
100,001 to 200,000 231 31,811,048 5.00%
200,001 to 400,000 104 28,355,512 4.46%
400,001 to 600,000 28 13,656,056 2.15%
600,001 to 800,000 22 15,341,249 2.41%
800,001 to 1,000,000 8 7,008,073 1.10%
1,000,001 or more 45 430,386,804 67.65%
Total 15,988 636,194,168 100.00%
Note: The table is based on the numbers of shares recorded in the shareholder register on the last book closure date, on which there was a total of
636,194,168 outstanding shares. Distribution of preferred shares: Not applicable as the Company has not issued any preferred shares.
4.1.5 Principal Shareholders
March 19, 2019 (book closure date)
Shares
Name of principal
shareholders
Number of shares Shareholding percentage
Lan, Chun-Sheng 197,793,456 31.09%
Pescadores Merchandise Co.,Ltd. 50,981,203 8.01%
Unicorn Marine Agency Co., Ltd. 34,311,126 5.39%
Hui Wen Investment Co., Ltd. 23,293,059 3.66%
Song Ying Transportation Co.,Ltd 12,600,237 1.98%
FUBON LIFE INSURANCE
CO.,LIMITED.-TWOTC-FFI 9,278,000 1.46%
Morgan Stanley & Co. International Plc 7,274,667 1.14%
Jingui Investment Co., Ltd. 6,500,821 1.02%
Luo, Ming-Ren 5,460,447 0.86%
JPMorgan Chase Bank N.A., Taipei Branch in custody for 5,022,102 0.79%

Funding Activities 79
Shares
Name of principal
shareholders
Number of shares Shareholding percentage
Vanguard Total International Stock Index Fund, a series of
Vanguard Star Funds
Note: The table is based on the numbers of shares recorded in the shareholder register on the last book closure date, on which there was a total of
636,194,168 outstanding shares.
4.1.6 Stock Price, Net Worth, Earnings, Dividends, and Related Information for Last 2 Years
Unit: TWD; 000 shares
Year
Item
2016 2017 2018
Stock price
Highest 38.10 34.25 33.80
Lowest 27.40 25.20 27.00
Average 33.81 30.14 29.11
Net worth
per share
Before distribution 51.80 42.48 45.41
After distribution (Note 1) 50.80 41.48 43.91
Earnings
per share
Weighted average shares 521,253 589,558 618,921
Earnings per share before
retrospective adjustments 2.69
0.71 2.92
Earnings per share after
retrospective adjustments 2.60
0.65 2.70
Dividend
per share
Cash dividend 1.00 1.00 1.50
Stock
dividend
Surplus dividend - - -
Capital surplus
dividend 0.50
- -
Accumulated unpaid
dividend -
- -
Return
analysis
P/E ratio 12.56 42.45 9.97
P/D ratio 33.81 30.14 19.40
Cash dividend yield 2.96% 3.32% 5.15%
Note 1: To be provided according to the distribution resolutions of the annual general meeting in the following year.
Note 2: The 2018 distribution proposal has been passed by the Board of Directors on March 29, 2019, and is pending approval of the annual general
meeting on May 17, 2019.
Note 3: P/E (price to earnings) ratio = average closing price for the year / earnings per share.
Note 4: P/D (price to dividend) ratio = average closing price for the year / cash dividend
Note 5: Cash dividend yield = cash dividends / average closing price for the year.

Funding Activities 80
4.1.7 Dividend Policy and Execution
4.1.7.1 Dividend Policy in Articles of Incorporation
The dividend policy of the Company is based on earnings of the year and considers factors including the
Company's overall growth, financial planning, funding needs, and industry outlook and prospects, while ensuring
shareholder equity and a balanced dividend policy are maintained. Every year, the Company pays taxes as
required by law, makes up losses from previous years, and has the Board of Directors prepare a dividend proposal
based on the earnings available for distribution ("distributable earnings") according to Article 120 of the Articles
of Incorporation. Dividends may be distributed in the form of cash and/or stock dividends. A dividend proposal is
not executed until approved by the annual general meeting. However, total dividends in a year shall not be lower
than ten percent of total "consolidated net income". The percentage of cash dividend shall not be lower than
twenty percent of total dividends for the year.
4.1.7.2 Current Year Dividend Distribution Proposal to Annual General Meeting
The 2018 distribution proposal has been passed by the Board of Directors on March 29, 2019. A cash dividend of
NT$1.5 is to be paid out of capital surplus. The proposal is expected to be submitted to the annual general meeting
for approval on May 17, 2019.
4.1.7.3 Expected Material Changes in Dividend Policy:
Dividend distribution for the year is consistent with the dividend policy established by the Articles of
Incorporation. The total amount of dividends does not vary significantly from those in past years.
4.1.8 Effects of Proposed Stock Dividends for the Year on Business Performance and EPS
N/A.
4.1.9 Employee Bonuses and Remuneration of Directors and Supervisors
4.1.9.1 Percentages or Ranges of Employee Bonuses and Remuneration of Directors and Supervisors
under the Articles of Incorporation
The remuneration of Directors of the Company for the last year has been passed by the Board of Directors on
March 29, 2019. The Directors are to be paid a total of NT$4,136,000 in compensation.
4.1.9.2 Basis for estimating the amount of employee bonuses and remuneration of Directors and
Supervisors, basis for calculating the number of shares to be distributed as bonuses, and the
accounting treatment of the discrepancy, if any, between the actual distributed amount and the
estimated amount, for the current period
Only remuneration of Directors is paid for the current period. The basis for estimating the amount is the net profit
after tax and a percentage within the range specified in the Director Remuneration Policy. However, if the actual
amount in the resolution approved by the annual general meeting later differs from the estimated amount, the
difference is treated as a change in accounting estimates and recognized as profit or loss for the year in which the

Funding Activities 81
resolution is passed.
4.1.9.3 Employee Bonuses Passed by Board of Directors
Amount of cash/stock bonuses paid to employees and remuneration of Directors and Supervisors for the
current year. The amount of, reason for, and treatment of discrepancy, if any, from the recognized costs
should be disclosed: The remuneration of Directors of the Company for the last year has been passed by the
Board of Directors on March 29, 2019. The Directors are to be paid a total of NT$4,136,000 in remuneration.
There is no discrepancy between the remuneration of Directors proposed by the Board of Directors and the
recognized costs.
Amount of employee stock bonus proposed and percentage out of the sum of net profit after tax and total
employee bonuses in the current individual or separate financial statements: No employee bonus is
distributed.
4.1.9.4 Actual distribution of employee bonuses and remuneration of Directors and Supervisors of
previous year (including number of shares, amount and stock price); and discrepancies, if any, from
the recognized employee bonuses and remuneration of Directors and Supervisors and the causes and
treatments of the discrepancies
Only a total of NT$414,000 was paid in remuneration of Directors and Supervisors in the previous year. There
was no discrepancy between the actually distributed amounts and the recognized costs.
4.1.10 Buyback of Treasury Stock
N/A.
4.2 Issuance of Corporate Bonds (Including Overseas Corporate Bonds)
4.2.1 Domestic Corporate Bonds
Unit: TWD
Type Second issue of domestic secured convertible corporate bond in the
Republic of China in 2017
Issuance (processing) date September 30, 2017
Par value NT$100,000
Place of issuance and trading Republic of China
Issue price 100% par
Total NT$400,000,000
Coupon rate 0% coupon rate
Term Three years. Maturity date September 30, 2020
Guarantor Bank SinoPac Company Limited

Funding Activities 82
Trustee Hua Nan Commercial Bank Co., Ltd.
Underwriter SinoPac Securities Co., Ltd.
Certifying attorney Jheding International Law Offices
Certifying CPA Ernst & Young Taiwan
Repayment
The bond is issued at a term of three years. Except for conversion or
redemption as permitted, repayment will be made in lumpsum cash
at maturity.
Outstanding principal NT$400,000,000
Redemption or early repayment clause
This convertible corporate bond gives the creditors the option to sell
it back early when two years have elapsed after issuance. The
Company shall send by registered mail the "Put Option Exercise
Notice" to the creditors (based on the creditor register on the fifth
business day prior to the mailing date for the "Put Option Exercise
Notice"; investors who acquire this convertible corporate bond by
trading or other means afterward will be notified by public
announcement) forty days prior to the exercise date. The Company
shall also send an official letter to request the Taipei Exchange to
announce the put option exercise notice to the creditors. The
Creditors may, within forty days (based on the arrival date or as
indicated by the post mark if sent by mail) after the announcement,
notify the Company's shareholder service agent and request that the
Company buy back the convertible corporate bond at par plus
interest [0% of par value after two years (0% yield)] with cash. Upon
accepting the sellback request, the Company shall complete cash
buyback of the convertible corporate bond within five business days
after the exercise date. If any of the dates above falls on a day when
trading is unavailable on the centralized exchanges in Taipei, the
next business day shall apply instead.
Restrictions N/A
Name of credit rating agency, rating date, corporate bond
rating result N/A
Other rights
attached
Amount converted to common
shares (by exchange or subscription),
global depository receipts, or other
securities up to the publication date
of this annual report
An amount of NT$0 has been converted to common shares up to the
publication date of this annual report.
Issuance and conversion (exchange
or subscription) rules
Please refer to the conversion rules on page 282 of the prospectus of
the convertible corporate bonds of the Company.
Potential share dilution or impact on current shareholder's
equity caused by issuance and conversion, exchange or
subscription rules, or conditions of issuance
The maximum share dilution possible on the current shareholder's
equity if the convertible corporate bond is entirely converted at par
to common shares is 2.14%.
Name of custodian for exchanged securities N/A
Unit: TWD

Funding Activities 83
Type
(Note 1) Second issue of domestic secured convertible corporate bond in the Republic of China in 2017
Year
Item 2018
Current year up to the publication date of this
annual report (Note 4)
Market
price
(Note 2)
Highest 123.00 117.80
Lowest 107.55 111.90
Average 114.09 115.82
Conversion price 28.80 29.80
Conversion price on issuance
(processing) date
September 30, 2017
30.00
September 30, 2017
30.00
Performance of conversion
obligations
(Note 3)
- -
Note 1: Please use additional rows as needed.
Note 2: Where they are traded in multiple places, overseas corporate bonds shall be listed by place of trading.
Note 3: Number of outstanding shares delivered or new shares issued.
Note 4: Information of the current year up to the publication date of this annual report.
Type Third issue of domestic unsecured convertible corporate bond in the
Republic of China in 2017
Issuance (processing) date October 2, 2017
Par value NT$100,000
Place of issuance and trading Republic of China
Issue price 100% par
Total NT$800,000,000
Coupon rate 0% coupon rate
Term Three years. Maturity date October 2, 2020
Guarantor N/A
Trustee Hua Nan Commercial Bank Co., Ltd.
Underwriter SinoPac Securities Co., Ltd.
Certifying attorney Jheding International Law Offices
Certifying CPA Ernst & Young Taiwan
Repayment
The bond is issued at a term of three years. Except for conversion or
redemption as permitted, repayment will be made in lumpsum cash
at maturity.
Outstanding principal NT$455,300,000
Redemption or early repayment clause
This convertible corporate bond gives the creditors the option to sell
it back early when two years have elapsed after issuance.
The Company shall send by registered mail the "Put Option Exercise
Notice" to the creditors (based on the creditor register on the fifth
business day prior to the mailing date for the "Put Option Exercise

Funding Activities 84
Notice"; investors who acquire this convertible corporate bond by
trading or other means afterward will be notified by public
announcement) forty days prior to the exercise date.
The Company shall also send an official letter to request the Taipei
Exchange to announce the put option exercise notice to the creditors.
The Creditors may, within forty days (based on the arrival date or as
indicated by the post mark if sent by mail) after the announcement,
notify the Company's shareholder service agent and request that the
Company buy back the convertible corporate bond at par plus
interest [1.0% of par value after two years (0.5% yield)] with cash.
Upon accepting the sellback request, the Company shall complete
cash buyback of the convertible corporate bond within five business
days after the exercise date. If any of the dates above falls on a day
when trading is unavailable on the centralized exchanges in Taipei,
the next business day shall apply instead.
Restrictions N/A
Name of credit rating agency, rating date, corporate bond
rating result N/A
Other rights
attached
Amount converted to common
shares (by exchange or subscription),
global depository receipts, or other
securities up to the publication date
of this annual report
An amount of NT$344,700 has been converted to common shares up
to the publication date of this annual report.
Issuance and conversion (exchange
or subscription) rules
Please refer to the conversion rules on page 309 of the prospectus of
the convertible corporate bonds of the Company.
Potential share dilution or impact on current shareholder's
equity caused by issuance and conversion, exchange or
subscription rules, or conditions of issuance
The maximum share dilution possible on the current shareholder's
equity if the convertible corporate bond is entirely converted at par
to common shares is 2.47%.
Name of custodian for exchanged securities N/A
Unit: TWD
Type
(Note 1) Third issue of domestic unsecured convertible corporate bond in the Republic of China in 2017
Year
Item 2018
Current year up to the publication date of
this annual report (Note 4)
Market
price (Note
2)
Highest 115.85 105.50
Lowest 98.20 102.20
Average 103.56 103.78
Conversion price 28.30 28.30
Conversion price on issuance
(processing) date
October 2, 2017
29.5
October 2, 2017
29.5
Performance of conversion
obligations(Note 3) - -
Note 1: Please use additional rows as needed.
Note 2: Where they are traded in multiple places, overseas corporate bonds shall be listed by place of trading.
Note 3: Number of outstanding shares delivered or new shares issued.

Funding Activities 85
Note 4: Information of the current year up to the publication date of this annual report.
4.2.2 Overseas Corporate Bonds
Type First overseas issue of unsecured convertible corporate bond in 2013
Issuance (processing) date November 12, 2013
Par value US$250,000
Place of issuance and trading Singapore
Issue price 100% par
Total US$60,000,000
Coupon rate 0% coupon rate
Term Five years. Maturity date November 12, 2018
Guarantor N/A
Trustee Citicorp International Limited
Underwriter Domestic: MasterLink Securities Corporation
International: J.P. Morgan Securities plc.
Certifying attorney Domestic: LCS & Partners Law Firm
International: Everstrong International Patent & Trademark Firm
Certifying CPA KPMG Taiwan
Repayment
The bond is issued at a term of five years. Except for conversion or
redemption as permitted, repayment will be made in lumpsum cash at
maturity.
Outstanding principal A principle repayment of US$4,750,000 was made on November 12,
2018.
Redemption or early repayment clause Please refer to the issuance rules on page 8 of the prospectus of the
convertible corporate bonds of the Company.
Restrictions N/A
Name of credit rating agency, rating date, corporate bond
rating result N/A
Other rights
attached
Amount converted to common shares
(by exchange or subscription), global
depository receipts, or other securities
up to the publication date of this annual
report
An amount of US$55,250,000 has been converted to common shares
up to the publication date of this annual report.
Issuance and conversion (exchange or
subscription) rules
Please refer to the issuance rules on page 6 of the prospectus of the
convertible corporate bonds of the Company.
Issuance and conversion (exchange or subscription) rules
and issuance conditions
Potential share dilution or impact on current shareholder's
equity
Not applicable as the principle was repaid at maturity on November
12, 2018.
Name of custodian for exchanged securities N/A
Unit: TWD
Type (Note 1) First overseas issue of unsecured convertible corporate bond in 2013
Year 2017 2018 (Note 5)

Funding Activities 86
Item
Market price
(Note 2)
Highest - -
Lowest - -
Average - -
Conversion price 25.8578 25.0035
Issuance (processing) date
and conversion price at issuance - -
Performance of conversion
obligations (Note 3) 1,560,393 shares 7,343,745 shares
Note 1: Please use additional rows as needed.
Note 2: Where they are traded in multiple places, overseas corporate bonds shall be listed by place of trading.
Note 3: Number of outstanding shares delivered or new shares issued.
Note 4: Information of the current year up to the publication date of this annual report.
Note 5: The first overseas issue of unsecured convertible corporate bond in 2013 had reached maturity on November 12, 2018.
Type Second overseas issue of unsecured convertible corporate bond in 2015
Issuance (processing) date April 10, 2015
Par value US$250,000
Place of issuance and trading Singapore
Issue price 100% par
Total US$80,000,000
Coupon rate 0% coupon rate
Term Five years. Maturity date April 10, 2020
Guarantor N/A
Trustee Citicorp International Limited
Underwriter Domestic: MasterLink Securities Corporation
International: J.P. Morgan Securities plc.
Certifying attorney Domestic: LCS & Partners Law Firm
International: Everstrong International Patent & Trademark Firm
Certifying CPA Ernst & Young Taiwan
Repayment
The bond is issued at a term of five years. Except for conversion or
redemption as permitted, repayment will be made in lumpsum cash at
maturity.
Outstanding principal US$5,000,000
Redemption or early repayment clause Please refer to the issuance rules on page 6 of the prospectus of the
convertible corporate bonds of the Company.
Restrictions N/A
Name of credit rating agency, rating date, corporate bond
rating result N/A

Funding Activities 87
Other rights
attached
Amount converted to common
shares (by exchange or
subscription), global depository
receipts, or other securities up to the
publication date of this annual
report
No amount has been converted to common shares up to the publication
date of this annual report.
Issuance and conversion (exchange
or subscription) rules
Please refer to the issuance rules on page 4 of the prospectus of the
convertible corporate bonds of the Company.
Issuance and conversion (exchange or subscription) rules
and issuance conditions
Potential share dilution or impact on current
shareholder's equity
The maximum share dilution possible on the current shareholder's equity
if the convertible corporate bond is entirely converted at par to common
shares is 0.76%.
Name of custodian for exchanged securities N/A
Unit: TWD
Type (Note 1) Second overseas issue of unsecured convertible corporate bond in 2015
Year
Item 2017 2018
Current year up to the publication
date of this annual report
(Note 4)
Market price
(Note 2)
Highest - - -
Lowest - - -
Average - - -
Conversion price 33.31 32.21 32.21
Issuance (processing) date
and conversion price at issuance - - -
Performance of conversion
obligations
(Note 3)
- - -
Note 1: Please use additional rows as needed.
Note 2: Where they are traded in multiple places, overseas corporate bonds shall be listed by place of trading.
Note 3: Number of outstanding shares delivered or new shares issued.
Note 4: Information of the current year up to the publication date of this annual report.
4.3 Preferred Shares
Not applicable as the Company has not issued any preferred shares up to the publication date of this annual report.
4.4 Global Depositary Receipts
Issuance (processing) date
Item November 12, 2013
Place of issuance and trading London Stock Exchange
Total Amount US$39,312,000.00

Funding Activities 88
4.5 Employee Stock Options
Not applicable as the Company has not issued any employee stock options up to the publication date of this
annual report.
4.6 Restricted Stock Awards
Not applicable as the Company has not issued any restricted stock awards up to the publication date of this annual
report.
4.7 New Share Issue for Merger or Acquisition of Another Company
Not applicable as the Company has not issued any new shares for a merger or acquisition of another company up
to the publication date of this annual report.
4.8 Implementation of Capital Allocation Plan
Not applicable up to the publication date of this annual report.
Unit issue price US$5.46
Total number of units issued 7,200,000 units
Source of securities represented New shares by cash issue
Amount of securities represented 36,000,000 common shares
Rights and obligations of depositary receipt
holder same as those of holders of common shares in the Company
Trustee -
Depositary institution JPMorgan Chase Bank, N.A.
Custodian JPMorgan Chase Bank, N.A., Taipei Branch
Balance not yet redeemed -
Allocation of costs for issuance and duration The costs for issuance and duration are paid by Wisdom Marine Lines.
Important provisions of the trustee services
agreement and the custodial services
agreement
Please refer to the trustee services agreement and the custodial services
agreement for details. The trustee exercises the rights and obligations on
behalf of the depository receipt holders, and the custodian holds the common
shares represented by the depository receipts on their behalf.
Unit market
price
2018
Highest Not applicable as no trading is made this year.
Lowest Not applicable as no trading is made this year.
Average Not applicable as no trading is made this year.
Current year up to
the publication
date of this annual
report
Highest Not applicable as no trading is made this year.
Lowest Not applicable as no trading is made this year.
Average Not applicable as no trading is made this year.

Business Overview 89
5. Business Overview
5.1 Business Activities
5.1.1 Scope of Business
5.1.1.1 Business Activities
International maritime transportation
Ship management and maintenance
Ship chartering
In addition to the licensed activities, other business activities that are not prohibited or restricted by law
5.1.1.2 Revenue Distribution
Unit: NT$000; %
5.1.1.3 Services
Wisdom Marine is a dry bulk shipping company that operates each ships under separate subsidiaries. There is a
total of 130 vessels in the fleet at the end of 2018. 118 vessels are self-owned and the rest 12 ships are under
management,chartered-in, or under joint ventures. The fleet consists of bulkers, loggers, tweendeckers,
multi-purpose, RoRo, and container vessels of various sizes from Handysize to Capesize. In particular, Handysize
vessels with their operational flexibility and relatively stable freight rates are the backbone of the fleet.
The scope of business for the Group includes short-term and long-term ship chartering, ship management, and
occasionally ship purchases and sales. The Company offers primarily wet lease contracts, which also include
complete crew, maintenance, and insurance. The Company provides not only financial arrangements, but also
strong professional management to work more closely with customers and reduce operating costs. At the end of
2018, there are 112 ships on long-term time charter, 13 self-operated, and 5 under management or other
arrangements.
Year 2018 2017
Item Amount Percentage Item Amount
Rental income 12,296,763 94.10% 10,290,299 93.22%
Shipping
income 393,830 3.01% 440,988 3.99%
Ship
management 118,535 0.91% 136,611 1.24%
Other 258,498 1.98% 170,650 1.55%
Total 13,067,626 100.00% 11,038,548 100.00%

Business Overview 90
5.1.1.4 New Services Under Development
The Company continues to replace old vessels in the fleet with Japanese-built Eco ships. The strategy allows the
Company to comply with the environmental requirements and making the fleet more competitive by reducing
charterers’ fuel expenditures. In the early years, Wisdom Marine built its business on Handysize vessels that
offered operational flexibility and relatively stable freight rates. In recent years, the Company has been adding
Supramax and Panamax vessels to the fleet in order to create a sufficiently diverse fleet to counter the impact of
market volatility and to provide a wider range of services.
5.1.2 Industry Overview
5.1.2.1 Current Trends and Outlook
Shipping remains the most economical transportation method today. There are approximately 11,300 dry bulk
carriers over 10,000 DWT around the world. In 2018, world fleet carried 11.9 billion tons of commodities or
goods. In particular, dry bulk carriers carried 5.2 billion tons of the commodities, including minerals, coal, grains,
timber, steel, cement, sugar, cotton, fertilizers, and mechanical parts.
Dry bulk carriers can be categorized by carrying capacity into Capesize, Panamax, Supramax, and Handysize. The
current average freight rates are based on four indices, BCI, BPI, BSI and BHSI. The indices are calculated for
various ship sizes as an weighted average of shipping rates on several typical routes. In the past, the equally
weighted average of BCI, BPI, BSI, and BHSI represented the Baltic Dry Index (BDI). BDI mirrors supply and
demand for dry bulk shipping in the spot market, and reflects the global outlook on dry bulk shipping.
The Baltic Exchange announced that from March 1, 2018, the BDI would be reweighted to the following ratios:
40% BCI, 30% BPI and 30% BSI, and would no longer include BHSI.
BHSI, in general, is less representative of the market as a whole. Smaller vessels can carry many types of cargo,
and some types of cargo may have to be accommodated by certain ship specifications. As a result, shipping rates
can vary greatly.
The combination of a global economic slowdown and excess dry bulk shipping capacity pushed BDI to a historic
low at 290 in February 2016. As supply and demand adjusted over time, BDI started bouncing back slowly but
steadily in 2017. The dry bulk shipping market remained stable in 2018. The decline in newbuilding investment
led to the recovery of equilibrium in dry bulk shipping capacity, where supply had exceeded demand for years.
Category Deadweight
tonnage (DWT) Main cargo
Shipping
rate index
Capesize 110,000+ Coal, iron ore BCI
Panamax 67-109,999 Bulk cargo including grains, coal, minerals, and
industrial raw materials BPI
Supramax 50-66,999 Bulk cargo including grains, coal, minerals, and
industrial raw materials BSI
Handy 26-49,999 Grains, steel, fertilizers, cement, timber, wood chips, and
pulp BHI

Business Overview 91
Given a growing world population and the demand for goods and raw materials in emerging economies, shipping
remains the most energy efficient, environmentally friendly, and economical transportation method. Hence, from a
long-term perspective, industry restructuring triggered by the business cycle can actually be an opportunity for the
shipping industry to reshape itself.
5.1.2.2 Supply Chain Relationships
There is an absence of clear supply chain relationships in the bulk shipping business as the demand for
commodities can come from all sectors of the economy and bulk shipping, by nature, does not involve production
of goods or supply of raw materials.
Raw material producers or commodity
traders →
Maritime
transportation → Raw material or commodity
users
5.1.2.3 Trends and Competition
Demand in shipping comes from demands in different industries. It is, therefore, rare to see a changing outlook on
a single industry to cause dramatic short-term volatility in the market. Instead, volatility in shipping is often
associated with systemic changes in demand due to changes in global macroeconomic conditions. Moreover,
self-adjustment of the supply of ships is one of the key factors in the business cycle of the market.
Since the services provided by shipping companies do not involve production, there is no inventory pressure or
pressure to convert inventory to cash flows. Hire on time charters (long-term leases) is collected in advance, and
freight on voyage charters (self-managed) is collected in a few days after loading. Cash flow management is
relatively simple in the business. It is, therefore, rare for a well-managed shipping company to have liquidity
issues. Funding pressure faced by shipping companies often arise from newbuildings. Ship purchases often require
installments be paid prior to delivery and operation. Hence, cash has to be considered carefully in an expansion
plan to avoid default due to insufficient fund.
Maritime transport can be divided by shipping type into container, dry bulk, and tanker, whereas routes can be
divided by distance into ocean routes and coastal routes. The scope of business includes self-management, ship
chartering, ship management, and crew despatching. Business models vary from one shipping company to the
other around the world. In fact, bulk shipping is an international competition market. In terms of the total number
and total capacity of dry bulk carriers worldwide at the end of 2018, individual shipping companies in Taiwan and
in other countries occupy only very small percentages. In addition, since cargo space cannot be stored, the
capacity of a shipping company is decided by its ability in chartering and despatching ships.
The Group has a competitive advantage in its fleet and partners. The risk of supply and demand change for each
ship type is reduced by a diversified fleet. The young fleet, where the average age is six years, provides consistent,
efficient services. The Company also works with some of the best international shipping companies. More than
80% of Wisdom fleet is time-chartered out on long-term employments to bring a steady income, while a
reasonable exposure in the spot market enables the Group to grasp the trends of market volatility.
5.1.3 Overview of Technology and R&D
Technical aspect of business activities and R&D: Not applicable

Business Overview 92
R&D personnel and education/experience: Not applicable
Annual R&D expenditures in last five years: Not applicable
Technology and product developed in last five years: Not applicable
5.1.4 Long- and Short-Term Business Development Strategies and Plans
5.1.4.1 Short-Term Business Development Strategy and Plan
Given changes in the market and different customer needs, the Company's newbuilding plan to expand the fleet
includes Handysize that are the backbone of the fleet, 60,000 DWT Supramax and 80,000 DWT Panamax. Most
of the newbuilding orders are Japanese-built Eco ships. These ships comply with the environmental regulations
and support green transportation. The reduced fuel expenditures is attractive to charterers and thus makes the fleet
more competitive. As a result, a win-win situation is achieved.
5.1.4.2 Long-Term Business Development Strategy and Plan
In the long term, the Company will continue to replace old ships and maintain a young, energy efficient fleet. The
Company will also strengthen its financial structure with steady profits, and takes a bold, innovative approach to
growing its customer base. The mission is to build a world-class dry bulk fleet and maximize the value of the
Company through sustainable development.
5.2 Market, production and sales
5.2.1 Market analysis
5.2.1.1 Regions of Service
Most customers of the Group's long-term time charter are Japanese or European charterers. Japanese charterers are
leading shipping companies, such as NYK, MOL, and "K" Line, that operate routes around the world. Meanwhile,
the routes for self-operated ships in the commodity market reach into Southeast Asia, India, China, and the Middle
East. They are also being extended into Africa and Southeast America.
5.2.1.2 Market Share
Business models of a shipping company vary from each other. In fact, bulk shipping is an international
competition business. There was a total of 11,300 dry bulk carriers over 10,000 DWT offering a total capacity up
to 840 million tons at the end of 2018. The Group's 130 ships and a total capacity of 6.0 million tons at the end of
2018 and those of other shipping companies in Taiwan and in other countries occupy only very small percentages
by comparison. In addition, since cargo space cannot be stored, the capacity of a shipping company is decided by
its ability in chartering and despatching ships. Hence, the nature of the business makes it difficult to calculate
market shares for individual shipping companies.
5.2.1.3 Future Market Supply and Demand and Growth Potential
Due to the unfavorable conditions in the dry bulk market in 2016 and 2017., shipowners were relatively less

Business Overview 93
equipped and less willing to order newbuildings. The number of newbuilding orders was visibly lower than the
two preceding years. The dry bulk shipping market remained stable in 2018. However, increasingly stringent
environmental regulations and the cost of funds continued to dampen shipowners' willingness to invest. As a result,
the newbuilding and secondhand markets did not rebound as strongly as the freight market. The supply of dry bulk
carriers is expected to continue to stagnate in the near future.
5.2.1.4 Competitive Niches
A professional management team:
As shipping routes often connect different countries, business decisions have to be made accurately and quickly to
reflect cultural, economic, and political differences across regions. Our management team consists of experts of
the industry whose know-how and years of experience enable them to accurately interpret market developments in
order to ensure success and stay ahead in business planning.
Close long-term relationships with business partners:
Our long-term time chaterers are fiirst class shipping companies with whom the Group works closely on a
long-term basis. When market conditions turn favorable and shipping rates rise sharply, Wisdom Marine charters
ships at below-market rates to long-term business partners. Thus when the market turns sour, major partners are
willing to continue to support the Group and work together in down cycles. This is the best business model to
benefit both sides.
A young, diverse dry bulk fleet:
Given changes in the market and different customer needs, the Group has been working to build a larger and more
diverse fleet for several years. Old ships are replaced by new Eco ships in an ongoing effort to improve efficiency
and stability while reducing the impact of freight rate changes in any single market.
Operational flexibility afforded by self-operated ships:
As a strategy, the Group holds a number of self-operated ships to keep itself alert to developments in the spot
market. These ships also serve a diversification purpose as the Group can move ships between long-term time
charters and self-operated in response to market volatility.
5.2.1.5 Long-term Outlook
Favorable factors
A young, diverse dry bulk fleet:
The Group has achieved economies of scale in a fleet consisting of a wide range of large, medium, and small
vessels. The young, well equipped, and energy efficient vessels are able to meet customer expectations and
provide a steady income under unstable market conditions.
Excellent ship quality:
When expanding its fleet, the Group tends to choose first class Japanese shipbuilding companies with an

Business Overview 94
excellent reputation and shipbuilding expertise in order to ensure quality of the vessels. Moreover, the
Group's long-term relationships with the shipbuilders establish trust between the companies, and make the
shipbuilders willing to offer the Group better terms. Should any plan for disposal be made in the future,
compared to similar models made by Chinese, South Korean, or Vietnamese shipbuilders, Japanese-built
vessels would be more popular with buyers and more likely to receive a premium on disposal.
Unfavorable factors and countermeasures
Recruitment difficult and seafarers less trained:
An increasing number of vessels in the last few years has led to a rising demand for seafarers. It has also led
to challenges in recruiting sufficient well trained seafarers, all of which create higher operating costs and
risks.
→Countermeasures:
In-house training - The Company started working with National Taiwan Ocean University in 2010. A
number of deck and engine internships are offered every year, and interns are trained and encouraged to
pursue key positions in the fleet.
More returning seafarers - As the fleet expands, the Company asks crew agencies to retain seafarers with
good performance scores and send them back to the Company's fleet, and not send those with
unsatisfactory scores.
Enforcement of preboarding orientation - The Company requires crew agencies gather seafarers before
boarding to complete training in order to familiarize them with the Company's policies and raise safety
awareness. In addition, the Company raises awareness by case study materials to keep seafarers vigilant.
Performance evaluation - The Company keeps records of seafares sent by crew agencies for annual
performance evaluation. The results are examined in order to decide whether to place more ships under
certain crew agencies.
A humanized management - We listen to the needs of its seafarers and endeavour to solve their problems
so to foster loyalty to the Company.
5.2.2 Application and production of key products
The Group is in the dry bulk shipping business and does not manufacture any goods or perform any production
process.
5.2.3 Supply status of primary raw materials
The Group provides shipping services, and therefore does not purchase any raw materials for production. There
are only the costs of fuels and lubricants for ships, which occupy a relatively larger percentage of the annual
operating costs. Depending on the length of voyage, route, weather conditions, and level of inventory, the Group
compares fuel prices and suppliers at different bunkering ports, and make purchases through brokers or directly
from suppliers in order to diversify sources and reduce costs.

Business Overview 95
5.2.4 List of Key Customers
5.2.4.1 Key Suppliers in Last Two Years
The Company provides shipping services, and therefore does not purchase any raw materials for production.
There are only the costs of fuels and lubricants for ships, which occupy a relatively large percentage of the annual
operating costs. Given lubricant requirements may vary from ship to ship, the Company works with four to five
international lubricant suppliers on a long-term basis. The Company usually asks for quotes and negotiates with
the suppliers before selecting a supplier offering the right specifications at an acceptable price. Since discounts are
often offered on large purchases, the Company tends to buy from the same suppliers. Meanwhile, factors to be
considered in fuel purchases include the length of voyage, route, weather conditions, and level of inventory as
well as fuel prices and suppliers at different bunkering ports. Source diversification and reduced costs are
achieved in the process.
Names of suppliers supplying 10% or more of purchases and the amounts and percentages of total
purchases:
Unit: NT$000; %
Note 1: USD amounts converted to TWD at an average exchange rate of 30.149 and 30.432 for 2018 and 2017, respectively.
Note 2: Figures for 2017 in the table above include lease expenses for two bulk carriers leased from Benefit Transport S.A. It technically is not a
supplier, and so is excluded in 2018 and onward.
5.2.4.2 Key Customers in Last Two Years
80% or more of the Group's operating income is income from ship leasing. Lessees are primarily well established
and managed European and Japanese shipping companies in long-term business relationships with the Group.
Glencore Shipping has been using a lot of the Group's energy efficient ships. It became the Group's largest
customer in 2015.
Year 2018 2017
Item Name Amount Net purchase
percentage
Relationship
with issuer Amount Item
Net purchase
percentage
Relationship
with issuer
1
Shell
Marine
Products
Limited
171,598 12.49% N/A
Shell
Marine
Products
Limited
189,947 12.64% N/A
2.
Benefit
Transport
S.A.
174,513 11.61% Other related
party
Other 1,202,320 87.51% Other 1,138,142 75.75%
Net
purchase 1,373,918 100.00%
Net
purchase 1,502,602 100.00%
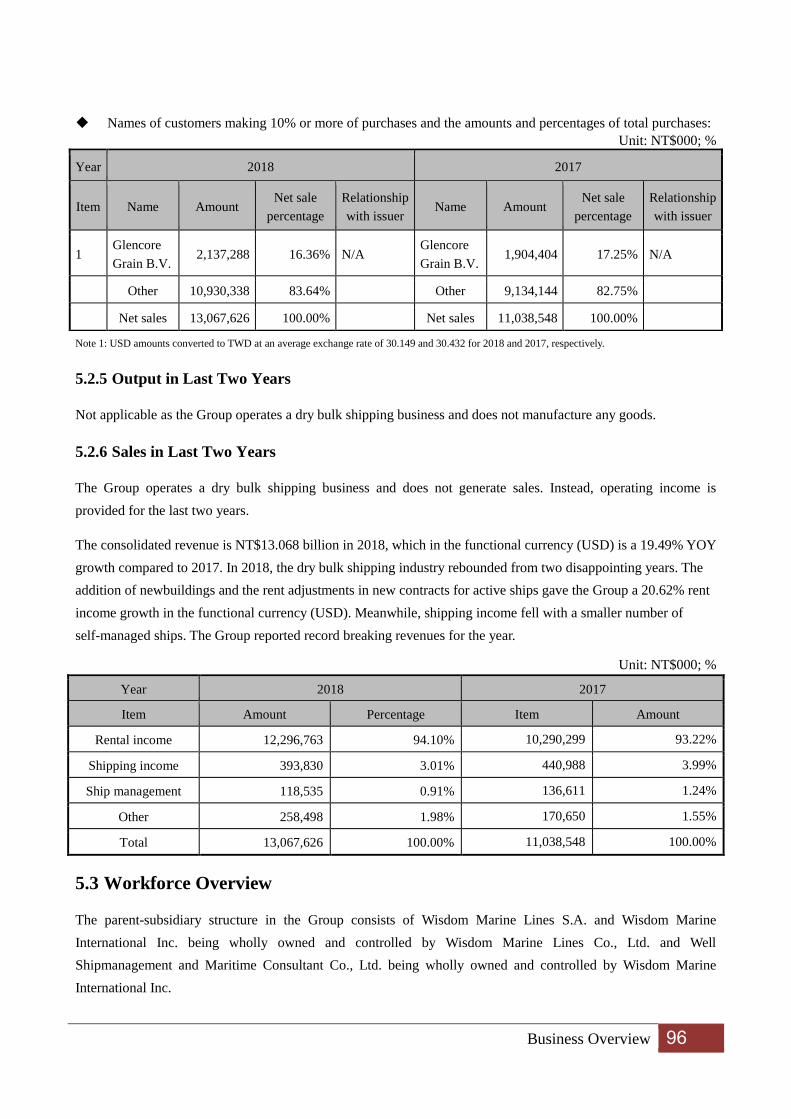
Business Overview 96
Names of customers making 10% or more of purchases and the amounts and percentages of total purchases:
Unit: NT$000; %
Note 1: USD amounts converted to TWD at an average exchange rate of 30.149 and 30.432 for 2018 and 2017, respectively.
5.2.5 Output in Last Two Years
Not applicable as the Group operates a dry bulk shipping business and does not manufacture any goods.
5.2.6 Sales in Last Two Years
The Group operates a dry bulk shipping business and does not generate sales. Instead, operating income is
provided for the last two years.
The consolidated revenue is NT$13.068 billion in 2018, which in the functional currency (USD) is a 19.49% YOY
growth compared to 2017. In 2018, the dry bulk shipping industry rebounded from two disappointing years. The
addition of newbuildings and the rent adjustments in new contracts for active ships gave the Group a 20.62% rent
income growth in the functional currency (USD). Meanwhile, shipping income fell with a smaller number of
self-managed ships. The Group reported record breaking revenues for the year.
Unit: NT$000; %
5.3 Workforce Overview
The parent-subsidiary structure in the Group consists of Wisdom Marine Lines S.A. and Wisdom Marine
International Inc. being wholly owned and controlled by Wisdom Marine Lines Co., Ltd. and Well
Shipmanagement and Maritime Consultant Co., Ltd. being wholly owned and controlled by Wisdom Marine
International Inc.
Year 2018 2017
Item Name Amount Net sale
percentage
Relationship
with issuer Name Amount
Net sale
percentage
Relationship
with issuer
1 Glencore
Grain B.V. 2,137,288 16.36% N/A
Glencore
Grain B.V. 1,904,404 17.25% N/A
Other 10,930,338 83.64% Other 9,134,144 82.75%
Net sales 13,067,626 100.00% Net sales 11,038,548 100.00%
Year 2018 2017
Item Amount Percentage Item Amount
Rental income 12,296,763 94.10% 10,290,299 93.22%
Shipping income 393,830 3.01% 440,988 3.99%
Ship management 118,535 0.91% 136,611 1.24%
Other 258,498 1.98% 170,650 1.55%
Total 13,067,626 100.00% 11,038,548 100.00%

Business Overview 97
The numbers of employees in the four companies under the Group are described as follows:
Wisdom Marine Lines Co., Ltd.
Between its establishment in 2008 and the publication date of this annual report, Wisdom Marine Lines has
consisted only of a management team that includes four employees: the chairman, the president, the
spokesperson, and the auditor. With the exception of the chairman, all employees are hired by Wisdom
Marine International on its behalf or employees of Wisdom Marine International.
Wisdom Marine Lines Co., Ltd. (Singapore Branch) was created in 2018. Plans are being made to hire
locally or have ship managers transferred from the headquarters.
Wisdom Marine Lines S.A.
Wisdom Marine Lines S.A. is a professional ship owner and controls all vessels in the Group via
subsidiaries. Seafarers are hired through recruitment agencies. It employs more than 2,600 seafarers at the
publishing date of this annual report.
Wisdom Marine International Inc.
Wisdom Marine International handles primarily administrative affairs for Wisdom Marine Lines. All
employees are part of an administrative staff. Following the change of organizational structure in July 2016,
the ship repair and maintenance departments were transferred to Well Shipmanagement and Maritime
Consultant.
Well Shipmanagement and Maritime Consultant Co., Ltd.
Well Shipmanagement and Maritime Consultant handles primarily ship management for the fleet of Wisdom
Marine Lines S.A. and other carriers. All employees are part of an administrative staff. Following the change
of organizational structure in July 2016, the ship repair and maintenance departments were transferred to
Year 2017 2018
Current year up to the
publication date of this
annual report
Number of
employees
The management 9 10 10
Non-managerial
employees 85 86 85
Total 94 96 95
Average age (year) 34.79 35.50 35.97
Average years of service 6.48 7.06 7.22
Education
background
Ph.D 0.0% 0.0% 0.0%
Master's 26.6% 24.0% 24.0%
University/College 68.1% 70.8% 70.9%
High school 5.3% 5.2% 5.1%
Below high school 0.0% 0.0% 0.0%

Business Overview 98
Well Shipmanagement and Maritime Consultant.
5.4 Environmental protection expenditure
5.4.1 Losses due to environmental pollution in last two years and up to the publication date of
this annual report
Date Description Total
losses/damages/disposal
Prospective
expenditure Countermeasure
2018/10/25
MV Daiwan Dolphin
entered the Poor Knights
Islands exclusion zone
(restricting undersea
noise) by mistake, and
received a warning and
fine from the local port
authority.
NT$294,000 (NZD14,000) None
The crew drove the vessel
immediately out of the area at
the port authority's warning.
The company sent a reminder
letter to the fleet to reiterate
the regulations regarding this
exclusion zone. The company
also had the Seaman Affairs
Department inform seaman
dispatch agencies to
strengthen preboarding
orientation and the Business
and Operation Department
reiterate onboard guidelines
in advance for the
corresponding routes.
5.4.2 Measures taken for environmental protection
Prevention of pollution by oil from ships has been implemented according to MARPOL Annex I.
Year 2017 2018
Current year up to the
publication date of this
annual report
Number of
employees
The management 4 5 5
Non-managerial
employees 45 52
54
Total 49 57 59
Average age (year) 35.93 36.42 36.77
Average years of service 4.71 4.88 4.75
Education
background
Ph.D 0.0% 0.0% 0.0%
Master's 34.7% 33.3% 32.2%
University/College 57.1% 61.4% 61.0%
High school 8.2% 5.3% 6.8%
Below high school 0.0% 0.0% 0.0%

Business Overview 99
Prevention of pollution by sewage from ships has been implemented according to MARPOL Annex IV.
Prevention of pollution by garbage from ships has been implemented according to MARPOL Annex V.
Prevention of air pollution from ships and energy efficiency management have been implemented according to
MARPOL Annex VI.
Ballast water management has been implemented according to the Ballast Water Management Convention.
5.5 Employer-employee relations
5.5.1 Employee benefits, continuing education, training, retirement systems and their
implementation as well as employer-employee agreements and various measures to protect
employee rights
5.5.1.1 Employee benefits
The Group provides employee benefits pursuant to the Labor Standard Act. The benefits include labor insurance,
health insurance, and group insurance. They also include bonuses and allowances provided by the Employee
Welfare Committee, such as childbirth allowance, hospital allowance, wedding gift, widow's allowance, and
birthday gift and cake.
5.5.1.2 Education and training
Internal training is provided as needed.
5.5.1.3 Retirement system and implementation status
The Company follows the new pension plan under the Labor Pension Act and contributes no less than 6% of
employee's monthly salary to the plan every month pursuant to the Labor Pension Act. The contributions are held
in personal pension accounts created by the Bureau of Labor Insurance. Other details are also handled as the law
requires.
Given past service is also recognized, the Company follows the Labor Standards Act and allocates 2% of total
employee salary to the pension reserve every month for employees except for those opt for the old labor pension
scheme. The contributions are deposited in the name of the Company's Pension Fund Oversight Committee into
the Bank of Taiwan, which handles collection, custody and management of the fund.
5.5.1.4 Employer-employee relations and measures to protect employee rights
The Group maintains strong employer-employee relations. To protect the rights of its employees, the Group has
implemented guidelines such as measures to prevent workplace sexual harassment and procedures for filing
complaints and taking disciplinary actions.

Business Overview 100
5.5.2 Losses due to labor disputes in last two years and up to the publication date of this
annual report
Date Description Losses incurred
so far
Prospective
expenditure
estimate
Countermeasure
2015/07/01
Captain Chang-Gung Chou sued
Wisdom Marine Lines S.A. and
Wisdom Marine International over
pension contributions.
NT$482,627 None
The Taiwan Taipei
District Court
delivered the final
judgment. (2017/8/31)
2015/07/21
Captain Chang-Gung Chou sued
Wisdom Marine Lines S.A. and
Wisdom Marine International over
distribution of special bonuses.
None None
The Taiwan Taipei
District Court
delivered the final
second instance
judgment in favor of
the Company.
(2017/03/27)
5.6 Major Contracts
5.6.1 Long-term Loan Agreements
Company Name Vessel Name Counterparty Contract
Date Period
Nature of
Contract
Restrictive
Clauses
Unicorn Bravo S.A. Unicorn Bravo Mega Bank, Chung Shan 2006/12/13 13 yrs from the
drawdown date
Loan
Agreement None
Unicorn Logger S.A. Unicorn Logger Mega Bank, Chung Shan 2006/12/13 13 yrs from the
drawdown date
Loan
Agreement None
Euroasia Investment
S.A. Beagle VII Mega Bank, Central 2007/1/19
13 yrs from the
drawdown date
Loan
Agreement None
Arikun Wisdom S.A. Arikun Hua Nan Bank, Hsin Wei 2007/6/13 13 yrs from the
drawdown date
Loan
Agreement None
Harmony Pescadores
S.A. (Panama) Izumo Mega Bank, Chung Shan 2007/12/7
15 yrs from the
drawdown date
Loan
Agreement None
Poavosa Wisdom
S.A.
Poavosa
Wisdom Credit Suisse 2008/5/28
10 yrs from the
drawdown date
Loan
Agreement None
Babuza Wisdom S.A. Babuza
Wisdom Mega Bank, Chung Shan 2008/6/2
13 yrs from the
drawdown date
Loan
Agreement None
Pazeh Wisdom S.A. Pazeh Wisdom Mega Bank, Chung Shan 2008/6/2 13 yrs from the
drawdown date
Loan
Agreement None
Unicorn Logistics
S.A. Bizen Hua Nan Bank, Hsin Wei 2009/2/16
12 yrs from the
drawdown date
Loan
Agreement None
Log Wisdom S.A. Genius Star IX Hua Nan Bank, Hsin Wei 2009/8/24 13 yrs from the
drawdown date
Loan
Agreement None
Paiwan Wisdom S.A. Amis Wisdom
III
Mega Bank, Central
(Syndicate) 2009/9/8
12.5 yrs from the
drawdown date
Loan
Agreement None

Business Overview 101
Company Name Vessel Name Counterparty Contract
Date Period
Nature of
Contract
Restrictive
Clauses
Saysiat Wisdom S.A. Amis Wisdom
VI
Mega Bank, Central
(Syndicate) 2009/9/8
12.5 yrs from the
drawdown date
Loan
Agreement None
GSX Maritime S.A. Genius Star X Mega Bank, Central
(Syndicate) 2009/9/8
12.5 yrs from the
drawdown date
Loan
Agreement None
Atayal Wisdom S.A. Poavosa
Wisdom III
Mega Bank, Central
(Syndicate) 2009/9/8
12.5 yrs from the
drawdown date
Loan
Agreement None
Bunun Wisdom S.A. Poavosa
Wisdom VI
Mega Bank, Central
(Syndicate) 2009/9/8
12.5 yrs from the
drawdown date
Loan
Agreement None
Tao Brave S.A. Tao Brave Mega Bank, Central
(Syndicate) 2009/9/8
12.5 yrs from the
drawdown date
Loan
Agreement None
Tao Mariner S.A. Tao Mariner Mega Bank, Central
(Syndicate) 2009/9/8
12.5 yrs from the
drawdown date
Loan
Agreement None
Favoran Wisdom S.A. Mino Hua Nan Bank, Hsin Wei 2009/10/1 13 yrs from the
drawdown date
Loan
Agreement None
Mimasaka Investment
S.A. Mimasaka
Cooperative Bank,
Business 2010/1/12
12 yrs from the
drawdown date
Loan
Agreement None
Sao Wisdom S.A. Global Faith Shin Kong Bank,
Dunnan 2010/2/9
13.5 yrs from the
drawdown date
Loan
Agreement None
Taokas Marine S.A. Daiwan
Wisdom CTBC Bank, Dunnan 2010/5/19
11 yrs from the
drawdown date
Loan
Agreement None
Rukai Maritime S.A. Naluhu Shin Kong Bank,
Dunnan 2010/5/25
13.5 yrs from the
drawdown date
Loan
Agreement None
Amis Wisdom S.A. Amis Wisdom I Mega Bank, Chung Shan 2010/6/15 15 yrs from the
drawdown date
Loan
Agreement None
Makatao Wisdom
S.A.
Amis Wisdom
II Mega Bank, Chung Shan 2010/7/21
15 yrs from the
drawdown date
Loan
Agreement None
Dumun Navigation
S.A.
Frontier
Bonanza First Bank, Ho Ping 2010/10/11
15 yrs from the
drawdown date
Loan
Agreement None
Ligulao Wisdom S.A. Ligulao Hua Nan Bank, Hsin Wei 2010/11/16 13 yrs from the
drawdown date
Loan
Agreement None
Sakizaya Wisdom
S.A.
Sakizaya
Wisdom Land Bank, Ho Ping 2011/5/24
8 yrs from the
drawdown date
Loan
Agreement None
Vayi Wisdom S.A. LBC Energy Cooperative Bank, Hsin
Wei 2011/7/25
12 yrs from the
drawdown date
Loan
Agreement None
Atayal Mariner S.A. Atayal Ace E. Sun Bank (Syndicate) 2011/7/28 8 yrs from the
drawdown date
Loan
Agreement None
Atayal Brave S.A. Atayal Brave E. Sun Bank (Syndicate) 2011/7/28 8 yrs from the
drawdown date
Loan
Agreement None
Atayal Star S.A. Atayal Star E. Sun Bank (Syndicate) 2011/7/28 8 yrs from the
drawdown date
Loan
Agreement None
Unicorn Successor
S.A. Taikli
Taipei Fubon Bank, An
Ho 2011/7/29
8.5 yrs from the
drawdown date
Loan
Agreement None

Business Overview 102
Company Name Vessel Name Counterparty Contract
Date Period
Nature of
Contract
Restrictive
Clauses
Atayal Mariner S.A. Atayal Mariner Bank SinoPac 2011/9/22 8 yrs from the
drawdown date
Loan
Agreement None
Amis Navigation S.A. Amis Brave Cooperative Bank, Hsin
Wei (Syndicate) 2011/12/21
8.5 yrs from the
drawdown date
Loan
Agreement None
Bunun Marine S.A. Bunun Ace Cooperative Bank, Hsin
Wei (Syndicate) 2011/12/21
8.5 yrs from the
drawdown date
Loan
Agreement None
Bunun Navigation
S.A. Bunun Wisdom
Cooperative Bank, Hsin
Wei (Syndicate) 2011/12/21
8.5 yrs from the
drawdown date
Loan
Agreement None
GS Navigation S.A. Genius Star XI Cooperative Bank, Hsin
Wei (Syndicate) 2011/12/21
8.5 yrs from the
drawdown date
Loan
Agreement None
GS Global S.A. Genius Star XII Cooperative Bank, Hsin
Wei (Syndicate) 2011/12/21
8.5 yrs from the
drawdown date
Loan
Agreement None
Katagalan Line S.A. Katagalan
Wisdom III
Cooperative Bank, Hsin
Wei (Syndicate) 2011/12/21
8.5 yrs from the
drawdown date
Loan
Agreement None
Poavosa International
S.A.
Poavosa
Wisdom VII
Cooperative Bank, Hsin
Wei (Syndicate) 2011/12/21
8.5 yrs from the
drawdown date
Loan
Agreement None
Poavosa Maritime
S.A.
Poavosa
Wisdom VIII
Cooperative Bank, Hsin
Wei (Syndicate) 2011/12/21
8.5 yrs from the
drawdown date
Loan
Agreement None
Tao Ace S.A. Tao Ace Cooperative Bank, Hsin
Wei (Syndicate) 2011/12/21
8.5 yrs from the
drawdown date
Loan
Agreement None
Tao Treasure S.A. Tao Treasure Cooperative Bank, Hsin
Wei (Syndicate) 2011/12/21
8.5 yrs from the
drawdown date
Loan
Agreement None
Kavalan Wisdom
S.A. Blue Horizon First Bank, Ho Ping 2012/3/6
8 yrs from the
drawdown date
Loan
Agreement None
Katagalan Wisdom
S.A. Clear Horizon Land Bank, Ho Ping 2012/7/5
8 yrs from the
drawdown date
Loan
Agreement None
Sakizaya Marine S.A. Sakizaya Ace Mega Bank, Chung Shan 2013/1/30 8 yrs from the
drawdown date
Loan
Agreement None
Amis Star S.A. Amis Ace First Bank, Ho Ping
(Syndicate) 2013/4/24
8.5 yrs from the
drawdown date
Loan
Agreement None
Amis Mariner S.A. Amis
Champion
First Bank, Ho Ping
(Syndicate) 2013/4/24
8.5 yrs from the
drawdown date
Loan
Agreement None
Amis Carriers S.A. Amis Dolphin First Bank, Ho Ping
(Syndicate) 2013/4/24
8.5 yrs from the
drawdown date
Loan
Agreement None
Sakizaya Line S.A. Sakizaya Brave First Bank, Ho Ping
(Syndicate) 2013/4/24
8.5 yrs from the
drawdown date
Loan
Agreement None
Katagalan Navigation
S.A. Scarlet Eagle
First Bank, Ho Ping
(Syndicate) 2013/4/24
8.5 yrs from the
drawdown date
Loan
Agreement None
Amis International
S.A. Scarlet Falcon
First Bank, Ho Ping
(Syndicate) 2013/4/24
8.5 yrs from the
drawdown date
Loan
Agreement None
Sakizaya Navigation
S.A.
Sakizaya
Champion Mega Bank, Central 2013/7/1
8 yrs from the
drawdown date
Loan
Agreement None

Business Overview 103
Company Name Vessel Name Counterparty Contract
Date Period
Nature of
Contract
Restrictive
Clauses
Poavosa Navigation
S.A. Poavosa Ace Credit Suisse 2013/9/16
10 yrs from the
drawdown date
Loan
Agreement None
Infinite Wisdom S.A. Daiwan Ace SLSS SHIPPING S.A.
(Showa Leasing) 2014/1/14
5.5 yrs from the
drawdown date
Loan
Agreement None
Daiwan Champion
S.A.
Daiwan
Champion
Amberjack Marine
S.A.(Tokyo Century) 2014/3/28
7 yrs from the
drawdown date
Loan
Agreement None
Katagalan Carriers
S.A. Scarlet Rosella
Dialease Maritime S.A.
(MUJFL) 2014/3/28
15 yrs from the
drawdown date
Loan
Agreement None
Katagalan Star S.A. Daiwan Brave NordL/B 2014/3/28 12 yrs from the
drawdown date
Loan
Agreement None
Bunun Fortune S.A. Bunun Fortune Dialease Maritime S.A.
(MUJFL) 2014/4/25
5 yrs from the
drawdown date
Loan
Agreement None
Daiwan Dolphin S.A. Daiwan
Dolphin
Amberjack Marine
S.A.(Tokyo Century) 2014/5/23
7 yrs from the
drawdown date
Loan
Agreement None
Bunun Brave S.A. Bunun Brave Credit Suisse 2014/6/30 10 yrs from the
drawdown date
Loan
Agreement None
Bunun Champion Bunun
Champion Credit Suisse 2014/6/30
10 yrs from the
drawdown date
Loan
Agreement None
Bunun Elegance S.A. Bunun
Elegance Mega Bank, Central 2014/9/2
8 yrs from the
drawdown date
Loan
Agreement None
Daiwan Elegance
S.A.
Daiwan
Elegance Mega Bank, Chung Shan 2014/9/2
8 yrs from the
drawdown date
Loan
Agreement None
Daiwan Fortune S.A. Daiwan
Fortune Mega Bank, Chung Shan 2014/9/2
8 yrs from the
drawdown date
Loan
Agreement None
Bunun Dynasty S.A. Bunun Dynasty BNP Paribas 2014/10/21 8 yrs from the
drawdown date
Loan
Agreement None
Amis Fortune S.A. Amis Fortune Dialease Maritime S.A.
(MUJFL) 2014/11/17
7 yrs from the
drawdown date
Loan
Agreement None
Daiwan Glory S.A. Daiwan Glory SLSS SHIPPING S.A.
(Showa Leasing) 2014/12/12
5 yrs from the
drawdown date
Loan
Agreement None
Sakizaya Diamond
S.A.
Sakizaya
Diamond
Bank of Taiwan, Hsin
Chuang 2015/1/6
8.5 yrs from the
drawdown date
Loan
Agreement None
Amis Elegance S.A. Amis Elegance Nordea 2015/1/12 6 yrs from the
drawdown date
Loan
Agreement None
Harmony Transport
S.A. Genius Star VII Sunny Bank, Pan Chiao 2015/1/19
5 yrs from the
drawdown date
Loan
Agreement None
Fourseas Mritime
S.A. Panama Bunun Glory First Bank, Ho Ping 2015/3/20
8 yrs from the
drawdown date
Loan
Agreement None
Bunun Hero S.A. Bunun Hero NordL/B 2015/7/9 10 yrs from the
drawdown date
Loan
Agreement None
Sakizaya Fortune
S.A.
Sakizaya
Future Mega Bank, Central 2015/11/19
8 yrs from the
drawdown date
Loan
Agreement None

Business Overview 104
Company Name Vessel Name Counterparty Contract
Date Period
Nature of
Contract
Restrictive
Clauses
Triumph Wisdom
S.A. Amis Glory
Dialease Maritime S.A.
(MUJFL) 2015/12/9
6 yrs from the
drawdown date
Loan
Agreement None
Siraya Wisdom S.A. Siraya Wisdom Dialease Maritime S.A.
(MUJFL) 2015/12/9
7 yrs from the
drawdown date
Loan
Agreement None
Daiwan Justice S.A. Daiwan Justice Mega Bank, Chung Shan 2016/3/7 8 yrs from the
drawdown date
Loan
Agreement None
Daiwan Kalon S.A. Daiwan Kalon Mega Bank, Chung Shan 2016/3/11 8 yrs from the
drawdown date
Loan
Agreement None
Daiwan Hero S.A. Daiwan Hero Bank of Taiwan
(Syndicate) 2016/4/18
8.5 yrs from the
drawdown date
Loan
Agreement None
Daiwan Infinity S.A. Daiwan Infinity Bank of Taiwan
(Syndicate) 2016/4/18
8.5 yrs from the
drawdown date
Loan
Agreement None
Sakizaya Justice S.A. Sakizaya
Justice
Bank of Taiwan
(Syndicate) 2016/4/18
8.5 yrs from the
drawdown date
Loan
Agreement None
Hoanya Wisdom S.A. Hoanya
Wisdom
The Higashi Nippon
Bank 2016/5/25
7 yrs from the
drawdown date
Loan
Agreement None
Taokas Wisdom S.A. Taokas Wisdom The Higashi Nippon
Bank 2016/5/25
7 yrs from the
drawdown date
Loan
Agreement None
Sakizaya Hero S.A. Sakizaya Hero Bank SinoPac 2016/7/28 5 yrs from the
drawdown date
Loan
Agreement None
Winsome Wisdom
S.A. Ocean Victory First Bank, Ho Ping 2016/8/4
3 yrs from the
drawdown date
Loan
Agreement None
Bunun Infinity S.A. Bunun Infinity Hua Nan Bank, Hsin Wei 2016/9/6 8.5 yrs from the
drawdown date
Loan
Agreement None
Sakizaya Integrity
S.A.
Sakizaya
Integrity
Bank of Taiwan, Hsin
Chuang 2016/9/29
8.5 yrs from the
drawdown date
Loan
Agreement None
Katagalan Marine
S.A.
Katagalan
Wisdom Bank SinoPac 2016/10/21
5 yrs from the
drawdown date
Loan
Agreement None
Mount Wisdom S.A. Beagle VI Grand Capital
International Ltd. 2016/12/23
5 yrs from the
drawdown date
Loan
Agreement None
Elite Wisdom S.A. Pacific Venus Grand Capital
International Ltd. 2016/12/23
5 yrs from the
drawdown date
Loan
Agreement None
Fraternity Ship
Investment S.A. Beagle II Sunny Bank, Pan Chiao 2016/12/30
5 yrs from the
drawdown date
Loan
Agreement None
Amis Hero S.A. Amis Hero Chang Hwa Bank 2017/3/24 8 yrs from the
drawdown date
Loan
Agreement None

Business Overview 105
Company Name Vessel Name Counterparty Contract
Date Period
Nature of
Contract
Restrictive
Clauses
Wisdom Marine
Lines Co., Ltd.
Collateral:
Hibiscus,
Magnate,
Wisdom Grace,
Genius Star
VIII; Frontier
Bonanza (2nd
preferred
mortgage)
First Bank, Ho Ping
(Syndicate) 2017/3/29
3 yrs from the
drawdown date
Loan
Agreement None
Sakizaya Kalon S.A. Sakizaya Kalon Mega Bank, Central 2017/4/5 8 yrs from the
drawdown date
Loan
Agreement None
Sakizaya Leader S.A. Sakizaya
Leader Mega Bank, Central 2017/4/5
8 yrs from the
drawdown date
Loan
Agreement None
Bunun Justice S.A. Bunun Justice Bank of Taiwan, Lian
Cheng 2017/4/5
8.5 yrs from the
drawdown date
Loan
Agreement None
Papora Wisdom S.A. Papora Wisdom Taichung Bank, Song
Shan 2017/6/30
5 yrs from the
drawdown date
Loan
Agreement None
Amis Integrity S.A. Amis Integrity SLSS SHIPPING S.A.
(Showa Leasing) 2017/7/6
5 yrs from the
drawdown date
Loan
Agreement None
Amis Justice S.A. Amis Justice The Iyo Bank 2017/8/22 8 yrs from the
drawdown date
Loan
Agreement None
Sakizaya Power S.A. Sakizaya Power Hua Nan Bank, Hsin Wei 2017/8/25 8.5 yrs from the
drawdown date
Loan
Agreement None
Sakizaya Orchid S.A. Sakizaya
Orchid Bank SinoPac 2017/10/6
5 yrs from the
drawdown date
Loan
Agreement None
Genius Star
Navigation S.A. Genius Star III
Bank of Panhsin, Min
Sheng 2017/10/16
3 yrs from the
drawdown date
Loan
Agreement None
Genius Prince S.A. Sakizaya Noble BNP Paribas 2017/12/21 8 yrs from the
drawdown date
Loan
Agreement None
Amis Miracle S.A. Amis Miracle Bank SinoPac 2017/12/21 5 yrs from the
drawdown date
Loan
Agreement None
Genius Star Carriers
S.A. Joseph Wisdom The Iyo Bank 2018/1/4
8 yrs from the
drawdown date
Loan
Agreement None
Adixi Wisdom S.A. Bunun Kalon En Tie Bank 2018/1/5 5 yrs from the
drawdown date
Loan
Agreement None
Sakizaya Respect
S.A.
Sakizaya
Respect BNP Paribas 2018/4/11
8 yrs from the
drawdown date
Loan
Agreement None
Sakizaya Miracle
S.A.
Sakizaya
Miracle
Taichung Bank
(Syndicate) 2018/4/27
5 yrs from the
drawdown date
Loan
Agreement None
Dumun Marine S.A. Amis Leader En Tie Bank 2018/6/27 5 yrs from the
drawdown date
Loan
Agreement None
Guma Marine S.A. Amis Kalon En Tie Bank 2018/6/27 5 yrs from the
drawdown date
Loan
Agreement None

Business Overview 106
Company Name Vessel Name Counterparty Contract
Date Period
Nature of
Contract
Restrictive
Clauses
Tao Star S.A. Tao Star Bank SinoPac 2018/7/24 5 yrs from the
drawdown date
Loan
Agreement None
Amis Nature Inc. Amis Nature Cooperative Bank, Hsin
Wei 2018/7/30
8 yrs from the
drawdown date
Loan
Agreement None
Genius Marine S.A. Amis Power New Roman S.A.
(ORIX) 2018/9/7
10 yrs from the
drawdown date
Loan
Agreement None
Daiwan Leader S.A. Daiwan Leader Shinsei Bank 2018/11/14 5 yrs from the
drawdown date
Loan
Agreement None
Daiwan Miracle S.A. Daiwan
Miracle Bank SinoPac 2019/3/26
5 yrs from the
drawdown date
Loan
Agreement None
5.6.2 Newbuilding Contracts
Company Name Vessel Name Counterparty Contract Date Delivery (Est.) Vessel Type Restrictive
Clauses
Wisdom Marine Lines
S.A. Daiwan Miracle Namura Shipbuilding Co. 2015/9/25 2019/Apr
34,000 dwt
bulk carrier None
Wisdom Marine Lines
S.A. Bunun Leader Giant Line Inc., S.A. 2017/10/31 2019/Jul
37,600 dwt
bulk carrier None
Wisdom Marine Lines
S.A. 8039
Kawasaki Heavy
Industries, Ltd. 2017/12/27 2019/Nov
61,000 dwt
bulk carrier None
Wisdom Marine Lines
S.A. 8040
Kawasaki Heavy
Industries, Ltd. 2017/12/27 2019/Dec
61,000 dwt
bulk carrier None
Wisdom Marine Lines
S.A. Amis Respect Giant Line Inc., S.A. 2016/11/9 2020/Q1
63,000 dwt
bulk carrier None
Wisdom Marine Lines
S.A. 1746
Kawasaki Heavy
Industries, Ltd. 2018/12/14 2020/Q1
61,000 dwt
bulk carrier None
Wisdom Marine Lines
S.A. S909 Giant Line Inc., S.A. 2018/1/24 2020/Q2
37,800 dwt
bulk carrier None
Wisdom Marine Lines
S.A. S-939 Giant Line Inc., S.A. 2018/1/24 2020/Q3
37,800 dwt
bulk carrier None
Wisdom Marine Lines
S.A. 5219
Japan Marine United
Corporation 2018/3/20 2020/Q3
82,400 dwt
bulk carrier None
Wisdom Marine Lines
S.A. 5220
Japan Marine United
Corporation 2018/3/20 2020/Q3
82,400 dwt
bulk carrier None
Wisdom Marine Lines
S.A. SS266
Tsuneishi Group
(Zhoushan) Shipbuilding
Inc.
2018/12/27 2020/Q4 63,300 dwt
bulk carrier None
Wisdom Marine Lines
S.A. 5366
Japan Marine United
Corporation 2018/7/26 2021/Q2
82,400 dwt
bulk carrier None
Wisdom Marine Lines
S.A. 5377
Japan Marine United
Corporation 2018/11/29 2021/Q2
82,400 dwt
bulk carrier None

Business Overview 107
5.6.3 Time Charter Parties
Company Name Vessel Name Counterparty Contract
Date Period
Nature of
Contract
Restrictive
Clauses
Amis Mariner S.A. Amis Champion Glencore Grain B.V. 2013/7/30 8 yrs from the
delivery Time Charter None
Amis Carriers S.A. Amis Dolphin Glencore Grain B.V. 2013/7/30 8 yrs from the
delivery Time Charter None
Amis Justice S.A. Amis Justice Glencore Agriculture
B.V. 2017/3/24
3 yrs from the
delivery Time Charter None
Dumun Marine S.A. Amis Leader 24Vision Chartering
Solutions DMCC 2017/3/24
2 yrs from the
delivery Time Charter None
Amis Miracle S.A. Amis Miracle
Trafigura Maritime
Logistics Pte. Ltd.,
Singapore
2017/9/25 3 yrs from the
delivery Time Charter None
Wisdom Marine Lines
S.A. Amis Queen Shoei Kisen Kaisha, Ltd. 2018/10/31
5 yrs from the
delivery
Time
Charter-in None
Wisdom Marine Lines
S.A. Amis Queen
Glencore Agriculture
B.V. 2017/3/24
5 yrs from the
delivery Time Charter None
Kavalan Wisdom S.A. Blue Horizon Nippon Yusen Kaisha,
Tokyo, Japan 2012/5/7
15 yrs from the
delivery Time Charter None
Bunun Marine SA Bunun Ace Pacific Basin Chartering
Limited BVI 2013/4/8
7 yrs from the
delivery Time Charter None
Bunun Champion S.A. Bunun Champion
Agriculture & Energy
Carriers Limited,
Bahamas
2017/9/27 2 yrs from the
delivery Time Charter None
Bunun Dynasty S.A. Bunun Dynasty The China Navigation
Co. Pte. Ltd 2013/5/28
5 yrs from the
delivery Time Charter None
Bunun Fortune S.A. Bunun Fortune Lauritzen Bulkers A/S,
Copenhagen, Denmark 2013/12/27
5 yrs from the
delivery Time Charter None
Fourseas Maritime
S.A. Panama Bunun Glory
24Vision Chartering
Solutions DMCC 2015/3/20
2 yrs from the
delivery Time Charter None
Bunun Justice S.A. Bunun Justice Seatrek Trans Pte Ltd 2016/11/28 2 yrs from the
delivery Time Charter None
Adixi Wisdom S.A. Bunun Kalon COFCO Agri Freight
S.A. 2017/10/30
2 yrs from the
delivery Time Charter None
Katagalan Wisdom
S.A. Clear Horizon
Nippon Yusen Kaisha,
Tokyo, Japan 2012/6/4
15 yrs from the
delivery Time Charter None
Daiwan Champion
S.A. Daiwan Champion
Pacific Basin Chartering
Limited BVI 2013/7/11
5 yrs from the
delivery Time Charter None
Daiwan Dolphin S.A. Daiwan Dolphin Pacific Basin Chartering
Limited BVI 2013/7/11
5 yrs from the
delivery Time Charter None
Daiwan Fortune S.A. Daiwan Fortune Lauritzen Bulkers A/S,
Copenhagen, Denmark 2013/8/23
5 yrs from the
delivery Time Charter None

Business Overview 108
Company Name Vessel Name Counterparty Contract
Date Period
Nature of
Contract
Restrictive
Clauses
Dumun Navigation
S.A. Frontier Bonanza
Nippon Yusen Kaisha,
Tokyo, Japan 2010/9/1
15 yrs from the
delivery Time Charter None
Genius Star Carriers
S.A. Joseph Wisdom Geogas Trading S.A. 2016/2/26
6 yrs from the
delivery Time Charter None
Vayi Wisdom S.A. LBC Energy NYK Bulkship (Atlantic)
N.V., Antwerp, Belgium 2011/9/1
15 yrs from the
delivery Time Charter None
Ligulao Wisdom S.A. Ligulao Eastern Car Liner, Ltd. 2010/8/26 3 yrs from the
delivery Time Charter None
Mimasaka Investment
S.A. Mimasaka
NYK-HINODE Line,
Ltd., Tokyo 2009/11/26
15 yrs from the
delivery Time Charter None
Favoran Wisdom S.A. Mino NYK-HINODE Line,
Ltd., Tokyo 2009/8/26
15 yrs from the
delivery Time Charter None
Winsome Wisdom
S.A. Ocean Victory Eastern Car Liner, Ltd. 2016/5/20
3 yrs from the
delivery Time Charter None
Bunun Wisdom S.A. Poavosa Wisdom VI Navision Shipping
Company A/S 2013/6/26
5 yrs from the
delivery Time Charter None
Sakizaya Line S.A. Sakizaya Brave Glencore Grain B.V. 2018/3/30 3 yrs from the
delivery Time Charter None
Sakizaya Diamond
S.A. Sakizaya Diamond Glencore Grain B.V. 2013/6/25
8 yrs from the
delivery Time Charter None
Sakizaya Glory S.A. Sakizaya Elegance Glencore Grain B.V. 2013/6/25 8 yrs from the
delivery Time Charter None
Sakizaya Glory S.A. Sakizaya Glory Noble Resources
International Pte. Ltd 2017/2/24
2 yrs from the
delivery Time Charter None
Sakizaya Kalon S.A. Sakizaya Kalon Glencore Agriculture
B.V. 2017/3/24
2 yrs from the
delivery Time Charter None
Sakizaya Leader S.A. Sakizaya Leader Noble Resources
International Pte. Ltd 2017/3/24
2 yrs from the
delivery Time Charter None
Sakizaya Miracle S.A. Sakizaya Miracle Glencore Agriculture
B.V. 2017/1/20
2 yrs from the
delivery Time Charter None
Genius Prince S.A. Sakizaya Noble Glencore Agriculture
B.V. 2017/8/28
3 yrs from the
delivery Time Charter None
Sakizaya Orchid S.A. Sakizaya Orchid COFCO Agri Freight
S.A. 2017/8/28
5 yrs from the
delivery Time Charter None
Sakizaya Power S.A. Sakizaya Power COFCO Agri Freight
S.A. 2017/8/28
5 yrs from the
delivery Time Charter None
Sakizaya Queen S.A. Sakizaya Queen COFCO Agri Freight
S.A. 2017/9/25
5 yrs from the
delivery Time Charter None
Sakizaya Wisdom
S.A. Sakizaya Wisdom Glencore Grain B.V. 2011/9/13
6 yrs from the
delivery Time Charter None
Katagalan Navigation
S.A. Scarlet Eagle TSC0212 Shipping S.A. 2014/8/5
15 yrs from the
delivery Time Charter None

Business Overview 109
Company Name Vessel Name Counterparty Contract
Date Period
Nature of
Contract
Restrictive
Clauses
Amis International
S.A. Scarlet Falcon OSC10646 Shipping S.A. 2014/3/7
15 yrs from the
delivery Time Charter None
Katagalan Carriers
S.A. Scarlet Rosella OSC10706 Shipping S.A. 2015/2/17
15 yrs from the
delivery Time Charter None
Unicorn Successor
S.A. Taikli Eastern Car Liner, Ltd. 2011/4/8
3 yrs from the
delivery Time Charter None
5.6.4 Bareboat Charter Parties
Company Name Vessel Name Counterparty Contract
Date Period
Nature of
Contract
Restricti
ve
Clauses
Unicorn Marine S.A. Poavosa Brave Gines Investments
Limited 2012/10/29
7 yrs from the
delivery
Bareboat
Charter None
Sakizaya Glory S.A. Sakizaya Elegance Norma Shipping
Cooperation 2015/10/16
9.5 yrs from the
delivery
Bareboat
Charter None
Sakizaya Glory S.A. Sakizaya Glory Marineway Shipping
Corporation 2016/3/3
9.5 yrs from the
delivery
Bareboat
Charter None
Taroko Wisdom S.A. Wisdom Grace Benefit Transport S.A. 2016/9/30
2 yrs from the
delivery,
extended to
2019/9
Bareboat
Charter None
Taroko Maritime S.A. Amis Orchid Zelkova Maritime S.A. 2017/7/12 7 yrs from the
delivery
Bareboat
Charter None
Sakizaya Queen S.A. Sakizaya Queen Sea Green Shipping, S.A. 2018/1/12 7 yrs from the
delivery
Bareboat
Charter None
Taokas Navigation
S.A. Paiwan Wisdom Fortunate Transport S.A. 2018/8/24
7 yrs from the
delivery
Bareboat
Charter None
Wisdom Marine Lines
Co., Ltd. Mega Benefit Sea Green Shipping, S.A. 2018/12/28
7 yrs from the
delivery
Bareboat
Charter None
5.6.5 Ship Management Contract
Company Name Vessel Name Counterparty Contract Date Period Nature of
Contract
Restrictive
Clauses
Wisdom Marine
Lines S.A. Ital Massima
Rich
Containership S.A. 2008/09/11
This Agreement shall
remain in effect unless
either party notifies the
counterparty in writing
3 months prior to the
intended termination
date.
Ship
Management
Contract
None
Wisdom Marine
Lines S.A. Ital Melodia
Prosperity
Containership S.A. 2008/12/10
This Agreement shall
remain in effect unless
Ship
Management None

Business Overview 110
Company Name Vessel Name Counterparty Contract Date Period Nature of
Contract
Restrictive
Clauses
either party notifies the
counterparty in writing
3 months prior to the
intended termination
date.
Contract
Wisdom Marine
Lines S.A.
As nominated by
Owner
Benefit Transport
S.A. 2017/5/31
This Agreement shall
remain in effect unless
either party notifies the
counterparty in writing
30 days prior to the
intended termination
date.
Ship
Management
Contract
None

Financial Information 111
6. Financial Information
6.1 Five-Year Financial Summary
6.1.1 Condensed Balance Sheet
6.1.1.1 Consolidated Condensed Balance Sheet
Unit: NT$000
Year
Item
Financial Summary for The Last Five Years(Note 1)
2014 2015 2016 2017 2018
Current assets 2,544,343 3,844,623 2,810,558 3,565,183 3,339,375
Property, Plant and Equipment 67,105,393 76,440,994 79,463,626 79,416,557 84,196,177
Intangible assets - - - - -
Other assets 4,894,684 3,897,624 3,377,431 1,992,453 1,399,300
Total assets 74,544,420 84,183,241 85,651,615 84,974,193 88,934,852
Current
liabilities
Before distribution 8,449,320 7,712,237 11,294,297 10,033,331 12,075,235
After distribution
(Note 2) 9,903,444 8,997,989 11,851,161 10,650,039 13,029,526
Non-current liabilities 39,374,472 46,870,494 45,492,249 48,741,101 48,752,324
Total
liabilities
Before distribution 47,823,792 54,582,731 56,786,546 58,774,432 60,827,559
After distribution
(Note 2) 49,277,916 55,868,483 57,343,410 59,391,140 61,781,850
Equity attributable to
shareholders of the parent 26,559,921 29,452,520 28,749,479 26,199,761 28,107,293
Common stock 4,705,131 5,142,401 5,549,741 6,167,076 6,298,055
Capital
surplus
Before distribution 2,757,982 2,523,318 1,971,794 1,612,164 1,250,933
After distribution
(Note 2) 1,303,858 1,237,566 1,414,930 995,456 296,642
Legal reserve - - 224 224 224
Retained
earnings
Before distribution 7,982,498 10,266,588 11,625,111 12,043,086 13,851,985
After distribution
(Note 2) 7,982,498 10,226,588 11,625,111 12,043,086 13,851,985
Other equity interest 11,114,310 11,560,213 9,602,609 6,377,211 6,706,096
Treasury stock - - - - -
Non-controlling interest 160,707 147,990 115,590 - -
Total Before distribution 26,720,628 29,600,510 28,865,069 26,199,761 28,107,293

Financial Information 112
Year
Item
Financial Summary for The Last Five Years(Note 1)
2014 2015 2016 2017 2018
equity After distribution
(Note 2) 25,266,504 28,314,758 28,308,205 25,583,053 27,153,002
Note 1:The data for 2014~2018 are based on consolidated financial statement already audited and certified by CPAs.
Note 2:The Distribution of 2018 has approves by the Board of Director on March 29, 2019 and submitted to the AGM for approval by the
shareholders of the Company.
6.1.1.2 Consolidated Condensed Statement of Comprehensive Income
Unit: NT$000
Year
Item
Financial Summary for The Last Five Years(Note 1)
2014 2015 2016 2017 2018
Operating revenues 9,056,880 11,011,958 10,678,876 11,038,548 13,067,626
Gross profit 1,871,513 2,652,944 1,754,521 2,036,269 3,636,284
Profit from operating activities 1,729,810 2,439,078 1,601,177 1,876,056 3,474,823
Non-operating income and expense 74,117 -189,186 -204,096 -1,457,072 -1,661,595
Profit before income tax 1,803,927 2,249,892 1,397,081 418,984 1,813,228
Profit before income tax 1,803,927 2,249,892 1,397,081 418,984 1,813,228
Profit for the year - - - - -
Other comprehensive income
(income after tax) 1,803,393 2,249,398 1,393,186 418,327 1,809,206
Total comprehensive income 4,608,381 450,730 -1,961,214 -3,232,998 328,578
Profit for the year attributable to
Owners of the Company 6,411,774 2,700,128 -568,028 -2,814,671 2,137,784
Profit for the year attributable to
non-controlling interest 1,766,657 2,244,612 1,399,776 417,981 1,809,206
Comprehensive income attributable
to Owners of the Company 36,736 4,786 -6,590 436 -
Comprehensive income attributable
to non-controlling interest 6,365,917 2,689,993 -558,857 -2,807,423 2,137,784
Earnings per share(NT$)(Note 2) 45,857 10,135 -9,171 -7,248 -
Operating revenues 3.81 4.53 2.56 0.71 2.92
Note 1:The data for 2014~2018 are based on consolidated financial statement already audited and certified by CPAs.
Note 2:Primary earnings per Share

Financial Information 113
6.1.2 Issues affecting the consistency of the above financial statements, such as accounting
changes, company mergers or business sector shutdowns, and their impact on the current
year's financial statements
N/A.
6.1.3 Auditors’ Opinions from 2014 to 2018
Year Accounting Firm CPA Audit Opinion
2014 Ernst & Young, Taiwan Lin, Li Huang
and Fuh, Wen Fun Unqualified Opinion
2015 Ernst & Young, Taiwan Lin, Li Huang
and Fuh, Wen Fun Unqualified Opinion
2016 Ernst & Young, Taiwan Lin, Li Huang
and Fuh, Wen Fun Unqualified Opinion
2017 Ernst & Young, Taiwan Lin, Li Huang
and Fuh, Wen Fun Unqualified Opinion
2018 Ernst & Young, Taiwan Lin, Li Huang
and Fuh, Wen Fun Unqualified Opinion
6.2 Five-Year Financial Analysis
Year
Item
Financial Analysis for the Last Five Years(Note 1)
2014 2015 2016 2017 2018
Financial
structure (%)
Debt Ratio(%) 64.15 64.84 66.30 69.17 68.40
Ratio of long-term capital
to property, plant and
equipment(%)
100.27 99.85 93.43 94.36 91.29
Solvency (%)
Current ratio(%) 30.11 49.85 24.88 35.53 27.65
Quick ratio(%) 27.41 46.41 22.29 34.38 24.94
Interest earned ratio
(times) 3.18 3.34 2.20 1.31 2.05
Operating
performance
Accounts receivable
turnover (times) 35.08 52.62 67.92 85.56 104.07
Average collection period 10.40 6.93 5.37 4.26 3.50
Inventory turnover (times) 74.43 115.38 88.45 78.22 76.61
Accounts payable turnover
(times) 61.32 84.06 74.65 55.18 38.20
Average days in sales 4.90 3.16 4.12 4.66 4.76
Property, plant and 0.14 0.14 0.13 0.14 0.16

Financial Information 114
Year
Item
Financial Analysis for the Last Five Years(Note 1)
2014 2015 2016 2017 2018
equipment turnover
(times)
Total assets turnover
(times) 0.12 0.13 0.12 0.13 0.15
Profitability
Return on total assets(%) 3.68 4.04 3.02 2.05 4.07
Return on stockholders'
equity(%) 7.46 8.01 4.81 1.52 6.66
Pre-tax
income to
paid-in
capital(%)
Income
from
operations
36.76 47.43 28.85 30.42 55.17
Income
before tax 37.56 43.66 25.29 6.79 28.79
Profit ratio(%) 19.51 20.38 13.11 3.79 13.84
Earnings per share (NT$) 3.81 4.53 2.69 0.71 2.92
Cash flow
Cash flow ratio(%) 62.02 73.82 48.25 46.28 50.02
Cash flow adequacy ratio
(%) 43.83 40.26 44.36 49.33 64.78
Cash reinvestment ratio
(%) 5.54 4.59 4.50 4.31 5.36
Leverage Operating leverage 2.76 2.49 3.48 3.11 2.21
Financial leverage 1.88 1.65 3.68 3.44 1.99
Note 1:The data for 2014~2018 are based on consolidated financial statement already audited and certified by CPAs.
6.2.1 The equations of preceding financial analysis are as the following:
6.2.1.1 Financial Structure
Liabilities-to-assets ratio=total liabilities/total assets。
Ratio of long-term fund to property, plant and equipment=(total shareholders’ equity+non-current
liabilities)/net property, plant and equipment
6.2.1.2 Solvency
Current ratio=current assets/current liabilities
Quick ratio=(current assets-inventory-prepaid expense)/current liabilities
Interest protection multiples=net income before tax and interest expense payment/current year’s
interest expense

Financial Information 115
6.2.1.3 Management capacity
Accounts receivable turnover ratio(including accounts receivable and notes receivable resulted from
business operation)=net sales/average balance of accounts receivable(including accounts receivable
and notes receivable resulted from business operation)
Average collection days=365/accounts receivable turnover ratio
Inventory turnover ratio=cost of goods sold/average inventory
Accounts payable turnover ratio(including accounts payable and notes payable resulted from business
operation)=cost of goods sold/average balance of accounts payable(including accounts payable and
notes payable resulted from business operation)
Average inventory days=365/Inventory turnover ratio
Property, plant and equipment turnover ratio=net sales/net property, plant and equipment
Total assets turnover ratio=net sales/net assets
6.2.1.4 Profitability
Rate of return on assets=[after-tax income+interest expense×(1-tax rate)]/total assets
Note:The Company is foreign company, need not count the tax rate.
Rate of return on equity=after-tax income/total equity
Net profit ratio=after-tax income/net sales
Earnings per share=(profit attributable to owners’ of the Company)/weighted average number of
shares
6.2.1.5 Cash flow
Cash flow ratio=cash flow from operating activities/current liabilities
Net cash flow adequacy ratio=cash flow from operating activities in the five most recent years/
(capital expenditure+inventory increase+cash dividends)in the five most recent years
Cash reinvestment ratio=(cash flow from operating activities-cash dividends)/(gross property,
plant and equipment+long-term investments+other non-current assets+operating fund)
6.2.1.6 Leverage
Operating leverage=(net operating revenue-variable operating costs and expenses)/profit from
operating activities
Financial leverage=profit from operating activities/(profit from operating activities-interest
expense)。

Financial Information 116
6.2.2 Analysis of financial ratio differences exceed 20% for the last two years:
Current ratio decrease:due to current assets are less than last year.
Quick ratio decrease:due to current assets are less than last year.
Interest protection multiples increase:due to income before tax increase
Accounts receivable turnover ratio increase:due to net sales are more than last year
Accounts payable turnover ratio decrease:due to average accounts payable is more than last year
Rate of return on assets increase:due to after-tax income is more than last year
Rate of return on equity increase:due to after-tax income is more than last year
profit from operating activities/income before tax to paid-in capital increase:due to profit from
operating activities/income before tax increase
Net profit ratio increase:due to after-tax income is more than last year
Earnings per share increase:due to profit attributable to owners’ of the Company increase
Net cash flow adequacy ratio increase:due to net cash flows from operating activities increase.
Cash reinvestment ratio increase:due to net cash flows from operating activities increase.
Operating leverage decrease:due to profit from operating activities increase.
Financial leverage decrease:due to profit from operating activities increase.
6.3 Audit Committee’s Report for the Most Recent Year
Please refer to page 153.
6.4 Consolidated Financial Statements for the Years Ended December 31, 2018,
and Independent Auditors’ Report
Please refer to page 154.

Financial Conditions,Business Results and Risk Analysis 117
7. Financial Conditions, Business Results and Risk Analysis
7.1 Financial Overview
7.1.1 Financial Status Analysis
Unit: NT$000; %
Year
Item
2017 2018 Increase/Decrease Description
Amount % Amount % Amount %
Current
assets 3,565,183 4.20 3,339,375 3.75 -225,808 -6.33
Mainly attributed
to decrease in cash
and cash
equivalents
Fixed assets 79,416,557 93.46 84,196,177 94.67 4,779,620 6.02
Mainly attributed
to increase in the
number of active
vessels
Current
long-term
loans
6,458,743 7.60 7,330,125 8.24 871,382 13.49
Mainly attributed
to new ship
purchases and
increase in
long-term
borrowings being
recorded
differently at
maturity
Long-term
borrowings 42,682,851 50.23 42,615,941 47.92 -66,910 -0.16
Mainly attributed
to decrease in
long-term
borrowings caused
by decrease in
newbuilding
investment
Long-term
lease
payments
payable
1,767,092 2.08 2,424,515 2.73 657,423 37.20
Increase in
long-term lease
payments payable
mainly attributed to
capital leases for
ships signed in the
period
Long-term
payables 2,993,823 3.52 3,548,893 3.99 555,070 18.54
Mainly attributed
to increase in the
balance of related
party loans
Common 6,167,076 7.26 6,298,055 7.08 130,979 2.12 Mainly attributed

Financial Conditions,Business Results and Risk Analysis 118
Year
Item
2017 2018 Increase/Decrease Description
Amount % Amount % Amount %
share capital to conversion of
convertible bonds
to common shares
Capital
surplus 1,612,164 1.90 1,250,933 1.41 -361,231 -22.41
Mainly attributed
to dividend
distribution out of
capital surplus
Retained
earnings 12,043,086 14.17 13,851,985 15.58 1,808,899 15.02
Mainly attributed
to increase in net
profit of current
period

Financial Conditions,Business Results and Risk Analysis 119
7.2 Business Results
7.2.1 Business Result Analysis
Unit: NT$000; %
Year
Item
2017 2018 Increase/Decrease
Description
Amount % Amount % Amount %
Operating
income 11,038,548 100.00 13,067,626 100.00 2,029,078 18.38
Mainly
attributed to
improved
conditions in the
shipping market
Depreciation
expense 3,957,763 35.85 4,203,690 32.17 245,927 6.21
Mainly
attributed to
increase in the
number of active
vessels
Operating costs 9,002,279 81.55 9,431,342 72.17 429,063 4.77
Mainly
attributed to
increase in the
number of active
vessels
Net operating
income 1,876,056 17.00 3,474,823 26.59 1,598,767 85.22
Mainly
attributed to
improved
conditions in the
shipping market
Non-operating
income 98,275 0.89 182,606 1.40 84,331 85.81
Mainly
attributed to
litigation
settlement
received in
November
Gain/loss on
the disposal of
fixed assets
-43,518 0.39 -6,183 -0.05 37,355 -85.79
Mainly
attributed to
unfavorable
conditions in the
secondhand
market
Interest
expenses 1,330,840 12.06 1,726,362 13.21 395,522 29.72
Mainly
attributed to ship
purchases and
increase in
long-term
borrowings
Foreign -31,345 -0.28 21,668 0.17 53,013 -169.13 Mainly

Financial Conditions,Business Results and Risk Analysis 120
Year
Item
2017 2018 Increase/Decrease
Description
Amount % Amount % Amount %
exchange
gain/loss
attributed to
depreciating
Japanese yen
against US
dollar in the end
of period
exchange rate
Net income
before tax 418,984 3.8 1,813,228 13.88 1,394,244 332.77
Mainly
attributed to
increase in net
profit of current
period

Financial Conditions,Business Results and Risk Analysis 121
7.3 Cash Flow
7.3.1 Cash Flow Analysis
Unit: NT$000; %
Year
Item 2017 2018 Increase/Decrease
Increase/Decrease
(%) Change analysis
Operating
activities 4,643,774 6,040,045 1,396,271 30.07
Mainly attributed to
increase in net
profit before tax
Investing
activities -9,978,251 -5,676,208 4,302,043 43.11
Mainly attributed to
decrease in
newbuilding
investment
Financing
activities 5,506,519 -784,216 -6,290,725 -114.24
Mainly attributed to
the fact that an issue
was offered in the
previous period but
none in the current
period
7.3.2 Cash Flow Analysis for the Coming Year and Plan to Improve Liquidity
Unit: NT$000; %
Beginning cash
balance
(1)
Expected total
cash flow from
operating
activities
(2)
Expected total
cash outflow
(3)
Expected cash
surplus (deficit)
(1)+(2)-(3)
Remedial measures for expected
cash deficit
Investment
plans
Financing
plans
796,882 14,230,747 8,799,681 6,227,948 - -
7.3.2.1 Analysis of Cash Flow Changes in the Coming Year
Expected net cash flow from operating activities: The dry bulk shipping market is expected to start to
recover in the coming year. Revenue from the fleet business can be expected to rise steadily, which can lead
to a higher cash flow from operating activities.
Expected net cash flow from investing activities: Given the Group's business plan for the coming year, the
number of newbuildings is expected to fall slightly compared to the previous year, which can lead to a
slightly lower net cash outflow from investing activities.
Expected net cash flow from financing activities: The number of newbuildings is expected to fall slightly in
the coming year. Hence, the net cash flow from financing activities is expected to be lower than the previous
year.
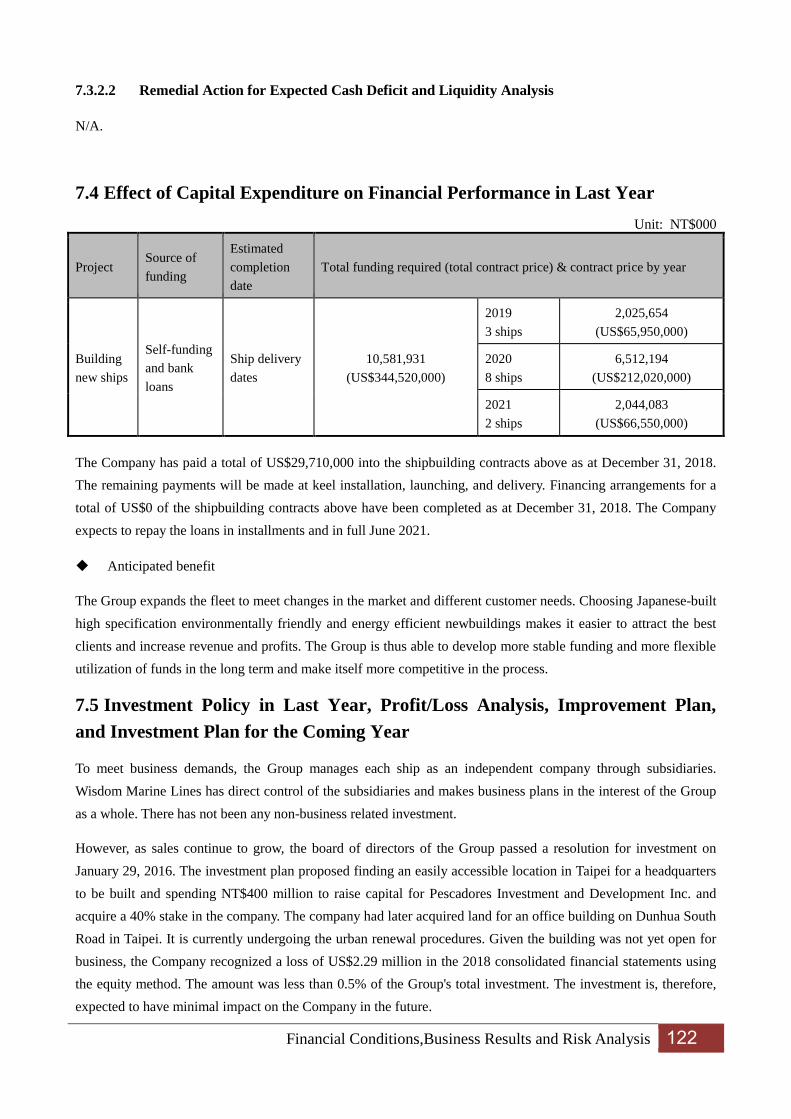
Financial Conditions,Business Results and Risk Analysis 122
7.3.2.2 Remedial Action for Expected Cash Deficit and Liquidity Analysis
N/A.
7.4 Effect of Capital Expenditure on Financial Performance in Last Year
Unit: NT$000
Project Source of
funding
Estimated
completion
date
Total funding required (total contract price) & contract price by year
Building
new ships
Self-funding
and bank
loans
Ship delivery
dates
10,581,931
(US$344,520,000)
2019
3 ships
2,025,654
(US$65,950,000)
2020
8 ships
6,512,194
(US$212,020,000)
2021
2 ships
2,044,083
(US$66,550,000)
The Company has paid a total of US$29,710,000 into the shipbuilding contracts above as at December 31, 2018.
The remaining payments will be made at keel installation, launching, and delivery. Financing arrangements for a
total of US$0 of the shipbuilding contracts above have been completed as at December 31, 2018. The Company
expects to repay the loans in installments and in full June 2021.
Anticipated benefit
The Group expands the fleet to meet changes in the market and different customer needs. Choosing Japanese-built
high specification environmentally friendly and energy efficient newbuildings makes it easier to attract the best
clients and increase revenue and profits. The Group is thus able to develop more stable funding and more flexible
utilization of funds in the long term and make itself more competitive in the process.
7.5 Investment Policy in Last Year, Profit/Loss Analysis, Improvement Plan,
and Investment Plan for the Coming Year
To meet business demands, the Group manages each ship as an independent company through subsidiaries.
Wisdom Marine Lines has direct control of the subsidiaries and makes business plans in the interest of the Group
as a whole. There has not been any non-business related investment.
However, as sales continue to grow, the board of directors of the Group passed a resolution for investment on
January 29, 2016. The investment plan proposed finding an easily accessible location in Taipei for a headquarters
to be built and spending NT$400 million to raise capital for Pescadores Investment and Development Inc. and
acquire a 40% stake in the company. The company had later acquired land for an office building on Dunhua South
Road in Taipei. It is currently undergoing the urban renewal procedures. Given the building was not yet open for
business, the Company recognized a loss of US$2.29 million in the 2018 consolidated financial statements using
the equity method. The amount was less than 0.5% of the Group's total investment. The investment is, therefore,
expected to have minimal impact on the Company in the future.

Financial Conditions,Business Results and Risk Analysis 123
7.6 Risk Assessment for Last Year Up To the Publication Date of this Report
7.6.1 Impact of Interest Rate and Exchange Rate Changes and Inflation on the Company's
Profit and Response Measures
Interest rate changes
The nature of its business means the Group has a great need for funds. As a result, it carries a relatively large
amount of loans. Interest expense was 12.06% and 13.21% of the revenue in 2017 and 2018, respectively.
Furthermore, the Group does not carry any fixed rate liabilities at fair value through profit or loss. Hence, any
interest rate change on the closing date is not likely to have any material impact on profits and losses. An interest
rate risk sensitivity analysis is included under Note 12.3 in the 2018 financial statements. The Group has accounts
with financially sound and well managed banks in Taiwan, Japan, and Europe. The Group evaluates interest rates
charged by different banks before deciding on suitable terms. Moreover, the Group, being a well managed
company in good credit standing, has stronger bargaining power over banks and benefits from lower financing
costs.
Exchange rate changes
The operating revenue and operating costs of the Group are often expressed in U.S. dollars. Exchange rate
changes have little impact on the operating revenue from core businesses. Exposure to exchange rate risk exists in
foreign currency loans to fund ships and rises mainly from exchange rate volatility in the Japanese yen. If the U.S.
dollar rises/falls by 10% against the Japanese yen (i.e. when the U.S. dollar appreciates/depreciates), the Group's
profit and loss will increase/decrease by US$3,371,548, and its equity will increase/decrease by US$0. The Group
finances ships in installments for a period of eight to ten years. Exchange rate risk is spread across the years in the
financing period. In addition, most financing agreements contain a "loan currency conversion" clause for which
the Company may apply as needed to counter exchange rate changes.
Inflation
The Group has not sustained any material impact on profit and loss from inflation. If operating costs rise due to
inflation, the Group may adjust prices when signing contracts.
7.6.2 Policy Regarding High-risk, High-Leverage Investments, Loans to Others,
Endorsements, Guarantees, and Derivatives, Reasons for Profit or Loss, and Response
Measures
High-risk, high-leveraged investments
The Group focuses on its core businesses and has not ventured into any high risk business in other industries. It
aims for stability when devising financial policies and does not make high-leverage investments. Therefore, risk
exposure is limited.
Loans to others
Except for borrowings between members of the Group, no loans to others were made in last year up to the

Financial Conditions,Business Results and Risk Analysis 124
publication date of this report. In addition, all borrowings between members of the Group were approved by the
board of directors of the Company and complied with the applicable regulations, and had no impact on profits or
losses on the Group's consolidated financial statements.
Endorsements and guarantees
Except for endorsements and guarantees between members of the Group, no endorsements and guarantees were
made in last year up to the publication date of this report. In addition, all endorsements and guarantees between
members of the Group were approved by the board of directors of the Company and complied with the applicable
regulations, and had no impact on profits or losses on the Group's consolidated financial statements.
Derivatives trading
The Group trade derivatives to avoid the exchange rate risk in foreign currency payments. The trading procedures
follow the Procedures for the Acquisition or Disposal of Assets and are evaluated regularly as required. Exchange
rates in derivatives contracts are provided in advance, and are, therefore, unlikely to cause any material cash flow
risk. Moreover, all counterparties are banks with good credit ratings. The chance of encountering credit risk is
extremely low.
7.6.3 Future R&D Programs and Expected R&D Investment
Not applicable as the Company operates mainly in the ship management and shipping services industries and is
not involved in shipbuilding.
7.6.4 Impact of Key Domestic or International Policy or Industry Changes on the
Company's Finance and Sales and Response Measures
The Company is registered in the Cayman Islands, while the business entity Wisdom Marine Lines S.A. is
incorporated in Panama. Most economic activities in the Cayman Islands take place in the financial services
industry. Panama is the world's leading country in the size of ship registry with an open economy and no foreign
exchange controls. Political and economic conditions are stable in both countries. As at the publication date of this
report, the Company has not learned of any key policy or regulatory changes in the Cayman Islands or in Panama
that would have a material impact on the Company's finance or sales.
The Group operates a network of routes that spreads across the world. Contracts and lawsuits may involve the
laws of different countries or take place in different countries as cases vary. While the Group has purchased the
appropriate insurance policies, it is impossible to guarantee that financial losses and business risks can always be
avoided. Hence, the Group's management team requires that employees have a clear understanding of the risks in
international operations and an excellent command of foreign languages so to ensure an accurate and timely
decision making process in risk management and in crisis management.
7.6.5 Impact of Technological and Industry Developments on the Company's Finance and
Sales and Response Measures
Not applicable as the Group offers shipping services and is not involved in any manufacturing or production
activities. Since marine transport remains the most economical shipping method at present, it is foreseeable that

Financial Conditions,Business Results and Risk Analysis 125
technological developments should have no material impact on the Company's finance or sales.
7.6.6 Impact of Corporate Image Change on Crisis Management and Response Measures
Not applicable as the Group places great emphasis on corporate governance and there has not been any significant
change in its corporate image in last year up to the publication date of this report.
7.6.7 Anticipated Benefits and Possible Risks Associated with Mergers and Acquisitions,
and Countermeasures
Not applicable as the Group has not had plans to acquire other companies outside the Group in last year up to the
publication date of this report.
7.6.8 Expected Benefits and Potential Risks of Factory Expansion and Response Measures
Not applicable as the Group has not had plans for factory expansion in last year up to the publication date of this
report.
7.6.9 Concentration Risk in Procurement or Sales and Response Measures
Procurement
For the Group, only the costs of fuels and lubricants for ships occupy a relatively large percentage of the annual
operating costs. Given lubricant requirements may vary from vessel to vessel, the Company works with four to
five international lubricant suppliers on a long-term basis. The Company usually asks for quotes and negotiates
with the suppliers before selecting a supplier offering the right specifications at better rates. In addition, the
Company tends to negotiate for bulk discounts with suppliers. The practice helps ensure a steady supply. There
has not been any incident of supply shortage or disruption causing an impact on shipping operations. In terms of
fuel, depending on the length of voyage, route, weather conditions, and level of inventory, the Company considers
fuel prices and suppliers at different bunkering ports, and make purchases through fuel brokers or directly from
suppliers in order to diversify sources and reduce costs. Meanwhile, the Group is open to new suppliers and
always assessing potential business relationships in order to diversify concentration risk in procurement.
Sales
In last year up to the publication date of this report, except for the largest client, who contributed 16.36% of the
revenue, no other single client of the Group contributed 10.00% or more of the revenue. Therefore, the Group is
not exposed to concentration risk in sales.
7.6.10 Impact of and Risks in Large Transfer or Change of Equity among Directors,
Supervisors, or Principal Shareholders with Over 10% Stake in the Company and Response
Measures
Up to the publication date of this report, except for Chairman Lan, who holds a 31.09% stake, no other
shareholders hold more than 10% of the shares. There is not likely to be any large transfer of equity to cause any
adverse effect on the Company.

Financial Conditions,Business Results and Risk Analysis 126
7.6.11 Impact of and Risks in Change of Management for the Company and Responding
Measures
Not applicable as the Group has not had any change of management in last year up to the publication date of this
report.
7.6.12 Litigious or Non-litigious Matters
Concluded or pending litigious, non-litigious, or administrative litigation events involving the Company or any of
its directors and supervisors, the president or de facto responsible person of the Company, or a principal
shareholder with an over 10% stake and its subsidiary where the outcome may have a material impact on the
rights of the Company's shareholders or the prices of its securities:
No. Wisdom
Marine Group Counterparty Fact in contention and amount of damages Status/Progress
1 Unicorn
Fortune S.A.
R. Piyarelall
International Pvt.
Ltd.
Regarding the sinking of MV Bingo on
October 13, 2013, R. Piyarelall International
sent through its lawyer a letter of demand for
US$700,000 in damages. (full coverage
insurance)
Proceedings not yet
initiated.
2 Saysiat
Wisdom S.A.
Copenship Bulkers
A/S
Since the lessee (Copenship Bulkers A/S)
declared bankruptcy in February 2015, a
claim for US$8 million in damages was made.
Pending settlement results
from Denmark.
3 Poavosa
Navigation
S.A.
Algeria Telecom
Joint Stock
Company
MV Poavosa Ace was suspected to have
damaged submarine cables on October 25,
2015. The plaintiff Algeria Telecom filed a
lawsuit with the Algeria Court for US$15
million in damages. (full coverage
insurance)
The insurer Japan P&I and
its French lawyers are
currently fighting the case
against Algeria Telecom.
4 Tao Mariner
S.A.
MGA International
Pte Ltd.
Regarding the damaged cargo incident on
February 12, 2016, the plaintiff MGA
International filed a lawsuit with the Bombay
High Court for US$3.5 million in damages.
(full coverage insurance)
The insurer Skuld P&I is
currently assisting with
investigation.
5 Wisdom
Marine Lines
S.A.
Arabian Gas & Oil
Development
Company
(AGODCO)
The buyer (AGODCO) failed to perform the
buyer's obligations in the newbuilding resale
agreement in February 2016. We terminated
the agreement and confiscated the down
payment of US$10.5 million already paid. We
also made a claim for damages against the
buyer.
Case closed
6 Bunun Justice
S.A.
Lu Rong Yu 58979,
Lu Rong Yu 58869,
Lu Rong Yuan Yu
001
Regarding the ship collision on March 30,
2018, the counterparty sent through its lawyer
a letter of demand for the Group to provide a
standby letter of credit for RMB11 million.
(full coverage insurance)
The insurer Japan P&I is
currently assisting with
investigation.
7 Sakizaya
Kalon S.A.
Pacific Pearl Co.,
Ltd.
Regarding the ship collision on July 15, 2018,
the Group sent through the lawyer a letter of
demand for the counterparty to provide a
standby letter of credit for US$5.7 million,
The insurers Swedish P&I
and MSIG are currently
assisting with
investigation.

Financial Conditions,Business Results and Risk Analysis 127
No. Wisdom
Marine Group Counterparty Fact in contention and amount of damages Status/Progress
including the costs of rescue under the full
coverage insurance and ship maintenance.
7.6.13 Other Material Risks and Response Measures
Risk of ship collision, damage, or loss
Ships are exposed to the risk of structural damage or mechanical failure due to collision caused by weather or
other forces of nature or human error by the crew, war, or other human factors and to the risk of sinking due to
extreme weather conditions. All of the Group's ships are insured against structural and war risks. However, it is
not guaranteed that risks arising from collision, damage, or loss can always be avoided. As part of its risk
management practices, the Company strengthens personnel training and management to ensure seaworthiness of
its vessels.
Third party liability risk
The Group may, in the process of conducting shipping operations, become liable for damage to third parties. The
most common examples include crew death and injury, freight claim, and pollution cleanup. The Group joins
international shipowners associations as a means to manage risks and their potential adverse effects on the
company. However, it is not guaranteed that risks arising from crew death and injury, freight claim, or pollution
cleanup can always be avoided. As part of its risk management practices, the Company strengthens personnel
training and management to ensure seaworthiness of its vessels.
Risk of piracy
The routes operated by the Group may pass through some relatively unsafe waters or countries. Therefore, the
Group tries to persuade lessees to keep from dangerous waters and avoid coastal navigation in order to reduce risk.
Where it is necessary to pass through high risk waters, the Group's ships will be accompanied by armed escorts
stationed at different countries or have hired armed guards onboard. Additional insurance coverages will also be
purchased for the voyage. All departments in the Group work constantly to keep the ships up to date on the latest
anti-piracy information, and help the captains familiarize themselves with the anti-piracy measures and related
safety regulations.
Risk of business interruption
The Group operates a network of routes that spreads across the world. There are occasional short interruptions of
business operations due to local regulations, freight claims, or mechanical failures. Sometimes ships and/or crew
may be seized or detained temporarily, leading to default of contract or other operating losses. To better manage
such risks, the Group implements more rigorous training for crew to be more prepared for emergencies, and
establishes a communication network and crisis management mechanisms to ensure normal operations are
restored in the shortest possible time.
Risk of market volatility
The global demand for raw materials and commodities and the supply of ships are the two factors driving the dry

Financial Conditions,Business Results and Risk Analysis 128
bulk shipping market. The Group has a diverse fleet consisting mainly of handysize bulk carriers that have the
lowest depreciation rates in the market. Therefore, the Group is less exposed to the impact of market volatility
compared to other companies in the business. Furthermore, the Group manages market volatility risk and confirms
cash flows for repayments by planning long term leases. The Group arranges its leases to avoid stacking, and
allocates ships to long term leases or to self management as needed for diversification.
Risk of oil price volatility
The Group is generally not responsible for the costs of fuels for ships on long term leases. The impact of fuel price
volatility on the Group is found mainly in the self managed ships operating in the spot market as it affects
short-term estimates of the cost of fuel. However, in the long term, shipping rates actually charged in the spot
market for dry bulk shipping will be adjusted to reflect oil price increase or decrease.
Liquidity risk
The liquidity risk for a shipping company occurs in out-of-pocket payments for newbuildings and repayments in
ship financing. For newbuildings, buyers are often required to pay for the ships in installments before delivery.
The buyer's failure to make the installment payments on time will give the shipbuilder the right to unilaterally
terminate the agreement and hold the buyer liable for damages to the shipbuilder. Moreover, the Company usually
apply to financial institutions for loans to fund newbuilding purchases. These loan agreements often contain a
cross default clause that provides the borrower's failure to repay principal or interest on another loan or default on
another agreement will constitute default on the loan agreements, thereby creating cross default risk. Under such
circumstances, the financial institutions will be entitled to demand early repayments from the Company. If the
Company is unable to make repayments, the creditors may proceed unilaterally to auction off the underlying ships
as compensation. The Group uses retained earnings to build up cash assets and revenue from the fleet to make
down payments for newbuildings. The Group takes a conservative approach to financial planning, and always
evaluates cash flows in new building projects with care and caution.
Risk of executive and crew turnover
The Group relies on the experience and knowledge of Chairman Lan and the executive management team for the
success of its operations. A high executive turnover will not be constructive to the Company's long-term
development. Hence, one of the Group's long-term strategies focuses on retaining talent and passing on experience
and knowledge.
A growing number of vessels in the shipping market over the last few years and the subsequent rising demand for
seafarers have led to challenges in recruitment and less trained seafarers and created higher operating costs and
risks. As a professional ship owner, the Group has to employ a large number of seafarers. The majority of the crew
currently employed by the Group are Chinese seafarers. The Group recruits, dispatches, and manages them
through local recruitment agencies in China. Given the limited number of experienced and qualified seafarer
recruitment and dispatch agencies in China, the qualification and quality of service offered by one agency may
vary greatly from the next. In addition, the lack of clearly established regulations and enforcement standards may
not be conductive for local recruitment agencies to provide a steady supply of seafarers for the Group.
Furthermore, the human resources market in China has been undergoing transformation in recent years. Therefore,
the Group has considered replacing a workforce consisting mainly of Chinese seafarers and building a crew

Financial Conditions,Business Results and Risk Analysis 129
trained in-house. As a result, the Group started working with National Taiwan Ocean University in 2010. A
number of deck and engine internships are offered every year, and interns are trained and encouraged to pursue
key positions in the fleet.
Risk of conducting business internationally
Marine transport is primarily governed by regulations at the global level. However, detailed requirements and
practices may vary from country to country. The industry also faces threats such as piracy, human trafficking, and
smuggling. All these factors can affect the loading/unloading schedule or supply of materials and the cost and
speed of mechanical maintenance. The Group's management team requires that employees have a clear
understanding of the risks in international operations and an excellent command of foreign languages so to ensure
an accurate and timely decision making process in risk management and in crisis management.
Risk of information security
The Company has implemented an internal control system for information management and personal information
management procedures in order to manage and monitor network and information security. However, it is
impossible to guarantee that third party attack on the networks and computer systems can always be avoided. It is
possible for the Company to lose important data under such an attack. Interruption of business or damage to ship
may also arise from hackers taking over the vessel tracking systems and electronic charts to extort money from the
Company. For internal information security, the Company has the Information Section in charge of overseeing
security of the IT systems, monitoring employee computers, creating daily backup schedules, and raising
awareness of information security and the correct procedures. For ship information system security, the Company
keeps close contact with specialized insurers to learn about information security coverages, and decides whether
to purchase policies as needed.
Protection of shareholder rights
The laws regarding shareholder rights and jurisdiction in the Company's place of registration, the Cayman Islands,
differ in some places from those of the Republic of China. The Company has amended the Articles of
Incorporation to comply with the Securities and Exchange Act, the Company Act and other applicable laws of the
Republic of China to the maximum extent permitted by the laws of the Cayman Islands. However, protection of
shareholder rights may not extend to the same degree as required of companies incorporated in Taiwan. Please
refer to Section 8.5 of this report for ways of exercising shareholder rights and material deviation in protection of
shareholder rights. Investors should find out and consult their advisors on any protection of shareholder rights not
available when investing in a Cayman Islands company. To learn more about the laws of the Cayman Islands,
please visit The Judicial Administration & Portfolio of Legal Affairs Legal Information Website.
(Website: http://staging.caymanjudicial-legalinfo.ky/laws/Laws-In-Force/Laws.aspx.)
7.7 Other Important Information
None.

Special Disclosure 130
8. Special Disclosure
8.1 Information of Related Party
8.1.1 Basic Information of Related Party
Units:US$
Company Name Established
Date Address Capital
Major Opreated
Item
Wisdom Marine International
Inc. 2008/12/4
7F-11 No. 237, Sec. 2, Fuxing South
Road, Taipei City, Taiwan 17,357,393.74
Advisory of
ship
management
Well Shipmanagement and
Maritine Consultant Co., Limited 2001/9/6
12F-3 No. 237, Sec. 2, Fuxing South
Road, Taipei City, Taiwan 772,611.72
Safety
management
for ships
Wisdom Marine Lines S.A. 1999/3/15
MMG Tower 23rd Floor, Paseo del Mar
and Pacific Avenues, Costa del Este,
Panama City, Republic of Panama
454,139,000.00 Marine
Transport
Adixi Wisdom S.A. 2010/5/20 As above. 10,000.00 As above.
Amis Carriers S.A. 2013/2/1 As above. 10,000.00 As above.
Amis Elegance S.A. 2013/4/25 As above. 10,000.00 As above.
Amis Fortune S.A. 2014/5/20 As above. 10,000.00 As above.
Amis Hero S.A. 2017/1/10 As above. 10,000.00 As above.
Amis Integrity S.A. 2017/3/17 As above. 10,000.00 As above.
Amis International S.A. 2012/8/14 As above. 10,000.00 As above.
Amis Justice S.A. 2017/5/3 As above. 10,000.00 As above.
Amis Mariner S.A. 2013/2/1 As above. 10,000.00 As above.
Amis Miracle S.A. 2017/5/1 As above. 10,000.00 As above.
Amis Nature Inc. 2018/2/26 80 Broad Street, Monrovia, Liberia 10,000.00 As above.
Amis Navigation S.A. 2011/9/16 MMG Tower 23rd Floor, Paseo del Mar
and Pacific Avenues, Costa del Este,
Panama City, Republic of Panama
10,000.00 As above.
Amis Star S.A. 2012/8/14 As above. 10,000.00 As above.
Amis Wisdom S.A. 2009/4/15 As above. 10,000.00 As above.
Arikun Wisdom S.A. 2007/1/4 As above. 10,000.00 As above.
Atayal Brave S.A. 2011/3/25 As above. 10,000.00 As above.
Atayal Mariner S.A. 2011/3/24 As above. 10,000.00 As above.
Atayal Star S.A. 2011/3/25 As above. 10,000.00 As above.
Atayal Wisdom S.A. 2009/4/15 As above. 10,000.00 As above.
Babuza Wisdom S.A. 2008/2/18 As above. 10,000.00 As above.
Beagle Marine S.A. 2008/2/18 As above. 10,000.00 As above.

Special Disclosure 131
Company Name Established
Date Address Capital
Major Opreated
Item
Beagle Wisdom S.A. 2004/8/10 As above. 3,500,000.00 As above.
Bunun Brave S.A. 2013/10/30 As above. 10,000.00 As above.
Bunun Champion S.A. 2013/11/25 As above. 10,000.00 As above.
Bunun Dynasty S.A. 2013/11/25 As above. 10,000.00 As above.
Bunun Elegance S.A. 2013/11/25 As above. 10,000.00 As above.
Bunun Fortune S.A. 2013/3/20 As above. 10,000.00 As above.
Bunun Hero S.A. 2015/6/4 As above. 10,000.00 As above.
Bunun Infinity S.A. 2016/1/5 As above. 10,000.00 As above.
Bunun Justice S.A. 2016/10/17 As above. 10,000.00 As above.
Bunun Marine S.A. 2011/9/16 As above. 10,000.00 As above.
Bunun Navigation S.A. 2011/5/30 As above. 10,000.00 As above.
Bunun Wisdom S.A. 2009/4/15 As above. 10,000.00 As above.
Cosmic Wisdom S.A. 2000/4/10 As above. 10,000.00 As above.
Daiwan Champion S.A. 2014/2/25 As above. 10,000.00 As above.
Daiwan Dolphin S.A. 2014/2/25 As above. 10,000.00 As above.
Daiwan Elegance S.A. 2014/2/25 As above. 10,000.00 As above.
Daiwan Fortune S.A. 2014/2/25 As above. 10,000.00 As above.
Daiwan Glory S.A. 2014/2/25 As above. 10,000.00 As above.
Daiwan Hero S.A. 2016/1/5 As above. 10,000.00 As above.
Daiwan Infinity S.A. 2016/1/5 As above. 10,000.00 As above.
Daiwan Justice S.A. 2016/1/5 As above. 10,000.00 As above.
Daiwan Kalon S.A. 2016/1/5 As above. 10,000.00 As above.
Daiwan Leader S.A. 2017/3/15 As above. 10,000.00 As above.
Daiwan Miracle S.A. 2017/3/15 As above. 10,000.00 As above.
Dumun Marine S.A. 2009/10/7 As above. 10,000.00 As above.
Dumun Navigation S.A. 2010/1/27 As above. 10,000.00 As above.
Elite Steamship S.A. 1996/10/4 As above. 10,000.00 As above.
Euroasia Investment S.A. 1999/7/23 As above. 10,000.00 As above.
Favoran Wisdom S.A. 2009/6/5 As above. 10,000.00 As above.
Fourseas Maritime S.A. Panama 1991/10/31 As above. 10,000.00 As above.
Fraternity Marine S.A. 1999/7/14 As above. 10,000.00 As above.
Fraternity Ship Investment S.A. 1999/8/24 As above. 10,000.00 As above.
Genius Marine S.A. 2001/10/12 As above. 10,000.00 As above.
Genius Prince S.A. 2003/12/15 As above. 10,000.00 As above.
Genius Star Carriers S.A. 2002/10/1 As above. 10,000.00 As above.
Genius Star Navigation S.A. 2004/8/10 As above. 10,000.00 As above.

Special Disclosure 132
Company Name Established
Date Address Capital
Major Opreated
Item
Gs Global S.A. 2011/5/25 As above. 10,000.00 As above.
Gs Navigation S.A. 2011/5/25 As above. 10,000.00 As above.
Gsx Maritime S.A. 2009/4/15 As above. 10,000.00 As above.
Guma Marine S.A. 2009/10/7 As above. 10,000.00 As above.
Guma Navigation S.A. 2010/1/27 As above. 10,000.00 As above.
Harmony Pescadores
S.A.(Panama)
1993/10/4 As above. 10,000.00 As above.
Harmony Transport S.A. 2003/4/15 As above. 10,000.00 As above.
Hoanya Wisdom S.A. 2006/11/15 As above. 10,000.00 As above.
Infinite Wisdom S.A. 2003/1/21 As above. 10,000.00 As above.
Katagalan Carriers S.A. 2013/3/14 As above. 10,000.00 As above.
Katagalan Line S.A. 2011/5/16 As above. 10,000.00 As above.
Katagalan Marine S.A. 2011/3/24 As above. 10,000.00 As above.
Katagalan Navigation S.A. 2013/2/1 As above. 10,000.00 As above.
Katagalan Star S.A. 2013/3/14 As above. 10,000.00 As above.
Katagalan Wisdom S.A. 2009/4/15 As above. 10,000.00 As above.
Kavalan Wisdom S.A. 2009/4/15 As above. 10,000.00 As above.
Ligulao Wisdom S.A. 2010/5/20 As above. 10,000.00 As above.
Lloa Wisdom S.A. 2009/9/21 As above. 10,000.00 As above.
Log Wisdom S.A. 2008/4/21 As above. 10,000.00 As above.
Luilang Wisdom S.A. 2009/4/16 As above. 10,000.00 As above.
Magnate Maritime S.A. 2004/6/8 As above. 10,000.00 As above.
Makatao Wisdom S.A. 2009/4/15 As above. 10,000.00 As above.
Mercy Marine Line S.A. 2002/3/18 As above. 10,000.00 As above.
Mighty Maritime S.A. 1997/8/5 As above. 10,000.00 As above.
Mimasaka Investment S.A. 2009/9/21 As above. 10,000.00 As above.
Mount Wisdom S.A. 2000/4/10 As above. 10,000.00 As above.
Paiwan Wisdom S.A. 2009/4/15 As above. 10,000.00 As above.
Papora Wisdom S.A. 2006/11/15 As above. 10,000.00 As above.
Pazeh Wisdom S.A. 2008/2/18 As above. 10,000.00 As above.
Pescadores International Line
S.A.
2006/11/27 As above. 10,000.00 As above.
Poavosa International S.A. 2011/5/25 As above. 10,000.00 As above.
Poavosa Maritime S.A. 2011/5/25 As above. 10,000.00 As above.
Poavosa Navigation S.A. 2013/1/23 As above. 10,000.00 As above.
Poavosa Wisdom S.A. 2006/4/10 As above. 10,000.00 As above.

Special Disclosure 133
Company Name Established
Date Address Capital
Major Opreated
Item
Rukai Maritime S.A. 2008/2/18 As above. 10,000.00 As above.
Sakizaya Diamond S.A. 2014/2/25 As above. 10,000.00 As above.
Sakizaya Fortune S.A. 2015/5/29 As above. 10,000.00 As above.
Sakizaya Glory S.A. 2015/5/29 As above. 10,000.00 As above.
Sakizaya Hero S.A. 2016/1/5 As above. 10,000.00 As above.
Sakizaya Integrity S.A. 2016/1/5 As above. 10,000.00 As above.
Sakizaya Justice S.A. 2016/1/5 As above. 10,000.00 As above.
Sakizaya Kalon S.A. 2016/10/12 As above. 10,000.00 As above.
Sakizaya Leader S.A. 2016/10/12 As above. 10,000.00 As above.
Sakizaya Line S.A. 2012/11/21 As above. 10,000.00 As above.
Sakizaya Marine S.A. 2012/1/18 As above. 10,000.00 As above.
Sakizaya Miracle S.A. 2017/1/10 As above. 10,000.00 As above.
Sakizaya Navigation S.A. 2012/1/18 As above. 10,000.00 As above.
Sakizaya Orchid S.A. 2017/4/28 As above. 10,000.00 As above.
Sakizaya Power S.A. 2017/4/28 As above. 10,000.00 As above.
Sakizaya Queen S.A. 2017/3/15 As above. 10,000.00 As above.
Sakizaya Respect S.A. 2017/3/15 As above. 10,000.00 As above.
Sakizaya Wisdom S.A. 2009/2/16 As above. 10,000.00 As above.
Sao Wisdom S.A. 2009/4/15 As above. 10,000.00 As above.
Saysiat Wisdom S.A. 2009/10/7 As above. 10,000.00 As above.
Siraya Wisdom S.A. 2009/4/15 As above. 10,000.00 As above.
Taivoan Wisdom S.A. 2006/11/15 As above. 10,000.00 As above.
Tao Ace S.A. 2011/5/30 As above. 10,000.00 As above.
Tao Brave S.A. 2009/6/5 As above. 10,000.00 As above.
Tao Mariner S.A. 2009/4/15 As above. 10,000.00 As above.
Tao Star S.A. 2010/6/2 As above. 10,000.00 As above.
Tao Treasure S.A. 2011/5/30 As above. 10,000.00 As above.
Taokas Marine S.A. 2009/4/15 As above. 10,000.00 As above.
Taokas Navigation S.A. 2009/7/10 As above. 10,000.00 As above.
Taokas Wisdom S.A. 2009/7/9 As above. 10,000.00 As above.
Taroko Maritime S.A. 2006/11/15 As above. 10,000.00 As above.
Taroko Wisdom S.A. 2009/2/26 As above. 20,000.00 As above.
Triumph Wisdom S.A. 2009/9/21 As above. 10,000.00 As above.
Trobian Wisdom S.A. 2009/4/16 As above. 10,000.00 As above.
Unicorn Bravo S.A. 2006/5/24 As above. 10,000.00 As above.
Unicorn Fortune S.A. 2006/5/25 As above. 10,000.00 As above.

Special Disclosure 134
Company Name Established
Date Address Capital
Major Opreated
Item
Unicorn Logger S.A. 2006/5/25 As above. 10,000.00 As above.
Unicorn Logistics S.A. 2008/5/16 As above. 10,000.00 As above.
Unicorn Marine S.A. 2000/1/17 As above. 10,000.00 As above.
Unicorn Pescadores S.A. 2006/5/24 As above. 10,000.00 As above.
Unicorn Successor S.A. 2003/4/15 As above. 10,000.00 As above.
Vayi Wisdom S.A. 2010/5/20 As above. 10,000.00 As above.
Winsome Wisdom S.A. 2003/4/15 As above. 10,000.00 As above.
Wisdom Ace S.A. 2000/7/20 As above. 10,000.00 As above.
8.1.2 According to Aiticles 369-3 of Company Act , presumed to be a control and affiliation
relation
Not applicable.
8.1.3 Related Party of Consolidated Financial Statements:Please refer to page 141.
8.1.4 The operation of the Company and related party:
The operation of the Company and related party include dry bulk shipping service.
8.1.5 Information of all related party director, supervision and president
Company Name Title Name Current shareholding
Shares Rate
Wisdom Marine International Inc. Chairman Lan, Chun-Sheng - -
Well Shipmanagement and Maritine
Consultant Co., Limited
Chairman Lan, Chun-Sheng - -
Wisdom Marine Lines S.A. Chairman Lan, Chun-Sheng - -
Adixi Wisdom S.A. As above. As above. - -
Amis Carriers S.A. As above. As above. - -
Amis Elegance S.A. As above. As above.
Amis Fortune S.A. As above. As above. - -
Amis Hero S.A. As above. As above. - -
Amis Integrity S.A. As above. As above. - -
Amis International S.A. As above. As above. - -
Amis Justice S.A. As above. As above. - -
Amis Mariner S.A. As above. As above. - -
Amis Miracle S.A. As above. As above. - -
Amis Nature Inc. As above. As above. - -
Amis Navigation S.A. As above. As above. - -

Special Disclosure 135
Company Name Title Name Current shareholding
Shares Rate
Amis Star S.A. As above. As above. - -
Amis Wisdom S.A. As above. As above. - -
Arikun Wisdom S.A. As above. As above. - -
Atayal Brave S.A. As above. As above. - -
Atayal Mariner S.A. As above. As above. - -
Atayal Star S.A. As above. As above. - -
Atayal Wisdom S.A. As above. As above. - -
Babuza Wisdom S.A. As above. As above. - -
Beagle Marine S.A. As above. As above. - -
Beagle Wisdom S.A. As above. As above. - -
Bunun Brave S.A. As above. As above. - -
Bunun Champion S.A. As above. As above. - -
Bunun Dynasty S.A. As above. As above. - -
Bunun Elegance S.A. As above. As above. - -
Bunun Fortune S.A. As above. As above. - -
Bunun Hero S.A. As above. As above. - -
Bunun Infinity S.A. As above. As above. - -
Bunun Justice S.A. As above. As above. - -
Bunun Marine S.A. As above. As above. - -
Bunun Navigation S.A. As above. As above. - -
Bunun Wisdom S.A. As above. As above. - -
Cosmic Wisdom S.A. As above. As above. - -
Daiwan Champion S.A. As above. As above. - -
Daiwan Dolphin S.A. As above. As above. - -
Daiwan Elegance S.A. As above. As above. - -
Daiwan Fortune S.A. As above. As above. - -
Daiwan Glory S.A. As above. As above. - -
Daiwan Hero S.A. As above. As above. - -
Daiwan Infinity S.A. As above. As above. - -
Daiwan Justice S.A. As above. As above. - -
Daiwan Kalon S.A. As above. As above. - -
Daiwan Leader S.A. As above. As above. - -
Daiwan Miracle S.A. As above. As above. - -
Dumun Marine S.A. As above. As above. - -
Dumun Navigation S.A. As above. As above. - -
Elite Steamship S.A. As above. As above. - -

Special Disclosure 136
Company Name Title Name Current shareholding
Shares Rate
Euroasia Investment S.A. As above. As above. - -
Favoran Wisdom S.A. As above. As above. - -
Fourseas Maritime S.A. Panama As above. As above. - -
Fraternity Marine S.A. As above. As above. - -
Fraternity Ship Investment S.A. As above. As above. - -
Genius Marine S.A. As above. As above. - -
Genius Prince S.A. As above. As above. - -
Genius Star Carriers S.A. As above. As above. - -
Genius Star Navigation S.A. As above. As above. - -
Gs Global S.A. As above. As above. - -
Gs Navigation S.A. As above. As above. - -
Gsx Maritime S.A. As above. As above. - -
Guma Marine S.A. As above. As above. - -
Guma Navigation S.A. As above. As above. - -
Harmony Pescadores S.A.(Panama) As above. As above. - -
Harmony Transport S.A. As above. As above. - -
Hoanya Wisdom S.A. As above. As above. - -
Infinite Wisdom S.A. As above. As above. - -
Katagalan Carriers S.A. As above. As above. - -
Katagalan Line S.A. As above. As above. - -
Katagalan Marine S.A. As above. As above. - -
Katagalan Navigation S.A. As above. As above. - -
Katagalan Star S.A. As above. As above. - -
Katagalan Wisdom S.A. As above. As above. - -
Kavalan Wisdom S.A. As above. As above. - -
Ligulao Wisdom S.A. As above. As above. - -
Lloa Wisdom S.A. As above. As above. - -
Log Wisdom S.A. As above. As above. - -
Luilang Wisdom S.A. As above. As above. - -
Magnate Maritime S.A. As above. As above. - -
Makatao Wisdom S.A. As above. As above. - -
Mercy Marine Line S.A. As above. As above. - -
Mighty Maritime S.A. As above. As above. - -
Mimasaka Investment S.A. As above. As above. - -
Mount Wisdom S.A. As above. As above. - -
Paiwan Wisdom S.A. As above. As above. - -

Special Disclosure 137
Company Name Title Name Current shareholding
Shares Rate
Papora Wisdom S.A. As above. As above. - -
Pazeh Wisdom S.A. As above. As above. - -
Pescadores International Line S.A. As above. As above. - -
Poavosa International S.A. As above. As above. - -
Poavosa Maritime S.A. As above. As above. - -
Poavosa Navigation S.A. As above. As above. - -
Poavosa Wisdom S.A. As above. As above. - -
Rukai Maritime S.A. As above. As above. - -
Sakizaya Diamond S.A. As above. As above. - -
Sakizaya Fortune S.A. As above. As above. - -
Sakizaya Glory S.A. As above. As above. - -
Sakizaya Hero S.A. As above. As above. - -
Sakizaya Integrity S.A. As above. As above. - -
Sakizaya Justice S.A. As above. As above. - -
Sakizaya Kalon S.A. As above. As above. - -
Sakizaya Leader S.A. As above. As above. - -
Sakizaya Line S.A. As above. As above. - -
Sakizaya Marine S.A. As above. As above. - -
Sakizaya Miracle S.A. As above. As above. - -
Sakizaya Navigation S.A. As above. As above. - -
Sakizaya Orchid S.A. As above. As above. - -
Sakizaya Power S.A. As above. As above. - -
Sakizaya Queen S.A. As above. As above. - -
Sakizaya Respect S.A. As above. As above. - -
Sakizaya Wisdom S.A. As above. As above. - -
Sao Wisdom S.A. As above. As above. - -
Saysiat Wisdom S.A. As above. As above. - -
Siraya Wisdom S.A. As above. As above. - -
Taivoan Wisdom S.A. As above. As above. - -
Tao Ace S.A. As above. As above. - -
Tao Brave S.A. As above. As above. - -
Tao Mariner S.A. As above. As above. - -
Tao Star S.A. As above. As above. - -
Tao Treasure S.A. As above. As above. - -
Taokas Marine S.A. As above. As above. - -

Special Disclosure 138
Company Name Title Name Current shareholding
Shares Rate
Taokas Navigation S.A. As above. As above. - -
Taokas Wisdom S.A. As above. As above. - -
Taroko Maritime S.A. As above. As above. - -
Taroko Wisdom S.A. As above. As above. - -
Triumph Wisdom S.A. As above. As above. - -
Trobian Wisdom S.A. As above. As above. - -
Unicorn Bravo S.A. As above. As above. - -
Unicorn Fortune S.A. As above. As above. - -
Unicorn Logger S.A. As above. As above. - -
Unicorn Logistics S.A. As above. As above. - -
Unicorn Marine S.A. As above. As above. - -
Unicorn Pescadores S.A. As above. As above. - -
Unicorn Successor S.A. As above. As above. - -
Vayi Wisdom S.A. As above. As above. - -
Winsome Wisdom S.A. As above. As above. - -
Wisdom Ace S.A. As above. As above. - -
8.1.6 Operation of Related Party
Unit:US$
Company Name Capital Assets Liabilities Equity Operation
Revenue
Profit on
Operating
Activites
Profit for the
Year
(after tax)
EPS
(after tax)
Wisdom Marine International
Inc.
17,357,393.74 9,134,292.25 1,619,244.14 7,515,048.11 5,175,661.86 333,090.43 -1,722,132.03 -0.03
Well Shipmanagement and
Maritine Consultant Co.,
Limited
772,611.72 2,210,259.49 1,519,842.11 690,417.38 2,968,986.25 54,734.43 64,101.45 0.03
Wisdom Marine Lines S.A. 454,139,000.00 554,905,954.33 273,033,147.91 281,872,806.42 4,029,699.74 -5,911,078.75 -9,359,950.24 -20.61
Adixi Wisdom S.A. 10,000.00 9,258,720.84 15,885,225.06 -6,626,504.22 3,619,999.99 1,507,691.61 892,979.10 8,929.79
Amis Carriers S.A. 10,000.00 21,894,557.52 14,905,146.67 6,989,410.85 4,787,500.00 2,232,194.17 1,902,632.98 19,026.33
Amis Elegance S.A. 10,000.00 19,792,472.38 13,443,917.19 6,348,555.19 3,871,984.45 1,558,180.35 911,279.36 9,112.79
Amis Fortune S.A. 10,000.00 28,792,990.45 15,124,798.10 13,668,192.35 2,838,428.87 561,307.16 274,830.20 2,748.30
Amis Hero S.A. 10,000.00 22,992,547.12 21,763,213.80 1,229,333.32 4,064,758.75 1,688,039.21 686,249.54 6,862.50
Amis Integrity S.A. 10,000.00 21,738,844.35 20,343,136.21 1,395,708.14 4,601,475.76 2,037,109.48 1,647,553.15 16,475.53
Amis International S.A. 10,000.00 38,721,407.41 19,754,308.33 18,967,099.08 6,678,016.01 3,889,550.82 3,492,698.61 34,926.99
Amis Justice S.A. 10,000.00 21,054,059.60 20,077,741.59 976,318.01 4,053,000.00 1,589,337.15 1,298,155.33 12,981.55
Amis Mariner S.A. 10,000.00 26,671,369.80 18,569,630.19 8,101,739.61 4,775,750.00 2,008,079.31 1,616,666.68 16,166.67

Special Disclosure 139
Company Name Capital Assets Liabilities Equity Operation
Revenue
Profit on
Operating
Activites
Profit for the
Year
(after tax)
EPS
(after tax)
Amis Miracle S.A. 10,000.00 22,718,330.37 21,923,758.16 794,572.21 4,068,500.00 1,684,709.07 794,634.29 7,946.34
Amis Nature Inc. 10,000.00 20,439,011.33 19,870,811.23 568,200.10 1,871,331.25 908,176.67 558,200.10 5,582.00
Amis Navigation S.A. 10,000.00 18,384,027.95 14,232,915.85 4,151,112.10 3,385,648.19 796,549.62 521,913.30 5,219.13
Amis Star S.A. 10,000.00 26,217,225.21 16,333,682.61 9,883,542.60 4,459,865.00 1,569,539.63 1,213,778.46 12,137.78
Amis Wisdom S.A. 10,000.00 48,176,329.01 15,383,352.93 32,792,976.08 3,716,974.35 900,062.82 730,138.28 7,301.38
Arikun Wisdom S.A. 10,000.00 -482,096.61 846,379.99 -1,328,476.60 1,734,635.56 -569,910.64 -588,572.82 -5,885.73
Atayal Brave S.A. 10,000.00 12,847,159.64 6,660,526.36 6,186,633.28 2,290,317.78 294,770.12 207,067.10 2,070.67
Atayal Mariner S.A. 10,000.00 25,172,929.82 13,817,824.93 11,355,104.89 4,352,449.11 402,655.72 222,566.38 2,225.66
Atayal Star S.A. 10,000.00 14,345,853.14 6,217,874.13 8,127,979.01 2,197,412.74 208,742.54 127,032.56 1,270.33
Atayal Wisdom S.A. 10,000.00 20,306,413.87 9,691,275.60 10,615,138.27 2,866,185.25 175,181.96 8,840.53 88.41
Babuza Wisdom S.A. 10,000.00 8,938,828.05 4,130,833.36 4,807,994.69 2,550,227.17 322,125.80 226,509.10 2,265.09
Beagle Marine S.A. 10,000.00 9,112,551.13 0.00 9,112,551.13 0.00 -460.50 -460.50 -4.61
Beagle Wisdom S.A. 3,500,000.00 33,648,743.16 15,641,892.69 18,006,850.47 2,051,453.67 186,758.25 39,159.54 1.12
Bunun Brave S.A. 10,000.00 16,235,308.14 11,870,219.38 4,365,088.76 3,721,743.24 1,179,502.84 621,328.28 6,213.28
Bunun Champion S.A. 10,000.00 17,080,883.28 11,598,248.81 5,482,634.47 3,727,720.11 1,443,284.28 880,946.36 8,809.46
Bunun Dynasty S.A. 10,000.00 17,681,711.21 11,596,574.55 6,085,136.66 5,070,538.72 2,821,732.47 2,254,789.23 22,547.89
Bunun Elegance S.A. 10,000.00 21,068,262.34 14,429,147.09 6,639,115.25 3,457,596.48 1,334,253.46 730,367.90 7,303.68
Bunun Fortune S.A. 10,000.00 20,128,504.87 14,037,089.24 6,091,415.63 4,353,100.96 2,120,578.04 1,863,584.62 18,635.85
Bunun Hero S.A. 10,000.00 13,159,809.70 11,499,364.76 1,660,444.94 2,879,036.66 997,782.85 454,211.18 4,542.11
Bunun Infinity S.A. 10,000.00 15,559,327.28 15,950,064.58 -390,737.30 2,564,625.00 529,163.41 -151,157.87 -1,511.58
Bunun Justice S.A. 10,000.00 14,941,029.03 14,589,121.90 351,907.13 2,935,167.19 944,869.81 309,251.03 3,092.51
Bunun Marine S.A. 10,000.00 22,039,457.16 14,178,823.20 7,860,633.96 3,469,057.98 1,067,426.69 506,494.11 5,064.94
Bunun Navigation S.A. 10,000.00 14,862,707.39 15,122,933.93 -260,226.54 2,719,113.28 -50,636.63 -647,722.92 -6,477.23
Bunun Wisdom S.A. 10,000.00 20,562,086.38 10,584,181.51 9,977,904.87 3,468,942.15 609,045.86 429,468.38 4,294.68
Cosmic Wisdom S.A. 10,000.00 6,879,678.44 79,164.94 6,800,513.50 2,971,723.98 -18,382.75 -18,186.27 -181.86
Daiwan Champion S.A. 10,000.00 19,943,365.31 13,551,939.17 6,391,426.14 3,747,644.51 1,984,952.76 1,717,743.79 17,177.44
Daiwan Dolphin S.A. 10,000.00 19,572,953.47 13,504,853.29 6,068,100.18 3,732,914.37 1,975,934.14 1,706,884.59 17,068.85
Daiwan Elegance S.A. 10,000.00 18,727,805.06 13,566,957.69 5,160,847.37 4,173,780.81 2,016,306.01 1,446,181.96 14,461.82
Daiwan Fortune S.A. 10,000.00 19,219,111.97 13,885,987.02 5,333,124.95 4,206,041.43 1,948,536.55 1,365,104.36 13,651.04
Daiwan Glory S.A. 10,000.00 19,599,135.85 16,208,724.53 3,390,411.32 3,577,241.54 1,460,400.69 1,135,840.91 11,358.41
Daiwan Hero S.A. 10,000.00 13,494,334.63 13,908,785.42 -414,450.79 2,525,729.67 475,067.72 -106,933.95 -1,069.34
Daiwan Infinity S.A. 10,000.00 13,914,220.96 13,899,160.24 15,060.72 2,780,650.08 733,193.51 136,671.54 1,366.72
Daiwan Justice S.A. 10,000.00 12,562,813.96 13,347,517.50 -784,703.54 2,114,522.29 426,452.07 -135,414.14 -1,354.14
Daiwan Kalon S.A. 10,000.00 14,362,033.46 13,586,480.00 775,553.46 3,345,865.41 1,483,340.66 926,852.18 9,268.52
Daiwan Leader S.A. 10,000.00 14,387,089.06 14,710,097.54 -323,008.48 434,850.00 154,750.19 131,323.32 1,313.23

Special Disclosure 140
Company Name Capital Assets Liabilities Equity Operation
Revenue
Profit on
Operating
Activites
Profit for the
Year
(after tax)
EPS
(after tax)
Daiwan Miracle S.A. 10,000.00 5,183.68 0.00 5,183.68 0.00 -2,907.93 -2,907.93 -29.08
Dumun Marine S.A. 10,000.00 21,539,955.62 8,487,243.00 13,052,712.62 3,632,255.00 1,058,793.24 806,031.46 8,060.31
Dumun Navigation S.A. 10,000.00 94,727,223.23 26,141,450.54 68,585,772.69 11,033,104.58 4,572,971.04 4,160,987.65 41,609.88
Elite Steamship S.A. 10,000.00 4,859,885.27 2,060,993.33 2,798,891.94 2,141,189.05 -367,407.96 -450,840.43 -4,508.40
Euroasia Investment S.A. 10,000.00 6,901,667.96 1,767,833.68 5,133,834.28 2,175,193.93 157,020.28 110,551.47 1,105.51
Favoran Wisdom S.A. 10,000.00 10,784,110.30 3,110,610.83 7,673,499.47 2,826,240.06 805,609.17 753,723.51 7,537.24
Fourseas Maritime S.A.
Panama
10,000.00 19,025,648.05 13,582,884.06 5,442,763.99 3,554,029.26 1,513,269.91 1,213,304.93 12,133.05
Fraternity Marine S.A. 10,000.00 8,130,965.29 0.00 8,130,965.29 1,119,093.51 370,614.35 370,906.73 3,709.07
Fraternity Ship Investment S.A. 10,000.00 14,507,908.65 4,330,602.99 10,177,305.66 3,019,602.30 748,926.26 664,392.84 6,643.93
Genius Marine S.A. 10,000.00 35,099,479.51 28,333,202.44 6,766,277.07 1,529,627.42 797,523.51 521,021.15 5,210.21
Genius Prince S.A. 10,000.00 21,768,529.76 16,636,414.41 5,132,115.35 4,127,435.00 1,813,866.60 1,065,782.98 10,657.83
Genius Star Carriers S.A. 10,000.00 19,771,404.76 17,066,259.31 2,705,145.45 3,258,509.59 395,485.99 263,552.25 2,635.52
Genius Star Navigation S.A. 10,000.00 7,869,517.12 1,874,857.40 5,994,659.72 1,624,801.05 -239,846.60 -340,797.37 -3,407.97
Gs Global S.A. 10,000.00 8,740,428.61 8,942,957.64 -202,529.03 2,403,823.84 -493,467.17 -646,872.27 -6,468.72
Gs Navigation S.A. 10,000.00 10,195,157.53 9,244,145.72 951,011.81 2,574,073.41 229,004.88 72,850.71 728.51
Gsx Maritime S.A. 10,000.00 8,158,012.27 4,992,095.80 3,165,916.47 2,015,956.77 -115,770.86 -224,039.32 -2,240.39
Guma Marine S.A. 10,000.00 21,465,562.94 8,798,066.03 12,667,496.91 3,189,015.62 459,767.72 70,942.69 709.43
Guma Navigation S.A. 10,000.00 -7,777,917.19 0.00 -7,777,917.19 0.00 -768.00 -18,230.77 -182.31
Harmony Pescadores
S.A.(Panama)
10,000.00 14,013,716.70 7,178,728.45 6,834,988.25 2,636,821.40 -38,898.51 -108,607.84 -1,086.08
Harmony Transport S.A. 10,000.00 7,080,807.09 2,834,465.48 4,246,341.61 2,538,786.87 -44,782.26 -98,226.15 -982.26
Hoanya Wisdom S.A. 10,000.00 14,122,172.46 4,806,979.79 9,315,192.67 2,731,309.11 242,862.69 109,601.74 1,096.02
Infinite Wisdom S.A. 10,000.00 32,794,357.50 12,599,111.93 20,195,245.57 4,096,970.93 2,087,228.06 1,845,138.75 18,451.39
Katagalan Carriers S.A. 10,000.00 33,002,459.64 22,191,016.65 10,811,442.99 6,459,638.42 3,867,476.92 3,403,103.64 34,031.04
Katagalan Line S.A. 10,000.00 18,016,169.15 17,814,998.85 201,170.30 4,342,862.50 1,375,878.64 701,202.73 7,012.03
Katagalan Marine S.A. 10,000.00 18,661,213.92 13,403,433.17 5,257,780.75 3,658,954.37 531,350.56 -73,040.47 -730.40
Katagalan Navigation S.A. 10,000.00 29,517,802.44 20,973,600.81 8,544,201.63 5,632,350.51 2,792,579.30 1,848,596.28 18,485.96
Katagalan Star S.A. 10,000.00 15,637,131.87 9,343,627.50 6,293,504.37 3,262,925.00 1,287,080.84 827,486.47 8,274.86
Katagalan Wisdom S.A. 10,000.00 77,409,618.80 28,944,961.83 48,464,656.97 9,658,864.26 4,040,205.61 3,604,113.42 36,041.13
Kavalan Wisdom S.A. 10,000.00 86,911,294.73 33,654,914.73 53,256,380.00 9,836,858.04 4,204,099.84 3,725,951.92 37,259.52
Ligulao Wisdom S.A. 10,000.00 24,735,082.84 6,648,104.26 18,086,978.58 3,568,891.66 1,308,216.99 1,221,264.77 12,212.65
Lloa Wisdom S.A. 10,000.00 -2,224,072.47 0.00 -2,224,072.47 241,853.50 -138,822.90 -138,822.90 -1,388.23
Log Wisdom S.A. 10,000.00 4,235,902.14 3,031,491.95 1,204,410.19 2,037,387.74 -180,982.52 -237,394.41 -2,373.94
Luilang Wisdom S.A. 10,000.00 1,664,200.53 0.00 1,664,200.53 0.00 -460.50 -460.50 -4.61

Special Disclosure 141
Company Name Capital Assets Liabilities Equity Operation
Revenue
Profit on
Operating
Activites
Profit for the
Year
(after tax)
EPS
(after tax)
Magnate Maritime S.A. 10,000.00 -885,116.38 353,233.70 -1,238,350.08 2,069,760.37 -619,363.00 -619,363.00 -6,193.63
Makatao Wisdom S.A. 10,000.00 34,441,541.88 15,639,718.72 18,801,823.16 4,040,008.26 986,336.94 826,870.50 8,268.70
Mercy Marine Line S.A. 10,000.00 7,083,056.67 0.00 7,083,056.67 0.00 -490.50 -4,399.66 -44.00
Mighty Maritime S.A. 10,000.00 1,046,278.75 14,288.46 1,031,990.29 2,385,249.53 -75,971.18 -119,944.70 -1,199.45
Mimasaka Investment S.A. 10,000.00 15,988,265.83 7,124,849.21 8,863,416.62 3,012,862.04 744,121.60 655,663.96 6,556.64
Mount Wisdom S.A. 10,000.00 -6,318,224.89 1,904,176.14 -8,222,401.03 2,881,633.98 -753,954.77 -859,206.24 -8,592.06
Paiwan Wisdom S.A. 10,000.00 24,154,800.63 11,320,759.27 12,834,041.36 3,448,036.27 174,655.94 -7,178.57 -71.79
Papora Wisdom S.A. 10,000.00 20,362,262.98 5,685,957.31 14,676,305.67 3,356,233.76 747,182.88 504,415.66 5,044.16
Pazeh Wisdom S.A. 10,000.00 8,059,898.73 3,842,943.48 4,216,955.25 2,316,339.80 -165,376.98 -255,625.79 -2,556.26
Pescadores International Line
S.A.
10,000.00 -267,968.26 0.00 -267,968.26 0.00 -460.50 -460.50 -4.61
Poavosa International S.A. 10,000.00 14,999,158.11 13,320,827.98 1,678,330.13 2,986,988.40 592,757.14 89,442.37 894.42
Poavosa Maritime S.A. 10,000.00 16,783,981.12 12,597,565.36 4,186,415.76 3,122,907.15 673,956.95 164,865.75 1,648.66
Poavosa Navigation S.A. 10,000.00 5,020,864.22 10,340,118.74 -5,319,254.52 868.00 -1,886,516.52 -2,404,390.16 -24,043.90
Poavosa Wisdom S.A. 10,000.00 23,635,691.46 4,177,289.38 19,458,402.08 2,908,965.73 508,987.56 439,184.80 4,391.85
Rukai Maritime S.A. 10,000.00 21,005,526.76 9,844,579.63 11,160,947.13 3,682,061.25 978,271.80 610,344.41 6,103.44
Sakizaya Diamond S.A. 10,000.00 22,764,931.52 15,847,149.66 6,917,781.86 4,953,445.28 2,468,821.69 1,770,155.42 17,701.55
Sakizaya Fortune S.A. 10,000.00 21,059,601.70 18,762,547.49 2,297,054.21 3,833,039.37 1,475,905.95 682,888.37 6,828.88
Sakizaya Glory S.A. 10,000.00 52,209,407.44 46,511,894.79 5,697,512.65 8,647,315.83 4,060,562.59 3,462,828.51 34,628.29
Sakizaya Hero S.A. 10,000.00 19,494,657.54 21,171,797.00 -1,677,139.46 2,828,447.08 269,080.26 -704,647.18 -7,046.47
Sakizaya Integrity S.A. 10,000.00 20,554,158.27 22,004,406.04 -1,450,247.77 2,770,500.00 240,368.73 -680,585.12 -6,805.85
Sakizaya Justice S.A. 10,000.00 22,407,275.75 22,660,635.58 -253,359.83 3,319,228.89 828,739.68 -128,668.98 -1,286.69
Sakizaya Kalon S.A. 10,000.00 22,341,508.68 21,388,355.09 953,153.59 3,746,586.84 1,340,720.48 438,699.92 4,387.00
Sakizaya Leader S.A. 10,000.00 23,243,634.16 21,749,873.75 1,493,760.41 4,345,550.00 1,872,276.25 955,917.69 9,559.18
Sakizaya Line S.A. 10,000.00 21,002,997.09 16,600,597.06 4,402,400.03 4,217,688.66 1,613,267.08 862,131.03 8,621.31
Sakizaya Marine S.A. 10,000.00 18,910,329.64 13,839,138.77 5,071,190.87 3,741,419.51 1,081,341.40 439,128.98 4,391.29
Sakizaya Miracle S.A. 10,000.00 23,615,678.60 23,902,205.65 -286,527.05 3,422,500.00 859,960.23 -273,039.20 -2,730.39
Sakizaya Navigation S.A. 10,000.00 21,820,692.66 15,614,778.41 6,205,914.25 4,552,518.25 2,003,288.55 1,273,709.25 12,737.09
Sakizaya Orchid S.A. 10,000.00 23,955,699.54 23,201,221.78 754,477.76 4,294,256.07 1,664,430.39 681,721.25 6,817.21
Sakizaya Power S.A. 10,000.00 18,941,911.87 17,553,677.02 1,388,234.85 4,232,750.00 1,960,033.01 1,186,852.35 11,868.52
Sakizaya Queen S.A. 10,000.00 27,923,949.29 26,091,067.38 1,832,881.91 3,883,600.01 1,797,707.61 1,463,605.65 14,636.06
Sakizaya Respect S.A. 10,000.00 18,941,154.29 17,372,032.60 1,569,121.69 3,781,950.00 2,097,444.93 1,561,619.16 15,616.19
Sakizaya Wisdom S.A. 10,000.00 27,815,668.61 12,018,178.30 15,797,490.31 4,621,116.01 1,321,607.62 1,145,738.56 11,457.39
Sao Wisdom S.A. 10,000.00 17,838,342.32 8,201,688.61 9,636,653.71 3,118,787.90 617,197.44 320,002.01 3,200.02
Saysiat Wisdom S.A. 10,000.00 20,587,551.42 12,988,881.70 7,598,669.72 3,855,676.88 487,650.12 272,776.72 2,727.77

Special Disclosure 142
Company Name Capital Assets Liabilities Equity Operation
Revenue
Profit on
Operating
Activites
Profit for the
Year
(after tax)
EPS
(after tax)
Siraya Wisdom S.A. 10,000.00 10,179,309.80 3,886,093.72 6,293,216.08 2,381,333.48 -36,762.63 -210,041.83 -2,100.42
Taivoan Wisdom S.A. 10,000.00 -1,604,254.11 0.00 -1,604,254.11 0.00 -460.50 -460.50 -4.61
Tao Ace S.A. 10,000.00 11,810,107.25 10,806,278.99 1,003,828.26 2,876,662.24 497,658.66 286,981.75 2,869.82
Tao Brave S.A. 10,000.00 13,867,704.90 8,225,166.76 5,642,538.14 2,540,465.95 -783,679.28 -919,365.45 -9,193.65
Tao Mariner S.A. 10,000.00 10,957,440.57 8,054,653.47 2,902,787.10 2,623,954.78 1,656.63 -135,667.80 -1,356.68
Tao Star S.A. 10,000.00 8,763,275.80 8,684,928.36 78,347.44 2,562,855.80 71,673.14 -252,697.95 -2,526.98
Tao Treasure S.A. 10,000.00 12,512,805.43 11,064,961.05 1,447,844.38 3,429,968.77 634,109.54 414,596.92 4,145.97
Taokas Marine S.A. 10,000.00 15,420,174.56 6,090,084.75 9,330,089.81 3,013,064.97 526,252.43 427,809.80 4,278.10
Taokas Navigation S.A. 10,000.00 15,821,577.61 6,986,111.08 8,835,466.53 3,263,055.12 707,889.91 623,913.67 6,239.14
Taokas Wisdom S.A. 10,000.00 17,994,899.90 6,081,872.04 11,913,027.86 2,573,301.16 -210,686.12 -378,026.44 -3,780.26
Taroko Maritime S.A. 10,000.00 20,112,208.28 13,811,270.99 6,300,937.29 3,933,687.89 1,954,146.89 1,736,816.07 17,368.16
Taroko Wisdom S.A. 20,000.00 -1,204,666.81 31,017.50 -1,235,684.31 2,287,795.50 -197,066.79 -197,066.79 -985.33
Triumph Wisdom S.A. 10,000.00 15,395,139.95 15,809,563.19 -414,423.24 3,618,750.00 1,068,371.08 751,525.54 7,515.26
Trobian Wisdom S.A. 10,000.00 -5,346,365.95 0.00 -5,346,365.95 0.00 -460.50 -418.24 -4.18
Unicorn Bravo S.A. 10,000.00 1,011,451.73 1,181,188.40 -169,736.67 1,595,589.00 -44,882.01 -74,540.36 -745.40
Unicorn Fortune S.A. 10,000.00 2,025,104.24 0.00 2,025,104.24 0.00 -460.50 -460.50 -4.61
Unicorn Logger S.A. 10,000.00 3,202,952.37 1,623,807.40 1,579,144.97 1,308,559.35 -266,503.07 -301,806.38 -3,018.06
Unicorn Logistics S.A. 10,000.00 -3,022,081.27 1,808,239.99 -4,830,321.26 1,345,977.94 -797,815.36 -878,911.82 -8,789.12
Unicorn Marine S.A. 10,000.00 15,998,094.89 6,765,379.39 9,232,715.50 2,571,406.61 599,196.92 273,930.83 2,739.31
Unicorn Pescadores S.A. 10,000.00 2,933.69 0.00 2,933.69 0.00 -460.50 -460.50 -4.61
Unicorn Successor S.A. 10,000.00 17,024,099.95 8,568,841.66 8,455,258.29 3,691,775.18 1,017,232.27 900,722.07 9,007.22
Vayi Wisdom S.A. 10,000.00 46,874,052.32 17,866,767.26 29,007,285.06 6,190,777.00 2,773,506.99 2,563,454.85 25,634.55
Winsome Wisdom S.A. 10,000.00 51,056,944.09 20,454,137.58 30,602,806.51 4,728,070.59 1,455,708.81 783,391.55 7,833.92
Wisdom Ace S.A. 10,000.00 293,307.97 0.00 293,307.97 0.00 -460.50 -460.50 -4.61
8.2 Status of private placement of securities in the last fiscal year and up to the
date of annual report publication
Not applicable as the Group has not offered any private placement of securities in the last fiscal year and up to the
date of annual report publication.
8.3 Holding or disposal of shares in the Company by subsidiaries in the last
fiscal year and up to the date of annual report publication
Not applicable as the Group has not had any subsidiary holding or disposing shares in the Company in the last
fiscal year and up to the date of annual report publication.

Special Disclosure 143
8.4 Other supplemental information
None.
8.5 Material deviation in protection of shareholders' rights
Pursuant to the amendment of the Articles of Incorporation of Wisdom Marine Lines passed in the extraordinary
general meeting on April 14, 2017, provided the Companies Law of the Cayman Islands is not violated, the
Company has followed the TWSE Shareholder Protection Checklist ("Shareholder Protection Checklist") and
established detailed measures in the Articles of Incorporation to ensure shareholders are able to exercise their
rights.
In particular, the shareholder protection requirements regarding the powers and responsibilities of supervisors do
not apply as Wisdom Marine Lines has independent directors instead. Furthermore, the following shareholder
protection requirements cannot be implemented as they are inconsistent with the laws of the Cayman Islands. The
reasons for deviation are provided as follows.
8.5.1 Special/Supermajority resolution
8.5.1.1 According to Shareholder Protection Checklist:
The following proposals involve important shareholder rights. To pass, a resolution will require a majority vote of
the shareholders present, who have to represent two thirds or more of the total number of outstanding shares.
Where the shareholders present do not represent a sufficient number of shares as specified above, a resolution may
be passed instead by a two-thirds vote of the shareholders present, who have to represent more than half of the
total number of outstanding shares.
Entering into, amending, or terminating any contract for lease of the Company’s business in whole, for
entrusted business, or for regular joint operation with others; transferring the whole or any essential
part of its business or assets; or accepting the transfer of another’s whole business or assets, which has
great bearing on the business operation of the Company.
Modifying the Articles of Incorporation.
Modification of the Articles of Incorporation prejudicial to the privileges of preferred shareholders will
require a resolution of the meeting of preferred shareholders.
Distribution of all or part of dividends and bonuses in the form of new shares.
Resolutions for dissolution, consolidation or merger, or split-up.
Private placement of securities.
8.5.1.2 According to the Companies Law of the Cayman Islands:
According to the lawyers in the Cayman Islands, Section 60 of the Companies Law of the Cayman Islands
provides that a resolution to be passed by voting is a "special resolution" when it has been passed by a majority of
at least two-thirds of such members as, being entitled to do so, vote in person or, where proxies are allowed, by
proxy at a general meeting, except that a company may in its articles of association specify that the required
majority shall be a number greater than two-thirds.

Special Disclosure 144
According to Section 10 and Section 24 of the Companies Law of the Cayman Islands, change of a company's
articles and memorandum of association requires passing of a "special resolution". According to Section 90 of the
Companies Law of the Cayman Islands, dissolution of a company requires passing of a "special resolution".
The shareholders are required to initiate a "special resolution" pursuant to the Articles of Incorporation for matters
requiring passing of a resolution under the Companies Law of the Cayman Islands. Any resolution on such matters
that is passed but fails to meet the voting threshold for a "special resolution" under the Companies Law of the
Cayman Islands shall have no effect under the Companies Law of the Cayman Islands.
8.5.1.3 According to the Articles of Incorporation:
To differentiate itself from "special resolution" under the Companies Law of the Cayman Islands, Section
2(a)(xlvii) of the Wisdom Marine Lines Articles of Incorporation provides a "Type A special/supermajority
resolution" is a resolution passed in a voting process that "requires a majority vote of the shareholders present,
who have to represent two thirds or more of the total number of outstanding shares"; and Section 2(xlvii) provides
a "Type B special/supermajority resolution" to be a resolution passed in a voting process that "requires a
two-thirds vote of the shareholders present, who have to represent more than half of the total number of
outstanding shares".
To the extent applicable to the Articles of Incorporation, the three voting processes are described as follows.
"Special/Supermajority resolution"
Section 30(A) provides that the following proposals require a "special resolution" to be passed:
issuance of preferred shares;
change of company name;
change of share capital into another currency;
capital reduction and capital redemption reserve; and
dissolution.
According to Section 150, amendment of a company's articles and memorandum of association or change of
company name require passing of a "special resolution".
"Type A special/supermajority resolution" and "Type B special/supermajority resolution"
Section 31 provides that the following proposals require a "Type A special resolution" to be passed. Where
the shareholders present do not represent a sufficient number of shares as specified above, the proposals may
be passed by "Type B special resolution" instead.
Entering into, amending, or terminating any contract for lease of the Company’s business in whole, for
entrusted business, or for regular joint operation with others.
Transferring the whole or any essential part of its business or assets.
Accepting the transfer of another’s whole business or assets, which has great bearing on the business
operation of the Company.
Distribution of all or part of dividends and bonuses in the form of new shares.
Split-up in accordance with the law of the Republic of China.

Special Disclosure 145
Private placement of securities.
8.5.1.4 Reasons for deviation:
According to the lawyers in the Cayman Islands, the articles of incorporation of a company incorporated in the
Cayman Islands are required to comply with the Companies Law of the Cayman Islands, and the Companies Law
of the Cayman Islands shall prevail in case of conflict. "Special resolution" is a legal term in the Companies Law
of the Cayman Islands. Matters requiring passing of a "special resolution" under the Companies Law of the
Cayman Islands require shareholders initiate a "special resolution" pursuant to the Articles of Incorporation. It is
also provided that a resolution that is passed but fails to meet the voting threshold for a "special resolution" under
the Companies Law of the Cayman Islands shall have no effect under the Companies Law of the Cayman Islands.
Furthermore, regarding matters requiring passing of a "special resolution", the Companies Law of the Cayman
Islands requires that, where applicable, a company inform clearly in the notice of annual general meeting that
matters requiring passing of a "special resolution" are to be discussed in the meeting. In addition, the company is
required to file a copy of the meeting minutes with the Registrar of Companies of the Cayman Islands within
fifteen days after the shareholders have passed the resolution.
According to the lawyers in the Cayman Islands, in order to comply with the "special resolution" provisions
(including but not limited to form of notification, percentage of votes, and filing requirements) in the Companies
Law of the Cayman Islands, the two matters, "amendment of articles of incorporation" and "dissolution", must
follow the Companies Law of the Cayman Islands and be included in the matters requiring passing of a "special
resolution" under Section 30 of the Articles of Incorporation.
Hence, provided they do not conflict with the Companies Law of the Cayman Islands, matters on the Shareholder
Protection Checklist that require passing of a "special/supermajority resolution" have been included in Section 31
of the Articles of Incorporation. Meanwhile, matters requiring passing of a "special resolution" under the
Companies Law of the Cayman Islands, mainly amendment of articles of incorporation and dissolution, remain
matters requiring passing of a "special resolution" under the Articles of Incorporation. In other words, they remain
resolutions to be passed by a majority of at least two-thirds of the shareholders as, being entitled to do so, vote in
person or, where proxies are allowed, by proxy at a general meeting. The Companies Law of the Cayman Islands
provides separate rules for "consolidation or merger" as described in Section 2 below.
8.5.1.5 Impact on Taiwanese shareholders:
The percentage of votes requirement for "special resolutions" under the Companies Law of the Cayman Islands is
technically not a lower standard than the requirement under the Company Act of the Republic of China or the
Shareholder Protection Checklist. Given Section 31 of the Company's Articles of Incorporation complies with the
Shareholder Protection Checklist in general and includes the matters requiring passing of a special/supermajority
resolution, except for amendment of articles of incorporation, dissolution, and consolidation and merger (see
Section 2 below), in the Articles of Incorporation. Proposals involving amendment of articles of incorporation,
dissolution, and consolidation and merger have to proceed in accordance with the "special resolution" (or "special
resolution for consolidation") provisions in the Companies Law of the Cayman Islands. Therefore, this part of the
Articles of Incorporation should have no negative impact on shareholder rights.

Special Disclosure 146
8.5.2 Resolutions for consolidation or merger
8.5.2.1 Shareholder Protection Checklist
According to the Shareholder Protection Checklist, for a consolidation or merger proposal to pass, the resolution
will require a majority vote of the shareholders present, who have to represent two thirds or more of the total
number of outstanding shares. Where the shareholders present do not represent a sufficient number of shares as
specified above, a resolution may be passed instead by a two-thirds vote of the shareholders present, who have to
represent more than half of the total number of outstanding shares.
8.5.2.2 According to the Companies Law of the Cayman Islands:
According to the lawyers in the Cayman Islands, Section 232 of the Companies Law of the Cayman Islands
provides that "merger" means the merging of two or more constituent companies and the vesting of their
undertaking, property and liabilities in one of such companies as the surviving company; and "consolidation"
means the combination of two or more constituent companies into a consolidated company and the vesting of the
undertaking, property and liabilities of such companies in the consolidated company.
According to Section 233(6) of the Companies Law of the Cayman Islands, A plan of "merger" or "consolidation"
shall be authorized by each constituent company by way of a 75% vote of the shareholders present, who have to
represent 75% or more of the total number of outstanding shares of each such constituent company. If the shares
issued by the surviving company or consolidated company to the shareholders of each constituent company carry
the same rights and value as the original shares, the plan of "merger" or "consolidation" may be authorized by
each constituent company by way of a "special resolution" of the shareholders of each such constituent company.
8.5.2.3 According to the Articles of Incorporation:
The "merger" and "consolidation" provisions in Section 2(a)(xxvi) and (xii) of the Articles of Incorporation are the
same as those under the laws of the Cayman Islands. In addition, under the laws of the Republic of China,
"merger" and "consolidation" of companies are not distinguished from each other and are known collectively as
"merger". Hence, to ensure compliance with the regulations in the Republic of China at the same time, Section
2(a)(xxv) provides explicitly that "merger" and "consolidation" are to be known collectively as "merger" and that
the definitions are in accordance with the laws of the Cayman Islands and those of the Republic of China. There is,
therefore, no real difference between the two in terms of the definition of "merger".
However, given the laws of the Cayman Islands require a "merger" be authorized by each constituent company by
way of a 75% vote of the shareholders present, who have to represent 75% or more of the total number of
outstanding shares of each such constituent company or by way of a "special resolution", the part of Section
2(a)(xliv) of the Articles of Incorporation regarding "special resolution of merger" follows the requirements of the
above laws of the Cayman Islands. In addition, Section 30(B) provides that mergers shall require a "special
resolution of merger" to proceed as required under the laws of the Cayman Islands.
8.5.2.4 Reasons for deviation:
According to the lawyers in the Cayman Islands, the articles of incorporation of a company incorporated in the

Special Disclosure 147
Cayman Islands are required to comply with the Companies Law of the Cayman Islands, and the Companies Law
of the Cayman Islands shall prevail in case of conflict. According to the Companies Law of the Cayman Islands,
mergers shall require a "special resolution of merger" to proceed. Any resolution on such matters that is passed but
fails to meet the voting threshold for a "special resolution of merger" under the Companies Law of the Cayman
Islands shall have no effect under the Companies Law of the Cayman Islands.
8.5.2.5 Impact on Taiwanese shareholders:
The Articles of Incorporation of Wisdom Marine Lines Co., Ltd. establishes explicitly the minimum attendance
requirement for passing a resolution in the annual general meeting to be shareholders (in person or by proxy)
representing more than 50% of the outstanding shares. The voting threshold under the "special resolution for
consolidation" provisions in the Companies Law of the Cayman Islands are technically not lower than the
requirements under the Company Act of the Republic of China or on the Shareholder Protection Checklist, and,
therefore, should have no negative impact on shareholder rights.
Given Section 31 of the Articles of Incorporation complies with the Shareholder Protection Checklist in general
and includes the matters requiring passing of a special/supermajority resolution, except for amendment of articles
of incorporation and dissolution, in the Articles of Incorporation. Proposals involving consolidation and merger
have to proceed in accordance with the "special resolution for consolidation" provisions. Therefore, this part of the
Articles of Incorporation should have limited negative impact on shareholder rights.
8.5.3 Treasury Stock
8.5.3.1 According to Shareholder Protection Checklist:
Where the Company intends to transfer shares to employees at a price below the actual average repurchase price,
the resolution has to be passed by a two-thirds vote of the shareholders present, who have to represent more than
half of the total number of outstanding shares. Furthermore, resolutions of this nature have to be listed in the
reasons for the annual general meeting and provide the following details, which shall not be brought up as
extemporary motions:
Transfer price, discount rate, and calculation assumptions and reasonableness.
Number of shares to be transferred, purpose, and reasonableness.
Employee eligibility for stock options and number of shares.
Impact on shareholder rights: the potential amount to be capitalized and dilution of the Company's EPS;
and description of the financial burden to be imposed on the Company by transferring shares to
employees at a price below the actual average repurchase price.
The cumulative number of shares transferred to employees as passed in previous annual general meetings shall not
exceed 5% of the total outstanding shares in the Company. In addition, the total number of stock options
subscribed by any one employee shall not represent more than 0.5% of the total outstanding shares in the
Company.
Regarding voting rights, the Shareholder Protection Checklist requires that a company establish explicitly that no
voting rights are attached to the shares in itself that it holds as part of a statutory requirement. Shares that do not

Special Disclosure 148
carry voting rights are excluded from the calculation of outstanding shares when voting for the final resolution.
8.5.3.2 According to the Companies Law of the Cayman Islands:
According to Section 37 of the Companies Law of the Cayman Islands revised April 27, 2011, shares that have
been purchased or redeemed by a company of the Cayman Islands pursuant to its articles of association shall be
classified as treasury shares until they are canceled or transferred.
8.5.3.3 According to the Articles of Incorporation:
The Company added provisions to allow treasury shares in accordance with the revised Companies Law of the
Cayman Islands, and made adjustments to comply with the applicable shareholder protection regulations in the
place of listing. The Company proposed an amendment to the Articles of Incorporation regarding repurchase of
outstanding shares and the addition of Sections 34(A) and 34(B) in the agenda for the 2012 annual general
meeting.
8.5.3.4 Reasons for deviation:
The laws of the Cayman Islands do not provide detailed rules on transferring treasury shares from repurchase to
employees.
8.5.3.5 Impact on Taiwanese shareholders:
Regarding detailed rules on transferring treasury shares from repurchase to employees, the Company proposed an
amendment to the Articles of Incorporation in the 2012 annual general meeting. The amendment could be
expected not to have any impact on shareholder rights.
8.5.4 Attendance by Proxy
8.5.4.1 Basis for Attendance by Proxy on Shareholder Protection Checklist
Articles 5, 6, 6-1, and 7, Article 8, Paragraph 4, Articles 10, 11, 12, 13, 13-1, and 14, Article 16, Paragraph 1,
Article 18, Article 19, Paragraph 1, Articles 20, 21, 22, and 23 of the Regulations Governing the Use of Proxies
for Attendance at Shareholder Meetings of Public Companies provide the rules and regulations on attendance by
proxy at annual general meetings.
8.5.4.2 According to The Companies Law of the Cayman Islands/Articles of Incorporation:
According to Section 59 of the Articles of Incorporation, shareholders attending annual general meetings by proxy
or conducting proxy solicitation shall follow the Regulations Governing the Use of Proxies for Attendance at
Shareholder Meetings of Public Companies and other applicable laws of the Republic of China.
8.5.4.3 Reasons for deviation:
Given the degree of detail and relative complexity of the rules on proxy use and solicitation provided by the
Shareholder Protection Checklist, the Company, in the interest of avoiding frequent changes of the Articles of
Incorporation while complying with the proxy use and solicitation regulations, decided to state in general that the
procedures shall follow the applicable laws of the Republic of China and the Regulations Governing the Use of

Special Disclosure 149
Proxies for Attendance at Shareholder Meetings of Public Companies.
8.5.4.4 Impact on Taiwanese shareholders:
Given the purpose of the Shareholder Protection Checklist is to require that public companies and their
shareholders comply with the proxy use and solicitation provisions under the Company Act and the Regulations
Governing the Use of Proxies for Attendance at Shareholder Meetings of Public Companies, Section 59 of the
Articles of Incorporation has been made to require shareholders attending annual general meetings by proxy or
conducting proxy solicitation follow the Regulations Governing the Use of Proxies for Attendance at Shareholder
Meetings of Public Companies and other applicable laws of the Republic of China. In addition, Section 2(6) of the
Taiwan Stock Exchange Letter Taiwan-Stock-Shang-0991701319 dated April 16, 2010 ("TWSE Letter") states
explicitly general provisions may be established without specifics. Therefore, this part should have no real impact
on shareholder rights.
8.5.5 Statutory Reserve
8.5.5.1 According to Shareholder Protection Checklist:
The following matters shall be listed and generally described in the reasons for the annual general meeting and not
be brought up as extemporary motions:
appointment or removal of directors/supervisors;
change of the Articles of Incorporation;
dissolution, consolidation or merger, or split-up of the Company;
entering into, amending, or terminating any contract for lease of the Company’s business in whole, for
entrusted business, or for regular joint operation with others;
transferring the whole or any essential part of its business or assets;
accepting the transfer of another’s whole business or assets, which has great bearing on the business
operation of the Company;
private placement of securities with equity characteristics;
permission for directors to engage in activities prohibited by noncompetition clauses;
distribution of all or part of dividends and bonuses in the form of new shares; and
distribution of capital surplus from the legal reserve and income from contributed capital in excess of
par or gift to original shareholders in the form of new shares.
8.5.5.2 According to The Companies Law of the Cayman Islands/Articles of Incorporation:
According to Item 5 in the TWSE Letter above, allocation of the legal reserve is one of the matters that companies
may decide on their own, and foreign issuers may be exempted from mandatory allocation of the legal reserve
under the Company Act of the Republic of China. Hence, given the purpose of the letter above, the Articles of
Incorporation, to avoid confusion, does not follow the the shareholder protection requirements and name
distribution of the legal reserve in the form new shares to shareholders as one of the matters not be brought up as
extemporary motions.
8.5.5.3 Reasons for deviation/impact on Taiwanese shareholders:
Based on Item 5 in the TWSE Letter above, foreign issuers may be exempted from mandatory allocation of the

Special Disclosure 150
legal reserve under the Company Act of the Republic of China. In addition, the Company's Articles of
Incorporation presently does not provide rules on allocation of legal reserve. To avoid confusion and follow the
subject of the letter above, the Articles of Incorporation does not follow the the shareholder protection
requirements and name distribution of the legal reserve in the form new shares to shareholders as one of the
matters not be brought up as extemporary motions. However, it should have no real impact on shareholder rights.
8.6 Corporate events with material impact on shareholders' equity or stock
prices set forth in Article 36, Paragraph 3, Subparagraph 2 of Securities and
Exchange Act in the past year and up to the date of report should be listed
individually:
None.

Statement on Internal Control 151
Wisdom Marine Lines Co., Ltd.
Statement on Internal Control
Date: March 29, 2019
This statement relates to the internal control system of the Company and the results of a self-assessment for
the year ending December 31, 2018.
I. The Company is fully aware that the establishment, implementation and maintenance of its internal
control system is the responsibility of the Board of Directors and the management personnel. In this
regard the Company has established such a system. The aim of the system is to provide reasonable
assurance of the achievement of objectives in the effectiveness and efficiency of operations
(including profits, performance, and safeguard of asset security), reliability, timeliness, and
transparency of reporting, and compliance with applicable laws and regulations.
II. There are inherent limitations to even the most well designed internal control system. As such, an
effective internal control system can only reasonably ensure the achievement of the three
aforementioned objectives. Moreover, the operating environment and situation may change and
impact the effectiveness of the internal control system. Nevertheless, self-supervision measures
have been built into the Company's internal control system to facilitate immediate rectification once
procedural flaws have been identified.
III. The Company judges the design and operating effectiveness of its internal control system based on
the criteria provided in the Regulations Governing the Establishment of Internal Control Systems by
Public Companies (hereinafter referred to as the "Regulations"). The internal control system
judgment criteria adopted by the Regulations divide internal control into five elements based on the
process of management control: 1. Control environment, 2. Risk assessment, 3. Control operation, 4.
Information and communication, and 5. Monitoring. Each element further contains several items.
For more information on the aforementioned items, please refer to the Regulations.
IV. The Company has evaluated the design and operating effectiveness of its internal control system
according to the aforesaid criteria.
V. Based on the findings of the assessment mentioned in the preceding paragraph, the Company
believes that at December 31, 2018, its internal control system (including its supervision and
management of subsidiaries), encompassing internal controls for knowledge of the degree of
achievement of operational effectiveness and efficiency objectives, reliability of reporting, and
compliance with applicable laws and regulations, is effectively designed and operating, and
reasonably assures the achievement of the aforementioned objectives.
VI. This Statement will become a major part of the content of the Company's Annual Report and
Prospectus, and will be made public. Any falsehood, concealment, or other illegality in the content
made public will entail legal liability under Articles 20, 32, 171, and 174 of the Securities and
Exchange Act.
VII. This Statement has been passed by the Board of Directors Meeting of the Company held on March
29, 2019, where 0 of the 9 attending Directors expressed dissenting opinions, and the remainder all
affirmed the content of this Statement.
Wisdom Marine Lines Co., Limited
Chairman: Lan, Chun-Sheng
President: Cheng, Chun-Sheng

Consolidated Financial Statements 152
Wisdom Marine Lines Co., Limited
Audit Committee’s Review Report
The Board of Directors has prepared the Company’s 2018 Business Report, Financial Statements and proposal for
distribution of 2018 earnings. Of which, the Financial Statements have been audited by Lin, Li Huang and Fuh,
Wen Fun, Ernst & Young, Taiwan.
The 2018 Business Report, Financial Statements and proposal for distribution of 2018 earnings have been audited
by us as Audit Committee of the Company. We deem no inappropriateness on these documents. Pursuant to
Article 14-4 of the Securities and Exchange Act and Article 219 of the Company Act, we hereby submit this
report.
Please review.
To
The 2019 Annual General Meeting
Wisdom Marine Lines Co., Limited
Chairman of the the Audit Committee : Tu, Neng-Mo
On the date of March 29, 2019

Consolidated Financial Statements 153
WISDOM MARINE LINES CO., LIMITED (CAYMAN)
AND ITS SUBSIDIARIES
CONSOLIDATED FINANCIAL STATEMENTS
WITH REPORT OF INDEPENDENT AUDITORS
31 DECEMBER 2018 AND 2017
Registered: Clifton House, 75 Fort Street, PO Box 1350, Grand Cayman
KY1-1108, Cayman Islands
Address: 7F., No. 237, Sec. 2, Fushing S. Rd., Taipei City, Taiwan
Telephone: 886-2-2755-2637
The reader is advised that these consolidated financial statements have been prepared originally in Chinese. In the event of a conflict
between these financial statements and the original Chinese version or difference in interpretation between the two versions, the
Chinese language financial statements shall prevail.

TABLE OF CONTENTS
Contents Page
Cover page 1
Table of contents 2
Statement by directors 3
Audit report of independent auditors 4-7
Consolidated balance sheets 8-9
Consolidated statements of comprehensive income 10
Consolidated statements of changes in equity 11
Consolidated statement of cash flows 12
Notes to the consolidated financial statements
1.History and organization 13
2.Date and authorization of financial statements for issue 13
3.Newly issued or revised standards and interpretations 13-22
4.Summary of significant accounting policies 23-50
5.Significant accounting judgments, estimates and assumptions 50-51
6.Contents of significant accounts 52-83
7.Related parties 83-88
8.Pledged assets 88
9.Significant commitments and contingencies 89-90
10.Losses due to major disasters 90
11.Significant subsequent events 90
12.Others 90-104
13.Segment information 104-105

Consolidated Financial Statements 155
STATEMENT BY DIRECTORS
This statement specifies the responsibility of the Board of Directors in compiling the Consolidated
Financial Report of Wisdom Marine Lines Co., Limited (Cayman) (the “Company”) and its
subsidiaries (together the “Group”).
In addition to the disclosure of accounting information, a complete consolidated financial report
shall include the roles of each segment of the Group and their future development, so that the
readers of the Financial Report can fully understand the future development and potential risk of the
Group. In respect of the full and complete disclosure of accounting procedures and financial
information, the Board has responsibility to review the Group’s strategies, important business plans,
and risk management policies, to set operational targets, and to monitor the results of operations, in
order to comply with relevant regulations, protect company interests, and avoid potential fraud
within the Group. We have provided the relevant financial information for every financial report
year, and disclosed the consolidated assets, liabilities, financial structure and operating performance
in a truthful, fair and objective manner. Our disclosure is based on the principles of consistency and
going concern assumption, and we make fair judgments and estimations regarding accrual items at
the end of each year, in order to prevent erroneous information in the consolidated financial report.
The Board of Directors and management reviewed the consolidated financial report of the Company
and its subsidiaries for 2018 and 2017 on 22 February 2019. The consolidated financial report have
been prepared in accordance with International Financial Reporting Standards, International
Accounting Standards and Interpretations developed by the International Financial Reporting
Interpretations Committee or the former Standing Interpretations Committee, and give a true and
fair view of the consolidated financial position of the Group as at 31 December 2018 and 2017 and
the consolidated results and changes in equity of the Group for the years then ended, and there is no
fraudulent or concealed information.
The Board of Directors has, on the date of this statement, authorized these financial statements for
issue.
Wisdom Marine Lines Co., Limited
Director
22 February 2019

Consolidated Financial Statements 156
Audit Report of Independent Auditors
Independent Auditors’ Report Translated from Chinese
To the Board of Directors and Stockholders of
Wisdom Marine Lines Co., Limited (Cayman)
Opinion
We have audited the accompanying consolidated balance sheets of Wisdom Marine Lines Co.,
Limited (Cayman) (the “Company”) and its subsidiaries (together the “Group”) as of 31 December
2018 and 2017, and the related consolidated statements of comprehensive income, changes in
equity and cash flows for the years ended 31 December 2018 and 2017, and notes to the
consolidated financial statements, including the summary of significant accounting policies
(together “the consolidated financial statements”).
In our opinion, the consolidated financial statements referred to above present fairly, in all material
respects, the consolidated financial position of the Company and its subsidiaries as of 31 December
2018 and 2017, and their consolidated financial performance and cash flows for the years ended 31
December 2018 and 2017, in conformity with the requirements of the International Financial
Reporting Standards, International Accounting Standards, Interpretations developed by the
International Financial Reporting Interpretations Committee or the former Standing Interpretations
Committee.
Basis for Opinion
We conducted our audits in accordance with the Regulations Governing Auditing and Attestation of
Financial Statements by Certified Public Accountants and auditing standards generally accepted in
the Republic of China. Our responsibilities under those standards are further described in the
Auditors’ Responsibilities for the Audit of the Consolidated Financial Statements section of our
report. We are independent of the Company and its subsidiaries in accordance with the Norm of
Professional Ethics for Certified Public Accountant of the Republic of China (the “Norm”), and we
have fulfilled our other ethical responsibilities in accordance with the Norm. We believe that the
audit evidence we have obtained is sufficient and appropriate to provide a basis for our opinion.
Key Audit Matters
Key audit matters are those matters that, in our professional judgment, were of most significance in
our audit of 2018 consolidated financial statements. These matters were addressed in the context of
our audit of the consolidated financial statements as a whole, and in forming our opinion thereon,
and we do not provide a separate opinion on these matters.

Consolidated Financial Statements 157
Impairment of property, plant and equipment
As at 31 December 2018, the amount of the Group’s property, plant and equipment was
$2,741,207,097, which accounted for 95% of total assets. The management assessed if there is any
indication that an asset may be impaired on balance sheet date. If there is any indication that an
asset may be impaired, the Group should evaluate the recoverable amount of the
cash-generating-unit (CGU), to which the asset belongs. The property, plant and equipment of the
Group mainly consists of vessel equipment. The subsidiaries of the Company took the
one-vessel-one-company strategy to manage vessels, and the main CGU for each subsidiary is their
vessels. With the view that the amount of property, plant and equipment being material and the
calculation of recoverable amount involving numerous assumptions and estimates, we have
determined the impairment of property, plant and equipment as a key audit matter. The audit
procedures we conducted regarding the impairment of property, plant and equipment included but
not limited to the following, evaluating the appropriateness of the accounting policy for impairment
of property, plant and equipment; inspecting the impairment evaluation report provided by the
Group and assess the reasonableness of the identification of indication of impairment and the
assumptions used, including identification of CGU, estimation of cash flows and discount rate. We
also evaluated the disclosure regarding to property, plant and equipment in Note 5 and 6 of the
consolidated financial statement.
Valuation of the put option embedded in bond payable
As at 31 December 2018, the amount of the Group’s financial liabilities at fair value through profit
or loss was $2,488,564, which accounted for 0% of total assets.The fair value measurement
hierarchy of the put option embedded in bond payable is categorized as Level 3. The measurement
of Level 3 investment uses unobservable inputs. The management measured the put option based on
source data from external valuation institute. As the external valuation has significant impact on the
estimates of fair value, we determined the issue to be a key audit matter. The audit procedures we
conducted regarding the valuation of the put option included but not limited to the following,
comparing the report provided by internal experts with the report and related documents provided
by the management; evaluating the reasonableness of the valuation methods and key valuation
assumptions used by external valuation institute; conducting the recalculation and comparing the
result with the one provided by the management. We also evaluated the disclosure regarding to
valuation of the put option in Note 5, 6 and 12 of the consolidated financial statement.
Responsibilities of Management and Those Charged with Governance for the Consolidated
Financial Statements
Management is responsible for the preparation and fair presentation of the consolidated financial
statements in accordance with the requirements of the International Financial Reporting Standards,
International Accounting Standards, Interpretations developed by the International Financial
Reporting Interpretations Committee and Interpretations developed by the Standing Interpretations
Committee and for such internal control as management determines is necessary to enable the
preparation of consolidated financial statements that are free from material misstatement, whether
due to fraud or error.

Consolidated Financial Statements 158
In preparing the consolidated financial statements, management is responsible for assessing the
ability to continue as a going concern of the Company and its subsidiaries, disclosing, as applicable,
matters related to going concern and using the going concern basis of accounting unless
management either intends to liquidate the Company and its subsidiaries or to cease operations, or
has no realistic alternative but to do so.
Those charged with governance, including audit committee or supervisors, are responsible for
overseeing the financial reporting process of the Company and its subsidiaries.
Auditor’s Responsibilities for the Audit of the Consolidated Financial Statements
Our objectives are to obtain reasonable assurance about whether the consolidated financial
statements as a whole are free from material misstatement, whether due to fraud or error, and to
issue an auditor’s report that includes our opinion. Reasonable assurance is a high level of
assurance, but is not a guarantee that an audit conducted in accordance with auditing standards
generally accepted in the Republic of China will always detect a material misstatement when it
exists. Misstatements can arise from fraud or error and are considered material if, individually or in
the aggregate, they could reasonably be expected to influence the economic decisions of users taken
on the basis of these consolidated financial statements.
As part of an audit in accordance with auditing standards generally accepted in the Republic of
China, we exercise professional judgment and maintain professional skepticism throughout the
audit. We also:
1. Identify and assess the risks of material misstatement of the consolidated financial statements,
whether due to fraud or error, design and perform audit procedures responsive to those risks, and
obtain audit evidence that is sufficient and appropriate to provide a basis for our opinion. The
risk of not detecting a material misstatement resulting from fraud is higher than for one resulting
from error, as fraud may involve collusion, forgery, intentional omissions, misrepresentations, or
the override of internal control.
2. Obtain an understanding of internal control relevant to the audit in order to design audit
procedures that are appropriate in the circumstances, but not for the purpose of expressing an
opinion on the effectiveness of the internal control of the Company and its subsidiaries.
3. Evaluate the appropriateness of accounting policies used and the reasonableness of accounting
estimates and related disclosures made by management.
4. Conclude on the appropriateness of management’s use of the going concern basis of accounting
and, based on the audit evidence obtained, whether a material uncertainty exists related to events
or conditions that may cast significant doubt on the ability to continue as a going concern of the
Company and its subsidiaries. If we conclude that a material uncertainty exists, we are required
to draw attention in our auditor’s report to the related disclosures in the consolidated financial
statements or, if such disclosures are inadequate, to modify our opinion. Our conclusions are
based on the audit evidence obtained up to the date of our auditor’s report. However, future
events or conditions may cause the Company and its subsidiaries to cease to continue as a going
concern.

Consolidated Financial Statements 159
5. Evaluate the overall presentation, structure and content of the consolidated financial statements,
including the accompanying notes, and whether the consolidated financial statements represent
the underlying transactions and events in a manner that achieves fair presentation.
6. Obtain sufficient appropriate audit evidence regarding the financial information of the entities or
business activities within the Company and its subsidiaries to express an opinion on the
consolidated financial statements. We are responsible for the direction, supervision and
performance of the group audit. We remain solely responsible for our audit opinion.
We communicate with those charged with governance regarding, among other matters, the planned
scope and timing of the audit and significant audit findings, including any significant deficiencies in
internal control that we identify during our audit.
We also provide those charged with governance with a statement that we have complied with
relevant ethical requirements regarding independence, and to communicate with them all
relationships and other matters that may reasonably be thought to bear on our independence, and
where applicable, related safeguards.
From the matters communicated with those charged with governance, we determine those matters
that were of most significance in the audit of 2018 consolidated financial statements and are
therefore the key audit matters. We describe these matters in our auditor’s report unless law or
regulation precludes public disclosure about the matter or when, in extremely rare circumstances,
we determine that a matter should not be communicated in our report because the adverse
consequences of doing so would reasonably be expected to outweigh the public interest benefits of
such communication.
Lin, Li Huang
Fuh, Wen Fun
Ernst & Young, Taiwan
22 February 2019
Notice to Readers
The accompanying consolidated financial statements are intended only to present the financial position, results of operations and cash
flows in accordance with accounting principles and practices generally accepted in the Republic of China and not those of any other
jurisdictions. The standards, procedures and practices to audit such consolidated financial statements are those generally accepted and
applied in the Republic of China.
Accordingly, the accompanying consolidated financial statements and report of independent accountants are not intended for use by
those who are not informed about the accounting principles or auditing standards generally accepted in the Republic of China, and
their applications in practice. As the financial statements are the responsibility of the management, Ernst & Young cannot accept any

Consolidated Financial Statements 160
liability for the use of, or reliance on, the English translation or for any errors or misunderstandings that may derive from the
translation.

Consolidated Financial Statements 161

Consolidated Financial Statements 162

Consolidated Financial Statements 163

Consolidated Financial Statements 164

Consolidated Financial Statements 165
WISDOM MARINE LINES CO., LIMITED (CAYMAN)
AND ITS SUBSIDIARIES
NOTES TO THECONSOLIDATED FINANCIAL STATEMENTS
31 DECEMBER 2018 AND 2017
(In US Dollars Unless Stated Otherwise)
English Translation of Consolidated Financial Statements Originally Issued in Chinese
1. History and organization
Wisdom Marine Lines Co., Limited (Cayman) (the “Company”) was incorporated in the Cayman
Islands on 21 October 2008 as a tax-exempt company with limited liability under the Companies
Act, Cap 22 (Law 3 of 1961, as consolidated and revised) of the Cayman Islands. The Company
and its subsidiaries (the “Group”) primarily provide marine cargo transportation services, service
related to the maintenance, vessel leasing, and shipping agency and management services. On 1
December 2010, the Company was approved and listed on Taiwan Stock Exchange (TWSE).
The Company’s ultimate parent company: None.
2. Date and procedures of authorization of financial statements for issue
The consolidated financial statements were authorized for issue by the board of directors on
22 February 2019.
3. Newly issued or revised standards and interpretations
(1) Except for the following, the accounting policies applied in these consolidated financial
statements are consistent with those applied in the consolidated financial statements for the
year ended 31 December 2017. Shown below are the standards and interpretations effective
for annual periods beginning on or after 1 January 2018.
A. IFRS 15“Revenue from Contracts with Customers” (including Amendments to IFRS 15
“Clarifications to IFRS 15 Revenue from Contracts with Customers”)
IFRS 15 replaces IAS 11 Construction Contracts, IAS 18 Revenue and related
Interpretations. In accordance with the transition provision in IFRS 15, the Group elected
to recognize the cumulative effect of initially applying IFRS 15 at the date of initial
application (1 January 2018). The Group also elected to apply this standard
retrospectively only to contracts that are not completed contracts at the date of initial
application.

Consolidated Financial Statements 166
The Group’s principal activities are rendering of services. The impacts arising from the
adoption of IFRS 15 on the Group are summarized as follows:
(a) Please refer to Note 4 for the accounting policies before or after 1 January 2018.
(b) Before 1 January 2018, revenue from rendering of services was recognized by
reference to the stage of completion which was measured by reference to the
proportion that contract cost incurred for work performed to date bear to the
estimated total contract costs. Starting from 1 January 2018, in accordance with IFRS
15, the Group recognized revenue when (or as) the Group satisfies a performance
obligation by transferring a promised service to a customer and also by reference to
the stage of completion. IFRS 15 has no significant impact on the Group’s revenue
recognition from rendering of services. However, for some rendering of services
contracts, part of the consideration was received from customers upon signing the
contract, then the Group has the obligation to provide the services subsequently.
Before 1 January 2018, the Group recognized the consideration received in advance
from customers under other current liabilities. Starting from 1 January 2018, in
accordance with IFRS 15, it should be recognized as contract liabilities. For some
contracts, if the Group has the right to render services to customers but does not has a
right to an amount of consideration that is unconditional, these contacts should be
presented as contract assets. It is different from the accounting treatment of
recognizing trade receivables before the date of initial application. Besides, loss
allowance for contract assets was assessed in accordance with IFRS 9.
(c) Please refer to Note 4 and Note 6 for additional disclosure note required by IFRS 15.
B. IFRS 9“Financial Instruments”
IFRS 9 replaces IAS 39 Financial Instruments: Recognition and Measurement. In
accordance with the transition provision in IFRS 9, the Group elected not to restate prior
periods at the date of initial application (1 January 2018). The adoption of IFRS 9 has the
following impacts on the Group:
(a) The Group adopted IFRS 9 since 1 January 2018 and it adopted IAS 39 before 1
January 2018. Please refer to Note 4 for more details on accounting policies.

Consolidated Financial Statements 167
(b) In accordance with the transition provision in IFRS 9, the assessment of the business
model and classification of financial assets into the appropriate categories are based
on the facts and circumstances that existed as at 1 January 2018. The classifications
of financial assets and it carrying amounts as at 1 January 2018 are as follow:
IAS 39 IFRS 9
Measurement categories
Carrying
amounts
Measurement categories
Carrying
amounts
Fair value through other
comprehensive income
Available-for-sale financial
assets
$1,028,103
Fair value through other
comprehensive income
$1,028,103
At amortized cost
Held-to-maturity investments
614,211
At amortized cost (including cash
and cash equivalents, financial assets
measured at amortized cost, trade
receivables, other receivables
(including due from related
parties)and Long-term
notes,accounts and overdue
receivables)
47,068,168
Loans and receivables (including
cash and cash equivalents, trade
receivables, other receivables
(including due from related
parties)and Long-term
notes,accounts and overdue
receivables)
46,453,957
Subtotal 47,068,168
Derivative financial assets for hedging 80,058 Financial assets for hedging 80,058
Other financial assets 60,402,742 Other financial assets 60,402,742
Total $108,579,071 Total $108,579,071
(c) The transition adjustments from IAS 39 to IFRS 9 for the classifications of financial
assets and financial liabilities as at 1 January 2018 are as follow:

Consolidated Financial Statements 168
IAS 39 IFRS 9
Retained
earnings
Other
components of
equity
Class of financial
instruments
Carrying
amounts
Class of financial
instruments
Carrying
amounts Difference Adjustment Adjustment
Available-for-sale
financial assets (Note i)
$1,028,103 Measured at fair value
through other
comprehensive income
(debt instruments)
$1,028,103 $- $- $-
Held-to-maturity
investments (Note ii)
614,211 Financial assets
measured at amortized
costs
614,211 - - -
Loans and receivables
(Note ii)
Cash and cash
equivalents(exclude
cash on hand)
40,856,106 Cash and cash
equivalents(exclude
cash on hand)
40,856,106 - - -
Accounts receivable
(include from related
parties)
2,647,645 Accounts receivable
(include from
related parties)
2,647,645 - - -
other receivables
(include from related
parties)
1,048,206 other receivables
(include from
related parties)
1,048,206 - - -
Long-term
notes,accounts and
overdue receivables
1,902,000 Long-term
notes,accounts and
overdue receivables
1,902,000 - - -
Subtotal 46,453,957
Derivative financial assets
for hedging
80,058 Financial assets for
hedging
80,058 - - -
Other financial assets 60,402,742 Other financial assets 60,402,742 - - -
Total $108,579,071 Total $108,579,071 $- $- $-
Note:
i. In accordance with IAS 39, available-for-sale financial assets are bonds of listed
companies. Details are described as follow:

Consolidated Financial Statements 169
The cash flow characteristics for bonds investments are solely payments of
principal and interest on the principal amount outstanding. In accordance with
IFRS 9, the assessment of the business model is based on the facts and
circumstances that existed as at 1 January 2018. These financial assets are
managed to achieve the business model’s objective by both collecting contractual
cash flows and selling financial assets, and they should be reclassified to financial
assets measured at fair value through other comprehensive income. As at 1
January 2018, available-for-sale investments of $1,028,103 were reclassified to
financial assets measured at fair value through other comprehensive income of
$1,028,103. This reclassification did not result any difference in the carrying
amount. Besides, in accordance with IFRS 9, there was no adjustment arised from
the assessment of impairment losses for the aforementioned assets as at 1 January
2018.
ii. In accordance with IAS 39, the cash flow characteristics for held-to-maturity
investments and loans and receivables are solely payments of principal and
interest on the principal amount outstanding. The assessment of the business
model is based on the facts and circumstances that exited as at 1 January 2018.
These financial assets were measured at amortized cost as they were held within a
business model whose objective was to hold financial assets in order to collect
contractual cash flows. Besides, in accordance with IFRS 9, there was no
adjustment arised from the assessment of impairment losses for the
aforementioned assets as at 1 January 2018. Therefore, there is no impact on the
carrying amount as at 1 January 2018. As at 1 January 2018, financial assets
held-to-maturity investments of $614,211 were reclassified to financial assets
measured at amortized cost of $614,211.
(d) Please refer to Note 4, Note 6 and Note 12 for the related disclosures required by
IFRS 7 and IFRS 9.
C. IFRIC 22 “Foreign Currency Transactions and Advance Consideration”
The interpretation clarifies that when applying paragraphs 21 and 22 of IAS 21 “The
Effects of Changes in Foreign Exchange Rates”, in determining the spot exchange rate to
use on initial recognition of the related asset, expense or income (or part of it) on the

Consolidated Financial Statements 170
derecognition of a non-monetary asset or non-monetary liability relating to advance
consideration, the date of the transaction is the date on which an entity initially
recognizes the non-monetary asset or non-monetary liability arising from the advance
consideration. If there are multiple payments or receipts in advance, then the entity must
determine a date of the transactions for each payment or receipt of advance consideration.
The Group has no relevant transaction or event. Aforementioned standards and
interpretations have no material impact on the Group.
(2) The following standards or interpretations issued by IASB are not yet effective:
A. IFRS 16“Leases”
The new standard requires lessees to account for all leases under a single on-balance
sheet model (subject to certain exemptions). Lessor accounting still uses the dual
classification approach: operating lease and finance lease.
B. IFRIC 23 “Uncertainty Over Income Tax Treatments”
The Interpretation clarifies application of recognition and measurement requirements in
IAS 12 “Income Taxes” when there is uncertainty over income tax treatments.
C. IAS 28“Investment in Associates and Joint Ventures” — Amendments to IAS 28
The amendments clarify that an entity applies IFRS 9 to long-term interests in an
associate or joint venture that form part of the net investment in the associate or joint
venture before it applies IAS 28, and in applying IFRS 9, does not take account of any
adjustments that arise from applying IAS 28.
D. Prepayment Features with Negative Compensation (Amendments to IFRS 9)
The amendment allows financial assets with prepayment features that permit or require a
party to a contract either to pay or receive reasonable compensation for the early
termination of the contract, to be measured at amortized cost or at fair value through
other comprehensive income.
E. Improvements to International Financial Reporting Standards (2015-2017 cycle):

Consolidated Financial Statements 171
IFRS 3 “Business Combinations”
The amendments clarify that an entity that has joint control of a joint operation shall
remeasure its previously held interest in a joint operation when it obtains control of the
business.
IFRS 11 “Joint Arrangements”
The amendments clarify that an entity that participates in, but does not have joint control
of, a joint operation does not remeasure its previously held interest in a joint operation
when it obtains joint control of the business.
IAS 12 “Income Taxes”
The amendments clarify that an entity shall recognize the income tax consequences of
dividends in profit or loss, other comprehensive income or equity according to where the
entity originally recognized those past transactions or events.
IAS 23 “Borrowing Costs”
The amendments clarify that an entity should treats as part of general borrowings any
borrowing made specifically to obtain an asset when the asset is ready for its intended use
or sale.
F. Plan Amendment, Curtailment or Settlement (Amendments to IAS 19)
The amendments clarify that when a change in a defined benefit plan is made (such as
amendment, curtailment or settlement, etc.), the entity should use the updated
assumptions to remeasure its net defined benefit liability or asset.
G. IFRS 10“Consolidated Financial Statements” and IAS 28“Investments in Associates and
Joint Ventures” — Sale or Contribution of Assets between an Investor and its Associate
or Joint Ventures
The amendments address the inconsistency between the requirements in IFRS 10
Consolidated Financial Statements and IAS 28 Investments in Associates and Joint
Ventures, in dealing with the loss of control of a subsidiary that is contributed to an
associate or a joint venture. IAS 28 restricts gains and losses arising from contributions of
non-monetary assets to an associate or a joint venture to the extent of the interest

Consolidated Financial Statements 172
attributable to the other equity holders in the associate or joint ventures. IFRS 10 requires
full profit or loss recognition on the loss of control of the subsidiary. IAS 28 was
amended so that the gain or loss resulting from the sale or contribution of assets that
constitute a business as defined in IFRS 3 between an investor and its associate or joint
venture is recognized in full. IFRS 10 was also amended so that the gains or loss resulting
from the sale or contribution of a subsidiary that does not constitute a business as defined
in IFRS 3 between an investor and its associate or joint venture is recognized only to the
extent of the unrelated investors’ interests in the associate or joint venture. The
effective date of the amendments has been postponed indefinitely, but early adoption is
allowed.
H. IFRS 17 “Insurance Contracts”
IFRS 17 provides a comprehensive model for insurance contracts, covering all relevant
accounting aspects (including recognition, measurement, presentation and disclosure
requirements). The core of IFRS 17 is the General (building block) Model, under this
model, on initial recognition, an entity shall measure a group of insurance contracts at the
total of the fulfilment cash flows and the contractual service margin. The fulfilment
cash flows comprise of the following:
(1) estimates of future cash flows;
(2) Discount rate: an adjustment to reflect the time value of money and the financial
risks related to the future cash flows, to the extent that the financial risks are not
included in the estimates of the future cash flows; and
(3) a risk adjustment for non-financial risk.
The carrying amount of a group of insurance contracts at the end of each reporting period
shall be the sum of the liability for remaining coverage and the liability for incurred
claims. Other than the General Model, the standard also provides a specific adaptation
for contracts with direct participation features (the Variable Fee Approach) and a
simplified approach (Premium Allocation Approach) mainly for short-duration contracts.
I. Definition of a Business (Amendments to IFRS 3)
The amendments clarify the definition of a business in IFRS 3 Business Combinations.
The amendments are intended to assist entities to determine whether a transaction should
be accounted for as a business combination or as an asset acquisition.
IFRS 3 continues to adopt a market participant’s perspective to determine whether an
acquired set of activities and assets is a business. The amendments clarify the minimum

Consolidated Financial Statements 173
requirements for a business; add guidance to help entities assess whether an acquired
process is substantive; and narrow the definitions of a business and of outputs; etc.
J. Definition of a Material (Amendments to IAS 1 and 8)
The main amendment is to clarify new definition of material. It states that “information is
material if omitting, misstating or obscuring it could reasonably be expected to influence
decisions that the primary users of general purpose financial statements make on the basis
of those financial statements, which provide financial information about a specific
reporting entity.” The amendments clarify that materiality will depend on the nature or
magnitude of information. An entity will need to assess whether the information, either
individually or in combination with other information, is material in the context of the
financial statements. A misstatement of information is material if it could reasonably be
expected to influence decisions made by the primary users.
The abovementioned standards and interpretations issued by IASB are not yet effective at
the date when the Group’s financial statements were authorized for issue. As the Group is
still currently determining the potential impact of the standards and interpretations listed
under B~C, E~G and J it is not practicable to estimate their impact on the Group at this point
in time. Apart from the potential impact of the standards and interpretations listed under A,
which is described below, all other standards and interpretations have no material impact on
the Group.
(a) IFRS 16“Leases”
IFRS 16 “Leases” replaces IAS 17 “Leases”, IFRIC 4 “Determining whether an
Arrangement contains a Lease”, SIC-15 “Operating Leases - Incentives” and SIC-27
“Evaluating the Substance of Transactions Involving the Legal Form of a Lease”. The
impact arising from the adoption of IFRS 16 on the Group are summarized as follows:
A. For the definition of a lease, the Group elects not to reassess whether a contract is, or
contains, a lease at the date of initial application (1 January 2019) in accordance with
the transition provision in IFRS 16. Instead, the Group is permitted to apply IFRS 16
to contracts that were previously identified as leases applying IAS 17 and IFRIC 4 but
not to apply IFRS 16 to contracts that were not previously identified as containing a
lease applying IAS 17 and IFRIC 4.
The Group is a lessee and elects not to restate comparative information in accordance
with the transition provision in IFRS 16. Instead, the Group recognizes the cumulative
effect of initially applying IFRS 16 as an adjustment to the opening balance of retained
earnings (or other component of equity, as appropriate) at the date of initial
application.
(a) Leases classified as operating leases

Consolidated Financial Statements 174
For leases that were classified as operating leases applying IAS 17, the Group
expects to measure and recognize those leases as lease liability on 1 January 2019
at the present value of the remaining lease payments, discounted using the lessee’s
incremental borrowing rate on 1 January 2019 and; the Group chooses, on a
lease-by-lease basis, to measure the right-of-use asset at either:
1. its carrying amount as if IFRS 16 had been applied since the commencement
date, but discounted using the lessee’s incremental borrowing rate on 1
January 2019; or
ii. an amount equal to the lease liability, adjusted by the amount of any prepaid
or accrued lease payments relating to that lease recognized in the balance
sheet immediately before 1 January 2019.
The Group expects the right-of-use asset will increase by $869,748 and the lease
liability will increase by $861,446 on 1 January 2019.
(b) Leases classified as finance leases
For leases that were classified as finance leases applying IAS 17, the Group
expects to reclassify the lease asset of $90,950,456 and the lease payable of
$86,458,202 as measured by IAS 17 to the right-of-use asset of $90,950,456 and
the lease liability of $86,458,202, respectively, on 1 January 2019.
B. The additional disclosures of lessee and lessor required by IFRS 16 will be disclosed
in the relevant notes.
4. Summary of significant accounting policies
(1) Statement of compliance
The consolidated financial statements of the Group for the year ended 31 December 2018
and 2017 have been prepared in accordance with International Financial Reporting
Standards (IFRSs) as issued by the International Accounting Standards Board.
(2) Basis of preparation
A. Basis of measurement
The consolidated financial statements have been prepared under the historical cost
convention, except for those financial instruments that are measured at fair value with
changes therein shown in the consolidated financial statements.
B. Functional and presentation currency

Consolidated Financial Statements 175
The functional currency of each Group entities is determined based on the primary
economic environment in which the entities operate. The Group’s consolidated financial
statements are presented in US Dollar, which is the Company’s functional currency and
presentation currency. However in order to comply with the listing requirement in
Taiwan, the Group translates its results and financial position into the presentation
currency, New Taiwan Dollar (in thousands of NTD), in accordance with paragraph 38 of
IAS 21 “The Effects of Changes in Foreign Exchange Rates”. Statement of financial
position presented is translated at the closing rate at the date of that statement of financial
position. Statement of comprehensive income is translated at exchange rates at the dates
of transactions. Equity transactions are translated at exchange rates at the dates of
transactions.
(3) Basis of consolidation
A. Preparation principle of consolidated financial statements
Control is achieved when the Group is exposed, or has rights, to variable returns from its
involvement with the investee and has the ability to affect those returns through its power
over the investee. Specifically, the Group controls an investee if and only if the Group
has:
(a) power over the investee (i.e. existing rights that give it the current ability to direct
the relevant activities of the investee)
(b) exposure, or rights, to variable returns from its involvement with the investee, and
(c) the ability to use its power over the investee to affect its returns
When the Group has less than a majority of the voting or similar rights of an investee, the
Group considers all relevant facts and circumstances in assessing whether it has power
over an investee, including:
(a) the contractual arrangement with the other vote holders of the investee
(b) rights arising from other contractual arrangements
(c) the Group’s voting rights and potential voting rights
The Group re-assesses whether or not it controls an investee if facts and circumstances
indicate that there are changes to one or more of the three elements of control.
Subsidiaries are fully consolidated from the acquisition date, being the date on which the
Group obtains control, and continue to be consolidated until the date that such control
ceases. The financial statements of the subsidiaries are prepared for the same reporting
period as the parent company, using uniform accounting policies. All intra-group
balances, income and expenses, unrealized gains and losses and dividends resulting from
intra-group transactions are eliminated in full.
A change in the ownership interest of a subsidiary, without a change of control, is
accounted for as an equity transaction.

Consolidated Financial Statements 176
Total comprehensive income of the subsidiaries is attributed to the owners of the parent
and to the non-controlling interests even if this results in the non-controlling interests
having a deficit balance.
If the Group loses control of a subsidiary, it:
(a) derecognizes the assets (including goodwill) and liabilities of the subsidiary;
(b) derecognizes the carrying amount of any non-controlling interest;
(c) recognizes the fair value of the consideration received;
(d) recognizes the fair value of any investment retained;
(e) recognizes any surplus or deficit in profit or loss; and
(f) reclassifies the parent’s share of components previously recognized in other
comprehensive income to profit or loss.
B. The consolidated entities are listed as follows:
Investor Investee Company Name
2018.12.31
Ownership
Percentage
2017.12.31
Ownership
Percentage
The Company Wisdom Marine Lines S.A. (Panama) (WML) 100% 100%
The Company Wisdom Marine International Inc. (WII) 100% 100%
WII Well Ship management and Maritime
Consultant Co., Ltd. (WELL) 100% 100%
WML Adixi Wisdom S.A. 100% 100%
WML Amis Carriers S.A. 100% 100%
WML Amis Elegance S.A. 100% 100%
WML Amis Fortune S.A. 100% 100%
WML Amis Hero S.A. 100% 100%
WML Amis Integrity S.A. 100% 100%
WML Amis International S.A. 100% 100%
WML Amis Justice S.A. 100% 100%
WML Amis Mariner S.A. 100% 100%
WML Amis Miracle S.A. 100% 100%
WML Amis Nature Inc. 100% -
WML Amis Navigation S.A. 100% 100%
WML Amis Star S.A. 100% 100%
WML Amis Wisdom S.A. 100% 100%
WML Arikun Wisdom S.A. 100% 100%
WML Atayal Brave S.A. 100% 100%
WML Atayal Mariner S.A. 100% 100%
WML Atayal Star S.A. 100% 100%
WML Atayal Wisdom S.A. 100% 100%
WML Babuza Wisdom S.A. 100% 100%
WML Beagle Marine S.A. 100% 100%
WML Beagle Wisdom S.A. 100% 100%

Consolidated Financial Statements 177
Investor Investee Company Name
2018.12.31
Ownership
Percentage
2017.12.31
Ownership
Percentage
WML Bunun Brave S.A. 100% 100%
WML Bunun Champion S.A. 100% 100%
WML Bunun Dynasty S.A. 100% 100%
WML Bunun Elegance S.A. 100% 100%
WML Bunun Fortune S.A. 100% 100%
WML Bunun Hero S.A. 100% 100%
WML Bunun Infinity S.A. 100% 100%
WML Bunun Justice S.A. 100% 100%
WML Bunun Marine S.A. 100% 100%
WML Bunun Navigation S.A. 100% 100%
WML Bunun Wisdom S.A. 100% 100%
WML Cosmic Wisdom S.A. 100% 100%
WML Daiwan Champion S.A. 100% 100%
WML Daiwan Dolphin S.A. 100% 100%
WML Daiwan Elegance S.A. 100% 100%
WML Daiwan Fortune S.A. 100% 100%
WML Daiwan Glory S.A. 100% 100%
WML Daiwan Hero S.A. 100% 100%
WML Daiwan Infinity S.A. 100% 100%
WML Daiwan Justice S.A. 100% 100%
WML Daiwan Kalon S.A. 100% 100%
WML Daiwan Leader S.A. 100% 100%
WML Daiwan Miracle S.A. 100% 100%
WML Dumun Marine S.A. 100% 100%
WML Dumun Navigation S.A. 100% 100%
WML Elite Steamship S.A. 100% 100%
WML Euroasia Investment S.A. 100% 100%
WML Favoran Wisdom S.A. 100% 100%
WML Fourseas Maritime S.A.Panama 100% 100%
WML Fraternity Marine S.A. 100% 100%
WML Fraternity Ship Investment S.A. 100% 100%
WML Genius Marine S.A. 100% 100%
WML Genius Prince S.A. 100% 100%
WML Genius Star Carriers S.A. 100% 100%
WML Genius Star Navigation S.A. 100% 100%
WML GS Global S.A. 100% 100%
WML GS Navigation S.A. 100% 100%
WML GSX Maritime S.A. 100% 100%
WML Guma Marine S.A. 100% 100%

Consolidated Financial Statements 178
Investor Investee Company Name
2018.12.31
Ownership
Percentage
2017.12.31
Ownership
Percentage
WML Guma Navigation S.A. 100% 100%
WML Harmony Pescadores S.A.(Panama) 100% 100%
WML Harmony Success S.A. - - (Note a)
WML Harmony Transport S.A. 100% 100%
WML Hoanya Wisdom S.A. 100% 100%
WML Infinite Wisdom S.A. 100% 100%
WML Katagalan Carriers S.A. 100% 100%
WML Katagalan Line S.A. 100% 100%
WML Katagalan Marine S.A. 100% 100%
WML Katagalan Navigation S.A. 100% 100%
WML Katagalan Star S.A. 100% 100%
WML Katagalan Wisdom S.A. 100% 100%
WML Kavalan Wisdom S.A. 100% 100%
WML Ligulao Wisdom S.A. 100% 100%
WML Lloa Wisdom S.A. 100% 100%
WML Log Wisdom S.A. 100% 100%
WML Luilang Wisdom S.A. 100% 100%
WML Magnate Maritime S.A. 100% 100%
WML Makatao Wisdom S.A. 100% 100%
WML Mercy Marine Line S.A. 100% 100%
WML Mighty Maritime S.A. 100% 100%
WML Mimasaka Investment S.A. 100% 100%
WML Mount Wisdom S.A. 100% 100%
WML Paiwan Wisdom S.A. 100% 100%
WML Papora Wisdom S.A. 100% 100%
WML Pazeh Wisdom S.A. 100% 100%
WML Pescadores International Line S.A. 100% 100%
WML Poavosa International S.A. 100% 100%
WML Poavosa Maritime S.A. 100% 100%
WML Poavosa Navigation S.A. 100% 100%
WML Poavosa Wisdom S.A. 100% 100%
WML Rukai Maritime S.A. 100% 100%
WML Sakizaya Diamond S.A. 100% 100%
WML Sakizaya Fortune S.A. 100% 100%
WML Sakizaya Glory S.A. 100% 100%
WML Sakizaya Hero S.A. 100% 100%
WML Sakizaya Integrity S.A. 100% 100%
WML Sakizaya Justice S.A. 100% 100%
WML Sakizaya Kalon S.A. 100% 100%

Consolidated Financial Statements 179
Investor Investee Company Name
2018.12.31
Ownership
Percentage
2017.12.31
Ownership
Percentage
WML Sakizaya Leader S.A. 100% 100%
WML Sakizaya Line S.A. 100% 100%
WML Sakizaya Marine S.A. 100% 100%
WML Sakizaya Miracle S.A. 100% 100%
WML Sakizaya Navigation S.A. 100% 100%
WML Sakizaya Orchid S.A. 100% 100%
WML Sakizaya Power S.A. 100% 100%
WML Sakizaya Queen S.A. 100% 100%
WML Sakizaya Respect S.A. 100% 100%
WML Sakizaya Wisdom S.A. 100% 100%
WML Sao Wisdom S.A. 100% 100%
WML Saysiat Wisdom S.A. 100% 100%
WML Siraya Wisdom S.A. 100% 100%
WML Taivoan Wisdom S.A. 100% 100%
WML Tao Ace S.A. 100% 100%
WML Tao Brave S.A. 100% 100%
WML Tao Mariner S.A. 100% 100%
WML Tao Star S.A. 100% 100%
WML Tao Treasure S.A. 100% 100%
WML Taokas Marine S.A. 100% 100%
WML Taokas Navigation S.A. 100% 100%
WML Taokas Wisdom S.A. 100% 100%
WML Taroko Maritime S.A. 100% 100%
WML Taroko Wisdom S.A. 100% 100%
WML Triumph Wisdom S.A. 100% 100%
WML Trobian Wisdom S.A. 100% 100%
WML Unicorn Bravo S.A. 100% 100%
WML Unicorn Fortune S.A. 100% 100%
WML Unicorn Logger S.A. 100% 100%
WML Unicorn Logistics S.A. 100% 100%
WML Unicorn Marine S.A. 100% 100%
WML Unicorn Pescadores S.A. 100% 100%
WML Unicorn Successor S.A. 100% 100%
WML Vayi Wisdom S.A. 100% 100%
WML Winsome Wisdom S.A. 100% 100%
WML Wisdom Ace S.A. 100% 100%
Note a : Although the percentage of ownership interests in Harmony Success S.A. is
less than 50%, the Company determined that it has control over Harmony
Success S.A. This is by virtue of an agreement with other investors, the
Company has the ability to fully control the operation of Harmony Success
S.A. and appoint or approve the key management personnel of Harmony

Consolidated Financial Statements 180
Success S.A. who have the ability to direct the relevant activities. The
Company also has rights to the variable returns of Harmony Success S.A.
Based on the aforementioned facts and circumstances, management is of the
view that the Group controls Harmony Success S.A. and therefore it has been
consolidated.
The Group sold the shares account for 40% of Harmony Success S.A. on 31
May 2017, please refer to Note 6. (24) for further information.
b: Subsidiaries excluded from consolidation: None.
(4) Foreign currency transactions
Transactions in foreign currencies are initially recorded by the Group entities at their
respective functional currency rates prevailing at the date of the transaction. Monetary assets
and liabilities denominated in foreign currencies are retranslated at the functional currency
closing rate of exchange ruling at the reporting date. Non-monetary items measured at fair
value in a foreign currency are translated using the exchange rates at the date when the fair
value is determined. Non-monetary items that are measured at historical cost in a foreign
currency are translated using the exchange rates as at the dates of the initial transactions.
All exchange differences arising on the settlement of monetary items or on translating
monetary items are taken to profit or loss in the period in which they arise except for the
following:
A. Exchange differences arising from foreign currency borrowings for an acquisition of a
qualifying asset to the extent that they are regarded as an adjustment to interest costs are
included in the borrowing costs that are eligible for capitalization.
B. Foreign currency items within the scope of IFRS 9 Financial Instruments (Before
January 1, 2018: IAS 39 Financial Instruments: Recognition and Measurement) are
accounted for based on the accounting policy for financial instruments.
C. Exchange differences arising on a monetary item that forms part of a reporting entity’s
net investment in a foreign operation is recognized initially in other comprehensive
income and reclassified from equity to profit or loss on disposal of the net investment.
When a gain or loss on a non-monetary item is recognized in other comprehensive income,
any exchange component of that gain or loss is recognized in other comprehensive income.
When a gain or loss on a non-monetary item is recognized in profit or loss, any exchange
component of that gain or loss is recognized in profit or loss.
(5) Translation of financial statements in foreign currency

Consolidated Financial Statements 181
The assets and liabilities of foreign operations are translated at the closing rate of exchange
prevailing at the reporting date and their income and expenses are translated at an average
rate for the period. The exchange differences arising on the translation are recognized in
other comprehensive income. On the disposal of a foreign operation, the cumulative amount
of the exchange differences relating to that foreign operation, recognized in other
comprehensive income and accumulated in the separate component of equity, is reclassified
from equity to profit or loss when the gain or loss on disposal is recognized.
The following partial disposals are accounted for as disposals:
A. when the partial disposal involves the loss of control of a subsidiary that includes a
foreign operation; and
B. when the retained interest after the partial disposal of an interest in a joint arrangement or
a partial disposal of an interest in an associate that includes a foreign operation is a
financial asset that includes a foreign operation.
On the partial disposal of a subsidiary that includes a foreign operation that does not result
in a loss of control, the proportionate share of the cumulative amount of the exchange
differences recognized in other comprehensive income is re-attributed to the non-controlling
interests in that foreign operation. In partial disposal of an associate or jointly controlled
entity that includes a foreign operation that does not result in a loss of significant influence
or joint control, only the proportionate share of the cumulative amount of the exchange
differences recognized in other comprehensive income is reclassified to profit or loss.
Any goodwill and any fair value adjustments to the carrying amounts of assets and liabilities
arising on the acquisition of a foreign operation are treated as assets and liabilities of the
foreign operation and expressed in its functional currency.
(6) Current and non-current distinction
An asset is classified as current when:
A. The Group expects to realize the asset, or intends to sell or consume it, in its normal
operating cycle
B. The Group holds the asset primarily for the purpose of trading
C. The Group expects to realize the asset within twelve months after the reporting period
D. The asset is cash or cash equivalent unless the asset is restricted from being exchanged or
used to settle a liability for at least twelve months after the reporting period.
All other assets are classified as non-current.
A liability is classified as current when:
A. The Group expects to settle the liability in its normal operating cycle
B. The Group holds the liability primarily for the purpose of trading

Consolidated Financial Statements 182
C. The liability is due to be settled within twelve months after the reporting period
D. The Group does not have an unconditional right to defer settlement of the liability for at
least twelve months after the reporting period. Terms of a liability that could, at the
option of the counterparty, result in its settlement by the issue of equity instruments do
not affect its classification.
(7) Cash and cash equivalents
Cash and cash equivalents comprises cash on hand, demand deposits and short-term, highly
liquid time deposits or investments that are readily convertible to known amounts of cash
and which are subject to an insignificant risk of changes in value.
Time deposits which mature over three months are held for the purpose of meeting
short-term cash commitments rather than for investment or other purposes. They are readily
convertible to known amounts of cash and are subject to an insignificant risk of changes in
value, therefore they are reported as cash and cash equivalents.
(8) Financial instruments
Financial assets and financial liabilities are recognized when the Group becomes a party to
the contractual provisions of the instrument.
Financial assets and financial liabilities within the scope of IFRS 9 Financial Instruments
(Before 1 January 2018: IAS 39 Financial Instruments: Recognition and Measurement) are
recognized initially at fair value plus or minus, in the case of investments not at fair value
through profit or loss, directly attributable transaction costs.
A. Financial instruments: Recognition and Measurement
The accounting policy from 1 January 2018 as follow:
The Group accounts for regular way purchase or sales of financial assets on the trade
date.
The Group classified financial assets as subsequently measured at amortized cost or fair
value through other comprehensive income on the basis of both:
(a) the Group’s business model for managing the financial assets and
(b) the contractual cash flow characteristics of the financial asset.
Financial assets measured at amortized cost
A financial asset is measured at amortized cost if both of the following conditions are met
and presented as note receivables, trade receivables financial assets measured at
amortized cost and other receivables etc., on balance sheet as at the reporting date:
(a) the financial asset is held within a business model whose objective is to hold
financial assets in order to collect contractual cash flows and

Consolidated Financial Statements 183
(b) the contractual terms of the financial asset give rise on specified dates to cash flows
that are solely payments of principal and interest on the principal amount
outstanding.
Such financial assets are subsequently measured at amortized cost (the amount at which
the financial asset is measured at initial recognition minus the principal repayments, plus
or minus the cumulative amortization using the effective interest method of any
difference between the initial amount and the maturity amount and adjusted for any loss
allowance) and is not part of a hedging relationship. A gain or loss is recognized in profit
or loss when the financial asset is derecognized, through the amortization process or in
order to recognize the impairment gains or losses.
Interest revenue is calculated by using the effective interest method. This is calculated by
applying the effective interest rate to the gross carrying amount of a financial asset except
for:
(a) purchased or originated credit-impaired financial assets. For those financial assets,
the Group applies the credit-adjusted effective interest rate to the amortized cost of
the financial asset from initial recognition.
(b) financial assets that are not purchased or originated credit-impaired financial assets
but subsequently have become credit-impaired financial assets. For those financial
assets, the Group applies the effective interest rate to the amortized cost of the
financial asset in subsequent reporting periods.
Financial asset measured at fair value through other comprehensive income
A financial asset is measured at fair value through other comprehensive income if both of
the following conditions are met:
(a) the financial asset is held within a business model whose objective is achieved by
both collecting contractual cash flows and selling financial assets and
(b) the contractual terms of the financial asset give rise on specified dates to cash flows
that are solely payments of principal and interest on the principal amount
outstanding.
Recognition of gain or loss on a financial asset measured at fair value through other
comprehensive income are described as below:
(a) A gain or loss on a financial asset measured at fair value through other
comprehensive income recognized in other comprehensive income, except for

Consolidated Financial Statements 184
impairment gains or losses and foreign exchange gains and losses, until the financial
asset is derecognized or reclassified.
(b) When the financial asset is derecognized the cumulative gain or loss previously
recognized in other comprehensive income is reclassified from equity to profit or
loss as a reclassification adjustment.
(c) Interest revenue is calculated by using the effective interest method. This is
calculated by applying the effective interest rate to the gross carrying amount of a
financial asset except for:
i. Purchased or originated credit-impaired financial assets. For those financial
assets, the Group applies the credit-adjusted effective interest rate to the
amortized cost of the financial asset from initial recognition.
ii. Financial assets that are not purchased or originated credit-impaired financial
assets but subsequently have become credit-impaired financial assets. For those
financial assets, the Group applies the effective interest rate to the amortized cost
of the financial asset in subsequent reporting periods.
Besides, for certain equity investments within the scope of IFRS 9 that is neither held for
trading nor contingent consideration recognized by an acquirer in a business combination
to which IFRS 3 applies, the Group made an irrevocable election to present the changes
of the fair value in other comprehensive income at initial recognition. Amounts presented
in other comprehensive income shall not be subsequently transferred to profit or loss
(when disposal of such equity instrument, its cumulated amount included in other
components of equity is transferred directly to the retained earnings) and these
investments should be presented as financial assets measured at fair value through other
comprehensive income on the balance sheet. Dividends on such investment are
recognized in profit or loss unless the dividends clearly represents a recovery of part of
the cost of investment.
The accounting policy before 1 January 2018 as follow:
The Group accounts for regular way purchase or sales of financial assets on the trade
date.
Financial assets of the Group are classified as financial assets at fair value through profit
or loss, available-for-sale financial assets, held-to-maturity investments and loans and
receivables. The Group determines the classification of its financial assets at initial
recognition.

Consolidated Financial Statements 185
Financial assets at fair value through profit or loss
Financial assets at fair value through profit or loss include financial assets held for
trading and financial assets designated as at fair value through profit or loss. A financial
asset is classified as held for trading if:
(a) it is acquired or incurred principally for the purpose of selling or repurchasing it in
the near term;
(b) on initial recognition it is part of a portfolio of identified financial instruments that
are managed together and for which there is evidence of a recent actual pattern of
short-term profit-taking; or
(c) it is a derivative (except for a derivative that is a financial guarantee contract or a
designated and effective hedging instrument).
If a contract contains one or more embedded derivatives, the entire hybrid (combined)
contract may be designated as a financial asset at fair value through profit or loss; or a
financial asset may be designated as at fair value through profit or loss when doing so
results in more relevant information, because either:
(a) it eliminates or significantly reduces a measurement or recognition inconsistency; or
(b) a group of financial assets, financial liabilities or both is managed and its
performance is evaluated on a fair value basis, in accordance with a documented risk
management or investment strategy, and information about the group is provided
internally on that basis to the key management personnel.
Financial assets at fair value through profit or loss are measured at fair value with
changes in fair value recognized in profit or loss. Dividends or interests on financial
assets at fair value through profit or loss are recognized in profit or loss (including those
received during the period of initial investment).
Available-for-sale financial assets
Available-for-sale investments are non-derivative financial assets that are designated as
available-for-sale or those not classified as financial assets at fair value through profit or
loss, held-to-maturity financial assets, or loans and receivables.
Foreign exchange gains and losses and interest calculated using the effective interest
method relating to monetary available-for-sale financial assets, or dividends on an
available-for-sale equity instrument, are recognized in profit or loss. Subsequent
measurement of available-for-sale financial assets at fair value is recognized in equity
until the investment is derecognized, at which time the cumulative gain or loss is
recognized in profit or loss.

Consolidated Financial Statements 186
If equity instrument investments do not have quoted prices in an active market and their
fair value cannot be reliably measured, then they are classified as financial assets
measured at cost on balance sheet and carried at cost net of accumulated impairment
losses, if any, as at the reporting date.
Held-to-maturity financial assets
Non-derivative financial assets with fixed or determinable payments and fixed maturities
are classified as held-to-maturity when the Group has the positive intention and ability to
hold it to maturity, other than those that are designated as available-for-sale, classified as
financial assets at fair value through profit or loss, or meet the definition of loans and
receivables.
After initial measurement held-to-maturity financial assets are measured at amortized
cost using the effective interest method, less impairment. Amortized cost is calculated by
taking into account any discount or premium on acquisition and fee or transaction costs.
The effective interest method amortization is recognized in profit or loss.
Loans and receivables
Loans and receivables are non-derivative financial assets with fixed or determinable
payments that are not quoted in an active market other than those that the Group upon
initial recognition designates as available for sale, classified as at fair value through profit
or loss, or those for which the holder may not recover substantially all of its initial
investment.
Loans and receivables are separately presented on the balance sheet as receivables or debt
instrument investments for which no active market exists. After initial measurement, such
financial assets are subsequently measured at amortized cost using the effective interest
rate method, less impairment. Amortized cost is calculated by taking into account any
discount or premium on acquisition and fee or transaction costs. The effective interest
method amortization is recognized in profit or loss.
B. Impairment of financial assets
The accounting policy from 1 January 2018 as follow:
The Group is recognizes a loss allowance for expected credit losses on debt instrument
investments measured at fair value through other comprehensive income and financial
asset measured at amortized cost. The loss allowance on debt instrument investments
measured at fair value through other comprehensive income is recognized in other
comprehensive income and not reduce the carrying amount in the statement of financial
position.
The Group measures expected credit losses of a financial instrument in a way that
reflects:

Consolidated Financial Statements 187
(a) an unbiased and probability-weighted amount that is determined by evaluating a
range of possible outcomes;
(b) the time value of money; and
(c) reasonable and supportable information that is available without undue cost or effort
at the reporting date about past events, current conditions and forecasts of future
economic conditions.
The loss allowance is measures as follow:
(a) At an amount equal to 12-month expected credit losses: the credit risk on a financial
asset has not increased significantly since initial recognition or the financial asset is
determined to have low credit risk at the reporting date. In addition, the Group
measures the loss allowance for a financial asset at an amount equal to lifetime
expected credit losses in the previous reporting period, but determines at the current
reporting date that condition is no longer met.
(b) At an amount equal to the lifetime expected credit losses: the credit risk on a
financial asset has increased significantly since initial recognition or financial asset
that is purchased or originated credit-impaired financial asset.
(c) For trade receivables or contract assets arising from transactions within the scope of
IFRS 15, the Group measures the loss allowance at an amount equal to lifetime
expected credit losses.
At each reporting date, the Group needs to assess whether the credit risk on a financial
asset has been increased significantly since initial recognition by comparing the risk of a
default occurring at the reporting date and the risk of default occurring at initial
recognition. Please refer to Note 12 for further details on credit risk.
The accounting policy before 1 January 2018 as follow:
The Group assesses at each reporting date whether there is any objective evidence that a
financial asset other than the financial assets at fair value through profit or loss is
impaired. A financial asset is deemed to be impaired if, and only if, there is objective
evidence of impairment as a result of one or more loss events that has occurred after the
initial recognition of the asset and that loss event has an impact on the estimated future
cash flows of the financial asset. The carrying amount of the financial asset impaired,
other than receivables impaired which are reduced through the use of an allowance
account is reduced directly and the amount of the loss is recognized in profit or loss.
Loss events include:
(a) significant financial difficulty of the issuer or obligor; or

Consolidated Financial Statements 188
(b) a breach of contract, such as a default or delinquency in interest or principal
payments; or
(c) it becoming probable that the borrower will enter bankruptcy or other financial
reorganisation; or
(d) the disappearance of an active market for that financial asset because of financial
difficulties.
For held-to-maturity financial assets and loans and receivables, the Group first assesses
individually whether objective evidence of impairment exists individually for financial
asset that are individually significant, or collectively for financial assets that are not
individually significant. If the Group determines that no objective evidence of
impairment exits for an individually assessed financial asset, whether significant or not, it
includes the asset in a group of financial assets with similar credit risk characteristics and
collectively assesses them for impairment. If there is objective evidence that an
impairment loss has been incurred, the amount of the loss is measured as the difference
between the assets carrying amount and the present value of estimated future cash flows.
The present value of the estimated future cash flows is discounted at the financial assets
original effective interest rate. If a loan has a variable interest rate, the discount rate for
measuring any impairment loss is the current effective interest rate. Interest income is
accrued based on the reduced carrying amount of the asset, using the rate of interest used
to discount the future cash flows for the purpose of measuring the impairment loss.
Receivables together with the associated allowance are written off when there is no
realistic prospect of future recovery. If, in a subsequent year, the amount of the estimated
impairment loss increases or decreases because of an event occurring after the
impairment was recognized, the previously recognized impairment loss is increased or
reduced by adjusting the allowance account. If a future write-off is later recovered, the
recovery is credited to profit or loss.
C. Derecognition of financial assets
A financial asset is derecognized when:
(a) The rights to receive cash flows from the asset have expired
(b) The Group has transferred the asset and substantially all the risks and rewards of the
asset have been transferred
(c) The Group has neither transferred nor retained substantially all the risks and rewards
of the asset, but has transferred control of the asset.
On derecognition of a financial asset in its entirety, the difference between the carrying
amount and the consideration received or receivable including any cumulative gain or
loss that had been recognized in other comprehensive income is recognized in profit or
loss.
D. Financial liabilities and equity

Consolidated Financial Statements 189
Classification between liabilities or equity
The Group classifies the instrument issued as a financial liability or an equity instrument
in accordance with the substance of the contractual arrangement and the definitions of a
financial liability, and an equity instrument.
Equity instruments
An equity instrument is any contract that evidences a residual interest in the assets of an
entity after deducting all of its liabilities. The transaction costs of an equity transaction
are accounted for as a deduction from equity (net of any related income tax benefit) to the
extent they are incremental costs directly attributable to the equity transaction that
otherwise would have been avoided.
Compound instruments
The Group evaluates the terms of the convertible bonds issued to determine whether it
contains both a liability and an equity component. Furthermore, the Group assesses if the
economic characteristics and risks of the put and call options contained in the convertible
bonds are closely related to the economic characteristics and risk of the host contract
before separating the equity element.
For the liability component excluding the derivatives, its fair value is determined based
on the rate of interest applied at that time by the market to instruments of comparable
credit status. The liability component is classified as a financial liability measured at
amortized cost before the instrument is converted or settled.
For the embedded derivative that is not closely related to the host contract (for example,
if the exercise price of the embedded call or put option is not approximately equal on
each exercise date to the amortized cost of the host debt instrument), it is classified as a
liability component and subsequently measured at fair value through profit or loss unless
it qualifies for an equity component. The equity component is assigned the residual
amount after deducting from the fair value of the instrument as a whole the amount
separately determined for the liability component. Its carrying amount is not re-measured
in the subsequent accounting periods. If the convertible bond issued does not have an
equity component, it is accounted for as a hybrid instrument in accordance with the
requirements under IFRS 9 Financial Instruments (before 1 January 2018: IAS 39
Financial Instruments: Recognition and Measurement).
Transaction costs are apportioned between the liability and equity components of the
convertible bond based on the allocation of proceeds to the liability and equity
components when the instruments are initially recognized.
On conversion of a convertible bond before maturity, the carrying amount of the liability
component being the amortized cost at the date of conversion is transferred to equity.
Financial liabilities

Consolidated Financial Statements 190
Financial liabilities within the scope of IFRS 9 Financial Instruments (before 1 January
2018: IAS 39 Financial Instruments: Recognition and Measurement) are classified as
financial liabilities at fair value through profit or loss or financial liabilities measured at
amortized cost upon initial recognition.
Financial liabilities at fair value through profit or loss
Financial liabilities at fair value through profit or loss include financial liabilities held for
trading and financial liabilities designated upon initial recognition as at fair value through
profit or loss. A financial liability is classified as held for trading if:
(a) it is acquired or incurred principally for the purpose of selling or repurchasing it in
the near term;
(b) on initial recognition it is part of a portfolio of identified financial instruments that
are managed together and for which there is evidence of a recent actual pattern of
short-term profit-taking; or
(c) it is a derivative (except for a derivative that is a financial guarantee contract or a
designated and effective hedging instrument).
If a contract contains one or more embedded derivatives, the entire hybrid (combined)
contract may be designated as a financial liability at fair value through profit or loss; or a
financial liability may be designated as at fair value through profit or loss when doing so
results in more relevant information, because either:
(a) it eliminates or significantly reduces a measurement or recognition inconsistency; or
(b) a group of financial assets, financial liabilities or both is managed and its
performance is evaluated on a fair value basis, in accordance with a documented risk
management or investment strategy, and information about the group is provided
internally on that basis to the key management personnel.
Gains or losses on the subsequent measurement of liabilities at fair value through profit
or losses including interest paid are recognized in profit or loss.
Financial liabilities at amortized cost
Financial liabilities measured at amortized cost include interest bearing loans and
borrowings that are subsequently measured using the effective interest rate method after
initial recognition. Gains and losses are recognized in profit or loss when the liabilities
are derecognized as well as through the effective interest rate method amortization
process.

Consolidated Financial Statements 191
Amortized cost is calculated by taking into account any discount or premium on
acquisition and fees or transaction costs.
Derecognition of financial liabilities
A financial liability is derecognized when the obligation under the liability is discharged
or cancelled or expires.
When an existing financial liability is replaced by another from the same lender on
substantially different terms, or the terms of an existing liability are substantially
modified (whether or not attributable to the financial difficulty of the debtor), such an
exchange or modification is treated as a derecognition of the original liability and the
recognition of a new liability, and the difference in the respective carrying amounts and
the consideration paid, including any non-cash assets transferred or liabilities assumed, is
recognized in profit or loss.
E. Offsetting of financial instruments
Financial assets and financial liabilities are offset and the net amount reported in the
balance sheet if, and only if, there is a currently enforceable legal right to offset the
recognized amounts and there is an intention to settle on a net basis, or to realize the
assets and settle the liabilities simultaneously.
(9) Derivative instrument
The Group uses derivative instruments to hedge its foreign currency risks. A derivative is
classified in the balance sheet as financial assets or liabilities at fair value through profit or
loss (held for trading) except for derivatives that are designated effective hedging
instruments which are classified as derivative financial assets or liabilities for hedging.
Derivative instruments are initially recognized at fair value on the date on which a derivative
contract is entered into and are subsequently re-measured at fair value. Derivatives are
carried as financial assets when the fair value is positive and as financial liabilities when the
fair value is negative. Any gains or losses arising from changes in the fair value of
derivatives are taken directly to profit or loss, except for the effective portion of cash flow
hedges, which is recognized in equity.
Before 1 January 2018, derivatives embedded in host contracts are accounted for as separate
derivatives and recorded at fair value if their economic characteristics and risks are not
closely related to those of the host contracts and the host contracts are not held for trading or
designated at fair value though profit or loss. These embedded derivatives are separated

Consolidated Financial Statements 192
from the host contract and accounted for as a derivative. The aforementioned policy are
applicable to host contracts as financial liabilities or non-financial assets since 1 January
2018.
(10) Fair value measurement
Fair value is the price that would be received to sell an asset or paid to transfer a liability in
an orderly transaction between market participants at the measurement date. The fair value
measurement is based on the presumption that the transaction to sell the asset or transfer the
liability takes place either:
A. In the principal market for the asset or liability, or
B. In the absence of a principal market, in the most advantageous market for the asset or
liability
The principal or the most advantageous market must be accessible to by the Group.
The fair value of an asset or a liability is measured using the assumptions that market
participants would use when pricing the asset or liability, assuming that market participants
in their economic best interest.
A fair value measurement of a non-financial asset takes into account a market participant’s
ability to generate economic benefits by using the asset in its highest and best use or by
selling it to another market participant that would use the asset in its highest and best use.
The Group uses valuation techniques that are appropriate in the circumstances and for which
sufficient data are available to measure fair value, maximizing the use of relevant observable
inputs and minimizing the use of unobservable inputs.
(11) Inventories
Inventories are bunker oil and are carried at the lower of cost or net realizable value. The
cost of fuel is determined using the “weighted-average” cost method. Net realizable value is
the determined based on the estimated selling price in the ordinary course of business, less
the estimated selling expenses at the end of the period.
(12) Investments accounted for using equity method

Consolidated Financial Statements 193
The Group’s investment in its associate is accounted for using equity method other than
those that meet the criteria to be classified as held for sale. An associate is an entity over
which the Group has significant influence.
Under equity method, the investment in the associate or an investment in a joint venture is
carried in the balance sheet at cost and adjusted thereafter for the post-acquisition change in
the Group’s share of net assets of the associate. After the interest in the associate is reduced
to zero, additional losses are provided for, and a liability is recognized, only to the extent
that the Group has incurred legal or constructive obligations or made payments on behalf of
the associate. Unrealized gains and losses resulting from transactions between the Group and
the associate or joint venture are eliminated to the extent of the Group’s related interest in
the associate.
When the associate issues new stock, and the Group’s interest in an associate is reduced or
increased as the Group fails to acquire shares newly issued in the associate proportionately
to its original ownership interest, the increase or decrease in the interest in the associate is
recognized in Additional Paid in Capital and Investment accounted for using equity method.
When the interest in the associate is reduced, the cumulative amounts previously recognized
in other comprehensive income are reclassified to profit or loss or other appropriate items.
The aforementioned capital surplus recognized is reclassified to profit or loss on a pro rata
basis when the Group disposes the associate.
The financial statements of the associate are prepared for the same reporting period as the
Group. Where necessary, adjustments are made to bring the accounting policies in line with
those of the Group.
The Group determines at each reporting date whether there is any objective evidence that the
investment in the associate is impaired in accordance with IAS 28 Investments in Associates
and Joint Ventures (before 1 January 2018: IAS 39 Financial Instruments: Recognition and
Measurement). If this is the case the Group calculates the amount of impairment as the
difference between the recoverable amount of the associate and its carrying value and
recognizes the amount in the ‘share of profit or loss of an associate’ in the statement of
comprehensive income in accordance with IAS 36 Impairment of Assets. In determining the
value in use of the investment, the Group estimates:
A. Its share of the present value of the estimated future cash flows expected to be generated
by the associate, including the cash flows from the operations of the associate and the
proceeds on the ultimate disposal of the investment; or

Consolidated Financial Statements 194
B. The present value of the estimated future cash flows expected to arise from dividends to
be received from the investment and from its ultimate disposal.
Because goodwill that forms part of the carrying amount of an investment in an associate is
not separately recognized, it is not tested for impairment separately by applying the
requirements for impairment testing goodwill in IAS 36 Impairment of Assets.
Upon loss of significant influence over the associate, the Group measures and recognizes
any retaining investment at its fair value. Any difference between the carrying amount of the
associate upon loss of significant influence and the fair value of the retaining investment and
proceeds from disposal is recognized in profit or loss. Furthermore, if an investment in an
associate becomes an investment in a joint venture or an investment in a joint venture
becomes an investment in an associate, the entity continues to apply equity method and does
not remeasure the retained interest.
(13) Property, plant and equipment
Property, plant and equipment is stated at cost, net of accumulated depreciation and
accumulated impairment losses, if any. Such cost includes the cost of dismantling and
removing the item and restoring the site on which it is located and borrowing costs for
construction in progress if the recognition criteria are met. Each part of an item of property,
plant and equipment with a cost that is significant in relation to the total cost of the item is
depreciated separately. When significant parts of property, plant and equipment are required
to be replaced in intervals, the Group recognized such parts as individual assets with specific
useful lives and depreciation, respectively. The carrying amount of those parts that are
replaced is derecognized in accordance with the derecognition provisions of IAS 16
Property, plant and equipment. When a major inspection is performed, its cost is recognized
in the carrying amount of the plant and equipment as a replacement if the recognition criteria
are satisfied. All other repair and maintenance costs are recognized in profit or loss as
incurred.
All major components of the vessels are depreciated on a straight-line basis over the useful
life of the assets. Depreciation is based on cost less the estimated residual value. The
residual value is estimated as the lightweight tonnage of each vessel multiplied by scrap
value per ton.
The dry-docking cost, including acquisition of a new vessel, is separated from the remaining
cost of the vessel. These two cost elements are recognized and depreciated separately. For
the building of new vessels, the initial dry-docking cost is also segregated and capitalized
separately.
The Group has a long-term plan for dry-docking of the vessels. Dry-docking cost is
capitalized and depreciated until the next planned dry-docking. Other capitalized
improvements are depreciated over the estimated economic life.
The carrying values of vessels and equipment are reviewed for impairment when events or
changes in circumstances indicate that the carrying value may not be recoverable. Valuations

Consolidated Financial Statements 195
are performed frequently to ensure that the fair value of a revalued asset does not differ
materially from its carrying amount. The residual values, useful lives, and depreciation
methods are reviewed, and adjusted if appropriate, at the end of each reporting period,
except for those cases which are of little consequence.
A vessel or item of equipment is derecognized upon disposal or when no future economic
benefits are expected from its use or disposal. Any gain or loss arising from derecognition of
an asset (calculated as the difference between the net disposal proceeds and the carrying
amount of the asset) is included in the consolidated income statement in the year the asset is
derecognized.
Expenditures on the building of new vessels are capitalized as vessels under construction as
they are paid. Capitalized value is reclassified from vessel under construction to vessels
upon delivery from the dock. The total acquisition cost of a vessel is determined based on
the sum of installments paid plus the costs incurred during the construction period.
Borrowing costs that are attributable to the construction of the vessels are capitalized as part
of the vessel. The interest rate is based on the weighted-average borrowing costs for the
Group, limited to the total borrowing costs incurred in the period.
Depreciation is calculated on a straight-line basis over the estimated economic lives of the
following assets:
vessels 15-25 years
vessel equipment 3-5 years
dry-dockings 2.5 years
other 3-10 years
The assets residual values, useful lives and methods of depreciation are reviewed at each
financial year end and adjusted prospectively, if appropriate.
(14) Leases
Group as a lessee
Finance leases which transfer to the Group substantially all the risks and benefits incidental
to ownership of the leased item, are capitalized at the commencement of the lease at the fair
value of the leased property or, if lower, at the present value of the minimum lease
payments. Lease payments are apportioned between finance charges and reduction of the
lease liability so as to achieve a constant rate of interest on the remaining balance of the
liability. Finance charges are recognized in profit or loss.
A leased asset is depreciated over the useful life of the asset. However, if there is no
reasonable certainty that the Group will obtain ownership by the end of the lease term, the
asset is depreciated over the shorter of the estimated useful life of the asset and the lease
term.

Consolidated Financial Statements 196
Operating lease payments are recognized as an expense on a straight-line basis over the lease
term.
Group as a lessor
Leases in which the Group does not transfer substantially all the risks and benefits of
ownership of the asset are classified as operating leases. Initial direct costs incurred in
negotiating an operating lease are added to the carrying amount of the leased asset and
recognized over the lease term on the same basis as rental income. Contingent rents are
recognized as revenue in the period in which they are earned.
(15) Impairment of non-financial assets
The Group assesses at the end of each reporting period whether there is any indication that
an asset in the scope of IAS 36 Impairment of Assets may be impaired. If any such
indication exists, or when annual impairment testing for an asset is required, the Group
estimates the asset’s recoverable amount. An asset’s recoverable amount is the higher of an
asset’s or cash-generating unit’s (“CGU”) fair value less costs to sell and its value in use and
is determined for an individual asset, unless the asset does not generate cash inflows that are
largely independent of those from other assets or groups of assets. Where the carrying
amount of an asset or CGU exceeds its recoverable amount, the asset is considered impaired
and is written down to its recoverable amount.
For assets excluding goodwill, an assessment is made at each reporting date as to whether
there is any indication that previously recognized impairment losses may no longer exist or
may have decreased. If such indication exists, the Group estimates the asset’s or
cash-generating unit’s recoverable amount. A previously recognized impairment loss is
reversed only if there has been an increase in the estimated service potential of an asset
which in turn increases the recoverable amount. However, the reversal is limited so that the
carrying amount of the asset does not exceed its recoverable amount, nor exceed the
carrying amount that would have been determined, net of depreciation, had no impairment
loss been recognized for the asset in prior years.
An impairment loss of continuing operations or a reversal of such impairment loss is
recognized in profit or loss.
(16) Provisions

Consolidated Financial Statements 197
A provision is recognized if, as a result of a past event, the Group has a present legal or
constructive obligation that can be estimated reliably, and it is probable that an outflow of
economic benefits will be required to settle the obligation.
A provision for onerous contracts is recognized when the expected benefits to be derived by
the Group from a contract are lower than the unavoidable cost of meeting its obligations
under the contract. The provision is measured at the present value of the lower of the
expected cost of terminating the contract or the expected net cost of continuing with the
contract. Before a provision is established, the Group recognizes any impairment loss on the
assets associated with that contract.
(17) Revenue recognition
The accounting policy from 1 January 2018 as follow:
Hire Revenue
Hire revenue is recognized when it is probable that the economic benefits will flow to the
Group and when the revenue can be measured reliably. The revenue is measured at the fair
value of consideration that the Group has received or had the right to receive. The revenue is
recognized on a time proportion basis over the lease term.
Freight Revenue and Vessel Management Revenue
The Group’s revenue arising from contracts with customers are rendering of services,
including shipping services and vessel management services. Such services are separately
priced or negotiated, and provided based on contract periods. As the Group provides the
services over the contract period, so that the customers simultaneously receive and consume
the benefits provided by the Group. Accordingly, the performance obligations are satisfied
over time, and the related revenue are recognized by reference to the stage of completion
over the period.
Most of the contractual considerations of the Group are received on average during the
contract period after the provision of services. When the Group has performed the services
to customers but does not has a right to an amount of consideration that is unconditional,
these contacts should be presented as contract assets. However, for some rendering of
services contracts, part of the consideration was received from customers upon signing the
contract, and the Group has the obligation to provide the services subsequently; accordingly,
these amounts are recognized as contract liabilities.
The period between the transfers of contract liabilities to revenue is usually within one year,
thus, no significant financing component is arised.

Consolidated Financial Statements 198
The accounting policy before 1 January 2018 as follow:
Revenue is recognized when it is probable that the economic benefits will flow to the Group
and when the revenue can be measured reliably. The revenue is measured at the fair value of
consideration that the Group has received or had the right to receive. The revenue is
recognized on the following basis:
(a) From freight, on a percentage of completion basis;
(b) From chartering hire, on a time proportion basis over the lease term;
(c) From vessel management, in the period in which the vessels are managed in accordance
with the respective agreement;
(d) Revenue is recognized when persuasive evidence exists, usually in the form of an
executed sales agreement, that the significant risks and rewards of ownership have been
transferred to the customer.
(18) Borrowing costs
Borrowing costs directly attributable to the acquisition, construction or production of an
asset that necessarily takes a substantial period of time to get ready for its intended use or
sale are capitalized as part of the cost of the respective assets. All other borrowing costs are
expensed in the period they occur. Borrowing costs consist of interest and other costs that an
entity incurs in connection with the borrowing of funds.
(19) Post-employment benefits
(a) Defined contribution plans
A defined contribution plan is a post-employment benefit plan under which an entity
pays fixed contributions into a separate entity and will have no legal or constructive
obligation to pay further amounts. Obligations for contributions to defined contribution
pension plans are recognized as an employee benefit expense in profit or loss during
which services are rendered by employees.
(b) Defined benefit plans
Post-employment benefit plan that is classified as a defined benefit plan uses the
Projected Unit Credit Method to measure its obligations and costs based on actuarial
assumptions. Re-measurements, comprising of the effect of the actuarial gains and
losses, the effect of the asset ceiling (excluding net interest) and the return on plan
assets, excluding net interest, are recognized as other comprehensive income with a
corresponding debit or credit to retained earnings in the period in which they occur.
Past service costs are recognized in profit or loss on the earlier of:

Consolidated Financial Statements 199
i. the date of the plan amendment or curtailment, and
ii. the date that the Group recognizes restructuring-related costs
Net interest is calculated by applying the discount rate to the net defined benefit liability
or asset, both as determined at the start of the annual reporting period, taking account of
any changes in the net defined benefit liability (asset) during the period as a result of
contribution and benefit payment.
(c) Short-term benefits
Short-term employee benefit obligations are measured on an undiscounted basis and are
expensed as related service is provided.
A liability is recognized for the amount expected to be paid under short-term cash bonus
or profit-sharing plans if the Group has a present legal or constructive obligation to pay
this amount as a result of past service provided by the employee and the obligation can
be estimated reliably.
(20) Income taxes
Income tax expense (income) is the aggregate amount included in the determination of profit
or loss for the period in respect of current tax and deferred tax.
Current income tax
Current income tax assets and liabilities for the current and prior periods are measured at the
amount expected to be recovered from or paid to the taxation authorities, using the tax rates
and tax laws that have been enacted or substantively enacted by the end of the reporting
period. Current income tax relating to items recognized in other comprehensive incomeor
directly in equity is recognized in other comprehensive incomeor equityand not in profit or
loss.
The income tax for undistributed earnings is recognized as income tax expense in the
subsequent year when the distribution proposal is approved by the Shareholders’ meeting.
Deferred tax
Deferred tax is provided on temporary differences at the reporting date between the tax
bases of assets and liabilities and their carrying amounts for financial reporting purposes.
Deferred tax liabilities are recognized for all taxable temporary differences, except:

Consolidated Financial Statements 200
i. Where the deferred tax liability arises from the initial recognition of goodwill or of an
asset or liability ina transaction that is not a business combination and, at the time of the
transaction, affects neither the accounting profit nor taxable profit or loss
ii. In respect of taxable temporary differences associated with investments in subsidiaries,
associates and interests in joint arrangements, where the timing of the reversal of the
temporary differences can be controlled and it is probable that the temporary differences
will not reverse in the foreseeable future.
Deferred tax assets are recognized for all deductible temporary differences, carry forward of
unused tax credits and unused tax losses, to the extent that it is probable that taxable profit
will be available against which the deductible temporary differences, and the carry forward
of unused tax credits and unused tax losses can be utilized, except:
i. Where the deferred tax asset relating to the deductible temporary difference arises from
the initial recognition of an asset or liability in a transaction that is not a business
combination and, at the time of the transaction, affects neither the accounting profit nor
taxable profit or loss
ii. In respect of deductible temporary differences associated with investments in
subsidiaries,associates and interests in joint arrangements, deferred tax assets are
recognized only to the extent that it is probable that the temporary differences will
reverse in the foreseeable future and taxable profit will be available against which the
temporary differences can be utilized.
Deferred tax assets and liabilities are measured at the tax rates that are expected to apply in
the year when the asset is realized or the liability is settled, based on tax rates and tax laws
that have been enacted or substantively enacted at the reporting date. The measurement of
deferred tax assets and deferred tax liabilities reflects the tax consequences that would
follow from the manner in which the Group expects, at the end of the reporting period, to
recover or settle the carrying amount of its assets and liabilities.
Deferred tax relating to items recognized outside profit or loss is recognized outside profit or
loss. Deferred tax items are recognized in correlation to the underlying transaction either in
other comprehensive income or directly in equity. Deferred tax assets are reassessed at each
reporting date and are recognized accordingly.
Deferred tax assets and deferred tax liabilities are offset, if a legally enforceable right exists
to set off current income tax assets against current income tax liabilities and the deferred
taxes relate to the same taxable entity and the same taxation authority.
5. Significant accounting judgments, estimates and assumptions

Consolidated Financial Statements 201
The preparation of the Group’s consolidated financial statements require management to make
judgements, estimates and assumptions that affect the reported amounts of revenues, expenses,
assets and liabilities, and the disclosure of contingent liabilities, at the end of the reporting
period. However, uncertainty about these assumption and estimate could result in outcomes
that require a material adjustment to the carrying amount of the asset or liability affected in
future periods. Please find the details as below:
(1) Fair value of financial instruments
Where the fair value of financial assets and financial liabilities recorded in the balance sheet
cannot be derived from active markets, they are determined using valuation techniques
including the income approach (for example the discounted cash flows model) or market
approach. Changes in assumptions about these factors could affect the reported fair value of
the financial instruments. Please refer to Note 12 for more details.
(2) Impairment of non-financial assets
An impairment exists when the carrying value of an asset or cash generating unit exceeds its
recoverable amount, which is the higher of its fair value less costs to sell and its value in use.
The fair value less costs to sell calculation is based on the price that would be received to
sell an asset or paid to transfer a liability in an orderly transaction between market
participants at the measurement date less incremental costs that would be directly
attributable to the disposal of the asset or cash generating unit. The value in use calculation
is based on a discounted cash flow model. The cash flows projections are derived from the
budget for the next five years and do not include restructuring activities that the Group is not
yet committed to or significant future investments that will enhance the asset’s performance
of the cash generating unit being tested. The recoverable amount is most sensitive to the
discount rate used for the discounted cash flow model as well as the expected future
cash-inflows and the growth rate used for extrapolation purposes.
(3) Useful lives and depreciation of vessels
Management determines the estimated useful lives and related depreciation charges for its
vessels. This estimate is based on the historical experience of the actual useful lives of
vessels of similar nature and functions. It could change significantly as a result of technical
innovations and competitor actions in response to severe industry activities. Management
will increase the depreciation charge where useful lives are less than previously estimated
lives, or it will write down technically obsolete or non-strategic assets that have been
abandoned or sold. Management assesses the scrap value according to the characteristics of
the Group’s vessels and the market research from Clarkson and Demolition Market.
The Group determines the depreciation amount of vessels based on the estimated useful
lives and residual values, which are reviewed at each reporting date. The principal

Consolidated Financial Statements 202
assumptions for the Group’s estimation of the useful lives and residual values include those
related to the mode of operations, government regulations, and scrap value of vessels in
future.
(4) Provision for losses from accidents
Provision for losses from accidents is made based on an assessment of the outcome of
negotiations, arbitration or litigation, and the recoverability of losses from insurance
companies, which requires management’s judgment and estimates. Where the actual
outcome or expectation in the future differs from the original estimate, such differences will
have an impact on the carrying amount of the provisions and losses incurred in
accidents/write-back in the period in which such estimate is changed.
6. Contents of significant accounts
(1) Cash and cash equivalents
31 December 2018 31 December 2017
Cash on hand $4,315 $4,535
Check deposits 22,082 185
Demand deposits 15,960,468 13,465,881
Time deposits 9,957,520 27,390,040
Total $25,944,385 $40,860,641
As at 31 December 2018 and 2017, cash and cash equivalents with carrying amounts of
$47,318,084 and $52,024,592 respectively, were pledged to secure bank loans and were
classified under other financial assets.
(2) Financial instruments at fair value through profit or loss
31 December 2018 31 December 2017
Financial liabilities at fair value through profit or loss
-Financial liabilities held for trading-current $2,488,564 $3,009,409
As at 31 December 2018 and 2017, the amount of the Group’s bonds payable, including
embedded derivative instruments-put right were $2,488,564 and $3,009,409, respectively.
The bonds payable, including embedded derivative instruments-put right was recognized
as financial liabilities held for trading-current/noncurrent. Please refer to Note 6. (13) for
further details.
(3) Financial assets at fair value through other comprehensive income
31 December 2018
31 December 2017
(note)
Debt instrument investments measured at fair
value through other comprehensive income

Consolidated Financial Statements 203
Bonds
Current $966,000 $-
Note: The Group adopted IFRS 9 since 1 January 2018. The Group elected not to restate
period periods in accordance with the transition provision in IFRS 9.
A. For the amount of aforementioned financial assets pledged for bank loans as at 31
December 2018, please refer to Note 8.
B. For the credit risk information of financial assets at fair value through other
comprehensive income, please refer to Note 12.
(4) Available-for-sale financial assets
31 December 2018 31 December 2017 Available-for-sale financial assets
Bonds Current $- $1,028,103
Note: The Group adopted IFRS 9 since 1 January 2018. The Group elected not to restate
period periods in accordance with the transition provision in IFRS 9.
The Group adopted IAS 39 before 1 January 2018 and classified certain financial assets as available-for-sale financial assets. Please refer to Note 8 for more details on available-for-sale financial assets pledged for bank loans as at 31 December 2017.
(5) Held-to-maturity financial assets
31 December 2018 31 December 2017 Held-to-maturity financial assets
Bonds Current $- $614,211
Note: The Group adopted IFRS 9 since 1 January 2018. The Group elected not to restate
period periods in accordance with the transition provision in IFRS 9 A. As at 31 December 2017, the held-to-maturity financial assets had maturities in February
2018. B. For the amount of aforementioned financial assets pledged for bank loans as at 31
December 2017, please refer to Note 8. (6) Financial instruments for hedging
31 December 2018 31 December 2017 Financial assets(liabilities) for hedging Cash flow hedge - Interest rate swap
Current $76,540 (note)
Non-current $72,731 (note)
Derivative Financial assets(liabilities) for hedging Cash flow hedge - Interest rate swap
Current (note) $(986)
Non-current (note) $80,058

Consolidated Financial Statements 204
Note:The Group adopted IFRS 9 since 1 January 2018. The Group elected not to restate prior
periods in accordance with the transition provison in IFRS 9. The Group’s risk control activities and hedging strategy relate primarily to the Group’s operating activities. As the Group has variable interest rate loan with bank, its future cash flows are exposed to interest rate risks and subject to interest rate fluctuations. In order to manage interest rate risks, the Group engages in interest rate swap contract to hedge the interest risk for better control and measurement of such risks. These interest rate swap contracts are cash flow hedges.
Interest rate swap contracts are designed to match the hedged items. The unsettled Interest
rate swap contracts at 31 December 2018 and 2017 were as follows:
As at 31 December 2018
Hedging instrument
Fair value of
designated
hedging
instrument
Periods when the
cash flows are
expected to occur
Periods when the
related profit or loss
are expected to
affect the statement
of comprehensive
income Amount
Financial assets(liabilities) for hedging – current
Interest rate swap contracts $76,540 2019/01~2019/12 2019/01~2019/12 $9,230,000
Financial assets(liabilities) for hedging –non-current
Interest rate swap contracts $72,731 2020/01~2021/06 2020/01~2021/06 $7,980,000
As 31 December 2017
Hedging instrument
Fair value of
designated
hedging
instrument
Periods when the
cash flows are
expected to occur
Periods when the
related profit or loss
are expected to
affect the statement
of comprehensive
income Amount
Derivative financial assets(liabilities) for hedging –current
Interest rate swap contracts $(986) 2018/01~2018/12 2018/01~2018/12 $10,480,000
Derivative financial assets (liabilities) for hedging –non-current
Interest rate swap contracts $80,058 2019/01~2021/06 2019/01~2021/06 $9,230,000
(7) Accounts receivable, net
31 December 2018 31 December 2017
Accounts receivable $5,445,357 $2,509,196

Consolidated Financial Statements 205
31 December 2018 31 December 2017
Less: allowance for doubtful debts (133,802) (83,258)
Subtotal 5,311,555 2,425,938
Accounts receivable-related parties 299,642 221,707
Less: allowance for doubtful debts - -
Subtotal 299,642 221,707
Net accounts receivable $5,611,197 $2,647,645
The aforementioned accounts receivable are generated by the operation and the Group does
not hold any collateral for such trade receivables.
The Group adopted IFRS 9 for impairment assessment since 1 January 2018. Please refer to
Note 6.18 for more details on impairment of accounts receivable. The Group adopted IAS 39
for impairment assessment before 1 January 2018. The movements in the provision for
impairment of trade receivables and trade receivables-related parties are as follows: (Please
refer to Note 12 for more details on credit risk management.)
31 December 2017
Amount at beginning of period $83,258
Provision for impairment 79,487
Write off (79,487)
Amount at end of period $83,258
Impairment loss that was individually determined at 31 December 2017, and was arose due
to the fact that the counterparty was in financial difficulties. The amount of impairment loss
recognized was the difference between the carrying amount of the trade receivable and the
present value of its expected recoverable amount. The Group does not hold any collateral for
such accounts receivables.
The aging analysis of accounts receivable and accounts receivable from related parties, net
was as follow:
Neither
past due nor
impaired
Past due but not impaired
Under
6 months
7~12
months
13~18
months
19~24
months
Over
24 months Total
2017.12.31 $2,000,583 $85,854 $338,855 $124,253 $98,100 $- $2,647,645
The Group’s major revenue comes from freight revenue and hire revenue. Freight revenue is
recognized on the percentage of completion basis according to the sailing time of each trip.
Hire revenue is recognized monthly on accrual basis. The main portion of accounts
receivable include hire revenue as contracted, hire dispute, vessel delay.
(8) Inventories

Consolidated Financial Statements 206
31 December 2018 31 December 2017
Fuel $4,243,752 $3,893,003
As at 31 December 2018 and 2017, the aforesaid inventories were not pledged as collateral.
(9) Investments accounted for using the equity method
31 December 2018 31 December 2017
Investees
Carrying
amount
Percentage
of ownership
(%)
Carrying
amount
Percentage
of ownership
(%)
Investments in associates:
Pescadores Investment and
Development Inc.
$2,854,380 40%
$3,655,924 40%
A. For the purpose of building the Group’s headquarter, the Group has participated in an
investment with Pescadores Co., Ltd. and Mr. Lan Chun Sheng by subscribing for new
shares of Pescadores Investment and Development Inc., of which capital has amounted to
NT$1 billion. The Group holds 40% of the shares issued by Pescadores Investment and
Development Inc.
B. The Group has subscribed for new shares of Pescadores Investment and Development
Inc., of which capital has amounted to NT1.12 billion, with a par value of NT$10 per
share for 4,800,000 shares. The Group remains 40% share of the shares issued by
Pescadores Investment and Development Inc. As at 2 April 2018, the Group had fully
paid the amount. As at 11 May 2018, Pescadores Investment and Development Inc. had
completed the alteration of the registered capital amount.
C. The summary financial information of the investment in associates was listed below:
31 December 2018 31 December 2017
Current assets $388,103 $401,896
Non-current assets 136,580,279 144,318,524
Current liabilities (905,198) (135,580,611)
Non-current liabilities (128,927,234) -
Equity 7,135,950 9,139,809
Percentage of ownership (%) 40% 40%
Group’s carrying amount of the investment $2,854,380 $3,655,924
For the Year Ended 31 December
2018 2017
Revenue $- $-
Profit for the year (continuing operations) (5,732,198) (2,383,427)
Other comprehensive income for the year - -
Comprehensive income for the year $(5,732,198) $(2,383,427)
1. The investments in associates do not have a quoted market price in active market.
2. The investments in associates had no contingent liabilities, capital commitments, or

Consolidated Financial Statements 207
guaranty.
D. The aforementioned investments in associates were not pledged and had no contingent
liabilities or capital commitments as at 31 December 2018 and 2017.
(10) Property, plant and equipment
31 December 2018
Beginning
balance Addition Disposal
Re-
classification
Foreign
exchange rate
effects
Ending balance
Cost
Vessel $3,193,780,321 $5,598,686 $9,925,493 $200,482,446 $(83,748) $3,389,852,212
Vessel equipment 15,459,370 2,327,127 3,674,527 - (420) 14,111,550
Dry-dock 21,893,845 10,783,540 8,132,611 856,882 (18,174) 25,383,482
Transportation equipment 184,812 - - - (5,746) 179,066
Office equipment 252,386 10,048 - - (8,032) 254,402
Leased assets 108,225,403 1,109,808 400,000 (4,831,232) - 104,103,979
Leasehold improvements 90,886 6,307 - - (2,942) 94,251
Total 3,339,887,023 19,835,516 22,132,631 196,508,096 (119,062) 3,533,978,942
Accumulated depreciation
Vessel 634,384,543 122,395,711 5,734,023 9,056,857 (17,972) 760,085,116
Vessel equipment 8,206,314 3,026,090 3,674,527 - (404) 7,557,473
Dry-dock 10,131,485 9,488,706 7,919,229 (188,025) (7,630) 11,505,307
Transportation equipment 184,812 - - - (5,746) 179,066
Office equipment 211,851 13,159 - - (6,829) 218,181
Leased assets 18,132,434 4,499,881 400,000 (9,078,792) - 13,153,523
Leasehold improvements 68,486 6,951 - - (2,258) 73,179
Total 671,319,925 139,430,498 17,727,779 (209,960) (40,839) 792,771,845
Net Balance $2,668,567,098 $(119,594,982) $4,404,852 $196,718,056 $(78,223) $2,741,207,097
31 December 2017
Beginning
balance Addition Disposal
Re-
classification
Foreign
exchange rate
effects
Ending balance
Cost
Vessel $2,900,034,948 $1,214,975 $9,153,048 $301,475,479 $207,967 $3,193,780,321
Vessel equipment 15,064,310 3,175,995 2,709,478 (72,500) 1,043 15,459,370
Dry-dock 20,999,113 8,990,109 9,957,691 1,831,988 30,326 21,893,845
Transportation equipment 170,543 - - - 14,269 184,812
Office equipment 232,900 - - - 19,486 252,386
Leased assets 93,516,827 15,226,725 518,149 - - 108,225,403
Leasehold improvements 83,869 - - - 7,017 90,886
Total 3,030,102,510 28,607,804 22,338,366 303,234,967 280,108 3,339,887,023
Accumulated depreciation
Vessel 532,386,291 113,495,563 3,497,530 (8,025,408) 25,627 634,384,543
Vessel equipment 7,898,630 3,088,966 2,709,478 (72,500) 696 8,206,314
Dry-dock 10,597,120 9,619,367 9,850,937 (240,994) 6,929 10,131,485
Transportation equipment 170,543 - - - 14,269 184,812
Office equipment 184,077 12,100 - - 15,674 211,851
Leased assets 14,820,513 3,830,070 518,149 - - 18,132,434
Leasehold improvements 56,945 6,627 - - 4,914 68,486
Total 566,114,119 130,052,693 16,576,094 (8,338,902) 68,109 671,319,925

Consolidated Financial Statements 208
31 December 2017
Beginning
balance Addition Disposal
Re-
classification
Foreign
exchange rate
effects
Ending balance
Net Balance $2,463,988,391 $(101,444,889) $5,762,272 $311,573,869 $211,999 $2,668,567,098
A. As at 31 December 2018 and 2017, the residual value of the vessels amounted to
$431,863 thousand and $402,413 thousand, respectively, and the estimated useful lives
were ranging from 15 to 25 years and 15 to 25 years.
B. As at 31 December 2018 and 2017, the Group had deposited the chartering income of
some vessels into reserve accounts of lending institutions.
C. As at 31 December 2018 and 2017, the pledge of these vessels is required by the banks
which granted the loans to finance the purchase of the vessels and to secure the timely
repayment of the loans. Refer to Note 8 for further details.
D. As at 31 December 2018 and 2017, the Group has entered into certain shipbuilding
contracts. Refer to Note 9.(a) for further details.
E. For the years ended 31 December 2018 and 2017, the Group disposed of certain vessels
for $3,948,750 and $4,332,250, which resulted in gains(losses) on disposal of property
and equipment of $(205,072) and $(1,430,022) , respectively.
F. As at 31 December 2018 and 2017, the amounts of total interest expense before
capitalization of borrowing costs were $57,314,178 and $43,860,905; the capitalization
of interest were $53,189 and $129,316 and the capitalization of interest will be paid
annually at a rate of 1.35~4.34% and 1.56~3.61%, respectively.
(11) Other noncurrent assets-Other
31 December 2018 31 December 2017
Prepayment for vessels $29,710,000 $52,856,831
Deferred expenses 31,614 31,880
Total $29,741,614 $52,888,711
Prepayment for vessels is the amount prepaid for building new vessels.
(12) Loans and borrowings
31 December 2018 31 December 2017
Bank loans-Short-term borrowings $50,972,826 $44,399,387

Consolidated Financial Statements 209
Long-term borrowings (including current portion) $1,626,113,165 $1,651,263,233
A. Terms and conditions of outstanding loans were as follows:
Loans Currency Nominal interest rate Year of maturity Amount
31 December 2018
Unsecured USD 2.64%~4.38% 2018.01.23~2020.03.30 $38,000,000
JPY 0.88%~1.20% 2018.05.31~2019.10.17 12,500,000
Secured USD 2.41%~5.38% 2009.02.20~2026.08.06 915,496,107
JPY 0.85%~2.13% 2007.01.12~2030.04.02 710,100,140
TWD 1.86%~2.07% 2016.03.28~2023.03.28 989,744
Total $1,677,085,991
Loans Currency Nominal interest rate Year of maturity Amount
31 December 2017
Unsecured USD 2.10%~3.04% 2016.06.30~2019.03.26 $23,750,000
JPY 0.88%~1.13% 2017.05.31~2019.08.31 11,104,207
Secured USD 1.97%~4.16% 2009.02.20~2026.06.30 908,495,757
JPY 0.85%~2.11% 2005.12.12~2030.04.02 737,635,236
TWD 1.76%~1.86% 2016.03.28~2023.03.28 14,677,420
Total $1,695,662,620
B. Future settlements of interest-bearing long-term loans and borrowings were as follows:
Maturity Period 31 December 2018 31 December 2017
Within one year $238,649,673 $217,027,648
Beyond one year and up to five years 1,023,750,045 1,017,159,280
More than five years 363,713,447 417,076,305
Total $1,626,113,165 $1,651,263,233
(a) As at 31 December 2018 and 2017, WML had provided financing guarantees for its
subsidiaries of $1,220,356 thousand and $1,319,653 thousand, respectively.
(b) As at 31 December 2018 and 2017, the Group had unused credit facilities of $41,640
thousand and $40,773 thousand, respectively.

Consolidated Financial Statements 210
(c) The Group’s covenants under the loan agreements are as follows:
(i) Loan lenders shall be notified of any significant movement of the Group’s
shareholder’s equity.
(ii) In certain circumstances, the Group retains the option to select the currency to be
used for loan or debt settlement.
(iii) Some equity shares of the Company’s subsidiaries were pledged to secure bank
loans.
(d) As at 31 December 2018 and 2017, WML and the Company had provided financial
guarantees for the Company’s subsidiaries. Please refer to Note 9.(2) for further
details.
(13) Bonds Payable
31 December 2018 31 December 2017
Domestic convertible bonds $37,439,252 $53,814,622
Less: current portion 32,584,867 10,773,060
Net $4,854,385 $43,041,562
A. The Group’s overseas convertible bonds were as follows:
31 December 2018 31 December 2017
First R.O.C. unsecured convertible bonds
issued in 2012
Convertible bonds issued $- $20,387,360
Discounts on bonds payable - -
Accumulated converted amount - (11,676,075)
Accumulated redeemed amount - (7,811,807)
Valuation on bonds payable - (899,478)
Net - -
Less: Current portion of bonds payable - -
Subtotal - -
First Singapore unsecured convertible bonds
issued in 2013
Convertible bonds issued 60,000,000 60,000,000
Discounts on bonds payable - (226,940)
Accumulated redeemed amount (4,750,000) -
Accumulated converted amount (55,250,000) (49,000,000)
Net - 10,773,060
Less: Current portion of bonds payable - (10,773,060)
Subtotal - -
Second Singapore unsecured convertible bonds
issued in 2015
Convertible bonds issued 80,000,000 80,000,000

Consolidated Financial Statements 211
31 December 2018 31 December 2017
Discounts on bonds payable (145,615) (256,397)
Accumulated converted amount - -
Accumulated redeemed amount (75,000,000) (75,000,000)
Net 4,854,385 4,743,603
Less: Current portion of bonds payable - -
Subtotal 4,854,385 4,743,603
Second R.O.C. secured convertible bonds
issued in 2017
Convertible bonds issued 13,218,771 13,218,771
Discounts on bonds payable (710,603) (1,101,982)
Accumulated converted amount - -
Accumulated redeemed amount - -
Valuation on bonds payable (187,290) 203,083
Net 12,320,878 12,319,872
Less: Current portion of bonds payable (12,320,878) -
Subtotal - 12,319,872
Third R.O.C. unsecured convertible bonds
issued in 2017
Convertible bonds issued 26,307,136 26,307,136
Discounts on bonds payable (448,408) (883,527)
Accumulated converted amount (5,304,549) -
Accumulated redeemed amount - -
Valuation on bonds payable (290,190) 554,478
Net 20,263,989 25,978,087
Less: Current portion of bonds payable (20,263,989) -
Subtotal - 25,978,087
Total $4,854,385 $43,041,562
Embedded derivative instruments-put right,
accounted for as financial liabilities at fair
value through profit or loss
$2,488,564 $3,009,409
Equity components-Capital surplus,
accounted for as capital surplus
$6,634,649 $7,124,808
Liability components-Financial liabilities
reported at fair value through (profit) or loss
$(109,673) $(1,114,575)
Interest expense $1,290,127 $1,672,874
B. The offering information of the convertible bonds was as follows:
Item First R.O.C. unsecured convertible bonds issued in 2012
1. Offering amount NT$600,000 thousand
2. Issue date 29 March 2012
3. Outstanding amount NT$0 thousand

Consolidated Financial Statements 212
4. Interest The bonds will not bear any interest.
5. Issue Period From 29 March 2012 to the maturity date of 29 March 2017
6. Guarantee Institutions None
7. Settlement A converting bond holder can convert bonds into the Company’s common stock or
execute put option based on the Company’s conversion rules. The Company can also
buy back cancellation from bonds dealers. Otherwise, bonds are repayable at face
value by cash when they mature.
8. Redemption at the
option of the holder
The bondholders can execute put option after two years from issuance date (29 March
2014). The Company should send through registered mail the “Notification of
bondholder’s put option” 30 days before the maturity date. (The list of bondholders
who should receive the notification through registered mail is based on the register list
5 business days before mailing date. Investors who purchase the bonds after the
mailing date are notified through announcement.) OTC (Over the Counter) should be
notified by the Company and should announce the bondholder’s put option; a written
notification should be sent to the share transfer agent by bondholders 30 days after the
OTC’s announcement. The redemption value is the bonds face value plus interest.
(Face value * 101% after two years maturity period, the real yield is 0.5%). After
accepting the redemption request, the Company should redeem the bonds by cash
within 5 business days after the maturity date.
9. Conversion (a) Conversion period
The bondholders will have the right to convert their bonds at any time during the
conversion period commencing 30 April 2012 (the 30th day following the closing
date) and ending at the close of business on 19 March 2017 (the 10th day prior to
the maturity Date), provided, however, that the conversion right during any closed
period shall be suspended and the conversion period shall not include any such
closed period, which means (i) the period during which the Company may be
required to close its stock transfer books under ROC laws and regulations
applicable from time to time; (ii) the period beginning on the 15th trading day prior
to the record date for the distribution of stock or cash dividends, or subscription of
new shares due to capital increase to the date ending on (and including) such
record date; (iii) the period beginning on the record date of a capital reduction to
one day prior to the trading day on which the shares of the Company are reissued
after such capital reduction.
(b) Conversion price
The conversion price had been adjusted from NT$46.00 per share to NT$40.36 per
share effective 14 August 2012.
The conversion price had been adjusted from NT$40.36 per share to NT$36.80 per
share effective 20 August 2013.
The conversion price had been adjusted from NT$36.80 per share to NT$33.70 per
share effective 2 August 2014.
The conversion price had been adjusted from NT$33.70 per share to NT$31.30 per
share effective 4 July 2015.
The conversion price had been adjusted from NT$31.30 per share to NT$29.20 per
share effective 3 July 2016.
The conversion price had been adjusted from NT$29.20 per share to NT$29.10 per
share effective 28 October 2016.
Item First Singapore unsecured convertible bonds issued in 2013
1. Offering amount US$60 million
2. Issue date 12 November 2013
3. Outstanding amount US$0 million
4. Interest The bonds will not bear any interest.
5. Issue Period From 12 November 2013 to maturity date of 12 November 2018
6. Guarantee Institutions None
7. Settlement Unless the bonds have been previously redeemed, repurchased and cancelled or
converted, the bonds will be redeemed by the Company on maturity date at an

Consolidated Financial Statements 213
amount equal to the principal amount of the bonds with a yield-to-maturity of 2.0%
per annum, calculated on semi-annual basis, which is 110.46% of the principal
amount.
8. Redemption at the
option of the holder
(1) Each holder has the right to require the Company to redeem all or any portion of
the principal amount of such holder's bonds on 12 November 2015 at a redemption
price equal to the principal amount of the bonds with a yield-to-maturity of 2.0%
per annum, calculated on semi-annual basis, which is 104.06% of the principal
amount.
(2) In the event that the Company’s common shares ceased to be listed or admitted to
trading on the TWSE, each holder has the right to require the Company to redeem
all or any portion of the principal amount of such holder's bonds at the early
redemption amount equal to the principal amount of the bonds with a
yield-to-maturity of 2.0% per annum, calculated on semi-annual basis.
(3) In the event of change of control occurs with respect to the Company, each holder
has the right to require the Company to redeem all or any portion of the principal
amount of such holder's bonds at the early redemption amount.
9. Conversion (1) Conversion period
Unless the bonds have been redeemed before maturity, repurchased and cancelled
or converted, each holder of the bonds will have the right at any time during the
conversion period commencing 23 December 2013 (the 41st day following the
closing Date) and ending at the close of business on 2 November 2018 (the 10thday
prior to the maturity Date), to convert their bonds.
(2) Conversion price
The conversion price was NT$35.3369 per share which was100.1% of the closing
price reported by the TWSE in respect of the common shares of the Company on 4
November 2013.
The conversion price had been adjusted from NT$35.3369 per share to
NT$32.6486 per share effective 2 August 2014.
The conversion price had been adjusted from NT$32.6486 per share to
NT$30.3524 per share effective 4 July 2015.
The conversion price had been adjusted from NT$30.3524 per share to
NT$28.3011 per share effective 3 July 2016.
The conversion price had been adjusted from NT$28.3011 per share to
NT$28.2794 per share effective 28 October 2016.
The conversion price had been adjusted from NT$28.2794 per share to
NT$26.0777 per share effective 29 July 2017.
The conversion price had been adjusted from NT$26.0777 per share to
NT$25.8578 per share effective 3 November 2017.
The conversion price had been adjusted from NT$25.8578 per share to
NT$25.0035 per share effective 18 September 2018.
(3) Conversion to common shares
Upon conversion, the number of common shares converted is calculated by the
issuance price (translated at a fixed exchange rate applicable on conversion of
bonds of NT$29.4180 =US$1.00) divided by the conversion price on the
conversion date.
Item Second Singapore unsecured convertible bonds issued in 2015
1. Offering amount US$80 million
2. Issue date 10 April 2015
3. Outstanding amount US$5 million
4. Interest The bonds will not bear any interest.
5. Issue Period From 10 April 2015 to maturity date of 10 April 2020
6. Guarantee Institutions None
7. Settlement Unless the bonds have been previously redeemed, repurchased and cancelled or
converted, the bonds will be redeemed by the Company on maturity date at an
amount equal to the principal amount of the bonds with a yield-to-maturity of 2.0%
per annum, calculated on semi-annual basis, which is 110.46% of the principal
amount.

Consolidated Financial Statements 214
8. Redemption at the
option of the holder
(1) Each holder has the right to require the Company to redeem all or any portion of
the principal amount of such holder's bonds on 10 April 2017 at a redemption
price equal to the principal amount of the bonds with a yield-to-maturity of 2.0%
per annum, calculated on semi-annual basis, which is 104.06% of the principal
amount.
(2) In the event that the Company’s common shares ceased to be listed or admitted
to trading on the TWSE, each holder has the right to require the Company to
redeem all or any portion of the principal amount of such holder's bonds at the
early redemption amount equal to the principal amount of the bonds with a
yield-to-maturity of 2.0% per annum, calculated on semi-annual basis.
(3) In the event of change of control occurs with respect to the Company, each
holder has the right to require the Company to redeem all or any portion of the
principal amount of such holder's bonds at the early redemption amount.
9. Conversion (1) Conversion period
Unless the bonds have been redeemed before maturity, repurchased and cancelled
or converted, each holder of the bonds will have the right at any time during the
conversion period commencing 21 May 2015 (the 41st day following the closing
Date) and ending at the close of business on 31 March 2020 (the 10thday prior to
the maturity Date), to convert their bonds.
(2) Conversion price
The conversion price was NT$42.79 per share which was 110% of the closing
price reported by the TWSE in respect of the common shares of the Company on 1
April 2015.
The conversion price had been adjusted from NT$42.79 per share to NT$39.78 per
share effective 4 July 2015.
The conversion price had been adjusted from NT$39.78 per share to NT$37.09 per
share effective 3 July 2016.
The conversion price had been adjusted from NT$37.09 per share to NT$36.43 per
share effective 28 October 2016.
The conversion price had been adjusted from NT$36.43 per share to NT$33.5938
per share effective 29 July 2017.
The conversion price had been adjusted from NT$33.5938 per share to NT$33.31
per share effective 3 November 2017.
The conversion price had been adjusted from NT$33.31 per share to NT$32.21 per
share effective 18 September 2018.
(3) Conversion to common shares
Upon conversion, the number of common shares converted is calculated by the
issuance price (translated at a fixed exchange rate applicable on conversion of
bonds of NT$31.271 =US$1.00) divided by the conversion price on the conversion
date.
Item Second R.O.C. secured convertible bonds issued in 2017
1. Offering amount NT$400,000 thousand
2. Issue date 30 September 2017
3. Outstanding amount NT$400,000 thousand
4. Interest The bonds will not bear any interest.
5. Issue Period From 30 September 2017 to maturity date of 30 September 2020
6. Guarantee Institutions Bank Sinopac Company Limited
7. Settlement A converting bond holder can convert bonds into the Company’s common stock or
execute put option based on the Company’s conversion rules. The Company can also
buy back cancellation from bonds dealers. Otherwise, bonds are repayable at face value
by cash when they mature.
8. Redemption at the
option of the holder
The bondholders can execute put option after two years from issuance date (30
September 2019). The Company should send through registered mail the “Notification

Consolidated Financial Statements 215
of bondholder’s put option” 40 days before the maturity date. (The list of bondholders
who should receive the notification through registered mail is based on the register list
5 business days before mailing date. Investors who purchase the bonds after the
mailing date are notified through announcement.) OTC (Over the Counter) should be
notified by the Company and should announce the bondholder’s put option; a written
notification should be sent to the share transfer agent by bondholders 40 days after the
OTC’s announcement. The redemption value is the bonds face value plus interest.
(Face value *0% after two years maturity period, the real yield is 0%). After accepting
the redemption request, the Company should redeem the bonds by cash within 5
business days after the maturity date.
9. Conversion (1) Conversion period
The bondholders will have the right to convert their bonds at any time during the
conversion period commencing 1 January 2018 (the 90th day following the closing
date) and ending at the close of business on 30 September 2020 (the maturity
Date), provided, however, that the conversion right during any closed period shall
be suspended and the conversion period shall not include any such closed period,
which means (i) the period during which the Company may be required to close its
stock transfer books under ROC laws and regulations applicable from time to time;
(ii) the period beginning on the 15th trading day prior to the record date for the
distribution of stock or cash dividends, or subscription of new shares due to capital
increase to the date ending on (and including) such record date; (iii) the period
beginning on the record date of a capital reduction to one day prior to the trading
day on which the shares of the Company are reissued after such capital reduction.
(2) Conversion price
The conversion price was NT$30 per share which was 106.07% of the average
closing price (NT$28.28) reported by the TWSE in respect of the common shares
of the Company during the 3 trading day period prior to 22 September 2017.
The conversion price had been adjusted from NT$30 per share to NT$29.8 per
share effective 3 November 2017.
The conversion price had been adjusted from NT$29.8 per share to NT$28.8 per
share effective 18 September 2018.
Item Third R.O.C. unsecured convertible bonds issued in 2017
1. Offering amount NT$800,000 thousand
2. Issue date 2 October 2017
3. Outstanding amount NT$636,100 thousand
4. Interest The bonds will not bear any interest.
5. Issue Period From 2 October 2017 to maturity date of 2 October 2020
6. Guarantee Institutions None
7. Settlement A converting bond holder can convert bonds into the Company’s common stock or
execute put option based on the Company’s conversion rules. The Company can also
buy back cancellation from bonds dealers. Otherwise, bonds are repayable at face value
by cash when they mature.
8. Redemption at the
option of the holder
The bondholders can execute put option after two years from issuance date (2 October
2019). The Company should send through registered mail the “Notification of
bondholder’s put option” 40 days before the maturity date. (The list of bondholders
who should receive the notification through registered mail is based on the register list

Consolidated Financial Statements 216
5 business days before mailing date. Investors who purchase the bonds after the
mailing date are notified through announcement.) OTC (Over the Counter) should be
notified by the Company and should announce the bondholder’s put option; a written
notification should be sent to the share transfer agent by bondholders 40 days after the
OTC’s announcement. The redemption value is the bonds face value plus interest.
(Face value *1% after two years maturity period, the real yield is 0.5%). After
accepting the redemption request, the Company should redeem the bonds by cash
within 5 business days after the maturity date.
9. Conversion (1) Conversion period
The bondholders will have the right to convert their bonds at any time during the
conversion period commencing 3 January 2018 (the 90th day following the closing
date) and ending at the close of business on 2 October 2020 (the maturity Date),
provided, however, that the conversion right during any closed period shall be
suspended and the conversion period shall not include any such closed period,
which means (i) the period during which the Company may be required to close its
stock transfer books under ROC laws and regulations applicable from time to time;
(ii) the period beginning on the 15th trading day prior to the record date for the
distribution of stock or cash dividends, or subscription of new shares due to capital
increase to the date ending on (and including) such record date; (iii) the period
beginning on the record date of a capital reduction to one day prior to the trading
day on which the shares of the Company are reissued after such capital reduction.
(2) Conversion price
The conversion price was NT$29.5 per share which was 103.98% of the average
closing price (NT$28.37) reported by the TWSE in respect of the common shares
of the Company during the 3 trading day period prior to 25 September 2017.
The conversion price had been adjusted from NT$29.5 per share to NT$29.3 per
share effective 3 November 2017.
The conversion price had been adjusted from NT$29.3 per share to NT$28.3 per
share effective 18 September 2018.
C. First R.O.C. unsecured convertible bonds issued in 2012 has matured on 29 March 2017. D. The bondholders exercised the right to repurchase within the period of repurchase (five
business days prior to 10 April 2017) the second Singapore unsecured convertible bonds issued by the Group in 2015 according to the issuance prospectus. The bondholders requested that the consolidated company redeem the convertible bonds at 104.06% face value. The Group recognized loss from the right to repurchase of corporate bonds in the amount of US$4,462 thousand (under other loss item) after deducting the book values of the corporate bond and the liabilities of the right to repurchase from the repurchase price. The Group reclassified expired conversion rights of US$5,871 thousand from Capital Surplus - Stock option from convertible bonds to Capital Surplus - Others. The book value of the second overseas unsecured convertible bonds issued by the Group in 2015, less the accumulated conversion has been reclassified to non-current liabilities after the expiration of resale period.
E. First Singapore unsecured convertible bonds issued in 2013 has matured on 12 November
2018. The Group reclassified expired conversion rights of US$373 thousand from Capital Surplus - Stock option from convertible bonds to Capital Surplus - Others.
(14) Leases

Consolidated Financial Statements 217
A. Lessors
Chartering Future hiring receivables as at 31 December 2018 and 2017 were as follows:
31 December 2018 31 December 2017
Within one year $337,888,573 $305,601,092 Beyond one year and up to five years 567,748,343 594,859,161 More than five years 234,049,054 325,934,314
Total $1,139,685,970 $1,226,394,567
B. Lessee
(a) Bareboat Hire and Purchase (BBHP)
(i) Future non-cancellable lease payments under financing lease as at 31 December 2018 and 2017:
31 December 2018 31 December 2017
Minimum
Lease Payment
Interest expense
Minimum
Lease Payment
Interest Expense
Within one year $7,522,354 $1,130,369 $14,405,443 $983,001 Beyond one year and
up to five years 26,050,586
3,622,429
20,086,115
2,602,883
More than five years 52,885,262 929,197 39,291,974 1,083,523
Total $86,458,202 $5,681,995 $73,783,532 $4,669,407
(ii) The Group planned to exercise its right to acquire some vessels in October 2009
and August 2017, and pay for the purchase price of the vessels after delivery.
However, the Group and the lessor had both agreed to extend the lease term to
October 2019 and August 2018, and the other conditions of the lease remained
unchanged.
(b) Sale and lease back transaction
(i) As at 31 December 2018 and 2017, the Group engaged in vessels sale and lease
back transactions based on the operating performance and the investment
strategies. The sale and lease back transactions resulted in financial leases, and
the related information of these transactions was as follows:
Vessel Lease term Rent Contract price Interest rate
31 December 2018 A 7 years from 2012.12 $347,750/quarter $14,980,000 Max (3m Libor+2.2%, Taifx+1.2%, 2.5%)
B 7 years from 2018.09 ¥28,928,000/quarter ¥810,000,000 1.5%
Vessel Lease term Rent Contract price Interest rate
31 December 2017 A 7 years from 2012.12 $347,750/quarter $14,980,000 Max (3m Libor+2.2%, Taifx+1.2%, 2.5%)

Consolidated Financial Statements 218
(ii) Future non-cancellable chartering payments as at 31 December 2018 and 2017
were as follows:
31 December 2018 31 December 2017
Within one year $7,682,116 $1,391,000
Beyond one year and up to five years 4,192,464 6,634,000
More than five years 1,834,348 -
Total $13,708,928 $8,025,000
(iii) Based on the Sale and lease back transaction contracts, the Group can acquire
the lease vessels when the Group makes the payment.
(iv) As at 31 December 2018 and 2017, the Group has issued promissory notes of
$6,940,000 and $8,706,000, respectively, for these lease agreements.
(v) Refer to Note 7 for further details of sale and lease back transaction regarding
related parties.
(c) Ship time charter
The Group has entered into leases on ships. These leases have an average life of one
year with no renewal option included in the contracts. There are no restrictions
placed upon the Group by entering into these leases.
Future minimum rentals payable under non-cancellable operating leases as at 31
December 2018 and 2017 are as follows:
31 December 2018 31 December 2017
Not later than one year $759,759 $2,002,629
Operating lease expenses recognized are as follows
For the Years Ended 31 December
2018 2017
Minimum lease payments $1,626,470 $4,216,132
(d) Other operating leases
The Group has entered into leases on offices, warehouses and copy machines. These
leases have an average life of one year with no renewal option included in the
contracts. There are no restrictions placed upon the Group by entering into these
leases.
Future minimum rentals payable under non-cancellable operating leases as at 31
December 2018 and 2017 are as follows:

Consolidated Financial Statements 219
31 December 2018 31 December 2017
Not later than one year $531,287 $532,444
Later than one year and not later than five
years
390,444 295,085
Total $921,731 $827,529
Operating lease expenses recognized are as follows
For the Years Ended 31 December
2018 2017
Minimum lease payments $550,552 $542,173
(15) Post-Employment Defined Benefit Plan
A. Defined contribution plans
WELL and WII provide cash contribution at the rate of 6% of the employee’s monthly
wages to the Labor Pension personal account of the Bureau of the Labor Insurance in
accordance with the provisions of the Labor Pension Act.
B. Defined benefit plans
WII also have a defined benefit plan covering all regular employees in accordance with
the Labor Standards Act. This plan provides for a pension benefit payment of 2 units for
each year of service. Each unit of retirement payment referred to above shall be computed
as the average monthly salary for the last six months at the time of approved retirement.
Under this plan, the Company contributes monthly an amount equal to 2% of gross salary
to a pension fund, which is deposited into a designated depository account with the Bank
of Taiwan.
(16) Equities
A. Capital
(a) On 21 October 2008, the Company was incorporated with a registered capital of NT
$3,300,000 thousand. In January 2009, based on the approval of the board of
directors, the Company issued shares of stock worth NT$2,000,000 thousand,
divided into 200,000 thousand shares with par value of NT $10 per share for listing
in Taiwan purpose.

Consolidated Financial Statements 220
As at 31 December 2018 and 2017, the total outstanding capital of the Company
amounted to NT$6,298,055 thousand and NT$6,167,076 thousand, consisting of
629,805 thousand and 616,708 thousand shares with a par value of NT $10 per share.
(b) On 23 June 2017, the shareholders resolved at their meeting to distribute the 2016
capital surplus as cash at NT$1.00 per share and increase capital by capitalizing its
capital surplus of NT$ 278,432 thousand, comprising 27,843 thousand shares with a
par value of NT$10. The record date of this capital increase was 29 July 2017.
(c) A resolution was passed at a board of directors meeting of the Company held on 28
July 2017 to issued 32,000,000 shares of stock with per value of NT$10 per share.
The board of directors authorized the chairman of directors to set the offering price at
NT$23.5 per share on 6 October. The issuance was approved by the Financial
Supervisory Commission on 8 September 2017, and the subscription was completed
on 3 November 2017.
(d) On 25 May 2018, the shareholders resolved at their meeting to distribute the 2017
capital surplus as cash at NT$1.00 per share. The record date of cash dividend was
18 September 2018, while the payable date was 8 October 2018.
(e) As at 31 December 2018 convertible bonds were converted into common stock and
capital surplus of $4,239,047 and $8,247,270, respectively.
B. Capital Surplus
The components of the capital surplus were as follows:
31 December 2018 31 December 2017
From issuance of share capital $33,483,746 $45,340,993
Employee share options 338,321 338,321
Stock option from convertible bonds 391,383 1,254,063
Others 6,243,266 5,870,745
Total $40,456,716 $52,804,122
C. Retained earnings
(a) The Company’s distribution of directors’ and supervisors’ remuneration is based on
the level of earnings and the resolution of the board of directors. Distributions of
directors’ and supervisors’ remuneration are classified into cost or operating expense.
Any difference between the amounts approved in the shareholders’ meeting and those
recognized in the financial statements, if any, is accounted for as a change in
accounting estimates and is charged to profit or loss.

Consolidated Financial Statements 221
(b) On 25 May 2018 and 23 June 2017, the Company’s shareholders resolved at the
shareholder’s meeting to appropriate the 2017 and 2016 earnings. These earnings
were distributed as dividends and remuneration to directors and supervisors as
follows:
Unit: NTD
For the Years Ended 31 December
Item 2017 2016
Cash dividends distributed from Capital
surplus -per share
$1.00 $1.00
Stock dividends distributed from Capital
surplus -per share
$- $0.50
For the amount and estimate basis of Directors’ and supervisors’ remuneration please
refer to Note 6.19(e)
(17) Operating revenues
For the Years Ended 31 December
2018 2017
Revenue from contracts with customers
Freight revenue $13,062,803 14,490,921
Vessel management revenue 3,931,632 4,489,049
Subtotal 16,994,435 18,979,970
Hire revenue 407,866,365 338,140,736
Other operating revenue 8,574,001 5,607,609
Total $433,434,801 $362,728,315
Note: The Group has adopted IFRS 15 from 1 January 2018. The Group elected to apply
the standard retrospectively by recognizing the cumulative effect of initially applying
the standard at the date of initial application (1 January 2018).
The Group has adopted IFRS 15 from 1 January 2018. Analysis of revenue from contracts
with customers during the year is as follows:
A. Revenue breakdown
Operation
Department
Rendering of services $16,994,435
Timing of revenue recognition :

Consolidated Financial Statements 222
At a point in time $16,994,435
B. Contract balances
Contract assets - current
31 December 2018
Beginning Balance $-
Ending Balance 12,599
Difference 12,599
Contract assets have increased during the period as the Group has no unconditional right
to receive the consideration in the contract.
(18) Expected credit losses/(gains)
For the Years Ended 31 December
2018 2017(note)
Operating expenses – Expected credit losses/(gains)
Accounts receivable $133,802 $-
Long-term Receivables 10,813 -
Total $144,615 $-
Note: The Group adopted IFRS 9 since 1 January 2018. The Group elected not to restate
prior periods in accordance with the transition provision in IFRS 9.
Please refer to Note 12 for more details on credit risk.
The Group measures the loss allowance of its accounts receivable at an amount equal to
lifetime expected credit losses. The assessment of the Group’s loss allowance as at 31
December 2018 is as follow:
Considering counterparties credit rating, industry characteristics and past experiences, the
loss allowance of accounts receivable is measured as a single group by using a provision
matrix. Details for provision matrix are as follow:
Past due
Neither past
due
Under 6
months
7~12
months
13~18
months
19~24
months
Over 24
months Total

Consolidated Financial Statements 223
Gross carrying
amount $5,153,032 $68,429 $135,224 $51,848 $336,466 $- $5,744,999
Loss ratio 0.57% 10.55% 13.70% 15.60% 20.94% 100%
Lifetime expected
credit losses 29,513 7,219 18,526 8,088 70,456 - 133,802
Net carrying amount $5,123,519 $61,210 $116,698 $43,760 $266,010 $- $5,611,197
The gross carrying amount of long-term receivables is $1,772,547, and its loss allowance
amounting to $10,813 which is measured at expected credit loss ratio of 0.61%.
The movement in the provision for impairment of contract assets, note receivables, trade
receivables and other receivables during the twelve-month period ended 31 December 2018
is as follows:
Accounts
receivable
Long-term
receivables Total
Beginning balance (in
accordance with IAS 39) $83,258 $-
$83,258
Beginning adjusted retained
earnings
- -
-
Beginning balance (in
accordance with IFRS 9)
83,258 -
83,258
Addition/(reversal) for the
current period
133,802 10,813
144,615
Write off for past due over
24months
(83,258) -
(83,258)
Ending balance $133,802 $10,813 $144,615
(19) Operating costs
For the Years Ended 31 December
2018 2017
Depreciation expense $139,410,388 $130,033,966
Cost of materials 38,588,834 37,537,388
Expenses for chartering services 27,625,735 26,310,810
Wages and personnel expenses 96,984,785 91,265,514
Other operating costs 10,214,643 10,668,540
Total $312,824,385 $295,816,218
(a) Cost of materials
For the Years Ended 31 December

Consolidated Financial Statements 224
2018 2017
Fuel oil $5,684,289 $7,174,459
Lubricants 10,015,944 9,413,715
Materials 7,210,523 5,900,175
Spare parts 8,607,272 7,626,287
Survey fees 4,692,845 4,861,572
Repairs and maintenance 1,413,992 1,739,112
Paints 963,969 822,068
Total $38,588,834 $37,537,388
(b) Expenses for chartering services
For the Years Ended 31 December
2018 2017
Commissions $16,631,200 $12,606,391
Expenses at ports 2,616,744 2,974,715
Agency costs 615,260 719,371
Chartering expenses 1,626,470 4,216,132
Dispatch expenses 207,363 305,574
Postage and international communication 2,818,989 2,678,515
Other 3,109,709 2,810,112
Total $27,625,735 $26,310,810
(c) Wages and personnel expenses
For the Years Ended 31 December
2018 2017
Crew wages $73,953,923 $68,659,509
Insurance fees 8,167,374 8,631,137
Food and meals 6,520,926 6,145,000
Crew travel fees 5,320,695 5,341,633
Bonus 2,871,646 2,346,886
Pension cost 150,221 141,349
Total $96,984,785 $91,265,514
(d) Other operating costs
For the Years Ended 31 December

Consolidated Financial Statements 225
2018 2017
Hull and machinery insurance $8,277,040 $8,631,082
Compensation 880,822 1,092,897
Lease payments 291,355 301,297
Other 765,426 643,264
Total $10,214,643 $10,668,540
(e) Summary statement of employee benefits, depreciation and amortization expenses by
function during the years ended 31 December 2018 and 2017:
For the years ended 31 December
2018 2017
Operating
costs
Operating
expenses
Total
amount
Operating
costs
Operating
expenses
Total
amount
Employee benefits expense
Salaries $76,825,569 $1,784,016 $78,609,585 $71,006,395 $1,498,116 $72,504,511
Insurance expenses 8,167,374 110,223 8,277,597 8,631,137 100,941 8,732,078
Pension 150,221 53,515 203,736 141,349 50,350 191,699
Other employee
benefits expense 6,522,292 57,764 6,580,056 6,147,807 52,834 6,200,641
Depreciation 139,410,388 20,110 139,430,498 130,033,966 18,727 130,052,693
Amortization - 10,106 10,106 - 11,077 11,077
For the Years Ended 31 December
Item 2017 2016
Directors’ and supervisors’ remuneration $148,304 $208,634
The differences between the actual appropriations of 2017 and 2016 earnings for
directors and supervisors’ remunerations as approved at the shareholders’ meeting and
the amounts recognized in the financial statements were as follows:
2017
The actual
appropriation
according to the
shareholders
meeting
The amount
recognized in the
financial report Difference
Directors’ and supervisors’ remuneration $148,304 $148,487 $(183)
2016
The actual
appropriation
The amount
recognized in the Difference

Consolidated Financial Statements 226
according to the
shareholders
meeting
financial report
Directors’ and supervisors’ remuneration $208,634 $232,835 $(24,201)
The aforementioned difference for the years ended 31 December 2017 and 2016 was
accounted for as a change in accounting estimates and was charged to profit or loss for
the years ended 31 December 2018 and 2017.
Directors’ and supervisors’ remuneration amounted to $278,965 and $148,487 ended 31
December 2018 and 2017, respectively. These amounts were estimated according to the
earnings allocation method, priority and factor for employee benefits and key
management personnel compensation as stated under the Articles of Association. These
benefits were expensed under salaries expense ended 31 December 2018 and 2017.
Information on the board of directors’ recommendations and shareholders’ approval
regarding the employee bonuses and remuneration to directors and supervisors can be
obtained from the “Market Observation Post System” on the website of the TWSE.
(20) Non-operating income and expenses
A. Other income
For the Years Ended 31 December
2018 2017
Interest income (Note) $531,612
Financial assets measured at amortized cost $834,161 (Note)
Financial assets at fair value through other
comprehensive income
40,281 (Note)
Subtotal 874,442 531,612
Other income and gains 6,056,800 3,229,356
Total $6,931,242 $3,760,968
Note: The Group adopted IFRS 9 since 1 January 2018. The Group elected not to restate
prior periods in accordance with the transition provision in IFRS 9.
B. Other gains and losses
For the Years Ended 31 December
2018 2017
Gains (losses) on disposal of investments $- $1,589,834
Foreign exchange gains (losses), net 718,695 (1,030,003)
Gains (losses) on financial liabilities at fair
value through profit or loss (Note)
235,213
1,114,575
Gains (losses) on disposal of property, plant
and equipment
(205,072)
(1,430,022)

Consolidated Financial Statements 227
For the Years Ended 31 December
Subtotal 748,836 244,384
Other expenses and losses (3,238,966) (7,199,981)
Total $(2,490,130) $(6,955,597)
Note: Balances in both periods were arising from held for trading investment.
C. Finance costs
For the Years Ended 31 December
2018 2017
Interest on borrowings from bank $50,731,984 $37,519,147
Interest on bonds payable 1,290,127 1,672,874
Interest for finance lease 1,372,839 1,124,705
Interest on long-term accounts payable (include
from related parties)
3,866,039
3,414,863
Total finance costs $57,260,989 $43,731,589
(21) Components of other comprehensive income
For the year ended 31 December 2018
Arising during
the period
The original
cost that was
removed to
hedged item
Other
comprehensive
income
Income tax
benefits
(expenses)
Other
comprehensive
income, net
of tax
Not to be reclassified to profit or loss in
subsequent periods:
Defined benefit plan actuarial losses $(17,525) $- $(17,525) $7,334 $(10,191)
To be reclassified to profit or loss in
subsequent periods:
Cumulative translation adjustments (17,166,016) - (17,166,016) - (17,166,016)
Unrealized gains or losses on
available-for-sale financial assets
(62,884) - (62,884) - (62,884)
Effective portion of gains (losses) on
hedging instrument in a cash flow hedge
70,199 - 70,199 - 70,199
Total of other comprehensive income $(17,176,226) $- $(17,176,226) $7,334 $(17,168,892)
For the year ended 31 December 2017
Arising during
the period
The original
cost that was
removed to
hedged item
Other
comprehensiv
e income
Income tax
benefits
(expenses)
Other
comprehensiv
e income, net
of tax
Not to be reclassified to profit or loss in
subsequent periods:
Defined benefit plan actuarial losses $2,769 $- $2,769 $(471) $2,298
To be reclassified to profit or loss in
subsequent periods:
Cumulative translation adjustments (31,837,383) - (31,837,383) - (31,837,383)
Unrealized gains or losses on (79,638) - (79,638) - (79,638)

Consolidated Financial Statements 228
Arising during
the period
The original
cost that was
removed to
hedged item
Other
comprehensiv
e income
Income tax
benefits
(expenses)
Other
comprehensiv
e income, net
of tax
available-for-sale financial assets
Effective portion of gains (losses) on
hedging instrument in a cash flow hedge
134,233 (1,681,904) (1,547,671) - (1,547,671)
Total of other comprehensive income $(31,780,019) $(1,681,904) $(33,461,923) $(471) $(33,462,394)
(22) Income tax
A. Pursuant to the rules and regulations of the local authority, the Group is not subject to any
income tax, except for WELL and WII. The Company has no issue of Integrated Income
Tax. Interim period income tax expense is accrued using the tax rate that would be
applicable to expected total annual earnings, that is, the estimated average annual
effective income tax rate applied to the pre-tax income of the interim period. As a result,
the Group does not disclose the reconciliation between accounting profit and taxable
income.
B. Based on the amendments to the Income Tax Act announced on 7 February 2018,
applicable corporate income tax rate of WELL and WMI for the year ended 31 December
2018 has changed from 17% to 20%. The corporate income surtax on undistributed
retained earnings has changed from 10% to 5%.
C. For the years ended 31 December 2018 and 2017, the components of income tax
expenses(benefits) of WELL and WII were as follows:
Income tax expense (income) recognized in profit or loss
For the years ended 31 December
2018 2017
Current income tax expense (income):
Current income tax charge $105,943 $50,695
Adjustments in respect of current income tax
of prior periods
4
-
Deferred tax expense (income):
Deferred tax expense (income) relating to
origination and reversal of temporary
differences
30,363
(29,586)
Deferred tax expense (income) relating to
changes in tax rate or the imposition of new
taxes
(2,908)
-
Total income tax expense (income) $133,402 $21,109
Income tax relating to components of other comprehensive income
For the years ended 31 December
2018 2017
Deferred tax expense (income):

Consolidated Financial Statements 229
Remeasurements
of the defined benefit
plans
$(3,505) $471
Deferred tax expense (income) relating to
changes in tax rate
(3,829) -
Income tax relating to components of other
comprehensive income
$(7,334)
$471
The effective income tax rate for WELL and WII is 20% and 17% for the years ended 31
December 2018 and 2017. These two companies are also subject to the "Income Basic
Tax Act" for purposes of calculating their basic income tax.
For the years ended 31 December
2018 2017
Tax at the domestic rates applicable to profits
in the country concerned
$(301,309) $(158,473)
Tax effect of revenues exempt from taxation and
expenses not deductible for tax purposes
444,694
168,294
Tax effect of deferred tax assets/liabilities (7,079) 8,831
Adjustments of other income tax 4 2,457
Deferred tax expense (income) relating to
changes in tax rate or the imposition of new
taxes
(2,908) -
Total income tax expense (income) recognized
in profit or loss
$133,402
$21,109
Deferred tax assets (liabilities) relate to the following:
(a) Unrecognized deferred tax assets
Unrecognized deferred tax assets of the Group are as follows:
31 December 2018 31 December 2017
Deductible temporary difference
Tax loss $120,552 $160,280
The ROC Income Tax Act allows net losses, as assessed by the tax authorities, to
offset taxable income over a period of ten years for local tax reporting purposes.
The Group’s estimated unused tax effects of the loss carry-forwards as at 31
December 2018:

Consolidated Financial Statements 230
Year Unused Amount Expiration Year
2014 assessment amount $69,082 2024
2017 assessment amount 51,470 2027
$120,552
(b) Recognized deferred tax assets
For the years ended 31 December 2018 and 2017, changes in deferred tax assets and
liabilities are as follows:
Defined
benefit plans Other Total
Deferred tax assets (liabilities):
Balance, 1st January 2018 $21,984 $16,692 $38,676
Debit (Credit) in income statement (1,142) (26,313) (27,455)
Relating to components of other
comprehensive income
7,334 - 7,334
Exchange rate effects (798) (34) (832)
Balance, 31 December 2018 $27,378 $(9,655) $17,723
Balance, 1st January 2017 $21,634 $(13,863) $7,771
Debit (Credit) in income statement (957) 31,014 30,057
Relating to components of other
comprehensive income
(471)
-
(471)
Exchange rate effects 1,778 (459) 1,319
Balance, 31 December 2017 $21,984 $16,692 $38,676
(c) The assessment of income tax returns
As at 31 December 2018, the assessment of the income tax returns of the Company
and its subsidiaries is as follows:
The assessment of income tax returns
Wisdom Marine International Inc. (WII) Assessed and approved up to 2016
Well Shipmanagement and Maritime
Consultant Co.,Ltd.(WELL)
Assessed and approved up to 2017
(23) Earnings per share

Consolidated Financial Statements 231
Basic earnings per share amounts are calculated by dividing net profit for the year
attributable to ordinary equity holders of the parent entity by the weighted average number
of ordinary shares outstanding during the year.
Diluted earnings per share amounts are calculated by dividing the net profit attributable to
ordinary equity holders of the parent entity (after adjusting for interest on the convertible
preference shares) by the weighted average number of ordinary shares outstanding during
the year plus the weighted average number of ordinary shares that would be issued on
conversion of all the dilutive potential ordinary shares into ordinary shares.
2018 2017
Basic earnings per share
Profit attributable to ordinary shareholders $60,008,818 $13,732,439
Weighted-average number of ordinary shares 618,920,575 589,557,930
$0.10 $0.02
Diluted earnings per share
Profit attributable to ordinary shareholders(diluted) $60,008,818 $13,732,439
Interest expenses on convertible notes, net of tax 1,290,127 1,034,128
Foreign exchange (gains) losses (1,235,040) 25,095
Amortization of deferred issuance costs 56,577 105,367
(Gains) Losses on valuation on convertible notes,
net of tax
(109,673) (2,214,209)
Profit attributable to ordinary shareholders (diluted) $60,010,809 $12,682,820
Weighted average number of ordinary shares (diluted) 618,920,575 589,557,930
Effect of conversion of convertible notes 52,105,075 4,767,301
Weight average number of ordinary shares (diluted) 671,025,650 594,325,231
$0.09 $0.02
There have been no other transactions involving ordinary shares or potential ordinary shares
between the reporting date and the date the financial statements were authorized for issue.
(24) Deconsolidation of Subsidiary
The Group sold the shares account for 40% of Harmony Success S.A. on 31 May 2017 for
$3,300,000 as a repayment of other payables – related party. After deducting the carrying

Consolidated Financial Statements 232
amount of the investment for $2,279,015, the Group recognized Gains on disposal of
investments for $1,020,985.
As at 31 May 2017, Harmony Success S.A.’s assets and liabilities mainly consist of:
31 May 2017
Accounts receivable $61,860
Inventories 147,065
Prepaid expenses 78,596
Other current assets 89,974
Property, plant and equipment 7,931,176
Accounts payable - related parties (2,463,064)
Other payables (24,780)
Other current liabilities (123,290)
Net assets $5,697,537
7. Related parties
A. Names and Relationships of Related Parties
Name of Related Party
Relationship
Lan Chun Sheng
Chairman
Pescadores Merchandise Co., Ltd
Other Related Party
Pescadores Travel Co., Ltd
Other Related Party
Wisdom Marine Agency Co., Ltd.
Other Related Party
Hui-wen Investment Co., Ltd
Other Related Party
Unicorn Maritime Agency Co., Ltd.
Other Related Party
Brave Line Co., Ltd.
Other Related Party
YOKO CO., LTD.
Other Related Party
Rich Containership S.A.
Other Related Party
Benefit Transport S.A.
Other Related Party
Samurai Investment S.A.
Other Related Party
Fortunate Transport S.A.
Other Related Party
Genius Star Management Consulting Co., Ltd.
Other Related Party
Pescadores Investment and Development Inc.
Associates
Directors, President and Vice President
Key Management
Note1: The name of related party with balance or amount of single transaction over 10% of
the total transaction balance or amount would be disclosed separately.
Note2: Genius Star Management Consulting Co., Ltd. has become our related party since
January 2018.

Consolidated Financial Statements 233
B. Significant transactions with related parties
(a) Chartering expenses
For the years ended 31 December 2018 and 2017, the Group entered into time chartering
with other related parties as follows:
For the years ended 31 December
Related party 2018 2017
Other related parties $1,626,470 $4,216,132
The price of time chartering with other related parties was determined based on the
normal market rate and the necessary costs of the Group.
(b) Services received / rendered
For the years ended 31 December 2018 and 2017, the Group received service from
(rendered service to) related parties as follows:
Related party Item Amount
For the year Ended
31 December 2018
Other related parties Vessel management service income $(2,526,638)
″ Commission income (4,855)
″ Other income(Passenger ticket revenue and
other revenue)
(1,095,258)
″ Commissions 3,347,904
″ Other expense(Business travel expense, agency
fee, management consultant fee)
574,034
″ Operating expenses(Business travel expenses,
entertainment expense)
196,926
″ Ballast water management systems cost 2,329,528
Related party Item Amount
For the year Ended
31 December 2017
Other related parties Vessel management service income $(3,085,049)
″ Commission income (25,744)
″ Other income(Passenger ticket revenue and
other revenue)
(682,770)
″ Commissions 2,721,143
″ Other expense(Business travel expense, agency
fee, management consultant fee)
251,997
″ Operating expenses(Business travel expenses,
entertainment expense)
198,945
″ Ballast water management systems cost -

Consolidated Financial Statements 234
(c) Receivables and payables
For the years ended 31 December 2018 and 2017, the Group incurred receivables and
payables with related parties due to vessels operation as follows:
Prepaid expense 31 December 2018 31 December 2017
Name of related party
Other related parties $20,106 $41,037
Other receivables 31 December 2018 31 December 2017
Name of related party
Other related parties $1,824 $3,614
Other current assets 31 December 2018 31 December 2017
Name of related party
Other related parties $816,627 $240,031
Accounts receivable 31 December 2018 31 December 2017
Name of related party
Brave Line Co., Ltd. $298,616 $221,707
Other related parties 1,026 -
Total $299,642 $221,707
Accounts payable 31 December 2018 31 December 2017
Name of related party
Genius Star Management Consulting Co., Ltd. $365,000 $-
Accrued expense 31 December 2018 31 December 2017
Name of related party
Other related parties $2,326,870 $1,035,166
Other current liabilities 31 December 2018 31 December 2017
Name of related party
Benefit Transport S.A. $- $554,726
Other related parties 45,688 -
Total $45,688 $554,726
(d) Financing

Consolidated Financial Statements 235
The details of financing provided by related parties to the Group were as follows:
31 December 2018
Max balance
Ending balance Name of related party
Benefit Transport S.A. $46,903,709 $46,903,709
Samurai Investment S.A. 43,697,278 43,697,278
Other related parties 2,000,000 -
Total $92,600,987 $90,600,987
31 December 2017
Max balance
Ending balance Name of related party
Benefit Transport S.A. $53,138,834 $31,039,140
Samurai Investment S.A. 43,697,278 43,697,278
Total $96,836,112 $74,736,418
Interest Expenses
For the years Ended 31 December
Name of related party 2018 2017
Benefit Transport S.A. $1,245,089
$1,314,352
Samurai Investment S.A. 1,764,223 1,364,224
Other Related Parties 2,525 -
Total $3,011,837 $2,678,576
1. The financing interesting expenses were calculated based on the rate of LIBOR plus
2% per month commencing from 24 October 2011.
2. The financing interesting expenses for other related party- YOKO CO., LTD were
calculated based on the rate of LIBOR plus 2% per month commencing from from 3
September to 13 September 2018.
(e) Leases
For the years ended 31 December 2018 and 2017, the Group incurred lease expenses of
office with other related parties and key management transactions as follows:
For the years Ended 31 December
2018 2017
Key management $170,274 $182,492
Other related parties 147,003 145,636
Total $317,277 $328,128
The above leases are paid monthly, and do not involve rental deposits. Lease conditions
are agreed by both parties. There was no significant difference in the price and payment
terms from those with third parties.

Consolidated Financial Statements 236
For the years ended 31 December 2018 and 2017, the Group leased other related parties
transactions as follows:
For the years Ended 31 December
2018 2017
Other related parties $505 $-
The above leases are paid monthly, and do not involve rental deposits. Lease conditions
are agreed by both parties. There was no significant difference in the price and payment
terms from those with third parties.
(f) Guarantee
1. As at 31 December 2018 and 2017, key management had provided a time deposit
guarantee for the Group’s financing loan of $32,883 thousand and $32,608 thousand,
respectively.
2. As at 31 December 2018 and 2017, the Group entered into a loan agreement with
financial institutes with M.V. Wisdom Grace and M.V. Jasmine Ace, M.V. Wisdom
Grace and M.V. Golden Kiku as pledge, provided by Benefit Transport S.A.
3. As at 31 December 2017, for the issuance of Second R.O.C. secured convertible bonds
issued in 2017, Hui-wen Investment Co., Ltd provided 12,000 thousand shares of First
Financial Holding Co., Ltd. stocks and 15,000 thousand shares of Taiwan Land
Development Co., Ltd. stocks, and Pescadores Merchandise Co., Ltd provided 10,000
thousand shares of Taiwan Land Development Co., Ltd. stocks as pledge for the
Group.
4. As at 31 December 2018, for the issuance of Second R.O.C. secured convertible bonds
issued in 2017, Hui-wen Investment Co., Ltd provided a time deposit of $5,100
thousand and 15,000 thousand shares of Taiwan Land Development Co., Ltd. stocks,
and Pescadores Merchandise Co., Ltd provided 10,000 thousand shares of Taiwan
Land Development Co., Ltd. stocks as pledge for the Group.
(g) Others
1. On 31 May 2017, the Group sold the shares account for 40% of Harmony Success
S.A. to Benefit Transport S.A. Please refer to Note 6.(24) for further information.

Consolidated Financial Statements 237
2. For the year ended 31 December 2018, the installments for sale and lease back
transaction paid to other related party were ¥28,928 thousand, while interest expenses
were ¥3,391,776 and interest payable were ¥96,297. As at 31 December 2018, the
unpaid amount of sale and lease back transaction was ¥781,072 thousand (accounted
for as long-term payable – related parties at $7,074,928.)
C. Salaries and compensation for key management
The Group paid salaries to key management as follows:
For the years ended 31 December
2018 2017
Salary and bonus $869,122 $639,284
Post-employment benefits 15,742 14,998
$884,864 $654,282
8. Pledged assets
The carrying amount of pledged assets were as follows:
Pledged assets Object 31 December 2018 31 December 2017
Property, plant and equipment Bank Loans $2,740,956,000 $2,661,928,000
Financial assets at fair value
through other comprehensive
income
〃
966,000 (Note)
Available-for-sale financial assets 〃 (Note) 1,028,103
Held-to-maturity investments 〃 (Note) 614,211
Other financial assets 〃 43,018,084 47,724,592
Other financial assets Bonds Payable 4,300,000 4,300,000
$2,789,240,084 $2,715,594,906
Note: The Group adopted IFRS 9 since 1 January 2018. The Group elected not to restate prior
periods in accordance with the transition provision in IFRS 9.
9. Significant commitments and contingencies
(1) The Group had entered into shipbuilding contracts as follows:
31 December 2018 31 December 2017
Vessels 13 14

Consolidated Financial Statements 238
Contract price ¥- thousand ¥2,270,000 thousand
$344,520 thousand $310,100 thousand
Prepaid ¥- thousand ¥113,500 thousand
$29,710 thousand $51,850 thousand
Financed shipbuilding contracts $- thousand $30,000 thousand
The remaining balance of the contract price is payable upon keel-laying, launching, and
delivery.
The ship building contracts categorized by year of delivery were as follows:
Year of delivery Contract Price Number of vessels
2019 $65,950 3
2020 212,020 8
2021 66,550 2
Total $344,520 13
(2) Financial Guarantee
Guarantor
Name of
relative party
guarantee 31 December 2018 Period Purpose
WML Subsidiaries $606,187 thousand
¥75,103,275 thousand
2005.12~2030.04 Borrowings
The Company Subsidiaries $709,151 thousand
¥84,150,128 thousand
2009.10~2030.04 Borrowings and
Operating fund
WML The Company $6,000 thousand 2018.01~2019.01 Operating fund
Guarantor
Name of
relative party
guarantee 31 December 2017 Period Purpose
The Company WML $16,250 thousand 2016.06~2018.06 Operating fund
The Company WII NT$270,000 thousand 2017.08~2018.08 Operating fund
The Company WELL NT$130,000 thousand 2017.08~2018.08 Operating fund
WML Subsidiaries $691,991 thousand
¥83,429,501 thousand
2005.12~2030.04 Borrowings
The Company Subsidiaries $742,752 thousand 2009.10~2030.04 Borrowings and

Consolidated Financial Statements 239
¥86,528,449 thousand Operating fund
WML The Company $6,000 thousand 2016.12~2017.12 Operating fund
(3) On 5 September 2018, the Group cancelled a ship purchase contract with Giant Line
Inc.,S.A. and agreed to operate the ship by lease after the shipbuilding.
10. Losses due to major disasters: None.
11. Significant subsequent events: None.
12. Others
A. Categories of financial instruments
Financial assets
31 December 2018 31 December 2017
(Note)
Financial assets at fair value through other
comprehensive income
$966,000
Financial assets at amortized cost:
Cash and cash equivalents (exclude cash on hand) 25,940,070
Accounts receivable and other receivables
(include from related parties)
8,827,991
Long-term Receivables 1,761,734
Subtotal 36,529,795
Financial assets for hedging 149,271
Other financial assets 58,403,237
Total $96,048,303
31 December 2018
(Note) 31 December 2017
Available-for-sale financial assets $1,028,103
Held-to-maturity investments 614,211
Cash and cash equivalents (exclude cash on hand) 40,856,106
Accounts receivable and other receivables
(include from related parties)
3,695,851
Long-term Receivables 1,902,000
Subtotal 46,453,957
Derivative financial assets for hedging 80,058
Other financial assets 60,402,742
Total $108,579,071

Consolidated Financial Statements 240
Note: The Group adopted IFRS 9 since 1 January 2018. The Group elected not to restate
prior periods in accordance with the transition provision in IFRS 9.
Financial liabilities
31 December 2018 31 December 2017
Financial liabilities at amortized cost:
Short-term borrowings $50,972,826 $44,399,387
Trade payables (include from related parties) 10,138,057 6,507,493
Bonds payable (include current portion) 37,439,252 53,814,622
Long-term borrowings (include current portion) 1,626,113,165 1,651,263,233
Long-term payable (include from related parties) 123,768,248 102,522,469
Lease payables (include current portion) 86,458,202 73,783,532
Subtotal 1,934,889,750 1,932,290,736
Financial liabilities at fair value through profit or loss:
Embedded derivative instruments-put right 2,488,564 3,009,409
Financial liabilities for
hedging-current(Derivative financial liabilities
for hedging as at 31 Dec. 2017)
- 986
Total $1,937,378,314 $1,935,301,131
B. Financial risk management objectives and policies
The Group’s principal financial risk management objective is to manage the market risk,
credit risk and liquidity risk related to its operating activities. The Group identifies measures
and manages the aforementioned risks based on the Group’s policy and risk appetite.
The Group has established appropriate policies, procedures and internal controls for
financial risk management. Before entering into significant transactions, due approval
process by the Group’s board of directors and audit committee must be carried out based on
related protocols and internal control procedures. The Group complies with its financial risk
management policies at all times.
C. Market risk
Market risk is the risk that the fair value of future cash flows of a financial instrument will
fluctuate because of the changes in market prices. Market prices comprise currency risk,
interest rate risk and other price risk (such as equity risk).
In practice, it is rarely the case that a single risk variable will change independently from
other risk variable, there is usually interdependencies between risk variables. However the
sensitivity analysis disclosed below does not take into account the interdependencies
between risk variables.
Foreign currency risk
The Group is exposed to currency risk on sales, purchases and borrowings that are
denominated in a currency other than the respective functional currencies of Group

Consolidated Financial Statements 241
entities, primarily USD and Japanese Yen.
The foreign currency sensitivity analysis of the possible change in foreign exchange rates on
the Group’s profit is performed on significant monetary items denominated in foreign
currencies as at the end of the reporting period. The Group’s foreign currency risk is mainly
related to the volatility in the exchange rates for foreign currency Yen. The information of
the sensitivity analysis is as follows:
When USD strengthens/weakens against foreign currency Yen by 10%, the profit for the
years ended 31 December 2018 and 2017 decreases/increases by $3,371,548 and
$3,946,298,respectively; the equity decreases/increases by $0 and $0, respectively.
Interest rate risk
Interest rate risk is managed by the Group on an ongoing basis with the primary objective of
limiting the extent to which net interest expense could be affected by an adverse movement
in interest rates. The Group’s has no financial liabilities at fair value through profit or loss
bearing fixed interest payable. The Group does not use financial derivatives to hedge against
interest rate risk.
The interest rate sensitivity analysis is performed on items exposed to interest rate risk as at
the end of the reporting period, including investments and borrowings with variable interest
rates and interest rate swaps. At the reporting date, a change of 0.25% of interest rate in a
reporting period could cause the profit for the years ended 31 December 2018 and 2017 to
increase/decrease by $4,718,281 and $4,679,922, respectively; the equity decreases
/increases by $48,752 and $73,392, respectively.
Equity price risk
The fair value of the Group’s conversion rights of the Euro-convertible bonds issued are
susceptible to market price risk arising from uncertainties about future values of the
investment securities. The conversion rights of the Euro-convertible bonds issued are
classified as financial liabilities at fair value through profit or loss as it does not satisfy the
definition of an equity component. Please refer to Note 12(h) for sensitivity analysis
information of other equity instruments or derivatives that are linked to such equity
instruments whose fair value measurement is categorized under Level 3.
D. Credit risk management
(a) Financial assets subject to credit risk include cash and cash equivalent and accounts
receivable. Cash is deposited in large bank institutions, while accounts receivable are
disclosed at net amount after deducting allowance for expected credit losses. Per
industry practice, most hire revenue are received in advance. In addition, the Group
manages credit risks through reviewing credit rating of individual client and limiting the

Consolidated Financial Statements 242
overall risk. The credit risk of accounts receivable and the credit concentration risk are
insignificant.
(b) The risk exposure of credit risk
The book value of financial assets represents the maximum amount of credit risk
exposure. On the reported date, the maximum amount of credit risk exposure is as
follows:
31 December 2018 31 December 2017
Cash and cash equivalents $25,940,070 $40,856,106
Accounts receivables and other receivables
(include from related parties)
8,827,991 3,695,851
Long-term Receivables 1,761,734 1,902,000
Financial assets at fair value through other
comprehensive income
966,000 (Note)
Available-for-sale financial assets (Note) 1,028,103
Held to maturity financial assets (Note) 614,211
Financial assets for hedging(Derivative
financial liabilities for hedging as at 31
December 2017)
149,271 80,058
Other financial assets 58,403,237 60,402,742
$96,048,303 $108,579,071
Note: The Group adopted IFRS 9 since 1 January 2018. The Group elected not to restate
prior periods in accordance with the transition provision in IFRS 9.
E. Liquidity risk management
The Group maintains financial flexibility by cash and cash equivalents, bank borrowings,
Euro-convertible bonds and finance leases. The following are the contractual maturities of
financial liabilities, including estimated interest payments and excluding the impact of
netting agreements.
As at 31 December 2018:
Carrying amount
Contractual
cash flow 1 year 2 years 3 to 5 years > 5 years
Non-derivative financial
instruments
Short-term borrowings $50,972,826 $52,487,542 $52,487,542 $- $- $-
Accounts payables
(include from related parties)
10,138,057 10,138,057 10,138,057 - - -
Corporate bonds payable 37,439,252 39,462,801 33,939,801 5,523,000 - -
Long-term borrowings 1,626,113,165 1,792,573,340 287,170,363 419,344,064 709,767,252 376,291,661
Long-term Accounts payable 26,092,333 29,350,990 7,966,152 1,043,952 3,884,600 16,456,286

Consolidated Financial Statements 243
Carrying amount
Contractual
cash flow 1 year 2 years 3 to 5 years > 5 years
Long-term Accounts
payable-related parties
97,675,915 117,388,164 5,017,253 5,001,018 14,906,561 92,463,332
Lease payables 86,458,202 92,140,197 8,652,723 7,485,872 22,187,143 53,814,459
$1,934,889,750 $2,133,541,091 $405,371,891 $438,397,906 $750,745,556 $539,025,738
As at 31 December 2017:
Carrying amount
Contractual
cash flow 1 year 2 years 3 to 5 years > 5 years
Non-derivative financial
instruments
Short-term borrowings $44,399,387 $45,343,081 $45,343,081 $- $- $-
Accounts payables
(include from related parties)
6,507,493 6,507,493 6,507,493 - - -
Corporate bonds payable 53,814,622 57,996,180 12,150,600 40,322,580 5,523,000 -
Long-term borrowings 1,651,263,233 1,804,561,152 256,206,968 287,212,188 827,742,041 433,399,955
Long-term Accounts payable 27,786,051 30,499,353 2,642,957 7,825,784 2,753,186 17,277,426
Long-term Accounts
payable-related parties
74,736,418 81,721,749 2,328,444 2,328,444 2,328,444 74,736,417
Lease payables 73,783,532 80,112,002 15,388,460 6,533,699 16,155,298 42,034,545
$1,932,290,736 $2,106,741,010 $340,568,003 $344,222,695 $854,501,969 $567,448,343
The Group is not expecting that the cash flows included in the maturity analysis could occur
significantly earlier or at significantly different amounts.
F. Reconciliation of liabilities arising from financing activities
Reconciliation of liabilities for the year ended 31 December 2018:
Reconciliation of liabilities for the year ended 31 December 2017:
Short-term
borrowings
Long-term
borrowings
(include current
portion)
Long-term
accounts
payable (include
from related
parties)
Lease payables
(include current
portion)
Corporate bonds
payable
Guarantee
deposits
received
Total liabilities
from financing
activities
As at 1 Jan. 2018 $44,399,387 $1,651,263,233 $102,522,469 $73,783,532 $53,814,622 $415,162 $1,926,198,405
Cash flows 6,573,439 (39,543,588) 20,727,973 11,663,201 (4,750,000) (124,657) (5,453,632)
Non-cash changes
Foreign exchange
movement - 14,393,520 517,806 1,011,469 (1,235,040) - 14,687,755
Other movement - - - - (10,390,330) - (10,390,330)
As at 31 Dec. 2018 $50,972,826 $1,626,113,165 $123,768,248 $86,458,202 $37,439,252 $290,505 $1,925,042,198

Consolidated Financial Statements 244
Short-term
borrowings
Long-term
borrowings
(include current
portion)
Long-term
accounts
payable (include
from related
parties)
Lease payables
(include current
portion)
Corporate bonds
payable
Guarantee
deposits
received
Total liabilities
from financing
activities
As at 1 Jan. 2017 $25,342,002 $1,419,206,480 $122,246,772 $62,170,364 $86,520,649 $- $1,715,486,267
Cash flows 19,057,385 203,969,219 (20,499,282) 9,245,521 (38,906,916) 415,162 173,281,089
Non-cash changes
Foreign exchange
movement - 28,087,534 774,979 2,367,647 796,682 - 32,026,842
Other movement - - - - 5,404,207 - 5,404,207
As at 31 Dec. 2017 $44,399,387 $1,651,263,233 $102,522,469 $73,783,532 $53,814,622 $415,162 $1,926,198,405
G. Fair values of financial instruments
(a) The methods and assumptions applied in determining the fair value of financial
instruments:
Fair value is the price that would be received to sell an asset or paid to transfer a
liability in an orderly transaction between market participants at the measurement date.
The following methods and assumptions were used by the Group to measure or disclose
the fair values of financial assets and financial liabilities:
(i) The carrying amount of cash and cash equivalents, accounts receivables,
held-to-maturity financial assets, accounts payable and other current liabilities
approximate their fair value due to their short maturities.
(ii) Fair value of debt instruments without market quotations, bank loans, bonds
payable and other non-current liabilities are determined based on the counterparty
prices or valuation method. The valuation method uses DCF method as a basis, and
the assumptions such as the interest rate and discount rate are primarily based on
relevant information of similar instrument (such as yield curves published by the
GreTai Securities Market, average prices for fixed rate commercial paper published
by Reuters and credit risk, etc.)
(iii) The fair value of derivatives which are not options and without market quotations,
is determined based on the counterparty prices or discounted cash flow analysis
using interest rate yield curve for the contract period. Fair value of option-based
derivative financial instruments is obtained using the counterparty prices or
appropriate option pricing model (for example, Binomial Tree model) or other
valuation method (for example, Monte Carlo Simulation).
(b) Fair value of financial instruments measured at amortized cost

Consolidated Financial Statements 245
The carrying amount of the Group’s financial assets (including held-to-maturity
investments, loans and receivables) and liabilities measured at amortized cost
approximate their fair value.
(c) Fair value measurement hierarchy for financial instruments
Please refer to Note 12.I for fair value measurement hierarchy for financial instruments
of the Group.
H. Derivative financial instruments
The Group’s derivative financial instruments include and embedded derivatives. The related
information for derivative financial instruments not qualified for hedge accounting and not
yet settled as at 31 December 2018 and 2017 is as follows:
Embedded derivatives
The embedded derivatives arising from issuing convertible bonds have been separated from
the host contract and carried at fair value through profit or loss. Please refer to Note 6.(13)
for further information on this transaction.
The counterparties for the aforementioned derivatives transactions are well known local or
overseas banks, as they have sound credit ratings, the credit risk is insignificant.
I. Fair value measurement hierarchy
(a) Fair value measurement hierarchy
All asset and liabilities for which fair value is measured or disclosed in the financial
statements are categorized within the fair value hierarchy, based on the lowest level
input that is significant to the fair value measurement as a whole. Level 1, 2 and 3
inputs are described as follows:
Level 1 – Quoted (unadjusted) market prices in active markets for identical assets or
liabilities that the entity can access at the measurement date
Level 2 – Inputs other than quoted prices included within Level 1 that are observable
for the asset or liability, either directly or indirectly
Level 3 – Unobservable inputs for the asset or liability

Consolidated Financial Statements 246
For assets and liabilities that are recognized in the financial statements on a recurring
basis, the Group determines whether transfers have occurred between Levels in the
hierarchy by re-assessing categorization at the end of each reporting period.
(b) Fair value measurement hierarchy of the Group’s assets and liabilities
The Group does not have assets that are measured at fair value on a non-recurring basis.
Fair value measurement hierarchy of the Group’s assets and liabilities measured at fair
value on a recurring basis is as follows:
As at 31 December 2018
Level 1 Level 2 Level 3 Total
Financial assets $- $149,271 $- $149,271
Financial assets at fair value through
other comprehensive income
$966,000
$-
$-
$966,000
Financial liabilities at fair value
through profit or loss
$-
$- $2,488,564
$2,488,564
As at 31 December 2017
Level 1 Level 2 Level 3 Total
Derivative financial assets $- $80,058 $- $80,058
Derivative financial liabilities $- $986 $- $986
Financial liabilities at fair value
through profit or loss
$- $- $3,009,409 $3,009,409
Available-for-sale financial assets $1,028,103 $- $- $1,028,103
Transfers between Level 1 and Level 2 during the period
During the years ended 31 December 2018 and 2017, there were no transfers between
Level 1 and Level 2 fair value measurements.
Reconciliation for fair value measurements in Level 3 of the fair value hierarchy for
movements during the period is as follows:
Liabilities
At fair value through
profit or loss

Consolidated Financial Statements 247
Derivatives
Beginning balances as at 31 December 2017 $3,009,409
Total gains and losses recognized for the year ended 31 December 2018:
Amount recognized in profit or loss(presented in “other profit or loss”) (109,673)
Acquisition/issues for the year ended 31 December 2018 -
Disposal/settlements for the year ended 31 December 2018 (411,172)
Transfer in/(out) of Level 3 -
Ending balances as at 31 December 2018 $2,488,564
Total gains and losses recognized for year ended 31 December 2018 in the table above
contain gains and losses related to derivatives on hand as at 31 December 2018 in the
amount of $206,923.
Information on significant unobservable inputs to valuation
Description of significant unobservable inputs to valuation of recurring fair value
measurements categorized within Level 3 of the fair value hierarchy is as follows:
As at 31 December 2018
Valuation
techniques
Significant
unobservable
inputs
Quantitative
information
Relationship
between inputs
and fair value
Sensitivity of the input to
fair value
Financial liabilities:
At fair value through profit or loss
Embedded derivatives –
Second R.O.C. secured
convertible bonds issued in 2018
Option
pricing
model
Volatility 15,46% The higher the
volatility, the
higher the fair
value of the
embedded
derivatives
5% increase in the
volatility would result in
decrease in the Group’s
profit by $309,946;5%
decrease in the volatility
would result in increase in
the Group’s profit by
$333,388
Embedded derivatives –
Third R.O.C. unsecured
convertible bonds issued in 2018
Option
pricing
model
Volatility 15.46% The higher the
volatility, the
higher the fair
value of the
embedded
derivatives
5% increase in the
volatility would result in
decrease in the Group’s
profit by $452,395;5%
decrease in the volatility
would result in increase in
the Group’s profit by
$481,448
As at 31 December 2017
Valuation
techniques
Significant
unobservable
inputs
Quantitative
information
Relationship
between inputs
and fair value
Sensitivity of the input to
fair value

Consolidated Financial Statements 248
Financial liabilities:
At fair value through profit or loss
Embedded derivatives –
Second R.O.C. secured
convertible bonds issued in 2017
Option
pricing
model
Volatility 17.83% The higher the
volatility, the
higher the fair
value of the
embedded
derivatives
5% increase in the
volatility would result in
decrease in the Group’s
profit by $331,989;5%
decrease in the volatility
would result in increase in
the Group’s profit by
$391,129
Embedded derivatives –
Third R.O.C. unsecured
convertible bonds issued in 2017
Option
pricing
model
Volatility 17.83% The higher the
volatility, the
higher the fair
value of the
embedded
derivatives
5% increase in the
volatility would result in
decrease in the Group’s
profit by $604,839;5%
decrease in the volatility
would result in increase in
the Group’s profit by
$704,301
Valuation process used for fair value measurements categorized within Level 3 of the
fair value hierarchy
The external evaluation institute ensures the results of the valuation are in line with
market conditions, based on independent and reliable inputs which are consistent with
other information, and represent exercisable prices. The group’s accounting department
analyses the movements in the values of assets and liabilities which are required to be
re-measured or re-assessed as per the Group’s accounting policies at each reporting
date.
J. Significant assets and liabilities denominated in foreign currencies
The Group is mainly affected by the impact of fluctuation in the currency exchange rate for
US Dollar or Japanese Yen. The Group’s significant exposure to foreign currency risk was as
follows:
31 December 2018 31 December 2017
Foreign currency
(Note1)
Exchange
rate
(Note2)
USD/JPY Foreign currency
(Note1)
Exchange
rate
(Note2)
USD/JPY
Financial liabilities
Monetary item
Borrowings: USD:JPY $34,507,759 110.40 ¥3,809,656,561 $33,392,724 112.66 ¥3,762,024,286
Borrowings: JPY:USD ¥7,531,846,049 0.0091 $68,223,243 ¥8,207,923,349 0.0089 $72,855,702
Corporate bonds payable:
NTD : USD
NT$1,000,844,186 0.0326 $32,584,867 NT$1,139,747,264 0.0336 $38,297,959
Note 1: The amounts under the monetary items are the carrying amounts of financial
liabilities.

Consolidated Financial Statements 249
Note 2: The exchange rates under the monetary items are the spot rate.
For the year ended 31 December 2018 and 2017, the Group had foreign exchange gains
(losses) of $718,695 and $(1,030,003) respectively.
K. Capital management
The capital risk management is established to ensure the Group’s ability to continue to
operate as a going concern. Under this risk management, the Group may adjust dividend
payment to the shareholders, reduce the capital for redistribution to shareholders, issue new
shares, adjust capital expenditure plan and dispose assets to settle any liabilities in order to
maintain or adjust capital structure according to operating needs, investment purpose and
market environment. The Group’s capital structures is consisted of net liabilities
(borrowings excluding the amount of cash and cash equivalents) and equity (common stock,
capital surplus and other equity).
L. Accounting policy differences as referred to in Article 3 of Regulations Governing the
Preparation of Financial Reports by Securities Issuers with respect to the Group’s balance
sheet and statement of comprehensive income for the periods: None.
M. Certain accounts in the consolidated financial statements as at and for the years ended 31
December 2017 were reclassified to conform to the presentation adopted in the consolidated
financial statements as at and for the year ended 31 December 2018.
N. List of the Group vessels as at 31 December 2018
No.
Name of Vessel
Construction year
D.W.T.
Vessel type
1 Amis Ace
2013
60,830
Supramax
2 Amis Brave
2013
61,467
Supramax
3 Amis Champion
2014
60,830
Supramax
4 Amis Dolphin
2015
60,830
Supramax
5 Amis Elegance
2015
55,404
Supramax
6 Amis Fortune
2015
55,468
Supramax
7 Amis Glory
2016
55,474
Supramax
8 Amis Hero 2017 63,469 Supramax
9 Amis Integrity 2017 62,980 Supramax
10 Amis Justice
2017
63,531
Supramax
11 Amis Kalon
2010
58,107
Supramax
12 Amis Leader
2010
58,107
Supramax
13 Amis Miracle
2018
59,982
Supramax
14 Amis Nature 2018 55,472 Supramax
15 Amis Orchid
2012
58,120
Supramax
16 Amis Power 2018 64,012 Supramax
17 Amis Wisdom I
2010
61,611
Supramax

Consolidated Financial Statements 250
No.
Name of Vessel
Construction year
D.W.T.
Vessel type
18 Amis Wisdom II
2010
61,611
Supramax
19 Amis Wisdom III
2011
61,527
Supramax
20 Amis Wisdom VI
2011
61,456
Supramax
21 Arikun
2007
8,763
Small Handy
22 Atayal Ace
2013
16,805
Small Handy
23 Atayal Brave
2012
16,805
Small Handy
24 Atayal Mariner
2012
16,805
Small Handy
25 Atayal Star
2012
16,805
Small Handy
26 Babuza Wisdom
2009
18,969
Small Handy
27 Beagle II
2007
17,224
Small Handy
28 Beagle VI
2001
18,320
Small Handy
29 Beagle VII
2007
16,822
Small Handy
30 Bizen
2008
8,721
Small Handy
31 Blue Horizon
2012
207,867
Cape
32 Bunun Ace
2013
37,744
Handy
33 Bunun Brave
2014
45,556
Handy
34 Bunun Champion
2014
45,556
Handy
35 Bunun Dynasty 2014 37,795 Handy
36 Bunun Elegance
2014
45,556
Handy
37 Bunun Fortune
2015
37,790
Handy
38 Bunun Glory
2015
37,046
Handy
39 Bunun Hero
2015
37,811
Handy
40 Bunun Infinity
2016
37,654
Handy
41 Bunun Justice
2017
37,748
Handy
42 Bunun Kalon
2018
37,653
Handy
43 Bunun Wisdom
2012
38,168
Handy
44 Clear Horizon
2012
207,947
Cape
45 Daiwan Ace
2014
34,358
Handy
46 Daiwan Brave 2014 34,358 Handy
47 Daiwan Champion 2015 34,393 Handy
48 Daiwan Dolphin
2015
34,393
Handy
49 Daiwan Elegance
2015
35,331
Handy
50 Daiwan Fortune
2015
34,893
Handy
51 Daiwan Glory
2015
35,531
Handy
52 Daiwan Hero
2016
34,376
Handy
53 Daiwan Infinity
2016
34,376
Handy
54 Daiwan Justice
2016
34,327
Handy
55 Daiwan Kalon
2016
34,327
Handy
56 Daiwan Leader
2018
34,442
Handy
57 Daiwan Wisdom
2010
31,967
Handy

Consolidated Financial Statements 251
No.
Name of Vessel
Construction year
D.W.T.
Vessel type
58 Frontier Bonanza
2010
179,435
Cape
59 Genius Star I
2004
10,977
Small Handy
60 Genius Star III
2006
13,567
Small Handy
61 Genius Star IX
2009
12,005
Small Handy
62 Genius Star VII
2007
12,005
Small Handy
63 Genius Star VIII
2007
12,005
Small Handy
64 Genius Star X
2010
12,005
Small Handy
65 Genius Star XI
2012
13,663
Small Handy
66 Genius Star XII
2013
13,077
Small Handy
67 Global Faith
2010
28,050
Handy
68 Hibiscus
2002
48,610
Handy
69 Hoanya Wisdom
2008
21,119
Handy
70 Izumo
2007
20,150
Handy
71 Joseph Wisdom
2018
6,400
LPG
72 Katagalan Wisdom
2012
98,697
Panamax
73 Katagalan Wisdom III
2012
98,697
Panamax
74 LBC Energy
2011
71,066
Panamax
75 Ligulao
2010
5,296
Other-pctc
76 Magnate
2004
18,828
Small Handy
77 Mimasaka
2010
14,062
Small Handy
78 Mino
2007
14,118
Small Handy
79 Naluhu
2010
58,107
Supramax
80 Ocean Victory
2011
28,386
Handy
81 Pacific Venus
2001
18,712
Small Handy
82 Paiwan Wisdom
2010
31,967
Handy
83 Papora Wisdom
2009
28,050
Handy
84 Pazeh Wisdom
2009
18,969
Small Handy
85 Pescadores
1999
198
Other-Passenger
86 Poavosa Ace
2013
28,208
Handy
87 Poavosa Brave
2009
28,367
Handy
88 Poavosa Wisdom
2009
28,050
Handy
89 Poavosa Wisdom III
2011
28,232
Handy
90 Poavosa Wisdom VI
2011
28,050
Handy
91 Poavosa Wisdom VII
2012
28,208
Handy
92 Poavosa Wisdom VIII
2013
28,208
Handy
93 Sakizaya Ace
2013
74,936
Panamax
94 Sakizaya Brave
2013
74,940
Panamax
95 Sakizaya Champion 2014 78,080 Panamax
96 Sakizaya Diamond
2015
81,938
Panamax
97 Sakizaya Elegance
2015
81,938
Panamax

Consolidated Financial Statements 252
No.
Name of Vessel
Construction year
D.W.T.
Vessel type
98 Sakizaya Future
2016
81,938
Panamax
99 Sakizaya Glory
2016
84,883
Panamax
100 Sakizaya Hero
2016
81,067
Panamax
101 Sakizaya Integrity
2016
81,010
Panamax
102 Sakizaya Justice
2017
81,691
Panamax
103 Sakizaya Kalon
2017
81,691
Panamax
104 Sakizaya Leader
2017
81,691
Panamax
105 Sakizaya Miracle
2017
81,668
Panamax
106 Sakizaya Noble
2017
80,982
Panamax
107 Sakizaya Orchid
2017
81,588
Panamax
108 Sakizaya Power
2017
81,574
Panamax
109 Sakizaya Queen
2018
81,858
Panamax
110 Sakizaya Respect
2018
81,858
Panamax
111 Sakizaya Wisdom
2011
76,457
Panamax
112 Scarlet Eagle
2014
81,842
Panamax
113 Scarlet Falcon
2014
82,260
Panamax
114 Scarlet Rosella
2015
82,235
Panamax
115 Siraya Wisdom
2007
21,119
Handy
116 Taikli
2011
13,139
Small Handy
117 Tao Ace
2013
25,037
Handy
118 Tao Brave
2011
25,065
Handy
119 Tao Mariner
2010
25,065
Handy
120 Tao Star
2010
25,065
Handy
121 Tao Treasure
2013
25,036
Handy
122 Taokas Wisdom
2008
31,943
Handy
123 Timu 2005 17,224 Small Handy
124 Unicorn Bravo 2007 8,759 Small Handy
125 Unicorn Logger 2008 8,700 Small Handy
126 Wisdom Grace 1998 18,193 Other-container
13. Segment information
(1) General information
The Group operates in a single industry. According to the global management nature of the
ship management industry, the Group determined each business unit as an operating
segment and was disclosed according to their operating types, operating assets and the
Group’s operating structure. The Group was identified as a single reportable segment.

Consolidated Financial Statements 253
The board of directors allocates the profit and assesses performance of the segments based
on the financial information used in internal management which is based on each vessel’s
operating result. The financial information is not different from the consolidated statement
of comprehensive income therefore no further segmental information was disclosed.
(2) Geographic information
Revenue from external customers is classified according to the location of customers and
non-current assets are classified according to the registry of assets. The Group’s
geographic information is as follows:
For the years ended 31 December
2018 2017
Revenue from external customers:
The Netherlands $98,019,650 $68,501,902
Japan 82,721,945 80,861,632
Singapore 65,860,786 44,948,010
Denmark 39,567,741 36,474,787
Hong Kong 37,829,965 39,474,913
Others 109,434,714 92,467,071
Total $433,434,801 $362,728,315
2018.12.31 2017.12.31
Non-current assets:
Panama $2,622,789,012 $2,613,292,646
Hong Kong 80,853,716 105,469,685
Taiwan
Liberia
2,337,440
24,936,929
2,661,598
-
Total $2,770,917,097 $2,721,423,929
Note: non-current assets are property, plant and equipment and prepaid expenses-vessel.
(3) Major customers
Individual customers accounting for at least 10% of net sales for the years ended 31
December 2018 and 2017 were as follows:
For the years ended 31 December
2018 2017
Customer A: $70,890,836 $62,579,009