wireless sensor networks for marginal
TRANSCRIPT

WIRELESS SENSOR NETWORKS FOR MARGINAL FARMING ININDIA
PRESENTEE A LA FACULTE INFORMATIQUE ET COMMUNICATIONS
ECOLE POLYTECHNIQUE FEDERALE DE LAUSANNE
POUR L’OBTENTION DU GRADE DE DOCTEUR ES SCIENCES
PAR
JACQUES PANCHARDIngenieur Diplome en Systemes de Communication (M.Sc.),
Ecole Polytechnique Federale de Lausanne, Suisse
de nationalite suisse
jury:
Prof. Jean-Pierre Hubaux, directeur de theseDr. Pearl Pu Faltings, presidente de jury
Prof. H.S. Jamadagni, rapporteurProf. Andre Mermoud, rapporteurDr. Kentaro Toyama, rapporteur
Lausanne, EPFL2008

ii

Abstract
In this dissertation, we explore the potential of wireless sensor networks (WSNs) in an original context,the small agriculture of Developing Countries (DCs). Our goal is to confront an emerging technologywith a concrete problem of world-wide dimensions, the sustainability of farming for small land-holdersliving in conditions of water scarcity. Based on a survey about information needs, we design a series ofprecise use cases, provide system design, implementation and deployment guidelines for the technology,present a toolkit including an original interface to wireless sensors for non-specialists, and bring to theattention of the research community the lessons we learned in the process.
In the first part, we present the environmental challenges faced by the developing world and identifyrelevant applications of environmental monitoring in this context. Then, we proceed with a review ofthe technology of environmental monitoring in the broad context of agriculture and formally present theopportunity represented by WSNs. Finally we show how this can be applied to addressing a crucialproblem of DCs, namely rural poverty.
The second part of the dissertation is devoted to the collaborative design of a decision-support toolfor marginal agriculture using wireless sensor networks. We first describe a survey that was made in2004 in three villages of Karnataka, India. The results highlighted the potential that environment-relatedinformation has for the improvement of farming strategies in the face of highly variable conditions,in particular for risk management strategies (choice of crop varieties, sowing and harvesting periods,prevention of pests and diseases, efficient use of irrigation water etc.). The results were used to identifypotential use cases for an environmental monitoring system for agriculture, and to make crucial designdecisions for this system. At this point, we present our toolkit in detail and proceed with its assessment.Deployment issues are covered in detail, as they are critical for the success of such a system.
The results of our field deployments, both in Switzerland and in India, highlighted the potential of thetechnology and demonstrated its applicability in the field. However, the direct use of this technology bythe farmers themselves did not foster the expected participation of the population. This made it difficultto develop the intended decision-support system.
The third part of this dissertation addresses the lessons learned and their consequences for upcom-ing experiments and deployments. We take the following position: Currently, the deployment of WSNtechnology in developing regions is more likely to be effective if it targets scientists and technical per-sonnel as users, rather than the farmers themselves. We base this finding on the lessons learned from theCOMMON-Sense system deployment and the results of an extensive user experiment with agriculturescientists, which is extensively described.
We also took steps to make the deployment and maintenance of wireless sensors easier. Their limitedresources, indeed, make them a challenging tool to handle in the field. In particular, they lack a properdisplay, which makes them difficult to deploy and to manage, once they are deployed. Accordingly,we present Sensor-Tune, a light-weight deployment and maintenance support tool for wireless sensornetworks. This tool is based on an auditory user interface using sonification. Sonification refers to the use
iii

of audio signals (mostly non-speech) to convey information. We explore the potential of this approach,in particular how it allows users to overcome the inherent limitations of visual interfaces. We then justifyour design choices, and present typical WSN applications where sonification can be particularly useful.Finally, we present the prototype that we built, and we describe a user experiment that we conducted inearly 2008, which is the first reported attempt to put a multi-hop wireless sensor network deployment inthe hands of non-specialists.
In a conclusive part, we go beyond the mere technology and technology use, by advocating an orig-inal use of Information and Communication Technologies (ICT) in the context of developing countries.We believe our demand-driven approach for the design of appropriate ICT tools that are targeted at theresource poor to be relatively new. In order to go beyond a pure technocratic approach, we adopted aniterative, participatory methodology.
Keywords: wireless sensor networks, sustainable development, developing countries, agriculture, sys-tem, toolkit

Resume
Dans cette dissertation, nous explorons le potentiel des reseaux de capteurs sans fil (RCSFs) dansun contexte particulier et original. Notre but est de confronter cette technologie en devenir avec unprobleme concret aux enjeux mondiaux, a savoir la petite agriculture dans les regions arides des pays endeveloppement (PDs).
A partir d’une etude de terrain sur les besoins en information de populations rurales du Karnataka(Inde du Sud), nous avons concu une serie d’applications precises, pour lesquelles nous fournissons lesdetails de design, implementation et deploiement. Nous presentons aussi un systeme incluant une inter-face originale qui permet de mettre des capteurs sans fil dans les mains de non-specialistes. Finalement,nous attirons l’attention de la communaute scientifique sur les lecons que nous avons apprises dans lecadre de ce projet de developpement et cooperation.
Dans la premiere partie de la dissertation, nous presentons les defis environnementaux que doiventrelever les pays en developpement, et nous identifions des domaines d’applications pour le monitoringde l’environnement dans ce cadre. Puis, nous passons en revue l’etat de l’art de cette technologie dansle contexte plus large de l’agriculture et presentons formellement la fenetre d’opportunite ouverte parles reseaux de capteurs. Finalement, nous montrons comment appliquer ces technologies a un problemecrucial des PDs, a savoir la pauvrete rurale.
La deuxieme partie est consacree au design participatif d’un outil d’aide a la decision pour la petiteagriculture (ou agriculture marginale) base sur les RCSFs. Tout d’abord, nous decrivons une etude alaquelle nous avons participe en 2004 dans trois villages du Karnataka. Les resultats obtenus ont mis enevidence le potentiel de l’information environnementale pour l’amelioration des strategies agricoles dansun climat semi-aride soumis a des fortes variations saisonnieres. Cela concerne en particulier la gestiondu risque, avec le choix des varietes a cultiver, les periodes de semailles et de moisson, la preventiondes maladies et des parasites ou l’utilisation efficace de l’eau d’irrigation. Les resultats nous ont servia identifier des cas d’utilisation pour un systeme de monitoring de l’environnement pour l’agriculturemarginale. Certaines decisions cruciales quant au design en dependent aussi directement. A ce stade,nous presentons egalement notre “boıte a outils” et l’evaluation que nous en avons faite. Nous couvronsen detail les questions de deploiement, parce qu’elles sont critiques pour le succes d’un tel systeme.
Les resultats de nos deploiements, en Suisse comme en Inde, ont mis en evidence le potentiel desRCSFs et demontre leur application sur le terrain. Pourtant, l’utilisation directe de cette technologie pardes agriculteurs indiens n’a pas beneficie de la collaboration esperee de la population. En consequence,le deploiement du systeme d’aide a la decision prevu s’est avere difficile.
La troisieme partie de cette dissertation aborde les leons apprises et leurs consequences pour experienceset deploiements a venir. Nous defendons le choix suivant: pour l’instant, le deploiement de RCSFs dansdes regions en developpement a plus de chance d’etre efficace s’il est dirige vers des utilisateurs scien-tifiques ou techniciens, plutot que des agriculteurs. Nous basons cette recommendation sur nos propresdeploiements, ainsi que sur une experience-utilisateurs menee aupres de scientifiques de l’agriculture,
v

experience que nous decrivons en detail.Nous avons egalement pris des mesures pour rendre le deploiement et l’entretien des capteurs sans
fil plus facile. Leurs ressources limitees, en effet, en font un outil difficile a gerer sur le terrain. Enparticulier, ils n’ont pas un affichage graphique, ce qui les rend delicats a deployer et a gerer une foisqu’ils sont deployes. En consequence, nous presentons Sensor-Tune, un outil de support au deploiementet a la maintenance de capteurs sans fil. Cet outil est base sur une interface-utilisateur auditive utilisant leconcept de sonification. La sonification consiste en l’utilisation des signaux audio (essentiellement non-verbaux) pour transmettre de l’information. Nous explorons le potentiel de cette approche, en particuliercomment elle permet de surmonter les limitations inherentes aux interfaces visuelles. Nous justifionsnos choix de design et presentons des applications typiques pour lesquelles la sonification peut etreparticulierement utile. Enfin, nous presentons le prototype que nous avons developpe en laboratoire, etdecrivons une experience-utilisateurs que nous avons menee au debut de 2008, et qui constitue a notreconnaissance la premiere tentative de mettre un reseau sans fil auto-organise entre les mains de non-specialistes.
En conclusion, nous allons au-dela des considerations purement technologiques en preconisant uneutilisation originale de l’information et des technologies de la communication (TIC) dans le contexte despays en developpement. Pour depasser une approche purement technocratique, nous avons adopte unedemarche iterative et une methodologie participative.
Mots-cles: reseaux de capteurs sans fil, developpement durable, pays en developpement, agriculture,systemes

Acknowledgements
I want to thank first my advisor, Professor Jean-Pierre Hubaux, for allowing me to pursue this excitingand original research topic, and for guiding me during all my time at EPFL. His trust and help in allaspects of the PhD never faltered.
I want to express my gratitude to the members of my thesis committee, Prof. H.S. Jamadagni, Prof.Andre Mermoud, Dr. Kentaro Toyama, as well as the president of the committee, Dr. Pearl Pu, for thetime and effort that they invested in criticizing my dissertation, and for the interest they expressed for myresearch.
The work presented in this thesis was supported by the National Competence Center in Researchon Mobile Information and Communication Systems (NCCR-MICS) and by the EPFL-SDC Fund. I amgrateful for this support.
During my PhD, I had the opportunity to collaborate with wonderful people, who made these yearsan exceptional learning experience, not only professionally, but at a personal level as well. In particular,many thanks to Seshagiri Rao, T.V. Prabhakar and M.S. Sheshshayee, who unveiled for me a tiny portionof the Great Indian Novel. Special thanks go to my friend Andre Pittet and his wife Catherine, for theirunconditional hospitality, their incomparable insight and their constant support during my stays in India.
I want also to pay tribute to the Sensorscope group at LCAV (Thomas Schmid and Henri Dubois-Ferrieres, and later Guillermo Barrenetxea), the “giant on whose shoulders I stood”.
Many thanks to my colleagues at LCA for making this PhD such an enjoyable experience. I amparticulary indebted to my successive office mates, Michal Piorkowski, Jun Luo and Julien Freudiger,for bearing with me in such a friendly way. I am thankful to the staff of LCA: Danielle Alvarez, HollyCogliati, Angela Devenoge, and Patricia Hjelt for helping me with all administrative issues, as wellas Philippe Chammartin, Jean-Pierre Dupertuis and Marc-Andre Luthi for keeping the computing in-frastructure up and running.
Finally, my gratitude goes to my family for their love, support and encouragement during all my stud-ies. Most of all, thank you my love, Sandra, for sharing my deepest moments of joy, and for supportingand encouraging me whenever fear or discouragement where looming over me.
vii


Main Abbreviations
CEDT: Centre for Electronics Design and TechnologyCSN: COMMON-Sense NetDC: Developing CountryICT: Information and Communication TechnologyICT4D: Information and Communication Technologies for DevelopmentIISc: Indian Institute of Science, Bangalore, IndiaMICS: Mobile Information and Communication SystemsNCCR: National Center of Competence in ResearchNGO: Non-Governmental OrganizationSDC: Swiss Agency for Development and CooperationWSN: Wireless Sensor Network
ix


Contents
Introduction 1
1 Environmental Challenges in Developing Countries 51.1 The Millennium Development Goals and the Environment . . . . . . . . . . . . . . . . 51.2 The Importance of Environmental Monitoring . . . . . . . . . . . . . . . . . . . . . . . 61.3 Agriculture . . . . . . . . . . . . . . . . . . . . . . . . . . . . . . . . . . . . . . . . . 7
1.3.1 Rationale . . . . . . . . . . . . . . . . . . . . . . . . . . . . . . . . . . . . . . 71.3.2 Potential Applications . . . . . . . . . . . . . . . . . . . . . . . . . . . . . . . 7
1.4 Air Pollution and Traffic . . . . . . . . . . . . . . . . . . . . . . . . . . . . . . . . . . 81.4.1 Potential Applications . . . . . . . . . . . . . . . . . . . . . . . . . . . . . . . 9
1.5 Water Quality Monitoring . . . . . . . . . . . . . . . . . . . . . . . . . . . . . . . . . . 101.6 Agriculture and Water in India: a Brief Historical Perspective . . . . . . . . . . . . . . . 101.7 India’s Agriculture Today . . . . . . . . . . . . . . . . . . . . . . . . . . . . . . . . . . 12
1.7.1 Facts and Figures . . . . . . . . . . . . . . . . . . . . . . . . . . . . . . . . . . 121.7.2 A Recent and Growing Concern: Water Scarcity . . . . . . . . . . . . . . . . . 121.7.3 The Specific Case of Karnataka . . . . . . . . . . . . . . . . . . . . . . . . . . 13
1.8 India Today: the Current Institutional Framework . . . . . . . . . . . . . . . . . . . . . 131.8.1 States and Central Government . . . . . . . . . . . . . . . . . . . . . . . . . . . 131.8.2 Local Institutions . . . . . . . . . . . . . . . . . . . . . . . . . . . . . . . . . . 14
1.9 Conclusion . . . . . . . . . . . . . . . . . . . . . . . . . . . . . . . . . . . . . . . . . 14
2 New Opportunities for Environmental Monitoring and Agriculture 172.1 Usual Techniques . . . . . . . . . . . . . . . . . . . . . . . . . . . . . . . . . . . . . . 17
2.1.1 Stand-Alone Sensors . . . . . . . . . . . . . . . . . . . . . . . . . . . . . . . . 172.1.2 Laboratory Analysis . . . . . . . . . . . . . . . . . . . . . . . . . . . . . . . . 182.1.3 Remote Sensing . . . . . . . . . . . . . . . . . . . . . . . . . . . . . . . . . . 182.1.4 Telemetry . . . . . . . . . . . . . . . . . . . . . . . . . . . . . . . . . . . . . . 18
2.2 Wireless Sensor Networks . . . . . . . . . . . . . . . . . . . . . . . . . . . . . . . . . 182.3 Design Dimensions in Environmental Monitoring . . . . . . . . . . . . . . . . . . . . . 192.4 Where Do WSNs Stand? . . . . . . . . . . . . . . . . . . . . . . . . . . . . . . . . . . 20
2.4.1 Wireless Networking . . . . . . . . . . . . . . . . . . . . . . . . . . . . . . . . 202.4.2 Self-Organization . . . . . . . . . . . . . . . . . . . . . . . . . . . . . . . . . . 212.4.3 Efficient Power Management . . . . . . . . . . . . . . . . . . . . . . . . . . . . 212.4.4 Modularity . . . . . . . . . . . . . . . . . . . . . . . . . . . . . . . . . . . . . 222.4.5 Web-based Data Management . . . . . . . . . . . . . . . . . . . . . . . . . . . 23
xi

2.5 Sensors and Agriculture . . . . . . . . . . . . . . . . . . . . . . . . . . . . . . . . . . . 232.5.1 Soil Moisture . . . . . . . . . . . . . . . . . . . . . . . . . . . . . . . . . . . . 232.5.2 Soil Salinity and PH . . . . . . . . . . . . . . . . . . . . . . . . . . . . . . . . 252.5.3 Climatic Variables . . . . . . . . . . . . . . . . . . . . . . . . . . . . . . . . . 25
2.6 WSNs in Agriculture . . . . . . . . . . . . . . . . . . . . . . . . . . . . . . . . . . . . 262.6.1 Vineyard Temperature Monitoring . . . . . . . . . . . . . . . . . . . . . . . . . 262.6.2 Potato Disease Prevention . . . . . . . . . . . . . . . . . . . . . . . . . . . . . 272.6.3 Tomato Disease Prevention . . . . . . . . . . . . . . . . . . . . . . . . . . . . . 272.6.4 Cattle Monitoring . . . . . . . . . . . . . . . . . . . . . . . . . . . . . . . . . . 282.6.5 Paddy Field Monitoring . . . . . . . . . . . . . . . . . . . . . . . . . . . . . . 282.6.6 Discussion . . . . . . . . . . . . . . . . . . . . . . . . . . . . . . . . . . . . . 29
3 WSNs and Developing Countries 313.1 Existing WSN Projects . . . . . . . . . . . . . . . . . . . . . . . . . . . . . . . . . . . 31
3.1.1 Groundwater Arsenic Contamination Assessment in Bangladesh . . . . . . . . . 313.1.2 SenSlide, A Sensor Network Based Landslide Prediction System . . . . . . . . . 323.1.3 Wireless Sensor Network for Water Quality Management . . . . . . . . . . . . . 333.1.4 Flood Detection System for Honduras . . . . . . . . . . . . . . . . . . . . . . . 343.1.5 Road Surface Condition Monitoring . . . . . . . . . . . . . . . . . . . . . . . . 353.1.6 Other Work . . . . . . . . . . . . . . . . . . . . . . . . . . . . . . . . . . . . . 36
3.2 A New Tool for Developing Regions? . . . . . . . . . . . . . . . . . . . . . . . . . . . 363.2.1 Assets . . . . . . . . . . . . . . . . . . . . . . . . . . . . . . . . . . . . . . . . 363.2.2 Challenges . . . . . . . . . . . . . . . . . . . . . . . . . . . . . . . . . . . . . 39
4 Wireless Sensor Networks for Marginal Agriculture in India 434.1 Project, Consortium and Funding . . . . . . . . . . . . . . . . . . . . . . . . . . . . . . 434.2 COMMON-Sense Net: a Decision-Support Tool for Agriculture . . . . . . . . . . . . . 444.3 Setting the Context . . . . . . . . . . . . . . . . . . . . . . . . . . . . . . . . . . . . . 45
4.3.1 The Pavagada Region . . . . . . . . . . . . . . . . . . . . . . . . . . . . . . . . 464.3.2 The Chennakeshavapura Village . . . . . . . . . . . . . . . . . . . . . . . . . . 474.3.3 Type of Agriculture . . . . . . . . . . . . . . . . . . . . . . . . . . . . . . . . . 474.3.4 Marginal Farmers . . . . . . . . . . . . . . . . . . . . . . . . . . . . . . . . . . 50
4.4 A Survey and Analysis on Farmers’ Needs . . . . . . . . . . . . . . . . . . . . . . . . . 514.4.1 Survey Methodology . . . . . . . . . . . . . . . . . . . . . . . . . . . . . . . . 514.4.2 Summary of Results . . . . . . . . . . . . . . . . . . . . . . . . . . . . . . . . 524.4.3 Interpretation and Motivation . . . . . . . . . . . . . . . . . . . . . . . . . . . 53
4.5 Use Cases and Related Environmental Data . . . . . . . . . . . . . . . . . . . . . . . . 544.5.1 Crop Modeling . . . . . . . . . . . . . . . . . . . . . . . . . . . . . . . . . . . 544.5.2 Water Conservation Measures . . . . . . . . . . . . . . . . . . . . . . . . . . . 564.5.3 Pest and Disease Prediction/Prevention . . . . . . . . . . . . . . . . . . . . . . 564.5.4 Water Management for Deficit Irrigation . . . . . . . . . . . . . . . . . . . . . . 57
4.6 Design Guidelines . . . . . . . . . . . . . . . . . . . . . . . . . . . . . . . . . . . . . . 584.6.1 Technical Point-of-View . . . . . . . . . . . . . . . . . . . . . . . . . . . . . . 584.6.2 Scientific Point-of-View . . . . . . . . . . . . . . . . . . . . . . . . . . . . . . 594.6.3 Economical and Sociocultural Point-of-View . . . . . . . . . . . . . . . . . . . 59
4.7 Methodology: Science and Farmers . . . . . . . . . . . . . . . . . . . . . . . . . . . . 59

5 System Design and Implementation 615.1 Design Options . . . . . . . . . . . . . . . . . . . . . . . . . . . . . . . . . . . . . . . 61
5.1.1 Data Generation Strategy . . . . . . . . . . . . . . . . . . . . . . . . . . . . . . 615.1.2 Data Transport Strategy . . . . . . . . . . . . . . . . . . . . . . . . . . . . . . 62
5.2 Design Choice: Overview . . . . . . . . . . . . . . . . . . . . . . . . . . . . . . . . . . 635.3 Embedded Probes . . . . . . . . . . . . . . . . . . . . . . . . . . . . . . . . . . . . . . 635.4 Wireless Sensor Network: Data Collection Subsystem . . . . . . . . . . . . . . . . . . . 64
5.4.1 Radio Range . . . . . . . . . . . . . . . . . . . . . . . . . . . . . . . . . . . . 655.4.2 Power Consumption . . . . . . . . . . . . . . . . . . . . . . . . . . . . . . . . 66
5.5 Hybrid Network: Data Transit Subsystem . . . . . . . . . . . . . . . . . . . . . . . . . 675.5.1 WiFi Bridge . . . . . . . . . . . . . . . . . . . . . . . . . . . . . . . . . . . . . 685.5.2 GPRS Bridge . . . . . . . . . . . . . . . . . . . . . . . . . . . . . . . . . . . . 695.5.3 Performance Evaluation . . . . . . . . . . . . . . . . . . . . . . . . . . . . . . 70
5.6 Data Management and Processing . . . . . . . . . . . . . . . . . . . . . . . . . . . . . 715.6.1 Tables . . . . . . . . . . . . . . . . . . . . . . . . . . . . . . . . . . . . . . . . 71
5.7 A Web-based Tool . . . . . . . . . . . . . . . . . . . . . . . . . . . . . . . . . . . . . . 725.7.1 Data Display . . . . . . . . . . . . . . . . . . . . . . . . . . . . . . . . . . . . 735.7.2 Network Statistics . . . . . . . . . . . . . . . . . . . . . . . . . . . . . . . . . 745.7.3 Commands . . . . . . . . . . . . . . . . . . . . . . . . . . . . . . . . . . . . . 74
6 A Wireless Sensor Network Toolkit for Rural India 776.1 Changins . . . . . . . . . . . . . . . . . . . . . . . . . . . . . . . . . . . . . . . . . . 776.2 Chennakeshavapura . . . . . . . . . . . . . . . . . . . . . . . . . . . . . . . . . . . . . 796.3 Issues of a Rural Deployment . . . . . . . . . . . . . . . . . . . . . . . . . . . . . . . . 80
6.3.1 Hardware Issues . . . . . . . . . . . . . . . . . . . . . . . . . . . . . . . . . . 806.3.2 Probe Assessment . . . . . . . . . . . . . . . . . . . . . . . . . . . . . . . . . 816.3.3 Power Management . . . . . . . . . . . . . . . . . . . . . . . . . . . . . . . . 856.3.4 Environment . . . . . . . . . . . . . . . . . . . . . . . . . . . . . . . . . . . . 866.3.5 Power and Telecommunications Infrastructure . . . . . . . . . . . . . . . . . . . 896.3.6 Connectivity Issues . . . . . . . . . . . . . . . . . . . . . . . . . . . . . . . . . 89
6.4 Human Issues . . . . . . . . . . . . . . . . . . . . . . . . . . . . . . . . . . . . . . . . 936.5 System Overview . . . . . . . . . . . . . . . . . . . . . . . . . . . . . . . . . . . . . . 946.6 Lessons Learned . . . . . . . . . . . . . . . . . . . . . . . . . . . . . . . . . . . . . . 96
7 Making the Invisible Audible 977.1 Introduction . . . . . . . . . . . . . . . . . . . . . . . . . . . . . . . . . . . . . . . . . 977.2 State of the Art . . . . . . . . . . . . . . . . . . . . . . . . . . . . . . . . . . . . . . . 99
7.2.1 WSN deployment and Maintenance Support . . . . . . . . . . . . . . . . . . . . 997.2.2 Sonification . . . . . . . . . . . . . . . . . . . . . . . . . . . . . . . . . . . . . 997.2.3 WSNs and their End-Users . . . . . . . . . . . . . . . . . . . . . . . . . . . . . 100
7.3 Sonification for Sensor Networks . . . . . . . . . . . . . . . . . . . . . . . . . . . . . . 1007.3.1 Applications . . . . . . . . . . . . . . . . . . . . . . . . . . . . . . . . . . . . 1007.3.2 Advantages . . . . . . . . . . . . . . . . . . . . . . . . . . . . . . . . . . . . . 1017.3.3 Challenges . . . . . . . . . . . . . . . . . . . . . . . . . . . . . . . . . . . . . 1027.3.4 Signal and Noise Metaphor . . . . . . . . . . . . . . . . . . . . . . . . . . . . . 103
7.4 System Design . . . . . . . . . . . . . . . . . . . . . . . . . . . . . . . . . . . . . . . 104

7.4.1 System Model . . . . . . . . . . . . . . . . . . . . . . . . . . . . . . . . . . . 1047.4.2 Tool and Scenarios . . . . . . . . . . . . . . . . . . . . . . . . . . . . . . . . . 1057.4.3 Protocols . . . . . . . . . . . . . . . . . . . . . . . . . . . . . . . . . . . . . . 1087.4.4 Sonification Mapping Strategy . . . . . . . . . . . . . . . . . . . . . . . . . . . 111
7.5 Initial Exploration: User Survey . . . . . . . . . . . . . . . . . . . . . . . . . . . . . . 1127.5.1 Description . . . . . . . . . . . . . . . . . . . . . . . . . . . . . . . . . . . . . 1127.5.2 Results . . . . . . . . . . . . . . . . . . . . . . . . . . . . . . . . . . . . . . . 113
7.6 Prototype Implementation . . . . . . . . . . . . . . . . . . . . . . . . . . . . . . . . . 1147.6.1 Prototype Description . . . . . . . . . . . . . . . . . . . . . . . . . . . . . . . 114
7.7 Experimental Validation . . . . . . . . . . . . . . . . . . . . . . . . . . . . . . . . . . 1177.7.1 Comparable Graphical Interface . . . . . . . . . . . . . . . . . . . . . . . . . . 1177.7.2 Experimental Design . . . . . . . . . . . . . . . . . . . . . . . . . . . . . . . . 1187.7.3 Participants . . . . . . . . . . . . . . . . . . . . . . . . . . . . . . . . . . . . . 1197.7.4 Results . . . . . . . . . . . . . . . . . . . . . . . . . . . . . . . . . . . . . . . 119
7.8 Discussion . . . . . . . . . . . . . . . . . . . . . . . . . . . . . . . . . . . . . . . . . . 120
8 Usability and Usefulness of the System 1238.1 Charting the Paradigm Shift . . . . . . . . . . . . . . . . . . . . . . . . . . . . . . . . 123
8.1.1 Choosing the Target Population . . . . . . . . . . . . . . . . . . . . . . . . . . 1248.1.2 Goal and Methodology . . . . . . . . . . . . . . . . . . . . . . . . . . . . . . . 124
8.2 Experiment Results . . . . . . . . . . . . . . . . . . . . . . . . . . . . . . . . . . . . . 1268.2.1 Questionnaires . . . . . . . . . . . . . . . . . . . . . . . . . . . . . . . . . . . 1268.2.2 User Activity Logging . . . . . . . . . . . . . . . . . . . . . . . . . . . . . . . 1288.2.3 Debriefing Meetings . . . . . . . . . . . . . . . . . . . . . . . . . . . . . . . . 129
8.3 Discussion . . . . . . . . . . . . . . . . . . . . . . . . . . . . . . . . . . . . . . . . . . 1338.3.1 Usefulness . . . . . . . . . . . . . . . . . . . . . . . . . . . . . . . . . . . . . 1348.3.2 Usability . . . . . . . . . . . . . . . . . . . . . . . . . . . . . . . . . . . . . . 1358.3.3 Use . . . . . . . . . . . . . . . . . . . . . . . . . . . . . . . . . . . . . . . . . 1358.3.4 Sectoral Analysis . . . . . . . . . . . . . . . . . . . . . . . . . . . . . . . . . . 136
9 Building a Knowldedge Society with the Use of WSNs? 1379.1 Experimental Technology for Social Change? . . . . . . . . . . . . . . . . . . . . . . . 1379.2 Design/Implementation Gaps . . . . . . . . . . . . . . . . . . . . . . . . . . . . . . . . 1389.3 Knowledge Creation, Context and Knowledge Assets . . . . . . . . . . . . . . . . . . . 1389.4 Apprenticeship & Participatory Methods to Develop ICT Capacities . . . . . . . . . . . 1409.5 From Theory to Practice . . . . . . . . . . . . . . . . . . . . . . . . . . . . . . . . . . 141
Conclusion 143Future Work . . . . . . . . . . . . . . . . . . . . . . . . . . . . . . . . . . . . . . . . . . . . 143
References 145
Index 156

Introduction
Wireless Sensor Networks (WSNs) are increasingly considered by the scientific community as the futureof Environmental Monitoring: Providing at a low cost the possibility to gather and process all sortsof data with a space and time resolution unimaginable before, these networks are viewed as a criticalelement of the revolution of ubiquitous computing .
The idea of automating the collection of physical data in order to monitor environments is not new.But recent technological advances have allowed for the networking of a wide variety of sensors, indepen-dently from any preexisting infrastructure. Whenever physical conditions in a milieu change rapidly overspace and time, WSNs allow for real-time data processing at a minimal cost. Their capacity to organizespontaneously in a network makes them easy to deploy, expand and maintain, and provides resilience tothe failure of individual measurement points.
After a variety of test beds have been reported in the scientific literature [SPMC04, ea02, BTB04,SDFV, BIS+08], the first commercial applications of WSNs started appearing on the market, in thearea of home or building automation (Control4 [Con], HomeHeartBeat [Hea]), safety (LifeTag [Ray]),automatic meter reading (Wellspring [Irrb]), storage monitoring (ip01 [IP0]), oil industry and agriculture(eko [Cro]). If such systems are to be adopted by a wide customer basis, early adopters will have todemonstrate the gains of using this technology. The search of a “killer application” is by many meansstill ongoing. In this context, it is legitimate to ask whether the wireless sensing technology can find newniches of applications.
The work presented in this thesis aims at broadening the scope in this quest. We investigate whetherthe WSNs application paradigm can be adapted from ubiquitous computing for mass consumption mar-kets to a decision-support tool for sustainable development in Developing Countries (DCs). To someextent, researchers have also tried to apply WSNs to this new context. However, such projects remainrare, and their socioeconomic effect remain to be proven.
Throughout this thesis, we explore the potential of such networks in developing countries with a par-ticular use case: environmental monitoring for marginal agriculture. Despite their rapid urban growth,DCs have to sustain an important, if not predominant, rural population. The livelihood of these popu-lations has changed dramatically with the cumulative effects of globalization and the Green Revolution.The new situation has raised formidable challenges for the small land holders, who still represent thebulk of the rural population. In 2008, they still live in a fragile equilibrium, dramatically illustrated bythe renewed threat of a worldwide food crisis [Edi08].
In this dissertation, we investigate the use of the WSN technology in the context of rural development,and we seek to determine if -and how- WSNs can help tackle some of the environmental challengesawaiting the developing countries in the face of globalization and climate change.
This work is resolutely multidisciplinary, as we aim at solving relevant social problems, with theappropriate use of environmental data for agriculture, through wireless networking. This triple (social,scientific and engineering) challenge is reflected in the choice of projects partners, who come from both
1

2 INTRODUCTION
the academic world and the civil society, and from two cultural backgrounds: India and Switzerland.The choice of India as a test-case for developing countries might be questioned by some, because
this country is emerging as a major economic power of the 21st century. India, however, is a countrywith two faces. In opposition to the rising power of mega-cities, the life conditions are deteriorating inthe countryside, still home to almost two-thirds of the total population. As a consequence, the countryis by no means alien to the issues faced by developing countries, but it possesses the brain-power andthe technological skills to address these problems efficiently. Hence, it is an ideal setting for the sortof investigation we wanted to pursue, providing both the appropriate problem and highly skilled localpartners to solve it.
In Chapter 1, we set the context by emphasizing the role of the environment in the sustainable de-velopment of emerging economies and less-developed countries alike. Setting our focus on India as atest-case, we highlight the role of agriculture, and draw a brief historical and institutional outline of thissector.
In Chapter 2, we present the state of the art in environmental monitoring, with a special focus onagriculture. First we draw a panorama of wireless sensor networks, then we give an outline of the newsensing technologies that are relevant in the cropping field. We also give a description of agriculturalpractices that benefit from a precise knowledge of the environmental conditions in and around the culti-vated plot. Finally, we propose a taxonomy of environmental monitoring, whose goal is to help decidewhen WSNs are a suitable option for a given task.
In Chapter 3, we highlight the potential of WSNs in developing countries. Firstly, we review ex-haustively the existing initiatives, then identify and explain through them the main assets and challengesassociated with this technology.
Chapter 4 is devoted to the user requirements of such an application. First, we introduce the test casethat we chose in order to explore the risks and opportunities offered by WSNs: a wireless sensor networkas a support tool for small land-holding agriculture in India. Then we present the survey about farmers’information needs in which we participated in 2004, and which resulted in the broad definition of WSNapplications for marginal agriculture.
In Chapter 5, we present the design and implementation choices that we made in the course of theCOMMON-Sense Net project. Several alternatives, such as hybrid networks, delay-tolerant networking,periodic data collection and data on-demand are discussed.
Chapter 6 highlights the challenges that are still at hand after all the technical hurdles have beensolved. It makes it clear that to this day, deploying a self-organized wireless sensor network is still acomplex process, especially in a remote areas of a developing country. We proceed to a formal evaluationof the performance of our system, evaluation that was compiled in the light of two years of operatingnetworks in a rural environment.
The lessons learned led us to design original solutions for deployment support, which we detail inChapter 7. In this chapter, we describe the elements of the toolkit that we propose for the deploymentof wireless sensor networks in rain-fed agriculture research. This toolkit is based on an auditory userinterface using sonification1. We explore the potential of this approach, particularly how it allows usersto overcome the inherent limitations of visual interfaces. We then justify our design choices and presenttypical WSN applications where sonification can be particularly useful. Finally, we present the prototypethat we built, and we describe a user experiment that we conducted in early 2008, which is the firstreported attempt to put a multi-hop wireless sensor network deployment in the hands of non-specialists.
Chapter 8 focuses on the users again, in this case agriculture scientists who gave us their feedback
1Sonification refers to the use of audio signals (mostly non-speech) to convey information.

3
on the technology developed in the framework of this project. Based on our experience, we take thefollowing position in this chapter: Currently, the deployment of WSN technology in developing regionsis more likely to be effective if it targets scientists and technical personnel as users, rather than thefarmers themselves. We base this claim on the lessons learned from the COMMON-Sense Net systemdeployment and the results of an extensive user experiment with agriculture scientists.
The societal and methodological issues are covered in Chapter 9, before we draw a conclusion on thework accomplished so far, and we set landmarks for future developments.

4 INTRODUCTION

Chapter 1
Environmental Challenges in DevelopingCountries
Developing countries face many challenges on their way to industrialization and economical well-being.Among them, ensuring environmental sustainability while promoting economic growth is more and moreregarded as a critical objective. As was illustrated by the negotiations that took place during the UN Cli-mate Talks held in Bali in December 2007, the role of emerging economies in the fight against globalwarming can no longer be ignored [FR07], even if their levels of greenhouse gas emissions per capitais still significantly lower than those of industrialized nations. Already today, DCs are confronted withsevere problems linked with the change of climatic patterns and the increased strain on their water re-sources caused by a booming population and improving living standards.
In this chapter, we investigate the potential of environmental monitoring in DCs from the perspectiveof sustainable development. We do not address yet the specific issue of technology, although the utilityof a network of sensors will become apparent in most of the use cases.
1.1 The Millennium Development Goals and the Environment
In general, the environmental threats affecting DCs are due to a variety of factors, from the decreaseand degradation of water resources caused by unsustainable agricultural practices, to the problem ofurban air pollution, to the general health concerns caused by unsatisfactory access to clean fresh water.There is a growing tension between short-term economic development goals and a long-term sustainableenvironmental policy, as exemplified by the eight Millennium Development Goals [UN 02]. Endorsedby 189 United Nations member states in 2000, the Millennium Declaration lists the eight following goalsas the primary targets for an equitable and sustainable human development:
1. Eradicate extreme poverty and hunger
2. Achieve universal primary education
3. Promote gender equality and empower women
4. Reduce child mortality
5. Improve maternal health
6. Combat HIV/AIDS, malaria, and other diseases
7. Ensure environmental sustainability
5
6 CHAPTER 1. ENVIRONMENTAL CHALLENGES IN DEVELOPING COUNTRIES
8. Develop a global partnership for development
In order to highlight the importance of environmental monitoring in developing countries, we showin the following section what role this technique can play in helping to meet at least three of the eightMillennium Goals:
• Eradicate extreme poverty and hunger: A large percentage of the population living in emergingand developing countries is still rural. The subsistence difficulties of the poor farmers representa major cause of both rural and urban poverty, because mass migration to the cities results in anincrease in unemployment and slum population. A better understanding and monitoring of theenvironmental conditions in which farming is done can make it more profitable and sustainable(irrigation, crop management, etc.).
• Reduce child mortality: About 15% of the child mortality in developing countries is due to diar-rhoeal diseases. In this case an environmental factor, water quality, is a direct culprit. In a moregeneral sense, child mortality rates are correlated with poverty levels [Wag02], so it can be as-sumed that reducing poverty by providing better means of subsistence in rural areas will decreasemortality.
• Ensure environmental sustainability: Sustainable development involves pollution monitoring, aswell as the monitoring and protection of natural resources and the prevention of natural disasters.
1.2 The Importance of Environmental Monitoring
There are several reasons environmental issues are not addressed properly today. They tend to be lowon the agenda of the countries whose main objective is to build a prosperous economy and to reachhigher standards of living [MC]. Often the longer term effects of environmental degradation are notwell known or understood. Information is a key issue in this regard, because only a precise knowledgeof the environment can lead to a proper assessment of the situation and a clear understanding of theconsequences. Only with this knowledge can timely alerts be issued and appropriate environmentalpolicies be implemented. As a consequence, we claim that environmental monitoring is not anymore aluxury for wealthy societies, but a necessity for all.
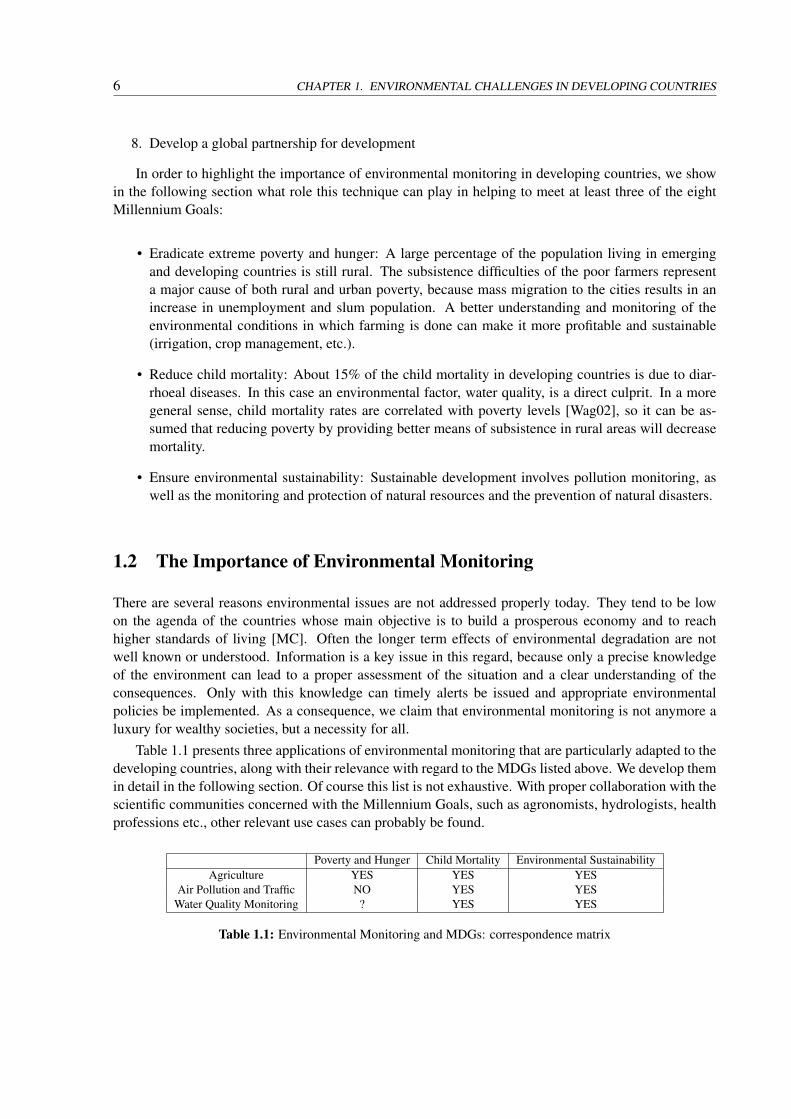
Table 1.1 presents three applications of environmental monitoring that are particularly adapted to thedeveloping countries, along with their relevance with regard to the MDGs listed above. We develop themin detail in the following section. Of course this list is not exhaustive. With proper collaboration with thescientific communities concerned with the Millennium Goals, such as agronomists, hydrologists, healthprofessions etc., other relevant use cases can probably be found.
Poverty and Hunger Child Mortality Environmental SustainabilityAgriculture YES YES YES
Air Pollution and Traffic NO YES YESWater Quality Monitoring ? YES YES
Table 1.1: Environmental Monitoring and MDGs: correspondence matrix

1.3. AGRICULTURE 7
1.3 Agriculture
1.3.1 Rationale
Agriculture is by far the human activity that uses the most of freshwater resources (65-70%). Worldwide,only 17% of the croplands are irrigated, but they account for 40 % of the global harvest. More than ever,water management has become vital for agriculture. Poor farmers around the globe, who survive on rain-fed farming, would more than double their average crop yield if they could use irrigation [HDM+06],[FotUN06], [TGCB04]. But for this to happen, irrigation techniques need to be made sustainable.
Generally speaking, it has been shown that irrigation efficiency in developing countries can be low[MTY05]. It is estimated that the overall efficiency of agricultural water use is currently lower than 30 %[Wal00]. Large losses occur in conveyance and distribution systems. Considerable volumes of waterare wasted due to inadequate irrigation management, which can also lead to water-logging or to soilsalinization (10 to 15 % of irrigated lands worldwide) [TM93], [SOF99]. Furthermore, due to overuse,irrigation is frequently responsible for the depletion of the groundwater table and loss of aquifer storagecapacity [DC07].
Better operation and management of irrigation water leads to significant savings and to a more sus-tainable use of water resources, as well as enhanced soil productivity [HDM+06, MTY05]. To achievethis, systematic monitoring is required for the soil water content in the root zone, as well as for other rel-evant variables (soil temperature, depth and salt content of the groundwater, climatic parameters, etc.).Indeed, real-time knowledge of these parameters would allow the farmer to define precisely the timeand the amount of water needed at each irrigation, based on the estimated needs of the plant at the corre-sponding stage of its development, and on the water available in the soil. As a result, the amount of waterused could be minimized, which would result not only in cost savings, but also in better preservation ofthe soil against salinization or water logging.
A proper environmental monitoring system for water management in agriculture has demanding re-quirements. Because of the spatial and time variability of the relevant parameters, continuous monitoringat several locations is necessary. In the cases where the amount of water is limited, an overview of thefields is necessary to determine the optimal distribution of water. This is especially true if the parcels arefragmented, as is the case in most developing countries, where the average land holding does not exceeda few hectares. In this situation, a community-based management of scarce water resources could leadto a more efficient use of these resources throughout the cropping season. As the optimal irrigation time-window is small, there is a strong real-time component. Finally, it is necessary to minimize intrusiveness,because free access to the fields is necessary throughout the cropping season.
1.3.2 Potential Applications
1.3.2.1 Irrigation Management
As the limits of groundwater exploitation are reached, farmers are beginning to invest in micro-irrigationtechnologies to conserve water. The cost of these technologies has been declining. For example, the costof trickle (or drip) irrigation equipment is US $0.03 per square meter or US$300 per hectare, easily af-fordable for those growing high-valued crops, and the equipment can be manufactured locally [WCS04],[Bra01]. This means that this technique is becoming attractive even for small farmers, as trickle irriga-tion can improve water use efficiency by up to 60 to 80 percent, compared to traditional surface irrigationtechniques [RTB98].

8 CHAPTER 1. ENVIRONMENTAL CHALLENGES IN DEVELOPING COUNTRIES
Because micro-irrigation efficiency depends on the adjustment of water provided to the water de-mand of the plant, improved environmental information is instrumental to its successful implementation,especially in a demand-based system.
A likely method is to determine significant thresholds in soil moisture as a function of soil, crop typeand crop growth stage, and to monitor the soil’s water content in order to know when to add water andhow much. Similar approaches have been proposed in the literature [GSR00], [MHH+96].
As shown in the survey on sensors that we present in Chapter 2 (Section 2.5), inexpensive soilmoisture sensors exist today. The fine-grained instrumentation of agricultural parcels is hence possibleat an affordable cost.
1.3.2.2 Pest and Disease Control
There is an interest in monitoring the probability of occurrence of pests or diseases based on the evolutionof climatic parameters (temperature, humidity, soil moisture). In this way, farmers can schedule more ef-ficiently the application of pesticides and fungicides and limit the associated monetary and environmentalcosts.
There are several environmental parameters susceptible to influence the emergence of pests and dis-eases in plants. Air humidity and temperature are known factors for a variety of crops, e.g. potato fungi[Bag05] or grapevines [CW03]. Soil moisture and leaf wetness often also play a role [AW00]. Wepresent appropriate sensors for such measurements in the next chapter.
The question of the time and space variability remains open. Air temperature and humidity can evolverapidly over time but usually slowly over space. However, cropping fields may present features of meso-or microclimates [BTB04], justifying dense environmental monitoring systems, if only for research andvalidation purposes. As for soil moisture, it may present high space variability but slow time response.Here again, clear scientific evidence is lacking to define the optimal granularity of measurements.
1.3.2.3 Other Applications
Many agricultural practices designed to improve productivity in the short-term can have devastatinglong-term effects. Intensive use of nitrogenous fertilizers can result into soil acidification [Moo]. Soilsalinization can be caused by excessive irrigation [TM93]. The same can provoke waterlogging or,on the contrary, water-table depletion. Control of all these phenomena would benefit from enhancedenvironmental monitoring techniques. Whereas it is still difficult today to assess the pH of the soilin-situ, simple piezometers can be used to monitor the level of the water table.
The appropriateness of installing measurement systems in the field for continuous monitoring needsto be carefully examined, however. Contrary to the previous use cases, these applications do not neces-sarily need a fast response, nor high granularity data.
1.4 Air Pollution and Traffic
In 2006, according to the last UN-habitat report, over 50% of the world’s population lives in cities. Inmany urban areas of developing countries, air pollution is a major concern, especially in the mega citiesof Asia [HKV02]. According to Romieu et al. [RKB04], “acute respiratory infections (ARIs) are themost common cause of illness and death in children in the developing world”.
One major challenge is to develop monitoring tools that can assess precisely pollution levels as afunction of the location and the time, in order to identify the precise causes of the problem (e.g. industrial

1.4. AIR POLLUTION AND TRAFFIC 9
plants, light or heavy vehicles’ traffic), to raise the awareness of the authorities and the civil society, andto take appropriate measures.
Using modeling tools, traffic emission factors and local measurements to ponder them, Zarate andClappier [Zar07] ran such a study in Bogota. They concluded that “traffic is the major contributor tothe plume of pollutants in Bogota” and “that strategies directed to mitigate air pollution might havecontradictory effects depending on the pollutant to be tackled”. They also recognized the importance ofinstrumenting a fleet of cars with sensors in order to obtain a more precise assessment of traffic emissionsover time and space for different types of vehicles, which was not possible at an affordable cost at thetime of their study.
Urban air pollution monitoring pursues a double goal. On one side,individual cars can have theirgas emissions monitored. On the other side, instrumenting the main crossroads and traffic routes withpollutant sensors would allow for warnings to be issued when pollution levels reach critical thresholds,and possibly for the traffic to be monitored accordingly, either based on instantaneous measurements orlonger trends (create one-way streets, modify traffic-lights periods, enforce limitation of traffic volumeduring peak periods, etc...).
The requirements for an air pollution monitoring system include several aspects. The real-time datais crucial for decision-making processes, such as: issuing air quality alerts, interrupting or rerouting thetraffic in certain areas, etc. The collection of extensive data over time and space is crucial, because it willenable a better understanding of urban air pollution and circulation behavior, and of the identification ofcritical periods and zones.
1.4.1 Potential Applications
Two different strategies can be adopted. One can instrument cars at the exhaust pipe, in order to assesstheir impact on the environment in a concrete context: a given city, a characteristic quality of fuel, typicaltraffic patterns and driving habits, etc. One would need to design a portable system making it possibleto store on the vehicle the data regarding speed, RPMs and gas emissions. These data would haveto be transmitted directly to a data management system for processing. A wireless technology seemsparticularly appropriate to facilitate this transfer. Known locations (such as domiciles or work places)could be equipped with data collection points (also called sinks, or base stations).
The whole system would then apply a store-and-forward mechanism that allows vehicles to keep thedata in memory until they opportunistically pass near a data collection point (e.g. at certain crossroads orgas stations). Public vehicles, taxis and private cars selected on a voluntary basis could be used. Findingsare targeted at policy makers primarily.
Another possibility is to instrument with sensors a grid of positions in the city - typically crossroads -in order to see how the emissions evolve over time at different time scales. In this model, sensors recordthe flow data about particle emissions and transmit them over wireless to a data management server. Anunprecedented wealth of data could then be used to refine and possibly adapt existing pollution models.The implications are again for policy making.
The ability to use low-cost automated sensors in order to conduct the needed experiments is crucial.Such sensors exist today, even if at the moment not all pollutants can be detected. Kanjo et al. [KL07]reported in 2007 on an experiment on air pollution monitoring in Cambridge (U.K.) using lightweightsensors mounted on bikes, which could detect carbon monoxide, nitrogen oxide, and nitrogen dioxide.

10 CHAPTER 1. ENVIRONMENTAL CHALLENGES IN DEVELOPING COUNTRIES
1.5 Water Quality Monitoring
In developing countries, diarrhoeal diseases are one of the main causes of child mortality [Wor03]. Thishigh death rate is directly correlated with the lack of sanitation and the consumption of polluted water.The United Nations Human Settlements Programme estimates that “systematic and sustained trackingand review of progress” of the sanitation system is important to “develop policies and programmes atnational and city-level targeted to improve services for the urban poor” [UNH]. This primarily concernsbiological contamination, mostly by fecal matters, because such contaminations lead rapidly to diarrhealdiseases that present high mortality rates, especially among small children. The chemical pollution ofwater, however, is also a serious environmental hazard, which is harder to track but leads to death bycancer or other diseases several years after exposure, claiming probably hundreds of thousands livesevery year [RBE+06].
Sensors may be used to sense water quality in the tanks and the distribution networks (as was donein 2007 in Boston for leakage detection [SNM07]). In the large cities of developing countries, thesenetworks are often under-documented. Hence, a dense network of sensors placed in the pipes has thepotential to help localize problems such as punctual and diffuse pollution sources or spills. It can also beused as an early warning system, in case of sudden degradation of water quality. In rural areas, water isalso directly extracted from wells or streams: these water sources can also be instrumented.
In this application, a major design issue is the development of inexpensive and reliable sensors forwater quality. More specifically, sensors monitoring biological contaminations -such as detection offaecal bacteria like E. Coli - are necessary. Currently, water analysis is usually performed in the labo-ratory where samples are cultivated to detect the growth of bacteria. This method is costly, takes time,and does not scale well. What is needed is the development of affordable automated sensors, that canmonitor fresh water sources in situ, without manual sampling and laboratory analysis. Methods for thishave been developed. E. Coli can be numbered in situ using gene-based remote detection technologies[LCF+05]. However, this method is not yet commercially available. Whereas, chemical water sensorsexist for pH and a variety of contaminants [RBE+06].
The system requirements of water quality monitoring are similar to the previous applications. Timeand space variability have to be dealt with, because contamination can occur at any time or anywhere inthe distribution network. The real-time aspect is also critical, due to the importance of reacting rapidlyin a case of water contamination. Finally, an automated collection is desirable, as pipes and wells are noteasily accessible by human staff.
As for potential applications, the general strategy would consist in instrumenting water distributionsystems at critical points, for both bacterial and chemical risks.
1.6 Agriculture and Water in India: a Brief Historical Perspective
In the previous sections, we have identified environmental monitoring applications that are of particularinterest for developing countries. Among them, agriculture seems an ideal candidate, because, on onehand it is related to well defined problems, and on the other hand the technology to solve them seemsmature enough to be deployed in the field. Now we focus on the special case of India by drawing ahistorical perspective that highlights the critical needs facing Indian agriculture today.
Large scale irrigation has been used for thousands of years throughout Asia, leveraging essentiallyon two lines of development: at the community level by the design and implementation of local watermanagement infrastructures such as dams and distribution networks, and through the action of emergingpowerful states, referred to as the first “hydraulic societies” [Wit57].

1.6. AGRICULTURE AND WATER IN INDIA: A BRIEF HISTORICAL PERSPECTIVE 11
At the local level, community irrigation systems were developed, essentially located in mountain-ous or hilly areas. Those systems were based on the intake from water streams (Himalayas) or on theconstruction of small tanks (India, Sri Lanka). They required community labor and management to gainaccess to and share water, and to minimize conflicts. Later on, increased socioeconomic heterogeneityas well as the intervention of the state in the construction or maintenance of weirs has often weakenedsocial cohesion and collective action. Nevertheless, the structures developed in the pre-colonial era serveeven today a significant portion of the total irrigated area [BM04].
In the Indus valley, a powerful agrarian society emerged as early as 3000 BC, based on large-scaleand government-led irrigation works [Wit57]. This early model of an hydraulic society led to a mas-sive economic development, because it provided a significant increase in food supply, which permittedpopulation growth, urbanization and development of alternative economic activities, such as trading andhandicrafts. However, it was always constrained by the availability of the one critical resource it re-lied on: water. Eventually, its sustainability was threatened by an increase of environmental problems,such as salinity or water shortage, which surfaced due to the intensification of irrigated agriculture. Inthe words of Barker [BM04], “it is worth noting that many of the ancient systems collapsed becausesocieties could not manage environmental problems”.
Under colonial rule, the occupant had to meet two conflicting goals: satisfying local market needs, soas to avoid unrest, and extracting as much surplus as possible. In semi-arid regions, dominant irrigationstrategies were to develop protective irrigation for famine prevention in years of drought, which oftenresulted in suboptimal land productivity [JMW96]. To this day, most large-scale systems in the Indo-Gangetic Plain are protective irrigation systems , “spreading the water thinly over a large area, regardlessof the degree of scarcity experienced” [BM04].
During the Cold War, the main concrete priority was to increase cereal grain production in order toattain food security. This triggered a Green Revolution (use of fertilizer, high-yielding varieties) but alsoa Blue Revolution (development and expansion of irrigation systems). The highest food-grain priceswere reached in the 1960s and 1970s, the same period where about 80% of the dams existing today inAsia were built [McC96]. Since then, however, Asia suffered a sharp decline in investments and largedam construction: cereal grain prices were divided by two. At the same time, construction prices rose,as did the opposition of the environmentalists.
During this period, following a top-down approach, public irrigation systems grew faster than thecorresponding regulation bodies, resulting in a failure to build community ownership and to foster coop-erative behavior at the local level [Hor98], [Jon95]. Foreign consultants promoted designs often inappro-priate for the developing-country situation; typically, optimistic design assumptions produced insufficientflows in pipes and led users to destroy facilities .
More recently, there has been a surge in private initiatives, as farmers, unsatisfied with governmentpolicies and projects started installing tube-wells or pumping from canals and drains. Such initiatives arehard to identify and quantify, as they are not officially acknowledged. Nevertheless, they enhanced theproductivity of the public sector’s investment in irrigation.
To summarize the effects of the Cold War years, the positive impact of irrigation on poverty reductionand in enhancing rural livelihoods is felt through increased employment, lower food prices, and morestable outputs. There are also multiplier effects and indirect effects. However, an unclear definition ofwater rights and the unequal distribution of water yielding assets created inequality. Concurrently, largescale irrigation works (typically dams) and unregulated use of groundwater and canal pumping at themicro level represent new threats to the environment [BM04].

12 CHAPTER 1. ENVIRONMENTAL CHALLENGES IN DEVELOPING COUNTRIES
1.7 India’s Agriculture Today
1.7.1 Facts and Figures
Since the early 1970s India has achieved food self-sufficiency. As reflected by the growing per capita in-come (USD 450, with purchasing power parity - ppp - USD 2’150), the rural poverty itself is decreasing:today, it reaches 33%, down from 56% in 1973-1974.
Even if the agriculture part of GDP is relatively small at around 24%, its share of employment isabout 67%. This agriculture remains largely rain-fed (60%). Nevertheless, the irrigation part is growing,as it is needed to sustain the general trend of a shift to a market economy. Although India is using onlyabout 57 percent of its total water resource potential at present, the country is already using about 66percent of its irrigation potential [oWR00].
Being a vast and monsoon-dependent country, India displays a wide variation across time and spacefor water resources availability. However, an average can be drawn for the effective water resourcepotential: 1’122 bn m3 per year. The projections for water requirements are sharply increasing. From644 bn m3 per year today, likely forecasts assess 784-850 bn m3 in 2025 [Sal04].
As a consequence, one witnesses an increasing supply-demand gap and a continuous decline in percapita water availability (in 1955: 5’277 m3, today: 1970 m3 [oWR00]).
The canal irrigation sector is developed and managed by public agencies. Its importance for dis-tributing water and recharging wells must not be underestimated. However, the inadequacy of the waterinstitutions’ projects and policies, and inequality of water distribution has led to a flourishing of privateinitiatives, which are mostly centered on exploitation of groundwater.
Groundwater irrigation is developed and managed by independent farmers, often illegally. It is esti-mated that 9.8 million electric and 4.4 diesel pump-sets are scattered across the country, as well as about10 million dug-wells [Sal04].
1.7.2 A Recent and Growing Concern: Water Scarcity
In rural India, the new era of globalization is marked by a shift from a subsistence society to a marketeconomy. This new economy is characterized by a new pressure on productivity, and by the shift to new,often water-demanding crops, such as cotton for instance. This situation is not exceptional in developingcountries, where irrigation demands recently grew to consume well over 70 percent of the total developedwater supplies [BM04].
Irrigation expansion has come to an end because developing more of the potentially utilizable wa-ter resources is costly. Raising ecological concerns has also led to the abandon of large scale irrigationprojects. As a consequence, the attention has turned to the improvement in the management and perfor-mance of existing irrigation systems.
Concomitantly, India (like the rest of Asia) is experiencing rapid growth in demand for water targetedat non-agricultural uses.
The consequence of this global trend is easy to imagine. Within the first quarter of this century, aprojected 400 million Indians will live in regions that experience severe water scarcity [SAM+98].
This situation is made worse by the sharp increase in the use of groundwater as primary source ofirrigation. Today it exceeds surface irrigation and threatens to alter the hydrology of the river basins, andto provoke irremediable environmental damage. While groundwater has contributed much to the growthin agricultural productivity, the over-exploitation of groundwater in the semi-arid regions is affecting boththe quantity and quality of water available for agriculture, domestic use, and other purposes [BM04].

1.8. INDIA TODAY: THE CURRENT INSTITUTIONAL FRAMEWORK 13
The culprit is often the poor level of public irrigation services [Jon95], [Hor98], which led individualfarmers to invest in the acquisition of pumps and to drill wells. These farmers may be less willing toparticipate in participatory irrigation schemes. But failure to maintain the surface irrigation systems can,in turn, affect groundwater recharge and increase the cost of pumping as groundwater tables fall.
Groundwater exploitation increasingly leads to the drying up of wells and rivers, as well as thesalinization of soils [SOF99]. Paradoxically, it can also lead to waterlogging in other areas, a state inwhich the subsoil water table is located at or near the surface. Excess water is accumulated in the rootzone of the soil. If the land is cultivated this results in a reduced yield of crops commonly grown.Uncultivated land is limited in its use because of the high subsoil water table. Waterlogging can also leadto irreversible soil salinization.
Groundwater depletion, on the other hand, is not a fatality. A 10 year study in Uttar Pradesh showsthat surplus monsoon water can be used to recharge underground aquifers and simultaneously providefarmers with better crop security [SC02]. This highlights the potential that innovative practices can havein the area of water management.
1.7.3 The Specific Case of Karnataka
It is to be noted that the region of main interest for the COMMON-Sense Net project, i.e. the semi-aridarea encompassing the main part of Karnataka and part of Andhra Pradesh has probably exhausted itspotential for rain-fed agriculture. A study by Droogers et al. from the International water ManagementInstitute [DSM01] comes to the conclusion that this area belongs to those absolutely needing more irri-gation to meet the needs of their growing populations. As a consequence, there is a large potential forincreasing food production through small-scale water harvesting systems that provide partial irrigationwhen water is most needed by the crops.
1.8 India Today: the Current Institutional Framework
During colonization, the British provided a highly centralized institutional framework. As a result mostcommunity-centered institutions and practices have lost their relevance and gradually disappeared. Un-fortunately, most water institutions, which were developed in an era of water surplus, especially duringthe colonial period, are becoming increasingly ineffective in addressing water challenges as the countryenters an era of water scarcity [Sal04]. Although the State and nationwide governance is often ineffectiveat tackling the problem globally, the situation in the villages shows local improvisations that try to copewith the new constraints faced by the population.
1.8.1 States and Central Government
The water legal framework can be broken down into three components: the law itself, the policy estab-lished by the government to achieve the intended goals, and the structure of the administration put inplace to reach the target.
There is no separate water law, but a profusion of water-related legal provisions that fail to reflectthe current conditions of water scarcity and water conflicts. While States have jurisdiction over water-resources within their borders, the central government has the prerogative to resolve interstate disputesand to foster inter-state legal harmonization. However, it does not have the means to enforce thesedecisions because of the present constitutional division of power. The water rights themselves are ill-defined. Individual rights to both surface water and groundwater are recognized indirectly through land

14 CHAPTER 1. ENVIRONMENTAL CHALLENGES IN DEVELOPING COUNTRIES
rights, which accentuates discrimination and inefficient water use . There is a groundwater permit system,but it fails to set withdrawal limits [Sal04].
The water policy relates to the declared statements, as well as the intended approaches, of the centraland state governments for water-resource planning, development, allocation, and management. Today,it recognizes the role of private sector participation. This marks a shift from water development toperformance improvement. However, it failed to identify the necessary institutional mechanisms andto enforce its recommendations. As for water pricing policy, despite the traditional view of water as apublic good, it is more and more acknowledged that if the method and level of water rates are such asto capture and convey the scarcity value of the resource, they can both induce efficiency and ensure fullcost recovery at the same time [Sal04].
The water administration framework is more effective. Although the state government has a dom-inant role, local governments such as municipalities and panchayats (village councils) unions also playan important role in the drinking water supply. Similarly, while irrigation departments have a larger rolein the provision and management of irrigation, users and stakeholder groups are also encouraged to getinvolved in cost recovery and management at the outlet and system levels. As for regulatory arrange-ments, however, a very ineffective top-down approach is still in place. There exists little harmonizationbetween states, and no credible enforcement mechanism at the top-level [Sal04].
1.8.2 Local Institutions
The situation at the local level is characterized by a sense of improvisation and self-organization. Admit-tedly, there are a variety of cooperatively-operated and community managed irrigation activities rangingfrom lift irrigation schemes in canal and groundwater areas, to water harvesting and sharing arrange-ments in arid and mountain areas. These can help developing a form of water rights in a canal region.This inheritance from the past, however, has been damaged by an inefficient centralization, which oftenresulted in a degradation of the proposed service [Sal04].
Private initiative, as we saw, widely took over. The expanding phenomenon of pump-set rentals is anindication of the existence of surplus pumping capacity, particularly in the case of diesel pump-sets. Inview of the monopolistic or oligopolistic tendencies in these markets, not only are the water rates severaltimes higher than the pumping cost but also the price and non-price discriminations remain pervasive.The root cause for the sub-optimality of these groundwater markets lies not so much in their economicand organizational aspects but in the legal and institutional vacuum within which they operate at present[Sal04].
1.9 Conclusion
In this chapter, we have sought to emphasize the role of the environment in the social and economicdevelopment of DCs. Agriculture itself represents a huge challenge in this area, as the outlook that wehave given of Indian farming very well illustrates. Many DCs, India among others, suffer from increasedwater scarcity. This situation will only get worse because of demographic pressure, improved livingstandards and climatic changes. It has become urgent to investigate new ways of increasing productivity,especially as this sector is in crisis, not only because of the water issue, but because of institutionalflaws and infrastructure disrepair. Often, the institutional trend has been a progressive deteriorationin the authority of operating agencies. One clear symptom of that trend is the destruction of systeminfrastructure by the farmers, because they have no means of verifying fairness of water delivery andthere is no clarity or transparency in the operation.

1.9. CONCLUSION 15
A crucial point is on-the-spot environmental knowledge, which requires enhanced environmentalmonitoring. In this context, it seems appropriate to try and apply new information technologies in orderto build a modern infrastructure that farmers can benefit at the local level. A bottom-up approach hasour preference. The crisis of institutions would make a top-down approach ineffectual. Although ruralcommunities suffer from the obsolescence of once thriving commonly-maintained infrastructure, theircapacity for improvisation is an asset in the search of applications.
In the next chapter, we investigate the state of the art in environmental monitoring. In the subsequentones, we will see how this can be transposed to the problems specific to developing countries. We willuse rural India as a test-case throughout.

16 CHAPTER 1. ENVIRONMENTAL CHALLENGES IN DEVELOPING COUNTRIES
Chapter 2
New Opportunities for EnvironmentalMonitoring and Agriculture
Before moving to the specific case of the rural areas of developing regions, let us examine the currentstatus of environmental monitoring for agriculture, regardless of the context where it is used.
Attempts at monitoring the cropping field’s environment are as old as agriculture. The close ob-servation of climate-related phenomenons and their effect on soil and crop alike are instrumental in thedefinition of any efficient cropping strategy, be it for crop selection, choice of sowing and harvesting win-dows, or irrigation schedules. More recently, the Green Revolution put to the use advanced fertilizingand irrigation techniques that benefit from improved sensing technologies, especially for soil monitoring.
Traditionally, however, a precise monitoring of the farming environment has always be seen as costly,for two reasons: The price of the sensing technology, and the human cost of manually collecting infor-mation from the sensors. More recently, automated sensors have started to appear in the cropping field.Until the recent advent of wireless sensor networks, however, such systems were cumbersome to deployand to maintain.
In this chapter, we describe the new opportunities for agriculture represented by state-of-the-art sen-sors (Section 2.5) and wireless sensor networks (Section 2.3), before presenting concrete test-cases inthe domain.
2.1 Usual Techniques
2.1.1 Stand-Alone Sensors
Inexpensive, portable and reliable sensors for air temperature, atmospheric pressure or humidity haveexisted for decades. More recently, stand-alone sensors with data-logging capability have been developedfor a wealth of physical phenomena, which has fostered the development of the technique of manual in-site reading, the most widely used today. Sometimes the sensors are connected to a data logger with theability to store data that can be retrieved at a later stage. This technique, which is essentially cumbersomeand work intensive, remains attractive in the developing countries, due to the low price of labor. However,it still limits significantly the time resolution and the responsiveness of the system, and leaves a large partto human error.
17

18 CHAPTER 2. NEW OPPORTUNITIES FOR ENVIRONMENTAL MONITORING AND AGRICULTURE
2.1.2 Laboratory Analysis
Traditionally, precise assessment of soil status was made by manual sampling and laboratory analysis.Such a technique is still widely used today for the analysis of chemical and biological contaminants, andas a reference technique to assess the performance of in-situ sensors.
2.1.3 Remote Sensing
We refer to remote sensing as the use of imaging sensor technologies to assess physical parameters,in general aboard aircrafts and satellites. For instance, remote sensing can be used to derive droughtconditions from electromagnetic radiation. It has been shown that even crop yields can be predicted5 to 13 weeks prior to harvests using remote-sensing techniques [UK98]. The satellite used to assesssoil moisture until recently was the AVHRR (Advanced Very High Resolution Radiometer), which has atime resolution of 10 days and a space resolution 10 km. Its recent successor is the Moderate-ResolutionImaging Spectrometer (MODIS), an advanced narrow bandwidth sensor, from which reflectance dataare made available at no cost every 8 days by NASA and USGS, through the Earth Resources Obser-vation Systems (EROS) data center. Raw images are available on a daily basis, but their use involvesconsiderable extra processing. MODIS’ spatial resolution is around 500m [TGS04].
Such a solution is minimally intrusive and allows for the monitoring of wide areas, including coun-tries or continents. However, it only works for electromagnetic radiation, which limits it to phenomenaaffecting the atmosphere and the shallow layers of the soil (down to 10 cm at most). The deeper layers(the root zone) are beyond the reach of such a system. For this reason, and because in remote sensing thephysical parameters are assessed indirectly – through interpretation of the electro-magnetic spectrum –obtaining complementary data from ground sensors is usually desirable.
Another limitation of satellite sensing is that the frequency and delay of data depend on the satellite’sorbit. It is not suitable for a real-time application if the continuous monitoring of a parameter is needed,especially if the required space resolution is high.
2.1.4 Telemetry
Telemetry using cellular networks such as GSM is widely used today. It presents the advantage of wideand rapidly expanding coverage. The main issue to take into consideration for the use of such systems isthe issue of cost. In particular, communication costs are prohibitive for messages sent several times perhour by a large number of sensors over a long period of time. Here a store-and-forward method can beused to send data in bulk, at the expense of responsiveness.
2.2 Wireless Sensor Networks
A wireless sensor is a self-powered computing unit usually containing a processing unit, a transceiverand both analog and digital interfaces, to which a variety of sensing units – typically sampling physicaldata, such as temperature, humidity etc. – can be adapted (see Figure 2.1 as an example). These sensorsautomatically organize themselves into an ad-hoc network, which means they do not need any preexistinginfrastructure, as do cellular networks such as GSM. For this reason, we refer to such a network as anad-hoc Wireless Sensor Network, which we denote as WSN throughout this document.
The sensor nodes communicate with each other in order to exchange and process the informationcollected by their sensing units. In some cases, nodes can use other wireless sensors as relays, in which

2.3. DESIGN DIMENSIONS IN ENVIRONMENTAL MONITORING 19
Figure 2.1: Wireless sensor with 2 alkaline batteries, a connector to 2 soil moistureprobes, and its weatherproof casing
case the network is said to be multi-hop. If nodes communicate only directly with each other or witha base station, the network is single-hop. In a data-collection model, sensors communicate with one orseveral base stations connected to a database and an application server that stores the data and performsextra data-processing. The result is available typically via a web-based interface 2.2. Recently, WSNshave raised considerable interest in the computing and communication systems’ research community.They have decisive advantages, compared with the technologies previously used to monitor environmentsvia the collection of physical data. Whenever physical conditions change rapidly over space and time,WSNs allow for real-time processing at a minimal cost. Their capacity to organize spontaneously in anetwork makes them easy to deploy, expand and maintain, as well as resilient to the failure of individualmeasurement points. Wireless sensors are order of magnitudes cheaper than traditional weather stationsconnected to cellular networks. Although they remain expensive at the moment (a few hundred USdollars for a typical weather station [BIS+08]) because they have yet to evolve from laboratory prototypesto off-the-shelf products, most analysts rely on Moore’s Law to predict a price per unit of a few US dollarswithin 5 to 10 years for light-weight applications using cheap off-the-shelf sensors, such as temperaturemonitoring in buildings.
2.3 Design Dimensions in Environmental Monitoring
In any environmental monitoring application, many design dimensions need to be taken into accountbefore choosing the appropriate technology to deploy. Based on the requirements of typical applicationsand our own experience, we propose the following dimensions to be the building blocks of any multi-criteria decision for a system designer.
Spatial scale: What is the size of the area to be instrumented? This can vary from single point ifthe phenomenon is to be observed at a single location, to local if the area spans a few hectares or square

20 CHAPTER 2. NEW OPPORTUNITIES FOR ENVIRONMENTAL MONITORING AND AGRICULTURE
Figure 2.2: Typical (Hybrid) Wireless Sensor Network Architecture
kilometers, to regional if an entire city or district must be instrumented, and even to global for largerareas (provinces, countries etc.).
Time scale: How long must the phenomenon be observed? We can distinguish one-time phenom-ena, where a single measure is sufficient, short-term phenomena, lasting a few days or weeks, seasonalphenomena, lasting several months, and permanent phenomena, supposed to last an indefinite time.
Spatial variability: How many measurement points are necessary to model a given phenomenonover the monitored area? We can distinguish dense phenomena and sparse phenomena.
Time variability: How fast does the phenomenon evolve over time? We can distinguish fast varyingphenomena, which vary at a time scale in the order of the second or the minute, and slow varyingphenomena, which remain constant several days, weeks or more.
Responsiveness: What is the time period, within which the environmental information must be madeavailable to the user? We can distinguish off-line systems, where data can be retrieved after an arbitrarylong time and real-time systems, with stringent response-time requirements.
Non-accessibility: Is the area to monitor remote or difficult to access?Non-Intrusiveness: Must the monitoring system be invisible and non-conflicting with any activity
happening in the monitored area?Deployment and Maintenance Costs What is the cost to deploy and maintain the system? This
includes the hardware and software costs incurred by the system, and also the price of labor necessary toaccomplish these tasks.
Wireless sensor networks present attractive characteristics when the requirements of one or severalof these dimensions are high. We detail these technical characteristics in the following sections.
2.4 Where Do WSNs Stand?
In this section, we describe the main technical characteristics and capabilities of WSNs with regard tothe design dimensions that we introduced in the previous section.
2.4.1 Wireless Networking
Organizing the sensors into a network allows for real-time collection of a large number of measurementpoints at a minimum human cost and effort. As such it enables the monitoring of phenomena of highvariability, both in time and space. It also makes it possible to retrieve data in real-time from locations

2.4. WHERE DO WSNS STAND? 21
that are difficult to access, either temporarily or permanently, thus addressing stringent responsivenessand accessibility requirements.
The wireless component makes the monitoring system minimally intrusive in places where wireswould disturb the normal operation of the environment to monitor. It reduces the installation costssignificantly, as it is estimated that typical wiring cost is US$ 130–650 per meter and adopting wirelesstechnology would eliminate 20–80% of this cost [WZW04].
Because WSNs are constrained by size and power consumption, they use low-power radios. In orderto achieve spatial scalability, most networks use multi-hop transmissions, meaning that each node canplay the role of a relay between two or more communicating nodes.
2.4.2 Self-Organization
By self-organization, we mean that the nodes do not need any configuration in order to be operationalonce installed. In order to achieve this, each node is programmed to run a discovery of its neighborhood,specifically to recognize which are the nodes that it can hear and talk to over its radio.
In typical wireless networks, each sensing node is supposed to send back its information to a base-station, or sink, which is connected to a data management system. This is known as the data collectionparadigm. In this model, nodes send data either periodically or as responses to events, typically threshold-based alerts or user explicit queries (e.g. what is the current temperature at a particular location, what isthe mean soil moisture content in a given area, etc.).
In order to send data in an optimal manner to the base station, nodes organize themselves sponta-neously into a data-collection tree, meaning that each node will choose a preferred parent, to which itwill send its data. On the other hand, each node can have several children. Several metrics can be usedto build the tree. Usually, the technique is based on a shortest path algorithm using the number of hopsto the base station.
The protocol typically runs as follows: The base station sends periodical beacons, which are selec-tively retransmitted by the nodes that receive them. Each beacon contains a hop-count, set to 0 by thebase station and incremented by 1 at each retransmission. Upon reception of a beacon, a node storesits hop-count as its own if it is smaller than the one it currently has (initially the hop count is infinite).A node retransmits a beacon only if its hop-count is smaller than its own. A typical example is theCollection Tree Protocol (CTP) defined within the TinyOS operating system for WSNs [FGJ+].
Using self-organization reduces notably the maintenance costs and allows for spatial scalability.
2.4.3 Efficient Power Management
Wireless Sensor Networks can be deployed in remote or difficultly accessible areas. As a result, theyoften cannot rely on the power grid for their energy source, and need to use either batteries or energyharvesting techniques such as solar panels [KYH+05]. In order to reach lifetimes of several months oryears, WSNs not only use energy-efficient micro-controllers and radios, but implement power-efficientschemes at the Medium-Access layer. Thanks to that, they allow for long-lasting deployments in loca-tions that are difficult to access or where minimum intrusion is required.
2.4.3.1 Medium Access Control
At the Medium Access Control layer, two large classes of protocols can be identified. Asynchronousschemes rely on the nodes coordinating their activity simply by listening to the medium, whereas insynchronized schemes, extra traffic is exchanged to keep the communicating devices in sync.

22 CHAPTER 2. NEW OPPORTUNITIES FOR ENVIRONMENTAL MONITORING AND AGRICULTURE
Asynchronous Schemes In this class of protocols, no synchronization is assumed between the nodes.In order to save energy, nodes go to sleep whenever they are inactive (which in a typical environmentalapplication is most of the time). They only wake-up periodically to perform their task and to listenfor possible incoming packets. As there is no synchronization, nodes that send packets need to sendpreambles that have a length corresponding to a duration at least equal to the period of sleep. This incursextra energy for emitting the packet (100% of the energy to emit the preamble) and for receiving it (inaverage 50% of the preamble) but allows for duty-cycles in the order of 1%. In order to reduce the cost ofoverhearing, the preamble can repeat the address of destination. B-MAC is an example of such a scheme[PHC04], widely used in TinyOS [tos].
Synchronized Schemes In synchronous schemes, nodes use a TDMA1-based transmission schedule.In other terms, communicating nodes send regularly synchronization beacons to prevent their internalclocks from drifting, to advertise which time-slots are available at a certain point in time, and to reservefree time-slots for their own use. This way, the periods of sleep are perfectly synchronized, whichremoves the necessity to send long preambles before the packets.
In a multi-hop data collection environment, each node has to maintain two schedules: the scheduleset by its parent, and the schedule it defines itself for its children. Dozer [BvRW07], designed andimplemented on the Tinynode [tin] platform, uses such a scheme, achieves a duty cycle of 0,2% andclaims a lifetime of up to 5 years for a typical data collection application.
Asynchronous schemes are notoriously simpler to implement than synchronized schemes, but areless-efficient for applications requiring very low duty-cycles. In any case, the choice of an appropriateMAC scheme is highly application-dependent.
2.4.3.2 Mobility for Load Balancing
A main concern for multi-hop data collection networks is that the nodes closest to the base station,relaying all the traffic en-route to the sink, will deplete their batteries faster. Mobility is a possibleanswer to that question, either by rotating or moving the base station according to a carefully establishedschedule, as is done for instance in the Mobi-Route protocol [LH05], [LPP+06], or by using mobileagents to manually bring the sink to the nodes, as in the work on data mules by Shah et al. [SRJB03].
The data mule approach is related to the body of work on Delay-Tolerant Networks (DTN) [HF04],because nodes need to wait for the sink to come to them. In other words, they cannot send directly thedata, they have to use a store-and-forward strategy. Such an approach is hence not adapted to applicationswith stringent response-time requirements.
2.4.4 Modularity
For widely distributed applications – for instance agricultural plots –, purely ad-hoc networks are anunsatisfying answer because of the limited range of their radio. This is an issue for:
1. minimizing the numbers of nodes to deploy by limiting the number of necessary relays,
2. ensuring Internet connectivity: a WSN cannot always be deployed close to an Internet access point,
3. addressing energy issues: servers usually need to be connected to the power grid because of theirpower consumption requirements.
1Time Division Multiple Access

2.5. SENSORS AND AGRICULTURE 23
Hybrid solutions have been widely investigated [LLT03], [MLV03], [SM05], etc. In general, theanswer to that problem revolves around the use of bridges (GSM, 802.11) between the WSN and externalmodules of the application (typically, a web-based management and data-processing system). This allowsfor the partitioning of the network into possibly far-away clusters, each connected to the central serverthrough a bridge.
Modularity allows for an increase in responsiveness, accessibility and space scale.
2.4.5 Web-based Data Management
With all the features described above, WSNs allow for the collection of an unprecedented wealth of data.The storage, mining and processing of these data then becomes an application-specific challenge in itself.
One might argue that this part is not specific to WSNs, as other environmental systems have the samedata display and processing requirements. However, the requirements for a data storage and processingsystem are particularly high for wireless sensing, because of the amount of data that are collected. Assuch web-based management can be considered an integral part of a WSN-based environmental moni-toring system.
Generic platforms exist for the collection and display of data in a geographical context. For example,Global Sensor Networks (GSN) [AHS06] and SenseWeb [NLZ07], both are web-based tools integratingGeographic Information Systems (GIS) features for the display of sensing data.
2.5 Sensors and Agriculture
Sensors have been used in precision agriculture for years. They are used in convergence with other tech-nologies like the Global Positioning System (GPS), Geographic Information Systems (GIS), miniaturizedcomputer components, automatic control, remote sensing, mobile computing and advanced informationprocessing and telecommunications.
In the following per-parameter state-of-the-art review, we focus on sensors that work in an automatedfashion, come at a reasonable price, and can be easily adapted to an existing system.
2.5.1 Soil Moisture
The soil moisture (or soil water) content is defined as the quantity of water contained in the soil. Thisquantity is calculated as a volumetric or gravimetric ratio between water and the soil. The most com-monly used metric is water content per volume θ, which links water volume Vw to the total volumeVt:
θ = Vw/Vt (2.1)
There are several methods to assess this ratio. Direct Methods consist in weighing explicitly thewater contained in a portion of soil, and in deriving the gravimetric or volumetric relative water content.Indirect methods consist in assessing this content by computing soil characteristics that change as afunction of soil moisture.
2.5.1.1 Direct Method: Gravimetric Method
This method is used as a reference to assess the efficiency of other techniques. The experimenter takessoil samples, weighs them, dries them in an oven (105 oC), reweighs them, and infers mass humidity:
w = (Mh −Md)/Md (2.2)
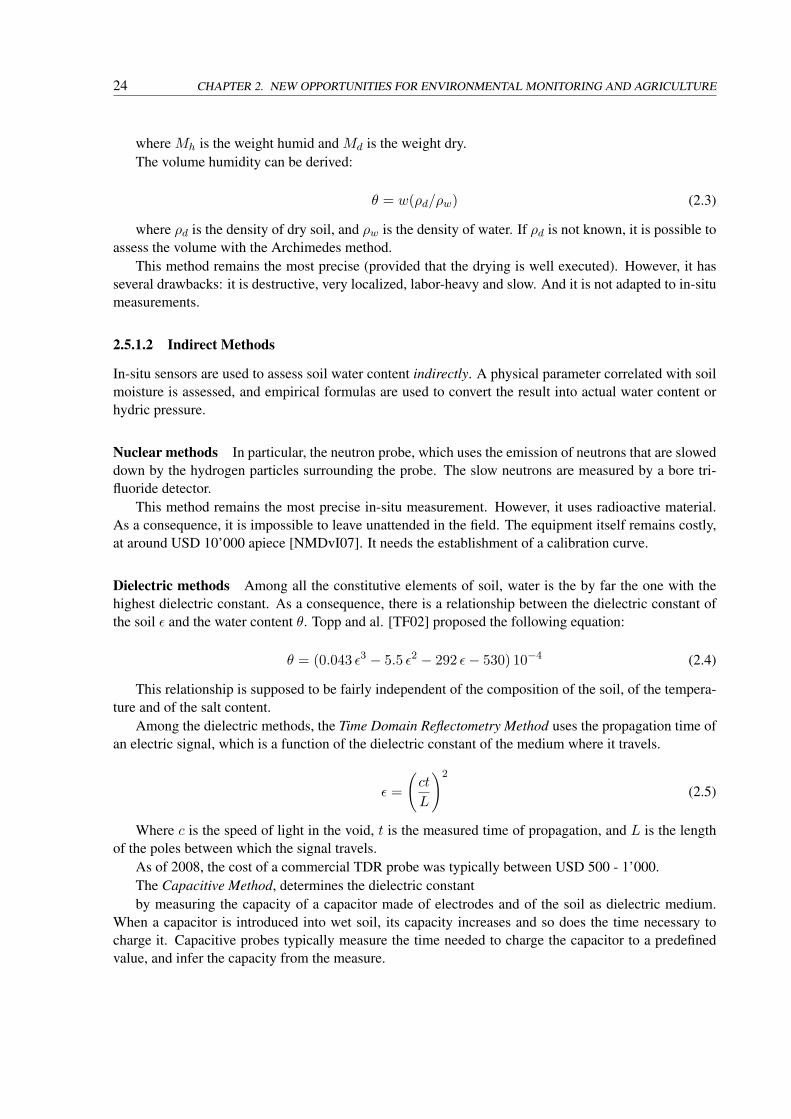
24 CHAPTER 2. NEW OPPORTUNITIES FOR ENVIRONMENTAL MONITORING AND AGRICULTURE
where Mh is the weight humid and Md is the weight dry.The volume humidity can be derived:
θ = w(ρd/ρw) (2.3)
where ρd is the density of dry soil, and ρw is the density of water. If ρd is not known, it is possible toassess the volume with the Archimedes method.
This method remains the most precise (provided that the drying is well executed). However, it hasseveral drawbacks: it is destructive, very localized, labor-heavy and slow. And it is not adapted to in-situmeasurements.
2.5.1.2 Indirect Methods
In-situ sensors are used to assess soil water content indirectly. A physical parameter correlated with soilmoisture is assessed, and empirical formulas are used to convert the result into actual water content orhydric pressure.
Nuclear methods In particular, the neutron probe, which uses the emission of neutrons that are sloweddown by the hydrogen particles surrounding the probe. The slow neutrons are measured by a bore tri-fluoride detector.
This method remains the most precise in-situ measurement. However, it uses radioactive material.As a consequence, it is impossible to leave unattended in the field. The equipment itself remains costly,at around USD 10’000 apiece [NMDvI07]. It needs the establishment of a calibration curve.
Dielectric methods Among all the constitutive elements of soil, water is the by far the one with thehighest dielectric constant. As a consequence, there is a relationship between the dielectric constant ofthe soil ε and the water content θ. Topp and al. [TF02] proposed the following equation:
θ = (0.043 ε3 − 5.5 ε2 − 292 ε− 530) 10−4 (2.4)
This relationship is supposed to be fairly independent of the composition of the soil, of the tempera-ture and of the salt content.
Among the dielectric methods, the Time Domain Reflectometry Method uses the propagation time ofan electric signal, which is a function of the dielectric constant of the medium where it travels.
ε =
(ct
L
)2
(2.5)
Where c is the speed of light in the void, t is the measured time of propagation, and L is the lengthof the poles between which the signal travels.
As of 2008, the cost of a commercial TDR probe was typically between USD 500 - 1’000.The Capacitive Method, determines the dielectric constantby measuring the capacity of a capacitor made of electrodes and of the soil as dielectric medium.
When a capacitor is introduced into wet soil, its capacity increases and so does the time necessary tocharge it. Capacitive probes typically measure the time needed to charge the capacitor to a predefinedvalue, and infer the capacity from the measure.

2.5. SENSORS AND AGRICULTURE 25
∆V =Q(t)dεA
(2.6)
Where A is the surface of the capacitor, ∆V the predefined voltage differential, t the time to reachthis differential and Q an exponentially decreasing function.
In Frequency Domain Reflectometry, the capacitor is connected together with an oscillator to form anelectrical circuit. Changes in soil moisture can be detected by changes in the circuit operating frequency.
There is a wide variety of probes using the fequency domain reflectometry method, and they usuallycome at an affordable price [sms]. As an example, the ECH2O sensors are available at a price of aroundUSD 80. Their simple mode of operation: the input is a short pulse of DC, the output a voltage, makethem an attractive option. The experimental results via dataloggers [NMDvI07] or wireless sensors[Rou08] are encouraging. The observed margin of error was around 4% [Rou08].
The Resistivity Method, uses a resistor embedded in a semi-porous material. The resulting probe isburied in the soil, where the semi-porous material comes little by little in a water-potential equilibriumwith the surrounding soil. Gypsum blocks and watermarkTM sensors are examples of such probes, whichcost between 5 and 30 USD. Watermarks typically have a 10% error margin, although the rate of faultyprobes is reported on web-forums to be quite high (up to 30%)
2.5.2 Soil Salinity and PH
In the current state of the technology, it is not possible to assess separately in-situ the different chemicalcomponents of the soil, such as nitrates, phosphates or potassium [Phi08], which at the proper concentra-tion are important nutrients for the plant. Instead, salinity and pH are measured, using similar electricalmethods as described in the previous section about soil moisture. Salinity indicates the total concentra-tion of soluble elements. PH is a measure of the acidity or alkalinity of the medium and as such indicatesthe availability of nutrients to plants. The shortcoming of these methods is their inability to discrimi-nate between the components, and to know their respective concentrations. Moreover, it is impossible toignore elements of little interest, such as carbonates, sulfates or chlorides.
Soil salinity and pH in-situ sensors exist on the market today [Mat04], [SCH07] [OI67]. To thebest of our knowledge, there are no commercially available in-situ soil nutrient sensors. However, somepromising technologies are under development, and commercial products are likely to appear in theyears to come. In particular, the use of electrochemical sensors yielded promising results in the recentpast [LNTN+07].
2.5.3 Climatic Variables
We restrict ourselves to the usual components of a weather station, and we focus our attention on inex-pensive sensors that can be easily adapted to analogous or digital channels of a custom data logger (ora wireless sensor). The sensors we took into consideration take a simple AC or DC current input, andprovide either a digital or analogous (voltage) response.
In fact, all the sensors described below have been tested in the context of a wireless sensor networkdeployment [SDF].
Air Temperature and Humidity Many commercially available sensors exist for this. We have hadexperience with the SHT75 manufactured by Sensirion. The SHT75 is a digital temperature and humiditysensor2 that has a relative error of ±0.3◦C in temperature, and of ±2% in humidity.
2Its cost in 2008 was around USD 30 apiece

26 CHAPTER 2. NEW OPPORTUNITIES FOR ENVIRONMENTAL MONITORING AND AGRICULTURE
Wind velocity and direction Many commercially available sensors exist. Among the most popularproducts in the scientific community, Davis proposes an anemometer3 assessing wind direction and speedat an accuracy of ±5% in speed and ±7◦ in direction.
Precipitations Here again, there are many rain gauges to choose from on the market. The Davis RainCollector4 is advertised as a high-accuracy tipping bucket. Experimentally, its performance was assessedat ±10% [SDF].
2.6 WSNs in Agriculture
Wireless sensor networks, a light-weight sensing and communication system necessitating little, if any,network configuration and maintenance, are entering their maturity phase as this thesis is being writ-ten. There are no examples of commercial applications to date. However, in recent years a number ofinvestigations have been conducted by scientists in realistic agricultural settings.
2.6.1 Vineyard Temperature Monitoring
In 2004, Beckwith, Burrell et al. [BBB04], [BTB04] reported on the use of sensor networks for integratedmanagement of a vineyard. Using an ethnographic approach, they first assessed the needs of vineyardmanagers, before designing and deploying a system in the field.
Their work was motivated by the primary importance of temperature in the development of grapes toensure wine quality. Because of the costs of environment monitoring, most vineyard owners have so farused single sensors for this purpose. However, at the vineyard scale, the climate is a microclimate.
Field work was conducted by Beckwith et al.[BTB04]. 48 nodes were deployed over a period of morethan 6 months in an Oregon vineyard, reporting temperature every five minutes. The results were loggedin a centralized way and could be displayed on a map and retrieved on a per-sensor basis. Moreover,alarms were sent when the temperature decreased below 0, indicating a risk of frost. The history of thetemperature variations throughout a cropping season are especially critical. Variation in fruit maturitywithin a management block (i.e., intrablock heterogeneity) is a well-known phenomenon and vineyardowners adapt their harvesting strategy accordingly.
• Organization Intel Research
• Application Vineyard fine-grained temperature monitoring
• Deployment duration 6 months
• Distance between nodes 15 to 25 meters
• Size of the network 48 nodes. 16 backbone nodes, and 3 leaf nodes for each of them
• Average lifetime 6 weeks for the backbone nodes, which were running at a 20% life-cycle.
• Networking platform Mica2 [xbo]
• Sensing platform Sensirion SHT
• Performance 77 % packet delivery rate
3Cost: around USD 120 (2008)4Cost: around USD 75 (2008)
2.6. WSNS IN AGRICULTURE 27
2.6.2 Potato Disease Prevention
In 2005, Baggio [Bag05] presented the initial results of the Lofar project in the monitoring of micro-climates in a crop field. The deployed WSN monitored humidity and temperature in order to better fightphytophtora in a potato field.
In Baggio’s words, “phytophtora is a fungal disease which can enter a field through a variety ofsources. The development and associated attack of the crop depends strongly on the climatologicalconditions within the field. Humidity is an important factor in the development of the disease. Bothtemperature and whether or not the leaves are wet are also important indicators.” The goal of the WSNdeployment is to predict the emergence of the disease and to schedule fongicide treatment only whenneeded.
The authors only reported on the pilot study, however. The full-size network has not been deployedyet.
• Application Lofar
• Application Fungus management in a potato field
• Deployment duration 1–2 months
• Distance between nodes 15–30 meters
• Size of the network 150 nodes (pilot study 12)
• Average lifetime Not disclosed
• Networking platform Mica2 [xbo]
• Sensing platform Sensirion SHT
• Performance Not disclosed
2.6.3 Tomato Disease Prevention
Mancuso and Bustaffa deployed in 2006 a small wireless sensor network in order to monitor the emer-gence of certain diseases in a greenhouse: gray mould, leaf mould and powdery mildew. The goal ofthe deployment was to explore the potential of WSNs for the control and maintenance of temperature,relative humidity and CO2 concentrations within optimal limits.
• Application Rinnovando S.R.L, Nemo S.R.L
• Application Tomato disease monitoring
• Deployment duration Unknown
• Distance between nodes 6.5–12.5 meters
• Size of the network 7 nodes
• Average lifetime Not calculated (1 year claimed)
• Networking platform Sensicast
• Sensing platform Sensirion SHT71 (air temperature and relative humidity), Picotech PT100 plat-inum resistance thermometer (soil temperature)
• Performance Not disclosed

28 CHAPTER 2. NEW OPPORTUNITIES FOR ENVIRONMENTAL MONITORING AND AGRICULTURE
2.6.4 Cattle Monitoring
Recently, two projects have addressed the possibility of using WSNs to monitor cattle in a farm [BHSA+07],[RW06].
Radenkovic and Wietrzyk [RW06] explore the potential of wireless sensor networks for nationwidecattle monitoring systems. Each wireless sensor acts as an extended RFID collar storing the identityand health status of the animal, which can be tracked at different locations, such as pasture or farmbuildings. Each location is equipped with a base station opportunistically recording the informationfrom the collars as the animals come into its range. The system was so far evaluated through extensiverounds of simulations.
Bishop-Hurley et al. [BHSA+07], tested in-situ the responsiveness of cattle to electrical and audiostimuli designed to modify their behavior and prevent them from crossing a line in an experimental alley.Cattle were equipped with collars containing a GPS receiver for positioning and a wireless transceiversimilar to a wireless sensor. The sensed data here is the positioning of the animal. Each collar communi-cated to a base station connected to a server responsible to analyze the received signals and to generatethe appropriate cues. The goal was to design a virtual fencing application replacing expensive wiredfences in extensive grazing systems.
• Organization CSIRO
• Application Virtual fencing
• Deployment duration punctual experiments
• Distance between nodes 0-40 meters
• Size of the network 25 nodes
• Average lifetime Not calculated
• Networking platform Proprietary
• Sensing platform GPS receiver
• Performance Not disclosed
2.6.5 Paddy Field Monitoring
Hirafuji et al. developed the concept of Field-Monitoring Server, a Wi-Fi based wireless sensing plat-form that was applied in settings as various as Earth observation, urban image monitoring and agriculture[HNK+07]. They report on the deployment of a network of 5 nodes in paddy fields. Taking an agnosticapproach to the current view on WSNs, they contend that agricultural monitoring systems need enhancedcapabilities, such as wireless broadband communication and high-resolution image-monitoring technol-ogy. In their words, “specific data such as images of emerging rice blast are indispensable to revise theprediction system”. However, concrete results on how to process this information and for what benefithave not been published yet.
• Organization Japanese National Agricultural Research Center
• Application Paddy fields Monitoring
• Deployment duration Unknown
• Distance between nodes < 100m

2.6. WSNS IN AGRICULTURE 29
Vineyard temperature Potato disease Tomato disease Cattle monitoring Paddy monitoring
Status Full deployment (6 months)
Pre-deployment (2 months)
Pre-deployment Prototyping Prototyping
Architecture Multihop WSN (backbone and
leaves)
2-Tier Network • Clustered WSN • Server bridge
Multihop WSN Single-hop WSN Mesh Network
Bridge None None None None Wi-Fi Size (number of nodes)
48 12 (150 expected) 7 25 5 – 10
Radio range 15 – 30 m 15 – 30 m 6.5 – 12.5 m 0 – 40 m 100 m Data sensed Air temperature Air temperature
Air humidity Air and soil temperature
Position (GPS) Unknown
Energy source Batteries Unknown Battery Battery Solar energy Node life-time ~ 6 weeks
(battery failure) Unknown Unknown
(1 year claimed) Unknown Unknown
Figure 2.3: Summary of WSN agriculture-related projects
• Size of the network 5 nodes
• Average lifetime Unknown (solar energy used)
• Networking platform Wi-Fi
• Sensing platform Unknown
• Performance Unknown
2.6.6 Discussion
Precision agriculture has been using state-of-the-art sensors for decades. However, the possibilities of-fered by environmental monitoring were limited due to the infrastructure and the labor costs it incurred.In this section, we have presented four typical projects in the area of wireless sensor networks for agri-culture. The projects are summarized in Fig. 2.3. Although it is generally admitted that fine-grainedenvironmental monitoring holds great promise for agricultural sciences, related projects are still few inthe scientific literature.
A possible explanation is that the wireless sensor networking is just reaching its maturity phase.Seminal works on WSNs in environmental monitoring in general [SPMC04], [BCI+08], [ARE05] havefinally demonstrated the feasibility of deploying and maintaining such networks for periods of time in theorder of a few months. Such endeavors were a prerequisite to the collection and analysis of the amountof data necessary to develop useful applications for agriculture.
Another observation is that most of the projects were focused on few and simple data measurements,usually air temperature and humidity. A possible explanation is that such sensors come as standards onmost platforms, which makes them easy to use. Whereas, the type of soil moisture probes simple andinexpensive enough to be adapted on wireless sensors necessitated until recently the design of specialdata acquisition boards, and in most cases needed to be properly validated in this new (wireless) contextof use.
A closer look at the individual projects leads to the following observations. Firstly, event-detectionemerges as a strong theme in the envisioned applications. Two of the projects deal with early detectionof diseases, one with prediction of frost, and one with virtual fencing (i.e., redirecting cattle when theyrisk to leave their grazing area). In all these applications, the capacity of networked sensors to reportevents in real-time is leveraged. In two occurrences, vineyard and paddy field monitoring, continuous

30 CHAPTER 2. NEW OPPORTUNITIES FOR ENVIRONMENTAL MONITORING AND AGRICULTURE
monitoring is also used to adapt farming strategies, in the short or long term. In all cases, spatial andtime fine-grained resolutions are perceived as a critical improvement.
Secondly, most of the networks focus on sensing rather than actuating. The goal is to provide theuser with enhanced information that lets him take his or her own decision. Only for cattle monitoring isthe sensor coupled with an actuator, namely an audio or electrical stimulus.
As for a power source, batteries are used in most cases, for different reasons. In vineyard monitoring,the constraint was to deploy light-weight sensing nodes on the vines themselves. Solar panels would bedifficult to adapt in this situation, because of their size and the effect of vegetation on solar energycollection over time. Similar concerns were probably considered by Bishop-Hurley et al., as solar panelswould be problematic to install on cows’ collars. The tomato disease prediction application is aimed atgreenhouses, where solar energy is not directly available.
Finally, the size of the networks remains small, in the order of a few tens of nodes in the largest case.This indicates both the investigative nature of the experiments, which are primarily aimed at researchrather than production, and the scalability challenges raised by WSNs to this day. In particular, Beckwithet al. [BTB04] acknowledge resorting to a planned network configuration rather than a self-organizingone, for deployment facilitation. Such an approach would not scale to large networks.
To summarize briefly, we can consider these projects as proofs of concepts, whose transposition tocommercial products will be the measure of success in years to come. This situation is likely to change,as proper commercial tools are soon going to be in the hands of agricultural scientists. Tim Wark et al.deployed in 2007 a network of 16 of such nodes equipped with ECH2O soil moisture probes in order toobserve the effects of irrigation on agricultural plots [WCS+07]. The results of the experiment, however,have yet to be disclosed. Chapters 5, 6 and 7 of the present document relate our own efforts in thedevelopment of such a toolkit. But for the time being, we set our sights on Developing Countries again,this time scrutinizing the use of WSNs in this context, and drawing lessons from existing deployments(see Chapter 3) before proposing our own problem statement and design (Chapter 4).

Chapter 3
WSNs and Developing Countries
As we mention in the introduction, typical applications of WSNs include home automation, forest fireprevention or monitoring of industrial processes. We have also seen that some pilot projects exist inthe area of agriculture as well. Such applications are often targeted at and tailored for industrializedcountries. But researchers have also tried to apply WSNs to issues that concern the developing countries.As of today, such projects remain few, and their effect on development issues remains to be proven.
This chapter explores existing initiatives and, from them, draws some design guidelines, identifyingboth opportunities and challenges brought by these systems.
3.1 Existing WSN Projects
In this section, we outline the characteristics of several WSN projects in developing countries. We brieflydescribe their aim and focus, and we summarize their technical characteristics. These projects are stillfew, and sometimes do not go beyond the design and simulation stage. However, a current trend canbe observed, consisting in attempts to apply state-of-the-art wireless sensing research to development-related problems.
3.1.1 Groundwater Arsenic Contamination Assessment in Bangladesh
The CENS unit of UCLA is involved in the deployment of a WSN in Bangladesh, with the goal ofbetter understanding the presence of arsenic in groundwater [RBE+06]. Every day, the Bangladeshipopulation living in the Ganges Delta consumes water that is contaminated with arsenic. This situation,which concerns millions of people, represents a major humanitarian disaster in the making. If nothingis done, it is estimated that hundreds of thousands of people every year will be affected by diseasessuch as arsenicosis and skin cancer, and that the incidence of death by cancer will be approximately3’000 cases per year. Say Ramanathan et al: ”A full understanding of the factors controlling arsenicmobilization to ground water is lacking. A current working hypothesis in some regions is that the influxof dissolved arsenic to ground water is greatly enhanced where irrigation for rice cultivation providesthe primary source of aquifer recharge.” In order to verify this hypothesis, CENS, in collaboration withthe Bangladesh University of Engineering and Technology and MIT, deployed a sensor network in a ricefield in the area of Dhaka.
The authors justify the usage of a network by the heterogeneity of soil, which requires dense spatialsampling. In the case of arsenic contamination, daily or longer period variations in the concentrations of
31

32 CHAPTER 3. WSNS AND DEVELOPING COUNTRIES
pollutants were of primary interest in order to understand the underlying mechanisms of contamination.In particular, they highlight the paradox between the criticality of water quality concerns and the factthat analysis is still primarily conducted in a laborious manner by physical collection of a sample that isanalyzed back in a laboratory.
Ramanathan et al. also introduced the concept of a wireless sensor as a shared resource, meaningthat several users should be able to benefit from one single sensor, by reusing it over time and space.In this model, the sensor itself becomes a possibly mobile resource, so that the necessary resources canbe minimized. Sensor sharing encompasses two contexts of use: moving a smaller number of sensorsaround in a deployment to emulate density, and gradually removing redundant sensors from a deploymentto go from dense to sparse deployments.
In early 2006, the authors deployed three pylons containing 3 complete suites of sensors (soil mois-ture, temperature, carbonate, calcium, nitrate, chloride, oxidation- reduction potential, ammonium, andpH), each deployed at a different depth (1, 1.5, and 2 meters below ground). Water depth was monitoredthrough a pressure transducer at the base. In total, they deployed 48 sensors in the field for a period of10 days.
The authors claim that even such a limited experiment allowed for the observation of daily trends inseveral redox active geochemical parameters [RLL+07].
• Organization: University of California, Los Angeles
• Application: groundwater arsenic contamination assessment
• Data monitored: soil moisture, temperature, carbonate, calcium, nitrate, chloride, oxidation- re-duction potential, ammonium, pH and arsenic
• Deployment duration: 10 days
• Distance between nodes: unknown
• Size of the network: 3 pylons, 48 sensors
• Average lifetime: 10 days
• Networking platform: Crossbow Mica2, 802.11b access point, GPRS bridge
• Sensing platform: unknown
• Results obtained so far: observation of daily cycles in geochemical parameters
• WSN added value: space and time variability of soil contaminants
3.1.2 SenSlide, A Sensor Network Based Landslide Prediction System
Sheth et al. [STM+05, STM+07] designed, simulated, and built a laboratory test-bed of a landslideprediction system via wireless sensor networks using 2-axis strain gauges to predict landslides. Theusual approaches to detect rocky landslides involve drilling 20 – 30 meter holes into the surface. Bothsensors and installation are costly, making it difficult to proceed to wide deployments.
In contrast, SenSlide’s approach to measure slope stability is to combine observations from a largenumber of distributed inexpensive wireless sensors connected to one-axis strain gauges. The strategy isto observe the cause of the landslide, specifically the increasing strain in the rocks. A Bayesian statisticalapproach is used to link the data of a sensor patch to the imminence of a landslide. For this approach to beeffective, geologists assess the optimal sensor-separation to be 30 - 40 meters. In this model, data needsto be sampled periodically to help earth scientists collect trend information over time. But the lifetime

3.1. EXISTING WSN PROJECTS 33
of the network must not be adversely affected by frequent sampling. As a direct consequence, SenSlideshares features of a rare-event detection network, as well as a very low sampling-rate data-collectionnetwork.
The primary objective of this work is to provide a distributed sensor system that is robust againstfailures. Redundancy is used throughout the network architecture. The point measurements made byindividual sensors are propagated to a set of “base stations” that are connected to GPRS and/or 802.11bridges.
A laboratory testbed of 65 sensor nodes was used, as well as simulation results for larger systems upto 400 sensor nodes. A prototype of the system should be deployed in-situ during an upcoming monsoonseason.
• Organization: Microsoft Research, University of Colorado, Boulder, Indian Institute of Technol-ogy, Mumbai
• Application: landslide prediction
• Data monitored: strains in rocks
• Deployment duration: not deployed yet
• Distance between nodes: 30-40 meters (projected)
• Size of the network: patches of 600 nodes (65 nodes deployed in the laboratory so far)
• Average lifetime: 4 months (projected)
• Networking platform: Telosb from moteiv [tel]
• Sensing platform: single-axis strain gauge (manufacturer not specified)
• Results obtained so far: simulation of the operation of a full-scale network, laboratory tests runon 65 nodes
• WSN added value: diversity provided by the dense deployment of inexpensive sensors
3.1.3 Wireless Sensor Network for Water Quality Management
In 2007, Zennaro et al. undertook a project on water quality management in Malawi [ZYFP07]. Theoverall goal of this project is to develop an infrastructure that will be used to measure water quality usingWireless Sensor Networks. The project focuses both on the design, implementation and deployment ofan innovative wireless sensing application, and on the dissemination of results.
The network is envisioned to be single-hop, with a periodic data collection paradigm. Samples aregoing to be collected once per day. Because the network is to be deployed in a remote region withouteasy access to technology and expertise, automated fault recovery is a major theme in the system design.
Throughout 2007, the project completed the initial system design and implementation phase. All theprobes used in the network were tested, validated and calibrated.
The next phase consists in the deployment of the system in the catchment area of the Mudi Dam,which spans about 1 km2.
• Organization: Royal Institute of Technology, Stockholm
• Application: water quality monitoring
• Data monitored: pH, water reduction/oxidation (redox) and turbidity

34 CHAPTER 3. WSNS AND DEVELOPING COUNTRIES
• Deployment duration: not deployed yet
• Distance between nodes: 200–300 meters (with relays in between)
• Size of the network: 4 nodes (first phase, planned in 2009)
• Average lifetime: upcoming (solar powered)
• Networking platform: Sun SPOT [Sun]
• Sensing platform: Ionode for the pH and redox sensors [ion], OBS-3+ for turbidity sensor [DAI]
• Results obtained so far: software and hardware design and implementation, sensors calibrationand testing
• WSN added value: automated data collection for continuous monitoring. POssibility to raisealarms automatically.
3.1.4 Flood Detection System for Honduras
Basha and Rus [BR07] began from the realization that natural disasters have aggravated effects in devel-oping countries, because of the lack of infrastructure and the absence of well established procedures andresponsibilities. They derive the necessity of developing integrated warning and evacuation systems thattake into account the specific technological, social and political constraints of this context. Say Bashaand Rus: “The complexity of these systems and the need for autonomy within the context of a developingcountry - while remaining maintainable and accessible by nontechnical personnel - provides a challengenot often solved within developed countries, much less the developing.”
The authors focus their attention on the design and implementation of a flood detection for Honduras,a country repeatedly hit by heavy rainfalls and devastating hurricanes in recent years. The Aguan Riverbasin was chosen as deployment site, as it constitutes a particularly exposed area.
Taking a holistic approach, Basha and Rus address the problem by subdividing the necessary actionsin four tasks: event prediction, authority notification, community alert, and community evacuation. Fromthe technology point-of-view the main issues they address are: protection of the system from environ-mental and human damages, appropriate coverage of the area at risk, effective prediction and electricitysupply.
For the authors, prediction entails a model of the physical system, an understanding of the relevantvariables that this model requires as input and output, physical measurements of these variables, com-munication of this data to the computation locations, and a computational system to run the variablesthrough the model. As for the physical variables, they decided to focus on water pressure sensors tomonitor the evolution of river level. As for the model, the authors contend that statistical computerizedmethods extend the prediction time to up to 48 hours. For prediction to be effective, monitoring has torun continuously during critical periods at critical points, hence justifying the use of a network of sensorsreporting autonomously to a centralized processing unit.
As for coverage issues, the authors designed a two-tier architecture. 8 km radius clusters are or-ganized as local single-hop networks in the 900MHz band. Inter-cluster communication necessitates aradio-range of up to 25 km, for which analog 144MHz radios with a custom modem were used.
Among the lessons learned from the project, the authors emphasize the importance of creating localpartnerships and of relying on local knowledge. In their case, they created a partnership with a Hondurannon-governmental agency. Another important point is the questioning of the usual approach of devel-oping and testing the system in the lab before deploying it in the field. The authors claim that such astrategy is likely to lead to a failure of the end-product. They opted instead for a hybrid approach of trial

3.1. EXISTING WSN PROJECTS 35
and error, where the system was partially tested in the lab, then deployed in the field as it was, beforegoing back to the lab to address the specific issues discovered in-situ.
• Organization: Massachusetts Institute of Technology
• Application: flood monitoring
• Data monitored: water pressure (river level)
• Deployment duration: not deployed yet (preliminary field tests conducted)
• Distance between nodes: up to 8 km in a cluster. Up to 25 km between clusters
• Size of the network:
• Average lifetime: unknown (solar panels)
• Networking platform: proprietary
• Sensing platform: unknown
• Results obtained so far: design and early deployment tests
• WSN added value: autonomous, distributed data collection
3.1.5 Road Surface Condition Monitoring
De Zoysa et al. [ZKSS07] started from the realization that in Sri Lanka “one of the main reasons for thedeteriorated condition of the road system is the lack of continuous monitoring of the surface condition.”
They designed BusNet, a delay-tolerant sensor network for monitoring the road surface condition,which is mounted on buses belonging to the public transport network. This way, the sensor-equippedbuses use the very roads that the authors want to monitor. Road surface conditions are assessed throughthe use of accelerometers. The data are stored while the bus is on the road, and transferred once a day toa collection point at the bus Main Station. A delay-tolerant solution is appropriate in this case, becausethe data gathered on road surface condition are not needed in real time.
The critical point for the usability of this system is the ability to translate the acceleration data intoactual information about the road condition. The authors are currently developing an analytical modelfor this. Precise positioning of the sensors over time is also mandatory. The authors plan to adapt GPSreceivers to the wireless sensors. Lifetime is not a serious issue in this case, since the sensors can bepowered by the bus battery, and maintenance can be performed regularly when the bus is at the MainStation.
• Organization: University of Colombo, Sri Lanka
• Application: road surface monitoring
• Data monitored: vertical and horizontal acceleration
• Deployment duration: not deployed yet (preliminary field tests conducted)
• Distance between nodes: variable. Nodes act as data mules and bring back data to a centralizedcollection point.
• Size of the network: prototype phase
• Average lifetime: unknown (Buses provide power)
• Networking platform: proprietary

36 CHAPTER 3. WSNS AND DEVELOPING COUNTRIES
• Sensing platform: MicaZ
• Results obtained so far: design and early deployment tests
• WSN added value: autonomous, distributed data collection
3.1.6 Other Work
InteleSense [Int] is deploying water and weather sensors and to integrate them with public health data toresearch links for water-borne illness, both in Vietnam and Ethiopia.
Johnson and Margalho studied wireless transmissions in the Brazilian Amazon, with the aim to de-ploy an environmental monitoring system at a later stage [JM02]. Their work focused on simulationstudies, using parameters collected from the environment. They identified a link between signal attenua-tion and climatic conditions.
Dargie and Zimmerling investigated the scope and usefulness of specific WSN application domainsin the context of developing countries [DZ07]. They concluded that wireless sensor networks have “thepotential of aiding developing countries to carefully utilise scarce resources, to protect and maintain in-frastructures, and to prevent undesirable occurrences”. Accordingly, they advocate their use for environ-ment, infrastructure and habitat monitoring, agricultural management and disaster prevention. However,they do not propose any design or design guidelines at this stage.
Similar high level work has been conducted by others (e.g. [PHL07]).
3.2 A New Tool for Developing Regions?
From the perspective of the specificities presented by Developing Countries, there are general lessons tobe drawn from the projects described in the previous section (see Fig. 3.1 for a summary). The challengesand opportunities presented by WSNs in this particular context are deeply influenced by its geographical,social, economical and cultural features. Most of them are highlighted by the projects described in theprevious section.
3.2.1 Assets
The potential that distributed, wireless solutions present for environmental monitoring was highlightedby Estrin et al. as early as 2001 [EGPS01]. Among the expected benefits, we can list:
1. Easiness of deployment and maintenance
2. Flexibility of the solution
3. Automation of data collection
4. Unattended operation
5. High space- and time-resolution at a low cost
3.2.1.1 Deployment and Maintenance
A recurring intended benefit of WSNs is their independence from any preexisting infrastructure. Thenodes themselves are the network, and can be added, moved or removed in a seamless fashion. Thepossibility of instrumenting phenomena continuously for extended periods of time is often mentioned.Being specifically designed at the hardware and software level for low power operation, WSNs have a

3.2. A NEW TOOL FOR DEVELOPING REGIONS? 37
Arsenic detection Landslide prediction
Water quality management Flood detection Road Monitoring
Location Bangladesh India Malawi Honduras Sri Lanka
Status Full deployment Simulation Laboratory deployment
Laboratory testing Laboratory testing Field pre-deployment
Laboratory testing
Architecture 3-Tier Network • Multi-cluster WSN • Inter-cluster access
point • Server bridge
2-Tier Network • Multi-cluster
WSN • Server bridge
Multihop WSN 2-Tier Network • Multicluster WSN • Server bridge
Delay-Tolerant Network
Bridge Wi-Fi (802.11b) GPRS
Wi-Fi (802.11b) GPRS
Unknown Proprietary (144MHz)
Size 48 sensors 3 access points
65 (deployed) 600 (projected)
4 nodes (projected) Unknown Unknown
Radio range < 100m 30 – 40 m (projected)
200–300 m (projected)
8 km (in a clsuter) 25 km (between
clusters)
30 – 40 m
Data sensed Soil moisture Temperature Carbonate Calcium Nitrate
Chloride Ammonium
pH Arsenic
Rock strains pH Redox
Turbidity
Water pressure Acceleration
Energy source Solar panel Battery Solar panel Solar panel Car battery Node life-time 10 days
(deployment duration)
3 – 4 months (projected)
Unknown Unknown Unknown
Figure 3.1: Summary of WSN projects in developing countries
longer autonomy than cellular-phone networks used for telemetry, which also incur extra communicationcosts. WSNs are also supposed to be configuration and maintenance free, the nodes being able to organizespontaneously into a network and to work unattended until failure or energy depletion.
The easiness of deployment and operation is repeatedly mentioned as a major argument by the de-signers of existing projects [RBE+06], [STM+07], [ZYFP07], [BR07]. The argument is that, in devel-oping countries, the existence of a reliable infrastructure is often questionable. On the front of telecom-munications, the traditional land-line infrastructure is usually old, sometimes totally obsolete. Cellularcoverage is still partial at best, although this situation is quickly changing. In India, for instance, GSMoperators claim to have coverage in 100,000 villages out of a total of 650,000, and figures suggest almosttripling the rural coverage by 2010 [CTT06]. However, whether fields outside of villages will be satis-factorily covered remains uncertain. The electricity supply infrastructure itself can often not be taken asgranted. The example of India, once again, is telling, with daily power cuts lasting several hours beingthe rule in most rural areas.
3.2.1.2 Flexibility
An environmental monitoring system often does not operate autonomously. It communicates with datastorage and management systems, with alert dissemination infrastructure, etc. Pure ad-hoc wirelesssensor networks cannot provide global connectivity. For this, an access point to the traditional publicswitched telecom network (PSTN) or to the Internet is needed. Moreover, even local connectivity is achallenge for resource limited devices such as wireless sensors. Typically, their radio range will varyfrom 50 to a few hundreds meters in outdoor conditions, depending on the platform. This means that for

38 CHAPTER 3. WSNS AND DEVELOPING COUNTRIES
applications necessitating sparse networks with a large coverage, hybrid solutions need to be provided, asdescribed in Chapter 2. Fortunately, their flexibility allows wireless sensor networks to act as a modulein a larger system, a capacity leveraged by several projects [RLL+07], [STM+07], [BR07].
3.2.1.3 Unattended Operation
“Human infrastructure” is a possible source of concern [BR07], or, more precisely, the level of technicalexpertise that can be expected in rural areas of developing regions. Even with the increased flexibilityof the technology, deploying a wireless sensor network remains to this day a specialist’s task. This isgenerally taken for granted by the existing projects. However, once the network is installed, engineerswill not be available through its deployment life. If WSNs manage to fulfill their promise of maintenancefree operation (which remains to be proven for long-term deployments, see [BTB04], [SPMC04]), theywill emerge as a primary option for environmental monitoring in developing countries.
3.2.1.4 Real-time Response
The capacity to collect and process data automatically on the flight is especially attractive for alert-basedsystems. In this case, the user needs to be warned as soon as a monitored environment threatens to driftfrom its desirable state [STM+07], [ZYFP07], [BR07].
Direct human intervention is today the primary resort for environment monitoring in developingcountries. However, such monitoring is usually ill-adapted to fast response-time requirements. Bashaand Rus pinpoint typical obstacles that would make such an approach unreliable in the case of a flooddetection system: “The geographic area involved hinders any form of volunteer-based system. Thecommunities upstream that would need to perform the measurements and/or the communication of thosemeasurements have almost no connection to the communities affected by the flooding. This removes anylevel of self-interest and peer-pressure in voluntarily performing any system tasks. Second, the nature ofthe problem involves measuring the river and surrounding area during heavy rains, hurricanes, and at alltimes of day and night. Very few volunteers would stand outside in a hurricane to perform a measurementor radio information to a central office. Neither would they perform these tasks in the middle of the night.Although paying someone may allow for night-time measurements, few people would remain during ahurricane, especially if that hurricane affects their own community with small-scale flooding, buildingleakages, or potential agriculture crop damage. Yet it is at these times that the measurements are mostneeded.” [BR07]
These are very context-specific issues, but similar problems can easily be transposed to other appli-cations. In particular, 24-hour a day manual monitoring is always costly. And the presence of persons inan area at risk should always be limited as much as possible.
3.2.1.5 High Resolution
Wireless Sensor Networks allow for the collection of data at a high spatial and temporal resolution[EGPS01], [ASSC02]. For phenomena presenting a high variability in these two domains, the benefitis obvious, and is repeatedly mentioned as a major asset. Contaminants’ concentrations in the soil areshown to vary due to the heterogeneity of the soil, and to present daily cycles [RLL+07]. Geologistsrecognize the importance of dense instrumentation for the prevention of landslides in rocky environments[STM+07]. Early signs of flooding can appear at any time at several locations in a river basin [BR07].In general, fine grained data, if it does not come at a higher cost, will always be considered welcome if itcan filtered out on-demand.

3.2. A NEW TOOL FOR DEVELOPING REGIONS? 39
3.2.2 Challenges
Many technical challenges related to the design and deployment of WSNs have been widely discussedand addressed by the research community in the recent years. For a list of issues, the reader can referto the survey done by Akyildiz et al. [ASSC02]. In this section, we focus our attention on those issuesthat bear some relevance with the particular context of developing countries. We will show how we tookthem into account in our own system in Chapter 5.
3.2.2.1 Technical Challenge
Most of technical issues are resolved today... in a laboratory environment. The critical challenge remainsto be able to operate a wireless sensor network for an extended period of time and in concrete, existingenvironments. In 2002-2003, Szewczyk et al. [SPMC04] deployed a sensor network for wildlife habi-tat monitoring. This system ran unattended for four months. Although researchers reported on severaldeployments, a large, long-term WSN deployment for environmental monitoring has yet to be demon-strated.
Lifetime: Reliable electricity supply remains a recurrent issue in developing countries, especiallyin rural settings. When wireless sensors are deployed in environments without an easy access to a per-manent power source (as would be the case in a house or a car) the question of lifetime of the systembecomes critical. Most WSN platforms available today advertise lifetimes in the order of years, thanksto optimized software and hardware power management techniques. However, real deployments tend toshow that networks do not last that long, because:
1. In multi-hop data collection networks, intermediate nodes’ lifetimes can decrease rapidly, becausethey need to relay other nodes’ packets.
2. Node failures are frequent in challenging environments.
3. One cannot manually restart a node that entered a non-functioning state.
4. The failure of intermediate nodes can make upstream nodes unreachable from the sink, especiallyin sparse networks, where routing alternatives are few if existing at all.
Solar energy is a possible solution if the sensor is to be deployed outdoor, but if systems are tobe deployed unattended in widely available environments, thefts are likely to occur frequently, as wasobserved by Basha et al. for instance. A solar panel is a visible, attractive and easy to resell part.
The design of efficient synchronized communication protocols, and the efficiency of sleep / wake-up cycles are likely design directions [BvRW07]. Energy scavenging techniques, that would in the endsuppress the need of using and changing batteries, are also being investigated, in particular the use ofvibrations [RWR03].
Reliable data collection: Due to the limited radio range of wireless sensors, which can not exceed inthe best cases a few hundred meters in line-of-sight, WSNs need to implement multi-hop communicationprotocols, where intermediate nodes relay the information towards the base station.
Low-power operation of multi-hop networks is particularly fragile. Experience shows that the through-put of nodes decreases rapidly with the number of hops to the base station [BTB04]. This necessitatesimplementing retransmission schemes and store-and-forward techniques that are costly in energy andaffect the network lifetime. Currently, the standard multihop protocols, such as CTP in tinyOS, sufferfrom high variations in the packet delivery rate, especially in cases where nodes are outdoor, and distantfrom each other, resulting in a sparsely connected network.

40 CHAPTER 3. WSNS AND DEVELOPING COUNTRIES
In most applications intended at industrialized countries, this effect can be mitigated by adding re-dundancy in the network. Home automation or industrial applications usually consider dense networkdeployments, where a packet transmitted through the network has the luxury to choose several paths andto rely on a predictable radio channel. In most applications targeted at developing countries, however, thedensity of the network is likely to be low, because of the expected coverage of the system, and becausecost issues become more stringent [BR07], [DZ07].
For this reason, the quest for simple, robust and energy efficient multihop protocols will be a criticalissue in the years to come, with an emphasis on multiple-layers protocols that can achieve more efficiencywith specialization and customization of the communication stack [BvRW07].
Data management: The likely topology of WSNs in our context is a large number of small clustersthat need to be interconnected, possibly across wide geographical areas. This can be done at the serverside, using middleware applications that make the creation, removal of new clusters plug and play, andtreat them as a single entity. This necessitates the development of back-ends that make it easy to dynam-ically query, store, process and aggregate data over widespread geographical locations. To display datain a meaningful way, one should consider the integration of Geographical Information Systems (GIS).
3.2.2.2 Scientific Challenge
A major challenge regards the usage of the data collected. So far, sensor networks’ projects resultessentially from initiatives taken by computer and communication systems’ scientists. The connectionwith the environmental sciences is often loose, if existent at all. Szewczyk et al., in their 2004 seminalwork [SPMC04], admit that the wealth of data they collected during their 4 months deployment was of noscientific use in the end. A recurring problem is the capacity for distinct scientific communities to workon a common problem from complementary perspectives. Another problem is that the unprecedentedcapability of sensor networks to collect data represents a disruptive point in environment monitoring.Often, the tools and theoretical backgrounds to process such an amount of data have yet to be created.
For instance, we have been conducting interviews with Indian agricultural scientists since 2004.These scientists always had to cope with limited environmental information in their research. Theyperceive this as a limitation, yet miss currently the models appropriate to process large amounts of data.Accordingly, the application design can become a chicken-and-egg problem, where the existence of thesystem is a prerequisite to the definition of requirements, while such requirements are necessary for asuccessful system design.
We address in detail the scientific challenges raised in our project in Chapter 4 and in Chapter 8.
3.2.2.3 Operational Challenge
Deploying a wireless sensor network raises issues well beyond the technical aspect of things. Survivabil-ity of the system in the face of adverse environmental conditions, maintenance of its components, butalso interaction with the local population can be experiences full of surprises. Among our examples, theonly project that went all the way to an actual deployment was only left in the field for a few weeks, andattended by specialists throughout [RBE+06]. The lessons to be learned for a long-lasting deploymentrepresent still an open question, which we address in Chapter 6.
3.2.2.4 Sociocultural Challenge
The hardest to grasp precisely, this challenge is also the most important to address. In the words ofBrewer et al., as far as technology is concerned, “(...) Western market forces will continue to meet the

3.2. A NEW TOOL FOR DEVELOPING REGIONS? 41
needs of developing regions accidentally at best” [BDD+05]. In the same spirit, we advocate the im-portance of exploring the potential of an emerging technology - sensor networks - in concrete situations,in order to take the ecological, social, cultural and economic conditions of developing countries intoaccount in the development of hardware and software platforms alike.
However, as is always the case with a disruptive technology, special care must be taken to avoid mostcommon pitfalls. This challenge is addressed in Chapter 9.
Design/Implementation Gaps: Heeks [Hee01] argues that the failures of information systems’projects in developing countries are often caused by design-actuality gaps. Country context mismatches(in terms of institutions, infrastructures etc.), as well as hard-soft gaps (rational design versus culturaland political actuality) play a role all the more important if the system was designed in an industrializedcontext. To summarize, failures can generally be explained by the distance (geographical, cultural orsocioeconomic) between the designers of the system and its intended community of users.
Using participatory design can mitigate this risk. Heeks warns, however, that participatory designin itself is no guarantee for success in developing countries, because these techniques have usually beendeveloped in and for industrialized countries organizations. A lesson to be drawn is that a participatoryapproach in a developing country is instrumental to success if and only if it integrates a tool to bridgethe contextual gap between design and use. In order to bridge this gap, Heeks advocates the usage ofhybrids, specifically individuals who understand both the alien worlds of the community of users and ofthe community of designers/builders of the artifact.
Wireless sensor networks also present an important feature, in the fact that they constitute an emerg-ing technology in constant evolution. This leaves a significant place for experimentation, and presentsthe advantage of being able to develop a technology specifically for the developing countries context,instead of tweaking existing systems made to operate in a different context, which is a criticism maderecurrently to projects dealing with ICT for development [Hee01].
Computer Literacy and Application Ownership: It is not enough for an information system tosatisfy adequately the needs of its intended target population. When this population is living in poor andremote areas with a low level of literacy (not to mention computer literacy), a major issue is the capacityof the user base to understand, use and finally own the system (we define ownership as the ability andwillingness to maintain the system in a working state and to integrate it in daily activities).
For this to happen in our case, we have to satisfy two conditions:1. The ability of the sensor network to function autonomously, without the need of skilled mainte-
nance. As we saw, this is a design goal of sensor networks, not yet fully realized, but on whichwill depend the success or failure of the whole technology.
2. The capacity of the population to learn about the use cases of the system. Here, one can usethe concept of capacity building and knowledge creation through apprenticeship [Pan04]. Ourhypothesis is that there are some aspects of apprenticeship that make it particularly suited in theacquisition and integration of radically new paradigms of knowledge. It is a self-organized processin which every individual takes ownership of the knowledge he or she is acquiring. Not relying onformal teaching, it can be more integrated in the social structure and possibly more equitable, aspeople without the time, resources or will to attend classes can be reached through it.
3.2.2.5 Economic Challenge
Business models for WSN deployment must be looked at carefully: Sensor networks are still a maturingtechnology, which remains costly. Today, the price of a single wireless sensor is typically betweenUSD 100.- to USD 300.-. The price of wireless transmitters and common sensors (temperature for

42 CHAPTER 3. WSNS AND DEVELOPING COUNTRIES
instance) is expected to drop sharply in the upcoming years. Even so, customized sensors (such as soilmoisture sensors), will remain expensive unless new designs and local manufacturing can be realized.This requires an expertise that emerging economies, such as India, Brazil or China, possess already.By building partnerships with companies and institutions from these countries, one can leverage on thiscapacity. In a first phase, one can privilege research projects that use sensor networks as a tool forvalidating or developing the theoretical frameworks (in hydrology, agronomy, environmental sciencesetc.) relevant to the pursued goals. Such small scale projects also play a role in the technology maturationprocess. More generally, due to the technology’s current high cost, it is important to raise awarenessamong potential sponsors, such as the development agencies and international organizations, about thepotential of wireless sensor networks in the context of development. As mentioned later on in thisthesis, we followed this approach in the COMMON-Sense Net project, with the involvement of theSwiss Agency for Development and Cooperation as main funding source [PRP+06]. However, a preciseeconomical analysis of the sustainability of our system is beyond the scope of this dissertation.

Chapter 4
Wireless Sensor Networks for MarginalAgriculture in India
In this chapter, we present our own contribution to the application of novel environment monitoringtechniques to the context of developing countries: a decision-support tool for marginal farming in India.
In Section 4.1, we start by a summary of the activities that led to the project definition and consortium.In Section 4.2, we explain the general objectives of the project. In Section 4.3, we give a description ofthe village where we concentrated our activities. In Section 4.4, we describe the survey on informationneeds that was run in this village and two others in Karnataka (India). The applications that we derivedfrom this survey are detailed in Section 4.5. Finally, Section 4.7 explains the methodology that wedecided to use throughout the project.
4.1 Project, Consortium and Funding
The initial idea for the project came in 2004. Initial personal contacts between EPFL and the Centre forElectronic Design and Technology (CEDT) at the Indian Institute of Science (IISc) were strengthenedwhen EPFL issued a call for proposals for projects centered on scientific collaboration with academicinstitutions from developing countries. The funding came from the Swiss Agency for Development andCooperation (SDC) via a research grant endowed with CHF 3 million (the NCCR MICS1 and CEDTprovided a matching fund for our project).
The primary goal of this call for proposal was to promote interdisciplinary research focused on criti-cal problems faced by emerging and developing countries. The author of this thesis traveled to Bangalorefor a set of introductory meetings where the theme of agricultural management quickly surfaced as oneof the most pressing issues in Karnataka. During these meetings, the need for a local partner in the fieldappeared as an important prerequisite before any action to be undertaken. The Chennakesha Trust, aNon-Governmental Organization (NGO) active in the district of Tumkur (see Fig. 4.1) was invited onboard at this stage.
We chose to focus on small land-holding farmers, because they represent an important part of thefarming population in Karnataka (see Section 4.3.4). Moreover, they are more concerned than any otherby the environmental issues that we identified in Chapter 3. As a local organization regrouping resource-poor farmers, the Chennakeshava Trust (see Fig. 4.2) seemed ideally placed to identify and address thechallenges faced by this category of population.
1Swiss National Centre for Competence in Research in Mobile Information and Communication Systems
43

44 CHAPTER 4. WIRELESS SENSOR NETWORKS FOR MARGINAL AGRICULTURE IN INDIA
Figure 4.1: Tumkur district in Karnataka, India
The project was submitted in Fall 2003, accepted in early 2004, and officially launched in Summer2004. Its background and rationale are described in the next section.
4.2 COMMON-Sense Net: a Decision-Support Tool for Agriculture
Since 2001, drought has hit India repeatedly. A wave of farmers’ suicides ensued, claiming probably tensof thousands of lives throughout the country, although official figures are lacking [Mis06], [Zub06]. Whatis certain, however, is that the principal cause of this outbreak is a vicious circle of borrowing money tobuy seeds, and getting into increasing debts because of crop failure [Sai05]. Adverse climatic events canoften be blamed, but farmers bear their part of responsibility, since they tend more and more to replacesubsistence crops with cash crops2, sometimes ill-adapted to the local conditions, often inefficientlygrown due to lack of knowledge and experience.
Farmers lack information and knowledge to face the new challenges raised by the shift of paradigmin their activity. Improved environment monitoring may be part of the answer. Although it cannot pre-vent drought or replace a political solution to the structural problems of Indian agriculture, environmentmonitoring can help to improve the lives of resource-poor farmers by mitigating the effects of extremeevents, allowing the farmers to adapt their strategy to abnormal or changing climatic features when theyoccur.
Information on the temporal and spatial variability of environmental parameters, their impact on soil,crop, pests, diseases and other components of farming, play a major role in formulating the farmers’ strat-egy [Gla03], [HNM00], [GRR02]. Today, large mechanized farms in developed countries take this factor
2A crop which is grown for money

4.3. SETTING THE CONTEXT 45
Figure 4.2: Some members of the Chennakeshava Trust
into account and utilize the convergence of several technologies, including in-field sensors, geographicinformation system (GIS), remote sensing, crop simulation models, prediction of climate and advancedinformation processing and telecommunications. Similar techniques can be highly useful to farmers inthe semi-arid regions of developing countries, provided they can be adapted to small land holdings andlabor intensive, low productivity agriculture. However, traditional approaches are too expensive f and donot scale down to the size of a marginal farmer’s plot. Moreover, the implications of climatic variabilityin developing countries are a largely unexplored area for agriculture research [SGB00].
Designing and implementing a decision-support tool based on environmental information for Indianmarginal farmers is an ideal occasion to investigate the use of wireless sensor networks in developingcountries (see Fig. 4.3). The rest of this chapter describes the research conducted around the design ofsuch a decision-support tool. This project is named COMMON Sense Net (for Community OrientedMonitoring and Management of Natural resources via a Sensor Network) and, as we mentioned, stemsfrom a multidisciplinary partnership between India and Switzerland, with both academic institutions andthe civil society involved.
Because of the novelty of the issues that this project addresses, it uses extensively a participatoryand iterative design (see Chapter 9). The initial goal is to provide farmers with more strategic optionsfor their crop management, thanks to enhanced environmental information. The long-term goal of theproject is to help developing replicable strategies for agricultural practices.
4.3 Setting the Context
In India the political institutions are organized hierarchically according to a 5-level scale:
1. Central Government in Delhi.
2. State: in our case, Karnataka.
3. District: around 10 taluks. Chennakeshavapura’s district is Tumkur.

46 CHAPTER 4. WIRELESS SENSOR NETWORKS FOR MARGINAL AGRICULTURE IN INDIA
Figure 4.3: Technical components of a decision-support system for agriculture
4. Taluk: around 100’000 citizens, corresponding to 10 panchayats. Chennakeshavapura’s taluk is inPagavada.
5. Panchayat: around 10’000 citizens. A panchayat usually comprises 5 villages.
Only the 3 upper-layers have legislative and judiciary bodies. Up to the taluk level, there is only anexecutive council. Each assembly is elected once every 5 years, but not in a synchronized fashion.
4.3.1 The Pavagada Region
The Pavagada region is a part of the large semi-arid tract of Southern India. It is centered on 14o N and77o E and is situated in the Eastern part of Karnataka state. The central part of the region is a plateauwith an elevation of about 600 to 700m, and several chains of rocky hills found in the landscape formseries of watersheds.
The upper catchment areas of the watersheds are utilized for rain-fed groundnut cultivation. Hillsand rocky outcrops constitute the grazing lands for the livestock. In the lower reaches of the watersheds,manmade tanks storing runoff for irrigation were constructed in the 19th century and first half of the 20th
century. In addition, large open wells, as well as tube wells, support small patches of irrigated farms. Foreconomical reasons, however, about 85% of the total cultivated area depends exclusively on rainfall forthe growing of groundnut during the rainy season (June-November). Indeed, water for irrigation is toocostly for the resource-poor farmers. Their farms are usually located on the upper reaches of the localwatershed, and thus cannot benefit from the water stored in traditional surface storage reservoirs in thevalleys below. Since the drilling of bore wells is costly and has a history of high failure rate, the risk istoo high for them to take.
The major climatic feature of the Pavagada region is the low amount of rainfall and its high variability.The annual average is 561mm, with a standard deviation as high as 190mm. The distribution of therainfall within the year is bimodal [RGK+04]. The maximum rainfall occurs in the second half ofSeptember. The second mode is between the last week of May and the first week of June. Another major

4.3. SETTING THE CONTEXT 47
Figure 4.4: Chennakeshavapura village surrounding fields
characteristic of the climate of the region is the frequent occurrence of long dry spells. Consequently,the crop is highly prone to moisture stress, a risk enhanced by the low moisture retention capacity ofthe shallow sandy loam soils. As a result, the cost of cultivation is not recovered in 60% of the harvests[RG99].
4.3.2 The Chennakeshavapura Village
Chennakeshavapura (see Figs. 4.4, 4.5, 4.6) is a village of approximately 2’000 inhabitants in the Pava-gada area. At the local level, wealth remains by and large the most important factor of political influence.According to a local contact-person, the elected members of the panchayat can be the target of significantpressure coming from the richest landowners, who usually prefer to act unofficially than to be exposedas officials. Thus, corruption is not uncommon, since the main task of the panchayat is to distribute thefunds coming from the higher levels in order to realize community-based projects: building roads orbuildings, distribute grants etc. [Rao08]
4.3.3 Type of Agriculture
As in other areas in Karnataka, rain-fed farming is the most practiced form of agriculture, revolvingessentially around groundnut, with other crops such as pigeon pea and cereals, and areca nut trees.
Irrigation remains possible thanks to the community tanks. The three biggest ones have a commandarea respectively of 85ha, 17ha and 12ha. Fig. 4.8 shows the dyke built more than one century ago tocircumscribe the main tank. Smaller reservoirs, of the type shown in Fig. 4.7 are scattered around thearea.
However, the recent trend is one of building individual electricity-powered wells, sometimes withretentions tanks (as in Fig. 4.9). There is an estimated 55 bore-wells in around the village, most of themunregistered.

48 CHAPTER 4. WIRELESS SENSOR NETWORKS FOR MARGINAL AGRICULTURE IN INDIA
Figure 4.5: A neighborhood in Chennakeshapura
Figure 4.6: The village’s movie theater
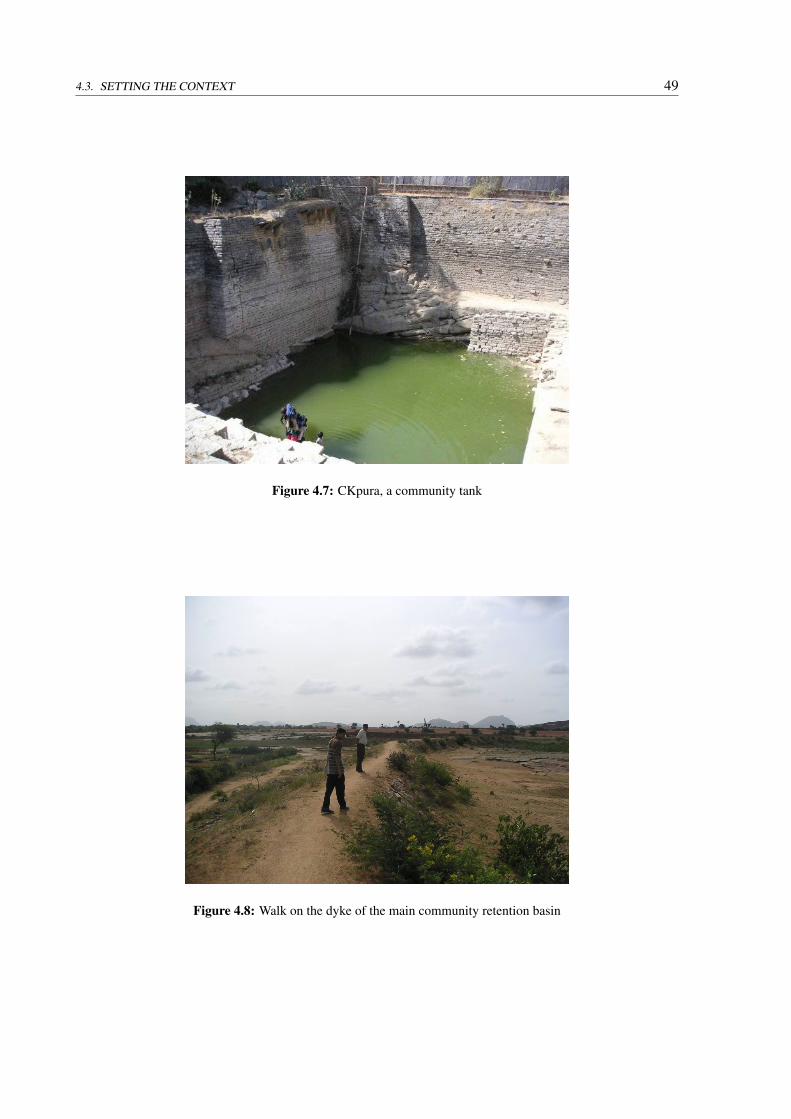
4.3. SETTING THE CONTEXT 49
Figure 4.7: CKpura, a community tank
Figure 4.8: Walk on the dyke of the main community retention basin

50 CHAPTER 4. WIRELESS SENSOR NETWORKS FOR MARGINAL AGRICULTURE IN INDIA
Figure 4.9: The reservoir of an individual well
4.3.4 Marginal Farmers
In India, the share of agriculture in employment is still about 67% [BM04], with a majority of small landholdings. In Karnataka, 87% of the farming families own farms of less than 4 ha, accounting for morethan 50% percent of the total cultivated area. Families with very small farms (less than 1 ha) constitute39% of the total. They usually lack access to irrigation facilities and depend on rain-fed farming fortheir livelihood. Their crop yields are highly unreliable due to the variability in both rain-fall amount andits distribution [GAR99]. For all these reasons, we refer to this group as resource-poor farmers, moretraditionally called marginal farmers.
Marginal farmers in India and South Asia in general are the category of population that benefittedthe less from the economic boom and overall poverty reduction of the last 15 years [BS05], [DKMU03].They constitute a recurrent target for development agencies, but are difficult to help efficiently, becauseof their economic helplessness. Our experience with marginal farmers in Karnataka shows that thesefarmers feel an estrangement with the outside world. The feeling of distrust towards the scientific com-munity is extremely widespread. It emerged from informal meetings held in CKPura with CK Trustmembers that farmers have the impression they did much more for the career of scientists than the latterdid for the improvement of their life conditions. In our experience, this leads to a general feeling ofinstrumentalization in the marginal farming community.
On top of that, three consecutive years of severe drought have taken their toll on the small and mar-ginal farmers of the area. Some of them, incapable of repaying their debts are now desperate. Marginalfarmers can also be bitter about former agricultural development projects that have consistently left thembehind while focusing on irrigated agriculture. Communication with outsiders is difficult, because oflanguage issues, most farmers speaking Telugu or Kannada only. Moreover, if a foreigner comes to talkto them, they are likely to expect something immediately, typically a loan.
As a consequence, the dialogue of scientists with resource-poor farmers is a challenge. The only wayto reach them is to bridge the gap with the use of a hybrid [Hee01], namely a person that has a foot inboth worlds, on one hand practicing science and technology, on the other hand, knowing the marginalfarmers and working with them for long enough to have gained their trust. We recognized this aspectearly on in our project and accordingly, built a partnership with an agronomist, farmer and founder of an

4.4. A SURVEY AND ANALYSIS ON FARMERS’ NEEDS 51
NGO working for marginal agriculture3, Mr. P.R. Seshagiri Rao4.Another characteristic of marginal farmers is their inability to make any investment that would im-
prove their productivity, due to unavailability of financial resources. As an obvious consequence, theirfirst and foremost claim is getting affordable loans [RGK+04]. Along these lines, we defend the devel-opment of appropriate microcredit [Sap06] schemes as a prerequisite to any rural development in India(and probably in developing countries at large). However, this is beyond the scope of an academic projectsuch as ours, and as a consequence, our solution is orthogonal to microcredit.
Our goal was to look beyond the current horizon of local farmers and to try and anticipate whatadvances in sciences, enabled by the proper technology, could improve their livelihood through betterland and water productivity. The gap is wide between the mental models of those who have first-handexperience of daily agricultural challenges and engineers. Hence the necessity to involve another partnerin the project: agricultural scientists who are trying to understand better the processes at work in thefield, where countless physical, biological and meteorological parameters interact constantly. In order toaddress the subject in a credible way, we had to build a communication chain involving ICT researchers,agricultural scientists, hybrids and marginal farmers. We initiated a partnership with the Centre forAtmospheric and Oceanographic Sciences (CAOS) at the IISc, which lasted until 2005. At that point, weapproached a Professor at the University of Agriculture Sciences (UAS) in Bangalore, which allowed usto conduct several interviews and surveys on UAS campus.
The first step was then to conduct an assessment of the needs perceived by a community of marginalfarmers for the improvement of their livelihood.
4.4 A Survey and Analysis on Farmers’ Needs
The results and discussion of this section are based on a field survey conducted over a period of tenmonths from August 2003 to May 2004 in three villages of the Pavagada region (Southern India): Chen-nakeshavapura (CKPura), Venkatapura and Ponnasamudra [RGK+04]. The goal of this enquiry was toidentify and categorize the information needs of the population living in the semi-arid regions of India,and to assess the relevance of environment monitoring in such a context.
4.4.1 Survey Methodology
Before beginning the assessment of information needs, Rao et al. classified the different user groups, withthe family as the basic unit. Each family can have more than one livelihood activity (e.g. farming, sheepkeeping, trade, fuel wood gathering etc.). The various livelihood activities of the families are listed on thebasis of effort allocated by the family for the activity. Livelihood activities with maximum allocation ofeffort are categorized as major livelihood activities. During the initial survey and mapping of the village,for each neighborhood (cluster of houses) or caste group (endogamous group signifying social status)the authors of the survey identified a set of knowledgeable individuals. Discussions with these peopleallowed determining the major livelihood and other livelihood options of the families belonging to therelevant user group.
In the second phase, Rao et al. collected information needs of various groups. For this part, they heldgroup meetings and complementary semi-structured interviews. For the group meetings, the resident
3The Chennakeshava Trust, introduced in Section 4.14Mr. Rao is the author and coauthor of several leading articles in the area of Indian ecology and agriculture. He lives and
farms in the village of CKPura, and works as a consultant for agro-business companies and international organizations alike.

52 CHAPTER 4. WIRELESS SENSOR NETWORKS FOR MARGINAL AGRICULTURE IN INDIA
User group Number of families Meetings held Participants (average)Rain-fed Farmers 160-200 11 29Irrigated Farmers 40-60 4 18
Irrigated Orchards Owners 10-12 2 10
Table 4.1: User survey participation
Rain-fed Farm Irrigated Orchard Irrigated FarmCrop yield prediction 1 4 1
Rain prediction 2 - -Plant disease prediction 3 2 4Daily jobs opportunities 4 - -Water level in bore wells - 1 2
Groundwater survey - 3 -Electricity supply - 5 3
Table 4.2: Priority of information needs per user group (1 denotes the highest interest)
families were grouped along patterns of resource use (such as irrigated agriculture, rain-fed agriculture,animal grazing, daily labor etc.). Table 4.1 show the three categories of main interest, with their weight inthe community in terms of number of households. It also gives the number of households that participatedactively to the survey, and indicates in each case the number of meetings that were held.
During group discussions, the farmers identified relevant issues and prioritized them. Several groupdiscussions with the members of the user group were held to determine focal issues of their informationneeds. The identified focal issues were prioritized by consensus. Any disagreements in choice of focalissues or assignment of priorities were also documented. Separate discussions were then held withinterested individuals, in order to gather the details of information on focal issues. These discussionstypically lasted for 2 - 4 hours with 3 to 6 users and usually took place at the farms or houses of usergroup members. The interviews were not based on questionnaires, but on open-ended interactions. Theinterviewers focused on the general categories highlighted in the group discussions, and sought to extractinformation from the individuals in an interactive manner. The questions and answers were collected ina written form and interpreted by the survey main author in order to create the themes that are presentedin detail in the survey document [RGK+04].
The following section focuses on the analysis of the different farming groups, at the expense ofshepherds, shop owners, craftsmen etc. Special emphasis is given to the resource-poor farmers, since theyconstitute the target population of the COMMON-Sense Net project. Richer farmers are also considered,since they are likely to be directly affected by a deployment of the system. More information can befound in the survey report.
4.4.2 Summary of Results
The information requirements of the rural families were very diverse. They covered a wide range ofneeds including weather prediction, market conditions on a particular day, or legal advice on land-holdingrights. A significant finding, however, is that environment-related information ranks high in the perceivedneeds of the rural families. Drawing directly from the user survey document, we constructed a prioriti-zation of information needs per user group, as depicted in Table 4.2, in which a 1 designates the highestpriority, 4 a low priority and - an absence of interest.
In this table, one can distinguish different types of issues. Concerns about electricity cuts or ground-

4.4. A SURVEY AND ANALYSIS ON FARMERS’ NEEDS 53
water and wells are specific to farmers rich enough to afford to pay for irrigation. As for resource-poorfarmers, their wish for better weather forecast or employment opportunities can hardly be satisfied bybetter agricultural practices. On the other hand, the two themes of crop yield prediction and diseasecontrol stand out prominently in all farmers’ categories. For these subjects, the management optionsavailable, their costs, risks and benefits are largely influenced by the high variability of environmentalparameters.
4.4.3 Interpretation and Motivation
At first sight, the realization that crop yield is an important concern for farmers seems obvious. However,the non-trivial finding of the survey is the fact that crop yield prediction is critical mainly for poorfarmers, because their lack of resources forces them to constantly adapt their strategies to the evolutionof the environment. Hence, expected yield plays an important role in the choice to invest or not in atactical option, such as buying fertilizer or pesticides, borrowing and carrying water, etc.
As we showed in the previous subsection, environment monitoring and understanding the impact ofvariability constitute a leitmotif for farmers. This calls for an extension of the usual paradigm of ruraldevelopment projects centered on ICT [PH03]. Whereas projects currently consider primarily interper-sonal communications such as rural phone and Internet connectivity, the COMMON-Sense Net projectwants to advocate a different category of applications that will allow the farmers to connect to- and acton the constraints of their own environment in a more precise way.
In semi-arid regions, the amount of rainfall and its distribution during the season influence most ofthe farming: crop yields, disease and pest incidence, farming operations, level of inputs, etc. Becausethey are farming under such a high-risk situation (uncertainty of expected benefit), poor families try tominimize their risk by investing as little as possible, be it for soil fertilizers, soil water conservation orspraying for pest and disease management. The downside of such a strategy is that in good rainfall yearstheir crop yields are much lower than the field potential. Experience shows that poor farmers usuallyachieve about half of the yields of large farmers, who use better soil-fertility- and pest-management.In situations of uncertain output, the use of a decision-support system able to give information on thebenefits and risks of all the available options will help resource-poor farmers to make an informed choicefor the best strategy.
It is in this area that a sensor network can help them in several ways: Firstly by making it a tool inthe hands of agricultural scientists who work on more sustainable practices and strategies. Simulationmodels of crops, pests, diseases and farming operations are important tools to answer several of thefarmers’ information requirements. The environment monitoring data provided over time and space bysensors can be used to validate and calibrate existing models. Finally, it can help to assess the efficiencyof simple water conservation measures, such as planting trees or mulching.
Secondly, when used directly in the field, sensors can improve farm-level decision making by pro-viding important benchmarks for the impact of moisture deficits, and monitor in real-time the field-conditions with regard to these benchmarks, providing the farmers with a decision support systemadapted to their needs, and encouraging them to invest in order to get higher profits from their farms.
In particular, resource-poor farmers resort to rain-fed farming not out of choice, but out of necessity.Irrigation practices in the semi-arid areas of developing countries are usually inefficient and require largequantities of water. This necessitates drilling wells, which is either too risky or unaffordable for them.A reliable decision-support system is a component of a deficit irrigation system that seeks to maximizethe impact of irrigation on crop yield while minimizing the intake of water. For poor farmers, this couldmean applying new strategies of partial irrigation, such as transporting water from community tanks on

54 CHAPTER 4. WIRELESS SENSOR NETWORKS FOR MARGINAL AGRICULTURE IN INDIA
InformationNeeds
Specific Questions ofMarginal Farmers
Strategy to Provide In-formation
Role of Sensors
Crop yield pre-diction
1) Assess appropriate-ness of crop choices
Use existing scenario-based models.
Soil moisture mea-surements to validategroundnut crop model.
2) Assess appropriate-ness of farming opera-tions.
Validate these modelswith local data.
Pest and Dis-ease Prevention
Provide forecasts of oc-currences during weed-ing.
Determine environmen-tal parameters that havean influence, and theirrespective values.
Gather soil moisture, airtemperature and relativehumidity data
Water Con-servationMeasures
Cost/benefit analysis ofusing bunds and trees.
Compare effectivenessof different measures
Gather soil mois-ture measurements indifferent conditions.
Deficit Irriga-tion
Increase yield with min-imal water use.
Define critical thresh-olds in soil water con-tent at different stages incrop growth.
Gather soil moisture in-formation in each ho-mogenous parcel
Issue warnings whenwater is needed (if pos-sible, indicate amountof water needed)
Table 4.3: Environmental data for marginal agriculture
carts, renting rich farmers’s wells, etc.
4.5 Use Cases and Related Environmental Data
At this early stage of the project (we were in Spring 2005), it seemed easier to collaborate with agriculturescientists in order to design possible applications, because a direct interaction with the farmers wasfeared to generate either incomprehension (their immediate attention being more focused on loans) orhigh expectations leading to disappointment and disinterest, since our prototype will take time to befully operational. As a consequence, we defined system functionalities and use cases jointly with acrop physiologist from the University of Agriculture Sciences, Bangalore, a farmer with high-educationtraining in agronomy and environmentalists from the IISc. The goal of these meetings was to translateperceived needs into scientific solutions.
Drawing on the survey’s analysis of the needs of small-farm families in terms of environmental data(Rao, 2005), we extracted the most promising and rapidly implementable applications and analyzed them(Table 4.3). These considerations led us to the use cases that we detail in the next section.
4.5.1 Crop Modeling
4.5.1.1 Rationale
The first and foremost concern expressed by marginal farmers was about crop yield prediction. Severalcrop simulation models are available for simulating the growth of various crops and crop mixes withdifferent environmental constraints such as moisture stress, nutrient stress and water logging. These
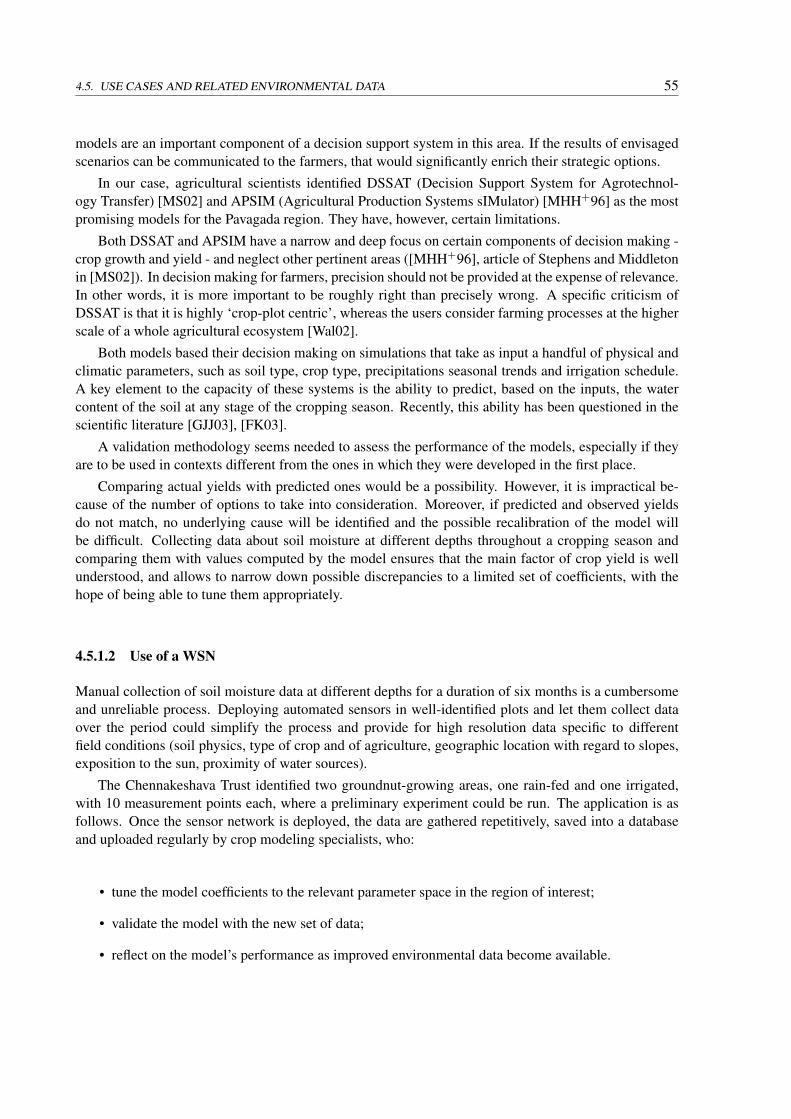
4.5. USE CASES AND RELATED ENVIRONMENTAL DATA 55
models are an important component of a decision support system in this area. If the results of envisagedscenarios can be communicated to the farmers, that would significantly enrich their strategic options.
In our case, agricultural scientists identified DSSAT (Decision Support System for Agrotechnol-ogy Transfer) [MS02] and APSIM (Agricultural Production Systems sIMulator) [MHH+96] as the mostpromising models for the Pavagada region. They have, however, certain limitations.
Both DSSAT and APSIM have a narrow and deep focus on certain components of decision making -crop growth and yield - and neglect other pertinent areas ([MHH+96], article of Stephens and Middletonin [MS02]). In decision making for farmers, precision should not be provided at the expense of relevance.In other words, it is more important to be roughly right than precisely wrong. A specific criticism ofDSSAT is that it is highly ‘crop-plot centric’, whereas the users consider farming processes at the higherscale of a whole agricultural ecosystem [Wal02].
Both models based their decision making on simulations that take as input a handful of physical andclimatic parameters, such as soil type, crop type, precipitations seasonal trends and irrigation schedule.A key element to the capacity of these systems is the ability to predict, based on the inputs, the watercontent of the soil at any stage of the cropping season. Recently, this ability has been questioned in thescientific literature [GJJ03], [FK03].
A validation methodology seems needed to assess the performance of the models, especially if theyare to be used in contexts different from the ones in which they were developed in the first place.
Comparing actual yields with predicted ones would be a possibility. However, it is impractical be-cause of the number of options to take into consideration. Moreover, if predicted and observed yieldsdo not match, no underlying cause will be identified and the possible recalibration of the model willbe difficult. Collecting data about soil moisture at different depths throughout a cropping season andcomparing them with values computed by the model ensures that the main factor of crop yield is wellunderstood, and allows to narrow down possible discrepancies to a limited set of coefficients, with thehope of being able to tune them appropriately.
4.5.1.2 Use of a WSN
Manual collection of soil moisture data at different depths for a duration of six months is a cumbersomeand unreliable process. Deploying automated sensors in well-identified plots and let them collect dataover the period could simplify the process and provide for high resolution data specific to differentfield conditions (soil physics, type of crop and of agriculture, geographic location with regard to slopes,exposition to the sun, proximity of water sources).
The Chennakeshava Trust identified two groundnut-growing areas, one rain-fed and one irrigated,with 10 measurement points each, where a preliminary experiment could be run. The application is asfollows. Once the sensor network is deployed, the data are gathered repetitively, saved into a databaseand uploaded regularly by crop modeling specialists, who:
• tune the model coefficients to the relevant parameter space in the region of interest;
• validate the model with the new set of data;
• reflect on the model’s performance as improved environmental data become available.

56 CHAPTER 4. WIRELESS SENSOR NETWORKS FOR MARGINAL AGRICULTURE IN INDIA
4.5.2 Water Conservation Measures
4.5.2.1 Rationale
Farmers who cannot resort to irrigation need to make the maximum use of precipitation water throughoutthe cropping season. They already do so, however a precise assessment of the efficiency of such measuresis still lacking. Comparative readings of soil-moisture can be used to assess the efficiency of differentwater conservation measures, such as building bunds and planting trees to trap water in the shallow layersof the soil, or using mulch and gypsum to reduce evaporation.
4.5.2.2 Use of a WSN
This use case is similar to the previous one, except that, here, soil moisture readings are used directly.Sensors are placed in fields that are comparable from a physical point-of-view, but where different waterconservation measures are used. Here again, different parameters are relevant, including the location ofthe cropping plots.
For this, spatial variability has to be taken into account, justifying the use of a wireless sensor net-work. Information would be eventually exchanged with farmers through participatory meetings.
4.5.3 Pest and Disease Prediction/Prevention
4.5.3.1 Rationale
Pests and disease are a major concern for farmers. They realize that environmental parameters play arole in the emergence of such phenomena. However, the nature and the value of these parameters is stillunclear. As a consequence, farmers who can afford it tend to treat their crop no matter what, whereaspoor farmers leave their crop unprotected because of the cost of spraying. Observing the correlationof different parameters with the outbreak of pests and diseases could lead to the definition of statisticalmodels of pest or disease prediction. If such models can be developed, they could be used subsequentlyin the field in order to issue warnings.
4.5.3.2 Use of a WSN
In a first phase, sensors can be deployed in a semi-controlled environment in order to observe correlationsbetween environmental parameters and outbreaks. The necessary granularity of such measurements isstill unclear, but field- and crop-variability, as in the previous applications, should not be underestimated.The time necessary to conduct such a study is not precisely specified by the agricultural scientist whomwe interviewed, but definitely spans several years.
If this phase is successful, in the longer term wireless sensors can be deployed in the field, in order toissue warnings to farmers. One could argue that in this case, the action depends on the local environmen-tal status, and that a network is not necessary in this case. However, there are two arguments to supportsuch a solution:
1. Not all environmental parameters have the same level of variability. It would be an overkill toinstrument air temperature or humidity at each and every plot. Using a networked solution allowsfor the efficient aggregation of data.
2. In case of risk, warnings need to be issued to farmers. One might think of an SMS-based system,the relevant sensor sending a message directly to the concerned owner. Or each sensor could have

4.5. USE CASES AND RELATED ENVIRONMENTAL DATA 57
a display that can be read by the farmer. However, both solutions increase the cost of a singlesensor. Using a network to centralize the collection of information at a local information kiosk isanother solution. In this case, farmers can pass by the kiosk whenever they want it. This solutionhas the advantage of fostering potential exchange of information among the stake-holders.
4.5.4 Water Management for Deficit Irrigation
4.5.4.1 Rationale
The situation of marginal farmers with regard to irrigation varies depending on the location of their fields.Some can access to community tanks, because their plot is located directly downstream from one, butothers are totally exposed to the unpredictability of weather. Their only lever is their willingness to buildtheir own retention tank (which they usually do not do) or to transport water from tanks to their field.
However, community tanks regularly dry out, and transporting water is an extenuating task. If wateris not used optimally to the last drop, the result is often not worth the effort. As a consequence, marginalfarmers can benefit from the technology of deficit irrigation, an agricultural water management systemin which the water needs of the crop (potential evapotranspiration) during the growing period can onlybe met partially by a combination of soil water, rainfall and irrigation [D.R05]. Deficit irrigation man-agement requires optimizing the timing and degree of plant stress within restrictions of available water.Of particular use to the farmers is the knowledge of benchmark points for crop/trees water requirements(those points are specific to a particular crop). Using the recent trend of soil moisture values recordedby sensors and the knowledge of these points, the farmer could predict the behavior of his crop and usesimple water management techniques.
4.5.4.2 Use of a WSN
For such an application, in addition to deploying soil-moisture sensors, other parameters are needed.Climatic parameters such as daily rainfall, sunlight hours, wind speed, and air humidity are homogenousenough to necessitate the deployment of only one weather station every few square kilometers. Soilcharacteristics, however, can vary significantly due to composition and situation. This means that thesoil moisture content has to be assessed every few hectares at least. This requirement is even reinforcedwhen the average size of individual plots is small.
Concretely, it is reasonable to deploy between 2 and 4 of sensors (for cross-checking) per homoge-nous parcel, compute the model coefficients for this parcel over a calibration phase, and retrieve themfrom a table when a prediction has to be made.
In order to assess the influence of a particular feature of the landscape (such as trees, bunds, etc.) onthe soil conditions, a sensor should be added at this particular location.
The use case is as follows:
• Calibration As a one time effort, soil moisture probes need to be calibrated with measurementsfrom the gravimetric method, an accepted standard procedure of determining soil moisture. Cli-matic probes are also calibrated. Then, in normal mode of operation, the calibration continues totake place, in a feedback loop based on the difference between the predicted and measured valuein order to take local variations into account.
• Alert Real-time alerts are given whenever the measured soil-moisture of a parcel reaches a thresh-old in the benchmark values. These alerts are automated, but farmers have to be notified by thesystem operator. Once the alert is given, the farmer should be able to look at weather forecast data

58 CHAPTER 4. WIRELESS SENSOR NETWORKS FOR MARGINAL AGRICULTURE IN INDIA
and know, based on historical climatic data for the region, what is the probability of rain in thenear future.
• Soil Moisture Prediction Based on the model and the actual measurements, the system uses areal-time learning process to give predictions on soil-moisture values over time.
• Water Requirements Assessment Based on the same type of request as above, the system givesan estimate of the minimum irrigation water needed according to the benchmarks.
4.6 Design Guidelines
In all the use cases developed in the previous sections, we gave arguments to advocate the use of awireless sensor network. The two first use cases do not take direct advantage of the possible real-timefeatures of a sensor network, because the response-time is not critical, and because they aim at improvingthe situation of marginal farmers indirectly, through observation and scientific analysis. The third andfourth use cases constitute direct applications in the field.
Regardless of their context of deployment, however, each of them has to be positioned according tothe challenges that we highlighted in the previous chapter, so that proper design guidelines can be drawn.
4.6.1 Technical Point-of-View
Lifetime: to yield usable results, all the use cases suppose a field deployment of several months. This re-quires adapted energy sources. Unfortunately, deploying sensors with solar panels is usually problematicin agriculture. Solar panels limit the choice of locations for sensors, because orientation and placementhave to be thought in relation with insolation. They also increase the total bulk of the equipment todeploy, making it more difficult to handle and more attractive to steal. For all these reasons, we foundit necessary to resort to batteries, whose energy profile must be carefully studied to insure the necessarylifetime.
An additional difficulty comes from the sparse nature of the network, which means the likely par-titioning of the network into clusters, with some nodes bearing the extra burden to connect clusters toa single data collection point. These nodes will have to implement some bridge technology (typicallyGSM or Wi-Fi) and their energy requirements will increase signigficantly. Solar energy will become analternative in this case, because it is impossible to rely on the power grid, and because the size of thebatteries necessary to power the nodes will become prohibitive. The small number of such nodes justifiesa more careful placement.
On the hardware side, the choice of the communication platform and of the environmental sensors touse will be conditioned in part by their energy profile. On the software side, low-power protocols (MACand routing) need to be assessed precisely to choose the best fit.
Reliable data collection: Sparse networks make it more difficult to collect data in a reliable fashion.Long distances between nodes and few routing alternatives are the main culprits. In our case, growingvegetation can significantly impair the communication as the cropping season advances. This means thatthe choice of the communication platform is especially crucial. Also, this has implications in the networkarchitecture. A clustered two-tier architecture will be necessary in most cases. Assessment of routingprotocols in such challenging settings is also a necessary prerequisite, because results of long-term WSNsare still lacking in the literature.
Sensing accuracy:Finally, one question to solve is that of the effectiveness of probes. Whereastemperature and relative humidity embedded sensors have been used for years, soil moisture probes have

4.7. METHODOLOGY: SCIENCE AND FARMERS 59
to the best of our knowledge not been formally evaluated in the context of wireless sensing.
4.6.2 Scientific Point-of-View
What use to make of the data is a complex challenge to address. As we realized, use cases are easy to find,but precise usage of data is not known, because scientists are not used to work at the level of granularityallowed by WSNs. There is a need first to collect extensive data, then to provide visualization andprocessing tools for scientists, in order to develop full decision support system and/or recommendationsbased on this.
A possible strategy is to start with the simplest use cases, the ones that need minimum data process-ing, such as assessment of water conservation practices. This would allow for the development of thetechnology and system, its deployment and deployment assessment and the collection of an extensiveset of data. At this point, it would also be possible to reuse the collected data by presenting them toagricultural scientists as a proof of concept, in order to foster the precise definition and development ofother use cases.
4.6.3 Economical and Sociocultural Point-of-View
It is to be noted at this point that a major question mark is the affordability of such a system by farmers.A wireless sensor, all equipped, costs in average USD 200 – 300.- in 2008, a price a priori too expensivefor an Indian farmer5. The technology’s cost is widely believed to drop dramatically in the years to come,but it remains to be seen to what extent.
Before we reached this state, the effectiveness of WSNs in the field needs to be proven. All theapplications that we mentioned earlier necessitate the deployment of a sparse network with an averagedistance between the nodes of 100m or more. Each node will have to survive at least one cropping seasonin order to minimize the maintenance. These are major design issues, as highlighted by Chapter 5.
Before a system can be made commercially viable, external sources of funding need to be sought, inorder to make a proof of concept of the whole technology. In this way, one can build a case for potentialcommercial applications, increase awareness of the users and hence their willingness to invest in a newtechnology, and be prepared for the time when the price of technology decreased enough.
Sources of funding depend on the use case and of the context of deployment. For applicationsdirectly targeted at poor farmers, and meant to be deployed in the field, development and cooperationorganizations are ideal targets. In our case, we obtained a grant from the Swiss Agency for Developmentand Cooperation.
4.7 Methodology: Science and Farmers
As shown in the previous sections, meetings with agriculture specialists led to general use cases. How-ever, it proved to be difficult to go beyond this initial stage, and to design experiments based on thesefindings. As mentioned by P.R. Seshagiri Rao [Rao08], WSNs seem to represent a disruptive technologywhose full potential is difficult to grasp for scientists who have been always working with the constraintof having to cope with sparse environmental data.
Another difficulty in working upfront with scientists is the lack of funding. As the meetings tookplace after the SDC-funded project started, we could not finance scientists to conduct experiments. On
5Profitability studies are yet to be conducted, which is beyond the scope of this work.

60 CHAPTER 4. WIRELESS SENSOR NETWORKS FOR MARGINAL AGRICULTURE IN INDIA
their side, these scientists expected to see a concrete system working before considering to spend timeand money on related experiments. Experiments in the field, on the other hand, have several advantages:
1. They allow for a thorough testing of the system in a real setting
2. They enable the collection of data that can attract interest from scientists and trigger the definitionof precise experiments.
3. They allow for the testing of the initial response of farmers to the intrusion of technology in theirfields.
Accordingly , we opted for a similar strategy as Basha and Rus [BR07] where we design and test tosome extent the system in the lab (both in Lausanne and Bangalore), before deploying it in the field asit is. We then would go back to the lab to address the identified issues. The results of the preliminarydeployment were expected to confirm the technical viability of the system, and to reflect on the initialefforts to involve farmers in the use of wireless networking in their plots. As we explain in Chapter 6,the results obtained in Chennakeshavapura encouraged us to recontact and probe scientists in order topursue collaboration with them.

Chapter 5
System Design and Implementation
As was made clear in the previous chapter, the agricultural issues faced by farmers in Karnataka illustratethe use that fine-grained environmental data can have in this context. In this chapter, we undertakethe task of designing and implementing a system that will provide the necessary data granularity. Thefollowing sections are based on our own experience, that of the setup of a wireless sensor network inrural Karnataka: COMMON-Sense Net (Community Oriented Monitoring and Management of Naturalresources via a SENSor network) [PRP+06], [PRS+07].
The functionalities described above have two features in common: the usefulness of gathering dataover a period of time spanning at least one crop season, and the necessity to collect locally heterogenousdata. If we refer to Chapter 3, wireless sensor networks are ideally suited for this type of applications.But it remains to be seen what type of such a network would correspond to the constraints we have.
Except for deficit irrigation, our use cases do not necessitate the collection of real-time data. How-ever, there is a need to centralize the data, even in the case of deficit irrigation, since:
• The farmer needs to be notified,
• the soil moisture predictions require the use of historical data and of a general mathematical model,whose operation is beyond the computing capabilities of wireless sensors.
A pure data collection model seems hence the most appropriate. In this model, data are generatedlocally but processed globally. Nodes do not analyze the data they collect, they transmit them to a centralserver, where they are stored and processed.
5.1 Design Options
Even with the data collection model in mind, there remain two main design questions to be solved. Willthe data be produced periodically or on demand (i.e. in response to events or explicit queries)? And willthe data be transmitted on the flight, or will we use a store-and-forward strategy?
5.1.1 Data Generation Strategy
Data can be generated periodically or as a response to an event, which can be human-generated – typicallythe explicit emission of queries to the network – or environment-based – for instance when a parameterreaches or exceeds a threshold. This latter model is the most reactive, and allows to capture on the
61

62 CHAPTER 5. SYSTEM DESIGN AND IMPLEMENTATION
flight important events, whose freshness is important for the proper operation of the system. Both event-based models offer the best energy consumption profile, because radio resources are used only when itis considered necessary by the application.
However, in our case, two constraints call for the use of a periodic model. Firstly, data must becollected periodically in order to feed the crop models, to assess continuously the effectiveness of waterconservation measures, or to run predictive scenarios about the soil moisture level. Secondly, the datarequirements are still unclear, because as it was mentioned in the previous chapter, the models that areused today take into account the limitation of the technology at the time they were developed. As aconsequence, agricultural scientists are curious to observe fine-grained data in order to determine whatlevel of granularity is significant.
Accordingly, we seek to generate as much data as possible, while not compromising the lifetime ofthe network, so that it remains operational throughout a full season at the minimum.
For the deficit irrigation use case, a hybrid strategy will be followed: a periodic data collectionmodel, with a variable rate of emission depending on the data variability at the time. For instance, it isnot necessary to collect soil moisture data at more than one sample per hour, or even per day, when norain is falling. However, when water is brought in either by precipitation or irrigation, a finer resolutionmight be desirable.
5.1.2 Data Transport Strategy
We envision networks spanning several hectares. With the communication capabilities of wireless sen-sors, this means that a direct connection to a single base station is unfeasible. On the other hand, a puread-hoc multihop network, where full connectivity is required, would not be adapted to our case, becausewe require the flexibility of instrumenting patches that can be distant from each other. As a consequence,we need to resort to a hybrid sensor network.
The term was first coined by Sharma and Mazumdar in 2005 [SM05]. The authors refer to a hybridsensor network as to a wireless sensor network where the use of limited infrastructure, in the form ofwires, is designed to improve the energy efficiency of the system. Our concern is more the sparseness ofthe network, although energy gains should not be overlooked. In our case, however, a wired infrastructurewould be impractical, due to the distances between nodes, and to the intrusiveness of such deploymentsin the fields. Accordingly, we expand the notion of hybrid network to an infrastructure, where mutuallydisconnected clusters of sensors communicate with each other via an alternative technology.
1. IEEE 802.11 bridge: this option, although attractive in a rural setting with partial connectivity,suffers from distance limitations. Emerging technologies, such as WiMax, might overcome thislimitation in the near future.
2. Cellular network bridge: This solution is appealing because the use of a global telephony networkallows global connectivity. Its major drawback is the cost of communication, which can be mit-igated if we aggregate data packets at each cluster-sink and send them in bulk (to the expense ofsome responsiveness)
3. Store-and-forward strategy: Also known as delay-tolerant networking [HF04], this option meansthat the cluster-sink stores the data until a mobile agent, also know as a data mule [JSS05], comesinto communication range, at which point the data is downloaded to the agent. The data are thentransported to the central server, where they are downloaded again. This solution has the advantageof cost, both in terms of energy and money, to the expense of responsiveness. In our case, the datamule would be a farmer equipped with a hand-held device.

5.2. DESIGN CHOICE: OVERVIEW 63
Finally, we chose the solution of the wireless bridge in order not to compromise the implementationof the deficit irrigation use-case, which necessitates timely measurements. We first used a WiFi bridge,because GSM connectivity was poor in our deployment area, but moved to GPRS as soon as base stationswere deployed, because the range limitations of 802.11 proved to be severe.
5.2 Design Choice: Overview
This section and the following ones present the ongoing design and implementation of COMMON-SenseNet (CSN), a decision support system for resource-poor farmers using the wireless sensor networks’technology for environment monitoring. The system design is as shown in Figure 5.1. This correspondsto a logical architecture summarized in Figure 5.3 for the 802.11 architecture, and in Figure 5.4 for itsGPRS equivalent.
On the left is depicted the data collection subsystem. This subsystem contains the wireless sensors,to which the embedded probes are attached, and which self-organize into a multi-hop data collectiontree. This network is designed to be deployed without configuration, the only restriction concerning theconnectivity between the nodes, which depends on the radio used. Each network can serve an homoge-nous agricultural patch, or a series of contiguous patches. Because deployment locations can be distantfrom each others, we introduce a data transit subsystem connecting each cluster from a data collectionsubsystem to the centralized server. The data transit connection is typically wireless, but with a morepowerful radio than the typical sensing nodes contain (Wi-Fi bridge) or relying on the cellular telephonyinfrastructure, if available at the deployment location (GPRS bridge). The node, on which the data tran-sit bridge is installed (the base station - or sink - of the corresponding cluster), needs a complementarysource of electrical power.
On the server side, one finds first the data logging and network management subsystem. This com-ponent is responsible for listening to the packets coming from the nodes via the data transit subsystem,to interpret them, to log them into the database, and to rely commands that a user could want to issueto one or several clusters. The data processing subsystem is envisioned as a modular component, wherethe processing of each use case can be implemented. For the first phase, this subsystem contains onlydata visualization and upload modules. Finally, the data access subsystem, a web-based graphical userinterface, can be collocated with the network server, or installed on another machine.
The data actuation part, is left open for future developments. We detail all the sub-systems in thefollowing subsections.
5.3 Embedded Probes
For meteorological parameters, CSN uses a battery of sensors for temperature and humidity (SensirionSHT11), ambient light (TAOS TSL2550D), and barometric pressure (Intersema MS5534AM). In theabsence of a microclimate, such parameters do not vary significantly over the deployment area, so only2 weather stations are deployed, for redundancy and detection of measurement drifts. Soil moisture is aparameter of higher variability. We chose to equip several sensors with two ECH2O probes each.
CSN does not measure solar radiation at this point, although this should be included in the nearfuture, as it is a major input for predicting the productivity of the crop. The Leaf Area Index (LAI) basedon the intercepted radiation provides information on the useful biomass of the crop and thus its yield.

64 CHAPTER 5. SYSTEM DESIGN AND IMPLEMENTATION
Figure 5.1: System overview
5.4 Wireless Sensor Network: Data Collection Subsystem
CSN uses a centralized data-collection model, where individual wireless sensor nodes perform minimaldata processing and send back the data via a base station (a node connected to a computer) to a singleserver where they are processed. Since neighboring nodes of the network can be more than hundredmeters apart, a majority of them are unable to reach the base station directly. They have to resort tomulti-hop transmissions, where nodes can relay data from other nodes in addition to sending their own.That means that every node in the network can perform three tasks: collecting data, sending them towardsthe base station, and, if needed, relay data sent by other nodes.
The chosen embedded operating system is TinyOS [tos], because it is widely used by the scientificcommunity, quickly becoming a de facto standard. Moreover, this operating system makes libraries ofcomponents readily available, such as Medium Access layer, and multihop routing. As for routing, sincethere is no mobility in the network, and since topology changes are rare (node failure, occasional movingor addition of a node), CSN uses a simple tree construction algorithm, based on neighboring radio linksquality and hop-counts to the base station.
There are two main issues affecting the platform choice for the wireless sensors. The first is radiorange. Given the data variability and sparse density of the network, a range of more than 100 metersis mandatory, and up to one km is desirable. The second important issue is the power consumption, al-though this characteristic can be mitigated by an appropriate power management scheme such as duty cy-cling. Ideally, the nodes have to perform autonomously for the duration of the cropping season (roughly6 months), either on batteries or with a small solar panel.
Given all these considerations, the most adapted platform available in late 2004 (when the initialchoice was made) was the Mica2 mote manufactured by Crossbow, because its power consumption isreasonably low, and its radio range is the highest among candidate technologies. The short range ofZigbee and Bluetooth radios disqualified them, and technologies such as 802.11 did not match the powerconsumption requirements. Still, the radio range of Mica2 is sometimes stretched. Tests conducted intypical landscapes of the deployment area indicated a higher bound of 100 meters in the best case withquarter wave antennas connected to a ground plane. In 2006, we moved to another platform, TinyNode[tin] by Shockfish, whose range we tested to be at least two times better, without compromising on thepower consumption. The next two subsections explain in details the platform choices.
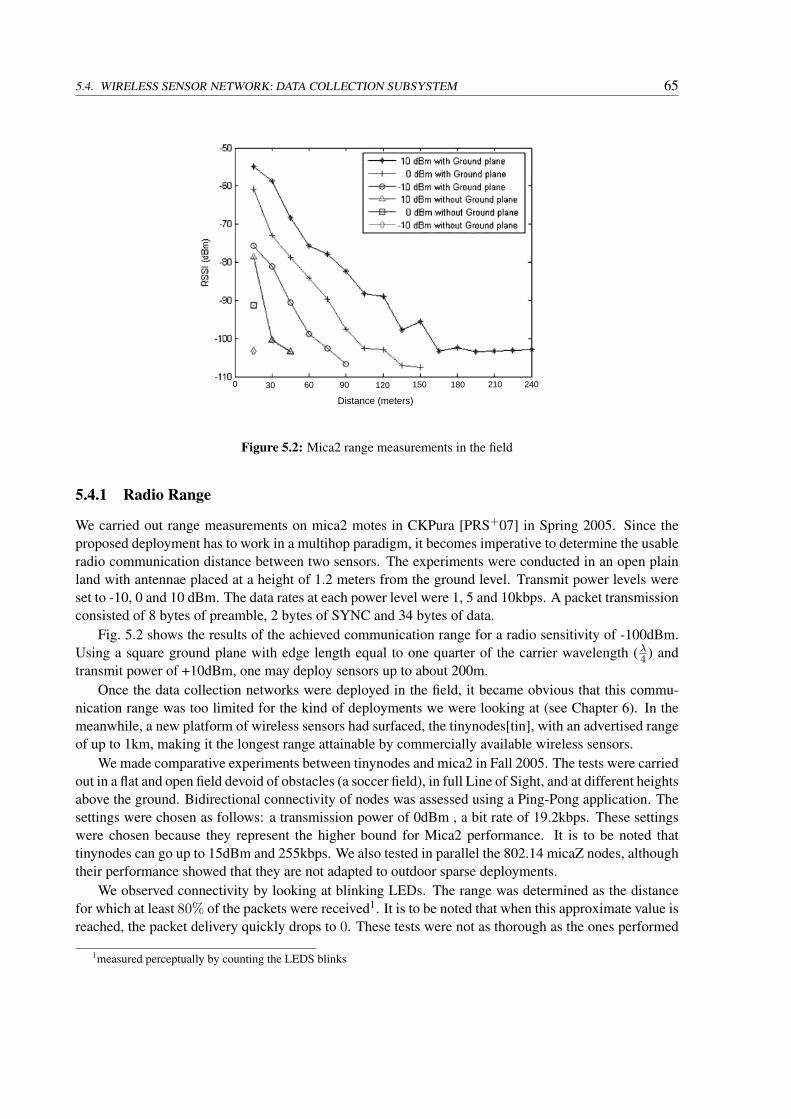
5.4. WIRELESS SENSOR NETWORK: DATA COLLECTION SUBSYSTEM 65
30 9060 150120 2402101800
Distance (meters)
Figure 5.2: Mica2 range measurements in the field
5.4.1 Radio Range
We carried out range measurements on mica2 motes in CKPura [PRS+07] in Spring 2005. Since theproposed deployment has to work in a multihop paradigm, it becomes imperative to determine the usableradio communication distance between two sensors. The experiments were conducted in an open plainland with antennae placed at a height of 1.2 meters from the ground level. Transmit power levels wereset to -10, 0 and 10 dBm. The data rates at each power level were 1, 5 and 10kbps. A packet transmissionconsisted of 8 bytes of preamble, 2 bytes of SYNC and 34 bytes of data.
Fig. 5.2 shows the results of the achieved communication range for a radio sensitivity of -100dBm.Using a square ground plane with edge length equal to one quarter of the carrier wavelength (λ
4 ) andtransmit power of +10dBm, one may deploy sensors up to about 200m.
Once the data collection networks were deployed in the field, it became obvious that this commu-nication range was too limited for the kind of deployments we were looking at (see Chapter 6). In themeanwhile, a new platform of wireless sensors had surfaced, the tinynodes[tin], with an advertised rangeof up to 1km, making it the longest range attainable by commercially available wireless sensors.
We made comparative experiments between tinynodes and mica2 in Fall 2005. The tests were carriedout in a flat and open field devoid of obstacles (a soccer field), in full Line of Sight, and at different heightsabove the ground. Bidirectional connectivity of nodes was assessed using a Ping-Pong application. Thesettings were chosen as follows: a transmission power of 0dBm , a bit rate of 19.2kbps. These settingswere chosen because they represent the higher bound for Mica2 performance. It is to be noted thattinynodes can go up to 15dBm and 255kbps. We also tested in parallel the 802.14 micaZ nodes, althoughtheir performance showed that they are not adapted to outdoor sparse deployments.
We observed connectivity by looking at blinking LEDs. The range was determined as the distancefor which at least 80% of the packets were received1. It is to be noted that when this approximate value isreached, the packet delivery quickly drops to 0. These tests were not as thorough as the ones performed
1measured perceptually by counting the LEDS blinks

66 CHAPTER 5. SYSTEM DESIGN AND IMPLEMENTATION
Height MicaZ Mica2 Tinynode0m unreliable unreliable unreliable1m 35m 110m 275m2m 80m 150m 280m
Table 5.1: Range measurements (indicative): micaZ, mica2, tinynode
State Sleep Active Radio Receive Radio Transmit (5dBm)Tinynode 4 µA 2 mA 16 mA 32 mA
Mica2 < 15 µA 8 mA 18 mA 27 mA
Table 5.2: Tinynode and Mica2 respective current consumptions in typical states
initially on mica2. However, they concluded to an average improvement by a factor close to 2 for thetinynode compared with mica2 (see Table ).
Another advantage of tinynodes is their ability to operate at higher transmission power, up to 15dBm. As a consequence, we chose at this point to migrate to this platform.
5.4.2 Power Consumption
Mica2 and Tinynode have similar power profiles in active state, and for radio transmit or receive states.However, Tinynode performs better in active and sleep states, as shown in Table 5.2. With a low data-rate application such as is the case with COMMON-Sense Net, one might expect the idle-state energyconsumption to become predominant. However, this depends on the efficiency of the power managementschemes implemented at the node’s level, in particular the duty-cycling algorithm that allows the node togo to sleep and save on all its radio and CPU resources whenever they are not needed.
Such a performance depends particularly on the efficiency of the Medium Access Control layer, sinceradio operations consume most of the energy (we observed that at a 5 minute sampling rate, probes’power consumption became negligible). We explain the options available in the next two paragraphs.
B-MAC To achieve low power operation, B-MAC[PHC04] employs an adaptive preamble samplingscheme to reduce duty cycle and minimize idle listening. When idle, nodes go to sleep in an asynchro-nous way, for a fixed period of time - around 100ms at the lowest duty cycle. They wake up periodicallyto listen to the radio channel or send their own packet. Since there is no schedule agreement betweenthe nodes, they prefix each packet with a preamble whose duration is the same as the sleeping period -271 bytes at the lowest duty cycle. This scheme allows the nodes to reach low duty cycle without theneed to send extra monitoring traffic over the channel. A significant drawback, however, is the increasein emission energy, as well as the energy wasted at the reception end in overhearing messages that arenot addressed to the node itself (since a node needs to wait for the whole preamble before reading thepacket header). A later optimization of the scheme includes the message destination in the preamble, sothat nodes can go back to sleep immediately if a message is not addressed to them.
Dozer In order to maximize power efficiency, Dozer [BvRW07] merges the MAC and the routinglayers of the communication stack. First, it establishes a tree structure on top of the physical network.In its bootstrap phase, a node tries to join the tree as quickly as possible. It starts listening for beaconmessages that are sent periodically by all nodes belonging to the network. The node then chooses its

5.5. HYBRID NETWORK: DATA TRANSIT SUBSYSTEM 67
potential best parent based on its distance to the sink (in number of hops) as well as its load (the numberof the node’s direct children). The actual connection setup is initiated after the transmission of the nextbeacon of the selected neighbor. After sending its beacon the potential parent stays in receive mode fora short amount of time. The prospective parent will send the new node its TDMA slot. Beacons are usedto maintain slot synchronization.
Comparison Both B-MAC and Dozer are designed to enable low duty cycles. Typically, they bothadvertise up to 99% of sleep time. For a given platform, as we have seen, the power consumptionof different states is well defined (Table 5.2). The difference in power consumption could come fromthe overhead induced by the signalling messages, in particular synchronization messages. With thisregard, both B-MAC and Dozer have minimal overhead, B-MAC because it is asynchronous by essence,Dozer because it leverages the routing beacons to keep synchronization once the schedules have beenestablished (that is, in regular operation mode).
The only difference that can be observed between Dozer and B-MAC is the duration of transmissionand reception. Since more recent B-MAC extensions managed to reduce overhearing (of long preamblesfrom packets addressed to another node), the power consumed in reception is not itself really discrimi-nant. At the transmission side, however, the difference is marked. Dozer sends normal TinyOS packetsthat are 36 bytes long, while at at duty cycle of 1%, the frames transmitted by B-MAC are 2160 byteslong. This difference can be observed at the oscilloscope. While a packet transmitted by Dozer takes5ms, a preamble plus packet sent by B-MAC takes about 350ms.
We consider a typically low data emission rate of one message every 120 seconds. With the valueswritten down in Table 5.2, that yields:
• Current consumption of idle listening: 0, 99 · 7µA ∼= 7µA
• Current consumption of reception: 0, 01 · 16mA ∼= 160µA
• Current consumption of emission with Dozer: 5·32mA120·1000
∼= 1.3µA
• Current consumption of emission with B-MAC: 350·32mA120·1000
∼= 90µA
As a result, one can estimate the average current consumption of Dozer to be around 160µA, whilethe same for B-MAC is around 250µA. Hence, Dozer would be 20% more efficient than B-MAC.Accordingly, we chose Dozer as our MAC protocol. What really matters, however, is the performancein the field, which has to be experienced first hand. We will reflect on effective power consumption inChapter 6.
5.5 Hybrid Network: Data Transit Subsystem
In order to interconnect disconnected patches to one single server for data logging and network manage-ment, CSN makes use of bridges between individual network clusters. Unlike individual sensor nodes,those bridges are connected to the power grid via electric poles that can be found regularly in the deploy-ment area. They are not power-constrained, and expand significantly the scalability of the network.
The first solution that we investigated makes use of classical 802.11 access points and a rugged PCfor the bridge (see Fig. 5.3). This solution is both expensive and power hungry. GSM connectivity, whichwas not satisfactory at the time of the deployment, since improved considerably in the region of CKPurain 2006. Accordingly, we implemented a GPRS bridge that aggregates and transmits the data directly tothe central server located at the Indian Institute of Science (IISc) in Bangalore (see Fig. 5.4). This work

68 CHAPTER 5. SYSTEM DESIGN AND IMPLEMENTATION
Figure 5.3: System architecture: 802.11 bridge
is described with all its technical core details in [Sta07]. The next paragraphs provide an overview of thetwo systems.
Figure 5.4: System architecture: GPRS bridge
5.5.1 WiFi Bridge
The system consists of several network clusters, each with their own Base Station (BS) that communi-cates with a local server (LS) over 802.11 (or WiFi). Data packets from the sensor nodes are transmittedin a multi-hop fashion to the BS, which gathers data packets from the sensor nodes and transfers themover a WiFi link to the LS, where it is temporarily stored. From time to time, the data is retrieved by thecentral server (CS) over a dial-up connection, and stored into a database.
Base Station The BS consists of three hardware elements: A base-station node (BSN), an 802.11access point and a Single Board Computer (SBC). The SBC is a simple, Linux-based computer equippedwith an Intel processing unit, USB, serial and ethernet connectivity. The FDC unit is mounted on anmetal pole and connected to the electricity network. The power control section of the FDC includes avoltage converter, a charger and a 12V, 7 ampere-hour battery. The voltage converter converts the 12V
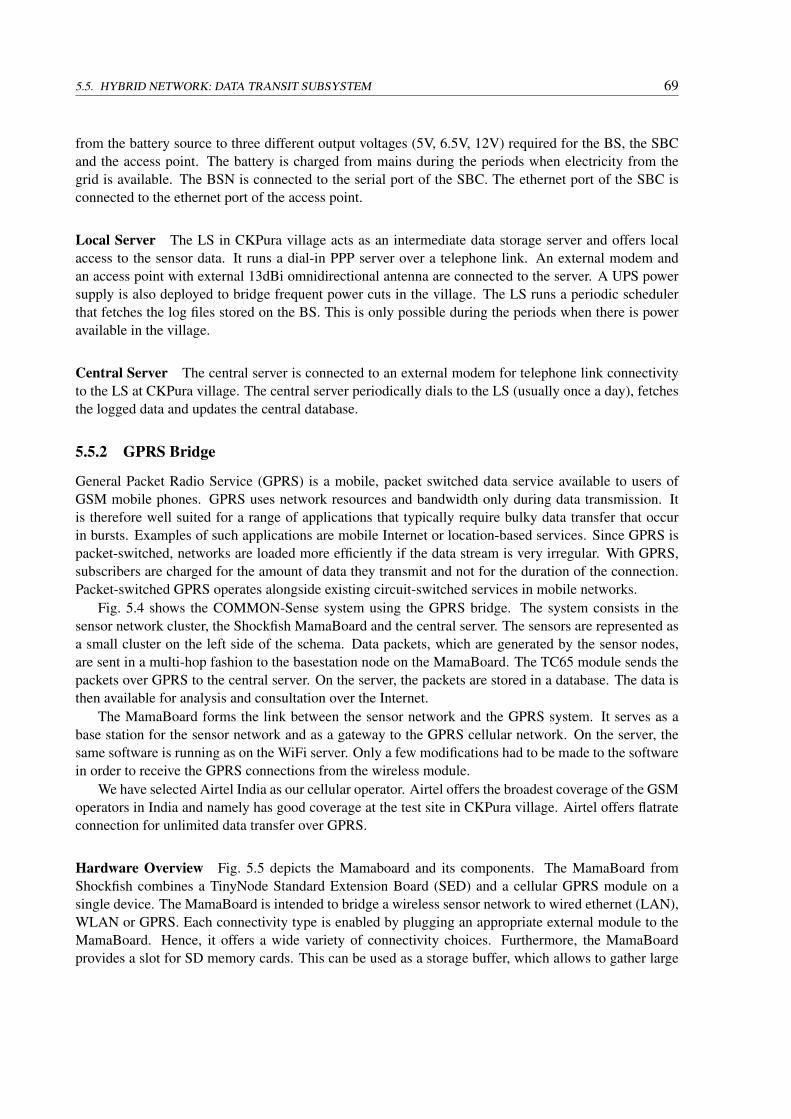
5.5. HYBRID NETWORK: DATA TRANSIT SUBSYSTEM 69
from the battery source to three different output voltages (5V, 6.5V, 12V) required for the BS, the SBCand the access point. The battery is charged from mains during the periods when electricity from thegrid is available. The BSN is connected to the serial port of the SBC. The ethernet port of the SBC isconnected to the ethernet port of the access point.
Local Server The LS in CKPura village acts as an intermediate data storage server and offers localaccess to the sensor data. It runs a dial-in PPP server over a telephone link. An external modem andan access point with external 13dBi omnidirectional antenna are connected to the server. A UPS powersupply is also deployed to bridge frequent power cuts in the village. The LS runs a periodic schedulerthat fetches the log files stored on the BS. This is only possible during the periods when there is poweravailable in the village.
Central Server The central server is connected to an external modem for telephone link connectivityto the LS at CKPura village. The central server periodically dials to the LS (usually once a day), fetchesthe logged data and updates the central database.
5.5.2 GPRS Bridge
General Packet Radio Service (GPRS) is a mobile, packet switched data service available to users ofGSM mobile phones. GPRS uses network resources and bandwidth only during data transmission. Itis therefore well suited for a range of applications that typically require bulky data transfer that occurin bursts. Examples of such applications are mobile Internet or location-based services. Since GPRS ispacket-switched, networks are loaded more efficiently if the data stream is very irregular. With GPRS,subscribers are charged for the amount of data they transmit and not for the duration of the connection.Packet-switched GPRS operates alongside existing circuit-switched services in mobile networks.
Fig. 5.4 shows the COMMON-Sense system using the GPRS bridge. The system consists in thesensor network cluster, the Shockfish MamaBoard and the central server. The sensors are represented asa small cluster on the left side of the schema. Data packets, which are generated by the sensor nodes,are sent in a multi-hop fashion to the basestation node on the MamaBoard. The TC65 module sends thepackets over GPRS to the central server. On the server, the packets are stored in a database. The data isthen available for analysis and consultation over the Internet.
The MamaBoard forms the link between the sensor network and the GPRS system. It serves as abase station for the sensor network and as a gateway to the GPRS cellular network. On the server, thesame software is running as on the WiFi server. Only a few modifications had to be made to the softwarein order to receive the GPRS connections from the wireless module.
We have selected Airtel India as our cellular operator. Airtel offers the broadest coverage of the GSMoperators in India and namely has good coverage at the test site in CKPura village. Airtel offers flatrateconnection for unlimited data transfer over GPRS.
Hardware Overview Fig. 5.5 depicts the Mamaboard and its components. The MamaBoard fromShockfish combines a TinyNode Standard Extension Board (SED) and a cellular GPRS module on asingle device. The MamaBoard is intended to bridge a wireless sensor network to wired ethernet (LAN),WLAN or GPRS. Each connectivity type is enabled by plugging an appropriate external module to theMamaBoard. Hence, it offers a wide variety of connectivity choices. Furthermore, the MamaBoardprovides a slot for SD memory cards. This can be used as a storage buffer, which allows to gather large

70 CHAPTER 5. SYSTEM DESIGN AND IMPLEMENTATION
amounts of data on the MamaBoard, before sending them to an adjacent network. The SD slot can beaccessed both by the TinyNode and the GPRS module.
The Siemens TC65 is the GPRS module that can be mounted on the Mamaboard. It includes a sim-plified version of the J2ME (Java 2 Mobile Environment) [24]. Hence, it is possible to execute standardJava applications on the GPRS module. Furthermore, the TC65 comes with an integrated TCP/IP stack.This allows to establish standard Java socket connections to a server by using AT commands2. The TC65is connected to the MamaBoard via a 80 pin board-to-board connector.
Figure 5.5: Mamaboard equipped with Siemens TC65 wireless module. 1. TinyNode, 2.GPRS antenna, 3. SD card slot, 4. TC65, 5. SIM card
5.5.3 Performance Evaluation
Major advantages of the GPRS bridge are simplicity, energy efficiency and deployment flexibility. Thesystem design is simpler than with the WiFi system.
The BS runs a simplified stack, since it only needs to feed the GPRS module with packets to send.The LS is no longer necessary, neither is the dial-up link to the CS. The MamaBoard is the only device re-quired to establish communication from the field to the central server. The two factors mentioned above,simplicity and energy efficiency, open up new possibilities for deployment of the network clusters. Set-ting up the network is faster, less laborious and easy to debug. Ideally, the GPRS enabled basestation caneven run on battery power for reasonable amounts of time. In this way, the clusters become completelyindependent of a power source and could therefore be deployed even in regions which are out of reach ofother systems. Such an architecture already approaches the classical concept of a sensor network whichoperates in an independent, self-organized manner. Finally, it also solves the problem of the power cuts,which caused many problems in the WiFi system.
However, there is one important drawback of the GPRS system. The command link has a large delay.Commands issued are transmitted to the network only once the MamaBoard sets up a GPRS connectionto the central server. Other solutions to minimize this delay have been studied, but were not implemented.
GPRS also introduces an ongoing operating cost. Right now, the weekly cost is INR 99.- (or USD2.30) per cluster. In networks with many clusters, an intermediate aggregation layer could be usedto gather data from several clusters on one GPRS Base Station to keep the operating cost low. Finally,
2AT (for “attention”) commands are the components of the Hayes command set, a specific command-language for modems.The command set consists of a series of short strings which combine together to produce complete commands for operationssuch as dialing, hanging up, and changing the parameters of the connection (definition from Wikipedia).

5.6. DATA MANAGEMENT AND PROCESSING 71
network coverage at the deployment sites can be a limitation for the GPRS system. While GPRS servicesare nowadays widely available in urban areas throughout India, it remains a limiting factor in rural areas.
5.6 Data Management and Processing
The collected data is logged into a PostGreSQL database, whose (simplified) structure is shown inFig. 5.6.
Figure 5.6: Database Structure
The essential features of the database are the following:
1. Login-based access to the application.
2. Several deployments can be managed jointly.
3. Clusters are regrouped by geographical location.
4. Data can be retrieved at any time based on the geographical location of the network, its identifierand time parameters.
5. A user can define an experiment, selecting one or several nodes from different clusters withoutgeographical constraint.
5.6.1 Tables
Log Command and Log Query This table is used to log queries and command messages sent to thenetwork. The command is stored as a string, with its associated address, value and cluster id.
Cluster This table is used to store information about clusters. A cluster usually refers to a physicalinstance of a sensor network. A cluster is associated with the name of a data table (which are created

72 CHAPTER 5. SYSTEM DESIGN AND IMPLEMENTATION
dynamically) and a unique group id . Duplicates for data tables and group ids must be looked for. Groupids are unique but reusable. Data table names are unique.
Cluster Group This table is used to regroup clusters by geographical location.Mote Info This table is used to store information about motes, such as their associated cluster id,
their location, and the platform type.Data xxxx This table stores the data received from a particular node id over time. Each sensor has
its own data table. This is necessary because of the size that an aggregated table would have. Given theamount of sensor data that is stored into the database (more than 700 per node and per day), this wouldmake the data access time prohibitive, especially for interactive display.
Experiment This table is to store information about application groups, namely individual experi-ments conducted on a set or subset of nodes from one or several clusters.
Experiment Node This is a joint table to associate a mote to an application group.Routing Parent This table is used to store parent statistics over time.For the moment, the data can be viewed based on their type in different graphs, and may be down-
loaded as well. There is no integrated data processing at the moment. We will see in the chapter aboutSystem Assessment why we had to review our ambitions on that side.
5.7 A Web-based Tool
A proprietary java front-end, based on an original design by the sensorscope group [SDFV], is used tosend commands to the wireless network and to log data and meta-data into a database, from which theyare extracted for display and processing. The java front-end is also used to send commands and queriesto the network (such as transmission power and radio channels change etc.)
The system contains a web-based interface for the display and upload of data. This interface has tworoles. Firstly to allow a user to select clusters and obtain the relevant data, either in order to display orto download them for further analysis. Secondly, to allow an administrator to monitor the state of anycluster, and to issue commands to the corresponding networks.
Figure 5.7: Web application: home page
From the home page (Fig. 5.7), one can choose 4 different functionalities:
• Displaying environmental data by cluster or experiment

5.7. A WEB-BASED TOOL 73
• Looking at the network statistics
• Sending a command to the network
• Learning more about the project (about)
5.7.1 Data Display
Figure 5.8: Web application: network selection page
Figure 5.9: Web application: display of data
From the Environmental Data tab, one can select a cluster group, then a cluster. Once the cluster isselected, the map is displayed (Fig. 5.8).
The map has several interactive features:1. On mouse-over a semi-transparent window allows to display details about the corresponding node.
2. The nodes can be selected by a mouse click.
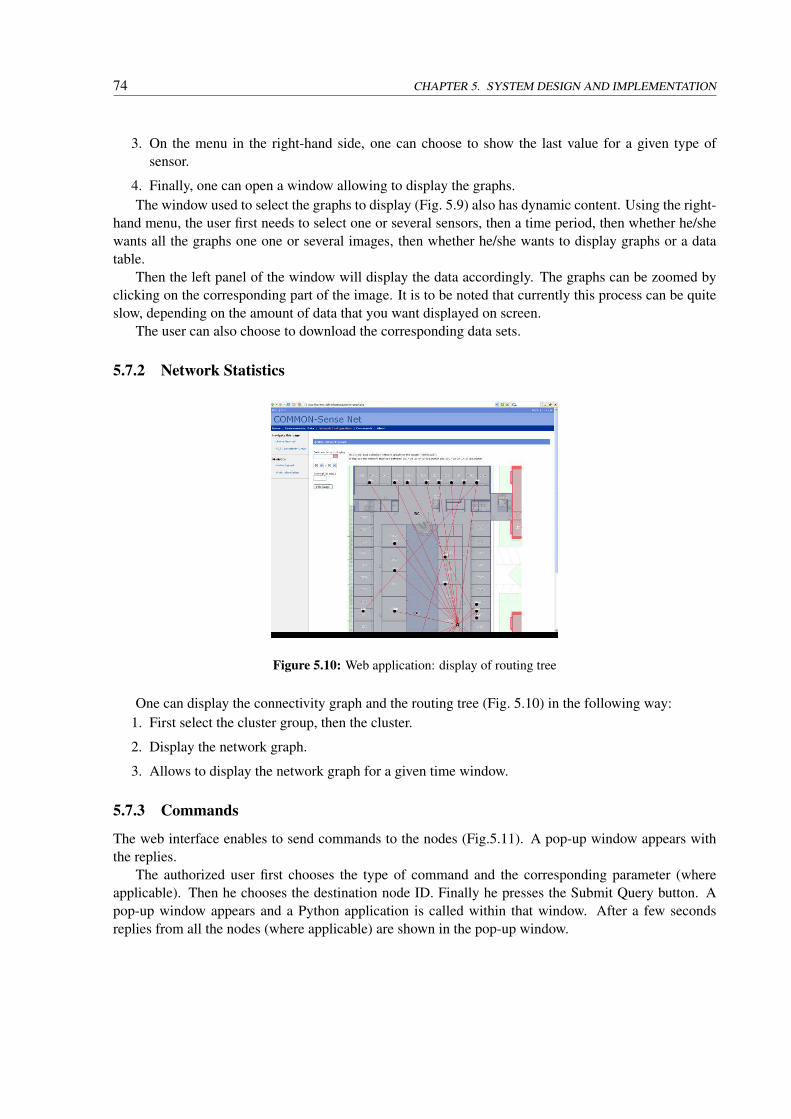
74 CHAPTER 5. SYSTEM DESIGN AND IMPLEMENTATION
3. On the menu in the right-hand side, one can choose to show the last value for a given type ofsensor.
4. Finally, one can open a window allowing to display the graphs.The window used to select the graphs to display (Fig. 5.9) also has dynamic content. Using the right-
hand menu, the user first needs to select one or several sensors, then a time period, then whether he/shewants all the graphs one one or several images, then whether he/she wants to display graphs or a datatable.
Then the left panel of the window will display the data accordingly. The graphs can be zoomed byclicking on the corresponding part of the image. It is to be noted that currently this process can be quiteslow, depending on the amount of data that you want displayed on screen.
The user can also choose to download the corresponding data sets.
5.7.2 Network Statistics
Figure 5.10: Web application: display of routing tree
One can display the connectivity graph and the routing tree (Fig. 5.10) in the following way:1. First select the cluster group, then the cluster.
2. Display the network graph.
3. Allows to display the network graph for a given time window.
5.7.3 Commands
The web interface enables to send commands to the nodes (Fig.5.11). A pop-up window appears withthe replies.
The authorized user first chooses the type of command and the corresponding parameter (whereapplicable). Then he chooses the destination node ID. Finally he presses the Submit Query button. Apop-up window appears and a Python application is called within that window. After a few secondsreplies from all the nodes (where applicable) are shown in the pop-up window.
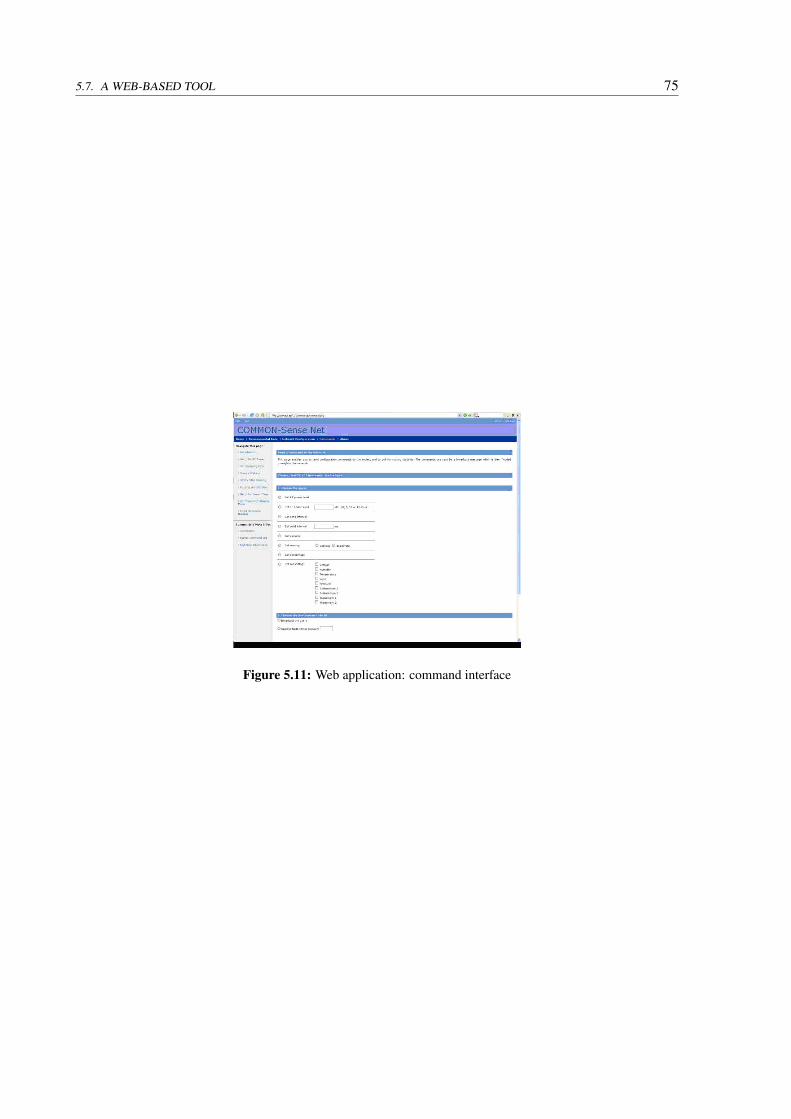
5.7. A WEB-BASED TOOL 75
Figure 5.11: Web application: command interface

76 CHAPTER 5. SYSTEM DESIGN AND IMPLEMENTATION

Chapter 6
A Wireless Sensor Network Toolkit forRural India
This chapter describes work that was carried out between 2005 and 2008 in partnership with the Centrefor Electronic Design and Technologies (CEDT) of the Indian Institute of Science (IISc). In particular,most of the field work was accomplished by a research team led by Prabhakar T.V. of the CEDT. Engi-neers who worked in the village are : Sujay M.S., Aswath Kumar M., Vinay S. and Amar Sahu. A localteam provided us support under the supervision of Mr. P.R. Seshagiri Rao.
We proceeded to the first deployment of our system in India in 2005. This took place on the campusof the Indian Institute of Science, in Bangalore, with Mica2 motes. A second experiment was conductedin early 2007 with the Tinynode platform. In parallel, a test field has been used in Switzerland (at theChangins agronomic station) from 2006 (first tests on Tinynodes) to 2007-2008 (first deployment of aGPRS bridge).
The success of these various deployments and the support from the local NGO Chennakeshava Trustencouraged us to go for live deployment in Chennakeshavapura in 2006 (Mica2), and again in the summerof 2007 (Tinynode) (Fig. 6.2 shows a view of the fields from the server’s location). Concomitantly, weextended our network deployment in Changins. This chapter details the history of these deploymentsand the lessons learned in the process.
6.1 Changins
The Changins deployment took place at the agronomic research station of the same name. A map of thisdeployment is depicted in Fig. 6.1. 23 nodes were deployed from July 2007 to March 2008. The basestation of the network, connected to a GPRS bridge, was installed on the third floor of the station’s mainbuilding, on the south balcony and was connected to a power plug inside the building (node 1 on themap). Other nodes were deployed outside. 10 nodes were installed in the orchard and vineyard locatedto the south-east of the building1. 3 nodes were located on a small vine research plot on the south ofthe building2. Two nodes were deployed in a vineyard on the north of the building3, and two more in anearby orchard4. Two nodes were set close to an existing meteorological station, further up the hillock
11200-1207, 1217, 1221, 123221226, 1229, 123031241, 124541258, 1260
77

78 CHAPTER 6. A WIRELESS SENSOR NETWORK TOOLKIT FOR RURAL INDIA
100 meters
Figure 6.1: Changins test-bed (Switzerland) : 25 nodes deployed for a period of 6 monthswithout interruption
on the north side of the building5. Finally, we placed two relay nodes on the south and east side of thebalcony6, and one relay node on a pole north-west from the base station7. The whole area is located onthe side of a hillock. There are trees close to the building and in the orchards, and a block of greenhouseson the east side of the main building.
This setting allowed us to test the longevity of the batteries in a multi-hop setting. We observedconsistently three hops connections in this network, with some temporary topologies going up to 4. Ageneral lesson to be drawn is the unpredictability of the topology. Nodes located 400m from the basestation regularly connected directly to it (node 1242 in Fig. 6.1), whereas nodes nearby sometimes usedintermediate nodes that are possibly further away from the base station than themselves (e.g. 1200-1206-1263). An extreme example of this situation is illustrated in Fig. 6.1 by node 1207, which communicateswith 1253 on the north-west side of the test-field, which in turn communicates with 1232 at the south-east side 400m away, which communicates with the base station. 1207 is about 80m away from the basestation.
We did not investigate this phenomenon in detail, as in our opinion it is linked with the unpredictablenature of the radio channel. In any realistic setting, phenomena such as multi-path effect or fading are
51258, 126061253, 126371256

6.2. CHENNAKESHAVAPURA 79
Figure 6.2: CKPura deployment: view of deployment field from the central server roof
extremely hard to predict because of the difficulty in building an exact model of the environment.We used the results obtained in Changins to analyze the performance of the system in terms of
throughput and lifetime. We present these results in Sections 6.3.3 and 6.3.6.
6.2 Chennakeshavapura
The first field deployment in India was carried out in 2006, for which we obtained data throughout thewhole year. The platform used at that time was Mica2, and the clusters were connected to the centralserver through a 802.11 bridge. The total number of nodes deployed during this period was 18. 10 nodesremained active throughout the deployment period.
Figure 6.3 details the settings of this deployment consisting of 2 separated clusters, (note: the bodiesof water indicated on the map are dry most of the year), from which the network has already collecteda wealth of data that were used in three ways: to validate the data collected by the different probes; toassess the performance of the network in terms of range, lifetime and connectivity; and to test and refinethe design.
A second deployment, this time with tinynode hardware, took place in the summer of 2007. Itconsisted of 7 nodes.
These deployments are sparse. The average distance between the nodes is 150 meters for the Mica2stations, and 300 meters for the Tinynode stations.
We deployed only one weather station containing temperature, humidity and pressure sensors (Fig. 6.5).All the other nodes were equipped solely with ECH2O probes (Fig. 6.4). By default, two probes weredeployed at each measurement point (i.e. by wireless sensor), at two different depths : 10 cm and 30 cm.

80 CHAPTER 6. A WIRELESS SENSOR NETWORK TOOLKIT FOR RURAL INDIA
Figure 6.3: Chennakeshava initial deployment
This was done in order to assess the water needs of a plant at two depths of its root zone. It is to be notedthat for subsequent deployments, the depth of the sensors for a given plot should depend on the type ofcrop cultivated at this location.
The base stations of each cluster were connected to the electrical grid, and also contained a recharge-able battery to cope with power cuts (Fig. 6.6).
The Chennakeshavapura deployment is particularly illustrative of the difficulties that remain aftertechnical design and lab testing have given satisfactory results.
6.3 Issues of a Rural Deployment
6.3.1 Hardware Issues
Memory corruption of motes contributes to the overall unreliability of the system. The experience inlive deployment with large leaf canopy cover resulted in unpredictable node ID changes in at least 3occasions. We also experienced a complete freezing of nodes in the field deployment at CKpura. Thenode ID change is mostly a one or two bit flips in the node ID field structure. Although the node ID maybe brought back to its original value by a software reboot of the running code, a node freeze proved tobe a corruption of the flash memory. We suspect high package temperatures to be the cause for the flashcorruption seen in the field deployment.

6.3. ISSUES OF A RURAL DEPLOYMENT 81
Figure 6.4: CKPura deployment: typical node in weather-proof package, powered bytwo AA batteries
6.3.2 Probe Assessment
6.3.2.1 Climatic Probes
The results obtained from the sensor network deployed at CEDT were compared to benchmark measure-ments from the Center of Atmospheric and Oceanic studies (CAOS) from the Indian Institute of Sciencein Bangalore, in order to see if the trend matched. As shown in Figure 6.7, the results for temperature arean exact match. The same result holds for humidity, which uses the same Sensirion SHT11 probe (seeFig. 6.8).
6.3.2.2 ECH2O
We validated the soil moisture readings indirectly by superposing them with rainfall data (Fig. 6.9).As one can see, the trend clearly matches. Rain falls of late May, when the soil water content is low,provoked a sharp increase in soil moisture. A similar phenomenon can be observed in mid-July and onSeptember 30th. On the other hand, important rain falls of late August only stabilized the soil moistureat a high value, since the water content at that time was probably close to field capacity (around 25%).

82 CHAPTER 6. A WIRELESS SENSOR NETWORK TOOLKIT FOR RURAL INDIA
Figure 6.5: CKPura deployment: Temperature, pressure and humidity micro-station
However, the measurements appeared to be noisier than hoped, although they remain in the 5 % rangespecified in the ECH2O user manual. This problem can be solved by averaging over a larger number ofsamples (which is what is done a traditional data logger), but this increases the power consumption anddecrease the lifetime significantly. Instead, when we moved to the Tinynode platform, we designed incollaboration with Shockfish a new data acquisition board filtering out high frequency signal variations.This proved to reduce significantly the effect of noise, while not compromising on the accuracy, as shownin the next paragraphs.
The laboratory of Hydrologogy at EPFL (HYDRAM) assessed the use of ECH2O probes througha wireless sensor. In order to do so, 6 samples of soils were gathered from the Changins test-site atdifferent locations. Two more samples of sand were added to the lot. These samples were fully dried andput into pots, where soil moisture probes were inserted. During two months, precise amounts of waterwere added to the pots, while evaporation was prevented with the use of aluminum sheets. The ECH2Oprobes’ measurements were then compared with punctual gravimetric measurements. The details of themethodology can be found in [Rou08].
The results obtained during these tests are summarized in Table 6.1 for a probe’s default calibrationas provided by the manufacturer, and in Table 6.2 for a soil specific calibration based on the gravimetricmethod. Based on these data, the authors’ conclusion (as can be found - in French - in [Rou08]) was thefollowing:
“The performed measures led to a result which is overall less satisfactory than the benchmark pro-vided by the manufacturer. The observed drift between the expected precision and the experimental

6.3. ISSUES OF A RURAL DEPLOYMENT 83
Figure 6.6: CKPura deployment: base station box containing linux box for 802.11 con-nectivity, wireless sensor and battery
Changins 1 Changins 2 Changins 3 Changins 4 Changins 5 Changins 6 Sand 1 Sand 2Average 0.0620 0.0518 0.0666 0.0679 0.0362 0.0565 0.0604 0.0470Sigma 0.0378 0.0280 0.0574 0.0456 0.0274 0.0259 0.0158 0.0197
Maximum 0.1313 0.0993 0.2050 0.2030 0.1057 0.1069 0.1038 0.0938
Table 6.1: ECH2O and Data Acquisition Board Assessment over Wireless: Precision ofmeasurement with default calibration
results, however, remain small and localized. As a consequence, they can be considered to be acceptabledepending on the intended use of the probes. (...) The zone of influence, i.e. the volume of the soilrepresentative of the measured water content, plays an important role for soil moisture probes in general,and in particular for our experiment. According to the manufacturer’s documentation, this zone coversa width of 2cm along the probe. The remaining uncertainty linked with the homogeneity of the non-manipulated soil emphasizes the importance of this zone. An extended experiment, as well as trials onvarious soil volumes and structures should be considered (...).
“The ECH2O probe that was tested in our framework seems to have a particularly interesting future.It needs to be put into its context of use. As a matter of fact, this tool must not be seen as a precision tooltargeted at laboratory research, but as a field-tool intended for long-term outdoor measures.”
6.3.2.3 Watermark
Although our experience with the ECH2O probes is so far satisfactory, there are some concerns aboutthe usability of the measurement method itself in the context of agriculture. As a matter of fact, thevolumetric water content of the soil is independent of soil physics. However, the capacity of a plant’s

84 CHAPTER 6. A WIRELESS SENSOR NETWORK TOOLKIT FOR RURAL INDIA
Figure 6.7: Temperature: Performance of SHT11
Changins 1 Changins 2 Changins 3 Changins 4 Changins 5 Changins 6 Sand 1 Sand 2Average 0.0310 0.0357 0.0344 0.0245 0.0377 0.0233 0.0367 0.0413Sigma 0.0176 0.0326 0.0242 0.0159 0.0254 0.0197 0.0164 0.0159
Maximum 0.0842 0.1218 0.1453 0.0976 0.0969 0.0926 0.0970 0.0995
Table 6.2: ECH2O and Data Acquisition Board Assessment over Wireless: Precision ofmeasurement with soil-specific calibration
roots to draw water is conditioned by the soil composition.This means that with ECH2O probes, a proper soil calibration might be needed in order to get rele-
vant information for agriculture. There exist, however, probes that assess the suction potential directly.Watermark probes are an example. These inexpensive probes use a resistor embedded into a semi-porousmaterial that mimics the action of the root itself. With this method, the result obtained is independent ofthe soil type.
The interfacing of such probes is a problem, however. The probe manufacturer is not keen on disclos-ing its technical sheet, because it interfaces the probes with data loggers itself. There exists a chip on themarket, the SMX [Sys], that translates the resistance into a voltage that can be used with an appropriatetable of values.
CEDT is currently performing tests on the watermark probe and its usage with the COMMON-SenseNet data acquisition board.
6.3.2.4 Field Data
The data that were collected on the test-bed at Chennakeshavapura (Figs. 6.10 and ??) were used in theuser experiment described in Chapter 8. Being presented to the participants via the Web application de-
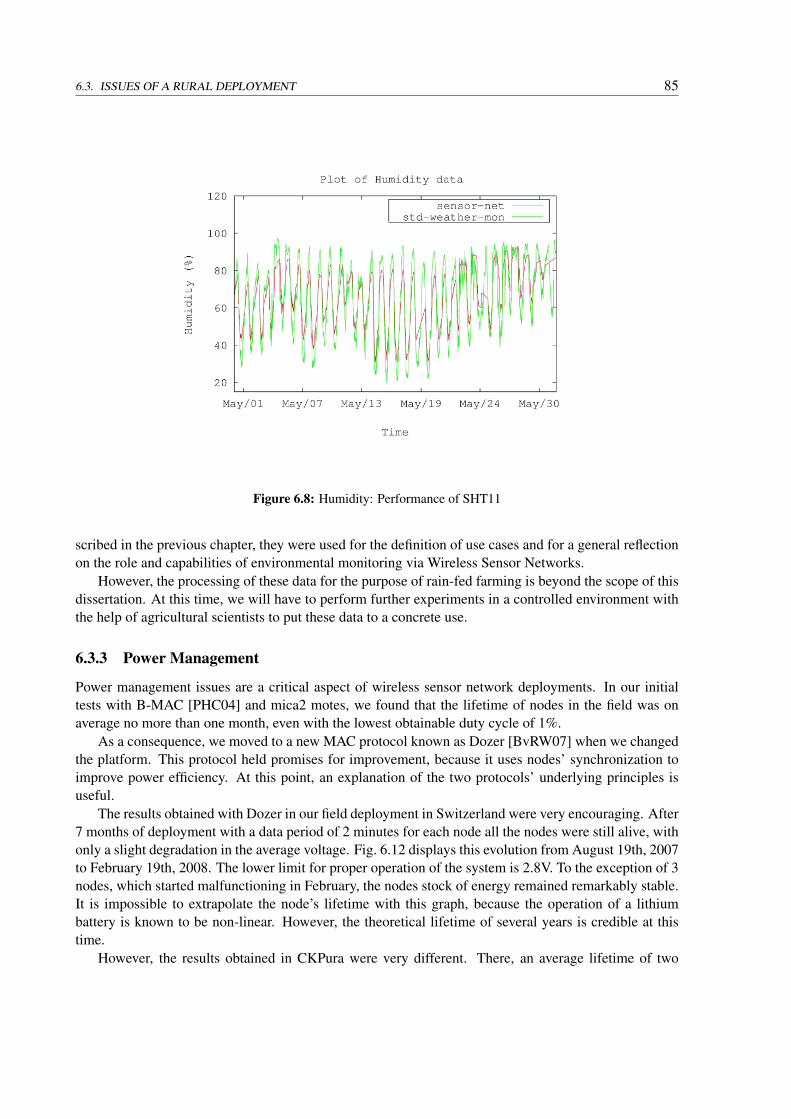
6.3. ISSUES OF A RURAL DEPLOYMENT 85
Figure 6.8: Humidity: Performance of SHT11
scribed in the previous chapter, they were used for the definition of use cases and for a general reflectionon the role and capabilities of environmental monitoring via Wireless Sensor Networks.
However, the processing of these data for the purpose of rain-fed farming is beyond the scope of thisdissertation. At this time, we will have to perform further experiments in a controlled environment withthe help of agricultural scientists to put these data to a concrete use.
6.3.3 Power Management
Power management issues are a critical aspect of wireless sensor network deployments. In our initialtests with B-MAC [PHC04] and mica2 motes, we found that the lifetime of nodes in the field was onaverage no more than one month, even with the lowest obtainable duty cycle of 1%.
As a consequence, we moved to a new MAC protocol known as Dozer [BvRW07] when we changedthe platform. This protocol held promises for improvement, because it uses nodes’ synchronization toimprove power efficiency. At this point, an explanation of the two protocols’ underlying principles isuseful.
The results obtained with Dozer in our field deployment in Switzerland were very encouraging. After7 months of deployment with a data period of 2 minutes for each node all the nodes were still alive, withonly a slight degradation in the average voltage. Fig. 6.12 displays this evolution from August 19th, 2007to February 19th, 2008. The lower limit for proper operation of the system is 2.8V. To the exception of 3nodes, which started malfunctioning in February, the nodes stock of energy remained remarkably stable.It is impossible to extrapolate the node’s lifetime with this graph, because the operation of a lithiumbattery is known to be non-linear. However, the theoretical lifetime of several years is credible at thistime.
However, the results obtained in CKPura were very different. There, an average lifetime of two

86 CHAPTER 6. A WIRELESS SENSOR NETWORK TOOLKIT FOR RURAL INDIA
Figure 6.9: Soil moisture: Correlation of ECH2O with rain fall
weeks was observed in preliminary tests. A software problem is one possible explanation, should someapplication parameters differ in one implementation and the other. Another possibility is the role playedby particularly challenging conditions, in particular distance between nodes, which might cause fre-quent losses of synchronization and increase the nodes’ power consumption significantly. Indeed, thedistance between the nodes is in average 200-300m in CKPura, while in Changins nodes are at most100m form their nearest neighbor. Failed links might indeed cause numerous retransmissions, exchangeof resynchronization packets and undue active-radio time. CEDT is currently performing tests on theseeventualities, until the boxes used in Changins can be used in CKPura.
6.3.4 Environment
This aspect is especially critical for the packaging issues. In this subsection, we explain why we chose todevelop self-contained light-weight stations comprising only soil moisture probes. Such a model is quiteunusual in environment monitoring, where people usually try to integrate as many probes as possible intoa single station.
First comes the issue of temperature. In the semi-arid region the ambient temperature can go over37°C. Packaged electronic systems can experience even higher levels. Semiconductor memories, micro-controllers and radio devices should work predictably in these conditions.
Then comes the issue of intrusiveness. The hardware must be minimally invasive, so as not tointerfere with the normal operation in the field. It is not practical to deploy bulky weather stationsthroughout the cropping fields. The sensors should be self-contained in a box that can be fixed to existinginfrastructure or on simple poles planted wherever needed.
To summarize, this means that:1. The number of probes used within a single sensor should be kept minimal

6.3. ISSUES OF A RURAL DEPLOYMENT 87
Figure 6.10: Data collected by soil moisture sensors at 15 cm below surface in Chen-nakeshavapura between September 2006 and February 2007

88 CHAPTER 6. A WIRELESS SENSOR NETWORK TOOLKIT FOR RURAL INDIA
Figure 6.11: Data collected by soil moisture sensors at 30 cm below surface in Chen-nakeshavapura between September 2006 and February 2007
Measurements for Voltage [mV]
Figure 6.12: Evolution of voltage over time for a 25 nodes network deployed in Chan-gins, Switzerland

6.3. ISSUES OF A RURAL DEPLOYMENT 89
2. The use of solar panels is not an option, as it requires installing a special infrastructure. Moreover,such panels are prone to theft, as was indicated by the local NGO we work with in the field [Rao05].
3. The boxes and hardware must withstand high temperatures and heavy rain.As we focus mostly on soil moisture data (see previous chapter), we opted for a self-powered light-
weight design with an enclosure providing a protection index IP67 [IP], meaning total protection againstdust and protection against strong jets of water. We adapted to the box a pressure equalizer plug (compat-ible with the norm IP67), in order to prevent condensation of water. Two membrane cable glands allowfor the connection of the cables to the probe wires. This design has a decisive advantage in that it doesnot impair sensing and is easy to deploy.
We powered each box with a 3.6V lithium battery, enough to ensure a 6 months lifetime accordingto our tests in Changins.
One essential argument in favor of WSNs is their low price, expected to drop even more in the yearsto come. We face an essential tradeoff here: the need to look for packaging that lives up to the standardsof environment monitoring, while remaining cheap. Hence a challenge in choosing and adapting off-the-shelf boxes so that they withstand temperatures and precipitation strains. In our project, we chose theenclosures and accessories provided by FIBOX [FIB]. These components are listed in Sec. 6.5.
6.3.5 Power and Telecommunications Infrastructure
In rural India, power cuts are frequent, often happening every day and lasting for hours. The design fordeployment should consider intermittent power as a major issue. Sometimes, the operation of auxiliarygenerators is not enough to cope with extended power outage. This is important when one considers thecluster heads that contain Wi-Fi or GPRS equipment (see Fig. 6.13).
GPRS has a further advantage, because GSM base stations are not affected by power cuts, as theyhave their own generator. In this case, we can bypass a local server that would suffer from the poweroutages as well, and send the data directly to a server located in a urban area, where power is morereliable.
This brings the question of cellular coverage in the deployment area. The price of GPRS data hasdropped sharply, while the coverage in rural India is progressing steadily [CTT06]. There was no GSMbase station close to the Chennakeshavapura village when we proceeded to our initial deployment in2005. In 2007, several companies had started to operate in the area.
As for us, we initially connected our base stations to the regular power grid, via a rechargeablebattery, but as we experienced problems with power cuts, we decided to move to a solar powered solution.Sensorscope [SDF] designed a GPRS-compatible station powered by a solar cell. We plan to reuse theirdesign in upcoming releases of the system.
6.3.6 Connectivity Issues
On the bright side, a deployment in a rural region does not have to take into account the same amountof interferences that can be observed in an urban environment. The radio channel can be expected to bemore predictable in the absence of tall buildings, metallic infrastructure and heavy traffic.
But this picture needs to be nuanced. Terrain in marginal farmer’s land can have undulations, makingLine-of-Sight (LOS) connectivity difficult. Then, there is the issue of vegetation, which grows consis-tently throughout the cropping season. That means the connectivity will tend to degrade as time passes.Having to cope with a sparse network does not help either. When two nodes get disconnected, there islittle other alternative than to deploy an intermediate node as a bridge.

90 CHAPTER 6. A WIRELESS SENSOR NETWORK TOOLKIT FOR RURAL INDIA
Figure 6.13: CKPura deployment: base station with WiFi bridge
We made an in-depth analysis of connectivity from the deployment we made in Changins betweenAugust 2007 and February 2008. This deployment represents the most extended data set we have to datewith the Dozer protocol (see Section 5.4.2). This connectivity study was based on effective throughputfigures obtained throughout the period. As the nodes report data every two minutes continuously, weanalyzed the evolution of the Packet Delivery Ratio (PDR, which we also call normalized throughput)over time.
Throughput figures in Changins are mixed. Fig. 6.14 shows the evolution of normalized throughputover time, by 24 hours increments. Apart from the network disruption that is observable from October 7to October 17, it is possible to make the following observations. On one hand, losses happen continuouslyin the network, and the average PDR stagnates around 55 to 60 %. On the other hand, disconnected nodesalways recover and manage to send messages at least every few hours. At this point, the most likely causeis recurring losses of synchronization at the MAC layer (Dozer), which force the nodes to go over thesynchronization and schedule establishment procedure over and over again.
As the network’s topology is heterogenous, we show in Fig. 6.15 the connectivity figures for thenodes located on the north side of the base station. These nodes are positioned on the upper side of thehillock, in small clusters separated by distances from 100m to 400m. We do the same for the south nodesin Fig.6.16. As one can see in Fig. 6.1, the density of the network is higher in this area, and nodes arealso closer to the base station. Although connectivity figures are still mixed, one can observe that the
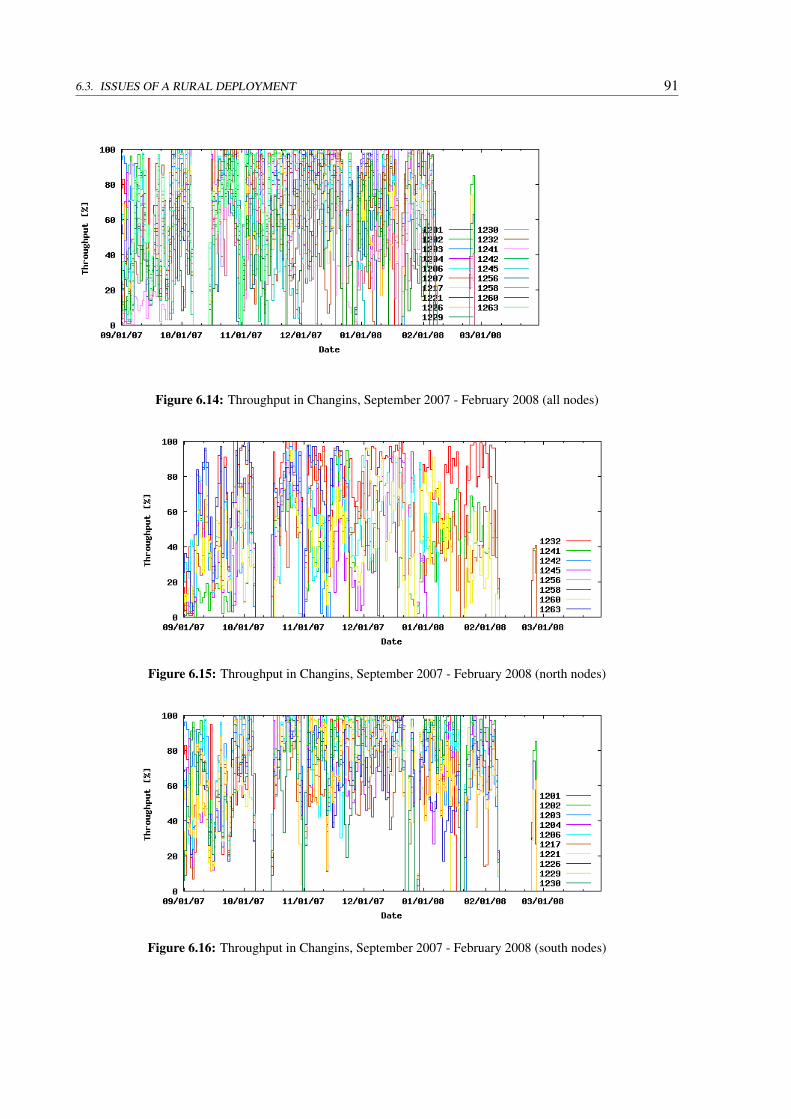
6.3. ISSUES OF A RURAL DEPLOYMENT 91
Figure 6.14: Throughput in Changins, September 2007 - February 2008 (all nodes)
Figure 6.15: Throughput in Changins, September 2007 - February 2008 (north nodes)
Figure 6.16: Throughput in Changins, September 2007 - February 2008 (south nodes)
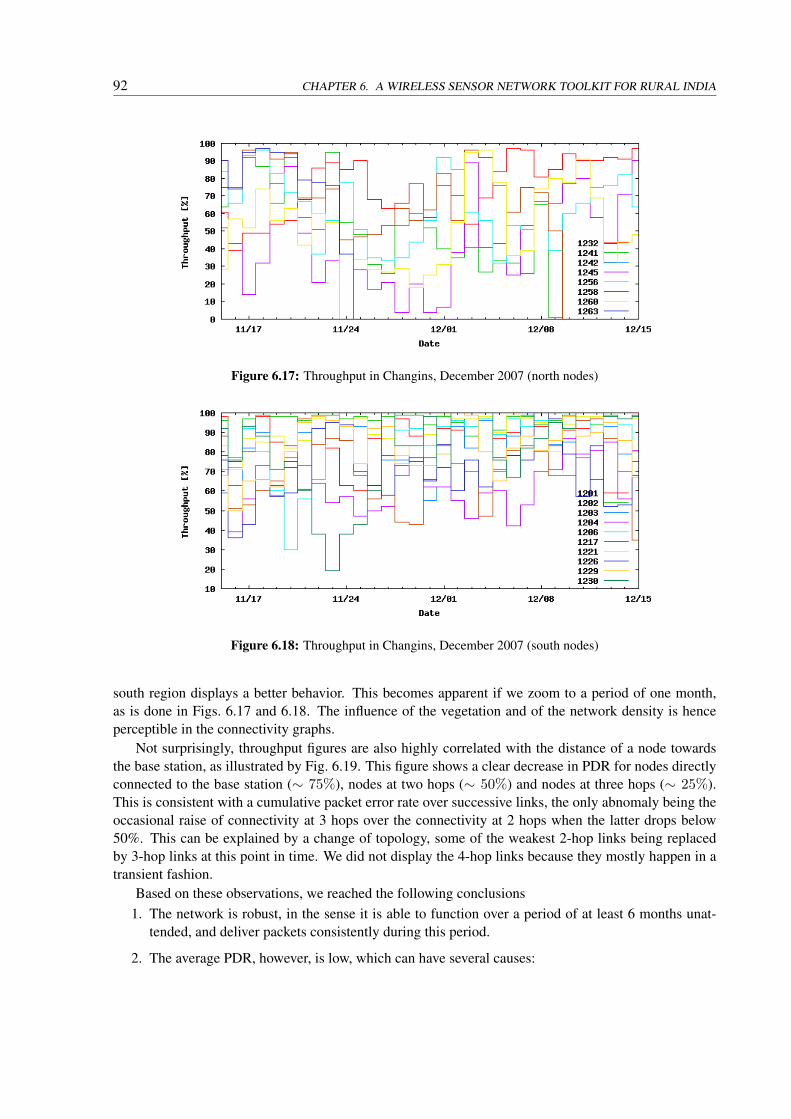
92 CHAPTER 6. A WIRELESS SENSOR NETWORK TOOLKIT FOR RURAL INDIA
Figure 6.17: Throughput in Changins, December 2007 (north nodes)
Figure 6.18: Throughput in Changins, December 2007 (south nodes)
south region displays a better behavior. This becomes apparent if we zoom to a period of one month,as is done in Figs. 6.17 and 6.18. The influence of the vegetation and of the network density is henceperceptible in the connectivity graphs.
Not surprisingly, throughput figures are also highly correlated with the distance of a node towardsthe base station, as illustrated by Fig. 6.19. This figure shows a clear decrease in PDR for nodes directlyconnected to the base station (∼ 75%), nodes at two hops (∼ 50%) and nodes at three hops (∼ 25%).This is consistent with a cumulative packet error rate over successive links, the only abnomaly being theoccasional raise of connectivity at 3 hops over the connectivity at 2 hops when the latter drops below50%. This can be explained by a change of topology, some of the weakest 2-hop links being replacedby 3-hop links at this point in time. We did not display the 4-hop links because they mostly happen in atransient fashion.
Based on these observations, we reached the following conclusions1. The network is robust, in the sense it is able to function over a period of at least 6 months unat-
tended, and deliver packets consistently during this period.
2. The average PDR, however, is low, which can have several causes:

6.4. HUMAN ISSUES 93
Figure 6.19: Throughput per number of hops in Changins, December 2007
(a) Synchronization issues at the MAC layer,(b) Sparseness of the network,(c) Additive effect on the multi-hop links.
The general lessons to be drawn from the connectivity issues that we faced in the field is the pressingneed of an appropriate deployment and maintenance support tool that helps with the deployment of awireless sensor network. Moreover, such a tool, if it is to be put in the hands of a non-specialist user, hasto be intuitive and must not require a priori knowledge of networking.
6.4 Human Issues
In order to achieve the successful implementation of the uses cases described in Chapter 4, the collab-oration of the farmers was required to protect the hardware, to report regularly on field conditions andto give feedback on the added value brought by the technology. Unfortunately, we observed an initialdistrust of the population towards the technology and the presence of scientists in the field.
Informal discussions with local stake-holders indicated that the population of small farmers has anexperience of being systematically left behind in the innovation process. A second obstacle was thedifficulty in translating the scientific terminology of environmental science (soil moisture, evapotranspi-ration, etc.) into the language of the field. Finally, the current uncertainty about the benefit to cost ratioof the technology did not encourage active collaboration.
In 2007, CEDT reassessed the situation in an internal project document[Jam]. Informal interviewswith some marginal farmers indicated that they are not interested in any project that does not bring themrains, a road to the village, a perennial bore well, or cash (as loans for example) and subsidies.

94 CHAPTER 6. A WIRELESS SENSOR NETWORK TOOLKIT FOR RURAL INDIA
In this assessment, the results of the survey on information needs [RGK+04] were not deemed in-valid, but considered in the light of the circumstances:
1. Farmers were asked to think about a very specific question, which might bear limited relevance inthe face of more immediate problems, in particular the threat of bankruptcy.
2. There is a minority of individuals who recognize the commitment of scientists to improve farmingconditions through this project. However, their importance was exaggerated in the survey becausethey were the ones more willing to participate actively to the survey
3. Farmers tend to have confidence in Mr. Sheshagiri Rao (our “hybrid”), because he is one of them
On three occasions, we experienced theft of hardware. Although such events could not be tracedwith certainty to the local population, the Chennakeshava Trust eventually concluded to the necessity oflocking the hardware in protected chambers in order to prevent more stealing. This clearly contradictsthe initial goal of using a participatory approach, and also conflicts with the flexibility required of alight-weight system.
6.5 System Overview
We provide in this section a summary of the components that we used in our toolkit, with useful links tomanufacturers whenever appropriate.
Operating System: tinyOS-2.x, with proprietary MAC plus Routing protocol Dozer by Shockfish(instructions on how to use it are available with the code).
Wireless Sensing Platform: Tinynode [tin] by Shockfish with Linx quarter-wave antennas solderedon the board [Tec].
Data Acquisition Board: Custom design (schematics in Fig. 6.20) with interfaces for two ECH2Oand two Watermark sensors, and a battery casing for one Lithium 3.6V battery.
Hybrid Network Bridge: GPRS transmitter over shockfish mama-board [tin], necessitating SiemensTC65 GPRS card [Sie]. Currently powered by the electrical grid.
Probes:
• temperature/humidity: Sensirion SHT15
• soil moisture: ECH2O [ECH]
• soil hydric pressure: Watermark [Irra]
Enclosure: FIBOX [FIB]
• Boxes: PC 150/50 LG
• 2 x PG 16 cable glands
• 1 x MB 10894 pressure equalizer plug
• Cables going in the soil need to be protected up to 1 meter above the ground
Server side:
• Web server Apache2
• PostGresql database
• Java servlet and python scripts
The full application code is available at http://commonsense.epfl.ch
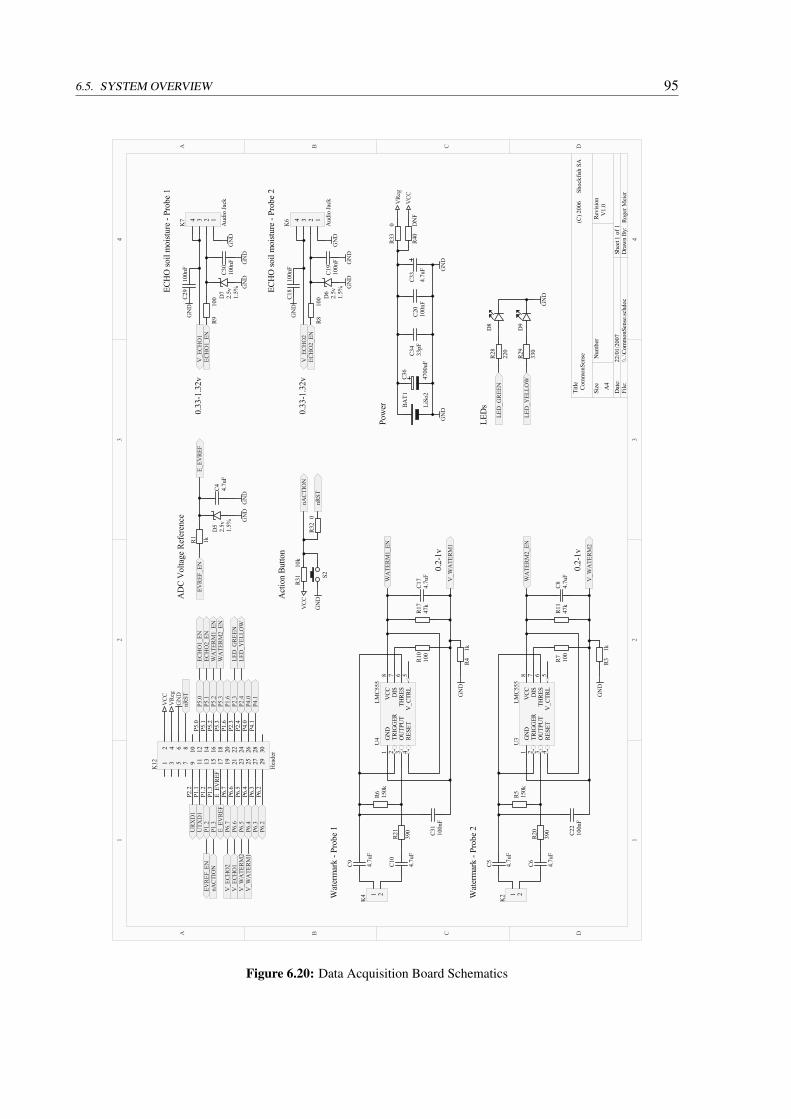
6.5. SYSTEM OVERVIEW 95
11
22
33
44
DD
CC
BB
AA
Title
Num
ber
Revi
sion
Size A4
Dat
e:22
/01/
2007
Shee
t o
fFi
le:
\\..\C
omm
onSe
nse.
schd
ocD
raw
n By
:
Com
mon
Sens
e
V1.
0
Roge
r Mei
er1
1
Shoc
kfish
SA
(C) 2
006
ECH
O so
il m
oistu
re -
Prob
e 2
1 2
K2W
ater
mar
k - P
robe
2
V_E
CHO
1
V_W
ATE
RM1
ECH
O1_
EN
WA
TERM
1_EN
LED
_GRE
ENLE
D_Y
ELLO
W
1.5%
2.5v
D5
AD
C V
olta
ge R
efer
ence
1kR1E_
EVRE
F
GN
D
EVRE
F_EN
GN
D
4.7u
FC4
ECH
O2_
ENV
_ECH
O2
100n
FC1
8
GN
D
GN
D
100n
FC1
9
100n
FC2
0
GN
D1
TRIG
GER
2
OU
TPU
T3
RESE
T4
THRE
S6
V_C
TRL
5
DIS
7V
CC8
LMC5
55U
3
WA
TERM
2_EN
150k
R5
V_W
ATE
RM2
1kR3
GN
D
100
R747
kR1
1
0.2-
1v
0.33
-1.3
2v
390
R20
4.7u
F
C5 4.7u
F
C6
100n
FC2
2
4.7u
F
C33
LED
sD
8
220
R28
GN
D
D9
330
R29
LED
_GRE
EN
LED
_YEL
LOW
33pF
C34
1234
Aud
io Ja
ck
K6
1.5%
2.5v
D6
100
R8
GN
D
S2G
NDA
ctio
n Bu
tton
4.7u
FC8
GN
D
ECH
O so
il m
oistu
re -
Prob
e 1
ECH
O1_
ENV
_ECH
O1
100n
FC2
9
GN
D
GN
D
100n
FC3
0
0.33
-1.3
2v
1234
Aud
io Ja
ck
K7
1.5%
2.5v
D7
100
R9
GN
DG
ND
V_E
CHO
2
ECH
O2_
EN
WA
TERM
2_EN
1 2
K4W
ater
mar
k - P
robe
1
GN
D1
TRIG
GER
2
OU
TPU
T3
RESE
T4
THRE
S6
V_C
TRL
5
DIS
7V
CC8
LMC5
55U
4
WA
TERM
1_EN
150k
R6
V_W
ATE
RM1
1kR4
GN
D
100
R10
47k
R17
0.2-
1v
390
R21
4.7u
F
C9 4.7u
F
C10
100n
FC3
14.
7uF
C17
GN
D
UTX
D1
URX
D1
1 3 5 7 9 11 13 15 17 19 21 23 25 27 2930282624222018161412108642
Hea
der
K12
nRST
VCC
VRe
g
P5.0
P5.1
P5.2
P5.3
P1.6
P2.3
P2.4
P4.0
P4.1
P6.2
P6.3
P6.4
P6.5
P6.6
P6.7
E_EV
REF
P1.3
P1.2
P1.1
P2.2
P6.4
P6.5
P6.2
P6.3
P1.2
P1.3
P6.6
E_EV
REF
P2.3
P2.4
P4.0
P4.1
P1.6
P6.7
EVRE
F_EN
P5.1
P5.2
P5.3
P5.0
V_W
ATE
RM2
10k
R31
VCC
nACT
ION
nRST
0R3
2
nACT
ION
LiSo
2
BAT1
4700
uF
C36
0R3
3
DN
FR4
0V
CC
VRe
g
GN
DG
ND
Pow
er
Figure 6.20: Data Acquisition Board Schematics

96 CHAPTER 6. A WIRELESS SENSOR NETWORK TOOLKIT FOR RURAL INDIA
6.6 Lessons Learned
Deploying a sparse network in a remote and uncontrolled environment raised critical deployment issues.Fluctuations of the radio channel caused by the growth of vegetation during the cropping season had asevere impact on the network connectivity. To diagnose such problems and other software or hardwarefailures would require a constant presence of communication engineers on the deployment site, which isdifficult to achieve in a rural setting.
The main lesson to be learned from this deployment, however, is the difficulty of implementing andtesting convincingly our use cases in the field. Firstly, stabilizing the system software and hardwaretook longer than expected, meaning that we started to collect reliable data only in 2007. The volume ofcollected data is not yet important enough to draw conclusions on the themes identified in Chapter 4. Thisprevented us from establishing convincing contacts with the marginal farmers, as their attitude towardsscientists is one of disbelief unless proven otherwise, as we already identified in Chapter 4.
Another reason for the inability to implement use cases yet was the particular situation of community-based irrigation. Because of several drought occurrences in recent years, community tanks have dis-played a low recharge level since the project started.
Closer study of irrigation practices also showed that farmers practice submersion irrigation, whichconsists in flooding the field at early stages in the cropping season. Such practice would receive littlebenefit from the use of wireless sensors. Currently, marginal farmers consider drip-irrigation as too costlya practice. Experiments conducted in controlled environments will be necessary if we are to prove theprofitability of drip irrigation to marginal farmers.
Both the difficulty in tracing the technical problems and the impossibility to create a partnershipwith farmers represented serious obstacles. This called for a change of paradigm: in our experience,the promise of ubiquitous computing will have to wait for maturation of both the technology and theusers before being fulfilled. Instead, managing the technology in a controlled environment with theparticipation of committed users can lead to rapid results, provided we can ensure a spill-over effect tothe farming population.
In the next chapters, we explain1. How we developed a user friendly original deployment and maintenance support tool, designed to
be used by non-network specialists (Chapter 7)
2. Why we decided to focus on scientists working on applied research for rain-fed agriculture, andhow we verified the appropriateness of this new approach (Chapter 8).

Chapter 7
Making the Invisible Audible
In this chapter, we draw on lessons learned from our deployment in Chennkeshavapura (see Chapter 6).Deploying a sparse wireless sensor network is not an easy task. Currently, this requires the interventionof networking specialists. One major issue in determining nodes’ placement is the connectivity betweenthem and its evolution over time. In particular, in an environment characterized by dense vegetation,partial line-of-sight and low network density, deploying sensors requires precisely analyzing the connec-tivity between nodes while they are being installed.
Once the nodes are deployed, specialists are not always available in the field. We realized thatmaintaining the network in operational state was a challenging task for the local staff. In particular,diagnosing the status of each node is not trivial in the absence of any embedded display. Some healthstatus can be assessed directly from the server, but if nodes stop responding, it can be difficult to tracedown the origin of the failure.
In this chapter, we present Sensor-Tune, a light-weight deployment and maintenance support tool forwireless sensor networks. This tool is based on an auditory user interface using sonification. Sonificationrefers to the use of audio signals (mostly non-speech) to convey information. We explore the potentialof this approach, in particular how it allows to overcome the inherent limitations of visual interfaces.We then justify our design choices, and present typical WSN applications where sonification can beparticularly useful. Finally, we present the prototype that we built, and describe a user experiment thatwe conducted in early 2008, which is the first reported attempt to put a multi-hop wireless sensor networkdeployment in the hands of non-specialists.
We claim that the tool that we developed can be used in a variety of deployments. Accordingly, weextend our focus to any data collection wireless sensor network. However, the reader should keep inmind that a context such as a developing country, where a large part of the population has still limitedcomputer literacy, would particularly benefit from such an approach.
7.1 Introduction
It is an experience commonly reported in the literature that deploying a wireless sensor network can be acumbersome and labor-intensive task [RYR06], [SWC+07], [RBE+06]. In particular the influence of theenvironment on network connectivity is often difficult to diagnose due to the limited display capabilitiesof wireless sensor nodes. These difficulties are exacerbated when the network topology is sparse (forinstance WSNs for agriculture), or when the environment is particulary challenging for the radio channel(indoor environment with metallic walls or pipes, etc.)
97

98 CHAPTER 7. MAKING THE INVISIBLE AUDIBLE
In the current state of affairs, the tools at disposal are ill adapted. The wireless sensors themselveslack a proper interface to convey precious information back to the user, in particular connectivity. Usu-ally, the only available feedback to the users is through a series of LEDs. A more sophisticated graphicdisplay would not be practical in most cases, as it would consume too much energy to be adapted to aresource-constrained device such as a wireless sensor.
With this in mind, the options left to a deployment team are few. The staff can work blindly ina long and painful trial-and-error process. It can use ad-hoc nodes blinking their LEDs in order toassess one-to-one connectivity. Such a measure involves moving around two nodes that run a Ping-Pongapplication, and constantly observing the LEDs indicating metrics such as Packet Error Rate (PER). Orit can use more complex network monitoring systems, to the extra cost of relying on extra infrastructureor software services.
Selavo et al. developed a portable graphical display for deployment time validation [SWC+07].However, our experience indicates that traditional displays are usually not convenient during a work-intensive deployment task. Indeed, portable devices generally use LCD displays that are difficult to readoutdoors, especially on sunny days. It is also to be noted that the necessity to actively look at a signal ora screen is an important distraction from the work to be accomplished. To this day, a light-weight toolthat makes it easy to assess the quality of the radio channel while performing the necessary deploymenttasks is still lacking.
Designing such a tool for the average user is challenging. Currently, deploying a WSN remains a taskrequiring a high level of expertise, while end-user installation is crucial for cost reduction, scalability andusers’ acceptance of the technology [BCL04]. In particular, the deployment-support tools that have beendeveloped so far (see Section 7.2) require advanced computer skills and knowledge in networking. IfWSNs are to become as ubiquitous as foreseen by many analysts, it will be necessary to develop intuitiveinterfaces for this technology. In this context, an important issue is the ability of untrained users to deploya WSN effectively by assessing connectivity and placing nodes appropriately.
A deployment and maintenance support tool for wireless sensor networks should satisfy a basic setof requirements. First of all, the system should interfere minimally with the task to be carried out. Inparticular, it should not require the installation of an extra infrastructure. Because deployments can takeplace in challenging environments, it should provide information that is easy to read in all circumstances.Finally, it should not require any special expertise to be interpreted by the person in charge for thedeployment, while providing expert users with extended information about the network.
The contribution of this chapter is three-fold. First, we introduce the application of sonification (theuse of non-verbal audio signals to convey information) to wireless sensor networks, discussing advan-tages and challenges of this approach. Second, we present the design and implementation of Sensor-Tune(see Fig. 7.1), a light-weight deployment and monitoring tool based on sonification. To the best of ourknowledge, it is the first tangible example of a sonification-based solution to WSN problems. Third, wereport on the field evaluation of our tool, showing the impact of our design choice through the analysis ofusers performance on a network deployment task. This experiment represents the first reported attemptto put a wireless sensor network deployment in the hands of non-specialists.
The rest of this chapter is structured as follows: in the next Section, we begin by presenting the stateof the art, both in deployment support systems and in sonification. In Section 7.3, we explain how weused sonification and justify the choices we made in order to make the sound feedback as intuitive aspossible. In Section 7.4, we explain in detail the scenarios and system design. In Section 7.5, we presenta survey on sonification validating our design choices. We present the implementation of our prototypein Section 7.6. Results from a field experiment are presented and discussed in Section 7.7. In Section 7.8,we summarize the contributions of this work and draw guidelines for future extensions.

7.2. STATE OF THE ART 99
7.2 State of the Art
7.2.1 WSN deployment and Maintenance Support
In wireless sensor networking, a traditional way to assess the connectivity between two points is to use aping-pong application that requires two wireless mobile nodes communicating with each other. Uni- andbi-directional connectivity can be assessed in this way.
The idea of using a PDA for field-inspections was mentioned before in several publications. Aconcrete example is the TASK project [BGH+05]. The TASK field tool provides the ability to ping asingle node, issue a command to turn on a LED, or to reset the node. Similarly, Ringwald et al. [RYR06]propose an in-field inspection tool on a compact device that not only simplifies the process of collectinginformation about the nodes state but also enables the actual users of the WSN to perform routine checkssuch as displaying the network topology, or uploading new firmware versions. In the same vein, Selavoet al. [SWC+07] recognize what they call the deployment time validation (DTV) as an “indispensablepart of fielding a real system”. They developed a deployment time validation approach, named SeeDTV,based on a simple communication protocol between a master node and a deployed network, and an in-situuser interface device, called SeeMote. The feedback is given to the user through a small screen adaptableto a mote.
In all these cases, the feedback given to the user is visual, not sound-based. As mentioned earlier, wecontend that sound is better suited to deployment tasks, the challenge being to provide intuitive feedbackin this form.
In the area of deployment-support tools, Ringwald and Romer emphasize the necessity to passivelyinspect the network in order not to disturb it nor modify its state [RR07]. Consequently, they designeda deployment-support network (DSN) that superposes itself onto the network to be monitored, commu-nicating with it on a back-channel. This approach supposes to deploy a second network in parallel withthe monitored network, and it requires the extra-nodes to have dual radios.
In contrast, our approach is resolutely light-weight. The interference caused to the network by theexchange of messages with the PDA is tolerable, because we only want to have a snapshot of the node’sstate and of its connectivity with the rest of the network. As such, the perturbation of the normal trafficis limited both in time and in intensity.
7.2.2 Sonification
Sonification refers to the use of audio signals (mostly non-speech) to convey information. The use ofsound to display information is not new, early examples include alarms, the telephone bell, the Geigercounter and medical instrumentation [KWB+97]. However, over the last decade this field has drawnincreasing attention, mainly because of the growing amount of scientific data to display and the improvedtechnology capabilities to process audio. A presentation of sonification, its usefulness, approaches andissues, as well as a list of resources can be found in [KWB+97, BK99].
In most of sonification systems, selected features of the data display – such as power onsets, spectralfeatures, crossing of thresholds – are used to control parameters of a sound synthesis process (such aspitch, amplitude, timbre...). The choice of these parameters - both features and synthesis parameters -and their relationship is known as mapping strategy.
Sonification research has often investigated applications targeted at expert users: either users ex-pert in the acoustic domain (e.g. people with a music background) [PH06a] or experts in the domainof application [GC00, MMea03, QMK+07]. Therefore mapping strategies generally leverage on users’advanced knowledge or ability to detect sound qualities in order to provide a rich output that displays

100 CHAPTER 7. MAKING THE INVISIBLE AUDIBLE
multiple data dimensions and at the same time associates each of them to different audio synthesis pa-rameters such as pitch, loudness, duration and timbre. As discussed below, our approach is targeted atnon-expert users, so it favors simplicity at the expense of multidimensional display.
Different projects investigate the application of sonification to the monitoring of computer networks.The Peep [GC00] and NeMoS [MMea03] systems provide a framework for associating different networktraffic conditions and events to the generation of sound, while Qi et al.[QMK+07] focus on intrusiondetection and denial-of-service attacks. All of them differ from what we propose in the present chapterin that they are targeted at advanced users - network administrators - rather than non-experts. Moreover,no usability experiments are reported for any of these systems.
7.2.3 WSNs and their End-Users
User studies are still a rarity in the field of wireless sensor networks.Beckmann et al. [BCL04] explored end-user installations of sensors for domestic use. Based on the
results of their study, they proposed five design principles to support this task. Their experiment consid-ered the placement of sensors in the environment from the perspective of the sensor operation (proximityof the phenomenon to monitor), but did not consider communication issues. Some of the derived princi-ples, however, still make sense in our context, in particular the benefits of detecting incorrect installationof sensors, and of providing value for partial installations. The authors also emphasize how important itis to “make appropriate use of user conceptual models for familiar technologies”, which is what guidedus when designing our audio interface (see Subsection 7.3), although in a different sense than meant byBeckmann et al.
Williams et al. [WKD05] ran a user experiment about the impact that augmented objects (such assensor-equipped appliances) will have on the perception people have of their surrounding space. Theyequipped toys with sensors generating sounds, in order to understand how people will “encounter andunderstand these spaces, and how they will interact with each other through the augmented capabilitiesof such spaces”. The authors of the study used an auditory interface; however, unlike our present work,they were not interested in the specificities of sound as a helper for WSN deployments. The feedbackprovided was not intended to improve user performance with the system.
7.3 Sonification for Sensor Networks
In this section we outline the advantages that sonification can bring to the field of sensor network deploy-ment and management, compared to the use of graphic displays. We also identify a number of challengesthat need to be considered. Later in the chapter, we will discuss how we specifically addressed some ofthese in the design and development of our deployment-support tool.
7.3.1 Applications
The precise description of the system model that we use is provided in Section 7.4. For the time being,let us only mention that we consider a self-organized multi-hop data collection network where nodessend packets to one or several base stations (sinks) either periodically or as responses to local events. Wealso suppose that the nodes are installed manually, and not at random.
In this context, we want to design a deployment and maintenance support tool for wireless sensornetworks that allows primarily for the monitoring of the connectivity of a node with the rest of the

7.3. SONIFICATION FOR SENSOR NETWORKS 101
Monitored node(Master)
Next hop node(Slave)
Next hop node(Slave) Next hop node
(Slave)
Next hop node(Slave)
Wireless monitorPDA
Serial cable
Headphone
Figure 7.1: Sensor-Tune system: The monitored node has a wireless connection with thefield manager, and queries its immediate neighbors for connectivity information. Boththe quality of the local link, and the distance to the sink are taken into account.
network. This depends on the quality of the radio channel between the monitored node and its neighbors,and on the general topology of the network.
A first application is to inform the user about the appropriateness of nodes’ locations during de-ployment. Since the radio channel can vary considerably due to the presence of natural obstacles orinterferences with other systems, it is important to get immediate feedback while nodes are being in-stalled. In this way, one can move nodes in order to find a better radio channel whenever possible, or toinstall efficiently relaying nodes if needed.
A second application is to report on a node’s activity after it has been deployed. In a multi-hop datacollection network, it can be difficult to identify the points of failure when some nodes start reportingerratically or stop transmitting altogether. In this case, one wants to be able to interrogate the nodesindividually about their recent packet-delivery-rate history in order to assess their connectivity status.
There are also other possible use cases for an in-field inspection system using sonification. Forinstance, to verify the proper functioning of the probes attached to a single node. A sound feedbackwould allow to check the responsiveness of a given probe. Also, if security becomes an issue, thedetection and localization of possible attacks - such as jamming or malicious modification of the routingtopology - are important features of the network. Here again, a sound feedback can inform a maintenanceperson present in the vicinity of a potential problem.
Nevertheless, we focus in this chapter on the two first use cases. A precise description of the first twouse cases will be provided in Section 7.4. For the moment, we are building a general case for sonificationin the context of WSNs.
7.3.2 Advantages
The deployment and monitoring of WSNs normally requires users to physically navigate in the environ-ment. In the deployment case, it is necessary to place the nodes in suitable locations, both in terms ofsensing ability and radio coverage. Nodes’ maintenance may also require physical proximity because ofthe wireless sensors’ limited radio range. Navigation is primarily a visual task, which may be particularlydemanding in areas that are not easily accessible. The use of auditory displays can be highly advanta-geous in these situations, because it frees completely the users’ visual resources, eliminating the need to

102 CHAPTER 7. MAKING THE INVISIBLE AUDIBLE
switch visual attention between the display and the environment. This visual attention switch is known tobe a frequent cause of distraction. For instance, it has been shown that medical students, faced with theconcomitant tasks of simulating an operation on patients while monitoring several of their health para-meters, performed better when these parameters were represented as sounds rather than graphs [FK94].Similar experiments performed on drivers and pilots led to comparable results [Bal94]. Moreover, con-sidering that the most common portable graphic displays are hand-held, the use of audio outputs alsofrees the users’ hands, which can be used to support or balance the body in impervious situations.
From the hardware and physical construction standpoint, an audio display, such as loudspeaker orheadphones, presents considerable advantages compared to a graphic display. Audio displays are avail-able at a fraction of the cost of the visual counterparts, and the same is true for the rendering and displaydriver systems. Because audio requires less processing and displaying power than image, the powerconsumption is also reduced, which is highly desirable in the context of WSN.
From the ergonomics point of view, visual displays are often problematic for outdoor usage. Underbright daylight, the contrast provided by common LCD screens is often insufficient. Graphic screens alsotend to be more fragile than their audio counterparts, which can be problematic in remote or industrialenvironments, where WSNs are often deployed [MPS+02], [HC05].
Sonification applications in other fields show the potential of the human ear to integrate simultane-ously several dimensions of information into a single auditory experience. Experiments with auditorydisplay of scientific data [MF95] tend to confirm “the effectiveness of auditory display in conveyinginformation and complex structures”. Sonification has been demonstrated to be effective for the humanrecognition of patterns in data, both from experts [PH06a] and non-experts. For example it has beenshown [PH06b] how in the context of physiotherapy it can be helpful to create real-time sonificationscorresponding to the patients’ movements and to let them compare the sounds that they produce to thetarget sound of a healthy person.
Another appealing aspect is that “sonifications can allow alternative perceptions and new insightsinto the data” [BK99]. This can give a certain level of intuitive understanding of specialized data sets tonon-specialists. As it is illustrated below, with the design of evaluation of our system, sonification allowsfor the definition of interface metaphors that can be well understood from novice users but at the sametime convey fine details to trained users.
7.3.3 Challenges
In order to apply sonification to the context of wireless sensor networks, it is important to considerdomain-specific constraints and challenges. The interpretation of sound by a user can be decomposedinto two parts. First a sound creates a sensation - a first contact between the sense organ and the stimulus.Shortly after comes the perception of the sound, namely the attempt to identify and classify it [IH06].In a system using sonification for extended periods of time, the sound must be designed not to generatefatigue in the sensation part.
At the same time, it must be complex enough to convey information during the perception phase. Inparticular the design of the mapping strategy has to take into account:
• Prolonged use: deployment and monitoring sessions can span from a few minutes to several hours.It is hence important that the interface sound be pleasant or at least not annoying over an extendedperiod of time.
• High-level metaphor: the overall impression of the interface should present a sound easy to inter-pret , if necessary conveying integrated and preprocessed information, making the tool accessible

7.3. SONIFICATION FOR SENSOR NETWORKS 103
by a non-specialist.
• Low-level details: specific aspects of the sound should allow advanced users to perceive detailedinformation about the status of the network or the node under examination.
• Ergonomics: The tool must work well in an outdoor environment. Sounds used in the interfaceneed to be easily distinguishable from ambient sounds.
• Non-invasiveness: The tool must not disrupt network’s operation.
• User acceptance: The tool must be acceptable regardless of the cultural background of the users.
Using audio output in noisy environments (such as construction sites, highways or windy environ-ments) can be problematic. The use of headphones with efficient sonic insulation could be a potentialsolution. However, the trade-off between sound insulation and the awareness of the environment requiredfor the user’s safety has yet to be carefully examined.
7.3.4 Signal and Noise Metaphor
To address the challenges described in the previous subsection, we propose here an audio metaphoradapted to sonification for WSNs. The starting point for the design is the following observation: Forthe deployment and maintenance of WSNs it is generally possible to define a good or desirable state inwhich the network is in a working state, all nodes being active and connected; and a bad or undesirablestate in which the system is in a non-working state, sensing and communication not functioning properly.These states may just be ideal and conceptual, because in reality the good state may correspond to severalactual network configurations. However they can be easily understood by even non-expert users. In fact,users will normally maintain some model of how the system actually works, which may or may not reflectthe reality – depending, among other things, on their technical literacy.
Based on this observation we decided to associate the desirable state to a sound that can be imme-diately identifiable as pleasant and undistorted, and to use a gradual degradation of this sound to signifythat the system state moves away from the desirable condition. The proposed mapping strategy can alsobe interpreted as a metaphor for the tuning of an FM radio, an action that is familiar to most peoplearound the world.
The emphasis is not on realistically mimicking the FM tuning effect, but just on providing users witha model easy to interpret. Excessively realistic metaphors are known to be problematic in HCI [SRP07].The proposed strategy leverages the assumption that even non-expert users of WSNs will have someunderstanding of a system relying on radio transmission.
The use of sound noise or distortion seems not to be very common in the auditory display literature,despite its strong metaphorical valence. This is perhaps due to the concern of confusing degradationgenerated by the interface with real degradation affecting the system. The advent of digital technology,however, allows for an easier control of the presence of noise or distortion, to the extent of completelyeliminating analogue noise, as demonstrated by the adoption of comfort noise in digital communicationsystems [New04].
7.3.4.1 What Sound to Play?
The proposed sonification strategy requires the choice of what we defined as a “pleasant and undistorted”sound. One advantage of the proposed mapping is that such a sound can be selected by the end-usersaccording to their taste. However, some consideration needs to be taken into account in this choice. First
104 CHAPTER 7. MAKING THE INVISIBLE AUDIBLE
and foremost, the sound needs to be easily distinguishable from the distortion. Second, it should notgenerate fatigue in the listener. Finally, in order to optimize the use of storage memory, it is convenientto use an audio loop of relatively short duration .
Our experience suggests that repeated speech clips can very quickly induce fatigue. Natural sounds(e.g. animals, water, wind) can be considered suitable background sounds, as they do not capture theattention of the auditor and are generally perceived as pleasant, but they are not always easy to distinguishfrom noise – especially wind and water flow sounds can be quite similar to white noise.
One alternative strategy could have been to translate into audio only the errors or problems in thenetwork, and to have silence signify perfect connectivity. However, while this strategy would havethe advantage of limiting the listener’s fatigue, as well as reducing energy consumption, we deem itfundamental to give clear feedback about the monitoring tool’ status – the use of silence makes it non-trivial to understand if the system is correctly working or the tool is just powered off.
As a consequence, we opted to play a piece of music customizable by the user according to his/herpreferences.
7.3.4.2 What Degradation?
There are several ways to degrade the quality of a sound, examples include:
• adding noise (including different types);
• reducing the resolution (increasing quantization noise);
• modifying the pitch or playback speed;
• reducing the signal bandwidth (bandpass filtering);
• convolving with another sound;
• adding a delayed copy of the same sound (echo);
• multiplying with a square wave of variable duty cycle (introducing silent gaps for duty cycle <100%).
Each method has its advantages and disadvantages, in terms of computational complexity and controlof perceived degradation. Different types of degradation can be used at the same time, mapping theintensity of each of them to a different variable (e.g. signal power level, packet error rate, SNR, ...).In this way, novice users can perceive the general status of the system from the overall sound quality,even without distinguishing different degradation types, whereas advanced users can get more preciseinformation recognizing what exactly is affecting the network.
As detailed later in this chapter, for Sensor-Tune we used two types of additive colored noise torepresent local and global properties of the network.
7.4 System Design
7.4.1 System Model
The context we consider is a multi-hop data collection network where nodes send packets to one orseveral base stations (sinks) that are connected to a server either directly or through a bridge (typicallyGSM or 802.11). The traffic can be either periodic, query-based or event-based. We assume that nodes

7.4. SYSTEM DESIGN 105
are capable of organizing into a data collection tree (or forest in the multiple-sink case). A critical issuefor each node is to find a suitable parent to route its data towards a sink.
The placement of each node is constrained by the landscape and the data it is supposed to collect.This means that for each node to install, there is a region within which this node must be placed. Wedo not make any assumption about the size of the region, as this depends on the type of applicationconsidered.
We assume that the radio channel is highly unpredictable. That can apply to both indoor and outdoorenvironments, depending on the presence of obstacles and interferences.
We must deploy a total of N sensors. M < N sensors are already deployed. We add nodes oneby one and want to place them as well as possible within their allowed region, which is determined bythe phenomenon to observe. Extra nodes can be deployed in between the measurement points to insureconnectivity, but as these nodes do not provide useful data, their number should be kept at a minimum.
7.4.2 Tool and Scenarios
7.4.2.1 Sensor-Tune: A Sonification Toolkit for WSN
We designed and implemented a deployment-support system that we call Sensor-Tune. It consists in alightweight tool integrating a wireless sensor with a sonification module connected to earphones. Thistool can interact with any node present in the network (see Fig. 7.1). It is designed to be carried easilyby any person deploying the network.
A small set of buttons are used to turn Sensor-Tune on and off, and to choose the mode of operationof the tool. Once Sensor-Tune is started in the proper mode of operation, no visual interaction withSensor-Tune is necessary. In this way, the staff can focus on handling the nodes to deploy or to maintain,possibly in places that are difficult to access and require full physical availability (see Fig. 7.3).
The acoustic feedback is intended to convey information that cannot be easily retrieved due to thelimited interface capabilities of wireless sensors. As a proof of concept of the use of sonification in thisframework, we decided to implement the following two use cases:
• Deployment support: Optimization of the placement of new nodes into a multi-hop network,
• Maintenance tool: Retrieval of recent connectivity history of a deployed node
7.4.2.2 Scenario 1: Live Information
In this scenario, we want to assess the connectivity of nodes as we are deploying them. In order toachieve this, we imagine the following flow of events:
1. The member of the deployment team carrying Sensor-Tune produces a new node from his stock.
2. As he/she turns it on, this node connects itself to Sensor-Tune and probes its neighbors in order toassess their potential as a parent.
3. This information is relayed to Sensor-Tune and displayed in real-time as audio data.
4. The deployment staff positions the node based on the obtained feedback.
5. When the node has been placed, a new node is turned on, which automatically takes over, whilethe previous node enters its normal mode of operation.

106 CHAPTER 7. MAKING THE INVISIBLE AUDIBLE
Figure 7.2: Carrying the Sensor-Tune: hand-free WSN deployment
Figure 7.3: Example of usage of Sensor-Tune, with a sensor difficult to access physically

7.4. SYSTEM DESIGN 107
In the event of total loss of connectivity, a continuous tone is played in order to spare the ears of the user.We implemented this scenario, evaluated it and used it for the experiments that we describe in Sec-
tion 8.1.
Information and Metrics When deploying one sensor i, we evaluate its connectivity with its neighborsClocal, and its “distance” to the sink Cglobal. For Clocal, we use the Packet Delivery Ratio (PDR) (or,which is equivalent, the Packet Error Rate PER), while the expression of Cglobal depends on the routingprotocol used. For CTP [FGJ+], the metric used is called CTP, and consists roughly in an aggregation ofthe link qualities from the node to the base station.
Local connectivity: For Clocal, we use the information about the quality of the radio link betweenthe node and its neighbors. For this information, we use the Packet Error Rate (PER) from this node toall its neighbors. It is defined as follows:
PER =(sf + nack)
(ack + sf + nack)(7.1)
where
• sf is the number of packets whose emission failed at the sender,
• nack is the number of packets that were not acknowledged,
• ack is the number of acknowledged packets.
General topology information: This information, Cglobal, reflects how well the neighbors of thecurrent node are positioned in the network with regard to the base station. For each potential parent, wetake into account the metric of the multi-hop protocol used. This metric is customizable in our systemthrough an API. Generally, it is based on the hop count and/or the aggregation of the connectivity levels(packet delivery ratios) of the nodes along the path to the base station. A good metaphor for this metricis the “distance” with the base station.
7.4.2.3 Scenario 2: Connectivity History
In this scenario, the connection is with an individual node, without local communication with its neigh-bors. It is assumed that this node has recorded relevant information over the last 24 hours, typicallystoring parameters in its flash memory for a succession of time steps that last 10 minutes each. It willreplay it on-demand. The parameter that can be easily stored in the flash is the PER, information comingfrom the radio itself. More precisely:
1. The maintenance staff carrying Sensor-Tune walks around the deployment area
2. He/she defines a minimum PER performance Pmin.
3. Automatically, Sensor-Tune beacons the neighboring nodes
4. When a node hears Sensor-Tune’s beacon, it answers if its average performance over thelast 24hours is lower than Pmin.
5. The nodes that answered are queried sequentially in a FIFO manner
6. The history is downloaded to Sensor-Tune, where it is played a fixed number of times (the totalsound sequence should last a few tens of seconds)

108 CHAPTER 7. MAKING THE INVISIBLE AUDIBLE
7. The user can interrupt the sequence by pressing on a button, either deleting it or saving it in thememory for later retrieval and finer grained analysis.
We implemented this scenario, but have not yet fully evaluated it.
7.4.2.4 Other Scenarios
Local Connectivity In the use case described above, we only monitor a node’s parent. This meansthat when moving a node, we do not know anything about its connectivity with its potential children. Ifwe want to know what effect the moving of a node will have on its children’s connectivity, we need totest the Packet Delivery Ratio, namely the percentage of packets received by this node coming from itschildren. The sonification technique for this use case can be directly derived from the previous ones.
Probes Operation When deploying a node, the proper operation of the probes can be tested as a soundas well. In this way, the deployment staff can make simple tests such as covering a solar radiation sensor,warming a thermometer, filling a rain gage, etc. In this case, the noise metaphor does not hold anymore.An appropriate sonification would be the synthesis of a sound whose pitch varies as a function of thesensed data.
7.4.3 Protocols
When monitoring a wireless network, it is important to do so in a minimally invasive way. Ideally, a fullypassive system should be used. In our case, however, it is not possible. Most of the time, indeed, the nodethat we monitor is not part of the network yet. It needs to interrogate its neighbors about their positionand to run a decision process to choose its parent. In a normal operation mode, this procedure takes time,and we cannot rely on the regularly exchanged routing messages to send instantaneous feedback to theuser as he/she moves the node to find its best placement.
Accordingly, we designed a communication protocol that provides real-time connectivity feedback,and is as minimally invasive as possible. The number of messages exchanged is compatible with a typicalenvironmental monitoring application, even if it might conflict with applications requiring very high datarates and a nearly instantaneous response. We analyze its overhead in Section 7.4.3.4.
7.4.3.1 The Actors
We distinguish several actors in the unfolding of the protocol.1. Sensor-Tune: the monitoring device.
2. Master: the node to deploy, which will query its neighbors for a suitable parent.
3. Slave: any node in the neighborhood of the master node, which is going to answer its queries.The basic idea behind Sensor-Tune operation is to run a one-hop multicast protocol between the
node to deploy (the master) and its neighbors. The radio link between the PDA and the master is used tobootstrap the process, to forward periodically data to the PDA, and to switch nodes.
7.4.3.2 Live Data
Fig. 7.4 describes the exchange of messages for this use case.

7.4. SYSTEM DESIGN 109
Figure 7.4: Communication protocol for the Live Data use case. The master initiatethe session, first querying the cluster heads, then all the nodes in its neighborhood. Nrequests are sent, then the neighbors have a time slot of duration D to answer if theirlocal and global connectivity metrics are good enough

110 CHAPTER 7. MAKING THE INVISIBLE AUDIBLE
1. Sensor-Tune receives a message from the PDA as soon as the latter is ready to accept candidates(meaning that the user pressed the on button).
2. When a new node is turned on in the vicinity of Sensor-Tune, it sends a INIT message to it, thusapplying to become a master.
3. If it does not receive an answer within a given (customizable) time, it enters its normal mode ofoperation (meaning that Sensor-Tune was off or not present).
4. If Sensor-Tune hears the INIT message, it answers with a START, turning the new node into amaster.
5. At this point, the master starts a series of rounds that last one second each. During the first500ms, it sends bursts of INFO QUERY messages (customizable, but typically 10), and waitsfor an INFO RESPONSE from its best potential parents during the next 400ms. In order to reducecollisions, the neighbors use a random back-off timer during this period.
6. The last 100ms of each round are left for regular data traffic to take place.
7. Based on the metrics we defined in the previous sections, the master will select the best potentialparent and forward its local and global connectivity parameters to Sensor-Tune. This informationwill ultimately be translated into sound.
8. When we are satisfied with the placement of the node, we simply turn a new node on. Upon re-ception of the new INIT message, Sensor-Tune first stops the previous master (which enters thenthe normal mode of operation), before starting the new one.
In order to avoid too many answers from the neighbors, the target value for the PER is included inthe INFO QUERY message. We denote it Cglobal∗. This value depends on the last value received (andincreases exponentially if no messages have been received in the last rounds). Nodes only respond if,based on the INFO QUERY messages they received, their own PER from the master combined with theirown distance to the base station is close enough to Cglobal∗.
Cglobal < Cglobal ∗ ±∆C
Where ∆C is a parameter. A higher value of ∆C improves the responsiveness to channel variations,but increases the traffic.
Cglobal∗ is updated at each round with the best value of the last round.
7.4.3.3 Clustering
Initially, the value of the threshold has to be set arbitrarily, which means that many answers can beexpected. In order to avoid a congestion at this point, we use an algorithm that partitions the networkinto different clusters. Each cluster is composed of a cluster head and a subset of its single-hop neighbors,the cluster members. At the first round of the Live-data protocol, only cluster heads can respond.
The clustering protocol takes place at the deployment of each new node (see Fig. 7.5).1. The new node sends a Request message to the network, and starts a one-shot random timer.
2. A node whose timer is expired sends a packet to all its single-hop neighbors, declaring its type asa cluster-head.
3. A node that receives a Request message will answer to it by a message that declares its type(clustered or non-clustered).

7.4. SYSTEM DESIGN 111
Figure 7.5: State machine of the clustering algorithm
4. If the new node receives a message from a cluster head, it stops its timer and becomes member ofthe corresponding cluster.
Each cluster is uniquely identified by the ID of its cluster-head.
7.4.3.4 Overhead
The protocol described above is based on a fast exchange of packets between a new node and its neigh-bors. During each one-second round, at least 10 messages are received by the neighbors. The numberof messages that are sent back depends on the number of neighbors and on the quality of their link withboth the new node and the base station. We tested this scheme successfully for up to 5 potential parents.If, above this limit, messages are lost due to collisions, this will not affect significantly the performanceof the system, because there will be more than enough parents to choose from. The resort to clusteringensures a successful bootstrapping of the protocol.
Another question is whether this protocol will have an effect on the operation of the WSN mainapplication, because it is communication-intensive, if only for a short period of time. If we are installinga whole network from scratch, the possible disruption is not an issue, as the network is usually notsupposed to be fully operational at the moment of deployment. If a node is to be added at a later stage,while the network is operational, we may disrupt the network operation locally during the period of timeit takes to install the new wireless sensor. As this task typically takes from a few minutes to up to an hour,this is not a problem for a typical environmental monitoring application, with data rates in the order ofthe minute or more, without tight response-time constraints, and with some tolerance to errors or missingdata. For an alert-based system, the 100 ms window will allow for the delivery of an alert message evenin a dense network.
7.4.4 Sonification Mapping Strategy
As outlined in section 7.3.4, the interface is based on a simple yet powerful model: a pleasant soundindicates that the network is in good condition, whereas additive colored noise indicates a degradationin the network status. The tool allows us to monitor one node at a time. The existence of a connectionbetween the current node and the sink is represented by a piece of music sm(t), corrupted by an amountof additive colored noise depending on the connection quality ng(q, t). This can be expressed as follows:
so(t) = sm(t) + ng(q, t) (7.2)
112 CHAPTER 7. MAKING THE INVISIBLE AUDIBLE
where so(t) is the sound output, t is time and q is the connection quality.The base sound sm(t) can be selected according to the taste of the end-user, so that different cultural
backgrounds can be accommodated. As discussed above, however, it is important that the sound chosenis easily distinguished from noise. For minimizing storage requirements, an audio loop is used for sm(t),selected to be long enough not to be annoying and to loop in a seamless way (discontinuities could beperceived as signal degradations). In the prototype evaluation described below we used a 16-second clipof classical piano music.
The noise signal is the weighted sum of two distinct colored components: a lower frequency compo-nent indicates local connectivity – the PER between the node and its parent – and the other componentindicates the global connectivity – the routing metric of the current node’s parent.
This can be more precisely expressed as follows:
ng(q, t) = α · nL(qPER, t) + β · nH(qroute, t) (7.3)
where α and β are two parameters; nL(t) and nH(t) are colored noises produced from the same whitenoise source filtered respectively with a low-pass filter with cut-off frequency 200 Hz and band-pass withcenter frequency at 2.7kHz and a bandwidth of 20 Hz.
The two components are distinguishable when needed, as shown by the user survey described in thenext section. Although normal usage does not rely on users distinguishing the two types of noise, thisfeature can provide an additional layer of information for advanced users.
We tuned α and β manually, in order to ensure a comfortable level of noise in desirable cases (lowPER, small distance to the base station). In particular, β was chosen significantly smaller than α, in orderto give more importance to the local connectivity, because this is the parameter of primary importancewhen placing a node.
The function that we chose to generate noise as a function of PER acts almost linearly for low valuesof PER and becomes exponential as the PER increases1. This is because we want to monitor moreclosely the low values of PER, as above a certain threshold of packet errors, experience shows a rapiddegradation towards total disconnection. At the same time, the human ear functions on a logarithmicscale, so higher intensities of noise become harder to distinguish.
Since the power of the output signal depends on the level at which the user will tune its headphones,we normalized the music waveform and added noise with an increasing envelope. For instance, a 5%PER corresponds to a normalized amplitude of 0.02.
7.5 Initial Exploration: User Survey
In the previous section, we discussed how sonification techniques, such as altering a sound file withnoise, are useful for the deployment of WSNs. We suggested the use of the PER and Cglobal to alter asound file with high and low frequency noise, respectively. In this section, we describe the results of auser survey which explores the perception of noise by users.
7.5.1 Description
Given the generic nature of this survey on noise perception, we do not require the users to have anyprior knowledge of sensor networks, nor musical predispositions. Similarly, we do not constrain the userauditive environment: Sensor-Tune should be usable in any milieu. The survey is thus available online
1This function behaves as the ETX value defined in [CABM03]

7.5. INITIAL EXPLORATION: USER SURVEY 113
Intensity |∆| Correct EntropyLow (PER < 10%) 0 85% 0.60
1 100% 0Middle (PER ' 20%) 0 92% 0.40
2 92% 0.40High (PER > 30) 2 64% 0.94
Table 7.1: Survey results for the first part. Users seem able to recognize noise intensityvariations in low and middle intensities (results based on 24 answers).
and was advertised at EPFL via email2 to users with different academic backgrounds. To stop the usersfrom taking the survey several times, we use persistent cookies3.
Sonification techniques are usually evaluated by measuring how helpful they are for users to accom-plish their task. In our case, we wish to know how precisely can users perceive the variations of noisein intensity and the frequency. The survey is composed of two parts. In the first part, the users are giveneight sound files containing a sequence of classical piano music altered with noise of low, middle andhigh intensity. We introduce noise intensity variations ∆ and test whether users can perceive these vari-ations by asking: Do you perceive a change in the noise intensity? Among the possible answers, usersare asked to choose whether they perceive an increasing/decreasing ∆ or no change at all. With thisquestion, we evaluate the granularity of noise intensity perception by users. On our normalized scale, a∆ of +1 corresponds to an increase of 0.02 in the noise envelope.
In the second part, we generate twelve sound files of the same piece of music, but this time, not onlydo we alter the files with varying noise intensities, we also use two types of noise: a low frequency andhigh frequency noise. We examine whether users could recognize the noise types (i.e frequencies) byasking: Ignoring changes in intensity, do you perceive different types of noise? Users are asked to sayyes or no. We consider various scenarios where both the intensity and frequency vary (DD), where onlythe intensity varies (DS), and where none varies (SS)4. Finally, we ask users for their age and whetherthey used a headset while taking the survey.
7.5.2 Results
Over a period of two weeks, 24 users took the survey online. 95% of the users were in their twenties(18-30) and 66% used headphones. Overall, we did not observe any changes in the quality of answersbetween users with and without headphones. As suggested in [FBB05], we use the entropy Hq to measurethe uncertainty of the answer to a question q:
Hq = −l∑
i=1
pi,q log2(pi,q) (7.4)
where pi,q is the probability to answer i to the q, and l is the number of categories for answers to q. Hq
is measured in bits and tells how easy it is for users to identify a sound.
2http://csn.epfl.ch/sonification3A stronger authentication mechanism could be used but was not deemed necessary because of low risk of attacks.4D stands for Dynamic, S for Static

114 CHAPTER 7. MAKING THE INVISIBLE AUDIBLE
Variations Correct EntropySS 4% 0.24DS 46% 0.99DD 100% 0
Table 7.2: Survey results for the second part. Noise type (i.e. frequency) and intensityvaries (DD), only intensity varies (DS) and none varies (SS) (results based on 24 answers).
In the results of the first question (Table 7.1), we found that 90% of the users seem to be able todistinguish noise intensity variations at low and middle intensities (Hq ∈ [0, 0.60]). This is much betterthan for high intensities (Hq = 0.94). This result confirms that because the human ear works in alogarithmic manner, users cannot efficiently recognize noise variations at high intensities. Accordingly,we empirically dimension our system with respect to the noise variations that we introduce when thePER and Cglobal vary. For instance, a value of +1 of ∆ corresponds to a PER of 5% in our final system,+2 to 10%, +5 to 20%, and +30 to 50%, etc.
With the second question (Table 7.2), we observe that people tend in SS and DS cases to aggregateboth noise types as one. In SS, they are even convinced that there is only one type of noise being played(i.e., note the low entropy). It appears that users could distinguish two noises only when one noisereplaces another over time (DD). In other words, when the relative importance of the two noises changes- the dominated noise becomes dominant - users can distinguish the two noise types.
With Sensor-Tune, a user must first optimize the local connectivity (PER). During this operation,while the PER is not good, the low and high frequency noises will not be distinguishable: the user canconcentrate on finding a good location for a node. Once a good location is found, the high frequency noisevanishes, and the low frequency noise appears clearly. Thus, users can alternately focus on optimizingthe local connectivity and global connectivity to the base station.
The results of the survey allowed us to verify our system design. We realized that we must carefullyselect noise intensity variations for the users to be able to notice them, and noise frequencies for the usersto recognize them when necessary.
7.6 Prototype Implementation
7.6.1 Prototype Description
In this section, we describe the implementation of a prototype of Sensor-Tune, using a PDA runningLinux Maemo (Nokia N800) (see Fig. 7.7). We emphasize the fact that a real commercial system can beimplemented in a much less expensive way than with the off-the-shelf components that we used 5.
The PDA is connected through a serial interface with a wireless device compatible with each nodethat is to be deployed. The wireless device communicates with the monitored node and forwards thereceived information to the PDA, where this information is analyzed and passed on to a sound-generator.The user can listen to the sonified data via headphones. Once packed, the system is quite compact (seeFig. 7.8).
5the technical details and software implementation are available on-line at http://csn.epfl.ch/anonymous

7.6. PROTOTYPE IMPLEMENTATION 115
Figure 7.6: Sensor-Tune simplistic graphical user interface
We used a simple graphical interface to start the tool and set it to the desired mode of operation (seeFig. 7.6). We decided to keep this interface at a bare minimum so that user options can be magnified andbe readable in outdoor conditions.
Figure 7.7: Sensor-Tune prototype: A linux-based PDA connected through a serial portto a wireless sensor
Figure 7.8: Sensor-Tune prototype once packed
We distinguish the embedded part from the PDA part. On the PDA, a Java subsystem is responsiblefor the message interface and the data analysis, and a dedicated software, pure data (PD), takes care ofthe sound generation part.
7.6.1.1 Software and Hardware
On the embedded side, we use the TinyOS [tos] operating system, as it has evolved to become thepreferred choice of the research community to design and implement wireless sensor network systems.

116 CHAPTER 7. MAKING THE INVISIBLE AUDIBLE
Figure 7.9: Sensor-Tune functional blocks
We implemented our tool on the tinynode [tin] platform.For the PDA, we used the Nokia N800, which runs Linux Maemo 3.2, thus making it easy to add
custom software to it. Java in particular is easy to install. Moreover, it runs PDa, the embedded versionof the open source Pure Data sound generator. All different software components communicate throughsockets.
7.6.1.2 Embedded Part
There is minimal change to be brought to any multi-hop application, whose performance we want tomonitor. The application comes as a plug-in to be added to the configuration file of the deployed appli-cation.
The global metric needs to be passed back to Sensor-Tune through an interface, because it depends onthe routing protocol to be used. All other metrics are dealt with at a lower layer, so they are independentfrom the particular context.
7.6.1.3 PDA
Java subsystem The java subsystem has four tasks:1. State machine: managing the PDA state machine,in order to keep synchronization with the node
to deploy.
2. Message interface: sending and receiving messages exchanged with the master.
3. Data processing: analyzing the incoming data, logging them if appropriate, and processing themso that they can be translated into sounds.
4. Sending the result to the sound generator through a socket.
Pure Data subsystem PD (Pure Data) is a real-time graphical programming environment for audio,video, and graphical processing. PD is an example of ”Dataflow programming” languages. In such

7.7. EXPERIMENTAL VALIDATION 117
Figure 7.10: PDA: PD subsystem description, with music and two additive noises
languages, functions or ”objects” are linked or ”patched” together in a graphical environment that modelsthe flow of the control and audio. PD is an open source project and has a large developer base workingon new extensions to the program. This tool, initially designed for desktop computers, has been portedon small handheld devices running Linux, under the name PDa (PD anywhere) [Gei03].
As mentioned earlier, we chose a method consisting in superposing to the background music twonoises at different frequencies: a high frequency noise whose volume increases as the packet error ratebetween the node and its best potential parent increases, and a low-frequency noise (perceptually lessannoying) whose volume increases as the distance from the base station in terms of hops increases.
The (simplified) PD subsystem that we designed is described in Fig. 7.10.
7.7 Experimental Validation
To validate the proposed design, and in particular the audio-based interface, an experiment was designedand performed. The first objective of the experiment was to assess whether, with an appropriate interface,it is possible for non-specialists to deploy a wireless sensor network in a challenging setting, and this withminimal training. We then wanted to evaluate the effects of the auditory presentation independently of theunderlying technical system and the actual information presented. For this reason, the audio interfacedescribed in Section 7.4 was compared with a graphical user interface (GUI) that presented the sameinformation on the screen of the Nokia PDA.
7.7.1 Comparable Graphical Interface
In order to assess the sonification based interface independently from the amount of information providedand of the underlying technical implementation of the system, we decided to compare it with a graphicaluser interface that would present the same information. Therefore we designed and implemented aninterface that displayed two horizontal bars of variable length, as illustrated in Figure 7.11, one relatedto the PER and the other to the ETX of the monitored node (see Section 7.4). We decided to mimic the

118 CHAPTER 7. MAKING THE INVISIBLE AUDIBLE
signal bar common in all mobile phones, so the bars are full when the connection is perfect and becomeshorter when the connection quality decreases – in other words the length of each bar was inverselyproportional to the PER and ETX, respectively.
Figure 7.11: Screen capture of graphical user interface used for the experiment as shownon the Nokia PDA. The horizontal bars convey information about the connection quality.
7.7.2 Experimental Design
The experiment consisted of 2 network deployment tasks, in each of them subjects had to create a linearmulti-hop network that connected specific start and destination points in a building on EPFL campus.
For both tasks the destination point was the same and it was located in the parking garage in thebasement of the building, and marked with an ’x’ sign on the floor. The starting points for the two taskwere on two different ends of the 4th floor of the building (there was a 5 floors distance between startand destination). The building has 5 different stairways and 3 elevator towers and it includes a mix ofglass, metal and concrete partitions that attenuate the radio signals of our wireless nodes in differentways (often drastically). A number of movable elements, such as doors and elevators, made the radiopath variable with time, which contributed to make the tasks even more challenging, given especiallythat the experiment took place during business hours, when many people walk around the building.
For each task, subjects had a maximum time of 20 minutes and a maximum of 6 nodes (but emphasiswas put on the fact that they could complete the task with less). As a benchmark, both tasks could becompleted by experts in less then 5 minutes, using only 3 nodes.
Subjects received instructions in written form (to ensure consistency), informing them about thesystem and the two tasks, asking them to try and complete them as quickly as possible, using the smallestnumber of nodes as possible, and making the connection quality as good as possible. The instructionswere kept concise, with total length of two A4 pages. The instruction simply reported that the audiodegradation through noise, or the length of the bars in the GUI indicated the quality of the connectionof the current node to the base station, but did not provide any details about the PER nor the ETX.Several participants asked what was the difference between the two bars, but they were answered that theyreflected different aspects of the connection quality but that the details were irrelevant to the experiment.After each subject read the instructions, and before the start of each task, the experimenter showed thestart and destination point, and a specific path between them, even though during the experiment subjectswere free to take any path they liked between the two points. A maximum duration of 20 minutes wasgiven for each task. If the subjects did not reach the destination point within this interval, the attemptwas considered failed.
7.7. EXPERIMENTAL VALIDATION 119
All subjects tried both interfaces, each on a different deployment task in alternate order: half of thesubjects used the audio interface in the first task and the GUI in the second, while the other half used theGUI for the first task and the audio interface in the second. The two tasks, however, were performed inthe same order.
The completion time, the number of nodes needed to achieve the task and the resulting networkperformance were recorded for all tasks. Participants were shadowed by an experimenter, who tooknotes about their behaviour and performance. At the end of the experiment subjects were asked to fill ashort questionnaire related to their previous experience with computers, with wireless networks and withmusic as well as their preferences between the audio and graphical interfaces in terms of ease of use,efficiency and overall favour.
7.7.3 Participants
Participants were 14 males, of age between 26 and 48 (avg. 32.6, st. dev. 7.4), all volunteers. All subjectswere naive, in that they had not used our system before the experiment and all had no experience indeploying a multi-hop wireless network. Four subjects reported having set-up a home wireless network(Wi-Fi access point).
7.7.4 Results
Overall, the network deployment was successful in 17 of the 28 trials (60.7%). The first task was com-pleted successfully in 7 of the 14 cases (50%), while the second task was completed sucessfully in 10of the 14 cases (71.4%). When the audio interface was used, the first task was successful in 4 out of 7cases (57.1%), while with the GUI the first task was successfully completed in 3 out 7 cases (42.9%).For the second task, subjects using the audio based interface were always successful (7 out of 7, 100%)while subjects using the GUI where successful in 3 out of 7 cases (42.9%). The results are summarizedin Table 7.3
Out of the 14 subjects, 5 succeeded in both tasks (2 started with the audio interface, 3 started withthe GUI); 2 subjects, who started with the GUI, failed in both tasks; 5 subjects failed in the first taskbut succeeded in the second (1 of them started with the audio interface and 4 started with the GUI); 2subjects completed successfully the first task using the audio interface, but failed in the second task usingthe GUI.
At the qualitative level, we noticed a number of frequent behaviors that were detrimental to the taskcompletion or even resulted in failure. First, most participants tried to “let the radio waves follow theirsame path” – in particular, most participants tried to “bring” the radio signal down the stairways, eventhough these are interrupted by a number of glass and metal doors that block the radio waves of thenodes. Often, it was noticed that these participants were aware of the fact that the radio waves can gothough walls, but simply did not actively use this information. Only 3 of the 14 subjects attempted to letthe wireless connection go through the floor, which results in a more efficient solution. All subjects whoattempted this alternative strategy were successful in completing the task and used a minimal (3) numberof nodes.
A second common source of problems was the fact that the very first node was placed in a positionwhere it was not very well connected with the base station, which compromised the connection of thefollowing nodes to the base station. In turn, the bad positioning of the first node was often the result ofthe two following behaviours: before choosing the position for a node subjects monitored its connectionquality for a period that was too short to notice signal drops due to transient events such as other people

120 CHAPTER 7. MAKING THE INVISIBLE AUDIBLE
Task 1 Task 2 TotalSuccess Success Success
Audio 4 of 7 7 of 7 11 of 14(57.1%) (100.0%) (78.6%)
GUI 3 of 7 3 of 7 6 of 14(42.9%) (42.9%) (42.9%)
Overall 7 of 14 10 of 14 17 of 28(50.0%) (71.4%) (60.7%)
Table 7.3: User experiment results: successful completion of the deployment tasks byuntrained participants.
passing by, doors opening and closing, or elevators moving; subjects monitored the connection qualityonly when they were very close to the nodes, while their body somehow influenced the EM field in favorof the connection. As soon as they walked away, the connection dropped.
Regarding the expressed preferences, 8 of the 14 subjects (57%) indicated the audio interface aseasier to use, while 9 (64%) indicated that they deemed the GUI let them perform better, and the samenumber reported it as generally preferable.
7.8 Discussion
Throughout the literature, one cannot help but feel there is a paradox in the fact that wireless sensornetworks are envisioned as the ubiquitous communication technology of the near future, while theyremain cumbersome to deploy and difficult to maintain. In this chapter, we have investigated a novelapproach for interfacing the wireless sensing world, relying on acoustic feedback.
We have presented the advantages of such an approach in terms of deployment efficiency, reliability,intuitiveness and cost, and have developed an original metaphor for the analysis of connectivity basedon the metaphor of noise. The implementation of a prototype allowed us to confirm that this approach ispromising for wireless sensor networks.
The overall success rate of 60.7% in the experiment indicates that the interface is effective in sup-porting non-expert users deploying a multi-hop wireless network, validating the proposed design forSensor-Tune. The results indicate no large differences between the performance with the audio interfaceand with the GUI, suggesting that the two interfaces perform as well as each other. The additional advan-tages provided by the audio interface, namely eyes-free and hands-free operation, are therefore availablewithout any penalty compared to a graphic counterpart.
This experiment was conducted indoors in a technical institution, although not all participants had aformal technical training. Since we want to apply this strategy in the field, by putting wireless sensorsin the hands of agriculture scientists if not farmers, another experiment needs to be conducted by theintended users. Only then will be the tool formally validated. This validation should include an improve-

7.8. DISCUSSION 121
ment whose necessity has been unveiled by the user experiment: from the observation that often onespecific link between two nodes is the cause of major problems in the entire network, the modificationof the interface so that users can easily select which link to monitor, or even monitor several links at thesame time, may dramatically increase its performance.
In terms of future developments, the first step will be to integrate the Sensor-Tune application withthe Common-Sense Net system, which uses a proprietary MAC and Routing protocol, designed forextremely low duty-cycling. Other applications than deployment support could also be implemented andtested, such as history of connectivity, on-board sensors validation, etc. Security applications can also besought. Finally, transposition of the sonification paradigm to other wireless technologies (such as 802.11access points) could be envisaged.

122 CHAPTER 7. MAKING THE INVISIBLE AUDIBLE

Chapter 8
Usability and Usefulness of the System
In the COMMON-Sense Net project, our goal was to help the farmers monitoring the physical farmingenvironment, in order to understand more precisely the physical processes at hand, and to react optimallyto changing conditions. Our initial vision had been to bring the benefits of technology directly to farmers,in a participatory way. We deployed our system after identifying use cases with the locals. Over a longperiod of data collection and usage, we reached an impasse: numerous difficulties emerged, essentiallyhindering our efforts to bring in a participatory manner the added value of WSN technology to thefarmers.
This has been primarily due to the farmers’ alienation with the worlds of science and technology. Af-ter we presented the lessons learned through our three-year long effort and deployment in Chapter 6, weare currently forced to consider as somewhat idealistic our initial objective. The resource-poor farmerscould not really put enhanced environmental data in use effectively.
Based on these experiences, we moved on with a different approach: we investigated controlled-environment strategies related to rain-fed farming, such as developing new crop varieties or pest predic-tion measures. Accordingly, the position this chapter takes is as follows: Under the current conditionsin developing regions, such as Karnataka, the targeted users for WSN-enabled applications should beresearchers, scientists, and technicians.
As our study case and field experience indicate, this orientation towards a new user group (scientists),which can then advise or guide the farmers, appears currently the only method to have an effectivedecision-support system for rain-fed farming. This position was corroborated by an experiment that weconducted in Bangalore, from November 2007 to February 2008.
This chapter brings this seemingly pessimistic yet realistic position to the attention of the community.Essentially, our concerted effort of deploying and running the COMMON-Sense Net system points thatstill scientists remain the preferred ’customers’ of WSN technology. Section 8.1 describes the method-ology for our user experiment to determine if our new user target group was an appropriate choice. InSection 8.2, we present our results, followed by a discussion in Section 8.3.
8.1 Charting the Paradigm Shift
The path from user needs to precise specifications of a system is not an easy one to trod. In the previ-ous section, we identified a strong necessity to find a mediator between the technology and the targetpopulation. Agricultural scientists are ideally placed to define use cases. However, this is no trivialmatter, because for them sensor data represents a new and unfamiliar context. Most of the scientists we
123

124 CHAPTER 8. USABILITY AND USEFULNESS OF THE SYSTEM
interacted with are not familiar with sensor data at high resolution in time and space provided by a largenumber of data gathering points with uniform accuracy.
8.1.1 Choosing the Target Population
For these two reasons, we decided to set-up an experiment where we confront soil physicists, cropphysiologists, entomologists, pathologists and agronomists with the results gathered from the field byour deployed prototypes.
The reason for selecting such a various user basis is twofold. On one hand, we wanted to find thelargest scope of use for the WSN technology in the context of rain-fed farming, and did not want torestrict ourselves to our own preconceptions. On the other hand, as different disciplines can have variousdata requirements, it was important to know whether an appropriate system design could meet all ofthem.
There are several types of institutions where such professionals are likely to work, each of them withits own goals and agenda:
1. Academia: scientists doing research in agricultural departments. For them, two competing goalsare at stake. Doing research that provides them with scientific impact and visibility, as well assolving practical problems.
2. Government: scientists working either as advisors for policy makers or as implementers of pro-grams at the local level. Marginal farming is only one aspect of their concern, which is agricultureas a socioeconomic sector.
3. Non-governmental agencies: NGOs focusing on rural development often are innovative in termsof agricultural practices. As such, they are interested in applied research.
We did not extend our survey to the industry of agriculture inputs or to corporate agriculture, althoughthese two sectors are likely users of the wireless sensor networking technology. In the first case, wedid not want to get involved in the controversy surrounding the effects of large seeds providers on thelivelihood of small and marginal farmers in India. In the second case, the type of agriculture practiced(mechanized farming, on-demand irrigation, precision agriculture with high added-value) was consideredtoo different from our focus of interest, namely rain-fed farming.
8.1.2 Goal and Methodology
We interviewed 30 people from the backgrounds detailed above, following both a qualitative and a quan-titative approach (Table. 8.1). The goal of the experiment was to identify the use that agriculture scientistswould make of the data that are collected by the COMMON-Sense Net system.
The experiment was scheduled to run for 2 weeks in November 2007. We asked the scientists a seriesof questions about the value of environmental data for them.
The goal of the experiment was to understand precisely:1. What are the types of environmental data they can make use of, and how?
2. What is the spatial diversity they will use for the data?
3. What is the time granularity they will make use of in their task?In order to answer to these questions, we used three complementary approaches:Structured interviews: As a preliminary, some general questions were asked to the participants in a
general questionnaire before they tested the interface during a two-weeks long study. These questionsserved to assess their current view of the field. Participants were asked to answer more concrete questions

8.1. CHARTING THE PARADIGM SHIFT 125
Name Field of Research AffiliationProf. Ali Agronomy UASProf. Bhaskar Crop Physiology UASProf. Bhaskar Forestry UASProf. Gowda Farming Systems UASProf. Kumar Entomology UASProf. Mohan Raju Crop Physiology UASProf. Murthy Soil Physics UASProf. Parama Soil Science UASDr. Ananth Genetics and Plant Breeding UASDr. Ashar Crop Physiology UASDr. Beena Crop Physiology UASDr. J.N. Madhura Crop Physiology UASDr. Masaki Crop Physiology UASDr. Reddy Crop Physiology UASDr. Shahidhar Agronomy UASDr. Sheshshayee Crop Physiology UASDr. Suvarna Microbiology UASDr. Reddy Veterinary Medicine BAIFF-Anonymous- Information Extension Karnataka State
Agriculture Dpt
Table 8.1: Names, research specialty and affiliation of researchers interviewed during theuser experiment. The list is restricted to faculty members and senior researchers

126 CHAPTER 8. USABILITY AND USEFULNESS OF THE SYSTEM
in a detailed questionnaire during the experiment. A detailed description of the questionnaires can befound in [PRS08].
Behavior observation: It is risky in such an experiment to rely solely on users’ opinions. This is whythe scientists were encouraged to provide data sets in order to substantiate their answers (in the formof graphs or numbers). Moreover, the queries they made to the database in order to retrieve data wererecorded. In particular, the time and space granularity of the data that they consulted was logged into adatabase. This makes it possible to analyze the scientists’ behavior as well as their discourse.
Semi-structured meetings: Finally, a debriefing took place after the experiment, in order to allow theparticipants to share their impressions in an informal discussion. As it will appear clearly in the nextsection, this part turned out to be surprisingly rich in information.
8.2 Experiment Results
8.2.1 Questionnaires
The questionnaire were answered thoroughly. Each and every participant wrote detailed comments.
8.2.1.1 General Questionnaire
This questionnaire was filled as a preliminary one, before participants had the occasion to use the appli-cation.
All participants but one identified environmental information as an important input for the study ofrain-fed farming.
The participants chose primarily soil water content as the relevant constraint for rain-fed agriculture,followed by temperature. Soil type, humidity and rain fall are also mentioned a significant number oftimes (see Table 8.2).
As for the characteristics per parameters (desired rate, spatial granularity and precision), they aredepicted in Figs 8.1, 8.2, 8.3.
Regarding spatial density, one can classify the parameters into two categories: the parameters con-sidered with a low spatial variability, i.e. one kilometer and above, such as temperature, rain fall andatmospheric pressure. And the parameters demanding high spatial variability (from 500m downwards):only soil moisture belongs to this category. Interestingly, soil type shows a bimodal result, about half theusers considering that a single measurement point is enough, and the other half considering that it shouldbe performed at least every few hundred meters.
The required measurement frequency shows a wider distribution. It is interesting to note, however,that in all cases but one (soil moisture), the lower limit is the day. Only for soil moisture were hourly ormore frequent measurements deemed appropriate, and only for a minority of users (less than 10 percent).
As for the error tolerated for each parameter, the participants tend to require high precision (less thanfive percent error).
8.2.1.2 Detailed Questionnaire
The detailed questionnaire was filled after the users had some time to play with the application. Fig. 8.4shows the choice users made as for crop. Groundnut, which is the crop currently most grown in the area,comes first, with almost half of the expressed opinions. Other indigenous crops are mentioned, such

8.2. EXPERIMENT RESULTS 127
Soil Type17%
Soil Water Content29%
Temperature22%
Humidity16%
Rain-Fall Pattern16%
Table 8.2: General Questionnaire: Constraints identified as important by the participants(% of answers)
as ragi, pigeon pea and sorghum. Cotton and potato are mentioned only once, while sun flower is notmentioned at all.
Farming constraints are depicted in Fig. 8.5. Not surprisingly, crop water stress is considered bya wide margin to be the most stringent constraint to take into account for marginal agriculture (27 %of expressed opinions). Pest and disease also rank high (at respectively 16 % and 18 %), while soilrelated concerns -physical properties and nutrient content- represent also a significant group. Weather(temperature, humidity) and insolation are not considered important parameters.
The results relative to the important parameters (Fig. 8.6) are consistent with those of the generalquestionnaire. The only notable difference is that temperature is now considered more important thansoil moisture, which still remains the second most important parameter, however.
Fig. 8.7 shows the parameter distribution per crop. This figure confirms that for each crop theparameters to take into account are the same, except pest, which is not considered to be an issue for ragi.
The results about parameter variability and tolerated error are not depicted, because the results areare consistent with those of the general questionnaire. In other terms, users did not noticeably changetheir mind after using the web application. The next section clearly explains why.

128 CHAPTER 8. USABILITY AND USEFULNESS OF THE SYSTEM
Measurement Rate
0
2
4
6
8
10
12
Humidity Soil WaterContent
Soil Type Temperature Rain Fall Pattern
MonthlyWeeklyDailyHourly5 minutes
Figure 8.1: General Questionnaire – Desired rate (y-axis: number of times a rate waschosen by the participants)
8.2.1.3 Comments
The participants wrote extensive comments. The time they spent reflecting on the application seemedencouraging, as they pondered the usage of this technology by marginal farmers, commented on thetechnical accuracy required by such as system and elaborated on useful sensors that could be addedto the data acquisition kit. A complete set of comments can be found in [Pan07]. We mention somecharacteristic remarks hereunder.
1. Several users questioned the capacity of farmers to act based on the environmental data collected.
2. Sensors for soil nutrient status are often mentioned as extra sensing devices.
3. Soil physical characteristics are considered important as well
4. Bio-sensors are mentioned
5. The accuracy of the system is mentioned as a constraint.
8.2.2 User Activity Logging
This is the set of meta-data that was generated by the logging of participants interactions with the webapplication. This part of the experiment led to inconclusive results. Out of the 30 participants, only sixactually used the on-line application at some point. All of them were PhD students and post-docs. Nosenior researcher used spontaneously the on-line application.

8.2. EXPERIMENT RESULTS 129
Measurement Granularity
0
1
2
3
4
5
6
7
8
Humidity Soil WaterContent
Soil Type Temperature Rain Fall Pattern
100 meters500 metersKilometerSingle MeasureMeter
Figure 8.2: General Questionnaire – Desired spatial granularity, per constraint (y-axis:number of times a granularity was chosen by the participants)
The participants who used the application did in average 3 queries to the system, mostly to look atthe soil moisture status.
This paradoxical disinterest for the on-line application is discussed in the Discussion undertaken inthe next question. It made the debriefing meetings very important, in order to understand the mismatchbetween the interest manifested in the survey and the actual usage of the application.
8.2.3 Debriefing Meetings
Initially, the debriefing meetings were intended to gather the opinions of the participants in a more in-formal manner than during the experiment. However, in light of the mismatch mentioned in the previoussection, they became a crucial element of the experiment. The goal was to find out why the users had notused the application as expected, and to assess their real level of interest.
The meetings were conducted with 8 Professors (out of the 10 who initially answered the survey).Additionally, we discussed the application with a top NGO executive, and a local official of the agricul-ture department of Karnataka.
Instead of asking these questions directly, which would have been likely to bias the answers, wechose to address concrete use cases. If people were able to come up with original use cases, that meantthey had conducted a reflection about the tool. Moreover, we could then talk concretely about upcomingpartnerships, an extra- measure of their interest, and a critical conditions for the continuation of theproject.
The results were encouraging. We found four compelling use cases, and in each case a concreteinterest in using the technology provided. Precise details about the requirements of each use case can be

130 CHAPTER 8. USABILITY AND USEFULNESS OF THE SYSTEM
Required Precision
0
2
4
6
8
10
12
Humidity Soil WaterContent
Soil Type Temperature Rain Fall Pattern
1%5%10%30%
Figure 8.3: General Questionnaire – Desired precision of the measure, per constraint(y-axis: number of times a precision was chosen by the participants)
found in [PRS08].
8.2.3.1 Soil Science
Provided we can adapt nutrient sensors to the wireless nodes, there is research to be conducted in theresponse at the root zone to different strategies of nutrient application and irrigation. The main objectivewould be to observe the variation in nitrogen , phosphorus and potassium content, in the context ofnutrient dynamics under a system of multiple crops and trees.
Appropriate sensors are of interest in order to understand the dynamics of nutrients and soil moisture,soil PH, etc. Experiment would be meaningful if conducted in the following way:
• 4 ha divided in 4 plots, 10 sensors per plot.
• Sensors placed at 2 different depths
• Experiment should last 2-3 years minimum
• Bi-weekly measurements 1
8.2.3.2 Entomology
The observation of pests present in the crop field shows that their activity depends on the weather, espe-cially rain fall, soil moisture and soil temperature. There is a clear correlation between the rain patterns
1For research purposes, having multiple measures per day would be useful, but that would not give meaningful results froman agriculture point-of-view, because the time-scale of farming operations is much larger.

8.2. EXPERIMENT RESULTS 131
Crop Choice
groundnut50%
pigeon pea15%
ragi15%
sorghum12%
cotton4%
potato4%
Figure 8.4: Detailed Questionnaire – Crops that are considered the most adapted to theregion given the data provided by the application (% of the answers)
and the emergence of adults of the insects from the soil. This happens in a fixed time of the year betweenthe last week of April and the end of June. If there is rain before April 20th, then there is no emergence.Moreover, after October all the larvae enter pupation and emerge as adults after 20 days. If the soilmoisture conditions are not favorable to them until the end of June, a large percentage of the populationmight die.
Another pest, the Red Hairy Caterpillar, has a similar biology but 2 months later than the white grubs.Emergence happens in two cycles, one in early July and the second in late September.
The hypothesis to verify is whether the insect’s activity depends on soil moisture evolution and ac-cumulation of soil heat in the weeks prior to emergence. If the soil moisture conditions are not favorableto them during pupation, a large percentage of the population might die.
Soil moisture, temperature sensors in specific regions of endemic populations of these pests (sam-pling various soil texture typologies) will help to investigate, understand their biology . This would makeit possible to provide advance information on the intensity of pest damage to farmers.

132 CHAPTER 8. USABILITY AND USEFULNESS OF THE SYSTEM
Critical Constraints
0
5
10
15
20
25
30
Soil Moisture Disease Pest Nutrient Soil Weather Day length
Figure 8.5: Detailed Questionnaire – Constraints to take into account in priority (y-axis:number of times a constraint was chosen by the participants)
The interviewee expressed keen interest on the usage of WSNs, in a first stage to test the technology’sreliability and effectiveness.
8.2.3.3 Crop Physiology
This use case is about the precise assessment of the ratio between the water that is transpired by the plantand the water that is evaporated, in other terms the plant’s water efficiency. The possibility to achievecrop improvement through selection would have a positive impact on yields achieved in rain-fed farming.For this, it is necessary to test plants with different genotypes obtained by cross-breeding and to assesswhich one has the best ratio of biomass production per water used.
The method used for this test today is gravimetric method. For this, plants in pots are used. The potsare filled daily with water up to field capacity. The next day, they are weighted to assess the water lost inevapotranspiration. Bare plots are used as a benchmark to assess the effect of pure evaporation.
The goal is to replace the gravimetric method with soil moisture sensors that would give directly thevolumetric content of water of the soil. The tedious weighting procedure could then be avoided.
A typical experience contains 120-200 pots. Each pot should contain 1-4 probes (ECH2O) connectedto one wireless sensor. The experiment duration is typically 80 days from plant sowing (out of which 50days of measures) The number of measures should be at least 4 per day, without upper limit.
His expressed interest is high. The interviewee would like to conduct as soon as possible a firstexperiment with 30 pots, as a proof of concept.

8.3. DISCUSSION 133
Critical Environmental Parameter
0
10
20
30
40
50
60
70
80
Temperature Soil WaterContent
Rain-FallPattern
Soil Type Humidity AtmospheriquePressure
Vapor-Pressure
Deficit
Figure 8.6: Detailed Questionnaire – Physical parameters most important to monitor, re-gardless of the corresponding constraint (y-axis: number of times a constraint was chosenby the participants)
8.2.3.4 Water Management
For a large NGO conducting applied research in the area of rain-fed farming, wireless sensor networksare perceived as a promising validation tool. Two experiments are envisioned:
1. the possibility to increase soil water-retention capacity through different measures, such as fertil-izer, mulching, etc.
2. assessing the efficiency of underground drip irrigation. Here, the goal is to bring the water directlyto the root zone of the plant.
For both experiments, soil moisture is the ultimate measure of success or failure.A second use case distinct from research validation is information sharing in rural kiosks. The
NGO implemented a network of internet kiosks in several districts of Karnataka. At the central server,extension specialists are analyzing data they receive from local kiosks in the villages. This data consistsin questions and environmental information. Then, they redistribute the information they analyzed to thekiosks. Obtaining live data about soil moisture content for different types of soil would be an interestingcomplementary source.
8.3 Discussion
Potential users expressed keen interest in several cases. In particular, a major NGO working in the fieldof dry-land farming throughout India expressed interest in the WSN technology. Such promising results
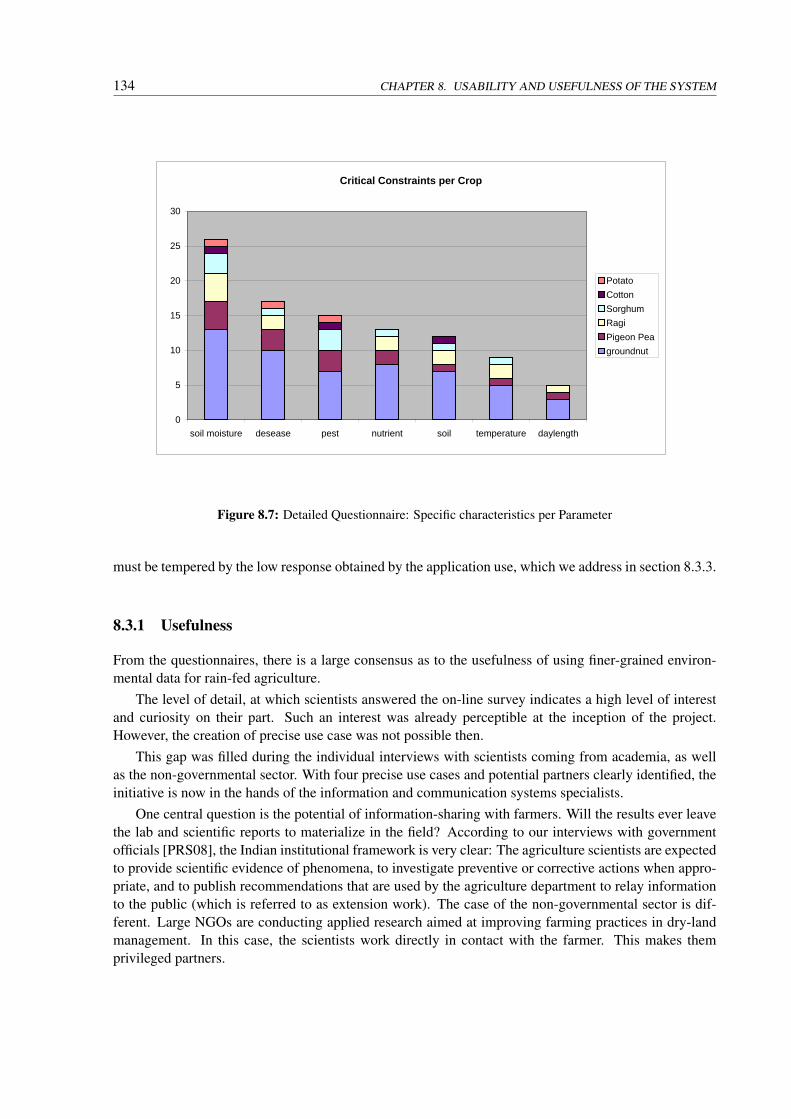
134 CHAPTER 8. USABILITY AND USEFULNESS OF THE SYSTEM
Critical Constraints per Crop
0
5
10
15
20
25
30
soil moisture desease pest nutrient soil temperature daylength
PotatoCottonSorghumRagiPigeon Peagroundnut
Figure 8.7: Detailed Questionnaire: Specific characteristics per Parameter
must be tempered by the low response obtained by the application use, which we address in section 8.3.3.
8.3.1 Usefulness
From the questionnaires, there is a large consensus as to the usefulness of using finer-grained environ-mental data for rain-fed agriculture.
The level of detail, at which scientists answered the on-line survey indicates a high level of interestand curiosity on their part. Such an interest was already perceptible at the inception of the project.However, the creation of precise use case was not possible then.
This gap was filled during the individual interviews with scientists coming from academia, as wellas the non-governmental sector. With four precise use cases and potential partners clearly identified, theinitiative is now in the hands of the information and communication systems specialists.
One central question is the potential of information-sharing with farmers. Will the results ever leavethe lab and scientific reports to materialize in the field? According to our interviews with governmentofficials [PRS08], the Indian institutional framework is very clear: The agriculture scientists are expectedto provide scientific evidence of phenomena, to investigate preventive or corrective actions when appro-priate, and to publish recommendations that are used by the agriculture department to relay informationto the public (which is referred to as extension work). The case of the non-governmental sector is dif-ferent. Large NGOs are conducting applied research aimed at improving farming practices in dry-landmanagement. In this case, the scientists work directly in contact with the farmer. This makes themprivileged partners.

8.3. DISCUSSION 135
8.3.2 Usability
New types of sensors were mentioned in the course of the experiment. Most prominently, in-situ chemicalsensors that could sense the concentration of nutrients (nitrogen, phosphorus, potassium) in the soil arementioned repeatedly. The development of such sensors is still at an experimental stage, but some recentadvances have been made for low-cost sensors using ion-selective electrodes [KHSM07].
The accuracy is a recurring concern. However, the exact precision to which sensors need to operateis still an open question. In general, it is more important to be roughly right than precisely wrong.
Parameters linked with the soil are pinpointed as having a high space variability. As a consequence,any high-precision technology that comes at a price such that it is not possible to diversify the readingsis not going to be usable. With low cost sensors, a relatively high error can be compensated by spatialdiversity, which allows for the statistical elimination of outlying measurements.
The sampling period of the data (time variability) is still the object of uncertainty. Measures shorterthan a day are not a priori taken into consideration by scientists in the framework of an applied researchfor agriculture. At present, the researchers mostly want daily data, since they use data of similar granu-larity obtained from conventional measurements without sensors. During debriefing sessions, however,we gathered evidence that the responses are likely to change with time spent on reflection and experiencewith high-resolution data. Indeed, when prompted by one of the authors with background in agricultureabout possible uses for research, the participants acknowledge in a majority of cases that such data couldbe used in the framework of their research.
It appears that certain elements of the current responses, particularly those related to time resolution,will change after some experience and / or contemplation on use of high time resolution data. Researchershave always viewed data gathering as a major constraint in research design and conceptualization. Thecurrent experiment presents a completely contrasting situation with the provision of very rich data inboth time and space for parameters of interest. It is in this light that we suggest a co-learning process foragriculture researchers and sensor technology providers to evolve better and meaningful use cases. Onthe technical side, more work has to be done to integrate new, more complex sensors to the current dataacquisition kit.
8.3.3 Use
We tried to provide possible explanations about the paradoxical low level of use recorded during theexperiment. It cannot be ruled out that this reflects the actual disinterest of the participants. However,that would be contradictory with all the other results of the survey.
Moderate computer literacy is a possible explanation. A similar result was obtained during a previousexperiment conducted in 2006, specifically about interface design [Pan06]. At that time, we had seen aclear difference of behavior between scientists used to working with environmental sensors and comput-ers, and those who did not have this expertise. As a consequence, we sought to improve the interface,but such a gap remains, as illustrated by the difference in handling the application from senior scientistsand their younger, computer-savvy students.
However, this is only a partial explanation to the observed phenomenon. As a matter of fact, despitetheir computer literacy, the students and post-docs did not extensively use the application. A posteriori,this can be explained by the difficulty in finding a one-size-fits-all scenario for the participants of thesurvey. We had not realized how diverse the concerns of agricultural scientists could be.

136 CHAPTER 8. USABILITY AND USEFULNESS OF THE SYSTEM
8.3.4 Sectoral Analysis
The response that we received from the government official illustrates the functioning of the Indian publicsector when it comes to design and implementation of policies. The academic institutions are expectedto provide scientific evidence of phenomena, to investigate preventive or corrective actions when appro-priate, and to publish recommendations. The administrative role is one of information spreading andrelaying to the public (which is referred to as extension work), and of control. A valid concern to raiseat this point is to question how the information is collected and forwarded in the other direction, in ourcase, how do the needs and wishes of the farmers come to the scientific’s desk. But we did not investigatethis question.
The case of the non-governmental sector is different. Large NGOs do not restrict themselves to ex-tension and implementation. They are conducting applied research aimed at improving farming practicesin dry-land management. In this case, the scientist works directly in contact with the farmer. This makeshim or her a privileged partner in the field.
We did not extend our survey to the industry of agriculture inputs or to corporate agriculture, althoughthese two sectors are likely users of the wireless sensor networking technology. In the first case, thereis currently a controversy surrounding the effects of large seeds providers on the livelihood of smalland marginal farmers in India. It seemed premature to contact such firms in the framework of a ruraldevelopment project. In the second case, the type of agriculture practiced (mechanized farming, on-demand irrigation, precision agriculture with high added-value) was considered too different from ourfocus of interest, namely rain-fed farming.

Chapter 9
Building a Knowldedge Society with theUse of WSNs?
Can an ICT engineering project contribute to building local ICT capacities for the Information Societyin a developing country context? How can it achieve this?
We address this question by applying a set of theoretical concepts to the COMMON Sense Netproject. We particularly look at human capacity building through participation as a form of ICT ed-ucation. We believe that rural communities and developing regions ask for innovative methods that gobeyond traditional classroom learning. Therefore we outline three categories of ICT capacities, introducea process of knowledge and capacity creation, study apprenticeship as a form of knowledge and capacityappropriation and analyze it all in the execution of the COMMON Sense Net project.
9.1 Experimental Technology for Social Change?
The COMMON-Sense Net project deals with an experimental technology: wireless sensor networks.As such, it is likely that it will not lead immediately to concrete ”economically profitable” applications.However, as Brewer et al. [BDD+05] reflected about technology needs, ”(...) Western market forces willcontinue to meet the needs of developing regions accidentally at best”. In the same spirit, we advocatethe importance of exploring the potential of an emerging technology - sensor networks - in the particularcase of rural development, in order to take the ecological, social, cultural and economic conditions ofdeveloping countries into account in the design of hardware and software platforms, and to developapplications that are well adapted to this context.
Several authors have discussed the formidable potential of ICTs to foster development in the South(Heeks, 2002 [Hee01], [Neg98], [Wal01], etc.). They show that ICTs can be applied to a wide spectrumof different areas to leverage development projects. Such literature exclusively deals with Person-to-Person ICTS, namely systems that interconnect people, such as phones or Internet-enabled computers.
We address the value and the issues of another important area of ICT for development that in ouropinion is still rather poorly researched: Environment-to-Person Information Systems (EPISs). Theseare systems that collect environmental information and communicate them to machines and people. Withthe goal to improve living conditions, this sub-area of ICTs helps individuals and communities developa better knowledge of the physical parameters that make up their environment (e.g. pollution monitor-ing, agricultural management, etc.). We argue that development projects that focus on designing andbuilding the tools for collecting and disclosing environmental information have a direct impact through
137

138 CHAPTER 9. BUILDING A KNOWLDEDGE SOCIETY WITH THE USE OF WSNS?
the artifacts they build, but can also have an indirect impact through the ICT capacities they create viadynamic knowledge generation. We will analyze this hypothesis in the COMMON-Sense Net project forICT-based agricultural water management in rural India, which we introduce in the following lines. Itis difficult at this stage of the project to talk about demonstrable gains, since we are using a technologystill in its maturation phase and not yet widely available on the market. As a consequence, rather thanstudying economic feasibility, we aim at verifying the hypothesis that resource-poor farmers can takebenefit from a system similar to ours.
This being said, it is important to keep in mind the ultimate benefits that local farmers will get fromthe system. The involvement of the agronomical scientific community and the ability to disseminatethe obtained results to the population in a credible way are the key points. This is no simple task, butleveraging on existing experience and success stories is possible (Sakthivadivel et al., 2001) [SLAH01].
9.2 Design/Implementation Gaps
Heeks [Hee01] argues that the failures of information systems projects in developing countries are oftencaused by design-actuality gaps. Country context mismatches (in terms of institutions, infrastructuresetc.) as well as hard-soft gaps (rational design versus cultural and political actuality) play a role allthe more important if the system was designed in an industrialized context. To summarize, failures cangenerally be explained by the distance (geographical, cultural or socioeconomic) between the designersof the system and its intended community of users.
As stated above, the CSN project uses participatory design extensively, which mitigates this risk.Heeks warns, however, that participatory design in itself is no guarantee for success in developing coun-tries, since these techniques have usually been developed in and for industrialized countries organiza-tions. A lesson to be drawn is that a participatory approach in a developing country is instrumental tosuccess if and only if it integrates a tool to bridge the contextual gap between design and use. In orderto bridge this gap, Heeks advocates the usage of hybrids, namely individuals who understand both thealien worlds of the community of users and of the community of designers/builders of the artifact. In theCSN case, the hybrid is a local farmer who is also an agronomist and who is familiar with informationsystems for having worked with them for more than a decade.
Despite all these precautions, the success at bridging the cultural gap with farmers gave mixed re-sults. After an initial positive response from farmers, who willingly participated to the user surveydescribed in Chapter 4, the interest of the rural community faltered in the absence of immediate impactof the CSN prototype on their livelihood. As explained in Chapters 6 and 8, we eventually refocusedour efforts towards the scientists who had participated to the initial design of the system. Possible de-sign/implementation gaps remained with this new user target, but they proved to be addressable withthe action of our hybrid, the organization of regular meetings and the presentation of environmentaldata that are immediately interpretable by scientists. This entertained a sustained interest in our systemand allowed a progressive understanding of the wireless sensor networks’ technology and its potentialapplications.
9.3 Knowledge Creation, Context and Knowledge Assets
Nonaka, Toyama et al. [NOO+00] outline four elements in the process of knowledge creation: Theknowledge creation cycle, a shared context for knowledge creation and the circulating knowledge assets.

9.3. KNOWLEDGE CREATION, CONTEXT AND KNOWLEDGE ASSETS 139
Figure 9.1: Knowledge creation cycle (Nonaka, Toyama et al. 2000)
The first element of knowledge creation, which Nonaka, Toyama et al. call SECI (acronym forSocialization, Externalization, Combination, Internalization), functions like a spiral describing the in-teractions between actors in order to transmit knowledge in it tacit or explicit form, and the actions ofindividuals or groups in order to translate knowledge from tacit to explicit, and vice-versa. This processfollows four modes feeding each-other in a spiral (Fig. 9.1). First, the socialization process of transmit-ting and converting new tacit knowledge through shared experiences. Socialization typically occurs ina traditional apprenticeship. Second, the externalization process of articulating tacit knowledge into ex-plicit knowledge. The success of such a conversion depends on the sequential use of metaphor, analogyand model. Third, the combination process of converting explicit knowledge into more complex and sys-tematic sets of explicit knowledge. Finally, the internalization process of embodying explicit knowledgeinto tacit knowledge.
In the COMMON Sense Net we aim at analyzing these four phases with regard to capacity build-ing. The first phase of socialization concerns discussions between agricultural scientists to emphasizetheir desires and aspirations regarding agricultural water management. The second phase of articulat-ing their desires concerns discussions between scientists and technical specialists (the hybrid mentionedin the previous section and the system designers). The third phase of combining knowledge concernsthe connection of the aspirations of the scientists with technical knowledge in rural engineering, watermanagement and ICT in order to design a system. The fourth phase consists of applying the system ina controlled environment, then extending the acquired knowledge to the scientists. The loop starts overwith phase one, with scientists’ feedback and/or recommendations on the proposed information.
The second element of knowledge creation that Nonaka, Toyama et al. mention is the context, whichthey call Ba, a Japanese concept that roughly translates into the English word “place”. This is particularlyinteresting for the case of ICT-for-Development projects such as COMMON Sense Net. It is oftenstressed that the particularities of the developing country context (stakeholders and environment) andtechnology development are highly dependent [BS98]. The COMMON Sense Net project covers a widediversity of contexts, which must be carefully considered during the execution of the project and theanalysis of the ICT capacities. Among several other diverse contexts most importantly figure the involved

140 CHAPTER 9. BUILDING A KNOWLDEDGE SOCIETY WITH THE USE OF WSNS?
rural Indian village, the laboratories at EPFL in Switzerland and the laboratory at the University ofAgriculture in Bangalore.
The last element of knowledge creation that Nonaka, Toyama et al. mention are the knowledge assets.Knowledge assets are the inputs, outputs and moderating factors of the knowledge-creating process.Those assets are experiential (e.g. skills, know-how), conceptual (e.g. concepts, designs, methods),systemic (technological platforms, manuals, libraries of software components) and routine-based (e.g.organizational routines). All these assets need to be ’mapped’ in order to be usable. This mapping processis at the core of the dynamic knowledge creation. In the COMMON Sense Net project we particularlyaim at observing the interaction between the tradition skills and know-how of the agricultural scientistsin terms of agricultural water management and the modern concepts and ICT systems brought in throughthe project.
9.4 Apprenticeship & Participatory Methods to Develop ICT Capacities
In the previous sections we presented the three axes along which capacities are built for creating an Infor-mation Society and argued that analyzing the knowledge creation process was central to understandingcapacity building. In this section we study apprenticeship as the main mechanism through which webelieve ICT knowledge and capacity will be created in the COMMON Sense Net project.
We define apprenticeship as a situation in which a learner works intensively with an expert to learna new task that may necessitate the understanding of new concepts. We present it as an alternative totraditional classroom learning that can be very effective to instrumentalize knowledge as capacity inrural communities of developing regions. Particularly for Environment-to-Person Information Systems aparticipatory approach seems an appropriate tool that can help overcome some underlying barriers to thedevelopment of innovative environmental technologies [FH01], [Sot03]. The question is how much of aspill-over effect participatory learning can have on the development of more general ICT capacities.
Misconceptions, what Heeks calls design-actuality gaps, namely the gap between the technocratswho design systems using scientific knowledge and the local context characterized by ”irrational” cul-tural features, seem to be at the root of most failures for Information Systems in developing countries.This recurring flaw calls for the concept of participatory design and implementation.
In participatory approaches, the end-user is constantly involved in the design and assessment of theproduct or service being developed for him. Cooper [Coo00] emphasizes the role that group working andend-user involvement can play in a successful implementation. However, Heeks [Hee01] warns that thisis no guarantee to success in developing countries, since these techniques have usually been developedin and for industrialized countries organizations. A lesson to be drawn is that a participatory approach ina developing country is instrumental to success if and only if it integrates a tool to bridge the contextualgap between design and use.
We claim that the resort to apprenticeship is such a tool. Freeman’s definition of apprenticeship is”learning by doing” [Fre02]. Adapting this definition to our context and trying to be more specific, weconsider apprenticeship as the process by which a person acquires a new knowledge or skill by imitationand interaction with someone who possesses that skill or knowledge already, rather than in a formal wayin the classroom with a teacher.
Our hypothesis is that there are some aspects of apprenticeship that make it particularly suited in theacquisition and integration of radically new paradigms of knowledge. It is a self-organized process inwhich every individual takes ownership of the knowledge he or she is acquiring. Not relying on formalteaching, it can be more integrated in the social structure and possibly more equitable since people not

9.5. FROM THEORY TO PRACTICE 141
having the time, the resources or the will to attend classes can be reached through it. Solving concreteissue one after another insures that people are interested in the process and increases the likelihood ofthem persevering in the endeavor. It allows for unexpected forms of organization to develop and isadaptive. Ultimately, it is empowering. It reserves surprises for the ”teacher” as well as for the student.
The challenge lies in bootstrapping the process, in other terms in convincing the local stake holdersthat a new formerly unheard of form of knowledge can be of value to them. One possibility is findinga local partner who speaks both languages, who understands and uses the indigenous knowledge, butmasters also the language of technology and science. At this stage, a more formal teaching approach maybe needed in order to form such a partner. But here again, knowledge exchange, rather than knowledgeprovision proves to be a key-concept in integrating new forms of knowledge in traditional societieswithout losing the value of what indigenous knowledge brought to the community in the first place.
The COMMON-Sense Net project is proposing to local stake-holders an ICT system that will helpthem accomplishing more efficiently daily tasks in accordance with specifications they laid down them-selves (in our case the information requirements for agricultural management).
9.5 From Theory to Practice
During the four years that the project lasted, we completed one full cycle of the Knowledge Creationspiral. The initial phase of socialization happened through the initial survey about information require-ments, where several meetings among farmers were organized in the villages.
The second phase of externalization provided a shared experience where communication scientists,agriculture specialists and farmers exchanged information with the facilitation of our hybrid. In particu-lar, the expectations of farmers were clearly identified, the constraints of rain-fed farming and researchwere understood, and the local stake-holders were presented for the first time with a disruptive technol-ogy through several participatory meetings.
Farmers became less involved at this point, because it was clear that what they expected were concretedemonstrable results before considering novel ways to practice agriculture. The scientists, although theydid not know anything about the technology and had problems initially to conceptualize it, showed keeninterest. Discussing the general case of rain-fed agriculture with them, we were able to define verygeneral use cases for an environmental monitoring system, but not to lay down precise requirements andconduct targeted experiments.
This was enough, however, to build and test a prototype, which we did in collaboration with ourhybrid. This took a full two years before the system could be considered operational. We reflected onthe many challenges involved in this phase in Chapter 6.
Then we came back to the scientists with early results for a new phase of socialization and external-ization, which is described in Chapter 8.
Seeing an interactive map of the deployment and being able to look at extensive environmental data,the scientists were able to refine greatly their use case and determine constraints for our data collectionsystem (parameters, their time and space granularity and their error-tolerance). In defining the use cases,the scientists showed an improved understanding of WSN and their capabilities.
We are now at the combination phase of the second cycle. If deployments of the tool can be finalizedin a controlled environment, the role of apprenticeship, already apparent in the use of our early system- where scientists developed their understanding of fine-grained environmental monitoring through theobservation of actual data - will become fundamental in the assessment of the system, since scientistswill have to operate wireless sensor networks and process their data themselves.

142 CHAPTER 9. BUILDING A KNOWLDEDGE SOCIETY WITH THE USE OF WSNS?
Conclusion
Wireless Sensor Networks are emerging as a fundamental block of the Internet of Things that is likelyto emerge in the years to come in highly technological societies. In this thesis, we broadened the scopeand sought to find relevant applications of this technology for issues specific to developing countries. Webegan by setting the context and showing the strengths of wireless sensor networks to tackle problemslinked with the Millennium Goals.
Then, we presented an on-going research and implementation work on an environmental monitoringsystem primarily aimed at resource-poor farmers of developing countries. Using participatory designand a rigorous technical approach, we developed an integrated wireless sensor-network system that wetested in the field. This system was deployed for an extended period of time in a village of Karnataka(India).
Based on our experience, we highlighted the challenges that await similar initiatives. For the benefitof the research community, we presented our environmental monitoring toolkit and the lessons learnedin a rural deployment over two years. This lead us to design and implement Sensor-Tune, a sonification-based deployment-support tool that would enable non-specialists to handle wireless sensor networks inthe field.
We also came to the conclusion that using the toolkit in a controlled or semi-controlled environmentwas the most promising approach for the time being. Accordingly, we proceeded to a user experimentwith scientists from the University of Agricultural Sciences in Bangalore. Promising use cases and userinterest have been clearly identified at this point.
This work is novel because it is the first example of an actual wireless sensor network in rural Indiaand, to the best of our knowledge, in developing regions as a whole. It is also the first documentedexample of an holistic approach in designing a WSN with a particular purpose through a participatorymethod including the main stakeholders - in our case, farmers, scientists and NGOs alike. As such, it ismeant to be a thorough case study outlining a reusable methodology and a reusable platform. We alsoreported honestly all the pitfalls that could appear in similar projects.
Future Work
Despite the successful design and implementation of an environmental monitoring toolkit, more workneeds to be done in order to assess the usefulness of this toolkit in real conditions. Initial tests in the fieldsled us to consider a more conservative strategy by putting our toolkit at the disposal of scientists. Theinitial response, based on environmental data collected in the field, was positive. However, successfullyimplementing the use cases isolated with the scientists will require more partnerships and deploymentsspanning one year or more. Ultimately, the technoology will have to be brought back to the croppingfield, with convincing results to show to the farmers.
143

144 CONCLUSION
Future work also includes the formal testing of our deployment-support tool in the Indian context(typically with the agriculture scientists mentioned above). We successfully put the deployment of aWSN in a challenging indoor setting into the hands of non-specialists. The use of a sonification-basedinterface proved to be useful, but only a full deployment will be the measure of the tool.
Finally, the other environmental challenges identified in this thesis should be investigated in a similarproject as COMMON-Sense Net. Bangalore itself is an ideal candidate for the air pollution monitoringexample.

References
[AHS06] K. Aberer, M. Hauswirth, and A. Salehi. Global Sensor Networks. EEE CommunicationsMagazine, special issue on Advances in Service Platform Technologies for Next Genera-tion Mobile Systems, 2006.
[ARE05] A. Arora, R. Ramnath, and E. Ertin. Exscal: Elements of an extreme scale wireless sensornetwork, 2005.
[ASSC02] I.F. Akyildiz, W. Su, Y. Sankarasubramaniam, and E. Cayirci. A Survey on Sensor Net-works. IEEE Communications Magazine, Vol. 40, No. 8, 2002.
[AW00] G. S. Abawi and T. L. Widmer. Impact of soil health management practices on soil-borne pathogens, nematodes and root diseases of vegetable crops. Applied Soil Ecology,15(1):37–47, 2000.
[Bag05] A. Baggio. Wireless sensor networks in precision agriculture. In The REALWSN’05 Work-shop on Real-World Wireless Sensor Networks, IVA, Stockholm, June 2005.
[Bal94] J.A. Ballass. Delivery of Information Through Sound. In G. Kramer, editor, AuditoryDisplay: Sonification, Audification, and Auditory Interfaces, volume XVII of SFI Studiesin the Sciences of Complexity. Addison Wesley, 1994.
[BBB04] J. Burrell, T. Brooke, and R. Beckwith. Vineyard Computing: Sensor Networks in Agri-cultural Production. IEEE Pervasive Computing, 2004.
[BCI+08] G. Barrenetxea, O. Couach, F. Ingelrest, M. Krichane, K. Aberer, M. Parlange, and M. Vet-terli. SenSorscope : an Environmental Monitoring Network. Water Resources ResearchJournal, 2008.
[BCL04] C. Beckmann, S. Consolvo, and A. Lamarca. Some assembly required: Supporting end-user sensor installation in domestic ubiquitous computing environments. UbiComp 2004:Ubiquitous Computing, pages 107–124, 2004.
[BDD+05] E. Brewer, M. Demmer, B. Du, M. Ho, M. Kam, S. Nedevschi, J. Pal, R. Patra, S. Surana,and K. Fall. The case for technology in developing regions. IEEE Computer magazine,38(6):25–38, 2005.
[BGH+05] P. Buonadonna, D. Gay, J. M. Hellerstein, W. Hong, and S. Madden. Task: Sensor networkin a box. In EWSN, 2005.
145
146 REFERENCES
[BHSA+07] G.J. Bishop-Hurley, D.L. Swain, D.M. Anderson, P. Sikka, C. Crossman, and P. Corke.Virtual fencing applications: Implementing and testing an automated cattle control system.Computers and Electronics in Agriculture, 56(1):14–22, 2007.
[BIS+08] G. Barrenetxea, F. Ingelrest, G. Schaefer, M. Vetterli, O. Couach, and M. Parlange. Sen-sorScope: Out-of-the-Box Environmental Monitoring. In The 7th International Conferenceon Information Processing in Sensor Networks (IPSN 2008), St. Louis, Missouri, USA,2008.
[BK99] S. Barrass and G. Kramer. Using sonification. Multimedia Syst., 7(1):23–31, 1999.
[BM04] R. Barker and F. Molle. Evolution of Irrigation in South and Southeast Asia. Technicalreport, International Water Management Institute, 2004.
[BR07] E. Basha and D. Rus. Design of early warning flood detection systems for developing coun-tries. In Proceedings of the Conference on Information and Communication Technologiesand Development, Bangalore, India, December 2007.
[Bra01] T. E. Brabben. Affordable irrigation technology: prospects for smallholders in SouthAfrica. In SABI Congress, 2001.
[BS98] S. Biggs and G. Smith. Beyond methodologies: Coalition-building for participatory tech-nology development. World Development, 26(2), 1998.
[BS05] P. Basu and P. Srivastava. Scaling-up Microfinance for Indias Rural Poor. National Councilof Applied Economic Research, India, 2005.
[BTB04] R. Beckwith, D. Teibel, and P. Bowen. Unwired wine: Sensor Networks in Vineyards. InIEEE International Conference on Sensors, 2004.
[BvRW07] N. Burri, P. von Rickenbach, and R. Wattenhofer. Dozer: ultra-low power data gatheringin sensor networks. In Tarek F. Abdelzaher, Leonidas J. Guibas, and Matt Welsh, editors,IPSN, pages 450–459. ACM, 2007.
[CABM03] D. De Couto, D. Aguayo, J. Bicket, and R. Morris. A high-throughput path metric formulti-hop wireless routing. In MOBICOM, 2003.
[Con] Control4. Home Automation System. http://www.control4.com/.
[Coo00] R. B. Cooper. Information technology development creativity:A case study of attemptedradical change. MIS Quarterly, 24, 2000.
[Cro] Crossbow. Eko Environmental Monitoring System. Documentation available athttp://www.xbow.com/eko/.
[CTT06] F. Chau, J. C. Tanner, , and S. Tippu. Country & Wireless. Wireless Asia, May 2006.
[CW03] J. E. Carroll and W. F. Wilcox. Effects of Humidity on the Development of GrapevinePowdery Mildew. Phytopathology, 93(9):1137–1144, September 2003.
[DAI] OBS-3+ turbidity sensor. Documentation available at http://www.d-a-instruments.com.

REFERENCES 147
[DC07] H. Diwikara and M.G. Chandrakanth. Beating negative externality through groundwaterrecharge in India: a resource economic analysis. Environment and Development Eco-nomics, Cambridge University Press, 12:271–296, 2007.
[DKMU03] A. Dorward, Jonathan Kydd, J. Morrison, and I. Urey. A Policy Agenda for Pro-PoorAgricultural Growth. World Development, 32:73–89, 2003.
[D.R05] D.R. Upchurch and J.R. Mahan and D.F. Wanjura and J.J. Burke. Concepts in Deficit Irri-gation: Defining a Basis for Effective Management. In Environmental & Water ResourcesInstitute Conference, 2005.
[DSM01] P. Droogers, D. Seckler, and I. Makin. Estimating the Potential of Rain-fed Agriculture.Technical report, International Water Management Institute, 2001.
[DZ07] W. Dargie and M. Zimmerling. Wireless sensor networks in the context of developingcountries. In IFIP World IT Forum (WITFOR), 2007.
[ea02] P. Juang et al. Energy-Efficient Computing for Wildlife Tracking: Design Tradeoffs andEarly Experiences with ZebraNet. In ASPLOS X, 2002.
[ECH] ECH2O Soil Moisture and Microclimate Monitoring. Documentation available athttp://www.ech2o.com/.
[Edi08] Editorialist. The World Food Crisis. New York Times, 2008.
[EGPS01] D. Estrin, L. Girod, L. Pottie, and M. Srivastava. Instrumenting the world with wirelesssensor networks. Acoustics, Speech, and Signal Processing, 2001. Proceedings. (ICASSP’01). 2001 IEEE International Conference on, 4:2033–2036 vol.4, 2001.
[FBB05] M. Fernstrom, Eoin Brazil, and Liam Bannon. Hci design and interactive sonification forfingers and ears. IEEE Computer Society, 2005.
[FGJ+] R. Fonseca, O. Gnawali, K. Jamieson, S. Kim, P. Levis, and A. Woo. The Collection TreeProtocol (CTP). TinyOS Extension Proposal 123. V1.8.
[FH01] B. Fleming and D. Henkel. Community-Based Ecological Monitoring: A Rapid AppraisalApproach. Journal of the American Planning Association, 67, 2001.
[FIB] FIBOX Enclosures. Documentation available at http://www.fibox.com/.
[FK94] W.T. Fitch and G. Kramer. Sonifying the Body Electric: Superiority of an Auditory over aVisual Display in a Complex Multivariate System. In G. Kramer, editor, Auditory Display:Sonification, Audification, and Auditory Interfaces, volume XVII of SFI Studies in theSciences of Complexity. Addison Wesley, 1994.
[FK03] N. Fodor and G.J. Kovac. Sensitivity of 4m maize model to the inaccuracy of weather andsoil input. Applied Ecology and Environmental Research, 1, 2003.
[FotUN06] Food and Agriculture Organization of the United Nations. Water at a glance, 2006.
[FR07] T. Fuller and A.C. Revkin. Climate plan looks beyond Bush’s tenure. New York Times,2007.

148 REFERENCES
[Fre02] H. A. Freeman. Comparison of Farmer-Participatory Research Methodologies: Case Stud-ies in Malawi and Zimbabwe. Technical report, International Crops Research Institute forthe Semi-Arid Tropics (ICRISAT), 2002.
[GAR99] S. Gadgil, Y. P. Abrol, and P.R.S. Rao. On growth and Fluctuation of Indian FoodgrainProduction. Current Science, 1999.
[GC00] M. Gilfix and A. L. Couch. Peep (the network auralizer): Monitoring your network withsound. In LISA ’00: Proceedings of the 14th USENIX conference on System administration,pages 109–118, Berkeley, CA, USA, 2000. USENIX Association.
[Gei03] G. Geiger. Pda - real time signal processing and sound generation on handheld devices. InInternational Computer Music Conference (ICMC), 2003.
[GJJ03] A.J. Gijsman, S.S. Jagtap, and J.W. Jones. Wading through a swamp of complete confusion:how to choose a method for estimating soil water retention parameters for crop models.European Journal of Agronomy, 18, 2003.
[Gla03] M. Glanz. Climate Affairs - A Primer. Island Press, Washington, USA, 2003.
[GRR02] S. Gadgil, P.R.S. Rao, and K.N. Rao. Use of climate information for farm-level decisionmaking: rainfed groundnut in southern India. Agricultural Systems, 74, 2002.
[GSR00] B. A. George, S. A. Shende, and N. S. Raghuwanshi. Development and testing of anirrigation scheduling model. Agricultural Water Management, 46(2), 2000.
[HC05] M. Hatler and C. Chi, editors. Wireless Sensor Networks for the Oil & Gas Industry. ONWorld, 2005.
[HDM+06] I. Hussain, D.Wijerathna, S. Arif Murtiningrum, A. Mawarni, and Suparmi. Irrigation,productivity and poverty linkages in irrigation systems in java, indonesia. Water ResourcesManagement, 20(3):313, 2006.
[Hea] Home Heartbeat. Home Awareness System. Documentation available athttp://www.homeheartbeat.com/.
[Hee01] R. Heeks. Information Systems and Developing Countries: Failure, Success and LocalImprovisations. The Information Society, 2001.
[HF04] M. Ho and K. Fall. Delay Tolerant Networking for Sensor Networks. In 1st IEEE Confer-ence on Sensor and Ad Hoc Communications and Networks, 2004.
[HKV02] G. Haq, C. Kim, and H. Vallack. Benchmarking Urban Air Quality Management andPractice in Major and Mega Cities of Asia. Technical report, Air Pollution in Mega Citiesof Asia (APMA), 2002.
[HNK+07] M. Hirafuji, S. Ninomiya, T. Kiura, T. Fukatsu, H. Hu, H. Yuoichi, K. Tanaka, K. Suga-hara, T. Watanabe, T. Kameoka, A. Hashimoto, R. Ito, R., and H. Shimamura. Field serverprojects. In SAINT-W ’07: Proceedings of the 2007 International Symposium on Applica-tions and the Internet Workshops, page 75, Washington, DC, USA, 2007. IEEE ComputerSociety.

REFERENCES 149
[HNM00] G.L. Hammer, N. Nicholls, and C. Mitchell, editors. Applications of seasonal climateforecasting in agriculture and natural ecosystems: The Australian experience. KluwerAcademic Publishers, Dordrecht, The Netherlands, 2000.
[Hor98] L. Horst. The dilemmas of water division: Considerations and criteria for irrigation systemdesign. Technical report, International Water Management Institute, 1998.
[IH06] A. A. A. Ibrahim and A. Hunt. An hci model for usability of sonification applications. InK. Coninx, K. Luyten, and K. A. Schneider, editors, TAMODIA, volume 4385 of LectureNotes in Computer Science, pages 245–258. Springer, 2006.
[Int] InteleSense. Public Health Monitoring in Vietnam and Ethiopia.http://www.intelesense.net/deployments/vietnam.
[ion] Ionode Pty. Ltd. Documentation available at http://www.ionode.com.au/.
[IP] Ingress Protection Rating. Documentation available athttp://en.wikipedia.org/wiki/IP Code.
[IP0] IP01. Cold Chain Management System. Documentation available at http://www.ip01.com/.
[Irra] Irrometer. Watermark Sensor. Documentation available athttp://www.irrometer.com/agcat.htm.
[Irrb] Irrometer. Wireless Meter Reading. http://www.wellspringwireless1.com/pdfs/aqura.html.
[Jam] H.S. Jamadagni. COMMONSense Net Internal Report.
[JM02] T. M. Johnson and M. Margalho. Performance Evaluation of Wireless Transmissions inan Amazonian Climate. In IEEE Wireless Communications and Networking Conference(WCNC), 2002.
[JMW96] M. Jurriens, P. O. Mollinga, and P. Wester. Scarcity by design. Protective irrigation in Indiaand Pakistan. International Livestock Research Institute, Nairobi, 1996.
[Jon95] W. I. Jones. The World Bank and irrigation. Technical report, Operations EvaluationDepartment, the World Bank, 1995.
[JSS05] D. Jea, A. A. Somasundara, and M. B. Srivastava. Multiple controlled mobile elements(data mules) for data collection in sensor networks. In IEEE/ACM International Conferenceon Distributed Computing in Sensor Systems (DCOSS), Marina del Rey, California, USA,June 2005.
[KHSM07] H.J. Kim, J.W. Hummel, K.A. Sudduthb, and P.P. Motavalli. Simultaneous Analysis of SoilMacronutrients Using Ion-Selective Electrodes. PhD thesis, 2007.
[KL07] Eiman Kanjo and Peter Landshoff. Mobile phones to monitor pollution. IEEE DistributedSystems Online, Urban Computing and Mobile Devices, 8(7), 2007.
[KWB+97] G. Kramer, B. Walker, T. Bonebright, P. Cook, J. Flowers, N. Miner, and Neuhoff. Soni-fication report: Status of the field and research agenda. Prepared for the National ScienceFoundation by members of the International Community for Auditory Display, 1997.

150 REFERENCES
[KYH+05] K.Lin, J. Yu, J. Hsu, S. Zahedi, D. Lee, J. Friedman, A. Kansal, V. Raghunathan, andM. Srivastava. Heliomote: enabling long-lived sensor networks through solar energy har-vesting. In SenSys ’05: Proceedings of the 3rd international conference on Embeddednetworked sensor systems, pages 309–309, New York, NY, USA, 2005. ACM.
[LCF+05] M.J. LaGier, C.A. Scholin CA, J.W. Fell, J. Wang, and K.D. Goodwin. An electrochemicalRNA hybridization assay for detection of the fecal indicator bacterium Escherichia coli.MARINE POLLUTION BULLETIN 50, November 2005.
[LH05] J. Luo and J.-P. Hubaux. Joint Mobility and Routing for Lifetime Elongation in WirelessSensor Networks. In Proc. of the 24th IEEE INFOCOM, 2005.
[LLT03] B. Liu, Z. Liu, and D. Towsley. On the Capacity of Hybrid Wireless Networks. Infocom,2003.
[LNTN+07] S. G. Lemos, A. R. Noguera, A Torre-Neto, A. Parra, and J. Alonso. Soil calcium and phmonitoring sensor system. Journal of Agricultural and Food Chemistry, 55:4658–4663,2007.
[LPP+06] J. Luo, J. Panchard, M. Piorkowski, M. Grossglauser, and J.-P. Hubaux. MobiRoute:Routing towards a Mobile Sink for Improving Lifetime in Sensor Networks. In the 2ndIEEE/ACM DCOSS, 2006.
[Mat04] H. Matthiesen. In situ measurement of soil ph. Journal of Archaeological Science,31(10):1373–1381, 2004.
[MC] M. Munasinghe and W. Cruz. Macroeconomics and the Environment.
[McC96] P. McCully. Silence drivers: The ecology and politics of large dams. Zed Books, London,1996.
[MF95] R. Minghim and A.R. Forrest. An Illustrated Analysis of Sonification for Scientific Visu-alisation. In 6th IEEE Visualization Conference (VISUALIZATION ’95), 1995.
[MHH+96] R.L. McCown, G.L. Hammer, J.N.G Hargreaves, D.P. Holzworth, and D.M Freebairn. AP-SIM: a Novel Software System for Model Development, Model Testing and Simulation inAgricultural Systems Research. Agricultural Systems, 50(3):255–271, 1996.
[Mis06] S. Mishra. Suicide of Farmers in Maharashtra. Indira Gandhi Institute of DevelopmentResearch, 2006.
[MLV03] M. Miller, W. List, and N. Vaidya. A Hybrid Network Implementation to Extend Infrastruc-ture Reach. Technical Report, University of Illinois at Urbana-Champaign, 2003.
[MMea03] D. Malandrino, D. Mea, and A. Negro et al. Nemos: Network monitoring with sound.ICAD, 2003.
[Moo] P. Moody.
[MPS+02] A. Mainwaring, J. Polastre, R. Szewczyk, D. Culler, and J. Anderson. Wireless Sensor Net-works for Habitat Monitoring. ACM International Workshop on Wireless Sensor Networksand Applications, 2002.

REFERENCES 151
[MS02] R.B. Matthews and W. Stephens, editors. Crop-Soil Simulation Models: Applications inDeveloping Countries. CaB Intl, 2002.
[MTY05] A. Mermoud, T. Tamini, and H. Yacouba. Impacts of different irrigation schedules onthe water balance components of an onion crop in a semi-arid zone. Agricultural WaterManagement, 77, 2005.
[Neg98] N. Negroponte. The Third Shall Be First. Wired, 1998.
[New04] H. Newton. Newton’s Telecom Dictionary. CMP Books, 20 edition, 2004.
[NLZ07] Suman Nath, Jie Liu, and Feng Zhao. Sensormap for wide-area sensor webs. Computer,40(7):90–93, 2007.
[NMDvI07] K. S. Nemali, F. Montesano, S. K. Dove, and M. W. van Iersel. Calibration and performanceof moisture sensors in soilless substrates: Ech2o and theta probes. Scientia Horticulturae,112(2):227–234, 2007.
[NOO+00] R. Nelson, R. Orrego, O. Ortiz, J. Tenorio, C. Mundt, M. Fredrix, and N.V. Vien. SECI, Baand Leadership: a Unified Model of Dynamic Knowledge Creation. Long Range Planning,33, 2000.
[OI67] J. D. Oster and R. D. Ingvalson. In Situ Measurement of Soil Salinity with a Sensor. SoilScience Society of America, 1967.
[oWR00] Ministry of Water Resources. Annual Report 1999-2000. Technical report, Government ofIndia, 2000.
[Pan04] J. Panchard. Water Sensors for Agriculture: A Technology Survey. Technical report, EPFL,Lausanne, 2004.
[Pan06] J. Panchard. Computer-assisted Cognition: Using Wireless Sensor Networks to Assist theMonitoring of Agricultural Fields. Technical report, EPFL, Lausanne, 2006. Available athttp://people.epfl.ch/jacques.panchard.
[Pan07] J. Panchard. Survey on Wireless Sensor Networks for Agriculture. Technical report, EPFL,Lausanne, 2007.
[PH03] C.K. Prahalad and Allen Hammond. What Works: Serving the Poor, Profitably. Technicalreport, World Resources Institute, 2003.
[PH06a] S. Pauletto and A. Hunt. The sonification of emg data. In Proceedings of the 12th Meetingof the International Conference on Auditory Display (ICAD), 20-23 June 2006, London,2006.
[PH06b] S. Pauletto and A. Hunt. ”the sonification of emg data”. In ICAD, 2006.
[PHC04] J. Polastre, J. Hill, and D. Culler. Versatile low power media access for wireless sensornetworks. In SenSys ’04: Proceedings of the 2nd international conference on Embeddednetworked sensor systems, pages 95–107, New York, NY, USA, 2004. ACM.
[Phi08] Philippe Monney, Agronomist. Private Communication, 2008.

152 REFERENCES
[PHL07] A. K. Pathan, C. S. Hong, and H.-W. Lee. Smartening the environment using wire-less sensor networks in a developing country. Computing Research Repository (CoRR),abs/0712.4170, 2007.
[PRP+06] J. Panchard, S. Rao, T. Prabhakar, H. Jamadagni, and J.-P. Hubaux. Common-sense net:Improved water management for resource-poor farmers via sensor networks. In Inter-national Conference on Communication and Information Technologies and Development(ICTD), 2006.
[PRS+07] T. V. Prabhakar, N. V. Chalapathi Rao, M. S. Sujay, J. Panchard, H. S. Jamadagni, andA. Pittet. Sensor network deployment for agronomical data gathering in semi-arid regions.In COMSWARE, 2007.
[PRS08] J. Panchard, S. Rao, and S. Sheshshayee. Wireless sensor networks for applied researchon rain-fed farming in India: an exploratory user experiment. Technical report, 2008.Available at: http://people.epfl.ch/jacques.panchard.
[QMK+07] L. Qi, M. V. Martin, B. Kapralos, M. Green, and M. Garcıa-Ruiz. Toward sound-assistedintrusion detection systems. In OTM Conferences (2), pages 1634–1645, 2007.
[Rao05] S. Rao. Minutes of Project Meeting, 2005.
[Rao08] S. Rao. Private Communication, 2004–2008.
[Ray] Raymarine. Lifetag: Wireless Man Overboard Monitoring System.http://www.raymarine.com/.
[RBE+06] N. Ramanathan, L. Balzano, D. Estrin, M. Hansen, T. Harmon, J. Jay, W. Kaiser, andG. Sukhatme. Designing wireless sensor networks as a shared resource for sustainable de-velopment. In International Conference on Information and Communication Technologiesand Development, 2006.
[RG99] S. Rao and S. Gadgil. Groundnut Cultivation in Variable Climate - Farmers’ Perspective.Technical report, Centre for Atmospheric and Oceanic Studies (CAOS), Indian Institute ofScience, Bangalore, 1999.
[RGK+04] S. Rao, M. Gadgil, R. Krishnapura, A. Krishna, M. Gangadhar, and S. Gadgil. Informa-tion Needs for Farming and Livestock Management in Semi-arid Tracts of Southern India.Technical Report AS 2, CAOS, IISc, September 2004.
[RKB04] I. Romieu, J.M. Sametand K.R. Smith KR, and N. Bruce. Outdoor air pollution and acuterespiratory infections among children in developing countries. Technical report, InstitutoNacional de Salud Publica, Mexico, 2004.
[RLL+07] N. Ramanathan, C. Lee, T. Lin, R. Neumann, S. Rothenberg, C. Harvey, T. Harmon,E. Kohler, D. Estrin, and J. Jay. Sensor-based investigation of biogeochemical controls onarsenic mobilization in rural bangladesh. In American Chemistry Society, General Meeting,2007.
[Rou08] C. Roussel. Fiabilite de capteurs de mesure de la teneur en eau du sol. Hydrology laboratorytechnical report, HYDRAM, EPFL, February 2008.

REFERENCES 153
[RR07] M. Ringwald and K. Romer. Snif: A comprehensive tool for passive inspection of sensornetworks. http://www.vs.inf.ethz.ch/publ/papers/mringwal-snif-kuvs.pdf, July 2007.
[RTB98] J.N. Raina, B.C. Thakur, and A.R. Bhandari. Effect of Drip Irrigation and Plastic Mulchon Yield, Water Use Efficiency and Benefit-Cost Ratio of Pea Cultivation. Journal of theIndian Society of Soil Science, 46(4), 1998.
[RW06] M. Radenkovic and B. Wietrzyk. Mobile Ad Hoc Networking Approach to Detectingand Querying Events Related to Farm Animals. In IEEE International Conference onNetworking and Services (IEEE ICNS), Silicon Valley, USA, July 2006.
[RWR03] S. Roundy, P.K. Wright, and J.M. Rabaey. Energy Scavenging for Wireless Sensor Net-works with Special Focus on Vibrations. Springer, 2003.
[RYR06] M. Ringwald, M. Yucel, and K. Romer. Demo abstract: Interactive in-field inspection ofwsns. In Adjunct Proceedings of the 3rd European Workshop on Wireless Sensor Networks(EWSN 2006), Zurich, Switzerland, February 2006.
[Sai05] ”P. Sainath”. Vidharbha: whose suicide is it, anyway? The Hindu Newspaper, June 252005.
[Sal04] R. Maria Saleth. Strategic Analysis of Water Institutions in India. Technical report, Inter-national Water Management Institute, 2004.
[SAM+98] D. Seckler, U. Amarasinghe, D. Molden, R. de Silva, and R. Barker. World Water Demandand Supply, 1990 to 2025: Scenarios and Issues. Research report 19, International WaterManagement Institute, 1998.
[Sap06] V.K Sapovadia. Micro Finance: The Pillars of a Tool to Socio-Economic Development.Development Gateway, 2006.
[SC02] R. Sakthivadivel and A.S. Chawla. Artificial recharging of river water: An experiment inMadhya Ganga Canal Project, India. Technical report, International Water ManagementInstitute, 2002.
[SCH07] S. A. Staggenborg, M. Carignano, and L. Haag. Predicting Soil pH and Buffer pH In Situwith a Real-Time Sensor. Agronomy Journal, 99:854–861, 2007.
[SDF] T. Schmid and H. Dubois-Ferrires. Sensorscope (LCAV laboratory, EPFL). Documentationavailable at http://sensorscope.epfl.ch.
[SDFV] T. Schmid, H. Dubois-Ferriere, and M. Vetterli. SensorScope: Experiences with a Wire-less Building Monitoring Sensor Network. In Workshop on Real-World Wireless SensorNetworks (REALWSN’05).
[SGB00] M.V.K Sivakumar, R. Gommes, and W. Baier. Agrometeorology and Sustainable Agricul-ture. Agricultural and Forest Meteorology, 103:11–26, 2000.
[Sie] Siemens. TC 65 GPRS Card. Documentation available athttps://pia.khe.siemens.com/efiles/wireless/datasheets/TC65 Datasheet.pdf.

154 REFERENCES
[SLAH01] R. Sakthivadivel, R. Loeve, U.A. Amarasinghe, and M. Hemakumara. Water Scarcityand Managing Seasonal Water Crisis: Lessons from the Kirindi Oya Project in Sri Lanka.Technical Report Research Report 55, International Water Management Institute, Septem-ber 2001.
[SM05] G. Sharma and R. Mazumdar. Hybrid sensor networks: a small world. In MobiHoc ’05:Proceedings of the 6th ACM international symposium on Mobile ad hoc networking andcomputing, pages 366–377, New York, NY, USA, 2005. ACM.
[sms] Soil moisture sensors. Documentation available at URLhttp://www.microirrigationforum.com/new/sensors/.
[SNM07] I. Stoianov, L. Nachman, and S. Madden. Pipenet: A wireless sensor network for pipelinemonitoring. IEEE International Conference on Information Processing in Sensor Networks(IPSN), 2007.
[SOF99] R. B. Salama, C. J. Otto, and R. W. Fitzpatrick. Contributions of groundwater conditionsto soil and water salinization. Hydrogeology Journal, 7:46–64, 1999.
[Sot03] M. Sotoudeh. Participatory methods: a tool for the improvement of innovative environ-mental technologies. International Journal of Environmental Technology & Management,3:336–348, 2003.
[SPMC04] R. Szewczyk, J. Polastre, A. Mainwaring, and D. Culler. Lessons From a Sensor NetworkExpedition. In Proceedings of the First European Workshop on Sensor Networks (EWSN’04), Berlin, Germany, January 2004.
[SRJB03] R. Shah, S. Roy, S. Jain, and W. Brunette. Data mules: Modeling a three-tier architecturefor sparse sensor networks. In IEEE SNPA Workshop, May 2003.
[SRP07] H. Sharp, Y. Rogers, and J. Preece. Interaction Design: Beyond Human Computer Inter-action. Wiley, March 2007.
[Sta07] S. Staehli. Evaluation of Bridge Architectures for the COMMON-Sense Net Project. Mas-ter thesis, EPFL, 2007.
[STM+05] A. Sheth, K. Tejaswi, P. Mehta, C. Parekh, R. Bansal, S. Merchant, T. Singh, U. B. Desai,C. A. Thekkath, and K. Toyama. Senslide: a sensor network based landslide predictionsystem. In SenSys ’05: Proceedings of the 3rd international conference on Embeddednetworked sensor systems, pages 280–281, New York, NY, USA, 2005. ACM Press.
[STM+07] A. Sheth, C. A. Thekkath, P. Mehta, K. Tejaswi, C. Parekh, T. N. Singh, and U. B. Desai.Senslide: a distributed landslide prediction system. SIGOPS Oper. Syst. Rev., 41(2):75–87,2007.
[Sun] Sun Small Programmable Object Technology. Documentation available athttp://www.sunspotworld.com/.
[SWC+07] L. Selavo, A. Wood, Q. Cao, T. Sookoor, H. Liu, A. Srinivasan, Y. Wu, W. Kang,J. Stankovic, D. Young, and J. Porter. Luster: wireless sensor network for environmen-tal research. In SenSys ’07: Proceedings of the 5th international conference on Embeddednetworked sensor systems, pages 103–116, New York, NY, USA, 2007. ACM.

REFERENCES 155
[Sys] EME Systems. SMX: Electrical Interface for Watermark or Gypsum Block Sensors. Doc-umentation available at the URL http://www.emesys.com/smx.htm.
[Tec] Linx Technologies.
[tel] Telosb wireless sensor from moteiv. http://www.moteiv.com.
[TF02] G. C. Topp and T. P. A. Ferre. Methods of Soil Analysis: Water content. Madison, WI,2002.
[TGCB04] K. Turner, S. Georgiou, R. Clark, and R. Brouwer. Economic valuation of water resourcesin agriculture : From the sectoral to a functional perspective of natural resource manage-ment. Food and Agriculture Organization of the United Nations, 2004.
[TGS04] P. S. Thenkabail, M. S. D. N. Gamage, and V. U. Smakhtin. The Use of Remote SensingData for Drought Assessment and Monitoring in Southwest Asia. Research Report 85,International Water Management Institute, 2004.
[tin] tinynode wireless sensor from Shockfish. http://www.tinynode.com.
[TM93] D.S.G. Thomas and N.J. Middleton. Salinization: new perspectives on a major desertifica-tion issue. Journal of arid environments, 24(1):113–127, 1993.
[tos] TinyOS operating system. Documentation available at URL http://www.tinyos.net.
[UK98] L.S. Ungani and F.N. Kogan. Drought monitoring and corn yield estimation in SouthernAfrica from AVHRR data. Remote Sesnsing of Environment, 63:219–232, 1998.
[UN 02] UN Genral Assembly. United Nations Millennium Declaration, 2002.
[UNH] Water and Sanitation Programme. http://www.unhabitat.org/categories.asp?catid=270.
[Wag02] Adam Wagstaff. Poverty and health sector inequalities. Bulletin of the World Health Or-ganization, 80:97 – 105, 00 2002.
[Wal00] J. S. Wallace. Increasing agricultural water use efficiency to meet future food production.Agriculture, Ecosystems & Environment, 82(1-3):105–119, December 2000.
[Wal01] G. Walsham. Making a World of Difference: It in a Global Context. John Wiley & Sons,Inc., New York, NY, USA, 2001.
[Wal02] D.H. Walker. Decision support, learning and rural resource management. AgriculturalSystems, 73:95–105, 2002.
[WCS04] S. Von Westarp, S. Chieng, and H. Schreier. A comparison between low-cost drip irrigation,conventional drip irrigation, and hand watering in nepal. Agricultural Water Management,64(2):143–160, 2004.
[WCS+07] T. Wark, P. Corke, P. Sikka, L. Klingbeil, Y. Guo, C. Crossman, P. Valencia, D. Swain, andG. Bishop-Hurley. Transforming agriculture through pervasive wireless sensor networks.IEEE Pervasive Computing, 6(2):50–57, 2007.

156 REFERENCES
[Wit57] K.A. Wittfogel. Oriental despotism: A comparative study of total power. New Haven andLondon: Yale University Press, 1957.
[WKD05] A. Williams, E. Kabisch, and P. Dourish. From interaction to participation: Configuringspace through embodied interaction. In Ubicomp, pages 287–304, 2005.
[Wor03] World Health Organization. World Health Report. Technical report, WHO, 2003.
[WZW04] N. Wang, N. Zhang, and M. Wang. Wireless sensors in agriculture and food industry–Recent development and future perspective. Computers and Electronics in Agriculture,50:1–14, January 2004.
[xbo] Mica2 Wireless Sensing Platform. Documentation available at URL http://www.xbow.com.
[Zar07] E. Zarate. Understanding the origins and fate of air pollution in Bogota, Colombia. PhDthesis, EPFL, Lausanne, 2007.
[ZKSS07] Kasun De Zoysa, Chamath Keppitiyagama, Gihan P. Seneviratne, and W. W. A. T. Shihan.A public transport system based sensor network for road surface condition monitoring.In NSDR ’07: Proceedings of the 2007 workshop on Networked systems for developingregions, pages 1–6, New York, NY, USA, 2007. ACM.
[Zub06] A. Zubair. Indian farmer suicide toll rises, 2006. BBC News, Mumbai, July 14, 2006.
[ZYFP07] M. Zennaro, A. Yemane, N. Farahbakhshzad, and B. Pehrson. WIRELESS SENSOR NET-WORKS FOR WATER QUALITY MANAGEMENT. Technical report, Royal Institute ofTechnology, Stockholm, 2007.

Index
Agriculture, 7Actors, 124, 136Irrigation Management, 7Pest and Disease, 8
Agriculture, IndianFacts and Figures, 12History, 10Institutions, 13Karnataka, 13Water Scarcity, 12
Air Pollution, 8Apprenticeship, 140
Chennakeshavapura, 47Agriculture, 47Marginal Farming, 50
COMMON-Sense NetData collection, 64Database, 71Design, 61
Data Generation, 61Data Transport, 62
Design guidelines, 58Embedded, 63GPRS, 69Information survey, 51Methodology, 59Partners, 43Project, 44System Overview, 63Usability, 135Use, 135Use cases, 54Usefulness, 134User Survey, 123Web, 72Wi-Fi, 68
Deployment Support, 100
Developing CountryEnvironmental Challenges, 5
Environmental monitoringDesign dimensions, 19
ICT4D, 137Gaps, 138
Karnataka, 45Knowledge Creation, 138Knowledge Society, 137
Medium Access ControlB-MAC, 66Dozer, 66
Millennium Development Goals, 5
Participatory Methods, 140Pavagada, 46
SensingCellular telemetry, 18Remote sensing, 18Stand-alone, 17Wireless sensor networks, 18
SensorAgriculture, 23Precipitation, 26Soil moisture, 23Soil pH, 25Soil salinity, 25Temperature, 25Wind, 26
Sensor-Tune, 104Design, 108History, 107Live, 105Prototype, 114User Experiment, 117
157

158 INDEX
User Survey, 112Shockfish
Mamaboard, 69Siemens TC65, 70Signal and Noise Metaphor, 103
Degradation, 104Sound, 103
Sonification, 99Advantages, 101Challenges, 102
Strategy, 123
TinyNode, 64Power consumption, 66Radio range, 65
TinyOS, 64Traffic, 8
Use CaseCrop Physiology, 132Entomology, 130Soil Science, 130Water Management, 133
Water Quality, 10Wireless Sensor Networks
Developing CountriesStrategy, 123
User Experiments, 100Wireless sensor networks, 20
Agriculture, 26Cattle monitoring, 28Developing countries (assets), 36Developing countries (challenges), 39Developing countries (examples), 31Disease prevention, 27Examples, 26Medium Access Control, 21Mobility, 22Modularity, 22Multihop, 21Power management, 21Self-organization, 21Vineyard, 26Web, 23Wireless, 20
Wireless Sesnor Networks
Interfaces, 99

JACQUES PANCHARD
Research and teaching assistantLaboratory for computer Communications and Applications (LCA) e-mail: [email protected] of Computer and Communication Sciences (IC) url: http://people.epfl.ch/jacques.panchardEPFL (Ecole Polytechnique Federale de Lausanne), Switzerland phone: +41 21 6935613Station 14CH-1015 Lausanne, Switzerland
PERSONAL
Born in Lausanne, Switzerland on March 25, 1970. Citizen of Switzerland.Languages: French - native, English - fluent, German - fluent
RESEARCH
Senior Communication Systems Engineer, with an experience in development projects. I will com-plete my PhD at EPFL in summer 2008. Prior to that, I worked as IT consultant, system designer andproject leader in Switzerland and California, in the area of mobile communications, Internet and Web.My PhD focuses on the use of Information and Communication Technologies for rural developmentin India.
EDUCATION
PhD. student in communication systems, July. 2004 – presentEPFL, SWITZERLAND
thesis title: Wireless Sensor Networks for Marginal Farming in Indiaadvisor: Prof. Jean-Pierre Hubauxexpected graduation: August 2008
Diploma (Dipl. Ing.) in Communication Systems, Sep. 1990 – July. 1995ECOLE POLYTECHNIQUE FEDERALE DE LAUSANNE (EPFL), SWITZERLAND
thesis title: Assessment of the VCELP Vocoder for Mobile Communicationsadvisor: Pr. Dirk Slock (Ericsson Research, Hungary)major in telecommunications, minor in mobile communications
Master (MSc.) in Communication Systems, Sep. 1990 – July. 1995INSTITUT EURECOM, SOPHIA ANTIPOLIS, FRANCE
major in telecommunications, minor in mobile communicationsPROFESSIONAL EXPERIENCE
Research and teaching assistant, Sep. 2004 – presentSCHOOL OF COMPUTER AND COMMUNICATION SCIENCES (IC)EPFL, SWITZERLAND
Project Manager, 1999 – 2002INFODESIGN COMMUNICATIONS SAGENEVA, SWITZERLANDDesign and implementation of strategic web portals in the area of banking, insurances, internationalorganizations (programming in Perl, Java and WebObjects)

Senior IT Consultant, 1998 – 1999ELLIPSIS COMMUNICATIONS CORP.PETALUMA, CA, USAProjects for telecommunications companies including Cerent Corporation (now part of Cisco) andAlcatel USA. Ellipsis Communications Corp. is now part of Turin Networks.
Software Design Engineer, 1997 – 1998NUSANTARA COMMUNICATIONSPETALUMA, CA, USASoftware design and development on the Advanced Rural Telephone System (ARTS), a wireless tele-phone system designed and developed for use in rural areas
IT Junior Consultant, 1996LOGICAZURICH, SWITZERLAND
TEACHING
Teaching assistantMobile Networks, EPFL – 2006, 2007, 2008Computer Networks, EPFL – 2005Embedded Systems, EPFL – 2007
Supervised projectsGael Ravot, Sudden Node Death in WSNs: Causes, Detection and Prevention, master, 2007Stefan Staehli, Bridge Architectures for the COMMON-Sense Net Project, master, 2007Behnaz Bostanipour, Sound-based Monitoring of Wireless Sensor Networks, semester, 2007Julien Giraudi, WSN for Environmental Monitoring: Data Exchange, semester, 2006Jean Rossier and Gael Charriere, Prototype of WSN for Water Management in India, sem., 2005Sathya Anand, Power Management Issues in the COMMON-Sense Net Project, intern., 2004
AWARDS
Selected paper at ICTD 2006 for MIT Press Journal PublicationEPFL- DDC Grant for Projects in Development and Cooperation (CHF 500’000)
REFERENCES
Prof. Jean-Pierre Hubaux, Full Professor,EPFL, SwitzerlandRoom BC 207, +41 21 6932627, [email protected]
Prof. H.S. Jamadagni, Chairman,CENTRE FOR ELECTRONIC DESIGN AND TECHNOLOGIESINDIAN INSTITUTE OF SCIENCE, Bangalore, India+91 (80) 2 360 08 08, [email protected]
Dr. Andre Pittet, Chief Project Advisor,SWISS AGENCY FOR DEVELOPMENT AND COOPERATION, Bangalore, India+91 (80)2 3600 809, [email protected]

PUBLICATIONS
Journals
1. J. Panchard, S. Rao, T. V. Prabhakar, J.-P. Hubaux, and H. S. Jamadagni, COMMON-Sense Net:A Wireless Sensor Network for Resource-Poor Agriculture in the Semiarid Areas of Develop-ing Countries, In Information Technologies and International Development, MIT Press, 4(1):51-67,2007.
Conferences, Workshops
2. J. Panchard, P. S. Rao, M. Sheshshayee, P. Papadimitratos, and J.-P. Hubaux, Wireless Sensor Net-working for Rain-fed Farming Decision Support – User Survey, In ACM SIGCOMM Workshopon Networked Systems for Developing Regions, Seattle, 2008.
3. J. Panchard, S. Rao, T. Prabhakar, H. Jamadagni, and J.-P. Hubaux, COMMON-Sense Net: Im-proved Water Management for Resource-Poor Farmers via Sensor Networks, In InternationalConference on Communication and Information Technologies and Development (ICTD), Berkeley,2006.
4. J. Panchard and A. Osterwalder, ICTs and Capacity Building through Apprenticeship and Partic-ipatory Methods - Applied to an ICT-based agricultural water management system, In Confer-ence of the International Federation of Information Processing - Social Implications of Computers inDeveloping Countries (IFIP WG9.4), Abuja, 2005.
5. T. V. Prabhakar, N. V. Chalapathi Rao, M. S. Sujay, J. Panchard, H. S. Jamadagni, and A. Pittet,Sensor Network Deployment For Agronomical Data Gathering in Semi-Arid Regions, In IEEEInternational Conference on COMmunication System softWAre and middlewaRE (COMSWARE),Bangalore, 2006.
6. J. Luo, J. Panchard, M. Piorkowski, M. Grossglauser, and J.-P. Hubaux, MobiRoute: Routing to-wards a Mobile Sink for Improving Lifetime in Sensor Networks, In the 2nd IEEE/ACM Inter-national Conference on Distributed Computing in Sensor Systems (DCOSS), San Francisco, 2006.
Technical Reports
7. J. Panchard, S. Rao, and S. Sheshshayee. Wireless sensor networks for applied research on rain-fed farming in India: an exploratory user experiment, Technical report, 2008.
8. J. Panchard. Computer-assisted Cognition: Using Wireless Sensor Networks to Assist the Moni-toring of Agricultural Fields, Technical report, 2007.