wireless sensor network for smart irrigation system
TRANSCRIPT

An-Najah National University
Faculty of Graduate Studies
Wireless Sensor Network for Smart
Irrigation System
By
Areen Ziad Ali Naji
Supervisor
Dr. Adnan Salman
This Thesis is Submitted in Partial Fulfillment of the Requirements for
the Degree of Master of Advanced Computing, Faculty of Graduate
Studies, An-Najah National University - Nablus, Palestine.
2019


III
Dedication
This humble work is dedicated to
“Praise be to God”
“All of my strong in the life, my lovely husband”
“My spiritual mother Om Ibrahim, because she always encourages
me and helps me”
“My destiny and whose taught me how to love learning, my father
Ziad Naji and father in law Abu Ibrahim”
“My mother, who god helped me because of her prayers”
“My lovely sisters, and my sweet heart son and daughter
Faisal & Manessa”
“Palestine exchange PEX family specially Mr. Mohammad
Obaid and my friends Mutaz, Beesan, and Haya”
“AN_Najah National University”
“The strong Palestinian people”

IV
Acknowledgement
All thanks to my supervisor Dr. Adnan Salman for his Support, helpful and
continual encouragement,
Special thanks to faculty members working in Computer science, and
Mathematics departments for their help and guidance.
Special thanks to Palestine Water Authority and MEDRC for their
sponsoring the research and valuable funding.
Special thanks for Eng. Hazem Kittany, from Palestine Water Authority
because he was the first initiator of this thesis idea.

V
اإلقرار
:أنا الموقع أدناه مقدمة الرسالة التي تحمل العنوان
Wireless Sensor Network for Smart Irrigation System
تمت اقر بان ما اشتملت عليه هذه الرسالة إنما هو نتاج جهدي الخاص، باستثناء ما
بل لنيل أية اإلشارة إليه حيثما ورد، وان هذه الرسالة ككل أو من جزء منها لم يقدم من ق
درجة أو بحث علمي أو بحثي لدى أية مؤسسة تعليمية أو بحثية أخرى.
Declaration
The work provided in this thesis, unless otherwise referenced, is
the researcher's own work, and has not been submitted elsewhere
for any other degree or qualification.
Student's name: عرين زياد ناجي :ةاسم الطالب
Signature: التوقيع:
Date: : التاريخ

VI
Table of Contents Dedication ................................................................................................... III
Acknowledgement ....................................................................................... IV
Declaration ................................................................................................... V
List of Figures ............................................................................................. IX
List of Symbols and Abbreviations .............................................................. X
Abstract ....................................................................................................... XI
Chapter One................................................................................................... 1
Introduction ................................................................................................... 1
1.1 Optimal irrigation parameters .............................................................. 2
1.2 Wireless Sensor Networks in Agriculture ........................................... 5
1.3 Cloud computing .................................................................................. 6
1.3 Thesis Objectives ................................................................................. 8
Chapter Two ................................................................................................ 10
Literature Review ........................................................................................ 10
Chapter Three .............................................................................................. 15
Background ................................................................................................. 15
3.1. Wireless Sensor Network .................................................................. 15
3.1.1 Wireless sensor nodes .................................................................. 16
3.1.2 Gateway ....................................................................................... 18
3.1.3 Base station .................................................................................. 19
3.1.4 WSN Communication Protocols.................................................. 20
3.1.5 ZigBee Standard .......................................................................... 21
3.2 Cloud Computing ............................................................................... 26
Chapter Four ................................................................................................ 28
System Architecture .................................................................................... 28
Chapter Five ................................................................................................ 35
Hardware components ................................................................................. 35
5.1 XBee Wireless Modules .................................................................... 35
VII
5.1.2 Xbee Communication Modes ...................................................... 36
5.1.2 XBee key features. ....................................................................... 40
5.2 XBee USB adapter ............................................................................. 41
5.3 XBee Arduino Shield ......................................................................... 41
5.4 The Arduino microcontroller ............................................................. 42
5.5 Soil moisture sensor ........................................................................... 44
5.6 Air Temperature-humidity sensor ...................................................... 47
5.7 Solenoid water electrical valve .......................................................... 51
5.8 Relay (for Arduino ( ........................................................................... 52
Chapter Six .................................................................................................. 55
System Implementation ............................................................................... 55
6.1 Requisite Software ............................................................................. 55
6.2 XBee nodes: ....................................................................................... 55
6.2.1 Arduino microcontroller WSN ....................................................... 56
6.2.2 Master node (coordinator) ........................................................... 57
6.3 XBee radio configuration ................................................................... 59
6.3 Arduino configuration ........................................................................ 62
6.4 Master Xbee Node ............................................................................. 64
Chapter seven .............................................................................................. 68
Results and discussion ................................................................................. 68
7.1.1 Experiment design ....................................................................... 68
7.1.2 Soil moisture results..................................................................... 72
7.1.4 Plant quality result .......................................................................... 74
7.2.5 Water consumption results .......................................................... 75
7.2 Experiment with slope ground. .......................................................... 76
7.2.2 Soil moisture comparison results ................................................. 79
7.2.3 Water consumption comparison .................................................. 81
7.3 Experiment with different slopes ....................................................... 81
Conclusion ............................................................................................... 84

VIII
Recommendations .................................................................................... 85
References ................................................................................................... 86
Appendex A................................................................................................. 92
Appendex B ................................................................................................. 94
ب ........................................................................................................... الملخص

IX
List of Figures
Figure 1: Wireless sensor network main components .................................................... 16
Figure 2: WSN Main Components ................................................................................. 17
Figure 3: ZigBee Network Components. ........................................................................ 23
Figure 4: ZigBee Network Topologies. .......................................................................... 24
Figure 5: Farm System Architecture ............................................................................... 30
Figure 6: XBee Module .................................................................................................. 36
Figure 7: XBee RF module. ............................................................................................ 40
Figure 8: XBee USB adapter. ......................................................................................... 41
Figure 9: XBee Arduino Shield. ..................................................................................... 42
Figure 10: Arduino microcontroller. ............................................................................... 43
Figure 11: Moisture Sensor............................................................................................. 45
Figure 12: Moisture Sensor parts. ................................................................................... 45
Figure 13: Arduino with moisture sensor connection .................................................... 46
Figure 14: Temperature Humidity Sensor ..................................................................... 47
Figure 15: AM2302 Pins................................................................................................. 50
Figure 16: connections between Arduino and AM2302 ................................................. 50
Figure 17: 5V Relay ........................................................................................................ 53
Figure 18: 5V Relay Connection .................................................................................... 54
Figure 19: Wireless Sensor Node components circuit .................................................... 57
Figure 20: Master Node components circuit................................................................... 58
Figure 21: XBee Connection with PC ........................................................................... 60
Figure 22 : Automatic and traditional system comparison architecture .......................... 69
Figure 23: Traditional System and Smart System comparison experiment module....... 70
Figure 24: Traditional and Smart comparison experiment one day result. ..................... 73
Figure 25: Traditional and Automatic comparison experiment result for five days. ..... 74
Figure 26: Traditional and Smart comparison experiment water consumption result. ... 76
Figure 27: Experiment with slope ground trial. ............................................................. 78
Figure 28: Automatic with slope results. ........................................................................ 79
Figure 29: Traditional with slope results. ....................................................................... 80
Figure 30: Case A ........................................................................................................... 82
Figure 31: Case B ........................................................................................................... 82
Figure 32: Case C ........................................................................................................... 82

X
List of Symbols and Abbreviations
IoT Internet of Things
SWMS Smart Water Management System
WSN Wireless Sensor Network
ICT Information and Communication Technology
OIS optimal irrigation schedule
GPS The Global Positioning System
ADC Analog to Digital Converter
LCD Liquid Crystal Display
RF Radio Frequency
IEEE Institute of Electrical and Electronics Engineers
API application programming interface
DSSS Direct Sequence Spread Spectrum
WLAN Wireless Local Area Network
WPAN Wireless Personal Area Network
SWSN Sensor Wireless Nodes
PANID Personal Area Network Identifier
SaaS Software-as-a-service
PaaS Platform-as-a-Service
IaaS Infrastructure-as-a-Service
MSB Most Significant Byte
IDE Integrated Development Environment
LSB Least Significant Byte
OS Operating System
DSS Design Support System
XI
Wireless sensor network for smart irrigation system
By
Areen Ziad Naji
Supervisor
Dr. Adnan Salman
Abstract
Recent advances in computing and wireless sensor technologies, allow
monitoring and controlling the environment around us. Conventional
agricultural irrigation scheme currently in use is a major water consumer,
where a significant amount of water is consumed through dissipation and
drainage. Further, the conventional irrigation approach sometimes results
over or under irrigation, which could have a negative impact on the quality
of the crops and their yield.
Since irrigation scheduling is highly dependent on weather condition, soil
properties, and plant type, a smart automatic irrigation and monitoring
scheme, that takes these factors into consideration, should achieve impact in
amount of water saving, increased crop yield, and better crops quality.
In this thesis, we provide a smart irrigation system that uses Wireless Sensor
Network (WSN) to monitor agricultural conditions and control the soil
moisture in the root zone to achieve better automatic cultivation.
As a result of this thesis we implemented smart irrigation system with
WSN, and accomplished a comparison between the Traditional and Smart
System which showed that the smart system controls the soil moisture stable
all the time, the smart system reduces the water consumption, and the smart
system has better plant quality and quantity.

XII
In the future works the smart irrigation system recommended to be
integrated with cloud computing system. Also the irrigation control
algorithm will consider more environmental data and the plant literature data
in the irrigation schedule determination.
The control algorithm also planned to consider the previous experiments
which are saved in the database, so the system will be expert.

1
Chapter One
Introduction
One of the major problems facing the Palestinian economy is the scarcity of
water. This is mainly due to inequitable allocation of water resources
between Palestine and Israel [49]. Further, all countries in the Middle East
region including Palestine suffer from scarcity of water resources. Therefore,
to meet the basic water demand of the existing population and to allow
economic development, water supply must be increased. Since all natural
resources in the region are already utilized, new smart water management
systems must be deployed to better utilize existing resources.
Accounting for more than three-fourths of water consumption, agriculture is
the largest consumer of fresh water. Furthermore, in Palestine the irrigation
time schedule is mainly conventional based on the farmer experience. This
conventional irrigation approach causes inefficient use of water and over or
under irrigation which can reduce the crops yield and quality. Water is not
only necessary for the growth of the plants in its own, but also it acts as a
medium to deliver nutrition and medicine to the plant. Therefore, good
management of water means good management of nutrition and medicines.
Saving water will result in saving fertilizers and medicine as well, because
the percentage of the medicine in water is constant. The challenge is how to
save water, while increasing the productivity of the crops.
In response, a new unconventional water resources are required to increase
water supply to increase the yield and the quality of the crops.

2
Furthermore, new unconventional efficient water management techniques
would be useful to meet the growing demand on fresh water. This can be
achieved by reducing water consumption in agriculture sector.
In this thesis, we provide the hardware design and implementation of a smart
water management system based on advanced Information and Communication
Technology (ICT) to achieve optimal irrigation scheduling [61].
The rest of this chapter is organized as follows. In subsection 1.1, we provide
a brief discussion about the main parameters that affect the optimal irrigation
schedule. In Section 1.2, we provide a brief review of the Wireless Sensor
Network. In Section 1.3 we provide the main objectives of this thesis.
1.1 Optimal irrigation parameters
Irrigation, can be defined as the proper supply of water to a plant root part at
proper times. To get optimal irrigation schedule, it is necessary to supply to
plants the required quantity of water taking into consideration several
parameters includes:
Type of plant, for instance, the irrigation requirement for tomato is
different from the irrigation requirement of cucumber.
Stage of growth of a plant, plant requires more water as they grow.
Texture of the soil, the fraction of sand, silt and clay in the soil mix,
different soil texture has different water holding capacity.
In addition to water, plants need optimal air concentration in the soil. Field
Capacity, refers to a moisture level where all excess water are drained out
due to the force of gravity. At this level, small pores space of soil are full of

3
water while large pores are full of air. This is the ideal condition for plant
growth. It is easy for the plant to pull water and nutrition from the soil and
air is available as well.
Lack of air in the soil due to excess water in the root part, a condition called
waterlogging or saturation, where soil pores are filled with water. If this
condition happened for a long period of time, it can cause harm (plant air
stress) to the plant and reduces yield due to the lack of Oxygen [11].
This will limit the growth of the root that causes the plants susceptible to
diseases and other deficiencies. Further, it causes losses in water, fertilizers,
and labor.
When the moisture level in the root part drops below a threshold value called
wilting point (where plant cannot pull water from the soil), it causes plant
water stress. Under this condition water is strongly bounded by capillary to
the soil particles and it is hard to be extracted by the crop. If this happens for
a long period of time, the plant will wilt and possibly die [62].
Field capacity and the wilting point depends on the soil texture and the kind
of crops. For optimal growth to maximize the yield and to reduce wasting
resources, water content should be maintained in the available water range.
At this level, it is easy for the plant to absorb water and air is available in the
soil as well. Figure (1) shows these cases [62].

4
Figure 1: Fielding Capacity and Wilting Point
In summary, maintaining soil moisture at optimal level in the root zone can
enhance farming productivity. Too much moisture can cause root diseases
and wasted water. While too little moisture can cause yield loss and plant
death. There are several challenges to achieve optimal irrigation schedule
includes: when to irrigate? And how much? The required amount of
irrigation must, at least, meet the crop water loss through evapotranspiration.
While both timing of irrigation and the amount of irrigation has a major
impact on productive farming, timing of irrigation has a significant influence
on crop yield and quality. In some growth stage, delayed irrigation can
reduce the potential yield and quality significantly.
The system described in this thesis provides the hardware components of an
automation technique to manage the root part moisture. The goal is to control
the water and air concentration in the root zone to part optimal level for a
given crop and soil texture. Application of such a system will help increase
the productivity of farming by increasing the yield and decreases losses in
resources such as water, nutrient and human labor.
Excess Water
(Air stress)
Available water (Ideal)
Dry (water stress)
Field Capacity
Wilting point

5
To achieve optimal irrigation schedule, it is necessary to take into
consideration the environment and plant parameters which the required
quantity and frequency of watering. The main parameters as mentioned in
the reference [63] are:
Plant Type: the requirement of water varies between different plant types.
Some plants need to be wet most of their times such as barely, and other
plants need to be dry such as cactus.
Plant age: at each stage of the plant growth, its demand for water is
different.
Soil texture: the fraction of sand, silt and clay in the soil mix. Different
soil texture has different water holding capacity and consequently has
different irrigation and nutrient requirements.
1.2 Wireless Sensor Networks in Agriculture
Advances in information and communication technologies including the
rapid development of a variety of low cost sensing elements enabled
monitoring and controlling the environment condition around us. One of the
key technologies of ICT is the Wireless Sensor Network (WSN) [25]. A
WSN consists of a distribution of low cost wireless sensor nodes. Various
kinds of sensors can be connected with wireless nodes to monitor a particular
environmental conditions, such as temperature, pressure, moisture, light, etc.
Nodes in a WSN broadcast their data wirelessly to a gateway that is
connected to a main computer for further processing and monitoring. Based
on this information, a decision support system controls the sensors

6
themselves and multiple processes in the environment to accomplish useful
tasks. Moreover, the gathered information is typically saved and analyzed to
extract knowledge and to improve the performance of different processes.
This technology has proven its success in several applications such as
industrial processes, health monitoring, and agriculture [14].
In this thesis, we provide a design and implementation of a WSN applier in
agriculture. The WSN gathers vital environment parameters includes air
temperature, air humidity, and soil moisture in a regularized timely manner.
Then, the WSN communicate this data to a base station in the field. The
software running on the base station investigates the data and decide the
amount of water to be delivered to the plant. This automatic management of
irrigation will not only reduce water consumption due to evaporation, but it
will give the suitable quantity of water to the plant avoiding over or under
irrigation. The result will be a better quality of crops and an increased yield.
Furthermore, this smart irrigation will save farmers time and effort.
1.3 Cloud computing
In the prototype of this project, all the data gathered from the sensors are
saved and processed in the base station computer. However, the amount of
data generated in a real farm is significantly large and requires high storage
and processing power beyond the capability of a personal computer in the
field. Furthermore, the gathered data need to be shared and monitored
remotely and usually more information from domain experts in the targeted
application is needed. Moreover, a feedback to the decision-support system

7
is useful in improving the future decisions based on previous experience
through the application of machine learning techniques. Typically, those
experts are not available on site and their remote access to the system is
essential to include their experience. Therefore, leveraging the recently
emerging Cloud Computing Paradigm provides an effective solution to these
issues. Cloud Computing provides a scalable computing and storage
resources as needed by the system. It provides most of its resources as
services which allows sharing data and information. Also, the data can be
saved for data analysis and data mining to explain any problems that might
happen in the farm [53].
To integrate the different parts of the system, a Cloud-based application have
to be designed which manages the data comes from the sensors in a WSN
for smart farming and water management. Using Web Services interface
[45], the application will gather data collected by the sensors in the field
through the master wireless sensor node which in turn collects the data from
the other WSN, and this data includes the environment condition soil
moisture. Furthermore, the application will be supported by data through a
web interface from literature resources and agricultural experts about best
agricultural practices which include the amount of water needed and the time
of irrigation for each kind of crops depending on age of the plant and the
nature of the soil.
This data will be saved in a database, and will be used in the Smart farming
framework, which will issue on different things in smart farming such as
irrigation schedule for the plants that needs it, and fertilizer needed as a

8
function of age and time, and it will send this information to the base station
in the field. Based on this information, the base station will trigger actuation
in the field. Another interface system may be designed to send to the farmer
or the investor to acknowledge him/ her about the field situation and if there
will be a need for human actions in the field, such as if there is a disease in
the plants it may be discovered with the WSN special sensors and cloud
system algorithm analysis, and worn the farmer that the plants may have a
disease and notify him/ her with the suitable the medicine if it is found.
1.3 Thesis Objectives
1) General objectives:
Design and implementation of a smart water management system that
leverages ICT technology for agricultural applications.
2) Specific objectives:
Employ smart ICT technology for efficient use of water in
agriculture by minimizing water consumption.
Save the environmental data storage, for further analysis and
applications design to make the system accessible and adaptable.
3) Problem:
The main problem that we need to minimize the inefficient water
consumption, at the same time to maximize the production of the crops
in agriculture, by modifying the irrigation system using IoT.
4) Research question:
Can we implement a smart irrigation system based on WSN?

9
Can we monitor the soil moisture, depending on the sensors values
and the factors of the plant accurately?
Will computer controlled irrigation schedule based on soil moisture
better consumes water compared to conventional irrigation based on
farmer experience, and by how much?
How data will be transferred and stored for DSS?

10
Chapter Two
Literature Review
Wireless Sensor Network (WSN) consists of distributed sensors to monitor
and control the environment around them. Their infrastructure consists of
elements that are capable of sensing, computing and communicating with a
controller to monitor and intervene with the environment. Recently, they
received a great deal of attention and they are one of the most rapidly
developing Information and Communication Technologies (ICT). Due to
their potential application in many domains, it is expected that their
performance will improve and their cost will drop which allow them to be
used in a large scale application [25].
Wireless Sensor Networks; have proven its capabilities and success in many
applications. They form the basic element of smart cities, smart environment,
smart water management systems, smart metering, smart agriculture, etc.
The use of WSN in agriculture has been successful in several prototyped
projects around the world and its success is expected to even get better as the
technology improves.
In 2002, a Software design for automated irrigation control are explored in
[8], where they designed and simulated set sprinkler irrigation systems by
using computer-aided design software, that allowed the design of a layout of
the irrigation system, without monitoring the soil moisture.
In 2004, authors of the work conducted in [6] explored the design of a
sprinkler valve controllers and smart soil moisture sensor for site-specific

11
irrigation automation. Uniformity of sprinkler irrigation (with and without)
sprinkler cycling was investigated for variable-rate water applications. The
result was that sprinkler cycling has no effect on uniformity [7]. In [4] and
[5], authors used a closed-loop irrigation system and determined irrigation
amount based on a distributed soil water measurement.
In the work presented in 2008 in [3], they described the design of WSN-
based variable rate irrigation system, and the software for real-time in-field
sensing, and control of a site-specific precision irrigation system. The system
offers a potential solution to support site-specific irrigation management,
which allows producers to maximize their productivity while saving water.
In the work presented in 2013 in [1], they applied WSN to monitor soil
moisture dynamic in space and time in an apple tree orchard of about 5000
m2 in northeastern Italy. The orchard is divided into three parcels each one
subjected to a different irrigation schedule.
Their results showed that an efficient water usage was accomplished by
introducing an irrigation schedule based on the information provided by
WSN.
Multiple different sensors can be used to monitor various environmental
conditions to be used in controlling the irrigation schedule. For example, in
[2] the water schedule was based on data gathered from leaf wetness, soil
moisture, and soil PH, and atmospheric pressure sensors. Further,
monitoring sensors are used to inform farmers about the chemical
composition of the soil to help them choose the appropriate kind of fertilizers
and to suggest the suitable crop for next season [2].

12
In the project presented in [13] the main objective is that it detects the
moisture level in the soil and help the farmer in multiple farming. They
developed a device to detect the moisture level in the soil. When the devise
is placed in the field, it works under three conditions wet, normal and dry.
When the condition is dry it turns on a water pump until the condition normal
is reached.
In the work [13], they used soil moisture sensors connected with Arduino
Uno microcontroller which control the Solenoid Valve using a DC motor and
it sends an on/off signs by using a relay and a transistor to amplify the signs.
The microcontroller always checks the status of the soil and it tries to keep
it in the normal situation.
As a result, the authors of [13] succeed to develop a real time response
control system which monitors all the activities of irrigation system. This
automated irrigation system is designed and implemented considering low
cost, reliability, and automatic control.
But the system in [13] needs to be wirelessly connected with other similar
systems to make integrated large area control system to fit the agricultural
requirements and avoid wired disadvantages.
In the project of [14] in 2016, the main purpose was to monitor the paddy
(India) crop field in a wireless manner. They monitor the temperature,
moisture and water level in a well using temperature, humidity and flow
sensor respectively. The analog value from the sensors is converted to digital
format by an ADC. The AT-mega controller gets the output from the ADC.
13
There are two sections in the project of [14]: one is transmitter section placed
in farm as sensors, and the other section is receiver section is users PC.
Soil moisture sensor is used to measure the amount of moisture content
present in soil. The sensor detects the soil moisture value, and the controller
reads this value as an analog value, between 0 and 1024, so moisture sensor
data are fed to a microcontroller, in which the microcontroller acts according
to the control algorithm [14].
Sensor output is analog in nature in the range of 0-5v. The microcontroller
converts analog data to digital data. When the moisture content in the soil is
dry, then water flow in a tank starts to flow in a pipe by turning the motor
ON. When the moisture content in the soil is high, then the water flow in a
tank stops to flow in a pipe by switching the motor OFF [14].
The same moisture content and flow level will be displayed in a LCD display
of micro-controller. The sensor values are transmitted to the receiver through
RF protocol. Those sensors are: Temperature sensor, level sensor, moisture
sensor connected with AT-mega.
At the receiver, the values of sensors are monitored on the user’s PC through
MATLAB application. The microcontroller transmits the data’s using RF
module.
This project offered stable remote access to field conditions and real-time
control and monitoring of the variable-rate irrigation controller [14].
But the authors of the work [14] said they need to improve the stability of
wireless sensors in communication, and improve the topology structure to
make all nodes communicate with each other.

14
Moreover, design and implementation of software architecture for the smart
monitor system need continuous improvement to meet various real demands
change the font style.

15
Chapter Three
Background
This chapter is organized as follows. In the section 3.1, we review the main
elements of a WSN. This includes, WSN architecture, protocols, and
topologies. In section 3.2, we provide a brief discussion about cloud
computing and its main services.
The smart irrigation system employs two recently emerged technologies, the
(WSN) [25], and the Cloud Computing [53]. The WSN is basically used to
provide two main functions: 1) it gathers data read by sensors distributed in
the field then send these data to a base station computer in the field, and 2)
it communicates control signals from the base station to trigger actions in the
field by actuators (e.g. to turn electric valves on/off). The cloud computing
is used to manage the large amount of data gathered by the sensors and other
information about the crops and soil characteristics. Furthermore, these data
and information are used to make decision about when to trigger actions in
the field. These two technologies can be coupled using web services [46].
The focus of this thesis is on the design and implementation of the WSN
network component.
3.1. Wireless Sensor Network
A WSN is a group of connected autonomous devices called nodes. The main
function of this network is to gather data from sensory devices connected to
the nodes to monitor physical or environmental conditions.

16
The availability of low-cost sensing devices, embedded microcontroller, and
wireless communications enables the design of WSN that contain a large
number of nodes. WSN has proven its success in many areas includes
transportation [17], engineering [12], and agriculture [14].
The architecture of a WSN consist of the following main components [55]
and shown in Figure 1:
Figure 1: Wireless sensor network main components
3.1.1 Wireless sensor nodes
Wireless sensor nodes are the basic elements in a WSN. They are deployed
over a geographic area to collect environmental data using various sensing
devices. A wireless node has the capability to process the data gathered from
the attached sensors and transmit it to a base station through wireless
channels.

17
The structure of a typical wireless sensor node as shown in the book of [25]
consists of four basic components shown and described in figure 2:
Figure 2: WSN Main Components
The WSN components:
Sensing unit, a sensing unit consists of a sensor and an analog-to-digital
converter (ADC). The analog signals generated by the sensors in response to
an observed event are converted to digital signals by the ADC and then
passed to a processing unit for further processing. A typical sensor node
contains multiple sensors [25].
Processing unit (Microcontroller): this unit has the capability to perform
certain local computation on the data based on how it is programmed.
Typically it is associated with memory module necessary to perform the
computation [25].
A wireless communication unit: allows a wireless node to communicate
with other nodes in the wireless network. The unit consists of a radio receiver

18
and a radio transmitter. The receiver is used to receive messages from the
network and the transmitter is used to send messages to the network [25].
Power unit: this is a battery that powers all components of the sensor node.
A sensor node is typically mounted in a small physical space which requires
small batteries. Furthermore, usually it is hard and sometimes impossible to
recharge or exchange batteries in some applications. However, in agriculture,
a solar panel unit can be used to recharge the batteries. The power of a
wireless node is consumed mainly in the wireless communication unit [25].
Global Positioning System (GPS) [58]: in wireless sensor networks there
are some nodes available with GPS receivers to acknowledge there
position, their locations are then used to determine the positions of other
ordinary sensor nodes, which do not have GPS receivers. Having a GPS
receiver at sensor nodes may not be feasible due to the limitations of satellite
coverage or obstructions in the path of satellite signals or harsh climate
conditions.
3.1.2 Gateway
A gateway is a network element that can connect two different-types of
networks with different communication protocols together. It is basically a
protocol translator that can communicate packets between two systems that
have different communication protocols and different architecture [25].
In a WSN system, the gateway acts as a bridge between the wireless sensors
network that uses a particular communication protocol such as ZigBee [25]
and other network. In the wireless sensor network, the gateway is the
19
interface between the application platform or the cloud system and the
wireless nodes in the WSN. Information received from the wireless nodes is
translated by the gateway and forwarded to the application.
The application may run on a cloud system or a local computer or a
networked computer. On the other hand, when a command is issued by the
application program to a wireless node, the gateway relays the information
to the wireless sensor network. A gateway can perform protocol conversion
to enable the wireless network to work with other industry or non-standard
network protocols.
The gateway in our system is represented with a Personal Computer serial
port. It is connected with the master wireless node (Section 4.3), and an API
protocol (Xbee library) is used to translate the massages between the
application and the Xbee nodes as discussed in details in (Section 5.1.2).
3.1.3 Base station
The base station is the center of the wireless sensor network. It is basically a
computer connected to a gateway. The base station runs an application that
mainly gathers the data from the sensor nodes, process the data, and controls
the agriculture environment by sending control signal to actuator in the
environment to trigger tasks [25].
Further, the base station can act as a bridge between the wireless sensor
network and applications that runs on the cloud.
In this thesis, an application running on the base station analyzes the received
data from the wireless sensor nodes, performs appropriate computation, and

20
then displays the information on a user screen and saves it to files. The
application on the base station schedule irrigation. However, in the proposed
system the role of the base station is to communicate the gathered data to the
cloud application where the data is processed, saved, and shared with other
users. Also, it receives control signals from the cloud application to trigger
action in the farm.
3.1.4 WSN Communication Protocols
Wireless sensor nodes are highly limited in resources. This includes a limited
amount of power, limited computational and storage capabilities, short
communication range, and low bandwidth. Therefore, unlike conventional
wireless network, a WSN has its own design that takes these resource
constraints into consideration. In this section we briefly discuss the
communication protocols and standard that are used in the design of a WSN.
The specification of a particular design of a WSN depends on the application
itself. This includes the size of the network, the deployment scheme, and the
network topology.
The communication protocols used in WSN enable the communication
between the sensor nodes themselves and between the sensor nodes and the
base station. It consists of the five OSI model [58] for packet switching:
application, transport, network, link, and physical layer. The WSN
performance and energy consumption are highly dependent on the protocols
used in each layer.

21
One of the main standard for WSN communication is the IEEE 802.15.4
ZigBee standard [25].
In WSN applications, ZigBee standard has greater flexibility compared to
other popular communication standards such as WiFi [28] used in Wireless
Local Area Network (WLAN) based on IEEE 802.11.x [59] and Bluetooth
used in Wireless Personal Area Network WPAN [28]. ZigBee is energy
efficient. ZigBee devices consume about 1/4 of power compared to WiFi. A
ZigBee network can have a much larger size (up to 65,000 nodes) compared
to WiFi (about 2000). However, the maximum range of a Zigbee is restricted
to (WPAN), reaching up to 30 meters compared to about 100 meter in WiFi.
Also, the data transfer in ZigBee is much slower than WifI (54 Mbps
compare to 250 Kbps).
3.1.5 ZigBee Standard
ZigBee is a standards-based network protocol, supported by the ZigBee
Alliance that uses the transport services of the IEEE 802.15.4 network
specification and adds more functionalities (full peer-to peer/ mesh). ZigBee,
is a one type of wireless network protocols that is specific for communication
in a wireless personal area network (WPAN). It is used in application
domains that require low power, low duty cycle and low data rate
requirement devices [27].
ZigBee offers four kinds of services: encryption services, authentication,
routing protocol (mainly perform data routing and forwarding process to any

22
node in the network), and application services such that each node belongs
to a predefined cluster and can take a predefined number of actions.
3.1.5.2 ZigBee layers
There are different layers in ZigBee protocol that define power management,
addressing, error correction, message formats, and the right path of
transferring a massage from a source node to a destination node.
ZigBee layers built on 802.15.4, add three important services, 1) routing to
define the routing table, 2) the ad hoc network creation of the entire network
of radios or wireless nodes automatically without need for human
intervention, and 3) self-healing mesh mainly a process that automatically
defines if one or more radios is missing from the network and reconfigures
the network, and creates another rout to replace the broken rout.
3.1.5.2 ZigBee Network Components
The Zigbee Network mainly contains is a connected device. Those devices
are ZigBee components which can be configured to be end devices, routers,
and coordinator. Look at figure 3 from the reference [31].

23
Figure 3: ZigBee Network Components.
A ZigBee node can be configured to be:
Coordinator: ZigBee networks have one and only one coordinator node.
The coordinator node responsibilities include, forming the network,
handing out addresses, and managing the other functions that define the
network, and secure it [37].
Router: A router can send, receive or route information. The network
may have zero or more routers. Router nodes receive messages from
sender’s nodes, and passes them to the receiver nodes. Routing is
necessary when the receiver and the sender are too far to communicate
directly. Routers are typically plugged into an electrical outlet because
they must be turned on all the time [37].
End device: The network may contain one or more end nodes. End nodes
can send or receive information, but they cannot rout it. They can save
power by going into a sleep mode. End nodes require a router or the
coordinator to be their parent to be able to join the network [37].

24
3.1.5.3 ZigBee Network Topology
Network topology is the way the WSN nodes are connected together. These
topologies indicate how the radios are logically connected to each other.
Their physical arrangement may be different. So, WSN can be applied using
different suitable topologies depending on the application requirements.
In this work, there is one master wireless node, which collects the data from
other Sensor Wireless Nodes (SWSN), and control each SWSN irrigation
applying the control algorithm to achieve the best irrigation schedule for
each node independently from the other nodes.
There are four major ZigBee topologies [31] described in figure 4:
Figure 4: ZigBee Network Topologies.
Pair: This is the simplest ZigBee network topology which contains just
two nodes. One node have to be the coordinator while the other node can
be configured as a router or an end device.
Star: This is the fairly simplest network topology. In which the
coordinator radio sits at the center of the star topology and connects to all
of end devices. Every message in the system must pass through the

25
coordinator node, which routes them as needed between devices, and the
failure of coordinator cause network failure.
Mesh: this is the ZigBee network topology which contains router nodes
in addition to the coordinator nodes. These nodes can pass messages
along to other routers and end devices as needed. The coordinator
manages the network. It can also route messages. Various end devices
may be attached to any router or to the coordinator. These can generate
and receive information.
Cluster tree: A network topology that routers form a backbone of sorts,
with end devices clustered around each router. It’s not very different from
a mesh configuration.
Another important thing in WSN is the identifiers of the nodes. That helps
them to communicate with other nodes in organized manner, the next section
is talks about the addressing basics in the WSN.
3.1.5.4 ZigBee Addressing Basics
When the massage is sent through the wireless sensor nodes it needs to define
the rout to pass from the source to the destination through the other nodes.
The network defines the routing and communication techniques depending
on nodes addresses. Each node is identified by several addresses [25].
Hardware address: Unique and permanently assigned 64-bit serial
number (hexadecimal).
Network address: A 16-bit address that is dynamically assigned to each
radio by the coordinator (hexadecimal), this address is unique only within

26
a given network. Since it’s shorter, many can be manipulated in the
limited memory.
A short string of text called the node identifier, when the short address is
not known, address resolution is performed.
Each network has unique identifier is called Personal Area Network
Identifier or PANID. Within a network, all devices must be configured
with the same PANID.
Special addressing:
0x0000 0000 0000 0000 = destination is the coordinator.
0x0000 0000 0000 FFFF = for broadcast.
The wireless module used in this system is the XBee module, It is important
to understand that ZigBee is different from XBee, ZigBee is a standard
communications protocol for low-power, wireless mesh networking and
XBee is an example of devices that apply ZigBee protocol, but in XBee side,
it is a brand of radio that supports a variety of communication protocols,
including Zig-Bee, 802.15.4, and WiFi, among others.
3.2 Cloud Computing
Cloud Computing is a really big developed technology. Which takes on its
hand the managements, processing and monitoring of a large amount of data.
And save the data in shared place to be accessible from anywhere, and any
target user [51].

27
In cloud computing, a large number of computer systems are connected in
private or public networks to provide dynamically scalable infrastructure for
applications and data storage as services over the Internet.
Cloud computing offers many services, in many ways, to suites different
applications needs.
The main cloud computing services are:
Software-as-a-service (SaaS): The SaaS concept is the broad market
solution, which may offer everything needed from software side, like web
based email, inventory, control, and database processing. End users can
access the service over the Internet, for example: collaboration, business
processes, industry applications and e-Health…
Platform-as-a-Service (PaaS): In PaaS consumers process their
applications, but can host applications using platforms which include the
runtime software necessary to host consumer developed applications.
Infrastructure-as-a-Service (IaaS): IaaS provides consumers with an
opportunity to consume processing, storage, network, and other resources.
There are multiple websites that supports the cloud computing infrastructure
includes: Google [51], Microsoft [52], Amazon [53], Oracle [54], etc. The
list is expected to grow in the near future. Cloud computing provides rapid
access to flexible and low cost IT resources. It eliminates the need to
purchase large hardware and spend time for installation and managing this
hardware. Therefore, cloud computing can be accessed from many resources
and applications.

28
Chapter Four
System Architecture
This chapter describes the architectural design of a WSN-based application
for smart farming and water management system.
In this system, the land is divided into several irrigation units called
"zones". The irrigation of each zone can be started or stopped using an
electrical valve controlled by the application running on the base station.
Multiple moisture sensors are placed in each zone. In a timely manner the
readings of these sensors are gathered by the WSN and then sent to the base
station.
In the project design, the application on the base station sends these data to
an application running on the cloud, where data can be monitored, processed,
and shared. Based on the sensor's data and other information, a decision
support system in the cloud application will issue a request to turn on or off
the irrigation valve for each zone.
However, in this thesis, we only provided a simple decision support system
running on the base station in the field. The decision of turning on or off the
irrigation of each zone is based only on the average moisture level of each
zone.
The application gathers data about the field environment condition which is
the soil moisture, through sensors attached to sensor nodes. The sensor nodes
send the collected data to a base station by wireless communication channels.

29
A farm application runs on the base station gathers the data, puts it in a
specific format and sends it through the Internet to a cloud application using
a web service. Also, in a timely manner the farm application query the cloud
application about which parts of the farm to be irrigated.
The cloud application saves the data in a database, share it with different
kind of users and contains a decision support system that based on the sensor
data and other information about the soil and the plant, it decides when and
how much to irrigate the plants.
The architecture of the management system consists of two main
components. The hardware component, and the software components. The
hardware component consists of a wireless sensor nodes distributed in the
field. These devices gathers data from the environment through sensors and
send this data to a base station through wireless network in the field. Other
IoT devices (actuators) are connected to the base station to trigger action in
the field such as open and close water valves. The software component
consists of two applications, the farm application, and the cloud application.
The farm application is executed on a computer in the farm. It has two main
tasks:
a. It gathers the data from WSN and puts it in a specific format and
communicate this data to the cloud application through a web service.
b. It receives decision from the cloud application in a timely manner
about which valve should be open for irrigation.

30
Further, it has a decision support system that determines when to irrigate
each zone of the farm based on the moisture sensors data and the agricultural
expert’s data.
The following figure 6 illustrates the architecture design for the smart
system:
Figure 5: Farm System Architecture
As it is shown in the figure 5, the smart irrigation system may be integrated
with other a cloud computing application to make the system more
deliverable to the users.
An important part of the system architecture is a WSN. A WSN is a group
of wireless sensor nodes distributed in the farm to sense the environmental
conditions, transfer the data wirelessly to the master node. The master node
is connected to the base station computer in the farm. The base station

31
computer is connected to the cloud application, a shared place for processing,
managing the data, and saving the data in a database.
Another important part can be developed is an interactive website. This is a
human accessible website that allows users to monitor the farm and the
cultivation status. Also, it allow users to configuration the WSN. For
example, the farmer can insert new WSN node, so he can access his farm
cloud web page and configure the new node.
The cloud system contains a decision-support algorithm to control the
irrigation schedule based on previous data, data from agricultural expert,
plant kind and age, and sensors data. The goal is to achieve optimal condition
for water that maximize the yield while saving water.
The main focus of this thesis is on the design and implementation of the
wireless sensor network architecture for smart farming. This includes the
calibration of the moisture sensors and the irrigation control algorithm. This
thesis doesn't cover the cloud application component of the system.
As it is shown from figure 5, the farm is divided into zones.
Each zone is a unit of predefined area, that present one management unit of
the field. The zone has the same properties that help the irrigation control
unit to define the optimal irrigation time and amount, those factors are: plant
type, plant edge, the stage of growth of the plant, and the texture of the soil,
the fraction of sand, silt and clay in the soil mix.
The sensors of one zone or more than one zone, can be connected with the
same wireless sensor node, which gathers the sensors data and sends them to
the master node.

32
The soil moisture sensor is the most important sensor in the irrigation system,
because it defines 90 percent of the plant optimal irrigation schedule.
So it is a good practice to deploy more than one sensor in the zone, and to
deploy many sensors at different depth to measure the extent of soil
absorption of water.
At each zone, depending on the soil moisture sensor reading and the other
factors mentioned before, the microcontroller decide to open or to close the
electrical valve of that zone.
On this work, there is a threshold for soil moisture, defined by an expert
farmer [64], such that he gives us the wet acceptable soil, and the maximum
dry acceptable soil, in order to keep the soil in the optimal case.
The microcontroller have the defined soil moisture threshold, this threshold
is the sensor readings for the wet (minimum boundary), and dry (maximum
boundary).
Depending on the factors that illustrated above, and the threshold it decide
to open or close the electrical valve such that when the sensor value is less
than the lower limit of the threshold, it means that the soil is wet so it turn
the valve off, and if the sensor value is more than the upper limit it mean that
the soil is dry so it turn the valve of and so on.
Wireless sensor node contents
The introduced system mainly divides the farm into zones, each one or more
zone are connected with a wireless sensor node, and the wireless sensor node
generally contains the following main components:
Sensors: soil moisture sensor, temperature sensor, humidity sensor.
33
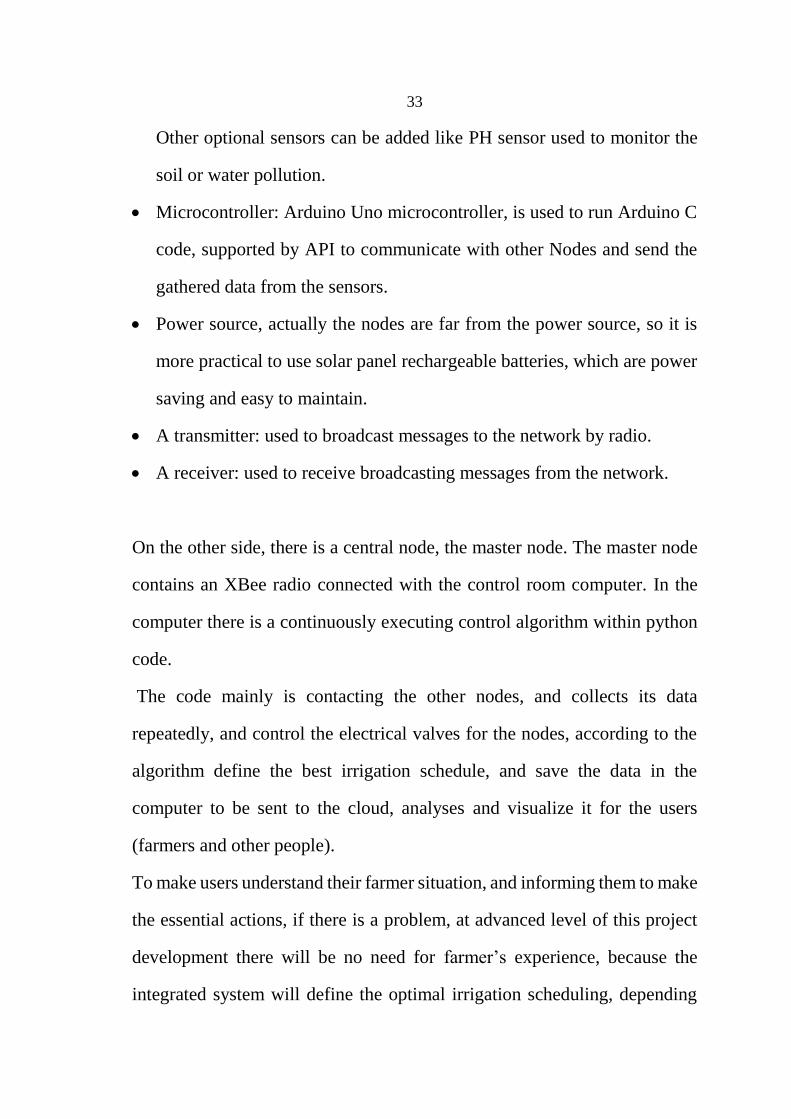
Other optional sensors can be added like PH sensor used to monitor the
soil or water pollution.
Microcontroller: Arduino Uno microcontroller, is used to run Arduino C
code, supported by API to communicate with other Nodes and send the
gathered data from the sensors.
Power source, actually the nodes are far from the power source, so it is
more practical to use solar panel rechargeable batteries, which are power
saving and easy to maintain.
A transmitter: used to broadcast messages to the network by radio.
A receiver: used to receive broadcasting messages from the network.
On the other side, there is a central node, the master node. The master node
contains an XBee radio connected with the control room computer. In the
computer there is a continuously executing control algorithm within python
code.
The code mainly is contacting the other nodes, and collects its data
repeatedly, and control the electrical valves for the nodes, according to the
algorithm define the best irrigation schedule, and save the data in the
computer to be sent to the cloud, analyses and visualize it for the users
(farmers and other people).
To make users understand their farmer situation, and informing them to make
the essential actions, if there is a problem, at advanced level of this project
development there will be no need for farmer’s experience, because the
integrated system will define the optimal irrigation scheduling, depending

34
on historical and theoretical data, which are collected from literature and
statistical data from farmers and other experts.
As it is mentioned above the overall Smart Irrigation System contains many
sub integrated systems. In this thesis the Wireless Sensor Network Smart
Irrigation System is designed and implemented, to be integrated later on with
the cloud computing system.

35
Chapter Five
Hardware components
In this chapter we describe the main hardware components that we used to
implement the Wireless Sensor Network described in chapter 3. As
discussed there, the main components of a Wireless Sensor Node are the
microcontroller, Radio Frequency transceiver (RF), power source, and one
or more sensors. There exist several technologies that can be used to
implement these components. The difference between these technologies is
in the cost, ease of use, and reliability which includes the communication
protocol stack that they support. In our implementation we used the popular
XBee modules for the short-range low-power wireless communication. For
the microprocessor, we used the Arduino Uno. For the environment sensors,
we used the moisture, temperature and humidity sensors. Further, several
shield and adapters are used. In this chapter we explain in more details all
these parts. In the following, we describe these parts in more details.
5.1 XBee Wireless Modules
Xbee is a family of wireless modules that share a form factor and support a
variety of communication protocols where Zigbee protocol is one of them.
ZigBee is a mesh protocol that is built upon 802.15.4 wireless personal area
network. XBee modules come with multiple antenna options, including
U.FL, PCB, wire, and RPSMA. Xbee modules are suitable for low-power

36
short-range requirements of wireless device networking [35]. Figure (6)
from the website [31] shows the 20-bin data sheet for this module.
Figure 6: XBee Module
XBee modules come in one of two basic types of physical hardware, Series
1 and Series 2. XBee Series 1 hardware provides simple and direct point-to-
point or point-to-multipoint communications only, but they don’t allow mesh
networking. In contrast, XBee series 2 provides automatic mesh networking
which allows the signal to be relayed through several nodes in its way to the
final destination. This capability allows a WSN to form a network using
auto-discovery and broadcast. Further it covers a large area which is suitable
for agriculture application. In this project, we used the regular version of
Xbee series 2 that comes with wire antennas. XBee Series 2 also comes with
PRO version which has more power, but cost more.
5.1.2 Xbee Communication Modes
XBee modules can communicate with each other in one of two modes, either
in a transparent mode or in a packet-based Application Programming
Interface (API) mode. In a transparent mode, all data received are instantly
transmitted over the radio. In this mode, the user configures the XBee with

37
AT commands (Attention commands) and communicates data using the
command mode. In contrast, XBee radios configured for API mode utilize a
data format that is more complex and is the suitable choice for computer
programs communicating with radio modules.
All XBee communications in this thesis are performed in API mode. This is
necessary since the XBee modules are communicating with a computer. One
advantage in using the API mode is that it allows specifying message
destination address at runtime. This allows software running on the base
station to communicate with a particular node to accomplish a particular task
dynamically at runtime based on a runtime decision.
In API mode [35], all incoming and outgoing messages are packaged in
frames. Each frame consists of start delimiter bytes, the Most Significant
Byte (MSB), the Least Significant Byte (LSB), the API identifier, the frame
data, and the checksum byte.
Each frame has a minimum of the following:
Start delimiter byte 0x7E.
Most Significant Byte (MSB).
Least Significant Byte (LSB).
API identifier (cmdID).
Frame data (including additional bytes specific to API message type).
Checksum byte.
The start delimiter byte is to denote the beginning of the frame. The MSB
and LSB are used to indicate the length of the data in the frame. The length
of the frame is the number of bytes after the LSB, not including the checksum

38
byte. The MSB is always 0x00, so the LSB will be equivalent to the length.
Every frame will have an API identifier specifying what type of frame is
being sent [35].
After the API identifier any additional bytes required by the specified frame
type. After that the actual frame data (in the case of transmit and receive
frame, the data to transmit/received) is inserted.
The checksum byte is used to verify the integrity of the contents.
The checksum is calculated using the following process:
Sum value of each byte after LSB.
Preserve only the lower 8 bits (AND with 0xFF).
Subtract the value from 255.
The checksum enables simple verification of received frames because the
lower 8 bits of the sum of all bytes after the LSB (including the checksum)
will be equal to 255 or 0xFF.
As it is noted from the above frames parts, each part has its characters read
as a control characters, when the XBee receive a massage and find one of the
control characters it will translate it meaning and doesn’t read it as a part of
the massage.
So, after formatting the previous parts, a final step is necessary for using API
mode with escaped characters.
When escaping is enabled, any bytes (excluding the start delimiter) that
contain reserved characters (0x7E, 0x7D, 0x11, and 0x13) must be escaped
so that the XBee will not interpret them as control characters [35].

39
This may seem like extra overhead, but escaped mode simplifies message
reception so that you can count on any 0x7E byte to only indicate a start
delimiter (or an ignorable error). This removes the need to program for more
edge cases and simplifies the code [31].
To escape a message a reserved character appears, anywhere in the message
(including the MSB, LSB, and checksum bytes), it should be replaced with
an 0x7D escape character followed by the original character XOR’ed
with 0x20. On the other side the XBee receiver, also in API mode will also
use the same technique but in reversed to understand the massage [35].
So, the process for formatting an API frame is:
Calculate the full length of the message (minus start delimiter and
checksum) and insert it as the LSB.
Calculate and insert any bytes necessary for the API frame type.
Calculate the checksum and place it at the end of the frame.
Escape any reserved characters (including MSB, LSB, and checksum)
that covers the basics of API frames.
XBee RF [26] modules shown in figure (7) give developers the fastest IP-to-
device and device-to-cloud capability possible.

40
These modules are interoperable with other devices, including devices from
other vendors. XBee radios are handy in embedded applications because they
enable wireless communications with relatively low power compared to Wi-
Fi, Bluetooth, or cellular technologies at the cost of slower speed.
5.1.2 XBee key features.
The Key feature of the XBee are listed with details in the product manual
[60], the most important features are:
Long range integrity, Indoor or Urban connection reached up to (30 m),
and outdoor line of strait up to 300’ (90 m), and its transmit power is 1
mW.
Low Power, transmit (TX) Peak Current is 45 mA, voltage 3.3 V. and it’s
receive (RX) Current is 50 mA, voltage 3.3 V, its Power-down Current is
less than 10 µA.
ADC and I/O line, support Analog-to-digital conversion, Digital I/O Line
Passing.
Figure 7: XBee RF module.

41
Easy-to-Use, No configuration necessary for out of box RF
communications, there is a Free X-CTU Software (Testing and
configuration software).
Advanced Networking & Security, with retries and acknowledgements,
DSSS (Direct Sequence Spread Spectrum) such that direct sequence
channels has over 65,000 unique network addresses available
Source/Destination Addressing Unicast & Broadcast Communications
Point-to-point, point-to-multipoint and peer-to-peer topologies
supported.
5.2 XBee USB adapter
The USB adapter [31] shown in figure 8, is used to connect the Xbee radio
to the computer USB for configuration, or data communication.
Figure 8: XBee USB adapter.
5.3 XBee Arduino Shield
The XBee Shield achieves the task of interfacing an XBee with the Arduino.
This board mates directly with an Arduino Pro or USB board, and equips it
with wireless communication capabilities using the popular XBee module.
This unit works with all XBee modules including the Series 1 and Series 2

42
(and 2.5), standard and pro version. Figure 9 shows an XBee connected with
an Arduino using the XBee shield [31].
Figure 9: XBee Arduino Shield.
Features:
Double shield interfaces compatible with Arduino for easy cascading.
Provide maximal 500mA under 3.3V.
Full 2.54mm break out for XBee.
Switchable of communication with FTDI-USB or Arduino with Hardware
Serial or Software Serial.
5.4 The Arduino microcontroller
Arduino is a computer hardware and software company, project, and user
community that designs and manufactures microcontroller’s kits for building
digital devices and interactive objects that can sense and control objects in
the physical world [15].
In other words, The Arduino is a programmable logic controller, it has some
features:
14 digital input/output pins (of which 6 can be used as PWM outputs).

43
6 analog inputs.
16 MHz quartz crystal.
USB connection.
A power jack.
ICSP header and a reset button.
It contains everything needed to support the microcontroller; you can simply
connect it to a computer with a USB cable or power it with an AC-to-DC
adapter or battery to get started. In Figure 10 you can see the Arduino-Uno
microcontroller device [16].
Figure 10: Arduino microcontroller.
Arduino inputs and outputs [15]:
1) The 14 digital pins can be used as an input or output, using (pinMode(),
digitalWrite(), and digitalRead() ) functions. They run at 5 volts. They
can transmit or receive a maximum of 40 mA and has an internal pull-
up resistor of 20-50 khoums.
Digital pins functions:

44
• Serial: 0 (RX) and 1 (TX). Used to receive (RX) and transmit (TX)
TTL serial data. These pins are connected to the corresponding pins
of the ATmega8U2 USB-to-TTL Serial chip.
• External Interrupts: 2 and 3. These pins can be configured to trigger
an interrupt on a low value, a rising or falling edge, or a change in
value.
• PWM: 3, 5, 6, 9, 10, and 11. Provide 8-bit PWM output with the
analogWrite() function.
• LED: 13. There is a built-in LED connected to digital pin 13. When
the pin is HIGH value, the LED is on, when the pin is LOW, it's off.
2) The Uno has 6 analog inputs, each of which provide 10 bits resolution
(from 0 to 1024). By default they measure from ground to 5 volts,
though it is possible to change the upper end of their range using the
AREF pin and the analogReference() function.
5.5 Soil moisture sensor
The soil moisture sensor name is YL-69 [19]; it is usually used to detect the
humidity of the soil.
The sensor is set up by two pieces: the electronic board (at the right), and the
probe with two pads, that detects the water content (at the left) as in figure 11.

45
Figure 11: Moisture Sensor.
The sensor has a built-in potentiometer for sensitivity adjustment of the
digital output (D0), a power LED and a digital output LED as in figure 12.
Figure 12: Moisture Sensor parts.
Sensor features [19]:
Brand new and high quality.
Dual output mode, analog output is accurate.
A fixed bolt hole for easy installation.
With power indicator (red) and digital switching output indicator
(green).
LM393 comparator chip, stable.
VCC: 3.3V-5V.
GND: GND.

46
DO: digital output interface (0 and 1).
AO: analog output interface.
Panel PCB Dimension: 3 x 1.5 cm.
Soil Probe Dimension: 6 x 2 cm.
The voltage that the sensor outputs, changes accordingly to the water content
in the soil. When the soil is wet, the output voltage decreases and when the
soil is dry, the output voltage increases. The output voltage is analog number
(0-1024).
The sensor is connected to the Arduino controller, its output voltage is
connected to an analog input pin of the Arduino.
The connections between Arduino and the moisture sensor are shown in the
figure 13:
Figure 13: Arduino with moisture sensor connection
47
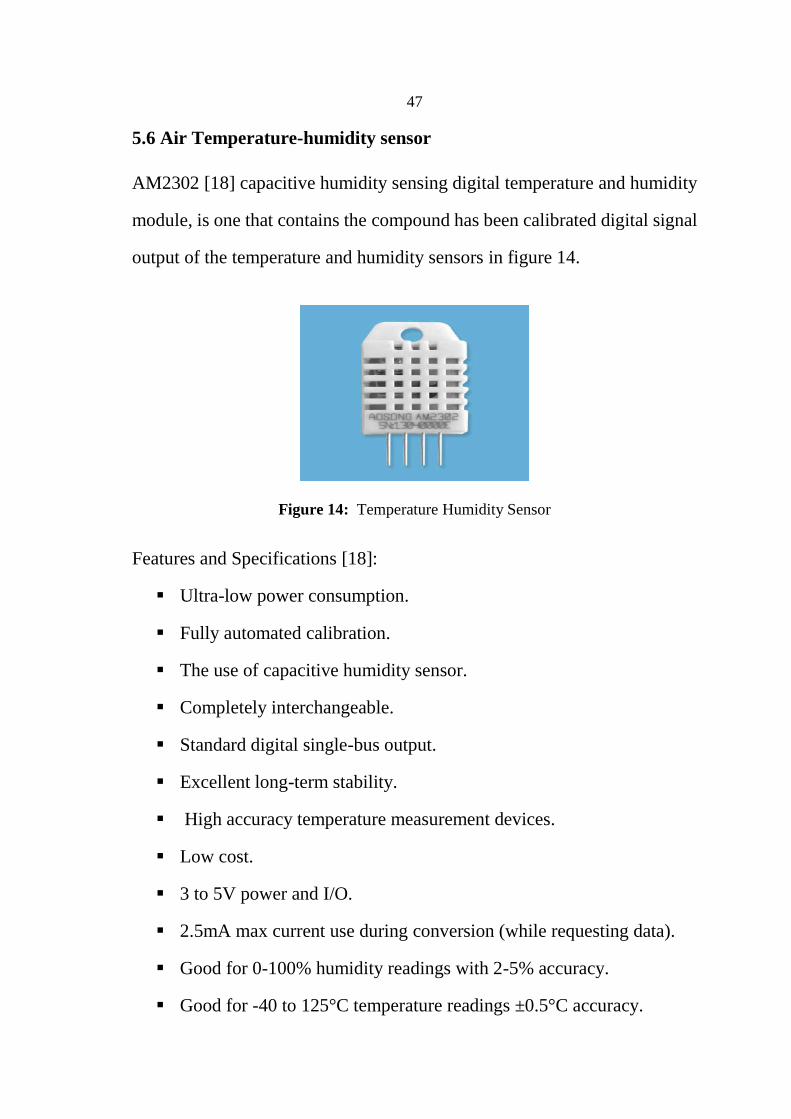
5.6 Air Temperature-humidity sensor
AM2302 [18] capacitive humidity sensing digital temperature and humidity
module, is one that contains the compound has been calibrated digital signal
output of the temperature and humidity sensors in figure 14.
Figure 14: Temperature Humidity Sensor
Features and Specifications [18]:
Ultra-low power consumption.
Fully automated calibration.
The use of capacitive humidity sensor.
Completely interchangeable.
Standard digital single-bus output.
Excellent long-term stability.
High accuracy temperature measurement devices.
Low cost.
3 to 5V power and I/O.
2.5mA max current use during conversion (while requesting data).
Good for 0-100% humidity readings with 2-5% accuracy.
Good for -40 to 125°C temperature readings ±0.5°C accuracy.

48
No more than 0.5 Hz sampling rate (once every 2 seconds).
AM2302 device uses a simplified single-bus communication. Single bus are
only one data line, data exchange system, controlled by the data line to
complete. Equipment (microprocessor) through an open-drain or tristate port
connected to the data line to prevent the device from sending data to release
the bus, while other devices use the bus. Single bus usually require an
external about 5.1kΩ pull-up resistor, so when the bus is idle, its status is
high, otherwise it will be low.
AM2302 connected to the Arduino microcontroller digital pin input, the
Arduino use the DHT library which use the communication format,
illustrated below, to gather the air humidity and temperature from the sensor.
AM2302 Communication format [18]:
• Start signal: Microprocessor data bus (SDA) to bring down a period
of time (at least 800μ s) to notify the sensor to prepare the data.
• Response signal: Sensor data bus (SDA) is pulled down to 80μ s,
followed by high-80μ s response to host the start signal.
• Data format: Host the start signal is received, the sensor one-time
string from the data bus (SDA) 40 data, the high first-out.
• Humidity: Humidity resolution of 16Bit, the previous high; humidity
sensor string value is 10 times the actual humidity values.
• Temp: Temperature resolution of 16Bit, the previous high;
temperature sensor string value is 10 times the actual temperature
value; The temperature is the highest bit (Bit15) is equal to 1 indicates
a negative temperature, the temperature is the highest bit (Bit15) is

49
equal to 0 indicates a positive temperature; Temperature in addition to
the most significant bit (Bit14 ~ bit 0) temperature values.
• Parity bit Parity bit = humidity high + humidity low + temperature
high + temperature low
Example [69]:
40 Data received: 0000 0010 1001 0010 0000 0001 0000 1101 1010 0010
High humidity Low humidity High temp. Low temp.
Parity bit Calculate:
0000 0010+1001 0010 +0000 0001+0000 1101= 1010 0010(Parity bit)
Received data is correct:
Humidity:0000 0010 1001 0010 = 0292H (Hexadecimal) = 2×256 + 9×16
+ 2 = 658
=> Humidity of air = 65.8%RH
Temp.:0000 0001 0000 1101 = 10DH (Hexadecimal) = 1×256 + 0×16 +
13 = 269
=> Temp. = 26.9℃
AM2302 Pin Assignment:
The sensor pins, and how it is connected with the Arduino microcontroller
are illustrated in figure 15:

50
Figure 15: AM2302 Pins
Am2302 connection with Arduino is shown in figure 16:
Figure 16: connections between Arduino and AM2302

51
5.7 Solenoid water electrical valve
A solenoid valve is an electromechanical device used for controlling water
flow. The solenoid valve is controlled by
electrical current, run through a coil. When the
coil is energized, a magnetic field is created,
causing a plunger inside the coil to move.
Depending on the design of the valve, the
plunger will either open or close the valve.
When electrical current is removed from the
coil, the valve will return to its de-energized
state. There are other kind of electrical valves which the flow of water itself
can be controlled.
The parts of a solenoid valve:
Figure 17 shows the basic components of a solenoid valve. The valve shown
in the picture is a normally-closed, direct-acting valve.
Figure 17: Soleniod valve parts

52
1. Valve Body 4. Coil / Solenoid 7. Plunger
2. Inlet Port 5. Coil Windings 8. Spring
3. Outlet Port 6. Lead Wires 9. Orifice
How solenoid valve work?
The water enters the valve through the inlet port (Part 2 in the illustration
above). The media must flow through the orifice (9) before continuing into
the outlet port (3). The orifice is closed and opened by the plunger (7).
The valve pictured above is a normally-closed solenoid valve. Normally-
closed valves use a spring (8) which presses the plunger tip against the
opening of the orifice. The sealing material at the tip of the plunger keeps
the media from entering the orifice, until the plunger is lifted up by an
electromagnetic field created by the coil [21].
5.8 Relay (for Arduino (
The solenoid valve mentioned above, need 220 volt voltage source; but the
Arduino outputs voltage of 5 volt, so we need a relay to solve this voltage
difference.
A relay is an electrically operated switch shown in figure 17. It uses an
electromagnet to mechanically operate the switch and provide electrical
isolation between two circuits.

53
Figure 17: 5V Relay
Relay board used to control 220 / 230 V. This is very general relay board, it
works at 5v input and it can control 250V AC, 125V AC, 30V DC or 28V
DC. The electrical valve for example runs on 230V which fits in the 250V
limit. The board relay says it is up to 10A. The relay can control any electrical
device used in homes and anywhere. The board in the figure below has 2
relays, but the needed is one relay for each valve. Relay boards are available
with 1, 2, 4, 8 and even 16 relays. The amount of relays you control is not
restricted to the amount of Arduino pins.
Figure 18 shows how to connect the relay with a 22 v voltage source, and a
22 v light, and Arduino digital output pin.
Using this way of connection, the Arduino can control the 22 v light, with 5
v digital output pin.
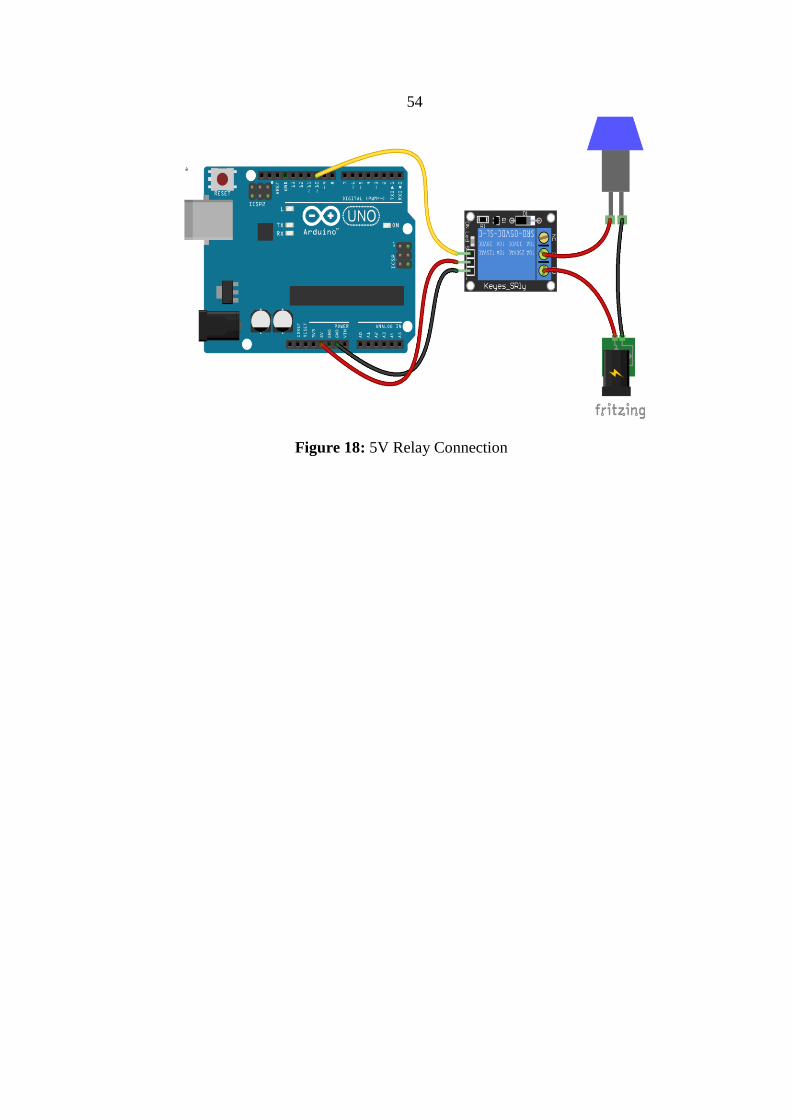
54
Figure 18: 5V Relay Connection

55
Chapter Six
System Implementation
This chapter includes full discretion for the WSN configuration, the software
needed to implement it, the sensors calibration, and system implementation.
The WSN mainly contain the wireless sensor nodes. WSN have two kind of
nodes, both of them are discussed, as well as every node functionality and
software algorithm is described.
The following section lists different types of software’s needed in the system
implementation.
6.1 Requisite Software
Digi X-CTU: the desktop application needed to configure the XBees, by
serial USB connection wire [38].
FTDI Drivers (for USB to Serial communications) [39].
Python 2.7 or 3.3: the platform for the python application that the master
node runs [40].
PySerial library: to be able to connect the python application with the
xbee using the USB connection [41].
Arduino Software: for Arduino uno microcontroller programming [42].
6.2 XBee nodes:
As illustrated in chapter four the farm mainly has two kinds of WSN nodes.
Those nodes functionality are discussed in the following section. The way

56
that each node integrates with other nodes in the WSN to achieve the system
objectives are also discussed.
6.2.1 Arduino microcontroller WSN
The wireless nodes that distributed is the farm mainly contain the Arduino
that reads the values of wireless node sensors, and send the collected data to
the master node.
It reads the temperature and the humidity from the AM2302 sensor, using
the DHT library, then save them in two float variables, then reads the soil
moisture, using the YL-69, and finally save them in float variable.
After that, it converts the variables to byte arrays, to be sent through packet
frame (API), and then send these values to the master nodes, using XBee
library send function, which converts the massages to the API frames.
We would like to raise up reader attention that the Arduino programing
language is C++.
The Arduino WSN Node mainly contain soil moisture sensor, DHT sensor,
Arduino microcontroller, and XBee RF component.
It may have more than one sensor of the same kind to cover more than one
zoon, and it may contain other kinds of sensors like pollution sensors such
as PH sensor…
The following figure shows the hardware components of the Arduino WSN
Node, and its circuit connections:
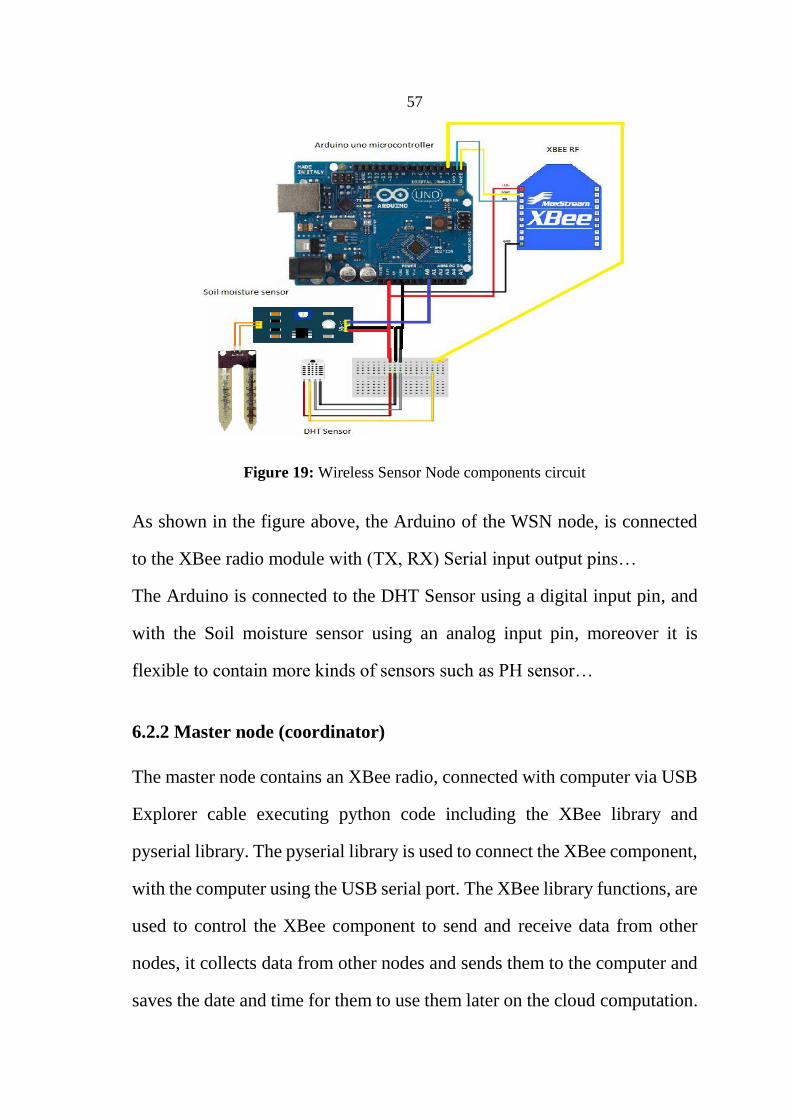
57
Figure 19: Wireless Sensor Node components circuit
As shown in the figure above, the Arduino of the WSN node, is connected
to the XBee radio module with (TX, RX) Serial input output pins…
The Arduino is connected to the DHT Sensor using a digital input pin, and
with the Soil moisture sensor using an analog input pin, moreover it is
flexible to contain more kinds of sensors such as PH sensor…
6.2.2 Master node (coordinator)
The master node contains an XBee radio, connected with computer via USB
Explorer cable executing python code including the XBee library and
pyserial library. The pyserial library is used to connect the XBee component,
with the computer using the USB serial port. The XBee library functions, are
used to control the XBee component to send and receive data from other
nodes, it collects data from other nodes and sends them to the computer and
saves the date and time for them to use them later on the cloud computation.
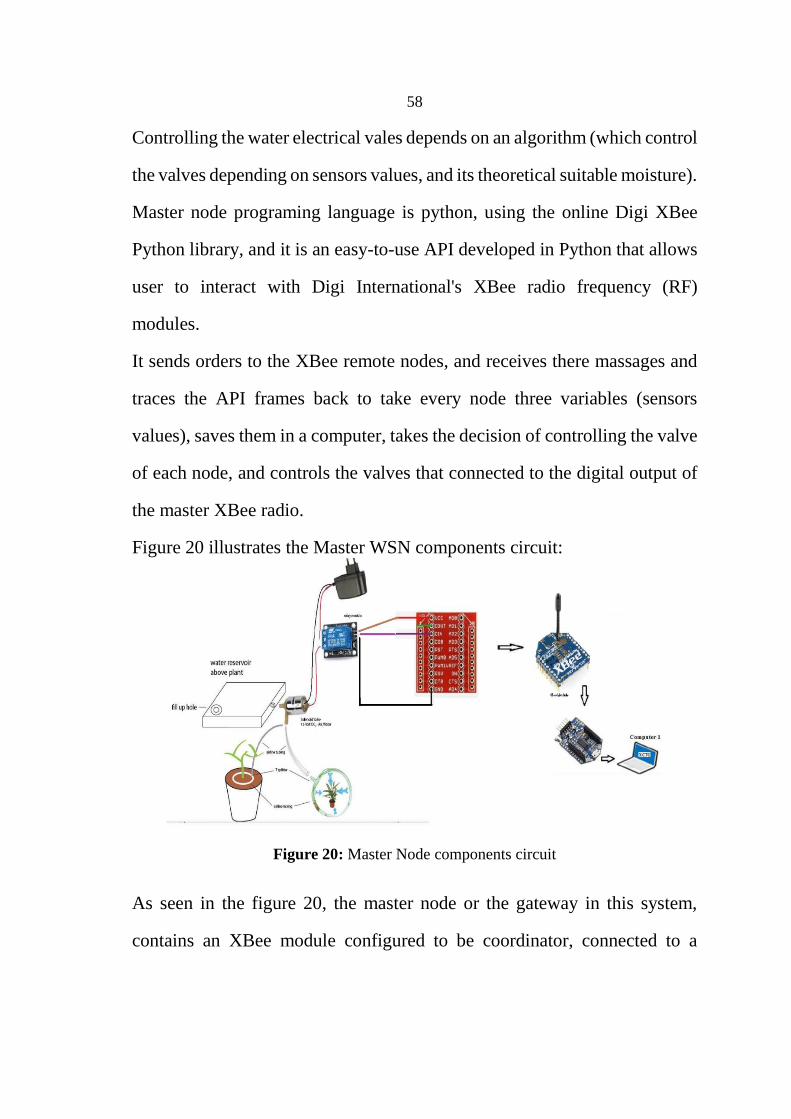
58
Controlling the water electrical vales depends on an algorithm (which control
the valves depending on sensors values, and its theoretical suitable moisture).
Master node programing language is python, using the online Digi XBee
Python library, and it is an easy-to-use API developed in Python that allows
user to interact with Digi International's XBee radio frequency (RF)
modules.
It sends orders to the XBee remote nodes, and receives there massages and
traces the API frames back to take every node three variables (sensors
values), saves them in a computer, takes the decision of controlling the valve
of each node, and controls the valves that connected to the digital output of
the master XBee radio.
Figure 20 illustrates the Master WSN components circuit:
Figure 20: Master Node components circuit
As seen in the figure 20, the master node or the gateway in this system,
contains an XBee module configured to be coordinator, connected to a

59
computer, using the USB adapter, and connected to the electrical valves
relays.
6.3 XBee radio configuration
Each XBee radio has internal microcontroller that runs a program known as
firmware that performs all its addressing, communication, security, and
utility functions.
A user can configure this firmware with different settings to configure set
of parameters like its local address, which type of security is enforced, and
how it should read sensors connected to its local input pins.
To change or upgrade the firmware, a user can use a program called X-CTU
that can be downloaded from the Digi website.
XBee radio is compatible with serial terminal programs on different
platform such as Macintosh, Linux, or Windows to change many of the
settings which will works with.
To configure the xbee radio, first of all connect the XBee radio with the USB
port of the computer using the USB adapter like the following figure [21]:

60
Figure 21: XBee Connection with PC
Open XCTU software and configure the xbee addresses and its position:
(coordinator, router, or end device) [37]. To configure the network
coordinator:
Set the Pan ID a custom value to identify the network, and this value will be
the same on the end devices and routers.
The DH and DL are the MSB and the LSB of the destination 64 Bit Address
unique for each component on the network. For the coordinator it should be
0XFFFF, which means broadcast, because the coordinator can send
messages and receive from all other components.
The 16-bit Source Address is any 16 bit number unique identifier for the
component per the network.
And the other settings as the following figure [22]:

61
Figure 22: Coordinator XCTU configuration
The other devices can be routers or end devices. The XCTU configuration
will be the same but the destination should be set to the coordinator, and the
source address is its unique identifier, while the CE Coordinator disabled.
After the configuration process, all XBees of the network can exchange the
data between each other’s using the XCTU terminal.
Figure 23 illustrates connection example between one coordinator and three
other end devices, the figure is the coordinator XCTU terminal:

62
Figure 23: Coordinator connection with three end devices
6.3 Arduino configuration
To configure the Arduino microcontroller, there are many steps to do which
includes the Installation Requirements and Procedures [35]:
Arduino Integrated Development Environment (IDE).
Connect the Arduino to the PC using USB cable.
Install the driver for the operating system.
Open the Arduino IDE software on the computer to set the IDE to
identify the Arduino being used.
Select the board following the trend: Tools >Board>Arduino.
Select the serial device using: Tools> Serial Port> COM ‘port
number’.
Download DHT library used to read temperature and humidity with
AM2303 Sensor.

63
Download XBee library which mainly enable the connected xbee with
the Arduino can send and receive API massages using this library
functions [35]:
xbee.SendStr(The Massage);
Msg = xbee.Receive();
Appendix B at the end of this thesis, is the c-programing language code
loaded to the end device wireless sensor Node Arduino.
The main tasks of Arduino WSN program are:
Uses pins (12,13) as (TX,RX) serial to transmit and receive massages
with XBee:
SoftwareSerial sserial(12,13);
Define a byte array (12 bits) to save the temperature + humidity
+moisture:
Uint8_t payload[12] = { 0, 0, 0, 0, 0, 0, 0, 0, 0, 0, 0, 0}:
Tigger the AM2303 Sensor to detect the humidity and save it in a float
variable h: Float h = dht.readHumidity();
trigger the AM2303 Sensor to detect the temperature and save it in a
float variable t: float t = dht.readTemperature();
Read the value of soil moisture sensor, and store the value in a float
variable soill: soill = analogRead(moistureAO):
convert humidity into a byte array and copy it into the payload array and
the same thing done for the temperature and soil moisture:
u.fval = h;
for (int i=0;i<4;i++){

64
payload[i]=u.b[i];}
Make the xbee listen until it receave a massage.:
while (sserial.available() > 0){
unsigned char in = (unsigned char)sserial.read();
if (!RxQ.Enqueue(in)){
break; } }
Receive the massage and store it in msgBuff
msgLen = xbee.Receive(checkBuff, checkLen, msgBuff);
Take the address of the sender massage from the frame massage.
int addr = ((int)msgBuff[4] << 8) + (int)msgBuff[5];
Put the byte array which stores the sensors values to outMsg:
memcpy(&outMsg,&payload,12);
Send the result outMsg to the sender:
frameLen = xbee.Send(outMsg, msgLen+3, outFrame, addr);
sserial.write(outFrame, frameLen);
6.4 Master Xbee Node
The master XBee wireless sensor network is the coordinator configured
XBee radio, connected with serial USB port with computer using the USB
Adapter.
python 2.7 software is used to run python code, and python XBee library to
send and receive the massages with the serial port connected to XBee. The
library in [43] is used to control digital input out pins of the XBee, specially
used in this project to control the water tank electrical valve.

65
The Python code for the master node is found in APPENDEX A.
The program uses an independent piece of code (functions), to make the
program simple, maintainable and reliable, by avoiding rewriting the same
code.
For example, connecting new node to the network, an independent function
take the node identifier and connect it to the master node, so when we add
new node we just call the function, and when we want to edit the process of
connection we will do one time at the function body.
The best approach for communication between the master node and the end
devices nodes WSNS is:
The master node will be always wakeup, and sends orders for data
continuously, because it has to collect data from all other remote nodes.
Furthermore it control the system output (water electrical valves in this case
study).
It is connected to the control room computer stable powered, on the other
side the remote XBee remains sleep for a period of time and wakes up to
check for RF data. When it is wake up it will receive order for data from the
master node and send the sensors data to the master and go back to sleep and
so on.
The list of functions :
The first function mainly send a request massage to the WSN and
receive the respond which contains the sensors values, split them and
save the results in the text file and control the electrical valve
depending on the moisture value:

66
recievesavecontrol( REMOTE_NODE_ID, device,f ):
xbee_network = device.get_network();
remote_device= discover_device(REMOTE_NODE_ID);
if remote_device is None:
device.send_data(remote_device, DATA_TO_SEND);
xbee_message = device.read_data()
if xbee_message is not None:
v=1
h = struct.unpack('f',xbee_message.data[0:4])
t = struct.unpack('f',xbee_message.data[4:8])
m = struct.unpack('f',xbee_message.data[8:12])
Note: struct.unpack('f',xbee_message.data[0:4]), is the function that take the
first four bytes from the byte array received, and unpacket them from API
packet frame to float value.
Write H,T,M on the text file f;
if (M < 370.0):
Turn the electrical valve off;
else:
if (M > 420.0):
Turn the electrical valve off;
The code has simple algorithm to control XBee digital output pin, connected
to the 5v relay which also connected to the electrical valve, depending on the
soil moisture sensor received value, as the following procedure:

67
If the moisture sensor value is less than or equal 370, then the soil is
wet so much, then turn the electrical valve off, stop the irrigation.
If the moisture sensor value is more than or equal 420, then the soil is
dry so much, then turn the electrical valve on, start the irrigation.
Other case, means the soil moisture sensor is between 370 and 420,
which means that the soil moisture is in the acceptable range, so it
doesn’t do any action.
If the water tanks are far from the control computer or the Rasbarybi, its
better to control its electrical valves wirelessly.
The control of the electrical valve can be done remotely easily by put an
XBee radio and connect the valve with its digital output pin using the
following commands:
DIGITAL_LINE = IOLine.DIO3_AD3
remote_device = xbee_network.discover_device(REMOTE_NODE_ID)
remote_device.set_dest_address(device.get_64bit_addr())
remote_device.set_io_configuration(DIGITAL_LINE, IOMode.DIGITAL_OUT)
68
Chapter Seven
Results and discussion
In this chapter we used our proposed smart irrigation system on a farm model
to evaluate the water saving when using the smart system compared to the
conventional irrigation approach. Furthermore, we compared the quality of
the crops between the two approaches. In the comparative study, we
considered two scenarios. In the first scenario the farm model was placed
level on the ground, while in the second one the farm model was inclined by
an angle. To show that the smart system will work effectively in the slope
grounds also.
7.1.1 Experiment design
In the proposed smart irrigation system, the land is divided into several
regions called zones. Each zone is an irrigation management unit chosen
such that it has kind of uniform characteristics. Each zone can be irrigated
separately using a separate electrical valve. Several sensors are placed in
each zone to monitor several physical quantities. The sensors that we used
are moisture, temperature, and humidity sensors. With the ability to add more
sensors easily. Each sensor is connected to the closest Wireless Sensor
Node.
To evaluate the performance of our system compared to traditional irrigation
in terms of water saving and crop quality, we considered the farm prototype
shown in Figure 23. In this approach the land is divided into two identical

69
parts exposed to the same conditions. The first part is to be planted using
traditional irrigation approach, where irrigation is based on the farmer
experience as shown in Figure 22 (left). The other part is to be irrigated using
the smart system as shown in Figure 22 (right). The water consumed and the
quality of crops can be compared.
Figure 22 : Automatic and traditional system comparison architecture
However, this approach takes long time to return results. Therefore, instead
of using a prototype farm, we used a farm model as shown in Figure 23.
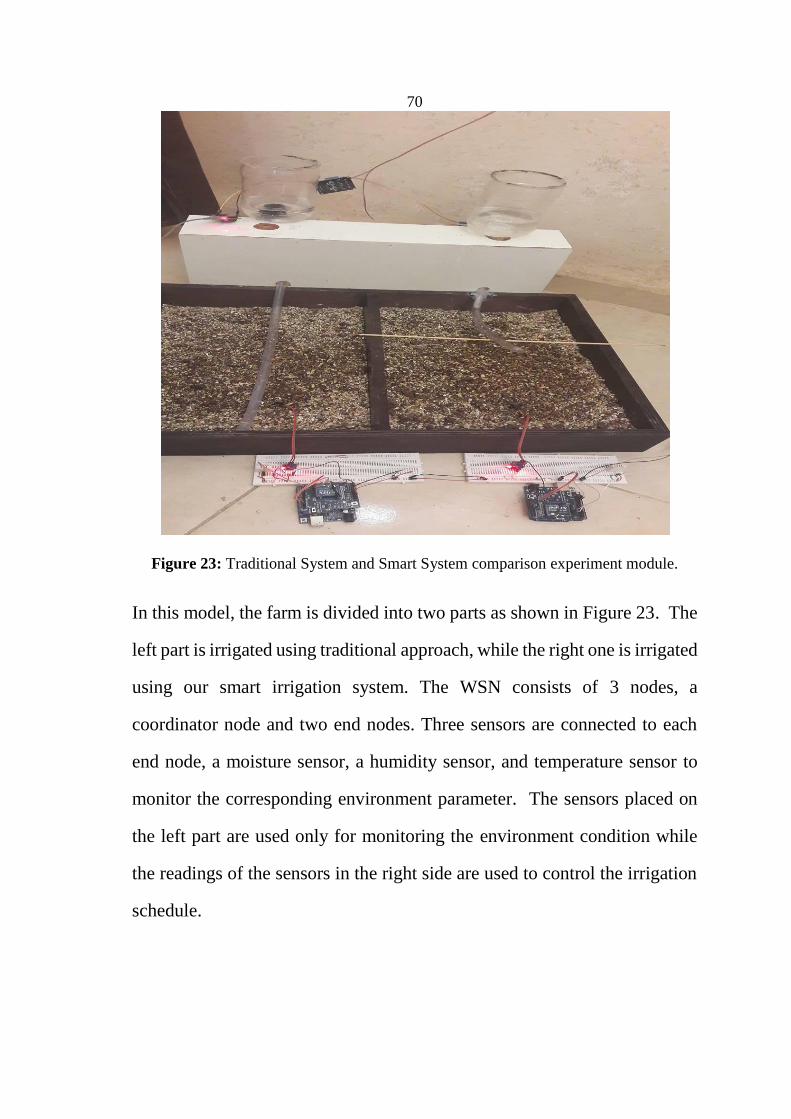
70
Figure 23: Traditional System and Smart System comparison experiment module.
In this model, the farm is divided into two parts as shown in Figure 23. The
left part is irrigated using traditional approach, while the right one is irrigated
using our smart irrigation system. The WSN consists of 3 nodes, a
coordinator node and two end nodes. Three sensors are connected to each
end node, a moisture sensor, a humidity sensor, and temperature sensor to
monitor the corresponding environment parameter. The sensors placed on
the left part are used only for monitoring the environment condition while
the readings of the sensors in the right side are used to control the irrigation
schedule.

71
The left water tank valve is manual and opened once a day for one hour. The
right water valve is an electrical valve (12 Volts) connected through a 5 Volts
relay, which is connected to the master XBee node.
Data gathered by the wireless sensor nodes are transmitted through an RF
antenna to a gateway node, where it receives all different kind of sensed data
in a timely manner. This data is passed from the gateway to a computer.
Then, a decision support system on the computer investigates the data and it
controls an irrigation schedule automatically of each region.
The study case plant was Barley, because it needs stable and high moisture;
to make the comparison between the automatic and traditional systems fair,
the traditional system part have to be in the best case, and the threshold
moisture values defined from the expert [46] evaluation of the soil moisture,
which was between the values 370 and 420.
One major issue in the application of WSN in agriculture is the power needed
by various sensor nodes distributed in the field. Wireless nodes use on board
batteries that require recharge frequently to provide enough power for
preprocessing and broadcasting data through the antenna. To supply the
necessary power, small solar panel units for recharging the batteries can be
used. However, in the prototype of this project we used the power supply
from the grid.
The master node is connected with the computer using serial USB line, and
running the python code in appendix A, it has the main function calls two
other functions every three minutes continuously.

72
The first function is to take the data from the traditional wireless sensor node
WSN, and save them in the suitable form in a text file, and the other is to
take the data from the automatic WSN, and save them in the text file.
Furthermore, it controls the electrical valves, such that open the valve when
the moisture is equal or more than 420 [46], and close the valve if the
moisture reading is equal or less than 370 [46] else it will do nothing.
The upper and lower boundaries of the moisture, can be variables and set by
the user directly or by the expert cloud system, in this case the boundaries
are points, and the time interval is three minutes is very short, so no way to
exceed the boundaries, but when the time interval is long, it’s possible for
the soil to exceed the boundary until the interval finishes and return to check
the moisture to find it exceeded the boundary and make the suitable action.
So it is good idea for another research to use fuzzy logic to determine the
boundaries depending on the moisture values and the time of check and the
time interval of continuously check the moisture to make it doesn’t exceed
the soil moisture boundaries.
7.1.2 Soil moisture results
The experiment was ten days, and we presented the sensor values for three
days in Figure 25, which are saved in the file, gives always almost constant
temperature and humidity because the experiment is done in a closed room,
and the soil moisture values for the traditional system is plotted in a curve,
while automatic moisture values are plotted on other curves, and the two

73
curves plotted in the same figure, in order to compare between them. Look
at Figure 24:
Figure 24: Traditional and Smart comparison experiment one day result.
As it is obvious in the figure, which contains the moisture comparison for
one day:
When the sensor read is high, the moisture is low (dry soil), and when the
sensor reads is low, the moisture is high (wet soil).
The blue curve is for the traditional system, in which the farmer open the
valve at the beginning, and that explains why the sensor reading decreases
sharply, and then the readings increases slowly and became so dry until the
end of day.
The red curve is for the automatic system, when the reading increases until
the value 420, the electrical valve is opened, and the reading decreased until

74
370, then the valve is closed, then the reading start increases again which
means that the soil is drying, and this cycle is repeated continuously.
As a result it is obvious that the traditional system has unstable moisture, and
the soil moisture differentiates is very big, the soil is wet for short time and
dry for long time, but in the automatic system, the moisture is stable and the
soil always has a suitable moisture all the time.
The figure 25 contains the data for the three days barely cultivation:
Figure 25: Traditional and Automatic comparison experiment result for three days.
7.1.4 Plant quality result
The plant quality result was better in the automatic irrigation part (the right
part), which is obvious in the following figure 28:

75
Figure 28: Traditional and Smart comparison experiment plant quality result.
7.2.5 Water consumption results
With respect to water consumption comparison results, this schedule
contains the water consumption in ml for each day on each part:
Node Start
Date End Date
Start
Time
End
Time
Water
consumption ml
Smart 5/17/2018 5/18/2018 15:00:00 14:30:00 1320
Traditional 5/17/2018 5/18/2018 15:00:00 14:30:00 1400
Smart 5/18/2018 5/19/2018 15:00:00 14:30:00 1322
Traditional 5/18/2018 5/19/2018 15:00:00 14:30:00 1400
Smart 5/19/2018 5/20/2018 15:00:00 14:30:00 1320
Traditional 5/19/2018 5/20/2018 15:00:00 14:30:00 1400
Smart 5/20/2018 5/21/2018 15:00:00 14:30:00 1320
Traditional 5/20/2018 5/21/2018 15:00:00 14:30:00 1400
As total water consumption the result is:

76
Figure 26: Traditional and Smart comparison experiment water consumption result.
Smart: the WSN of the automatic system, its water total consumption
is 5282 ml.
Traditional: the WSN of the Traditional system, its water total
consumption is 5600 ml.
Which means that the automatic system is water saving, such that it saves
around 6% of water consumption.
7.2 Experiment with slope ground.
The efficiency of smart irrigation system will increase if the irrigation area
contains sloping ground. In the straight ground all areas have equal needs for
water, unlike the slop ground which have areas with different needs for
water.
In the slop ground, the high areas needs more times to be watered than the
low areas, this is because gravity.
Total5000
5200
5400
5600
Smart
Traditional
Sum of Water consumption ml by Node

77
In the traditional irrigation system, Every time the farmer open the valves, it
will irrigate all nodes with the same magnitude (considering that the water
source have suitable pumps, or its being on the top of farm)
Those factors are taken in consideration to make water cover all nodes with
different height. So, in the best traditional case the water will slip down from
the high area to the low area, and stays on the lowest one, and so the high
areas will be dry faster, and as a sequence the plants in these areas will suffer
from the lack of water most of times, On the other side, the lower nodes will
be wet most of the times, and the plants there will be harmed because of extra
wet soil.
Most of plants need some time to be dry, over water saturated which causes
problems. For example, the plants may mildew if it is wet all the time.
In the smart irrigation system every node will be watered depending on its
moisture. So if it needs water, it will have. Moreover the higher nodes will
be irrigated more times and as a result all points will have the suitable
moisture, and the nodes in the bottom areas will not have extra wet soil as it
is in the traditional way irrigation method.
As a result of this effective smart irrigation system with slop area the plants
will grow better, and so it will have better production, because of the better
exploitation of all nodes in the farm.
7.2.1 Experiment architecture
We established a study case as a practical experiment for our model. We tried
for it to be slop ground and inserted two wireless sensor nodes, one at the top

78
of the model and the other at the bottom, to observe the moisture of those
nodes for one day.
To compare between the traditional system and the automatic one control of
moisture, the left side of the model is irrigated with manual valves to present
the traditional irrigation system behavior, and the right side is irrigated with
two electrical valves which are controlled by our system.
The figure 27 describe the module for slope ground experiment:
Figure 27: Experiment with slope ground trial.

79
7.2.2 Soil moisture comparison results
The readings of the four nodes were taken every three minutes, the readings
of the two automatic nodes, and the two traditional nodes, in the interval
(16:00:16 – 20:30:16), are drown in the figures 28, 29:
Figure 28: Automatic with slope results.

80
Figure 29: Traditional with slope results.
As data shows in the previous figures, in the automatic system (figure 28)
the upper node and the lower node have almost stable and controlled
moisture values. Although the two nodes soil moisture differences is very
low, they almost have closed values.
On the other hand the traditional system (figure 29) has bigger differences
between upper and lower nodes, note that those readings start at the irrigation
time for the traditional system, (the time which the farmer open the valve for
such time -in our case one hour).
So the difference will be increased with time until the valve open again in
the next day, that because as it is notices from the figure the slope of the
lower node line after irrigation time finished, is much lower than the slope
of the upper node, which means that the upper node becomes dry much faster

81
than the lower node, and as a result the farmer should irrigate the upper areas
more frequently to make its moisture normal with the automatic system.
7.2.3 Water consumption comparison
Now about the water consumption comparison:
The traditional system model used the average of 87.5 m/hour.
The automatic system used the average of 63.3 m/hour.
This differencing shows a big water saving, because when it is measured for
long intervals of time, and bigger ground spaces, the difference between
systems is much bigger.
For example our model size is (60*50) cm is 300 cm, so when the land space
is 1000m the water usage will be:
1000 ∗ 100 ∗87.5
300= 29, 166.6 Liter/hour in the Traditional system,
1000 ∗ 100 ∗63.3
300= 21,099.9 Liter/hour in the Automatic system.
7.3 Experiment with different slopes
We tried to test the Smart system efficiency in different slopes:
Case a: in the first case the slope angle is Ѳ ≅ 6.50° .
Case b: in the second case the slope angle is Ѳ ≅ 6.53° .
Case c : in the second case the slope angle is Ѳ ≅ 6.56°
And by focusing on the moistures range (200.0-400.0) to make the difference
more obvious the three figures are:

82
Figure 30: Case A
Figure 31: Case B
Figure 32: Case C

83
The three cases results in figures 30, 31, 32 illustrate the following main
points:
The upper node soil moisture became in the top dry point faster when
the slope is more and more. In (figure 30) which slope angle is 6.50
the first top dry point time (x-axis) is 61, in (figure 31) with angle 6.53
it reached its first top dry point at x= 38, and the third having slope
angle 6.56 reached the first dry point at x =33.
The lower point humidity average is increased, when the slope
increased, note the maximum point in figure 30, is (71,406) and figure
31 is (48,401) and in figure 32 is (41,380).
The differences between the upper node, and the lower node, are
increased when the system is sloped more sharply and more.
The automatic system will save water more effectively when the slope
is increased, because the upper nodes need more times
To be irrigated with smaller quantities.
In all cases the moisture values are controlled between system
maximum and minimum values which are considered settings in the
system.
84
Conclusion
In this thesis we implemented smart irrigation system using WSN. The main
objective of the Smart irrigation system is to reduce water consumption in
the agriculture sector, and save the crops yields at the same time, and this
system tried to be experiment such that irrigates the plants when it need the
water, depending on the moisture sensors.
And a comparison between the Traditional and Smart System showed that:
The smart system controls the soil moisture stable all the time.
The smart system reduces the water consumption.
The smart system has better plant quality and quantity.
The efficiency of the smart system is better in the slope grounds.
Furthermore the data collected from wireless sensor nodes, saved on the
master node computer, and this qualify the system to be integrated with cloud
system that manages these data to achieve more objectives.

85
Recommendations
It is obvious from our Smart System Implementation, that the WSN
adaptable to contain different number and types of sensors, so the irrigation
control algorithm will consider more environmental data such as
temperature, air humidity and PH Sensors, and the plant literature data, such
as plant type, plant age. All of these factors can be considered in the irrigation
schedule determination.
The smart irrigation system is planned to be integrated with a Cloud-based
application which have to be designed to manage the data comes from the
sensors in a WSN for smart farming and water management. Using Web
Services interface [45].
So the Smart Irrigation system can be developed to integrate with other
different distributed systems to achieve more objectives and services.

86
References
[1] Procedia Environmental Sciences 19 ( 2013 ) 426 – 435 Wireless
Sensor Network deployment for monitoring soil moisture dynamics
at the field scale B. Majone a* , F. Vianib , E. Filippic , A. Bellina ,
A. Massab , G. Toller d , F. Robolb and M. Saluccib a.
[2] Middle-East Journal of Scientific Research 20 (9): 1127-1132, 2014
An Effective Method for Crop Monitoring Using Wireless Sensor
Network N. Sakthipriya.
[3] IEEE TRANSACTIONS ON INSTRUMENTATION AND
MEASUREMENT, VOL. 57, NO. 7, JULY 2008 1379 Remote
Sensing and Control of an Irrigation System Using a Distributed
Wireless Sensor Network, Yunseop (James) Kim, Member, IEEE,
Robert G. Evans, and William M. Iversen
[4] F. R. Miranda, R. Yoder, and J. B. Wilkerson, “A site-specific irrigation
control system,” presented at the ASAE Annu. Int. Meeting, Las
Vegas, NV, Jul. 27–30, 2003, Paper No. 031129.
[5] C. C. Shock, R. J. David, C. A. Shock, and C. A. Kimberling,
“Innovative, automatic, low-cost reading of Watermark soil
moisture sensors,” inProc. Irrig. Assoc. Tech. Conf., Falls Church,
VA, 1999, pp. 147–152.
[6] R. W. Wall and B. A. King, “Incorporating plug and play technology
into measurement and control systems for irrigation management,”
presented at the ASAE/CSAE Annu. Int. Meeting, Ottawa, ON,
Canada, Aug. 1–4, 2004, Paper No. 042189.

87
[7] C. D. Perry, M. D. Dukes, and K. A. Harrison, “Effects of variable-rate
sprinkler cycling on irrigation uniformity,” presented at the
ASAE/CSAE Annu. Int. Meeting, Ottawa, ON, Canada, Aug. 1–4,
2004, Paper No. 041117.
[8] V. M. Abreu and L. S. Pereira, “Sprinkler irrigation systems design
using ISADim,” presented at the ASAE Annu. Int. Meeting, Chicago,
IL, Jul. 27–31, 2002, Paper No. 022254.
[9] T. Oksanen, M. Ohman, M. Miettinen, and A. Visala, “Open
configurable control system for precision farming,” inProc. ASAE
Int. Conf. Autom. Technol. Off-Road Equipment, Kyoto, Japan, Aug.
1–4, 2004, pp. 184–191.
[10] W. S. Lee, T. F. Burks, and J. K. Schueller, “Silage yield monitoring
system,” presented at the ASAE Annu. Int. Meeting, Chicago, IL, Jul.
27–31, 2002, Paper No. 021165.
[11] Z. Zhang, “Investigation of wireless sensor networks for precision
agriculture,” presented at the ASAE/CSAE Annu. Int. Meeting,
Ottawa, ON, Canada, Aug. 1–4, 2004, Paper No. 041154.
[12] Xiaoyun Xu, Xi Zhang, Long Wang, “SIMULATING ENERGY
EFFICIENT WIRELESS SENSOR NETWORKS USING
CELLULAR AUTOMATA”, Department of Industrial
Engineering and Management, college of Engineering, Peking
University.

88
[13] International Research Journal of Engineering and Technology
(IRJET) -2015 “Application of Soil Moisture Sensor in Mixed
Farming” Manoj H G1, Dr N G S Udupa2.
[14] International Research Journal of Engineering and Technology
(IRJET)-2016 “AUTOMATIC IRRIGATION SYSTEM FOR
AGRICULTURE FIELD USING WIRELESS SENSOR
NETWORK (WSN)”, Prof. Rashmi Jain, Shaunak Kulkarni,
Ahtesham Shaikh, Akash Sood.
[15] Arduino description, https://en.wikipedia.org/wiki/Arduino, LSD
25/01/2019.
[16] Arduino site, https://www.arduino.cc/en/Main/ArduinoBoardUno,
LSD 25/01/2019.
[18] DHT sensor product manual,
https://akizukidenshi.com/download/ds/aosong/AM2302.pdf,
LSD 25/01/2019.
[19] https://randomnerdtutorials.com/guide-for-soil-moisture-sensor-yl-69-
or-hl-69-with-the-arduino/
[20] http://store.roboticsbd.com/sensors/145-yl-69-soil-humidity-moisture-
sensor-bangladesh.html
[21] http://www.solenoid-valve-info.com/solenoid-valve-basics.html
http://browse-tutorials.com/tutorial/controlling-220v-using-arduino-
relay-board
[22] http://electron-space.blogspot.co.uk/2013/09/soil-moisture-sensor-
soil-hygrometer.html?m=1

89
[23] http://arduinobasics.blogspot.com/2014/09/relay-module.html
[24] https://www.slideshare.net/DevduttaChakrabarti/wsn-dev-copy
[25] Building Wireless Sensor Networks with Zigbee Dr. Mohammad
Rafiq Muqri, DeVry University, Pomona Robert Alfaro
[26] https://www.cse.unr.edu/~mgunes/cpe401/cpe401sp11/student/Xbee.pptx
[27] https://www.cse.unr.edu/~mgunes/cpe401/cpe401sp11/student/Xbee.pptx
[28] https://www.link-labs.com/blog/zigbee-vs-wifi-802-11ah
[29] http://www.digi.com/pdf/ds_xbeemultipointmodules.pdf
[30] http://www.sparkfun.com/products/8665
[31]http://www.amazon.com/Building-Wireless-Sensor-Networks-
Processing/dp/0596807732/ref=sr_1_1?ie=UTF8&qid=1303747985
&sr=8-1
[32]http://www.elechouse.com/elechouse/index.php?main_page=product_i
nfo&cPath=90_94&products_id=353
[34] https://en.wikipedia.org/wiki/XBee
[35] https://serdmanczyk.github.io/XBeeAPI-PythonArduino-Tutorial/
[36] https://www.itead.cc/itead-xbee-shield.html
[37] https://alselectro.wordpress.com/2017/01/23/zigbee-xbee-s2c-how-to-
configure-as-coordinator-router-end-device/
[38] https://www.digi.com/products/xbee-rf-solutions/xctu-software/xctu
[39] https://www.ftdichip.com/FTDrivers.htm
[40] https://www.python.org/download/releases/2.7.7/
[41] http://pyserial.sourceforge.net/
[42] https://www.arduino.cc/en/main/software

90
[43]https://github.com/digidotcom/python-
xbee/blob/master/examples/io/IOSamplingSample/IOSamplingSample
.py
[44] https://en.wikipedia.org/wiki/OSI_model
[45] Ye Wint Maung Maung, Aung Aung Hein, “Colored Petri-Nets (CPN)
based Model for Web Services Composition”. International Journal
of Computer and Communication Engineering research, Volume 2,
Issue 5, PP. 169-172, and September 2014.
[46] www.tutorialspoint.com , “Web Services – web application
component”.
[47] Sana Baccar, Mohsen Rouached, “ A Web Services based Approach
for Resource-Constrained Wireless Sensor Networks”, International
Journal of Computer Science Issues, Vol. 9, Issue 3, No. 2, PP. 63-
72, May 2002.
[48] Product Manual v1.xEx - 802.15.4 Protocol for RF Module Part
Numbers: XB24-A...-001, XBP24-A...-001 IEEE® 802.15.4 RF
Modules by Digi International. Digi International Inc. 11001 Bren
Road East Minnetonka, MN 55343 877 912-3444 or 952 912-3444
http://www.digi.com, 2009.09.23
[49] Gray A., Hilal J. (2007) Water and Security for Palestine. In: Lipchin
C., Pallant E., Saranga D., Amster A. (eds) Integrated Water
Resources Management and Security in the Middle East. NATO
Science for Peace and Security Series. Springer, Dordrecht

91
[50]http://www.sase.com.ar/2011/files/2010/11/SASE2011-
Protocolos_para_Redes_de_Sensores_Inalambricos.pdf
[51] https://cloud.google.com/
[52]https://azure.microsoft.com/en-us/services/cloud-services
[53] https://aws.amazon.com/what-is-cloud-computing/
[54] https://www.oracle.com/cloud/index.html
[55] http://www.ni.com/white-paper/11529/en/
[56]https://pdfs.semanticscholar.org/bf85/9199fb03f30972af6d8c8df28630
7667fe17.pdf
[57] https://www.slideshare.net/KannanRajan/zigbee-7761292
[58] http://microchipdeveloper.com/tcpip:tcp-ip-five-layer-model
[59] https://searchmobilecomputing.techtarget.com/definition/80211x
[60]https://www.digi.com/resources/documentation/digidocs/pdfs/90000982.p
df
[61]https://www.researchgate.net/publication/228977391_ICT_in_water_s
upply_and_irrigation_management
[62] Field Capacity, Wilting Point, Available Water, and the Non-Limiting Water Range,
M.B. Kirkham, in Principles of Soil and Plant Water Relations, 2005 II WILTING
POINT
[63] http://www.fao.org/3/t7202e/t7202e06.htm.
[64] The expert farmer Faisal Ibrahim Sabaaneh /Jenin- 00972597347030.
[65]https://img.filipeflop.com/files/download/Datasheet_DHT22_AM2302.pd
f

92
Appendex A
from digi.xbee.devices import XBeeDevice
from digi.xbee.io import IOLine, IOMode
import struct
import time
from time import sleep
PORT = "COM3"
BAUD_RATE = 9600
IO_LINE_OUT = IOLine.DIO4_AD4
DATA_TO_SEND = "Hello XBee!"
def recievesavecontrol( REMOTE_NODE_ID, device,f ):
xbee_network = device.get_network()
remote_device = xbee_network.discover_device(REMOTE_NODE_ID)
if remote_device is None:
print("Could not find the remote device")
return
print("Sending data to %s >> %s..." % (remote_device.get_64bit_addr(),
DATA_TO_SEND))
device.send_data(remote_device, DATA_TO_SEND)
print("Success")
device.flush_queues()
print("Waiting for data...\n")
v=0
cc=0
while (v==0 and cc<=10000000):
cc+=1
xbee_message = device.read_data()
if xbee_message is not None:
v=1
print("From %s >> %s" % (xbee_message.remote_device.get_64bit_addr(),
xbee_message.data))
h = struct.unpack('f',xbee_message.data[0:4])
t = struct.unpack('f',xbee_message.data[4:8])
m = struct.unpack('f',xbee_message.data[8:12])
dat = time.strftime("%H:%M:%S")
print (' ',REMOTE_NODE_ID,' : h= ',h,' t= ',t,' m= ',m)
f.write("\r\n "+REMOTE_NODE_ID+" "+time.strftime("%H:%M:%S")+"
"+time.strftime("%x")+" t="+str(t)+" h="+str(h)+" m= "+str(m))
f.flush()
mo = m[0]
io_value = IOMode.DIGITAL_OUT_HIGH
if (mo <= 370.0):
io_value = IOMode.DIGITAL_OUT_HIGH
print(' the soil in node : ',REMOTE_NODE_ID,' is very wet, turn its valve OFF ')
else:
if (mo >=420.0):
io_value = IOMode.DIGITAL_OUT_LOW
print(' the soil in node : ',REMOTE_NODE_ID,' is dry, turn its valve ON ')
device.set_dio_value(IO_LINE_OUT,io_value)
return

93
def recievesave( REMOTE_NODE_ID, device,f ):
xbee_network = device.get_network()
remote_device = xbee_network.discover_device(REMOTE_NODE_ID)
if remote_device is None:
print("Could not find the remote device")
return
print("Sending data to %s >> %s..." % (remote_device.get_64bit_addr(),
DATA_TO_SEND))
device.send_data(remote_device, DATA_TO_SEND)
print("Success")
device.flush_queues()
print("Waiting for data...\n")
v=0
cc=0
while (v==0 and cc<=10000000):
cc+=1
xbee_message = device.read_data()
if xbee_message is not None:
v=1
print("From %s >> %s" % (xbee_message.remote_device.get_64bit_addr(),
xbee_message.data))
h = struct.unpack('f',xbee_message.data[0:4])
t = struct.unpack('f',xbee_message.data[4:8])
m = struct.unpack('f',xbee_message.data[8:12])
dat = time.strftime("%H:%M:%S")
print (' ',REMOTE_NODE_ID,' : h= ',h,' t= ',t,' m= ',m)
f.write("\r\n "+REMOTE_NODE_ID+" "+time.strftime("%H:%M:%S")+"
"+time.strftime("%x")+" t="+str(t)+" h="+str(h)+" m= "+str(m))
f.flush()
return
def main():
while(1):
device = XBeeDevice(PORT, BAUD_RATE)
try:
sleep(2)
device.open()
f= open('sensors1.txt','a')
device.set_io_configuration(IO_LINE_OUT, IOMode.DIGITAL_OUT_HIGH)
counterr=0
while(counterr<=10):
recievesavecontrol("END-DEVICE", device,f)
recievesave("END-DEVICE1", device,f)
sleep(2)
counterr+=1
finally:
if device is not None and device.is_open():
device.close()
f.close()
if __name__ == '__main__':
main()

94
Appendex B
#include "XBee.h" #include "queue.h" #include <SoftwareSerial.h> #include "DHT.h" // DHT & AM2302 library #define DHTPIN 2 // Data pin connected to AM2302 #define DHTTYPE DHT22 // DHT 22 (AM2302) DHT dht(DHTPIN, DHTTYPE); // LED pins const int moistureAO = 0; // select the input pin for the potentiometer const int sensorValue = 0; // variable to store the value coming from the sensor const int moistureDO = 11; // digital bit of moisture sensor int soil = 0; int AO = 0; int DO = 0; int tmp = 0; int soill = 0; String moisture, humidity, temperature; unsigned int s1, s2, s3; // size of moisture, humidity, temperatur XBee xbee; Queue RxQ; SoftwareSerial sserial(12,13); // we are going to send two floats of 4 bytes each uint8_t payload[12] = { 0, 0, 0, 0, 0, 0, 0, 0, 0, 0, 0, 0}; // union to convery float to byte string union u_tag { uint8_t b[4]; float fval; } u; void setup(void) { sserial.begin(9600); pinMode(moistureAO, INPUT); pinMode(moistureDO, INPUT); dht.begin(); } void loop(void) { // read the value from the sensor: tmp = analogRead(moistureAO); soill = tmp; // moisture = String(soill); // s1= moisture.length(); if ( tmp != AO ) { AO=tmp; } delay(10); tmp=digitalRead( moistureDO ); if ( tmp != DO ) { DO=tmp; } delay(10);

95
// Reading temperature or humidity takes about 250 milliseconds! // Sensor readings may also be up to 2 seconds 'old' (its a very slow sensor) float h = dht.readHumidity(); //humidity = String(h); //s2= humidity.length(); float t = dht.readTemperature(); //temperature = String(t); //s3= temperature.length(); delay(40); delay(5); int queueLen = 0; int delPos = 0; if (!isnan(t) && !isnan(h)) { // check if returns are valid, if they are NaN (not a number) then something went wrong! u.fval = h; // convert humidity into a byte array and copy it into the payload array for (int i=0;i<4;i++){ payload[i]=u.b[i]; } // same for the temperature u.fval = t; for (int i=0;i<4;i++){ payload[i+4]=u.b[i]; } u.fval = soill; // same for the moisture for (int i=0;i<4;i++){ payload[i+8]=u.b[i]; } } while (sserial.available() > 0){ unsigned char in = (unsigned char)sserial.read(); if (!RxQ.Enqueue(in)){ break; } } queueLen = RxQ.Size(); for (int i=0;i<queueLen;i++){ if (RxQ.Peek(i) == 0x7E){ unsigned char checkBuff[Q_SIZE]; unsigned char msgBuff[Q_SIZE]; int checkLen = 0; int msgLen = 0; checkLen = RxQ.Copy(checkBuff, i); msgLen = xbee.Receive(checkBuff, checkLen, msgBuff); if (msgLen > 0){ unsigned char outMsg[Q_SIZE]; unsigned char outFrame[Q_SIZE]; int frameLen = 0; int addr = ((int)msgBuff[4] << 8) + (int)msgBuff[5]; memcpy(&outMsg,&payload,12); memcpy(&outMsg[12], &msgBuff[8], msgLen-9); frameLen = xbee.Send(outMsg, msgLen+3, outFrame, addr); sserial.write(outFrame, frameLen); i += msgLen; delPos = i; }else{ if (i>0){ delPos = i-1; } } }

جامعة النجاح الوطنية
كلية الدراسات العليا
شبكة مجسات السلكيه لنظام ري ذكي
إعداد
ناجيعرين زياد
إشراف
ا. د. عدنان سلمان
تقدمة قدمت هذه األطروحة استكماال لمتطلبات الحصول على درجة الماجستير في الحوسبة الم
.بكلية الدراسات العليا في جامعة النجاح الوطنية في نابلس، فلسطين
2019

ب
شبكة مجسات السلكيه لنظام ري ذكي إعداد
عرين زياد ناجي
إشراف
سلماند.عدنان
الملخص
رصد أصبح باالمكانتطورات الحديثة في تقنيات الحوسبة وأجهزة االستشعار الالسلكية ، مع ال
مسكما يع ومراقبة البيئة من حولنا. رئيسيا تبر نظام الري الزراعي التقليدي المستخدم حاليا تهلكا
ك ، يمكن والصرف. عالوة على ذلللمياه حيث يتم استهالك كمية كبيرة من المياه من خالل التبديد
أثير سلبي تالذي يمكن أن يكون له , والري المبالغه او الجحاف في أن يؤدي نهج الري التقليدي إلى
على جودة المحاصيل وإنتاجية المحاصيل.
فإن بما أن جدولة الري تعتمد بشكل كبير على حالة الطقس ، وخصائص التربة ، ونوع النبات ،
يؤدي إلى توفير لقائي الذكي والمراقبة ، الذي يأخذ هذه العوامل في االعتبار ، يمكن أننظام الري الت
كمية كبيرة من المياه ، وزيادة غلة المحاصيل ، وتحسين جودة المحاصيل. .
لمراقبة ، WSNفي هذه األطروحة ، نقدم نظام الري الذكي الذي يستخدم شبكة االستشعار الالسلكية
ة ، والتحكم في رطوبة التربة ، لتحقيق زراعة تلقائية أفضل.الظروف الزراعي