wide-field global vlbi and merlin combined monitoring of supernova remnants in m82
TRANSCRIPT

arX
iv:1
006.
1504
v1 [
astr
o-ph
.CO
] 8
Jun
2010
Mon. Not. R. Astron. Soc.000, 1–31 () Printed 9 June 2010 (MN LATEX style file v2.2)
Wide-field Global VLBI and MERLIN combined monitoring of
supernova remnants in M82.
D. Fenech1,2 ⋆ R. Beswick2, T. W. B. Muxlow2, A. Pedlar2 and M. K. Argo3
1Department of Physics and astronomy, University College London
2Jodrell Bank Centre for Astrophysics, School of Physics andAstronomy, Alan Turing Building, University of Manchester, M13 9PL
3ICRAR, Curtin University of Technology, GPO Box UI987, Perth, Western Australia 6845, Australia
ABSTRACT
From a combination of MERLIN (Multi-Element Radio-Linked Interferometer Net-
work) and global VLBI (Very Long Baseline Interferometry) observations of the star-
burst galaxy M82, images of 36 discrete sources at resolutions ranging from∼3 to
∼80 mas at 1.7 GHz are presented. Of these 36 sources, 32 are identified as supernova
remnants, 2 are Hii regions, and 3 remain unclassified. Sizes, flux densities andra-
dio brightnesses are given for all of the detected sources. Additionally, global VLBI
only data from this project are used to image four of the most compact radio sources.
These data provide a fifth epoch of VLBI observations of thesesources, covering a
19-yr time-line. In particular, the continued expansion ofone of the youngest super-
nova remnants, 43.31+59.3 is discussed. The deceleration parameter is a power-law
index used to represent the time evolution of the size of a supernova remnant. For
the source 43.31+59.3, a lower limit to the deceleration parameter is calculated to be
0.53±0.06, based on a lower limit of the age of this source.
Key words: interstellar medium:supernova remnants – interstellar medium:HII re-
gions galaxies:individual:M82 – galaxies:starburst – galaxies:interstellar medium
1 INTRODUCTION
Supernovae and supernova remnants (SNR) are a significant by-product of the intense star-formation
found in starburst galaxies. As such, they play an importantrole in galaxy evolution and the feed-
back of material into the interstellar medium (ISM), and collectively via energy deposition into the
⋆ E-mail:[email protected]
c© RAS
2 D. Fenech, R. Beswick, T. W. B. Muxlow, A. Pedlar and M. K. Argo
ISM can drive massive superwinds as can be found in nearby galaxies such as M82 (Ohyama et al.
2002). Individual SNR are interesting in their own right andhave been the subject of intense study
for decades (e.g. Bartel & Bietenholz 2003; Marcaide et al. 2009). However, a population of SNR
within a galaxy can provide information on the statistical properties of SNR evolution within the
interstellar medium, as well as provide insight into the star-formation history of the galaxy via
independent tracers of the supernova and star-formation rates.
Detailed investigations of SNR within the Galaxy are hindered both by the difficulty in deter-
mining accurate distances, and by the fact that all known Galactic SNR are over 150 years old
(Green et al. 2008). The use of radio interferometry allows high resolution observations of a star-
burst region and reveals sources that are otherwise obscured by the high levels of gas and dust
associated with the star formation. In addition, such studies are free from selection effects as all
of the SNR are at essentially the same distance and are observed with the same angular resolution
and brightness sensitivity.
For these reasons, a number of starburst galaxies have been well-studied using radio interfero-
metric techniques, for example the southern hemisphere starburst galaxy, NGC 253 (e.g. Lenc & Tingay
2006) and the more distant intense starburst of Arp 220 (e.g.Parra et al. 2007). However, as one of
closest starburst galaxies, M82 (∼3.2 Mpc, Burbidge, Burbidge & Rubin 1964) presents a unique
opportunity for a more detailed investigation of a young population of SNR.
The first detailed radio observations of M82, began in the 1970s (Hargrave 1974; Kronberg & Wilkinson
1975) with the discovery of several compact sources within the central kpc. Subsequent observa-
tions (Unger et al. 1984; Kronberg, Biermann & Schwab 1985 ; Huang et al. 1994) have shown
these to be part of a population of supernova remnants and Hii regions now approaching 100 identi-
fied sources. MERLIN observations of M82 have revealed the parsec-scale, shell-like structures of
a large portion of these sources (Muxlow et al. 1994; Fenech et al. 2008) at 5 GHz, though detailed
observations at lower frequencies have been limited by the achievable resolutions and brightness
temperature sensitivities of available interferometers.
High angular resolution observations using the European VLBI Network (EVN), at a frequency
of 1.7 GHz began in 1997 utilising previous 1.4 GHz observations from 1986, in order to observe
and monitor the five most compact sources within M82. This began a now established global VLBI
monitoring programme of these compact sources. The fifth epoch of this programme are presented
here, extending the timeline of these observations to 19-yrs. However, these purely VLBI observa-
tions lack the surface brightness sensitivity to image all but the most compact objects. To remedy
c© RAS, MNRAS000, 1–31

Global VLBI and MERLIN combined monitoring of M82 SNR3
this in this work we present results from the first combined, simultaneous MERLIN and global
VLBI observations of M82, which have enabled high surface brightness imaging at mas resolu-
tions of the wider population of SNR and Hii regions.
We present the results of these combined observations in this paper. The detected population
of sources is discussed in section 3.1. The most compact sources are discussed individually as
observed in the global VLBI only observations along with a detailed investigation of the possible
deceleration of 43.31+59.2 in section 4.3.1. Section 5 discusses the supernova remnant environ-
ment in M82 and a summary is provided in section 6.
2 OBSERVATIONS AND IMAGE PROCESSING
This paper includes observations of M82 at 1.7 GHz using bothMERLIN and global VLBI as well
as archival global VLBI and EVN observations from 1986, 1997, 1998 and 2001.
2.1 New Observations
Observations of M82 were performed with seven telescopes, of the MERLIN array on the 3rd
Mar. 2005, at a frequency of 1.7 GHz. Global VLBI observations were made simultaneously at the
same frequency and included use of the ten telescopes of the VLBA (Very Long Baseline Array)
in the USA as well as Westerbork, Medecina, Noto and Effelsberg antennas from the European
VLBI Network (EVN). The global VLBI data also incorporated information from two MERLIN
telescopes; the 76-m Lovell and 32-m Cambridge telescopes.The observations were made over a
period of 18 hours with both the MERLIN and global VLBI arraysswitching between M82 and
the same phase calibration source J0958+65; this facilitates the combination of the two separate
datasets.
2.1.1 Global VLBI
The global VLBI data covers a range in frequency of 1.6595-1.6755 GHz, split over 128 channels,
each 250 KHz in width. The data were correlated at JIVE (JointInstitute for VLBI in Europe)
centred on the position of the most compact radio source 41.95+57.5. All subsequent data reduc-
tion and imaging was performed using the NRAO’s AIPS software. Amplitude calibration was
performed using the system temperature and gain information provided for each telescope. The
c© RAS, MNRAS000, 1–31

4 D. Fenech, R. Beswick, T. W. B. Muxlow, A. Pedlar and M. K. Argo
Table 1.Observing information for the 1.7 GHz observations made on Mar. 3 2005.
Array MERLIN Global VLBI
Central frequency (GHz) 1.6646 1.6675Total Bandwidth (MHz) 8 16
Number of channels 32 128Bandwidth per channel (KHz) 250 125
final delays, fringe rates and antenna gains were found for the calibration sources J0958+65 and
J0927+39 and then applied to the target source, M82.
2.1.2 MERLIN
The MERLIN data were reduced using the MERLIN pipeline, utilising observations of the calibra-
tion source, 3C84 to set the flux density scale and the point source calibrator J0927+39 to perform
a bandpass calibration. These MERLIN observations were reduced using standard routines to ap-
ply phase reference solutions from the phase calibrator J0958+65 to M82. Both the global VLBI
and MERLIN observations were made using spectral channels to facilitate wide-field imaging, the
channel setup used in each case is described in Table 1.
2.1.3 Combination
Following the separate calibration some preparation was required to enable combination. This in-
cluded the splitting of the two datasets into their individual spectral channels which were then
recombined to ensure the frequencies of the datasets matched (within 0.1%), whilst not averaging
the channels to enable wide-field imaging with the global VLBI data. This process avoids introduc-
ing the effects of bandwidth smearing. The flux density scales were thenchecked using th LT-CM
baseline, common to both the MERLIN and global VLBI data, forobservations of the calibration
sources. A small positional correction of the global VLBI data was performed to ensure coinci-
dence with the reference position of the MERLIN data. Following this correction, the two datasets
were coincident to within. 0.10 mas. The datasets were then combined using theaips taskdbcon.
2.2 Archive VLBI and EVN observations
Four previously published datasets have been included in the analysis presented here. EVN ob-
servations from 1986 and 1997 initially published in Pedlaret al. (1999) and global VLBI obser-
vations from 1998 and 2001 published in McDonald et al. (2001) and Beswick et al. (2006). The
telescopes included in each of these observations are listed in Table 2 as well as those from the
c© RAS, MNRAS000, 1–31

Global VLBI and MERLIN combined monitoring of M82 SNR5
Figure 1.The spatial frequency coverage of the combined MERLIN and global VLBI observations at 1.7 GHz. The plot shows Every 500thvisibilityfollowing the splitting of the data into individual spectral channels and subsequent combination.
Table 2.A summary of the EVN and global VLBI observations of M82.
Epoch Date Array Frequency Reference
1 11 Dec. 1986 (1986.95) Ef, Jb, Wb, Mc 1.4 GHz Pedlar et al. (1999)2 02 Jun. 1997 (1997.42) Ef, Jb, Mc, Nt, On, Wb, Cm, Tr 1.7 GHz Pedlar et al. (1999)3 28 Nov. 1998 (1998.91) VLBA, Y1, Ro, Go, Ef, Jb, Mc, Nt, On, Wb, Tr 1.7 GHz McDonald et al. (2001)4 23 Feb. 2001 (2001.15) VLBA, Y1, Ro, Ef, Jb, Mc, Nt, On, Wb, Tr 1.7 GHz Beswick et al. (2006)5 03 Mar. 2005 (2005.17) VLBA, Jb, Ef, Cm, Wb, Nt, Mc+ MERLIN 1.7 GHz This paper
most recent epoch. Full details of the reduction proceduresused for each of these datasets is de-
scribed in the literature. The 1997, 1998 and 2001 observations all utilised very similar techniques
for the observational and data reduction processes. The 1986 observations differed slightly in that
the observing frequency used was 1.4 GHz and the flux density scale was based on the total flux
density of 41.95+57.5, at the epoch of these observations.
2.3 Imaging
Following combination, the MERLIN+global data were imaged using theaips taskimagr and de-
convolved with the Hogbom cleaning algorithm (Hogbom 1974). In order to image each source in
the most suitable way, a number of resolutions were used. Initially, a beam size of 50 mas was used
together with a cellsize of 10 mas and a robustness weightingof 0. The whole of the central 700 pc
of M82 was imaged in this way using ten 1024×1024 fields. These 50 mas field images have a 1
σ rms noise level of∼310µJy beam−1 and a brightness temperature sensitivity level of∼5900 K.
Images with resolutions between 25 and 50 mas (in 5 mas steps)as well as 60, 70 and 80 mas using
c© RAS, MNRAS000, 1–31
6 D. Fenech, R. Beswick, T. W. B. Muxlow, A. Pedlar and M. K. Argo
a Gaussian taper to give the required resolution were also produced. The final parameters used to
produce the images presented in section 3 are listed in Table3.
The observational setup for this experiment has been chosento provide a well-sampled, evenly
spaced spatial frequency coverage with minimal gaps (see Fig. 1), achieved in this case using a
large number of telescopes to perform a full imaging track ofa circumpolar source. This limits
any image fidelity or brightness sensitivity issues as a result of an incomplete aperture coverage
and represents the state-of-the-art in long baseline arrayobservations. Multiple resolutions were
used to provide the best image of each source and ensure that the Gaussian tapering applied did
not result in any significant change in the observed source structures over the resolutions sampled.
A MERLIN only image has been used to measure the flux density values presented in Table
5. This naturally weighted 4096×2048 image has a restoring beam of 130 mas and a cellsize of
30 mas, a contour image of which is shown in Fig. 2. The rms noise over source free areas of this
MERLIN-only image is∼55µJy beam−1 .
c© RAS, MNRAS000, 1–31
Glo
ba
lVLB
Ian
dM
ER
LIN
com
bin
ed
mo
nito
ring
ofM
82
SN
R7
Figure 2. A MERLIN 1.7 GHz contour image of M82 from the observations presented here, restored with a 130 mas beam,which is plotted in the bottom right-hand corner. The contours are plotted at−1, 1, 2, 4, 6, 8, 10, 12, 14, 16, 18, 20, 25, 30, 35, 40 × 250µJy beam−1 .
c©R
AS
,MN
RA
S000,1–31
8 D. Fenech, R. Beswick, T. W. B. Muxlow, A. Pedlar and M. K. Argo
Table 3.The beam size and corresponding noise levels of the the MERLIN and global VLBI combined images used to produce the contourplots ofthe individual sources at 1.7 GHz.
Resolution (mas) rms noise level (µJy beam−1 )
25 27.030 28.035 29.640 32.550 31.1
The global VLBI (not including MERLIN) datasets were imagedusing imagr, applying an
appropriate taper, to produce 512×512 images, centred on 41.95+57.5, 43.18+58.3, 43.31+59.2,
44.01+59.6 and 45.17+61.2, restored with a 15 mas circular beam. This enabled effective compar-
ison with the original EVN dataset images with a matched angular resolution. Images were also
produced using only the global VLBI epochs, with a cellsize of 1 mas and a robustness weighting
of 0 at suitable resolutions for each source. The source 41.95+57.5 was imaged using a circular
3.3 mas beam and 43.31+59.2 was imaged with a circular beamsize of 4 mas. The remaining three
sources (43.18+58.3, 44.01+59.6 and 45.17+61.2) were imaged using resolutions of 8 and 10 mas.
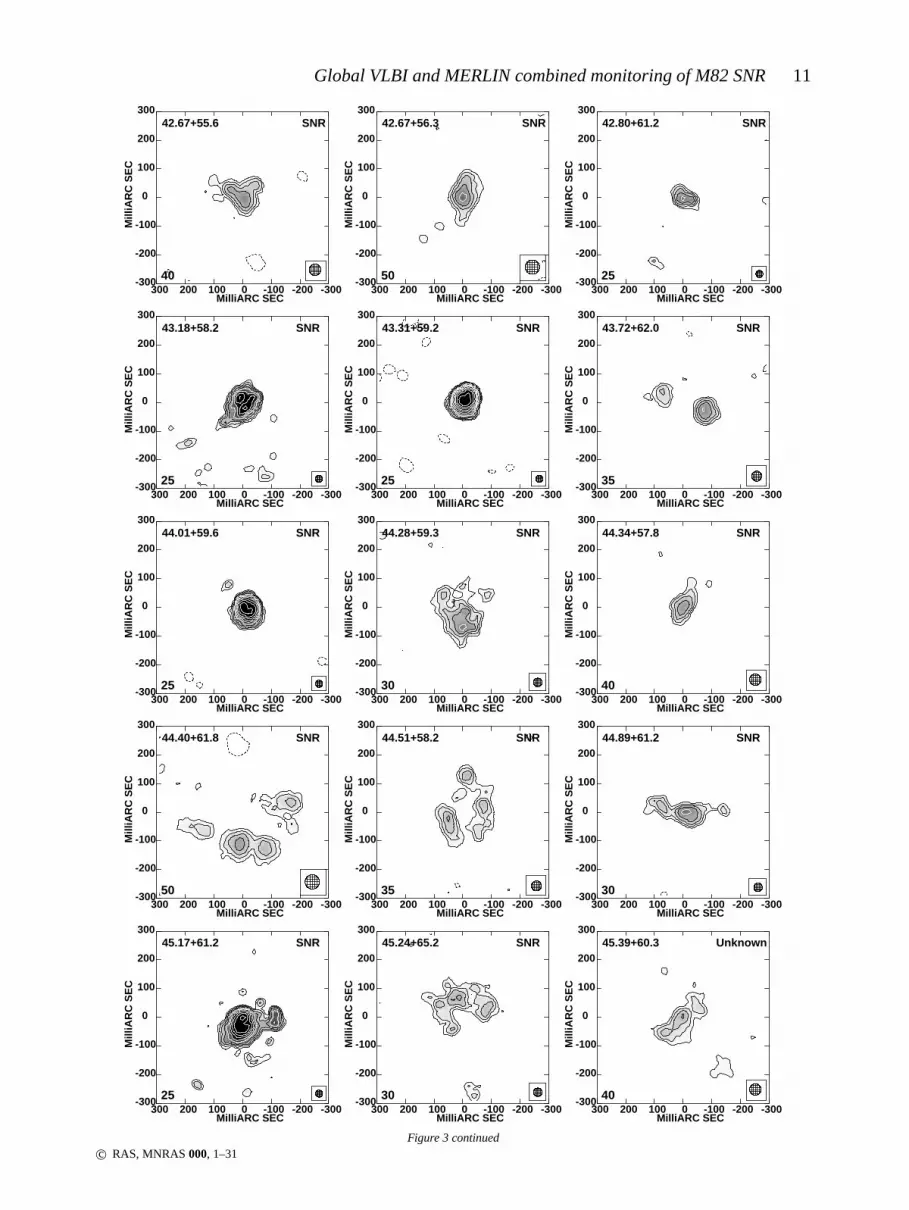
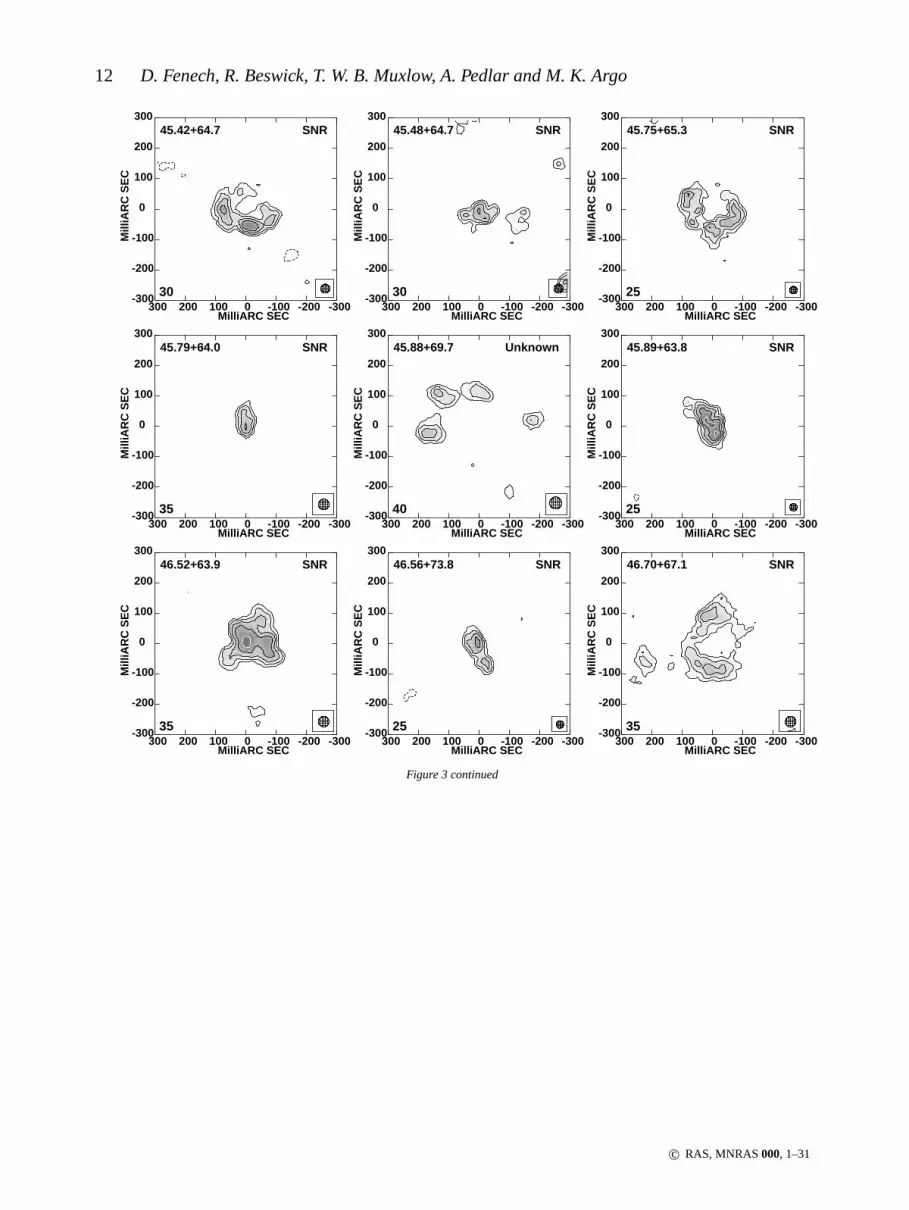
3 SOURCE STRUCTURES AT 1.7 GHZ
Contour and grey-scale images of the individual sources made from the combined MERLIN+global
VLBI data are presented in Fig. 3. Several shell or partial-shell structures can be clearly identified.
The global VLBI and EVN images of the most compact sources canbe found in section 4, where
the sources are discussed individually.
Sources have been included with peak flux density of> 5σ in both the MERLIN only im-
age and the combined 50 mas resolution images, which corresponds to> 275µJy beam−1 and
>150µJy beam−1 respectively, providing a sample of 36 sources.
The source sizes have been measured in accordance with the observed source structure. The
single peaked sources have been measured using Gaussian fitting to find the full width half maxi-
mum. The obvious shell-structured sources with a peak flux density (in the combined images) of
>300µJy beam−1 have been measured using radial profiles averaged in azimuthand measured to
50% of the peak. The weaker more extended sources (peak flux density> 250µJy beam−1 ) have
been measured using the flux density profiles produced by drawing slices across the source. The
values quoted are average diameters or a major by minor axis,wherever appropriate. An example
of the measured sizes of two sources using all of the described methods is shown in Table 4 . This
c© RAS, MNRAS000, 1–31
Global VLBI and MERLIN combined monitoring of M82 SNR9
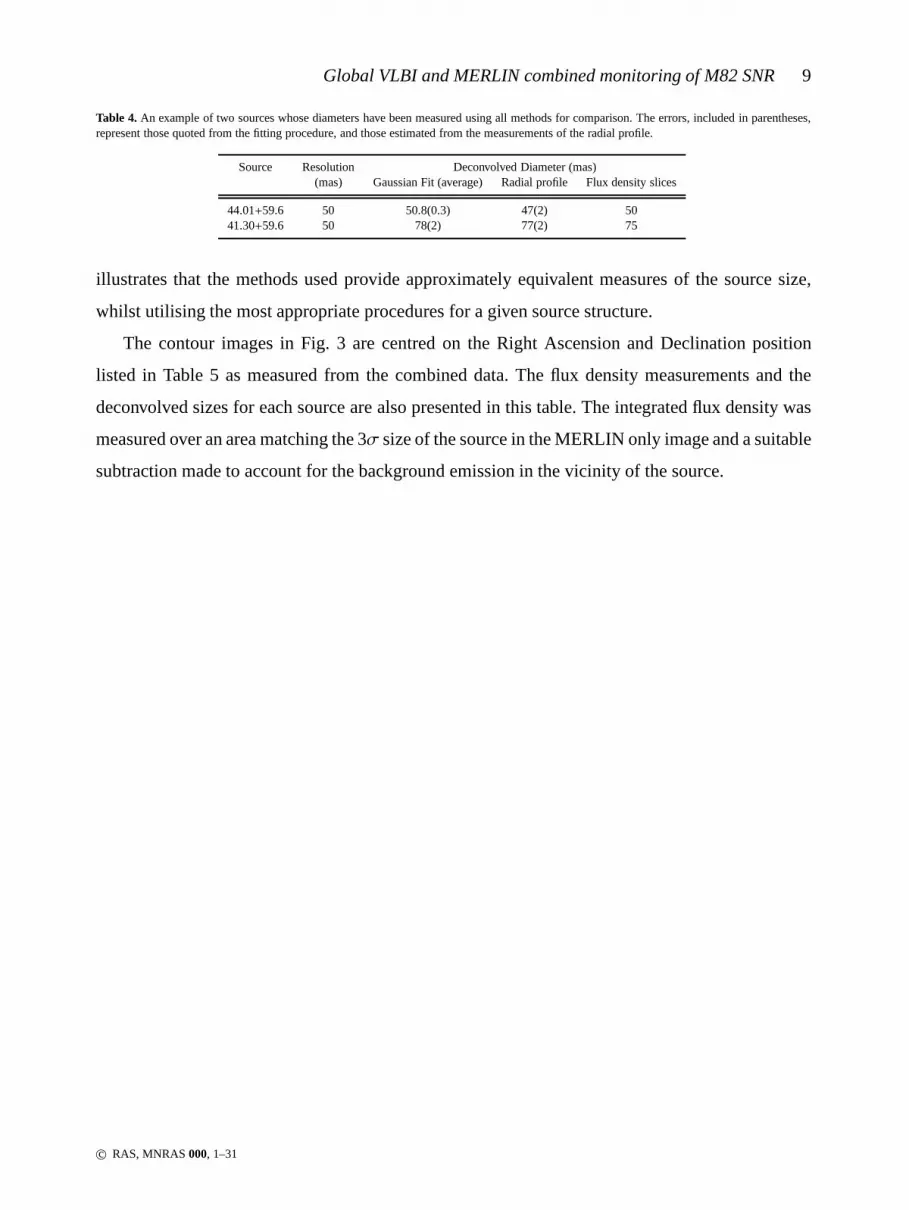
Table 4.An example of two sources whose diameters have been measuredusing all methods for comparison. The errors, included in parentheses,represent those quoted from the fitting procedure, and thoseestimated from the measurements of the radial profile.
Source Resolution Deconvolved Diameter (mas)(mas) Gaussian Fit (average) Radial profile Flux density slices
44.01+59.6 50 50.8(0.3) 47(2) 5041.30+59.6 50 78(2) 77(2) 75
illustrates that the methods used provide approximately equivalent measures of the source size,
whilst utilising the most appropriate procedures for a given source structure.
The contour images in Fig. 3 are centred on the Right Ascension and Declination position
listed in Table 5 as measured from the combined data. The flux density measurements and the
deconvolved sizes for each source are also presented in thistable. The integrated flux density was
measured over an area matching the 3σ size of the source in the MERLIN only image and a suitable
subtraction made to account for the background emission in the vicinity of the source.
c© RAS, MNRAS000, 1–31

10 D. Fenech, R. Beswick, T. W. B. Muxlow, A. Pedlar and M. K. Argo
Mill
iAR
C S
EC
MilliARC SEC300 200 100 0 -100 -200 -300
38.76+53.5 HII
35
300
200
100
0
-100
-200
-300
Mill
iAR
C S
EC
MilliARC SEC300 200 100 0 -100 -200 -300
39.10+57.3 SNR
25
300
200
100
0
-100
-200
-300
Mill
iAR
C S
EC
MilliARC SEC300 200 100 0 -100 -200 -300
39.28+54.1 HII
35
300
200
100
0
-100
-200
-300
Mill
iAR
C S
EC
MilliARC SEC300 200 100 0 -100 -200 -300
39.40+56.2 SNR
40
300
200
100
0
-100
-200
-300
Mill
iAR
C S
EC
MilliARC SEC300 200 100 0 -100 -200 -300
39.47+55.4 Unknown
35
300
200
100
0
-100
-200
-300
Mill
iAR
C S
EC
MilliARC SEC300 200 100 0 -100 -200 -300
39.64+53.3 SNR
40
300
200
100
0
-100
-200
-300
Mill
iAR
C S
EC
MilliARC SEC300 200 100 0 -100 -200 -300
40.32+55.2 SNR
35
300
200
100
0
-100
-200
-300
Mill
iAR
C S
EC
MilliARC SEC300 200 100 0 -100 -200 -300
40.61+56.3 SNR
50
300
200
100
0
-100
-200
-300
Mill
iAR
C S
EC
MilliARC SEC300 200 100 0 -100 -200 -300
40.68+55.1 SNR
25
300
200
100
0
-100
-200
-300
Mill
iAR
C S
EC
MilliARC SEC300 200 100 0 -100 -200 -300
41.30+59.6 SNR
25
300
200
100
0
-100
-200
-300
Mill
iAR
C S
EC
MilliARC SEC300 200 100 0 -100 -200 -300
41.95+57.5 SNR?
25
300
200
100
0
-100
-200
-300
Mill
iAR
C S
EC
MilliARC SEC300 200 100 0 -100 -200 -300
42.66+61.6 SNR
50
300
200
100
0
-100
-200
-300
1
Figure 3. Grey-scale and contour images of the individual sources produced from the combined MERLIN+global VLBI data. The grey-scale rangesfrom 130− 600µJy beam−1 and the contours are plotted at−1, 1, 1.414, 2, 2.828, 4, 5.656, 8, 11.282 × 3σ noise level (see Table 3). The beamsize is listed numerically in units of milliarcseconds in the bottom left-hand corner and graphically in the bottom right-hand corner of each image.The source 41.95+57.5 has a grey-scale ranging from 200− 800µJy beam−1 and contour levels plotted at multiples of 0.2 mJybm−1.
c© RAS, MNRAS000, 1–31
Global VLBI and MERLIN combined monitoring of M82 SNR11
Mill
iAR
C S
EC
MilliARC SEC300 200 100 0 -100 -200 -300
42.67+55.6 SNR
40
300
200
100
0
-100
-200
-300
Mill
iAR
C S
EC
MilliARC SEC300 200 100 0 -100 -200 -300
42.67+56.3 SNR
50
300
200
100
0
-100
-200
-300
Mill
iAR
C S
EC
MilliARC SEC300 200 100 0 -100 -200 -300
42.80+61.2 SNR
25
300
200
100
0
-100
-200
-300
Mill
iAR
C S
EC
MilliARC SEC300 200 100 0 -100 -200 -300
43.18+58.2 SNR
25
300
200
100
0
-100
-200
-300
Mill
iAR
C S
EC
MilliARC SEC300 200 100 0 -100 -200 -300
43.31+59.2 SNR
25
300
200
100
0
-100
-200
-300
Mill
iAR
C S
EC
MilliARC SEC300 200 100 0 -100 -200 -300
43.72+62.0 SNR
35
300
200
100
0
-100
-200
-300
Mill
iAR
C S
EC
MilliARC SEC300 200 100 0 -100 -200 -300
44.01+59.6 SNR
25
300
200
100
0
-100
-200
-300
Mill
iAR
C S
EC
MilliARC SEC300 200 100 0 -100 -200 -300
44.28+59.3 SNR
30
300
200
100
0
-100
-200
-300
Mill
iAR
C S
EC
MilliARC SEC300 200 100 0 -100 -200 -300
44.34+57.8 SNR
40
300
200
100
0
-100
-200
-300
Mill
iAR
C S
EC
MilliARC SEC300 200 100 0 -100 -200 -300
44.40+61.8 SNR
50
300
200
100
0
-100
-200
-300
Mill
iAR
C S
EC
MilliARC SEC300 200 100 0 -100 -200 -300
44.51+58.2 SNR
35
300
200
100
0
-100
-200
-300
Mill
iAR
C S
EC
MilliARC SEC300 200 100 0 -100 -200 -300
44.89+61.2 SNR
30
300
200
100
0
-100
-200
-300
Mill
iAR
C S
EC
MilliARC SEC300 200 100 0 -100 -200 -300
45.17+61.2 SNR
25
300
200
100
0
-100
-200
-300
Mill
iAR
C S
EC
MilliARC SEC300 200 100 0 -100 -200 -300
45.24+65.2 SNR
30
300
200
100
0
-100
-200
-300
Mill
iAR
C S
EC
MilliARC SEC300 200 100 0 -100 -200 -300
45.39+60.3 Unknown
40
300
200
100
0
-100
-200
-300
1
Figure 3 continuedc© RAS, MNRAS000, 1–31
12 D. Fenech, R. Beswick, T. W. B. Muxlow, A. Pedlar and M. K. Argo
Mill
iAR
C S
EC
MilliARC SEC300 200 100 0 -100 -200 -300
45.42+64.7 SNR
30
300
200
100
0
-100
-200
-300
Mill
iAR
C S
EC
MilliARC SEC300 200 100 0 -100 -200 -300
45.48+64.7 SNR
30
300
200
100
0
-100
-200
-300
Mill
iAR
C S
EC
MilliARC SEC300 200 100 0 -100 -200 -300
45.75+65.3 SNR
25
300
200
100
0
-100
-200
-300
Mill
iAR
C S
EC
MilliARC SEC300 200 100 0 -100 -200 -300
45.79+64.0 SNR
35
300
200
100
0
-100
-200
-300
Mill
iAR
C S
EC
MilliARC SEC300 200 100 0 -100 -200 -300
45.88+69.7 Unknown
40
300
200
100
0
-100
-200
-300
Mill
iAR
C S
EC
MilliARC SEC300 200 100 0 -100 -200 -300
45.89+63.8 SNR
25
300
200
100
0
-100
-200
-300
Mill
iAR
C S
EC
MilliARC SEC300 200 100 0 -100 -200 -300
46.52+63.9 SNR
35
300
200
100
0
-100
-200
-300
Mill
iAR
C S
EC
MilliARC SEC300 200 100 0 -100 -200 -300
46.56+73.8 SNR
25
300
200
100
0
-100
-200
-300
Mill
iAR
C S
EC
MilliARC SEC300 200 100 0 -100 -200 -300
46.70+67.1 SNR
35
300
200
100
0
-100
-200
-300
Figure 3 continued
c© RAS, MNRAS000, 1–31

Global VLBI and MERLIN combined monitoring of M82 SNR13
Table 5: Flux densities and deconvolved sizes of the sourcesdetected in the global VLBI+MERLIN
dataset. The names of each source are a combination of their B1950 Right Ascension seconds
and Declination arcseconds, offset from 09h 51m 00s and+69o 54′ 00′′, following the convention
of Kronberg et al. (1985). The J2000 Right Ascension and Declination are as measured in the com-
bined data and are offset from 09h 55m 00s and+69o 40′ 00′′. The flux densities are measured from
the MERLIN-only data. Errors are shown in brackets where appropriate.
Name RA Dec Diameter Peak Flux Density Total Flux Density
J2000 J2000 mas pc (mJy/beam) (mJy)
38.76+53.5 47.53 39.94 69(9)×46(7) 1.1×0.7 0.36 (0.03) 0.52 (0.08)
39.10+57.3 47.88 43.72 229 3.5 3.63 (0.05) 5.74 (0.10)
39.28+54.1 48.04 40.59 164 2.5 0.27 (0.06) 0.40 (0.11)
39.40+56.2 48.16 43.00 197×63 3.1×1.0 0.36 (0.05) 0.65 (0.09)
39.47+55.4 48.26 41.91 251×53 3.9×0.8 0.29 (0.07) 0.56 (0.13)
39.64+53.3 48.40 39.82 177×93 2.7×1.4 0.27 (0.03) 0.41 (0.05)
40.32+55.2 49.06 41.53 81(7)×50(5) 1.3×0.8 0.79 (0.06) 0.95 (0.11)
40.61+56.3 49.37 42.44 250 3.9 0.39 (0.06) 0.64 (0.09)
40.68+55.1 49.42 41.43 182 2.8 6.48 (0.06) 11.33 (0.17)
41.30+59.6 50.05 45.92 65 1.0 3.39 (0.06) 3.64 (0.11)
41.95+57.5 50.69 43.76 28.5(0.1)×21.7(0.1) 0.4×0.3 36.19 (0.08) 38.25 (0.21)
42.66+51.6 51.39 47.80 207 3.2 0.93 (0.04) 1.83 (0.08)
42.67+55.6 51.39 41.80 99 1.5 0.73 (0.05) 0.97 (0.09)
42.67+56.3 51.40 42.63 132(13)×61(7) 2.0×0.9 0.92 (0.04) 1.08 (0.07)
42.80+61.2 51.55 47.54 71×40 1.1×0.6 0.87 (0.05) 0.90 (0.06)
43.18+58.2 51.91 44.57 107 1.7 6.90 (0.07) 8.39 (0.14)
43.31+59.2 52.03 45.42 53.6(0.3)×44.1(0.2) 0.8×0.7 22.66 (0.16) 23.55 (0.35)
43.72+62.0 52.45 48.80 208×56 3.2×0.9 1.08 (0.05) 1.65 (0.09)
44.01+59.6 52.73 45.78 56.7(0.6)×46.6(0.5) 0.9×0.7 11.43 (0.06) 12.32 (0.12)
44.28+59.3 52.99 45.49 156 2.4 2.12 (0.05) 2.84 (0.09)
44.34+57.8 53.05 43.94 118(13)×51(6) 1.8×0.8 0.65 (0.06) 0.66 (0.10)
44.40+61.8 53.15 48.04 235 3.6 1.14 (0.06) 2.25 (0.13)
44.51+58.2 53.23 44.36 234 3.6 0.95 (0.05) 1.53 (0.10)
44.89+61.2 53.61 47.36 223×54 3.5×0.8 1.24 (0.05) 1.97 (0.11)
45.17+61.2 53.88 47.43 74×56 1.1×0.9 14.23 (0.07) 17.60 (0.16)
45.24+65.2 53.96 51.29 223 3.4 1.31 (0.06) 1.59 (0.10)
45.39+60.3 54.07 46.50 172×49 2.7×0.8 0.88 (0.06) 1.73 (0.13)
Continued on next page
c© RAS, MNRAS000, 1–31

14 D. Fenech, R. Beswick, T. W. B. Muxlow, A. Pedlar and M. K. Argo
Table 5 – continued from previous page
Name RA Dec Diameter Peak Flux Density Total Flux Density
J2000 J2000 mas pc (mJy/beam) (mJy)
45.42+64.7 54.13 53.58 201 3.1 1.24 (0.05) 1.54 (0.09)
45.48+64.7 54.22 50.94 116×55 1.8×0.9 0.92 (0.06) 1.04 (0.08)
45.75+65.3 54.46 51.43 222(10) 3.4 2.30 (0.08) 3.35 (0.16)
45.79+64.0 54.50 50.20 100(13)×47(8) 1.6×0.7 0.27 (0.03) 0.31 (0.05)
45.88+69.7 54.60 55.75 405×183 6.3×2.8 0.57 (0.07) 1.08 (0.14)
45.89+63.9 54.60 49.98 118×30 1.8×0.5 2.12 (0.01) 2.37 (0.01)
46.52+63.9 55.22 50.01 172×139 2.7×2.2 2.00 (0.05) 2.60 (0.09)
46.56+73.8 55.26 59.91 135×47 2.1×0.7 1.26 (0.07) 1.40 (0.12)
46.70+67.1 55.41 53.17 260 4.0 1.22 (0.06) 2.18 (0.14)
3.1 The source population
A total of 36 sources have been detected in these combined observations, 31 of which are previ-
ously identified supernova remnants with diameters rangingfrom 0.4 to 4.0 pc and a mean size
of 2.1 pc (identifications taken from catalogues in Wills et al. 1997; Allen 1999; McDonald et al.
2002; Rodriguez-Rico et al. 2004). The remaining five sources consist of two Hii regions and three
as yet unidentified sources. The two detected Hii regions are 38.76+53.5 and 39.28+54.1, origi-
nally identified by McDonald et al. (2002) with brightness temperatures∼1100 K. These are shown
in the histogram of source sizes in Fig. 4. The distribution of the spectral index of the known SNR
and Hii regions within M82 as a function of brightness temperature was studied by McDonald et al.
(2002), who showed the distribution to be distinctly bi-modal and hence the study of the spectra
can be used as an indication of the nature of the source. The unknown sources from this dataset
are currently lacking sufficient spectral information to distinguish them fully as either Hii regions
or SNR. The source 45.39+60.3 does have a three point spectral energy distribution published in
Allen (1999) suggesting it has a flat spectrum and is therefore an Hii region, though the brightness
temperature measured here (∼ 5 × 10⁴ K) is larger than expected for an Hii region and thus there
classification remains ambiguous. Allen (1999) also detected the source 39.47+55.4 at 3.6 cm and
6 cm, which combined with the flux density of 0.56±0.13 mJy presented here would suggest a
flat spectrum for this source. The flux density and size measured implies a brightness temperature
of ∼ 104 K, consistent with that of an Hii region. The remaining unknown source is detected for
c© RAS, MNRAS000, 1–31

Global VLBI and MERLIN combined monitoring of M82 SNR15
Figure 4. A histogram showing the observed diameters of the SNR, Hii regions and the unknown sources at 1.7 GHz.
the first time in these observations and shows what could be interpreted as knots of radio emis-
sion within a shell structure, making it a strong SNR candidate. This is a faint source with a large
(∼5 pc) diameter and a steep spectrum expected of a SNR would make it difficult to detect in higher
frequency observations, providing a possible explanationfor its prior non-detection.
4 THE COMPACT SOURCES
The more compact sources within M82 will now be discussed in view of their observed properties
at milli-arcsecond resolutions using the global VLBI and previous EVN observations
4.1 41.95+57.5
This source is the most compact and until recently the brightest source within M82. It was first
discovered in 1968 (Bash 1968). The EVN observations from 1986 and 1997 do not completely
resolve the elongated structure of this source and its unusual morphology is only clearly seen in the
higher resolution global VLBI epochs. This source is somewhat atypical and does not possess the
shell morphology seen in other supernova remnants, showinga distinctly double-lobed structure.
In addition, it has a measured expansion velocity of 1500±400 km s−1 (Beswick et al. 2006), lower
than typically expected for a SNR. It is possible that combined with the large and persistent flux
density decay of∼ 8.5%yr−1, that this source may represent the remnant of a gamma ray burst
(Muxlow et al. 2005; Fenech 2007) . The full discussion of thenature of this source is deferred to
a later paper.
c© RAS, MNRAS000, 1–31
16 D. Fenech, R. Beswick, T. W. B. Muxlow, A. Pedlar and M. K. Argo
4.2 43.18+58.3
This source, along with 44.01+59.6 and 45.17+61.2, was only marginally detected in the first
epoch of EVN observations and by 1997 showed three weak peaksof emission in 15 mas resolution
images (Pedlar et al. 1999). There has been no subsequent detection of this SNR in these very high
resolution studies. However, this source can be clearly seen in the combined 1.7 GHz observations
(see Fig. 3), which reveals a distinct shell-like structurewith three peaks of emission and a radius
of ∼53 mas. Comparison of two epochs of MERLIN 5 GHz observationshave shown this source
to be expanding at 10,500±3000 km s−1 (Fenech et al. 2008).
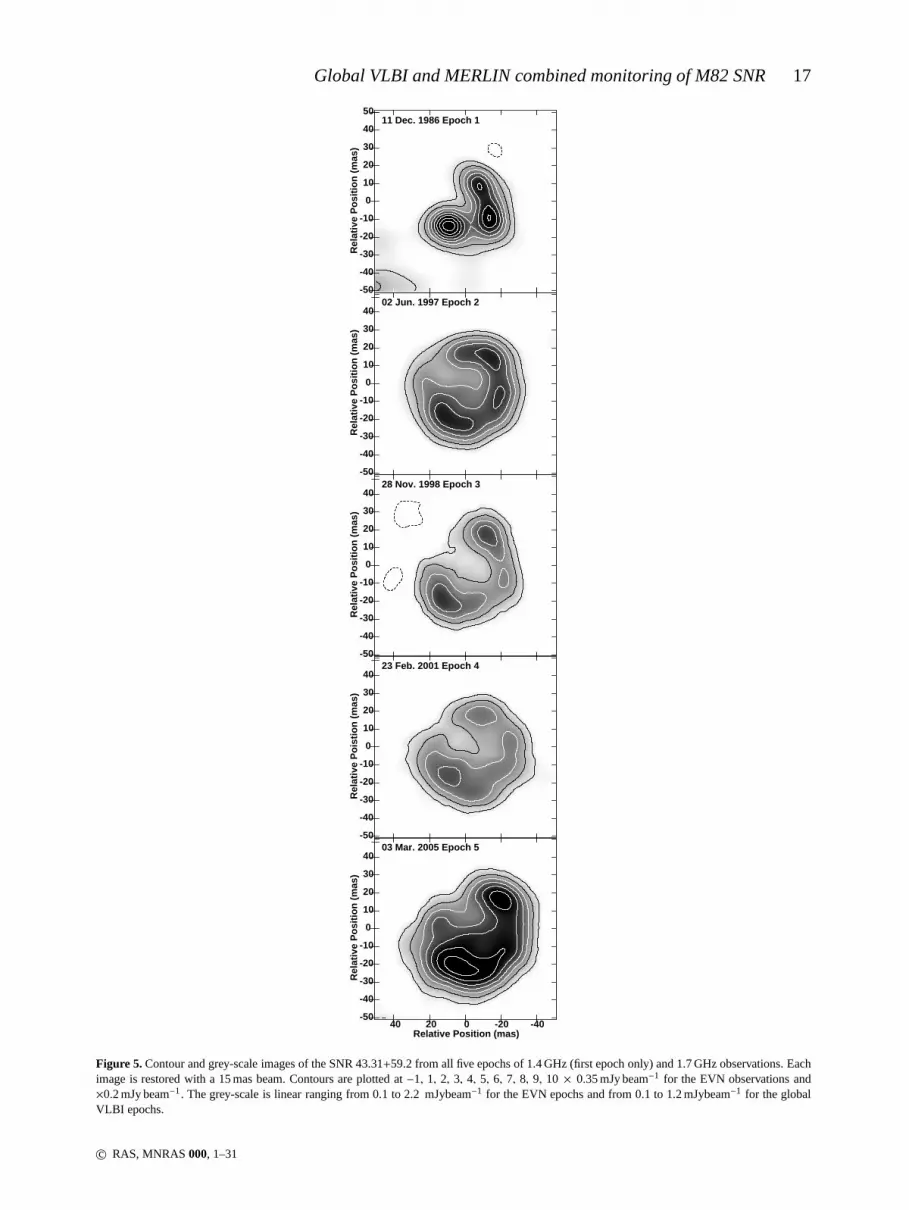
4.3 43.31+59.2
This SNR was first observed in images of M82 in 1972 (Kronberg &Wilkinson 1975), though has
remained unresolved in MERLIN and VLA studies of the galaxy.However, the EVN and global
VLBI observations discussed here completely resolve this source, showing a well-defined almost
complete shell structure (see Fig. 5). This source is an excellent example of a shell-like SNR and
provides an ideal opportunity to study the evolution of a relatively young, rapidly evolving remnant.
This will be discussed in detail in the following section.
4.3.1 The expansion of 43.31+59.2
In order to determine the size and therefore expansion of 43.31+59.2 theaips taskiring was used
to measure radial profiles (averaged in azimuth) of the source at each of the five epochs using the
15 mas resolution images. The centre of the source was determined as the point equidistant from
the positions of the peaks of radio emission in each image, which were measured using Gaussian
fitting. Radial profiles were then measured from each pixel in1 mas separations, in a 9×9 grid
centred on this point. As discussed in detail in Beswick et al. (2006), this process was performed
in order to assess the robustness of the use of the radial profiles to measure the shell radius when
offset from the centre. The radial flux density profiles producedfrom the annuli at the central point
are shown in Fig. 6 and the sizes measured from the peak and 50%of the peak, in each case, are
listed in Table 6. This process was also performed using the higher resolution 4 mas images for only
the global VLBI epochs, shown in Fig. 7. The errors listed in Table 6 represent the 1σ deviation of
the sizes as measured from all of the radial profiles in the grid. As can be seen in Table 6, measured
values of the radius-at-peak of these profiles is systematically slightly larger when measured from
the 4 mas resolution image than the 15 mas image. This effect results from the smoothing of the
c© RAS, MNRAS000, 1–31
Global VLBI and MERLIN combined monitoring of M82 SNR17
Rel
ativ
e P
osi
tio
n (
mas
)
11 Dec. 1986 Epoch 150
40
30
20
10
0
-10
-20
-30
-40
-50
Rel
ativ
e P
osi
tio
n (
mas
)
02 Jun. 1997 Epoch 240
30
20
10
0
-10
-20
-30
-40
-50
Rel
ativ
e P
osi
tio
n (
mas
)
28 Nov. 1998 Epoch 340
30
20
10
0
-10
-20
-30
-40
-50
Rel
ativ
e P
ois
tio
n (
mas
)
23 Feb. 2001 Epoch 440
30
20
10
0
-10
-20
-30
-40
-50
Rel
ativ
e P
osi
tio
n (
mas
)
Relative Position (mas)40 20 0 -20 -40
03 Mar. 2005 Epoch 540
30
20
10
0
-10
-20
-30
-40
-50
Figure 5. Contour and grey-scale images of the SNR 43.31+59.2 from all five epochs of 1.4 GHz (first epoch only) and 1.7 GHz observations. Eachimage is restored with a 15 mas beam. Contours are plotted at−1, 1, 2, 3, 4, 5, 6, 7, 8, 9, 10 × 0.35 mJy beam−1 for the EVN observations and×0.2 mJy beam−1. The grey-scale is linear ranging from 0.1 to 2.2 mJybeam−1 for the EVN epochs and from 0.1 to 1.2 mJybeam−1 for the globalVLBI epochs.
c© RAS, MNRAS000, 1–31

18 D. Fenech, R. Beswick, T. W. B. Muxlow, A. Pedlar and M. K. Argo
Table 6.Measured radii of the SNR 43.31+59.2 from the 15 mas and 4 mas resolution images, derived using the integrated radial profiles shown inFig. 6.
Epoch 4 mas resolution 15 mas resolutionRadius at peak Radius at peak Radius at 50% of peak
(mas) (pc) (mas) (pc) (mas) (pc)
1 – – 13.2± 1.0 0.205±0.016 22.0±0.9 0.343±0.0142 – – 19.2± 0.6 0.300±0.009 29.5±0.8 0.457±0.0123 21.5± 0.3 0.333±0.005 19.5± 0.9 0.302±0.014 30.1±0.9 0.467±0.0144 22.5± 0.3 0.349±0.005 20.0± 0.8 0.310±0.012 31.4±0.8 0.487±0.0125 24.5± 0.4 0.380±0.006 20.8± 0.9 0.322±0.014 33.5±0.9 0.519±0.014
data and hence the increased contribution of fainter more diffuse emission filling the SNR shell (see
Fig. 7 of Beswick et al. 2006). This effect is minimised if the size at 50% of the peak is used. It
should be noted that this has no systematic affect on the expansion velocities found using similarly
derived size measurements between epochs. The evolution ofthe small-scale structure visible at
full global VLBI resolutions makes identifying common knots of radio emission between epochs
difficult. As a consequence, it has not been possible to perform Gaussian fitting to the four knots
of radio emission initially identified by McDonald et al. (2001) to follow their expansion.
As can be seen in the contour images and from the information in Table 6, the radio shell of
43.31+59.2 visibly expands between the first and subsequent epochs. The azimuthally-averaged
radial profiles from the higher angular resolution (4 mas) images have increased in peak radius
from 22.5 mas to 24.5 mas between 2001 and 2005, corresponding to an angular expansion rate
of 0.50±0.12 mas yr−1. This results in an expansion velocity of 7600±1800 km s−1 . Determining
the expansion from the peak of the lower resolution (15 mas) radial profiles is more difficult but
using the measurements at 50% of the peak, also shows a marginally significant expansion for the
latest two epochs, consistent with measurements made on thehigher (4 mas) resolution images.
This is in good agreement with previous measurements from EVN (e.g. 9850±1500 km s−1 from
Pedlar et al. 1999) and global VLBI epochs, as well as the measurement from MERLIN 5 GHz
observations (Fenech et al. 2008).
4.3.2 Possible deceleration
A supernova remnant is expected to follow a size evolution described by (Huang et al. 1994)
D = ktm (1)
whereD is the shell diameter in pc,k is a constant,t is the age in years andm is the deceleration
parameter. Free expansion of a supernova remnant is described bym = 1 and values ofm < 1
c© RAS, MNRAS000, 1–31

Global VLBI and MERLIN combined monitoring of M82 SNR19
-0.2
0
0.2
0.4
0.6
0.8
1
1.2
5 10 15 20 25 30 35 40 45 50 55
0 0.1 0.2 0.3 0.4 0.5 0.6 0.7 0.8 0.9
Nor
mal
ised
flux
den
sity
Radius (mas)
Radius (pc)
20052001199819971986
0
0.2
0.4
0.6
0.8
1
0 5 10 15 20 25 30 35 40 45 50 55 60
0 0.1 0.2 0.3 0.4 0.5 0.6 0.7 0.8 0.9
Nor
mal
ised
flux
den
sity
Radius (mas)
Radius (pc)
1998
20052001
Figure 6. Azimuthally-averaged radial profiles of 43.31+59.2 at all epochs from 15 mas resolution images as well as from the global VLBI epochsat 4 mas resolution. The error-bars are 1σ errors on the measured flux density around the annulus at a specific radius as derived by IRING for each1 mas increment in radius It should be noted that these pointsare not independent as their separation is less than the beamsize.
50 100 150 200
Rel
ativ
e p
osi
tio
n (
mas
)
Relative position (mas)60
28 Nov. 1998 Epoch 3
40 20 0 -20 -40
60
40
20
0
-20
-40
-60
50 100 150 200
Relative position (mas)60
23 Feb. 2001 Epoch 4
40 20 0 -20 -40
50 100 150 200
Relative position (mas)60 40 20 0 -20 -40 -60
03 Mar. 2005 Epoch 5
Figure 7. Contour and grey-scale images of the SNR 43.31+59.2 from the global VLBI epochs, restored with a 4 mas beam. The images have beencontoured with multiples of−1, 1, 1.414, 2, 2.828, 4 and 5.657× 0.1 mJy beam−1 for the 1998 epoch and×0.08 mJy beam−1 for the other twoepochs.
describe various stages of the evolution of a SNR as the radioshell begins to decelerate as a result
of strong interaction with the material surrounding the SNR. When the SNR enters the Sedov phase
of the evolution, the expected deceleration parameter is∼0.45.
The size measurements for the SNR shell of 43.31+59.2 can be used to determine if it is still
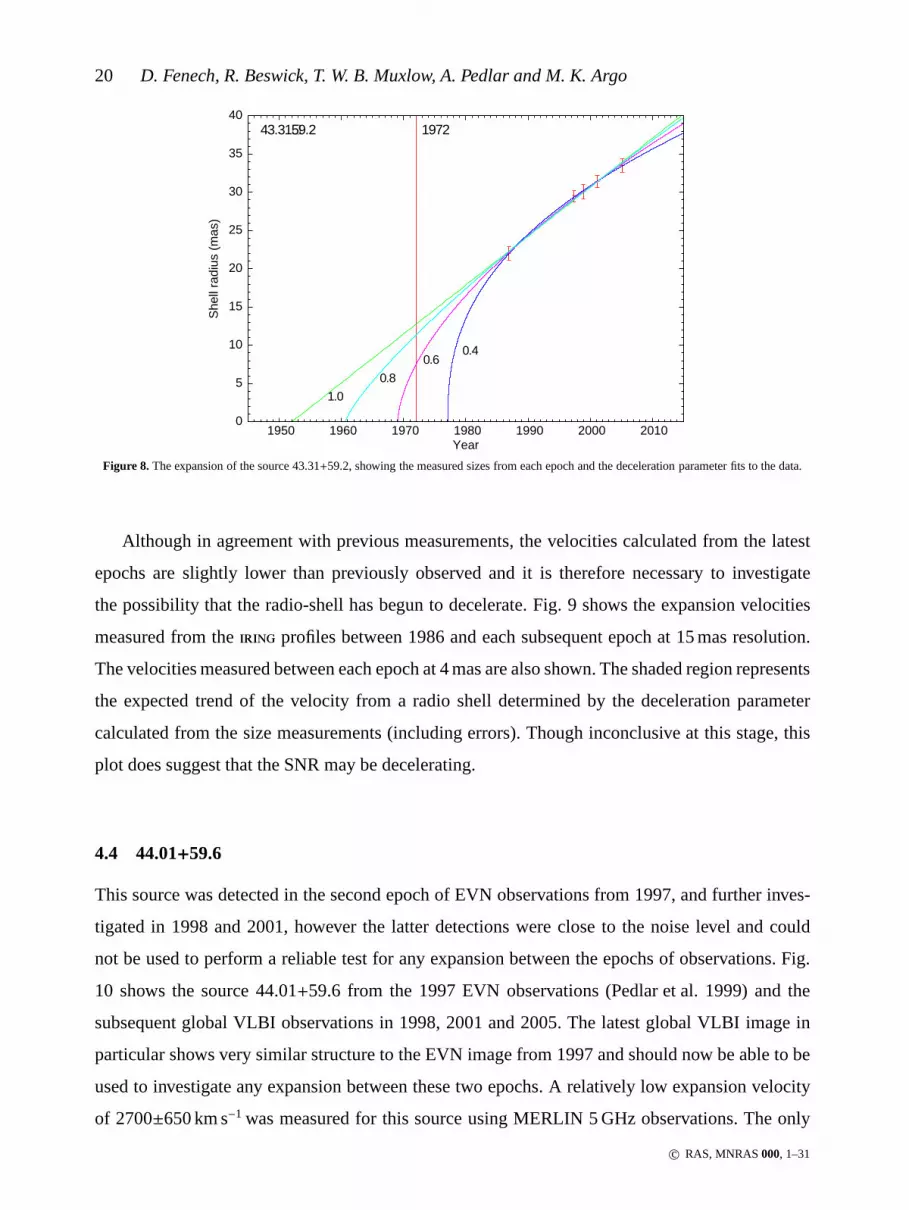
freely expanding or has begun to decelerate. Fig. 8 shows thesizes from Table 6 and a number of
possible deceleration parameters fitted to the data. The SNRwas first detected in observations of
M82 made in 1972 (Kronberg & Wilkinson 1975), providing a lower limit to the age of this source.
Incorporating this source age limit with the fit to the observed shell size provides a lower limit to
the deceleration parameter of 0.53±0.06. As can be seen from Fig. 8 it is still very difficult to dis-
tinguish between the possible values and hence whether the SNR has actually begun to decelerate.
Therefore, assuming the source to be in free expansion givesan approximate birth date of∼ 1952,
giving an upper limit to the age of 53 yrs in 2005.
c© RAS, MNRAS000, 1–31
20 D. Fenech, R. Beswick, T. W. B. Muxlow, A. Pedlar and M. K. Argo
0
5
10
15
20
25
30
35
40
1950 1960 1970 1980 1990 2000 2010
She
ll ra
dius
(m
as)
Year
0.40.6
0.81.0
197243.31+59.2
Figure 8. The expansion of the source 43.31+59.2, showing the measured sizes from each epoch and the deceleration parameter fits to the data.
Although in agreement with previous measurements, the velocities calculated from the latest
epochs are slightly lower than previously observed and it istherefore necessary to investigate
the possibility that the radio-shell has begun to decelerate. Fig. 9 shows the expansion velocities
measured from theiring profiles between 1986 and each subsequent epoch at 15 mas resolution.
The velocities measured between each epoch at 4 mas are also shown. The shaded region represents
the expected trend of the velocity from a radio shell determined by the deceleration parameter
calculated from the size measurements (including errors).Though inconclusive at this stage, this
plot does suggest that the SNR may be decelerating.
4.4 44.01+59.6
This source was detected in the second epoch of EVN observations from 1997, and further inves-
tigated in 1998 and 2001, however the latter detections wereclose to the noise level and could
not be used to perform a reliable test for any expansion between the epochs of observations. Fig.
10 shows the source 44.01+59.6 from the 1997 EVN observations (Pedlar et al. 1999) and the
subsequent global VLBI observations in 1998, 2001 and 2005.The latest global VLBI image in
particular shows very similar structure to the EVN image from 1997 and should now be able to be
used to investigate any expansion between these two epochs.A relatively low expansion velocity
of 2700±650 km s−1 was measured for this source using MERLIN 5 GHz observations. The only
c© RAS, MNRAS000, 1–31

Global VLBI and MERLIN combined monitoring of M82 SNR21
Vel
ocity
(km
/s)
Year
1.0
0.53
15 mas resolution (1986)MERLIN 5GHz (Fenech et al. 2008)
15 mas resolution (1998)4 mas resolution 2000
4000
6000
8000
10000
12000
1985 1990 1995 2000 2005 2010
Figure 9. Expansion velocities for the SNR 43.31+59.2. The vertical bar shows the error on the velocity measurement and the horizontal barrepresents the timerange between the size measurements used. Velocities from all available epochs have been included as well as the measurementfrom MERLIN 5 GHz observations (Fenech et al. 2008). The shaded region represents the trend in velocity determined by a deceleration parameterof 0.53±0.06. Velocities from 15 mas measurements between 1986 and each subsequent epoch have been plotted. The 15 mas equivalent velocitiesto those from the 4 mas sizes have also been included for direct comparison, these are from measurements between 1998 and each subsequent epoch.
Relative Position (mas)60 40 20 0 -20 -40 -60
602005.17
40
20
0
-20
-40
-60
Relative Position (mas)60 40 20 0 -20 -40 -60
602001.15
40
20
0
-20
-40
-60
Relative Position (mas)60 40 20 0 -20 -40 -60
601998.91
40
20
0
-20
-40
-60
Rel
ativ
e P
osi
tio
n (
mas
)
Relative Position (mas)120 100 80 60 40 20 0
801997.42
60
40
20
0
-20
-40
Figure 10.Contour and grey-scale images of the source 44.01+59.6 from the three global VLBI epochs, restored with a 15 masbeam. Contours areplotted at−1, 1, 2, 3, 4, 5, 6, 7, 8, 9, 10× 0.1 mJy beam−1.
lower measured velocity for a SNR in M82 is that of the peculiar source 41.95+57.5. These and
future global VLBI studies of this source will enable a more detailed analysis.
4.5 45.17+61.2
This source has a more complex structure (see Fig. 11) than anobvious shell-like morphology
of for example, the SNR 43.31+59.2 (see Fig. 5). The elongation of this source has led to its
identification as a possible partial shell of a larger SNR, and assuming this to be the case, mon-
itoring of the position of the peak of emission at 5 GHz has ledto an expansion velocity of
∼6000 km s−1 (Fenech et al. 2008). The use of self-calibration in the datareduction degrades the
absolute astrometry making calculation of the expansion inthis way using the global VLBI data
c© RAS, MNRAS000, 1–31

22 D. Fenech, R. Beswick, T. W. B. Muxlow, A. Pedlar and M. K. Argo
Relative Position (mas)60 40 20 0 -20 -40 -60
60 2005.17
40
20
0
-20
-40
-60
Relative Position (mas)60 40 20 0 -20 -40 -60
60 2001.15
40
20
0
-20
-40
-60
Relative Position (mas)60 40 20 0 -20 -40 -60
60 1998.91
40
20
0
-20
-40
-60Rel
ativ
e P
osi
tio
n (
mas
)
Relative Position (mas)-50 0 50
80 1997.4260
40
20
0
-20
-40
-60
Figure 11.Grey-scale and contour image of 45.17+65.3 from the EVN (1997) and global VLBI epochs, restored with an 15 mas beam.
Table 7.A comparison of the number of sources detected in these 1.7 GHz and the 5 GHz MERLIN observations presented in Fenech et al.(2008).
Source 1.7 GHz 5 GHz
SNR 31 37Hii regions 2 13Unknown 3 4
Total 36 55
Shell structures ∼20 ∼28
difficult. However, these EVN/global VLBI observations allow a more detailed study of the inter-
nal structure of this source, which has clearly evolved between 1997 and 2005, though its overall
morphology is still consistent with a partial shell interpretation.
5 THE PROPERTIES OF THE ISM IN M82
5.1 Ionised gas
SNR characteristically exhibit a steep spectrum followingthe power lawS ∝ να, whereα is the
spectral index. Hence, the SNR previously observed at 5 GHz (Muxlow et al. 1994; McDonald et al.
2002; Fenech et al. 2008) (and those below the detection threshold) are expected to be brighter at
1.7 GHz. However, not all of the known SNR detected at higher frequencies at similar resolutions
have been observed in these data. As the noise levels of the images presented here are greater than
for some of the previously published data at higher frequencies, there is an inherent selection effect
toward the brighter sources, hence fewer of the fainter SNR and Hii regions are detected.
In addition to the known thermal Hii regions, extensive regions of molecular and ionised
gas have been identified within the central kpc of M82 from the92 GHz continuum studies by
Carlstrom & Kronberg (1991), where the emission is dominated by free-free emission, as well as
via radio recombination line (RRL) observations (e.g. the 1.7 and 5 GHz RRLs in Seaquist, Bell & Bignell
1985, as well as those presented by Rodriguez-Rico et al. 2004). Low frequency observations of
c© RAS, MNRAS000, 1–31

Global VLBI and MERLIN combined monitoring of M82 SNR23
M82 (Wills et al. 1997; Noglik 1996), have shown the presenceof significant free-free absorp-
tion by ionised gas. The most striking example of this is the large ‘hole’ observed at 408 MHz
and 327 MHz, roughly centred on the source 41.95+57.5 and approximately 100 pc in diameter.
Wills et al. (1997) attribute this to free-free absorption from a large Hii region ionised by a cluster
of early-type stars.
Analysis of the spectral energy distributions (SEDs) have been performed for a number of the
sources within M82 such as those by Wills et al. (1997); McDonald et al. (2001); Allen & Kronberg
(1998); Allen (1999) and Tsai et al. (2009). These are used todistinguish the flat spectrum Hii re-
gions from the steep spectrum SNR. Such studies also includemodelling of the free-free absorption
seen for individual sources providing an estimate of the amount of ionised gas along the line of
sight via the emission measure.
The spectrum of a number of sources show low-frequency turnovers, in the case of SNR sug-
gesting free-free absorption, indicating that some of the SNR are located either within or even
behind the ionised gas. A total of nine of the known SNR withinM82 show a turnover in their
spectrum at frequencies greater than 1.7 GHz, eight of whichhave been detected in these obser-
vations and have reduced flux densities consistent with thispicture. Whilst not detected in these
observations, the SNR 43.81+62.8 has been detected at a number of frequencies and was suggested
to have a turnover frequency of∼2-3 GHz by Wills et al. (1997) via a spectral analysis incorporat-
ing observations from 0.408, 5 and 8.3 GHz (Wills et al. 1997;Kronberg et al. 1985; Huang et al.
1994). However, later observations reported in Allen (1999) at similar frequencies suggest the flux
density of this source to have increased. In addition, MERLIN observations at 1.4 GHz in 1995
(Wills, Pedlar & Muxlow 1998) give a flux density of 2.1±0.8 mJy, compared to an upper limit of
0.2 mJy beam−1 in these observations. It is therefore difficult to attribute the lack of detection of
this SNR to free-free absorption alone, as it may well be a result of its apparent variability.
There are twenty previously identified Hii regions in M82, all but two of which have been
shown to be or become optically thick above 1.7 GHz (see Willset al. 1997; McDonald et al. 2001;
Rodriguez-Rico et al. 2004). As a result, only two of the Hii regions expected to be in the optically
thick regime have been detected in the combined 1.7 GHz observations, the remainder having pre-
dicted flux densities below the image noise level. The Hii regions 45.63+66.9 and 43.21+61.3 iden-
tified by Rodriguez-Rico et al. (2004), have a spectral indexof ∼-0.04 between 8.3 and 43 GHz.
The lack of detection here would suggest that these sources also become optically thick at a fre-
quency greater than 1.7 GHz. The low-resolution image produced from the MERLIN-only data
c© RAS, MNRAS000, 1–31
24 D. Fenech, R. Beswick, T. W. B. Muxlow, A. Pedlar and M. K. Argo
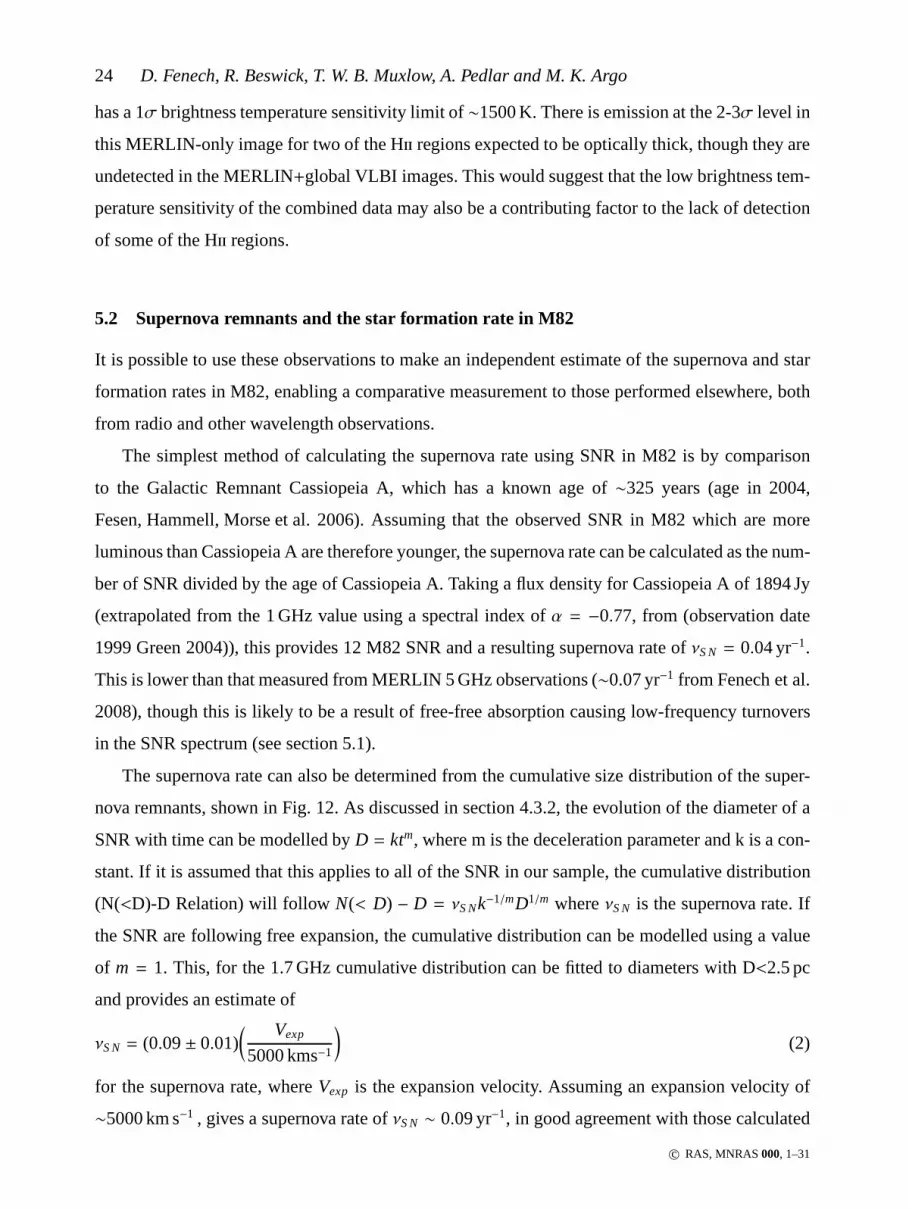
has a 1σ brightness temperature sensitivity limit of∼1500 K. There is emission at the 2-3σ level in
this MERLIN-only image for two of the Hii regions expected to be optically thick, though they are
undetected in the MERLIN+global VLBI images. This would suggest that the low brightness tem-
perature sensitivity of the combined data may also be a contributing factor to the lack of detection
of some of the Hii regions.
5.2 Supernova remnants and the star formation rate in M82
It is possible to use these observations to make an independent estimate of the supernova and star
formation rates in M82, enabling a comparative measurementto those performed elsewhere, both
from radio and other wavelength observations.
The simplest method of calculating the supernova rate usingSNR in M82 is by comparison
to the Galactic Remnant Cassiopeia A, which has a known age of∼325 years (age in 2004,
Fesen, Hammell, Morse et al. 2006). Assuming that the observed SNR in M82 which are more
luminous than Cassiopeia A are therefore younger, the supernova rate can be calculated as the num-
ber of SNR divided by the age of Cassiopeia A. Taking a flux density for Cassiopeia A of 1894 Jy
(extrapolated from the 1 GHz value using a spectral index ofα = −0.77, from (observation date
1999 Green 2004)), this provides 12 M82 SNR and a resulting supernova rate ofνS N = 0.04 yr−1.
This is lower than that measured from MERLIN 5 GHz observations (∼0.07 yr−1 from Fenech et al.
2008), though this is likely to be a result of free-free absorption causing low-frequency turnovers
in the SNR spectrum (see section 5.1).
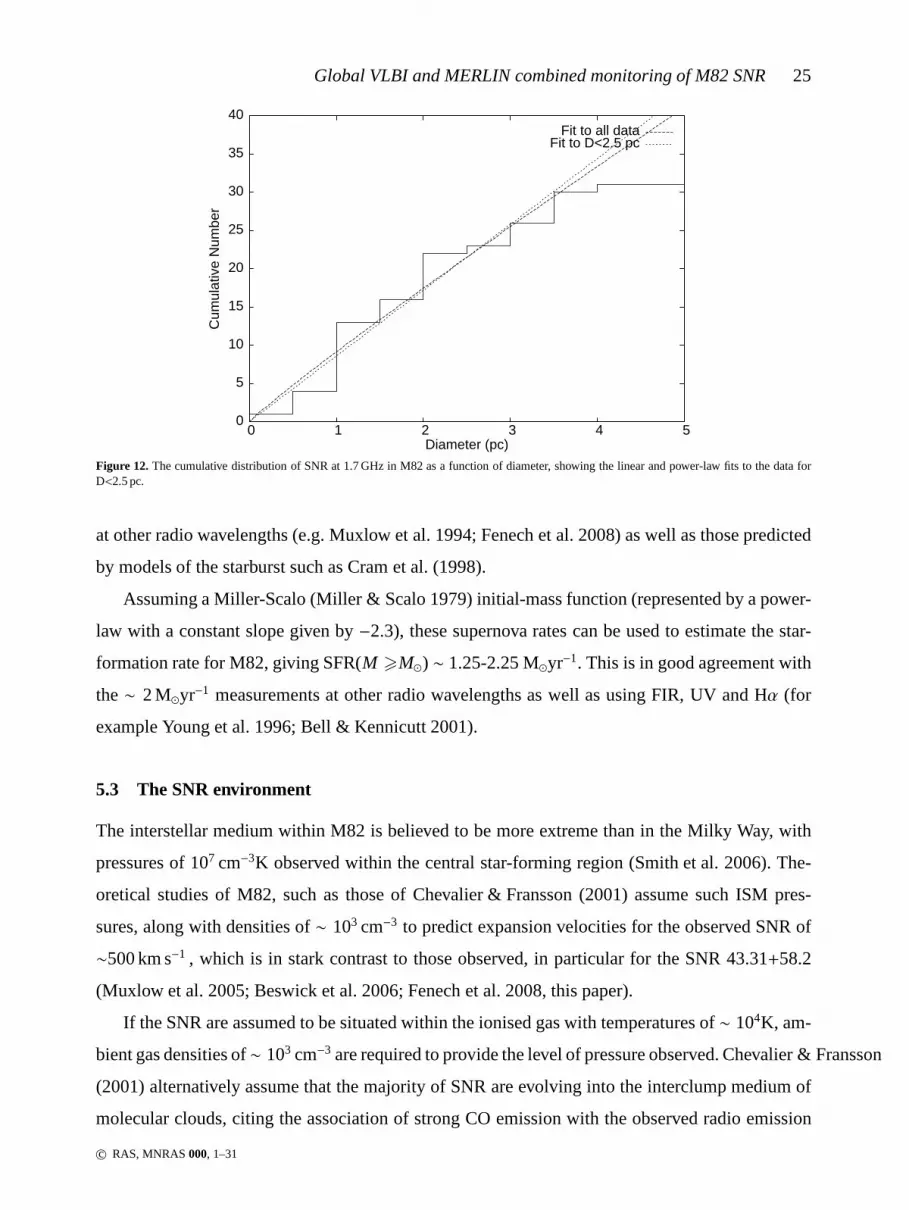
The supernova rate can also be determined from the cumulative size distribution of the super-
nova remnants, shown in Fig. 12. As discussed in section 4.3.2, the evolution of the diameter of a
SNR with time can be modelled byD = ktm, where m is the deceleration parameter and k is a con-
stant. If it is assumed that this applies to all of the SNR in our sample, the cumulative distribution
(N(<D)-D Relation) will follow N(< D) − D = νS Nk−1/mD1/m whereνS N is the supernova rate. If
the SNR are following free expansion, the cumulative distribution can be modelled using a value
of m = 1. This, for the 1.7 GHz cumulative distribution can be fittedto diameters with D<2.5 pc
and provides an estimate of
νS N = (0.09± 0.01)( Vexp
5000 kms−1
)
(2)
for the supernova rate, whereVexp is the expansion velocity. Assuming an expansion velocity of
∼5000 km s−1 , gives a supernova rate ofνS N ∼ 0.09 yr−1, in good agreement with those calculated
c© RAS, MNRAS000, 1–31
Global VLBI and MERLIN combined monitoring of M82 SNR25
0
5
10
15
20
25
30
35
40
0 1 2 3 4 5
Cum
ulat
ive
Num
ber
Diameter (pc)
Fit to all dataFit to D<2.5 pc
Figure 12. The cumulative distribution of SNR at 1.7 GHz in M82 as a function of diameter, showing the linear and power-law fits to the data forD<2.5 pc.
at other radio wavelengths (e.g. Muxlow et al. 1994; Fenech et al. 2008) as well as those predicted
by models of the starburst such as Cram et al. (1998).
Assuming a Miller-Scalo (Miller & Scalo 1979) initial-massfunction (represented by a power-
law with a constant slope given by−2.3), these supernova rates can be used to estimate the star-
formation rate for M82, giving SFR(M >M⊙) ∼ 1.25-2.25 M⊙yr−1. This is in good agreement with
the∼ 2 M⊙yr−1 measurements at other radio wavelengths as well as using FIR, UV and Hα (for
example Young et al. 1996; Bell & Kennicutt 2001).
5.3 The SNR environment
The interstellar medium within M82 is believed to be more extreme than in the Milky Way, with
pressures of 107 cm−3K observed within the central star-forming region (Smith etal. 2006). The-
oretical studies of M82, such as those of Chevalier & Fransson (2001) assume such ISM pres-
sures, along with densities of∼ 103 cm−3 to predict expansion velocities for the observed SNR of
∼500 km s−1 , which is in stark contrast to those observed, in particularfor the SNR 43.31+58.2
(Muxlow et al. 2005; Beswick et al. 2006; Fenech et al. 2008, this paper).
If the SNR are assumed to be situated within the ionised gas with temperatures of∼ 104K, am-
bient gas densities of∼ 103 cm−3 are required to provide the level of pressure observed. Chevalier & Fransson
(2001) alternatively assume that the majority of SNR are evolving into the interclump medium of
molecular clouds, citing the association of strong CO emission with the observed radio emission
c© RAS, MNRAS000, 1–31
26 D. Fenech, R. Beswick, T. W. B. Muxlow, A. Pedlar and M. K. Argo
as a good indication of this. However, Weiß et al. (2001) conclude that most of the CO emission
from the central regions of M82 arises from a warm, low density interclump medium with ki-
netic temperatures of∼150 K and densities∼ 103 cm−3 in agreement with previous studies such as
Mao et al. (2000). More recent investigations using formaldehyde line transitions to independently
constrain the properties of the dense molecular gas (e.g. M¨uhle et al. 2007, 2009) find kinetic gas
temperatures of∼200 K and densities of∼ 7× 103 cm−3 in strong agreement with the CO studies.
Such temperatures and gas densities imply pressures of∼ 105 − 106 cm−3 K, between one and two
orders of magnitude lower than those assumed by Chevalier & Fransson (2001).
Following the free expansion phase, a supernova remnant is expected to enter the Sedov phase
of its evolution when the mass of swept-up material becomes equivalent to the mass of the ejecta.
For an SNR, this is expected to occur whilst interacting witha constant density ISM, at a radius
rs ≃ 4.1× (Me j/n0)1/3pc, whereMe j is the ejecta mass in units of 10 M⊙ andn0 is the ISM density
in cm−3. In the case of 43.31+59.2, this stage of evolution has not yet been reached (as shown in
section 4.3.1), hence an upper limit to the surrounding density can be set of6 250 cm−3, for an
ejecta mass of 5 M⊙. This would suggest that for the required pressures, 43.31+59.2 is not likely
to be situated within the ionised gas, a conclusion supported by the lack of low frequency turnover
observed in its spectra (Wills et al. 1997; Tsai et al. 2009).
5.3.1 A wind-blown bubble?
It has previously been suggested that the low density environment that 43.31+59.2 appears to be
experiencing, may be a result of a wind-blown bubble from themass-loss of the progenitor star
(Beswick et al. 2006).
The SNR in M82 are expected to be the result of core-collapse supernova events of mas-
sive progenitors (typically> 8M⊙). Most stars with masses> 11M⊙will become red supergiants
(RSG) in their final stages of evolution and are believed to bethe progenitors of the major-
ity of core-collapse supernovae. Such stars (typically OB stars), undergo mass-loss during their
main-sequence phase with expected terminal velocities of. 3000 km s−1 and rates of 10−6 − 10−5
(e.g. Vink, de Koter & Lamers 2000; Muller & Vink 2008). The subsequent mass-loss during the
red-supergiant phase is expected to be slower and more dense, with typical mass-loss rates of
∼ 10−5 − 10−4M⊙yr−1 and wind velocities of<100 km s−1 (e.g. Schaller et al. 1992; Dwarkadas
2005). Hence prior to the eventual supernova explosion, there will be a complex circumstellar
c© RAS, MNRAS000, 1–31

Global VLBI and MERLIN combined monitoring of M82 SNR27
environment consisting of stellar-wind material from various evolutionary stages as well as poten-
tially a collapsed Hii region.
Modelling of the pre-supernova circumstellar environmentfor red-supergiants indicates that
there will be a region of RSG wind close to the progenitor witha density profile given byρRSG∼
5×10⁻²⁰M−4r−217ν−11 , reaching distances of a few parsecs (van Marle, Langer & Garcıa-Segura 2004;
Dwarkadas 2005; Perez-Rendon, Garcia-Segura & Langer 2009). This will be followed by a lower,
roughly constant density region, created by the fast main-sequence wind driving a shocked shell
into the surrounding medium. This is the wind-blown bubble and reaches distances of a few
tens of parsecs from the progenitor star (see e.g. van Marle et al. 2004, 2006; Dwarkadas 2005;
Perez-Rendon et al. 2009, and references therein).
Given the sizes of the respective regions and the measured radius of< 1 pc for 43.31+59.2,
this would imply that this source would still be expanding into the remaining RSG wind. However
the density gradient would produce a variable flux density, which is not observed. Kronberg et al.
(2000) showed the flux density of 43.31+59.2 and 23 other SNR to be stable over a 10 year period.
The majority of these models assume an interstellar environment more typical of the Galaxy
than for a starburst such as M82 and it is therefore possible that the increased pressures found in
M82 will have a stronger effect on the development of any wind-blown bubble surroundingthe
progenitor star (e.g. van Marle et al. 2006). The most likelyoutcome of which would be a reduced
propagation of the various stages of mass-loss into any surrounding Hii region and the ISM. Hence
it is possible that for the case of 43.31+59.2, the expanding remnant has already entered the lower-
density environment of a wind-blown bubble, from which it isyet to emerge.
The interstellar medium within M82 is clearly very complex and whilst this possibility may
be argued for a number of other SNR, it may well be a scenario that will not fit all. For example,
44.01+59.6 is comparable in size to 43.31+59.2, though has a measured expansion velocity signif-
icantly lower, at∼2700 km s−1 (Fenech et al. 2008), suggesting it’s experiencing a higherdensity
environment. A similar point can be made for 41.95+57.5, if it is assumed that it does in fact
represent a comparable SNR scenario.
Conversely, sources such as 43.18+58.2 have been shown to be expanding at∼10500 km s−1 .
This is close to that of the newly discovered radio supernovaSN2008iz, which has an aver-
age expansion over the first year of∼11000 km s−1 (assuming a distance to M82 of 3.6 Mpc)
(Brunthaler et al. 2009a,b, 2010). This implies 43.18+58.2 may still be in free-expansion at a size
c© RAS, MNRAS000, 1–31

28 D. Fenech, R. Beswick, T. W. B. Muxlow, A. Pedlar and M. K. Argo
of ∼2 pc, even though its spectra shows a low-frequency turnover, suggesting it could be situated
within or behind the dense ionised gas.
6 CONCLUSIONS
The relatively young SNR in M82, such as 43.31+59.2, are believed to have ages measured in
decades, situating them between the young radio supernovaesuch as SN 1979c, and the more
evolved SNR within our own Galaxy (e.g. Cass A) which are a fewhundred years old. Hence,
detailed studies of the SNR in M82 are vital to our understanding of the evolution of SNR in
general and in particular, to their early stages of development. The latest global VLBI observations
of M82 presented here, have been used to monitor the expansion of the young SNR 43.31+59.2
over a 19 year timeline and show the detailed structure of thesources 44.01+59.6 and 45.17+61.2
and 41.95+57.5.
(i) The expansion velocity of the SNR 43.31+59.2, has been measured between 2001 and 2005
is 7600±1800 km s−1 . This confirms the high expansion velocity of this SNR measured using pre-
vious epochs by Pedlar et al. (1999); McDonald et al. (2001);Beswick et al. (2006)
(ii) Size measurements at each epoch, have been used to studythe possible deceleration of
43.31+59.2. Including the 1972 observation of (Kronberg & Wilkinson 1975), a lower limit to the
deceleration parameter of 0.53±0.06 can be fitted to these measurements.
(iii) The SNR 44.01+59.6 has been imaged at each of the global VLBI epochs at 15 masreso-
lution. The latest epoch shows a very similar structure to that originally observed by Pedlar et al.
(1999) in 1997.
(iv) The structure of the source 45.17+61.2 has been revealed using the global VLBI 2005
observations confirming its elongated structure.
In addition the first combined 1.7 GHz global VLBI and MERLIN observations of M82 have
provided detailed images of the individual sources within M82 at this frequency. This has shown
many of the SNR to have clear shell or partial shell structures.
(i) A total of 32 SNR have been detected in these observationswith sizes ranging from 0.4 to
4.0 pc, with a mean diameter of 2.1 pc as well as two of the knownHii regions.
(ii) A possible previously unknown SNR (45.88+69.7) has been detected, with a potential ring-
like structure and diameter∼5 pc.
c© RAS, MNRAS000, 1–31

Global VLBI and MERLIN combined monitoring of M82 SNR29
(iii) The supernova rate has been estimated from these combined observations using several
methods which result in measurements ofνS N ∼ 0.04 − 0.09. Use of these supernova rates to
calculate the SFR for M82 gives values of SFR(M > 5 M⊙) ∼ 1.25− 2.25 M⊙yr−1 in agreement
with measurements from other wavelengths.
ACKNOWLEDGMENTS
MERLIN is a national facility operated by The University of Manchester on behalf of the Science
and Technology Facilities Council (STFC). The VLBA is operated by the National Radio Astron-
omy Observatory which is a facility of the National Science Foundation operated under cooperative
agreement by Associated Universities Inc. The European VLBI Network is a joint facility of the
European, Chinese, South African and other radio astronomyinstitutes funded by their national
research councils.parseltongue was developed in the context of the ALBUS project, which has
benefited from research funding from the European Community’s sixth Framework Programme
under RadioNet R113CT 2003 5058187. We would like to thank the anonymous referee for the
many helpful comments and suggestions that have helped improve this paper.
REFERENCES
Allen M. L., 1999, PhD thesis, Univ. of Toronto, Canada
Allen M. L., Kronberg P. P., 1998, ApJ, 502, 218
Bartel N., Bietenholz M. F., 2003, ApJ, 591, 301
Bash F. N., 1968, ApJS, 16, 373
Bell E. F., Kennicutt Jr. R. C., 2001, ApJ, 548, 681
Beswick R. J., Riley J. D., Marti-Vidal I. et. al., 2006, MNRAS, 369, 1221
Brunthaler A., Menten K. M., Reid M. J., Henkel C., Bower G. C., Falcke H., 2009, A&A, 499,
L17
Brunthaler A., Menten K. M., Henkel C., Reid M. J., Bower G. C., Falcke H., Green D. W. E.,
2009, Central Bureau Electronic Telegrams, 1803, 1
Brunthaler A., Marti-Vidal I., Menten K. M., et. al., 2010, A&A accepted, arXiv:1003.4665
Burbidge E. M., Burbidge G. R., Rubin V. C., 1964, ApJ, 140, 942
Carlstrom J. E., Kronberg P. P., 1991, ApJ, 366, 422
Chevalier R. A., Fransson C., 2001, ApJ, 558, L27
c© RAS, MNRAS000, 1–31

30 D. Fenech, R. Beswick, T. W. B. Muxlow, A. Pedlar and M. K. Argo
Cram L., Hopkins A., Mobasher B., Rowan-Robinson M., 1998, ApJ, 507, 155
Dwarkadas V. V., 2005, ApJ, 630, 892
Fenech D., 2007, PhD thesis, Jodrell Bank Observatory, Univ. of Manchester, UK
Fenech D. M., Muxlow T. W. B., Beswick R. J., Pedlar A., Argo M.K., 2008, MNRAS, 391,
1384
Fesen R. A., Hammell M. C., Morse J. et al., 2006, ApJ, 645, 283
Green D. A., 2004, Bull. Astron. Soc. India, 32, 335
Green D. A., Reynolds S. P., Borkowski K. J., Hwang U., HarrusI., Petre R., 2008, MNRAS,
387, L54
Hargrave P. J., 1974, MNRAS, 168, 491
Hogbom J. A., 1974, A&AS, 15, 417
Huang Z. P., Thuan T. X., Chevalier R. A., Condon J. J., Yin Q. F., 1994, ApJ, 424, 114
Kronberg P. P., Biermann P., Schwab F. R., 1985, ApJ, 291, 693
Kronberg P. P., Sramek R. A., Birk G. T., Dufton Q. W., Clarke T. E., Allen M. L., 2000, ApJ,
535, 706
Kronberg P. P., Wilkinson P. N., 1975, ApJ, 200, 430
Lenc E., Tingay S. J., 2006, AJ, 132, 1333
Mao R. Q., Henkel C., Schulz A., Zielinsky M., Mauersberger R., Storzer H., Wilson T. L.,
Gensheimer P., 2000, A&A, 358, 433
Marcaide J. M., Martı-Vidal I., Alberdi A., et al. 2009, A&A, 505, 927
McDonald A. R., Muxlow T. W. B., Pedlar A., Garrett M. A., Wills K. A., Garrington S. T.,
Diamond P. J., Wilkinson P. N., 2001, MNRAS, 322, 100
McDonald A. R., Muxlow T. W. B., Wills K. A., Pedlar A., Beswick R. J., 2002, MNRAS, 334,
912
Miller G. E., Scalo J. M., 1979, ApJS, 41, 513
Muhle S., Seaquist E. R., Henkel C., 2007, ApJ, 671, 1579
Muhle S., Seaquist E. R., Henkel C., 2009, The 9th European VLBI Network Symposium: The
Role of VLBI in the Golden Age for Radio Astronomy and EVN Users Meeting, PoS(IX EVN
Symposium)032
Muller P. E., Vink J. S., 2008, A&A, 492, 493
Muxlow T. W. B., Pedlar A., Beswick R. J., Argo M. K., O’Brien T. J., Fenech D., Trotman W.,
2005, Mem. Soc. Astron. Ital., 76, 586
c© RAS, MNRAS000, 1–31

Global VLBI and MERLIN combined monitoring of M82 SNR31
Muxlow T. W. B., Pedlar A., Wilkinson P. N., Axon D. J., Sanders E. M., de Bruyn A. G., 1994,
MNRAS, 266, 455
Noglik J. B., 1996, PhD thesis, Univ. of Manchester, U.K.
Ohyama Y., Taniguchi Y., Iye M., et al. 2002, PASJ, 54, 891
Parra R., Conway J. E., Diamond P., Thrall H., Lonsdale C. J.,Lonsdale C. J., Smith H. E. 2007,
ApJ, 659, 314
Pedlar A., Muxlow T. W. B., Garrett M. A., Diamond P., Wills K.A., Wilkinson P. N., Alef W.,
1999, MNRAS, 307, 761
Perez-Rendon B., Garcia-Segura G., Langer N., 2009, A&A, 506, 1249
Rodriguez-Rico C. A., Viallefond F., Zhao J.-H., Goss W. M.,Anantharamaiah K. R., 2004, ApJ,
616, 783
Schaller G., Schaerer D., Meynet G., Maeder A., 1992, A&AS, 96, 269
Seaquist E. R., Bell M. B., Bignell R. C., 1985, ApJ, 294, 546
Smith L. J., Westmoquette M. S., Gallagher J. S., O’Connell R. W., Rosario D. J., de Grijs R.,
2006, MNRAS, 370, 513
Tsai C.-W., Turner J. L., Beck S. C., Meier D. S., Ho P. T. P., 2009, AJ, 137, 4655
Unger S. W., Pedlar A., Axon D. J., Wilkinson P. N., Appleton P. N., 1984, MNRAS, 211, 783
van Marle A. J., Langer N., Achterberg A., Garcıa-Segura G., 2006, A&A, 460, 105
van Marle A. J., Langer N., Garcıa-Segura G., 2004, in Garcia-Segura G., Tenorio-Tagle G.,
Franco J., Yorke H. W., eds, Revista Mexicana de Astronomia yAstrofisica Conference Series
Vol. 22, Wind-Blown Bubbles around Massive Stars. The effects of stellar wind and photo-
ionization on the circumstellar Medium. pp 136–139
Vink J. S., de Koter A., Lamers H. J. G. L. M., 2000, A&A, 362, 295
Weiß A., Neininger N., Huttemeister S., Klein U., 2001, A&A, 365, 571
Wills K. A., Pedlar A., Muxlow T. W. B., 1998, MNRAS, 298, 347
Wills K. A., Pedlar A., Muxlow T. W. B., Wilkinson P. N., 1997,MNRAS, 291, 517
Young J. S., Allen L., Kenney J. D. P., Lesser A., Rownd B., 1996, AJ, 112, 1903
c© RAS, MNRAS000, 1–31