whence the red panda?
TRANSCRIPT

Whence the Red Panda?
Molecular Phylogenetics and EvolutionVol. 17, No. 2, November, pp. 190–199, 2000doi:10.1006/mpev.2000.0819, available online at http://www.idealibrary.com on
John J. Flynn,* Michael A. Nedbal,* ,1 Jerry W. Dragoo,† and Rodney L. Honeycutt‡
*Department of Geology, The Field Museum, Roosevelt Road at Lake Shore Drive, Chicago, Illinois 60605; †Museum of SouthwesternBiology, Department of Biology, University of New Mexico, Albuquerque, New Mexico 87131; and ‡Department of Wildlife
and Fisheries Sciences, Texas A&M University, College Station, Texas 77843-2258
Received October 19, 1999; revised April 7, 2000
sets) conclusions about phylogenetic relationshipsand taxonomy.
The evolutionary history of the red panda (Ailurusfulgens) plays a pivotal role in the higher-level phy-logeny of the “bear-like” arctoid carnivoran mam-mals. Characters from morphology and moleculeshave provided inconsistent evidence for placementof the red panda. Whereas it certainly is an arctoid,there has been major controversy about whether itshould be placed with the bears (ursids), ursids pluspinnipeds (seals, sea lions, walrus), raccoons (procy-onids), musteloids (raccoons plus weasels, skunks,otters, and badgers [mustelids]), or as a monotypiclineage of uncertain phylogenetic affinities. Nucleo-tide sequence data from three mitochondrial genesand one nuclear intron were analyzed, with morecomplete taxonomic sampling of relevant taxa (arc-toids) than previously available in analyses of pri-mary molecular data, to clarify the phylogenetic re-lationships of the red panda to other arctoidcarnivorans. This study provides detailed phyloge-netic analyses (both parsimony and maximum-like-lihood) of primary character data for arctoid car-nivorans, including bootstrap and decay indices forall arctoid nodes, and three statistical tests of alter-native phylogenetic hypotheses for the placement ofthe red panda. Combined phylogenetic analyses re-ject the hypotheses that the red panda is mostclosely related to the bears (ursids) or to the rac-coons (procyonids). Rather, evidence from nucleo-tide sequences strongly support placement of thered panda within a broad Musteloidea (sensu lato)clade, including three major lineages (the redpanda, the skunks [mephitids], and a clearly mono-phyletic clade of procyonids plus mustelids [sensustricto, excluding skunks]). Within the Musteloidea,interrelationships of the three major lineages areunclear and probably are best considered an unre-solved trichotomy. These data provide compellingevidence for the relationships of the red panda anddemonstrate that small taxonomic sample sizes canresult in misleading or possibly erroneous (based onprior modeling, as well as conflict between the re-sults of our analyses of less and more complete data
1 Present address: P.O. Box 637, Maple Valley, WA 98038.
1055-7903/00 $35.00Copyright © 2000 by Academic PressAll rights of reproduction in any form reserved.
190
© 2000 Academic Press
INTRODUCTION
Relationships among arctoid carnivorans have beendifficult to resolve. In particular, the pandas have takencenter stage because of their peculiar specializations andcontroversy regarding their evolutionary relationships.The highly endangered, high-profile giant panda (Ailu-ropoda melanoleuca) has dominated many prior phyloge-netic discussions and analyses, but in fact its position (asa bear, representing the sister lineage to all other livingursids) has been well documented for some time (Davis,1964; see Flynn et al., 1988 and Wyss and Flynn, 1993).The most puzzling question in panda relations, the evo-lutionary position of the red or lesser panda (Ailurusfulgens), has yet to be resolved. This lack of resolution isdue primarily to its unique morphology and peculiar spe-cializations to herbivory (e.g., complexly elaborated cheekteeth, especially the premolars, with P2-3 morphologyunique among carnivorans; small extra “thumb,” a radialsesamoid, on the hand; distinctive red fur; cranial modi-fications, including very large zygomatic arch and tem-poral fossa widths; powerful jaw apparatus, includingvery robust jaw cross-sectional area, tall coronoid pro-cess, and highest moment arm of the temporalis muscleamong living carnivorans [Radinsky, 1981]). In addition,the red panda retains some primitive characteristics ofthe basicranium and ear region, features that havebeen modified in potential close relatives. Unfortunately,the red panda has not been included in many molecularstudies.
Geoffroy-Saint-Hilaire and Cuvier (1825) first de-scribed the red panda as closely resembling a raccoon(procyonid), although they gave it the name Ailurusbased on its superficial likeness to that of the domesticcat. Subsequent morphological and molecular evidencehas supported several phylogenetic hypotheses, includ-ing (1) related to the ursids (or ursids plus pinnipeds;Sarich, 1973; Wozencraft, 1989; Wyss and Flynn, 1993;Vrana et al., 1994); (2) related to the procyonids (Greg-

ory, 1936; Thenius, 1979; O’Brien et al., 1985; Goldman
1rs11u1(eW
ccticnrpss
am(scicwglsbpst
D
cBcimD(wcwcv
published data and GenBank accession numbers aresrtocrw
P
(eyPmwaasso(rcctbdrtioltfqatmstihtpfmatnumra(
191WHENCE THE RED PANDA?
et al., 1989; Wayne et al., 1989; Slattery and O’Brien,995; questionably, Flynn et al., 1988; Wang, 1997); (3)elated to the musteloids, including procyonids plusome or all “mustelids” (see below; Schmidt-Kittler,981; Flynn and Nedbal, 1998; Bininda-Emonds et al.,999); (4) sister taxon to the giant panda either withncertainty about their broader relationships (Segall,943) or with the panda clade as sister taxon to ursidsGinsburg, 1982); and (5) an unresolved monotypic lin-age within the arctoids (Ledje and Arnason, 1996a,b;olsan, 1993).Bininda-Emonds et al. (1999) included analysis of all
arnivoran species, but developed their phylogeny byompositing tree topologies of prior studies (via “super-ree” consensus methods of “matrix representation us-ng parsimony analysis”), rather than from primaryharacter data. In a study focused on higher-level car-ivoran phylogeny rather than the placement of Ailu-us, Flynn and Nedbal (1998) determined that the redanda is sister taxon to Musteloidea (sensu stricto,.s.), based on analysis of a less complete taxonomic (nokunks) and molecular character (no 16S rRNA) data set.
In this study, we expanded sampling of both taxand characters beyond all previous analyses of primaryolecular phylogenetic data by including sequences
3450 nucleotides; all confirmed by double-strandedequencing) from three mitochondrial genes (cyto-hrome b, 12S rRNA, and 16S rRNA) and one nuclearntron (transthyretin intron I) for 17 carnivoran spe-ies representing all caniform families, including aide diversity of arctoids, and several feliform out-roups. We also performed extensive analyses of phy-ogeny robustness (parsimony and likelihood boot-trap, parsimony decay indices, likelihood ratio tests ofranch lengths) and tests of statistical support for theroposed Ailurus phylogeny or alternatives (Wilcoxonigned rank, Kishino–Hasegawa, compare-2 permuta-ion).
METHODS
ata Collection
Nucleotide sequence data used in this study wereompiled from previously published studies and Gen-ank accessions or sequenced for 16S rRNA (specta-
led bear, giant panda, red panda) and transthyretinntron I (spotted skunk, striped skunk). Sequencing
ethods were similar to those previously described inragoo and Honeycutt (1997) and Flynn and Nedbal
1998). When sequence data from the same speciesere not available for all genes, sequences from very
losely related species (e.g., same genus or subfamily)ere used as proxies, assuming that variation within
losely related taxa was insignificant compared to theariation among the higher-level study taxa. Sources of
hown in Table 1. The composite (concatenated; afteremoval of ambiguously aligned nucleotides) nucleo-ide sequence data comprised a total of 3450 bp (851 bpf nuclear transthyretin intron I, 1140 bp of mt cyto-hrome b, 964 bp of mt 12S rRNA, 495 bp of mt 16SRNA) for 17 carnivoran taxa (15 caniforms, 13 ofhich were arctoids, and 2 feliform outgroups).
hylogenetic Analyses
New sequences were joined to existing alignmentsArnason et al., 1995; Dragoo and Honeycutt, 1997) byye. Ambiguous regions were excluded from the anal-ses. Phylogenetic analyses were conducted withAUP 4.0d59 (Swofford, 1998). For maximum-parsi-ony analyses, the following character weightingsere used: (1) transversion substitutions only for 12Snd 16S rRNA genes, (2) the conservative weightingpproach (tranversions only at 3rd positions, all sub-titutions at 2nd positions, all substitutions at 1st po-itions with changes involving leucine recoded as a “Y”)f Irwin et al. (1991) for cytochrome b sequences, and3) equally weighted substitutions within the transthy-etin intron, following Flynn and Nedbal (1998). In thease of transthyretin, transition/transversion and nu-leotide position biases are not applicable to this puta-ively noncoding region, and prior analyses of aroader suite of carnivorans showed no tree topologyifferences between equal-weighting parsimony andate-heterogeneous likelihood analyses of transthyre-in data. Incorporating among-site rate heterogeneityn likelihood analyses of the entire molecular data setf the current study yielded no conflict (only less reso-ution, in the likelihood tree) in the comparative treeopologies. Maximum-likelihood analyses were per-ormed using a general time-reversible model of se-uence evolution incorporating rate heterogeneitymong sites using a “discrete gamma” model. Substi-ution model parameters were estimated via maxi-um-likelihood and the most-parsimonious tree. Boot-
trap (BS) values for maximum-parsimony analyses ofhe concatenated molecular data set were obtained us-ng 1000 replicates, each consisting of 10 heuristic (100euristic for the individual gene/intron analyses only;ree bisection–reconnection) searches in which the in-ut order of the taxa was randomized. Bootstrap valuesor maximum-likelihood analyses of the concatenated
olecular data set were obtained using 100 replicatesnd the “asis” addition sequence of taxa. In addition,he decay index (DI; Bremer, 1988), representing theumber of extra steps required for a clade not to benequivocally supported, was used in maximum-parsi-ony analyses. Three statistical tests [Wilcoxon signed
ank (Templeton, 1983), Kishino–Hasegawa (Kishinond Hasegawa, 1989), and compare-2 permutationSwofford, 1998)] were applied to determine whether

FtB
TABLE 1
s
192 FLYNN ET AL.
the level of support for the placement of the red pandain the maximum-parsimony analyses is significantlyhigher than that for alternative hypotheses of phylo-genetic relationships.
Prior to combining all genes into a single phyloge-netic analysis, we tested for significant conflict inphylogenetic signal among the genes (Bull et al.,1993). Specifically, we performed maximum-parsi-mony reconstruction on each gene separately (in-cluding estimation of nodal bootstrap proportions)and then compared the most-parsimonious treesfrom each analysis. Genes that yielded topologicaldifferences, supported by nodal bootstrap propor-
Taxon and Gene Sampling,
Taxona/Gene Cy
HerpestidaeMongoose or Cusimanse: Crossarchus obscurus
(Java mongoose): Herpestes auropunctatus(Cape gray mongoose): H. (5Galerella) pulverulentus
FelidaeCat: Felis sylvestris
(Ocelot): Felis pardalisCanidae
Red fox: Vulpes vulpes(Grey fox): Vulpes cinereoargenteus
Wolf: Canis lupus(Canis familiaris)
UrsidaeBrown bear: Ursus arctosSpectacled bear: Tremarctos ornatus
(Black bear): Ursus americanusGiant panda: Ailuopoda melanoleuca
PinnipediaSea lion: Zalophus californianusWalrus: Odobenus rosmarusBearded seal: Erignathus barbatus
(Grey seal): Halichoerus grypus(Harbour seal): Phoca vitulina
ProcyonidaeKinkajou: Potos flavus
(Olingo): Bassaricyon gabbiiRaccoon: Procyon lotor
Mustelidae (s.s.)River otter: Lontra longicaudus
(Sea otter): Enhydra lutrisLong-tailed weasel: Mustela frenata
(European polecat): Mustela putoriusMephitidae
Spotted skunk: Spilogale putoriusStriped skunk: Mephitis mephitis
AilurusRed panda: Ailurus fulgens
a In some cases the same species had not been sequenced for all gequenced for those genes were incorporated into the analyses.
b Cytochrome b: Ledje and Arnason, 1996a; Arnason et al., 1995;c 12S rRNA: Ledje and Arnason, 1996b; Arnason et al., 1993.d 16S rRNA: Arnason and Widegren, 1986; Arnason and Johnssone Transthyretin: Flynn and Nedbal, 1998.f New GenBank accessions, this paper.
tions .70%, were not combined (de Quiroz, 1993;lynn and Nedbal, 1998). This approach is similar tohe conditional data combination (CDC) approach ofull et al. (1993). Results from these individual gene
analyses were twofold. First, the bootstrap criteriondid not reject the null hypothesis of homogeneity inphylogenetic signal among the gene sequences, en-abling them to be combined in a single analysis.Second, separate analyses of individual genes alonewere unable to completely resolve phylogenetic rela-tionships involving the red panda, highlighting thevalue of combining multiple data sets in reconstruct-ing resolved and robustly supported phylogenies.
th GenBank Accession Nos.
hrome bb 12S rRNAc 16S rRNAd Transthyretine
AF03972694926 Y08506
U78332
82296 Y08503 AF039724U78331
94929 Y08508 AF039733U78348
Y08507 U78329 AF03973294920
82038 Y08519 U78349 AF03974123554 AF306947 f AF039740
Y0852094918 Y08521 AF306945 f AF039738
82310 Y08525 U78350 AF03974582299 L&A 1996a U78343 AF03974382295 AF039742
X72004X63726
U78344 AF03973794931 Y0850994930 Y08510 U78345 AF039736
94923 U78335 AF039734Y08512
U78339 AF03973594925 Y08516
94928 Y08518 U78346 AF306949 f
94927 Y08517 U78338 AF306948 f
94919 Y08511 AF306946 f AF039739
es. The most closely related taxa, listed in the table, that had been
bot and Shields, 1995.
992; Dragoo and Honeycutt, 1997.
wi
toc
X
X
X
X
XU
X
XXX
XX
X
X
XX
X
en
Tal
, 1

iptpcHvt
TABLE 2
rwh
193WHENCE THE RED PANDA?
RESULTS
Our related earlier study (Flynn and Nedbal, 1998)ndicated strong support for placement of the redanda as a member of the clearly monophyletic Mus-eloidea (sensu lato, s.l.), although both molecular sam-ling and taxonomic coverage of arctoids were lessomplete (no mt 16S rRNA sequences, no skunks).owever, as in this study, separate analyses of indi-
idual nucleotide sequences alone (transthyretin in-ron I, mt cytochrome b, mt 12S rRNA; Flynn and
Nedbal, 1998) were unable to completely or robustlyresolve phylogenetic relationships of the red pandawithin the well-supported clade of Musteloidea (s.l.).For example, analyses of the transthyretin intron se-quences effectively yielded a trichotomy of procyonids/mustelids/red panda, as none of the three taxa werelinked to one another with strong support (.70 BS:procyonids and mustelids were linked only weakly [BS/DI 5 53/1] to the exclusion of the red panda). To fur-ther test hypotheses concerning phylogenetic relation-ships of the red panda, we applied the statistical test ofKishino and Hasegawa (1989), using maximum-likeli-hood (implemented using the PHYLIP software pack-age of Felsenstein, 1993) and the Flynn and Nedbal(1998) data set. This test compares the mean and vari-ance of log-likelihood differences between constrainttrees to determine whether the means are significantlydifferent. If one assumes the robustly supported rela-tionships in Flynn and Nedbal (1998) (1) monophyly ofall caniform families (note that the data from Flynnand Nedbal do not include any skunks, thus mustelidmonophyly is not at issue), (2) monophyly of pinnipeds,and (3) basal placement of the Canidae within thecaniforms, then there are five possible sister clades(otters/weasels, raccoons, otters/weasels 1 raccoons,
Statistical Tests of Ph
Hypotheses tested Wilcoxon signed rank
Hypotheses in Fig. 1A versusRed panda 1 bear clade Z 5 2.737**Red panda 1 raccoon clade Z 5 1.651
Hypotheses in Fig. 1B versusRed panda 1 bear clade Z 5 1.988*
Hypotheses in Fig. 1C versus:Red panda 1 bear clade Z 5 2.230*Red panda 1 raccoon clade Z 5 2.737**
Note. The constraint trees used to test the hypotheses were thelationships constrained. For example, in the first test in which all tas tested against the most-parsimonious tree having a monophylyypothesis tested (e.g., red panda 1 bear clade) was rejected.
* P , 0.05.** P , 0.01.
*** P , 0.001.
bears, and pinnipeds) to the red panda. Pinnipeds wereincluded because their phylogenetic position withinArctoidea may influence the statistical tests for sup-port of the position of the red panda. In Flynn andNedbal (1998), the pinnipeds were of uncertain posi-tion within the Arctoidea (depending on the data setsanalyzed) and could be the sister group to any of threelarger clades (bears, raccoons 1 otters/weasels [with orwithout the red panda], and all the remaining Arc-toidea). In combination, 15 different constraint trees (3alternative phylogenetic placements for pinnipeds,multiplied by 5 alternatives for the red panda) werecompared against one another to determine the rela-tive character support for alternative phylogenetic hy-potheses. The 12S rRNA gene lacked sufficient resolv-ing power to differentiate among any of the alternativehypotheses of relationships for the red panda. Thetransthyretin intron always demonstrated significantcharacter support for placement of the red pandawithin a clade containing mustelids and procyonids(Musteloidea, s.l.), but interrelationships of the taxawithin that musteloid clade were equivocal (Table 2).The cytochrome b gene demonstrated significant char-acter support for a monophyletic mustelid/procyonidclade, excluding the red panda. It was only when com-bined, however, that the transthyretin intron and cy-tochrome b sequences provided significant resolvingpower to definitively place the red panda as the sistergroup to the other Musteloidea (mustelids and procy-onids). The phylogenetic position of pinnipeds, how-ever, remained equivocal.
Phylogenetic parsimony analyses of the three indi-vidual mitochondrial genes (cytochrome b, 12S rRNA,16S rRNA) and the nuclear transthyretin intron I com-piled for the current analysis were tested for signifi-
ogenetic Hypotheses
Kishino–Hasegawa
Compare-2 permutationParsimony Likelihood
T53.149** T53.323*** T-PTP 5 0.001, 22 stepsT51.900 T51.814 T-PTP 5 0.001, 13 steps
T52.287* T52.873** T-PTP 5 0.001, 18 steps
T52.568* T53.421*** T-PTP 5 0.001, 21 stepsT53.132** T52.452* T-PTP 5 0.001, 15 steps
ost parsimonious or most likely topology having the appropriatewere included, the unconstrained most-parsimonious tree (Fig. 1A)straint of the red panda and bears. Significance indicates that the
yl
e maxacon

cant conflict in phylogenetic signal (Bull et al., 1993).T.if
would not affect the topology of the higher-level phy-
194 FLYNN ET AL.
opological conflicts with nodal bootstrap support70% were considered indicative of significant conflict
n the phylogenetic signal, therefore excluding themrom a combined analysis (Bull et al., 1993; de Quiroz et
al., 1995; Flynn and Nedbal, 1998). There were nocases of significant conflict or heterogeneity in phylo-genetic signal, indicating that all data could be com-bined in a single “total evidence” analysis. None of theindividual mitochondrial gene analyses alone resultedin a well-resolved topology among the major arctoidcarnivoran clades. However, all of them supportedmonophyly of the Caniformia (BS 5 91–100), canids(BS 5 100 in all), and skunks (BS 5 100 in all). Cyto-chrome b and 16S rRNA both showed robust bootstrapsupport for pinniped monophyly and relationshipswithin that clade, whereas 12S rRNA did not. Cyto-chrome b and 12S rRNA showed moderate to strongsupport for mustelid (s.s., excluding skunks) mono-phyly, ursid monophyly, and relationships within theursid clade, whereas 16S rRNA did not. The trans-thyretin intron data yielded a topology and nodal sup-port that were almost identical to those in Flynn andNedbal (1998), even though the previous study in-cluded many more feliforms but no skunks. Althoughthe topologies for both transthyretin analyses wereidentical, the addition of skunks to the current studylowered bootstrap support below 50% for the associa-tions between procyonids and mustelids (s.s.) and be-tween pinnipeds and Musteloidea (s.l.), yielding unre-solved polytomies of ursids/pinnipeds/musteloids (andprocyonids/red panda/skunks/mustelids [s.s.], withinthe musteloids [s.l.]). In Flynn and Nedbal (1998) eachof those clades had a decay index of 1 and bootstrapsupport of 53 and 66, respectively.
Phylogenetic parsimony analyses of the four concat-enated nucleotide sequences for all 17 taxa providedstrong support for monophyly of previously well-cor-roborated clades of carnivorans (e.g., Arctoidea, Ursi-dae [including Ailuropoda], and Pinnipedia; see Wyssand Flynn, 1993 and Flynn and Nedbal, 1998). Theseanalyses also indicated monophyly of the skunks, aswell as their distant relationship to the mustelids(hence, these analyses could support recognition of adistinct mephitid clade and taxon). In contrast, Wolsan(1999) suggested that skunks (“mephitines”) are closeto otters (lutrines), within a traditionally conceivedMustelidae. We note that Wolsan’s conclusion wasbased on comparisons of skunk basicrania to ottersonly, with no other carnivoran taxa included explicitlyin the comparison and no character matrices or cladis-tic analyses provided.
Comparison of analyses of individual data sets ver-sus the “total evidence” analysis indicated no signifi-cant conflicts among them, supporting the assumptionthat incorporating sequence data from taxon proxies
logeny.Our analyses (Fig. 1A) strongly rejected the phylo-
genetic hypotheses that the red panda (Ailurus) wasmost closely related either to the ursids (22 more stepsthan the most-parsimonious tree to support an ursid/red panda clade) or to the procyonids (13 more stepsthan the most-parsimonious tree to support a procy-onid/red panda clade). Instead, there is very strongsupport (BS/DI 5 100/19) for a Musteloidea clade (s.l.;see Flynn and Nedbal, 1998) associating the red panda,skunks, and a clade comprising the mustelids (s.s.,otter and weasel) and procyonids (raccoon and kinka-jou). Within that clade of Musteloidea (s.l.), the Procy-onidae and Mustelidae (s.s.) are robustly supported asclosest relatives (maximum-likelihood BS 5 100; par-simony BS 5 85/DI 5 6), but there is only weak evi-dence of a sister group relationship between the redpanda and the skunks (maximum-likelihood BS ,50;parsimony BS 5 54/DI 5 3). Conservative assessmentof the results would indicate an unresolved trichotomyof the three main lineages within the Musteloidea (s.l.:red panda/skunks/procyonids 1 mustelids [s.s.]). In ad-dition to bootstrap and decay indices, the three statis-tical tests [Wilcoxon signed rank (Templeton, 1983),Kishino–Hasegawa (Kishino and Hasegawa, 1989),and compare-2 permutation (Swofford, 1998); Table 2]also confirmed the significance of these phylogeneticresults and rejected (at P , 0.05 to P , 0.001 prob-ability levels) alternative hypotheses of phylogeneticrelationships traditionally proposed for the red panda.However, when the skunks were included in the anal-yses (Table 2 [top]; Fig. 1A), the significance was bor-derline for two of the three tests (Wilcoxon signed rank,Kishino–Hasegawa) in rejecting a sister group rela-tionship between the raccoon clade and the red panda.We presume that this is due to the increased ho-moplasy, lower nodal synapomorphy number, and re-duced nodal support (compare bootstrap/decay index inFigs. 1A–1C), with the associated reduction in proba-bility of rejecting the null hypothesis for alternativegeometries of relationship that typically accompaniesaddition of taxa when number of characters is con-stant.
DISCUSSION
Phylogeny
Our analyses of the molecular data from four genes/introns show very strong support for a broad musteloid(s.l.) clade, distinct from all other arctoids. Both Ailu-rus and skunks are closely related to a monophyleticcrown clade of Musteloidea (s.s., procyonids 1 mustel-ids [excluding skunks]), and there is weak support fora skunk/Ailurus clade. Conservative interpretation ofthe data would consider the three musteloid (s.l.) lin-
195WHENCE THE RED PANDA?
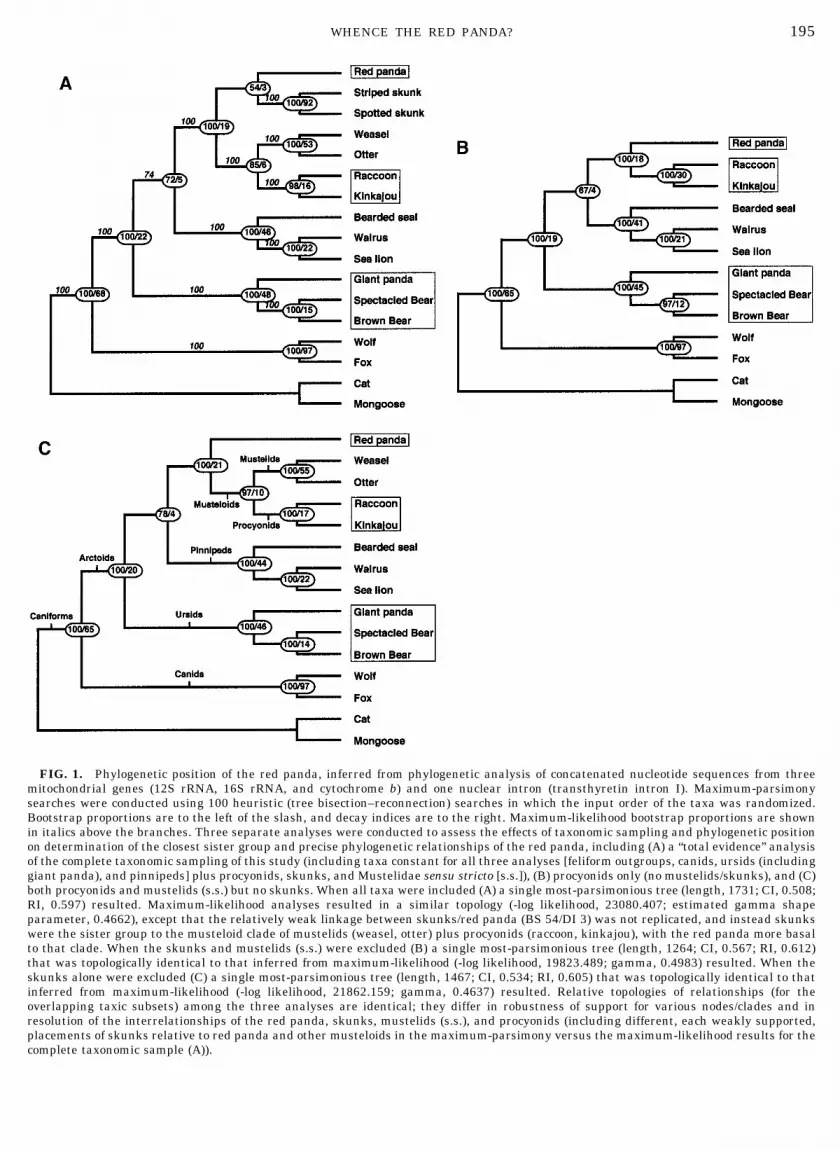
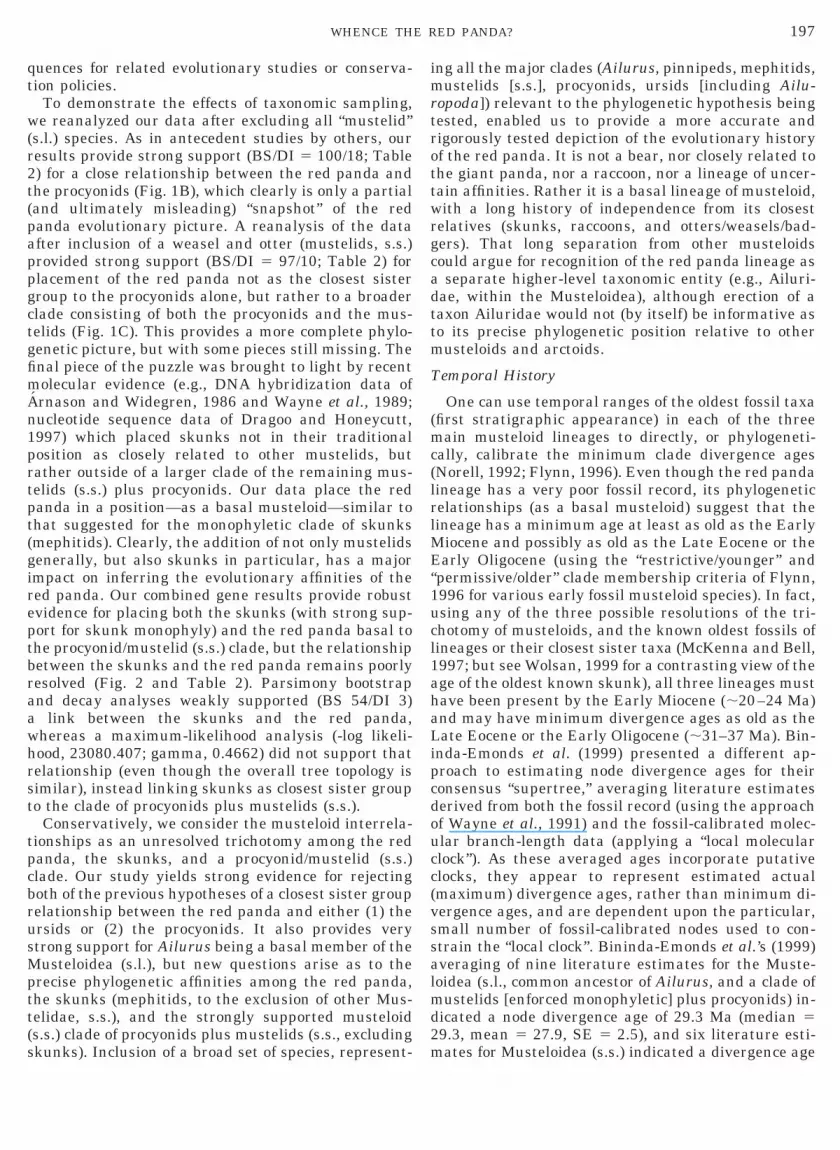
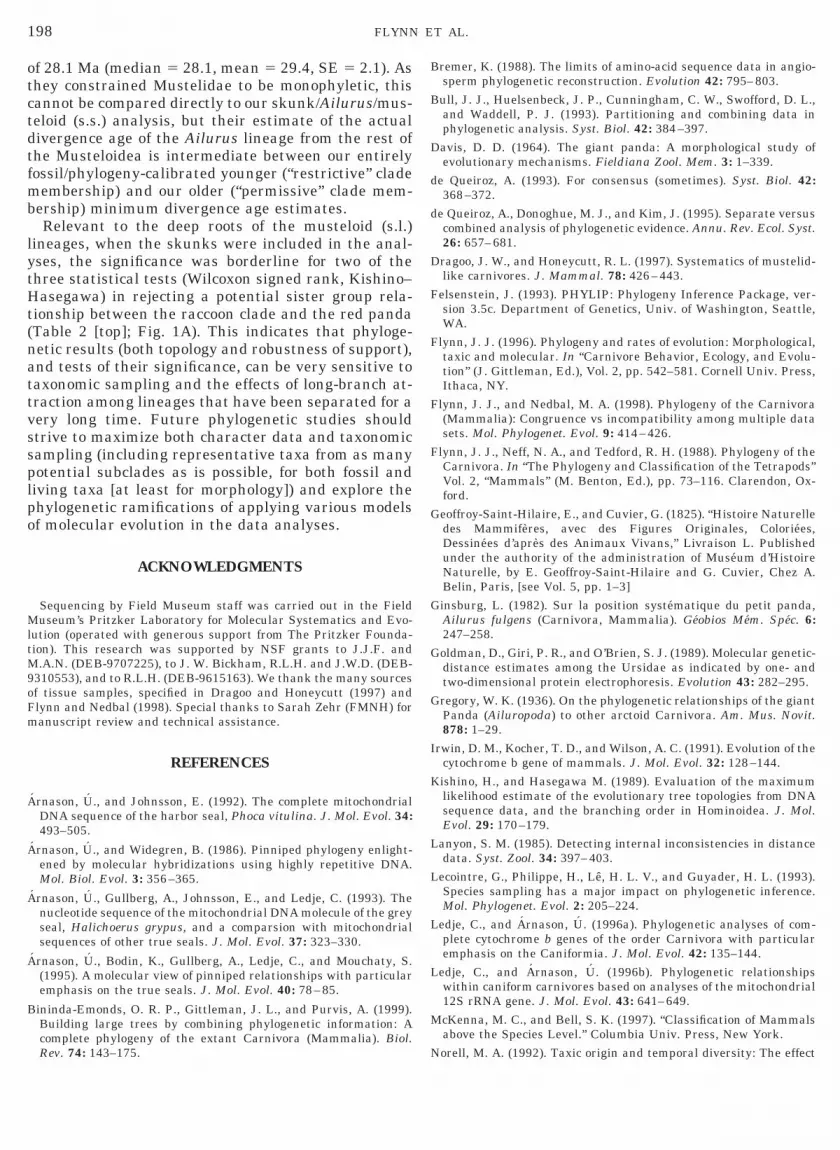
FIG. 1. Phylogenetic position of the red panda, inferred from phylogenetic analysis of concatenated nucleotide sequences from threemitochondrial genes (12S rRNA, 16S rRNA, and cytochrome b) and one nuclear intron (transthyretin intron I). Maximum-parsimonysearches were conducted using 100 heuristic (tree bisection–reconnection) searches in which the input order of the taxa was randomized.Bootstrap proportions are to the left of the slash, and decay indices are to the right. Maximum-likelihood bootstrap proportions are shownin italics above the branches. Three separate analyses were conducted to assess the effects of taxonomic sampling and phylogenetic positionon determination of the closest sister group and precise phylogenetic relationships of the red panda, including (A) a “total evidence” analysisof the complete taxonomic sampling of this study (including taxa constant for all three analyses [feliform outgroups, canids, ursids (includinggiant panda), and pinnipeds] plus procyonids, skunks, and Mustelidae sensu stricto [s.s.]), (B) procyonids only (no mustelids/skunks), and (C)both procyonids and mustelids (s.s.) but no skunks. When all taxa were included (A) a single most-parsimonious tree (length, 1731; CI, 0.508;RI, 0.597) resulted. Maximum-likelihood analyses resulted in a similar topology (-log likelihood, 23080.407; estimated gamma shapeparameter, 0.4662), except that the relatively weak linkage between skunks/red panda (BS 54/DI 3) was not replicated, and instead skunkswere the sister group to the musteloid clade of mustelids (weasel, otter) plus procyonids (raccoon, kinkajou), with the red panda more basalto that clade. When the skunks and mustelids (s.s.) were excluded (B) a single most-parsimonious tree (length, 1264; CI, 0.567; RI, 0.612)that was topologically identical to that inferred from maximum-likelihood (-log likelihood, 19823.489; gamma, 0.4983) resulted. When theskunks alone were excluded (C) a single most-parsimonious tree (length, 1467; CI, 0.534; RI, 0.605) that was topologically identical to thatinferred from maximum-likelihood (-log likelihood, 21862.159; gamma, 0.4637) resulted. Relative topologies of relationships (for theoverlapping taxic subsets) among the three analyses are identical; they differ in robustness of support for various nodes/clades and inresolution of the interrelationships of the red panda, skunks, mustelids (s.s.), and procyonids (including different, each weakly supported,placements of skunks relative to red panda and other musteloids in the maximum-parsimony versus the maximum-likelihood results for thecomplete taxonomic sample (A)).

eages (skunks/Ailurus/procyonids 1 mustelids [s.s.]) as and the procyonids. Because those two taxa were the
196 FLYNN ET AL.
an unresolved trichotomy.Bininda-Emonds et al. (1999) proposed a similar re-
lationship of Ailurus to a Procyonidae 1 Mustelidaeclade (they enforced monophyly of Mustelidae, includ-ing skunks), although their result was derived througha very different method of tree-consensus analysis ofphylogenies published between 1981 and 1995 (withvarying taxon and character sampling regimes, oftennonindependent among source analyses), rather thanprimary character data. They further emphasizedthat this relationship was exceptionally weakly sup-ported (decay index of 1) and was explicitly present inonly one source tree—the placement arises largelythrough parsimony optimization of matrix data fromthree classes of potentially conflicting trees (4 sourcetrees relating Ailurus to, or including it within,procyonids; 10 source trees relating procyonids tomustelids, without explicitly addressing Ailurus; 11source trees uniting Ailurus with ursids, which was notglobally parsimonious [and presumably helped pullAilurus basally, because of “character” homoplasy oftree structure “resemblance” to ursids]). This conflictwould have been further emphasized by studies pub-lished prior to Bininda-Emonds (1999; but after their1995 inclusion date), such as Dragoo and Honeycutt(1997; mephitid monophyly, outside other mustelidsplus procyonids) or Flynn and Nedbal (1998; Ailurussister taxon to Mustelidae [s.s.] plus Procyonidae). Wehave greater confidence in the largely congruent andmore robust phylogenetic results of our analyses ofmultiple primary nucleotide data sets (applying multi-ple tests of node support and tree topology) from ataxonomically diverse subset of arctoid species. Sam-pling large numbers of species, alone, does not ensuregreater tree resolution or accuracy—that is dependenton the “true” phylogenetic position and distribution ofthe species sampled, the information content of thegenes (or other character systems) sampled, and thehierarchical level of relationships being assessed. Forexample, adding taxa that break long branches or sam-pling more slowly evolving gene systems should bemore informative about higher-level phylogeny thanadding numerous closely related species or samplingrapidly evolving genes.
Although the traditional notion of the red panda as arelative of the procyonids is correct at some broadhierarchical level, there is no support for placement ofAilurus within the Procyonidae, or as a closest sistertaxon, in our parsimony analyses, the boostrap anddecay index assessments of phylogeny robustness, orthe three statistical tests. Many prior conclusions ofphylogenetic relationships of the red panda within theArctoidea were biased by the taxonomic sampling used.For example, some studies did not include bears and/orskunks (or even any mustelids [s.s.]) in the analysis,yielding a de facto relationship between the red panda
only members of the clearly monophyletic Musteloidea(s.l.) sampled, they necessarily would be more closelyrelated to each other than to any other arctoids orcaniforms. A similar result is seen in our limited taxonsampling analysis (Fig. 1B).
Results of an earlier investigation of hemoglobin pro-tein amino acid sequences (Tagle et al., 1986) resemblethose of our analysis of multiple genes in their supportof a sister group relationship between the pandas (ei-ther separately or together) and a clade of Musteloidea(s.s.—the mustelids and procyonids; no skunks wereincluded). However, those results must be interpretedwith great caution, as they proposed a relationship(linkage of red and giant pandas) in strong conflict withalmost all later studies, derived from less rigorousanalysis of more restricted taxonomic and characterdata sets.
The possible sister group relationship between theskunks and the red panda presented herein (Fig. 1A),although very weakly supported, represents a hypoth-esis that has never been proposed before. Adding newand more extensive character data (e.g., multiple genesor molecular data sets, or molecular plus morphologicaldata) can greatly benefit phylogenetic analyses. Ourresults also document that increased taxon sampling(especially representatives of all possible in-grouptaxa) can enhance phylogenetic analyses by yielding abetter-resolved topology through addition of new char-acter combinations (new synapomorphy) or breakingup of long branches (changing optimization/homologypresumptions). This can result in support for previ-ously unsuspected hypotheses of relationships.
It has long been recognized that methods of estimat-ing evolutionary relationships are sensitive to thenumber and taxonomic distribution of the species in-cluded (Lanyon, 1985; Lecointre et al., 1993). Notwith-standing this fact, much previous research in carnivo-ran phylogeny has downplayed the importance of broadtaxonomic sampling. In fact, the majority of studiesthat have provided evidence suggesting that the redpanda is closely related to the procyonids ignored thepinnipeds, the mustelids (s.s.—otters, badgers, wea-sels), and the skunks. Pinnipeds are an ancient anddiverse group of arctoid carnivorans, mustelids havebeen hypothesized to be closely related to the procyon-ids, and skunks now appear to be an early divergingarctoid lineage (separate from the mustelids withwhich they had traditionally been classified; e.g., Ar-nason and Widegren, 1986 and Wayne et al., 1989[molecular hybridization data]; Vrana et al., 1994 andDragoo and Honeycutt, 1997 [sequence data]). Becausemany prior studies did not include these diverse taxa(of significance because of their positions within arctoidphylogeny), they may have drawn incomplete or inac-curate conclusions about the evolutionary history ofthe red panda. This could lead to unfortunate conse-
quences for related evolutionary studies or conserva- ing all the major clades (Ailurus, pinnipeds, mephitids,
ucc(vssalmd2m
197WHENCE THE RED PANDA?
tion policies.To demonstrate the effects of taxonomic sampling,
we reanalyzed our data after excluding all “mustelid”(s.l.) species. As in antecedent studies by others, ourresults provide strong support (BS/DI 5 100/18; Table2) for a close relationship between the red panda andthe procyonids (Fig. 1B), which clearly is only a partial(and ultimately misleading) “snapshot” of the redpanda evolutionary picture. A reanalysis of the dataafter inclusion of a weasel and otter (mustelids, s.s.)provided strong support (BS/DI 5 97/10; Table 2) forplacement of the red panda not as the closest sistergroup to the procyonids alone, but rather to a broaderclade consisting of both the procyonids and the mus-telids (Fig. 1C). This provides a more complete phylo-genetic picture, but with some pieces still missing. Thefinal piece of the puzzle was brought to light by recentmolecular evidence (e.g., DNA hybridization data ofArnason and Widegren, 1986 and Wayne et al., 1989;nucleotide sequence data of Dragoo and Honeycutt,1997) which placed skunks not in their traditionalposition as closely related to other mustelids, butrather outside of a larger clade of the remaining mus-telids (s.s.) plus procyonids. Our data place the redpanda in a position—as a basal musteloid—similar tothat suggested for the monophyletic clade of skunks(mephitids). Clearly, the addition of not only mustelidsgenerally, but also skunks in particular, has a majorimpact on inferring the evolutionary affinities of thered panda. Our combined gene results provide robustevidence for placing both the skunks (with strong sup-port for skunk monophyly) and the red panda basal tothe procyonid/mustelid (s.s.) clade, but the relationshipbetween the skunks and the red panda remains poorlyresolved (Fig. 2 and Table 2). Parsimony bootstrapand decay analyses weakly supported (BS 54/DI 3)a link between the skunks and the red panda,whereas a maximum-likelihood analysis (-log likeli-hood, 23080.407; gamma, 0.4662) did not support thatrelationship (even though the overall tree topology issimilar), instead linking skunks as closest sister groupto the clade of procyonids plus mustelids (s.s.).
Conservatively, we consider the musteloid interrela-tionships as an unresolved trichotomy among the redpanda, the skunks, and a procyonid/mustelid (s.s.)clade. Our study yields strong evidence for rejectingboth of the previous hypotheses of a closest sister grouprelationship between the red panda and either (1) theursids or (2) the procyonids. It also provides verystrong support for Ailurus being a basal member of theMusteloidea (s.l.), but new questions arise as to theprecise phylogenetic affinities among the red panda,the skunks (mephitids, to the exclusion of other Mus-telidae, s.s.), and the strongly supported musteloid(s.s.) clade of procyonids plus mustelids (s.s., excludingskunks). Inclusion of a broad set of species, represent-
mustelids [s.s.], procyonids, ursids [including Ailu-ropoda]) relevant to the phylogenetic hypothesis beingtested, enabled us to provide a more accurate andrigorously tested depiction of the evolutionary historyof the red panda. It is not a bear, nor closely related tothe giant panda, nor a raccoon, nor a lineage of uncer-tain affinities. Rather it is a basal lineage of musteloid,with a long history of independence from its closestrelatives (skunks, raccoons, and otters/weasels/bad-gers). That long separation from other musteloidscould argue for recognition of the red panda lineage asa separate higher-level taxonomic entity (e.g., Ailuri-dae, within the Musteloidea), although erection of ataxon Ailuridae would not (by itself) be informative asto its precise phylogenetic position relative to othermusteloids and arctoids.
Temporal History
One can use temporal ranges of the oldest fossil taxa(first stratigraphic appearance) in each of the threemain musteloid lineages to directly, or phylogeneti-cally, calibrate the minimum clade divergence ages(Norell, 1992; Flynn, 1996). Even though the red pandalineage has a very poor fossil record, its phylogeneticrelationships (as a basal musteloid) suggest that thelineage has a minimum age at least as old as the EarlyMiocene and possibly as old as the Late Eocene or theEarly Oligocene (using the “restrictive/younger” and“permissive/older” clade membership criteria of Flynn,1996 for various early fossil musteloid species). In fact,using any of the three possible resolutions of the tri-chotomy of musteloids, and the known oldest fossils oflineages or their closest sister taxa (McKenna and Bell,1997; but see Wolsan, 1999 for a contrasting view of theage of the oldest known skunk), all three lineages musthave been present by the Early Miocene (;20–24 Ma)and may have minimum divergence ages as old as theLate Eocene or the Early Oligocene (;31–37 Ma). Bin-inda-Emonds et al. (1999) presented a different ap-proach to estimating node divergence ages for theirconsensus “supertree,” averaging literature estimatesderived from both the fossil record (using the approachof Wayne et al., 1991) and the fossil-calibrated molec-
lar branch-length data (applying a “local molecularlock”). As these averaged ages incorporate putativelocks, they appear to represent estimated actualmaximum) divergence ages, rather than minimum di-ergence ages, and are dependent upon the particular,mall number of fossil-calibrated nodes used to con-train the “local clock”. Bininda-Emonds et al.’s (1999)veraging of nine literature estimates for the Muste-oidea (s.l., common ancestor of Ailurus, and a clade of
ustelids [enforced monophyletic] plus procyonids) in-icated a node divergence age of 29.3 Ma (median 59.3, mean 5 27.9, SE 5 2.5), and six literature esti-ates for Musteloidea (s.s.) indicated a divergence age
of 28.1 Ma (median 5 28.1, mean 5 29.4, SE 5 2.1). As
A
A
B
Bremer, K. (1988). The limits of amino-acid sequence data in angio-sperm phylogenetic reconstruction. Evolution 42: 795–803.
B
D
d
d
D
F
F
F
F
G
G
G
G
I
K
L
L
L
L
M
N
198 FLYNN ET AL.
they constrained Mustelidae to be monophyletic, thiscannot be compared directly to our skunk/Ailurus/mus-teloid (s.s.) analysis, but their estimate of the actualdivergence age of the Ailurus lineage from the rest ofthe Musteloidea is intermediate between our entirelyfossil/phylogeny-calibrated younger (“restrictive” clademembership) and our older (“permissive” clade mem-bership) minimum divergence age estimates.
Relevant to the deep roots of the musteloid (s.l.)lineages, when the skunks were included in the anal-yses, the significance was borderline for two of thethree statistical tests (Wilcoxon signed rank, Kishino–Hasegawa) in rejecting a potential sister group rela-tionship between the raccoon clade and the red panda(Table 2 [top]; Fig. 1A). This indicates that phyloge-netic results (both topology and robustness of support),and tests of their significance, can be very sensitive totaxonomic sampling and the effects of long-branch at-traction among lineages that have been separated for avery long time. Future phylogenetic studies shouldstrive to maximize both character data and taxonomicsampling (including representative taxa from as manypotential subclades as is possible, for both fossil andliving taxa [at least for morphology]) and explore thephylogenetic ramifications of applying various modelsof molecular evolution in the data analyses.
ACKNOWLEDGMENTS
Sequencing by Field Museum staff was carried out in the FieldMuseum’s Pritzker Laboratory for Molecular Systematics and Evo-lution (operated with generous support from The Pritzker Founda-tion). This research was supported by NSF grants to J.J.F. andM.A.N. (DEB-9707225), to J. W. Bickham, R.L.H. and J.W.D. (DEB-9310553), and to R.L.H. (DEB-9615163). We thank the many sourcesof tissue samples, specified in Dragoo and Honeycutt (1997) andFlynn and Nedbal (1998). Special thanks to Sarah Zehr (FMNH) formanuscript review and technical assistance.
REFERENCES
Arnason, U., and Johnsson, E. (1992). The complete mitochondrialDNA sequence of the harbor seal, Phoca vitulina. J. Mol. Evol. 34:493–505.
Arnason, U., and Widegren, B. (1986). Pinniped phylogeny enlight-ened by molecular hybridizations using highly repetitive DNA.Mol. Biol. Evol. 3: 356–365.
´ rnason, U., Gullberg, A., Johnsson, E., and Ledje, C. (1993). Thenucleotide sequence of the mitochondrial DNA molecule of the greyseal, Halichoerus grypus, and a comparsion with mitochondrialsequences of other true seals. J. Mol. Evol. 37: 323–330.
´ rnason, U., Bodin, K., Gullberg, A., Ledje, C., and Mouchaty, S.(1995). A molecular view of pinniped relationships with particularemphasis on the true seals. J. Mol. Evol. 40: 78–85.
ininda-Emonds, O. R. P., Gittleman, J. L., and Purvis, A. (1999).Building large trees by combining phylogenetic information: Acomplete phylogeny of the extant Carnivora (Mammalia). Biol.Rev. 74: 143–175.
ull, J. J., Huelsenbeck, J. P., Cunningham, C. W., Swofford, D. L.,and Waddell, P. J. (1993). Partitioning and combining data inphylogenetic analysis. Syst. Biol. 42: 384–397.
avis, D. D. (1964). The giant panda: A morphological study ofevolutionary mechanisms. Fieldiana Zool. Mem. 3: 1–339.
e Queiroz, A. (1993). For consensus (sometimes). Syst. Biol. 42:368–372.
e Queiroz, A., Donoghue, M. J., and Kim, J. (1995). Separate versuscombined analysis of phylogenetic evidence. Annu. Rev. Ecol. Syst.26: 657–681.
ragoo, J. W., and Honeycutt, R. L. (1997). Systematics of mustelid-like carnivores. J. Mammal. 78: 426–443.
elsenstein, J. (1993). PHYLIP: Phylogeny Inference Package, ver-sion 3.5c. Department of Genetics, Univ. of Washington, Seattle,WA.
lynn, J. J. (1996). Phylogeny and rates of evolution: Morphological,taxic and molecular. In “Carnivore Behavior, Ecology, and Evolu-tion” (J. Gittleman, Ed.), Vol. 2, pp. 542–581. Cornell Univ. Press,Ithaca, NY.
lynn, J. J., and Nedbal, M. A. (1998). Phylogeny of the Carnivora(Mammalia): Congruence vs incompatibility among multiple datasets. Mol. Phylogenet. Evol. 9: 414–426.
lynn, J. J., Neff, N. A., and Tedford, R. H. (1988). Phylogeny of theCarnivora. In “The Phylogeny and Classification of the Tetrapods”Vol. 2, “Mammals” (M. Benton, Ed.), pp. 73–116. Clarendon, Ox-ford.
eoffroy-Saint-Hilaire, E., and Cuvier, G. (1825). “Histoire Naturelledes Mammiferes, avec des Figures Originales, Coloriees,Dessinees d’apres des Animaux Vivans,” Livraison L. Publishedunder the authority of the administration of Museum d’HistoireNaturelle, by E. Geoffroy-Saint-Hilaire and G. Cuvier, Chez A.Belin, Paris, [see Vol. 5, pp. 1–3]
insburg, L. (1982). Sur la position systematique du petit panda,Ailurus fulgens (Carnivora, Mammalia). Geobios Mem. Spec. 6:247–258.
oldman, D., Giri, P. R., and O’Brien, S. J. (1989). Molecular genetic-distance estimates among the Ursidae as indicated by one- andtwo-dimensional protein electrophoresis. Evolution 43: 282–295.
regory, W. K. (1936). On the phylogenetic relationships of the giantPanda (Ailuropoda) to other arctoid Carnivora. Am. Mus. Novit.878: 1–29.
rwin, D. M., Kocher, T. D., and Wilson, A. C. (1991). Evolution of thecytochrome b gene of mammals. J. Mol. Evol. 32: 128–144.
ishino, H., and Hasegawa M. (1989). Evaluation of the maximumlikelihood estimate of the evolutionary tree topologies from DNAsequence data, and the branching order in Hominoidea. J. Mol.Evol. 29: 170–179.
anyon, S. M. (1985). Detecting internal inconsistencies in distancedata. Syst. Zool. 34: 397–403.
ecointre, G., Philippe, H., Le, H. L. V., and Guyader, H. L. (1993).Species sampling has a major impact on phylogenetic inference.Mol. Phylogenet. Evol. 2: 205–224.
edje, C., and Arnason, U. (1996a). Phylogenetic analyses of com-plete cytochrome b genes of the order Carnivora with particularemphasis on the Caniformia. J. Mol. Evol. 42: 135–144.
edje, C., and Arnason, U. (1996b). Phylogenetic relationshipswithin caniform carnivores based on analyses of the mitochondrial12S rRNA gene. J. Mol. Evol. 43: 641–649.
cKenna, M. C., and Bell, S. K. (1997). “Classification of Mammalsabove the Species Level.” Columbia Univ. Press, New York.
orell, M. A. (1992). Taxic origin and temporal diversity: The effect
of phylogeny. In “Extinction and Phylogeny” (M. Novacek and Q.Wheeler, Eds.), pp. 89–118. Columbia Univ. Press, New York.
S
S
S
S
T
T
T
Thenius, E. (1979). Zur systematischen und phylogenetischen Stel-lung des Bambusbaren: Ailuropoda melanoleuca David (Carni-
V
W
W
W
W
W
W
W
199WHENCE THE RED PANDA?
O’Brien, S. J., Nash, W. G., Wildt, D. E., Bush, M. E. , and Ben-veniste, R. E. (1985). A molecular solution to the riddle of the giantpanda’s phylogeny. Nature 317: 140–144.
Radinsky, L. A. (1981). Evolution of skull shape in carnivores 2.Additional modern carnivores. Biol. J. Linn. Soc. 16: 337–355.
Sarich, V. M. (1973). The giant panda is a bear. Nature 245: 218–220.
chmidt-Kittler, N. (1981). Zur stammegeschichte der marderver-wandten Raubtiergruppen (Musteloidea, Carnivora). Ecolog. Geol.Helvetica 74: 753–801.
egall, W. (1943). The auditory region of the arctoid carnivores. Zool.Ser. Field Mus. Nat. Hist. 29: 33–59.
lattery, J. P., and O’Brien, S. J. (1995). Molecular phylogeny of thered panda (Ailurus fulgens). J. Hered. 86: 413–422.
wofford, D. L. (1998). PAUP*: Phylogenetic analysis using parsi-mony, beta test version 4.0 59d–60d. Sinauer, Sunderland, MA.
agle, D. A., Miyamoto, M. M., Goodman, M., Hofmann, O., Braun-itzer, G., Goltenboth, R., and Jalanka, H. (1986). Hemoglobin ofpandas: Phylogenetic relationships of carnivores as ascertainedwith protein sequence data. Naturwissenschaften 73: 512–514.
albot, S. L., and Shields, G. F. (1995). Phylogeny of the bears(Ursidae) inferred from complete sequences of three mitochondrialgenes. Genbank U23555.
empleton, A. R. (1983). Phylogenetic inference from restrictionendonuclease cleavage maps with particular reference to the evo-lution of the humans and the apes. Evolution 37: 221–244.
vora, Mammalia). Z. Saugetierk. 44: 286–305.rana, P. B., Milinkovitch, M. C., Powell, J. R., and Wheeler, W. C.(1994). Higher level relationships of the arctoid Carnivora basedon sequence data and “total evidence.” Mol. Phylogenet. Evol. 3:47–58.ang, X. (1997). New cranial material of Simocyon from China, andits implications for phylogenetic relationship to the red panda(Ailurus). J. Vert. Paleontol. 17: 184–198.ayne, R. K., Benveniste, R. E., Janczewski, D. N., and O’Brien, S. J.(1989). Molecular and biochemical evolution of the Carnivora. In“Carnivore Behavior, Ecology, and Evolution” (J. Gittleman, Ed.),pp. 465–494. Cornell Univ. Press, Ithaca, NY.ayne, R. K., Van Valkenburgh, B., and O’Brien, S. (1991). Molec-ular distance and divergence time in carnivores and primates. Mol.Biol. Evol. 8: 297–319.olsan, M. (1993). Phylogeny and classification of early EuropeanMustelida (Mammalia: Carnivora). Acta Theriol. 38: 345–384.olsan, M. (1999). Oldest mephitine cranium and its implicationsfor the origin of skunks. Acta Palaeontol. Polon. 44: 223–230.ozencraft, W. C. (1989). The phylogeny of the Recent Carnivora. In“Carnivore Behavior, Ecology, and Evolution” (J. Gittleman, Ed.),pp. 495–535. Cornell Univ. Press, Ithaca, NY.yss, A. R., and Flynn, J. J. (1993). A phylogenetic analysis anddefinition of the Carnivora. In “Mammal Phylogeny: Placentals”(F. Szalay, M. Novacek, and M. McKenna, Eds.), pp. 32–52.Springer-Verlag, New York.