when stable-stage equilibrium is unlikely: integrating transient population dynamics improves...
TRANSCRIPT
PART OF A HIGHLIGHT ON ORCHID BIOLOGY
When stable-stage equilibrium is unlikely integrating transient population
dynamics improves asymptotic methods
Raymond L Tremblay1ndash3 Josep Raventos4 and James D Ackerman23
1Department of Biology PO Box 860 University of Puerto Rico Humacao 00791 Puerto Rico 2Department of Biology POBox 23360 University of Puerto Rico Rio Piedras campus San Juan 00931-3360 Puerto Rico 3Center for Applied Tropical
Ecology and Conservation PO Box 23360 University of Puerto Rico Rio Piedras campus San Juan 00931-3360 Puerto Ricoand 4Departamento de Ecologıa Universidad de Alicante Carretera S Vicente del Raspeig sn 03080 San Vicente del
Raspeig Alicante Spain For correspondence E-mail raymondhpcfupredu
Received 20 June 2014 Returned for revision 1 August 2014 Accepted 4 February 2015
Background and Aims Evaluation of population projection matrices (PPMs) that are focused on asymptoticallybased properties of populations is a commonly used approach to evaluate projected dynamics of managed popula-tions Recently a set of tools for evaluating the properties of transient dynamics has been expanded to evaluatePPMs and to consider the dynamics of populations prior to attaining the stable-stage distribution a state thatmay never be achieved in disturbed or otherwise ephemeral habitats or persistently small populations This studyre-evaluates data for a tropical orchid and examines the value of including such analyses in an integrative approachMethods Six small populations of Lepanthes rubripetala were used as a model system and the R software packagepopdemo was used to produce estimates of the indices for the asymptotic growth rate (lambda) sensitivities reac-tivity first-time step attenuation maximum amplification maximum attenuation maximal inertia and maximalattenuation The response in lambda to perturbations of demographic parameters using transfer functions and multi-ple perturbations on growth stasis and fecundity were also determined The results were compared with previouslypublished asymptotic indices Key Results It was found that combining asymptotic and transient dynamics expands the understanding of possiblepopulation changes Comparison of the predicted density from reactivity and first-time step attenuation with theobserved change in population size in two orchid populations showed that the observed density was within the pre-dicted range However transfer function analysis suggests that the traditional approach of measuring perturbationof growth rates and persistence (inertia) may be misleading and is likely to result in erroneous managementdecisions Conclusions Based on the results an integrative approach is recommended using traditional PPMs (asymptoticprocesses) with an evaluation of the diversity of dynamics that may arise when populations are not at a stable-stagedistribution (transient processes) This method is preferable for designing rapid and efficient interventions after dis-turbances and for developing strategies to establish new populations
Key words Transient population dynamics stable-stage equilibrium lambda reactivity first-time step attenuationmaximum amplification maximum attenuation maximum inertia transfer function population projection matricesPPM orchids Lepanthes rubripetala Orchidaceae Puerto Rico
INTRODUCTION
Biologists conservation managers and decision makers with in-terest in the trajectories of population dynamics need tools thatare easy to use and interpret apply across a wide range of taxaand give results that predict future population sizes with thehighest possible confidence The preferred approach has beento use asymptotically based population projection matrices(PPMs) as a set of models that have tractable outcomes includ-ing calculations of asymptotic growth rates population stabledistributions elasticities sensitivities damping ratios etc(Caswell 2001) Stochastic PPM models are a modification ofthese approaches and explore the likely changes in populationdynamics over time as a consequence of demographic spatialand environmental variation (Tuljapurkar 1997 Fieberg andEllner 2001 Lande et al 2003)
Although these models are commonly employed in the eco-logical and conservation literature little attention has beengiven to the accuracy and effectiveness of PPM models(Kephart and Paladino 1997 Bierzychudek 1999 Coulsonet al 2001 Lindborg and Erhlen 2002 Van Mantgem andStephenson 2005 Schodelbauerova et al 2010 Jakalaniemiet al 2013) So what is the predictive power of population pro-jection analyses In a recent review of the population dynamicsof 82 populations of 20 species Crone et al (2013) found thatin more than half of the studies using PPMs the actual popula-tion sizes over a period of time were either above or below theprojected confidence intervals suggesting weaknesses in themethods the data or both
An alternative novel and infrequently considered approachfor characterizing population dynamics over time is to use tran-sient dynamics which are fluctuations describing how much
VC The Author 2015 Published by Oxford University Press on behalf of the Annals of Botany CompanyAll rights reserved For Permissions please email journalspermissionsoupcom
Annals of Botany Page 1 of 10
doi101093aobmcv031 available online at wwwaoboxfordjournalsorg
at University of Puerto R
ico Rio Piedras on M
arch 27 2015httpaoboxfordjournalsorg
Dow
nloaded from
populations vary as a consequence of stochastic events priorto reaching asymptotic growth and achieving a stable-stage dis-tribution Originally part of the robust control theory of engi-neering several attempts have been made to include transferfunctions in the population ecology and conservation manage-ment toolbox (Rebarber and Townley 1995 Hodgson andTownley 2004) Caswell (2007) developed an approach to ana-lyse transient sensitivities and elasticities using matrix calculusbut more recently Stott et al (2010a 2011 2012a b) offered aseries of set of functions which are available in R (popdemopackage R Project for Statistical Computing 2013) to investi-gate short-term time series as a consequence of ecologicallyenvironmentally and anthropologically induced perturbationsThe traditional way to assess the effects of perturbations ondemographic parameters using sensitivity analysis relies on ei-genvectors and gives a linear approximation that could be mis-leading for non-linear responses This was addressed by Stottet al (2012b) who calculated sensitivities without using eigen-vectors through a derivative process based on transfer functions(McCarthy et al 2008) One of the advantages of the transferfunction is that it only needs to specify the magnitude of theperturbation of a demographic parameter to describe the non-linear changes in that parameter Furthermore transient dynam-ics may be more appropriate for conservation because itaddresses outcomes that are more likely to occur within thetime frame of a management project (Ezard et al 2010)
To complement asymptotic and transient analysis we usetransfer functions to perform an analysis of the population dy-namics of a Neotropical orchid by assessing the non-linearchanges in asymptotic growth produced by changes in transi-tion parameters We re-analyse the data of Schodelbauerovaet al (2010) on Lepanthes rubripetala using transient dynamicsand transfer function tools and compare the observed dynamicsand likely persistence of the population with the stochastic sim-ulations from Schodelbauerova et al (2010) We hypothesizethat for many small populations using only the traditional PPMmodels based on stable-stage distribution and asymptoticgrowth rate is likely to be either misleading or give a differentperspective on the likely population dynamics under study
METHODS
Data collection
Our model species was Lepanthes rubripetala Orchidaceaewhich is endemic to the Caribbean island of Puerto Rico and isa member of a large genus (gt1100 species Govaerts et al2014) renowned for its narrow endemism (Crain and Tremblay2014) All but one of 120 species in the Caribbean are single-island endemics (Ackerman 2012 Luer 2014) Lepanthesrubripetala is a small epiphytic or epipetric species restricted toshady montane wet habitats The caespitose plants grow sym-podially with each slender stem bearing a single leaf The ter-minal fasciculate racemes are adpressed to the underside of theleaf and produce flowers in succession usually one at a timethroughout the year The flowers are 3ndash4 mm long Fruit andseed production is pollinator-dependent and flowers are protan-drous (Tremblay et al 2006) and infrequently pollinated pol-lination is probably the result of fungus gnat pseudocopulation(Blanco and Barbosa 2005 Tremblay and Ackerman 2001)
The small scattered populations of this species make a goodmodel system because plant size and lifespan are manageablefor demographic work Furthermore relatively few studieshave been conducted on the demographic dynamics of tropicalplants especially herbaceous ones
Our data are the same as those of Schodelbauerova et al(2010) who selected six populations distributed along threestreams Rıo Grande and Quebrada Grande along the westernslopes of the Luquillo Mountains in the El Yunque NationalForest and Rıo Patillas at Charco Azul in the Carite StateForest Three hundred and eighty-one individuals of L rubripe-tala were marked and observed monthly from June 1994 toJanuary 1996 Population sizes at the first survey were 84 1749 86 101 and 44 At each observation period the numbers ofleaves flowers and fruits were counted and individuals fromall populations were classified as seedlings juveniles non-reproductive adults and reproductive adults These categoriesare defined as follows (Tremblay and Hutchings 2003 Rivera-Gomez et al 2006) seedlings are small plants without lepan-thiform sheaths on any shoot juveniles are individuals with atleast one lepanthiform sheath on the stem and lack evidence ofpast or current inflorescences non-reproductive adults havedried inflorescences from a previous flowering event but theyare not currently flowering reproductive adults have active in-florescences that have buds flowers andor fruits (the theoreti-cal life cycle of L rubripetala is illustrated in Fig 1)
Population dynamics analysis and comparisons
The traditional approach of asymptotic analysis of PPMs fo-cuses on long-term population dynamics to predict populationtrajectories Stable-stage distributions (the predicted populationstructure when asymptotic growth rate is attained) and sensitivi-ties (a measure evaluating the effect of absolute change of aparameter on growth rate) are calculated which are density-independent and time-invariant indices (Caswell 2001)Transient-based evaluation of PPMs is also time-invariant butby varying the starting demographic distribution as a conse-quence of demographic stochasticity whether of biotic abioticor anthropogenic origin an initial stage distribution is obtainedthat diverges from the stable-stage distribution This differenceleads initially to either a short-term increase in population sizedensity (amplifications) or a short-term decrease (attenuation)If no other perturbations or disturbances are present (eg hurri-canes flash floods landslides biotic invasions) then the tran-sient dynamics models are expected to settle to the stable-stagedistribution The time it takes to reach the stable stage is thetransient period (Stott et al 2011) Transient population dy-namics are usually not evaluated in most published PPM arti-cles however indices such as the damping ratio (Caswell2001) Keyfitzrsquos delta (Keyfitz 1968) and Cohenrsquos cumulativedistance metric (Cohen 1979) are sometimes considered surro-gates for considering the transient dynamics of populations butthey have limitations (Stott et al 2011)
We calculated using the package popdemo in R (R Projectfor Statistical Computing 2013) the following indices of tran-sient dynamics as described by Stott et al (2011) and includesthe expected lower and upper limits of change in the first-timestep reactivity (maximum population growth in a single time
Page 2 of 10 Tremblay et al mdash Transient dynamics improve population projections for orchids
at University of Puerto R
ico Rio Piedras on M
arch 27 2015httpaoboxfordjournalsorg
Dow
nloaded from
step relative to stable-stage growth) first-time attenuation (min-imum population growth in a single time step relative to stable-stage growth) maximal amplification (the largest possible fu-ture population size relative to a stable growth rate and sameinitial population size) and maximal attenuation (the smallestpossible future population size relative to a stable growth rateand the same initial population size) We also calculated twoother indices amplified inertia (the largest long-term popula-tion size relative to a population with stable growth rate and thesame initial density) and attenuated inertia (the smallest long-term population size relative to a population with stable growthrate and the same initial density) In other words populationsthat have not achieved a stable-stage distribution are likely toachieve long-term population density at a fixed ratio below orabove the expected stable-stage distribution (Stott et al2012b)
Natural perturbations affect the demographic parameters of apopulation to different degrees (Hodgson and Townley 2004Hodgson et al 2006) Consequently we present the responseof asymptotic growth rate (lambda) to perturbations of demo-graphic parameters using a transfer function and multiple per-turbations of growth stasis and fecundity
Moreover we investigate the expected effect of changes inparameter estimates on lambda using a non-linear function(Stott et al 2012b) Transfer functions are commonly used inthe analysis of linear time-invariant systems such as single-input single-output filters They allow one to calculate the rela-tionship between lambda (k) and the intensity of perturbation(d) We only need to define the position of the vital rate per-turbed through two vectors e and d the intensity of the pertur-bation with one scalar d to obtain the new asymptotic growthrate as a consequence of the perturbed vital rate The exact rela-tionship between perturbation and growth rate was given byHodgson and Townley (2004) as dndash1frac14 e
T(kI ndash A)ndash1d A is a
generic way to indicate the matrix population of the species weare working with in our case all of six populations of L rubri-petala have (4 4) dimension I is the identity matrix with thesame dimension of A Inertia in the context of transient dynam-ics measures how much larger or smaller a population changescompared with an equivalent population at stable-stage distribu-tion (Stott et al 2012b) Non-stable populations show differentgrowth patterns compared with populations at stable distribu-tion ultimately resulting in long-term population densitiesabove or below those predicted if the population was at a stable
distribution (Stott et al 2012b) This long-term persistence istermed inertia Inertia is calculated as the ratio between thelong-term population densities at non-equilibrium above anequivalent stable population (Koons et al 2007 Stott et al2012b) Consequently populations with inertia values gt1 be-come and remain larger whereas those with inertia lt1 aresmaller and remain smaller Transfer function plots of inertiafor the whole life cycle for the six populations of L rubripetalawere evaluated for the upper and lower bounds and the case-specific inertia for the current population structure
Non-linear sensitivities were calculated (tfamatrix functionin the popdemo package) and compared with the original linearapproach We tested the assumptions of reducibility and ergo-dicity for matrices using the tests as described in Stott et al(2010b) and all were met
To evaluate how transient dynamics mirror real populationgrowth rates we compared the change in population size across17 time periods with the extremes of population growth and re-duction (reactivity and first-time attenuation) which evaluatedthe likely range of change in the first time step with a time lagof 1 with n equal to the number of observed individuals in thetime period in each of the observed stages
The PPMs are available in Supplementary Data S1
RESULTS
Transient dynamics
The transient indices suggest that the range of amplitude of pre-dicted population densities over the first time interval is sub-stantial Populations in which the structure is dominated byseedlings are expected to have large reductions in populationsize (density) resulting in a first-time attenuation ranging from084 to 057 suggesting that in one time period populationscould be reduced to 57 of the expected stable-stage distribu-tion When populations are dominated by reproductive adultsthe expected population densities increase due to reactivity inthe first time step suggesting that populations could increaseby 11ndash18 (Fig 2 Table 1)
The same two initial conditions only seedlings or only repro-ductive adults could have long-term effects on population den-sity The long-term expected reduction maximal attenuationcould be dramatic with density reductions ranging from 13 to73 in the transient period (Fig 2 Table 1) On the other
Fruit production
Seed1 2
Death Death Death Death
3Seedling Juvenile
Floweringindividuals
Mycorrhizal
associates
FIG 1 The theoretical life cycle of Lepanthes rubripetala For successful germination seeds must be colonized by mycorrhizal fungi to form protocorms which sub-sequently grow into juveniles non-reproductive adults or reproductive adults Once adulthood is achieved the plant remains an adult however adults move readily
among reproductive and non-reproductive phases within a year
Tremblay et al mdash Transient dynamics improve population projections for orchids Page 3 of 10
at University of Puerto R
ico Rio Piedras on M
arch 27 2015httpaoboxfordjournalsorg
Dow
nloaded from
Population 1 Population 2
1middot6
1middot4
1middot2
0middot8
0middot6
0middot4
0middot2
0
01 2 3 4
1 2 3 4
1 2 3 4
1 2 3 4
1 2 3 4
1
0middot5
0
1
0middot5
0
1
0middot5
0
1
0middot5
0
1
0middot5
Lower bound
Initial I
Initial I
lmax = 1middot007
lmax = 1middot010
rmax = rinfin = 1middot237
Initial II
Initial II
Life stage
Upper bound
Stable
01 2 3 4
1 2 3 4
1 2 3 4
1 2 3 4
1 2 3 4
1
0middot5
0
1
0middot5
0
1
0middot5
0
1
0middot5
0
1
0middot5
Lower bound
Initial I
Initial II
Life stage
Upper bound
Stable
Stable
Density in current stage distribution
A
B
01 2 3 4
1 2 3 4
1 2 3 4
1 2 3 4
1 2 3 4
1
0middot5
0
1
0middot5
0
1
0middot5
0
1
0middot5
0
1
0middot5
Lower bound
Initial I
Initial II
Life stage
Upper bound
Stable
Density in current stage distribution
Density in current stage distribution
Pop
ulat
ion
dens
ity
1
1middot6
1middot4
1middot2
0middot8
0middot6
0middot4
0middot2
00 20 40
Projection intervals
1
1middot6
1middot4
1middot2
0middot8
0middot6
0middot4
0middot2
0
Pop
ulat
ion
dens
ity
1
1middot6
1middot4
1middot2
0middot8
0middot6
0middot4
0middot2
00 20 40
Projection intervals
1
rmax = rinfin = 1middot240
rmin = rinfin = 0middot464
rmin = rinfin = 0middot392
r1 =1middot122
r1 =0middot804
Population 3
1middot6
1middot4
1middot2
0middot8
0middot6
0middot4
0middot2
0
Initial I
lmax = 1middot032
rmax = rinfin = 1middot202
Initial II
Stable
Pop
ulat
ion
dens
ityP
opul
atio
n de
nsity
rel
ativ
e to
lam
bda
max
Pop
ulat
ion
dens
ity r
elat
ive
to la
mbd
a m
ax
Pop
ulat
ion
dens
ity r
elat
ive
to la
mbd
a m
ax
Pop
ulat
ion
dens
ity r
elat
ive
to la
mbd
a m
ax
1
1middot6
1middot4
1middot2
0middot8
0middot6
0middot4
0middot2
0 0 20 40
Projection intervals
1
rmin = rinfin = 0middot539
r1 = 1middot111
r1 =0middot785
01 2 3 4
1 2 3 4
1 2 3 4
1 2 3 4
1 2 3 4
1
0middot5
0
1
0middot5
0
1
0middot5
0
1
0middot5
0
1
0middot5
Lower bound
Initial I
Initial II
Life stage
Upper bound
Stable
Density in current stage distribution
Population 4
1middot6
1middot4
1middot2
0middot8
0middot6
0middot4
0middot2
0
Initial I
lmax = 1middot982
rmax = rinfin = 1middot214
Initial II
Stable
Pop
ulat
ion
dens
ity
1
1middot6
1middot4
1middot2
0middot8
0middot6
0middot4
0middot2
0 0 20 40
Projection intervals
1
rmin = rinfin = 0middot727
r1 = 1middot122
r1 =0middot848
Initial I
Initial II
Stabler1 = 1middot124
r1 =0middot802
FIG 2 (A) Absolute population dynamics including transient and asymptotic influences for the six populations of Lepanthes rubripetala (B) Standardized transientdynamics excluding the influence of asymptotic growth for L rubripetala All demographic distributions are scaled to an initial population density sum 1 The tran-sient bounds for L rubripetala are superimposed on the graph We simulated five initial conditions The two black bar plots at top and bottom correspond to havingall individuals in the smallest and largest class respectively The two red bar plots correspond to distributions between the above distributions and the blue bar plotcorresponds to a stable demographic distribution Bias distribution of individuals among stages bias1frac14 [1 0 0 0] bias2frac14 [015 035 030 020] bias3frac14 stable-stage
distribution (varies among matrices) bias4frac14 [04 02 02 02] bias5frac14 [0 0 0 1]
Page 4 of 10 Tremblay et al mdash Transient dynamics improve population projections for orchids
at University of Puerto R
ico Rio Piedras on M
arch 27 2015httpaoboxfordjournalsorg
Dow
nloaded from
hand the expected pattern of maximal amplification is no morethan 19ndash30 a much smaller proportional change comparedwith the maximal attenuation The amplified inertia also rangesfrom 19 to 30 whereas the expected range of attenuated in-ertia is 13ndash73 (Fig 2 Table 1)
Transfer functions
The general pattern for the non-linear sensitivities ie trans-fer function analysis on lambda (Fig 3 population 1 andSupplementary Data S2 populations 2ndash6) shows that parame-ters below the diagonal which indicate the probability ofgrowth from one growth class to another in one time intervalare more or less linear whereas the diagonal (the probability ofindividuals staying in the same stage) are clearly non-linear
Thus change in stasis could be misleading solely by using thetraditional method of calculating sensitivities as a likely predic-tor of the impact of absolute changes of the parameter onlambda (Supplementary Data S4)
The non-linear response of inertia to perturbation shows amore complex pattern of relationships compared with the effecton lambda (Fig 4 Supplementary Data S3) The effects of per-turbation on inertia were evaluated for the upper and lowerbounds and case-specific results for each population are shownin Appendix 3 As an example of the complex dynamics thenon-reproductive adults remaining in this stage show a double-hump inertia response The density of the population would beexpected to increase by 24 as result of a small reduction inthis stasis parameter in population 1 whereas no such densitychange is expected in population 2 However in both popula-tions a density increase is expected Another equally variable
TABLE 1 Predicted stochastic asymptotic growth (lambda) of six Lepanthes rubripetala populations deterministic and stochasticlambda (the 95 confidence interval of the se of the stochastic lambda) and transient dynamics reactivity first-time step attenua-tion maximum amplification maximum attenuation and upper and lower bound inertia (see Methods section for explanation of indi-
ces stochastic lambdas from Schodelbauerova et al 2010)
Population Deterministic lambdastochasticlambda (se)
Reactivity First-time stepattenuation
Maximumamplification
Maximumattenuation
Amplitude inertia(upper bound)
Attenuation inertia(lower bound)
1 100710072 (10070ndash10074) 1122 0805 1237 0464 1237 04642 101010161 (10159ndash10163) 1125 0802 1240 0393 1240 03933 10281011 (10108ndash10113) 1112 0786 1202 0539 1202 05394 098209824 (09782ndash09801) 1123 0848 1214 0728 1214 07285 102410233 (10230ndash10236) 1118 0837 1191 0627 1191 06276 098710075 (10072ndash10079) 1180 0567 1301 0133 1301 0133
0
1
0middot5
0
1
0middot5
0
1
0middot5
0
1
0middot5
0
1
0middot5
0
1
0middot5
0
1
0middot5
0
1
0middot5
0
1
0middot5
0
1
0middot5
Density in current stage distribution
lmax = 1middot023
lmax = 0middot982
Pop
ulat
ion
dens
ity r
elat
ive
to la
mbd
a m
axP
opul
atio
n de
nsity
1middot6
1middot4
1middot2
0middot8
0middot6
0middot4
0middot2
0
1
1middot6
1middot4
1middot2
0middot8
0middot6
0middot4
0middot2
0
1
Pop
ulat
ion
dens
ity r
elat
ive
to la
mbd
a m
axP
opul
atio
n de
nsity
1middot6
1middot4
1middot2
0middot8
0middot6
0middot4
0middot2
0
1
1middot6
1middot4
1middot2
0middot8
0middot6
0middot4
0middot2
0
1Initial I
rmax = rinfin = 1middot191
Initial II
Stable
rmin = rinfin = 0middot626
r1 = 1middot118
r1 = 0middot837
Density in current stage distribution
Population 5 Population 6
Lower bound
Upper bound
Life stage Life stageProjection intervalsProjection intervals
Initial I
Initial Il
Stable
Lower bound
Upper bound
Initial I
Initial Il
Stable
rmax = rinfin = 1middot288
Initial I
Initial II
Stable
rmin = rinfin = 0middot139
r1 = 1middot178
r1 = 0middot569
1 2 3 40 20 40 1 2 3 4
1 2 3 4
1 2 3 4
1 2 3 4
1 2 3 4
1 2 3 4
1 2 3 4
1 2 3 4
1 2 3 4
0 20 40
FIG 2 Continued
Tremblay et al mdash Transient dynamics improve population projections for orchids Page 5 of 10
at University of Puerto R
ico Rio Piedras on M
arch 27 2015httpaoboxfordjournalsorg
Dow
nloaded from
response in inertia is observed in the transition from the non-re-productive to the reproductive stage for the case-specific popu-lation structure where the response is a decreasing function(populations 1 2 and 5) an increasing function (population 3)or a complex response (populations 4 and 6) These complexvariable patterns of inertia are observed in many of thetransitions
Observed versus expected population density changes
Observed population densities of L rubripetala were similarto the predicted first-time attenuation and reactivity for thecomplete 17 time periods in the two populations evaluated(populations 1 and 5) (Fig 5) The number of individuals wastoo low in the other populations for a reasonable comparison
DISCUSSION
Schodelbauerova et al (2010) reported results of PPM analysisusing an asymptotic approach and noted that if populationgrowth rates are consistent and the expected stable populationdistributions are reached four populations of L rubripetala(populations 1 2 3 and 5) are expected to grow whereas twoare expected to decline (populations 4 and 6) The asymptotic
growth rate (non-stochastic) ranged from 0987 to 1029(Fig 2 Table 1) With the same data set but integrating tran-sient dynamics and transfer function tools we found that theroad to stable-stage distribution is non-linear and the startingpopulation structure at the beginning influences populationdensities
The expected transient dynamics of the surveyed populationsvaried among populations of L rubripetala and population den-sity could be expected to change readily The transients amongpopulations varied in their predicted projection in the differentindices One of the conspicuous patterns is that populationsare much less likely to have large increases in density(reactivity and maximum amplification) compared with reduc-tion (first-step attenuation and maximum attenuation)For species that are rarely if ever found in large numbers(Tremblay 1997) this suggests that populations could bereduced or even disappear much more readily than they can in-crease in size thus not only influencing population persistence(Morris and Doak 2002) but also leading to the possibility ofreduction in the effective population size (Tremblay andAckerman 2001)
The asymptotic behaviour of all six populations of L rubri-petala showed growth rates near to 1 five of them slightlyabove 1 and one slightly below 1 which means that a popula-tion of L rubripetala as a whole tends to show long-term
1middot0
0middot98
1middot01
1middot00
1middot0050middot95
1middot051middot009
1middot012
1middot00
1middot10 1middot20
1middot10
1middot10
1middot00
1middot10
1middot001middot05
0middot900middot90
0middot95
1middot04
1middot04
2middot0
3middot0
4middot0
0
0middot0 0middot0
0middot0
0middot0 0middot2 0middot4 0middot6 0middot8 0middot0 0middot2 0middot4 0middot6 0middot8
0middot000 0middot010 0middot020
0middot2 0middot4 0middot6ndash0middot4 ndash0middot4ndash0middot8
0middot0 0middot2ndash0middot4ndash0middot8
ndash0middot2 ndash0middot6 ndash0middot2
0middot0 0middot2
0middot0 0middot2
0middot4
0middot5 1middot0
0middot6 0middot8ndash0middot2
1 2
Seedlings
Seedlings
Juveniles
Adults
Non-reprouctiveadults
Juveniles
Time t
Tim
e t+
1
AdultsNon-reprouctiveadults
3 4
FIG 3 Transfer functions between transition parameters and the resulting changes in asymptotic growth rate lambda for population 1 of L rubripetala (seeSupplementary Data S2 for other populations) Each graph represents the effect of change in lambda as a function of change in the parameter while holding the otherparameters constant A graph is produced only if a parameter is present in the matrix for the specific transition In general we see that most changes in the transitionof growth (below the diagonal) have close to a linear effect on lambda (but none is linear) but in stasis (the diagonal) the effect of changes in parameters is clearly
non-linear
Page 6 of 10 Tremblay et al mdash Transient dynamics improve population projections for orchids
at University of Puerto R
ico Rio Piedras on M
arch 27 2015httpaoboxfordjournalsorg
Dow
nloaded from
Population 1 Population 2
Perturbation range
ndash0middot15 ndash0middot10 ndash0middot05 0
Perturbation range
ndash0middot8 ndash0middot6 ndash0middot4 ndash0middot2 0In
ertia
1middot5
0
1middot5
0
Iner
tia
Population 3 Population 4
Perturbation range Perturbation range
ndash0middot08 ndash0middot04 0middot040middot00ndash0middot8 ndash0middot6 ndash0middot4 ndash0middot2 0
Iner
tia
1middot5
0
1middot5
0
Iner
tia
Population 6Population 5
Perturbation range
ndash0middot6 ndash0middot4 ndash0middot2 0
Perturbation range
ndash0middot6 ndash0middot4 ndash0middot2 0
Iner
tia
1middot5
0
1middot5
0In
ertia
FIG 4 Transfer function plots of population inertia for the elements that have the maximum sensitivity value of the whole life cycle for each of the six populationsof Lepanthes rubripetala On each plot the two black lines represent the upper and lower bounds of population inertia respectively the blue line represents the trans-
fer function of the current population structure for each population and the dashed red line represents sensitivity at zero perturbation
80
60
Den
sity
40
5 10 15 5
Time (months) Time (months)
10 15
Population 5Population 1
ReacObs NAtt
Max Reac
Max First Att
Indices
FIG 5 Observed population density first-time attenuation and reactivity for the 17 time periods for populations 1 and 5 First-time attenuation and reactivity are theexpected changes in density for a given time period as determined by the change in population demographic structure Maximal reactivity (Max Reac) and first-timestep (Max Att) attenuation are the results of biasing the population towards reproductive adults or seedlings respectively attenuation (Att) and reactivity (Reac) arethe expected decrease or increase in density as a function of the observed sample size at time t ndash 1 and the observed line (Obs N) is the density of the surveyed popu-
lation at time t
Tremblay et al mdash Transient dynamics improve population projections for orchids Page 7 of 10
at University of Puerto R
ico Rio Piedras on M
arch 27 2015httpaoboxfordjournalsorg
Dow
nloaded from
stationary behaviour However due to uncertainty associatedwith the process of demographic stochasticity and the fact thatparameters are estimated from small sample sizes it is risky tomake a statement regarding the lsquotruersquo state of the transition pa-rameters Therefore parameter estimates should always includeconfidence intervals and some measure of uncertainty in thePPMs Furthermore parameters for each population could bebetter estimated using a Bayesian approach by including infor-mation from all populations (Tremblay and McCarthy 2014)Demographic stochasticity (important for small populationsizes) and environmental stochasticity (flash floods hurricanestree falls) can result in a loss of many individuals and result invariation in parameter estimates and ultimately variation in thepopulation growth rate (Morris and Doak 2002) The likely ef-fect of demographic stochasticity was explicitly modelled bySchodelbauerova et al (2010) who showed that in all popula-tions of this orchid the density of future populations could bedrastically reduced and most simulation outcomes included theprobability of populations going extinct
A comparison of transient dynamics and population growthoutcomes after 13 years (from Schodelbauerova et al 2010)shows that population 4 which went extinct had the lowesttransient dynamic range among all surveyed populations Thispopulation went extinct after a flash flood (December 1995)that resulted in the removal of all but one large individual fromthe population due to the force of the water The remainingplants perished in the following months In populations that arecontinuously perturbed by the environment as are these or-chids evaluation of the growth pattern by asymptotic processesmay not reflect the possible change in population size even ifthe species is long-lived because attaining a stable-stage distri-bution may take much longer than the frequency of disturbanceDisturbance is probably a common process in epiphytic andlithophytic species so realization of a stable-stage distributionmay be an uncommon phenomenon Thus limiting the applica-tion of PPMs to the evaluation of asymptotic population dy-namics may not appropriately reflect extinction risks
The observed number of individuals was consistently similarto the predicted number of individuals (Fig 3) In the absenceof immigration and migrations or disturbance population dy-namics should be similar Noting densities outside the predictedbounds should be considered a rare event For examplestrongly biased dynamics would be expected for founder popu-lations comprising only seedlings or relocated populations of afew reproductive adults
The absolute density of the population may not follow the at-tenuation predicted by the transient dynamics as in Fig 3 iflambda gt1 thus population density could be relatively lowerat tthorn 1 compared with an equivalent population at stable-stagedistribution but absolutely higher than at t Biologically thePPM may not necessarily represent adequately the recruitmentprocess in Lepanthes Fruits can have many seeds (6000) andthe recruitment process is variable and unpredictable and un-likely to follow a simple pattern whereas stochastic demo-graphic recruitment will influence density by overestimatingattenuation In this PPM model recruitment distribution may beunrealistic because the recruitment is likely to have a Poissondistribution with low mean probability but an extremely flatand wide probability distribution However we are still
ignorant of recruitment processes across time and space in natu-ral populations of orchids and how best to model these in a real-istic fashion (Ackerman et al 1996 Murren and Ellison 1998Raventos et al 20 11 Jacquemyn et al 2012)
Transfer function analyses were consistent among all sixpopulations The slope represents the likely rates of change oflambda as a function of change in the parameter estimatesConsequently if small changes (increase or decrease) in survi-vorshipstasis are applied to juveniles non-reproductive adultsand reproductive adults staying in the same stage would havethe largest effect on growth rates compared with equivalentchanges in parameters with smaller slopes Environmental fluc-tuations will result in changes in the parameters of stasis andtransitions so that population growth rates will probablychange as well Although a shift in environmental conditionswill cause a proportional change in the parameters it does notnecessarily result in proportional change in growth rate nor isthe proportional response likely to be linear Thus predictingthe influence of growth rate as a function of linear responses(sensitivities) is likely to be misleading Consequently we sug-gest that transfer functions be used to evaluate non-linear re-sponses to changes in parameters instead of the traditionalmeasures of sensitivities In addition Hodgson and Townley(2004) showed a similar pattern in that the curvature of re-sponse seems to be more pronounced in the stasis parametersthan in the growth parameters in the desert tortoise
Inertia the persistence of the increase or decrease in popula-tion density as a consequence of perturbations and not being ata stable-stage equilibrium is extremely variable and variesamong populations This extreme variation in the pattern of in-ertia among populations would make it difficult to predict theresponse to an equal perturbation in an unevaluated sister popu-lation Nevertheless some patterns are evident populationsdominated by the later life stages result in positive inertiawhereas populations dominated by early life stages are likely tohave persistent small population densities Consequently foun-der events are likely to be either disastrous or result in a longperiod at low densities
For populations that are frequently perturbed because of flashfloods as a consequence of tropical storms and hurricanes theconcept of stable-stageage distribution and the parameters thatare dependent on this index may be unrealistic Transient indi-ces may be more amenable to the needs of wildlife managersand conservation biologists because they describe the range ofpossible outcomes from diverse starting points in populationsize and structure Pielke et al (2003) pointed out that many lo-cations in the tropics had at least a 10 chance of experiencinga hurricane annually In these areas the occurrence of hurri-canes shows high inter-annual variability and large multidecadechanges
An additional difficulty is in the use of elasticities and sensi-tivities which occurs when categorizing continuous variablesto make the model fit a discrete model of stage structure as inthe PPM approach Biases may emerge if different categoricalcutoff points that are selected influence the relative importanceof growth stage and survival rates (Enright et al 1995) Whenthe matrices are constructed from continuous variables integralprojection models (IPMs) should be the preferred way to evalu-ate PPMs (Easterling et al 2000 Ellner and Rees 2006
Page 8 of 10 Tremblay et al mdash Transient dynamics improve population projections for orchids
at University of Puerto R
ico Rio Piedras on M
arch 27 2015httpaoboxfordjournalsorg
Dow
nloaded from
Metcalf et al 2013) but these are limited as they do not yet in-corporate transient analysis
As a general pattern transient dynamics are strongly depen-dent on initial conditions (ie a population composed only ofseedlings will have trajectories different from those of a popula-tion composed only of adults Stott et al 2010a) Fortunatelythe first years of a reintroduction programme or new foundingpopulations can be evaluated to determine the range of likelydensity changes in subsequent years Such analyses could pro-vide better choices for determining the initial population struc-ture that could maximize long-term persistence
In situ species conservation requires knowledge not only ofecological variables that influence life history stages but alsoof how they enhance the likelihood of speciespopulationpersistence A drawback of asymptotic growth rates and relatedindices is that they do not readily include estimates of the tran-sient dynamics and variation in growth rates and stage distribu-tions prior to attaining the asymptotic growth rate and theexpected stable-stage distribution Thus an integrativeapproach could elucidate alternative scenarios of population dy-namics for the conservation management of species We recom-mend unifying the study of PPMs using the traditionalasymptotic analysis with an evaluation of the diversity of dy-namics that may arise when populations are not at a stable-stage distribution
SUPPLEMENTARY DATA
Supplementary Data are available online at wwwaoboxford-journalsorg and consist of the following Data S1 populationmatrices of the six populations of L rubripetala and calculationof transition parameters Data S2 sensitivities of non-linear re-lationship between changes (permutations) in transition param-eters and the resulting change in the asymptotic growth ratelambda for the six populations of L rubripetala Data S3transfer functions plots of inertia for the whole life cycle for thesix populations of L rubripetala Data S4 sensitivity matricesas 3-D surface plots for the six populations of L rubripetala
ACKNOWLEDGEMENTS
Partial funding for this work was provided by the Center forApplied Tropical Ecology and Conservation and a grant fromthe US National Science Foundation to the University ofPuerto Rico (E Cuevas project director HRD 0206200)
LITERATURE CITED
Ackerman JD 2012 Orchidaceae In P Acevedo-Rodrıguez MT Strong edsCatalogue of seed plants of the West Indies Smithsonian Contributions toBotany 98 622ndash667
Ackerman JD Sabat A Zimmerman JK 1996 Seedling establishment in anepiphytic orchid an experimental study of seed limitation Oecologia 106192ndash198
Blanco M Barbosa G 2005 Pseudocopulatory pollination in Lepanthes(Orchidaceae Pleurothallidinae) by fungus gnats Annals of Botany 95763ndash772
Bierzychudek P 1999 Looking backwards assessing the projections of a transi-tion matrix model Journal of Applied Ecology 9 1278ndash1287
Caswell H 2001 Matrix population models construction analysis and interpre-tation 2nd edn Sunderland Sinauer
Caswell H 2007 Sensitivity analysis of transient population dynamics EcologyLetters 10 1ndash15
Cohen JE 1979 The cumulative distance from an observed to a stable age struc-ture SIAM Journal of Applied Mathematics 36 169ndash175
Coulson T Mace GM Hudson E Possingham H 2001 The use andabuse of population viability analysis Trends in Ecology and Evolution 16219ndash221
Crain B Tremblay RL 2014 Do richness and rarity hotspots really matter fororchid conservation in light of anticipated habitat lost Diversity andDistributions 20 652ndash662
Crone EE Ellis MM Morris WF et al 2013 Ability of matrix models to ex-plain the past and predict the future of plant populations ConservationBiology 27 968ndash978
Easterling MR Ellner SP Dixon PM 2000 Size-specific sensitivity applyinga new structured population model Ecology 81 694ndash708
Ellner SP Rees M 2006 Integral projection models for species with complexdemography American Naturalist 167 410ndash418
Enright NJ Franco M Silvertown J 1995 Comparing plant life histories us-ing elasticity analysis the importance of life span and the number of life-cy-cle stages Oecologia 104 79ndash84
Ezard THG Bullock JM Dalgleish HJ et al 2010 Matrix models for achangeable world the importance of transient dynamics in population man-agement Journal of Applied Ecology 47 515ndash523
Fieberg J Ellner SP 2001 Stochastic matrix models for conservation and man-agement a comparative review of methods Ecology Letters 4 244ndash266
Govaerts R Kratochvil K Gerlach G et al 2014 World checklist ofLepanthes Facilitated by the Royal Botanic Gardens Kew httpappskeworgwcsp
Hodgson DJ Townley S 2004 Linking management changes to population dy-namic responses the transfer function of a projection matrix perturbationJournal of Applied Ecology 41 1155ndash1161
Hodgson DJ Townley S McCarthy D 2006 Robustness predicting the effectsof life history perturbations on stage-structured population dynamicsTheoretical Population Biology 70 214ndash224
Jacquemyn H Brys R Lievens B Wiegand T 2012 Spatial variation in be-low-ground seed germination and divergent mycorrhizal associations corre-late with spatial segregation of three co-occurring orchids species Journalof Ecology 100 1328ndash1337
Jakalaniemi A Postila H Tuomi J 2013 Accuracy of short-term demographicdata in projecting long-term fate of populations Conservation Biology 27552ndash559
Kephart SR Paladino C 1997 Demographic change and microhabitat variabil-ity in a grassland endemic Silene douglasii var oraria (Carophyllaceae)American Journal of Botany 84 179ndash189
Keyfitz N 1968 Introduction to mathematics of populations Reading Addison-Wesley
Koons DN Holmes RR Grand JB 2007 Population inertia and its sensitivityto changes in vital rates and population structure Ecology 88 2857ndash2867
Lande R Engen S Saether BE 2003 Stochastic population dynamics in ecol-ogy and conservation Oxford Oxford University Press
Lindborg R Ehrlen J 2002 Evaluating the extinction risk of a perennial herb de-mographic data versus historical records Conservation Biology 16 683ndash690
Luer CA 2014 Lepanthes In Ackerman JD collaborators Orchid flora of theGreater Antilles Memoirs of the New York Botanical Garden Vol 109New York NYBG Press 232ndash300
Van Mantgem PJ Stephenson NL 2005 The accuracy of matrix populationmodel projections for coniferous trees in the Sierra Nevada CaliforniaJournal of Ecology 93 737ndash747
McCarthy D Townley S Hodgson DJ 2008 On second order sensitivity forstage-based population projection matrix models Theoretical PopulationBiology 74 68ndash73
Metcalf CJE McMahon SN Gomez RS Jongejans E 2013 ApplicationIPMpack an R package for integral projection models Methods in Ecologyand Evolution 4 195ndash200
Morris WF Doak DF 2002 Quantitative conservation biology The theoriesand practice of population viability analysis Sunderland Sinauer
Murren CJ Ellison AM 1998 Seed dispersal characteristics of Brassavolanodosa (Orchidaceae) American Journal of Botany 85 675ndash680
Pielke RA Rubiera J Landsea C Fernandez ML Klein R 2003 Hurricanevulnerability in Latin America and the Caribbean normalized damage andloss potentials Natural Hazards Review 4 101ndash114
R Project for Statistical Computing 2013 The R project for statistical comput-ing wwwR-projectorg
Tremblay et al mdash Transient dynamics improve population projections for orchids Page 9 of 10
at University of Puerto R
ico Rio Piedras on M
arch 27 2015httpaoboxfordjournalsorg
Dow
nloaded from
Raventos J Mujica E Wiegand T Bronet A 2011 Analyzing the spatialstructure of Broughtonia cubensis (Orchidaceae) populations in the dry for-ests of Guanahacabibes Cuba Biotropica 43 173ndash182
Rebarber R Townley S 1995 Robustness and continuity of the spectrum of thespectrum for uncertain distributed-parameter systems Automatica 311533ndash1546
Rivera-Gomez N Tremblay RL Melendez-Ackerman E 2006 Density de-pendent effects in a lithophytic and epiphytic orchid Folia GeoBotanica 41107ndash120
Schodelbauerova I Tremblay RL Kindlmann P 2010 Prediction vs realitycan a PVA model predict population persistence 13 years later Biodiversityand Conservation 19 637ndash650
Stott I Franco M Carslake D Townley S Hodgson DJ 2010a Boom orbust A comparative analysis of transient population dynamics in plantsJournal of Ecology 98 302ndash311
Stott I Townley S Carslake D Hodgson DJ 2010b On reducibility and ergo-dicity of population projection matrix models Methods in Ecology andEvolution 1 242ndash252
Stott I Townley S Hodgson DJ 2011 A framework for studying transient dy-namics of population projection matrix models Ecological Letters 14959ndash970
Stott I Hodgson DJ Townley S 2012a Popdemo an R package for populationdemography using projection matrix analysis Methods in Ecology andEvolution 3 797ndash802
Stott I Hodgson DJ Townley S 2012b Beyond sensitivity nonlinear perturba-tion analysis of transient dynamics Methods in Ecology and Evolution 3673ndash684
Tremblay RL 1997 Distribution and dispersion patterns of individuals in ninespecies of Lepanthes (Orchidaceae) Biotropica 29 38ndash45
Tremblay RL Ackerman JD 2001 Gene flow and effective population size inLepanthes (Orchidaceae) a case for genetic drift Biological Journal of theLinnean Society 72 47ndash62
Tremblay RL Hutchings MJ 2003 Population dynamics in orchid
conservation a review of analytical methods based on the rare species
Lepanthes eltoroensis In K Dixon S Kell R Barrett P Cribb eds Orchidconservation Kota Kinabalu Natural History Publications (Borneo)
183ndash204Tremblay RL McCarthy MA 2014 Bayesian estimates of transition probabili-
ties in seven small lithophytic orchid populations maximizing data avail-
ability from many small samples PLoS One doi 101371
journalpone0102859Tremblay RL Pomales-Hernandez G Mendez-Cintron ML 2006 Flower
phenology and sexual maturation partial protandrous behavior in three spe-
cies of orchids Caribbean Journal of Science 42 75ndash80Tuljapurkar S 1997 Stochastic matrix models In S Tuljapurkar H Caswell
eds Structured-population models in marine terrestrial and freshwater sys-tems New York Chapman amp Hall 59ndash82
Page 10 of 10 Tremblay et al mdash Transient dynamics improve population projections for orchids
at University of Puerto R
ico Rio Piedras on M
arch 27 2015httpaoboxfordjournalsorg
Dow
nloaded from
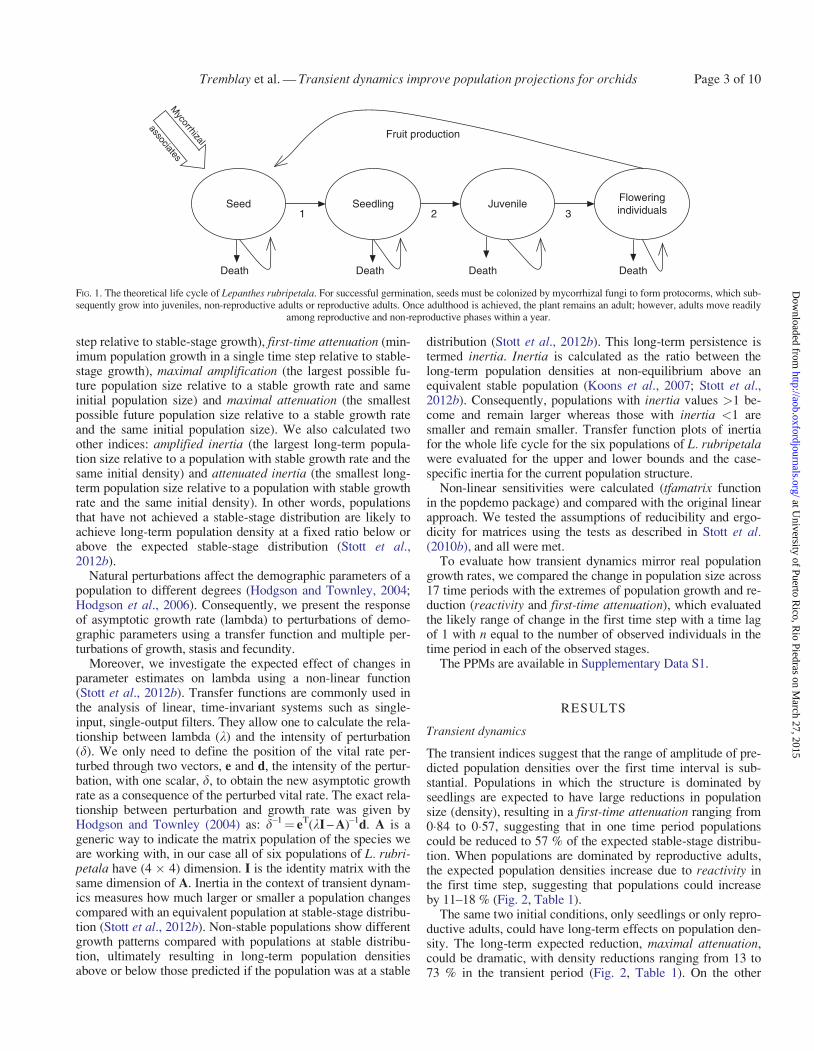
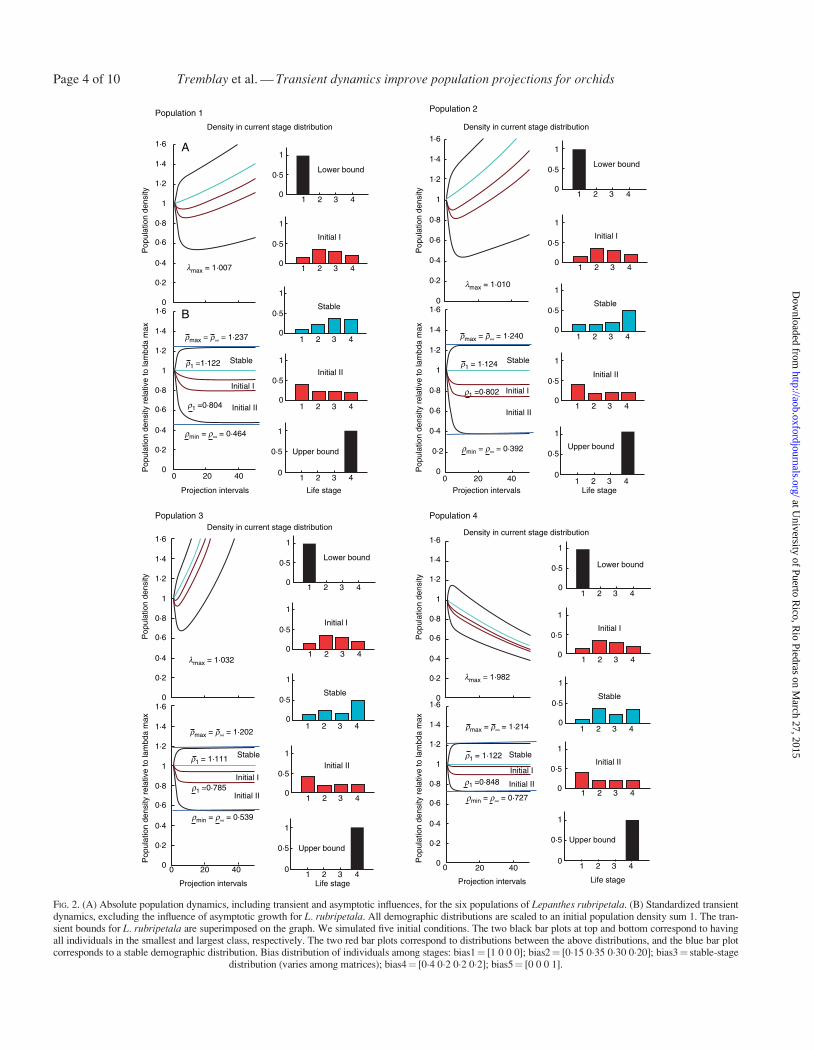
Population 1 Population 2
1middot6
1middot4
1middot2
0middot8
0middot6
0middot4
0middot2
0
01 2 3 4
1 2 3 4
1 2 3 4
1 2 3 4
1 2 3 4
1
0middot5
0
1
0middot5
0
1
0middot5
0
1
0middot5
0
1
0middot5
Lower bound
Initial I
Initial I
lmax = 1middot007
lmax = 1middot010
rmax = rinfin = 1middot237
Initial II
Initial II
Life stage
Upper bound
Stable
01 2 3 4
1 2 3 4
1 2 3 4
1 2 3 4
1 2 3 4
1
0middot5
0
1
0middot5
0
1
0middot5
0
1
0middot5
0
1
0middot5
Lower bound
Initial I
Initial II
Life stage
Upper bound
Stable
Stable
Density in current stage distribution
A
B
01 2 3 4
1 2 3 4
1 2 3 4
1 2 3 4
1 2 3 4
1
0middot5
0
1
0middot5
0
1
0middot5
0
1
0middot5
0
1
0middot5
Lower bound
Initial I
Initial II
Life stage
Upper bound
Stable
Density in current stage distribution
Density in current stage distribution
Pop
ulat
ion
dens
ity
1
1middot6
1middot4
1middot2
0middot8
0middot6
0middot4
0middot2
00 20 40
Projection intervals
1
1middot6
1middot4
1middot2
0middot8
0middot6
0middot4
0middot2
0
Pop
ulat
ion
dens
ity
1
1middot6
1middot4
1middot2
0middot8
0middot6
0middot4
0middot2
00 20 40
Projection intervals
1
rmax = rinfin = 1middot240
rmin = rinfin = 0middot464
rmin = rinfin = 0middot392
r1 =1middot122
r1 =0middot804
Population 3
1middot6
1middot4
1middot2
0middot8
0middot6
0middot4
0middot2
0
Initial I
lmax = 1middot032
rmax = rinfin = 1middot202
Initial II
Stable
Pop
ulat
ion
dens
ityP
opul
atio
n de
nsity
rel
ativ
e to
lam
bda
max
Pop
ulat
ion
dens
ity r
elat
ive
to la
mbd
a m
ax
Pop
ulat
ion
dens
ity r
elat
ive
to la
mbd
a m
ax
Pop
ulat
ion
dens
ity r
elat
ive
to la
mbd
a m
ax
1
1middot6
1middot4
1middot2
0middot8
0middot6
0middot4
0middot2
0 0 20 40
Projection intervals
1
rmin = rinfin = 0middot539
r1 = 1middot111
r1 =0middot785
01 2 3 4
1 2 3 4
1 2 3 4
1 2 3 4
1 2 3 4
1
0middot5
0
1
0middot5
0
1
0middot5
0
1
0middot5
0
1
0middot5
Lower bound
Initial I
Initial II
Life stage
Upper bound
Stable
Density in current stage distribution
Population 4
1middot6
1middot4
1middot2
0middot8
0middot6
0middot4
0middot2
0
Initial I
lmax = 1middot982
rmax = rinfin = 1middot214
Initial II
Stable
Pop
ulat
ion
dens
ity
1
1middot6
1middot4
1middot2
0middot8
0middot6
0middot4
0middot2
0 0 20 40
Projection intervals
1
rmin = rinfin = 0middot727
r1 = 1middot122
r1 =0middot848
Initial I
Initial II
Stabler1 = 1middot124
r1 =0middot802
FIG 2 (A) Absolute population dynamics including transient and asymptotic influences for the six populations of Lepanthes rubripetala (B) Standardized transientdynamics excluding the influence of asymptotic growth for L rubripetala All demographic distributions are scaled to an initial population density sum 1 The tran-sient bounds for L rubripetala are superimposed on the graph We simulated five initial conditions The two black bar plots at top and bottom correspond to havingall individuals in the smallest and largest class respectively The two red bar plots correspond to distributions between the above distributions and the blue bar plotcorresponds to a stable demographic distribution Bias distribution of individuals among stages bias1frac14 [1 0 0 0] bias2frac14 [015 035 030 020] bias3frac14 stable-stage
distribution (varies among matrices) bias4frac14 [04 02 02 02] bias5frac14 [0 0 0 1]
Page 4 of 10 Tremblay et al mdash Transient dynamics improve population projections for orchids
at University of Puerto R
ico Rio Piedras on M
arch 27 2015httpaoboxfordjournalsorg
Dow
nloaded from
hand the expected pattern of maximal amplification is no morethan 19ndash30 a much smaller proportional change comparedwith the maximal attenuation The amplified inertia also rangesfrom 19 to 30 whereas the expected range of attenuated in-ertia is 13ndash73 (Fig 2 Table 1)
Transfer functions
The general pattern for the non-linear sensitivities ie trans-fer function analysis on lambda (Fig 3 population 1 andSupplementary Data S2 populations 2ndash6) shows that parame-ters below the diagonal which indicate the probability ofgrowth from one growth class to another in one time intervalare more or less linear whereas the diagonal (the probability ofindividuals staying in the same stage) are clearly non-linear
Thus change in stasis could be misleading solely by using thetraditional method of calculating sensitivities as a likely predic-tor of the impact of absolute changes of the parameter onlambda (Supplementary Data S4)
The non-linear response of inertia to perturbation shows amore complex pattern of relationships compared with the effecton lambda (Fig 4 Supplementary Data S3) The effects of per-turbation on inertia were evaluated for the upper and lowerbounds and case-specific results for each population are shownin Appendix 3 As an example of the complex dynamics thenon-reproductive adults remaining in this stage show a double-hump inertia response The density of the population would beexpected to increase by 24 as result of a small reduction inthis stasis parameter in population 1 whereas no such densitychange is expected in population 2 However in both popula-tions a density increase is expected Another equally variable
TABLE 1 Predicted stochastic asymptotic growth (lambda) of six Lepanthes rubripetala populations deterministic and stochasticlambda (the 95 confidence interval of the se of the stochastic lambda) and transient dynamics reactivity first-time step attenua-tion maximum amplification maximum attenuation and upper and lower bound inertia (see Methods section for explanation of indi-
ces stochastic lambdas from Schodelbauerova et al 2010)
Population Deterministic lambdastochasticlambda (se)
Reactivity First-time stepattenuation
Maximumamplification
Maximumattenuation
Amplitude inertia(upper bound)
Attenuation inertia(lower bound)
1 100710072 (10070ndash10074) 1122 0805 1237 0464 1237 04642 101010161 (10159ndash10163) 1125 0802 1240 0393 1240 03933 10281011 (10108ndash10113) 1112 0786 1202 0539 1202 05394 098209824 (09782ndash09801) 1123 0848 1214 0728 1214 07285 102410233 (10230ndash10236) 1118 0837 1191 0627 1191 06276 098710075 (10072ndash10079) 1180 0567 1301 0133 1301 0133
0
1
0middot5
0
1
0middot5
0
1
0middot5
0
1
0middot5
0
1
0middot5
0
1
0middot5
0
1
0middot5
0
1
0middot5
0
1
0middot5
0
1
0middot5
Density in current stage distribution
lmax = 1middot023
lmax = 0middot982
Pop
ulat
ion
dens
ity r
elat
ive
to la
mbd
a m
axP
opul
atio
n de
nsity
1middot6
1middot4
1middot2
0middot8
0middot6
0middot4
0middot2
0
1
1middot6
1middot4
1middot2
0middot8
0middot6
0middot4
0middot2
0
1
Pop
ulat
ion
dens
ity r
elat
ive
to la
mbd
a m
axP
opul
atio
n de
nsity
1middot6
1middot4
1middot2
0middot8
0middot6
0middot4
0middot2
0
1
1middot6
1middot4
1middot2
0middot8
0middot6
0middot4
0middot2
0
1Initial I
rmax = rinfin = 1middot191
Initial II
Stable
rmin = rinfin = 0middot626
r1 = 1middot118
r1 = 0middot837
Density in current stage distribution
Population 5 Population 6
Lower bound
Upper bound
Life stage Life stageProjection intervalsProjection intervals
Initial I
Initial Il
Stable
Lower bound
Upper bound
Initial I
Initial Il
Stable
rmax = rinfin = 1middot288
Initial I
Initial II
Stable
rmin = rinfin = 0middot139
r1 = 1middot178
r1 = 0middot569
1 2 3 40 20 40 1 2 3 4
1 2 3 4
1 2 3 4
1 2 3 4
1 2 3 4
1 2 3 4
1 2 3 4
1 2 3 4
1 2 3 4
0 20 40
FIG 2 Continued
Tremblay et al mdash Transient dynamics improve population projections for orchids Page 5 of 10
at University of Puerto R
ico Rio Piedras on M
arch 27 2015httpaoboxfordjournalsorg
Dow
nloaded from
response in inertia is observed in the transition from the non-re-productive to the reproductive stage for the case-specific popu-lation structure where the response is a decreasing function(populations 1 2 and 5) an increasing function (population 3)or a complex response (populations 4 and 6) These complexvariable patterns of inertia are observed in many of thetransitions
Observed versus expected population density changes
Observed population densities of L rubripetala were similarto the predicted first-time attenuation and reactivity for thecomplete 17 time periods in the two populations evaluated(populations 1 and 5) (Fig 5) The number of individuals wastoo low in the other populations for a reasonable comparison
DISCUSSION
Schodelbauerova et al (2010) reported results of PPM analysisusing an asymptotic approach and noted that if populationgrowth rates are consistent and the expected stable populationdistributions are reached four populations of L rubripetala(populations 1 2 3 and 5) are expected to grow whereas twoare expected to decline (populations 4 and 6) The asymptotic
growth rate (non-stochastic) ranged from 0987 to 1029(Fig 2 Table 1) With the same data set but integrating tran-sient dynamics and transfer function tools we found that theroad to stable-stage distribution is non-linear and the startingpopulation structure at the beginning influences populationdensities
The expected transient dynamics of the surveyed populationsvaried among populations of L rubripetala and population den-sity could be expected to change readily The transients amongpopulations varied in their predicted projection in the differentindices One of the conspicuous patterns is that populationsare much less likely to have large increases in density(reactivity and maximum amplification) compared with reduc-tion (first-step attenuation and maximum attenuation)For species that are rarely if ever found in large numbers(Tremblay 1997) this suggests that populations could bereduced or even disappear much more readily than they can in-crease in size thus not only influencing population persistence(Morris and Doak 2002) but also leading to the possibility ofreduction in the effective population size (Tremblay andAckerman 2001)
The asymptotic behaviour of all six populations of L rubri-petala showed growth rates near to 1 five of them slightlyabove 1 and one slightly below 1 which means that a popula-tion of L rubripetala as a whole tends to show long-term
1middot0
0middot98
1middot01
1middot00
1middot0050middot95
1middot051middot009
1middot012
1middot00
1middot10 1middot20
1middot10
1middot10
1middot00
1middot10
1middot001middot05
0middot900middot90
0middot95
1middot04
1middot04
2middot0
3middot0
4middot0
0
0middot0 0middot0
0middot0
0middot0 0middot2 0middot4 0middot6 0middot8 0middot0 0middot2 0middot4 0middot6 0middot8
0middot000 0middot010 0middot020
0middot2 0middot4 0middot6ndash0middot4 ndash0middot4ndash0middot8
0middot0 0middot2ndash0middot4ndash0middot8
ndash0middot2 ndash0middot6 ndash0middot2
0middot0 0middot2
0middot0 0middot2
0middot4
0middot5 1middot0
0middot6 0middot8ndash0middot2
1 2
Seedlings
Seedlings
Juveniles
Adults
Non-reprouctiveadults
Juveniles
Time t
Tim
e t+
1
AdultsNon-reprouctiveadults
3 4
FIG 3 Transfer functions between transition parameters and the resulting changes in asymptotic growth rate lambda for population 1 of L rubripetala (seeSupplementary Data S2 for other populations) Each graph represents the effect of change in lambda as a function of change in the parameter while holding the otherparameters constant A graph is produced only if a parameter is present in the matrix for the specific transition In general we see that most changes in the transitionof growth (below the diagonal) have close to a linear effect on lambda (but none is linear) but in stasis (the diagonal) the effect of changes in parameters is clearly
non-linear
Page 6 of 10 Tremblay et al mdash Transient dynamics improve population projections for orchids
at University of Puerto R
ico Rio Piedras on M
arch 27 2015httpaoboxfordjournalsorg
Dow
nloaded from
Population 1 Population 2
Perturbation range
ndash0middot15 ndash0middot10 ndash0middot05 0
Perturbation range
ndash0middot8 ndash0middot6 ndash0middot4 ndash0middot2 0In
ertia
1middot5
0
1middot5
0
Iner
tia
Population 3 Population 4
Perturbation range Perturbation range
ndash0middot08 ndash0middot04 0middot040middot00ndash0middot8 ndash0middot6 ndash0middot4 ndash0middot2 0
Iner
tia
1middot5
0
1middot5
0
Iner
tia
Population 6Population 5
Perturbation range
ndash0middot6 ndash0middot4 ndash0middot2 0
Perturbation range
ndash0middot6 ndash0middot4 ndash0middot2 0
Iner
tia
1middot5
0
1middot5
0In
ertia
FIG 4 Transfer function plots of population inertia for the elements that have the maximum sensitivity value of the whole life cycle for each of the six populationsof Lepanthes rubripetala On each plot the two black lines represent the upper and lower bounds of population inertia respectively the blue line represents the trans-
fer function of the current population structure for each population and the dashed red line represents sensitivity at zero perturbation
80
60
Den
sity
40
5 10 15 5
Time (months) Time (months)
10 15
Population 5Population 1
ReacObs NAtt
Max Reac
Max First Att
Indices
FIG 5 Observed population density first-time attenuation and reactivity for the 17 time periods for populations 1 and 5 First-time attenuation and reactivity are theexpected changes in density for a given time period as determined by the change in population demographic structure Maximal reactivity (Max Reac) and first-timestep (Max Att) attenuation are the results of biasing the population towards reproductive adults or seedlings respectively attenuation (Att) and reactivity (Reac) arethe expected decrease or increase in density as a function of the observed sample size at time t ndash 1 and the observed line (Obs N) is the density of the surveyed popu-
lation at time t
Tremblay et al mdash Transient dynamics improve population projections for orchids Page 7 of 10
at University of Puerto R
ico Rio Piedras on M
arch 27 2015httpaoboxfordjournalsorg
Dow
nloaded from
stationary behaviour However due to uncertainty associatedwith the process of demographic stochasticity and the fact thatparameters are estimated from small sample sizes it is risky tomake a statement regarding the lsquotruersquo state of the transition pa-rameters Therefore parameter estimates should always includeconfidence intervals and some measure of uncertainty in thePPMs Furthermore parameters for each population could bebetter estimated using a Bayesian approach by including infor-mation from all populations (Tremblay and McCarthy 2014)Demographic stochasticity (important for small populationsizes) and environmental stochasticity (flash floods hurricanestree falls) can result in a loss of many individuals and result invariation in parameter estimates and ultimately variation in thepopulation growth rate (Morris and Doak 2002) The likely ef-fect of demographic stochasticity was explicitly modelled bySchodelbauerova et al (2010) who showed that in all popula-tions of this orchid the density of future populations could bedrastically reduced and most simulation outcomes included theprobability of populations going extinct
A comparison of transient dynamics and population growthoutcomes after 13 years (from Schodelbauerova et al 2010)shows that population 4 which went extinct had the lowesttransient dynamic range among all surveyed populations Thispopulation went extinct after a flash flood (December 1995)that resulted in the removal of all but one large individual fromthe population due to the force of the water The remainingplants perished in the following months In populations that arecontinuously perturbed by the environment as are these or-chids evaluation of the growth pattern by asymptotic processesmay not reflect the possible change in population size even ifthe species is long-lived because attaining a stable-stage distri-bution may take much longer than the frequency of disturbanceDisturbance is probably a common process in epiphytic andlithophytic species so realization of a stable-stage distributionmay be an uncommon phenomenon Thus limiting the applica-tion of PPMs to the evaluation of asymptotic population dy-namics may not appropriately reflect extinction risks
The observed number of individuals was consistently similarto the predicted number of individuals (Fig 3) In the absenceof immigration and migrations or disturbance population dy-namics should be similar Noting densities outside the predictedbounds should be considered a rare event For examplestrongly biased dynamics would be expected for founder popu-lations comprising only seedlings or relocated populations of afew reproductive adults
The absolute density of the population may not follow the at-tenuation predicted by the transient dynamics as in Fig 3 iflambda gt1 thus population density could be relatively lowerat tthorn 1 compared with an equivalent population at stable-stagedistribution but absolutely higher than at t Biologically thePPM may not necessarily represent adequately the recruitmentprocess in Lepanthes Fruits can have many seeds (6000) andthe recruitment process is variable and unpredictable and un-likely to follow a simple pattern whereas stochastic demo-graphic recruitment will influence density by overestimatingattenuation In this PPM model recruitment distribution may beunrealistic because the recruitment is likely to have a Poissondistribution with low mean probability but an extremely flatand wide probability distribution However we are still
ignorant of recruitment processes across time and space in natu-ral populations of orchids and how best to model these in a real-istic fashion (Ackerman et al 1996 Murren and Ellison 1998Raventos et al 20 11 Jacquemyn et al 2012)
Transfer function analyses were consistent among all sixpopulations The slope represents the likely rates of change oflambda as a function of change in the parameter estimatesConsequently if small changes (increase or decrease) in survi-vorshipstasis are applied to juveniles non-reproductive adultsand reproductive adults staying in the same stage would havethe largest effect on growth rates compared with equivalentchanges in parameters with smaller slopes Environmental fluc-tuations will result in changes in the parameters of stasis andtransitions so that population growth rates will probablychange as well Although a shift in environmental conditionswill cause a proportional change in the parameters it does notnecessarily result in proportional change in growth rate nor isthe proportional response likely to be linear Thus predictingthe influence of growth rate as a function of linear responses(sensitivities) is likely to be misleading Consequently we sug-gest that transfer functions be used to evaluate non-linear re-sponses to changes in parameters instead of the traditionalmeasures of sensitivities In addition Hodgson and Townley(2004) showed a similar pattern in that the curvature of re-sponse seems to be more pronounced in the stasis parametersthan in the growth parameters in the desert tortoise
Inertia the persistence of the increase or decrease in popula-tion density as a consequence of perturbations and not being ata stable-stage equilibrium is extremely variable and variesamong populations This extreme variation in the pattern of in-ertia among populations would make it difficult to predict theresponse to an equal perturbation in an unevaluated sister popu-lation Nevertheless some patterns are evident populationsdominated by the later life stages result in positive inertiawhereas populations dominated by early life stages are likely tohave persistent small population densities Consequently foun-der events are likely to be either disastrous or result in a longperiod at low densities
For populations that are frequently perturbed because of flashfloods as a consequence of tropical storms and hurricanes theconcept of stable-stageage distribution and the parameters thatare dependent on this index may be unrealistic Transient indi-ces may be more amenable to the needs of wildlife managersand conservation biologists because they describe the range ofpossible outcomes from diverse starting points in populationsize and structure Pielke et al (2003) pointed out that many lo-cations in the tropics had at least a 10 chance of experiencinga hurricane annually In these areas the occurrence of hurri-canes shows high inter-annual variability and large multidecadechanges
An additional difficulty is in the use of elasticities and sensi-tivities which occurs when categorizing continuous variablesto make the model fit a discrete model of stage structure as inthe PPM approach Biases may emerge if different categoricalcutoff points that are selected influence the relative importanceof growth stage and survival rates (Enright et al 1995) Whenthe matrices are constructed from continuous variables integralprojection models (IPMs) should be the preferred way to evalu-ate PPMs (Easterling et al 2000 Ellner and Rees 2006
Page 8 of 10 Tremblay et al mdash Transient dynamics improve population projections for orchids
at University of Puerto R
ico Rio Piedras on M
arch 27 2015httpaoboxfordjournalsorg
Dow
nloaded from
Metcalf et al 2013) but these are limited as they do not yet in-corporate transient analysis
As a general pattern transient dynamics are strongly depen-dent on initial conditions (ie a population composed only ofseedlings will have trajectories different from those of a popula-tion composed only of adults Stott et al 2010a) Fortunatelythe first years of a reintroduction programme or new foundingpopulations can be evaluated to determine the range of likelydensity changes in subsequent years Such analyses could pro-vide better choices for determining the initial population struc-ture that could maximize long-term persistence
In situ species conservation requires knowledge not only ofecological variables that influence life history stages but alsoof how they enhance the likelihood of speciespopulationpersistence A drawback of asymptotic growth rates and relatedindices is that they do not readily include estimates of the tran-sient dynamics and variation in growth rates and stage distribu-tions prior to attaining the asymptotic growth rate and theexpected stable-stage distribution Thus an integrativeapproach could elucidate alternative scenarios of population dy-namics for the conservation management of species We recom-mend unifying the study of PPMs using the traditionalasymptotic analysis with an evaluation of the diversity of dy-namics that may arise when populations are not at a stable-stage distribution
SUPPLEMENTARY DATA
Supplementary Data are available online at wwwaoboxford-journalsorg and consist of the following Data S1 populationmatrices of the six populations of L rubripetala and calculationof transition parameters Data S2 sensitivities of non-linear re-lationship between changes (permutations) in transition param-eters and the resulting change in the asymptotic growth ratelambda for the six populations of L rubripetala Data S3transfer functions plots of inertia for the whole life cycle for thesix populations of L rubripetala Data S4 sensitivity matricesas 3-D surface plots for the six populations of L rubripetala
ACKNOWLEDGEMENTS
Partial funding for this work was provided by the Center forApplied Tropical Ecology and Conservation and a grant fromthe US National Science Foundation to the University ofPuerto Rico (E Cuevas project director HRD 0206200)
LITERATURE CITED
Ackerman JD 2012 Orchidaceae In P Acevedo-Rodrıguez MT Strong edsCatalogue of seed plants of the West Indies Smithsonian Contributions toBotany 98 622ndash667
Ackerman JD Sabat A Zimmerman JK 1996 Seedling establishment in anepiphytic orchid an experimental study of seed limitation Oecologia 106192ndash198
Blanco M Barbosa G 2005 Pseudocopulatory pollination in Lepanthes(Orchidaceae Pleurothallidinae) by fungus gnats Annals of Botany 95763ndash772
Bierzychudek P 1999 Looking backwards assessing the projections of a transi-tion matrix model Journal of Applied Ecology 9 1278ndash1287
Caswell H 2001 Matrix population models construction analysis and interpre-tation 2nd edn Sunderland Sinauer
Caswell H 2007 Sensitivity analysis of transient population dynamics EcologyLetters 10 1ndash15
Cohen JE 1979 The cumulative distance from an observed to a stable age struc-ture SIAM Journal of Applied Mathematics 36 169ndash175
Coulson T Mace GM Hudson E Possingham H 2001 The use andabuse of population viability analysis Trends in Ecology and Evolution 16219ndash221
Crain B Tremblay RL 2014 Do richness and rarity hotspots really matter fororchid conservation in light of anticipated habitat lost Diversity andDistributions 20 652ndash662
Crone EE Ellis MM Morris WF et al 2013 Ability of matrix models to ex-plain the past and predict the future of plant populations ConservationBiology 27 968ndash978
Easterling MR Ellner SP Dixon PM 2000 Size-specific sensitivity applyinga new structured population model Ecology 81 694ndash708
Ellner SP Rees M 2006 Integral projection models for species with complexdemography American Naturalist 167 410ndash418
Enright NJ Franco M Silvertown J 1995 Comparing plant life histories us-ing elasticity analysis the importance of life span and the number of life-cy-cle stages Oecologia 104 79ndash84
Ezard THG Bullock JM Dalgleish HJ et al 2010 Matrix models for achangeable world the importance of transient dynamics in population man-agement Journal of Applied Ecology 47 515ndash523
Fieberg J Ellner SP 2001 Stochastic matrix models for conservation and man-agement a comparative review of methods Ecology Letters 4 244ndash266
Govaerts R Kratochvil K Gerlach G et al 2014 World checklist ofLepanthes Facilitated by the Royal Botanic Gardens Kew httpappskeworgwcsp
Hodgson DJ Townley S 2004 Linking management changes to population dy-namic responses the transfer function of a projection matrix perturbationJournal of Applied Ecology 41 1155ndash1161
Hodgson DJ Townley S McCarthy D 2006 Robustness predicting the effectsof life history perturbations on stage-structured population dynamicsTheoretical Population Biology 70 214ndash224
Jacquemyn H Brys R Lievens B Wiegand T 2012 Spatial variation in be-low-ground seed germination and divergent mycorrhizal associations corre-late with spatial segregation of three co-occurring orchids species Journalof Ecology 100 1328ndash1337
Jakalaniemi A Postila H Tuomi J 2013 Accuracy of short-term demographicdata in projecting long-term fate of populations Conservation Biology 27552ndash559
Kephart SR Paladino C 1997 Demographic change and microhabitat variabil-ity in a grassland endemic Silene douglasii var oraria (Carophyllaceae)American Journal of Botany 84 179ndash189
Keyfitz N 1968 Introduction to mathematics of populations Reading Addison-Wesley
Koons DN Holmes RR Grand JB 2007 Population inertia and its sensitivityto changes in vital rates and population structure Ecology 88 2857ndash2867
Lande R Engen S Saether BE 2003 Stochastic population dynamics in ecol-ogy and conservation Oxford Oxford University Press
Lindborg R Ehrlen J 2002 Evaluating the extinction risk of a perennial herb de-mographic data versus historical records Conservation Biology 16 683ndash690
Luer CA 2014 Lepanthes In Ackerman JD collaborators Orchid flora of theGreater Antilles Memoirs of the New York Botanical Garden Vol 109New York NYBG Press 232ndash300
Van Mantgem PJ Stephenson NL 2005 The accuracy of matrix populationmodel projections for coniferous trees in the Sierra Nevada CaliforniaJournal of Ecology 93 737ndash747
McCarthy D Townley S Hodgson DJ 2008 On second order sensitivity forstage-based population projection matrix models Theoretical PopulationBiology 74 68ndash73
Metcalf CJE McMahon SN Gomez RS Jongejans E 2013 ApplicationIPMpack an R package for integral projection models Methods in Ecologyand Evolution 4 195ndash200
Morris WF Doak DF 2002 Quantitative conservation biology The theoriesand practice of population viability analysis Sunderland Sinauer
Murren CJ Ellison AM 1998 Seed dispersal characteristics of Brassavolanodosa (Orchidaceae) American Journal of Botany 85 675ndash680
Pielke RA Rubiera J Landsea C Fernandez ML Klein R 2003 Hurricanevulnerability in Latin America and the Caribbean normalized damage andloss potentials Natural Hazards Review 4 101ndash114
R Project for Statistical Computing 2013 The R project for statistical comput-ing wwwR-projectorg
Tremblay et al mdash Transient dynamics improve population projections for orchids Page 9 of 10
at University of Puerto R
ico Rio Piedras on M
arch 27 2015httpaoboxfordjournalsorg
Dow
nloaded from
Raventos J Mujica E Wiegand T Bronet A 2011 Analyzing the spatialstructure of Broughtonia cubensis (Orchidaceae) populations in the dry for-ests of Guanahacabibes Cuba Biotropica 43 173ndash182
Rebarber R Townley S 1995 Robustness and continuity of the spectrum of thespectrum for uncertain distributed-parameter systems Automatica 311533ndash1546
Rivera-Gomez N Tremblay RL Melendez-Ackerman E 2006 Density de-pendent effects in a lithophytic and epiphytic orchid Folia GeoBotanica 41107ndash120
Schodelbauerova I Tremblay RL Kindlmann P 2010 Prediction vs realitycan a PVA model predict population persistence 13 years later Biodiversityand Conservation 19 637ndash650
Stott I Franco M Carslake D Townley S Hodgson DJ 2010a Boom orbust A comparative analysis of transient population dynamics in plantsJournal of Ecology 98 302ndash311
Stott I Townley S Carslake D Hodgson DJ 2010b On reducibility and ergo-dicity of population projection matrix models Methods in Ecology andEvolution 1 242ndash252
Stott I Townley S Hodgson DJ 2011 A framework for studying transient dy-namics of population projection matrix models Ecological Letters 14959ndash970
Stott I Hodgson DJ Townley S 2012a Popdemo an R package for populationdemography using projection matrix analysis Methods in Ecology andEvolution 3 797ndash802
Stott I Hodgson DJ Townley S 2012b Beyond sensitivity nonlinear perturba-tion analysis of transient dynamics Methods in Ecology and Evolution 3673ndash684
Tremblay RL 1997 Distribution and dispersion patterns of individuals in ninespecies of Lepanthes (Orchidaceae) Biotropica 29 38ndash45
Tremblay RL Ackerman JD 2001 Gene flow and effective population size inLepanthes (Orchidaceae) a case for genetic drift Biological Journal of theLinnean Society 72 47ndash62
Tremblay RL Hutchings MJ 2003 Population dynamics in orchid
conservation a review of analytical methods based on the rare species
Lepanthes eltoroensis In K Dixon S Kell R Barrett P Cribb eds Orchidconservation Kota Kinabalu Natural History Publications (Borneo)
183ndash204Tremblay RL McCarthy MA 2014 Bayesian estimates of transition probabili-
ties in seven small lithophytic orchid populations maximizing data avail-
ability from many small samples PLoS One doi 101371
journalpone0102859Tremblay RL Pomales-Hernandez G Mendez-Cintron ML 2006 Flower
phenology and sexual maturation partial protandrous behavior in three spe-
cies of orchids Caribbean Journal of Science 42 75ndash80Tuljapurkar S 1997 Stochastic matrix models In S Tuljapurkar H Caswell
eds Structured-population models in marine terrestrial and freshwater sys-tems New York Chapman amp Hall 59ndash82
Page 10 of 10 Tremblay et al mdash Transient dynamics improve population projections for orchids
at University of Puerto R
ico Rio Piedras on M
arch 27 2015httpaoboxfordjournalsorg
Dow
nloaded from
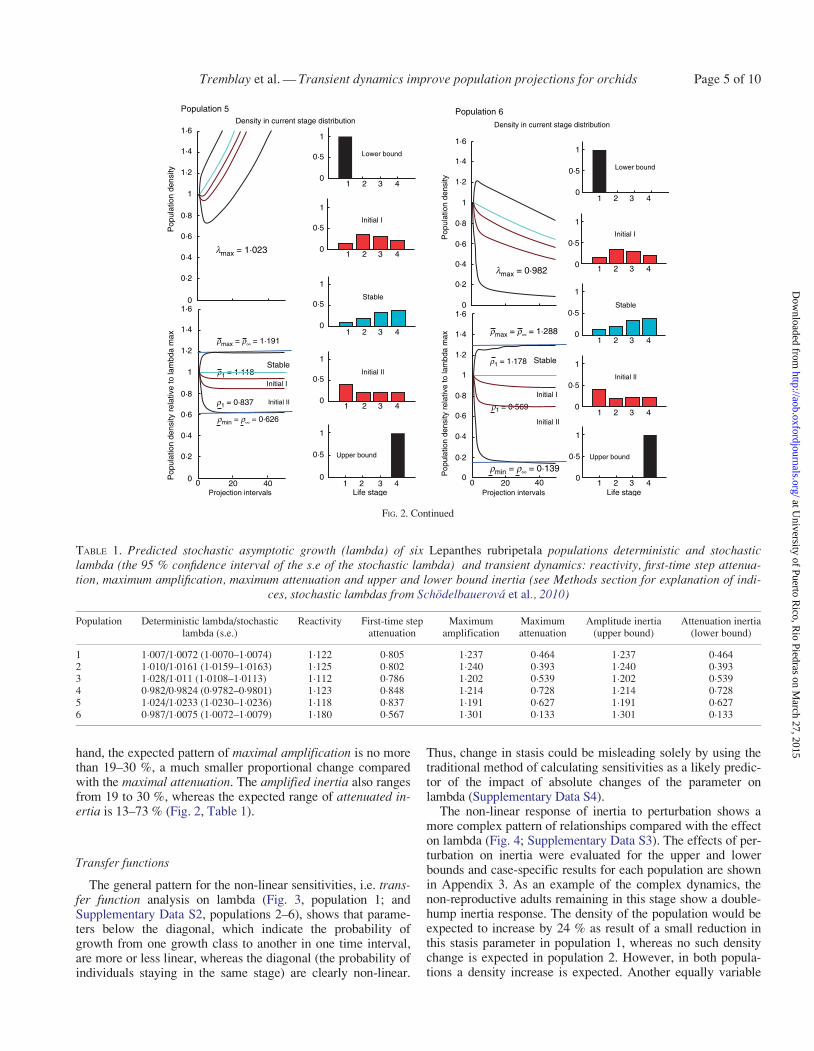
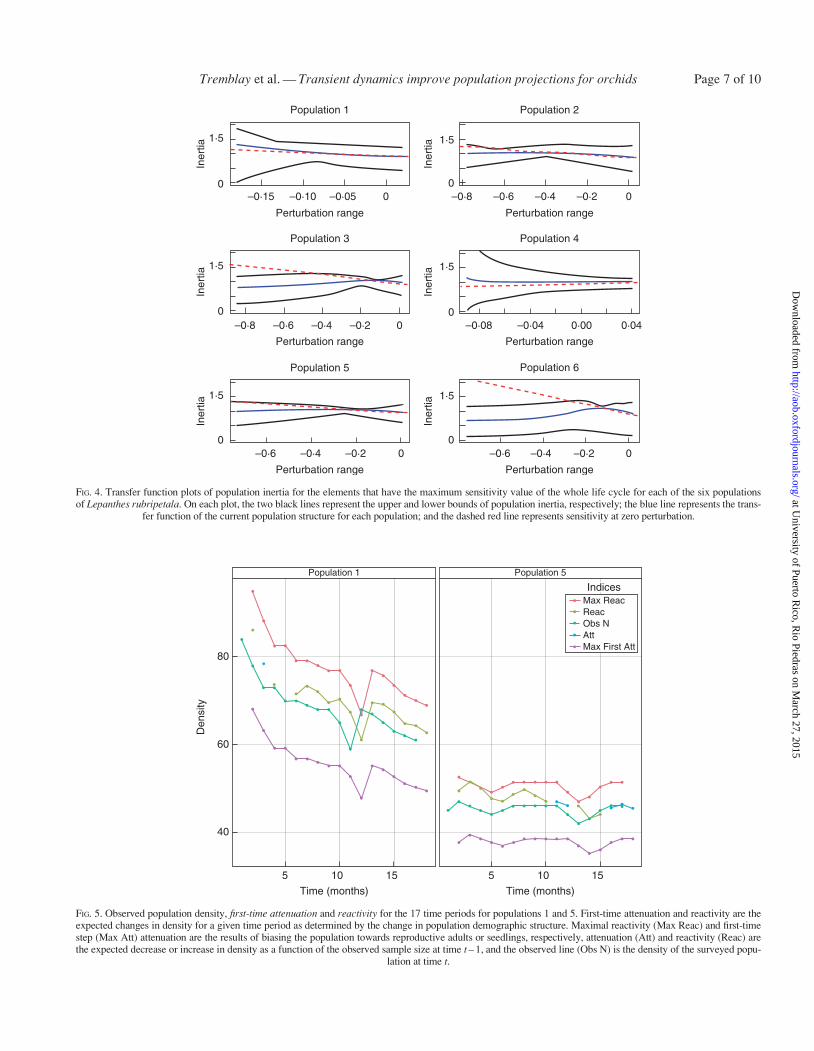