what's inside this report - rhb
TRANSCRIPT

FINANCIAL REPORT 2020
RHB BANK BERHAD
WWW.RHBGROUP.COM
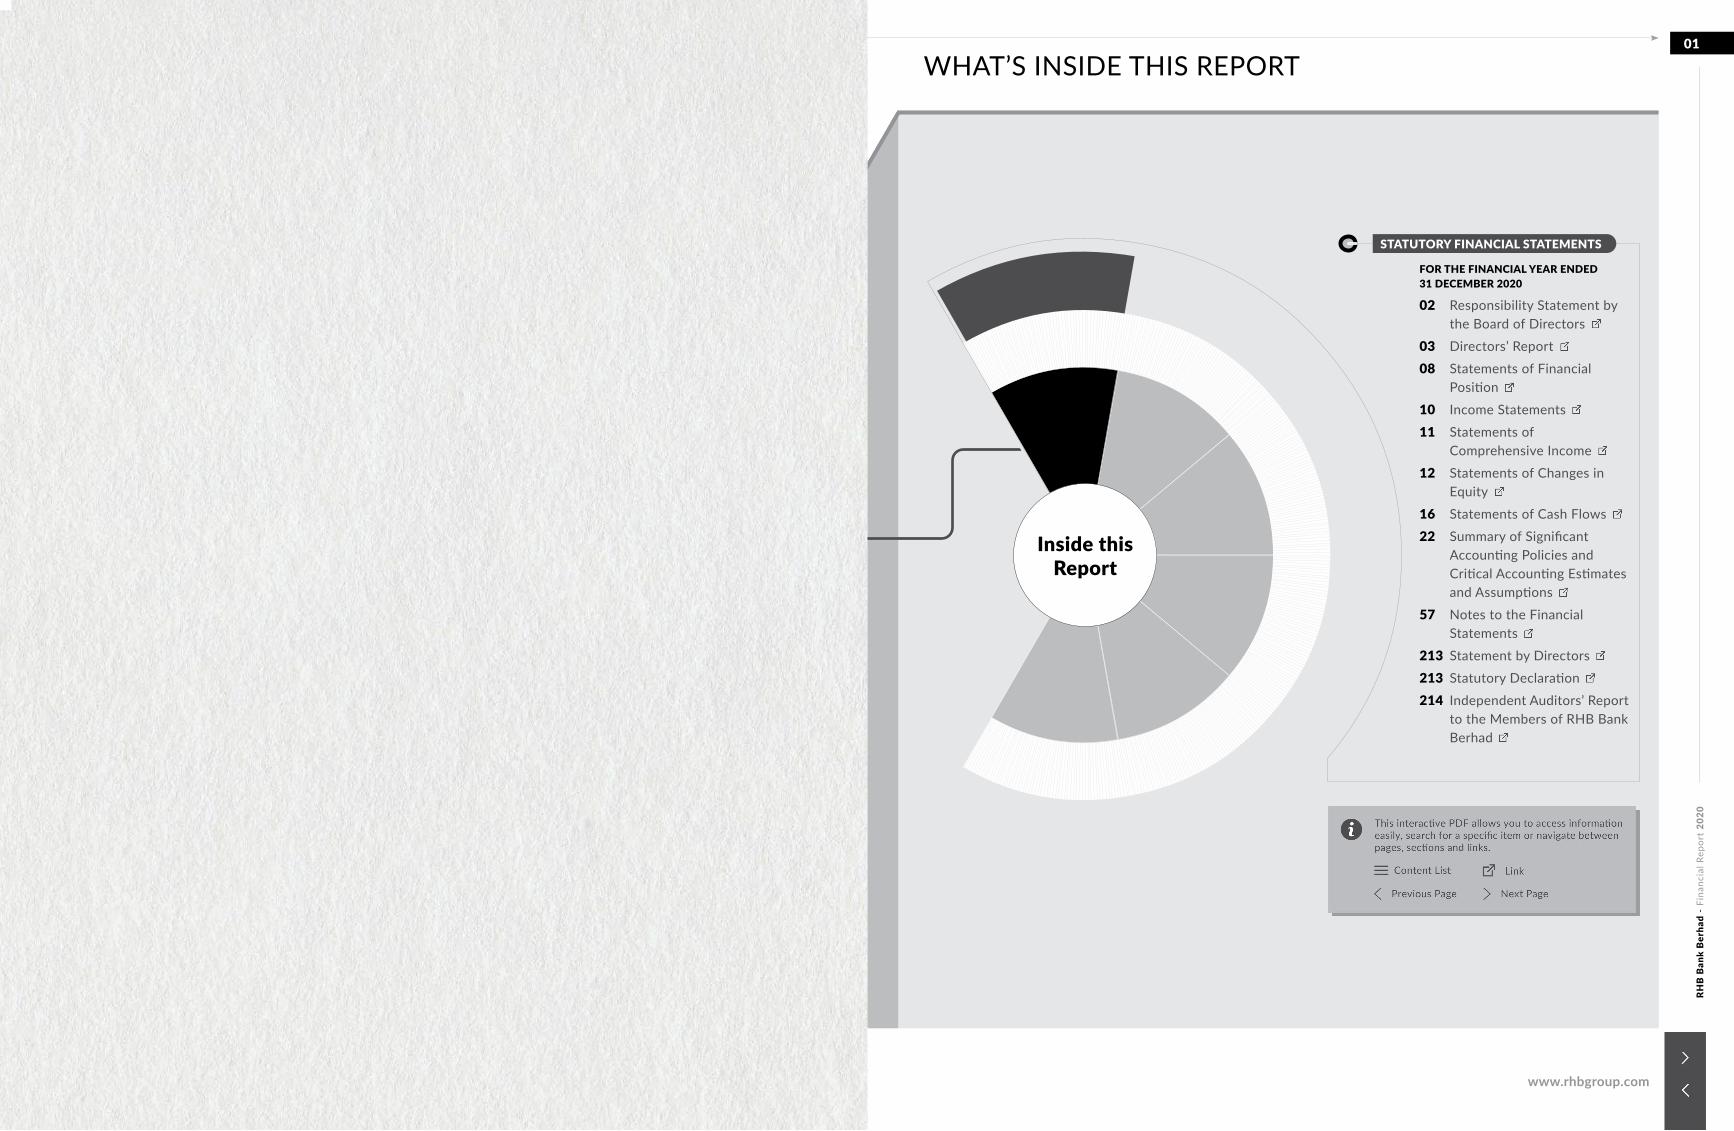
WHAT’S INSIDE THIS REPORT
FOR THE FINANCIAL YEAR ENDED 31 DECEMBER 2020
02 Responsibility Statement by the Board of Directors
03 Directors’ Report08 Statements of Financial
Position10 Income Statements11 Statements of
Comprehensive Income12 Statements of Changes in
Equity16 Statements of Cash Flows22 Summary of Significant
Accounting Policies and Critical Accounting Estimates and Assumptions
57 Notes to the Financial Statements
213 Statement by Directors213 Statutory Declaration214 Independent Auditors’ Report
to the Members of RHB Bank Berhad
STATUTORY FINANCIAL STATEMENTS
01
www.rhbgroup.com
RHB
Ban
k B
erha
d -
Fina
ncia
l Rep
ort
2020
RHB
Ban
k B
erha
d -
Fina
ncia
l Rep
ort
2020
RHB
Ban
k B
erha
d -
Fina
ncia
l Rep
ort
2020
02
03STATUTORY FINANCIAL STATEMENTS
www.rhbgroup.com
The Directors submit herewith their report together with the audited financial statements of the Group and the Bank for the financial year ended 31 December 2020.
PRINCIPAL ACTIVITIES
The principal activities of the Bank are commercial banking and finance related business and the provision of related services. The Group is involved in commercial banking and finance related business, Islamic banking, investment banking, stock broking, leasing, offshore banking, offshore trust services, property investment, general insurance, unit trust management, asset management, nominee and custodian services.
There have been no significant changes in these principal activities during the financial year.
FINANCIAL RESULTS
Group RM’000
Bank RM’000
Profit from continuing operations 1,997,869 1,799,605
Profit from discontinued operation 34,661 -
Net profit for the financial year 2,032,530 1,799,605
DIVIDENDS
The dividends paid by the Bank since 31 December 2019 were as follows:
RM’000
In respect of the financial year ended 31 December 2019:
- Single-tier final dividend of 18.50 sen per share, paid on 26 June 2020 741,858
The Directors have declared a single-tier interim dividend of 10.00 sen per share amounting to RM401,005,000 in respect of the financial year ended 31 December 2020. This interim dividend has been accounted for in the shareholders’ equity as an appropriation of retained profits for the financial year ended 31 December 2020, and payment has been made on 9 February 2021.
At the forthcoming Annual General Meeting, a single-tier final dividend in respect of the current financial year of 7.65 sen per share amounting to RM306,768,000 will be proposed for shareholders’ approval. The single-tier final dividend was approved by the Board of Directors on 27 January 2021. Subject to the relevant regulatory approvals being obtained and shareholders’ approval on the Proposed Dividend Reinvestment Plan (‘DRP’) as disclosed in Note 57(4) to the financial statements at the forthcoming Annual General Meeting, the Board of Directors, in its absolute discretion, recommends that the shareholders’ of the Bank be given an option to elect to reinvest the entire proposed single-tier final dividend into new ordinary shares in the Bank in accordance with the Proposed DRP scheme of the Bank.
The financial statements for the current financial year do not reflect this single-tier final dividend. This dividend payment will be accounted for in the shareholders’ equity as an appropriation of retained profits in the financial year ending 31 December 2021.
RESERVES AND PROVISIONS
All material transfers to or from reserves and provisions during the financial year are disclosed in the financial statements.
RESPONSIBILITY STATEMENT BY THEBOARD OF DIRECTORS
DIRECTORS’ REPORT
The Directors are responsible in ensuring that the audited financial statements of the Group and the Bank are drawn up in accordance with Malaysian Financial Reporting Standards, International Financial Reporting Standards, the requirements of the Companies Act 2016 in Malaysia, Bank Negara Malaysia’s Guidelines and the Listing Requirements of Bursa Malaysia Securities Berhad.
The Directors are also responsible for ensuring that the annual audited financial statements of the Group and the Bank are prepared with reasonable accuracy from the accounting records of the Group and the Bank so as to give a true and fair view of the financial position of the Group and the Bank as at 31 December 2020 and of the financial performance and cash flows of the Group and the Bank for the financial year ended 31 December 2020.
The audited financial statements are prepared on the going concern basis and the Directors have ensured that appropriate and relevant accounting policies are applied on a consistent basis and accounting judgements and estimates made are reasonable and fair so as to enable the preparation of the financial statements of the Group and the Bank.
The Directors have also taken the necessary steps to safeguard the assets of the Group and the Bank to prevent and detect fraud and other irregularities.
RHB
Ban
k B
erha
d -
Fina
ncia
l Rep
ort
2020
RHB
Ban
k B
erha
d -
Fina
ncia
l Rep
ort
2020
04
05STATUTORY FINANCIAL STATEMENTS
www.rhbgroup.com
ISSUE OF SHARES
There were no issue of shares in the Bank during the financial year.
BAD AND DOUBTFUL DEBTS AND FINANCING
Before the financial statements of the Group and the Bank were made out, the Directors took reasonable steps to ascertain that proper actions have been taken in relation to the writing off of bad debts and financing and the making of allowance for impaired debts and financing, and satisfied themselves that all known bad debts and financing have been written off and that adequate allowance had been made for impaired debts and financing.
At the date of this report, the Directors are not aware of any circumstances which would render the amount written off for bad debts and financing or the amount of allowance for impaired debts and financing in the financial statements of the Group and the Bank inadequate to any substantial extent.
CURRENT ASSETS
Before the financial statements of the Group and the Bank were made out, the Directors took reasonable steps to ensure that any current assets, other than debts and financing, which were unlikely to realise in the ordinary course of business, their values as shown in the accounting records of the Group and the Bank, had been written down to an amount which they might be expected to realise.
At the date of this report, the Directors are not aware of any circumstances which would render the values attributed to the current assets in the financial statements of the Group and the Bank misleading.
VALUATION METHOD
At the date of this report, the Directors are not aware of any circumstances which have arisen which render adherence to the existing methods of valuation of assets or liabilities of the Group and the Bank misleading or inappropriate.
CONTINGENT AND OTHER LIABILITIES
At the date of this report, there does not exist:
(a) any charge on the assets of the Group and the Bank which has arisen since the end of the financial year which secures the liabilities of any other person; or
(b) any contingent liability of the Group and the Bank which has arisen since the end of the financial year other than in the ordinary course of business.
No contingent or other liability of the Group and the Bank has become enforceable, or is likely to become enforceable within the period of twelve months after the end of the financial year which, in the opinion of the Directors, will or may substantially affect the ability of the Group and the Bank to meet their obligations as and when they fall due.
CHANGE OF CIRCUMSTANCES
At the date of this report, the Directors are not aware of any circumstances not otherwise dealt with in this report or the financial statements of the Group and the Bank which would render any amount stated in the financial statements misleading or inappropriate.
ITEMS OF AN UNUSUAL NATURE
The results of the operations of the Group and the Bank for the financial year were not, in the opinion of the Directors, substantially affected by any item, transaction or event of a material and unusual nature, other than the impact of COVID-19 and net modification loss as disclosed in Note 40 to the financial statements and the disposal of a subsidiary as disclosed in Note 57(2) to the financial statements.
There has not arisen in the interval between the end of the financial year and the date of this report any item, transaction or event of a material and unusual nature likely, in the opinion of the Directors, to affect substantially the results of the operations of the Group or the Bank for the financial year in which this report is made.
SIGNIFICANT EVENTS DURING THE FINANCIAL YEAR
The World Health Organisation declared the outbreak of Coronavirus disease (COVID-19) as a global pandemic in March 2020. The direct and indirect effects of the COVID-19 outbreak have impacted the global economy, markets and the Group’s and the Bank’s counterparties and clients.
The COVID-19 effects have a material negative impact on the Group’s and the Bank’s results of operations. In particular, the process to determine expected credit losses (‘ECL’) requires numerous estimates and assumptions, some of which require a high degree of judgement. Changes in the estimates and assumptions can result in significant changes in ECL. The Group and the Bank are not able to predict the COVID-19’s potential future direct or indirect effects. However, the Group and the Bank are taking actions to mitigate the impacts, and will continue to closely monitor the impact and the related risks as they evolve.
Other than as mentioned above, other significant events during the financial year are disclosed in Note 57 to the financial statements.
EVENTS SUBSEQUENT TO THE FINANCIAL YEAR END
Events subsequent to the financial year end are disclosed in Note 58 to the financial statements.
DIRECTORS
The Directors of the Bank in office during the financial year and during the period from the end of the financial year to the date of the report are:
Tan Sri Azlan ZainolTan Sri Ahmad Badri Mohd Zahir (Appointed on 16 November 2020)Tan Sri Ong Leong Huat @ Wong Joo HwaTan Sri Dr Rebecca Fatima Sta MariaOng Ai LinLim Cheng TeckSharifatu Laila Syed AliDato’ Mohamad Nasir Ab Latif (Appointed on 16 March 2020)Donald Joshua Jaganathan (Appointed on 17 August 2020)Datuk Iain John Lo (Appointed on 15 September 2020)Dato’ Khairussaleh RamliTan Sri Saw Choo Boon (Retired on 29 May 2020)Abdul Aziz Peru Mohamed (Retired on 29 May 2020)Datuk Seri Dr Govindan a/l Kunchamboo (Appointed on 1 January 2020 and resigned on 20 October 2020)
DIRECTORS’ REPORT
RHB
Ban
k B
erha
d -
Fina
ncia
l Rep
ort
2020
RHB
Ban
k B
erha
d -
Fina
ncia
l Rep
ort
2020
06
07STATUTORY FINANCIAL STATEMENTS
www.rhbgroup.com
DIRECTORS (CONTINUED)
Pursuant to Clause 94 of the Bank’s Constitution, Tan Sri Ong Leong Huat @ Wong Joo Hwa and Ong Ai Lin retire at the forthcoming Annual General Meeting of the Bank and being eligible, offer themselves for re-election.
Tan Sri Azlan Zainol who retires pursuant to Clause 94 of the Bank’s Constitution, has indicated his intention of not seeking re-election. He shall accordingly retire at the forthcoming Annual General Meeting.
Pursuant to Clause 98 of the Bank’s Constitution, Tan Sri Ahmad Badri Mohd Zahir, Donald Joshua Jaganathan and Datuk Iain John Lo retire at the forthcoming Annual General Meeting of the Bank and being eligible, offer themselves for re-election.
DIRECTORS’ INTERESTS
According to the register of Directors’ shareholdings required to be kept under Section 59 of the Companies Act 2016, the Directors in office at the end of the financial year holding securities of the Bank and its related corporations are as follows:
Number of ordinary sharesAs at
1.1.2020 Bought SoldAs at
31.12.2020
BankTan Sri Ong Leong Huat @ Wong Joo Hwa:
- Indirect* 31,431 - - 31,431- Indirect^ 406,171,518 - - 406,171,518
Ong Ai Lin:
- Direct 25,000 - - 25,000
Notes:* The interest is held through family members.^ Deemed interest pursuant to Section 8(4) of the Companies Act 2016 by virtue of shares held through OSK Holdings Berhad.
Other than the above, none of the other Directors holding office at the end of the financial year had any interest in the securities of the Bank or its related corporations during the financial year.
DIRECTORS’ BENEFITS
Since the end of the previous financial year, no Director of the Bank has received or become entitled to receive any benefit (other than Directors’ remuneration and benefits-in-kind as disclosed in Note 42 to the financial statements) by reason of a contract made by the Bank or a related corporation with the Director or with a firm of which the Director is a member, or with a company in which the Director has a substantial financial interest.
During and at the end of the financial year, no arrangements subsisted to which the Bank or its subsidiaries is a party, being arrangements with the object or objects of enabling the Directors of the Bank to acquire benefits by means of the acquisition of shares in, or debentures of, the Bank or any other body corporate.
SUBSIDIARIES
Details of subsidiaries are set out in Note 15 to the financial statements.
AUDITORS’ REMUNERATION
Details of auditors’ remuneration are set out in Note 41 to the financial statements.
AUDITORS
The auditors, PricewaterhouseCoopers PLT (LLP0014401-LCA & AF 1146), have expressed their willingness to continue in office.
This report was approved by the Board of Directors on 24 February 2021. Signed on behalf of the Board of Directors:
TAN SRI AZLAN ZAINOL DATO’ KHAIRUSSALEH RAMLICHAIRMAN GROUP MANAGING DIRECTOR
Kuala Lumpur
DIRECTORS’ REPORT
RHB
Ban
k B
erha
d -
Fina
ncia
l Rep
ort
2020
RHB
Ban
k B
erha
d -
Fina
ncia
l Rep
ort
2020
08
09STATUTORY FINANCIAL STATEMENTS
www.rhbgroup.com
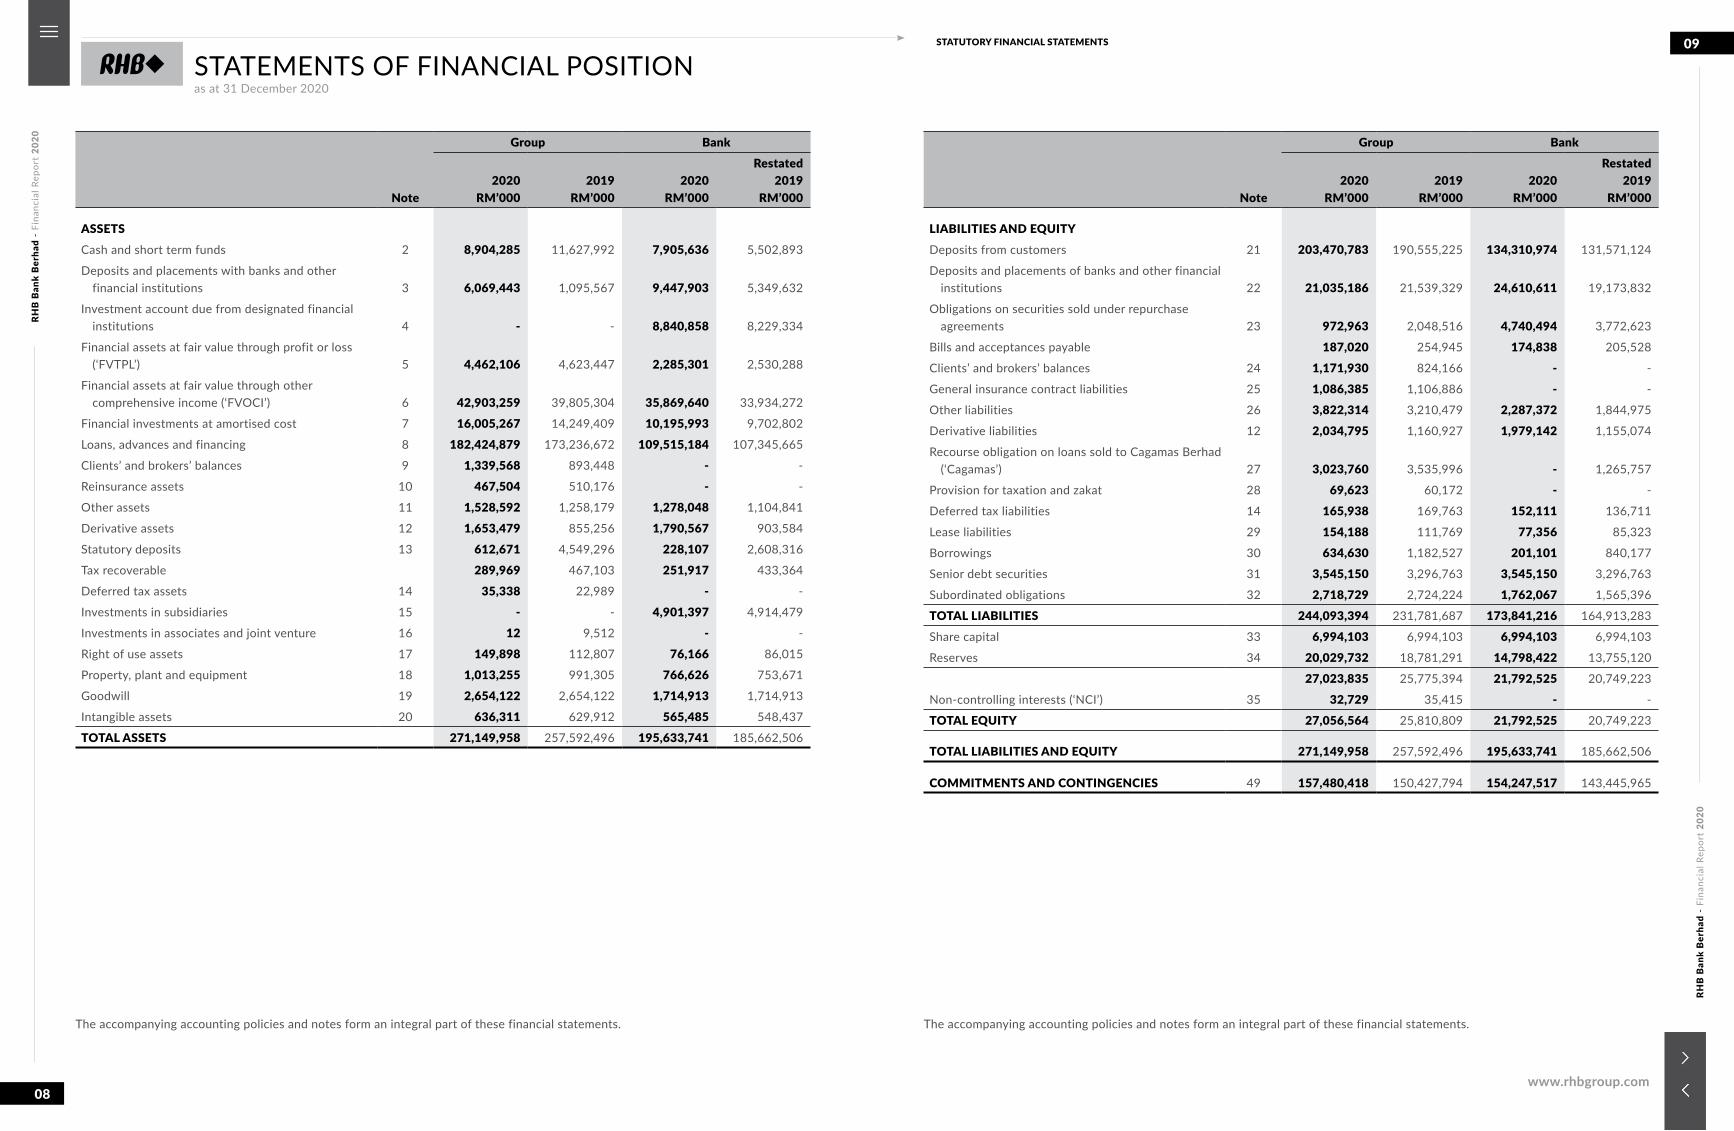
Note
Group Bank
2020RM’000
2019RM’000
2020RM’000
Restated2019
RM’000
ASSETSCash and short term funds 2 8,904,285 11,627,992 7,905,636 5,502,893
Deposits and placements with banks and other financial institutions 3 6,069,443 1,095,567 9,447,903 5,349,632
Investment account due from designated financial institutions 4 - - 8,840,858 8,229,334
Financial assets at fair value through profit or loss (‘FVTPL’) 5 4,462,106 4,623,447 2,285,301 2,530,288
Financial assets at fair value through other comprehensive income (‘FVOCI’) 6 42,903,259 39,805,304 35,869,640 33,934,272
Financial investments at amortised cost 7 16,005,267 14,249,409 10,195,993 9,702,802
Loans, advances and financing 8 182,424,879 173,236,672 109,515,184 107,345,665
Clients’ and brokers’ balances 9 1,339,568 893,448 - -
Reinsurance assets 10 467,504 510,176 - -
Other assets 11 1,528,592 1,258,179 1,278,048 1,104,841
Derivative assets 12 1,653,479 855,256 1,790,567 903,584
Statutory deposits 13 612,671 4,549,296 228,107 2,608,316
Tax recoverable 289,969 467,103 251,917 433,364
Deferred tax assets 14 35,338 22,989 - -
Investments in subsidiaries 15 - - 4,901,397 4,914,479
Investments in associates and joint venture 16 12 9,512 - -
Right of use assets 17 149,898 112,807 76,166 86,015
Property, plant and equipment 18 1,013,255 991,305 766,626 753,671
Goodwill 19 2,654,122 2,654,122 1,714,913 1,714,913
Intangible assets 20 636,311 629,912 565,485 548,437
TOTAL ASSETS 271,149,958 257,592,496 195,633,741 185,662,506
Note
Group Bank
2020RM’000
2019RM’000
2020RM’000
Restated2019
RM’000
LIABILITIES AND EQUITYDeposits from customers 21 203,470,783 190,555,225 134,310,974 131,571,124
Deposits and placements of banks and other financial institutions 22 21,035,186 21,539,329 24,610,611 19,173,832
Obligations on securities sold under repurchase agreements 23 972,963 2,048,516 4,740,494 3,772,623
Bills and acceptances payable 187,020 254,945 174,838 205,528
Clients’ and brokers’ balances 24 1,171,930 824,166 - -
General insurance contract liabilities 25 1,086,385 1,106,886 - -
Other liabilities 26 3,822,314 3,210,479 2,287,372 1,844,975
Derivative liabilities 12 2,034,795 1,160,927 1,979,142 1,155,074
Recourse obligation on loans sold to Cagamas Berhad (‘Cagamas’) 27 3,023,760 3,535,996 - 1,265,757
Provision for taxation and zakat 28 69,623 60,172 - -
Deferred tax liabilities 14 165,938 169,763 152,111 136,711
Lease liabilities 29 154,188 111,769 77,356 85,323
Borrowings 30 634,630 1,182,527 201,101 840,177
Senior debt securities 31 3,545,150 3,296,763 3,545,150 3,296,763
Subordinated obligations 32 2,718,729 2,724,224 1,762,067 1,565,396
TOTAL LIABILITIES 244,093,394 231,781,687 173,841,216 164,913,283
Share capital 33 6,994,103 6,994,103 6,994,103 6,994,103
Reserves 34 20,029,732 18,781,291 14,798,422 13,755,120
27,023,835 25,775,394 21,792,525 20,749,223
Non-controlling interests (‘NCI’) 35 32,729 35,415 - -
TOTAL EQUITY 27,056,564 25,810,809 21,792,525 20,749,223
TOTAL LIABILITIES AND EQUITY 271,149,958 257,592,496 195,633,741 185,662,506
COMMITMENTS AND CONTINGENCIES 49 157,480,418 150,427,794 154,247,517 143,445,965
STATEMENTS OF FINANCIAL POSITIONas at 31 December 2020
The accompanying accounting policies and notes form an integral part of these financial statements.The accompanying accounting policies and notes form an integral part of these financial statements.
RHB
Ban
k B
erha
d -
Fina
ncia
l Rep
ort
2020
RHB
Ban
k B
erha
d -
Fina
ncia
l Rep
ort
2020
10
11STATUTORY FINANCIAL STATEMENTS
www.rhbgroup.com
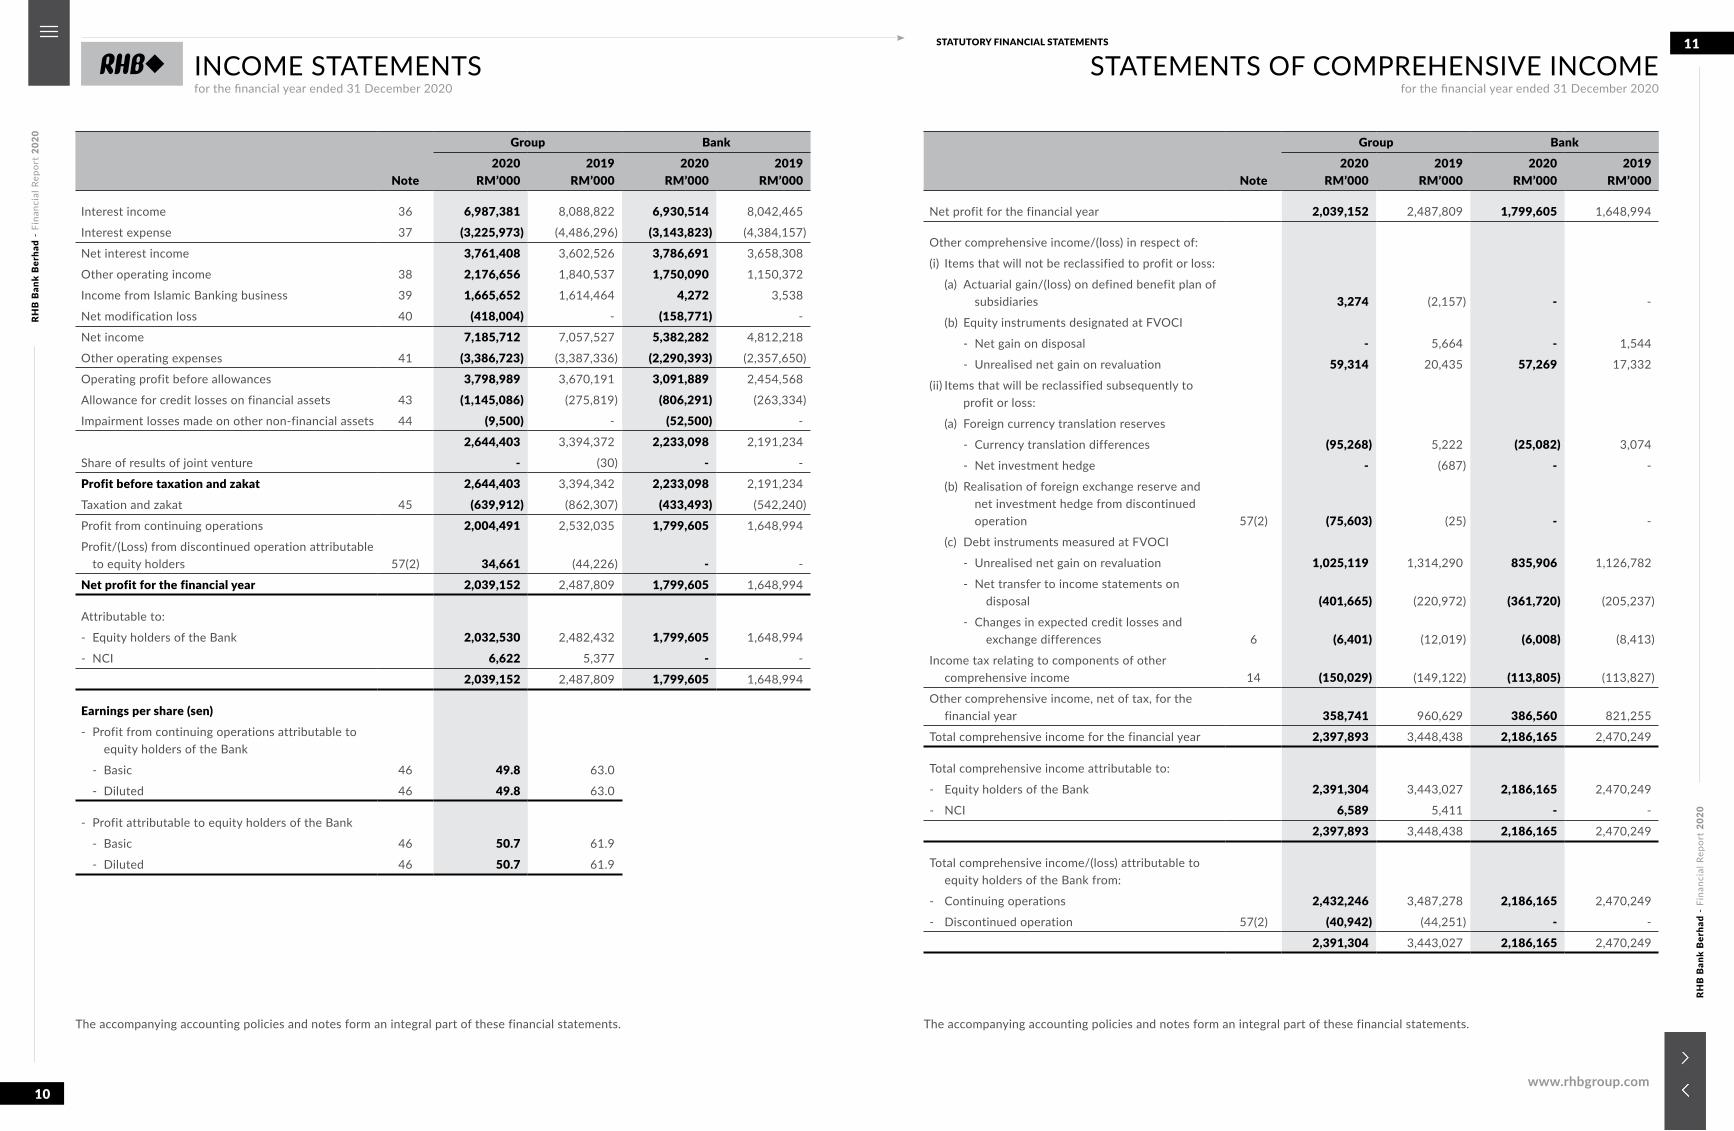
Note
Group Bank2020
RM’0002019
RM’0002020
RM’0002019
RM’000
Interest income 36 6,987,381 8,088,822 6,930,514 8,042,465
Interest expense 37 (3,225,973) (4,486,296) (3,143,823) (4,384,157)
Net interest income 3,761,408 3,602,526 3,786,691 3,658,308
Other operating income 38 2,176,656 1,840,537 1,750,090 1,150,372
Income from Islamic Banking business 39 1,665,652 1,614,464 4,272 3,538
Net modification loss 40 (418,004) - (158,771) -
Net income 7,185,712 7,057,527 5,382,282 4,812,218
Other operating expenses 41 (3,386,723) (3,387,336) (2,290,393) (2,357,650)
Operating profit before allowances 3,798,989 3,670,191 3,091,889 2,454,568
Allowance for credit losses on financial assets 43 (1,145,086) (275,819) (806,291) (263,334)
Impairment losses made on other non-financial assets 44 (9,500) - (52,500) -
2,644,403 3,394,372 2,233,098 2,191,234
Share of results of joint venture - (30) - -
Profit before taxation and zakat 2,644,403 3,394,342 2,233,098 2,191,234
Taxation and zakat 45 (639,912) (862,307) (433,493) (542,240)
Profit from continuing operations 2,004,491 2,532,035 1,799,605 1,648,994
Profit/(Loss) from discontinued operation attributable to equity holders 57(2) 34,661 (44,226) - -
Net profit for the financial year 2,039,152 2,487,809 1,799,605 1,648,994
Attributable to:
- Equity holders of the Bank 2,032,530 2,482,432 1,799,605 1,648,994
- NCI 6,622 5,377 - -
2,039,152 2,487,809 1,799,605 1,648,994
Earnings per share (sen)- Profit from continuing operations attributable to
equity holders of the Bank
- Basic 46 49.8 63.0
- Diluted 46 49.8 63.0
- Profit attributable to equity holders of the Bank
- Basic 46 50.7 61.9
- Diluted 46 50.7 61.9
Note
Group Bank2020
RM’0002019
RM’0002020
RM’0002019
RM’000
Net profit for the financial year 2,039,152 2,487,809 1,799,605 1,648,994
Other comprehensive income/(loss) in respect of:
(i) Items that will not be reclassified to profit or loss:
(a) Actuarial gain/(loss) on defined benefit plan ofsubsidiaries 3,274 (2,157) - -
(b) Equity instruments designated at FVOCI
- Net gain on disposal - 5,664 - 1,544
- Unrealised net gain on revaluation 59,314 20,435 57,269 17,332
(ii) Items that will be reclassified subsequently toprofit or loss:
(a) Foreign currency translation reserves
- Currency translation differences (95,268) 5,222 (25,082) 3,074
- Net investment hedge - (687) - -
(b) Realisation of foreign exchange reserve andnet investment hedge from discontinued
operation 57(2) (75,603) (25) - -
(c) Debt instruments measured at FVOCI
- Unrealised net gain on revaluation 1,025,119 1,314,290 835,906 1,126,782
- Net transfer to income statements ondisposal (401,665) (220,972) (361,720) (205,237)
- Changes in expected credit losses andexchange differences 6 (6,401) (12,019) (6,008) (8,413)
Income tax relating to components of other comprehensive income 14 (150,029) (149,122) (113,805) (113,827)
Other comprehensive income, net of tax, for the financial year 358,741 960,629 386,560 821,255
Total comprehensive income for the financial year 2,397,893 3,448,438 2,186,165 2,470,249
Total comprehensive income attributable to:
- Equity holders of the Bank 2,391,304 3,443,027 2,186,165 2,470,249
- NCI 6,589 5,411 - -
2,397,893 3,448,438 2,186,165 2,470,249
Total comprehensive income/(loss) attributable to equity holders of the Bank from:
- Continuing operations 2,432,246 3,487,278 2,186,165 2,470,249
- Discontinued operation 57(2) (40,942) (44,251) - -
2,391,304 3,443,027 2,186,165 2,470,249
INCOME STATEMENTSfor the financial year ended 31 December 2020
STATEMENTS OF COMPREHENSIVE INCOMEfor the financial year ended 31 December 2020
The accompanying accounting policies and notes form an integral part of these financial statements.The accompanying accounting policies and notes form an integral part of these financial statements.
RHB
Ban
k B
erha
d -
Fina
ncia
l Rep
ort
2020
RHB
Ban
k B
erha
d -
Fina
ncia
l Rep
ort
2020
12
13STATUTORY FINANCIAL STATEMENTS
www.rhbgroup.com
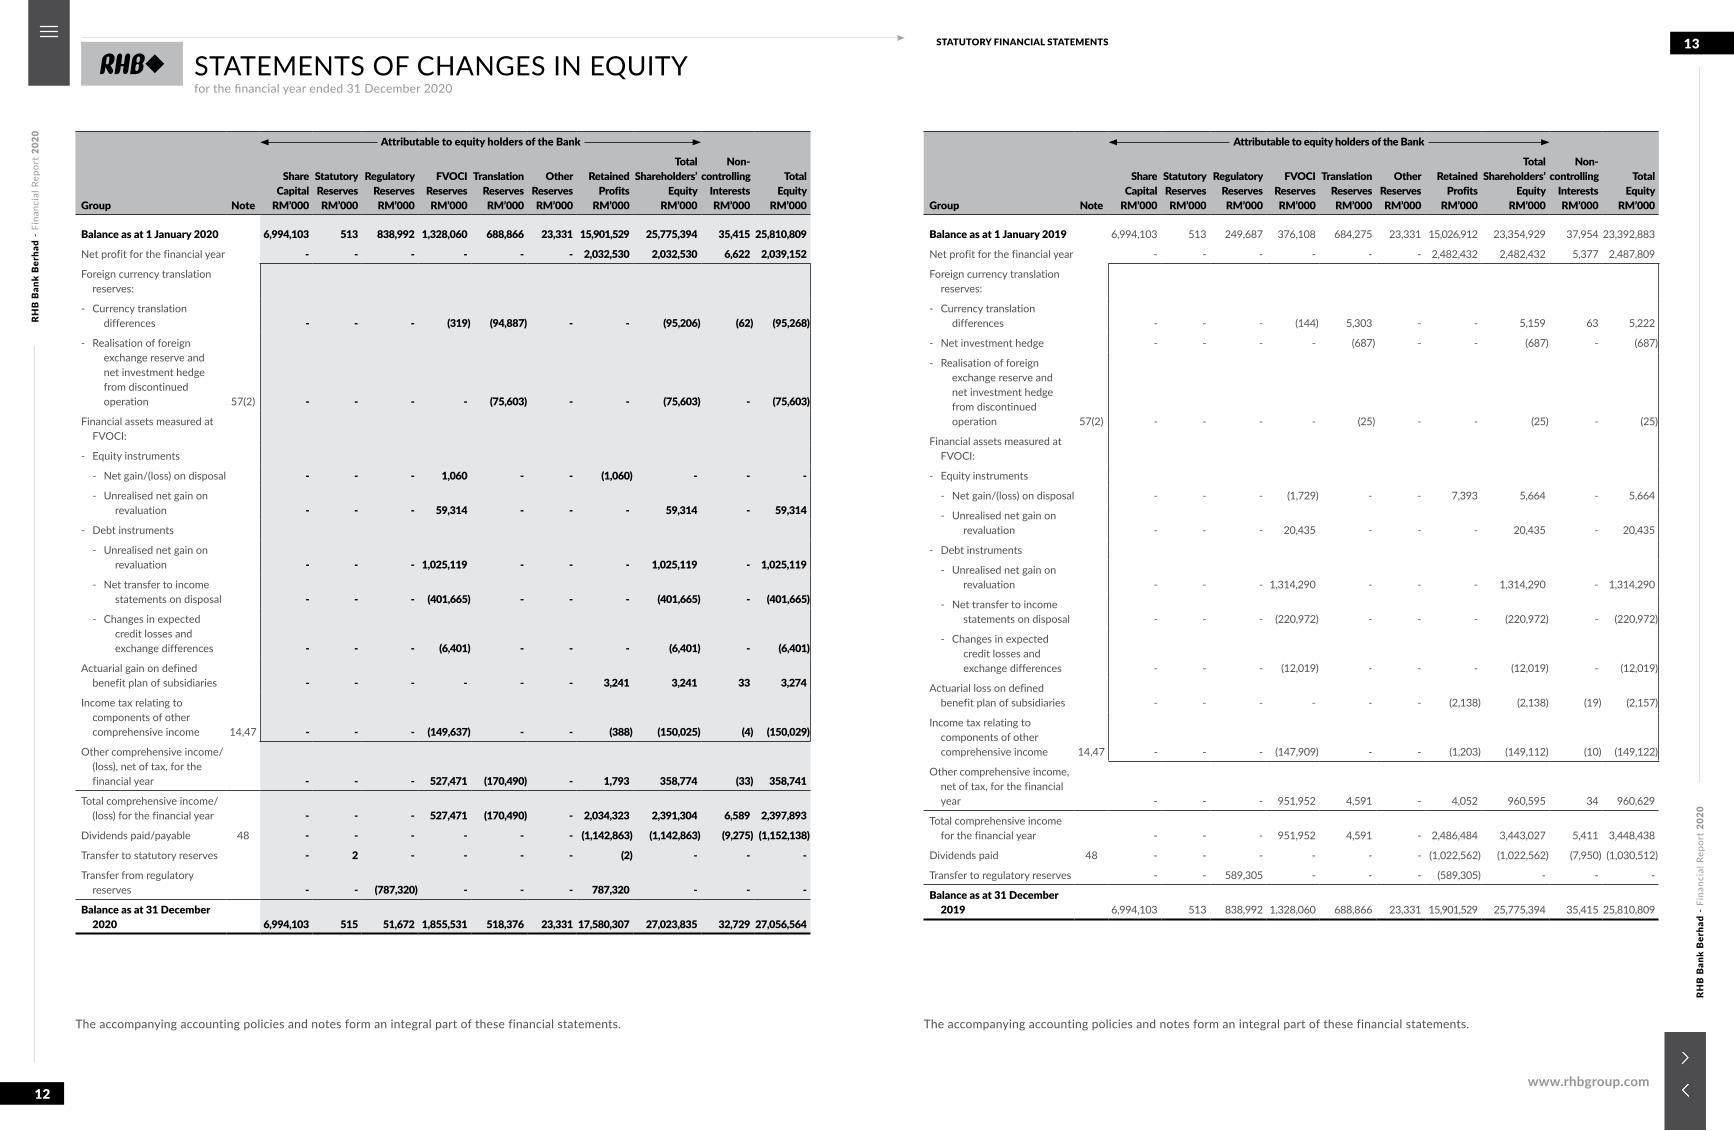
Group Note
Attributable to equity holders of the Bank
Non-controlling
InterestsRM’000
TotalEquity
RM’000
ShareCapital
RM’000
StatutoryReservesRM’000
RegulatoryReservesRM’000
FVOCIReservesRM’000
TranslationReservesRM’000
OtherReservesRM’000
RetainedProfits
RM’000
TotalShareholders’
EquityRM’000
Balance as at 1 January 2020 6,994,103 513 838,992 1,328,060 688,866 23,331 15,901,529 25,775,394 35,415 25,810,809
Net profit for the financial year - - - - - - 2,032,530 2,032,530 6,622 2,039,152
Foreign currency translation reserves:
- Currency translationdifferences - - - (319) (94,887) - - (95,206) (62) (95,268)
- Realisation of foreignexchange reserve andnet investment hedge from discontinued
operation 57(2) - - - - (75,603) - - (75,603) - (75,603)
Financial assets measured at FVOCI:
- Equity instruments
- Net gain/(loss) on disposal - - - 1,060 - - (1,060) - - -
- Unrealised net gain on revaluation - - - 59,314 - - - 59,314 - 59,314
- Debt instruments
- Unrealised net gain onrevaluation - - - 1,025,119 - - - 1,025,119 - 1,025,119
- Net transfer to incomestatements on disposal - - - (401,665) - - - (401,665) - (401,665)
- Changes in expectedcredit losses and
exchange differences - - - (6,401) - - - (6,401) - (6,401)
Actuarial gain on defined benefit plan of subsidiaries - - - - - - 3,241 3,241 33 3,274
Income tax relating to components of other comprehensive income 14,47 - - - (149,637) - - (388) (150,025) (4) (150,029)
Other comprehensive income/(loss), net of tax, for the financial year - - - 527,471 (170,490) - 1,793 358,774 (33) 358,741
Total comprehensive income/(loss) for the financial year - - - 527,471 (170,490) - 2,034,323 2,391,304 6,589 2,397,893
Dividends paid/payable 48 - - - - - - (1,142,863) (1,142,863) (9,275) (1,152,138)
Transfer to statutory reserves - 2 - - - - (2) - - -
Transfer from regulatory reserves - - (787,320) - - - 787,320 - - -
Balance as at 31 December 2020 6,994,103 515 51,672 1,855,531 518,376 23,331 17,580,307 27,023,835 32,729 27,056,564
Group Note
Attributable to equity holders of the Bank
Non-controlling
InterestsRM’000
TotalEquity
RM’000
ShareCapital
RM’000
StatutoryReservesRM’000
RegulatoryReservesRM’000
FVOCIReservesRM’000
TranslationReservesRM’000
OtherReservesRM’000
RetainedProfits
RM’000
TotalShareholders’
EquityRM’000
Balance as at 1 January 2019 6,994,103 513 249,687 376,108 684,275 23,331 15,026,912 23,354,929 37,954 23,392,883
Net profit for the financial year - - - - - - 2,482,432 2,482,432 5,377 2,487,809
Foreign currency translation reserves:
- Currency translationdifferences - - - (144) 5,303 - - 5,159 63 5,222
- Net investment hedge - - - - (687) - - (687) - (687)
- Realisation of foreignexchange reserve andnet investment hedge from discontinued
operation 57(2) - - - - (25) - - (25) - (25)
Financial assets measured at FVOCI:
- Equity instruments
- Net gain/(loss) on disposal - - - (1,729) - - 7,393 5,664 - 5,664
- Unrealised net gain onrevaluation - - - 20,435 - - - 20,435 - 20,435
- Debt instruments
- Unrealised net gain onrevaluation - - - 1,314,290 - - - 1,314,290 - 1,314,290
- Net transfer to incomestatements on disposal - - - (220,972) - - - (220,972) - (220,972)
- Changes in expectedcredit losses and
exchange differences - - - (12,019) - - - (12,019) - (12,019)
Actuarial loss on defined benefit plan of subsidiaries - - - - - - (2,138) (2,138) (19) (2,157)
Income tax relating to components of other comprehensive income 14,47 - - - (147,909) - - (1,203) (149,112) (10) (149,122)
Other comprehensive income, net of tax, for the financial year - - - 951,952 4,591 - 4,052 960,595 34 960,629
Total comprehensive income for the financial year - - - 951,952 4,591 - 2,486,484 3,443,027 5,411 3,448,438
Dividends paid 48 - - - - - - (1,022,562) (1,022,562) (7,950) (1,030,512)
Transfer to regulatory reserves - - 589,305 - - - (589,305) - - -
Balance as at 31 December 2019 6,994,103 513 838,992 1,328,060 688,866 23,331 15,901,529 25,775,394 35,415 25,810,809
STATEMENTS OF CHANGES IN EQUITYfor the financial year ended 31 December 2020
The accompanying accounting policies and notes form an integral part of these financial statements.The accompanying accounting policies and notes form an integral part of these financial statements.
RHB
Ban
k B
erha
d -
Fina
ncia
l Rep
ort
2020
RHB
Ban
k B
erha
d -
Fina
ncia
l Rep
ort
2020
14
15STATUTORY FINANCIAL STATEMENTS
www.rhbgroup.com
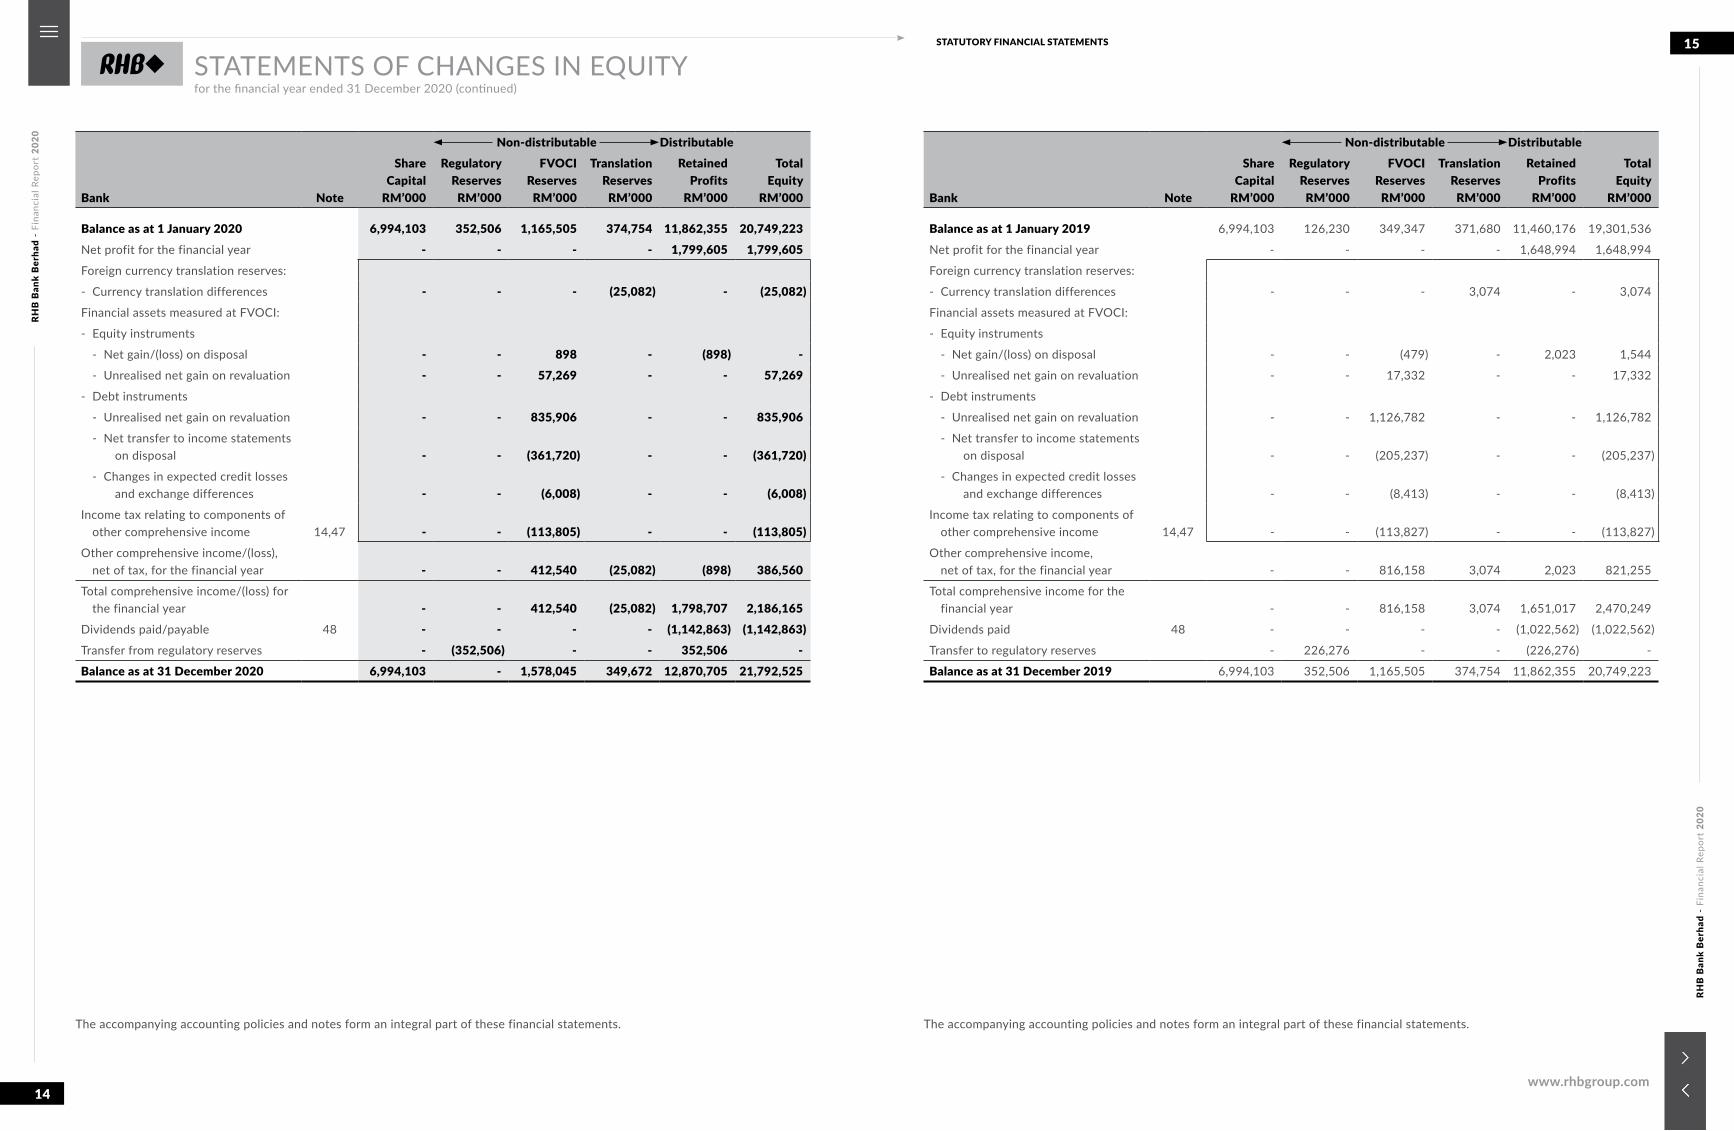
Bank Note
ShareCapital
RM’000
Non-distributable DistributableTotal
EquityRM’000
RegulatoryReserves
RM’000
FVOCIReserves
RM’000
TranslationReserves
RM’000
RetainedProfits
RM’000
Balance as at 1 January 2020 6,994,103 352,506 1,165,505 374,754 11,862,355 20,749,223Net profit for the financial year - - - - 1,799,605 1,799,605Foreign currency translation reserves:
- Currency translation differences - - - (25,082) - (25,082)Financial assets measured at FVOCI:
- Equity instruments
- Net gain/(loss) on disposal - - 898 - (898) - - Unrealised net gain on revaluation - - 57,269 - - 57,269- Debt instruments
- Unrealised net gain on revaluation - - 835,906 - - 835,906 - Net transfer to income statements
on disposal - - (361,720) - - (361,720) - Changes in expected credit losses
and exchange differences - - (6,008) - - (6,008)Income tax relating to components of
other comprehensive income 14,47 - - (113,805) - - (113,805)Other comprehensive income/(loss),
net of tax, for the financial year - - 412,540 (25,082) (898) 386,560Total comprehensive income/(loss) for
the financial year - - 412,540 (25,082) 1,798,707 2,186,165Dividends paid/payable 48 - - - - (1,142,863) (1,142,863)Transfer from regulatory reserves - (352,506) - - 352,506 -Balance as at 31 December 2020 6,994,103 - 1,578,045 349,672 12,870,705 21,792,525
Bank Note
ShareCapital
RM’000
Non-distributable DistributableTotal
EquityRM’000
RegulatoryReserves
RM’000
FVOCIReserves
RM’000
TranslationReserves
RM’000
RetainedProfits
RM’000
Balance as at 1 January 2019 6,994,103 126,230 349,347 371,680 11,460,176 19,301,536
Net profit for the financial year - - - - 1,648,994 1,648,994
Foreign currency translation reserves:
- Currency translation differences - - - 3,074 - 3,074
Financial assets measured at FVOCI:
- Equity instruments
- Net gain/(loss) on disposal - - (479) - 2,023 1,544
- Unrealised net gain on revaluation - - 17,332 - - 17,332
- Debt instruments
- Unrealised net gain on revaluation - - 1,126,782 - - 1,126,782
- Net transfer to income statements on disposal - - (205,237) - - (205,237)
- Changes in expected credit losses and exchange differences - - (8,413) - - (8,413)
Income tax relating to components of other comprehensive income 14,47 - - (113,827) - - (113,827)
Other comprehensive income, net of tax, for the financial year - - 816,158 3,074 2,023 821,255
Total comprehensive income for the financial year - - 816,158 3,074 1,651,017 2,470,249
Dividends paid 48 - - - - (1,022,562) (1,022,562)
Transfer to regulatory reserves - 226,276 - - (226,276) -
Balance as at 31 December 2019 6,994,103 352,506 1,165,505 374,754 11,862,355 20,749,223
STATEMENTS OF CHANGES IN EQUITYfor the financial year ended 31 December 2020 (continued)
The accompanying accounting policies and notes form an integral part of these financial statements.The accompanying accounting policies and notes form an integral part of these financial statements.
RHB
Ban
k B
erha
d -
Fina
ncia
l Rep
ort
2020
RHB
Ban
k B
erha
d -
Fina
ncia
l Rep
ort
2020
16
17STATUTORY FINANCIAL STATEMENTS
www.rhbgroup.com
Note
Group2020
RM’0002019
RM’000
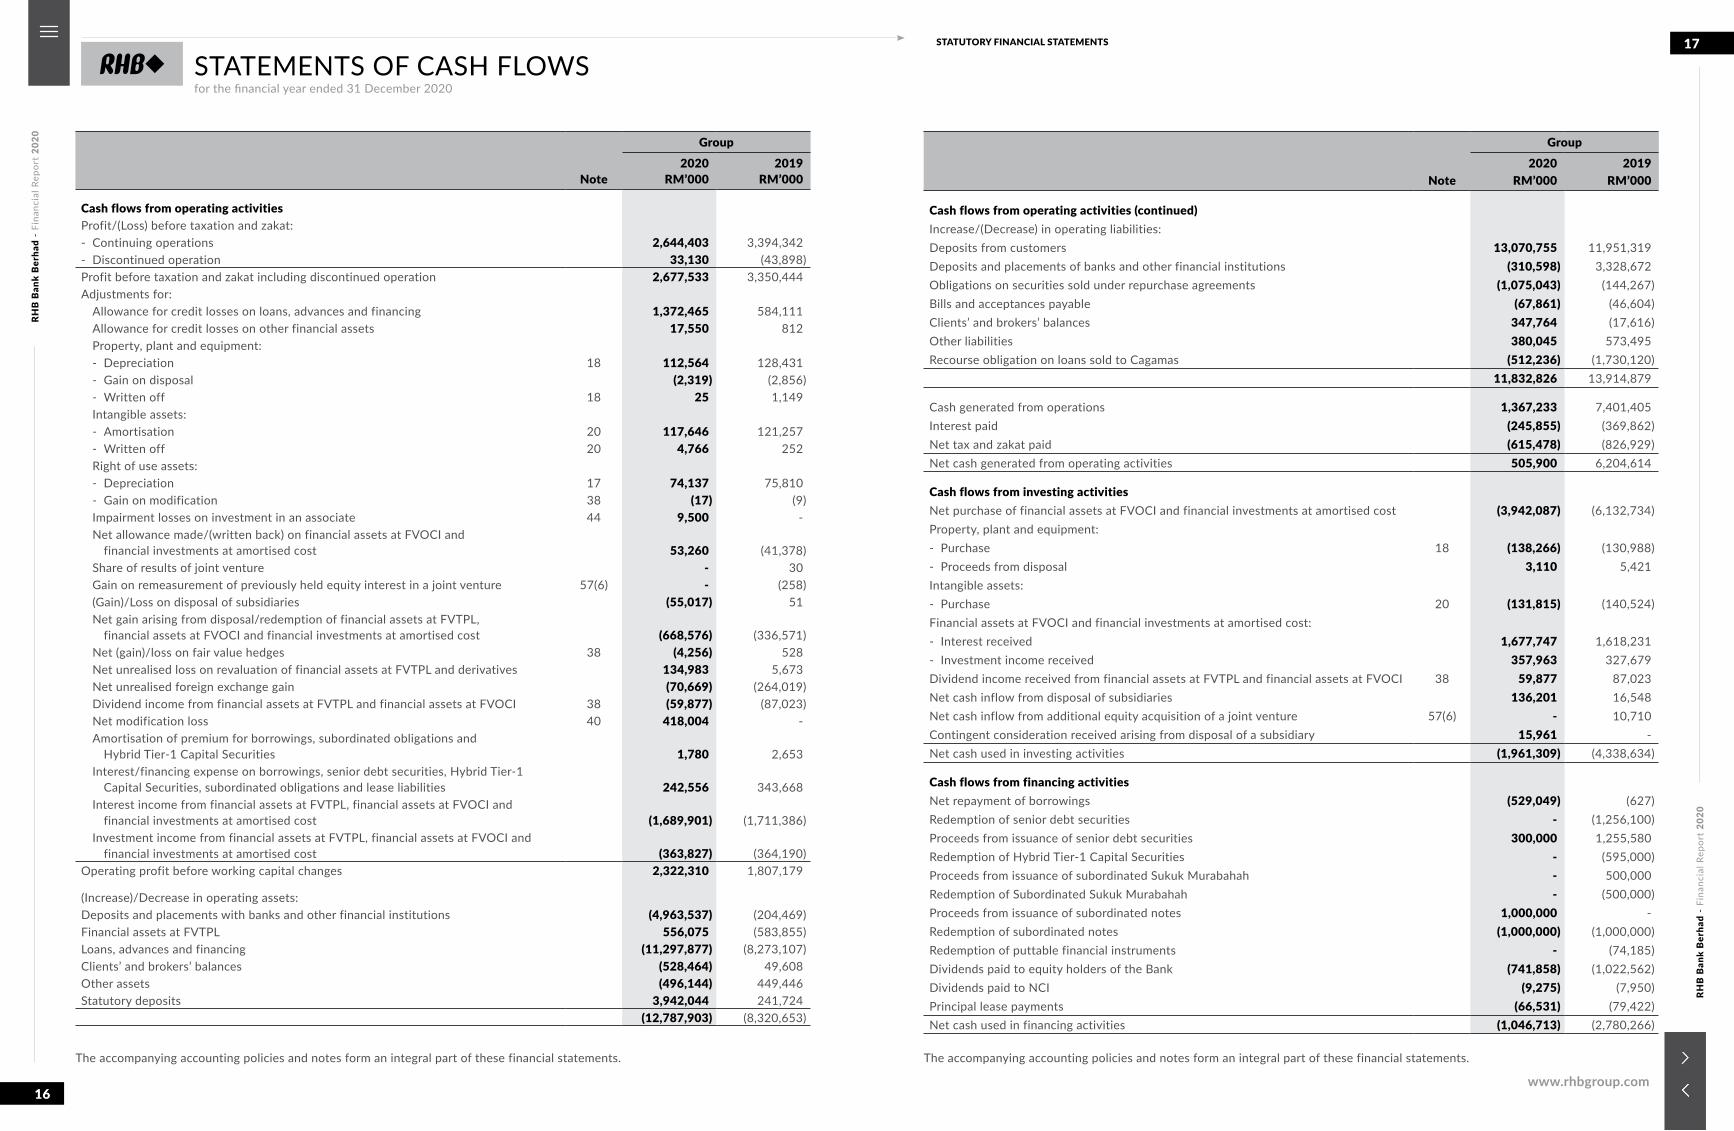
Cash flows from operating activitiesProfit/(Loss) before taxation and zakat:- Continuing operations 2,644,403 3,394,342- Discontinued operation 33,130 (43,898)Profit before taxation and zakat including discontinued operation 2,677,533 3,350,444Adjustments for:
Allowance for credit losses on loans, advances and financing 1,372,465 584,111Allowance for credit losses on other financial assets 17,550 812Property, plant and equipment:- Depreciation 18 112,564 128,431- Gain on disposal (2,319) (2,856)- Written off 18 25 1,149Intangible assets:- Amortisation 20 117,646 121,257- Written off 20 4,766 252Right of use assets:- Depreciation 17 74,137 75,810- Gain on modification 38 (17) (9)Impairment losses on investment in an associate 44 9,500 -Net allowance made/(written back) on financial assets at FVOCI and
financial investments at amortised cost 53,260 (41,378)Share of results of joint venture - 30Gain on remeasurement of previously held equity interest in a joint venture 57(6) - (258)(Gain)/Loss on disposal of subsidiaries (55,017) 51Net gain arising from disposal/redemption of financial assets at FVTPL,
financial assets at FVOCI and financial investments at amortised cost (668,576) (336,571)Net (gain)/loss on fair value hedges 38 (4,256) 528Net unrealised loss on revaluation of financial assets at FVTPL and derivatives 134,983 5,673Net unrealised foreign exchange gain (70,669) (264,019)Dividend income from financial assets at FVTPL and financial assets at FVOCI 38 (59,877) (87,023)Net modification loss 40 418,004 -Amortisation of premium for borrowings, subordinated obligations and
Hybrid Tier-1 Capital Securities 1,780 2,653Interest/financing expense on borrowings, senior debt securities, Hybrid Tier-1
Capital Securities, subordinated obligations and lease liabilities 242,556 343,668Interest income from financial assets at FVTPL, financial assets at FVOCI and financial investments at amortised cost (1,689,901) (1,711,386)Investment income from financial assets at FVTPL, financial assets at FVOCI and
financial investments at amortised cost (363,827) (364,190)Operating profit before working capital changes 2,322,310 1,807,179
(Increase)/Decrease in operating assets:Deposits and placements with banks and other financial institutions (4,963,537) (204,469)Financial assets at FVTPL 556,075 (583,855)Loans, advances and financing (11,297,877) (8,273,107)Clients’ and brokers’ balances (528,464) 49,608Other assets (496,144) 449,446Statutory deposits 3,942,044 241,724
(12,787,903) (8,320,653)
Note
Group2020
RM’0002019
RM’000
Cash flows from operating activities (continued)Increase/(Decrease) in operating liabilities:Deposits from customers 13,070,755 11,951,319Deposits and placements of banks and other financial institutions (310,598) 3,328,672Obligations on securities sold under repurchase agreements (1,075,043) (144,267)Bills and acceptances payable (67,861) (46,604)Clients’ and brokers’ balances 347,764 (17,616)Other liabilities 380,045 573,495Recourse obligation on loans sold to Cagamas (512,236) (1,730,120)
11,832,826 13,914,879
Cash generated from operations 1,367,233 7,401,405Interest paid (245,855) (369,862)Net tax and zakat paid (615,478) (826,929)Net cash generated from operating activities 505,900 6,204,614
Cash flows from investing activitiesNet purchase of financial assets at FVOCI and financial investments at amortised cost (3,942,087) (6,132,734)Property, plant and equipment:- Purchase 18 (138,266) (130,988)- Proceeds from disposal 3,110 5,421Intangible assets:- Purchase 20 (131,815) (140,524)Financial assets at FVOCI and financial investments at amortised cost:- Interest received 1,677,747 1,618,231- Investment income received 357,963 327,679Dividend income received from financial assets at FVTPL and financial assets at FVOCI 38 59,877 87,023Net cash inflow from disposal of subsidiaries 136,201 16,548Net cash inflow from additional equity acquisition of a joint venture 57(6) - 10,710Contingent consideration received arising from disposal of a subsidiary 15,961 - Net cash used in investing activities (1,961,309) (4,338,634)
Cash flows from financing activitiesNet repayment of borrowings (529,049) (627)Redemption of senior debt securities - (1,256,100)Proceeds from issuance of senior debt securities 300,000 1,255,580Redemption of Hybrid Tier-1 Capital Securities - (595,000)Proceeds from issuance of subordinated Sukuk Murabahah - 500,000Redemption of Subordinated Sukuk Murabahah - (500,000)Proceeds from issuance of subordinated notes 1,000,000 -Redemption of subordinated notes (1,000,000) (1,000,000)Redemption of puttable financial instruments - (74,185)Dividends paid to equity holders of the Bank (741,858) (1,022,562)Dividends paid to NCI (9,275) (7,950)Principal lease payments (66,531) (79,422)Net cash used in financing activities (1,046,713) (2,780,266)
STATEMENTS OF CASH FLOWSfor the financial year ended 31 December 2020
The accompanying accounting policies and notes form an integral part of these financial statements.The accompanying accounting policies and notes form an integral part of these financial statements.
RHB
Ban
k B
erha
d -
Fina
ncia
l Rep
ort
2020
RHB
Ban
k B
erha
d -
Fina
ncia
l Rep
ort
2020
18
19STATUTORY FINANCIAL STATEMENTS
www.rhbgroup.com
Note
Group2020
RM’0002019
RM’000
Net decrease in cash and cash equivalents (2,502,122) (914,286)
Effects of exchange rate differences (221,585) (10,910)
Cash and cash equivalents:
- at the beginning of the financial year 11,627,992 12,553,188
- at the end of the financial year 8,904,285 11,627,992
Cash and cash equivalents comprise the following:
- Cash and short term funds 2 8,904,285 11,627,992
Balance as atthe beginning
of thefinancial year
RM’000
Cash Changes Non-Cash Changes
Balance as atthe end of the financial year
RM’000
Net cashflow fromfinancingactivities
RM’000
Net cashflow fromoperatingactivities
RM’000
Foreignexchange
movement/other income
RM’000
Netadditions
to leaseliabilities
RM’000
Accruedinterest and
amortisation/(accretion)
RM’000
2020Lease liabilities 111,769 (66,531) (7,307) (1,825) 110,692 7,390 154,188Borrowings 1,182,527 (535,226) (23,722) (13,414) - 24,465 634,630Senior debt securities 3,296,763 300,000 (100,703) (54,763) - 103,853 3,545,150Subordinated obligations 2,724,224 - (114,123) - - 108,628 2,718,729
7,315,283 (301,757) (245,855) (70,002) 110,692 244,336 7,052,697
2019Puttable financial instruments 70,615 (74,185) - 3,570 - - -
Lease liabilities 118,511 (79,422) (4,340) 742 71,768 4,510 111,769
Borrowings 1,182,885 (627) (39,888) 823 - 39,334 1,182,527
Senior debt securities 3,323,664 (520) (114,146) (35,876) - 123,641 3,296,763
Hybrid Tier-1 Capital Securities 603,221 (595,000) (29,962) - - 21,741 -
Subordinated obligations 3,748,655 (1,000,000) (181,526) - - 157,095 2,724,224
9,047,551 (1,749,754) (369,862) (30,741) 71,768 346,321 7,315,283
Note
Bank2020
RM’0002019
RM’000
Cash flows from operating activitiesProfit before taxation 2,233,098 2,191,234Adjustments for: Allowance for credit losses on loans, advances and financing 1,019,203 546,792 Allowance for credit losses on other financial assets 4,042 (319) Property, plant and equipment: - Depreciation 18 92,591 99,854 - Gain on disposal 38 (2,209) (2,489) - Written off 18 1 956 Intangible assets: - Amortisation 20 100,434 99,694 - Written off 20 - 5 Right of use assets: - Depreciation 17 52,083 47,952 - Gain on modification 38 (4) - Impairment losses on investment in a subsidiary 44 52,500 - Net allowance made/(written back) on financial assets at FVOCI and
financial investments at amortised cost 54,612 (36,402) Net gain arising from disposal/redemption of financial assets at FVTPL,
financial assets at FVOCI and financial investments at amortised cost (491,081) (294,564) Net (gain)/loss on fair value hedges 38 (4,256) 528 Net unrealised loss on revaluation of financial assets at FVTPL and derivatives 32,586 14,809 Net unrealised foreign exchange gain (68,774) (87,305) Dividend income from financial assets at FVOCI 38 (4,404) (9,566) Dividend income from subsidiaries 38 (580,585) (63,544) Net modification loss 40 158,771 - Amortisation of premium for borrowings, subordinated obligations and
Hybrid Tier-1 Capital Securities 1,780 2,653 Interest expense on borrowings, senior debt securities, Hybrid Tier-1
Capital Securities, subordinated obligations and lease liabilities 180,243 277,322 Interest income from financial assets at FVTPL, financial assets at FVOCI and
financial investments at amortised cost (1,615,174) (1,632,200)Operating profit before working capital changes 1,215,457 1,155,410
(Increase)/Decrease in operating assets:Deposits and placements with banks and other financial institutions (4,098,229) (2,257,107)Investment accounts due from designated financial institutions (611,524) (330,723)Financial assets at FVTPL 432,624 (466,598)Loans, advances and financing (3,653,911) 454,259Other assets (1,100,007) 44,503Statutory deposits 2,380,258 370,624
(6,650,789) (2,185,042)
STATEMENTS OF CASH FLOWSfor the financial year ended 31 December 2020 (continued)
The accompanying accounting policies and notes form an integral part of these financial statements.The accompanying accounting policies and notes form an integral part of these financial statements.
RHB
Ban
k B
erha
d -
Fina
ncia
l Rep
ort
2020
RHB
Ban
k B
erha
d -
Fina
ncia
l Rep
ort
2020
20
21STATUTORY FINANCIAL STATEMENTS
www.rhbgroup.com
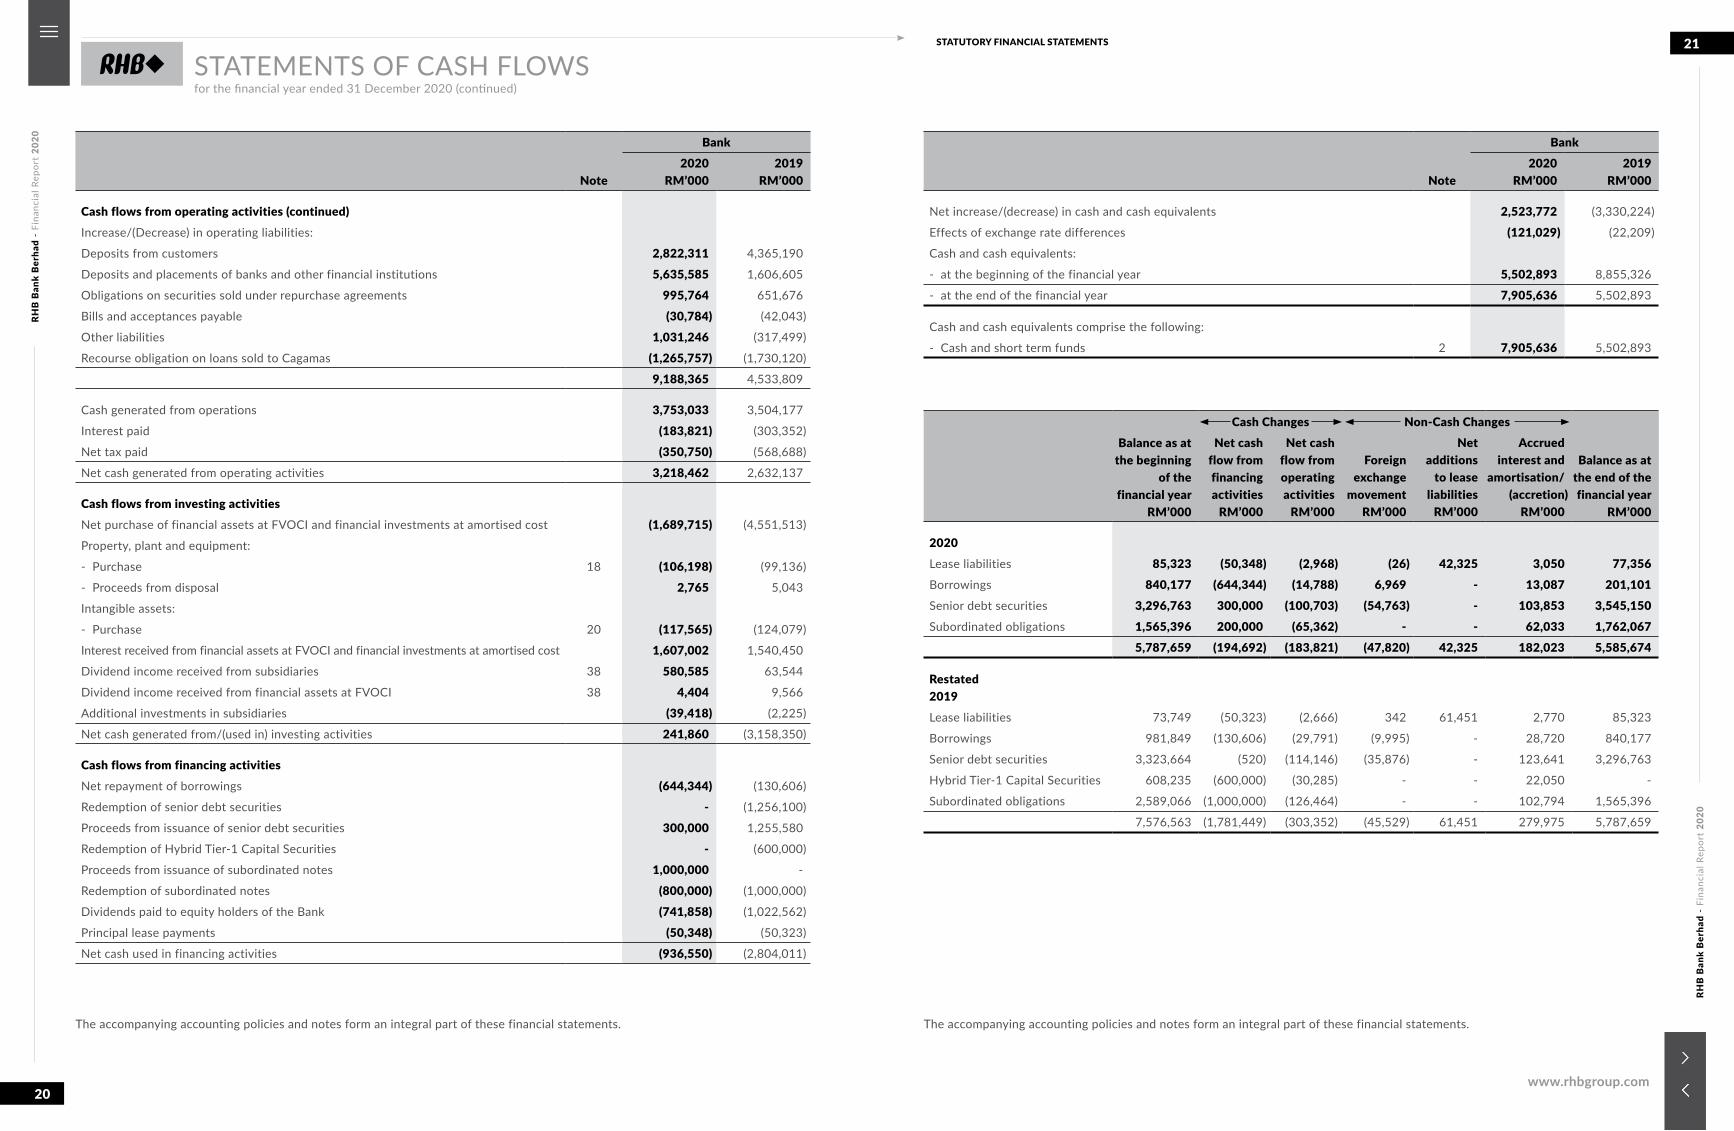
Note
Bank2020
RM’0002019
RM’000
Cash flows from operating activities (continued)Increase/(Decrease) in operating liabilities:
Deposits from customers 2,822,311 4,365,190
Deposits and placements of banks and other financial institutions 5,635,585 1,606,605
Obligations on securities sold under repurchase agreements 995,764 651,676
Bills and acceptances payable (30,784) (42,043)
Other liabilities 1,031,246 (317,499)
Recourse obligation on loans sold to Cagamas (1,265,757) (1,730,120)
9,188,365 4,533,809
Cash generated from operations 3,753,033 3,504,177
Interest paid (183,821) (303,352)
Net tax paid (350,750) (568,688)
Net cash generated from operating activities 3,218,462 2,632,137
Cash flows from investing activitiesNet purchase of financial assets at FVOCI and financial investments at amortised cost (1,689,715) (4,551,513)
Property, plant and equipment:
- Purchase 18 (106,198) (99,136)
- Proceeds from disposal 2,765 5,043
Intangible assets:
- Purchase 20 (117,565) (124,079)
Interest received from financial assets at FVOCI and financial investments at amortised cost 1,607,002 1,540,450
Dividend income received from subsidiaries 38 580,585 63,544
Dividend income received from financial assets at FVOCI 38 4,404 9,566
Additional investments in subsidiaries (39,418) (2,225)
Net cash generated from/(used in) investing activities 241,860 (3,158,350)
Cash flows from financing activitiesNet repayment of borrowings (644,344) (130,606)
Redemption of senior debt securities - (1,256,100)
Proceeds from issuance of senior debt securities 300,000 1,255,580
Redemption of Hybrid Tier-1 Capital Securities - (600,000)
Proceeds from issuance of subordinated notes 1,000,000 -
Redemption of subordinated notes (800,000) (1,000,000)
Dividends paid to equity holders of the Bank (741,858) (1,022,562)
Principal lease payments (50,348) (50,323)
Net cash used in financing activities (936,550) (2,804,011)
Note
Bank2020
RM’0002019
RM’000
Net increase/(decrease) in cash and cash equivalents 2,523,772 (3,330,224)
Effects of exchange rate differences (121,029) (22,209)
Cash and cash equivalents:
- at the beginning of the financial year 5,502,893 8,855,326
- at the end of the financial year 7,905,636 5,502,893
Cash and cash equivalents comprise the following:
- Cash and short term funds 2 7,905,636 5,502,893
Balance as atthe beginning
of thefinancial year
RM’000
Cash Changes Non-Cash Changes
Balance as atthe end of thefinancial year
RM’000
Net cashflow fromfinancingactivities
RM’000
Net cashflow fromoperatingactivities
RM’000
Foreignexchange
movementRM’000
Netadditions
to leaseliabilities
RM’000
Accruedinterest and
amortisation/(accretion)
RM’000
2020Lease liabilities 85,323 (50,348) (2,968) (26) 42,325 3,050 77,356Borrowings 840,177 (644,344) (14,788) 6,969 - 13,087 201,101Senior debt securities 3,296,763 300,000 (100,703) (54,763) - 103,853 3,545,150Subordinated obligations 1,565,396 200,000 (65,362) - - 62,033 1,762,067
5,787,659 (194,692) (183,821) (47,820) 42,325 182,023 5,585,674
Restated2019Lease liabilities 73,749 (50,323) (2,666) 342 61,451 2,770 85,323
Borrowings 981,849 (130,606) (29,791) (9,995) - 28,720 840,177
Senior debt securities 3,323,664 (520) (114,146) (35,876) - 123,641 3,296,763
Hybrid Tier-1 Capital Securities 608,235 (600,000) (30,285) - - 22,050 -
Subordinated obligations 2,589,066 (1,000,000) (126,464) - - 102,794 1,565,396
7,576,563 (1,781,449) (303,352) (45,529) 61,451 279,975 5,787,659
STATEMENTS OF CASH FLOWSfor the financial year ended 31 December 2020 (continued)
The accompanying accounting policies and notes form an integral part of these financial statements.The accompanying accounting policies and notes form an integral part of these financial statements.
RHB
Ban
k B
erha
d -
Fina
ncia
l Rep
ort
2020
RHB
Ban
k B
erha
d -
Fina
ncia
l Rep
ort
2020
22
23STATUTORY FINANCIAL STATEMENTS
www.rhbgroup.com
(A) SUMMARY OF SIGNIFICANT ACCOUNTING POLICIES
The following accounting policies have been used consistently in dealing with items which are considered material in relation to thefinancial statements. These accounting policies have been consistently applied to all the years presented, unless otherwise stated.
(1) BASIS OF PREPARATION OF THE FINANCIAL STATEMENTS
The financial statements of the Group and the Bank have been prepared in accordance with Malaysian Financial ReportingStandards (‘MFRS’), International Financial Reporting Standards (‘IFRS’) and the requirements of the Companies Act 2016 inMalaysia.
The financial statements have been prepared under the historical cost convention, as modified by the revaluation of financialassets at FVOCI, financial assets and financial liabilities (including derivative financial instruments) at fair value through profitor loss.
The financial statements also incorporate those activities relating to Islamic banking which have been undertaken by theGroup and the Bank. Islamic banking refers generally to the acceptance of deposits, granting of financing and dealing inIslamic securities under the Shariah principles.
The preparation of financial statements in conformity with MFRS requires the use of certain critical accounting estimates andassumptions that affect the reported amounts of assets and liabilities and disclosure of contingent assets and liabilities at thedate of the financial statements, and the reported amounts of revenues and expenses during the reported financial year. Italso requires Directors to exercise their judgement in the process of applying the Group and the Bank’s accounting policies.Although these estimates and judgement are based on the Directors’ best knowledge of current events and actions, actualresults may differ.
The areas involving a higher degree of judgement or complexity, or areas where assumptions and estimates are significant tothe financial statements are disclosed in Section (B).
(a) Standards, amendments to published standards and interpretations to existing standards that are applicable to theGroup and the Bank and are effective
The relevant new accounting standards, annual improvements and amendments to published standards andinterpretations to existing accounting standards that are effective for the Group and the Bank’s financial year beginningon or after 1 January 2020 are as follows:
(i) The Conceptual Framework for Financial Reporting (Revised 2018)
The Framework was revised with the primary purpose to assist the IASB to develop IFRS that are based onconsistent concepts and enable preparers to develop consistent accounting policies where an issue is notaddressed by an IFRS. The Framework is not an IFRS, and does not override any IFRSs.
Key changes to the Framework are as follows:
• Objective of general purpose financial reporting - clarification that the objective of financial reporting isto provide useful information to the users of financial statements for resource allocation decisions andassessment of management’s stewardship;
• Qualitative characteristics of useful financial information - reinstatement of the concepts of prudence whenmaking judgement of uncertain conditions and ‘substance over form’ concept to ensure faithful representationof economic phenomenon;
(A) SUMMARY OF SIGNIFICANT ACCOUNTING POLICIES (CONTINUED)
(1) BASIS OF PREPARATION OF THE FINANCIAL STATEMENTS (CONTINUED)
(a) Standards, amendments to published standards and interpretations to existing standards that are applicable to theGroup and the Bank and are effective (continued)
The relevant new accounting standards, annual improvements and amendments to published standards andinterpretations to existing accounting standards that are effective for the Group and the Bank’s financial year beginningon or after 1 January 2020 are as follows (continued):
(i) The Conceptual Framework for Financial Reporting (Revised 2018) (continued)
Key changes to the Framework are as follows (continued):
• Clarification on reporting entity for financial reporting - introduction of new definition of a reporting entity,which might be a legal entity or a portion of a legal entity;
• Elements of financial statements - the definitions of an asset and a liability have been refined. Guidance indetermining unit of account for assets and liabilities have been added, by considering the nature of executory contracts and substance of contracts;
• Recognition and derecognition - the probability threshold for asset or liability recognition has been removed.New guidance on de-recognition of asset and liability have been added;
• Measurement - explanation of factors to consider when selecting a measurement basis have been provided; and• Presentation and disclosure - clarification that income statements is the primary source of information about
an entity’s financial performance for a reporting period. In principle, recycling of income/expense includedin other comprehensive income to income statements is required if this results in more relevant informationor a more faithful representation of income statements.
Amendments to References to the Conceptual Framework in MFRS Standards
The MASB also issued Amendments to References to the Conceptual Framework in MFRS Standards (‘Amendments’), to update references and quotations to fourteen (14) Standards so as to clarify the version of Conceptual Framework these Standards refer to, for which the effective date above applies.
The amendments should be applied retrospectively in accordance with MFRS 108 unless retrospective application would be impracticable or involve undue cost or effort.
(ii) Amendments to MFRS 101 and MFRS 108 ‘Definition of Material’
The amendments clarify the definition of materiality and use a consistent definition throughout MFRSs and theConceptual Framework for Financial Reporting.
The definition of ‘material’ has been revised as ‘Information is material if omitting, misstating or obscuring it couldreasonably be expected to influence decisions that the primary users of general purpose financial statementsmake on the basis of those financial statements, which provide financial information about a specific reportingentity.’
SUMMARY OF SIGNIFICANT ACCOUNTING POLICIES AND CRITICAL ACCOUNTING ESTIMATES AND ASSUMPTIONSfor the financial year ended 31 December 2020
RHB
Ban
k B
erha
d -
Fina
ncia
l Rep
ort
2020
RHB
Ban
k B
erha
d -
Fina
ncia
l Rep
ort
2020
24
25STATUTORY FINANCIAL STATEMENTS
www.rhbgroup.com
(A) SUMMARY OF SIGNIFICANT ACCOUNTING POLICIES (CONTINUED)
(1) BASIS OF PREPARATION OF THE FINANCIAL STATEMENTS (CONTINUED)
(a) Standards, amendments to published standards and interpretations to existing standards that are applicable to the Group and the Bank and are effective (continued)
The relevant new accounting standards, annual improvements and amendments to published standards and interpretations to existing accounting standards that are effective for the Group and the Bank’s financial year beginning on or after 1 January 2020 are as follows (continued):
(ii) Amendments to MFRS 101 and MFRS 108 ‘Definition of Material’ (continued)
The amendments also:
• clarify that an entity assess materiality in the context of the financial statements as a whole;• explain the concept of obscuring information in the new definition. Information is obscured if it has the
effect similar as omitting or misstating of that information. For example, material transaction is scattered throughout the financial statements, dissimilar items are inappropriately aggregated, or material information is hidden by immaterial information; and
• Clarify the meaning of ‘primary users of general purpose financial statements’ to whom those financial statements are directed, by defining them as ‘existing and potential investors, lenders and other creditors’ that must rely on general purpose financial statements for much of the financial information they need.
(iii) Amendments to MFRS 3 ‘Definition of a Business’
The amendments clarify that to be considered a business, an acquisition would have to include an input and a substantive process that together significantly contribute to the ability to create outputs.
The amendments provide guidance to determine whether an input and a substantive process are present, including situation where an acquisition does not have outputs. To be a business without outputs, there will now need to be an organised workforce. It is also no longer necessary to assess whether market participants are capable of replacing missing elements or integrating the acquired activities and assets.
In addition, the revised definition of the term ‘outputs’ is narrower, focusses on goods or services provided to customers, generating investment returns and other income but excludes returns in the form of cost savings.
The amendments introduce an optional simplified assessment known as ‘concentration test’ that, if met, eliminates the need for further assessment. The assets acquired would not represent a business when substantially all of the fair value of gross assets acquired is concentrated in a single identifiable asset (or a group of similar assets).
(iv) Amendments to MFRS 7, MFRS 9 and MFRS 139 ‘Interest Rate Benchmark Reform’
The amendments provide temporary relief from applying specific hedge accounting requirements to hedging relationships directly affected by inter-bank offered rate (‘IBOR’) reform. The reliefs have the effect that IBOR reform should not generally cause hedge accounting to terminate. However, any hedge ineffectiveness continues to be recorded in the statements of comprehensive income. The reliefs will cease to apply when the uncertainty arising from interest rate benchmark reform is no longer present.
The adoption of the above accounting standards, annual improvements and amendments do not give rise to any material financial impact to the Group and the Bank.
(A) SUMMARY OF SIGNIFICANT ACCOUNTING POLICIES (CONTINUED)
(1) BASIS OF PREPARATION OF THE FINANCIAL STATEMENTS (CONTINUED)
(b) Standards, amendments to published standards and interpretations to existing standards that are applicable to the Group and the Bank but not yet effective
(i) Amendments to MFRS 16 ‘COVID-19 Related Rent Concessions’ – effective 1 June 2020
The amendments grant an optional exemption for lessees to account for rent concession related to COVID-19 in the same way as they would if they were not lease modifications. In many cases, this will result in accounting for the concession as a variable lease payment in the period(s) in which the event or condition that triggers the reduced payment occurs.
The exemption only applies to rent concessions occurring as a direct consequence of the COVID-19 pandemic and only if all of the following conditions are met:
• the change in lease payments results in revised consideration for the lease that is substantially the same as, or less than, the consideration for the lease immediately preceding the change;
• any reduction in lease payments affects only payments due on or before 30 June 2021; and• there is no substantive change to other terms and conditions of the lease.
The amendment shall be applied retrospectively.
Lessees are not required to restate comparative information or to provide the disclosure under paragraph 28(f) of MFRS 108.
(ii) Amendments to MFRS 3 ‘Business Combinations’: Reference to the Conceptual Framework - effective 1 January 2022
The amendments replace the reference to Framework for Preparation and Presentation of Financial Statements with 2018 Conceptual Framework. The amendments did not change the current accounting for business combinations on acquisition date.
The amendments provide an exception for the recognition of liabilities and contingent liabilities should be in accordance with the principles of MFRS 137 ‘Provisions, Contingent Liabilities and Contingent Assets’ and IC Interpretation 21 ‘Levies’ when falls within their scope. It also clarifies that contingent assets should not be recognised at the acquisition date.
The amendments shall be applied prospectively.
(iii) Annual Improvements to MFRSs 2018 - 2020 - effective 1 January 2022
• Amendments to MFRS 1 ‘First-time Adoption of MFRS’: Subsidiary as First-time Adopter
Cumulative translation differences - a subsidiary that adopts MFRS later than its parent and elects to measure its assets and liabilities based on the carrying amounts that would be included in the parent’s consolidated financial statements, based on the parent’s date of transition to MFRS, if no adjustments were made for consolidation procedures and for the effects of the business combination in which the parent acquired the subsidiary, may likewise elect to measure cumulative translation differences for all its foreign operations based on the carrying amounts that would be included in the parent’s consolidated financial statements in the same manner.
The amendments shall be applied retrospectively for annual periods beginning on or after 1 January 2022. Earlier application is permitted.
SUMMARY OF SIGNIFICANT ACCOUNTING POLICIES AND CRITICAL ACCOUNTING ESTIMATES AND ASSUMPTIONSfor the financial year ended 31 December 2020 (continued)
RHB
Ban
k B
erha
d -
Fina
ncia
l Rep
ort
2020
RHB
Ban
k B
erha
d -
Fina
ncia
l Rep
ort
2020
26
27STATUTORY FINANCIAL STATEMENTS
www.rhbgroup.com
(A) SUMMARY OF SIGNIFICANT ACCOUNTING POLICIES (CONTINUED)
(1) BASIS OF PREPARATION OF THE FINANCIAL STATEMENTS (CONTINUED)
(b) Standards, amendments to published standards and interpretations to existing standards that are applicable to the Group and the Bank but not yet effective (continued)
(iii) Annual Improvements to MFRSs 2018 - 2020 - effective 1 January 2022 (continued)
• Amendments to MFRS 9 ‘Financial Instruments’
When entities restructure their loans with existing lenders, they are required to quantitatively assess the significance of the difference in cash flows based on the old and new contractual terms (commonly known as the MFRS 9 ‘10% test’).
Fees could be paid by the borrower to either third parties or the lender in a debt modification. This amendment to MFRS 9 clarifies that only fees paid or received between the borrower and the lender, including the fees paid or received on each other’s behalf, are included in the assessment. Fees paid to third parties (e.g. fee paid to lawyers) are not included in the 10% test.
The amendment need not be applied retrospectively for annual periods beginning on or after 1 January 2022 and is applicable to financial liabilities that are modified or exchanged on or after the beginning of the annual reporting period in which the entity first applies the amendment.
• Amendments to illustrative Example 13 accompanying MFRS 16 ‘Leases’: Lease Incentives
Removed the illustration on the reimbursement relating to leasehold improvements by the lessor to avoid potential confusion as the example had not explained clearly enough the conclusion as to whether the reimbursement would meet the definition of a lease incentive in MFRS 16.
The amendments shall be applied retrospectively for annual periods beginning on or after 1 January 2022. Earlier application is permitted.
(iv) Amendments to MFRS 116 ‘Property, Plant and Equipment’: Proceeds before Intended Use - effective 1 January 2022
The amendments prohibit an entity from deducting from the cost of a property, plant and equipment (‘PPE’) the proceeds received from selling items produced by the PPE before it is ready for its intended use. The sales proceeds would have met the revenue definition and therefore should be recognised in income statements.
The amendments also clarify that ‘testing’ in MFRS 116 refers to assessing the technical and physical performance of the PPE rather than its financial performance.
The amendments shall be applied retrospectively to PPE that became available for use on or after the beginning of the earliest period presented in the financial statements when an entity first applies the amendments.
(v) Amendments to MFRS 137 ‘Provisions, Contingent Liabilities and Contingent Assets’: ‘Onerous Contracts - Cost of Fulfilling a Contract’ - effective 1 January 2022
The amendments clarify that direct costs of fulfilling a contract include both the incremental cost of fulfilling the contract as well as an allocation of other costs directly related to fulfilling contracts. The amendments also clarify that before recognising a separate provision for an onerous contract, impairment loss that has occurred on assets used in fulfilling the contract should be recognised.
The amendments shall be applied retrospectively.
(A) SUMMARY OF SIGNIFICANT ACCOUNTING POLICIES (CONTINUED)
(1) BASIS OF PREPARATION OF THE FINANCIAL STATEMENTS (CONTINUED)
(b) Standards, amendments to published standards and interpretations to existing standards that are applicable to the Group and the Bank but not yet effective (continued)
(vi) Amendments to MFRS 101 ‘Classification of Liabilities as Current or Non-current’ - effective 1 January 2023
The MFRS 101 classification principle requires an assessment of whether an entity has the substantive right to defer settlement of a liability at the end of the reporting period.
The amendments clarify that when the right to defer settlement is subject to complying with specified conditions, the right only exists at the end of the reporting period if the entity complies with those conditions at that date. The entity must comply with the conditions at the end of the reporting period even if the lender does not test compliance until a later date.
Also, classification is unaffected by the expectations of the entity or events after the reporting date (e.g. waiver obtained or breach of loan covenant).
In addition, the amendments clarify that when a liability could be settled by the transfer of an entity’s own equity instruments (e.g. a conversion option in a convertible bond), the conversion option does not affect the classification of the convertible bond if the option meets the definition of an equity instrument in accordance with MFRS 132 ‘Financial Instruments: Presentation’. Conversion option that is not an equity instrument should therefore be considered in the current or non-current classification of a convertible instrument.
These amendments should be applied retrospectively for annual periods beginning on or after 1 January 2023. Earlier application is permitted. If an entity applies those amendments for an earlier period, it should disclose that fact.
(vii) MFRS 17 ‘Insurance Contracts’ - effective 1 January 2023
MFRS 17 ‘Insurance Contracts’ replaces MFRS 4 ‘Insurance Contracts’.
MFRS 17 applies to insurance contracts issued, to all reinsurance contracts and to investment contracts with discretionary participating features if an entity also issues insurance contracts. For fixed-fee service contracts whose primary purpose is the provision of services, an entity has an accounting policy choice to account for them in accordance with either MFRS 17 or MFRS 15 ‘Revenue from Contracts with Customers’. An entity is allowed to account financial guarantee contracts in accordance with MFRS 17 if the entity has asserted explicitly that it regarded them as insurance contracts. Insurance contracts, (other than reinsurance) where the entity is the policyholder are not within the scope of MFRS 17. Embedded derivatives and distinct investment and service components should be ‘unbundled’ and accounted for separately in accordance with the related MFRSs. Voluntary unbundling of other components is prohibited.
MFRS 17 requires a current measurement model where estimates are re-measured at each reporting period. The measurement is based on the building blocks of discounted, probability-weighted cash flows, a risk adjustment and a contractual service margin (‘CSM’) representing the unearned profit of the contract. An entity has a policy choice to recognise the impact of changes in discount rates and other assumptions that related to financial risks either in profit or loss or in other comprehensive income.
Alternative measurement models are provided for the different insurance coverages:
• Simplified Premium Allocation Approach if the insurance coverage period is a year or less.• Variable Fee Approach should be applied for insurance contracts that specify a link between payments to the
policyholder and the returns on the underlying items.
SUMMARY OF SIGNIFICANT ACCOUNTING POLICIES AND CRITICAL ACCOUNTING ESTIMATES AND ASSUMPTIONSfor the financial year ended 31 December 2020 (continued)
RHB
Ban
k B
erha
d -
Fina
ncia
l Rep
ort
2020
RHB
Ban
k B
erha
d -
Fina
ncia
l Rep
ort
2020
28
29STATUTORY FINANCIAL STATEMENTS
www.rhbgroup.com
(A) SUMMARY OF SIGNIFICANT ACCOUNTING POLICIES (CONTINUED)
(1) BASIS OF PREPARATION OF THE FINANCIAL STATEMENTS (CONTINUED)
(b) Standards, amendments to published standards and interpretations to existing standards that are applicable to the Group and the Bank but not yet effective (continued)
(vii) MFRS 17 ‘Insurance Contracts’ - effective 1 January 2023 (continued)
The requirements of MFRS 17 align the presentation of revenue with other industries. Revenue is allocated to the periods in proportion to the value of the expected coverage and other services that the insurer provides in the period, and claims are presented when incurred. Investment components are excluded from revenue and claims.
An entity shall apply MFRS 17 retrospectively unless impracticable, except that an entity:
• is not required to present the quantitative information required by paragraph 28(f) of MFRS 108 ‘Accounting Policies, Changes in Accounting Estimates and Errors’; and
• shall not apply the option in MFRS 17.B115 for periods before the date of initial application of MFRS 17.
If retrospective application is impracticable, an entity shall apply one of the following approaches:
• the modified retrospective approach (to achieve the closest outcome to retrospective application using reasonable and supportable information and choosing from a list of available simplification); or
• the fair value approach.
The adoption of the accounting standards, amendments to published standards and interpretations to existing standards that are applicable to the Group and the Bank but not yet effective above are not expected to give rise to any material financial impact to the Group and the Bank, except for the adoption of MFRS 17, of which the cumulative impact upon adoption will be recognised in the retained earnings as at 1 January 2023, and with enhanced disclosures.
(c) Changes in regulatory requirements
(i) Additional measures issued by Bank Negara Malaysia (‘BNM’)
On 24 March 2020 and 24 July 2020, BNM announced that the following measures which are aimed to ensure that the financial intermediation function of the financial sector remains intact, access to financing continues to be available and banking institutions remain focused on supporting the economy during the COVID-19 pandemic:
I Moratorium on repayment/payment of loans/financing
(1) Banking institutions to grant an automatic moratorium on all loan/financing repayments covering both principal and interest/profit (except for credit card balances) by individuals and small and medium-sized enterprises (‘SMEs’) for a period of 6 months effective 1 April 2020. This automatic moratorium is applicable to loans/financing that are not in arrears exceeding 90 days as at 1 April 2020 and denominated in Malaysian Ringgit;
(2) For credit cards, customers shall have the option of converting the outstanding balances into a term loan/financing of a tenure of not more than 3 years and an effective interest/profit rate capped at 13% per annum. For customers who have been unable to meet the minimum repayment for 3 consecutive months, their credit card balances will be automatically converted into a term loan with the abovementioned terms; and
(3) Banking institutions are also strongly encouraged to facilitate requests for a moratorium for corporate borrowers in a way that enables viable corporations to preserve jobs and swiftly resume economic activities.
(A) SUMMARY OF SIGNIFICANT ACCOUNTING POLICIES (CONTINUED)
(1) BASIS OF PREPARATION OF THE FINANCIAL STATEMENTS (CONTINUED)
(c) Changes in regulatory requirements (continued)
(i) Additional measures issued by Bank Negara Malaysia (‘BNM’) (continued)
II Definition of defaulted exposures under the policy documents on Capital Adequacy Framework and Capital Adequacy Framework for Islamic Banks
In applying the definition of defaulted exposures under the above policies to loans/financing for which repayment assistance is extended:
(1) The determination of ‘days past due’ should be based on the new repayment terms of a loan/financing that has been rescheduled and restructured. Where the repayment terms include a repayment deferral, the determination of days past due should exclude the deferred repayment period;
(2) For loans/financing to individuals or SMEs, a borrower/customer should not be considered to be in default based on ‘unlikeliness to repay’ at the time the repayment assistance is granted, except where the loan/financing is sold by the banking institution at a material loss or the borrower/customer is subjected to bankruptcy actions; and
(3) For loans/financing to corporates, the assessment of ‘unlikeliness to repay’ should not be based solely on the borrower/customer taking up an offer of repayment assistance extended by the banking institution but based on a more holistic assessment of all relevant indicators and information available on the corporate borrower/customer.
Regulatory Capital Treatment
The regulatory capital treatment above shall apply to loans/financing denominated in Malaysian Ringgit or foreign currency that meet the following criteria:
(1) The principal or interest/profit, or both, is not in arrears exceeding 90 days as at the date of application for repayment assistance; and
(2) The application for repayment assistance by a borrower/customer is received on or before 30 June 2021.
The regulatory capital treatment would also be applicable to rescheduled and restructured loans/financing that are facilitated by Agensi Kaunseling dan Pengurusan Kredit, the Small Debt Resolution Scheme and the Corporate Debt Restructuring Committee.
III Drawdown of prudential buffers
(1) Banking institutions are given the following relaxation of the prudential buffers, which will need to be restored to the minimum regulatory requirements by 30 September 2021:
• Drawdown of capital conservation buffer of 2.5%;• Operate below the minimum liquidity coverage ratio (‘LCR’) of 100%; and• Reduce the regulatory reserves held against expected credit losses to 0%.
(2) The implementation of the Net Stable Funding Ratio (‘NSFR’) will proceed as scheduled on 1 July 2020. However, the minimum NSFR will be lowered to 80% and banking institutions will be required to comply with the requirement of 100% from 30 September 2021.
SUMMARY OF SIGNIFICANT ACCOUNTING POLICIES AND CRITICAL ACCOUNTING ESTIMATES AND ASSUMPTIONSfor the financial year ended 31 December 2020 (continued)
RHB
Ban
k B
erha
d -
Fina
ncia
l Rep
ort
2020
RHB
Ban
k B
erha
d -
Fina
ncia
l Rep
ort
2020
30
31STATUTORY FINANCIAL STATEMENTS
www.rhbgroup.com
(A) SUMMARY OF SIGNIFICANT ACCOUNTING POLICIES (CONTINUED)
(1) BASIS OF PREPARATION OF THE FINANCIAL STATEMENTS (CONTINUED)
(c) Changes in regulatory requirements (continued)
(i) Additional measures issued by Bank Negara Malaysia (‘BNM’) (continued)
The adoption of the above additional measures gave rise to the following observations and financial impact:
(1) The financial impact to the Group and the Bank as disclosed in Note 40 to the financial statements;
(2) Loan/financing granted with moratorium will not be considered as ‘restructuring and rescheduling’, unless with extended tenure and revising original repayment amount;
(3) The moratorium does not automatically result in stage transfer under MFRS 9 in the absence of other factors relevant to the assessment of whether there has been a significant increase in credit risk. Instead, the Group and the Bank will assess other factors, such as historical repayment and delinquency trends before the COVID-19 outbreak, in considering whether the borrower has experienced a significant increase in credit risk; and
(4) The Group and the Bank have continued to maintain in aggregate the loss allowance for non-credit impaired exposures and regulatory reserves of no less than 1% of total credit exposures, net of loss allowance for credit- impaired exposures.
(2) BASIS OF CONSOLIDATION
(a) Subsidiaries
Subsidiaries are all entities (including structured entities) over which the Group has control. The Group controls an entity when the Group is exposed to, or has rights to, variable returns from its involvement with the entity and has the ability to affect those returns through its power over the entity.
Subsidiaries are fully consolidated from the date on which control is transferred to the Group and are de-consolidated from the date that control ceases.
(i) Acquisition accounting
The Group applies the acquisition method to account for business combination. The consideration transferred for acquisition of a subsidiary is the fair value of the assets transferred, the liabilities incurred and the equity interests issued by the Group. The consideration transferred includes the fair value of any asset or liability resulting from a contingent consideration arrangement and fair value of any pre-existing equity interest in the subsidiary. Identifiable assets acquired and liabilities and contingent liabilities assumed in a business combination are measured initially at their fair values at the acquisition date.
Non-controlling interest is the equity in a subsidiary not attributable, directly or indirectly, to the Group or the Bank. Non-controlling interest is measured either at fair value or proportionate share of the acquiree’s identifiable net assets at the acquisition date, determined on a case by case basis. At the end of a reporting period, non-controlling interest consists of the amount calculated on the date of combination and its share of changes in the subsidiary’s equity since the date of combination.
Acquisition-related costs are expensed as incurred.
(A) SUMMARY OF SIGNIFICANT ACCOUNTING POLICIES (CONTINUED)
(2) BASIS OF CONSOLIDATION (CONTINUED)
(a) Subsidiaries (continued)
(i) Acquisition accounting (continued)
In a business combination achieved in stages, the previously held equity interest in the acquiree is remeasured at its acquisition date fair value and the resulting gain or loss is recognised in income statements.
Any contingent consideration to be transferred by the Group is recognised at fair value at the acquisition date. Subsequent changes to the fair value of the contingent consideration that is deemed to be an asset or liability is recognised in accordance with MFRS 9 in income statements. Contingent consideration that is classified as equity is not remeasured, and its subsequent settlement is accounted for within equity.
The excess of the aggregate of the consideration transferred, the amount of any non-controlling interest in the acquiree and the acquisition-date fair value of any previous equity interest in the acquiree over the fair value of the Group’s share of the identifiable net assets acquired is recorded as goodwill. If this is less than the fair value of the net assets of the subsidiary acquired, the gain is recognised in income statements. Refer to accounting policy Note 7 on goodwill.
(ii) Predecessor accounting
The Group and the Bank apply predecessor accounting to account for business combinations under common control. Under the predecessor accounting, assets and liabilities acquired are not restated to their respective fair values but at the carrying amounts from the consolidated financial statements of the ultimate holding company of the Group and adjusted to ensure uniform accounting policies of the Group. The difference between any consideration given and the aggregate carrying amounts of the assets and liabilities (as of the date of the transaction) of the acquired entity is recorded as an adjustment to retained earnings. No additional goodwill is recognised.
The acquired entity’s results, assets and liabilities are consolidated as if both the acquirer and acquiree had always been combined. Consequently, the consolidated financial statements reflect both entities’ full year results. The corresponding amounts for the previous year are restated to reflect the combined results of both entities.
All earnings and losses of the subsidiary are attributed to the parent and the non-controlling interest, even if the attribution of losses to the non-controlling interest results in a debit balance in the shareholders’ equity. Profit or loss attributed to non-controlling interest for prior years is not restated.
All material inter-company and intra-group transactions and balances are eliminated on consolidation. Where necessary, adjustments are made to the financial statements of subsidiaries to ensure consistency of accounting policies with those of the Group.
(b) Changes in ownership interests in subsidiaries without change of control
Transactions with non-controlling interests that do not result in loss of control are accounted for as equity transactions – that is, as transactions with the owners in their capacity as owners. The difference between fair value of any consideration paid and the relevant share acquired of the carrying value of net assets of the subsidiary is recorded in equity. Gains or losses on disposals to non-controlling interests are also recorded in equity attributable to owners of the Group.
SUMMARY OF SIGNIFICANT ACCOUNTING POLICIES AND CRITICAL ACCOUNTING ESTIMATES AND ASSUMPTIONSfor the financial year ended 31 December 2020 (continued)
RHB
Ban
k B
erha
d -
Fina
ncia
l Rep
ort
2020
RHB
Ban
k B
erha
d -
Fina
ncia
l Rep
ort
2020
32
33STATUTORY FINANCIAL STATEMENTS
www.rhbgroup.com
(A) SUMMARY OF SIGNIFICANT ACCOUNTING POLICIES (CONTINUED)
(2) BASIS OF CONSOLIDATION (CONTINUED)
(c) Disposal of subsidiaries
When the Group ceases to have control, any retained interest in the entity is remeasured to its fair value at the date when control is lost, with the change in carrying amount recognised in profit and loss. The fair value is the initial carrying amount for the purposes of subsequently accounting for the retained interest as an associate, joint venture or financial asset. In addition, any amounts previously recognised in other comprehensive income in respect of that entity are accounted for as if the Group had directly disposed of the related assets or liabilities. This may mean that amounts previously recognised in other comprehensive income are reclassified to income statements.
Gain or loss on disposal of subsidiaries included the carrying amount of goodwill relating to subsidiaries sold.
(d) Joint ventures
A joint venture is a joint arrangement whereby the joint ventures have rights to the net assets of the arrangement. The Group’s interest in a joint venture is accounted for in the financial statements by the equity method of accounting. Under the equity method of accounting, interests in joint ventures are initially recognised at cost and adjusted thereafter to recognise the Group’s share of the post-acquisition profits or losses in income statements and the Group’s share of movements in other comprehensive income. When the Group’s share of losses in a joint venture equals or exceeds its interests in the joint ventures (which includes any long-term interests that, in substance, form part of the Group’s net investment in the joint ventures), the Group does not recognise further losses, unless it has incurred obligations or made payments on behalf of the joint ventures.
The Group determines at each reporting date whether there is any objective evidence that the investment in the joint venture is impaired. An impairment loss is recognised for the amount by which the carrying amount of the joint venture exceeds its recoverable amount.
Unrealised gains on transactions between the Group and its joint ventures are eliminated to the extent of the Group’s
interest in the joint ventures. Unrealised losses are also eliminated unless the transaction provides evidence of an impairment of the asset transferred. Accounting policies of the joint ventures have been changed where necessary to ensure consistency with the policies adopted by the Group.
When the Group ceases to equity account its joint venture because of a loss of joint control, any retained interest in the entity is remeasured to its fair value with the change in carrying amount recognised in income statements. This fair value becomes the initial carrying amount for the purposes of subsequently accounting for the retained interest as an associate or financial asset. In addition, any amount previously recognised in other comprehensive income in respect of the entity is accounted for as if the Group had directly disposed of the related assets or liabilities. This may mean that amounts previously recognised in other comprehensive income are reclassified to income statements.
If the ownership interest in a joint venture is reduced but joint control is retained, only a proportionate share of the amounts previously recognised in other comprehensive income is reclassified to income statements where appropriate.
(A) SUMMARY OF SIGNIFICANT ACCOUNTING POLICIES (CONTINUED)
(2) BASIS OF CONSOLIDATION (CONTINUED)
(e) Associates
Associates are those corporations or other entities in which the Group exercises significant influence, but which it does not control or joint control, generally accompanying a shareholding of between 20% and 50% of the voting rights. Significant influence is the power to participate in the financial and operating policies through representation on the Board but not power to exercise control over those policies.
Investments in associates are accounted for in the consolidated financial statements using the equity method of accounting and are initially recognised at cost. Equity accounting involves recognising the Group’s share of its associates’ post-acquisition profits or losses in income statements, and its share of post-acquisition movements in reserves is recognised in other comprehensive income. The cumulative post-acquisition changes are adjusted against the cost of investment and include goodwill on acquisition, less accumulated impairment loss.
The Group determines at each reporting date whether there is any objective evidence that the investment in the associate is impaired. An impairment loss is recognised for the amount by which the carrying amount of the associate exceeds its amount.
When the Group’s share of losses in an associate equals or exceeds its interest in the associate, the Group discontinues recognising its shares of further losses. After the Group’s interest is reduced to zero, additional losses are provided for, and a liability is recognised, only to the extent that the investor has incurred legal or constructive obligations or made payments on behalf of the associate. If the associate subsequently reports profits, the Group resumes recognising its share of those profits only after its share of the profits equals the share of losses not recognised.
Dilution gains and losses arising in investments in associates are recognised in the income statements.
Unrealised gains on transactions between the Group and its associates are eliminated to the extent of the Group’s interest in the associates; unrealised losses are also eliminated unless the transaction provides evidence on impairment of the asset transferred. Where necessary, in applying the equity method of accounting, adjustments are made to the financial statements of associates to ensure consistency of accounting policies with those of the Group.
(3) INVESTMENTS IN SUBSIDIARIES, ASSOCIATES AND JOINT VENTURES
In the Bank’s separate financial statements, investments in subsidiaries, associates and joint ventures are stated at cost less accumulated impairment losses. At the end of each reporting period, the Group and the Bank assess whether there is any indication of impairment. Where an indication of impairment exists, the carrying amount of the investment is assessed and written down immediately to its recoverable amount. Refer to accounting policy Note 22 on impairment of non-financial assets.
On disposal of investments in subsidiaries, associates and joint ventures, the difference between disposal proceeds and the carrying amount of the investments is recognised in income statements.
SUMMARY OF SIGNIFICANT ACCOUNTING POLICIES AND CRITICAL ACCOUNTING ESTIMATES AND ASSUMPTIONSfor the financial year ended 31 December 2020 (continued)
RHB
Ban
k B
erha
d -
Fina
ncia
l Rep
ort
2020
RHB
Ban
k B
erha
d -
Fina
ncia
l Rep
ort
2020
34
35STATUTORY FINANCIAL STATEMENTS
www.rhbgroup.com
(A) SUMMARY OF SIGNIFICANT ACCOUNTING POLICIES (CONTINUED)
(4) FINANCIAL ASSETS
(a) Classification
The Group and the Bank classify their financial assets into the following measurement categories:
• Those to be measured at fair value (either through other comprehensive income (‘OCI’), or through profit or loss; and• Those to be measured at amortised cost
The classification of debt instruments depends on the Group and the Bank’s business model for managing the financial assets and the contractual cash flow characteristics of the financial assets:
(i) Business model assessment
The Group and the Bank conduct assessment of the objective of a business model to align with how an asset held within a portfolio is being managed. Factors that are being considered include the key objectives of a portfolio whether the business strategy is to earn contractual interest revenue, matching the duration of the financial assets to the duration of the liabilities that are funding those assets or realising a portfolio through sale of assets. Other factors considered also include the frequency and volume of sales in prior periods, how the asset’s performance is evaluated and reported to key management personnel.
(ii) Assessment whether contractual cash flows are solely payments of principal and interest (‘SPPI’)
Where the business model is to hold the financial assets to collect contractual cash flows, or to collect contractual cash flows and sell, the Group and the Bank assess whether the financial assets’ contractual cash flows represent SPPI. In applying the SPPI test, the Group and the Bank consider whether the contractual cash flows are consistent with a basic lending arrangement, i.e. interest includes only consideration for time value of money, credit risk, other basic lending risks and a profit margin that is consistent with a basic lending arrangement. Where the contractual terms introduce exposure to risk or volatility that are inconsistent with a basic lending arrangement, the related financial asset is classified and measured at fair value through profit or loss.
(b) Recognition and derecognition
Financial assets are recognised when the Group and the Bank become parties to the contractual provisions of the instrument.
Regular way purchases and sales of financial assets are recognised on trade date, the date on which the Group and the Bank commit to purchase and sell the assets.
(c) Measurement
At initial recognition, the Group and the Bank measure a financial asset at fair value plus transaction costs that are directly attributable to acquisition of the financial asset in the case of a financial asset not FVTPL. Transaction costs of financial assets carried at FVTPL are expensed in the income statements.
Financial assets with embedded derivatives are considered in their entirety when determining whether their cash flows are SPPI.
(i) Debt instruments
Debt instruments are those instruments that meet the definition of a financial liability from the issuer’s perspective, such as loans, government and corporate bonds and trade receivables purchased from clients in factoring arrangements without recourse.
(A) SUMMARY OF SIGNIFICANT ACCOUNTING POLICIES (CONTINUED)
(4) FINANCIAL ASSETS (CONTINUED)
(c) Measurement (continued)
(i) Debt instruments (continued)
Subsequent measurement of debt instruments depends on the Group’s and the Bank’s business model for managing the financial asset and the cash flow characteristics of the financial asset. There are three measurement categories into which the Group and the Bank classify its debt instruments:
(1) Financial investments at amortised cost
Financial assets that are held for collection of contractual cash flows where those cash flows represent SPPI, and that are not designated as fair value through profit or loss (‘FVTPL’), are measured at amortised cost. The carrying amount of these assets is adjusted for any expected credit losses that are recognised into income statements. The interest income is recognised into income statements using the effective interest rate method. Upon derecognition, any gain or loss will be recognised in income statements and presented under ‘other operating income’.
(2) Financial assets through other comprehensive income (‘FVOCI’)
Financial assets that are held for collection of contractual cash flows and for selling the financial assets, where those cash flows represent SPPI, and that are not designated at FVTPL, are measured at FVOCI. Changes in the fair value of these assets are recognised in OCI, except for recognition of interest, foreign exchange gains or losses and expected credit losses which are recognised in income statements.
When these financial assets are derecognised, the cumulative gains or losses previously recognised in OCI is reclassified from equity to income statements and recognised in ‘other operating income’. The interest income is recognised into income statements using the effective interest rate method. Foreign exchange gains or losses are recognised in ‘other operating income’ and impairment credit losses are presented separately under ‘allowance for credit losses’.
(3) Financial assets at FVTPL
Financial assets that do not meet the criteria for amortised cost or FVOCI are measured at FVTPL. A gain or loss on a debt instrument that is subsequently measured at FVTPL and is not part of a hedging relationship is recognised in profit or loss and presented in the income statements within ‘net gain/(loss) arising from financial assets at FVTPL’ in the period in which it arises. The interest income is recognised into income statements using the effective interest rate method.
(ii) Equity instruments
Equity instruments are instruments that meet the definition of equity from the issuers’ perspective; that is, instruments that do not contain a contractual obligation to pay and that evidence a residual interest in the issuers’ net assets.
The Group and the Bank subsequently measure all equity instruments at FVTPL, except where the management has elected, at initial recognition, to irrevocably designate an equity instrument as FVOCI. The Group and the Bank’s policy is to designate equity instruments as FVOCI when those instruments are held for purposes other than to generate investment returns. When this election is used, fair value gains and losses are recognised in OCI and are not subsequently reclassified to income statements, including on disposal. Dividend, when representing a return on such investments, continue to be recognised in income statements as dividend income when the Group and the Bank’s right to receive payments is established.
Gains and losses on equity instruments at FVTPL are included in the ‘net gain/(loss) arising from financial assets at FVTPL’ in the income statements.
SUMMARY OF SIGNIFICANT ACCOUNTING POLICIES AND CRITICAL ACCOUNTING ESTIMATES AND ASSUMPTIONSfor the financial year ended 31 December 2020 (continued)
RHB
Ban
k B
erha
d -
Fina
ncia
l Rep
ort
2020
RHB
Ban
k B
erha
d -
Fina
ncia
l Rep
ort
2020
36
37STATUTORY FINANCIAL STATEMENTS
www.rhbgroup.com
(A) SUMMARY OF SIGNIFICANT ACCOUNTING POLICIES (CONTINUED)
(4) FINANCIAL ASSETS (CONTINUED)
(d) Derecognition
(i) Derecognition due to modification of terms and conditions
The Group and the Bank sometimes renegotiate or otherwise modify the contractual cash flows of loans to customers. When this happens, the Group and the Bank assess whether or not the new terms are substantially different to the original terms. The Group and the Bank do this by considering, among others, the following factors:
• If the borrower is in financial difficulty, whether the modification merely reduces the contractual cash flows to amounts the borrower is expected to be able to pay;
• Whether any substantial new terms are introduced, such as a profit share or equity-based return that substantially affects the risk profile of the loan;
• Significant extension of the loan term when the borrower is not in financial difficulty;• Significant change in the interest rate;• Change in the currency the loan is denominated in; and• Insertion of collaterals, other securities or credit enhancements that significantly affect the credit risk
associated with the loan.
If the terms are substantially different, the Group and the Bank derecognise the original financial assets and recognise a ‘new’ asset at fair value and recalculate a new effective interest rate for the asset. The date of renegotiation is consequently considered to be the date of initial recognition for impairment calculation purposes, including for the purpose of determining whether a significant in credit risk has occurred. However, the Group and the Bank also assess whether the new financial asset recognised is deemed to be credit-impaired at initial recognition, especially in circumstances where the renegotiation was driven by the debtor being unable to make the originally agreed payments. Differences in the carrying amount are also recognised in income statements as a gain or loss on derecognition.
If the terms are not substantially different, the renegotiation or modification does not result in derecognition. The Group and the Bank recalculate the gross carrying amount based on the revised cash flows of the financial asset and recognise a modification gain or loss in income statements. The new gross carrying amount is recalculated by discounting the modified cash flows at the original effective interest rate (or credit-adjusted effective interest rate for purchased or originated credit-impaired financial assets).
(ii) Derecognition other than modification of terms and conditions
Financial assets, or a portion thereof, are derecognised when the contractual rights to receive the cash flows from the assets have expired, or when they have been transferred and either (i) the Group and the Bank transfer substantially all the risks and rewards of ownership, or (ii) the Group and the Bank neither transfer nor retain substantially all the risks and rewards of ownership and the Group and the Bank have not retained control.
Collateral furnished by the Group and the Bank under repurchase agreements are not derecognised as the Group and the Bank retain substantially all risks and rewards on the basis of the pre-determined repurchase price, and hence the criteria for derecognition are not met.
(A) SUMMARY OF SIGNIFICANT ACCOUNTING POLICIES (CONTINUED)
(4) FINANCIAL ASSETS (CONTINUED)
(e) Reclassification policy
Reclassification of financial assets is required when, and only when, the Group and the Bank change their business model for managing the assets. In such cases, the Group and the Bank are required to reclassify all affected financial assets.
However, it will be inappropriate to reclassify financial assets that have been designated at FVTPL, or equity instruments that have been designated as FVOCI even when there is a change in business model. Such designations are irrevocable.
(5) REPURCHASE AGREEMENTS
Securities purchased under resale agreements are securities which the Group and the Bank have purchased with a commitment to resell at future dates. The commitment to resell the securities is reflected as an asset on the statements of financial position.
Conversely, obligations on securities sold under repurchase agreements are securities which the Group and the Bank have sold from its portfolio, with a commitment to repurchase at future dates. Such financing and the obligation to repurchase the securities is reflected as a liability on the statements of financial position.
The difference between sale and repurchase price as well as purchase and resale price are amortised as interest income and interest expense respectively on an effective yield method.
(6) DERIVATIVE FINANCIAL INSTRUMENTS AND HEDGE ACCOUNTING
Derivatives are initially recognised at fair value on the date on which derivative contracts are entered into and are subsequently remeasured at their fair values at the end of each reporting period. Fair values are obtained from quoted market prices in active markets, including recent market transactions, and valuation techniques, including discounted cash flow models and option pricing models, as appropriate. All derivatives are carried as assets when fair values are positive and as liabilities when fair values are negative. Changes in the fair value of any derivatives that do not qualify for hedge accounting are recognised immediately in the income statements. Cash collateral held in relation to derivative transactions are carried at amortised cost.
The best evidence of the fair value of a derivative at initial recognition is the transaction price (i.e. the fair value of the consideration given or received) unless the fair value of that instrument is evidenced by comparison with other observable current market transactions in the same instrument (i.e. without modification or repackaging) or based on a valuation technique whose variables include only data from observable markets. When such evidence exists, the Group and the Bank recognise profits on day one.
The method of recognising the resulting fair value gain or loss depends on whether the derivative is designated and qualifies as a hedging instrument, and if so, the nature of the item being hedged. The Group and the Bank designate certain derivatives as either: (1) hedges of the fair value of recognised assets or liabilities or firm commitments (fair value hedge); or (2) hedges of highly probable future cash flows attributable to a recognised asset or liability, or a forecasted transaction (cash flow hedge); or (3) hedges of a net investment in a foreign operation (net investment hedge). Hedge accounting is used for derivatives designated in this way provided certain criteria are met.
The Group and the Bank document at the inception of the hedging transaction, the risk management objective and strategy and the economic relationship between hedging instruments and hedged items including whether the hedging instrument is expected to offset changes in cash flows of hedged items.
SUMMARY OF SIGNIFICANT ACCOUNTING POLICIES AND CRITICAL ACCOUNTING ESTIMATES AND ASSUMPTIONSfor the financial year ended 31 December 2020 (continued)
RHB
Ban
k B
erha
d -
Fina
ncia
l Rep
ort
2020
RHB
Ban
k B
erha
d -
Fina
ncia
l Rep
ort
2020
38
39STATUTORY FINANCIAL STATEMENTS
www.rhbgroup.com
(A) SUMMARY OF SIGNIFICANT ACCOUNTING POLICIES (CONTINUED)
(6) DERIVATIVE FINANCIAL INSTRUMENTS AND HEDGE ACCOUNTING (CONTINUED)
If the hedge ratio for risk management purposes is no longer optimal but the risk management objective remains unchanged and the hedge continues to qualify for hedge accounting, the hedge relationship will be rebalanced by adjusting either the volume of the hedging instrument or the volume of the hedged item so that the hedge ratio aligns with the ratio used for risk management purposes. Any hedge ineffectiveness is calculated and accounted for in profit or loss at the time of the hedge relationship rebalancing.
The fair values of various derivative instruments used for hedging purposes are disclosed in Note 12 to the financial statements.
(a) Fair value hedge
Changes in the fair value of derivatives that are designated and qualify as fair value hedges are recorded in the income statements, together with any changes in the fair value of the hedged assets or liabilities that are attributable to the hedged risk.
The Group and the Bank apply fair value hedge accounting for hedging fixed interest risk on loans, advances and financing and financial assets at FVOCI. The gain or loss relating to the effective portion of interest rate swaps hedging fixed rate loans, advances and financing is recognised in income statements within other operating income. The gain or loss relating to the ineffective portion is recognised in income statements within net gain or loss on fair value hedges.
For fair value hedge of financial assets designated as FVOCI, any changes in fair value of the hedged financial assets FVOCI are recycled from FVOCI reserves to income statements, while the changes in fair value of the derivatives that is related to the effective portion of the hedge is recognised in income statements within other operating income. The ineffective portion of the aforesaid hedging derivatives is recognised in income statements with net gain or loss on fair value changes of derivatives.
For financial instruments measured at amortised cost, if the hedge no longer meets the criteria for hedge accounting, the adjustment to the carrying amount of a hedged item for which the effective interest method is used is amortised to the income statements over the period to maturity and recorded as other operating income. Effective interest rate amortisation may begin as soon as an adjustment exists and no later than when the hedged item ceases to be adjusted for changes in its fair value attributable to the risk being hedged. If the hedged item is derecognised, the unamortised fair value adjustment is recognised immediately in the income statements.
(b) Cash flow hedge
The effective portion of changes in the fair value of derivatives that are designated and qualify as cash flow hedges is recognised in other comprehensive income and accumulated in reserves within equity. The gain or loss relating to the ineffective portion is recognised immediately in the income statements.
Amounts accumulated in equity are recycled to the income statements in the periods when the hedged item affects profit or loss. They are recorded in the income or expense lines in which the revenue or expense associated with the related hedged item is reported.
When a hedging instrument expires or is sold or terminated, or when a hedge no longer meets the criteria for hedge accounting, any cumulative gain or loss existing in equity at that time remains in equity and is recognised in the periods when the hedged item affects profit or loss. When a forecast transaction is no longer expected to occur, the cumulative gain or loss previously recognised in other comprehensive income is immediately reclassified to the income statements.
(A) SUMMARY OF SIGNIFICANT ACCOUNTING POLICIES (CONTINUED)
(6) DERIVATIVE FINANCIAL INSTRUMENTS AND HEDGE ACCOUNTING (CONTINUED)
(c) Net investment hedge
Net investment hedge is a hedge against the exposure to exchange rate fluctuations on the net assets of the Group’s foreign operations/subsidiaries. Any gain or loss on the hedging instrument relating to the effective portion of the hedge is recognised directly in the foreign currency translation reserve in equity via other comprehensive income while any gain or loss relating to the ineffective portion is recognised directly in the income statements. On disposal of the foreign operations/subsidiaries, the cumulative value of any such gains or losses recognised in equity is transferred to the income statements.
(d) Derivatives that do not qualify for hedge accounting
Certain derivative instruments do not qualify for hedge accounting. Changes in the fair value of any derivative instrument that does not qualify for hedge accounting are recognised immediately in the income statements.
(7) GOODWILL
Goodwill arising on the acquisition of subsidiaries represents the excess of consideration transferred over the Group’s interest in the net fair value of the net identifiable assets, liabilities and contingent liabilities of the acquiree and the fair value of non- controlling interest in the acquiree.
Goodwill is stated at cost less accumulated impairment loss and is tested for impairment annually or more frequently if events or changes in circumstances indicate that it might be impaired. Impairment loss on goodwill (inclusive of impairment losses recognised in a previous interim period) is not reversed. Gains and losses on the disposal of a subsidiary include the carrying amount of goodwill relating to the subsidiary sold. Refer to accounting policy Note 22 on impairment of non-financial assets.
Goodwill is allocated to Cash-Generating-Units (‘CGUs’) for the purpose of impairment testing. The allocation is made to those CGUs or groups of CGUs that are expected to benefit from the synergies of the business combination in which the goodwill arose, identified according to operating segment. Each unit or group of units to which the goodwill is allocated represents the lowest level within the entity at which the goodwill is monitored for internal management purposes.
(8) INTANGIBLE ASSETS
Intangible assets comprise separately identifiable intangible items arising from business combinations, computer software licenses and other intangible assets. Intangible assets are recognised at cost. The cost of an intangible asset acquired in a business combination is its fair value at the date of acquisition. Intangible assets with a definite useful life are amortised using the straight-line method over their estimated useful economic life. Intangible assets with an indefinite useful life are not amortised. Generally, the identified intangible assets of the Group and the Bank have a definite useful life. At each date of the statement of financial position, intangible assets are reviewed for indications of impairment or changes in estimated future economic benefits. If such indications exist the intangible assets are analysed to assess whether their carrying amount is fully recoverable. An impairment loss is recognised if the carrying amount exceeds the recoverable amount. Intangible assets with indefinite useful life are annually tested for impairment and whenever there is an indication that the asset may be impaired. Refer to accounting policy Note 22 on impairment of non-financial assets.
(a) Computer software licenses
Acquired computer software licenses are capitalised on the basis of the costs incurred to acquire and bring to use the specific software. Computer software licenses are subsequently carried at cost less accumulated amortisation and impairment losses. These costs are amortised over the estimated useful lives of 3 to 10 years.
SUMMARY OF SIGNIFICANT ACCOUNTING POLICIES AND CRITICAL ACCOUNTING ESTIMATES AND ASSUMPTIONSfor the financial year ended 31 December 2020 (continued)
RHB
Ban
k B
erha
d -
Fina
ncia
l Rep
ort
2020
RHB
Ban
k B
erha
d -
Fina
ncia
l Rep
ort
2020
40
41STATUTORY FINANCIAL STATEMENTS
www.rhbgroup.com
(A) SUMMARY OF SIGNIFICANT ACCOUNTING POLICIES (CONTINUED)
(8) INTANGIBLE ASSETS (CONTINUED)
(b) Other intangible assets
Other intangible assets consist of customer relationship, brands, trading rights and membership. Other intangible assets are initially recognised when they are separable or arose from contractual or other legal rights, and when the cost can be measured reliably and, in the case of intangible assets not acquired in a business combination, it is recognised where it is probable that future economic benefits attributable to the assets will flow from their use. The value of intangible assets which are acquired in a business combination is generally determined using income approach methodologies such as the discounted cash flow method.
Other intangible assets with definite life are stated at cost less amortisation and allowance for impairment, if any, plus reversals of impairment, if any. They are amortised over their useful lives in a manner that reflects the pattern to which they contribute to future cash flows, generally over the following useful lives:
Customer relationship 10 years Brand 3 to 10 years
(9) PROPERTY, PLANT AND EQUIPMENT AND DEPRECIATION
Property, plant and equipment are stated at cost less accumulated depreciation and impairment losses, if any. Cost includes expenditure that is directly attributable to the acquisition of the items. Subsequent costs are included in the asset’s carrying amount or recognised as a separate asset as appropriate, only when it is probable that future economic benefits associated with the item will flow to the Group and the Bank and the cost of the item can be measured reliably. The carrying amount of the replaced part is derecognised. All other repair and maintenance costs are recognised as expense in income statements during the financial period in which they are incurred.
Freehold land, buildings in progress and renovations in progress are not depreciated. Other property, plant and equipment are depreciated on a straight-line basis to write down their costs to their residual values over their estimated useful lives. The principal annual depreciation rates are as follows:
Leasehold land Amortised over the period of the lease* Buildings 2% to 3.33% Renovations and improvements 10% to 11% Computer equipment 14.28% to 33.33% Furniture, fittings and equipment 10% to 20% Motor vehicles 20% Computer software 10% to 33.33%
* The remaining period of the lease ranges from 3 to 863 years.
The asset’s residual values and useful lives are reviewed, and adjusted if appropriate, at the end of each reporting period. There are no material adjustments arising from the review that would require disclosure in the financial statements.
Leasehold land acquired prior to date of initial application of MFRS 16 ‘Leases’ which is effective 1 January 2019, continues to be classified under property, plant and equipment.
Gains or losses on disposals are determined by comparing proceeds with carrying amounts and are included in other operating income in income statements.
At the end of the reporting period, the Group and the Bank assess whether there is any indication of impairment. Where an indication of impairment exists, the carrying amount of the asset is written down to its recoverable amount. Refer to accounting policy Note 22 on impairment of non-financial assets.
(A) SUMMARY OF SIGNIFICANT ACCOUNTING POLICIES (CONTINUED)
(10) FINANCIAL LIABILITIES
Financial liabilities are measured at amortised cost, except for trading liabilities designated at fair value, which are held at fair value through profit or loss. Financial liabilities are initially recognised at fair value plus transaction costs for all financial liabilities not carried at fair value through profit or loss. Financial liabilities at fair value through profit or loss are initially recognised at fair value, and transaction costs are expensed in income statements. Financial liabilities are de-recognised when extinguished.
(a) Financial liabilities at fair value through profit or loss
This category comprises two sub-categories: financial liabilities as held-for-trading, and financial liabilities designated at fair value through profit or loss upon initial recognition.
A financial liability is classified as held-for-trading if it is acquired or incurred principally for the purpose of selling or repurchasing it in the near term or if it is part of a portfolio of identified financial instruments that are managed together and for which there is evidence of a recent actual pattern of short term profit-taking. Derivatives are also categorised as held-for-trading unless they are designated as hedges. Refer to accounting policy Note 6 on hedge accounting.
(b) Other financial liabilities measured at amortised cost
Other financial liabilities are initially recognised at fair value plus transaction costs. Subsequently, other financial liabilities are remeasured at amortised cost using the effective interest rate.
Other financial liabilities measured at amortised cost are deposits from customers, deposits and placements of banks and other financial institutions, obligations on securities sold under repurchase agreements, bills and acceptances payable, clients’ and brokers’ balances, recourse obligation on loans sold to Cagamas, lease liabilities, general insurance contract liabilities and other financial liabilities.
(c) Borrowings measured at amortised cost
Borrowings are initially recognised at fair value, net of transaction costs incurred. Borrowings are subsequently carried at amortised cost, any difference between initial recognised amount and the redemption value is recognised in income statements over the period of the borrowings using the effective interest method.
All other borrowing costs are recognised in income statements in the period in which they are incurred.
Borrowings measured at amortised cost are long term and short term borrowings from financial institutions, subordinated obligations and senior debt securities.
(11) RECOURSE OBLIGATION ON LOANS SOLD TO CAGAMAS
In the normal course of banking operations, the Group and the Bank sell loans to Cagamas but undertake to administer the loans on behalf of Cagamas and to buy back any loans which are regarded as defective. Such financing transactions and the obligation to buy back the loans are reflected as a liability on the statements of financial position and accounted for in accordance with accounting policy Note 10(b).
SUMMARY OF SIGNIFICANT ACCOUNTING POLICIES AND CRITICAL ACCOUNTING ESTIMATES AND ASSUMPTIONSfor the financial year ended 31 December 2020 (continued)
RHB
Ban
k B
erha
d -
Fina
ncia
l Rep
ort
2020
RHB
Ban
k B
erha
d -
Fina
ncia
l Rep
ort
2020
42
43STATUTORY FINANCIAL STATEMENTS
www.rhbgroup.com
(A) SUMMARY OF SIGNIFICANT ACCOUNTING POLICIES (CONTINUED)
(12) LEASES – WHERE THE GROUP AND THE BANK IS THE LESSEE
The Group and the Bank recognise leases as right of use (‘ROU’) asset, with a corresponding liability at the date on which the leased asset is available for use (i.e. the commencement date).
Contracts may contain both lease and non-lease components. The Group and the Bank allocate the consideration in the contract to the lease and non-lease components based on their relative stand-alone prices.
(a) Lease term
In determining the lease term, the Group and the Bank consider all facts and circumstances that create an economic incentive to exercise an extension option, or not to exercise a termination option. Extension options (or periods after termination options) are only included in the lease term if the lease is reasonably certain to be extended (or not to be terminated).
The Group and the Bank reassess the lease term upon the occurrence of a significant event or change in circumstances that is within the control of the Group and the Bank, and affects whether the Group and the Bank is reasonably certain to exercise an option not previously included in the determination of lease term, or not to exercise an option previously included in the determination of lease term. A revision in lease term results in remeasurement of the lease liabilities (refer to (d) below).
(b) ROU assets
ROU assets are initially measured at cost comprising the following:
• the amount of the initial measurement of lease liability;• any lease payments made at or before the commencement date less any lease incentive received;• any initial direct costs; and• decommissioning or restoration costs.
ROU assets that are not investment properties are subsequently measured at cost, less accumulated depreciation and impairment loss (if any). The ROU assets are generally depreciated over the shorter of the asset’s useful life and the lease term on a straight-line basis. If the Group and the Bank are reasonably certain to exercise a purchase option, the ROU asset is depreciated over the underlying asset’s useful life. In addition, the ROU assets are adjusted for certain remeasurement of the lease liabilities.
(c) Lease liabilities
Lease liabilities are initially measured at the present value of the lease payments that are not paid at that date. The lease payments include the following:
• fixed payments (including in-substance fixed payments), less any lease incentive receivable;• variable lease payments that are based on an index or a rate, initially measured using the index or rate as at the
commencement date;• amounts expected to be payable by the Group and the Bank under residual value guarantees;• the exercise price of a purchase and extension options if the Group and the Bank are reasonably certain to exercise
that option; and• payments of penalties for terminating the lease, if the lease term reflects the Group and the Bank exercising that option.
(A) SUMMARY OF SIGNIFICANT ACCOUNTING POLICIES (CONTINUED)
(12) LEASES – WHERE THE GROUP AND THE BANK IS THE LESSEE (CONTINUED)
(c) Lease liabilities (continued)
Lease payments are discounted using the interest rate implicit in the lease. If that rate cannot be readily determined, which is generally the case for leases in the Group and the Bank, the lessee’s incremental borrowing is used. This is the rate that the individual lessee would have to pay to borrow the funds necessary to obtain an asset of similar value to the ROU in a similar economic environment with similar term, security and conditions.
Lease payments are allocated between principal and finance cost. The finance cost is charged to income statements over the lease period so as to produce a constant periodic rate of interest on the remaining balance of the liability for each period.
Variable lease payments that depend on sales are recognised in income statements in the period in which the condition that triggers those payments occurs.
The Group and the Bank present the lease liabilities as a separate line item in the statements of financial position. Interest expense on the lease liability is presented within the other interest expenses in the income statements.
(d) Reassessment of lease liabilities
The Group and the Bank are also exposed to potential future increases in variable lease payments that depend on an index or rate, which are not included in the lease liability until they take effect. When adjustments to lease payments based on an index or rate take effect, the lease liability is remeasured and adjusted against the ROU assets.
(e) Short term leases and leases of low-value assets
Short term leases are leases with a lease term of 12 months or less. Low-value assets comprise information technology equipment and small items of office furniture. Payments associated with short term leases of information technology and all leases of low-value assets are recognised on a straight-line basis as an expense in income statements.
(13) LEASES – WHERE THE GROUP AND THE BANK IS THE LESSOR
As a lessor, the Group and the Bank determine at lease inception whether each lease is a finance lease or an operating lease. To classify each lease, the Group and the Bank make an overall assessment of whether the lease transfers substantially all of the risks and rewards incidental to ownership of the underlying asset to the lessee. As part of this assessment, the Group and the Bank consider certain indicators such as whether the lease is for the major part of the economic life of the asset.
(a) Operating lease
When assets are leased out under an operating lease, the asset is included in the statements of financial position based on the nature of the asset. Lease income is recognised over the term of the lease on a straight-line basis.
(b) Finance lease
When assets are leased out under a finance lease, the present value of the lease payment is recognised as a receivable. The receivable is subject to MFRS 9 impairment (refer to accounting policy Note 21 on impairment of financial assets). The difference between the gross receivable and the present value of the receivable is recognised as unearned finance income. Lease income is recognised over the term of the lease using the ‘net investment’ method so as to reflect a constant periodic rate of return.
SUMMARY OF SIGNIFICANT ACCOUNTING POLICIES AND CRITICAL ACCOUNTING ESTIMATES AND ASSUMPTIONSfor the financial year ended 31 December 2020 (continued)
RHB
Ban
k B
erha
d -
Fina
ncia
l Rep
ort
2020
RHB
Ban
k B
erha
d -
Fina
ncia
l Rep
ort
2020
44
45STATUTORY FINANCIAL STATEMENTS
www.rhbgroup.com
(A) SUMMARY OF SIGNIFICANT ACCOUNTING POLICIES (CONTINUED)
(14) PROVISIONS
Provisions are recognised when the Group and the Bank have a present legal or constructive obligation, as a result of past events, it is probable that an outflow of resources will be required to settle the obligation and a reliable estimate of the amount of obligation can be made.
Where the Group and the Bank expect a provision to be reimbursed (for example, under an insurance contract), the reimbursement is recognised as a separate asset but only when the reimbursement is virtually certain. Provisions are not recognised for future operating losses.
Where there are a number of similar obligations, the likelihood that an outflow will be required in settlement is determined by considering the class of obligations as a whole. A provision is recognised even if the likelihood of an outflow with respect to any one item included in the same class of obligations may be small.
Provisions are measured at the present value of the expenditure expected to be required to settle the obligation using a pre-tax rate that reflects current market assessment of the time value of money and the risks specific to the obligation. The increase in the provision due to passage of time is recognised as finance cost expense.
(a) Onerous contracts
The Group and the Bank recognise a provision for onerous contracts when the expected benefits to be derived from a contract are less than the unavoidable costs of meeting the obligations under the contract.
(b) Restructuring
Restructuring provisions mainly comprise lease termination penalties and employee termination payments and are recognised in the period in which the Group becomes legally or constructively committed to payment. Future operating costs are not provided for.
(15) FINANCIAL GUARANTEE CONTRACTS
Financial guarantee contracts are contracts that require the Group or the Bank to make specified payments to reimburse the holder for a loss it incurs because a specified debtor fails to make payments when due, in accordance with the terms of a debt instrument. Such financial guarantees are given to financial institutions and other bodies on behalf of customers to secure loans, overdrafts and other banking facilities.
Financial guarantee contracts are recognised as a financial liability at the time the guarantee is issued. The fair value of a financial guarantee at the time of issuance is zero because all guarantees are agreed on arm’s length terms and the value of the premium agreed corresponds to the value of the guarantee obligation. No receivable for the future premium is recognised.
The fair value of financial guarantee is determined as the present value of the difference in net cash flows between the contractual payments under the debt instrument and the payments that would be required without the guarantee, or the estimated amount that would be payable to a third party for assuming the obligations.
Financial guarantee contracts are subsequently measured at the higher of the amount determined in accordance with the expected credit loss model under MFRS 9 ‘Financial Instruments’ and the amount initially recognised less cumulative amount of income recognised in accordance with the principles of MFRS 15 ‘Revenue from Contracts with Customers’, where appropriate.
Where financial guarantees in relation to loans or payables of subsidiaries are provided by the Group and the Bank for no compensation, the fair values are accounted for as contributions and recognised as part of the cost of investment in subsidiaries.
(A) SUMMARY OF SIGNIFICANT ACCOUNTING POLICIES (CONTINUED)
(16) GOVERNMENT GRANTS
Financing under a government scheme is recognised and measured in accordance with MFRS 9 ‘Financial Instruments’, with the benefit at below market rate, which is measured as the difference between the initial carrying amount or fair value of the financing and the amount received.
Financial contribution under a government scheme is measured in accordance with the amount received. The benefit of a financing under a government scheme or a financial contribution under a government scheme that addresses identified costs or expenses incurred by the Group and the Bank is recognised in the income statements in the same financial period when the costs or expenses are recognised, when the required conditions are fulfilled in accordance with MFRS 120 ‘Accounting for Government Grants and Disclosure of Government Assistance’.
(17) CONTINGENT LIABILITIES AND CONTINGENT ASSETS
The Group and the Bank do not recognise contingent assets and liabilities other than those arising from business combinations, but disclose their existence in the financial statements. A contingent liability is a possible obligation that arises from past events whose existence will be confirmed by the occurrence or non-occurrence of one or more uncertain future events beyond the control of the Group or the Bank or a present obligation that is not recognised because it is not probable that an outflow of resources will be required to settle the obligation. A contingent liability also arises in the extremely rare case where there is a liability that cannot be recognised because it cannot be measured reliably. However, contingent liabilities do not include financial guarantee contracts.
A contingent asset is a possible asset that arises from past events whose existence will be confirmed by the occurrence or non-occurrence of one or more uncertain future events beyond the control of the Group and the Bank. The Group and the Bank do not recognise contingent assets but disclose their existence where inflows of economic benefits are probable, but not virtually certain.
The Group recognises separately the contingent liabilities of the acquiree as part of allocating the cost of a business combination where their fair values can be measured reliably. Where the fair values cannot be measured reliably, the resulting effect will be reflected in the goodwill arising from the acquisitions and the information about the contingent liabilities acquired are disclosed in the financial statements.
Subsequent to the initial recognition, the Group measures the contingent liabilities that are recognised separately at the date of acquisition at the higher of the amount that would be recognised in accordance with the provision of MFRS 137 ‘Provisions, Contingent Liabilities and Contingent Assets’ and the amount initially recognised less when appropriate, cumulative amortisation recognised in accordance with MFRS 15 ‘Revenue from Contracts with Customers’.
(18) SHARE CAPITAL
(a) Classification
Ordinary shares are classified as equity. Other shares, if issued, are classified as equity and/or liability according to the economic substance of the particular instrument.
(b) Share issue cost
Incremental costs directly attributable to the issue of new shares or options are shown in equity as a deduction, net of tax, from the proceeds.
(c) Dividend distribution
Distributions to holders of an equity instrument are debited directly to equity, and the corresponding liability is recognised in the period in which the shareholders’ right to receive the dividends are established or the dividends are approved.
SUMMARY OF SIGNIFICANT ACCOUNTING POLICIES AND CRITICAL ACCOUNTING ESTIMATES AND ASSUMPTIONSfor the financial year ended 31 December 2020 (continued)
RHB
Ban
k B
erha
d -
Fina
ncia
l Rep
ort
2020
RHB
Ban
k B
erha
d -
Fina
ncia
l Rep
ort
2020
46
47STATUTORY FINANCIAL STATEMENTS
www.rhbgroup.com
(A) SUMMARY OF SIGNIFICANT ACCOUNTING POLICIES (CONTINUED)
(19) CASH AND CASH EQUIVALENTS
For the purpose of the statements of cash flows, cash equivalents are held for the purpose of meeting short term cash commitments rather than for investment or other purposes. Cash and cash equivalents comprise cash on hand, deposits held at call with financial institutions, other short term, highly liquid investments with original maturities of one month or less that are readily convertible to known amounts of cash and which are subject to an insignificant risk of changes in value.
(20) REVENUE RECOGNITION
(a) Interest income is recognised using the effective interest rate method. The effective interest rate is the rate that discounts estimated future cash receipts or payments through the expected life of the financial instrument or, when appropriate, a shorter period to its carrying amount. The calculation includes significant fees and transaction costs that are integral to the effective interest rate, as well as premiums or discounts. Interest income is calculated by applying the effective interest rate to the gross carrying amount of a financial asset except for financial asset that subsequently becomes credit-impaired. For credit-impaired financial asset, the effective interest rate is applied to the net carrying amount of the financial asset (after deduction of the loss allowance).
(b) Fees and commissions are recognised as income when all conditions precedent are fulfilled. Commitment fees and guarantee fees for loans, advances and financing that are likely to be drawdown are deferred (together with related direct costs) and income which forms an integral part of the effective interest rate of a financial instrument is recognised as an adjustment to the effective interest rate of the financial instrument.
(c) Income from Islamic Banking business is recognised using effective profit method in accordance with the principles of Shariah.
(d) Brokerage commission is recognised when services are rendered. Interest income from margin financing, clients’ overdue outstanding purposes and contra losses are recognised using effective interest rate method.
(e) Premium income from general insurance business (net of all reinsurance) is recognised on the date of assumption of risks. Premium in respect of risk incepted, for which policies have not been raised as at the date of statements of financial position, is accrued at that date.
Premiums, claims and other transactions of inward treaty business are accounted for in the income statements as and when the statements of account are received. Outward reinsurance premiums are recognised in the same accounting period as the original policies to which the reinsurance relate.
(f) Corporate advisory fees are recognised as income based on fulfilment of the performance obligation.
(g) Management fees of the unit trust and asset management company are recognised based on time apportionment method over the period of services.
(h) Dividends are recognised when the shareholders’ right to receive payment is established. This applies even if they are paid out of the pre-acquisition profits. However, the investment may need to be tested for impairment as a consequence. Dividend income received from subsidiaries, financial assets at FVTPL and FVOCI are recognised as other operating income in income statements.
Dividend that clearly represents a recovery of part of the cost of an investment is recognised in other comprehensive income if it relates to an investment in equity investment measured at fair value through other comprehensive income.
(i) Income from bancassurance/bancatakaful agreements are recognised based on time apportionment method throughout the exclusive services agreement period.
(A) SUMMARY OF SIGNIFICANT ACCOUNTING POLICIES (CONTINUED)
(21) IMPAIRMENT OF FINANCIAL ASSETS
Under MFRS 9, impairment model requires the recognition of expected credit loss (‘ECL’) for all financial assets, except for financial assets classified or designated as FVTPL and equity securities classified under FVOCI, which are not subject to impairment assessment. Off-balance sheet items that are subject to ECL include financial guarantees and undrawn loan commitments.
There are two approaches adopted by the Group and the Bank:
(1) General approach
ECL will be assessed using an approach which classifies financial assets into three stages which reflects the change in credit quality of the financial assets since initial recognition:
(i) Stage 1: 12 months ECL – not credit impaired
For credit exposures where there has not been a significant increase in credit risk since initial recognition or which has low credit risk at reporting date and that are not credit impaired upon origination, the ECL associated with the probability of default events occurring within the next 12 months will be recognised.
(ii) Stage 2: Lifetime ECL – not credit impaired
For credit exposures where there has been a significant increase in credit risk since initial recognition but that are not credit impaired, the ECL associated with the probability of default events occurring within the lifetime ECL will be recognised.
Unless identified at an earlier stage, all financial assets are deemed to have suffered a significant increase in credit risk when 30 days past due.
(iii) Stage 3: Lifetime ECL – credit impaired
Financial assets are assessed as credit impaired when one or more objective evidence of defaults that have a detrimental impact on the estimated future cash flows of that asset have occurred. For financial assets that have become credit impaired, a lifetime ECL will be recognised.
Generally, all financial assets that are 90 days past due or more are classified under Stage 3. The Group and the Bank consider the following as constituting an event of default:
(1) Quantitative criteria
• the borrower is past due more than 90 days on any material credit obligation to the Group and the Bank.
(2) Qualitative criteria
• legal action has been initiated by the Group and the Bank for recovery purposes;• borrower is a bankrupt;• borrower has been assigned to external collection agency.
Significant increase in credit risk (‘SICR’)
(1) The Group and the Bank consider the probability of default upon initial recognition of asset and whether there has been a significant increase in credit risk on an ongoing basis throughout each reporting period. To assess whether there is a significant increase in credit risk, the Group and the Bank compare the risk of a default occurring on the asset as at the reporting date with the risk of default as at the date of initial recognition.
SUMMARY OF SIGNIFICANT ACCOUNTING POLICIES AND CRITICAL ACCOUNTING ESTIMATES AND ASSUMPTIONSfor the financial year ended 31 December 2020 (continued)
RHB
Ban
k B
erha
d -
Fina
ncia
l Rep
ort
2020
RHB
Ban
k B
erha
d -
Fina
ncia
l Rep
ort
2020
48
49STATUTORY FINANCIAL STATEMENTS
www.rhbgroup.com
(A) SUMMARY OF SIGNIFICANT ACCOUNTING POLICIES (CONTINUED)
(21) IMPAIRMENT OF FINANCIAL ASSETS (CONTINUED)
Significant increase in credit risk (‘SICR’) (continued)
(2) Among the indicators incorporated in ascertaining SICR are:
• internal credit rating;• external credit rating (as far as available);• actual or expected significant adverse changes in business, financial or economic conditions that are expected to
cause a significant change to the borrower’s ability to meet its obligations;• actual or expected significant changes in the operating results of the borrower;• significant increase in credit risk on other financial instruments of the same borrower;• significant changes in the value of the collateral supporting the obligation or in the quality of third-party guarantees
or credit enhancements; and• significant changes in the expected performance and behaviour of the borrower, including changes in the payment
status of borrower in the group and changes in the operating results of the borrower.
Macroeconomic information (such as market interest rates or growth rates) is incorporated as part of the internal rating model.
The assessment of credit risk, as well as the estimation of ECL, are required to be unbiased, probability-weighted and should incorporate all available information which is relevant to the assessment, including information about past events, current conditions and reasonable and supportable forecasts of future events and economic conditions at the reporting date. The measurement of ECL is based on the discounted products of the Probability of Default model (‘PD’), Loss Given Default model (‘LGD’) and Exposure at Default model (‘EAD’). Certain ECL models are leveraging on the existing Group and the Bank’s Basel II Internal Ratings-Based (‘IRB’) model, where feasible or available, with necessary adjustment to meet MFRS 9 requirements. The changes in ECL between two-periods will be recognised in income statements.
An exposure will migrate through the ECL stages as asset quality deteriorates. If, in a subsequent period, asset quality improves and also reverses any previously assessed significant increase in credit risk since origination, then the provision for doubtful debts reverts from lifetime ECL to 12-month ECL. Exposures that have not deteriorated significantly since origination, or where the deterioration remains within the Group’s and the Bank’s investment grade criteria, or which are less than 30 days past due, are considered to have a low credit risk. The provision for doubtful debts for these financial assets is based on a 12-month ECL. When an asset is uncollectible, it is written off against the related provision. Such assets are written off after all the necessary procedures have been completed and the amount of the loss has been determined. Subsequent recoveries of amounts previously written off reduce the amount of the expense in the income statements.
The Group and the Bank leverage on the model/segments/credit related factors implemented under the Basel II IRB framework where feasible or available, with calibration to meet MFRS 9 requirements. For portfolio without Basel model, other relevant historical information, loss experience or proxies will be utilised if deemed feasible.
In determining the ECL, management will evaluate a range of possible outcomes, taking into account past events, current conditions/trends and economic outlooks. Additional consideration through structured management overlays have been considered and reflected to ensure adequacy of ECL. The structured management overlays are subject to robust review and governance process.
Generally, all financial assets are considered to have experienced a significant increase in credit risk if the exposures is more than 30 days past due on its contractual payments.
(2) Simplified approach
The Group applies the MFRS 9 simplified approach to measure ECL which uses a lifetime expected loss allowance for clients’ and brokers’ balances, fee and premium receivables. The expected loss allowance is based on provisional matrix.
(A) SUMMARY OF SIGNIFICANT ACCOUNTING POLICIES (CONTINUED)
(22) IMPAIRMENT OF NON-FINANCIAL ASSETS
Non-financial assets that have an indefinite useful life, for example goodwill, are not subject to amortisation and are tested annually for impairment. The Group and the Bank also assess goodwill, intangible assets with indefinite useful life and other assets that are subject to amortisation for impairment whenever events or changes in circumstances indicate that the carrying amount may not be recoverable. An impairment loss is recognised for the amount by which the carrying amount of the non- financial assets exceeds its recoverable amount.
The recoverable amount is the higher of a non-financial assets’ fair value less costs to sell and value in use. For the purpose of assessing impairment, non-financial assets are grouped at the lowest levels for which there is separately identifiable cash flows or CGU. Non-financial assets other than goodwill that suffered an impairment are reviewed for possible reversal of the impairment at each reporting period.
The impairment loss is charged to income statements. Impairment losses on goodwill are not reversed. In respect of other non- financial assets, any subsequent increase in recoverable amount is recognised in income statements.
(23) GENERAL INSURANCE
Insurance contracts are those contracts that transfer significant insurance risk. An insurance contract is a contract under which the insurance subsidiary (the insurer) has accepted significant insurance risk from another party (the policyholders) by agreeing to compensate the policyholders if a specified uncertain future event (the insured event) adversely affects the policyholders. As a general guideline, the Group determines whether it has significant insurance risk, by comparing benefits paid with benefits payable if the insured event did not occur.
The general insurance underwriting results are determined for each class of business after taking into account reinsurances, commissions, unearned premiums and claims incurred.
(a) Premium income
Premium income is recognised on the date of assumption of risk. Premiums in respect of risks incepted for which policies have not been raised as of the date of statements of financial position, are accrued at the date.
Premiums, claims and other transactions of inward treaty business are accounted for in the income statements as and when the statements of account are received.
Outward reinsurance premiums are recognised in the same accounting period as the original policies to which the reinsurance relate.
(b) Premium liabilities
Premium liabilities refer to the higher of:
(i) the aggregate of the unearned premium reserves; or
(ii) the best estimate value of the insurer’s unexpired risk reserves at the valuation date and the Provision of Risk Margin for Adverse Deviation (‘PRAD’) calculated at the overall insurance subsidiary. The best estimate value is a prospective estimate of the expected future payments arising from future events insured under policies in force as at the valuation date and also includes allowance for the insurer’s expense including overheads and cost of reinsurance, expected to be incurred during the unexpired period in administering these policies and settling the relevant claims, and shall allow for expected future premium refunds.
SUMMARY OF SIGNIFICANT ACCOUNTING POLICIES AND CRITICAL ACCOUNTING ESTIMATES AND ASSUMPTIONSfor the financial year ended 31 December 2020 (continued)
RHB
Ban
k B
erha
d -
Fina
ncia
l Rep
ort
2020
RHB
Ban
k B
erha
d -
Fina
ncia
l Rep
ort
2020
50
51STATUTORY FINANCIAL STATEMENTS
www.rhbgroup.com
(A) SUMMARY OF SIGNIFICANT ACCOUNTING POLICIES (CONTINUED)
(23) GENERAL INSURANCE (CONTINUED)
(b) Premium liabilities (continued)
Unearned premium reserves (‘UPR’) represent the portion of premium income not yet earned at the date of statements of financial position. UPR is computed with reference to the month of accounting for the premium on the following basis:
(i) 25% method for marine and aviation cargo, and transit business;
(ii) 1/24th method for all other classes of general business except for non-annual policies in respect of Malaysian policies, reduced by the percentage of accounted gross direct business commission to the corresponding premium, not exceeding limits specified by BNM; and
(iii) time apportionment method for non-annual policies (including long term inwards treaty business) reduced by the percentage of accounted gross direct business commission to the corresponding premium, not exceeding limits specified by BNM.
(c) Claim liabilities
A liability for outstanding claims is recognised in respect of both direct insurance and inward reinsurance. The amount of claims liabilities is the best estimate of the expenditure required together with related expenses less recoveries to settle the present obligations at the date of statements of financial position. These include provision for claims reported, claims incurred but not reported, claims incurred but not enough reserved and direct and indirect claims-related expenses such as investigation fees, loss adjustment fees, legal fees, sue and labour charges and the expected internal costs that the insurer expects to incur when settling these claims.
(d) Acquisition costs
The cost of acquiring and renewing insurance policies net of income derived from ceding reinsurance premium is recognised as incurred and properly allocated to the periods in which it is probable they give rise to income.
(e) Reinsurance
The insurance subsidiary cedes insurance risk in the normal course of business for all of its businesses. Reinsurance assets represent balances due from reinsurance companies. Amounts recoverable from reinsurers are estimated in a manner consistent with the outstanding claims provision or settled claims associated with the reinsurer’s policies and are in accordance with the related reinsurance contracts.
Ceded reinsurance arrangements do not relieve the insurance subsidiary from its obligations to policyholders. Premiums and claims are presented on a gross basis for both ceded and assumed reinsurance.
Reinsurance assets are reviewed for impairment at each reporting date or more frequently when an indication of impairment arises during the reporting period. Impairment occurs when there is objective evidence as a result of an event that occurred after initial recognition of the reinsurance asset that the insurance subsidiary may not receive all outstanding amounts due under the terms of the contract and the event has a reliably measurable impact on the amounts that the insurance subsidiary will receive from the reinsurer. The impairment loss is recorded in income statements.
Gains or losses on buying reinsurance are recognised in income statements immediately at the date of purchase and are not amortised.
(A) SUMMARY OF SIGNIFICANT ACCOUNTING POLICIES (CONTINUED)
(23) GENERAL INSURANCE (CONTINUED)
(e) Reinsurance (continued)
The insurance subsidiary also assumes reinsurance risk in the normal course of business for general insurance contracts when applicable.
Premiums and claims on assumed reinsurance are recognised as revenue or expenses in the same manner as they would be if the reinsurance were considered direct business, taking into account the product classification of the reinsured business. Reinsurance liabilities represent balances due to reinsurance companies. Amounts payable are estimated in a manner consistent with the related reinsurance contract.
Reinsurance assets or liabilities are derecognised when the contractual rights are extinguished or expired or when the contract is transferred to another party.
Reinsurance contracts that do not transfer significant insurance risk are accounted for directly through the statements of financial position. These are deposit assets or financial liabilities that are recognised based on the consideration paid or received less any explicit identified premiums or fees to be retained by the reinsured. Investment income on these contracts is accounted for using the effective yield method when accrued.
(f) Insurance contract liabilities
General insurance contract liabilities are recognised when contracts are entered into and premiums are charged.
These liabilities comprise claims liabilities and premium liabilities.
Outstanding claims provision are based on the estimated ultimate cost of all claims incurred but not settled at the date of statements of financial position, whether reported or not, together with related claims handling costs and reduction for the expected value of salvage and other recoveries. Delays can be experienced in the notification and settlement of certain types of claims, therefore, the ultimate cost of these claims cannot be known with certainty at the date of statements of financial position. The liability is calculated at the reporting date using a range of standard actuarial claim projection techniques based on empirical data and current assumptions that may include a margin for adverse deviation. The liability is not discounted for the time value of money. No provision for equalisation or catastrophe reserves is recognised. The liabilities are derecognised when the contract expires, is discharged or is cancelled. The provision for unearned premiums represents premiums received for risks that have not yet expired. Generally, the reserve is released over the term of the contract and is recognised as premium income.
At each reporting date, the insurance subsidiary reviews its unexpired risks and a liability adequacy test is performed to determine whether there is any overall excess of expected claims and deferred acquisition costs over unearned premiums. This calculation uses current estimates of future contractual cash flows (taking into consideration current loss ratios) after taking into account of the investment return expected to arise on assets relating to the relevant general insurance technical provisions. If these estimates show that the carrying amount of the unearned premiums less related deferred acquisition costs is inadequate, the deficiency is recognised in income statements by setting up a provision for liability adequacy.
SUMMARY OF SIGNIFICANT ACCOUNTING POLICIES AND CRITICAL ACCOUNTING ESTIMATES AND ASSUMPTIONSfor the financial year ended 31 December 2020 (continued)
RHB
Ban
k B
erha
d -
Fina
ncia
l Rep
ort
2020
RHB
Ban
k B
erha
d -
Fina
ncia
l Rep
ort
2020
52
53STATUTORY FINANCIAL STATEMENTS
www.rhbgroup.com
(A) SUMMARY OF SIGNIFICANT ACCOUNTING POLICIES (CONTINUED)
(24) EMPLOYEE BENEFITS
(a) Short term employee benefits
The Group and the Bank recognise a liability and an expense for bonuses. The Group and the Bank recognise a provision where contractually obliged or where there is a past practice that has created a constructive obligation.
Wages, salaries, paid annual leave and sick leave, bonuses and non-monetary benefits are accrued in the period in which the associated services are rendered by employees of the Group and the Bank.
(b) Defined contribution plans
A defined contribution plan is a pension plan under which the Group and the Bank pay fixed contributions to the national pension scheme, the Employees’ Provident Fund. The Group’s and the Bank’s contributions to defined contribution plans are charged to income statements in the period to which they relate. Once the contributions have been paid, the Group and the Bank have no further legal or constructive obligations.
(c) Termination benefits
Termination benefits are payable whenever an employee’s employment is terminated before the normal retirement date or whenever an employee accepts voluntary redundancy in exchange for these benefits. The Group recognises termination benefits at the earlier of the following dates:
(i) when the Group can no longer withdraw the offer of those benefits; and
(ii) when the entity recognises costs for a restructuring that is within the scope of MFRS 137 and involves the payment of termination benefits.
(25) CURRENT AND DEFERRED INCOME TAXES
The tax expense for the period comprises current and deferred tax. Tax is recognised in income statements, except to the extent that it relates to items recognised in other comprehensive income or directly in equity. In this case, the tax is recognised in other comprehensive income or directly in equity, respectively.
Current tax expense is determined according to the tax laws of each jurisdiction in which the Group and the Bank operate and include all taxes based upon the taxable profits, including withholding taxes payable by foreign subsidiaries, associates and joint ventures and arising from distributions of retained profits to companies in the Group.
Management periodically evaluates positions taken in tax returns with respect to situations in which applicable tax regulation is subject to interpretation. It establishes provisions where appropriate on the basis of amounts expected to be paid to the tax authorities. This liability is measured using the single best estimate of the most likely outcome.
Deferred income tax is provided in full, using the liability method, on temporary differences arising between the tax bases of assets and liabilities and their carrying amounts in the financial statements. However, deferred tax is not accounted for if it arises from initial recognition of an asset or liability in a transaction other than a business combination that at the time of the transaction affects neither accounting nor taxable profit or loss.
Deferred tax assets are recognised to the extent that it is probable that future taxable profits will be available against which the deductible temporary differences or unused tax losses can be utilised.
(A) SUMMARY OF SIGNIFICANT ACCOUNTING POLICIES (CONTINUED)
(25) CURRENT AND DEFERRED INCOME TAXES (CONTINUED)
Deferred tax is recognised on temporary differences arising on investments in subsidiaries, associates and joint ventures except where the timing of the reversal of the temporary differences can be controlled by the Group and it is probable that the temporary differences will not reverse in the foreseeable future.
Deferred tax is determined using tax rates (and tax laws) that have been enacted or substantially enacted by the date of statements of financial position and are expected to apply when the related deferred tax asset is realised or the deferred tax liability is settled.
Deferred and income tax assets and liabilities are offset when there is a legally enforceable right to offset current tax assets against current tax liabilities and when the deferred income tax assets and liabilities relate to taxes levied by the same taxation authority on either the taxable entity or different taxable entities where there is an intention to settle the balances on a net basis.
(26) CURRENCY CONVERSION AND TRANSLATION
(a) Functional and presentation currency
Items included in the financial statements of each of the Group’s entities are measured using the currency of the primary economic environment in which the entity operates (the ‘functional currency’). The financial statements are presented in Ringgit Malaysia, which is the Bank’s functional and presentation currency.
(b) Transactions and balances
Foreign currency transactions are translated into the functional currency using the exchange rates prevailing at the dates of the transactions. Foreign exchange gains and losses resulting from the settlement of such transactions and from the translation at year-end exchange rates of monetary assets and liabilities denominated in foreign currencies are recognised in income statements, except when deferred in other comprehensive income as qualifying cash flow hedges and qualifying net investment hedges. Foreign exchange gains and losses are presented in income statements within other operating income.
Changes in the fair value of monetary securities denominated in foreign currency classified as debt instruments under fair value through other comprehensive income are analysed between translation differences resulting from changes in the amortised cost of the security and other changes in the carrying amount of the security. Translation differences related to changes in amortised cost are recognised in income statements, and other changes in carrying amount are recognised in other comprehensive income.
Non-monetary items that are measured at fair value in a foreign currency are translated using the exchange rates at the date when the fair value was determined. Translation differences on assets and liabilities carried at fair value are reported as part of the fair value gain or loss. Translation differences on non-monetary financial assets and liabilities such as equities held at fair value through profit or loss are recognised in income statements as part of the fair value gain or loss. Translation differences on non-monetary financial assets, such as equities classified as at fair value through other comprehensive income, are included in other comprehensive income.
SUMMARY OF SIGNIFICANT ACCOUNTING POLICIES AND CRITICAL ACCOUNTING ESTIMATES AND ASSUMPTIONSfor the financial year ended 31 December 2020 (continued)
RHB
Ban
k B
erha
d -
Fina
ncia
l Rep
ort
2020
RHB
Ban
k B
erha
d -
Fina
ncia
l Rep
ort
2020
54
55STATUTORY FINANCIAL STATEMENTS
www.rhbgroup.com
(A) SUMMARY OF SIGNIFICANT ACCOUNTING POLICIES (CONTINUED)
(26) CURRENCY CONVERSION AND TRANSLATION (CONTINUED)
(c) Group companies
The results and financial position of all the group entities (none of which has the currency of a hyperinflationary economy) that have a functional currency different from the presentation currency are translated into the presentation currency as follows:
(i) Assets and liabilities for each statements of financial position presented are translated at the closing rate at the date of that statements of financial position;
(ii) Income and expenses for each statements of comprehensive income are translated at average exchange rates (unless this average is not a reasonable approximation of the cumulative effect of the rates prevailing on the transaction dates, in which case income and expenses are translated at the rate on the dates of transactions); and
(iii) All resulting exchange differences are recognised as a separate component of other comprehensive income.
On consolidation, exchange differences arising from the translation of any net investment in foreign operations, and of borrowings and other financial instruments designated as hedges of such investments, are recognised in other comprehensive income. When a foreign operation is partially disposed of or sold, a proportionate share of such exchange differences is recognised in income statements as part of the gain or loss on sale.
Goodwill and fair value adjustments arising on the acquisition of a foreign entity are treated as assets and liabilities of the foreign entity and translated at the closing rate.
(27) SEGMENT REPORTING
Operating segments are reported in a manner consistent with the internal reporting provided to the chief operating decision- maker, who is responsible for allocating resources to and assessing performance of the operating segments of an entity. The Group has determined its Group Management Committee as its chief operating decision-maker.
(B) CRITICAL ACCOUNTING ESTIMATES AND ASSUMPTIONS
The Group and the Bank make estimates and assumptions that affect the reported amounts of assets and liabilities within the next financial year. Estimates and judgements are continuously evaluated and are based on historical experience and other factors, including expectations of future events that are believed to be reasonable under the circumstances. The estimates and assumptions that have a significant risk of causing a material adjustment to the carrying amount of assets within the next financial year are outlined below:
(1) Fair value measurement
A significant portion of financial instruments are carried on the statements of financial position at fair value.
Fair value is the price that would be received to sell an asset or paid to transfer a liability in an orderly transaction between market participants at the measurement date.
Where the classification of a financial asset or liability results in it being measured at fair value, wherever possible, the fair value is determined by reference to the quoted bid or offer price in the most advantageous active market to which the Group and the Bank has immediate access. An adjustment for credit risk is also incorporated into the fair value as appropriate.
(B) CRITICAL ACCOUNTING ESTIMATES AND ASSUMPTIONS (CONTINUED)
(1) Fair value measurement (continued)
Fair value for a net open position that is a financial liability quoted in an active market is the current offer price, and for a financial asset the bid price, multiplied by the number of units of the instrument held or issued.
Where no active market exists for a particular asset or liability, the Group and the Bank use a valuation technique to arrive at the fair value, including the use of transaction prices obtained in recent arm’s length transactions, discounted cash flow analysis, option pricing models and other valuation techniques, based on market conditions and risks existing at reporting date. In doing so, fair value is estimated using a valuation technique that makes maximum use of observable market inputs and places minimal reliance upon entity-specific inputs.
The best evidence of the fair value of a financial instrument at initial recognition is the transaction price (i.e. the fair value of the consideration given or received) unless the fair value of that instrument is evidenced by comparison with other observable current market transactions in the same instrument (i.e. without modification or repackaging) or based on a valuation technique whose variables include only data from observable markets. When such evidence exists, the Group and the Bank recognise the difference between the transaction price and the fair value in profit or loss on initial recognition (i.e. on day one).
The valuation techniques are further disclosed in Note 55(g)(i) to the financial statements.
(2) Allowance for expected credit losses (‘ECL’)
The measurement of the ECL for financial assets measured at amortised cost and FVOCI is an area that requires the use of complex models and significant assumptions about future economic conditions and credit behaviour.
MFRS 9 introduces the use of macroeconomic factors which include, but is not limited to, private consumption, unemployment rates, inflation and KLIBOR-3M, and requires an evaluation of both the current and forecast direction of the economic cycle. Incorporating forward looking information increases the level of judgement as to how changes in these macroeconomic factors will affect ECL. The methodology and assumptions including any forecasts of future economic conditions are reviewed regularly.
A number of significant judgements are also required in applying the accounting requirements for measuring ECL, such as:
(i) Determining criteria for significant increase in credit risk;
(ii) Choosing appropriate models and assumptions for the measurement of ECL;
(iii) Establishing the number and relative weightings of forward-looking scenarios for each type of product/market and the associated ECL;
(iv) Establishing groups of similar financial assets for the purposes of measuring ECL; and
(v) Identifying and calculating adjustments to model output (model overlay adjustments).
SUMMARY OF SIGNIFICANT ACCOUNTING POLICIES AND CRITICAL ACCOUNTING ESTIMATES AND ASSUMPTIONSfor the financial year ended 31 December 2020 (continued)
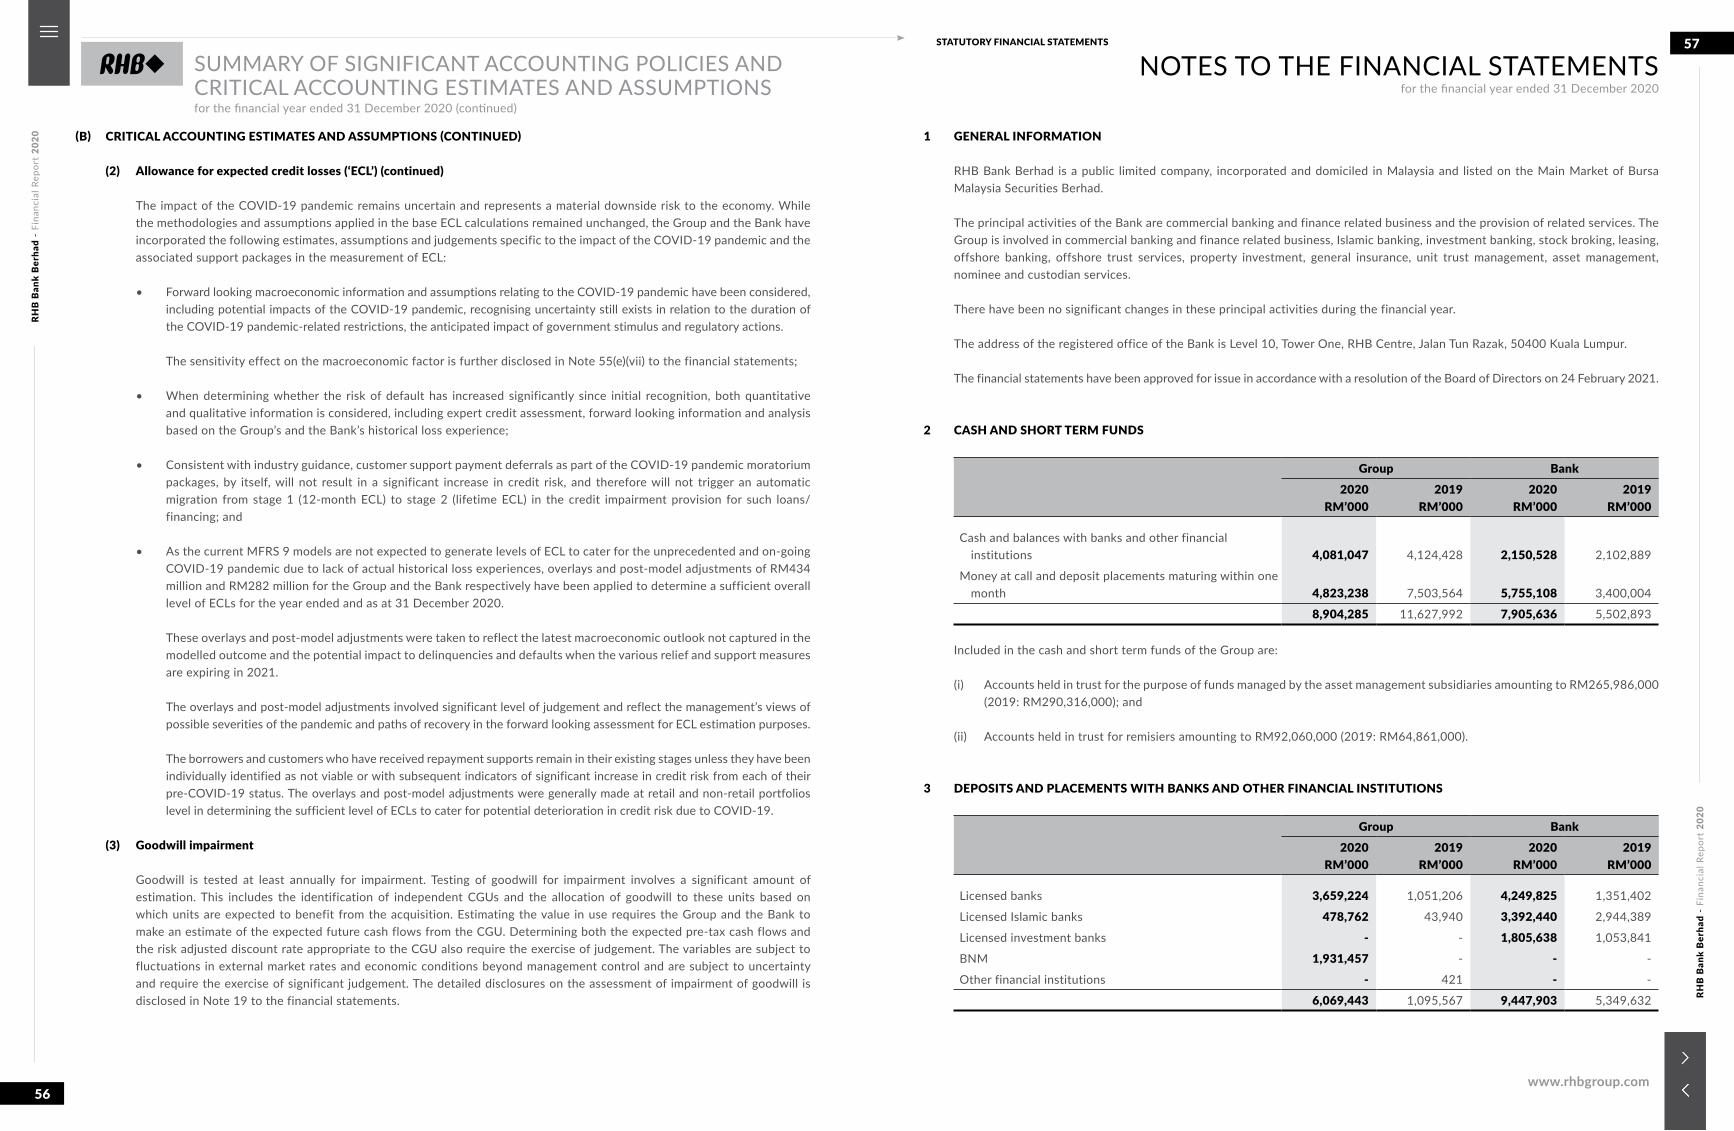
RHB
Ban
k B
erha
d -
Fina
ncia
l Rep
ort
2020
RHB
Ban
k B
erha
d -
Fina
ncia
l Rep
ort
2020
56
57STATUTORY FINANCIAL STATEMENTS
www.rhbgroup.com
(B) CRITICAL ACCOUNTING ESTIMATES AND ASSUMPTIONS (CONTINUED)
(2) Allowance for expected credit losses (‘ECL’) (continued)
The impact of the COVID-19 pandemic remains uncertain and represents a material downside risk to the economy. Whilethe methodologies and assumptions applied in the base ECL calculations remained unchanged, the Group and the Bank haveincorporated the following estimates, assumptions and judgements specific to the impact of the COVID-19 pandemic and theassociated support packages in the measurement of ECL:
• Forward looking macroeconomic information and assumptions relating to the COVID-19 pandemic have been considered,including potential impacts of the COVID-19 pandemic, recognising uncertainty still exists in relation to the duration ofthe COVID-19 pandemic-related restrictions, the anticipated impact of government stimulus and regulatory actions.
The sensitivity effect on the macroeconomic factor is further disclosed in Note 55(e)(vii) to the financial statements;
• When determining whether the risk of default has increased significantly since initial recognition, both quantitativeand qualitative information is considered, including expert credit assessment, forward looking information and analysisbased on the Group’s and the Bank’s historical loss experience;
• Consistent with industry guidance, customer support payment deferrals as part of the COVID-19 pandemic moratoriumpackages, by itself, will not result in a significant increase in credit risk, and therefore will not trigger an automaticmigration from stage 1 (12-month ECL) to stage 2 (lifetime ECL) in the credit impairment provision for such loans/financing; and
• As the current MFRS 9 models are not expected to generate levels of ECL to cater for the unprecedented and on-goingCOVID-19 pandemic due to lack of actual historical loss experiences, overlays and post-model adjustments of RM434million and RM282 million for the Group and the Bank respectively have been applied to determine a sufficient overalllevel of ECLs for the year ended and as at 31 December 2020.
These overlays and post-model adjustments were taken to reflect the latest macroeconomic outlook not captured in themodelled outcome and the potential impact to delinquencies and defaults when the various relief and support measuresare expiring in 2021.
The overlays and post-model adjustments involved significant level of judgement and reflect the management’s views ofpossible severities of the pandemic and paths of recovery in the forward looking assessment for ECL estimation purposes.
The borrowers and customers who have received repayment supports remain in their existing stages unless they have been individually identified as not viable or with subsequent indicators of significant increase in credit risk from each of theirpre-COVID-19 status. The overlays and post-model adjustments were generally made at retail and non-retail portfolioslevel in determining the sufficient level of ECLs to cater for potential deterioration in credit risk due to COVID-19.
(3) Goodwill impairment
Goodwill is tested at least annually for impairment. Testing of goodwill for impairment involves a significant amount ofestimation. This includes the identification of independent CGUs and the allocation of goodwill to these units based onwhich units are expected to benefit from the acquisition. Estimating the value in use requires the Group and the Bank tomake an estimate of the expected future cash flows from the CGU. Determining both the expected pre-tax cash flows andthe risk adjusted discount rate appropriate to the CGU also require the exercise of judgement. The variables are subject tofluctuations in external market rates and economic conditions beyond management control and are subject to uncertaintyand require the exercise of significant judgement. The detailed disclosures on the assessment of impairment of goodwill isdisclosed in Note 19 to the financial statements.
1 GENERAL INFORMATION
RHB Bank Berhad is a public limited company, incorporated and domiciled in Malaysia and listed on the Main Market of Bursa Malaysia Securities Berhad.
The principal activities of the Bank are commercial banking and finance related business and the provision of related services. The Group is involved in commercial banking and finance related business, Islamic banking, investment banking, stock broking, leasing, offshore banking, offshore trust services, property investment, general insurance, unit trust management, asset management, nominee and custodian services.
There have been no significant changes in these principal activities during the financial year.
The address of the registered office of the Bank is Level 10, Tower One, RHB Centre, Jalan Tun Razak, 50400 Kuala Lumpur.
The financial statements have been approved for issue in accordance with a resolution of the Board of Directors on 24 February 2021.
2 CASH AND SHORT TERM FUNDS
Group Bank2020
RM’0002019
RM’0002020
RM’0002019
RM’000
Cash and balances with banks and other financial institutions 4,081,047 4,124,428 2,150,528 2,102,889
Money at call and deposit placements maturing within one month 4,823,238 7,503,564 5,755,108 3,400,004
8,904,285 11,627,992 7,905,636 5,502,893
Included in the cash and short term funds of the Group are:
(i) Accounts held in trust for the purpose of funds managed by the asset management subsidiaries amounting to RM265,986,000(2019: RM290,316,000); and
(ii) Accounts held in trust for remisiers amounting to RM92,060,000 (2019: RM64,861,000).
3 DEPOSITS AND PLACEMENTS WITH BANKS AND OTHER FINANCIAL INSTITUTIONS
Group Bank2020
RM’0002019
RM’0002020
RM’0002019
RM’000
Licensed banks 3,659,224 1,051,206 4,249,825 1,351,402
Licensed Islamic banks 478,762 43,940 3,392,440 2,944,389
Licensed investment banks - - 1,805,638 1,053,841
BNM 1,931,457 - - -
Other financial institutions - 421 - -
6,069,443 1,095,567 9,447,903 5,349,632
SUMMARY OF SIGNIFICANT ACCOUNTING POLICIES AND CRITICAL ACCOUNTING ESTIMATES AND ASSUMPTIONSfor the financial year ended 31 December 2020 (continued)
NOTES TO THE FINANCIAL STATEMENTSfor the financial year ended 31 December 2020
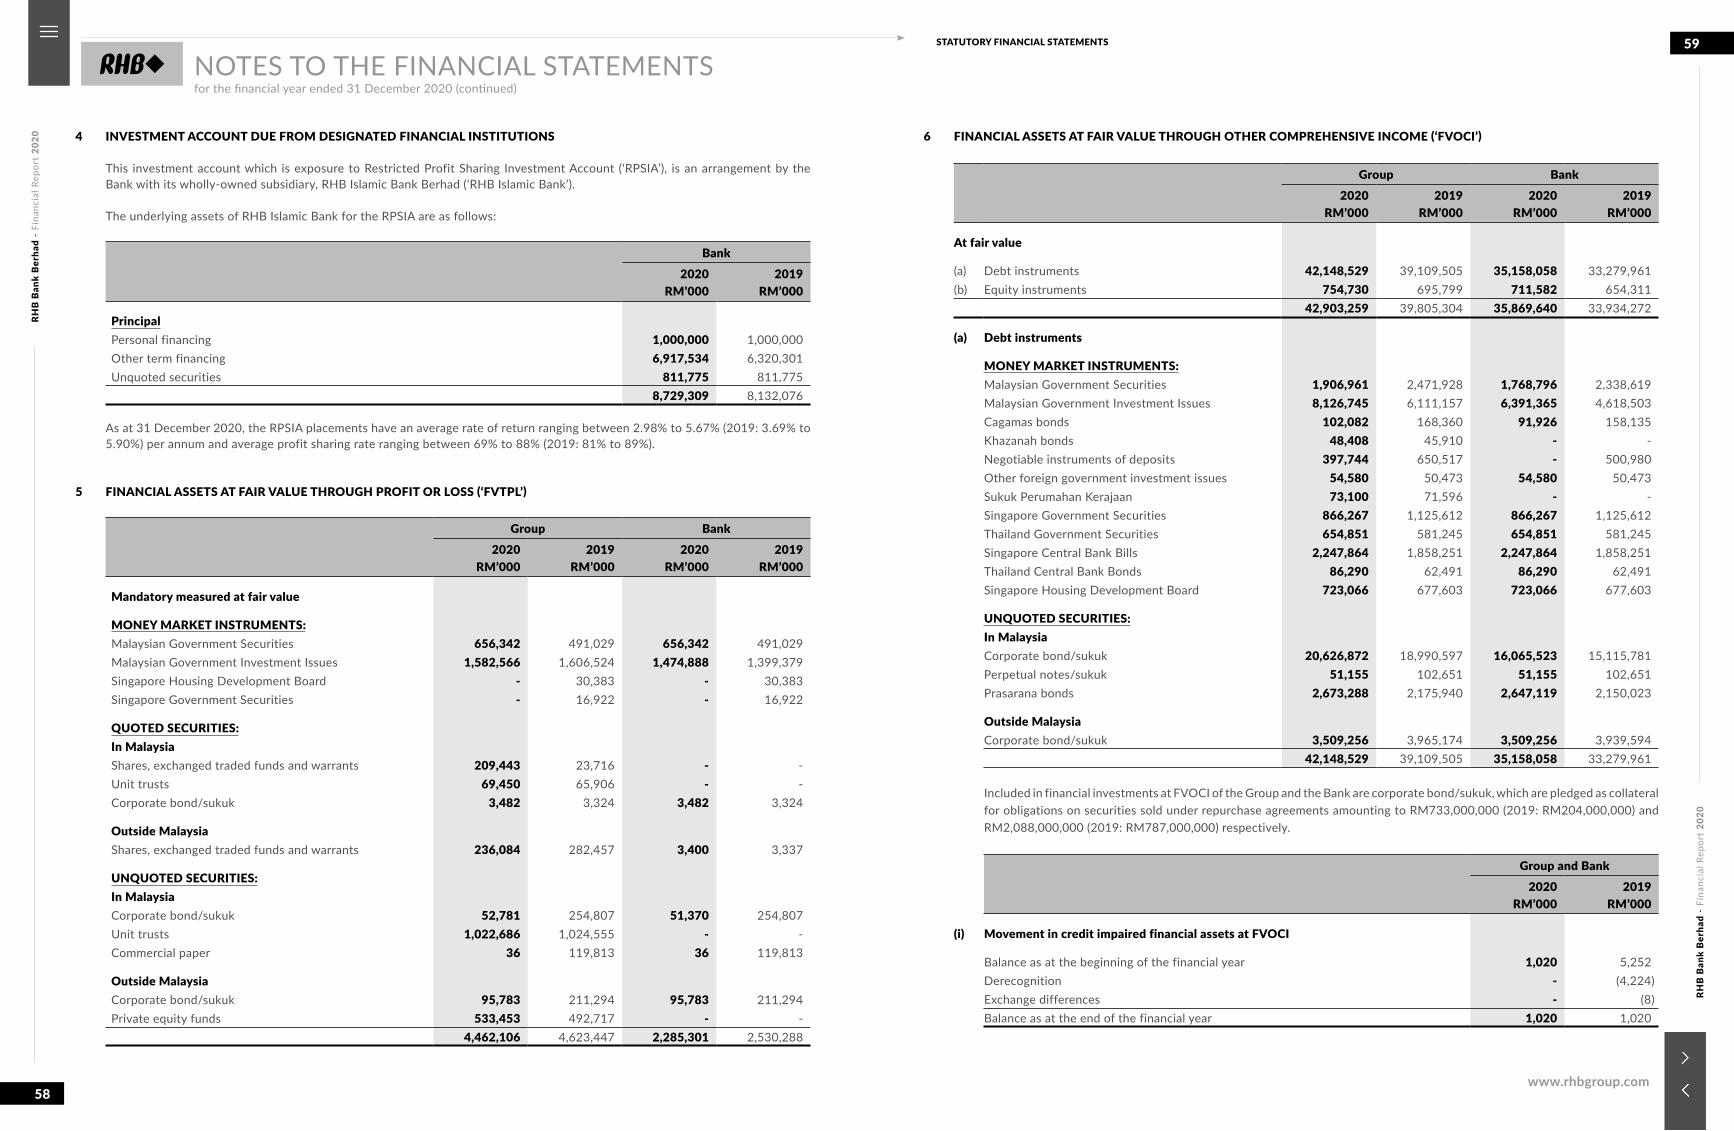
RHB
Ban
k B
erha
d -
Fina
ncia
l Rep
ort
2020
RHB
Ban
k B
erha
d -
Fina
ncia
l Rep
ort
2020
58
59STATUTORY FINANCIAL STATEMENTS
www.rhbgroup.com
NOTES TO THE FINANCIAL STATEMENTSfor the financial year ended 31 December 2020 (continued)
4 INVESTMENT ACCOUNT DUE FROM DESIGNATED FINANCIAL INSTITUTIONS
This investment account which is exposure to Restricted Profit Sharing Investment Account (‘RPSIA’), is an arrangement by the Bank with its wholly-owned subsidiary, RHB Islamic Bank Berhad (‘RHB Islamic Bank’).
The underlying assets of RHB Islamic Bank for the RPSIA are as follows:
Bank2020
RM’0002019
RM’000
PrincipalPersonal financing 1,000,000 1,000,000Other term financing 6,917,534 6,320,301Unquoted securities 811,775 811,775
8,729,309 8,132,076
As at 31 December 2020, the RPSIA placements have an average rate of return ranging between 2.98% to 5.67% (2019: 3.69% to 5.90%) per annum and average profit sharing rate ranging between 69% to 88% (2019: 81% to 89%).
5 FINANCIAL ASSETS AT FAIR VALUE THROUGH PROFIT OR LOSS (‘FVTPL’)
Group Bank2020
RM’0002019
RM’0002020
RM’0002019
RM’000
Mandatory measured at fair value
MONEY MARKET INSTRUMENTS:Malaysian Government Securities 656,342 491,029 656,342 491,029Malaysian Government Investment Issues 1,582,566 1,606,524 1,474,888 1,399,379Singapore Housing Development Board - 30,383 - 30,383Singapore Government Securities - 16,922 - 16,922
QUOTED SECURITIES:In MalaysiaShares, exchanged traded funds and warrants 209,443 23,716 - -Unit trusts 69,450 65,906 - -Corporate bond/sukuk 3,482 3,324 3,482 3,324
Outside MalaysiaShares, exchanged traded funds and warrants 236,084 282,457 3,400 3,337
UNQUOTED SECURITIES:In MalaysiaCorporate bond/sukuk 52,781 254,807 51,370 254,807Unit trusts 1,022,686 1,024,555 - -Commercial paper 36 119,813 36 119,813
Outside MalaysiaCorporate bond/sukuk 95,783 211,294 95,783 211,294Private equity funds 533,453 492,717 - -
4,462,106 4,623,447 2,285,301 2,530,288
6 FINANCIAL ASSETS AT FAIR VALUE THROUGH OTHER COMPREHENSIVE INCOME (‘FVOCI’)
Group Bank2020
RM’0002019
RM’0002020
RM’0002019
RM’000
At fair value
(a) Debt instruments 42,148,529 39,109,505 35,158,058 33,279,961(b) Equity instruments 754,730 695,799 711,582 654,311
42,903,259 39,805,304 35,869,640 33,934,272
(a) Debt instruments
MONEY MARKET INSTRUMENTS:Malaysian Government Securities 1,906,961 2,471,928 1,768,796 2,338,619Malaysian Government Investment Issues 8,126,745 6,111,157 6,391,365 4,618,503Cagamas bonds 102,082 168,360 91,926 158,135Khazanah bonds 48,408 45,910 - -Negotiable instruments of deposits 397,744 650,517 - 500,980Other foreign government investment issues 54,580 50,473 54,580 50,473Sukuk Perumahan Kerajaan 73,100 71,596 - -Singapore Government Securities 866,267 1,125,612 866,267 1,125,612Thailand Government Securities 654,851 581,245 654,851 581,245Singapore Central Bank Bills 2,247,864 1,858,251 2,247,864 1,858,251Thailand Central Bank Bonds 86,290 62,491 86,290 62,491Singapore Housing Development Board 723,066 677,603 723,066 677,603
UNQUOTED SECURITIES:In MalaysiaCorporate bond/sukuk 20,626,872 18,990,597 16,065,523 15,115,781Perpetual notes/sukuk 51,155 102,651 51,155 102,651Prasarana bonds 2,673,288 2,175,940 2,647,119 2,150,023
Outside MalaysiaCorporate bond/sukuk 3,509,256 3,965,174 3,509,256 3,939,594
42,148,529 39,109,505 35,158,058 33,279,961
Included in financial investments at FVOCI of the Group and the Bank are corporate bond/sukuk, which are pledged as collateral for obligations on securities sold under repurchase agreements amounting to RM733,000,000 (2019: RM204,000,000) and RM2,088,000,000 (2019: RM787,000,000) respectively.
Group and Bank2020
RM’0002019
RM’000
(i) Movement in credit impaired financial assets at FVOCI
Balance as at the beginning of the financial year 1,020 5,252Derecognition - (4,224)Exchange differences - (8)Balance as at the end of the financial year 1,020 1,020
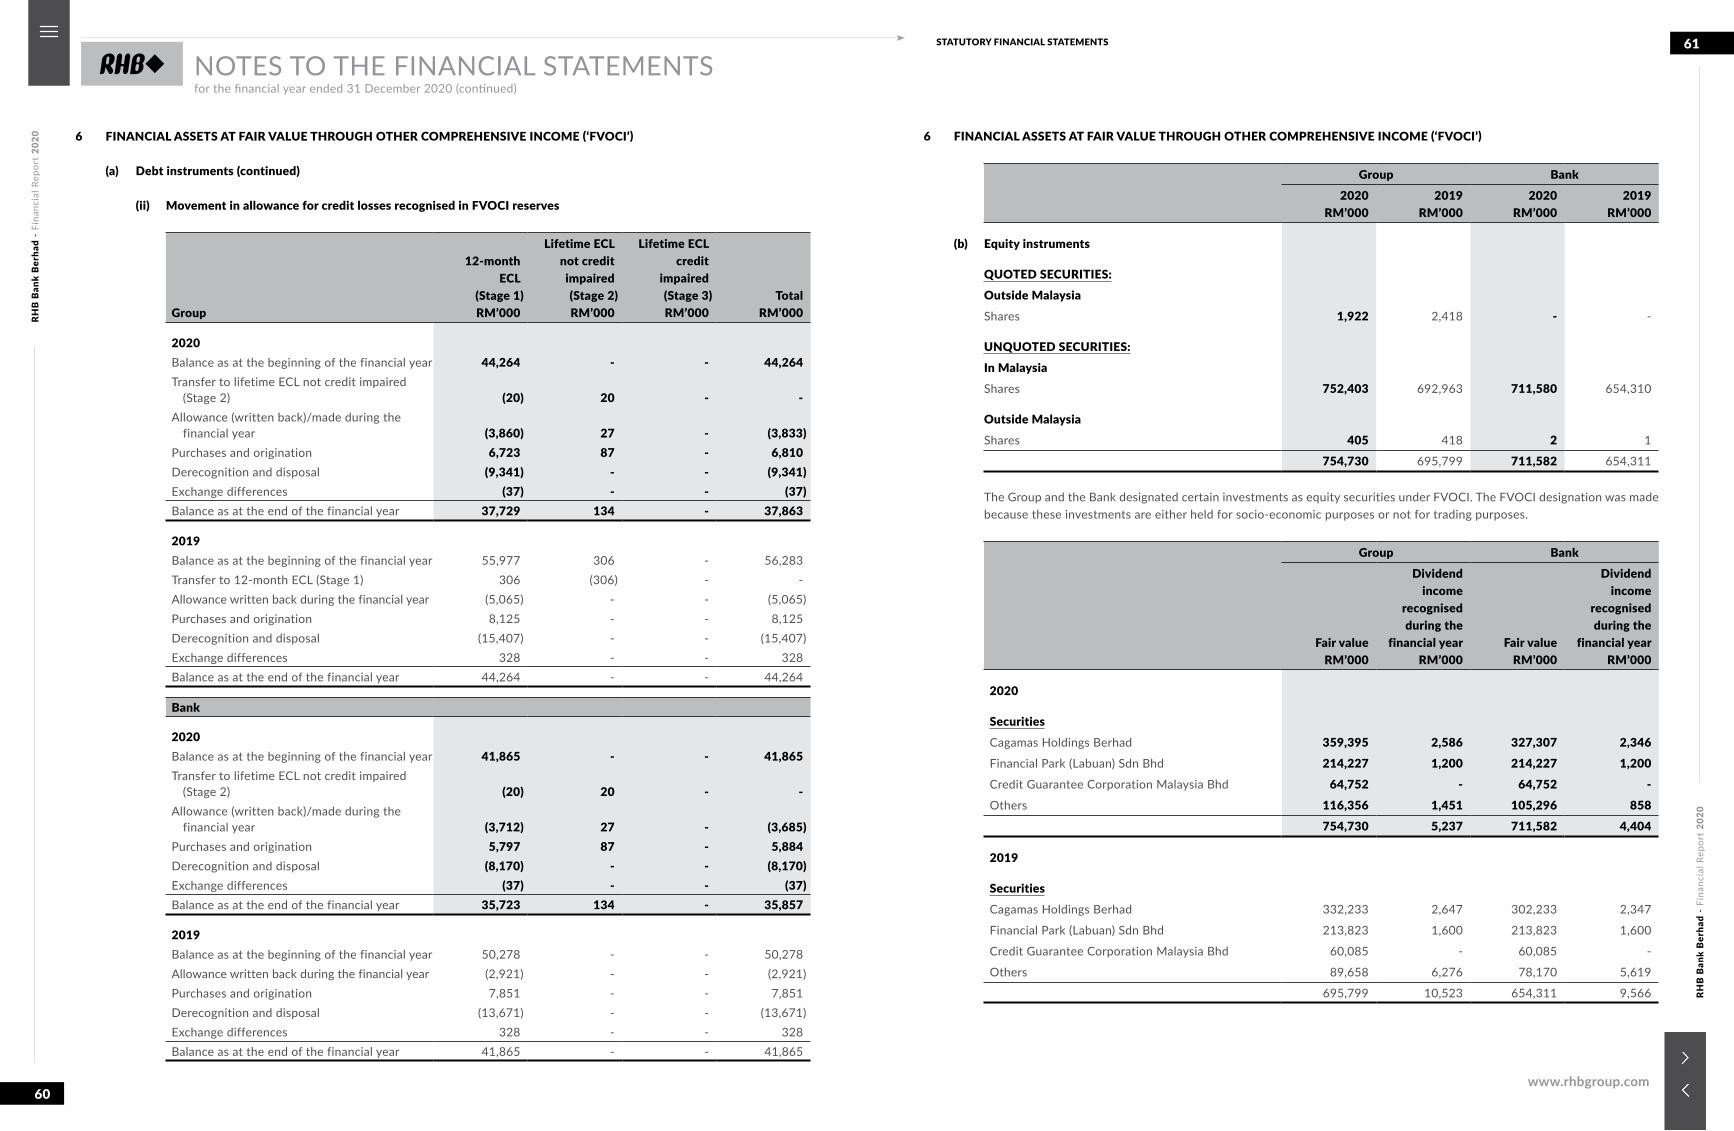
RHB
Ban
k B
erha
d -
Fina
ncia
l Rep
ort
2020
RHB
Ban
k B
erha
d -
Fina
ncia
l Rep
ort
2020
60
61STATUTORY FINANCIAL STATEMENTS
www.rhbgroup.com
NOTES TO THE FINANCIAL STATEMENTSfor the financial year ended 31 December 2020 (continued)
6 FINANCIAL ASSETS AT FAIR VALUE THROUGH OTHER COMPREHENSIVE INCOME (‘FVOCI’)
(a) Debt instruments (continued)
(ii) Movement in allowance for credit losses recognised in FVOCI reserves
Group
12-monthECL
(Stage 1) RM’000
Lifetime ECLnot creditimpaired(Stage 2) RM’000
Lifetime ECLcredit
impaired(Stage 3) RM’000
Total RM’000
2020Balance as at the beginning of the financial year 44,264 - - 44,264Transfer to lifetime ECL not credit impaired
(Stage 2) (20) 20 - -Allowance (written back)/made during the
financial year (3,860) 27 - (3,833)Purchases and origination 6,723 87 - 6,810Derecognition and disposal (9,341) - - (9,341)Exchange differences (37) - - (37)Balance as at the end of the financial year 37,729 134 - 37,863
2019Balance as at the beginning of the financial year 55,977 306 - 56,283Transfer to 12-month ECL (Stage 1) 306 (306) - -Allowance written back during the financial year (5,065) - - (5,065)Purchases and origination 8,125 - - 8,125Derecognition and disposal (15,407) - - (15,407)Exchange differences 328 - - 328 Balance as at the end of the financial year 44,264 - - 44,264
Bank
2020Balance as at the beginning of the financial year 41,865 - - 41,865Transfer to lifetime ECL not credit impaired
(Stage 2) (20) 20 - -Allowance (written back)/made during the
financial year (3,712) 27 - (3,685)Purchases and origination 5,797 87 - 5,884Derecognition and disposal (8,170) - - (8,170)Exchange differences (37) - - (37)Balance as at the end of the financial year 35,723 134 - 35,857
2019Balance as at the beginning of the financial year 50,278 - - 50,278Allowance written back during the financial year (2,921) - - (2,921)Purchases and origination 7,851 - - 7,851Derecognition and disposal (13,671) - - (13,671)Exchange differences 328 - - 328 Balance as at the end of the financial year 41,865 - - 41,865
6 FINANCIAL ASSETS AT FAIR VALUE THROUGH OTHER COMPREHENSIVE INCOME (‘FVOCI’)
Group Bank2020
RM’0002019
RM’0002020
RM’0002019
RM’000
(b) Equity instruments
QUOTED SECURITIES:Outside MalaysiaShares 1,922 2,418 - -
UNQUOTED SECURITIES:In MalaysiaShares 752,403 692,963 711,580 654,310
Outside MalaysiaShares 405 418 2 1
754,730 695,799 711,582 654,311
The Group and the Bank designated certain investments as equity securities under FVOCI. The FVOCI designation was made because these investments are either held for socio-economic purposes or not for trading purposes.
Group Bank
Fair value RM’000
Dividendincome
recognisedduring the
financial year RM’000
Fair value RM’000
Dividendincome
recognisedduring the
financial year RM’000
2020
SecuritiesCagamas Holdings Berhad 359,395 2,586 327,307 2,346Financial Park (Labuan) Sdn Bhd 214,227 1,200 214,227 1,200Credit Guarantee Corporation Malaysia Bhd 64,752 - 64,752 -Others 116,356 1,451 105,296 858
754,730 5,237 711,582 4,404
2019
SecuritiesCagamas Holdings Berhad 332,233 2,647 302,233 2,347
Financial Park (Labuan) Sdn Bhd 213,823 1,600 213,823 1,600
Credit Guarantee Corporation Malaysia Bhd 60,085 - 60,085 -
Others 89,658 6,276 78,170 5,619
695,799 10,523 654,311 9,566
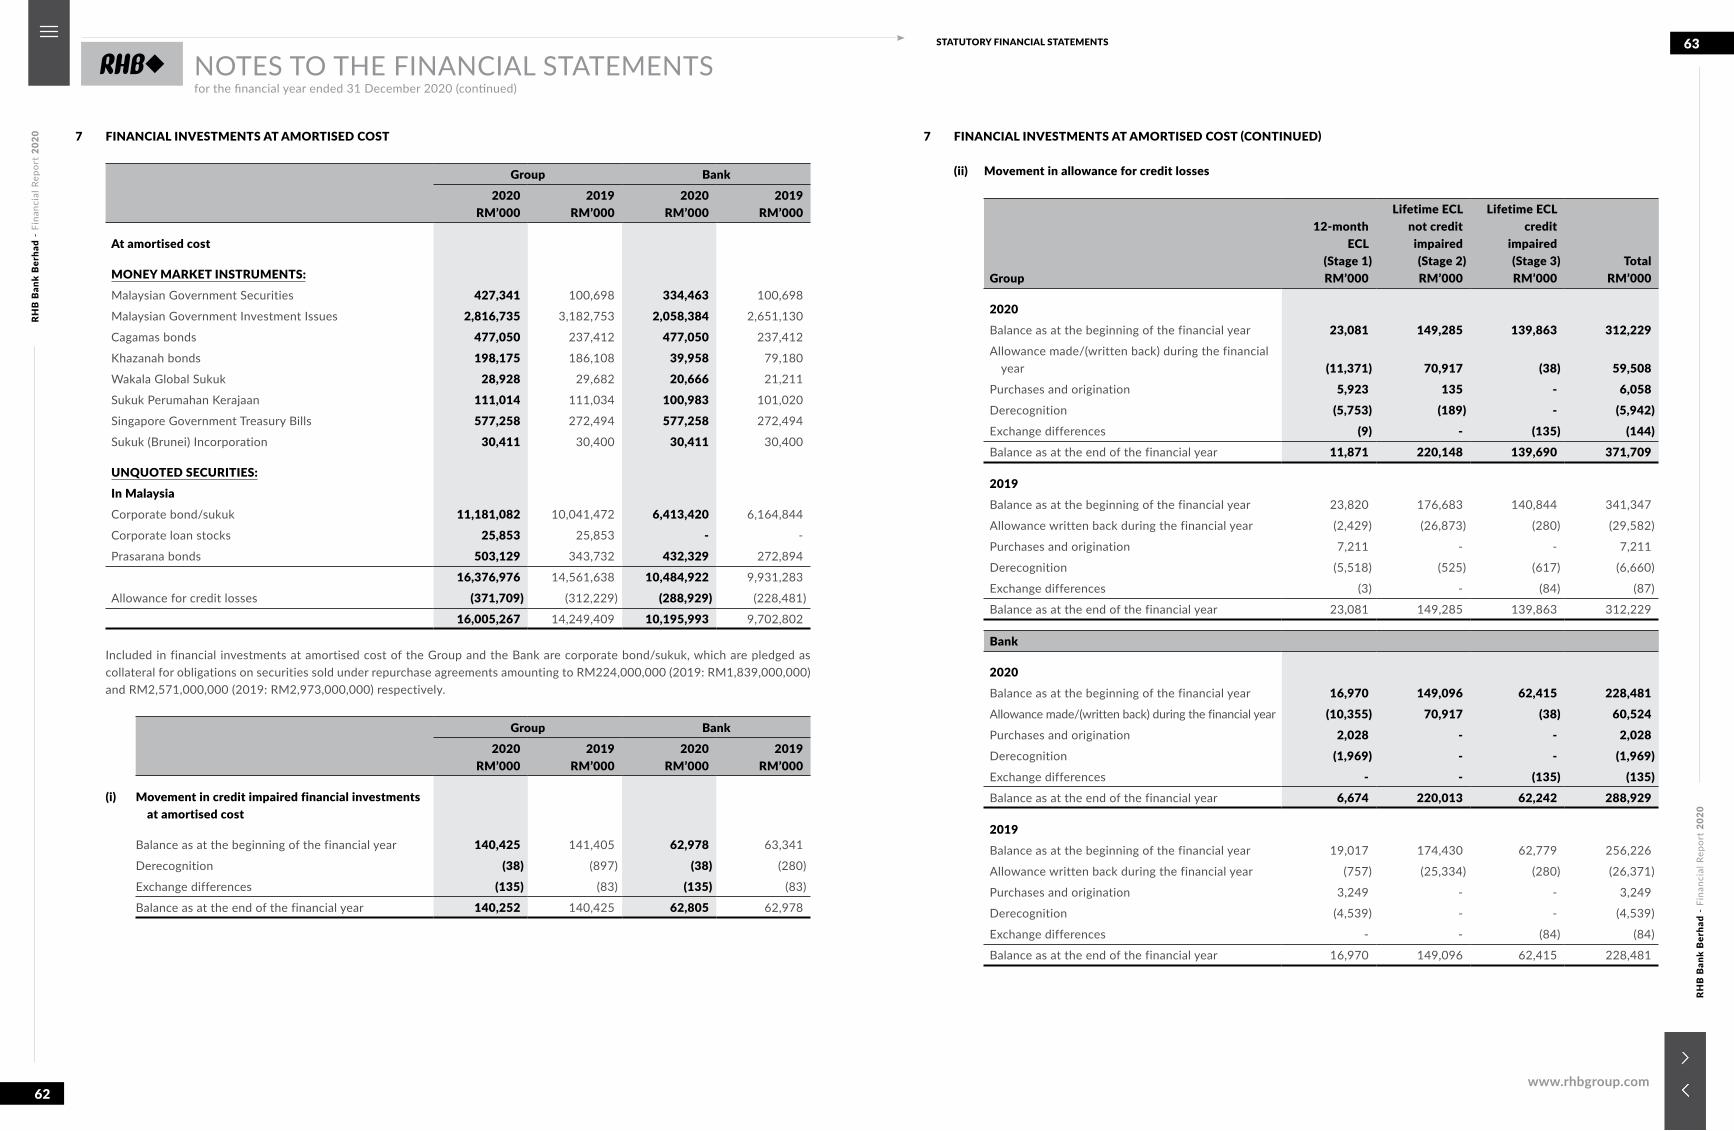
RHB
Ban
k B
erha
d -
Fina
ncia
l Rep
ort
2020
RHB
Ban
k B
erha
d -
Fina
ncia
l Rep
ort
2020
62
63STATUTORY FINANCIAL STATEMENTS
www.rhbgroup.com
NOTES TO THE FINANCIAL STATEMENTSfor the financial year ended 31 December 2020 (continued)
7 FINANCIAL INVESTMENTS AT AMORTISED COST
Group Bank2020
RM’0002019
RM’0002020
RM’0002019
RM’000
At amortised cost
MONEY MARKET INSTRUMENTS:Malaysian Government Securities 427,341 100,698 334,463 100,698
Malaysian Government Investment Issues 2,816,735 3,182,753 2,058,384 2,651,130
Cagamas bonds 477,050 237,412 477,050 237,412
Khazanah bonds 198,175 186,108 39,958 79,180
Wakala Global Sukuk 28,928 29,682 20,666 21,211
Sukuk Perumahan Kerajaan 111,014 111,034 100,983 101,020
Singapore Government Treasury Bills 577,258 272,494 577,258 272,494
Sukuk (Brunei) Incorporation 30,411 30,400 30,411 30,400
UNQUOTED SECURITIES:In MalaysiaCorporate bond/sukuk 11,181,082 10,041,472 6,413,420 6,164,844
Corporate loan stocks 25,853 25,853 - -
Prasarana bonds 503,129 343,732 432,329 272,894
16,376,976 14,561,638 10,484,922 9,931,283
Allowance for credit losses (371,709) (312,229) (288,929) (228,481)
16,005,267 14,249,409 10,195,993 9,702,802
Included in financial investments at amortised cost of the Group and the Bank are corporate bond/sukuk, which are pledged as collateral for obligations on securities sold under repurchase agreements amounting to RM224,000,000 (2019: RM1,839,000,000) and RM2,571,000,000 (2019: RM2,973,000,000) respectively.
Group Bank2020
RM’0002019
RM’0002020
RM’0002019
RM’000
(i) Movement in credit impaired financial investments at amortised cost
Balance as at the beginning of the financial year 140,425 141,405 62,978 63,341
Derecognition (38) (897) (38) (280)
Exchange differences (135) (83) (135) (83)
Balance as at the end of the financial year 140,252 140,425 62,805 62,978
7 FINANCIAL INVESTMENTS AT AMORTISED COST (CONTINUED)
(ii) Movement in allowance for credit losses
Group
12-monthECL
(Stage 1) RM’000
Lifetime ECLnot creditimpaired(Stage 2) RM’000
Lifetime ECLcredit
impaired(Stage 3) RM’000
Total RM’000
2020Balance as at the beginning of the financial year 23,081 149,285 139,863 312,229Allowance made/(written back) during the financial
year (11,371) 70,917 (38) 59,508Purchases and origination 5,923 135 - 6,058Derecognition (5,753) (189) - (5,942)Exchange differences (9) - (135) (144)Balance as at the end of the financial year 11,871 220,148 139,690 371,709
2019Balance as at the beginning of the financial year 23,820 176,683 140,844 341,347
Allowance written back during the financial year (2,429) (26,873) (280) (29,582)
Purchases and origination 7,211 - - 7,211
Derecognition (5,518) (525) (617) (6,660)
Exchange differences (3) - (84) (87)
Balance as at the end of the financial year 23,081 149,285 139,863 312,229
Bank
2020Balance as at the beginning of the financial year 16,970 149,096 62,415 228,481Allowance made/(written back) during the financial year (10,355) 70,917 (38) 60,524Purchases and origination 2,028 - - 2,028Derecognition (1,969) - - (1,969)Exchange differences - - (135) (135)Balance as at the end of the financial year 6,674 220,013 62,242 288,929
2019Balance as at the beginning of the financial year 19,017 174,430 62,779 256,226
Allowance written back during the financial year (757) (25,334) (280) (26,371)
Purchases and origination 3,249 - - 3,249
Derecognition (4,539) - - (4,539)
Exchange differences - - (84) (84)
Balance as at the end of the financial year 16,970 149,096 62,415 228,481
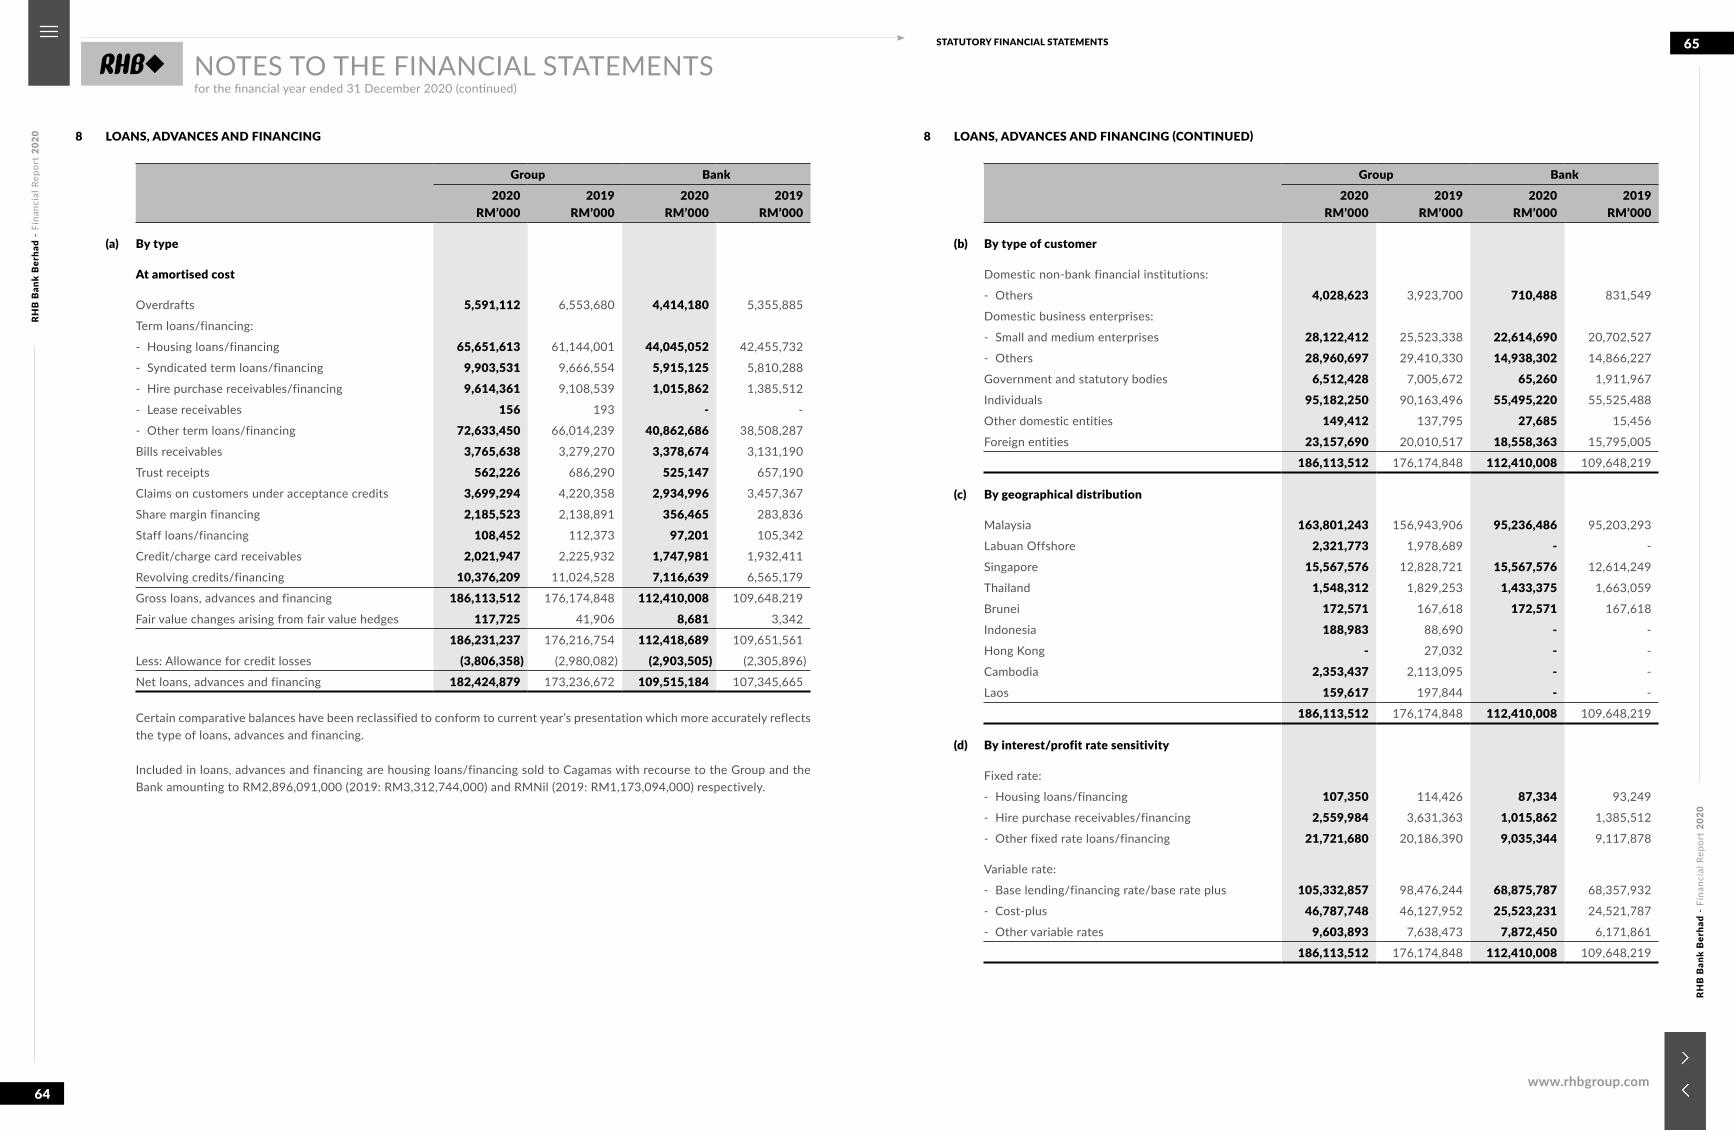
RHB
Ban
k B
erha
d -
Fina
ncia
l Rep
ort
2020
RHB
Ban
k B
erha
d -
Fina
ncia
l Rep
ort
2020
64
65STATUTORY FINANCIAL STATEMENTS
www.rhbgroup.com
NOTES TO THE FINANCIAL STATEMENTSfor the financial year ended 31 December 2020 (continued)
8 LOANS, ADVANCES AND FINANCING
Group Bank2020
RM’0002019
RM’0002020
RM’0002019
RM’000
(a) By type
At amortised cost
Overdrafts 5,591,112 6,553,680 4,414,180 5,355,885
Term loans/financing:
- Housing loans/financing 65,651,613 61,144,001 44,045,052 42,455,732
- Syndicated term loans/financing 9,903,531 9,666,554 5,915,125 5,810,288
- Hire purchase receivables/financing 9,614,361 9,108,539 1,015,862 1,385,512
- Lease receivables 156 193 - -
- Other term loans/financing 72,633,450 66,014,239 40,862,686 38,508,287
Bills receivables 3,765,638 3,279,270 3,378,674 3,131,190
Trust receipts 562,226 686,290 525,147 657,190
Claims on customers under acceptance credits 3,699,294 4,220,358 2,934,996 3,457,367
Share margin financing 2,185,523 2,138,891 356,465 283,836
Staff loans/financing 108,452 112,373 97,201 105,342
Credit/charge card receivables 2,021,947 2,225,932 1,747,981 1,932,411
Revolving credits/financing 10,376,209 11,024,528 7,116,639 6,565,179
Gross loans, advances and financing 186,113,512 176,174,848 112,410,008 109,648,219
Fair value changes arising from fair value hedges 117,725 41,906 8,681 3,342
186,231,237 176,216,754 112,418,689 109,651,561
Less: Allowance for credit losses (3,806,358) (2,980,082) (2,903,505) (2,305,896)
Net loans, advances and financing 182,424,879 173,236,672 109,515,184 107,345,665
Certain comparative balances have been reclassified to conform to current year’s presentation which more accurately reflects the type of loans, advances and financing.
Included in loans, advances and financing are housing loans/financing sold to Cagamas with recourse to the Group and the Bank amounting to RM2,896,091,000 (2019: RM3,312,744,000) and RMNil (2019: RM1,173,094,000) respectively.
8 LOANS, ADVANCES AND FINANCING (CONTINUED)
Group Bank2020
RM’0002019
RM’0002020
RM’0002019
RM’000
(b) By type of customer
Domestic non-bank financial institutions:
- Others 4,028,623 3,923,700 710,488 831,549
Domestic business enterprises:
- Small and medium enterprises 28,122,412 25,523,338 22,614,690 20,702,527
- Others 28,960,697 29,410,330 14,938,302 14,866,227
Government and statutory bodies 6,512,428 7,005,672 65,260 1,911,967
Individuals 95,182,250 90,163,496 55,495,220 55,525,488
Other domestic entities 149,412 137,795 27,685 15,456
Foreign entities 23,157,690 20,010,517 18,558,363 15,795,005
186,113,512 176,174,848 112,410,008 109,648,219
(c) By geographical distribution
Malaysia 163,801,243 156,943,906 95,236,486 95,203,293
Labuan Offshore 2,321,773 1,978,689 - -
Singapore 15,567,576 12,828,721 15,567,576 12,614,249
Thailand 1,548,312 1,829,253 1,433,375 1,663,059
Brunei 172,571 167,618 172,571 167,618
Indonesia 188,983 88,690 - -
Hong Kong - 27,032 - -
Cambodia 2,353,437 2,113,095 - -
Laos 159,617 197,844 - -
186,113,512 176,174,848 112,410,008 109,648,219
(d) By interest/profit rate sensitivity
Fixed rate:
- Housing loans/financing 107,350 114,426 87,334 93,249
- Hire purchase receivables/financing 2,559,984 3,631,363 1,015,862 1,385,512
- Other fixed rate loans/financing 21,721,680 20,186,390 9,035,344 9,117,878
Variable rate:
- Base lending/financing rate/base rate plus 105,332,857 98,476,244 68,875,787 68,357,932
- Cost-plus 46,787,748 46,127,952 25,523,231 24,521,787
- Other variable rates 9,603,893 7,638,473 7,872,450 6,171,861
186,113,512 176,174,848 112,410,008 109,648,219
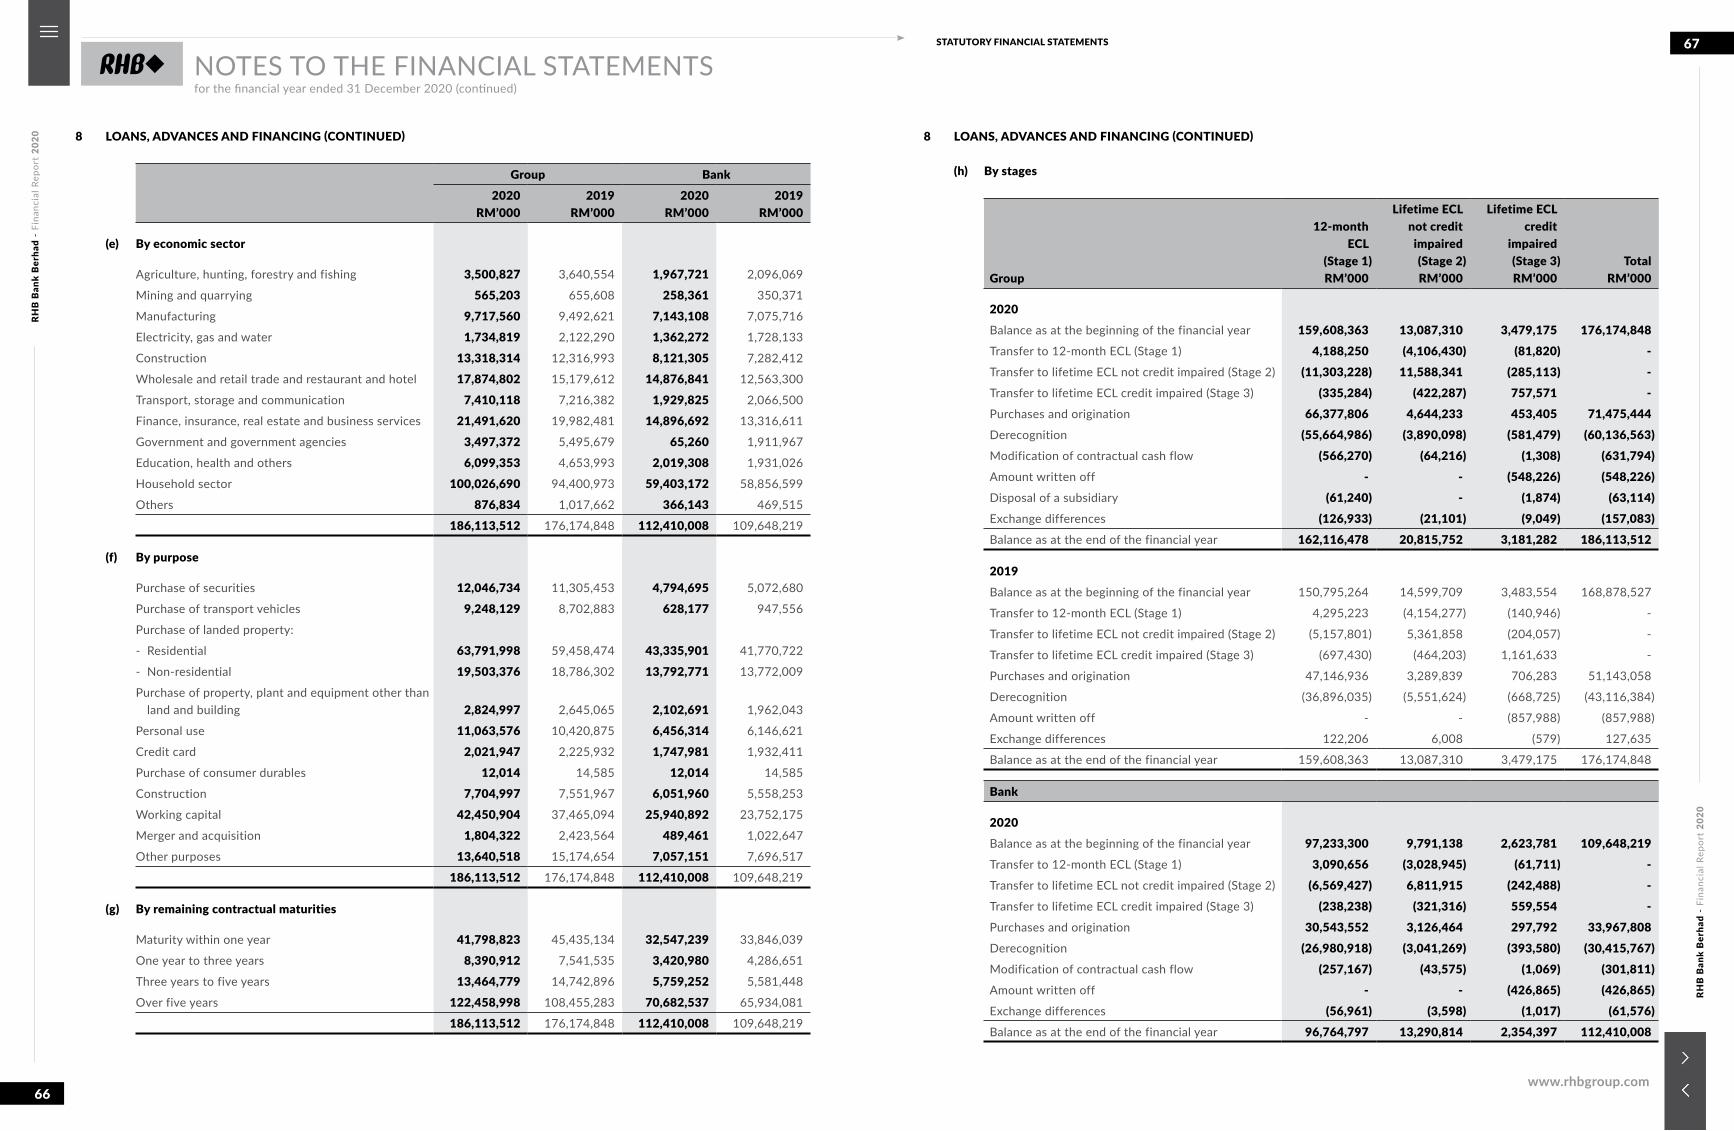
RHB
Ban
k B
erha
d -
Fina
ncia
l Rep
ort
2020
RHB
Ban
k B
erha
d -
Fina
ncia
l Rep
ort
2020
66
67STATUTORY FINANCIAL STATEMENTS
www.rhbgroup.com
NOTES TO THE FINANCIAL STATEMENTSfor the financial year ended 31 December 2020 (continued)
8 LOANS, ADVANCES AND FINANCING (CONTINUED)
Group Bank2020
RM’0002019
RM’0002020
RM’0002019
RM’000
(e) By economic sector
Agriculture, hunting, forestry and fishing 3,500,827 3,640,554 1,967,721 2,096,069
Mining and quarrying 565,203 655,608 258,361 350,371
Manufacturing 9,717,560 9,492,621 7,143,108 7,075,716
Electricity, gas and water 1,734,819 2,122,290 1,362,272 1,728,133
Construction 13,318,314 12,316,993 8,121,305 7,282,412
Wholesale and retail trade and restaurant and hotel 17,874,802 15,179,612 14,876,841 12,563,300
Transport, storage and communication 7,410,118 7,216,382 1,929,825 2,066,500
Finance, insurance, real estate and business services 21,491,620 19,982,481 14,896,692 13,316,611
Government and government agencies 3,497,372 5,495,679 65,260 1,911,967
Education, health and others 6,099,353 4,653,993 2,019,308 1,931,026
Household sector 100,026,690 94,400,973 59,403,172 58,856,599
Others 876,834 1,017,662 366,143 469,515
186,113,512 176,174,848 112,410,008 109,648,219
(f) By purpose
Purchase of securities 12,046,734 11,305,453 4,794,695 5,072,680
Purchase of transport vehicles 9,248,129 8,702,883 628,177 947,556
Purchase of landed property:
- Residential 63,791,998 59,458,474 43,335,901 41,770,722
- Non-residential 19,503,376 18,786,302 13,792,771 13,772,009
Purchase of property, plant and equipment other than land and building 2,824,997 2,645,065 2,102,691 1,962,043
Personal use 11,063,576 10,420,875 6,456,314 6,146,621
Credit card 2,021,947 2,225,932 1,747,981 1,932,411
Purchase of consumer durables 12,014 14,585 12,014 14,585
Construction 7,704,997 7,551,967 6,051,960 5,558,253
Working capital 42,450,904 37,465,094 25,940,892 23,752,175
Merger and acquisition 1,804,322 2,423,564 489,461 1,022,647
Other purposes 13,640,518 15,174,654 7,057,151 7,696,517
186,113,512 176,174,848 112,410,008 109,648,219
(g) By remaining contractual maturities
Maturity within one year 41,798,823 45,435,134 32,547,239 33,846,039
One year to three years 8,390,912 7,541,535 3,420,980 4,286,651
Three years to five years 13,464,779 14,742,896 5,759,252 5,581,448
Over five years 122,458,998 108,455,283 70,682,537 65,934,081
186,113,512 176,174,848 112,410,008 109,648,219
8 LOANS, ADVANCES AND FINANCING (CONTINUED)
(h) By stages
Group
12-monthECL
(Stage 1) RM’000
Lifetime ECLnot creditimpaired(Stage 2) RM’000
Lifetime ECLcredit
impaired(Stage 3) RM’000
Total RM’000
2020Balance as at the beginning of the financial year 159,608,363 13,087,310 3,479,175 176,174,848Transfer to 12-month ECL (Stage 1) 4,188,250 (4,106,430) (81,820) -Transfer to lifetime ECL not credit impaired (Stage 2) (11,303,228) 11,588,341 (285,113) -Transfer to lifetime ECL credit impaired (Stage 3) (335,284) (422,287) 757,571 -Purchases and origination 66,377,806 4,644,233 453,405 71,475,444Derecognition (55,664,986) (3,890,098) (581,479) (60,136,563)Modification of contractual cash flow (566,270) (64,216) (1,308) (631,794)Amount written off - - (548,226) (548,226)Disposal of a subsidiary (61,240) - (1,874) (63,114)Exchange differences (126,933) (21,101) (9,049) (157,083)Balance as at the end of the financial year 162,116,478 20,815,752 3,181,282 186,113,512
2019Balance as at the beginning of the financial year 150,795,264 14,599,709 3,483,554 168,878,527
Transfer to 12-month ECL (Stage 1) 4,295,223 (4,154,277) (140,946) -
Transfer to lifetime ECL not credit impaired (Stage 2) (5,157,801) 5,361,858 (204,057) -
Transfer to lifetime ECL credit impaired (Stage 3) (697,430) (464,203) 1,161,633 -
Purchases and origination 47,146,936 3,289,839 706,283 51,143,058
Derecognition (36,896,035) (5,551,624) (668,725) (43,116,384)
Amount written off - - (857,988) (857,988)
Exchange differences 122,206 6,008 (579) 127,635
Balance as at the end of the financial year 159,608,363 13,087,310 3,479,175 176,174,848
Bank
2020Balance as at the beginning of the financial year 97,233,300 9,791,138 2,623,781 109,648,219Transfer to 12-month ECL (Stage 1) 3,090,656 (3,028,945) (61,711) -Transfer to lifetime ECL not credit impaired (Stage 2) (6,569,427) 6,811,915 (242,488) -Transfer to lifetime ECL credit impaired (Stage 3) (238,238) (321,316) 559,554 -Purchases and origination 30,543,552 3,126,464 297,792 33,967,808Derecognition (26,980,918) (3,041,269) (393,580) (30,415,767)Modification of contractual cash flow (257,167) (43,575) (1,069) (301,811)Amount written off - - (426,865) (426,865)Exchange differences (56,961) (3,598) (1,017) (61,576)Balance as at the end of the financial year 96,764,797 13,290,814 2,354,397 112,410,008
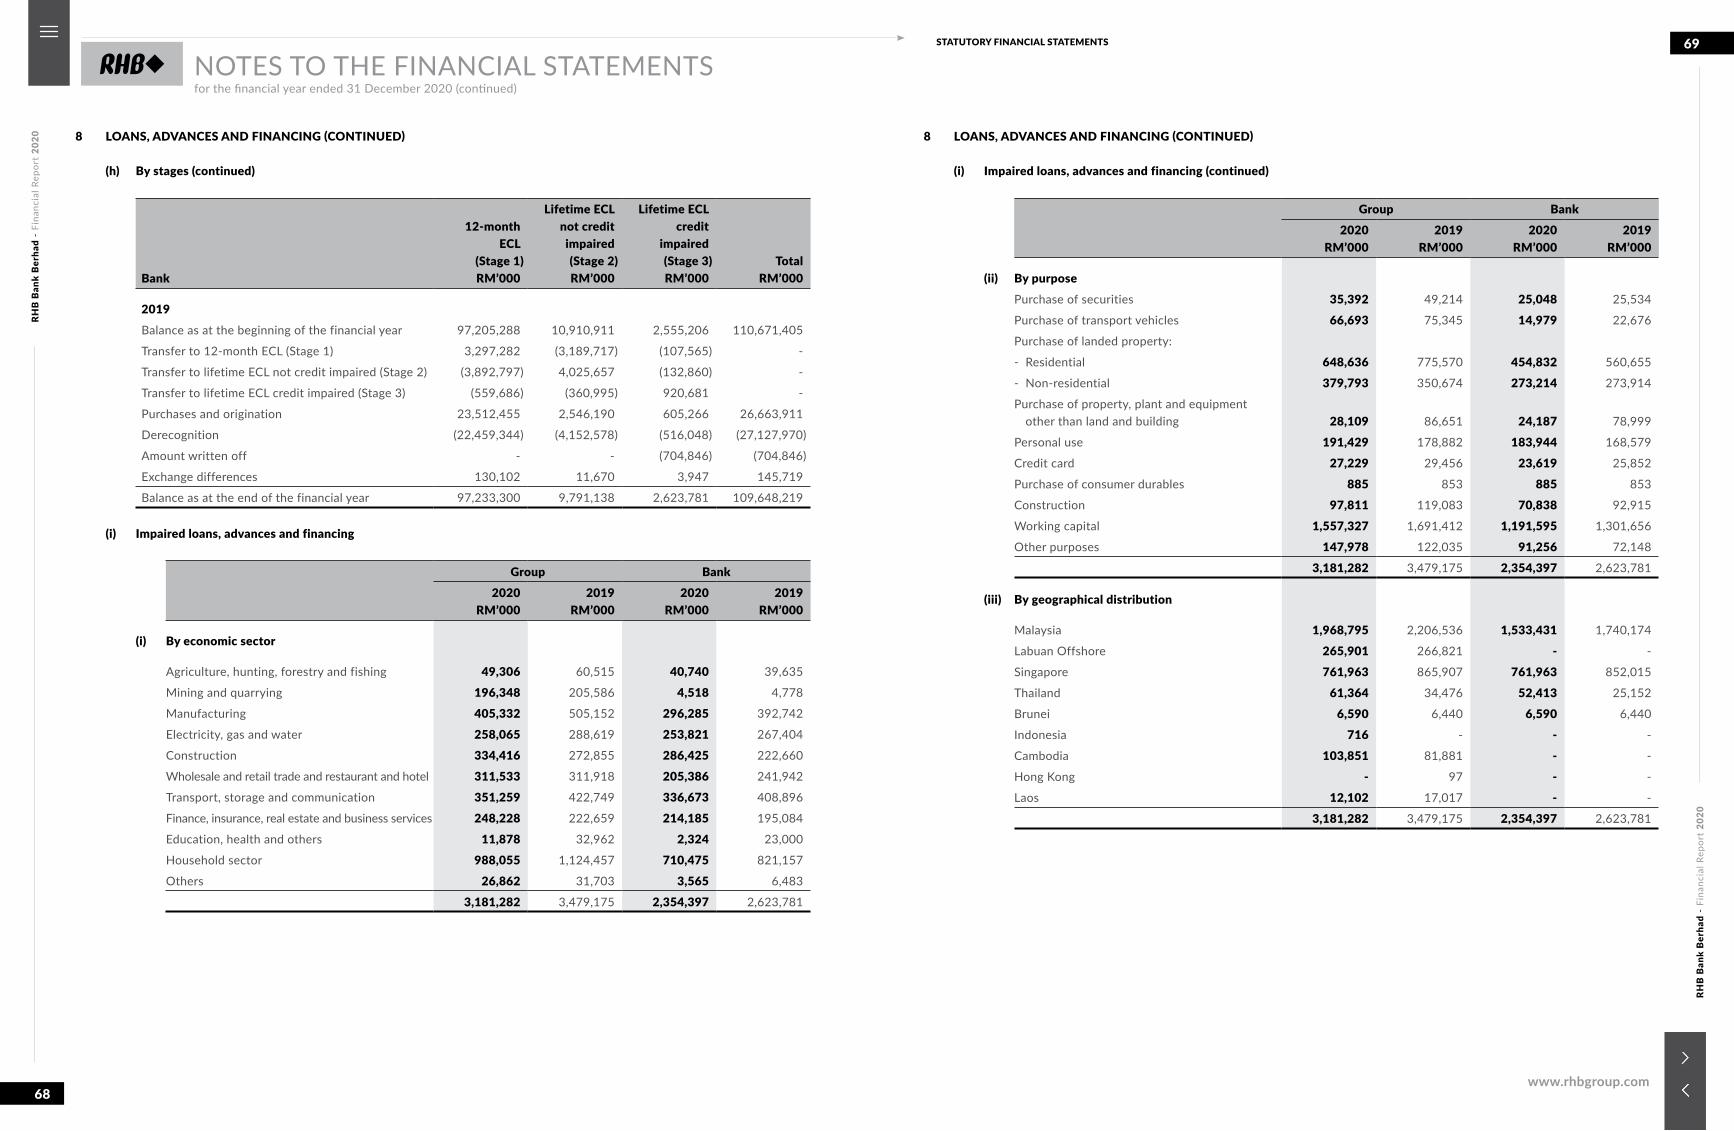
RHB
Ban
k B
erha
d -
Fina
ncia
l Rep
ort
2020
RHB
Ban
k B
erha
d -
Fina
ncia
l Rep
ort
2020
68
69STATUTORY FINANCIAL STATEMENTS
www.rhbgroup.com
NOTES TO THE FINANCIAL STATEMENTSfor the financial year ended 31 December 2020 (continued)
8 LOANS, ADVANCES AND FINANCING (CONTINUED)
(h) By stages (continued)
Bank
12-monthECL
(Stage 1)RM’000
Lifetime ECLnot creditimpaired(Stage 2) RM’000
Lifetime ECLcredit
impaired(Stage 3) RM’000
Total RM’000
2019Balance as at the beginning of the financial year 97,205,288 10,910,911 2,555,206 110,671,405
Transfer to 12-month ECL (Stage 1) 3,297,282 (3,189,717) (107,565) -
Transfer to lifetime ECL not credit impaired (Stage 2) (3,892,797) 4,025,657 (132,860) -
Transfer to lifetime ECL credit impaired (Stage 3) (559,686) (360,995) 920,681 -
Purchases and origination 23,512,455 2,546,190 605,266 26,663,911
Derecognition (22,459,344) (4,152,578) (516,048) (27,127,970)
Amount written off - - (704,846) (704,846)
Exchange differences 130,102 11,670 3,947 145,719
Balance as at the end of the financial year 97,233,300 9,791,138 2,623,781 109,648,219
(i) Impaired loans, advances and financing
Group Bank2020
RM’0002019
RM’0002020
RM’0002019
RM’000
(i) By economic sector
Agriculture, hunting, forestry and fishing 49,306 60,515 40,740 39,635
Mining and quarrying 196,348 205,586 4,518 4,778
Manufacturing 405,332 505,152 296,285 392,742
Electricity, gas and water 258,065 288,619 253,821 267,404
Construction 334,416 272,855 286,425 222,660
Wholesale and retail trade and restaurant and hotel 311,533 311,918 205,386 241,942
Transport, storage and communication 351,259 422,749 336,673 408,896
Finance, insurance, real estate and business services 248,228 222,659 214,185 195,084
Education, health and others 11,878 32,962 2,324 23,000
Household sector 988,055 1,124,457 710,475 821,157
Others 26,862 31,703 3,565 6,483
3,181,282 3,479,175 2,354,397 2,623,781
8 LOANS, ADVANCES AND FINANCING (CONTINUED)
(i) Impaired loans, advances and financing (continued)
Group Bank2020
RM’0002019
RM’0002020
RM’0002019
RM’000
(ii) By purposePurchase of securities 35,392 49,214 25,048 25,534
Purchase of transport vehicles 66,693 75,345 14,979 22,676
Purchase of landed property:
- Residential 648,636 775,570 454,832 560,655
- Non-residential 379,793 350,674 273,214 273,914
Purchase of property, plant and equipment other than land and building 28,109 86,651 24,187 78,999
Personal use 191,429 178,882 183,944 168,579
Credit card 27,229 29,456 23,619 25,852
Purchase of consumer durables 885 853 885 853
Construction 97,811 119,083 70,838 92,915
Working capital 1,557,327 1,691,412 1,191,595 1,301,656
Other purposes 147,978 122,035 91,256 72,148
3,181,282 3,479,175 2,354,397 2,623,781
(iii) By geographical distribution
Malaysia 1,968,795 2,206,536 1,533,431 1,740,174
Labuan Offshore 265,901 266,821 - -
Singapore 761,963 865,907 761,963 852,015
Thailand 61,364 34,476 52,413 25,152
Brunei 6,590 6,440 6,590 6,440
Indonesia 716 - - -
Cambodia 103,851 81,881 - -
Hong Kong - 97 - -
Laos 12,102 17,017 - -
3,181,282 3,479,175 2,354,397 2,623,781
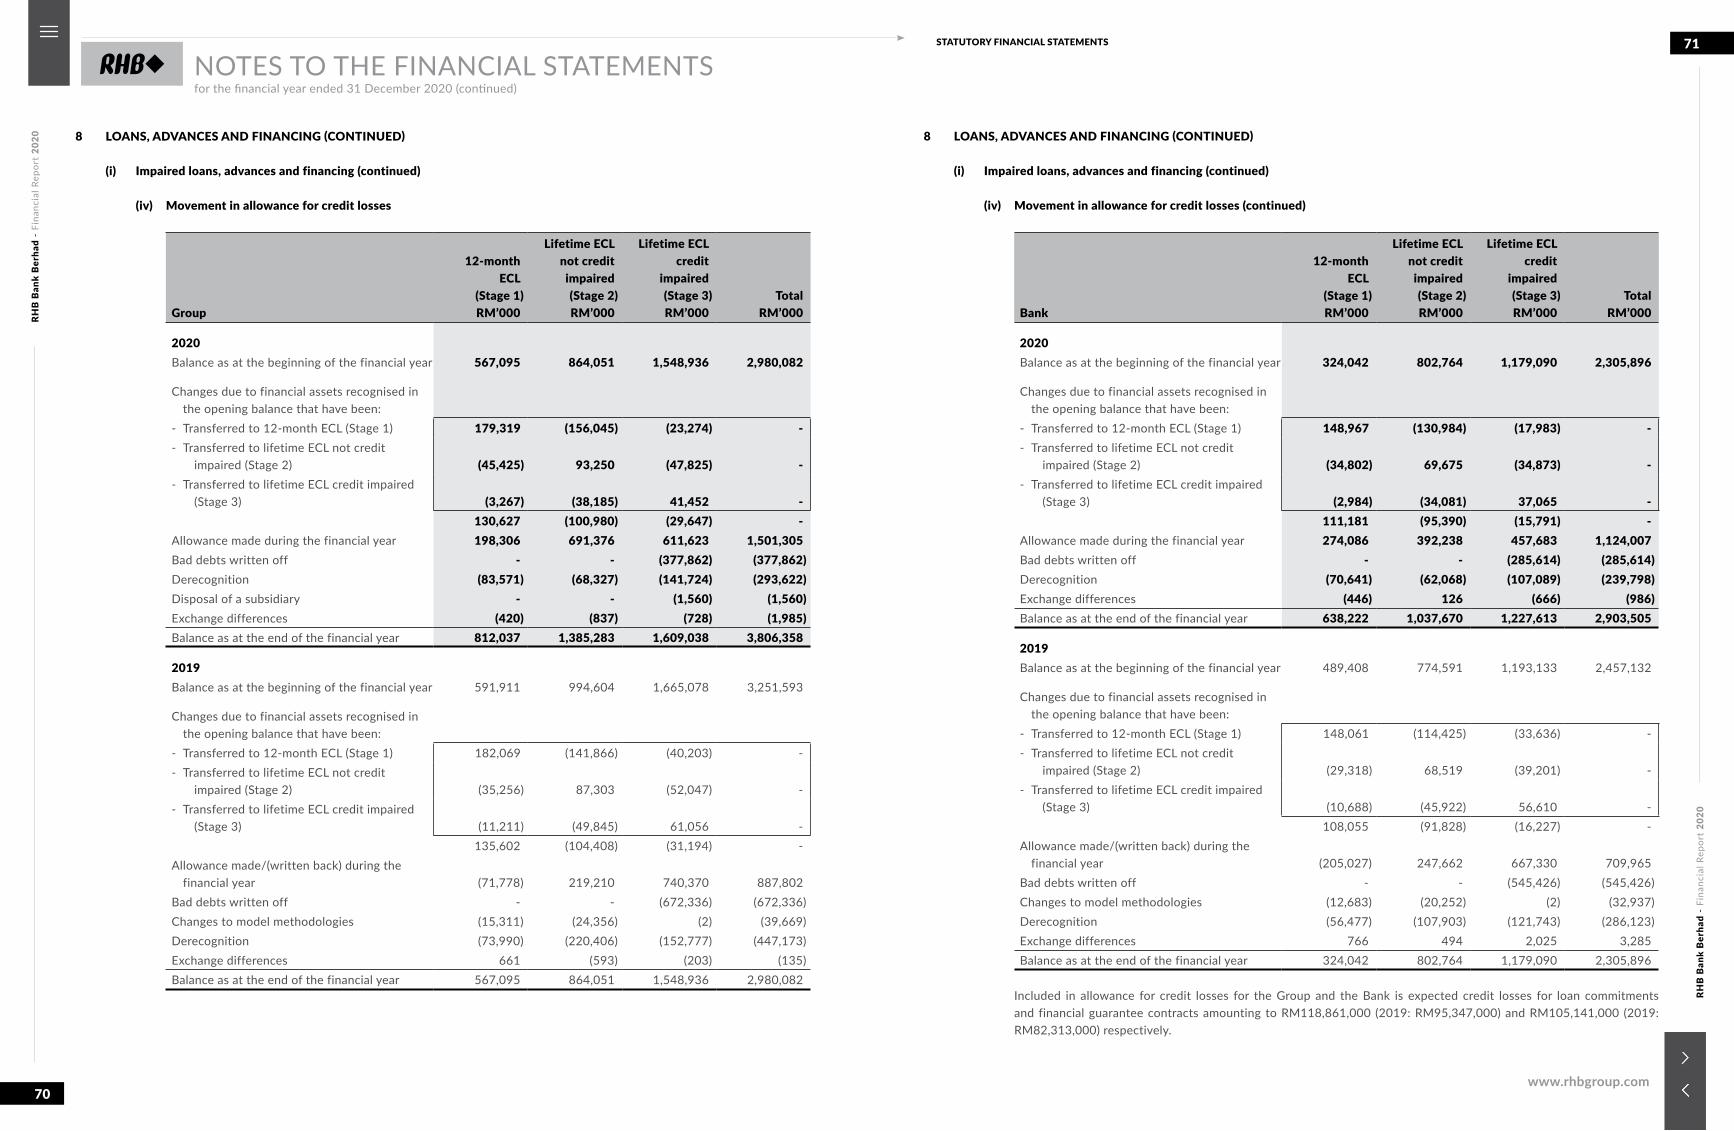
RHB
Ban
k B
erha
d -
Fina
ncia
l Rep
ort
2020
RHB
Ban
k B
erha
d -
Fina
ncia
l Rep
ort
2020
70
71STATUTORY FINANCIAL STATEMENTS
www.rhbgroup.com
NOTES TO THE FINANCIAL STATEMENTSfor the financial year ended 31 December 2020 (continued)
8 LOANS, ADVANCES AND FINANCING (CONTINUED)
(i) Impaired loans, advances and financing (continued)
(iv) Movement in allowance for credit losses
Group
12-monthECL
(Stage 1) RM’000
Lifetime ECLnot creditimpaired(Stage 2) RM’000
Lifetime ECLcredit
impaired(Stage 3) RM’000
Total RM’000
2020Balance as at the beginning of the financial year 567,095 864,051 1,548,936 2,980,082
Changes due to financial assets recognised in the opening balance that have been:
- Transferred to 12-month ECL (Stage 1) 179,319 (156,045) (23,274) -- Transferred to lifetime ECL not credit
impaired (Stage 2) (45,425) 93,250 (47,825) -- Transferred to lifetime ECL credit impaired
(Stage 3) (3,267) (38,185) 41,452 -130,627 (100,980) (29,647) -
Allowance made during the financial year 198,306 691,376 611,623 1,501,305Bad debts written off - - (377,862) (377,862)Derecognition (83,571) (68,327) (141,724) (293,622)Disposal of a subsidiary - - (1,560) (1,560)Exchange differences (420) (837) (728) (1,985)Balance as at the end of the financial year 812,037 1,385,283 1,609,038 3,806,358
2019Balance as at the beginning of the financial year 591,911 994,604 1,665,078 3,251,593
Changes due to financial assets recognised in the opening balance that have been:
- Transferred to 12-month ECL (Stage 1) 182,069 (141,866) (40,203) -- Transferred to lifetime ECL not credit
impaired (Stage 2) (35,256) 87,303 (52,047) -- Transferred to lifetime ECL credit impaired
(Stage 3) (11,211) (49,845) 61,056 -135,602 (104,408) (31,194) -
Allowance made/(written back) during the financial year (71,778) 219,210 740,370 887,802
Bad debts written off - - (672,336) (672,336)Changes to model methodologies (15,311) (24,356) (2) (39,669)Derecognition (73,990) (220,406) (152,777) (447,173)Exchange differences 661 (593) (203) (135)Balance as at the end of the financial year 567,095 864,051 1,548,936 2,980,082
8 LOANS, ADVANCES AND FINANCING (CONTINUED)
(i) Impaired loans, advances and financing (continued)
(iv) Movement in allowance for credit losses (continued)
Bank
12-monthECL
(Stage 1) RM’000
Lifetime ECLnot creditimpaired(Stage 2) RM’000
Lifetime ECLcredit
impaired(Stage 3) RM’000
Total RM’000
2020Balance as at the beginning of the financial year 324,042 802,764 1,179,090 2,305,896
Changes due to financial assets recognised in the opening balance that have been:
- Transferred to 12-month ECL (Stage 1) 148,967 (130,984) (17,983) -- Transferred to lifetime ECL not credit
impaired (Stage 2) (34,802) 69,675 (34,873) -- Transferred to lifetime ECL credit impaired
(Stage 3) (2,984) (34,081) 37,065 -111,181 (95,390) (15,791) -
Allowance made during the financial year 274,086 392,238 457,683 1,124,007Bad debts written off - - (285,614) (285,614)Derecognition (70,641) (62,068) (107,089) (239,798)Exchange differences (446) 126 (666) (986)Balance as at the end of the financial year 638,222 1,037,670 1,227,613 2,903,505
2019Balance as at the beginning of the financial year 489,408 774,591 1,193,133 2,457,132
Changes due to financial assets recognised in the opening balance that have been:
- Transferred to 12-month ECL (Stage 1) 148,061 (114,425) (33,636) -- Transferred to lifetime ECL not credit
impaired (Stage 2) (29,318) 68,519 (39,201) -- Transferred to lifetime ECL credit impaired
(Stage 3) (10,688) (45,922) 56,610 -108,055 (91,828) (16,227) -
Allowance made/(written back) during the financial year (205,027) 247,662 667,330 709,965
Bad debts written off - - (545,426) (545,426)Changes to model methodologies (12,683) (20,252) (2) (32,937)Derecognition (56,477) (107,903) (121,743) (286,123)Exchange differences 766 494 2,025 3,285 Balance as at the end of the financial year 324,042 802,764 1,179,090 2,305,896
Included in allowance for credit losses for the Group and the Bank is expected credit losses for loan commitments and financial guarantee contracts amounting to RM118,861,000 (2019: RM95,347,000) and RM105,141,000 (2019: RM82,313,000) respectively.
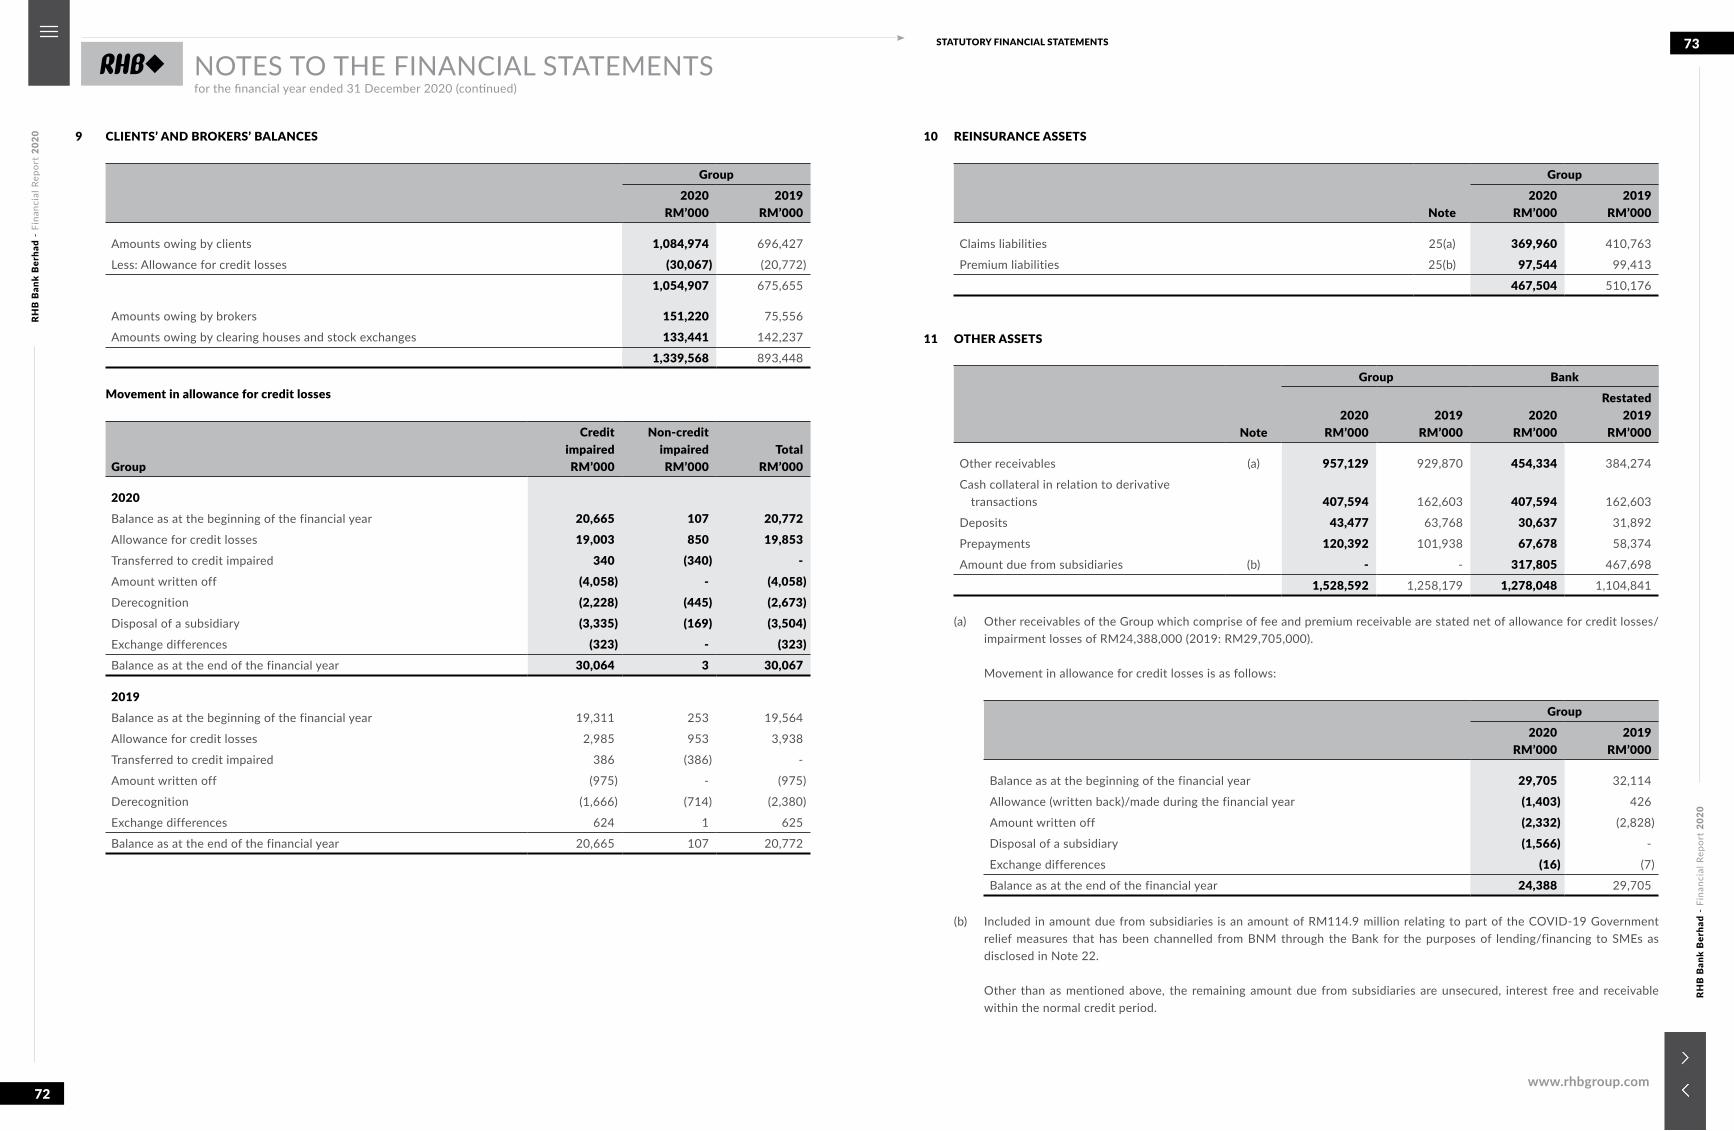
RHB
Ban
k B
erha
d -
Fina
ncia
l Rep
ort
2020
RHB
Ban
k B
erha
d -
Fina
ncia
l Rep
ort
2020
72
73STATUTORY FINANCIAL STATEMENTS
www.rhbgroup.com
NOTES TO THE FINANCIAL STATEMENTSfor the financial year ended 31 December 2020 (continued)
9 CLIENTS’ AND BROKERS’ BALANCES
Group2020
RM’0002019
RM’000
Amounts owing by clients 1,084,974 696,427
Less: Allowance for credit losses (30,067) (20,772)
1,054,907 675,655
Amounts owing by brokers 151,220 75,556
Amounts owing by clearing houses and stock exchanges 133,441 142,237
1,339,568 893,448
Movement in allowance for credit losses
Group
CreditimpairedRM’000
Non-creditimpairedRM’000
Total RM’000
2020Balance as at the beginning of the financial year 20,665 107 20,772Allowance for credit losses 19,003 850 19,853Transferred to credit impaired 340 (340) -Amount written off (4,058) - (4,058)Derecognition (2,228) (445) (2,673)Disposal of a subsidiary (3,335) (169) (3,504)Exchange differences (323) - (323)Balance as at the end of the financial year 30,064 3 30,067
2019Balance as at the beginning of the financial year 19,311 253 19,564
Allowance for credit losses 2,985 953 3,938
Transferred to credit impaired 386 (386) -
Amount written off (975) - (975)
Derecognition (1,666) (714) (2,380)
Exchange differences 624 1 625
Balance as at the end of the financial year 20,665 107 20,772
10 REINSURANCE ASSETS
Note
Group2020
RM’0002019
RM’000
Claims liabilities 25(a) 369,960 410,763
Premium liabilities 25(b) 97,544 99,413
467,504 510,176
11 OTHER ASSETS
Note
Group Bank
2020RM’000
2019RM’000
2020RM’000
Restated2019
RM’000
Other receivables (a) 957,129 929,870 454,334 384,274
Cash collateral in relation to derivative transactions 407,594 162,603 407,594 162,603
Deposits 43,477 63,768 30,637 31,892
Prepayments 120,392 101,938 67,678 58,374
Amount due from subsidiaries (b) - - 317,805 467,698
1,528,592 1,258,179 1,278,048 1,104,841
(a) Other receivables of the Group which comprise of fee and premium receivable are stated net of allowance for credit losses/impairment losses of RM24,388,000 (2019: RM29,705,000).
Movement in allowance for credit losses is as follows:
Group2020
RM’0002019
RM’000
Balance as at the beginning of the financial year 29,705 32,114
Allowance (written back)/made during the financial year (1,403) 426
Amount written off (2,332) (2,828)
Disposal of a subsidiary (1,566) -
Exchange differences (16) (7)
Balance as at the end of the financial year 24,388 29,705
(b) Included in amount due from subsidiaries is an amount of RM114.9 million relating to part of the COVID-19 Government relief measures that has been channelled from BNM through the Bank for the purposes of lending/financing to SMEs as disclosed in Note 22.
Other than as mentioned above, the remaining amount due from subsidiaries are unsecured, interest free and receivable within the normal credit period.
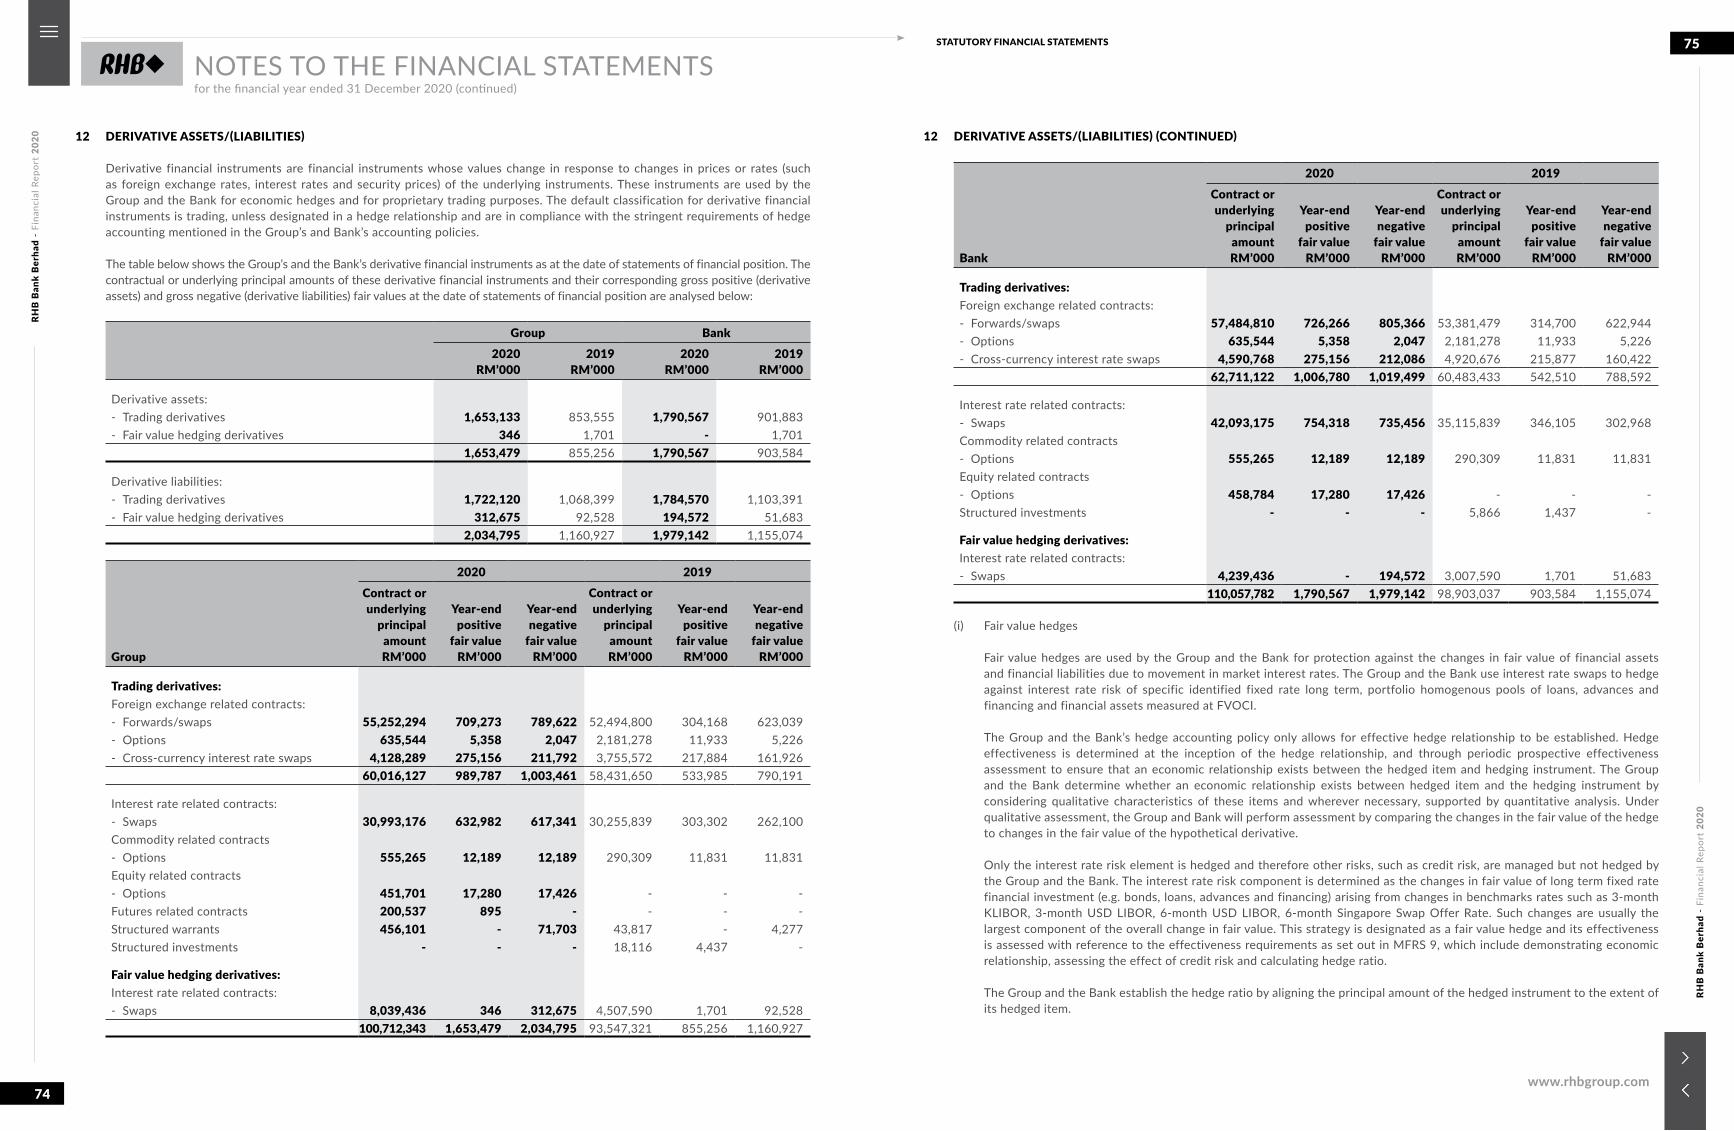
RHB
Ban
k B
erha
d -
Fina
ncia
l Rep
ort
2020
RHB
Ban
k B
erha
d -
Fina
ncia
l Rep
ort
2020
74
75STATUTORY FINANCIAL STATEMENTS
www.rhbgroup.com
NOTES TO THE FINANCIAL STATEMENTSfor the financial year ended 31 December 2020 (continued)
12 DERIVATIVE ASSETS/(LIABILITIES)
Derivative financial instruments are financial instruments whose values change in response to changes in prices or rates (such as foreign exchange rates, interest rates and security prices) of the underlying instruments. These instruments are used by the Group and the Bank for economic hedges and for proprietary trading purposes. The default classification for derivative financial instruments is trading, unless designated in a hedge relationship and are in compliance with the stringent requirements of hedge accounting mentioned in the Group’s and Bank’s accounting policies.
The table below shows the Group’s and the Bank’s derivative financial instruments as at the date of statements of financial position. The contractual or underlying principal amounts of these derivative financial instruments and their corresponding gross positive (derivative assets) and gross negative (derivative liabilities) fair values at the date of statements of financial position are analysed below:
Group Bank2020
RM’0002019
RM’0002020
RM’0002019
RM’000
Derivative assets:- Trading derivatives 1,653,133 853,555 1,790,567 901,883- Fair value hedging derivatives 346 1,701 - 1,701
1,653,479 855,256 1,790,567 903,584
Derivative liabilities:- Trading derivatives 1,722,120 1,068,399 1,784,570 1,103,391- Fair value hedging derivatives 312,675 92,528 194,572 51,683
2,034,795 1,160,927 1,979,142 1,155,074
Group
2020 2019Contract orunderlying
principalamountRM’000
Year-endpositive
fair valueRM’000
Year-endnegative
fair valueRM’000
Contract orunderlying
principalamountRM’000
Year-endpositive
fair valueRM’000
Year-endnegative
fair value RM’000
Trading derivatives:Foreign exchange related contracts:- Forwards/swaps 55,252,294 709,273 789,622 52,494,800 304,168 623,039- Options 635,544 5,358 2,047 2,181,278 11,933 5,226- Cross-currency interest rate swaps 4,128,289 275,156 211,792 3,755,572 217,884 161,926
60,016,127 989,787 1,003,461 58,431,650 533,985 790,191
Interest rate related contracts:- Swaps 30,993,176 632,982 617,341 30,255,839 303,302 262,100Commodity related contracts- Options 555,265 12,189 12,189 290,309 11,831 11,831Equity related contracts- Options 451,701 17,280 17,426 - - -Futures related contracts 200,537 895 - - - -Structured warrants 456,101 - 71,703 43,817 - 4,277Structured investments - - - 18,116 4,437 -
Fair value hedging derivatives:Interest rate related contracts:- Swaps 8,039,436 346 312,675 4,507,590 1,701 92,528
100,712,343 1,653,479 2,034,795 93,547,321 855,256 1,160,927
12 DERIVATIVE ASSETS/(LIABILITIES) (CONTINUED)
Bank
2020 2019Contract orunderlying
principalamountRM’000
Year-endpositive
fair valueRM’000
Year-endnegative
fair valueRM’000
Contract orunderlying
principalamountRM’000
Year-endpositive
fair valueRM’000
Year-endnegative
fair value RM’000
Trading derivatives:Foreign exchange related contracts:- Forwards/swaps 57,484,810 726,266 805,366 53,381,479 314,700 622,944- Options 635,544 5,358 2,047 2,181,278 11,933 5,226- Cross-currency interest rate swaps 4,590,768 275,156 212,086 4,920,676 215,877 160,422
62,711,122 1,006,780 1,019,499 60,483,433 542,510 788,592
Interest rate related contracts:- Swaps 42,093,175 754,318 735,456 35,115,839 346,105 302,968Commodity related contracts- Options 555,265 12,189 12,189 290,309 11,831 11,831Equity related contracts- Options 458,784 17,280 17,426 - - -Structured investments - - - 5,866 1,437 -
Fair value hedging derivatives:Interest rate related contracts:- Swaps 4,239,436 - 194,572 3,007,590 1,701 51,683
110,057,782 1,790,567 1,979,142 98,903,037 903,584 1,155,074
(i) Fair value hedges
Fair value hedges are used by the Group and the Bank for protection against the changes in fair value of financial assets and financial liabilities due to movement in market interest rates. The Group and the Bank use interest rate swaps to hedge against interest rate risk of specific identified fixed rate long term, portfolio homogenous pools of loans, advances and financing and financial assets measured at FVOCI.
The Group and the Bank’s hedge accounting policy only allows for effective hedge relationship to be established. Hedge effectiveness is determined at the inception of the hedge relationship, and through periodic prospective effectiveness assessment to ensure that an economic relationship exists between the hedged item and hedging instrument. The Group and the Bank determine whether an economic relationship exists between hedged item and the hedging instrument by considering qualitative characteristics of these items and wherever necessary, supported by quantitative analysis. Under qualitative assessment, the Group and Bank will perform assessment by comparing the changes in the fair value of the hedge to changes in the fair value of the hypothetical derivative.
Only the interest rate risk element is hedged and therefore other risks, such as credit risk, are managed but not hedged by the Group and the Bank. The interest rate risk component is determined as the changes in fair value of long term fixed rate financial investment (e.g. bonds, loans, advances and financing) arising from changes in benchmarks rates such as 3-month KLIBOR, 3-month USD LIBOR, 6-month USD LIBOR, 6-month Singapore Swap Offer Rate. Such changes are usually the largest component of the overall change in fair value. This strategy is designated as a fair value hedge and its effectiveness is assessed with reference to the effectiveness requirements as set out in MFRS 9, which include demonstrating economic relationship, assessing the effect of credit risk and calculating hedge ratio.
The Group and the Bank establish the hedge ratio by aligning the principal amount of the hedged instrument to the extent of its hedged item.
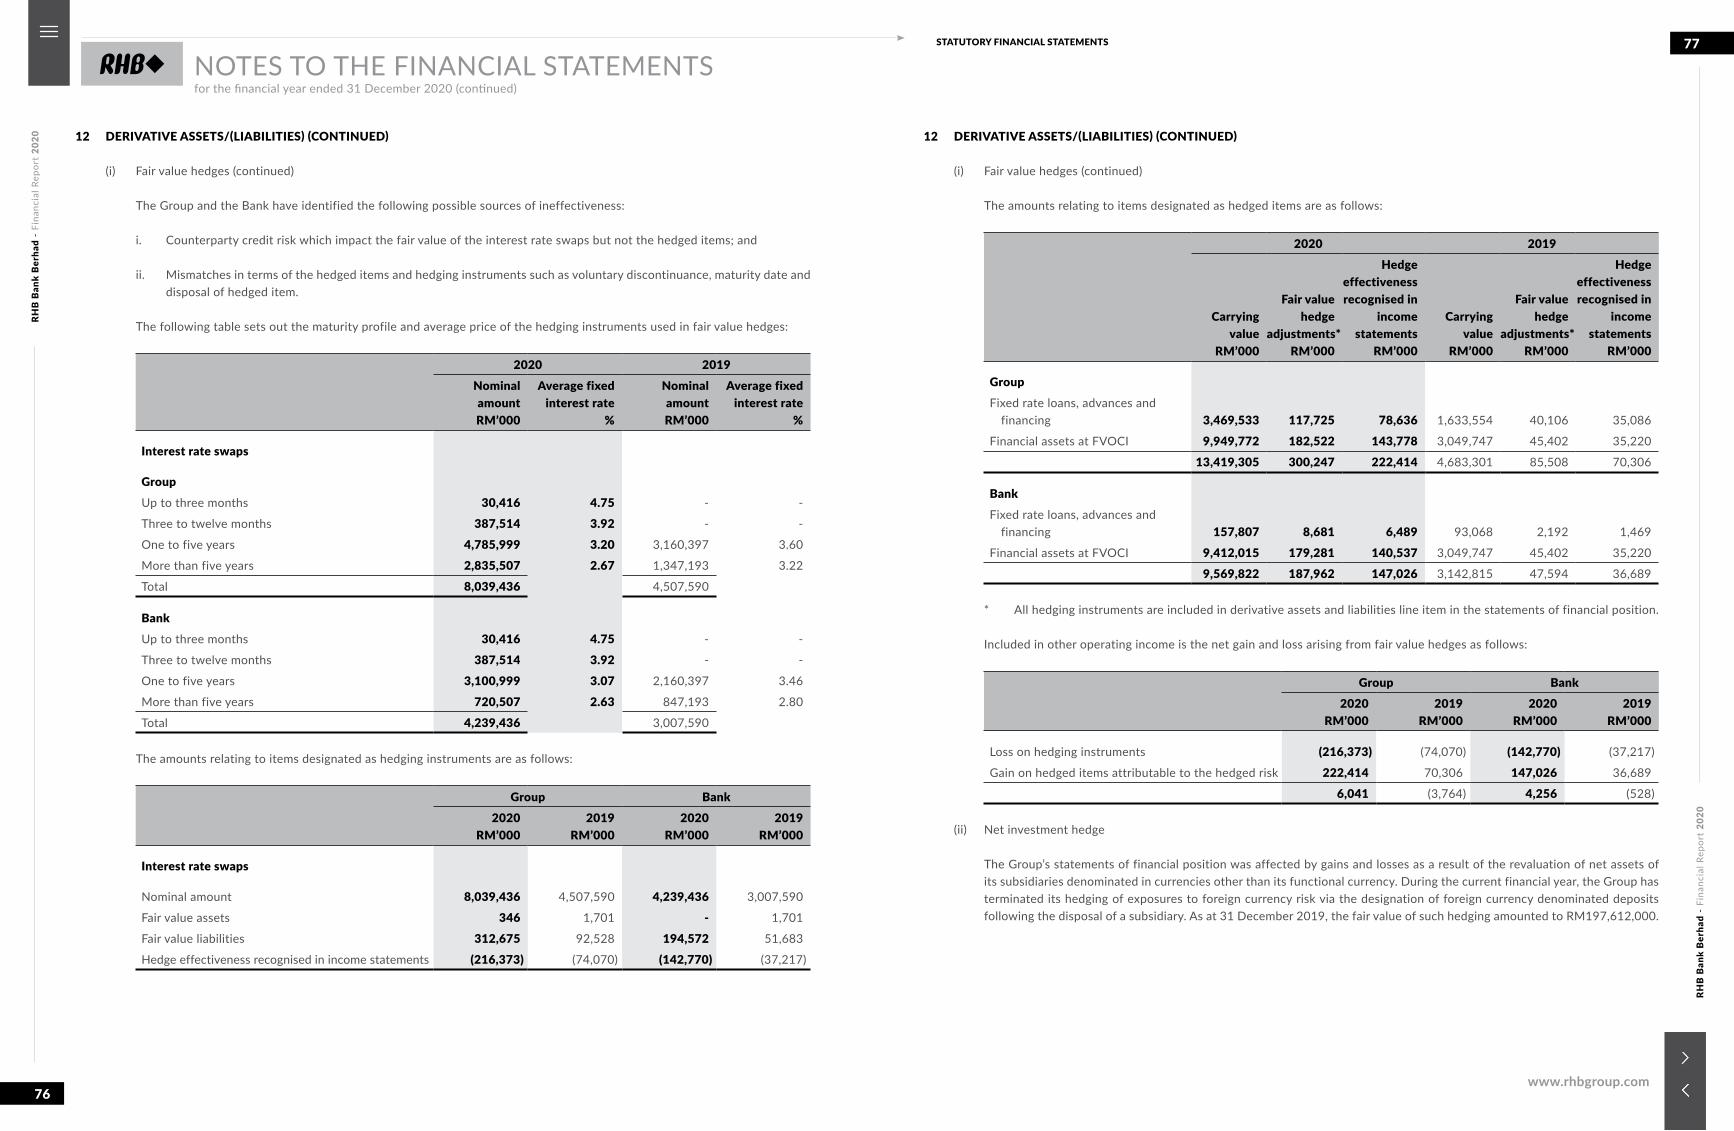
RHB
Ban
k B
erha
d -
Fina
ncia
l Rep
ort
2020
RHB
Ban
k B
erha
d -
Fina
ncia
l Rep
ort
2020
76
77STATUTORY FINANCIAL STATEMENTS
www.rhbgroup.com
NOTES TO THE FINANCIAL STATEMENTSfor the financial year ended 31 December 2020 (continued)
12 DERIVATIVE ASSETS/(LIABILITIES) (CONTINUED)
(i) Fair value hedges (continued)
The Group and the Bank have identified the following possible sources of ineffectiveness:
i. Counterparty credit risk which impact the fair value of the interest rate swaps but not the hedged items; and
ii. Mismatches in terms of the hedged items and hedging instruments such as voluntary discontinuance, maturity date and disposal of hedged item.
The following table sets out the maturity profile and average price of the hedging instruments used in fair value hedges:
2020 2019NominalamountRM’000
Average fixedinterest rate
%
NominalamountRM’000
Average fixedinterest rate
%
Interest rate swaps
GroupUp to three months 30,416 4.75 - -
Three to twelve months 387,514 3.92 - -
One to five years 4,785,999 3.20 3,160,397 3.60
More than five years 2,835,507 2.67 1,347,193 3.22
Total 8,039,436 4,507,590
BankUp to three months 30,416 4.75 - -
Three to twelve months 387,514 3.92 - -
One to five years 3,100,999 3.07 2,160,397 3.46
More than five years 720,507 2.63 847,193 2.80
Total 4,239,436 3,007,590
The amounts relating to items designated as hedging instruments are as follows:
Group Bank2020
RM’0002019
RM’0002020
RM’0002019
RM’000
Interest rate swaps
Nominal amount 8,039,436 4,507,590 4,239,436 3,007,590
Fair value assets 346 1,701 - 1,701
Fair value liabilities 312,675 92,528 194,572 51,683
Hedge effectiveness recognised in income statements (216,373) (74,070) (142,770) (37,217)
12 DERIVATIVE ASSETS/(LIABILITIES) (CONTINUED)
(i) Fair value hedges (continued)
The amounts relating to items designated as hedged items are as follows:
2020 2019
Carryingvalue
RM’000
Fair valuehedge
adjustments*RM’000
Hedgeeffectivenessrecognised in
incomestatements
RM’000
Carryingvalue
RM’000
Fair value hedge
adjustments*RM’000
Hedgeeffectivenessrecognised in
incomestatements
RM’000
GroupFixed rate loans, advances and
financing 3,469,533 117,725 78,636 1,633,554 40,106 35,086
Financial assets at FVOCI 9,949,772 182,522 143,778 3,049,747 45,402 35,220
13,419,305 300,247 222,414 4,683,301 85,508 70,306
BankFixed rate loans, advances and
financing 157,807 8,681 6,489 93,068 2,192 1,469
Financial assets at FVOCI 9,412,015 179,281 140,537 3,049,747 45,402 35,220
9,569,822 187,962 147,026 3,142,815 47,594 36,689
* All hedging instruments are included in derivative assets and liabilities line item in the statements of financial position.
Included in other operating income is the net gain and loss arising from fair value hedges as follows:
Group Bank2020
RM’0002019
RM’0002020
RM’0002019
RM’000
Loss on hedging instruments (216,373) (74,070) (142,770) (37,217)
Gain on hedged items attributable to the hedged risk 222,414 70,306 147,026 36,689
6,041 (3,764) 4,256 (528)
(ii) Net investment hedge
The Group’s statements of financial position was affected by gains and losses as a result of the revaluation of net assets of its subsidiaries denominated in currencies other than its functional currency. During the current financial year, the Group has terminated its hedging of exposures to foreign currency risk via the designation of foreign currency denominated deposits following the disposal of a subsidiary. As at 31 December 2019, the fair value of such hedging amounted to RM197,612,000.
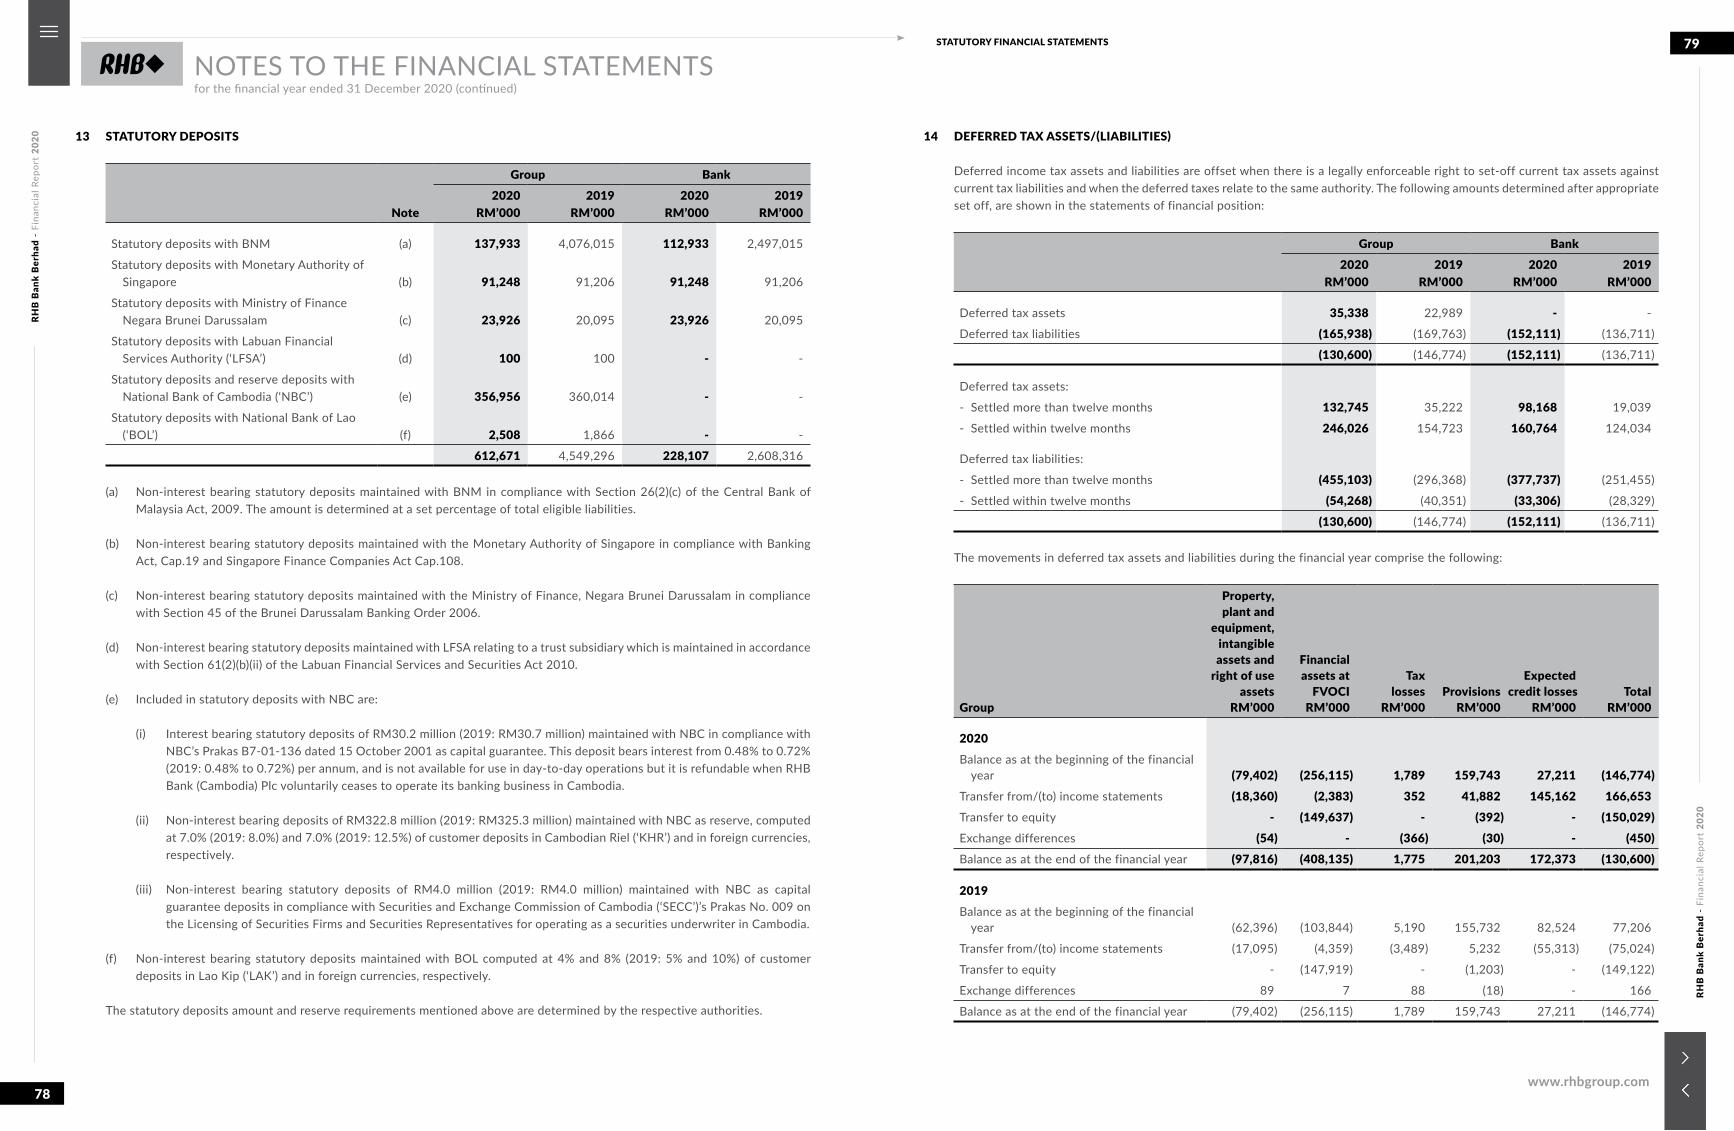
RHB
Ban
k B
erha
d -
Fina
ncia
l Rep
ort
2020
RHB
Ban
k B
erha
d -
Fina
ncia
l Rep
ort
2020
78
79STATUTORY FINANCIAL STATEMENTS
www.rhbgroup.com
NOTES TO THE FINANCIAL STATEMENTSfor the financial year ended 31 December 2020 (continued)
13 STATUTORY DEPOSITS
Note
Group Bank2020
RM’0002019
RM’0002020
RM’0002019
RM’000
Statutory deposits with BNM (a) 137,933 4,076,015 112,933 2,497,015
Statutory deposits with Monetary Authority of Singapore (b) 91,248 91,206 91,248 91,206
Statutory deposits with Ministry of Finance Negara Brunei Darussalam (c) 23,926 20,095 23,926 20,095
Statutory deposits with Labuan Financial Services Authority (‘LFSA’) (d) 100 100 - -
Statutory deposits and reserve deposits with National Bank of Cambodia (‘NBC’) (e) 356,956 360,014 - -
Statutory deposits with National Bank of Lao (‘BOL’) (f) 2,508 1,866 - -
612,671 4,549,296 228,107 2,608,316
(a) Non-interest bearing statutory deposits maintained with BNM in compliance with Section 26(2)(c) of the Central Bank of Malaysia Act, 2009. The amount is determined at a set percentage of total eligible liabilities.
(b) Non-interest bearing statutory deposits maintained with the Monetary Authority of Singapore in compliance with Banking Act, Cap.19 and Singapore Finance Companies Act Cap.108.
(c) Non-interest bearing statutory deposits maintained with the Ministry of Finance, Negara Brunei Darussalam in compliance with Section 45 of the Brunei Darussalam Banking Order 2006.
(d) Non-interest bearing statutory deposits maintained with LFSA relating to a trust subsidiary which is maintained in accordance with Section 61(2)(b)(ii) of the Labuan Financial Services and Securities Act 2010.
(e) Included in statutory deposits with NBC are:
(i) Interest bearing statutory deposits of RM30.2 million (2019: RM30.7 million) maintained with NBC in compliance with NBC’s Prakas B7-01-136 dated 15 October 2001 as capital guarantee. This deposit bears interest from 0.48% to 0.72% (2019: 0.48% to 0.72%) per annum, and is not available for use in day-to-day operations but it is refundable when RHB Bank (Cambodia) Plc voluntarily ceases to operate its banking business in Cambodia.
(ii) Non-interest bearing deposits of RM322.8 million (2019: RM325.3 million) maintained with NBC as reserve, computed at 7.0% (2019: 8.0%) and 7.0% (2019: 12.5%) of customer deposits in Cambodian Riel (‘KHR’) and in foreign currencies, respectively.
(iii) Non-interest bearing statutory deposits of RM4.0 million (2019: RM4.0 million) maintained with NBC as capital guarantee deposits in compliance with Securities and Exchange Commission of Cambodia (‘SECC’)’s Prakas No. 009 on the Licensing of Securities Firms and Securities Representatives for operating as a securities underwriter in Cambodia.
(f) Non-interest bearing statutory deposits maintained with BOL computed at 4% and 8% (2019: 5% and 10%) of customer deposits in Lao Kip (‘LAK’) and in foreign currencies, respectively.
The statutory deposits amount and reserve requirements mentioned above are determined by the respective authorities.
14 DEFERRED TAX ASSETS/(LIABILITIES)
Deferred income tax assets and liabilities are offset when there is a legally enforceable right to set-off current tax assets against current tax liabilities and when the deferred taxes relate to the same authority. The following amounts determined after appropriate set off, are shown in the statements of financial position:
Group Bank2020
RM’0002019
RM’0002020
RM’0002019
RM’000
Deferred tax assets 35,338 22,989 - -
Deferred tax liabilities (165,938) (169,763) (152,111) (136,711)
(130,600) (146,774) (152,111) (136,711)
Deferred tax assets:
- Settled more than twelve months 132,745 35,222 98,168 19,039
- Settled within twelve months 246,026 154,723 160,764 124,034
Deferred tax liabilities:
- Settled more than twelve months (455,103) (296,368) (377,737) (251,455)
- Settled within twelve months (54,268) (40,351) (33,306) (28,329)
(130,600) (146,774) (152,111) (136,711)
The movements in deferred tax assets and liabilities during the financial year comprise the following:
Group
Property,plant and
equipment,intangibleassets and
right of useassets
RM’000
Financialassets at
FVOCI RM’000
Taxlosses
RM’000Provisions
RM’000
Expectedcredit losses
RM’000Total
RM’000
2020Balance as at the beginning of the financial
year (79,402) (256,115) 1,789 159,743 27,211 (146,774)Transfer from/(to) income statements (18,360) (2,383) 352 41,882 145,162 166,653Transfer to equity - (149,637) - (392) - (150,029)Exchange differences (54) - (366) (30) - (450)Balance as at the end of the financial year (97,816) (408,135) 1,775 201,203 172,373 (130,600)
2019Balance as at the beginning of the financial
year (62,396) (103,844) 5,190 155,732 82,524 77,206
Transfer from/(to) income statements (17,095) (4,359) (3,489) 5,232 (55,313) (75,024)
Transfer to equity - (147,919) - (1,203) - (149,122)
Exchange differences 89 7 88 (18) - 166
Balance as at the end of the financial year (79,402) (256,115) 1,789 159,743 27,211 (146,774)
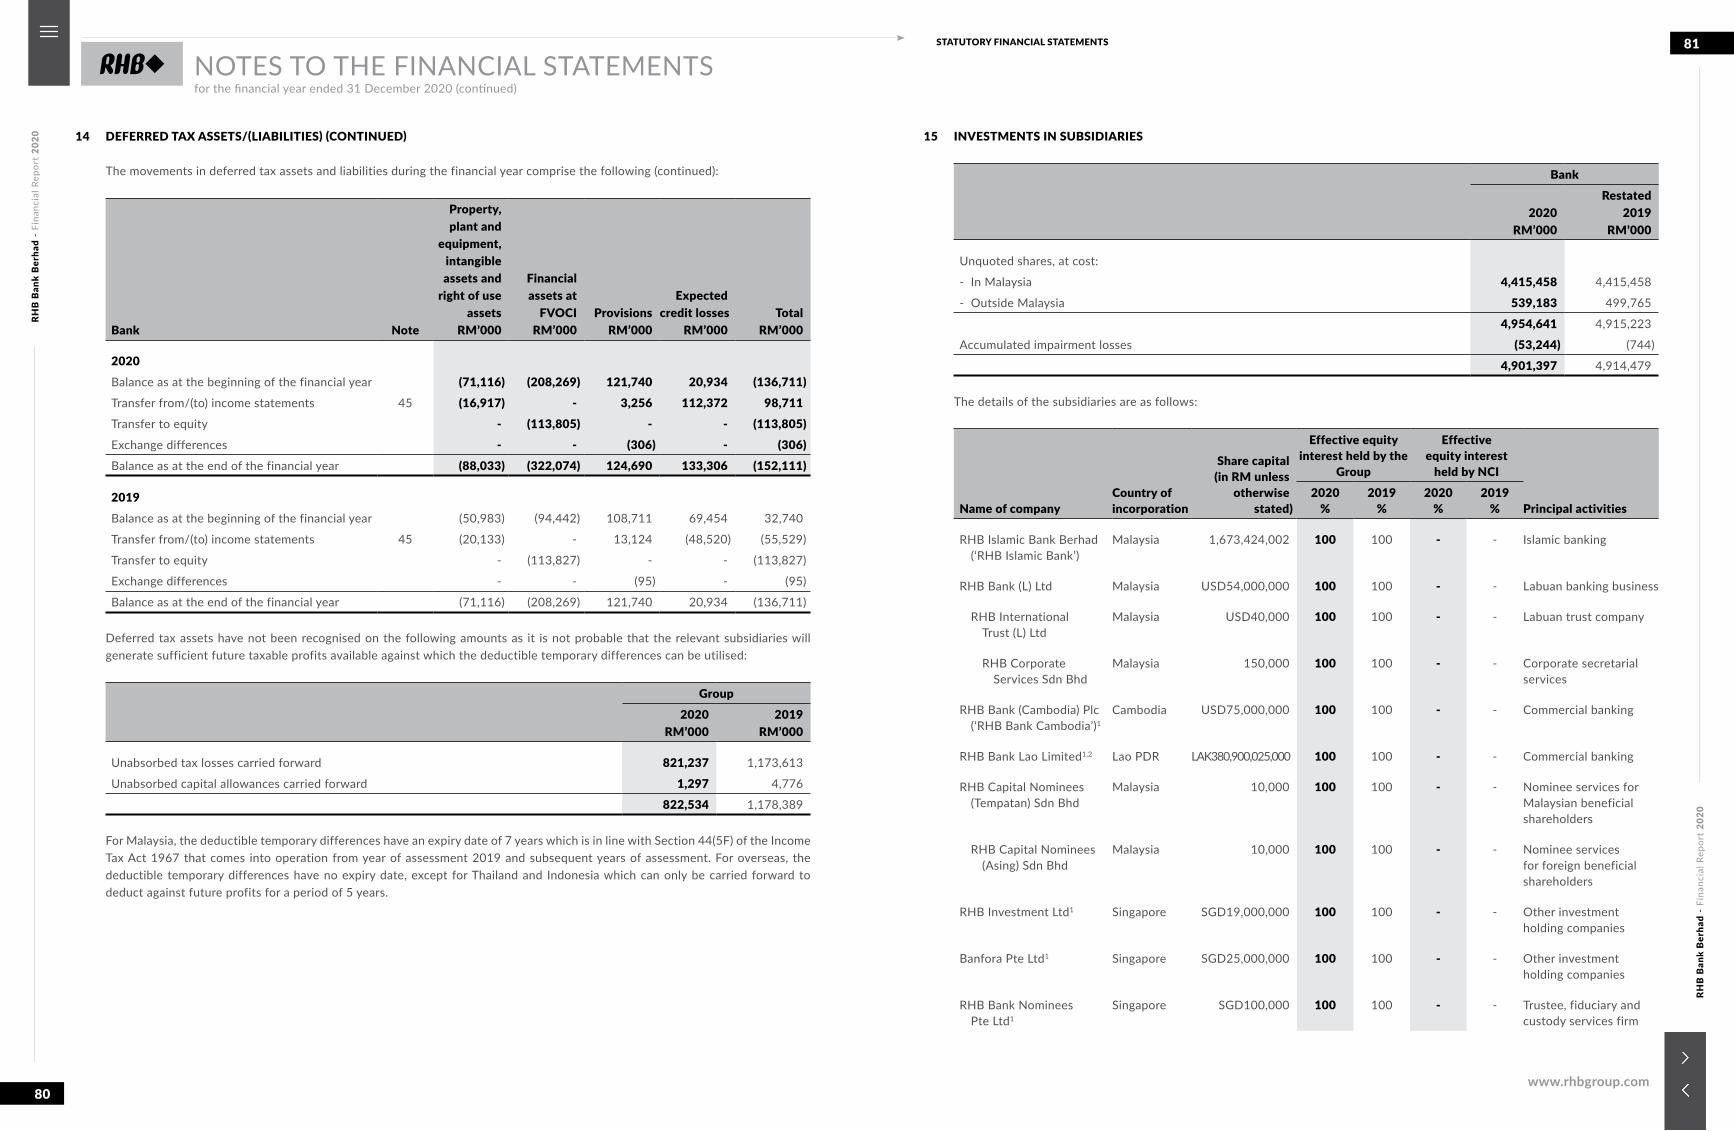
RHB
Ban
k B
erha
d -
Fina
ncia
l Rep
ort
2020
RHB
Ban
k B
erha
d -
Fina
ncia
l Rep
ort
2020
80
81STATUTORY FINANCIAL STATEMENTS
www.rhbgroup.com
NOTES TO THE FINANCIAL STATEMENTSfor the financial year ended 31 December 2020 (continued)
14 DEFERRED TAX ASSETS/(LIABILITIES) (CONTINUED)
The movements in deferred tax assets and liabilities during the financial year comprise the following (continued):
Bank Note
Property,plant and
equipment,intangibleassets and
right of useassets
RM’000
Financialassets at
FVOCI RM’000
Provisions RM’000
Expectedcredit losses
RM’000Total
RM’000
2020Balance as at the beginning of the financial year (71,116) (208,269) 121,740 20,934 (136,711)Transfer from/(to) income statements 45 (16,917) - 3,256 112,372 98,711Transfer to equity - (113,805) - - (113,805)Exchange differences - - (306) - (306)Balance as at the end of the financial year (88,033) (322,074) 124,690 133,306 (152,111)
2019Balance as at the beginning of the financial year (50,983) (94,442) 108,711 69,454 32,740
Transfer from/(to) income statements 45 (20,133) - 13,124 (48,520) (55,529)
Transfer to equity - (113,827) - - (113,827)
Exchange differences - - (95) - (95)
Balance as at the end of the financial year (71,116) (208,269) 121,740 20,934 (136,711) Deferred tax assets have not been recognised on the following amounts as it is not probable that the relevant subsidiaries will
generate sufficient future taxable profits available against which the deductible temporary differences can be utilised:
Group2020
RM’0002019
RM’000
Unabsorbed tax losses carried forward 821,237 1,173,613
Unabsorbed capital allowances carried forward 1,297 4,776
822,534 1,178,389
For Malaysia, the deductible temporary differences have an expiry date of 7 years which is in line with Section 44(5F) of the Income Tax Act 1967 that comes into operation from year of assessment 2019 and subsequent years of assessment. For overseas, the deductible temporary differences have no expiry date, except for Thailand and Indonesia which can only be carried forward to deduct against future profits for a period of 5 years.
15 INVESTMENTS IN SUBSIDIARIES
Bank
2020 RM’000
Restated2019
RM’000
Unquoted shares, at cost:
- In Malaysia 4,415,458 4,415,458
- Outside Malaysia 539,183 499,765
4,954,641 4,915,223
Accumulated impairment losses (53,244) (744)
4,901,397 4,914,479 The details of the subsidiaries are as follows:
Name of companyCountry ofincorporation
Share capital(in RM unless
otherwisestated)
Effective equity interest held by the
Group
Effectiveequity interest
held by NCI
Principal activities2020
%2019
%2020
%2019
%
RHB Islamic Bank Berhad (‘RHB Islamic Bank’)
Malaysia 1,673,424,002 100 100 - - Islamic banking
RHB Bank (L) Ltd Malaysia USD54,000,000 100 100 - - Labuan banking business
RHB International Trust (L) Ltd
Malaysia USD40,000 100 100 - - Labuan trust company
RHB Corporate Services Sdn Bhd
Malaysia 150,000 100 100 - - Corporate secretarial services
RHB Bank (Cambodia) Plc (‘RHB Bank Cambodia’)1
Cambodia USD75,000,000 100 100 - - Commercial banking
RHB Bank Lao Limited1,2 Lao PDR LAK380,900,025,000 100 100 - - Commercial banking
RHB Capital Nominees (Tempatan) Sdn Bhd
Malaysia 10,000 100 100 - - Nominee services for Malaysian beneficial shareholders
RHB Capital Nominees (Asing) Sdn Bhd
Malaysia 10,000 100 100 - - Nominee servicesfor foreign beneficialshareholders
RHB Investment Ltd1 Singapore SGD19,000,000 100 100 - - Other investmentholding companies
Banfora Pte Ltd1 Singapore SGD25,000,000 100 100 - - Other investmentholding companies
RHB Bank Nominees Pte Ltd1
Singapore SGD100,000 100 100 - - Trustee, fiduciary and custody services firm
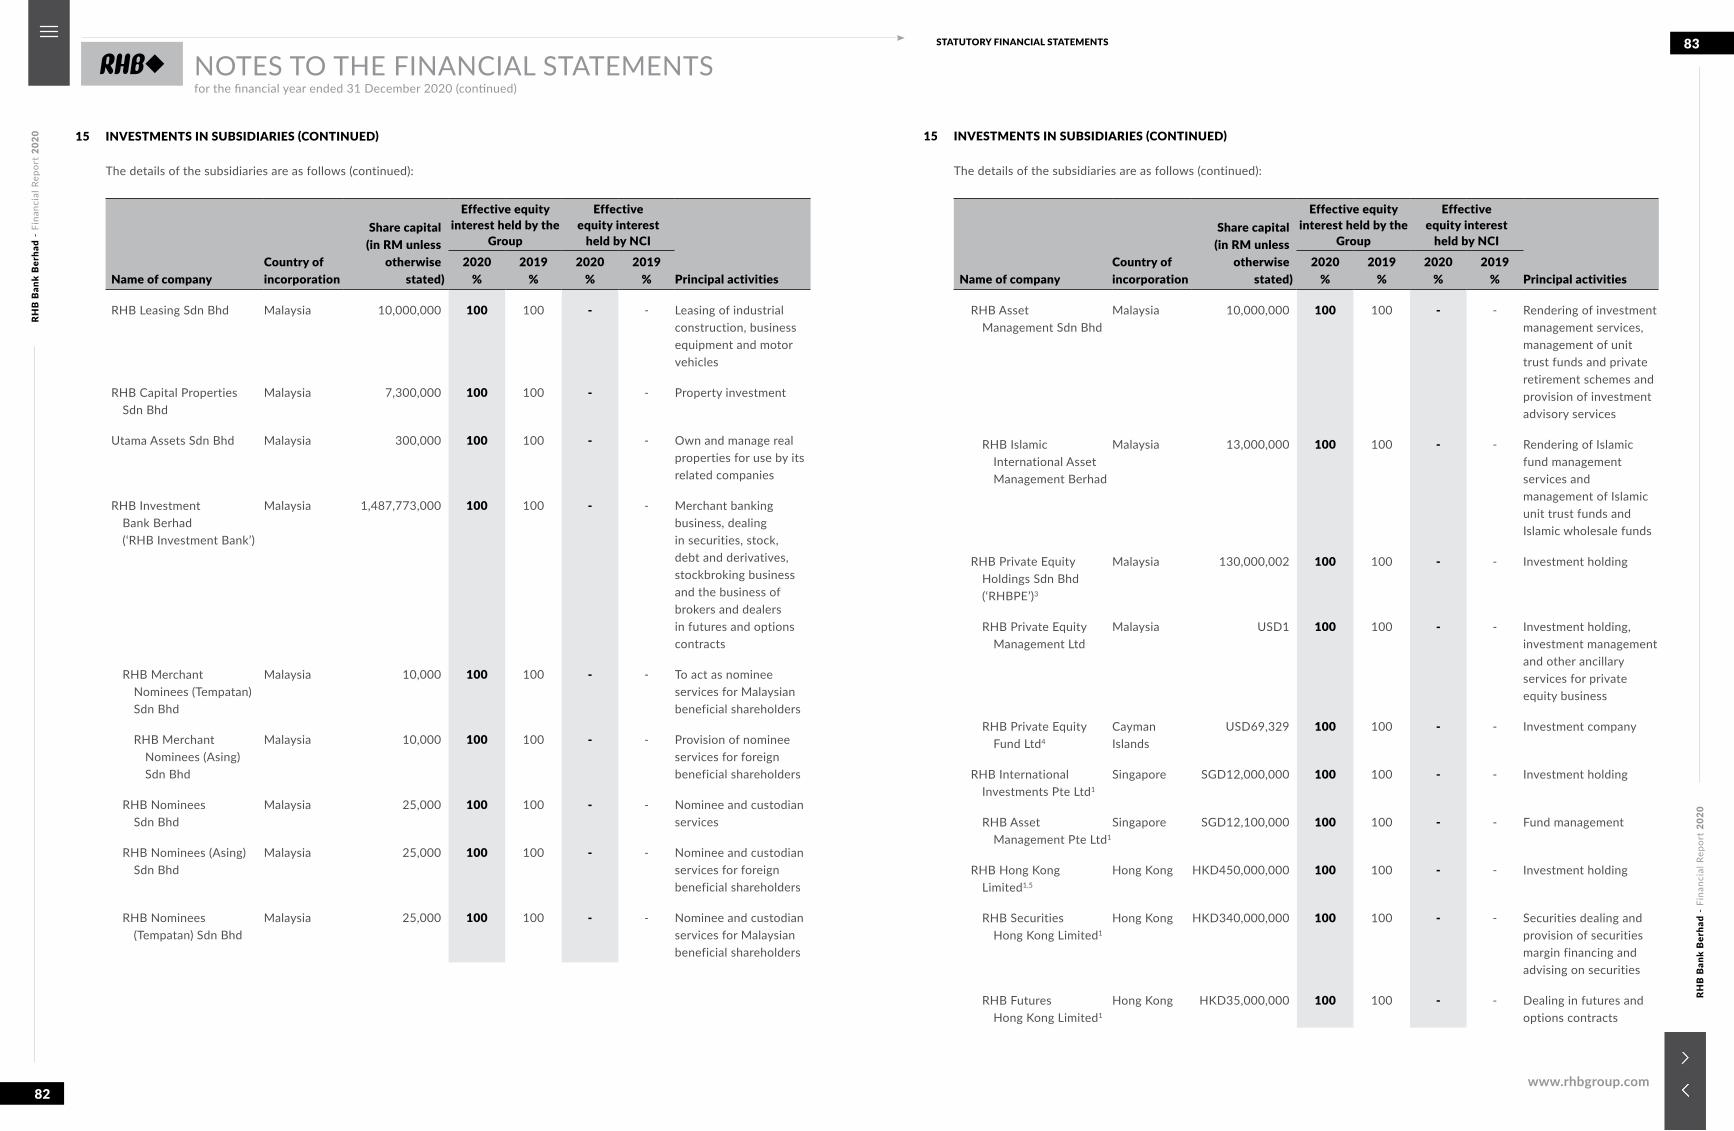
RHB
Ban
k B
erha
d -
Fina
ncia
l Rep
ort
2020
RHB
Ban
k B
erha
d -
Fina
ncia
l Rep
ort
2020
82
83STATUTORY FINANCIAL STATEMENTS
www.rhbgroup.com
NOTES TO THE FINANCIAL STATEMENTSfor the financial year ended 31 December 2020 (continued)
15 INVESTMENTS IN SUBSIDIARIES (CONTINUED)
The details of the subsidiaries are as follows (continued):
Name of companyCountry ofincorporation
Share capital(in RM unless
otherwisestated)
Effective equity interest held by the
Group
Effectiveequity interest
held by NCI
Principal activities2020
%2019
%2020
%2019
%
RHB Leasing Sdn Bhd Malaysia 10,000,000 100 100 - - Leasing of industrial construction, business equipment and motor vehicles
RHB Capital Properties Sdn Bhd
Malaysia 7,300,000 100 100 - - Property investment
Utama Assets Sdn Bhd Malaysia 300,000 100 100 - - Own and manage real properties for use by its related companies
RHB Investment Bank Berhad (‘RHB Investment Bank’)
Malaysia 1,487,773,000 100 100 - - Merchant banking business, dealing in securities, stock, debt and derivatives, stockbroking business and the business of brokers and dealers in futures and options contracts
RHB Merchant Nominees (Tempatan) Sdn Bhd
Malaysia 10,000 100 100 - - To act as nominee services for Malaysian beneficial shareholders
RHB Merchant Nominees (Asing) Sdn Bhd
Malaysia 10,000 100 100 - - Provision of nominee services for foreign beneficial shareholders
RHB Nominees Sdn Bhd
Malaysia 25,000 100 100 - - Nominee and custodian services
RHB Nominees (Asing) Sdn Bhd
Malaysia 25,000 100 100 - - Nominee and custodian services for foreign beneficial shareholders
RHB Nominees (Tempatan) Sdn Bhd
Malaysia 25,000 100 100 - - Nominee and custodian services for Malaysian beneficial shareholders
15 INVESTMENTS IN SUBSIDIARIES (CONTINUED)
The details of the subsidiaries are as follows (continued):
Name of companyCountry ofincorporation
Share capital(in RM unless
otherwisestated)
Effective equity interest held by the
Group
Effectiveequity interest
held by NCI
Principal activities2020
%2019
%2020
%2019
%
RHB Asset Management Sdn Bhd
Malaysia 10,000,000 100 100 - - Rendering of investment management services, management of unit trust funds and private retirement schemes and provision of investment advisory services
RHB Islamic International Asset Management Berhad
Malaysia 13,000,000 100 100 - - Rendering of Islamic fund management services and management of Islamic unit trust funds and Islamic wholesale funds
RHB Private Equity Holdings Sdn Bhd (‘RHBPE’)3
Malaysia 130,000,002 100 100 - - Investment holding
RHB Private Equity Management Ltd
Malaysia USD1 100 100 - - Investment holding, investment management and other ancillary services for private equity business
RHB Private Equity Fund Ltd4
Cayman Islands
USD69,329 100 100 - - Investment company
RHB International Investments Pte Ltd1
Singapore SGD12,000,000 100 100 - - Investment holding
RHB Asset Management Pte Ltd1
Singapore SGD12,100,000 100 100 - - Fund management
RHB Hong Kong Limited1,5
Hong Kong HKD450,000,000 100 100 - - Investment holding
RHB Securities Hong Kong Limited1
Hong Kong HKD340,000,000 100 100 - - Securities dealing and provision of securities margin financing and advising on securities
RHB Futures Hong Kong Limited1
Hong Kong HKD35,000,000 100 100 - - Dealing in futures and options contracts
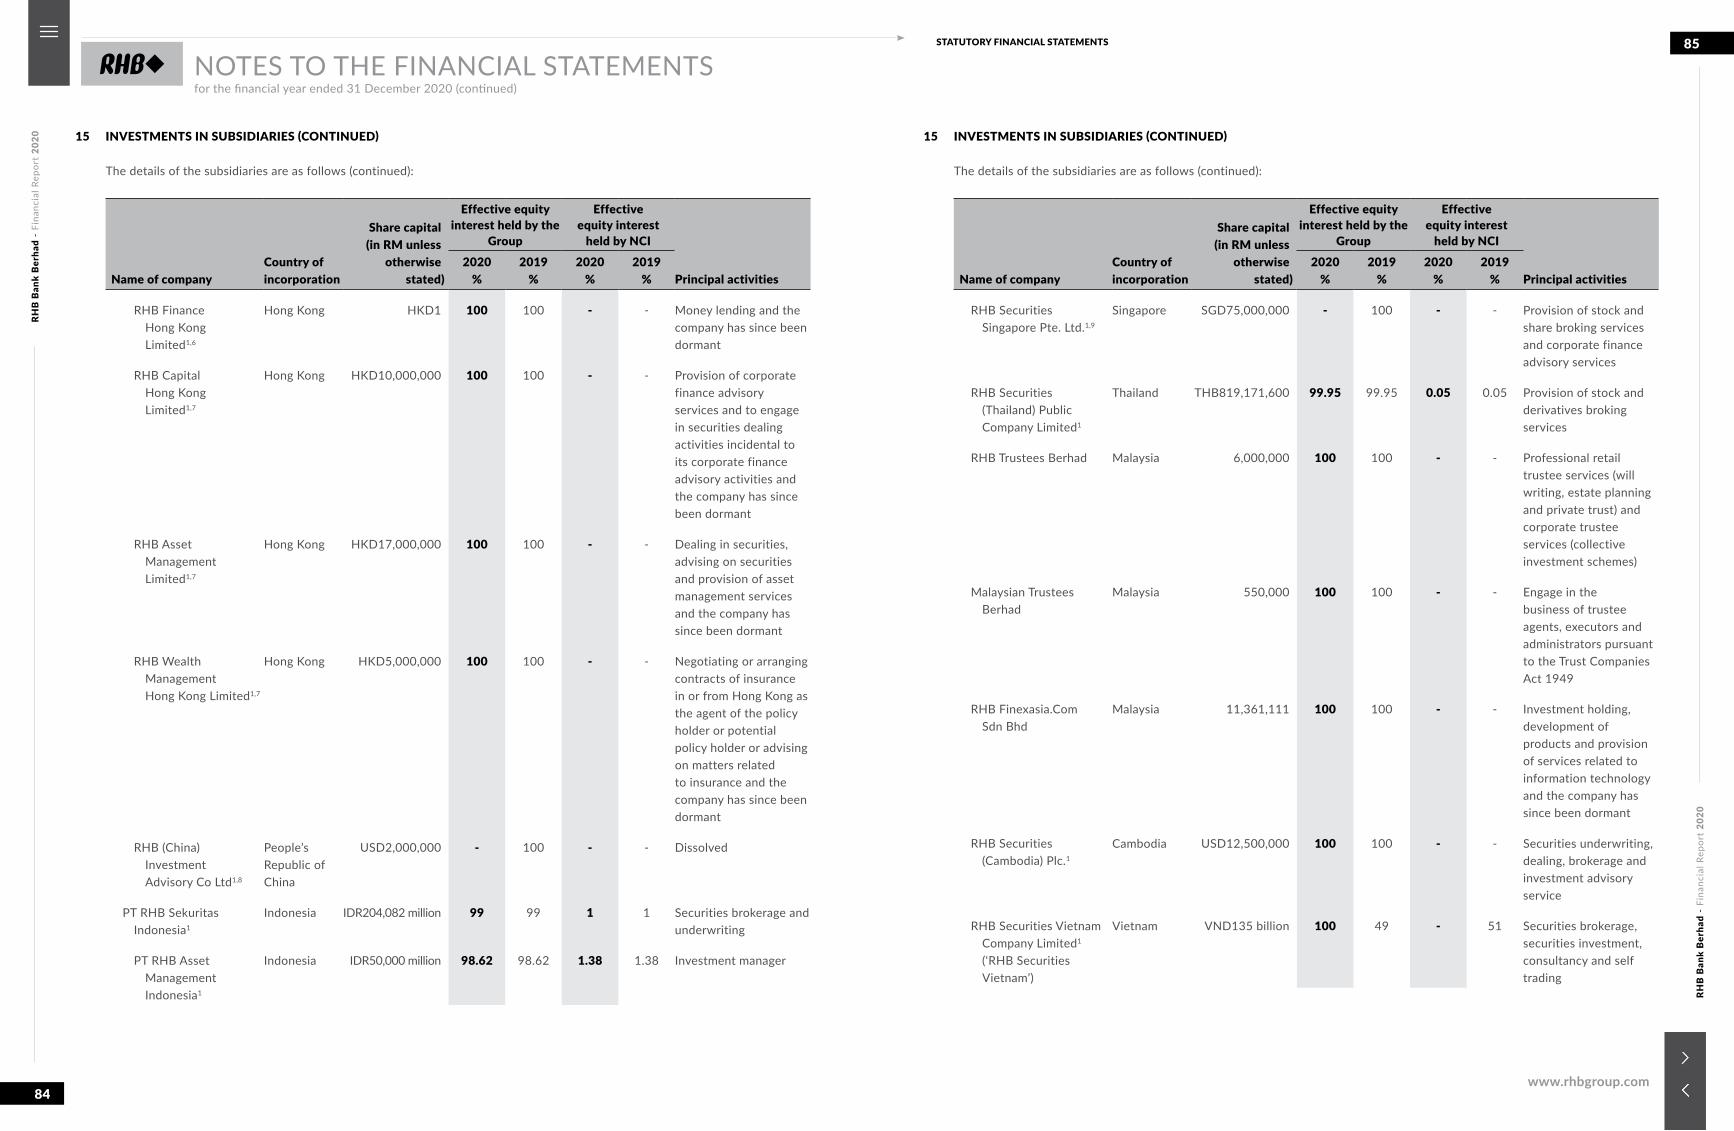
RHB
Ban
k B
erha
d -
Fina
ncia
l Rep
ort
2020
RHB
Ban
k B
erha
d -
Fina
ncia
l Rep
ort
2020
84
85STATUTORY FINANCIAL STATEMENTS
www.rhbgroup.com
NOTES TO THE FINANCIAL STATEMENTSfor the financial year ended 31 December 2020 (continued)
15 INVESTMENTS IN SUBSIDIARIES (CONTINUED)
The details of the subsidiaries are as follows (continued):
Name of companyCountry ofincorporation
Share capital(in RM unless
otherwisestated)
Effective equity interest held by the
Group
Effectiveequity interest
held by NCI
Principal activities2020
%2019
%2020
%2019
%
RHB Finance Hong Kong Limited1,6
Hong Kong HKD1 100 100 - - Money lending and the company has since been dormant
RHB Capital Hong Kong Limited1,7
Hong Kong HKD10,000,000 100 100 - - Provision of corporate finance advisory services and to engage in securities dealing activities incidental to its corporate finance advisory activities and the company has since been dormant
RHB Asset Management Limited1,7
Hong Kong HKD17,000,000 100 100 - - Dealing in securities, advising on securities and provision of asset management services and the company has since been dormant
RHB Wealth Management Hong Kong Limited1,7
Hong Kong HKD5,000,000 100 100 - - Negotiating or arranging contracts of insurance in or from Hong Kong as the agent of the policy holder or potential policy holder or advising on matters related to insurance and the company has since been dormant
RHB (China) Investment Advisory Co Ltd1,8
People’s Republic ofChina
USD2,000,000 - 100 - - Dissolved
PT RHB Sekuritas Indonesia1
Indonesia IDR204,082 million 99 99 1 1 Securities brokerage and underwriting
PT RHB Asset Management Indonesia1
Indonesia IDR50,000 million 98.62 98.62 1.38 1.38 Investment manager
15 INVESTMENTS IN SUBSIDIARIES (CONTINUED)
The details of the subsidiaries are as follows (continued):
Name of companyCountry ofincorporation
Share capital(in RM unless
otherwisestated)
Effective equity interest held by the
Group
Effectiveequity interest
held by NCI
Principal activities2020
%2019
%2020
%2019
%
RHB Securities Singapore Pte. Ltd.1,9
Singapore SGD75,000,000 - 100 - - Provision of stock and share broking services and corporate finance advisory services
RHB Securities (Thailand) Public Company Limited1
Thailand THB819,171,600 99.95 99.95 0.05 0.05 Provision of stock and derivatives broking services
RHB Trustees Berhad Malaysia 6,000,000 100 100 - - Professional retail trustee services (will writing, estate planning and private trust) and corporate trustee services (collective investment schemes)
Malaysian Trustees Berhad
Malaysia 550,000 100 100 - - Engage in the business of trustee agents, executors and administrators pursuant to the Trust Companies Act 1949
RHB Finexasia.Com Sdn Bhd
Malaysia 11,361,111 100 100 - - Investment holding, development of products and provision of services related to information technology and the company has since been dormant
RHB Securities (Cambodia) Plc.1
Cambodia USD12,500,000 100 100 - - Securities underwriting, dealing, brokerage and investment advisory service
RHB Securities Vietnam Company Limited1 (‘RHB Securities Vietnam’)
Vietnam VND135 billion 100 49 - 51 Securities brokerage, securities investment, consultancy and self trading
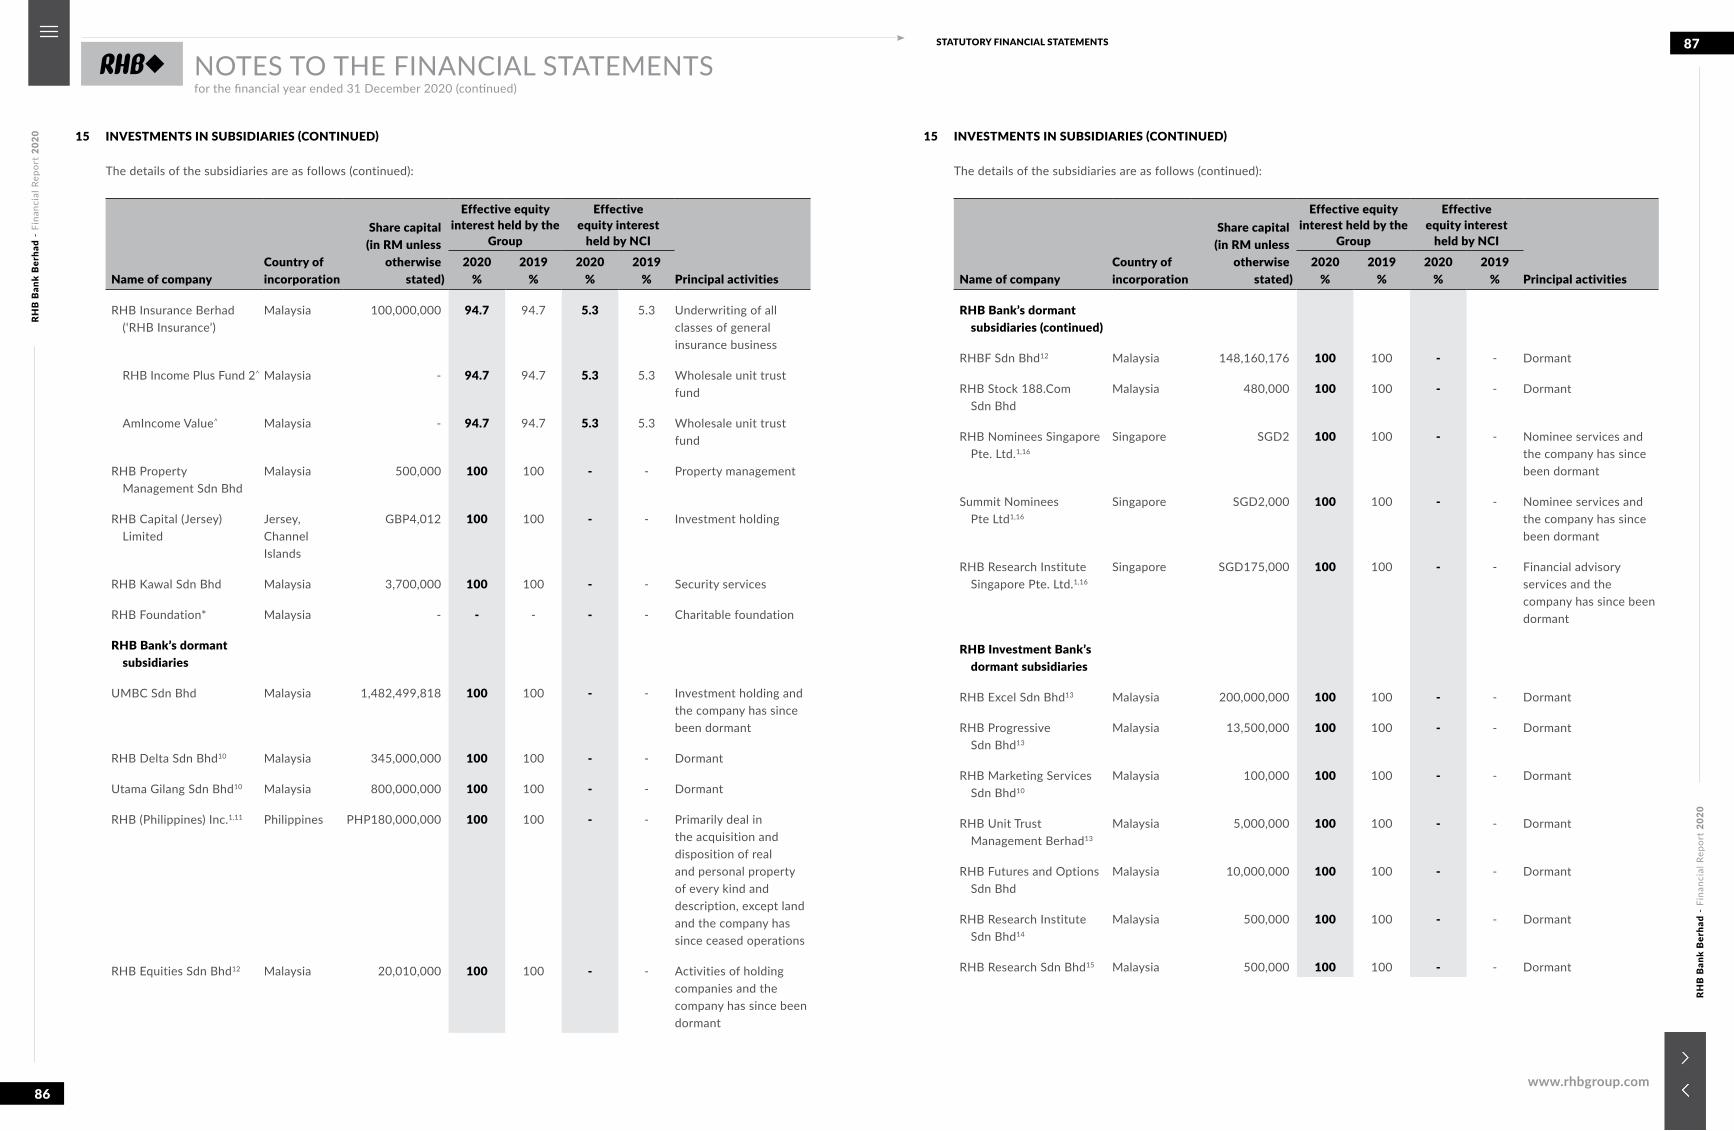
RHB
Ban
k B
erha
d -
Fina
ncia
l Rep
ort
2020
RHB
Ban
k B
erha
d -
Fina
ncia
l Rep
ort
2020
86
87STATUTORY FINANCIAL STATEMENTS
www.rhbgroup.com
NOTES TO THE FINANCIAL STATEMENTSfor the financial year ended 31 December 2020 (continued)
15 INVESTMENTS IN SUBSIDIARIES (CONTINUED)
The details of the subsidiaries are as follows (continued):
Name of companyCountry ofincorporation
Share capital(in RM unless
otherwisestated)
Effective equity interest held by the
Group
Effectiveequity interest
held by NCI
Principal activities2020
%2019
%2020
%2019
%
RHB Insurance Berhad (‘RHB Insurance’)
Malaysia 100,000,000 94.7 94.7 5.3 5.3 Underwriting of all classes of general insurance business
RHB Income Plus Fund 2^ Malaysia - 94.7 94.7 5.3 5.3 Wholesale unit trust fund
AmIncome Value^ Malaysia - 94.7 94.7 5.3 5.3 Wholesale unit trust fund
RHB Property Management Sdn Bhd
Malaysia 500,000 100 100 - - Property management
RHB Capital (Jersey) Limited
Jersey, Channel Islands
GBP4,012 100 100 - - Investment holding
RHB Kawal Sdn Bhd Malaysia 3,700,000 100 100 - - Security services
RHB Foundation* Malaysia - - - - - Charitable foundation
RHB Bank’s dormant subsidiaries
UMBC Sdn Bhd Malaysia 1,482,499,818 100 100 - - Investment holding and the company has since been dormant
RHB Delta Sdn Bhd10 Malaysia 345,000,000 100 100 - - Dormant
Utama Gilang Sdn Bhd10 Malaysia 800,000,000 100 100 - - Dormant
RHB (Philippines) Inc.1,11 Philippines PHP180,000,000 100 100 - - Primarily deal in the acquisition and disposition of real and personal property of every kind and description, except land and the company has since ceased operations
RHB Equities Sdn Bhd12 Malaysia 20,010,000 100 100 - - Activities of holding companies and the company has since been dormant
15 INVESTMENTS IN SUBSIDIARIES (CONTINUED)
The details of the subsidiaries are as follows (continued):
Name of companyCountry ofincorporation
Share capital(in RM unless
otherwisestated)
Effective equity interest held by the
Group
Effectiveequity interest
held by NCI
Principal activities2020
%2019
%2020
%2019
%
RHB Bank’s dormant subsidiaries (continued)
RHBF Sdn Bhd12 Malaysia 148,160,176 100 100 - - Dormant
RHB Stock 188.Com Sdn Bhd
Malaysia 480,000 100 100 - - Dormant
RHB Nominees Singapore Pte. Ltd.1,16
Singapore SGD2 100 100 - - Nominee services and the company has since been dormant
Summit Nominees Pte Ltd1,16
Singapore SGD2,000 100 100 - - Nominee services and the company has since been dormant
RHB Research Institute Singapore Pte. Ltd.1,16
Singapore SGD175,000 100 100 - - Financial advisory services and the company has since been dormant
RHB Investment Bank’s dormant subsidiaries
RHB Excel Sdn Bhd13 Malaysia 200,000,000 100 100 - - Dormant
RHB Progressive Sdn Bhd13
Malaysia 13,500,000 100 100 - - Dormant
RHB Marketing Services Sdn Bhd10
Malaysia 100,000 100 100 - - Dormant
RHB Unit Trust Management Berhad13
Malaysia 5,000,000 100 100 - - Dormant
RHB Futures and Options Sdn Bhd
Malaysia 10,000,000 100 100 - - Dormant
RHB Research Institute Sdn Bhd14
Malaysia 500,000 100 100 - - Dormant
RHB Research Sdn Bhd15 Malaysia 500,000 100 100 - - Dormant
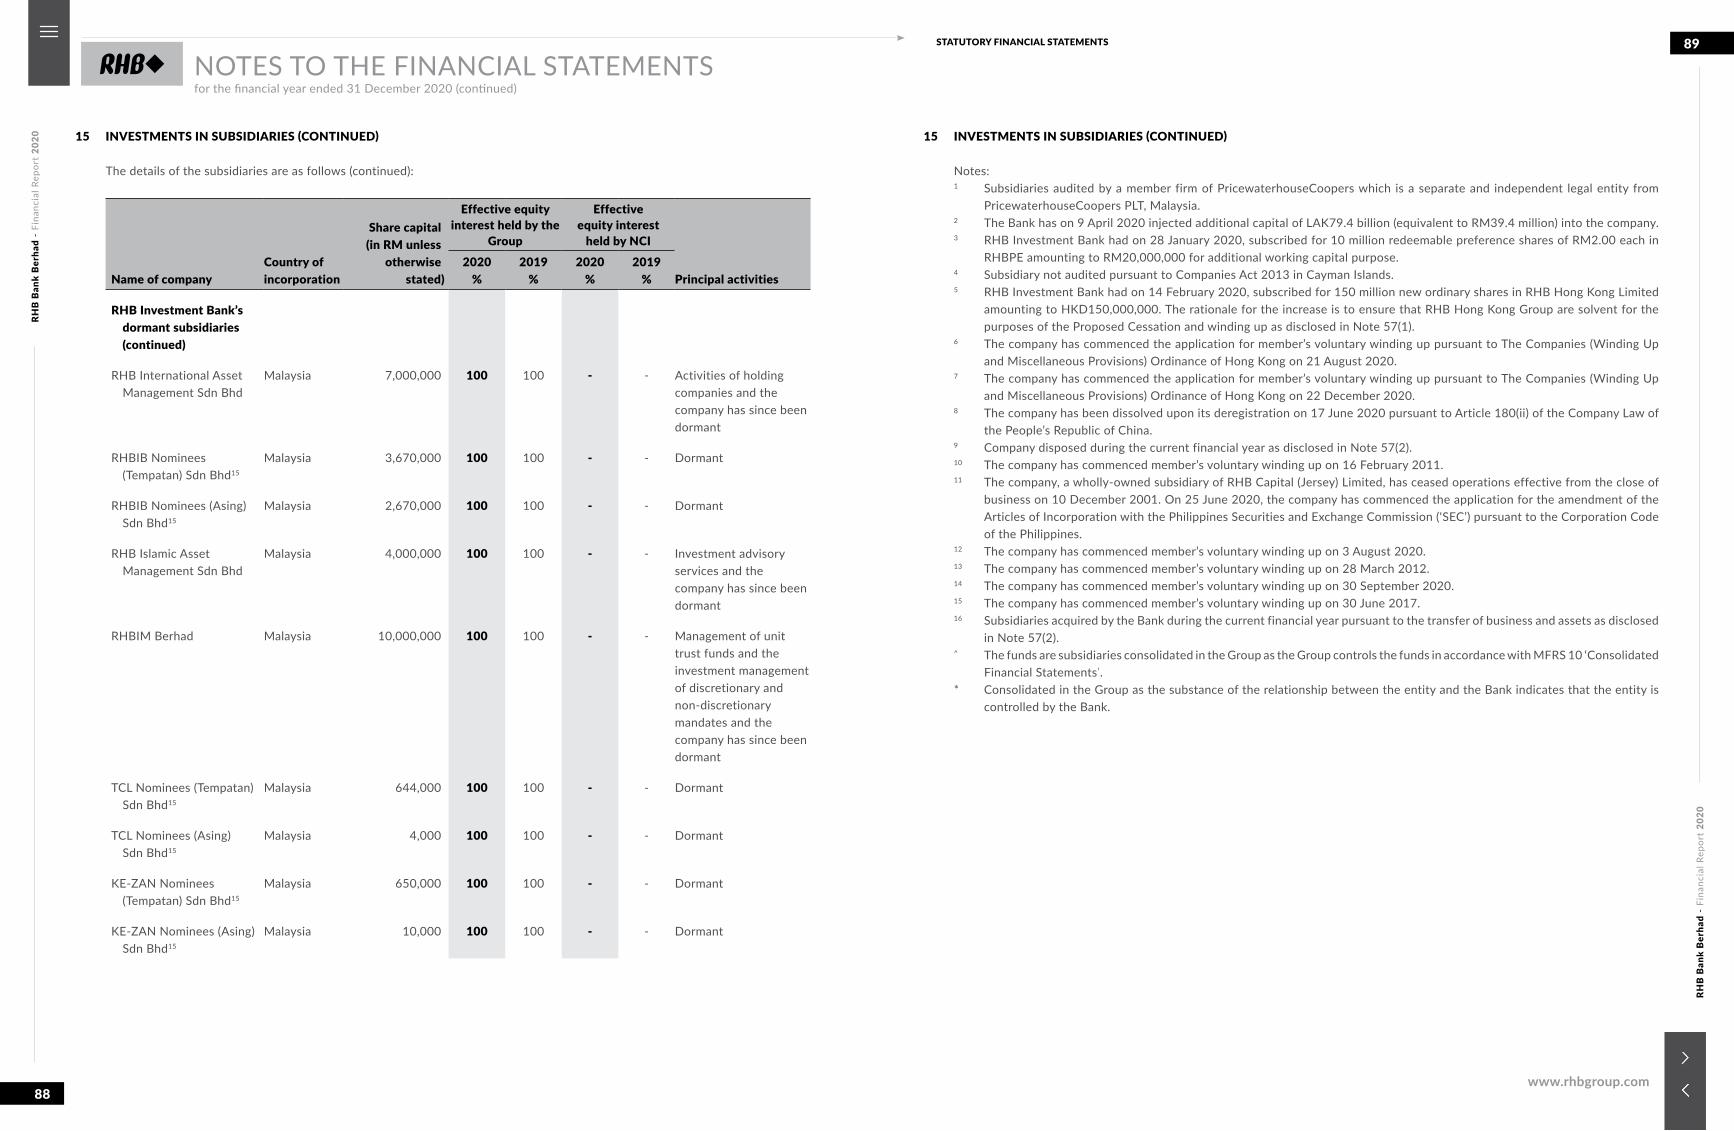
RHB
Ban
k B
erha
d -
Fina
ncia
l Rep
ort
2020
RHB
Ban
k B
erha
d -
Fina
ncia
l Rep
ort
2020
88
89STATUTORY FINANCIAL STATEMENTS
www.rhbgroup.com
NOTES TO THE FINANCIAL STATEMENTSfor the financial year ended 31 December 2020 (continued)
15 INVESTMENTS IN SUBSIDIARIES (CONTINUED)
The details of the subsidiaries are as follows (continued):
Name of companyCountry ofincorporation
Share capital(in RM unless
otherwisestated)
Effective equity interest held by the
Group
Effectiveequity interest
held by NCI
Principal activities2020
%2019
%2020
%2019
%
RHB Investment Bank’s dormant subsidiaries (continued)
RHB International Asset Management Sdn Bhd
Malaysia 7,000,000 100 100 - - Activities of holding companies and the company has since been dormant
RHBIB Nominees (Tempatan) Sdn Bhd15
Malaysia 3,670,000 100 100 - - Dormant
RHBIB Nominees (Asing) Sdn Bhd15
Malaysia 2,670,000 100 100 - - Dormant
RHB Islamic Asset Management Sdn Bhd
Malaysia 4,000,000 100 100 - - Investment advisory services and the company has since been dormant
RHBIM Berhad Malaysia 10,000,000 100 100 - - Management of unit trust funds and the investment management of discretionary and non-discretionary mandates and the company has since been dormant
TCL Nominees (Tempatan) Sdn Bhd15
Malaysia 644,000 100 100 - - Dormant
TCL Nominees (Asing) Sdn Bhd15
Malaysia 4,000 100 100 - - Dormant
KE-ZAN Nominees (Tempatan) Sdn Bhd15
Malaysia 650,000 100 100 - - Dormant
KE-ZAN Nominees (Asing) Sdn Bhd15
Malaysia 10,000 100 100 - - Dormant
15 INVESTMENTS IN SUBSIDIARIES (CONTINUED)
Notes:1 Subsidiaries audited by a member firm of PricewaterhouseCoopers which is a separate and independent legal entity from
PricewaterhouseCoopers PLT, Malaysia.2 The Bank has on 9 April 2020 injected additional capital of LAK79.4 billion (equivalent to RM39.4 million) into the company.3 RHB Investment Bank had on 28 January 2020, subscribed for 10 million redeemable preference shares of RM2.00 each in
RHBPE amounting to RM20,000,000 for additional working capital purpose.4 Subsidiary not audited pursuant to Companies Act 2013 in Cayman Islands.5 RHB Investment Bank had on 14 February 2020, subscribed for 150 million new ordinary shares in RHB Hong Kong Limited
amounting to HKD150,000,000. The rationale for the increase is to ensure that RHB Hong Kong Group are solvent for the purposes of the Proposed Cessation and winding up as disclosed in Note 57(1).
6 The company has commenced the application for member’s voluntary winding up pursuant to The Companies (Winding Up and Miscellaneous Provisions) Ordinance of Hong Kong on 21 August 2020.
7 The company has commenced the application for member’s voluntary winding up pursuant to The Companies (Winding Up and Miscellaneous Provisions) Ordinance of Hong Kong on 22 December 2020.
8 The company has been dissolved upon its deregistration on 17 June 2020 pursuant to Article 180(ii) of the Company Law of the People’s Republic of China.
9 Company disposed during the current financial year as disclosed in Note 57(2).10 The company has commenced member’s voluntary winding up on 16 February 2011.11 The company, a wholly-owned subsidiary of RHB Capital (Jersey) Limited, has ceased operations effective from the close of
business on 10 December 2001. On 25 June 2020, the company has commenced the application for the amendment of the Articles of Incorporation with the Philippines Securities and Exchange Commission (‘SEC’) pursuant to the Corporation Code of the Philippines.
12 The company has commenced member’s voluntary winding up on 3 August 2020.13 The company has commenced member’s voluntary winding up on 28 March 2012.14 The company has commenced member’s voluntary winding up on 30 September 2020.15 The company has commenced member’s voluntary winding up on 30 June 2017.16 Subsidiaries acquired by the Bank during the current financial year pursuant to the transfer of business and assets as disclosed
in Note 57(2).^ The funds are subsidiaries consolidated in the Group as the Group controls the funds in accordance with MFRS 10 ‘Consolidated
Financial Statementsʾ.* Consolidated in the Group as the substance of the relationship between the entity and the Bank indicates that the entity is
controlled by the Bank.
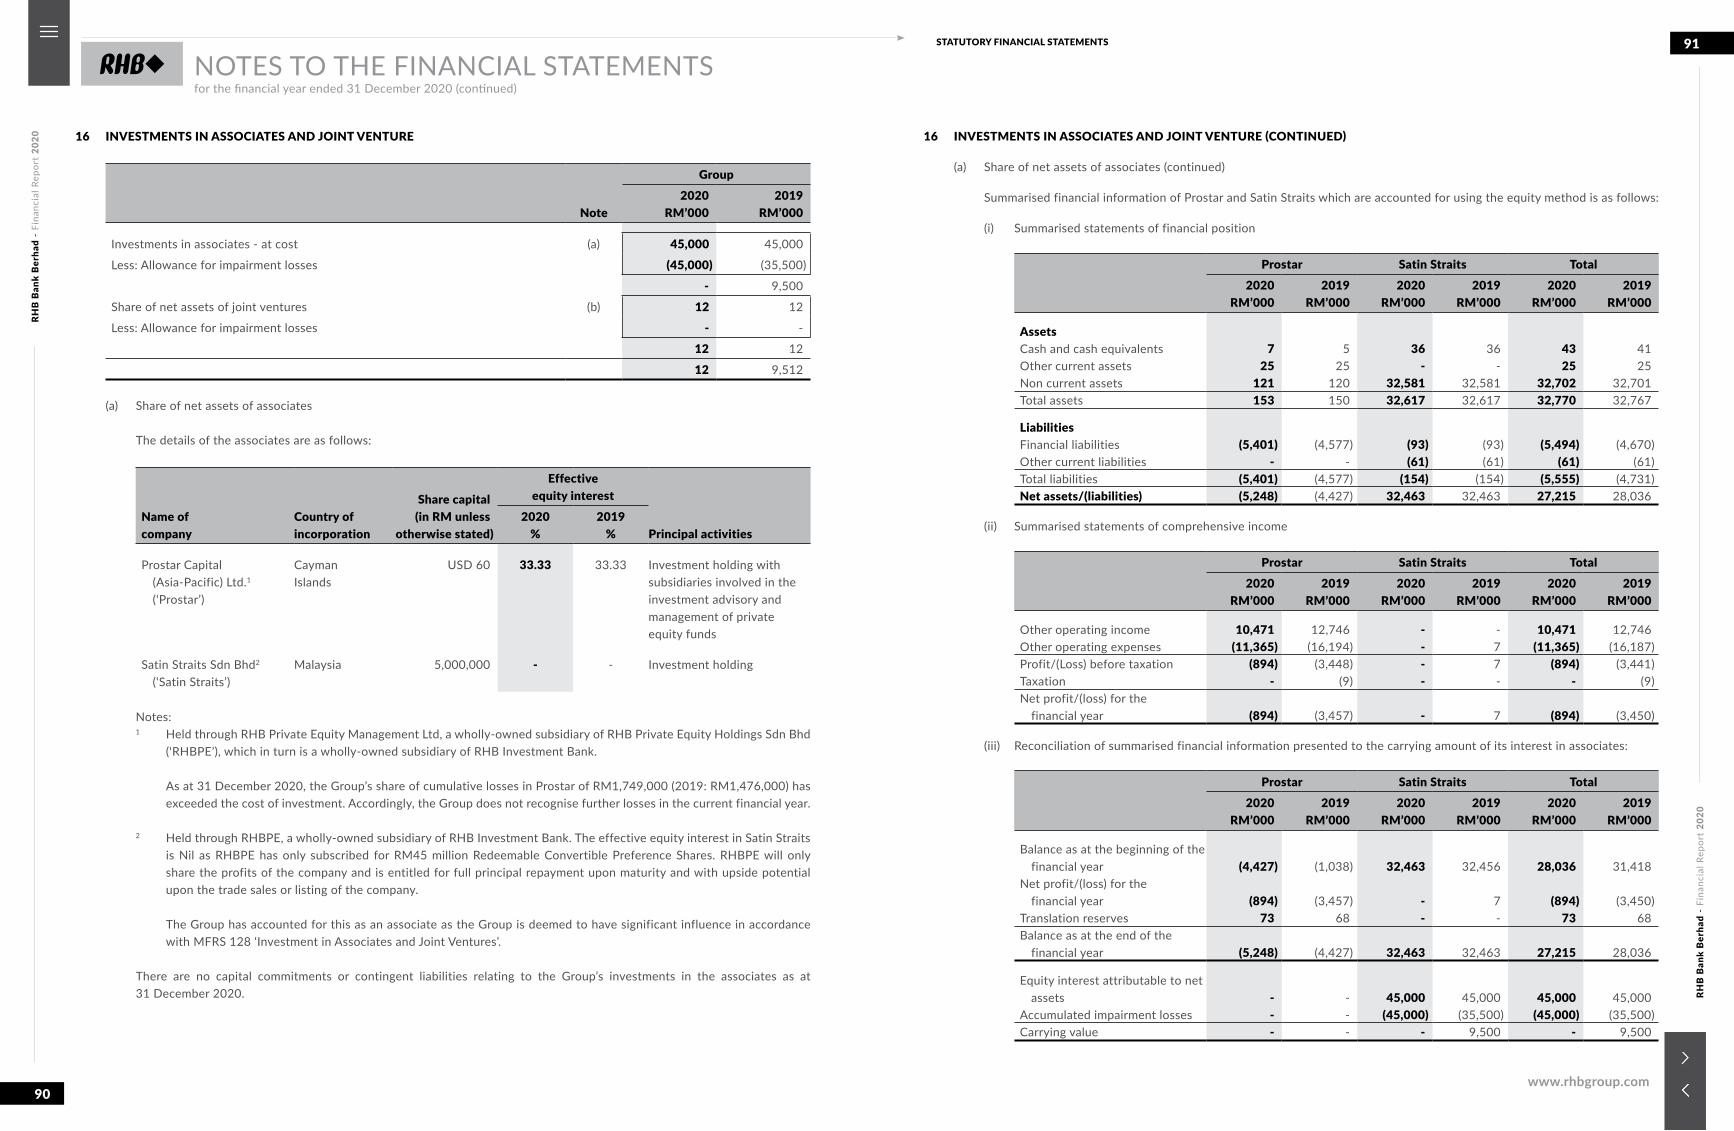
RHB
Ban
k B
erha
d -
Fina
ncia
l Rep
ort
2020
RHB
Ban
k B
erha
d -
Fina
ncia
l Rep
ort
2020
90
91STATUTORY FINANCIAL STATEMENTS
www.rhbgroup.com
NOTES TO THE FINANCIAL STATEMENTSfor the financial year ended 31 December 2020 (continued)
16 INVESTMENTS IN ASSOCIATES AND JOINT VENTURE
Note
Group2020
RM’0002019
RM’000
Investments in associates - at cost (a) 45,000 45,000
Less: Allowance for impairment losses (45,000) (35,500)
- 9,500
Share of net assets of joint ventures (b) 12 12
Less: Allowance for impairment losses - -
12 12
12 9,512
(a) Share of net assets of associates
The details of the associates are as follows:
Name ofcompany
Country ofincorporation
Share capital(in RM unless
otherwise stated)
Effective equity interest
Principal activities2020
%2019
%
Prostar Capital (Asia-Pacific) Ltd.1 (‘Prostar’)
CaymanIslands
USD 60 33.33 33.33 Investment holding with subsidiaries involved in the investment advisory and management of private equity funds
Satin Straits Sdn Bhd2 (‘Satin Straits’)
Malaysia 5,000,000 - - Investment holding
Notes:1 Held through RHB Private Equity Management Ltd, a wholly-owned subsidiary of RHB Private Equity Holdings Sdn Bhd
(‘RHBPE’), which in turn is a wholly-owned subsidiary of RHB Investment Bank.
As at 31 December 2020, the Group’s share of cumulative losses in Prostar of RM1,749,000 (2019: RM1,476,000) has exceeded the cost of investment. Accordingly, the Group does not recognise further losses in the current financial year.
2 Held through RHBPE, a wholly-owned subsidiary of RHB Investment Bank. The effective equity interest in Satin Straits is Nil as RHBPE has only subscribed for RM45 million Redeemable Convertible Preference Shares. RHBPE will only share the profits of the company and is entitled for full principal repayment upon maturity and with upside potential upon the trade sales or listing of the company.
The Group has accounted for this as an associate as the Group is deemed to have significant influence in accordance with MFRS 128 ‘Investment in Associates and Joint Ventures’.
There are no capital commitments or contingent liabilities relating to the Group’s investments in the associates as at 31 December 2020.
16 INVESTMENTS IN ASSOCIATES AND JOINT VENTURE (CONTINUED)
(a) Share of net assets of associates (continued)
Summarised financial information of Prostar and Satin Straits which are accounted for using the equity method is as follows:
(i) Summarised statements of financial position
Prostar Satin Straits Total2020
RM’0002019
RM’0002020
RM’0002019
RM’0002020
RM’0002019
RM’000
AssetsCash and cash equivalents 7 5 36 36 43 41Other current assets 25 25 - - 25 25Non current assets 121 120 32,581 32,581 32,702 32,701Total assets 153 150 32,617 32,617 32,770 32,767
LiabilitiesFinancial liabilities (5,401) (4,577) (93) (93) (5,494) (4,670)Other current liabilities - - (61) (61) (61) (61)Total liabilities (5,401) (4,577) (154) (154) (5,555) (4,731)Net assets/(liabilities) (5,248) (4,427) 32,463 32,463 27,215 28,036
(ii) Summarised statements of comprehensive income
Prostar Satin Straits Total2020
RM’0002019
RM’0002020
RM’0002019
RM’0002020
RM’0002019
RM’000
Other operating income 10,471 12,746 - - 10,471 12,746Other operating expenses (11,365) (16,194) - 7 (11,365) (16,187)Profit/(Loss) before taxation (894) (3,448) - 7 (894) (3,441)Taxation - (9) - - - (9)Net profit/(loss) for the
financial year (894) (3,457) - 7 (894) (3,450)
(iii) Reconciliation of summarised financial information presented to the carrying amount of its interest in associates:
Prostar Satin Straits Total2020
RM’0002019
RM’0002020
RM’0002019
RM’0002020
RM’0002019
RM’000
Balance as at the beginning of the financial year (4,427) (1,038) 32,463 32,456 28,036 31,418
Net profit/(loss) for the financial year (894) (3,457) - 7 (894) (3,450)
Translation reserves 73 68 - - 73 68Balance as at the end of the
financial year (5,248) (4,427) 32,463 32,463 27,215 28,036
Equity interest attributable to net assets - - 45,000 45,000 45,000 45,000
Accumulated impairment losses - - (45,000) (35,500) (45,000) (35,500)Carrying value - - - 9,500 - 9,500
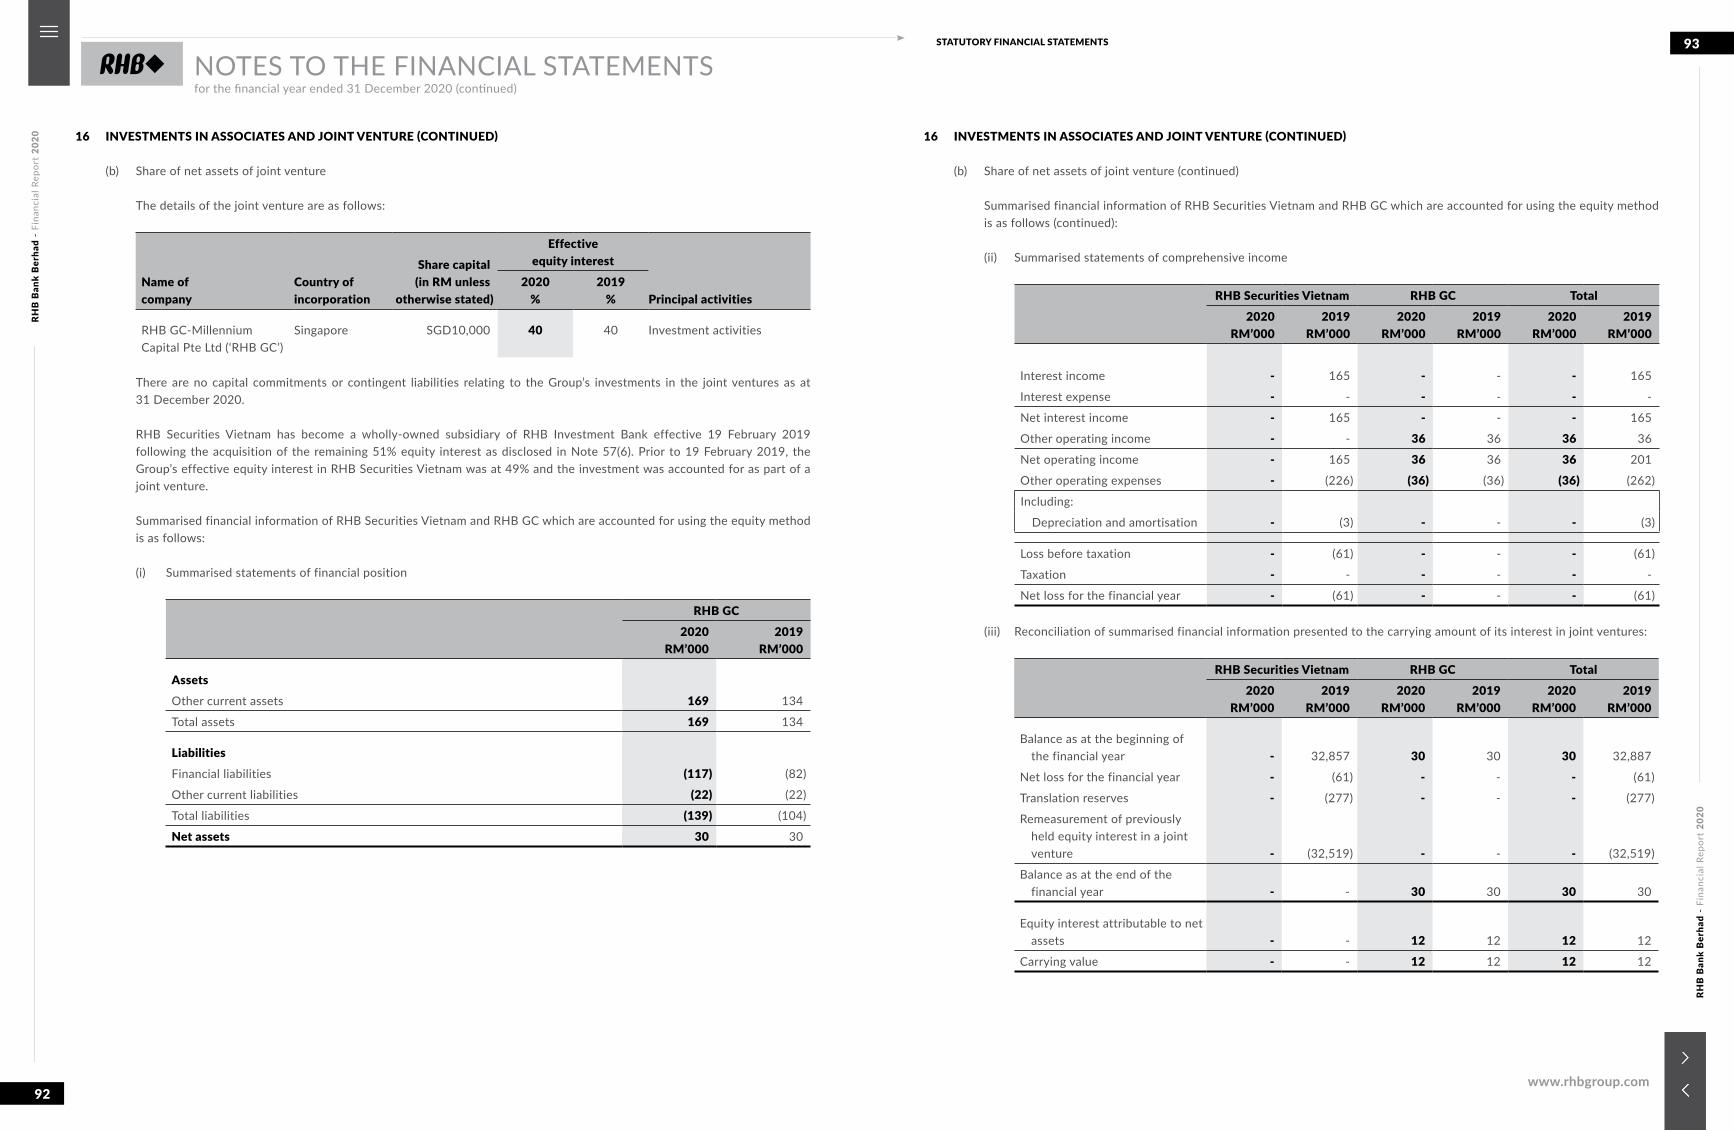
RHB
Ban
k B
erha
d -
Fina
ncia
l Rep
ort
2020
RHB
Ban
k B
erha
d -
Fina
ncia
l Rep
ort
2020
92
93STATUTORY FINANCIAL STATEMENTS
www.rhbgroup.com
NOTES TO THE FINANCIAL STATEMENTSfor the financial year ended 31 December 2020 (continued)
16 INVESTMENTS IN ASSOCIATES AND JOINT VENTURE (CONTINUED)
(b) Share of net assets of joint venture
The details of the joint venture are as follows:
Name ofcompany
Country ofincorporation
Share capital(in RM unless
otherwise stated)
Effective equity interest
Principal activities2020
%2019
%
RHB GC-MillenniumCapital Pte Ltd (‘RHB GC’)
Singapore SGD10,000 40 40 Investment activities
There are no capital commitments or contingent liabilities relating to the Group’s investments in the joint ventures as at 31 December 2020.
RHB Securities Vietnam has become a wholly-owned subsidiary of RHB Investment Bank effective 19 February 2019 following the acquisition of the remaining 51% equity interest as disclosed in Note 57(6). Prior to 19 February 2019, the Group’s effective equity interest in RHB Securities Vietnam was at 49% and the investment was accounted for as part of a joint venture.
Summarised financial information of RHB Securities Vietnam and RHB GC which are accounted for using the equity method is as follows:
(i) Summarised statements of financial position
RHB GC2020
RM’0002019
RM’000
AssetsOther current assets 169 134
Total assets 169 134
LiabilitiesFinancial liabilities (117) (82)
Other current liabilities (22) (22)
Total liabilities (139) (104)
Net assets 30 30
16 INVESTMENTS IN ASSOCIATES AND JOINT VENTURE (CONTINUED)
(b) Share of net assets of joint venture (continued)
Summarised financial information of RHB Securities Vietnam and RHB GC which are accounted for using the equity method is as follows (continued):
(ii) Summarised statements of comprehensive income
RHB Securities Vietnam RHB GC Total2020
RM’0002019
RM’0002020
RM’0002019
RM’0002020
RM’0002019
RM’000
Interest income - 165 - - - 165
Interest expense - - - - - -
Net interest income - 165 - - - 165
Other operating income - - 36 36 36 36
Net operating income - 165 36 36 36 201
Other operating expenses - (226) (36) (36) (36) (262)
Including:
Depreciation and amortisation - (3) - - - (3)
Loss before taxation - (61) - - - (61)
Taxation - - - - - -
Net loss for the financial year - (61) - - - (61)
(iii) Reconciliation of summarised financial information presented to the carrying amount of its interest in joint ventures:
RHB Securities Vietnam RHB GC Total2020
RM’0002019
RM’0002020
RM’0002019
RM’0002020
RM’0002019
RM’000
Balance as at the beginning of the financial year - 32,857 30 30 30 32,887
Net loss for the financial year - (61) - - - (61)
Translation reserves - (277) - - - (277)
Remeasurement of previously held equity interest in a joint venture - (32,519) - - - (32,519)
Balance as at the end of the financial year - - 30 30 30 30
Equity interest attributable to net assets - - 12 12 12 12
Carrying value - - 12 12 12 12
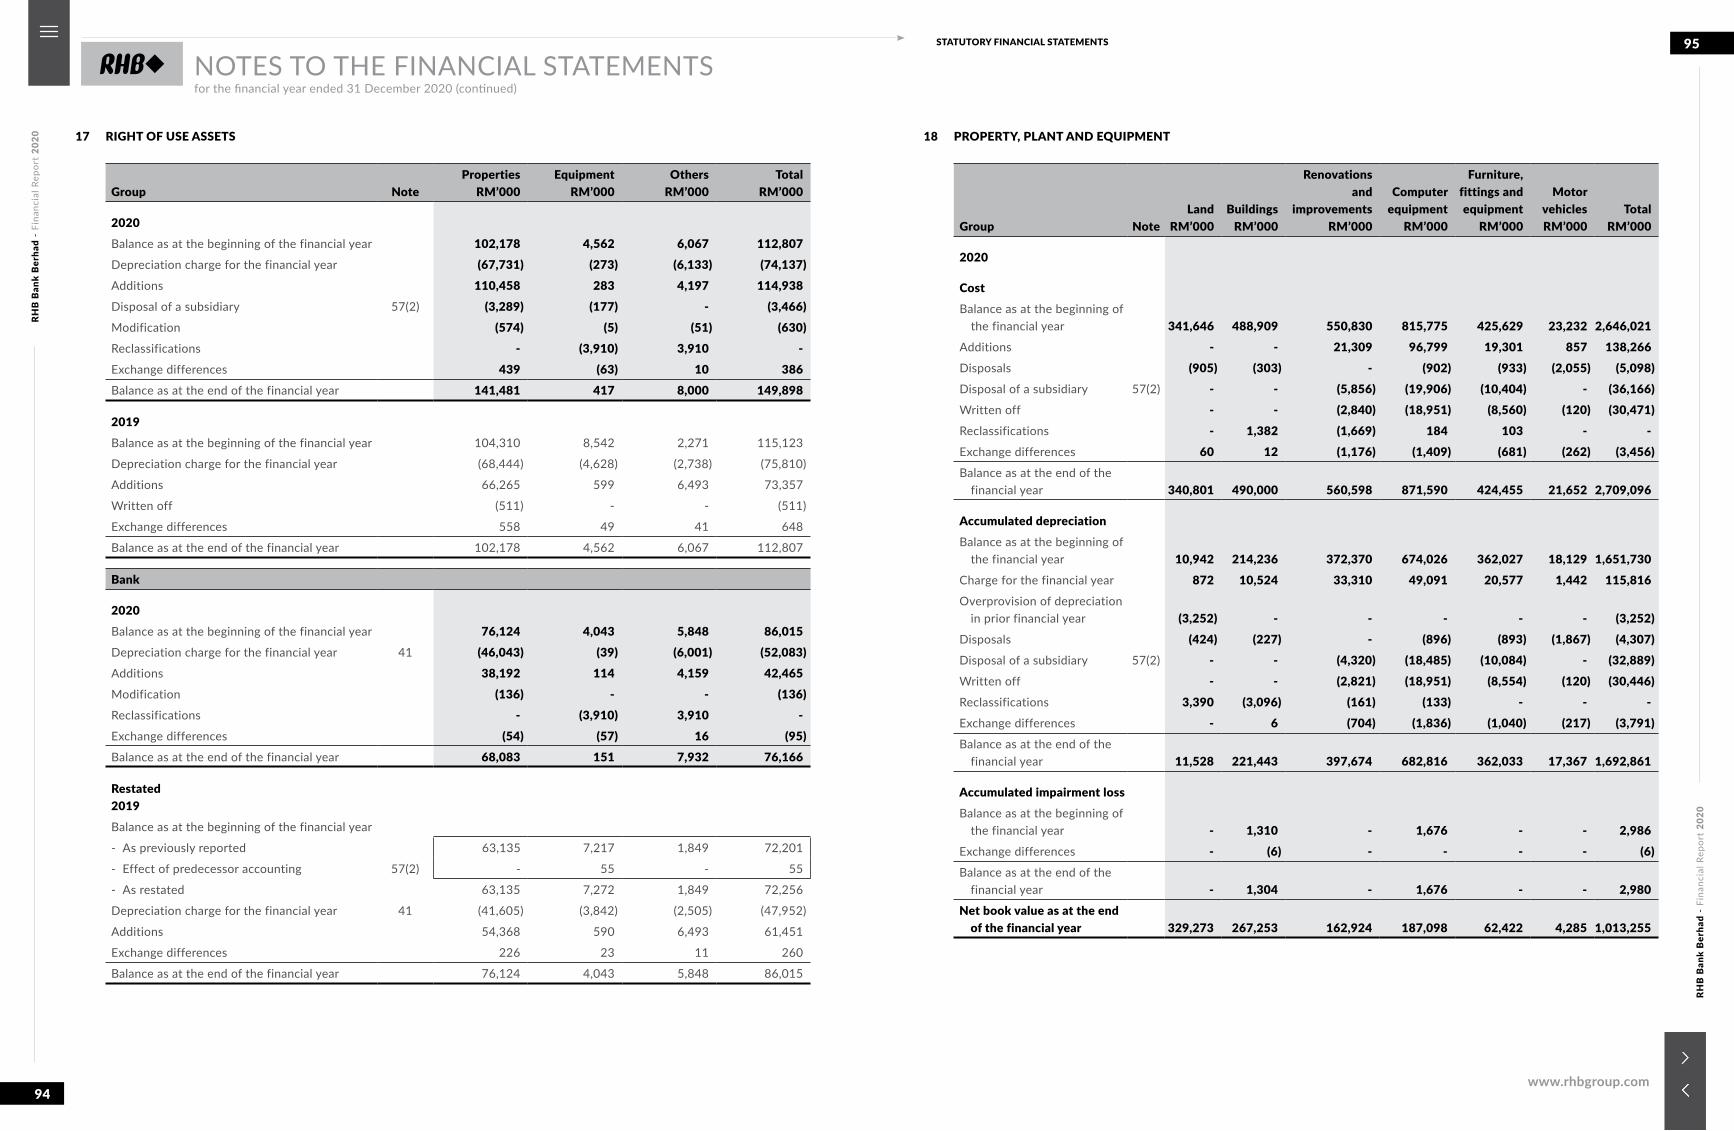
RHB
Ban
k B
erha
d -
Fina
ncia
l Rep
ort
2020
RHB
Ban
k B
erha
d -
Fina
ncia
l Rep
ort
2020
94
95STATUTORY FINANCIAL STATEMENTS
www.rhbgroup.com
NOTES TO THE FINANCIAL STATEMENTSfor the financial year ended 31 December 2020 (continued)
17 RIGHT OF USE ASSETS
Group NoteProperties
RM’000Equipment
RM’000Others
RM’000Total
RM’000
2020Balance as at the beginning of the financial year 102,178 4,562 6,067 112,807Depreciation charge for the financial year (67,731) (273) (6,133) (74,137)Additions 110,458 283 4,197 114,938Disposal of a subsidiary 57(2) (3,289) (177) - (3,466)Modification (574) (5) (51) (630)Reclassifications - (3,910) 3,910 -Exchange differences 439 (63) 10 386Balance as at the end of the financial year 141,481 417 8,000 149,898
2019Balance as at the beginning of the financial year 104,310 8,542 2,271 115,123
Depreciation charge for the financial year (68,444) (4,628) (2,738) (75,810)
Additions 66,265 599 6,493 73,357
Written off (511) - - (511)
Exchange differences 558 49 41 648
Balance as at the end of the financial year 102,178 4,562 6,067 112,807
Bank
2020Balance as at the beginning of the financial year 76,124 4,043 5,848 86,015Depreciation charge for the financial year 41 (46,043) (39) (6,001) (52,083)Additions 38,192 114 4,159 42,465Modification (136) - - (136)Reclassifications - (3,910) 3,910 -Exchange differences (54) (57) 16 (95)Balance as at the end of the financial year 68,083 151 7,932 76,166
Restated2019Balance as at the beginning of the financial year
- As previously reported 63,135 7,217 1,849 72,201
- Effect of predecessor accounting 57(2) - 55 - 55
- As restated 63,135 7,272 1,849 72,256
Depreciation charge for the financial year 41 (41,605) (3,842) (2,505) (47,952)
Additions 54,368 590 6,493 61,451
Exchange differences 226 23 11 260
Balance as at the end of the financial year 76,124 4,043 5,848 86,015
18 PROPERTY, PLANT AND EQUIPMENT
Group NoteLand
RM’000Buildings
RM’000
Renovationsand
improvementsRM’000
Computerequipment
RM’000
Furniture,fittings andequipment
RM’000
MotorvehiclesRM’000
TotalRM’000
2020
CostBalance as at the beginning of
the financial year 341,646 488,909 550,830 815,775 425,629 23,232 2,646,021Additions - - 21,309 96,799 19,301 857 138,266Disposals (905) (303) - (902) (933) (2,055) (5,098)Disposal of a subsidiary 57(2) - - (5,856) (19,906) (10,404) - (36,166)Written off - - (2,840) (18,951) (8,560) (120) (30,471)Reclassifications - 1,382 (1,669) 184 103 - -Exchange differences 60 12 (1,176) (1,409) (681) (262) (3,456)Balance as at the end of the
financial year 340,801 490,000 560,598 871,590 424,455 21,652 2,709,096
Accumulated depreciationBalance as at the beginning of
the financial year 10,942 214,236 372,370 674,026 362,027 18,129 1,651,730Charge for the financial year 872 10,524 33,310 49,091 20,577 1,442 115,816Overprovision of depreciation
in prior financial year (3,252) - - - - - (3,252)Disposals (424) (227) - (896) (893) (1,867) (4,307)Disposal of a subsidiary 57(2) - - (4,320) (18,485) (10,084) - (32,889)Written off - - (2,821) (18,951) (8,554) (120) (30,446)Reclassifications 3,390 (3,096) (161) (133) - - -Exchange differences - 6 (704) (1,836) (1,040) (217) (3,791)Balance as at the end of the
financial year 11,528 221,443 397,674 682,816 362,033 17,367 1,692,861
Accumulated impairment lossBalance as at the beginning of
the financial year - 1,310 - 1,676 - - 2,986Exchange differences - (6) - - - - (6)Balance as at the end of the
financial year - 1,304 - 1,676 - - 2,980Net book value as at the end
of the financial year 329,273 267,253 162,924 187,098 62,422 4,285 1,013,255
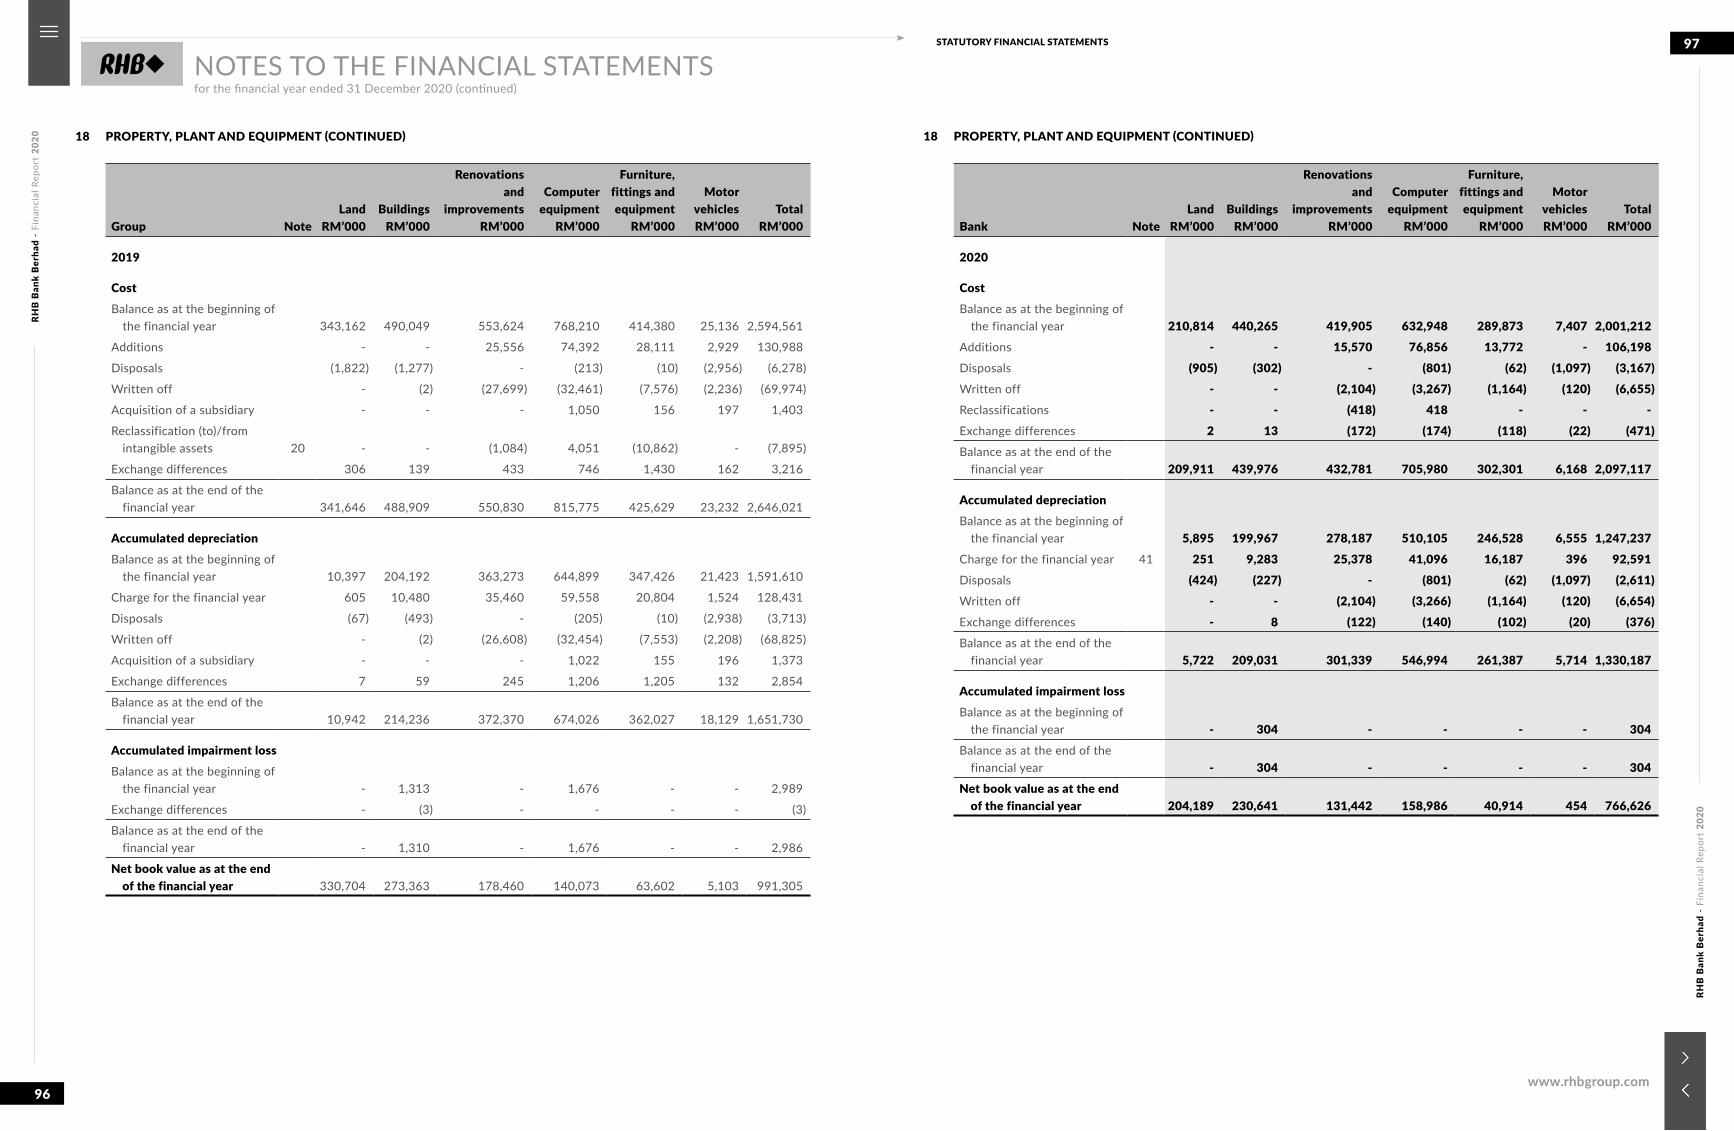
RHB
Ban
k B
erha
d -
Fina
ncia
l Rep
ort
2020
RHB
Ban
k B
erha
d -
Fina
ncia
l Rep
ort
2020
96
97STATUTORY FINANCIAL STATEMENTS
www.rhbgroup.com
NOTES TO THE FINANCIAL STATEMENTSfor the financial year ended 31 December 2020 (continued)
18 PROPERTY, PLANT AND EQUIPMENT (CONTINUED)
Group NoteLand
RM’000Buildings
RM’000
Renovationsand
improvementsRM’000
Computerequipment
RM’000
Furniture,fittings andequipment
RM’000
MotorvehiclesRM’000
TotalRM’000
2019
CostBalance as at the beginning of
the financial year 343,162 490,049 553,624 768,210 414,380 25,136 2,594,561
Additions - - 25,556 74,392 28,111 2,929 130,988
Disposals (1,822) (1,277) - (213) (10) (2,956) (6,278)
Written off - (2) (27,699) (32,461) (7,576) (2,236) (69,974)
Acquisition of a subsidiary - - - 1,050 156 197 1,403
Reclassification (to)/from intangible assets 20 - - (1,084) 4,051 (10,862) - (7,895)
Exchange differences 306 139 433 746 1,430 162 3,216
Balance as at the end of the financial year 341,646 488,909 550,830 815,775 425,629 23,232 2,646,021
Accumulated depreciationBalance as at the beginning of
the financial year 10,397 204,192 363,273 644,899 347,426 21,423 1,591,610
Charge for the financial year 605 10,480 35,460 59,558 20,804 1,524 128,431
Disposals (67) (493) - (205) (10) (2,938) (3,713)
Written off - (2) (26,608) (32,454) (7,553) (2,208) (68,825)
Acquisition of a subsidiary - - - 1,022 155 196 1,373
Exchange differences 7 59 245 1,206 1,205 132 2,854
Balance as at the end of the financial year 10,942 214,236 372,370 674,026 362,027 18,129 1,651,730
Accumulated impairment lossBalance as at the beginning of
the financial year - 1,313 - 1,676 - - 2,989
Exchange differences - (3) - - - - (3)
Balance as at the end of the financial year - 1,310 - 1,676 - - 2,986
Net book value as at the end of the financial year 330,704 273,363 178,460 140,073 63,602 5,103 991,305
18 PROPERTY, PLANT AND EQUIPMENT (CONTINUED)
Bank NoteLand
RM’000Buildings
RM’000
Renovationsand
improvementsRM’000
Computerequipment
RM’000
Furniture,fittings andequipment
RM’000
MotorvehiclesRM’000
TotalRM’000
2020
CostBalance as at the beginning of
the financial year 210,814 440,265 419,905 632,948 289,873 7,407 2,001,212Additions - - 15,570 76,856 13,772 - 106,198Disposals (905) (302) - (801) (62) (1,097) (3,167)Written off - - (2,104) (3,267) (1,164) (120) (6,655)Reclassifications - - (418) 418 - - -Exchange differences 2 13 (172) (174) (118) (22) (471)Balance as at the end of the
financial year 209,911 439,976 432,781 705,980 302,301 6,168 2,097,117
Accumulated depreciationBalance as at the beginning of
the financial year 5,895 199,967 278,187 510,105 246,528 6,555 1,247,237Charge for the financial year 41 251 9,283 25,378 41,096 16,187 396 92,591Disposals (424) (227) - (801) (62) (1,097) (2,611)Written off - - (2,104) (3,266) (1,164) (120) (6,654)Exchange differences - 8 (122) (140) (102) (20) (376)Balance as at the end of the
financial year 5,722 209,031 301,339 546,994 261,387 5,714 1,330,187
Accumulated impairment lossBalance as at the beginning of
the financial year - 304 - - - - 304Balance as at the end of the
financial year - 304 - - - - 304Net book value as at the end
of the financial year 204,189 230,641 131,442 158,986 40,914 454 766,626
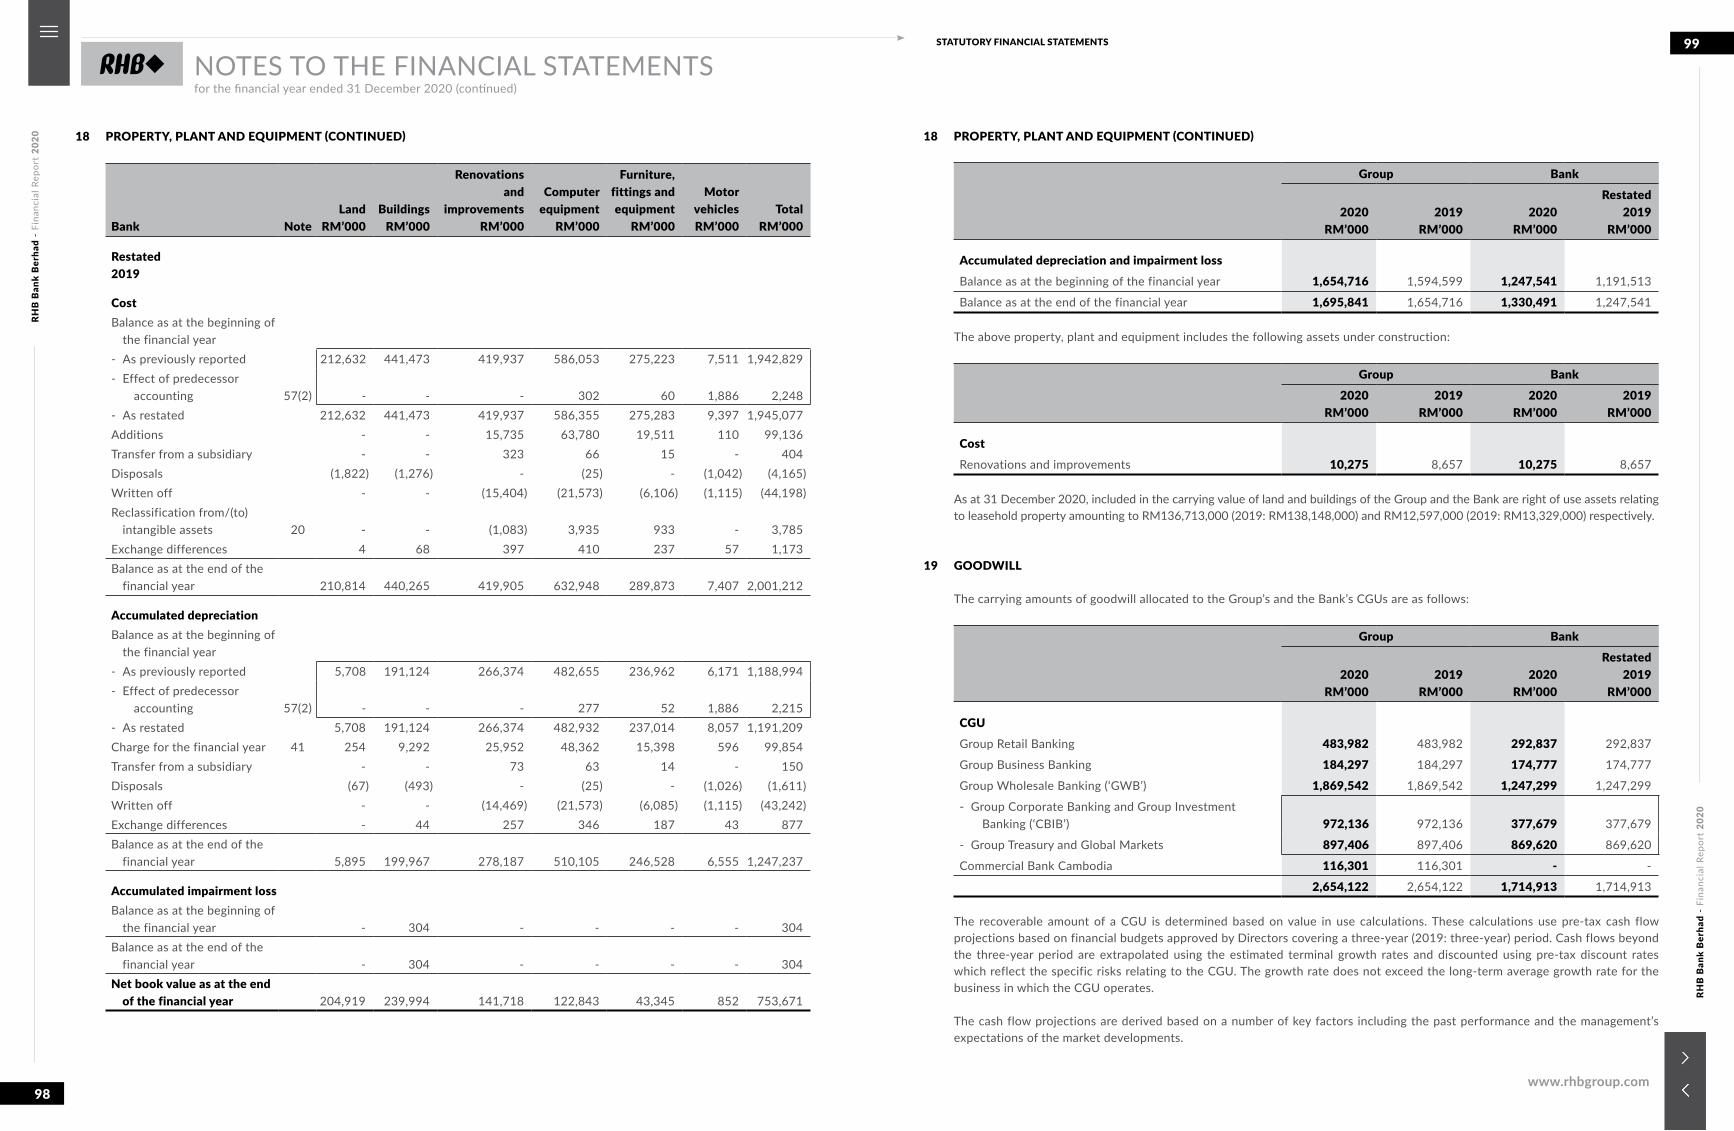
RHB
Ban
k B
erha
d -
Fina
ncia
l Rep
ort
2020
RHB
Ban
k B
erha
d -
Fina
ncia
l Rep
ort
2020
98
99STATUTORY FINANCIAL STATEMENTS
www.rhbgroup.com
NOTES TO THE FINANCIAL STATEMENTSfor the financial year ended 31 December 2020 (continued)
18 PROPERTY, PLANT AND EQUIPMENT (CONTINUED)
Bank NoteLand
RM’000Buildings
RM’000
Renovationsand
improvementsRM’000
Computerequipment
RM’000
Furniture,fittings andequipment
RM’000
MotorvehiclesRM’000
TotalRM’000
Restated2019
CostBalance as at the beginning of
the financial year- As previously reported 212,632 441,473 419,937 586,053 275,223 7,511 1,942,829- Effect of predecessor
accounting 57(2) - - - 302 60 1,886 2,248- As restated 212,632 441,473 419,937 586,355 275,283 9,397 1,945,077Additions - - 15,735 63,780 19,511 110 99,136Transfer from a subsidiary - - 323 66 15 - 404Disposals (1,822) (1,276) - (25) - (1,042) (4,165)Written off - - (15,404) (21,573) (6,106) (1,115) (44,198)Reclassification from/(to)
intangible assets 20 - - (1,083) 3,935 933 - 3,785Exchange differences 4 68 397 410 237 57 1,173Balance as at the end of the
financial year 210,814 440,265 419,905 632,948 289,873 7,407 2,001,212
Accumulated depreciationBalance as at the beginning of
the financial year- As previously reported 5,708 191,124 266,374 482,655 236,962 6,171 1,188,994- Effect of predecessor
accounting 57(2) - - - 277 52 1,886 2,215- As restated 5,708 191,124 266,374 482,932 237,014 8,057 1,191,209Charge for the financial year 41 254 9,292 25,952 48,362 15,398 596 99,854Transfer from a subsidiary - - 73 63 14 - 150Disposals (67) (493) - (25) - (1,026) (1,611)Written off - - (14,469) (21,573) (6,085) (1,115) (43,242)Exchange differences - 44 257 346 187 43 877Balance as at the end of the
financial year 5,895 199,967 278,187 510,105 246,528 6,555 1,247,237
Accumulated impairment lossBalance as at the beginning of
the financial year - 304 - - - - 304Balance as at the end of the
financial year - 304 - - - - 304Net book value as at the end
of the financial year 204,919 239,994 141,718 122,843 43,345 852 753,671
18 PROPERTY, PLANT AND EQUIPMENT (CONTINUED)
Group Bank
2020RM’000
2019 RM’000
2020 RM’000
Restated2019
RM’000
Accumulated depreciation and impairment lossBalance as at the beginning of the financial year 1,654,716 1,594,599 1,247,541 1,191,513
Balance as at the end of the financial year 1,695,841 1,654,716 1,330,491 1,247,541
The above property, plant and equipment includes the following assets under construction:
Group Bank2020
RM’0002019
RM’0002020
RM’0002019
RM’000
CostRenovations and improvements 10,275 8,657 10,275 8,657
As at 31 December 2020, included in the carrying value of land and buildings of the Group and the Bank are right of use assets relating to leasehold property amounting to RM136,713,000 (2019: RM138,148,000) and RM12,597,000 (2019: RM13,329,000) respectively.
19 GOODWILL
The carrying amounts of goodwill allocated to the Group’s and the Bank’s CGUs are as follows:
Group Bank
2020RM’000
2019 RM’000
2020 RM’000
Restated2019
RM’000
CGUGroup Retail Banking 483,982 483,982 292,837 292,837
Group Business Banking 184,297 184,297 174,777 174,777
Group Wholesale Banking (‘GWB’) 1,869,542 1,869,542 1,247,299 1,247,299
- Group Corporate Banking and Group Investment Banking (‘CBIB’) 972,136 972,136 377,679 377,679
- Group Treasury and Global Markets 897,406 897,406 869,620 869,620
Commercial Bank Cambodia 116,301 116,301 - -
2,654,122 2,654,122 1,714,913 1,714,913
The recoverable amount of a CGU is determined based on value in use calculations. These calculations use pre-tax cash flow projections based on financial budgets approved by Directors covering a three-year (2019: three-year) period. Cash flows beyond the three-year period are extrapolated using the estimated terminal growth rates and discounted using pre-tax discount rates which reflect the specific risks relating to the CGU. The growth rate does not exceed the long-term average growth rate for the business in which the CGU operates.
The cash flow projections are derived based on a number of key factors including the past performance and the management’s expectations of the market developments.
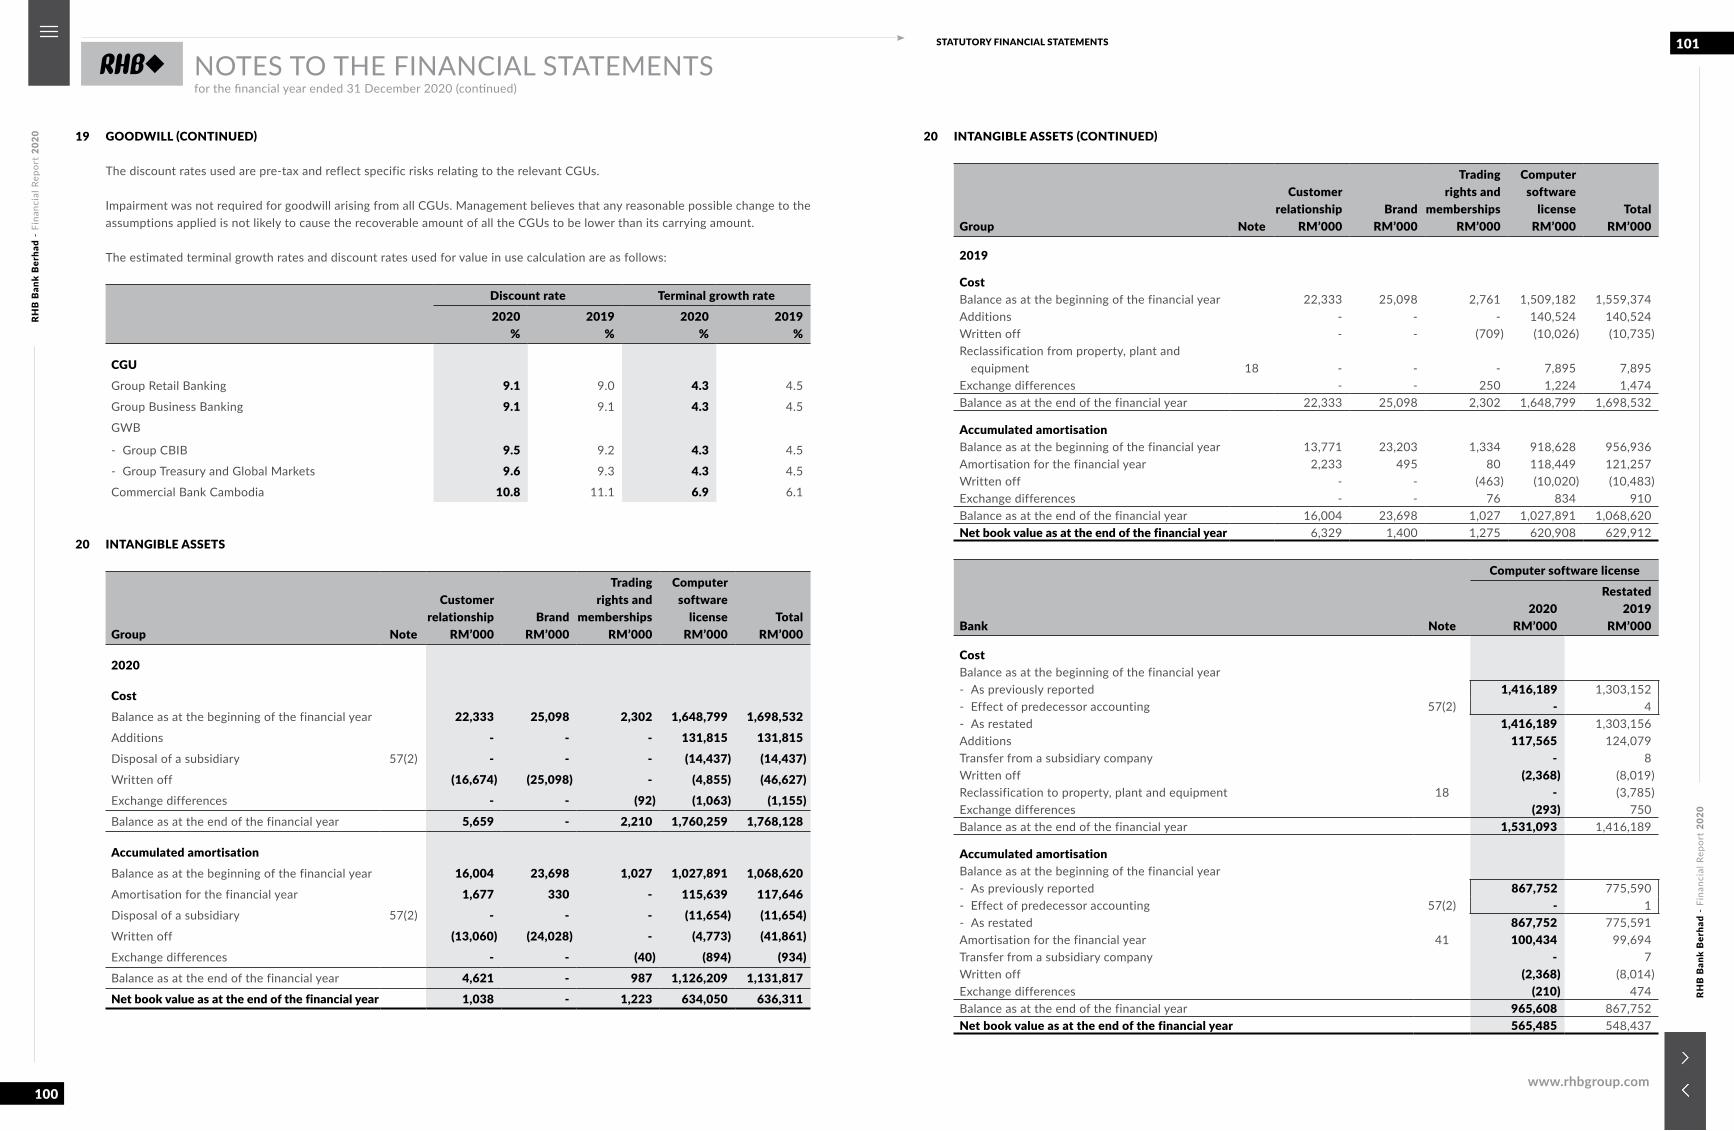
RHB
Ban
k B
erha
d -
Fina
ncia
l Rep
ort
2020
RHB
Ban
k B
erha
d -
Fina
ncia
l Rep
ort
2020
100
101STATUTORY FINANCIAL STATEMENTS
www.rhbgroup.com
NOTES TO THE FINANCIAL STATEMENTSfor the financial year ended 31 December 2020 (continued)
19 GOODWILL (CONTINUED)
The discount rates used are pre-tax and reflect specific risks relating to the relevant CGUs.
Impairment was not required for goodwill arising from all CGUs. Management believes that any reasonable possible change to the assumptions applied is not likely to cause the recoverable amount of all the CGUs to be lower than its carrying amount.
The estimated terminal growth rates and discount rates used for value in use calculation are as follows:
Discount rate Terminal growth rate2020
%2019
%2020
%2019
%
CGUGroup Retail Banking 9.1 9.0 4.3 4.5
Group Business Banking 9.1 9.1 4.3 4.5
GWB
- Group CBIB 9.5 9.2 4.3 4.5
- Group Treasury and Global Markets 9.6 9.3 4.3 4.5
Commercial Bank Cambodia 10.8 11.1 6.9 6.1
20 INTANGIBLE ASSETS
Group Note
Customerrelationship
RM’000Brand
RM’000
Tradingrights and
membershipsRM’000
Computersoftware
licenseRM’000
TotalRM’000
2020
CostBalance as at the beginning of the financial year 22,333 25,098 2,302 1,648,799 1,698,532Additions - - - 131,815 131,815Disposal of a subsidiary 57(2) - - - (14,437) (14,437)Written off (16,674) (25,098) - (4,855) (46,627)Exchange differences - - (92) (1,063) (1,155)Balance as at the end of the financial year 5,659 - 2,210 1,760,259 1,768,128
Accumulated amortisationBalance as at the beginning of the financial year 16,004 23,698 1,027 1,027,891 1,068,620Amortisation for the financial year 1,677 330 - 115,639 117,646Disposal of a subsidiary 57(2) - - - (11,654) (11,654)Written off (13,060) (24,028) - (4,773) (41,861)Exchange differences - - (40) (894) (934)Balance as at the end of the financial year 4,621 - 987 1,126,209 1,131,817Net book value as at the end of the financial year 1,038 - 1,223 634,050 636,311
20 INTANGIBLE ASSETS (CONTINUED)
Group Note
Customerrelationship
RM’000Brand
RM’000
Tradingrights and
membershipsRM’000
Computersoftware
licenseRM’000
TotalRM’000
2019
CostBalance as at the beginning of the financial year 22,333 25,098 2,761 1,509,182 1,559,374Additions - - - 140,524 140,524Written off - - (709) (10,026) (10,735)Reclassification from property, plant and
equipment 18 - - - 7,895 7,895Exchange differences - - 250 1,224 1,474Balance as at the end of the financial year 22,333 25,098 2,302 1,648,799 1,698,532
Accumulated amortisationBalance as at the beginning of the financial year 13,771 23,203 1,334 918,628 956,936Amortisation for the financial year 2,233 495 80 118,449 121,257Written off - - (463) (10,020) (10,483)Exchange differences - - 76 834 910Balance as at the end of the financial year 16,004 23,698 1,027 1,027,891 1,068,620Net book value as at the end of the financial year 6,329 1,400 1,275 620,908 629,912
Bank Note
Computer software license
2020 RM’000
Restated2019
RM’000
CostBalance as at the beginning of the financial year- As previously reported 1,416,189 1,303,152- Effect of predecessor accounting 57(2) - 4- As restated 1,416,189 1,303,156Additions 117,565 124,079Transfer from a subsidiary company - 8Written off (2,368) (8,019)Reclassification to property, plant and equipment 18 - (3,785)Exchange differences (293) 750 Balance as at the end of the financial year 1,531,093 1,416,189
Accumulated amortisationBalance as at the beginning of the financial year- As previously reported 867,752 775,590- Effect of predecessor accounting 57(2) - 1- As restated 867,752 775,591Amortisation for the financial year 41 100,434 99,694Transfer from a subsidiary company - 7Written off (2,368) (8,014)Exchange differences (210) 474 Balance as at the end of the financial year 965,608 867,752 Net book value as at the end of the financial year 565,485 548,437
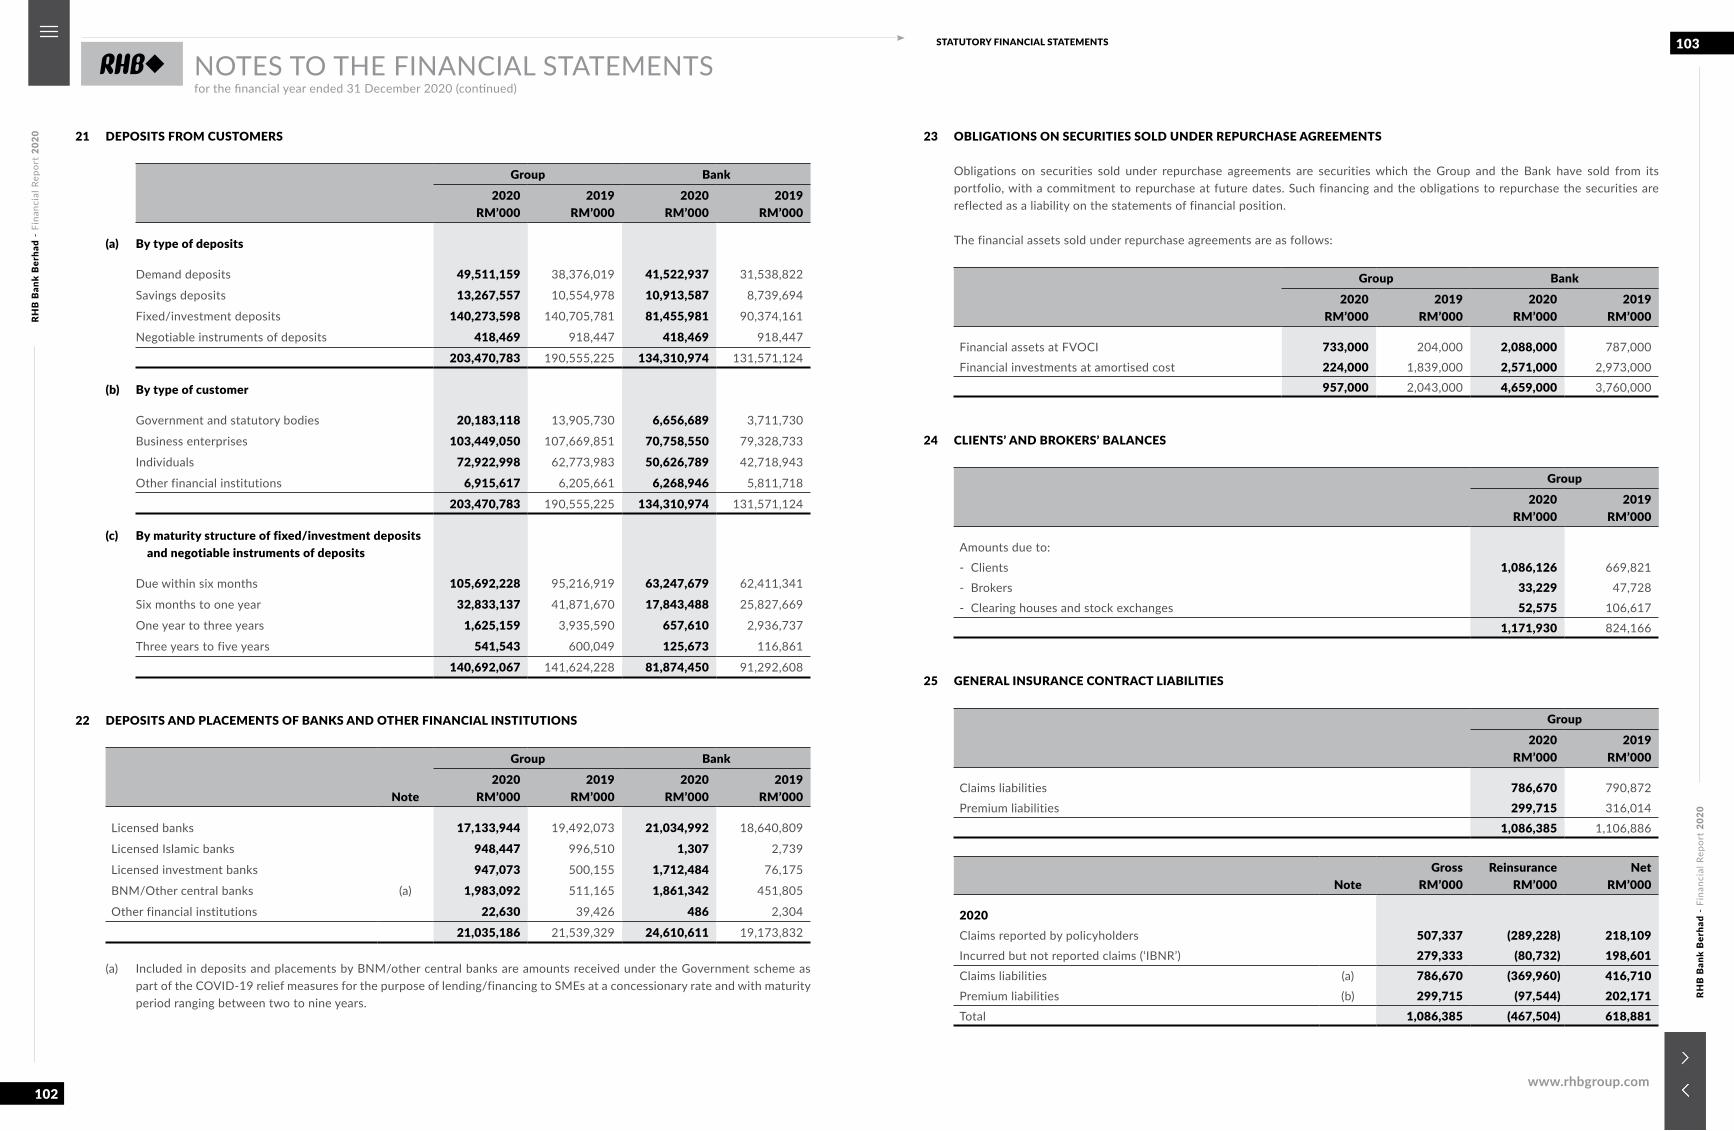
RHB
Ban
k B
erha
d -
Fina
ncia
l Rep
ort
2020
RHB
Ban
k B
erha
d -
Fina
ncia
l Rep
ort
2020
102
103STATUTORY FINANCIAL STATEMENTS
www.rhbgroup.com
NOTES TO THE FINANCIAL STATEMENTSfor the financial year ended 31 December 2020 (continued)
21 DEPOSITS FROM CUSTOMERS
Group Bank2020
RM’0002019
RM’0002020
RM’0002019
RM’000
(a) By type of deposits
Demand deposits 49,511,159 38,376,019 41,522,937 31,538,822
Savings deposits 13,267,557 10,554,978 10,913,587 8,739,694
Fixed/investment deposits 140,273,598 140,705,781 81,455,981 90,374,161
Negotiable instruments of deposits 418,469 918,447 418,469 918,447
203,470,783 190,555,225 134,310,974 131,571,124
(b) By type of customer
Government and statutory bodies 20,183,118 13,905,730 6,656,689 3,711,730
Business enterprises 103,449,050 107,669,851 70,758,550 79,328,733
Individuals 72,922,998 62,773,983 50,626,789 42,718,943
Other financial institutions 6,915,617 6,205,661 6,268,946 5,811,718
203,470,783 190,555,225 134,310,974 131,571,124
(c) By maturity structure of fixed/investment deposits and negotiable instruments of deposits
Due within six months 105,692,228 95,216,919 63,247,679 62,411,341
Six months to one year 32,833,137 41,871,670 17,843,488 25,827,669
One year to three years 1,625,159 3,935,590 657,610 2,936,737
Three years to five years 541,543 600,049 125,673 116,861
140,692,067 141,624,228 81,874,450 91,292,608
22 DEPOSITS AND PLACEMENTS OF BANKS AND OTHER FINANCIAL INSTITUTIONS
Note
Group Bank2020
RM’0002019
RM’0002020
RM’0002019
RM’000
Licensed banks 17,133,944 19,492,073 21,034,992 18,640,809
Licensed Islamic banks 948,447 996,510 1,307 2,739
Licensed investment banks 947,073 500,155 1,712,484 76,175
BNM/Other central banks (a) 1,983,092 511,165 1,861,342 451,805
Other financial institutions 22,630 39,426 486 2,304
21,035,186 21,539,329 24,610,611 19,173,832
(a) Included in deposits and placements by BNM/other central banks are amounts received under the Government scheme as part of the COVID-19 relief measures for the purpose of lending/financing to SMEs at a concessionary rate and with maturity period ranging between two to nine years.
23 OBLIGATIONS ON SECURITIES SOLD UNDER REPURCHASE AGREEMENTS
Obligations on securities sold under repurchase agreements are securities which the Group and the Bank have sold from its portfolio, with a commitment to repurchase at future dates. Such financing and the obligations to repurchase the securities are reflected as a liability on the statements of financial position.
The financial assets sold under repurchase agreements are as follows:
Group Bank2020
RM’0002019
RM’0002020
RM’0002019
RM’000
Financial assets at FVOCI 733,000 204,000 2,088,000 787,000
Financial investments at amortised cost 224,000 1,839,000 2,571,000 2,973,000
957,000 2,043,000 4,659,000 3,760,000
24 CLIENTS’ AND BROKERS’ BALANCES
Group2020
RM’0002019
RM’000
Amounts due to:
- Clients 1,086,126 669,821
- Brokers 33,229 47,728
- Clearing houses and stock exchanges 52,575 106,617
1,171,930 824,166
25 GENERAL INSURANCE CONTRACT LIABILITIES
Group2020
RM’0002019
RM’000
Claims liabilities 786,670 790,872
Premium liabilities 299,715 316,014
1,086,385 1,106,886
NoteGross
RM’000Reinsurance
RM’000Net
RM’000
2020Claims reported by policyholders 507,337 (289,228) 218,109Incurred but not reported claims (‘IBNR’) 279,333 (80,732) 198,601 Claims liabilities (a) 786,670 (369,960) 416,710Premium liabilities (b) 299,715 (97,544) 202,171 Total 1,086,385 (467,504) 618,881
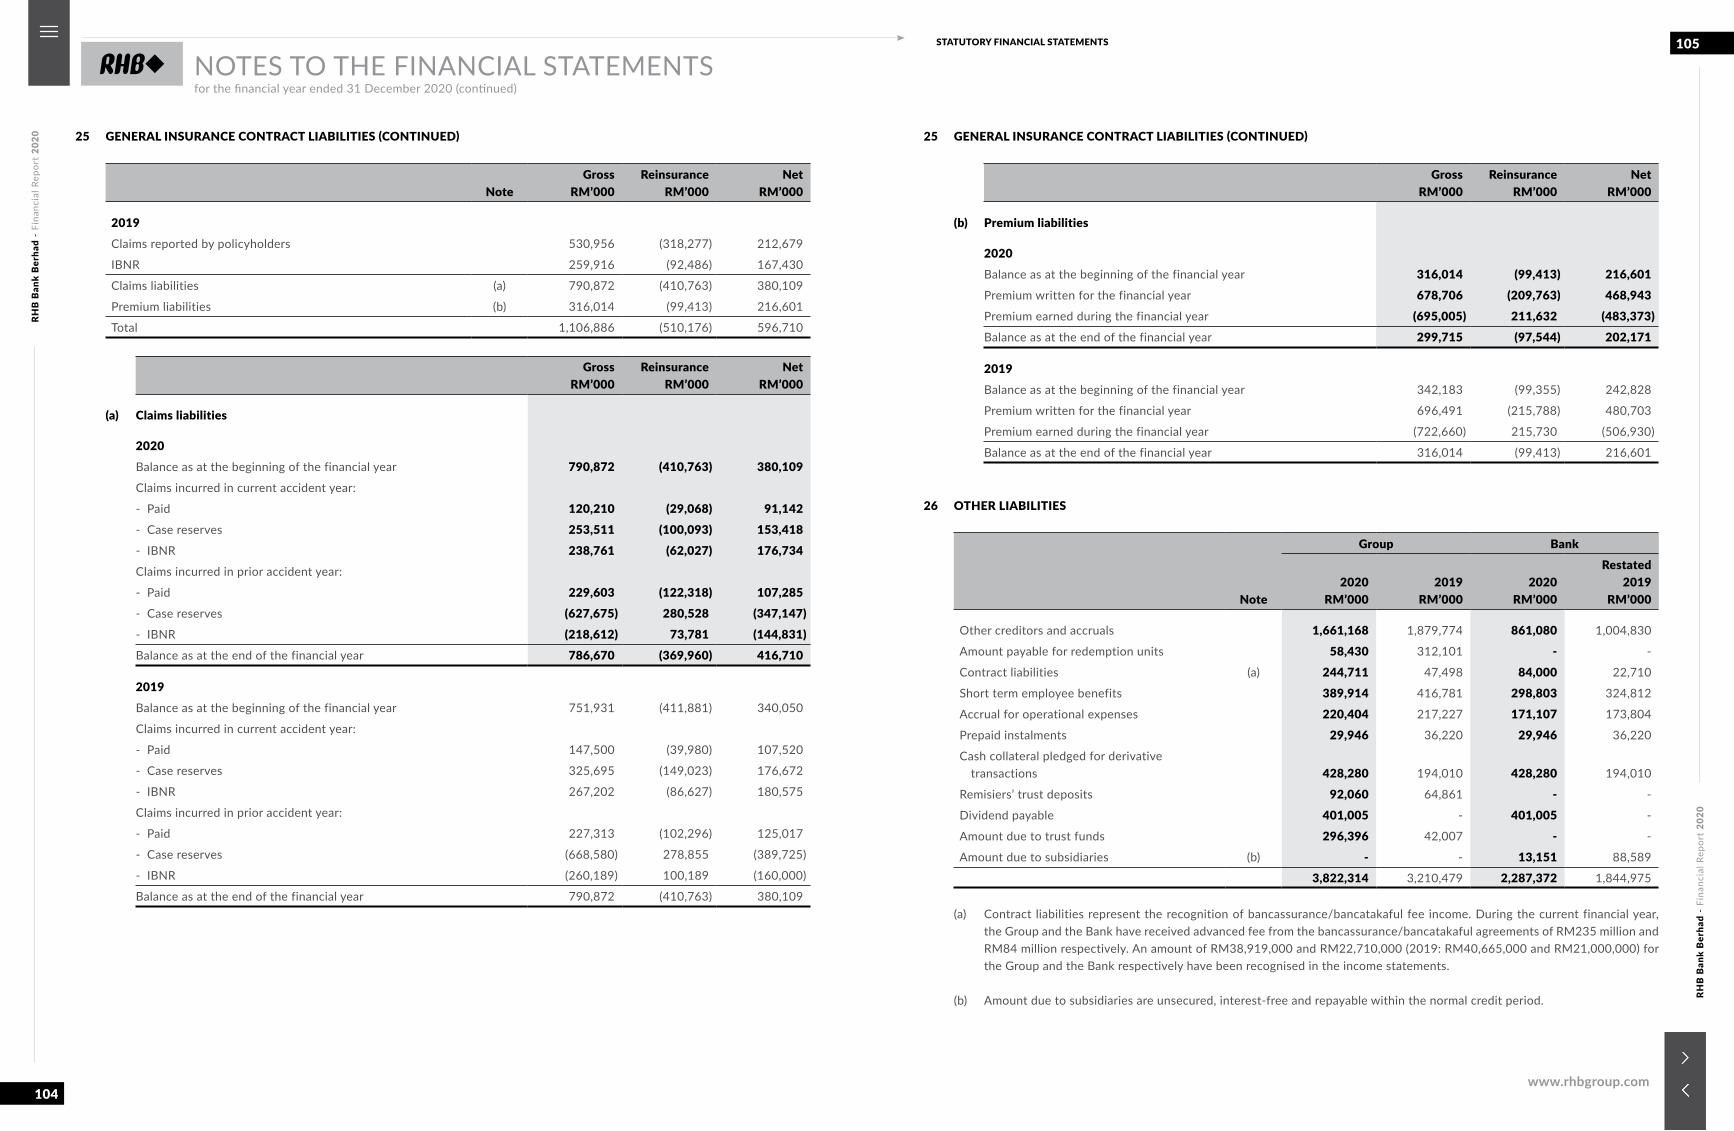
RHB
Ban
k B
erha
d -
Fina
ncia
l Rep
ort
2020
RHB
Ban
k B
erha
d -
Fina
ncia
l Rep
ort
2020
104
105STATUTORY FINANCIAL STATEMENTS
www.rhbgroup.com
NOTES TO THE FINANCIAL STATEMENTSfor the financial year ended 31 December 2020 (continued)
25 GENERAL INSURANCE CONTRACT LIABILITIES (CONTINUED)
NoteGross
RM’000Reinsurance
RM’000Net
RM’000
2019Claims reported by policyholders 530,956 (318,277) 212,679
IBNR 259,916 (92,486) 167,430
Claims liabilities (a) 790,872 (410,763) 380,109
Premium liabilities (b) 316,014 (99,413) 216,601
Total 1,106,886 (510,176) 596,710
Gross RM’000
Reinsurance RM’000
Net RM’000
(a) Claims liabilities
2020Balance as at the beginning of the financial year 790,872 (410,763) 380,109Claims incurred in current accident year:
- Paid 120,210 (29,068) 91,142- Case reserves 253,511 (100,093) 153,418- IBNR 238,761 (62,027) 176,734Claims incurred in prior accident year:
- Paid 229,603 (122,318) 107,285- Case reserves (627,675) 280,528 (347,147)- IBNR (218,612) 73,781 (144,831)Balance as at the end of the financial year 786,670 (369,960) 416,710
2019Balance as at the beginning of the financial year 751,931 (411,881) 340,050
Claims incurred in current accident year:
- Paid 147,500 (39,980) 107,520
- Case reserves 325,695 (149,023) 176,672
- IBNR 267,202 (86,627) 180,575
Claims incurred in prior accident year:
- Paid 227,313 (102,296) 125,017
- Case reserves (668,580) 278,855 (389,725)
- IBNR (260,189) 100,189 (160,000)
Balance as at the end of the financial year 790,872 (410,763) 380,109
25 GENERAL INSURANCE CONTRACT LIABILITIES (CONTINUED)
Gross RM’000
ReinsuranceRM’000
Net RM’000
(b) Premium liabilities
2020Balance as at the beginning of the financial year 316,014 (99,413) 216,601Premium written for the financial year 678,706 (209,763) 468,943Premium earned during the financial year (695,005) 211,632 (483,373)Balance as at the end of the financial year 299,715 (97,544) 202,171
2019Balance as at the beginning of the financial year 342,183 (99,355) 242,828
Premium written for the financial year 696,491 (215,788) 480,703
Premium earned during the financial year (722,660) 215,730 (506,930)
Balance as at the end of the financial year 316,014 (99,413) 216,601
26 OTHER LIABILITIES
Note
Group Bank
2020RM’000
2019 RM’000
2020RM’000
Restated2019
RM’000
Other creditors and accruals 1,661,168 1,879,774 861,080 1,004,830
Amount payable for redemption units 58,430 312,101 - -
Contract liabilities (a) 244,711 47,498 84,000 22,710
Short term employee benefits 389,914 416,781 298,803 324,812
Accrual for operational expenses 220,404 217,227 171,107 173,804
Prepaid instalments 29,946 36,220 29,946 36,220
Cash collateral pledged for derivative transactions 428,280 194,010 428,280 194,010
Remisiers’ trust deposits 92,060 64,861 - -
Dividend payable 401,005 - 401,005 -
Amount due to trust funds 296,396 42,007 - -
Amount due to subsidiaries (b) - - 13,151 88,589
3,822,314 3,210,479 2,287,372 1,844,975
(a) Contract liabilities represent the recognition of bancassurance/bancatakaful fee income. During the current financial year, the Group and the Bank have received advanced fee from the bancassurance/bancatakaful agreements of RM235 million and RM84 million respectively. An amount of RM38,919,000 and RM22,710,000 (2019: RM40,665,000 and RM21,000,000) for the Group and the Bank respectively have been recognised in the income statements.
(b) Amount due to subsidiaries are unsecured, interest-free and repayable within the normal credit period.
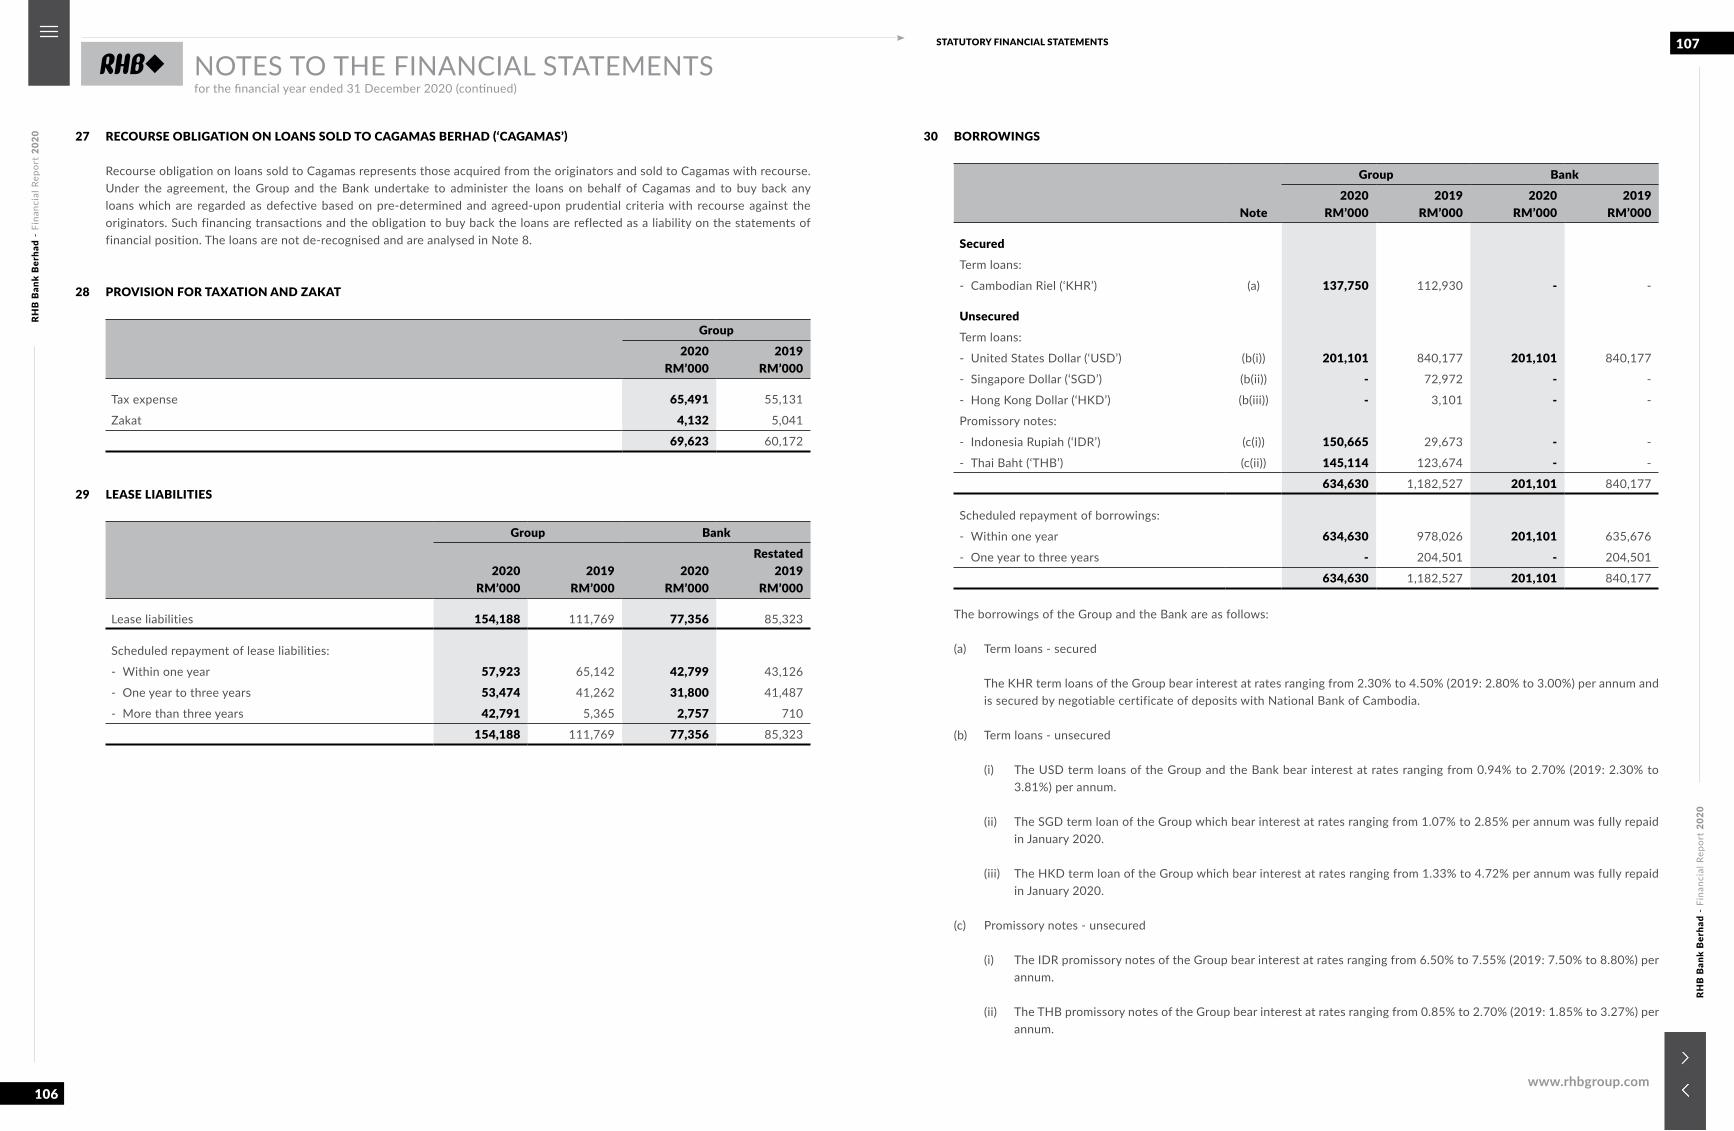
RHB
Ban
k B
erha
d -
Fina
ncia
l Rep
ort
2020
RHB
Ban
k B
erha
d -
Fina
ncia
l Rep
ort
2020
106
107STATUTORY FINANCIAL STATEMENTS
www.rhbgroup.com
NOTES TO THE FINANCIAL STATEMENTSfor the financial year ended 31 December 2020 (continued)
27 RECOURSE OBLIGATION ON LOANS SOLD TO CAGAMAS BERHAD (‘CAGAMAS’)
Recourse obligation on loans sold to Cagamas represents those acquired from the originators and sold to Cagamas with recourse. Under the agreement, the Group and the Bank undertake to administer the loans on behalf of Cagamas and to buy back any loans which are regarded as defective based on pre-determined and agreed-upon prudential criteria with recourse against the originators. Such financing transactions and the obligation to buy back the loans are reflected as a liability on the statements of financial position. The loans are not de-recognised and are analysed in Note 8.
28 PROVISION FOR TAXATION AND ZAKAT
Group2020
RM’0002019
RM’000
Tax expense 65,491 55,131
Zakat 4,132 5,041
69,623 60,172
29 LEASE LIABILITIES
Group Bank
2020RM’000
2019 RM’000
2020 RM’000
Restated2019
RM’000
Lease liabilities 154,188 111,769 77,356 85,323
Scheduled repayment of lease liabilities:
- Within one year 57,923 65,142 42,799 43,126
- One year to three years 53,474 41,262 31,800 41,487
- More than three years 42,791 5,365 2,757 710
154,188 111,769 77,356 85,323
30 BORROWINGS
Note
Group Bank2020
RM’0002019
RM’0002020
RM’0002019
RM’000
SecuredTerm loans:
- Cambodian Riel (‘KHR’) (a) 137,750 112,930 - -
UnsecuredTerm loans:
- United States Dollar (‘USD’) (b(i)) 201,101 840,177 201,101 840,177
- Singapore Dollar (‘SGD’) (b(ii)) - 72,972 - -
- Hong Kong Dollar (‘HKD’) (b(iii)) - 3,101 - -
Promissory notes:
- Indonesia Rupiah (‘IDR’) (c(i)) 150,665 29,673 - -
- Thai Baht (‘THB’) (c(ii)) 145,114 123,674 - -
634,630 1,182,527 201,101 840,177
Scheduled repayment of borrowings:
- Within one year 634,630 978,026 201,101 635,676
- One year to three years - 204,501 - 204,501
634,630 1,182,527 201,101 840,177
The borrowings of the Group and the Bank are as follows:
(a) Term loans - secured
The KHR term loans of the Group bear interest at rates ranging from 2.30% to 4.50% (2019: 2.80% to 3.00%) per annum and is secured by negotiable certificate of deposits with National Bank of Cambodia.
(b) Term loans - unsecured
(i) The USD term loans of the Group and the Bank bear interest at rates ranging from 0.94% to 2.70% (2019: 2.30% to 3.81%) per annum.
(ii) The SGD term loan of the Group which bear interest at rates ranging from 1.07% to 2.85% per annum was fully repaid in January 2020.
(iii) The HKD term loan of the Group which bear interest at rates ranging from 1.33% to 4.72% per annum was fully repaid in January 2020.
(c) Promissory notes - unsecured
(i) The IDR promissory notes of the Group bear interest at rates ranging from 6.50% to 7.55% (2019: 7.50% to 8.80%) per annum.
(ii) The THB promissory notes of the Group bear interest at rates ranging from 0.85% to 2.70% (2019: 1.85% to 3.27%) per annum.
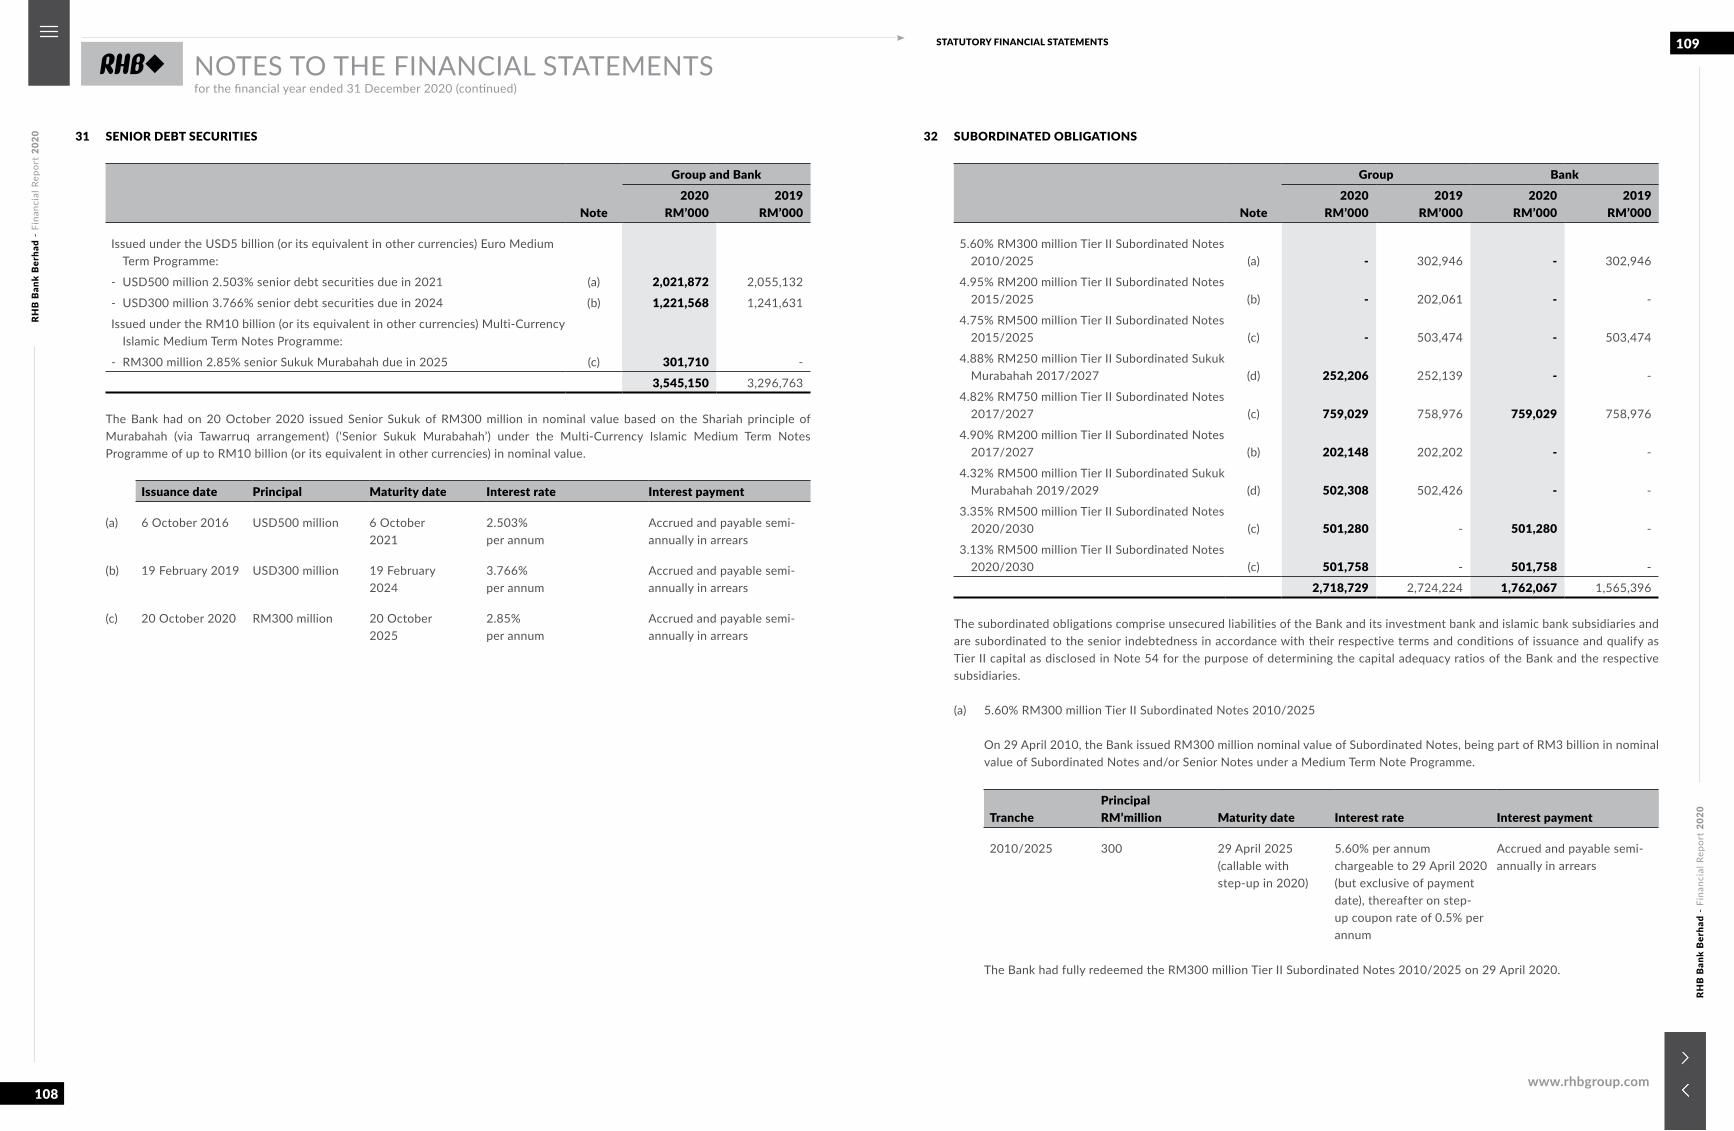
RHB
Ban
k B
erha
d -
Fina
ncia
l Rep
ort
2020
RHB
Ban
k B
erha
d -
Fina
ncia
l Rep
ort
2020
108
109STATUTORY FINANCIAL STATEMENTS
www.rhbgroup.com
NOTES TO THE FINANCIAL STATEMENTSfor the financial year ended 31 December 2020 (continued)
31 SENIOR DEBT SECURITIES
Note
Group and Bank2020
RM’0002019
RM’000
Issued under the USD5 billion (or its equivalent in other currencies) Euro Medium Term Programme:
- USD500 million 2.503% senior debt securities due in 2021 (a) 2,021,872 2,055,132
- USD300 million 3.766% senior debt securities due in 2024 (b) 1,221,568 1,241,631
Issued under the RM10 billion (or its equivalent in other currencies) Multi-Currency Islamic Medium Term Notes Programme:
- RM300 million 2.85% senior Sukuk Murabahah due in 2025 (c) 301,710 -
3,545,150 3,296,763
The Bank had on 20 October 2020 issued Senior Sukuk of RM300 million in nominal value based on the Shariah principle of Murabahah (via Tawarruq arrangement) (‘Senior Sukuk Murabahah’) under the Multi-Currency Islamic Medium Term Notes Programme of up to RM10 billion (or its equivalent in other currencies) in nominal value.
Issuance date Principal Maturity date Interest rate Interest payment
(a) 6 October 2016 USD500 million 6 October2021
2.503%per annum
Accrued and payable semi-annually in arrears
(b) 19 February 2019 USD300 million 19 February2024
3.766%per annum
Accrued and payable semi-annually in arrears
(c) 20 October 2020 RM300 million 20 October2025
2.85% per annum
Accrued and payable semi-annually in arrears
32 SUBORDINATED OBLIGATIONS
Note
Group Bank2020
RM’0002019
RM’0002020
RM’0002019
RM’000
5.60% RM300 million Tier II Subordinated Notes 2010/2025 (a) - 302,946 - 302,946
4.95% RM200 million Tier II Subordinated Notes 2015/2025 (b) - 202,061 - -
4.75% RM500 million Tier II Subordinated Notes 2015/2025 (c) - 503,474 - 503,474
4.88% RM250 million Tier II Subordinated Sukuk Murabahah 2017/2027 (d) 252,206 252,139 - -
4.82% RM750 million Tier II Subordinated Notes 2017/2027 (c) 759,029 758,976 759,029 758,976
4.90% RM200 million Tier II Subordinated Notes 2017/2027 (b) 202,148 202,202 - -
4.32% RM500 million Tier II Subordinated Sukuk Murabahah 2019/2029 (d) 502,308 502,426 - -
3.35% RM500 million Tier II Subordinated Notes 2020/2030 (c) 501,280 - 501,280 -
3.13% RM500 million Tier II Subordinated Notes 2020/2030 (c) 501,758 - 501,758 -
2,718,729 2,724,224 1,762,067 1,565,396
The subordinated obligations comprise unsecured liabilities of the Bank and its investment bank and islamic bank subsidiaries and are subordinated to the senior indebtedness in accordance with their respective terms and conditions of issuance and qualify as Tier II capital as disclosed in Note 54 for the purpose of determining the capital adequacy ratios of the Bank and the respective subsidiaries.
(a) 5.60% RM300 million Tier II Subordinated Notes 2010/2025
On 29 April 2010, the Bank issued RM300 million nominal value of Subordinated Notes, being part of RM3 billion in nominal value of Subordinated Notes and/or Senior Notes under a Medium Term Note Programme.
TranchePrincipalRM’million Maturity date Interest rate Interest payment
2010/2025 300 29 April 2025 (callable with step-up in 2020)
5.60% per annum chargeable to 29 April 2020 (but exclusive of payment date), thereafter on step-up coupon rate of 0.5% per annum
Accrued and payable semi-annually in arrears
The Bank had fully redeemed the RM300 million Tier II Subordinated Notes 2010/2025 on 29 April 2020.
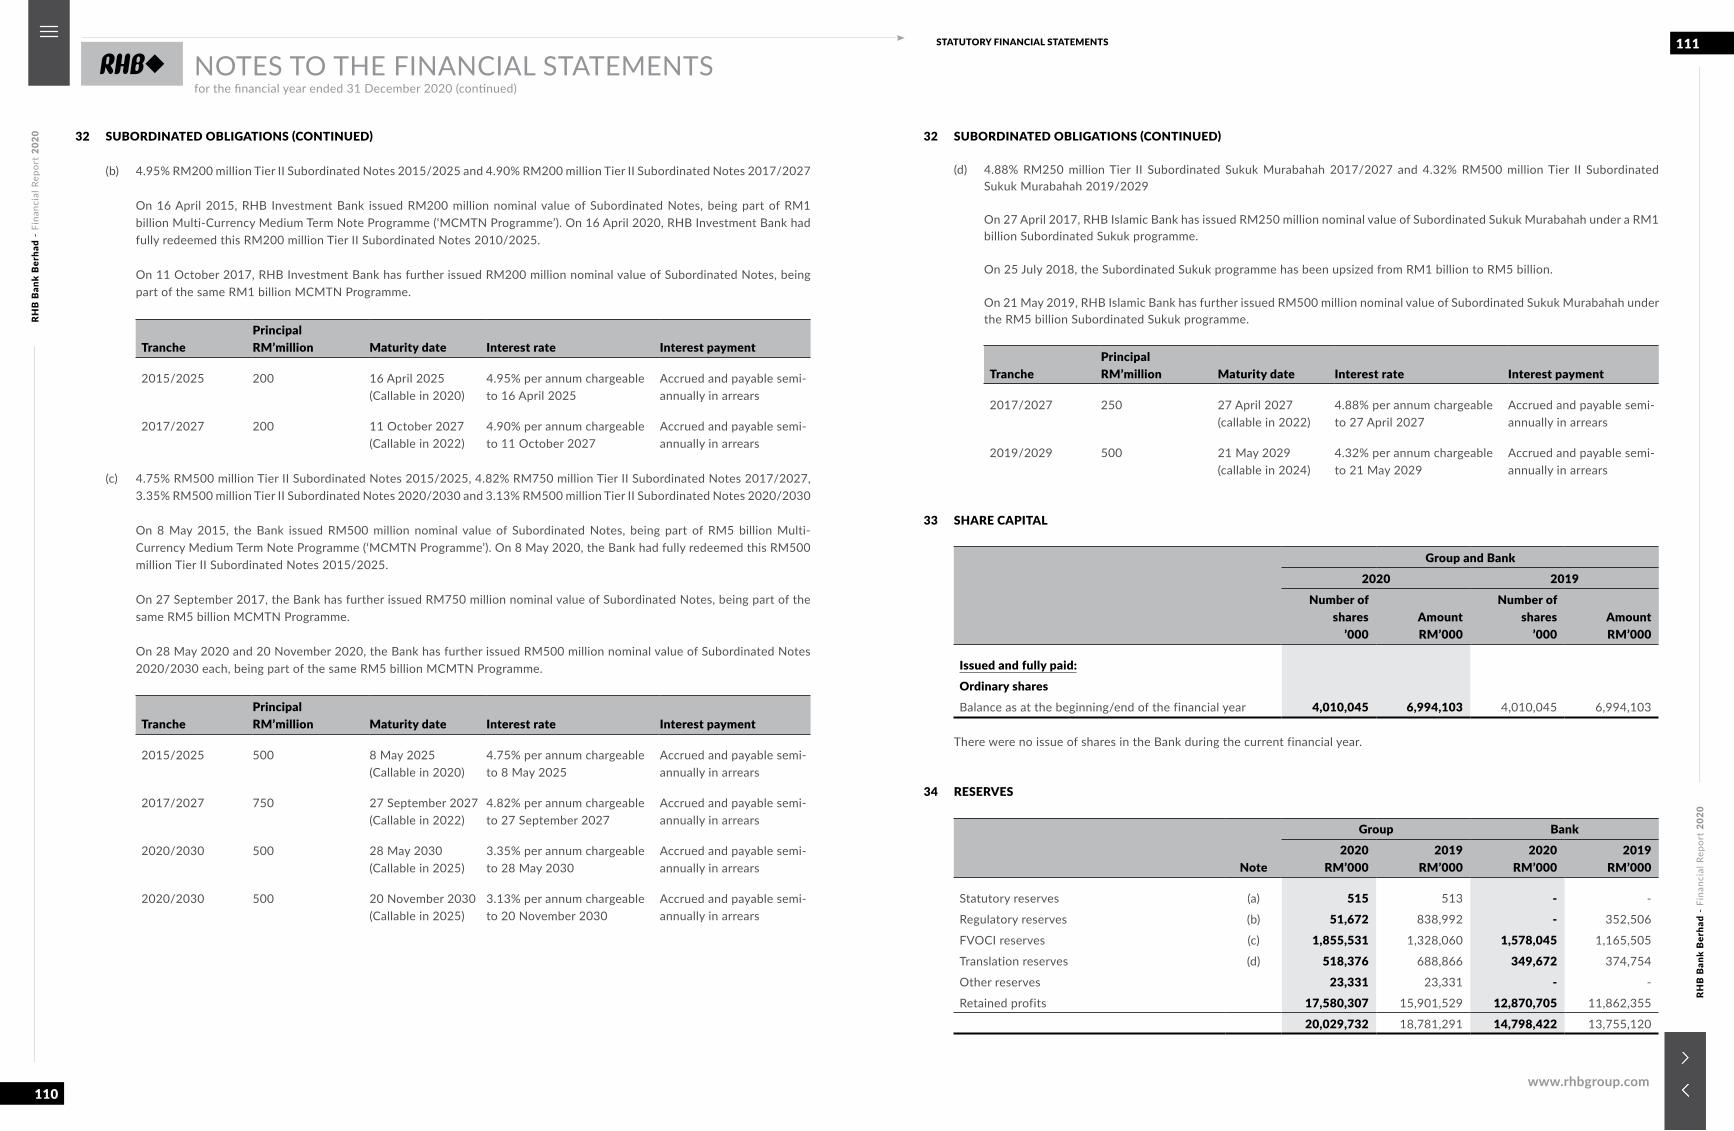
RHB
Ban
k B
erha
d -
Fina
ncia
l Rep
ort
2020
RHB
Ban
k B
erha
d -
Fina
ncia
l Rep
ort
2020
110
111STATUTORY FINANCIAL STATEMENTS
www.rhbgroup.com
NOTES TO THE FINANCIAL STATEMENTSfor the financial year ended 31 December 2020 (continued)
32 SUBORDINATED OBLIGATIONS (CONTINUED)
(b) 4.95% RM200 million Tier II Subordinated Notes 2015/2025 and 4.90% RM200 million Tier II Subordinated Notes 2017/2027
On 16 April 2015, RHB Investment Bank issued RM200 million nominal value of Subordinated Notes, being part of RM1 billion Multi-Currency Medium Term Note Programme (‘MCMTN Programme’). On 16 April 2020, RHB Investment Bank had fully redeemed this RM200 million Tier II Subordinated Notes 2010/2025.
On 11 October 2017, RHB Investment Bank has further issued RM200 million nominal value of Subordinated Notes, being part of the same RM1 billion MCMTN Programme.
TranchePrincipalRM’million Maturity date Interest rate Interest payment
2015/2025 200 16 April 2025(Callable in 2020)
4.95% per annum chargeable to 16 April 2025
Accrued and payable semi-annually in arrears
2017/2027 200 11 October 2027(Callable in 2022)
4.90% per annum chargeable to 11 October 2027
Accrued and payable semi-annually in arrears
(c) 4.75% RM500 million Tier II Subordinated Notes 2015/2025, 4.82% RM750 million Tier II Subordinated Notes 2017/2027,
3.35% RM500 million Tier II Subordinated Notes 2020/2030 and 3.13% RM500 million Tier II Subordinated Notes 2020/2030
On 8 May 2015, the Bank issued RM500 million nominal value of Subordinated Notes, being part of RM5 billion Multi- Currency Medium Term Note Programme (‘MCMTN Programme’). On 8 May 2020, the Bank had fully redeemed this RM500 million Tier II Subordinated Notes 2015/2025.
On 27 September 2017, the Bank has further issued RM750 million nominal value of Subordinated Notes, being part of the same RM5 billion MCMTN Programme.
On 28 May 2020 and 20 November 2020, the Bank has further issued RM500 million nominal value of Subordinated Notes 2020/2030 each, being part of the same RM5 billion MCMTN Programme.
TranchePrincipalRM’million Maturity date Interest rate Interest payment
2015/2025 500 8 May 2025 (Callable in 2020)
4.75% per annum chargeable to 8 May 2025
Accrued and payable semi-annually in arrears
2017/2027 750 27 September 2027 (Callable in 2022)
4.82% per annum chargeable to 27 September 2027
Accrued and payable semi-annually in arrears
2020/2030 500 28 May 2030 (Callable in 2025)
3.35% per annum chargeable to 28 May 2030
Accrued and payable semi-annually in arrears
2020/2030 500 20 November 2030 (Callable in 2025)
3.13% per annum chargeable to 20 November 2030
Accrued and payable semi-annually in arrears
32 SUBORDINATED OBLIGATIONS (CONTINUED)
(d) 4.88% RM250 million Tier II Subordinated Sukuk Murabahah 2017/2027 and 4.32% RM500 million Tier II Subordinated Sukuk Murabahah 2019/2029
On 27 April 2017, RHB Islamic Bank has issued RM250 million nominal value of Subordinated Sukuk Murabahah under a RM1 billion Subordinated Sukuk programme.
On 25 July 2018, the Subordinated Sukuk programme has been upsized from RM1 billion to RM5 billion.
On 21 May 2019, RHB Islamic Bank has further issued RM500 million nominal value of Subordinated Sukuk Murabahah under the RM5 billion Subordinated Sukuk programme.
TranchePrincipalRM’million Maturity date Interest rate Interest payment
2017/2027 250 27 April 2027 (callable in 2022)
4.88% per annum chargeable to 27 April 2027
Accrued and payable semi-annually in arrears
2019/2029 500 21 May 2029 (callable in 2024)
4.32% per annum chargeable to 21 May 2029
Accrued and payable semi-annually in arrears
33 SHARE CAPITAL
Group and Bank2020 2019
Number ofshares
’000AmountRM’000
Number ofshares
’000AmountRM’000
Issued and fully paid:Ordinary sharesBalance as at the beginning/end of the financial year 4,010,045 6,994,103 4,010,045 6,994,103
There were no issue of shares in the Bank during the current financial year.
34 RESERVES
Note
Group Bank2020
RM’0002019
RM’0002020
RM’0002019
RM’000
Statutory reserves (a) 515 513 - -
Regulatory reserves (b) 51,672 838,992 - 352,506
FVOCI reserves (c) 1,855,531 1,328,060 1,578,045 1,165,505
Translation reserves (d) 518,376 688,866 349,672 374,754
Other reserves 23,331 23,331 - -
Retained profits 17,580,307 15,901,529 12,870,705 11,862,355
20,029,732 18,781,291 14,798,422 13,755,120
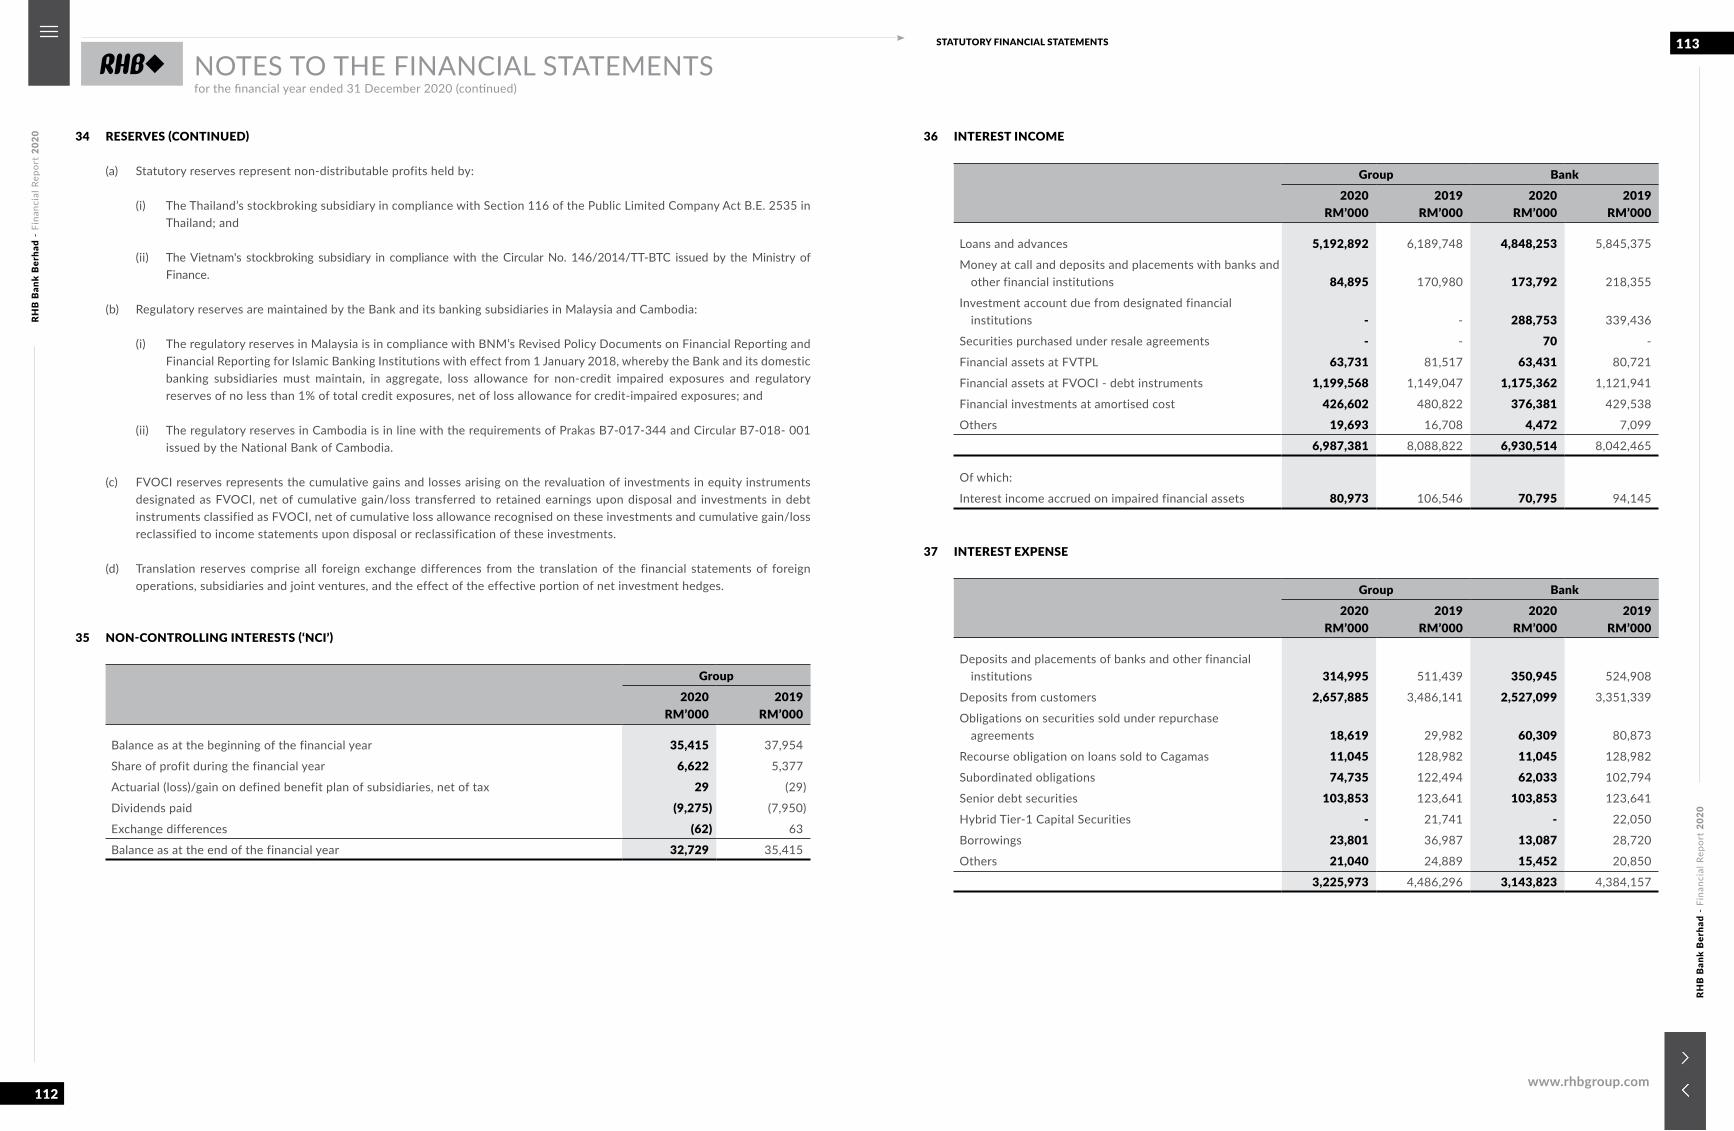
RHB
Ban
k B
erha
d -
Fina
ncia
l Rep
ort
2020
RHB
Ban
k B
erha
d -
Fina
ncia
l Rep
ort
2020
112
113STATUTORY FINANCIAL STATEMENTS
www.rhbgroup.com
NOTES TO THE FINANCIAL STATEMENTSfor the financial year ended 31 December 2020 (continued)
34 RESERVES (CONTINUED)
(a) Statutory reserves represent non-distributable profits held by:
(i) The Thailand’s stockbroking subsidiary in compliance with Section 116 of the Public Limited Company Act B.E. 2535 in Thailand; and
(ii) The Vietnam's stockbroking subsidiary in compliance with the Circular No. 146/2014/TT-BTC issued by the Ministry of Finance.
(b) Regulatory reserves are maintained by the Bank and its banking subsidiaries in Malaysia and Cambodia:
(i) The regulatory reserves in Malaysia is in compliance with BNM’s Revised Policy Documents on Financial Reporting and Financial Reporting for Islamic Banking Institutions with effect from 1 January 2018, whereby the Bank and its domestic banking subsidiaries must maintain, in aggregate, loss allowance for non-credit impaired exposures and regulatory reserves of no less than 1% of total credit exposures, net of loss allowance for credit-impaired exposures; and
(ii) The regulatory reserves in Cambodia is in line with the requirements of Prakas B7-017-344 and Circular B7-018- 001 issued by the National Bank of Cambodia.
(c) FVOCI reserves represents the cumulative gains and losses arising on the revaluation of investments in equity instruments designated as FVOCI, net of cumulative gain/loss transferred to retained earnings upon disposal and investments in debt instruments classified as FVOCI, net of cumulative loss allowance recognised on these investments and cumulative gain/loss reclassified to income statements upon disposal or reclassification of these investments.
(d) Translation reserves comprise all foreign exchange differences from the translation of the financial statements of foreign operations, subsidiaries and joint ventures, and the effect of the effective portion of net investment hedges.
35 NON-CONTROLLING INTERESTS (‘NCI’)
Group2020
RM’0002019
RM’000
Balance as at the beginning of the financial year 35,415 37,954
Share of profit during the financial year 6,622 5,377
Actuarial (loss)/gain on defined benefit plan of subsidiaries, net of tax 29 (29)
Dividends paid (9,275) (7,950)
Exchange differences (62) 63
Balance as at the end of the financial year 32,729 35,415
36 INTEREST INCOME
Group Bank2020
RM’0002019
RM’0002020
RM’0002019
RM’000
Loans and advances 5,192,892 6,189,748 4,848,253 5,845,375
Money at call and deposits and placements with banks and other financial institutions 84,895 170,980 173,792 218,355
Investment account due from designated financial institutions - - 288,753 339,436
Securities purchased under resale agreements - - 70 -
Financial assets at FVTPL 63,731 81,517 63,431 80,721
Financial assets at FVOCI - debt instruments 1,199,568 1,149,047 1,175,362 1,121,941
Financial investments at amortised cost 426,602 480,822 376,381 429,538
Others 19,693 16,708 4,472 7,099
6,987,381 8,088,822 6,930,514 8,042,465
Of which:
Interest income accrued on impaired financial assets 80,973 106,546 70,795 94,145
37 INTEREST EXPENSE
Group Bank2020
RM’0002019
RM’0002020
RM’0002019
RM’000
Deposits and placements of banks and other financial institutions 314,995 511,439 350,945 524,908
Deposits from customers 2,657,885 3,486,141 2,527,099 3,351,339
Obligations on securities sold under repurchase agreements 18,619 29,982 60,309 80,873
Recourse obligation on loans sold to Cagamas 11,045 128,982 11,045 128,982
Subordinated obligations 74,735 122,494 62,033 102,794
Senior debt securities 103,853 123,641 103,853 123,641
Hybrid Tier-1 Capital Securities - 21,741 - 22,050
Borrowings 23,801 36,987 13,087 28,720
Others 21,040 24,889 15,452 20,850
3,225,973 4,486,296 3,143,823 4,384,157
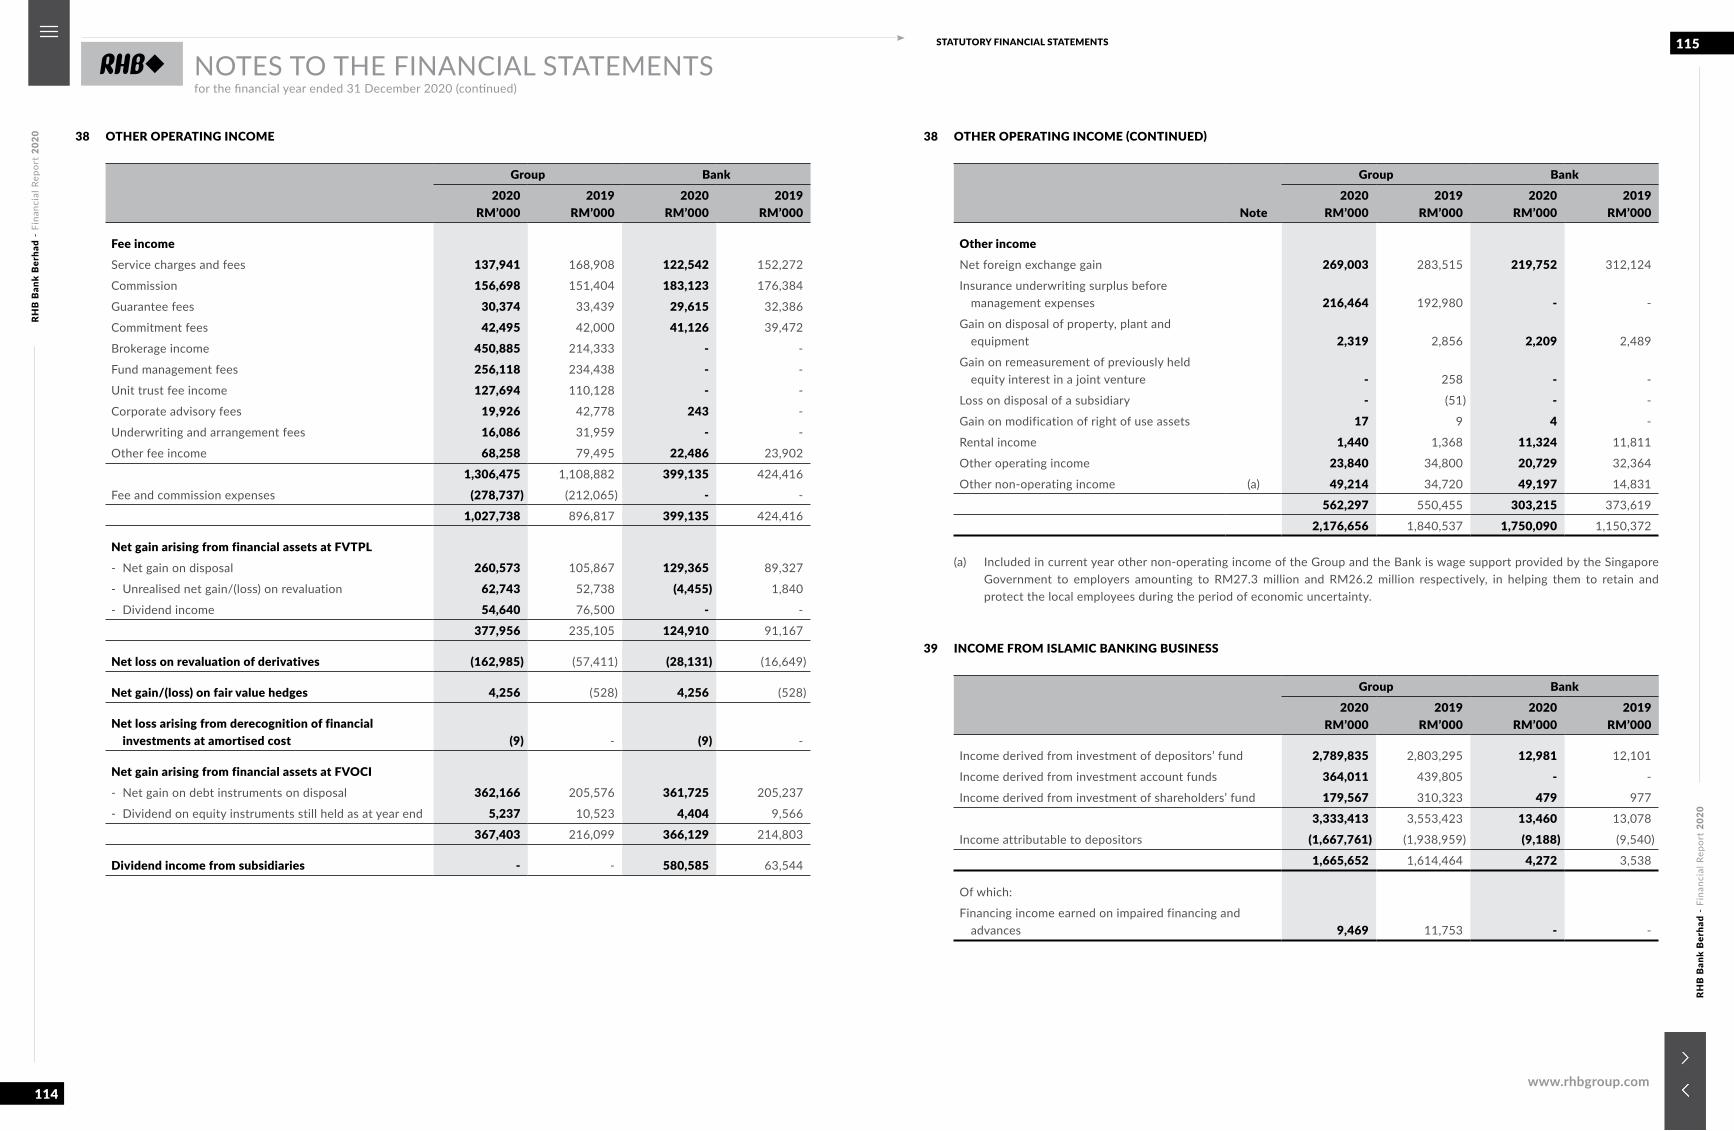
RHB
Ban
k B
erha
d -
Fina
ncia
l Rep
ort
2020
RHB
Ban
k B
erha
d -
Fina
ncia
l Rep
ort
2020
114
115STATUTORY FINANCIAL STATEMENTS
www.rhbgroup.com
NOTES TO THE FINANCIAL STATEMENTSfor the financial year ended 31 December 2020 (continued)
38 OTHER OPERATING INCOME
Group Bank2020
RM’0002019
RM’0002020
RM’0002019
RM’000
Fee incomeService charges and fees 137,941 168,908 122,542 152,272
Commission 156,698 151,404 183,123 176,384
Guarantee fees 30,374 33,439 29,615 32,386
Commitment fees 42,495 42,000 41,126 39,472
Brokerage income 450,885 214,333 - -
Fund management fees 256,118 234,438 - -
Unit trust fee income 127,694 110,128 - -
Corporate advisory fees 19,926 42,778 243 -
Underwriting and arrangement fees 16,086 31,959 - -
Other fee income 68,258 79,495 22,486 23,902
1,306,475 1,108,882 399,135 424,416
Fee and commission expenses (278,737) (212,065) - -
1,027,738 896,817 399,135 424,416
Net gain arising from financial assets at FVTPL- Net gain on disposal 260,573 105,867 129,365 89,327
- Unrealised net gain/(loss) on revaluation 62,743 52,738 (4,455) 1,840
- Dividend income 54,640 76,500 - -
377,956 235,105 124,910 91,167
Net loss on revaluation of derivatives (162,985) (57,411) (28,131) (16,649)
Net gain/(loss) on fair value hedges 4,256 (528) 4,256 (528)
Net loss arising from derecognition of financial investments at amortised cost (9) - (9) -
Net gain arising from financial assets at FVOCI- Net gain on debt instruments on disposal 362,166 205,576 361,725 205,237
- Dividend on equity instruments still held as at year end 5,237 10,523 4,404 9,566
367,403 216,099 366,129 214,803
Dividend income from subsidiaries - - 580,585 63,544
38 OTHER OPERATING INCOME (CONTINUED)
Note
Group Bank2020
RM’0002019
RM’0002020
RM’0002019
RM’000
Other incomeNet foreign exchange gain 269,003 283,515 219,752 312,124
Insurance underwriting surplus before management expenses 216,464 192,980 - -
Gain on disposal of property, plant and equipment 2,319 2,856 2,209 2,489
Gain on remeasurement of previously held equity interest in a joint venture - 258 - -
Loss on disposal of a subsidiary - (51) - -
Gain on modification of right of use assets 17 9 4 -
Rental income 1,440 1,368 11,324 11,811
Other operating income 23,840 34,800 20,729 32,364
Other non-operating income (a) 49,214 34,720 49,197 14,831
562,297 550,455 303,215 373,619
2,176,656 1,840,537 1,750,090 1,150,372
(a) Included in current year other non-operating income of the Group and the Bank is wage support provided by the Singapore Government to employers amounting to RM27.3 million and RM26.2 million respectively, in helping them to retain and protect the local employees during the period of economic uncertainty.
39 INCOME FROM ISLAMIC BANKING BUSINESS
Group Bank2020
RM’0002019
RM’0002020
RM’0002019
RM’000
Income derived from investment of depositors’ fund 2,789,835 2,803,295 12,981 12,101
Income derived from investment account funds 364,011 439,805 - -
Income derived from investment of shareholders’ fund 179,567 310,323 479 977
3,333,413 3,553,423 13,460 13,078
Income attributable to depositors (1,667,761) (1,938,959) (9,188) (9,540)
1,665,652 1,614,464 4,272 3,538
Of which:
Financing income earned on impaired financing and advances 9,469 11,753 - -
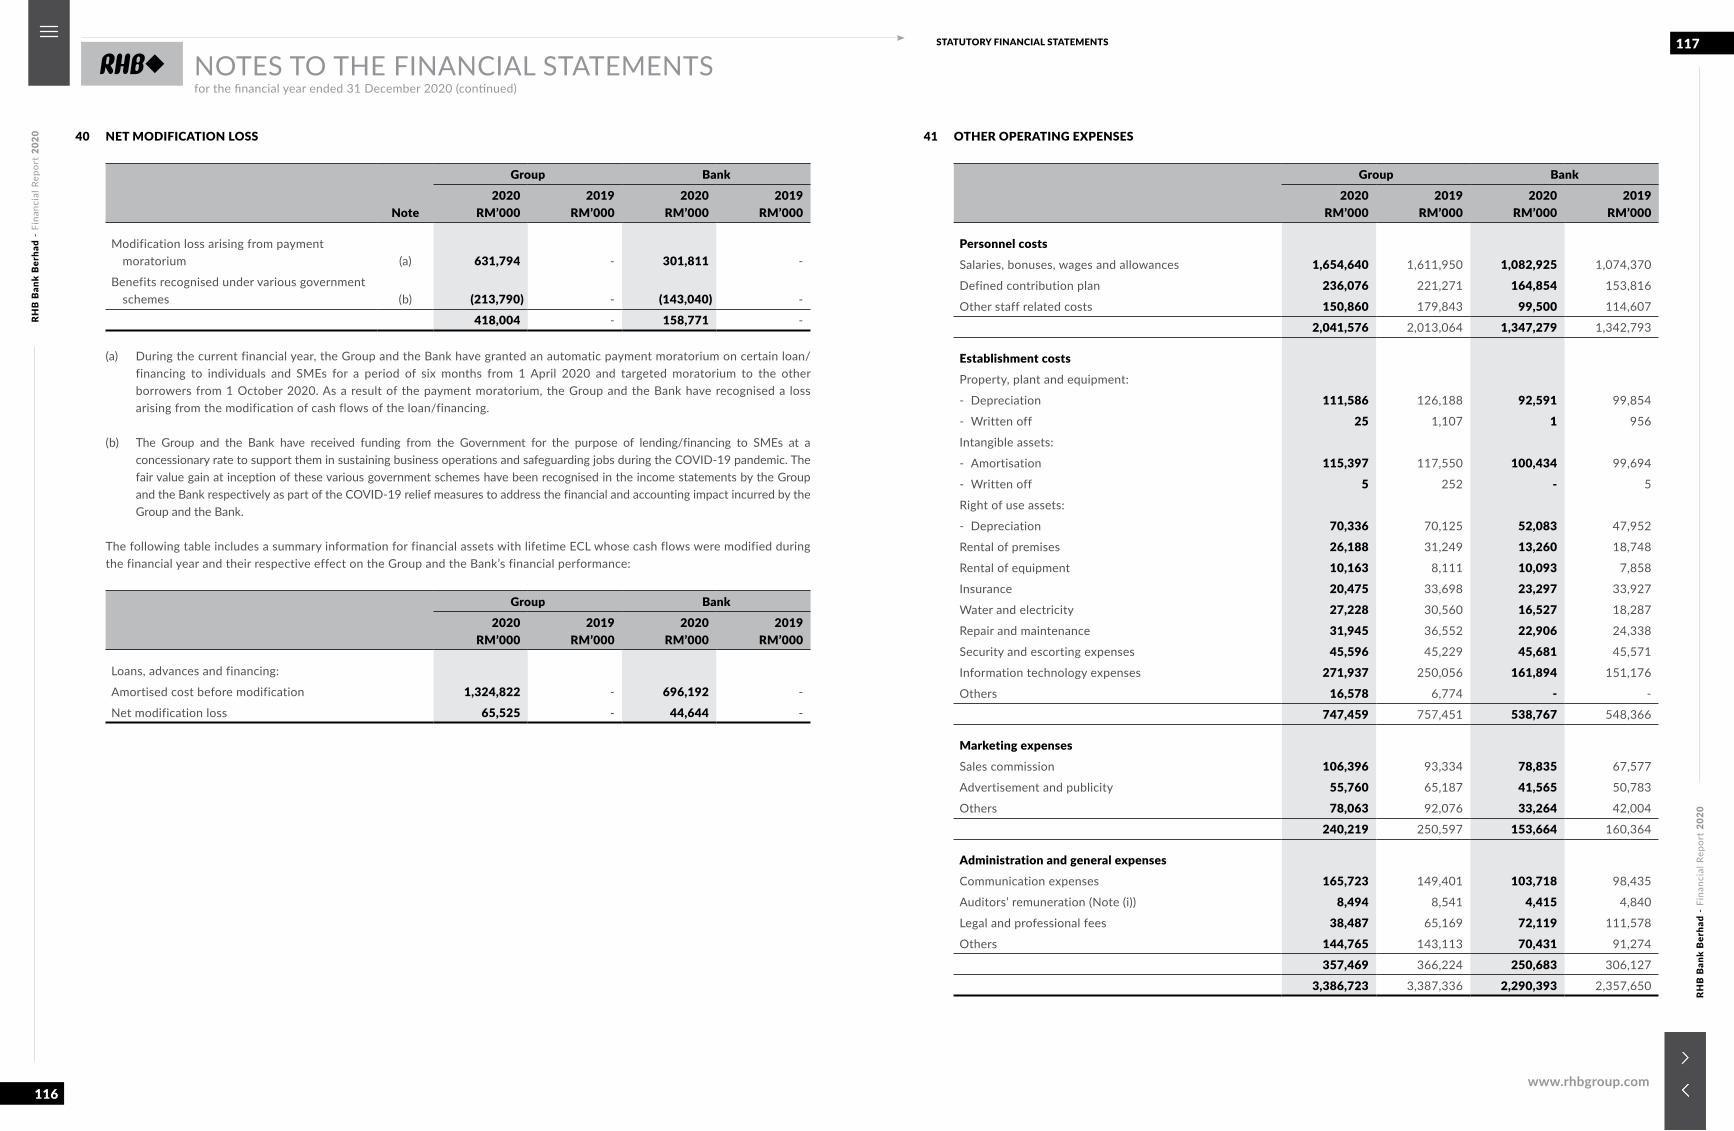
RHB
Ban
k B
erha
d -
Fina
ncia
l Rep
ort
2020
RHB
Ban
k B
erha
d -
Fina
ncia
l Rep
ort
2020
116
117STATUTORY FINANCIAL STATEMENTS
www.rhbgroup.com
NOTES TO THE FINANCIAL STATEMENTSfor the financial year ended 31 December 2020 (continued)
40 NET MODIFICATION LOSS
Note
Group Bank2020
RM’0002019
RM’0002020
RM’0002019
RM’000
Modification loss arising from payment moratorium (a) 631,794 - 301,811 -
Benefits recognised under various government schemes (b) (213,790) - (143,040) -
418,004 - 158,771 -
(a) During the current financial year, the Group and the Bank have granted an automatic payment moratorium on certain loan/financing to individuals and SMEs for a period of six months from 1 April 2020 and targeted moratorium to the other borrowers from 1 October 2020. As a result of the payment moratorium, the Group and the Bank have recognised a loss arising from the modification of cash flows of the loan/financing.
(b) The Group and the Bank have received funding from the Government for the purpose of lending/financing to SMEs at a concessionary rate to support them in sustaining business operations and safeguarding jobs during the COVID-19 pandemic. The fair value gain at inception of these various government schemes have been recognised in the income statements by the Group and the Bank respectively as part of the COVID-19 relief measures to address the financial and accounting impact incurred by the Group and the Bank.
The following table includes a summary information for financial assets with lifetime ECL whose cash flows were modified during the financial year and their respective effect on the Group and the Bank’s financial performance:
Group Bank2020
RM’0002019
RM’0002020
RM’0002019
RM’000
Loans, advances and financing:
Amortised cost before modification 1,324,822 - 696,192 -
Net modification loss 65,525 - 44,644 -
41 OTHER OPERATING EXPENSES
Group Bank2020
RM’0002019
RM’0002020
RM’0002019
RM’000
Personnel costsSalaries, bonuses, wages and allowances 1,654,640 1,611,950 1,082,925 1,074,370
Defined contribution plan 236,076 221,271 164,854 153,816
Other staff related costs 150,860 179,843 99,500 114,607
2,041,576 2,013,064 1,347,279 1,342,793
Establishment costsProperty, plant and equipment:
- Depreciation 111,586 126,188 92,591 99,854
- Written off 25 1,107 1 956
Intangible assets:
- Amortisation 115,397 117,550 100,434 99,694
- Written off 5 252 - 5
Right of use assets:
- Depreciation 70,336 70,125 52,083 47,952
Rental of premises 26,188 31,249 13,260 18,748
Rental of equipment 10,163 8,111 10,093 7,858
Insurance 20,475 33,698 23,297 33,927
Water and electricity 27,228 30,560 16,527 18,287
Repair and maintenance 31,945 36,552 22,906 24,338
Security and escorting expenses 45,596 45,229 45,681 45,571
Information technology expenses 271,937 250,056 161,894 151,176
Others 16,578 6,774 - -
747,459 757,451 538,767 548,366
Marketing expensesSales commission 106,396 93,334 78,835 67,577
Advertisement and publicity 55,760 65,187 41,565 50,783
Others 78,063 92,076 33,264 42,004
240,219 250,597 153,664 160,364
Administration and general expensesCommunication expenses 165,723 149,401 103,718 98,435
Auditors’ remuneration (Note (i)) 8,494 8,541 4,415 4,840
Legal and professional fees 38,487 65,169 72,119 111,578
Others 144,765 143,113 70,431 91,274
357,469 366,224 250,683 306,127
3,386,723 3,387,336 2,290,393 2,357,650
RHB
Ban
k B
erha
d -
Fina
ncia
l Rep
ort
2020
RHB
Ban
k B
erha
d -
Fina
ncia
l Rep
ort
2020
118
119STATUTORY FINANCIAL STATEMENTS
www.rhbgroup.com
NOTES TO THE FINANCIAL STATEMENTSfor the financial year ended 31 December 2020 (continued)
41 OTHER OPERATING EXPENSES (CONTINUED)
Group Bank2020
RM’0002019
RM’0002020
RM’0002019
RM’000
(i) Auditors’ remuneration(a) Audit:
Statutory audit:
- Malaysia 3,034 2,784 1,794 1,646
- Overseas 2,919 3,829 1,540 1,474
Limited review 630 490 496 433
Other audit related 300 300 200 200
6,883 7,403 4,030 3,753
(b) Non-audit:
- Malaysia 1,611 638 385 587
- Overseas - 500 - 500
1,611 1,138 385 1,087
8,494 8,541 4,415 4,840
Included in the personnel costs is the Group Managing Director’s remuneration for the Group and the Bank, as disclosed in Note 42.
Included in administration and general expenses of the Group and the Bank are other directors’ remuneration as disclosed in Note 42.
42 DIRECTORS’ REMUNERATION
Group and Bank
Salary and other
remunerationRM’000
Benefits-in- kind (based on an
estimated monetary value)
RM’000Bonus
RM’000Total
RM’000
2020Group Managing DirectorDato’ Khairussaleh Ramli 2,637 23 1,487 4,147
2019Group Managing DirectorDato’ Khairussaleh Ramli 2,759 35 2,100 4,894
In addition to the above, during the financial year ended 31 December 2020, the Group Managing Director who led the achievement of the Group’s short and long term business objectives, was awarded a sum of RM1,747,000 (inclusive of the employer’s EPF contribution) (2019: RM2,240,000) as the Special Recognition Award and Cash Deferred Scheme.
42 DIRECTORS’ REMUNERATION (CONTINUED)
Group Bank
FeesRM’000
Benefits-in-kind (based
on anestimatedmonetary
value)RM’000
Otherremuneration
RM’000Total
RM’000Fees
RM’000
Benefits-in-kind (based
on anestimatedmonetary
value)RM’000
Otherremuneration
RM’000Total
RM’000
2020
Non-executive Directors
Tan Sri Azlan Zainol 395 24 349 768 200 24 327 551
Tan Sri Ahmad Badri Mohd Zahir 22 - 3 25 22 - 3 25
Tan Sri Ong Leong Huat @ Wong Joo Hwa 310 - 130 440 175 - 68 243
Tan Sri Dr Rebecca Fatima Sta Maria 175 - 72 247 175 - 72 247
Ong Ai Lin 310 - 208 518 175 - 93 268
Lim Cheng Teck 175 - 147 322 175 - 147 322
Sharifatu Laila Syed Ali 367 - 181 548 175 - 66 241
Dato’ Mohamad Nasir Ab Latif 250 15 53 318 139 - 28 167
Donald Joshua Jaganathan 99 - 61 160 65 - 45 110
Datuk Iain John Lo 52 - 6 58 52 - 6 58
Tan Sri Saw Choo Boon 166 13 75 254 72 - 46 118
Abdul Aziz Peru Mohamed 204 7 59 270 72 - 7 79
Datuk Seri Dr Govindan a/l Kunchamboo 249 - 88 337 140 - 48 188
2,774 59 1,432 4,265 1,637 24 956 2,617
2019
Non-executive Directors
Tan Sri Azlan Zainol 415 24 362 801 200 24 335 559
Tan Sri Saw Choo Boon 370 32 184 586 175 - 117 292
Abdul Aziz Peru Mohamed 425 17 97 539 175 - 24 199
Tan Sri Ong Leong Huat @ Wong Joo Hwa 335 - 151 486 175 - 83 258
Tan Sri Dr Rebecca Fatima Sta Maria 213 - 95 308 175 - 76 251
Ong Ai Lin 310 - 214 524 175 - 97 272
Lim Cheng Teck 175 - 107 282 175 - 107 282
Sharifatu Laila Syed Ali 388 - 138 526 140 - 52 192
Mohamed Ali Ismaeil Ali Alfahim 61 - 8 69 61 - 8 69
2,692 73 1,356 4,121 1,451 24 899 2,374
Note: During the financial year, Directors of the Group and the Bank are covered under the Directors’ Liability Insurance in respect of liabilities
arising from acts committed in their respective capacity as, inter alia, Directors of the Group and the Bank subject to the term of the policy. The total amount of Directors’ Liability Insurance effected for the Directors of the Group and the Bank was RM200 million (2019: RM200 million). The total amount of premium paid for the Directors’ Liability Insurance by the Group and the Bank was RM843,000 and RM714,000 (2019: RM828,000 and RM700,000) respectively.
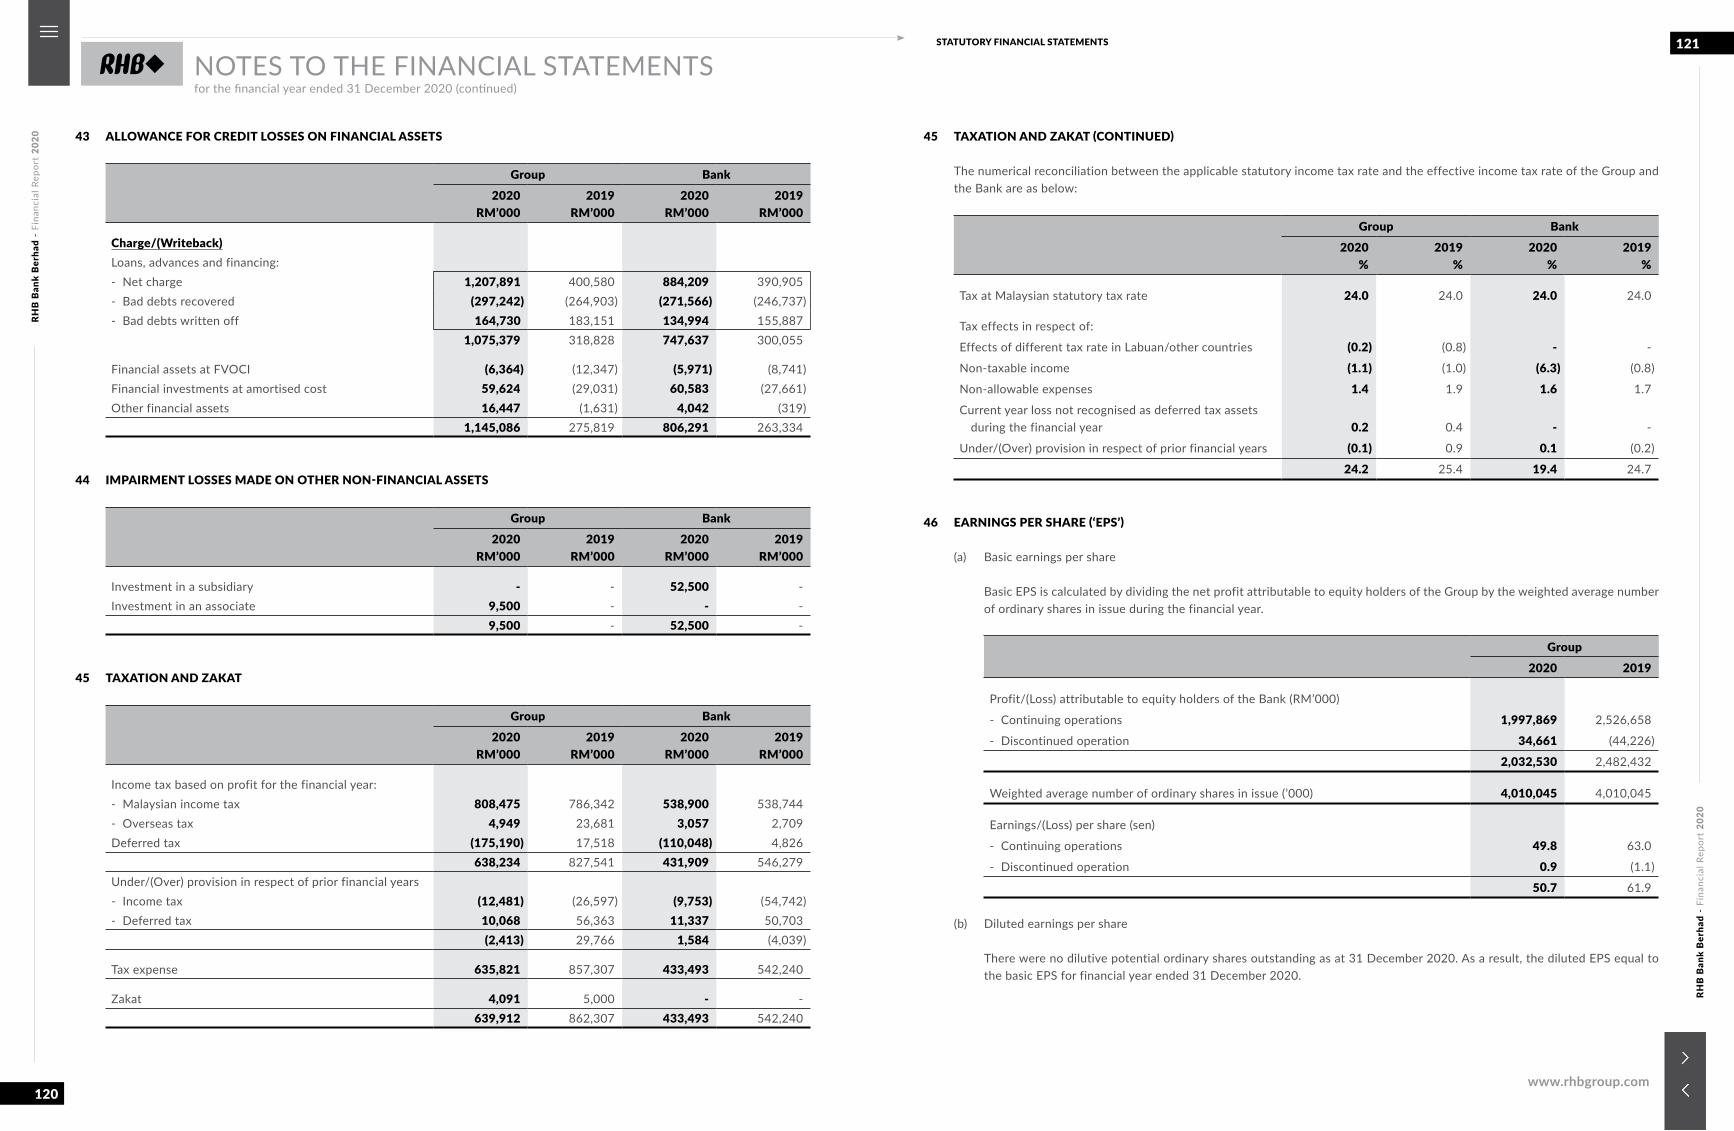
RHB
Ban
k B
erha
d -
Fina
ncia
l Rep
ort
2020
RHB
Ban
k B
erha
d -
Fina
ncia
l Rep
ort
2020
120
121STATUTORY FINANCIAL STATEMENTS
www.rhbgroup.com
NOTES TO THE FINANCIAL STATEMENTSfor the financial year ended 31 December 2020 (continued)
43 ALLOWANCE FOR CREDIT LOSSES ON FINANCIAL ASSETS
Group Bank2020
RM’0002019
RM’0002020
RM’0002019
RM’000
Charge/(Writeback)Loans, advances and financing:- Net charge 1,207,891 400,580 884,209 390,905- Bad debts recovered (297,242) (264,903) (271,566) (246,737)- Bad debts written off 164,730 183,151 134,994 155,887
1,075,379 318,828 747,637 300,055
Financial assets at FVOCI (6,364) (12,347) (5,971) (8,741)Financial investments at amortised cost 59,624 (29,031) 60,583 (27,661)Other financial assets 16,447 (1,631) 4,042 (319)
1,145,086 275,819 806,291 263,334
44 IMPAIRMENT LOSSES MADE ON OTHER NON-FINANCIAL ASSETS
Group Bank2020
RM’0002019
RM’0002020
RM’0002019
RM’000
Investment in a subsidiary - - 52,500 -Investment in an associate 9,500 - - -
9,500 - 52,500 -
45 TAXATION AND ZAKAT
Group Bank2020
RM’0002019
RM’0002020
RM’0002019
RM’000
Income tax based on profit for the financial year:- Malaysian income tax 808,475 786,342 538,900 538,744- Overseas tax 4,949 23,681 3,057 2,709Deferred tax (175,190) 17,518 (110,048) 4,826
638,234 827,541 431,909 546,279Under/(Over) provision in respect of prior financial years- Income tax (12,481) (26,597) (9,753) (54,742)- Deferred tax 10,068 56,363 11,337 50,703
(2,413) 29,766 1,584 (4,039)
Tax expense 635,821 857,307 433,493 542,240
Zakat 4,091 5,000 - - 639,912 862,307 433,493 542,240
45 TAXATION AND ZAKAT (CONTINUED)
The numerical reconciliation between the applicable statutory income tax rate and the effective income tax rate of the Group and the Bank are as below:
Group Bank2020
%2019
%2020
%2019
%
Tax at Malaysian statutory tax rate 24.0 24.0 24.0 24.0
Tax effects in respect of:
Effects of different tax rate in Labuan/other countries (0.2) (0.8) - -
Non-taxable income (1.1) (1.0) (6.3) (0.8)
Non-allowable expenses 1.4 1.9 1.6 1.7
Current year loss not recognised as deferred tax assets during the financial year 0.2 0.4 - -
Under/(Over) provision in respect of prior financial years (0.1) 0.9 0.1 (0.2)
24.2 25.4 19.4 24.7
46 EARNINGS PER SHARE (‘EPS’)
(a) Basic earnings per share
Basic EPS is calculated by dividing the net profit attributable to equity holders of the Group by the weighted average number of ordinary shares in issue during the financial year.
Group2020 2019
Profit/(Loss) attributable to equity holders of the Bank (RM’000)
- Continuing operations 1,997,869 2,526,658
- Discontinued operation 34,661 (44,226)
2,032,530 2,482,432
Weighted average number of ordinary shares in issue (’000) 4,010,045 4,010,045
Earnings/(Loss) per share (sen)
- Continuing operations 49.8 63.0
- Discontinued operation 0.9 (1.1)
50.7 61.9
(b) Diluted earnings per share
There were no dilutive potential ordinary shares outstanding as at 31 December 2020. As a result, the diluted EPS equal to the basic EPS for financial year ended 31 December 2020.
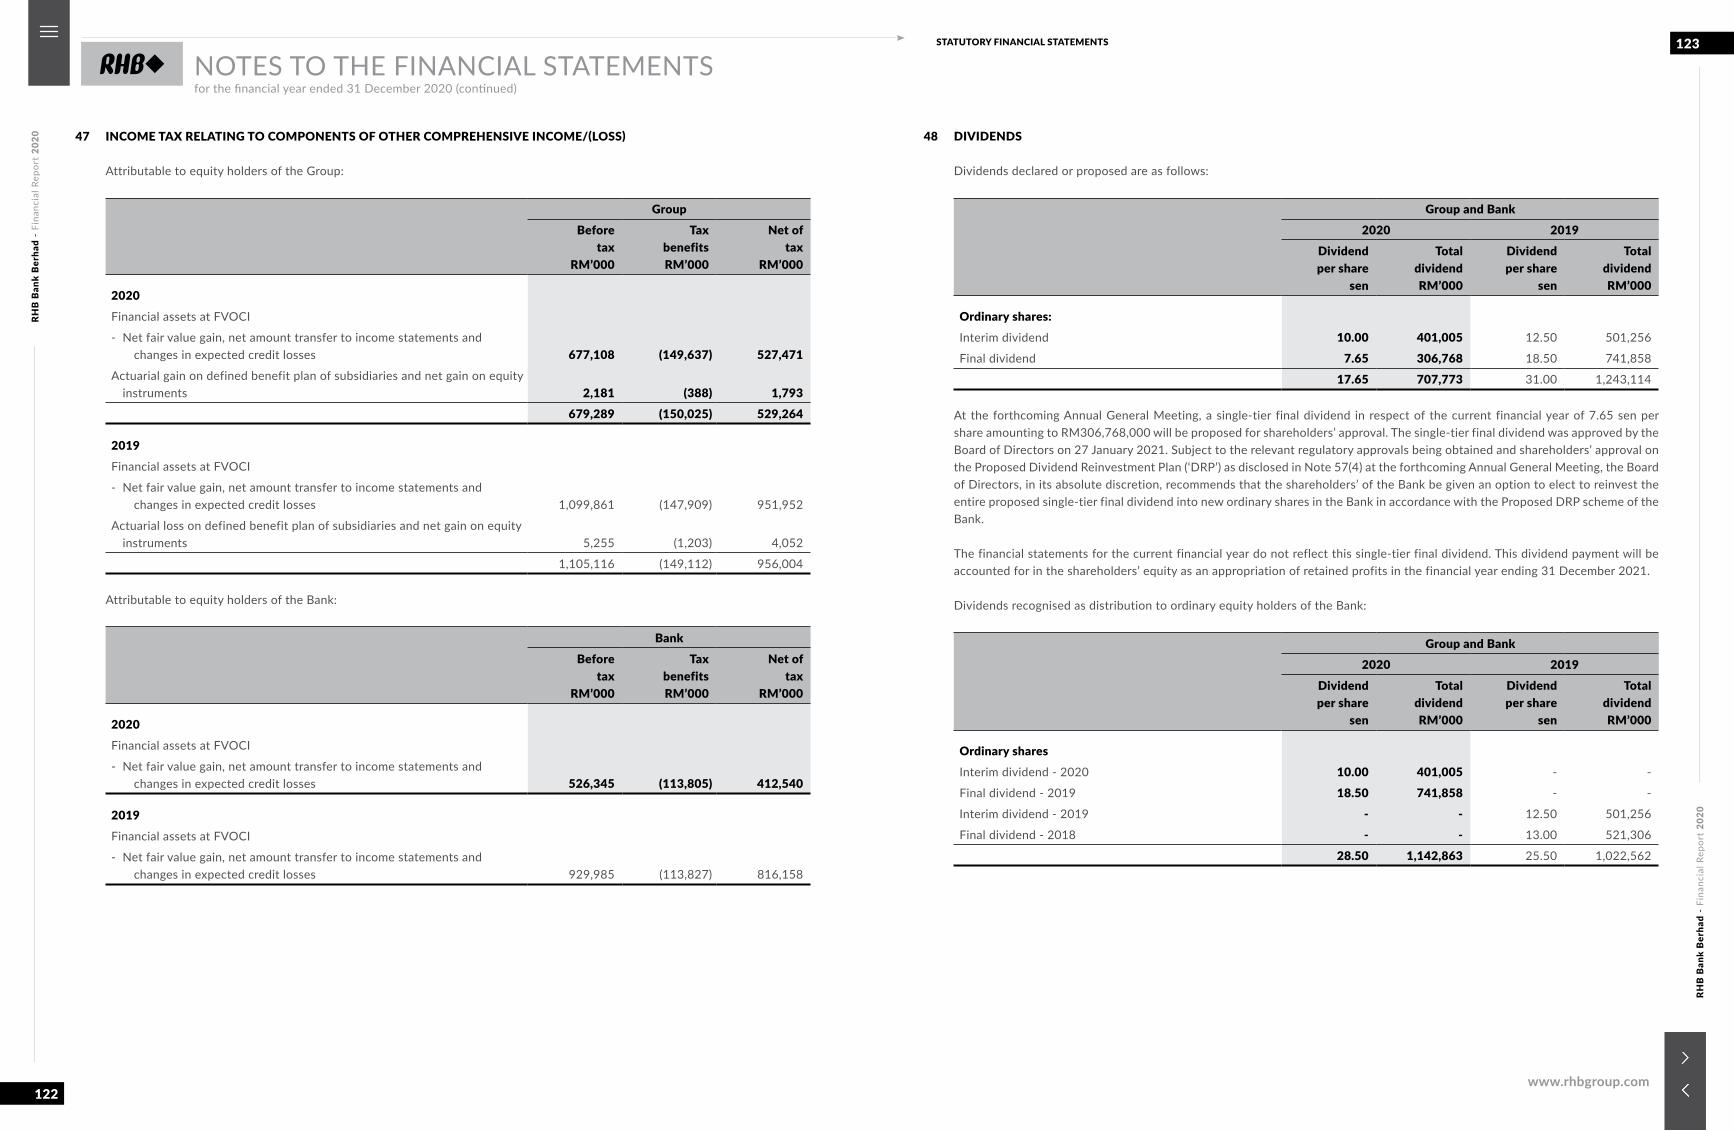
RHB
Ban
k B
erha
d -
Fina
ncia
l Rep
ort
2020
RHB
Ban
k B
erha
d -
Fina
ncia
l Rep
ort
2020
122
123STATUTORY FINANCIAL STATEMENTS
www.rhbgroup.com
NOTES TO THE FINANCIAL STATEMENTSfor the financial year ended 31 December 2020 (continued)
47 INCOME TAX RELATING TO COMPONENTS OF OTHER COMPREHENSIVE INCOME/(LOSS)
Attributable to equity holders of the Group:
GroupBefore
tax RM’000
Taxbenefits RM’000
Net oftax
RM’000
2020Financial assets at FVOCI
- Net fair value gain, net amount transfer to income statements and changes in expected credit losses 677,108 (149,637) 527,471
Actuarial gain on defined benefit plan of subsidiaries and net gain on equity instruments 2,181 (388) 1,793
679,289 (150,025) 529,264
2019Financial assets at FVOCI
- Net fair value gain, net amount transfer to income statements and changes in expected credit losses 1,099,861 (147,909) 951,952
Actuarial loss on defined benefit plan of subsidiaries and net gain on equity instruments 5,255 (1,203) 4,052
1,105,116 (149,112) 956,004
Attributable to equity holders of the Bank:
BankBefore
tax RM’000
Taxbenefits RM’000
Net oftax
RM’000
2020Financial assets at FVOCI
- Net fair value gain, net amount transfer to income statements and changes in expected credit losses 526,345 (113,805) 412,540
2019Financial assets at FVOCI
- Net fair value gain, net amount transfer to income statements and changes in expected credit losses 929,985 (113,827) 816,158
48 DIVIDENDS
Dividends declared or proposed are as follows:
Group and Bank2020 2019
Dividendper share
sen
Totaldividend RM’000
Dividendper share
sen
Totaldividend RM’000
Ordinary shares:Interim dividend 10.00 401,005 12.50 501,256
Final dividend 7.65 306,768 18.50 741,858
17.65 707,773 31.00 1,243,114
At the forthcoming Annual General Meeting, a single-tier final dividend in respect of the current financial year of 7.65 sen per share amounting to RM306,768,000 will be proposed for shareholders’ approval. The single-tier final dividend was approved by the Board of Directors on 27 January 2021. Subject to the relevant regulatory approvals being obtained and shareholders’ approval on the Proposed Dividend Reinvestment Plan (‘DRP’) as disclosed in Note 57(4) at the forthcoming Annual General Meeting, the Board of Directors, in its absolute discretion, recommends that the shareholders’ of the Bank be given an option to elect to reinvest the entire proposed single-tier final dividend into new ordinary shares in the Bank in accordance with the Proposed DRP scheme of the Bank.
The financial statements for the current financial year do not reflect this single-tier final dividend. This dividend payment will be accounted for in the shareholders’ equity as an appropriation of retained profits in the financial year ending 31 December 2021.
Dividends recognised as distribution to ordinary equity holders of the Bank:
Group and Bank2020 2019
Dividendper share
sen
Totaldividend RM’000
Dividendper share
sen
Totaldividend RM’000
Ordinary sharesInterim dividend - 2020 10.00 401,005 - -
Final dividend - 2019 18.50 741,858 - -
Interim dividend - 2019 - - 12.50 501,256
Final dividend - 2018 - - 13.00 521,306
28.50 1,142,863 25.50 1,022,562
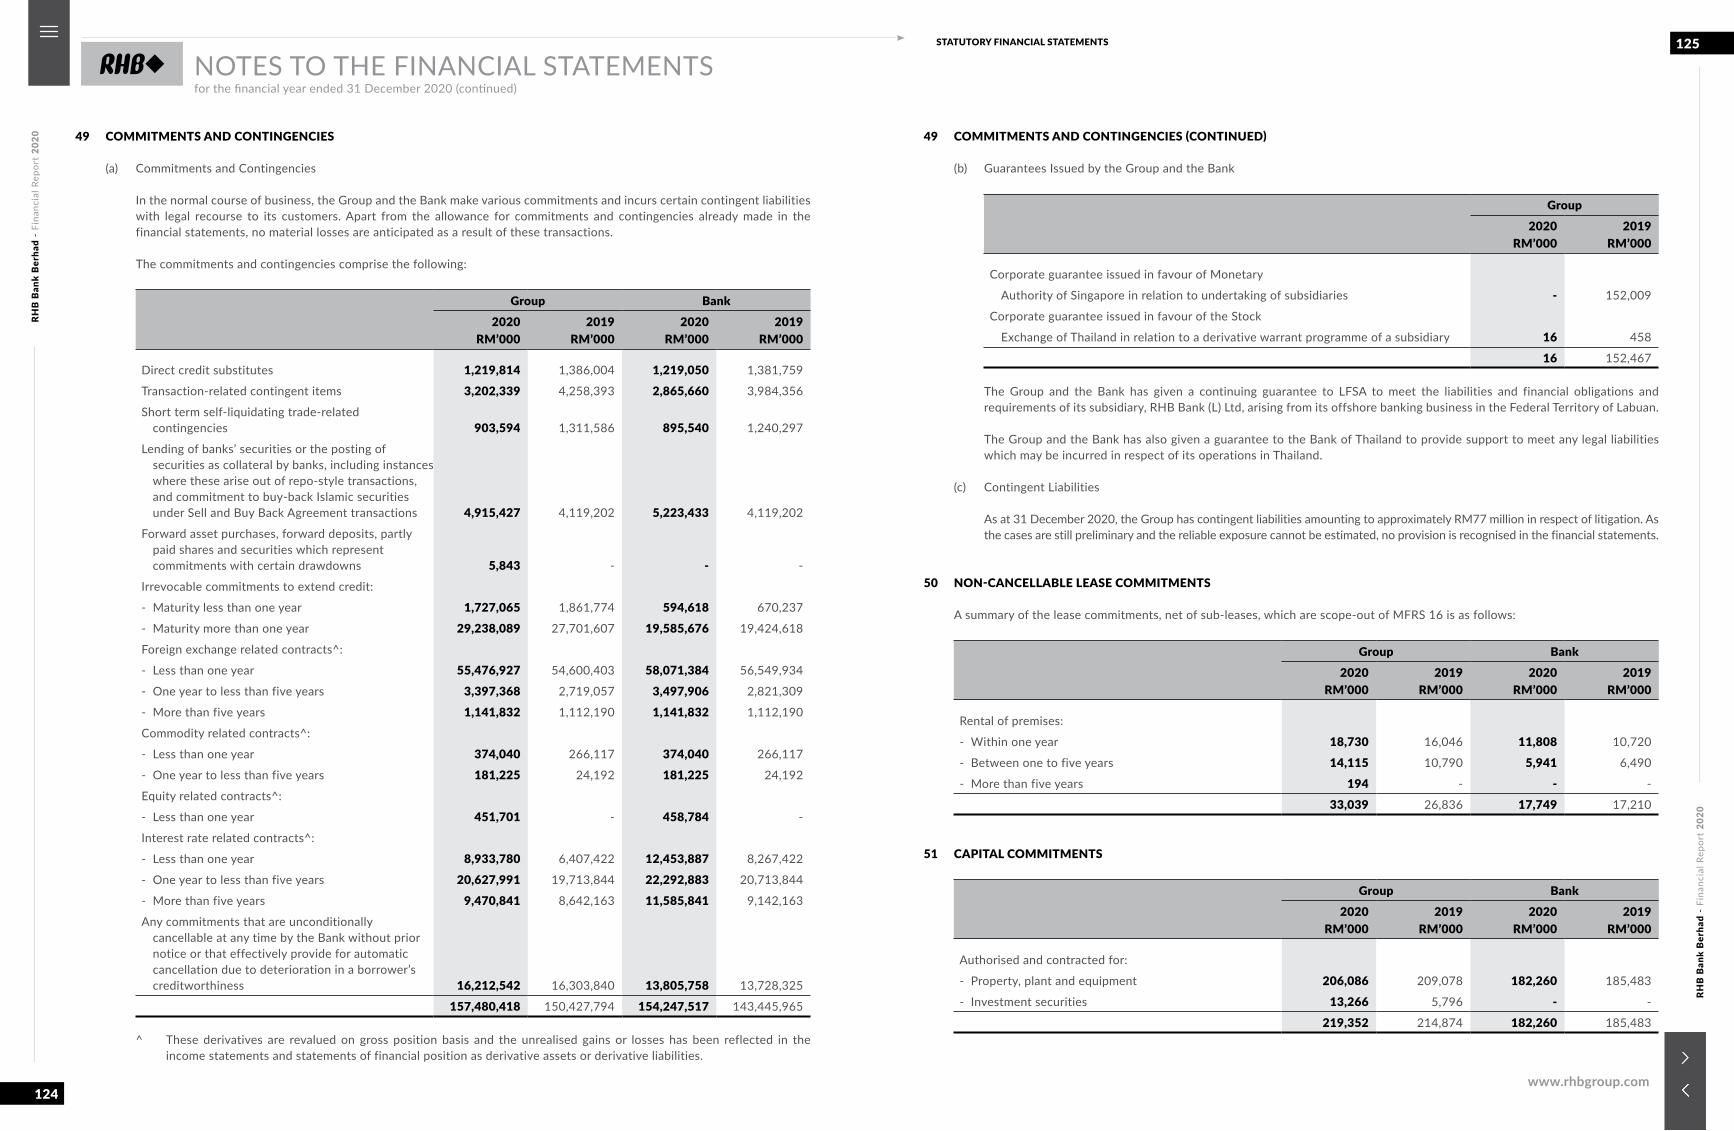
RHB
Ban
k B
erha
d -
Fina
ncia
l Rep
ort
2020
RHB
Ban
k B
erha
d -
Fina
ncia
l Rep
ort
2020
124
125STATUTORY FINANCIAL STATEMENTS
www.rhbgroup.com
NOTES TO THE FINANCIAL STATEMENTSfor the financial year ended 31 December 2020 (continued)
49 COMMITMENTS AND CONTINGENCIES
(a) Commitments and Contingencies
In the normal course of business, the Group and the Bank make various commitments and incurs certain contingent liabilities with legal recourse to its customers. Apart from the allowance for commitments and contingencies already made in the financial statements, no material losses are anticipated as a result of these transactions.
The commitments and contingencies comprise the following:
Group Bank2020
RM’0002019
RM’0002020
RM’0002019
RM’000
Direct credit substitutes 1,219,814 1,386,004 1,219,050 1,381,759
Transaction-related contingent items 3,202,339 4,258,393 2,865,660 3,984,356
Short term self-liquidating trade-related contingencies 903,594 1,311,586 895,540 1,240,297
Lending of banks’ securities or the posting of securities as collateral by banks, including instances where these arise out of repo-style transactions, and commitment to buy-back Islamic securities under Sell and Buy Back Agreement transactions 4,915,427 4,119,202 5,223,433 4,119,202
Forward asset purchases, forward deposits, partly paid shares and securities which represent commitments with certain drawdowns 5,843 - - -
Irrevocable commitments to extend credit:
- Maturity less than one year 1,727,065 1,861,774 594,618 670,237
- Maturity more than one year 29,238,089 27,701,607 19,585,676 19,424,618
Foreign exchange related contracts^:
- Less than one year 55,476,927 54,600,403 58,071,384 56,549,934
- One year to less than five years 3,397,368 2,719,057 3,497,906 2,821,309
- More than five years 1,141,832 1,112,190 1,141,832 1,112,190
Commodity related contracts^:
- Less than one year 374,040 266,117 374,040 266,117
- One year to less than five years 181,225 24,192 181,225 24,192
Equity related contracts^:
- Less than one year 451,701 - 458,784 -
Interest rate related contracts^:
- Less than one year 8,933,780 6,407,422 12,453,887 8,267,422
- One year to less than five years 20,627,991 19,713,844 22,292,883 20,713,844
- More than five years 9,470,841 8,642,163 11,585,841 9,142,163
Any commitments that are unconditionally cancellable at any time by the Bank without prior notice or that effectively provide for automatic cancellation due to deterioration in a borrower’s creditworthiness 16,212,542 16,303,840 13,805,758 13,728,325
157,480,418 150,427,794 154,247,517 143,445,965
^ These derivatives are revalued on gross position basis and the unrealised gains or losses has been reflected in the income statements and statements of financial position as derivative assets or derivative liabilities.
49 COMMITMENTS AND CONTINGENCIES (CONTINUED)
(b) Guarantees Issued by the Group and the Bank
Group2020
RM’0002019
RM’000
Corporate guarantee issued in favour of Monetary
Authority of Singapore in relation to undertaking of subsidiaries - 152,009
Corporate guarantee issued in favour of the Stock
Exchange of Thailand in relation to a derivative warrant programme of a subsidiary 16 458
16 152,467
The Group and the Bank has given a continuing guarantee to LFSA to meet the liabilities and financial obligations and requirements of its subsidiary, RHB Bank (L) Ltd, arising from its offshore banking business in the Federal Territory of Labuan.
The Group and the Bank has also given a guarantee to the Bank of Thailand to provide support to meet any legal liabilities which may be incurred in respect of its operations in Thailand.
(c) Contingent Liabilities
As at 31 December 2020, the Group has contingent liabilities amounting to approximately RM77 million in respect of litigation. As the cases are still preliminary and the reliable exposure cannot be estimated, no provision is recognised in the financial statements.
50 NON-CANCELLABLE LEASE COMMITMENTS
A summary of the lease commitments, net of sub-leases, which are scope-out of MFRS 16 is as follows:
Group Bank2020
RM’0002019
RM’0002020
RM’0002019
RM’000
Rental of premises:
- Within one year 18,730 16,046 11,808 10,720
- Between one to five years 14,115 10,790 5,941 6,490
- More than five years 194 - - -
33,039 26,836 17,749 17,210
51 CAPITAL COMMITMENTS
Group Bank2020
RM’0002019
RM’0002020
RM’0002019
RM’000
Authorised and contracted for:
- Property, plant and equipment 206,086 209,078 182,260 185,483
- Investment securities 13,266 5,796 - -
219,352 214,874 182,260 185,483
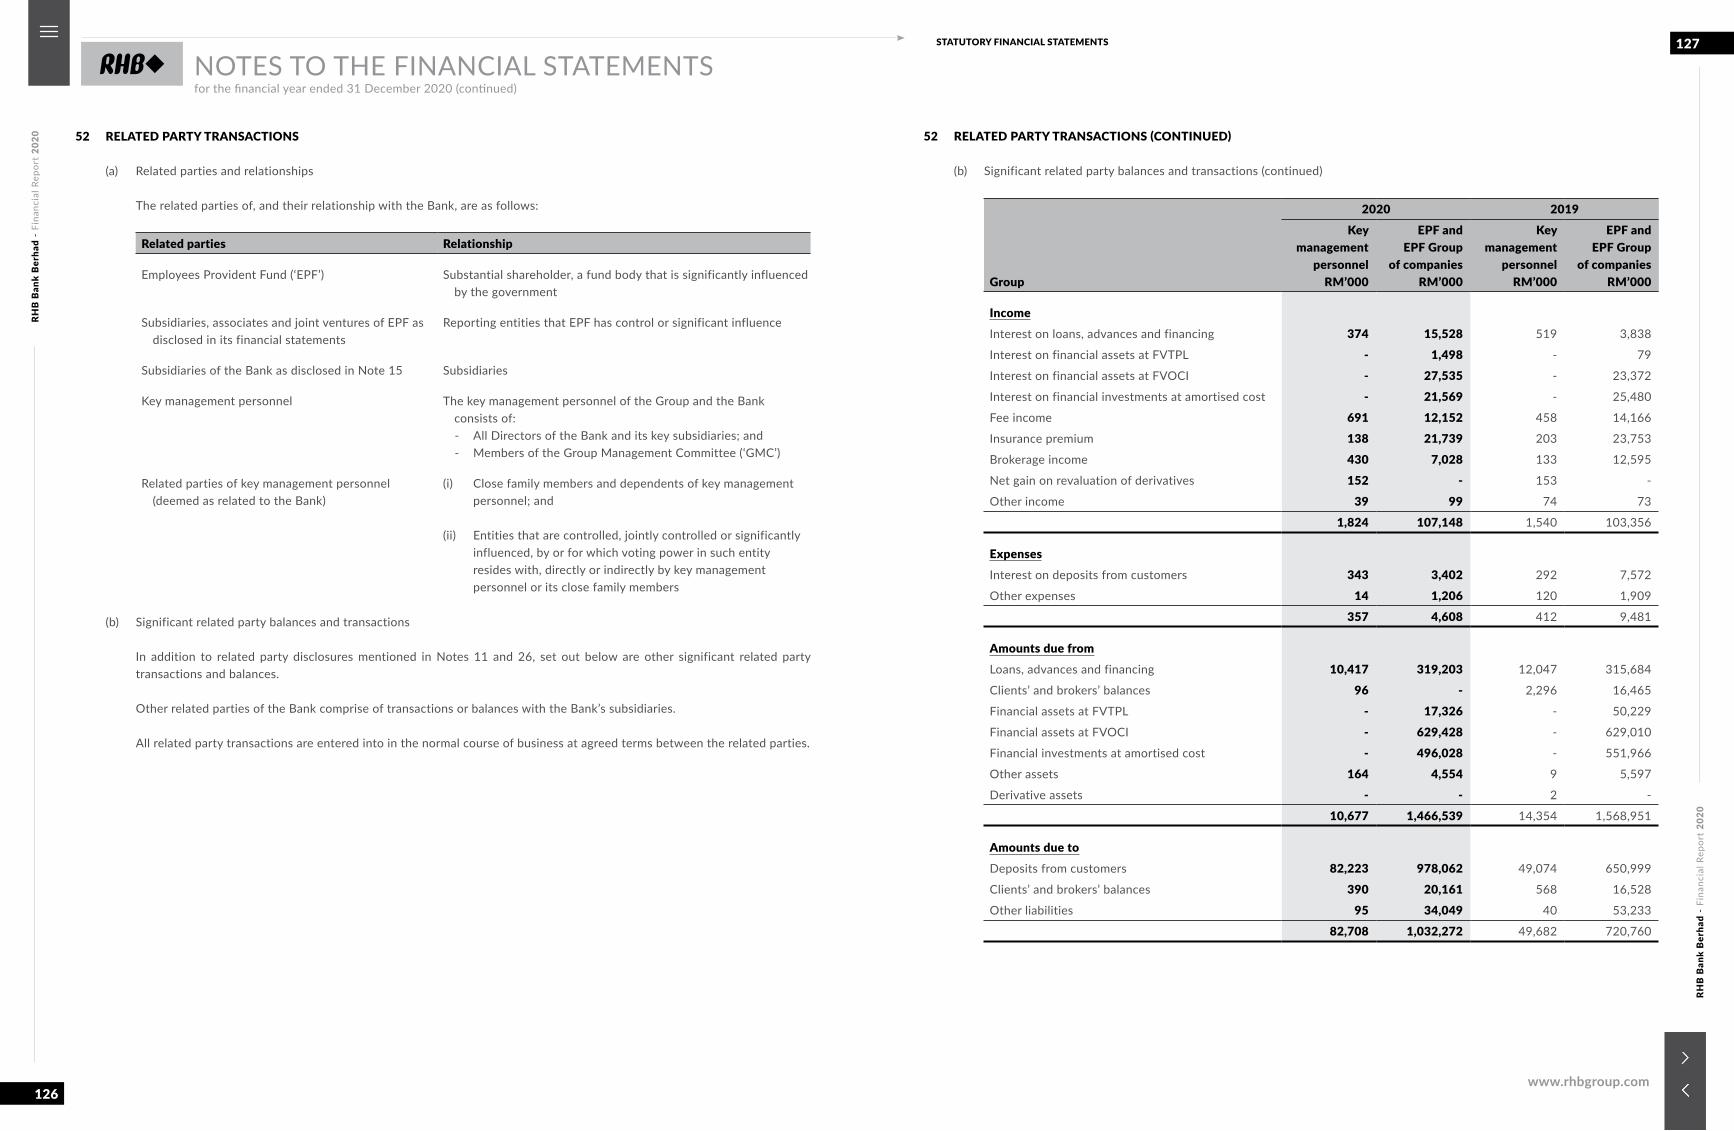
RHB
Ban
k B
erha
d -
Fina
ncia
l Rep
ort
2020
RHB
Ban
k B
erha
d -
Fina
ncia
l Rep
ort
2020
126
127STATUTORY FINANCIAL STATEMENTS
www.rhbgroup.com
NOTES TO THE FINANCIAL STATEMENTSfor the financial year ended 31 December 2020 (continued)
52 RELATED PARTY TRANSACTIONS
(a) Related parties and relationships
The related parties of, and their relationship with the Bank, are as follows:
Related parties Relationship
Employees Provident Fund (‘EPF’) Substantial shareholder, a fund body that is significantly influenced by the government
Subsidiaries, associates and joint ventures of EPF as disclosed in its financial statements
Reporting entities that EPF has control or significant influence
Subsidiaries of the Bank as disclosed in Note 15 Subsidiaries
Key management personnel The key management personnel of the Group and the Bank consists of:
- All Directors of the Bank and its key subsidiaries; and - Members of the Group Management Committee (‘GMC’)
Related parties of key management personnel (deemed as related to the Bank)
(i) Close family members and dependents of key management personnel; and
(ii) Entities that are controlled, jointly controlled or significantly
influenced, by or for which voting power in such entity resides with, directly or indirectly by key management personnel or its close family members
(b) Significant related party balances and transactions
In addition to related party disclosures mentioned in Notes 11 and 26, set out below are other significant related party transactions and balances.
Other related parties of the Bank comprise of transactions or balances with the Bank’s subsidiaries.
All related party transactions are entered into in the normal course of business at agreed terms between the related parties.
52 RELATED PARTY TRANSACTIONS (CONTINUED)
(b) Significant related party balances and transactions (continued)
Group
2020 2019Key
managementpersonnel
RM’000
EPF andEPF Group
of companiesRM’000
Keymanagement
personnelRM’000
EPF andEPF Group
of companiesRM’000
IncomeInterest on loans, advances and financing 374 15,528 519 3,838
Interest on financial assets at FVTPL - 1,498 - 79
Interest on financial assets at FVOCI - 27,535 - 23,372
Interest on financial investments at amortised cost - 21,569 - 25,480
Fee income 691 12,152 458 14,166
Insurance premium 138 21,739 203 23,753
Brokerage income 430 7,028 133 12,595
Net gain on revaluation of derivatives 152 - 153 -
Other income 39 99 74 73
1,824 107,148 1,540 103,356
ExpensesInterest on deposits from customers 343 3,402 292 7,572
Other expenses 14 1,206 120 1,909
357 4,608 412 9,481
Amounts due fromLoans, advances and financing 10,417 319,203 12,047 315,684
Clients’ and brokers’ balances 96 - 2,296 16,465
Financial assets at FVTPL - 17,326 - 50,229
Financial assets at FVOCI - 629,428 - 629,010
Financial investments at amortised cost - 496,028 - 551,966
Other assets 164 4,554 9 5,597
Derivative assets - - 2 -
10,677 1,466,539 14,354 1,568,951
Amounts due toDeposits from customers 82,223 978,062 49,074 650,999
Clients’ and brokers’ balances 390 20,161 568 16,528
Other liabilities 95 34,049 40 53,233
82,708 1,032,272 49,682 720,760
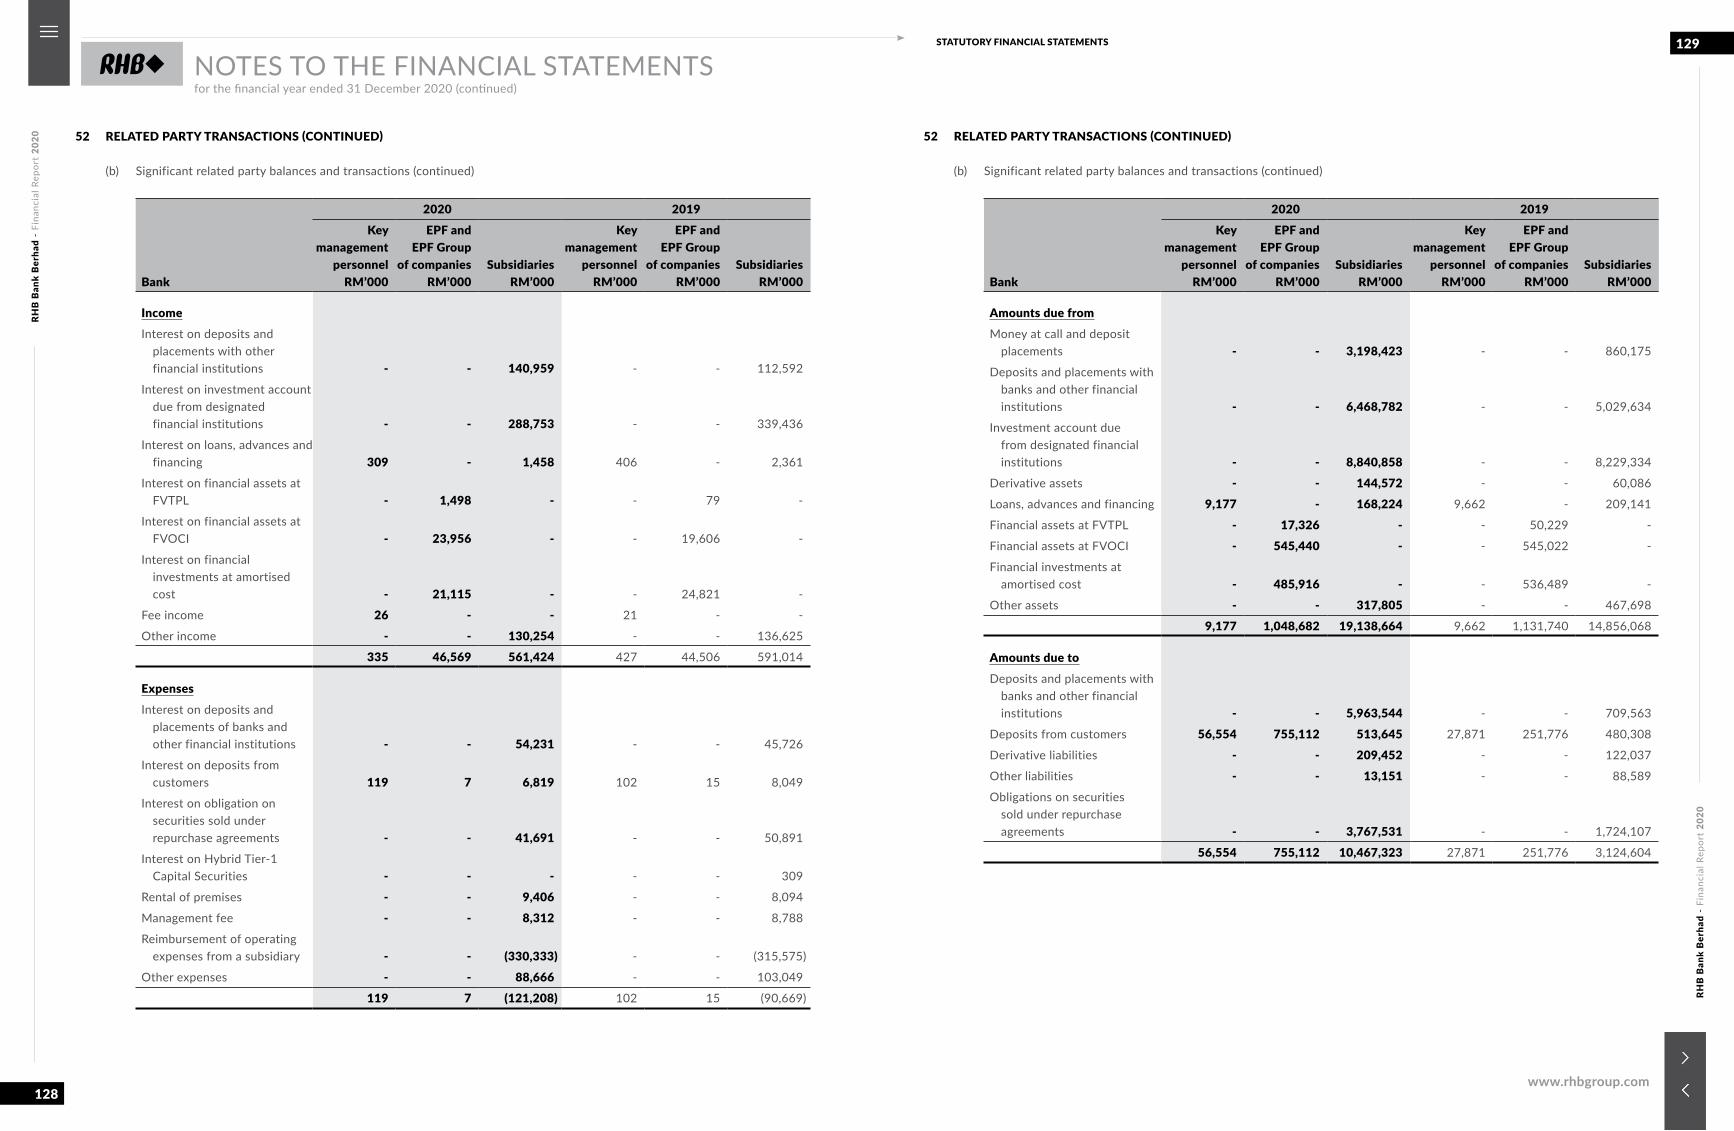
RHB
Ban
k B
erha
d -
Fina
ncia
l Rep
ort
2020
RHB
Ban
k B
erha
d -
Fina
ncia
l Rep
ort
2020
128
129STATUTORY FINANCIAL STATEMENTS
www.rhbgroup.com
NOTES TO THE FINANCIAL STATEMENTSfor the financial year ended 31 December 2020 (continued)
52 RELATED PARTY TRANSACTIONS (CONTINUED)
(b) Significant related party balances and transactions (continued)
Bank
2020 2019Key
managementpersonnel
RM’000
EPF andEPF Group
of companiesRM’000
SubsidiariesRM’000
Keymanagement
personnelRM’000
EPF andEPF Group
of companiesRM’000
SubsidiariesRM’000
IncomeInterest on deposits and
placements with other financial institutions - - 140,959 - - 112,592
Interest on investment account due from designated financial institutions - - 288,753 - - 339,436
Interest on loans, advances and financing 309 - 1,458 406 - 2,361
Interest on financial assets at FVTPL - 1,498 - - 79 -
Interest on financial assets at FVOCI - 23,956 - - 19,606 -
Interest on financial investments at amortised cost - 21,115 - - 24,821 -
Fee income 26 - - 21 - -
Other income - - 130,254 - - 136,625
335 46,569 561,424 427 44,506 591,014
ExpensesInterest on deposits and
placements of banks and other financial institutions - - 54,231 - - 45,726
Interest on deposits from customers 119 7 6,819 102 15 8,049
Interest on obligation on securities sold under repurchase agreements - - 41,691 - - 50,891
Interest on Hybrid Tier-1 Capital Securities - - - - - 309
Rental of premises - - 9,406 - - 8,094
Management fee - - 8,312 - - 8,788
Reimbursement of operating expenses from a subsidiary - - (330,333) - - (315,575)
Other expenses - - 88,666 - - 103,049
119 7 (121,208) 102 15 (90,669)
52 RELATED PARTY TRANSACTIONS (CONTINUED)
(b) Significant related party balances and transactions (continued)
Bank
2020 2019Key
managementpersonnel
RM’000
EPF andEPF Group
of companiesRM’000
SubsidiariesRM’000
Keymanagement
personnelRM’000
EPF andEPF Group
of companiesRM’000
SubsidiariesRM’000
Amounts due fromMoney at call and deposit
placements - - 3,198,423 - - 860,175
Deposits and placements with banks and other financial institutions - - 6,468,782 - - 5,029,634
Investment account due from designated financial institutions - - 8,840,858 - - 8,229,334
Derivative assets - - 144,572 - - 60,086
Loans, advances and financing 9,177 - 168,224 9,662 - 209,141
Financial assets at FVTPL - 17,326 - - 50,229 -
Financial assets at FVOCI - 545,440 - - 545,022 -
Financial investments at amortised cost - 485,916 - - 536,489 -
Other assets - - 317,805 - - 467,698
9,177 1,048,682 19,138,664 9,662 1,131,740 14,856,068
Amounts due toDeposits and placements with
banks and other financial institutions - - 5,963,544 - - 709,563
Deposits from customers 56,554 755,112 513,645 27,871 251,776 480,308
Derivative liabilities - - 209,452 - - 122,037
Other liabilities - - 13,151 - - 88,589
Obligations on securities sold under repurchase agreements - - 3,767,531 - - 1,724,107
56,554 755,112 10,467,323 27,871 251,776 3,124,604
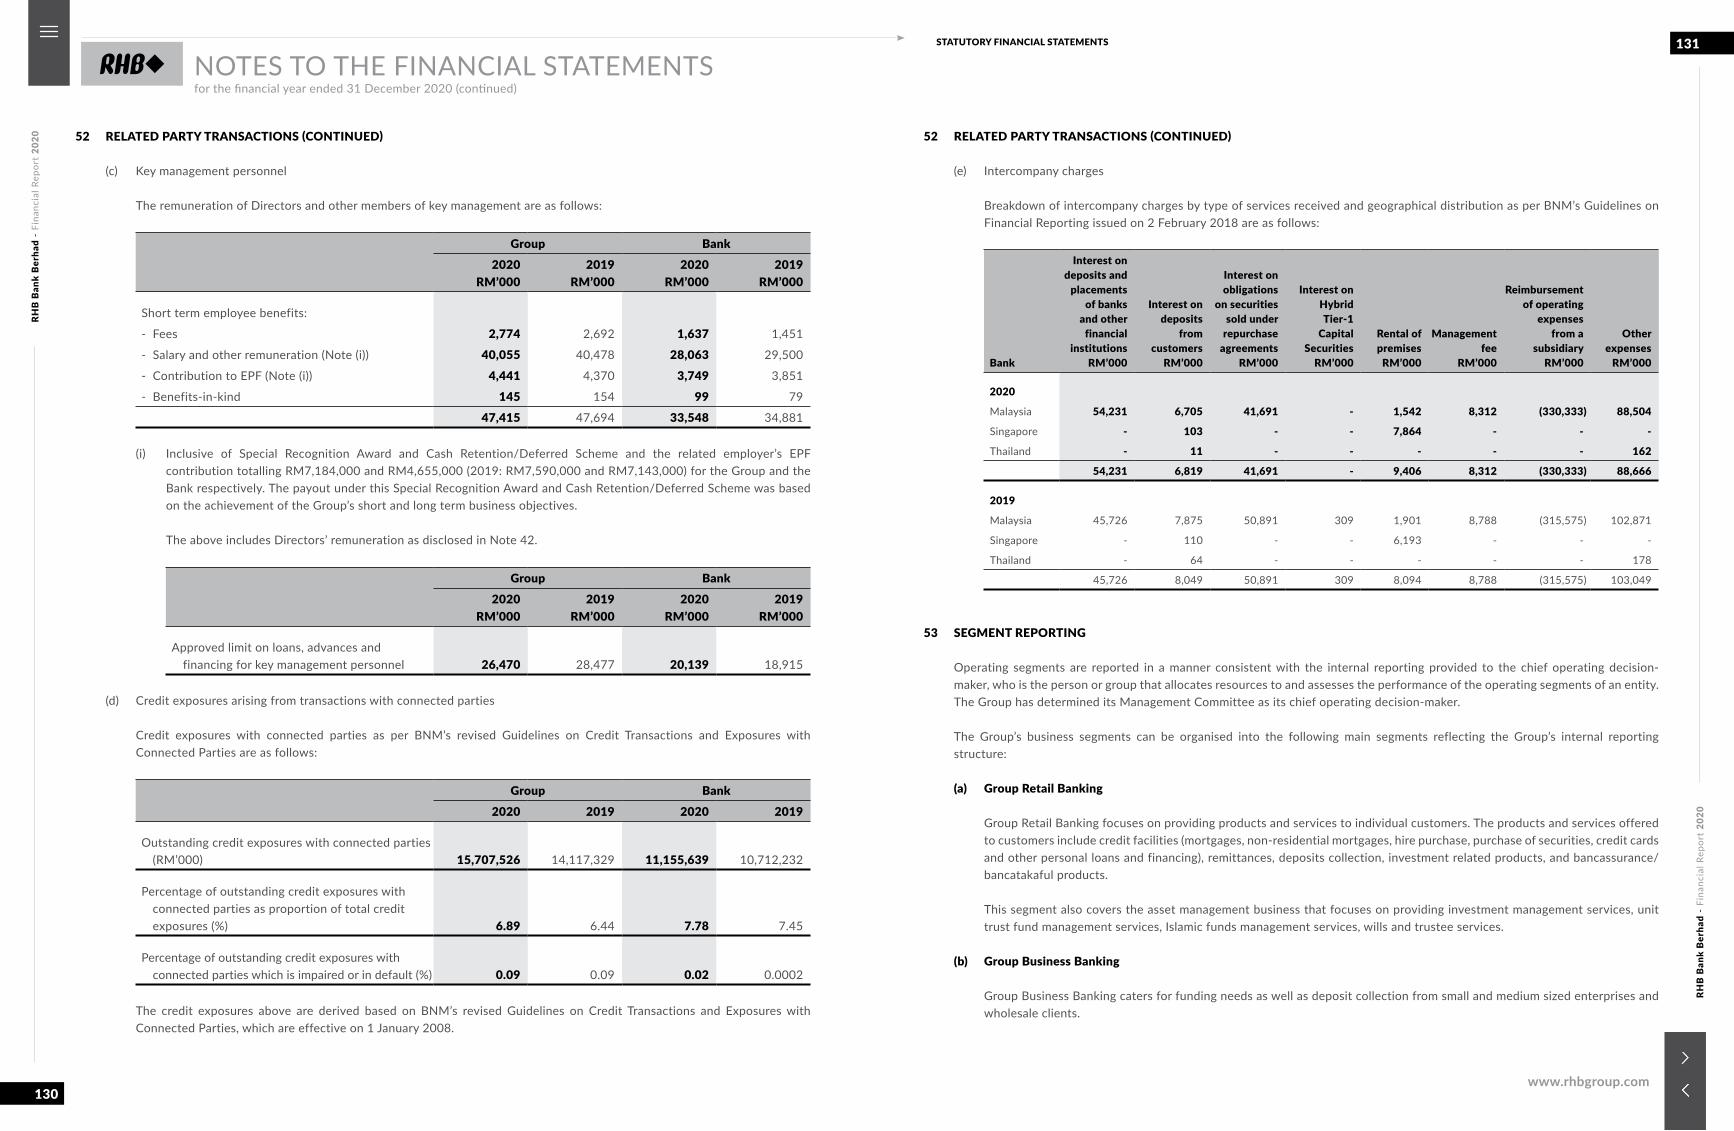
RHB
Ban
k B
erha
d -
Fina
ncia
l Rep
ort
2020
RHB
Ban
k B
erha
d -
Fina
ncia
l Rep
ort
2020
130
131STATUTORY FINANCIAL STATEMENTS
www.rhbgroup.com
NOTES TO THE FINANCIAL STATEMENTSfor the financial year ended 31 December 2020 (continued)
52 RELATED PARTY TRANSACTIONS (CONTINUED)
(c) Key management personnel
The remuneration of Directors and other members of key management are as follows:
Group Bank2020
RM’0002019
RM’0002020
RM’0002019
RM’000
Short term employee benefits:
- Fees 2,774 2,692 1,637 1,451
- Salary and other remuneration (Note (i)) 40,055 40,478 28,063 29,500
- Contribution to EPF (Note (i)) 4,441 4,370 3,749 3,851
- Benefits-in-kind 145 154 99 79
47,415 47,694 33,548 34,881
(i) Inclusive of Special Recognition Award and Cash Retention/Deferred Scheme and the related employer’s EPF contribution totalling RM7,184,000 and RM4,655,000 (2019: RM7,590,000 and RM7,143,000) for the Group and the Bank respectively. The payout under this Special Recognition Award and Cash Retention/Deferred Scheme was based on the achievement of the Group’s short and long term business objectives.
The above includes Directors’ remuneration as disclosed in Note 42.
Group Bank2020
RM’0002019
RM’0002020
RM’0002019
RM’000
Approved limit on loans, advances and financing for key management personnel 26,470 28,477 20,139 18,915
(d) Credit exposures arising from transactions with connected parties
Credit exposures with connected parties as per BNM’s revised Guidelines on Credit Transactions and Exposures with Connected Parties are as follows:
Group Bank2020 2019 2020 2019
Outstanding credit exposures with connected parties (RM’000) 15,707,526 14,117,329 11,155,639 10,712,232
Percentage of outstanding credit exposures with connected parties as proportion of total credit exposures (%) 6.89 6.44 7.78 7.45
Percentage of outstanding credit exposures with connected parties which is impaired or in default (%) 0.09 0.09 0.02 0.0002
The credit exposures above are derived based on BNM’s revised Guidelines on Credit Transactions and Exposures with Connected Parties, which are effective on 1 January 2008.
52 RELATED PARTY TRANSACTIONS (CONTINUED)
(e) Intercompany charges
Breakdown of intercompany charges by type of services received and geographical distribution as per BNM’s Guidelines on Financial Reporting issued on 2 February 2018 are as follows:
Bank
Interest ondeposits and
placementsof banks
and otherfinancial
institutionsRM’000
Interest ondeposits
fromcustomers
RM’000
Interest onobligations
on securitiessold under
repurchaseagreements
RM’000
Interest onHybridTier-1
CapitalSecurities
RM’000
Rental ofpremises
RM’000
Managementfee
RM’000
Reimbursementof operating
expensesfrom a
subsidiaryRM’000
Otherexpenses
RM’000
2020
Malaysia 54,231 6,705 41,691 - 1,542 8,312 (330,333) 88,504
Singapore - 103 - - 7,864 - - -
Thailand - 11 - - - - - 162
54,231 6,819 41,691 - 9,406 8,312 (330,333) 88,666
2019
Malaysia 45,726 7,875 50,891 309 1,901 8,788 (315,575) 102,871
Singapore - 110 - - 6,193 - - -
Thailand - 64 - - - - - 178
45,726 8,049 50,891 309 8,094 8,788 (315,575) 103,049
53 SEGMENT REPORTING
Operating segments are reported in a manner consistent with the internal reporting provided to the chief operating decision- maker, who is the person or group that allocates resources to and assesses the performance of the operating segments of an entity. The Group has determined its Management Committee as its chief operating decision-maker.
The Group’s business segments can be organised into the following main segments reflecting the Group’s internal reporting structure:
(a) Group Retail Banking
Group Retail Banking focuses on providing products and services to individual customers. The products and services offered to customers include credit facilities (mortgages, non-residential mortgages, hire purchase, purchase of securities, credit cards and other personal loans and financing), remittances, deposits collection, investment related products, and bancassurance/bancatakaful products.
This segment also covers the asset management business that focuses on providing investment management services, unit trust fund management services, Islamic funds management services, wills and trustee services.
(b) Group Business Banking
Group Business Banking caters for funding needs as well as deposit collection from small and medium sized enterprises and wholesale clients.
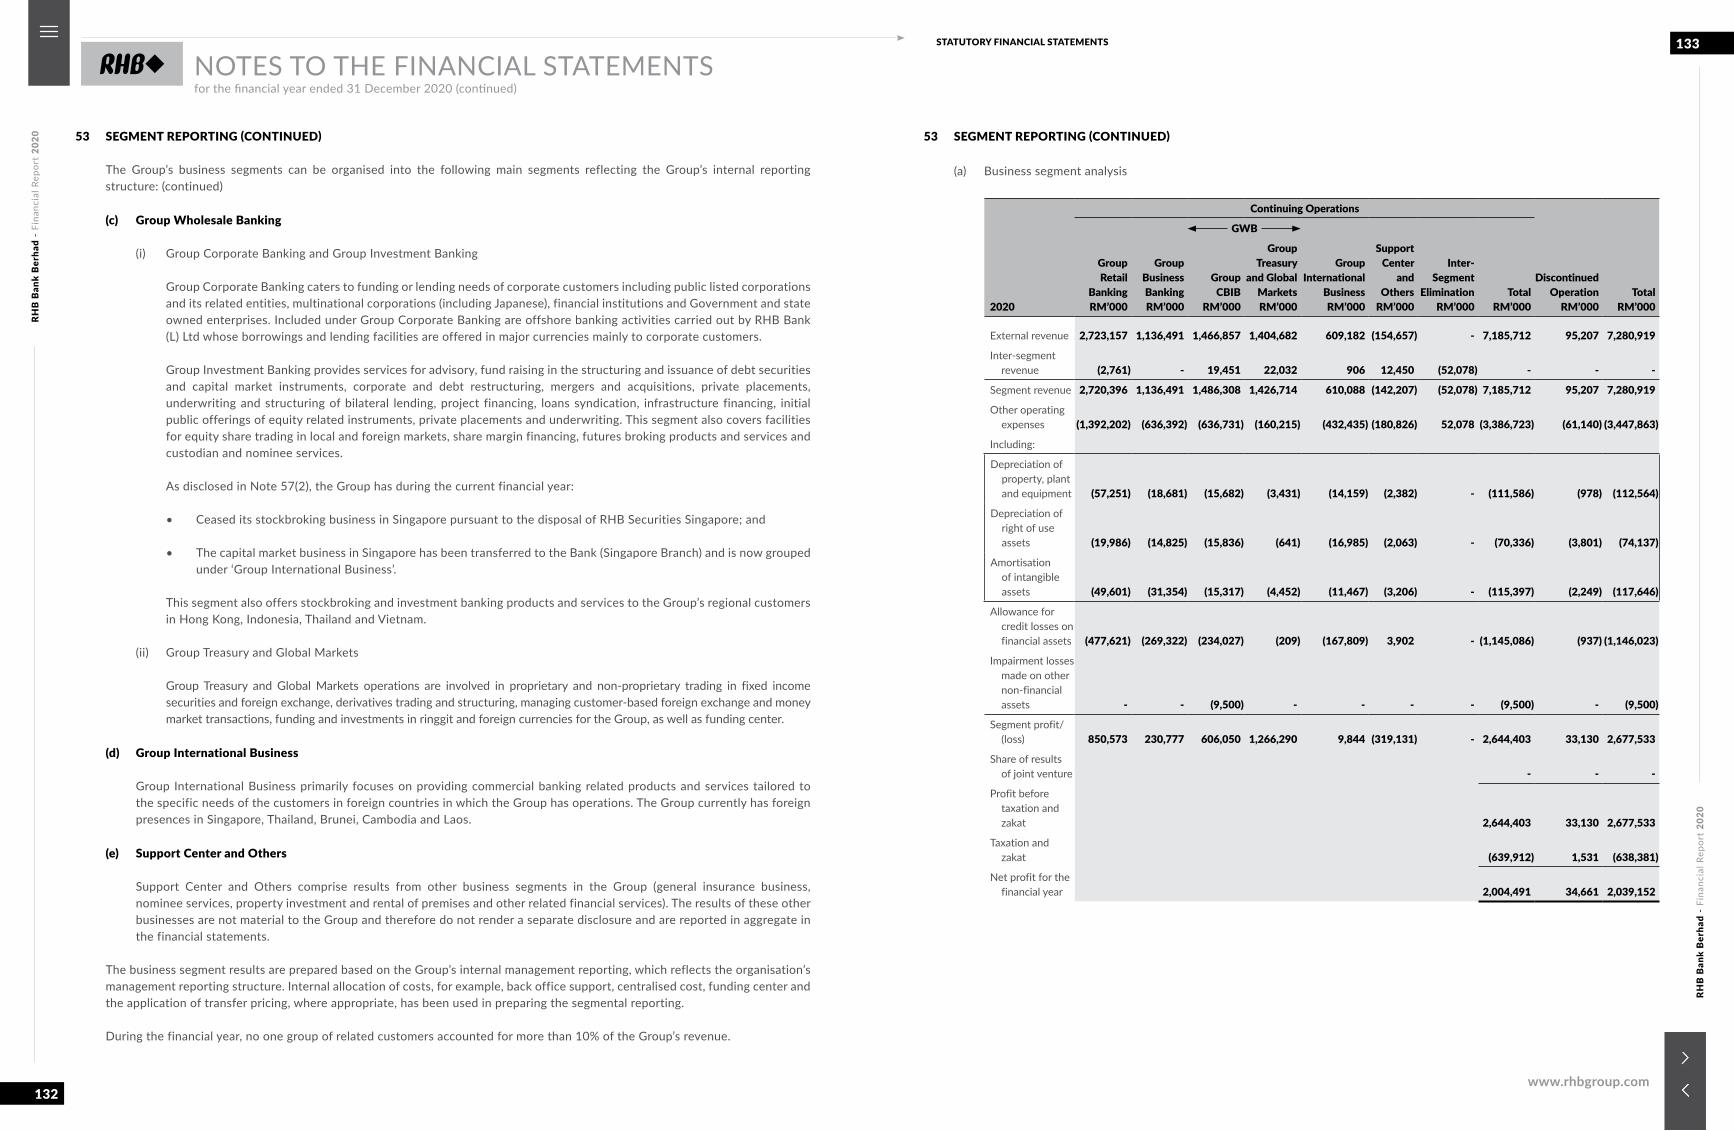
RHB
Ban
k B
erha
d -
Fina
ncia
l Rep
ort
2020
RHB
Ban
k B
erha
d -
Fina
ncia
l Rep
ort
2020
132
133STATUTORY FINANCIAL STATEMENTS
www.rhbgroup.com
NOTES TO THE FINANCIAL STATEMENTSfor the financial year ended 31 December 2020 (continued)
53 SEGMENT REPORTING (CONTINUED)
The Group’s business segments can be organised into the following main segments reflecting the Group’s internal reporting structure: (continued)
(c) Group Wholesale Banking
(i) Group Corporate Banking and Group Investment Banking
Group Corporate Banking caters to funding or lending needs of corporate customers including public listed corporations and its related entities, multinational corporations (including Japanese), financial institutions and Government and state owned enterprises. Included under Group Corporate Banking are offshore banking activities carried out by RHB Bank (L) Ltd whose borrowings and lending facilities are offered in major currencies mainly to corporate customers.
Group Investment Banking provides services for advisory, fund raising in the structuring and issuance of debt securities and capital market instruments, corporate and debt restructuring, mergers and acquisitions, private placements, underwriting and structuring of bilateral lending, project financing, loans syndication, infrastructure financing, initial public offerings of equity related instruments, private placements and underwriting. This segment also covers facilities for equity share trading in local and foreign markets, share margin financing, futures broking products and services and custodian and nominee services.
As disclosed in Note 57(2), the Group has during the current financial year:
• Ceased its stockbroking business in Singapore pursuant to the disposal of RHB Securities Singapore; and
• The capital market business in Singapore has been transferred to the Bank (Singapore Branch) and is now grouped under ‘Group International Business’.
This segment also offers stockbroking and investment banking products and services to the Group’s regional customers in Hong Kong, Indonesia, Thailand and Vietnam.
(ii) Group Treasury and Global Markets
Group Treasury and Global Markets operations are involved in proprietary and non-proprietary trading in fixed income securities and foreign exchange, derivatives trading and structuring, managing customer-based foreign exchange and money market transactions, funding and investments in ringgit and foreign currencies for the Group, as well as funding center.
(d) Group International Business
Group International Business primarily focuses on providing commercial banking related products and services tailored to the specific needs of the customers in foreign countries in which the Group has operations. The Group currently has foreign presences in Singapore, Thailand, Brunei, Cambodia and Laos.
(e) Support Center and Others
Support Center and Others comprise results from other business segments in the Group (general insurance business, nominee services, property investment and rental of premises and other related financial services). The results of these other businesses are not material to the Group and therefore do not render a separate disclosure and are reported in aggregate in the financial statements.
The business segment results are prepared based on the Group’s internal management reporting, which reflects the organisation’s management reporting structure. Internal allocation of costs, for example, back office support, centralised cost, funding center and the application of transfer pricing, where appropriate, has been used in preparing the segmental reporting.
During the financial year, no one group of related customers accounted for more than 10% of the Group’s revenue.
53 SEGMENT REPORTING (CONTINUED)
(a) Business segment analysis
2020
Continuing Operations
DiscontinuedOperation
RM’000Total
RM’000
GroupRetail
BankingRM’000
GroupBusinessBankingRM’000
GWB
GroupInternational
BusinessRM’000
SupportCenter
andOthers
RM’000
Inter-Segment
EliminationRM’000
TotalRM’000
GroupCBIB
RM’000
GroupTreasury
and GlobalMarketsRM’000
External revenue 2,723,157 1,136,491 1,466,857 1,404,682 609,182 (154,657) - 7,185,712 95,207 7,280,919
Inter-segment revenue (2,761) - 19,451 22,032 906 12,450 (52,078) - - -
Segment revenue 2,720,396 1,136,491 1,486,308 1,426,714 610,088 (142,207) (52,078) 7,185,712 95,207 7,280,919
Other operating expenses (1,392,202) (636,392) (636,731) (160,215) (432,435) (180,826) 52,078 (3,386,723) (61,140) (3,447,863)
Including:
Depreciation of property, plant and equipment (57,251) (18,681) (15,682) (3,431) (14,159) (2,382) - (111,586) (978) (112,564)
Depreciation of right of use assets (19,986) (14,825) (15,836) (641) (16,985) (2,063) - (70,336) (3,801) (74,137)
Amortisation of intangible assets (49,601) (31,354) (15,317) (4,452) (11,467) (3,206) - (115,397) (2,249) (117,646)
Allowance for credit losses on financial assets (477,621) (269,322) (234,027) (209) (167,809) 3,902 - (1,145,086) (937) (1,146,023)
Impairment losses made on other non-financial assets - - (9,500) - - - - (9,500) - (9,500)
Segment profit/(loss) 850,573 230,777 606,050 1,266,290 9,844 (319,131) - 2,644,403 33,130 2,677,533
Share of results of joint venture - - -
Profit before taxation and zakat 2,644,403 33,130 2,677,533
Taxation and zakat (639,912) 1,531 (638,381)
Net profit for the financial year 2,004,491 34,661 2,039,152
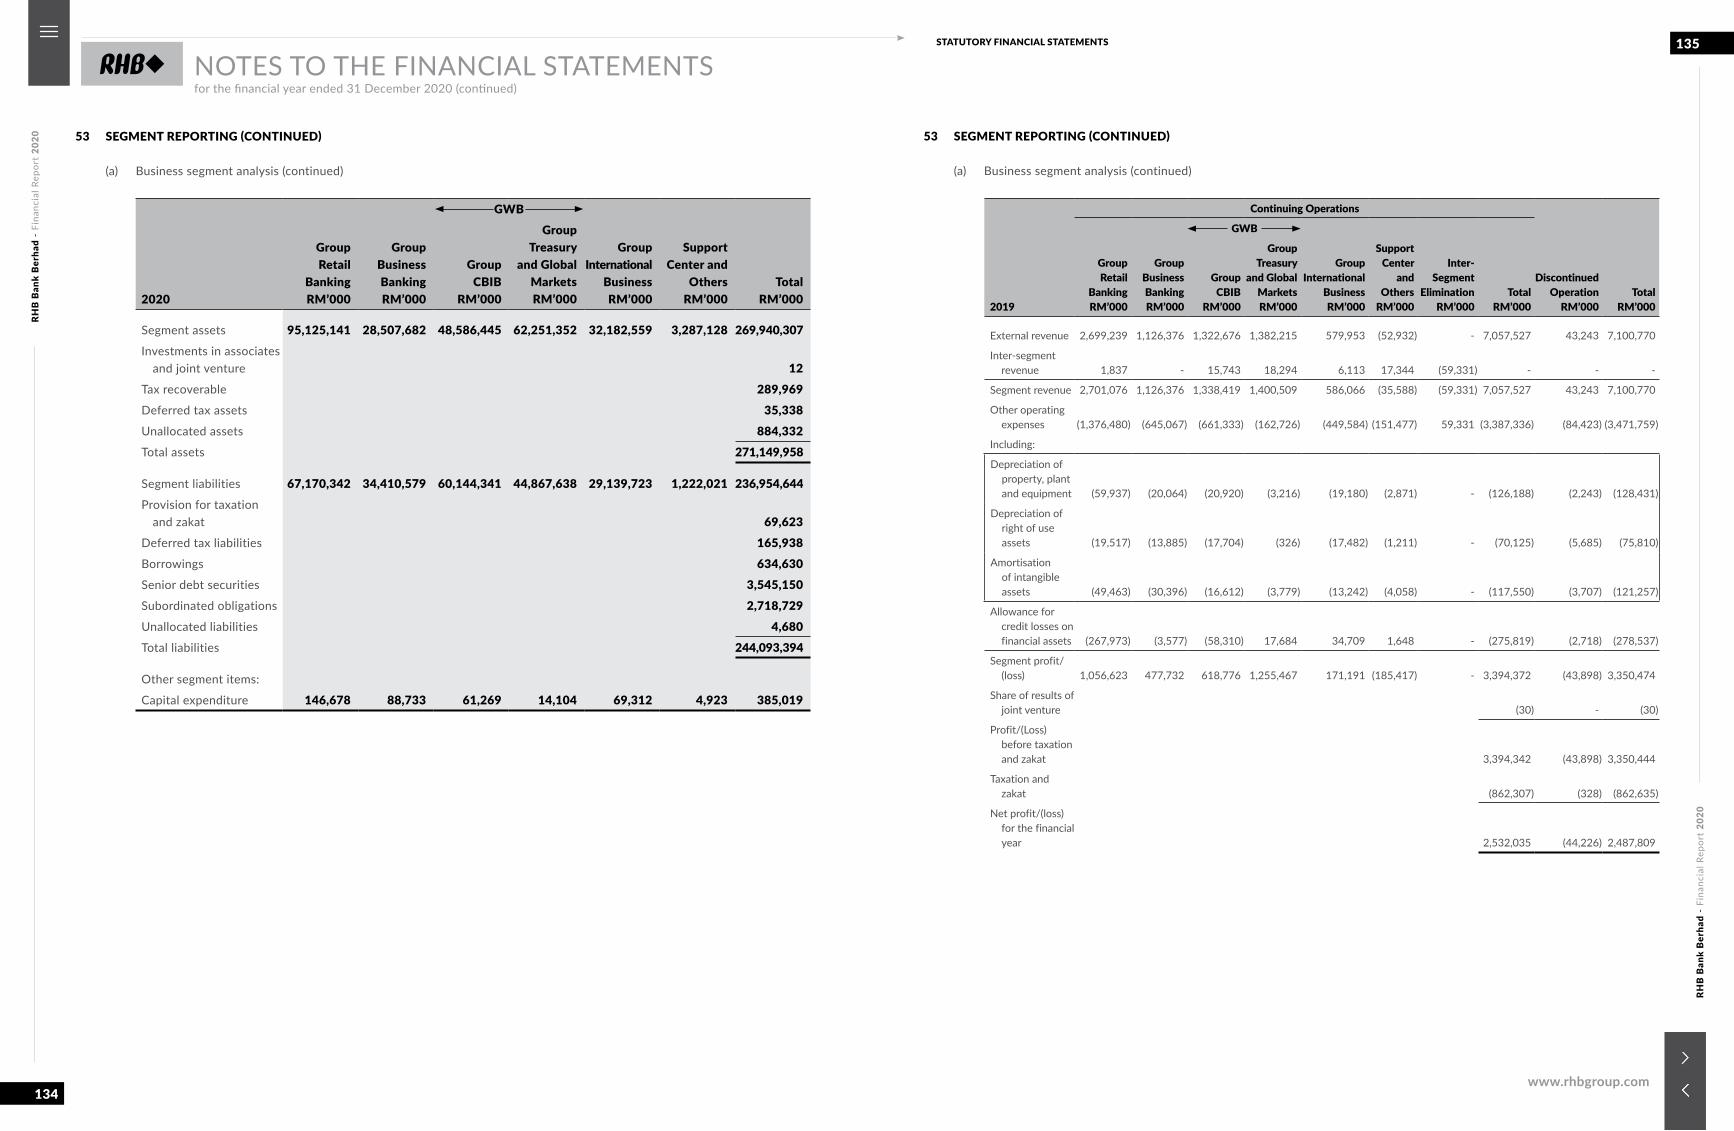
RHB
Ban
k B
erha
d -
Fina
ncia
l Rep
ort
2020
RHB
Ban
k B
erha
d -
Fina
ncia
l Rep
ort
2020
134
135STATUTORY FINANCIAL STATEMENTS
www.rhbgroup.com
NOTES TO THE FINANCIAL STATEMENTSfor the financial year ended 31 December 2020 (continued)
53 SEGMENT REPORTING (CONTINUED)
(a) Business segment analysis (continued)
2020
GroupRetail
BankingRM’000
GroupBusinessBankingRM’000
GWB
GroupInternational
BusinessRM’000
SupportCenter and
OthersRM’000
TotalRM’000
GroupCBIB
RM’000
GroupTreasury
and GlobalMarketsRM’000
Segment assets 95,125,141 28,507,682 48,586,445 62,251,352 32,182,559 3,287,128 269,940,307Investments in associates
and joint venture 12Tax recoverable 289,969Deferred tax assets 35,338Unallocated assets 884,332 Total assets 271,149,958
Segment liabilities 67,170,342 34,410,579 60,144,341 44,867,638 29,139,723 1,222,021 236,954,644Provision for taxation
and zakat 69,623Deferred tax liabilities 165,938Borrowings 634,630Senior debt securities 3,545,150Subordinated obligations 2,718,729Unallocated liabilities 4,680 Total liabilities 244,093,394
Other segment items:
Capital expenditure 146,678 88,733 61,269 14,104 69,312 4,923 385,019
53 SEGMENT REPORTING (CONTINUED)
(a) Business segment analysis (continued)
2019
Continuing Operations
DiscontinuedOperation
RM’000Total
RM’000
GroupRetail
BankingRM’000
GroupBusinessBankingRM’000
GWB
GroupInternational
BusinessRM’000
SupportCenter
andOthers
RM’000
Inter-Segment
EliminationRM’000
TotalRM’000
GroupCBIB
RM’000
GroupTreasury
and GlobalMarketsRM’000
External revenue 2,699,239 1,126,376 1,322,676 1,382,215 579,953 (52,932) - 7,057,527 43,243 7,100,770
Inter-segment revenue 1,837 - 15,743 18,294 6,113 17,344 (59,331) - - -
Segment revenue 2,701,076 1,126,376 1,338,419 1,400,509 586,066 (35,588) (59,331) 7,057,527 43,243 7,100,770
Other operating expenses (1,376,480) (645,067) (661,333) (162,726) (449,584) (151,477) 59,331 (3,387,336) (84,423) (3,471,759)
Including:
Depreciation of property, plant and equipment (59,937) (20,064) (20,920) (3,216) (19,180) (2,871) - (126,188) (2,243) (128,431)
Depreciation of right of use assets (19,517) (13,885) (17,704) (326) (17,482) (1,211) - (70,125) (5,685) (75,810)
Amortisation of intangible assets (49,463) (30,396) (16,612) (3,779) (13,242) (4,058) - (117,550) (3,707) (121,257)
Allowance for credit losses on financial assets (267,973) (3,577) (58,310) 17,684 34,709 1,648 - (275,819) (2,718) (278,537)
Segment profit/(loss) 1,056,623 477,732 618,776 1,255,467 171,191 (185,417) - 3,394,372 (43,898) 3,350,474
Share of results of joint venture (30) - (30)
Profit/(Loss) before taxation and zakat 3,394,342 (43,898) 3,350,444
Taxation and zakat (862,307) (328) (862,635)
Net profit/(loss) for the financial year 2,532,035 (44,226) 2,487,809
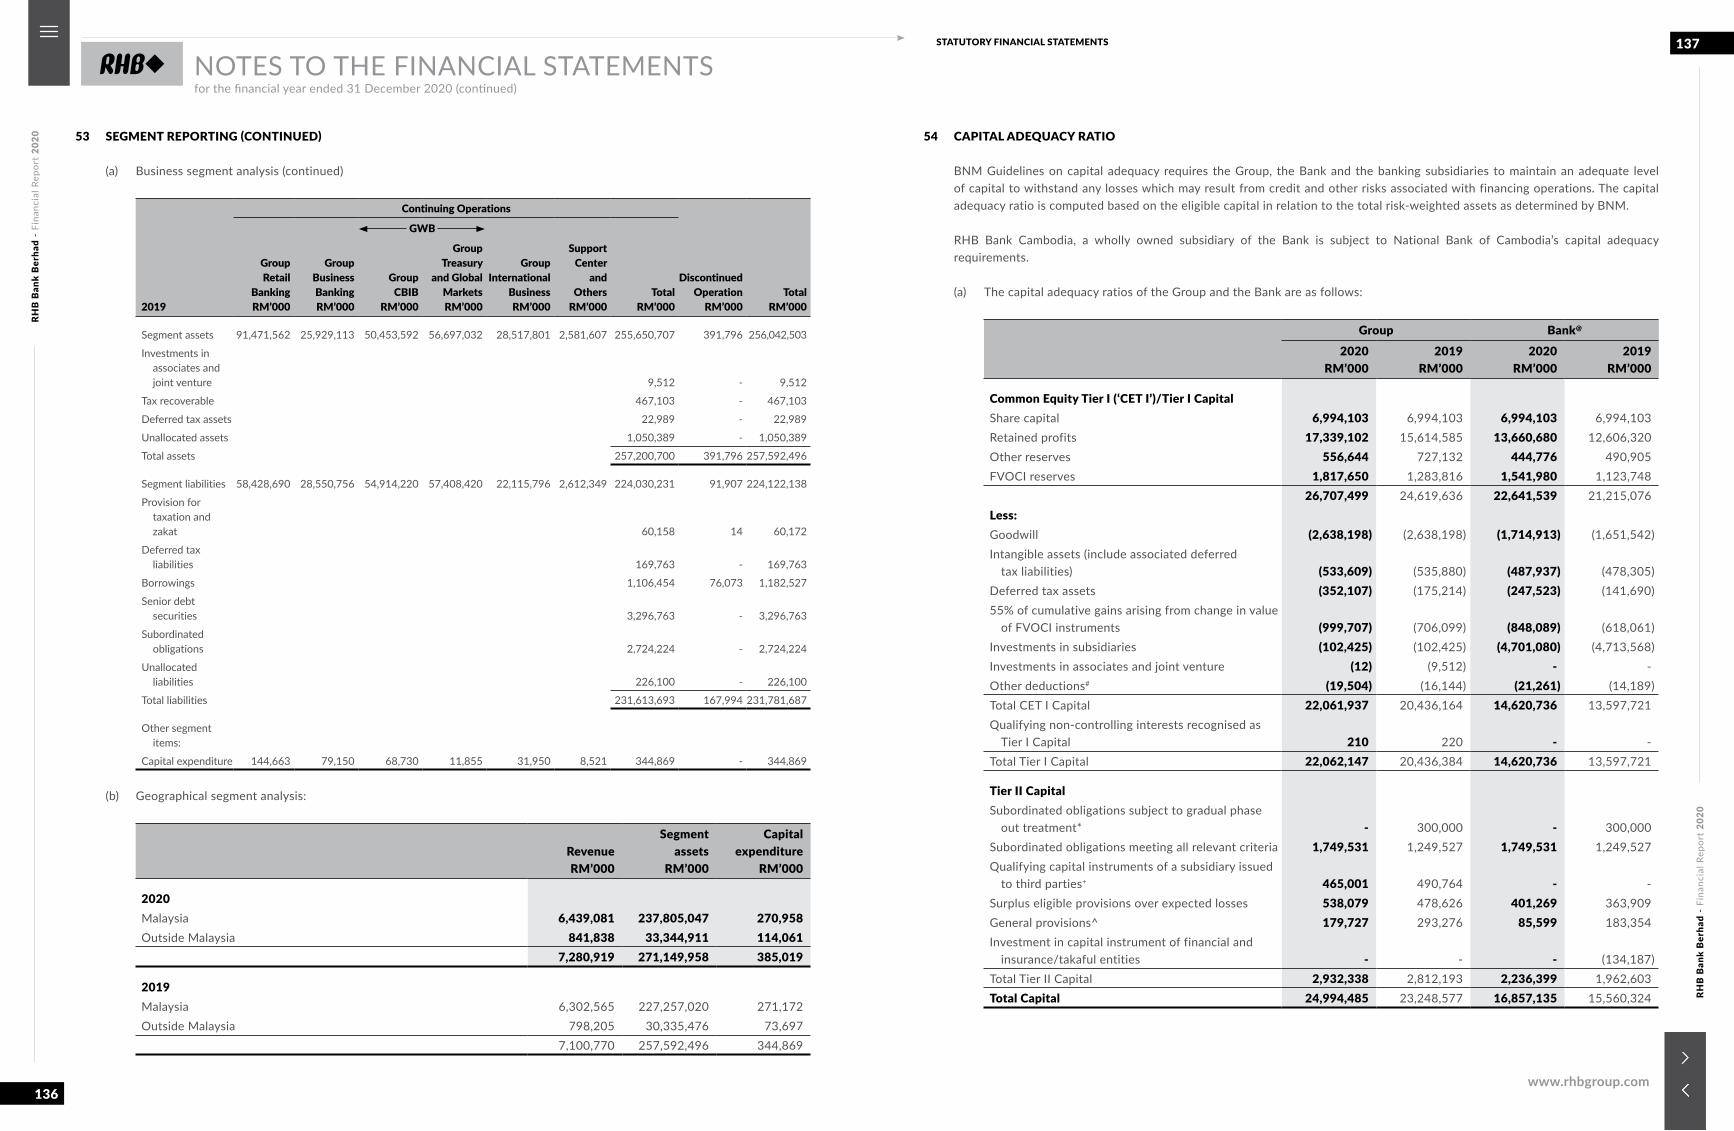
RHB
Ban
k B
erha
d -
Fina
ncia
l Rep
ort
2020
RHB
Ban
k B
erha
d -
Fina
ncia
l Rep
ort
2020
136
137STATUTORY FINANCIAL STATEMENTS
www.rhbgroup.com
NOTES TO THE FINANCIAL STATEMENTSfor the financial year ended 31 December 2020 (continued)
53 SEGMENT REPORTING (CONTINUED)
(a) Business segment analysis (continued)
2019
Continuing Operations
DiscontinuedOperation
RM’000Total
RM’000
GroupRetail
BankingRM’000
GroupBusinessBankingRM’000
GWB
GroupInternational
BusinessRM’000
SupportCenter
andOthers
RM’000Total
RM’000
GroupCBIB
RM’000
GroupTreasury
and GlobalMarketsRM’000
Segment assets 91,471,562 25,929,113 50,453,592 56,697,032 28,517,801 2,581,607 255,650,707 391,796 256,042,503
Investments in associates and joint venture 9,512 - 9,512
Tax recoverable 467,103 - 467,103
Deferred tax assets 22,989 - 22,989
Unallocated assets 1,050,389 - 1,050,389
Total assets 257,200,700 391,796 257,592,496
Segment liabilities 58,428,690 28,550,756 54,914,220 57,408,420 22,115,796 2,612,349 224,030,231 91,907 224,122,138
Provision for taxation and zakat 60,158 14 60,172
Deferred tax liabilities 169,763 - 169,763
Borrowings 1,106,454 76,073 1,182,527
Senior debt securities 3,296,763 - 3,296,763
Subordinated obligations 2,724,224 - 2,724,224
Unallocated liabilities 226,100 - 226,100
Total liabilities 231,613,693 167,994 231,781,687
Other segment items:
Capital expenditure 144,663 79,150 68,730 11,855 31,950 8,521 344,869 - 344,869
(b) Geographical segment analysis:
Revenue RM’000
Segmentassets
RM’000
Capitalexpenditure
RM’000
2020Malaysia 6,439,081 237,805,047 270,958Outside Malaysia 841,838 33,344,911 114,061
7,280,919 271,149,958 385,019
2019Malaysia 6,302,565 227,257,020 271,172Outside Malaysia 798,205 30,335,476 73,697
7,100,770 257,592,496 344,869
54 CAPITAL ADEQUACY RATIO
BNM Guidelines on capital adequacy requires the Group, the Bank and the banking subsidiaries to maintain an adequate level of capital to withstand any losses which may result from credit and other risks associated with financing operations. The capital adequacy ratio is computed based on the eligible capital in relation to the total risk-weighted assets as determined by BNM.
RHB Bank Cambodia, a wholly owned subsidiary of the Bank is subject to National Bank of Cambodia’s capital adequacy requirements.
(a) The capital adequacy ratios of the Group and the Bank are as follows:
Group Bank@
2020 RM’000
2019 RM’000
2020 RM’000
2019 RM’000
Common Equity Tier I (ʻCET I’)/Tier I CapitalShare capital 6,994,103 6,994,103 6,994,103 6,994,103Retained profits 17,339,102 15,614,585 13,660,680 12,606,320Other reserves 556,644 727,132 444,776 490,905FVOCI reserves 1,817,650 1,283,816 1,541,980 1,123,748
26,707,499 24,619,636 22,641,539 21,215,076Less:Goodwill (2,638,198) (2,638,198) (1,714,913) (1,651,542)Intangible assets (include associated deferred
tax liabilities) (533,609) (535,880) (487,937) (478,305)Deferred tax assets (352,107) (175,214) (247,523) (141,690)55% of cumulative gains arising from change in value
of FVOCI instruments (999,707) (706,099) (848,089) (618,061)Investments in subsidiaries (102,425) (102,425) (4,701,080) (4,713,568)Investments in associates and joint venture (12) (9,512) - -Other deductions# (19,504) (16,144) (21,261) (14,189)Total CET I Capital 22,061,937 20,436,164 14,620,736 13,597,721Qualifying non-controlling interests recognised as
Tier I Capital 210 220 - - Total Tier I Capital 22,062,147 20,436,384 14,620,736 13,597,721
Tier II CapitalSubordinated obligations subject to gradual phase
out treatment* - 300,000 - 300,000Subordinated obligations meeting all relevant criteria 1,749,531 1,249,527 1,749,531 1,249,527Qualifying capital instruments of a subsidiary issued
to third parties+ 465,001 490,764 - -Surplus eligible provisions over expected losses 538,079 478,626 401,269 363,909General provisions^ 179,727 293,276 85,599 183,354Investment in capital instrument of financial and
insurance/takaful entities - - - (134,187)Total Tier II Capital 2,932,338 2,812,193 2,236,399 1,962,603 Total Capital 24,994,485 23,248,577 16,857,135 15,560,324
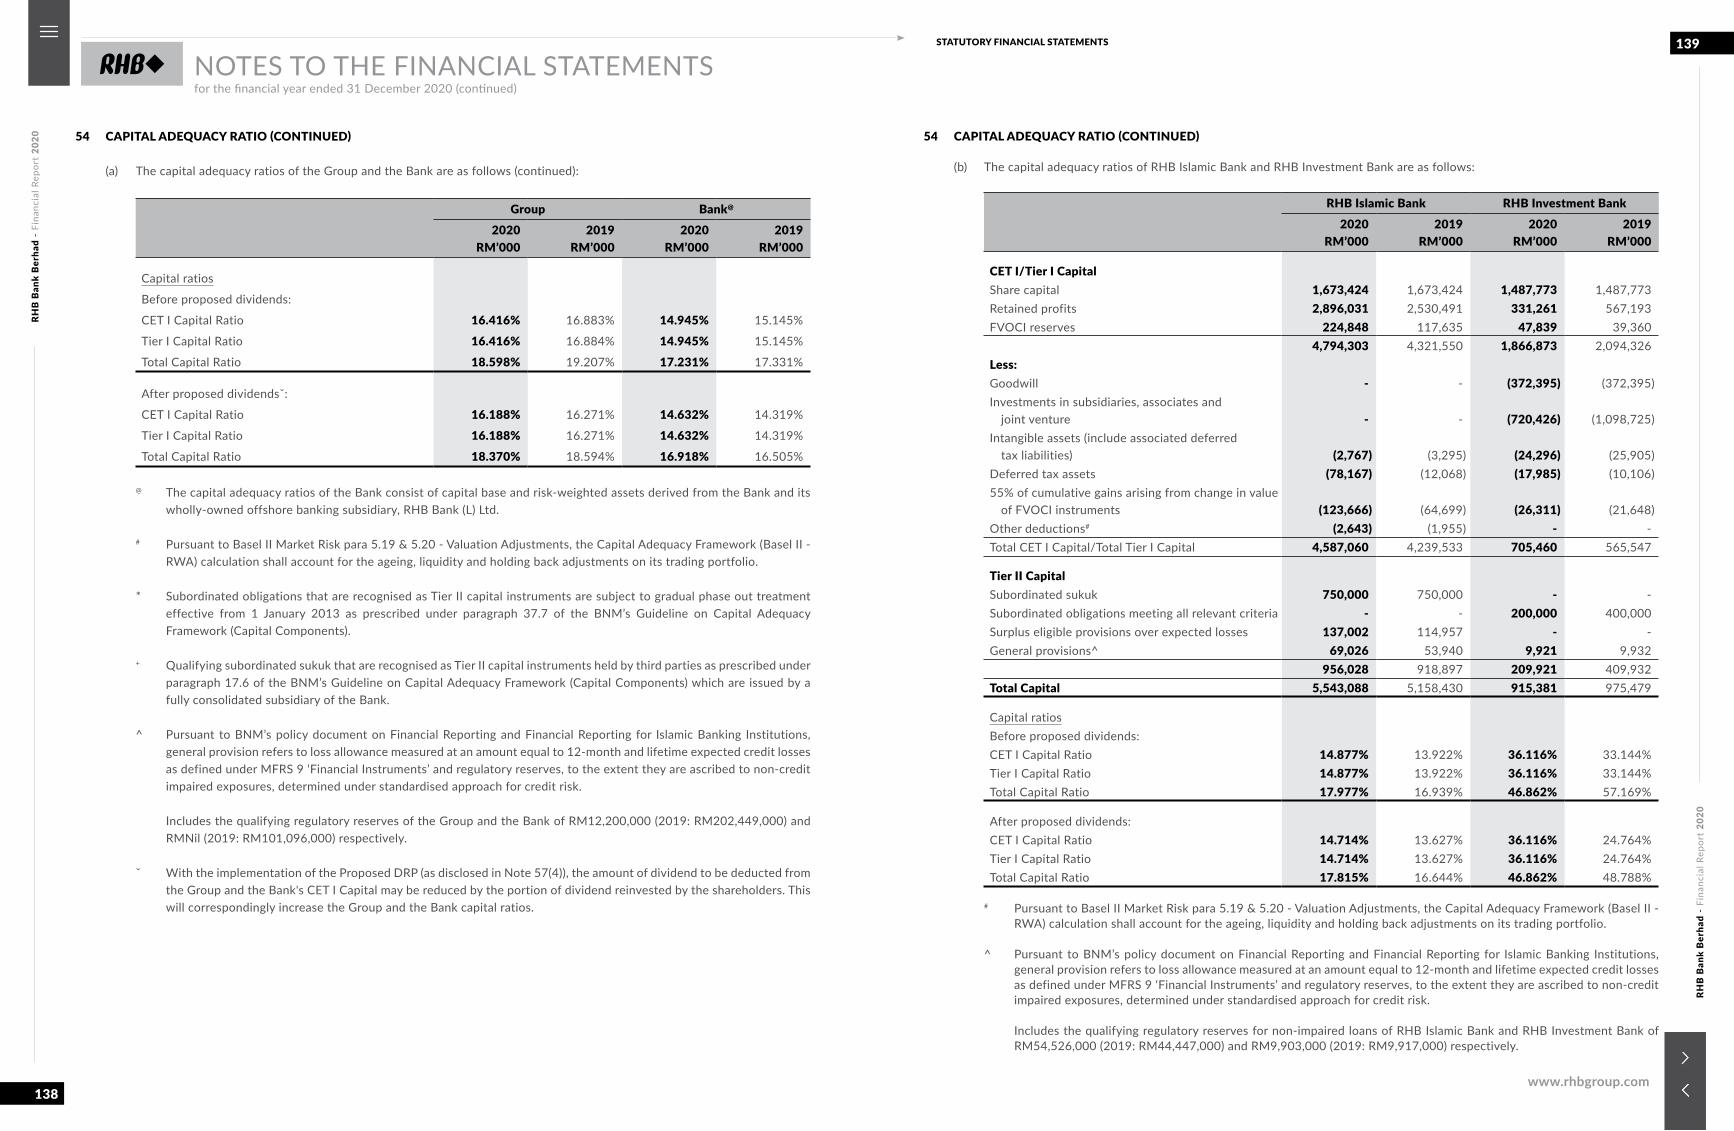
RHB
Ban
k B
erha
d -
Fina
ncia
l Rep
ort
2020
RHB
Ban
k B
erha
d -
Fina
ncia
l Rep
ort
2020
138
139STATUTORY FINANCIAL STATEMENTS
www.rhbgroup.com
NOTES TO THE FINANCIAL STATEMENTSfor the financial year ended 31 December 2020 (continued)
54 CAPITAL ADEQUACY RATIO (CONTINUED)
(a) The capital adequacy ratios of the Group and the Bank are as follows (continued):
Group Bank@
2020 RM’000
2019 RM’000
2020 RM’000
2019 RM’000
Capital ratios
Before proposed dividends:
CET I Capital Ratio 16.416% 16.883% 14.945% 15.145%
Tier I Capital Ratio 16.416% 16.884% 14.945% 15.145%
Total Capital Ratio 18.598% 19.207% 17.231% 17.331%
After proposed dividendsˇ:
CET I Capital Ratio 16.188% 16.271% 14.632% 14.319%
Tier I Capital Ratio 16.188% 16.271% 14.632% 14.319%
Total Capital Ratio 18.370% 18.594% 16.918% 16.505%
@ The capital adequacy ratios of the Bank consist of capital base and risk-weighted assets derived from the Bank and its wholly-owned offshore banking subsidiary, RHB Bank (L) Ltd.
# Pursuant to Basel II Market Risk para 5.19 & 5.20 - Valuation Adjustments, the Capital Adequacy Framework (Basel II - RWA) calculation shall account for the ageing, liquidity and holding back adjustments on its trading portfolio.
* Subordinated obligations that are recognised as Tier II capital instruments are subject to gradual phase out treatment effective from 1 January 2013 as prescribed under paragraph 37.7 of the BNM’s Guideline on Capital Adequacy Framework (Capital Components).
+ Qualifying subordinated sukuk that are recognised as Tier II capital instruments held by third parties as prescribed under paragraph 17.6 of the BNM’s Guideline on Capital Adequacy Framework (Capital Components) which are issued by a fully consolidated subsidiary of the Bank.
^ Pursuant to BNM’s policy document on Financial Reporting and Financial Reporting for Islamic Banking Institutions, general provision refers to loss allowance measured at an amount equal to 12-month and lifetime expected credit losses as defined under MFRS 9 ‘Financial Instruments’ and regulatory reserves, to the extent they are ascribed to non-credit impaired exposures, determined under standardised approach for credit risk.
Includes the qualifying regulatory reserves of the Group and the Bank of RM12,200,000 (2019: RM202,449,000) and RMNil (2019: RM101,096,000) respectively.
ˇ With the implementation of the Proposed DRP (as disclosed in Note 57(4)), the amount of dividend to be deducted from the Group and the Bank's CET I Capital may be reduced by the portion of dividend reinvested by the shareholders. This will correspondingly increase the Group and the Bank capital ratios.
54 CAPITAL ADEQUACY RATIO (CONTINUED)
(b) The capital adequacy ratios of RHB Islamic Bank and RHB Investment Bank are as follows:
RHB Islamic Bank RHB Investment Bank2020
RM’0002019
RM’0002020
RM’0002019
RM’000
CET I/Tier I CapitalShare capital 1,673,424 1,673,424 1,487,773 1,487,773Retained profits 2,896,031 2,530,491 331,261 567,193FVOCI reserves 224,848 117,635 47,839 39,360
4,794,303 4,321,550 1,866,873 2,094,326Less:Goodwill - - (372,395) (372,395)Investments in subsidiaries, associates and
joint venture - - (720,426) (1,098,725)Intangible assets (include associated deferred
tax liabilities) (2,767) (3,295) (24,296) (25,905)Deferred tax assets (78,167) (12,068) (17,985) (10,106)55% of cumulative gains arising from change in value
of FVOCI instruments (123,666) (64,699) (26,311) (21,648)Other deductions# (2,643) (1,955) - - Total CET I Capital/Total Tier I Capital 4,587,060 4,239,533 705,460 565,547
Tier II CapitalSubordinated sukuk 750,000 750,000 - -Subordinated obligations meeting all relevant criteria - - 200,000 400,000Surplus eligible provisions over expected losses 137,002 114,957 - -General provisions^ 69,026 53,940 9,921 9,932
956,028 918,897 209,921 409,932 Total Capital 5,543,088 5,158,430 915,381 975,479
Capital ratiosBefore proposed dividends:CET I Capital Ratio 14.877% 13.922% 36.116% 33.144%Tier I Capital Ratio 14.877% 13.922% 36.116% 33.144%Total Capital Ratio 17.977% 16.939% 46.862% 57.169%
After proposed dividends:CET I Capital Ratio 14.714% 13.627% 36.116% 24.764%Tier I Capital Ratio 14.714% 13.627% 36.116% 24.764%Total Capital Ratio 17.815% 16.644% 46.862% 48.788%
# Pursuant to Basel II Market Risk para 5.19 & 5.20 - Valuation Adjustments, the Capital Adequacy Framework (Basel II -
RWA) calculation shall account for the ageing, liquidity and holding back adjustments on its trading portfolio.
^ Pursuant to BNM’s policy document on Financial Reporting and Financial Reporting for Islamic Banking Institutions, general provision refers to loss allowance measured at an amount equal to 12-month and lifetime expected credit losses as defined under MFRS 9 ‘Financial Instruments’ and regulatory reserves, to the extent they are ascribed to non-credit impaired exposures, determined under standardised approach for credit risk.
Includes the qualifying regulatory reserves for non-impaired loans of RHB Islamic Bank and RHB Investment Bank of RM54,526,000 (2019: RM44,447,000) and RM9,903,000 (2019: RM9,917,000) respectively.
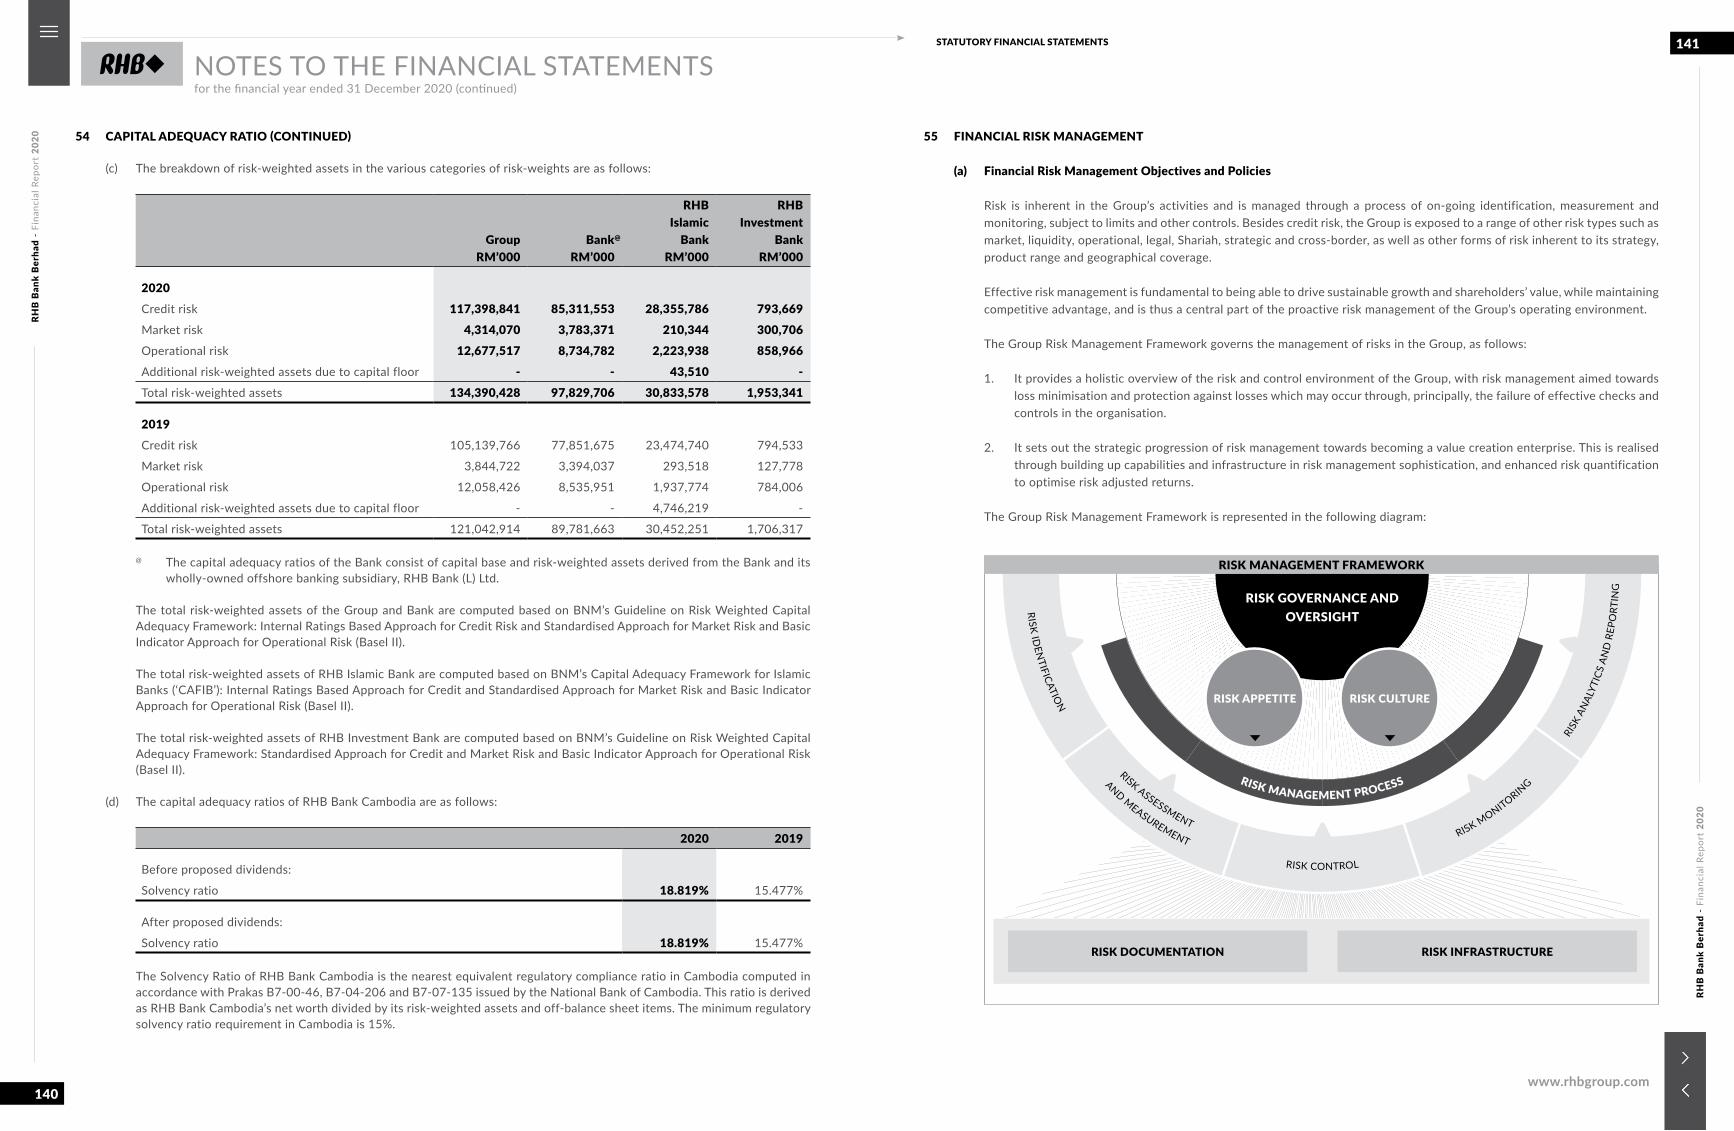
RHB
Ban
k B
erha
d -
Fina
ncia
l Rep
ort
2020
RHB
Ban
k B
erha
d -
Fina
ncia
l Rep
ort
2020
140
141STATUTORY FINANCIAL STATEMENTS
www.rhbgroup.com
NOTES TO THE FINANCIAL STATEMENTSfor the financial year ended 31 December 2020 (continued)
54 CAPITAL ADEQUACY RATIO (CONTINUED)
(c) The breakdown of risk-weighted assets in the various categories of risk-weights are as follows:
GroupRM’000
Bank@
RM’000
RHB Islamic
BankRM’000
RHB Investment
BankRM’000
2020Credit risk 117,398,841 85,311,553 28,355,786 793,669Market risk 4,314,070 3,783,371 210,344 300,706Operational risk 12,677,517 8,734,782 2,223,938 858,966Additional risk-weighted assets due to capital floor - - 43,510 - Total risk-weighted assets 134,390,428 97,829,706 30,833,578 1,953,341
2019Credit risk 105,139,766 77,851,675 23,474,740 794,533
Market risk 3,844,722 3,394,037 293,518 127,778
Operational risk 12,058,426 8,535,951 1,937,774 784,006
Additional risk-weighted assets due to capital floor - - 4,746,219 -
Total risk-weighted assets 121,042,914 89,781,663 30,452,251 1,706,317
@ The capital adequacy ratios of the Bank consist of capital base and risk-weighted assets derived from the Bank and its wholly-owned offshore banking subsidiary, RHB Bank (L) Ltd.
The total risk-weighted assets of the Group and Bank are computed based on BNM’s Guideline on Risk Weighted Capital Adequacy Framework: Internal Ratings Based Approach for Credit Risk and Standardised Approach for Market Risk and Basic Indicator Approach for Operational Risk (Basel II).
The total risk-weighted assets of RHB Islamic Bank are computed based on BNM’s Capital Adequacy Framework for Islamic Banks (‘CAFIB’): Internal Ratings Based Approach for Credit and Standardised Approach for Market Risk and Basic Indicator Approach for Operational Risk (Basel II).
The total risk-weighted assets of RHB Investment Bank are computed based on BNM’s Guideline on Risk Weighted Capital Adequacy Framework: Standardised Approach for Credit and Market Risk and Basic Indicator Approach for Operational Risk (Basel II).
(d) The capital adequacy ratios of RHB Bank Cambodia are as follows:
2020 2019
Before proposed dividends:
Solvency ratio 18.819% 15.477%
After proposed dividends:
Solvency ratio 18.819% 15.477%
The Solvency Ratio of RHB Bank Cambodia is the nearest equivalent regulatory compliance ratio in Cambodia computed in accordance with Prakas B7-00-46, B7-04-206 and B7-07-135 issued by the National Bank of Cambodia. This ratio is derived as RHB Bank Cambodia’s net worth divided by its risk-weighted assets and off-balance sheet items. The minimum regulatory solvency ratio requirement in Cambodia is 15%.
55 FINANCIAL RISK MANAGEMENT
(a) Financial Risk Management Objectives and Policies
Risk is inherent in the Group’s activities and is managed through a process of on-going identification, measurement and monitoring, subject to limits and other controls. Besides credit risk, the Group is exposed to a range of other risk types such as market, liquidity, operational, legal, Shariah, strategic and cross-border, as well as other forms of risk inherent to its strategy, product range and geographical coverage.
Effective risk management is fundamental to being able to drive sustainable growth and shareholders’ value, while maintaining competitive advantage, and is thus a central part of the proactive risk management of the Group’s operating environment.
The Group Risk Management Framework governs the management of risks in the Group, as follows:
1. It provides a holistic overview of the risk and control environment of the Group, with risk management aimed towards loss minimisation and protection against losses which may occur through, principally, the failure of effective checks and controls in the organisation.
2. It sets out the strategic progression of risk management towards becoming a value creation enterprise. This is realised through building up capabilities and infrastructure in risk management sophistication, and enhanced risk quantification to optimise risk adjusted returns.
The Group Risk Management Framework is represented in the following diagram:
RISK GOVERNANCE AND OVERSIGHT
RISK MANAGEMENT PROCESS
RISK IDEN
TIFICATION
RISK ASSESSMENT
RISK CONTROL
RISK MONITORING
RISK
AN
ALYT
ICS
AND
REP
ORT
ING
RISK APPETITE RISK CULTURE
RISK DOCUMENTATION RISK INFRASTRUCTURE
RISK MANAGEMENT FRAMEWORK
AND MEASUREMENT
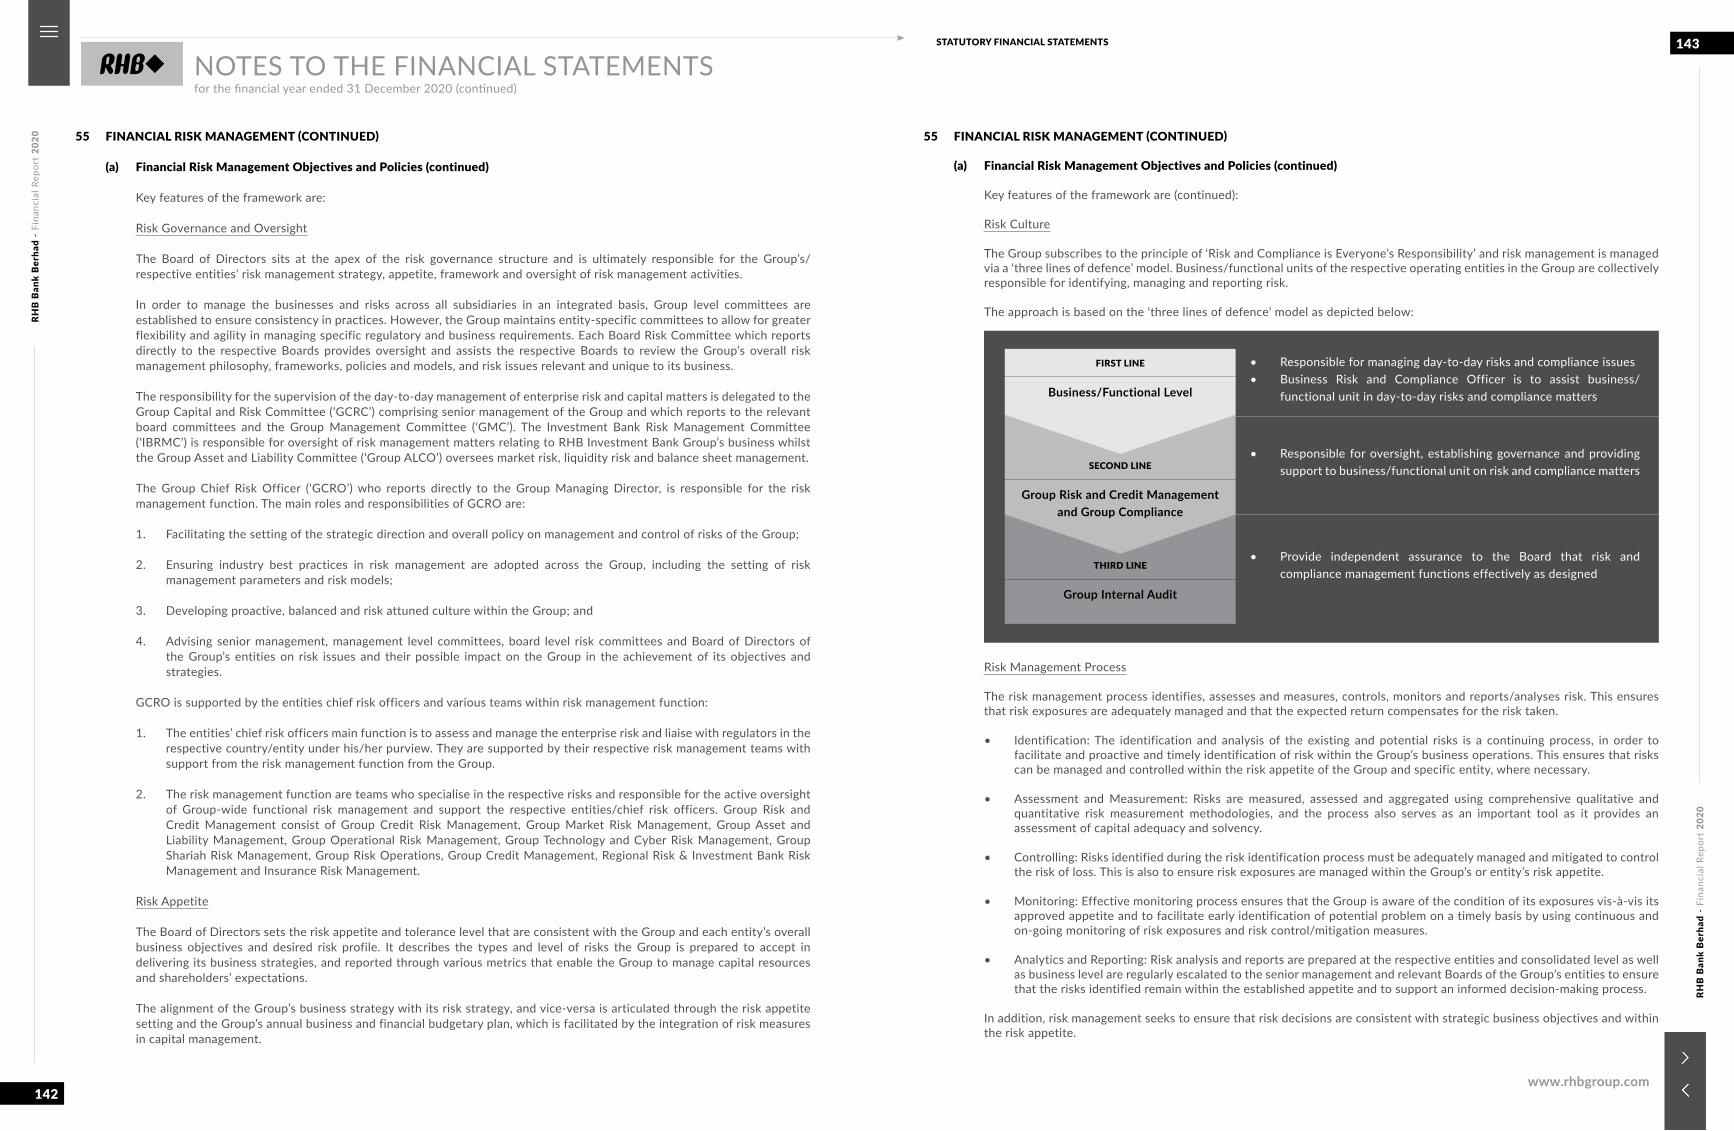
RHB
Ban
k B
erha
d -
Fina
ncia
l Rep
ort
2020
RHB
Ban
k B
erha
d -
Fina
ncia
l Rep
ort
2020
142
143STATUTORY FINANCIAL STATEMENTS
www.rhbgroup.com
NOTES TO THE FINANCIAL STATEMENTSfor the financial year ended 31 December 2020 (continued)
55 FINANCIAL RISK MANAGEMENT (CONTINUED)
(a) Financial Risk Management Objectives and Policies (continued)
Key features of the framework are:
Risk Governance and Oversight
The Board of Directors sits at the apex of the risk governance structure and is ultimately responsible for the Group’s/respective entities’ risk management strategy, appetite, framework and oversight of risk management activities.
In order to manage the businesses and risks across all subsidiaries in an integrated basis, Group level committees are established to ensure consistency in practices. However, the Group maintains entity-specific committees to allow for greater flexibility and agility in managing specific regulatory and business requirements. Each Board Risk Committee which reports directly to the respective Boards provides oversight and assists the respective Boards to review the Group’s overall risk management philosophy, frameworks, policies and models, and risk issues relevant and unique to its business.
The responsibility for the supervision of the day-to-day management of enterprise risk and capital matters is delegated to the Group Capital and Risk Committee (ʻGCRC’) comprising senior management of the Group and which reports to the relevant board committees and the Group Management Committee (ʻGMC’). The Investment Bank Risk Management Committee (ʻIBRMC’) is responsible for oversight of risk management matters relating to RHB Investment Bank Group’s business whilst the Group Asset and Liability Committee (ʻGroup ALCO’) oversees market risk, liquidity risk and balance sheet management.
The Group Chief Risk Officer (ʻGCRO’) who reports directly to the Group Managing Director, is responsible for the risk management function. The main roles and responsibilities of GCRO are:
1. Facilitating the setting of the strategic direction and overall policy on management and control of risks of the Group;
2. Ensuring industry best practices in risk management are adopted across the Group, including the setting of risk management parameters and risk models;
3. Developing proactive, balanced and risk attuned culture within the Group; and
4. Advising senior management, management level committees, board level risk committees and Board of Directors of the Group’s entities on risk issues and their possible impact on the Group in the achievement of its objectives and strategies.
GCRO is supported by the entities chief risk officers and various teams within risk management function:
1. The entities’ chief risk officers main function is to assess and manage the enterprise risk and liaise with regulators in the respective country/entity under his/her purview. They are supported by their respective risk management teams with support from the risk management function from the Group.
2. The risk management function are teams who specialise in the respective risks and responsible for the active oversight of Group-wide functional risk management and support the respective entities/chief risk officers. Group Risk and Credit Management consist of Group Credit Risk Management, Group Market Risk Management, Group Asset and Liability Management, Group Operational Risk Management, Group Technology and Cyber Risk Management, Group Shariah Risk Management, Group Risk Operations, Group Credit Management, Regional Risk & Investment Bank Risk Management and Insurance Risk Management.
Risk Appetite
The Board of Directors sets the risk appetite and tolerance level that are consistent with the Group and each entity’s overall business objectives and desired risk profile. It describes the types and level of risks the Group is prepared to accept in delivering its business strategies, and reported through various metrics that enable the Group to manage capital resources and shareholders’ expectations.
The alignment of the Group’s business strategy with its risk strategy, and vice-versa is articulated through the risk appetite setting and the Group’s annual business and financial budgetary plan, which is facilitated by the integration of risk measures in capital management.
55 FINANCIAL RISK MANAGEMENT (CONTINUED)
(a) Financial Risk Management Objectives and Policies (continued)
Key features of the framework are (continued):
Risk Culture
The Group subscribes to the principle of ‘Risk and Compliance is Everyone’s Responsibility’ and risk management is managed via a ‘three lines of defence’ model. Business/functional units of the respective operating entities in the Group are collectively responsible for identifying, managing and reporting risk.
The approach is based on the ‘three lines of defence’ model as depicted below:
• Provide independent assurance to the Board that risk and compliance management functions effectively as designed
THIRD LINE
Group Internal Audit
SECOND LINE
Group Risk and Credit Managementand Group Compliance
FIRST LINE
Business/Functional Level
• Responsible for managing day-to-day risks and compliance issues• Business Risk and Compliance Officer is to assist business/
functional unit in day-to-day risks and compliance matters
• Responsible for oversight, establishing governance and providing support to business/functional unit on risk and compliance matters
Risk Management Process
The risk management process identifies, assesses and measures, controls, monitors and reports/analyses risk. This ensures that risk exposures are adequately managed and that the expected return compensates for the risk taken.
• Identification: The identification and analysis of the existing and potential risks is a continuing process, in order to facilitate and proactive and timely identification of risk within the Group’s business operations. This ensures that risks can be managed and controlled within the risk appetite of the Group and specific entity, where necessary.
• Assessment and Measurement: Risks are measured, assessed and aggregated using comprehensive qualitative and quantitative risk measurement methodologies, and the process also serves as an important tool as it provides an assessment of capital adequacy and solvency.
• Controlling: Risks identified during the risk identification process must be adequately managed and mitigated to control the risk of loss. This is also to ensure risk exposures are managed within the Group’s or entity’s risk appetite.
• Monitoring: Effective monitoring process ensures that the Group is aware of the condition of its exposures vis-à-vis its approved appetite and to facilitate early identification of potential problem on a timely basis by using continuous and on-going monitoring of risk exposures and risk control/mitigation measures.
• Analytics and Reporting: Risk analysis and reports are prepared at the respective entities and consolidated level as well as business level are regularly escalated to the senior management and relevant Boards of the Group’s entities to ensure that the risks identified remain within the established appetite and to support an informed decision-making process.
In addition, risk management seeks to ensure that risk decisions are consistent with strategic business objectives and within the risk appetite.
RHB
Ban
k B
erha
d -
Fina
ncia
l Rep
ort
2020
RHB
Ban
k B
erha
d -
Fina
ncia
l Rep
ort
2020
144
145STATUTORY FINANCIAL STATEMENTS
www.rhbgroup.com
NOTES TO THE FINANCIAL STATEMENTSfor the financial year ended 31 December 2020 (continued)
55 FINANCIAL RISK MANAGEMENT (CONTINUED)
(a) Financial Risk Management Objectives and Policies (continued)
Key features of the framework are (continued):
Risk Documentation
The Group recognises that effective implementation of the risk management system and process must be supported by a robust set of documentation. Towards this end, the Group has established frameworks, policies and other relevant control documents to ensure clearly defined practices and processes are effected consistently across the Group.
Risk Infrastructure
The Group has organised its resources and talents into specific functions, and invested in the technology, including data management to support the Group’s risk management activities.
Major Areas of Risk
As a banking institution with key activities covering retail, business banking, corporate banking and advisory services, treasury products and services, and securities and futures related business, the Group is subject to business risks which are inherent in the financial services industry. Generally, these business risks can be broadly classified as follows:
(i) Credit risk – the risk of loss arising from customers’ or counterparties’ failure to fulfil their financial and contractual obligations in accordance to the agreed terms. It stems primarily from the Group’s and the Bank’s lending/financing, trade finance and its placement, underwritings, investment, hedging and trading activities from both on- and off-balance sheet transactions. Credit risk does not happen in isolation as certain risk event (e.g. fluctuation of interest rate and foreign exchange) may give rise to both market and credit risks.
(ii) Market risk – the risk of losses arising from adverse movements in market drivers, such as interest/profit rates, credit spreads, equity prices, currency exchange rates and commodity prices. Under this definition, market risk will constitute:
• the interest/profit rate and equity risks pertaining to financial instruments in the trading book; and• foreign exchange risk and commodities risk in the trading and banking books.
(iii) Liquidity risk – the risk of the Group and the Bank being unable to maintain sufficient liquidity to meet its financial commitments and obligations when they fall due and transact at a reasonable cost. Liquidity risk also arises from the inability to manage unplanned decreases or changes in funding sources.
(iv) Operational risk – the risk of loss resulting from inadequate or failed internal processes, people, systems and/or external events, which also includes IT, legal and Shariah non-compliance risk but excludes strategic and reputational risk.
(v) Technology and Cyber risk – Technology risk is the business risk associated with the use, ownership, operation, involvement, influence and adoption of IT within an enterprise while Cyber risk refers to threats or vulnerabilities emanating from the connectivity of internal infrastructure to external networks such as the Internet.
To mitigate the various business risks of the Group and the Bank, the following has been put in place:
Credit Risk
• The Group and the Bank abide to the Board approved credit policy which supports the development of a strong credit culture and with the objective of maintaining a well-diversified portfolio that addresses credit risk, and mitigates concern for unexpected losses.
• Regulatory requirement and Industry best practices are incorporated into the approved policy.
• Group Credit Committee (‘GCC’) is responsible for ensuring adherence to the Board approved credit risk appetite as well as the effectiveness of credit risk management. GCC is the senior management committee empowered to approve or reject all financial investments, counterparty credit and lending/financing up to the defined threshold limits.
55 FINANCIAL RISK MANAGEMENT (CONTINUED)
(a) Financial Risk Management Objectives and Policies (continued)
Major Areas of Risk (continued)
Credit Risk (continued)
• Group Investment Underwriting Committee (‘GIUC’) deliberates, approves and rejects stockbroking/equities/futures business related proposals such as equity underwriting, equity derivatives and structured products, and share margin financing.
• GCC and GIUC submit to the Board Credit Committee (‘BCC’) for affirmation or veto if the financing facilities exceed a pre-defined threshold.
• The Group and the Bank also ensure that internal processes and credit underwriting standards are adhered to before credit proposals are approved. All credit proposals are first evaluated by the originating business units before being evaluated by Group Credit Management/Group Retail Credit prior to submission to the relevant committees for approval. With the exception of credit applications for consumer and approved products under program lending/financing which can be auto approved by loan origination system or business units’ supervisors, all other credit facilities are subject to independent assessment by a team of dedicated and experienced credit evaluators in Head Office. For proper checks and controls, joint or escalated approval is required for all discretionary lending between business and independent credit underwriters, except for end-financing which can only be singly assessed by independent credit underwriter. Loans/financing which are beyond the delegated lending authority limits will be escalated to the relevant committees for approval.
• Internal credit rating models are an integral part of the Group’s and the Bank’s credit risk management, decision-making process, and regulatory capital calculations.
• Clients’ accounts are reviewed at regular intervals and weakening credits are transferred to Loan Recovery for more effective management.
• Counterparty, industry and product exposure limits/directions are set and risk reward relationships are mapped with the aim of maintaining a diverse credit profile and track the changing risk concentrations in response to market changes and external events.
• The Bank applies the Internal Ratings-Based (‘IRB’) approach for credit risk, whereby more advanced Basel II approaches and key program components are implemented, which includes (i) enhancing the returns of the Bank using established credit risk framework and methodologies, (ii) implementing and using empirical credit scoring models for consumer financing and credit rating models for business loans/financing, and (iii) designing and implementing modelling of expected and unexpected losses.
• The Bank has embarked on an end-to-end credit transformation journey to support business growth responsibly and protect the asset quality in challenging times. The coverage of the transformation covers the core business segments of Retail Banking, Business Banking and Corporate Banking.
• In addition, the Credit War Room has been established to steer, coordinate and ensure the effective implementation of the Group’s repayment assistance strategy in relation to borrowers/customers affected by the COVID-19 pandemic, in a consistent and structured response across RHB Banking Group headed by the Group Managing Director in line with BNM requirement for FIs to set-up a dedicated function led by the Chief Executive Officer.
Market Risk
• A framework of risk policies, measurement methodologies and limits, as approved by the Board, which controls the Group’s and the Bank’s financial market activities as well as to identify potential risk areas early in order to mitigate against any adverse effects arising from market volatility.
• The senior management committees; namely Group ALCO, the GCRC and IBRMC performs a critical role in the oversight of the management of market risk and supports the board risk committees in the overall market risk management.
• The Group Risk Management function forms a centralised function to support senior management to operationalise the processes and methods, to ensure adequate risk control and oversight are in place.
RHB
Ban
k B
erha
d -
Fina
ncia
l Rep
ort
2020
RHB
Ban
k B
erha
d -
Fina
ncia
l Rep
ort
2020
146
147STATUTORY FINANCIAL STATEMENTS
www.rhbgroup.com
NOTES TO THE FINANCIAL STATEMENTSfor the financial year ended 31 December 2020 (continued)
55 FINANCIAL RISK MANAGEMENT (CONTINUED)
(a) Financial Risk Management Objectives and Policies (continued)
Major Areas of Risk (continued)
Market Risk (continued)
• The Group and the Bank apply risk monitoring and assessment tools to measure trading book positions and market risk factors. Statistical and non-statistical risk assessment tools applied include Value-at-Risk (‘VaR’), sensitivity analysis and stress testing.
• Market risk is primarily monitored and controlled via a structure of limits and triggers i.e. cut loss, VaR, trading and notional limit set in accordance with the size of positions and risk tolerance appetites.
• Periodic stress testing is applied to ascertain market risk under abnormal market conditions.
Liquidity Risk
• The Group ALCO plays a fundamental role in the asset and liability management of the Group and the Bank, and establishes strategies to assist in controlling and reducing any potential exposures to liquidity risk.
• The liquidity risk management process involves establishing liquidity risk management policies and limits, regular monitoring against liquidity risk limits, regular stress testing, and establishing contingency funding plans. These processes are subject to regular reviews to ensure that they remain relevant in the context of prevailing market conditions.
• Minimum liquid assets buffer, capping on large depositor concentration and sufficient long term funding are available to meet obligations and aligned to Liquidity Coverage Ratio and Net Stable Funding Ratio to ensure adequate cover for withdrawals arising from unexpected levels of demand.
• Defined liquidity management ratios are maintained and monitored.
• The Group and the Bank have established a Liquidity Incident Management Procedure to manage any potential adverse liquidity incidences, and which can be implemented on a timely basis so that appropriate actions can be taken to mitigate against any unexpected market developments.
Operational Risk
• The Group Operational Risk Management function is responsible for the development of group-wide operational risk policies, framework and methodologies, and providing guidance and information to the business units on operational risk matters. The respective business units are primarily responsible for managing operational risk on a day-to-day basis. Some of the operational risk tools used include Risk and Control Self-Assessment, Key Risk Indicators, Key Control Testing, Incident Management and Loss Data Collection and Scenario Analysis.
• The Group’s and the Bank’s operational risk management system has integrated applications to support the operational risk management process (i.e. assessment, reporting, database/library).
• The Group and the Bank have Business Continuity Management (‘BCM’) programme for the major critical business operations and activities at the Head Office, data centre, and branches’ locations. The BCM programme is subject to regular testing to ensure efficacy, reliability and functionality.
• There is continuous refinement of existing policies, procedures and internal control measures; and regular internal review, compliance monitoring, and audits are performed to prevent and/or minimise unexpected losses.
• Regular operational risk reporting is made to senior management, relevant committees and board to facilitate the identification of adverse operational lapses, taking of prompt corrective actions, and ensuring appropriate risk mitigation decision making action plans.
55 FINANCIAL RISK MANAGEMENT (CONTINUED)
(a) Financial Risk Management Objectives and Policies (continued)
Major Areas of Risk (continued)
Technology & Cyber Risk
• The Group Technology & Cyber Risk function is responsible for the development of group-wide technology and cyber risk policies, framework and methodologies, and providing guidance and consultation to the business units on technology and cyber risk areas.
• There is a continuous enhancement of existing policies, procedures and internal control measures; with regular independent assessment on areas pertaining to technology and cyber risks to prevent and/or minimise unexpected losses.
• Development of policies and mitigating controls are made reference to industry standards such as ISO/IEC:27001:2013, COBIT 5 and the NIST Cyber Security Framework.
• Regular technology and cyber risk reporting is made to senior management, relevant senior management and board committees to facilitate a risk informed decision by proactively identifying emerging cyber threats, assessment on the effectiveness of the controls implemented and the recommendation of new appropriate controls.
• Subscription to threat intelligence service providers for the latest cyber threats, and modus operandi in compromising an organisation. The information shall be shared with business units in improving their controls.
• Continuous education and awareness on technology and cyber risks to Board, business units, new recruits and third party service providers via Computer Based Training, classroom training and regular email broadcast communication.
RHB
Ban
k B
erha
d -
Fina
ncia
l Rep
ort
2020
RHB
Ban
k B
erha
d -
Fina
ncia
l Rep
ort
2020
148
149STATUTORY FINANCIAL STATEMENTS
www.rhbgroup.com
NOTES TO THE FINANCIAL STATEMENTSfor the financial year ended 31 December 2020 (continued)
55 FINANCIAL RISK MANAGEMENT (CONTINUED)
(b) Financial Instruments by Category
Group2020
Atamortised
cost RM’000
Atfair value
throughprofit
and loss RM’000
Atfair value
through othercomprehensive
incomeRM’000
Total RM’000
ASSETSCash and short term funds 8,904,285 - - 8,904,285Deposits and placements with banks and other
financial institutions 6,069,443 - - 6,069,443Financial assets at FVTPL - 4,462,106 - 4,462,106Financial assets at FVOCI - - 42,903,259 42,903,259- Debt instruments - - 42,148,529 42,148,529- Equity instruments - - 754,730 754,730Financial investments at amortised cost 16,005,267 - - 16,005,267Loans, advances and financing 182,424,879 - - 182,424,879Clients’ and brokers’ balances 1,339,568 - - 1,339,568Other financial assets 1,286,290 - - 1,286,290Derivative assets - 1,653,479 - 1,653,479
216,029,732 6,115,585 42,903,259 265,048,576
LIABILITIESDeposits from customers 203,470,783 - - 203,470,783Deposits and placements of banks and other
financial institutions 21,035,186 - - 21,035,186Obligations on securities sold under repurchase
agreements 972,963 - - 972,963Bills and acceptances payables 187,020 - - 187,020Clients’ and brokers’ balances 1,171,930 - - 1,171,930Other financial liabilities 3,377,046 - - 3,377,046Derivative liabilities - 2,034,795 - 2,034,795Recourse obligation on loans sold to Cagamas 3,023,760 - - 3,023,760Lease liabilities 154,188 - - 154,188Borrowings 634,630 - - 634,630Senior debt securities 3,545,150 - - 3,545,150Subordinated obligations 2,718,729 - - 2,718,729
240,291,385 2,034,795 - 242,326,180
55 FINANCIAL RISK MANAGEMENT (CONTINUED)
(b) Financial Instruments by Category (continued)
Group2019
Atamortised
cost RM’000
Atfair value
throughprofit
and loss RM’000
Atfair value
through othercomprehensive
incomeRM’000
Total RM’000
ASSETSCash and short term funds 11,627,992 - - 11,627,992
Deposits and placements with banks and other financial institutions 1,095,567 - - 1,095,567
Financial assets at FVTPL - 4,623,447 - 4,623,447
Financial assets at FVOCI - - 39,805,304 39,805,304
- Debt instruments - - 39,109,505 39,109,505
- Equity instruments - - 695,799 695,799
Financial investments at amortised cost 14,249,409 - - 14,249,409
Loans, advances and financing 173,236,672 - - 173,236,672
Clients’ and brokers’ balances 893,448 - - 893,448
Other financial assets 1,158,266 - - 1,158,266
Derivative assets - 855,256 - 855,256
202,261,354 5,478,703 39,805,304 247,545,361
LIABILITIESDeposits from customers 190,555,225 - - 190,555,225
Deposits and placements of banks and other financial institutions 21,539,329 - - 21,539,329
Obligations on securities sold under repurchase agreements 2,048,516 - - 2,048,516
Bills and acceptances payables 254,945 - - 254,945
Clients’ and brokers’ balances 824,166 - - 824,166
Other financial liabilities 2,844,118 - - 2,844,118
Derivative liabilities - 1,160,927 - 1,160,927
Recourse obligation on loans sold to Cagamas 3,535,996 - - 3,535,996
Lease liabilities 111,769 - - 111,769
Borrowings 1,182,527 - - 1,182,527
Senior debt securities 3,296,763 - - 3,296,763
Subordinated obligations 2,724,224 - - 2,724,224
228,917,578 1,160,927 - 230,078,505
RHB
Ban
k B
erha
d -
Fina
ncia
l Rep
ort
2020
RHB
Ban
k B
erha
d -
Fina
ncia
l Rep
ort
2020
150
151STATUTORY FINANCIAL STATEMENTS
www.rhbgroup.com
NOTES TO THE FINANCIAL STATEMENTSfor the financial year ended 31 December 2020 (continued)
55 FINANCIAL RISK MANAGEMENT (CONTINUED)
(b) Financial Instruments by Category (continued)
Bank2020
Atamortised
cost RM’000
Atfair value
throughprofit
and loss RM’000
Atfair value
through othercomprehensive
incomeRM’000
Total RM’000
ASSETSCash and short term funds 7,905,636 - - 7,905,636Deposits and placements with banks and other
financial institutions 9,447,903 - - 9,447,903Investment account due from designated
financial institutions 8,840,858 - - 8,840,858Financial assets at FVTPL - 2,285,301 - 2,285,301Financial assets at FVOCI - - 35,869,640 35,869,640- Debt instruments - - 35,158,058 35,158,058- Equity instruments - - 711,582 711,582Financial investments at amortised cost 10,195,993 - - 10,195,993Loans, advances and financing 109,515,184 - - 109,515,184Other financial assets 1,021,009 - - 1,021,009Derivative assets - 1,790,567 - 1,790,567
146,926,583 4,075,868 35,869,640 186,872,091
LIABILITIESDeposits from customers 134,310,974 - - 134,310,974Deposits and placements of banks and other
financial institutions 24,610,611 - - 24,610,611Obligations on securities sold under repurchase
agreements 4,740,494 - - 4,740,494Bills and acceptances payables 174,838 - - 174,838Other financial liabilities 2,118,870 - - 2,118,870Derivative liabilities - 1,979,142 - 1,979,142Lease liabilities 77,356 - - 77,356Borrowings 201,101 - - 201,101Senior debt securities 3,545,150 - - 3,545,150Subordinated obligations 1,762,067 - - 1,762,067
171,541,461 1,979,142 - 173,520,603
55 FINANCIAL RISK MANAGEMENT (CONTINUED)
(b) Financial Instruments by Category (continued)
BankRestated2019
Atamortised
cost RM’000
Atfair value
throughprofit
and loss RM’000
Atfair value
through othercomprehensive
incomeRM’000
Total RM’000
ASSETSCash and short term funds 5,502,893 - - 5,502,893
Deposits and placements with banks and other financial institutions 5,349,632 - - 5,349,632
Investment account due from designated financial institutions 8,229,334 - - 8,229,334
Financial assets at FVTPL - 2,530,288 - 2,530,288
Financial assets at FVOCI - - 33,934,272 33,934,272
- Debt instruments - - 33,279,961 33,279,961
- Equity instruments - - 654,311 654,311
Financial investments at amortised cost 9,702,802 - - 9,702,802
Loans, advances and financing 107,345,665 - - 107,345,665
Other financial assets 751,623 - - 751,623
Derivative assets - 903,584 - 903,584
136,881,949 3,433,872 33,934,272 174,250,093
LIABILITIESDeposits from customers 131,571,124 - - 131,571,124
Deposits and placements of banks and other financial institutions 19,173,832 - - 19,173,832
Obligations on securities sold under repurchase agreements 3,772,623 - - 3,772,623
Bills and acceptances payables 205,528 - - 205,528
Other financial liabilities 1,630,879 - - 1,630,879
Derivative liabilities - 1,155,074 - 1,155,074
Recourse obligation on loans sold to Cagamas 1,265,757 - - 1,265,757
Lease liabilities 85,323 - - 85,323
Borrowings 840,177 - - 840,177
Senior debt securities 3,296,763 - - 3,296,763
Subordinated obligations 1,565,396 - - 1,565,396
163,407,402 1,155,074 - 164,562,476
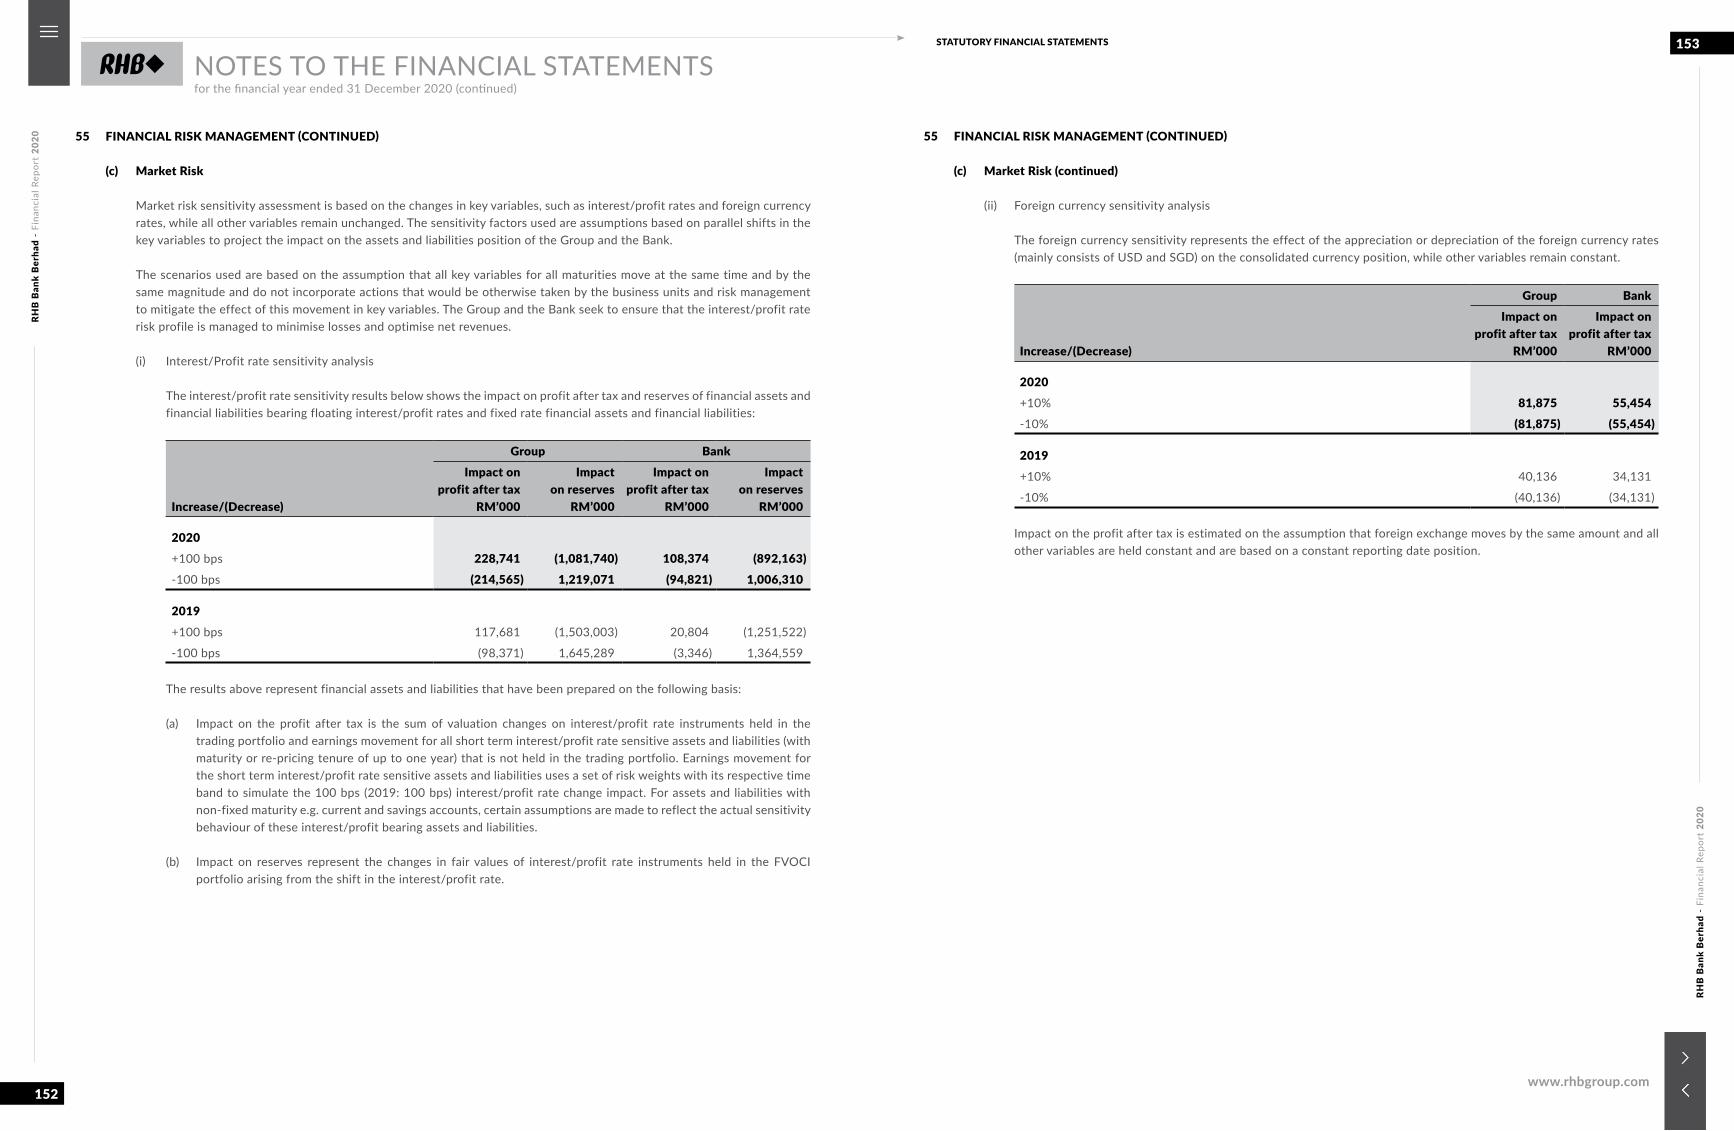
RHB
Ban
k B
erha
d -
Fina
ncia
l Rep
ort
2020
RHB
Ban
k B
erha
d -
Fina
ncia
l Rep
ort
2020
152
153STATUTORY FINANCIAL STATEMENTS
www.rhbgroup.com
NOTES TO THE FINANCIAL STATEMENTSfor the financial year ended 31 December 2020 (continued)
55 FINANCIAL RISK MANAGEMENT (CONTINUED)
(c) Market Risk
Market risk sensitivity assessment is based on the changes in key variables, such as interest/profit rates and foreign currency rates, while all other variables remain unchanged. The sensitivity factors used are assumptions based on parallel shifts in the key variables to project the impact on the assets and liabilities position of the Group and the Bank.
The scenarios used are based on the assumption that all key variables for all maturities move at the same time and by the same magnitude and do not incorporate actions that would be otherwise taken by the business units and risk management to mitigate the effect of this movement in key variables. The Group and the Bank seek to ensure that the interest/profit rate risk profile is managed to minimise losses and optimise net revenues.
(i) Interest/Profit rate sensitivity analysis
The interest/profit rate sensitivity results below shows the impact on profit after tax and reserves of financial assets and financial liabilities bearing floating interest/profit rates and fixed rate financial assets and financial liabilities:
Increase/(Decrease)
Group BankImpact on
profit after tax RM’000
Impacton reserves
RM’000
Impact onprofit after tax
RM’000
Impacton reserves
RM’000
2020+100 bps 228,741 (1,081,740) 108,374 (892,163)-100 bps (214,565) 1,219,071 (94,821) 1,006,310
2019+100 bps 117,681 (1,503,003) 20,804 (1,251,522)
-100 bps (98,371) 1,645,289 (3,346) 1,364,559
The results above represent financial assets and liabilities that have been prepared on the following basis:
(a) Impact on the profit after tax is the sum of valuation changes on interest/profit rate instruments held in the trading portfolio and earnings movement for all short term interest/profit rate sensitive assets and liabilities (with maturity or re-pricing tenure of up to one year) that is not held in the trading portfolio. Earnings movement for the short term interest/profit rate sensitive assets and liabilities uses a set of risk weights with its respective time band to simulate the 100 bps (2019: 100 bps) interest/profit rate change impact. For assets and liabilities with non-fixed maturity e.g. current and savings accounts, certain assumptions are made to reflect the actual sensitivity behaviour of these interest/profit bearing assets and liabilities.
(b) Impact on reserves represent the changes in fair values of interest/profit rate instruments held in the FVOCI portfolio arising from the shift in the interest/profit rate.
55 FINANCIAL RISK MANAGEMENT (CONTINUED)
(c) Market Risk (continued)
(ii) Foreign currency sensitivity analysis
The foreign currency sensitivity represents the effect of the appreciation or depreciation of the foreign currency rates (mainly consists of USD and SGD) on the consolidated currency position, while other variables remain constant.
Increase/(Decrease)
Group Bank Impact on
profit after tax RM’000
Impact onprofit after tax
RM’000
2020+10% 81,875 55,454-10% (81,875) (55,454)
2019+10% 40,136 34,131
-10% (40,136) (34,131)
Impact on the profit after tax is estimated on the assumption that foreign exchange moves by the same amount and all other variables are held constant and are based on a constant reporting date position.
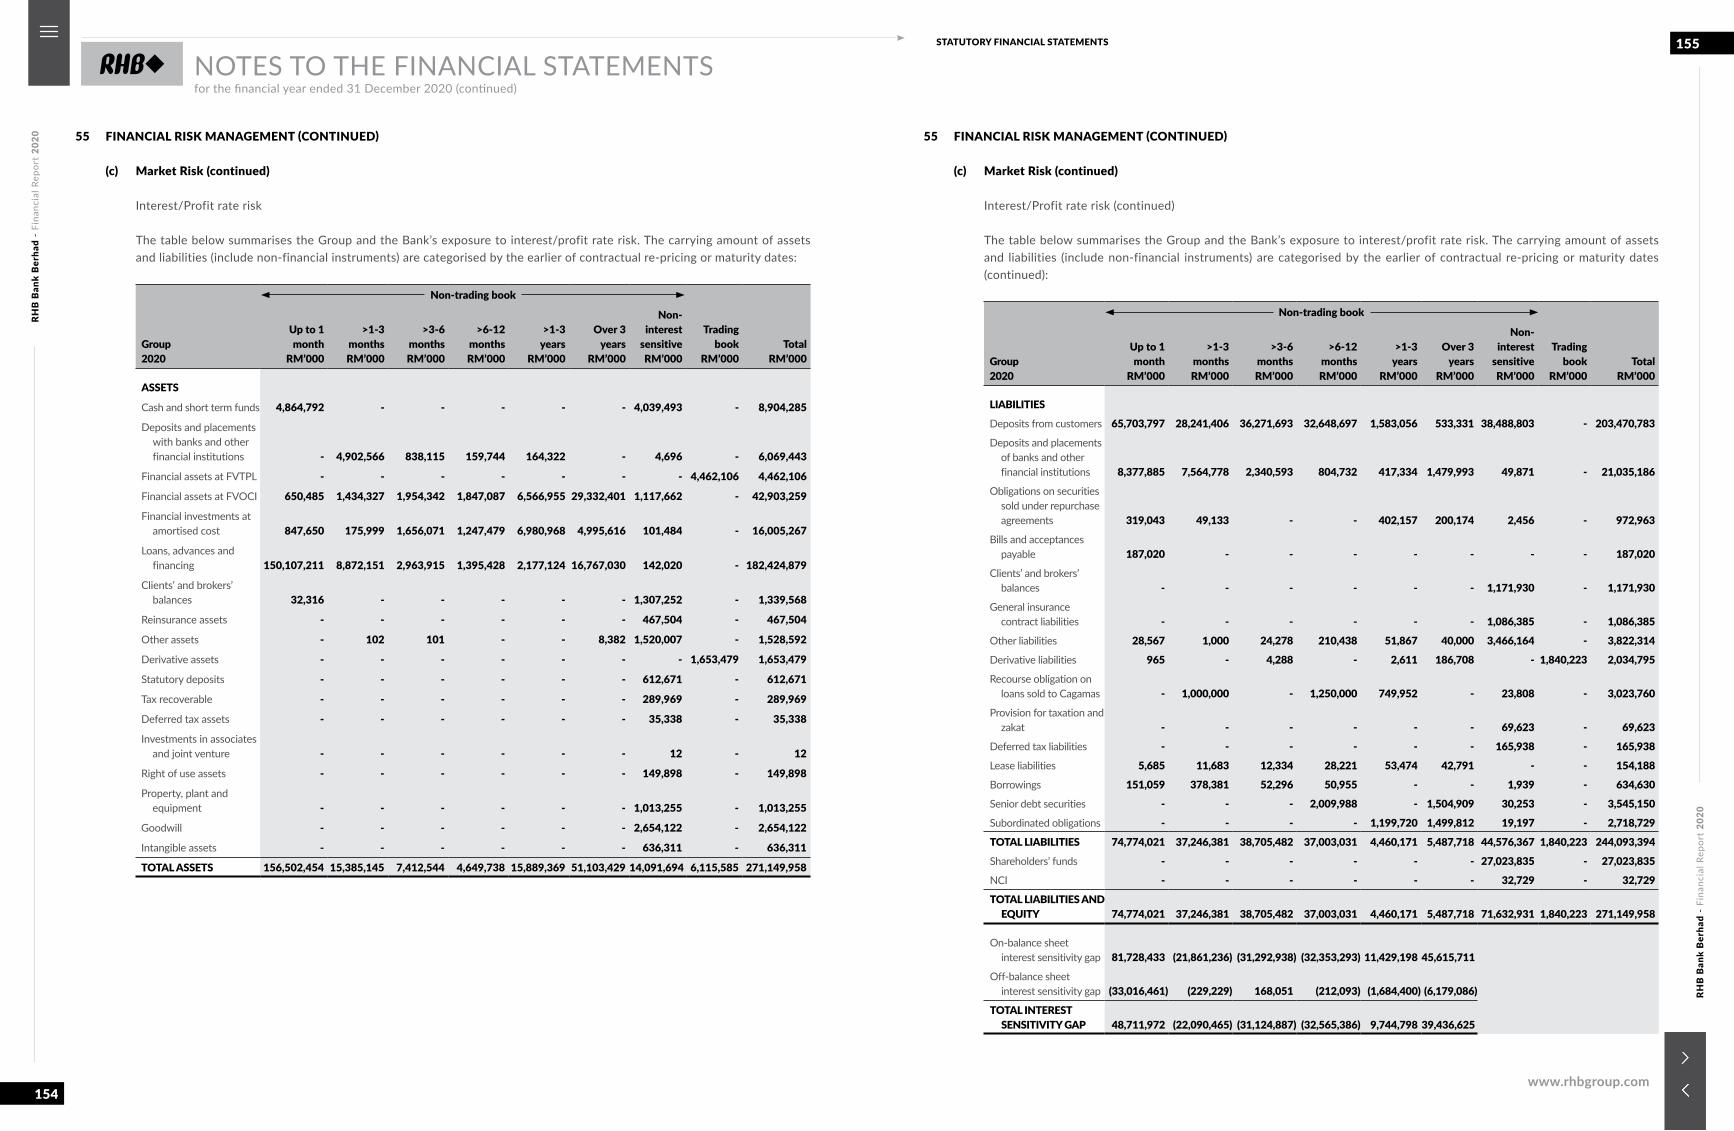
RHB
Ban
k B
erha
d -
Fina
ncia
l Rep
ort
2020
RHB
Ban
k B
erha
d -
Fina
ncia
l Rep
ort
2020
154
155STATUTORY FINANCIAL STATEMENTS
www.rhbgroup.com
NOTES TO THE FINANCIAL STATEMENTSfor the financial year ended 31 December 2020 (continued)
55 FINANCIAL RISK MANAGEMENT (CONTINUED)
(c) Market Risk (continued)
Interest/Profit rate risk
The table below summarises the Group and the Bank’s exposure to interest/profit rate risk. The carrying amount of assets and liabilities (include non-financial instruments) are categorised by the earlier of contractual re-pricing or maturity dates:
Group2020
Non-trading book
Tradingbook
RM’000Total
RM’000
Up to 1month
RM’000
>1-3monthsRM’000
>3-6months RM’000
>6-12monthsRM’000
>1-3years
RM’000
Over 3years
RM’000
Non- interest
sensitive RM’000
ASSETS
Cash and short term funds 4,864,792 - - - - - 4,039,493 - 8,904,285
Deposits and placements with banks and other financial institutions - 4,902,566 838,115 159,744 164,322 - 4,696 - 6,069,443
Financial assets at FVTPL - - - - - - - 4,462,106 4,462,106
Financial assets at FVOCI 650,485 1,434,327 1,954,342 1,847,087 6,566,955 29,332,401 1,117,662 - 42,903,259
Financial investments at amortised cost 847,650 175,999 1,656,071 1,247,479 6,980,968 4,995,616 101,484 - 16,005,267
Loans, advances and financing 150,107,211 8,872,151 2,963,915 1,395,428 2,177,124 16,767,030 142,020 - 182,424,879
Clients’ and brokers’ balances 32,316 - - - - - 1,307,252 - 1,339,568
Reinsurance assets - - - - - - 467,504 - 467,504
Other assets - 102 101 - - 8,382 1,520,007 - 1,528,592
Derivative assets - - - - - - - 1,653,479 1,653,479
Statutory deposits - - - - - - 612,671 - 612,671
Tax recoverable - - - - - - 289,969 - 289,969
Deferred tax assets - - - - - - 35,338 - 35,338
Investments in associates and joint venture - - - - - - 12 - 12
Right of use assets - - - - - - 149,898 - 149,898
Property, plant and equipment - - - - - - 1,013,255 - 1,013,255
Goodwill - - - - - - 2,654,122 - 2,654,122
Intangible assets - - - - - - 636,311 - 636,311
TOTAL ASSETS 156,502,454 15,385,145 7,412,544 4,649,738 15,889,369 51,103,429 14,091,694 6,115,585 271,149,958
55 FINANCIAL RISK MANAGEMENT (CONTINUED)
(c) Market Risk (continued)
Interest/Profit rate risk (continued)
The table below summarises the Group and the Bank’s exposure to interest/profit rate risk. The carrying amount of assets and liabilities (include non-financial instruments) are categorised by the earlier of contractual re-pricing or maturity dates (continued):
Group2020
Non-trading book
Tradingbook
RM’000Total
RM’000
Up to 1month
RM’000
>1-3monthsRM’000
>3-6months RM’000
>6-12months RM’000
>1-3years
RM’000
Over 3years
RM’000
Non-interest
sensitive RM’000
LIABILITIES
Deposits from customers 65,703,797 28,241,406 36,271,693 32,648,697 1,583,056 533,331 38,488,803 - 203,470,783
Deposits and placements of banks and other financial institutions 8,377,885 7,564,778 2,340,593 804,732 417,334 1,479,993 49,871 - 21,035,186
Obligations on securities sold under repurchase agreements 319,043 49,133 - - 402,157 200,174 2,456 - 972,963
Bills and acceptances payable 187,020 - - - - - - - 187,020
Clients’ and brokers’ balances - - - - - - 1,171,930 - 1,171,930
General insurance contract liabilities - - - - - - 1,086,385 - 1,086,385
Other liabilities 28,567 1,000 24,278 210,438 51,867 40,000 3,466,164 - 3,822,314
Derivative liabilities 965 - 4,288 - 2,611 186,708 - 1,840,223 2,034,795
Recourse obligation on loans sold to Cagamas - 1,000,000 - 1,250,000 749,952 - 23,808 - 3,023,760
Provision for taxation and zakat - - - - - - 69,623 - 69,623
Deferred tax liabilities - - - - - - 165,938 - 165,938
Lease liabilities 5,685 11,683 12,334 28,221 53,474 42,791 - - 154,188
Borrowings 151,059 378,381 52,296 50,955 - - 1,939 - 634,630
Senior debt securities - - - 2,009,988 - 1,504,909 30,253 - 3,545,150
Subordinated obligations - - - - 1,199,720 1,499,812 19,197 - 2,718,729
TOTAL LIABILITIES 74,774,021 37,246,381 38,705,482 37,003,031 4,460,171 5,487,718 44,576,367 1,840,223 244,093,394
Shareholders’ funds - - - - - - 27,023,835 - 27,023,835
NCI - - - - - - 32,729 - 32,729
TOTAL LIABILITIES AND EQUITY 74,774,021 37,246,381 38,705,482 37,003,031 4,460,171 5,487,718 71,632,931 1,840,223 271,149,958
On-balance sheet interest sensitivity gap 81,728,433 (21,861,236) (31,292,938) (32,353,293) 11,429,198 45,615,711
Off-balance sheet interest sensitivity gap (33,016,461) (229,229) 168,051 (212,093) (1,684,400) (6,179,086)
TOTAL INTEREST SENSITIVITY GAP 48,711,972 (22,090,465) (31,124,887) (32,565,386) 9,744,798 39,436,625
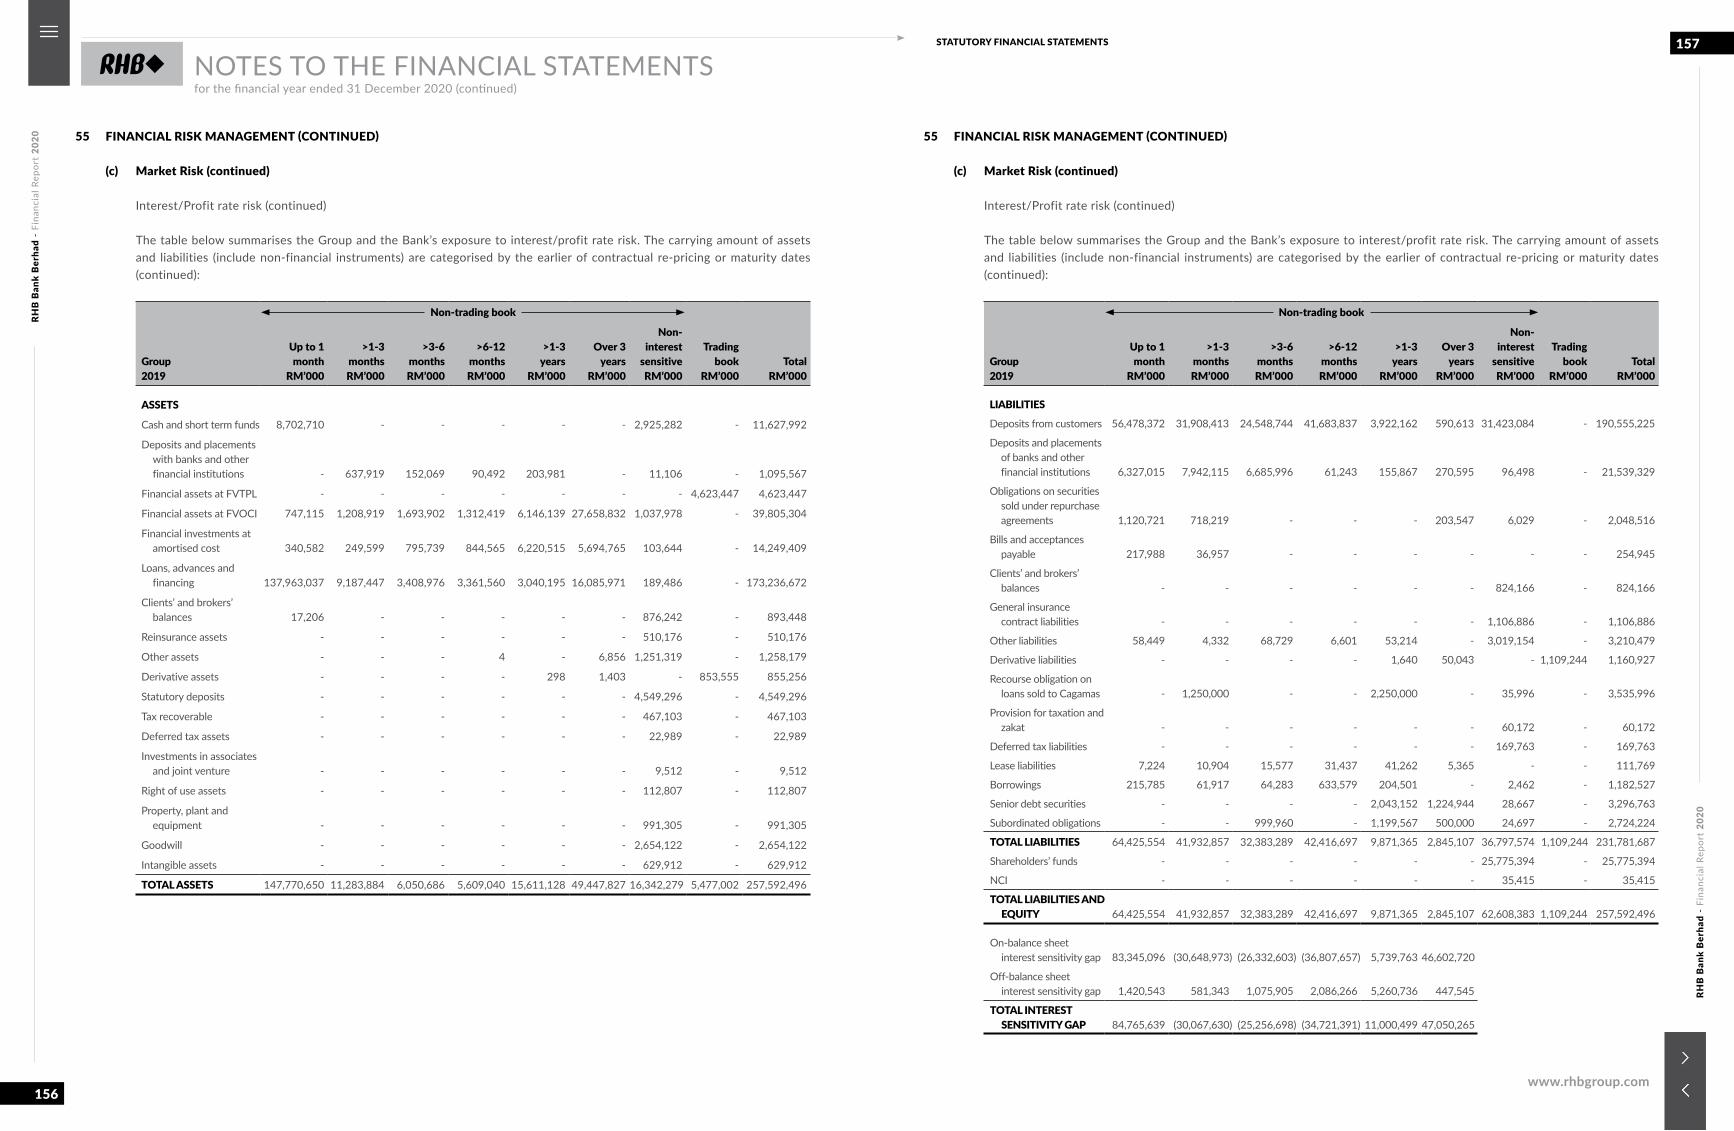
RHB
Ban
k B
erha
d -
Fina
ncia
l Rep
ort
2020
RHB
Ban
k B
erha
d -
Fina
ncia
l Rep
ort
2020
156
157STATUTORY FINANCIAL STATEMENTS
www.rhbgroup.com
NOTES TO THE FINANCIAL STATEMENTSfor the financial year ended 31 December 2020 (continued)
55 FINANCIAL RISK MANAGEMENT (CONTINUED)
(c) Market Risk (continued)
Interest/Profit rate risk (continued)
The table below summarises the Group and the Bank’s exposure to interest/profit rate risk. The carrying amount of assets and liabilities (include non-financial instruments) are categorised by the earlier of contractual re-pricing or maturity dates (continued):
Group2019
Non-trading book
Tradingbook
RM’000Total
RM’000
Up to 1month
RM’000
>1-3monthsRM’000
>3-6monthsRM’000
>6-12monthsRM’000
>1-3years
RM’000
Over 3years
RM’000
Non-interest
sensitiveRM’000
ASSETS
Cash and short term funds 8,702,710 - - - - - 2,925,282 - 11,627,992
Deposits and placements with banks and other financial institutions - 637,919 152,069 90,492 203,981 - 11,106 - 1,095,567
Financial assets at FVTPL - - - - - - - 4,623,447 4,623,447
Financial assets at FVOCI 747,115 1,208,919 1,693,902 1,312,419 6,146,139 27,658,832 1,037,978 - 39,805,304
Financial investments at amortised cost 340,582 249,599 795,739 844,565 6,220,515 5,694,765 103,644 - 14,249,409
Loans, advances and financing 137,963,037 9,187,447 3,408,976 3,361,560 3,040,195 16,085,971 189,486 - 173,236,672
Clients’ and brokers’ balances 17,206 - - - - - 876,242 - 893,448
Reinsurance assets - - - - - - 510,176 - 510,176
Other assets - - - 4 - 6,856 1,251,319 - 1,258,179
Derivative assets - - - - 298 1,403 - 853,555 855,256
Statutory deposits - - - - - - 4,549,296 - 4,549,296
Tax recoverable - - - - - - 467,103 - 467,103
Deferred tax assets - - - - - - 22,989 - 22,989
Investments in associates and joint venture - - - - - - 9,512 - 9,512
Right of use assets - - - - - - 112,807 - 112,807
Property, plant and equipment - - - - - - 991,305 - 991,305
Goodwill - - - - - - 2,654,122 - 2,654,122
Intangible assets - - - - - - 629,912 - 629,912
TOTAL ASSETS 147,770,650 11,283,884 6,050,686 5,609,040 15,611,128 49,447,827 16,342,279 5,477,002 257,592,496
55 FINANCIAL RISK MANAGEMENT (CONTINUED)
(c) Market Risk (continued)
Interest/Profit rate risk (continued)
The table below summarises the Group and the Bank’s exposure to interest/profit rate risk. The carrying amount of assets and liabilities (include non-financial instruments) are categorised by the earlier of contractual re-pricing or maturity dates (continued):
Group2019
Non-trading book
Trading book
RM’000 Total
RM’000
Up to 1 month
RM’000
>1-3 months RM’000
>3-6 months RM’000
>6-12 months RM’000
>1-3 years
RM’000
Over 3 years
RM’000
Non- interest
sensitive RM’000
LIABILITIES
Deposits from customers 56,478,372 31,908,413 24,548,744 41,683,837 3,922,162 590,613 31,423,084 - 190,555,225
Deposits and placements of banks and other financial institutions 6,327,015 7,942,115 6,685,996 61,243 155,867 270,595 96,498 - 21,539,329
Obligations on securities sold under repurchase agreements 1,120,721 718,219 - - - 203,547 6,029 - 2,048,516
Bills and acceptances payable 217,988 36,957 - - - - - - 254,945
Clients’ and brokers’ balances - - - - - - 824,166 - 824,166
General insurance contract liabilities - - - - - - 1,106,886 - 1,106,886
Other liabilities 58,449 4,332 68,729 6,601 53,214 - 3,019,154 - 3,210,479
Derivative liabilities - - - - 1,640 50,043 - 1,109,244 1,160,927
Recourse obligation on loans sold to Cagamas - 1,250,000 - - 2,250,000 - 35,996 - 3,535,996
Provision for taxation and zakat - - - - - - 60,172 - 60,172
Deferred tax liabilities - - - - - - 169,763 - 169,763
Lease liabilities 7,224 10,904 15,577 31,437 41,262 5,365 - - 111,769
Borrowings 215,785 61,917 64,283 633,579 204,501 - 2,462 - 1,182,527
Senior debt securities - - - - 2,043,152 1,224,944 28,667 - 3,296,763
Subordinated obligations - - 999,960 - 1,199,567 500,000 24,697 - 2,724,224
TOTAL LIABILITIES 64,425,554 41,932,857 32,383,289 42,416,697 9,871,365 2,845,107 36,797,574 1,109,244 231,781,687
Shareholders’ funds - - - - - - 25,775,394 - 25,775,394
NCI - - - - - - 35,415 - 35,415
TOTAL LIABILITIES AND EQUITY 64,425,554 41,932,857 32,383,289 42,416,697 9,871,365 2,845,107 62,608,383 1,109,244 257,592,496
On-balance sheet interest sensitivity gap 83,345,096 (30,648,973) (26,332,603) (36,807,657) 5,739,763 46,602,720
Off-balance sheet interest sensitivity gap 1,420,543 581,343 1,075,905 2,086,266 5,260,736 447,545
TOTAL INTEREST SENSITIVITY GAP 84,765,639 (30,067,630) (25,256,698) (34,721,391) 11,000,499 47,050,265
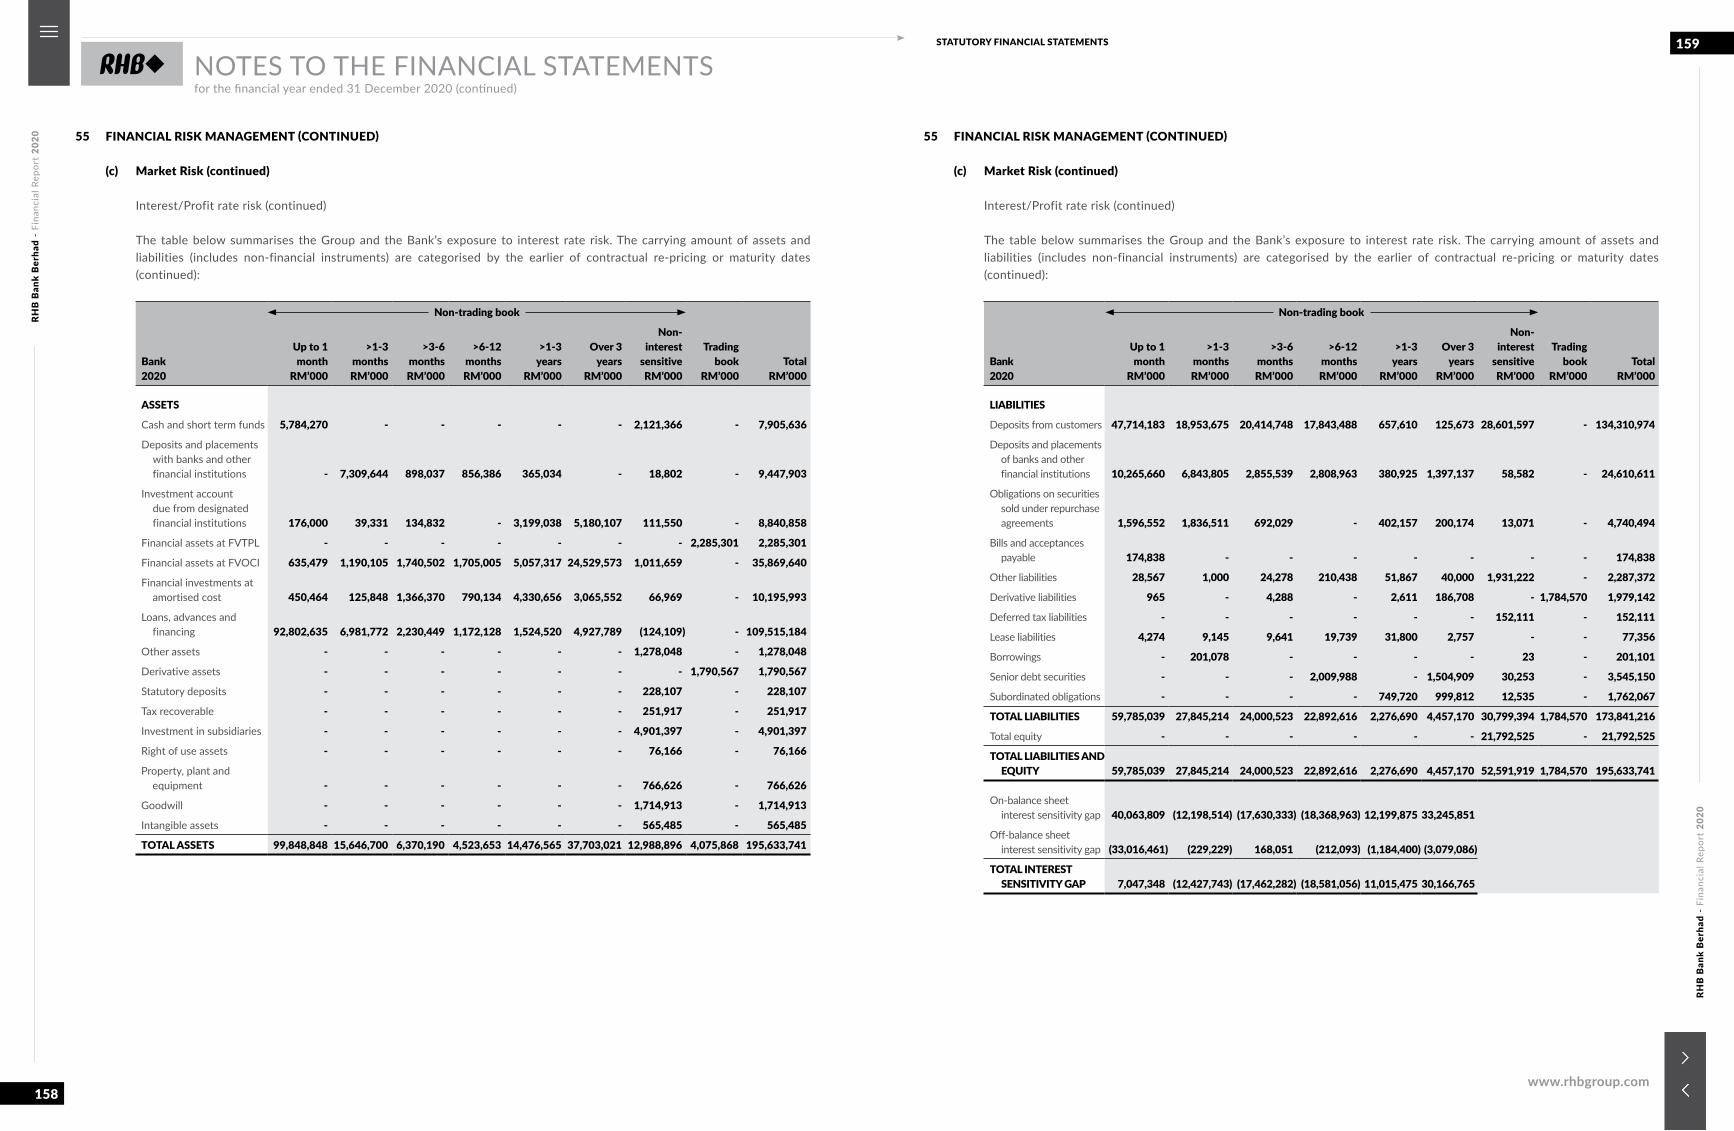
RHB
Ban
k B
erha
d -
Fina
ncia
l Rep
ort
2020
RHB
Ban
k B
erha
d -
Fina
ncia
l Rep
ort
2020
158
159STATUTORY FINANCIAL STATEMENTS
www.rhbgroup.com
NOTES TO THE FINANCIAL STATEMENTSfor the financial year ended 31 December 2020 (continued)
55 FINANCIAL RISK MANAGEMENT (CONTINUED)
(c) Market Risk (continued)
Interest/Profit rate risk (continued)
The table below summarises the Group and the Bank’s exposure to interest rate risk. The carrying amount of assets and liabilities (includes non-financial instruments) are categorised by the earlier of contractual re-pricing or maturity dates (continued):
Bank2020
Non-trading book
Tradingbook
RM’000Total
RM’000
Up to 1month
RM’000
>1-3months
RM’000
>3-6monthsRM’000
>6-12months
RM’000
>1-3years
RM’000
Over 3years
RM’000
Non-interest
sensitive RM’000
ASSETS
Cash and short term funds 5,784,270 - - - - - 2,121,366 - 7,905,636
Deposits and placements with banks and other financial institutions - 7,309,644 898,037 856,386 365,034 - 18,802 - 9,447,903
Investment account due from designated financial institutions 176,000 39,331 134,832 - 3,199,038 5,180,107 111,550 - 8,840,858
Financial assets at FVTPL - - - - - - - 2,285,301 2,285,301
Financial assets at FVOCI 635,479 1,190,105 1,740,502 1,705,005 5,057,317 24,529,573 1,011,659 - 35,869,640
Financial investments at amortised cost 450,464 125,848 1,366,370 790,134 4,330,656 3,065,552 66,969 - 10,195,993
Loans, advances and financing 92,802,635 6,981,772 2,230,449 1,172,128 1,524,520 4,927,789 (124,109) - 109,515,184
Other assets - - - - - - 1,278,048 - 1,278,048
Derivative assets - - - - - - - 1,790,567 1,790,567
Statutory deposits - - - - - - 228,107 - 228,107
Tax recoverable - - - - - - 251,917 - 251,917
Investment in subsidiaries - - - - - - 4,901,397 - 4,901,397
Right of use assets - - - - - - 76,166 - 76,166
Property, plant and equipment - - - - - - 766,626 - 766,626
Goodwill - - - - - - 1,714,913 - 1,714,913
Intangible assets - - - - - - 565,485 - 565,485
TOTAL ASSETS 99,848,848 15,646,700 6,370,190 4,523,653 14,476,565 37,703,021 12,988,896 4,075,868 195,633,741
55 FINANCIAL RISK MANAGEMENT (CONTINUED)
(c) Market Risk (continued)
Interest/Profit rate risk (continued)
The table below summarises the Group and the Bank’s exposure to interest rate risk. The carrying amount of assets and liabilities (includes non-financial instruments) are categorised by the earlier of contractual re-pricing or maturity dates (continued):
Bank2020
Non-trading book
Tradingbook
RM’000Total
RM’000
Up to 1month
RM’000
>1-3monthsRM’000
>3-6monthsRM’000
>6-12monthsRM’000
>1-3years
RM’000
Over 3years
RM’000
Non-interest
sensitiveRM’000
LIABILITIES
Deposits from customers 47,714,183 18,953,675 20,414,748 17,843,488 657,610 125,673 28,601,597 - 134,310,974
Deposits and placements of banks and other financial institutions 10,265,660 6,843,805 2,855,539 2,808,963 380,925 1,397,137 58,582 - 24,610,611
Obligations on securities sold under repurchase agreements 1,596,552 1,836,511 692,029 - 402,157 200,174 13,071 - 4,740,494
Bills and acceptances payable 174,838 - - - - - - - 174,838
Other liabilities 28,567 1,000 24,278 210,438 51,867 40,000 1,931,222 - 2,287,372
Derivative liabilities 965 - 4,288 - 2,611 186,708 - 1,784,570 1,979,142
Deferred tax liabilities - - - - - - 152,111 - 152,111
Lease liabilities 4,274 9,145 9,641 19,739 31,800 2,757 - - 77,356
Borrowings - 201,078 - - - - 23 - 201,101
Senior debt securities - - - 2,009,988 - 1,504,909 30,253 - 3,545,150
Subordinated obligations - - - - 749,720 999,812 12,535 - 1,762,067
TOTAL LIABILITIES 59,785,039 27,845,214 24,000,523 22,892,616 2,276,690 4,457,170 30,799,394 1,784,570 173,841,216
Total equity - - - - - - 21,792,525 - 21,792,525
TOTAL LIABILITIES AND EQUITY 59,785,039 27,845,214 24,000,523 22,892,616 2,276,690 4,457,170 52,591,919 1,784,570 195,633,741
On-balance sheet interest sensitivity gap 40,063,809 (12,198,514) (17,630,333) (18,368,963) 12,199,875 33,245,851
Off-balance sheet interest sensitivity gap (33,016,461) (229,229) 168,051 (212,093) (1,184,400) (3,079,086)
TOTAL INTEREST SENSITIVITY GAP 7,047,348 (12,427,743) (17,462,282) (18,581,056) 11,015,475 30,166,765
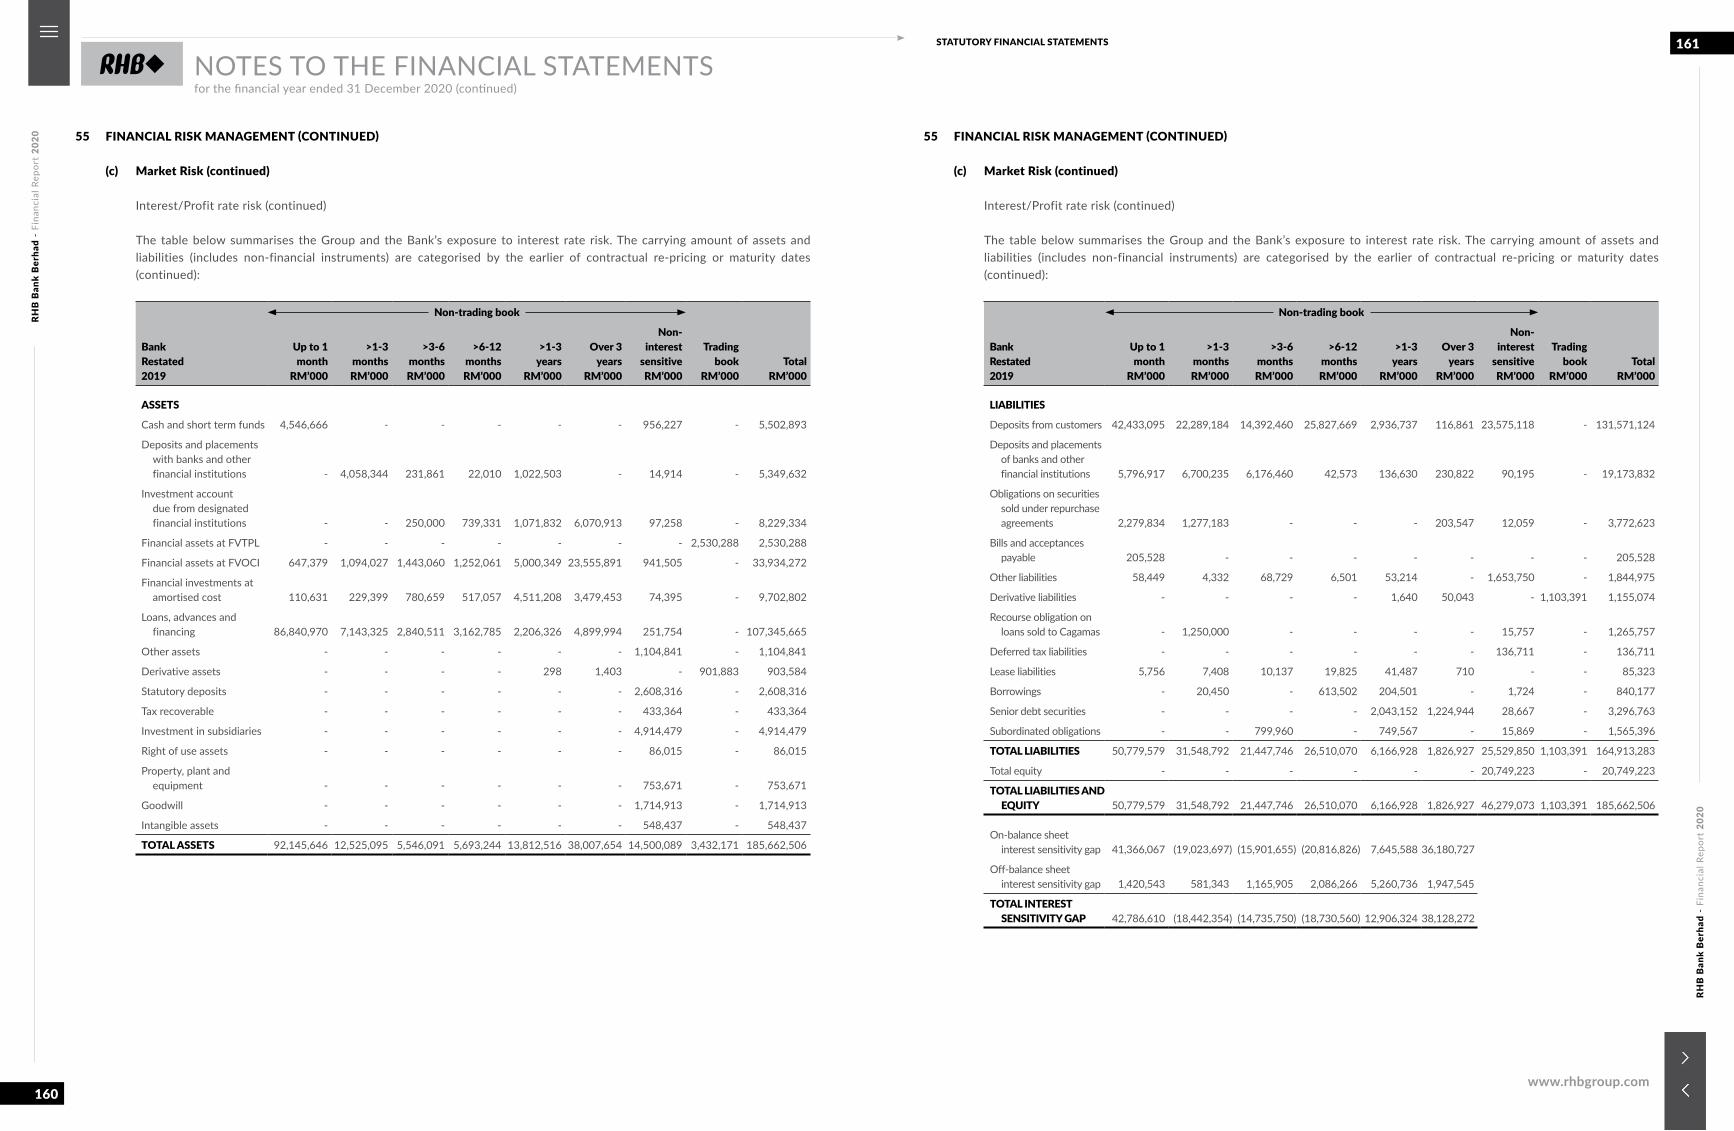
RHB
Ban
k B
erha
d -
Fina
ncia
l Rep
ort
2020
RHB
Ban
k B
erha
d -
Fina
ncia
l Rep
ort
2020
160
161STATUTORY FINANCIAL STATEMENTS
www.rhbgroup.com
NOTES TO THE FINANCIAL STATEMENTSfor the financial year ended 31 December 2020 (continued)
55 FINANCIAL RISK MANAGEMENT (CONTINUED)
(c) Market Risk (continued)
Interest/Profit rate risk (continued)
The table below summarises the Group and the Bank’s exposure to interest rate risk. The carrying amount of assets and liabilities (includes non-financial instruments) are categorised by the earlier of contractual re-pricing or maturity dates (continued):
BankRestated2019
Non-trading book
Tradingbook
RM’000Total
RM’000
Up to 1month
RM’000
>1-3monthsRM’000
>3-6monthsRM’000
>6-12monthsRM’000
>1-3years
RM’000
Over 3years
RM’000
Non-interest
sensitive RM’000
ASSETS
Cash and short term funds 4,546,666 - - - - - 956,227 - 5,502,893
Deposits and placements with banks and other financial institutions - 4,058,344 231,861 22,010 1,022,503 - 14,914 - 5,349,632
Investment account due from designated financial institutions - - 250,000 739,331 1,071,832 6,070,913 97,258 - 8,229,334
Financial assets at FVTPL - - - - - - - 2,530,288 2,530,288
Financial assets at FVOCI 647,379 1,094,027 1,443,060 1,252,061 5,000,349 23,555,891 941,505 - 33,934,272
Financial investments at amortised cost 110,631 229,399 780,659 517,057 4,511,208 3,479,453 74,395 - 9,702,802
Loans, advances and financing 86,840,970 7,143,325 2,840,511 3,162,785 2,206,326 4,899,994 251,754 - 107,345,665
Other assets - - - - - - 1,104,841 - 1,104,841
Derivative assets - - - - 298 1,403 - 901,883 903,584
Statutory deposits - - - - - - 2,608,316 - 2,608,316
Tax recoverable - - - - - - 433,364 - 433,364
Investment in subsidiaries - - - - - - 4,914,479 - 4,914,479
Right of use assets - - - - - - 86,015 - 86,015
Property, plant and equipment - - - - - - 753,671 - 753,671
Goodwill - - - - - - 1,714,913 - 1,714,913
Intangible assets - - - - - - 548,437 - 548,437
TOTAL ASSETS 92,145,646 12,525,095 5,546,091 5,693,244 13,812,516 38,007,654 14,500,089 3,432,171 185,662,506
55 FINANCIAL RISK MANAGEMENT (CONTINUED)
(c) Market Risk (continued)
Interest/Profit rate risk (continued)
The table below summarises the Group and the Bank’s exposure to interest rate risk. The carrying amount of assets and liabilities (includes non-financial instruments) are categorised by the earlier of contractual re-pricing or maturity dates (continued):
BankRestated2019
Non-trading book
Tradingbook
RM’000Total
RM’000
Up to 1month
RM’000
>1-3monthsRM’000
>3-6months RM’000
>6-12months RM’000
>1-3years
RM’000
Over 3years
RM’000
Non-interest
sensitive RM’000
LIABILITIES
Deposits from customers 42,433,095 22,289,184 14,392,460 25,827,669 2,936,737 116,861 23,575,118 - 131,571,124
Deposits and placements of banks and other financial institutions 5,796,917 6,700,235 6,176,460 42,573 136,630 230,822 90,195 - 19,173,832
Obligations on securities sold under repurchase agreements 2,279,834 1,277,183 - - - 203,547 12,059 - 3,772,623
Bills and acceptances payable 205,528 - - - - - - - 205,528
Other liabilities 58,449 4,332 68,729 6,501 53,214 - 1,653,750 - 1,844,975
Derivative liabilities - - - - 1,640 50,043 - 1,103,391 1,155,074
Recourse obligation on loans sold to Cagamas - 1,250,000 - - - - 15,757 - 1,265,757
Deferred tax liabilities - - - - - - 136,711 - 136,711
Lease liabilities 5,756 7,408 10,137 19,825 41,487 710 - - 85,323
Borrowings - 20,450 - 613,502 204,501 - 1,724 - 840,177
Senior debt securities - - - - 2,043,152 1,224,944 28,667 - 3,296,763
Subordinated obligations - - 799,960 - 749,567 - 15,869 - 1,565,396
TOTAL LIABILITIES 50,779,579 31,548,792 21,447,746 26,510,070 6,166,928 1,826,927 25,529,850 1,103,391 164,913,283
Total equity - - - - - - 20,749,223 - 20,749,223
TOTAL LIABILITIES AND EQUITY 50,779,579 31,548,792 21,447,746 26,510,070 6,166,928 1,826,927 46,279,073 1,103,391 185,662,506
On-balance sheet interest sensitivity gap 41,366,067 (19,023,697) (15,901,655) (20,816,826) 7,645,588 36,180,727
Off-balance sheet interest sensitivity gap 1,420,543 581,343 1,165,905 2,086,266 5,260,736 1,947,545
TOTAL INTEREST SENSITIVITY GAP 42,786,610 (18,442,354) (14,735,750) (18,730,560) 12,906,324 38,128,272
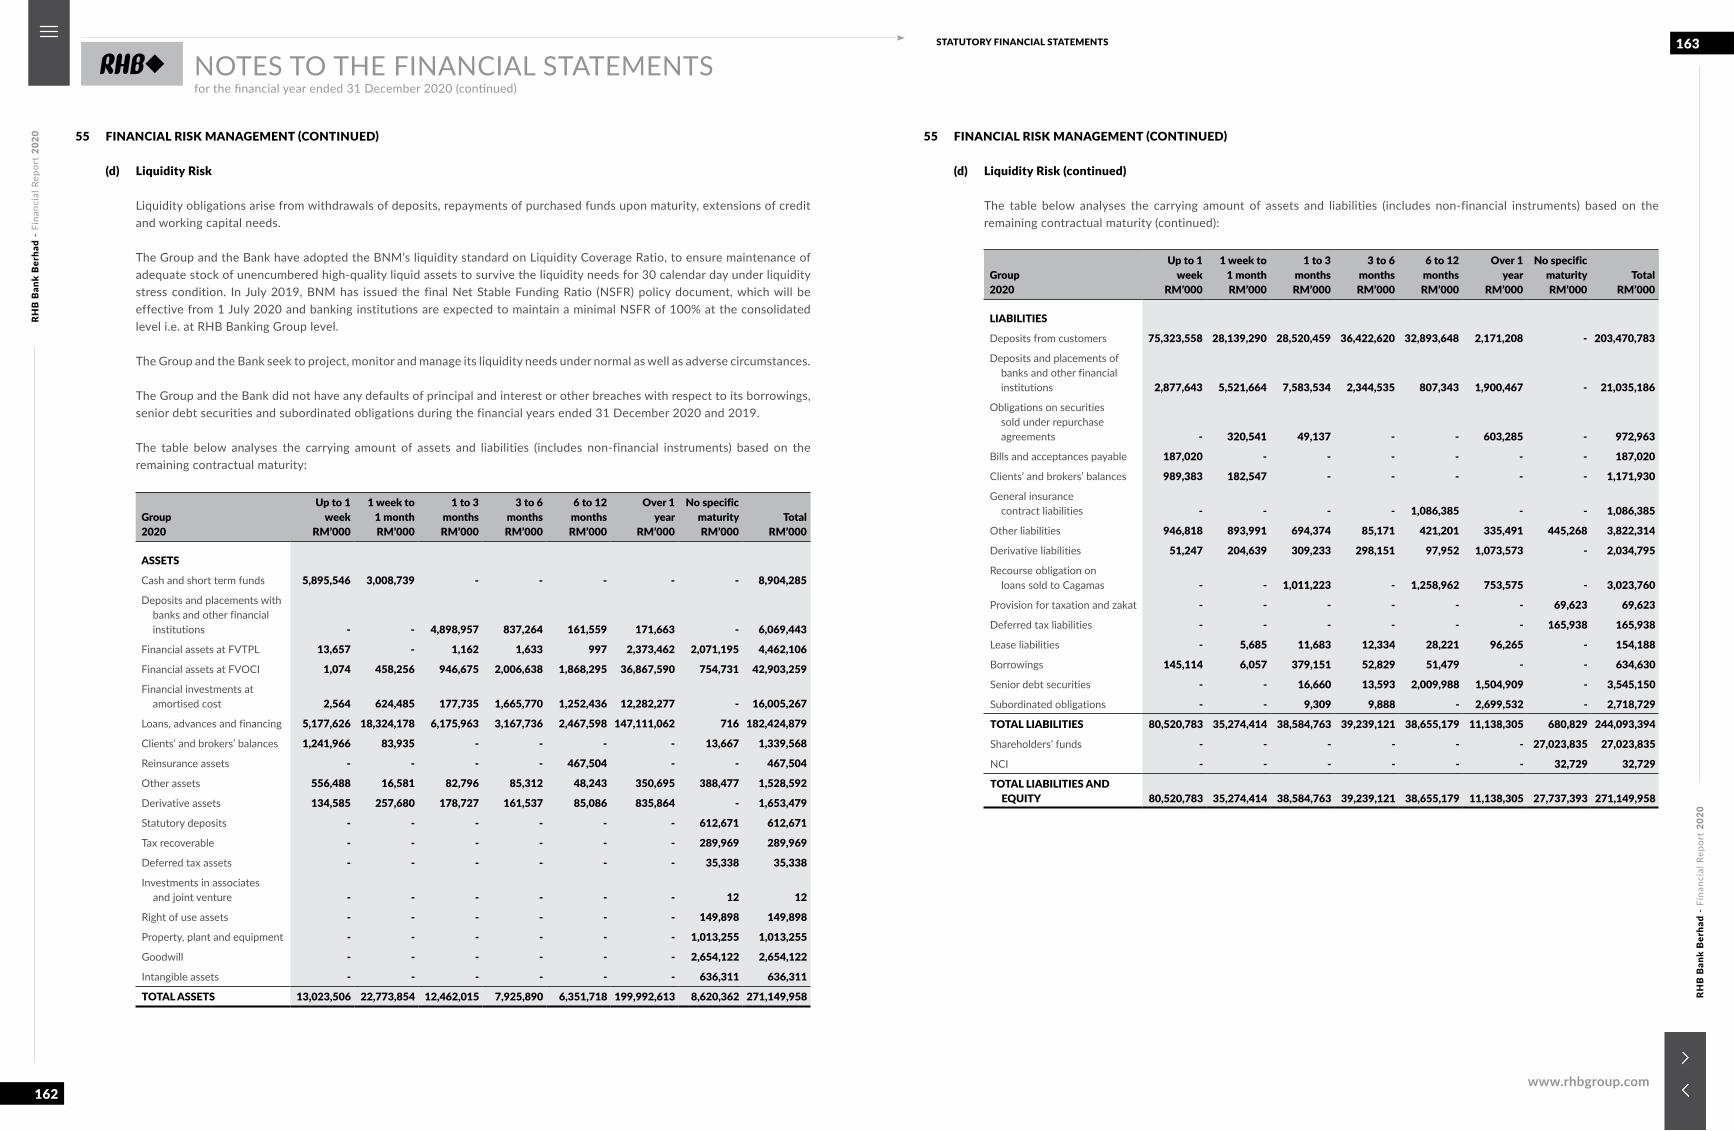
RHB
Ban
k B
erha
d -
Fina
ncia
l Rep
ort
2020
RHB
Ban
k B
erha
d -
Fina
ncia
l Rep
ort
2020
162
163STATUTORY FINANCIAL STATEMENTS
www.rhbgroup.com
NOTES TO THE FINANCIAL STATEMENTSfor the financial year ended 31 December 2020 (continued)
55 FINANCIAL RISK MANAGEMENT (CONTINUED)
(d) Liquidity Risk
Liquidity obligations arise from withdrawals of deposits, repayments of purchased funds upon maturity, extensions of credit and working capital needs.
The Group and the Bank have adopted the BNM’s liquidity standard on Liquidity Coverage Ratio, to ensure maintenance of adequate stock of unencumbered high-quality liquid assets to survive the liquidity needs for 30 calendar day under liquidity stress condition. In July 2019, BNM has issued the final Net Stable Funding Ratio (NSFR) policy document, which will be effective from 1 July 2020 and banking institutions are expected to maintain a minimal NSFR of 100% at the consolidated level i.e. at RHB Banking Group level.
The Group and the Bank seek to project, monitor and manage its liquidity needs under normal as well as adverse circumstances.
The Group and the Bank did not have any defaults of principal and interest or other breaches with respect to its borrowings, senior debt securities and subordinated obligations during the financial years ended 31 December 2020 and 2019.
The table below analyses the carrying amount of assets and liabilities (includes non-financial instruments) based on the remaining contractual maturity:
Group2020
Up to 1week
RM’000
1 week to1 month RM’000
1 to 3months RM’000
3 to 6months RM’000
6 to 12months RM’000
Over 1year
RM’000
No specificmaturityRM’000
Total RM’000
ASSETS
Cash and short term funds 5,895,546 3,008,739 - - - - - 8,904,285
Deposits and placements with banks and other financial institutions - - 4,898,957 837,264 161,559 171,663 - 6,069,443
Financial assets at FVTPL 13,657 - 1,162 1,633 997 2,373,462 2,071,195 4,462,106
Financial assets at FVOCI 1,074 458,256 946,675 2,006,638 1,868,295 36,867,590 754,731 42,903,259
Financial investments at amortised cost 2,564 624,485 177,735 1,665,770 1,252,436 12,282,277 - 16,005,267
Loans, advances and financing 5,177,626 18,324,178 6,175,963 3,167,736 2,467,598 147,111,062 716 182,424,879
Clients’ and brokers’ balances 1,241,966 83,935 - - - - 13,667 1,339,568
Reinsurance assets - - - - 467,504 - - 467,504
Other assets 556,488 16,581 82,796 85,312 48,243 350,695 388,477 1,528,592
Derivative assets 134,585 257,680 178,727 161,537 85,086 835,864 - 1,653,479
Statutory deposits - - - - - - 612,671 612,671
Tax recoverable - - - - - - 289,969 289,969
Deferred tax assets - - - - - - 35,338 35,338
Investments in associates and joint venture - - - - - - 12 12
Right of use assets - - - - - - 149,898 149,898
Property, plant and equipment - - - - - - 1,013,255 1,013,255
Goodwill - - - - - - 2,654,122 2,654,122
Intangible assets - - - - - - 636,311 636,311
TOTAL ASSETS 13,023,506 22,773,854 12,462,015 7,925,890 6,351,718 199,992,613 8,620,362 271,149,958
55 FINANCIAL RISK MANAGEMENT (CONTINUED)
(d) Liquidity Risk (continued)
The table below analyses the carrying amount of assets and liabilities (includes non-financial instruments) based on the remaining contractual maturity (continued):
Group 2020
Up to 1week
RM’000
1 week to1 month RM’000
1 to 3months RM’000
3 to 6months RM’000
6 to 12months RM’000
Over 1year
RM’000
No specificmaturityRM’000
Total RM’000
LIABILITIES
Deposits from customers 75,323,558 28,139,290 28,520,459 36,422,620 32,893,648 2,171,208 - 203,470,783
Deposits and placements of banks and other financial institutions 2,877,643 5,521,664 7,583,534 2,344,535 807,343 1,900,467 - 21,035,186
Obligations on securities sold under repurchase agreements - 320,541 49,137 - - 603,285 - 972,963
Bills and acceptances payable 187,020 - - - - - - 187,020
Clients’ and brokers’ balances 989,383 182,547 - - - - - 1,171,930
General insurance contract liabilities - - - - 1,086,385 - - 1,086,385
Other liabilities 946,818 893,991 694,374 85,171 421,201 335,491 445,268 3,822,314
Derivative liabilities 51,247 204,639 309,233 298,151 97,952 1,073,573 - 2,034,795
Recourse obligation on loans sold to Cagamas - - 1,011,223 - 1,258,962 753,575 - 3,023,760
Provision for taxation and zakat - - - - - - 69,623 69,623
Deferred tax liabilities - - - - - - 165,938 165,938
Lease liabilities - 5,685 11,683 12,334 28,221 96,265 - 154,188
Borrowings 145,114 6,057 379,151 52,829 51,479 - - 634,630
Senior debt securities - - 16,660 13,593 2,009,988 1,504,909 - 3,545,150
Subordinated obligations - - 9,309 9,888 - 2,699,532 - 2,718,729
TOTAL LIABILITIES 80,520,783 35,274,414 38,584,763 39,239,121 38,655,179 11,138,305 680,829 244,093,394
Shareholders’ funds - - - - - - 27,023,835 27,023,835
NCI - - - - - - 32,729 32,729
TOTAL LIABILITIES AND EQUITY 80,520,783 35,274,414 38,584,763 39,239,121 38,655,179 11,138,305 27,737,393 271,149,958
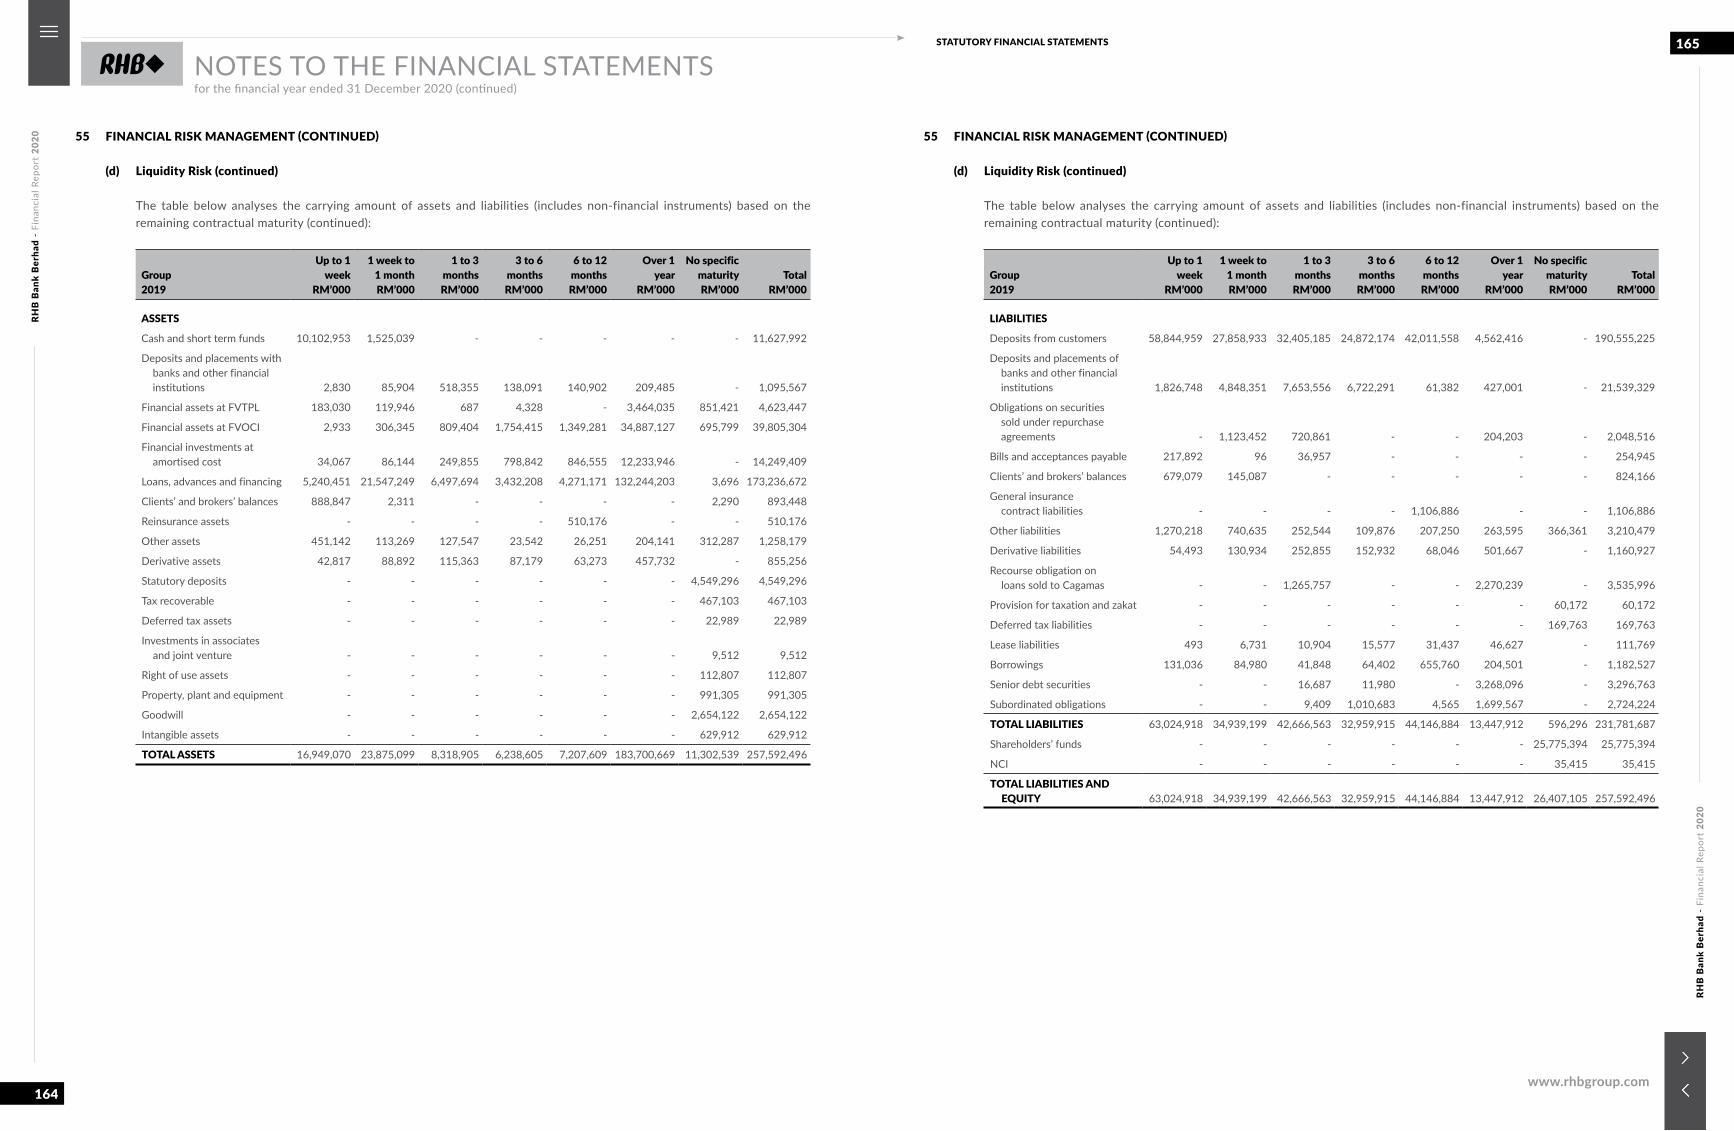
RHB
Ban
k B
erha
d -
Fina
ncia
l Rep
ort
2020
RHB
Ban
k B
erha
d -
Fina
ncia
l Rep
ort
2020
164
165STATUTORY FINANCIAL STATEMENTS
www.rhbgroup.com
NOTES TO THE FINANCIAL STATEMENTSfor the financial year ended 31 December 2020 (continued)
55 FINANCIAL RISK MANAGEMENT (CONTINUED)
(d) Liquidity Risk (continued)
The table below analyses the carrying amount of assets and liabilities (includes non-financial instruments) based on the remaining contractual maturity (continued):
Group2019
Up to 1week
RM’000
1 week to1 month RM’000
1 to 3months RM’000
3 to 6months RM’000
6 to 12months RM’000
Over 1year
RM’000
No specificmaturityRM’000
Total RM’000
ASSETS
Cash and short term funds 10,102,953 1,525,039 - - - - - 11,627,992
Deposits and placements with banks and other financial institutions 2,830 85,904 518,355 138,091 140,902 209,485 - 1,095,567
Financial assets at FVTPL 183,030 119,946 687 4,328 - 3,464,035 851,421 4,623,447
Financial assets at FVOCI 2,933 306,345 809,404 1,754,415 1,349,281 34,887,127 695,799 39,805,304
Financial investments at amortised cost 34,067 86,144 249,855 798,842 846,555 12,233,946 - 14,249,409
Loans, advances and financing 5,240,451 21,547,249 6,497,694 3,432,208 4,271,171 132,244,203 3,696 173,236,672
Clients’ and brokers’ balances 888,847 2,311 - - - - 2,290 893,448
Reinsurance assets - - - - 510,176 - - 510,176
Other assets 451,142 113,269 127,547 23,542 26,251 204,141 312,287 1,258,179
Derivative assets 42,817 88,892 115,363 87,179 63,273 457,732 - 855,256
Statutory deposits - - - - - - 4,549,296 4,549,296
Tax recoverable - - - - - - 467,103 467,103
Deferred tax assets - - - - - - 22,989 22,989
Investments in associates and joint venture - - - - - - 9,512 9,512
Right of use assets - - - - - - 112,807 112,807
Property, plant and equipment - - - - - - 991,305 991,305
Goodwill - - - - - - 2,654,122 2,654,122
Intangible assets - - - - - - 629,912 629,912
TOTAL ASSETS 16,949,070 23,875,099 8,318,905 6,238,605 7,207,609 183,700,669 11,302,539 257,592,496
55 FINANCIAL RISK MANAGEMENT (CONTINUED)
(d) Liquidity Risk (continued)
The table below analyses the carrying amount of assets and liabilities (includes non-financial instruments) based on the remaining contractual maturity (continued):
Group2019
Up to 1week
RM’000
1 week to1 month RM’000
1 to 3months RM’000
3 to 6months RM’000
6 to 12months RM’000
Over 1year
RM’000
No specificmaturityRM’000
Total RM’000
LIABILITIES
Deposits from customers 58,844,959 27,858,933 32,405,185 24,872,174 42,011,558 4,562,416 - 190,555,225
Deposits and placements of banks and other financial institutions 1,826,748 4,848,351 7,653,556 6,722,291 61,382 427,001 - 21,539,329
Obligations on securities sold under repurchase agreements - 1,123,452 720,861 - - 204,203 - 2,048,516
Bills and acceptances payable 217,892 96 36,957 - - - - 254,945
Clients’ and brokers’ balances 679,079 145,087 - - - - - 824,166
General insurance contract liabilities - - - - 1,106,886 - - 1,106,886
Other liabilities 1,270,218 740,635 252,544 109,876 207,250 263,595 366,361 3,210,479
Derivative liabilities 54,493 130,934 252,855 152,932 68,046 501,667 - 1,160,927
Recourse obligation on loans sold to Cagamas - - 1,265,757 - - 2,270,239 - 3,535,996
Provision for taxation and zakat - - - - - - 60,172 60,172
Deferred tax liabilities - - - - - - 169,763 169,763
Lease liabilities 493 6,731 10,904 15,577 31,437 46,627 - 111,769
Borrowings 131,036 84,980 41,848 64,402 655,760 204,501 - 1,182,527
Senior debt securities - - 16,687 11,980 - 3,268,096 - 3,296,763
Subordinated obligations - - 9,409 1,010,683 4,565 1,699,567 - 2,724,224
TOTAL LIABILITIES 63,024,918 34,939,199 42,666,563 32,959,915 44,146,884 13,447,912 596,296 231,781,687
Shareholders’ funds - - - - - - 25,775,394 25,775,394
NCI - - - - - - 35,415 35,415
TOTAL LIABILITIES AND EQUITY 63,024,918 34,939,199 42,666,563 32,959,915 44,146,884 13,447,912 26,407,105 257,592,496
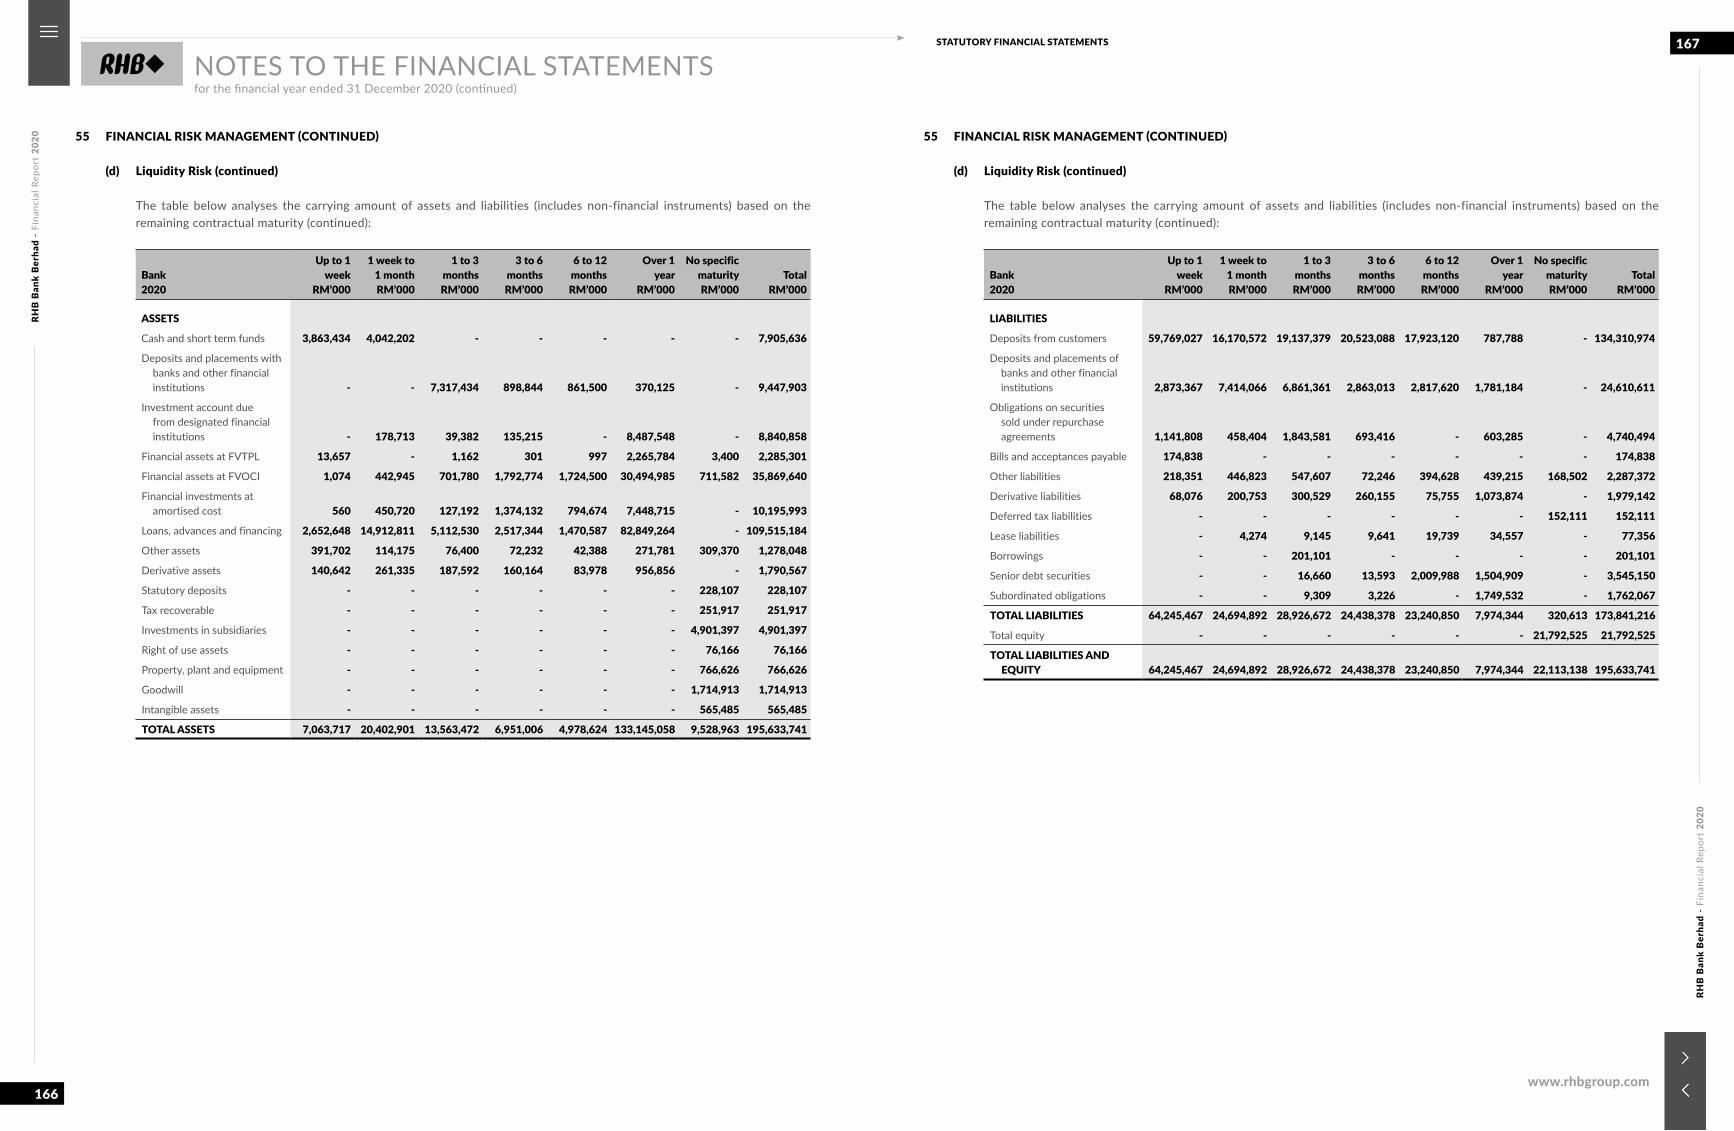
RHB
Ban
k B
erha
d -
Fina
ncia
l Rep
ort
2020
RHB
Ban
k B
erha
d -
Fina
ncia
l Rep
ort
2020
166
167STATUTORY FINANCIAL STATEMENTS
www.rhbgroup.com
NOTES TO THE FINANCIAL STATEMENTSfor the financial year ended 31 December 2020 (continued)
55 FINANCIAL RISK MANAGEMENT (CONTINUED)
(d) Liquidity Risk (continued)
The table below analyses the carrying amount of assets and liabilities (includes non-financial instruments) based on the remaining contractual maturity (continued):
Bank2020
Up to 1week
RM’000
1 week to1 month RM’000
1 to 3months RM’000
3 to 6months RM’000
6 to 12months RM’000
Over 1year
RM’000
No specificmaturityRM’000
Total RM’000
ASSETS
Cash and short term funds 3,863,434 4,042,202 - - - - - 7,905,636
Deposits and placements with banks and other financial institutions - - 7,317,434 898,844 861,500 370,125 - 9,447,903
Investment account due from designated financial institutions - 178,713 39,382 135,215 - 8,487,548 - 8,840,858
Financial assets at FVTPL 13,657 - 1,162 301 997 2,265,784 3,400 2,285,301
Financial assets at FVOCI 1,074 442,945 701,780 1,792,774 1,724,500 30,494,985 711,582 35,869,640
Financial investments at amortised cost 560 450,720 127,192 1,374,132 794,674 7,448,715 - 10,195,993
Loans, advances and financing 2,652,648 14,912,811 5,112,530 2,517,344 1,470,587 82,849,264 - 109,515,184
Other assets 391,702 114,175 76,400 72,232 42,388 271,781 309,370 1,278,048
Derivative assets 140,642 261,335 187,592 160,164 83,978 956,856 - 1,790,567
Statutory deposits - - - - - - 228,107 228,107
Tax recoverable - - - - - - 251,917 251,917
Investments in subsidiaries - - - - - - 4,901,397 4,901,397
Right of use assets - - - - - - 76,166 76,166
Property, plant and equipment - - - - - - 766,626 766,626
Goodwill - - - - - - 1,714,913 1,714,913
Intangible assets - - - - - - 565,485 565,485
TOTAL ASSETS 7,063,717 20,402,901 13,563,472 6,951,006 4,978,624 133,145,058 9,528,963 195,633,741
55 FINANCIAL RISK MANAGEMENT (CONTINUED)
(d) Liquidity Risk (continued)
The table below analyses the carrying amount of assets and liabilities (includes non-financial instruments) based on the remaining contractual maturity (continued):
Bank2020
Up to 1week
RM’000
1 week to1 month RM’000
1 to 3months RM’000
3 to 6months RM’000
6 to 12months RM’000
Over 1year
RM’000
No specificmaturityRM’000
Total RM’000
LIABILITIES
Deposits from customers 59,769,027 16,170,572 19,137,379 20,523,088 17,923,120 787,788 - 134,310,974
Deposits and placements of banks and other financial institutions 2,873,367 7,414,066 6,861,361 2,863,013 2,817,620 1,781,184 - 24,610,611
Obligations on securities sold under repurchase agreements 1,141,808 458,404 1,843,581 693,416 - 603,285 - 4,740,494
Bills and acceptances payable 174,838 - - - - - - 174,838
Other liabilities 218,351 446,823 547,607 72,246 394,628 439,215 168,502 2,287,372
Derivative liabilities 68,076 200,753 300,529 260,155 75,755 1,073,874 - 1,979,142
Deferred tax liabilities - - - - - - 152,111 152,111
Lease liabilities - 4,274 9,145 9,641 19,739 34,557 - 77,356
Borrowings - - 201,101 - - - - 201,101
Senior debt securities - - 16,660 13,593 2,009,988 1,504,909 - 3,545,150
Subordinated obligations - - 9,309 3,226 - 1,749,532 - 1,762,067
TOTAL LIABILITIES 64,245,467 24,694,892 28,926,672 24,438,378 23,240,850 7,974,344 320,613 173,841,216
Total equity - - - - - - 21,792,525 21,792,525
TOTAL LIABILITIES AND EQUITY 64,245,467 24,694,892 28,926,672 24,438,378 23,240,850 7,974,344 22,113,138 195,633,741
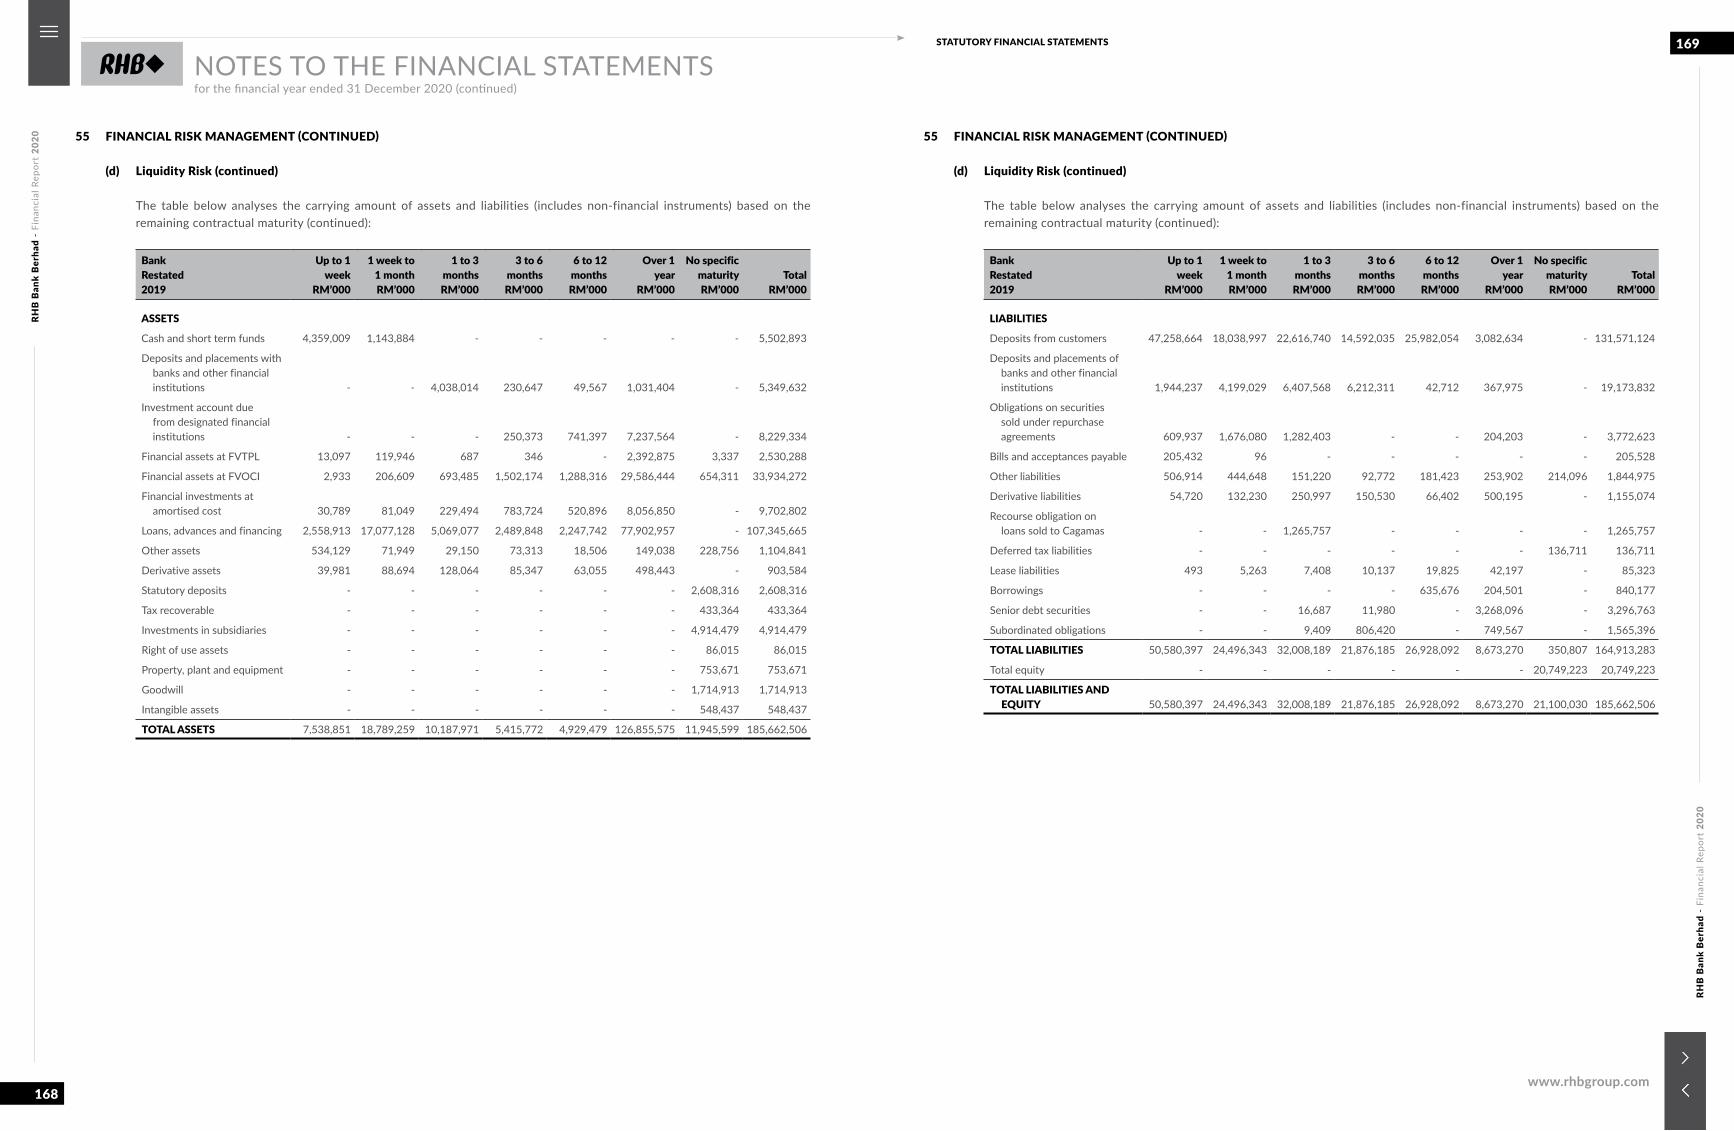
RHB
Ban
k B
erha
d -
Fina
ncia
l Rep
ort
2020
RHB
Ban
k B
erha
d -
Fina
ncia
l Rep
ort
2020
168
169STATUTORY FINANCIAL STATEMENTS
www.rhbgroup.com
NOTES TO THE FINANCIAL STATEMENTSfor the financial year ended 31 December 2020 (continued)
55 FINANCIAL RISK MANAGEMENT (CONTINUED)
(d) Liquidity Risk (continued)
The table below analyses the carrying amount of assets and liabilities (includes non-financial instruments) based on the remaining contractual maturity (continued):
Bank Restated2019
Up to 1week
RM’000
1 week to1 month RM’000
1 to 3months RM’000
3 to 6months RM’000
6 to 12months RM’000
Over 1year
RM’000
No specificmaturityRM’000
Total RM’000
ASSETS
Cash and short term funds 4,359,009 1,143,884 - - - - - 5,502,893
Deposits and placements with banks and other financial institutions - - 4,038,014 230,647 49,567 1,031,404 - 5,349,632
Investment account due from designated financial institutions - - - 250,373 741,397 7,237,564 - 8,229,334
Financial assets at FVTPL 13,097 119,946 687 346 - 2,392,875 3,337 2,530,288
Financial assets at FVOCI 2,933 206,609 693,485 1,502,174 1,288,316 29,586,444 654,311 33,934,272
Financial investments at amortised cost 30,789 81,049 229,494 783,724 520,896 8,056,850 - 9,702,802
Loans, advances and financing 2,558,913 17,077,128 5,069,077 2,489,848 2,247,742 77,902,957 - 107,345,665
Other assets 534,129 71,949 29,150 73,313 18,506 149,038 228,756 1,104,841
Derivative assets 39,981 88,694 128,064 85,347 63,055 498,443 - 903,584
Statutory deposits - - - - - - 2,608,316 2,608,316
Tax recoverable - - - - - - 433,364 433,364
Investments in subsidiaries - - - - - - 4,914,479 4,914,479
Right of use assets - - - - - - 86,015 86,015
Property, plant and equipment - - - - - - 753,671 753,671
Goodwill - - - - - - 1,714,913 1,714,913
Intangible assets - - - - - - 548,437 548,437
TOTAL ASSETS 7,538,851 18,789,259 10,187,971 5,415,772 4,929,479 126,855,575 11,945,599 185,662,506
55 FINANCIAL RISK MANAGEMENT (CONTINUED)
(d) Liquidity Risk (continued)
The table below analyses the carrying amount of assets and liabilities (includes non-financial instruments) based on the remaining contractual maturity (continued):
BankRestated2019
Up to 1week
RM’000
1 week to1 month RM’000
1 to 3months RM’000
3 to 6months RM’000
6 to 12months RM’000
Over 1year
RM’000
No specificmaturityRM’000
Total RM’000
LIABILITIES
Deposits from customers 47,258,664 18,038,997 22,616,740 14,592,035 25,982,054 3,082,634 - 131,571,124
Deposits and placements of banks and other financial institutions 1,944,237 4,199,029 6,407,568 6,212,311 42,712 367,975 - 19,173,832
Obligations on securities sold under repurchase agreements 609,937 1,676,080 1,282,403 - - 204,203 - 3,772,623
Bills and acceptances payable 205,432 96 - - - - - 205,528
Other liabilities 506,914 444,648 151,220 92,772 181,423 253,902 214,096 1,844,975
Derivative liabilities 54,720 132,230 250,997 150,530 66,402 500,195 - 1,155,074
Recourse obligation on loans sold to Cagamas - - 1,265,757 - - - - 1,265,757
Deferred tax liabilities - - - - - - 136,711 136,711
Lease liabilities 493 5,263 7,408 10,137 19,825 42,197 - 85,323
Borrowings - - - - 635,676 204,501 - 840,177
Senior debt securities - - 16,687 11,980 - 3,268,096 - 3,296,763
Subordinated obligations - - 9,409 806,420 - 749,567 - 1,565,396
TOTAL LIABILITIES 50,580,397 24,496,343 32,008,189 21,876,185 26,928,092 8,673,270 350,807 164,913,283
Total equity - - - - - - 20,749,223 20,749,223
TOTAL LIABILITIES AND EQUITY 50,580,397 24,496,343 32,008,189 21,876,185 26,928,092 8,673,270 21,100,030 185,662,506
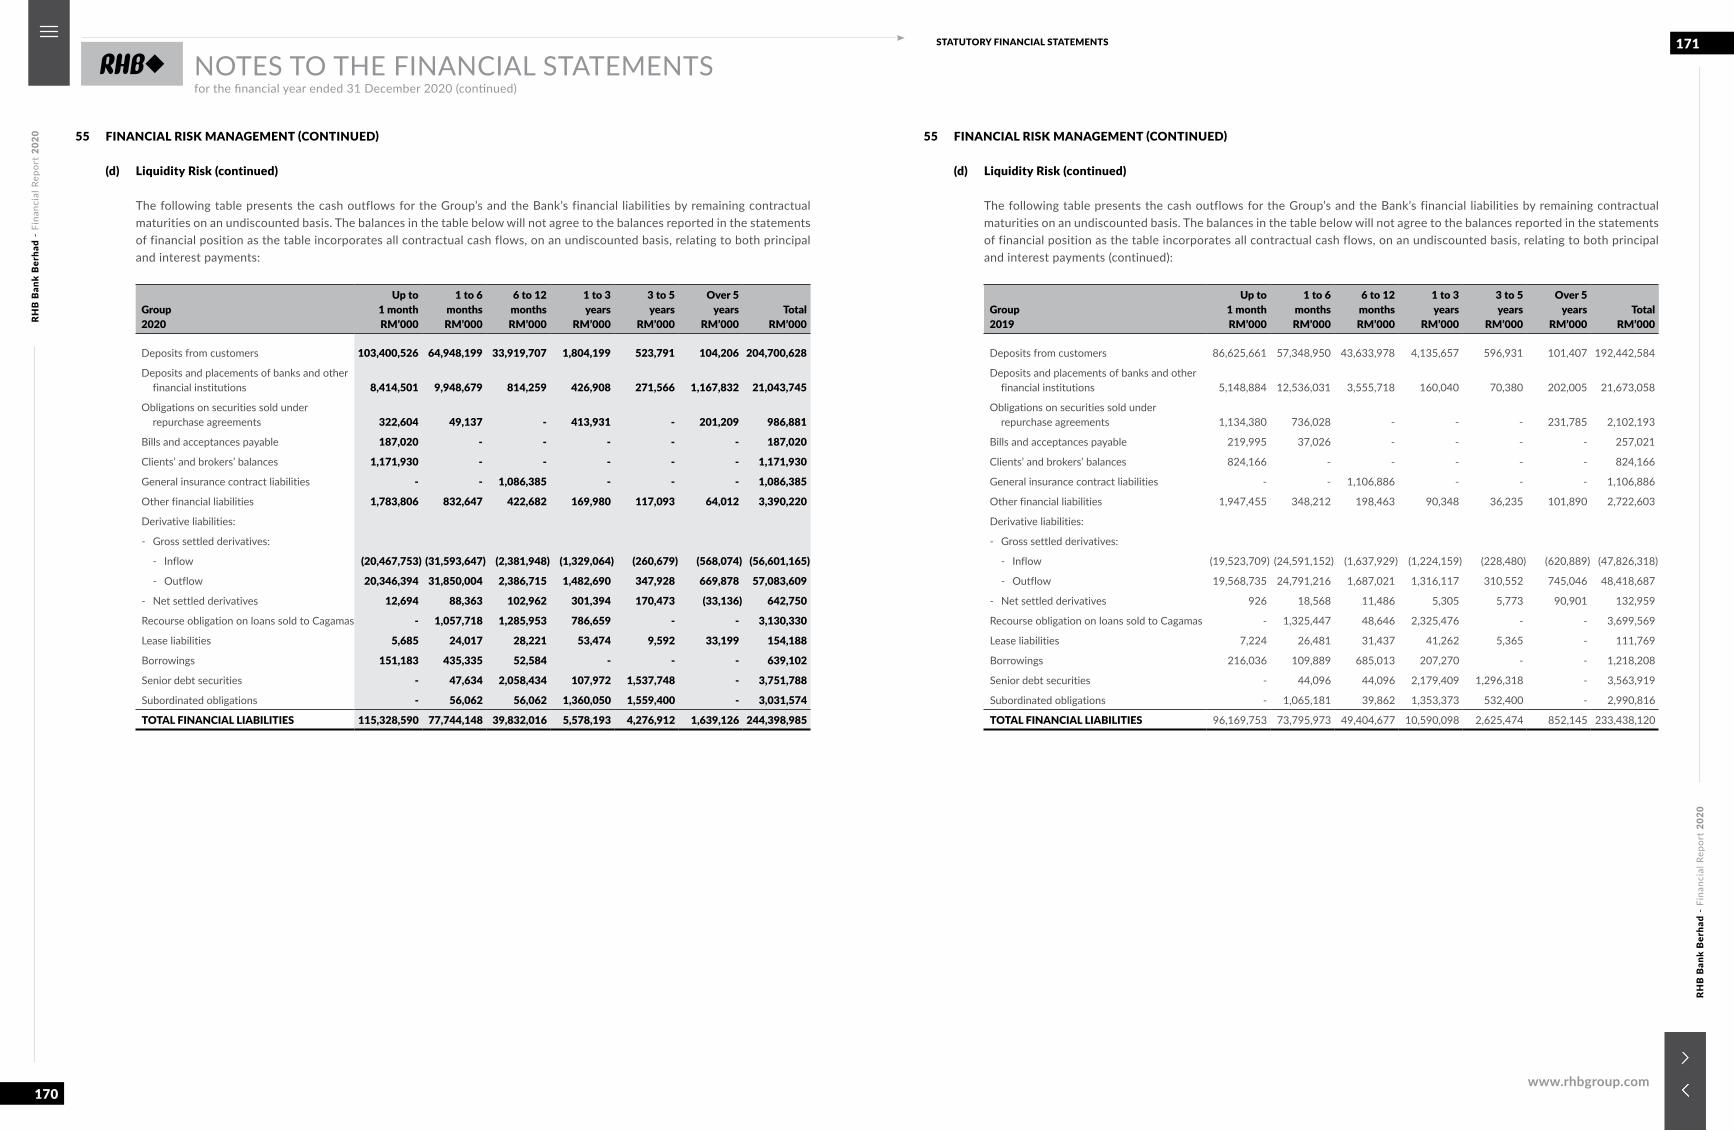
RHB
Ban
k B
erha
d -
Fina
ncia
l Rep
ort
2020
RHB
Ban
k B
erha
d -
Fina
ncia
l Rep
ort
2020
170
171STATUTORY FINANCIAL STATEMENTS
www.rhbgroup.com
NOTES TO THE FINANCIAL STATEMENTSfor the financial year ended 31 December 2020 (continued)
55 FINANCIAL RISK MANAGEMENT (CONTINUED)
(d) Liquidity Risk (continued)
The following table presents the cash outflows for the Group’s and the Bank’s financial liabilities by remaining contractual maturities on an undiscounted basis. The balances in the table below will not agree to the balances reported in the statements of financial position as the table incorporates all contractual cash flows, on an undiscounted basis, relating to both principal and interest payments:
Group2020
Up to1 month RM’000
1 to 6months RM’000
6 to 12months RM’000
1 to 3years
RM’000
3 to 5years
RM’000
Over 5years
RM’000Total
RM’000
Deposits from customers 103,400,526 64,948,199 33,919,707 1,804,199 523,791 104,206 204,700,628
Deposits and placements of banks and other financial institutions 8,414,501 9,948,679 814,259 426,908 271,566 1,167,832 21,043,745
Obligations on securities sold under repurchase agreements 322,604 49,137 - 413,931 - 201,209 986,881
Bills and acceptances payable 187,020 - - - - - 187,020
Clients’ and brokers’ balances 1,171,930 - - - - - 1,171,930
General insurance contract liabilities - - 1,086,385 - - - 1,086,385
Other financial liabilities 1,783,806 832,647 422,682 169,980 117,093 64,012 3,390,220
Derivative liabilities:
- Gross settled derivatives:
- Inflow (20,467,753) (31,593,647) (2,381,948) (1,329,064) (260,679) (568,074) (56,601,165)
- Outflow 20,346,394 31,850,004 2,386,715 1,482,690 347,928 669,878 57,083,609
- Net settled derivatives 12,694 88,363 102,962 301,394 170,473 (33,136) 642,750
Recourse obligation on loans sold to Cagamas - 1,057,718 1,285,953 786,659 - - 3,130,330
Lease liabilities 5,685 24,017 28,221 53,474 9,592 33,199 154,188
Borrowings 151,183 435,335 52,584 - - - 639,102
Senior debt securities - 47,634 2,058,434 107,972 1,537,748 - 3,751,788
Subordinated obligations - 56,062 56,062 1,360,050 1,559,400 - 3,031,574
TOTAL FINANCIAL LIABILITIES 115,328,590 77,744,148 39,832,016 5,578,193 4,276,912 1,639,126 244,398,985
55 FINANCIAL RISK MANAGEMENT (CONTINUED)
(d) Liquidity Risk (continued)
The following table presents the cash outflows for the Group’s and the Bank’s financial liabilities by remaining contractual maturities on an undiscounted basis. The balances in the table below will not agree to the balances reported in the statements of financial position as the table incorporates all contractual cash flows, on an undiscounted basis, relating to both principal and interest payments (continued):
Group2019
Up to1 month RM’000
1 to 6months RM’000
6 to 12months RM’000
1 to 3years
RM’000
3 to 5years
RM’000
Over 5years
RM’000Total
RM’000
Deposits from customers 86,625,661 57,348,950 43,633,978 4,135,657 596,931 101,407 192,442,584
Deposits and placements of banks and other financial institutions 5,148,884 12,536,031 3,555,718 160,040 70,380 202,005 21,673,058
Obligations on securities sold under repurchase agreements 1,134,380 736,028 - - - 231,785 2,102,193
Bills and acceptances payable 219,995 37,026 - - - - 257,021
Clients’ and brokers’ balances 824,166 - - - - - 824,166
General insurance contract liabilities - - 1,106,886 - - - 1,106,886
Other financial liabilities 1,947,455 348,212 198,463 90,348 36,235 101,890 2,722,603
Derivative liabilities:
- Gross settled derivatives:
- Inflow (19,523,709) (24,591,152) (1,637,929) (1,224,159) (228,480) (620,889) (47,826,318)
- Outflow 19,568,735 24,791,216 1,687,021 1,316,117 310,552 745,046 48,418,687
- Net settled derivatives 926 18,568 11,486 5,305 5,773 90,901 132,959
Recourse obligation on loans sold to Cagamas - 1,325,447 48,646 2,325,476 - - 3,699,569
Lease liabilities 7,224 26,481 31,437 41,262 5,365 - 111,769
Borrowings 216,036 109,889 685,013 207,270 - - 1,218,208
Senior debt securities - 44,096 44,096 2,179,409 1,296,318 - 3,563,919
Subordinated obligations - 1,065,181 39,862 1,353,373 532,400 - 2,990,816
TOTAL FINANCIAL LIABILITIES 96,169,753 73,795,973 49,404,677 10,590,098 2,625,474 852,145 233,438,120
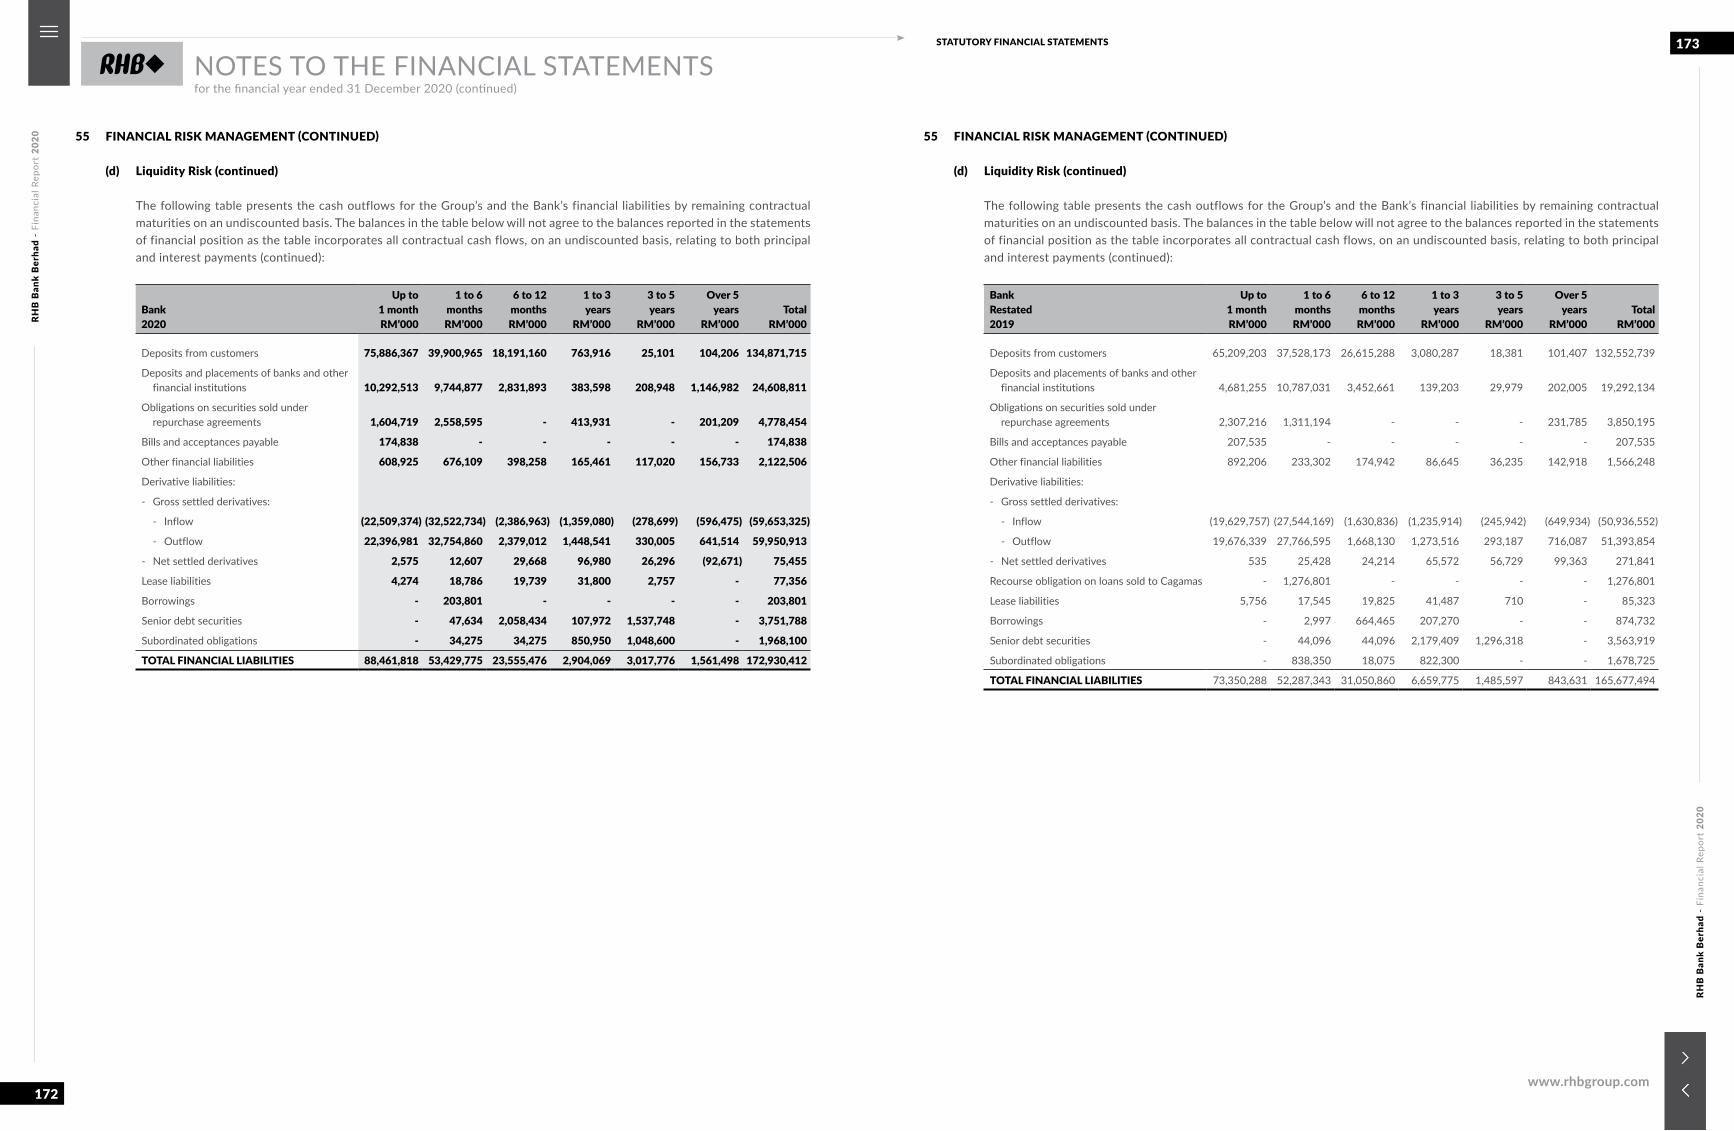
RHB
Ban
k B
erha
d -
Fina
ncia
l Rep
ort
2020
RHB
Ban
k B
erha
d -
Fina
ncia
l Rep
ort
2020
172
173STATUTORY FINANCIAL STATEMENTS
www.rhbgroup.com
NOTES TO THE FINANCIAL STATEMENTSfor the financial year ended 31 December 2020 (continued)
55 FINANCIAL RISK MANAGEMENT (CONTINUED)
(d) Liquidity Risk (continued)
The following table presents the cash outflows for the Group’s and the Bank’s financial liabilities by remaining contractual maturities on an undiscounted basis. The balances in the table below will not agree to the balances reported in the statements of financial position as the table incorporates all contractual cash flows, on an undiscounted basis, relating to both principal and interest payments (continued):
Bank2020
Up to1 month RM’000
1 to 6months RM’000
6 to 12months RM’000
1 to 3years
RM’000
3 to 5years
RM’000
Over 5years
RM’000Total
RM’000
Deposits from customers 75,886,367 39,900,965 18,191,160 763,916 25,101 104,206 134,871,715
Deposits and placements of banks and other financial institutions 10,292,513 9,744,877 2,831,893 383,598 208,948 1,146,982 24,608,811
Obligations on securities sold under repurchase agreements 1,604,719 2,558,595 - 413,931 - 201,209 4,778,454
Bills and acceptances payable 174,838 - - - - - 174,838
Other financial liabilities 608,925 676,109 398,258 165,461 117,020 156,733 2,122,506
Derivative liabilities:
- Gross settled derivatives:
- Inflow (22,509,374) (32,522,734) (2,386,963) (1,359,080) (278,699) (596,475) (59,653,325)
- Outflow 22,396,981 32,754,860 2,379,012 1,448,541 330,005 641,514 59,950,913
- Net settled derivatives 2,575 12,607 29,668 96,980 26,296 (92,671) 75,455
Lease liabilities 4,274 18,786 19,739 31,800 2,757 - 77,356
Borrowings - 203,801 - - - - 203,801
Senior debt securities - 47,634 2,058,434 107,972 1,537,748 - 3,751,788
Subordinated obligations - 34,275 34,275 850,950 1,048,600 - 1,968,100
TOTAL FINANCIAL LIABILITIES 88,461,818 53,429,775 23,555,476 2,904,069 3,017,776 1,561,498 172,930,412
55 FINANCIAL RISK MANAGEMENT (CONTINUED)
(d) Liquidity Risk (continued)
The following table presents the cash outflows for the Group’s and the Bank’s financial liabilities by remaining contractual maturities on an undiscounted basis. The balances in the table below will not agree to the balances reported in the statements of financial position as the table incorporates all contractual cash flows, on an undiscounted basis, relating to both principal and interest payments (continued):
BankRestated2019
Up to1 month RM’000
1 to 6months RM’000
6 to 12months RM’000
1 to 3years
RM’000
3 to 5years
RM’000
Over 5years
RM’000Total
RM’000
Deposits from customers 65,209,203 37,528,173 26,615,288 3,080,287 18,381 101,407 132,552,739
Deposits and placements of banks and other financial institutions 4,681,255 10,787,031 3,452,661 139,203 29,979 202,005 19,292,134
Obligations on securities sold under repurchase agreements 2,307,216 1,311,194 - - - 231,785 3,850,195
Bills and acceptances payable 207,535 - - - - - 207,535
Other financial liabilities 892,206 233,302 174,942 86,645 36,235 142,918 1,566,248
Derivative liabilities:
- Gross settled derivatives:
- Inflow (19,629,757) (27,544,169) (1,630,836) (1,235,914) (245,942) (649,934) (50,936,552)
- Outflow 19,676,339 27,766,595 1,668,130 1,273,516 293,187 716,087 51,393,854
- Net settled derivatives 535 25,428 24,214 65,572 56,729 99,363 271,841
Recourse obligation on loans sold to Cagamas - 1,276,801 - - - - 1,276,801
Lease liabilities 5,756 17,545 19,825 41,487 710 - 85,323
Borrowings - 2,997 664,465 207,270 - - 874,732
Senior debt securities - 44,096 44,096 2,179,409 1,296,318 - 3,563,919
Subordinated obligations - 838,350 18,075 822,300 - - 1,678,725
TOTAL FINANCIAL LIABILITIES 73,350,288 52,287,343 31,050,860 6,659,775 1,485,597 843,631 165,677,494
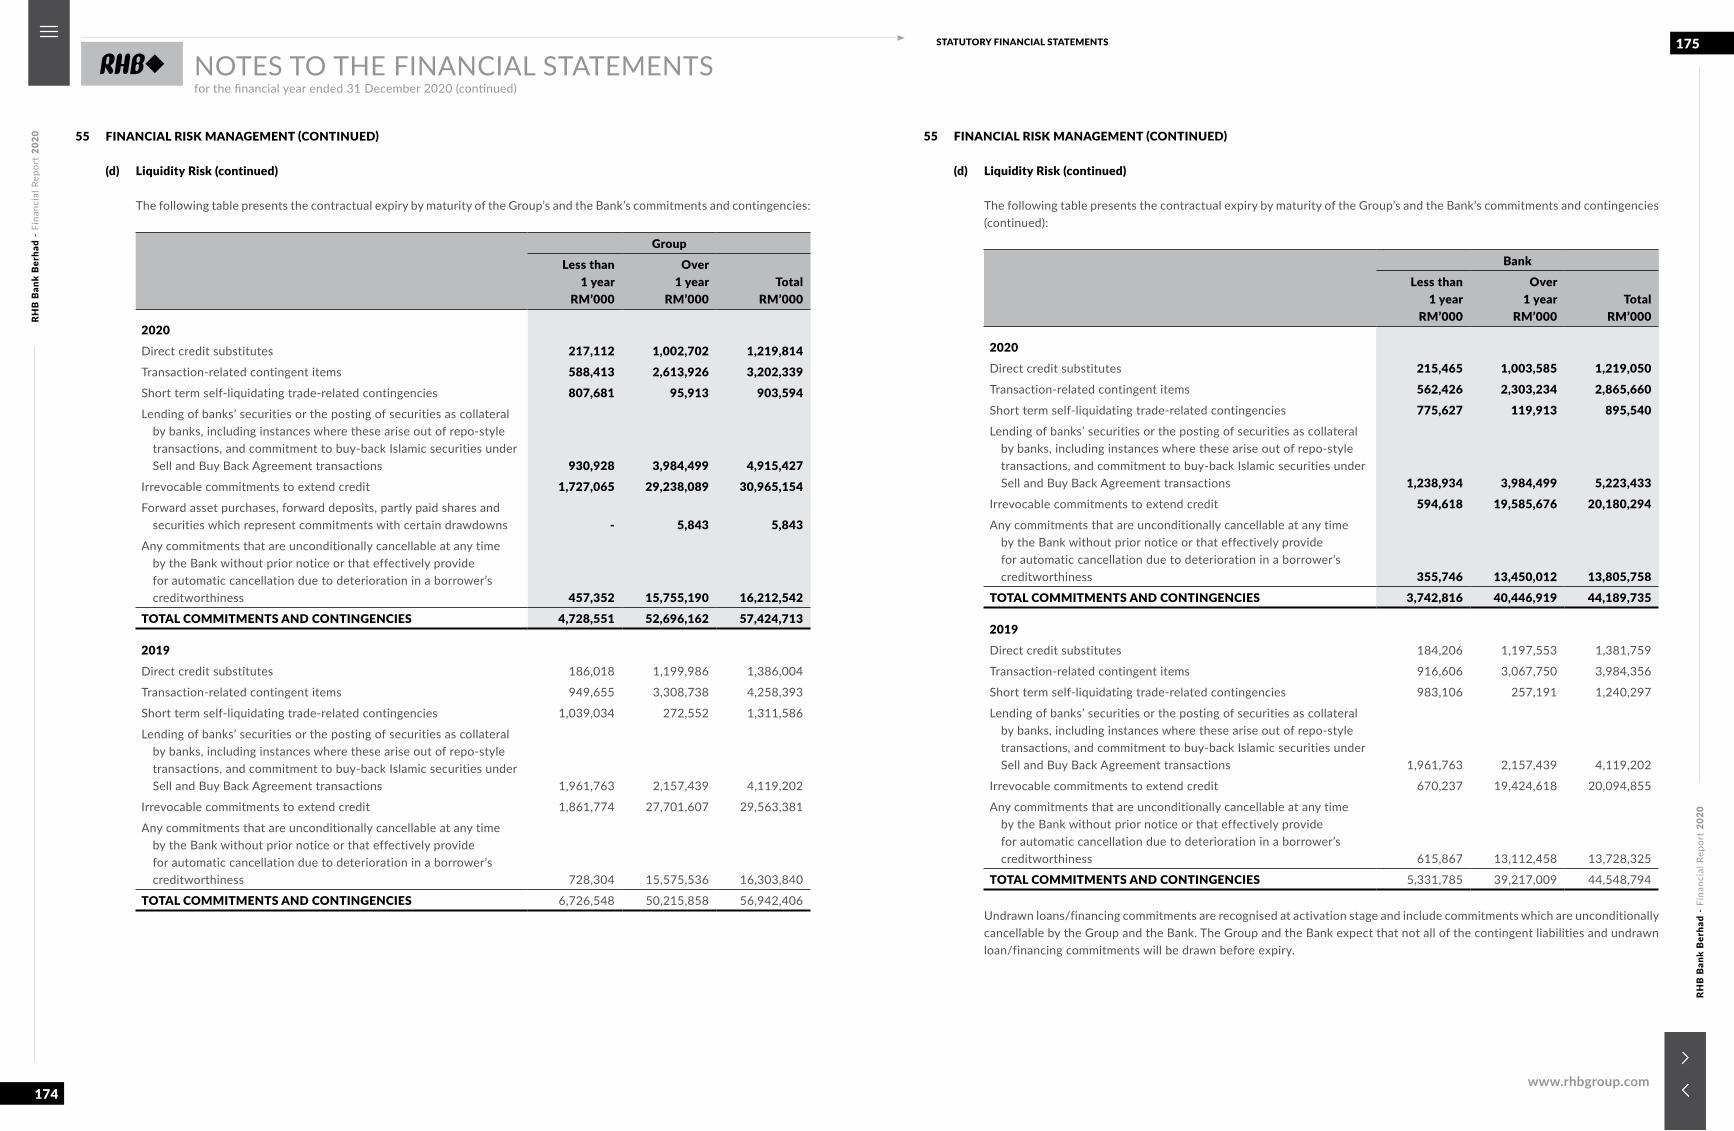
RHB
Ban
k B
erha
d -
Fina
ncia
l Rep
ort
2020
RHB
Ban
k B
erha
d -
Fina
ncia
l Rep
ort
2020
174
175STATUTORY FINANCIAL STATEMENTS
www.rhbgroup.com
NOTES TO THE FINANCIAL STATEMENTSfor the financial year ended 31 December 2020 (continued)
55 FINANCIAL RISK MANAGEMENT (CONTINUED)
(d) Liquidity Risk (continued)
The following table presents the contractual expiry by maturity of the Group’s and the Bank’s commitments and contingencies:
GroupLess than
1 year RM’000
Over1 year
RM’000Total
RM’000
2020Direct credit substitutes 217,112 1,002,702 1,219,814Transaction-related contingent items 588,413 2,613,926 3,202,339Short term self-liquidating trade-related contingencies 807,681 95,913 903,594Lending of banks’ securities or the posting of securities as collateral
by banks, including instances where these arise out of repo-style transactions, and commitment to buy-back Islamic securities under Sell and Buy Back Agreement transactions 930,928 3,984,499 4,915,427
Irrevocable commitments to extend credit 1,727,065 29,238,089 30,965,154Forward asset purchases, forward deposits, partly paid shares and
securities which represent commitments with certain drawdowns - 5,843 5,843Any commitments that are unconditionally cancellable at any time
by the Bank without prior notice or that effectively provide for automatic cancellation due to deterioration in a borrower’s creditworthiness 457,352 15,755,190 16,212,542
TOTAL COMMITMENTS AND CONTINGENCIES 4,728,551 52,696,162 57,424,713
2019Direct credit substitutes 186,018 1,199,986 1,386,004
Transaction-related contingent items 949,655 3,308,738 4,258,393
Short term self-liquidating trade-related contingencies 1,039,034 272,552 1,311,586
Lending of banks’ securities or the posting of securities as collateral by banks, including instances where these arise out of repo-style transactions, and commitment to buy-back Islamic securities under Sell and Buy Back Agreement transactions 1,961,763 2,157,439 4,119,202
Irrevocable commitments to extend credit 1,861,774 27,701,607 29,563,381
Any commitments that are unconditionally cancellable at any time by the Bank without prior notice or that effectively provide for automatic cancellation due to deterioration in a borrower’s creditworthiness 728,304 15,575,536 16,303,840
TOTAL COMMITMENTS AND CONTINGENCIES 6,726,548 50,215,858 56,942,406
55 FINANCIAL RISK MANAGEMENT (CONTINUED)
(d) Liquidity Risk (continued)
The following table presents the contractual expiry by maturity of the Group’s and the Bank’s commitments and contingencies (continued):
BankLess than
1 year RM’000
Over1 year
RM’000Total
RM’000
2020Direct credit substitutes 215,465 1,003,585 1,219,050Transaction-related contingent items 562,426 2,303,234 2,865,660Short term self-liquidating trade-related contingencies 775,627 119,913 895,540Lending of banks’ securities or the posting of securities as collateral
by banks, including instances where these arise out of repo-style transactions, and commitment to buy-back Islamic securities under Sell and Buy Back Agreement transactions 1,238,934 3,984,499 5,223,433
Irrevocable commitments to extend credit 594,618 19,585,676 20,180,294Any commitments that are unconditionally cancellable at any time
by the Bank without prior notice or that effectively provide for automatic cancellation due to deterioration in a borrower’s creditworthiness 355,746 13,450,012 13,805,758
TOTAL COMMITMENTS AND CONTINGENCIES 3,742,816 40,446,919 44,189,735
2019Direct credit substitutes 184,206 1,197,553 1,381,759
Transaction-related contingent items 916,606 3,067,750 3,984,356
Short term self-liquidating trade-related contingencies 983,106 257,191 1,240,297
Lending of banks’ securities or the posting of securities as collateral by banks, including instances where these arise out of repo-style transactions, and commitment to buy-back Islamic securities under Sell and Buy Back Agreement transactions 1,961,763 2,157,439 4,119,202
Irrevocable commitments to extend credit 670,237 19,424,618 20,094,855
Any commitments that are unconditionally cancellable at any time by the Bank without prior notice or that effectively provide for automatic cancellation due to deterioration in a borrower’s creditworthiness 615,867 13,112,458 13,728,325
TOTAL COMMITMENTS AND CONTINGENCIES 5,331,785 39,217,009 44,548,794
Undrawn loans/financing commitments are recognised at activation stage and include commitments which are unconditionally cancellable by the Group and the Bank. The Group and the Bank expect that not all of the contingent liabilities and undrawn loan/financing commitments will be drawn before expiry.
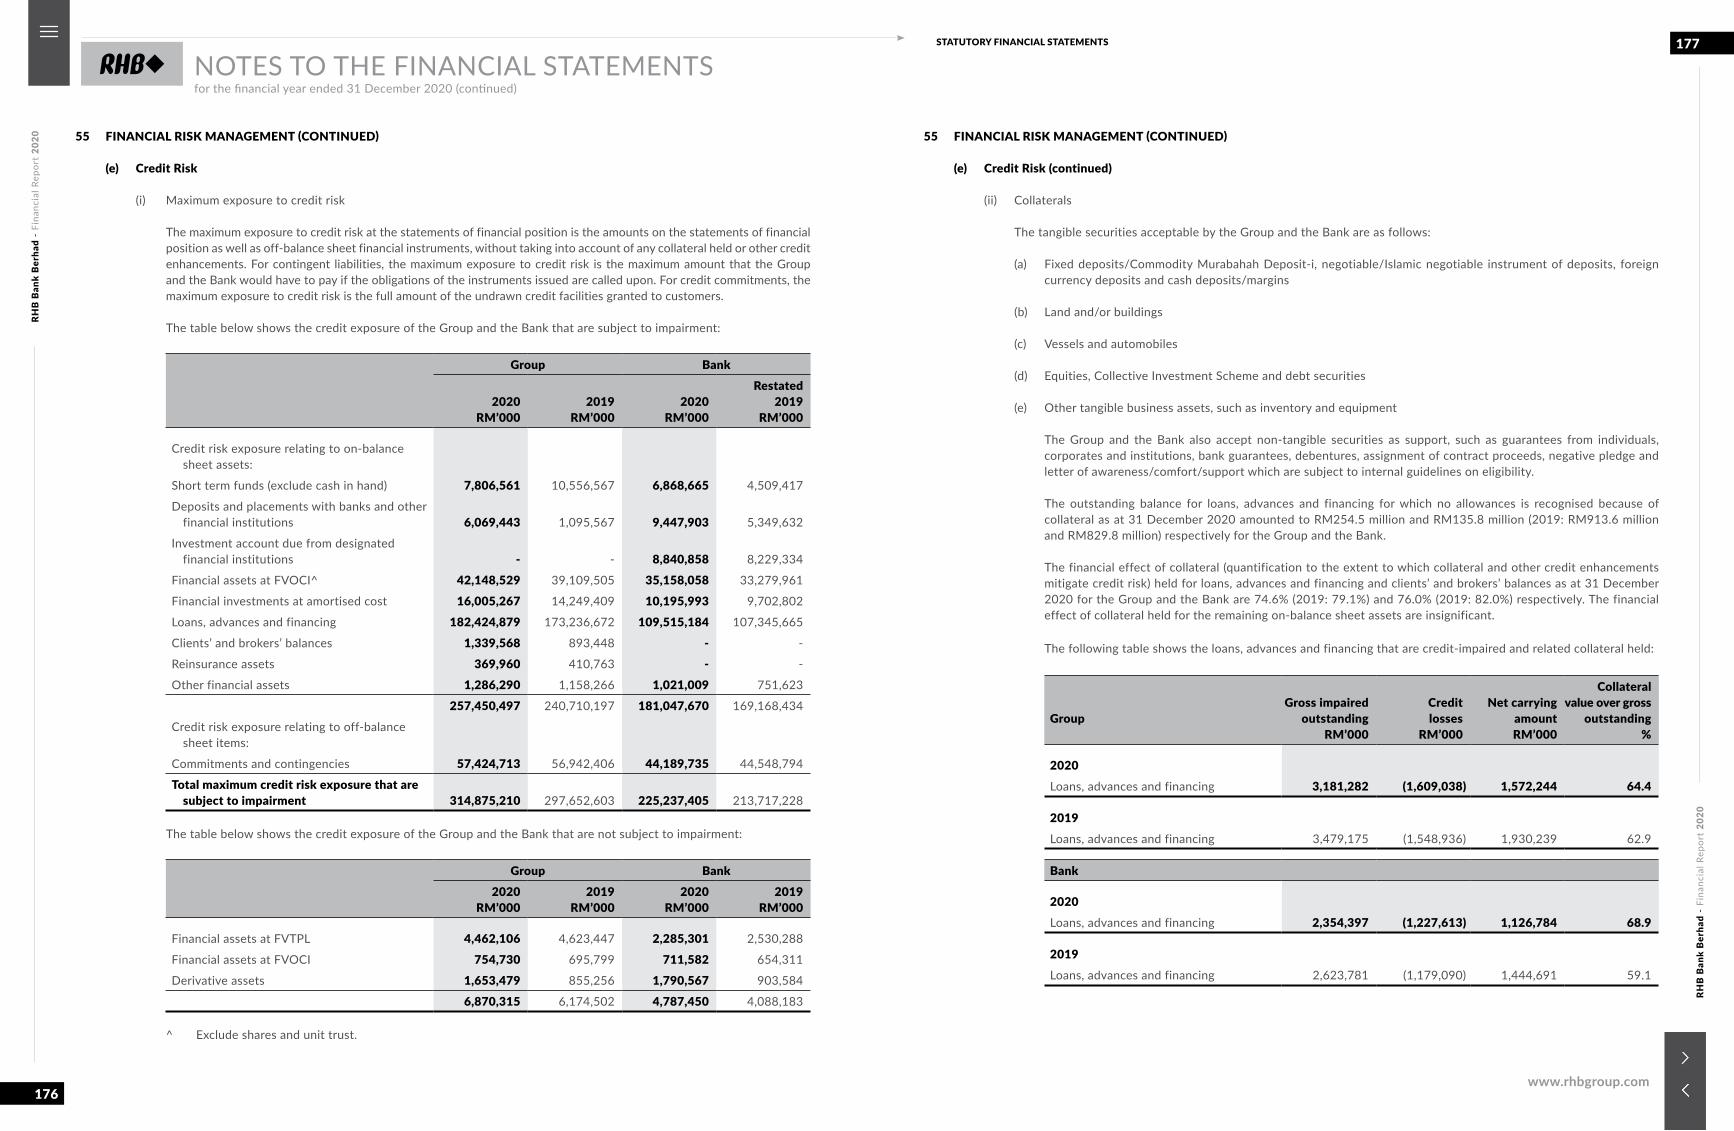
RHB
Ban
k B
erha
d -
Fina
ncia
l Rep
ort
2020
RHB
Ban
k B
erha
d -
Fina
ncia
l Rep
ort
2020
176
177STATUTORY FINANCIAL STATEMENTS
www.rhbgroup.com
NOTES TO THE FINANCIAL STATEMENTSfor the financial year ended 31 December 2020 (continued)
55 FINANCIAL RISK MANAGEMENT (CONTINUED)
(e) Credit Risk
(i) Maximum exposure to credit risk
The maximum exposure to credit risk at the statements of financial position is the amounts on the statements of financial position as well as off-balance sheet financial instruments, without taking into account of any collateral held or other credit enhancements. For contingent liabilities, the maximum exposure to credit risk is the maximum amount that the Group and the Bank would have to pay if the obligations of the instruments issued are called upon. For credit commitments, the maximum exposure to credit risk is the full amount of the undrawn credit facilities granted to customers.
The table below shows the credit exposure of the Group and the Bank that are subject to impairment:
Group Bank
2020 RM’000
2019 RM’000
2020 RM’000
Restated2019
RM’000
Credit risk exposure relating to on-balance sheet assets:
Short term funds (exclude cash in hand) 7,806,561 10,556,567 6,868,665 4,509,417
Deposits and placements with banks and other financial institutions 6,069,443 1,095,567 9,447,903 5,349,632
Investment account due from designated financial institutions - - 8,840,858 8,229,334
Financial assets at FVOCI^ 42,148,529 39,109,505 35,158,058 33,279,961
Financial investments at amortised cost 16,005,267 14,249,409 10,195,993 9,702,802
Loans, advances and financing 182,424,879 173,236,672 109,515,184 107,345,665
Clients’ and brokers’ balances 1,339,568 893,448 - -
Reinsurance assets 369,960 410,763 - -
Other financial assets 1,286,290 1,158,266 1,021,009 751,623
257,450,497 240,710,197 181,047,670 169,168,434
Credit risk exposure relating to off-balance sheet items:
Commitments and contingencies 57,424,713 56,942,406 44,189,735 44,548,794
Total maximum credit risk exposure that are subject to impairment 314,875,210 297,652,603 225,237,405 213,717,228
The table below shows the credit exposure of the Group and the Bank that are not subject to impairment:
Group Bank2020
RM’000 2019
RM’000 2020
RM’000 2019
RM’000
Financial assets at FVTPL 4,462,106 4,623,447 2,285,301 2,530,288
Financial assets at FVOCI 754,730 695,799 711,582 654,311
Derivative assets 1,653,479 855,256 1,790,567 903,584
6,870,315 6,174,502 4,787,450 4,088,183
^ Exclude shares and unit trust.
55 FINANCIAL RISK MANAGEMENT (CONTINUED)
(e) Credit Risk (continued)
(ii) Collaterals
The tangible securities acceptable by the Group and the Bank are as follows:
(a) Fixed deposits/Commodity Murabahah Deposit-i, negotiable/Islamic negotiable instrument of deposits, foreign currency deposits and cash deposits/margins
(b) Land and/or buildings
(c) Vessels and automobiles
(d) Equities, Collective Investment Scheme and debt securities
(e) Other tangible business assets, such as inventory and equipment
The Group and the Bank also accept non-tangible securities as support, such as guarantees from individuals, corporates and institutions, bank guarantees, debentures, assignment of contract proceeds, negative pledge and letter of awareness/comfort/support which are subject to internal guidelines on eligibility.
The outstanding balance for loans, advances and financing for which no allowances is recognised because of collateral as at 31 December 2020 amounted to RM254.5 million and RM135.8 million (2019: RM913.6 million and RM829.8 million) respectively for the Group and the Bank.
The financial effect of collateral (quantification to the extent to which collateral and other credit enhancements mitigate credit risk) held for loans, advances and financing and clients’ and brokers’ balances as at 31 December 2020 for the Group and the Bank are 74.6% (2019: 79.1%) and 76.0% (2019: 82.0%) respectively. The financial effect of collateral held for the remaining on-balance sheet assets are insignificant.
The following table shows the loans, advances and financing that are credit-impaired and related collateral held:
GroupGross impaired
outstandingRM’000
Creditlosses
RM’000
Net carryingamountRM’000
Collateralvalue over gross
outstanding%
2020Loans, advances and financing 3,181,282 (1,609,038) 1,572,244 64.4
2019Loans, advances and financing 3,479,175 (1,548,936) 1,930,239 62.9
Bank
2020Loans, advances and financing 2,354,397 (1,227,613) 1,126,784 68.9
2019Loans, advances and financing 2,623,781 (1,179,090) 1,444,691 59.1
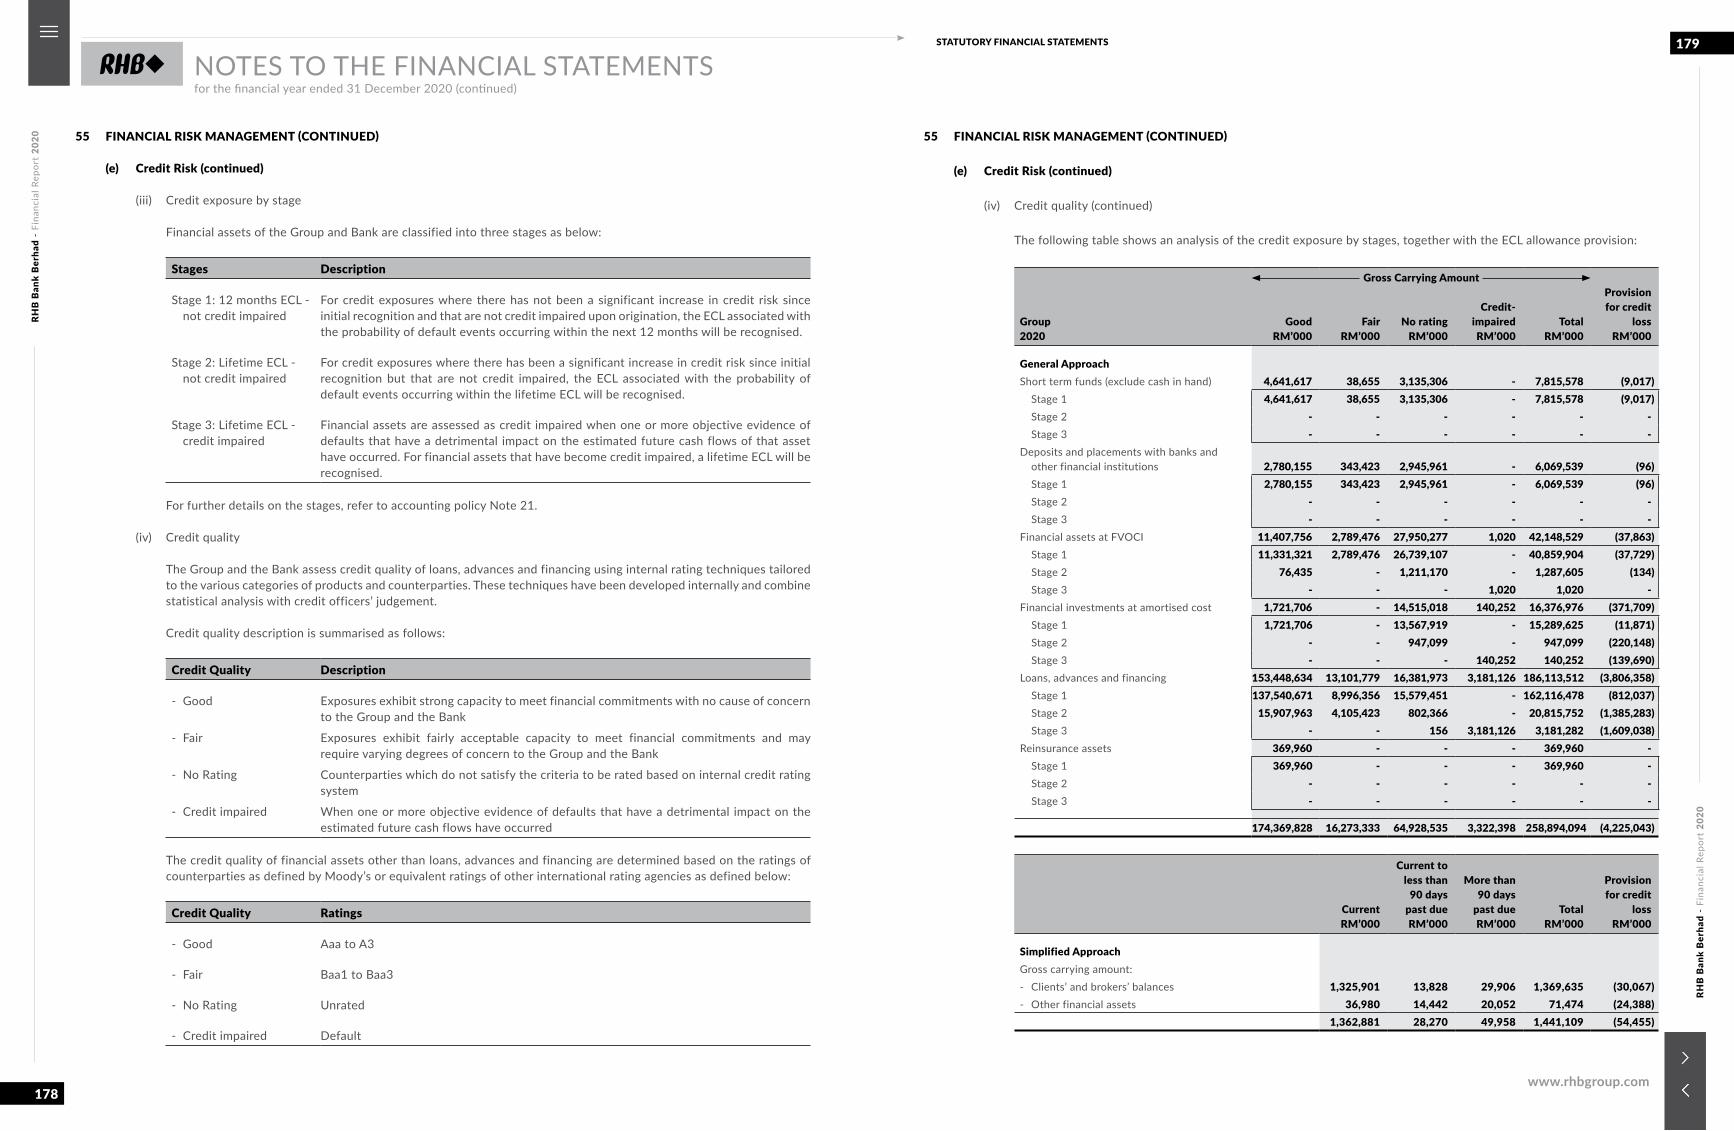
RHB
Ban
k B
erha
d -
Fina
ncia
l Rep
ort
2020
RHB
Ban
k B
erha
d -
Fina
ncia
l Rep
ort
2020
178
179STATUTORY FINANCIAL STATEMENTS
www.rhbgroup.com
NOTES TO THE FINANCIAL STATEMENTSfor the financial year ended 31 December 2020 (continued)
55 FINANCIAL RISK MANAGEMENT (CONTINUED)
(e) Credit Risk (continued)
(iii) Credit exposure by stage
Financial assets of the Group and Bank are classified into three stages as below:
Stages Description
Stage 1: 12 months ECL - not credit impaired
For credit exposures where there has not been a significant increase in credit risk since initial recognition and that are not credit impaired upon origination, the ECL associated with the probability of default events occurring within the next 12 months will be recognised.
Stage 2: Lifetime ECL - not credit impaired
For credit exposures where there has been a significant increase in credit risk since initial recognition but that are not credit impaired, the ECL associated with the probability of default events occurring within the lifetime ECL will be recognised.
Stage 3: Lifetime ECL - credit impaired
Financial assets are assessed as credit impaired when one or more objective evidence of defaults that have a detrimental impact on the estimated future cash flows of that asset have occurred. For financial assets that have become credit impaired, a lifetime ECL will be recognised.
For further details on the stages, refer to accounting policy Note 21.
(iv) Credit quality
The Group and the Bank assess credit quality of loans, advances and financing using internal rating techniques tailored to the various categories of products and counterparties. These techniques have been developed internally and combine statistical analysis with credit officers’ judgement.
Credit quality description is summarised as follows:
Credit Quality Description
- Good Exposures exhibit strong capacity to meet financial commitments with no cause of concern to the Group and the Bank
- Fair Exposures exhibit fairly acceptable capacity to meet financial commitments and may require varying degrees of concern to the Group and the Bank
- No Rating Counterparties which do not satisfy the criteria to be rated based on internal credit rating system
- Credit impaired When one or more objective evidence of defaults that have a detrimental impact on the estimated future cash flows have occurred
The credit quality of financial assets other than loans, advances and financing are determined based on the ratings of counterparties as defined by Moody’s or equivalent ratings of other international rating agencies as defined below:
Credit Quality Ratings
- Good Aaa to A3
- Fair Baa1 to Baa3
- No Rating Unrated
- Credit impaired Default
55 FINANCIAL RISK MANAGEMENT (CONTINUED)
(e) Credit Risk (continued)
(iv) Credit quality (continued)
The following table shows an analysis of the credit exposure by stages, together with the ECL allowance provision:
Group2020
Gross Carrying AmountProvision for credit
lossRM’000
GoodRM’000
FairRM’000
No ratingRM’000
Credit-impairedRM’000
TotalRM’000
General ApproachShort term funds (exclude cash in hand) 4,641,617 38,655 3,135,306 - 7,815,578 (9,017) Stage 1 4,641,617 38,655 3,135,306 - 7,815,578 (9,017) Stage 2 - - - - - - Stage 3 - - - - - -Deposits and placements with banks and
other financial institutions 2,780,155 343,423 2,945,961 - 6,069,539 (96) Stage 1 2,780,155 343,423 2,945,961 - 6,069,539 (96) Stage 2 - - - - - - Stage 3 - - - - - -Financial assets at FVOCI 11,407,756 2,789,476 27,950,277 1,020 42,148,529 (37,863) Stage 1 11,331,321 2,789,476 26,739,107 - 40,859,904 (37,729) Stage 2 76,435 - 1,211,170 - 1,287,605 (134) Stage 3 - - - 1,020 1,020 -Financial investments at amortised cost 1,721,706 - 14,515,018 140,252 16,376,976 (371,709) Stage 1 1,721,706 - 13,567,919 - 15,289,625 (11,871) Stage 2 - - 947,099 - 947,099 (220,148) Stage 3 - - - 140,252 140,252 (139,690)Loans, advances and financing 153,448,634 13,101,779 16,381,973 3,181,126 186,113,512 (3,806,358) Stage 1 137,540,671 8,996,356 15,579,451 - 162,116,478 (812,037) Stage 2 15,907,963 4,105,423 802,366 - 20,815,752 (1,385,283) Stage 3 - - 156 3,181,126 3,181,282 (1,609,038)Reinsurance assets 369,960 - - - 369,960 - Stage 1 369,960 - - - 369,960 - Stage 2 - - - - - - Stage 3 - - - - - -
174,369,828 16,273,333 64,928,535 3,322,398 258,894,094 (4,225,043)
Current RM’000
Current toless than
90 days past due
RM’000
More than 90 days
past due RM’000
Total RM’000
Provision for credit
loss RM’000
Simplified ApproachGross carrying amount:- Clients’ and brokers’ balances 1,325,901 13,828 29,906 1,369,635 (30,067)- Other financial assets 36,980 14,442 20,052 71,474 (24,388)
1,362,881 28,270 49,958 1,441,109 (54,455)
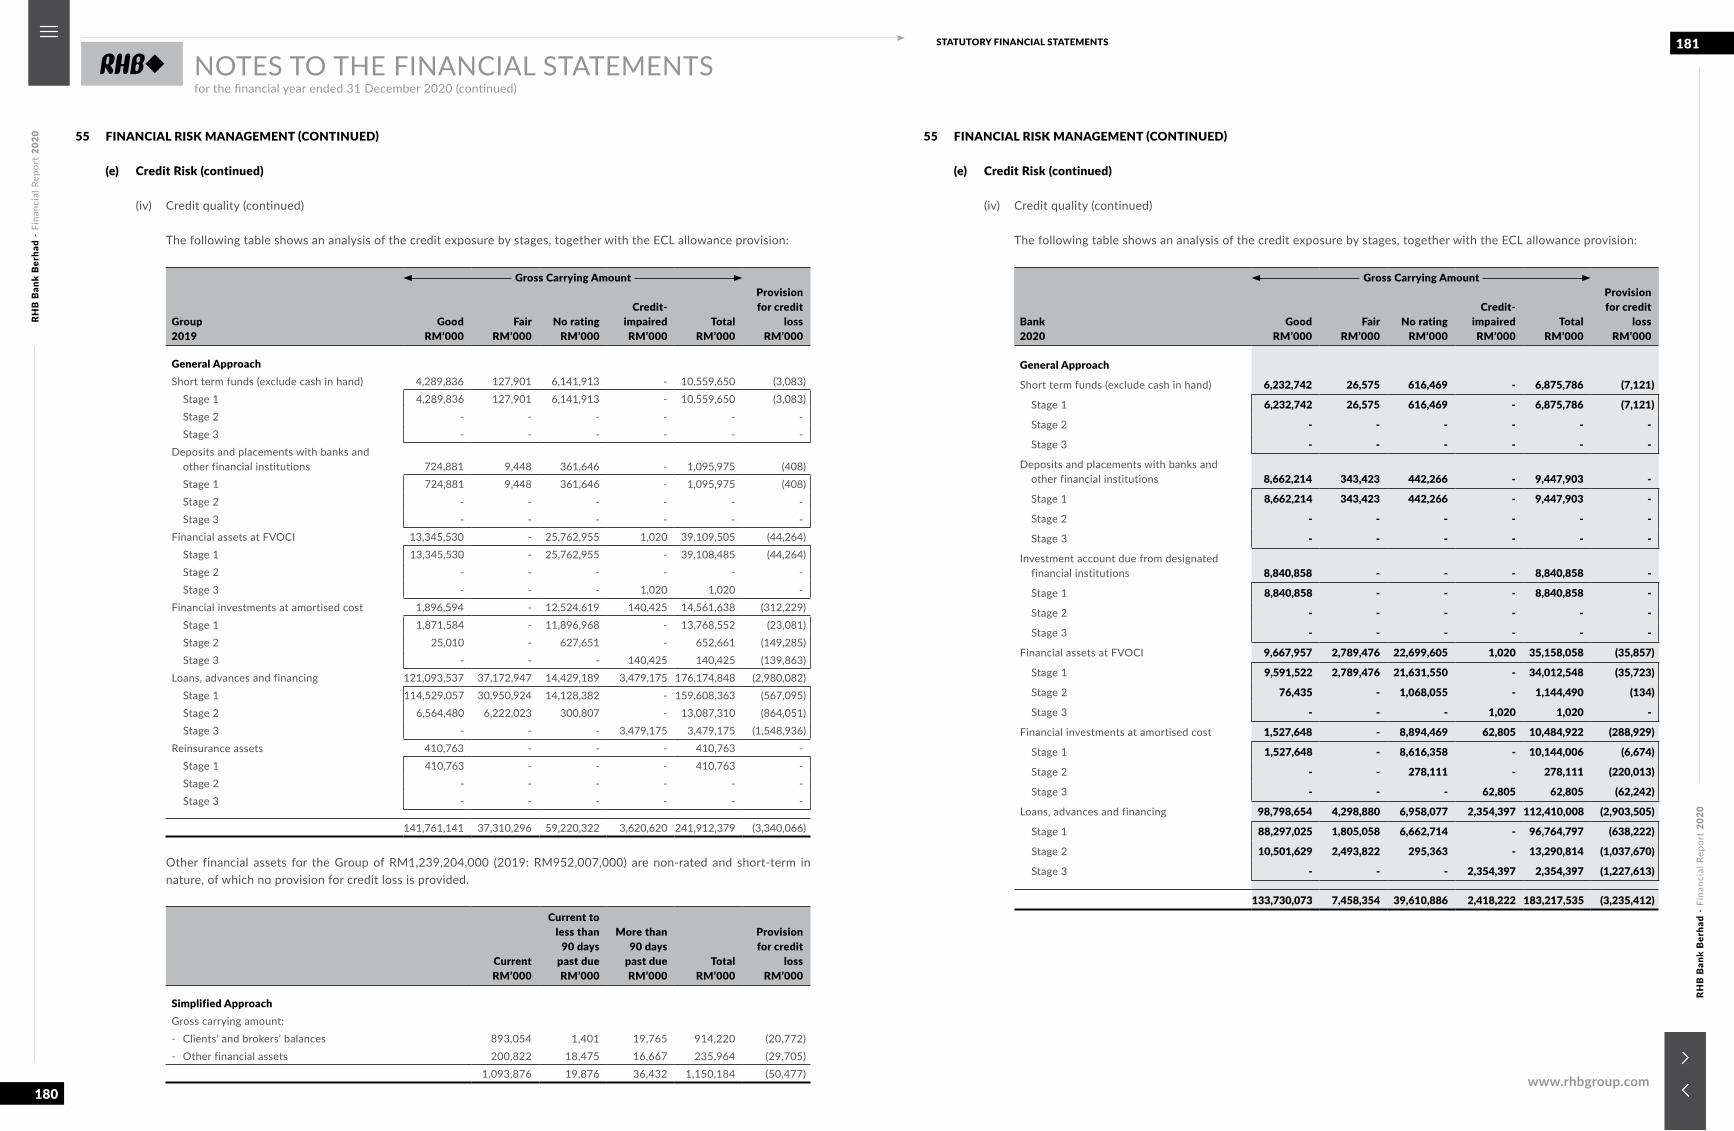
RHB
Ban
k B
erha
d -
Fina
ncia
l Rep
ort
2020
RHB
Ban
k B
erha
d -
Fina
ncia
l Rep
ort
2020
180
181STATUTORY FINANCIAL STATEMENTS
www.rhbgroup.com
NOTES TO THE FINANCIAL STATEMENTSfor the financial year ended 31 December 2020 (continued)
55 FINANCIAL RISK MANAGEMENT (CONTINUED)
(e) Credit Risk (continued)
(iv) Credit quality (continued)
The following table shows an analysis of the credit exposure by stages, together with the ECL allowance provision:
Group2019
Gross Carrying AmountProvision for credit
lossRM’000
GoodRM’000
FairRM’000
No ratingRM’000
Credit-impairedRM’000
TotalRM’000
General ApproachShort term funds (exclude cash in hand) 4,289,836 127,901 6,141,913 - 10,559,650 (3,083) Stage 1 4,289,836 127,901 6,141,913 - 10,559,650 (3,083) Stage 2 - - - - - - Stage 3 - - - - - -Deposits and placements with banks and
other financial institutions 724,881 9,448 361,646 - 1,095,975 (408) Stage 1 724,881 9,448 361,646 - 1,095,975 (408) Stage 2 - - - - - - Stage 3 - - - - - -Financial assets at FVOCI 13,345,530 - 25,762,955 1,020 39,109,505 (44,264) Stage 1 13,345,530 - 25,762,955 - 39,108,485 (44,264) Stage 2 - - - - - - Stage 3 - - - 1,020 1,020 -Financial investments at amortised cost 1,896,594 - 12,524,619 140,425 14,561,638 (312,229) Stage 1 1,871,584 - 11,896,968 - 13,768,552 (23,081) Stage 2 25,010 - 627,651 - 652,661 (149,285) Stage 3 - - - 140,425 140,425 (139,863)Loans, advances and financing 121,093,537 37,172,947 14,429,189 3,479,175 176,174,848 (2,980,082) Stage 1 114,529,057 30,950,924 14,128,382 - 159,608,363 (567,095) Stage 2 6,564,480 6,222,023 300,807 - 13,087,310 (864,051) Stage 3 - - - 3,479,175 3,479,175 (1,548,936)Reinsurance assets 410,763 - - - 410,763 - Stage 1 410,763 - - - 410,763 - Stage 2 - - - - - - Stage 3 - - - - - -
141,761,141 37,310,296 59,220,322 3,620,620 241,912,379 (3,340,066)
Other financial assets for the Group of RM1,239,204,000 (2019: RM952,007,000) are non-rated and short-term in nature, of which no provision for credit loss is provided.
Current RM’000
Current toless than
90 dayspast due RM’000
More than 90 days
past due RM’000
TotalRM’000
Provision for credit
loss RM’000
Simplified ApproachGross carrying amount:- Clients’ and brokers’ balances 893,054 1,401 19,765 914,220 (20,772)- Other financial assets 200,822 18,475 16,667 235,964 (29,705)
1,093,876 19,876 36,432 1,150,184 (50,477)
55 FINANCIAL RISK MANAGEMENT (CONTINUED)
(e) Credit Risk (continued)
(iv) Credit quality (continued)
The following table shows an analysis of the credit exposure by stages, together with the ECL allowance provision:
Bank 2020
Gross Carrying AmountProvision for credit
lossRM’000
GoodRM’000
FairRM’000
No ratingRM’000
Credit-impairedRM’000
TotalRM’000
General Approach
Short term funds (exclude cash in hand) 6,232,742 26,575 616,469 - 6,875,786 (7,121)
Stage 1 6,232,742 26,575 616,469 - 6,875,786 (7,121)
Stage 2 - - - - - -
Stage 3 - - - - - -
Deposits and placements with banks and other financial institutions 8,662,214 343,423 442,266 - 9,447,903 -
Stage 1 8,662,214 343,423 442,266 - 9,447,903 -
Stage 2 - - - - - -
Stage 3 - - - - - -
Investment account due from designated financial institutions 8,840,858 - - - 8,840,858 -
Stage 1 8,840,858 - - - 8,840,858 -
Stage 2 - - - - - -
Stage 3 - - - - - -
Financial assets at FVOCI 9,667,957 2,789,476 22,699,605 1,020 35,158,058 (35,857)
Stage 1 9,591,522 2,789,476 21,631,550 - 34,012,548 (35,723)
Stage 2 76,435 - 1,068,055 - 1,144,490 (134)
Stage 3 - - - 1,020 1,020 -
Financial investments at amortised cost 1,527,648 - 8,894,469 62,805 10,484,922 (288,929)
Stage 1 1,527,648 - 8,616,358 - 10,144,006 (6,674)
Stage 2 - - 278,111 - 278,111 (220,013)
Stage 3 - - - 62,805 62,805 (62,242)
Loans, advances and financing 98,798,654 4,298,880 6,958,077 2,354,397 112,410,008 (2,903,505)
Stage 1 88,297,025 1,805,058 6,662,714 - 96,764,797 (638,222)
Stage 2 10,501,629 2,493,822 295,363 - 13,290,814 (1,037,670)
Stage 3 - - - 2,354,397 2,354,397 (1,227,613)
133,730,073 7,458,354 39,610,886 2,418,222 183,217,535 (3,235,412)

RHB
Ban
k B
erha
d -
Fina
ncia
l Rep
ort
2020
RHB
Ban
k B
erha
d -
Fina
ncia
l Rep
ort
2020
182
183STATUTORY FINANCIAL STATEMENTS
www.rhbgroup.com
NOTES TO THE FINANCIAL STATEMENTSfor the financial year ended 31 December 2020 (continued)
55 FINANCIAL RISK MANAGEMENT (CONTINUED)
(e) Credit Risk (continued)
(iv) Credit quality (continued)
The following table shows an analysis of the credit exposure by stages, together with the ECL allowance provision:
Bank2019
Gross Carrying AmountProvision for credit
lossRM’000
GoodRM’000
FairRM’000
No ratingRM’000
Credit-impairedRM’000
TotalRM’000
General Approach
Short term funds (exclude cash in hand) 3,006,708 23,942 1,481,500 - 4,512,150 (2,733)
Stage 1 3,006,708 23,942 1,481,500 - 4,512,150 (2,733)
Stage 2 - - - - - -
Stage 3 - - - - - -
Deposits and placements with banks and other financial institutions 5,267,908 - 82,064 - 5,349,972 (340)
Stage 1 5,267,908 - 82,064 - 5,349,972 (340)
Stage 2 - - - - - -
Stage 3 - - - - - -
Investment account due from designated financial institutions 8,229,334 - - - 8,229,334 -
Stage 1 8,229,334 - - - 8,229,334 -
Stage 2 - - - - - -
Stage 3 - - - - - -
Financial assets at FVOCI 12,453,840 - 20,825,101 1,020 33,279,961 (41,865)
Stage 1 12,453,840 - 20,825,101 - 33,278,941 (41,865)
Stage 2 - - - - - -
Stage 3 - - - 1,020 1,020 -
Financial investments at amortised cost 1,433,118 - 8,435,187 62,978 9,931,283 (228,481)
Stage 1 1,408,108 - 8,435,187 - 9,843,295 (16,970)
Stage 2 25,010 - - - 25,010 (149,096)
Stage 3 - - - 62,978 62,978 (62,415)
Loans, advances and financing 79,115,728 21,552,575 6,356,135 2,623,781 109,648,219 (2,305,896)
Stage 1 74,212,459 16,884,002 6,136,839 - 97,233,300 (324,042)
Stage 2 4,903,269 4,668,573 219,296 - 9,791,138 (802,764)
Stage 3 - - - 2,623,781 2,623,781 (1,179,090)
109,506,636 21,576,517 37,179,987 2,687,779 170,950,919 (2,579,315)
Other financial assets for the Bank of RM1,021,009,000 (2019: RM751,623,000) are non-rated and short-term in nature, of which no provision for credit loss is provided.
55 FINANCIAL RISK MANAGEMENT (CONTINUED)
(e) Credit Risk (continued)
(iv) Credit quality (continued)
Credit risk exposure analysed by industry in respect of the Group’s financial assets, including commitments and contingencies, are set out below:
Group2020
Short termfunds and
deposits and
placementswith banks
and otherfinancial
institutionsˇ RM’000
Financialassets at
FVTPL~ RM’000
Financialassets at
FVOCI@ RM’000
Financialinvestments
atamortised
costsˠ RM’000
Loans,advances
andfinancing# RM’000
Clients’and
brokers’balances^ RM’000
Reinsuranceassets
RM’000
Otherfinancial
assets*RM’000
Commitmentsand
contingenciesRM’000
TotalRM’000
Agriculture, hunting, forestry and fishing - - 63,453 102,634 3,465,857 - - 25 834,255 4,466,224
Mining and quarrying - 2,704 52,487 - 389,611 - - 5 593,328 1,038,135
Manufacturing - 13,376 104,982 560 9,421,004 - - 6,734 7,139,496 16,686,152
Electricity, gas and water - - 1,539,464 75,550 1,680,463 - - 2,348 667,078 3,964,903
Construction - 17,326 1,720,626 1,019,050 13,163,308 - - 2,000 7,727,311 23,649,621
Wholesale & retail trade and restaurant & hotel - - 186,726 159,024 17,472,541 - - 1,526 7,324,483 25,144,300
Transport, storage and communication - 13,657 3,821,677 1,035,519 7,127,700 - - 78,752 1,653,763 13,731,068
Finance, insurance, real estate and business services 9,059,478 105,019 17,793,729 8,546,288 21,318,283 - - 2,043,502 10,180,985 69,047,284
Government and government agencies 4,825,639 2,238,908 16,550,532 5,290,398 3,497,372 - - 50,059 - 32,452,908
Others - - 314,853 8,263 106,968,335 1,339,571 369,960 755,494 21,304,014 131,060,490
13,885,117 2,390,990 42,148,529 16,237,286 184,504,474 1,339,571 369,960 2,940,445 57,424,713 321,241,085
ˇ Excludes stage 1 expected credit losses amounting to RM9,113,000.~ Excludes equity instruments, unit trusts and private equity funds amounting to RM2,071,116,000.@ Excludes equity instruments amounting to RM754,730,000.ˠ Excludes stage 1 and stage 2 expected credit losses amounting to RM232,019,000.# Excludes stage 1 and stage 2 expected credit losses amounting to RM2,197,320,000 and positive fair value changes amounting to
RM117,725,000.^ Excludes allowance for credit losses for non-credit impaired amounting to RM3,000.* Excludes allowance for credit losses for non-credit impaired amounting to RM676,000. Other financial assets include other assets
amounting to RM1,286,290,000 and derivative assets amounting to RM1,653,479,000.
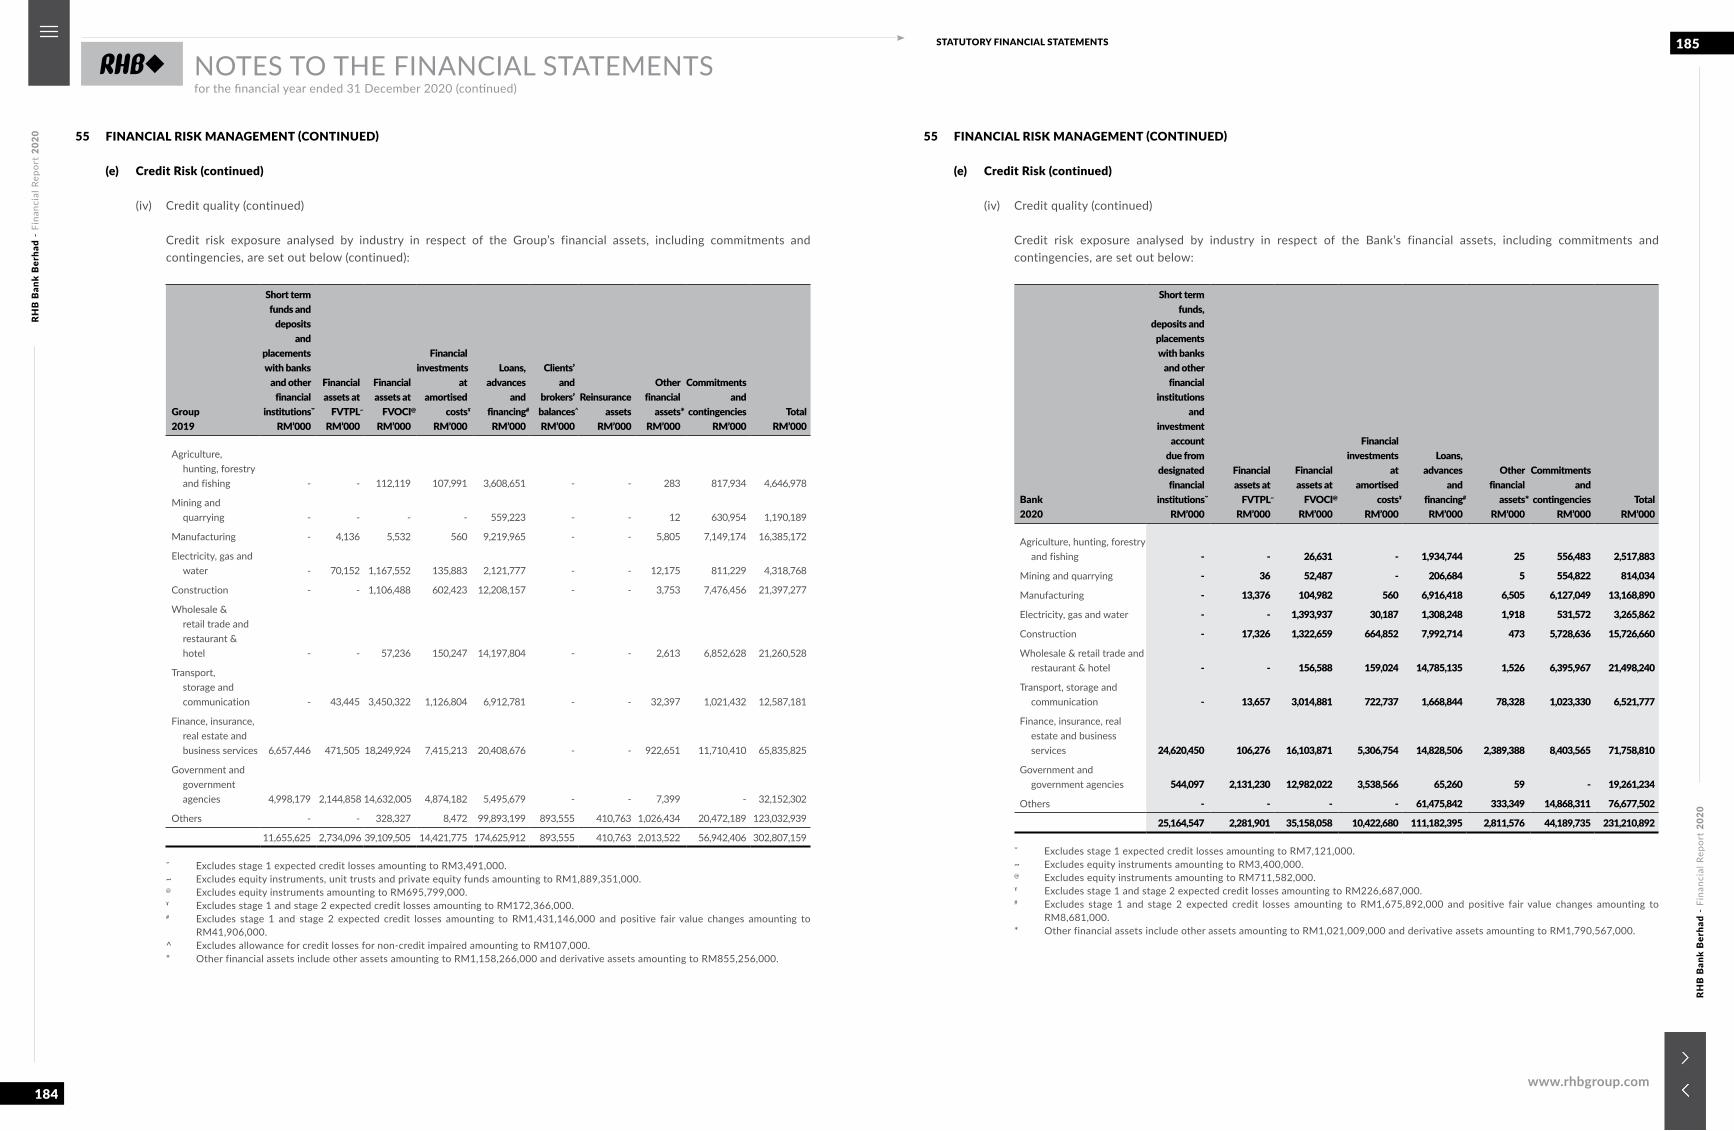
RHB
Ban
k B
erha
d -
Fina
ncia
l Rep
ort
2020
RHB
Ban
k B
erha
d -
Fina
ncia
l Rep
ort
2020
184
185STATUTORY FINANCIAL STATEMENTS
www.rhbgroup.com
NOTES TO THE FINANCIAL STATEMENTSfor the financial year ended 31 December 2020 (continued)
55 FINANCIAL RISK MANAGEMENT (CONTINUED)
(e) Credit Risk (continued)
(iv) Credit quality (continued)
Credit risk exposure analysed by industry in respect of the Group’s financial assets, including commitments and contingencies, are set out below (continued):
Group2019
Short termfunds and
deposits and
placementswith banks
and otherfinancial
institutionsˇ RM’000
Financialassets at
FVTPL~ RM’000
Financialassets at
FVOCI@ RM’000
Financialinvestments
atamortised
costsˠ RM’000
Loans,advances
andfinancing# RM’000
Clients’and
brokers’balances^ RM’000
Reinsuranceassets
RM’000
Otherfinancial
assets*RM’000
Commitmentsand
contingenciesRM’000
TotalRM’000
Agriculture, hunting, forestry and fishing - - 112,119 107,991 3,608,651 - - 283 817,934 4,646,978
Mining and quarrying - - - - 559,223 - - 12 630,954 1,190,189
Manufacturing - 4,136 5,532 560 9,219,965 - - 5,805 7,149,174 16,385,172
Electricity, gas and water - 70,152 1,167,552 135,883 2,121,777 - - 12,175 811,229 4,318,768
Construction - - 1,106,488 602,423 12,208,157 - - 3,753 7,476,456 21,397,277
Wholesale & retail trade and restaurant & hotel - - 57,236 150,247 14,197,804 - - 2,613 6,852,628 21,260,528
Transport, storage and communication - 43,445 3,450,322 1,126,804 6,912,781 - - 32,397 1,021,432 12,587,181
Finance, insurance, real estate and business services 6,657,446 471,505 18,249,924 7,415,213 20,408,676 - - 922,651 11,710,410 65,835,825
Government and government agencies 4,998,179 2,144,858 14,632,005 4,874,182 5,495,679 - - 7,399 - 32,152,302
Others - - 328,327 8,472 99,893,199 893,555 410,763 1,026,434 20,472,189 123,032,939
11,655,625 2,734,096 39,109,505 14,421,775 174,625,912 893,555 410,763 2,013,522 56,942,406 302,807,159
ˇ Excludes stage 1 expected credit losses amounting to RM3,491,000.~ Excludes equity instruments, unit trusts and private equity funds amounting to RM1,889,351,000.@ Excludes equity instruments amounting to RM695,799,000.ˠ Excludes stage 1 and stage 2 expected credit losses amounting to RM172,366,000.# Excludes stage 1 and stage 2 expected credit losses amounting to RM1,431,146,000 and positive fair value changes amounting to
RM41,906,000.^ Excludes allowance for credit losses for non-credit impaired amounting to RM107,000.* Other financial assets include other assets amounting to RM1,158,266,000 and derivative assets amounting to RM855,256,000.
55 FINANCIAL RISK MANAGEMENT (CONTINUED)
(e) Credit Risk (continued)
(iv) Credit quality (continued)
Credit risk exposure analysed by industry in respect of the Bank’s financial assets, including commitments and contingencies, are set out below:
Bank2020
Short term funds,
deposits and placements with banks
and other financial
institutions and
investment account
due from designated
financialinstitutionsˇ
RM’000
Financialassets at
FVTPL~ RM’000
Financialassets at
FVOCI@ RM’000
Financialinvestments
atamortised
costsˠ RM’000
Loans,advances
andfinancing# RM’000
Otherfinancial
assets*RM’000
Commitmentsand
contingenciesRM’000
TotalRM’000
Agriculture, hunting, forestry and fishing - - 26,631 - 1,934,744 25 556,483 2,517,883
Mining and quarrying - 36 52,487 - 206,684 5 554,822 814,034
Manufacturing - 13,376 104,982 560 6,916,418 6,505 6,127,049 13,168,890
Electricity, gas and water - - 1,393,937 30,187 1,308,248 1,918 531,572 3,265,862
Construction - 17,326 1,322,659 664,852 7,992,714 473 5,728,636 15,726,660
Wholesale & retail trade and restaurant & hotel - - 156,588 159,024 14,785,135 1,526 6,395,967 21,498,240
Transport, storage and communication - 13,657 3,014,881 722,737 1,668,844 78,328 1,023,330 6,521,777
Finance, insurance, real estate and business services 24,620,450 106,276 16,103,871 5,306,754 14,828,506 2,389,388 8,403,565 71,758,810
Government and government agencies 544,097 2,131,230 12,982,022 3,538,566 65,260 59 - 19,261,234
Others - - - - 61,475,842 333,349 14,868,311 76,677,502
25,164,547 2,281,901 35,158,058 10,422,680 111,182,395 2,811,576 44,189,735 231,210,892
ˇ Excludes stage 1 expected credit losses amounting to RM7,121,000.~ Excludes equity instruments amounting to RM3,400,000.@ Excludes equity instruments amounting to RM711,582,000.ˠ Excludes stage 1 and stage 2 expected credit losses amounting to RM226,687,000.# Excludes stage 1 and stage 2 expected credit losses amounting to RM1,675,892,000 and positive fair value changes amounting to
RM8,681,000.* Other financial assets include other assets amounting to RM1,021,009,000 and derivative assets amounting to RM1,790,567,000.
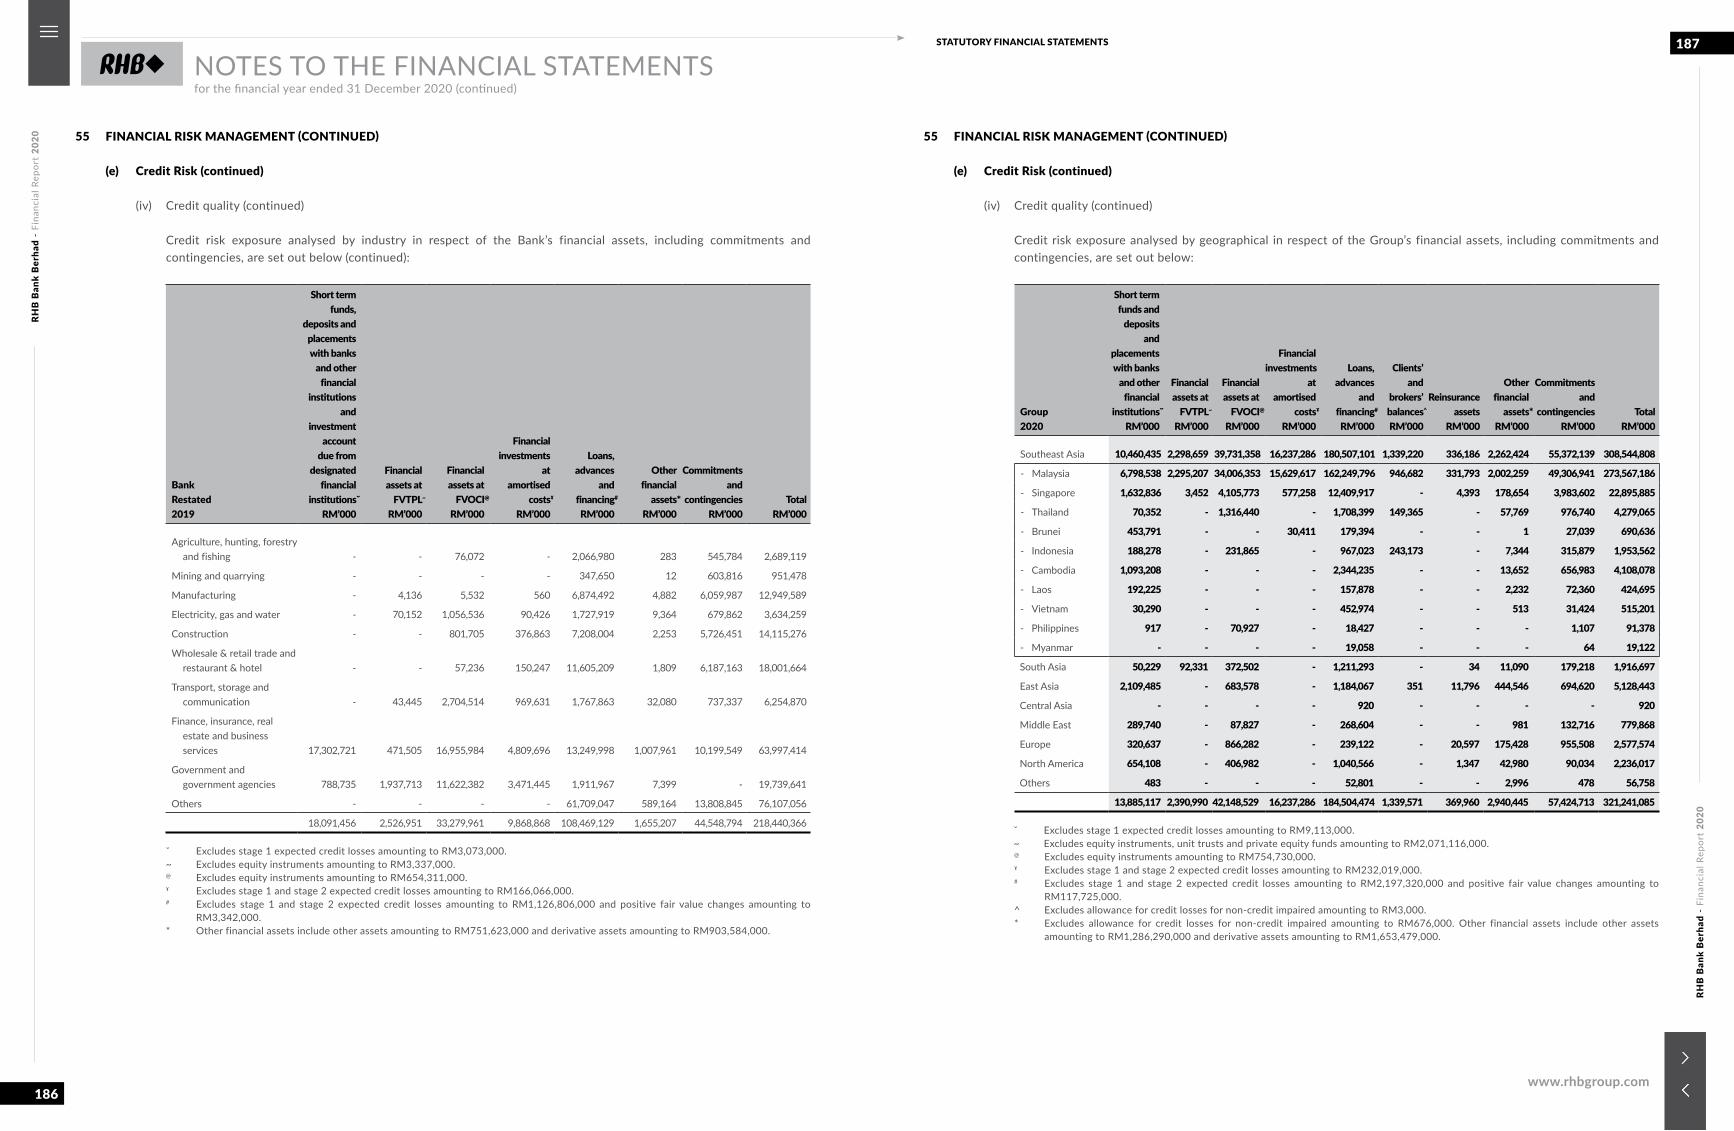
RHB
Ban
k B
erha
d -
Fina
ncia
l Rep
ort
2020
RHB
Ban
k B
erha
d -
Fina
ncia
l Rep
ort
2020
186
187STATUTORY FINANCIAL STATEMENTS
www.rhbgroup.com
NOTES TO THE FINANCIAL STATEMENTSfor the financial year ended 31 December 2020 (continued)
55 FINANCIAL RISK MANAGEMENT (CONTINUED)
(e) Credit Risk (continued)
(iv) Credit quality (continued)
Credit risk exposure analysed by industry in respect of the Bank’s financial assets, including commitments and contingencies, are set out below (continued):
BankRestated2019
Short term funds,
deposits and placements with banks
and other financial
institutions and
investment account
due from designated
financialinstitutionsˇ
RM’000
Financialassets at
FVTPL~ RM’000
Financialassets at
FVOCI@ RM’000
Financialinvestments
atamortised
costsˠ RM’000
Loans,advances
andfinancing# RM’000
Otherfinancial
assets*RM’000
Commitmentsand
contingenciesRM’000
TotalRM’000
Agriculture, hunting, forestry and fishing - - 76,072 - 2,066,980 283 545,784 2,689,119
Mining and quarrying - - - - 347,650 12 603,816 951,478
Manufacturing - 4,136 5,532 560 6,874,492 4,882 6,059,987 12,949,589
Electricity, gas and water - 70,152 1,056,536 90,426 1,727,919 9,364 679,862 3,634,259
Construction - - 801,705 376,863 7,208,004 2,253 5,726,451 14,115,276
Wholesale & retail trade and restaurant & hotel - - 57,236 150,247 11,605,209 1,809 6,187,163 18,001,664
Transport, storage and communication - 43,445 2,704,514 969,631 1,767,863 32,080 737,337 6,254,870
Finance, insurance, real estate and business services 17,302,721 471,505 16,955,984 4,809,696 13,249,998 1,007,961 10,199,549 63,997,414
Government and government agencies 788,735 1,937,713 11,622,382 3,471,445 1,911,967 7,399 - 19,739,641
Others - - - - 61,709,047 589,164 13,808,845 76,107,056
18,091,456 2,526,951 33,279,961 9,868,868 108,469,129 1,655,207 44,548,794 218,440,366
ˇ Excludes stage 1 expected credit losses amounting to RM3,073,000.~ Excludes equity instruments amounting to RM3,337,000.@ Excludes equity instruments amounting to RM654,311,000.ˠ Excludes stage 1 and stage 2 expected credit losses amounting to RM166,066,000.# Excludes stage 1 and stage 2 expected credit losses amounting to RM1,126,806,000 and positive fair value changes amounting to
RM3,342,000.* Other financial assets include other assets amounting to RM751,623,000 and derivative assets amounting to RM903,584,000.
55 FINANCIAL RISK MANAGEMENT (CONTINUED)
(e) Credit Risk (continued)
(iv) Credit quality (continued)
Credit risk exposure analysed by geographical in respect of the Group’s financial assets, including commitments and contingencies, are set out below:
Group2020
Short termfunds and
deposits and
placementswith banks
and otherfinancial
institutionsˇ RM’000
Financialassets at
FVTPL~ RM’000
Financialassets at
FVOCI@ RM’000
Financialinvestments
atamortised
costsˠ RM’000
Loans,advances
andfinancing# RM’000
Clients’and
brokers’balances^ RM’000
Reinsuranceassets
RM’000
Otherfinancial
assets*RM’000
Commitmentsand
contingenciesRM’000
TotalRM’000
Southeast Asia 10,460,435 2,298,659 39,731,358 16,237,286 180,507,101 1,339,220 336,186 2,262,424 55,372,139 308,544,808
- Malaysia 6,798,538 2,295,207 34,006,353 15,629,617 162,249,796 946,682 331,793 2,002,259 49,306,941 273,567,186
- Singapore 1,632,836 3,452 4,105,773 577,258 12,409,917 - 4,393 178,654 3,983,602 22,895,885
- Thailand 70,352 - 1,316,440 - 1,708,399 149,365 - 57,769 976,740 4,279,065
- Brunei 453,791 - - 30,411 179,394 - - 1 27,039 690,636
- Indonesia 188,278 - 231,865 - 967,023 243,173 - 7,344 315,879 1,953,562
- Cambodia 1,093,208 - - - 2,344,235 - - 13,652 656,983 4,108,078
- Laos 192,225 - - - 157,878 - - 2,232 72,360 424,695
- Vietnam 30,290 - - - 452,974 - - 513 31,424 515,201
- Philippines 917 - 70,927 - 18,427 - - - 1,107 91,378
- Myanmar - - - - 19,058 - - - 64 19,122
South Asia 50,229 92,331 372,502 - 1,211,293 - 34 11,090 179,218 1,916,697
East Asia 2,109,485 - 683,578 - 1,184,067 351 11,796 444,546 694,620 5,128,443
Central Asia - - - - 920 - - - - 920
Middle East 289,740 - 87,827 - 268,604 - - 981 132,716 779,868
Europe 320,637 - 866,282 - 239,122 - 20,597 175,428 955,508 2,577,574
North America 654,108 - 406,982 - 1,040,566 - 1,347 42,980 90,034 2,236,017
Others 483 - - - 52,801 - - 2,996 478 56,758
13,885,117 2,390,990 42,148,529 16,237,286 184,504,474 1,339,571 369,960 2,940,445 57,424,713 321,241,085
ˇ Excludes stage 1 expected credit losses amounting to RM9,113,000.~ Excludes equity instruments, unit trusts and private equity funds amounting to RM2,071,116,000.@ Excludes equity instruments amounting to RM754,730,000.ˠ Excludes stage 1 and stage 2 expected credit losses amounting to RM232,019,000.# Excludes stage 1 and stage 2 expected credit losses amounting to RM2,197,320,000 and positive fair value changes amounting to
RM117,725,000.^ Excludes allowance for credit losses for non-credit impaired amounting to RM3,000.* Excludes allowance for credit losses for non-credit impaired amounting to RM676,000. Other financial assets include other assets
amounting to RM1,286,290,000 and derivative assets amounting to RM1,653,479,000.
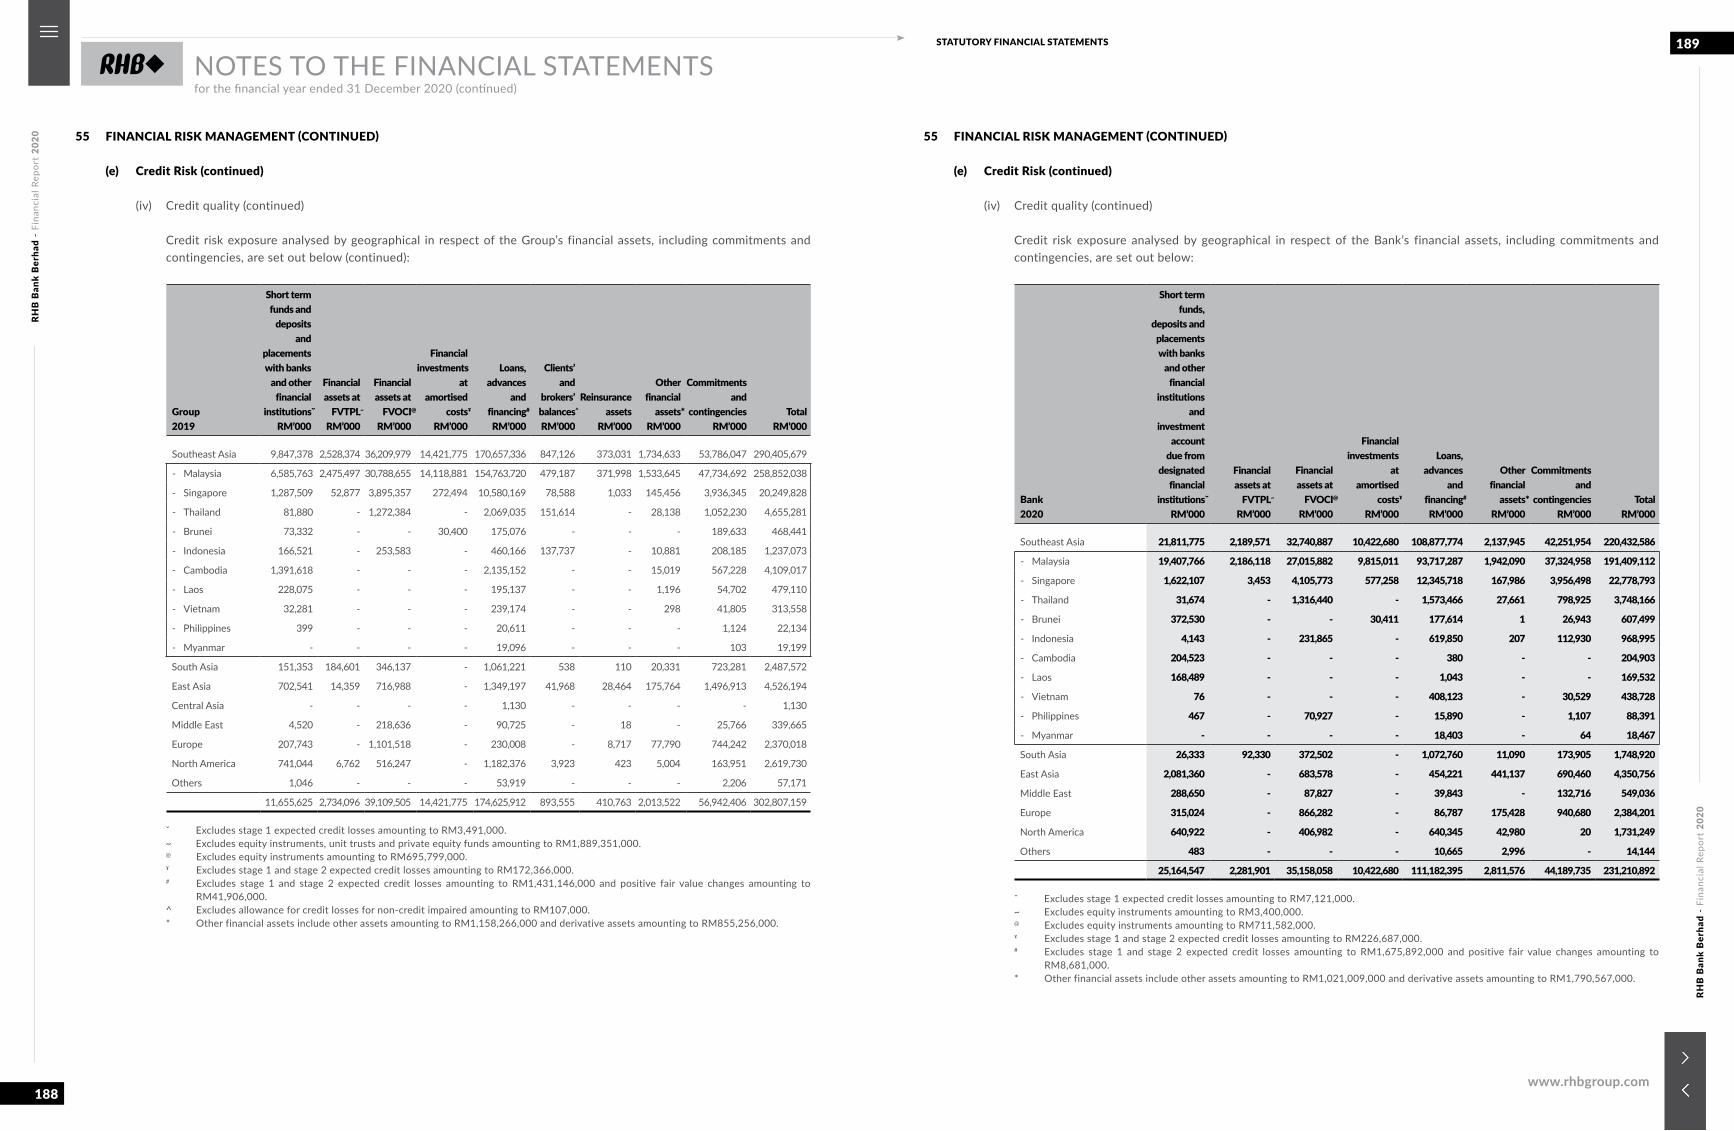
RHB
Ban
k B
erha
d -
Fina
ncia
l Rep
ort
2020
RHB
Ban
k B
erha
d -
Fina
ncia
l Rep
ort
2020
188
189STATUTORY FINANCIAL STATEMENTS
www.rhbgroup.com
NOTES TO THE FINANCIAL STATEMENTSfor the financial year ended 31 December 2020 (continued)
55 FINANCIAL RISK MANAGEMENT (CONTINUED)
(e) Credit Risk (continued)
(iv) Credit quality (continued)
Credit risk exposure analysed by geographical in respect of the Group’s financial assets, including commitments and contingencies, are set out below (continued):
Group2019
Short termfunds and
deposits and
placementswith banks
and otherfinancial
institutionsˇ RM’000
Financialassets at
FVTPL~ RM’000
Financialassets at
FVOCI@ RM’000
Financialinvestments
atamortised
costsˠ RM’000
Loans,advances
andfinancing# RM’000
Clients’and
brokers’balances^ RM’000
Reinsuranceassets
RM’000
Otherfinancial
assets*RM’000
Commitmentsand
contingenciesRM’000
TotalRM’000
Southeast Asia 9,847,378 2,528,374 36,209,979 14,421,775 170,657,336 847,126 373,031 1,734,633 53,786,047 290,405,679
- Malaysia 6,585,763 2,475,497 30,788,655 14,118,881 154,763,720 479,187 371,998 1,533,645 47,734,692 258,852,038
- Singapore 1,287,509 52,877 3,895,357 272,494 10,580,169 78,588 1,033 145,456 3,936,345 20,249,828
- Thailand 81,880 - 1,272,384 - 2,069,035 151,614 - 28,138 1,052,230 4,655,281
- Brunei 73,332 - - 30,400 175,076 - - - 189,633 468,441
- Indonesia 166,521 - 253,583 - 460,166 137,737 - 10,881 208,185 1,237,073
- Cambodia 1,391,618 - - - 2,135,152 - - 15,019 567,228 4,109,017
- Laos 228,075 - - - 195,137 - - 1,196 54,702 479,110
- Vietnam 32,281 - - - 239,174 - - 298 41,805 313,558
- Philippines 399 - - - 20,611 - - - 1,124 22,134
- Myanmar - - - - 19,096 - - - 103 19,199
South Asia 151,353 184,601 346,137 - 1,061,221 538 110 20,331 723,281 2,487,572
East Asia 702,541 14,359 716,988 - 1,349,197 41,968 28,464 175,764 1,496,913 4,526,194
Central Asia - - - - 1,130 - - - - 1,130
Middle East 4,520 - 218,636 - 90,725 - 18 - 25,766 339,665
Europe 207,743 - 1,101,518 - 230,008 - 8,717 77,790 744,242 2,370,018
North America 741,044 6,762 516,247 - 1,182,376 3,923 423 5,004 163,951 2,619,730
Others 1,046 - - - 53,919 - - - 2,206 57,171
11,655,625 2,734,096 39,109,505 14,421,775 174,625,912 893,555 410,763 2,013,522 56,942,406 302,807,159
ˇ Excludes stage 1 expected credit losses amounting to RM3,491,000.~ Excludes equity instruments, unit trusts and private equity funds amounting to RM1,889,351,000.@ Excludes equity instruments amounting to RM695,799,000.ˠ Excludes stage 1 and stage 2 expected credit losses amounting to RM172,366,000.# Excludes stage 1 and stage 2 expected credit losses amounting to RM1,431,146,000 and positive fair value changes amounting to
RM41,906,000.^ Excludes allowance for credit losses for non-credit impaired amounting to RM107,000.* Other financial assets include other assets amounting to RM1,158,266,000 and derivative assets amounting to RM855,256,000.
55 FINANCIAL RISK MANAGEMENT (CONTINUED)
(e) Credit Risk (continued)
(iv) Credit quality (continued)
Credit risk exposure analysed by geographical in respect of the Bank’s financial assets, including commitments and contingencies, are set out below:
Bank2020
Short term funds,
deposits and placements with banks
and other financial
institutions and
investment account
due from designated
financialinstitutionsˇ
RM’000
Financialassets at
FVTPL~ RM’000
Financialassets at
FVOCI@ RM’000
Financialinvestments
atamortised
costsˠ RM’000
Loans,advances
andfinancing# RM’000
Otherfinancial
assets*RM’000
Commitmentsand
contingenciesRM’000
TotalRM’000
Southeast Asia 21,811,775 2,189,571 32,740,887 10,422,680 108,877,774 2,137,945 42,251,954 220,432,586
- Malaysia 19,407,766 2,186,118 27,015,882 9,815,011 93,717,287 1,942,090 37,324,958 191,409,112
- Singapore 1,622,107 3,453 4,105,773 577,258 12,345,718 167,986 3,956,498 22,778,793
- Thailand 31,674 - 1,316,440 - 1,573,466 27,661 798,925 3,748,166
- Brunei 372,530 - - 30,411 177,614 1 26,943 607,499
- Indonesia 4,143 - 231,865 - 619,850 207 112,930 968,995
- Cambodia 204,523 - - - 380 - - 204,903
- Laos 168,489 - - - 1,043 - - 169,532
- Vietnam 76 - - - 408,123 - 30,529 438,728
- Philippines 467 - 70,927 - 15,890 - 1,107 88,391
- Myanmar - - - - 18,403 - 64 18,467
South Asia 26,333 92,330 372,502 - 1,072,760 11,090 173,905 1,748,920
East Asia 2,081,360 - 683,578 - 454,221 441,137 690,460 4,350,756
Middle East 288,650 - 87,827 - 39,843 - 132,716 549,036
Europe 315,024 - 866,282 - 86,787 175,428 940,680 2,384,201
North America 640,922 - 406,982 - 640,345 42,980 20 1,731,249
Others 483 - - - 10,665 2,996 - 14,144
25,164,547 2,281,901 35,158,058 10,422,680 111,182,395 2,811,576 44,189,735 231,210,892
ˇ Excludes stage 1 expected credit losses amounting to RM7,121,000.~ Excludes equity instruments amounting to RM3,400,000.@ Excludes equity instruments amounting to RM711,582,000.ˠ Excludes stage 1 and stage 2 expected credit losses amounting to RM226,687,000.# Excludes stage 1 and stage 2 expected credit losses amounting to RM1,675,892,000 and positive fair value changes amounting to
RM8,681,000.* Other financial assets include other assets amounting to RM1,021,009,000 and derivative assets amounting to RM1,790,567,000.
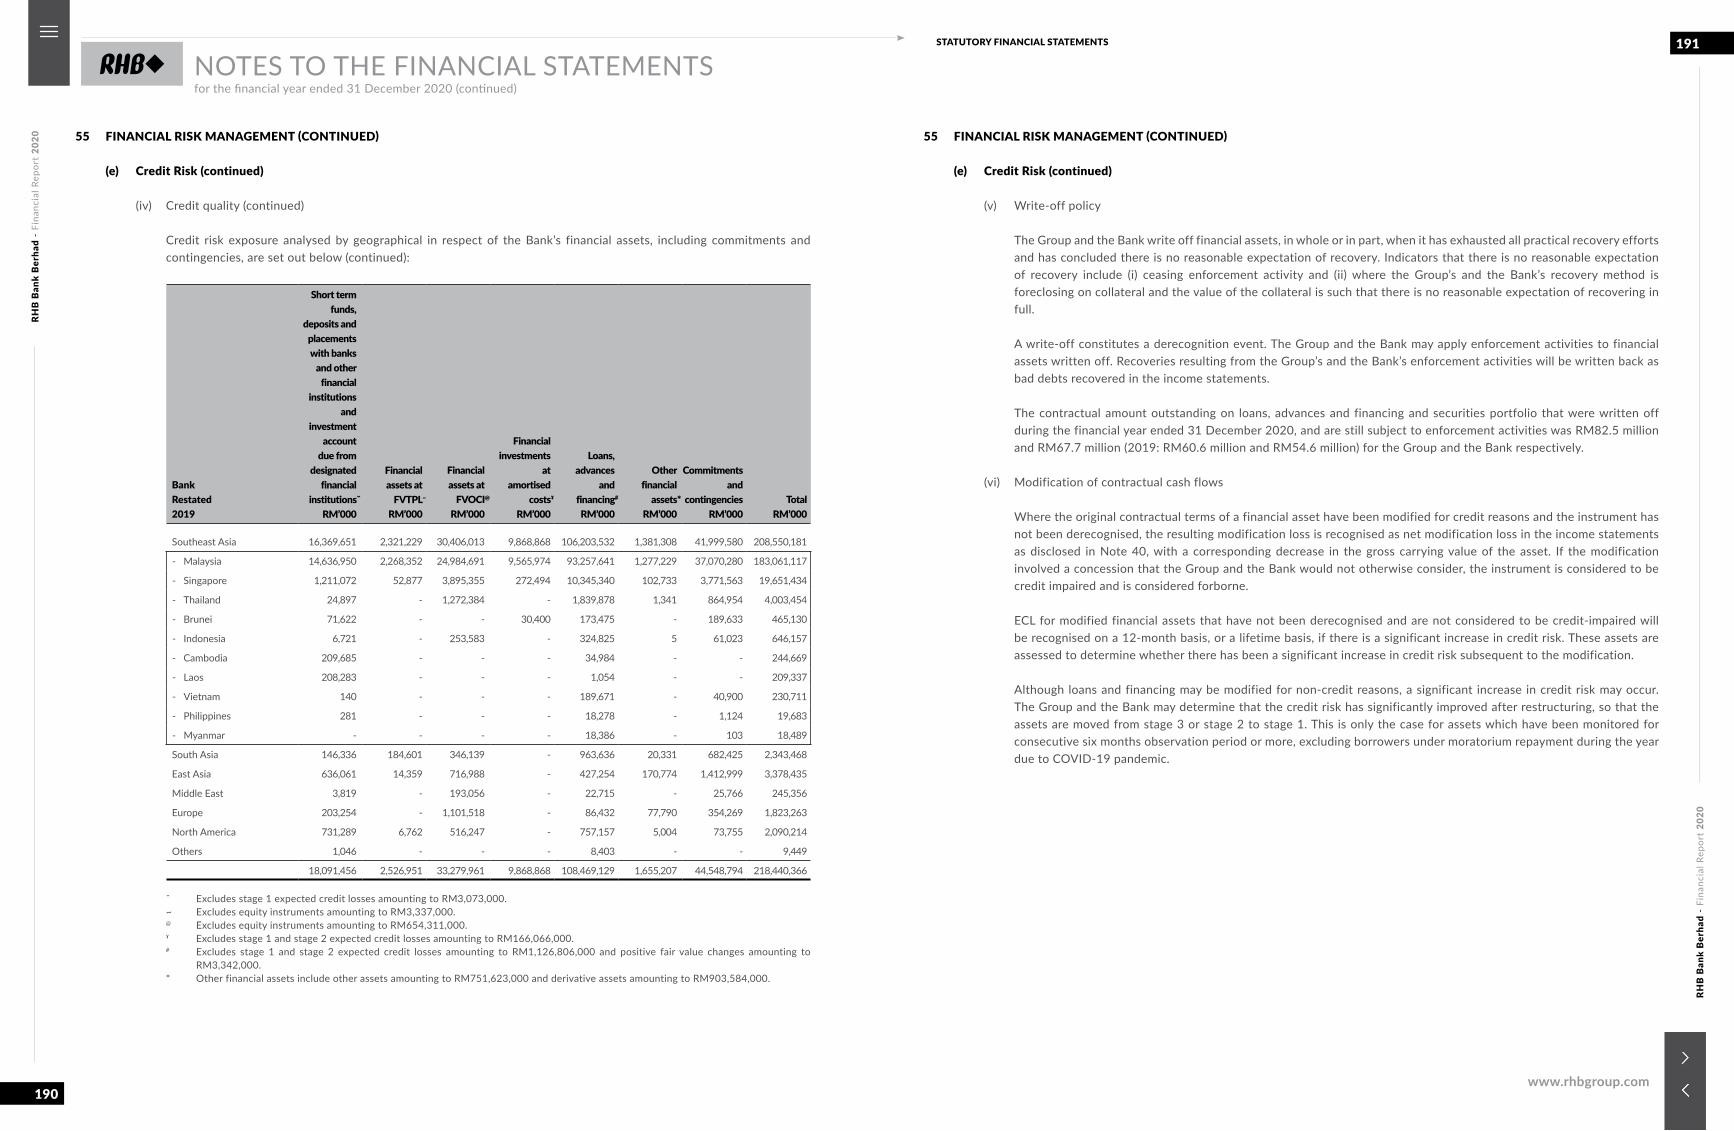
RHB
Ban
k B
erha
d -
Fina
ncia
l Rep
ort
2020
RHB
Ban
k B
erha
d -
Fina
ncia
l Rep
ort
2020
190
191STATUTORY FINANCIAL STATEMENTS
www.rhbgroup.com
NOTES TO THE FINANCIAL STATEMENTSfor the financial year ended 31 December 2020 (continued)
55 FINANCIAL RISK MANAGEMENT (CONTINUED)
(e) Credit Risk (continued)
(iv) Credit quality (continued)
Credit risk exposure analysed by geographical in respect of the Bank’s financial assets, including commitments and contingencies, are set out below (continued):
BankRestated2019
Short term funds,
deposits and placements with banks
and other financial
institutions and
investment account
due from designated
financialinstitutionsˇ
RM’000
Financialassets at
FVTPL~ RM’000
Financialassets at
FVOCI@ RM’000
Financialinvestments
atamortised
costsˠ RM’000
Loans,advances
andfinancing# RM’000
Otherfinancial
assets*RM’000
Commitmentsand
contingenciesRM’000
TotalRM’000
Southeast Asia 16,369,651 2,321,229 30,406,013 9,868,868 106,203,532 1,381,308 41,999,580 208,550,181
- Malaysia 14,636,950 2,268,352 24,984,691 9,565,974 93,257,641 1,277,229 37,070,280 183,061,117
- Singapore 1,211,072 52,877 3,895,355 272,494 10,345,340 102,733 3,771,563 19,651,434
- Thailand 24,897 - 1,272,384 - 1,839,878 1,341 864,954 4,003,454
- Brunei 71,622 - - 30,400 173,475 - 189,633 465,130
- Indonesia 6,721 - 253,583 - 324,825 5 61,023 646,157
- Cambodia 209,685 - - - 34,984 - - 244,669
- Laos 208,283 - - - 1,054 - - 209,337
- Vietnam 140 - - - 189,671 - 40,900 230,711
- Philippines 281 - - - 18,278 - 1,124 19,683
- Myanmar - - - - 18,386 - 103 18,489
South Asia 146,336 184,601 346,139 - 963,636 20,331 682,425 2,343,468
East Asia 636,061 14,359 716,988 - 427,254 170,774 1,412,999 3,378,435
Middle East 3,819 - 193,056 - 22,715 - 25,766 245,356
Europe 203,254 - 1,101,518 - 86,432 77,790 354,269 1,823,263
North America 731,289 6,762 516,247 - 757,157 5,004 73,755 2,090,214
Others 1,046 - - - 8,403 - - 9,449
18,091,456 2,526,951 33,279,961 9,868,868 108,469,129 1,655,207 44,548,794 218,440,366
ˇ Excludes stage 1 expected credit losses amounting to RM3,073,000.~ Excludes equity instruments amounting to RM3,337,000.@ Excludes equity instruments amounting to RM654,311,000.ˠ Excludes stage 1 and stage 2 expected credit losses amounting to RM166,066,000.# Excludes stage 1 and stage 2 expected credit losses amounting to RM1,126,806,000 and positive fair value changes amounting to
RM3,342,000.* Other financial assets include other assets amounting to RM751,623,000 and derivative assets amounting to RM903,584,000.
55 FINANCIAL RISK MANAGEMENT (CONTINUED)
(e) Credit Risk (continued)
(v) Write-off policy
The Group and the Bank write off financial assets, in whole or in part, when it has exhausted all practical recovery efforts and has concluded there is no reasonable expectation of recovery. Indicators that there is no reasonable expectation of recovery include (i) ceasing enforcement activity and (ii) where the Group’s and the Bank’s recovery method is foreclosing on collateral and the value of the collateral is such that there is no reasonable expectation of recovering in full.
A write-off constitutes a derecognition event. The Group and the Bank may apply enforcement activities to financial assets written off. Recoveries resulting from the Group’s and the Bank’s enforcement activities will be written back as bad debts recovered in the income statements.
The contractual amount outstanding on loans, advances and financing and securities portfolio that were written off during the financial year ended 31 December 2020, and are still subject to enforcement activities was RM82.5 million and RM67.7 million (2019: RM60.6 million and RM54.6 million) for the Group and the Bank respectively.
(vi) Modification of contractual cash flows
Where the original contractual terms of a financial asset have been modified for credit reasons and the instrument has not been derecognised, the resulting modification loss is recognised as net modification loss in the income statements as disclosed in Note 40, with a corresponding decrease in the gross carrying value of the asset. If the modification involved a concession that the Group and the Bank would not otherwise consider, the instrument is considered to be credit impaired and is considered forborne.
ECL for modified financial assets that have not been derecognised and are not considered to be credit-impaired will be recognised on a 12-month basis, or a lifetime basis, if there is a significant increase in credit risk. These assets are assessed to determine whether there has been a significant increase in credit risk subsequent to the modification.
Although loans and financing may be modified for non-credit reasons, a significant increase in credit risk may occur. The Group and the Bank may determine that the credit risk has significantly improved after restructuring, so that the assets are moved from stage 3 or stage 2 to stage 1. This is only the case for assets which have been monitored for consecutive six months observation period or more, excluding borrowers under moratorium repayment during the year due to COVID-19 pandemic.
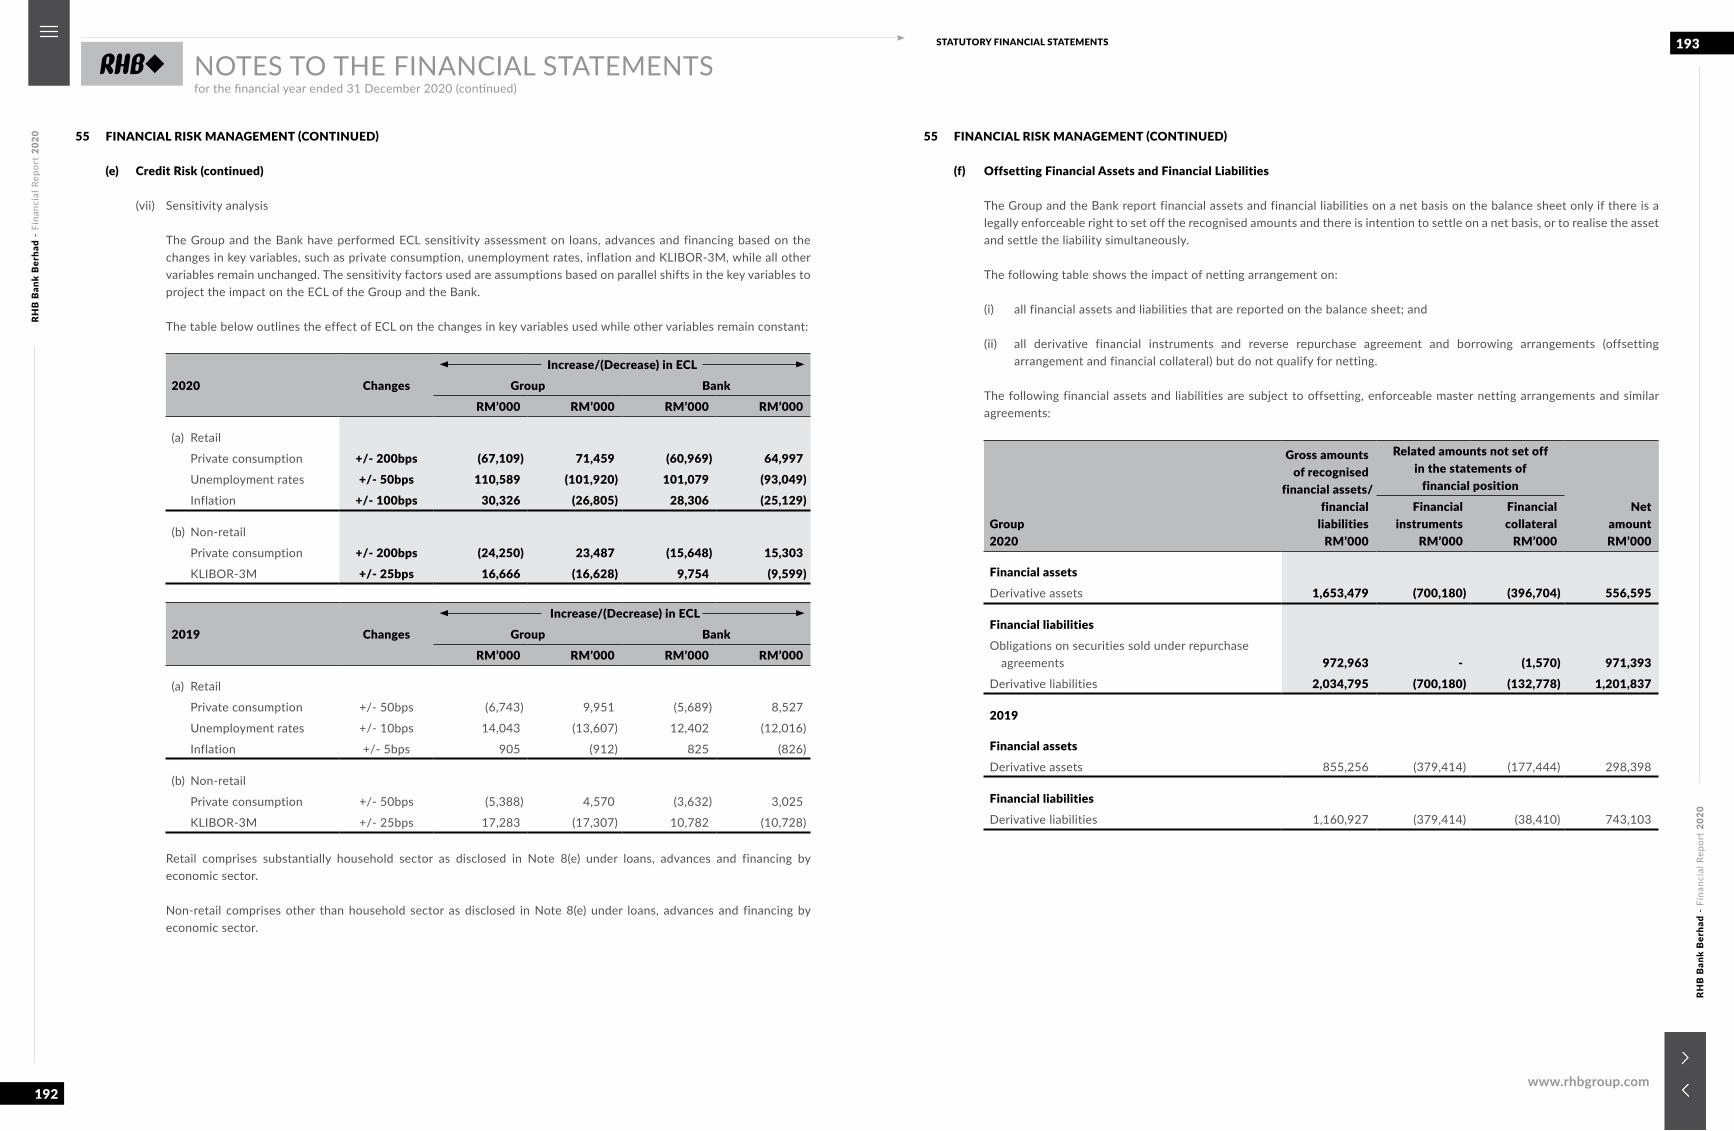
RHB
Ban
k B
erha
d -
Fina
ncia
l Rep
ort
2020
RHB
Ban
k B
erha
d -
Fina
ncia
l Rep
ort
2020
192
193STATUTORY FINANCIAL STATEMENTS
www.rhbgroup.com
NOTES TO THE FINANCIAL STATEMENTSfor the financial year ended 31 December 2020 (continued)
55 FINANCIAL RISK MANAGEMENT (CONTINUED)
(e) Credit Risk (continued)
(vii) Sensitivity analysis
The Group and the Bank have performed ECL sensitivity assessment on loans, advances and financing based on the changes in key variables, such as private consumption, unemployment rates, inflation and KLIBOR-3M, while all other variables remain unchanged. The sensitivity factors used are assumptions based on parallel shifts in the key variables to project the impact on the ECL of the Group and the Bank.
The table below outlines the effect of ECL on the changes in key variables used while other variables remain constant:
2020 ChangesIncrease/(Decrease) in ECL
Group BankRM’000 RM’000 RM’000 RM’000
(a) Retail
Private consumption +/- 200bps (67,109) 71,459 (60,969) 64,997 Unemployment rates +/- 50bps 110,589 (101,920) 101,079 (93,049) Inflation +/- 100bps 30,326 (26,805) 28,306 (25,129)
(b) Non-retail
Private consumption +/- 200bps (24,250) 23,487 (15,648) 15,303 KLIBOR-3M +/- 25bps 16,666 (16,628) 9,754 (9,599)
2019 ChangesIncrease/(Decrease) in ECL
Group BankRM’000 RM’000 RM’000 RM’000
(a) Retail
Private consumption +/- 50bps (6,743) 9,951 (5,689) 8,527
Unemployment rates +/- 10bps 14,043 (13,607) 12,402 (12,016)
Inflation +/- 5bps 905 (912) 825 (826)
(b) Non-retail
Private consumption +/- 50bps (5,388) 4,570 (3,632) 3,025
KLIBOR-3M +/- 25bps 17,283 (17,307) 10,782 (10,728)
Retail comprises substantially household sector as disclosed in Note 8(e) under loans, advances and financing by economic sector.
Non-retail comprises other than household sector as disclosed in Note 8(e) under loans, advances and financing by economic sector.
55 FINANCIAL RISK MANAGEMENT (CONTINUED)
(f) Offsetting Financial Assets and Financial Liabilities
The Group and the Bank report financial assets and financial liabilities on a net basis on the balance sheet only if there is a legally enforceable right to set off the recognised amounts and there is intention to settle on a net basis, or to realise the asset and settle the liability simultaneously.
The following table shows the impact of netting arrangement on:
(i) all financial assets and liabilities that are reported on the balance sheet; and
(ii) all derivative financial instruments and reverse repurchase agreement and borrowing arrangements (offsetting arrangement and financial collateral) but do not qualify for netting.
The following financial assets and liabilities are subject to offsetting, enforceable master netting arrangements and similar agreements:
Group2020
Gross amountsof recognised
financial assets/financial
liabilities RM’000
Related amounts not set offin the statements of
financial position Net
amount RM’000
Financialinstruments
RM’000
Financialcollateral
RM’000
Financial assetsDerivative assets 1,653,479 (700,180) (396,704) 556,595
Financial liabilitiesObligations on securities sold under repurchase
agreements 972,963 - (1,570) 971,393Derivative liabilities 2,034,795 (700,180) (132,778) 1,201,837
2019
Financial assetsDerivative assets 855,256 (379,414) (177,444) 298,398
Financial liabilitiesDerivative liabilities 1,160,927 (379,414) (38,410) 743,103
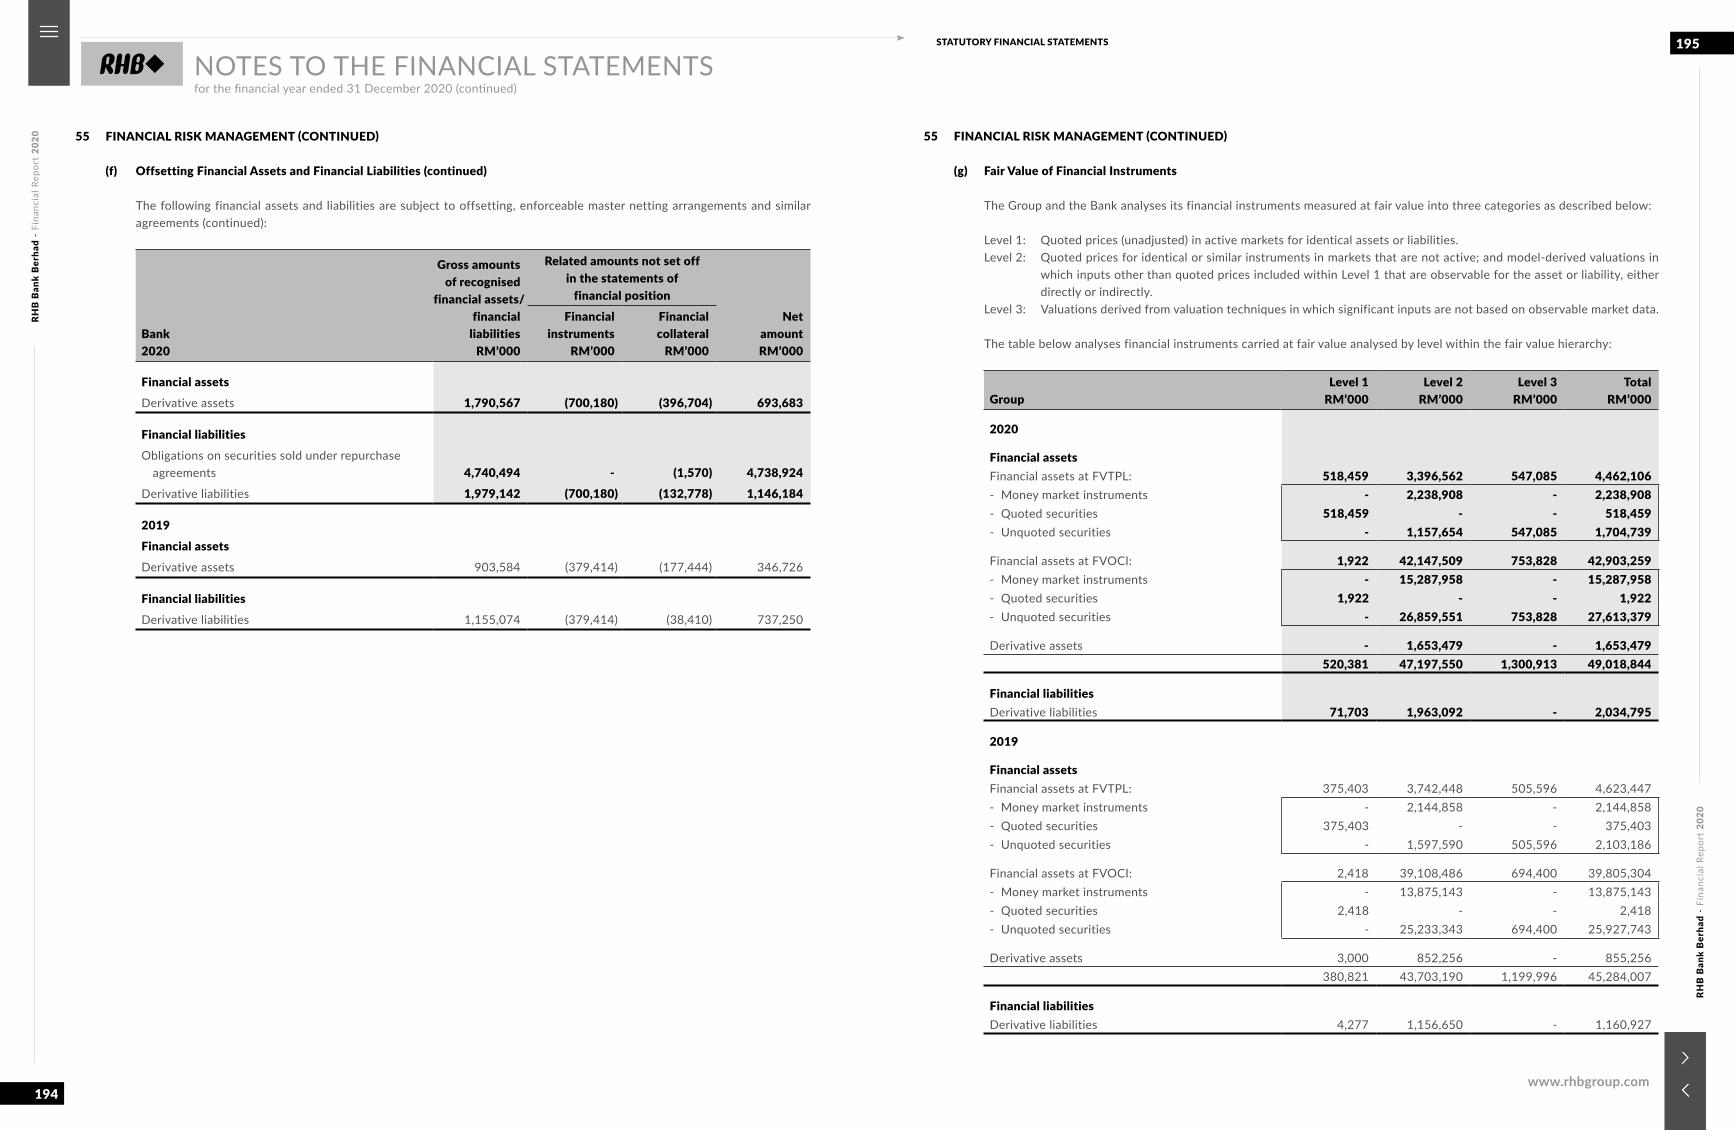
RHB
Ban
k B
erha
d -
Fina
ncia
l Rep
ort
2020
RHB
Ban
k B
erha
d -
Fina
ncia
l Rep
ort
2020
194
195STATUTORY FINANCIAL STATEMENTS
www.rhbgroup.com
NOTES TO THE FINANCIAL STATEMENTSfor the financial year ended 31 December 2020 (continued)
55 FINANCIAL RISK MANAGEMENT (CONTINUED)
(f) Offsetting Financial Assets and Financial Liabilities (continued)
The following financial assets and liabilities are subject to offsetting, enforceable master netting arrangements and similar agreements (continued):
Bank2020
Gross amountsof recognised
financial assets/financial
liabilities RM’000
Related amounts not set offin the statements of
financial position Net
amount RM’000
Financialinstruments
RM’000
Financialcollateral
RM’000
Financial assetsDerivative assets 1,790,567 (700,180) (396,704) 693,683
Financial liabilitiesObligations on securities sold under repurchase
agreements 4,740,494 - (1,570) 4,738,924Derivative liabilities 1,979,142 (700,180) (132,778) 1,146,184
2019Financial assetsDerivative assets 903,584 (379,414) (177,444) 346,726
Financial liabilitiesDerivative liabilities 1,155,074 (379,414) (38,410) 737,250
55 FINANCIAL RISK MANAGEMENT (CONTINUED)
(g) Fair Value of Financial Instruments
The Group and the Bank analyses its financial instruments measured at fair value into three categories as described below:
Level 1: Quoted prices (unadjusted) in active markets for identical assets or liabilities.Level 2: Quoted prices for identical or similar instruments in markets that are not active; and model-derived valuations in
which inputs other than quoted prices included within Level 1 that are observable for the asset or liability, either directly or indirectly.
Level 3: Valuations derived from valuation techniques in which significant inputs are not based on observable market data.
The table below analyses financial instruments carried at fair value analysed by level within the fair value hierarchy:
GroupLevel 1
RM’000Level 2
RM’000Level 3
RM’000Total
RM’000
2020
Financial assetsFinancial assets at FVTPL: 518,459 3,396,562 547,085 4,462,106- Money market instruments - 2,238,908 - 2,238,908- Quoted securities 518,459 - - 518,459- Unquoted securities - 1,157,654 547,085 1,704,739
Financial assets at FVOCI: 1,922 42,147,509 753,828 42,903,259- Money market instruments - 15,287,958 - 15,287,958- Quoted securities 1,922 - - 1,922- Unquoted securities - 26,859,551 753,828 27,613,379
Derivative assets - 1,653,479 - 1,653,479 520,381 47,197,550 1,300,913 49,018,844
Financial liabilitiesDerivative liabilities 71,703 1,963,092 - 2,034,795
2019
Financial assetsFinancial assets at FVTPL: 375,403 3,742,448 505,596 4,623,447- Money market instruments - 2,144,858 - 2,144,858- Quoted securities 375,403 - - 375,403- Unquoted securities - 1,597,590 505,596 2,103,186
Financial assets at FVOCI: 2,418 39,108,486 694,400 39,805,304- Money market instruments - 13,875,143 - 13,875,143- Quoted securities 2,418 - - 2,418- Unquoted securities - 25,233,343 694,400 25,927,743
Derivative assets 3,000 852,256 - 855,256 380,821 43,703,190 1,199,996 45,284,007
Financial liabilitiesDerivative liabilities 4,277 1,156,650 - 1,160,927
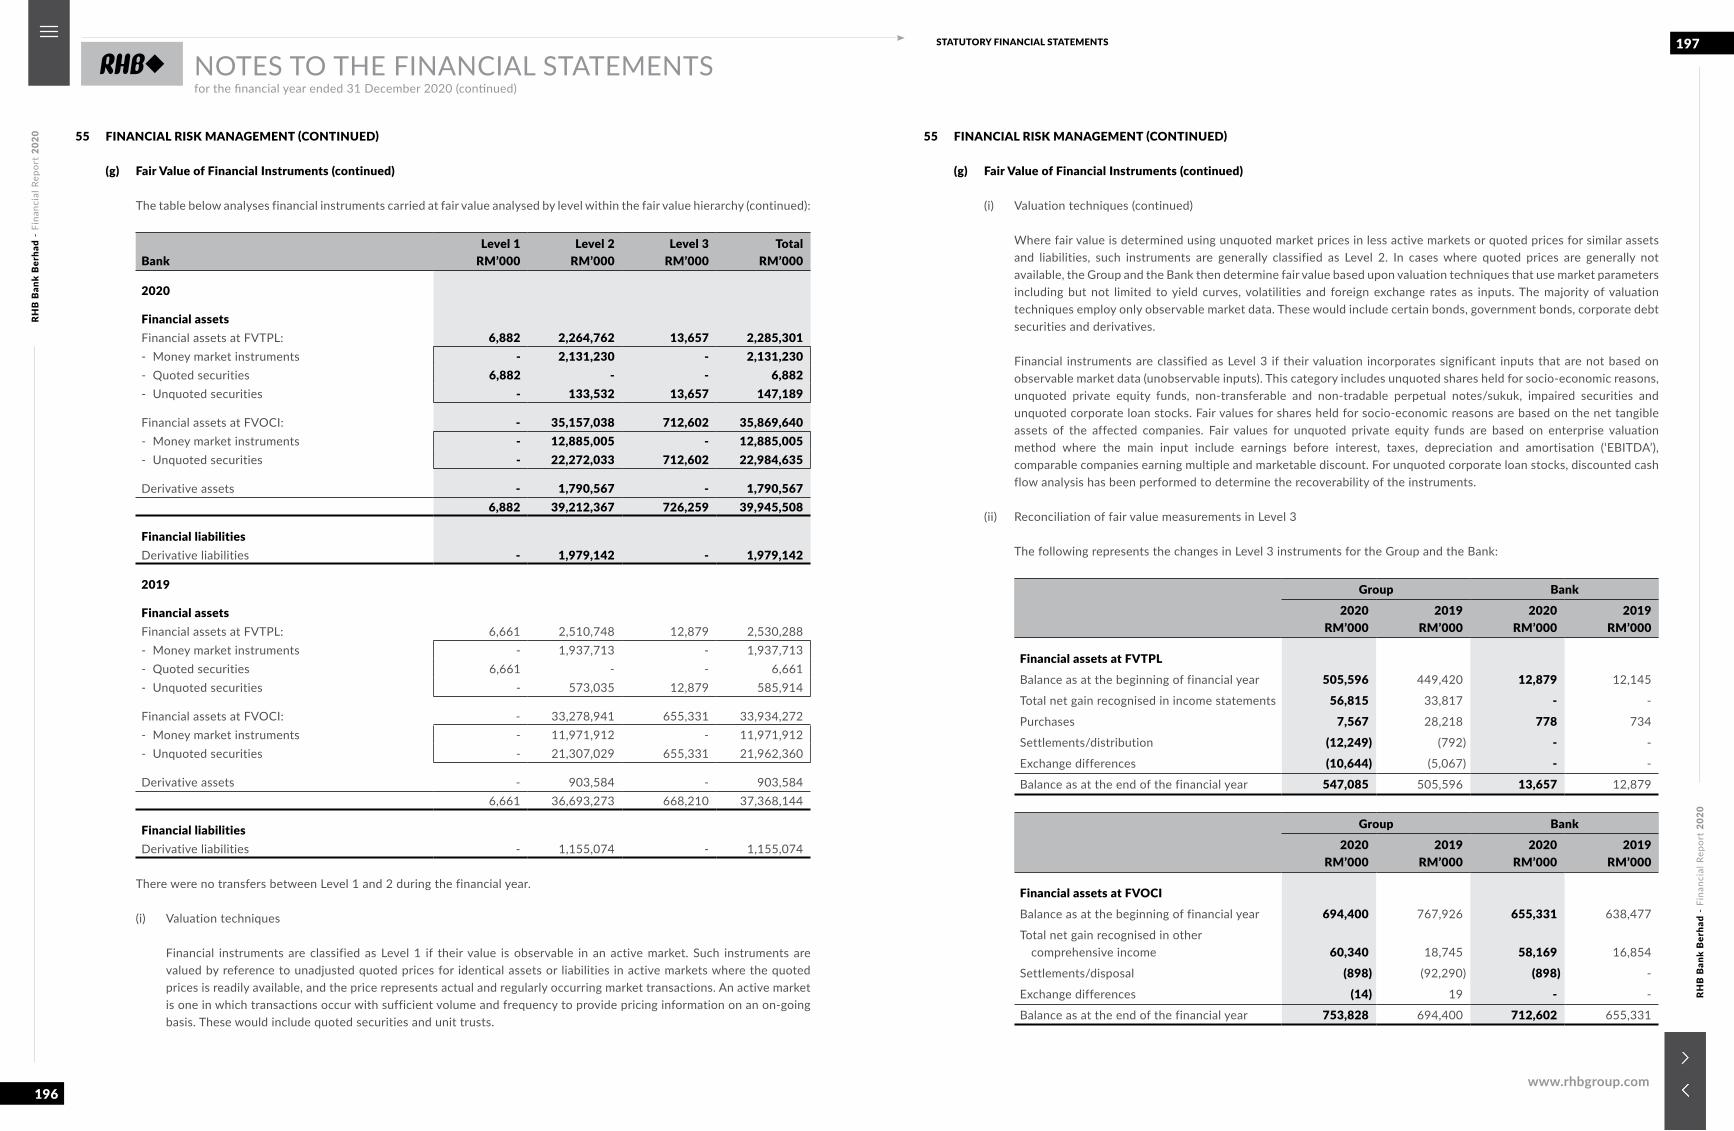
RHB
Ban
k B
erha
d -
Fina
ncia
l Rep
ort
2020
RHB
Ban
k B
erha
d -
Fina
ncia
l Rep
ort
2020
196
197STATUTORY FINANCIAL STATEMENTS
www.rhbgroup.com
NOTES TO THE FINANCIAL STATEMENTSfor the financial year ended 31 December 2020 (continued)
55 FINANCIAL RISK MANAGEMENT (CONTINUED)
(g) Fair Value of Financial Instruments (continued)
The table below analyses financial instruments carried at fair value analysed by level within the fair value hierarchy (continued):
BankLevel 1
RM’000Level 2
RM’000Level 3
RM’000Total
RM’000
2020
Financial assetsFinancial assets at FVTPL: 6,882 2,264,762 13,657 2,285,301 - Money market instruments - 2,131,230 - 2,131,230 - Quoted securities 6,882 - - 6,882 - Unquoted securities - 133,532 13,657 147,189
Financial assets at FVOCI: - 35,157,038 712,602 35,869,640 - Money market instruments - 12,885,005 - 12,885,005 - Unquoted securities - 22,272,033 712,602 22,984,635
Derivative assets - 1,790,567 - 1,790,567 6,882 39,212,367 726,259 39,945,508
Financial liabilitiesDerivative liabilities - 1,979,142 - 1,979,142
2019
Financial assetsFinancial assets at FVTPL: 6,661 2,510,748 12,879 2,530,288 - Money market instruments - 1,937,713 - 1,937,713 - Quoted securities 6,661 - - 6,661 - Unquoted securities - 573,035 12,879 585,914
Financial assets at FVOCI: - 33,278,941 655,331 33,934,272 - Money market instruments - 11,971,912 - 11,971,912 - Unquoted securities - 21,307,029 655,331 21,962,360
Derivative assets - 903,584 - 903,584 6,661 36,693,273 668,210 37,368,144
Financial liabilitiesDerivative liabilities - 1,155,074 - 1,155,074
There were no transfers between Level 1 and 2 during the financial year.
(i) Valuation techniques
Financial instruments are classified as Level 1 if their value is observable in an active market. Such instruments are valued by reference to unadjusted quoted prices for identical assets or liabilities in active markets where the quoted prices is readily available, and the price represents actual and regularly occurring market transactions. An active market is one in which transactions occur with sufficient volume and frequency to provide pricing information on an on-going basis. These would include quoted securities and unit trusts.
55 FINANCIAL RISK MANAGEMENT (CONTINUED)
(g) Fair Value of Financial Instruments (continued)
(i) Valuation techniques (continued)
Where fair value is determined using unquoted market prices in less active markets or quoted prices for similar assets and liabilities, such instruments are generally classified as Level 2. In cases where quoted prices are generally not available, the Group and the Bank then determine fair value based upon valuation techniques that use market parameters including but not limited to yield curves, volatilities and foreign exchange rates as inputs. The majority of valuation techniques employ only observable market data. These would include certain bonds, government bonds, corporate debt securities and derivatives.
Financial instruments are classified as Level 3 if their valuation incorporates significant inputs that are not based on observable market data (unobservable inputs). This category includes unquoted shares held for socio-economic reasons, unquoted private equity funds, non-transferable and non-tradable perpetual notes/sukuk, impaired securities and unquoted corporate loan stocks. Fair values for shares held for socio-economic reasons are based on the net tangible assets of the affected companies. Fair values for unquoted private equity funds are based on enterprise valuation method where the main input include earnings before interest, taxes, depreciation and amortisation (‘EBITDA’), comparable companies earning multiple and marketable discount. For unquoted corporate loan stocks, discounted cash flow analysis has been performed to determine the recoverability of the instruments.
(ii) Reconciliation of fair value measurements in Level 3
The following represents the changes in Level 3 instruments for the Group and the Bank:
Group Bank2020
RM’0002019
RM’0002020
RM’0002019
RM’000
Financial assets at FVTPLBalance as at the beginning of financial year 505,596 449,420 12,879 12,145
Total net gain recognised in income statements 56,815 33,817 - -
Purchases 7,567 28,218 778 734
Settlements/distribution (12,249) (792) - -
Exchange differences (10,644) (5,067) - -
Balance as at the end of the financial year 547,085 505,596 13,657 12,879
Group Bank2020
RM’0002019
RM’0002020
RM’0002019
RM’000
Financial assets at FVOCIBalance as at the beginning of financial year 694,400 767,926 655,331 638,477
Total net gain recognised in other comprehensive income 60,340 18,745 58,169 16,854
Settlements/disposal (898) (92,290) (898) -
Exchange differences (14) 19 - -
Balance as at the end of the financial year 753,828 694,400 712,602 655,331
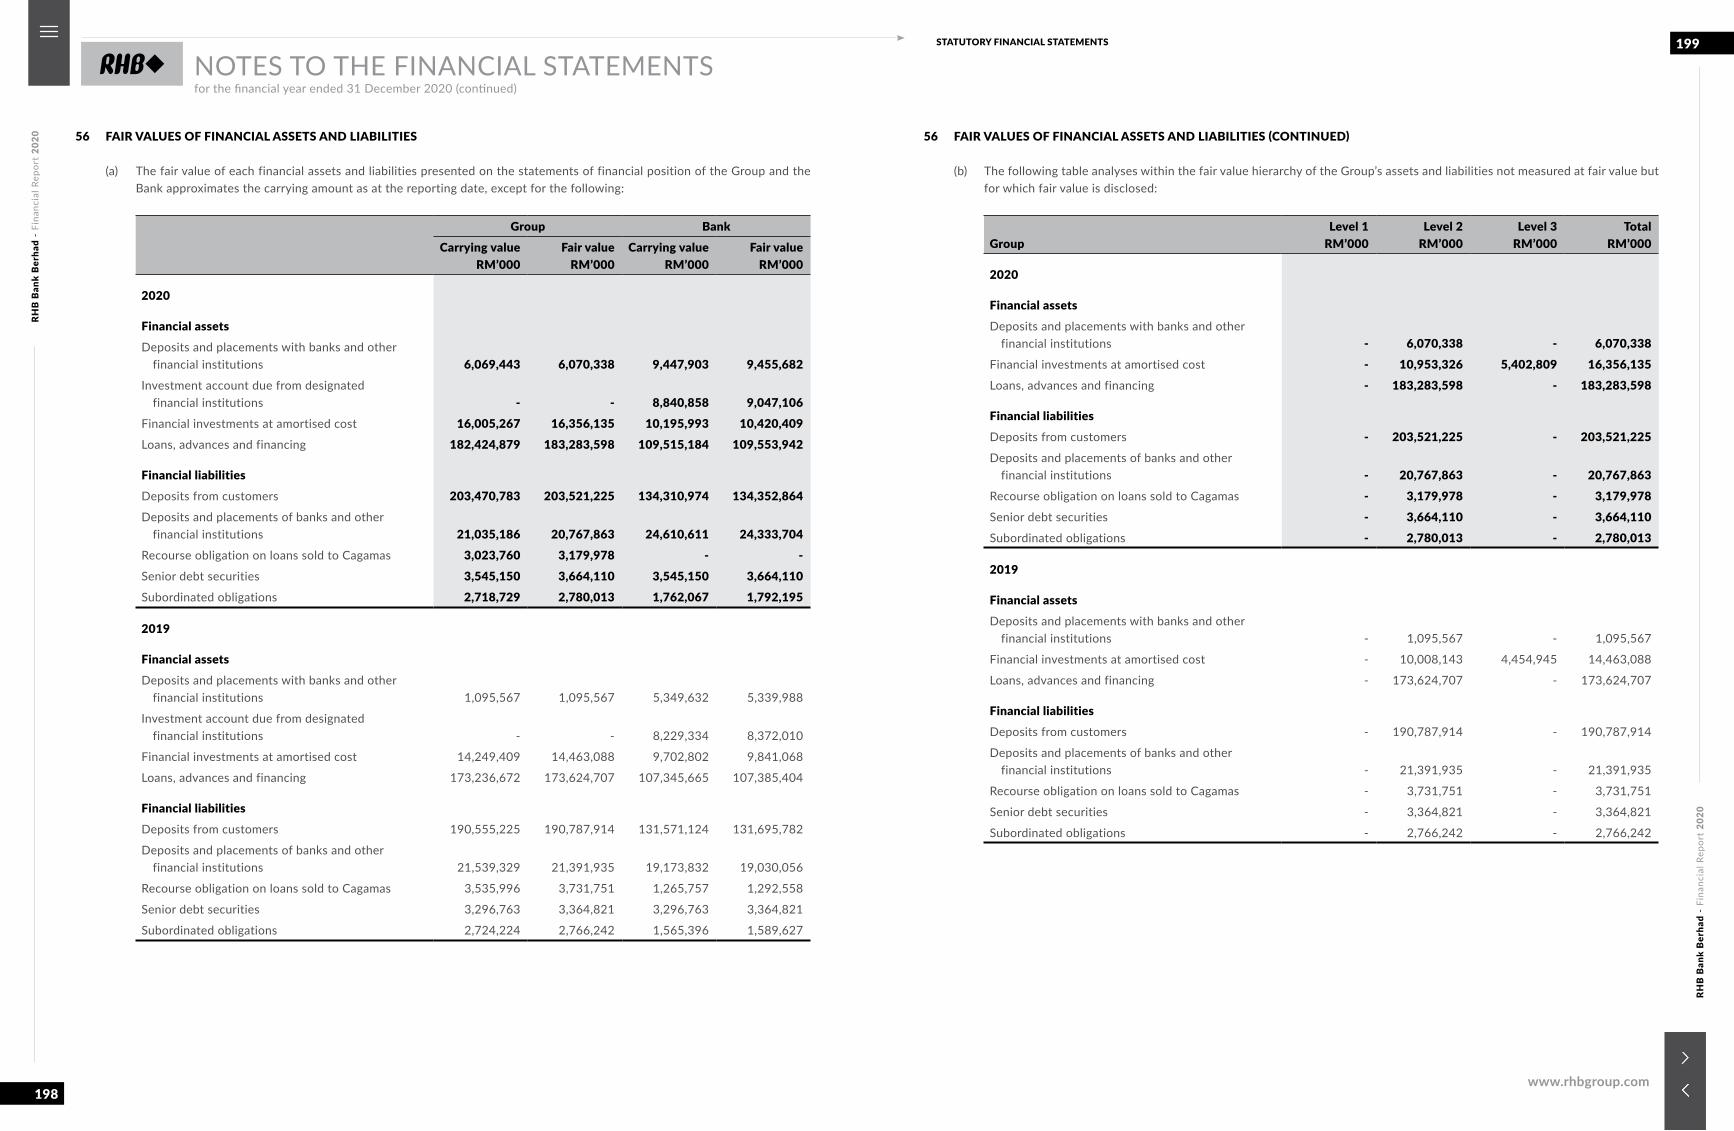
RHB
Ban
k B
erha
d -
Fina
ncia
l Rep
ort
2020
RHB
Ban
k B
erha
d -
Fina
ncia
l Rep
ort
2020
198
199STATUTORY FINANCIAL STATEMENTS
www.rhbgroup.com
NOTES TO THE FINANCIAL STATEMENTSfor the financial year ended 31 December 2020 (continued)
56 FAIR VALUES OF FINANCIAL ASSETS AND LIABILITIES
(a) The fair value of each financial assets and liabilities presented on the statements of financial position of the Group and the Bank approximates the carrying amount as at the reporting date, except for the following:
Group BankCarrying value
RM’000Fair value
RM’000Carrying value
RM’000Fair value
RM’000
2020
Financial assetsDeposits and placements with banks and other
financial institutions 6,069,443 6,070,338 9,447,903 9,455,682Investment account due from designated
financial institutions - - 8,840,858 9,047,106Financial investments at amortised cost 16,005,267 16,356,135 10,195,993 10,420,409Loans, advances and financing 182,424,879 183,283,598 109,515,184 109,553,942
Financial liabilitiesDeposits from customers 203,470,783 203,521,225 134,310,974 134,352,864Deposits and placements of banks and other
financial institutions 21,035,186 20,767,863 24,610,611 24,333,704Recourse obligation on loans sold to Cagamas 3,023,760 3,179,978 - -Senior debt securities 3,545,150 3,664,110 3,545,150 3,664,110Subordinated obligations 2,718,729 2,780,013 1,762,067 1,792,195
2019
Financial assetsDeposits and placements with banks and other
financial institutions 1,095,567 1,095,567 5,349,632 5,339,988
Investment account due from designated financial institutions - - 8,229,334 8,372,010
Financial investments at amortised cost 14,249,409 14,463,088 9,702,802 9,841,068
Loans, advances and financing 173,236,672 173,624,707 107,345,665 107,385,404
Financial liabilitiesDeposits from customers 190,555,225 190,787,914 131,571,124 131,695,782
Deposits and placements of banks and other financial institutions 21,539,329 21,391,935 19,173,832 19,030,056
Recourse obligation on loans sold to Cagamas 3,535,996 3,731,751 1,265,757 1,292,558
Senior debt securities 3,296,763 3,364,821 3,296,763 3,364,821
Subordinated obligations 2,724,224 2,766,242 1,565,396 1,589,627
56 FAIR VALUES OF FINANCIAL ASSETS AND LIABILITIES (CONTINUED)
(b) The following table analyses within the fair value hierarchy of the Group’s assets and liabilities not measured at fair value but for which fair value is disclosed:
GroupLevel 1
RM’000Level 2
RM’000Level 3
RM’000Total
RM’000
2020
Financial assetsDeposits and placements with banks and other
financial institutions - 6,070,338 - 6,070,338Financial investments at amortised cost - 10,953,326 5,402,809 16,356,135Loans, advances and financing - 183,283,598 - 183,283,598
Financial liabilitiesDeposits from customers - 203,521,225 - 203,521,225Deposits and placements of banks and other
financial institutions - 20,767,863 - 20,767,863Recourse obligation on loans sold to Cagamas - 3,179,978 - 3,179,978Senior debt securities - 3,664,110 - 3,664,110Subordinated obligations - 2,780,013 - 2,780,013
2019
Financial assetsDeposits and placements with banks and other
financial institutions - 1,095,567 - 1,095,567
Financial investments at amortised cost - 10,008,143 4,454,945 14,463,088
Loans, advances and financing - 173,624,707 - 173,624,707
Financial liabilitiesDeposits from customers - 190,787,914 - 190,787,914
Deposits and placements of banks and other financial institutions - 21,391,935 - 21,391,935
Recourse obligation on loans sold to Cagamas - 3,731,751 - 3,731,751
Senior debt securities - 3,364,821 - 3,364,821
Subordinated obligations - 2,766,242 - 2,766,242
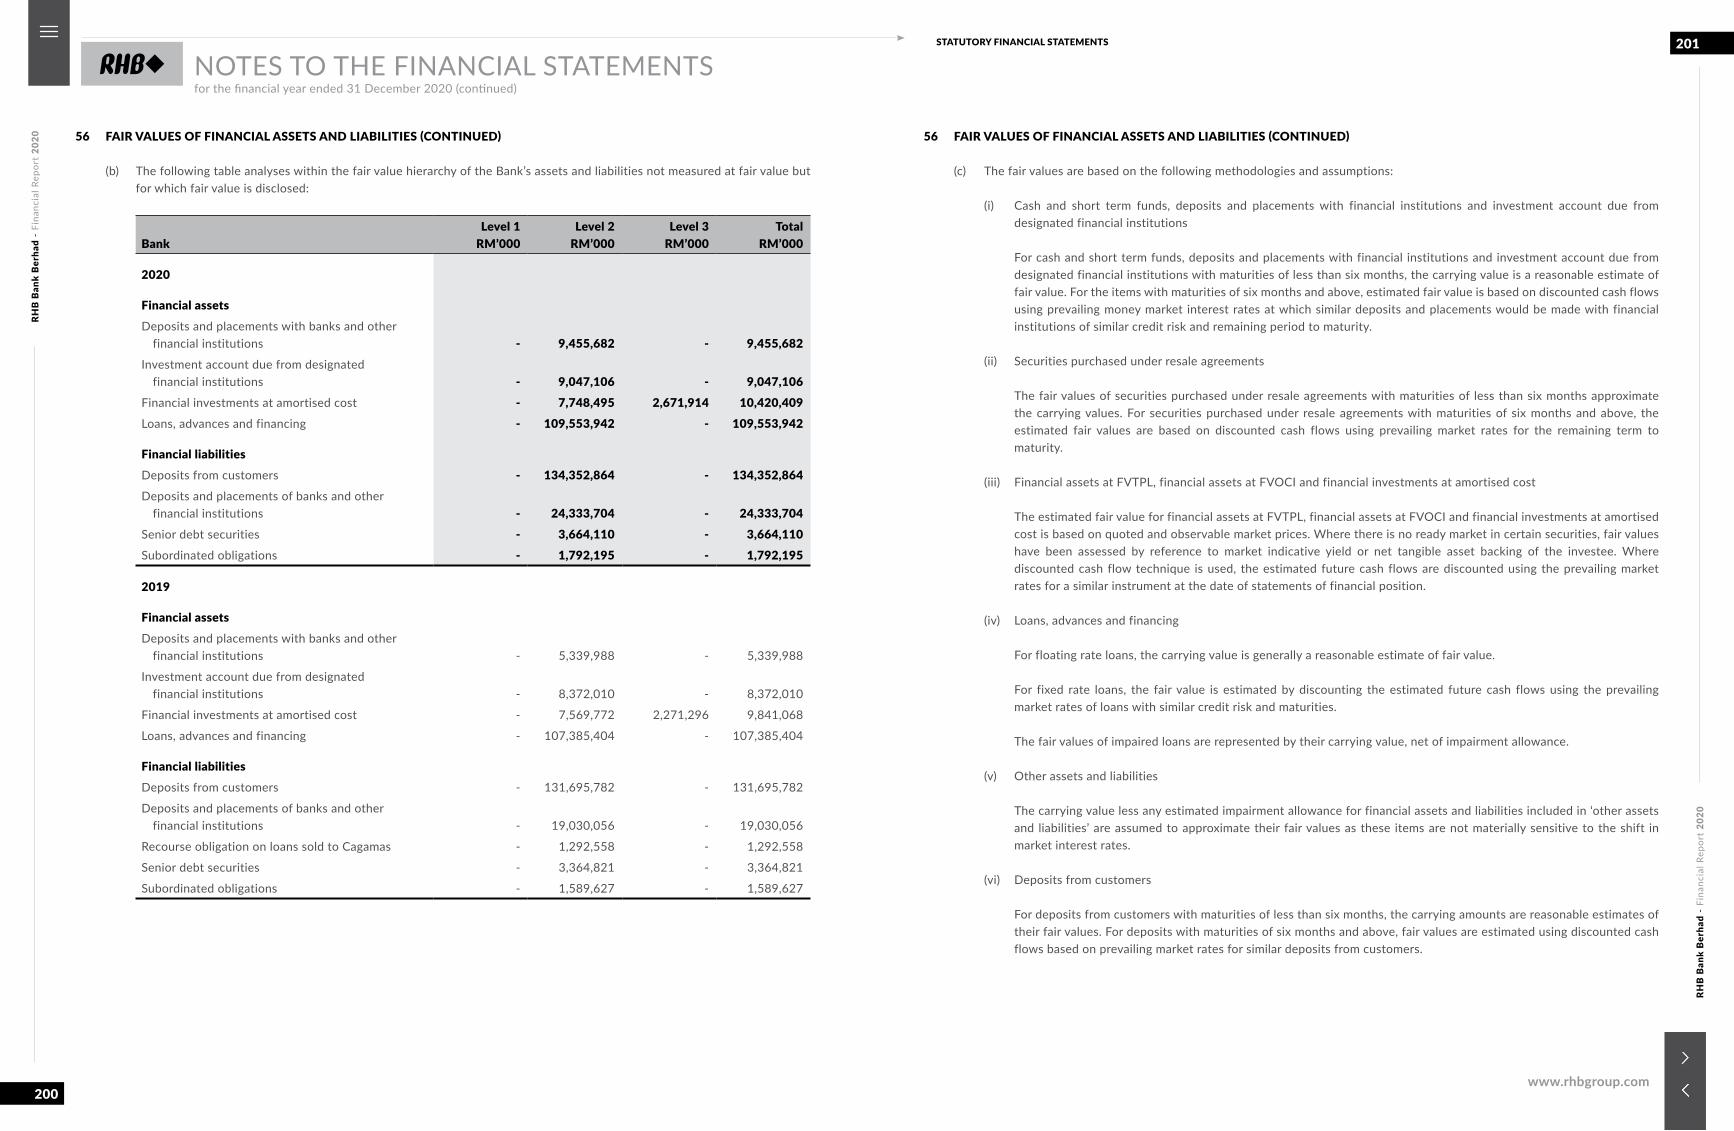
RHB
Ban
k B
erha
d -
Fina
ncia
l Rep
ort
2020
RHB
Ban
k B
erha
d -
Fina
ncia
l Rep
ort
2020
200
201STATUTORY FINANCIAL STATEMENTS
www.rhbgroup.com
NOTES TO THE FINANCIAL STATEMENTSfor the financial year ended 31 December 2020 (continued)
56 FAIR VALUES OF FINANCIAL ASSETS AND LIABILITIES (CONTINUED)
(b) The following table analyses within the fair value hierarchy of the Bank’s assets and liabilities not measured at fair value but for which fair value is disclosed:
BankLevel 1
RM’000Level 2
RM’000Level 3
RM’000Total
RM’000
2020
Financial assetsDeposits and placements with banks and other
financial institutions - 9,455,682 - 9,455,682Investment account due from designated
financial institutions - 9,047,106 - 9,047,106Financial investments at amortised cost - 7,748,495 2,671,914 10,420,409Loans, advances and financing - 109,553,942 - 109,553,942
Financial liabilitiesDeposits from customers - 134,352,864 - 134,352,864Deposits and placements of banks and other
financial institutions - 24,333,704 - 24,333,704Senior debt securities - 3,664,110 - 3,664,110Subordinated obligations - 1,792,195 - 1,792,195
2019
Financial assetsDeposits and placements with banks and other
financial institutions - 5,339,988 - 5,339,988
Investment account due from designated financial institutions - 8,372,010 - 8,372,010
Financial investments at amortised cost - 7,569,772 2,271,296 9,841,068
Loans, advances and financing - 107,385,404 - 107,385,404
Financial liabilitiesDeposits from customers - 131,695,782 - 131,695,782
Deposits and placements of banks and other financial institutions - 19,030,056 - 19,030,056
Recourse obligation on loans sold to Cagamas - 1,292,558 - 1,292,558
Senior debt securities - 3,364,821 - 3,364,821
Subordinated obligations - 1,589,627 - 1,589,627
56 FAIR VALUES OF FINANCIAL ASSETS AND LIABILITIES (CONTINUED)
(c) The fair values are based on the following methodologies and assumptions:
(i) Cash and short term funds, deposits and placements with financial institutions and investment account due from designated financial institutions
For cash and short term funds, deposits and placements with financial institutions and investment account due from designated financial institutions with maturities of less than six months, the carrying value is a reasonable estimate of fair value. For the items with maturities of six months and above, estimated fair value is based on discounted cash flows using prevailing money market interest rates at which similar deposits and placements would be made with financial institutions of similar credit risk and remaining period to maturity.
(ii) Securities purchased under resale agreements
The fair values of securities purchased under resale agreements with maturities of less than six months approximate the carrying values. For securities purchased under resale agreements with maturities of six months and above, the estimated fair values are based on discounted cash flows using prevailing market rates for the remaining term to maturity.
(iii) Financial assets at FVTPL, financial assets at FVOCI and financial investments at amortised cost
The estimated fair value for financial assets at FVTPL, financial assets at FVOCI and financial investments at amortised cost is based on quoted and observable market prices. Where there is no ready market in certain securities, fair values have been assessed by reference to market indicative yield or net tangible asset backing of the investee. Where discounted cash flow technique is used, the estimated future cash flows are discounted using the prevailing market rates for a similar instrument at the date of statements of financial position.
(iv) Loans, advances and financing
For floating rate loans, the carrying value is generally a reasonable estimate of fair value.
For fixed rate loans, the fair value is estimated by discounting the estimated future cash flows using the prevailing market rates of loans with similar credit risk and maturities.
The fair values of impaired loans are represented by their carrying value, net of impairment allowance.
(v) Other assets and liabilities
The carrying value less any estimated impairment allowance for financial assets and liabilities included in ‘other assets and liabilities’ are assumed to approximate their fair values as these items are not materially sensitive to the shift in market interest rates.
(vi) Deposits from customers
For deposits from customers with maturities of less than six months, the carrying amounts are reasonable estimates of their fair values. For deposits with maturities of six months and above, fair values are estimated using discounted cash flows based on prevailing market rates for similar deposits from customers.
RHB
Ban
k B
erha
d -
Fina
ncia
l Rep
ort
2020
RHB
Ban
k B
erha
d -
Fina
ncia
l Rep
ort
2020
202
203STATUTORY FINANCIAL STATEMENTS
www.rhbgroup.com
NOTES TO THE FINANCIAL STATEMENTSfor the financial year ended 31 December 2020 (continued)
56 FAIR VALUES OF FINANCIAL ASSETS AND LIABILITIES (CONTINUED)
(c) The fair values are based on the following methodologies and assumptions: (continued)
(vii) Deposits and placements of banks and other financial institutions, obligations on securities sold under repurchase agreements and bills and acceptances payable
The estimated fair values of deposits and placements of banks and other financial institutions, obligations on securities sold under repurchase agreements and bills and acceptances payable with maturities of less than six months approximate the carrying values. For the items with maturities of six months and above, the fair values are estimated based on discounted cash flows using prevailing money market interest rates with similar remaining period to maturity.
(viii) Recourse obligation on loans sold to Cagamas
For amounts due to Cagamas with maturities of less than one year, the carrying amounts are a reasonable estimate of their fair values. For amounts due to Cagamas with maturities of more than one year, fair value is estimated based on discounted cash flows using prevailing money market interest rates with similar remaining period to maturity.
(ix) Lease liabilities
The estimated fair value of lease liabilities with maturities of less than six months approximate the carrying values. For other lease liabilities with maturities of six months or more, the fair values are estimated based on discounted cash flows using prevailing market rates of incremental borrowings.
(x) Borrowings
For floating rate borrowings, the carrying value is generally a reasonable estimate of fair value.
The estimated fair values of other borrowings with maturities of less than six months approximate the carrying values. For other borrowings with maturities of six months or more, the fair values are estimated based on discounted cash flows using prevailing market rates for borrowings with similar risk profile.
(xi) Senior debt securities
The estimated fair value of senior debt securities is generally based on quoted and observable market prices at the date of statements of financial position.
(xii) Subordinated obligations
The estimated fair value of subordinated obligations is generally based on quoted and observable market prices at the date of statements of financial position.
(xiii) Credit related commitments and contingencies
The net fair value of these items was not calculated as estimated fair values are not readily ascertainable. These financial instruments generally relate to credit risks and attract fees in line with market prices for similar arrangements. They are not presently sold nor traded. The fair value may be represented by the present value of fees expected to be received, less associated costs.
(xiv) Foreign exchange and interest rate related contracts
The fair values of foreign exchange and interest rate related contracts are the estimated amounts the Group or the Bank would receive to sell or pay to transfer the contracts at the date of statements of financial position.
57 SIGNIFICANT EVENTS DURING THE FINANCIAL YEAR
Current Year
(1) Proposed cessation of business operations of subsidiaries in Hong Kong
RHB Hong Kong Limited (‘RHB Hong Kong’) and its subsidiaries (collectively, ‘RHB Hong Kong Group’), had on 4 December 2019 decided that they will commence to cease their business operations (‘Proposed Cessation’). RHB Hong Kong is a wholly-owned subsidiary of RHB Investment Bank, which in turn is wholly-owned by the Bank.
Pursuant to the Proposed Cessation, RHB Hong Kong Group will gradually discontinue offering financial services to its existing and potential clients. RHB Investment Bank, being the shareholder of RHB Hong Kong Group will provide the requisite support to ensure an orderly winding down of their business operations. RHB Investment Bank had on 14 February 2020 injected additional capital into RHB Hong Kong as disclosed in Note 15.
The increasingly challenging operating broking environment in Hong Kong has resulted in losses being recorded for RHB Hong Kong Group. As a result, it is no longer viable for RHB Hong Kong Group to continue its business operations. The Proposed Cessation would allow RHB Investment Bank to refocus efforts and resources in driving long-term growth in other ASEAN markets in line with the larger RHB Banking Group’s FIT22 strategy.
As part of RHB Hong Kong Group:
(i) RHB (China) Investment Advisory Co Ltd had been deregistered with the registration authority in China on 17 June 2020 as disclosed in Note 15; and
(ii) RHB Finance Hong Kong Limited, RHB Asset Management Limited, RHB Capital Hong Kong Limited and RHB Wealth Management Hong Kong Limited have commenced the application for member’s voluntary winding up as disclosed in Note 15.
(2) Disposal of RHB Securities Singapore Pte Ltd (‘RHB Securities Singapore’)
RHB Investment Bank, a wholly owned subsidiary of the Bank has on 29 June 2020, entered into a conditional share purchase agreement with Phillip Securities Pte Ltd (‘Purchaser’) in respect of the disposal of its entire equity interest in its wholly owned subsidiary, RHB Securities Singapore (‘Disposal’).
Prior to the completion of the Disposal, RHB Securities Singapore undertook a corporate exercise to transfer the following businesses and assets to the Bank (‘Business Transfer’):
(i) the client coverage team, research and advisory services in relation to corporate finance, mergers and acquisitions, equity capital markets and institutional equities sales;
(ii) the entire equity interests of RHB Securities Singapore’s wholly-owned subsidiaries in RHB Nominees Singapore Pte Ltd, Summit Nominees Singapore Pte Ltd and RHB Research Institute Singapore Pte Ltd; and
(iii) other assets and liabilities in respect of item (i) above.
The Disposal is conditional upon the completion of the Business Transfer but not vice versa.
With the Disposal, the Bank will be in a position to better serve its wholesale clients in Singapore with the transfer of the capital markets business to RHB Bank Singapore. The increasingly competitive broking environment has made it no longer viable for RHB Securities Singapore to continue its stock broking business.
The Business Transfer and the Disposal were completed on 31 August 2020 and 11 September 2020 respectively, following approvals from the relevant regulatory authorities in Malaysia and Singapore.
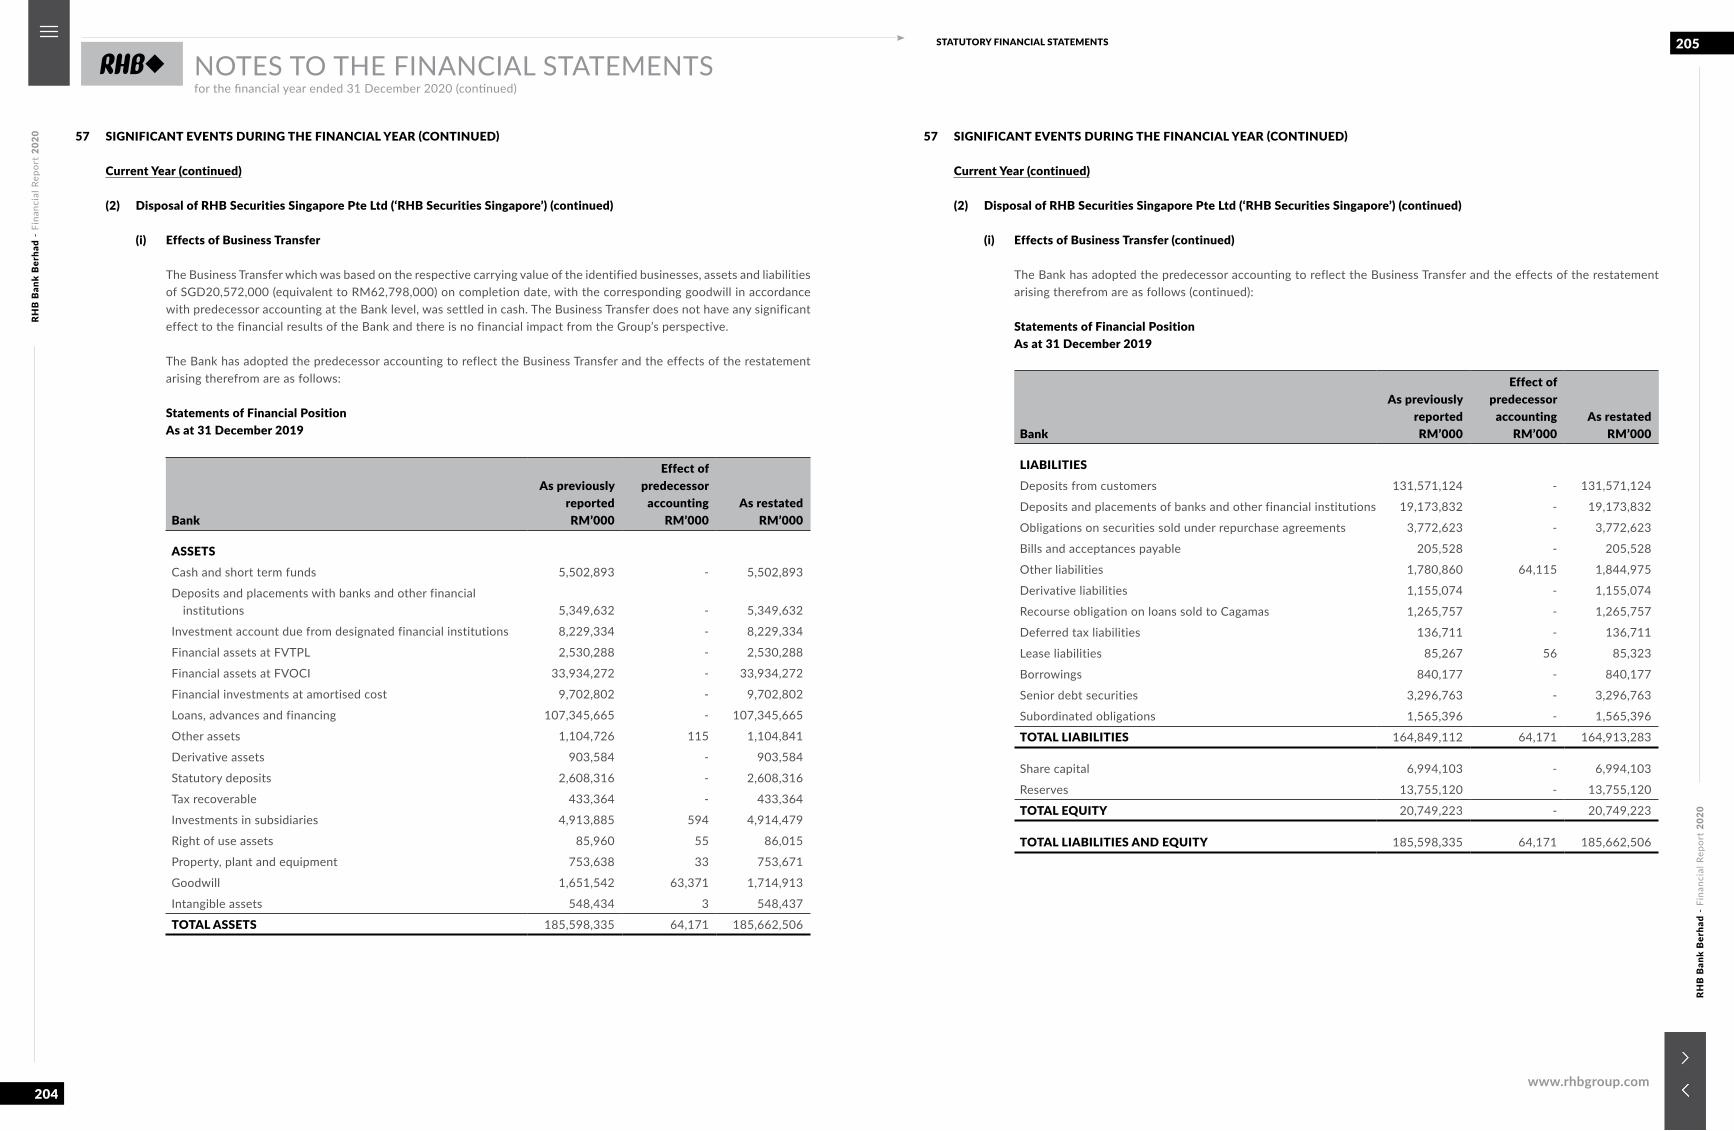
RHB
Ban
k B
erha
d -
Fina
ncia
l Rep
ort
2020
RHB
Ban
k B
erha
d -
Fina
ncia
l Rep
ort
2020
204
205STATUTORY FINANCIAL STATEMENTS
www.rhbgroup.com
NOTES TO THE FINANCIAL STATEMENTSfor the financial year ended 31 December 2020 (continued)
57 SIGNIFICANT EVENTS DURING THE FINANCIAL YEAR (CONTINUED)
Current Year (continued)
(2) Disposal of RHB Securities Singapore Pte Ltd (‘RHB Securities Singapore’) (continued)
(i) Effects of Business Transfer
The Business Transfer which was based on the respective carrying value of the identified businesses, assets and liabilities of SGD20,572,000 (equivalent to RM62,798,000) on completion date, with the corresponding goodwill in accordance with predecessor accounting at the Bank level, was settled in cash. The Business Transfer does not have any significant effect to the financial results of the Bank and there is no financial impact from the Group’s perspective.
The Bank has adopted the predecessor accounting to reflect the Business Transfer and the effects of the restatement arising therefrom are as follows:
Statements of Financial Position As at 31 December 2019
Bank
As previouslyreported RM’000
Effect ofpredecessor
accountingRM’000
As restated RM’000
ASSETSCash and short term funds 5,502,893 - 5,502,893
Deposits and placements with banks and other financial institutions 5,349,632 - 5,349,632
Investment account due from designated financial institutions 8,229,334 - 8,229,334
Financial assets at FVTPL 2,530,288 - 2,530,288
Financial assets at FVOCI 33,934,272 - 33,934,272
Financial investments at amortised cost 9,702,802 - 9,702,802
Loans, advances and financing 107,345,665 - 107,345,665
Other assets 1,104,726 115 1,104,841
Derivative assets 903,584 - 903,584
Statutory deposits 2,608,316 - 2,608,316
Tax recoverable 433,364 - 433,364
Investments in subsidiaries 4,913,885 594 4,914,479
Right of use assets 85,960 55 86,015
Property, plant and equipment 753,638 33 753,671
Goodwill 1,651,542 63,371 1,714,913
Intangible assets 548,434 3 548,437
TOTAL ASSETS 185,598,335 64,171 185,662,506
57 SIGNIFICANT EVENTS DURING THE FINANCIAL YEAR (CONTINUED)
Current Year (continued)
(2) Disposal of RHB Securities Singapore Pte Ltd (‘RHB Securities Singapore’) (continued)
(i) Effects of Business Transfer (continued)
The Bank has adopted the predecessor accounting to reflect the Business Transfer and the effects of the restatement arising therefrom are as follows (continued):
Statements of Financial Position As at 31 December 2019
Bank
As previouslyreported RM’000
Effect ofpredecessor
accountingRM’000
As restated RM’000
LIABILITIESDeposits from customers 131,571,124 - 131,571,124
Deposits and placements of banks and other financial institutions 19,173,832 - 19,173,832
Obligations on securities sold under repurchase agreements 3,772,623 - 3,772,623
Bills and acceptances payable 205,528 - 205,528
Other liabilities 1,780,860 64,115 1,844,975
Derivative liabilities 1,155,074 - 1,155,074
Recourse obligation on loans sold to Cagamas 1,265,757 - 1,265,757
Deferred tax liabilities 136,711 - 136,711
Lease liabilities 85,267 56 85,323
Borrowings 840,177 - 840,177
Senior debt securities 3,296,763 - 3,296,763
Subordinated obligations 1,565,396 - 1,565,396
TOTAL LIABILITIES 164,849,112 64,171 164,913,283
Share capital 6,994,103 - 6,994,103
Reserves 13,755,120 - 13,755,120
TOTAL EQUITY 20,749,223 - 20,749,223
TOTAL LIABILITIES AND EQUITY 185,598,335 64,171 185,662,506
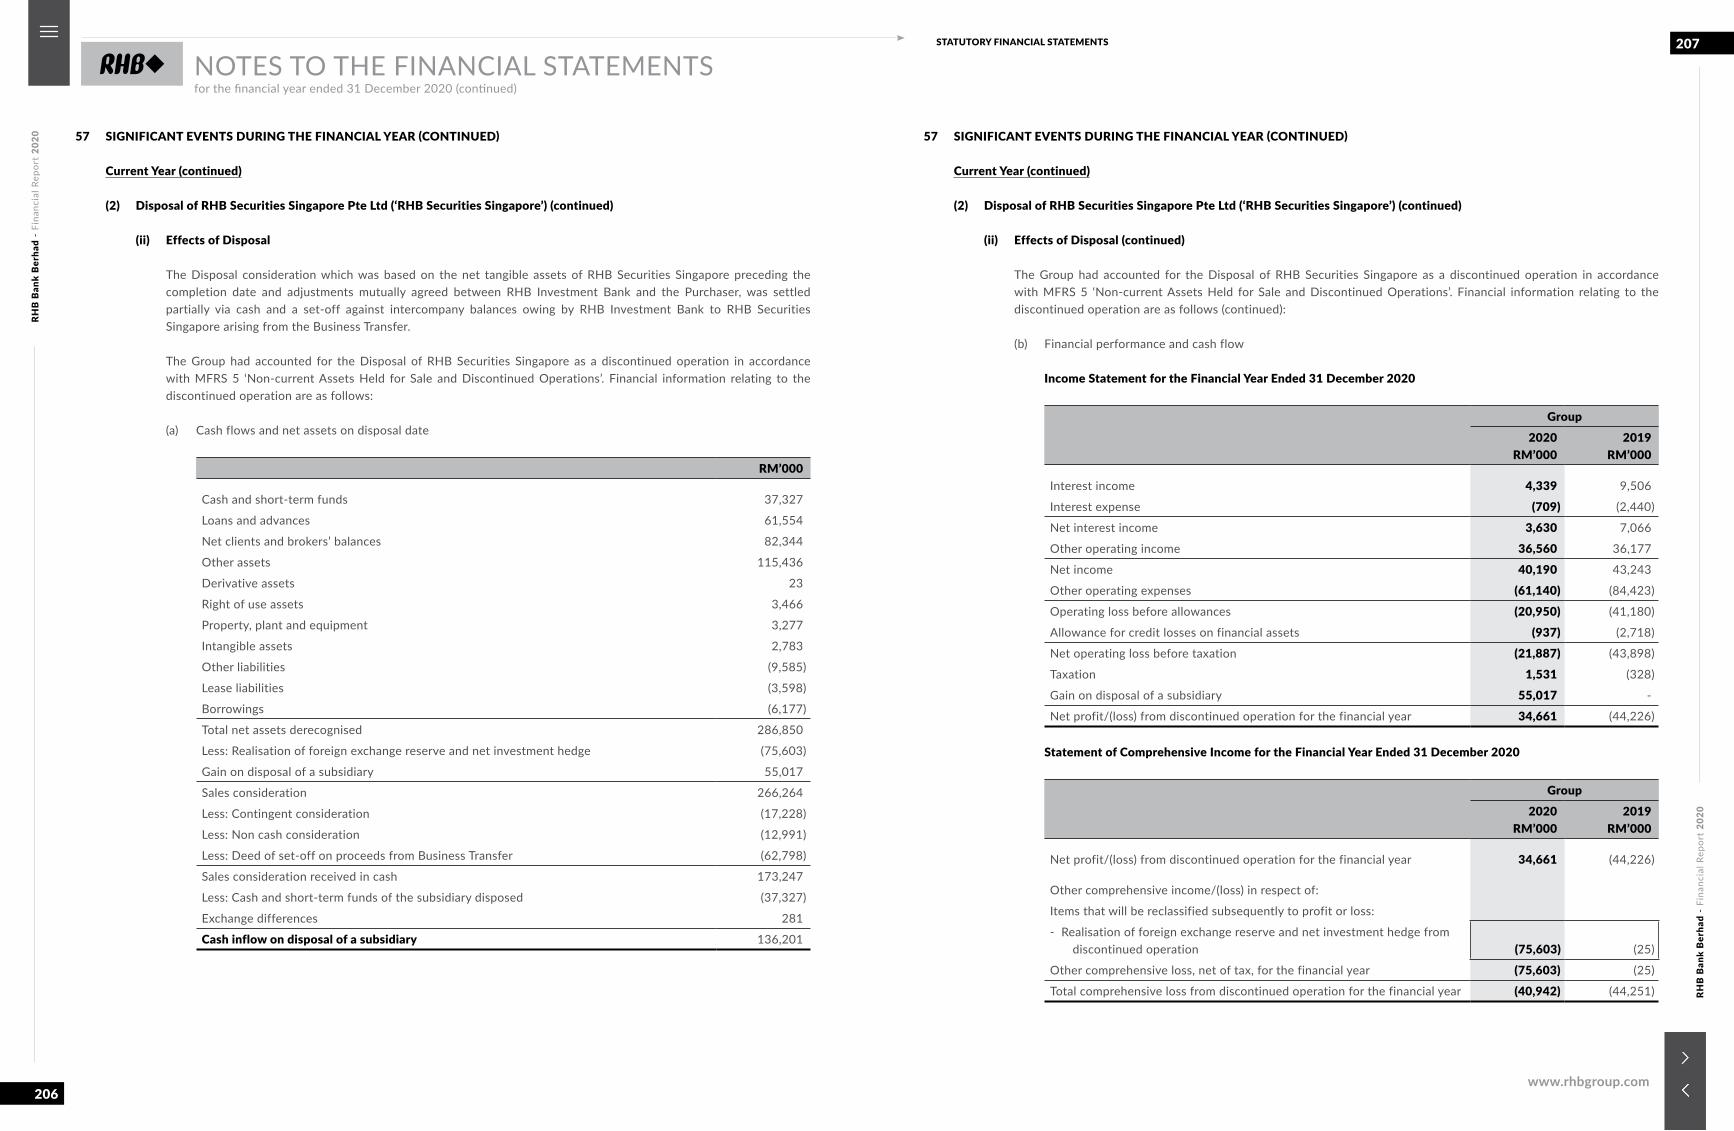
RHB
Ban
k B
erha
d -
Fina
ncia
l Rep
ort
2020
RHB
Ban
k B
erha
d -
Fina
ncia
l Rep
ort
2020
206
207STATUTORY FINANCIAL STATEMENTS
www.rhbgroup.com
NOTES TO THE FINANCIAL STATEMENTSfor the financial year ended 31 December 2020 (continued)
57 SIGNIFICANT EVENTS DURING THE FINANCIAL YEAR (CONTINUED)
Current Year (continued)
(2) Disposal of RHB Securities Singapore Pte Ltd (‘RHB Securities Singapore’) (continued)
(ii) Effects of Disposal
The Disposal consideration which was based on the net tangible assets of RHB Securities Singapore preceding the completion date and adjustments mutually agreed between RHB Investment Bank and the Purchaser, was settled partially via cash and a set-off against intercompany balances owing by RHB Investment Bank to RHB Securities Singapore arising from the Business Transfer.
The Group had accounted for the Disposal of RHB Securities Singapore as a discontinued operation in accordance with MFRS 5 ‘Non-current Assets Held for Sale and Discontinued Operations’. Financial information relating to the discontinued operation are as follows:
(a) Cash flows and net assets on disposal date
RM’000
Cash and short-term funds 37,327
Loans and advances 61,554
Net clients and brokers’ balances 82,344
Other assets 115,436
Derivative assets 23
Right of use assets 3,466
Property, plant and equipment 3,277
Intangible assets 2,783
Other liabilities (9,585)
Lease liabilities (3,598)
Borrowings (6,177)
Total net assets derecognised 286,850
Less: Realisation of foreign exchange reserve and net investment hedge (75,603)
Gain on disposal of a subsidiary 55,017
Sales consideration 266,264
Less: Contingent consideration (17,228)
Less: Non cash consideration (12,991)
Less: Deed of set-off on proceeds from Business Transfer (62,798)
Sales consideration received in cash 173,247
Less: Cash and short-term funds of the subsidiary disposed (37,327)
Exchange differences 281
Cash inflow on disposal of a subsidiary 136,201
57 SIGNIFICANT EVENTS DURING THE FINANCIAL YEAR (CONTINUED)
Current Year (continued)
(2) Disposal of RHB Securities Singapore Pte Ltd (‘RHB Securities Singapore’) (continued)
(ii) Effects of Disposal (continued)
The Group had accounted for the Disposal of RHB Securities Singapore as a discontinued operation in accordance with MFRS 5 ‘Non-current Assets Held for Sale and Discontinued Operations’. Financial information relating to the discontinued operation are as follows (continued):
(b) Financial performance and cash flow
Income Statement for the Financial Year Ended 31 December 2020
Group2020
RM’0002019
RM’000
Interest income 4,339 9,506
Interest expense (709) (2,440)
Net interest income 3,630 7,066
Other operating income 36,560 36,177
Net income 40,190 43,243
Other operating expenses (61,140) (84,423)
Operating loss before allowances (20,950) (41,180)
Allowance for credit losses on financial assets (937) (2,718)
Net operating loss before taxation (21,887) (43,898)
Taxation 1,531 (328)
Gain on disposal of a subsidiary 55,017 -
Net profit/(loss) from discontinued operation for the financial year 34,661 (44,226)
Statement of Comprehensive Income for the Financial Year Ended 31 December 2020
Group2020
RM’0002019
RM’000
Net profit/(loss) from discontinued operation for the financial year 34,661 (44,226)
Other comprehensive income/(loss) in respect of:
Items that will be reclassified subsequently to profit or loss:
- Realisation of foreign exchange reserve and net investment hedge from discontinued operation (75,603) (25)
Other comprehensive loss, net of tax, for the financial year (75,603) (25)
Total comprehensive loss from discontinued operation for the financial year (40,942) (44,251)
RHB
Ban
k B
erha
d -
Fina
ncia
l Rep
ort
2020
RHB
Ban
k B
erha
d -
Fina
ncia
l Rep
ort
2020
208
209STATUTORY FINANCIAL STATEMENTS
www.rhbgroup.com
NOTES TO THE FINANCIAL STATEMENTSfor the financial year ended 31 December 2020 (continued)
57 SIGNIFICANT EVENTS DURING THE FINANCIAL YEAR (CONTINUED)
Current Year (continued)
(2) Disposal of RHB Securities Singapore Pte Ltd (‘RHB Securities Singapore’) (continued)
(ii) Effects of Disposal (continued)
The Group had accounted for the Disposal of RHB Securities Singapore as a discontinued operation in accordance with MFRS 5 ‘Non-current Assets Held for Sale and Discontinued Operations’. Financial information relating to the discontinued operation are as follows (continued):
(b) Financial performance and cash flow (continued)
Statements of Cash Flow for the Financial Year Ended 31 December 2020
Group2020
RM’0002019
RM’000
From discontinued operation:
Net cash generated from operating activities 27,134 28,999
Net cash used in investing activities (585) (1,899)
Net cash used in financing activities (74,912) (22,736)
Net (decrease)/increase in cash and cash equivalents (48,363) 4,364
(3) Bancatakaful service agreements between RHB Islamic Bank and Syarikat Takaful Malaysia Keluarga Berhad (‘STMKB’) and Syarikat Takaful Malaysia Am Berhad (‘STMAB’)
RHB Islamic Bank had on 28 July 2020, entered into the following agreements:
(i) Bancatakaful service agreement in respect of family Takaful products (‘Family Bancatakaful Agreement’) with STMKB; and
(ii) Bancatakaful service agreement in respect of general Takaful products (‘General Bancatakaful Agreement’) with STMAB, a wholly-owned subsidiary of STMKB.
The salient terms of the Bancatakaful Agreements are as follows:
Family Bancatakaful Agreement General Bancatakaful Agreement
(a) Tenure shall be for a period of 5 years commencing on 1 August 2020 and subject to RHB Islamic Bank meeting the pre-agreed budgets for the family credit Takaful products, and shall end on 31 July 2025. In event that RHB Islamic Bank fails to meet the pre-agreed budgets for the family credit Takaful products at the end of the 5th year of the contract period, the tenure of the Family Bancatakaful Agreement may be extended for a period of up to 1 year;
(a) Tenure shall be for a period of 5 years commencing on 1 August 2020 and subject to RHB Islamic Bank meeting the pre-agreed budgets for the general Takaful products, and shall end on 31 July 2025. In event that RHB Islamic Bank fails to meet the pre-agreed budgets for the general Takaful products at the end of the 5th year of the contract period, the tenure of the General Bancatakaful Agreement may be extended for a period of up to 1 year; and
57 SIGNIFICANT EVENTS DURING THE FINANCIAL YEAR (CONTINUED)
Current Year (continued)
(3) Bancatakaful service agreements between RHB Islamic Bank and Syarikat Takaful Malaysia Keluarga Berhad (‘STMKB’) and Syarikat Takaful Malaysia Am Berhad (‘STMAB’) (continued)
The salient terms of the Bancatakaful Agreements are as follows (continued):
Family Bancatakaful Agreement General Bancatakaful Agreement
(b) RHB Islamic Bank shall sell, distribute, market and promote family credit Takaful products developed by STMKB for distribution by RHB Islamic Bank on an exclusive basis to the extent permitted by the applicable laws and regulatory requirements. In consideration thereof, STMKB will pay a facilitation fee of RM145 million to RHB Islamic Bank; and
(c) STMKB shall have the right of first refusal to develop and offer for sale by RHB Islamic Bank non-credit related/advisory family Takaful products proposed by RHB Islamic Bank, in accordance with the terms of the Family Bancatakaful Agreement.
(b) RHB Islamic Bank shall sell, distribute, market and promote general Takaful products developed by STMAB for distribution by RHB Islamic Bank on an exclusive basis to the extent permitted by the applicable laws and regulatory requirements. In consideration thereof, STMAB will pay a facilitation fee of RM6 million to RHB Islamic Bank.
(4) Proposed establishment of a Dividend Reinvestment Plan (‘DRP’)
On 17 December 2020, the Bank announced that it proposes to undertake the establishment of a DRP that provides the shareholders of the Bank (‘Shareholders’) with an option to elect to reinvest, in whole or in part, their cash dividend declared by the Bank in new RHB Bank Shares (‘DRP Shares’) (‘Proposed DRP’).
The rationale of the Proposed DRP is as follows:
(i) It provides the Bank with flexibility in managing and strengthening its capital position as part of the Bank’s capital management strategy. The reinvestment of dividend by the Shareholders for DRP Shares will also enlarge the share capital base of the Bank.
The cash retained which would otherwise be used for the payment of dividend, may be utilised for working capital, repay borrowings and/or other requirements of the Bank or RHB Banking Group to be identified at the point when such funds are retained.
(ii) It allows Shareholders to have the option of reinvesting further into the Bank and provides the Shareholders with the following:
(a) an opportunity to enhance and maximise the value of their shareholdings in the Bank by investing in DRP Shares at a discount; and
(b) flexibility to the Shareholders in meeting their investment objectives as the Shareholders would have the option of receiving dividend in cash and/or reinvesting in DRP Shares.
(iii) The implementation of the Proposed DRP will provide an avenue to the Shareholders to exercise the electable portion under the reinvestment option into DRP Shares in lieu of receiving cash.
(iv) The Proposed DRP may potentially improve the trading liquidity of RHB Bank shares as well as strengthen the financial position and capital base of the Bank through the issuance of DRP Shares.
RHB
Ban
k B
erha
d -
Fina
ncia
l Rep
ort
2020
RHB
Ban
k B
erha
d -
Fina
ncia
l Rep
ort
2020
210
211STATUTORY FINANCIAL STATEMENTS
www.rhbgroup.com
NOTES TO THE FINANCIAL STATEMENTSfor the financial year ended 31 December 2020 (continued)
57 SIGNIFICANT EVENTS DURING THE FINANCIAL YEAR (CONTINUED)
Current Year (continued)
(4) Proposed establishment of a Dividend Reinvestment Plan (‘DRP’) (continued)
The Proposed DRP is not conditional or inter-conditional upon any other corporate exercise being or proposed to be undertaken by the Bank. However, the Proposed DRP is conditional upon the following:
(i) approval from BNM for the implementation of the Proposed DRP, of which application to BNM has been submitted on 18 January 2021;
(ii) Bursa Malaysia Securities Berhad ('Bursa Securities') for the listing and quotation of the DRP Shares on the Main Market of Bursa Securities;
(iii) the approval from Shareholders for the Proposed DRP at the forthcoming Annual General Meeting; and
(iv) any other relevant authority and/or party, if required.
The effects of the Proposed DRP on the share capital, substantial shareholders’ shareholdings, net assets, gearing, earnings and earnings per share as well as the number of new ordinary shares to be issued by the Bank are dependent on the following:
(i) the quantum of the dividend to be announced by the Board of which the Proposed DRP can be applied with;
(ii) the Board’s decision on the proportion/size of the electable portion;
(iii) the issue price;
(iv) the extent to which Shareholders elect to exercise the reinvestment option;
(v) the applicable withholding tax rates of the Shareholders; and
(vi) any necessary downward adjustment by the Board to the final number of DRP Shares to be allotted and issued to any of the Shareholders.
None of the Bank’s Directors, major shareholders and/or persons connected with them have any interest, direct or indirect, in the Proposed DRP apart from their respective entitlements under the Proposed DRP to which all Shareholders are similarly entitled.
(5) Proposed disposal of RHB International Trust (L) Ltd (‘RHBIT’)
RHB Bank (L) Ltd (‘RHBBL’) has on 14 December 2020 entered into a conditional share sale and purchase agreement with Pacific Trustees Berhad (‘Pacific Trustees’) in respect of the proposed disposal of its entire equity interest in RHBIT for a cash consideration of approximately USD173,490 (‘Proposed Disposal’).
Upon completion of the Proposed Disposal, RHBIT will cease to be a wholly-owned subsidiary of RHBBL. Barring any unforeseen circumstances and subject to regulatory approval being obtained from the Labuan Financial Services Authority (‘Labuan FSA’) for the Proposed Disposal, the Proposed Disposal is expected to be completed in the first quarter of 2021.
57 SIGNIFICANT EVENTS DURING THE FINANCIAL YEAR (CONTINUED)
Prior Year
(6) Acquisition by RHB Investment Bank of the remaining 51% equity interest in RHB Securities Vietnam Company Limited (‘RHB Securities Vietnam’) (‘Acquisition’)
Prior to 19 February 2019, RHB Investment Bank, a wholly-owned subsidiary of the Bank, held 49% equity interest in RHB Securities Vietnam and has accounted for this investment as a joint venture.
RHB Investment Bank had on 19 February 2019 completed the acquisition of the remaining 51% equity interest in RHB Securities Vietnam following the full payment of the purchase consideration of VND121,629,915,000 (equivalent to RM21,400,000) to Chu Thi Phuong Dung, Truong Lan Anh and Viet Quoc Insurance Broker Joint Stock Company.
RHB Securities Vietnam had since become a wholly-owned subsidiary of RHB Investment Bank effective 19 February 2019.
The Group had accounted for the Acquisition of RHB Securities Vietnam in accordance with MFRS 3 ‘Business Combination’ and the following are the accounting effects:
(i) Equity interest previously held as joint venture at 49% in RHB Securities Vietnam was deemed as disposed at fair value, giving rise to a gain on disposal of RM258,000 as disclosed in Note 38.
RM’000
Fair value of previously held equity interest 15,934Less: Equity attributable to net assets (15,676)Gain on remeasurement of previously held equity interest in a joint venture 258
(ii) The acquisition of assets and liabilities of RHB Securities Vietnam on acquisition date were as follows:
RM’000
Cash and short term funds 1,765Deposits and placements with banks and other financial institutions 30,345Other assets 397Property, plant and equipment 30Other liabilities (18)Total identifiable net assets 32,519Less: Fair value of previously held equity interest (15,934)Goodwill arising from acquisition 4,815 Cash consideration 21,400
(iii) Effect of financial results
The financial results of the Acquisition in the period between the date of acquisition and the date of statements of financial position was not significant to the Group.
(iv) The net cash flows arising from the Acquisition was as follows:
RM’000
Cash settlement (21,400)Cash and short term funds 1,765Deposits and placements with banks and other financial institutions 30,345 Acquisition of a subsidiary, net of cash and cash equivalents acquired 10,710
RHB
Ban
k B
erha
d -
Fina
ncia
l Rep
ort
2020
RHB
Ban
k B
erha
d -
Fina
ncia
l Rep
ort
2020
212
213STATUTORY FINANCIAL STATEMENTS
www.rhbgroup.com
NOTES TO THE FINANCIAL STATEMENTSfor the financial year ended 31 December 2020 (continued)
57 SIGNIFICANT EVENTS DURING THE FINANCIAL YEAR (CONTINUED)
Prior Year (continued)
(7) Reorganisation of the equity, economic and fixed income and currencies research operations of RHB Research InstituteSdn Bhd (‘RHBRI’) into RHB Investment Bank and the Bank
In 2019, RHB Investment Bank undertook a reorganisation of its equity and economic research operations, previously housedunder RHBRI, a wholly-owned subsidiary of RHB Investment Bank, into a division within RHB Investment Bank, while theirfixed income and currencies research function is absorbed by the Bank.
The Reorganisation was intended to streamline the research operations under RHB Investment Bank and the Bank, and torationalise the costs of maintaining a separate licensed entity for research.
The Securities Commission Malaysia (‘SC’) had on 15 April 2019, granted approval for the Reorganisation, including the variationof RHB Investment Bank’s Capital Market Services Licence (‘CMSL’) to include the regulated activity of Investment Advice.
Following SC’s approval, the Reorganisation was completed on 2 May 2019 via an Asset Purchase Agreement (‘APA’) enteredinto between RHB Investment Bank and RHBRI and included a novation of contracts entered into by RHBRI and a transfer ofemployees. Similarly, the Bank and RHBRI entered into an APA in relation to the transfer of assets.
RHBRI has since surrendered its CMSL and had commenced member’s voluntary winding up on 30 September 2020 asdisclosed in Note 15.
58 EVENTS SUBSEQUENT TO THE FINANCIAL YEAR END
(a) Proposed capital repayment by RHB Investment Bank
RHB Investment Bank had on 12 January 2021 passed a special resolution to reduce its issued and paid up ordinary sharecapital pursuant to Section 117 of Companies Act 2016 ('CA 2016'), by way of:
(i) cancellation of 20,000,000 ordinary shares in RHB Investment Bank which are held by the Bank, resulting in thetotal number of issued ordinary shares in RHB Investment Bank being reduced from 100,000,000 ordinary shares to80,000,000 ordinary shares; and
(ii) reduction of RHB Investment Bank's share capital from RM1,487,773,000 to RM1,220,000,000 by repaying the surpluscapital of the amount of RM267,773,000 to the Bank.
Upon the elapsed time as required under CA 2016, RHB Investment Bank shall make the necessary lodgments with the Companies Commission of Malaysia ('CCM') for the Proposed Capital Repayment. The reduction of the share capital shall take effect upon CCM issuing a confirmation notice.
(b) On 13 January 2021, the Government of Malaysia reintroduced the movement control order to curb the soaring number ofCOVID-19 cases. The lock down may have a negative impact on the Group's and the Bank's results of operations, similar tothe areas highlighted in the Directors’ Report. The Group and the Bank are not able to predict the potential future direct orindirect effects resulted from the movement control order. However, the Group and the Bank are taking actions to mitigatethe impacts, and will continue to closely monitor the impact and the related risks as they evolve.
We, Tan Sri Azlan Zainol and Dato’ Khairussaleh Ramli, being two of the Directors of RHB Bank Berhad state that, in the opinion of the Directors, the financial statements set out on pages 8 to 212 are drawn up so as to give a true and fair view of the financial position of the Group and the Bank as at 31 December 2020 and financial performance of the Group and of the Bank for the financial year ended on 31 December 2020 in accordance with Malaysian Financial Reporting Standards, International Financial Reporting Standards and the requirements of the Companies Act 2016 in Malaysia.
Signed on behalf of the Board of Directors in accordance with a resolution of the Directors dated 24 February 2021.
TAN SRI AZLAN ZAINOL DATO’ KHAIRUSSALEH RAMLICHAIRMAN GROUP MANAGING DIRECTOR
Kuala Lumpur
STATEMENT BY DIRECTORSPURSUANT TO SECTION 251(2) OF THE COMPANIES ACT 2016
STATUTORY DECLARATIONPURSUANT TO SECTION 251(1) OF THE COMPANIES ACT 2016
I, Syed Ahmad Taufik Albar, the Officer primarily responsible for the financial management of RHB Bank Berhad, do solemnly and sincerely declare that the accompanying financial statements set out on pages 8 to 212 are, to the best of my knowledge and belief, correct and I make this solemn declaration conscientiously believing the same to be true and by virtue of the provisions of the Statutory Declarations Act, 1960.
SYED AHMAD TAUFIK ALBAR(MIA Membership No: 29842)
Subscribed and solemnly declared by the abovenamed Syed Ahmad Taufik Albar at Kuala Lumpur in Malaysia on 24 February 2021.
COMMISSIONER FOR OATHSKuala Lumpur
RHB
Ban
k B
erha
d -
Fina
ncia
l Rep
ort
2020
RHB
Ban
k B
erha
d -
Fina
ncia
l Rep
ort
2020
214
215STATUTORY FINANCIAL STATEMENTS
www.rhbgroup.com
REPORT ON THE AUDIT OF THE FINANCIAL STATEMENTS
Our opinion
In our opinion, the financial statements of RHB Bank Berhad (‘the Bank’) and its subsidiaries (‘the Group’) give a true and fair view of the financial position of the Group and of the Bank as at 31 December 2020, and of their financial performance and their cash flows for the financial year then ended in accordance with Malaysian Financial Reporting Standards, International Financial Reporting Standards and the requirements of the Companies Act 2016 in Malaysia.
What we have audited
We have audited the financial statements of the Group and of the Bank, which comprise the statements of financial position as at 31 December 2020 of the Group and of the Bank, and the income statements, statements of comprehensive income, statements of changes in equity and statements of cash flows of the Group and of the Bank for the financial year then ended, and notes to the financial statements, including a summary of significant accounting policies, as set out on pages 8 to 212.
Basis for opinion
We conducted our audit in accordance with approved standards on auditing in Malaysia and International Standards on Auditing. Our responsibilities under those standards are further described in the ‘Auditors’ responsibilities for the audit of the financial statements’ section of our report.
We believe that the audit evidence we have obtained is sufficient and appropriate to provide a basis for our opinion.
Independence and other ethical responsibilities
We are independent of the Group and of the Bank in accordance with the By-Laws (on Professional Ethics, Conduct and Practice) of the Malaysian Institute of Accountants (‘By-Laws’) and the International Ethics Standards Board for Accountants’ Code of Ethics for Professional Accountants (including International Independence Standards) (‘IESBA Code’), and we have fulfilled our other ethical responsibilities in accordance with the By-Laws and the IESBA Code.
Our audit approach
As part of designing our audit, we determined materiality and assessed the risks of material misstatement in the financial statements of the Group and of the Bank. In particular, we considered where the Directors made subjective judgements; for example, in respect of significant accounting estimates that involved making assumptions and considering future events that are inherently uncertain. As in all of our audits, we also addressed the risk of management override of internal controls, including among other matters, consideration of whether there was evidence of bias that represented a risk of material misstatement due to fraud.
We tailored the scope of our audit in order to perform sufficient work to enable us to provide an opinion on the financial statements as a whole, taking into account the structure of the Group and of the Bank, the accounting processes and controls, and the industry in which the Group and the Bank operate.
INDEPENDENT AUDITORS’ REPORTTO THE MEMBERS OF RHB BANK BERHAD
REPORT ON THE AUDIT OF THE FINANCIAL STATEMENTS (CONTINUED)
Key audit matters
Key audit matters are those matters that, in our professional judgement, were of most significance in our audit of the financial statements of the Group and of the Bank for the current financial year. These matters were addressed in the context of our audit of the financial statements of the Group and of the Bank as a whole, and in forming our opinion thereon, and we do not provide a separate opinion on these matters.
Key audit matter How our audit addressed the key audit matter
Allowances for credit losses of loans, advances and financing for the Group and the Bank
Refer to:- Accounting policy 21;- Critical accounting estimate (2); and- Notes 8, 43, 55(e)(vii) of the financial statements.
MFRS 9 introduces an expected credit loss (‘ECL’) impairment model, which requires the use of complex models and significant assumptions about future economic conditions and credit behaviour.
This is an area of focus as the Directors make significant judgements in applying the accounting requirements for measuring ECL, such as:- Choosing the appropriate collective assessment models
used to calculate ECL. The models are inherently complexand judgement is applied in determining the appropriateconstruct of model;
- Identification of loans, advances and financing that haveexperienced a significant increase in credit risk;
- Assumptions used in the ECL models such as expectedfuture cash flows, forward-looking macroeconomic factorsand datasets to be used as input to the models, includingidentifying and calculating adjustments to model output(model overlay adjustments), given the economic uncertainty arising from COVID-19 that may impact future expectedcredit losses.
Individual assessment
We evaluated the design and operating effectiveness of the controls over the process of identification of loans, advances and financing that have experienced significant increase in credit risk, process of identification of loss event and the process of forecasting future cash flows to determine the ECL amount.
In addition, we tested a sample of loans, advances and financing selected based on risk with particular focus on the impact of COVID-19 on high risk industries, and formed our judgement whether the Directors’ assessment on either the occurrence of loss event or significant increase in credit risk was appropriate. Where a loss event or significant increase in credit risk had been identified, we checked the ECL calculated for exposures assessed on an individual basis. We checked the forecasts of future cash flows prepared by the Directors to calculate the amount of ECL. We assessed the reasonableness of the assumptions underlying the forecasted cash flows. In addition, we compared the collateral values assumed in the cash flow forecasts to external valuation reports.
Collective assessment
To determine the appropriateness of the MFRS 9 collective assessment ECL models implemented by the Group and the Bank, we have:- Assessed the methodologies inherent within the collective
assessment ECL models applied against the requirements ofMFRS 9;
- Tested the design and operating effectiveness of the controlsrelating to:• Governance and model development, including model
build, model approval and model validation;• Data used to determine the allowances for credit
losses; and• Calculation, review and approval of the ECL calculation
- Assessed and tested the significant modelling assumptions;- Assessed and considered reasonableness of forward-
looking forecasts assumptions, taking into consideration ofthe economic uncertainty arising from COVID-19;
- Assessed and tested the identification and calculationof overlay adjustments to the ECL due to the impact ofCOVID-19; and
- Checked the accuracy of data and calculation of the ECLamount, on a sample basis;
Based on the above procedures, the results of our evaluation of the allowances for credit losses for loans, advances and financing are consistent with the Directors’ assessment.
RHB
Ban
k B
erha
d -
Fina
ncia
l Rep
ort
2020
RHB
Ban
k B
erha
d -
Fina
ncia
l Rep
ort
2020
216
217STATUTORY FINANCIAL STATEMENTS
www.rhbgroup.com
REPORT ON THE AUDIT OF THE FINANCIAL STATEMENTS (CONTINUED)
Key audit matters (continued)
Key audit matter How our audit addressed the key audit matter
Impairment testing of goodwill for the Group
Refer to accounting policy 7, critical accounting estimate (3) and Note 19 of the financial statements.
As required by MFRS 136, an annual impairment assessment is performed on the goodwill balance of RM2,654.1 million. The recoverable amount of each cash generating unit (‘CGU’) with allocated goodwill is determined based on the higher of value in use (‘VIU’) and fair value less cost of disposal. The Directors have determined VIU to be the recoverable amount of these CGU.
We focused on this area due to the size of the carrying amount of the goodwill, which represented 0.98% of total assets and because the Directors make significant estimates about the future cash flows of these CGU and the discount rate applied to each CGU.
We tested the Directors’ impairment assessment of goodwill by performing the following procedures:
- Agreed the cash flow projection of each CGU to the approved budget by the Directors for the respective CGU, taking into account the impact of COVID-19. We also compared previous projection to actual result of each CGU to assess the reasonableness of assumptions used in the cash flow projections;
- Assessed reasonableness of discount rates which reflects the specific risk relating to each CGU based on external information, with higher risk premium to the discount rate to reflect the COVID-19 uncertainties;
- Evaluated the reasonableness of growth rates beyond three years (‘Terminal Growth Rates’) based on historical results, economic outlook and industry forecasts;
- Performed sensitivity analysis over Terminal Growth Rates and discount rates used in the determination of the VIU cash flows to assess the potential impact of a reasonable possible change to any of these assumptions on the recoverable amount of each CGU.
Based on the evidence obtained we found that the assumptions used by the Directors in the impairment assessment of goodwill were consistent with our understanding.
Information other than the financial statements and auditors’ report thereon
The Directors of the Bank are responsible for the other information. The other information comprises the Directors’ Report which we obtained prior to the date of this auditors’ report, and the 2020 Annual Report, which is expected to be made available to us after that date. Other information does not include the financial statements of the Group and of the Bank and our auditors’ report thereon.
Our opinion on the financial statements of the Group and of the Bank does not cover the other information and we do not express any form of assurance conclusion thereon.
In connection with our audit of the financial statements of the Group and of the Bank, our responsibility is to read the other information and, in doing so, consider whether the other information is materially inconsistent with the financial statements of the Group and of the Bank or our knowledge obtained in the audit or otherwise appears to be materially misstated.
If, based on the work we have performed on the other information that we obtained prior to the date of this auditors’ report, we conclude that there is a material misstatement of this other information, we are required to report that fact. We have nothing to report in this regard.
REPORT ON THE AUDIT OF THE FINANCIAL STATEMENTS (CONTINUED)
Responsibilities of the Directors for the financial statements
The Directors of the Bank are responsible for the preparation of the financial statements of the Group and of the Bank that give a true and fair view in accordance with Malaysian Financial Reporting Standards, International Financial Reporting Standards and the requirements of the Companies Act 2016 in Malaysia. The Directors are also responsible for such internal control as the Directors determine is necessary to enable the preparation of financial statements of the Group and of the Bank that are free from material misstatement, whether due to fraud or error.
In preparing the financial statements of the Group and of the Bank, the Directors are responsible for assessing the Group’s and the Bank’s ability to continue as a going concern, disclosing, as applicable, matters related to going concern and using the going concern basis of accounting unless the Directors either intend to liquidate the Group or the Bank or to cease operations, or have no realistic alternative but to do so.
Auditors’ responsibilities for the audit of the financial statements
Our objectives are to obtain reasonable assurance about whether the financial statements of the Group and of the Bank as a whole are free from material misstatement, whether due to fraud or error, and to issue an auditors’ report that includes our opinion. Reasonable assurance is a high level of assurance, but is not a guarantee that an audit conducted in accordance with approved standards on auditing in Malaysia and International Standards on Auditing will always detect a material misstatement when it exists. Misstatements can arise from fraud or error and are considered material if, individually or in the aggregate, they could reasonably be expected to influence the economic decisions of users taken on the basis of these financial statements.
As part of an audit in accordance with approved standards on auditing in Malaysia and International Standards on Auditing, we exercise professional judgement and maintain professional scepticism throughout the audit. We also:
(a) Identify and assess the risks of material misstatement of the financial statements of the Group and of the Bank, whether due to fraud or error, design and perform audit procedures responsive to those risks, and obtain audit evidence that is sufficient and appropriate to provide a basis for our opinion. The risk of not detecting a material misstatement resulting from fraud is higher than for one resulting from error, as fraud may involve collusion, forgery, intentional omissions, misrepresentations, or the override of internal control.
(b) Obtain an understanding of internal control relevant to the audit in order to design audit procedures that are appropriate in the circumstances, but not for the purpose of expressing an opinion on the effectiveness of the Group’s and of the Bank’s internal control.
(c) Evaluate the appropriateness of accounting policies used and the reasonableness of accounting estimates and related disclosures made by the Directors.
(d) Conclude on the appropriateness of the Directors’ use of the going concern basis of accounting and, based on the audit evidence obtained, whether a material uncertainty exists related to events or conditions that may cast significant doubt on the Group’s or on the Bank’s ability to continue as a going concern. If we conclude that a material uncertainty exists, we are required to draw attention in our auditors’ report to the related disclosures in the financial statements of the Group and of the Bank or, if such disclosures are inadequate, to modify our opinion. Our conclusions are based on the audit evidence obtained up to the date of our auditors’ report. However, future events or conditions may cause the Group or the Bank to cease to continue as a going concern.
(e) Evaluate the overall presentation, structure and content of the financial statements of the Group and of the Bank, including the disclosures, and whether the financial statements of the Group and of the Bank represent the underlying transactions and events in a manner that achieves fair presentation.
(f) Obtain sufficient appropriate audit evidence regarding the financial information of the entities or business activities within the Group to express an opinion on the financial statements of the Group. We are responsible for the direction, supervision and performance of the group audit. We remain solely responsible for our audit opinion.
INDEPENDENT AUDITORS’ REPORTTO THE MEMBERS OF RHB BANK BERHAD (CONTINUED)
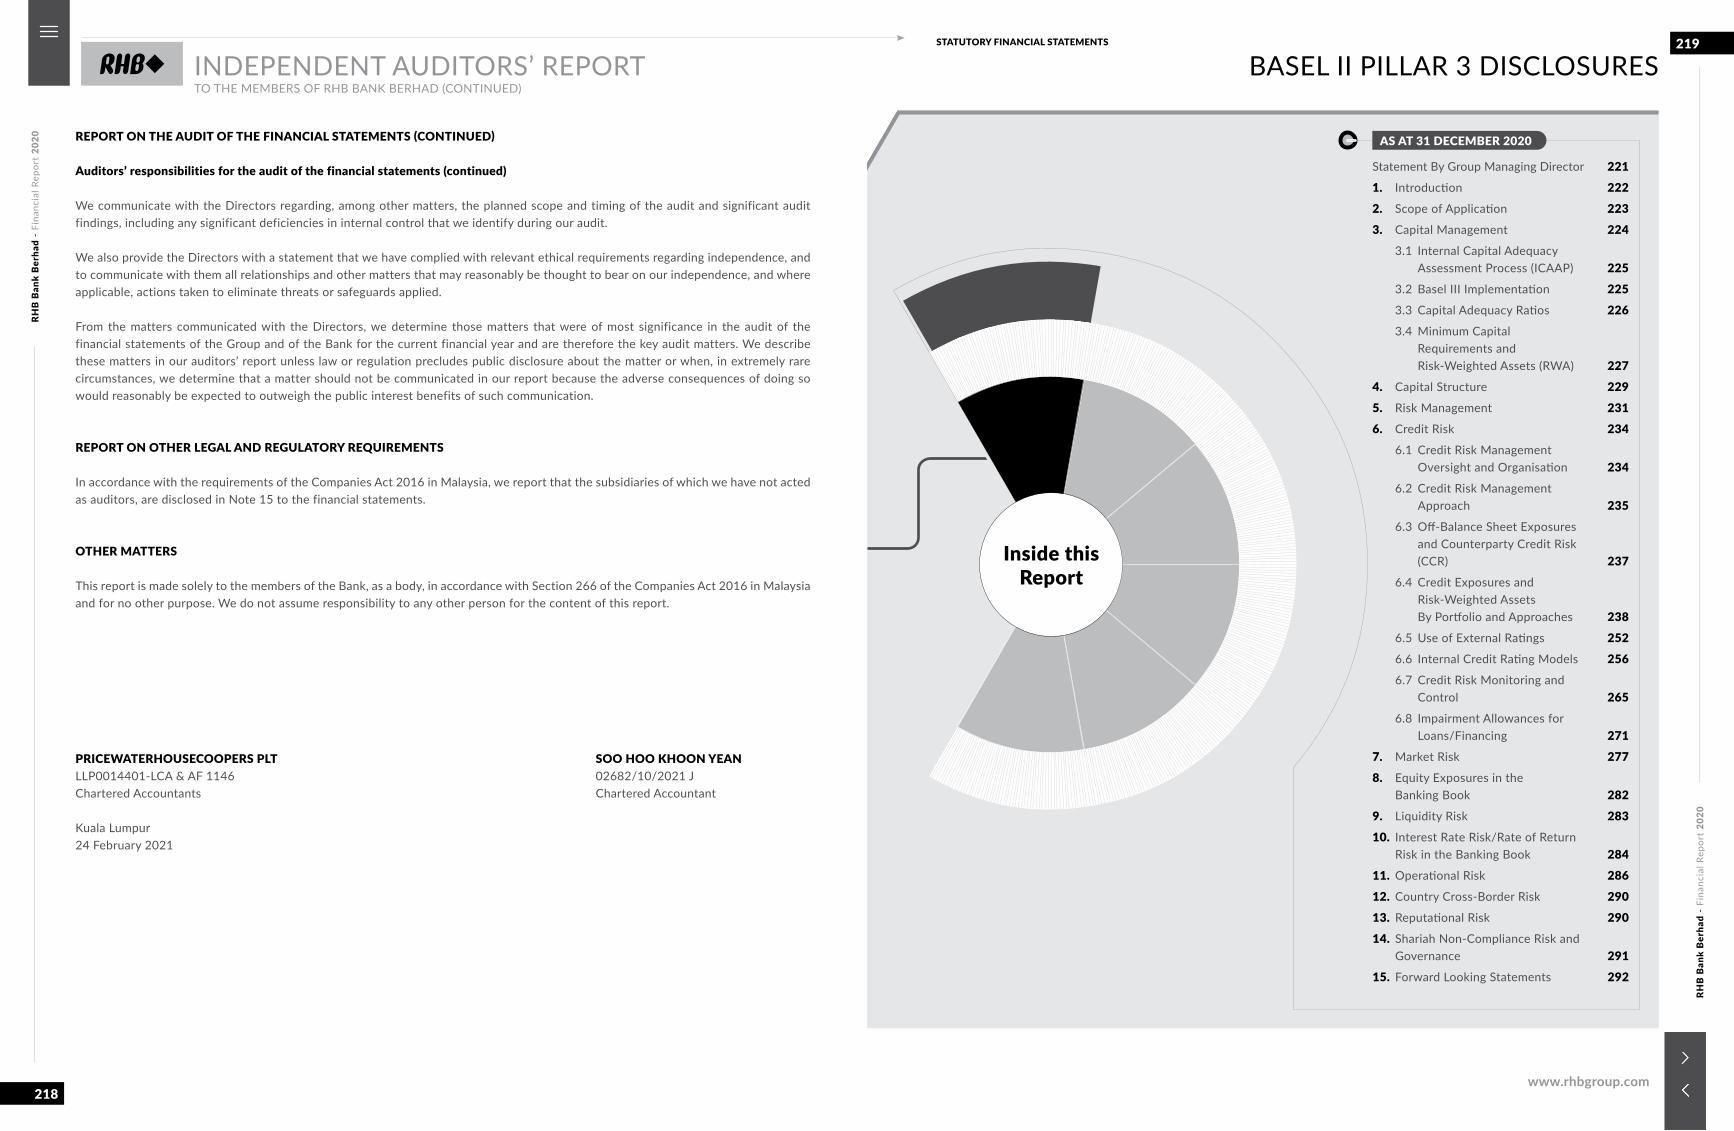
RHB
Ban
k B
erha
d -
Fina
ncia
l Rep
ort
2020
RHB
Ban
k B
erha
d -
Fina
ncia
l Rep
ort
2020
218
219STATUTORY FINANCIAL STATEMENTS
www.rhbgroup.com
REPORT ON THE AUDIT OF THE FINANCIAL STATEMENTS (CONTINUED)
Auditors’ responsibilities for the audit of the financial statements (continued)
We communicate with the Directors regarding, among other matters, the planned scope and timing of the audit and significant audit findings, including any significant deficiencies in internal control that we identify during our audit.
We also provide the Directors with a statement that we have complied with relevant ethical requirements regarding independence, and to communicate with them all relationships and other matters that may reasonably be thought to bear on our independence, and where applicable, actions taken to eliminate threats or safeguards applied.
From the matters communicated with the Directors, we determine those matters that were of most significance in the audit of the financial statements of the Group and of the Bank for the current financial year and are therefore the key audit matters. We describe these matters in our auditors’ report unless law or regulation precludes public disclosure about the matter or when, in extremely rare circumstances, we determine that a matter should not be communicated in our report because the adverse consequences of doing so would reasonably be expected to outweigh the public interest benefits of such communication.
REPORT ON OTHER LEGAL AND REGULATORY REQUIREMENTS
In accordance with the requirements of the Companies Act 2016 in Malaysia, we report that the subsidiaries of which we have not acted as auditors, are disclosed in Note 15 to the financial statements.
OTHER MATTERS
This report is made solely to the members of the Bank, as a body, in accordance with Section 266 of the Companies Act 2016 in Malaysia and for no other purpose. We do not assume responsibility to any other person for the content of this report.
PRICEWATERHOUSECOOPERS PLT SOO HOO KHOON YEANLLP0014401-LCA & AF 1146 02682/10/2021 JChartered Accountants Chartered Accountant
Kuala Lumpur24 February 2021
INDEPENDENT AUDITORS’ REPORTTO THE MEMBERS OF RHB BANK BERHAD (CONTINUED)
BASEL II PILLAR 3 DISCLOSURES
Statement By Group Managing Director 2211. Introduction 2222. Scope of Application 2233. Capital Management 224
3.1 Internal Capital Adequacy Assessment Process (ICAAP) 225
3.2 Basel III Implementation 2253.3 Capital Adequacy Ratios 2263.4 Minimum Capital
Requirements and Risk-Weighted Assets (RWA) 227
4. Capital Structure 2295. Risk Management 2316. Credit Risk 234
6.1 Credit Risk Management Oversight and Organisation 234
6.2 Credit Risk Management Approach 235
6.3 Off-Balance Sheet Exposures and Counterparty Credit Risk (CCR) 237
6.4 Credit Exposures and Risk-Weighted Assets By Portfolio and Approaches 238
6.5 Use of External Ratings 2526.6 Internal Credit Rating Models 2566.7 Credit Risk Monitoring and
Control 2656.8 Impairment Allowances for
Loans/Financing 2717. Market Risk 2778. Equity Exposures in the
Banking Book 2829. Liquidity Risk 28310. Interest Rate Risk/Rate of Return
Risk in the Banking Book 28411. Operational Risk 28612. Country Cross-Border Risk 29013. Reputational Risk 29014. Shariah Non-Compliance Risk and
Governance 29115. Forward Looking Statements 292
AS AT 31 DECEMBER 2020
RHB
Ban
k B
erha
d -
Fina
ncia
l Rep
ort
2020
RHB
Ban
k B
erha
d -
Fina
ncia
l Rep
ort
2020
220
221STATUTORY FINANCIAL STATEMENTS
www.rhbgroup.com
TABLE NO DESCRIPTION PAGE(S)Table 1 Capital Adequacy Ratios 226
Table 2 Risk-Weighted Assets (RWA) by Risk Types 227
Tables 3a & 3b Risk-Weighted Assets by Risk Types and Minimum Capital Requirements 227
Table 4 Capital Structure 229
Tables 5a & 5b Summary of Credit Exposures with Credit Risk Mitigation (CRM) by Asset Class and Minimum Capital Requirements (On and Off-Balance Sheet Exposures)
239
Tables 6a & 6b Exposures on Off-Balance Sheet and Counterparty Credit Risk (Before Credit Risk Mitigation)
243
Tables 7a & 7b Credit Risk Exposures (Before Credit Risk Mitigation) by Geographical Distribution 245
Tables 8a & 8b Credit Risk Exposures (Before Credit Risk Mitigation) by Industry Sector 247
Tables 9a & 9b Credit Risk Exposures (Before Credit Risk Mitigation) by Remaining Maturity 249
Tables 10a & 10b Portfolios under the Standardised Approach by Risk Weights 251
Tables 11a & 11b Rated Exposures According to Ratings by External Credit Assessment Institutions (ECAIs) 252
Tables 12a & 12b Exposures Subject to the Supervisory Risk Weights under the IRB Approach 258
Tables 13a & 13b Exposures under the IRB Approach by PD Band, Exposure Weighted Average Loss Given Default (LGD) and Exposure Weighted Average Risk Weights
259
Tables 14a & 14b Exposures under the A-IRB Approach by EL Range and Exposure Weighted Average Risk Weights
263
Table 15 Exposures under IRB Approach by Actual Losses versus Expected Losses 265
Tables 16a & 16b Credit Risk Mitigation of Portfolios under the Standardised Approach 266
Tables 17a & 17b Credit Risk Mitigation of Portfolios under the IRB Approach 268
Tables 18a & 18b Impaired and Past Due Loans/Financing and Allowance for Credit Losses by Industry Sector
274
Table 19 Net Charges/(Write back) and Write-Offs for Loans/Financing Impairment by Industry Sector
275
Tables 20a & 20b Impaired and Past Due Loans/Financing and Allowance for Credit Losses by Geographical Distribution
275
Tables 21a & 21b Movement in Loans/Financing Allowance for Credit Losses 276
Tables 22a & 22b Market Risk-Weighted Assets and Minimum Capital Requirements 279
Table 23 Equity Exposures in the Banking Book 282
Tables 24a & 24b Interest Rate Risk/Rate of Return Risk in the Banking Book 285
Tables 25a & 25b Operational Risk-Weighted Assets and Minimum Capital Requirements 289
Table 26 Glossary of Terms 293
In accordance with the requirements of Bank Negara Malaysia’s Guideline on Risk-Weighted Capital Adequacy Framework (Basel II) – Disclosure Requirements (Pillar 3), and on behalf of the Board of Directors and Senior Management of RHB Bank Berhad, I am pleased to provide an attestation that the Basel II Pillar 3 disclosures of RHB Bank Berhad for the year ended 31 December 2020 are accurate and complete.
DATO’ KHAIRUSSALEH BIN RAMLIGroup Managing Director
LIST OF TABLES STATEMENT BY GROUP MANAGING DIRECTOR
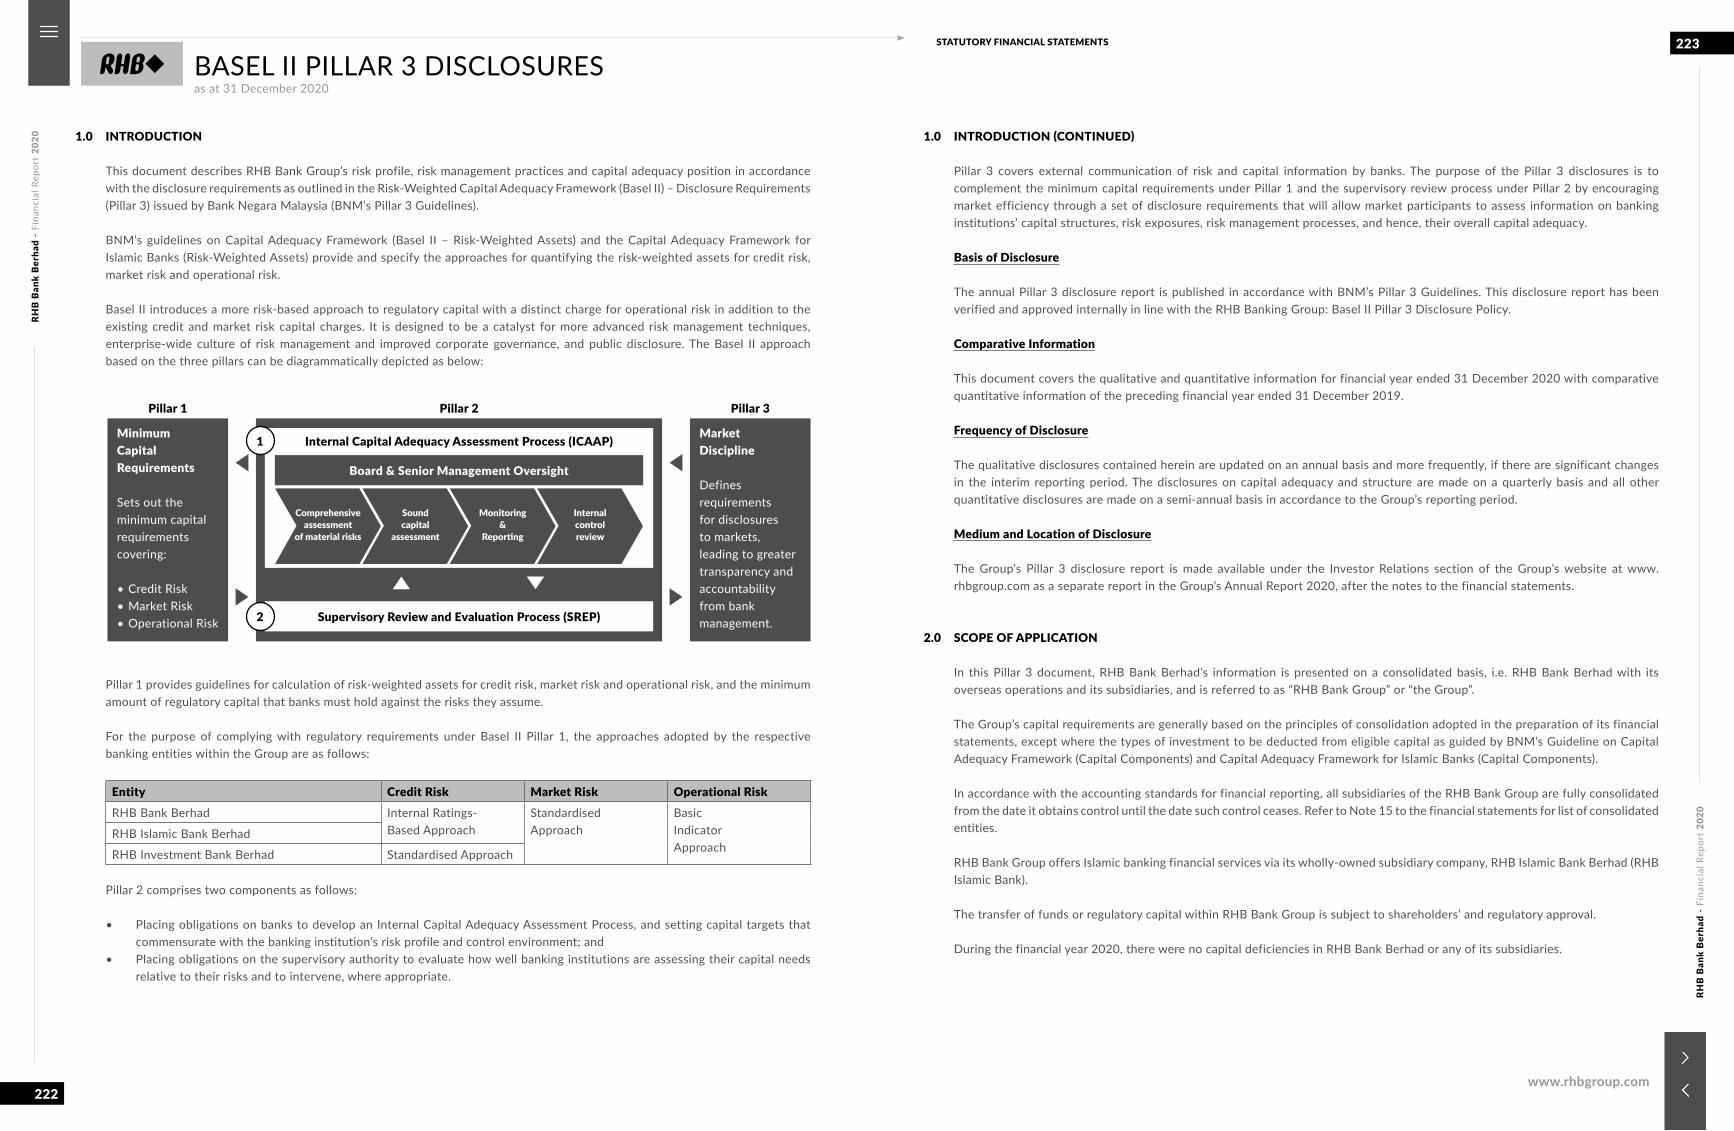
RHB
Ban
k B
erha
d -
Fina
ncia
l Rep
ort
2020
RHB
Ban
k B
erha
d -
Fina
ncia
l Rep
ort
2020
222
223STATUTORY FINANCIAL STATEMENTS
www.rhbgroup.com
1.0 INTRODUCTION
This document describes RHB Bank Group’s risk profile, risk management practices and capital adequacy position in accordance with the disclosure requirements as outlined in the Risk-Weighted Capital Adequacy Framework (Basel II) – Disclosure Requirements (Pillar 3) issued by Bank Negara Malaysia (BNM’s Pillar 3 Guidelines).
BNM’s guidelines on Capital Adequacy Framework (Basel II – Risk-Weighted Assets) and the Capital Adequacy Framework for Islamic Banks (Risk-Weighted Assets) provide and specify the approaches for quantifying the risk-weighted assets for credit risk, market risk and operational risk.
Basel II introduces a more risk-based approach to regulatory capital with a distinct charge for operational risk in addition to the existing credit and market risk capital charges. It is designed to be a catalyst for more advanced risk management techniques, enterprise-wide culture of risk management and improved corporate governance, and public disclosure. The Basel II approach based on the three pillars can be diagrammatically depicted as below:
1.0 INTRODUCTION (CONTINUED)
Pillar 3 covers external communication of risk and capital information by banks. The purpose of the Pillar 3 disclosures is to complement the minimum capital requirements under Pillar 1 and the supervisory review process under Pillar 2 by encouraging market efficiency through a set of disclosure requirements that will allow market participants to assess information on banking institutions’ capital structures, risk exposures, risk management processes, and hence, their overall capital adequacy.
Basis of Disclosure
The annual Pillar 3 disclosure report is published in accordance with BNM’s Pillar 3 Guidelines. This disclosure report has been verified and approved internally in line with the RHB Banking Group: Basel II Pillar 3 Disclosure Policy.
Comparative Information
This document covers the qualitative and quantitative information for financial year ended 31 December 2020 with comparative quantitative information of the preceding financial year ended 31 December 2019.
Frequency of Disclosure
The qualitative disclosures contained herein are updated on an annual basis and more frequently, if there are significant changes in the interim reporting period. The disclosures on capital adequacy and structure are made on a quarterly basis and all other quantitative disclosures are made on a semi-annual basis in accordance to the Group’s reporting period.
Medium and Location of Disclosure
The Group’s Pillar 3 disclosure report is made available under the Investor Relations section of the Group’s website at www.rhbgroup.com as a separate report in the Group’s Annual Report 2020, after the notes to the financial statements.
2.0 SCOPE OF APPLICATION
In this Pillar 3 document, RHB Bank Berhad’s information is presented on a consolidated basis, i.e. RHB Bank Berhad with its overseas operations and its subsidiaries, and is referred to as “RHB Bank Group” or “the Group”.
The Group’s capital requirements are generally based on the principles of consolidation adopted in the preparation of its financial statements, except where the types of investment to be deducted from eligible capital as guided by BNM’s Guideline on Capital Adequacy Framework (Capital Components) and Capital Adequacy Framework for Islamic Banks (Capital Components).
In accordance with the accounting standards for financial reporting, all subsidiaries of the RHB Bank Group are fully consolidated from the date it obtains control until the date such control ceases. Refer to Note 15 to the financial statements for list of consolidated entities.
RHB Bank Group offers Islamic banking financial services via its wholly-owned subsidiary company, RHB Islamic Bank Berhad (RHB Islamic Bank).
The transfer of funds or regulatory capital within RHB Bank Group is subject to shareholders’ and regulatory approval.
During the financial year 2020, there were no capital deficiencies in RHB Bank Berhad or any of its subsidiaries.
BASEL II PILLAR 3 DISCLOSURESas at 31 December 2020
MinimumCapitalRequirements
Sets out theminimum capitalrequirementscovering:
• Credit Risk• Market Risk• Operational Risk
MarketDiscipline
Definesrequirementsfor disclosuresto markets,leading to greatertransparency andaccountability from bank management.
Pillar 1 Pillar 3Pillar 2
Internal Capital Adequacy Assessment Process (ICAAP)
Board & Senior Management Oversight
Supervisory Review and Evaluation Process (SREP)
Comprehensiveassessment
of material risks
Soundcapital
assessment
Monitoring&
Reporting
Internalcontrolreview
1
2
Pillar 1 provides guidelines for calculation of risk-weighted assets for credit risk, market risk and operational risk, and the minimum amount of regulatory capital that banks must hold against the risks they assume.
For the purpose of complying with regulatory requirements under Basel II Pillar 1, the approaches adopted by the respective banking entities within the Group are as follows:
Entity Credit Risk Market Risk Operational RiskRHB Bank Berhad Internal Ratings-
Based ApproachStandardisedApproach
BasicIndicatorApproach
RHB Islamic Bank Berhad
RHB Investment Bank Berhad Standardised Approach
Pillar 2 comprises two components as follows:
• Placing obligations on banks to develop an Internal Capital Adequacy Assessment Process, and setting capital targets thatcommensurate with the banking institution’s risk profile and control environment; and
• Placing obligations on the supervisory authority to evaluate how well banking institutions are assessing their capital needsrelative to their risks and to intervene, where appropriate.
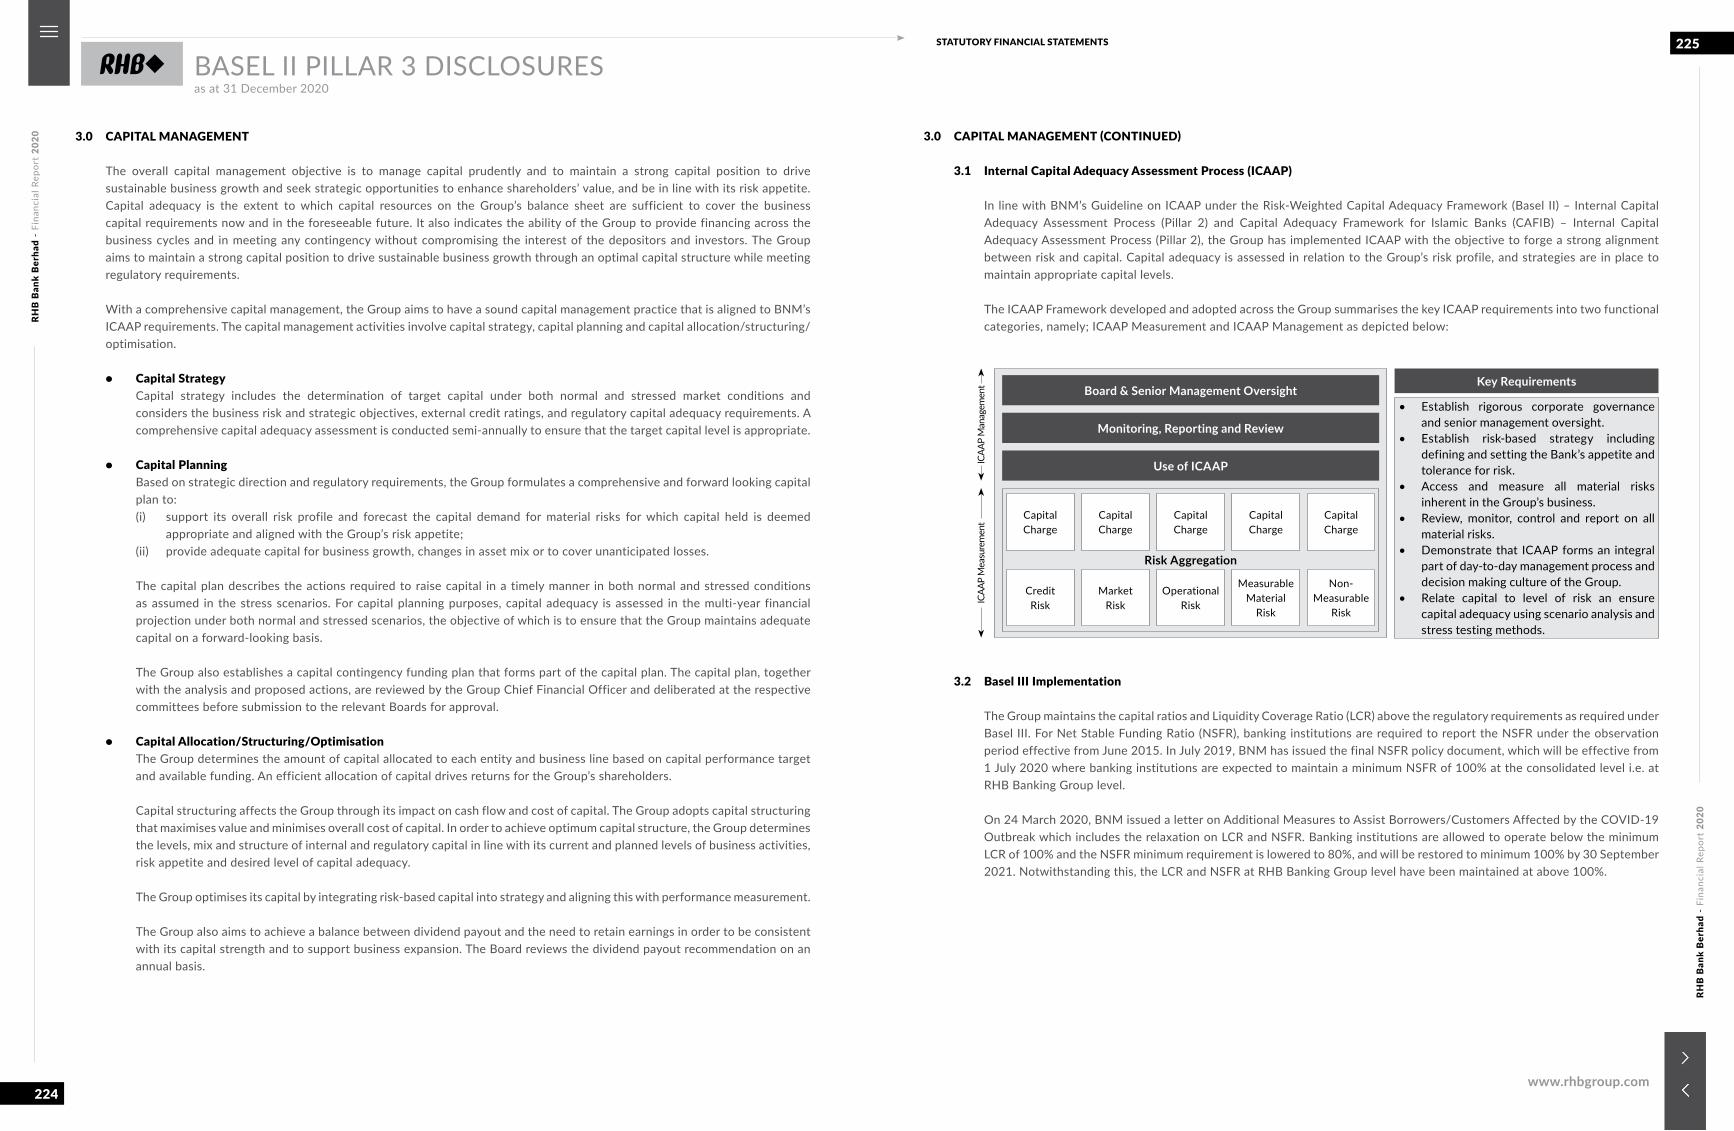
RHB
Ban
k B
erha
d -
Fina
ncia
l Rep
ort
2020
RHB
Ban
k B
erha
d -
Fina
ncia
l Rep
ort
2020
224
225STATUTORY FINANCIAL STATEMENTS
www.rhbgroup.com
BASEL II PILLAR 3 DISCLOSURESas at 31 December 2020
3.0 CAPITAL MANAGEMENT
The overall capital management objective is to manage capital prudently and to maintain a strong capital position to drive sustainable business growth and seek strategic opportunities to enhance shareholders’ value, and be in line with its risk appetite. Capital adequacy is the extent to which capital resources on the Group’s balance sheet are sufficient to cover the business capital requirements now and in the foreseeable future. It also indicates the ability of the Group to provide financing across the business cycles and in meeting any contingency without compromising the interest of the depositors and investors. The Group aims to maintain a strong capital position to drive sustainable business growth through an optimal capital structure while meeting regulatory requirements.
With a comprehensive capital management, the Group aims to have a sound capital management practice that is aligned to BNM’s ICAAP requirements. The capital management activities involve capital strategy, capital planning and capital allocation/structuring/optimisation.
• Capital Strategy Capital strategy includes the determination of target capital under both normal and stressed market conditions and
considers the business risk and strategic objectives, external credit ratings, and regulatory capital adequacy requirements. A comprehensive capital adequacy assessment is conducted semi-annually to ensure that the target capital level is appropriate.
• Capital Planning Based on strategic direction and regulatory requirements, the Group formulates a comprehensive and forward looking capital
plan to:(i) support its overall risk profile and forecast the capital demand for material risks for which capital held is deemed
appropriate and aligned with the Group’s risk appetite;(ii) provide adequate capital for business growth, changes in asset mix or to cover unanticipated losses.
The capital plan describes the actions required to raise capital in a timely manner in both normal and stressed conditions as assumed in the stress scenarios. For capital planning purposes, capital adequacy is assessed in the multi-year financial projection under both normal and stressed scenarios, the objective of which is to ensure that the Group maintains adequate capital on a forward-looking basis.
The Group also establishes a capital contingency funding plan that forms part of the capital plan. The capital plan, together with the analysis and proposed actions, are reviewed by the Group Chief Financial Officer and deliberated at the respective committees before submission to the relevant Boards for approval.
• Capital Allocation/Structuring/Optimisation The Group determines the amount of capital allocated to each entity and business line based on capital performance target
and available funding. An efficient allocation of capital drives returns for the Group’s shareholders.
Capital structuring affects the Group through its impact on cash flow and cost of capital. The Group adopts capital structuring that maximises value and minimises overall cost of capital. In order to achieve optimum capital structure, the Group determines the levels, mix and structure of internal and regulatory capital in line with its current and planned levels of business activities, risk appetite and desired level of capital adequacy.
The Group optimises its capital by integrating risk-based capital into strategy and aligning this with performance measurement.
The Group also aims to achieve a balance between dividend payout and the need to retain earnings in order to be consistent with its capital strength and to support business expansion. The Board reviews the dividend payout recommendation on an annual basis.
3.0 CAPITAL MANAGEMENT (CONTINUED)
3.1 Internal Capital Adequacy Assessment Process (ICAAP)
In line with BNM’s Guideline on ICAAP under the Risk-Weighted Capital Adequacy Framework (Basel II) – Internal Capital Adequacy Assessment Process (Pillar 2) and Capital Adequacy Framework for Islamic Banks (CAFIB) – Internal Capital Adequacy Assessment Process (Pillar 2), the Group has implemented ICAAP with the objective to forge a strong alignment between risk and capital. Capital adequacy is assessed in relation to the Group’s risk profile, and strategies are in place to maintain appropriate capital levels.
The ICAAP Framework developed and adopted across the Group summarises the key ICAAP requirements into two functional categories, namely; ICAAP Measurement and ICAAP Management as depicted below:
Key Requirements
• Establish rigorous corporate governance and senior management oversight.
• Establish risk-based strategy including defining and setting the Bank’s appetite and tolerance for risk.
• Access and measure all material risks inherent in the Group’s business.
• Review, monitor, control and report on all material risks.
• Demonstrate that ICAAP forms an integral part of day-to-day management process and decision making culture of the Group.
• Relate capital to level of risk an ensure capital adequacy using scenario analysis and stress testing methods.
ICAA
P M
anag
emen
tIC
AAP
Mea
sure
men
t
Board & Senior Management Oversight
Monitoring, Reporting and Review
Use of ICAAP
CapitalCharge
CapitalCharge
CapitalCharge
CapitalCharge
CapitalCharge
CreditRisk
MarketRisk
OperationalRisk
MeasurableMaterial
Risk
Non-Measurable
Risk
Risk Aggregation
3.2 Basel III Implementation
The Group maintains the capital ratios and Liquidity Coverage Ratio (LCR) above the regulatory requirements as required under Basel III. For Net Stable Funding Ratio (NSFR), banking institutions are required to report the NSFR under the observation period effective from June 2015. In July 2019, BNM has issued the final NSFR policy document, which will be effective from 1 July 2020 where banking institutions are expected to maintain a minimum NSFR of 100% at the consolidated level i.e. at RHB Banking Group level.
On 24 March 2020, BNM issued a letter on Additional Measures to Assist Borrowers/Customers Affected by the COVID-19 Outbreak which includes the relaxation on LCR and NSFR. Banking institutions are allowed to operate below the minimum LCR of 100% and the NSFR minimum requirement is lowered to 80%, and will be restored to minimum 100% by 30 September 2021. Notwithstanding this, the LCR and NSFR at RHB Banking Group level have been maintained at above 100%.
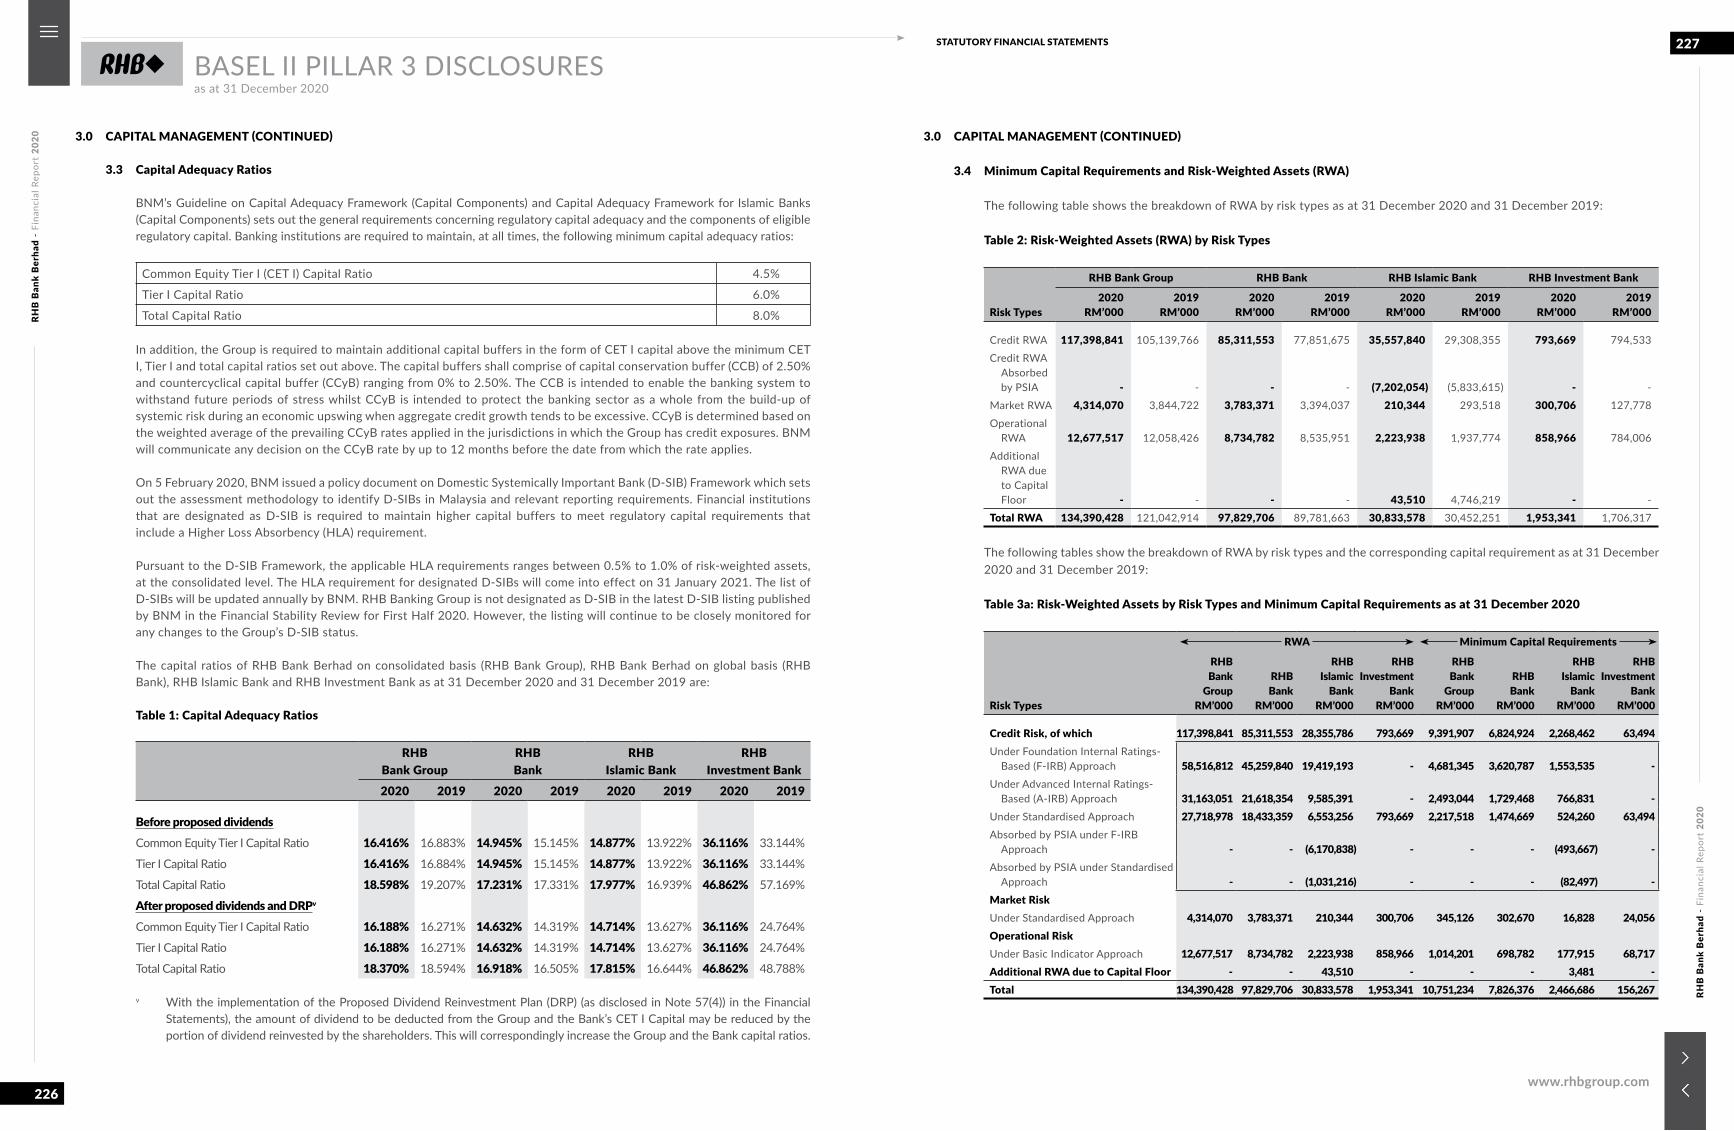
RHB
Ban
k B
erha
d -
Fina
ncia
l Rep
ort
2020
RHB
Ban
k B
erha
d -
Fina
ncia
l Rep
ort
2020
226
227STATUTORY FINANCIAL STATEMENTS
www.rhbgroup.com
BASEL II PILLAR 3 DISCLOSURESas at 31 December 2020
3.0 CAPITAL MANAGEMENT (CONTINUED)
3.3 Capital Adequacy Ratios
BNM’s Guideline on Capital Adequacy Framework (Capital Components) and Capital Adequacy Framework for Islamic Banks (Capital Components) sets out the general requirements concerning regulatory capital adequacy and the components of eligible regulatory capital. Banking institutions are required to maintain, at all times, the following minimum capital adequacy ratios:
Common Equity Tier I (CET I) Capital Ratio 4.5%
Tier I Capital Ratio 6.0%
Total Capital Ratio 8.0%
In addition, the Group is required to maintain additional capital buffers in the form of CET I capital above the minimum CET I, Tier I and total capital ratios set out above. The capital buffers shall comprise of capital conservation buffer (CCB) of 2.50% and countercyclical capital buffer (CCyB) ranging from 0% to 2.50%. The CCB is intended to enable the banking system to withstand future periods of stress whilst CCyB is intended to protect the banking sector as a whole from the build-up of systemic risk during an economic upswing when aggregate credit growth tends to be excessive. CCyB is determined based on the weighted average of the prevailing CCyB rates applied in the jurisdictions in which the Group has credit exposures. BNM will communicate any decision on the CCyB rate by up to 12 months before the date from which the rate applies.
On 5 February 2020, BNM issued a policy document on Domestic Systemically Important Bank (D-SIB) Framework which sets out the assessment methodology to identify D-SIBs in Malaysia and relevant reporting requirements. Financial institutions that are designated as D-SIB is required to maintain higher capital buffers to meet regulatory capital requirements that include a Higher Loss Absorbency (HLA) requirement.
Pursuant to the D-SIB Framework, the applicable HLA requirements ranges between 0.5% to 1.0% of risk-weighted assets, at the consolidated level. The HLA requirement for designated D-SIBs will come into effect on 31 January 2021. The list of D-SIBs will be updated annually by BNM. RHB Banking Group is not designated as D-SIB in the latest D-SIB listing published by BNM in the Financial Stability Review for First Half 2020. However, the listing will continue to be closely monitored for any changes to the Group’s D-SIB status.
The capital ratios of RHB Bank Berhad on consolidated basis (RHB Bank Group), RHB Bank Berhad on global basis (RHB Bank), RHB Islamic Bank and RHB Investment Bank as at 31 December 2020 and 31 December 2019 are:
Table 1: Capital Adequacy Ratios
RHBBank Group
RHBBank
RHBIslamic Bank
RHBInvestment Bank
2020 2019 2020 2019 2020 2019 2020 2019
Before proposed dividendsCommon Equity Tier I Capital Ratio 16.416% 16.883% 14.945% 15.145% 14.877% 13.922% 36.116% 33.144%
Tier I Capital Ratio 16.416% 16.884% 14.945% 15.145% 14.877% 13.922% 36.116% 33.144%
Total Capital Ratio 18.598% 19.207% 17.231% 17.331% 17.977% 16.939% 46.862% 57.169%
After proposed dividends and DRPv
Common Equity Tier I Capital Ratio 16.188% 16.271% 14.632% 14.319% 14.714% 13.627% 36.116% 24.764%
Tier I Capital Ratio 16.188% 16.271% 14.632% 14.319% 14.714% 13.627% 36.116% 24.764%
Total Capital Ratio 18.370% 18.594% 16.918% 16.505% 17.815% 16.644% 46.862% 48.788%
v With the implementation of the Proposed Dividend Reinvestment Plan (DRP) (as disclosed in Note 57(4)) in the Financial Statements), the amount of dividend to be deducted from the Group and the Bank’s CET I Capital may be reduced by the portion of dividend reinvested by the shareholders. This will correspondingly increase the Group and the Bank capital ratios.
3.0 CAPITAL MANAGEMENT (CONTINUED)
3.4 Minimum Capital Requirements and Risk-Weighted Assets (RWA)
The following table shows the breakdown of RWA by risk types as at 31 December 2020 and 31 December 2019:
Table 2: Risk-Weighted Assets (RWA) by Risk Types
Risk Types
RHB Bank Group RHB Bank RHB Islamic Bank RHB Investment Bank
2020RM’000
2019RM’000
2020RM’000
2019RM’000
2020RM’000
2019RM’000
2020RM’000
2019RM’000
Credit RWA 117,398,841 105,139,766 85,311,553 77,851,675 35,557,840 29,308,355 793,669 794,533
Credit RWA Absorbed by PSIA - - - - (7,202,054) (5,833,615) - -
Market RWA 4,314,070 3,844,722 3,783,371 3,394,037 210,344 293,518 300,706 127,778
Operational RWA 12,677,517 12,058,426 8,734,782 8,535,951 2,223,938 1,937,774 858,966 784,006
Additional RWA due to Capital Floor - - - - 43,510 4,746,219 - -
Total RWA 134,390,428 121,042,914 97,829,706 89,781,663 30,833,578 30,452,251 1,953,341 1,706,317
The following tables show the breakdown of RWA by risk types and the corresponding capital requirement as at 31 December 2020 and 31 December 2019:
Table 3a: Risk-Weighted Assets by Risk Types and Minimum Capital Requirements as at 31 December 2020
Risk Types
RWA Minimum Capital Requirements
RHBBank
GroupRM’000
RHB Bank
RM’000
RHBIslamic
Bank RM’000
RHB Investment
Bank RM’000
RHBBank
GroupRM’000
RHB Bank
RM’000
RHBIslamic
Bank RM’000
RHB Investment
BankRM’000
Credit Risk, of which 117,398,841 85,311,553 28,355,786 793,669 9,391,907 6,824,924 2,268,462 63,494Under Foundation Internal Ratings-
Based (F-IRB) Approach 58,516,812 45,259,840 19,419,193 - 4,681,345 3,620,787 1,553,535 -Under Advanced Internal Ratings-
Based (A-IRB) Approach 31,163,051 21,618,354 9,585,391 - 2,493,044 1,729,468 766,831 -Under Standardised Approach 27,718,978 18,433,359 6,553,256 793,669 2,217,518 1,474,669 524,260 63,494Absorbed by PSIA under F-IRB
Approach - - (6,170,838) - - - (493,667) -Absorbed by PSIA under Standardised
Approach - - (1,031,216) - - - (82,497) -Market RiskUnder Standardised Approach 4,314,070 3,783,371 210,344 300,706 345,126 302,670 16,828 24,056Operational RiskUnder Basic Indicator Approach 12,677,517 8,734,782 2,223,938 858,966 1,014,201 698,782 177,915 68,717Additional RWA due to Capital Floor - - 43,510 - - - 3,481 -Total 134,390,428 97,829,706 30,833,578 1,953,341 10,751,234 7,826,376 2,466,686 156,267
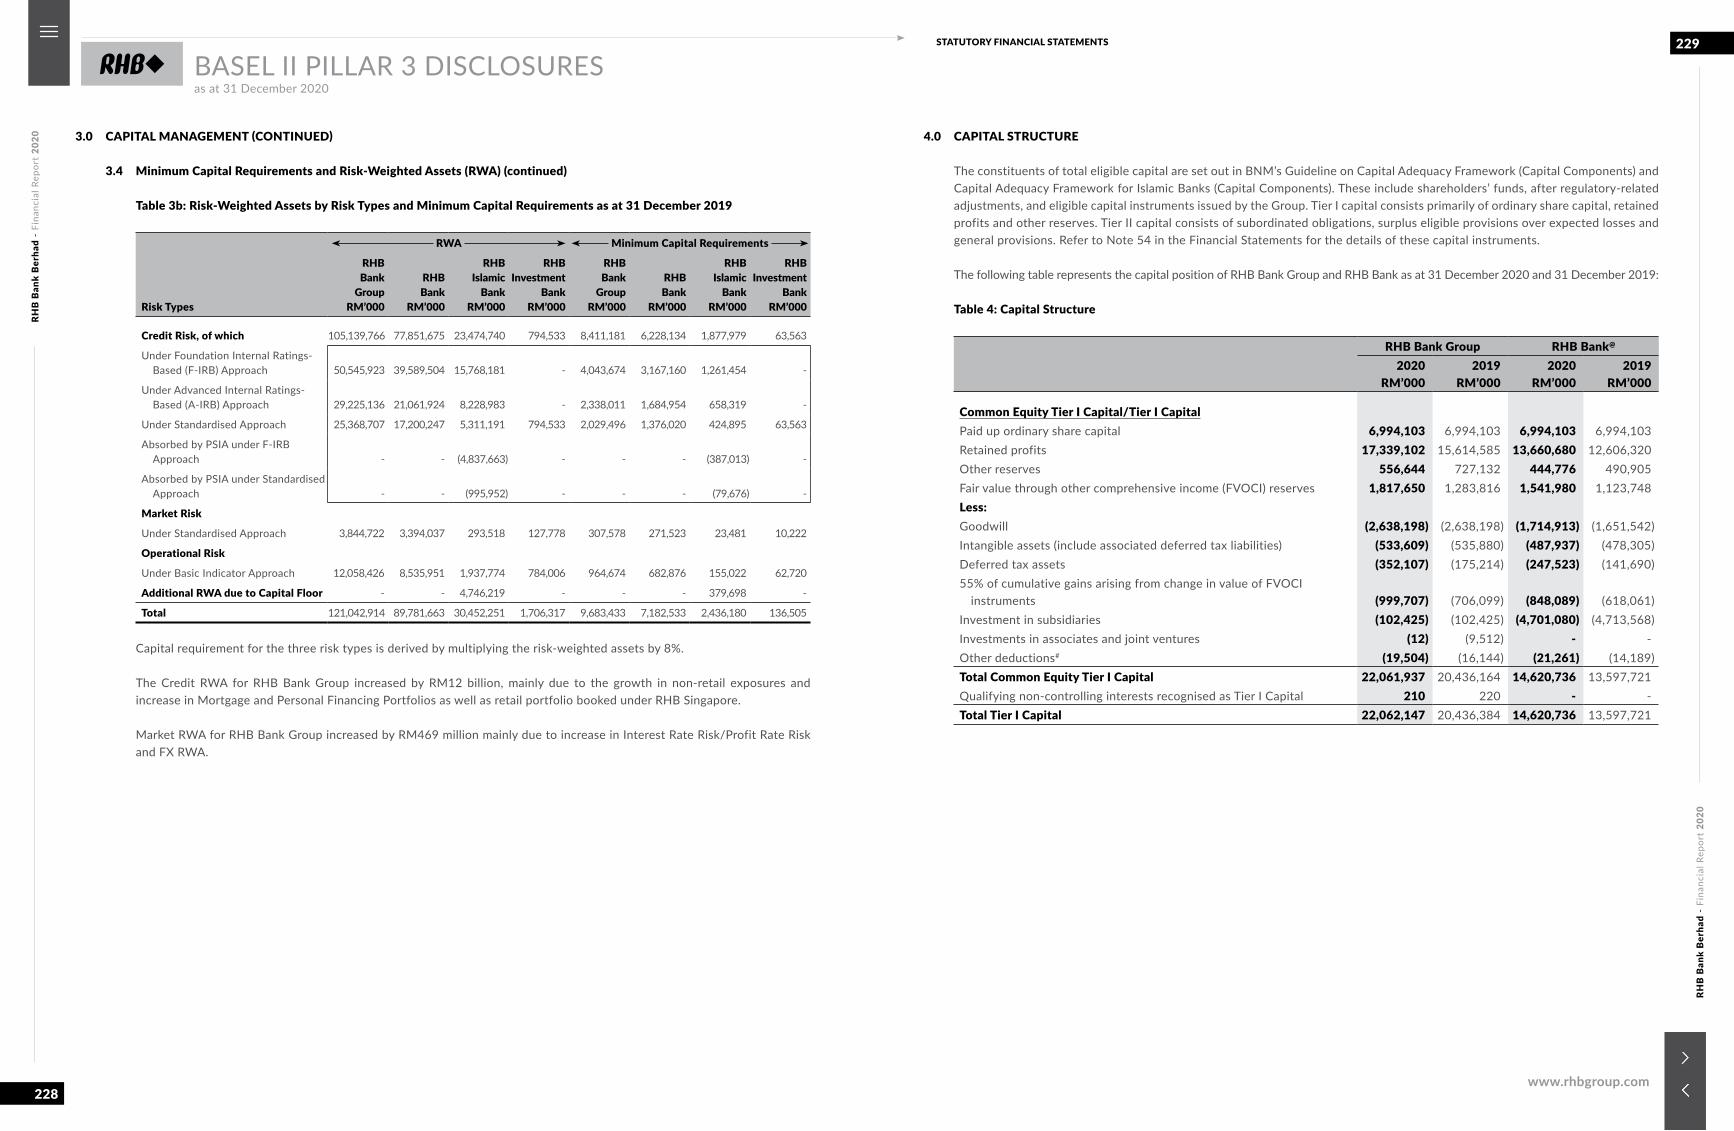
RHB
Ban
k B
erha
d -
Fina
ncia
l Rep
ort
2020
RHB
Ban
k B
erha
d -
Fina
ncia
l Rep
ort
2020
228
229STATUTORY FINANCIAL STATEMENTS
www.rhbgroup.com
BASEL II PILLAR 3 DISCLOSURESas at 31 December 2020
3.0 CAPITAL MANAGEMENT (CONTINUED)
3.4 Minimum Capital Requirements and Risk-Weighted Assets (RWA) (continued)
Table 3b: Risk-Weighted Assets by Risk Types and Minimum Capital Requirements as at 31 December 2019
Risk Types
RWA Minimum Capital Requirements
RHBBank
Group RM’000
RHBBank
RM’000
RHBIslamic
BankRM’000
RHBInvestment
BankRM’000
RHBBank
GroupRM’000
RHBBank
RM’000
RHBIslamic
BankRM’000
RHBInvestment
BankRM’000
Credit Risk, of which 105,139,766 77,851,675 23,474,740 794,533 8,411,181 6,228,134 1,877,979 63,563
Under Foundation Internal Ratings-Based (F-IRB) Approach 50,545,923 39,589,504 15,768,181 - 4,043,674 3,167,160 1,261,454 -
Under Advanced Internal Ratings-Based (A-IRB) Approach 29,225,136 21,061,924 8,228,983 - 2,338,011 1,684,954 658,319 -
Under Standardised Approach 25,368,707 17,200,247 5,311,191 794,533 2,029,496 1,376,020 424,895 63,563
Absorbed by PSIA under F-IRB Approach - - (4,837,663) - - - (387,013) -
Absorbed by PSIA under Standardised Approach - - (995,952) - - - (79,676) -
Market Risk
Under Standardised Approach 3,844,722 3,394,037 293,518 127,778 307,578 271,523 23,481 10,222
Operational Risk
Under Basic Indicator Approach 12,058,426 8,535,951 1,937,774 784,006 964,674 682,876 155,022 62,720
Additional RWA due to Capital Floor - - 4,746,219 - - - 379,698 -
Total 121,042,914 89,781,663 30,452,251 1,706,317 9,683,433 7,182,533 2,436,180 136,505
Capital requirement for the three risk types is derived by multiplying the risk-weighted assets by 8%.
The Credit RWA for RHB Bank Group increased by RM12 billion, mainly due to the growth in non-retail exposures and increase in Mortgage and Personal Financing Portfolios as well as retail portfolio booked under RHB Singapore.
Market RWA for RHB Bank Group increased by RM469 million mainly due to increase in Interest Rate Risk/Profit Rate Risk and FX RWA.
4.0 CAPITAL STRUCTURE
The constituents of total eligible capital are set out in BNM’s Guideline on Capital Adequacy Framework (Capital Components) and Capital Adequacy Framework for Islamic Banks (Capital Components). These include shareholders’ funds, after regulatory-related adjustments, and eligible capital instruments issued by the Group. Tier I capital consists primarily of ordinary share capital, retained profits and other reserves. Tier II capital consists of subordinated obligations, surplus eligible provisions over expected losses and general provisions. Refer to Note 54 in the Financial Statements for the details of these capital instruments.
The following table represents the capital position of RHB Bank Group and RHB Bank as at 31 December 2020 and 31 December 2019:
Table 4: Capital Structure
RHB Bank Group RHB Bank@
2020RM’000
2019RM’000
2020 RM’000
2019RM’000
Common Equity Tier I Capital/Tier I CapitalPaid up ordinary share capital 6,994,103 6,994,103 6,994,103 6,994,103Retained profits 17,339,102 15,614,585 13,660,680 12,606,320Other reserves 556,644 727,132 444,776 490,905Fair value through other comprehensive income (FVOCI) reserves 1,817,650 1,283,816 1,541,980 1,123,748Less:Goodwill (2,638,198) (2,638,198) (1,714,913) (1,651,542)Intangible assets (include associated deferred tax liabilities) (533,609) (535,880) (487,937) (478,305)Deferred tax assets (352,107) (175,214) (247,523) (141,690)55% of cumulative gains arising from change in value of FVOCI
instruments (999,707) (706,099) (848,089) (618,061)Investment in subsidiaries (102,425) (102,425) (4,701,080) (4,713,568)Investments in associates and joint ventures (12) (9,512) - -Other deductions# (19,504) (16,144) (21,261) (14,189)Total Common Equity Tier I Capital 22,061,937 20,436,164 14,620,736 13,597,721Qualifying non-controlling interests recognised as Tier I Capital 210 220 - -Total Tier I Capital 22,062,147 20,436,384 14,620,736 13,597,721
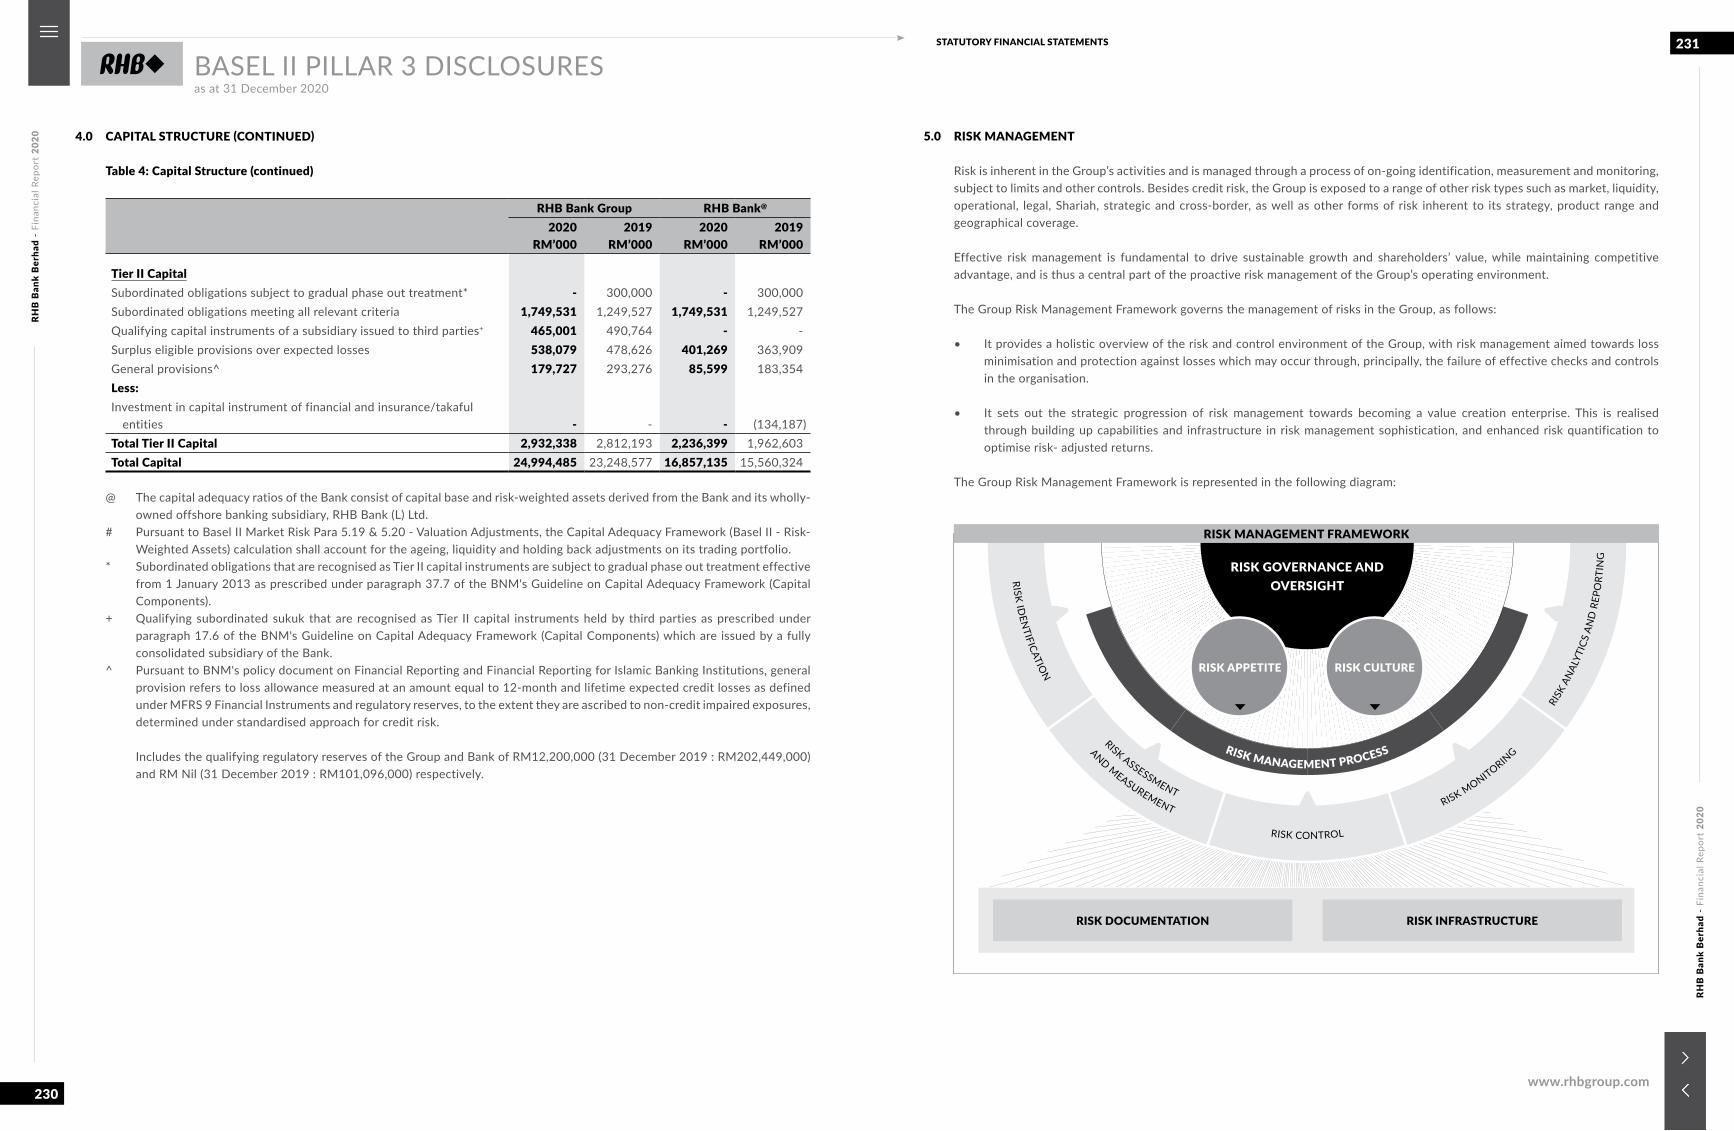
RHB
Ban
k B
erha
d -
Fina
ncia
l Rep
ort
2020
RHB
Ban
k B
erha
d -
Fina
ncia
l Rep
ort
2020
230
231STATUTORY FINANCIAL STATEMENTS
www.rhbgroup.com
BASEL II PILLAR 3 DISCLOSURESas at 31 December 2020
4.0 CAPITAL STRUCTURE (CONTINUED)
Table 4: Capital Structure (continued)
RHB Bank Group RHB Bank@
2020RM’000
2019RM’000
2020RM’000
2019RM’000
Tier II CapitalSubordinated obligations subject to gradual phase out treatment* - 300,000 - 300,000Subordinated obligations meeting all relevant criteria 1,749,531 1,249,527 1,749,531 1,249,527Qualifying capital instruments of a subsidiary issued to third parties+ 465,001 490,764 - -Surplus eligible provisions over expected losses 538,079 478,626 401,269 363,909General provisions^ 179,727 293,276 85,599 183,354Less:Investment in capital instrument of financial and insurance/takaful
entities - - - (134,187)Total Tier II Capital 2,932,338 2,812,193 2,236,399 1,962,603Total Capital 24,994,485 23,248,577 16,857,135 15,560,324
@ The capital adequacy ratios of the Bank consist of capital base and risk-weighted assets derived from the Bank and its wholly-owned offshore banking subsidiary, RHB Bank (L) Ltd.
# Pursuant to Basel II Market Risk Para 5.19 & 5.20 - Valuation Adjustments, the Capital Adequacy Framework (Basel II - Risk-Weighted Assets) calculation shall account for the ageing, liquidity and holding back adjustments on its trading portfolio.
* Subordinated obligations that are recognised as Tier II capital instruments are subject to gradual phase out treatment effective from 1 January 2013 as prescribed under paragraph 37.7 of the BNM's Guideline on Capital Adequacy Framework (Capital Components).
+ Qualifying subordinated sukuk that are recognised as Tier II capital instruments held by third parties as prescribed under paragraph 17.6 of the BNM's Guideline on Capital Adequacy Framework (Capital Components) which are issued by a fully consolidated subsidiary of the Bank.
^ Pursuant to BNM's policy document on Financial Reporting and Financial Reporting for Islamic Banking Institutions, general provision refers to loss allowance measured at an amount equal to 12-month and lifetime expected credit losses as defined under MFRS 9 Financial Instruments and regulatory reserves, to the extent they are ascribed to non-credit impaired exposures, determined under standardised approach for credit risk.
Includes the qualifying regulatory reserves of the Group and Bank of RM12,200,000 (31 December 2019 : RM202,449,000) and RM Nil (31 December 2019 : RM101,096,000) respectively.
5.0 RISK MANAGEMENT
Risk is inherent in the Group’s activities and is managed through a process of on-going identification, measurement and monitoring, subject to limits and other controls. Besides credit risk, the Group is exposed to a range of other risk types such as market, liquidity, operational, legal, Shariah, strategic and cross-border, as well as other forms of risk inherent to its strategy, product range and geographical coverage.
Effective risk management is fundamental to drive sustainable growth and shareholders’ value, while maintaining competitive advantage, and is thus a central part of the proactive risk management of the Group’s operating environment.
The Group Risk Management Framework governs the management of risks in the Group, as follows:
• It provides a holistic overview of the risk and control environment of the Group, with risk management aimed towards loss minimisation and protection against losses which may occur through, principally, the failure of effective checks and controls in the organisation.
• It sets out the strategic progression of risk management towards becoming a value creation enterprise. This is realised through building up capabilities and infrastructure in risk management sophistication, and enhanced risk quantification to optimise risk- adjusted returns.
The Group Risk Management Framework is represented in the following diagram:
RISK GOVERNANCE AND OVERSIGHT
RISK MANAGEMENT PROCESS
RISK IDEN
TIFICATION
RISK ASSESSMENT
RISK CONTROL
RISK MONITORING
RISK
AN
ALYT
ICS
AND
REP
ORT
ING
RISK APPETITE RISK CULTURE
RISK DOCUMENTATION RISK INFRASTRUCTURE
RISK MANAGEMENT FRAMEWORK
AND MEASUREMENT
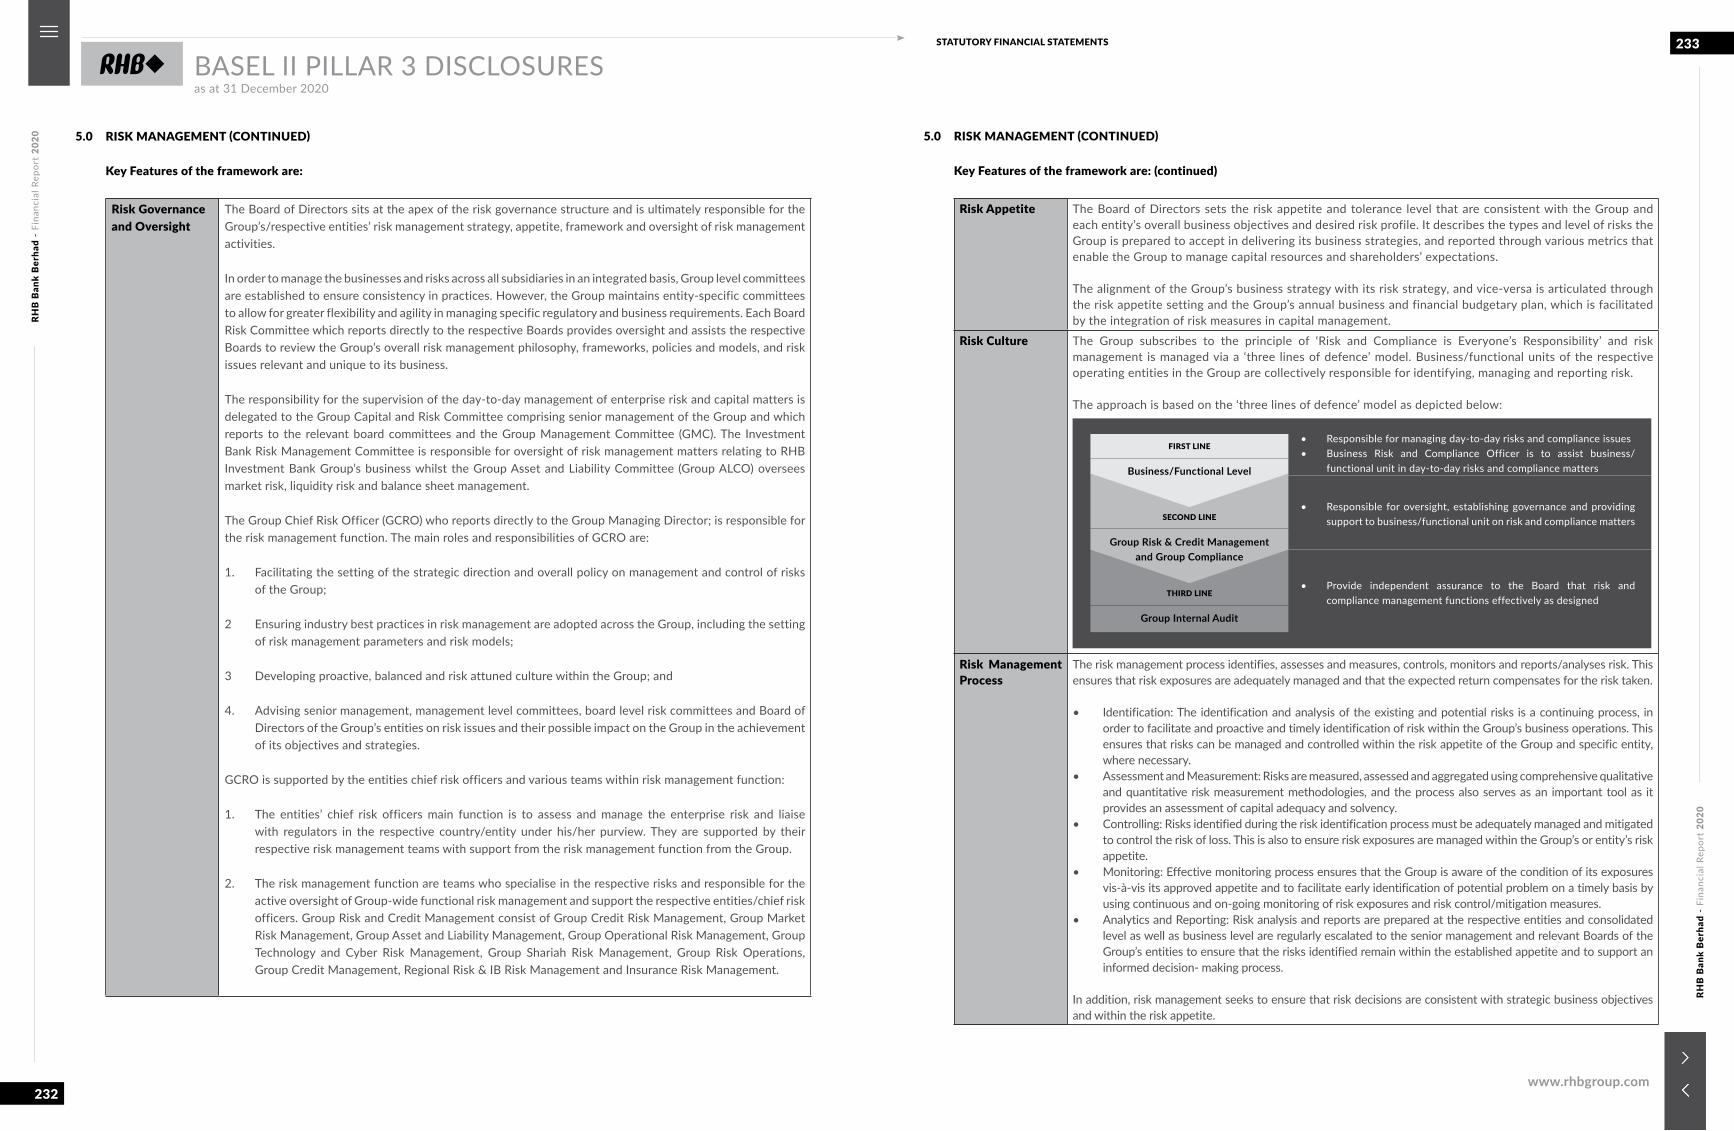
RHB
Ban
k B
erha
d -
Fina
ncia
l Rep
ort
2020
RHB
Ban
k B
erha
d -
Fina
ncia
l Rep
ort
2020
232
233STATUTORY FINANCIAL STATEMENTS
www.rhbgroup.com
BASEL II PILLAR 3 DISCLOSURESas at 31 December 2020
5.0 RISK MANAGEMENT (CONTINUED)
Key Features of the framework are:
Risk Governance and Oversight
The Board of Directors sits at the apex of the risk governance structure and is ultimately responsible for the Group’s/respective entities’ risk management strategy, appetite, framework and oversight of risk management activities.
In order to manage the businesses and risks across all subsidiaries in an integrated basis, Group level committees are established to ensure consistency in practices. However, the Group maintains entity-specific committees to allow for greater flexibility and agility in managing specific regulatory and business requirements. Each Board Risk Committee which reports directly to the respective Boards provides oversight and assists the respective Boards to review the Group’s overall risk management philosophy, frameworks, policies and models, and risk issues relevant and unique to its business.
The responsibility for the supervision of the day-to-day management of enterprise risk and capital matters is delegated to the Group Capital and Risk Committee comprising senior management of the Group and which reports to the relevant board committees and the Group Management Committee (GMC). The Investment Bank Risk Management Committee is responsible for oversight of risk management matters relating to RHB Investment Bank Group’s business whilst the Group Asset and Liability Committee (Group ALCO) oversees market risk, liquidity risk and balance sheet management.
The Group Chief Risk Officer (GCRO) who reports directly to the Group Managing Director; is responsible for the risk management function. The main roles and responsibilities of GCRO are:
1. Facilitating the setting of the strategic direction and overall policy on management and control of risks of the Group;
2 Ensuring industry best practices in risk management are adopted across the Group, including the setting of risk management parameters and risk models;
3 Developing proactive, balanced and risk attuned culture within the Group; and
4. Advising senior management, management level committees, board level risk committees and Board of Directors of the Group’s entities on risk issues and their possible impact on the Group in the achievement of its objectives and strategies.
GCRO is supported by the entities chief risk officers and various teams within risk management function:
1. The entities’ chief risk officers main function is to assess and manage the enterprise risk and liaise with regulators in the respective country/entity under his/her purview. They are supported by their respective risk management teams with support from the risk management function from the Group.
2. The risk management function are teams who specialise in the respective risks and responsible for the active oversight of Group-wide functional risk management and support the respective entities/chief risk officers. Group Risk and Credit Management consist of Group Credit Risk Management, Group Market Risk Management, Group Asset and Liability Management, Group Operational Risk Management, Group Technology and Cyber Risk Management, Group Shariah Risk Management, Group Risk Operations, Group Credit Management, Regional Risk & IB Risk Management and Insurance Risk Management.
5.0 RISK MANAGEMENT (CONTINUED)
Key Features of the framework are: (continued)
Risk Appetite The Board of Directors sets the risk appetite and tolerance level that are consistent with the Group and each entity’s overall business objectives and desired risk profile. It describes the types and level of risks the Group is prepared to accept in delivering its business strategies, and reported through various metrics that enable the Group to manage capital resources and shareholders’ expectations.
The alignment of the Group’s business strategy with its risk strategy, and vice-versa is articulated through the risk appetite setting and the Group’s annual business and financial budgetary plan, which is facilitated by the integration of risk measures in capital management.
Risk Culture The Group subscribes to the principle of ‘Risk and Compliance is Everyone’s Responsibility’ and risk management is managed via a ‘three lines of defence’ model. Business/functional units of the respective operating entities in the Group are collectively responsible for identifying, managing and reporting risk.
The approach is based on the ‘three lines of defence’ model as depicted below:
• Provide independent assurance to the Board that risk and compliance management functions effectively as designed
THIRD LINE
Group Internal Audit
SECOND LINE
Group Risk & Credit Managementand Group Compliance
FIRST LINE
Business/Functional Level
• Responsible for managing day-to-day risks and compliance issues• Business Risk and Compliance Officer is to assist business/
functional unit in day-to-day risks and compliance matters
• Responsible for oversight, establishing governance and providing support to business/functional unit on risk and compliance matters
Risk Management Process
The risk management process identifies, assesses and measures, controls, monitors and reports/analyses risk. This ensures that risk exposures are adequately managed and that the expected return compensates for the risk taken. • Identification: The identification and analysis of the existing and potential risks is a continuing process, in
order to facilitate and proactive and timely identification of risk within the Group’s business operations. This ensures that risks can be managed and controlled within the risk appetite of the Group and specific entity, where necessary.
• Assessment and Measurement: Risks are measured, assessed and aggregated using comprehensive qualitative and quantitative risk measurement methodologies, and the process also serves as an important tool as it provides an assessment of capital adequacy and solvency.
• Controlling: Risks identified during the risk identification process must be adequately managed and mitigated to control the risk of loss. This is also to ensure risk exposures are managed within the Group’s or entity’s risk appetite.
• Monitoring: Effective monitoring process ensures that the Group is aware of the condition of its exposures vis-à-vis its approved appetite and to facilitate early identification of potential problem on a timely basis by using continuous and on-going monitoring of risk exposures and risk control/mitigation measures.
• Analytics and Reporting: Risk analysis and reports are prepared at the respective entities and consolidated level as well as business level are regularly escalated to the senior management and relevant Boards of the Group’s entities to ensure that the risks identified remain within the established appetite and to support an informed decision- making process.
In addition, risk management seeks to ensure that risk decisions are consistent with strategic business objectives and within the risk appetite.
RHB
Ban
k B
erha
d -
Fina
ncia
l Rep
ort
2020
RHB
Ban
k B
erha
d -
Fina
ncia
l Rep
ort
2020
234
235STATUTORY FINANCIAL STATEMENTS
www.rhbgroup.com
BASEL II PILLAR 3 DISCLOSURESas at 31 December 2020
5.0 RISK MANAGEMENT (CONTINUED)
Key Features of the framework are: (continued)
Risk Documentation
The Group recognises that effective implementation of the risk management system and process must be supported by a robust set of documentation. Towards this end, the Group has established frameworks, policies and other relevant control documents to ensure clearly defined practices and processes are effected consistently across the Group.
Risk Infrastructure
The Group has organised its resources and talents into specific functions, and invested in the technology, including data management to support the Group’s risk management activities.
6.0 CREDIT RISK
Credit Risk Definition
Credit risk is the risk of loss arising from customers’ or counterparties’ failure to fulfil their financial and contractual obligations in accordance to the agreed terms. It stems primarily from the Group’s lending/financing, trade finance and its placement, underwritings, investment, hedging and trading activities from both on- and off-balance sheet transactions. Credit risk does not happen in isolation as certain risk event (e.g. fluctuation of interest rate and FX) may give rise to both market and credit risks.
6.1 Credit Risk Management Oversight and Organisation The Group Credit Committee (GCC) is the senior management committee empowered to approve or reject all financial
investments, counterparty credit and lending/financing up to the defined threshold limits.
GCC will direct, monitor, review and consider such issues as may materially impact on the present and future quality of the Group’s loan/asset book. GCC also acts as the body which, through the relevant Board committees, recommends to the respective Boards, on matters pertaining to credit risk (such as credit and underwriting evaluation/approval/procedure, and delegated lending/financing authorities).
The Group Investment Underwriting Committee (GIUC) deliberates, approves and rejects stockbroking/equities/futures business related proposals such as equity underwriting, equity derivatives and structured products, and share margin financing.
The Board Credit Committee's (BCC) main functions are (i) affirming, vetoing or imposing more stringent conditions on credits of the Group which are duly approved by the GCC and/or GIUC, (ii) overseeing the management of impaired and high risk accounts, and (iii) approving credit transactions to connected parties up to the defined threshold limits. BCC also endorses policy loans/financing and loans/financing required by BNM to be referred to the respective members of the Boards for approval.
The Group Credit Management has the functional responsibility to ensure that internal processes and credit underwriting standards are adhered to before financing proposals are approved. All financing proposals are firstly assessed for its credit worthiness by the originating business units before being evaluated by an independent credit manager and decided upon by the delegated lending/financing authority/relevant committees.
6.0 CREDIT RISK (CONTINUED)
6.1 Credit Risk Management Oversight and Organisation (continued)
All financing exposure limits are approved within a defined credit approval authority framework. Large financing exposures are further subject to post approval credit review on a sampling basis by Group Internal Audit. With the exception of credit applications for consumer and approved products under program lending/financing which can be auto approved by loan origination system or business units’ supervisors, all other credit facilities, are subject to independent assessment by a team of dedicated and experienced credit evaluators in Head Office. For proper checks and controls, joint or escalated approval is required for all discretionary lending/financing between business and independent credit underwriters, except for end-financing, which can only be singly assessed by independent credit underwriters. Loans/financing which are beyond the delegated lending/financing authority limits will be escalated to the relevant committees for approval.
Within Group Risk Management, the Group Credit Risk Management has the functional responsibility for credit risk management, portfolio risk monitoring, risk reporting and development of credit policies and guidelines. The Group also conducts regular credit stress tests to assess the credit portfolio’s vulnerability to adverse credit risk events.
Regular risk reporting is made to the senior management, respective commitees and the Board. These reports include various credit risk aspects such as portfolio quality, expected losses, and concentration risk exposures. Such reporting allows senior management to identify adverse credit trends, take prompt corrective actions, and ensure appropriate risk-adjusted decision making.
6.2 Credit Risk Management Approach
The Group’s credit risk management framework is founded upon BNM’s Policy on Credit Risk. The Group abides by its Group Credit Policy which supports the development of a strong credit culture with the objective of maintaining a diversified portfolio, and a reliable and satisfactory risk-weighted return. Latest regulator requirement and industry best practices are instilled in the continual updating of the Group Credit Policy.
The Group’s credit risk management process is documented in the Group Credit Guidelines (GCG) and the Group Credit Procedures Manual (GCPM) which set out the operational procedures and guidelines governing the credit processes within the Group.
The GCG and GCPM have been designed to ensure that:
• The process of credit initiation, administration, supervision and management of loans/financing and advances are carried out consistently and uniformly by the business origination and other credit support functions within the Group.
• Procedures and guidelines governing the credit function are in compliance with the credit policies of the Group.
Lending/Financing to Corporate and Institutional Customers
Loans/financing to corporate and institutional customers are individually evaluated and risk-rated. Credit underwriters identify and assess the credit risk of large corporate or institutional customers, or customer groups, taking into consideration their financial and business profiles, industry and economic factors, collateral, or other credit support.
Credit Risk from Investment or Trading Activities
In the course of its trading or investment activities, the Group is also exposed to credit risks from trading, derivative and debt securities activities. Relevant credit guidelines are established to govern the credit risk via guidance on derivatives, hedging and investment related activities of the different exposures.
RHB
Ban
k B
erha
d -
Fina
ncia
l Rep
ort
2020
RHB
Ban
k B
erha
d -
Fina
ncia
l Rep
ort
2020
236
237STATUTORY FINANCIAL STATEMENTS
www.rhbgroup.com
BASEL II PILLAR 3 DISCLOSURESas at 31 December 2020
6.0 CREDIT RISK (CONTINUED)
6.2 Credit Risk Management Approach (continued)
Lending/Financing to Consumers and Small Businesses
For retail and small business’ program lending/financing, credit risk is managed on a portfolio basis leveraging on internal credit rating models; Retail lending/financing products comprise residential mortgages/home financing, credit cards, motor vehicle financing, commercial property loans/financing, personal financing, and Amanah Saham Bumiputera (ASB) financing.
Whilst for small business’ non-program lending/financing, credit risk is assessed and extended based on a set of clearly defined credit risk acceptance criteria, regular post approval review and credit risk monitoring to enable rigorous risk assessment, objective decision making, cost efficient processing and effective portfolio management.
Lending/Financing to Share Margin Financing
Loans/financing to share margin clients are based on credit/financing facilities made available to these clients for trading or redemption of securities that are listed in Bursa Malaysia Berhad in accordance with the Bursa Securities Rules.
For share margin financing, credit risk is mitigated through the establishment of appropriate approving authority structure/matrix for the extension of trading/credit limits. Within clearly defined guidelines approved by the Board and in line with applicable laws and regulations, credit risk management also encompasses the systematic credit assessment, close monitoring of limits, exposures and concentration risk to counterparties or issuer, through timely management reporting procedures.
Credit Transformation
The Bank has embarked on an end-to-end credit transformation journey to support business growth responsibility and protect the asset quality in challenging times. The coverage of the transformation initiative covers the core business segments of Retail Banking, Business Banking and Corporate Banking.
Credit War Room
Established to steer, coordinate and ensure the effective implementation of the Group’s repayment assistance strategy in relation to borrowers/customers affected by the COVID-19 pandemic, in a consistent and structured response across RHB Banking Group headed by the Group Managing Director in line with BNM requirement for financial institutions to set-up a dedicated function led by the chief executive officer of the banking institution.
Credit Risk Measurement
Along with judgement and experience, risk measurement or quantification plays a critical role in making informed risk taking and portfolio management decisions. As the nature of credit risk varies by financing type, the Group applies different credit risk measuring tools, so that the credit risk of each financing type is appropriately reflected. These measurement tools are developed for the material credit exposures, which fall under the IRB Approach.
6.0 CREDIT RISK (CONTINUED)
6.2 Credit Risk Management Approach (continued)
Credit Risk Measurement (continued)
The followings represent the dimensions considered in the credit risk measurement: 1.0 Probability of Default (PD)
Probability of default refer to likelihood that a borrower/customer is unable to meet its debt obligation. For corporate/non-retail financing, the probability of default is measured from obligor (or customer) rating obtained from the risk rating system to determine obligor’s level of default risk. The risk rating of each obligor is regularly reviewed to ensure that it actually reflects the debtor’s/customer’s updated default risk. For retail exposures/financing, the default risk is measured via respective scoring model i.e. application scorecard, behavioural scorecard and customer centric scorecard.
2.0 Loss Given Default (LGD)
LGD is the amount of loss incurred when a borrower/customer defaults. For corporate financing, LGD is determined via the credit risk mitigation adjustment, in which the coverage of collateral and security will determine the level of LGD for a specific transaction. For retail financing, LGD is determined at respective segment (or pool) level.
3.0 Exposure at Default (EAD)
EAD is calculated from the current outstanding balance and availability of committed financing line. In this regard, the key factor is the Group’s obligation related to the available financing line. For corporate financing, the EAD is measured at an individual obligor exposure as per BNM’s Guideline on Capital Adequacy Framework (Basel II – Risk-Weighted Assets) and the Capital Adequacy Framework for Islamic Banks (Risk-Weighted Assets). For retail financing, the principle of credit risk measurement is similar, but measured on a pooled basis, based on internal models.
6.3 Off-Balance Sheet Exposures and Counterparty Credit Risk (CCR)
The management of the following off-balance sheet exposures of the Group is in accordance to the credit risk management approach as set out under Section 6.2 of this document:
• Financial guarantees and standby letters of credit, which represent undertakings that the Group will make payments in the event that its customer cannot meet its obligations to third-parties. These exposures carry the same credit risk as loans/financing even though they are contingent in nature;
• Documentary and commercial letters of credit, which are undertakings by the Group on behalf of its customers. These exposures are usually collateralised by the underlying shipment of goods to which they relate;
• Commitments to extend financing, which includes the unutilised or undrawn portions of financing facilities;
• Unutilised credit card lines; and
• Credit equivalent amount of derivative financial instruments.
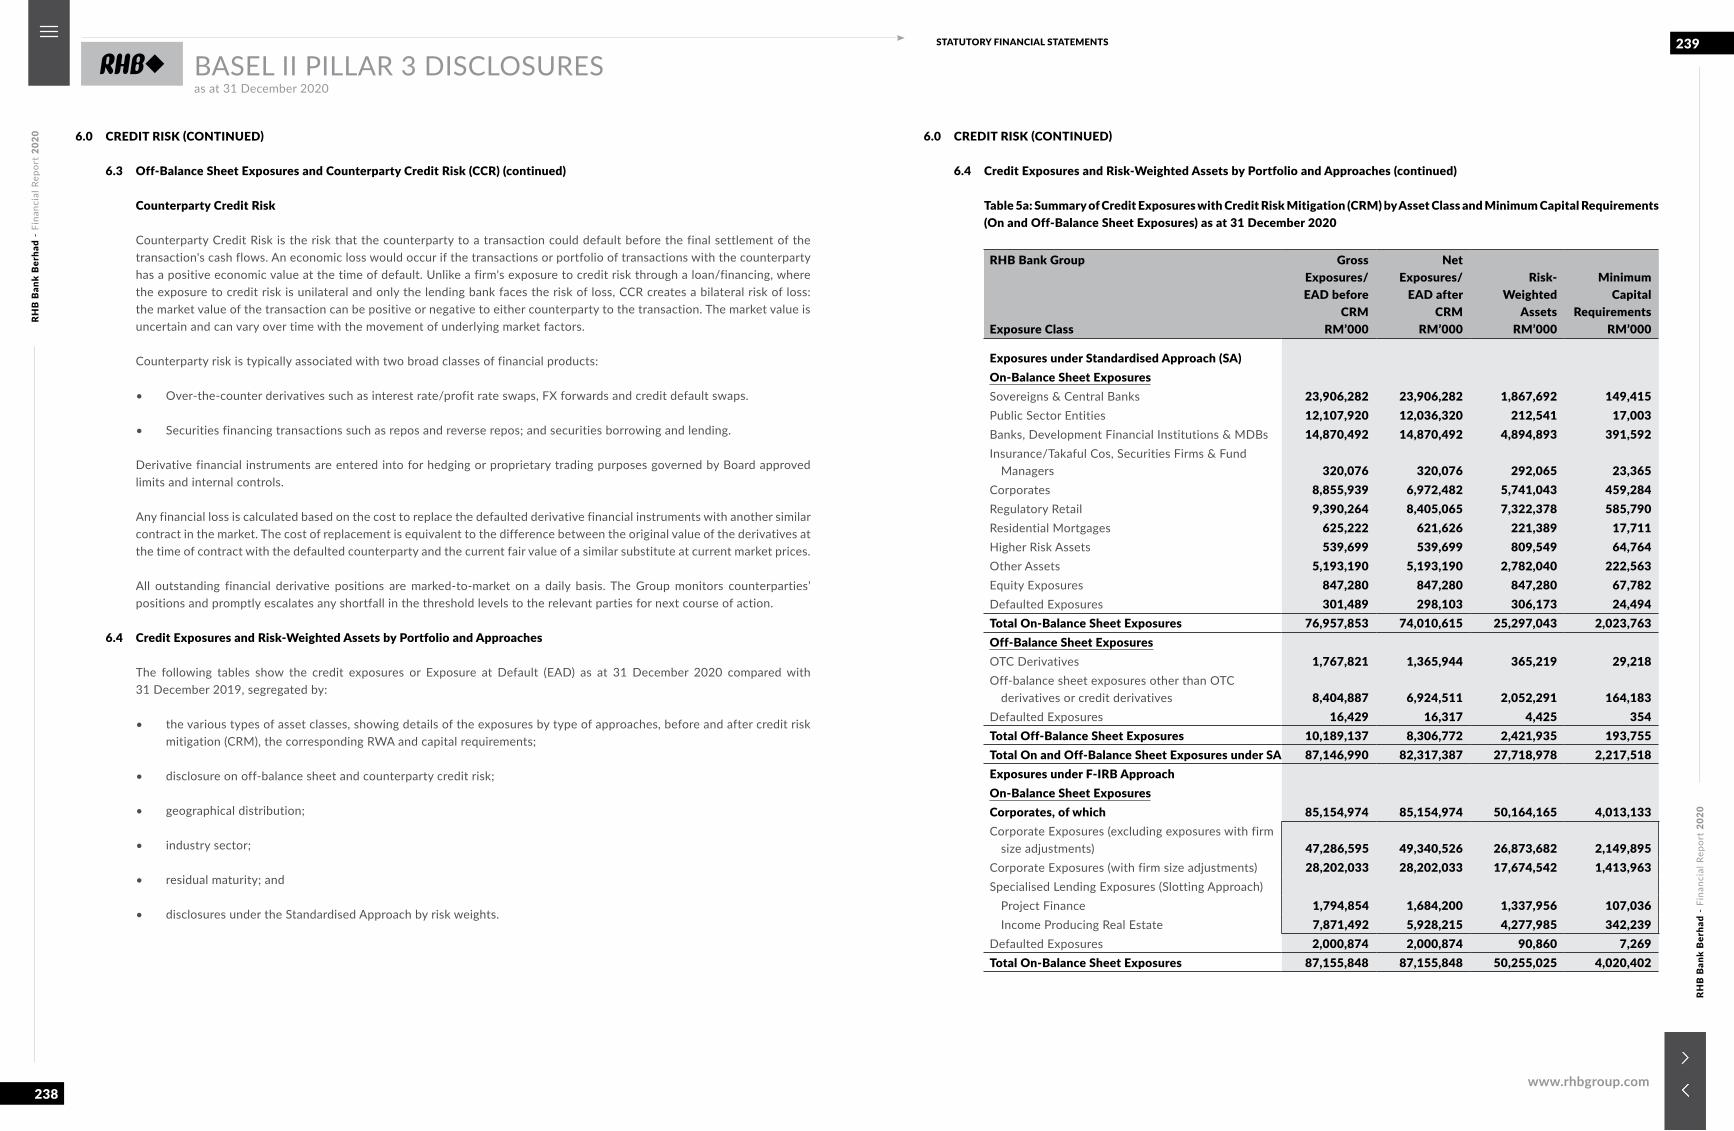
RHB
Ban
k B
erha
d -
Fina
ncia
l Rep
ort
2020
RHB
Ban
k B
erha
d -
Fina
ncia
l Rep
ort
2020
238
239STATUTORY FINANCIAL STATEMENTS
www.rhbgroup.com
BASEL II PILLAR 3 DISCLOSURESas at 31 December 2020
6.0 CREDIT RISK (CONTINUED)
6.3 Off-Balance Sheet Exposures and Counterparty Credit Risk (CCR) (continued)
Counterparty Credit Risk
Counterparty Credit Risk is the risk that the counterparty to a transaction could default before the final settlement of the transaction's cash flows. An economic loss would occur if the transactions or portfolio of transactions with the counterparty has a positive economic value at the time of default. Unlike a firm's exposure to credit risk through a loan/financing, where the exposure to credit risk is unilateral and only the lending bank faces the risk of loss, CCR creates a bilateral risk of loss: the market value of the transaction can be positive or negative to either counterparty to the transaction. The market value is uncertain and can vary over time with the movement of underlying market factors.
Counterparty risk is typically associated with two broad classes of financial products:
• Over-the-counter derivatives such as interest rate/profit rate swaps, FX forwards and credit default swaps.
• Securities financing transactions such as repos and reverse repos; and securities borrowing and lending.
Derivative financial instruments are entered into for hedging or proprietary trading purposes governed by Board approved limits and internal controls.
Any financial loss is calculated based on the cost to replace the defaulted derivative financial instruments with another similar contract in the market. The cost of replacement is equivalent to the difference between the original value of the derivatives at the time of contract with the defaulted counterparty and the current fair value of a similar substitute at current market prices.
All outstanding financial derivative positions are marked-to-market on a daily basis. The Group monitors counterparties’ positions and promptly escalates any shortfall in the threshold levels to the relevant parties for next course of action.
6.4 Credit Exposures and Risk-Weighted Assets by Portfolio and Approaches
The following tables show the credit exposures or Exposure at Default (EAD) as at 31 December 2020 compared with 31 December 2019, segregated by:
• the various types of asset classes, showing details of the exposures by type of approaches, before and after credit risk mitigation (CRM), the corresponding RWA and capital requirements;
• disclosure on off-balance sheet and counterparty credit risk;
• geographical distribution;
• industry sector;
• residual maturity; and
• disclosures under the Standardised Approach by risk weights.
6.0 CREDIT RISK (CONTINUED)
6.4 Credit Exposures and Risk-Weighted Assets by Portfolio and Approaches (continued)
Table 5a: Summary of Credit Exposures with Credit Risk Mitigation (CRM) by Asset Class and Minimum Capital Requirements (On and Off-Balance Sheet Exposures) as at 31 December 2020
RHB Bank Group
Exposure Class
GrossExposures/EAD before
CRMRM’000
NetExposures/
EAD afterCRM
RM’000
Risk-Weighted
AssetsRM’000
MinimumCapital
RequirementsRM’000
Exposures under Standardised Approach (SA)On-Balance Sheet ExposuresSovereigns & Central Banks 23,906,282 23,906,282 1,867,692 149,415Public Sector Entities 12,107,920 12,036,320 212,541 17,003Banks, Development Financial Institutions & MDBs 14,870,492 14,870,492 4,894,893 391,592Insurance/Takaful Cos, Securities Firms & Fund
Managers 320,076 320,076 292,065 23,365Corporates 8,855,939 6,972,482 5,741,043 459,284Regulatory Retail 9,390,264 8,405,065 7,322,378 585,790Residential Mortgages 625,222 621,626 221,389 17,711Higher Risk Assets 539,699 539,699 809,549 64,764Other Assets 5,193,190 5,193,190 2,782,040 222,563Equity Exposures 847,280 847,280 847,280 67,782Defaulted Exposures 301,489 298,103 306,173 24,494Total On-Balance Sheet Exposures 76,957,853 74,010,615 25,297,043 2,023,763Off-Balance Sheet ExposuresOTC Derivatives 1,767,821 1,365,944 365,219 29,218Off-balance sheet exposures other than OTC
derivatives or credit derivatives 8,404,887 6,924,511 2,052,291 164,183Defaulted Exposures 16,429 16,317 4,425 354Total Off-Balance Sheet Exposures 10,189,137 8,306,772 2,421,935 193,755Total On and Off-Balance Sheet Exposures under SA 87,146,990 82,317,387 27,718,978 2,217,518Exposures under F-IRB ApproachOn-Balance Sheet ExposuresCorporates, of which 85,154,974 85,154,974 50,164,165 4,013,133Corporate Exposures (excluding exposures with firm
size adjustments) 47,286,595 49,340,526 26,873,682 2,149,895Corporate Exposures (with firm size adjustments) 28,202,033 28,202,033 17,674,542 1,413,963Specialised Lending Exposures (Slotting Approach) Project Finance 1,794,854 1,684,200 1,337,956 107,036 Income Producing Real Estate 7,871,492 5,928,215 4,277,985 342,239Defaulted Exposures 2,000,874 2,000,874 90,860 7,269Total On-Balance Sheet Exposures 87,155,848 87,155,848 50,255,025 4,020,402
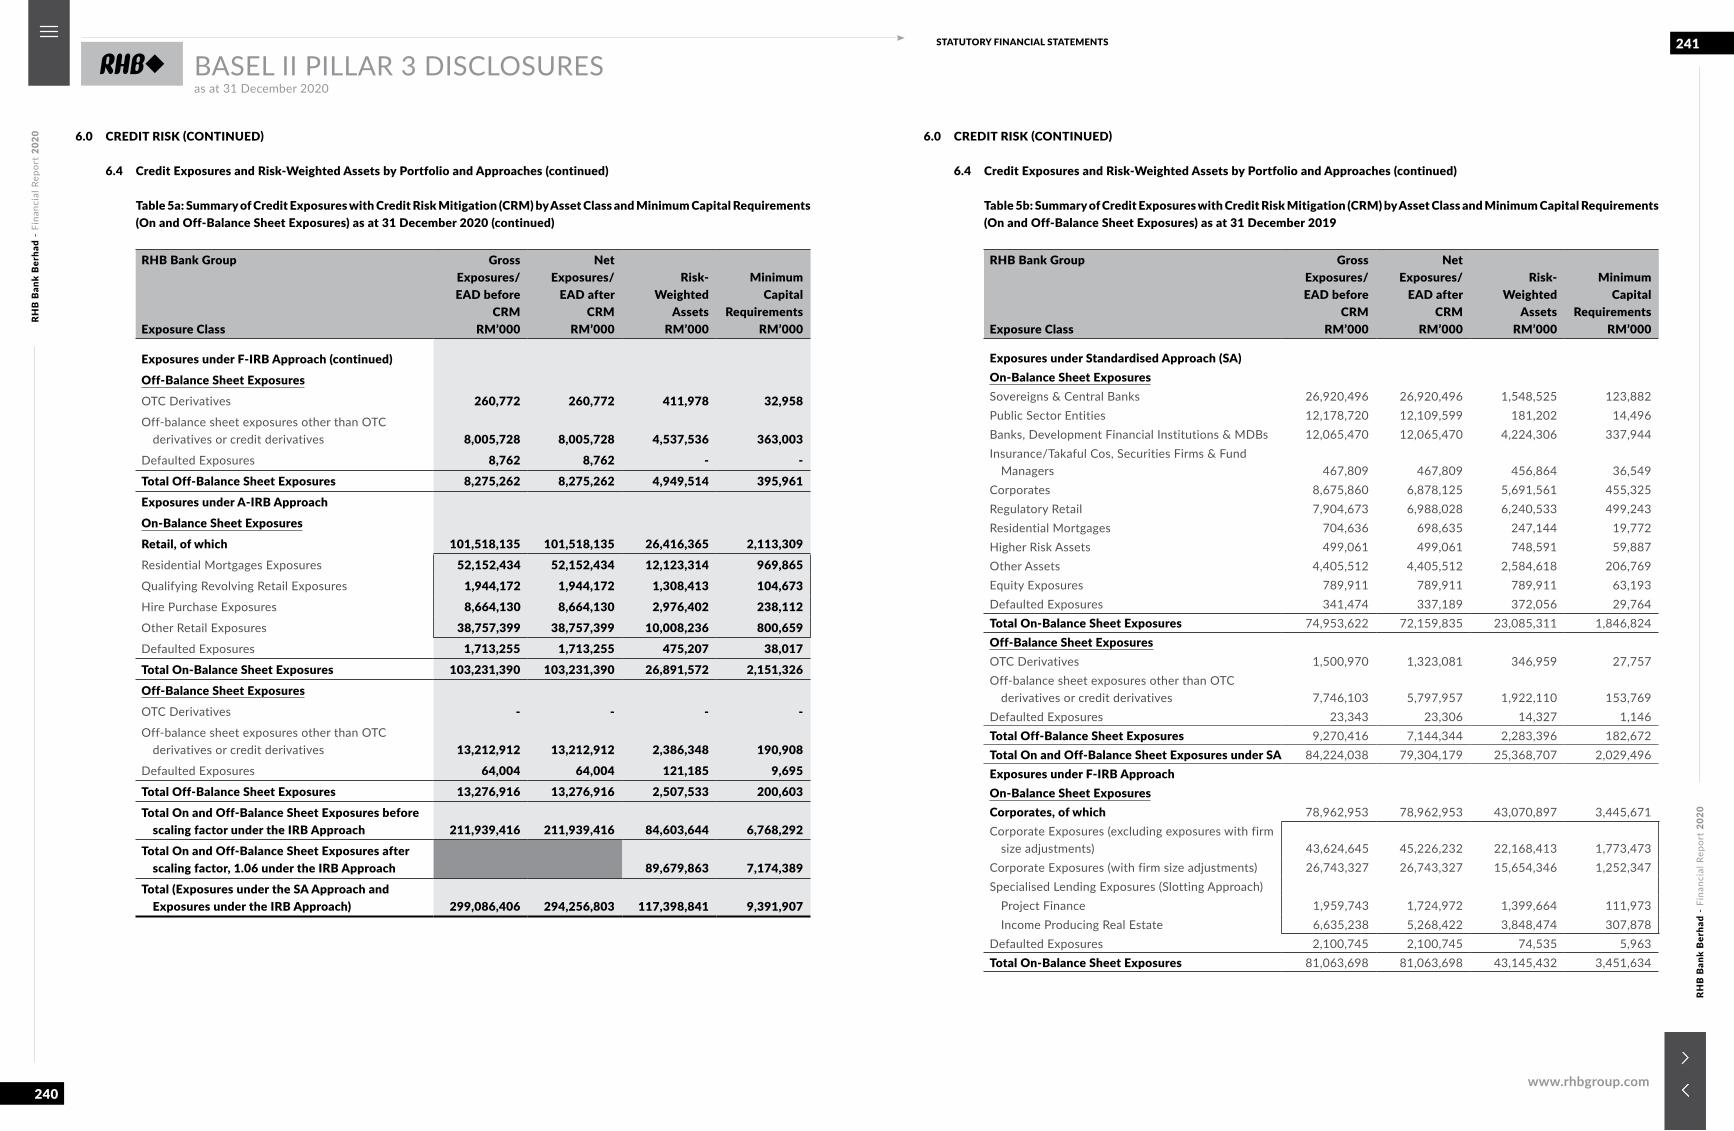
RHB
Ban
k B
erha
d -
Fina
ncia
l Rep
ort
2020
RHB
Ban
k B
erha
d -
Fina
ncia
l Rep
ort
2020
240
241STATUTORY FINANCIAL STATEMENTS
www.rhbgroup.com
BASEL II PILLAR 3 DISCLOSURESas at 31 December 2020
6.0 CREDIT RISK (CONTINUED)
6.4 Credit Exposures and Risk-Weighted Assets by Portfolio and Approaches (continued)
Table 5a: Summary of Credit Exposures with Credit Risk Mitigation (CRM) by Asset Class and Minimum Capital Requirements (On and Off-Balance Sheet Exposures) as at 31 December 2020 (continued)
RHB Bank Group
Exposure Class
GrossExposures/EAD before
CRMRM’000
NetExposures/
EAD afterCRM
RM’000
Risk-Weighted
AssetsRM’000
MinimumCapital
RequirementsRM’000
Exposures under F-IRB Approach (continued)Off-Balance Sheet ExposuresOTC Derivatives 260,772 260,772 411,978 32,958Off-balance sheet exposures other than OTC
derivatives or credit derivatives 8,005,728 8,005,728 4,537,536 363,003Defaulted Exposures 8,762 8,762 - -Total Off-Balance Sheet Exposures 8,275,262 8,275,262 4,949,514 395,961Exposures under A-IRB ApproachOn-Balance Sheet ExposuresRetail, of which 101,518,135 101,518,135 26,416,365 2,113,309Residential Mortgages Exposures 52,152,434 52,152,434 12,123,314 969,865Qualifying Revolving Retail Exposures 1,944,172 1,944,172 1,308,413 104,673Hire Purchase Exposures 8,664,130 8,664,130 2,976,402 238,112Other Retail Exposures 38,757,399 38,757,399 10,008,236 800,659Defaulted Exposures 1,713,255 1,713,255 475,207 38,017Total On-Balance Sheet Exposures 103,231,390 103,231,390 26,891,572 2,151,326Off-Balance Sheet ExposuresOTC Derivatives - - - -Off-balance sheet exposures other than OTC
derivatives or credit derivatives 13,212,912 13,212,912 2,386,348 190,908Defaulted Exposures 64,004 64,004 121,185 9,695Total Off-Balance Sheet Exposures 13,276,916 13,276,916 2,507,533 200,603Total On and Off-Balance Sheet Exposures before
scaling factor under the IRB Approach 211,939,416 211,939,416 84,603,644 6,768,292Total On and Off-Balance Sheet Exposures after
scaling factor, 1.06 under the IRB Approach 89,679,863 7,174,389Total (Exposures under the SA Approach and
Exposures under the IRB Approach) 299,086,406 294,256,803 117,398,841 9,391,907
6.0 CREDIT RISK (CONTINUED)
6.4 Credit Exposures and Risk-Weighted Assets by Portfolio and Approaches (continued)
Table 5b: Summary of Credit Exposures with Credit Risk Mitigation (CRM) by Asset Class and Minimum Capital Requirements (On and Off-Balance Sheet Exposures) as at 31 December 2019
RHB Bank Group
Exposure Class
GrossExposures/EAD before
CRMRM’000
NetExposures/
EAD afterCRM
RM’000
Risk-Weighted
AssetsRM’000
MinimumCapital
RequirementsRM’000
Exposures under Standardised Approach (SA)On-Balance Sheet ExposuresSovereigns & Central Banks 26,920,496 26,920,496 1,548,525 123,882Public Sector Entities 12,178,720 12,109,599 181,202 14,496Banks, Development Financial Institutions & MDBs 12,065,470 12,065,470 4,224,306 337,944Insurance/Takaful Cos, Securities Firms & Fund
Managers 467,809 467,809 456,864 36,549Corporates 8,675,860 6,878,125 5,691,561 455,325Regulatory Retail 7,904,673 6,988,028 6,240,533 499,243Residential Mortgages 704,636 698,635 247,144 19,772Higher Risk Assets 499,061 499,061 748,591 59,887Other Assets 4,405,512 4,405,512 2,584,618 206,769Equity Exposures 789,911 789,911 789,911 63,193Defaulted Exposures 341,474 337,189 372,056 29,764Total On-Balance Sheet Exposures 74,953,622 72,159,835 23,085,311 1,846,824Off-Balance Sheet ExposuresOTC Derivatives 1,500,970 1,323,081 346,959 27,757Off-balance sheet exposures other than OTC
derivatives or credit derivatives 7,746,103 5,797,957 1,922,110 153,769Defaulted Exposures 23,343 23,306 14,327 1,146Total Off-Balance Sheet Exposures 9,270,416 7,144,344 2,283,396 182,672Total On and Off-Balance Sheet Exposures under SA 84,224,038 79,304,179 25,368,707 2,029,496Exposures under F-IRB ApproachOn-Balance Sheet ExposuresCorporates, of which 78,962,953 78,962,953 43,070,897 3,445,671Corporate Exposures (excluding exposures with firm
size adjustments) 43,624,645 45,226,232 22,168,413 1,773,473Corporate Exposures (with firm size adjustments) 26,743,327 26,743,327 15,654,346 1,252,347Specialised Lending Exposures (Slotting Approach) Project Finance 1,959,743 1,724,972 1,399,664 111,973 Income Producing Real Estate 6,635,238 5,268,422 3,848,474 307,878Defaulted Exposures 2,100,745 2,100,745 74,535 5,963Total On-Balance Sheet Exposures 81,063,698 81,063,698 43,145,432 3,451,634
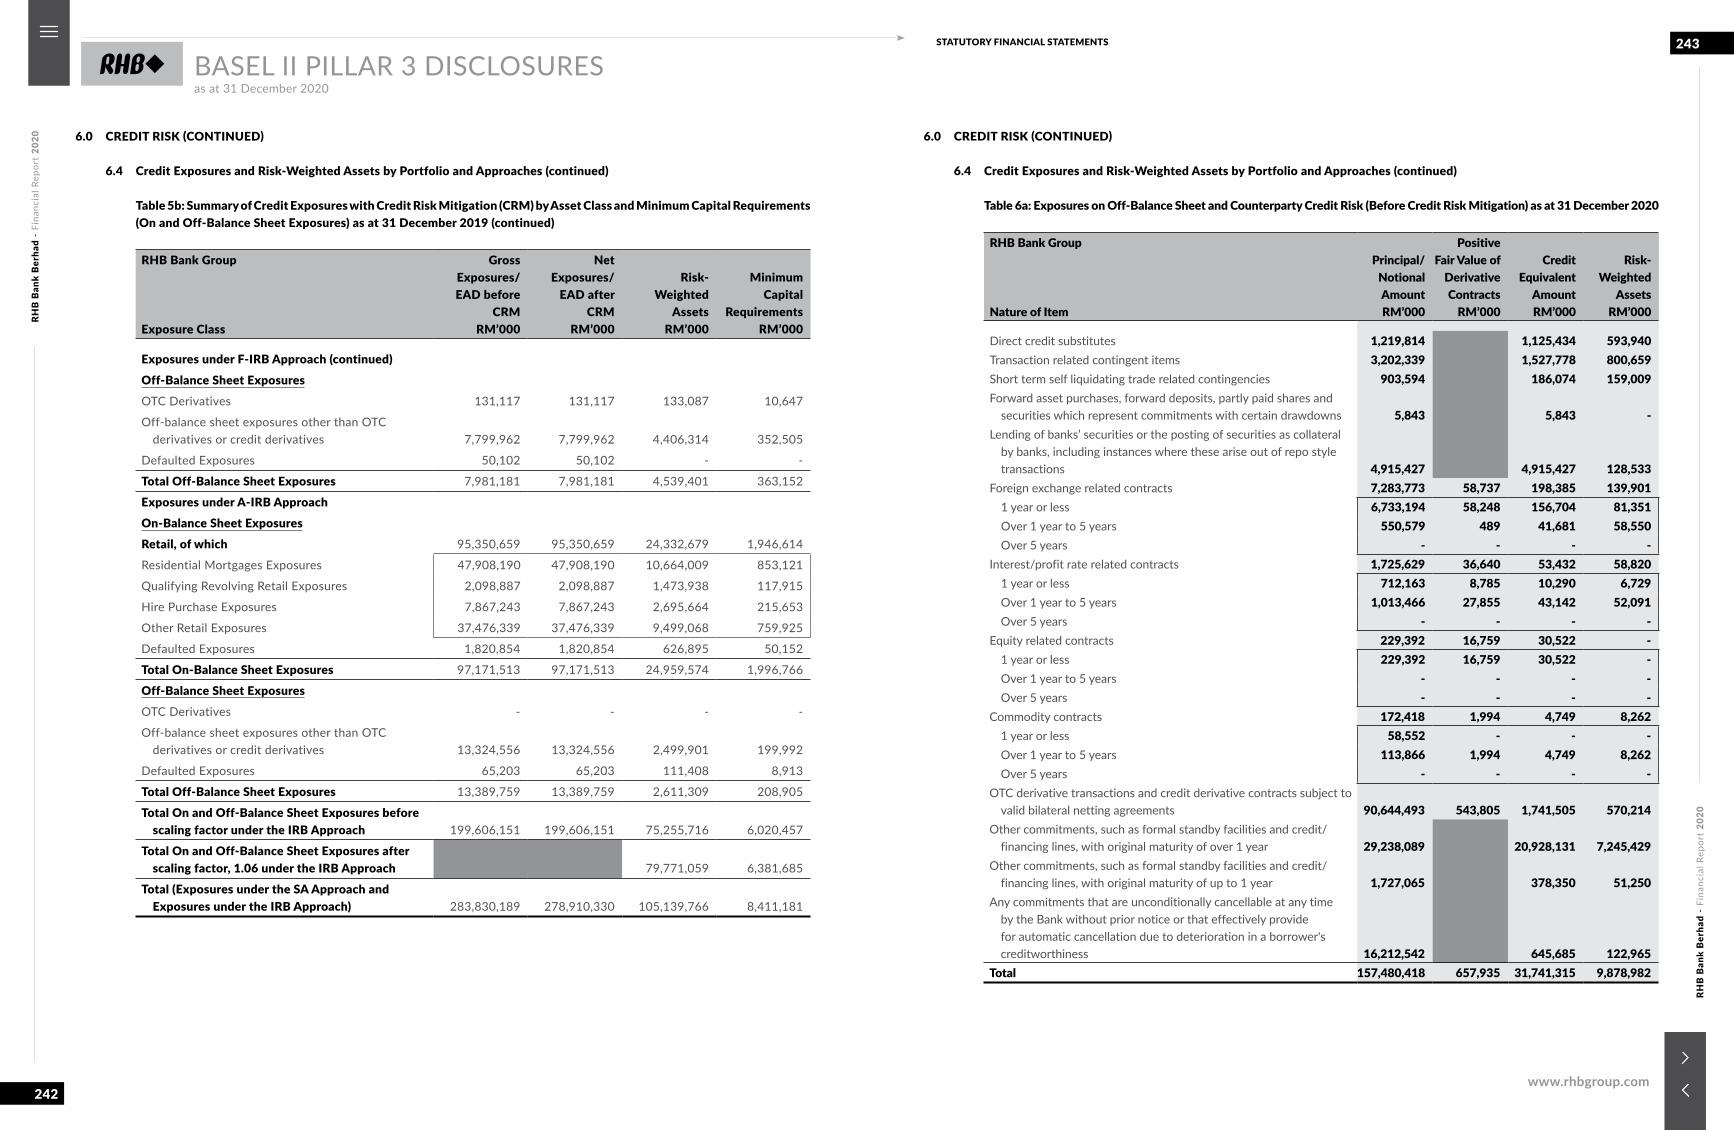
RHB
Ban
k B
erha
d -
Fina
ncia
l Rep
ort
2020
RHB
Ban
k B
erha
d -
Fina
ncia
l Rep
ort
2020
242
243STATUTORY FINANCIAL STATEMENTS
www.rhbgroup.com
BASEL II PILLAR 3 DISCLOSURESas at 31 December 2020
6.0 CREDIT RISK (CONTINUED)
6.4 Credit Exposures and Risk-Weighted Assets by Portfolio and Approaches (continued)
Table 5b: Summary of Credit Exposures with Credit Risk Mitigation (CRM) by Asset Class and Minimum Capital Requirements (On and Off-Balance Sheet Exposures) as at 31 December 2019 (continued)
RHB Bank Group
Exposure Class
GrossExposures/EAD before
CRMRM’000
NetExposures/
EAD afterCRM
RM’000
Risk-Weighted
AssetsRM’000
MinimumCapital
RequirementsRM’000
Exposures under F-IRB Approach (continued)Off-Balance Sheet ExposuresOTC Derivatives 131,117 131,117 133,087 10,647
Off-balance sheet exposures other than OTC derivatives or credit derivatives 7,799,962 7,799,962 4,406,314 352,505
Defaulted Exposures 50,102 50,102 - -
Total Off-Balance Sheet Exposures 7,981,181 7,981,181 4,539,401 363,152
Exposures under A-IRB ApproachOn-Balance Sheet ExposuresRetail, of which 95,350,659 95,350,659 24,332,679 1,946,614
Residential Mortgages Exposures 47,908,190 47,908,190 10,664,009 853,121
Qualifying Revolving Retail Exposures 2,098,887 2,098,887 1,473,938 117,915
Hire Purchase Exposures 7,867,243 7,867,243 2,695,664 215,653
Other Retail Exposures 37,476,339 37,476,339 9,499,068 759,925
Defaulted Exposures 1,820,854 1,820,854 626,895 50,152
Total On-Balance Sheet Exposures 97,171,513 97,171,513 24,959,574 1,996,766
Off-Balance Sheet ExposuresOTC Derivatives - - - -
Off-balance sheet exposures other than OTC derivatives or credit derivatives 13,324,556 13,324,556 2,499,901 199,992
Defaulted Exposures 65,203 65,203 111,408 8,913
Total Off-Balance Sheet Exposures 13,389,759 13,389,759 2,611,309 208,905
Total On and Off-Balance Sheet Exposures before scaling factor under the IRB Approach 199,606,151 199,606,151 75,255,716 6,020,457
Total On and Off-Balance Sheet Exposures after scaling factor, 1.06 under the IRB Approach 79,771,059 6,381,685
Total (Exposures under the SA Approach and Exposures under the IRB Approach) 283,830,189 278,910,330 105,139,766 8,411,181
6.0 CREDIT RISK (CONTINUED)
6.4 Credit Exposures and Risk-Weighted Assets by Portfolio and Approaches (continued)
Table 6a: Exposures on Off-Balance Sheet and Counterparty Credit Risk (Before Credit Risk Mitigation) as at 31 December 2020
RHB Bank Group
Nature of Item
Principal/NotionalAmountRM’000
PositiveFair Value of
DerivativeContracts
RM’000
CreditEquivalent
AmountRM’000
Risk-Weighted
AssetsRM’000
Direct credit substitutes 1,219,814 1,125,434 593,940Transaction related contingent items 3,202,339 1,527,778 800,659Short term self liquidating trade related contingencies 903,594 186,074 159,009Forward asset purchases, forward deposits, partly paid shares and
securities which represent commitments with certain drawdowns 5,843 5,843 -Lending of banks’ securities or the posting of securities as collateral
by banks, including instances where these arise out of repo style transactions 4,915,427 4,915,427 128,533
Foreign exchange related contracts 7,283,773 58,737 198,385 139,901 1 year or less 6,733,194 58,248 156,704 81,351 Over 1 year to 5 years 550,579 489 41,681 58,550 Over 5 years - - - -Interest/profit rate related contracts 1,725,629 36,640 53,432 58,820 1 year or less 712,163 8,785 10,290 6,729 Over 1 year to 5 years 1,013,466 27,855 43,142 52,091 Over 5 years - - - -Equity related contracts 229,392 16,759 30,522 - 1 year or less 229,392 16,759 30,522 - Over 1 year to 5 years - - - - Over 5 years - - - -Commodity contracts 172,418 1,994 4,749 8,262 1 year or less 58,552 - - - Over 1 year to 5 years 113,866 1,994 4,749 8,262 Over 5 years - - - -OTC derivative transactions and credit derivative contracts subject to
valid bilateral netting agreements 90,644,493 543,805 1,741,505 570,214Other commitments, such as formal standby facilities and credit/
financing lines, with original maturity of over 1 year 29,238,089 20,928,131 7,245,429Other commitments, such as formal standby facilities and credit/
financing lines, with original maturity of up to 1 year 1,727,065 378,350 51,250Any commitments that are unconditionally cancellable at any time
by the Bank without prior notice or that effectively provide for automatic cancellation due to deterioration in a borrower's creditworthiness 16,212,542 645,685 122,965
Total 157,480,418 657,935 31,741,315 9,878,982
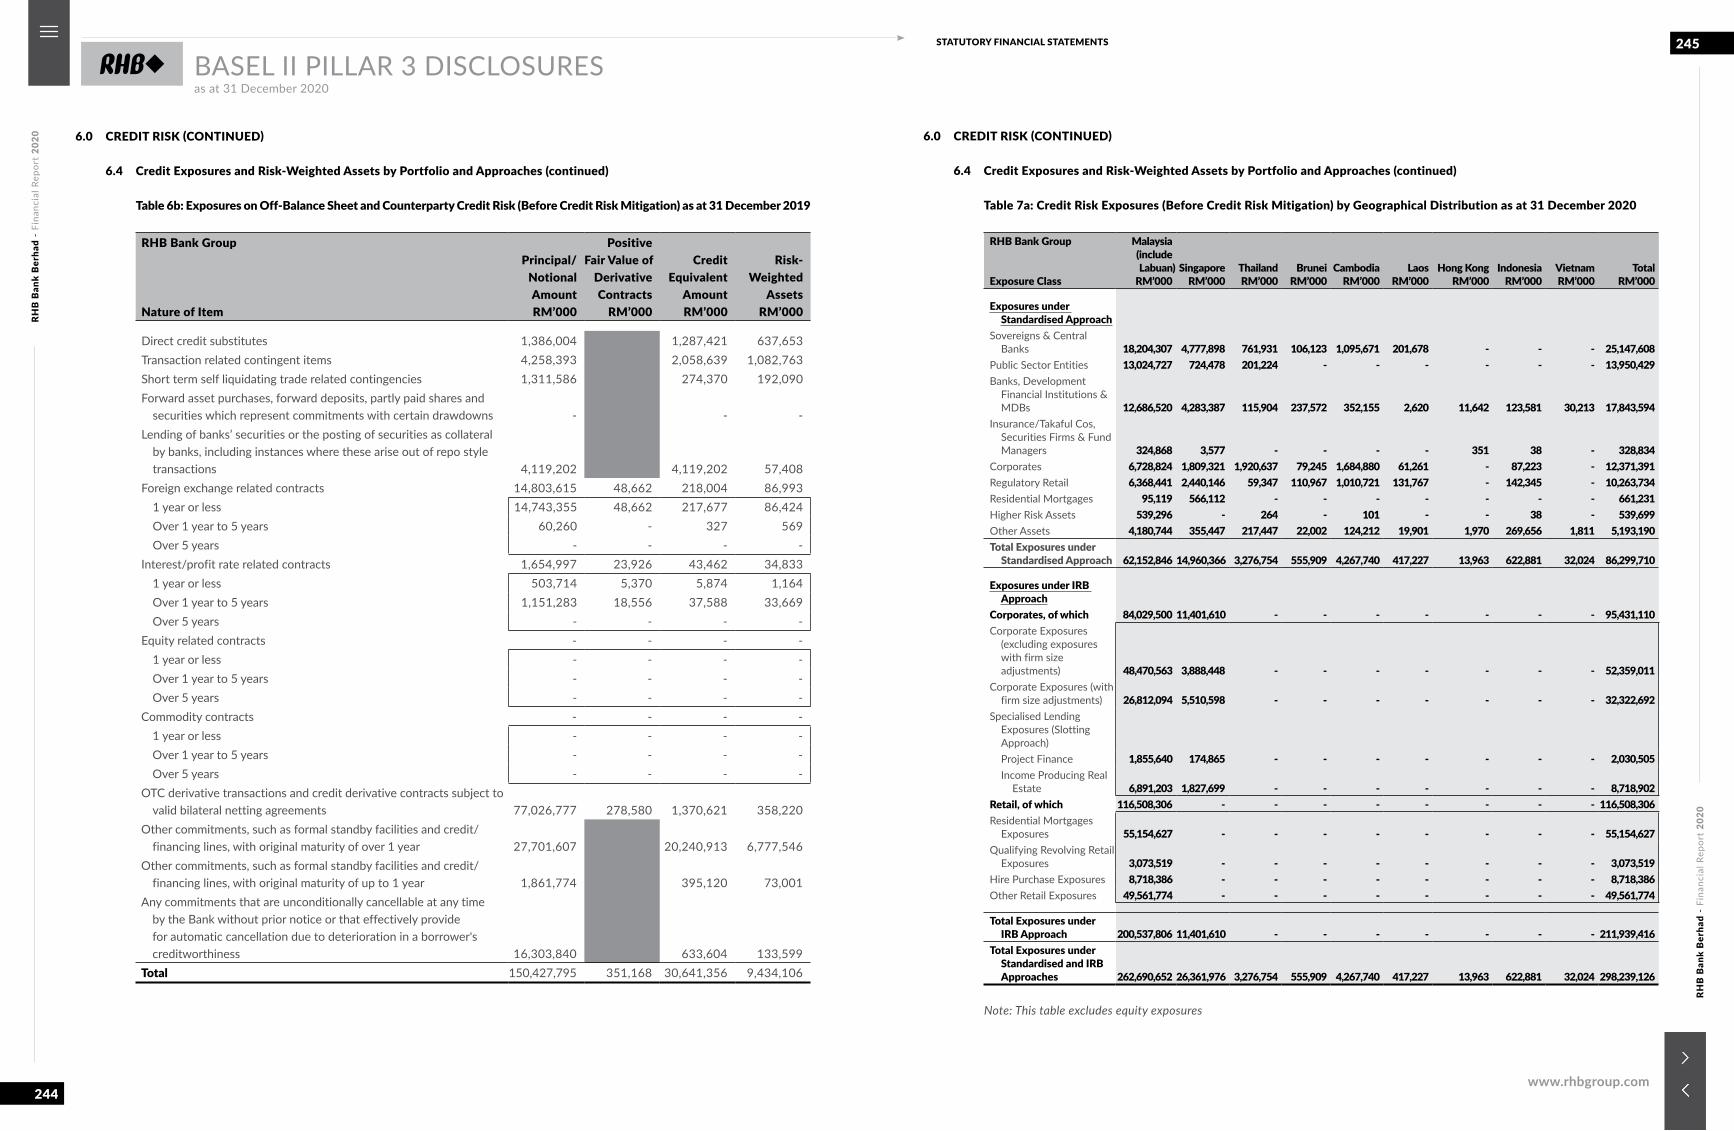
RHB
Ban
k B
erha
d -
Fina
ncia
l Rep
ort
2020
RHB
Ban
k B
erha
d -
Fina
ncia
l Rep
ort
2020
244
245STATUTORY FINANCIAL STATEMENTS
www.rhbgroup.com
BASEL II PILLAR 3 DISCLOSURESas at 31 December 2020
6.0 CREDIT RISK (CONTINUED)
6.4 Credit Exposures and Risk-Weighted Assets by Portfolio and Approaches (continued)
Table 6b: Exposures on Off-Balance Sheet and Counterparty Credit Risk (Before Credit Risk Mitigation) as at 31 December 2019
RHB Bank Group
Nature of Item
Principal/NotionalAmount RM’000
PositiveFair Value of
DerivativeContracts
RM’000
CreditEquivalent
Amount RM’000
Risk-Weighted
AssetsRM’000
Direct credit substitutes 1,386,004 1,287,421 637,653Transaction related contingent items 4,258,393 2,058,639 1,082,763Short term self liquidating trade related contingencies 1,311,586 274,370 192,090Forward asset purchases, forward deposits, partly paid shares and
securities which represent commitments with certain drawdowns - - -Lending of banks’ securities or the posting of securities as collateral
by banks, including instances where these arise out of repo style transactions 4,119,202 4,119,202 57,408
Foreign exchange related contracts 14,803,615 48,662 218,004 86,993 1 year or less 14,743,355 48,662 217,677 86,424 Over 1 year to 5 years 60,260 - 327 569 Over 5 years - - - -Interest/profit rate related contracts 1,654,997 23,926 43,462 34,833 1 year or less 503,714 5,370 5,874 1,164 Over 1 year to 5 years 1,151,283 18,556 37,588 33,669 Over 5 years - - - -Equity related contracts - - - - 1 year or less - - - - Over 1 year to 5 years - - - - Over 5 years - - - -Commodity contracts - - - - 1 year or less - - - - Over 1 year to 5 years - - - - Over 5 years - - - -OTC derivative transactions and credit derivative contracts subject to
valid bilateral netting agreements 77,026,777 278,580 1,370,621 358,220Other commitments, such as formal standby facilities and credit/
financing lines, with original maturity of over 1 year 27,701,607 20,240,913 6,777,546Other commitments, such as formal standby facilities and credit/
financing lines, with original maturity of up to 1 year 1,861,774 395,120 73,001Any commitments that are unconditionally cancellable at any time
by the Bank without prior notice or that effectively provide for automatic cancellation due to deterioration in a borrower's creditworthiness 16,303,840 633,604 133,599
Total 150,427,795 351,168 30,641,356 9,434,106
6.0 CREDIT RISK (CONTINUED)
6.4 Credit Exposures and Risk-Weighted Assets by Portfolio and Approaches (continued)
Table 7a: Credit Risk Exposures (Before Credit Risk Mitigation) by Geographical Distribution as at 31 December 2020
RHB Bank Group
Exposure Class
Malaysia(includeLabuan)
RM’000Singapore
RM’000ThailandRM’000
BruneiRM’000
CambodiaRM’000
LaosRM’000
Hong KongRM’000
IndonesiaRM’000
VietnamRM’000
TotalRM’000
Exposures under Standardised Approach
Sovereigns & Central Banks 18,204,307 4,777,898 761,931 106,123 1,095,671 201,678 - - - 25,147,608
Public Sector Entities 13,024,727 724,478 201,224 - - - - - - 13,950,429Banks, Development
Financial Institutions & MDBs 12,686,520 4,283,387 115,904 237,572 352,155 2,620 11,642 123,581 30,213 17,843,594
Insurance/Takaful Cos, Securities Firms & Fund Managers 324,868 3,577 - - - - 351 38 - 328,834
Corporates 6,728,824 1,809,321 1,920,637 79,245 1,684,880 61,261 - 87,223 - 12,371,391Regulatory Retail 6,368,441 2,440,146 59,347 110,967 1,010,721 131,767 - 142,345 - 10,263,734Residential Mortgages 95,119 566,112 - - - - - - - 661,231Higher Risk Assets 539,296 - 264 - 101 - - 38 - 539,699Other Assets 4,180,744 355,447 217,447 22,002 124,212 19,901 1,970 269,656 1,811 5,193,190Total Exposures under
Standardised Approach 62,152,846 14,960,366 3,276,754 555,909 4,267,740 417,227 13,963 622,881 32,024 86,299,710
Exposures under IRB Approach
Corporates, of which 84,029,500 11,401,610 - - - - - - - 95,431,110Corporate Exposures
(excluding exposures with firm size adjustments) 48,470,563 3,888,448 - - - - - - - 52,359,011
Corporate Exposures (with firm size adjustments) 26,812,094 5,510,598 - - - - - - - 32,322,692
Specialised Lending Exposures (Slotting Approach)
Project Finance 1,855,640 174,865 - - - - - - - 2,030,505 Income Producing Real
Estate 6,891,203 1,827,699 - - - - - - - 8,718,902Retail, of which 116,508,306 - - - - - - - - 116,508,306Residential Mortgages
Exposures 55,154,627 - - - - - - - - 55,154,627Qualifying Revolving Retail
Exposures 3,073,519 - - - - - - - - 3,073,519Hire Purchase Exposures 8,718,386 - - - - - - - - 8,718,386Other Retail Exposures 49,561,774 - - - - - - - - 49,561,774
Total Exposures under IRB Approach 200,537,806 11,401,610 - - - - - - - 211,939,416
Total Exposures under Standardised and IRB Approaches 262,690,652 26,361,976 3,276,754 555,909 4,267,740 417,227 13,963 622,881 32,024 298,239,126
Note: This table excludes equity exposures
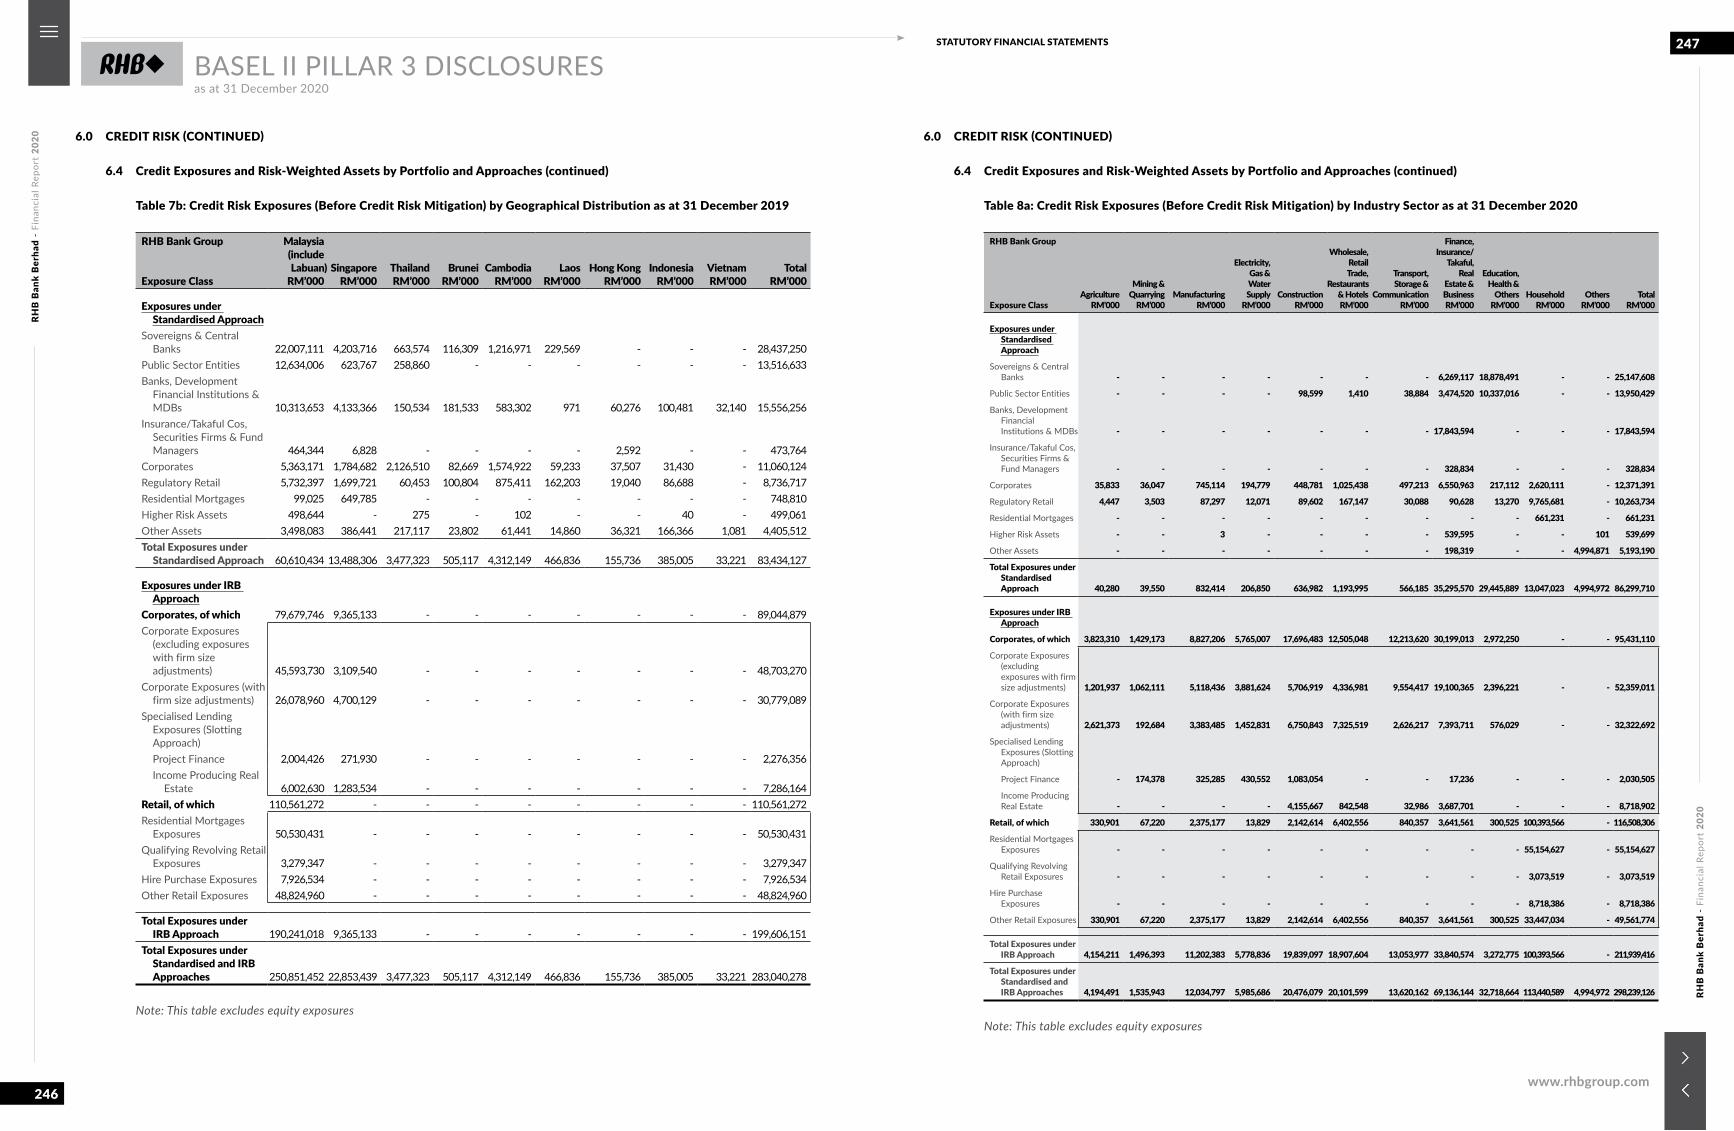
RHB
Ban
k B
erha
d -
Fina
ncia
l Rep
ort
2020
RHB
Ban
k B
erha
d -
Fina
ncia
l Rep
ort
2020
246
247STATUTORY FINANCIAL STATEMENTS
www.rhbgroup.com
BASEL II PILLAR 3 DISCLOSURESas at 31 December 2020
6.0 CREDIT RISK (CONTINUED)
6.4 Credit Exposures and Risk-Weighted Assets by Portfolio and Approaches (continued)
Table 7b: Credit Risk Exposures (Before Credit Risk Mitigation) by Geographical Distribution as at 31 December 2019
RHB Bank Group
Exposure Class
Malaysia(includeLabuan)
RM’000Singapore
RM’000ThailandRM’000
BruneiRM’000
CambodiaRM’000
LaosRM’000
Hong KongRM’000
IndonesiaRM’000
VietnamRM’000
TotalRM’000
Exposures under Standardised Approach
Sovereigns & Central Banks 22,007,111 4,203,716 663,574 116,309 1,216,971 229,569 - - - 28,437,250
Public Sector Entities 12,634,006 623,767 258,860 - - - - - - 13,516,633Banks, Development
Financial Institutions & MDBs 10,313,653 4,133,366 150,534 181,533 583,302 971 60,276 100,481 32,140 15,556,256
Insurance/Takaful Cos, Securities Firms & Fund Managers 464,344 6,828 - - - - 2,592 - - 473,764
Corporates 5,363,171 1,784,682 2,126,510 82,669 1,574,922 59,233 37,507 31,430 - 11,060,124Regulatory Retail 5,732,397 1,699,721 60,453 100,804 875,411 162,203 19,040 86,688 - 8,736,717Residential Mortgages 99,025 649,785 - - - - - - - 748,810Higher Risk Assets 498,644 - 275 - 102 - - 40 - 499,061Other Assets 3,498,083 386,441 217,117 23,802 61,441 14,860 36,321 166,366 1,081 4,405,512Total Exposures under
Standardised Approach 60,610,434 13,488,306 3,477,323 505,117 4,312,149 466,836 155,736 385,005 33,221 83,434,127
Exposures under IRB Approach
Corporates, of which 79,679,746 9,365,133 - - - - - - - 89,044,879Corporate Exposures
(excluding exposures with firm size adjustments) 45,593,730 3,109,540 - - - - - - - 48,703,270
Corporate Exposures (with firm size adjustments) 26,078,960 4,700,129 - - - - - - - 30,779,089
Specialised Lending Exposures (Slotting Approach)
Project Finance 2,004,426 271,930 - - - - - - - 2,276,356 Income Producing Real
Estate 6,002,630 1,283,534 - - - - - - - 7,286,164Retail, of which 110,561,272 - - - - - - - - 110,561,272Residential Mortgages
Exposures 50,530,431 - - - - - - - - 50,530,431Qualifying Revolving Retail
Exposures 3,279,347 - - - - - - - - 3,279,347Hire Purchase Exposures 7,926,534 - - - - - - - - 7,926,534Other Retail Exposures 48,824,960 - - - - - - - - 48,824,960
Total Exposures under IRB Approach 190,241,018 9,365,133 - - - - - - - 199,606,151
Total Exposures under Standardised and IRB Approaches 250,851,452 22,853,439 3,477,323 505,117 4,312,149 466,836 155,736 385,005 33,221 283,040,278
Note: This table excludes equity exposures
6.0 CREDIT RISK (CONTINUED)
6.4 Credit Exposures and Risk-Weighted Assets by Portfolio and Approaches (continued)
Table 8a: Credit Risk Exposures (Before Credit Risk Mitigation) by Industry Sector as at 31 December 2020
RHB Bank Group
Exposure ClassAgriculture
RM’000
Mining &Quarrying
RM’000Manufacturing
RM’000
Electricity,Gas & WaterSupply
RM’000Construction
RM’000
Wholesale,Retail Trade,
Restaurants & HotelsRM’000
Transport,Storage &
CommunicationRM’000
Finance,Insurance/
Takaful, Real
Estate &BusinessRM’000
Education,Health &
OthersRM’000
HouseholdRM’000
OthersRM’000
TotalRM’000
Exposures under Standardised Approach
Sovereigns & Central Banks - - - - - - - 6,269,117 18,878,491 - - 25,147,608
Public Sector Entities - - - - 98,599 1,410 38,884 3,474,520 10,337,016 - - 13,950,429
Banks, Development Financial Institutions & MDBs - - - - - - - 17,843,594 - - - 17,843,594
Insurance/Takaful Cos, Securities Firms & Fund Managers - - - - - - - 328,834 - - - 328,834
Corporates 35,833 36,047 745,114 194,779 448,781 1,025,438 497,213 6,550,963 217,112 2,620,111 - 12,371,391
Regulatory Retail 4,447 3,503 87,297 12,071 89,602 167,147 30,088 90,628 13,270 9,765,681 - 10,263,734
Residential Mortgages - - - - - - - - - 661,231 - 661,231
Higher Risk Assets - - 3 - - - - 539,595 - - 101 539,699
Other Assets - - - - - - - 198,319 - - 4,994,871 5,193,190
Total Exposures under Standardised Approach 40,280 39,550 832,414 206,850 636,982 1,193,995 566,185 35,295,570 29,445,889 13,047,023 4,994,972 86,299,710
Exposures under IRB Approach
Corporates, of which 3,823,310 1,429,173 8,827,206 5,765,007 17,696,483 12,505,048 12,213,620 30,199,013 2,972,250 - - 95,431,110
Corporate Exposures (excluding exposures with firm size adjustments) 1,201,937 1,062,111 5,118,436 3,881,624 5,706,919 4,336,981 9,554,417 19,100,365 2,396,221 - - 52,359,011
Corporate Exposures (with firm size adjustments) 2,621,373 192,684 3,383,485 1,452,831 6,750,843 7,325,519 2,626,217 7,393,711 576,029 - - 32,322,692
Specialised Lending Exposures (Slotting Approach)
Project Finance - 174,378 325,285 430,552 1,083,054 - - 17,236 - - - 2,030,505
Income Producing Real Estate - - - - 4,155,667 842,548 32,986 3,687,701 - - - 8,718,902
Retail, of which 330,901 67,220 2,375,177 13,829 2,142,614 6,402,556 840,357 3,641,561 300,525 100,393,566 - 116,508,306
Residential Mortgages Exposures - - - - - - - - - 55,154,627 - 55,154,627
Qualifying Revolving Retail Exposures - - - - - - - - - 3,073,519 - 3,073,519
Hire Purchase Exposures - - - - - - - - - 8,718,386 - 8,718,386
Other Retail Exposures 330,901 67,220 2,375,177 13,829 2,142,614 6,402,556 840,357 3,641,561 300,525 33,447,034 - 49,561,774
Total Exposures under IRB Approach 4,154,211 1,496,393 11,202,383 5,778,836 19,839,097 18,907,604 13,053,977 33,840,574 3,272,775 100,393,566 - 211,939,416
Total Exposures under Standardised and IRB Approaches 4,194,491 1,535,943 12,034,797 5,985,686 20,476,079 20,101,599 13,620,162 69,136,144 32,718,664 113,440,589 4,994,972 298,239,126
Note: This table excludes equity exposures
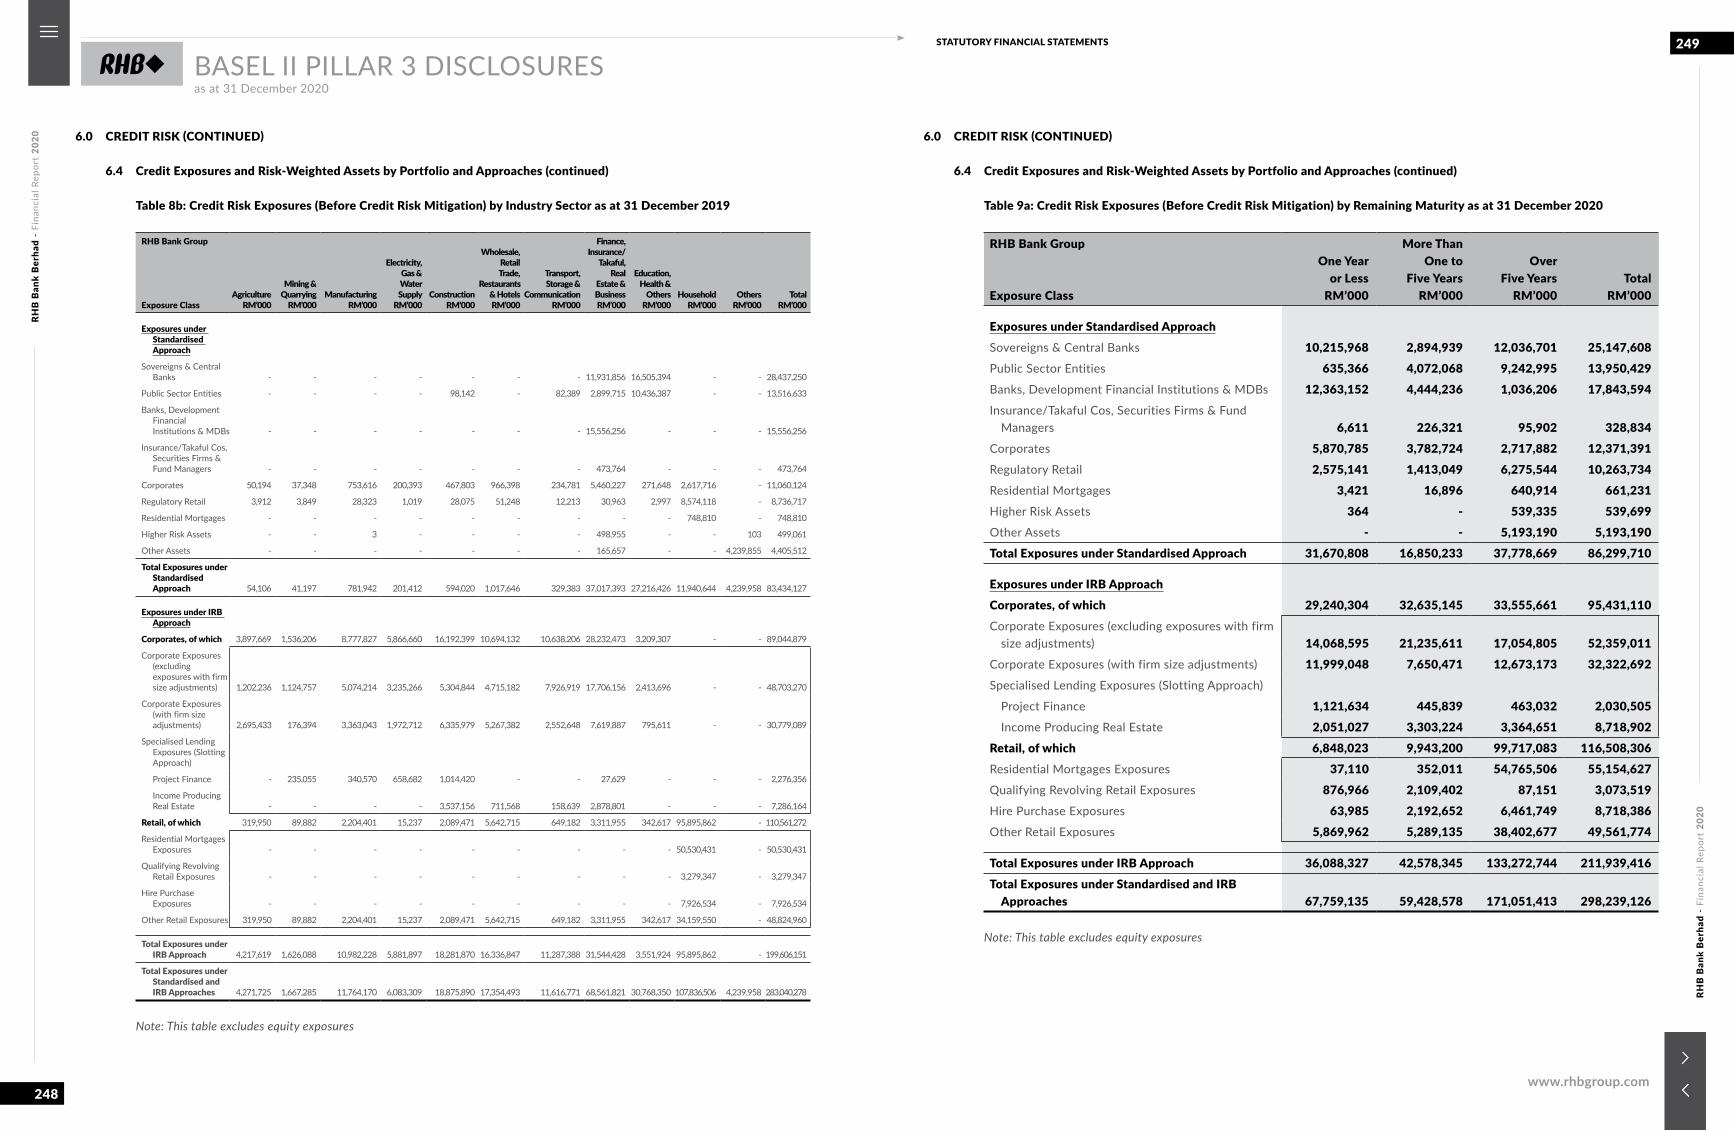
RHB
Ban
k B
erha
d -
Fina
ncia
l Rep
ort
2020
RHB
Ban
k B
erha
d -
Fina
ncia
l Rep
ort
2020
248
249STATUTORY FINANCIAL STATEMENTS
www.rhbgroup.com
BASEL II PILLAR 3 DISCLOSURESas at 31 December 2020
6.0 CREDIT RISK (CONTINUED)
6.4 Credit Exposures and Risk-Weighted Assets by Portfolio and Approaches (continued)
Table 8b: Credit Risk Exposures (Before Credit Risk Mitigation) by Industry Sector as at 31 December 2019
RHB Bank Group
Exposure ClassAgriculture
RM’000
Mining &Quarrying
RM’000Manufacturing
RM’000
Electricity,Gas & WaterSupply
RM’000Construction
RM’000
Wholesale,Retail Trade,
Restaurants& HotelsRM’000
Transport,Storage &
CommunicationRM’000
Finance,Insurance/
Takaful, Real
Estate &BusinessRM’000
Education,Health &
OthersRM’000
HouseholdRM’000
OthersRM’000
TotalRM’000
Exposures under Standardised Approach
Sovereigns & Central Banks - - - - - - - 11,931,856 16,505,394 - - 28,437,250
Public Sector Entities - - - - 98,142 - 82,389 2,899,715 10,436,387 - - 13,516,633
Banks, Development Financial Institutions & MDBs - - - - - - - 15,556,256 - - - 15,556,256
Insurance/Takaful Cos, Securities Firms & Fund Managers - - - - - - - 473,764 - - - 473,764
Corporates 50,194 37,348 753,616 200,393 467,803 966,398 234,781 5,460,227 271,648 2,617,716 - 11,060,124
Regulatory Retail 3,912 3,849 28,323 1,019 28,075 51,248 12,213 30,963 2,997 8,574,118 - 8,736,717
Residential Mortgages - - - - - - - - - 748,810 - 748,810
Higher Risk Assets - - 3 - - - - 498,955 - - 103 499,061
Other Assets - - - - - - - 165,657 - - 4,239,855 4,405,512
Total Exposures under Standardised Approach 54,106 41,197 781,942 201,412 594,020 1,017,646 329,383 37,017,393 27,216,426 11,940,644 4,239,958 83,434,127
Exposures under IRB Approach
Corporates, of which 3,897,669 1,536,206 8,777,827 5,866,660 16,192,399 10,694,132 10,638,206 28,232,473 3,209,307 - - 89,044,879
Corporate Exposures (excluding exposures with firm size adjustments) 1,202,236 1,124,757 5,074,214 3,235,266 5,304,844 4,715,182 7,926,919 17,706,156 2,413,696 - - 48,703,270
Corporate Exposures (with firm size adjustments) 2,695,433 176,394 3,363,043 1,972,712 6,335,979 5,267,382 2,552,648 7,619,887 795,611 - - 30,779,089
Specialised Lending Exposures (Slotting Approach)
Project Finance - 235,055 340,570 658,682 1,014,420 - - 27,629 - - - 2,276,356
Income Producing Real Estate - - - - 3,537,156 711,568 158,639 2,878,801 - - - 7,286,164
Retail, of which 319,950 89,882 2,204,401 15,237 2,089,471 5,642,715 649,182 3,311,955 342,617 95,895,862 - 110,561,272
Residential Mortgages Exposures - - - - - - - - - 50,530,431 - 50,530,431
Qualifying Revolving Retail Exposures - - - - - - - - - 3,279,347 - 3,279,347
Hire Purchase Exposures - - - - - - - - - 7,926,534 - 7,926,534
Other Retail Exposures 319,950 89,882 2,204,401 15,237 2,089,471 5,642,715 649,182 3,311,955 342,617 34,159,550 - 48,824,960
Total Exposures under IRB Approach 4,217,619 1,626,088 10,982,228 5,881,897 18,281,870 16,336,847 11,287,388 31,544,428 3,551,924 95,895,862 - 199,606,151
Total Exposures under Standardised and IRB Approaches 4,271,725 1,667,285 11,764,170 6,083,309 18,875,890 17,354,493 11,616,771 68,561,821 30,768,350 107,836,506 4,239,958 283,040,278
Note: This table excludes equity exposures
6.0 CREDIT RISK (CONTINUED)
6.4 Credit Exposures and Risk-Weighted Assets by Portfolio and Approaches (continued)
Table 9a: Credit Risk Exposures (Before Credit Risk Mitigation) by Remaining Maturity as at 31 December 2020
RHB Bank Group
Exposure Class
One Yearor Less
RM’000
More ThanOne to
Five YearsRM’000
OverFive Years
RM’000Total
RM’000
Exposures under Standardised ApproachSovereigns & Central Banks 10,215,968 2,894,939 12,036,701 25,147,608Public Sector Entities 635,366 4,072,068 9,242,995 13,950,429Banks, Development Financial Institutions & MDBs 12,363,152 4,444,236 1,036,206 17,843,594Insurance/Takaful Cos, Securities Firms & Fund
Managers 6,611 226,321 95,902 328,834Corporates 5,870,785 3,782,724 2,717,882 12,371,391Regulatory Retail 2,575,141 1,413,049 6,275,544 10,263,734Residential Mortgages 3,421 16,896 640,914 661,231Higher Risk Assets 364 - 539,335 539,699Other Assets - - 5,193,190 5,193,190Total Exposures under Standardised Approach 31,670,808 16,850,233 37,778,669 86,299,710
Exposures under IRB ApproachCorporates, of which 29,240,304 32,635,145 33,555,661 95,431,110Corporate Exposures (excluding exposures with firm
size adjustments) 14,068,595 21,235,611 17,054,805 52,359,011Corporate Exposures (with firm size adjustments) 11,999,048 7,650,471 12,673,173 32,322,692Specialised Lending Exposures (Slotting Approach)
Project Finance 1,121,634 445,839 463,032 2,030,505 Income Producing Real Estate 2,051,027 3,303,224 3,364,651 8,718,902Retail, of which 6,848,023 9,943,200 99,717,083 116,508,306Residential Mortgages Exposures 37,110 352,011 54,765,506 55,154,627Qualifying Revolving Retail Exposures 876,966 2,109,402 87,151 3,073,519Hire Purchase Exposures 63,985 2,192,652 6,461,749 8,718,386Other Retail Exposures 5,869,962 5,289,135 38,402,677 49,561,774
Total Exposures under IRB Approach 36,088,327 42,578,345 133,272,744 211,939,416Total Exposures under Standardised and IRB
Approaches 67,759,135 59,428,578 171,051,413 298,239,126
Note: This table excludes equity exposures
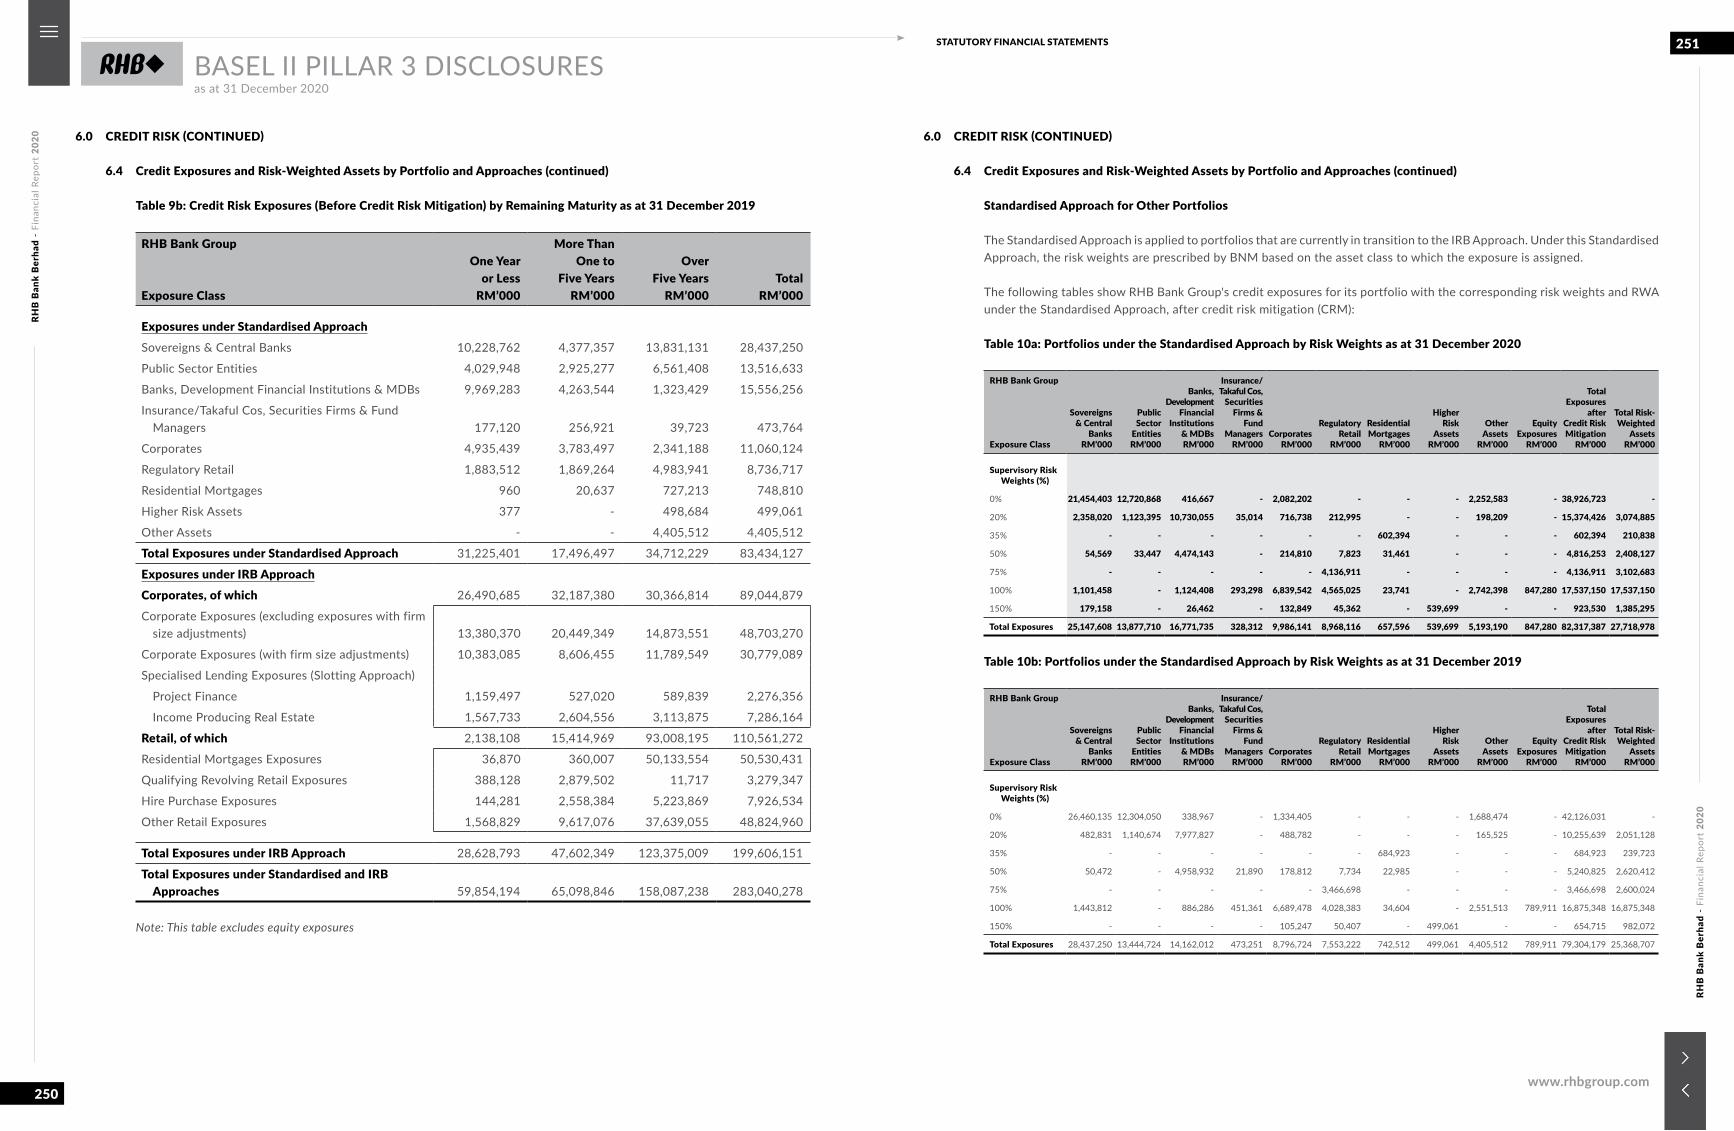
RHB
Ban
k B
erha
d -
Fina
ncia
l Rep
ort
2020
RHB
Ban
k B
erha
d -
Fina
ncia
l Rep
ort
2020
250
251STATUTORY FINANCIAL STATEMENTS
www.rhbgroup.com
BASEL II PILLAR 3 DISCLOSURESas at 31 December 2020
6.0 CREDIT RISK (CONTINUED)
6.4 Credit Exposures and Risk-Weighted Assets by Portfolio and Approaches (continued)
Table 9b: Credit Risk Exposures (Before Credit Risk Mitigation) by Remaining Maturity as at 31 December 2019
RHB Bank Group
Exposure Class
One Yearor Less
RM’000
More ThanOne to
Five YearsRM’000
OverFive Years
RM’000Total
RM’000
Exposures under Standardised ApproachSovereigns & Central Banks 10,228,762 4,377,357 13,831,131 28,437,250
Public Sector Entities 4,029,948 2,925,277 6,561,408 13,516,633
Banks, Development Financial Institutions & MDBs 9,969,283 4,263,544 1,323,429 15,556,256
Insurance/Takaful Cos, Securities Firms & Fund Managers 177,120 256,921 39,723 473,764
Corporates 4,935,439 3,783,497 2,341,188 11,060,124
Regulatory Retail 1,883,512 1,869,264 4,983,941 8,736,717
Residential Mortgages 960 20,637 727,213 748,810
Higher Risk Assets 377 - 498,684 499,061
Other Assets - - 4,405,512 4,405,512
Total Exposures under Standardised Approach 31,225,401 17,496,497 34,712,229 83,434,127
Exposures under IRB ApproachCorporates, of which 26,490,685 32,187,380 30,366,814 89,044,879
Corporate Exposures (excluding exposures with firm size adjustments) 13,380,370 20,449,349 14,873,551 48,703,270
Corporate Exposures (with firm size adjustments) 10,383,085 8,606,455 11,789,549 30,779,089
Specialised Lending Exposures (Slotting Approach)
Project Finance 1,159,497 527,020 589,839 2,276,356
Income Producing Real Estate 1,567,733 2,604,556 3,113,875 7,286,164
Retail, of which 2,138,108 15,414,969 93,008,195 110,561,272
Residential Mortgages Exposures 36,870 360,007 50,133,554 50,530,431
Qualifying Revolving Retail Exposures 388,128 2,879,502 11,717 3,279,347
Hire Purchase Exposures 144,281 2,558,384 5,223,869 7,926,534
Other Retail Exposures 1,568,829 9,617,076 37,639,055 48,824,960
Total Exposures under IRB Approach 28,628,793 47,602,349 123,375,009 199,606,151
Total Exposures under Standardised and IRB Approaches 59,854,194 65,098,846 158,087,238 283,040,278
Note: This table excludes equity exposures
6.0 CREDIT RISK (CONTINUED)
6.4 Credit Exposures and Risk-Weighted Assets by Portfolio and Approaches (continued)
Standardised Approach for Other Portfolios
The Standardised Approach is applied to portfolios that are currently in transition to the IRB Approach. Under this Standardised Approach, the risk weights are prescribed by BNM based on the asset class to which the exposure is assigned.
The following tables show RHB Bank Group's credit exposures for its portfolio with the corresponding risk weights and RWA under the Standardised Approach, after credit risk mitigation (CRM):
Table 10a: Portfolios under the Standardised Approach by Risk Weights as at 31 December 2020
RHB Bank Group
Exposure Class
Sovereigns& Central
BanksRM’000
PublicSector
EntitiesRM’000
Banks,Development
FinancialInstitutions
& MDBsRM’000
Insurance/Takaful Cos,
SecuritiesFirms &
FundManagers
RM’000Corporates
RM’000
RegulatoryRetail
RM’000
ResidentialMortgages
RM’000
Higher Risk
AssetsRM’000
Other Assets
RM’000
EquityExposures
RM’000
TotalExposures
after Credit RiskMitigation
RM’000
Total Risk-Weighted
AssetsRM’000
Supervisory Risk Weights (%)
0% 21,454,403 12,720,868 416,667 - 2,082,202 - - - 2,252,583 - 38,926,723 -
20% 2,358,020 1,123,395 10,730,055 35,014 716,738 212,995 - - 198,209 - 15,374,426 3,074,885
35% - - - - - - 602,394 - - - 602,394 210,838
50% 54,569 33,447 4,474,143 - 214,810 7,823 31,461 - - - 4,816,253 2,408,127
75% - - - - - 4,136,911 - - - - 4,136,911 3,102,683
100% 1,101,458 - 1,124,408 293,298 6,839,542 4,565,025 23,741 - 2,742,398 847,280 17,537,150 17,537,150
150% 179,158 - 26,462 - 132,849 45,362 - 539,699 - - 923,530 1,385,295
Total Exposures 25,147,608 13,877,710 16,771,735 328,312 9,986,141 8,968,116 657,596 539,699 5,193,190 847,280 82,317,387 27,718,978
Table 10b: Portfolios under the Standardised Approach by Risk Weights as at 31 December 2019
RHB Bank Group
Exposure Class
Sovereigns& Central
BanksRM’000
PublicSector
EntitiesRM’000
Banks,Development
FinancialInstitutions
& MDBsRM’000
Insurance/Takaful Cos,
SecuritiesFirms &
FundManagers
RM’000Corporates
RM’000
RegulatoryRetail
RM’000
ResidentialMortgages
RM’000
Higher Risk
AssetsRM’000
Other Assets
RM’000
EquityExposures
RM’000
TotalExposures
after Credit RiskMitigation
RM’000
Total Risk-Weighted
AssetsRM’000
Supervisory Risk Weights (%)
0% 26,460,135 12,304,050 338,967 - 1,334,405 - - - 1,688,474 - 42,126,031 -
20% 482,831 1,140,674 7,977,827 - 488,782 - - - 165,525 - 10,255,639 2,051,128
35% - - - - - - 684,923 - - - 684,923 239,723
50% 50,472 - 4,958,932 21,890 178,812 7,734 22,985 - - - 5,240,825 2,620,412
75% - - - - - 3,466,698 - - - - 3,466,698 2,600,024
100% 1,443,812 - 886,286 451,361 6,689,478 4,028,383 34,604 - 2,551,513 789,911 16,875,348 16,875,348
150% - - - - 105,247 50,407 - 499,061 - - 654,715 982,072
Total Exposures 28,437,250 13,444,724 14,162,012 473,251 8,796,724 7,553,222 742,512 499,061 4,405,512 789,911 79,304,179 25,368,707
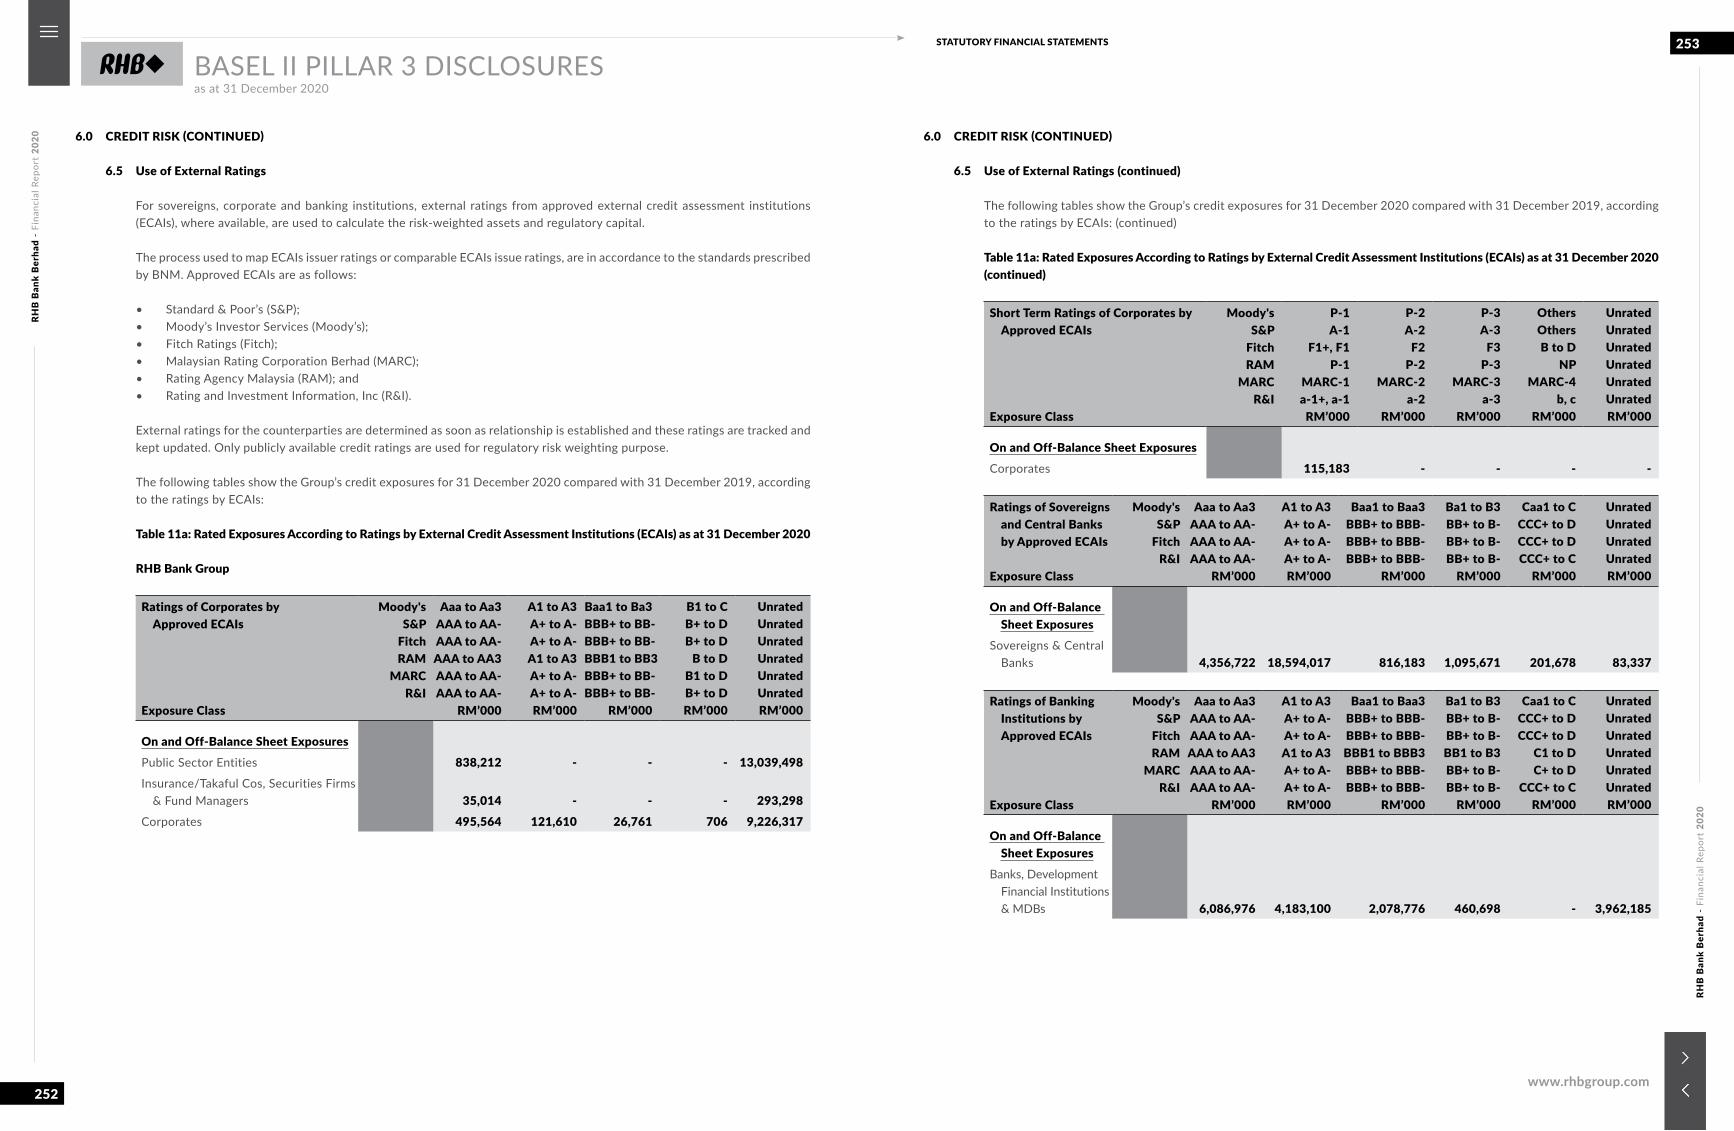
RHB
Ban
k B
erha
d -
Fina
ncia
l Rep
ort
2020
RHB
Ban
k B
erha
d -
Fina
ncia
l Rep
ort
2020
252
253STATUTORY FINANCIAL STATEMENTS
www.rhbgroup.com
BASEL II PILLAR 3 DISCLOSURESas at 31 December 2020
6.0 CREDIT RISK (CONTINUED)
6.5 Use of External Ratings
For sovereigns, corporate and banking institutions, external ratings from approved external credit assessment institutions (ECAIs), where available, are used to calculate the risk-weighted assets and regulatory capital.
The process used to map ECAIs issuer ratings or comparable ECAIs issue ratings, are in accordance to the standards prescribed by BNM. Approved ECAIs are as follows:
• Standard & Poor’s (S&P);• Moody’s Investor Services (Moody’s);• Fitch Ratings (Fitch);• Malaysian Rating Corporation Berhad (MARC);• Rating Agency Malaysia (RAM); and• Rating and Investment Information, Inc (R&I).
External ratings for the counterparties are determined as soon as relationship is established and these ratings are tracked and kept updated. Only publicly available credit ratings are used for regulatory risk weighting purpose.
The following tables show the Group’s credit exposures for 31 December 2020 compared with 31 December 2019, according to the ratings by ECAIs:
Table 11a: Rated Exposures According to Ratings by External Credit Assessment Institutions (ECAIs) as at 31 December 2020
RHB Bank Group
Ratings of Corporates by Approved ECAIs
Exposure Class
Moody'sS&P
FitchRAM
MARCR&I
Aaa to Aa3AAA to AA-AAA to AA-AAA to AA3AAA to AA-AAA to AA-
RM’000
A1 to A3A+ to A-A+ to A-A1 to A3A+ to A-A+ to A-RM’000
Baa1 to Ba3BBB+ to BB-BBB+ to BB-BBB1 to BB3BBB+ to BB-BBB+ to BB-
RM’000
B1 to CB+ to DB+ to D
B to DB1 to DB+ to DRM’000
UnratedUnratedUnratedUnratedUnratedUnratedRM’000
On and Off-Balance Sheet ExposuresPublic Sector Entities 838,212 - - - 13,039,498Insurance/Takaful Cos, Securities Firms
& Fund Managers 35,014 - - - 293,298Corporates 495,564 121,610 26,761 706 9,226,317
6.0 CREDIT RISK (CONTINUED)
6.5 Use of External Ratings (continued)
The following tables show the Group’s credit exposures for 31 December 2020 compared with 31 December 2019, according to the ratings by ECAIs: (continued)
Table 11a: Rated Exposures According to Ratings by External Credit Assessment Institutions (ECAIs) as at 31 December 2020 (continued)
Short Term Ratings of Corporates by Approved ECAIs
Exposure Class
Moody'sS&P
FitchRAM
MARCR&I
P-1A-1
F1+, F1P-1
MARC-1a-1+, a-1
RM’000
P-2A-2
F2P-2
MARC-2a-2
RM’000
P-3A-3
F3P-3
MARC-3a-3
RM’000
OthersOthersB to D
NPMARC-4
b, cRM’000
UnratedUnratedUnratedUnratedUnratedUnratedRM’000
On and Off-Balance Sheet ExposuresCorporates 115,183 - - - -
Ratings of Sovereigns and Central Banks by Approved ECAIs
Exposure Class
Moody'sS&P
FitchR&I
Aaa to Aa3AAA to AA-AAA to AA-AAA to AA-
RM’000
A1 to A3A+ to A-A+ to A-A+ to A-RM’000
Baa1 to Baa3BBB+ to BBB-BBB+ to BBB-BBB+ to BBB-
RM’000
Ba1 to B3BB+ to B-BB+ to B-BB+ to B-
RM’000
Caa1 to CCCC+ to DCCC+ to DCCC+ to C
RM’000
UnratedUnratedUnratedUnratedRM’000
On and Off-Balance Sheet Exposures
Sovereigns & Central Banks 4,356,722 18,594,017 816,183 1,095,671 201,678 83,337
Ratings of Banking Institutions by Approved ECAIs
Exposure Class
Moody'sS&P
FitchRAM
MARCR&I
Aaa to Aa3AAA to AA-AAA to AA-AAA to AA3AAA to AA-AAA to AA-
RM’000
A1 to A3A+ to A-A+ to A-A1 to A3A+ to A-A+ to A-RM’000
Baa1 to Baa3BBB+ to BBB-BBB+ to BBB-BBB1 to BBB3BBB+ to BBB-BBB+ to BBB-
RM’000
Ba1 to B3BB+ to B-BB+ to B-BB1 to B3BB+ to B-BB+ to B-
RM’000
Caa1 to CCCC+ to DCCC+ to D
C1 to DC+ to D
CCC+ to CRM’000
UnratedUnratedUnratedUnratedUnratedUnratedRM’000
On and Off-Balance Sheet Exposures
Banks, Development Financial Institutions & MDBs 6,086,976 4,183,100 2,078,776 460,698 - 3,962,185
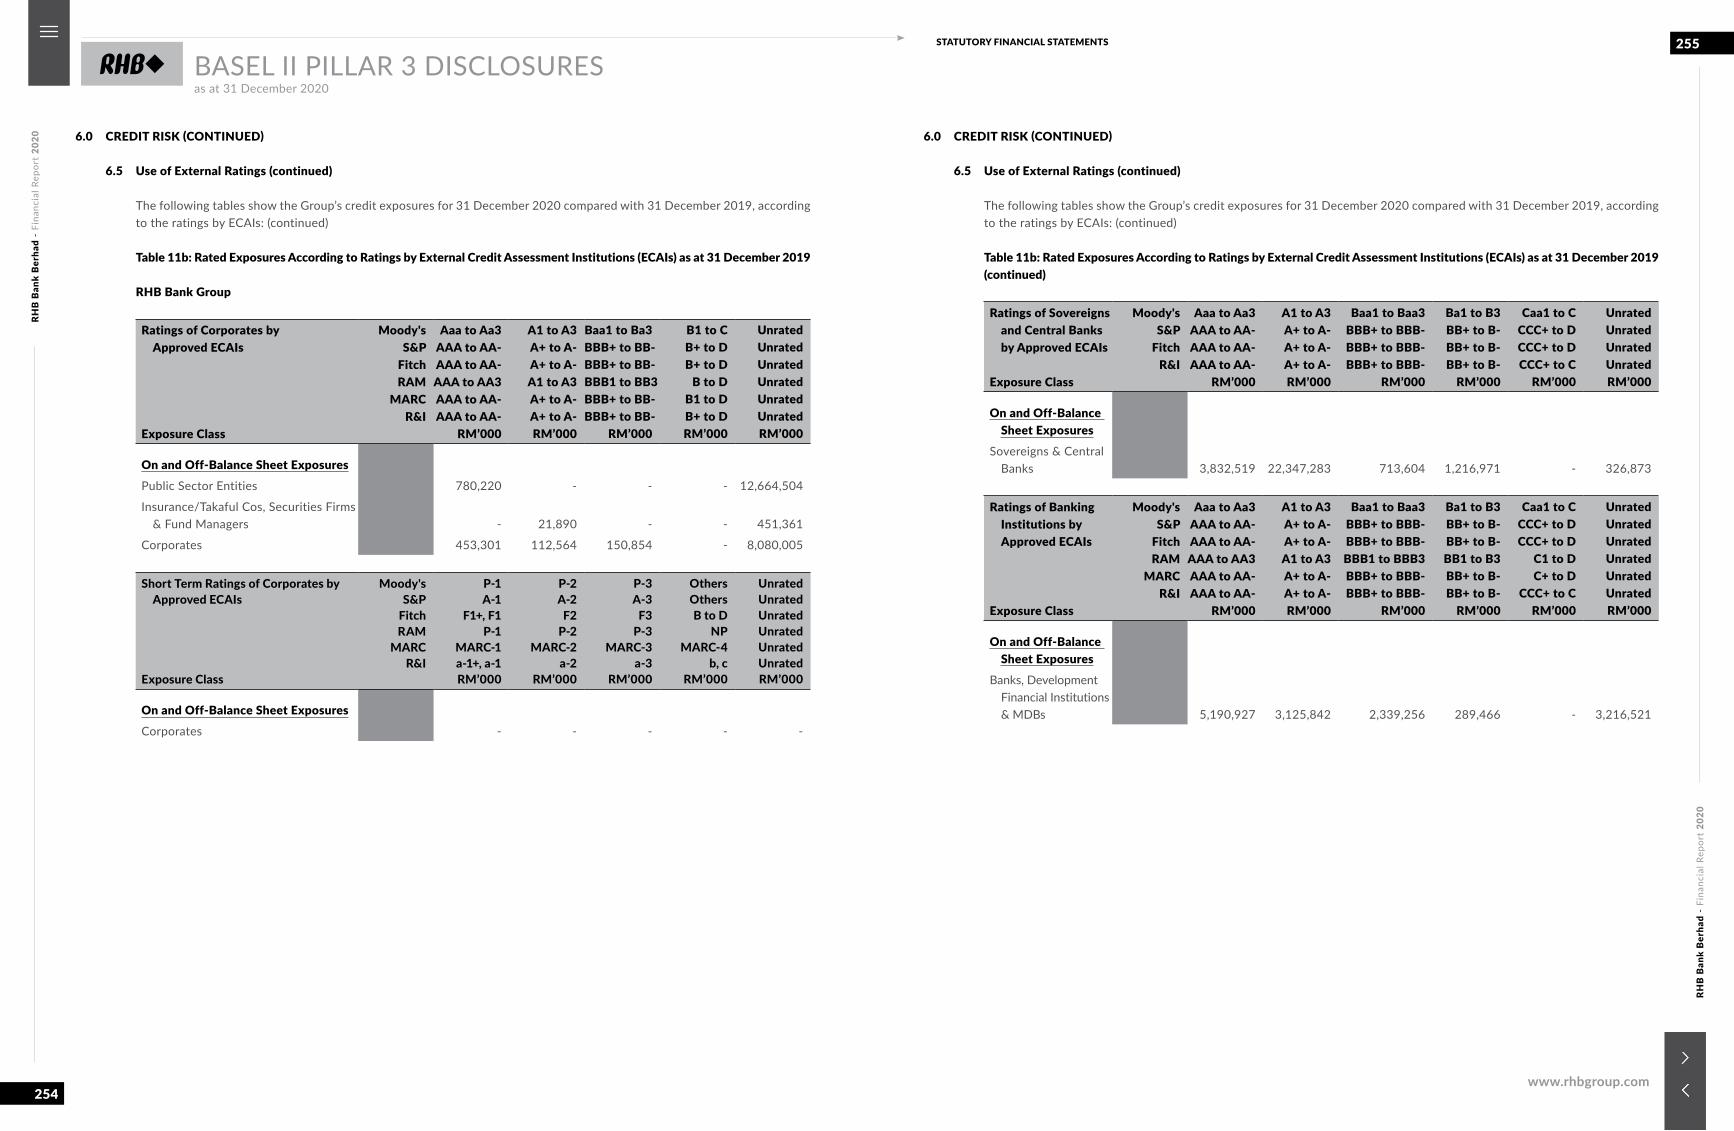
RHB
Ban
k B
erha
d -
Fina
ncia
l Rep
ort
2020
RHB
Ban
k B
erha
d -
Fina
ncia
l Rep
ort
2020
254
255STATUTORY FINANCIAL STATEMENTS
www.rhbgroup.com
BASEL II PILLAR 3 DISCLOSURESas at 31 December 2020
6.0 CREDIT RISK (CONTINUED)
6.5 Use of External Ratings (continued)
The following tables show the Group’s credit exposures for 31 December 2020 compared with 31 December 2019, according to the ratings by ECAIs: (continued)
Table 11b: Rated Exposures According to Ratings by External Credit Assessment Institutions (ECAIs) as at 31 December 2019
RHB Bank Group
Ratings of Corporates by Approved ECAIs
Exposure Class
Moody'sS&P
FitchRAM
MARCR&I
Aaa to Aa3AAA to AA-AAA to AA-AAA to AA3AAA to AA-AAA to AA-
RM’000
A1 to A3A+ to A-A+ to A-A1 to A3A+ to A-A+ to A-RM’000
Baa1 to Ba3BBB+ to BB-BBB+ to BB-BBB1 to BB3BBB+ to BB-BBB+ to BB-
RM’000
B1 to CB+ to DB+ to D
B to DB1 to DB+ to DRM’000
UnratedUnratedUnratedUnratedUnratedUnratedRM’000
On and Off-Balance Sheet ExposuresPublic Sector Entities 780,220 - - - 12,664,504
Insurance/Takaful Cos, Securities Firms & Fund Managers - 21,890 - - 451,361
Corporates 453,301 112,564 150,854 - 8,080,005
Short Term Ratings of Corporates by Approved ECAIs
Exposure Class
Moody'sS&P
FitchRAM
MARCR&I
P-1A-1
F1+, F1P-1
MARC-1a-1+, a-1RM’000
P-2A-2F2
P-2MARC-2
a-2RM’000
P-3A-3
F3P-3
MARC-3a-3
RM’000
OthersOthersB to D
NPMARC-4
b, cRM’000
UnratedUnratedUnratedUnratedUnratedUnratedRM’000
On and Off-Balance Sheet ExposuresCorporates - - - - -
6.0 CREDIT RISK (CONTINUED)
6.5 Use of External Ratings (continued)
The following tables show the Group’s credit exposures for 31 December 2020 compared with 31 December 2019, according to the ratings by ECAIs: (continued)
Table 11b: Rated Exposures According to Ratings by External Credit Assessment Institutions (ECAIs) as at 31 December 2019(continued)
Ratings of Sovereigns and Central Banks by Approved ECAIs
Exposure Class
Moody'sS&P
FitchR&I
Aaa to Aa3AAA to AA-AAA to AA-AAA to AA-
RM’000
A1 to A3A+ to A-A+ to A-A+ to A-RM’000
Baa1 to Baa3BBB+ to BBB-BBB+ to BBB-
BBB+ to BBB-RM’000
Ba1 to B3BB+ to B-BB+ to B-BB+ to B-
RM’000
Caa1 to CCCC+ to DCCC+ to DCCC+ to C
RM’000
UnratedUnratedUnratedUnratedRM’000
On and Off-Balance Sheet Exposures
Sovereigns & Central Banks 3,832,519 22,347,283 713,604 1,216,971 - 326,873
Ratings of Banking Institutions by Approved ECAIs
Exposure Class
Moody'sS&P
FitchRAM
MARCR&I
Aaa to Aa3AAA to AA-AAA to AA-AAA to AA3AAA to AA-AAA to AA-
RM’000
A1 to A3A+ to A-A+ to A-A1 to A3A+ to A-A+ to A-RM’000
Baa1 to Baa3BBB+ to BBB-BBB+ to BBB-BBB1 to BBB3BBB+ to BBB-BBB+ to BBB-
RM’000
Ba1 to B3BB+ to B-BB+ to B-BB1 to B3BB+ to B-BB+ to B-
RM’000
Caa1 to CCCC+ to DCCC+ to D
C1 to DC+ to D
CCC+ to CRM’000
UnratedUnratedUnratedUnratedUnratedUnratedRM’000
On and Off-Balance Sheet Exposures
Banks, Development Financial Institutions & MDBs 5,190,927 3,125,842 2,339,256 289,466 - 3,216,521
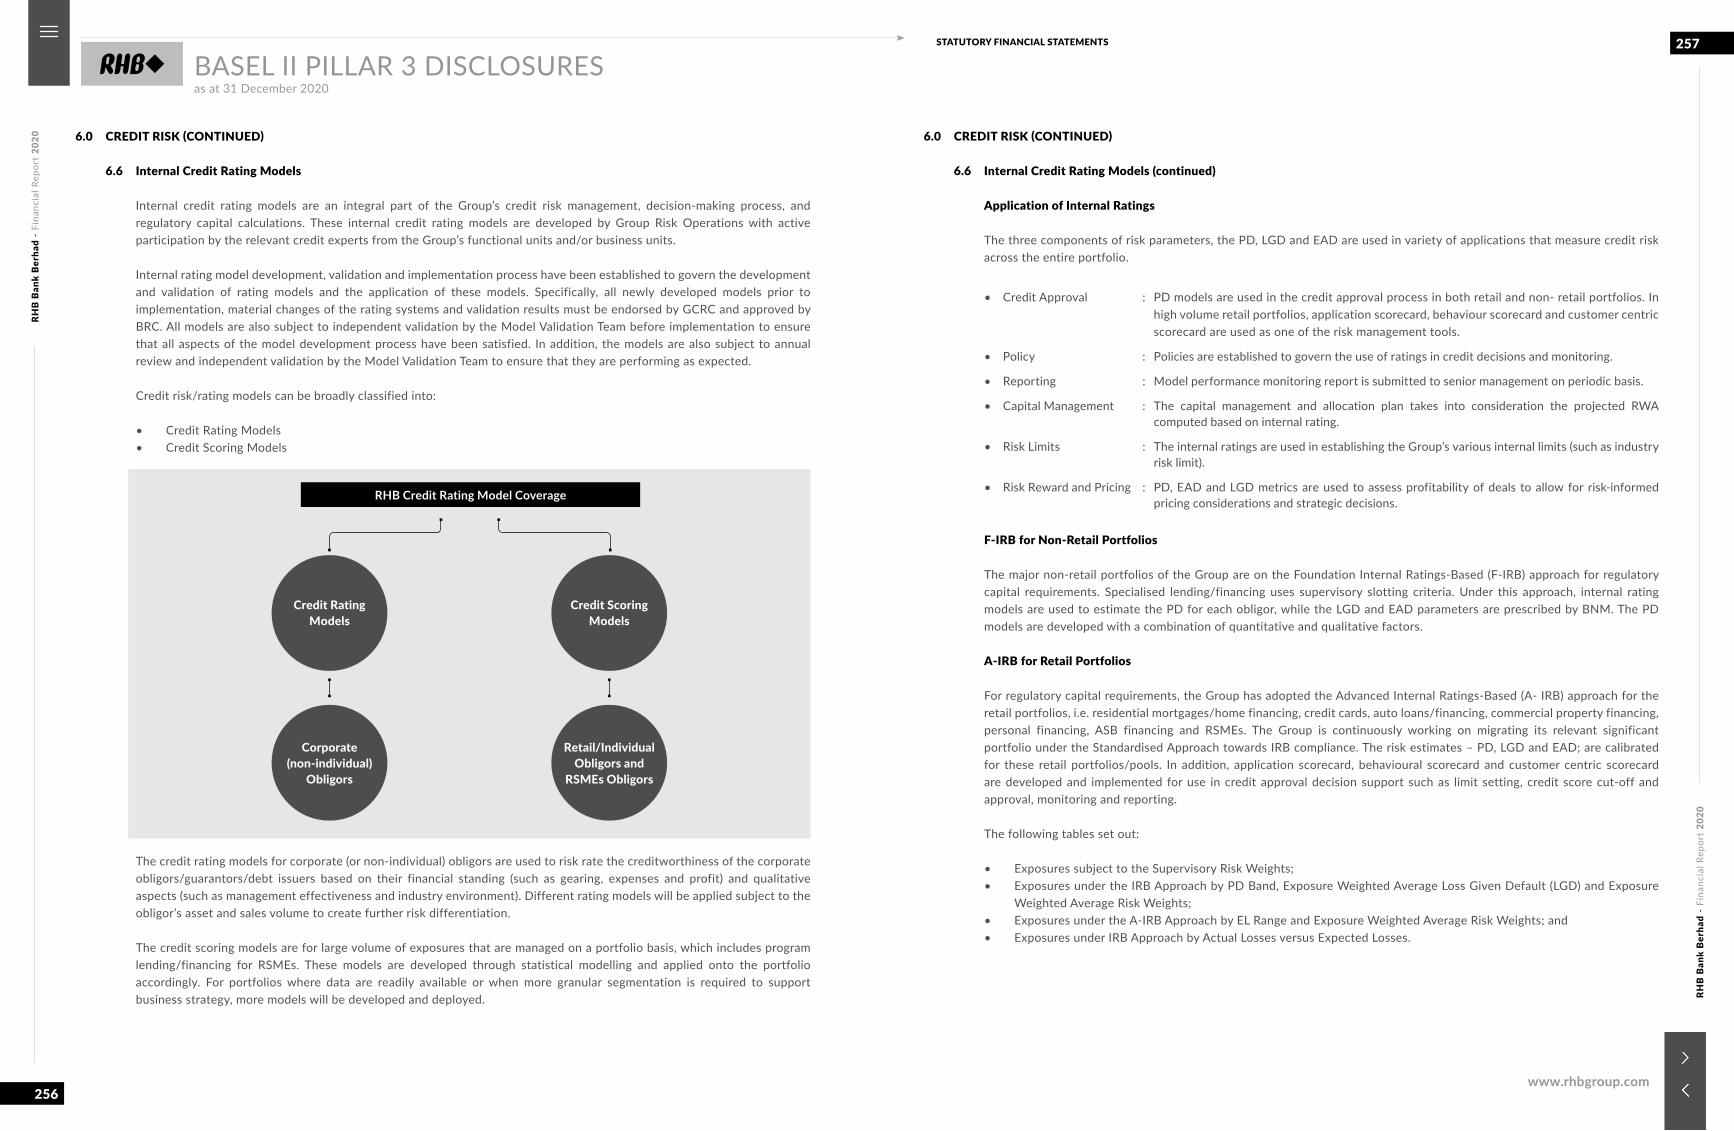
RHB
Ban
k B
erha
d -
Fina
ncia
l Rep
ort
2020
RHB
Ban
k B
erha
d -
Fina
ncia
l Rep
ort
2020
256
257STATUTORY FINANCIAL STATEMENTS
www.rhbgroup.com
BASEL II PILLAR 3 DISCLOSURESas at 31 December 2020
6.0 CREDIT RISK (CONTINUED)
6.6 Internal Credit Rating Models
Internal credit rating models are an integral part of the Group’s credit risk management, decision-making process, and regulatory capital calculations. These internal credit rating models are developed by Group Risk Operations with active participation by the relevant credit experts from the Group’s functional units and/or business units.
Internal rating model development, validation and implementation process have been established to govern the development and validation of rating models and the application of these models. Specifically, all newly developed models prior to implementation, material changes of the rating systems and validation results must be endorsed by GCRC and approved by BRC. All models are also subject to independent validation by the Model Validation Team before implementation to ensure that all aspects of the model development process have been satisfied. In addition, the models are also subject to annual review and independent validation by the Model Validation Team to ensure that they are performing as expected.
Credit risk/rating models can be broadly classified into:
• Credit Rating Models• Credit Scoring Models
6.0 CREDIT RISK (CONTINUED)
6.6 Internal Credit Rating Models (continued)
Application of Internal Ratings
The three components of risk parameters, the PD, LGD and EAD are used in variety of applications that measure credit risk across the entire portfolio.
• Credit Approval : PD models are used in the credit approval process in both retail and non- retail portfolios. In high volume retail portfolios, application scorecard, behaviour scorecard and customer centric scorecard are used as one of the risk management tools.
• Policy : Policies are established to govern the use of ratings in credit decisions and monitoring.
• Reporting : Model performance monitoring report is submitted to senior management on periodic basis.
• Capital Management : The capital management and allocation plan takes into consideration the projected RWA computed based on internal rating.
• Risk Limits : The internal ratings are used in establishing the Group’s various internal limits (such as industry risk limit).
• Risk Reward and Pricing : PD, EAD and LGD metrics are used to assess profitability of deals to allow for risk-informed pricing considerations and strategic decisions.
F-IRB for Non-Retail Portfolios
The major non-retail portfolios of the Group are on the Foundation Internal Ratings-Based (F-IRB) approach for regulatory capital requirements. Specialised lending/financing uses supervisory slotting criteria. Under this approach, internal rating models are used to estimate the PD for each obligor, while the LGD and EAD parameters are prescribed by BNM. The PD models are developed with a combination of quantitative and qualitative factors.
A-IRB for Retail Portfolios
For regulatory capital requirements, the Group has adopted the Advanced Internal Ratings-Based (A- IRB) approach for the retail portfolios, i.e. residential mortgages/home financing, credit cards, auto loans/financing, commercial property financing, personal financing, ASB financing and RSMEs. The Group is continuously working on migrating its relevant significant portfolio under the Standardised Approach towards IRB compliance. The risk estimates – PD, LGD and EAD; are calibrated for these retail portfolios/pools. In addition, application scorecard, behavioural scorecard and customer centric scorecard are developed and implemented for use in credit approval decision support such as limit setting, credit score cut-off and approval, monitoring and reporting.
The following tables set out:
• Exposures subject to the Supervisory Risk Weights;• Exposures under the IRB Approach by PD Band, Exposure Weighted Average Loss Given Default (LGD) and Exposure
Weighted Average Risk Weights;• Exposures under the A-IRB Approach by EL Range and Exposure Weighted Average Risk Weights; and• Exposures under IRB Approach by Actual Losses versus Expected Losses.
Credit Rating Models
Corporate (non-individual)
Obligors
Credit Scoring Models
Retail/Individual Obligors and
RSMEs Obligors
RHB Credit Rating Model Coverage
The credit rating models for corporate (or non-individual) obligors are used to risk rate the creditworthiness of the corporate obligors/guarantors/debt issuers based on their financial standing (such as gearing, expenses and profit) and qualitative aspects (such as management effectiveness and industry environment). Different rating models will be applied subject to the obligor’s asset and sales volume to create further risk differentiation.
The credit scoring models are for large volume of exposures that are managed on a portfolio basis, which includes program lending/financing for RSMEs. These models are developed through statistical modelling and applied onto the portfolio accordingly. For portfolios where data are readily available or when more granular segmentation is required to support business strategy, more models will be developed and deployed.
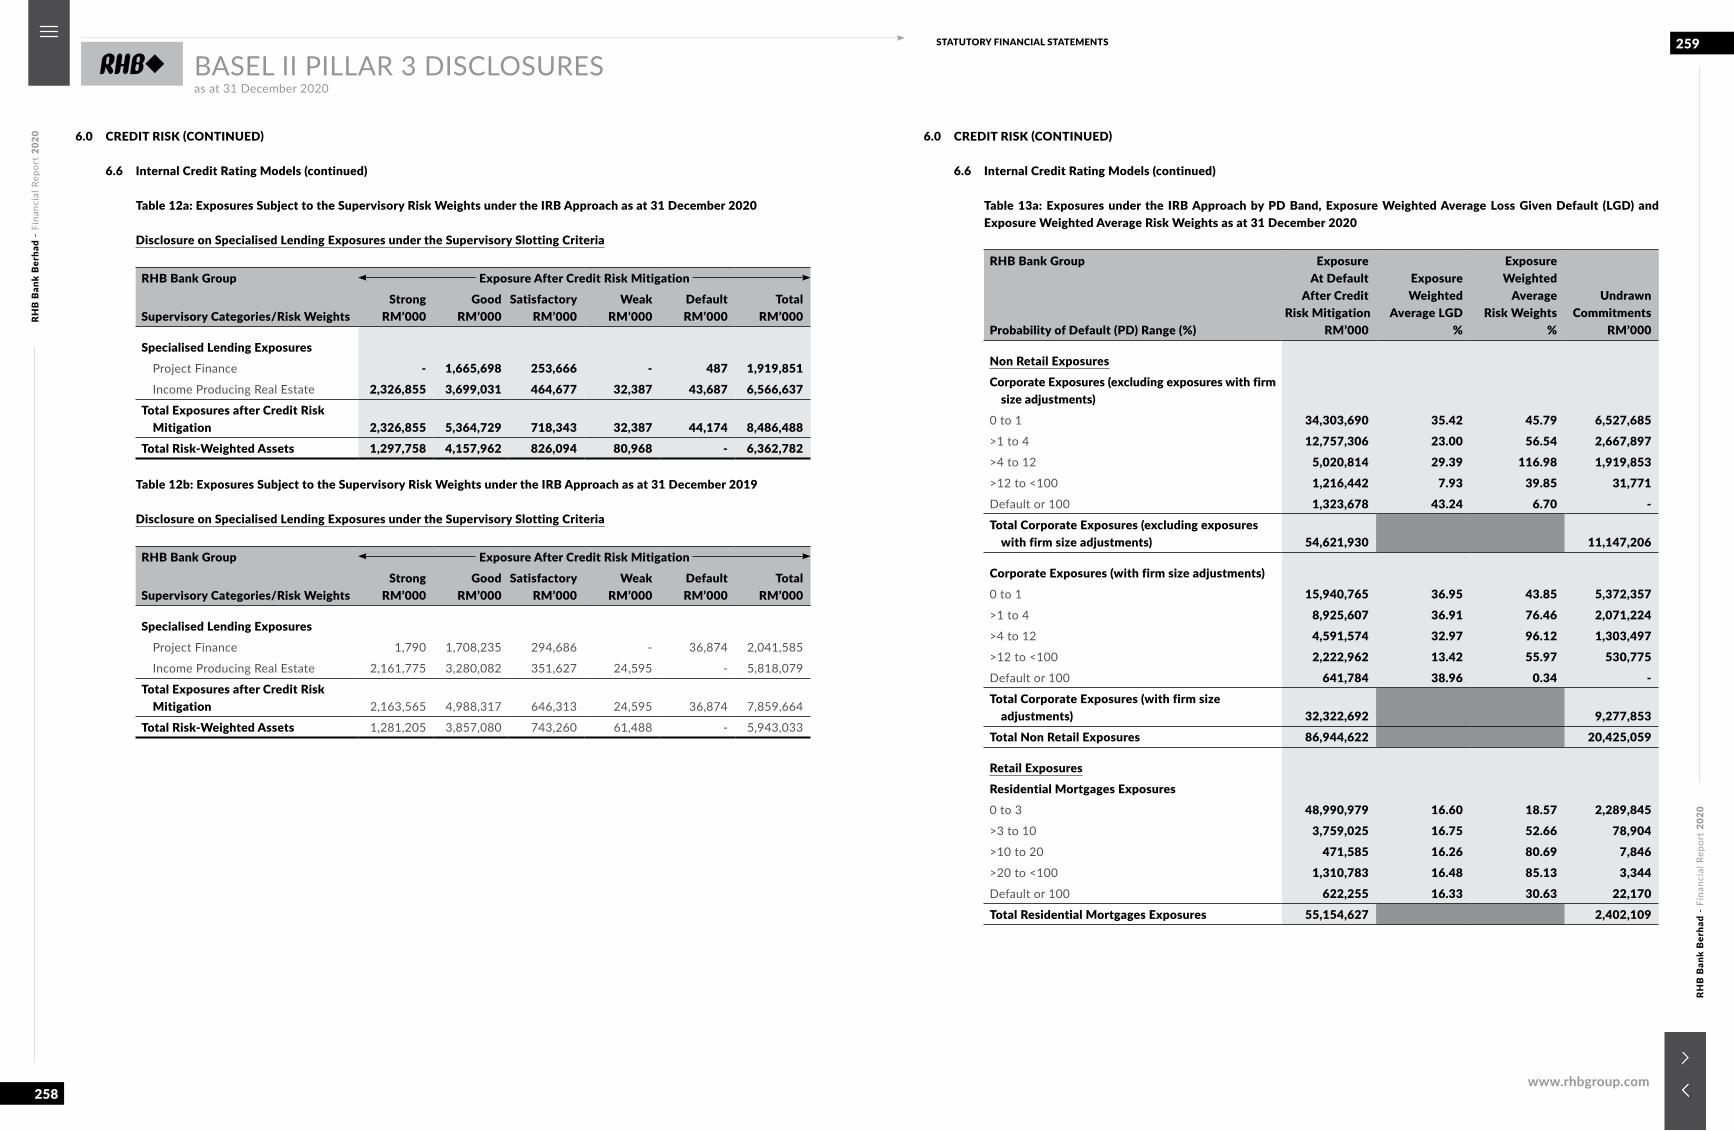
RHB
Ban
k B
erha
d -
Fina
ncia
l Rep
ort
2020
RHB
Ban
k B
erha
d -
Fina
ncia
l Rep
ort
2020
258
259STATUTORY FINANCIAL STATEMENTS
www.rhbgroup.com
BASEL II PILLAR 3 DISCLOSURESas at 31 December 2020
6.0 CREDIT RISK (CONTINUED)
6.6 Internal Credit Rating Models (continued)
Table 12a: Exposures Subject to the Supervisory Risk Weights under the IRB Approach as at 31 December 2020
Disclosure on Specialised Lending Exposures under the Supervisory Slotting Criteria
RHB Bank Group Exposure After Credit Risk Mitigation
Supervisory Categories/Risk Weights Strong
RM’000Good
RM’000Satisfactory
RM’000Weak
RM’000 DefaultRM’000
TotalRM’000
Specialised Lending Exposures Project Finance - 1,665,698 253,666 - 487 1,919,851 Income Producing Real Estate 2,326,855 3,699,031 464,677 32,387 43,687 6,566,637Total Exposures after Credit Risk
Mitigation 2,326,855 5,364,729 718,343 32,387 44,174 8,486,488Total Risk-Weighted Assets 1,297,758 4,157,962 826,094 80,968 - 6,362,782
Table 12b: Exposures Subject to the Supervisory Risk Weights under the IRB Approach as at 31 December 2019
Disclosure on Specialised Lending Exposures under the Supervisory Slotting Criteria
RHB Bank Group Exposure After Credit Risk Mitigation
Supervisory Categories/Risk WeightsStrong
RM’000Good
RM’000Satisfactory
RM’000Weak
RM’000DefaultRM’000
TotalRM’000
Specialised Lending Exposures Project Finance 1,790 1,708,235 294,686 - 36,874 2,041,585
Income Producing Real Estate 2,161,775 3,280,082 351,627 24,595 - 5,818,079
Total Exposures after Credit Risk Mitigation 2,163,565 4,988,317 646,313 24,595 36,874 7,859,664
Total Risk-Weighted Assets 1,281,205 3,857,080 743,260 61,488 - 5,943,033
6.0 CREDIT RISK (CONTINUED)
6.6 Internal Credit Rating Models (continued)
Table 13a: Exposures under the IRB Approach by PD Band, Exposure Weighted Average Loss Given Default (LGD) and Exposure Weighted Average Risk Weights as at 31 December 2020
RHB Bank Group
Probability of Default (PD) Range (%)
ExposureAt Default
After Credit Risk Mitigation
RM’000
ExposureWeighted
Average LGD %
ExposureWeighted
AverageRisk Weights
%
UndrawnCommitments
RM’000
Non Retail ExposuresCorporate Exposures (excluding exposures with firm
size adjustments)0 to 1 34,303,690 35.42 45.79 6,527,685>1 to 4 12,757,306 23.00 56.54 2,667,897>4 to 12 5,020,814 29.39 116.98 1,919,853>12 to <100 1,216,442 7.93 39.85 31,771Default or 100 1,323,678 43.24 6.70 -Total Corporate Exposures (excluding exposures
with firm size adjustments) 54,621,930 11,147,206
Corporate Exposures (with firm size adjustments)0 to 1 15,940,765 36.95 43.85 5,372,357>1 to 4 8,925,607 36.91 76.46 2,071,224>4 to 12 4,591,574 32.97 96.12 1,303,497>12 to <100 2,222,962 13.42 55.97 530,775Default or 100 641,784 38.96 0.34 -Total Corporate Exposures (with firm size
adjustments) 32,322,692 9,277,853Total Non Retail Exposures 86,944,622 20,425,059
Retail ExposuresResidential Mortgages Exposures0 to 3 48,990,979 16.60 18.57 2,289,845>3 to 10 3,759,025 16.75 52.66 78,904>10 to 20 471,585 16.26 80.69 7,846>20 to <100 1,310,783 16.48 85.13 3,344Default or 100 622,255 16.33 30.63 22,170Total Residential Mortgages Exposures 55,154,627 2,402,109
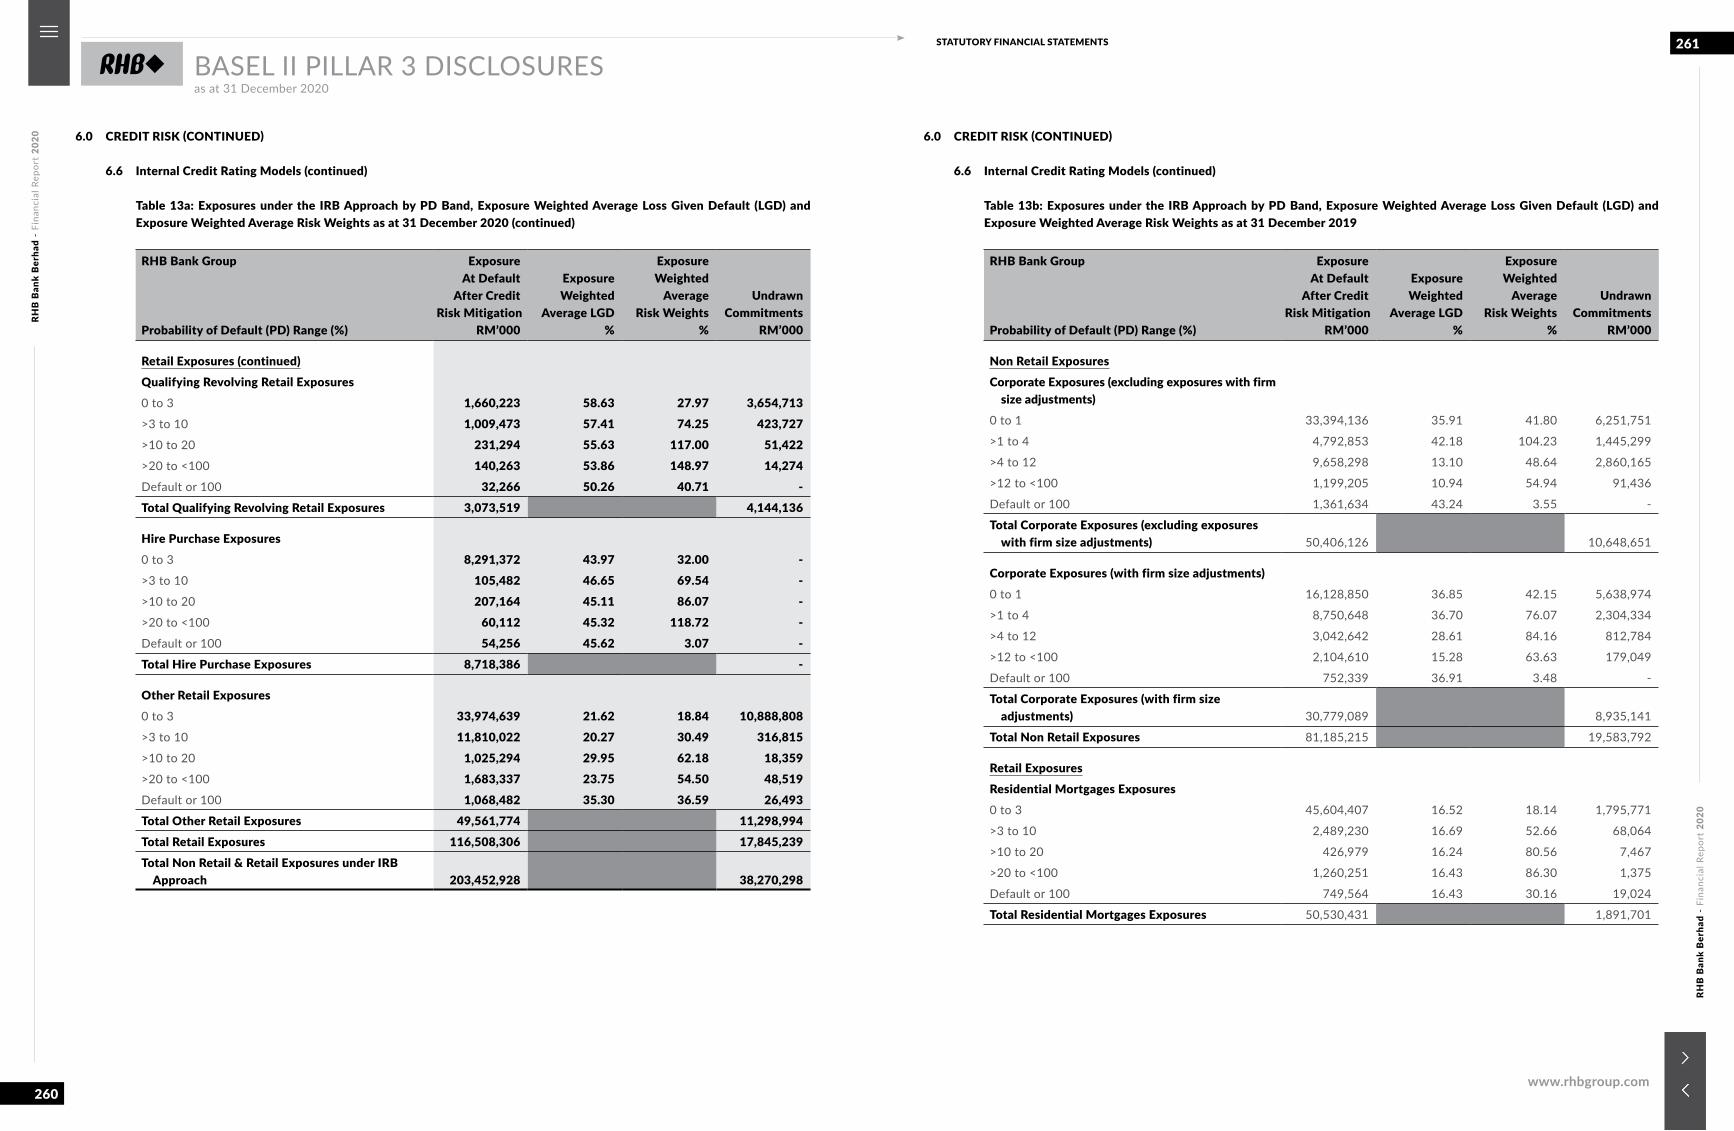
RHB
Ban
k B
erha
d -
Fina
ncia
l Rep
ort
2020
RHB
Ban
k B
erha
d -
Fina
ncia
l Rep
ort
2020
260
261STATUTORY FINANCIAL STATEMENTS
www.rhbgroup.com
BASEL II PILLAR 3 DISCLOSURESas at 31 December 2020
6.0 CREDIT RISK (CONTINUED)
6.6 Internal Credit Rating Models (continued)
Table 13a: Exposures under the IRB Approach by PD Band, Exposure Weighted Average Loss Given Default (LGD) and Exposure Weighted Average Risk Weights as at 31 December 2020 (continued)
RHB Bank Group
Probability of Default (PD) Range (%)
ExposureAt Default
After Credit Risk Mitigation
RM’000
ExposureWeighted
Average LGD %
ExposureWeighted
AverageRisk Weights
%
UndrawnCommitments
RM’000
Retail Exposures (continued)Qualifying Revolving Retail Exposures0 to 3 1,660,223 58.63 27.97 3,654,713>3 to 10 1,009,473 57.41 74.25 423,727>10 to 20 231,294 55.63 117.00 51,422>20 to <100 140,263 53.86 148.97 14,274Default or 100 32,266 50.26 40.71 -Total Qualifying Revolving Retail Exposures 3,073,519 4,144,136
Hire Purchase Exposures0 to 3 8,291,372 43.97 32.00 ->3 to 10 105,482 46.65 69.54 ->10 to 20 207,164 45.11 86.07 ->20 to <100 60,112 45.32 118.72 -Default or 100 54,256 45.62 3.07 -Total Hire Purchase Exposures 8,718,386 -
Other Retail Exposures0 to 3 33,974,639 21.62 18.84 10,888,808>3 to 10 11,810,022 20.27 30.49 316,815>10 to 20 1,025,294 29.95 62.18 18,359>20 to <100 1,683,337 23.75 54.50 48,519Default or 100 1,068,482 35.30 36.59 26,493Total Other Retail Exposures 49,561,774 11,298,994Total Retail Exposures 116,508,306 17,845,239Total Non Retail & Retail Exposures under IRB
Approach 203,452,928 38,270,298
6.0 CREDIT RISK (CONTINUED)
6.6 Internal Credit Rating Models (continued)
Table 13b: Exposures under the IRB Approach by PD Band, Exposure Weighted Average Loss Given Default (LGD) and Exposure Weighted Average Risk Weights as at 31 December 2019
RHB Bank Group
Probability of Default (PD) Range (%)
ExposureAt Default
After Credit Risk Mitigation
RM’000
ExposureWeighted
Average LGD %
ExposureWeighted
AverageRisk Weights
%
UndrawnCommitments
RM’000
Non Retail ExposuresCorporate Exposures (excluding exposures with firm
size adjustments)0 to 1 33,394,136 35.91 41.80 6,251,751
>1 to 4 4,792,853 42.18 104.23 1,445,299
>4 to 12 9,658,298 13.10 48.64 2,860,165
>12 to <100 1,199,205 10.94 54.94 91,436
Default or 100 1,361,634 43.24 3.55 -
Total Corporate Exposures (excluding exposures with firm size adjustments) 50,406,126 10,648,651
Corporate Exposures (with firm size adjustments)0 to 1 16,128,850 36.85 42.15 5,638,974
>1 to 4 8,750,648 36.70 76.07 2,304,334
>4 to 12 3,042,642 28.61 84.16 812,784
>12 to <100 2,104,610 15.28 63.63 179,049
Default or 100 752,339 36.91 3.48 -
Total Corporate Exposures (with firm size adjustments) 30,779,089 8,935,141
Total Non Retail Exposures 81,185,215 19,583,792
Retail ExposuresResidential Mortgages Exposures0 to 3 45,604,407 16.52 18.14 1,795,771
>3 to 10 2,489,230 16.69 52.66 68,064
>10 to 20 426,979 16.24 80.56 7,467
>20 to <100 1,260,251 16.43 86.30 1,375
Default or 100 749,564 16.43 30.16 19,024
Total Residential Mortgages Exposures 50,530,431 1,891,701
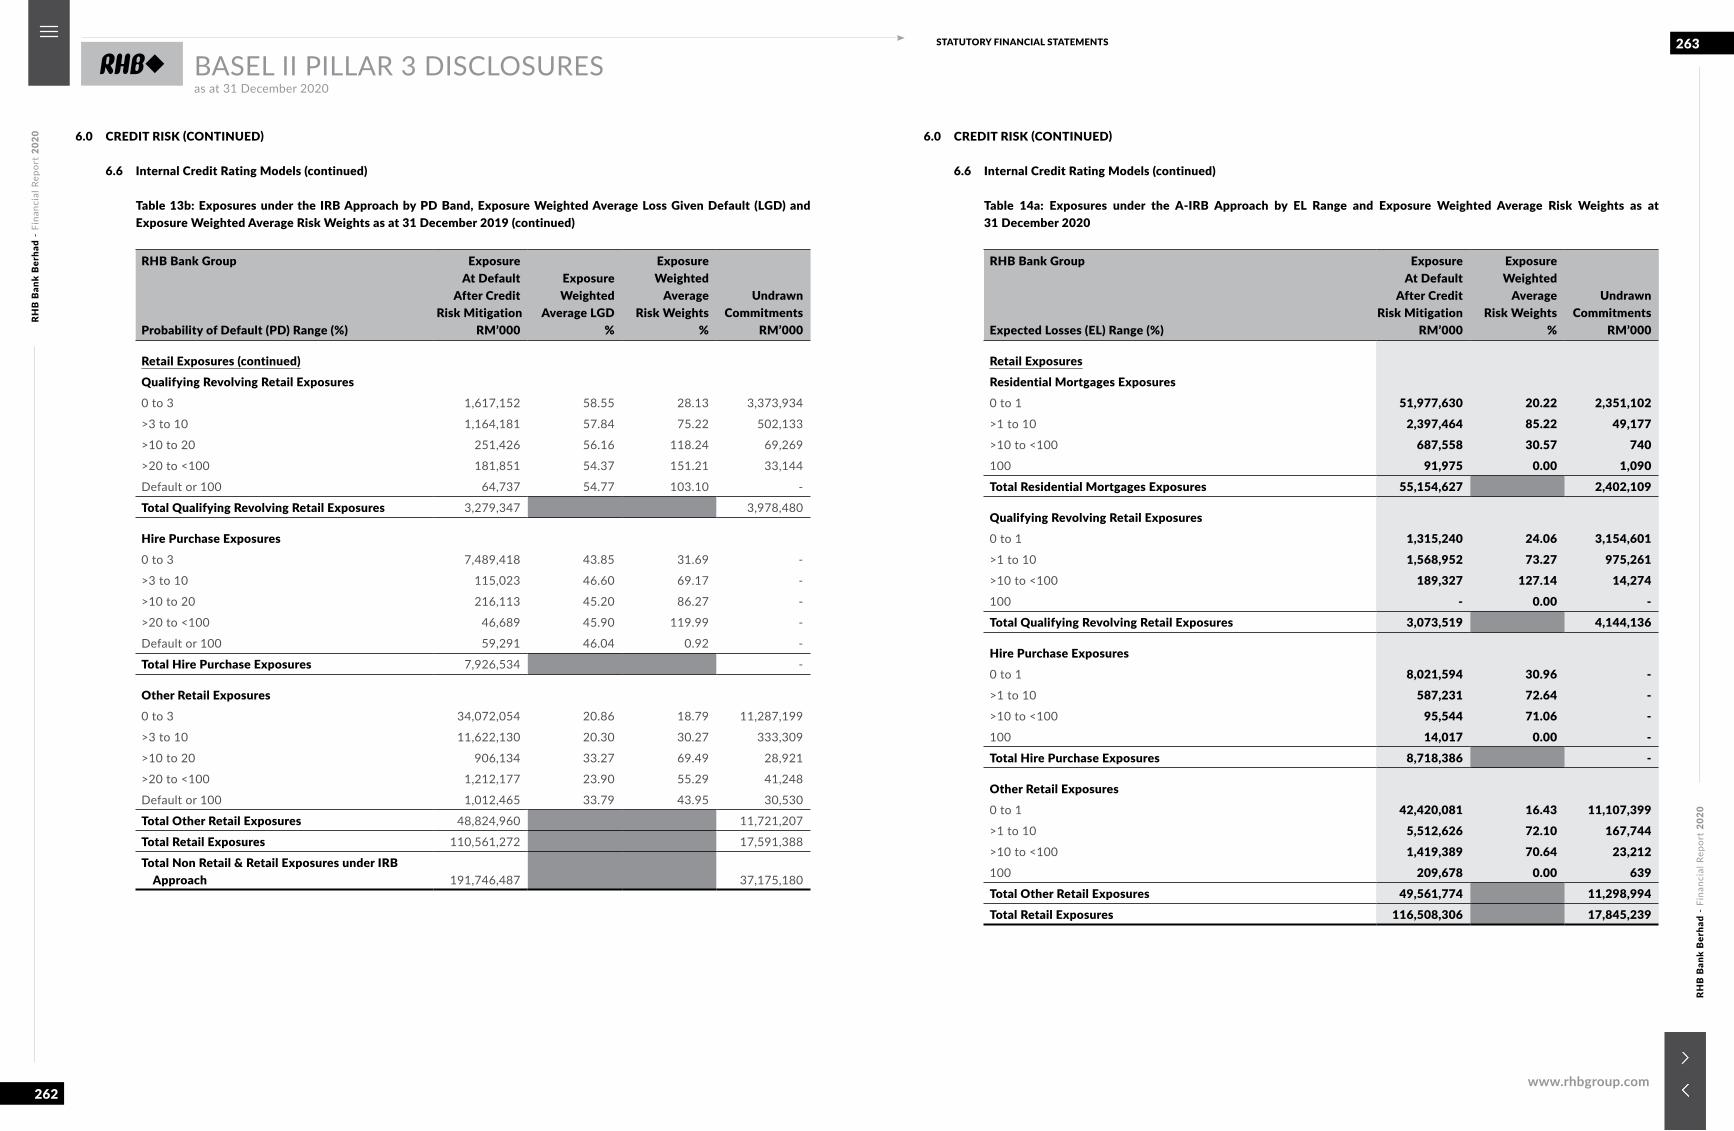
RHB
Ban
k B
erha
d -
Fina
ncia
l Rep
ort
2020
RHB
Ban
k B
erha
d -
Fina
ncia
l Rep
ort
2020
262
263STATUTORY FINANCIAL STATEMENTS
www.rhbgroup.com
BASEL II PILLAR 3 DISCLOSURESas at 31 December 2020
6.0 CREDIT RISK (CONTINUED)
6.6 Internal Credit Rating Models (continued)
Table 13b: Exposures under the IRB Approach by PD Band, Exposure Weighted Average Loss Given Default (LGD) and Exposure Weighted Average Risk Weights as at 31 December 2019 (continued)
RHB Bank Group
Probability of Default (PD) Range (%)
ExposureAt Default
After Credit Risk Mitigation
RM’000
ExposureWeighted
Average LGD %
ExposureWeighted
AverageRisk Weights
%
UndrawnCommitments
RM’000
Retail Exposures (continued)Qualifying Revolving Retail Exposures0 to 3 1,617,152 58.55 28.13 3,373,934
>3 to 10 1,164,181 57.84 75.22 502,133
>10 to 20 251,426 56.16 118.24 69,269
>20 to <100 181,851 54.37 151.21 33,144
Default or 100 64,737 54.77 103.10 -
Total Qualifying Revolving Retail Exposures 3,279,347 3,978,480
Hire Purchase Exposures0 to 3 7,489,418 43.85 31.69 -
>3 to 10 115,023 46.60 69.17 -
>10 to 20 216,113 45.20 86.27 -
>20 to <100 46,689 45.90 119.99 -
Default or 100 59,291 46.04 0.92 -
Total Hire Purchase Exposures 7,926,534 -
Other Retail Exposures0 to 3 34,072,054 20.86 18.79 11,287,199
>3 to 10 11,622,130 20.30 30.27 333,309
>10 to 20 906,134 33.27 69.49 28,921
>20 to <100 1,212,177 23.90 55.29 41,248
Default or 100 1,012,465 33.79 43.95 30,530
Total Other Retail Exposures 48,824,960 11,721,207
Total Retail Exposures 110,561,272 17,591,388
Total Non Retail & Retail Exposures under IRB Approach 191,746,487 37,175,180
6.0 CREDIT RISK (CONTINUED)
6.6 Internal Credit Rating Models (continued)
Table 14a: Exposures under the A-IRB Approach by EL Range and Exposure Weighted Average Risk Weights as at 31 December 2020
RHB Bank Group
Expected Losses (EL) Range (%)
ExposureAt Default
After CreditRisk Mitigation
RM’000
ExposureWeighted
AverageRisk Weights
%
UndrawnCommitments
RM’000
Retail ExposuresResidential Mortgages Exposures0 to 1 51,977,630 20.22 2,351,102>1 to 10 2,397,464 85.22 49,177>10 to <100 687,558 30.57 740100 91,975 0.00 1,090Total Residential Mortgages Exposures 55,154,627 2,402,109
Qualifying Revolving Retail Exposures0 to 1 1,315,240 24.06 3,154,601>1 to 10 1,568,952 73.27 975,261>10 to <100 189,327 127.14 14,274100 - 0.00 -Total Qualifying Revolving Retail Exposures 3,073,519 4,144,136
Hire Purchase Exposures0 to 1 8,021,594 30.96 ->1 to 10 587,231 72.64 ->10 to <100 95,544 71.06 -100 14,017 0.00 -Total Hire Purchase Exposures 8,718,386 -
Other Retail Exposures0 to 1 42,420,081 16.43 11,107,399>1 to 10 5,512,626 72.10 167,744>10 to <100 1,419,389 70.64 23,212100 209,678 0.00 639Total Other Retail Exposures 49,561,774 11,298,994Total Retail Exposures 116,508,306 17,845,239
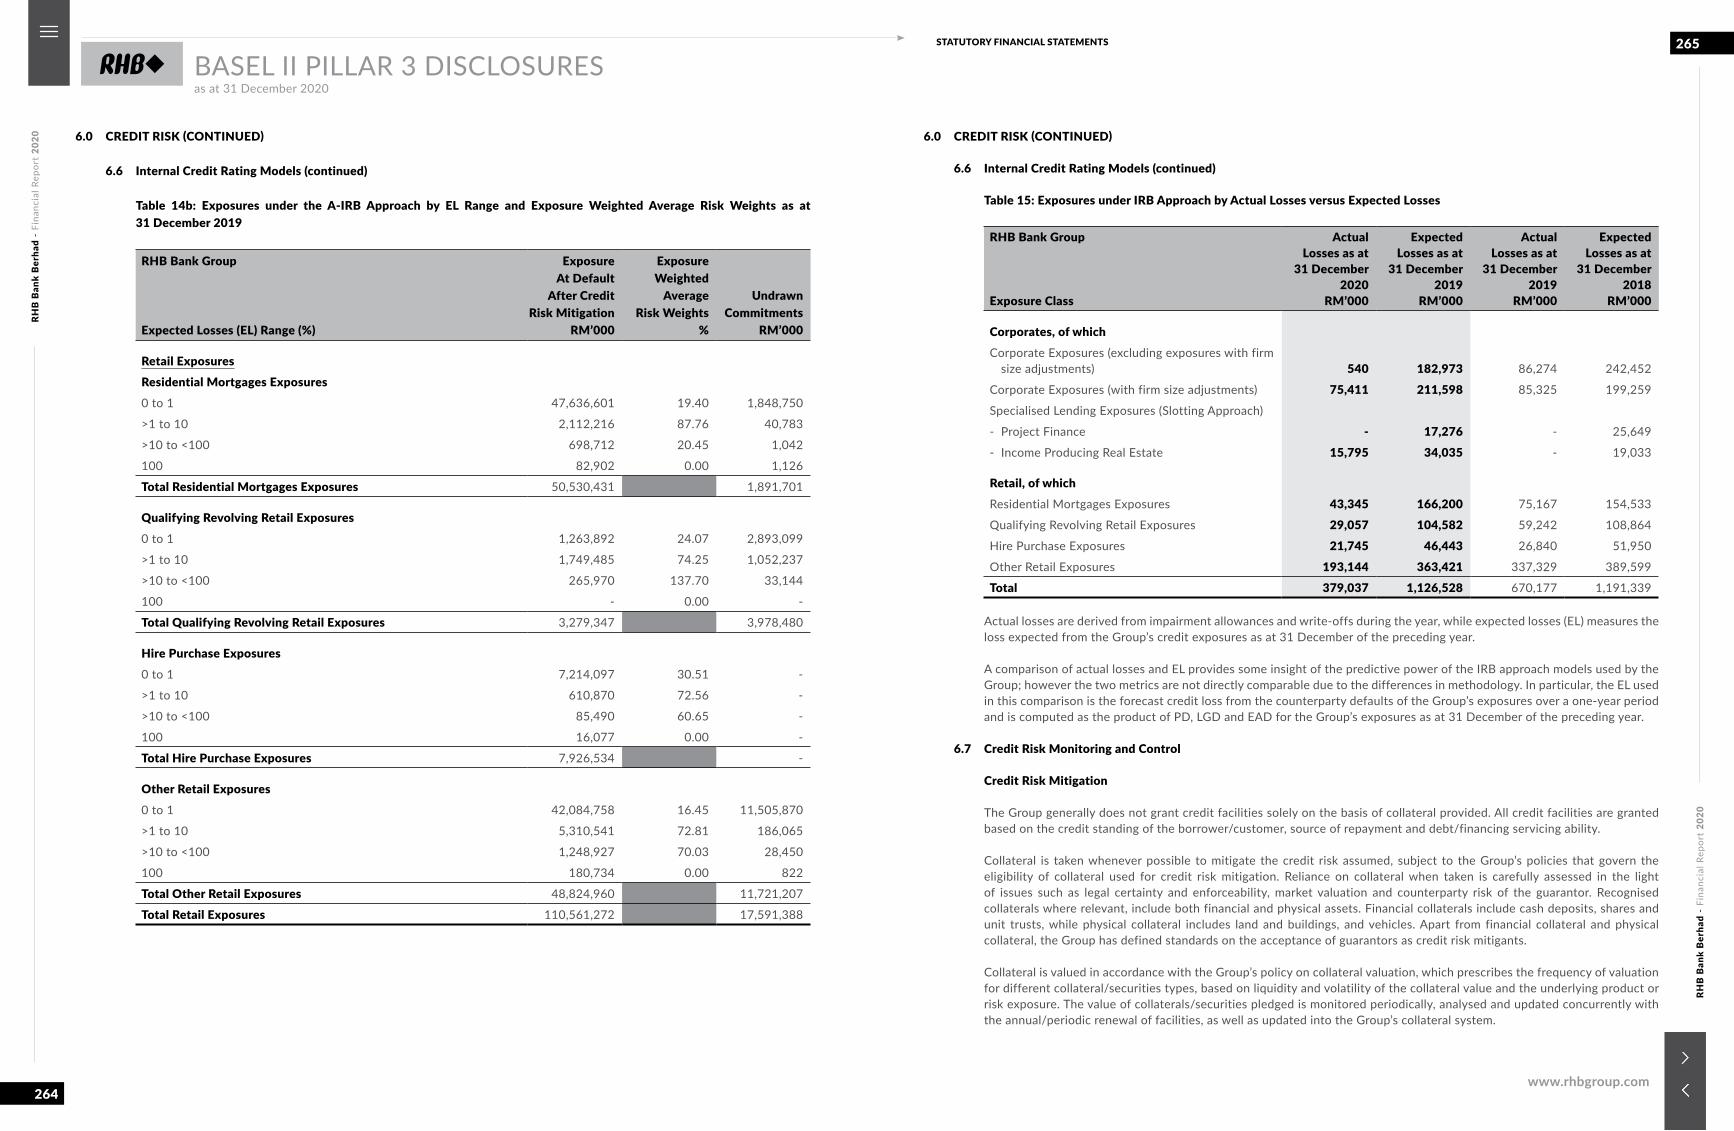
RHB
Ban
k B
erha
d -
Fina
ncia
l Rep
ort
2020
RHB
Ban
k B
erha
d -
Fina
ncia
l Rep
ort
2020
264
265STATUTORY FINANCIAL STATEMENTS
www.rhbgroup.com
BASEL II PILLAR 3 DISCLOSURESas at 31 December 2020
6.0 CREDIT RISK (CONTINUED)
6.6 Internal Credit Rating Models (continued)
Table 14b: Exposures under the A-IRB Approach by EL Range and Exposure Weighted Average Risk Weights as at 31 December 2019
RHB Bank Group
Expected Losses (EL) Range (%)
ExposureAt Default
After CreditRisk Mitigation
RM’000
ExposureWeighted
AverageRisk Weights
%
UndrawnCommitments
RM’000
Retail ExposuresResidential Mortgages Exposures0 to 1 47,636,601 19.40 1,848,750
>1 to 10 2,112,216 87.76 40,783
>10 to <100 698,712 20.45 1,042
100 82,902 0.00 1,126
Total Residential Mortgages Exposures 50,530,431 1,891,701
Qualifying Revolving Retail Exposures0 to 1 1,263,892 24.07 2,893,099
>1 to 10 1,749,485 74.25 1,052,237
>10 to <100 265,970 137.70 33,144
100 - 0.00 -
Total Qualifying Revolving Retail Exposures 3,279,347 3,978,480
Hire Purchase Exposures0 to 1 7,214,097 30.51 -
>1 to 10 610,870 72.56 -
>10 to <100 85,490 60.65 -
100 16,077 0.00 -
Total Hire Purchase Exposures 7,926,534 -
Other Retail Exposures0 to 1 42,084,758 16.45 11,505,870
>1 to 10 5,310,541 72.81 186,065
>10 to <100 1,248,927 70.03 28,450
100 180,734 0.00 822
Total Other Retail Exposures 48,824,960 11,721,207
Total Retail Exposures 110,561,272 17,591,388
6.0 CREDIT RISK (CONTINUED)
6.6 Internal Credit Rating Models (continued)
Table 15: Exposures under IRB Approach by Actual Losses versus Expected Losses
RHB Bank Group
Exposure Class
ActualLosses as at
31 December2020
RM’000
ExpectedLosses as at
31 December 2019
RM’000
ActualLosses as at
31 December2019
RM’000
ExpectedLosses as at
31 December2018
RM’000
Corporates, of whichCorporate Exposures (excluding exposures with firm
size adjustments) 540 182,973 86,274 242,452
Corporate Exposures (with firm size adjustments) 75,411 211,598 85,325 199,259
Specialised Lending Exposures (Slotting Approach)
- Project Finance - 17,276 - 25,649
- Income Producing Real Estate 15,795 34,035 - 19,033
Retail, of whichResidential Mortgages Exposures 43,345 166,200 75,167 154,533
Qualifying Revolving Retail Exposures 29,057 104,582 59,242 108,864
Hire Purchase Exposures 21,745 46,443 26,840 51,950
Other Retail Exposures 193,144 363,421 337,329 389,599
Total 379,037 1,126,528 670,177 1,191,339
Actual losses are derived from impairment allowances and write-offs during the year, while expected losses (EL) measures the loss expected from the Group’s credit exposures as at 31 December of the preceding year.
A comparison of actual losses and EL provides some insight of the predictive power of the IRB approach models used by the Group; however the two metrics are not directly comparable due to the differences in methodology. In particular, the EL used in this comparison is the forecast credit loss from the counterparty defaults of the Group’s exposures over a one-year period and is computed as the product of PD, LGD and EAD for the Group’s exposures as at 31 December of the preceding year.
6.7 Credit Risk Monitoring and Control
Credit Risk Mitigation
The Group generally does not grant credit facilities solely on the basis of collateral provided. All credit facilities are granted based on the credit standing of the borrower/customer, source of repayment and debt/financing servicing ability.
Collateral is taken whenever possible to mitigate the credit risk assumed, subject to the Group’s policies that govern the eligibility of collateral used for credit risk mitigation. Reliance on collateral when taken is carefully assessed in the light of issues such as legal certainty and enforceability, market valuation and counterparty risk of the guarantor. Recognised collaterals where relevant, include both financial and physical assets. Financial collaterals include cash deposits, shares and unit trusts, while physical collateral includes land and buildings, and vehicles. Apart from financial collateral and physical collateral, the Group has defined standards on the acceptance of guarantors as credit risk mitigants.
Collateral is valued in accordance with the Group’s policy on collateral valuation, which prescribes the frequency of valuation for different collateral/securities types, based on liquidity and volatility of the collateral value and the underlying product or risk exposure. The value of collaterals/securities pledged is monitored periodically, analysed and updated concurrently with the annual/periodic renewal of facilities, as well as updated into the Group’s collateral system.
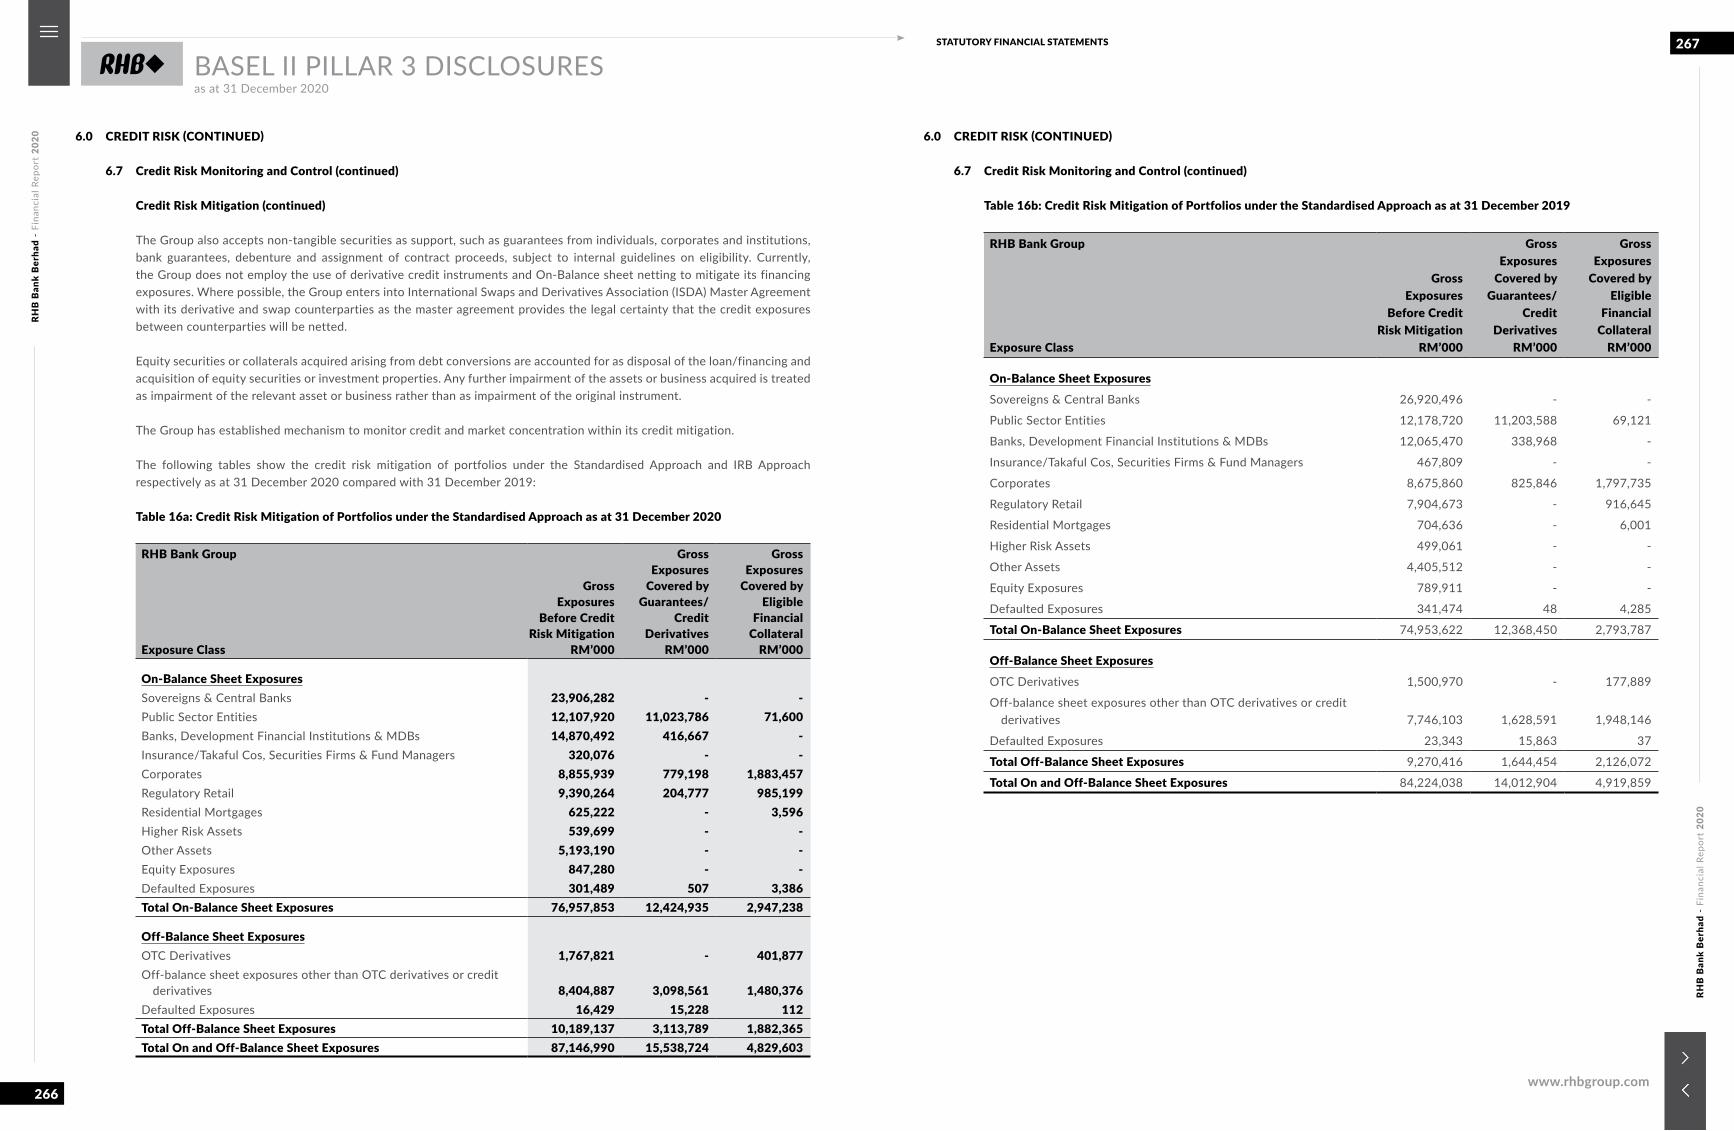
RHB
Ban
k B
erha
d -
Fina
ncia
l Rep
ort
2020
RHB
Ban
k B
erha
d -
Fina
ncia
l Rep
ort
2020
266
267STATUTORY FINANCIAL STATEMENTS
www.rhbgroup.com
BASEL II PILLAR 3 DISCLOSURESas at 31 December 2020
6.0 CREDIT RISK (CONTINUED)
6.7 Credit Risk Monitoring and Control (continued)
Credit Risk Mitigation (continued)
The Group also accepts non-tangible securities as support, such as guarantees from individuals, corporates and institutions, bank guarantees, debenture and assignment of contract proceeds, subject to internal guidelines on eligibility. Currently, the Group does not employ the use of derivative credit instruments and On-Balance sheet netting to mitigate its financing exposures. Where possible, the Group enters into International Swaps and Derivatives Association (ISDA) Master Agreement with its derivative and swap counterparties as the master agreement provides the legal certainty that the credit exposures between counterparties will be netted.
Equity securities or collaterals acquired arising from debt conversions are accounted for as disposal of the loan/financing and acquisition of equity securities or investment properties. Any further impairment of the assets or business acquired is treated as impairment of the relevant asset or business rather than as impairment of the original instrument.
The Group has established mechanism to monitor credit and market concentration within its credit mitigation.
The following tables show the credit risk mitigation of portfolios under the Standardised Approach and IRB Approach respectively as at 31 December 2020 compared with 31 December 2019:
Table 16a: Credit Risk Mitigation of Portfolios under the Standardised Approach as at 31 December 2020
RHB Bank Group
Exposure Class
GrossExposures
Before CreditRisk Mitigation
RM’000
Gross Exposures
Covered byGuarantees/
CreditDerivatives
RM’000
GrossExposures
Covered byEligible
FinancialCollateral
RM’000
On-Balance Sheet ExposuresSovereigns & Central Banks 23,906,282 - -Public Sector Entities 12,107,920 11,023,786 71,600Banks, Development Financial Institutions & MDBs 14,870,492 416,667 -Insurance/Takaful Cos, Securities Firms & Fund Managers 320,076 - -Corporates 8,855,939 779,198 1,883,457Regulatory Retail 9,390,264 204,777 985,199Residential Mortgages 625,222 - 3,596Higher Risk Assets 539,699 - -Other Assets 5,193,190 - -Equity Exposures 847,280 - -Defaulted Exposures 301,489 507 3,386Total On-Balance Sheet Exposures 76,957,853 12,424,935 2,947,238
Off-Balance Sheet ExposuresOTC Derivatives 1,767,821 - 401,877Off-balance sheet exposures other than OTC derivatives or credit
derivatives 8,404,887 3,098,561 1,480,376Defaulted Exposures 16,429 15,228 112Total Off-Balance Sheet Exposures 10,189,137 3,113,789 1,882,365Total On and Off-Balance Sheet Exposures 87,146,990 15,538,724 4,829,603
6.0 CREDIT RISK (CONTINUED)
6.7 Credit Risk Monitoring and Control (continued)
Table 16b: Credit Risk Mitigation of Portfolios under the Standardised Approach as at 31 December 2019
RHB Bank Group
Exposure Class
GrossExposures
Before CreditRisk Mitigation
RM’000
Gross Exposures
Covered byGuarantees/
CreditDerivatives
RM’000
GrossExposures
Covered byEligible
FinancialCollateral
RM’000
On-Balance Sheet ExposuresSovereigns & Central Banks 26,920,496 - -
Public Sector Entities 12,178,720 11,203,588 69,121
Banks, Development Financial Institutions & MDBs 12,065,470 338,968 -
Insurance/Takaful Cos, Securities Firms & Fund Managers 467,809 - -
Corporates 8,675,860 825,846 1,797,735
Regulatory Retail 7,904,673 - 916,645
Residential Mortgages 704,636 - 6,001
Higher Risk Assets 499,061 - -
Other Assets 4,405,512 - -
Equity Exposures 789,911 - -
Defaulted Exposures 341,474 48 4,285
Total On-Balance Sheet Exposures 74,953,622 12,368,450 2,793,787
Off-Balance Sheet ExposuresOTC Derivatives 1,500,970 - 177,889
Off-balance sheet exposures other than OTC derivatives or credit derivatives 7,746,103 1,628,591 1,948,146
Defaulted Exposures 23,343 15,863 37
Total Off-Balance Sheet Exposures 9,270,416 1,644,454 2,126,072
Total On and Off-Balance Sheet Exposures 84,224,038 14,012,904 4,919,859
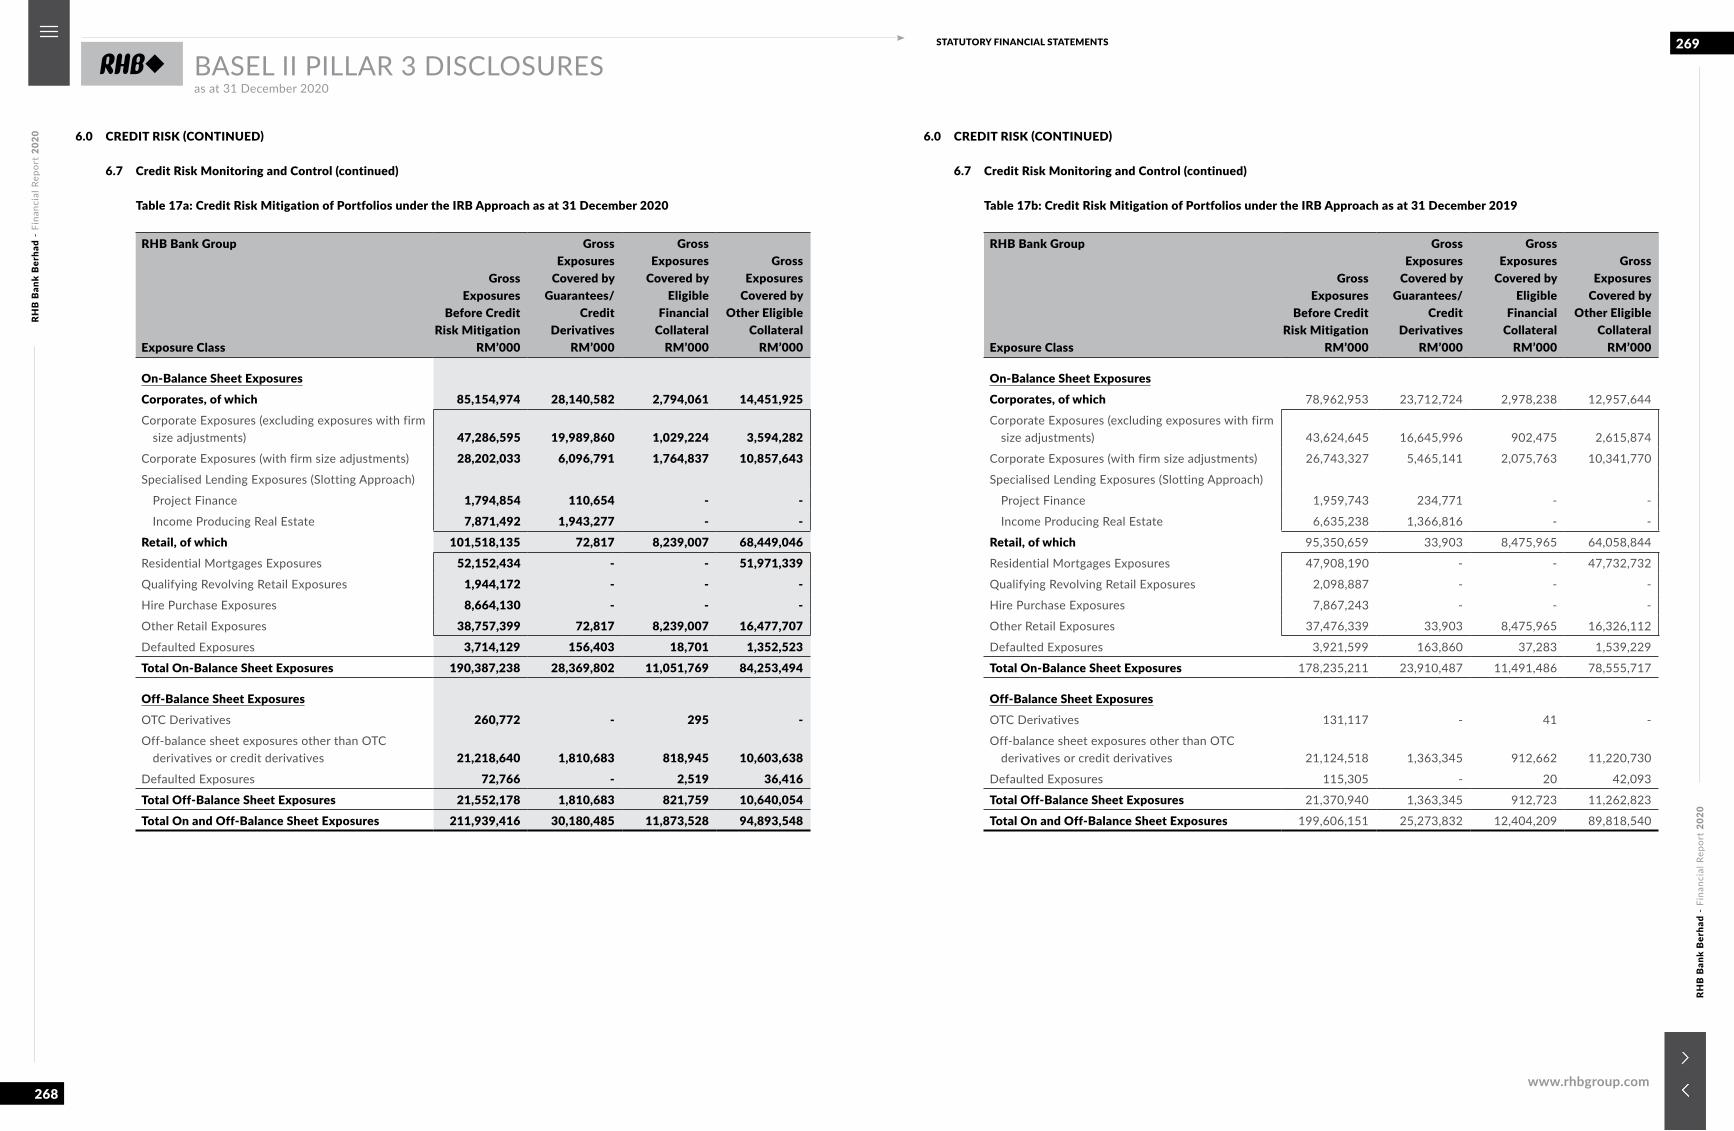
RHB
Ban
k B
erha
d -
Fina
ncia
l Rep
ort
2020
RHB
Ban
k B
erha
d -
Fina
ncia
l Rep
ort
2020
268
269STATUTORY FINANCIAL STATEMENTS
www.rhbgroup.com
BASEL II PILLAR 3 DISCLOSURESas at 31 December 2020
6.0 CREDIT RISK (CONTINUED)
6.7 Credit Risk Monitoring and Control (continued)
Table 17a: Credit Risk Mitigation of Portfolios under the IRB Approach as at 31 December 2020
RHB Bank Group
Exposure Class
GrossExposures
Before CreditRisk Mitigation
RM’000
GrossExposures
Covered byGuarantees/
CreditDerivatives
RM’000
GrossExposures
Covered byEligible
FinancialCollateral
RM’000
GrossExposures
Covered byOther Eligible
CollateralRM’000
On-Balance Sheet ExposuresCorporates, of which 85,154,974 28,140,582 2,794,061 14,451,925Corporate Exposures (excluding exposures with firm
size adjustments) 47,286,595 19,989,860 1,029,224 3,594,282Corporate Exposures (with firm size adjustments) 28,202,033 6,096,791 1,764,837 10,857,643Specialised Lending Exposures (Slotting Approach)
Project Finance 1,794,854 110,654 - - Income Producing Real Estate 7,871,492 1,943,277 - -Retail, of which 101,518,135 72,817 8,239,007 68,449,046Residential Mortgages Exposures 52,152,434 - - 51,971,339Qualifying Revolving Retail Exposures 1,944,172 - - -Hire Purchase Exposures 8,664,130 - - -Other Retail Exposures 38,757,399 72,817 8,239,007 16,477,707Defaulted Exposures 3,714,129 156,403 18,701 1,352,523Total On-Balance Sheet Exposures 190,387,238 28,369,802 11,051,769 84,253,494
Off-Balance Sheet ExposuresOTC Derivatives 260,772 - 295 -Off-balance sheet exposures other than OTC
derivatives or credit derivatives 21,218,640 1,810,683 818,945 10,603,638Defaulted Exposures 72,766 - 2,519 36,416Total Off-Balance Sheet Exposures 21,552,178 1,810,683 821,759 10,640,054Total On and Off-Balance Sheet Exposures 211,939,416 30,180,485 11,873,528 94,893,548
6.0 CREDIT RISK (CONTINUED)
6.7 Credit Risk Monitoring and Control (continued)
Table 17b: Credit Risk Mitigation of Portfolios under the IRB Approach as at 31 December 2019
RHB Bank Group
Exposure Class
GrossExposures
Before CreditRisk Mitigation
RM’000
GrossExposures
Covered byGuarantees/
CreditDerivatives
RM’000
GrossExposures
Covered byEligible
FinancialCollateral
RM’000
GrossExposures
Covered byOther Eligible
CollateralRM’000
On-Balance Sheet ExposuresCorporates, of which 78,962,953 23,712,724 2,978,238 12,957,644
Corporate Exposures (excluding exposures with firm size adjustments) 43,624,645 16,645,996 902,475 2,615,874
Corporate Exposures (with firm size adjustments) 26,743,327 5,465,141 2,075,763 10,341,770
Specialised Lending Exposures (Slotting Approach)
Project Finance 1,959,743 234,771 - -
Income Producing Real Estate 6,635,238 1,366,816 - -
Retail, of which 95,350,659 33,903 8,475,965 64,058,844
Residential Mortgages Exposures 47,908,190 - - 47,732,732
Qualifying Revolving Retail Exposures 2,098,887 - - -
Hire Purchase Exposures 7,867,243 - - -
Other Retail Exposures 37,476,339 33,903 8,475,965 16,326,112
Defaulted Exposures 3,921,599 163,860 37,283 1,539,229
Total On-Balance Sheet Exposures 178,235,211 23,910,487 11,491,486 78,555,717
Off-Balance Sheet ExposuresOTC Derivatives 131,117 - 41 -
Off-balance sheet exposures other than OTC derivatives or credit derivatives 21,124,518 1,363,345 912,662 11,220,730
Defaulted Exposures 115,305 - 20 42,093
Total Off-Balance Sheet Exposures 21,370,940 1,363,345 912,723 11,262,823
Total On and Off-Balance Sheet Exposures 199,606,151 25,273,832 12,404,209 89,818,540
RHB
Ban
k B
erha
d -
Fina
ncia
l Rep
ort
2020
RHB
Ban
k B
erha
d -
Fina
ncia
l Rep
ort
2020
270
271STATUTORY FINANCIAL STATEMENTS
www.rhbgroup.com
BASEL II PILLAR 3 DISCLOSURESas at 31 December 2020
6.0 CREDIT RISK (CONTINUED)
6.7 Credit Risk Monitoring and Control (continued)
Credit Concentration Risk
Risk concentration refers to an exposure with the potential to produce losses that are substantial enough to threaten the financial condition of a banking institution. Risk concentrations can materialise from excessive exposures to a single counterparty or group of connected counterparties, a particular instrument or a particular market segment.
The Group manages the diversification of its portfolio to avoid undue credit concentration risk. Credit concentration risk exists in lending/financing to single customer groups, borrowers/customers engaged in similar activities, or diverse groups of borrowers/customers that could be affected by similar economic or underlying shares/counters pledged or other factors. To manage this concentration risk, appropriate exposure thresholds/limits are established accordingly.
Analysis of any single large exposure and group of exposures is regularly conducted and the lending/financing units undertake regular account updates, monitoring and management of these exposures. In addition, the Group also continuously updates lending or financing guidelines based on periodic reviews of sector risk factors and economic outlook.
Credit Monitoring and Annual Reviews
The Group regularly monitors credit exposures, portfolio performance, and external trends which may impact risk management outcomes. Internal risk management reports generated for senior management, respective risk committees and Board, and include information on portfolio quality, credit rating migration and concentration risk exposures.
In addition to the on-going qualitative assessment by the account relationship managers, reviews are conducted at least once a year with updated information on the customer’s financial position, market position, industry and economic condition and account conduct. Specific loans/financings may be reviewed more frequently under appropriate circumstances. Such circumstances may arise if, for instance, the Group believes that heightened risk exists in a particular industry, or the borrower/customer exhibits early warning signals such as defaulted on obligations to suppliers or other financial institutions or is facing cash flow or other difficulties.
Within Group Risk & Credit Management, there is a mechanism in place for credit monitoring to flagout problematic loans/financing (watch list accounts) for intensive monitoring under Watchlist Credit Management. These are accounts which may be exhibiting early distress patterns or in the early stages of delinquency but not yet in default.
For these cases, Watchlist Credit Management department will conduct independent assessment and work closely with the business units to implement strategies to address lending/business relationships under Watchlist Credit Management to rehabilitate the accounts after discussion with the borrower/customer to determine the root cause of the problem which may result in rescheduling, restructuring or “exit” strategies to be applied. For the larger accounts, regular position update meetings are held with business units to review or revise these strategies. The relevant guidelines are refined from time to time, to better identify, monitor and resolve such accounts.
Group Internal Audit conducts independent post-approval reviews on a sampling basis to ensure that the quality of credit appraisals and approval standards is in accordance with the credit underwriting standards and financing policies established by the Group’s management, and relevant laws and regulations.
6.0 CREDIT RISK (CONTINUED)
6.8 Impairment Allowances for Loans/Financing
The Group adopts BNM’s guidelines on Financial Reporting. The principles in this guidelines are in line with those applicable under the International Financial Reporting Standards compliant framework, Malaysian Financial Reporting Standards 9 (MFRS 9).
MFRS 9 introduces a new impairment model that requires the recognition of expected credit loss (ECL), replacing the incurred loss methodology model under MFRS 139, for all financial assets, except for financial assets classified or designated as Fair Value Through Profit & Loss and equity securities classified under Fair Value through Other Comprehensive Income or FVOCI, which are not subject to impairment assessment. Off-balance sheet items that are subject to ECL include financial guarantees and undrawn loan commitments.
MFRS 9 does not distinguish between individual assessment and collective assessment. The Group first assess whether objective evidence of impairment exists for financial assets which are individually significant. If the Group determine that objective evidence of impairment exists, i.e. credit impaired, for an individually assessed financial asset, a lifetime ECL will be recognised for impairment loss which has been incurred. Financial assets which are individually significant but non-impaired and not individually significant are grouped on the basis of similar credit risk characteristics (such as credit quality, instrument type, credit risk ratings, credit utilisation, level of collateralisation and other relevant factors) for collective assessment. Collectively, the individually assessment allowance and collective assessment allowance form the total expected credit allowance for the Group.
ECL will be assessed using an approach which classifies financial assets into three stages which reflects the change in credit quality of the financial assets since initial recognition:
Stage 1: 12 months ECL – not credit impaired
For credit exposures where there has not been a significant increase in credit risk since initial recognition and that are not credit impaired upon origination, the ECL associated with the probability of default events occurring within the next 12 months will be recognised.
Stage 2: Lifetime ECL – not credit impaired
For credit exposures where there has been a significant increase in credit risk since initial recognition but that are not credit impaired, the ECL associated with the probability of default events occurring within the lifetime ECL will be recognised.
Stage 3: Lifetime ECL – credit impaired
Financial assets are assessed as credit impaired when one or more objective evidence of defaults that have a detrimental impact on the estimated future cashflows of that asset have occurred. For financial assets that have become credit impaired, a lifetime ECL will be recognised.
The changes in ECL between two-periods will be recognised in profit and loss.
The assessment of significant deterioration in credit risk since initial recognition is key in establishing the point of switching between the requirement to measure an allowance based on 12-month ECL and one that is based on lifetime ECL. The quantitative and qualitative assessments are required to estimate the significant increase in credit risk by comparing the risk of a default occurring on the financial assets as at reporting date with the risk of default occurring on the financial assets as at the date of initial recognition.
The assessment of credit risk, as well as the estimation of ECL, are required to be unbiased, probabilityweighted and should incorporate all available information which is relevant to the assessment, including information about past events, current conditions and reasonable and supportable forecasts of future events and economic conditions at the reporting date. The measurement of ECL is based on the discounted products of the PD, LGD and EAD models. Certain ECL models are leveraging on the existing Group’s Basel II Internal Ratings-Based model, where feasible or available, with necessary adjustment to meet MFRS 9 requirements.
RHB
Ban
k B
erha
d -
Fina
ncia
l Rep
ort
2020
RHB
Ban
k B
erha
d -
Fina
ncia
l Rep
ort
2020
272
273STATUTORY FINANCIAL STATEMENTS
www.rhbgroup.com
BASEL II PILLAR 3 DISCLOSURESas at 31 December 2020
6.0 CREDIT RISK (CONTINUED)
6.8 Impairment Allowances for Loans/Financing (continued)
Individual Assessment - Impairment Triggers
The borrower/customer assessed under Impairment Allowances (IA) shall be classified as impaired under any one of the following situations:
1. When the principal or interest/profit or both, of any facility(s) of the borrower/customer is past due for 90 days or 3 months and above.
2. In the case of revolving facilities (e.g. overdraft facilities), the borrower/customer of the facility shall be classified as impaired where the outstanding amount has remained in excess of the approved limit for 90 days or 3 months and above.
3. Where the amount is past due or the outstanding amount has been in excess of the approved limit for less than 90 days or 3 months, the loan/financing exhibits weaknesses (refer to impairment trigger) that would render it to be classified as impaired.
4. Where repayments of the loans/financing are scheduled on intervals of 3 months or longer, the borrower/customer is classified as impaired as soon as a default occurs.
5. Upon occurrence of any one Mandatory Status Triggers (MSTs), both Ancillary Status Trigger (AST) 1 and AST4 or any three ASTs and above. These MSTs and ASTs are pre-defined trigger events approved by the Group to facilitate impairment classification.
6. In the case of share margin facilities, the borrower/customer shall be classified as impaired where the force selling ratio is triggered and after a period of time after force selling has commenced or where margin of finance exceeds a set threshold above the force selling ratio.
Note: For R&R facilities, the customer shall be classified as impaired in accordance with paras 1 to 4 above based on the revised or
restructured terms.
Individual Impairment Allowances
Borrowers/customers under individual assessment and triggered either by any one MSTs, both AST1 and AST4, or any three ASTs and above will be classified as impaired. Consequently, impairment assessment is to be carried out on these impaired borrowers/customers, based on reasonable and well documented estimates of the future cashflows/realisations of collateral that is expected to recover from the impaired borrowers/customers i.e. net present value of future cashflows are discounted based on original effective interest/profit rates and compared against carrying amount. Any impairment on the shortfalls will be provided in full immediately.
Re-classification and Recovery of Impaired Borrowers/Customers
An impaired borrower/customer may be re-classified as a non-impaired status under the following situations:
1. When the loan/financing repayment of the impaired borrower/customer has improved with the principal or interest/profit or both, of its facilities with the Group being past due less than 90 days or 3 months.
2. Where the borrower/customer exhibits weakness(es) that render it to be classified as impaired, even though the loan/financing is past-due less than 90 days or 3 months, such borrowers may be reclassified as non-impaired status when these weaknesses have been subsequently addressed or resolved.
3. Where the borrower/customer has been individually assessed as impaired due to either any one MSTs, both AST1 and AST4, or any three and above, the borrower/customer may be reclassified as non-impaired status when these triggers have since been addressed and resolved totally, or with only one AST remaining.
4. When the borrower’s/customer’s share margin account no longer meet the impairment criteria above.
6.0 CREDIT RISK (CONTINUED)
6.8 Impairment Allowances for Loans/Financing (continued)
Write-Off of Impaired Loans/Financing
All loans/financing that satisfy any one of the following criteria, may be recommended for write-off:
1. Deemed irrecoverable, worthless and with slim prospect of recovery.
2. Waiver under approved composite settlement schemes.
3. Abandoned project with no sign of revival. The definition of abandoned project must be in compliance with the definition stated under valuation for abandoned projects.
4. Completed projects but is left abandoned or no occupancy for 12 months with 2 rounds of abortive auctions. This includes units/lots in the same complex/project but have not put up for auction due to cost savings reason.
5. Loans/financing secured with properties which have undergone at least 5 rounds of abortive auctions.
6. Loans/financing secured with property with balance outstanding below RM5,000 subject to judgment obtained against all and borrower(s)/customer(s) uncontactable.
7. For retail and programmed lending/financing impaired loans/financing, the write-off may be expedited for those with ageing of 12 months and above, provided legal action has reached at least writ of summon filed.
8. In the case of credit card and personal financing, aging is at least 6 months and above.
Partial write-offs of impaired loans/financing is permitted under the following circumstances:
1. The value of security (net recoverable amount in the case of IA) is less than the balance outstanding (including principal, accrued interest and other charges) and topping up of the security deficiency is not forthcoming.
2. The shortfall in security value over the outstanding balance (including principal, accrued interest, and any other charges) is uncollectible and worthless; or
3. Loans/financings secured with properties classified as impaired > 3 years with 3 rounds of abortive auctions. The balance outstanding is written down to 50% of the value of security, with the shortfall to be written off.
4. The Group is in the final stage of realising the security/collateral; or
5. The balance outstanding is written down to the value of security i.e. shortfall in security value over the outstanding balances is written-off.
6. Upon disposal of the security, shortfall arising from the set off of auction proceeds against written down balance outstanding, if any, will be written off immediately.
7. In the case of approved settlement arrangement, the Group shall write down the outstanding balance to approved settlement sum at the point of approval of the settlement agreement.
This policy of impairment loans/financing write-off is intended to provide a timely and consistent methodology for loans/financing to be written-off and to reflect the true value of assets in the Group’s books.
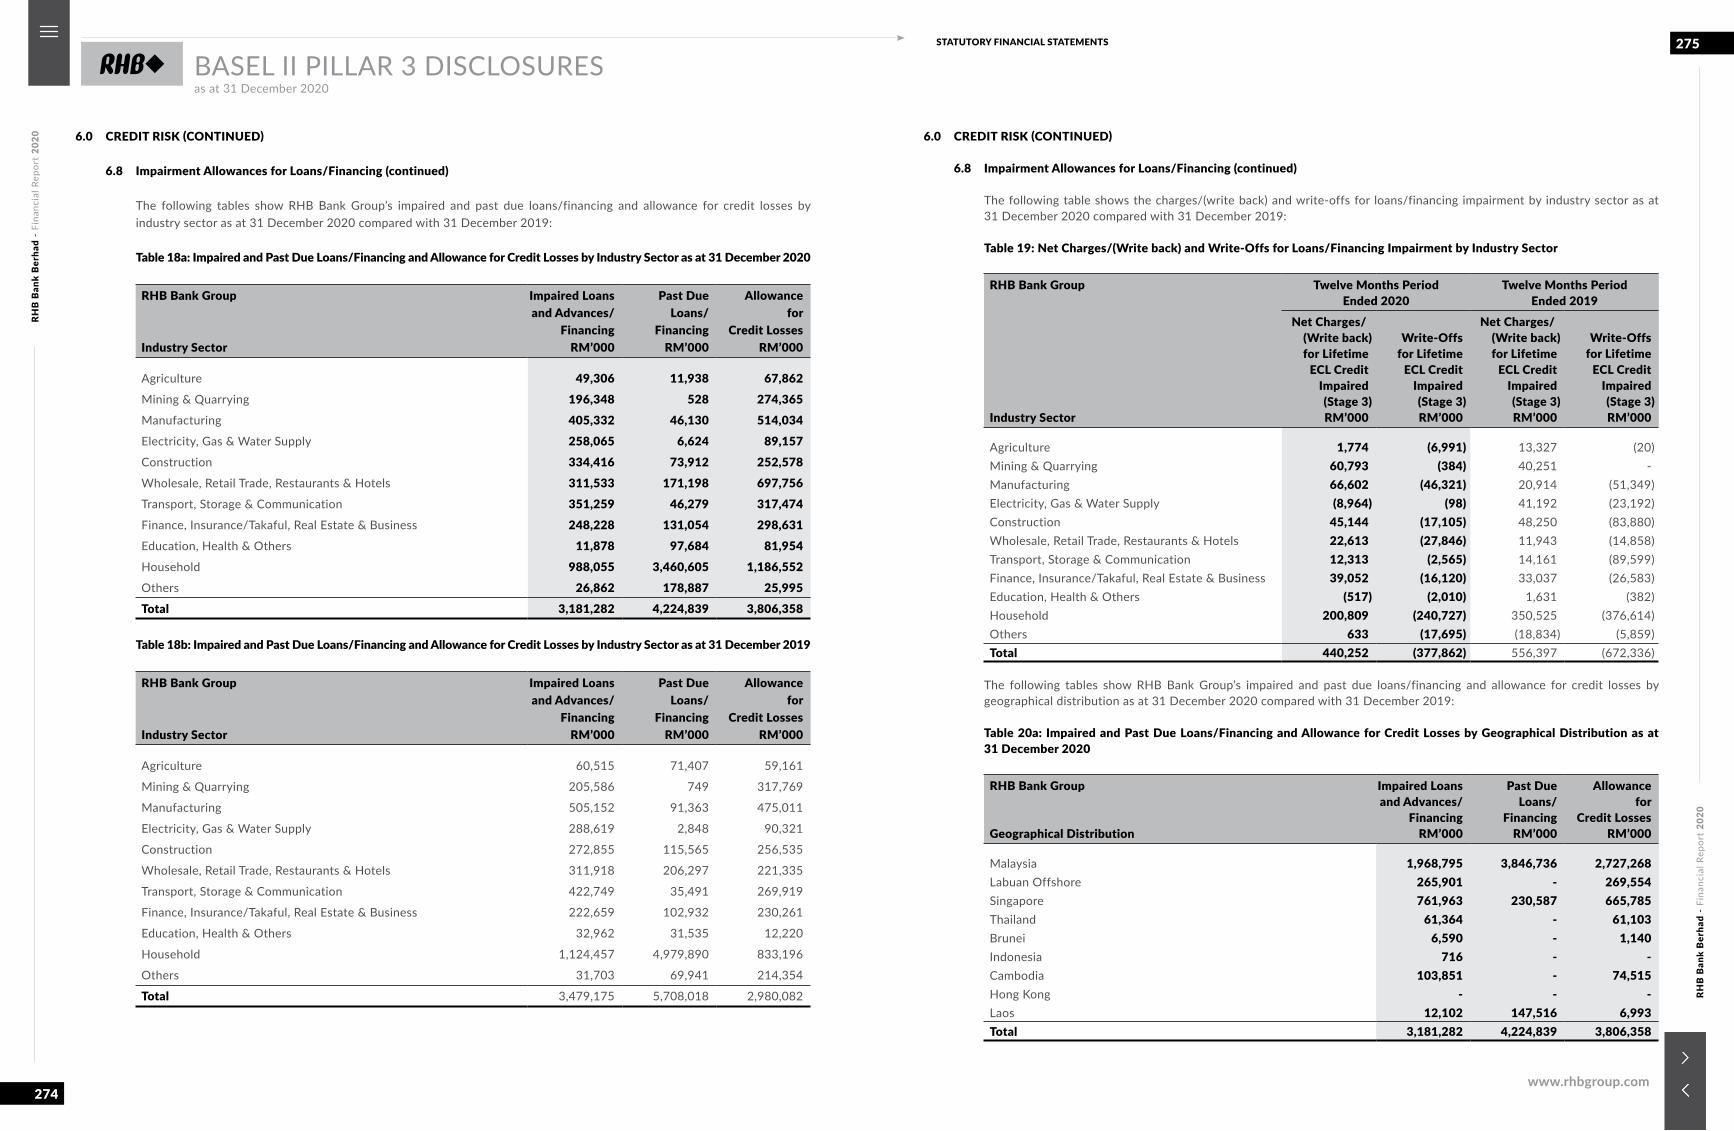
RHB
Ban
k B
erha
d -
Fina
ncia
l Rep
ort
2020
RHB
Ban
k B
erha
d -
Fina
ncia
l Rep
ort
2020
274
275STATUTORY FINANCIAL STATEMENTS
www.rhbgroup.com
BASEL II PILLAR 3 DISCLOSURESas at 31 December 2020
6.0 CREDIT RISK (CONTINUED)
6.8 Impairment Allowances for Loans/Financing (continued)
The following tables show RHB Bank Group’s impaired and past due loans/financing and allowance for credit losses by industry sector as at 31 December 2020 compared with 31 December 2019:
Table 18a: Impaired and Past Due Loans/Financing and Allowance for Credit Losses by Industry Sector as at 31 December 2020
RHB Bank Group
Industry Sector
Impaired Loans and Advances/
Financing RM’000
Past Due Loans/
Financing RM’000
Allowancefor
Credit LossesRM’000
Agriculture 49,306 11,938 67,862Mining & Quarrying 196,348 528 274,365Manufacturing 405,332 46,130 514,034Electricity, Gas & Water Supply 258,065 6,624 89,157Construction 334,416 73,912 252,578Wholesale, Retail Trade, Restaurants & Hotels 311,533 171,198 697,756Transport, Storage & Communication 351,259 46,279 317,474Finance, Insurance/Takaful, Real Estate & Business 248,228 131,054 298,631Education, Health & Others 11,878 97,684 81,954Household 988,055 3,460,605 1,186,552Others 26,862 178,887 25,995Total 3,181,282 4,224,839 3,806,358
Table 18b: Impaired and Past Due Loans/Financing and Allowance for Credit Losses by Industry Sector as at 31 December 2019
RHB Bank Group
Industry Sector
Impaired Loans and Advances/
Financing RM’000
Past Due Loans/
Financing RM’000
Allowancefor
Credit LossesRM’000
Agriculture 60,515 71,407 59,161
Mining & Quarrying 205,586 749 317,769
Manufacturing 505,152 91,363 475,011
Electricity, Gas & Water Supply 288,619 2,848 90,321
Construction 272,855 115,565 256,535
Wholesale, Retail Trade, Restaurants & Hotels 311,918 206,297 221,335
Transport, Storage & Communication 422,749 35,491 269,919
Finance, Insurance/Takaful, Real Estate & Business 222,659 102,932 230,261
Education, Health & Others 32,962 31,535 12,220
Household 1,124,457 4,979,890 833,196
Others 31,703 69,941 214,354
Total 3,479,175 5,708,018 2,980,082
6.0 CREDIT RISK (CONTINUED)
6.8 Impairment Allowances for Loans/Financing (continued)
The following table shows the charges/(write back) and write-offs for loans/financing impairment by industry sector as at 31 December 2020 compared with 31 December 2019:
Table 19: Net Charges/(Write back) and Write-Offs for Loans/Financing Impairment by Industry Sector
RHB Bank Group Twelve Months PeriodEnded 2020
Twelve Months Period Ended 2019
Industry Sector
Net Charges/(Write back)for Lifetime
ECL CreditImpaired(Stage 3)RM’000
Write-Offsfor Lifetime
ECL CreditImpaired(Stage 3)RM’000
Net Charges/(Write back)for Lifetime
ECL CreditImpaired(Stage 3)RM’000
Write-Offsfor Lifetime
ECL CreditImpaired(Stage 3)RM’000
Agriculture 1,774 (6,991) 13,327 (20)Mining & Quarrying 60,793 (384) 40,251 -Manufacturing 66,602 (46,321) 20,914 (51,349)Electricity, Gas & Water Supply (8,964) (98) 41,192 (23,192)Construction 45,144 (17,105) 48,250 (83,880)Wholesale, Retail Trade, Restaurants & Hotels 22,613 (27,846) 11,943 (14,858)Transport, Storage & Communication 12,313 (2,565) 14,161 (89,599)Finance, Insurance/Takaful, Real Estate & Business 39,052 (16,120) 33,037 (26,583)Education, Health & Others (517) (2,010) 1,631 (382)Household 200,809 (240,727) 350,525 (376,614)Others 633 (17,695) (18,834) (5,859)Total 440,252 (377,862) 556,397 (672,336)
The following tables show RHB Bank Group’s impaired and past due loans/financing and allowance for credit losses by geographical distribution as at 31 December 2020 compared with 31 December 2019:
Table 20a: Impaired and Past Due Loans/Financing and Allowance for Credit Losses by Geographical Distribution as at 31 December 2020
RHB Bank Group
Geographical Distribution
Impaired Loans and Advances/
FinancingRM’000
Past Due Loans/
FinancingRM’000
Allowancefor
Credit LossesRM’000
Malaysia 1,968,795 3,846,736 2,727,268Labuan Offshore 265,901 - 269,554Singapore 761,963 230,587 665,785Thailand 61,364 - 61,103Brunei 6,590 - 1,140Indonesia 716 - -Cambodia 103,851 - 74,515Hong Kong - - -Laos 12,102 147,516 6,993Total 3,181,282 4,224,839 3,806,358
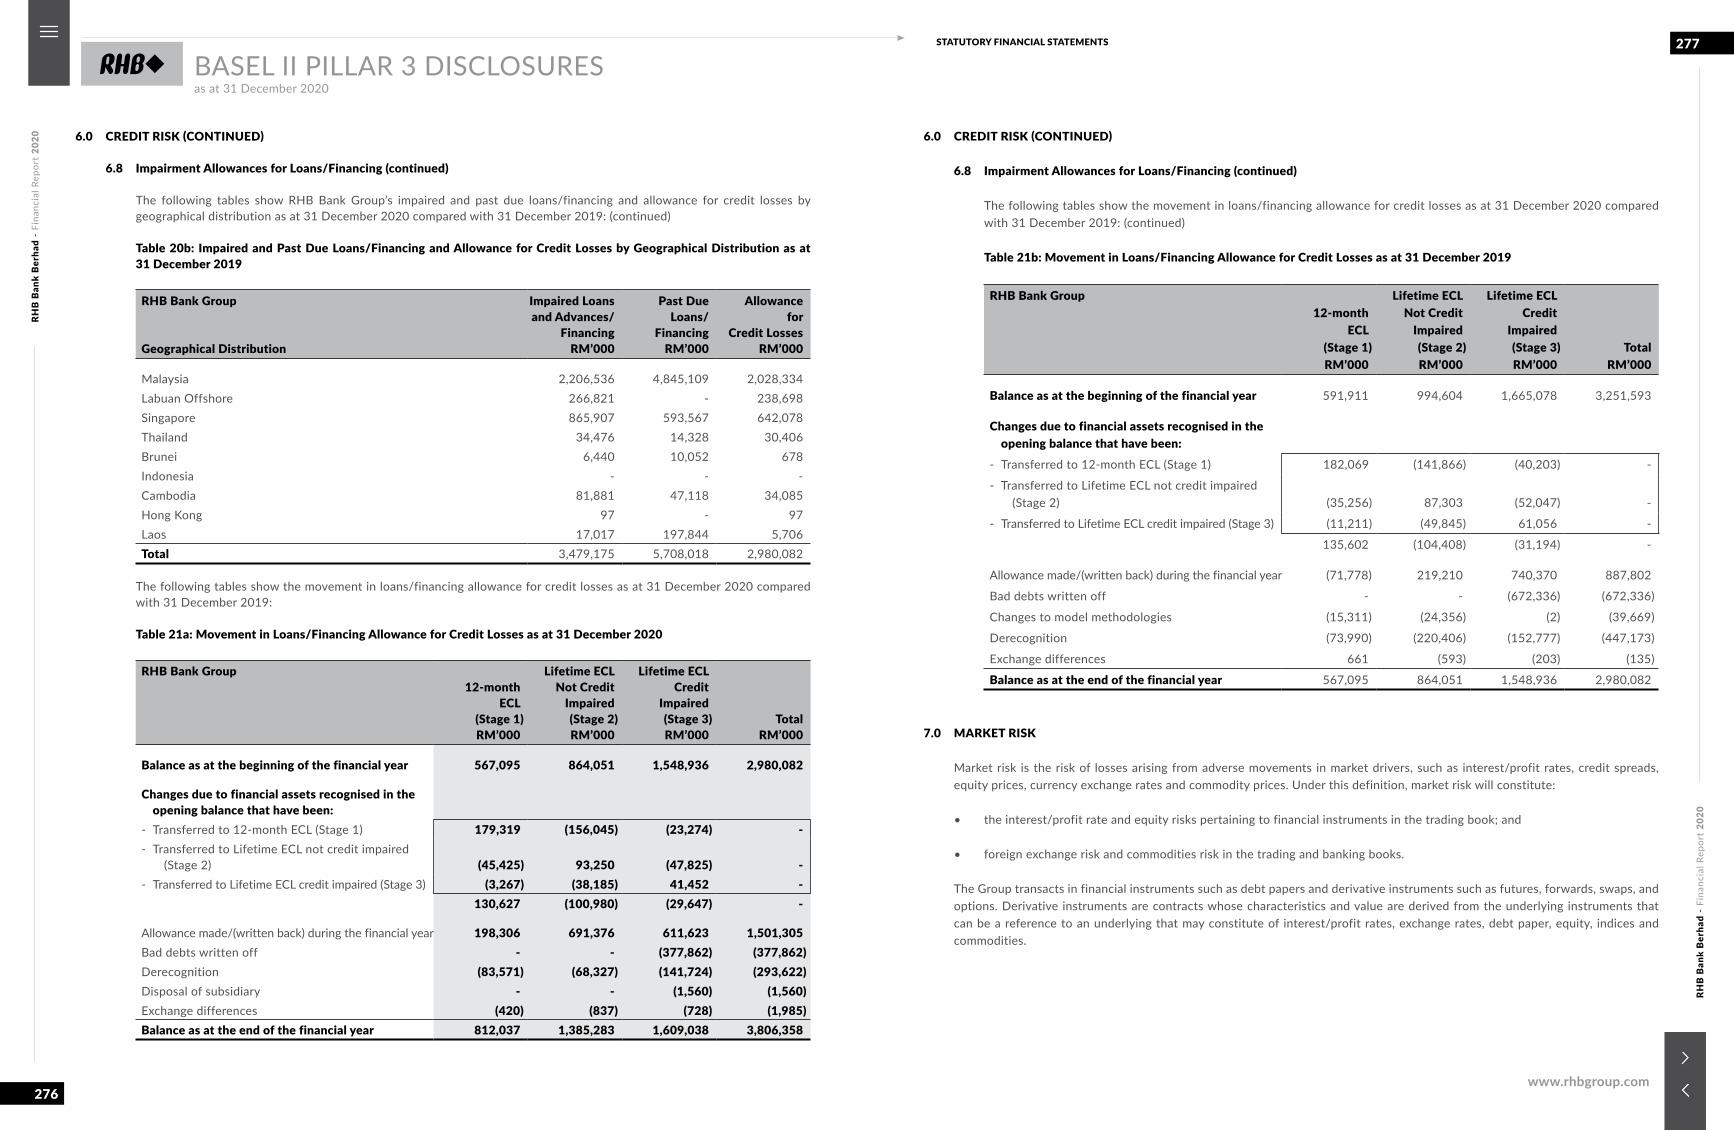
RHB
Ban
k B
erha
d -
Fina
ncia
l Rep
ort
2020
RHB
Ban
k B
erha
d -
Fina
ncia
l Rep
ort
2020
276
277STATUTORY FINANCIAL STATEMENTS
www.rhbgroup.com
BASEL II PILLAR 3 DISCLOSURESas at 31 December 2020
6.0 CREDIT RISK (CONTINUED)
6.8 Impairment Allowances for Loans/Financing (continued)
The following tables show RHB Bank Group’s impaired and past due loans/financing and allowance for credit losses by geographical distribution as at 31 December 2020 compared with 31 December 2019: (continued)
Table 20b: Impaired and Past Due Loans/Financing and Allowance for Credit Losses by Geographical Distribution as at 31 December 2019
RHB Bank Group
Geographical Distribution
Impaired Loans and Advances/
FinancingRM’000
Past Due Loans/
FinancingRM’000
Allowance for
Credit LossesRM’000
Malaysia 2,206,536 4,845,109 2,028,334Labuan Offshore 266,821 - 238,698Singapore 865,907 593,567 642,078Thailand 34,476 14,328 30,406Brunei 6,440 10,052 678Indonesia - - -Cambodia 81,881 47,118 34,085Hong Kong 97 - 97Laos 17,017 197,844 5,706Total 3,479,175 5,708,018 2,980,082
The following tables show the movement in loans/financing allowance for credit losses as at 31 December 2020 compared
with 31 December 2019:
Table 21a: Movement in Loans/Financing Allowance for Credit Losses as at 31 December 2020
RHB Bank Group12-month
ECL (Stage 1)RM’000
Lifetime ECL Not Credit
Impaired(Stage 2)RM’000
Lifetime ECL Credit
Impaired(Stage 3)RM’000
TotalRM’000
Balance as at the beginning of the financial year 567,095 864,051 1,548,936 2,980,082
Changes due to financial assets recognised in the opening balance that have been:
- Transferred to 12-month ECL (Stage 1) 179,319 (156,045) (23,274) -- Transferred to Lifetime ECL not credit impaired
(Stage 2) (45,425) 93,250 (47,825) -- Transferred to Lifetime ECL credit impaired (Stage 3) (3,267) (38,185) 41,452 -
130,627 (100,980) (29,647) -
Allowance made/(written back) during the financial year 198,306 691,376 611,623 1,501,305Bad debts written off - - (377,862) (377,862)Derecognition (83,571) (68,327) (141,724) (293,622)Disposal of subsidiary - - (1,560) (1,560)Exchange differences (420) (837) (728) (1,985)Balance as at the end of the financial year 812,037 1,385,283 1,609,038 3,806,358
6.0 CREDIT RISK (CONTINUED)
6.8 Impairment Allowances for Loans/Financing (continued)
The following tables show the movement in loans/financing allowance for credit losses as at 31 December 2020 compared with 31 December 2019: (continued)
Table 21b: Movement in Loans/Financing Allowance for Credit Losses as at 31 December 2019
RHB Bank Group12-month
ECL (Stage 1)RM’000
Lifetime ECL Not Credit
Impaired(Stage 2)RM’000
Lifetime ECL Credit
Impaired(Stage 3) RM’000
TotalRM’000
Balance as at the beginning of the financial year 591,911 994,604 1,665,078 3,251,593
Changes due to financial assets recognised in the opening balance that have been:
- Transferred to 12-month ECL (Stage 1) 182,069 (141,866) (40,203) -
- Transferred to Lifetime ECL not credit impaired (Stage 2) (35,256) 87,303 (52,047) -
- Transferred to Lifetime ECL credit impaired (Stage 3) (11,211) (49,845) 61,056 -
135,602 (104,408) (31,194) -
Allowance made/(written back) during the financial year (71,778) 219,210 740,370 887,802
Bad debts written off - - (672,336) (672,336)
Changes to model methodologies (15,311) (24,356) (2) (39,669)
Derecognition (73,990) (220,406) (152,777) (447,173)
Exchange differences 661 (593) (203) (135)
Balance as at the end of the financial year 567,095 864,051 1,548,936 2,980,082
7.0 MARKET RISK
Market risk is the risk of losses arising from adverse movements in market drivers, such as interest/profit rates, credit spreads, equity prices, currency exchange rates and commodity prices. Under this definition, market risk will constitute:
• the interest/profit rate and equity risks pertaining to financial instruments in the trading book; and
• foreign exchange risk and commodities risk in the trading and banking books.
The Group transacts in financial instruments such as debt papers and derivative instruments such as futures, forwards, swaps, and options. Derivative instruments are contracts whose characteristics and value are derived from the underlying instruments that can be a reference to an underlying that may constitute of interest/profit rates, exchange rates, debt paper, equity, indices and commodities.
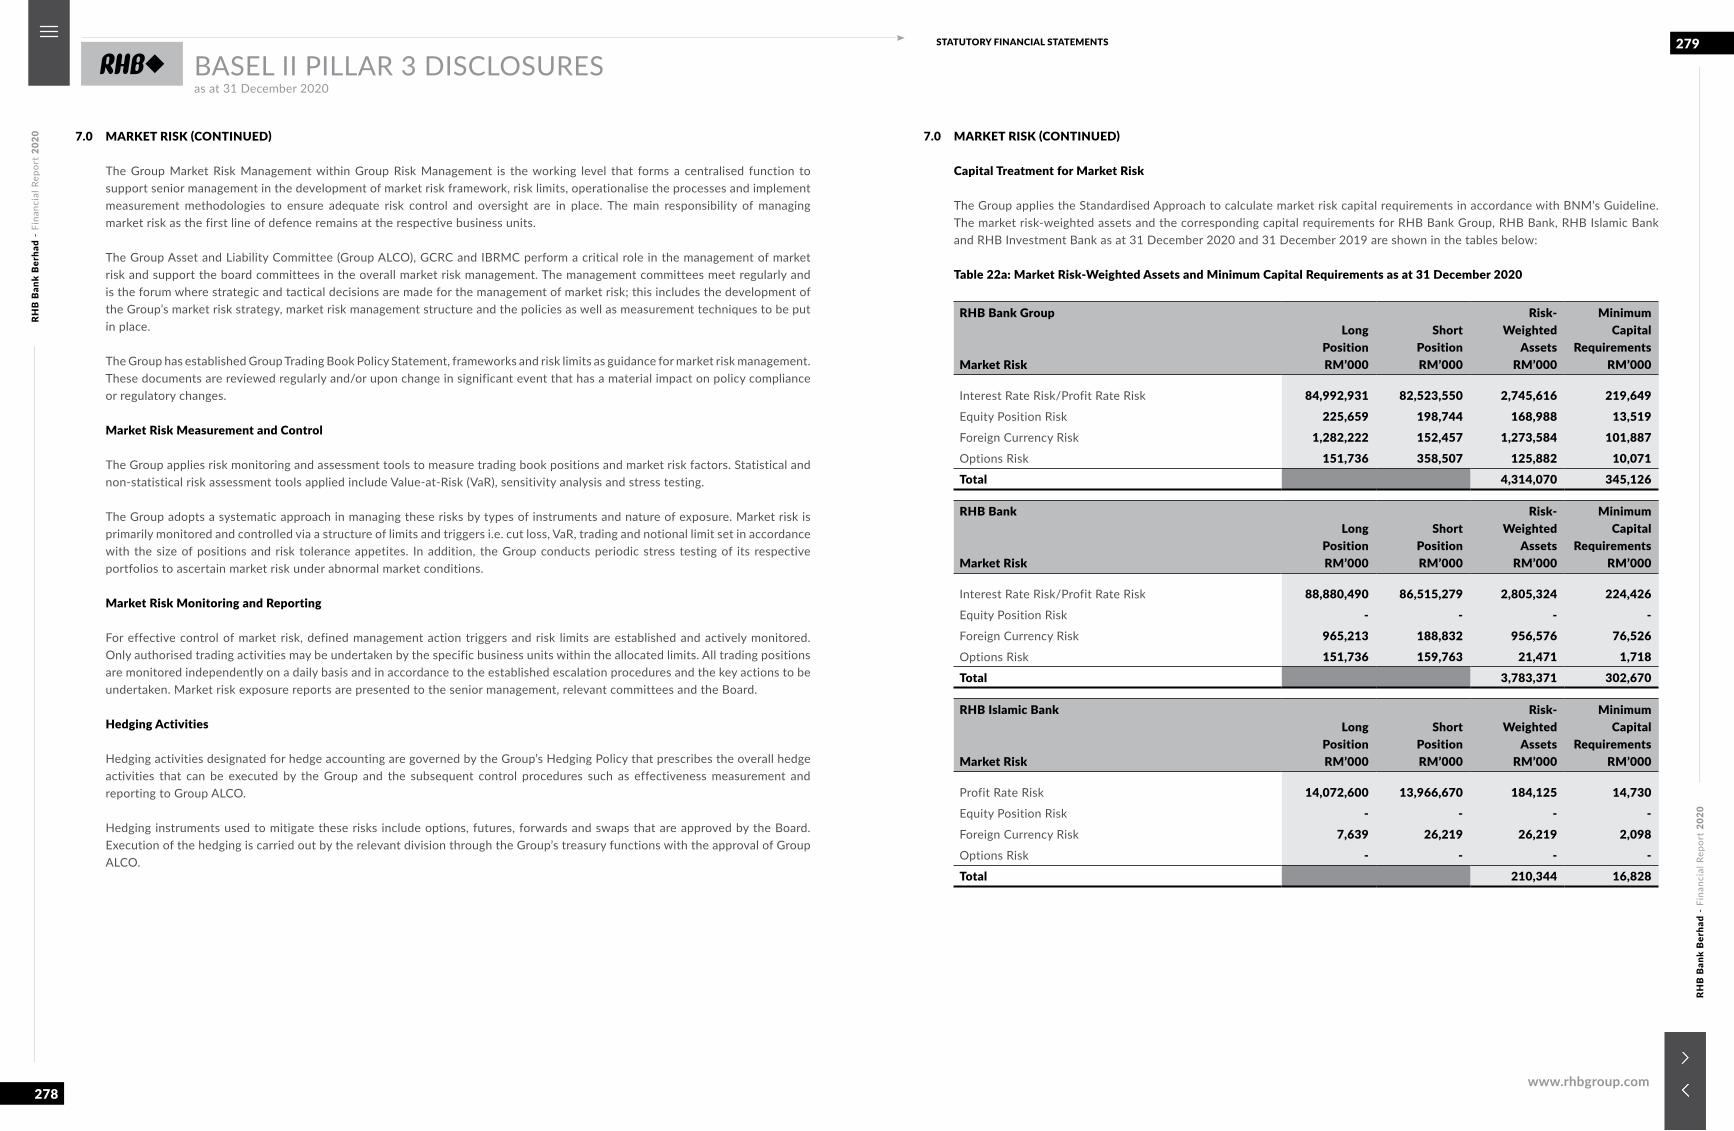
RHB
Ban
k B
erha
d -
Fina
ncia
l Rep
ort
2020
RHB
Ban
k B
erha
d -
Fina
ncia
l Rep
ort
2020
278
279STATUTORY FINANCIAL STATEMENTS
www.rhbgroup.com
BASEL II PILLAR 3 DISCLOSURESas at 31 December 2020
7.0 MARKET RISK (CONTINUED)
The Group Market Risk Management within Group Risk Management is the working level that forms a centralised function to support senior management in the development of market risk framework, risk limits, operationalise the processes and implement measurement methodologies to ensure adequate risk control and oversight are in place. The main responsibility of managing market risk as the first line of defence remains at the respective business units.
The Group Asset and Liability Committee (Group ALCO), GCRC and IBRMC perform a critical role in the management of market risk and support the board committees in the overall market risk management. The management committees meet regularly and is the forum where strategic and tactical decisions are made for the management of market risk; this includes the development of the Group’s market risk strategy, market risk management structure and the policies as well as measurement techniques to be put in place.
The Group has established Group Trading Book Policy Statement, frameworks and risk limits as guidance for market risk management. These documents are reviewed regularly and/or upon change in significant event that has a material impact on policy compliance or regulatory changes.
Market Risk Measurement and Control
The Group applies risk monitoring and assessment tools to measure trading book positions and market risk factors. Statistical and non-statistical risk assessment tools applied include Value-at-Risk (VaR), sensitivity analysis and stress testing.
The Group adopts a systematic approach in managing these risks by types of instruments and nature of exposure. Market risk is primarily monitored and controlled via a structure of limits and triggers i.e. cut loss, VaR, trading and notional limit set in accordance with the size of positions and risk tolerance appetites. In addition, the Group conducts periodic stress testing of its respective portfolios to ascertain market risk under abnormal market conditions.
Market Risk Monitoring and Reporting
For effective control of market risk, defined management action triggers and risk limits are established and actively monitored. Only authorised trading activities may be undertaken by the specific business units within the allocated limits. All trading positions are monitored independently on a daily basis and in accordance to the established escalation procedures and the key actions to be undertaken. Market risk exposure reports are presented to the senior management, relevant committees and the Board.
Hedging Activities
Hedging activities designated for hedge accounting are governed by the Group’s Hedging Policy that prescribes the overall hedge activities that can be executed by the Group and the subsequent control procedures such as effectiveness measurement and reporting to Group ALCO.
Hedging instruments used to mitigate these risks include options, futures, forwards and swaps that are approved by the Board. Execution of the hedging is carried out by the relevant division through the Group’s treasury functions with the approval of Group ALCO.
7.0 MARKET RISK (CONTINUED)
Capital Treatment for Market Risk
The Group applies the Standardised Approach to calculate market risk capital requirements in accordance with BNM’s Guideline. The market risk-weighted assets and the corresponding capital requirements for RHB Bank Group, RHB Bank, RHB Islamic Bank and RHB Investment Bank as at 31 December 2020 and 31 December 2019 are shown in the tables below:
Table 22a: Market Risk-Weighted Assets and Minimum Capital Requirements as at 31 December 2020
RHB Bank Group
Market Risk
Long PositionRM’000
Short PositionRM’000
Risk- Weighted
AssetsRM’000
Minimum Capital
RequirementsRM’000
Interest Rate Risk/Profit Rate Risk 84,992,931 82,523,550 2,745,616 219,649Equity Position Risk 225,659 198,744 168,988 13,519Foreign Currency Risk 1,282,222 152,457 1,273,584 101,887Options Risk 151,736 358,507 125,882 10,071Total 4,314,070 345,126
RHB Bank
Market Risk
Long PositionRM’000
Short PositionRM’000
Risk- Weighted
AssetsRM’000
Minimum Capital
RequirementsRM’000
Interest Rate Risk/Profit Rate Risk 88,880,490 86,515,279 2,805,324 224,426Equity Position Risk - - - -Foreign Currency Risk 965,213 188,832 956,576 76,526Options Risk 151,736 159,763 21,471 1,718Total 3,783,371 302,670
RHB Islamic Bank
Market Risk
Long PositionRM’000
Short PositionRM’000
Risk- Weighted
AssetsRM’000
Minimum Capital
RequirementsRM’000
Profit Rate Risk 14,072,600 13,966,670 184,125 14,730Equity Position Risk - - - -Foreign Currency Risk 7,639 26,219 26,219 2,098Options Risk - - - -Total 210,344 16,828
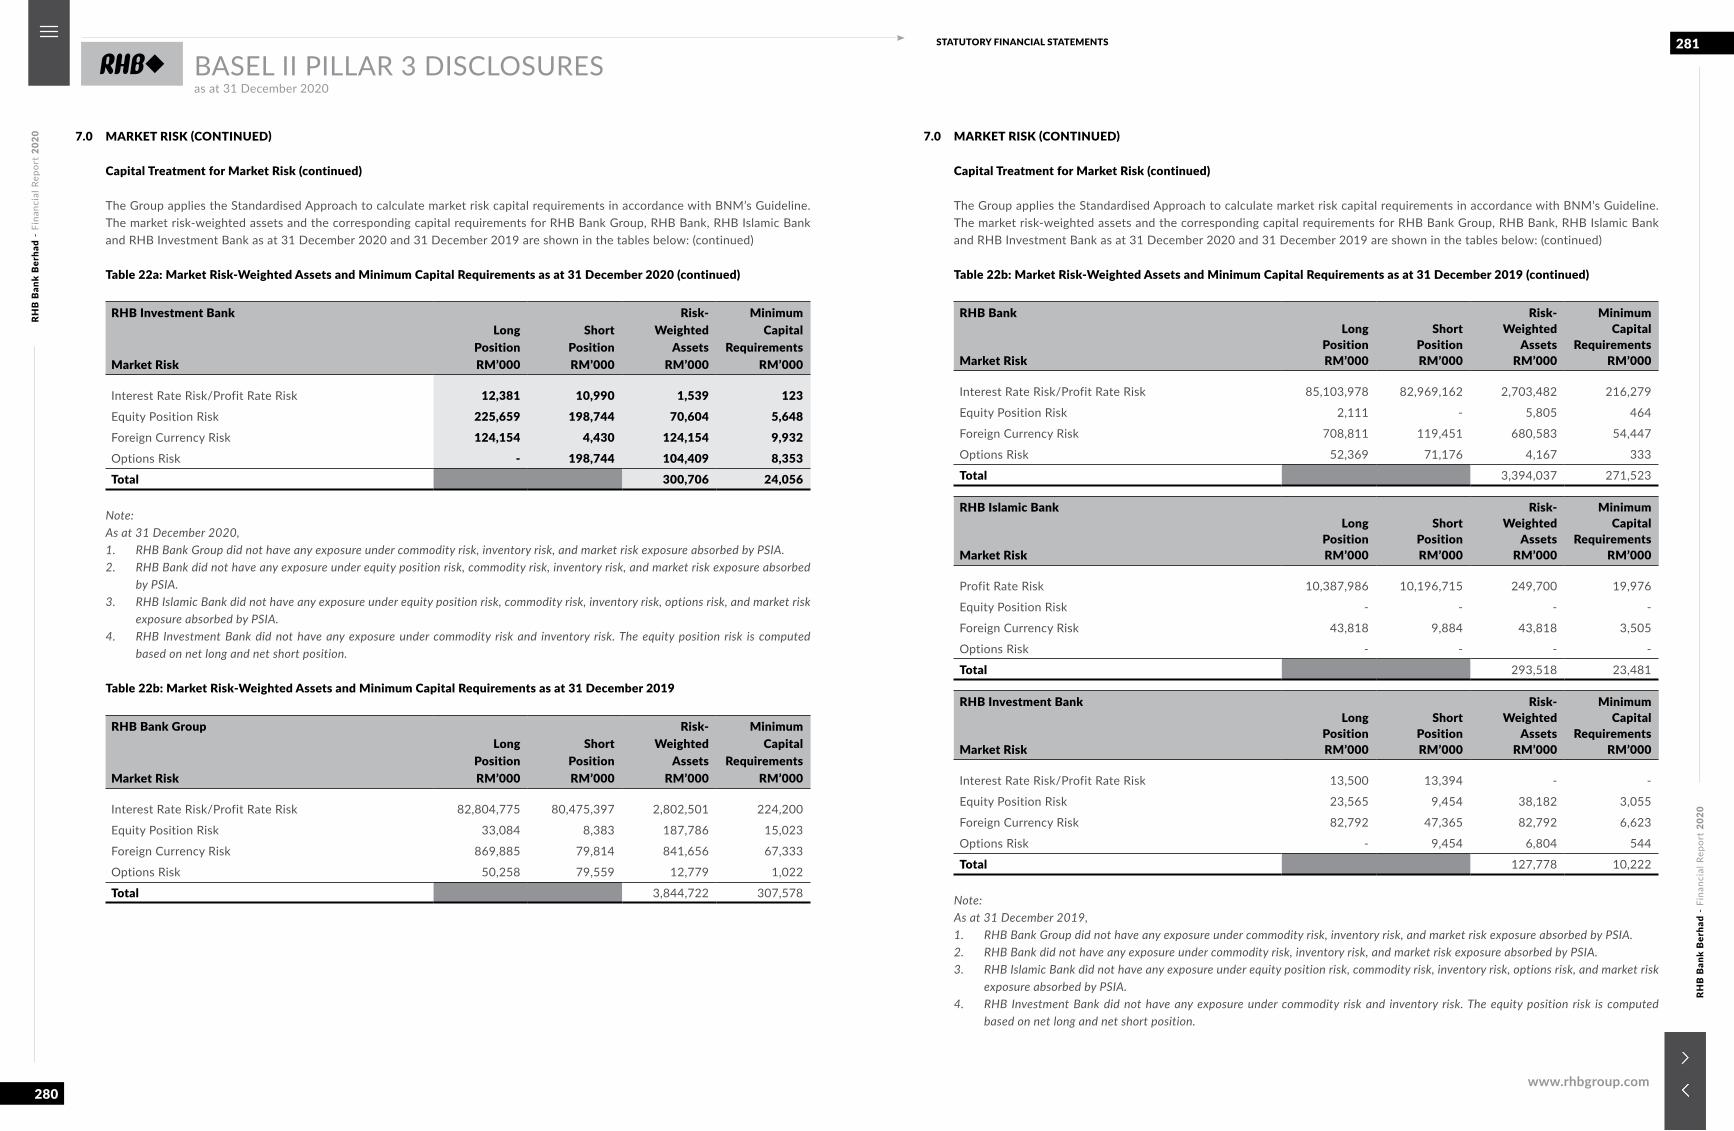
RHB
Ban
k B
erha
d -
Fina
ncia
l Rep
ort
2020
RHB
Ban
k B
erha
d -
Fina
ncia
l Rep
ort
2020
280
281STATUTORY FINANCIAL STATEMENTS
www.rhbgroup.com
BASEL II PILLAR 3 DISCLOSURESas at 31 December 2020
7.0 MARKET RISK (CONTINUED)
Capital Treatment for Market Risk (continued)
The Group applies the Standardised Approach to calculate market risk capital requirements in accordance with BNM’s Guideline. The market risk-weighted assets and the corresponding capital requirements for RHB Bank Group, RHB Bank, RHB Islamic Bank and RHB Investment Bank as at 31 December 2020 and 31 December 2019 are shown in the tables below: (continued)
Table 22a: Market Risk-Weighted Assets and Minimum Capital Requirements as at 31 December 2020 (continued)
RHB Investment Bank
Market Risk
Long PositionRM’000
Short PositionRM’000
Risk- Weighted
AssetsRM’000
Minimum Capital
RequirementsRM’000
Interest Rate Risk/Profit Rate Risk 12,381 10,990 1,539 123Equity Position Risk 225,659 198,744 70,604 5,648Foreign Currency Risk 124,154 4,430 124,154 9,932Options Risk - 198,744 104,409 8,353Total 300,706 24,056
Note:As at 31 December 2020,1. RHB Bank Group did not have any exposure under commodity risk, inventory risk, and market risk exposure absorbed by PSIA.2. RHB Bank did not have any exposure under equity position risk, commodity risk, inventory risk, and market risk exposure absorbed
by PSIA.3. RHB Islamic Bank did not have any exposure under equity position risk, commodity risk, inventory risk, options risk, and market risk
exposure absorbed by PSIA.4. RHB Investment Bank did not have any exposure under commodity risk and inventory risk. The equity position risk is computed
based on net long and net short position.
Table 22b: Market Risk-Weighted Assets and Minimum Capital Requirements as at 31 December 2019
RHB Bank Group
Market Risk
Long PositionRM’000
Short PositionRM’000
Risk- Weighted
AssetsRM’000
Minimum Capital
RequirementsRM’000
Interest Rate Risk/Profit Rate Risk 82,804,775 80,475,397 2,802,501 224,200
Equity Position Risk 33,084 8,383 187,786 15,023
Foreign Currency Risk 869,885 79,814 841,656 67,333
Options Risk 50,258 79,559 12,779 1,022
Total 3,844,722 307,578
7.0 MARKET RISK (CONTINUED)
Capital Treatment for Market Risk (continued)
The Group applies the Standardised Approach to calculate market risk capital requirements in accordance with BNM’s Guideline. The market risk-weighted assets and the corresponding capital requirements for RHB Bank Group, RHB Bank, RHB Islamic Bank and RHB Investment Bank as at 31 December 2020 and 31 December 2019 are shown in the tables below: (continued)
Table 22b: Market Risk-Weighted Assets and Minimum Capital Requirements as at 31 December 2019 (continued)
RHB Bank
Market Risk
Long PositionRM’000
Short PositionRM’000
Risk- Weighted
AssetsRM’000
Minimum Capital
RequirementsRM’000
Interest Rate Risk/Profit Rate Risk 85,103,978 82,969,162 2,703,482 216,279
Equity Position Risk 2,111 - 5,805 464
Foreign Currency Risk 708,811 119,451 680,583 54,447
Options Risk 52,369 71,176 4,167 333
Total 3,394,037 271,523
RHB Islamic Bank
Market Risk
Long PositionRM’000
Short PositionRM’000
Risk- Weighted
AssetsRM’000
Minimum Capital
RequirementsRM’000
Profit Rate Risk 10,387,986 10,196,715 249,700 19,976
Equity Position Risk - - - -
Foreign Currency Risk 43,818 9,884 43,818 3,505
Options Risk - - - -
Total 293,518 23,481
RHB Investment Bank
Market Risk
Long PositionRM’000
Short PositionRM’000
Risk- Weighted
AssetsRM’000
Minimum Capital
RequirementsRM’000
Interest Rate Risk/Profit Rate Risk 13,500 13,394 - -
Equity Position Risk 23,565 9,454 38,182 3,055
Foreign Currency Risk 82,792 47,365 82,792 6,623
Options Risk - 9,454 6,804 544
Total 127,778 10,222
Note:As at 31 December 2019,1. RHB Bank Group did not have any exposure under commodity risk, inventory risk, and market risk exposure absorbed by PSIA.2. RHB Bank did not have any exposure under commodity risk, inventory risk, and market risk exposure absorbed by PSIA.3. RHB Islamic Bank did not have any exposure under equity position risk, commodity risk, inventory risk, options risk, and market risk
exposure absorbed by PSIA.4. RHB Investment Bank did not have any exposure under commodity risk and inventory risk. The equity position risk is computed
based on net long and net short position.
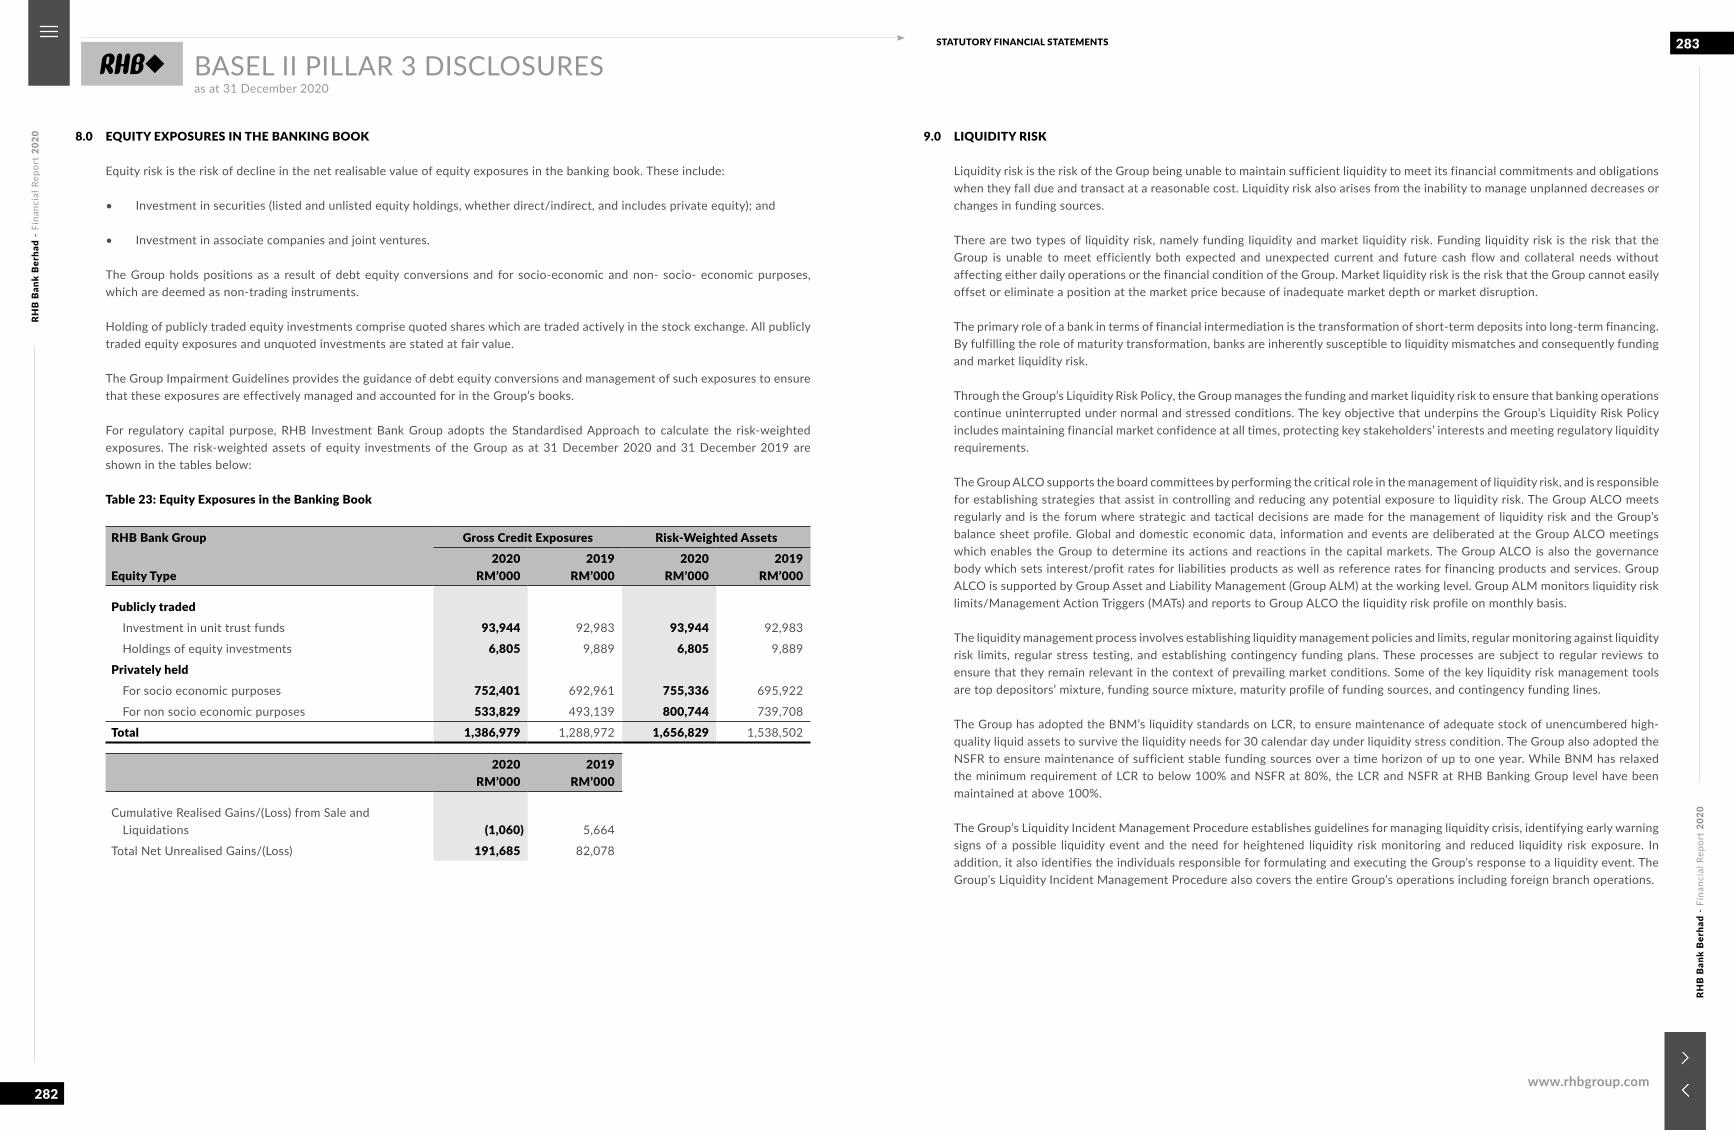
RHB
Ban
k B
erha
d -
Fina
ncia
l Rep
ort
2020
RHB
Ban
k B
erha
d -
Fina
ncia
l Rep
ort
2020
282
283STATUTORY FINANCIAL STATEMENTS
www.rhbgroup.com
BASEL II PILLAR 3 DISCLOSURESas at 31 December 2020
8.0 EQUITY EXPOSURES IN THE BANKING BOOK
Equity risk is the risk of decline in the net realisable value of equity exposures in the banking book. These include:
• Investment in securities (listed and unlisted equity holdings, whether direct/indirect, and includes private equity); and
• Investment in associate companies and joint ventures.
The Group holds positions as a result of debt equity conversions and for socio-economic and non- socio- economic purposes, which are deemed as non-trading instruments.
Holding of publicly traded equity investments comprise quoted shares which are traded actively in the stock exchange. All publicly traded equity exposures and unquoted investments are stated at fair value.
The Group Impairment Guidelines provides the guidance of debt equity conversions and management of such exposures to ensure that these exposures are effectively managed and accounted for in the Group’s books.
For regulatory capital purpose, RHB Investment Bank Group adopts the Standardised Approach to calculate the risk-weighted exposures. The risk-weighted assets of equity investments of the Group as at 31 December 2020 and 31 December 2019 are shown in the tables below:
Table 23: Equity Exposures in the Banking Book
RHB Bank Group Gross Credit Exposures Risk-Weighted Assets
Equity Type2020
RM’000 2019
RM’000 2020
RM’000 2019
RM’000
Publicly traded Investment in unit trust funds 93,944 92,983 93,944 92,983
Holdings of equity investments 6,805 9,889 6,805 9,889
Privately held For socio economic purposes 752,401 692,961 755,336 695,922
For non socio economic purposes 533,829 493,139 800,744 739,708
Total 1,386,979 1,288,972 1,656,829 1,538,502
2020 RM’000
2019RM’000
Cumulative Realised Gains/(Loss) from Sale and Liquidations (1,060) 5,664
Total Net Unrealised Gains/(Loss) 191,685 82,078
9.0 LIQUIDITY RISK
Liquidity risk is the risk of the Group being unable to maintain sufficient liquidity to meet its financial commitments and obligations when they fall due and transact at a reasonable cost. Liquidity risk also arises from the inability to manage unplanned decreases or changes in funding sources.
There are two types of liquidity risk, namely funding liquidity and market liquidity risk. Funding liquidity risk is the risk that the Group is unable to meet efficiently both expected and unexpected current and future cash flow and collateral needs without affecting either daily operations or the financial condition of the Group. Market liquidity risk is the risk that the Group cannot easily offset or eliminate a position at the market price because of inadequate market depth or market disruption.
The primary role of a bank in terms of financial intermediation is the transformation of short-term deposits into long-term financing. By fulfilling the role of maturity transformation, banks are inherently susceptible to liquidity mismatches and consequently funding and market liquidity risk.
Through the Group’s Liquidity Risk Policy, the Group manages the funding and market liquidity risk to ensure that banking operations continue uninterrupted under normal and stressed conditions. The key objective that underpins the Group’s Liquidity Risk Policy includes maintaining financial market confidence at all times, protecting key stakeholders’ interests and meeting regulatory liquidity requirements.
The Group ALCO supports the board committees by performing the critical role in the management of liquidity risk, and is responsible for establishing strategies that assist in controlling and reducing any potential exposure to liquidity risk. The Group ALCO meets regularly and is the forum where strategic and tactical decisions are made for the management of liquidity risk and the Group’s balance sheet profile. Global and domestic economic data, information and events are deliberated at the Group ALCO meetings which enables the Group to determine its actions and reactions in the capital markets. The Group ALCO is also the governance body which sets interest/profit rates for liabilities products as well as reference rates for financing products and services. Group ALCO is supported by Group Asset and Liability Management (Group ALM) at the working level. Group ALM monitors liquidity risk limits/Management Action Triggers (MATs) and reports to Group ALCO the liquidity risk profile on monthly basis.
The liquidity management process involves establishing liquidity management policies and limits, regular monitoring against liquidity risk limits, regular stress testing, and establishing contingency funding plans. These processes are subject to regular reviews to ensure that they remain relevant in the context of prevailing market conditions. Some of the key liquidity risk management tools are top depositors’ mixture, funding source mixture, maturity profile of funding sources, and contingency funding lines.
The Group has adopted the BNM’s liquidity standards on LCR, to ensure maintenance of adequate stock of unencumbered high-quality liquid assets to survive the liquidity needs for 30 calendar day under liquidity stress condition. The Group also adopted the NSFR to ensure maintenance of sufficient stable funding sources over a time horizon of up to one year. While BNM has relaxed the minimum requirement of LCR to below 100% and NSFR at 80%, the LCR and NSFR at RHB Banking Group level have been maintained at above 100%.
The Group’s Liquidity Incident Management Procedure establishes guidelines for managing liquidity crisis, identifying early warning signs of a possible liquidity event and the need for heightened liquidity risk monitoring and reduced liquidity risk exposure. In addition, it also identifies the individuals responsible for formulating and executing the Group’s response to a liquidity event. The Group’s Liquidity Incident Management Procedure also covers the entire Group’s operations including foreign branch operations.
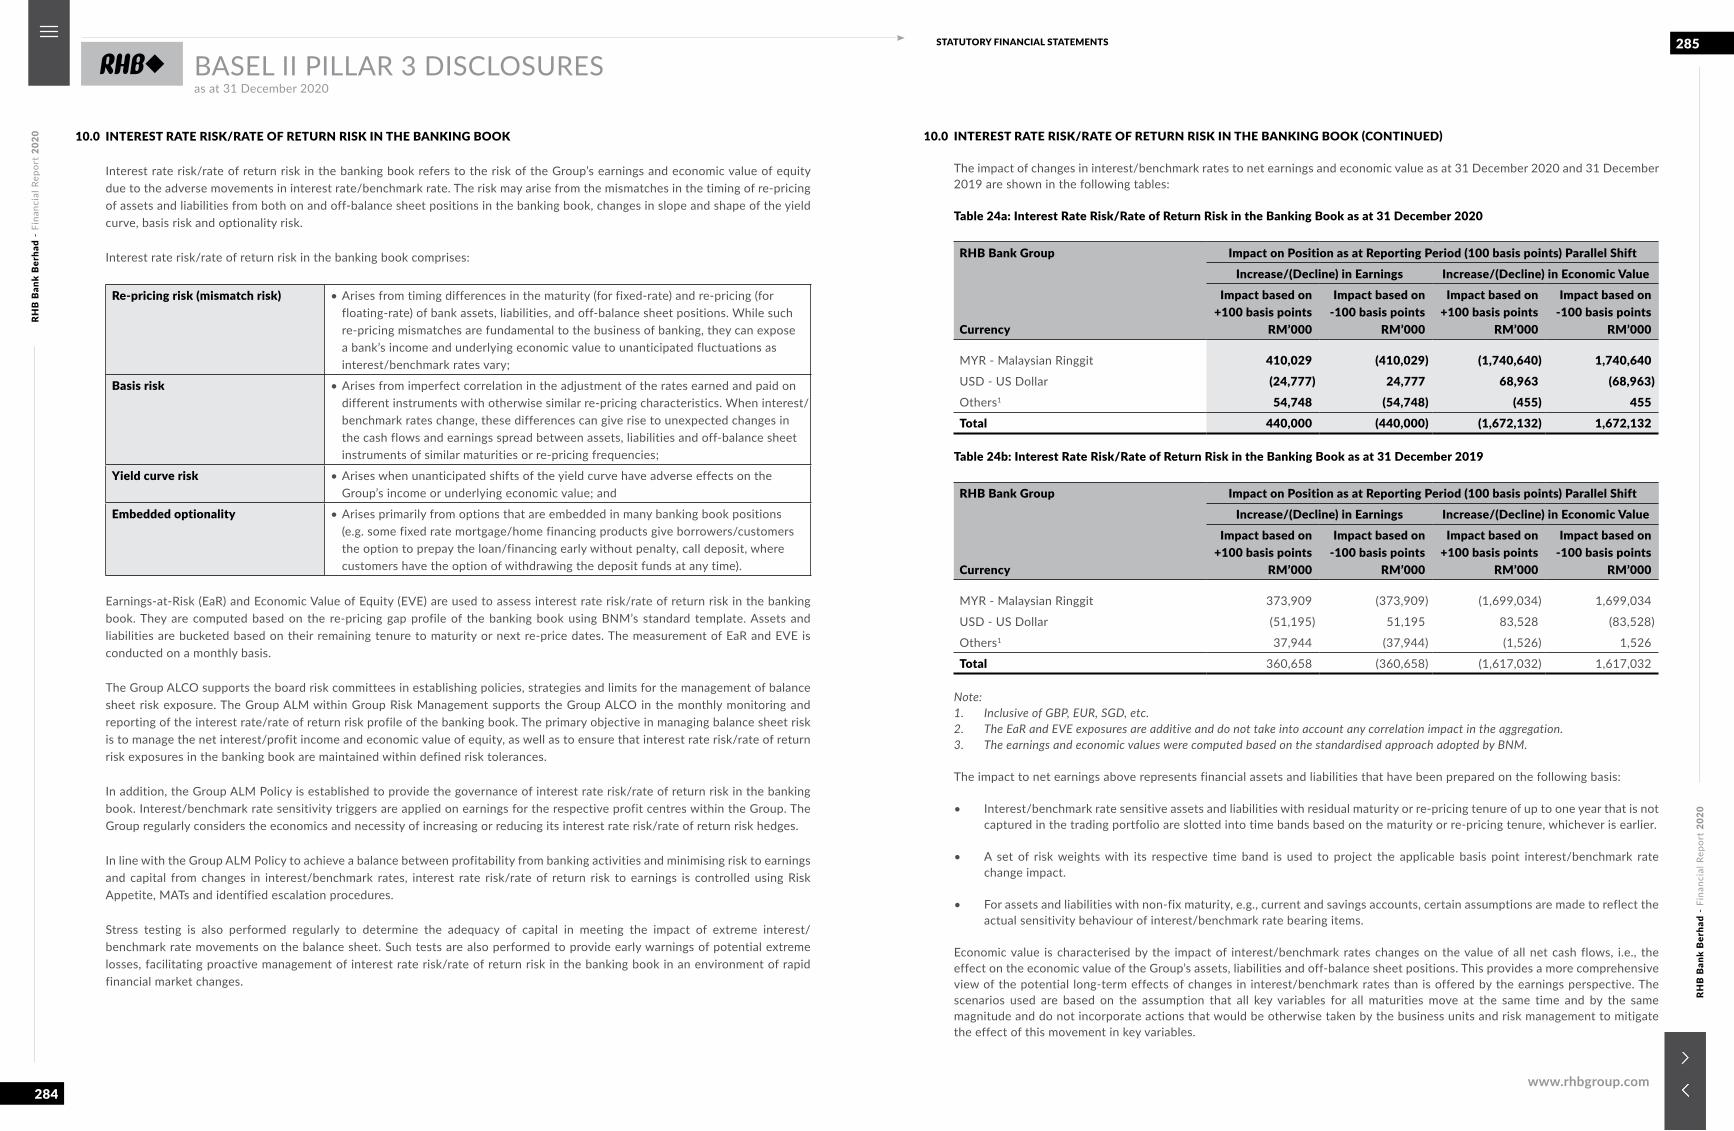
RHB
Ban
k B
erha
d -
Fina
ncia
l Rep
ort
2020
RHB
Ban
k B
erha
d -
Fina
ncia
l Rep
ort
2020
284
285STATUTORY FINANCIAL STATEMENTS
www.rhbgroup.com
BASEL II PILLAR 3 DISCLOSURESas at 31 December 2020
10.0 INTEREST RATE RISK/RATE OF RETURN RISK IN THE BANKING BOOK
Interest rate risk/rate of return risk in the banking book refers to the risk of the Group’s earnings and economic value of equity due to the adverse movements in interest rate/benchmark rate. The risk may arise from the mismatches in the timing of re-pricing of assets and liabilities from both on and off-balance sheet positions in the banking book, changes in slope and shape of the yield curve, basis risk and optionality risk.
Interest rate risk/rate of return risk in the banking book comprises:
Re-pricing risk (mismatch risk) • Arises from timing differences in the maturity (for fixed-rate) and re-pricing (for floating-rate) of bank assets, liabilities, and off-balance sheet positions. While such re-pricing mismatches are fundamental to the business of banking, they can expose a bank’s income and underlying economic value to unanticipated fluctuations as interest/benchmark rates vary;
Basis risk • Arises from imperfect correlation in the adjustment of the rates earned and paid on different instruments with otherwise similar re-pricing characteristics. When interest/benchmark rates change, these differences can give rise to unexpected changes in the cash flows and earnings spread between assets, liabilities and off-balance sheet instruments of similar maturities or re-pricing frequencies;
Yield curve risk • Arises when unanticipated shifts of the yield curve have adverse effects on the Group’s income or underlying economic value; and
Embedded optionality • Arises primarily from options that are embedded in many banking book positions (e.g. some fixed rate mortgage/home financing products give borrowers/customers the option to prepay the loan/financing early without penalty, call deposit, where customers have the option of withdrawing the deposit funds at any time).
Earnings-at-Risk (EaR) and Economic Value of Equity (EVE) are used to assess interest rate risk/rate of return risk in the banking book. They are computed based on the re-pricing gap profile of the banking book using BNM’s standard template. Assets and liabilities are bucketed based on their remaining tenure to maturity or next re-price dates. The measurement of EaR and EVE is conducted on a monthly basis.
The Group ALCO supports the board risk committees in establishing policies, strategies and limits for the management of balance sheet risk exposure. The Group ALM within Group Risk Management supports the Group ALCO in the monthly monitoring and reporting of the interest rate/rate of return risk profile of the banking book. The primary objective in managing balance sheet risk is to manage the net interest/profit income and economic value of equity, as well as to ensure that interest rate risk/rate of return risk exposures in the banking book are maintained within defined risk tolerances.
In addition, the Group ALM Policy is established to provide the governance of interest rate risk/rate of return risk in the banking book. Interest/benchmark rate sensitivity triggers are applied on earnings for the respective profit centres within the Group. The Group regularly considers the economics and necessity of increasing or reducing its interest rate risk/rate of return risk hedges.
In line with the Group ALM Policy to achieve a balance between profitability from banking activities and minimising risk to earnings and capital from changes in interest/benchmark rates, interest rate risk/rate of return risk to earnings is controlled using Risk Appetite, MATs and identified escalation procedures.
Stress testing is also performed regularly to determine the adequacy of capital in meeting the impact of extreme interest/benchmark rate movements on the balance sheet. Such tests are also performed to provide early warnings of potential extreme losses, facilitating proactive management of interest rate risk/rate of return risk in the banking book in an environment of rapid financial market changes.
10.0 INTEREST RATE RISK/RATE OF RETURN RISK IN THE BANKING BOOK (CONTINUED)
The impact of changes in interest/benchmark rates to net earnings and economic value as at 31 December 2020 and 31 December 2019 are shown in the following tables:
Table 24a: Interest Rate Risk/Rate of Return Risk in the Banking Book as at 31 December 2020
RHB Bank Group Impact on Position as at Reporting Period (100 basis points) Parallel Shift Increase/(Decline) in Earnings Increase/(Decline) in Economic Value
Currency
Impact based on +100 basis points
RM’000
Impact based on -100 basis points
RM’000
Impact based on +100 basis points
RM’000
Impact based on -100 basis points
RM’000
MYR - Malaysian Ringgit 410,029 (410,029) (1,740,640) 1,740,640 USD - US Dollar (24,777) 24,777 68,963 (68,963)Others1 54,748 (54,748) (455) 455 Total 440,000 (440,000) (1,672,132) 1,672,132
Table 24b: Interest Rate Risk/Rate of Return Risk in the Banking Book as at 31 December 2019
RHB Bank Group Impact on Position as at Reporting Period (100 basis points) Parallel ShiftIncrease/(Decline) in Earnings Increase/(Decline) in Economic Value
Currency
Impact based on +100 basis points
RM’000
Impact based on -100 basis points
RM’000
Impact based on +100 basis points
RM’000
Impact based on -100 basis points
RM’000
MYR - Malaysian Ringgit 373,909 (373,909) (1,699,034) 1,699,034
USD - US Dollar (51,195) 51,195 83,528 (83,528)
Others1 37,944 (37,944) (1,526) 1,526
Total 360,658 (360,658) (1,617,032) 1,617,032
Note:1. Inclusive of GBP, EUR, SGD, etc.2. The EaR and EVE exposures are additive and do not take into account any correlation impact in the aggregation.3. The earnings and economic values were computed based on the standardised approach adopted by BNM.
The impact to net earnings above represents financial assets and liabilities that have been prepared on the following basis:
• Interest/benchmark rate sensitive assets and liabilities with residual maturity or re-pricing tenure of up to one year that is not captured in the trading portfolio are slotted into time bands based on the maturity or re-pricing tenure, whichever is earlier.
• A set of risk weights with its respective time band is used to project the applicable basis point interest/benchmark rate change impact.
• For assets and liabilities with non-fix maturity, e.g., current and savings accounts, certain assumptions are made to reflect the actual sensitivity behaviour of interest/benchmark rate bearing items.
Economic value is characterised by the impact of interest/benchmark rates changes on the value of all net cash flows, i.e., the effect on the economic value of the Group’s assets, liabilities and off-balance sheet positions. This provides a more comprehensive view of the potential long-term effects of changes in interest/benchmark rates than is offered by the earnings perspective. The scenarios used are based on the assumption that all key variables for all maturities move at the same time and by the same magnitude and do not incorporate actions that would be otherwise taken by the business units and risk management to mitigate the effect of this movement in key variables.
RHB
Ban
k B
erha
d -
Fina
ncia
l Rep
ort
2020
RHB
Ban
k B
erha
d -
Fina
ncia
l Rep
ort
2020
286
287STATUTORY FINANCIAL STATEMENTS
www.rhbgroup.com
BASEL II PILLAR 3 DISCLOSURESas at 31 December 2020
11.0 OPERATIONAL RISK
Operational risk is the risk of loss resulting from inadequate or failed internal processes, people, systems and/or external events, which also includes IT, legal and Shariah non-compliance risk but excludes strategic and reputational risk. Operational risk is inherent in the Group’s operations and can never be eliminated entirely. The impact can be in the form of actual financial loss as well as non-financial loss such as loss of reputation, non-compliance and unsatisfactory service level to customers.
One of the Group’s primary safeguards against operational risk is the existence of a sound internal control system, based on the principle of dual control checks and balances, segregation of duties, independent checks and verification processes, and a segmented system access control and authorisation process. These controls are documented through a set of policies and procedures at the respective business and operation level.
The Group’s Operational Risk Management Framework comprises a wide range of activities and elements, broadly classified into:
Analysis and Enhancement • The Group has implemented a Basel II compliant operational risk management system to support its workflow and analytical capabilities.
Education and Awareness • The Group undertakes change management activities to improve risk management knowledge, culture and practices of the Group personnel. This is aligned with the principle and requirement that the front-line business and support units of the Group, are by nature of their direct involvement in interfacing with customers and in operating the business, responsible for managing operational risk and acting as the first line of defence.
Monitoring and Intervention • This is where the principal head office risk control units, including the risk management function, compliance function and the internal audit function, actively manage operational non-compliances and incidences as a second and third line of defence respectively. The second line of defence also monitors and oversees the recovery actions, including business continuity measures in cases of incidents causing disruption to business activities as proposed and undertaken by First Line of Defense.
Operational Risk Management Function and Organisation
The Group Operational Risk Management within Group Risk Management has functional responsibility for the development of operational risk framework, policy and methodologies, and providing guidance and information to the business units on operational risk areas. Its responsibility also includes generating a broader understanding and awareness of operational risk issues at all levels in the Group. It also ensures that operational risks from new products, processes and systems are adequately managed and mitigated.
The respective business and support units are primarily responsible for managing operational risk on a day-to-day basis.
Regular operational risk reporting is made to the senior management, respective committees and the Board that includes various operational risk information such as risk analysis, risk mitigation action plans, risk tools outcomes, risk appetite breaches, significant operational risk events and control failures, and lessons learnt. In addition, key operational risk incidents are reported to senior management daily. Such reporting enables senior management to be informed and deliberate on the identified operational lapses, promptness of corrective actions, and to ensure appropriate risk mitigation decision making and action plans are performed.
11.0 OPERATIONAL RISK (CONTINUED)
Operational Risk Management Processes and Tools
The Group applies a defined operational risk management process in managing operational risk to enable an institutional and transparent operational risk management practice. The five (5) processes are as follows:
1. Establish the context;2. Risk identification;3. Risk analysis;4. Risk mitigating; and5. Risk monitoring.
The Group uses relevant operational risk tools and methodologies to support and ensure an effective operational risk management process. The following tools are being used:
• Risk and Control Self-Assessment (RCSA)
RCSA is a methodology to build risk profile for each business and support unit. RCSA sets out a structured process for the identification and assessment of inherent operational risk, the effectiveness of the control environment, and the adequacy of the risk mitigation in place. The RCSA process is facilitated by the business and support units themselves jointly with personnel from Group Operational Risk Management.
• Key Risk Indicators (KRI)
KRI is a measurable indicator utilised to track and monitor key operational risk exposures. KRI serves as an early warning signal; once a risk indicator exceeds the predefined threshold, a warning message is sent to a predefined list of users. Business and support units are required to monitor their risk exposures via KRIs and are required to develop specific and concrete plans to address those where indicators are unfavourable. KRIs are embedded into critical processes to provide early warning signals of increasing risk and/or control failures by flagging up frequencies of events as a mechanism for continuous risk assessment and monitoring.
• Key Control Testing (KCT)
KCT is a methodology to assist business/functional units in performing assessments periodically to determine the effectiveness of key controls by evaluating whether the control procedures/activities are adequately designed to achieve the goals of the function and control objectives; and testing whether the key controls are operating as intended in actual practice. Effective KCT can lead to early detection of control weakness and deficiencies which will assist the senior management and business/functional units to quickly focus on control weakness and take concentrated efforts where they are most needed.
• Incident Management and Loss Data Collection (IMLDC)
IMLDC provides structured process for the reporting and management of operational risk incidents that have occurred, from the point of discovery until resolution. Business and functional units are required to report and manage all operational risk incidences and losses within defined timeline with further analysis of root cause to avoid further recurrence. Information obtained from such analysis could also be used to review the effectiveness of the RCSA and KRIs.
• Scenario Analysis
Scenario Analysis is used to identify plausible risk scenario that could materialise for assessment. A plausible risk scenario is a possible event resulting in unexpected and extreme losses which may arise when considering a sequence of control failures or individually significant events. Business/functional units are required to assess the potential outcomes related to a variety of operational risks failure, evaluate the vulnerabilities of the Group to the manifestation of plausible risk scenario, and put in appropriate risk mitigation plans to safeguard the Group’s safety and soundness.
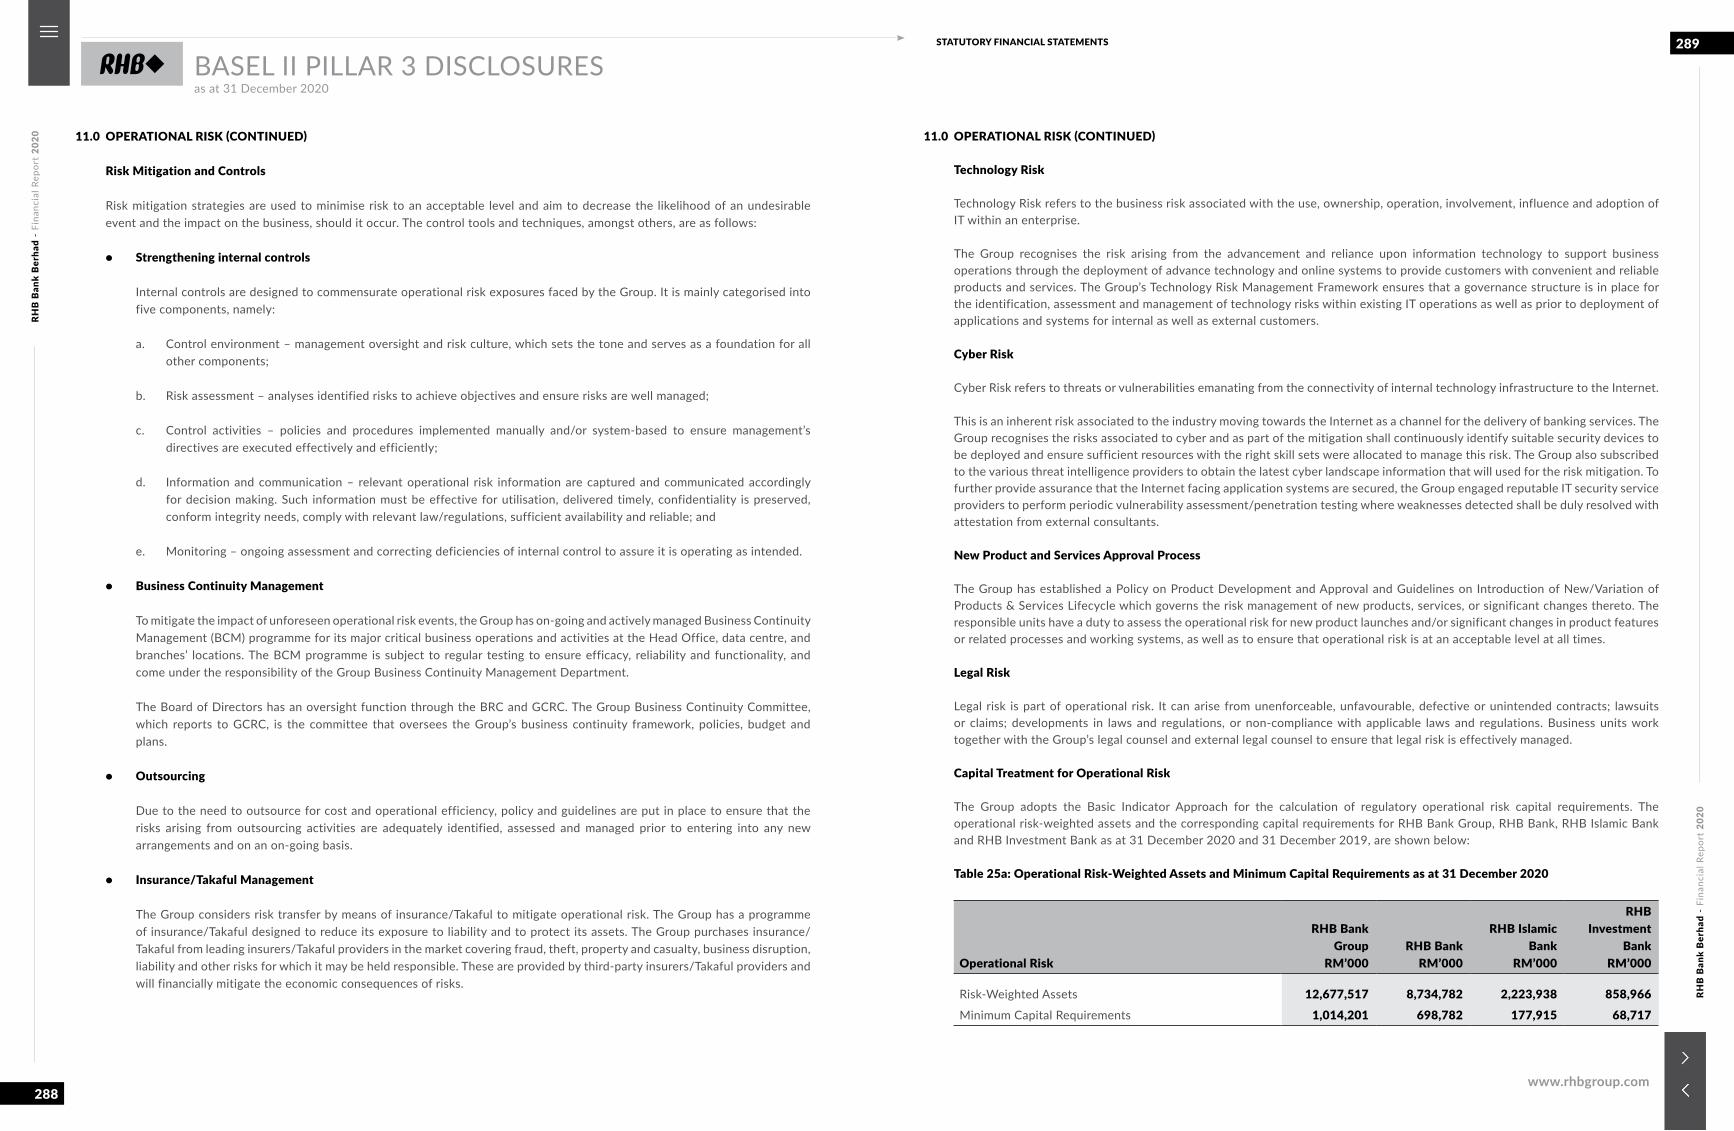
RHB
Ban
k B
erha
d -
Fina
ncia
l Rep
ort
2020
RHB
Ban
k B
erha
d -
Fina
ncia
l Rep
ort
2020
288
289STATUTORY FINANCIAL STATEMENTS
www.rhbgroup.com
BASEL II PILLAR 3 DISCLOSURESas at 31 December 2020
11.0 OPERATIONAL RISK (CONTINUED)
Risk Mitigation and Controls
Risk mitigation strategies are used to minimise risk to an acceptable level and aim to decrease the likelihood of an undesirable event and the impact on the business, should it occur. The control tools and techniques, amongst others, are as follows:
• Strengthening internal controls
Internal controls are designed to commensurate operational risk exposures faced by the Group. It is mainly categorised into five components, namely:
a. Control environment – management oversight and risk culture, which sets the tone and serves as a foundation for all other components;
b. Risk assessment – analyses identified risks to achieve objectives and ensure risks are well managed;
c. Control activities – policies and procedures implemented manually and/or system-based to ensure management’s directives are executed effectively and efficiently;
d. Information and communication – relevant operational risk information are captured and communicated accordingly for decision making. Such information must be effective for utilisation, delivered timely, confidentiality is preserved, conform integrity needs, comply with relevant law/regulations, sufficient availability and reliable; and
e. Monitoring – ongoing assessment and correcting deficiencies of internal control to assure it is operating as intended.
• Business Continuity Management
To mitigate the impact of unforeseen operational risk events, the Group has on-going and actively managed Business Continuity Management (BCM) programme for its major critical business operations and activities at the Head Office, data centre, and branches’ locations. The BCM programme is subject to regular testing to ensure efficacy, reliability and functionality, and come under the responsibility of the Group Business Continuity Management Department.
The Board of Directors has an oversight function through the BRC and GCRC. The Group Business Continuity Committee, which reports to GCRC, is the committee that oversees the Group’s business continuity framework, policies, budget and plans.
• Outsourcing
Due to the need to outsource for cost and operational efficiency, policy and guidelines are put in place to ensure that the risks arising from outsourcing activities are adequately identified, assessed and managed prior to entering into any new arrangements and on an on-going basis.
• Insurance/Takaful Management
The Group considers risk transfer by means of insurance/Takaful to mitigate operational risk. The Group has a programme of insurance/Takaful designed to reduce its exposure to liability and to protect its assets. The Group purchases insurance/Takaful from leading insurers/Takaful providers in the market covering fraud, theft, property and casualty, business disruption, liability and other risks for which it may be held responsible. These are provided by third-party insurers/Takaful providers and will financially mitigate the economic consequences of risks.
11.0 OPERATIONAL RISK (CONTINUED)
Technology Risk
Technology Risk refers to the business risk associated with the use, ownership, operation, involvement, influence and adoption of IT within an enterprise.
The Group recognises the risk arising from the advancement and reliance upon information technology to support business operations through the deployment of advance technology and online systems to provide customers with convenient and reliable products and services. The Group’s Technology Risk Management Framework ensures that a governance structure is in place for the identification, assessment and management of technology risks within existing IT operations as well as prior to deployment of applications and systems for internal as well as external customers.
Cyber Risk
Cyber Risk refers to threats or vulnerabilities emanating from the connectivity of internal technology infrastructure to the Internet.
This is an inherent risk associated to the industry moving towards the Internet as a channel for the delivery of banking services. The Group recognises the risks associated to cyber and as part of the mitigation shall continuously identify suitable security devices to be deployed and ensure sufficient resources with the right skill sets were allocated to manage this risk. The Group also subscribed to the various threat intelligence providers to obtain the latest cyber landscape information that will used for the risk mitigation. To further provide assurance that the Internet facing application systems are secured, the Group engaged reputable IT security service providers to perform periodic vulnerability assessment/penetration testing where weaknesses detected shall be duly resolved with attestation from external consultants.
New Product and Services Approval Process
The Group has established a Policy on Product Development and Approval and Guidelines on Introduction of New/Variation of Products & Services Lifecycle which governs the risk management of new products, services, or significant changes thereto. The responsible units have a duty to assess the operational risk for new product launches and/or significant changes in product features or related processes and working systems, as well as to ensure that operational risk is at an acceptable level at all times.
Legal Risk
Legal risk is part of operational risk. It can arise from unenforceable, unfavourable, defective or unintended contracts; lawsuits or claims; developments in laws and regulations, or non-compliance with applicable laws and regulations. Business units work together with the Group’s legal counsel and external legal counsel to ensure that legal risk is effectively managed.
Capital Treatment for Operational Risk
The Group adopts the Basic Indicator Approach for the calculation of regulatory operational risk capital requirements. The operational risk-weighted assets and the corresponding capital requirements for RHB Bank Group, RHB Bank, RHB Islamic Bank and RHB Investment Bank as at 31 December 2020 and 31 December 2019, are shown below:
Table 25a: Operational Risk-Weighted Assets and Minimum Capital Requirements as at 31 December 2020
Operational Risk
RHB BankGroup
RM’000RHB Bank
RM’000
RHB IslamicBank
RM’000
RHB Investment
BankRM’000
Risk-Weighted Assets 12,677,517 8,734,782 2,223,938 858,966Minimum Capital Requirements 1,014,201 698,782 177,915 68,717
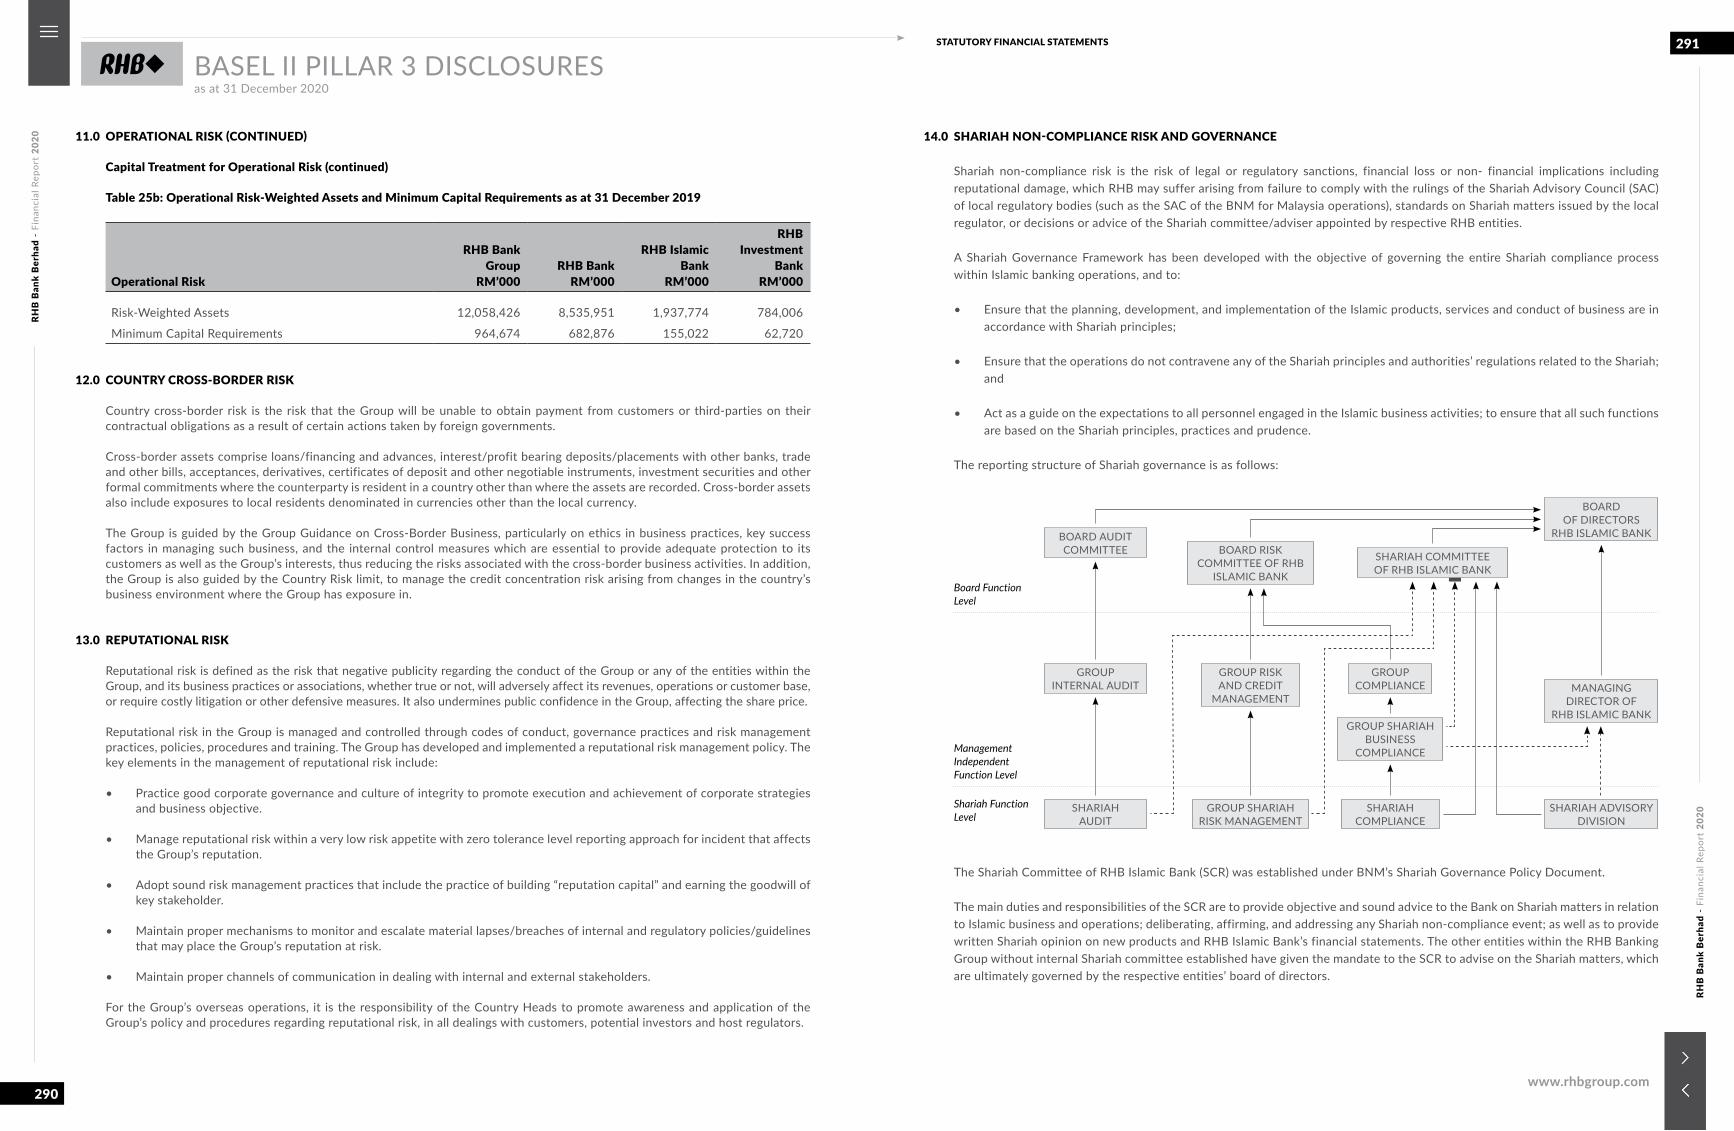
RHB
Ban
k B
erha
d -
Fina
ncia
l Rep
ort
2020
RHB
Ban
k B
erha
d -
Fina
ncia
l Rep
ort
2020
290
291STATUTORY FINANCIAL STATEMENTS
www.rhbgroup.com
BASEL II PILLAR 3 DISCLOSURESas at 31 December 2020
11.0 OPERATIONAL RISK (CONTINUED)
Capital Treatment for Operational Risk (continued)
Table 25b: Operational Risk-Weighted Assets and Minimum Capital Requirements as at 31 December 2019
Operational Risk
RHB Bank Group
RM’000RHB Bank
RM’000
RHB Islamic Bank
RM’000
RHB Investment
BankRM’000
Risk-Weighted Assets 12,058,426 8,535,951 1,937,774 784,006
Minimum Capital Requirements 964,674 682,876 155,022 62,720
12.0 COUNTRY CROSS-BORDER RISK
Country cross-border risk is the risk that the Group will be unable to obtain payment from customers or third-parties on their contractual obligations as a result of certain actions taken by foreign governments.
Cross-border assets comprise loans/financing and advances, interest/profit bearing deposits/placements with other banks, trade and other bills, acceptances, derivatives, certificates of deposit and other negotiable instruments, investment securities and other formal commitments where the counterparty is resident in a country other than where the assets are recorded. Cross-border assets also include exposures to local residents denominated in currencies other than the local currency.
The Group is guided by the Group Guidance on Cross-Border Business, particularly on ethics in business practices, key success factors in managing such business, and the internal control measures which are essential to provide adequate protection to its customers as well as the Group’s interests, thus reducing the risks associated with the cross-border business activities. In addition, the Group is also guided by the Country Risk limit, to manage the credit concentration risk arising from changes in the country’s business environment where the Group has exposure in.
13.0 REPUTATIONAL RISK
Reputational risk is defined as the risk that negative publicity regarding the conduct of the Group or any of the entities within the Group, and its business practices or associations, whether true or not, will adversely affect its revenues, operations or customer base, or require costly litigation or other defensive measures. It also undermines public confidence in the Group, affecting the share price.
Reputational risk in the Group is managed and controlled through codes of conduct, governance practices and risk management practices, policies, procedures and training. The Group has developed and implemented a reputational risk management policy. The key elements in the management of reputational risk include:
• Practice good corporate governance and culture of integrity to promote execution and achievement of corporate strategies and business objective.
• Manage reputational risk within a very low risk appetite with zero tolerance level reporting approach for incident that affects the Group’s reputation.
• Adopt sound risk management practices that include the practice of building “reputation capital” and earning the goodwill of key stakeholder.
• Maintain proper mechanisms to monitor and escalate material lapses/breaches of internal and regulatory policies/guidelines that may place the Group’s reputation at risk.
• Maintain proper channels of communication in dealing with internal and external stakeholders.
For the Group’s overseas operations, it is the responsibility of the Country Heads to promote awareness and application of the Group’s policy and procedures regarding reputational risk, in all dealings with customers, potential investors and host regulators.
14.0 SHARIAH NON-COMPLIANCE RISK AND GOVERNANCE
Shariah non-compliance risk is the risk of legal or regulatory sanctions, financial loss or non- financial implications including reputational damage, which RHB may suffer arising from failure to comply with the rulings of the Shariah Advisory Council (SAC) of local regulatory bodies (such as the SAC of the BNM for Malaysia operations), standards on Shariah matters issued by the local regulator, or decisions or advice of the Shariah committee/adviser appointed by respective RHB entities.
A Shariah Governance Framework has been developed with the objective of governing the entire Shariah compliance process within Islamic banking operations, and to:
• Ensure that the planning, development, and implementation of the Islamic products, services and conduct of business are in accordance with Shariah principles;
• Ensure that the operations do not contravene any of the Shariah principles and authorities’ regulations related to the Shariah; and
• Act as a guide on the expectations to all personnel engaged in the Islamic business activities; to ensure that all such functions are based on the Shariah principles, practices and prudence.
The reporting structure of Shariah governance is as follows:
The Shariah Committee of RHB Islamic Bank (SCR) was established under BNM’s Shariah Governance Policy Document.
The main duties and responsibilities of the SCR are to provide objective and sound advice to the Bank on Shariah matters in relation to Islamic business and operations; deliberating, affirming, and addressing any Shariah non-compliance event; as well as to provide written Shariah opinion on new products and RHB Islamic Bank’s financial statements. The other entities within the RHB Banking Group without internal Shariah committee established have given the mandate to the SCR to advise on the Shariah matters, which are ultimately governed by the respective entities’ board of directors.
BOARD AUDITCOMMITTEE BOARD RISK
COMMITTEE OF RHB ISLAMIC BANK
SHARIAH COMMITTEEOF RHB ISLAMIC BANK
BOARDOF DIRECTORS
RHB ISLAMIC BANK
MANAGINGDIRECTOR OF
RHB ISLAMIC BANK
SHARIAH ADVISORYDIVISION
GROUP RISKAND CREDIT
MANAGEMENT
GROUP SHARIAH RISK MANAGEMENT
GROUPINTERNAL AUDIT
GROUPCOMPLIANCE
SHARIAHCOMPLIANCE
GROUP SHARIAHBUSINESS
COMPLIANCE
SHARIAHAUDIT
Board Function Level
Management Independent Function Level
Shariah Function Level
RHB
Ban
k B
erha
d -
Fina
ncia
l Rep
ort
2020
RHB
Ban
k B
erha
d -
Fina
ncia
l Rep
ort
2020
292
293STATUTORY FINANCIAL STATEMENTS
www.rhbgroup.com
BASEL II PILLAR 3 DISCLOSURESas at 31 December 2020
14.0 SHARIAH NON-COMPLIANCE RISK AND GOVERNANCE (CONTINUED)
On a functional basis, the RHB Banking Group Islamic businesses are supported by Shariah Advisory Division, Group Shariah Risk Management, Group Shariah Business Compliance and Shariah Audit.
The Head of Shariah Advisory Division reports functionally to the SCR and administratively to the Managing Director of RHB Islamic Bank.
The main duties and responsibilities of Shariah Advisory Division include, but not limited to, conduct reviews on Islamic products and services; provide internal Shariah advisory support to the management in its daily business and operational matters; assist the SCR in elaborating and discussing on pertinent Shariah issues; provide in-depth research on competitive analysis in order to assist the SCR’s decision-making process; ensure the internal Shariah governance, the internal process flow and policies, and Shariah approval processes are well managed and maintained in an efficient manner; ensure the Bank is in compliance with the highest standard of Shariah governance as set by BNM; serve as the secretariat of the SCR and to act as the mediator between the management and the SCR; oversee the computation and distribution of zakat and funds to be channelled to charity; and to represent the management in any Shariah related matters.
The key role and responsibilities of Group Shariah Risk Management is to facilitate the process of identifying, measuring, monitoring and controlling of Shariah non-compliance risks inherent in the Islamic business and operations to mitigate any potential Shariah non-compliance events. Group Shariah Risk Management also performs independent assessment and provides support relating to Shariah non-compliance risk.
Group Shariah Business Compliance conducts review and assists the SCR in providing opinions from Shariah perspective in relation to the status of Shariah compliance of products, services and operations of the Islamic business operations. Shariah Audit provides independent assessment and objective assurance designed to add value and improve the degree of compliance in relation to the Islamic business operations, with the main objective of ensuring a sound and effective internal control system for Shariah compliance.
Any incidences of Shariah non-compliance decided by the SCR are reported to the GCRC, Board Risk Committee-i, BRC, the Board of Directors of respective entities in RHB Banking Group and the BNM (for Malaysia operations). Remedial actions may include the immediate termination of the Shariah non-compliant products or services and de-recognition of any Shariah non-compliant income.
There are 4 Shariah Non-Compliance events reported during the year 2020 with income de-recognised amounting to RM360,426.82. This amount has been channelled to charity during the same year.
15.0 FORWARD LOOKING STATEMENTS
This document could or may contain forward looking statements that are based on current expectations as well as assumptions or anticipation of future events. These forward looking statements can be identified by the fact that they do not relate only to historical or current facts, and often use words such as anticipate, target, expect, estimate, intend, plan, believe, will, may, should, would, could or other words of similar expressions.
Undue reliance should not be placed on any of such statements. By their nature, forward looking statements are subject to risks and uncertainty because they relate to future events and circumstances, including, but not limited to domestic and global economic and business conditions, the effects of continued volatility in the credit markets, market-related risks such as changes in interest/profit rates and exchange rates, changes in regulation, and future business combinations or dispositions. As a result, the Group’s actual future results may differ materially from the plans, goals, and the expectations contained in the forward looking statements.
The Group undertakes no obligation to revise or update any forward looking statements contained in this document, regardless of whether these statements are affected as a result of new information, future events or otherwise.
15.0 FORWARD LOOKING STATEMENTS (CONTINUED)
Table 26: Glossary of Terms
A-IRB Advanced Internal Ratings-Based Approach
BCC Board Credit Committee
BCM Business Continuity Management
BNM Bank Negara Malaysia
Board Board of Directors
BRC Board Risk Committee
CAFIB Capital Adequacy Framework for Islamic Banks
CCB Capital Conservation Buffer
CCR Counterparty Credit Risk
CCyB Countercyclical Capital Buffer
CET Common Equity Tier
CRM Credit Risk Mitigation
DFIs Development Financial Institutions
DRP Dividend Reinvestment Plan
EAD Exposure at Default
EaR Earnings-at-Risk
ECAIs External Credit Assessment Institutions
EL Expected Loss
EUR Euro Dollar
EVE Economic Value of Equity
F-IRB Foundation Internal Ratings-Based Approach
Fitch Fitch Ratings
GBP Pound Sterling
GCC Group Credit Committee
GCG Group Credit Guidelines
GCPM Group Credit Procedures Manual
GCRC Group Capital and Risk Committee
GIUC Group Investment Underwriting Committee
GMC Group Management Committee
Group ALCO Group Asset and Liability Committee
Group ALM Group Asset and Liability Management
IBRMC Investment Bank Risk Management Committee
ICAAP Internal Capital Adequacy Assessment Process
IMLDC Incident Management and Loss Data Collection
IRB Approach Internal Ratings-Based Approach
ISDA International Swaps and Derivatives Association
KCT Key Control Testing
KRI Key Risk Indicators
LCR Liquidity Coverage Ratio
LGD Loss Given Default
MARC Malaysian Rating Corporation Berhad
MATs Management Action Triggers
MDBs Multilateral Development Banks
MFRS 9 Malaysian Financial Reporting Standards 9
MFRS 139 Malaysian Financial Reporting Standards 139
Moody’s Moody’s Investor Services
MYR Malaysian Ringgit
NSFR Net Stable Funding Ratio
OTC Over-the-Counter
PD Probability of Default
PSIA Profit Sharing Investment Accounts
R&I Rating and Investment Information, Inc
RAM Rating Agency Malaysia
RCSA Risk and Control Self-Assessment
RM’000 Malaysian Ringgit in nearest thousand
RSMEs Retail Small and Medium Sized Enterprises
RWCAF Risk-Weighted Capital Adequacy Framework
RWA Risk-Weighted Assets
SA Standardised Approach
SCR Shariah Committee of RHB Islamic Bank
SGD Singapore Dollar
S&P Standard & Poor's
USD US Dollar
VaR Value-at-Risk

w w w . r h b g r o u p . c o m
RHB Bank Berhad 196501000373 (6171-M)
Level 10, Tower One, RHB Centre, Jalan Tun Razak50400 Kuala Lumpur, Malaysia
Tel : +603-9287 8888 Fax : +603-9281 9314facebook.com/RHBGroup
FINANCIAL REPORT 2020