what four million mappings can tell you about two hundred ontologies
TRANSCRIPT
What Four Million Mappings Can Tell You About TwoHundred Ontologies
Amir Ghazvinian, Natalya F. Noy, Clement Jonquet, Nigam Shah, Mark A. Musen
Stanford University, Stanford, CA 94305, US{amirg,noy,jonquet,nigam,musen}@stanford.edu
Abstract. The field of biomedicine has embraced the Semantic Web probablymore than any other field. As a result, there is a large number of biomedical on-tologies covering overlapping areas of the field. We have developed BioPortal—an open community-based repository of biomedical ontologies. We analyzed on-tologies and terminologies in BioPortal and the Unified Medical Language Sys-tem (UMLS), creating more than 4 million mappings between concepts in theseontologies and terminologies based on the lexical similarity of concept namesand synonyms. We then analyzed the mappings and what they tell us about theontologies themselves, the structure of the ontology repository, and the ways inwhich the mappings can help in the process of ontology design and evaluation.For example, we can use the mappings to guide users who are new to a field tothe most pertinent ontologies in that field, to identify areas of the domain that arenot covered sufficiently by the ontologies in the repository, and to identify whichontologies will serve well as background knowledge in domain-specific tools.While we used a specific (but large) ontology repository for the study, we believethat the lessons we learned about the value of a large-scale set of mappings toontology users and developers are general and apply in many other domains.
1 Why Create the Mappings?
The field of biomedicine has embraced the Semantic Web probably more than anyother field. Ontologies in biomedicine facilitate information integration, data exchange,search and query of heterogeneous biomedical data, and other critical knowledge-intensivetasks [12]. As a result, there is a large number of biomedical ontologies covering over-lapping areas of the field [3]. Creating mappings among ontologies by identifying sim-ilar concepts is a critical step in integrating data and applications that use differentontologies. With these mappings, for example, we can link resources annotated withterms in one ontology to resources annotated with related terms in another ontology,discovering new relations among the resources themselves (e.g., linking drugs and dis-eases).
As part of our work for the National Center for Biomedical Ontology (NCBO),we have developed BioPortal—an open community-based repository of biomedical on-tologies [10].1 This repository contains 140 ontologies with more than one million con-cepts among them. We view mappings between concepts in different ontologies as an
1 http://bioportal.bioontology.org
225
hal-0
0489
094,
ver
sion
1 -
4 Ju
n 20
10Author manuscript, published in "8th International Semantic Web Conference, ISWC'09, Washington DC : United States (2009)"
essential part of the ontology repository. Users can browse the mappings, create newmappings, upload mappings created with other tools, download the mappings storedin BioPortal, or comment on the mappings and discuss them [11]. Other NCBO tools,such as a service for automatic creation of ontology-based text annotations [7], relyon the mappings to annotate biomedical resources with terms from different ontologiesand for linking these resources to one another.
Over the past year, our team and our collaborators have uploaded more than 30,000mappings to BioPortal. However, these mappings constitute only a tiny subset of themappings between concepts in BioPortal ontologies. Thus, one of our goals was to usesimple methods to generate quickly a large number of high-precision mappings to in-clude in the repository. Our earlier studies have shown that in the case of biomedicalontologies simple lexical techniques, such as comparing preferred names of conceptsand their synonyms, are extremely effective in creating mappings [6]. We have reportedelsewhere [6] that this simple method for generating mappings achieves extremely highprecision for biomedical ontologies—where preferred names of concepts and synonymsare used extensively and represent a rich source of information. In addition, we com-pared our results with the gold standard produced by the Ontology Alignment Eval-uation Initiative (OAEI) [4]. For the use case of biomedical ontologies, our methodachieved levels of recall and precision comparable to the best tools in the competition.
We have applied this simple lexical matching of preferred names and synonyms togenerate mappings between concepts in BioPortal ontologies. In addition, the UnifiedMedical Language System (UMLS) [9] is a large collection of biomedical ontologiesand terminologies that the researchers at the US National Library of Medicine haveintegrated. We plan to include UMLS terminologies in BioPortal in the near future andthus, when creating the mappings, we included the UMLS terminologies as well.
We generated mappings across all concepts in 140 BioPortal ontologies and 67UMLS terminologies with more than 4 million concepts among them. We had twogoals in generating the mappings: (1) we wanted to create a large set of mappings forthe BioPortal resource that other applications can access and use; and (2) we wantedto learn more about the characteristics of the ontologies and the relationships betweenthem. Using a set of more than 4 million mappings generated over our ontology set, wewould like to answer several practical questions with implications for ontology reuseand development. These questions include, but are not limited to, the following:
To what degree are the domains covered by different ontologies connected? Mappingout the connections between ontologies will help us understand which domains areclosely related, which ontologies may serve as a bridge between domains, and so on.
If you are new to a domain, what are the important or representative ontologies withgood coverage? Ontology developers seeking to develop or reuse knowledge froma particular domain will be interested to know which ontologies have good coveragewithin that domain.
If you want to build domain-specific tools for creating ontology mappings, what aregood ontologies to use for background knowledge? Many tools that seek to providemappings for the purpose of ontology alignment use background knowledge to improve
226
hal-0
0489
094,
ver
sion
1 -
4 Ju
n 20
10
their ability to produce valid and accurate mappings (e.g., [15, 1]). Such backgroundknowledge allows these tools to use information about the representation of the domainto identify equivalent concepts. Thus knowing which ontologies are optimal for use asa source of background knowledge may greatly improve these tools.
What can we learn about the characteristics of the ontologies themselves and the on-tology repository from the mappings between them? A set of mappings can provideinsight about the ontologies themselves, their importance to their respective domains,or their coverage.
Researchers have previously successfully applied network analysis to gain insightsinto the structure and connectedness of large data sets [8]. In this paper, we applynetwork-analysis methods to analyze the ontologies and their mappings, to answer thequestions posed above, and to reason about the distribution of mappings among theontologies.
Note that our analysis does not depend on the specific methods that was used togenerate the mappings and relies only on the fact that we have large set of high-precisionmappings.
This paper makes the following contributions:
– We demonstrate that large-scale mapping sets can be useful in understanding thestructure of an ontology repository, by identifying the most pertinent ontologies,the domains of overlap among ontologies, and the missing parts in an ontologyrepository.
– We propose network-based analysis metrics of ontologies based on mappings be-tween them.
– We produce a set of more than 4 million mappings for the repository of ontologiesand terminologies in BioPortal and UMLS.
2 Materials and Methods: What’s in a Link?
We will now describe how we created the mappings used in this study and what datawe analyzed.
We define a mapping as a relationship between two classes from different ontolo-gies. The mappings that we discuss in this paper are similarity mappings: we declarethat two classes from different ontologies are similar if the meaning that one class rep-resents is similar or identical to the meaning of the other. We use the term “mapping”throughout this paper to refer to similarity mapping.
2.1 The NCBO Ontology Set
To develop our mappings, we used a set of 207 ontologies in the domain of biomedicine.These ontologies include 140 ontologies in BioPortal and 67 terminologies in the UMLS.The ontologies in BioPortal come from two sources: (1) 70 ontologies are downloadednightly from the OBO Foundry repository;2 (2) 70 ontologies are submitted by theirdevelopers directly to BioPortal. Among them, the 207 ontologies and terminologiesthat we used in this study contained 4,021,662 concepts.
2 http://obofoundry.org
227
hal-0
0489
094,
ver
sion
1 -
4 Ju
n 20
10
2.2 Creating Lexical Mappings Between Concepts
We created the mappings using the following steps, which we describe in detail in therest of this section:
1. generate a database of terms used for preferred names and synonyms of ontologyconcepts;
2. normalize the strings in the database;3. find pairs of matching terms;4. create mappings between concepts based on the matching terms identified in the
previous step.
In the first step—creating a database of preferred names and synonyms of all con-cepts in all ontologies—we needed to identify for each ontology which properties con-tained the strings representing these preferred names and synonyms. All UMLS ter-minologies have preferred names and synonyms clearly identified for all the concepts.Many of the BioPortal ontologies are represented in the OBO format, which also hasdesignated properties to define preferred name and synonyms of a class. The OWLlanguage does not itself provide any special annotation properties to store preferrednames and synonyms (although many ontologies use rdfs:label for the former).3
Thus, when users submit an OWL ontology to BioPortal, we ask them to indicate whichOWL properties their ontology uses for preferred names and synonyms. We store thenames of these properties as part of ontology metadata.
Extracting all terms for preferred names and synonyms resulted in a database of7,637,125 terms. We then normalized all the strings, by converting them to lower caseand removing all delimiters (e.g., spaces, underscores, parentheses, etc.). We used amySQL database to store each term along with the ID for the ontology and the conceptthat it came from.
We used an SQL query to find pairs of matched terms among the normalized terms.From the database table of normalized terms, we utilized an SQL query to identify pairsof terms that matched exactly. To improve precision, we compared only strings with atleast three characters and ignored the strings with three characters or less.
Since each term refers to a preferred name or synonym of a specific concept from aparticular ontology, we used matching terms to connect concepts from different ontolo-gies.
Consider the following example. The class “Myocardium” in Foundational Modelof Anatomy (FMA) has the preferred name “Myocardium.” The class “Heart myocardium”in the ontology of Mouse adult gross anatomy has a synonym “myocardium.”4 We willmatch the two normalized terms “myocardium” and therefore create a mapping be-tween the two classes, “Myocardium” in FMA and “Heart myocardium” in Mouse adultgross anatomy ontology. Such mapping between the mouse myocardium represented inMouse adult gross anatomy ontology and the human myocardium represented in FMA
3 The Simple Knowledge Organization System (SKOS) provides the RDF-based vocabularyfor defining preferred names and synonyms for concepts, but so far none of the BioPortalontologies use SKOS.
4 http://bioportal.bioontology/org/ontologies
228
hal-0
0489
094,
ver
sion
1 -
4 Ju
n 20
10
can facilitate cross-species data exploration and integration. Having created this map-ping, we could then integrate data annotated with the concept “Heart myocardium” ina database describing mouse experiments and data annotated with “Myocardium” de-scribing human-related data.
This process resulted in a set of 4,001,775 mappings, where each each mappingrepresents a class from one ontology that is similar to a class from another ontology. Themapping is bi-directional as the similarity relationship generated this way is symmetric.
Note that UMLS itself contains a large set of manually created mappings betweenterms in different ontologies and terminologies. In the work described in this paper,we did not include those mappings. Rather, we used only the lexical mappings that wehave generated. In future work, we plan to include the mappings that UMLS providesfor additional information.
2.3 Identifying Links Between Ontologies
Because our goals include analysis of relations between ontologies and not individualconcepts, we define a link between two ontologies based on a set of mappings betweenconcepts from those ontologies. We use the notation mapping(c1, c2) to describe amapping between two concepts from different ontologies, such as the mappings that wedescribed in Section 2.2. We denote a set of all concept-to-concept mappings betweentwo ontologies S and T as M(S, T ), where M(S, T ) = {mapping(cs, ct), cs ∈ S, ct ∈T}.
Definition 1 (Mapping-Based Link Between Ontologies). Given two ontologies, thesource ontology S and the target ontology T , and a set of mappings between themM(S, T ), we say that there exists a mapping-based link L between ontologies S and Tiff M is not an empty set: M 6= ∅.
If two ontologies have at least one pair of concepts with similar names or synonymsbetween them, there will be a mapping-based link between the two ontologies. How-ever, a more meaningful measure is the number of links between two ontologies or,more precisely, the fraction of one ontology that is mapped to another. For instance, iftwo ontologies each have 1,000 concepts, then, intuitively, the two ontologies are muchcloser to each other if 700 of these concepts match than if 5 concepts do. Thus, we de-fine the notion of a percent-normalized link between ontologies which reflects not onlyhow many mappings one ontology has to another, but also normalizes this measure withrespect to the ontology size.
Definition 2 (Percent-Normalized Link Between Ontologies). Given two ontologies,the source ontology S and the target ontology T , and a set of mappings M(S, T ) be-tween them, we say that there is a percent-normalized link between S and T , Lp(S, T )where p ≥ 0 and p ≤ 100, iff at least p% of the concepts in the ontology S are sourcesfor the mappings in M(S, T ). We say that L0(S, T ) holds if there is at least one map-ping between concepts in S and T
For instance, if an ontology S has 1,000 concepts, and 500 of these concepts aremapped to concepts in an ontology T , then Lp(S, T ) is true for all values of p from 0%to 50%.
229
hal-0
0489
094,
ver
sion
1 -
4 Ju
n 20
10
Note that Lp(S, T ) is directional and it is entirely possible (and, in fact, common)for Lp(S, T ) to be true and for Lp(T, S) to be false at the same time. If one ontologyis much larger than another, a large fraction of the smaller ontology may be mapped tothe larger ontology, but the set of mappings still constitutes a small portion of the largerontology.
Intuitively, the percent-normalized link reflects how significant a set of mappingsbetween ontologies is in the context of those ontologies. We evaluated the distribution ofthese links for several different values of p. We determined what percent of all ontologylinks were present at different values of p. Additionally, we implemented a graphicalvisualization of the links at each of these thresholds to analyze the clustering patternsand the link distribution for different values of p. Finally, we counted the number oflinks for each ontology at different values. We used this data to analyze the frequencywith which an ontology has exactly k links.
3 Results
We used the data that we collected from the mappings to plot and analyze several met-rics: First, we analyzed the number of links between ontologies at different values of p(i.e., at varying sizes of the mapped portion of the ontology, normalized by the ontologysize) and the distribution of ontologies based on the number of links (Section 3.1). Sec-ond, we treated ontologies and the links between them as nodes and edges in a graph,again for several values of p. We analyzed the properties of these graphs as networks,using metrics such as the number of hubs and clusters (Section 3.2). Finally, we exam-ined the overall similarity of the ontologies (Section 3.3). We discuss and analyze ourresults in Section 4.
3.1 How many links do ontologies have?
Figure 1 shows a distribution of the number of links that ontologies have for two valuesof p: 20% (Figure 1a) and 1% (Figure 1b). Recall that when p = 20%, we create a linkbetween source ontology S and target ontology T iff at least 20% of concepts from Sare mapped to concepts from T . In other words, ontologies that we count in the graphon the right have a looser connection to each other than the ontologies in the graph onthe left. Due to lack of space, we do not present the graphs for values of p > 20%.5 Thedistribution for larger values of p is very similar to the distribution for p = 20%.
The graphs in Figure 1 show that the links between ontologies follow a power-lawdistribution for p = 20% (and larger values of p): There is a small number of ontologiesthat have large number of links and a large number of ontologies with just a few links.For smaller values of p, however, such as p = 1%, where we include ontologies withvery little overlap, our network becomes essentially random.
We analyzed the average distance between two nodes in the graph for some valuesof p. We found that for small values of p, the network is quite well connected and
5 This data is available at http://www.bioontology.org/wiki/index.php/Mapping_Set
230
hal-0
0489
094,
ver
sion
1 -
4 Ju
n 20
10
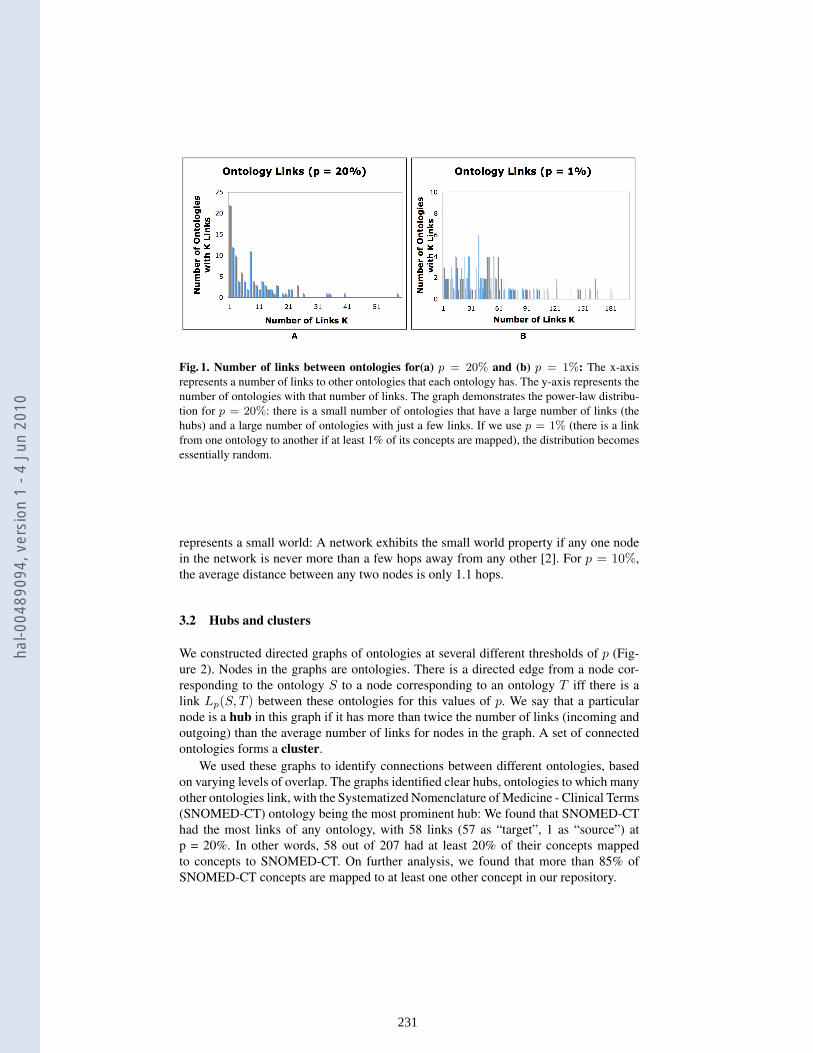
Fig. 1. Number of links between ontologies for(a) p = 20% and (b) p = 1%: The x-axisrepresents a number of links to other ontologies that each ontology has. The y-axis represents thenumber of ontologies with that number of links. The graph demonstrates the power-law distribu-tion for p = 20%: there is a small number of ontologies that have a large number of links (thehubs) and a large number of ontologies with just a few links. If we use p = 1% (there is a linkfrom one ontology to another if at least 1% of its concepts are mapped), the distribution becomesessentially random.
represents a small world: A network exhibits the small world property if any one nodein the network is never more than a few hops away from any other [2]. For p = 10%,the average distance between any two nodes is only 1.1 hops.
3.2 Hubs and clusters
We constructed directed graphs of ontologies at several different thresholds of p (Fig-ure 2). Nodes in the graphs are ontologies. There is a directed edge from a node cor-responding to the ontology S to a node corresponding to an ontology T iff there is alink Lp(S, T ) between these ontologies for this values of p. We say that a particularnode is a hub in this graph if it has more than twice the number of links (incoming andoutgoing) than the average number of links for nodes in the graph. A set of connectedontologies forms a cluster.
We used these graphs to identify connections between different ontologies, basedon varying levels of overlap. The graphs identified clear hubs, ontologies to which manyother ontologies link, with the Systematized Nomenclature of Medicine - Clinical Terms(SNOMED-CT) ontology being the most prominent hub: We found that SNOMED-CThad the most links of any ontology, with 58 links (57 as “target”, 1 as “source”) atp = 20%. In other words, 58 out of 207 had at least 20% of their concepts mappedto concepts to SNOMED-CT. On further analysis, we found that more than 85% ofSNOMED-CT concepts are mapped to at least one other concept in our repository.
231
hal-0
0489
094,
ver
sion
1 -
4 Ju
n 20
10
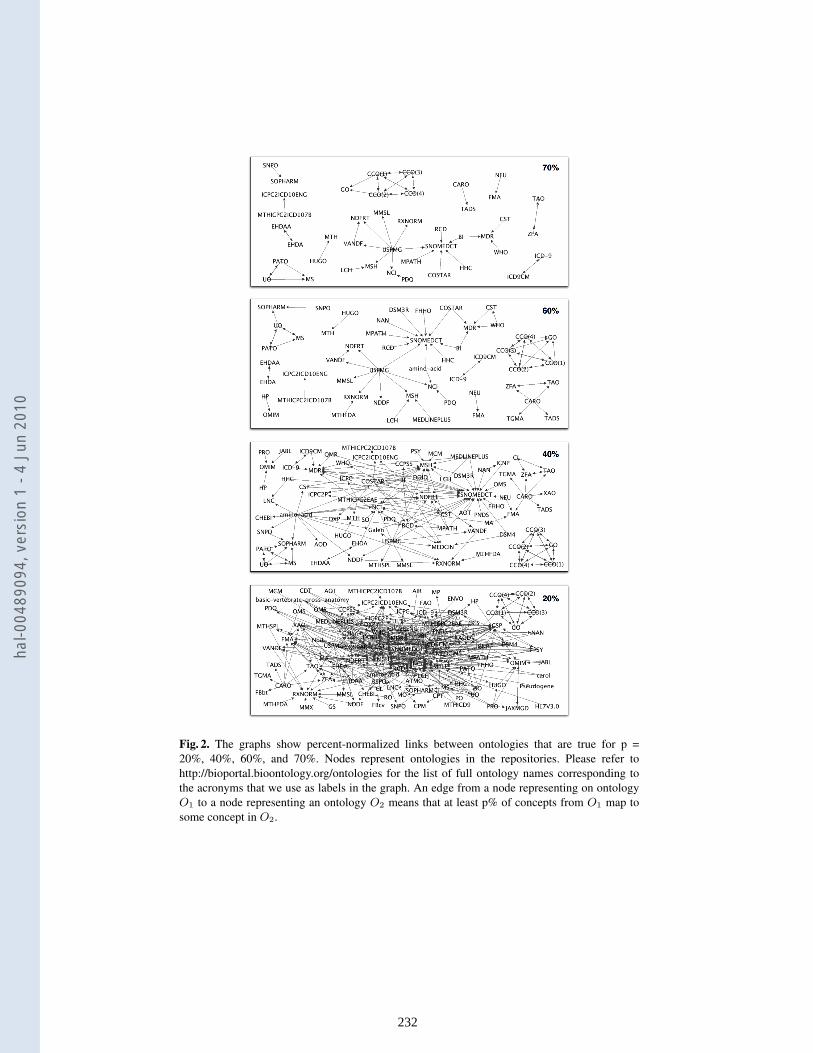
Fig. 2. The graphs show percent-normalized links between ontologies that are true for p =20%, 40%, 60%, and 70%. Nodes represent ontologies in the repositories. Please refer tohttp://bioportal.bioontology.org/ontologies for the list of full ontology names corresponding tothe acronyms that we use as labels in the graph. An edge from a node representing on ontologyO1 to a node representing an ontology O2 means that at least p% of concepts from O1 map tosome concept in O2.
232
hal-0
0489
094,
ver
sion
1 -
4 Ju
n 20
10
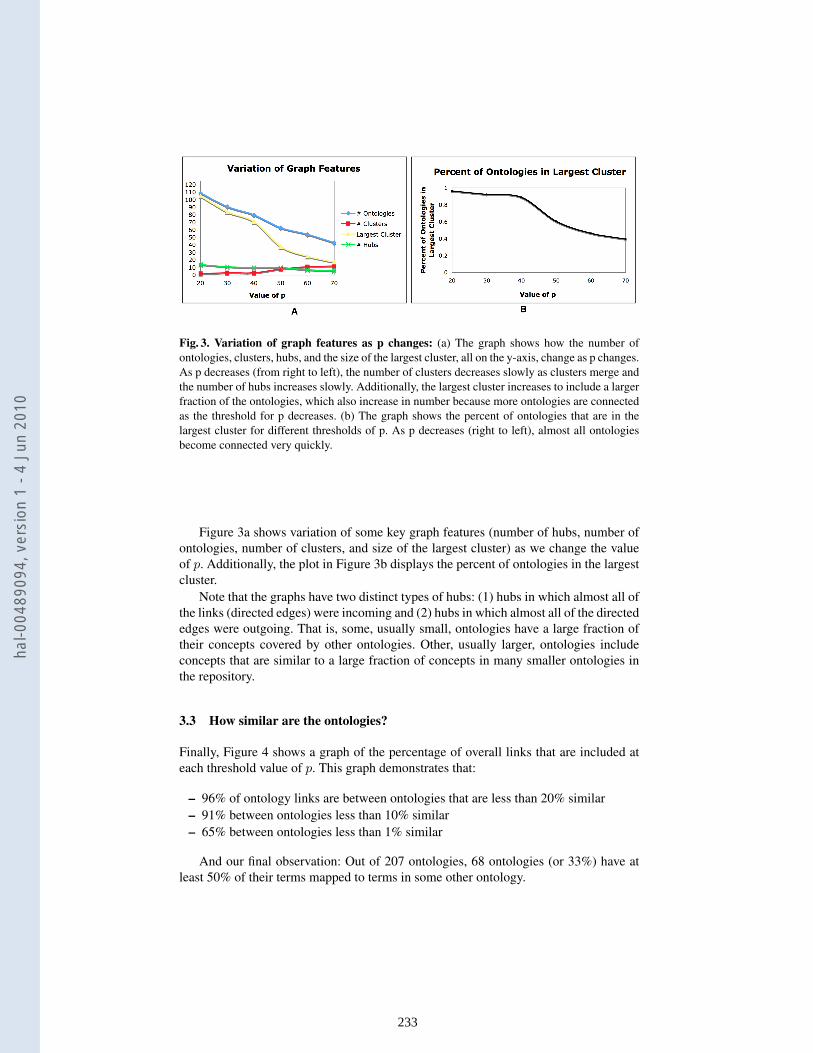
Fig. 3. Variation of graph features as p changes: (a) The graph shows how the number ofontologies, clusters, hubs, and the size of the largest cluster, all on the y-axis, change as p changes.As p decreases (from right to left), the number of clusters decreases slowly as clusters merge andthe number of hubs increases slowly. Additionally, the largest cluster increases to include a largerfraction of the ontologies, which also increase in number because more ontologies are connectedas the threshold for p decreases. (b) The graph shows the percent of ontologies that are in thelargest cluster for different thresholds of p. As p decreases (right to left), almost all ontologiesbecome connected very quickly.
Figure 3a shows variation of some key graph features (number of hubs, number ofontologies, number of clusters, and size of the largest cluster) as we change the valueof p. Additionally, the plot in Figure 3b displays the percent of ontologies in the largestcluster.
Note that the graphs have two distinct types of hubs: (1) hubs in which almost all ofthe links (directed edges) were incoming and (2) hubs in which almost all of the directededges were outgoing. That is, some, usually small, ontologies have a large fraction oftheir concepts covered by other ontologies. Other, usually larger, ontologies includeconcepts that are similar to a large fraction of concepts in many smaller ontologies inthe repository.
3.3 How similar are the ontologies?
Finally, Figure 4 shows a graph of the percentage of overall links that are included ateach threshold value of p. This graph demonstrates that:
– 96% of ontology links are between ontologies that are less than 20% similar– 91% between ontologies less than 10% similar– 65% between ontologies less than 1% similar
And our final observation: Out of 207 ontologies, 68 ontologies (or 33%) have atleast 50% of their terms mapped to terms in some other ontology.
233
hal-0
0489
094,
ver
sion
1 -
4 Ju
n 20
10
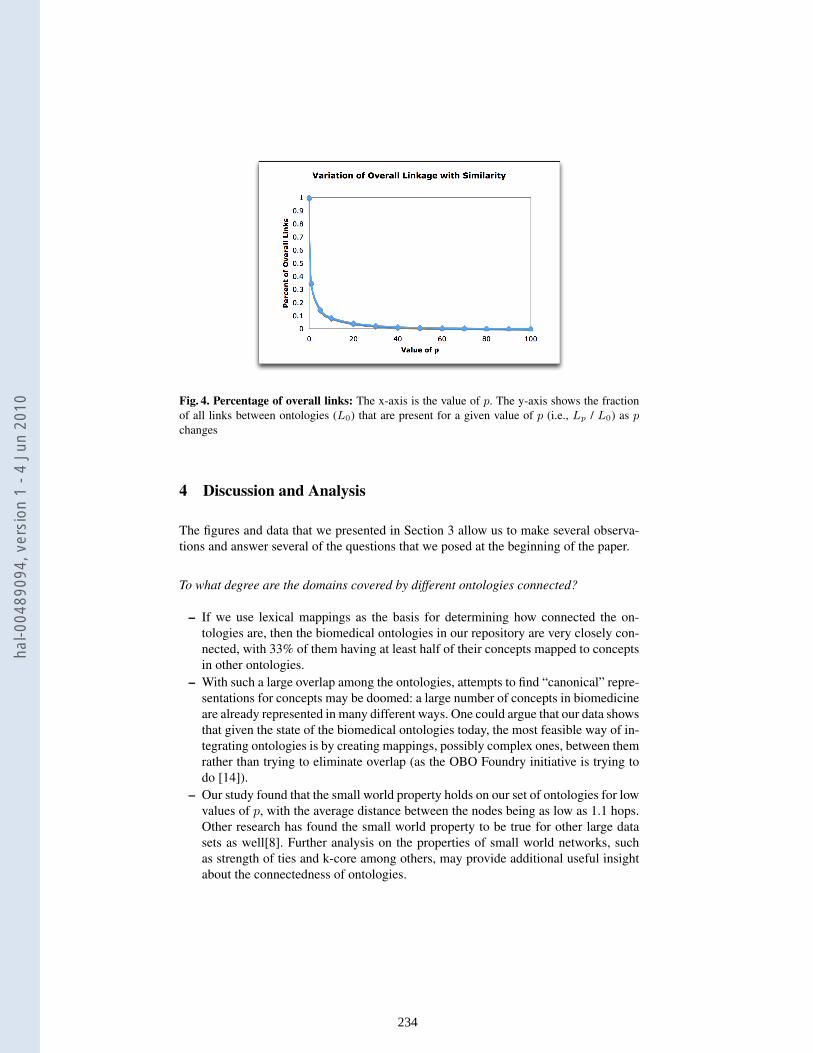
Fig. 4. Percentage of overall links: The x-axis is the value of p. The y-axis shows the fractionof all links between ontologies (L0) that are present for a given value of p (i.e., Lp / L0) as pchanges
4 Discussion and Analysis
The figures and data that we presented in Section 3 allow us to make several observa-tions and answer several of the questions that we posed at the beginning of the paper.
To what degree are the domains covered by different ontologies connected?
– If we use lexical mappings as the basis for determining how connected the on-tologies are, then the biomedical ontologies in our repository are very closely con-nected, with 33% of them having at least half of their concepts mapped to conceptsin other ontologies.
– With such a large overlap among the ontologies, attempts to find “canonical” repre-sentations for concepts may be doomed: a large number of concepts in biomedicineare already represented in many different ways. One could argue that our data showsthat given the state of the biomedical ontologies today, the most feasible way of in-tegrating ontologies is by creating mappings, possibly complex ones, between themrather than trying to eliminate overlap (as the OBO Foundry initiative is trying todo [14]).
– Our study found that the small world property holds on our set of ontologies for lowvalues of p, with the average distance between the nodes being as low as 1.1 hops.Other research has found the small world property to be true for other large datasets as well[8]. Further analysis on the properties of small world networks, suchas strength of ties and k-core among others, may provide additional useful insightabout the connectedness of ontologies.
234
hal-0
0489
094,
ver
sion
1 -
4 Ju
n 20
10
If you are new to a domain, what are the important or representative ontologies withgood coverage?
– The lexical mappings identified SNOMED-CT as the most prominent hub, and,indeed, SNOMED-CT is the largest and one of the most prominent and popularbiomedical ontologies. Thus if we use mappings as a way of identifying prominentontologies in a domain (i.e., an ontology with lots of mappings to other ontologies isan “important” one), then at least in this case, this approach would have identifiedcorrectly the ontology that a newcomer to the domain of biomedical ontologiesmust become familiar with.
– Hubs with many outgoing links show shared domains, particularly at high thresholdvalues for p. For these hub ontologies, a large portion of their concepts is mappedto several different ontologies. Thus, ontologies that are linked through such a hublikely share the content that is represented in the hub ontology. For example, atp= 50%, the Common Anatomy Reference Ontology (CARO) is a hub with out-going links to Foundational Model of Anatomy, Zebrafish anatomy and develop-ment, Tick gross anatomy, Teleost anatomy and development, and Mosquito grossanatomy—all ontologies in the anatomy domain. At p= 70%, the United StatesPharmacopeia Model Guidelines ontology (USPMG) has outgoing links to Mul-tum MediSource Lexicon, RxNorm Vocabulary, Veterans Health AdministrationNational Drug File, National Drug File Reference Terminology, Medical SubjectHeadings, National Cancer Institute Thesaurus, and SNOMED-CT—all ontologiesthat describe drugs, among other things.
If you want to build domain-specific tools for creating ontology mappings, what aregood ontologies to use for background knowledge?
– The two previous points lead to several practical uses of hubs identified throughmappings: First, for ontology-mapping algorithms that require domain-specific back-ground knowledge, hubs with many incoming links (such as SNOMED-CT) canserve as useful sources of such background knowledge. Second, these hubs are alsogood candidates for being representative ontologies for a domain.
What can we learn about the characteristics of the ontologies themselves and the on-tology repository from the mappings between them?
– Links at a low value of p (1%) (i.e., when less than 1% of the concepts from thesource ontology have a mapping to the target) do not say much about connectednessof ontologies. The domain of biomedicine is such that there is a little bit of overlapin everything, resulting in the extremely connected model we see at 1% mark. At20%, however, we see a meaningful power-law distribution. At even higher thresh-olds, we can see ontologies that are very closely related. For example, we see thatthe Gene Ontology (GO) is very closely related to the cell cycle ontologies (CCO).65% of links fall in a range lower than 1% similarity, which indicates that links be-low the p = 1% threshold are not as informative of connections between ontologies.
– If we were to use mappings between terms (identified in any way) as an indicationof distance or similarity between ontologies in a repository, then the previous ob-servation leads to the following practical implication: These links at low values of
235
hal-0
0489
094,
ver
sion
1 -
4 Ju
n 20
10
p are not very meaningful and should probably not be used as an indication of anyrelation between the ontologies.
5 Conclusions, Limitations, and Future Work
Our analysis does not depend on the specific method used to identify mappings betweenconcepts. We used a simple method because it worked well and was very scalable (cfSection 2.2). Our earlier research has found that most of the openly available advancedmapping algorithms are simply not scalable to the size of biomedical ontologies in ourrepository [6]. One of the interesting directions for future work, when more scalableadvanced algorithms become available, would be to perform similar analysis of rela-tionships between ontologies taking a more advanced set of mappings as input.
Our main contribution in this paper is not the method for generating mappings be-tween ontologies, but rather the analysis of these mappings. We believe that networkanalysis serves as a powerful tool for analyzing the structure of an ontology repositoryby providing insights into the characteristics of the ontologies and the structure of therepository. As the Semantic Web grows in popularity and use of ontologies expands,these methods may play an important role in understanding the connections among on-tologies.
Our approach has certain critical limitations. Because we use a simple lexical match-ing method, our results are limited to the domain of biomedicine and other domainswhere such mapping method works well. In other domains, where concept definitionsdo not contain rich lexical information in the form of preferred names and synonyms,one will need to find scalable tools that would produce a large number of mappingsthat enable statistically significant analysis. Also, because of the way we generate themappings, we do not account for the ontologies that have alternate lexical structures torepresent the same concepts. Thus, we may miss a connection between two ontologiesthat actually have a significant amount of overlap in terms of the actual concepts theyrepresent simply because these concepts have different lexical structures in the two on-tologies. Our methods would work best for sets of ontologies that use similar namingconventions [13].
Another limitation of our work is that it gives no information as to the nature ofthe mappings or the actual specific relationship between linked ontologies. We cannotknow whether one ontology simply has the same concept names as another ontologyor if it imports terms from that ontology directly. Many BioPortal ontologies use OBOformat and often simply copy the ontology that they import rather than use the importmechanism that recently has become available in OBO. As a result, a number of themappings that we created are not actually mappings in the traditional sense. We plan todevelop heuristics to identify this overlap and exclude it from the mappings set.
As part of our future work, we plan to compare our lexical mappings on the set ofUMLS terminologies to the set of mappings provided by UMLS. The UMLS has a largenumber of mappings between the terminologies that were created manually. While thepurpose of those mappings was slightly different from ours, comparing the results ofthe lexical mapping to the manual one will likely produce useful insights.
236
hal-0
0489
094,
ver
sion
1 -
4 Ju
n 20
10
We also plan to implement automatic maintenance and updates on the set of map-pings generated with this method. Not only does the number of BioPortal ontologiesincrease regularly, but also new versions of some of the ontologies are uploaded everynight. These frequent updates makes manual creation of mappings among ontologiesin the repository a daunting, if not impossible, task. By contrast, UMLS terminologiesupdate twice a year.
In addition to the work outlined above, we plan to perform similar analysis on themappings from other sources if the number of mappings is significant enough to makesuch analysis valid. For instance, the Alignment Server [5] in the NeON project couldprove to be one such source of mappings in the future.
Finally, we uploaded the set of mappings between BioPortal ontologies to BioPortal.Users can browse the mappings through the BioPortal user interface and access themprogrammatically through REST services. We believe that the mappings should proveuseful to developers of tools dependent on these mappings or for ontology developerslooking at specific domain ontologies. All the data that we used for the analysis in thispaper is available in raw spreadsheet form at http://www.bioontology.org/wiki/index.php/Mapping_Set.
The study that we reported in this paper offered the first glimpse at the possibilitiesand challenges that large numbers of related ontologies bring to the fore. Our resultsshow that using network analysis on a network defined by mappings between ontologyterms helps us understand and navigate a world with a large number of ontologies. Asmore ontologies become available on the Semantic Web, such analysis will becomemore interesting, more useful, and more challenging.
Acknowledgements
This work was supported by the National Center for Biomedical Ontology, under roadmap-initiative grant U54 HG004028 from the National Institutes of Health. Nick Griffith has imple-mented the support for mappings in BioPortal.
References
1. Z. Aleksovski, M. Klein, W. ten Kate, and F. van Harmelen. Matching unstructured vo-cabularies using a background ontology. In 15th International Conference on KnowledgeEngineering and Knowledge Management (EKAW’06), 2006.
2. A.-L. Barabsi. Linked: How Everything Is Connected to Everything Else and What It Meansfor Business, Science, and Everyday Life. Basic Books, 2003.
3. O. Bodenreider and R. Stevens. Bio-ontologies: current trends and future directions. Brief-ings in Bioinformatics, 7:256–274, 2006.
4. C. Caracciolo, J. Euzenat, L. Hollink, R. Ichise, A. Isaac, V. Malaise, C. Meilicke, J. Pane,P. Shvaiko, H. Stuckenschmidt, O. Svab Zamazal, and V. Svatek. Results of the ontologyalignment evaluation initiative 2008. In 3d International Workshop on Ontology Matching(OM-2008) at ISWC 2008, Karlsruhe, Germany, 2008.
5. J. Euzenat. Alignment infrastructure for ontology mediation and other applications. InWorkshop on Mediation in Semantic Web Services, 2005.
237
hal-0
0489
094,
ver
sion
1 -
4 Ju
n 20
10
6. A. Ghazvinian, N. F. Noy, and M. A. Musen. Creating mappings for ontologies inbiomedicine: Simple methods work. In AMIA Annual Symposium (AMIA 2009), San Fran-cisco, CA, 2009.
7. C. Jonquet, N. H. Shah, and M. A. Musen. The open biomedical annotator. In AMIA Summiton Translational Bioinformatics, pages 56–60, San Francisco, CA, USA, 2009.
8. J. Leskovec and E. Horvitz. Planetary-scale views on a large instant-messaging network. In17th International World Wide Web Conference (WWW2008), Beijing, China, 2008.
9. D. Lindberg, B. Humphreys, and A. McCray. The unified medical language system. Methodsof Information in Medicine, 32(4):281, 1993.
10. N. Noy, N. Shah, B. Dai, M. Dorf, N. Griffith, C. Jonquet, M. Montegut, D. Rubin, C. Youn,and M. Musen. Bioportal: A web repository for biomedical ontologies and data resources.In Demo session at 7th International Semantic Web Conference (ISWC 2008), Karlsruhe,Germany, 2008. Springer.
11. N. F. Noy, N. Griffith, and M. A. Musen. Collecting community-based mappings in anontology repository. In 7th International Semantic Web Conference (ISWC 2008), Karlsruhe,Germany, 2008.
12. D. L. Rubin, N. H. Shah, and N. F. Noy. Biomedical ontologies: a functional perspective.Briefings in Bioinformatics, 9(1):75–90, 2008.
13. D. Schober, B. Smith, S. E. Lewis, W. Kusnierczyk, J. Lomax, C. Mungall, C. F. Taylor,P. Rocca-Serra, and S.-A. Sansone. Survey-based naming conventions for use in obo foundryontology development. BMC Bioinformatics, 2009.
14. B. Smith, M. Ashburner, C. Rosse, J. Bard, W. Bug, W. Ceusters, L. J. Goldberg, K. Eil-beck, A. Ireland, C. J. Mungall, N. Leontis, P. Rocca-Serra, A. Ruttenberg, S. A. Sansone,R. H. Scheuermann, N. Shah, P. L. Whetzel, and S. Lewis. The OBO Foundry: coordi-nated evolution of ontologies to support biomedical data integration. Nature Biotechnology,25(11):1251–5, 2007.
15. S. Zhang and O. Bodenreider. Alignment of multiple ontologies of anatomy: Deriving in-direct mappings from direct mappings to a reference. In AMIA Annual Symposium, pages864–868, 2005.
238
hal-0
0489
094,
ver
sion
1 -
4 Ju
n 20
10