what determines the entrepreneurial innovative capability of portuguese industrial firms
TRANSCRIPT
MPRAMunich Personal RePEc Archive
What Determines the EntrepreneurialInnovative Capability of PortugueseIndustrial Firms?
Maria Jose Silva and Joao Leitao
University of Beira Interior
8. October 2007
Online at http://mpra.ub.uni-muenchen.de/5216/MPRA Paper No. 5216, posted 9. October 2007
1
WHAT DETERMINES THE ENTREPRENEURIAL INNOVATIVECAPABILITY OF PORTUGUESE INDUSTRIAL FIRMS?
Maria José Silva Prof. of Innovation and Technological Entrepreneurship
University of Beira InteriorManagement and Economics Department
Pólo IV, 6200-209 Covilhã, Portugal E-mail: [email protected], Phone: +351 275 319 651, Fax: +351 275 319 601
João LeitãoProf. of Economics of Firm and Marketing
University of Beira InteriorManagement and Economics Department
Pólo IV, 6200-209 Covilhã, PortugalE-mail: [email protected], Phone: +351 275 319 653, Fax: +351 275 319 601
ABSTRACT
In the context of globalisation, innovation is considered as a key factor for enhancing the competitiveness of firms. Nowadays, it is widely accepted that Portuguese firms face an increasing competitive environment, which is characterised by internationalization and globalization. In this sense, it becomes important to analyse the determinant factors of innovation capability of firms.
This paper aims to identify and analyse the degree of importance of the determinant factors of innovation capability of Portuguese industrial firms. The data obtained through the 2rd
Community Innovation Survey (CIS II) conducted by EUROSTAT, is used in a linear regression model. The entrepreneurial innovative capability, measured as product innovation, is considered as the variable answer, in the estimation process of a Logit function.
The paper presents an innovative contribution since it uses a set of five determinant factors of innovation capability of industrial firms, at a product innovation level. Technological capacity, dimension of the firm, activity sector, market orientation and location of the firm, are considered as determinants factors of innovation capability of the firms. The results of the joint analysis provide the identification of stimulating factors and restraining factors of the entrepreneurial innovative capability of a selected sample of Portuguese industrial firms.
Under a Schumpeterian approach, the paper ratifies that large enterprises are more prone to innovate than small enterprises. The dimension plays a role, in terms of the strategic conduct implemented by small firms, which are not so prone to innovate, due to its small dimension. Benchmarking the Portuguese case is particularly important, because small industrial enterprises face restraining conditions imposed by outsourcing contracts that are established between small producers and leading international buyers. This restrains, broadly, the entrepreneurial innovative capability of small industrial enterprises.
Keywords: Innovation, Entrepreneurial Innovative Capability.
JEL Classification Codes: O31, O32.
2
1. INTRODUCTION
This paper aims to identify and analyze two categories of determinants factors of the
innovation process: stimulating and restraining. A selected sample of Portuguese industrial
firms is used to test several hypotheses related to the determination of entrepreneurial
innovative capability, both of large and small and medium sized enterprises.
The conceptual model that is proposed, makes use of two innovation approaches: (i) the
systemic; and (ii) the networks and inter-organizational relationships. The selection of these
approaches is due to the adequacy they present for the study of the determinant factors of
entrepreneurial innovative capability.
The database that is used corresponds to the one that belongs to the Second Community
Innovation Survey for – CIS II (Community Innovation Survey II). According to the data
granted by the OCT, from 819 firms that answered the questionnaire, 193 carried through
innovations in the product, during the period of 1995-1997. In order to identify the significant
determinants of entrepreneurial innovative capability, a logistic regression is preformed.
This study is structured as follows. In section two presents a literature review is made. In
section three the conceptual model is proposed. In section four, the sample, the variables, the
hypotheses and the logistic regression model to be tested are presented. In section five, the
results are discussed. In section six, the concluding remarks as well as guidelines for futures
research are presented.
2. LITERATURE REVIEW
In several studies regarding innovation, there is a tendency to associate the concept of
innovation to R&D activities or to technology, regarding the acquisition of new equipment, in
order to introduce products or new processes. In fact, the concept of innovation is not only
focused on this dimension, it goes beyond the boundaries of technology and R&D.
In this research, the innovation concept is defined as a non-linear linear, evolutionary,
complex and interactive process between the firm and its environment. The results of this
process are denominated entrepreneurial innovative capability. Thus, the term entrepreneurial
innovative capability was integrated to adopt the several components that result from the
3
innovative process of the firm, namely, product innovation, process and organisational
innovation. Although, it should be stressed that in the present paper, the entrepreneurial
innovative capability is limited to product innovation, due to lack of available information for
performing the empirical tests.
This way, it is considered that the firm is innovative, when it introduces a new technological
product or improved during the period of 1995-1997. It is defined as new product when “the
product’s characteristics or its use, differ significantly from those products previously
produced” (CIS II, 1999:3). An improved product consists on “an existing one, whose
performance was significantly widened or developed” (CIS II, 1999:3).
In the literature there has been in the last decades an increasing interest in studying
innovation. Recently, the systemic approach about innovation and the networks and inter-
organizational approach have made progress in the field of innovation.
The theoretical approach, developed in the scope of the innovation systems support the basic
idea, that innovation is not an isolated action within the firm and it is not only dependent from
the R&D intensity. Innovation is regarded as an evolutionary, non-linear, and interactive
process between the firm and its environment (Kline and Rosenberg, 1986; Dosi et al., 1988,
Malecki, 1997). Interactivity of the innovation process refers to the collaboration amongst
internal divisions of the firm (R&D, production, logistics, marketing, etc) as well as to the
external relations that are established with other stakeholders (suppliers and customers),
knowledge institutions (universities and technological centers), finance, and public
administration. In this context a wide range of partners may contribute to acquire external
resources, knowledge and crucial information for developing productive and innovative
activities. Moreover, it may reinforce the innovative capability of firms (Lundvall, 1992;
Edquist, 1997; Kaufmann and Tödtling, 2001, Romijn and Albaladejo, 2002).
The present paper considers both stimulating and restraining factors that seem to present a
significant impact on the innovative capability of firms. In this context, technological
capacity, dimension of the firm, activity sector, market orientation and location of the firm,
are considered as determinants factors of entrepreneurial innovation capability.
4
The importance of the technological capacity of the firm to obtain new knowledge, to
stimulate learning, and to explore external knowledge is demonstrated in the studies of Cohen
and Levinthal, (1989, 1990), Monery, Oxley and Silverman, (1996), Tsai (2001) and Vinding
(2006). According to these authors, firms that have greater technological capacity, have
greater capacity of assimilating and reproducing the new knowledge obtained through
external sources and, consequently have the capability of producing more innovation.
Additionally, this kind of firms has a greater absorptive capacity of knowledge (Tsai, 2001).
The obtained results regarding the existing relation between the entrepreneurial dimension
and the entrepreneurial innovative capability are very contradictory; this is why it is
fundamental to clarify this relation. In fact, Schumpeter (1942) and the approaches of
‘technology-push’ (Nelson, 1959) and ‘market-pull’ (Schmookler, 1966) innovation, defend
that innovation is positively related to the firm’s dimension and its entrepreneurial innovative
capability. In the studies of Sengenberger and Pyke, (1992), Rothwell and Dodgson, (1994)
and Tidd, Bessant and Pavitt, (2003), negative effects of the entrepreneurial dimension on
innovative capability were identified.
The industrial sector of activity is a classic determinant factor in the study of innovation. The
influence of the activity sector in the firm’s innovative capability is highlighted in several
previous studies (Fritsch and Lukas, 1999, 2001; Kaufmann and Tödtling, 2000, 2001;
Bayona, García-Marco, Huerta, 2001; Romijn and Albaladejo, 2002; Tether, 2002). It is
expected that firms belonging to activity sectors with high technological intensity such as
electronics, computer science and biochemistry, innovate more than firms belonging to other
activity sectors. In this research, the rule that is used for selecting the sector corresponds to
the classification proposed by OECD (1997a) that is based on the level of technological
intensity.
Several approaches present the market orientation as a determinant factor of the innovative
capability. The market-pull approach, the interactive model of innovation, the industrial
clusters, and the dynamics of network services, promote a constant request for more
innovation (Porter, 1990; Porter and Stern; 2001; Furman, Porter and Stern; 2002, Leitão,
2004; Leitão, 2006). Given that Portuguese firms exist in a competitive context that is
characterized by internationalization and globalization, it becomes important to analyse if the
strategic choices made by firms, influence their innovative capability.
5
The importance of the firm’s location on its innovative capability is enhanced by several
approaches, namely, industrial district, industrial cluster innovation and regional innovation
systems. Empirical evidence shows that firms’ location influences its innovative capability
(Cooke, Uranga and Etxebarria, 1997; Simões, 1997; Braczyk, Cooke and Heidenreich, 1998;
Cooke, et al., 2000; Furman, Porter and Stern; 2002, Asheim, et al., 2006; Cooke and
Leydesdorff, 2006).
Under a different perspective Sternberg and Arndt (2001) defend that the degree of influence
of the firms’ location depends on internal aspects of the firms. In fact there are innovative
firms located in regions with weak innovative potential and the opposite is also observed, that
is, firms located in innovative regions that do not innovate. In this sense, it is important to
clarify if the firms’ location influences its entrepreneurial innovative capability.
3. ENTREPRENEURIAL INNOVATIVE CAPABILITY: A PROPOSAL OF
CONCEPTUAL MODEL
The entrepreneurial innovative capability varies from firm to firm and is determined by a vast
and complex number of aspects, both internal and external to the firm. Previous studies about
innovation, with few exceptions, “were limited to the diagnosis of R&D and the activities to
which it would immediately origin, such as register of patents, technology transfer and not
much more. In the last few years, due to the studies of the OECD, the analysis of the diffusion
process of innovation, has gained an increasing importance, which appeals to the study of
non-R&D aspects of innovation (CISEP/GEPE, 1992:55).
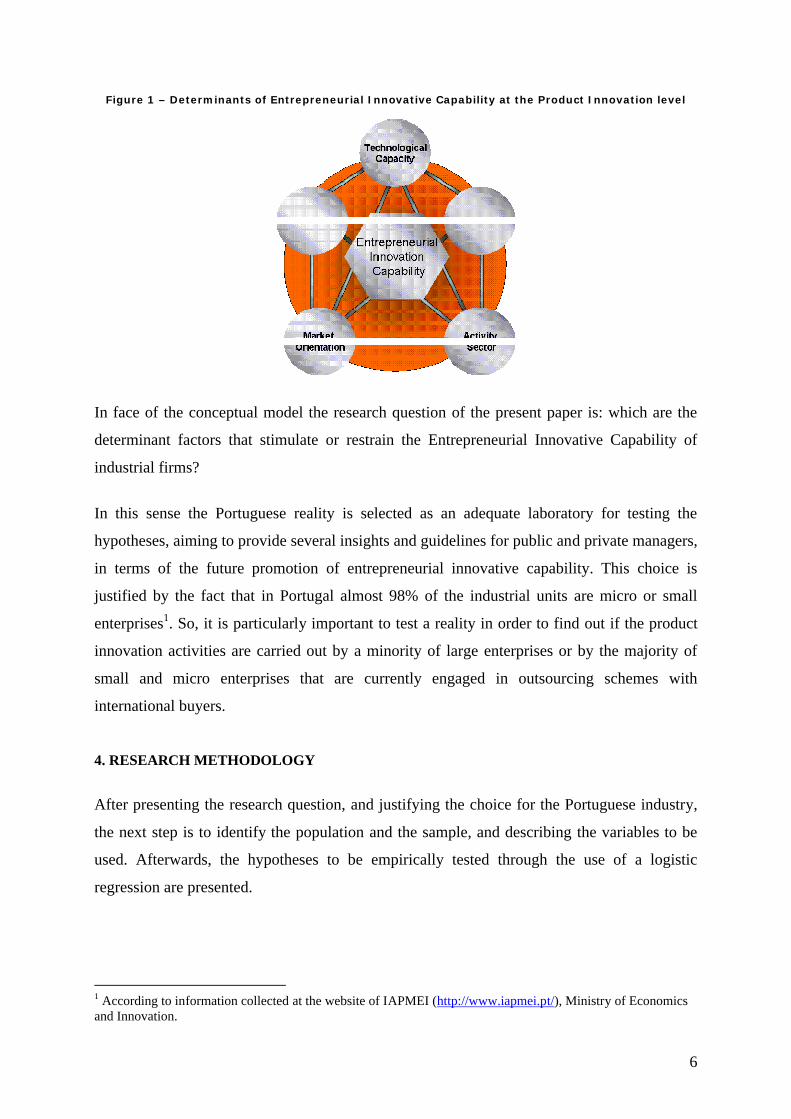
There is an extensive literature that considers aspects which determine the entrepreneurial
innovative activity. Nevertheless, by making an analysis of the innovation process, at the firm
level, and by considering the literature review, this study points out a set of stimulating and
restraining determinants of the entrepreneurial innovative capability, namely: technological
capacity, dimension of the firm, activity sector, market orientation and location of the firm, as
presented in Figure 1.
6
Figure 1 – Determinants of Entrepreneurial Innovative Capability at the Product Innovation level
In face of the conceptual model the research question of the present paper is: which are the
determinant factors that stimulate or restrain the Entrepreneurial Innovative Capability of
industrial firms?
In this sense the Portuguese reality is selected as an adequate laboratory for testing the
hypotheses, aiming to provide several insights and guidelines for public and private managers,
in terms of the future promotion of entrepreneurial innovative capability. This choice is
justified by the fact that in Portugal almost 98% of the industrial units are micro or small
enterprises1. So, it is particularly important to test a reality in order to find out if the product
innovation activities are carried out by a minority of large enterprises or by the majority of
small and micro enterprises that are currently engaged in outsourcing schemes with
international buyers.
4. RESEARCH METHODOLOGY
After presenting the research question, and justifying the choice for the Portuguese industry,
the next step is to identify the population and the sample, and describing the variables to be
used. Afterwards, the hypotheses to be empirically tested through the use of a logistic
regression are presented.
1 According to information collected at the website of IAPMEI (http://www.iapmei.pt/), Ministry of Economics and Innovation.
7
4.1. Data
The data used in this study were collected by the “OCT – Observatório das Ciências e das
Tecnologias” (Sciences and Technologies Observatory). The data was collected during the
second semester of 1998, through a survey that consisted in a questionnaire named as
Community Innovation Survey II. The surveyed year was 1997 and there is a great deal of
indicators that concern the period from 1995 until 1997. This questionnaire was applied in
Europe, under the supervision of EUROSTAT and following the guidelines presented at the
Oslo Manual (OCDE, 1997).
The population includes all the industrial firms with less than 20 employees. The economic
activity classes belonging to the population, more specifically to the industry, are the ones that
follow: from 15 until 37 and from 40 until 41. The sample was built by the “INE – Instituto
Nacional de Estatística” (National Institute of Statistics), according to the methodological
specifications of EUROSTAT. The INE has selected an initial sample of industrial firms,
selected from the 9289 firms that are registered at the “FGUE – Ficheiro Geral de Unidades
Estatísticas do INE” (Global File of INE’s Statistical Units). According to the report of OCT
(2000), and Conceição and Ávila (2001), the sample was built through a mixed method that
combines the census approach with the stratified random sampling, in following way:
- for firms with more than 200 workers a census approach was used, therefore all CAE firms
with at least 200 workers were considered;
- for firms with less than 200 workers, a stratified sample method was used, in which the
economical activity type and the dimension class (number of active workers: 20-49, 50-200
and 200 or more) was considered. Thus, randomly chosen firms by CAE and dimension, were
selected.
- finally, there was an attempt to assure that all stratus had at least 5 firms and that stratus
with less than 5 firms in the population, were all included in the sample.
Thus, an initial sample of 1556 industrial firms was extracted from the population. Some
adjustments that resulted from the survey were made to the initial sample, due to file mistakes
or activity changes. Consequently, the activities and/or the dimension classes of some firms
were reclassified. After being corrected by the survey results, the obtained sample comprised
1429 firms, being named as corrected sample. The firms that answered the questionnaire in a
valid way, following the guidelines defined by EUROSTAT, came to a total of 819 firms,
8
thus constituting the final sample. The following table presents the distribution of industrial
firms by dimensional steps.
Table 1 – Population and Sample of the Portuguese Industrial firms
SamplePopulation
Initial Corrected Final
Industrial firmsSmall (20-49) 5 770 558 508 232Medium (50-200) 2 980 387 327 229Large (200 e mais) 611 611 594 358
Total 9 289 1 556 1429 819 Fonte: OCT (2000) e Conceição e Ávila (2001)
The survey was completed through post mail, sending questionnaires to be filled out by the
firms. Assistance was given via telephone or email address. For the lacking companies, there
was some insistence made by fax and telephone in order to forward the questionnaire as
requested. Considering the number of firms that answered the questionnaire, which represent
the final sample, with the firms of the corrected theoretical sample, it was verified that the 819
answers obtained by the industrial firms represented a global answer rate of 57, 3%
In accordance with the methodology defined by EUROSTAT, in all countries that obtained
reply rates less than 70%, there should be an inquiry to the non replies. As presented by
Conceição and Ávila (2001) an inquiry to a random sample of about 12% of firms that did not
reply was carried out, with a reduced questionnaire of 3 key- questions, equal to those in the
main questionnaire. The non-replies were filled out by 85% of the sub-sample firms. The
statistical comparison of the results in the key- questions, among the firms that answered to
the complete and the sample of the non- responses, showed that in the industry case,
“significant differences were not detected regarding the importance of participant and non
participant innovative firms “(Conceição and Ávila, 2001;19). According to the same
researchers, these results led EUROSTAT into not altering the factor of balance in the
industry case.
Considering all the available observations, 819 firms, the description and characterization of
the variables: product innovation, technological capacity, dimension of the firm, activity
sector, market orientation and location of the firm; are subsequently presented.
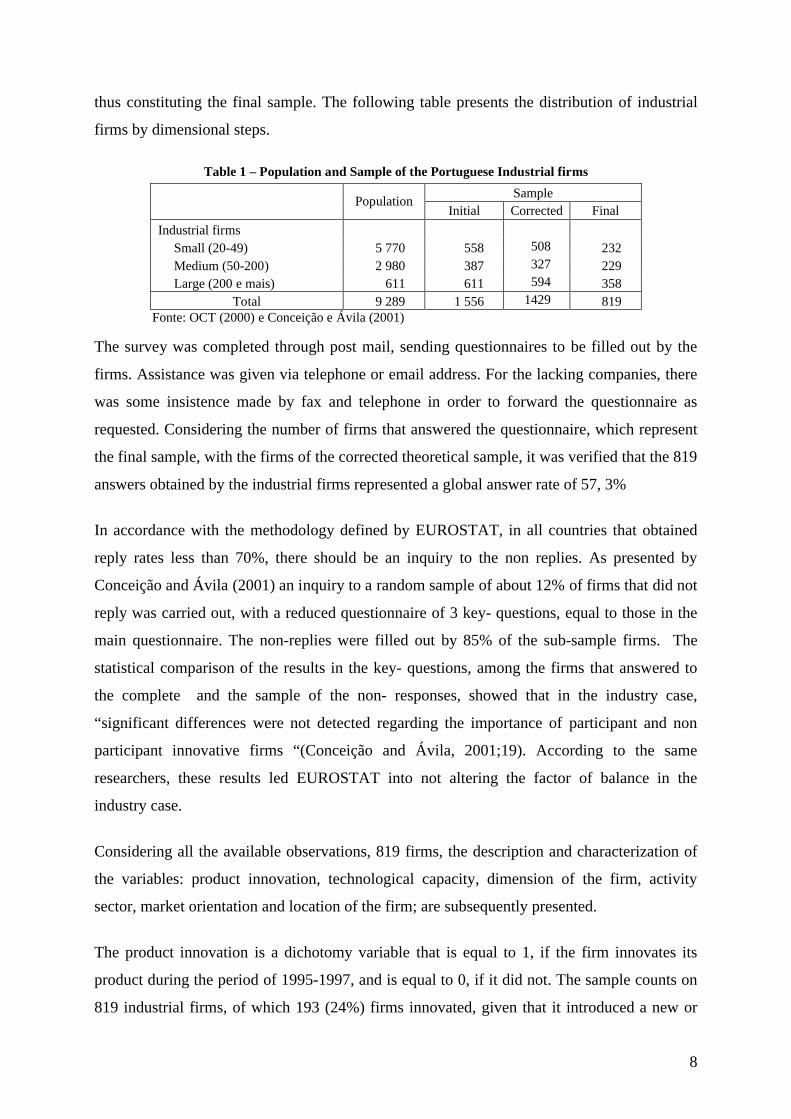
The product innovation is a dichotomy variable that is equal to 1, if the firm innovates its
product during the period of 1995-1997, and is equal to 0, if it did not. The sample counts on
819 industrial firms, of which 193 (24%) firms innovated, given that it introduced a new or
9
improved technological product during the period of 1995-1997 and, consequently, 626
(76%) did not innovate its product.
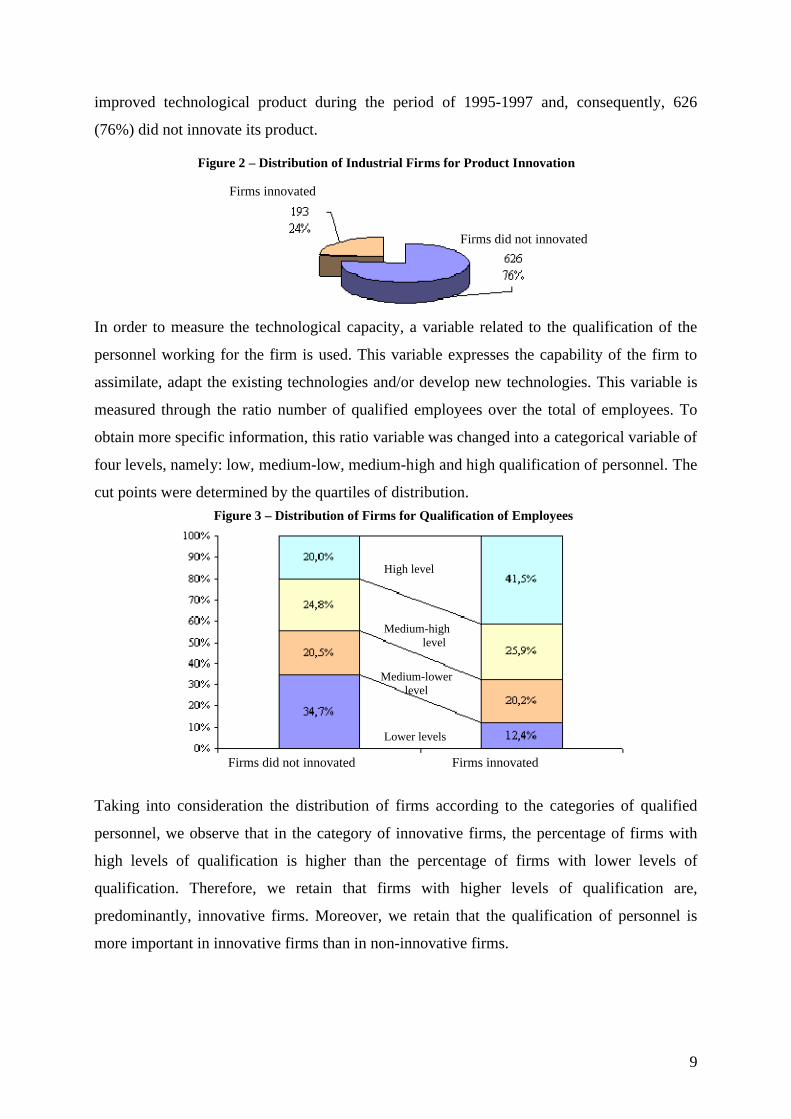
In order to measure the technological capacity, a variable related to the qualification of the
personnel working for the firm is used. This variable expresses the capability of the firm to
assimilate, adapt the existing technologies and/or develop new technologies. This variable is
measured through the ratio number of qualified employees over the total of employees. To
obtain more specific information, this ratio variable was changed into a categorical variable of
four levels, namely: low, medium-low, medium-high and high qualification of personnel. The
cut points were determined by the quartiles of distribution.
Taking into consideration the distribution of firms according to the categories of qualified
personnel, we observe that in the category of innovative firms, the percentage of firms with
high levels of qualification is higher than the percentage of firms with lower levels of
qualification. Therefore, we retain that firms with higher levels of qualification are,
predominantly, innovative firms. Moreover, we retain that the qualification of personnel is
more important in innovative firms than in non-innovative firms.
Figure 2 – Distribution of Industrial Firms for Product Innovation
Firms innovated
Firms did not innovated
Firms innovatedFirms did not innovated
High level
Medium-highlevel
Medium-lowerlevel
Lower levels
Figure 3 – Distribution of Firms for Qualification of Employees
10
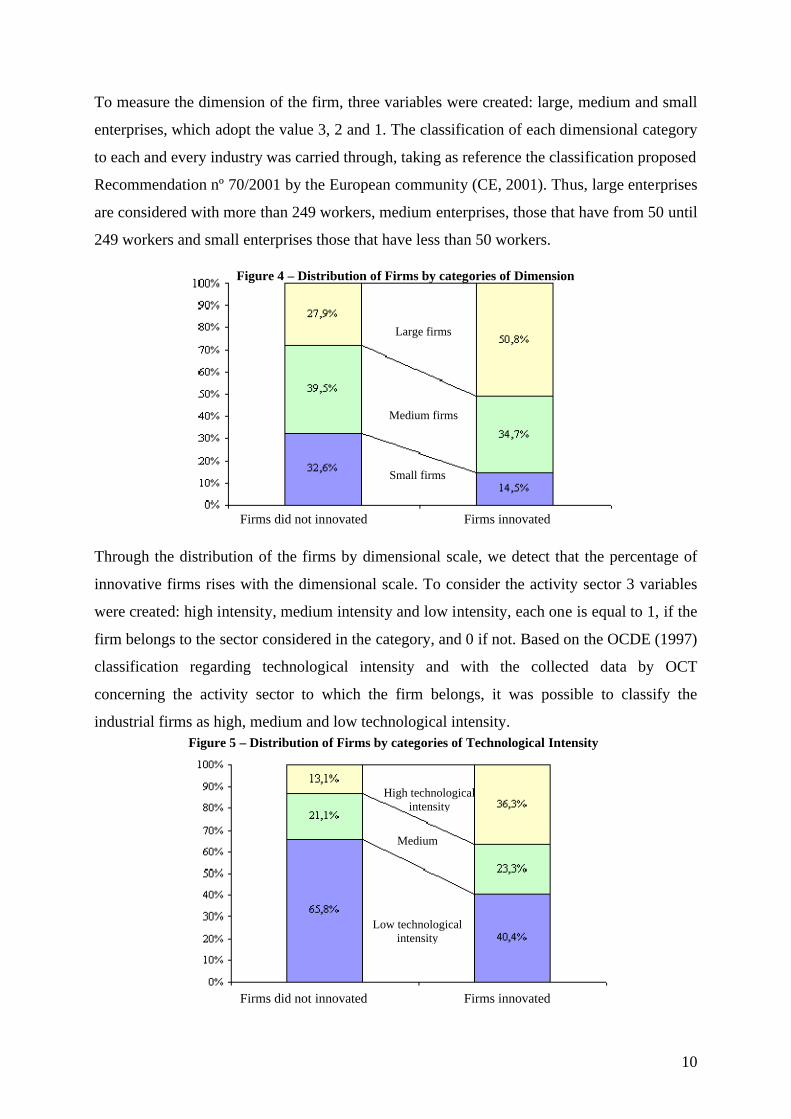
To measure the dimension of the firm, three variables were created: large, medium and small
enterprises, which adopt the value 3, 2 and 1. The classification of each dimensional category
to each and every industry was carried through, taking as reference the classification proposed
Recommendation nº 70/2001 by the European community (CE, 2001). Thus, large enterprises
are considered with more than 249 workers, medium enterprises, those that have from 50 until
249 workers and small enterprises those that have less than 50 workers.
Through the distribution of the firms by dimensional scale, we detect that the percentage of
innovative firms rises with the dimensional scale. To consider the activity sector 3 variables
were created: high intensity, medium intensity and low intensity, each one is equal to 1, if the
firm belongs to the sector considered in the category, and 0 if not. Based on the OCDE (1997)
classification regarding technological intensity and with the collected data by OCT
concerning the activity sector to which the firm belongs, it was possible to classify the
industrial firms as high, medium and low technological intensity.
Figure 4 – Distribution of Firms by categories of Dimension
Firms innovatedFirms did not innovated
Large firms
Medium firms
Small firms
Figure 5 – Distribution of Firms by categories of Technological Intensity
Firms innovatedFirms did not innovated
High technological intensity
Medium
Low technological intensity
11
In terms of the percentage of firms for each level of technological intensity, we retain that
most non innovative firms are located on the level of low technological intensity. In what
concerns the innovative firms, it is considered that in the scale of low intensity are 40.4% of
innovative firms, followed by the scale of high intensity with 36.3% of the firms.
As illustrated in Figure 6, the innovative firms are mainly located in the scales of medium and
high technological intensity, and they represent 59.6%, while non innovative firms are located
in the low technological scale (65.8%).
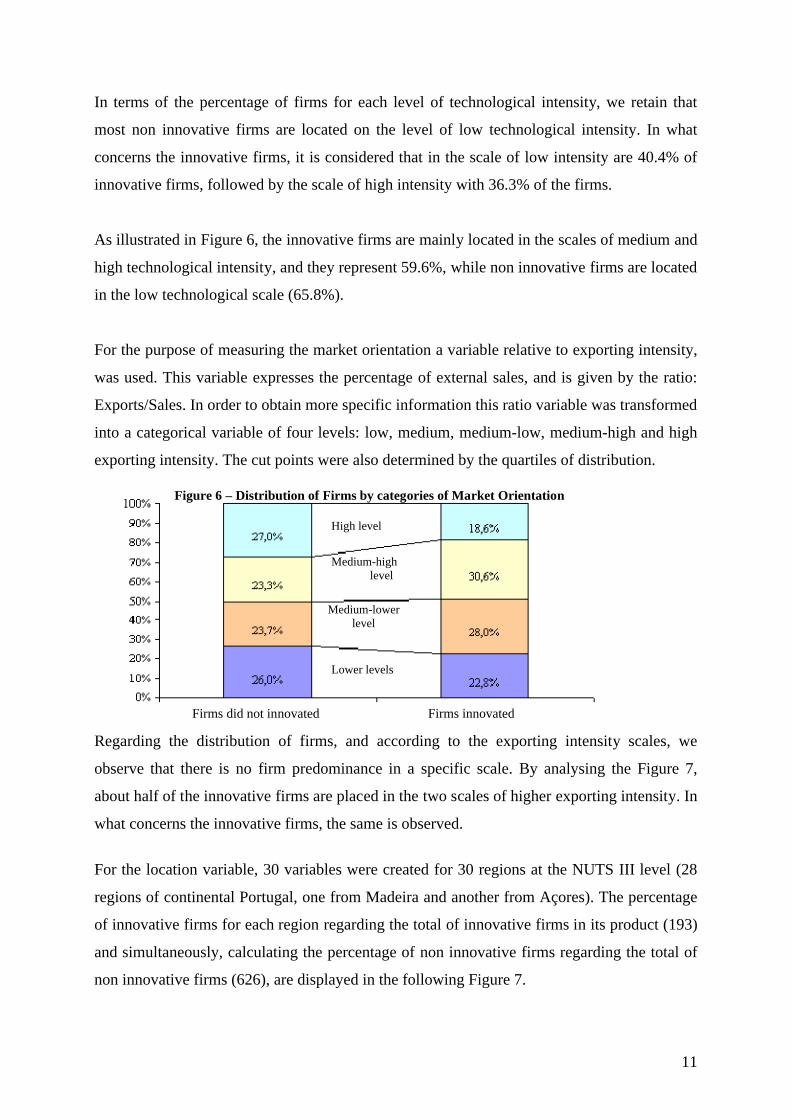
For the purpose of measuring the market orientation a variable relative to exporting intensity,
was used. This variable expresses the percentage of external sales, and is given by the ratio:
Exports/Sales. In order to obtain more specific information this ratio variable was transformed
into a categorical variable of four levels: low, medium, medium-low, medium-high and high
exporting intensity. The cut points were also determined by the quartiles of distribution.
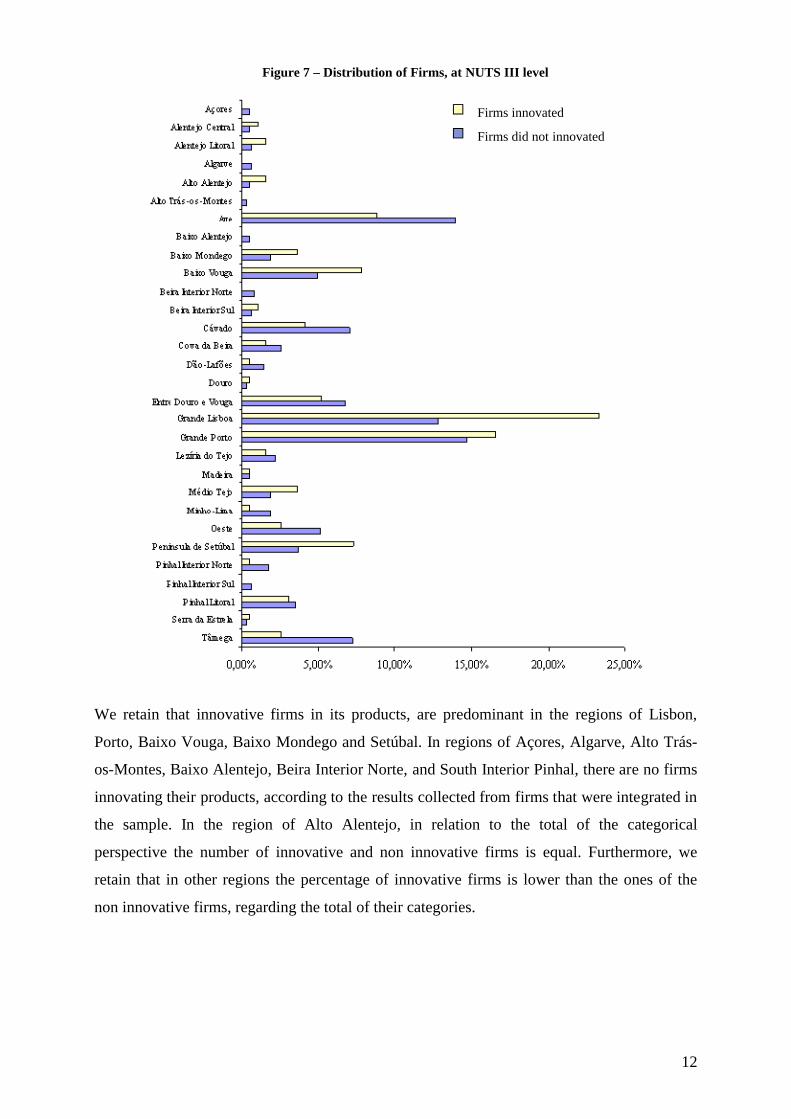
Regarding the distribution of firms, and according to the exporting intensity scales, we
observe that there is no firm predominance in a specific scale. By analysing the Figure 7,
about half of the innovative firms are placed in the two scales of higher exporting intensity. In
what concerns the innovative firms, the same is observed.
For the location variable, 30 variables were created for 30 regions at the NUTS III level (28
regions of continental Portugal, one from Madeira and another from Açores). The percentage
of innovative firms for each region regarding the total of innovative firms in its product (193)
and simultaneously, calculating the percentage of non innovative firms regarding the total of
non innovative firms (626), are displayed in the following Figure 7.
Figure 6 – Distribution of Firms by categories of Market Orientation
Firms innovatedFirms did not innovated
High level
Medium-highlevel
Medium-lowerlevel
Lower levels
12
We retain that innovative firms in its products, are predominant in the regions of Lisbon,
Porto, Baixo Vouga, Baixo Mondego and Setúbal. In regions of Açores, Algarve, Alto Trás-
os-Montes, Baixo Alentejo, Beira Interior Norte, and South Interior Pinhal, there are no firms
innovating their products, according to the results collected from firms that were integrated in
the sample. In the region of Alto Alentejo, in relation to the total of the categorical
perspective the number of innovative and non innovative firms is equal. Furthermore, we
retain that in other regions the percentage of innovative firms is lower than the ones of the
non innovative firms, regarding the total of their categories.
Figure 7 – Distribution of Firms, at NUTS III level
Firms innovated
Firms did not innovated
13
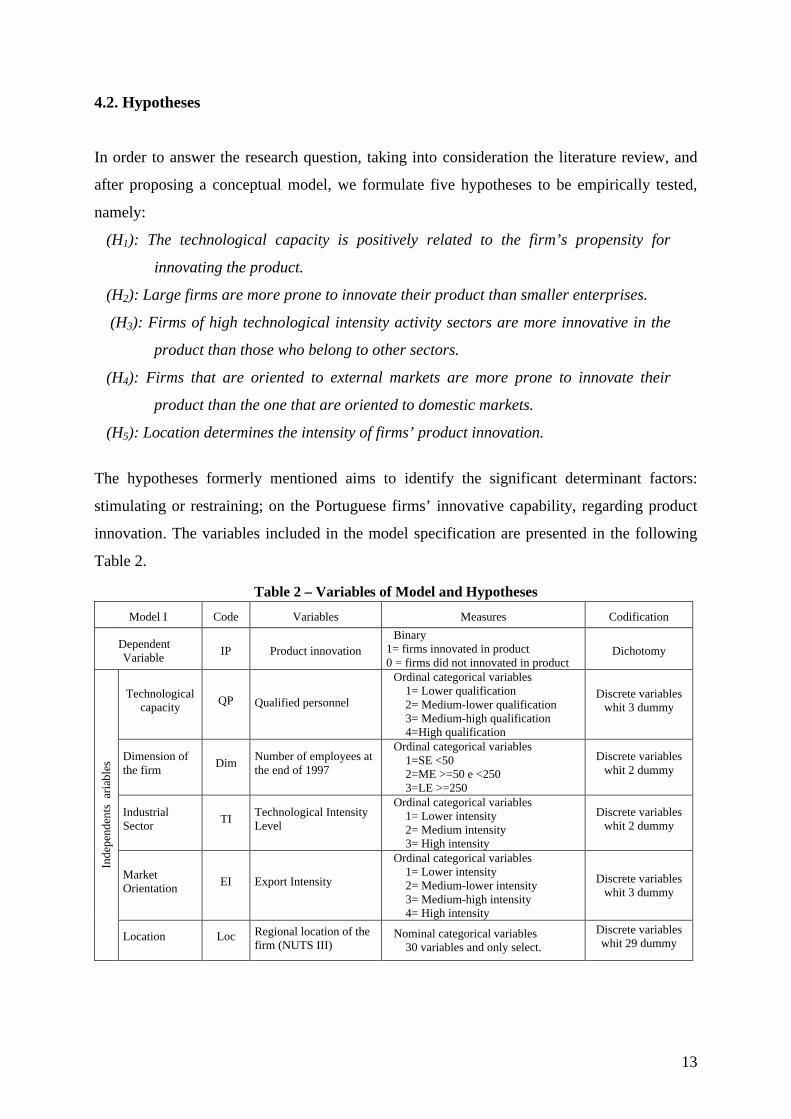
4.2. Hypotheses
In order to answer the research question, taking into consideration the literature review, and
after proposing a conceptual model, we formulate five hypotheses to be empirically tested,
namely:
(H1): The technological capacity is positively related to the firm’s propensity for
innovating the product.
(H2): Large firms are more prone to innovate their product than smaller enterprises.
(H3): Firms of high technological intensity activity sectors are more innovative in the
product than those who belong to other sectors.
(H4): Firms that are oriented to external markets are more prone to innovate their
product than the one that are oriented to domestic markets.
(H5): Location determines the intensity of firms’ product innovation.
The hypotheses formerly mentioned aims to identify the significant determinant factors:
stimulating or restraining; on the Portuguese firms’ innovative capability, regarding product
innovation. The variables included in the model specification are presented in the following
Table 2.
Table 2 – Variables of Model and Hypotheses
Model I Code Variables Measures Codification
Dependent Variable
IP Product innovationBinary
1= firms innovated in product0 = firms did not innovated in product
Dichotomy
Technological capacity
QP Qualified personnel
Ordinal categorical variables1= Lower qualification2= Medium-lower qualification3= Medium-high qualification4=High qualification
Discrete variables whit 3 dummy
Dimension of the firm
DimNumber of employees at the end of 1997
Ordinal categorical variables1=SE <502=ME >=50 e <2503=LE >=250
Discrete variables whit 2 dummy
Industrial Sector
TITechnological Intensity Level
Ordinal categorical variables1= Lower intensity2= Medium intensity3= High intensity
Discrete variables whit 2 dummy
Market Orientation
EI Export Intensity
Ordinal categorical variables1= Lower intensity2= Medium-lower intensity3= Medium-high intensity4= High intensity
Discrete variables whit 3 dummy
Inde
pend
ents
ari
able
s
Location Loc Regional location of the firm (NUTS III)
Nominal categorical variables30 variables and only select.
Discrete variables whit 29 dummy
14
4.3 Logistic Regression Model for Product Innovation
According to what has been previously defined, the product innovation (PI) is a binary
variable, which is equal to 1, if the firm innovates; or equal to 0, if the firm does not innovate.
The binary data are very common amongst the several types of categorical data and their
modelling is part of the general linear regression models (McCullagh and Nelder, 1989). The
logistic regression model the most common one (Agresti, 1996, Ferrão, 2003), regarding the
way it facilitates the substantive interpretation of parameters. Thus, logit regression is an
approach used in studies of factors of innovation capability (Kaufmann and Tödtling, 2000,
2001; Silva, 2003, Silva et al. 2005, Silva and Leitão, 2007).
Considering the response variable (or dependent) PI, let p (PI) be the probability of the firm
to innovate, p (PI)=Pr [PI=1]. Considering the technological intensity explanatory variable,
TI, let p(PI|TI) be the probability of the firm to innovate according to its degree of
technological intensity, Pr[PI=1¦TI=ti]. It is assumed that PI follows the binomial
distribution, PI~Bin(1,p).
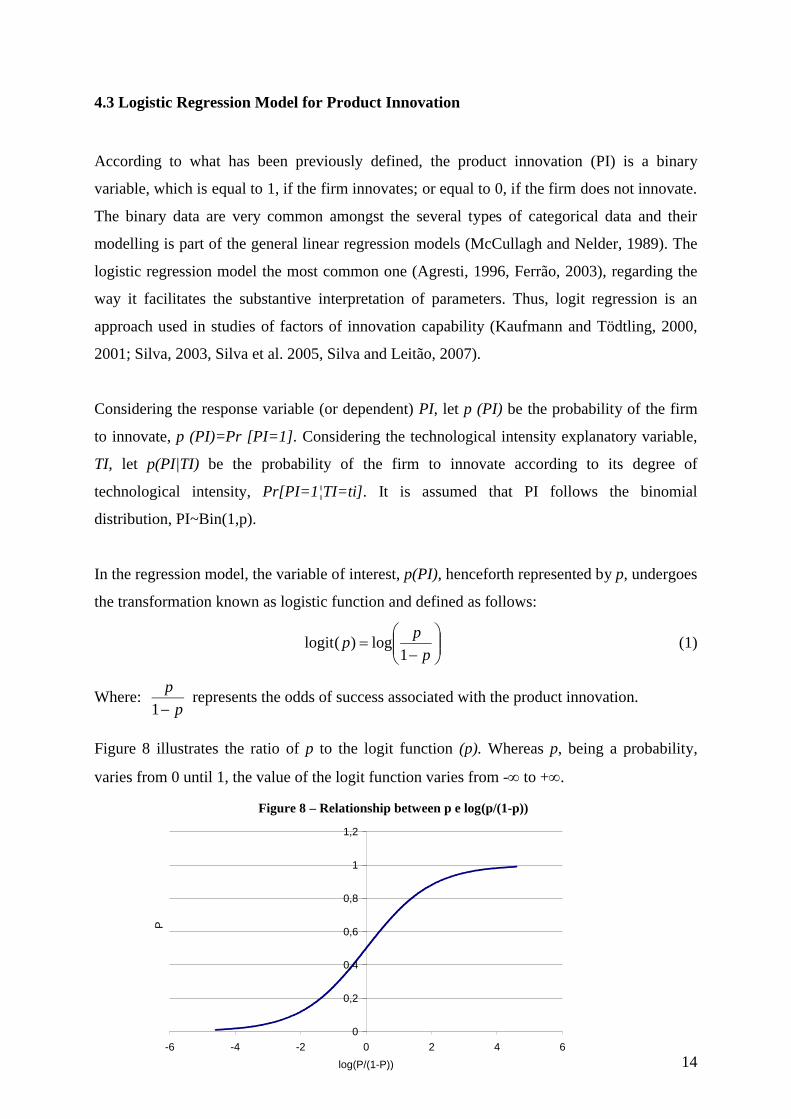
In the regression model, the variable of interest, p(PI), henceforth represented by p, undergoes
the transformation known as logistic function and defined as follows:
p
pp
1log)(logit (1)
Where: p
p
1represents the odds of success associated with the product innovation.
Figure 8 illustrates the ratio of p to the logit function (p). Whereas p, being a probability,
varies from 0 until 1, the value of the logit function varies from - to +.
0
0,2
0,4
0,6
0,8
1
1,2
-6 -4 -2 0 2 4 6
log(P/(1-P))
P
Figure 8 – Relationship between p e log(p/(1-p))
15
The logistic regression model is defined as linear in the fixed parameters, 0 and 1, and has
the following functional form,
TIp 10)(logit (2)
The model (3) can also be re-written in terms of the probability of success,
TITI
TIp
1010
10
exp1
1
exp1
exp
(3)
The extension of this model to multiple explanatory variables, such as the previously defined
QP, Dim and EI, is processed through their inclusion in the linear predictor. Since all the
referred variables are nominal categorical and recoded through dummy variables see Table 2,
the linear predictor of the model is specified according the equation (4):
mhEImlEIlEIhDimmDim
hQPmhQPmlQPhTImTIpit
________
_____)(log
4342413231
23222112110
(4)
The estimation procedure used in this study is the maximum likelihood procedure.
The logit function establishes the connection between the variable answer and the linear
predictor. This is the most commonly used connection function because it easily enables the
substantive interpretation of the model parameters. Thus, the odds of success concerning
product innovation have the value exp(1) for each additional unit in the level of technological
intensity. Let us suppose that IT=1, if the firm has a high technological intensity and IT=0, if
otherwise. If the estimate of 1=1,322 this means that the advantages success ratio of the
firms with high technological intensity to the firms with low technological intensity consists
of exp(1,322)=3,75. In other words, the innovation advantage in the product is 3,75 bigger in
firms with high technological intensity than in small firms.
5 – DISCUSSION AND RESULTS
Logistic regression models were applied to the Community Innovation Survey data and the
estimations of the final model are shown in the following Table 3. It is noticed that all the
estimations of the regression parameters are statistically significant up to 5%, in which the
Wald statistics was used as test statistics.
16
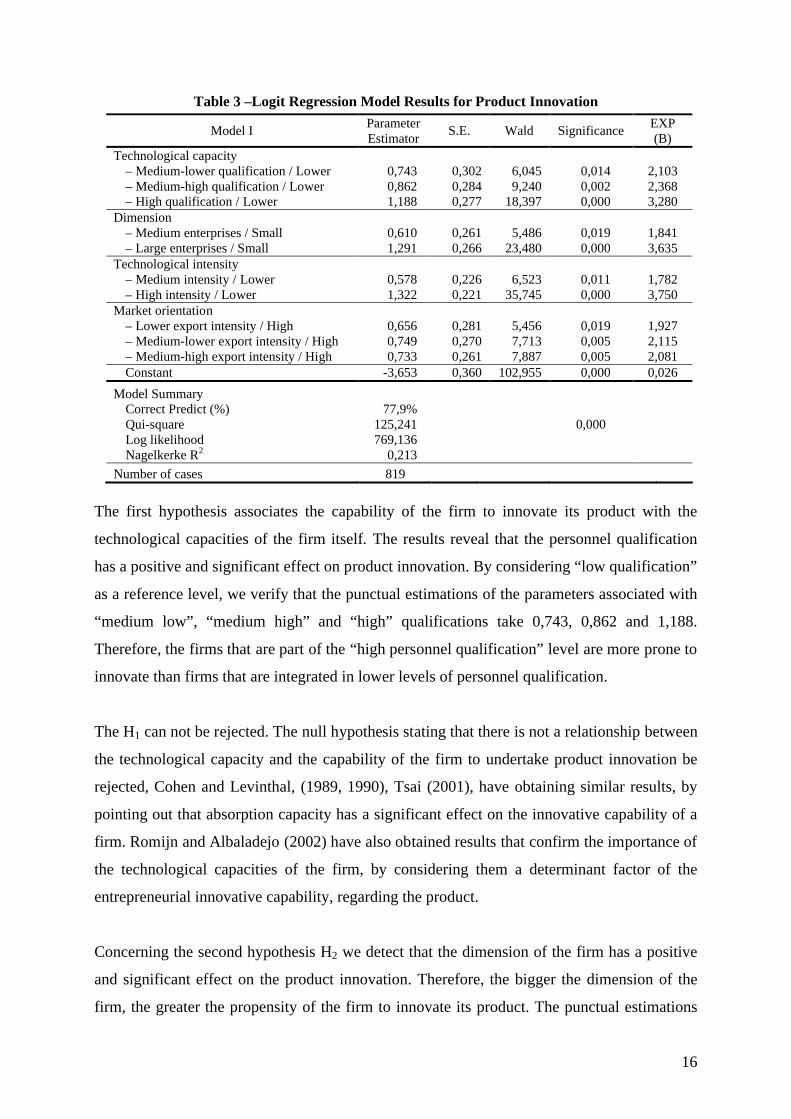
Table 3 –Logit Regression Model Results for Product Innovation
Model IParameter Estimator
S.E. Wald SignificanceEXP (B)
Technological capacity– Medium-lower qualification / Lower 0,743 0,302 6,045 0,014 2,103– Medium-high qualification / Lower 0,862 0,284 9,240 0,002 2,368– High qualification / Lower 1,188 0,277 18,397 0,000 3,280
Dimension– Medium enterprises / Small 0,610 0,261 5,486 0,019 1,841– Large enterprises / Small 1,291 0,266 23,480 0,000 3,635
Technological intensity– Medium intensity / Lower 0,578 0,226 6,523 0,011 1,782– High intensity / Lower 1,322 0,221 35,745 0,000 3,750
Market orientation– Lower export intensity / High 0,656 0,281 5,456 0,019 1,927– Medium-lower export intensity / High 0,749 0,270 7,713 0,005 2,115– Medium-high export intensity / High 0,733 0,261 7,887 0,005 2,081Constant -3,653 0,360 102,955 0,000 0,026
Model SummaryCorrect Predict (%) 77,9%Qui-square 125,241 0,000Log likelihood 769,136Nagelkerke R2 0,213
Number of cases 819
The first hypothesis associates the capability of the firm to innovate its product with the
technological capacities of the firm itself. The results reveal that the personnel qualification
has a positive and significant effect on product innovation. By considering “low qualification”
as a reference level, we verify that the punctual estimations of the parameters associated with
“medium low”, “medium high” and “high” qualifications take 0,743, 0,862 and 1,188.
Therefore, the firms that are part of the “high personnel qualification” level are more prone to
innovate than firms that are integrated in lower levels of personnel qualification.
The H1 can not be rejected. The null hypothesis stating that there is not a relationship between
the technological capacity and the capability of the firm to undertake product innovation be
rejected, Cohen and Levinthal, (1989, 1990), Tsai (2001), have obtaining similar results, by
pointing out that absorption capacity has a significant effect on the innovative capability of a
firm. Romijn and Albaladejo (2002) have also obtained results that confirm the importance of
the technological capacities of the firm, by considering them a determinant factor of the
entrepreneurial innovative capability, regarding the product.
Concerning the second hypothesis H2 we detect that the dimension of the firm has a positive
and significant effect on the product innovation. Therefore, the bigger the dimension of the
firm, the greater the propensity of the firm to innovate its product. The punctual estimations
17
of the parameters associated with “medium” and “large enterprises” are 0,610 and 1,291
respectively, comparing with “small enterprises”.
Therefore, the null hypothesis stating that there is not a relationship between the
entrepreneurial dimension and the capability of the firm to undertake product innovation can
be rejected, whereas the H2 can not be rejected . These results follow the empirical research
done by Martins (1999). As the marginal effects of the dummy variables are analysed, the
probability of the firm to innovate its product has an increasing positive relationship between
entrepreneurial dimension. The advantages ratio shows that “large enterprises” have a 3,635
advantage regarding product innovation, comparing with “small enterprises”, and a 1,841
advantage, comparing with “medium enterprises”.
Relative to the third hypothesis, we detect that firms belonging to a “high technological
intensity” level present a greater propensity to innovate their product. The variable
coefficients have positive values and they increase according to the technological intensity
level. Considering “low technological intensity” as a reference level, the punctual estimations
of the parameters associated with “medium” and “high technological intensity” are 0,578 and
1,322. As the intensity level increases, the probability of the firms to innovate their product
increases as well. Hence, the null hypothesis stating that there is not a connection between the
activity sectors and the capability of the firm to innovate its product can be rejected, so the H3
can not be rejected. The study of CISEP/GEPE (1992) confirms these findings, since it shows
that sectors with a low technological intensity, namely the textile, clothing and footwear
industry, have introduced less product innovations than activity sectors that are part of other
technological intensity levels.
By analysing the fourth hypothesis and considering “high export intensity” as a reference
level, one would expect that the sign associated with the parameters estimation would be
negative and that the absolute value of the estimations would decrease according to the export
intensity levels.
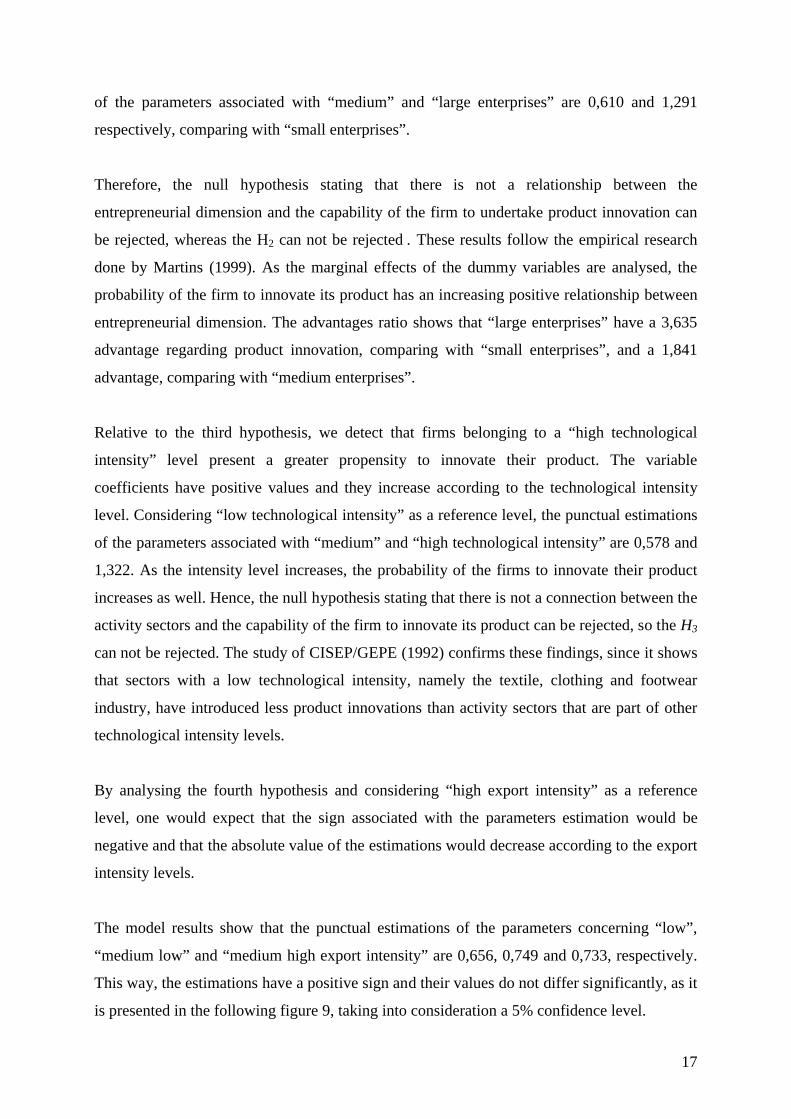
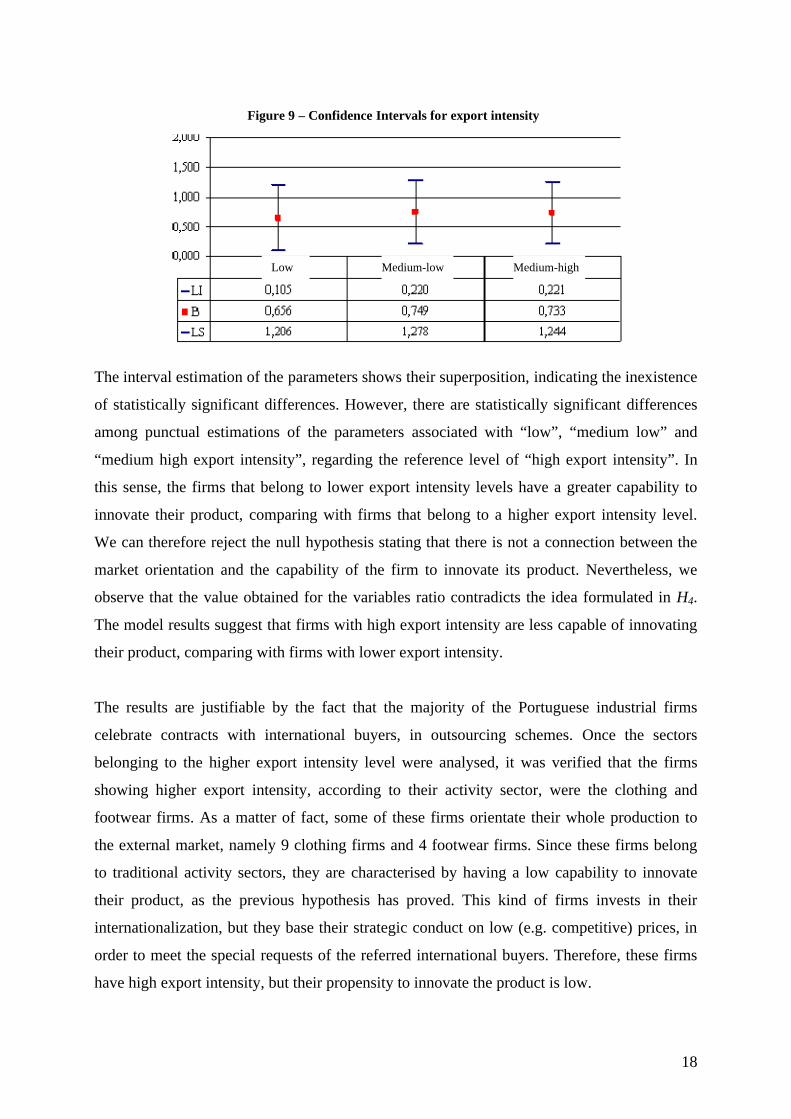
The model results show that the punctual estimations of the parameters concerning “low”,
“medium low” and “medium high export intensity” are 0,656, 0,749 and 0,733, respectively.
This way, the estimations have a positive sign and their values do not differ significantly, as it
is presented in the following figure 9, taking into consideration a 5% confidence level.
18
The interval estimation of the parameters shows their superposition, indicating the inexistence
of statistically significant differences. However, there are statistically significant differences
among punctual estimations of the parameters associated with “low”, “medium low” and
“medium high export intensity”, regarding the reference level of “high export intensity”. In
this sense, the firms that belong to lower export intensity levels have a greater capability to
innovate their product, comparing with firms that belong to a higher export intensity level.
We can therefore reject the null hypothesis stating that there is not a connection between the
market orientation and the capability of the firm to innovate its product. Nevertheless, we
observe that the value obtained for the variables ratio contradicts the idea formulated in H4.
The model results suggest that firms with high export intensity are less capable of innovating
their product, comparing with firms with lower export intensity.
The results are justifiable by the fact that the majority of the Portuguese industrial firms
celebrate contracts with international buyers, in outsourcing schemes. Once the sectors
belonging to the higher export intensity level were analysed, it was verified that the firms
showing higher export intensity, according to their activity sector, were the clothing and
footwear firms. As a matter of fact, some of these firms orientate their whole production to
the external market, namely 9 clothing firms and 4 footwear firms. Since these firms belong
to traditional activity sectors, they are characterised by having a low capability to innovate
their product, as the previous hypothesis has proved. This kind of firms invests in their
internationalization, but they base their strategic conduct on low (e.g. competitive) prices, in
order to meet the special requests of the referred international buyers. Therefore, these firms
have high export intensity, but their propensity to innovate the product is low.
Figure 9 – Confidence Intervals for export intensity
Low Medium-low Medium-high
19
Presently, Portugal is a very open economy, and the local consumers often prefer foreign
products to national ones. The firms that orientate part of their production to the internal
market have to innovate their product, in order to prevent losing their share in the national
market. Even though these firms present low levels of export intensity, they innovate due to
the demand pull observed at the internal market level.
To test the fifth hypothesis, 29 dummy variables (one for each region) were included in the
model, and “Cova da Beira” was used as a reference.2 All the estimations associated with the
regions were not statistically significant.3 Nevertheless, the obtained estimations are
associated with the process of choosing the reference region, meaning that the inexistence of a
relation between the regions and the probability of the firm to innovate is not excluded.
The predictive capacity of the model is 77,9%, which results from the comparison between
the values of the variable answer predicted by the model and the observed values. The chi-
square test statistics comprises125,241 with a proof value smaller than the significance level
of 0,05. The log-likelihood statistics, comprising 769,136, also corroborates the global
significance of the model, when compared with the null model. The Nagelkerke coefficient of
determination indicates that the model explains 21,3% of the total variation.
6. CONCLUDING REMARKS
Nowadays, the innovation word is on the spotlight, but talking about innovation is not
enough, it is necessary to collect innovation data and to perform empirical studies, in order to
better guide the entrepreneurial orientation of firms.
In the paper, we test the contributions of several determinant factors of the innovative
capability concerning product innovation of industrial firms, by using as laboratory the
Portuguese reality. A conceptual model was proposed and several hypotheses were
formulated, according to the literature review.
The conceptual model has two underlying premises. The first premise analyses the
determinant factors, by using a double approach, which means that they are considered as
2 During the exploratory modelling phase, other regions were also regarded as a reference.3 Overall, the effect of location on all the experimental models was not very significant. However, when we consider Minho-Lima or Alto Alentejo as a reference, some locations emerge as statistically significant.
20
being both stimulating and restraining the entrepreneurial innovative capability. The second
premise consists in a joint analysis of the determinant factors, in order to allow the
simultaneous study of their direct and indirect effects, as well as the impact that they have on
the entrepreneurial innovative capability.
A set of five stimulating and restraining factors concerning entrepreneurial innovative
capability was analysed: technological capacities, entrepreneurial dimension, activity sector,
market orientation and location of the firm. Throughout the analysis, we find that the
determinant factors considered in the conceptual model indicate that firms with greater
technological capacities are more prone to innovate their product. This result agrees with the
idea that technological capacities which are internal to the firm allow it to obtain and absorb
new knowledge, using it for entrepreneurial purposes. Thus, the firms that have greater
technological capacities will be more prone to innovate. This concluding remark follows the
theory of Cohen and Levinthal (1989, 1990).
The model presents results which indicate that, as the technological intensity level increases,
the probability of the firms to innovate their product increases as well. Therefore, the firms
that are more prone to innovate integrate the high-tech sectors. In the meanwhile, traditional
industries are less prone to innovate. This is a problematic point, since these sectors show a
higher level of export intensity. It will be necessary to take measures concerning the
restructuring of these sectors, making them competitive through critical factors, such as
innovation, design, brand image and fashion.
Unlike what was expected, the model results indicate that firms with higher export intensity
present a lower probability to innovate. This is due to the fact that many of these firms belong
to traditional activity sectors that have a low propensity to innovate, as the previous
hypothesis has proved.
In terms of limitations, we must stress that the results obtained through the first statistical
analysis of data did not allow us to test, under an empirical basis, the hypothesis concerned
with the relationship between the location of firm and the product innovation choice.
Regarding the theoretical hypothesis about entrepreneurial dimension, it was revealed that
dimension has a positive and significant effect on product innovation. Hence it is possible to
state that large enterprises are more prone to innovate. Following the first phase of the
21
Schumpeterian approach large enterprises reveal a greater capability to innovate, because they
have the necessary dimension to develop, efficiently, innovations. Whereas, small enterprises
feel hindered when developing innovative activities, due to its small dimension, and
especially, in the Portuguese case because of the restraining conditions imposed by
outsourcing contracts that some small enterprises maintain with international buyers.
Even though large enterprises are more prone to innovate, it does not mean that innovation is
a prerogative of this type of firms. Innovation can also be a goal for the smaller enterprises;
probably the entrepreneurial innovation process will have to be faced in another way,
different from the way large enterprises approach it. Small and medium enterprises have
limitations caused by their dimension. In the scope of innovation, it is urgent to overcome
these restrictions through resources accessible to all firms. More specifically, concerning the
hindrances that smaller enterprises have, they should be able to establish relationships with
external partners, regarding innovation, in order to surmount their weaknesses and to access
the resources and capacities they need to develop innovative activities. As a result, smaller
enterprises will be able to innovate in their processes and products. To achieve this, smaller
firms should be aware of their own shortcomings, and they also have to know the resources at
their disposal, in order to overcome their limitations.
Bearing in mind that the Portuguese entrepreneurial network consists mainly of small and
medium enterprises, and that the small entrepreneurial dimension emerges as a factor that
restricts entrepreneurial innovative capability, those who are responsible for the design and
implementation of public policies should strive to create measures that can stimulate
innovation in these firms. Therefore, entrepreneurs are not the only ones who should be
responsible for accepting the challenge to innovate. In this area, there are several intervening
entities and institutions that are responsible for stimulating innovation and for creating a truly
innovative system, capable of maximizing an innovative environment. More than a current
subject, it is necessary to act and to view innovation as a global challenge.
Future researches may incorporate alternative determinant factors of the innovation capability
of European firms, as for example, the degree of cooperation of the firms with different kinds
of stakeholders. Furthermore, the present study will be replicated on the services industries in
a European context.
22
REFERENCES
AGRESTI, A. (1996): An introduction to categorical data analysis, New York: John Wiley & Sons.
ASHEIM, B., COENEN, L, MOODYSSON, J.; VANG, J. (2006): “Constructing knowledge based regional advantage: Implications for regional innovation policy”, Innovation Pressure Conference, Tampere, Finland, March 2006.
BAYONA,C. GARCIA-MARCO, T. HUERTA, E. (2001): “Firm’s motivations for cooperative R&D: an empirical analysis of Spanish firms”, Research Policy, Vol. 30; pp. 1289-1307.
BRACZYK,H., COOKE, P.; HEIDENREICH R., (1998): Regional Innovation Systems, UCL, Press, London
CE (2001): Recomendação da Comunidade Europeia 96/280/CE relativa à definição de pequenas e médias empresas, nº 70 /2001
CIS II (1999): “Segundo Inquérito Comunitário às Actividades de Inovação”, Observatório das Ciências e Tecnologias, Ministério da Ciência e da Tecnologia, Lisboa
CISEP/GEPE (1992): ”Inovação Indústria Portuguesa – Observatório M.I.E.”, GEPE, Lisboa.
COHEN, W.; LEVINTHAL, D.A. (1989): “Innovation and Learning: the Two Faces of R&D –Implications for the Analysis of R&D Investment”, Economic Journal, 99, Set, pp. 569-596.
COHEN, W.M.; LEVINTHAL, D.A. (1990): “Absorptive Capacity: A New Perspective on Learning and Innovation”, Administrative Science Quarterly, Vol. 35, March, pp.128-152.
CONCEIÇÃO, P.; ÁVILA, P. (2001): Inovação em Portugal: II Inquérito Comunitário às Actividades de Inovação, Celta Editora, Oeiras.
COOKE, P., BOEKHOLT, P., TÖDTLING, F. (2000): "The governance of innovation in Europe: regional perspectives on global competitiveness ", Printer, London.
COOKE, P.; LEYDESDORFF, L. (2006): "Regional Development in the Knowledge-Based Economy: The Construction of Advantage" The Journal of Technology Transfer, Vol. 31(1), pp. 5-15.
COOKE, P.; URANGA, M.G.; ETXEBARRIA, G. (1997): "Regional Innovation Systems: Institutional and Organisational Dimensions", Research Policy, 26 (4-5), December, pp. 475-491.
DOSI, G.; FREEMAN, C.; NELSON, R.; SILVERBERG, G. and SOETE, L. (1988): Technical Change and Economic Theory, Printer, London.
EDQUIST, C. (1997): “Systems of Innovation Approaches - Their Emergence and Characteristics” in Edquist (Ed.) Systems of Innovation: Technologies, Institutions and Organizations, Chapter One, London, Printer, pp. 1-35.
FERRÃO, M.E. (2003): Introdução aos modelos de regressão multinível em educação, Campinas: Komedi.
FRITSCH, M.; LUKAS R., (1999): "Innovation, Cooperation, and the Region", in: David B. Audretsch e Roy Thurik (eds.), Innovation, Industry Evolution and Employment, Cambridge (UK): Cambridge University Press, pp. 157-181.
FRITSCH, M.; LUKAS R., (2001): "Co-operation in Regional Innovation Systems", Regional Studies, 35 (4), pp. 297-307.
FURMAN, J.L., PORTER, M.E.; STERN, S. (2002): “The Determinants of National Innovative Capacity”, Research Policy, 31, pp. 899-933.
KAUFMANN, A.; TÖDTLING, F. (2000): “Systems of Innovation in Traditional Industrial Regions: the Case of Styria in a Comparative Perspective”, Regional Studies, 34 (1), pp. 29-40.
23
KAUFMANN, A.; TÖDTLING, F. (2001): “Science-industry Interaction in the Process of Innovation: the Importance of Boundary-crossing Between Systems”, Research Policy, 30, pp. 791-804.
KLINE, S.J., and ROSENBERG, N. (1986): “An Overview of Innovation”, in The Positive Sum Strategy: Harnessing Technology for Economic Growth, Laudau, R. and Rosenberg, N. (Eds), National Academy Press, Washington, pp. 275-306.
LEITÃO, J. (2004): Estratégias de Integração Vertical e de Fixação de Preços nos Serviços de Televisão por Cabo em Portugal, Ph.D. Thesis in Economics, University of Beira Interior, Covilhã.
LEITÃO, J. (2006): "Demand Pull and Supply Push In Portuguese Cable Television Networks: A Var Approach", The ICFAI Journal of Applied Economics, ICFAI Press, vol. 0(2), pp. 26-36, March.
LUNDVALL, B.A. (1992): National Systems of Innovation: Towards a Theory of Innovation and Interactive Learning, Printer, London.
MALECKI, E. (1997) Technology and Economic Development, Addison Wesley/Longman, Harlow.
MARTINS, A.G. (1999): “Os Determinantes da Inovação na Indústria Transformadora Portuguesa”, Tese de Doutoramento em Gestão, ISCTE, Lisboa.
McCULLAGH, P.; NELDER, J.A. (1989): Generalised Linear models,2ª Ed., Londres: Chapman & Hall.
MONERY, D.C.; OXLEY J.E.; SILVERMAN, B.S. (1996): “Strategic alliances and interfirm knowledge transfer” Strategic Management Journal, Vol.17 (winter special issue), pp. 77-91.
NELSON, R. R. (1959): “The Simple Economics of Basic Scientific Research”, in The Journal of Political Economy, LXVII, Feb.-Dec., pp. 297-306.
OCDE (1997): OSLO Manual: Proposed Guidelines for Collecting and Interpreting Technological Innovation Data, Paris, OCDE.
OCDE (1997a): Revision of the High-Technology Sector and Product Classification, STI Working Papers, 1997/2, Paris, OCDE.
OCT (2000): Ministério Ciência e Tecnologia - Observatório de Ciência e Tecnologia - Execução e Resultados do 2º Inquérito Comunitário às Actividades de Inovação em Portugal, Lisboa.
PORTER, M. E., (1990): The Competitive Advantage of Nations, New York, Macmillan.
PORTER, M.E.; STERN S, (2001): "Innovation: Location Matters", MIT Sloan Management Review, Summer, 42 (4), pp.28-36.
ROMIJN H.; ALBALADEJO, M. (2002): “Determinants of Innovation Capability in Small Electronics and Software Firms in Southeast England”, Research Policy, Sep; Vol. 31 (7); pp. 1053-1067.
ROTHWELL, R.; DODGSON, M (1994): "Innovation and Size of Firm", in Rothwell, R. e Dodgson, M. (eds.), The Handbook of Industrial Innovation,. Edward Elgar Publishing Company, UK. pp. 310-324.
SCHUMPETER, J. (1942): Capitalism, Socialism and Democracy, 5ª ed. George Allen & Unwin, London.
SCHMOOKLER, J. (1966): Invention and Economic Growth, Cambridge, Harvard University Press.
SENGENBERGER, W.; PYKE, F. (1992): "Industrial Districts and Local Economic Regeneration: Research and Policy Issues" in Pyke e Sengenberger (eds): Industrial Districts and Local Economic Regeneration, International Institute for Labour Studies, Geneva, pp.3-29.
SILVA, M. J. (2003) Capacidade Inovadora Empresarial – Estudos dos Factores Impulsionadores e Limitadores nas Empresas Industriais Portuguesas, Ph.D. Thesis in Management, University of da Beira Interior, Covilhã.
24
SILVA, M. J., LEITÃO, J., (2007): “Determinant Factors of Innovation Capability of Portuguese Services Firms: A Logit Model”, proceedings XVII International RESER Conference "Service Competitiveness and Cohesion - Balancing Dynamics in the Knowledge Society", 13-15th September 2007, Tampere Hall, Tampere, Finland
SILVA, M. J.; RAPOSO, M.; FERRÃO, M.; JIMÉNEZ, J. (2005): “Relacionamentos externos no âmbito da Inovação Empresarial: Modelo Aplicado aos Avanços Inovadores”, Portuguese Journal of Management Studies, nº 1, 5-19
SIMÕES, V. (1997): ”Inovação e Gestão em PME”, Gabinete de Estudos e Prospectiva Económica (GEPE), Ministério de Economia, Lisboa.
STERNBERG, R.; ARNDT, O. (2001): “The Firm or the Region: What Determines the Innovation Behavior of European Firms?”, Economic Geography, October, Vol. 77, (4) pp. 364-382.
TETHER, B. (2002): “Who co-operates for innovation, and why. An empirical analysis”, Research Policy, Vol. 31; pp. 947-967.
TIDD, J.; BESSANT, J.; PAVITT, K. (2003) Gestão da inovação : integração das mudanças tecnológicas, de mercado e internacionais, Monitor, Lisboa.
TSAI, W. (2001): “Knowledge transfer in intraorganizational networks: effects network position and absorptive capacity on business unit innovation and performance”, Academy of Management Journal, Vol.44, nº5 pp. 996-1004.
VINDING, L. (2006): “Absorptive capacity and innovative performance: A human capital approach”, Economics of Innovation and New Technology, Vol. 15(4/5), pp. 507–517.