wg iii contribution to the sixth assessment report chapter 10
TRANSCRIPT
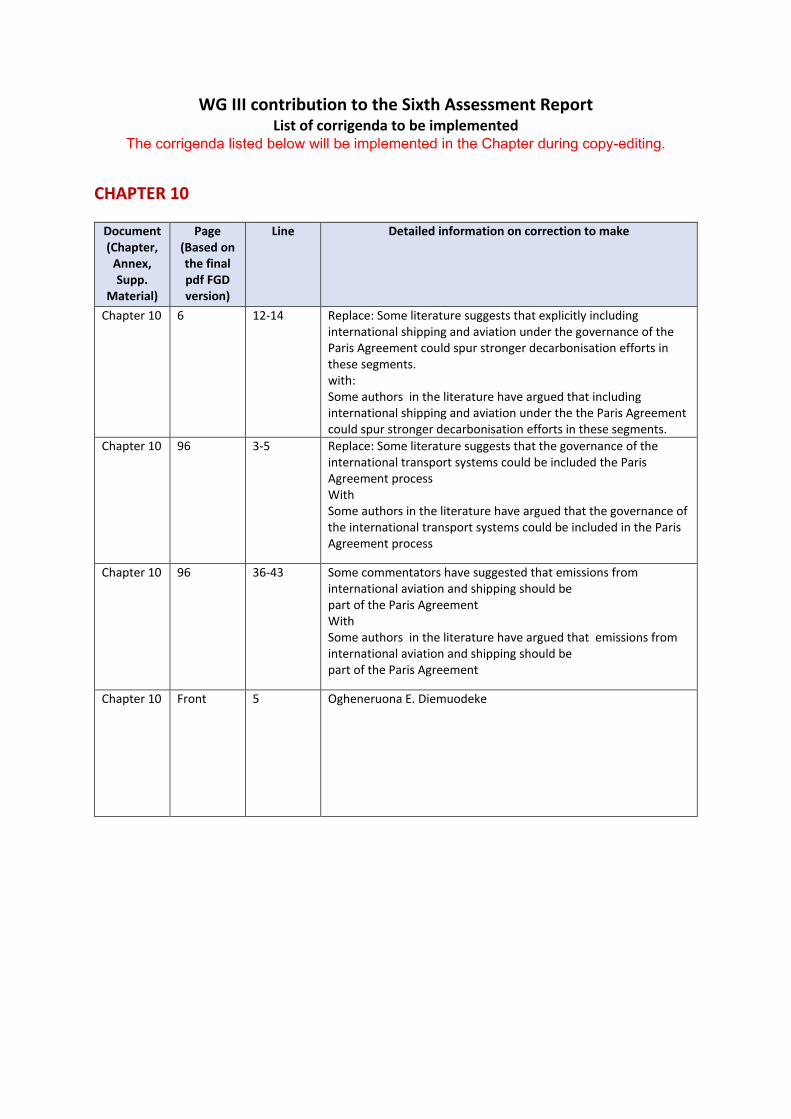
WG III contribution to the Sixth Assessment Report List of corrigenda to be implemented
The corrigenda listed below will be implemented in the Chapter during copy-editing.
CHAPTER 10
Document (Chapter,
Annex, Supp.
Material)
Page (Based on the final pdf FGD version)
Line Detailed information on correction to make
Chapter 10 6 12-14 Replace: Some literature suggests that explicitly including international shipping and aviation under the governance of the Paris Agreement could spur stronger decarbonisation efforts in these segments. with: Some authors in the literature have argued that including international shipping and aviation under the the Paris Agreement could spur stronger decarbonisation efforts in these segments.
Chapter 10 96 3-5 Replace: Some literature suggests that the governance of the international transport systems could be included the Paris Agreement process With Some authors in the literature have argued that the governance of the international transport systems could be included in the Paris Agreement process
Chapter 10 96 36-43 Some commentators have suggested that emissions from international aviation and shipping should be part of the Paris Agreement With Some authors in the literature have argued that emissions from international aviation and shipping should be part of the Paris Agreement
Chapter 10 Front 5 Ogheneruona E. Diemuodeke
Do Not Cite, Quote or Distribute 10-1 Total pages: 176
Chapter 10: Transport 1
2
Coordinating Lead Authors: Paulina Jaramillo (the United States of America), Suzana Kahn Ribeiro 3
(Brazil), Peter Newman (Australia) 4
Lead Authors: Subash Dhar (India), Ogheneruona Diemuodeke (Nigeria), Tsutomu Kajino (Japan), 5
David S. Lee (United Kingdom), Sudarmanto Budi Nugroho (Indonesia), Xunmin Ou (China), Anders 6
Hammer Strømman (Norway), Jake Whitehead (Australia) 7
Contributing Authors: Otavio Cavalett (Brazil), Michael Craig (the United States of America), Felix 8
Creutzig (Germany), Nick Cumpsty (United Kingdom), Maria Josefina Figueroa 9
(Venezuela/Denmark), Maximilian Held (Switzerland), Christine Hung (Norway), Alan Jenn (the 10
United States of America), Paul Kishimoto (Canada), William Lamb (Germany/ United Kingdom), 11
Shivika Mittal (India), Helene Muri (Norway), Minal Pathak (India), Daniel Posen (Canada), Simon 12
Robertson (Australia), Andrea Santos (Brazil), Karen Seto (the United States of America), Rohit 13
Sharma (India), Benjamin Sovacool (Denmark/United Kingdom), Linda Steg (the Netherlands), 14
Lorenzo Usai (Italy), Aranya Venkatesh (the United States of America /India), Sonia Yeh (Sweden), 15
Takashi Kuzuya (Japan) 16
Review Editors: Lynette Cheah (Singapore), Ralph E H Sims (New Zealand) 17
Chapter Scientist: Yuan Gao (China) 18
Date of Draft: 28/11/2021 19
ACCEPTED VERSION
SUBJECT TO FIN
AL EDITS
Final Government Distribution Chapter 10 IPCC AR6 WGIII
Do Not Cite, Quote or Distribute 10-2 Total pages: 176
Table of Contents 1
Chapter 10: Transport .................................................................................................................. 10-1 2
Executive summary ........................................................................................................................ 10-4 3
10.1 Introduction and overview ................................................................................................. 10-7 4
10.1.1 Transport and the sustainable development goals ...................................................... 10-7 5
10.1.2 Trends, drivers and the critical role of transport in GHG growth .............................. 10-9 6
10.1.3 Climate adaptation on the transport sector ............................................................... 10-12 7
10.1.4 Transport disruption and transformation .................................................................. 10-12 8
10.2 Systemic changes in the transport sector ......................................................................... 10-13 9
10.2.1 Urban form, physical geography, and transport infrastructure ................................ 10-14 10
Cross-Chapter Box 7 Urban Form: Simultaneously reducing urban transport emissions, avoiding 11
infrastructure lock-in, and providing accessible services......................................................... 10-15 12
10.2.2 Behaviour and mode choice ..................................................................................... 10-16 13
10.2.3 New demand concepts ............................................................................................. 10-18 14
10.2.4 Overall perspectives on systemic change ................................................................. 10-21 15
10.3 Transport technology innovations for decarbonisation .................................................... 10-23 16
10.3.1 Alternative fuels – an option for decarbonising internal combustion engines ......... 10-24 17
10.3.2 Electric technologies ................................................................................................ 10-30 18
10.3.3 Fuel cell technologies ............................................................................................... 10-33 19
10.3.4 Refuelling and charging infrastructure..................................................................... 10-34 20
10.4 Decarbonisation of land-based transport .......................................................................... 10-38 21
10.4.1 Light-duty vehicles for passenger transport ............................................................. 10-38 22
10.4.2 Transit technologies for passenger transport ............................................................ 10-46 23
10.4.3 Land-based freight transport .................................................................................... 10-52 24
10.4.4 Abatement costs ....................................................................................................... 10-57 25
10.5 Decarbonisation of aviation ............................................................................................. 10-58 26
10.5.1 Historical and current emissions from aviation ....................................................... 10-58 27
10.5.2 Short lived climate forcers and aviation................................................................... 10-59 28
10.5.3 Mitigation potential of fuels, operations, energy efficiency, and market-based measures29
10-59 30
10.5.4 Assessment of aviation-specific projections and scenarios ...................................... 10-64 31
10.5.5 Accountability and governance options ................................................................... 10-67 32
10.6 Decarbonisation of Shipping ............................................................................................ 10-67 33
10.6.1 Historical and current emissions from shipping ....................................................... 10-67 34
10.6.2 Short lived climate forcers and shipping .................................................................. 10-68 35
10.6.3 Shipping in the Arctic .............................................................................................. 10-69 36
10.6.4 Mitigation potential of fuels, operations and energy efficiency ............................... 10-70 37
ACCEPTED VERSION
SUBJECT TO FIN
AL EDITS
Final Government Distribution Chapter 10 IPCC AR6 WGIII
Do Not Cite, Quote or Distribute 10-3 Total pages: 176
10.6.5 Accountability and governance options ................................................................... 10-73 1
10.6.6 Transformation trajectories for the maritime sector ................................................. 10-74 2
10.7 Scenarios from integrated, sectoral, and regional models ................................................ 10-75 3
10.7.1 Transport scenario modelling ................................................................................... 10-75 4
10.7.2 Global emission trajectories ..................................................................................... 10-76 5
10.7.3 Transport activity trajectories .................................................................................. 10-79 6
10.7.4 Transport modes trajectories .................................................................................... 10-83 7
10.7.5 Energy and Carbon efficiency trajectories ............................................................... 10-85 8
10.7.6 Fuel energy and technology trajectories .................................................................. 10-87 9
10.7.7 Insights from the modelling literature ...................................................................... 10-90 10
10.8 Enabling conditions ......................................................................................................... 10-91 11
10.8.1 Conclusions across the chapter ................................................................................ 10-91 12
10.8.2 Feasibility Assessment ............................................................................................. 10-94 13
10.8.3 Emerging Transport Issues ....................................................................................... 10-95 14
10.8.4 Tools and Strategies to Enable Decarbonisation of the Transport Sector ................ 10-99 15
Frequently Asked Questions (FAQs) ......................................................................................... 10-103 16
References .................................................................................................................................. 10-105 17
Appendix 10.1: Data and methods for life cycle assessment ..................................................... 10-154 18
Appendix 10.2: Data and assumptions for life cycle cost analysis ............................................ 10-158 19
Appendix 10.3: Line of sight for feasibility assessment ............................................................ 10-161 20
21
22
ACCEPTED VERSION
SUBJECT TO FIN
AL EDITS
Final Government Distribution Chapter 10 IPCC AR6 WGIII
Do Not Cite, Quote or Distribute 10-4 Total pages: 176
Executive summary 1
Meeting climate mitigation goals would require transformative changes in the transport sector 2
(high confidence). In 2019, direct greenhouse gas (GHG) emissions from the transport sector were 8.7 3
Gt CO2-eq (up from 5.0 Gt CO2-eq in 1990) and accounted for 23% of global energy-related CO2 4
emissions. 70% of direct transport emissions came from road vehicles, while 1%, 11%, and 12% came 5
from rail, shipping, and aviation, respectively. Emissions from shipping and aviation continue to grow 6
rapidly. Transport-related emissions in developing regions of the world have increased more rapidly 7
than in Europe or North America, a trend that is likely to continue in coming decades (high confidence). 8
{10.1, 10.5, 10.6}. 9
Since AR5 there has been a growing awareness of the need for demand management solutions 10
combined with new technologies, such as the rapidly growing use of electromobility for land 11
transport and the emerging options in advanced biofuels and hydrogen-based fuels for shipping 12
and aviation. There is a growing need for systemic infrastructure changes that enable behavioural 13
modifications and reductions in demand for transport services that can in turn reduce energy demand. 14
The response to the COVID-19 pandemic has also shown that behavioural interventions can reduce 15
transport-related GHG emissions. For example, COVID-19-based lockdowns have confirmed the 16
transformative value of telecommuting replacing significant numbers of work and personal journeys as 17
well as promoting local active transport. There are growing opportunities to implement strategies that 18
drive behavioural change and support the adoption of new transport technology options. {Chapter 5, 19
10.2, 10.3, 10.4, 10.8} 20
Changes in urban form, behaviour programs, the circular economy, the shared economy, and 21
digitalisation trends can support systemic changes that lead to reductions in demand for transport 22
services or expands the use of more efficient transport modes (high confidence). Cities can reduce 23
their transport-related fuel consumption by around 25% through combinations of more compact land 24
use and the provision of less car-dependent transport infrastructure. Appropriate infrastructure, 25
including protected pedestrian and bike pathways, can also support much greater localised active travel1. 26
Transport demand management incentives are expected to be necessary to support these systemic 27
changes (high confidence). There is mixed evidence of the effect of circular economy initiatives, shared 28
economy initiatives, and digitalisation on demand for transport services. For example, while 29
dematerialisation can reduce the amount of material that need to be transported to manufacturing 30
facilities, an increase in online shopping with priority delivery can increase demand for freight transport. 31
Similarly, while teleworking could reduce travel demand, increased ridesharing could increase vehicle-32
km travelled. {Chapter 1, Chapter 5, 10.2, 10.8} 33
Battery-electric vehicles (BEVs) have lower life cycle greenhouse gas emissions than internal 34
combustion engine vehicles (ICEVs) when BEVs are charged with low carbon electricity (high 35
confidence). Electromobility is being rapidly implemented in micro-mobility (e-autorickshaws, e-36
scooters, e-bikes), in transit systems, especially buses, and, to a lesser degree, in the electrification of 37
personal vehicles. BEVs could also have the added benefit of supporting grid operations. The 38
commercial availability of mature Lithium-Ion Batteries (LIBs) has underpinned this growth in 39
electromobility. 40
As global battery production increases, unit costs are declining. Further efforts to reduce the GHG 41
footprint of battery production, however, are essential for maximising the mitigation potential of BEVs. 42
The continued growth of electromobility for land transport would require investments in electric 43
charging and related grid infrastructure (high confidence). Electromobility powered by low-carbon 44
FOOTNOTE 1 Active travel is travel that requires physical effort, for example journeys made by walking or
cycling.
ACCEPTED VERSION
SUBJECT TO FIN
AL EDITS
Final Government Distribution Chapter 10 IPCC AR6 WGIII
Do Not Cite, Quote or Distribute 10-5 Total pages: 176
electricity has the potential to rapidly reduce transport GHG and can be applied with multiple co-1
benefits in the developing world’s growing cities (high confidence). {10.3, 10.4, 10.8} 2
Land-based, long-range, heavy-duty trucks can be decarbonised through battery-electric haulage 3
(including the use of Electric Road Systems), complemented by hydrogen- and biofuel-based fuels 4
in some contexts (medium confidence). These same technologies and expanded use of available 5
electric rail systems can support rail decarbonisation (medium confidence). Initial deployments of 6
battery-electric, hydrogen- and bio-based haulage are underway, and commercial operations of some of 7
these technologies are considered feasible by 2030 (medium confidence). These technologies 8
nevertheless face challenges regarding driving range, capital and operating costs, and infrastructure 9
availability. In particular, fuel cell durability, high energy consumption, and costs continue to challenge 10
the commercialisation of hydrogen-based fuel cell vehicles. Increased capacity for low-carbon 11
hydrogen production would also be essential for hydrogen-based fuels to serve as an emissions 12
reduction strategy (high confidence). {10.3, 10.4, 10.8} 13
Decarbonisation options for shipping and aviation still require R&D, though advanced biofuels, 14
ammonia, and synthetic fuels are emerging as viable options (medium confidence). Increased 15
efficiency has been insufficient to limit the emissions from shipping and aviation, and natural gas-based 16
fuels are likely inadequate to meet stringent decarbonisation goals for these segments (high confidence). 17
High energy density, low carbon fuels are required, but they have not yet reached commercial scale. 18
Advanced biofuels could provide low carbon jet fuel (medium confidence). The production of synthetic 19
fuels using low-carbon hydrogen with CO2 captured through DAC/BECCS could provide jet and marine 20
fuels but these options still require demonstration at scale (low confidence). Ammonia produced with 21
low-carbon hydrogen could also serve as a marine fuel (medium confidence). Deployment of these fuels 22
requires reductions in production costs. {10.2, 10.3, 10.4, 10.5, 10.6, 10.8}. 23
Scenarios from bottom-up and top-down models indicate that without intervention, CO2 24
emissions from transport could grow in the range of 16% and 50% by 2050 (medium confidence). 25
The scenarios literature projects continued growth in demand for freight and passenger services, 26
particularly in developing countries in Africa and Asia (high confidence). This growth is projected to 27
take place across all transport modes. Increases in demand not-withstanding, scenarios that limit 28
warming to 1.5°C degree with no or limited overshoot suggest that a 59% reduction (42-68% 29
interquartile range) in transport-related CO2 emissions by 2050, compared to modelled 2020 levels is 30
required. While many global scenarios place greater reliance on emissions reduction in sectors other 31
than transport, a quarter of the 1.5°C degree scenarios describe transport-related CO2 emissions 32
reductions in excess of 68% (relative to modelled 2020 levels) (medium confidence). Illustrative 33
mitigation pathways 1.5 REN and 1.5 LD describe emission reductions of 80% and 90% in the transport 34
sector, respectively, by 2050. Transport-related emission reductions, however, may not happen 35
uniformly across regions. For example, transport emissions from the Developed Countries, and Eastern 36
Europe and West-Central Asia (EEA) countries decrease from 2020 levels by 2050 across all scenarios 37
compatible with a 1.5°C degree goal (C1 - C2 group), but could increase in Africa, Asia and developing 38
Pacific (APC), Latin America and Caribbean, and the Middle East in some of these scenarios. {10.7} 39
The scenarios literature indicates that fuel and technology shifts are crucial to reducing carbon 40
emissions to meet temperature goals. In general terms, electrification tends to play the key role in land-41
based transport, but biofuels and hydrogen (and derivatives) could play a role in decarbonisation of 42
freight in some contexts (high confidence). Biofuels and hydrogen (and derivatives) are likely more 43
prominent in shipping and aviation (high confidence). The shifts towards these alternative fuels must 44
occur alongside shifts towards clean technologies in other sectors (high confidence). {10.7}. 45
There is a growing awareness of the need to plan for the significant expansion of low-carbon 46
energy infrastructure, including low-carbon power generation and hydrogen production, to 47
support emissions reductions in the transport sector (high confidence). Integrated energy planning 48
ACCEPTED VERSION
SUBJECT TO FIN
AL EDITS

Final Government Distribution Chapter 10 IPCC AR6 WGIII
Do Not Cite, Quote or Distribute 10-6 Total pages: 176
and operations that take into account energy demand and system constraints across all sectors (transport, 1
buildings, and industry) offer the opportunity to leverage sectoral synergies and avoid inefficient 2
allocation of energy resources. Integrated planning of transport and power infrastructure would be 3
particularly useful in developing countries where ‘greenfield’ development doesn’t suffer from 4
constraints imposed by legacy systems. {10.3, 10.4, 10.8} 5
The deployment of low-carbon aviation and shipping fuels that support decarbonisation of the 6
transport sector could require changes to national and international governance structures 7
(medium confidence). Currently, the Paris Agreement does not specifically cover emissions from 8
international shipping and aviation. Instead, accounting for emissions from international transport in 9
the Nationally Determined Contributions is at the discretion of each country. While the ICAO and IMO 10
have established emissions reductions targets, only strategies to improve fuel efficiency and demand 11
reductions have been pursued, and there has been minimal commitment to new technologies. Some 12
literature suggests that explicitly including international shipping and aviation under the governance of 13
the Paris Agreement could spur stronger decarbonisation efforts in these segments. {10.5, 10.6, 10.7} 14
There are growing concerns about resource availability, labour rights, non-climate 15
environmental impacts, and costs of critical minerals needed for LIBs (medium confidence). 16
Emerging national strategies on critical minerals and the requirements from major vehicle 17
manufacturers are leading to new, more geographically diverse mines. The standardisation of battery 18
modules and packaging within and across vehicle platforms, as well as increased focus on design for 19
recyclability are important. Given the high degree of potential recyclability of LIBs, a nearly closed-20
loop system in the future could mitigate concerns about critical mineral issues (medium confidence). 21
{10.3, 10.8} 22
Legislated climate strategies are emerging at all levels of government, and, together with pledges 23
for personal choices, could spur the deployment of demand and supply-side transport mitigation 24
strategies (medium confidence). At the local level, legislation can support local transport plans that 25
include commitments or pledges from local institutions to encourage behaviour change by adopting an 26
organisational culture that motivates sustainable behaviour with inputs from the creative arts. Such 27
institution-led mechanisms could include bike-to-work campaigns, free transport passes, parking 28
charges, or eliminating car benefits. Community-based solutions like solar sharing, community 29
charging, and mobility as a service can generate new opportunities to facilitate low-carbon transport 30
futures. At the regional and national levels, legislation can include vehicle and fuel efficiency standards, 31
R&D support, and large-scale investments in low-carbon transport infrastructure. {10.8, Chapter 15} 32
33
34
ACCEPTED VERSION
SUBJECT TO FIN
AL EDITS
Final Government Distribution Chapter 10 IPCC AR6 WGIII
Do Not Cite, Quote or Distribute 10-7 Total pages: 176
10.1 Introduction and overview 1
This chapter examines the transport sector’s role in climate change mitigation. It appraises the transport 2
system’s interactions beyond the technology of vehicles and fuels to include the full life cycle analysis 3
of mitigation options, a review of enabling conditions, and metrics that can facilitate advancing 4
transport decarbonisation goals. The chapter assesses developments in the systems of land-based 5
transport and introduces, as a new feature since AR5, two separate sections focusing on the trends and 6
challenges in aviation and shipping. The chapter assesses the future trajectories emerging from global, 7
energy, and national scenarios and concludes with a discussion on enabling conditions for 8
transformative change in the sector. 9
This section (10.1) discusses how transport relates to virtually all the Sustainable Development Goals 10
(SDGs), the trends and drivers making transport a big contributor in greenhouse gas (GHG) emissions, 11
the impacts climate change is having on transport that can be addressed as part of mitigation, and the 12
overview of emerging transport disruptions with potential to shape a low carbon transport pathway. 13
14
10.1.1 Transport and the sustainable development goals 15
The adoption of the 2030 Agenda for Sustainable Development by the United Nations (UN) has 16
renewed international efforts to pursue and accurately measure global actions towards sustainable 17
development (United Nations 2015). The 17 SDGs set out the overall goals that are further specified by 18
169 targets and 232 SDG indicators, many of which relate to transport (United Nations 2017; Lisowski 19
et al. 2020). A sustainable transport system provides safe, inclusive, affordable, and clean passenger 20
and freight mobility for current and future generations (Williams 2017; Litman 2021) so transport is 21
particularly linked to SDGs 3, 7, 8, 9, 11, 12, and 13 (Move Humanity 2018; WBA 2019; SLoCaT 22
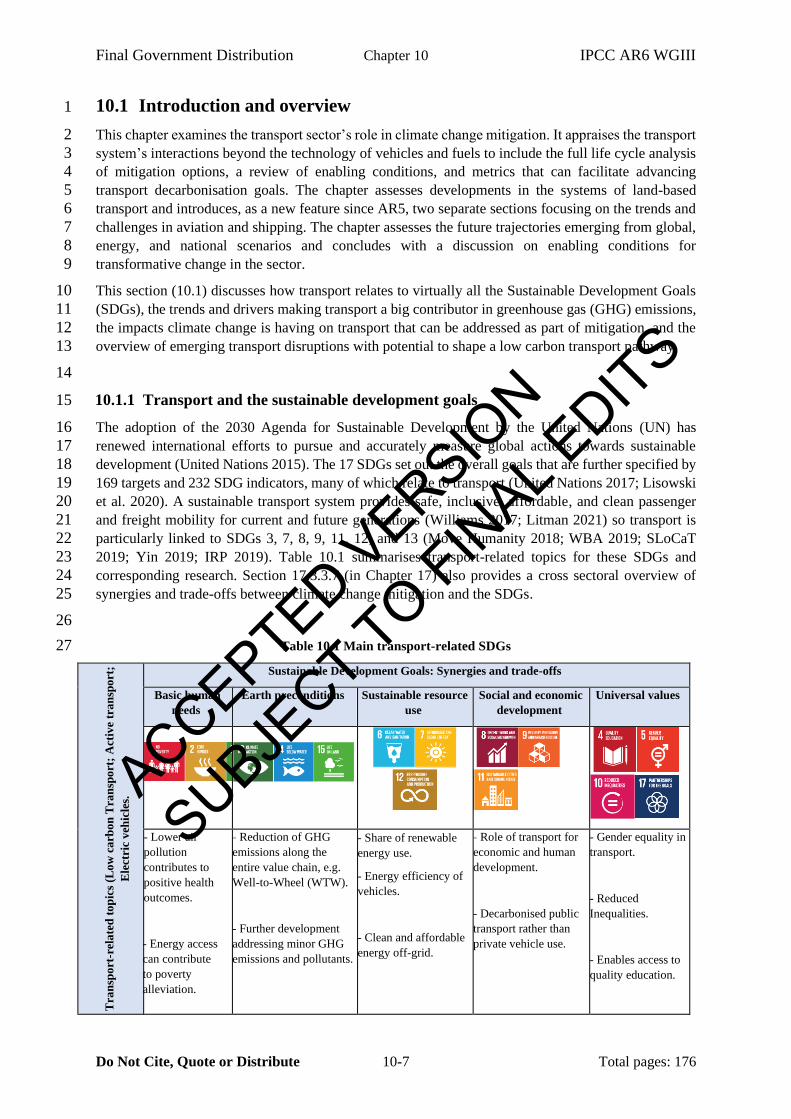
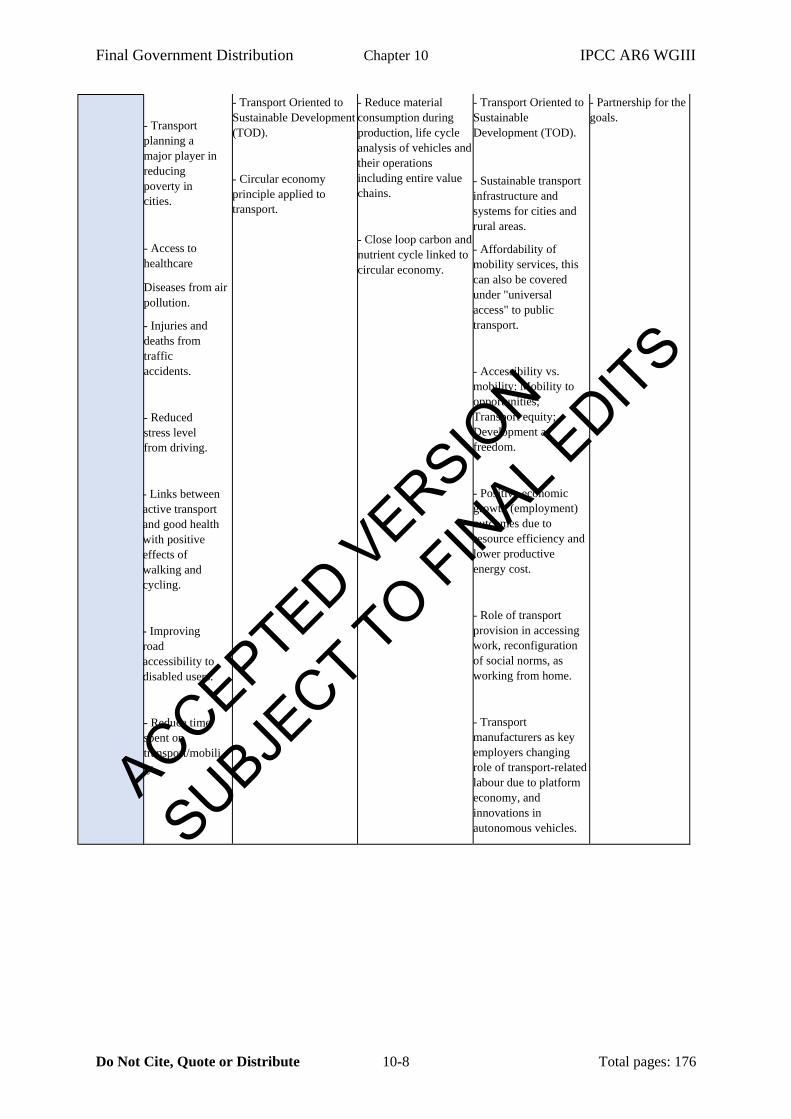
2019; Yin 2019; IRP 2019). Table 10.1 summarises transport-related topics for these SDGs and 23
corresponding research. Section 17.3.3.7 (in Chapter 17) also provides a cross sectoral overview of 24
synergies and trade-offs between climate change mitigation and the SDGs. 25
26
Table 10.1 Main transport-related SDGs 27
Tra
nsp
ort
-rel
ate
d t
op
ics
(Lo
w c
arb
on
Tra
nsp
ort
; A
ctiv
e tr
an
spo
rt;
Ele
ctri
c v
ehic
les.
Ad
va
nce
s in
veh
icle
tec
hn
olo
gy
; Im
pro
ved
pu
bli
c tr
an
spo
rt s
yst
em
Sustainable Development Goals: Synergies and trade-offs
Basic human
needs
Earth preconditions Sustainable resource
use
Social and economic
development
Universal values
- Lower air
pollution
contributes to
positive health
outcomes.
- Energy access
can contribute
to poverty
alleviation.
- Reduction of GHG
emissions along the
entire value chain, e.g.
Well-to-Wheel (WTW).
- Further development
addressing minor GHG
emissions and pollutants.
• - Share of renewable
energy use.
- Energy efficiency of
vehicles.
- Clean and affordable
energy off-grid.
- Role of transport for
economic and human
development.
- Decarbonised public
transport rather than
private vehicle use.
- Gender equality in
transport.
- Reduced
Inequalities.
- Enables access to
quality education.
ACCEPTED VERSION
SUBJECT TO FIN
AL EDITS
Final Government Distribution Chapter 10 IPCC AR6 WGIII
Do Not Cite, Quote or Distribute 10-8 Total pages: 176
- Transport
planning a
major player in
reducing
poverty in
cities.
• - Access to
healthcare
• Diseases from air
pollution.
- Injuries and
deaths from
traffic
accidents.
- Reduced
stress level
from driving.
- Links between
active transport
and good health
with positive
effects of
walking and
cycling.
- Improving
road
accessibility to
disabled users.
- Reduce time
spent on
transport/mobili
ty.
- Transport Oriented to
Sustainable Development
(TOD).
- Circular economy
principle applied to
transport.
- Reduce material
consumption during
production, life cycle
analysis of vehicles and
their operations
including entire value
chains.
- Close loop carbon and
nutrient cycle linked to
circular economy.
- Transport Oriented to
Sustainable
Development (TOD).
•
• - Sustainable transport
infrastructure and
systems for cities and
rural areas.
- Affordability of
mobility services, this
can also be covered
under "universal
access" to public
transport.
- Accessibility vs.
mobility: Mobility to
opportunities;
Transport equity;
Development as
freedom.
- Positive economic
growth (employment)
outcomes due to
resource efficiency and
lower productive
energy cost.
- Role of transport
provision in accessing
work, reconfiguration
of social norms, as
working from home.
- Transport
manufacturers as key
employers changing
role of transport-related
labour due to platform
economy, and
innovations in
autonomous vehicles.
- Partnership for the
goals.
ACCEPTED VERSION
SUBJECT TO FIN
AL EDITS
Final Government Distribution Chapter 10 IPCC AR6 WGIII
Do Not Cite, Quote or Distribute 10-9 Total pages: 176
Ref
eren
ces
(Grant et al.
2016; Haines et
al. 2017; Cheng
et al. 2018;
Nieuwenhuijsen
2018; Smith et
al. 2018; Sofiev
et al. 2018;
Peden and
Puvanachandra
2019; King and
Krizek 2020;
Macmillan et al.
2020)
(Farzaneh et al. 2019);
see particularly following
chapters.
(SLoCaT 2019); see
particularly following
chapters.
(Bruun and Givoni
2015; Pojani and Stead
2015; Hensher 2017;
ATAG 2018;
Grzelakowski 2018;
Weiss et al. 2018;
Brussel et al. 2019;
Gota et al. 2019;
Mohammadi et al.
2019; Peden and
Puvanachandra 2019;
SLoCaT 2019; Xu et al.
2019)
(Hernandez 2018;
Prati 2018; Levin
and Faith-Ell 2019;
Vecchio et al. 2020)
10.1.2 Trends, drivers and the critical role of transport in GHG growth 1
The transport sector directly emitted around 8.9 Gt Carbon dioxide equivalent (CO2eq) in 2019, up from 2
5.1 Gt CO2eq in 1990 (Figure 10.1). Global transport was the fourth largest source of GHG emissions 3
in 2019 following the power, industry, and the Agriculture, Forestry and Land Use (AFOLU) sectors. 4
In absolute terms, the transport sector accounts for roughly 15% of total greenhouse gas (GHG) 5
emissions and about 23% of global energy-related CO2 emissions (IEA 2020a). Transport GHG 6
emissions have increased fast over the last two decades, and since 2010, the sector’s emissions have 7
increased faster than for any other end-use sector, averaging +1.8% annual growth (see Section 10.7). 8
Addressing emissions from transport is crucial for GHG mitigation strategies across many countries, as 9
the sector represents the largest energy consuming sector in 40% of countries worldwide. In most 10
remaining countries, transport is the second largest energy-consuming sector, reflecting different levels 11
of urbanisation and land use patterns, speed of demographic changes and socio-economic development 12
(IEA 2012; Hasan et al. 2019; Xie et al. 2019; Gota et al. 2019). 13
14
15
ACCEPTED VERSION
SUBJECT TO FIN
AL EDITS
Final Government Distribution Chapter 10 IPCC AR6 WGIII
Do Not Cite, Quote or Distribute 10-10 Total pages: 176
1
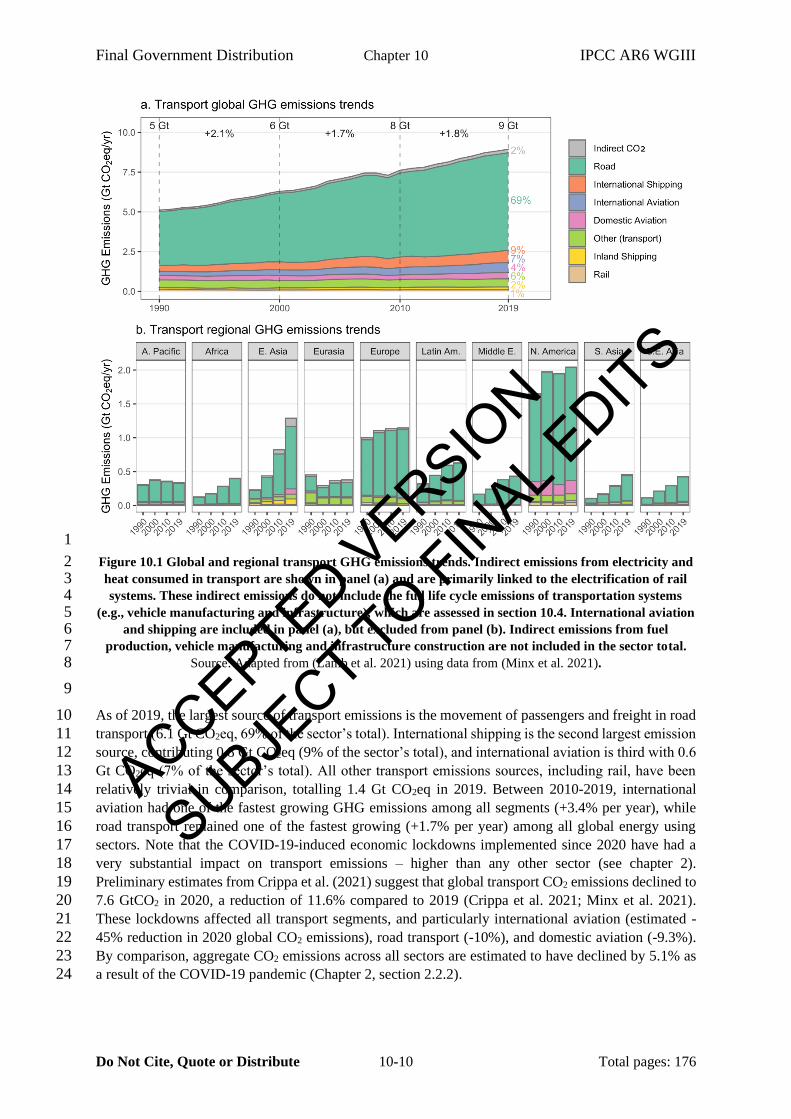
Figure 10.1 Global and regional transport GHG emissions trends. Indirect emissions from electricity and 2 heat consumed in transport are shown in panel (a) and are primarily linked to the electrification of rail 3 systems. These indirect emissions do not include the full life cycle emissions of transportation systems 4
(e.g., vehicle manufacturing and infrastructure), which are assessed in section 10.4. International aviation 5 and shipping are included in panel (a), but excluded from panel (b). Indirect emissions from fuel 6
production, vehicle manufacturing and infrastructure construction are not included in the sector total. 7 Source: Adapted from (Lamb et al. 2021) using data from (Minx et al. 2021). 8
9
As of 2019, the largest source of transport emissions is the movement of passengers and freight in road 10
transport (6.1 Gt CO2eq, 69% of the sector’s total). International shipping is the second largest emission 11
source, contributing 0.8 Gt CO2eq (9% of the sector’s total), and international aviation is third with 0.6 12
Gt CO2eq (7% of the sector’s total). All other transport emissions sources, including rail, have been 13
relatively trivial in comparison, totalling 1.4 Gt CO2eq in 2019. Between 2010-2019, international 14
aviation had one of the fastest growing GHG emissions among all segments (+3.4% per year), while 15
road transport remained one of the fastest growing (+1.7% per year) among all global energy using 16
sectors. Note that the COVID-19-induced economic lockdowns implemented since 2020 have had a 17
very substantial impact on transport emissions – higher than any other sector (see chapter 2). 18
Preliminary estimates from Crippa et al. (2021) suggest that global transport CO2 emissions declined to 19
7.6 GtCO2 in 2020, a reduction of 11.6% compared to 2019 (Crippa et al. 2021; Minx et al. 2021). 20
These lockdowns affected all transport segments, and particularly international aviation (estimated -21
45% reduction in 2020 global CO2 emissions), road transport (-10%), and domestic aviation (-9.3%). 22
By comparison, aggregate CO2 emissions across all sectors are estimated to have declined by 5.1% as 23
a result of the COVID-19 pandemic (Chapter 2, section 2.2.2). 24
ACCEPTED VERSION
SUBJECT TO FIN
AL EDITS
Final Government Distribution Chapter 10 IPCC AR6 WGIII
Do Not Cite, Quote or Distribute 10-11 Total pages: 176
Growth in transport-related GHG emissions has taken place across most world regions (see Figure 1
10.1, panel b). Between 1990 and 2019, growth in emissions was relatively slow in Europe, Asia 2
Pacific, Eurasia, and North America while it was unprecedently fast in other regions. Driven by 3
economic and population growth, the annual growth rates in East Asia, South Asia, South East Asia, 4
and Africa were 6.1%, 5.2%, 4.7%, and 4.1%, respectively. Latin America and the Middle East have 5
seen somewhat slower growth in transport-related GHG emission (annual growth rates of 2.4% and 6
3.3%, respectively) (ITF 2019; Minx et al. 2021). Section 10.7 provides a more detailed 7
comparison of global transport emissions trends with those from regional and sub-sectoral 8
studies. 9
The rapid growth in global transport emissions is primarily a result of the fast growth in global transport 10
activity levels, which grew by 73% between 2000 and 2018. Passenger and freight activity growth have 11
outpaced energy efficiency and fuel economy improvements in this period (ITF 2019) . The global 12
increase in passenger travel activities has taken place almost entirely in non-OECD countries, often 13
starting from low motorization rates (SLoCaT 2018a). Passenger cars, two-and-three wheelers, and mini 14
buses contribute about 75% of passenger transport-related CO2 emissions, while collective transport 15
services (bus and railways) generates about 7% of the passenger transport-related CO2 emissions despite 16
covering a fifth of passenger transport globally (Rodrigue 2017; Halim et al. 2018; Sheng et al. 2018; 17
SLoCaT 2018a; Gota et al. 2019). While alternative lighter powertrains have great potential for 18
mitigating GHG emissions from cars, the trend has been towards increasing vehicle size and engine 19
power within all vehicle size classes, driven by consumer preferences towards larger sport utility 20
vehicles (SUVs) (IEA 2020a). On a global scale, SUV sales have been constantly growing in the last 21
decade, with 40% of the vehicles sold in 2019 being SUVs (IEA 2020a) – see Section 10.4, Box 10.3. 22
Indirect emissions from electricity and heat shown in Figure 10.1 account for only a small fraction of 23
current emissions from the transport sector (2%) and are associated with electrification of certain modes 24
like rail or bus transport (Lamb et al. 2021). Increasing transport electrification will affect indirect 25
emissions, especially where carbon-intense electricity grids operate. 26
Global freight transport, measured in tonne-kilometres (tkm), grew by 68% between 2000 and 2015 and 27
is projected to grow 3.3 times by 2050 (ITF 2019). If unchecked, this growth will make decarbonisation 28
of freight transport very difficult (McKinnon 2018; ITF 2019). International trade and global supply 29
chains from industries frequently involving large geographical distances are responsible for the fast 30
increase of CO2 emissions from freight transport (Yeh et al. 2017; McKinnon 2018), which are growing 31
faster than emissions from passenger transport (Lamb et al. 2021). Heavy-duty vehicles (HDVs) make 32
a disproportionate contribution to air pollution, relative to their global numbers, because of their 33
substantial emissions of particulate matter and of black carbon with high short-term warming potentials 34
(Anenberg et al. 2019). 35
On-road passenger and freight vehicles dominate global transport-related CO2 emissions and offer the 36
largest mitigation potential (Taptich et al. 2016; Halim et al. 2018). This chapter examines a wide range 37
of possible transport emission reduction strategies. These strategies can be categorised under the 38
‘Avoid- Shift-Improve’ (ASI) framework described in Chapter 5 (Taptich et al. 2016). Avoid strategies 39
reduce total vehicle-travel. They include compact communities and other policies that minimise travel 40
distances and promote efficient transport through pricing and demand management programs. Shift 41
strategies shift travel from higher-emitting to lower-emitting modes. These strategies include more 42
multimodal planning that improves active and collective transport modes, complete streets roadway 43
design, High Occupant Vehicle (HOV) priority strategies that favour shared mode, Mobility as a Service 44
(MaaS), and multimodal navigation and payment apps. Improve strategies reduce per-kilometre 45
emission rates. These strategies include hybrid and electric vehicle incentives, lower carbon and cleaner 46
fuels, high emitting vehicle scrappage programs, and efficient driving and anti-idling campaigns 47
(Lutsey and Sperling 2012; Gota et al. 2015). These topics are assessed within the rest of this chapter 48
ACCEPTED VERSION
SUBJECT TO FIN
AL EDITS
Final Government Distribution Chapter 10 IPCC AR6 WGIII
Do Not Cite, Quote or Distribute 10-12 Total pages: 176
including how combinations of ASI with new technologies can potentially lead from incremental 1
interventions into low carbon transformative transport improvements that include social and equity 2
benefits (see section 10.8). 3
4
10.1.3 Climate adaptation on the transport sector 5
Climate change impacts such as extremely high temperatures, intense rainfall leading to flooding, more 6
intense winds and/or storms, and sea level rise can seriously impact transport infrastructure, operations, 7
and mobility for road, rail, shipping, and aviation. Studies since AR5 confirm that serious challenges to 8
all transport infrastructures are increasing, with consequent delays or derailing (Miao et al. 2018; 9
Moretti and Loprencipe 2018; Pérez-Morales et al. 2019; Palin et al. 2021). These impacts have been 10
increasingly documented but, according to (Forzieri et al. 2018), little is known about the risks of 11
multiple climate extremes on critical infrastructures at local to continental scales. All roads, bridges, 12
rail systems, and ports are likely to be affected to some extent. Flexible pavements are particularly 13
vulnerable to extreme high temperatures that can cause permanent deformation and crumbling of 14
asphalt (Underwood et al. 2017; Qiao et al. 2019). Rail systems are also vulnerable, with a variety of 15
hazards, both meteorological and non-meteorological, affecting railway asset lifetimes. Severe impacts 16
on railway infrastructure and operations can arise from the occurrence of temperatures below freezing, 17
excess precipitation, storms and wildfires (Thaduri et al. 2020; Palin et al. 2021) as are underground 18
transport systems (Forero-Ortiz et al. 2020). 19
Most countries are examining opportunities for combined mitigation-adaptation efforts, using the need 20
to mitigate climate change through transport-related GHG emissions reductions and pollutants as the 21
basis for adaptation action (Thornbush et al. 2013; Wang et al. 2020). For example, urban sprawl 22
indirectly affects climate processes, increasing emissions and vulnerability, which worsens the potential 23
to adapt (Congedo and Munafò 2014; Macchi and Tiepolo 2014). Hence, using a range of forms of 24
rapid transit as structuring elements for urban growth can mitigate climate change-related risks as well 25
as emissions, reducing impacts on new infrastructure, often in more vulnerable areas (Newman et al. 26
2017). Such changes are increasingly seen as having economic benefit (Ha et al. 2017), especially in 27
developing nations (Chang 2016; Monioudi et al. 2018). 28
Since AR5 there has been a growing awareness of the potential and actual impacts from global sea level 29
rise due to climate change on transport systems (Dawson et al. 2016; Rasmussen et al. 2018; IPCC 30
2019; Noland et al. 2019), particularly on port facilities (Stephenson et al. 2018; Yang et al. 2018b; 31
Pérez-Morales et al. 2019). Similarly, recent studies suggest changes in global jet streams could affect 32
the aviation sector (Staples et al. 2018; Becken and Shuker 2019), and extreme weather conditions can 33
affect runways (heat buckling) and aircraft lift. Combined, climate impacts on aviation could result in 34
payload restrictions and disruptions (Coffel et al. 2017; Monioudi et al. 2018). According to (Williams 35
2017), studies have indicated that the amount of moderate-or-greater clear-air turbulence on 36
transatlantic flight routes in winter will increase significantly in the future as the climate changes. More 37
research is needed to fully understand climate induced risks to transportation systems. 38
39
10.1.4 Transport disruption and transformation 40
Available evidence suggests that transport-related CO2 emissions would need to be restricted to about 41
2 to 3 Gt in 2050 (1.5°C scenario-1.5DS, B2DS), or about 70 to 80% below 2015 levels, to meet the 42
goals set in the Paris Agreement. It also indicates that a balanced and inter-modal application of Avoid, 43
Shift, and Improve measures is capable of yielding an estimated reduction in transport emissions of 44
2.39 Gt of CO2-equivalent by 2030 and 5.74 Gt of CO2-equivalent by 2050 (IPCC 2018; Gota et al. 45
2019). Such a transformative decarbonisation of the global transport system requires, in addition to 46
ACCEPTED VERSION
SUBJECT TO FIN
AL EDITS
Final Government Distribution Chapter 10 IPCC AR6 WGIII
Do Not Cite, Quote or Distribute 10-13 Total pages: 176
technological changes, a paradigm shift that ensures prioritisation of high-accessibility transport 1
solutions that minimise the amount of mobility required to meet people’s needs, and favours transit and 2
active transport modes (Lee and Handy 2018; SLoCaT 2021). These changes are sometimes called 3
disruptive as they are frequently surprising in how they accelerate through a technological system. 4
The assessment of transport innovations and their mitigation potentials is at the core of how this chapter 5
examines the possibilities for changing transport-related GHG trajectories. The transport technology 6
innovation literature analysed in this chapter emphasises how a mixture of mitigation technology 7
options and social changes are now converging and how, in combination, they may have potential to 8
accelerate trends toward a low carbon transport transition. Such changes are considered disruptive or 9
transformative (Sprei 2018). Of the current transport trends covered in the literature, this chapter focuses 10
on three key technology and policy areas: electro-mobility in land-based transport vehicles, new fuels 11
for ships and planes, and overall demand reductions and efficiency. These strategies are seen as being 12
necessary to integrate at all levels of governance and, in combination with the creation of fast, extensive, 13
and affordable multi-modal public transport networks, can help achieve multiple advantages in 14
accordance with SDGs 15
Electrification of passenger transport in light-duty vehicles (LDVs) is well underway as a commercial 16
process with socio-technical transformative potential and will be examined in detail in Sections 10.3 17
and 10.4. But the rapid mainstreaming of EV’s will still need enabling conditions for land transport to 18
achieve the shift away from petroleum fuels, as outlined in Chapter 3 and detailed in Section 10.8. The 19
other mitigation options reviewed in this chapter are so far only incremental and are less commercial, 20
especially shipping and aviation fuels, so stronger enabling conditions are likely, as detailed further in 21
Sections 10.5 to 10.8. The enabling conditions that would be needed for the development of an emerging 22
technological solution for such fuels are likely to be very different to electromobility, but nevertheless 23
they both will need demand and efficiency changes to ensure they are equitable and inclusive. 24
Section 10.2 sets out the transformation of transport through examining systemic changes that affect 25
demand for transport services and the efficiency of the system. Section 10.3 looks at the most promising 26
technological innovations in vehicles and fuels. The next three sections (10.4, 10.5, and 10.6) examine 27
mitigation options for land transport, aviation, and shipping. Section 10.7 describes the space of 28
solutions assessed in a range of integrated modelling and sectoral transport scenarios; Finally, Section 29
10.8 sets out what would be needed for the most transformative scenario that can manage to achieve 30
the broad goals set out in Chapter 3 and the transport goals set out in Section 10.7. 31
32
10.2 Systemic changes in the transport sector 33
Systemic change is the emergence of new organisational patterns that affect the structure of a system. 34
While much attention has been given to engine and fuel technologies to mitigate GHG emissions from 35
the transport sector, population dynamics, finance and economic systems, urban form, culture, and 36
policy also drive emissions from the sector. Thus, systemic change requires innovations in these 37
components. These systemic changes offer the opportunity to decouple transport emissions from 38
economic growth. In turn, such decoupling allows environmental improvements like reduced GHG 39
emissions without loss of economic activity (UNEP 2011, 2013; Newman et al. 2017; IPCC 2018). 40
There is evidence that suggests decoupling of transport emissions and economic growth is already 41
happening in developed and developing countries. Europe and China have shown the most dramatic 42
changes (Huizenga et al. 2015; Gao and Newman 2018; SLoCaT 2018b) and many cities are 43
demonstrating decoupling of transport-related emissions through new net zero urban economic activity 44
(Loo and Banister 2016; SLoCaT 2018a). A continued and accelerated decoupling of the growth of 45
transport-related GHG emissions from economic growth is crucial for meeting the SDGs outlined in 46
ACCEPTED VERSION
SUBJECT TO FIN
AL EDITS
Final Government Distribution Chapter 10 IPCC AR6 WGIII
Do Not Cite, Quote or Distribute 10-14 Total pages: 176
Section 1. This section focuses on several overlapping components of systemic change in the transport 1
sector that affect the drivers of GHG emissions: Urban form, physical geography, and infrastructure; 2
behaviour and mode choice; and new demand concepts. Table 10.3, at the end of the section provides a 3
high-level summary of the effect of these systemic changes on emissions from the transport sector. 4
5
10.2.1 Urban form, physical geography, and transport infrastructure 6
The physical characteristics that make up built areas define the urban form. These physical 7
characteristics include the shape, size, density, and configuration of the human settlements. Urban form 8
is intrinsically coupled with the infrastructure that allows human settlements to operate. In the context 9
of the transport sector, urban form and urban infrastructure influence the time and cost of travel, which, 10
in turn, drive travel demand and modal choice (Marchetti and Ausubel 2004; Newman and Kenworthy 11
2015). 12
Throughout history, three main urban fabrics have developed, each with different effects on transport 13
patterns based on a fixed travel time budget of around one hour (Newman et al. 2016). The high-density 14
urban fabric developed over the past several millennia favoured walking and active transport for only a 15
few kilometres (kms). In the mid-19th century, urban settlements developed a medium density fabric 16
that favoured trains and trams traveling over 10 to 30-km corridors. Finally, since the mid-20th century, 17
urban form has favoured automobile travel, enabling mass movement between 50-60 kms. Table 10.2 18
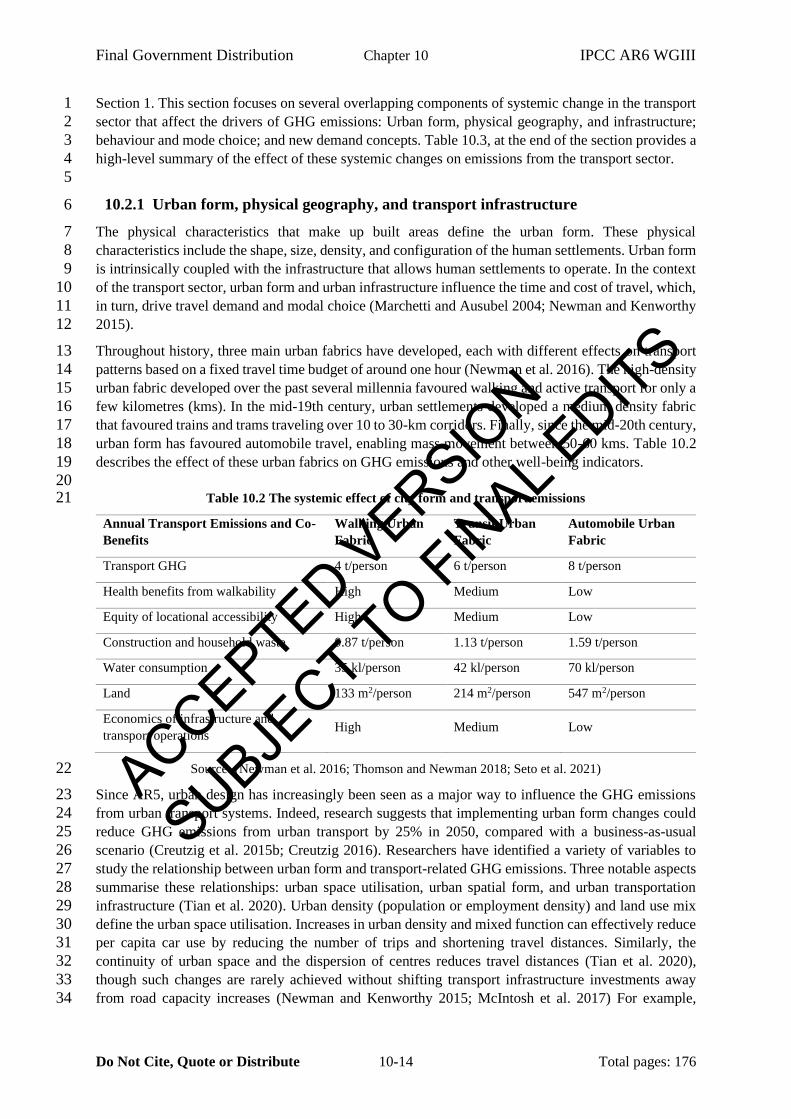
describes the effect of these urban fabrics on GHG emissions and other well-being indicators. 19
20 Table 10.2 The systemic effect of city form and transport emissions 21
Annual Transport Emissions and Co-
Benefits
Walking Urban
Fabric
Transit Urban
Fabric
Automobile Urban
Fabric
Transport GHG 4 t/person 6 t/person 8 t/person
Health benefits from walkability High Medium Low
Equity of locational accessibility High Medium Low
Construction and household waste 0.87 t/person 1.13 t/person 1.59 t/person
Water consumption 35 kl/person 42 kl/person 70 kl/person
Land 133 m2/person 214 m2/person 547 m2/person
Economics of infrastructure and
transport operations High Medium Low
Source: (Newman et al. 2016; Thomson and Newman 2018; Seto et al. 2021) 22
Since AR5, urban design has increasingly been seen as a major way to influence the GHG emissions 23
from urban transport systems. Indeed, research suggests that implementing urban form changes could 24
reduce GHG emissions from urban transport by 25% in 2050, compared with a business-as-usual 25
scenario (Creutzig et al. 2015b; Creutzig 2016). Researchers have identified a variety of variables to 26
study the relationship between urban form and transport-related GHG emissions. Three notable aspects 27
summarise these relationships: urban space utilisation, urban spatial form, and urban transportation 28
infrastructure (Tian et al. 2020). Urban density (population or employment density) and land use mix 29
define the urban space utilisation. Increases in urban density and mixed function can effectively reduce 30
per capita car use by reducing the number of trips and shortening travel distances. Similarly, the 31
continuity of urban space and the dispersion of centres reduces travel distances (Tian et al. 2020), 32
though such changes are rarely achieved without shifting transport infrastructure investments away 33
from road capacity increases (Newman and Kenworthy 2015; McIntosh et al. 2017) For example, 34
ACCEPTED VERSION
SUBJECT TO FIN
AL EDITS
Final Government Distribution Chapter 10 IPCC AR6 WGIII
Do Not Cite, Quote or Distribute 10-15 Total pages: 176
increased investment in public transport coverage, optimal transfer plans, shorter transit travel time, and 1
improved transit travel efficiency make public transit more attractive (Heinen et al. 2017; Nugroho et 2
al. 2018a,b) and hence increase density and land values (Sharma and Newman 2020). Similarly, 3
forgoing the development of major roads for the development of pedestrian and bike pathways enhances 4
the attractiveness of active transport modes (Zahabi et al. 2016; Keall et al. 2018; Tian et al. 2020). 5
Ultimately, infrastructure investments influence the structural dependence on cars, which in turn 6
influence the lock-in or path dependency of transport options with their greenhouse emissions (Newman 7
et al. 2015b; Grieco and Urry 2016). The 21st century saw a new trend to reach peak car use in some 8
countries as a result of a revival in walking and transit use (Grieco and Urry 2016; Newman et al. 2017; 9
Gota et al. 2019). While some cities continue on a trend towards reaching peak car use on a per-capita 10
basis, for example Shanghai and Beijing (Gao and Newman 2020), there is a need for increased 11
investments in urban form strategies that can continue to reduce car-dependency around the world. 12
13
START CROSS-CHAPTER BOX HERE 14
15 Cross-Chapter Box 7 Urban Form: Simultaneously reducing urban transport emissions, avoiding 16
infrastructure lock-in, and providing accessible services 17
Authors: Felix Creutzig (Germany), Karen Seto (the United States of America), Peter Newman 18
(Australia) 19
Urban transport is responsible for about 8% of global CO2 emissions or 3 Gt CO2 per year (see Chapters 20
5 and 8). In contrast to energy supply technologies, urban transport directly interacts with mobility 21
lifestyles (see Section 5.4). Similarly, non-GHG emission externalities, such as congestion, air 22
pollution, noise, and safety, directly affect urban quality of life, and result in considerable welfare 23
losses. Low-carbon, highly accessible urban design is not only a major mitigation option, it also 24
provides for more inclusive city services related to wellbeing (Chapter 5, Sections 5.1 and 5.2). Urban 25
planning and design of cities for people are central to realise emission reductions without relying simply 26
on technologies, though the modes of transport favoured will influence the ability to overcome the lock-27
in around automobile use (Gehl 2010; Creutzig et al. 2015b). 28
Where lock-in has occurred, other strategies may alleviate the GHG emissions burden. Urban planning 29
still plays a key role in recreating local hubs. Available land can be used to build rail-based transit, 30
made financially viable by profiting from land value captured around stations (Ratner and Goetz 2013). 31
Shared or pooled mobility can offer flexible on-demand mobility solutions that are efficient also in 32
suburbs and for integrating with longer commuting trips (ITF 2017). 33
Global emission trajectories of urban transport will be decided in rapidly urbanising Asia and Africa. 34
Urban transport-related GHG emissions are driven by incomes and car ownership but there is 35
considerable variation amongst cities with similar income and car ownership levels (Newman and 36
Kenworthy 2015). While electrification is a key strategy to decarbonise urban transport, urban 37
infrastructures can make a difference of up to a factor of 10 in energy use and induced GHG emissions 38
(Erdogan 2020). Ongoing urbanisation patterns risk future lock-in of induced demand on GHG 39
emissions, constraining lifestyles to energy intensive and high CO2-related technologies (See Section 40
5.4; 8.2.3; 10.2.1; (Erickson and Tempest 2015; Seto et al. 2016). Instead, climate solutions can be 41
locked into urban policies and infrastructures (Ürge-Vorsatz et al. 2018) especially through the 42
enhancement of the walking and transit urban fabric. Avoiding urban sprawl, associated with several 43
externalities (Dieleman and Wegener 2004), is a necessary decarbonisation condition, and can be 44
guided macro-economically by increasing fuel prices and marginal costs of motorised transport 45
(Creutzig 2014). Resulting urban forms not only reduce GHG emission from transport but also from 46
buildings, as greater compactness results in reduced thermal loss (Borck and Brueckner 2018). Health 47
ACCEPTED VERSION
SUBJECT TO FIN
AL EDITS
Final Government Distribution Chapter 10 IPCC AR6 WGIII
Do Not Cite, Quote or Distribute 10-16 Total pages: 176
benefits from reduced car dependence are an increasing element driving this policy agenda (Section 1
10.8; (Speck 2018)). 2
Low-carbon highly accessible urban design is not only a major mitigation option, it also provides for 3
more inclusive city services related to wellbeing (Chapter 5, Sections 5.1 and 5.2). Solutions involve 4
planning cities around walkable sub-centres, where multiple destinations, such as shopping, jobs, leisure 5
activities, and others, can be accessed within a 10 minute walk or bicycle ride (Newman and Kenworthy 6
2006). Overall, the mitigation potential of urban planning is about 25% in 2050 compared with a 7
business as usual scenario (Creutzig et al. 2015a,b). Much higher levels of decarbonisation can be 8
achieved if cities take on a regenerative development approach and act as geo-engineering systems on 9
the atmosphere (Thomson and Newman 2016). 10
END CROSS-CHAPTER BOX HERE 11
12
10.2.2 Behaviour and mode choice 13
Behaviour continues to be a major source of interest in the decarbonisation of transport as it directly 14
addresses demand. Behaviour is about people’s actions based on their preferences. Chapter 5 described 15
an ‘Avoid, Shift, Improve’ process for demand-side changes that affect sectoral emissions. This section 16
discusses some of the drivers of behaviour related to the transport sector and how they link to this 17
‘Avoid, Shift, Improve’ process. 18
Avoid - the effect of prices and income on demand: Research has shown that household income and 19
price have a strong influence on people’s preferences for transport services (Bakhat et al. 2017; Palmer 20
et al. 2018). The relationship between income and demand is defined by the income elasticity of 21
demand. For example, research suggests that in China, older and wealthier populations continued to 22
show a preference for car travel (Yang et al. 2019) while younger and low-income travellers sought 23
variety in transport modes (Song et al. 2018). Similarly, (Bergantino et al. 2018b) evaluated the income 24
elasticity of transport by mode in the UK. They found that the income elasticity for private cars is 0.714, 25
while the income elasticities of rail and bus use are 3.253 (The greater elasticity the greater the demand 26
will grow or decline, depending on income). Research has also shown a positive relationship between 27
income and demand for air travel, with income elasticities of air travel demand being positive and as 28
large as 2 (Gallet and Doucouliagos 2014; Valdes 2015; Hakim and Merkert 2016, 2019; Hanson et al. 29
2022). A survey in 98 Indian cities also showed income as the main factor influencing travel demand 30
(Ahmad and de Oliveira 2016). Thus, as incomes and wealth across the globe rise, demand for travel is 31
likely to increase as well. 32
The price elasticity of demand measures changes in demand as a result of changes in the prices of the 33
services. In a meta-analysis of the price elasticity of energy demand, (Labandeira et al. 2017) report the 34
average long-term price elasticity of demand for gasoline and diesel to be -0.773 and -0.443, 35
respectively. That is, demand will decline with increasing prices. A similar analysis of long-term data 36
in the United States (US), the United Kingdom (UK), Sweden, Australia, and Germany reports the 37
gasoline price elasticity of demand for car travel (as measured through vehicle-kilometre -vkm- per 38
capita) ranges between -0.1 and -0.4 (Bastian et al. 2016). For rail travel, the price elasticity of demand 39
has been found to range between -1.05 and -1.1 (Zeng et al. 2021). Similarly, price elasticities for air 40
travel range from -0.53 to -1.91 depending on various factors such as purpose of travel (business or 41
leisure), season, and month and day of departure (Morlotti et al. 2017). The price elasticities of demand 42
suggest that car use is inelastic to prices, while train use is relatively inelastic to the cost of using rail. 43
Conversely, consumers seem to be more responsive to the cost of flying, so that strategies that increase 44
the cost of flying are likely to contribute to some avoidance of aviation-related GHG emissions. 45
ACCEPTED VERSION
SUBJECT TO FIN
AL EDITS
Final Government Distribution Chapter 10 IPCC AR6 WGIII
Do Not Cite, Quote or Distribute 10-17 Total pages: 176
While the literature continues to show that time, cost, and income dominate people’s travel choices 1
(Ahmad and de Oliveira 2016; Capurso et al. 2019; He et al. 2020), there is also evidence of a role for 2
personal values, and environmental values in particular, shaping choices within these structural 3
limitations (Bouman and Steg 2019). For example, individuals are more likely to drive less when they 4
care about the environment (De Groot et al. 2008; Abrahamse et al. 2009; Jakovcevic and Steg 2013; 5
Hiratsuka et al. 2018; Ünal et al. 2019). Moreover, emotional and symbolic factors affect the level of 6
car use (Steg 2005). Differences in behaviour may also result due to differences in gender, age, norms, 7
values, and social status. For example, women have been shown to be more sensitive to parking pricing 8
than men (Simićević et al. 2020). 9
Finally, structural shocks, such as a financial crisis, a pandemic, or the impacts of climate change could 10
affect the price and income elasticities of demand for transport services (van Ruijven et al. 2019). 11
COVID-19 lock-downs reduced travel demand by 19% (aviation by 32%) and some of the patterns that 12
have emerged from the lockdowns could permanently change the elasticity of demand for transport 13
(Tirachini and Cats 2020; Hendrickson and Rilett 2020; Newman 2020a; SLoCaT 2021; Hanson et al. 14
2022). In particular, the COVID-19 lock-downs have spurred two major trends: electronic 15
communications replacing many work and personal travel requirements; and, revitalised local active 16
transport and e-micro-mobility (Newman 2020a; SLoCaT 2021). The permanence of these changes 17
post- COVID-19 is uncertain but possible ((Early and Newman 2021); see Box on COVID-19, chapter 18
1). However, these changes will require growth of infrastructure for better ICT bandwidths in 19
developing countries, and better provision for micro-mobility in all cities. 20
Shift - Mode choice for urban and intercity transport: Shifting demand patterns (as opposed to 21
avoiding demand) can be particularly important in decarbonising the transport sector. As a result, the 22
cross-elasticity of demand across transport modes is of particular interest for understanding the 23
opportunities for modal shift. The cross-elasticity represents the demand effect on mode i (e.g. bus) 24
when an attribute of mode j (e.g. rail) changes marginally. Studies on the cross-elasticities of mode 25
choice for urban travel suggest that the cross-elasticity for car demand is low, but the cross-elasticities 26
of walking, bus, and rail with respect to cars are relatively large (Fearnley et al. 2017; Wardman et al. 27
2018). In practice, these cross-elasticities suggest that car drivers are not very responsive to increased 28
prices for public transit, but transit users are responsive to reductions in the cost of driving. When 29
looking at the cross-elasticities of public transit options (bus vs. metro vs. rail), research suggests that 30
consumers are particularly sensitive to in-vehicle and waiting time when choosing public transit modes 31
(Fearnley et al. 2018). These general results provide additional evidence that increasing the use of active 32
and public transport requires interventions that make car use more expensive while making public 33
transit more convenient (e.g. with smart apps that explain the exact time for transit arrival, see Box 34
10.1). 35
The literature on mode competition for intercity travel reveals that while cost of travel is a significant 36
factor (Zhang et al. 2017), sensitivity decreases with increasing income as well as when the cost of the 37
trip was paid by someone else (Capurso et al. 2019). Some research suggests little competition between 38
bus and air travel but the cross-elasticity between air and rail suggest strong interactions (Wardman et 39
al. 2018). Price reduction strategies such as discounted rail fares could enhance the switch from air 40
travel to high-speed rail. Both air fares and flight frequency impact high speed rail (HSR) usage (Zhang 41
et al. 2019b). Airline companies reduce fares on routes that are directly competing with HSR 42
(Bergantino et al. 2018a) and charge high fares on non-HSR routes (Xia and Zhang 2016). On the 43
Rome-Milan route, better frequency and connections, and low costs of HSR resulting from competition 44
between HSR companies has significantly reduced air travel and shares of buses and cars (Desmaris 45
and Croccolo 2018). 46
Finally, and as noted in Chapter 5, recent research shows that individual, social, and infrastructure 47
factors also affect people’s mode choices. For example, perceptions about common travel behaviour 48
ACCEPTED VERSION
SUBJECT TO FIN
AL EDITS
Final Government Distribution Chapter 10 IPCC AR6 WGIII
Do Not Cite, Quote or Distribute 10-18 Total pages: 176
(what people perceive to be “normal” behaviour) influences their travel mode choice. The research 1
suggests that well-informed individuals whose personal norms match low-carbon objectives, and who 2
believe they have control over their decisions are most motivated to shift mode. Nonetheless, such 3
individual and social norms can only marginally influence mode choice unless infrastructure factors 4
can enable reasonable time and cost savings (Convery and Williams 2019; Javaid et al. 2020; Feng et 5
al. 2020; Wang et al. 2021). 6
Improve – consumer preferences for improved and alternative vehicles: While reductions in demand 7
for travel and changes in the mode choice can contribute to reducing GHG emissions from the transport 8
sector, cars are likely to continue to play a prominent role. As a result, improving the performance of 9
cars will be crucial for the decarbonisation of the transport sector. Sections 10.3 and 10.4 describe the 10
technological options available for reduced CO2 emissions from vehicles. The effectiveness in 11
deploying such technologies will partly depend on consumer preferences and their effect on adoption 12
rates. Given the expanded availability of electric vehicles, there is also a growing body of work on the 13
drivers of vehicle choice. A survey in Nanjing found women had more diverse travel purposes than 14
men, resulting in a greater acceptance of electric bikes (Lin et al. 2017). Individuals are more likely to 15
adopt an electric vehicle (EV) when they think this adoption benefits the environment or implies a 16
positive personal attribute (Noppers et al. 2014, 2015; Haustein and Jensen 2018). Other work suggests 17
that people’s preference for EVs depends upon vehicle attributes, infrastructure availability, and 18
policies that promote EV adoption, specifically, purchasing and operating costs, driving range, charging 19
duration, vehicle performance, and brand diversity (Liao et al. 2016). Behaviour change to enable 20
transport transformations will need to make the most of these factors whilst also working on the more 21
structural issues of time, space, and cost. 22
23
10.2.3 New demand concepts 24
Structural and behavioural choices that drive transport-related GHG emissions, such as time and cost 25
based on geography of freight and urban fabric, are likely to continue to be major factors. But there is 26
also a variation within each structural choice that is based around personal demand factors related to 27
values that indirectly change choices in transport. Chapter 5 identified three megatrends that affect 28
demand for services, including circular economy, the shared economy, and digitalisation. These three 29
megatrends can have specific effect on transport emissions, as described below. 30
Circular Economy: The problem of resources and their environmental impacts is driving the move to 31
a circular economy (Bleischwitz et al. 2017). Circular economy principles include increased material 32
efficiency, re-using or extending product lifetimes, recycling, and green logistics. Dematerialisation, 33
the reduction in the quantity of the materials used in the production of one unit of output, is a circular 34
economy principle that can affect the operations and emissions of the transport sector, as reductions in 35
the quantities of materials used reduces transport needs, while reductions in the weight of products 36
improves the efficiency of transporting them. Dematerialisation can occur through more efficient 37
production processes but also when a new product is developed to provide the same functionality as 38
multiple products. The best example of this trend is a smart phone, which provides the service of at 39
least 22 other former devices (Rivkin 2019). A move to declutter lifestyles can also drive 40
dematerialisation (Whitmarsh et al. 2017). Some potential for dematerialisation has been suggested due 41
to 3-D printing, which would also reduce transport emissions through localised production of product 42
components (d’Aveni 2015; UNCTAD 2018). There is evidence to suggest, however, that reductions 43
in material use resulting from more efficient product design or manufacturing are offset by increased 44
consumer demand (Kasulaitis et al. 2019). Whether or not dematerialisation can lead to reduction of 45
emissions from the transport sector is still an open questions that requires evaluating the entire product 46
ecosystem (Van Loon et al. 2014; Coroama et al. 2015; Kasulaitis et al. 2019). 47
ACCEPTED VERSION
SUBJECT TO FIN
AL EDITS
Final Government Distribution Chapter 10 IPCC AR6 WGIII
Do Not Cite, Quote or Distribute 10-19 Total pages: 176
Shared Economy. Shared mobility is arguably the most rapidly growing and evolving sector of the 1
sharing economy and includes bike sharing, e-scooter sharing, car-sharing, and on-demand mobility 2
(Greenblatt and Shaheen 2015). The values of creating a more shared economy are related to both 3
reduced demand and greater efficiency, as well as the notion of community well-being associated with 4
the act of sharing instead of simply owning for oneself (Maginn et al. 2018; Sharp 2018). The literature 5
on shared mobility is expanding, but there is much uncertainty about the effect shared mobility will 6
have on transport demand and associated emissions (Nijland and Jordy 2017; ITF 2018a; Tikoudis et 7
al. 2021). 8
Asia represents the largest car-sharing region with 58% of worldwide membership and 43% of global 9
fleets deployed (Dhar et al. 2020). Europe accounts for 29% of worldwide members and 37% of shared 10
vehicle fleets (Shaheen et al. 2018). Ride-sourcing and carpooling systems are amongst the many new 11
entrants in the short-term shared mobility options. On-demand transport options complemented with 12
technology have enhanced the possibility of upscaling (Alonso-González et al. 2018). Car-sharing could 13
provide the same level of service as taxis, but taxis could be three times more expensive (Cuevas et al. 14
2016). The sharing economy, as an emerging economic-technological phenomenon (Kaplan and 15
Haenlein 2010), is likely to be a key driver of demand for transport of goods although data shows 16
increasing container movement due to online shopping (Suel and Polak 2018). 17
There is growing evidence that this more structured form of behavioural change through shared 18
economy practices, supported by a larger group than a single family, has a much greater potential to 19
save transport emissions, especially when complemented with decarbonised grid electricity (Greenblatt 20
and Shaheen 2015; Sharp 2018). Carpooling, for example, could result in an 11% reduction in vkm and 21
a 12% reduction in emissions, as carpooling requires less empty or non-productive passenger-22
kilometres (pkm) (ITF 2020a,b). However, the use of local shared mobility systems such as on-demand 23
transport may create more transport emissions if there is an overall modal shift out of transit (ITF 2018a; 24
Schaller 2018). Similarly, some work suggests that commercial shared vehicle services such as Uber 25
and Lyft are leading to increased vehicle kms travelled (and associated GHG emissions) in part due to 26
deadheading (Schaller 2018; Tirachini and Gomez-Lobo 2020; Ward et al. 2021). Successful providers 27
compete by optimising personal comfort and convenience rather than enabling a sharing culture 28
(Eckhardt and Bardhi 2015), and concerns have been raised regarding the wider societal impacts of 29
these systems and for specific user groups such as older people (Fitt 2018; Marsden 2018). Concerns 30
have also been expressed over the financial viability of demand-responsive transport systems (Ryley et 31
al. 2014; Marsden 2018), how the mainstreaming of shared mobility systems can be institutionalised 32
equitably, and the operation and governance of existing systems that are only mode and operator-33
focused (Akyelken et al. 2018; Jittrapirom et al. 2018; Pangbourne et al. 2020; Marsden 2018). 34
Digitalisation: In the context of the transport sector, digitalisation has enabled teleworking, which in 35
turn reduces travel demand. On the other hand, the prevalence of online shopping, enabled by the digital 36
economy, could have mixed effects on transport emissions (Le et al. 2021). For example, online 37
shopping could reduce vkm travelled but the move to expedited or rush delivery could mitigate some 38
benefits as they prevent consolidation of freight (Jaller and Pahwa 2020). 39
Digitalisation could also lead to systemic changes by enabling smart mobility. The smart mobility 40
paradigm refers to the process and practices of assimilation of ICTs and other sophisticated hi-41
technology innovations into transport (Noy and Givoni 2018). Smart mobility can be used to influence 42
transport demand and efficiency (Benevolo et al. 2016). The synergies of emerging technologies (ICT, 43
IOT, Big Data) and shared economy could overcome some of the challenges facing the adoption of 44
emerging technologies (Marletto 2014; Chen et al. 2016; Weiss et al. 2018; Taiebat and Xu 2019) and 45
enable the expected large growth in emerging cities to be more sustainable (Docherty et al. 2018). 46
However, ICT, in particular IoT, could also cause more global energy demand (Hittinger and Jaramillo 47
2019). Box 10.1 summarises the main smart technologies being adopted rapidly by cities across the 48
ACCEPTED VERSION
SUBJECT TO FIN
AL EDITS
Final Government Distribution Chapter 10 IPCC AR6 WGIII
Do Not Cite, Quote or Distribute 10-20 Total pages: 176
world and their use in transport. There is a growing body of literature about the effect of smart 1
technology (including sensors guiding vehicles) on the demand for transport services. Smart 2
technologies can improve competitiveness of transit and active transport over personal vehicle use by 3
combining the introduction of new electro-mobility that improves time and cost along with behaviour 4
change factors (Henrik et al. 2017; SLoCaT 2018a,b, 2021). However, it is unclear what will be the net 5
effect of smart technology on the GHG emissions from the transport sector (Debnath et al. 2014; Lenz 6
and Heinrichs 2017). 7
8
START BOX HERE 9
Box 10.1 Smart city technologies and transport 10
Information and Communication Technology (ICT): ICT is at the core of Smart Mobility and will 11
provide the avenue for data to be collected and shared across the mobility system. The use of ICT can 12
help cities by providing real-time information on mobility options that can inform private vehicles along 13
with transit users or those using bikes, or who are walking. ICT can help with ticketing and payment 14
for transit or for road user charges (Tafidis et al. 2017; Gössling 2018) when combined with other 15
technologies such as Blockchain (Hargroves et al. 2020). 16
Internet of Things (IoT) Sensors: Sensors can be used to collect data to improve road safety, improve 17
fuel efficiency of vehicles, and reduce CO2 emissions (Kubba and Jiang 2014; Kavitha et al. 2018). 18
Sensors can also provide data to digitally simulate transport planning options, inform the greater 19
utilisation of existing infrastructure and modal interconnections, and significantly improve disaster and 20
emergency responses (Hargroves et al. 2017). In particular, IoT sensors can be used to inform the 21
operation of fast-moving Trackless Tram and its associated last mile connectivity shuttles as part of a 22
transit activated corridor (Newman et al. 2019, 2021). 23
Mobility as a Service (MaaS): New, app-based mobility platforms will allow for the integration of 24
different transport modes (such as last mile travel, shared transit, and even micro-transit such as scooters 25
or bikes) into easy-to-use platforms. By integrating these modes, users will be able to navigate from A 26
to B to C based on which modes are most efficient with the necessary bookings and payments being 27
made through the one service. With smart city planning, these platforms can steer users towards shared 28
and rapid-transit (which should be the centre-piece of these systems), rather than encourage more people 29
to opt for the perceived convenience of booking a single-passenger ride (Becker et al. 2020). In low 30
density car-dependent cities, however, MaaS services such as the use of electric scooters/bikes are less 31
effective as the distances are too long and they do not enable the easy sharing that can happen in dense 32
station precincts (Jittrapirom et al. 2017). 33
Artificial Intelligence (AI) and Big Data Analytics: The rapidly growing level of technology enablement 34
of vehicles and urban infrastructure, combined with the growing ability to analyse larger and larger data 35
sets, presents a significant opportunity for transport planning, design, and operation in the future. These 36
technologies are used together to enable decisions about what kind of transport planning is used down 37
particular corridors. Options such as predictive congestion management of roads and freeways, 38
simulating planning options, and advanced shared transit scheduling can provide value to new and 39
existing transit systems (Toole et al. 2015; Anda et al. 2017; Hargroves et al. 2017). 40
Blockchain or Distributed Ledger Technology: Blockchain Technology provides a non-hackable 41
database that can be programmed to enable shared services like a local, solar microgrid where both solar 42
and shared electric vehicles can be managed (Green and Newman 2017). Blockchain can be used for 43
many transport-related applications including being the basis of MaaS or any local shared mobility 44
service as it facilitates shared activity without intermediary controls. Other applications include verified 45
vehicle ownership documentation, establishing identification, real-time road user pricing, congestion 46
ACCEPTED VERSION
SUBJECT TO FIN
AL EDITS
Final Government Distribution Chapter 10 IPCC AR6 WGIII
Do Not Cite, Quote or Distribute 10-21 Total pages: 176
zone charging, vehicle generated collision information, collection of tolls and charges, enhanced freight 1
tracking and authenticity, and automated car parking and payments (Hargroves et al. 2020). This type 2
of functionality will be particularly valuable for urban regeneration along a transit-activated corridor 3
where it can be used for managing shared solar in and around station precincts as well as managing 4
shared vehicles linked to the whole transport system (Newman et al. 2021). This technology can also 5
be used for road user charging along any corridor and by businesses accessing any services and in 6
managing freight (Carter and Koh 2018; Nguyen et al. 2019; Sedlmeir et al. 2020; Hargroves et al. 7
2020). 8
END BOX HERE 9
10
Autonomous vehicles are the other emerging transport technology that have the potential to 11
significantly improve ride quality and safety. Planes and high-speed trains are already largely 12
autonomous as they are guided in all their movements, especially coming into stations and airports, 13
although that does not necessarily mean they are driverless. Automation is also being used in new on-14
road transit systems like Trackless Trams (Ndlovu and Newman 2020)). Private vehicles are being fitted 15
with more and more levels of autonomy and many are being trialled as ‘driverless’ in cities (Aria et al. 16
2016; Skeete 2018). If autonomous systems can be used to help on-road transit become more time and 17
cost competitive with cars, then the kind of transformative and disruptive changes needed to assist 18
decarbonisation of transport become more feasible (Bösch et al. 2018; Kassens-Noor et al. 2020; Abe 19
2021). Similarly, vehicle automation could improve vehicle efficiency and reduce congestion, which 20
would in turn reduce emissions (Vahidi and Sciarretta 2018; Massar et al. 2021). On the other hand, if 21
autonomous cars make driving more convenient, they could reduce demand for transit (Auld et al. 2017; 22
Sonnleitner et al. 2021). Paradoxically, autonomous cars could provide access to marginal groups such 23
as the elderly, people with disabilities, and those who cannot drive, which could in turn increase travel 24
demand (as measured by pkm) (Harper et al. 2016). 25
Heavy haulage trucks in the mining industry are already autonomous (Gaber et al. 2021) and automation 26
of long-haul trucks may happen sooner than automation of LDVs (Hancock et al. 2019). Autonomous 27
trucks may facilitate route, speed optimisation, and reduced fuel use, which can in turn reduce emissions 28
(Nasri et al. 2018; Paddeu and Denby 2021). There is growing interest in using drones for package 29
delivery. Drones could have lower impacts than ground-based delivery and, if deployed carefully, 30
drones could reduce energy use and GHG emissions from freight transport (Stolaroff et al. 2018). 31
Overall, some commentators are optimistic that smart and autonomous technologies can transform the 32
GHG from the transport sector (Seba 2014; Rivkin 2019; Sedlmeir et al. 2020). Others are more 33
sanguine unless policy interventions can enable the technologies to be used for purposes that include 34
zero carbon and the SDGs (Faisal et al. 2019; Hancock et al. 2019). 35
36
10.2.4 Overall perspectives on systemic change 37
The interactions between systemic factors set out here and technology factors discussed in much more 38
detail in the next sections, show that there is always going to be a need to integrate both approaches. 39
Good technology that has the potential to transform transport will not be used unless it fulfils broad 40
mobility and accessibility objectives related to time, cost, and well-being. Chapter 5 has set out three 41
transport transformations based on demand-side factors with highly transformative potential. Table 10.3 42
provides a summary of these systemic changes and their likely impact on GHG emissions. Note that the 43
quantitative estimates provided in the table may not be additive and the combined effect of 44
these strategies on GHG emissions from the transport sector require additional analysis. 45
Table 10.3 Components of systemic change and their impacts on the transport sector 46
ACCEPTED VERSION
SUBJECT TO FIN
AL EDITS
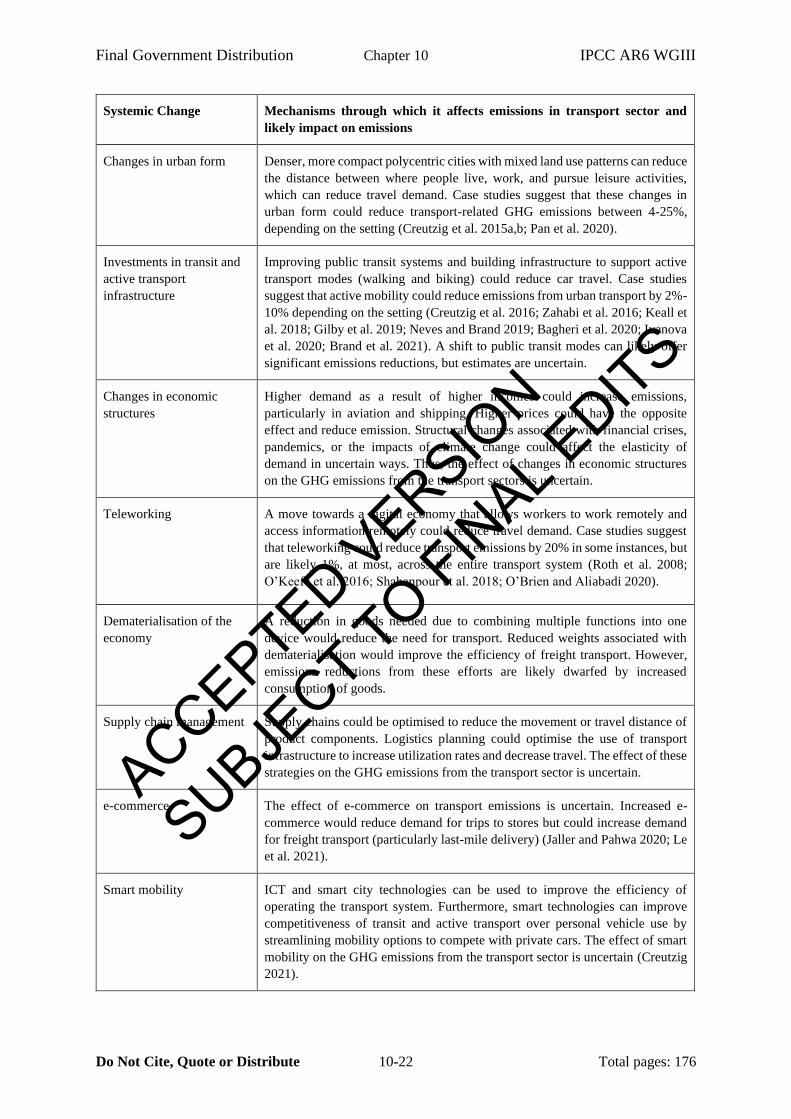
Final Government Distribution Chapter 10 IPCC AR6 WGIII
Do Not Cite, Quote or Distribute 10-22 Total pages: 176
Systemic Change Mechanisms through which it affects emissions in transport sector and
likely impact on emissions
Changes in urban form Denser, more compact polycentric cities with mixed land use patterns can reduce
the distance between where people live, work, and pursue leisure activities,
which can reduce travel demand. Case studies suggest that these changes in
urban form could reduce transport-related GHG emissions between 4-25%,
depending on the setting (Creutzig et al. 2015a,b; Pan et al. 2020).
Investments in transit and
active transport
infrastructure
Improving public transit systems and building infrastructure to support active
transport modes (walking and biking) could reduce car travel. Case studies
suggest that active mobility could reduce emissions from urban transport by 2%-
10% depending on the setting (Creutzig et al. 2016; Zahabi et al. 2016; Keall et
al. 2018; Gilby et al. 2019; Neves and Brand 2019; Bagheri et al. 2020; Ivanova
et al. 2020; Brand et al. 2021). A shift to public transit modes can likely offer
significant emissions reductions, but estimates are uncertain.
Changes in economic
structures
Higher demand as a result of higher incomes could increase emissions,
particularly in aviation and shipping. Higher prices could have the opposite
effect and reduce emission. Structural changes associated with financial crises,
pandemics, or the impacts of climate change could affect the elasticity of
demand in uncertain ways. Thus, the effect of changes in economic structures
on the GHG emissions from the transport sectors is uncertain.
Teleworking A move towards a digital economy that allows workers to work remotely and
access information remotely could reduce travel demand. Case studies suggest
that teleworking could reduce transport emissions by 20% in some instances, but
are likely 1%, at most, across the entire transport system (Roth et al. 2008;
O’Keefe et al. 2016; Shabanpour et al. 2018; O’Brien and Aliabadi 2020).
Dematerialisation of the
economy
A reduction in goods needed due to combining multiple functions into one
device would reduce the need for transport. Reduced weights associated with
dematerialisation would improve the efficiency of freight transport. However,
emissions reductions from these efforts are likely dwarfed by increased
consumption of goods.
Supply chain management Supply chains could be optimised to reduce the movement or travel distance of
product components. Logistics planning could optimise the use of transport
infrastructure to increase utilization rates and decrease travel. The effect of these
strategies on the GHG emissions from the transport sector is uncertain.
e-commerce The effect of e-commerce on transport emissions is uncertain. Increased e-
commerce would reduce demand for trips to stores but could increase demand
for freight transport (particularly last-mile delivery) (Jaller and Pahwa 2020; Le
et al. 2021).
Smart mobility ICT and smart city technologies can be used to improve the efficiency of
operating the transport system. Furthermore, smart technologies can improve
competitiveness of transit and active transport over personal vehicle use by
streamlining mobility options to compete with private cars. The effect of smart
mobility on the GHG emissions from the transport sector is uncertain (Creutzig
2021).
ACCEPTED VERSION
SUBJECT TO FIN
AL EDITS
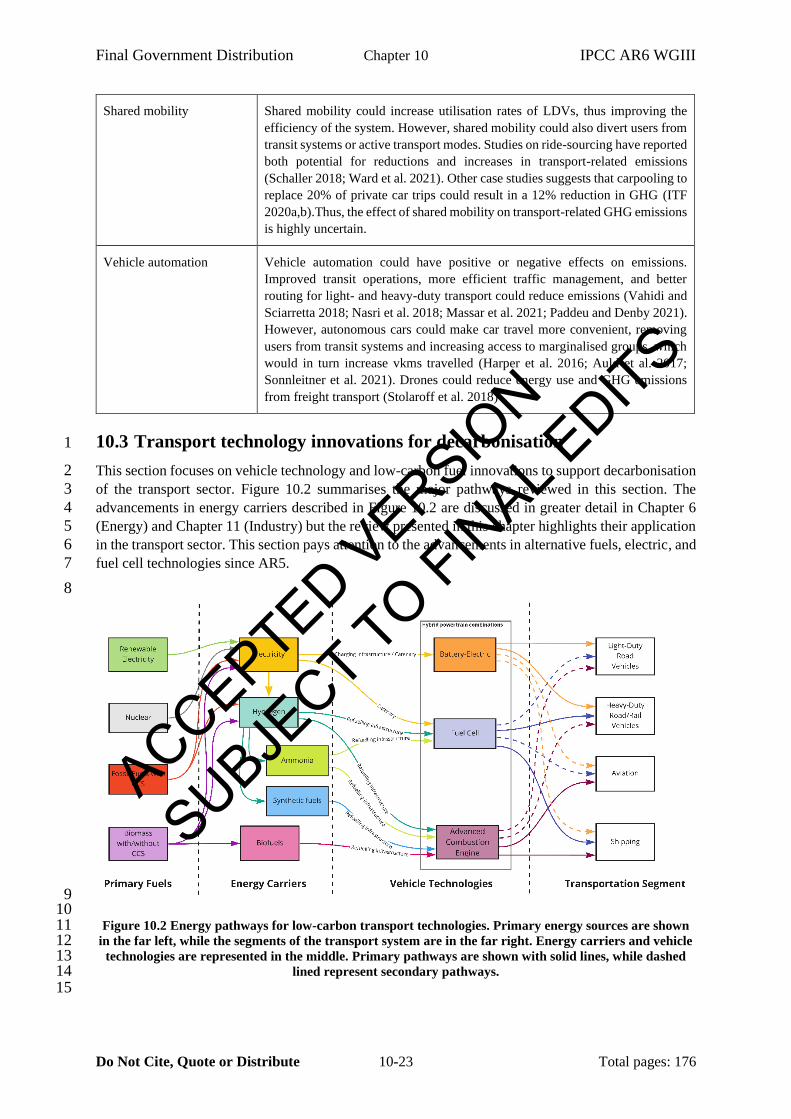
Final Government Distribution Chapter 10 IPCC AR6 WGIII
Do Not Cite, Quote or Distribute 10-23 Total pages: 176
Shared mobility Shared mobility could increase utilisation rates of LDVs, thus improving the
efficiency of the system. However, shared mobility could also divert users from
transit systems or active transport modes. Studies on ride-sourcing have reported
both potential for reductions and increases in transport-related emissions
(Schaller 2018; Ward et al. 2021). Other case studies suggests that carpooling to
replace 20% of private car trips could result in a 12% reduction in GHG (ITF
2020a,b).Thus, the effect of shared mobility on transport-related GHG emissions
is highly uncertain.
Vehicle automation Vehicle automation could have positive or negative effects on emissions.
Improved transit operations, more efficient traffic management, and better
routing for light- and heavy-duty transport could reduce emissions (Vahidi and
Sciarretta 2018; Nasri et al. 2018; Massar et al. 2021; Paddeu and Denby 2021).
However, autonomous cars could make car travel more convenient, removing
users from transit systems and increasing access to marginalised groups, which
would in turn increase vkms travelled (Harper et al. 2016; Auld et al. 2017;
Sonnleitner et al. 2021). Drones could reduce energy use and GHG emissions
from freight transport (Stolaroff et al. 2018)
10.3 Transport technology innovations for decarbonisation 1
This section focuses on vehicle technology and low-carbon fuel innovations to support decarbonisation 2
of the transport sector. Figure 10.2 summarises the major pathways reviewed in this section. The 3
advancements in energy carriers described in Figure 10.2 are discussed in greater detail in Chapter 6 4
(Energy) and Chapter 11 (Industry) but the review presented in this chapter highlights their application 5
in the transport sector. This section pays attention to the advancements in alternative fuels, electric, and 6
fuel cell technologies since AR5. 7
8
9 10 Figure 10.2 Energy pathways for low-carbon transport technologies. Primary energy sources are shown 11
in the far left, while the segments of the transport system are in the far right. Energy carriers and vehicle 12 technologies are represented in the middle. Primary pathways are shown with solid lines, while dashed 13
lined represent secondary pathways. 14 15
ACCEPTED VERSION
SUBJECT TO FIN
AL EDITS
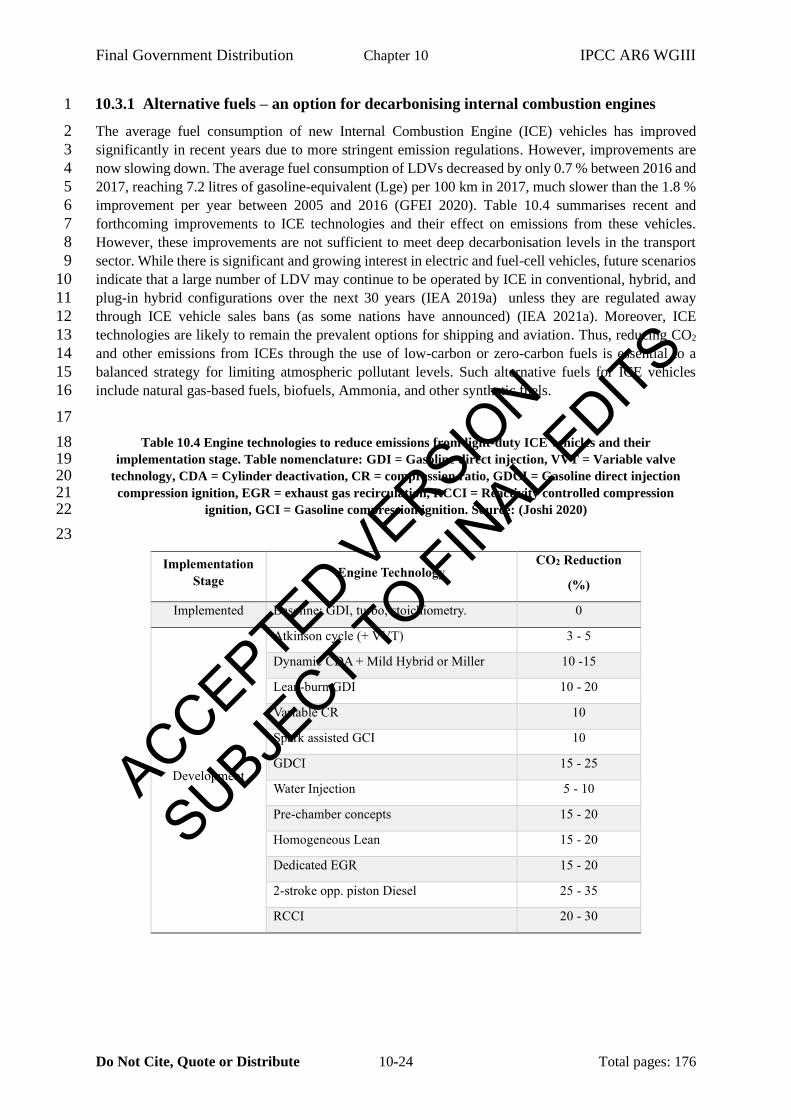
Final Government Distribution Chapter 10 IPCC AR6 WGIII
Do Not Cite, Quote or Distribute 10-24 Total pages: 176
10.3.1 Alternative fuels – an option for decarbonising internal combustion engines 1
The average fuel consumption of new Internal Combustion Engine (ICE) vehicles has improved 2
significantly in recent years due to more stringent emission regulations. However, improvements are 3
now slowing down. The average fuel consumption of LDVs decreased by only 0.7 % between 2016 and 4
2017, reaching 7.2 litres of gasoline-equivalent (Lge) per 100 km in 2017, much slower than the 1.8 % 5
improvement per year between 2005 and 2016 (GFEI 2020). Table 10.4 summarises recent and 6
forthcoming improvements to ICE technologies and their effect on emissions from these vehicles. 7
However, these improvements are not sufficient to meet deep decarbonisation levels in the transport 8
sector. While there is significant and growing interest in electric and fuel-cell vehicles, future scenarios 9
indicate that a large number of LDV may continue to be operated by ICE in conventional, hybrid, and 10
plug-in hybrid configurations over the next 30 years (IEA 2019a) unless they are regulated away 11
through ICE vehicle sales bans (as some nations have announced) (IEA 2021a). Moreover, ICE 12
technologies are likely to remain the prevalent options for shipping and aviation. Thus, reducing CO2 13
and other emissions from ICEs through the use of low-carbon or zero-carbon fuels is essential to a 14
balanced strategy for limiting atmospheric pollutant levels. Such alternative fuels for ICE vehicles 15
include natural gas-based fuels, biofuels, Ammonia, and other synthetic fuels. 16
17
Table 10.4 Engine technologies to reduce emissions from light-duty ICE vehicles and their 18 implementation stage. Table nomenclature: GDI = Gasoline direct injection, VVT = Variable valve 19
technology, CDA = Cylinder deactivation, CR = compression ratio, GDCI = Gasoline direct injection 20 compression ignition, EGR = exhaust gas recirculation, RCCI = Reactivity controlled compression 21
ignition, GCI = Gasoline compression ignition. Source: (Joshi 2020) 22
23
Implementation
Stage Engine Technology
CO2 Reduction
(%)
Implemented Baseline: GDI, turbo, stoichiometry. 0
Development
Atkinson cycle (+ VVT) 3 - 5
Dynamic CDA + Mild Hybrid or Miller 10 -15
Lean-burn GDI 10 - 20
Variable CR 10
Spark assisted GCI 10
GDCI 15 - 25
Water Injection 5 - 10
Pre-chamber concepts 15 - 20
Homogeneous Lean 15 - 20
Dedicated EGR 15 - 20
2-stroke opp. piston Diesel 25 - 35
RCCI 20 - 30
ACCEPTED VERSION
SUBJECT TO FIN
AL EDITS
Final Government Distribution Chapter 10 IPCC AR6 WGIII
Do Not Cite, Quote or Distribute 10-25 Total pages: 176
1
Natural Gas: Natural gas could be used as an alternative fuel to replace gasoline and diesel. Natural gas 2
in vehicles can be used as compressed natural gas (CNG) and liquefied natural gas (LNG). CNG is 3
gaseous at relatively high pressure (10 to 25 MPa) and temperature (-40 to 30oC). In contrast, LNG is 4
used in liquid form at relatively low pressure (0.1 MPa) and temperature (-160oC). Therefore, CNG is 5
particularly suitable for commercial vehicles and light- to medium-duty vehicles, whereas LNG is better 6
suited to replace diesel in HDVs (Dubov et al. 2020; Dziewiatkowski et al. 2020; Yaïci and Ribberink 7
2021). CNG vehicles have been widely deployed in some regions, particularly in Asian-Pacific 8
countries. For example, there are about 6 million CNG vehicles domiciled in China, the most of any 9
country (Qin et al. 2020). However, only 20% of vehicles that operate using CNG were originally 10
designed as CNG vehicles, with the rest being gasoline-fuelled vehicles that have been converted to 11
operate with CNG (Chala et al. 2018). 12
Natural gas-based vehicles have certain advantages over conventional fuel-powered ICE vehicles, 13
including lower emissions of criteria air pollutants, no soot or particulate, low carbon to Hydrogen ratio, 14
moderate noise, a wide range of flammability limits, and high-octane numbers (Kim 2019; Bayat and 15
Ghazikhani 2020). Furthermore, the technology readiness of natural gas vehicles is very high (TRL 8-16
9), with direct modification of existing gasoline and diesel vehicles possible (Transport and 17
Environment 2018; Peters et al. 2021; Sahoo and Srivastava 2021). On the other hand, methane 18
emissions from the natural gas supply chain and tailpipe CO2 emissions remain a significant concern 19
(Trivedi et al. 2020). As a result, natural gas as a transition transportation fuel may be limited due to 20
better alternative options being available and due to regulatory pressure to decarbonise the transport 21
sector rapidly. For example, the International Maritime Office (IMO) has set a target of 40% less carbon 22
intensity in shipping by 2030, which cannot be obtained by simply switching to natural gas. 23
Biofuels: Since AR5, the faster than anticipated adoption of electromobility, primarily for LDVs, has 24
partially shifted the debate around the primary use of biofuels from land transport to the shipping and 25
aviation sectors (Davis et al. 2018; IEA 2017a).At the same time, other studies highlight that biofuels 26
may have to complement electromobility in road transport, particularly in developing countries, offering 27
relevant mitigation opportunities in the short- and mid-term (up to 2050) (IEA 2021b). An important 28
advantage of biofuels is that they can be converted into energy carriers compatible with existing 29
technologies, including current powertrains and fuel infrastructure. Also, biofuels can diversify the 30
supply of transport fuel, raise energy self-sufficiency in many countries, and be used as a strategy to 31
diversify and strengthen the agro-industrial sector (Puricelli et al. 2021). The use of biofuels as a 32
mitigation strategy is driven by a combination of factors, including not only the costs and technology 33
readiness levels of the different biofuel conversion technologies, but also the availability and costs of 34
both biomass feedstocks and alternative mitigation options, and the relative speed and scale of the 35
energy transition in energy and transport sectors (Box 10.2). 36
37
START BOX HERE 38
39 Box 10.2 – Bridging land use and feedstock conversion footprints for biofuels 40
41 Under specific conditions, biofuels may represent an important climate mitigation strategy for the 42
transport sector (Muratori et al. 2020; Daioglou et al. 2020). Both SR1.5 and SRCCL highlighted that 43
biofuels could be associated with climate mitigation co-benefits and adverse side effects to many SDGs. 44
These side-effects depend on context-specific conditions, including deployment scale, associated land-45
use changes and agricultural management practices (see Section 7.4.4 and Box 7.10 in Chapter 7). There 46
is broad agreement in the literature that the most important factors in determining the climate footprint 47
of biofuels are the land use and land use change characteristics associated with biofuel deployment 48
ACCEPTED VERSION
SUBJECT TO FIN
AL EDITS
Final Government Distribution Chapter 10 IPCC AR6 WGIII
Do Not Cite, Quote or Distribute 10-26 Total pages: 176
scenarios e.g. (Elshout et al. 2015; Daioglou et al. 2020). This issue is covered in more detail in Chapter 1
7, Box 7.1. While the mitigation literature primarily focuses on the GHG-related climate forcings, note 2
that land is an integral part of the climate system through multiple geophysical and geochemical 3
mechanisms (albedo, evaporation, etc.). For example, Sections 2.2.7, 7.3.4 in the WGI report indicate 4
that geophysical aspects of historical land use change outweigh the geochemical effects, leading to a 5
net cooling effect. The land-related carbon footprints of biofuels presented in sections 10.4-10.6 are 6
adopted from Chapter 7 (See section 7.4.4 and Box 7, Figure 7.1). The results show how the land-related 7
footprint increases due to an increased outtake of biomass, as estimated with different models that rely 8
on global supply scenarios of biomass for energy and fuel of 100 EJ. The integrated assessment models 9
and scenarios used include the EMF 33 scenarios (IAM-EMF33), from partial models with constant 10
land cover (PM-CLC), and from partial models with natural regrowth (PM-NGR). These results are 11
combined with both biomass cultivation emission ranges for advanced biofuels aligned with (Edwards 12
et al. 2017; El Akkari et al. 2018; Jeswani et al. 2020; Puricelli et al. 2021) and conversion efficiencies 13
and conversion phase emissions as described in Table 10.5. The modelled footprints resulting from land 14
use changes related to delivering 100 EJ of biomass at global level are in the range of 3 – 77 gCO2eq./MJ 15
of advanced biofuel (median 38 gCO2eq./MJ) at an aggregate level for IAMs and partial models, with 16
constant land cover (Rose et al. 2020; Daioglou et al. 2020). The results for partial models with natural 17
regrowth are much higher (91-246 CO2eq./MJ advanced biofuel. The latter ranges may appear in 18
contrast with the results from the scenario literature in 10.7, where biofuels play a role in many scenarios 19
compatible low warming levels. This contrast is a result of different underlying modelling practices. 20
The general modelling approach used for the scenarios in the AR6 database accounts for the land-use 21
change and all other GHG emissions along a given transformation trajectory, enabling assessments of 22
the warming level incurred. The results labelled "EMF33" and "partial models with constant land cover" 23
are obtained with this modelling approach. The results in the category "partial models with natural 24
regrowth" attribute additional CO2 emissions to the bioenergy system, corresponding to estimated 25
uptake of CO2 in a counterfactual scenario where land is not used for bioenergy, but instead subject to 26
natural vegetation regrowth. While the partial analysis provides insights into the implications of 27
alternative land-use strategies, such analysis does not identify the actual emissions of bioenergy 28
production. As a result, the partial analysis is not compatible with the identification of warming levels 29
incurred by an individual transformation trajectory, and therefore not aligned with the general approach 30
applied for the scenarios in the AR6 database. 31
More details on land-use change impacts and the potential to deliver the projected demands of biofuels 32 at the global level are further addressed in Chapter 7. While, in general, the above results cover most of 33 the variety of GHG range intensities of biofuel options presented in the literature, the more specific 34 LCA literature should be consulted when considering specific combinations of biomass feedstock and 35 conversion technologies in specific regions. 36 37 END BOX HERE 38
39
Many studies have addressed the life cycle emissions of biofuel conversion pathways for land transport, 40
aviation, and marine applications, e.g. (Edwards et al. 2017; Staples et al. 2018; Tanzer et al. 2019). 41
Bioenergy technologies generally struggle to compete with existing fossil fuel-based ones because of 42
the higher costs involved. However, the extent of the cost gap depends critically on the availability and 43
costs of biomass feedstock (IEA 2021b). Ethanol from corn and sugarcane is commercially available in 44
countries such as Brazil and the US. Biodiesel from oil crops and hydro-processed esters and fatty acids 45
are available in various countries, notably in Europe and parts of Southeast Asia. On the infrastructure 46
side, biomethane blending is being implemented in some regions of the US and Europe, particularly in 47
Germany, with the help of policy measures (IEA 2021b). While many of these biofuel conversion 48
ACCEPTED VERSION
SUBJECT TO FIN
AL EDITS
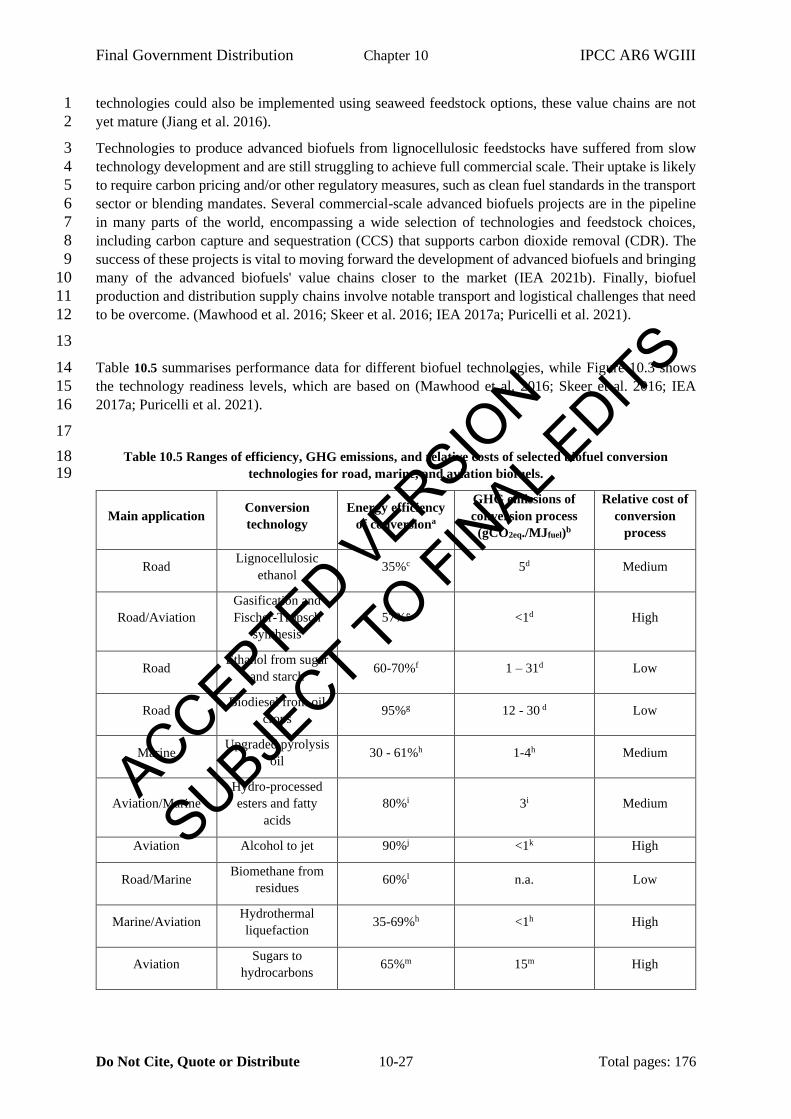
Final Government Distribution Chapter 10 IPCC AR6 WGIII
Do Not Cite, Quote or Distribute 10-27 Total pages: 176
technologies could also be implemented using seaweed feedstock options, these value chains are not 1
yet mature (Jiang et al. 2016). 2
Technologies to produce advanced biofuels from lignocellulosic feedstocks have suffered from slow 3
technology development and are still struggling to achieve full commercial scale. Their uptake is likely 4
to require carbon pricing and/or other regulatory measures, such as clean fuel standards in the transport 5
sector or blending mandates. Several commercial-scale advanced biofuels projects are in the pipeline 6
in many parts of the world, encompassing a wide selection of technologies and feedstock choices, 7
including carbon capture and sequestration (CCS) that supports carbon dioxide removal (CDR). The 8
success of these projects is vital to moving forward the development of advanced biofuels and bringing 9
many of the advanced biofuels' value chains closer to the market (IEA 2021b). Finally, biofuel 10
production and distribution supply chains involve notable transport and logistical challenges that need 11
to be overcome. (Mawhood et al. 2016; Skeer et al. 2016; IEA 2017a; Puricelli et al. 2021). 12
13
Table 10.5 summarises performance data for different biofuel technologies, while Figure 10.3 shows 14
the technology readiness levels, which are based on (Mawhood et al. 2016; Skeer et al. 2016; IEA 15
2017a; Puricelli et al. 2021). 16
17
Table 10.5 Ranges of efficiency, GHG emissions, and relative costs of selected biofuel conversion 18 technologies for road, marine, and aviation biofuels. 19
Main application Conversion
technology
Energy efficiency
of conversiona
GHG emissions of
conversion process
(gCO2eq./MJfuel)b
Relative cost of
conversion
process
Road Lignocellulosic
ethanol 35%c 5d Medium
Road/Aviation
Gasification and
Fischer-Tropsch
synthesis
57%e <1d High
Road Ethanol from sugar
and starch 60-70%f 1 – 31d Low
Road Biodiesel from oil
crops 95%g 12 - 30 d Low
Marine Upgraded pyrolysis
oil 30 - 61%h 1-4h Medium
Aviation/Marine
Hydro-processed
esters and fatty
acids
80%i 3i Medium
Aviation Alcohol to jet 90%j <1k High
Road/Marine Biomethane from
residues 60%l n.a. Low
Marine/Aviation Hydrothermal
liquefaction 35-69%h <1h High
Aviation Sugars to
hydrocarbons 65%m 15m High
ACCEPTED VERSION
SUBJECT TO FIN
AL EDITS
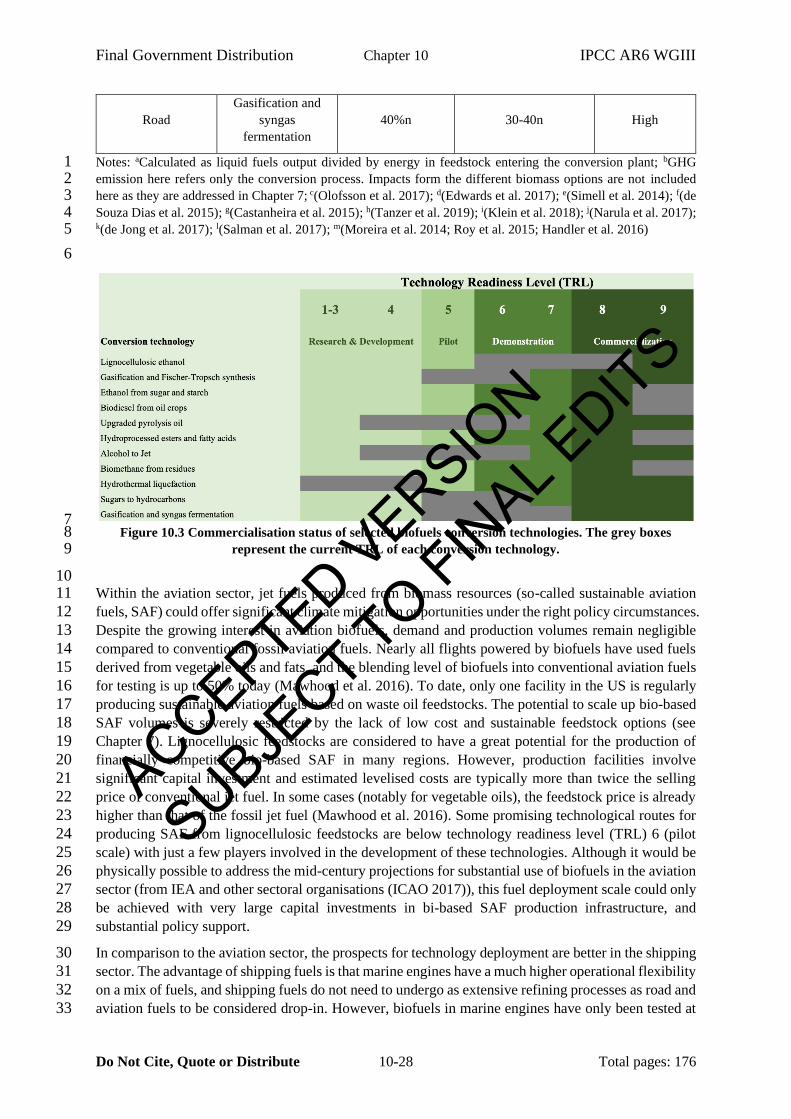
Final Government Distribution Chapter 10 IPCC AR6 WGIII
Do Not Cite, Quote or Distribute 10-28 Total pages: 176
Road
Gasification and
syngas
fermentation
40%n 30-40n High
Notes: aCalculated as liquid fuels output divided by energy in feedstock entering the conversion plant; bGHG 1 emission here refers only the conversion process. Impacts form the different biomass options are not included 2 here as they are addressed in Chapter 7; c(Olofsson et al. 2017); d(Edwards et al. 2017); e(Simell et al. 2014); f(de 3 Souza Dias et al. 2015); g(Castanheira et al. 2015); h(Tanzer et al. 2019); i(Klein et al. 2018); j(Narula et al. 2017); 4 k(de Jong et al. 2017); l(Salman et al. 2017); m(Moreira et al. 2014; Roy et al. 2015; Handler et al. 2016) 5
6
7 Figure 10.3 Commercialisation status of selected biofuels conversion technologies. The grey boxes 8
represent the current TRL of each conversion technology. 9
10 Within the aviation sector, jet fuels produced from biomass resources (so-called sustainable aviation 11
fuels, SAF) could offer significant climate mitigation opportunities under the right policy circumstances. 12
Despite the growing interest in aviation biofuels, demand and production volumes remain negligible 13
compared to conventional fossil aviation fuels. Nearly all flights powered by biofuels have used fuels 14
derived from vegetable oils and fats, and the blending level of biofuels into conventional aviation fuels 15
for testing is up to 50% today (Mawhood et al. 2016). To date, only one facility in the US is regularly 16
producing sustainable aviation fuels based on waste oil feedstocks. The potential to scale up bio-based 17
SAF volumes is severely restricted by the lack of low cost and sustainable feedstock options (see 18
Chapter 7). Lignocellulosic feedstocks are considered to have a great potential for the production of 19
financially competitive bio-based SAF in many regions. However, production facilities involve 20
significant capital investment and estimated levelised costs are typically more than twice the selling 21
price of conventional jet fuel. In some cases (notably for vegetable oils), the feedstock price is already 22
higher than that of the fossil jet fuel (Mawhood et al. 2016). Some promising technological routes for 23
producing SAF from lignocellulosic feedstocks are below technology readiness level (TRL) 6 (pilot 24
scale) with just a few players involved in the development of these technologies. Although it would be 25
physically possible to address the mid-century projections for substantial use of biofuels in the aviation 26
sector (from IEA and other sectoral organisations (ICAO 2017)), this fuel deployment scale could only 27
be achieved with very large capital investments in bi-based SAF production infrastructure, and 28
substantial policy support. 29
In comparison to the aviation sector, the prospects for technology deployment are better in the shipping 30
sector. The advantage of shipping fuels is that marine engines have a much higher operational flexibility 31
on a mix of fuels, and shipping fuels do not need to undergo as extensive refining processes as road and 32
aviation fuels to be considered drop-in. However, biofuels in marine engines have only been tested at 33
ACCEPTED VERSION
SUBJECT TO FIN
AL EDITS
Final Government Distribution Chapter 10 IPCC AR6 WGIII
Do Not Cite, Quote or Distribute 10-29 Total pages: 176
an experimental or demonstration stage, leaving open the question about the scalability of the 1
operations, including logistics issues. Similar to the aviation sector, securing a reliable, sustainable 2
biomass feedstock supply and mature processing technologies to produce price-competitive biofuels at 3
a large scale remains a challenge for the shipping sector (Hsieh and Felby 2017). Other drawbacks 4
include industry concerns about oxidation, storage, and microbial stability for less purified or more 5
crude biofuels. Assuming that biofuels are technically developed and available for the shipping sector 6
in large quantities, a wider initial introduction of biofuels in the sector is likely to depend upon increased 7
environmental regulation of particulate and GHG emissions. Biofuels may also may offer a significant 8
advantage in meeting ambitious sulphur emission reduction targets set by the sectoral organisations. 9
More extensive use of marine biofuels will most likely be first implemented in inner-city waterways, 10
inland river freight routes, and coastal green zones. Given the high efficiency of the diesel engine, a 11
large-scale switch to a different standard marine propulsion method in the near to medium-term future 12
seems unlikely. Thus, much of the effort has been placed on developing biofuels compatible with diesel 13
engines. So far, biodiesel blends look promising, as used in land transport. Hydrotreated vegetable oil 14
(HVO) is also a technically good alternative and is compatible with current engines and supply chains, 15
while the introduction of multifuel engines may open the market for ethanol fuels (Hsieh and Felby 16
2017). 17
Ammonia: At room temperature and atmospheric pressure, Ammonia is a colourless gas with a distinct 18
odour. Due to relatively mild conditions for liquefaction, Ammonia is transferred and stored as a 19
liquefied or compressed gas and has been used as an essential industrial chemical resource for many 20
products. In addition, since the chemical structure of Ammonia is without carbon molecules, Ammonia 21
has attracted attention as a carbon-neutral fuel that can also improve combustion efficiency (Gill et al. 22
2012). Furthermore, Ammonia could also serve as a Hydrogen carrier and used in fuel cells. These 23
characteristics have driven increased interest in the low-carbon production of Ammonia, which would 24
have to be coupled to low-carbon Hydrogen production (with low-carbon electricity providing the 25
needed energy or with CCS). 26
For conventional internal combustion engines, the use of Ammonia remains challenging due to the 27
relatively low burning velocity and high ignition temperature. Therefore, Frigo and Gentili (2014) have 28
suggested a dual-fuelled spark-ignition engine operated by liquid Ammonia and Hydrogen, where 29
Hydrogen is generated from Ammonia using the thermal energy of exhaust gas. On the other hand, the 30
high-octane number of Ammonia means good knocking resistance of spark ignition engines and is 31
promising for improving thermal efficiency. For compression ignition engines, the high-ignition 32
temperature of Ammonia requires a high compression ratio causing an increase in mechanical friction. 33
Since Gray et al. (1966), many studies have shown that the compression ratio can be reduced by mixing 34
combustion with secondary fuels such as diesel and Hydrogen with low self-ignition temperatures, as 35
summarised by Dimitriou and Javaid (2020). Using a secondary fuel with a high cetane number and the 36
adoption of a suitable fuel injection timing has enabled highly efficient combustion of compression 37
ignition engines in the dual fuel mode with Ammonia ratios up to 95% (Dimitriou and Javaid 2020). 38
One major challenge for realising an Ammonia-fuelled engine is the reduction of unburned Ammonia, 39
as described in Section 6.4.5. (Reiter and Kong 2011). Processes being examined include the use of 40
exhaust gas recirculation (EGR) (Pochet et al. 2017) and after treatment systems. However, these 41
processes require space, which is a constraint for LDVs and air transport but more practical for ships. 42
Shipbuilders are developing an Ammonia engine based on the existing diesel dual-fuel engine to launch 43
a service in 2025 (Brown 2019; MAN-ES 2019). Ammonia could therefore contribute significantly to 44
decarbonisation in the shipping sector (as expanded in section 10.6) with potential niche applications 45
elsewhere. 46
Synthetic fuels: Synthetic fuels can contribute to transport decarbonisation through synthesis from 47
electrolytic Hydrogen produced with low carbon electricity or Hydrogen produced with CCS, and 48
ACCEPTED VERSION
SUBJECT TO FIN
AL EDITS

Final Government Distribution Chapter 10 IPCC AR6 WGIII
Do Not Cite, Quote or Distribute 10-30 Total pages: 176
captured CO2 using the Fischer-Tropsch process (Liu et al. 2020a). Due to similar properties of synthetic 1
fuels to those of fossil fuels, synthetic fuels can reduce GHG emissions in both existing and new 2
vehicles without significant changes to the engine design. While the Fischer-Tropsch process is a well-3
established technology (Liu et al. 2020a), low-carbon synthetic fuel production is still in the 4
demonstration stage. Even though their production costs are expected to decline in the future due to 5
lower renewable electricity prices, increased scale of production, and learning effects, synthetic fuels 6
are still up to 3 times more expensive than conventional fossil fuels (Section 6.6.2.4). Furthermore, 7
since the production of synthetic fuels involves thermodynamic conversion loss, there is a concern that 8
the total energy efficiency is lower than that of electric vehicles (Soler 2019). Given these high costs 9
and limited scales, the adoption of synthetic fuels will likely focus on the aviation, shipping, and long-10
distance road transport segments, where decarbonisation by electrification is more challenging. In 11
particular, synthetic fuels are considered promising as an aviation fuel (as expanded in section 10.5). 12
13
10.3.2 Electric technologies 14
Widespread electrification of the transport sector is likely crucial for reducing transport emissions and 15
depends on appropriate energy storage systems (EES). However, large-scale diffusion of EES depends 16
on improvements in energy density (energy stored per unit volume), specific energy (energy stored per 17
unit weight), and costs (Cano et al. 2018). Recent trends suggest EES-enabled vehicles are on a path of 18
becoming the leading technology for LDVs, but their contribution to heavy-duty freight is more 19
uncertain. 20
Electrochemical storage of light and medium-duty vehicles: Electrochemical storage, i.e., batteries, are 21
one of the most promising forms of energy storage for the transport sector and have dramatically 22
improved in their commerciality since AR5. Rechargeable batteries are of primary interest for 23
applications within the transport sector, with a range of mature and emerging chemistries able to support 24
the electrification of vehicles. The most significant change since AR5 and SPR1.5 is the dramatic rise 25
in lithium-ion batteries (LIB), which has enabled electromobility to become a major feature of 26
decarbonisation. 27
Before the recent growth in market share of LIBs, lead-acid batteries, nickel batteries, high-temperature 28
sodium batteries, and redox flow batteries were of particular interest for the transport sector (Placke et 29
al. 2017). Due to their low costs, lead-acid batteries have been used in smaller automotive vehicles, e.g. 30
e-scooters and e-rickshaws (Dhar et al. 2017). However, their application in electric vehicles will be 31
limited due to their low specific energy (Andwari et al. 2017). Nickel-metal hydride (NiMH) batteries 32
have a better energy density than lead-acid batteries and have been well-optimised for regenerative 33
braking (Cano et al. 2018). As a result, NiMH batteries were the battery of choice for hybrid electric 34
vehicles (HEVs). Ni-Cadmium (NiCd) batteries have energy densities lower than NiMH batteries and 35
cost around ten times more than lead-acid batteries (Table 6.5, Chapter 6). For this reason, NiCd 36
batteries do not have major prospects within automotive applications. There are also no examples of 37
high-temperature sodium or redox flow batteries being used within automotive applications. 38
Commercial application of LIBs in automotive applications started around 2000 when the price of LIBs 39
was more than 1,000 USD per kWh (Schmidt et al. 2017). By 2020, the battery manufacturing capacity 40
for automotive applications was around 300 GWh per year (IEA 2021a). Furthermore, by 2020, the 41
average battery pack cost had come down to 137 USD per kWh, a reduction of 89% in real terms since 42
2010 (Henze 2020). Further improvements in specific energy, energy density (Nykvist et al. 2015; 43
Placke et al. 2017) and battery service life (Liu et al. 2017) of LIBs are expected through additional 44
design optimisation (Table 6.5, Chapter 6). These advancements are expected to lead to EVs with even 45
longer driving ranges, further supporting the uptake of LIBs for transport applications (Cano et al. 46
2018). However, the performance of LIBs under freezing and high temperatures is a concern (Liu et al. 47
ACCEPTED VERSION
SUBJECT TO FIN
AL EDITS
Final Government Distribution Chapter 10 IPCC AR6 WGIII
Do Not Cite, Quote or Distribute 10-31 Total pages: 176
2017) for reliability. Auto manufacturers have some pre-heating systems for batteries to see that they 1
perform well in very cold conditions (Wu et al. 2020). 2
For EVs sold in 2018, the material demand was about 11 kilotonnes (kt) of optimised lithium, 15 kt of 3
cobalt, 11 kt of manganese, and 34 kt of nickel (IEA 2019a, 2021a). IEA projections for 2030 in the EV 4
30@30 scenario show that the demand for these materials would increase by 30 times for lithium and 5
around 25 times for cobalt. While there are efforts to move away from expensive materials such as 6
cobalt (IEA 2019a, 2021a), dependence on lithium will remain, which may be a cause of concern 7
(Olivetti et al. 2017; You and Manthiram 2018). A more detailed discussion on resource constraints for 8
lithium is provided in Box 10.6 on critical materials. 9
Externalities from resource extraction are another concern, though current volumes of lithium are much 10
smaller than other metals (steel, aluminium). As a result, lithium was not even mentioned in the global 11
resource outlook of UNEP (IRP 2019). Nonetheless, it is essential to manage demand and limit 12
externalities since the demand for lithium is going to increase many times in the future. Reuse of LIBs 13
used in EVs for stationary energy applications can help in reducing the demand for LIBs. However, the 14
main challenges are the difficulty in accessing the information on the health of batteries to be recycled 15
and technical problems in remanufacturing the batteries for their second life (Ahmadi et al. 2017). 16
Recycling lithium from used batteries could be another possible supply source (Winslow et al. 2018). 17
While further R&D is required for commercialisation (Ling et al., 2018), recent efforts at recycling 18
LIBs are very encouraging (Ma et al. 2021). The standardisation of battery modules and packaging 19
within and across vehicle platforms, increased focus on design for recyclability, and supportive 20
regulation are important to enable higher recycling rates for LIBs (Harper et al. 2019). 21
Several next-generation battery chemistries are often referred to as post-LIBs (Placke et al. 2017). These 22
chemistries include metal-sulphur, metal-air, metal-ion (besides Li) and all-solid-state batteries 23
(ASSB). The long development cycles of the automotive industry (Cano et al. 2018) and the advantages 24
of LIBs in terms of energy density and cycle life (Table 6.5, Chapter 6) mean that it is unlikely that 25
post-LIB technologies will replace LIBs in the next decade. However, lithium-sulphur, lithium-air, and 26
zinc-air have emerged as potential alternatives for LIBs. These emerging chemistries may also be used 27
to supplement LIBs in dual-battery configurations, to extend the driving range at lower costs or with 28
higher energy density (Cano et al. 2018). Lithium-sulphur (Li-S) batteries have a lithium metal anode 29
with a higher theoretical capacity than lithium-ion anodes and much lower cost sulphur cathodes relative 30
to typical Li-ion insertion cathodes (Manthiram et al. 2014). As a result, Li-S batteries are much cheaper 31
than LIB to manufacture and have a higher energy density (Table 6.5, Chapter 6). Conversely, these 32
batteries face challenges from sulphur cathodes, such as low conductivity of the sulphur and lithium 33
sulphide phases, and the relatively high solubility of sulphur species in common lithium battery 34
electrolytes, leading to low cycle life (Cano et al. 2018). Lithium-air batteries offer a further 35
improvement in specific energy and energy density above Li–S batteries owing to their use of 36
atmospheric oxygen as a cathode in place of sulphur. However, their demonstrated cycle-life is much 37
lower (Table 6.5, Chapter 6). Lithium-air batteries also have low specific power. Therefore, lithium-air 38
require an extra battery for practical applications (Cano et al. 2018). Finally, zinc–air batteries could 39
more likely be used in future EVs because of their more advanced technology status and higher 40
practically achievable energy density (Fu et al. 2017). Like Li-air batteries, their poor specific power 41
and energy efficiency will probably prevent zinc-air batteries from being used as a primary energy 42
source for EVs. Still, they could be promising when used in a dual-battery configuration (Cano et al. 43
2018). 44
The technological readiness of batteries is a crucial parameter in the advancement of EVs (Manzetti 45
and Mariasiu 2015). Energy density, power density, cycle life, calendar life, and the cost per kWh are 46
the pertinent parameters for comparing the technological readiness of various battery technologies 47
(Manzetti and Mariasiu 2015; Andwari et al. 2017; Lajunen et al. 2018). Table 6.5 in Chapter 6 provides 48
ACCEPTED VERSION
SUBJECT TO FIN
AL EDITS
Final Government Distribution Chapter 10 IPCC AR6 WGIII
Do Not Cite, Quote or Distribute 10-32 Total pages: 176
a summary of the values of these parameters for alternative battery technologies. LIBs comprehensively 1
dominate the other battery types and are at a readiness level where they can be applied for land transport 2
applications (cars, scooters, electrically assisted cycles) and at battery pack costs below 150 USD per 3
kWh, making EVs cost-competitive with conventional vehicles (Nykvist et al. 2019). In 2020 the stock 4
of battery-electric LDVs had crossed the 10 million mark (IEA 2021a). (Schmidt et al. 2017) project 5
that the cost of a battery pack for LIBs will reach 100 USD per kWh by 2030, but more recent trends 6
show this could happen much earlier. For example, according to IEA, battery pack costs could be as 7
low as 80 USD per kWh by 2030 (IEA 2019a). In addition, there are clear trends that now vehicle 8
manufacturers are offering vehicles with bigger batteries, greater driving ranges, higher top speeds, 9
faster acceleration, and all size categories (Nykvist et al. 2019). In 2020 there were over 600,000 10
battery-electric buses and over 31,000 battery-electric trucks operating globally (IEA 2021a). 11
LIBs are not currently envisaged to be suitable for long-haul transport. However, several battery 12
technologies are under development (Table 6.5, Chapter 6), which could further enhance the 13
competitiveness of EVs and expand their applicability to very short-haul aviation and ships, especially 14
smaller vehicles. Li-S, Li-air, and Zn-air hold the highest potential for these segments (Cano et al. 15
2018). All three of these technologies rely on making use of relatively inexpensive elements, which can 16
help bring down battery costs (Cano et al. 2018). The main challenge these technologies face is in terms 17
of the cycle life. Out of the three, Li-S has already been used for applications in unmanned aerial 18
vehicles (Fotouhi et al., 2017) due to relatively high specific energy (almost double the state of art 19
LIBs). However, even with low cycle life, Li-air and Zn-air hold good prospects for commercialisation 20
as range extender batteries for long-range road transport and with vehicles that are typically used for 21
city driving (Cano et al. 2018). 22
Alternative electricity storage technologies for heavy-duty transport: While LIBs described in the 23
previous section are driving the electrification of LDVs, their application to railways, aviation, ships, 24
and large vehicles faces challenges due to the higher power requirements of these applications. The use 25
of a capacitor with a higher power density than LIBs could be suitable for the electrification of such 26
vehicles. It is one of the solutions for regenerating large and instantaneous energy from regenerative 27
brakes. Classical capacitors generally show more attractive characteristics in power density (8,000-28
10,000 W/kg) than batteries. However, the energy density is poor (1-4 Wh/kg) compared to batteries, 29
and there is an issue of self-discharge (González et al. 2016; Poonam et al. 2019). To improve the energy 30
density, electrochemical double layer capacitors (EDLCs; supercapacitor) and hybrid capacitors (10-24 31
Wh/kg, 900-9000 W/kg in the product-level) such as Li-ion capacitors (LICs) have been developed. 32
The highest energy density of the LIC system (100-140 Wh/kg in the research stage) are approaching 33
that of the Li-ion battery systems (80-240 Wh/kg in the product stage) (Naoi et al. 2012; Panja et al. 34
2020). Examples of effective use of capacitors include a 12 tonne truck with a capacitor-based kinetic 35
energy recovery system (KERS) that has been reported to save up to 32% of the fuel use of standard 36
truck (Kamdar 2017). Similarly, an EDLC bank applied to electric railway systems has been shown to 37
result in a 10% reduction in power consumption per day (Takahashi et al. 2017). Finally, systems in 38
which capacitors are mounted on an electric bus for charging at a stop have been put into practical use, 39
e.g., Trackless Tram (Newman et al. 2019). At the bus stop, the capacitor is charged at 600 kW for 10 40
~ 40 seconds, which provides enough power for 5 ~ 10 km (Newman et al. 2019). In addition, more 41
durable capacitors can achieve a longer life than LIB systems (ADB 2018). 42
Hybrid energy storage (HES) systems, which combine a capacitor and a battery, achieve both high 43
power and high energy, solving problems such as capacity loss of the battery and self-discharge of the 44
capacitor. In these systems, the capacitor absorbs the steeper power, while the LIB handles the steady 45
power, thereby reducing the power loss of the EV to half. Furthermore, since the in-rush current of the 46
battery is suppressed, there is an improvement in the reliability of the LIB (Noumi et al., 2014). In a 47
hybrid diesel train, 8.2% of the regenerative energy is lost due to batteries' limited charge-discharge 48
ACCEPTED VERSION
SUBJECT TO FIN
AL EDITS
Final Government Distribution Chapter 10 IPCC AR6 WGIII
Do Not Cite, Quote or Distribute 10-33 Total pages: 176
performance; however, using an EDLC with batteries can save this energy (Takahashi et al. 2017; 1
Mayrink et al. 2020) 2
The development of power storage devices and advanced integrated system approaches, including 3
power electronics circuits such as HES and their control technologies, are important for the 4
electrification of mobility. These technologies are solutions that could promote the electrification of 5
systems, reduce costs, and contribute to the social environment through multiple outcomes in the 6
decarbonisation agenda. 7
8
10.3.3 Fuel cell technologies 9
In harder-to-electrify transport segments, such as heavy-duty vehicles, shipping, and aviation, 10
Hydrogen holds significant promise for delivering emissions reductions if it is produced using low-11
carbon energy sources. In particular, Hydrogen fuel cells are seen as an emerging option to power larger 12
vehicles for land-based transport (Tokimatsu et al. 2016; IPCC 2018; IEA 2019b). Despite this 13
potential, further advancements in technological and economic maturity will be required in order for 14
Hydrogen fuel cells to play a greater role. While this section focuses primarily on Hydrogen fuel cells, 15
Ammonia and Methanol fuel cells may also emerge as options for low power applications. 16
During the last decade, Hydrogen fuel cell vehicles (HFCVs) have attracted growing attention, with 17
fuel cell technology improving through research and development. Fuel cell systems cost 80 to 95 per 18
cent less than they did in the early 2000s, at approximately $50 per kW for light-duty (80 kW) and $100 19
per kW for medium-heavy duty (160 kW). These costs are approaching the US Department of Energy's 20
(US DOE) goal of $40 per kW in 2025 at a production target of 500,000 systems per year(IEA 2019c). 21
In addition to cost reductions, the power density of fuel cell stacks has now reached around 3.0 kW/L, 22
and average durability has improved to approximately 2,000-3,000 hours (Jouin et al. 2016; Kurtz et al. 23
2019). Despite these improvements, fuel cell systems are not yet mature for many commercial 24
applications. For example, the US DOE has outlined that for Hydrogen fuel cell articulated trucks (semi-25
trailers) to compete with diesel vehicles, fuel cell durability will need to reach 30,000 hours (US DOE 26
2019). While some fuel cell buses have demonstrated durability close to these targets (Eudy and Post 27
2018a), another review of light fuel cell vehicles found maximum durability of 4,000 hours (Kurtz et 28
al. 2019). As more fuel cell vehicles are trialled, it is expected that further real-world data will become 29
available to track ongoing fuel cell durability improvements. 30
Ammonia and Methanol fuel cells are considered to be less mature than Hydrogen fuel cells. However, 31
they offer the benefit of using a more easily transported fuel that can be directly used without converting 32
to Hydrogen (Zhao et al. 2019). Conversely, both Methanol and Ammonia are toxic, and in the case of 33
Methanol fuel cells, carbon dioxide is released as a by-product of generating electricity with the fuel 34
cell (Zhao et al. 2019). Due to the lower power output, Methanol and Ammonia fuel cells are also not 35
well-suited to heavy duty vehicles (Jeerh et al. 2021). They are therefore unlikely to compete with 36
Hydrogen fuel cells. However, Ammonia and Methanol could be converted at refuelling stations to 37
Hydrogen as an alternative to being directly used in fuel cells (Zhao et al. 2019). 38
Several FCV-related technologies are fully ready for demonstration and early market deployment, 39
however, further research and development will be required to achieve full-scale commercialisation, 40
likely from 2030 onwards (Staffell et al. 2019; Energy Transitions Commission 2020; IEA 2021b). 41
Some reports argue that it may be possible to achieve serial production of fuel cell heavy-duty trucks 42
in the late 2020s, with comparable costs to diesel vehicles achieved after 2030 (Jordbakker et al. 2018). 43
Over the next decade or so, Hydrogen FCVs could become cost-competitive for various transport 44
applications, potentially including long-haul trucks, marine ships, and aviation (FCHEA 2019; FCHJU 45
2019; BloombergNEF 2020; Hydrogen Council 2017, 2020). The speed of fuel cell system cost 46
reduction is a key factor for achieving widespread uptake. Yet, experts disagree on the relationship 47
ACCEPTED VERSION
SUBJECT TO FIN
AL EDITS
Final Government Distribution Chapter 10 IPCC AR6 WGIII
Do Not Cite, Quote or Distribute 10-34 Total pages: 176
between the scale of fuel cell demand, cost, and performance improvements (Cano et al. 2018). Costs 1
of light-, medium-, and heavy-duty fuel cell powertrains have decreased by orders of magnitude with 2
further reductions of a factor of two expected with continued technological progress (Whiston et al. 3
2019). For example, the costs of platinum for fuel cell stacks have decreased by an order of magnitude 4
(Staffell et al. 2019); current generation FCVs use approximately 0.25 g/kW Pt and a further reduction 5
of 50-80% is expected by 2030 (Hao et al. 2019). 6
Hydrogen is likely to take diverse roles in the future energy system: as a fuel in industry and buildings, 7
as well as transport, and as energy storage for variable renewable electricity. Further research is required 8
to understand better how a Hydrogen transport fuel supply system fits within the larger Hydrogen 9
energy system, especially in terms of integration within existing infrastructure, such as the electricity 10
grid and the natural gas pipeline system (IEA 2015). 11
Strong and durable policies would be needed to enable widespread use of Hydrogen as a transport fuel 12
and to sustain momentum during a multi-decade transition period for Hydrogen FCVs to become cost-13
competitive with electric vehicles (IEA 2019c; FCHEA 2019; FCHJU 2019; BNEF 2020; Hydrogen 14
Council 2017, 2020). The analysis suggests that Hydrogen is likely to have strategic and niche roles in 15
transport, particularly in long-haul shipping and aviation. With continuing improvements, Hydrogen 16
and electrification will likely play a role in decarbonising heavy-duty road and rail vehicles. 17
18
10.3.4 Refuelling and charging infrastructure 19
The transport sector relies on liquid gasoline, and diesel for land-based transport, jet fuel for aviation, 20
and heavy fuel oil for shipping. Extensive infrastructure for refuelling liquid fossil fuels already exists. 21
Ammonia, synthetic fuels, and biofuels have emerged as alternative fuels for powering combustion 22
engines and turbines used in land, shipping, and aviation (Figure 10.2). Synthetic fuels such as e-23
Methanol and Fischer-Tropsch liquids have similar physical properties and could be used with existing 24
fossil fuel infrastructure (Soler, 2019). Similarly, biofuels have been used in several countries together 25
with fossil fuels (Panoutsou et al. 2021). Ammonia is a liquid, but only under pressure, and therefore 26
will not be compatible with liquid fossil fuel refuelling infrastructure. Ammonia is, however, widely 27
used as a fertiliser and chemical raw material and 10% of annual Ammonia production is transported 28
via sea (Gallucci 2021). As such, a number of port facilities include Ammonia storage and transport 29
infrastructure and the shipping industry has experience in handling Ammonia (Gallucci 2021). This 30
infrastructure would likely need to be extended in order to support the use of Ammonia as a fuel for 31
shipping and therefore ports are likely to be the primary sites for these new refuelling facilities. 32
EVs and HFCV require separate infrastructure than liquid fuels. The successful diffusion of new vehicle 33
technologies is dependent on the preceding deployment of infrastructure (Leibowicz 2018), so that the 34
deployment of new charging and refuelling infrastructure will be critical for supporting the uptake of 35
emerging transport technologies like EVs and HFCVs, where it makes sense for each to be deployed. 36
As a result, there is likely a need for the simultaneous investment in both infrastructure and vehicle 37
technologies to accelerate decarbonisation of the transport sector. 38
Charging infrastructure: Charging infrastructure is important for a number of key reasons. From a 39
consumer perspective, robust and reliable charging infrastructure networks are required to build 40
confidence in the technology and overcome the often-cited barrier of 'range anxiety' (She et al. 2017). 41
Range anxiety is where consumers do not have confidence that an EV will meet their driving range 42
requirements. For LDVs, the majority of charging (75-90%) has been reported to take place at or near 43
homes (Figenbaum 2017; Webb et al. 2019; Wenig et al. 2019). Charging at home is a particularly 44
significant factor in the adoption of EVs as consumers are less willing to purchase an EV without home 45
charging (Berkeley et al. 2017; Funke and Plötz 2017; Nicholas et al. 2017). However, home charging 46
may not be an option for all consumers. For example, apartment dwellers may face specific challenges 47
ACCEPTED VERSION
SUBJECT TO FIN
AL EDITS
Final Government Distribution Chapter 10 IPCC AR6 WGIII
Do Not Cite, Quote or Distribute 10-35 Total pages: 176
in installing charging infrastructure (Hall and Lutsey 2020). Thus, the provision of public charging 1
infrastructure is another avenue for alleviating range anxiety, facilitating longer distance travel in EVs, 2
and in turn, encouraging adoption (Hall and Lutsey 2017; Melliger et al. 2018; Narassimhan and 3
Johnson 2018; Melton et al. 2020). Currently, approximately 10% of charging occurs at public 4
locations, roughly split equally between AC (slower) and DC (fast) charging (Figenbaum 2017; Webb 5
et al. 2019; Wenig et al. 2019). Deploying charging infrastructure at workplaces and commuter car 6
parks is also important, particularly as these vehicles are parked at these locations for many hours. 7
Indeed, around 15-30% of EV charging currently occurs at these locations (Figenbaum 2017; Webb et 8
al. 2019; Wenig et al. 2019). It has been suggested that automakers and utilities could provide support 9
for the installation of home charging infrastructure (Hardman et al. 2018), while policy-makers can 10
provide support for public charging. Such support could come via supportive planning policy, building 11
regulations, and financial support. Policy support could also incentivise the deployment of charging 12
stations at workplaces and commuter car parks. Charging at these locations would have the added 13
benefit of using excess solar energy generated during the day (Hardman et al. 2018; Webb et al. 2019). 14
While charging infrastructure is of high importance for the electrification of light-duty vehicles, 15
arguably, it is even more important for heavy-duty vehicles given the costs of high-power charging 16
infrastructure. It is estimated that the installed cost of fast-charging hardware can vary between 17
approximately USD 45,000 to 200,000 per charger, depending on the charging rate, the number of 18
chargers per site, and other site conditions (Nicholas 2019; Hall and Lutsey 2019; Nelder and Rogers 19
2019). Deployment of shared charging infrastructure at key transport hubs, such as bus and truck depots, 20
freight distribution centres, marine shipping ports and airports, can encourage a transition to electric 21
vehicles across the heavy transport segments. Furthermore, if charging infrastructure sites are designed 22
to cater for both light and heavy-duty vehicles, infrastructure costs could decrease by increasing 23
utilisation across multiple applications and/or fleets (Nelder and Rogers 2019). 24
There are two types of charging infrastructure for electric vehicles: conductive charging involving a 25
physical connection and wireless/induction charging. The majority of charging infrastructure deployed 26
today for light and heavy-duty vehicles is conductive. However, wireless charging technologies are 27
beginning to emerge – particularly for applications like bus rapid transit – with vehicles able to charge 28
autonomously while parked and/or in motion (IRENA 2019). For road vehicles, electric road systems, 29
or road electrification, is also emerging as an alternative form of conductive charging infrastructure that 30
replaces a physical plug (Ainalis et al. 2020; Hill et al. 2020). This type of charging infrastructure is 31
particularly relevant for road freight where load demand is higher. Road electrification can take the 32
form of a charging rail built into the road pavement, run along the side of the road, through overhead 33
catenary power lines - similar to electrical infrastructure used for rail - or at recharging facilities at 34
stations along the route. This infrastructure can also be used to directly power other electrified 35
powertrains, such as hybrid and HFCV (Hardman et al. 2018; Hill et al. 2020). 36
Charging infrastructure also varies in terms of the level of charging power. For light vehicles, charging 37
infrastructure is generally up to 350 kW, which provide approximately 350 kilometres for every 10 38
minutes of charging. For larger vehicles, like buses and trucks, charging infrastructure is generally up 39
to 600 kW, providing around 50-100 km for every 10 minutes of charging (depending on the size of the 40
bus/truck). Finally, even higher power charging infrastructure is currently being developed at rates 41
greater than 1 MW, particularly for long-haul trucks and for short-haul marine shipping and aviation. 42
For example, one of the largest electric ferries in the world, currently operating in Denmark, uses a 4.4 43
MW charger (Heinemann et al. 2020). 44
Finally, there are several different charging standards, varying across transport segments and across 45
geographical locations. Like electrical appliances, different EV charging connectors and sockets have 46
emerged in different regions, e.g. CCS2 in Europe (ECA 2021), GB/T in China (Hove and Sandalow 47
2019). Achieving interoperability between charging stations is seen as another important issue for 48
ACCEPTED VERSION
SUBJECT TO FIN
AL EDITS
Final Government Distribution Chapter 10 IPCC AR6 WGIII
Do Not Cite, Quote or Distribute 10-36 Total pages: 176
policy-makers to address to provide transparent data to the market on where EV chargers are located 1
and a consistent approach to paying for charging sessions (van der Kam and Bekkers 2020). 2
Interoperability could also play an important role in enabling smart charging infrastructure (Neaimeh 3
and Andersen 2020). 4
Smart charging - electric vehicle-grid integration strategies: EVs provide several opportunities for 5
supporting electricity grids if appropriately integrated. Conversely, a lack of integration could 6
negatively affect the grid, particularly if several vehicles are charged in parallel at higher charging rates 7
during peak demand periods (Webb et al. 2019; Jochem et al. 2021). There are three primary approaches 8
to EV charging. In unmanaged charging, EVs are charged ad-hoc, whenever connected, regardless of 9
conditions on the broader electricity grid (Webb et al. 2019; Jochem et al. 2021). Second, in managed 10
charging, EVs are charged during periods beneficial to the grid, e.g. high renewable generation and/or 11
low demand periods. Managed charging also allows utilities to regulate the rate of charge and can thus 12
provide frequency and regulation services to the grid (Weis et al. 2014). Finally, in bidirectional 13
charging or vehicle-to-grid (V2G), EVs are generally subject to managed charging, but an extension 14
provides the ability to export electricity from the vehicle's battery back to the building and/or wider 15
electricity grid (Ercan et al. 2016; Noel et al. 2019; Jochem et al. 2021). The term 'smart charging' has 16
become an umbrella term to encompass both managed charging (often referred to as a V1G) and 17
vehicle-to-grid (V2G). For electric utilities, smart charging strategies can provide backup power, 18
support load balancing, reduce peak loads (Zhuk et al. 2016; Noel et al. 2019; Jochem et al. 2021), 19
reduce the uncertainty in forecasts of daily and hourly electrical loads (Peng et al. 2012), and allow 20
greater utilisation of generation capacity (Hajimiragha et al. 2010; Madzharov et al. 2014). 21
Smart charging strategies can also enhance the climate benefits of EVs (Yuan et al. 2021). Controlled 22
charging can help avoid high carbon electricity sources, decarbonisation of the ancillary service 23
markets, or peak shaving of high carbon electricity sources (Jochem et al. 2021). V2G-capable EVs can 24
result in even lower total emissions, particularly when compared to other alternatives (Reddy et al. 25
2016). Noel et al.(2019) analysed V2G pathways in Denmark and noted that at a penetration rate of 26
75% by 2030, $34 billion in social benefits could be accrued (through things like displaced pollution). 27
These social benefits translate to $1,200 per vehicle. V2G-capable EVs were found to have the potential 28
to reduce carbon emissions compared to a conventional gasoline vehicle by up to 59%, assuming 29
optimised charging schedules (Hoehne and Chester 2016). 30
Projections of energy storage suggest smart charging strategies will come to play a significant role in 31
future energy systems. Assessment of different energy storage technologies for Europe showed that 32
V2G offered the most storage potential compared to other options and could account for 200 GW of 33
installed capacity by 2060, whereas utility-scale batteries and pumped hydro storage could provide 160 34
GW of storage capacity (Després et al., 2017). Another study found that EVs with controlled charging 35
(V1G) could provide similar services to stationary storage but at a far lower cost (Coignard et al. 2018). 36
While most deployments of smart charging strategies are still at the pilot stage, the number of projects 37
continues to expand, with the V2G Hub documenting at least 90 V2G projects across 22 countries in 38
2021 (Vehicle to Grid (VG) 2021). Policymakers have an important role in facilitating collaboration 39
between vehicle manufacturers, electricity utilities, infrastructure providers, and consumers to enable 40
smart charging strategies and ensure EVs can support grid stability and the uptake of renewable energy. 41
This is a critical part of decarbonising transport. 42
Hydrogen infrastructure: HFCVs are reliant on the development of widespread and convenient 43
Hydrogen refuelling stations (FCHEA 2019; IEA 2019c; BNEF 2020). Globally, there are around 540 44
Hydrogen refuelling stations, with the majority located in North America, Europe, Japan, and China 45
(IEA 2021a). Approximately 70% of these refuelling stations are open to the public (Coignard et al. 46
2018). Typical refuelling stations currently have a refuelling capacity of 100 to 350 kg/day (CARB 47
ACCEPTED VERSION
SUBJECT TO FIN
AL EDITS
Final Government Distribution Chapter 10 IPCC AR6 WGIII
Do Not Cite, Quote or Distribute 10-37 Total pages: 176
2019, 2020; H2 Tools 2020; AFDC 2021). At most, current Hydrogen refuelling stations have daily 1
capacities under 500 kg/day (Liu et al. 2020b). 2
The design of Hydrogen refuelling stations depends on the choice of methods for Hydrogen supply and 3
delivery, compression and storage, and the dispensing strategy. Hydrogen supply could happen via on-4
site production or via transport and delivery of Hydrogen produced off-site. At the compression stage, 5
Hydrogen is compressed to achieve the pressure needed for economic stationery and vehicle storage. 6
This pressure depends on the storage strategy. Hydrogen can be stored as a liquid or a gas. Hydrogen 7
can also be dispensed to the vehicles as a gas or a liquid, depending on the design of the vehicles (though 8
it tests the extremes of temperature range and storage capacity for an industrial product). The 9
technological and economic development of each of these components continues to be researched. 10
If Hydrogen is produced off site in a large centralised plant, it must be stored and delivered to refuelling 11
stations. The cost of Hydrogen delivery depends on the amount of Hydrogen delivered, the delivery 12
distance, the storage method (compressed gas or cryogenic liquid), and the delivery mode (truck vs. 13
pipeline). Table 10.6 describes the three primary options for Hydrogen delivery. Most Hydrogen 14
refuelling stations today are supplied by trucks and, very occasionally, Hydrogen pipelines. Gaseous 15
tube trailers could also be used to deliver Hydrogen in the near term, or over shorter distances, due to 16
the low fixed cost (although the variable cost is high). Both liquefied truck trailers and pipelines are 17
recognised as options in the medium to long-term as they have higher capacities and lower costs over 18
longer distances (FCHJU 2019; Li et al. 2020; EU 2021).Alternatively, Hydrogen can be produced on 19
site using a small-scale onsite electrolyser or steam methane reforming unit combined with CCS. 20
Hydrogen is generally dispensed to vehicles as a compressed gas at pressures 350 or 700 bar, or as 21
liquified Hydrogen at – 253oC (Hydrogen Council 2020). 22
23
Table 10.6 Overview of three transport technologies for Hydrogen delivery in the transport sector 24 showing relative differences. Source: (IEA 2019c) 25
Capacity Delivery
distance Energy loss Fixed costs
Variable
costs
Deployment
phase
Gaseous tube
trailers Low Low Low Low High Near term
Liquefied
truck trailers Medium High High Medium Medium
Medium to
long term
Hydrogen
pipelines High High Low High Low
Medium to
long term
26
The costs for Hydrogen refuelling stations vary widely and remain uncertain for the future (IEA 2019c). 27
The IEA reports that the investment cost for one Hydrogen refuelling station ranges between USD 0.6–28
2 million for Hydrogen at a pressure of 700 bar and a delivery capacity of 1,300 kg per day. The 29
investment cost of Hydrogen refuelling stations with lower refuelling capacities (~50 kg H2 per day) 30
delivered at lower pressure (350 bar) range between USD 0.15–1.6 million. A separate estimate by the 31
International Council for Clean Transport suggests that at a capacity of 600 kg of Hydrogen per day, 32
the capital cost of a single refuelling station would be approximately USD 1.8 million (ICCT 2017). 33
Given the high investment costs for Hydrogen refuelling stations, low utilisation can translate into a 34
high price for delivered Hydrogen. In Europe, most pumps operate at less than 10% capacity. For small 35
refuelling stations with a capacity of 50 kg H2 per day, this utilisation rate translates to a high price of 36
around USD 15–25 per kg H2 – in line with current retail prices (IEA 2019c). The dispensed cost of 37
ACCEPTED VERSION
SUBJECT TO FIN
AL EDITS
Final Government Distribution Chapter 10 IPCC AR6 WGIII
Do Not Cite, Quote or Distribute 10-38 Total pages: 176
Hydrogen is also highly correlated with the cost of electricity, when H2 is produced using electrolysis, 1
which is required to produce low-carbon Hydrogen. 2
3
10.4 Decarbonisation of land-based transport 4
10.4.1 Light-duty vehicles for passenger transport 5
LDVs represent the main mode of transport for private citizens (ITF 2019) and currently represent the 6
largest share of transport emissions globally (IEA 2019d). Currently, powertrains depending on gasoline 7
and diesel fuels remain the dominant technology in the LDV segment (IEA 2019d). HEVs, and fully 8
battery electric vehicles (BEVs), however, have become increasingly popular in recent years (IEA 9
2021a). Correspondingly, the number of life cycle assessment (LCA) studies investigating HEVs, 10
BEVs, and fuel cell vehicles have increased. While historically the focus has been on the tailpipe 11
emissions of LDVs, LCA studies demonstrate the importance of including emissions from the entire 12
vehicle value chain, particularly for alternative powertrain technologies. 13
Figure 10.4 presents the cumulative life cycle emissions for selected powertrain technologies and fuel 14
chain combinations for compact and mid-sized LDV. This figure summarizes the harmonized findings 15
from the academic literature reviewed and the data submitted through an IPCC data collection effort, 16
as described in Appendix 10.1 (Cusenza et al. 2019; Hawkins et al. 2013; Tong et al. 2015b; Bauer et 17
al. 2015; Gao et al. 2016; Ellingsen et al. 2016; Kim and Wallington 2016; Cai et al. 2017; Ke et al. 18
2017; Lombardi et al. 2017; Miotti et al. 2017; Evangelisti et al. 2017; Valente et al. 2017; de Souza et 19
al. 2018; Elgowainy et al. 2018; Luk et al. 2018; Bekel and Pauliuk 2019; Messagie et al. 2014; Hoque 20
et al. 2019; IEA 2019a; Rosenfeld et al. 2019; Shen et al. 2019; Wang et al. 2019; Wu et al. 2019; 21
Benajes et al. 2020; Ambrose et al. 2020; Hill et al. 2020; Knobloch et al. 2020; JEC 2020; Qiao et al. 22
2020; Cox et al. 2018; Sacchi 2021; Zheng et al. 2020; Wolfram et al. 2020; Valente et al. 2021). The 23
values in the figure (and the remaining figures in this section) depend on the 100-year GWP used in 24
each study, which may differ from the recent GWP updates from WGI. However, it is unlikely that the 25
qualitative insights gained from the figures in this section would change using the update 100-year 26
GWP values. 27
Furthermore, note that the carbon footprint of biofuels used in Figure 10.4 are aggregate numbers not 28
specific to any individual value chain or fuel type. They are derived by combining land use-related 29
carbon emissions from Chapter 7 with conversion efficiencies and emissions as described in Section 30
10.3. Specifically, land use footprints derived from the three modelling approaches employed here are: 31
1) Integrated Assessment Models – Energy Modelling Forum 33 (IAM EMF33); 2) Partial models 32
assuming constant land cover (CLC), and, 3) Partial models using natural regrowth (NRG). The 33
emissions factors used here correspond to scenarios where global production of biomass for energy 34
purposes are 100 EJ/year, with lower emissions factors expected at lower levels of consumption and 35
vice-versa. Further details are available in Box 10.2 and Chapter 7. 36
37
38
ACCEPTED VERSION
SUBJECT TO FIN
AL EDITS
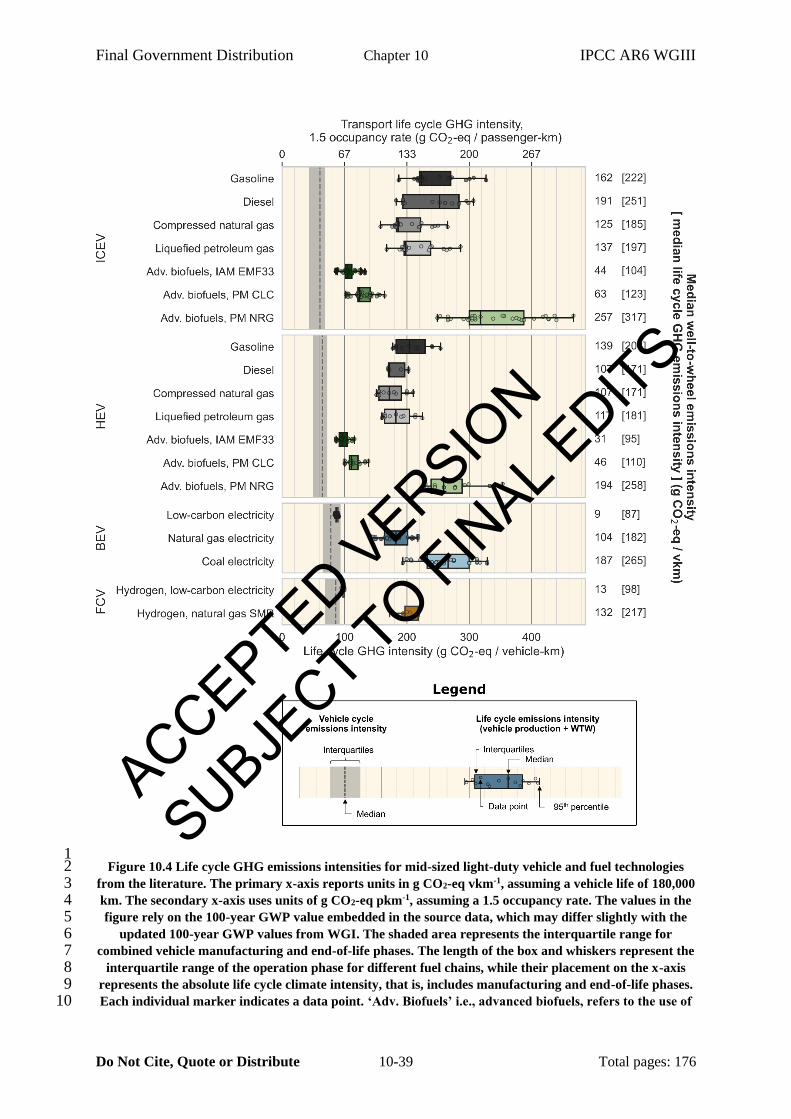
Final Government Distribution Chapter 10 IPCC AR6 WGIII
Do Not Cite, Quote or Distribute 10-39 Total pages: 176
1 Figure 10.4 Life cycle GHG emissions intensities for mid-sized light-duty vehicle and fuel technologies 2
from the literature. The primary x-axis reports units in g CO2-eq vkm-1, assuming a vehicle life of 180,000 3 km. The secondary x-axis uses units of g CO2-eq pkm-1, assuming a 1.5 occupancy rate. The values in the 4 figure rely on the 100-year GWP value embedded in the source data, which may differ slightly with the 5
updated 100-year GWP values from WGI. The shaded area represents the interquartile range for 6 combined vehicle manufacturing and end-of-life phases. The length of the box and whiskers represent the 7
interquartile range of the operation phase for different fuel chains, while their placement on the x-axis 8 represents the absolute life cycle climate intensity, that is, includes manufacturing and end-of-life phases. 9 Each individual marker indicates a data point. ‘Adv. Biofuels’ i.e., advanced biofuels, refers to the use of 10
ACCEPTED VERSION
SUBJECT TO FIN
AL EDITS

Final Government Distribution Chapter 10 IPCC AR6 WGIII
Do Not Cite, Quote or Distribute 10-40 Total pages: 176
second-generation biofuels and their respective conversion and cultivation emission factors. ‘IAM 1 EMF33’ refers to emissions factors for advanced biofuels derived from simulation results from the 2 integrated assessment models EMF33 scenarios. ‘PM’ refers to partial models, where ‘CLC’ is with 3
constant land cover and ‘NRG’ is with natural regrowth. ‘Hydrogen, low-carbon electricity’ is produced 4 via electrolysis using low-carbon electricity. ‘Hydrogen, natural gas SMR’ refers to fuels produced via 5
steam methane reforming of natural gas. 6
7
The tailpipe emissions and fuel consumption reported in the literature generally do not use empirical 8
emissions data. Rather, they tend to report fuel efficiency using driving cycles such as New European 9
Driving Cycle (NEDC) or the US EPA Federal Test Procedure. As a result, depending on the driving 10
cycle used, operating emissions reported in literature are possibly underestimated by as much as 15-11
38%, in comparison to actual real driving emissions (Fontaras et al. 2017; Tsiakmakis et al. 2017; 12
Triantafyllopoulos et al. 2019). The extent of these underestimations, however, vary between 13
powertrain types, engine sizes, driving behaviour and environment. 14
Current average life cycle impacts of mid-size ICEVs span from approximately 65 g CO2-eq pkm-1 to 15
210 g CO2-eq pkm-1, with both values stemming from ICEVs running on biofuels. Between this range 16
of values, the current reference technologies are found, with diesel-powered ICEVs having total median 17
life cycle impacts of 130 g CO2-eq pkm-1 and gasoline-fuelled vehicles with 160 g CO2-eq pkm-1. Fuel 18
consumption dominates the life cycle emissions of ICEVs, with approximately 75% of these emissions 19
arising from the tailpipe and fuel chain. 20
HEVs and plug-in HEVs (PHEVs) vary in terms of degree of powertrain electrification. HEVs mainly 21
rely on regenerative braking for charging the battery. PHEVs combine regenerative braking with 22
external power sources for charging the battery. Operating emissions intensity is highly dependent on 23
the degree to which electrified driving is performed, which in turn is user- and route-dependent. For 24
PHEVs, emissions intensity is also dependent on the source of the electricity for charging. HEV and 25
PHEV production impacts are comparable to the emissions generated for producing ICEVs as the 26
batteries are generally small compared to those of BEVs. Current HEVs may reduce emissions 27
compared to ICEVs by up to 30%, depending on the fuel, yielding median life cycle intensities varying 28
between 60 g CO2-eq pkm-1 (biofuels, EMF33) and 165-170 g CO2-eq pkm-1 (biofuels, partial models 29
NRG). Within this wide range, all the combinations of electric/fossil driving can be found, as well as 30
the life cycle intensity for driving 100% on fossil fuel. Because HEVs rely on combustion as the main 31
energy conversion process, they offer limited mitigation opportunities. However, HEVs represent a 32
suitable temporary solution, yielding a moderate mitigation potential, in areas where the electricity mix 33
is currently so carbon intensive that the use of PHEVs and BEVs is not an effective mitigation solution 34
(Wolfram and Wiedmann 2017; Wu et al. 2019). 35
In contrast to HEVs, PHEVs may provide greater opportunities for use-phase emissions reductions for 36
LDVs. These increased potential benefits are due to the ability to charge the battery with low-carbon 37
electricity and the longer full-electric range in comparison to HEVs (Laberteaux et al. 2019). Consumer 38
behaviour (e.g., utility factor (UF) and charging patterns), manufacturer settings, and access to 39
renewable electricity for charging strongly influence the total operational impacts (Wu et al, 2019). The 40
UF is a weighting of the percentage of distance covered using the electric charge (charge depleting (CD) 41
stage) versus the distance covered using the internal combustion engine (charge sustaining (CS) stage) 42
(Paffumi et al. 2018). When the PHEV operates in CS mode, the internal combustion engine is used for 43
propulsion and to maintain the state of charge of the battery within a certain range, together with 44
regenerative braking (Plötz et al. 2018; Raghavan and Tal 2020). When running in CS mode, PHEVs 45
have a reduced mitigation potential and have impacts comparable to those of HEVs. On the other hand, 46
when the PHEV operates in CD mode, the battery alone provides the required propulsion energy (Plötz 47
et al. 2018; Raghavan and Tal 2020). Thus, in CD mode, PHEVs hold potential for higher mitigation 48
ACCEPTED VERSION
SUBJECT TO FIN
AL EDITS
Final Government Distribution Chapter 10 IPCC AR6 WGIII
Do Not Cite, Quote or Distribute 10-41 Total pages: 176
potential, due to the possibility of charging the battery with low carbon electricity sources. 1
Consequently, the UF greatly influences the life cycle emissions of PHEVs. The current peer-reviewed 2
literature presents a wide range of UFs mainly due to varying testing protocols applied for estimating 3
the fuel efficiency and user behaviour (Pavlovic et al. 2017; Paffumi et al. 2018; Plötz et al. 2018, 2020; 4
Raghavan and Tal 2020; Hao et al. 2021). These factors make it difficult to harmonize and compare 5
impacts across PHEV studies. Due to the low number of appropriate PHEV studies relative to the other 6
LDV technologies and the complications in harmonizing available PHEV results, this technology is 7
omitted from Figure 10.4. However, due to the dual operating nature of PHEV vehicles, one can expect 8
that the life cycle GHG emissions intensities for these vehicles will lie between those of their ICEV and 9
BEV counterparts of similar size and performance. 10
Currently, BEVs have higher manufacturing emissions than equivalently sized ICEVs, with median 11
emissions of 14 t CO2-eq/vehicle against approximately 10 t CO2-eq/vehicle of their mid-sized fossil-12
fuelled counterparts. These higher production emissions of BEVs are largely attributed to the battery 13
pack manufacturing and to the additional power electronics required. As manufacturing technology and 14
capacity utilization improve and globalizes to regions with low-carbon electricity, battery 15
manufacturing emissions will likely decrease. Due to the higher energy efficiency of the electric 16
powertrain, BEVs may compensate for these higher production emissions in the driving phase. 17
However, the mitigation ability of this technology relative to ICEVs is highly dependent on the 18
electricity mix used to charge the vehicle. As a consequence of the variety of energy sources available 19
today, current BEVs have a wide range of potential average life cycle impacts, ranging between 60 and 20
180 g CO2-eq pkm-1 with electricity generated from wind and coal, respectively. The ability to achieve 21
large carbon reductions via vehicle electrification is thus highly dependent on the generation of low-22
carbon electricity, with the greatest mitigation effects achieved when charging the battery with low-23
carbon electricity. The literature suggests that current BEVs, if manufactured on low carbon electricity 24
as well as operated on low carbon electricity would have footprints as low 22 g CO2-eq pkm-1 for a 25
compact sized car (Ellingsen et al. 2014, 2016). This value suggests a reduction potential of around 26
85% compared to similarly sized fossil fuel vehicles (median values). Furthermore, BEVs have a co-27
benefit of reducing local air pollutants that are responsible for human health complications, particularly 28
in densely populated areas (Hawkins et al. 2013; Ke et al. 2017). 29
As with BEVs, current HFCVs have higher production emissions than similarly sized ICEVs and BEVs, 30
generating on average approximately 15 t CO2-eq/vehicle. As with BEVs, the life cycle impacts of 31
FCVs are highly dependent on the fuel chain. To date, the most common method of Hydrogen 32
production is steam methane reforming from natural gas (Khojasteh Salkuyeh et al. 2017), which is 33
relatively carbon intensive, resulting in life cycle emissions of approximately 88 g CO2-eq pkm-1. 34
Current literature covering life cycle impacts of the FCVs show that vehicles fuelled with Hydrogen 35
produced from steam methane reforming through natural gas offer little or no mitigation potential over 36
ICEVs. Other available Hydrogen fuel chains vary widely in carbon intensity, depending on the 37
synthesis method and the energy source used (electrolysis or steam methane reforming; fossil fuels vs. 38
renewables). The least carbon-intensive Hydrogen pathways rely on electrolysis powered by low-39
carbon electricity. Compared to ICEVs and BEVs, FCVs for LDVs are at a lower technology readiness 40
level as discussed in section 10.3. 41
42
START BOX HERE 43
44 Box 10.3 – Vehicle size trends and implications on the fuel efficiency of LDVs 45
Vehicle size trends: On a global scale, SUV sales have been constantly growing in the last decade, with 46
39% of the vehicles sold in 2018 being SUVs (IEA 2019d). If the trend towards increasing vehicle size 47
and engine power continues, it may result in higher overall emissions from the LDV fleet (relatively to 48
ACCEPTED VERSION
SUBJECT TO FIN
AL EDITS
Final Government Distribution Chapter 10 IPCC AR6 WGIII
Do Not Cite, Quote or Distribute 10-42 Total pages: 176
smaller vehicles with the same powertrain technology). The magnitude of the influence vehicle mass 1
has on fuel efficiency varies with the powertrain, which have different efficiencies. Box 10.3 Figure 1 2
highlights this relationship using data from the same literature used to create Figure 10.4. Higher 3
powertrain efficiency results in lower energy losses in operation, and thus requires less energy input to 4
move a given mass than a powertrain of lower efficiency. This pattern is illustrated by the more gradual 5
slope of BEVs in Box 10.3 Figure 1. The trend towards bigger and heavier vehicles with consequently 6
higher use phase emissions can be somewhat offset by improvements in powertrain design, fuel 7
efficiency, light weighting, and aerodynamics (Gargoloff et al. 2018; Wolfram et al. 2020). The 8
potential improvements provided by these strategies are case-specific and not thoroughly evaluated in 9
the literature, either individually or as a combination of multiple strategies. 10
Light weighting: There is an increasing use of advanced materials such as high-strength steel, 11
aluminium, carbon fibre, and polymer composites for vehicle light weighting (Hottle et al. 2017). These 12
materials reduce the mass of the vehicle and thereby also reduce the fuel or energy required to drive. 13
Light-weighted components often have higher production emissions than the components they replace 14
due to the advanced materials used (Kim and Wallington 2016). Despite these higher production 15
emissions, some studies suggest that the reduced fuel consumption over the lifetime of the light-16
weighted vehicle may provide a net mitigation effect in comparison to the non-light-weighted vehicle 17
(Hottle et al. 2017; Kim and Wallington 2013; Upadhyayula et al. 2019; Milovanoff et al. 2019; 18
Wolfram et al. 2020). However, multiple recent publications have found that in some cases, depending 19
on, for example, vehicle size and carbon intensity of the light weighting materials employed, the GHG 20
emissions avoided due to improved fuel efficiency do not offset the higher manufacturing emissions of 21
the vehicle (Luk et al. 2018; Wu et al. 2019). In addition, these advanced materials may be challenging 22
to recycle in a way that retains their high technical performance (Meng et al. 2017). 23
Co-effects on particulate matter: Light weighting may also alleviate the particulate matter (PM) 24
emissions arising from road and brake wear. BEVs are generally heavier than their ICEV counterparts, 25
which may potentially cause higher stress on the road surfaces and tires, with consequently higher PM 26
emissions per kilometre driven (Timmers and Achten 2016). Regenerative braking in HEVs, BEVs and 27
FCVs, however, reduces the mechanical braking required, and therefore may compensate for the higher 28
brake wear emissions from these heavier vehicle types. In addition, BEVs have no tailpipe emissions, 29
which further offsets the increased PM emissions from road and tire wear. Therefore, light-weighting 30
strategies may offer a carbon and particulates mitigation effect; however, in some cases, other 31
technological options may reduce CO2 emissions even further. 32
33
34
ACCEPTED VERSION
SUBJECT TO FIN
AL EDITS
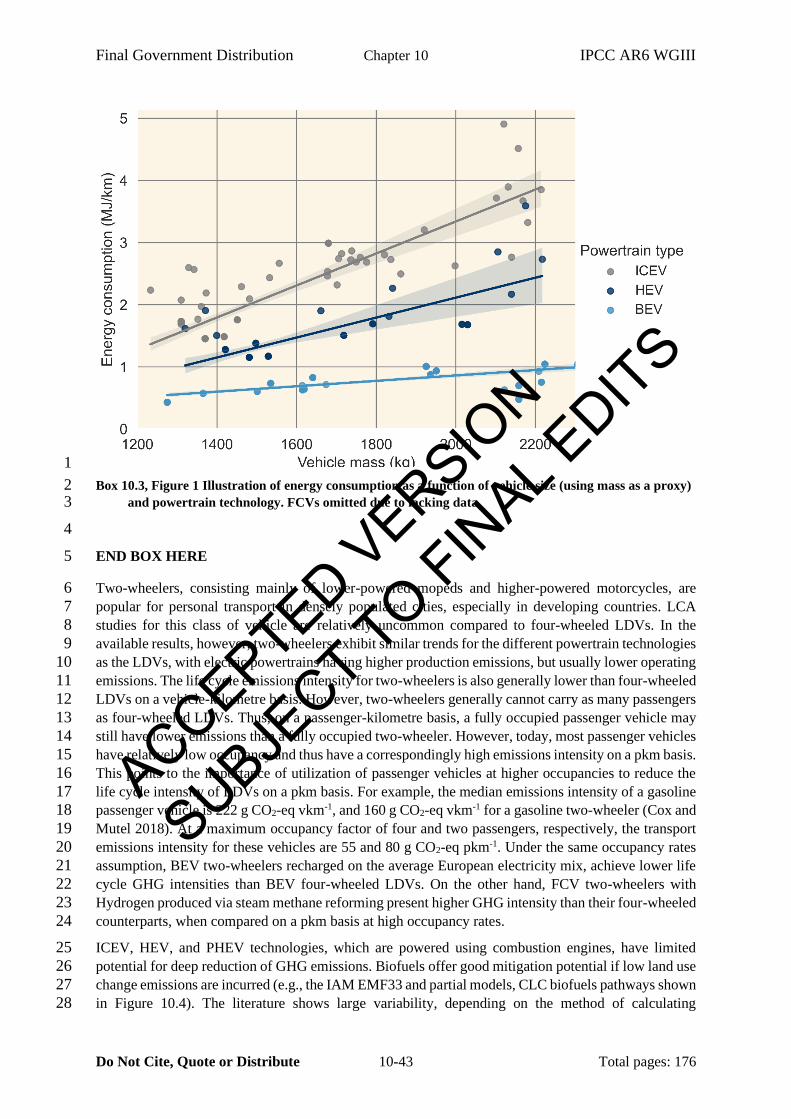
Final Government Distribution Chapter 10 IPCC AR6 WGIII
Do Not Cite, Quote or Distribute 10-43 Total pages: 176
1
Box 10.3, Figure 1 Illustration of energy consumption as a function of vehicle size (using mass as a proxy) 2 and powertrain technology. FCVs omitted due to lacking data. 3
4
END BOX HERE 5
Two-wheelers, consisting mainly of lower-powered mopeds and higher-powered motorcycles, are 6
popular for personal transport in densely populated cities, especially in developing countries. LCA 7
studies for this class of vehicle are relatively uncommon compared to four-wheeled LDVs. In the 8
available results, however, two-wheelers exhibit similar trends for the different powertrain technologies 9
as the LDVs, with electric powertrains having higher production emissions, but usually lower operating 10
emissions. The life cycle emissions intensity for two-wheelers is also generally lower than four-wheeled 11
LDVs on a vehicle-kilometre basis. However, two-wheelers generally cannot carry as many passengers 12
as four-wheeled LDVs. Thus, on a passenger-kilometre basis, a fully occupied passenger vehicle may 13
still have lower emissions than a fully occupied two-wheeler. However, today, most passenger vehicles 14
have relatively low occupancy and thus have a correspondingly high emissions intensity on a pkm basis. 15
This points to the importance of utilization of passenger vehicles at higher occupancies to reduce the 16
life cycle intensity of LDVs on a pkm basis. For example, the median emissions intensity of a gasoline 17
passenger vehicle is 222 g CO2-eq vkm-1, and 160 g CO2-eq vkm-1 for a gasoline two-wheeler (Cox and 18
Mutel 2018). At a maximum occupancy factor of four and two passengers, respectively, the transport 19
emissions intensity for these vehicles are 55 and 80 g CO2-eq pkm-1. Under the same occupancy rates 20
assumption, BEV two-wheelers recharged on the average European electricity mix, achieve lower life 21
cycle GHG intensities than BEV four-wheeled LDVs. On the other hand, FCV two-wheelers with 22
Hydrogen produced via steam methane reforming present higher GHG intensity than their four-wheeled 23
counterparts, when compared on a pkm basis at high occupancy rates. 24
ICEV, HEV, and PHEV technologies, which are powered using combustion engines, have limited 25
potential for deep reduction of GHG emissions. Biofuels offer good mitigation potential if low land use 26
change emissions are incurred (e.g., the IAM EMF33 and partial models, CLC biofuels pathways shown 27
in Figure 10.4). The literature shows large variability, depending on the method of calculating 28
ACCEPTED VERSION
SUBJECT TO FIN
AL EDITS
Final Government Distribution Chapter 10 IPCC AR6 WGIII
Do Not Cite, Quote or Distribute 10-44 Total pages: 176
associated land use changes. Resolving these apparent methodological differences is important to 1
consolidating the role biofuels may play in mitigation, as well as the issues raised in Chapter 7 about 2
the conflicts over land use. The mitigation potential of battery and fuel cell vehicles is strongly 3
dependent on the carbon intensity of their production and the energy carriers used in operation. 4
However, these technologies likely offer the highest potential for reducing emissions from LDVs. Prior 5
work on the diffusion dynamics of transport technologies suggests that “the diffusion of infrastructure 6
precedes the adoption of vehicles, which precedes the expansion of travel” (Leibowicz 2018). These 7
dynamics reinforce the argument for strong investments in both the energy infrastructure and the vehicle 8
technologies. 9
To successfully transition towards LDVs utilizing low-carbon fuels or energy sources, the technologies 10
need to be accessible to as many people as possible, which requires competitive costs compared to 11
conventional diesel and gasoline vehicles. The life cycle costs (LCCs) of LDVs depend on the 12
purchasing costs of the vehicles, their efficiency, the fuel costs, and the discount rate. Figure 10.5 shows 13
the results of a parametric analysis of LCC for diesel LDVs, BEVs, and FCVs. The range of vehicle 14
efficiencies captured in Figure 10.5 are the same as the ranges used for Figure 10.4, while the ranges 15
for fuel costs and vehicle purchase prices come from the literature. The assumed discount rate for this 16
parametric analysis is 3%. Appendix 10.2 includes the details about the method and underlying data 17
used to create this figure. 18
19
20
ACCEPTED VERSION
SUBJECT TO FIN
AL EDITS
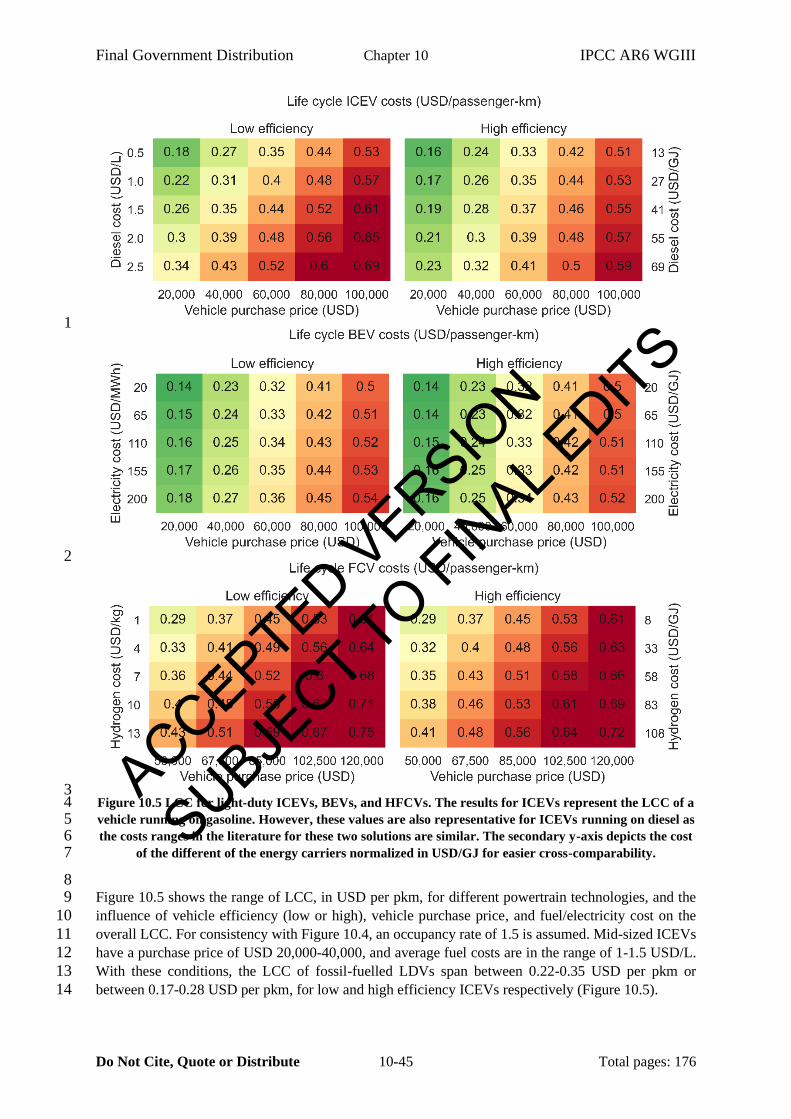
Final Government Distribution Chapter 10 IPCC AR6 WGIII
Do Not Cite, Quote or Distribute 10-45 Total pages: 176
1
2
3 Figure 10.5 LCC for light-duty ICEVs, BEVs, and HFCVs. The results for ICEVs represent the LCC of a 4 vehicle running on gasoline. However, these values are also representative for ICEVs running on diesel as 5 the costs ranges in the literature for these two solutions are similar. The secondary y-axis depicts the cost 6
of the different of the energy carriers normalized in USD/GJ for easier cross-comparability. 7
8 Figure 10.5 shows the range of LCC, in USD per pkm, for different powertrain technologies, and the 9
influence of vehicle efficiency (low or high), vehicle purchase price, and fuel/electricity cost on the 10
overall LCC. For consistency with Figure 10.4, an occupancy rate of 1.5 is assumed. Mid-sized ICEVs 11
have a purchase price of USD 20,000-40,000, and average fuel costs are in the range of 1-1.5 USD/L. 12
With these conditions, the LCC of fossil-fuelled LDVs span between 0.22-0.35 USD per pkm or 13
between 0.17-0.28 USD per pkm, for low and high efficiency ICEVs respectively (Figure 10.5). 14
ACCEPTED VERSION
SUBJECT TO FIN
AL EDITS
Final Government Distribution Chapter 10 IPCC AR6 WGIII
Do Not Cite, Quote or Distribute 10-46 Total pages: 176
BEVs have higher purchase prices than ICEVs, though a sharp decline has been observed since AR5. 1
Due to the rapid development of the lithium-ion battery technology over the years (Schmidt et al. 2017) 2
and the introduction of subsidies in several countries, BEVs are quickly reaching cost parity with 3
ICEVs. Mid-sized BEVs average purchase prices are in the range of USD 30,000-50,000 but the 4
levelised cost of electricity shows a larger spread (65-200 USD/MWh) depending on the geographical 5
location and the technology (see Chapter 6). Therefore, assuming purchase price parity between ICEVs 6
and BEVs, BEVs show lower LCC (Figure 10.5) due to higher efficiency and the lower cost of 7
electricity compared to fossil fuels on a per-GJ basis (secondary y-axis on Figure 10.5). 8
FCVs represent the most expensive solution for LDV, mainly due to the currently higher purchase price 9
of the vehicle itself. However, given the lower technology readiness level of FCVs and the current 10
efforts in the research and development of this technology, FCVs could become a viable technology for 11
LDVs in the coming years. The issues regarding the extra energy involved in creating the Hydrogen 12
and its delivery to refuelling sites remain, however. The levelized cost of Hydrogen on a per GJ basis 13
is lower than conventional fossil fuels but higher than electricity. In addition, within the levelized cost 14
of Hydrogen, there are significant cost differences between the Hydrogen producing technologies. 15
Conventional technologies such as coal gasification and steam methane reforming from natural gas, 16
both with and without carbon capture and storage, represent the cheapest options (Bekel and Pauliuk 17
2019; Parkinson et al. 2019; Khzouz et al. 2020; Al-Qahtani et al. 2021). Hydrogen produced via 18
electrolysis is currently the most expensive technology, but with significant potential cost reductions 19
due to the current technology readiness level. 20
21
10.4.2 Transit technologies for passenger transport 22
Buses provide urban and peri-urban transport services to millions of people around the world and a 23
growing number of transport agencies are exploring alternative-fuelled buses. Alternative technologies 24
to conventional diesel-powered buses include buses powered with CNG, LNG, synthetic fuels, and 25
biofuels (e.g., biodiesel, renewable diesel, dimethyl ether); diesel hybrid-electric buses; battery electric 26
buses; electric catenary buses, and Hydrogen fuel cell buses. Rail is an alternative mode of transit that 27
could support decarbonisation of land-based passenger mobility. Electric rail systems can provide urban 28
services (light rail and metro systems), as well as longer distance transport. Indeed, many cities of the 29
world already have extensive metro systems, and regions like China, Japan and Europe have a robust 30
high-speed inter-city railway network. Intercity rail transport can be powered with electricity; however, 31
fossil fuels are still prevalent for long-distance rail passenger transport in some regions. Battery electric 32
long-distance trains may be a future option for these areas. 33
Figure 10.6 shows the life cycle GHG emissions from different powertrain and fuel technologies for 34
buses and passenger rail. The data in each panel came from a number of relevant scientific studies (IEA 35
2019e; Tong et al. 2015a; Dimoula et al. 2016; de Bortoli et al. 2017; Meynerts et al. 2018; Cai et al. 36
2015; de Bortoli and Christoforou 2020; Hill et al. 2020; Liu et al. 2020a; Valente et al. 2021, 2017). 37
The width of the bar represents the variability in available estimates, which is primarily driven by 38
variability in reported vehicle efficiency, size, or drive cycle. While some bars overlap, the figure may 39
not fully capture correlations between results. For example, low efficiency associated with aggressive 40
drive cycles may drive the upper end of the emission ranges for multiple technologies; thus, an overlap 41
does not necessarily suggest uncertainty regarding which vehicle type would have lower emissions for 42
a comparable trip. Additionally, reported life cycle emissions do not include embodied GHG emissions 43
associated with infrastructure construction and maintenance. These embodied emissions are potentially 44
a larger fraction of life cycle emissions for rail than for other transport modes (Chester and Horvath 45
2012; Chester et al. 2013). One study reported values ranging from 10-25 g CO2 per passenger-46
kilometre (International Union of Railways 2016), although embodied emissions from rail are known 47
to vary widely across case studies (Olugbenga et al. 2019). These caveats are also applicable to the 48
ACCEPTED VERSION
SUBJECT TO FIN
AL EDITS
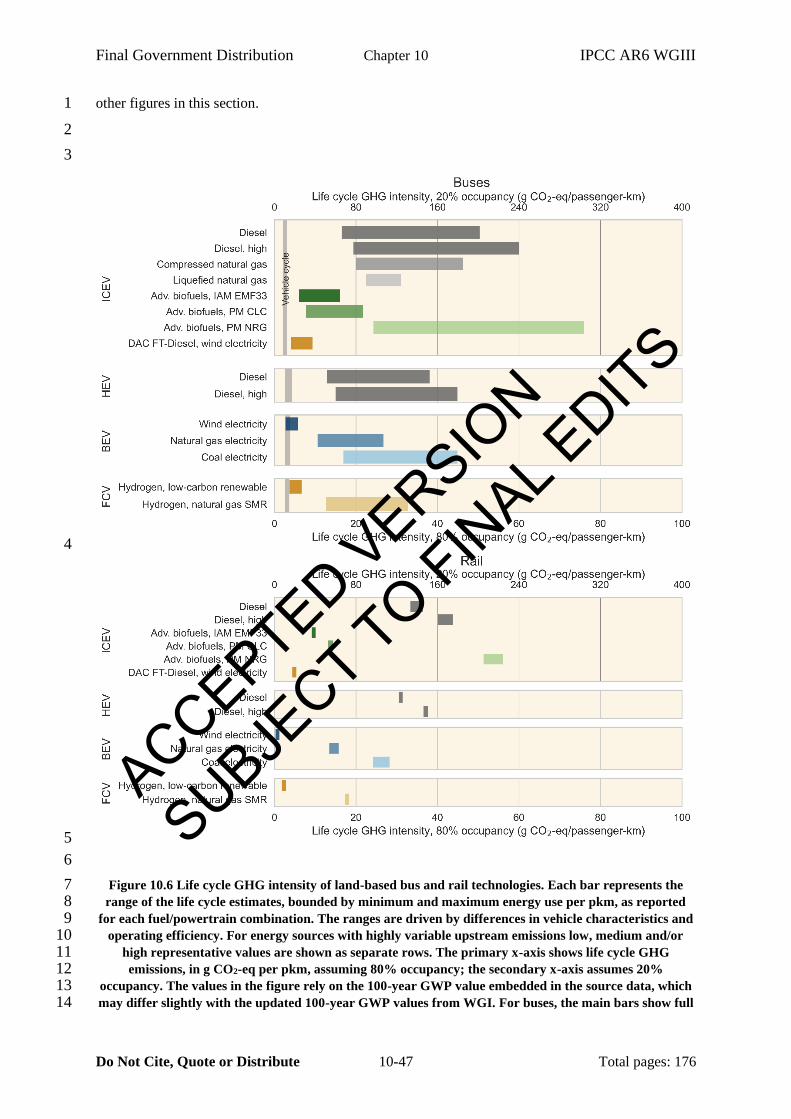
Final Government Distribution Chapter 10 IPCC AR6 WGIII
Do Not Cite, Quote or Distribute 10-47 Total pages: 176
other figures in this section. 1
2
3
4
5
6
Figure 10.6 Life cycle GHG intensity of land-based bus and rail technologies. Each bar represents the 7 range of the life cycle estimates, bounded by minimum and maximum energy use per pkm, as reported 8
for each fuel/powertrain combination. The ranges are driven by differences in vehicle characteristics and 9 operating efficiency. For energy sources with highly variable upstream emissions low, medium and/or 10
high representative values are shown as separate rows. The primary x-axis shows life cycle GHG 11 emissions, in g CO2-eq per pkm, assuming 80% occupancy; the secondary x-axis assumes 20% 12
occupancy. The values in the figure rely on the 100-year GWP value embedded in the source data, which 13 may differ slightly with the updated 100-year GWP values from WGI. For buses, the main bars show full 14
ACCEPTED VERSION
SUBJECT TO FIN
AL EDITS
Final Government Distribution Chapter 10 IPCC AR6 WGIII
Do Not Cite, Quote or Distribute 10-48 Total pages: 176
life cycle, with vertical bars disaggregating the vehicle cycle. ‘Diesel, high’ references emissions factors for 1 diesel from oil sands. ‘Adv. Biofuels’ i.e., advanced biofuels, refers to the use of second-generation 2 biofuels and their respective conversion and cultivation emission factors. ‘IAM EMF33’ refers to 3
emissions factors for advanced biofuels derived from simulation results from the integrated assessment 4 models EMF33 scenarios. ‘PM’ refers to partial models, where ‘CLC’ is with constant land cover and 5
‘NRG’ is with natural regrowth. ‘DAC FT-Diesel, wind electricity’ refers to Fischer-Tropsch diesel 6 produced via a CO2 direct air capture process that uses wind electricity. ‘Hydrogen, low-carbon 7
renewable’ refers to fuels produced via electrolysis using low-carbon electricity. ‘Hydrogen, natural gas 8 SMR’ refers to fuels produced via steam methane reforming of natural gas. Results for ICEVs with ‘high 9
emissions DAC FT-Diesel from natural gas’ are not included here since the life cycle emissions are 10 estimated to be substantially higher than petroleum diesel ICEVs. 11
12
Figure 10.6 highlights that BEV and FCV buses and passenger rail powered with low carbon electricity 13
or low carbon Hydrogen, could offer reductions in GHG emissions compared to diesel-powered buses 14
or diesel-powered passenger rail. However, and not surprisingly, these technologies would offer only 15
little emissions reductions if power generation and Hydrogen production rely on fossil fuels. While 16
buses powered with CNG and LNG could offer some reductions compared to diesel-powered buses, 17
these reductions are unlikely to be sufficient to contribute to deep decarbonisation of the transport sector 18
and they may slow down conversion to low or zero-carbon options already commercially available. 19
Biodiesel and renewable diesel fuels (from sources with low upstream emissions and low risk of induced 20
land use change) could offer important near-term reductions for buses and passenger rail, as these fuels 21
can often be used with existing vehicle infrastructure. They could also be used for long haul trucks and 22
trains, shipping and aviation as discussed below and in later sections. 23
There has been growing interest in the production of synthetic fuels from CO2 produced by direct air 24
capture (DAC) processes. Figure 10.6 includes the life cycle GHG emissions from buses and passenger 25
rail powered with synthetic diesel produced through a DAC system paired with a Fischer-Tropsch (FT) 26
process based on (Liu et al. 2020a). This process requires the use of Hydrogen (as shown in Figure 10.2 27
in section 10.3), so the emissions factors of the resulting fuel depend on the emissions intensity of 28
Hydrogen production. An electricity emissions factor less than 140 g CO2-eq kWh-1 would be required 29
for this pathway to achieve lower emissions than petroleum diesel (Liu et al. 2020a); e.g., this would 30
be equivalent to 75% wind and 25% natural gas electricity mix (see Appendix 10.1). If the process 31
relied on steam methane reforming for Hydrogen production or fossil-based power generation, synthetic 32
diesel from the DAC-FT process would not provide GHG emissions reductions compared to 33
conventional diesel. DAC-FT from low-carbon energy sources appears to be promising from an 34
emissions standpoint and could warrant the R&D and demonstration attention outlined in the rest of the 35
chapter, but it cannot be contemplated as a decarbonisation strategy without the availability of low-36
carbon Hydrogen. 37
At high occupancy, both bus and rail transport offer substantial GHG reduction potential per pkm, even 38
compared with the lowest-emitting private vehicle options. Even at 20% occupancy, bus and rail may 39
still offer emission reductions compared to passenger cars, especially notable when comparing BEVs 40
with low-carbon electricity (the lowest emission option for all technologies) across the three modes. 41
Only when comparing a fossil fuel-powered bus at low occupancy with a low-carbon powered car at 42
high occupancy is this conclusion reversed. Use of public transit systems, especially those that rely on 43
buses and passenger rail fuelled with the low carbon fuels previously described would thus support 44
efforts to decarbonise the transport sector. Use of these public transit systems will depend on urban 45
design and consumer preferences (as described in Section 10.2 and Chapters 5 and 8), which in turn 46
depend on time, costs, and behavioural choices. 47
Figure 10.7 shows the results of a parametric analysis of the LCCs of transit technologies with the 48
highest potential for GHG emissions reductions. As with Figure 10.5, the vehicle efficiency ranges are 49
ACCEPTED VERSION
SUBJECT TO FIN
AL EDITS
Final Government Distribution Chapter 10 IPCC AR6 WGIII
Do Not Cite, Quote or Distribute 10-49 Total pages: 176
the same as those from the LCA estimates (80% occupancy). Vehicle, fuel, and maintenance costs 1
represent ranges in the literature (Eudy and Post 2018b; IEA 2019e; Argonne National Laboratory 2020; 2
BNEF 2020; Eudy and Post 2020; Hydrogen Council 2020; IEA 2020b,c; IRENA 2020; Johnson et al. 3
2020; Burnham et al. 2021; IEA 2021c,d; U.S. Energy Information Administration 2021), and the 4
discount rate is 3% where applicable. Appendix 10.2 of the chapter provides the details behind these 5
estimates. The panels for the ICEV can represent buses and passenger trains powered with any form of 6
diesel, whether derived from petroleum, synthetic hydrocarbons, or biofuels. For reference, global 7
average automotive diesel prices from 2015-2020 fluctuated around 1 USD/L, and the 2019 world 8
average industrial electricity price was approximately 100 USD/MWh (IEA 2021d). Retail Hydrogen 9
prices in excess of 13 USD/kg have been observed (Eudy and Post 2018a; Argonne National Laboratory 10
2020; Burnham et al. 2021) though current production cost estimates for Hydrogen produced from 11
electrolysis are far lower ((IRENA 2020), and as reported in Chapter 6), at around 5-7 USD/kg with 12
future forecasts as low as 1 USD/kg ((IRENA 2020; BNEF 2020; Hydrogen Council 2020), and as 13
reported in Chapter 6). 14
Under most parameter combinations, rail is the most cost-effective option, followed by buses, both of 15
which are an order of magnitude cheaper than passenger vehicles. Note that costs per pkm are strongly 16
influenced by occupancy assumptions; at low occupancy (e.g., <20% for buses and <10% for rail), the 17
cost of transit approaches the LCC for passenger cars. For diesel rail and buses, cost ranges are driven 18
by fuel costs, whereas vehicle are both important drivers for electric or Hydrogen modes due to high 19
costs (but also large projected improvements) associated with batteries and fuel cell stacks. Whereas 20
the current state of ICEV technologies is best represented by cheap vehicles and low fuel costs for diesel 21
(top left of each panel), these costs are likely to rise in future due to stronger emission/efficiency 22
regulations and rising crude oil prices. On the contrary, the current status of alternative fuels is better 23
represented by high capital costs and mid-to-high fuel costs (right side of each panel; mid-to-bottom 24
rows), but technology costs are anticipated to fall with increasing experience, research, and 25
development. Thus, while electric rail is already competitive with diesel rail, and electric buses are 26
competitive with diesel buses in the low efficiency case, improvements are still required in battery costs 27
to compete against modern diesel buses on high efficiency routes, at current diesel costs. Similarly, 28
improvements to both vehicle cost and fuel costs are required for Hydrogen vehicles to become cost 29
effective compared to their diesel or electric counterparts. At either the upper end of the diesel cost 30
range (bottom row of ICEV panels), or within the 2030-2050 projections for battery costs, fuel cell 31
costs and Hydrogen costs (top left of BEV and FCV panels) – both battery and Hydrogen powered 32
vehicles become financially attractive. 33
34
35
ACCEPTED VERSION
SUBJECT TO FIN
AL EDITS
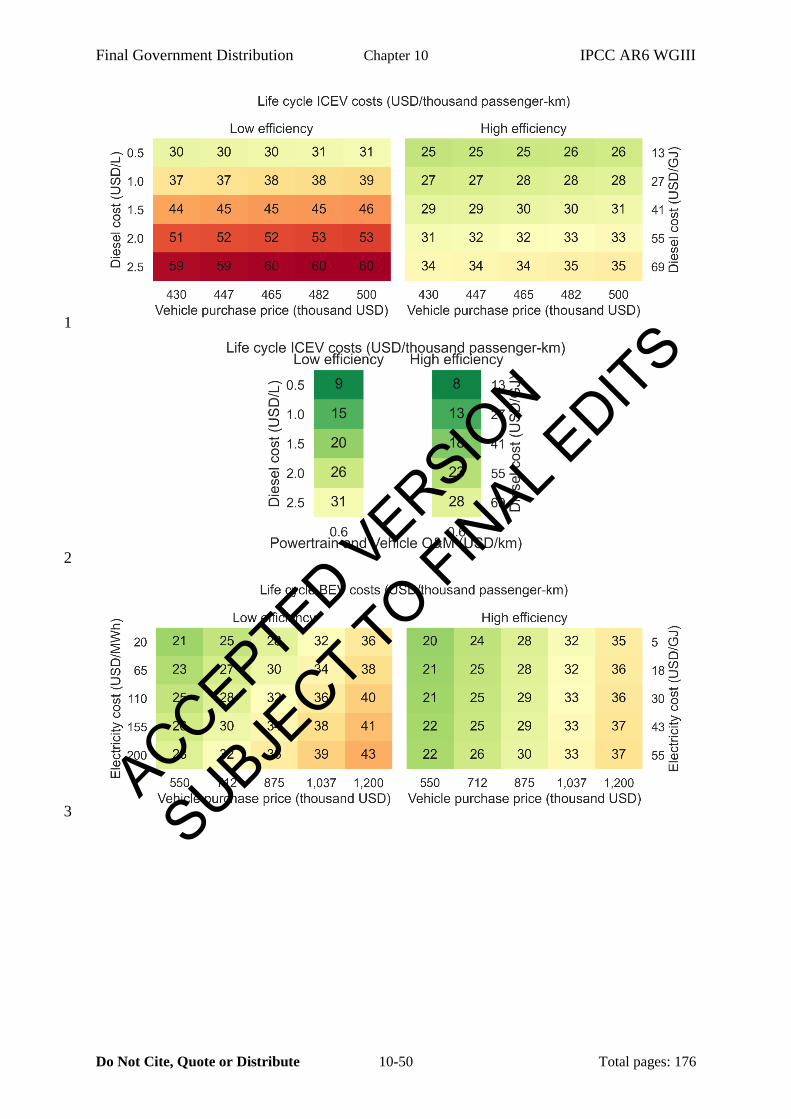
Final Government Distribution Chapter 10 IPCC AR6 WGIII
Do Not Cite, Quote or Distribute 10-50 Total pages: 176
1
2
3 ACCEPTED VERSIO
N
SUBJECT TO FIN
AL EDITS
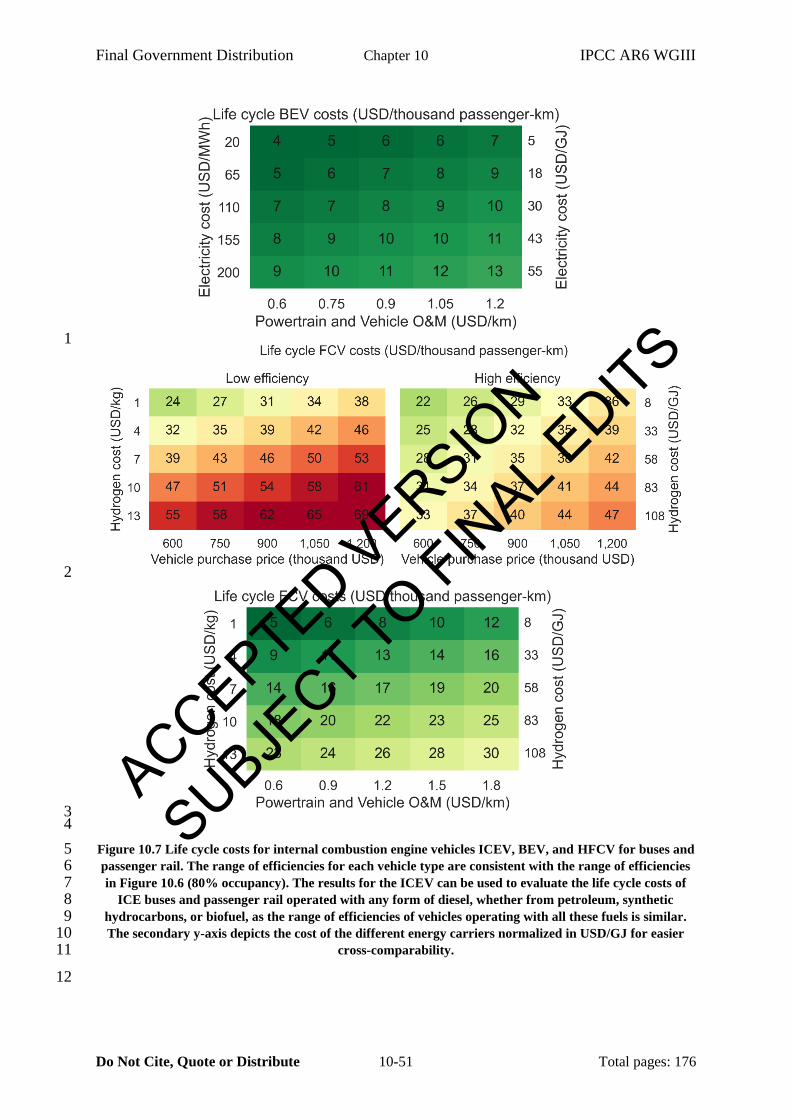
Final Government Distribution Chapter 10 IPCC AR6 WGIII
Do Not Cite, Quote or Distribute 10-51 Total pages: 176
1
2
3 4
Figure 10.7 Life cycle costs for internal combustion engine vehicles ICEV, BEV, and HFCV for buses and 5 passenger rail. The range of efficiencies for each vehicle type are consistent with the range of efficiencies 6 in Figure 10.6 (80% occupancy). The results for the ICEV can be used to evaluate the life cycle costs of 7
ICE buses and passenger rail operated with any form of diesel, whether from petroleum, synthetic 8 hydrocarbons, or biofuel, as the range of efficiencies of vehicles operating with all these fuels is similar. 9 The secondary y-axis depicts the cost of the different energy carriers normalized in USD/GJ for easier 10
cross-comparability. 11
12
ACCEPTED VERSION
SUBJECT TO FIN
AL EDITS
Final Government Distribution Chapter 10 IPCC AR6 WGIII
Do Not Cite, Quote or Distribute 10-52 Total pages: 176
10.4.3 Land-based freight transport 1
As is the case with passenger transport, there is growing interest in alternative fuels that could reduce 2
GHG emissions from freight transport. Natural gas-based fuels (e.g., CNG, LNG) are an example, 3
however these may not lead to drastic reductions in GHG emissions compared to diesel. Natural gas-4
powered vehicles have been discussed as a means to mitigate air quality impacts (Khan et al. 2015; Pan 5
et al. 2020; Cai et al. 2017) but those impacts are not the focus of this review. Decarbonisation of 6
medium and heavy-duty trucks would likely require the use of low-carbon electricity in battery-electric 7
trucks, low-carbon Hydrogen or Ammonia in fuel-cell trucks, or bio-based fuels (from sources with low 8
upstream emissions and low risk of induced land use change) used in ICE trucks. 9
Freight rail is also a major mode for the inland movement of goods. Trains are more energy efficient 10
(per tkmm) than trucks, so expanded use of rail systems (particularly in developing countries where 11
demand for goods could grow exponentially) could provide carbon abatement opportunities. While 12
diesel-based locomotives are still a major propulsion used in freight rail, interest in low-carbon 13
propulsion technologies is growing. Electricity already powers freight rail in many European countries 14
using overhead catenaries. Other low-carbon technologies for rail may include advanced storage 15
technologies, biofuels, synthetic fuels, Ammonia, or Hydrogen. 16
17
ACCEPTED VERSION
SUBJECT TO FIN
AL EDITS
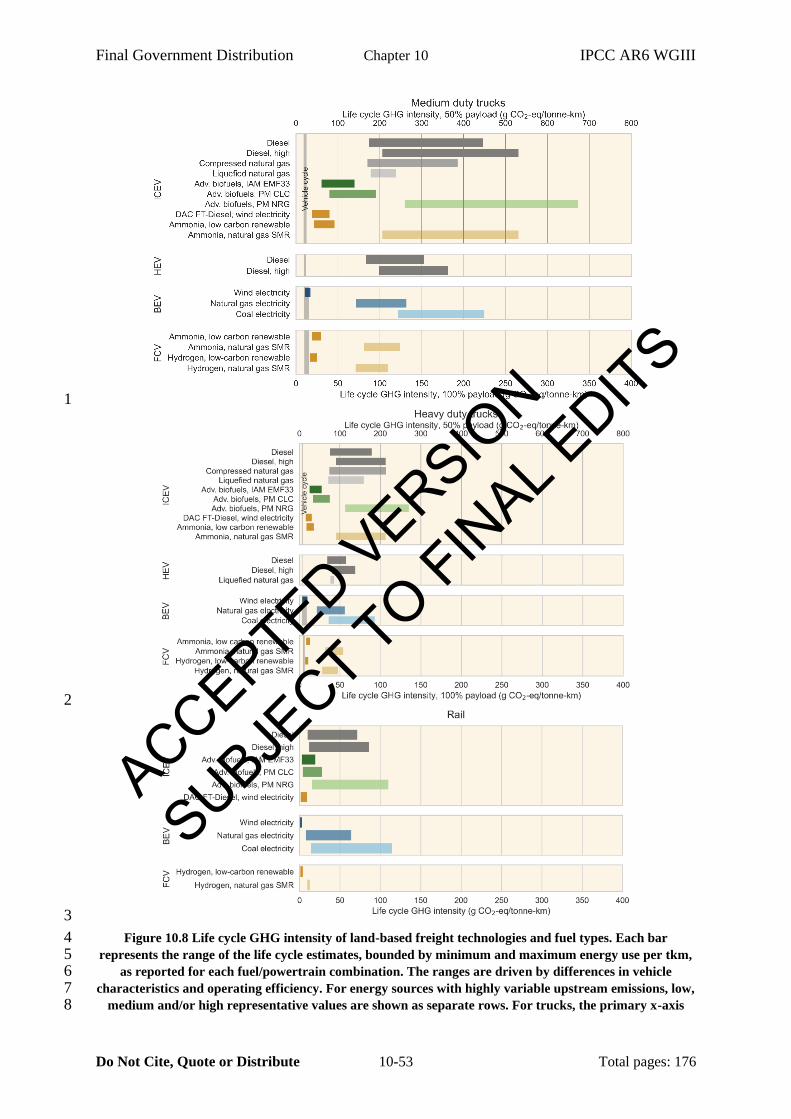
Final Government Distribution Chapter 10 IPCC AR6 WGIII
Do Not Cite, Quote or Distribute 10-53 Total pages: 176
1
2
3
Figure 10.8 Life cycle GHG intensity of land-based freight technologies and fuel types. Each bar 4 represents the range of the life cycle estimates, bounded by minimum and maximum energy use per tkm, 5
as reported for each fuel/powertrain combination. The ranges are driven by differences in vehicle 6 characteristics and operating efficiency. For energy sources with highly variable upstream emissions, low, 7
medium and/or high representative values are shown as separate rows. For trucks, the primary x-axis 8
ACCEPTED VERSION
SUBJECT TO FIN
AL EDITS
Final Government Distribution Chapter 10 IPCC AR6 WGIII
Do Not Cite, Quote or Distribute 10-54 Total pages: 176
shows life cycle GHG emissions, in g CO2-eq per tkm, assuming 100% payload; the secondary x-axis 1 assumes 50% payload. The values in the figure rely on the 100-year GWP value embedded in the source 2
data, which may differ slightly with the updated 100-year GWP values from WGI. For rail, values 3 represent average payloads. For trucks, main bars show full life cycle, with vertical bars disaggregating 4
the vehicle cycle. ‘Diesel, high’ references emissions factors for diesel from oil sands. ‘Adv. Biofuels’ 5 refers to the use of second-generation biofuels and their respective conversion and cultivation emission 6 factors. ‘IAM EMF33’ refers to emissions factors for advanced biofuels derived from simulation results 7 from the EMF33 scenarios. ‘PM’ refers to partial models, where ‘CLC’ is with constant land cover and 8
‘NRG’ is with natural regrowth. DAC FT-Diesel, wind electricity refers to Fischer-Tropsch diesel 9 produced via a CO2 direct air capture process that uses wind electricity. ‘Ammonia and Hydrogen, low-10 carbon renewable’ refers to fuels produced via electrolysis using low-carbon electricity. ‘Ammonia and 11
Hydrogen, natural gas SMR’ refers to fuels produced via steam methane reforming of natural gas. 12
13
Figure 10.8 presents a review of life cycle GHG emissions from land-based freight technologies (heavy 14
and medium-duty trucks, and rail). Each panel within the figure represents data in GHG emissions per 15
tkm of freight transported by different technology and/or fuel types, as indicated by the labels to the 16
left. The data in each panel came from a number of relevant scientific studies (Merchan et al. 2020; 17
Frattini et al. 2016; Zhao et al. 2016; CE Delft 2017; Isaac and Fulton 2017; Song et al. 2017; Cooper 18
and Balcombe 2019; S. Mojtaba et al. 2019; Nahlik et al. 2016; Prussi et al. 2020; Hill et al. 2020; Liu 19
et al. 2020a; Valente et al. 2021; Gray et al. 2021; Valente et al. 2017; Tong et al. 2015a). Similar to 20
the results for buses, technologies that offer substantial emission reductions for freight include: ICEV 21
trucks powered with the low carbon variants for biofuels, Ammonia or synthetic diesel; BEVs charged 22
with low carbon electricity; and FCVs powered with renewable-based electrolytic Hydrogen, or 23
Ammonia. Since Ammonia and Fischer-Tropsch diesel are produced from Hydrogen, their emissions 24
are higher than the source Hydrogen, but their logistical advantages over Hydrogen are also a 25
consideration (as discussed in Section 10.3). 26
Trucks exhibit economies of scale in fuel consumption, with heavy duty trucks generally showing lower 27
emissions per tkm than medium duty trucks. Comparing the life cycle GHG emissions from trucks and 28
rail, it is clear that rail using internal combustion engines is more carbon efficient than using internal 29
combustion trucks. Note that the rail emissions are reported for an average representative payload, while 30
the trucks are presented at 50% and 100% payload, based on available data. The comparison between 31
trucks and rail powered with electricity or Hydrogen is less clear – especially considering that these 32
values omit embodied GHG from infrastructure construction. One study reported embodied rail 33
infrastructure emissions of 15 g CO2 per tonne-kilometre for rail (International Union of Railways 34
2016), although such embodied emissions from rail are known to vary widely across case studies 35
(Olugbenga et al. 2019). Regardless, trucks and rail with low carbon electricity or low-carbon Hydrogen 36
have substantially lower emissions than incumbent technologies. 37
For trucks, Figure 10.8 includes two x-axes representing two different assumptions about their payload, 38
which substantially influence emissions per tonne-kilometre. These results highlight the importance of 39
truckload planning as an emissions reduction mechanism, for example, as also shown in (Kaack et al. 40
2018). Several studies also point to improvements in vehicle efficiency as an important mechanism to 41
reduce emissions from freight transport (Taptich et al. 2016; Kaack et al. 2018). However, projections 42
for diesel vehicles using such efficiencies beyond 2030 are promising, but still far higher emitting than 43
vehicles powered with low carbon sources. 44
Figure 10.9 shows the results of a parametric analysis of the LCC of trucks and freight rail technologies 45
with the highest potential for deep GHG reductions. As with Figure 10.8, the vehicle efficiency ranges 46
are the same as those from the LCA estimates (80% payload for trucks; effective payload as reported 47
by original studies for rail). Vehicle, fuel and maintenance costs represent ranges in the literature 48
(Moultak et al. 2017; Eudy and Post 2018b; IEA 2019e; Argonne National Laboratory 2020; BNEF 49
ACCEPTED VERSION
SUBJECT TO FIN
AL EDITS
Final Government Distribution Chapter 10 IPCC AR6 WGIII
Do Not Cite, Quote or Distribute 10-55 Total pages: 176
2020; IRENA 2020; Burnham et al. 2021; IEA 2021c), and the discount rate is 3% where applicable 1
(details are in Appendix 10.2). The panels for the ICEV can represent trucks and freight trains powered 2
with any form of diesel, whether derived from petroleum, synthetic hydrocarbons, or biofuels. See 3
discussion preceding Figure 10.7 for additional details about current global fuel costs. Under most 4
parameter combinations, rail is the more cost-effective option, but the high efficiency case for trucks 5
(representing fuel efficient vehicles, favourable drive cycles and high payload) can be more cost-6
effective than the low efficiency case for rail (representing systems with higher fuel consumption and 7
lower payload). For BEV trucks, cost ranges are driven by vehicle purchase price due to the large 8
batteries required and the associated wide range between their current high costs and anticipated future 9
cost reductions. For all other truck and rail technologies, fuel cost ranges play a larger role. Similar to 10
transit technologies, the current state of freight ICEV technologies is best represented by cheap vehicles 11
and low fuel costs for diesel (top left of each panel), and the current status of alternative fuels is better 12
represented by high capital costs and mid-to-high fuel costs (right side of each panel; mid-to-bottom 13
rows), with expected future increases in ICEV LCC and decreases in alternative fuel vehicle LCC. 14
Electric and Hydrogen freight rail are potentially already competitive with diesel rail (especially electric 15
catenary (IEA 2019e)), but low data availability (especially for Hydrogen efficiency ranges) and wide 16
ranges for reported diesel rail efficiency (likely encompassing low capacity utilization) makes this 17
comparison challenging. Alternative fuel trucks are currently more expensive than diesel trucks, but 18
future increases in diesel costs or a respective decrease in Hydrogen costs or in BEV capital costs 19
(especially the battery) would enable either alternative fuel technology to become financially attractive. 20
These results are largely consistent with raw results reported in existing literature, which suggest 21
ambiguity over whether BEV trucks are already competitive, but more consistency that Hydrogen is 22
not yet competitive, but could be in future (Zhao et al. 2016; White and Sintov 2017; Moultak et al. 23
2017; Sen et al. 2017; Zhou et al. 2017; Mareev et al. 2018; Yang et al. 2018a; El Hannach et al. 2019; 24
S. Mojtaba et al. 2019; Tanco et al. 2019; Burke and Sinha 2020; Jones et al. 2020). There is limited 25
data available on the LCC for freight rail, but at least one study IEA (2019g) suggests that electric 26
catenary rail is likely to have similar costs as diesel rail, while battery electric trains remain more 27
expensive and Hydrogen rail could become cheaper under forward-looking cost reduction scenarios. 28
29
30
31
ACCEPTED VERSION
SUBJECT TO FIN
AL EDITS
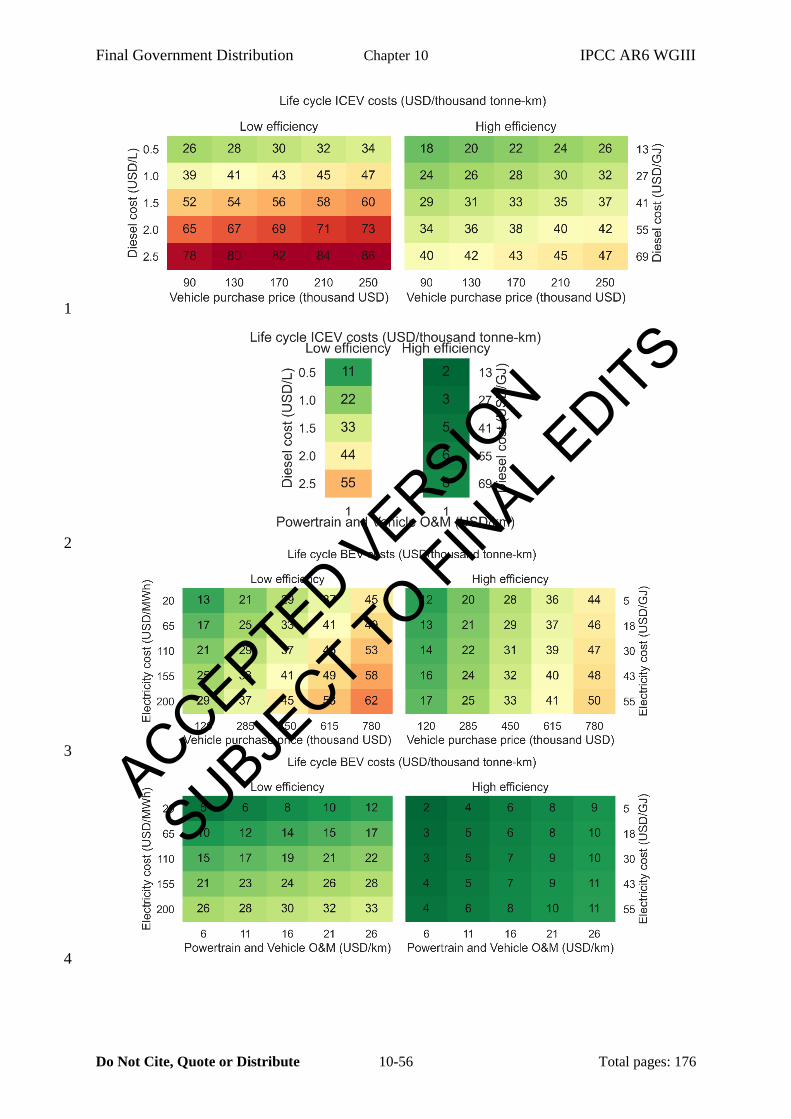
Final Government Distribution Chapter 10 IPCC AR6 WGIII
Do Not Cite, Quote or Distribute 10-56 Total pages: 176
1
2
3
4
ACCEPTED VERSION
SUBJECT TO FIN
AL EDITS
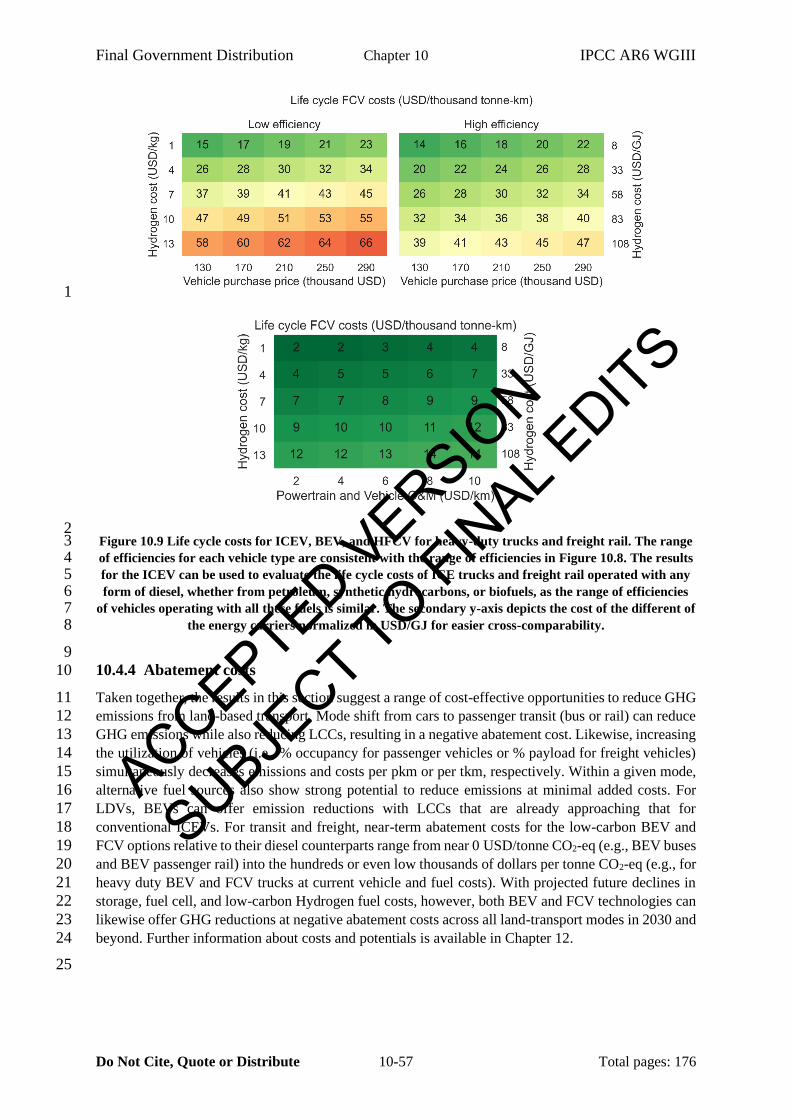
Final Government Distribution Chapter 10 IPCC AR6 WGIII
Do Not Cite, Quote or Distribute 10-57 Total pages: 176
1
2 Figure 10.9 Life cycle costs for ICEV, BEV, and HFCV for heavy-duty trucks and freight rail. The range 3 of efficiencies for each vehicle type are consistent with the range of efficiencies in Figure 10.8. The results 4 for the ICEV can be used to evaluate the life cycle costs of ICE trucks and freight rail operated with any 5 form of diesel, whether from petroleum, synthetic hydrocarbons, or biofuels, as the range of efficiencies 6
of vehicles operating with all these fuels is similar. The secondary y-axis depicts the cost of the different of 7 the energy carriers normalized in USD/GJ for easier cross-comparability. 8
9
10.4.4 Abatement costs 10
Taken together, the results in this section suggest a range of cost-effective opportunities to reduce GHG 11
emissions from land-based transport. Mode shift from cars to passenger transit (bus or rail) can reduce 12
GHG emissions while also reducing LCCs, resulting in a negative abatement cost. Likewise, increasing 13
the utilization of vehicles (i.e., % occupancy for passenger vehicles or % payload for freight vehicles) 14
simultaneously decreases emissions and costs per pkm or per tkm, respectively. Within a given mode, 15
alternative fuel sources also show strong potential to reduce emissions at minimal added costs. For 16
LDVs, BEVs can offer emission reductions with LCCs that are already approaching that for 17
conventional ICEVs. For transit and freight, near-term abatement costs for the low-carbon BEV and 18
FCV options relative to their diesel counterparts range from near 0 USD/tonne CO2-eq (e.g., BEV buses 19
and BEV passenger rail) into the hundreds or even low thousands of dollars per tonne CO2-eq (e.g., for 20
heavy duty BEV and FCV trucks at current vehicle and fuel costs). With projected future declines in 21
storage, fuel cell, and low-carbon Hydrogen fuel costs, however, both BEV and FCV technologies can 22
likewise offer GHG reductions at negative abatement costs across all land-transport modes in 2030 and 23
beyond. Further information about costs and potentials is available in Chapter 12. 24
25
ACCEPTED VERSION
SUBJECT TO FIN
AL EDITS
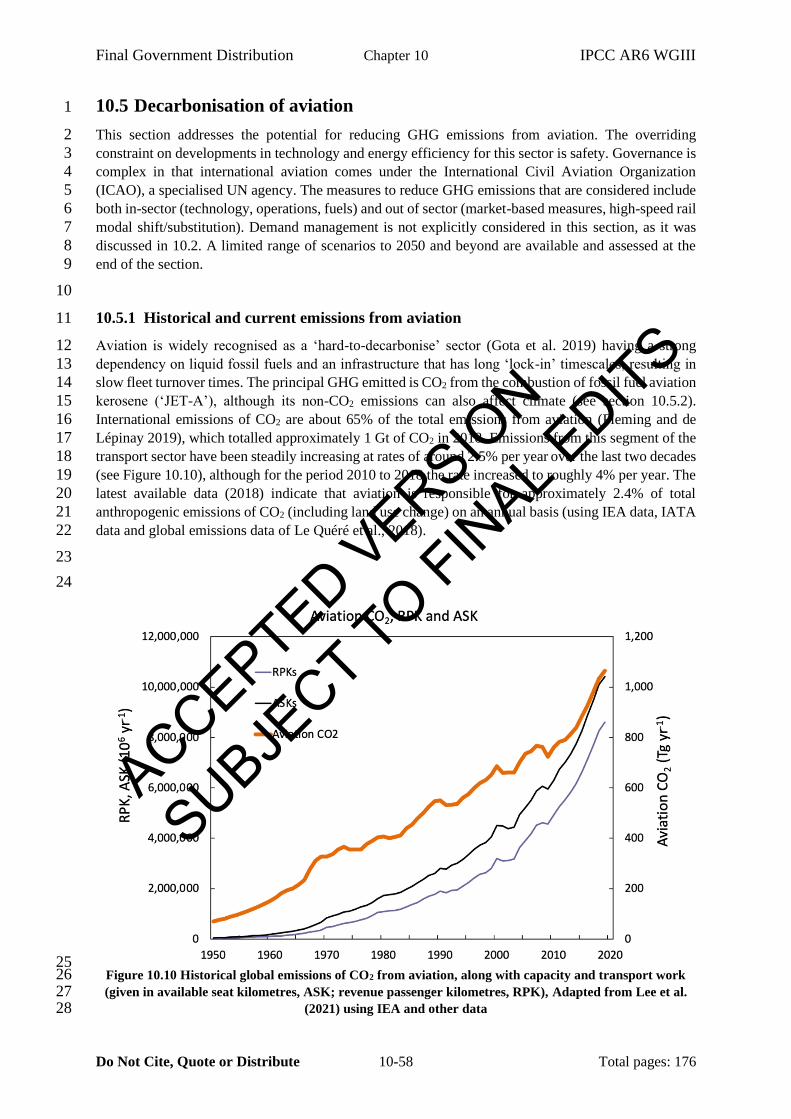
Final Government Distribution Chapter 10 IPCC AR6 WGIII
Do Not Cite, Quote or Distribute 10-58 Total pages: 176
10.5 Decarbonisation of aviation 1
This section addresses the potential for reducing GHG emissions from aviation. The overriding 2
constraint on developments in technology and energy efficiency for this sector is safety. Governance is 3
complex in that international aviation comes under the International Civil Aviation Organization 4
(ICAO), a specialised UN agency. The measures to reduce GHG emissions that are considered include 5
both in-sector (technology, operations, fuels) and out of sector (market-based measures, high-speed rail 6
modal shift/substitution). Demand management is not explicitly considered in this section, as it was 7
discussed in 10.2. A limited range of scenarios to 2050 and beyond are available and assessed at the 8
end of the section. 9
10
10.5.1 Historical and current emissions from aviation 11
Aviation is widely recognised as a ‘hard-to-decarbonise’ sector (Gota et al. 2019) having a strong 12
dependency on liquid fossil fuels and an infrastructure that has long ‘lock-in’ timescales, resulting in 13
slow fleet turnover times. The principal GHG emitted is CO2 from the combustion of fossil fuel aviation 14
kerosene (‘JET-A’), although its non-CO2 emissions can also affect climate (see section 10.5.2). 15
International emissions of CO2 are about 65% of the total emissions from aviation (Fleming and de 16
Lépinay 2019), which totalled approximately 1 Gt of CO2 in 2018. Emissions from this segment of the 17
transport sector have been steadily increasing at rates of around 2.5% per year over the last two decades 18
(see Figure 10.10), although for the period 2010 to 2018 the rate increased to roughly 4% per year. The 19
latest available data (2018) indicate that aviation is responsible for approximately 2.4% of total 20
anthropogenic emissions of CO2 (including land use change) on an annual basis (using IEA data, IATA 21
data and global emissions data of Le Quéré et al., 2018). 22
23
24
25 Figure 10.10 Historical global emissions of CO2 from aviation, along with capacity and transport work 26 (given in available seat kilometres, ASK; revenue passenger kilometres, RPK), Adapted from Lee et al. 27
(2021) using IEA and other data 28
ACCEPTED VERSION
SUBJECT TO FIN
AL EDITS
Final Government Distribution Chapter 10 IPCC AR6 WGIII
Do Not Cite, Quote or Distribute 10-59 Total pages: 176
1
10.5.2 Short lived climate forcers and aviation 2
Aviation’s net warming effect results from its historical and current emissions of CO2, and non-CO2 3
emissions of water vapour, soot, sulphur dioxide (from sulphur in the fuel), and nitrogen oxides (NOx, 4
= NO + NO2) (Penner et al. 1999; Lee et al. 2021; Naik et al. 2021). Although the effective radiative 5
forcing (ERF) of CO2 from historic aviation emissions is not currently the largest forcing term, it is 6
difficult to address because of the sector’s current dependency on fossil-based hydrocarbon fuels and 7
the longevity of CO2. A residual of emissions of CO2 today will still have a warming effect in many 8
thousands of years (Archer et al. 2009; Canadell et al. 2021) whereas water vapour, soot, and NOx 9
emissions will have long ceased to contribute to warming after some decades. As a result, CO2 10
mitigation of aviation to ‘net zero’ levels, as required in 1.5 ºC emission scenarios, requires fundamental 11
shifts in technology, fuel types, or changes of behaviour or demand. 12
The non-CO2 effects of aviation on climate fall into the category of short-lived climate forcers (SLCFs). 13
Emissions of NOx currently result in net positive warming from the formation of short-term ozone 14
(warming) and the destruction of ambient methane (cooling). If the conditions are suitable, emissions 15
of soot and water vapour can trigger the formation of contrails (Kärcher 2018), which can spread to 16
form extensive contrail-cirrus cloud coverage. Such cloud coverage is estimated to have a combined 17
ERF that is ~57% of the current net ERF of global aviation (Lee et al. 2021), although a comparison of 18
cirrus cloud observations under pre- and post-COVID-19 pandemic conditions suggest that this forcing 19
could be smaller (Digby et al. 2021). Additional effects from aviation from aerosol-cloud interactions 20
on high-level ice clouds through soot (Chen and Gettelman 2013; Zhou and Penner 2014; Penner et al. 21
2018), and lower-level warm clouds through Sulphur (Righi et al. 2013; Kapadia et al. 2016) are highly 22
uncertain, with no best estimates available (Lee et al. 2021). In total, the net ERF from aviation’s non-23
CO2 SLCFs is estimated to be approximately 66% of aviation’s current total forcing. It is important to 24
note that the fraction of non-CO2 forcing to total forcing is not a fixed quantity and is dependent on the 25
recent history of growth (or otherwise) of CO2 emissions (Klöwer et al. 2021) The non-CO2 effects 26
from aviation are the subject of discussion for mitigation options (e.g., (Arrowsmith et al. 2020)). 27
However, the issues are complex, potentially involving technological and operational trade-offs with 28
CO2. 29
30
10.5.3 Mitigation potential of fuels, operations, energy efficiency, and market-based 31
measures 32
Technology options for engine and airframe: For every kg of jet fuel combusted, 3.16 kg CO2 is emitted. 33
Engine and airframe manufacturers’ primary objective, after safety issues, is to reduce direct operating 34
costs, which are highly dependent on fuel burn. Large investments have gone into engine technology 35
and aircraft aerodynamics to improve fuel burn per km (Cumpsty et al. 2019). There have been major 36
step changes in engine technology over time, from early turbojet engines, to larger turbofan engines. 37
However, the basic configuration of an aircraft has remained more or less the same for decades and will 38
likely remain at least to 2037 (Cumpsty et al. 2019). Airframes performance has improved over the 39
years with better wing design, but large incremental gains have become much harder as the technology 40
has matured. For twin-aisle aircraft, generally used for long ranges, fuel-burn is a pressing concern and 41
there have been several all-new aircraft designs with improvements in their lift-to-drag ratio (Cumpsty 42
et al. 2019). The principal opportunities for fuel reduction come from improvements in aerodynamic 43
efficiency, aircraft mass reduction, and propulsion system improvements. In the future, Cumpsty et al. 44
(2019) suggest that the highest rate of fuel burn reduction achievable for new aircraft is likely to be no 45
more than about 1.3% per year, which is well short of ICAO’s aspirational goal of 2% global annual 46
average fuel efficiency improvement. Radically different aircraft shapes, like the blended wing body 47
ACCEPTED VERSION
SUBJECT TO FIN
AL EDITS
Final Government Distribution Chapter 10 IPCC AR6 WGIII
Do Not Cite, Quote or Distribute 10-60 Total pages: 176
(where the wings are not distinct from the fuselage) are likely to use about 10% less fuel than future 1
advanced aircraft of conventional form (Cumpsty et al. 2019). Such improvements would be “one-off” 2
gains, do not compensate for growth in emissions of CO2 expected to be in excess of 2% per annum, 3
and would take a decade or more to penetrate the fleet completely. Thus, the literature does not support 4
the idea that there are large improvements to be made in the energy efficiency of aviation that keep pace 5
with the projected growth in air transport. 6
Operational improvements for navigation: From a global perspective, aircraft navigation is relatively 7
efficient, with many long-haul routes travelling close to great circle trajectories, and avoiding 8
headwinds that increase fuel consumption. The ICAO estimates that flight inefficiencies on a global 9
basis are currently of the order 2–6% (ICAO 2019), while (Fleming and de Lépinay 2019) project 10
operational improvements (air traffic management) of up to 13% on a regional basis by 2050. 11
‘Intermediate stop operations’ have been suggested, whereby longer-distance travel is broken into flight 12
legs, obviating the need to carry fuel for the whole mission. (Linke et al. 2017) modelled this operational 13
behaviour on a global basis and calculated a fuel savings of 4.8% over a base case in which normal fuel 14
loads were carried. However, this approach increases the number of landing/take-off cycles at airports. 15
‘Formation flying’, which has the potential to reduce fuel burn on feasible routes has also been proposed 16
(Xu et al. 2014; Marks et al. 2021). 17
Alternative biofuels, synthetic fuels, and liquid Hydrogen: As noted above, the scope for reducing CO2 18
emissions from aviation through improved airplane technology or operations is limited and unable to 19
keep up with the projected growth, let alone reduce beyond the present emission rate at projected levels 20
of demand (assuming post-pandemic recovery of traffic). Thus, the literature outlined here suggests that 21
the only way for demand for aviation to continue to grow without increasing CO2 emissions is to employ 22
alternative lower-carbon bio- or synthetic aviation fuels (Klöwer et al. 2021). For shorter ranges, flights 23
of light planes carrying up to 50 passengers may be able to use electric power (Sahoo et al. 2020) but 24
these planes are a small proportion of the global aviation fleet (Epstein and O’Flarity 2019; Langford 25
and Hall 2020) and account for less than 12% of current aviation CO2 emissions. Alternative lower-26
carbon footprint fuels have been certified for use over recent years, principally from bio-feedstocks, but 27
are not yet widely available at economic prices (Kandaramath Hari et al. 2015; Capaz et al. 2021a). In 28
addition, alternative fuels from bio-feedstocks have variable carbon footprints because of different life 29
cycle emissions associated with various production methods and associated land-use change (de Jong 30
et al. 2017; Staples et al. 2018; Capaz et al. 2021b; Zhao et al. 2021). 31
The development of ‘sustainable aviation fuels’ (referred to as ‘SAFs’) that can reduce aviation’s carbon 32
footprint is a growing area of interest and research. Alternative aviation fuels to replace fossil-based 33
kerosene have to be certified to an equivalent standard as Jet-A for a variety of parameters associated 34
with safety issues. Currently, the organisation responsible for aviation fuel standards, ASTM 35
International, has certified seven different types of sustainable aviation fuels with maximum blends 36
ranging from 10% to 50% (Chiaramonti 2019). Effectively, these blend requirements limit the amount 37
of non-hydrocarbon fuel (e.g., Methanol) that can be added at present. While there currently is a 38
minimum level of aromatic hydrocarbon contained in jet fuel to prevent ‘O-ring’ shrinkage in the fuel 39
seals (Khandelwal et al. 2018), this minimum level can likely be lower in the medium- to long- term, 40
with the added benefits of reduced soot formation and reduced contrail cirrus formation (Bier et al. 41
2017; Bier and Burkhardt 2019). 42
Bio-based fuels can be produced using a variety of feedstocks including cultivated feedstock crops, crop 43
residues, municipal solid waste, waste fats, oils and greases, wood products and forestry residues 44
(Staples et al. 2018). Each of these different sources can have different associated life cycle emissions, 45
such that they are not net zero-CO2 emissions but have associated emissions of CO2 or other GHGs 46
from their production and distribution (see Section 10.3 and Box 10.2). In addition, associated land use 47
change emissions of CO2 represent a constraint in climate change mitigation potential with biofuel 48
ACCEPTED VERSION
SUBJECT TO FIN
AL EDITS
Final Government Distribution Chapter 10 IPCC AR6 WGIII
Do Not Cite, Quote or Distribute 10-61 Total pages: 176
(Staples et al. 2017) and has inherent large uncertainties (Plevin et al. 2010). Other sustainability issues 1
include food vs. fuel arguments, water resource use, and impacts on biodiversity. Cost-effective 2
production, feedstock availability, and certification costs are also relevant (Kandaramath Hari et al. 3
2015). Nonetheless, bio-based SAFs have been estimated to achieve life cycle emissions reductions 4
ranging between approximately 2% and 70% under a wide range of scenarios (Staples et al. 2018). For 5
a set of European aviation demand scenarios, Kousoulidou and Lonza (2016) estimated that the fuel 6
demand in 2030 would be ~100 Mtoe and biokerosene (HEFA/HVO) penetration would provide around 7
2% of the total fuel demand at that date. Several issues limit the expansion of biokerosene for aviation, 8
the primary one being the current cost of fossil fuel compared to the costs SAF production (Capaz et al. 9
2021a). Other hybrid pathways e.g., the Hydrogenation of biofuels (the Hydrogen assumed to be 10
generated with low carbon energy), could increase the output and improve the economic feasibility of 11
bio-based SAF (Hannula 2016; Albrecht et al. 2017). 12
Costs remain a major barrier for bio-SAF, which cost around three times the price of kerosene by 13
(Kandaramath Hari et al. 2015). Clearly, for SAFs to be economically competitive, large adjustments 14
in prices of fossil fuels or the introduction of policies is required. Staples et al. (2018) estimated that in 15
order to introduce bio-SAFs that reduce life cycle GHG emissions by at least 50% by 2050, prices and 16
policies were necessary for incentivization. They estimate the need for 268 new biorefineries per year 17
and capital investments of approximately USD 22 to 88 billion (2015 prices) per year between 2020 18
and 2050. Wise et al. (2017) suggest that carbon prices would help leverage production and availability. 19
Various pathways have been discussed for the production of non-bio SAFs such as power-to-liquid 20
pathways (Schmidt et al. 2018), sometimes termed ‘electro-fuels’ (Goldmann et al. 2018), or more 21
generalised power to ‘x’ pathways (Kober and Bauer 2019). This process would involve the use of low 22
carbon energy electricity, CO2, and water to synthesise jet fuel through the Fischer-Tropsch process or 23
Methanol synthesis. Hydrogen would be produced via an electrochemical process, powered by low 24
carbon energy and combined with CO2 captured directly from the atmosphere or through BECCS. The 25
energy requirement from photovoltaics has been estimated to be of the order 14 – 20 EJ to phase out 26
aviation fossil fuel by 2050 (Gössling et al. 2021a). These synthetic fuels have potential for large life 27
cycle emission reductions (Schmidt et al. 2016). In comparison to bio-SAF production, the 28
implementation of the processes is in its infancy. However, assuming availability of low carbon energy 29
electricity, these fuels have much smaller land and water requirements than bio-SAF. Low carbon 30
energy supply, scalable technology, and therefore costs represent barriers. (Scheelhaase et al. 2019) 31
review current estimates of costs, which are estimated to be approximately 4 to 6 times the price of 32
fossil kerosene. 33
Liquid Hydrogen (LH2) as a fuel has been discussed for aeronautical applications since the 1950s 34
(Brewer 1991) and a few experimental aircraft have flown using such a fuel. Experimental, small 35
aircraft have also flown using Hydrogen fuel cells. Although the fuel has an energy density per unit 36
mass about 3 times greater than kerosene, it has a much lower energy density per unit volume 37
(approximately factor 4, (McKinsey 2020)). The increased volume requirement makes the fuel less 38
attractive for aviation since it would require the wings to be thickened or else fuel to take up space in 39
the fuselage. Bicer and Dincer (2017) found that LH2-powered aircraft compared favourably to 40
conventional kerosene-powered aircraft on a life cycle basis, providing that the LH2 was generated from 41
low carbon energy sources (0.014 kg CO2 per tonne km cf 1.03 kg CO2 per tonne km, unspecified 42
passenger aircraft). However, Ramos Pereira et al. (2014) also made a life cycle comparison and found 43
much smaller benefits of LH2-powered aircraft (manufactured from low carbon energy) compared with 44
conventional fossil-kerosene. The two studies expose the sensitivities of boundaries and assumptions 45
in the analyses. (Shreyas Harsha 2014; Rondinelli et al. 2017) conclude that there are many 46
infrastructural barriers but that the environmental benefits of low carbon-based LH2 could be 47
considerable. Khandelwal et al. (2013) take a more optimistic view of the prospect of LH2-powered 48
ACCEPTED VERSION
SUBJECT TO FIN
AL EDITS
Final Government Distribution Chapter 10 IPCC AR6 WGIII
Do Not Cite, Quote or Distribute 10-62 Total pages: 176
aircraft but envisage them within a Hydrogen-oriented energy economy. A recently commissioned 1
study by the European Union (EU)’s ‘Clean Sky’ (McKinsey 2020) addresses many of the aspects of 2
the opportunities and obstacles in developing LH2 powered aircrafts. The report provides an optimistic 3
view of the feasibility of developing such aircraft for short to medium haul but makes clear that new 4
aircraft designs (such as blended-wing body aircraft) would be needed for longer distances. 5
The non-CO2 impacts of LH2-powered aircrafts remain poorly understood. The emission index of water 6
vapour would be much larger (estimated to be 2.6 times greater by Ström and Gierens (2002)) than for 7
conventional fuels, and the occurrence of contrails may increase but have lower ERF because of the 8
lower optical depth (Marquart et al. 2005). Moreover, contrails primarily form on soot particles from 9
kerosene-powered aircraft, which would be absent from LH2 exhaust (Kärcher 2018). The overall effect 10
is currently unknown as there are no measurements. Potentially, NOx emissions could be lower with 11
combustor redesign (Khandelwal et al. 2013). 12
In conclusion, there are favourable arguments for LH2-powered aircraft both on an efficiency basis 13
(Verstraete 2013) and an overall reduction in GHG emissions, even on an life cycle basis. However, 14
LH2 requires redesign of the aircraft, particularly for long-haul operations. Similarly, there would be a 15
need for expanded infrastructure for fuel manufacture, storage, and distribution at airports, which is 16
likely to be more easily overcome if there is a more general move towards a Hydrogen-based energy 17
economy. 18
Technological and operational trade-offs between CO2 and non-CO2 effects: Since aviation has 19
additional non-CO2 warming effects, there has been some discussion as to whether these can be 20
addressed by either technological or operational means. For example, improved fuel efficiency has 21
resulted from high overall pressure ratio engines with large bypass ratios. This improvement has 22
increased pressure and temperature at the combustor inlet, with a resultant tendency to increase thermal 23
NOx formation in the combustor. Combustor technology aims to reduce this increase, but it represents 24
a potential technology trade-off whereby NOx control may be at the expense of extra fuel efficiency. 25
Estimating the benefits or disbenefits of CO2 (proportional to fuel burned) vs. NOx in terms of climate 26
is complex (Freeman et al. 2018). 27
Any GWP/GTP type emissions equivalency calculation always involves the user selection of a time 28
horizon over which the calculation is made, which is a subjective choice (Fuglestvedt et al. 2010). In 29
general, the longer the time horizon, the more important CO2 becomes in comparison with a short-lived 30
climate forcing agent. So, for example, a net (overall) aviation GWP for a 20-year time horizon is 4.0 31
times that of CO2 alone, but only 1.7 over a 100-year time horizon. Correspondingly, a GTP for a 20-32
year time horizon is 1.3, but it is 1.1 for 100 years (Lee et al. 2021). 33
A widely discussed opportunity mitigation of non-CO2 emissions from aviation is the avoidance of 34
persistent contrails that can form contrail cirrus. Contrails only form in ice-supersaturated air below a 35
critical temperature threshold (Kärcher 2018). It is therefore feasible to alter flight trajectories to avoid 36
such areas conducive to contrail formation, since ice-supersaturated areas tend to be 10s to 100s of km 37
in the horizontal and only a few 100 metres in the vertical extent (Gierens et al. 1997). Theoretical 38
approaches show that avoidance is possible on a flight-by-flight basis (Matthes et al. 2017; Teoh et al. 39
2020). Case studies have shown that flight planning according to trajectories with minimal climate 40
impact can substantially (up to 50%) reduce the aircraft net climate impacts despite small additional 41
CO2 emissions (e.g., (Niklaß et al. 2019)). However, any estimate of the net benefit or disbenefit 42
depends firstly on the assumed magnitude of the contrail cirrus ERF effect (itself rather uncertain, 43
assessed with a low confidence level;) and upon the choice of metric and time-horizon applied. While 44
this is a potentially feasible mitigation option, notwithstanding the CO2 percontrail trade-off question, 45
meteorological models cannot currently predict the formation of persistent contrails with sufficient 46
accuracy in time and space (Gierens et al. 2020) such that this mitigation option is speculated to take of 47
the order of up to a decade to mature (Arrowsmith et al. 2020) 48
ACCEPTED VERSION
SUBJECT TO FIN
AL EDITS

Final Government Distribution Chapter 10 IPCC AR6 WGIII
Do Not Cite, Quote or Distribute 10-63 Total pages: 176
Market-based offsetting measures: The EU introduced aviation into its CO2 emissions trading scheme 1
(ETS) in 2012. Currently, the EU-ETS for aviation includes all flights within the EU as well as to and 2
from EEA states. Globally, ICAO agreed in 2016 to commence, in 2020, the ‘Carbon Offsetting and 3
Reduction Scheme for International Aviation’ (CORSIA). The pandemic subsequently resulted in the 4
baseline being changed to 2019. 5
CORSIA has a phased implementation, with an initial pilot phase (2021–2023) and a first phase (2024–6
2026) in which states will participate voluntarily. The second phase will then start in 2026–2035, and 7
all states will participate unless exempted. States may be exempted if they have lower aviation activity 8
levels or based on their UN development status. As of September 2021, 109 ICAO Member States will 9
voluntarily be participating in CORSIA starting in 2022. In terms of routes, only those where both States 10
are participating are included. There will be a special review of CORSIA by the end of 2032 to 11
determine the termination of the scheme, its extension, or any other changes to the scheme beyond 12
2035. 13
By its nature, CORSIA does not lead to a reduction in in-sector emissions from aviation since the 14
program deals mostly in approved offsets. At its best, CORSIA is a transition arrangement to allow 15
aviation to reduce its impact in a more meaningful way later. From 2021 onwards, operators can reduce 16
their CORSIA offsetting requirements by claiming emissions reductions from ‘CORSIA Eligible Fuels’ 17
that have demonstrably reduced life cycle emissions. These fuels are currently available at greater costs 18
than the offsets (Capaz et al. 2021a). As a result, most currently approved CORSIA offsets are avoided 19
emissions, which raises the issue of additionality (Warnecke et al. 2019) The nature of ‘avoided 20
emissions’ is to prevent an emission that was otherwise considered to be going to occur, e.g. prevented 21
deforestation. Avoided emissions are ‘reductions’ (over a counterfactual) and purchased from other 22
sectors that withhold from an intended emission (Becken and Mackey 2017), such that if additionality 23
were established, a maximum of 50% of the intended emissions are avoided. Some researchers suggest 24
that avoided deforestation offsets are not a meaningful reduction, since deforestation continues to be a 25
net source of CO2 emissions (Mackey et al. 2013; Friedlingstein et al. 2020). 26
Modal shift to High-Speed Rail: Due to the limitations of the current suite of aviation mitigation 27
strategies, the potential for high-speed rail (HSR) is of increasing interest (Givoni and Banister 2006; 28
Chen 2017; Bi et al. 2019). The IEA’s Net Zero by 2050 roadmap suggests significant behavioural 29
change with more regional flights shifting to HSR in the NZE pathway (IEA 2021e). For HSR services 30
to be highly competitive with air travel, the optimal distance between the departure and arrival points 31
has been found to be in the approximate range of 400-800 km (Bows et al. 2008; Rothengatter 2010), 32
although in the case of China’s HSR operations, this range can be extended out to 1,000 km with 33
corresponding air services having experienced significant demand reduction upon HSR service 34
commencement (Lawrence et al. 2019). In some instances, negative effects on air traffic, air fare, and 35
flight frequency have occurred at medium-haul distances such as HSR services in China on the Wuhan-36
Guangzhou route (1,069 km) and the Beijing-Shanghai route (1,318 km) (Fu et al. 2015; Zhang and 37
Zhang 2016; Chen 2017; Li et al. 2019; Ma et al. 2019). This competition at medium-haul distances is 38
contrary to that which has been experienced in European and other markets and may be attributable to 39
China having developed a comprehensive network with hub stations, higher average speeds, and an 40
integrated domestic market with strong patronage (Zhang et al. 2019a). 41
The LCA literature suggests that the GHG emissions associated with HSR vary depending on spatial, 42
temporal, and operational specifics (Åkerman 2011; Baron et al. 2011; Chester and Horvath 2012; Yue 43
et al. 2015; Hoyos et al. 2016; Jones et al. 2017; Robertson 2016, 2018; Lin et al. 2019). These studies 44
found a wide range of approximately 10 - 110 grams CO2 per pkm for HSR. This range is principally 45
attributable to the sensitivity of operational parameters such as the HSR passenger seating capacity, 46
load factor, composition of renewable and non-renewable energy sources in electricity production, 47
rolling stock energy efficiency and patronage (i.e. ridership both actual and forecast), and line-haul 48
ACCEPTED VERSION
SUBJECT TO FIN
AL EDITS
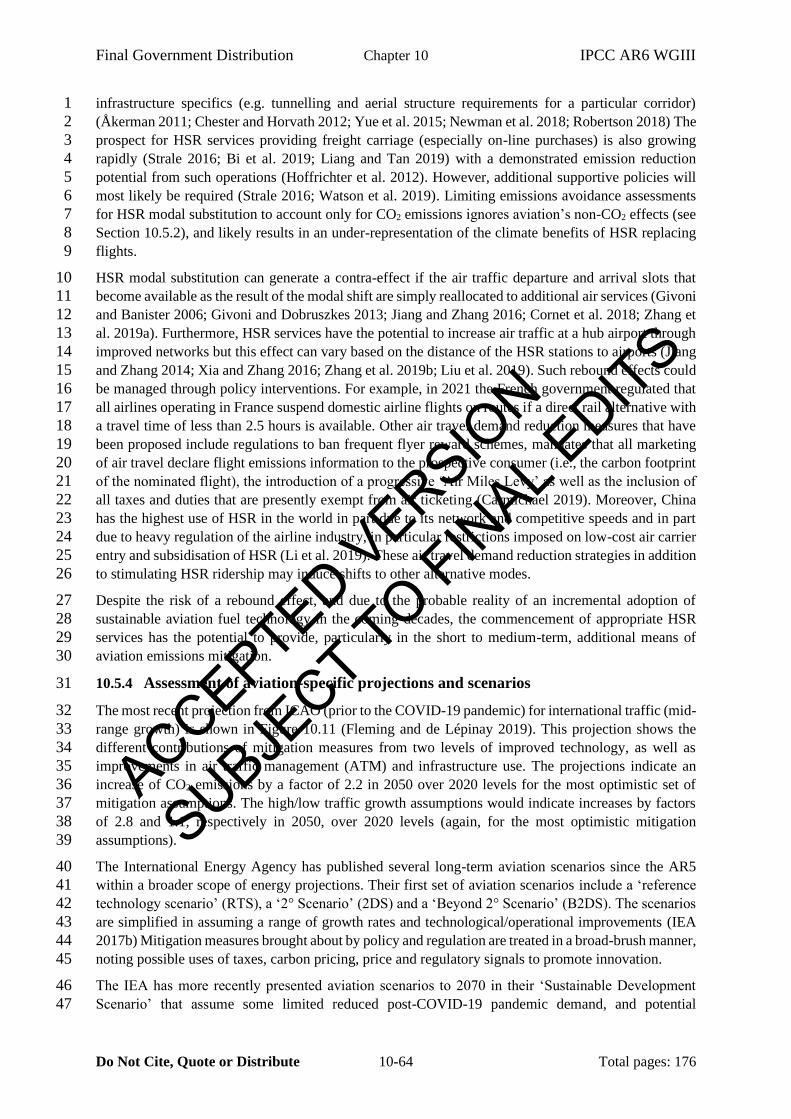
Final Government Distribution Chapter 10 IPCC AR6 WGIII
Do Not Cite, Quote or Distribute 10-64 Total pages: 176
infrastructure specifics (e.g. tunnelling and aerial structure requirements for a particular corridor) 1
(Åkerman 2011; Chester and Horvath 2012; Yue et al. 2015; Newman et al. 2018; Robertson 2018) The 2
prospect for HSR services providing freight carriage (especially on-line purchases) is also growing 3
rapidly (Strale 2016; Bi et al. 2019; Liang and Tan 2019) with a demonstrated emission reduction 4
potential from such operations (Hoffrichter et al. 2012). However, additional supportive policies will 5
most likely be required (Strale 2016; Watson et al. 2019). Limiting emissions avoidance assessments 6
for HSR modal substitution to account only for CO2 emissions ignores aviation’s non-CO2 effects (see 7
Section 10.5.2), and likely results in an under-representation of the climate benefits of HSR replacing 8
flights. 9
HSR modal substitution can generate a contra-effect if the air traffic departure and arrival slots that 10
become available as the result of the modal shift are simply reallocated to additional air services (Givoni 11
and Banister 2006; Givoni and Dobruszkes 2013; Jiang and Zhang 2016; Cornet et al. 2018; Zhang et 12
al. 2019a). Furthermore, HSR services have the potential to increase air traffic at a hub airport through 13
improved networks but this effect can vary based on the distance of the HSR stations to airports (Jiang 14
and Zhang 2014; Xia and Zhang 2016; Zhang et al. 2019b; Liu et al. 2019). Such rebound effects could 15
be managed through policy interventions. For example, in 2021 the French government regulated that 16
all airlines operating in France suspend domestic airline flights on routes if a direct rail alternative with 17
a travel time of less than 2.5 hours is available. Other air travel demand reduction measures that have 18
been proposed include regulations to ban frequent flyer reward schemes, mandates that all marketing 19
of air travel declare flight emissions information to the prospective consumer (i.e., the carbon footprint 20
of the nominated flight), the introduction of a progressive ‘Air Miles Levy’ as well as the inclusion of 21
all taxes and duties that are presently exempt from air ticketing (Carmichael 2019). Moreover, China 22
has the highest use of HSR in the world in part due to its network and competitive speeds and in part 23
due to heavy regulation of the airline industry, in particular restrictions imposed on low-cost air carrier 24
entry and subsidisation of HSR (Li et al. 2019). These air travel demand reduction strategies in addition 25
to stimulating HSR ridership may induce shifts to other alternative modes. 26
Despite the risk of a rebound effect, and due to the probable reality of an incremental adoption of 27
sustainable aviation fuel technology in the coming decades, the commencement of appropriate HSR 28
services has the potential to provide, particularly in the short to medium-term, additional means of 29
aviation emissions mitigation. 30
10.5.4 Assessment of aviation-specific projections and scenarios 31
The most recent projection from ICAO (prior to the COVID-19 pandemic) for international traffic (mid-32
range growth) is shown in Figure 10.11 (Fleming and de Lépinay 2019). This projection shows the 33
different contributions of mitigation measures from two levels of improved technology, as well as 34
improvements in air traffic management (ATM) and infrastructure use. The projections indicate an 35
increase of CO2 emissions by a factor of 2.2 in 2050 over 2020 levels for the most optimistic set of 36
mitigation assumptions. The high/low traffic growth assumptions would indicate increases by factors 37
of 2.8 and 1.1, respectively in 2050, over 2020 levels (again, for the most optimistic mitigation 38
assumptions). 39
The International Energy Agency has published several long-term aviation scenarios since the AR5 40
within a broader scope of energy projections. Their first set of aviation scenarios include a ‘reference 41
technology scenario’ (RTS), a ‘2° Scenario’ (2DS) and a ‘Beyond 2° Scenario’ (B2DS). The scenarios 42
are simplified in assuming a range of growth rates and technological/operational improvements (IEA 43
2017b) Mitigation measures brought about by policy and regulation are treated in a broad-brush manner, 44
noting possible uses of taxes, carbon pricing, price and regulatory signals to promote innovation. 45
The IEA has more recently presented aviation scenarios to 2070 in their ‘Sustainable Development 46
Scenario’ that assume some limited reduced post-COVID-19 pandemic demand, and potential 47
ACCEPTED VERSION
SUBJECT TO FIN
AL EDITS
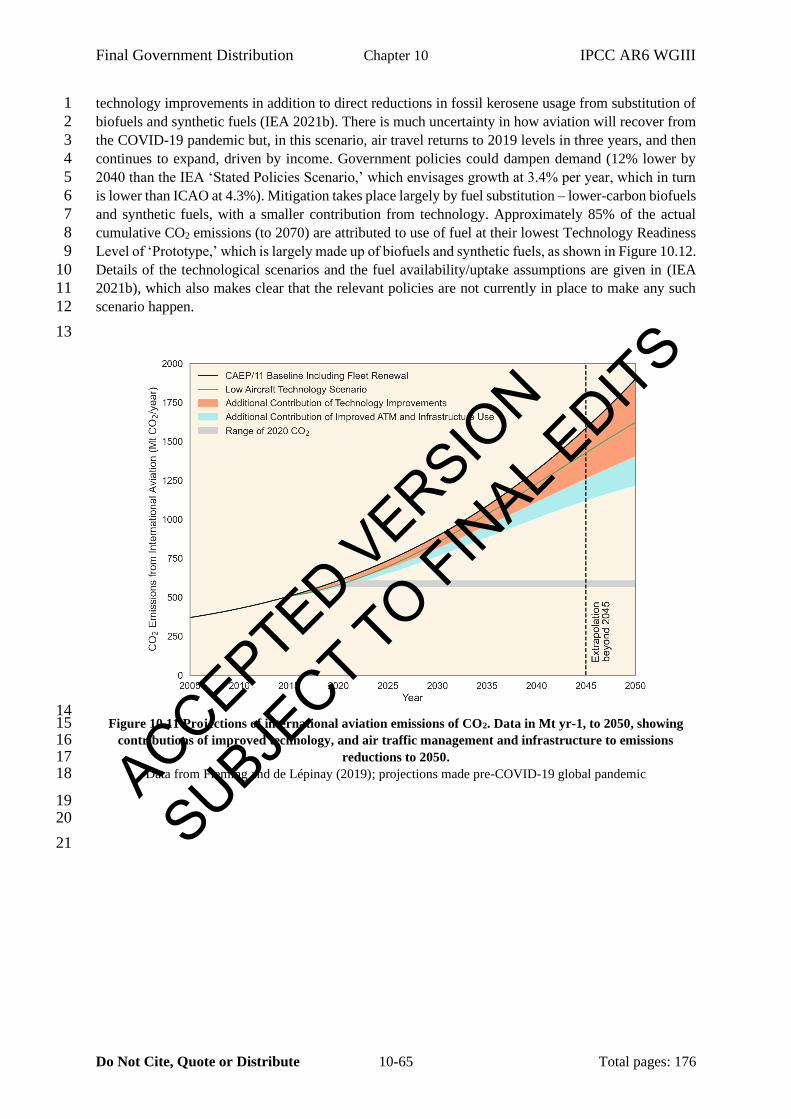
Final Government Distribution Chapter 10 IPCC AR6 WGIII
Do Not Cite, Quote or Distribute 10-65 Total pages: 176
technology improvements in addition to direct reductions in fossil kerosene usage from substitution of 1
biofuels and synthetic fuels (IEA 2021b). There is much uncertainty in how aviation will recover from 2
the COVID-19 pandemic but, in this scenario, air travel returns to 2019 levels in three years, and then 3
continues to expand, driven by income. Government policies could dampen demand (12% lower by 4
2040 than the IEA ‘Stated Policies Scenario,’ which envisages growth at 3.4% per year, which in turn 5
is lower than ICAO at 4.3%). Mitigation takes place largely by fuel substitution – lower-carbon biofuels 6
and synthetic fuels, with a smaller contribution from technology. Approximately 85% of the actual 7
cumulative CO2 emissions (to 2070) are attributed to use of fuel at their lowest Technology Readiness 8
Level of ‘Prototype,’ which is largely made up of biofuels and synthetic fuels, as shown in Figure 10.12. 9
Details of the technological scenarios and the fuel availability/uptake assumptions are given in (IEA 10
2021b), which also makes clear that the relevant policies are not currently in place to make any such 11
scenario happen. 12
13
14 Figure 10.11 Projections of international aviation emissions of CO2. Data in Mt yr-1, to 2050, showing 15
contributions of improved technology, and air traffic management and infrastructure to emissions 16 reductions to 2050. 17
Data from Fleming and de Lépinay (2019); projections made pre-COVID-19 global pandemic 18
19 20
21
ACCEPTED VERSION
SUBJECT TO FIN
AL EDITS
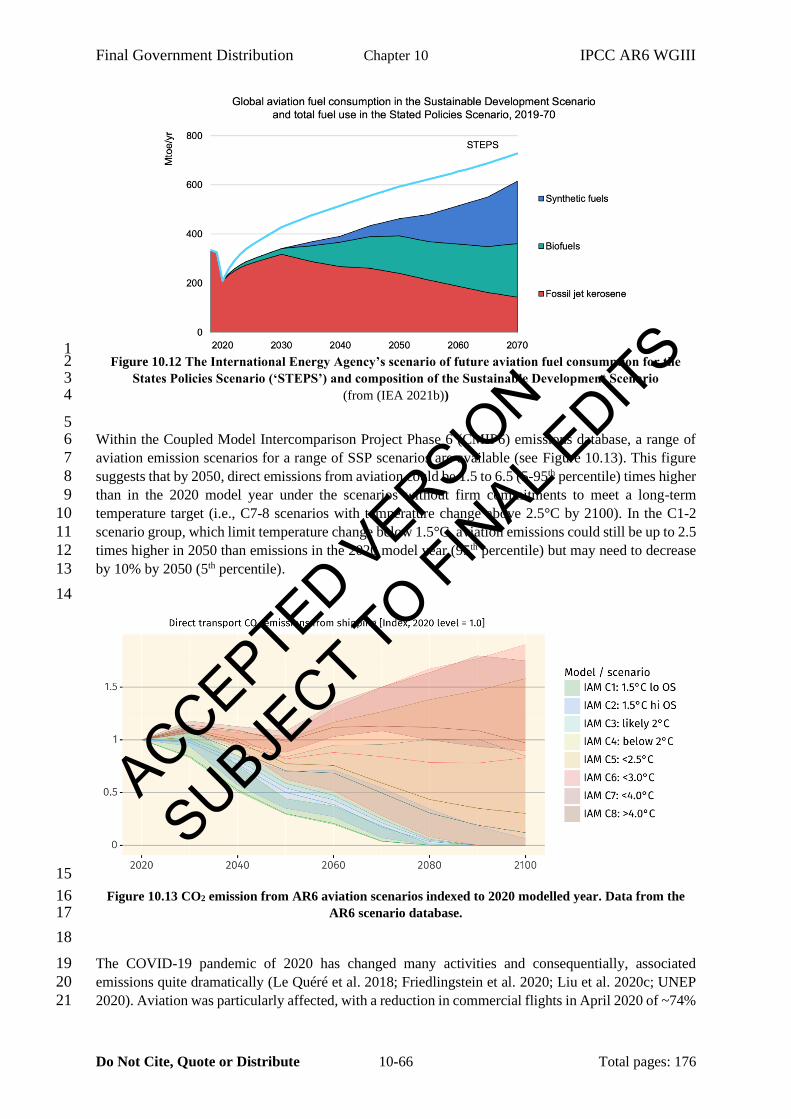
Final Government Distribution Chapter 10 IPCC AR6 WGIII
Do Not Cite, Quote or Distribute 10-66 Total pages: 176
1 Figure 10.12 The International Energy Agency’s scenario of future aviation fuel consumption for the 2
States Policies Scenario (‘STEPS’) and composition of the Sustainable Development Scenario 3 (from (IEA 2021b)) 4
5 Within the Coupled Model Intercomparison Project Phase 6 (CMIP6) emissions database, a range of 6
aviation emission scenarios for a range of SSP scenarios are available (see Figure 10.13). This figure 7
suggests that by 2050, direct emissions from aviation could be 1.5 to 6.5 (5-95th percentile) times higher 8
than in the 2020 model year under the scenarios without firm commitments to meet a long-term 9
temperature target (i.e., C7-8 scenarios with temperature change above 2.5°C by 2100). In the C1-2 10
scenario group, which limit temperature change below 1.5°C, aviation emissions could still be up to 2.5 11
times higher in 2050 than emissions in the 2020 model year (95th percentile) but may need to decrease 12
by 10% by 2050 (5th percentile). 13
14
15
Figure 10.13 CO2 emission from AR6 aviation scenarios indexed to 2020 modelled year. Data from the 16 AR6 scenario database. 17
18
The COVID-19 pandemic of 2020 has changed many activities and consequentially, associated 19
emissions quite dramatically (Le Quéré et al. 2018; Friedlingstein et al. 2020; Liu et al. 2020c; UNEP 20
2020). Aviation was particularly affected, with a reduction in commercial flights in April 2020 of ~74% 21
ACCEPTED VERSION
SUBJECT TO FIN
AL EDITS
Final Government Distribution Chapter 10 IPCC AR6 WGIII
Do Not Cite, Quote or Distribute 10-67 Total pages: 176
over 2019 levels, with some recovery over the following months, remaining at 42% lower as of October 1
2020 (Petchenik 2021). The industry is considering a range of potential recovery scenarios, with the 2
International Air Transport Association (IATA) speculating that recovery to 2019 levels may take up 3
until 2024 (see Box on COVID-19 and (Early and Newman 2021). Others suggest, however, that the 4
COVID-19 pandemic and increased costs as a result of feed-in quotas or carbon taxes, could slow down 5
the rate of growth of air travel demand, though global demand in 2050 would still grow 57%–187% 6
between 2018 and 2050 (instead of 250% in a baseline recovery scenario) (Gössling et al. 2021a). 7
8
10.5.5 Accountability and governance options 9
Under Article 2.2 of the Kyoto Protocol, Annex I countries were called to “…pursue limitation or 10
reduction of emissions of GHGs not controlled by the Montreal Protocol from aviation and marine 11
bunker fuels, working through the International Civil Aviation Organization and the International 12
Maritime Organization, respectively.” The Paris Agreement is different, in that ICAO (and the IMO) 13
are not named. As a result, the Paris Agreement, through the NDCs, seemingly covers CO2 emissions 14
from domestic aviation (currently 35% of the global total) but does not cover international emissions. 15
A number of states and regions, including the UK, France, Sweden, and Norway, have declared their 16
intentions to include international aviation in their net zero commitments, while the EU, New Zealand, 17
California, and Denmark are considering doing the same (Committee on Climate Change 2019). The 18
Paris Agreement describes temperature-based goals, such that it is unclear how emissions of GHGs 19
from international aviation would be accounted for. Clearly, this is a less than ideal situation for clarity 20
of governance of international GHG emissions from both aviation and shipping. At its 40th General 21
Assembly (October 2019) the ICAO requested its Council to “…continue to explore the feasibility of a 22
long-term global aspirational goal for international aviation, through conducting detailed studies 23
assessing the attainability and impacts of any goals proposed, including the impact on growth as well 24
as costs in all countries, especially developing countries, for the progress of the work to be presented 25
to the 41st Session of the ICAO Assembly”. What form this goal will take is unclear until work is 26
presented to the 41st Assembly (Autumn, 2022). It is likely, however, that new accountability and 27
governance structures will be needed to support decarbonisation of the aviation sector. 28
29
10.6 Decarbonisation of Shipping 30
Maritime transport is considered one of the key cornerstones enabling globalisation (Kumar and 31
Hoffmann 2002). But as for aviation, shipping has its challenges in decarbonisation, with a strong 32
dependency on fossil fuels without major changes since AR5. At the same time, the sector has a range 33
of opportunities that could help reduce emissions through not only changing fuels, but also by increasing 34
the energy efficiency, optimising operations and ship design, reducing demand, improving regulations, 35
as well as other options that will be reviewed in this section. 36
37
10.6.1 Historical and current emissions from shipping 38
Maritime transport volume has increased by 250% over the past 40 years, reaching an all-time high of 39 11 billion tons of transported goods in 2018 (UNCTAD 2019). This growth in transport volumes has 40 resulted in continued growth in GHG emissions from the shipping sector, despite an improvement in 41 the carbon intensity of ship operations, especially since 2014. The estimated total emissions from 42 maritime transport can vary depending on data set and calculation method, but range over 600 – 1,100 43 Mt CO2 per year over the past decade (Figure 10. 14), corresponding to 2 - 3% of total anthropogenic 44 emissions. The legend in Figure 10.14 refers to the following data sources: (Endresen et al. 2003), 45 (Eyring et al. 2005), (Dalsøren et al. 2009), DNV-GL (DNV GL 2019), CAMS-GLOB-SHIP (Jalkanen 46
ACCEPTED VERSION
SUBJECT TO FIN
AL EDITS
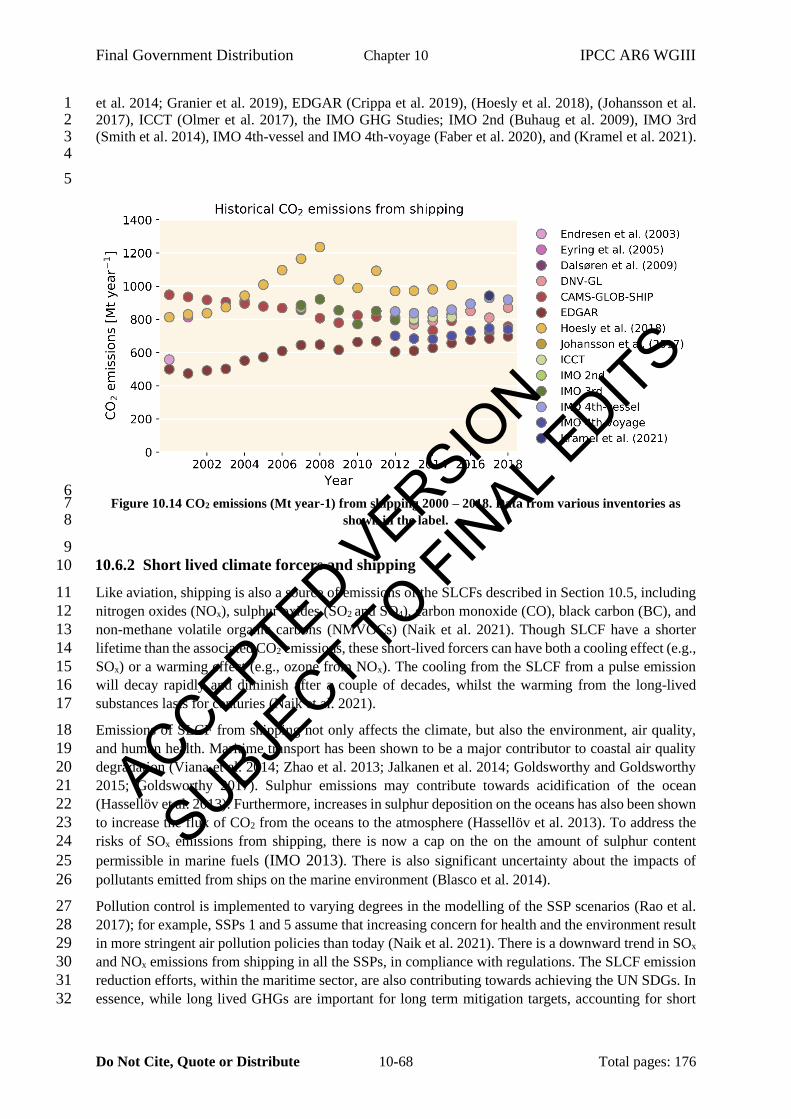
Final Government Distribution Chapter 10 IPCC AR6 WGIII
Do Not Cite, Quote or Distribute 10-68 Total pages: 176
et al. 2014; Granier et al. 2019), EDGAR (Crippa et al. 2019), (Hoesly et al. 2018), (Johansson et al. 1 2017), ICCT (Olmer et al. 2017), the IMO GHG Studies; IMO 2nd (Buhaug et al. 2009), IMO 3rd 2 (Smith et al. 2014), IMO 4th-vessel and IMO 4th-voyage (Faber et al. 2020), and (Kramel et al. 2021). 3 4
5
6 Figure 10.14 CO2 emissions (Mt year-1) from shipping 2000 – 2018. Data from various inventories as 7
shown in the label. 8
9
10.6.2 Short lived climate forcers and shipping 10
Like aviation, shipping is also a source of emissions of the SLCFs described in Section 10.5, including 11
nitrogen oxides (NOx), sulphur oxides (SO2 and SO4), carbon monoxide (CO), black carbon (BC), and 12
non-methane volatile organic carbons (NMVOCs) (Naik et al. 2021). Though SLCF have a shorter 13
lifetime than the associated CO2 emissions, these short-lived forcers can have both a cooling effect (e.g., 14
SOx) or a warming effect (e.g., ozone from NOx). The cooling from the SLCF from a pulse emission 15
will decay rapidly and diminish after a couple of decades, whilst the warming from the long-lived 16
substances lasts for centuries (Naik et al. 2021). 17
Emissions of SLCF from shipping not only affects the climate, but also the environment, air quality, 18
and human health. Maritime transport has been shown to be a major contributor to coastal air quality 19
degradation (Viana et al. 2014; Zhao et al. 2013; Jalkanen et al. 2014; Goldsworthy and Goldsworthy 20
2015; Goldsworthy 2017). Sulphur emissions may contribute towards acidification of the ocean 21
(Hassellöv et al. 2013). Furthermore, increases in sulphur deposition on the oceans has also been shown 22
to increase the flux of CO2 from the oceans to the atmosphere (Hassellöv et al. 2013). To address the 23
risks of SOx emissions from shipping, there is now a cap on the on the amount of sulphur content 24
permissible in marine fuels (IMO 2013). There is also significant uncertainty about the impacts of 25
pollutants emitted from ships on the marine environment (Blasco et al. 2014). 26
Pollution control is implemented to varying degrees in the modelling of the SSP scenarios (Rao et al. 27
2017); for example, SSPs 1 and 5 assume that increasing concern for health and the environment result 28
in more stringent air pollution policies than today (Naik et al. 2021). There is a downward trend in SOx 29
and NOx emissions from shipping in all the SSPs, in compliance with regulations. The SLCF emission 30
reduction efforts, within the maritime sector, are also contributing towards achieving the UN SDGs. In 31
essence, while long lived GHGs are important for long term mitigation targets, accounting for short 32
ACCEPTED VERSION
SUBJECT TO FIN
AL EDITS
Final Government Distribution Chapter 10 IPCC AR6 WGIII
Do Not Cite, Quote or Distribute 10-69 Total pages: 176
lived climate forcers is important both for current and near-term forcing levels as well as broader air 1
pollution and SDG implications. 2
3
10.6.3 Shipping in the Arctic 4
Shipping in the Arctic is a topic of increasing interest. The reduction of Arctic summer sea ice increases 5
the access to the northern sea routes (Melia et al. 2016; Smith and Stephenson 2013; Aksenov et al. 6
2017; Fox-Kemper et al. 2021). Literature and public discourse on the increased access sometimes has 7
portrayed this trend as positive (Zhang et al. 2016b), as it allows for shorter shipping routes, e.g. 8
between Asia and Europe with estimated travel time savings of 25 – 40% (Aksenov et al. 2017). 9
However, the acceleration of Arctic cryosphere melt and reduced sea ice that enable Arcitc shipping 10
reduce surface albedo and amplify climate warming (Eyring et al. 2021). Furthermore, local air 11
pollutants can play different roles in the Arctic. For example, Black Carbon (BC) emissions reduce 12
albedo and absorb heat in air, on snow and ice (Messner 2020; Browse et al. 2013; Kang et al. 2020; 13
Eyring et al. 2021). Finally, changing routing from Suez to the north-eastern sea route may reduce total 14
emissions for a voyage, but also shift emissions from low to high latitudes. Changing the location of 15
the emissions adds complexity to the assessment of the climatic impacts of Arctic shipping, as the local 16
conditions are different and the SLCF may have a different impact on clouds, precipitation, albedo and 17
local environment (Marelle et al. 2016; Fuglestvedt et al. 2014; Dalsøren et al. 2013). Observations 18
have shown that 5-25% of air pollution in the Arctic stem from shipping activity within the Arctic itself 19
(Aliabadi et al. 2015). Emissions outside of the Arctic can affect Arctic climate, and changes within the 20
Arctic may have global climate impacts. Both modelling and observations have shown that aerosol 21
emissions from shipping can have a significant effect on air pollution, and shortwave radiative forcing 22
(Peters et al. 2012; Roiger et al. 2014; Marelle et al. 2016; Dalsøren et al. 2013; Ødemark et al. 2012; 23
Righi et al. 2015). 24
Increased Arctic shipping activity may also impose increased risks to local marine ecosystems and 25
coastal communities from invasive species, underwater noise, and pollution (Halliday et al. 2017; IPCC 26
2019). Greater levels of Arctic maritime transport and tourism have political, as well as socio-economic 27
implications for trade, and nations and economies reliant on the traditional shipping corridors. There 28
has been an increase in activity from cargo, tankers, supply, and fishing vessels in particular (Zhao et 29
al. 2015; Winther et al. 2014). Projections indicate more navigable Arctic waters in the coming decades 30
(Smith and Stephenson 2013; Melia et al. 2016) and continued increases in transport volumes through 31
the northern sea routes (Winther et al. 2014; Corbett et al. 2010; Lasserre and Pelletier 2011). Emission 32
patterns and quantities, however, are also likely to change with future regulations from IMO, and 33
depend on technology developments, and activity levels which may depend upon geopolitics, 34
commodity pricing, trade, natural resource extractions, insurance costs, taxes, and tourism demand 35
(Johnston et al. 2017). The need to include indigenous peoples’ voices when shaping policies and 36
governance of shipping activities in the high north is increasing (Dawson et al. 2020). 37
The Arctic climate and environment pose unique hazards and challenges with regards to safe and 38
efficient shipping operations: low temperature challenges, implications for vessel design, evacuation 39
and rescue systems, communications, oil spills, variable sea ice, and meteorological conditions 40
(Buixadé Farré et al. 2014). To understand the total implications of shipping in the Arctic, including its 41
climate impacts, a holistic view of synergies, trade-offs, and co-benefits is needed, with assessments of 42
impacts on not only the physical climate, but also the local environment and ecosystems. To furthermore 43
ensure safe operations in the Arctic waters, close monitoring of activities may be valuable. 44
45
ACCEPTED VERSION
SUBJECT TO FIN
AL EDITS
Final Government Distribution Chapter 10 IPCC AR6 WGIII
Do Not Cite, Quote or Distribute 10-70 Total pages: 176
10.6.4 Mitigation potential of fuels, operations and energy efficiency 1
A range of vessel mitigation options for the international fleet exist and are presented in this section. A 2
variety of feedstocks and energy carriers can be considered for shipping. As feedstocks, fuels from 3
biomass (advanced biofuels), fuels produced from renewable electricity and CO2 capture from flue gas 4
or the air (electro-, e-, or power-fuels), and fuels produced via thermochemical processes (solar fuels) 5
can be considered. As energy carriers, synthetic fuels and the direct use of electricity (stored in batteries) 6
are of relevance. The most prominent synthetic fuels discussed in literature are Hydrogen, Ammonia, 7
Methane, Methanol, and synthetic hydrocarbon diesel. Figure 10.15 shows the emissions reductions 8
potential for alternative energy carriers that have been identified as having the highest potential to 9
mitigate operational emissions from the sector (Psaraftis 2015; DNV GL 2017; Hansson et al. 2019; 10
Gilbert et al. 2018; Balcombe et al. 2019; Brynolf et al. 2014; Winebrake et al. 2019; Perčić et al. 2020; 11
Bongartz et al. 2018; Biernacki et al. 2018; Faber et al. 2020; Sharafian et al. 2019; Seddiek 2015; ITF 12
2018b; Seithe et al. 2020; Xing et al. 2020; Czermański et al. 2020; Hua et al. 2018; Bicer and Dincer 13
2018a; Kim et al. 2020; Liu et al. 2020a; Hansson et al. 2020; Singh et al. 2018; Valente et al. 2021; 14
Sadeghi et al. 2020; Nguyen et al. 2020; Stolz et al. 2021; Winkel et al. 2016; Chatzinikolaou and 15
Ventikos 2013; Lindstad et al. 2015; Tillig et al. 2015; Traut et al. 2014; Teeter and Cleary 2014). 16
Low-carbon Hydrogen and Ammonia are seen to have a positive potential as a decarbonised shipping 17
fuel. Hydrogen and Ammonia when produced from renewables or coupled to CCS, as opposed to mainly 18
by fossil fuels with high life-cycle emissions (Bhandari et al. 2014), may contribute to significant CO2-19
eq reductions of up to 70 - 80% compared to low-sulphur heavy fuel oil (Bicer and Dincer 2018b; 20
Gilbert et al. 2018). These fuels have their own unique transport and storage challenges as Ammonia 21
requires a pilot fuel due to difficulty in combustion, and Ammonia combustion could lead to elevated 22
levels of NOx, N2O, or NH3 emissions depending on engine technology used (DNV GL 2020). There is 23
a need for the further development of technology and procedures for safe storage and handling of fuels 24
such as Hydrogen and Ammonia both onboard and onshore for a faster rate of uptake of such shipping 25
fuels (Hoegh-Guldberg et al. 2019), but they remain an encouraging decarbonisation option for shipping 26
in the next decade. 27
While Methanol produced from fossil sources induces an emission increase of +7.5% (+44%), e-28
Methanol (via Hydrogen from electrolysis based on renewable energy and carbon from direct air 29
capture) reduces emission by 80% (82%). In general, several synthetic fuels, such as synthetic diesel, 30
methane, Methanol, ethanol, and dimethyl ether (DME) could in principle be used for shipping (Horvath 31
et al. 2018). The mitigation potential of these is though fully dependent on the sourcing of the Hydrogen 32
and carbon required for their synthesis. 33
As noted in Section 10.3, LNG has been found to have a relatively limited mitigation potential and may 34
not be viewed as a low-carbon alternative, but has a higher availability than other fuel options (Gilbert 35
et al. 2018). Emission reductions across the full fuel life cycle are found in the order of 10%, with ranges 36
reported from -30% (reduction) to +8% (increase), if switching from heavy fuel oil to LNG, as indicated 37
in Figure 10.15 (Bengtsson et al. 2011). Regardless of the production pathway, the literature points to 38
the risk of methane slip (emissions of unburnt methane especially at low engine loads and from transport 39
to ports) from LNG fuelled vessels, with no current regulation on emission caps (Ushakov et al. 2019; 40
Anderson et al. 2015; Peng et al. 2020). Leakage rates are a critical point for the total climate impact of 41
LNG as a fuel, where high pressure engines remedy this more than low pressure ones. As discussed in 42
10.3, some consider LNG as a transition fuel, whilst some literature point to the risk of stranded assets 43
due to the increasing decarbonisation regulation from IMO and the challenge of meeting IMO’s 2030 44
emissions reductions targets using this fuel. 45
In addition to fossil and e-fuels, advanced biofuels might play a role to provide the energy demand for 46
future shipping. Biomass is presently used to produce alcohol fuels (such as ethanol and Methanol), 47
liquid biogas, or biodiesel that can be used for shipping and could reduce CO2 emissions from this 48
ACCEPTED VERSION
SUBJECT TO FIN
AL EDITS
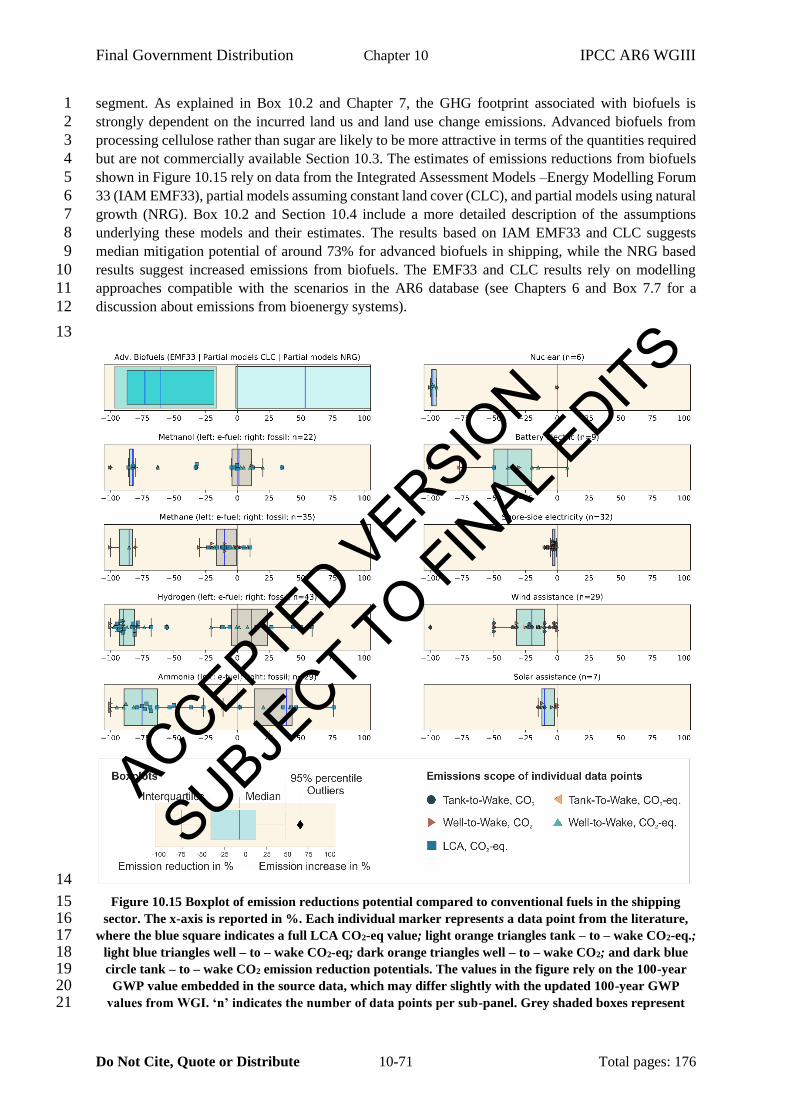
Final Government Distribution Chapter 10 IPCC AR6 WGIII
Do Not Cite, Quote or Distribute 10-71 Total pages: 176
segment. As explained in Box 10.2 and Chapter 7, the GHG footprint associated with biofuels is 1
strongly dependent on the incurred land us and land use change emissions. Advanced biofuels from 2
processing cellulose rather than sugar are likely to be more attractive in terms of the quantities required 3
but are not commercially available Section 10.3. The estimates of emissions reductions from biofuels 4
shown in Figure 10.15 rely on data from the Integrated Assessment Models –Energy Modelling Forum 5
33 (IAM EMF33), partial models assuming constant land cover (CLC), and partial models using natural 6
growth (NRG). Box 10.2 and Section 10.4 include a more detailed description of the assumptions 7
underlying these models and their estimates. The results based on IAM EMF33 and CLC suggests 8
median mitigation potential of around 73% for advanced biofuels in shipping, while the NRG based 9
results suggest increased emissions from biofuels. The EMF33 and CLC results rely on modelling 10
approaches compatible with the scenarios in the AR6 database (see Chapters 6 and Box 7.7 for a 11
discussion about emissions from bioenergy systems). 12
13
14
Figure 10.15 Boxplot of emission reductions potential compared to conventional fuels in the shipping 15 sector. The x-axis is reported in %. Each individual marker represents a data point from the literature, 16
where the blue square indicates a full LCA CO2-eq value; light orange triangles tank – to – wake CO2-eq.; 17 light blue triangles well – to – wake CO2-eq; dark orange triangles well – to – wake CO2; and dark blue 18 circle tank – to – wake CO2 emission reduction potentials. The values in the figure rely on the 100-year 19
GWP value embedded in the source data, which may differ slightly with the updated 100-year GWP 20 values from WGI. ‘n’ indicates the number of data points per sub-panel. Grey shaded boxes represent 21
ACCEPTED VERSION
SUBJECT TO FIN
AL EDITS
Final Government Distribution Chapter 10 IPCC AR6 WGIII
Do Not Cite, Quote or Distribute 10-72 Total pages: 176
data where the energy comes from fossil resources, and turquoise from low carbon renewable energy 1 sources. Advanced Biofuels EMF33 refers to emissions factors derived from simulation results from the 2 integrated assessment models EMF33 scenarios (darkest coloured box in top left panel). Biofuels partial 3
models CLC refers to partial models with constant land cover. Biofuels partial models NRG refers to 4 partial models with natural regrowth. For ammonia and Hydrogen, low-carbon electricity is produced 5
via electrolysis using low-carbon electricity, and ‘fossil’ refers to fuels produced via steam methane 6 reforming of natural gas. 7
8
In addition to the fuels, there are other measures that may aid the low-carbon transition shipping. The 9
amounts and speed of uptake of alternative low- or zero-carbon fuels in ports depend upon investments 10
in infrastructure – including bunkering infrastructure, refinery readiness, reliable supply of the fuels, as 11
well as sustainable production. The ship lifetime and age also play a role, whereupon retrofitting ships 12
to accommodate engines and fuel systems for new fuel types may not be an option for older vessels. As 13
such, operational efficiency becomes more important (Bullock et al. 2020). There is some potential to 14
continue to improve the energy efficiency of vessels through operational changes (e.g., Traut et al. 15
2018), reducing the speed or ‘slow steaming’ (Bullock et al. 2020), and improved efficiency in port 16
operations (Viktorelius and Lundh 2019; Poulsen and Sampson 2020). There is also a growing interest 17
in onboard technologies for capturing carbon, with prototype ships underway showing 65-90% potential 18
reduction in CO2 emissions (Japan Ship Technology Reserach Association et al. 2020; Luo and Wang 19
2017; Awoyomi et al. 2020). Challenges identified include CO2 capture efficiency (Zhou and Wang 20
2014), increased operating costs, and limited onboard power supply (Fang et al. 2019). Furthermore, 21
designing CO2 storage tanks for transport to shore may pose a challenge, as the volume and weight of 22
captured CO2 could be up to four times more than standard oil (Decarre et al. 2010). 23
Changes in design and engineering provide potential for reducing emissions from shipping through a 24
range of measures, e.g., by optimizing hull design and vessel shape, power and propulsion systems that 25
include wind or solar assisted propulsion, and through improved operations of vessels and ports. Figure 26
10.15 shows that such measures may decrease emissions by 5 - 40%, though with a broad range in 27
potential (Bouman et al. 2017). Nuclear propulsion could decrease emissions from individual vessels 28
by 98%. Battery- or hybrid-electric ships have been identified as a means to reduce emissions in short-29
sea shipping such as ferries and inland waterways (Gagatsi et al., 2016), which may also importantly 30
reduce near-shore SLCF pollution (Nguyen et al. 2020). Figure 10.15 shows that the median emission 31
from electric ships can be ~40% lower than equivalent fossil-based vessels but can vary widely. The 32
wide reduction potential of battery-electric propulsion is due to different assumptions about the CO2 33
intensity of the electricity used and the levels of CO2 footprints associated with battery production. 34
Although projections indicate continued increase in freight demand in the future, demand-side 35
reductions could contribute to mitigation. The development of autonomous systems may play a role 36
(Colling and Hekkenberg 2020; Liu et al. 2021) while 3-D printing can reduce all forms of freight as 37
parts and products can be printed instead of shipped (UNCTAD 2018). As more than 40% of transported 38
freight is fossil fuels, a lessened demand for such products in low emission scenarios should contribute 39
to reduce the overall maritime transport needs and hence emissions in the future (Sharmina et al. 2017). 40
An increase in alternative fuels on the other hand, may increase freight demand (Mander et al. 2012). 41
Potentials for demand-side reduction in shipping emissions may arise from improving processes around 42
logistics and packaging, and further taxes and charges could serve as leverage for reducing demand and 43
emissions. 44
The coming decade is projected to be costly for the shipping sector, as it is preparing to meet the 2030 45
and 2050 emission reduction targets set by the IMO (UNCTAD 2018). With enough investments, 46
incentives, and regulation, substantial reductions of CO2 emissions from shipping could be achieved 47
through alternative energy carriers. The literature suggests that their cost could be manyfold higher than 48
ACCEPTED VERSION
SUBJECT TO FIN
AL EDITS
Final Government Distribution Chapter 10 IPCC AR6 WGIII
Do Not Cite, Quote or Distribute 10-73 Total pages: 176
for conventional fuels, which in itself could reduce demand for shipping, and hence its emissions, but 1
make the transition difficult. Hence R&D may help reduce these costs. The literature points to the need 2
for developing technology roadmaps for enabling the maritime transport sector to get on to pathways 3
for decarbonisation early enough to reach global goals (Kuramochi et al. 2018). Accounting for the full 4
life cycle of emissions of the vessels and the fuels is required to meet the overall long-term objectives 5
of cutting GHG and SLCF emissions. The urgency of implementing measures for reducing emissions 6
is considered to be high, considering the lifetime of vessels is typically 20 years, if not more. 7
8
10.6.5 Accountability and governance options 9
Regulatory frameworks for the shipping sector have been developed over time and will continue to do 10
so through bodies such as the IMO, which was established by the UN to manage international shipping. 11
The IMO strategy involves a 50% reduction in GHG emissions from international shipping by 2050 12
compared to 2008 (IMO 2018). The strategy includes a reduction in carbon intensity of international 13
shipping by at least 40% by 2030, and 70% by 2050, compared to 2008. IMO furthermore aims for the 14
sectoral phase out of GHG emissions as soon as possible this century. 15
In 2020, the IMO approved the short-term goal-based measure to reduce the carbon intensity of existing 16
international vessels. This measure addresses both technical and operational strategies. The operational 17
element is represented by a Carbon Intensity Indicator (CII), and the technical element is represented 18
by the Energy Efficiency Existing Ship Index (EEXI), which will apply to ships from 2023. The EEXI 19
builds upon the Energy Efficiency Design Index (EEDI), which is a legally binding mitigation 20
regulation for newbuild ships, established as a series of baselines for the amount of fuel ships may burn 21
for a particular cargo-carrying capacity. The EEDI differs per ship segment. E.g., ships built in 2022 22
and beyond should be 50% more energy efficient than in 2013. This legislation aims to reduce GHG 23
emissions in particular. Energy efficiency may be improved by several of the mitigation options 24
outlined above. The ship energy efficiency management plan (SEEMP) is seen as the international 25
governance instrument to improve energy efficiency and hence emissions from ships. SEEMP is a 26
measure to enable changes to operational measures and retrofits (see Johnson et al., 2013). The 27
combination of EEXI, EEDI, and SEEMP may reduce emissions by 23% by 2030 compared to a ‘no 28
policy’ scenario (Sims et al. 2014). With regards to accountability, it is mandatory for ships of ≥5,000 29
gross tonnage to collect fuel consumption data, as well as specified data for e.g. transport work. 30
Similarly, the EU MRV (Monitoring, Reporting, Verification) requires mandatory reporting of a 31
vessel’s fuel consumption when operating in European waters. 32
Policy choices may enable or hinder changes, and gaps in governance structures may, to some degree, 33
hinder the objectives of mechanisms like SEEMP to improve energy efficiency and emissions. Policies 34
may be developed to incentivize investments in necessary changes to the global fleet and related 35
infrastructures. The literature argues that regulations and incentives that motivates mitigation through 36
speed optimisation, ship efficiency improvements, and retrofits with lower-carbon technologies at a 37
sub-global scale may contribute to immediate reductions in CO2 emissions from the sector (Bows-38
Larkin 2015). The role of the financial sector through initiatives such as the Poseidon Principle, 39
whereupon financial institutions limit lending to companies that fail to uphold environmental standards, 40
could also become increasingly important (Sumaila et al. 2021). 41
It has been proposed to make shipping corporations accountable for their emissions by making it 42
mandatory to disclose their vessel’s emissions reductions (Rahim et al. 2016). Market based 43
mechanisms may increasingly encourage ship operators to comply with IMO GHG regulations. 44
Development of policies such as carbon pricing / taxing to enable a business case for adopting low 45
carbon fuels could be a near term priority for acceleration of transformation of the sector (Hoegh-46
Guldberg et al. 2019). The EU is considering including shipping in its carbon trading system, with the 47
ACCEPTED VERSION
SUBJECT TO FIN
AL EDITS
Final Government Distribution Chapter 10 IPCC AR6 WGIII
Do Not Cite, Quote or Distribute 10-74 Total pages: 176
details still to be agreed upon but expected to come into force in 2023, along with the CII. The 1
proposition is that shipowners who conduct voyages within Europe, or start or end at an EU port, will 2
have to pay for carbon permits to cover the CO2 emitted by their vessel. 3
Regulations exist also to limit emissions of air pollution from shipping with the aim to improve 4
environment and health impacts from shipping in ports and coastal communities. In sulphur emission 5
control areas (SECAS), the maximum permissible sulphur content in marine fuels is 0.10% m/m 6
(mass/mass). These are further tightened by the IMO legislation on reducing marine fuel sulphur content 7
to a maximum of 0.5% in 2020 outside of SECAS, compared to 3.5% permissible since 2012 (MARPOL 8
Convention). The MARPOL Annex VI also limits the emissions of ozone depleting substances and 9
ozone precursors; NOx, and VOCs from tankers (Mertens et al. 2018). The implementation of the 10
emission control areas have been shown to reduce the impacts on health and the environment (Viana et 11
al. 2015). 12
While there are many governance and regulatory initiatives that help reduce emissions from the 13
shipping sector, few are transformative on their own, unless zero carbon fuels can become available at 14
a reasonable cost as suggested in 10.3 and in scenarios outlined next. 15
16
10.6.6 Transformation trajectories for the maritime sector 17
Figure 10.16 shows CO2 emissions from shipping in scenarios from the AR6 database and the 4th GHG 18
study by the IMO (Faber et al., 2020). Panel (a) shows that CO2 emissions from shipping go down by 19
33-70% (5-95% percentile) by 2050 in the scenarios limiting warming to 1.5°C (C1-C2). By 2080, 20
median values for the same set of scenarios reach net zero CO2 emissions. IAMs often do not report 21
emission pathways for shipping transport and the sector is underrepresented in most IAMs (Esmeijer et 22
al. 2020). Hence pathways established outside of IAMs can be different for the sector. Indeed, the IMO 23
projections for growth in transport demand (Faber et al. 2020) indicate increases by 40 - 100 % by 2050 24
for the global fleet. Faber and et al. (2020), at the same time predict, reductions in trade for fossil fuels 25
dependent on decarbonisation trajectories. The energy efficiency improvements of the vessels in these 26
scenarios are typically of 20 - 30%. This offsets some of the increases from higher demand in the future 27
scenarios. Fuels assessed by the 4th IMO GHG study were limited to HFO, MGO, LNG, and Methanol, 28
with a fuels mix ranging from 91 - 98% conventional fuel use and a small remainder of alternative fuels 29
(primarily LNG, and some Methanol). Panel (b) in Figure 10.16 shows average fleetwide emissions of 30
CO2 emissions based on these aggregate growth and emission trajectories from the IMO scenarios. In 31
these scenarios, CO2 emissions from shipping remain stable or grow compared to 2020 modelled levels. 32
These results contrast with the low emission trajectories in the C1-C2 bin in panel (a) of Figure 10.16. 33
It seems evident that the scenarios in the AR6 database explore a broader solutions space for the sector, 34
than the 4th GHG study by IMO. However, the 1.5°C - 2°C warming goal has led to an IMO 2050 target 35
of 40% reductions in carbon intensity by 2030, which would require emission reduction efforts to begin 36
immediately. Results from global models, suggest the solutions space for deep emission reductions in 37
shipping is available. 38
39
40
ACCEPTED VERSION
SUBJECT TO FIN
AL EDITS
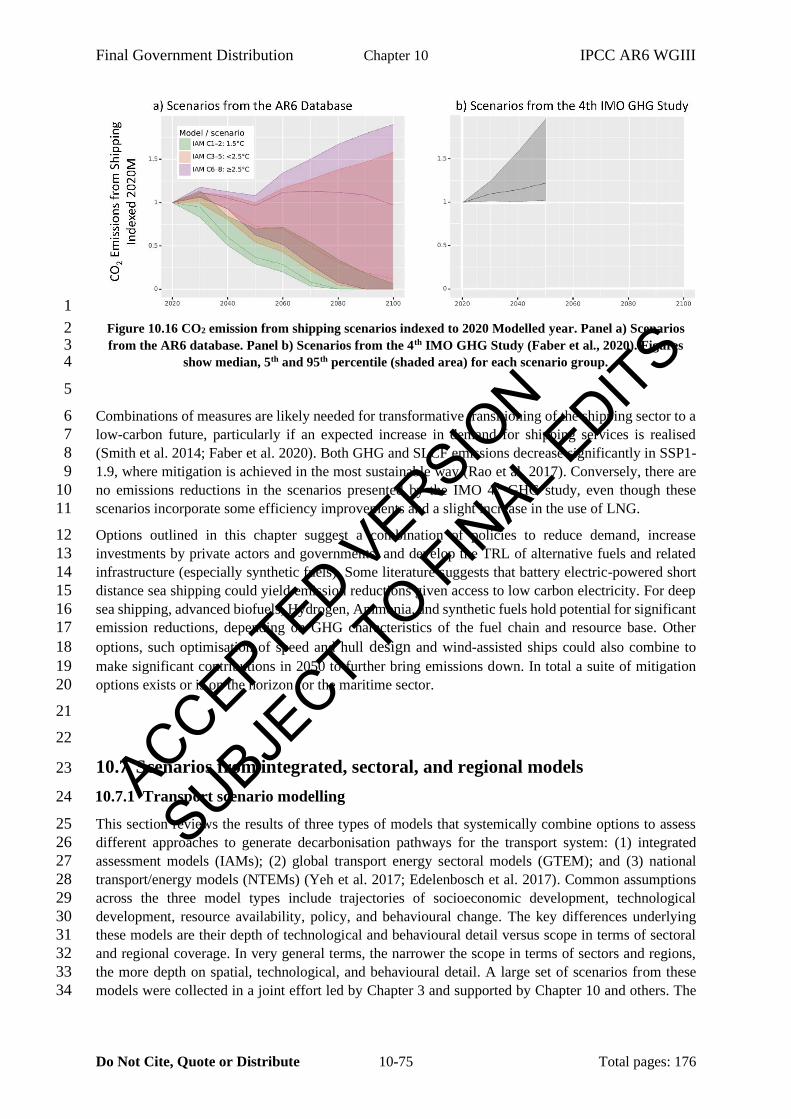
Final Government Distribution Chapter 10 IPCC AR6 WGIII
Do Not Cite, Quote or Distribute 10-75 Total pages: 176
1
Figure 10.16 CO2 emission from shipping scenarios indexed to 2020 Modelled year. Panel a) Scenarios 2 from the AR6 database. Panel b) Scenarios from the 4th IMO GHG Study (Faber et al., 2020). Figures 3
show median, 5th and 95th percentile (shaded area) for each scenario group. 4
5
Combinations of measures are likely needed for transformative transitioning of the shipping sector to a 6
low-carbon future, particularly if an expected increase in demand for shipping services is realised 7
(Smith et al. 2014; Faber et al. 2020). Both GHG and SLCF emissions decrease significantly in SSP1-8
1.9, where mitigation is achieved in the most sustainable way (Rao et al. 2017). Conversely, there are 9
no emissions reductions in the scenarios presented by the IMO 4th GHG study, even though these 10
scenarios incorporate some efficiency improvements and a slight increase in the use of LNG. 11
Options outlined in this chapter suggest a combination of policies to reduce demand, increase 12
investments by private actors and governments, and develop the TRL of alternative fuels and related 13
infrastructure (especially synthetic fuels). Some literature suggests that battery electric-powered short 14
distance sea shipping could yield emission reductions given access to low carbon electricity. For deep 15
sea shipping, advanced biofuels, Hydrogen, Ammonia, and synthetic fuels hold potential for significant 16
emission reductions, depending on GHG characteristics of the fuel chain and resource base. Other 17
options, such optimisation of speed and hull design and wind-assisted ships could also combine to 18
make significant contributions in 2050 to further bring emissions down. In total a suite of mitigation 19
options exists or is on the horizon for the maritime sector. 20
21
22
10.7 Scenarios from integrated, sectoral, and regional models 23
10.7.1 Transport scenario modelling 24
This section reviews the results of three types of models that systemically combine options to assess 25
different approaches to generate decarbonisation pathways for the transport system: (1) integrated 26
assessment models (IAMs); (2) global transport energy sectoral models (GTEM); and (3) national 27
transport/energy models (NTEMs) (Yeh et al. 2017; Edelenbosch et al. 2017). Common assumptions 28
across the three model types include trajectories of socioeconomic development, technological 29
development, resource availability, policy, and behavioural change. The key differences underlying 30
these models are their depth of technological and behavioural detail versus scope in terms of sectoral 31
and regional coverage. In very general terms, the narrower the scope in terms of sectors and regions, 32
the more depth on spatial, technological, and behavioural detail. A large set of scenarios from these 33
models were collected in a joint effort led by Chapter 3 and supported by Chapter 10 and others. The 34
ACCEPTED VERSION
SUBJECT TO FIN
AL EDITS
Final Government Distribution Chapter 10 IPCC AR6 WGIII
Do Not Cite, Quote or Distribute 10-76 Total pages: 176
outcomes from over 100 models have been analysed for this chapter with the methodologies set out in 1
Annex III for the whole report. 2
GHG emissions from transport are a function of travel demand, travel mode, transport technology, GHG 3
intensity of fuels, and energy efficiency. These drivers can be organized around a group of levers that 4
can advance the decarbonisation of the transport system. The levers thus include reducing travel 5
activity, increasing use of lower-carbon modes, and reducing modal energy intensity and fuel carbon 6
content. This section explores each lever's contributions to the decarbonisation of the transport sector 7
by reviewing the results from the three model types IAM and G-/NTEMs. 8
IAMs integrate factors from other sectors that interact with the transport system endogenously, such as 9
fuel availability and costs. IAMs minimize mitigation costs to achieve a temperature goal across all 10
sectors of the economy over a long-time horizon (typically to 2100). IAMs typically capture mitigation 11
options for energy and carbon intensity changes with greater technology/fuel details and endogeneity 12
linked to the other sectors. In the scenarios with very large-scale electrification of the transport sector, 13
the coupling with the other sectors in fuel production, storage, and utilization becomes more important. 14
G-/NTEMs and related regional transport sectoral models have more details in transport demand, 15
technology, behaviours, and policies than IAMs, but treat the interactions with the other sectors 16
exogenously, potentially missing some critical interactions, such as the fuel prices and carbon intensity 17
of electricity. National models have detailed representation of national policies related to transport and 18
energy, sometimes with greater spatial resolution. Compared with IAMs, G-/NTEMs typically have 19
greater detailed representation to explore mitigation options along the activity and mode dimensions 20
where spatial, cultural, and behavioural details can be more explicitly represented. The appendix in 21
Annex III provides more details about these types of models. Scenarios for shipping and aviation are 22
handled in more detail in sections 10.5 and 10.6, respectively. 23
This section applies the following categorization of scenarios (see table 3.1 in Chapter 3 for more 24
details): C1 (1.5°C with no or limited Overshoot (OS)), C2 (1.5°C with high OS), C3 (>67% below 25
2°C), C4 (>50% below 2°C), C5 (below 2.5°C), C6 (below 3°C), C7 (above 3°C). A large share of the 26
scenarios was developed prior to 2020. Results from such the scenario are indexed to a modelled (non-27
covid) year 2020, referred to as 2020Mod. 28
29
10.7.2 Global emission trajectories 30
In 2018, transport emitted 8.5 Gt CO2eq, reaching a near doubling from 1990 levels after two decades 31
of 2% per year emissions growth (see Section 10.1). Assessing future trajectories, Figure 10.17 provides 32
an overview of direct CO2 emissions estimates from the transport sector across IAMs (colour bars) and 33
selected global transport models (grey bars). The results from the IAMs are grouped in bins by different 34
temperature goal. Global energy transport models (GTEMs) are grouped into reference and policy bins, 35
since the transport sector cannot by itself achieve fixed global temperature goals. The policy scenarios 36
in G-/NTEMs cover a wide range of "non-reference" scenarios, which include, for example, 37
assumptions based on the "fair share action" principles. In these scenarios, transport emissions reach 38
emissions reductions consistent with the overall emission trajectories aligning with warming levels of 39
2°C. These scenarios may also consider strengthening existing transport policies such as increasing fuel 40
economy standards or large-scale deployments of electric vehicles. In most cases, these Policy scenarios 41
are not necessarily in line with the temperature goals explored by the IAMs. 42
43
44
ACCEPTED VERSION
SUBJECT TO FIN
AL EDITS
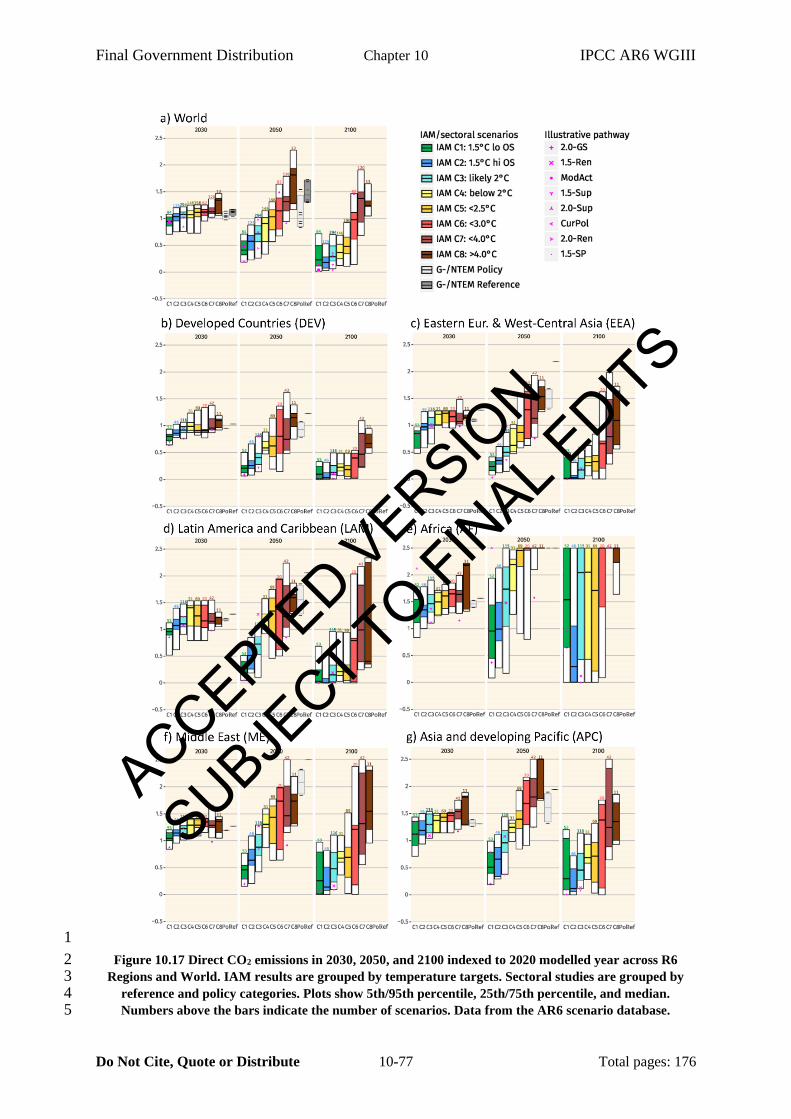
Final Government Distribution Chapter 10 IPCC AR6 WGIII
Do Not Cite, Quote or Distribute 10-77 Total pages: 176
1
Figure 10.17 Direct CO2 emissions in 2030, 2050, and 2100 indexed to 2020 modelled year across R6 2 Regions and World. IAM results are grouped by temperature targets. Sectoral studies are grouped by 3
reference and policy categories. Plots show 5th/95th percentile, 25th/75th percentile, and median. 4 Numbers above the bars indicate the number of scenarios. Data from the AR6 scenario database. 5
ACCEPTED VERSION
SUBJECT TO FIN
AL EDITS
Final Government Distribution Chapter 10 IPCC AR6 WGIII
Do Not Cite, Quote or Distribute 10-78 Total pages: 176
1
According to the collection of simulations from the IAM and GTEM models shown in Figure 10.17, 2
global transport emissions could grow up to 2–47% (5–95th percentile) by 2030 and -6–130% by 2050 3
under the scenarios without firm commitments to meet a long-term temperature goal (i.e., C7-8 4
scenarios with temperature change above 3.0°C by 2100). Population and GDP growth and the 5
secondary effects, including higher travel service demand per capita and increased freight activities per 6
GDP, drive the growth in emissions in these scenarios (see Section 10.7.3). Though transport 7
efficiencies (energy use per pkm travelled and per ton-km of delivery) are expected to continue to 8
improve in line with the historical trends (see Section 10.7.4), total transport emissions would grow due 9
to roughly constant carbon intensity (Section 10.7.5) under the C7-8 (>3.0°C) scenarios. Significant 10
increases in emissions (> 150% for the medium values by 2050) would come from Asia and developing 11
Pacific (APC), the Middle East and (ME), and Africa (AF), whereas Developed Countries (DEV) would 12
have lower transport emissions (medium value -25% for C7 and 15% for C8) than the estimated 2020 13
level in 2050. 14
To meet temperature goals, global transport emissions would need to decrease by 17% (67–+23% for 15
the 5–95th percentile) below 2020Mod levels in the C3-5 scenario group (1.5 - 2.5°C, orange bars), and 16
47% (14–80% for the 5–95th percentile) in the C1-2 scenario group (below 1.5°C, green bars) by 2050. 17
However, transport-related emission reductions may not happen uniformly across regions. For example, 18
transport emissions from the Developed Countries (DEV), and Eastern Europe and West-Central Asia 19
(EEA) would decrease from 2020 levels by 2050 across all C1-2 scenarios, but could increase in Africa 20
(AF), Asia and developing Pacific (APC), Latin America and Caribbean (LAM) and the Middle East 21
(ME), in some of these scenarios. In particular, the median transport emissions in India and Africa could 22
increase by 2050 in C1-2 scenarios, while the 95th percentile emissions in Asia and developing Pacific 23
(APC), Latin America and Caribbean (LAM), and the Middle East (ME), could be higher in 2050 than 24
in 2020. 25
The Reference scenario emission pathways from GTEMs described in Figure 10.17 have similar ranges 26
as C7-8 scenario groups in 2050. The Policy scenarios are roughly in line with C6-7 scenarios for the 27
world region. The results suggest that the majority of the Policy scenarios examined by the GTEMS 28
reviewed here are in the range of the 2-3°C temperature goal scenarios examined by the IAMs (Gota et 29
al. 2016; Yeh et al. 2017; IEA 2017b; Fisch-Romito and Guivarch 2019). The NDCs in the transport 30
sector include a mix of measures targeting efficiency improvements of vehicles and trucks; improving 31
public transit services; decarbonising fuels with alternative fuels and technologies including biofuels, 32
fossil- or bio-based natural gas, and electrification; intelligent transport systems; and vehicle restrictions 33
(Gota et al. 2016). Because of the long lag-time for technology turnover, these measures are not 34
expected to change 2030 emissions significantly. However, they could have greater impacts on 2050 35
emissions. 36
Several GTEMs not included in AR6 scenario database have examined ambitious CO2 mitigation 37
scenarios. For example, a meta-analysis of scenarios suggests that global transport emissions consistent 38
with warming levels of 2°C, would peak in 2020 at around 7-8 GtCO2 and decrease to 2.5-9.2 Gt for 39
2°C with an average of 5.4 Gt by 2050 (Gota et al. 2019). For comparison, the IEA’s Sustainable 40
Development Scenario (SDS) suggests global transport emissions decrease to 3.3 Gt (or 55% reduction 41
from 2020 level) by 2050 (IEA 2021f). In the latest IEA Net Zero by 2050 report proposes transport 42
emissions to be close to zero by 2050 (IEA 2021e). The latter is lower than the interquartile ranges of 43
the C1 group of scenarios from the AR6 database analysed here. 44
Low carbon scenarios are also available from national models (Latin America, Brazil, Canada, China, 45
France, Germany, Indonesia, India, Italy, Japan, Mexico, South Africa, UK, US) with a good 46
representation of the transport sector. The low carbon scenarios are either defined with respect to a 47
global climate stabilization level of e.g., 2°C /1.5°C Scenario (Dhar et al. 2018), or a CO2 target that is 48
ACCEPTED VERSION
SUBJECT TO FIN
AL EDITS
Final Government Distribution Chapter 10 IPCC AR6 WGIII
Do Not Cite, Quote or Distribute 10-79 Total pages: 176
more stringent than what has been considered in the NDCs, such as the net zero emissions pathways 1
(Bataille et al. 2020; IEA 2021e). These studies have generally used bottom-up models (see Annex III) 2
for the analysis, but in some cases, they are run by national teams using global models (e.g., GCAM for 3
China and India). National studies show that transport CO2 emissions could decline significantly in low-4
carbon scenarios in all the developed countries reviewed (Bataille et al. 2015; Kainuma et al. 205AD; 5
Virdis et al. 2015; Pye et al. 2015; Criqui et al. 2015; Kemfert et al.; Williams et al. 2015; Zhang et al. 6
2016a) in 2050 from the emissions in 2010 and reductions vary from 65% to 95%. However, in 7
developing countries reviewed (Altieri et al. 2015; Buira and Tovilla 2015; Teng et al. 2015; Rovere et 8
al. 2015; Siagian et al. 2015; Shukla et al. 2015; Di Sbroiavacca et al. 2014; Dhar et al. 2018), emissions 9
could increase in 2050 in the range of 35% - 83% relative to 2010 levels. Transport CO2 emissions per 10
capita in the developing countries were much lower in 2010 (vary from 0.15 to 1.39 tCO2 per capita) 11
relative to developed countries (vary from 1.76 to 5.95 tCO2 per capita). However, results from national 12
modelling efforts suggest that, by 2050, the CO2 emissions per capita in developed countries (vary from 13
0.19 to 1.04 tCO2 per capita) could be much lower than in developing countries (vary from 0.21 to 1.7 14
tCO2 per capita). 15
The transport scenario literature's mean outcomes suggest that the transport sector may take a less steep 16
emission reduction trajectory than the cross-sectoral average and still be consistent with the 2°C goal. 17
For example, most of the 1.5°C pathway scenarios (C1-2) reach zero-emission by 2060, whereas 18
transport sector emissions are estimated in the range of 20% of the 2020Mod level (4-65% for the 10th 19
– 90th percentiles) by 2100. This finding is in line with perspectives in the literature suggesting that 20
transport is one of the most difficult sectors to decarbonise (Davis et al. 2018). There is, however, 21
quite a spread in the results for 2050. Since temperature warming levels relate to global emissions from 22
all sectors, modelling results from IAMs tend to suggest that in the short and medium-term, there might 23
be lower cost mitigation options outside the transport sector. On the other hand, compared with G-24
/NTEMs, some IAMs may have limited mitigation options available including technology, behavioural 25
changes, and policy tools especially for aviation and shipping. The models therefore rely on other 26
sectors and/or negative emissions elsewhere to achieve the overall desired warming levels. This 27
potential shortcoming should be kept in mind when interpreting the sectoral results from IAMs. 28
29
10.7.3 Transport activity trajectories 30
Growth in passenger and freight travel demand is strongly dependent on population growth and GDP. 31
In 2015, transport activities were estimated at around 35-50 trillion pkm or 5,000-7,000 pkm per person 32
per year, with significant variations among studies (IEA 2017b; ITF 2019). The number of passenger 33
cars in use has grown 45% globally between 2005-2015, with the most significant growth occurring in 34
the developing countries of Asia and the Middle East (119%), Africa (79%) and, South and Central 35
America (80%), while the growth in Europe and North America is the slowest (21% and 4% 36
respectively) (IOMVM 2021). On the other hand, car ownership levels in terms of vehicles per 1,000 37
people in 2015 were low in developing countries of Asia and the Middle East (141), Africa (42), South 38
and Central America (176), while in Europe and North America they are relatively high (581 and 670 39
respectively) (IOMVM 2021). The growth rate in commercial vehicles (freight and passenger) was 41% 40
between 2005 and 2015, with a somewhat more even growth across developed and developing countries 41
(IOMVM 2021). 42
Figure 10.18 shows activity trajectories for both freight and passenger transport based on the AR6 43
database for IAMs. According to demand projections from the IAMs, global passenger and freight 44
transport demand could increase relative to a modelled year 2020 across temperature goals. The median 45
transport demand from IAMs for all the scenarios in line with warming levels below 2.5°C (C1-C5) 46
suggests the global passenger transport demand could grow by 1.14-1.3 times in 2030 and by 1.5-1.8 47
times in 2050 (1.27-2.33 for the 5th – 95th percentile across C1-C5 scenarios) relative to modelled 2020 48
ACCEPTED VERSION
SUBJECT TO FIN
AL EDITS
Final Government Distribution Chapter 10 IPCC AR6 WGIII
Do Not Cite, Quote or Distribute 10-80 Total pages: 176
level. Developed regions including North America and Europe exhibit lower growth in passenger 1
demand in 2050 compared to developing countries across all the scenarios. In 2030, most of the global 2
passenger demand growth happens in Africa (AF) (44%% growth relative to 2020), and Asia and 3
developing Pacific (APC) (57%% growth in China and 59% growth in India relative to 2020) in the 4
below 2.5 scenario (C5). These regions start from a low level of per capita demand. For example, in 5
India, demand may grow by 84%. However, the per capita demand in 2010 was under 7,000 km per 6
person per year (Dhar and Shukla 2015). Similarly, in China, demand may grow by 52%, starting from 7
per capita demand of 8,000 km per person per year in 2010 (Pan et al. 2018). The per capita passenger 8
demand in these regions was lower than in developed countries in 2010, but it converges towards the 9
per capita passenger transport demand of advanced economies in less stringent climate scenarios (C6-10
7). Demand for passenger travel would grow at a slower rate in the stricter temperature stabilization 11
scenarios (< 2.5 and 1.5 scenarios, C1-C5) compared to the scenarios with higher warming levels (C7-12
C8). The median global passenger demand in the scenarios with warming levels below 1.5oC scenarios 13
(C1-C2) are 27% lower in 2050 relative to C8. 14
Due to limited data availability, globally consistent freight data is difficult to obtain. In 2015, global 15
freight demand was estimated to be 108 trillion tkm, most of which was transported by sea (ITF 16
2019). The growth rates of freight service demand vary dramatically among different regions: over the 17
1975–2015 period, road freight activity in India increased more than 9-fold, 30-fold in China, and 2.5-18
fold in the US (Mulholland et al. 2018). Global freight demand continues to grow but at a slower rate 19
compared to passenger demand across all the scenarios in 2050 compared to modelled 2020 values. 20
Global median freight demand could increase by 1.17 -1.28 times in 2030 and 1.18-1.7 times in 2050 21
in all the scenarios with warming level below 2.5°C (C1-C5). Like passenger transport, the models 22
suggest that a large share of growth occurs in Africa (AF) and Asian regions (59% growth in India and 23
50% growth in China in 2030 relative to a modelled year 2020) in C5 scenario. Global median freight 24
demand grows slower in the stringent temperature stabilization scenarios, and is 40% and 22% lower 25
in 2050 in the below 1.5°C scenarios (C1-C2) and below 2.5°C scenarios (C3-C4), respectively, 26
compared to scenarios with warming levels of above 4°C (C8). 27
28
29
ACCEPTED VERSION
SUBJECT TO FIN
AL EDITS
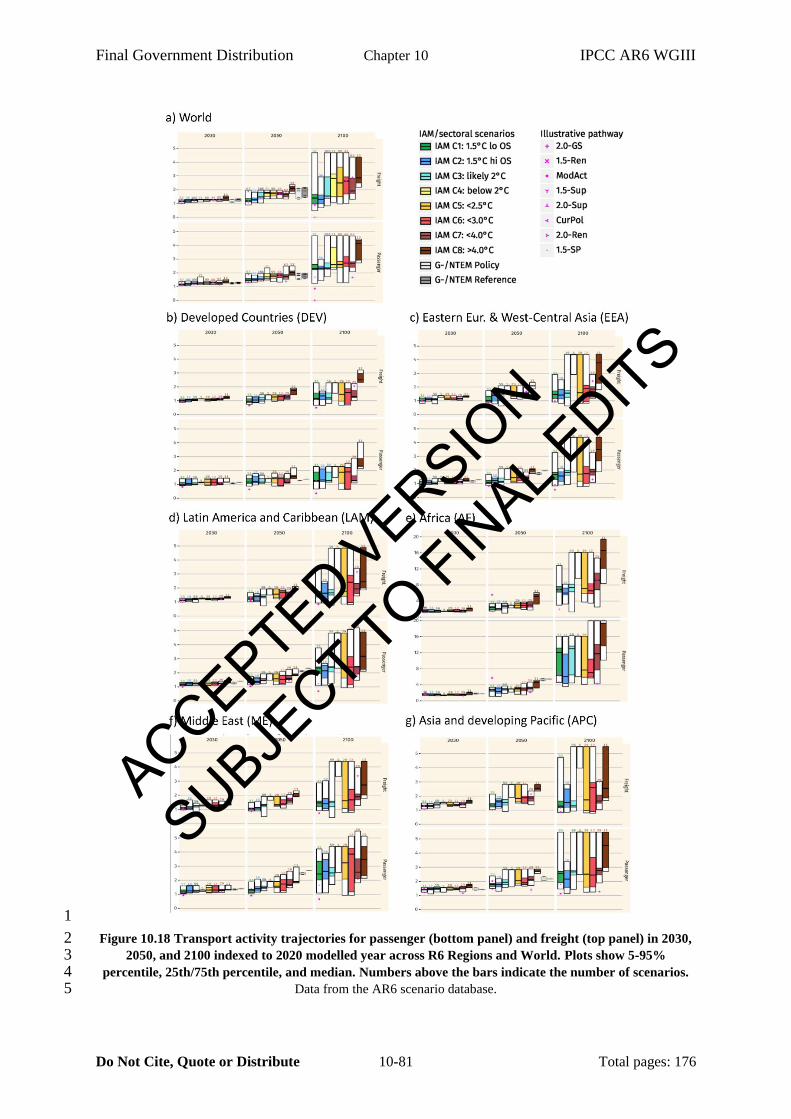
Final Government Distribution Chapter 10 IPCC AR6 WGIII
Do Not Cite, Quote or Distribute 10-81 Total pages: 176
1
Figure 10.18 Transport activity trajectories for passenger (bottom panel) and freight (top panel) in 2030, 2 2050, and 2100 indexed to 2020 modelled year across R6 Regions and World. Plots show 5-95% 3
percentile, 25th/75th percentile, and median. Numbers above the bars indicate the number of scenarios. 4 Data from the AR6 scenario database. 5
ACCEPTED VERSION
SUBJECT TO FIN
AL EDITS
Final Government Distribution Chapter 10 IPCC AR6 WGIII
Do Not Cite, Quote or Distribute 10-82 Total pages: 176
1
GTEMs show broad ranges for future travel demand, particularly for the freight sector. These results 2
show more dependency on models than on baseline or policy scenarios. According to ITF Transport 3
Outlook (ITF 2019) , global passenger transport and freight demand could more than double by 2050 4
in a business-as-usual (BAU) scenario. Mulholland et al. (2018) suggest the freight sector could grow 5
by 2.4-fold over 2015–2050 in the reference scenario, with the majority of growth attributable to 6
developing countries. The IEA suggests a more modest increase in passenger transport, from 51 trillion 7
pkm in 2014 to 110 trillion pkm in 2060, in a reference scenario without climate policies and a climate 8
scenario that would limit emissions below 2oC. The demand for land-based freight transport in 2060 is, 9
however, slightly lower in the climate scenario (116 trillion tkm) compared to the reference scenario 10
(130 trillion tkm) (IEA 2017b)The ITF, however, suggests that ambitious decarbonisation policies could 11
reduce global demand for passenger transport by 13-20% in 2050, compared to the business-as-usual 12
scenario (ITF 2019, 2021). The reduction in vehicle travel through shared mobility could reduce 13
emissions from urban passenger transport by 30% compared to the BAU scenario. Others suggest 14
reductions larger than 25%, on average, for both passenger and freight in 2030 and 2050 may be needed 15
to achieve very low carbon emission pathways (Fisch-Romito and Guivarch 2019). In absence of large-16
scale carbon dioxide removal, few global studies highlight the need for significant demand reduction in 17
critical sectors (aviation, shipping and road freight) in well below 2oC scenarios (van Vuuren et al. 18
2018; Grant et al. 2021; Sharmina et al. 2021). 19
Many models find small differences in passenger transport demand across temperature goals because 20
IAM models rely on historical relationships between population, GDP, and demand for services to 21
estimate future demand. This assumption poses a limitation to the modelling efforts, as mitigation 22
efforts would likely increase travel costs that could result in lower transport demand (Zhang et al. 2018). 23
In most models, demand is typically an exogenous input. These models often assume mode shifts of 24
activities from the most carbon-intensive modes (driving and flying for passenger travel and trucking 25
for freight) to less carbon-intensive modes (public transit and passenger rails, and freight rail) to reduce 26
emissions. 27
Traditionally there is a disconnection between IAM models and bottom-up sectoral or city-based 28
models due to the different scale (both spatial and temporal) and focus (climate mitigation vs. urban 29
pollutions, safety (Creutzig 2016)). The proliferation of shared and on-demand mobility solutions are 30
leading to rebound effects for travel demand (Chen and Kockelman 2016; Coulombel et al. 2019) and 31
this is a new challenge for modelling. Some IAM studies have recently begun to explore demand-side 32
solutions for reducing transport demand to achieve very low-carbon scenarios through a combination 33
of culture and low-carbon lifestyle (Creutzig et al. 2018; van Vuuren et al. 2018); urban development 34
(Creutzig et al. 2015a); increased vehicle occupancy (Grubler et al. 2018); improved logistics and 35
streamline supply chains for the freight sector (Mulholland et al. 2018); and disruptive low-carbon 36
innovation, described as technological and business model innovations offering "novel value 37
propositions to consumers and which can reduce GHG emissions if adopted at scale" (Wilson et al. 38
2019). In the literature from national models, demand has been differentiated between conventional and 39
sustainable development scenarios through narratives built around policies, projects, and programs 40
envisaged at the national level (Shukla et al. 2015; Dhar and Shukla 2015) and price elasticities of travel 41
demand (Dhar et al. 2018). However, a greater understanding of the mechanisms underlying energy-42
relevant decisions and behaviours (Brosch et al. 2016), and the motivations for sustainable behaviour 43
(Steg et al. 2015) are critically needed to realize these solutions in reality. 44
Overall, passenger and freight activity are likely to continue to grow rapidly under the C7 (>3.0°C) 45
scenarios, but most growth would occur in developing countries. Most models treat travel demand 46
exogenously following the growth of population and GDP, but they have limited representation of 47
responses to price changes, policy incentives, behavioural shifts, nor innovative mobility solutions that 48
ACCEPTED VERSION
SUBJECT TO FIN
AL EDITS
Final Government Distribution Chapter 10 IPCC AR6 WGIII
Do Not Cite, Quote or Distribute 10-83 Total pages: 176
can be expected to occur in more stringent mitigation scenarios Chapter 5 provides a more detailed 1
discussion of the opportunities for demand changes that may results from social and behavioural 2
interventions. 3
4
10.7.4 Transport modes trajectories 5
Globally over the last century, shares of faster transport modes have generally increased with increasing 6
passenger travel demand (Schafer and Victor 2000; Schäfer 2017). For short- to medium-distance 7
travel, private cars have displaced public transit, particularly in OECD countries, due to a variety of 8
factors, including faster travel times in many circumstances (Liao et al. 2020); increasing consumers' 9
value of time and convenience with GDP growth; and broader transport policies, e.g. provision of road 10
versus public transit infrastructure (Mattioli et al. 2020). For long-distance travel, travel via aviation for 11
leisure and business has increased (Lee et al. 2021). These trends do not hold in all countries and cities, 12
as many now have rail transit that is faster than driving (Newman et al. 2015a). For instance, public 13
transport demand rose from 1990 through 2016 in France, Denmark, and Finland (eurostat 2019). In 14
general, smaller and denser countries and cities with higher or increasing urbanization rates tend to have 15
greater success in increasing public transport share. However, other factors, like privatisation of public 16
transit (Bayliss and Mattioli 2018) and urban form (ITF 2021), also play a role. Different transport 17
modes can provide passenger and freight services, affecting the emissions trajectories for the sector. 18
Figure 10.19 shows activity trajectories for freight and passenger transport through 2100 relative to a 19
modelled year 2020 across different modes based on the AR6 database for IAMs and global transport 20
models. Globally, climate scenarios from IAMs, and policy and reference scenarios from global 21
transport models indicate increasing demand for freight and passenger transport via most modes through 22
2100 (Yeh et al. 2017; Zhang et al. 2018; Mulholland et al. 2018; Khalili et al. 2019). Road passenger 23
transport exhibits a similar increase (roughly tripling) through 2100 across scenarios. For road 24
passenger transport, scenarios that limit warming to 1.5 °C (C1-C2) have a smaller increase from 25
modelled 2020 levels (median increase of 2.4 times modelled 2020 levels) than do scenarios with higher 26
warming levels (C3-C8) (median increase of 2.7-2.8 times modelled 2020 levels). There are similar 27
patterns for passenger road transport via light-duty vehicle, for which median increases from modelled 28
2020 levels are smaller for C1-2 (3 times larger) than for C3-5 (3.1 times larger) or C6-7 (3.2 times 29
larger). Passenger transport via aviation exhibits a 2.2 times median increase relative to modelled 2020 30
levels under C1-2 and C3-5 scenarios but exhibits a 6.2 times increase under C6-C8. The only passenger 31
travel mode that exhibits a decline in its median value through 2100 according to IAMs is 32
walking/bicycling, in C3-5 and C6-8 scenarios. However, in C1-2 scenarios, walking/bicycling 33
increases by 1.4 times relative to modelled 2020 levels. At the 5th percentile of IAM solutions (lower 34
edge of bands in Figure 10.19), buses and walking/bicycling for passenger travel both exhibit significant 35
declines. 36
37
38
ACCEPTED VERSION
SUBJECT TO FIN
AL EDITS
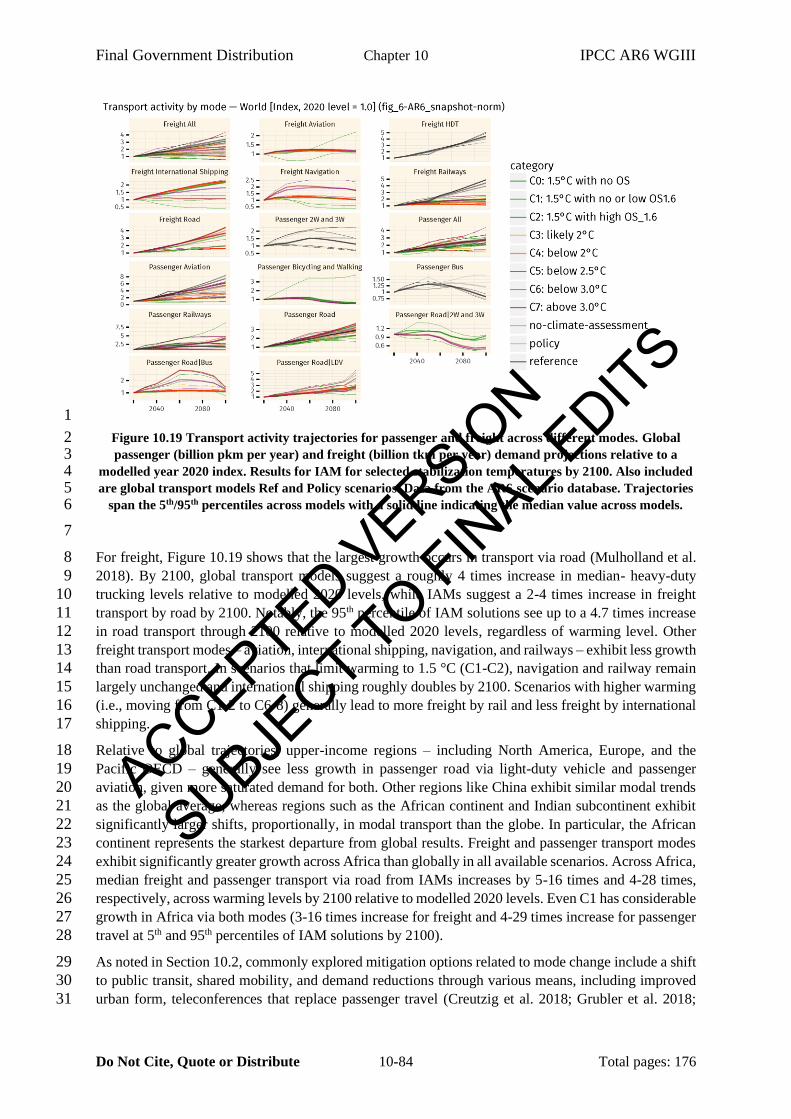
Final Government Distribution Chapter 10 IPCC AR6 WGIII
Do Not Cite, Quote or Distribute 10-84 Total pages: 176
1
Figure 10.19 Transport activity trajectories for passenger and freight across different modes. Global 2 passenger (billion pkm per year) and freight (billion tkm per year) demand projections relative to a 3
modelled year 2020 index. Results for IAM for selected stabilization temperatures by 2100. Also included 4 are global transport models Ref and Policy scenarios. Data from the AR6 scenario database. Trajectories 5
span the 5th/95th percentiles across models with a solid line indicating the median value across models. 6
7
For freight, Figure 10.19 shows that the largest growth occurs in transport via road (Mulholland et al. 8
2018). By 2100, global transport models suggest a roughly 4 times increase in median- heavy-duty 9
trucking levels relative to modelled 2020 levels, while IAMs suggest a 2-4 times increase in freight 10
transport by road by 2100. Notably, the 95th percentile of IAM solutions see up to a 4.7 times increase 11
in road transport through 2100 relative to modelled 2020 levels, regardless of warming level. Other 12
freight transport modes – aviation, international shipping, navigation, and railways – exhibit less growth 13
than road transport. In scenarios that limit warming to 1.5 °C (C1-C2), navigation and railway remain 14
largely unchanged and international shipping roughly doubles by 2100. Scenarios with higher warming 15
(i.e., moving from C1-2 to C6-8) generally lead to more freight by rail and less freight by international 16
shipping. 17
Relative to global trajectories, upper-income regions – including North America, Europe, and the 18
Pacific OECD – generally see less growth in passenger road via light-duty vehicle and passenger 19
aviation, given more saturated demand for both. Other regions like China exhibit similar modal trends 20
as the global average, whereas regions such as the African continent and Indian subcontinent exhibit 21
significantly larger shifts, proportionally, in modal transport than the globe. In particular, the African 22
continent represents the starkest departure from global results. Freight and passenger transport modes 23
exhibit significantly greater growth across Africa than globally in all available scenarios. Across Africa, 24
median freight and passenger transport via road from IAMs increases by 5-16 times and 4-28 times, 25
respectively, across warming levels by 2100 relative to modelled 2020 levels. Even C1 has considerable 26
growth in Africa via both modes (3-16 times increase for freight and 4-29 times increase for passenger 27
travel at 5th and 95th percentiles of IAM solutions by 2100). 28
As noted in Section 10.2, commonly explored mitigation options related to mode change include a shift 29
to public transit, shared mobility, and demand reductions through various means, including improved 30
urban form, teleconferences that replace passenger travel (Creutzig et al. 2018; Grubler et al. 2018; 31
ACCEPTED VERSION
SUBJECT TO FIN
AL EDITS
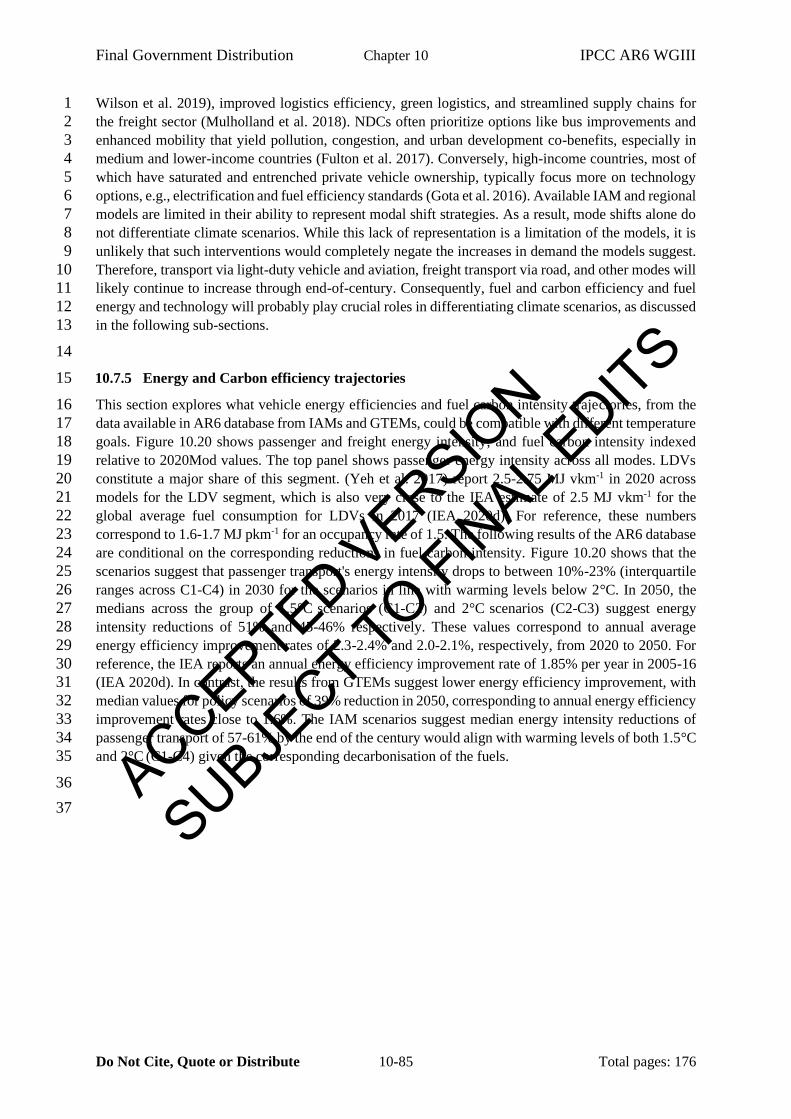
Final Government Distribution Chapter 10 IPCC AR6 WGIII
Do Not Cite, Quote or Distribute 10-85 Total pages: 176
Wilson et al. 2019), improved logistics efficiency, green logistics, and streamlined supply chains for 1
the freight sector (Mulholland et al. 2018). NDCs often prioritize options like bus improvements and 2
enhanced mobility that yield pollution, congestion, and urban development co-benefits, especially in 3
medium and lower-income countries (Fulton et al. 2017). Conversely, high-income countries, most of 4
which have saturated and entrenched private vehicle ownership, typically focus more on technology 5
options, e.g., electrification and fuel efficiency standards (Gota et al. 2016). Available IAM and regional 6
models are limited in their ability to represent modal shift strategies. As a result, mode shifts alone do 7
not differentiate climate scenarios. While this lack of representation is a limitation of the models, it is 8
unlikely that such interventions would completely negate the increases in demand the models suggest. 9
Therefore, transport via light-duty vehicle and aviation, freight transport via road, and other modes will 10
likely continue to increase through end-of-century. Consequently, fuel and carbon efficiency and fuel 11
energy and technology will probably play crucial roles in differentiating climate scenarios, as discussed 12
in the following sub-sections. 13
14
10.7.5 Energy and Carbon efficiency trajectories 15
This section explores what vehicle energy efficiencies and fuel carbon intensity trajectories, from the 16
data available in AR6 database from IAMs and GTEMs, could be compatible with different temperature 17
goals. Figure 10.20 shows passenger and freight energy intensity, and fuel carbon intensity indexed 18
relative to 2020Mod values. The top panel shows passenger energy intensity across all modes. LDVs 19
constitute a major share of this segment. (Yeh et al. 2017) report 2.5-2.75 MJ vkm-1 in 2020 across 20
models for the LDV segment, which is also very close to the IEA estimate of 2.5 MJ vkm-1 for the 21
global average fuel consumption for LDVs in 2017 (IEA 2020d). For reference, these numbers 22
correspond to 1.6-1.7 MJ pkm-1 for an occupancy rate of 1.5. The following results of the AR6 database 23
are conditional on the corresponding reductions in fuel carbon intensity. Figure 10.20 shows that the 24
scenarios suggest that passenger transport's energy intensity drops to between 10%-23% (interquartile 25
ranges across C1-C4) in 2030 for the scenarios in line with warming levels below 2°C. In 2050, the 26
medians across the group of 1.5°C scenarios (C1-C2) and 2°C scenarios (C2-C3) suggest energy 27
intensity reductions of 51% and 45-46% respectively. These values correspond to annual average 28
energy efficiency improvement rates of 2.3-2.4% and 2.0-2.1%, respectively, from 2020 to 2050. For 29
reference, the IEA reports an annual energy efficiency improvement rate of 1.85% per year in 2005-16 30
(IEA 2020d). In contrast, the results from GTEMs suggest lower energy efficiency improvement, with 31
median values for policy scenarios of 39% reduction in 2050, corresponding to annual energy efficiency 32
improvement rates close to 1.6%. The IAM scenarios suggest median energy intensity reductions of 33
passenger transport of 57-61% by the end of the century would align with warming levels of both 1.5°C 34
and 2°C (C1-C4) given the corresponding decarbonisation of the fuels. 35
36
37 ACCEPTED VERSIO
N
SUBJECT TO FIN
AL EDITS
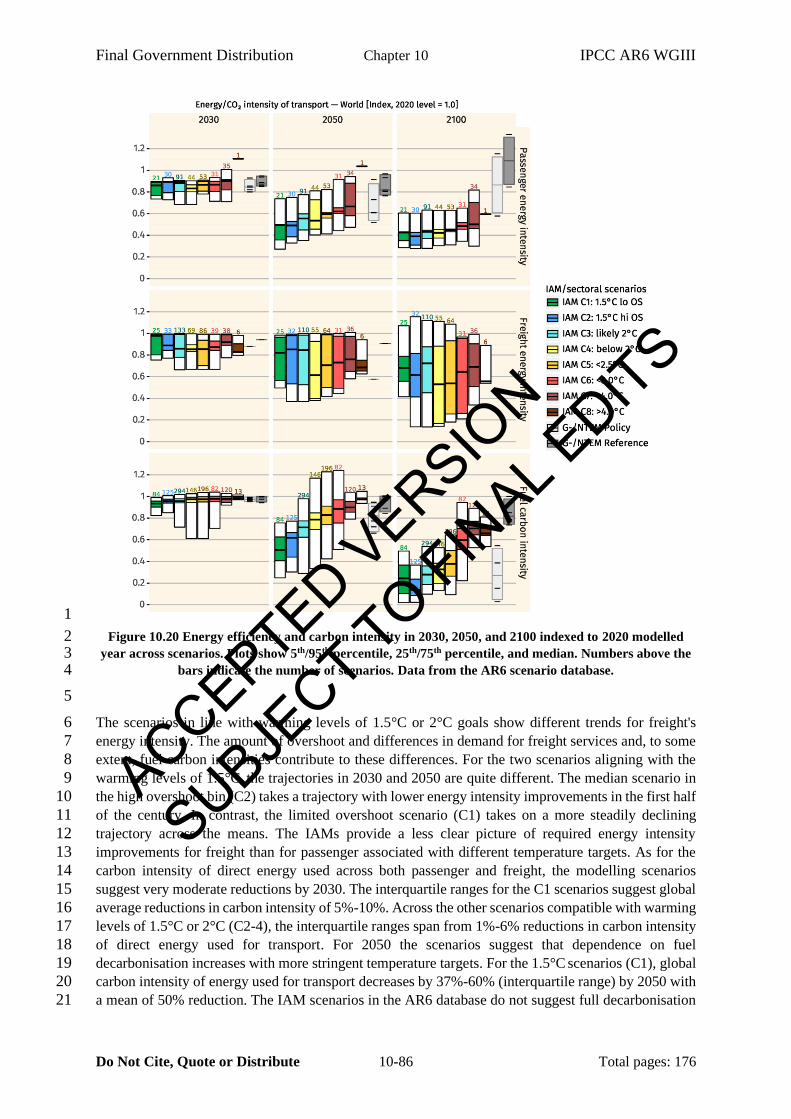
Final Government Distribution Chapter 10 IPCC AR6 WGIII
Do Not Cite, Quote or Distribute 10-86 Total pages: 176
1
Figure 10.20 Energy efficiency and carbon intensity in 2030, 2050, and 2100 indexed to 2020 modelled 2 year across scenarios. Plots show 5th/95th percentile, 25th/75th percentile, and median. Numbers above the 3
bars indicate the number of scenarios. Data from the AR6 scenario database. 4
5
The scenarios in line with warming levels of 1.5°C or 2°C goals show different trends for freight's 6
energy intensity. The amount of overshoot and differences in demand for freight services and, to some 7
extent, fuel carbon intensities contribute to these differences. For the two scenarios aligning with the 8
warming levels of 1.5°C, the trajectories in 2030 and 2050 are quite different. The median scenario in 9
the high overshoot bin (C2) takes a trajectory with lower energy intensity improvements in the first half 10
of the century. In contrast, the limited overshoot scenario (C1) takes on a more steadily declining 11
trajectory across the means. The IAMs provide a less clear picture of required energy intensity 12
improvements for freight than for passenger associated with different temperature targets. As for the 13
carbon intensity of direct energy used across both passenger and freight, the modelling scenarios 14
suggest very moderate reductions by 2030. The interquartile ranges for the C1 scenarios suggest global 15
average reductions in carbon intensity of 5%-10%. Across the other scenarios compatible with warming 16
levels of 1.5°C or 2°C (C2-4), the interquartile ranges span from 1%-6% reductions in carbon intensity 17
of direct energy used for transport. For 2050 the scenarios suggest that dependence on fuel 18
decarbonisation increases with more stringent temperature targets. For the 1.5°C scenarios (C1), global 19
carbon intensity of energy used for transport decreases by 37%-60% (interquartile range) by 2050 with 20
a mean of 50% reduction. The IAM scenarios in the AR6 database do not suggest full decarbonisation 21
ACCEPTED VERSION
SUBJECT TO FIN
AL EDITS
Final Government Distribution Chapter 10 IPCC AR6 WGIII
Do Not Cite, Quote or Distribute 10-87 Total pages: 176
of transport fuels by 2100. The interquartile ranges across the C1-C4 set of scenarios, compatible with 1
warming levels of 2°C and less, span from 61%-91% reduction from 2020Mod levels. 2
Increasing occupancy rate of passenger transport (Grubler et al. 2018) and reducing empty miles or 3
increasing payload in freight deliveries (Gucwa and Schäfer 2013; McKinnon 2018) via improved 4
logistics efficiency or streamlined supply chains (Mulholland et al. 2018), can present significant 5
opportunities to effectively improve energy efficiency and decrease GHG emissions in transport. 6
However, the recent trends of consumer behaviours have shown a declining occupancy rate of light-7
duty vehicles in industrialized countries (Schäfer and Yeh 2020), and the accelerating growing 8
preference for SUVs challenges emissions reductions in the passenger car market (IEA 2019d). These 9
trends motivate a strong focus on demand-side options. 10
Based on the scenario literature, a 51% reduction in median energy intensity of passenger transport and 11
a corresponding reduction of 38%-50% reduction in median carbon intensity by 2050 would be aligned 12
with transition trajectories yielding warming levels below 1.5°C by the end of the century. For 13
comparison, the LCA literature suggests a switch from current ICEs to current BEVs would yield a 14
reduction in energy intensity well beyond 45% and up to 70%, for a mid-sized vehicle (see Sections 15
10.4). Correspondingly, a switch from diesel or gasoline to low-carbon electricity or low-carbon 16
Hydrogen would yield carbon intensity reduction beyond the median scenario value. Thus, the LCA 17
literature suggests technologies exist today that would already match and exceed the median energy and 18
carbon intensities values that might be needed by 2050 for low warming levels. 19
20
10.7.6 Fuel energy and technology trajectories 21
Two mechanisms for reducing carbon emissions from the transport sector are fuel switching for current 22
vehicle technologies and transitioning to low carbon vehicle technologies. Figure 10.21 combines data 23
from IAMs and GTEMs on shares of transport final energy by fuel. These shares account for fuels uses 24
across modes - road, aviation, rail, and shipping- and both passenger and freight transport. Since the 25
technologies have different conversion efficiencies, these shares of final energy by fuel are necessarily 26
different from the shares of service (passenger- or ton-km) by fuel and shares of vehicle stock by fuel. 27
For example, a current battery-electric LDV powertrain is roughly 3 times more energy-efficient than 28
a comparable ICE powertrain (see Section 10.3, and Table 10.9 in Appendix 10.1); thus, fuel shares of 29
0.25 for electricity and 0.75 for oil could correspond to vehicle stock shares of 0.5 and 0.5, respectively. 30
In general, while models may project that EVs constitute a greater share of road vehicle stock, and 31
provide a greater share of road passenger-kilometres, their share of transport final energy (shown in 32
Figure 10.21) can still remain lower than the final energy share of fuels used in less-efficient (e.g. ICE) 33
vehicles. Thus, the shares of transport final energy by fuel presented in Figure 10.21 should be 34
interpreted with care. 35
36
37
38
ACCEPTED VERSION
SUBJECT TO FIN
AL EDITS
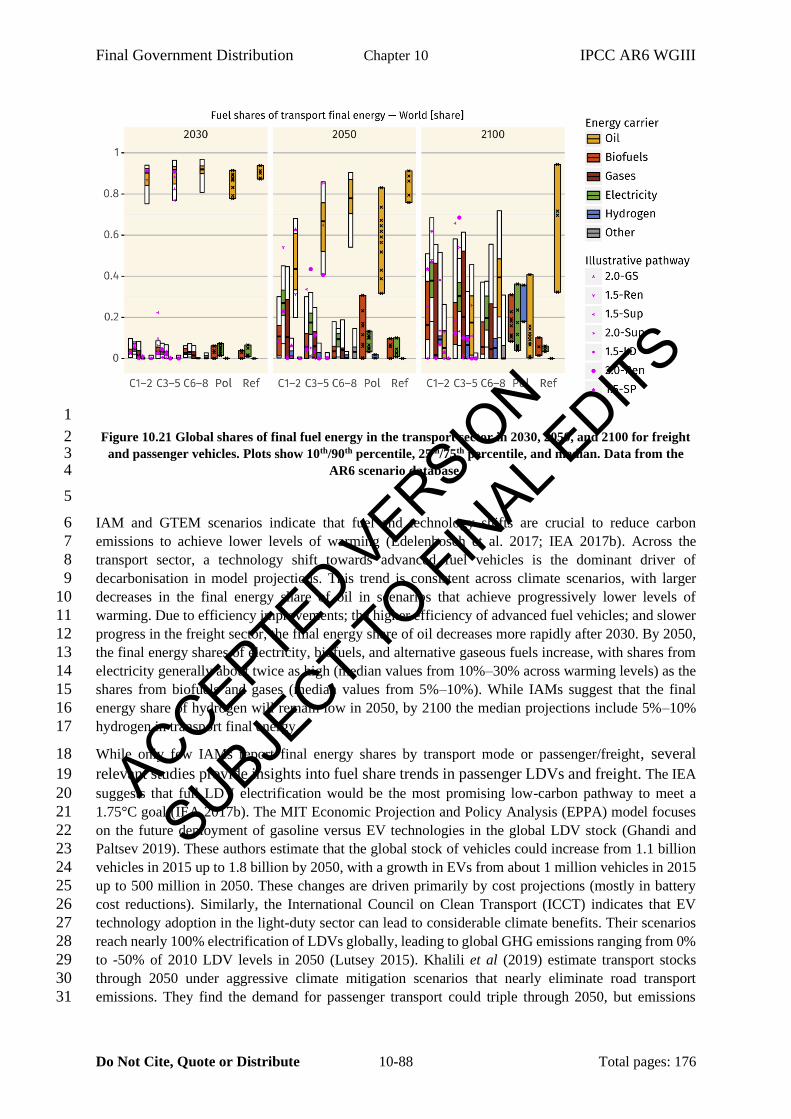
Final Government Distribution Chapter 10 IPCC AR6 WGIII
Do Not Cite, Quote or Distribute 10-88 Total pages: 176
1
Figure 10.21 Global shares of final fuel energy in the transport sector in 2030, 2050, and 2100 for freight 2 and passenger vehicles. Plots show 10th/90th percentile, 25th/75th percentile, and median. Data from the 3
AR6 scenario database. 4
5
IAM and GTEM scenarios indicate that fuel and technology shifts are crucial to reduce carbon 6
emissions to achieve lower levels of warming (Edelenbosch et al. 2017; IEA 2017b). Across the 7
transport sector, a technology shift towards advanced fuel vehicles is the dominant driver of 8
decarbonisation in model projections. This trend is consistent across climate scenarios, with larger 9
decreases in the final energy share of oil in scenarios that achieve progressively lower levels of 10
warming. Due to efficiency improvements; the higher efficiency of advanced fuel vehicles; and slower 11
progress in the freight sector, the final energy share of oil decreases more rapidly after 2030. By 2050, 12
the final energy shares of electricity, biofuels, and alternative gaseous fuels increase, with shares from 13
electricity generally about twice as high (median values from 10%–30% across warming levels) as the 14
shares from biofuels and gases (median values from 5%–10%). While IAMs suggest that the final 15
energy share of hydrogen will remain low in 2050, by 2100 the median projections include 5%–10% 16
hydrogen in transport final energy. 17
While only few IAMs report final energy shares by transport mode or passenger/freight, several 18
relevant studies provide insights into fuel share trends in passenger LDVs and freight. The IEA 19
suggests that full LDV electrification would be the most promising low-carbon pathway to meet a 20
1.75°C goal (IEA 2017b). The MIT Economic Projection and Policy Analysis (EPPA) model focuses 21
on the future deployment of gasoline versus EV technologies in the global LDV stock (Ghandi and 22
Paltsev 2019). These authors estimate that the global stock of vehicles could increase from 1.1 billion 23
vehicles in 2015 up to 1.8 billion by 2050, with a growth in EVs from about 1 million vehicles in 2015 24
up to 500 million in 2050. These changes are driven primarily by cost projections (mostly in battery 25
cost reductions). Similarly, the International Council on Clean Transport (ICCT) indicates that EV 26
technology adoption in the light-duty sector can lead to considerable climate benefits. Their scenarios 27
reach nearly 100% electrification of LDVs globally, leading to global GHG emissions ranging from 0% 28
to -50% of 2010 LDV levels in 2050 (Lutsey 2015). Khalili et al (2019) estimate transport stocks 29
through 2050 under aggressive climate mitigation scenarios that nearly eliminate road transport 30
emissions. They find the demand for passenger transport could triple through 2050, but emissions 31
ACCEPTED VERSION
SUBJECT TO FIN
AL EDITS
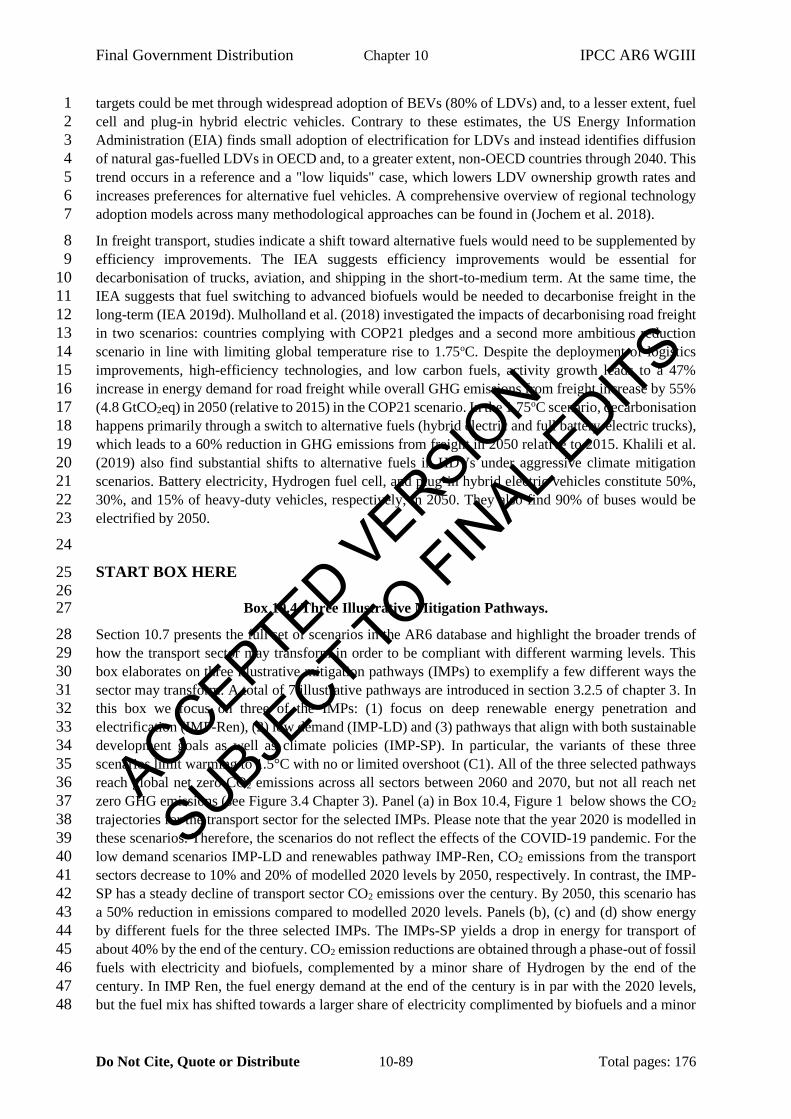
Final Government Distribution Chapter 10 IPCC AR6 WGIII
Do Not Cite, Quote or Distribute 10-89 Total pages: 176
targets could be met through widespread adoption of BEVs (80% of LDVs) and, to a lesser extent, fuel 1
cell and plug-in hybrid electric vehicles. Contrary to these estimates, the US Energy Information 2
Administration (EIA) finds small adoption of electrification for LDVs and instead identifies diffusion 3
of natural gas-fuelled LDVs in OECD and, to a greater extent, non-OECD countries through 2040. This 4
trend occurs in a reference and a "low liquids" case, which lowers LDV ownership growth rates and 5
increases preferences for alternative fuel vehicles. A comprehensive overview of regional technology 6
adoption models across many methodological approaches can be found in (Jochem et al. 2018). 7
In freight transport, studies indicate a shift toward alternative fuels would need to be supplemented by 8
efficiency improvements. The IEA suggests efficiency improvements would be essential for 9
decarbonisation of trucks, aviation, and shipping in the short-to-medium term. At the same time, the 10
IEA suggests that fuel switching to advanced biofuels would be needed to decarbonise freight in the 11
long-term (IEA 2019d). Mulholland et al. (2018) investigated the impacts of decarbonising road freight 12
in two scenarios: countries complying with COP21 pledges and a second more ambitious reduction 13
scenario in line with limiting global temperature rise to 1.75oC. Despite the deployment of logistics 14
improvements, high-efficiency technologies, and low carbon fuels, activity growth leads to a 47% 15
increase in energy demand for road freight while overall GHG emissions from freight increase by 55% 16
(4.8 GtCO2eq) in 2050 (relative to 2015) in the COP21 scenario. In the 1.75oC scenario, decarbonisation 17
happens primarily through a switch to alternative fuels (hybrid electric and full battery-electric trucks), 18
which leads to a 60% reduction in GHG emissions from freight in 2050 relative to 2015. Khalili et al. 19
(2019) also find substantial shifts to alternative fuels in HDVs under aggressive climate mitigation 20
scenarios. Battery electricity, Hydrogen fuel cell, and plug-in hybrid electric vehicles constitute 50%, 21
30%, and 15% of heavy-duty vehicles, respectively, in 2050. They also find 90% of buses would be 22
electrified by 2050. 23
24
START BOX HERE 25
26 Box 10.4 Three Illustrative Mitigation Pathways. 27
Section 10.7 presents the full set of scenarios in the AR6 database and highlight the broader trends of 28
how the transport sector may transform in order to be compliant with different warming levels. This 29
box elaborates on three illustrative mitigation pathways (IMPs) to exemplify a few different ways the 30
sector may transform. A total of 7 illustrative pathways are introduced in section 3.2.5 of chapter 3. In 31
this box we focus on three of the IMPs: (1) focus on deep renewable energy penetration and 32
electrification (IMP-Ren), (2) low demand (IMP-LD) and (3) pathways that align with both sustainable 33
development goals as well as climate policies (IMP-SP). In particular, the variants of these three 34
scenarios limit warming to 1.5°C with no or limited overshoot (C1). All of the three selected pathways 35
reach global net zero CO2 emissions across all sectors between 2060 and 2070, but not all reach net 36
zero GHG emissions (see Figure 3.4 Chapter 3). Panel (a) in Box 10.4, Figure 1 below shows the CO2 37
trajectories for the transport sector for the selected IMPs. Please note that the year 2020 is modelled in 38
these scenarios. Therefore, the scenarios do not reflect the effects of the COVID-19 pandemic. For the 39
low demand scenarios IMP-LD and renewables pathway IMP-Ren, CO2 emissions from the transport 40
sectors decrease to 10% and 20% of modelled 2020 levels by 2050, respectively. In contrast, the IMP-41
SP has a steady decline of transport sector CO2 emissions over the century. By 2050, this scenario has 42
a 50% reduction in emissions compared to modelled 2020 levels. Panels (b), (c) and (d) show energy 43
by different fuels for the three selected IMPs. The IMPs-SP yields a drop in energy for transport of 44
about 40% by the end of the century. CO2 emission reductions are obtained through a phase-out of fossil 45
fuels with electricity and biofuels, complemented by a minor share of Hydrogen by the end of the 46
century. In IMP Ren, the fuel energy demand at the end of the century is in par with the 2020 levels, 47
but the fuel mix has shifted towards a larger share of electricity complimented by biofuels and a minor 48
ACCEPTED VERSION
SUBJECT TO FIN
AL EDITS
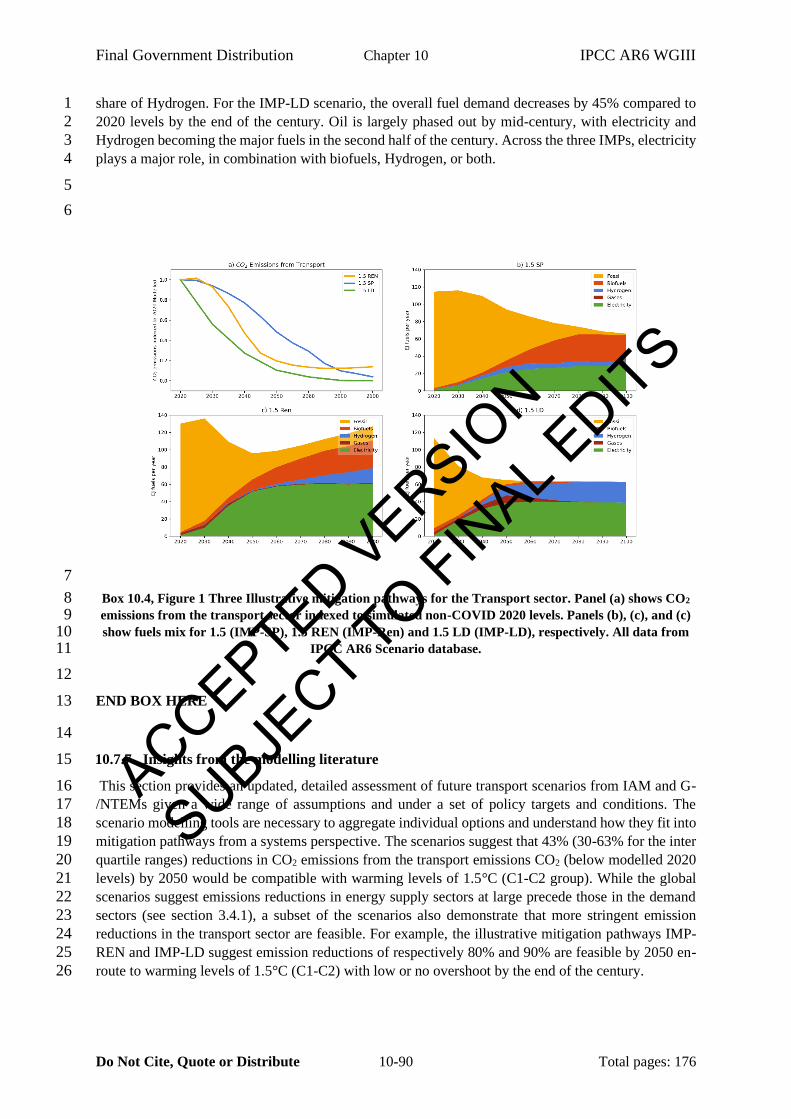
Final Government Distribution Chapter 10 IPCC AR6 WGIII
Do Not Cite, Quote or Distribute 10-90 Total pages: 176
share of Hydrogen. For the IMP-LD scenario, the overall fuel demand decreases by 45% compared to 1
2020 levels by the end of the century. Oil is largely phased out by mid-century, with electricity and 2
Hydrogen becoming the major fuels in the second half of the century. Across the three IMPs, electricity 3
plays a major role, in combination with biofuels, Hydrogen, or both. 4
5
6
7
Box 10.4, Figure 1 Three Illustrative mitigation pathways for the Transport sector. Panel (a) shows CO2 8 emissions from the transport sector indexed to simulated non-COVID 2020 levels. Panels (b), (c), and (c) 9 show fuels mix for 1.5 (IMP-SP), 1.5 REN (IMP-Ren) and 1.5 LD (IMP-LD), respectively. All data from 10
IPCC AR6 Scenario database. 11
12
END BOX HERE 13
14
10.7.7 Insights from the modelling literature 15
This section provides an updated, detailed assessment of future transport scenarios from IAM and G-16
/NTEMs given a wide range of assumptions and under a set of policy targets and conditions. The 17
scenario modelling tools are necessary to aggregate individual options and understand how they fit into 18
mitigation pathways from a systems perspective. The scenarios suggest that 43% (30-63% for the inter 19
quartile ranges) reductions in CO2 emissions from the transport emissions CO2 (below modelled 2020 20
levels) by 2050 would be compatible with warming levels of 1.5°C (C1-C2 group). While the global 21
scenarios suggest emissions reductions in energy supply sectors at large precede those in the demand 22
sectors (see section 3.4.1), a subset of the scenarios also demonstrate that more stringent emission 23
reductions in the transport sector are feasible. For example, the illustrative mitigation pathways IMP-24
REN and IMP-LD suggest emission reductions of respectively 80% and 90% are feasible by 2050 en-25
route to warming levels of 1.5°C (C1-C2) with low or no overshoot by the end of the century. 26
ACCEPTED VERSION
SUBJECT TO FIN
AL EDITS
Final Government Distribution Chapter 10 IPCC AR6 WGIII
Do Not Cite, Quote or Distribute 10-91 Total pages: 176
The scenarios from the different models project continued growth in demand for freight and passenger 1
services, particularly in developing countries. The potential of demand reductions is evident, but the 2
specifics of demand reduction measures remain less explored by the scenario literature. This limitation 3
not-withstanding, the IAM and GTEMs suggest interventions that reduce the energy and fuel carbon 4
intensity are likely crucial to successful mitigation strategies. 5
The scenario literature suggests that serious attempts at carbon mitigation in the transport sector must 6
examine the uptake of alternative fuels. The scenarios described in the IAMs and GTEMs literature 7
decarbonise through a combination of fuels. Across the scenarios, electrification plays a key role, 8
complemented by biofuels and Hydrogen. In general terms, electrification tends to play the key role in 9
passenger transport while biofuels and Hydrogen are more prominent in the freight segment. The three 10
illustrative mitigation pathways in Box 10.4 exemplify different ways these technologies may be 11
combined and still be compatible with warming levels of 1.5°C with low or no overshoot. Shifts towards 12
alternative fuels must occur alongside shifts towards clean technologies in other sectors, as all 13
alternative fuels have upstream impacts. Without considering other sectors, fuel shifts would not yield 14
their full mitigation potentials. These collective efforts are particularly important for the electrification 15
of transport, as the transformative mitigation potential is strongly dependent on the decarbonisation of 16
the power sector. In this regard, the scenario literature is well aligned with the LCA literature reviewed 17
in Section 10.4. 18
The models reviewed in this section would all generally be considered to have a good representation of 19
fuels, technologies, and costs, but they often better represent land transport modes than shipping and 20
aviation. While these models have their strengths in some areas, they have some limitations in other 21
areas, like behavioural aspects. Analogously, these models are also limited in their ability to account 22
for unexpected technological innovation such as a breakthrough in heavy vehicle fuels, AI, autonomy 23
and big data, even the extent of digital communications replacing travel (see Section 10.2). As a result 24
of these type of limitations, the models cannot yet provide a fully exhaustive set of options for 25
decarbonising the transport sectors. These limitations not-withstanding, the models can find solutions 26
encompassing the transport sector and its interactions with other sectors that are compatible with 27
stringent emissions mitigation efforts. The solution space of transportation technology trajectories is 28
therefore wider than explored by the models, so there is still a need to better understand how all options 29
in combination may support the transformative mitigation targets. 30
31
10.8 Enabling conditions 32
10.8.1 Conclusions across the chapter 33
This final section draws some conclusions from the chapter, provides an overview-based feasibility 34
assessment of the major transport mitigation options, as well as a description of emerging issues. The 35
section ends by outlining an integrated framework for enabling the transformative changes that are 36
emerging and required to meet the potential transformative scenarios from Section 10.7. 37
Transport is becoming a major focus for mitigation as its GHG emissions are large and growing faster 38
than for other sectors, especially in aviation and shipping. The scenarios literature suggests that without 39
mitigation actions, transport emissions could grow by up to 65% by 2050. Alternatively, successful 40
deployment of mitigation strategies could reduce sectoral emissions by 68%, which would be consistent 41
with the goal of limiting temperature change to 1.5°C above pre-industrial levels. This chapter has 42
reviewed the literature on all aspects of transport and has featured three special points of focus: (1) A 43
survey of life cycle analysis from the academic and industry community that uses these tools; (2) A 44
similar exercise of surveying the modelling community for top-down and bottom-up approaches to 45
identify decarbonisation pathways for the transport sector, and (3) For the first time in the IPCC, 46
ACCEPTED VERSION
SUBJECT TO FIN
AL EDITS
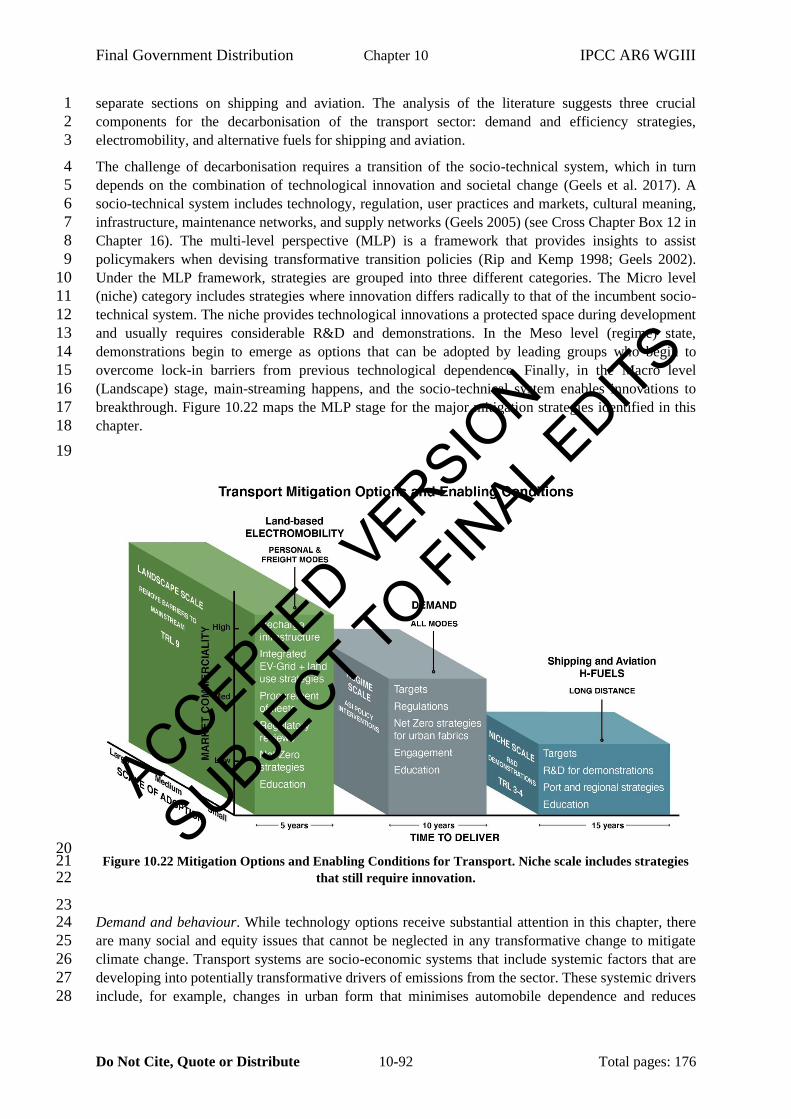
Final Government Distribution Chapter 10 IPCC AR6 WGIII
Do Not Cite, Quote or Distribute 10-92 Total pages: 176
separate sections on shipping and aviation. The analysis of the literature suggests three crucial 1
components for the decarbonisation of the transport sector: demand and efficiency strategies, 2
electromobility, and alternative fuels for shipping and aviation. 3
The challenge of decarbonisation requires a transition of the socio-technical system, which in turn 4
depends on the combination of technological innovation and societal change (Geels et al. 2017). A 5
socio-technical system includes technology, regulation, user practices and markets, cultural meaning, 6
infrastructure, maintenance networks, and supply networks (Geels 2005) (see Cross Chapter Box 12 in 7
Chapter 16). The multi-level perspective (MLP) is a framework that provides insights to assist 8
policymakers when devising transformative transition policies (Rip and Kemp 1998; Geels 2002). 9
Under the MLP framework, strategies are grouped into three different categories. The Micro level 10
(niche) category includes strategies where innovation differs radically to that of the incumbent socio-11
technical system. The niche provides technological innovations a protected space during development 12
and usually requires considerable R&D and demonstrations. In the Meso level (regime) state, 13
demonstrations begin to emerge as options that can be adopted by leading groups who begin to 14
overcome lock-in barriers from previous technological dependence. Finally, in the Macro level 15
(Landscape) stage, main-streaming happens, and the socio-technical system enables innovations to 16
breakthrough. Figure 10.22 maps the MLP stage for the major mitigation strategies identified in this 17
chapter. 18
19
20 Figure 10.22 Mitigation Options and Enabling Conditions for Transport. Niche scale includes strategies 21
that still require innovation. 22
23 Demand and behaviour. While technology options receive substantial attention in this chapter, there 24
are many social and equity issues that cannot be neglected in any transformative change to mitigate 25
climate change. Transport systems are socio-economic systems that include systemic factors that are 26
developing into potentially transformative drivers of emissions from the sector. These systemic drivers 27
include, for example, changes in urban form that minimises automobile dependence and reduces 28
ACCEPTED VERSION
SUBJECT TO FIN
AL EDITS
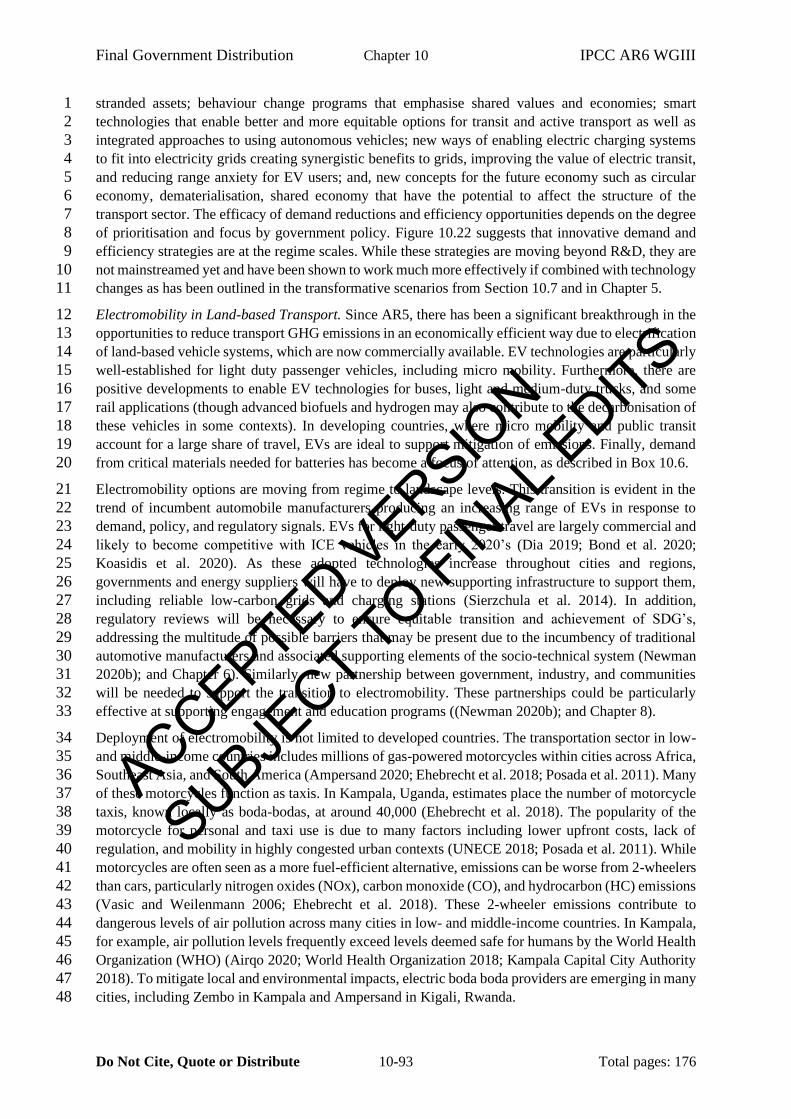
Final Government Distribution Chapter 10 IPCC AR6 WGIII
Do Not Cite, Quote or Distribute 10-93 Total pages: 176
stranded assets; behaviour change programs that emphasise shared values and economies; smart 1
technologies that enable better and more equitable options for transit and active transport as well as 2
integrated approaches to using autonomous vehicles; new ways of enabling electric charging systems 3
to fit into electricity grids creating synergistic benefits to grids, improving the value of electric transit, 4
and reducing range anxiety for EV users; and, new concepts for the future economy such as circular 5
economy, dematerialisation, shared economy that have the potential to affect the structure of the 6
transport sector. The efficacy of demand reductions and efficiency opportunities depends on the degree 7
of prioritisation and focus by government policy. Figure 10.22 suggests that innovative demand and 8
efficiency strategies are at the regime scales. While these strategies are moving beyond R&D, they are 9
not mainstreamed yet and have been shown to work much more effectively if combined with technology 10
changes as has been outlined in the transformative scenarios from Section 10.7 and in Chapter 5. 11
Electromobility in Land-based Transport. Since AR5, there has been a significant breakthrough in the 12
opportunities to reduce transport GHG emissions in an economically efficient way due to electrification 13
of land-based vehicle systems, which are now commercially available. EV technologies are particularly 14
well-established for light duty passenger vehicles, including micro mobility. Furthermore, there are 15
positive developments to enable EV technologies for buses, light and medium-duty trucks, and some 16
rail applications (though advanced biofuels and hydrogen may also contribute to the decarbonisation of 17
these vehicles in some contexts). In developing countries, where micro mobility and public transit 18
account for a large share of travel, EVs are ideal to support mitigation of emissions. Finally, demand 19
from critical materials needed for batteries has become a focus of attention, as described in Box 10.6. 20
Electromobility options are moving from regime to landscape levels. This transition is evident in the 21
trend of incumbent automobile manufacturers producing an increasing range of EVs in response to 22
demand, policy, and regulatory signals. EVs for light-duty passenger travel are largely commercial and 23
likely to become competitive with ICE vehicles in the early 2020’s (Dia 2019; Bond et al. 2020; 24
Koasidis et al. 2020). As these adopted technologies increase throughout cities and regions, 25
governments and energy suppliers will have to deploy new supporting infrastructure to support them, 26
including reliable low-carbon grids and charging stations (Sierzchula et al. 2014). In addition, 27
regulatory reviews will be necessary to ensure equitable transition and achievement of SDG’s, 28
addressing the multitude of possible barriers that may be present due to the incumbency of traditional 29
automotive manufacturers and associated supporting elements of the socio-technical system (Newman 30
2020b); and Chapter 6). Similarly, new partnership between government, industry, and communities 31
will be needed to support the transition to electromobility. These partnerships could be particularly 32
effective at supporting engagement and education programs ((Newman 2020b); and Chapter 8). 33
Deployment of electromobility is not limited to developed countries. The transportation sector in low- 34
and middle-income countries includes millions of gas-powered motorcycles within cities across Africa, 35
Southeast Asia, and South America (Ampersand 2020; Ehebrecht et al. 2018; Posada et al. 2011). Many 36
of these motorcycles function as taxis. In Kampala, Uganda, estimates place the number of motorcycle 37
taxis, known locally as boda-bodas, at around 40,000 (Ehebrecht et al. 2018). The popularity of the 38
motorcycle for personal and taxi use is due to many factors including lower upfront costs, lack of 39
regulation, and mobility in highly congested urban contexts (UNECE 2018; Posada et al. 2011). While 40
motorcycles are often seen as a more fuel-efficient alternative, emissions can be worse from 2-wheelers 41
than cars, particularly nitrogen oxides (NOx), carbon monoxide (CO), and hydrocarbon (HC) emissions 42
(Vasic and Weilenmann 2006; Ehebrecht et al. 2018). These 2-wheeler emissions contribute to 43
dangerous levels of air pollution across many cities in low- and middle-income countries. In Kampala, 44
for example, air pollution levels frequently exceed levels deemed safe for humans by the World Health 45
Organization (WHO) (Airqo 2020; World Health Organization 2018; Kampala Capital City Authority 46
2018). To mitigate local and environmental impacts, electric boda boda providers are emerging in many 47
cities, including Zembo in Kampala and Ampersand in Kigali, Rwanda. 48
ACCEPTED VERSION
SUBJECT TO FIN
AL EDITS
Final Government Distribution Chapter 10 IPCC AR6 WGIII
Do Not Cite, Quote or Distribute 10-94 Total pages: 176
Bulawayo, the capital city of Zimbabwe, is also looking at opportunities for deploying electromobility 1
solutions. The city is now growing again after a difficult recent history, and there is a new emphasis on 2
achieving the Sustainable Development Goals (City of Bulawayo 2020a,b). With this goal in mind, 3
Bulawayo is seeking opportunities for investment that can enable leapfrogging private, fossil fuel 4
vehicle ownership. In particular, trackless trams, paired with solar energy, have emerged as a potential 5
pathway forward (Kazunga 2019). Trackless trams are a new battery-based mid-tier transit system that 6
could enable urban development around stations that use solar energy for powering both transit and the 7
surrounding buildings (Newman et al. 2019). The new trams are rail-like in their capacities and speed, 8
providing a vastly better mobility system that is decarbonised and enable low transport costs (Ndlovu 9
and Newman 2020). While this concept is only under consideration in Bulawayo, climate funding could 10
enable the wider deployment of such projects in developing countries. 11
Fuels for Aviation and Shipping. Despite technology improvements for land-based transport, equivalent 12
technologies for long distance aviation and shipping remain elusive. Alternative fuels for use in long 13
range aviation and shipping are restricted to the niche level. The aviation sector is increasingly looking 14
towards synthetic fuels using low-carbon combined with CO2 from direct air capture, while shipping is 15
moving towards Ammonia produced using low-carbon Hydrogen. Biofuels are also of interest for these 16
segments. To move out of the niche level, there is a need to set deployment targets to support 17
breakthroughs in these fuels. Similarly, there is a need for regulatory changes to remove barriers in new 18
procurement systems that accommodate uncertainty and risks inherent in the early adoption new 19
technologies and infrastructure (Borén 2019; Sclar et al. 2019; Marinaro et al. 2020). R&D programs 20
and demonstration trials are the best focus for achieving fuels for such systems. Finally, there is a need 21
for regulatory changes. Such regulatory changes need to be coordinated through ICAO and IMO as well 22
as with national implementation tools related to the Paris Agreement (see Box 10.5). Long-term visions, 23
including creative exercises for cities and regions will be required providing a protected space for the 24
purpose of trialling new technologies (Borén 2019; Geels 2019). 25
26
10.8.2 Feasibility Assessment 27
Figure 10.23 sets out the feasibility of the core mitigation options using the six criteria created for the 28
cross-sectoral analysis. This feasibility assessment outlines how the conclusions outlined in Section 29
10.8.1 fit into the broader criteria created for feasibility in the whole AR6 report and that emphasise the 30
SDGs. Figure 10.23 highlights that there is high confidence that demand reductions and mode shift can 31
be feasible as the basis of a GHG emissions mitigation strategy for the transport sector. However, 32
demand-side interventions work best when integrated with technology changes. The technologies that 33
can support such changes have a range of potential limitations as well as opportunities. EV have a 34
reliance on renewable resources (wind, solar, and hydro) for power generation, which could pose 35
constraints on geophysical resources, land use, water use. Furthermore, expanding the deployment of 36
EVs requires a rapid deployment of new power generation capacity and charging infrastructure. The 37
overall feasibility of electric vehicles for land transport is likely high and their adoption is accelerating. 38
HFCVs for land transport would also have constraints related to land geophysical resource needs, land 39
use, and water use. These constraints are likely higher than for EVs, since producing Hydrogen with 40
electricity reduces the overall efficiency of meeting travel demand. Furthermore, the infrastructure to 41
produce, transport, and deliver Hydrogen is under-developed and would require significant R&D and a 42
rapid scale-up. Thus, the feasibility of HFCV is likely lower than for EVs. Biofuels could be used in all 43
segments of the transport sector, but there may be some concerns about their feasibility. Specifically, 44
there are concerns about land use, water use, impacts on water quality and eutrophication, and 45
biodiversity impacts. Advanced biofuels could mitigate some concerns and the feasibility of using these 46
fuels likely varies by world region. The feasibility assessment for alternative fuels for shipping and 47
aviation suggests that Hydrogen-based fuels like Ammonia and synthetic fuels have the lowest 48
ACCEPTED VERSION
SUBJECT TO FIN
AL EDITS
Final Government Distribution Chapter 10 IPCC AR6 WGIII
Do Not Cite, Quote or Distribute 10-95 Total pages: 176
technology readiness of all mitigation options considered in this chapter. Reliance on electrolytic 1
Hydrogen for the production of these fuels poses concerns about land and water use. Using Ammonia 2
for shipping could pose risks for air quality and toxic discharges to the environment. The DAC/BECCS 3
infrastructure that would be needed to produce synthetic fuel does not yet exist. Thus, the feasibility 4
suggests that the technologies for producing and using these Hydrogen-based fuels for transport are in 5
their infancy. 6
7 8
9 Figure 10.23 Summary of the extent to which different factors would enable or inhibit the deployment of 10
mitigation options in Transport. Blue bars indicate the extent to which the indicator enables the 11 implementation of the option (E) and orange bars indicate the extent to which an indicator is a barrier 12
(B) to the deployment of the option, relative to the maximum possible barriers and enablers assessed. An 13 ‘X’ signifies the indicator is not applicable or does not affect the feasibility of the option, while a forward 14
slash indicates that there is no or limited evidence whether the indicator affects the feasibility of the 15 option. The shading indicates the level of confidence, with darker shading signifying higher levels of 16
confidence. Appendix 10.3 provides an overview of the extent to which the feasibility of options may differ 17 across context (e.g., region), time (e.g., 2030 versus 2050), and scale (e.g., small versus large), and includes 18
a line of sight on which the assessment is based. The assessment method is explained in Annex II.11. 19
20
10.8.3 Emerging Transport Issues 21
Planning for integration with the power sector: Decarbonising the transport sector will require 22
significant growth in low-carbon electricity to power EVs, and more so for producing energy-intensive 23
fuels, such as Hydrogen, Ammonia and synthetic fuels. Higher electricity demand will necessitate 24
greater expansion of the power sector and increase land use. The strategic use of energy-intensive fuels, 25
focussed on harder-to-decarbonise transport segments, can minimise the increase in electricity demand. 26
Additionally, integrated planning of transport and power infrastructure could enable sectoral synergies 27
and reduce the environmental, social, and economic impacts of decarbonising transport and energy. For 28
example, smart charging of EVs could support more efficient grid operations. Hydrogen production, 29
which is likely crucial for the decarbonisation of shipping and aviation, could also serve as storage for 30
electricity produced during low-demand periods. Integrated planning of transport and power 31
infrastructure would be particularly useful in developing countries where “greenfield” development 32
doesn’t suffer from constraints imposed by legacy systems. 33
ACCEPTED VERSION
SUBJECT TO FIN
AL EDITS
Final Government Distribution Chapter 10 IPCC AR6 WGIII
Do Not Cite, Quote or Distribute 10-96 Total pages: 176
Shipping and aviation governance: Strategies to deliver fuels in sufficient quantity for aviation and 1
shipping to achieve transformative targets are growing in intensity and often feature the need to review 2
international and national governance. Some literature suggests that the governance of the international 3
transport systems could be included the Paris Agreement process (Gençsü and Hino 2015; Traut et al. 4
2018; Lee 2018). Box 10.6 sets out these issues. 5
6
START BOX HERE 7 8
Box 10.5 Governance Options for shipping and aviation 9
Whenever borders are crossed, the aviation and shipping sector creates international emissions that are 10
not assigned to states’ Nationally Declared Contributions in the Paris Agreement. Emissions from these 11
segments are rapidly growing (apart from COVID affecting aviation) and are projected to grow between 12
60% to 220% by 2050 (IPCC 2018; UNEP 2020). Currently, the International Civil Aviation 13
Organization (ICAO) and the International Marine Organization (IMO), specialised UN Agencies, are 14
responsible for accounting and suggesting options for managing these emissions. 15
Transformational goals? 16
ICAO has two global aspirational goals for the international aviation sector: 2% annual fuel efficiency 17
improvement through 2050; and carbon neutral growth from 2020 onwards. To achieve these goals, 18
ICAO has established CORSIA – Carbon Offsetting and Reduction Scheme for International Aviation, 19
a market-based program. 20
In 2018, IMO adopted an ‘Initial Strategy’ on the reduction of GHG emissions from ships. This strategy 21
calls for a reduction of the carbon intensity of new ships through implementation of further phases of 22
the energy efficiency design index (EEDI). Similarly, the IMO calls for a 40% reduction of the carbon 23
intensity of international shipping by 2030, and is striving for a 70% reduction by 2050. Such reductions 24
in carbon intensity would result in an overall decline in emissions of 50% in 2050 (relative to 2008). 25
These goals are likely insufficiently transformative for the decarbonisation of aviation or shipping, 26
though they are moving towards a start of decarbonisation at a period in history where the options are 27
still not clear, as set out in Sections 10.5 and 10.6. 28
Regulations? 29
The ICAO is not a regulatory agency, but rather produces standards and recommended practices that 30
are adopted in national/international legislation. IMO does publish ‘regulations’ but does not have 31
power of enforcement. Non-compliance can be regulated by nation states if they so desire, as a ship’s 32
‘MARPOL’ certificate, issued by the flag state of the ship, means there is some responsibility for states 33
with global shipping fleets. 34
Paris? 35
Some commentators have suggested that emissions from international aviation and shipping should be 36
part of the Paris Agreement (Gençsü and Hino 2015; Traut et al. 2018; Lee 2018; Rayner 2021) argue 37
that the shipping and aviation industries would prefer emissions to be treated under an international 38
regime rather than a national-oriented regime. If international aviation and shipping emissions were a 39
part of the Paris Agreement, it may remove something of the present ambiguity of responsibilities. 40
However, inclusion in the Paris agreement is unlikely to fundamentally change emissions trends unless 41
targets and enforcement mechanisms are developed either by ICAO and IMO or by nation states through 42
global processes. 43
Individual nations? 44
ACCEPTED VERSION
SUBJECT TO FIN
AL EDITS
Final Government Distribution Chapter 10 IPCC AR6 WGIII
Do Not Cite, Quote or Distribute 10-97 Total pages: 176
If international regulations do not occur, then the transformation of aviation and shipping will be left to 1
individual nations like Switzerland. In 2020, Switzerland approved a new CO2 tax on flights (The Swiss 2
Parliament 2020) with part of its revenues earmarked for the development of synthetic aviation fuels, 3
to cover up to 80% of their additional costs compared to fossil jet fuel (Energieradar 2020). Hence, 4
appropriate financing frameworks will be a key to the large-scale market adoption of these fuels. Egli 5
et al. (2019) suggest that the successful design of renewable energy investment policies for solar and 6
wind power over the past 20 years could serve as a model for future synthetic aviation fuels production 7
projects “attracting a broad spectrum of investors in order to create competition that drives down 8
financing cost”, and with state investment banks building “investor confidence in new technologies.” 9
These national investment policies would provide the key enablers for successful deployments. 10
END BOX HERE 11
Managing critical minerals: Critical minerals are required to manufacture LIB’s and other renewable 12
power technologies. There has been growing awareness that critical minerals may face challenges 13
related to resource availability, labour rights, and costs. Box 10.6, below, sets out the issues showing 14
how emerging national strategies on critical minerals, along with requirements from major vehicle 15
manufacturers, are addressing the need for rapid development of new mines with a more balanced 16
geography, less use of cobalt through continuing LIB innovations, and a focus on recycling batteries. 17
The standardisation of battery modules and packaging within and across vehicle platforms, as well as 18
increased focus on design for recyclability are important. Given the high degree of potential 19
recyclability of LIBs, a near closed-loop system in the future would be a feasible opportunity to 20
minimise critical mineral issues. 21
22
START BOX HERE 23 24
Box 10.6 Critical Minerals and The Future of Electro-Mobility and Renewables 25
The global transition towards renewable energy technologies and battery systems necessarily involves 26
materials, markets, and supply chains on a hitherto unknown scale and scope. This has raised concerns 27
regarding mineral requirements central to the feasibility of the energy transition. Constituent materials 28
required for the development of these low carbon technologies are regarded as “critical” materials (US 29
Geological Survey 2018; Commonwealth of Australia 2019; Lee et al. 2020; Marinaro et al. 2020; 30
Sovacool et al. 2020). ‘Critical materials’ are critical because of their economic or national security 31
importance, or high risk of supply disruption (UK Government 2019). describes many of these materials 32
and rare earth elements (REEs) as “technologically critical” not only due to their strategic or economic 33
importance but the risk of short supply or price volatility (Marinaro et al. 2020). In addition to these 34
indicators, production growth and market dynamics are also incorporated into screening tools to assess 35
emerging trends in material commodities that are deemed as fundamental to the well-being of the nation 36
(NSTC 2018). 37
The critical materials identified by most nations are: REEs Neodymium and Dysprosium for permanent 38
magnets in wind turbines and electric motors; Lithium and Cobalt, primarily for batteries though many 39
other metals are involved (see figure below); and, Cadmium, Telluriam, Selenium, Gallium and Indium 40
for solar PV manufacture (Valero et al. 2018; Giurco et al. 2019). Predictions are that the transition to 41
a clean energy world will be significantly energy intensive (World Bank Group 2017; Sovacool et al. 42
2020) putting pressure on the supply chain for many of the metals and materials required. 43
Governance of the sustainability of mining and processing of many of these materials, in areas generally 44
known for their variable environmental stewardship, remains inadequate and often a source for conflict. 45
(Sovacool et al. 2020) propose four holistic recommendations for improvement to make these industries 46
ACCEPTED VERSION
SUBJECT TO FIN
AL EDITS
Final Government Distribution Chapter 10 IPCC AR6 WGIII
Do Not Cite, Quote or Distribute 10-98 Total pages: 176
more efficient and resilient: diversification of mining enterprises for local ownership and livelihood 1
benefit; improve the traceability of material sources and transparency of mining enterprise; exploration 2
of alternative resources; and the incorporation of minerals into climate and energy planning by 3
connecting to the NDCs under the Paris Accord. 4
Resource Constraints? 5
Valero et al. (2018) highlights that the demand for many of the REEs and other critical minerals will, 6
at the current rate of RE infrastructure growth, increase a multiple of 3,000 times or more by 2050. 7
Some believe this growth may reach constraints in supply (Giurco et al. 2019). Others suggest that the 8
minerals involved are not likely to physically run out (Sovacool et al. 2020) if well managed, especially 9
as markets are found in other parts of the world (for example the transition away from Lithium in brine 10
lakes to hard rock sources). Lithium hydroxide, more suitable for batteries, now competes well, in terms 11
of cost, when extracted from rock sources (Azevedo et al. 2018) due to the ability to more easily create 12
high quality Lithium Hydroxide from rock sources, even though brines provide a cheaper source of 13
Lithium per se (Kavanagh et al. 2018). Australia has proven resources for all the Li-ion battery minerals 14
and has a strategy for their ethical and transparent production (Commonwealth of Australia 2019). 15
Changes in the technology have also been used to create less need for certain critical minerals 16
(Månberger and Stenqvist 2018). Recycling of all the minerals is not yet well developed but is likely to 17
be increasingly important (Habib and Wenzel 2014; Golroudbary et al. 2019; World Bank Group 2017; 18
Giurco et al. 2019). 19
International Collaboration 20
There have been many instances since the 1950’s when the supply of essential minerals has been 21
restricted by nations in times of conflict and world tensions, but international trade has continued under 22
the framework of the World Trade Organization. Keeping access open to critical minerals needed for a 23
low-carbon transition will be an essential role of the international community as the need for local 24
manufacture of such renewable and electro-mobility technologies will be necessary for local economies. 25
shows that the trend over the past 30 years has been for the US to move from being self-sufficient in 26
REEs to being 100% reliant on imports, predominantly from China, Japan, and France. In terms of 27
heavy REEs, essential for permanent magnets for wind turbines, China has a near-monopoly on REE 28
processing though other mines and manufacturing facilities are now responding to these constrained 29
markets (Stegen 2015; Gulley et al. 2018, 2019; Yan et al. 2020). China, on the other hand, is reliant 30
on other nations for the supply of other critical metals, particularly cobalt and lithium for batteries. 31
A number of Critical Materials Strategies have now been developed by nations developing the 32
manufacturing-base of new power and transport technologies. Some of these strategies pay particular 33
attention to the supply of lithium (Martin et al. 2017; Hache et al. 2019). For example, Horizon 2020, a 34
substantial EU Research and Innovation program, couples research and innovation in science, industry, 35
and society to foster a circular economy in Europe thus reducing these bottlenecks in the EU nations. 36
Similarly CREEN (Canada Rare Earth Elements Network) is supporting the US-EU-Japan resource 37
partnership with Australia (Klossek et al. 2016). 38
As renewables and electromobility-based development leapfrogs into the developing world it will be 39
important to ensure the critical minerals issues are managed for local security of supply as well as 40
participation in the mining and processing of such minerals to develop their own employment around 41
renewables and electro-mobility (Sovacool et al. 2020). 42
END BOX HERE 43
44
Enabling creative foresight: Human culture has always had a creative instinct that enables the future to 45
be better dealt with through imagination (Montgomery 2017). Science and engineering have often been 46
ACCEPTED VERSION
SUBJECT TO FIN
AL EDITS
Final Government Distribution Chapter 10 IPCC AR6 WGIII
Do Not Cite, Quote or Distribute 10-99 Total pages: 176
preceded by artistic expressions such as Jules Verne, who first dreamed of the Hydrogen future in 1874 1
in his novel The Mysterious Island. Autonomous vehicles have regularly occupied the minds of science 2
fiction authors and filmmakers (Braun 2019). Such narratives, scenario building, and foresighting are 3
increasingly seen as a part of the climate change mitigation process (Lennon et al. 2015; Muiderman et 4
al. 2020) and can ‘liberate oppressed imaginaries’ (Luque-Ayala 2018). (Barber 2021) have emphasised 5
the important role of positive images about the future instead of dystopian visions and the impossibility 6
of business-as-usual futures. 7
Transport visions can be a part of this cultural change as well as the more frequently presented visions 8
of renewable energy (Wentland 2016; Breyer et al. 2017). There are some emerging technologies like 9
Maglev, Hyperloop, and Drones that are likely to continue the electrification of transport even further 10
(Daim 2021) and which are only recently at the imagination stage. Decarbonised visions for heavy 11
vehicle systems appear to be a core need from the assessment of technologies in this chapter. Such 12
visioning or foresighting requires deliberative processes and the literature contains a growing list of 13
transport success stories based on such processes (Weymouth and Hartz-Karp 2015). Ultimately, 14
reducing GHG emissions from the transport sector would benefit from creative visions that integrate a 15
broad set of ideas about technologies, urban and infrastructure planning (including transport, electricity, 16
and telecommunication infrastructure), and human behaviour and at the same time can create 17
opportunities to achieve the SDGs. 18
Enabling transport climate emergency plans, local pledges and net zero strategies: National, regional 19
and local governments are now producing transport plans with a climate emergency focus (e.g. (Jaeger 20
et al. 2015; Pollard 2019)). Such plans are often grounded in the goals of the Paris Agreement, based 21
around Local Low Carbon Transport Roadmaps that contain targets for and involve commitments or 22
pledges from local stakeholders, such as workplaces, local community groups, and civil society 23
organisations. Pledges often include phasing out fossil-fuel based cars, buses, and trucks (Plötz et al. 24
2020), strategies to meet the targets through infrastructure, urban regeneration and incentives, and 25
detailed programs to help citizens adopt change. These institution-led mechanisms could include bike-26
to-work campaigns, free transport passes, parking charges, or eliminating car benefits. Community-27
based solutions like solar sharing, community charging, and mobility as a service can generate new 28
opportunities to facilitate low-carbon transport futures. Cities in India and China have established these 29
transport roadmaps, which are also supported by the UNCRD’s Environmentally Sustainable Transport 30
program (Baeumler et al. 2012; Pathak and Shukla 2016; UNCRD 2020). There have been concerns 31
raised that these pledges may be used to delay climate action in some cases (Lamb et al. 2020) but but 32
such pledges can be calculated at a personal level and applied through every level of activity from 33
individual, household, neighbourhood, business, city, nation or groups of nations (Meyer and Newman 34
2020) and are increasingly being demonstrated through shared communities and local activism 35
(Bloomberg and Pope 2017; Sharp 2018; Figueres and Rivett-Carnac 2020). Finally, the world’s major 36
financing institutions are also engaging in decarbonisation efforts by requiring their recipients to 37
commit to Net Zero Strategies before they can receive their funding (COVID Box, Chapter 1; Chapter 38
15; (Robins 2018; Newman 2020a)). As a result, transparent methods are emerging for calculating what 39
these financing requirements mean for transport by companies, cities, regions, and infrastructure 40
projects (see Chapters 8, 15). The continued engagement of financial institutions may, like in other 41
sectors, become a major factor in enabling transformative futures for transport as long as governance 42
and communities continue to express the need for such change. 43
44
10.8.4 Tools and Strategies to Enable Decarbonisation of the Transport Sector 45
Using the right tools and strategies is crucial for the successful deployment of mitigation options. Table 46
10.7 summarises the tools and strategies to enable electromobility, new fuels for aviation and shipping, 47
and the more social aspects of demand efficiency. 48
ACCEPTED VERSION
SUBJECT TO FIN
AL EDITS
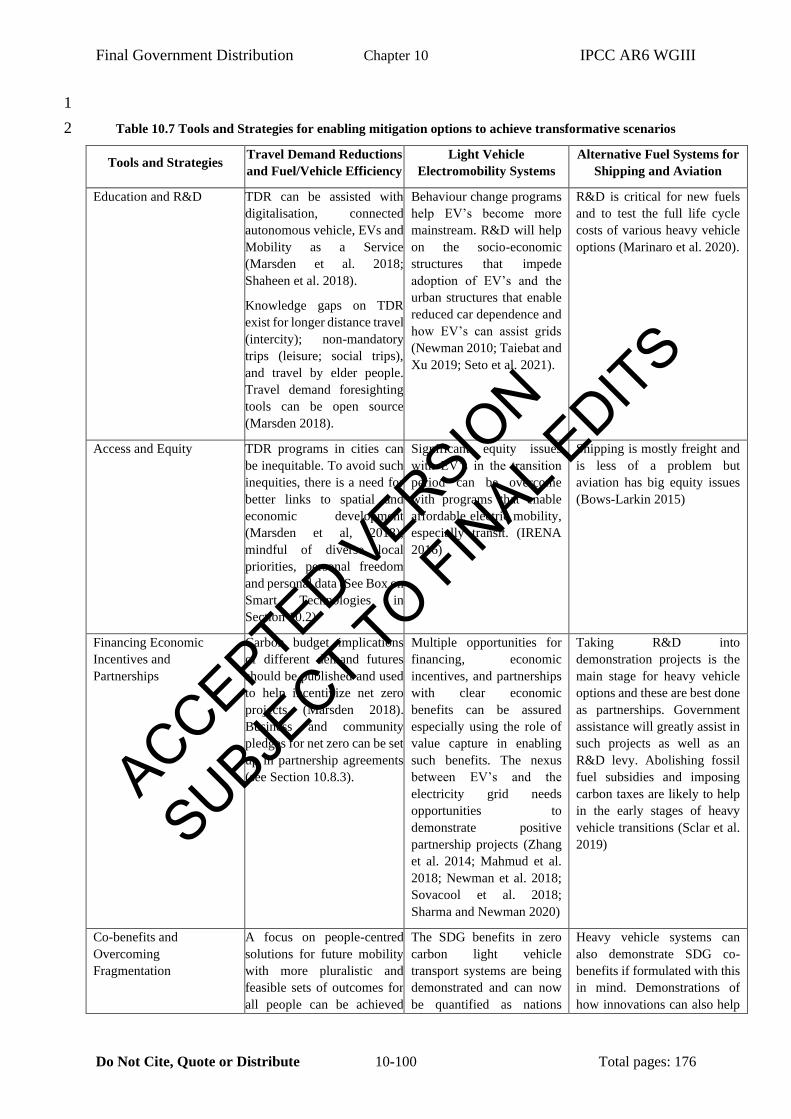
Final Government Distribution Chapter 10 IPCC AR6 WGIII
Do Not Cite, Quote or Distribute 10-100 Total pages: 176
1
Table 10.7 Tools and Strategies for enabling mitigation options to achieve transformative scenarios 2
Tools and Strategies Travel Demand Reductions
and Fuel/Vehicle Efficiency
Light Vehicle
Electromobility Systems
Alternative Fuel Systems for
Shipping and Aviation
Education and R&D TDR can be assisted with
digitalisation, connected
autonomous vehicle, EVs and
Mobility as a Service
(Marsden et al. 2018;
Shaheen et al. 2018).
Knowledge gaps on TDR
exist for longer distance travel
(intercity); non-mandatory
trips (leisure; social trips),
and travel by elder people.
Travel demand foresighting
tools can be open source
(Marsden 2018).
Behaviour change programs
help EV’s become more
mainstream. R&D will help
on the socio-economic
structures that impede
adoption of EV’s and the
urban structures that enable
reduced car dependence and
how EV’s can assist grids
(Newman 2010; Taiebat and
Xu 2019; Seto et al. 2021).
R&D is critical for new fuels
and to test the full life cycle
costs of various heavy vehicle
options (Marinaro et al. 2020).
Access and Equity TDR programs in cities can
be inequitable. To avoid such
inequities, there is a need for
better links to spatial and
economic development
(Marsden et al, 2018),
mindful of diverse local
priorities, personal freedom
and personal data (See Box on
Smart Technologies in
Section 10.2)
Significant equity issues
with EV’s in the transition
period can be overcome
with programs that enable
affordable electric mobility,
especially transit. (IRENA
2016)
Shipping is mostly freight and
is less of a problem but
aviation has big equity issues
(Bows-Larkin 2015)
Financing Economic
Incentives and
Partnerships
Carbon budget implications
of different demand futures
should be published and used
to help incentivize net zero
projects (Marsden 2018).
Business and community
pledges for net zero can be set
up in partnership agreements
(see Section 10.8.3).
Multiple opportunities for
financing, economic
incentives, and partnerships
with clear economic
benefits can be assured
especially using the role of
value capture in enabling
such benefits. The nexus
between EV’s and the
electricity grid needs
opportunities to
demonstrate positive
partnership projects (Zhang
et al. 2014; Mahmud et al.
2018; Newman et al. 2018;
Sovacool et al. 2018;
Sharma and Newman 2020)
Taking R&D into
demonstration projects is the
main stage for heavy vehicle
options and these are best done
as partnerships. Government
assistance will greatly assist in
such projects as well as an
R&D levy. Abolishing fossil
fuel subsidies and imposing
carbon taxes are likely to help
in the early stages of heavy
vehicle transitions (Sclar et al.
2019)
Co-benefits and
Overcoming
Fragmentation
A focus on people-centred
solutions for future mobility
with more pluralistic and
feasible sets of outcomes for
all people can be achieved
The SDG benefits in zero
carbon light vehicle
transport systems are being
demonstrated and can now
be quantified as nations
Heavy vehicle systems can
also demonstrate SDG co-
benefits if formulated with this
in mind. Demonstrations of
how innovations can also help
ACCEPTED VERSION
SUBJECT TO FIN
AL EDITS
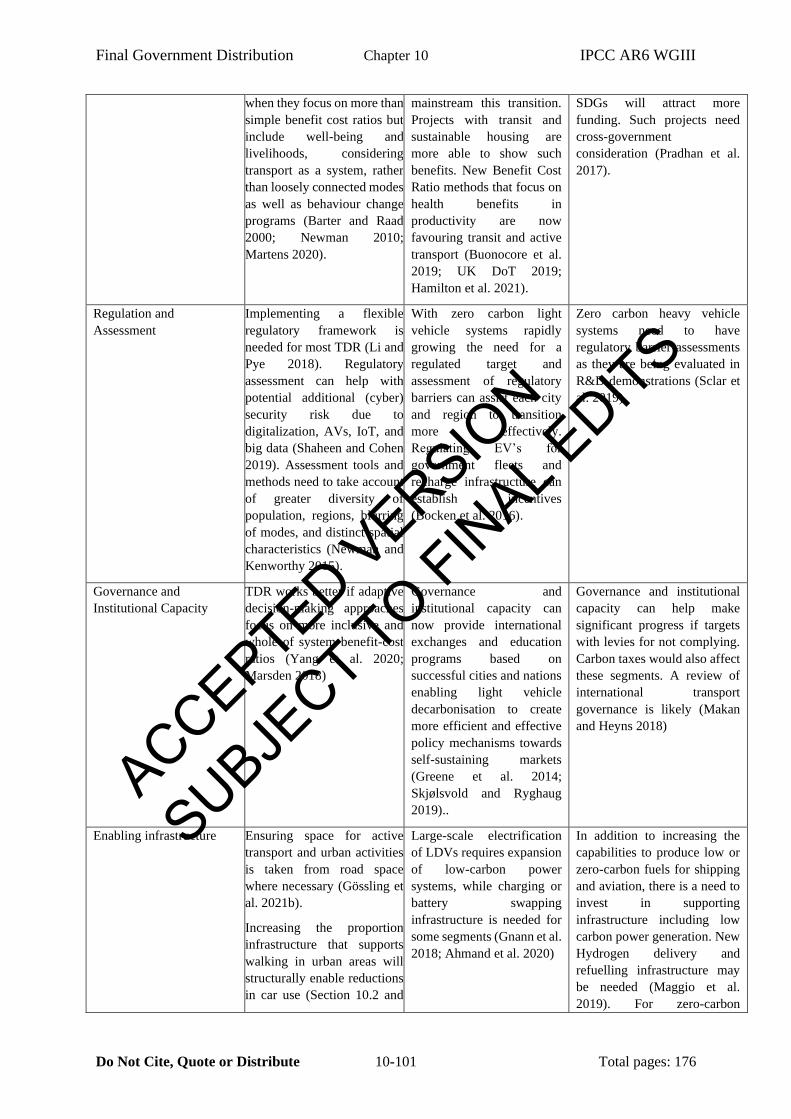
Final Government Distribution Chapter 10 IPCC AR6 WGIII
Do Not Cite, Quote or Distribute 10-101 Total pages: 176
when they focus on more than
simple benefit cost ratios but
include well-being and
livelihoods, considering
transport as a system, rather
than loosely connected modes
as well as behaviour change
programs (Barter and Raad
2000; Newman 2010;
Martens 2020).
mainstream this transition.
Projects with transit and
sustainable housing are
more able to show such
benefits. New Benefit Cost
Ratio methods that focus on
health benefits in
productivity are now
favouring transit and active
transport (Buonocore et al.
2019; UK DoT 2019;
Hamilton et al. 2021).
SDGs will attract more
funding. Such projects need
cross-government
consideration (Pradhan et al.
2017).
Regulation and
Assessment
Implementing a flexible
regulatory framework is
needed for most TDR (Li and
Pye 2018). Regulatory
assessment can help with
potential additional (cyber)
security risk due to
digitalization, AVs, IoT, and
big data (Shaheen and Cohen
2019). Assessment tools and
methods need to take account
of greater diversity of
population, regions, blurring
of modes, and distinct spatial
characteristics (Newman and
Kenworthy 2015).
With zero carbon light
vehicle systems rapidly
growing the need for a
regulated target and
assessment of regulatory
barriers can assist each city
and region to transition
more effectively.
Regulating EV’s for
government fleets and
recharge infrastructure can
establish incentives
(Bocken et al. 2016).
Zero carbon heavy vehicle
systems need to have
regulatory barrier assessments
as they are being evaluated in
R&D demonstrations (Sclar et
al. 2019).
Governance and
Institutional Capacity
TDR works better if adaptive
decision-making approaches
focus on more inclusive and
whole of system benefit-cost
ratios (Yang et al. 2020;
Marsden 2018)
Governance and
institutional capacity can
now provide international
exchanges and education
programs based on
successful cities and nations
enabling light vehicle
decarbonisation to create
more efficient and effective
policy mechanisms towards
self-sustaining markets
(Greene et al. 2014;
Skjølsvold and Ryghaug
2019)..
Governance and institutional
capacity can help make
significant progress if targets
with levies for not complying.
Carbon taxes would also affect
these segments. A review of
international transport
governance is likely (Makan
and Heyns 2018)
Enabling infrastructure Ensuring space for active
transport and urban activities
is taken from road space
where necessary (Gössling et
al. 2021b).
Increasing the proportion
infrastructure that supports
walking in urban areas will
structurally enable reductions
in car use (Section 10.2 and
Large-scale electrification
of LDVs requires expansion
of low-carbon power
systems, while charging or
battery swapping
infrastructure is needed for
some segments (Gnann et al.
2018; Ahmand et al. 2020)
In addition to increasing the
capabilities to produce low or
zero-carbon fuels for shipping
and aviation, there is a need to
invest in supporting
infrastructure including low
carbon power generation. New
Hydrogen delivery and
refuelling infrastructure may
be needed (Maggio et al.
2019). For zero-carbon
ACCEPTED VERSION
SUBJECT TO FIN
AL EDITS
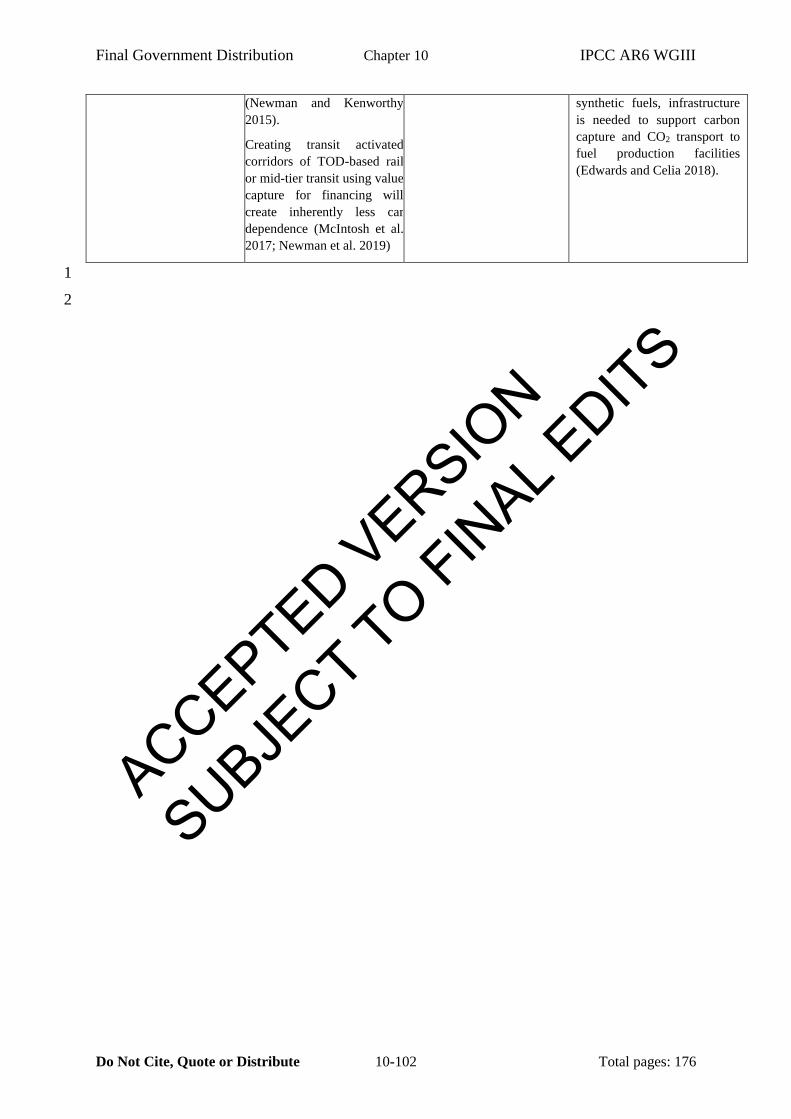
Final Government Distribution Chapter 10 IPCC AR6 WGIII
Do Not Cite, Quote or Distribute 10-102 Total pages: 176
(Newman and Kenworthy
2015).
Creating transit activated
corridors of TOD-based rail
or mid-tier transit using value
capture for financing will
create inherently less car
dependence (McIntosh et al.
2017; Newman et al. 2019)
synthetic fuels, infrastructure
is needed to support carbon
capture and CO2 transport to
fuel production facilities
(Edwards and Celia 2018).
1
2
ACCEPTED VERSION
SUBJECT TO FIN
AL EDITS

Final Government Distribution Chapter 10 IPCC AR6 WGIII
Do Not Cite, Quote or Distribute 10-103 Total pages: 176
Frequently Asked Questions (FAQs) 1
FAQ 10.1 -How important is electro-mobility in decarbonising transport and are there major 2
constraints in battery minerals? 3
Electromobility is the biggest change in transport since AR5. When powered with low-carbon 4
electricity, electric vehicles (EVs) provide a mechanism for major GHG emissions reductions from the 5
largest sources in the transport sectors, including cars, motor-bikes, tuk tuks, buses and trucks. The 6
mitigation potential of EVs depends on the decarbonization of the power system. EVs can be charged 7
by home or business renewable power before or in parallel to the transition to grid-based low-carbon 8
power. 9
Electromobility is happening rapidly in micro-mobility (e-autorickshaws, e-scooters, e-bikes) and in 10
transit systems, especially buses. EV adoption is also accelerating for personal cars. EVs can be used 11
in grid stabilization through smart charging applications. 12
The state-of-the-art Lithium-Ion Batteries (LIBs) available in 2020 are superior to alternative cell 13
technologies in terms of battery life, energy density, specific energy, and cost. The expected further 14
improvements in LIBs suggest these chemistries will remain superior to alternative battery technologies 15
in the medium-term, and therefore LIBs will continue to dominate the electric vehicle market. 16
Dependence on LIB metals will remain, which may be a concern from the perspective of resource 17
availability and costs. However, the demand for such metals is much lower than the reserves available, 18
with many new mines starting up in response to the new market particularly in a diversity of places. 19
Recycling batteries will significantly reduce long-term resource requirements. The standardisation of 20
battery modules and packaging within and across vehicle platforms, as well as increased focus on design 21
for recyclability are important. Many mobility manufacturers and governments are considering battery 22
recycling issues to ensure the process is mainstreamed. 23
The most significant enabling condition in electro-mobility is to provide electric recharging 24
opportunities and a strategy to show they can be helping the grid. 25
FAQ 10.2 - How hard is it to decarbonise heavy vehicles in transport like long haul trucks, ships 26
and planes? 27
Unlike for land transport vehicles, there are few obvious solutions to decarbonizing heavy vehicles like 28
international ships and planes. The main focus has been increased efficiency, which so far has not 29
prevented these large vehicles from becoming the fastest growing source of GHG globally. These 30
vehicles likely need alternative fuels that can be fitted to the present propulsion systems. Emerging 31
demonstrations suggest that ammonia, advanced biofuels, or synthetic fuels could become commercial. 32
Electric propulsion using hydrogen fuel cells or Li-ion batteries could work with short-haul aviation 33
and shipping, but the large long-lived vessels and aircraft likely 34
need alternative liquid fuels for most major long-distance functions. 35
Advanced biofuels, if sourced from resources with low GHG footprints, offer decarbonisation 36
opportunities. As shown in Chapters 2, 6, and 12, there are multiple issues constraining traditional 37
biofuels. Sustainable land management and feedstocks, as well as R&D efforts to improve 38
lignocellulosic conversion routes are key to maximise the mitigation potential from advanced biofuels. 39
Synthetic fuels made using CO2 captured with DAC/BECCS and low-carbon hydrogen can 40
subsequently be refined to a net zero jet fuel or marine fuel. These fuels may also have less contrails-41
based climate impacts and low emissions of local air pollution. However, these fuels still require 42
significant R&D and demonstration. 43
ACCEPTED VERSION
SUBJECT TO FIN
AL EDITS
Final Government Distribution Chapter 10 IPCC AR6 WGIII
Do Not Cite, Quote or Distribute 10-104 Total pages: 176
The deployment of low-carbon aviation and shipping fuels that support decarbonisation of the transport 1
sector will likely require changes to national and international governance structures 2
FAQ 10.3 - How can governments, communities and individuals reduce demand and be more 3
efficient in consuming transport energy? 4
Cities can reduce their transport-related fuel consumption by around 25% through combinations of more 5
compact land use and less car dependent transport infrastructure. 6
More traditional programs for reducing unnecessary high-energy travel through behaviour change 7
programs (i.e., taxes on fuel, parking, and vehicles or subsidies for alternative low-carbon modes), 8
continue to be evaluated with mixed results due to the dominance of time savings in an individual’s 9
decision-making. 10
The circular economy, the shared economy, and digitalisation trends can support systemic changes that 11
lead to reductions in demand for transport services or expands the use of more efficient transport modes 12
COVID-19-based lockdowns have confirmed the transformative value of telecommuting replacing 13
significant numbers of work and personal journeys as well as promoting local active transport. These 14
changes may not last and impacts on productivity and health are still to be fully evaluated. 15
Solutions for individual households and businesses involving pledges and shared communities that set 16
new cultural means of reducing fossil fuel consumption, especially in transport, are setting out new 17
approaches for how climate change mitigation can be achieved. 18
19
ACCEPTED VERSION
SUBJECT TO FIN
AL EDITS
Final Government Distribution Chapter 10 IPCC AR6 WGIII
Do Not Cite, Quote or Distribute 10-105 Total pages: 176
References 1
Abe, R., 2021: Preferences of urban rail users for first-and last-mile autonomous vehicles: Price and 2 service elasticities of demand in a multimodal environment. Transportation Research Part C: 3 Emerging Technologies, 126. 4
Abrahamse, W., L. Steg, R. Gifford, and C. Vlek, 2009: Factors influencing car use for commuting and 5 the intention to reduce it: A question of self-interest or morality? Transportation Research Part 6 F: Traffic Psychology and Behaviour, 12, 317–324, https://doi.org/10.1016/j.trf.2009.04.004. 7
ADB, 2018: Sustainable Transport Solutions. Low-Carbon Buses in the People’s Republic of China 12. 8
AFDC, 2021: Hydrogen Fueling Station Locations. 9 https://afdc.energy.gov/fuels/hydrogen_stations.html. 10
Ahmad, S., and J. A. P. de Oliveira, 2016: Determinants of urban mobility in India: Lessons for 11 promoting sustainable and inclusive urban transportation in developing countries. Transport 12 Policy, 50, 106–114. 13
Ahmadi, L., S. B. Young, M. Fowler, R. A. Fraser, and M. A. Achachlouei, 2017: A cascaded life cycle: 14 reuse of electric vehicle lithium-ion battery packs in energy storage systems. The International 15 Journal of Life Cycle Assessment, 22, 111–124. 16
Ahmand, F., M. Alam, I. Alsaidan, and S. Shariff, 2020: Battery swapping station for electric vehicles: 17 opportunities and challenges. IET Smart Grid, 3, 280–286. 18
Ainalis, D., C. Thorne, and D. Cebon, 2020: Decarbonising the UK’s Long-Haul Road Freight at 19 Minimum Economic Cost,: Centre for Sustainable Road Freight. http://www.csrf.ac.uk/wp-20 content/uploads/2020/07/SRF-WP-UKEMS-v2.pdf. 21
Airqo, 2020: Know your air. airqo.net,. 22
Åkerman, J., 2011: The role of high-speed rail in mitigating climate change–The Swedish case 23 Europabanan from a life cycle perspective. Transportation Research Part D: Transport and 24 Environment, 16, 208–217. 25
El Akkari, M., O. Réchauchère, A. Bispo, B. Gabrielle, and D. Makowski, 2018: A meta-analysis of 26 the greenhouse gas abatement of bioenergy factoring in land use changes. Scientific reports, 8, 1–27 7. 28
Aksenov, Y., E. E. Popova, A. Yool, A. J. G. Nurser, T. D. Williams, L. Bertino, and J. Bergh, 2017: 29 On the future navigability of Arctic sea routes: High-resolution projections of the Arctic Ocean 30 and sea ice. Marine Policy, 75, 300–317. 31
Akyelken, N., D. Banister, and M. Givoni, 2018: The sustainability of shared mobility in London: The 32 dilemma for governance. Sustainability, 10, 420. 33
Al-Qahtani, A., B. Parkinson, K. Hellgardt, N. Shah, and G. Guillen-Gosalbez, 2021: Uncovering the 34 true cost of hydrogen production routes using life cycle monetisation. Applied Energy, 281, 35 115958, https://doi.org/10.1016/j.apenergy.2020.115958. 36
Albrecht, F. G., D. König, N. Baucks, and R.-U. Dietrich, 2017: A standardized methodology for the 37 techno-economic evaluation of alternative fuels–A case study. Fuel, 194, 511–526. 38
Aliabadi, A. A., R. M. Staebler, and S. Sharma, 2015: Air quality monitoring in communities of the 39 Canadian Arctic during the high shipping season with a focus on local and marine pollution. 40 Atmospheric Chemistry and Physics, 15, 2651–2673, https://doi.org/10.5194/acp-15-2651-2015. 41
Alonso-González, M. J., T. Liu, O. Cats, N. Van Oort, and S. Hoogendoorn, 2018: The potential of 42 demand-responsive transport as a complement to public transport: An assessment framework and 43 an empirical evaluation. Transportation Research Record, 2672, 879–889. 44
Altieri, K., H. Trollip, T. Caetano, A. Hughes, B. Merven, and H. Winkler, 2015: Pathways to deep 45
ACCEPTED VERSION
SUBJECT TO FIN
AL EDITS
Final Government Distribution Chapter 10 IPCC AR6 WGIII
Do Not Cite, Quote or Distribute 10-106 Total pages: 176
decarbonization in South Africa. 1–218 pp. 1
Ambrose, H., A. Kendall, M. Lozano, S. Wachche, and L. Fulton, 2020: Trends in life cycle greenhouse 2 gas emissions of future light duty electric vehicles. Transportation Research Part D: Transport 3 and Environment, 81, 102287, https://doi.org/10.1016/j.trd.2020.102287. 4
Ampersand, 2020: Ampersand. ampersand.solar,. 5
Anda, C., A. Earth, and P. J. Fourie, 2017: Transport modelling in the age of big data. International 6 Journal of Urban Sciences, 21, 19–42. 7
Anderson, M., K. Salo, and E. Fridell, 2015: Particle- and Gaseous Emissions from an LNG Powered 8 Ship. Environmental Science and Technology, 49, 12568–12575, 9 https://doi.org/10.1021/acs.est.5b02678. 10
Andwari, A. M., A. Pesiridis, S. Rajoo, and R. Martinez-, 2017: A review of Battery Electric Vehicle 11 technology and readiness levels. Renewable and Sustainable Energy Reviews, 78, 414–430, 12 https://doi.org/10.1016/j.rser.2017.03.138. 13
Anenberg, S., J. Miller, D. Henze, and R. Minjares, 2019: A global snapshot of the air pollution-related 14 health impacts of transportation sector emissions in 2010 and 2015. International Council on 15 Clean Transportation, 55. 16
Archer, D., and Coauthors, 2009: Atmospheric lifetime of fossil fuel carbon dioxide. Annual review of 17 earth and planetary sciences, 37, 117–134, 18 https://doi.org/https://doi.org/10.1146/annurev.earth.031208.100206. 19
Argonne National Laboratory, 2020: AFLEET Tool. https://greet.es.anl.gov/afleet_tool (Accessed 20 September 30, 2021). 21
Aria, E., J. Olstam, and C. Schwietering, 2016: Investigation of Automated Vehicle Effects on Driver’s 22 Behavior and Traffic Performance. Transportation Research Procedia, Vol. 15 of, Elsevier B.V., 23 761–770. 24
Arrowsmith, S., and Coauthors, 2020: Updated analysis of the non-CO2 climate impacts of aviation 25 and potential policy measures pursuant to the EU Emissions Trading System Directive Article 26 30(4). 193 pp. 27 https://www.easa.europa.eu/sites/default/files/dfu/201119_report_com_ep_council_updated_ana28 lysis_non_co2_climate_impacts_aviation.pdf. 29
ATAG, 2018: Aviation: Benefits Beyond Borders. https://aviationbenefits.org/ (Accessed November 30 23, 2019). 31
Auld, J., V. Sokolov, and T. S. Stephens, 2017: Analysis of the effects of connected-automated vehicle 32 technologies on travel demand. Transportation Research Record, 2625, 1–8, 33 https://doi.org/10.3141/2625-01. 34
Awoyomi, A., K. Patchigolla, and E. J. Anthony, 2020: Process and Economic Evaluation of an 35 Onboard Capture System for LNG-Fueled CO2 Carriers. Industrial and Engineering Chemistry 36 Research, 59, 6951–6960, https://doi.org/10.1021/acs.iecr.9b04659. 37
Azevedo, M., N. Campagnol, T. Hagenbruch, K. Hoffman, A. Lala, and O. Ramsbottom, 2018: Lithium 38 and cobalt: A tale of two commodities. 39
Baeumler, A., E. Ijjasz-Vasquez, and S. Mehndiratta, 2012: Sustainable low-carbon city development 40 in China. 41
Bagheri, M., M. N. Mladenović, I. Kosonen, and J. K. Nurminen, 2020: Analysis of potential shift to 42 low-carbon urban travel modes: A computational framework based on high-resolution smartphone 43 data. Sustainability, 12, 5901. 44
Bakhat, M., X. Labandeira, L. José M., and X. López-Otero, 2017: Elasticities of transport fuels at times 45 of economic crisis: An empirical analysis for Spain. Energy Economics, 68, 66–80. 46
ACCEPTED VERSION
SUBJECT TO FIN
AL EDITS
Final Government Distribution Chapter 10 IPCC AR6 WGIII
Do Not Cite, Quote or Distribute 10-107 Total pages: 176
Balcombe, P., J. Brierley, C. Lewis, L. Skatvedt, J. Speirs, A. Hawkes, and I. Staffell, 2019: How to 1 decarbonise international shipping: Options for fuels, technologies and policies. Energy 2 Conversion and Management, 182, 72–88, https://doi.org/10.1016/j.enconman.2018.12.080. 3
Barber, J., 2021: The Challenge of Imagining Sustainable Futures: Climate Fiction in Sustainability 4 Communication. The Sustainability Communication Reader: A Reflective Compendium, 143–160. 5
Baron, T., G. Martinetti, and D. Pepion, 2011: Carbon footprint of high speed rail. 58 pp. 6 https://railroads.dot.gov/sites/fra.dot.gov/files/fra_net/15009/Carbon Footprint of High-Speed 7 Rail UIC 2011.pdf. 8
Barter, P. A., and T. Raad, 2000: TAKING STEPS-A COMMUNITY ACTION GUIDE TO PEOPLE-9 CENTRED, EQUITABLE AND SUSTAINABLE URBAN TRANSPORT. 10
Bastian, A., M. Börjesson, and J. Eliasson, 2016: Explaining “peak car” with economic variables. 11 Transportation Research Part A: Policy and Practice, 88, 236–250, 12 https://doi.org/10.1016/J.TRA.2016.04.005. 13
Bataille, C., D. Sawyer, and N. Melton, 2015: Pathways to deep decarbonization in Canada. 14
Bataille, C., and Coauthors, 2020: Net-zero deep decarbonization pathways in Latin America: 15 Challenges and opportunities. Energy Strategy Reviews, 30, 16 https://doi.org/10.1016/j.esr.2020.100510. 17
Bauer, C., J. Hofer, H.-J. Althaus, A. Del Duce, and A. Simons, 2015: The environmental performance 18 of current and future passenger vehicles: Life cycle assessment based on a novel scenario analysis 19 framework. Applied Energy, 157, 871–883, 20 https://doi.org/https://doi.org/10.1016/j.apenergy.2015.01.019. 21
Bayat, Y., and M. Ghazikhani, 2020: Experimental investigation of compressed natural gas using in an 22 indirect injection diesel engine at different conditions. Journal of Cleaner Production, 271, 23 122450, https://doi.org/10.1016/j.jclepro.2020.122450. 24
Bayliss, K., and G. Mattioli, 2018: Privatisation, Inequality and Poverty in the UK. 25
Becken, S., and B. Mackey, 2017: What role for offsetting aviation greenhouse gas emissions in a deep-26 cut carbon world? Journal of Air Transport Management, 63, 71–83. 27
——, and J. Shuker, 2019: A framework to help destinations manage carbon risk from aviation 28 emissions. Tourism Management, 71, 294–304, https://doi.org/10.1016/j.tourman.2018.10.023. 29
Becker, H., M. Balac, F. Ciari, and K. W. Axhausen, 2020: Assessing the welfare impacts of Shared 30 Mobility and Mobility as a Service (MaaS). Transportation Research Part A: Policy and Practice, 31 131, 228–243, https://doi.org/10.1016/J.TRA.2019.09.027. 32
Bekel, K., and S. Pauliuk, 2019: Prospective cost and environmental impact assessment of battery and 33 fuel cell electric vehicles in Germany. International Journal of Life Cycle Assessment, 24, 2220–34 2237, https://doi.org/10.1007/s11367-019-01640-8. 35
Benajes, J., G. Antonio, J. Monsalve-Serrano, and S. Martinez-Boggio, 2020: Emissions Reduction 36 from Passenger Cars with RCCI Plug-in Hybrid Electric Vehicle Technology. Applied Thermal 37 Engineering, 164, 114430. 38
Benevolo, C., R. P. Dameri, and B. D’Auria, 2016: Smart mobility in smart city action taxonomy, ICT 39 intensity and public benefits. Lecture Notes in Information Systems and Organisation, Vol. 11 of, 40 Springer Heidelberg, 13–28. 41
Bengtsson, S., K. Andersson, and E. Fridell, 2011: A comparative life cycle assessment of marine fuels: 42 Liquefied natural gas and three other fossil fuels. Proceedings of the Institution of Mechanical 43 Engineers Part M: Journal of Engineering for the Maritime Environment, 225, 97–110, 44 https://doi.org/10.1177/1475090211402136. 45
Bergantino, A. S., C. Capozza, and M. Capurso, 2018a: Pricing strategies: who leads and who follows 46 in the air and rail passenger markets in Italy. Applied Economics, 50, 4937–4953. 47
ACCEPTED VERSION
SUBJECT TO FIN
AL EDITS
Final Government Distribution Chapter 10 IPCC AR6 WGIII
Do Not Cite, Quote or Distribute 10-108 Total pages: 176
Bergantino, A. S., M. Capurso, and J. Toner, 2018b: Households ’ expenditure elasticities for transport 1 products and services : a geo-demographic approach. 2
Berkeley, N., D. Bailey, A. Jones, and D. Jarvis, 2017: Assessing the transition towards Battery Electric 3 Vehicles: A Multi-Level Perspective on drivers of, and barriers to, take up. Transportation 4 Research Part A: Policy and Practice, 106, 320–332. 5
Bhandari, R., Trudewind, C. A., and P. Zapp, 2014: Life cycle assessment of hydrogen production via 6 electrolysis – a review. Journal of Cleaner Production, 85, 151–163, 7 https://doi.org/10.1016/j.jclepro.2013.07.048. 8
Bi, M., S. He, and W. Xu, 2019: Express delivery with high-speed railway: Definitely feasible or just a 9 publicity stunt. Transportation Research Part A: Policy and Practice, 120, 165–187. 10
Bicer, Y., and I. Dincer, 2017: Life cycle evaluation of hydrogen and other potential fuels for aircrafts. 11 International Journal of Hydrogen Energy, 42, 10722–10738. 12
Bicer, Y., and I. Dincer, 2018a: Environmental impact categories of hydrogen and ammonia driven 13 transoceanic maritime vehicles: A comparative evaluation. International Journal of Hydrogen 14 Energy, 43, 4583–4596. 15
Bicer, Y., and I. Dincer, 2018b: Clean fuel options with hydrogen for sea transportation: A life cycle 16 approach. International Journal of Hydrogen Energy, 43, 1179–1193, 17 https://doi.org/https://doi.org/10.1016/j.ijhydene.2017.10.157. 18
Bier, A., and U. Burkhardt, 2019: Variability in contrail ice nucleation and its dependence on soot 19 number emissions. Journal of Geophysical Research: Atmospheres, 124, 3384–3400. 20
——, ——, and L. Bock, 2017: Synoptic control of contrail cirrus life cycles and their modification 21 due to reduced soot number emissions. Journal of Geophysical Research: Atmospheres, 122, 22 11,584-11,603. 23
Biernacki, P., T. Röther, W. Paul, P. Werner, and S. Steinigeweg, 2018: Environmental impact of the 24 excess electricity conversion into methanol. Journal of Cleaner Production, 191, 87–98, 25 https://doi.org/10.1016/j.jclepro.2018.04.232. 26
Blasco, J., V. Durán-Grados, M. Hampel, and J. Moreno-Gutiérrez, 2014: Towards an integrated 27 environmental risk assessment of emissions from ships’ propulsion systems. Environment 28 International, 66, 44–47, https://doi.org/10.1016/J.ENVINT.2014.01.014. 29
Bleischwitz, R., H. Hoff, C. Spataru, E. Van der Voet, S. D., and VanDeveer, 2017: Routledge handbook 30 of the resource nexus. Routledge,. 31
Bloomberg, M., and C. Pope, 2017: Climate of hope: How cities, businesses, and citizens can save the 32 planet. St. Martin’s Press,. 33
BloombergNEF, 2020: Hydrogen economy outlook key messages Key messages. 34
BNEF, 2020: Hydrogen Economy Outlook Key messages. 35 https://data.bloomberglp.com/professional/sites/24/BNEF-Hydrogen-Economy-Outlook-Key-36 Messages-30-Mar-2020.pdf (Accessed September 30, 2021). 37
Bocken, N. M. P., I. de Pauw, C. Bakker, and B. van der Grinten, 2016: Product design and business 38 model strategies for a circular economy. Journal of Industrial and Production Engineering, 33, 39 308–320. 40
Bond, K., E. Vaughan, and H. Benham, 2020: Decline and Fall: The size and vulnerability of the fossil 41 fuel system. https://carbontracker.org/reports/decline-and-fall/. 42
Bongartz, D., and Coauthors, 2018: Comparison of light-duty transportation fuels produced from 43 renewable hydrogen and green carbon dioxide. Applied Energy, 231, 757–767, 44 https://doi.org/10.1016/j.apenergy.2018.09.106. 45
Borck, R., and J. K. Brueckner, 2018: Optimal Energy Taxation in Cities. Journal of the association of 46
ACCEPTED VERSION
SUBJECT TO FIN
AL EDITS
Final Government Distribution Chapter 10 IPCC AR6 WGIII
Do Not Cite, Quote or Distribute 10-109 Total pages: 176
environmental and resource economists, 5, 481–516, https://doi.org/10.1086/695614. 1
Borén, S., 2019: Electric buses’ sustainability effects, noise, energy use, and costs. International 2 Journal of Sustainable Transportation,. 3
de Bortoli, A., and Z. Christoforou, 2020: Consequential LCA for territorial and multimodal 4 transportation policies: method and application to the free-floating e-scooter disruption in Paris. 5 Journal of Cleaner Production, 273, 122898, https://doi.org/10.1016/j.jclepro.2020.122898. 6
——, A. Féraille, and F. Leurent, 2017: Life Cycle Assessment to Support Decision-Making in 7 Transportation Planning: A Case of French Bus Rapid Transit. Proceedings of the Transportation 8 Research Board, Washington, D.C. 9
Bösch, P. M., F. CIARI, and kAY W. Axhausen, 2018: Transport policy optimization with autonomous 10 vehicles. Transportation Research Record, 2672, 698–707. 11
Bouman, E. A., E. Lindstad, A. I. Rialland, and A. H. Strømman, 2017: State-of-the-art technologies, 12 measures, and potential for reducing GHG emissions from shipping – A review. Transportation 13 Research Part D: Transport and Environment, 52, 408–421, 14 https://doi.org/10.1016/J.TRD.2017.03.022. 15
Bouman, T., and L. Steg, 2019: Motivating Society-wide Pro-environmental Change. One Earth, 1, 27–16 30, https://doi.org/10.1016/j.oneear.2019.08.002. 17
Bows-Larkin, A., 2015: All adrift: aviation, shipping, and climate change policy. Climate Policy, 15, 18 681–702, https://doi.org/10.1080/14693062.2014.965125. 19
Bows, A., K. Anderson, and P. Upham, 2008: Aviation and climate change: Lessons for European 20 policy. 21
Brand, C., and Coauthors, 2021: The climate change mitigation effects of daily active travel in cities. 22 Transportation Research Part D: Transport and Environment, 93, 102764. 23
Braun, R., 2019: Autonomous vehicles: from science fiction to sustainable future. Mobilities, 24 Literature, Culture, Palgrave Macmillan, Cham, 259–280. 25
Brewer, G. D., 1991: Hydrogen aircraft technology. London: CRC Press.,. 26
Breyer, C., S. Heinonen, and J. Ruotsalainen, 2017: New consciousness: A societal and energetic vision 27 for rebalancing humankind within the limits of planet Earth. Technological Forecasting and 28 Social Change, 114, 7–15. 29
Brosch, T., D. Sander, and M. K. Patel, 2016: Editorial: Behavioral Insights for a Sustainable Energy 30 Transition . Frontiers in Energy Research , 4, 15. 31
Brown, T., 2019: MAN Energy Solutions: An Ammonia Engine for the Maritime Sector; Ammonia 32 Energy Association. https://www.ammoniaenergy.org/articles/man-energy-solutions-an-33 ammonia-engine-for-the-maritime-sector/ (Accessed October 18, 2021). 34
Browse, J., K. S. Carslaw, A. Schmidt, and J. J. Corbett, 2013: Impact of future Arctic shipping on 35 high-latitude black carbon deposition. Geophysical Research Letters, 40, 4459–4463, 36 https://doi.org/10.1002/grl.50876. 37
Brussel, M., M. Zuidgeest, K. Pfeffer, and M. van Maarseveen, 2019: Access or Accessibility? A 38 Critique of the Urban Transport SDG Indicator. ISPRS International Journal of Geo-Information, 39 8, 67, https://doi.org/10.3390/ijgi8020067. 40
Bruun, E., and M. Givoni, 2015: Sustainable mobility: Six research routes to steer transport policy. 41 Nature, 523, 29–31, https://doi.org/10.1038/523029a. 42
Brynolf, S., E. Fridell, and K. Andersson, 2014: Environmental assessment of marine fuels: Liquefied 43 natural gas, liquefied biogas, methanol and bio-methanol. Journal of Cleaner Production, 74, 86–44 95, https://doi.org/10.1016/j.jclepro.2014.03.052. 45
Buhaug, Ø., J. J. Corbett, O. Endresen, V. Eyring, J. Faber, S. Hanayama, and K. Yoshida, 2009: 2nd 46
ACCEPTED VERSION
SUBJECT TO FIN
AL EDITS
Final Government Distribution Chapter 10 IPCC AR6 WGIII
Do Not Cite, Quote or Distribute 10-110 Total pages: 176
IMO GHG Study 2009. 1 http://www.imo.org/en/OurWork/Environment/PollutionPrevention/AirPollution/Documents/Se2 condIMOGHGStudy2009.pdf. 3
Buira, D., and J. Tovilla, 2015: Pathways to deep decarbonization in Mexico. 4
Buixadé Farré, A., and Coauthors, 2014: Commercial Arctic shipping through the Northeast Passage: 5 routes, resources, governance, technology, and infrastructure. Polar Geography, 37, 298–324, 6 https://doi.org/10.1080/1088937X.2014.965769. 7
Bullock, S., J. Mason, J. Broderick, and A. Larkin, 2020: Shipping and the Paris climate agreement: a 8 focus on committed emissions. BMC Energy 2020 2:1, 2, 1–16, https://doi.org/10.1186/S42500-9 020-00015-2. 10
Buonocore, J. J., and Coauthors, 2019: Metrics for the sustainable development goals: renewable energy 11 and transportation. Plagrave communications,. 12
Burke, A., and A. K. Sinha, 2020: Technology, Sustainability, and Marketing of Battery Electric and 13 Hydrogen Fuel Cell Medium-Duty and Heavy-Duty Trucks and Buses in 2020-2040. 14
Burnham, A., and Coauthors, 2021: Comprehensive total cost of ownership quantification for vehicles 15 with different size classes and powertrains. 16
Cai, H., A. Burnham, M. Wang, W. Hang, and A. Vyas, 2015: The GREET Model Expansion for Well-17 to-Wheels Analysis of Heavy-Duty Vehicles. No. ANL/ESD-15/9 pp. 18
——, ——, R. Chen, and M. Wang, 2017: Wells to wheels: Environmental implications of natural gas 19 as a transportation fuel. Energy Policy, 109, 565–578, 20 https://doi.org/10.1016/j.enpol.2017.07.041. 21
Canadell, J. G., and Coauthors, 2021: Global carbon and other biogeochemical cycles and feedbacks. 22 Climate change 2021: The physical science basis. Contribution of working group i to the sixth 23 assessment report of the intergovernmental panel on climate change, Cambridge University Press. 24
Cano, Z. P., D. Banham, S. Ye, A. Hintennach, J. Lu, M. Fowler, and Z. Chen, 2018: Batteries and fuel 25 cells for emerging electric vehicle markets. Nature Energy, 3, 279–289, 26 https://doi.org/10.1038/s41560-018-0108-1. 27
Capaz, R. S., E. Guida, J. E. A. Seabra, P. Osseweijer, and J. A. Posada, 2021a: Mitigating carbon 28 emissions through sustainable aviation fuels: costs and potential. Biofuels, Bioproducts and 29 Biorefining, 15, 502–524, https://doi.org/10.1002/bbb.2168. 30
——, J. A. Posada, P. Osseweijer, and J. E. A. Seabra, 2021b: The carbon footprint of alternative jet 31 fuels produced in Brazil: exploring different approaches. Resources, Conservation and Recycling, 32 166, 105260, https://doi.org/10.1016/j.resconrec.2020.105260. 33
Capurso, M., S. Hess, and T. Dekker, 2019: Modelling the role of consideration of alternatives in mode 34 choice: An application on the Rome-Milan corridor. Transportation Research Part A: Policy and 35 Practice, 129, 170–184. 36
CARB, 2019: Annual Evaluation of Fuel Cell Electric Vehicle Deployment & Hydrogen Fuel Station 37 Network Development,: California Air Resources Board (CARB). 38 https://ww2.arb.ca.gov/sites/default/files/2019-07/AB8_report_2019_Final.pdf. 39
——, 2020: California Hydrogen Infrastructure Tool (CHIT): California Air Resources Board (CARB). 40
Carmichael, R., 2019: Behaviour change, public engagement and Net Zero, a report for the Committee 41 on Climate Change. 81 pp. https://d423d1558e1d71897434.b-cdn.net/wp-42 content/uploads/2019/10/Behaviour-change-public-engagement-and-Net-Zero-Imperial-College-43 London.pdf. 44
Carter, C., and L. Koh, 2018: Blockchain disruption in transport: are you decentralised yet? 45
Castanheira, É. G., R. Grisoli, S. Coelho, G. Anderi Da Silva, and F. Freire, 2015: Life-cycle assessment 46
ACCEPTED VERSION
SUBJECT TO FIN
AL EDITS
Final Government Distribution Chapter 10 IPCC AR6 WGIII
Do Not Cite, Quote or Distribute 10-111 Total pages: 176
of soybean-based biodiesel in Europe: Comparing grain, oil and biodiesel import from Brazil. 1 Journal of Cleaner Production, 102, 188–201, https://doi.org/10.1016/j.jclepro.2015.04.036. 2
CE Delft, 2017: STREAM Freight Transport 2016: Emissions of freight transport modes - Version 2. 3 https://www.cedelft.eu/publicatie/stream_freight_transport_2016/1855 (Accessed December 2, 4 2020). 5
Chala, G. T., A. R. A. Aziz, and F. Y. Hagos, 2018: Natural Gas Engine Technologies: Challenges and 6 Energy Sustainability Issue. Energies, 11, https://doi.org/10.3390/en11112934. 7
Chang, S. E., 2016: Socioeconomic impacts of infrastructure disruptions. Oxford research encyclopedia 8 of natural hazard science. 9
Chatzinikolaou, S. D., and N. P. Ventikos, 2013: Assessment of ship emissions in a life cycle 10 perspective. 3rd International Energy, Life Cycle Assessment, and Sustainability Workshop & 11 Symposium (ELCAS3), 7-9 July, Nisyros, Greece, Nisyros, Greece https://www.elcasnet.com/ 12 (Accessed April 16, 2020). 13
Chen, C. C., and A. Gettelman, 2013: Simulated radiative forcing from contrails and contrail cirrus. 14 Atmospheric Chemistry and Physics, 13, 12525–12536, https://doi.org/10.5194/ACP-13-12525-15 2013. 16
Chen, T. D., and K. M. Kockelman, 2016: Carsharing’s life-cycle impacts on energy use and greenhouse 17 gas emissions. Transportation Research Part D: Transport and Environment, 47, 276–284, 18 https://doi.org/10.1016/j.trd.2016.05.012. 19
——, ——, and J. P. Hanna, 2016: Operations of a shared, autonomous, electric vehicle fleet: 20 Implications of vehicle & charging infrastructure decisions. Transportation Research Part A: 21 Policy and Practice, https://doi.org/10.1016/j.tra.2016.08.020. 22
Chen, Z., 2017: Impacts of high-speed rail on domestic air transportation in China. Journal of Transport 23 Geography, 62, 184–196. 24
Cheng, X., Y. Wu, P. Ning, P. Cheng, D. C. Schwebel, and G. Hu, 2018: Comparing road safety 25 performance across countries: Do data source and type of mortality indicator matter? Accident 26 Analysis & Prevention, 121, 129–133, https://doi.org/10.1016/j.aap.2018.09.012. 27
Chester, M., and A. Horvath, 2012: High-speed rail with emerging automobiles and aircraft can reduce 28 environmental impacts in California’s future. Environmental Research Letters, 7, 030412, 29 https://doi.org/10.1088/1748-9326/7/3/034012. 30
——, S. Pincetl, Z. Elizabeth, W. Eisenstein, and J. Matute, 2013: Infrastructure and automobile shifts: 31 Positioning transit to reduce life-cycle environmental impacts for urban sustainability goals. 32 Environmental Research Letters, 8, 015041, https://doi.org/10.1088/1748-9326/8/1/015041. 33
Chiaramonti, D., 2019: Sustainable Aviation Fuels: the challenge of decarbonization. Energy Procedia, 34 158, 1202–1207. 35
City of Bulawayo, 2020a: Report of Study - Master Plan 2019-2034. 36 http://citybyo.co.zw/Downloads/Policies. 37
——, 2020b: Corporate Strategy 2020-2024. 38 http://citybyo.co.zw/Downloads/GetPolicy?fileShortName=BCC_strategy_document_Final.pdf. 39
Coffel, E. D., T. R. Thompson, and R. M. Horton, 2017: The impacts of rising temperatures on aircraft 40 takeoff performance. Climatic Change, 144, 381–388, https://doi.org/10.1007/s10584-017-2018-41 9. 42
Coignard, J., S. Saxena, J. Greenblatt, and D. Wang, 2018: Clean vehicles as an enabler for a clean 43 electricity grid. Environmental Research Letters, 13, 054031. 44
Colling, A., and R. Hekkenberg, 2020: Waterborne platooning in the short sea shipping sector. 45 Transportation Research Part C: Emerging Technologies, 120, 102778, 46 https://doi.org/10.1016/J.TRC.2020.102778. 47
ACCEPTED VERSION
SUBJECT TO FIN
AL EDITS
Final Government Distribution Chapter 10 IPCC AR6 WGIII
Do Not Cite, Quote or Distribute 10-112 Total pages: 176
Committee on Climate Change, 2019: Net Zero: The UK’s contribution to stopping global warming. 1 275 pp. www.theccc.org.uk/publications (Accessed December 18, 2019). 2
Commonwealth of Australia, 2019: Australia’s Critical Minerals Strategy 2019. 22 pp. 3 https://www.industry.gov.au/sites/default/files/2019-03/australias-critical-minerals-strategy-4 2019.pdf. 5
Congedo, L., and M. Munafò, 2014: Urban sprawl as a factor of vulnerability to climate change: 6 Monitoring land cover change in Dar es Salaam. Climate Change Vulnerability in Southern 7 African Cities, 73–88. 8
Convery, S., and B. Williams, 2019: Determinants of Transport Mode Choice for Non-Commuting 9 Trips: The Roles of Transport, Land Use and Socio-Demographic Characteristics. Urban Science, 10 3, 82. 11
Cooper, J., and P. Balcombe, 2019: Life cycle environmental impacts of natural gas drivetrains used in 12 road freighting. Procedia CIRP, 80, 334–339, https://doi.org/10.1016/j.procir.2019.01.070. 13
Corbett, J. J., D. A. Lack, J. J. Winebrake, S. Harder, J. A. Silberman, and M. Gold, 2010: Arctic 14 shipping emissions inventories and future scenarios. Atmos. Chem. Phys., 10, 9689–9704, 15 https://doi.org/10.5194/acp-10-9689-2010. 16
Cornet, Y., G. Dudley, and D. Banister, 2018: High Speed Rail: Implications for carbon emissions and 17 biodiversity. Case Studies on Transport Policy, 6, 376–390. 18
Coroama, V. C., Å. Moberg, and L. M. Hilty, 2015: Dematerialization through electronic media? ICT 19 innovations for sustainability, Springer, 405–421. 20
Coulombel, N., V. Boutueil, L. Liu, V. Viguié, and B. Yin, 2019: Substantial rebound effects in urban 21 ridesharing: Simulating travel decisions in Paris, France. Transportation Research Part D: 22 Transport and Environment, 71, 110–126, https://doi.org/10.1016/j.trd.2018.12.006. 23
Cox, B. L., and C. L. Mutel, 2018: The environmental and cost performance of current and future 24 motorcycles. Applied Energy, 212, 1013–1024, 25 https://doi.org/https://doi.org/10.1016/j.apenergy.2017.12.100. 26
Cox, B., C. L. Mutel, C. Bauer, A. Mendoza Beltran, and D. P. van Vuuren, 2018: Uncertain 27 Environmental Footprint of Current and Future Battery Electric Vehicles. Environ. Sci. Technol., 28 52(8), 4989–4995, doi:10.1021/acs.est.8b00261. 29
Creutzig, F., 2014: How fuel prices determine public transport infrastructure, modal shares and urban 30 form. Urban Climate, 10, 63–76, https://doi.org/10.1016/j.uclim.2014.09.003. 31
——, 2016: Evolving Narratives of Low-Carbon Futures in Transportation. Transport Reviews, 36, 32 341–360, https://doi.org/10.1080/01441647.2015.1079277. 33
——, 2021: Making Smart Mobility Sustainable: How to Leverage the Potential of Smart and Shared 34 Mobility to Mitigate Climate Change. 35
——, and Coauthors, 2015a: Transport: A roadblock to climate change mitigation? Science, 350, 911–36 912, https://doi.org/10.1126/science.aac8033. 37
——, G. Baiocchi, R. Bierkandt, P.-P. Pichler, and K. C. Seto, 2015b: Global typology of urban energy 38 use and potentials for an urbanization mitigation wedge. Proceedings of the national academy of 39 sciences, 6283–6288. 40
——, B. Fernandez, H. Haberl, R. Khosla, Y. Mulugetta, and K. C. Seto, 2016: Beyond technology: 41 demand-side solutions for climate change mitigation. Annual Review of Environment and 42 Resources, 41, 173–198. 43
——, and Coauthors, 2018: Towards demand-side solutions for mitigating climate change. Nature 44 Climate Change, https://doi.org/10.1038/s41558-018-0121-1. 45
Crippa, M., and Coauthors, 2019: Fossil CO2 and GHG emissions of all world countries - 2019 Report. 46
ACCEPTED VERSION
SUBJECT TO FIN
AL EDITS
Final Government Distribution Chapter 10 IPCC AR6 WGIII
Do Not Cite, Quote or Distribute 10-113 Total pages: 176
Crippa, M., and Coauthors, 2021: Global anthropogenic emissions in urban areas: patterns, trends, and 1 challenges. Environmental Research Letters, 16, 074033. 2
Criqui, P., S. Mathy, and J.-C. Hourcade, 2015: Pathways to deep decarbonization in France. 3
Cuevas, V., M. Estrada, and J. M. Salanova, 2016: Management of on-demand transport services in 4 urban contexts. barcelona case study. Transportation Research Procedia, 13, 155–165. 5
Cumpsty, N., and Coauthors, 2019: Independent expert integrated technology goals assessment and 6 review for engines and aircraft. 7
Cusenza, M. A., S. Bobba, F. Ardente, M. Cellura, and F. Di Persio, 2019: Energy and environmental 8 assessment of a traction lithium-ion battery pack for plug-in hybrid electric vehicles. Journal of 9 Cleaner Production, 215, 634–649, https://doi.org/https://doi.org/10.1016/j.jclepro.2019.01.056. 10
Czermański, E., B. Pawłowska, A. Oniszczuk-Jastrząbek, and G. T. Cirella, 2020: Decarbonization of 11 Maritime Transport: Analysis of External Costs. Frontiers in Energy Research, 8, 28, 12 https://doi.org/10.3389/fenrg.2020.00028. 13
d’Aveni, R., 2015: The 3-D printing revolution. Harvard Business Review, 93, 40–48. 14
Daim, T. U., 2021: Roadmapping Future Technologies, Products and Services. Springer, London,. 15
Daioglou, V., G. Woltjer, B. Strengers, B. Elbersen, G. Barberena Ibañez, D. Sánchez Gonzalez, J. Gil 16 Barno, and D. P. van Vuuren, 2020: Progress and barriers in understanding and preventing indirect 17 land-use change. Biofuels, Bioproducts and Biorefining, https://doi.org/10.1002/bbb.2124. 18
Dalsøren, S. B., M. S. Eide, Ø. Endresen, & Mjelde, A., and Isaksen, 2009: Update on emissions and 19 environmental impacts from the international fleet of ships: the contribution from major ship types 20 and ports. Atmospheric Chemistry & Physics, 9. 21
——, B. H. Samset, G. Myhre, J. J. Corbett, R. Minjares, D. Lack, and J. S. Fuglestvedt, 2013: 22 Environmental impacts of shipping in 2030 with a particular focus on the Arctic region. 23 Atmospheric Chemistry and Physics, 13, 1941–1955, https://doi.org/10.5194/acp-13-1941-2013. 24
Davis, S. J., and Coauthors, 2018: Net-zero emissions energy systems. Science, 360, 25 https://doi.org/10.1126/science.aas9793. 26
Dawson, D., J. Shaw, and W. R. Gehrels, 2016: Sea-level rise impacts on transport infrastructure: The 27 notorious case of the coastal railway line at Dawlish, England. Journal of Transport Geography, 28 51, 97–109. 29
Dawson, J., N. Carter, N. van Luijk, C. Parker, M. Weber, A. Cook, K. Grey, and J. Provencher, 2020: 30 Infusing inuit and local knowledge into the low impact shipping corridors: An adaptation to 31 increased shipping activity and climate change in Arctic Canada. Environmental Science and 32 Policy, 105, 19–36, https://doi.org/10.1016/j.envsci.2019.11.013. 33
Debnath, A. K., H. C. Chin, M. M. Haque, and B. Yuen, 2014: A methodological framework for 34 benchmarking smart transport cities. Cities, 37, 47–56. 35
Decarre, S., J. Berthiaud, N. Butin, and J. L. Guillaume-Combecave, 2010: CO2 maritime 36 transportation. International Journal of Greenhouse Gas Control, 4, 857–864, 37 https://doi.org/10.1016/J.IJGGC.2010.05.005. 38
Desmaris, C., and F. Croccolo, 2018: The HSR competition in Italy: How are the regulatory design and 39 practices concerned? Research in Transportation Economics, 69, 290–299. 40
Dhar, S., and P. R. Shukla, 2015: Low carbon scenarios for transport in India: Co-benefits analysis. 41 Energy Policy, 81, 186–198, https://doi.org/10.1016/j.enpol.2014.11.026. 42
——, M. Pathak, and P. R. Shukla, 2017: Electric vehicles and India’s low carbon passenger transport: 43 a long-term co-benefits assessment. Journal of Cleaner Production, 146, 139–148, 44 https://doi.org/10.1016/j.jclepro.2016.05.111. 45
——, ——, and P. R. Shukla, 2018: Transformation of India’s transport sector under global warming 46
ACCEPTED VERSION
SUBJECT TO FIN
AL EDITS
Final Government Distribution Chapter 10 IPCC AR6 WGIII
Do Not Cite, Quote or Distribute 10-114 Total pages: 176
of 2 °C and 1.5 °C scenario. Journal of Cleaner Production, 172, 417–427, 1 https://doi.org/10.1016/j.jclepro.2017.10.076. 2
——, ——, and P. R. Shukla, 2020: Transformation of India’s steel and cement industry in a sustainable 3 1.5 °C world. Energy Policy, 137, 111104. 4
Dia, H., 2019: Rethinking urban mobility: unlocking the benefits of vehicle electrification. 5 Decarbonising the built environment, 83–98. 6
Dieleman, F., and M. Wegener, 2004: Compact city and urban sprawl. Built Environment, 30, 308–323, 7 https://doi.org/10.2148/benv.30.4.308.57151. 8
Digby, R. A. R., N. P. Gillett, A. H. Monahan, and J. N. S. Cole, 2021: An Observational Constraint on 9 Aviation-Induced Cirrus From the COVID-19-Induced Flight Disruption. Geophysical Research 10 Letters, 48, e2021GL095882, https://doi.org/10.1029/2021GL095882. 11
Dimitriou, P., and R. Javaid, 2020: A review of ammonia as a compression ignition engine fuel. 12 International Journal of Hydrogen Energy, 45, 7098–7118, 13 https://doi.org/10.1016/J.IJHYDENE.2019.12.209. 14
Dimoula, V., F. Kehagia, and A. Tsakalidis, 2016: A Holistic Approach for Estimating Carbon 15 Emissions of Road and Rail Transport Systems. Aerosol and Air Quality Research, 16, 61–68, 16 https://doi.org/10.4209/aaqr.2015.05.0313. 17
DNV GL, 2017: Low Carbon Shipping Towards 2050. https://www.dnvgl.com/publications/low-18 carbon-shipping-towards-2050-93579. 19
——, 2019: Maritime Forecast To 2050 Eenergy Transition Outlook 2019. 118 pp. 20
——, 2020: Ammonia as a marine fuel. 48 pp. https://www.dnv.com/Publications/ammonia-as-a-21 marine-fuel-191385. 22
Docherty, I., G. Marsden, and J. Anable, 2018: The governance of smart mobility. Transportation 23 Research Part A: Policy and Practice, 115, 114–125. 24
Dubov, G. M., D. S. Trukhmanov, and S. A. Nokhrin, 2020: The Use of Alternative Fuel for Heavy-25 Duty Dump Trucks as a Way to Reduce the Anthropogenic Impact on the Environment. IOP 26 Conference Series: Earth and Environmental Science, 459, 042059, https://doi.org/10.1088/1755-27 1315/459/4/042059. 28
Dziewiatkowski, M., D. Szpica, and A. Borawski, 2020: Evaluation of impact of combustion engine 29 controller adaptation process on level of exhaust gas emissions in gasoline and compressed natural 30 gas supply process. 31
Early, R., and P. Newman, 2021: Transport in the Aftermath of COVID-19: Lessons Learned and Future 32 Directions. Journal of Transportation Technologies, 11, 109. 33
ECA, 2021: Infrastructure for charging electric vehicles: more charging stations but uneven 34 deployment makes travel across the EU complicated. 35
Eckhardt, G. M., and F. Bardhi, 2015: The Sharing Economy isn’t About Sharing At All. Harvard 36 Business Review. 37
Edelenbosch, O. Y., and Coauthors, 2017: Decomposing passenger transport futures: Comparing results 38 of global integrated assessment models. Transportation Research Part D: Transport and 39 Environment, 55, 281–293, https://doi.org/10.1016/j.trd.2016.07.003. 40
Edwards, R., M. Padella, J. Giuntoli, R. Koeble, A. O’Connell, C. Bulgheroni, and L. Marelli, 2017: 41 Definition of input data to assess GHG default emissions from biofuels in EU legislation. Version 42 1c–July,. 43
Edwards, R. W., and M. A. Celia, 2018: Infrastructure to enable deployment of carbon capture, 44 utilization, and storage in the United States. Proceedings of the National Academy of Sciences, 45 115, E8815–E8824. 46
ACCEPTED VERSION
SUBJECT TO FIN
AL EDITS
Final Government Distribution Chapter 10 IPCC AR6 WGIII
Do Not Cite, Quote or Distribute 10-115 Total pages: 176
Egli, F., B. Steffen, and T. S. Schmidt, 2019: Bias in energy system models with uniform cost of capital 1 assumption. Nature Communications, 10, 1–3. 2
Ehebrecht, D., D. Heinrichs, and B. Lenz, 2018: Motorcycle-taxis in sub-Saharan Africa: Current 3 knowledge, implications for the debate on “informal” transport and research needs. Journal of 4 Transport Geography, 69, 242–256, https://doi.org/10.1016/j.jtrangeo.2018.05.006. 5
Elgowainy, A., and Coauthors, 2018: Current and Future United States Light-Duty Vehicle Pathways: 6 Cradle-to-Grave Lifecycle Greenhouse Gas Emissions and Economic Assessment. Environmental 7 Science & Technology, 52, 2392–2399, https://doi.org/10.1021/acs.est.7b06006. 8
Ellingsen, L. A.-W., B. Singh, and A. H. Strømman, 2016: The size and range effect: lifecycle 9 greenhouse gas emissions of electric vehicles. Environmental Research Letters, 11, 54010, 10 https://doi.org/10.1088/1748-9326/11/5/054010. 11
Ellingsen, L. A. W., G. Majeau-Bettez, B. Singh, A. K. Srivastava, L. O. Valøen, and A. H. Strømman, 12 2014: Life Cycle Assessment of a Lithium-Ion Battery Vehicle Pack. Journal of Industrial 13 Ecology, 18, 113–124, https://doi.org/10.1111/jiec.12072. 14
Elshout, P. M. F., R. Van Zelm, J. Balkovic, M. Obersteiner, E. Schmid, R. Skalsky, M. Van Der Velde, 15 and M. A. J. Huijbregts, 2015: Greenhouse-gas payback times for crop-based biofuels. Nature 16 Climate Change, 5, 604–610, https://doi.org/10.1038/nclimate2642. 17
Endresen, Ø., E. Sørgård, J. K. Sundet, S. B. Dalsøren, I. S. A. Isaksen, T. F. Berglen, and G. Gravir, 18 2003: Emission from international sea transportation and environmental impact. Journal of 19 Geophysical Research: Atmospheres, 108, https://doi.org/10.1029/2002jd002898. 20
Energieradar, 2020: CO2-Gesetz. 21
Energy Transitions Commission, 2020: Making Mission Possible : Delivering a Net-Zero Economy: 22 Energy Transitions Commission. https://www.energy-transitions.org/wp-23 content/uploads/2020/09/Making-Mission-Possible-Full- 32 Report.pdf. 24
Epstein, A. H., and S. M. O’Flarity, 2019: Considerations for reducing aviation’s co 2 with aircraft 25 electric propulsion. Journal of Propulsion and Power, 35, 572–582. 26
Ercan, T., M. Noori, Y. Zhao, and O. Tatari, 2016: On the Front Lines of a Sustainable Transportation 27 Fleet: Applications of Vehicle-to-Grid Technology for Transit and School Buses. Energies, 9, 230, 28 https://doi.org/10.3390/en9040230. 29
Erdogan, S., 2020: Analyzing the environmental Kuznets curve hypothesis: the role of disaggregated 30 transport infrastructure investments. Sustainable Cities and Society, 61, 102338. 31
Erickson, P., and K. Tempest, 2015: Keeping cities green: Avoiding carbon lock-in due to urban 32 development. https://www.sei.org/publications/keeping-cities-green-avoiding-carbon-lock-in-33 due-to-urban-development/ (Accessed October 10, 2021). 34
Esmeijer, K., M. Den Elzen, and H. Van Soest, 2020: Analysing International Shipping and Aviation 35 Emission Projections of Integrated Assessment Models. PBL Netherlands Environmental 36 Assessment Agency,. 37
EU, 2021: Assessment of Hydrogen Delivery Options. 38 https://ec.europa.eu/jrc/sites/default/files/jrc124206_assessment_of_hydrogen_delivery_options.39 pdf (Accessed October 18, 2021). 40
Eudy, L., and M. Post, 2018a: Zero-Emission Bus Evaluation Results: Orange County Transportation 41 Authority Fuel Cell Electric Bus. 48 pp. 42 https://www.transit.dot.gov/sites/fta.dot.gov/files/docs/research-innovation/132691/zero-43 emission-bus-evaluation-results-orange-county-transportation-authority-fuel-cell-electric-44 bus.pdf. 45
——, and ——, 2018b: Fuel Cell Buses in U.S. Transit Fleets: Current Status 2018. 46 www.nrel.gov/publications. (Accessed September 30, 2021). 47
ACCEPTED VERSION
SUBJECT TO FIN
AL EDITS
Final Government Distribution Chapter 10 IPCC AR6 WGIII
Do Not Cite, Quote or Distribute 10-116 Total pages: 176
——, and ——, 2020: Fuel Cell Buses in U.S. Transit Fleets: Current Status 2020. 1
eurostat, 2019: Modal split of passenger transport. https://ec.europa.eu/eurostat/web/products-datasets/-2 /t2020_rk310. 3
Evangelisti, S., C. Tagliaferri, D. J. L. Brett, and P. Lettieri, 2017: Life cycle assessment of a polymer 4 electrolyte membrane fuel cell system for passenger vehicles. Journal of Cleaner Production, 142, 5 4339–4355, https://doi.org/https://doi.org/10.1016/j.jclepro.2016.11.159. 6
Eyring, V., H. W. Köhler, J. Van Aardenne, and A. Lauer, 2005: Emissions from international shipping: 7 1. The last 50 years. Journal of Geophysical Research D: Atmospheres, 110, 171–182, 8 https://doi.org/10.1029/2004JD005619. 9
Eyring, V., and Coauthors, 2021: Chapter 3: Human influence on the climate system. Climate Change 10 2021: The Physical Science Basis. Contribution of Working Group I to the Sixth Assessment 11 Report of the Intergovernmental Panel on Climate Change, Cambridge University Press. 12
Faber, J., and Coauthors, 2020: Fourth IMO GHG Study 2020 – Final report. 524 pp. 13 https://wwwcdn.imo.org/localresources/en/OurWork/Environment/Documents/Fourth IMO 14 GHG Study 2020 - Full report and annexes.pdf. 15
Faisal, A., M. Kamruzzaman, T. Yigitcanlar, and G. Currie, 2019: Understanding autonomous vehicles. 16 Journal of Transport and Land Use, 12, 45–72. 17
Fang, S., Y. Xu, Z. Li, Z. Ding, L. Liu, and H. Wang, 2019: Optimal Sizing of Shipboard Carbon 18 Capture System for Maritime Greenhouse Emission Control. IEEE Transactions on Industry 19 Applications, 55, 5543–5553, https://doi.org/10.1109/TIA.2019.2934088. 20
Farzaneh, H., J. A. P. de Oliveira, B. McLellan, and H. Ohgaki, 2019: Towards a Low Emission 21 Transport System: Evaluating the Public Health and Environmental Benefits. Energies, 12, 3747, 22 https://doi.org/10.3390/en12193747. 23
FCHEA, 2019: Roadmap to a US Hydrogen Economy: Reudcing emissions and driving growth across 24 the nation. 96 pp. http://www.fchea.org/s/Road-Map-to-a-US-Hydrogen-Economy-Full-25 Report.pdf. 26
FCHJU, 2019: A sustainable pathway for the European energy transtition: Hydrogen roadmap Europe. 27 70 pp. https://www.fch.europa.eu/sites/default/files/Hydrogen Roadmap Europe_Report.pdf. 28
Fearnley, N., S. Flügel, M. Killi, F. A. Gregersen, M. Wardman, E. Caspersern, and J. P. Toner, 2017: 29 Triggers of Urban Passenger Mode Shift – State of the Art and Model Evidence. Transportation 30 Research Procedia, 26, 62–80, https://doi.org/10.1016/J.TRPRO.2017.07.009. 31
——, G. Currie, S. Flügel, F. A. Gregersen, M. Killi, J. Toner, and M. Wardman, 2018: Competition 32 and substitution between public transport modes. Research in Transportation Economics, 69, 51–33 58, https://doi.org/10.1016/j.retrec.2018.05.005. 34
Feng, C., Y.-S. Xia, and L.-X. Sun, 2020: Structural and social-economic determinants of China’s 35 transport low-carbon development under the background of aging and industrial migration. 36 Environmental research, 188, 109701. 37
Figenbaum, E., 2017: Perspectives on Norway’s supercharged electric vehicle policy. Environmental 38 Innovation and Societal Transitions, 25, 14–34, https://doi.org/10.1016/j.eist.2016.11.002. 39
Figueres, C., and T. Rivett-Carnac, 2020: The Future we choose: Surviving the climate crisis. Vintage,. 40
Fisch-Romito, V., and C. Guivarch, 2019: Transportation infrastructures in a low carbon world: An 41 evaluation of investment needs and their determinants. Transportation Research Part D: 42 Transport and Environment, 72, 203–219, https://doi.org/10.1016/j.trd.2019.04.014. 43
Fitt, H., 2018: Exploring how older people might experience future transport systems. Geographies of 44 Transport and Ageing. Palgrave Macmillan, 199–225. 45
Fleming, G. G., and I. de Lépinay, 2019: Environmental Trends in Aviation to 2050. 7 pp. 46
ACCEPTED VERSION
SUBJECT TO FIN
AL EDITS
Final Government Distribution Chapter 10 IPCC AR6 WGIII
Do Not Cite, Quote or Distribute 10-117 Total pages: 176
https://www.icao.int/environmental-1 protection/Documents/EnvironmentalReports/2019/ENVReport2019_pg17-23.pdf (Accessed 2 December 12, 2019). 3
Fontaras, G., B. Ciuffo, N. Zacharof, S. Tsiakmakis, A. Marotta, J. Pavlovic, and K. Anagnostopoulos, 4 2017: The difference between reported and real-world CO2 emissions: How much improvement 5 can be expected by WLTP introduction?∗. Transportation Research Procedia, 25, 3933–3943, 6 https://doi.org/10.1016/j.trpro.2017.05.333. 7
Forero-Ortiz, E., E. Martinez-Gomariz, M. C. Porcuna, L. Locatelli, and B. Russo, 2020: Flood Risk 8 Assessment in an Underground Railway System under the Impact of Climate Change—A Case 9 Study of the Barcelona Metro. Sustainability, 12, 5291. 10
Forzieri, G., A. Bianchi, F. B. e. Silva, M. A. Marin Herrera, A. Leblois, C. Lavalle, J. C. J. H. Aerts, 11 and L. Feyen, 2018: Escalating impacts of climate extremes on critical infrastructures in Europe. 12 Global Environmental Change, 48, 97–107, https://doi.org/10.1016/j.gloenvcha.2017.11.007. 13
Fox-Kemper, B., and Coauthors, 2021: Chapter 9: Ocean, cryosphere and sea level change. Climate 14 Change 2021: The Physical Science Basis. Contribution of Working Group I to the Sixth 15 Assessment Report of the Intergovernmental Panel on Climate Change, Cambridge University 16 Press. 17
Frattini, D., G. Cinti, G. Bidini, U. Desideri, R. Cioffi, and E. Jannelli, 2016: A system approach in 18 energy evaluation of different renewable energies sources integration in ammonia production 19 plants. Renewable Energy, 99, 472–482, https://doi.org/10.1016/J.RENENE.2016.07.040. 20
Freeman, S., D. S. Lee, L. L. Lim, A. Skowron, and R. R. De León, 2018: Trading off Aircraft Fuel 21 Burn and NO x Emissions for Optimal Climate Policy. Environmental Science & Technology, 52, 22 2498–2505, https://doi.org/10.1021/acs.est.7b05719. 23
Friedlingstein, P., and Coauthors, 2020: Global carbon budget 2020. Earth System Science Data, 12, 24 3269–3340. 25
Frigo, S., and R. Gentili, 2014: Further evolution of an ammonia fuelled range extender for hybrid 26 vehicles. Proceedings of the NH3 Fuel Association, 21–24. 27
Fu, H., L. Nie, L. Meng, B. R. Sperry, and Z. He, 2015: No TitleA hierarchical line planning approach 28 for a large-scale high speed rail network: the China case. Transportation Research Part A: Policy 29 and Practice, 75, 61–83. 30
Fu, J., Z. P. Cano, M. G. Park, A. Yu, M. Fowler, and Z. Chen, 2017: Electrically rechargeable zinc–31 air batteries: progress, challenges, and perspectives. Advanced Materials, 29, 1604685. 32
Fuglestvedt, J. S., and Coauthors, 2010: Transport impacts on atmosphere and climate: Metrics. 33 Atmospheric Environment, 44, 4648–4677. 34
Fuglestvedt, J. S., S. B. Dalsøren, B. H. Samset, T. Berntsen, G. Myhre, Ø. Hodnebrog, M. S. Eide, and 35 T. F. Bergh, 2014: Climate penalty for shifting shipping to the Arctic. Environmental Science and 36 Technology, 48, 13273–13279, https://doi.org/10.1021/es502379d. 37
Fulton, L., A. Mejia, M. Arioli, K. Dematera, and O. Lah, 2017: Climate change mitigation pathways 38 for Southeast Asia: CO2 emissions reduction policies for the energy and transport sectors. 39 Sustainability (Switzerland), 9, https://doi.org/10.3390/su9071160. 40
Funke, S. A., and P. Plötz, 2017: A techno-economic analysis of fast charging needs in Germany for 41 different ranges of battery electric vehicles. 42
Gaber, T., Y. Jazouli, E. Eldesouky, and A. Ali, 2021: Autonomous haulage systems in the mining 43 industry: cybersecurity, communication and safety issues and challenges. Electronics, 10, 1357. 44
Gallet, C. A., and H. Doucouliagos, 2014: The income elasticity of air travel: A meta-analysis. Annals 45 of Tourism Research, 49, 141–155, https://doi.org/10.1016/J.ANNALS.2014.09.006. 46
Gallucci, M., 2021: The Ammonia Solution: Ammonia engines and fuel cells in cargo ships could slash 47
ACCEPTED VERSION
SUBJECT TO FIN
AL EDITS
Final Government Distribution Chapter 10 IPCC AR6 WGIII
Do Not Cite, Quote or Distribute 10-118 Total pages: 176
their carbon emissions. IEEE Spectrum, 58, 44–50. 1
Gao, T., and Coauthors, 2016: A Rechargeable Al/S Battery with an Ionic‐Liquid Electrolyte. 2 Angewandte Chemie International Edition, 55, 9898–9901. 3
Gao, Y., and P. Newman, 2018: Beijing’s peak car transition: Hope for emerging cities in the 1.5 °C 4 agenda. Urban Planning, 3, 82–93, https://doi.org/10.17645/up.v3i2.1246. 5
——, and ——, 2020: Are Beijing and Shanghai automobile dependent cities? Handbook on Transport 6 and Urban Transformation in China, Edward Elgar Publishing, 229–245. 7
Gargoloff, J., B. Duncan, E. Tate, A. Alajbegovic, A. Belanger, P. Bernali, and B. Paul, 2018: Robust 8 Optimization for Real World CO2 Reduction. 1–10 pp. 9
Geels, F. W., 2002: Technological transitions as evolutionary reconfiguration processes: a multi-level 10 perspective and a case-study. Research policy, 31, 1257–1274. 11
Geels, F. W., 2005: Technological transitions and system innovations: a co-evolutionary and socio-12 technical analysis. Edward Elgar Publishing,. 13
Geels, F. W., 2019: Socio-technical transitions to sustainability: a review of criticisms and elaborations 14 of the Multi-Level Perspective. Current Opinion in Environmental Sustainability, 15 https://doi.org/10.1016/j.cosust.2019.06.009. 16
——, B. K. Sovacool, T. Schwanen, and S. Sorrell, 2017: Sociotechnical transitions for deep 17 decarbonization. Science, 357, 1242–1244, https://doi.org/10.1126/science.aao3760. 18
Gehl, J., 2010: Cities for People. Island Press, 288 pp. 19
Gençsü, I., and M. Hino, 2015: Raising ambition to reduce international aviation and maritime 20 emissions. Contributing paper for Seizing the Global Opportunity: Partnerships for Better Growth 21 and a Better Climate. 22
GFEI, 2020: Vehicle Efficiency and Electrification: A Global Status Report: Global Fuel Economy 23 Initiative (GFEI). 24
Ghandi, A., and S. Paltsev, 2019: Projecting a Deployment of Light-Duty Internal Combustion and 25 Electric Vehicles in Economy-Wide Models. 4307, 1–42. 26
Gierens, K., S. Matthes, and S. Rohs, 2020: How Well Can Persistent Contrails Be Predicted? 27 Aerospace, 7, 169. 28
Gierens, K. M., U. Schumann, H. G. J. Smit, M. Helten, and G. Zängl, 1997: Determination of humidity 29 and temperature fluctuations based on MOZAIC data and parametrisation of persistent contrail 30 coverage for general circulation models. Annales Geophysicae, 15, 1057–1066, 31 https://doi.org/10.1007/s00585-997-1057-3. 32
Gilbert, P., C. Walsh, M. Traut, U. Kesieme, K. Pazouki, and A. Murphy, 2018: Assessment of full life-33 cycle air emissions of alternative shipping fuels. Journal of Cleaner Production, 172, 855–866, 34 https://doi.org/10.1016/j.jclepro.2017.10.165. 35
Gilby, S., and Coauthors, 2019: Sustainable Lifestyles Policy and Practice: Challenges and Way 36 Forward - Annex: Case Studies. 144 pp. 37
Gill, S. S., G. S. Chatha, A. Tsolakis, S. E. Golunski, and A. P. E. York, 2012: Assessing the effects of 38 partially decarbonising a diesel engine by co-fuelling with dissociated ammonia. International 39 Journal of Hydrogen Energy, 37, 6074–6083, https://doi.org/10.1016/J.IJHYDENE.2011.12.137. 40
Giurco, D., E. Dominish, N. Florin, T. Watari, and B. McLellan, 2019: Requirements for minerals and 41 metals for 100% renewable scenarios. chieving the Paris Climate Agreement Goals, Springer, 42 Cham, 437–457. 43
Givoni, M., and D. Banister, 2006: Airline and railway integration. Transport Policy, 13, 386–397. 44
——, and F. Dobruszkes, 2013: A review of ex-post evidence for mode substitution and induced 45
ACCEPTED VERSION
SUBJECT TO FIN
AL EDITS
Final Government Distribution Chapter 10 IPCC AR6 WGIII
Do Not Cite, Quote or Distribute 10-119 Total pages: 176
demand following the introduction of high-speed rail. Transport Reviews, 33, 720–742. 1
Gnann, T., S. Funke, N. Jakobsson, P. Plötz, F. Sprei, and A. Bennehag, 2018: Fast charging 2 infrastructure for electric vehicles: Today’s situation and future needs. Transportation Research 3 Part D: Transport and Environment, 62, 314–329. 4
Goldmann, A., W. Sauter, M. Oettinger, T. Kluge, U. Schröder, J. R. Seume, J. Friedrichs, and F. 5 Dinkelacker, 2018: A study on electrofuels in aviation. Energies, 11, 392. 6
Goldsworthy, B., 2017: Spatial and temporal allocation of ship exhaust emissions in Australian coastal 7 waters using AIS data: Analysis and treatment of data gaps. Atmospheric Environment, 163, 77–8 86, https://doi.org/10.1016/J.ATMOSENV.2017.05.028. 9
Goldsworthy, L., and B. Goldsworthy, 2015: Modelling of ship engine exhaust emissions in ports and 10 extensive coastal waters based on terrestrial AIS data – An Australian case study. Environmental 11 Modelling & Software, 63, 45–60, https://doi.org/10.1016/J.ENVSOFT.2014.09.009. 12
Golroudbary, S. R., D. Calisaya-Azpilcueta, and A. Kraslawski, 2019: The life cycle of energy 13 consumption and greenhouse gas emissions from critical minerals recycling: Case of lithium-ion 14 batteries. Procedia CIRP, 80, 316–321. 15
González, A., E. Goikolea, J. A. Barrena, and R. Mysyk, 2016: Review on supercapacitors: 16 Technologies and materials. Renewable and Sustainable Energy Reviews, 58, 1189–1206, 17 https://doi.org/10.1016/J.RSER.2015.12.249. 18
Gössling, S., 2018: ICT and transport behavior: A conceptual review. International journal of 19 sustainable transportation, 12, 153–164. 20
——, A. Humpe, F. Fichert, and F. Creutzig, 2021a: COVID-19 and pathways to low-carbon air 21 transport until 2050. Environmental Research Letters, 16, 034063. 22
——, J. Nicolosi, and T. Litman, 2021b: The health cost of transport in cities. Current environmental 23 health reports, 1–6. 24
Gota, S., C. Huizenaga, K. Peet, and G. Kaar, 2015: Emission Reduction Poetential in the Transport 25 Sector by 2030. 26
——, ——, ——, and ——, 2016: Nationally Determined Contributions (NDCs) Offer Opportunities 27 for Ambitious Action on Transport and Climate Change. Partnership on Sustainable Low Carbon 28 Transport, 1–58. 29
——, C. Huizenga, K. Peet, N. Medimorec, and S. Bakker, 2019: Decarbonising transport to achieve 30 Paris Agreement targets. Energy Efficiency, 12, 363–386, https://doi.org/10.1007/s12053-018-31 9671-3. 32
Granier, C., and Coauthors, 2019: The Copernicus Atmosphere Monitoring Service global and regional 33 emissions. The Copernicus Atmosphere Monitoring Service global and regional emissions. 34
Grant, N., A. Hawkes, S. Mittal, and A. Gambhir, 2021: Confronting mitigation deterrence in low-35 carbon scenarios. Environmental Research Letters, 16, https://doi.org/10.1088/1748-36 9326/ac0749. 37
Grant, R., G. Goldsmith, D. Gracy, and D. Johnson, 2016: Better Transportation to Health Care Will 38 Improve Child Health and Lower Costs. Advances in Pediatrics, 63, 389–401, 39 https://doi.org/10.1016/j.yapd.2016.04.003. 40
Gray, J. T., E. D. Nelson, T. Meckel, and R. D. Quillian, 1966: Ammonia Fuel - Engine Compatibility 41 and Combustion. SAE Technical Paper, 660156. 42
Gray, N., S. McDonagh, R. O’Shea, B. Smyth, and J. D. Murphy, 2021: Decarbonising ships, planes 43 and trucks: An analysis of suitable low-carbon fuels for the maritime, aviation and haulage sectors. 44 Advances in Applied Energy, 1, 100008, https://doi.org/10.1016/j.adapen.2021.100008. 45
Green, J., and P. Newman, 2017: Citizen utilities: The emerging power paradigm. Energy Policy, 105, 46
ACCEPTED VERSION
SUBJECT TO FIN
AL EDITS

Final Government Distribution Chapter 10 IPCC AR6 WGIII
Do Not Cite, Quote or Distribute 10-120 Total pages: 176
283–293. 1
Greenblatt, J. B., and S. Shaheen, 2015: Automated vehicles, on-demand mobility, and environmental 2 impacts. Current sustainable/renewable energy reports, 2, 74–81. 3
Greene, D. L., S. Park, and C. Liu, 2014: Public policy and the transition to electric drive vehicles in 4 the US: The role of the zero emission vehicles mandates. Energy Strategy Reviews, 5, 66–77. 5
Grieco, M., and J. Urry, 2016: Mobilities: New perspectives on transport and society. Routledge, 1–6 384 pp. 7
De Groot, J. I., L. Steg, and M. Dicke, 2008: TRANSPORTATION TRENDS FROM A MORAL 8 PERSPECTIVE: VALUE ORIENTATIONS. New Transportation Research Progress, 67–91. 9
Grubler, A., and Coauthors, 2018: A low energy demand scenario for meeting the 1.5 °c target and 10 sustainable development goals without negative emission technologies. Nature Energy, 3, 515–11 527, https://doi.org/10.1038/s41560-018-0172-6. 12
Grzelakowski, A. S., 2018: Transport conditions of the global economy. Transport Economics and 13 Logistics, 80, 75–84, https://doi.org/10.26881/etil.2018.80.08. 14
Gucwa, M., and A. Schäfer, 2013: The impact of scale on energy intensity in freight transportation. 15 Transportation Research Part D: Transport and Environment, 23, 41–49, 16 https://doi.org/10.1016/j.trd.2013.03.008. 17
Gulley, A. L., N. T. Nassar, and S. Xun, 2018: China, the United States, and competition for resources 18 that enable emerging technologies. Proceedings of the national academy of sciences, 115, 4111–19 4115. 20
——, E. A. McCullough, and K. B. Shedd, 2019: China’s domestic and foreign influence in the global 21 cobalt supply chain. Resources Policy, 62, 317–323. 22
Guo, J., A. Orellana, S. Sleep, I. J. Laurenzi, H. L. MacLean, and J. A. Bergerson, 2020: Statistically 23 enhanced model of oil sands operations: Well-to-wheel comparison of in situ oil sands pathways. 24 Energy, 208, 118250, https://doi.org/10.1016/j.energy.2020.118250. 25
H2 Tools, 2020: International Hydrogen Fueling Stations. 26
Ha, S., K. Kim, K. Kim, H. Jeong, and H. Kim, 2017: Reliability Approach in Economic Assessment 27 of Adapting Infrastructure to Climate Change. Journal of Management in Engineering, 33, 28 04017022, https://doi.org/10.1061/(asce)me.1943-5479.0000530. 29
Habib, K., and H. Wenzel, 2014: Exploring rare earths supply constraints for the emerging clean energy 30 technologies and the role of recycling. Journal of Cleaner Production, 84, 348–359, 31 https://doi.org/10.1016/j.jclepro.2014.04.035. 32
Hache, E., G. S. Seck, M. Simoen, C. Bonnet, and S. Carcanague, 2019: Critical raw materials and 33 transportation sector electrification: A detailed bottom-up analysis in world transport. Applied 34 Energy, 240, 6–25, https://doi.org/10.1016/j.apenergy.2019.02.057. 35
Haines, A., M. Amann, N. Borgford-Parnell, S. Leonard, J. Kuylenstierna, and D. Shindell, 2017: Short-36 lived climate pollutant mitigation and the Sustainable Development Goals. Nature Climate 37 Change, 7, 863–869, https://doi.org/10.1038/s41558-017-0012-x. 38
Hajimiragha, A., C. A. Canizares, M. W. Fowler, and A. Elkamel, 2010: Optimal transition to plug-in 39 hybrid electric vehicles in Ontario, Canada, considering the electricity-grid limitations. IEEE 40 Transactions on Industrial Electronics, Vol. 57 of, 690–701. 41
Hakim, M. M., and R. Merkert, 2016: The causal relationship between air transport and economic 42 growth: Empirical evidence from South Asia. Journal of Transport Geography, 56, 120–127, 43 https://doi.org/10.1016/j.jtrangeo.2016.09.006. 44
——, and ——, 2019: Econometric evidence on the determinants of air transport in South Asian 45 countries. Transport Policy, 83, 120–126, https://doi.org/10.1016/j.tranpol.2017.12.003. 46
ACCEPTED VERSION
SUBJECT TO FIN
AL EDITS
Final Government Distribution Chapter 10 IPCC AR6 WGIII
Do Not Cite, Quote or Distribute 10-121 Total pages: 176
Halim, R., L. Kirstein, O. Merk, and L. Martinez, 2018: Decarbonization Pathways for International 1 Maritime Transport: A Model-Based Policy Impact Assessment. Sustainability, 10, 2243, 2 https://doi.org/10.3390/su10072243. 3
Hall, D., and N. Lutsey, 2017: Literature review on power utility best practices regarding electric 4 vehicles. International council on clean transportation. 5 https://theicct.org/sites/default/files/publications/Power-utility-best-practices-EVs_white-6 paper_14022017_vF.pdf. 7
Hall, D., and N. Lutsey, 2019: Estimating the infrastructure needs and costs for the launch of zero-8 emission trucks. 9
——, and ——, 2020: Electric vehicle charging guide for cities. 24 pp. 10 https://theicct.org/sites/default/files/publications/EV_charging_guide_03162020.pdf. 11
Halliday, W. D., S. J. Insley, R. C. Hilliard, T. de Jong, and M. K. Pine, 2017: Potential impacts of 12 shipping noise on marine mammals in the western Canadian Arctic. Marine Pollution Bulletin, 13 123, 73–82, https://doi.org/10.1016/J.MARPOLBUL.2017.09.027. 14
Hamilton, I., and Coauthors, 2021: The public health implications of the Paris Agreement: a modelling 15 study. The Lancet Planetary Health, 5, e74–e83. 16
Hancock, P., I. Nourbakhsh, and J. Stewart, 2019: On the future of transportation in an era of automated 17 and autonomous vehicles. Proceedings of the National Academy of Sciences, 116, 7684–7691. 18
Handler, R. M., D. R. Shonnard, E. M. Griffing, A. Lai, and I. Palou-Rivera, 2016: Life Cycle 19 Assessments of Ethanol Production via Gas Fermentation: Anticipated Greenhouse Gas Emissions 20 for Cellulosic and Waste Gas Feedstocks. Industrial & Engineering Chemistry Research, 55, 21 https://doi.org/10.1021/acs.iecr.5b03215. 22
El Hannach, M., P. Ahmadi, L. Guzman, S. Pickup, and E. Kjeang, 2019: Life cycle assessment of 23 hydrogen and diesel dual-fuel class 8 heavy duty trucks. International Journal of Hydrogen 24 Energy, 44, 8575–8584, https://doi.org/10.1016/J.IJHYDENE.2019.02.027. 25
Hannula, I., 2016: Hydrogen enhancement potential of synthetic biofuels manufacture in the European 26 context: A techno-economic assessment. Energy, 104, 199–212. 27
Hanson, D., T. Toru Delibasi, M. Gatti, and S. Cohen, 2022: How do changes in economic activity 28 affect air passenger traffic? The use of state-dependent income elasticities to improve aviation 29 forecasts. Journal of Air Transport Management, 98, 102147, 30 https://doi.org/10.1016/J.JAIRTRAMAN.2021.102147. 31
Hansson, J., S. Månsson, S. Brynolf, and M. Grahn, 2019: Alternative marine fuels: Prospects based on 32 multi-criteria decision analysis involving Swedish stakeholders. Biomass and Bioenergy, 126, 33 159–173, https://doi.org/10.1016/j.biombioe.2019.05.008. 34
——, S. Brynolf, E. Fridell, and M. Lehtveer, 2020: The potential role of ammonia as marine fuel-35 based on energy systems modeling and multi-criteria decision analysis. Sustainability 36 (Switzerland), 12, 10–14, https://doi.org/10.3390/SU12083265. 37
Hao, H., and Coauthors, 2019: Securing platinum-group metals for transport low-carbon transition. One 38 Earth, 1, 117–125. 39
Hao, X., Y. Yuan, H. Wang, and Y. Sun, 2021: Actual Electricity Utility Factor of Plug-In Hybrid 40 Electric Vehicles in Typical Chinese Cities Considering Charging Pattern Heterogeneity. 41
Hardman, S., and Coauthors, 2018: A review of consumer preferences of and interactions with electric 42 vehicle charging infrastructure. Transportation Research Part D: Transport and Environment, 62, 43 508–523, https://doi.org/10.1016/j.trd.2018.04.002. 44
Hargroves, K., B. Stantic, D. Conley, D. Ho, and G. Grant, 2017: Big Data, Technology and Transport 45 - The State of Play. 46
Hargroves, K., B.Stantic, and D. Allen, 2020: Exploring the potential for artificial intelligence and 47
ACCEPTED VERSION
SUBJECT TO FIN
AL EDITS
Final Government Distribution Chapter 10 IPCC AR6 WGIII
Do Not Cite, Quote or Distribute 10-122 Total pages: 176
blockchain to enhance transport. 1
Harper, C. D., C. T. Hendrickson, S. Mangones, and C. Samaras, 2016: Estimating potential increases 2 in travel with autonomous vehicles for the non-driving, elderly and people with travel-restrictive 3 medical conditions. Transportation Research Part C: Emerging Technologies, 72, 1–9, 4 https://doi.org/10.1016/J.TRC.2016.09.003. 5
Harper, G., and Coauthors, 2019: Recycling lithium-ion batteries from electric vehicles. Nature, 575, 6 75–86, https://doi.org/10.1038/s41586-019-1682-5. 7
Harris, A., D. Soban, B. M. Smyth, and R. Best, 2020: A probabilistic fleet analysis for energy 8 consumption, life cycle cost and greenhouse gas emissions modelling of bus technologies. Applied 9 Energy, 261, 114422, https://doi.org/10.1016/J.APENERGY.2019.114422. 10
Hasan, M. A., D. J. Frame, R. Chapman, and K. M. Archie, 2019: Emissions from the road transport 11 sector of New Zealand: key drivers and challenges. Environmental Science and Pollution 12 Research, 26, 23937–23957, https://doi.org/10.1007/s11356-019-05734-6. 13
Hassellöv, I. M., D. R. Turner, A. Lauer, and J. J. Corbett, 2013: Shipping contributes to ocean 14 acidification. Geophysical Research Letters, 40, 2731–2736, https://doi.org/10.1002/grl.50521. 15
Haustein, S., and A. F. Jensen, 2018: Factors of electric vehicle adoption: A comparison of conventional 16 and electric car users based on an extended theory of planned behavior. International Journal of 17 Sustainable Transportation, 12, 484–496, https://doi.org/10.1080/15568318.2017.1398790. 18
Hawkins, T. R., B. Singh, G. Majeau-Bettez, and A. H. Strømman, 2013: Comparative Environmental 19 Life Cycle Assessment of Conventional and Electric Vehicles. Journal of Industrial Ecology, 17, 20 53–64, https://doi.org/10.1111/j.1530-9290.2012.00532.x. 21
He, B.-J., D. Zhao, and Z. Gou, 2020: Integration of Low-Carbon Eco-City, Green Campus and Green 22 Building in China. Green Guilding in developing countries. 23
Heinemann, T., H. Mikkelsen, A. Kortsari, and L. Mitropoulos, 2020: D7.5 Final validation and 24 evaluation report, E-Ferry Project.: Europeaon Commission. 25 https://ec.europa.eu/research/participants/documents/downloadPublic?documentIds=080166e5cf26 bf7f6f&appId=PPGMS. 27
Heinen, E., A. Harshfield, J. Panter, R. Mackett, and D. Ogilvie, 2017: Does exposure to new transport 28 infrastructure result in modal shifts? Patterns of change in commute mode choices in a four-year 29 quasi-experimental cohort study. Journal of Transport and Health, 6, 396–410, 30 https://doi.org/10.1016/j.jth.2017.07.009. 31
Hendrickson, C., and L. R. Rilett, 2020: The COVID-19 Pandemic and Transportation Engineering. 32 Journal of Transportation Engineering, Part A: Systems, 146, 01820001, 33 https://doi.org/10.1061/JTEPBS.0000418. 34
Henrik, P., P. Fredrik, and L. W. Hiselius, 2017: Energy consumption in e-commerce versus 35 conventional trade channels-Insights into packaging, the last mile, unsold products and product 36 returns. Journal of Cleaner Production, 164, 765–778. 37
Hensher, D. A., 2017: Future bus transport contracts under a mobility as a service (MaaS) regime in the 38 digital age: Are they likely to change? Transportation Research Part A: Policy and Practice, 98, 39 86–96, https://doi.org/10.1016/J.TRA.2017.02.006. 40
Henze, V., 2020: Battery Pack Prices Cited Below $100/kWh for the First Time in 2020, While Market 41 Average Sits at $137/kWh. BloombergNEF,. 42
Hernandez, D., 2018: Uneven mobilities, uneven opportunities: Social distribution of public transport 43 accessibility to jobs and education in Montevideo. Journal of Transport Geography, 67, 119–125, 44 https://doi.org/10.1016/j.jtrangeo.2017.08.017. 45
Hill, N., and Coauthors, 2020: Determining the environmental impacts of conventional and alternatively 46 fuelled vehicles through {LCA}. 47
ACCEPTED VERSION
SUBJECT TO FIN
AL EDITS
Final Government Distribution Chapter 10 IPCC AR6 WGIII
Do Not Cite, Quote or Distribute 10-123 Total pages: 176
Hiratsuka, J., G. Perlaviciute, and L. Steg, 2018: Testing VBN theory in Japan: Relationships between 1 values, beliefs, norms, and acceptability and expected effects of a car pricing policy. 2 Transportation Research Part F: Traffic Psychology and Behaviour, 53, 74–83, 3 https://doi.org/10.1016/j.trf.2017.12.015. 4
Hittinger, E., and P. Jaramillo, 2019: Internet of Things: Energy boon or bane? Science, 364, 326–328. 5
Hoegh-Guldberg, O., and Coauthors, 2019: The Ocean as a Solution to Climate Change: Five 6 Opportunities for Action. 116. 7
Hoehne, C. G., and M. V. Chester, 2016: Optimizing plug-in electric vehicle and vehicle-to-grid charge 8 scheduling to minimize carbon emissions. Energy, 115, 646–657, 9 https://doi.org/10.1016/j.energy.2016.09.057. 10
Hoesly, R. M., and Coauthors, 2018: Historical (1750–2014) anthropogenic emissions of reactive gases 11 and aerosols from the Community Emissions Data System (CEDS). Geosci. Model Dev., 11, 369–12 408, https://doi.org/10.5194/gmd-11-369-2018. 13
Hoffrichter, A., J. Silmon, S. Iwnicki, S. Hillmansen, and C. Roberts, 2012: Rail freight in 2035–traction 14 energy analysis for high-performance freight trains. HOFFRICHTER, Andreas, et al. Rail freight 15 in 2035–traction energy analysis for high-performance freight trains. Proceedings of the 16 Institution of Mechanical Engineers, Part F: Journal of Rail and Rapid Transit, 2012, 226.6: 568-17 574. BibTeX EndNote RefMan , 568–574. 18
Hoque, N., W. Biswas, I. Mazhar, and I. Howard, 2019: Environmental life cycle assessment of 19 alternative fuels for Western Australia’s transport sector. Atmosphere, 10, 1–27, 20 https://doi.org/10.3390/atmos10070398. 21
Horvath, S., M. Fasihi, and C. Breyer, 2018: Techno-economic analysis of a decarbonized shipping 22 sector: Technology suggestions for a fleet in 2030 and 2040. Energy Conversion and 23 Management, 164, 230–241, https://doi.org/10.1016/J.ENCONMAN.2018.02.098. 24
Hottle, T., C. Caffrey, J. McDonald, and R. Dodder, 2017: Critical factors affecting life cycle 25 assessments of material choice for vehicle mass reduction. Transportation Research Part D: 26 Transport and Environment, 56, 241–257, https://doi.org/10.1016/j.trd.2017.08.010. 27
Hove, A., and D. Sandalow, 2019: Electric vehicle charging in China and the United States. 28
Hoyos, D., G. Bueno, and I. Capellán-Pérez, 2016: Environmental assessment of high-speed rail. 29 Evaluating High-Speed Rail, 135–155. 30
Hsieh, C., and C. Felby, 2017: Biofuels for the marine shipping sector. 31
Hua, J., C.-W. Cheng, and D.-S. Hwang, 2018: Total life cycle emissions of post-Panamax 32 containerships powered by conventional fuel or natural gas. 33 https://doi.org/10.1080/10962247.2018.1505675, 69, 131–144, 34 https://doi.org/10.1080/10962247.2018.1505675. 35
Huizenga, C., K. Pete, and S. Gota, 2015: Analysis on national transport sector emissions: 1990-2012. 36 https://slocat.net/wp-content/uploads/2020/02/PPMC_2015_Analysis-on-National-Transport-37 Sector-Emissions-1990-2012.pdf (Accessed October 10, 2021). 38
Hydrogen Council, 2017: How Hydrogen Empowers the Energy Transition: Hydrogen Council. 39 https://hydrogencouncil.com/en/study-how-hydrogen-empowers/. 40
——, 2020: Path to hydrogen competitiveness A cost perspective. https://hydrogencouncil.com/wp-41 content/uploads/2020/01/Path-to-Hydrogen-Competitiveness_Full-Study-1.pdf (Accessed 42 September 30, 2021). 43
ICAO, 2017: Sustainable Aviation Fuels Guide. https://www.icao.int/environmental-44 protection/knowledge-sharing/Docs/Sustainable Aviation Fuels Guide_vf.pdf (Accessed October 45 19, 2021). 46
——, 2019: 2019 Environment Report Aviation and Environment Destiniation Green The Next Chapter. 47
ACCEPTED VERSION
SUBJECT TO FIN
AL EDITS
Final Government Distribution Chapter 10 IPCC AR6 WGIII
Do Not Cite, Quote or Distribute 10-124 Total pages: 176
376 pp. https://www.icao.int/environmental-protection/Documents/ICAO-ENV-Report2019-F1-1 WEB (1).pdf. 2
ICCT, 2017: Developing hydrogen fueling infrastructure for fuel cell vehicles: A status update: The 3 International Council on Clean Transportation (ICCT). 4
IEA, 2012: Technology Roadmap Fuel Economy of Road Vehicles. 50 pp. 5 https://iea.blob.core.windows.net/assets/7fa0800c-ce93-432e-ab5d-6 da475a1f5056/Fuel_Economy_2012_WEB.pdf. 7
——, 2015: Technology Roadmap Hydrogen and Fuel Cells. www.iea.org/t&c/ (Accessed November 8 28, 2019). 9
——, 2017a: Technology Roadmap - Delivering Sustainable Bioenergy. 10 https://www.ieabioenergy.com/wp-11 content/uploads/2017/11/Technology_Roadmap_Delivering_Sustainable_Bioenergy.pdf. 12
——, 2017b: Energy Technology Perspectives 2017: Catalysing Energy Technology Transformations 13 Together Secure Sustainable. www.iea.org/etp2017. 14
——, 2019a: Global EV Outlook 2019. https://www.iea.org/reports/global-ev-outlook-2019. 15
——, 2019b: CO2 emissions from fuel combustion (Data accessed via https://stats.oecd.org/). IEA, 16 https://stats.oecd.org/ (Accessed October 31, 2019). 17
——, 2019c: The Future of Hydrogen Seizing today’s opportunities. 203 pp. 18 https://www.iea.org/reports/the-future-of-hydrogen. 19
——, 2019d: World Energy Outlook 2019. International Energy Agency (IEA), 810 pp. 20 https://www.iea.org/reports/world-energy-outlook-2019. 21
——, 2019e: The Future of Rail. https://www.iea.org/reports/the-future-of-rail. 22
——, 2020a: Tracking Transport 2020. https://www.iea.org/reports/tracking-transport-2020. 23
——, 2020b: World Energy Outlook. https://www.iea.org/topics/world-energy-outlook (Accessed 24 September 30, 2021). 25
——, 2020c: IEA Bioenergy Summary Series: Advanced Biofuels – Potential for Cost Reduction. 26 https://www.ieabioenergy.com/wp-content/uploads/2020/02/IEABioenergy-2pSummary-27 CostAdvancedBiofuels.pdf (Accessed September 30, 2021). 28
——, 2020d: Fuel Consumption of Cars and Vans. 29
——, 2021a: Global EV Outlook 2021. 30
——, 2021b: Energy Technology Perspectives 2020. 400 pp. 31 https://iea.blob.core.windows.net/assets/7f8aed40-89af-4348-be19-32 c8a67df0b9ea/Energy_Technology_Perspectives_2020_PDF.pdf. 33
——, 2021c: Energy Prices and Taxes Statistics. https://www.oecd-ilibrary.org/energy/data/iea-energy-34 prices-and-taxes-statistics_eneprice-data-en (Accessed September 30, 2021). 35
——, 2021d: Energy Prices: Overview. https://www.iea.org/reports/energy-prices-overview (Accessed 36 September 29, 2021). 37
——, 2021e: Net Zero by 2050. 38
——, 2021f: World Energy Model Documentation: 2020 Version. 1–91 pp. 39
IMO, 2013: MARPOL : Annex VI and NTC 2008 with guidelines for implementation. I.M.O.M.E.P. 40 Committee, Ed. International Maritime Organization,. 41
——, 2018: Note by the International Maritime Organization to the UNFCCC Talanoa Dialogue. 27. 42
International Union of Railways, 2016: Carbon Footprint of Railway Infrastructure Comparing existing 43 methodologies on typical corridors Recommendations for harmonized approach. 44
ACCEPTED VERSION
SUBJECT TO FIN
AL EDITS
Final Government Distribution Chapter 10 IPCC AR6 WGIII
Do Not Cite, Quote or Distribute 10-125 Total pages: 176
IOMVM, 2021: World Vehicles in use. 1
IPCC, 2018: Global Warming of 1.5 °C an IPCC special report on the impacts of global warming of 2 1.5 °C above pre-industrial levels and related global greenhouse gas emission pathways, in the 3 context of strengthening the global response to the threat of climate change. 4 http://www.ipcc.ch/report/sr15/. 5
——, 2019: Special Report: The Ocean and Cryosphere in a Changing Climate (final draft). TBD pp. 6
IRENA, 2016: The renewable energy route to sustainable transport. 7
——, 2019: Navigating the way to a renewable future: Solutions to decarbonise shipping, Preliminary 8 findings. International Renewable Energy Agency, 36 pp. 9
——, 2020: Green hydrogen cost reduction: Scaling up electrolysers to meet the 1.5oC climate goal. 10 https://www.irena.org/publications/2020/Dec/Green-hydrogen-cost-reduction. 11
IRP, 2019: Global Resources Outlook 2019 Natural Resources for the Future We Want. 162 pp. 12 https://www.resourcepanel.org/reports/global-resources-outlook. 13
Isaac, R., and L. Fulton, 2017: Propulsion Systems for 21 st Century Rail. Transportation Research 14 Procedia, Vol. 00 of, 10–15 15 https://pdfs.semanticscholar.org/52ba/7add103ba4564d379a04d4ca7837bdca7763.pdf (Accessed 16 November 7, 2019). 17
ITF, 2017: Shared Mobility Simulations for Helsinki Case-Specific Policy Analysis. www.itf-oecd.org 18 (Accessed October 10, 2021). 19
——, 2018a: Transition to Shared Mobility how larger cities can deliver inclusive transport service. 20 https://www.itf-oecd.org/sites/default/files/docs/transition-shared-mobility.pdf. 21
——, 2018b: Decarbonising Maritime Transport: Pathways to zero-carbon shipping by 2035. www.itf-22 oecd.org (Accessed October 3, 2020). 23
——, 2019: ITF Transport Outlook 2019. 200 pp. 24
——, 2020a: Shared Mobility Simulations for Lyon. 25
——, 2020b: Good to Go? Assessing the Environmental Performance of New Mobility. 26
——, 2021: ITF Transport Outlook 2021. 27
Ivanova, D., J. Barrett, D. Wiedenhofer, B. Macura, M. Callaghan, and F. Creutzig, 2020: Quantifying 28 the potential for climate change mitigation of consumption options. Environmental Research 29 Letters, 15, 093001. 30
Jaeger, A., S. B. Nugroho, E. Zusman, R. Nakano, and R. Daggy, 2015: Governing sustainable low‐31 carbon transport in I ndonesia: An assessment of provincial transport plans. Natural resources 32 forum, 39, 27–40. 33
Jakovcevic, A., and L. Steg, 2013: Sustainable transportation in Argentina: Values, beliefs, norms and 34 car use reduction. Transportation Research Part F: Traffic Psychology and Behaviour, 20, 70–35 79, https://doi.org/10.1016/j.trf.2013.05.005. 36
Jalkanen, J.-P., L. Johansson, and J. Kukkonen, 2014: A Comprehensive Inventory of the Ship Traffic 37 Exhaust Emissions in the Baltic Sea from 2006 to 2009. Ambio, 43, 311–324. 38
Jaller, M., and A. Pahwa, 2020: Evaluating the environmental impacts of online shopping: A behavioral 39 and transportation approach. Transportation Research Part D: Transport and Environment, 80, 40 102223, https://doi.org/10.1016/J.TRD.2020.102223. 41
Japan Ship Technology Reserach Association, The Nippon Foundation, and Ministry of Land 42 Infrastructure Transport and Tourism, 2020: Roadmap to Zero Emission from International 43 Shipping. 136. 44
Javaid, A., F. Creutzig, and S. Bamberg, 2020: Determinants of low-carbon transport mode adoption: 45
ACCEPTED VERSION
SUBJECT TO FIN
AL EDITS
Final Government Distribution Chapter 10 IPCC AR6 WGIII
Do Not Cite, Quote or Distribute 10-126 Total pages: 176
systematic review of reviews. Environmental Research Letters, 15, 103002, 1 https://doi.org/10.1088/1748-9326/ABA032. 2
JEC, 2020: Well-To-Wheels report v5: Well-to-Wheels analysis of future automotive fuels and 3 powertrains in the European context. 4
Jeerh, G., M. Zhang, and S. Tao, 2021: Recent progress in ammonia fuel cells and their potential 5 applications. Journal of Materials Chemistry A, 9, 727–752. 6
Jeswani, H. K., A. Chilvers, and A. Azapagic, 2020: Environmental sustainability of biofuels: a review. 7 Proceedings of the Royal Society A, 476, 20200351. 8
Jiang, C., and A. Zhang, 2014: Effects of high-speed rail and airline cooperation under hub airport 9 capacity constraint. Transportation Research Part B: Methodological, 60, 33–49, 10 https://doi.org/10.1016/j.trb.2013.12.002. 11
——, and ——, 2016: Airline network choice and market coverage under high-speed rail competition. 12 Transportation Research Part A: Policy and Practice, 92, 248–260. 13
Jiang, R., K. N. Ingle, and A. Golberg, 2016: Macroalgae (seaweed) for liquid transportation biofuel 14 production: what is next? Algal Research, 14, 48–57, 15 https://doi.org/10.1016/J.ALGAL.2016.01.001. 16
Jittrapirom, P., V. Caiati, A. M. Feneri, S. Ebrahimigharehbaghi, M. J. Alonso-González, and J. 17 Narayan, 2017: Mobility as a service: A critical review of definitions, assessments of schemes, 18 and key challenges. Urban Planning, 2, 13–25, https://doi.org/10.17645/up.v2i2.931. 19
——, V. Marchau, R. van der Heijden, and H. Meurs, 2018: Dynamic adaptive policymaking for 20 implementing Mobility-as-a Service (MaaS). Research in Transportation Business & 21 Management, 27, 46–55. 22
Jochem, P., J. J. Gómez Vilchez, A. Ensslen, J. Schäuble, and W. Fichtner, 2018: Methods for 23 forecasting the market penetration of electric drivetrains in the passenger car market. Transport 24 Reviews, 38, 322–348, https://doi.org/10.1080/01441647.2017.1326538. 25
Jochem, P., J. Whitehead, and E. Dütschke, 2021: The Impact of Electric Vehicles on Energy Systems. 26 International Encyclopedia of Transportation, 1, 560–565. 27
Johansson, L., J. P. Jalkanen, and J. Kukkonen, 2017: Global assessment of shipping emissions in 2015 28 on a high spatial and temporal resolution. Atmospheric Environment, 167, 403–415, 29 https://doi.org/10.1016/j.atmosenv.2017.08.042. 30
Johnson, C., E. Nobler, L. Eudy, and M. Jeffers, 2020: Financial Analysis of Battery Electric Transit 31 Buses. www.nrel.gov/publications. (Accessed September 30, 2021). 32
Johnston, M., J. Dawson, E. De Souza, and E. J. Stewart, 2017: Management challenges for the fastest 33 growing marine shipping sector in Arctic Canada: Pleasure crafts. Polar Record, 53, 67–78, 34 https://doi.org/10.1017/S0032247416000565. 35
Jones, H., F. Moura, and T. Domingos, 2017: Life cycle assessment of high-speed rail: a case study in 36 Portugal. The International Journal of Life Cycle Assessment, 22, 410–422. 37
Jones, J., A. Genovese, and A. Tob-Ogu, 2020: Hydrogen vehicles in urban logistics: A total cost of 38 ownership analysis and some policy implications. Renewable and Sustainable Energy Reviews, 39 119, 109595, https://doi.org/10.1016/J.RSER.2019.109595. 40
de Jong, S., K. Antonissen, R. Hoefnagels, L. Lonza, M. Wang, A. Faaij, and M. Junginger, 2017: Life-41 cycle analysis of greenhouse gas emissions from renewable jet fuel production. Biotechnology for 42 Biofuels, 10, 64, https://doi.org/10.1186/s13068-017-0739-7. 43
Jordbakker, G. N., A. Amundsen, I. Sundvor, E. Figenbaum, and I. B. Hovi, 2018: Technological 44 maturity level and market introduction timeline of zero-emission heavy-duty vehicles. 82 pp. 45 http://st-vtoi01.coretrek.net/getfile.php/1348918-1538579785/Publikasjoner/TØI 46 rapporter/2018/1655-2018/1655-2018-elektronisk.pdf. 47
ACCEPTED VERSION
SUBJECT TO FIN
AL EDITS
Final Government Distribution Chapter 10 IPCC AR6 WGIII
Do Not Cite, Quote or Distribute 10-127 Total pages: 176
Joshi, A., 2020: Review of vehicle engine efficiency and emissions. WCX SAE World Congress 1 Experience, Society of Automotive Engineers (SAE). 2
Jouin, M., and Coauthors, 2016: Estimating the end-of-life of PEM fuel cells: Guidelines and metrics. 3 Applied Energy, 177, 87–97. 4
Kaack, L. H., P. Vaishnav, M. G. Morgan, I. L. Azevedo, and S. Rai, 2018: Decarbonizing intraregional 5 freight systems with a focus on modal shift. Environmental Research Letters, 13, 83001, 6 https://doi.org/10.1088/1748-9326/aad56c. 7
Kainuma, M., T. Masui, K. Oshiro, and G. Hibino, 205AD: Pathways to deep decarbonization in Japan. 8
van der Kam, M., and R. Bekkers, 2020: Comparative analysis of standardized protocols for EV 9 roaming. 10
Kamdar, A., 2017: Ultracapacitor kinetic energy recovery systems in road transport vehicles. is it a 11 viable retrofit option for reducing fuel consumption and co2 emissions? Southern African 12 Transport Conference. 13
Kampala Capital City Authority, 2018: Kampala’s Air Quality Is Six Times Worse Than Global 14 Standards -KCCA | For a better City. 15
Kandaramath Hari, T., Z. Yaakob, and N. N. Binitha, 2015: Aviation biofuel from renewable resources: 16 Routes, opportunities and challenges. Renewable and Sustainable Energy Reviews, 42, 1234–17 1244, https://doi.org/10.1016/j.rser.2014.10.095. 18
Kang, S., Y. Zhang, Y. Qian, and H. Wang, 2020: A review of black carbon in snow and ice and its 19 impact on the cryosphere. Earth-Science Reviews, 210, 103346, 20 https://doi.org/10.1016/J.EARSCIREV.2020.103346. 21
Kapadia, Z. Z., and Coauthors, 2016: Impacts of aviation fuel sulfur content on climate and human 22 health. Atmospheric Chemistry and Physics, 16, 10521–10541, https://doi.org/10.5194/acp-16-23 10521-2016. 24
Kaplan, A. M., and M. Haenlein, 2010: Users of the world, unite! The challenges and opportunities of 25 Social Media. Business Horizons, 53, 59–68, https://doi.org/10.1016/j.bushor.2009.09.003. 26
Kärcher, B., 2018: Formation and radiative forcing of contrail cirrus. Nature Communications 2018 27 9:1, 9, 1–17, https://doi.org/10.1038/s41467-018-04068-0. 28
Kassens-Noor, E., D. Dake, T. Decaminada, Z. Kotval-k, T. Qu, M. Wilson, and B. Pentland, 2020: 29 Sociomobility of the 21st century: Autonomous vehicles, planning, and the future city. Transport 30 Policy, 99, 329–335. 31
Kasulaitis, B. V., C. W. Babbitt, and A. K. Krock, 2019: Dematerialization and the Circular Economy: 32 Comparing Strategies to Reduce Material Impacts of the Consumer Electronic Product Ecosystem. 33 Journal of Industrial Ecology, 23, 119–132, https://doi.org/10.1111/jiec.12756. 34
Kavanagh, L., J. Keohane, G. G. Cabellos, A. Lloyd, and J. Cleary, 2018: Global lithium sources—35 industrial use and future in the electric vehicle industry: a review. Resources, 7, 57. 36
Kavitha, N., P. Shakthipriya, S. Sivakannan, G. . Peter, R. K, and H. Joy, 2018: A SMART 37 MONITORING SYSTEM IN VEHICLES. Journal of Pure and Applied Mathematics, 118, 1485–38 1490. 39
Kazunga, O., 2019: Bulawayo dreams of ‘Trackless Tram.’ https://www.chronicle.co.zw/bulawayo-40 dreams-of-trackless-tram/. 41
Ke, W., S. Zhang, X. He, Y. Wu, and J. Hao, 2017: Well-to-wheels energy consumption and emissions 42 of electric vehicles: Mid-term implications from real-world features and air pollution control 43 progress. Applied Energy, 188, 367–377, https://doi.org/10.1016/J.APENERGY.2016.12.011. 44
Keall, M. D., C. Shaw, R. Chapman, and P. Howden-Chapman, 2018: Reductions in carbon dioxide 45 emissions from an intervention to promote cycling and walking: A case study from New Zealand. 46
ACCEPTED VERSION
SUBJECT TO FIN
AL EDITS
Final Government Distribution Chapter 10 IPCC AR6 WGIII
Do Not Cite, Quote or Distribute 10-128 Total pages: 176
Transportation Research Part D: Transport and Environment, 65, 687–696, 1 https://doi.org/10.1016/J.TRD.2018.10.004. 2
Kemfert, C., P. Opitz, T. Traber, and L. Handrich, Pathways to deep decarbonization in Germany. 3
Khalili, S., E. Rantanen, D. Bogdanov, and C. Breyer, 2019: Global Transportation Demand 4 Development with Impacts on the Energy Demand and Greenhouse Gas Emissions in a Climate-5 Constrained World. Energies, 12, 3870. 6
Khan, M. I., T. Yasmin, and A. Shakoor, 2015: Technical overview of compressed natural gas (CNG) 7 as a transportation fuel. Renewable and Sustainable Energy Reviews, 51, 785–797, 8 https://doi.org/10.1016/j.rser.2015.06.053. 9
Khandelwal, B., A. Karakurt, P. R. Sekaran, V. Sethi, and R. Singh, 2013: Hydrogen powered aircraft: 10 The future of air transport. Progress in Aerospace Sciences, 60, 45–59. 11
——, C. J. Wijesinghe, and S. Sriraman, 2018: Effect of alternative fuels on emissions and engine 12 compatibility. Energy for Propulsion, 27–50. 13
Khojasteh Salkuyeh, Y., B. A. Saville, and H. L. MacLean, 2017: Techno-economic analysis and life 14 cycle assessment of hydrogen production from natural gas using current and emerging 15 technologies. International Journal of Hydrogen Energy, 42, 18894–18909, 16 https://doi.org/10.1016/j.ijhydene.2017.05.219. 17
Khzouz, M., E. I. Gkanas, J. Shao, F. Sher, D. Beherskyi, A. El-Kharouf, and M. Al Qubeissi, 2020: 18 Life Cycle Costing Analysis: Tools and Applications for Determining Hydrogen Production Cost 19 for Fuel Cell Vehicle Technology. Energies, 13, https://doi.org/10.3390/en13153783. 20
Kim, E. S., 2019: Structural integrity evaluation of CNG pressure vessel with defects caused by heat 21 treatment using numerical analysis. Journal of Mechanical Science and Technology, 33, 5297–22 5302, https://doi.org/10.1007/s12206-019-1021-7. 23
Kim, H. C., and T. J. Wallington, 2013: Life-cycle energy and greenhouse gas emission benefits of 24 lightweighting in automobiles: Review and harmonization. Environmental Science and 25 Technology, 47, 6089–6097, https://doi.org/10.1021/es3042115. 26
——, and ——, 2016: Life Cycle Assessment of Vehicle Lightweighting: A Physics-Based Model To 27 Estimate Use-Phase Fuel Consumption of Electrified Vehicles. Environmental Science & 28 Technology, 50, 11226–11233, https://doi.org/10.1021/acs.est.6b02059. 29
Kim, K., G. Roh, W. Kim, and K. Chun, 2020: A Preliminary Study on an Alternative Ship Propulsion 30 System Fueled by Ammonia: Environmental and Economic Assessments. Journal of Marine 31 Science and Engineering, 8, 183, https://doi.org/10.3390/jmse8030183. 32
King, D. A., and K. J. Krizek, 2020: The power of reforming streets to boost access for human-scaled 33 vehicles. Transportation Research Part D: Transport and Environment, 83, 102336, 34 https://doi.org/10.1016/j.trd.2020.102336. 35
Klein, B. C., M. F. Chagas, T. L. Junqueira, M. C. A. F. Rezende, T. de F. Cardoso, O. Cavalett, and 36 A. Bonomi, 2018: Techno-economic and environmental assessment of renewable jet fuel 37 production in integrated Brazilian sugarcane biorefineries. Applied Energy, 209, 38 https://doi.org/10.1016/j.apenergy.2017.10.079. 39
Klossek, P., J. Kullik, and K. G. van den Boogaart, 2016: A systemic approach to the problems of the 40 rare earth market. Resources Policy, 50, 131–140. 41
Klöwer, M., M. Allen, D. Lee, S. Proud, L. Gallagher, and A. Skowron, 2021: Quantifying aviation’s 42 contribution to global warming. Environmental Research Letters, In Press,. 43
Knobloch, F., S. V. Hanssen, A. Lam, H. Pollitt, P. Salas, U. Chewpreecha, M. A. J. Huijbregts, and J. 44 F. Mercure, 2020: Net emission reductions from electric cars and heat pumps in 59 world regions 45 over time. Nature Sustainability, 3, 437–447, https://doi.org/10.1038/s41893-020-0488-7. 46
Koasidis, K., A. Karamaneas, A. Nikas, H. Neofytou, E. A. T. Hermansen, K. Vaillancourt, and H. 47
ACCEPTED VERSION
SUBJECT TO FIN
AL EDITS
Final Government Distribution Chapter 10 IPCC AR6 WGIII
Do Not Cite, Quote or Distribute 10-129 Total pages: 176
Doukas, 2020: Many miles to Paris: A sectoral innovation system analysis of the transport sector 1 in norway and canada in light of the Paris Agreement. Sustainability, 12, 5832. 2
Kober, T., and C. Bauer, 2019: Perspectives of Power-to-X technologies in Switzerland. 40 pp. 3
Kousoulidou, M., and L. Lonza, 2016: Biofuels in aviation: Fuel demand and CO2 emissions evolution 4 in Europe toward 2030. Transportation Research Part D: Transport and Environment, 46, 166–5 181, https://doi.org/10.1016/j.trd.2016.03.018. 6
Kramel, D., and Coauthors, 2021: Global shipping emissions from a well-to-wake perspective: the 7 MariTEAM model. Environmental Science & Technology, 8 https://doi.org/https://doi.org/10.1021/acs.est.1c03937. 9
Kubba, A., and K. Jiang, 2014: A Comprehensive Study on Technologies of Tyre Monitoring Systems 10 and Possible Energy Solutions. Sensors, 14, 10306–10345, https://doi.org/10.3390/s140610306. 11
Kumar, S., and F. Hoffmann, 2002: Globalization: The maritime nexus. Handbook of maritime 12 economics. London, UK: Maritime Press,. 13
Kuramochi, T., and Coauthors, 2018: Ten key short-term sectoral benchmarks to limit warming to 14 1.5°C. Climate Policy, 18, 287–305, https://doi.org/10.1080/14693062.2017.1397495. 15
Kurtz, J. M., S. Sprik, G. Saur, and S. Onorato, 2019: Fuel Cell Electric Vehicle Durability and Fuel 16 Cell Performance. 20 pp. https://www.nrel.gov/docs/fy19osti/73011.pdf. 17
Labandeira, X., J. M. Labeaga, and X. López-Otero, 2017: A meta-analysis on the price elasticity of 18 energy demand. Energy Policy, 102, 549–568, https://doi.org/10.1016/j.enpol.2017.01.002. 19
Laberteaux, K. P., K. Hamza, and J. Willard, 2019: Optimizing the electric range of plug-in vehicles 20 via fuel economy simulations of real-world driving in California. Transportation Research Part 21 D: Transport and Environment, 73, 15–33, https://doi.org/10.1016/j.trd.2019.05.013. 22
Lajunen, A., P. Sainio, L. Laurila, J. Pippuri-mäkeläinen, and K. Tammi, 2018: Overview of Powertrain 23 Electrification and Future Scenarios for Non-Road Mobile Machinery. 24 https://doi.org/10.3390/en11051184. 25
Lamb, W. F., and Coauthors, 2020: Discourses of climate delay. Global Sustainability, 3. 26
Lamb, W. F., and Coauthors, 2021: A review of trends and drivers of greenhouse gas emissions by 27 sector from 1990 to 2018. Environmental Research Letters, 16, 073005, 28 https://doi.org/10.1088/1748-9326/abee4e. 29
Langford, J. S., and D. K. Hall, 2020: Electrified Aircraft Propulsion. The Bridge, 50, 30 https://doi.org/ISSN: 0737-6278. 31
Lasserre, F., and S. Pelletier, 2011: Polar super seaways? Maritime transport in the Arctic: an analysis 32 of shipowners’ intentions. Journal of Transport Geography, 19, 1465–1473, 33 https://doi.org/https://doi.org/10.1016/j.jtrangeo.2011.08.006. 34
Lawrence, M., R. Bullock, and Z. Liu, 2019: China’s high-speed rail development. World Bank 35 Publications,. 36
Le, H. T. K., A. L. Carrel, and H. Shah, 2021: Impacts of online shopping on travel demand: a systematic 37 review. https://doi.org/10.1080/01441647.2021.1961917, 38 https://doi.org/10.1080/01441647.2021.1961917. 39
Lee, A. E., and S. L. Handy, 2018: Leaving level-of-service behind: The implications of a shift to VMT 40 impact metrics. Research in Transportation Business & Management, 29, 14–25. 41
Lee, D. S., 2018: International aviation and the Paris Agreement temperature goals. 1–15. 42
Lee, D. S., and Coauthors, 2021: The contribution of global aviation to anthropogenic climate forcing 43 for 2000 to 2018. Atmospheric Environment, 244, 117834. 44
Lee, J., and Coauthors, 2020: Reviewing the material and metal security of low-carbon energy 45
ACCEPTED VERSION
SUBJECT TO FIN
AL EDITS
Final Government Distribution Chapter 10 IPCC AR6 WGIII
Do Not Cite, Quote or Distribute 10-130 Total pages: 176
transitions. Renewable and Sustainable Energy Reviews, 124, 109789. 1
Leibowicz, B. D., 2018: Policy recommendations for a transition to sustainable mobility based on 2 historical diffusion dynamics of transport systems. Energy Policy, 119, 357–366, 3 https://doi.org/10.1016/j.enpol.2018.04.066. 4
Lennon, M., H. A. Baer, and M. Singer, 2015: The Anthropology of Climate Change: An Integrated 5 Critical Perspective. Hum Ecol, 43, 871–873. 6
Lenz, B., and D. Heinrichs, 2017: What Can We Learn from Smart Urban Mobility Technologies? IEEE 7 Pervasive Computing, 16, 84–86. 8
Levin, L., and C. Faith-Ell, 2019: How to apply gender equality goals in transport and infrastructure 9 planning. Integrating Gender into Transport Planning, 89–118. 10
Li, H., J. Strauss, and L. Lu, 2019: The impact of high-speed rail on civil aviation in China. Transport 11 Policy, 74, 187–200. 12
Li, P.-H., and S. Pye, 2018: Assessing the benefits of demand-side flexibility in residential and transport 13 sectors from an integrated energy systems perspective. Applied Energy, 228, 965–979. 14
Li, X. J., J. D. Allen, J. A. Stager, and A. Y. Ku, 2020: Paths to low-cost hydrogen energy at a scale for 15 transportation applications in the USA and China via liquid-hydrogen distribution networks. 16 Clean Energy, 4, https://doi.org/10.1093/ce/zkz033. 17
Liang, X.-H., and K.-H. Tan, 2019: Market potential and approaches of parcels and mail by high speed 18 rail in China. Case Studies on Transport Policy, 7, 583–597. 19
Liao, F., E. Molin, and B. van Wee, 2016: Consumer preferences for electric vehicles: a literature 20 review. Transport Reviews, 37, 252–275, https://doi.org/10.1080/01441647.2016.1230794. 21
Liao, Y., J. Gil, R. H. M. Pereira, S. Yeh, and V. Verendel, 2020: Disparities in travel times between 22 car and transit: Spatiotemporal patterns in cities. Scientific Reports, 10, 1–12, 23 https://doi.org/10.1038/s41598-020-61077-0. 24
Lin, J., H. Li, W. Huang, W. Xu, and S. Cheng, 2019: A Carbon Footprint of High‐Speed Railways in 25 China: A Case Study of the Beijing‐Shanghai Line. Journal of Industrial Ecology, 23, 869–878. 26
Lin, X., P. Wells, and B. Sovacool, 2017: Benign mobility? Electric bicycles, sustainable transport 27 consumption behaviour and socio-technical transitions in Nanjing, China. Transportation 28 Research Part A: Policy and Practice, 103, 223–234. 29
Lindstad, H., and Coauthors, 2015: GHG emission reduction potential of EU-related maritime transport 30 and on its impacts. Ref: CLIMA.B.3/ETU/2013/0015. 130 pp. 31
Linke, F., V. Grewe, and V. Gollnick, 2017: The implications of intermediate stop operations on 32 aviation emissions and climate. Meteorologische Zeitschrift, 26, 697–709. 33
Lisowski, S., M. Berger, J. Caspers, K. Mayr-Rauch, G. Bäuml, and M. Finkbeiner, 2020: Criteria-34 based approach to select relevant environmental sdg indicators for the automobile industry. 35 Sustainability (Switzerland), 12, 1–22, https://doi.org/10.3390/su12218811. 36
Litman, T., 2021: Well Measured Developing Indicators for Sustainable and Livable Transport 37 Planning. 117 pp. https://www.vtpi.org/wellmeas.pdf. 38
Littlefield, J., S. Roman-White, D. Augustine, A. Pegallapati, G. G. Zaimes, S. Rai, G. Cooney, and T. 39 J. Skone, 2019: Life Cycle Analysis of Natural Gas Extraction and Power Generation. 40 https://www.netl.doe.gov/energy-analysis/details?id=7C7809C2-49AC-4CE0-AC72-41 3C8F8A4D87AD. 42
Littlefield, J. A., J. Marriott, G. A. Schivley, and T. J. Skone, 2017: Synthesis of recent ground-level 43 methane emission measurements from the U.S. natural gas supply chain. Journal of Cleaner 44 Production, 148, 118–126, https://doi.org/10.1016/J.JCLEPRO.2017.01.101. 45
Liu, C. M., N. K. Sandhu, S. T. McCoy, and J. A. Bergerson, 2020a: A life cycle assessment of 46
ACCEPTED VERSION
SUBJECT TO FIN
AL EDITS
Final Government Distribution Chapter 10 IPCC AR6 WGIII
Do Not Cite, Quote or Distribute 10-131 Total pages: 176
greenhouse gas emissions from direct air capture and Fischer-Tropsch fuel production. 1 Sustainable Energy & Fuels, 4, 3129–3142, https://doi.org/10.1039/C9SE00479C. 2
Liu, J., A. W. K. Law, and O. Duru, 2021: Abatement of atmospheric pollutant emissions with 3 autonomous shipping in maritime transportation using Bayesian probabilistic forecasting. 4 Atmospheric Environment, 261, 118593, https://doi.org/10.1016/j.atmosenv.2021.118593. 5
Liu, N., F. Xie, Z. Lin, and M. Jin, 2020b: Evaluating national hydrogen refueling infrastructure 6 requirement and economic competitiveness of fuel cell electric long-haul trucks. Mitigation and 7 Adaptation Strategies for Global Change, 25, 477–493. 8
Liu, S., Y. Wan, H.-K. Ha, Y. Yoshida, and A. Zhang, 2019: Impact of high-speed rail network 9 development on airport traffic and traffic distribution: Evidence from China and Japan. 10 Transportation Research Part A: Policy and Practice, 127, 115–135. 11
Liu, Y., B. Yang, X. Dong, Y. Wang, and Y. Xia, 2017: A Simple Prelithiation Strategy To Build a 12 High-Rate and Long-Life Lithium-Ion Battery with Improved Low-Temperature Performance. 13 Angewandte Chemie International Edition, 56, https://doi.org/10.1002/anie.201710555. 14
Liu, Z., and Coauthors, 2020c: Near-real-time monitoring of global CO 2 emissions reveals the effects 15 of the COVID-19 pandemic. Nature Communications, 11, 1–12. 16
Lombardi, L., L. Tribioli, R. Cozzolino, and G. Bella, 2017: Comparative environmental assessment of 17 conventional, electric, hybrid, and fuel cell powertrains based on LCA. The International Journal 18 of Life Cycle Assessment, 22, 1989–2006, https://doi.org/10.1007/s11367-017-1294-y. 19
Loo, B. P. Y., and D. Banister, 2016: Decoupling transport from economic growth: Extending the debate 20 to include environmental and social externalities. Journal of Transport Geography, 57, 134–144. 21
Van Loon, P., A. McKinnon, L. Deketele, and J. Dewaele, 2014: The growth of online retailing: A 22 review of its carbon impacts. Carbon Management, 5, 285–292. 23
Luk, J. M., H. C. Kim, R. D. De Kleine, T. J. Wallington, and H. L. MacLean, 2018: Greenhouse gas 24 emission benefits of vehicle lightweighting: Monte Carlo probabalistic analysis of the multi 25 material lightweight vehicle glider. Transportation Research Part D: Transport and Environment, 26 62, 1–10, https://doi.org/10.1016/j.trd.2018.02.006. 27
Luo, X., and M. Wang, 2017: Study of solvent-based carbon capture for cargo ships through process 28 modelling and simulation. Applied Energy, 195, 402–413, 29 https://doi.org/10.1016/J.APENERGY.2017.03.027. 30
Luque-Ayala, A., 2018: Post-development carbon. Rethinking Urban Transitions, Routledge, 224–241. 31
Lutsey, N., 2015: Global climate change mitigation potential from a transition to electric vehicles | 32 International Council on Clean Transportation. 33
Lutsey, N., and D. Sperling, 2012: Regulatory adaptation: Accommodating electric vehicles in a 34 petroleum world. Energy Policy, 45, 308–316, https://doi.org/10.1016/j.enpol.2012.02.038. 35
Ma, W., Q. Wang, H. Yang, A. Zhang, and Y. Zhang, 2019: Effects of Beijing-Shanghai high-speed 36 rail on air travel: Passenger types, airline groups and tacit collusion. Research in Transportation 37 Economics, 74, 64–76. 38
Ma, X., and Coauthors, 2021: Recycled cathode materials enabled superior performance for lithium-39 ion batteries. Joule, https://doi.org/10.1016/j.joule.2021.09.005. 40
Macchi, S., and M. Tiepolo, 2014: Climate change vulnerability in Southern African cities. 41
Mackey, B., I. C. Prentice, W. Steffen, J. I. House, D. Lindenmayer, H. Keith, and S. Berry, 2013: 42 Untangling the confusion around land carbon science and climate change mitigation policy. 43 Nature Climate Change, 3, 552–557. 44
Macmillan, A., M. Smith, K. Witten, A. Woodward, J. Hosking, K. Wild, and A. Field, 2020: Suburb-45 level changes for active transport to meet the SDGs: Causal theory and a New Zealand case study. 46
ACCEPTED VERSION
SUBJECT TO FIN
AL EDITS
Final Government Distribution Chapter 10 IPCC AR6 WGIII
Do Not Cite, Quote or Distribute 10-132 Total pages: 176
Science of the Total Environment, 714, https://doi.org/10.1016/j.scitotenv.2020.136678. 1
Madzharov, D., E. Delarue, and W. D’haeseleer, 2014: Integrating electric vehicles as flexible load in 2 unit commitment modeling. Energy, 65, 285–294, https://doi.org/10.1016/j.energy.2013.12.009. 3
Maggio, G., A. Nicita, and G. Squadrito, 2019: How the hydrogen production from RES could change 4 energy and fuel markets: A review of recent literature. International journal of hydrogen energy, 5 44, 11371–11384. 6
Maginn, P. J., P. Burton, and C. Legacy, 2018: Disruptive Urbanism? Implications of the ‘Sharing 7 Economy’ for Cities, Regions, and Urban Policy. Urban Policy and Research, 36, 393–398, 8 https://doi.org/10.1080/08111146.2018.1555909. 9
Mahmud, M. A. P., N. Huda, S. H. Farjana, and C. Lang, 2018: Environmental sustainability assessment 10 of hydropower plant in Europe using life cycle assessment. IOP Conference Series: Materials 11 Science and Engineering, Vol. 351 of, Institute of Physics Publishing. 12
Makan, H., and G. J. Heyns, 2018: Sustainable supply chain initiatives in reducing greenhouse gas 13 emission within the road freight industry. Journal of Transport and Supply Chain Management, 14 12, https://doi.org/10.4102/jtscm.v12i0.365. 15
MAN-ES, 2019: Technical Paper: Engineering the future two-stroke green-ammonia engine. 16 Copenhagen: MAN ES. https://fathom.world/wp-17 content/uploads/2020/05/engineeringthefuturetwostrokegreenammoniaengine1589339239488.pd18 f. 19
Månberger, A., and B. Stenqvist, 2018: Global metal flows in the renewable energy transition: exploring 20 the effects of substitutes, technological mix and development. Energy Policy, 119, 226–241. 21
Mander, S., C. Walsh, P. Gilbert, M. Traut, and A. Bows, 2012: Decarbonizing the UK energy system 22 and the implications for UK shipping. Carbon Management, 3, 601–614, 23 https://doi.org/10.4155/cmt.12.67. 24
Manthiram, A., Y. Fu, S.-H. Chung, C. Zu, and Y.-S. Su, 2014: Rechargeable Lithium–Sulfur Batteries. 25 Chemical Reviews, 114, 11751–11787, https://doi.org/10.1021/cr500062v. 26
Manzetti, S., and F. Mariasiu, 2015: Electric vehicle battery technologies: From present state to future 27 systems. Renewable and Sustainable Energy Reviews, 51, 1004–1012, 28 https://doi.org/https://doi.org/10.1016/j.rser.2015.07.010. 29
Marchetti, C., and J. Ausubel, 2004: The Evolution of Transport. The Industrial Physicist, 7, 20–24. 30
Mareev, I., J. Becker, and D. Sauer, 2018: Battery Dimensioning and Life Cycle Costs Analysis for a 31 Heavy-Duty Truck Considering the Requirements of Long-Haul Transportation. Energies, 11, 55, 32 https://doi.org/10.3390/en11010055. 33
Marelle, L., and Coauthors, 2016: Air quality and radiative impacts of Arctic shipping emissions in the 34 summertime in northern Norway: From the local to the regional scale. Atmospheric Chemistry and 35 Physics, 16, 2359–2379, https://doi.org/10.5194/acp-16-2359-2016. 36
Marinaro, M., and Coauthors, 2020: Bringing forward the development of battery cells for automotive 37 applications: Perspective of R&D activities in China, Japan, the EU and the USA. Journal of 38 Power Sources, 459, 228073. 39
Marks, T., and Coauthors, 2021: Climate impact mitigation potential of formation flight. Aerospace, 8, 40 14. 41
Marletto, G., 2014: Car and the city: Socio-technical transition pathways to 2030. TECHNOLOGICAL 42 FORECASTING AND SOCIAL CHANGE, 87, 164–178, 43 https://doi.org/10.1016/j.techfore.2013.12.013. 44
Marquart, S., M. Ponater, L. Ström, and K. Gierens, 2005: An upgraded estimate of the radiative forcing 45 of cryoplane contrails. Meteorol. Zeitschrift, 14, 573–582. 46
ACCEPTED VERSION
SUBJECT TO FIN
AL EDITS
Final Government Distribution Chapter 10 IPCC AR6 WGIII
Do Not Cite, Quote or Distribute 10-133 Total pages: 176
Marsden, G., 2018: Planning for autonomous vehicles? Questions of purpose, place and pace. Plann 1 Theory Practice, 19. 2
Marsden, G., J. Dales, P. Jones, E. Seagriff, and N. J. Spurling, 2018: All Change?: The future of travel 3 demand and its implications for policy and planning. 4
Martens, K., 2020: people-centred approach to accessibility. International Transport Forum Discussion 5 Papers, 2020/24. 6
Martin, G., L. Rentsch, M. Höck, and M. Bertau, 2017: Lithium market research–global supply, future 7 demand and price development. Energy Storage Materials, 6, 171–179. 8
Massar, M., I. Reza, S. M. Rahman, S. M. H. Abdullah, A. Jamal, and F. S. Al-Ismail, 2021: Impacts 9 of autonomous vehicles on greenhouse gas emissions—positive or negative? International 10 Journal of Environmental Research and Public Health, 18, 5567, 11 https://doi.org/10.3390/ijerph18115567. 12
Matthes, S., and Coauthors, 2017: A Concept for Multi-Criteria Environmental Assessment of Aircraft 13 Trajectories. Aerospace, 4, 42, https://doi.org/10.3390/aerospace4030042. 14
Mattioli, G., C. Roberts, J. K. Steinberger, and A. Brown, 2020: The political economy of car 15 dependence: A systems of provision approach. Energy Research and Social Science, 66, 101486, 16 https://doi.org/10.1016/j.erss.2020.101486. 17
Mawhood, R., E. Gazis, S. de Jong, R. Hoefnagels, and R. Slade, 2016: Production pathways for 18 renewable jet fuel: a review of commercialization status and future prospects. Biofuels, 19 Bioproducts and Biorefining, 10, 462–484, https://doi.org/10.1002/bbb.1644. 20
Mayrink, S., J. G. Oliveira, B. H. Dias, L. W. Oliveira, J. S. Ochoa, and G. S. Rosseti, 2020: 21 Regenerative Braking for Energy Recovering in Diesel-Electric Freight Trains: A Technical and 22 Economic Evaluation. Energies, 13, https://doi.org/10.3390/en13040963. 23
McIntosh, J. R., P. Newman, R. Trubka, and J. Kenworthy, 2017: Framework for land value capture 24 from investments in transit in car-dependent cities. Journal of Transport and Land Use, 10, 155–25 185, https://doi.org/10.5198/JTLU.2015.531. 26
McKinnon, A., 2018: Decarbonizing Logistics: Distributing Goods in a Low Carbon World. Kogan 27 Page Publishers,. 28
McKinsey, 2020: Hydrogen-powered aviation: A fact-based study of hydrogen technology, economics, 29 and climate impact by 2050. 96 pp. 30
Melia, N., K. Haines, and E. Hawkins, 2016: Sea ice decline and 21st century trans-Arctic shipping 31 routes. Geophysical Research Letters, 43, 9720–9728, https://doi.org/10.1002/2016GL069315. 32
Melliger, M., O. van Vliet, and H. Liimatainen, 2018: Anxiety vs reality–Sufficiency of battery electric 33 vehicle range in Switzerland and Finland. Transportation Research Part D: Transport and 34 Environment, 65, 101–115. 35
Melton, N., J. Axsen, and B. Moawad, 2020: Which plug-in electric vehicle policies are best? A multi-36 criteria evaluation framework applied to Canada. Energy Research & Social Science, 64, 101411, 37 https://doi.org/10.1016/J.ERSS.2019.101411. 38
Meng, F., J. Mckechnie, T. Turner, K. H. Wong, and S. J. Pickering, 2017: Environmental Aspects of 39 Use of Recycled Carbon Fiber Composites in Automotive Applications. 12727–12736, 40 https://doi.org/10.1021/acs.est.7b04069. 41
Merchan, A. L., S. Belboom, and A. Léonard, 2020: Life cycle assessment of rail freight transport in 42 Belgium. Clean Technologies and Environmental Policy, 22, 1109–1131, 43 https://doi.org/10.1007/s10098-020-01853-8. 44
Mertens, M., V. Grewe, V. S. Rieger, and P. Jöckel, 2018: Revisiting the contribution of land transport 45 and shipping emissions to tropospheric ozone. Atmospheric Chemistry and Physics, 18, 5567–46 5588, https://doi.org/10.5194/ACP-18-5567-2018. 47
ACCEPTED VERSION
SUBJECT TO FIN
AL EDITS
Final Government Distribution Chapter 10 IPCC AR6 WGIII
Do Not Cite, Quote or Distribute 10-134 Total pages: 176
Messagie, M., F.-S. Boureima, T. Coosemans, C. Macharis, and J. Van Mierlo, 2014: A Range-Based 1 Vehicle Life Cycle Assessment Incorporating Variability in the Environmental Assessment of 2 Different Vehicle Technologies and Fuels. Energies, 7, 1467–1482, 3 https://doi.org/10.3390/en7031467. 4
Messner, S., 2020: Future Arctic shipping, black carbon emissions, and climate change. Maritime 5 Transport and Regional Sustainability, Elsevier, 195–208. 6
Meyer, K., and P. Newman, 2020: Planetary Accounting: Quantifying How to Live Within Planetary 7 Limits at Different Scales of Human Activity. Springer Nature,. 8
Meynerts, L., J. Brito, I. Ribeiro, P. Peças, S. Claus, and U. Götze, 2018: ScienceDirect Life Cycle 9 Assessment of a Hybrid Train Comparison of Different Propulsion Systems. Procedia CIRP, 69, 10 511–516, https://doi.org/10.1016/j.procir.2017.11.035. 11
Miao, Q., M. K. Feeney, F. Zhang, E. W. Welch, and P. S. Sriraj, 2018: Through the storm: Transit 12 agency management in response toclimate change. Transp. Res. Part D, 63, 421–432. 13
Milovanoff, A., H. C. Kim, R. De Kleine, T. J. Wallington, I. D. Posen, and H. L. Maclean, 2019: A 14 Dynamic Fleet Model of U.S Light-Duty Vehicle Lightweighting and Associated Greenhouse Gas 15 Emissions from 2016 to 2050. Environmental Science and Technology, 16 https://doi.org/10.1021/acs.est.8b04249. 17
Minx, J. C., and Coauthors, 2021: A comprehensive dataset for global, regional and national greenhouse 18 gas emissions by sector 1970–2019. Earth System Science Data Discussions, 1–63. 19
Miotti, M., J. Hofer, and C. Bauer, 2017: Integrated environmental and economic assessment of current 20 and future fuel cell vehicles. International Journal of Life Cycle Assessment, 22, 94–110, 21 https://doi.org/10.1007/s11367-015-0986-4. 22
Mohammadi, A., F. Elsaid, and L. Amador-Jiminez, 2019: Optimizing transit maintenance and 23 rehabilitation to support human development and sustainability: A case study of Costa Rica’s 24 railroad network. International Journal of Sustainable Transportation, 13, 497–510, 25 https://doi.org/10.1080/15568318.2018.1486488. 26
Monioudi, I. Ν., and Coauthors, 2018: Climate change impacts on critical international transportation 27 assets of Caribbean Small Island Developing States (SIDS): the case of Jamaica and Saint Lucia. 28 Regional Environmental Change, 18, 2211–2225, https://doi.org/10.1007/s10113-018-1360-4. 29
Montgomery, J., 2017: The new wealth of cities: city dynamics and the fifth wave. Routledge,. 30
Moreira, M., A. C. Gurgel, and J. E. A. Seabra, 2014: Life cycle greenhouse gas emissions of sugar 31 cane renewable jet fuel. Environmental science & technology, 48, 14756–14763. 32
Moretti, L., and G. Loprencipe, 2018: Climate Change and Transport Infrastructures: State of the Art. 33 Sustainability, 10, 4098, https://doi.org/10.3390/su10114098. 34
Morlotti, C., M. Cattaneo, P. Malighetti, and R. Redondi, 2017: Multi-dimensional price elasticity for 35 leisure and business destinations in the low-cost air transport market: Evidence from easyJet. 36 Tourism Management, 61, 23–34. 37
Moultak, M., N. Lutsey, and D. Hall, 2017: Transitioning to Zero-Emission Heavy-Duty Freight 38 Vehicles. 53p pp. www.theicct.org (Accessed June 26, 2019). 39
Move Humanity, 2018: Closing the SDG Budget Gap. www.pica-publishing.com (Accessed November 40 10, 2019). 41
Muiderman, K., A. Gupta, J. Vervoort, and F. Biermann, 2020: Four approaches to anticipatory climate 42 governance: Different conceptions of the future and implications for the present. Wiley 43 Interdisciplinary Reviews: Climate Change, 11, e673. 44
Mulholland, E., J. Teter, P. Cazzola, Z. McDonald, and B. P. Ó Gallachóir, 2018: The long haul towards 45 decarbonising road freight – A global assessment to 2050. Applied Energy, 216, 678–693, 46 https://doi.org/10.1016/J.APENERGY.2018.01.058. 47
ACCEPTED VERSION
SUBJECT TO FIN
AL EDITS
Final Government Distribution Chapter 10 IPCC AR6 WGIII
Do Not Cite, Quote or Distribute 10-135 Total pages: 176
Muratori, M., and Coauthors, 2020: EMF-33 insights on bioenergy with carbon capture and storage 1 (BECCS). Climatic Change, 163, https://doi.org/10.1007/s10584-020-02784-5. 2
Nahlik, M. J., A. T. Kaehr, M. V. Chester, A. Horvath, and M. N. Taptich, 2016: Goods Movement Life 3 Cycle Assessment for Greenhouse Gas Reduction Goals. Journal of Industrial Ecology, 20, 317–4 328, https://doi.org/10.1111/jiec.12277. 5
Naik, V., and Coauthors, 2021: Chapter 6: Short-lived climate forcers. Climate Change 2021: The 6 Physical Science Basis. Contribution of Working Group I to the Sixth Assessment Report of the 7 Intergovernmental Panel on Climate Change, Cambridge University Press. 8
Naoi, K., S. Ishimoto, J. Miyamoto, and W. Naoi, 2012: Second generation ‘nanohybrid 9 supercapacitor’: evolution of capacitive energy storage devices. Energy & Environmental Science, 10 5, 9363–9373. 11
Narassimhan, E., and C. Johnson, 2018: The role of demand-side incentives and charging infrastructure 12 on plug-in electric vehicle adoption: analysis of US States. Environmental Research Letters, 13, 13 074032. 14
Narula, C. K., B. H. Davison, and M. Keller, 2017: Zeolitic catalytic conversion of alochols to 15 hydrocarbons. 16
Nasri, M. I., T. Bektaş, and G. Laporte, 2018: Route and speed optimization for autonomous trucks. 17 Computers & Operations Research, 100, 89–101, https://doi.org/10.1016/J.COR.2018.07.015. 18
Ndlovu, V., and P. Newman, 2020: Leapfrog Technology and How It Applies to Trackless Tram. 19 Journal of Transportation Technologies, 10, 198–213. 20
Neaimeh, M., and P. B. Andersen, 2020: Mind the gap-open communication protocols for vehicle grid 21 integration. Energy Informatics, 3, 1–17. 22
Nelder, C., and E. Rogers, 2019: Reducing EV charging infrastructure costs. 49 pp. 23 https://www.researchgate.net/profile/Chris-24 Nelder/publication/338660434_Reducing_EV_Charging_Infrastructure_Costs/links/5e2237d62925 9bf1e1fab9ed9c/Reducing-EV-Charging-Infrastructure-Costs.pdf. 26
Neves, A., and C. Brand, 2019: Assessing the potential for carbon emissions savings from replacing 27 short car trips with walking and cycling using a mixed GPS-travel diary approach. Transportation 28 Research Part A: Policy and Practice, 123, 130–146, https://doi.org/10.1016/J.TRA.2018.08.022. 29
Newman, P., 2010: Sustainable cities of the future: The behavior change driver. Sustainable Dev. L. & 30 Pol’y, 11. 31
——, 2020a: COVID, CITIES and CLIMATE: Historical Precedents and Potential Transitions for the 32 New Economy. Urban Science, 4, 32, https://doi.org/10.3390/urbansci4030032. 33
——, 2020b: Cool planning: How urban planning can mainstream responses to climate change. Cities, 34 103. 35
——, and J. Kenworthy, 2006: Urban Design to Reduce Automobile Dependence. Opolis, 2, 35–52. 36
——, and ——, 2015: The End of Automobile Dependence: How Cities are Moving Beyond Car-Based 37 Planning. 3rd None e. Island Press, 320 pp. 38
——, ——, P. Newman, and J. Kenworthy, 2015a: The End of Automobile Dependence: The End of 39 Automobile Dependence, Island Press/Center for Resource Economics, 201–226. 40
——, A. Matan, and J. McIntosh, 2015b: Urban transport and sustainable development. Routledge 41 International Handbook of Sustainable Development, Routledge, 337–350. 42
——, L. Kosonen, and J. Kenworthy, 2016: Theory of urban fabrics: planning the walking, 43 transit/public transport and automobile/motor car cities for reduced car dependency. Town 44 Planning Review, 87, 429–458, https://doi.org/https://doi.org/10.3828/tpr.2016.28. 45
——, T. Beatley, and H. Boyer, 2017: Resilient Cities: Overcoming Fossil Fuel Dependence. 2nd ed. 46
ACCEPTED VERSION
SUBJECT TO FIN
AL EDITS
Final Government Distribution Chapter 10 IPCC AR6 WGIII
Do Not Cite, Quote or Distribute 10-136 Total pages: 176
Island Press, 264 pp. 1
——, S. Davies-Slate, and E. Jones, 2018: The Entrepreneur Rail Model: Funding urban rail through 2 majority private investment in urban regeneration. Research in Transportation Economics, 67, 3 19–28, https://doi.org/10.1016/j.retrec.2017.04.005. 4
——, K. Hargroves, S. Davies-Slate, D. Conley, M. Verschuer, M. Mouritz, and D. Yangka, 2019: The 5 Trackless Tram: Is It the Transit and City Shaping Catalyst We Have Been Waiting for? Journal 6 of Transportation Technologies, 09, 31–55, https://doi.org/10.4236/jtts.2019.91003. 7
——, S. Davies-Slate, D. Conley, K. Hargroves, and M. Mouritz, 2021: From TOD to TAC: Why and 8 How Transport and Urban Policy Needs to Shift to Regenerating Main Road Corridors with New 9 Transit Systems. Urban Science, 5, 52. 10
Nguyen, H. P., A. T. Hoang, S. Nizetic, X. P. Nguyen, A. T. Le, C. N. Luong, V. D. Chu, and V. V. 11 Pham, 2020: The electric propulsion system as a green solution for management strategy of CO2 12 emission in ocean shipping: A comprehensive review. International Transactions on Electrical 13 Energy Systems, 1–29, https://doi.org/10.1002/2050-7038.12580. 14
Nguyen, T. H., J. Partala, and S. Pirttikangas, 2019: Blockchain-based mobility-as-a-service. 019 28th 15 International Conference on Computer Communication and Networks (ICCCN). 16
Nicholas, M., 2019: Estimating electric vehicle charging infrastructure costs across major U.S. 17 metropolitan areas. 18
——, G. Tal, and T. Turrentine, 2017: Advanced plug-in electric vehicle travel and charging behavior 19 interim report. 20
Nieuwenhuijsen, M. J., 2018: Influence of urban and transport planning and the city environment on 21 cardiovascular disease. Nature Reviews Cardiology, 15, 432–438, https://doi.org/10.1038/s41569-22 018-0003-2. 23
Nijland, H., and van M. Jordy, 2017: Mobility and environmental impacts of car sharing in the 24 Netherlands. Environmental Innovation and Societal Transitions, 23, 84–91. 25
Niklaß, M., B. Lührs, V. Grewe, K. Dahlmann, T. Luchkova, F. Linke, and V. Gollnick, 2019: Potential 26 to reduce the climate impact of aviation by climate restricted airspaces. Transport Policy, 83, 102–27 110, https://doi.org/10.1016/j.tranpol.2016.12.010. 28
Noel, L., J. Kester, G. Z. de Rubens, and B. Sovacool, 2019: Vehicle-to-Grid: A Sociotechnical 29 Transition Beyond Electric Mobility -. Springer,. 30
Noland, R. B., S. Wang, S. Kulp, and B. H. Strauss, 2019: Employment accessibility and rising seas. 31 Transportation Research Part D: Transport and Environment, 32 https://doi.org/10.1016/j.trd.2019.09.017. 33
Noppers, E. H., K. Keizer, J. W. Bolderdijk, and L. Steg, 2014: The adoption of sustainable innovations: 34 Driven by symbolic and environmental motives. Global Environmental Change, 25, 52–62, 35 https://doi.org/10.1016/j.gloenvcha.2014.01.012. 36
——, ——, M. Bockarjova, and L. Steg, 2015: The adoption of sustainable innovations: The role of 37 instrumental, environmental, and symbolic attributes for earlier and later adopters. Journal of 38 Environmental Psychology, 44, 74–84, https://doi.org/10.1016/j.jenvp.2015.09.002. 39
Noy, K., and M. Givoni, 2018: Is ‘Smart Mobility’ Sustainable? Examining the Views and Beliefs of 40 Transport’s Technological Entrepreneurs. Sustainability, 10, 422, 41 https://doi.org/10.3390/su10020422. 42
NSTC, 2018: National Science and Technology Council 2018: Assessment of Critical Minerals: 43 Updated Application of Screening Methodology. 10 pp. 44 https://trumpwhitehouse.archives.gov/wp-content/uploads/2018/02/Assessment-of-Critical-45 Minerals-Update-2018.pdf. 46
Nugroho, S. B., E. Zusman, and R. Nakano, 2018a: Pedestrianisation programs and its impacts on the 47
ACCEPTED VERSION
SUBJECT TO FIN
AL EDITS
Final Government Distribution Chapter 10 IPCC AR6 WGIII
Do Not Cite, Quote or Distribute 10-137 Total pages: 176
willingness to increase walking distance in Indonesian cities: The case of Bandung City and Bogor 1 City, Indonesia. Transportation Systems in the Connected Era - Proceedings of the 23rd 2 International Conference of Hong Kong Society for Transportation Studies, HKSTS 2018. 3
——, ——, ——, R. B. Frazila, F. Zukhruf, J. Jihanny, and K. Nawassa, 2018b: Does the Improvement 4 of Pedestrian Facilities Increase Willingness to Walk? The Case of Bandung, Indonesia. 5 Transportation Research Board 97th Annual Meeting. 6
Nykvist, B., M. Nilsson, and M. Nykvist, B. and Nilsson, 2015: Rapidly falling costs of battery packs 7 for electric vehicles. Nature Climate Change, 5, 329–332, https://doi.org/10.1038/nclimate2564. 8
——, F. Sprei, and M. Nilsson, 2019: Assessing the progress toward lower priced long range battery 9 electric vehicles. Energy Policy, 124, 144–155. 10
O’Brien, W., and F. Y. Aliabadi, 2020: Does telecommuting save energy? A critical review of 11 quantitative studies and their research methods. Energy and Buildings, 225, 110298. 12
O’Keefe, P., B. Caulfield, W. Brazil, and P. White, 2016: The impacts of telecommuting in Dublin. 13 Research in Transportation Economics, 57, 13–20, 14 https://doi.org/10.1016/J.RETREC.2016.06.010. 15
Ødemark, K., S. B. Dalsøren, B. H. Samset, T. K. Berntsen, J. S. Fuglestvedt, and G. Myhre, 2012: 16 Short-lived climate forcers from current shipping and petroleum activities in the Arctic. Atmos. 17 Chem. Phys., 12, 1979–1993, https://doi.org/10.5194/acp-12-1979-2012. 18
Olivetti, E. A., G. Ceder, G. G. Gaustad, and X. Fu, 2017: Lithium-Ion Battery Supply Chain 19 Considerations: Analysis of Potential Bottlenecks in Critical Metals. Joule, 1, 229–243, 20 https://doi.org/https://doi.org/10.1016/j.joule.2017.08.019. 21
Olmer, N., B. Comer, B. Roy, X. Mao, and D. Rutherford, 2017: Greenhouse Gas Emissions from 22 Global Shipping, 2013–2015 Detailed Methodology. International Council on Clean 23 Transportation: Washington, DC, USA, 1–38. 24
Olofsson, J., Z. Barta, P. Börjesson, and O. Wallberg, 2017: Integrating enzyme fermentation in 25 lignocellulosic ethanol production: Life-cycle assessment and techno-economic analysis. 26 Biotechnology for Biofuels, 10, 51–64, https://doi.org/10.1186/s13068-017-0733-0. 27
Olugbenga, O., N. Kalyviotis, and S. Saxe, 2019: Embodied emissions in rail infrastructure: A critical 28 literature review. Environmental Research Letters, 14, 123002, https://doi.org/10.1088/1748-29 9326/ab442f. 30
Paddeu, D., and J. Denby, 2021: Decarbonising road freight: Is truck automation and platooning an 31 opportunity? Clean Technologies and Environmental Policy, 1, https://doi.org/10.1007/s10098-32 020-02020-9. 33
Paffumi, E., M. De Gennaro, and G. Martini, 2018: Alternative utility factor versus the SAE J2841 34 standard method for PHEV and BEV applications. Transport Policy, 68, 80–97, 35 https://doi.org/10.1016/j.tranpol.2018.02.014. 36
Palin, E. J., I. S. Oslakovic, K. Gavin, and A. Quinn, 2021: Implications of climate change for railway 37 infrastructure. Wiley Interdisciplinary Reviews: Climate Change, 12, e728, 38 https://doi.org/10.1002/WCC.728. 39
Palmer, K., J. E. Tate, Z. Wadud, and J. Nellthorp, 2018: Total cost of ownership and market share for 40 hybrid and electric vehicles in the UK, US and Japan. Applied Energy, 209, 108–119, 41 https://doi.org/10.1016/j.apenergy.2017.10.089. 42
Pan, D., and Coauthors, 2020: Methane emissions from natural gas vehicles in China. Nature 43 Communications, 11, 1–10, https://doi.org/10.1038/s41467-020-18141-0. 44
Pan, X., H. Wang, L. Wang, and W. Chen, 2018: Decarbonization of China’s transportation sector: In 45 light of national mitigation toward the Paris Agreement goals. Energy, 155, 853–864, 46 https://doi.org/10.1016/j.energy.2018.04.144. 47
ACCEPTED VERSION
SUBJECT TO FIN
AL EDITS
Final Government Distribution Chapter 10 IPCC AR6 WGIII
Do Not Cite, Quote or Distribute 10-138 Total pages: 176
Pangbourne, K., M. N. Mladenović, D. Stead, and D. Milakis, 2020: Questioning mobility as a service: 1 Unanticipated implications for society and governance. Transportation Research Part A: Policy 2 and Practice, 131, 35–49. 3
Panja, T., J. Ajuria, N. Díez, D. Bhattacharjya, E. Goikolea, and D. Carriazo, 2020: Fabrication of high-4 performance dual carbon Li-ion hybrid capacitor: mass balancing approach to improve the energy-5 power density and cycle life. Scientific Reports, 10, https://doi.org/10.1038/s41598-020-67216-x. 6
Panoutsou, C., and Coauthors, 2021: Advanced biofuels to decarbonise European transport by 2030: 7 Markets, challenges, and policies that impact their successful market uptake. Energy Strategy 8 Reviews, 34, 100633. 9
Parkinson, B., P. Balcombe, J. F. Speirs, A. D. Hawkes, and K. Hellgardt, 2019: Levelized cost of CO 10 2 mitigation from hydrogen production routes. Energy and Environmental Science, 12, 19–40, 11 https://doi.org/10.1039/c8ee02079e. 12
Pathak, M., and P. R. Shukla, 2016: Co-benefits of low carbon passenger transport actions in Indian 13 cities: Case study of Ahmedabad. ransportation Research Part D: Transport and Environment, 14 44, 303–316. 15
Pavlovic, J., A. Tansini, G. Fontaras, B. Ciuffo, M. Garcia Otura, G. Trentadue, R. Suarez Bertoa, and 16 F. Millo, 2017: The Impact of WLTP on the Official Fuel Consumption and Electric Range of 17 Plug-in Hybrid Electric Vehicles in Europe. SAE Technical Papers, 2017-Septe, 18 https://doi.org/10.4271/2017-24-0133. 19
Peden, M. M., and P. Puvanachandra, 2019: Looking back on 10 years of global road safety. 20 International Health, 11, 327–330, https://doi.org/10.1093/inthealth/ihz042. 21
Peng, M., L. Liu, and C. Jiang, 2012: A review on the economic dispatch and risk management of the 22 large-scale plug-in electric vehicles (PHEVs)-penetrated power systems. Renewable and 23 Sustainable Energy Reviews, 16, 1508–1515, https://doi.org/10.1016/j.rser.2011.12.009. 24
Peng, W., and Coauthors, 2020: Comprehensive analysis of the air quality impacts of switching a marine 25 vessel from diesel fuel to natural gas. Environmental Pollution, 266, 26 https://doi.org/10.1016/j.envpol.2020.115404. 27
Penner, J. E., D. H. Lister, D. J. Griggs, D. J. Dokken, and M. McFarland, 1999: Aviation and the Global 28 Atmosphere: A Special Report of the Intergovernmental Panel on Climate Change. Cambridge 29 University Press, 373 pp. 30
Penner, J. E., C. Zhou, A. Garnier, and D. L. Mitchell, 2018: Anthropogenic aerosol indirect effects in 31 cirrus clouds. Journal of Geophysical Research: Atmospheres, 123, 11–652. 32
Perčić, M., N. Vladimir, and A. Fan, 2020: Life-cycle cost assessment of alternative marine fuels to 33 reduce the carbon footprint in short-sea shipping: A case study of Croatia. Applied Energy, 279, 34 115848, https://doi.org/10.1016/J.APENERGY.2020.115848. 35
Pérez-Morales, A., F. Gomariz-Castillo, and P. Pardo-Zaragoza, 2019: Vulnerability of Transport 36 Networks to Multi-Scenario Flooding and Optimum Location of Emergency Management 37 Centers. Water, 11, 1197, https://doi.org/10.3390/w11061197. 38
Petchenik, I., 2021: Commercial flights down 42% in 2020. Flightradar24 Blog,. 39 https://www.flightradar24.com/blog/commercial-flights-down-42-in-2020/ (Accessed October 40 28, 2021). 41
Peters, K., P. Stier, J. Quaas, and H. Graßl, 2012: Aerosol indirect effects from shipping emissions: 42 Sensitivity studies with the global aerosol-climate model ECHAM-HAM. Atmospheric Chemistry 43 and Physics, 12, 5985–6007, https://doi.org/10.5194/ACP-12-5985-2012. 44
Peters, R., J. L. Breuer, M. Decker, T. Grube, M. Robinius, R. C. Samsun, and D. Stolten, 2021: Future 45 power train solutions for long-haul trucks. Sustainability (Switzerland), 13, 1–59, 46 https://doi.org/10.3390/su13042225. 47
ACCEPTED VERSION
SUBJECT TO FIN
AL EDITS
Final Government Distribution Chapter 10 IPCC AR6 WGIII
Do Not Cite, Quote or Distribute 10-139 Total pages: 176
Placke, T., R. Kloepsch, S. Dühnen, and M. Winter, 2017: Lithium ion, lithium metal, and alternative 1 rechargeable battery technologies: the odyssey for high energy density. Journal of Solid State 2 Electrochemistry, 21, 1939–1964, https://doi.org/10.1007/s10008-017-3610-7. 3
Plevin, R. J., M. O’Hare, A. D. Jones, M. S. Torn, and H. K. Gibbs, 2010: The greenhouse gas emissions 4 from market-mediated land use change are uncertain, but potentially much greater than previously 5 estimated. Environmental Science & Technology, 44, 8015–8021. 6
Plötz, P., S. Á. Funke, and P. Jochem, 2018: Empirical fuel consumption and CO2 emissions of plug-7 in hybrid electric vehicles. Journal of Industrial Ecology, 22, 773–784, 8 https://doi.org/10.1111/jiec.12623. 9
——, C. Moll, G. Bieker, P. Mock, and Y. Li, 2020: Real-world usage of plug-in hybrid electric 10 vehicles. International Council on Clean Transportation (ICCT) white paper,. 11
Pochet, M., I. Truedsson, F. Foucher, H. Jeanmart, and F. Contino, 2017: Ammonia-Hydrogen Blends 12 in Homogeneous-Charge Compression-Ignition Engine. 13
Pojani, D., and D. Stead, 2015: Sustainable Urban Transport in the Developing World: Beyond 14 Megacities. Sustainability 2015, Vol. 7, Pages 7784-7805, 7, 7784–7805, 15 https://doi.org/10.3390/SU7067784. 16
Pollard, S. G., 2019: Imagining the net zero emissions city: Urban climate governance in the City of 17 Melbourne, Australia. The role of non-state actors in the green transition: Building a sustainable 18 future, Routledge, 211–229. 19
Poonam, K. Sharma, A. Arora, and S. K. Tripathi, 2019: Review of supercapacitors: Materials and 20 devices. Journal of Energy Storage, 21, 801–825, https://doi.org/10.1016/J.EST.2019.01.010. 21
Posada, F., F. Kamakate, and A. Bandivadekar, 2011: Sustainable Management of Two-and Three-22 Wheelers in Asia. ICCT,. 23
Poulsen, R. T., and H. Sampson, 2020: A swift turnaround? Abating shipping greenhouse gas emissions 24 via port call optimization. Transportation Research Part D: Transport and Environment, 86, 25 102460, https://doi.org/10.1016/J.TRD.2020.102460. 26
Pradhan, P., L. Costa, D. Rybski, W. Lucht, and J. P. Kropp, 2017: A Systematic Study of Sustainable 27 Development Goal (SDG) Interactions. Earth’s Future, 5, 1169–1179. 28
Prati, G., 2018: Gender equality and women’s participation in transport cycling. Journal of Transport 29 Geography, 66, 369–375, https://doi.org/10.1016/j.jtrangeo.2017.11.003. 30
Prussi, M., M. Yugo, L. De Prada, M. Padella, and M. Edwards, 2020: JEC Well-To-Wheels report v5. 31 129 pp. 32
Psaraftis, H. N., 2015: Green maritime transportation: Market based measures. Green Transportation 33 Logistics: The Quest for Win-Win Solutions, Springer International Publishing, 267–297. 34
Puricelli, S., G. Cardellini, S. Casadei, D. Faedo, A. E. M. van den Oever, and M. Grosso, 2021: A 35 review on biofuels for light-duty vehicles in Europe. Renewable and Sustainable Energy Reviews, 36 137, 110398, https://doi.org/10.1016/J.RSER.2020.110398. 37
Pye, S., G. Anandarajah, B. Fals, C. McGlade, and N. Strachan, 2015: Pathways to deep 38 decarbonization in United Kingdom. 39
Qiao, Q., F. Zhao, Z. Liu, H. Hao, X. He, S. V. Przesmitzki, and A. A. Amer, 2020: Life cycle cost and 40 GHG emission benefits of electric vehicles in China. Transportation Research Part D: Transport 41 and Environment, 86, 102418, https://doi.org/10.1016/j.trd.2020.102418. 42
Qiao, Y., J. Santos, A. M. K. Stoner, and G. Flinstch, 2019: Climate change impacts on asphalt road 43 pavement construction and maintenance: An economic life cycle assessment of adaptation 44 measures in the State of Virginia, United States. Journal of Industrial Ecology, jiec.12936, 45 https://doi.org/10.1111/jiec.12936. 46
ACCEPTED VERSION
SUBJECT TO FIN
AL EDITS
Final Government Distribution Chapter 10 IPCC AR6 WGIII
Do Not Cite, Quote or Distribute 10-140 Total pages: 176
Qin, X., L. Liang, X. Zhang, G. Deng, and H. Liang, 2020: Structural Design and Stress Analysis of a 1 Fully-Wrapped Composite CNG Gas Cylinder With Nominal Working Pressure of 30 MPa. 2 Volume 3: Design and Analysis, American Society of Mechanical Engineers. 3
Quéré, C. Le, and Coauthors, 2018: Global carbon budget 2018. Earth System Science Data, 10, 2141–4 2194. 5
Le Quéré, C., and Coauthors, 2018: Global Carbon Budget 2017. Earth System Science Data, 10, 405–6 448, https://doi.org/10.5194/essd-10-405-2018. 7
Raghavan, S. S., and G. Tal, 2020: Plug-in hybrid electric vehicle observed utility factor: Why the 8 observed electrification performance differ from expectations. International Journal of 9 Sustainable Transportation, 0, 1–46, https://doi.org/10.1080/15568318.2020.1849469. 10
Rahim, M. M., M. T. Islam, and S. Kuruppu, 2016: Regulating global shipping corporations’ 11 accountability for reducing greenhouse gas emissions in the seas. Marine Policy, 69, 159–170, 12 https://doi.org/10.1016/j.marpol.2016.04.018. 13
Ramos Pereira, S., T. Fontes, and M. C. Coelho, 2014: Can hydrogen or natural gas be alternatives for 14 aviation?–A life cycle assessment. International Journal of Hydrogen Energy, 39, 13266–13275. 15
Rao, S., and Coauthors, 2017: Future air pollution in the Shared Socio-economic Pathways. Global 16 Environmental Change, 42, 346–358, 17 https://doi.org/https://doi.org/10.1016/j.gloenvcha.2016.05.012. 18
Rasmussen, D. J., K. Bittermann, M. K. Buchanan, S. Kulp, B. H. Strauss, R. E. Kopp, and M. 19 Oppenheimer, 2018: Extreme sea level implications of 1.5 °C, 2.0 °C, and 2.5 °C temperature 20 stabilization targets in the 21st and 22nd centuries. Environmental Research Letters, 13, 034040, 21 https://doi.org/10.1088/1748-9326/aaac87. 22
Ratner, K. A., and A. R. Goetz, 2013: The reshaping of land use and urban form in Denver through 23 transit-oriented development. Cities, 30, 31–46, https://doi.org/10.1016/J.CITIES.2012.08.007. 24
Rayner, T., 2021: Taking the slow route to decarbonisation? Developing climate governance for 25 international transport. Earth System Governance, 8, 100100. 26
Reddy, K. S., L. K. Panwar, R. Kumar, and B. K. Panigrahi, 2016: Distributed resource scheduling in 27 smart grid with electric vehicle deployment using fireworks algorithm. Journal of Modern Power 28 Systems and Clean Energy, 4, 188–199, https://doi.org/10.1007/s40565-016-0195-6. 29
Reiter, A. J., and S. C. Kong, 2011: Combustion and emissions characteristics of compression-ignition 30 engine using dual ammonia-diesel fuel. Fuel, 90, 87–97, 31 https://doi.org/10.1016/J.FUEL.2010.07.055. 32
Righi, M., J. Hendricks, and R. Sausen, 2013: The global impact of the transport sectors on atmospheric 33 aerosol: simulations for year 2000 emissions. Atmospheric Chemistry and Physics, 13, 9939–34 9970, https://doi.org/10.5194/acp-13-9939-2013. 35
——, ——, and ——, 2015: The global impact of the transport sectors on atmospheric aerosol in 2030-36 Part 1: Land transport and shipping. Atmospheric Chemistry and Physics, 15, 633–651, 37 https://doi.org/10.5194/ACP-15-633-2015. 38
Rip, A., and R. Kemp, 1998: Technological change. Human choice and climate change, Vol. 2 of, 327–39 399. 40
Rivkin, 2019: The Green New Deal: Why the Fossil Fuel Civilization Will Collapse by 2028, and the 41 Bold Economic Plan to Save Life on Earth. The Green New Deal: Why the Fossil Fuel Civilization 42 Will Collapse by 2028, and the Bold Economic Plan to Save Life on Earth, St. Martin’s Press. 43
Robertson, S., 2016: The potential mitigation of CO2 emissions via modal substitution of high-speed 44 rail for short-haul air travel from a life cycle perspective–An Australian case study. Transportation 45 Research Part D: Transport and Environment, 46, 365–380. 46
——, 2018: A carbon footprint analysis of renewable energy technology adoption in the modal 47
ACCEPTED VERSION
SUBJECT TO FIN
AL EDITS
Final Government Distribution Chapter 10 IPCC AR6 WGIII
Do Not Cite, Quote or Distribute 10-141 Total pages: 176
substitution of high-speed rail for short-haul air travel in Australia. International Journal of 1 Sustainable Transportation, 12, 299–312. 2
Robins, N., 2018: THE ROAD TO NET-ZERO FINANCE A report prepared by the Advisory Group on 3 Finance for the UK’s Climate Change Committee, UK Government, London. 4
Rodrigue, J.-P., 2017: The Geography of Transport Systems. FOURTH EDI. 440 pp. 5
Roiger, A., and Coauthors, 2014: Quantifying Emerging Local Anthropogenic Emissions in the Arctic 6 Region: The ACCESS Aircraft Campaign Experiment. Bulletin of the American Meteorological 7 Society, 96, 441–460, https://doi.org/10.1175/BAMS-D-13-00169.1. 8
Rondinelli, S., A. Gardi, R. Kapoor, and R. Sabatini, 2017: Benefits and challenges of liquid hydrogen 9 fuels in commercial aviation. International Journal of Sustainable Aviation, 3, 200–216. 10
Rosenfeld, D. C., J. Lindorfer, and K. Fazeni-Fraisl, 2019: Comparison of advanced fuels—Which 11 technology can win from the life cycle perspective? Journal of Cleaner Production, 238, 117879, 12 https://doi.org/https://doi.org/10.1016/j.jclepro.2019.117879. 13
Roth, K. W., T. Rhodes, and R. Ponoum, 2008: The energy and greenhouse gas emission impacts of 14 telecommuting in the US. 2008 IEEE International Symposium on Electronics and the 15 Environment, 1–6. 16
Rothengatter, W., 2010: Competition between airlines and high-speed rail. Critical issues in air 17 transport economics and business, Routledge, 329–352. 18
Rovere, L. La, C. G. E., C. Grottera, and W. Wills, 2015: Pathways to deep decarbonization in Brazil. 19
Roy, P., A. Dutta, and B. Deen, 2015: Greenhouse gas emissions and production cost of ethanol 20 produced from biosyngas fermentation process. Bioresource Technology, 192, 185–191, 21 https://doi.org/10.1016/J.BIORTECH.2015.05.056. 22
van Ruijven, B. J., E. De Cian, and I. S. Wang, 2019: Amplification of future energy demand growth 23 due to climate change. Nature Communications, 10, 1–12. 24
Ryley, T. J., P. A. Stanley, M. P. Enoch, A. M. Zanni, and M. A. Quddus, 2014: Investigating the 25 contribution of Demand Responsive Transport to a sustainable local public transport system. 26 Research in Transportation Economics, 48, 364–372. 27
S. Mojtaba, L., J. Axsen, and C. Crawford, 2019: Comparing alternative heavy-duty drivetrains based 28 on GHG emissions, ownership and abatement costs: Simulations of freight routes in British 29 Columbia. Transportation Research Part D: Transport and Environment, 76, 19–55, 30 https://doi.org/10.1016/j.trd.2019.08.031. 31
Sacchi, R., 2021: Carculator: Prospective environmental and economic life cycle assessment of vehicles 32 made blazing fast. Available from: 33 https://github.com/romainsacchi/carculator/blob/master/docs/introduction.rst 34
Sadeghi, S., S. Ghandehariun, and M. A. Rosen, 2020: Comparative economic and life cycle assessment 35 of solar-based hydrogen production for oil and gas industries. Energy, 208, 118347, 36 https://doi.org/10.1016/j.energy.2020.118347. 37
Sahoo, S., and D. K. Srivastava, 2021: Effect of compression ratio on engine knock, performance, 38 combustion and emission characteristics of a bi-fuel CNG engine. Energy, 233, 121144, 39 https://doi.org/10.1016/J.ENERGY.2021.121144. 40
Sahoo, S., X. Zhao, and K. Kyprianidis, 2020: A Review of Concepts, Benefits, and Challenges for 41 Future Electrical Propulsion-Based Aircraft. Aerospace 2020, Vol. 7, Page 44, 7, 44, 42 https://doi.org/10.3390/AEROSPACE7040044. 43
Salman, C. A., S. Schwede, E. Thorin, and J. Yan, 2017: Enhancing biomethane production by 44 integrating pyrolysis and anaerobic digestion processes. Applied energy, 204, 1074–1083. 45
Di Sbroiavacca, N., G. Nadal, F. Lallana, J. Falzon, and K. Calvin, 2014: Emissions reduction scenarios 46
ACCEPTED VERSION
SUBJECT TO FIN
AL EDITS
Final Government Distribution Chapter 10 IPCC AR6 WGIII
Do Not Cite, Quote or Distribute 10-142 Total pages: 176
in the Argentinean Energy Sector. Energy Economics, 56, 552–563, 1 https://doi.org/10.1016/j.eneco.2015.03.021. 2
Schafer, A., and D. G. Victor, 2000: The future mobility of the world population. Transportation 3 Research Part A: Policy and Practice, 34, 171–205, https://doi.org/10.1016/S0965-4 8564(98)00071-8. 5
Schäfer, A. W., 2017: Long-term trends in domestic US passenger travel: the past 110 years and the 6 next 90. Transportation, 44, 293–310, https://doi.org/10.1007/s11116-015-9638-6. 7
——, and S. Yeh, 2020: A holistic analysis of passenger travel energy and greenhouse gas intensities. 8 Nature Sustainability, 3, 459–462, https://doi.org/10.1038/s41893-020-0514-9. 9
Schaller, B., 2018: The New Automobility: Lyft, Uber and the Future of American Cities. 10
Scheelhaase, J., S. Maertens, and W. Grimme, 2019: Synthetic fuels in aviation–Current barriers and 11 potential political measures. Transportation Research Procedia, 43, 21–30. 12
Schmidt, O., A. Hawkes, A. Gambhir, and I. Staffell, 2017: The future cost of electrical energy storage 13 based on experience rates. Nature Energy, 2, 1–8, https://doi.org/10.1038/nenergy.2017.110. 14
Schmidt, P., W. Weindorf, A. Roth, V. Batteiger, and F. Riegel, 2016: Power-to-Liquids – Potentials 15 and Perspectives for the Future Supply of Renewable Aviation Fuel. 16 https://www.umweltbundesamt.de/sites/default/files/medien/377/publikationen/161005_uba_hin17 tergrund_ptl_barrierrefrei.pdf. 18
——, V. Batteiger, A. Roth, W. Weindorf, and T. Raksha, 2018: Power-to-Liquids as Renewable Fuel 19 Option for Aviation: A Review. Chemie Ingenieur Technik, 90, 127–140, 20 https://doi.org/10.1002/cite.201700129. 21
Sclar, R., C. Gorguinpour, S. Castellanos, and X. Li, 2019: Barriers to Adopting Electric Buses. 22
Seba, T., 2014: Clean Disruption of Energy and Transportation: How Silicon Valley Will Make Oil, 23 Nuclear, Natural Gas, Coal, Electric Utilities and Conventional Cars Obsolete by 2030. 24
Seddiek, I. S., 2015: An Overview: Environmental and Economic Strategies for Improving Quality of 25 Ships Exhaust Gases. International Journal of Maritime Engineering, 157, 53–64, 26 https://doi.org/10.3940/rina.ijme.2015.a1.311. 27
Sedlmeir, J., H. U. Buhl, G. Fridgen, and R. Keller, 2020: The energy consumption of blockchain 28 technology: beyond myth. Business & Information Systems Engineering, 62, 599–608. 29
Seithe, G. J., A. Bonou, D. Giannopoulos, C. A. Georgopoulou, and M. Founti, 2020: Maritime 30 Transport in a Life Cycle Perspective: How Fuels, Vessel Types, and Operational Profiles 31 Influence Energy Demand and Greenhouse Gas Emissions. Energies, 13, 2739, 32 https://doi.org/10.3390/en13112739. 33
Sen, B., T. Ercan, and O. Tatari, 2017: Does a battery-electric truck make a difference? – Life cycle 34 emissions, costs, and externality analysis of alternative fuel-powered Class 8 heavy-duty trucks in 35 the United States. Journal of Cleaner Production, 141, 110–121, 36 https://doi.org/10.1016/J.JCLEPRO.2016.09.046. 37
Seto, K. C., S. J. Davis, R. B. Mitchell, E. C. Stokes, G. Unruh, and D. Ürge-Vorsatz, 2016: Carbon 38 Lock-In: Types, Causes, and Policy Implications. http://dx.doi.org/10.1146/annurev-environ-39 110615-085934, 41, 425–452, https://doi.org/10.1146/ANNUREV-ENVIRON-110615-085934. 40
Seto, K. C., G. Churkina, A. Hsu, M. Keller, P. W. G. Newman, B. Qin, and A. Ramaswami, 2021: 41 From Low-to Net-Zero Carbon Cities: The Next Global Agenda. Annual Review of Environment 42 and Resources, 46, 23.1-23.9, https://doi.org/10.1146/annurev-environ-050120. 43
Shabanpour, R., N. Golshani, M. Tayarani, J. Auld, and A. (Kouros) Mohammadian, 2018: Analysis of 44 telecommuting behavior and impacts on travel demand and the environment. Transportation 45 Research Part D: Transport and Environment, 62, 563–576, 46 https://doi.org/10.1016/J.TRD.2018.04.003. 47
ACCEPTED VERSION
SUBJECT TO FIN
AL EDITS
Final Government Distribution Chapter 10 IPCC AR6 WGIII
Do Not Cite, Quote or Distribute 10-143 Total pages: 176
Shaheen, S., and A. Cohen, 2019: Shared ride services in North America: definitions, impacts, and the 1 future of pooling. Transport Reviews, 39, 427–442. 2
——, ——, and M. Jaffee, 2018: Innovative Mobility: Carsharing Outlook. 3
Sharafian, A., P. Blomerus, and W. Mérida, 2019: Natural gas as a ship fuel: Assessment of greenhouse 4 gas and air pollutant reduction potential. Energy Policy, 131, 332–346, 5 https://doi.org/10.1016/j.enpol.2019.05.015. 6
Sharma, R., and P. Newman, 2020: Land Value Capture Tools: Integrating Transit and Land Use 7 through Finance to Enable Economic Value Creation. Morden Economy, 11, 938–964. 8
Sharmina, M., C. McGlade, P. Gilbert, and A. Larkin, 2017: Global energy scenarios and their 9 implications for future shipped trade. Marine Policy, 84, 12–21, 10 https://doi.org/10.1016/j.marpol.2017.06.025. 11
Sharmina, M., and Coauthors, 2021: Decarbonising the critical sectors of aviation, shipping, road 12 freight and industry to limit warming to 1.5–2°C. Climate Policy, 21, 455–474, 13 https://doi.org/10.1080/14693062.2020.1831430. 14
Sharp, D., 2018: Sharing Cities for Urban Transformation: Narrative, Policy and Practice. Urban Policy 15 and Research, 36, 513–526, https://doi.org/10.1080/08111146.2017.1421533. 16
She, Z.-Y., Qing Sun, J.-J. Ma, and B.-C. Xie, 2017: What are the barriers to widespread adoption of 17 battery electric vehicles? A survey of public perception in Tianjin, China. Transport Policy, 56, 18 29–40, https://doi.org/10.1016/J.TRANPOL.2017.03.001. 19
Shen, W., W. Han, T. J. Wallington, and S. L. Winkler, 2019: China Electricity Generation Greenhouse 20 Gas Emission Intensity in 2030: Implications for Electric Vehicles. Environmental Science and 21 Technology, 53, 6063–6072, https://doi.org/10.1021/acs.est.8b05264. 22
Sheng, Y., X. Shi, and B. Su, 2018: Re-analyzing the economic impact of a global bunker emissions 23 charge. Energy Economics, 74, 107–119, https://doi.org/10.1016/j.eneco.2018.05.035. 24
Shreyas Harsha, 2014: Liquid hydrogen as aviation fuel and its relative performance with commercial 25 aircraft fuel. International Journal of Mechanical Engineering and Robotics Research, 1, 73–77. 26
Shukla, P. R., S. Dhar, M. Pathak, D. Mahadevia, and A. Garg, 2015: Pathways to deep decarbonization 27 in India. Sustainable Development Solutions Network (SDSN) and Institute for Sustainable 28 Development and International Relations (IDDRI), http://deepdecarbonization.org/wp-29 content/uploads/2015/09/DDPP_IND.pdf. 30
Siagian, U. W. R., R. G. Dewi, B. Rizaldi, H. Iwan, Y. B. Budi, and G. E. Ginting, 2015: Pathways to 31 deep decarbonization in Indonesia. 32
Sierzchula, W., S. Bakker, K. Maat, and B. Wee, 2014: The influence of financial incentives and other 33 socio-economic factors on electric vehicle adoption. Energy Policy. Energy Policy, 68, 183–194. 34
Simell, P., I. Hannula, S. Tuomi, M. Nieminen, E. Kurkela, I. Hiltunen, N. Kaisalo, and J. Kihlman, 35 2014: Clean syngas from biomass—process development and concept assessment. Biomass 36 Conversion and Biorefinery, 4, 357–370, https://doi.org/10.1007/s13399-014-0121-y. 37
Simićević, J., V. Molan, and N. Milosavljević, 2020: Informal park-and-ride behaviour. Journal of 38 Road and Traffic Engineering, 66, 9–13. 39
Sims, R., and Coauthors, 2014: Transport. Mitigation of Climate Change. Contribution of Working 40 Group III to the Fifth Assessment Report of the Intergovernmental Panel on Climate Change, 41 Cambridge and New York: Cambridge University Press. 42
Singh, V., I. Dincer, and M. A. Rosen, 2018: Chapter 4.2 - Life Cycle Assessment of Ammonia 43 Production Methods. I. Dincer, C.O. Colpan, and O.B.T.-E. Kizilkan Energetic and 44 Environmental Dimensions, Eds., Academic Press, 935–959. 45
Skeer, J., F. Boshell, and M. Ayuso, 2016: Technology Innovation Outlook for Advanced Liquid 46
ACCEPTED VERSION
SUBJECT TO FIN
AL EDITS
Final Government Distribution Chapter 10 IPCC AR6 WGIII
Do Not Cite, Quote or Distribute 10-144 Total pages: 176
Biofuels in Transport. ACS Energy Letters, 1, 724–725, 1 https://doi.org/10.1021/acsenergylett.6b00290. 2
Skeete, J. P., 2018: Level 5 autonomy: The new face of disruption in road transport. Technological 3 Forecasting and Social Change, https://doi.org/10.1016/j.techfore.2018.05.003. 4
Skjølsvold, T. M., and M. Ryghaug, 2019: Temporal echoes and cross-geography policy effects: 5 multiple levels of transition governance and the electric vehicle breakthrough. Environmental 6 Innovation and Societal Transitions, https://doi.org/10.1016/j.elst.2019.06.004. 7
SLoCaT, 2018a: Transport and Climate Change: Global Status Report 2018. http://slocat.net/tcc-gsr. 8
——, 2018b: Sustainable Development Goals & Transport. Partnership on Sustainable Low Carbon 9 Transport,. http://www.slocat.net/sdgs-transport (Accessed November 23, 2019). 10
——, 2019: Sustainable Transport: A Critical Driver to Achieve the Sustainable Development Goals 11 An analysis of 2016 - 2019 Voluntary National Reviews. 44 pp. 12
——, 2021: SLOCAT Transport and Climate Change Global Status Report Tracking Trends in a Time 13 of Change: The Need for Radical Action Towards Sustainable Transport Decarbonisation. 365 14 pp. https://tcc-gsr.com/wp-content/uploads/2021/06/Slocat-Global-Status-Report-2nd-15 edition_high-res.pdf. 16
Smith, L. C., and S. R. Stephenson, 2013: New Trans-Arctic shipping routes navigable by midcentury. 17 Proceedings of the National Academy of Sciences of the United States of America, 110, E1191--18 5, https://doi.org/10.1073/pnas.1214212110. 19
Smith, M. S., C. Cook, Y. Sokona, T. Elmqvist, K. Fukushi, W. Broadgate, and M. P. Jarzebski, 2018: 20 Advancing sustainability science for the SDGs. Sustainability Science, 13, 1483–1487, 21 https://doi.org/10.1007/s11625-018-0645-3. 22
Smith, T. W. P., and Coauthors, 2014: Third International Maritime Organization Green House Gas 23 study. 24
Sofiev, M., and Coauthors, 2018: Cleaner fuels for ships provide public health benefits with climate 25 tradeoffs. Nature Communications, 9, 406, https://doi.org/10.1038/s41467-017-02774-9. 26
Soler, A., 2019: A look into the role of e-fuels in the transport system in Europe (2030-2050) (literature 27 review). https://www.concawe.eu/wp-content/uploads/Rpt_19-14.pdf (Accessed October 18, 28 2021). 29
Song, F., S. Hess, and T. Dekker, 2018: Accounting for the impact of variety-seeking: Theory and 30 application to HSR-air intermodality in China. Journal of Air Transport Management, 69, 99–31 111. 32
Song, H., X. Ou, J. Yuan, M. Yu, and C. Wang, 2017: Energy consumption and greenhouse gas 33 emissions of diesel/LNG heavy-duty vehicle fleets in China based on a bottom-up model analysis. 34 Energy, 140, 966–978, https://doi.org/10.1016/j.energy.2017.09.011. 35
Sonnleitner, J., M. Friedrich, and E. Richter, 2021: Impacts of highly automated vehicles on travel 36 demand: macroscopic modeling methods and some results. Transportation, 1–24. 37
de Souza Dias, M. O., R. Maciel Filho, P. E. Mantelatto, O. Cavalett, C. E. V. Rossell, A. Bonomi, and 38 M. R. L. V. Leal, 2015: Sugarcane processing for ethanol and sugar in Brazil. Environmental 39 Development, 15, https://doi.org/10.1016/j.envdev.2015.03.004. 40
de Souza, L. L. P., E. E. S. Lora, J. C. E. Palacio, M. H. Rocha, M. L. G. Renó, and O. J. Venturini, 41 2018: Comparative environmental life cycle assessment of conventional vehicles with different 42 fuel options, plug-in hybrid and electric vehicles for a sustainable transportation system in Brazil. 43 Journal of Cleaner Production, 203, 444–468, 44 https://doi.org/https://doi.org/10.1016/j.jclepro.2018.08.236. 45
Sovacool, B. K., L. Noel, J. Axsen, and W. Kempton, 2018: The neglected social dimensions to a 46 vehicle-to-grid (V2G) transition: a critical and systematic review. Environmental Research 47
ACCEPTED VERSION
SUBJECT TO FIN
AL EDITS
Final Government Distribution Chapter 10 IPCC AR6 WGIII
Do Not Cite, Quote or Distribute 10-145 Total pages: 176
Letters, 13, 13001, https://doi.org/10.1088/1748-9326/aa9c6d. 1
——, S. H. Ali, M. Bazilian, B. Radley, B. Nemery, J. Okatz, and D. Mulvaney, 2020: Sustainable 2 minerals and metals for a low-carbon future. Science, 367, 30–33. 3
Speck, J., 2018: Walkable city rules: 101 steps to making better places. Island Press/Center for Resource 4 Economics,. 5
Sprei, F., 2018: Disrupting mobility. Energy Research & Social Science, 37, 238–242, 6 https://doi.org/10.1016/j.erss.2017.10.029. 7
Staffell, I., D. Scamman, A. V. Abad, P. Balcombe, P. E. Dodds, P. Ekins, N. Shah, and K. R. Ward, 8 2019: The role of hydrogen and fuel cells in the global energy system. Energy & Environmental 9 Science, 12, 463–491. 10
Staples, M. D., R. Malina, and S. R. H. Barrett, 2017: The limits of bioenergy for mitigating global life-11 cycle greenhouse gas emissions from fossil fuels. Nature Energy, 12 https://doi.org/10.1038/nenergy.2016.202. 13
——, ——, P. Suresh, J. I. Hileman, and S. R. H. Barrett, 2018: Aviation CO2 emissions reductions 14 from the use of alternative jet fuels. Energy Policy, 114, 342–354, 15 https://doi.org/10.1016/j.enpol.2017.12.007. 16
Steg, L., 2005: Car use: Lust and must. Instrumental, symbolic and affective motives for car use. 17 Transportation Research Part A: Policy and Practice, 39, 147–162, 18 https://doi.org/10.1016/j.tra.2004.07.001. 19
——, G. Perlaviciute, and E. van der Werff, 2015: Understanding the human dimensions of a 20 sustainable energy transition. Frontiers in Psychology, 6, 1–17, 21 https://doi.org/10.3389/fpsyg.2015.00805. 22
Stegen, K. S., 2015: Heavy rare earths, permanent magnets, and renewable energies: An imminent 23 crisis. Energy Policy, 79, 1–8. 24
Stephenson, S. R., W. Wang, C. S. Zender, H. Wang, S. J. Davis, and P. J. Rasch, 2018: Climatic 25 Responses to Future Trans-Arctic Shipping. Geophysical Research Letters, 45, 9898–9908, 26 https://doi.org/10.1029/2018GL078969. 27
Stolaroff, J. K., C. Samaras, E. R. O’Neill, A. Lubers, A. S. Mitchell, and D. Ceperley, 2018: Energy 28 use and life cycle greenhouse gas emissions of drones for commercial package delivery. Nature 29 Communications, 9, 409, https://doi.org/10.1038/s41467-017-02411-5. 30
Stolz, B., M. Held, G. Georges, and K. Boulouchos, 2021: The CO2 reduction potential of shore-side 31 electricity in Europe. Applied Energy, 285, 116425, 32 https://doi.org/10.1016/j.apenergy.2020.116425. 33
Strale, M., 2016: High-speed rail for freight: Potential developments and impacts on urban dynamics. 34 The Open Transportation Journal, 10. 35
Ström, L., and K. Gierens, 2002: First simulations of cryoplane contrails. Journal of Geophysical 36 Research: Atmospheres, 107, AAC 2-1, https://doi.org/10.1029/2001JD000838. 37
Suel, E., and J. W. Polak, 2018: Incorporating online shopping into travel demand modelling: 38 challenges, progress, and opportunities. Transport Reviews, 38, 576–601, 39 https://doi.org/10.1080/01441647.2017.1381864. 40
Sumaila, U. R., and Coauthors, 2021: Financing a sustainable ocean economy. Nature Communications 41 2021 12:1, 12, 1–11, https://doi.org/10.1038/s41467-021-23168-y. 42
Tafidis, P., and Coauthors, 2017: Exploring the impact of ICT on urban mobility in heterogenic regions. 43 Transportation Research Procedia, 27, 309–316. 44
Taiebat, M., and M. Xu, 2019: Synergies of four emerging technologies for accelerated adoption of 45 electric vehicles: Shared mobility, wireless charging, vehicle-to-grid, and vehicle automation. 46
ACCEPTED VERSION
SUBJECT TO FIN
AL EDITS
Final Government Distribution Chapter 10 IPCC AR6 WGIII
Do Not Cite, Quote or Distribute 10-146 Total pages: 176
Journal of Cleaner Production, 230, 794–797, https://doi.org/10.1016/j.jclepro.2019.05.142. 1
Takahashi, S., T. Uemura, S. Kon, and H. Nebashi, 2017: Effect evaluation of electric double-layer 2 capacitor (EDLC) for regenerative braking energy utilization in sinjuku line, Seibu railway. 3 IECON 2017-43rd Annual Conference of the IEEE Industrial Electronics Society, IEEE, 3881–4 3883. 5
Tanco, M., L. Cat, and S. Garat, 2019: A break-even analysis for battery electric trucks in Latin 6 America. Journal of Cleaner Production, 228, 1354–1367, 7 https://doi.org/10.1016/J.JCLEPRO.2019.04.168. 8
Tanzer, S. E., J. Posada, S. Geraedts, and A. Ramirez, 2019: Lignocellulosic marine biofuel: 9 Technoeconomic and environmental assessment for production in Brazil and Sweden. Journal of 10 Cleaner Production, 239, 117845. 11
Taptich, M. N., A. Horvath, and M. V. Chester, 2016: Worldwide Greenhouse Gas Reduction Potentials 12 in Transportation by 2050. Journal of Industrial Ecology, 20, 329–340, 13 https://doi.org/10.1111/jiec.12391. 14
Teeter, J. L., and S. A. Cleary, 2014: Decentralized oceans: Sail-solar shipping for sustainable 15 development in SIDS. Natural Resources Forum, 38, 182–192, https://doi.org/10.1111/1477-16 8947.12048. 17
Teng, F., A. Gu, X. Yang, X. Wang., Q. Liu, Y. Chen, C. Tian, and X. Zheng, 2015: Pathways to deep 18 decarbonization in China. Sustainable Development Solutions Network (SDSN) and Institute for 19 Sustainable Development and International Relations (IDDRI),. 20
Teoh, R., U. Schumann, A. Majumdar, and M. E. J. Stettler, 2020: Mitigating the Climate Forcing of 21 Aircraft Contrails by Small-Scale Diversions and Technology Adoption. Environmental Science 22 & Technology, 54, 2941–2950, https://doi.org/10.1021/ACS.EST.9B05608. 23
Thaduri, A., D. Galar, and U. Kumar, 2020: Space weather climate impacts on railway infrastructure. 24 International Journal of Systems Assurance Engineering and Management, 11, 267–281, 25 https://doi.org/10.1007/S13198-020-01003-9. 26
The Swiss Parliament, 2020: Un oui franc à la taxe sur les billets d’avion (Press release, 15.01.2020). 27
Thomson, G., and P. Newman, 2016: Geoengineering in the Anthropocene through Regenerative 28 Urbanism. Geosciences, 6, 46, https://doi.org/10.3390/GEOSCIENCES6040046. 29
——, and ——, 2018: Urban fabrics and urban metabolism – from sustainable to regenerative cities. 30 Resources, Conservation and Recycling, 132, 218–229, 31 https://doi.org/10.1016/j.resconrec.2017.01.010. 32
Thornbush, M., O. Golubchikov, and S. Bouzarovski, 2013: Sustainable cities targeted by combined 33 mitigation–adaptation efforts for future-proofing. Sustainable Cities and Society, 9, 1–9. 34
Tian, X. L., C. J. An, and Z. K. Chen, 2020: Assessing the Impact of Urban Form on the Greenhouse 35 Gas Emissions from Household Vehicles: A Review. Journal of Environmental Informatics 36 Letters, https://doi.org/10.3808/jeil.202000029. 37
Tikoudis, I., L. Martinez, K. Farrow, C. G. Bouyssou, O. Petrik, and W. Oueslati, 2021: Ridesharing 38 services and urban transport CO2 emissions: Simulation-based evidence from 247 cities. 39 Transportation Research Part D: Transport and Environment, 97, 102923. 40
Tillig, F., W. Mao, and J. W. Ringsberg, 2015: Systems modelling for energy-efficient shipping. 40 pp. 41
Timmers, V. R. J. H., and P. A. J. Achten, 2016: Non-exhaust PM emissions from electric vehicles. 42 Atmospheric Environment, 134, 10–17, https://doi.org/10.1016/j.atmosenv.2016.03.017. 43
Tirachini, A., and O. Cats, 2020: COVID-19 and Public Transportation: Current Assessment, Prospects, 44 and Research Needs. Journal of Public Transportation, 22, 1, 45 https://doi.org/https://doi.org/10.5038/2375-0901.22.1.1. 46
ACCEPTED VERSION
SUBJECT TO FIN
AL EDITS
Final Government Distribution Chapter 10 IPCC AR6 WGIII
Do Not Cite, Quote or Distribute 10-147 Total pages: 176
——, and A. Gomez-Lobo, 2020: Does ride-hailing increase or decrease vehicle kilometers traveled 1 (VKT)? A simulation approach for Santiago de Chile. International Journal of Sustainable 2 Transportation, 14, 187–204, https://doi.org/10.1080/15568318.2018.1539146. 3
Tokimatsu, K., S. Konishi, K. Ishihara, T. Tezuka, R. Yasuoka, and M. Nishio, 2016: Role of innovative 4 technologies under the global zero emissions scenarios. Applied Energy, 162, 1483–1493, 5 https://doi.org/10.1016/j.apenergy.2015.02.051. 6
Tong, F., P. Jaramillo, and I. M. L. Azevedo, 2015a: Comparison of Life Cycle Greenhouse Gases from 7 Natural Gas Pathways for Medium and Heavy-Duty Vehicles. Environmental Science & 8 Technology, 49, 7123–7133, https://doi.org/10.1021/es5052759. 9
——, ——, and I. M. L. I. M. L. Azevedo, 2015b: Comparison of Life Cycle Greenhouse Gases from 10 Natural Gas Pathways for Light-Duty Vehicles. Energy and Fuels, 29, 6008–6018, 11 https://doi.org/10.1021/acs.energyfuels.5b01063. 12
Toole, J. L., S. Colak, B. Sturt, L. P. Alexander, A. Evsukoff, and M. C. González, 2015: The path most 13 traveled: Travel demand estimation using big data resources. Transportation Research Part C: 14 Emerging Technologies, 58, 162–177. 15
Transport and Environment, 2018: CNG and LNG for vehicles and ships - the facts. Transport and 16 Environmen,. 17
Traut, M., P. Gilbert, C. Walsh, A. Bows, A. Filippone, P. Stansby, and R. Wood, 2014: Propulsive 18 power contribution of a kite and a Flettner rotor on selected shipping routes. Applied Energy, 113, 19 362–372, https://doi.org/10.1016/j.apenergy.2013.07.026. 20
——, A. Larkin, K. Anderson, C. McGlade, M. Sharmina, and T. Smith, 2018: CO2 abatement goals 21 for international shipping. Climate Policy, 18, 1066–1075, 22 https://doi.org/10.1080/14693062.2018.1461059. 23
Triantafyllopoulos, G., A. Dimaratos, L. Ntziachristos, Y. Bernard, J. Dornoff, and Z. Samaras, 2019: 24 A study on the CO 2 and NO x emissions performance of Euro 6 diesel vehicles under various 25 chassis dynamometer and on-road conditions including latest regulatory provisions. Science of the 26 Total Environment, 666, 337–346, https://doi.org/10.1016/j.scitotenv.2019.02.144. 27
Trivedi, S., R. Prasad, A. Mishra, A. Kalam, and P. Yadav, 2020: Current scenario of CNG vehicular 28 pollution and their possible abatement technologies: an overview. Environmental Science and 29 Pollution Research, 27, 39977–40000, https://doi.org/10.1007/s11356-020-10361-7. 30
Tsiakmakis, S., G. Fontaras, C. Cubito, J. Pavlovic, K. Anagnostopoulos, and B. Ciuffo, 2017: From 31 NEDC to WLTP: effect on the type-approval CO2 emissions of light-duty vehicles. 32
U.S. Energy Information Administration, 2021: Annual Energy Outlook. 33 https://www.eia.gov/outlooks/aeo/ (Accessed September 30, 2021). 34
UK DoT, 2019: Transport, health, and wellbeing. 35
UK Government, 2019: Houses of Parliament Parliamentary Office of Science & Technology. 36
Ünal, A. B., L. Steg, and J. Granskaya, 2019: “To support or not to support, that is the question”. Testing 37 the VBN theory in predicting support for car use reduction policies in Russia. Transportation 38 Research Part A: Policy and Practice, 119, 73–81, https://doi.org/10.1016/j.tra.2018.10.042. 39
UNCRD, 2020: Environmentally Sustainable Transport (EST) Initiative and Programs in Asia. 27 pp. 40 https://www.unescap.org/sites/default/files/3b.3_AsianEnvironSustainTransportInitiative_CRC 41 Mohanty.pdf. 42
UNCTAD, 2018: 50 Years of Review of Maritime Transport, 1968-2018: Reflecting on the past, 43 exploring the future. TR News, 97p. 44
——, 2019: Review of maritime transport 2019. 129 pp. Review of Maritime Transport 2019 - 45 UNCTAD. 46
ACCEPTED VERSION
SUBJECT TO FIN
AL EDITS
Final Government Distribution Chapter 10 IPCC AR6 WGIII
Do Not Cite, Quote or Distribute 10-148 Total pages: 176
Underwood, B. S., Z. Guido, P. Gudipudi, and Y. Feinberg, 2017: Increased costs to US pavement 1 infrastructure from future temperature rise. Nature Climate Change, 7, 704–707, 2 https://doi.org/10.1038/nclimate3390. 3
UNECE, 2018: Road Safety Performance Review Uganda Road Safety Performance Review Uganda 4 UNITED NATIONS ECONOMIC COMMISSION FOR AFRICA UNITED NATIONS 5 ECONOMIC COMMISSION FOR EUROPE Information Service United Nations Economic 6 Commission for Europe. 7
UNEP, 2011: Decoupling Natural Resource Use and Environmental Impacts from Economic Growth. 8 1–58 pp. https://wedocs.unep.org/xmlui/handle/20.500.11822/9816 (Accessed October 10, 2021). 9
——, 2013: City-level decoupling: urban resource flows and the governance of infrastructure 10 transitions. https://www.resourcepanel.org/reports/city-level-decoupling (Accessed October 10, 11 2021). 12
——, 2020: Emissions Gap Report 2020. https://www.unep.org/emissions-gap-report-2020 (Accessed 13 October 23, 2021). 14
United Nations, 2015: Transforming our world: the 2030 Agenda for Sustainable Development. 15 https://www.un.org/en/development/desa/population/migration/generalassembly/docs/globalcom16 pact/A_RES_70_1_E.pdf (Accessed November 23, 2019). 17
——, 2017: Work of the Statistical Commission pertaining to the 2030 Agenda for Sustainable 18 Development. https://digitallibrary.un.org/record/1291226#record-files-collapse-header 19 (Accessed November 23, 2019). 20
Upadhyayula, V. K. K., A. G. Parvatker, A. Baroth, and K. Shanmugam, 2019: Lightweighting and 21 electrification strategies for improving environmental performance of passenger cars in India by 22 2030: A critical perspective based on life cycle assessment. Journal of Cleaner Production, 209, 23 1604–1613, https://doi.org/10.1016/j.jclepro.2018.11.153. 24
Ürge-Vorsatz, D., C. Rosenzweig, R. J. Dawson, R. Sanchez Rodriguez, X. Bai, A. S. Barau, K. C. 25 Seto, and S. Dhakal, 2018: Locking in positive climate responses in cities. Nature Climate Change 26 2018 8:3, 8, 174–177, https://doi.org/10.1038/s41558-018-0100-6. 27
US DOE, 2019: Hydrogen Class 8 Long Haul Truck Targets. 31 pp. 28 https://www.hydrogen.energy.gov/pdfs/19006_hydrogen_class8_long_haul_truck_targets.pdf. 29
US Geological Survey, 2018: USGS Critical Minerals Annual Review. 30
Ushakov, S., D. Stenersen, and P. M. Einang, 2019: Methane slip from gas fuelled ships: a 31 comprehensive summary based on measurement data. Journal of Marine Science and Technology 32 (Japan), 24, 1308–1325, https://doi.org/10.1007/s00773-018-00622-z. 33
Vahidi, A., and A. Sciarretta, 2018: Energy saving potentials of connected and automated vehicles. 34 Transportation Research Part C: Emerging Technologies, 95, 822–843, 35 https://doi.org/10.1016/j.trc.2018.09.001. 36
Valdes, V., 2015: Determinants of air travel demand in Middle Income Countries. Journal of Air 37 Transport Management, 42, 75–84, https://doi.org/10.1016/J.JAIRTRAMAN.2014.09.002. 38
Valente, A., D. Iribarren, and J. Dufour, 2017: Harmonised life-cycle global warming impact of 39 renewable hydrogen. Journal of Cleaner Production, 149, 762–772, 40 https://doi.org/10.1016/j.jclepro.2017.02.163. 41
——, ——, and ——, 2021: Harmonised carbon and energy footprints of fossil hydrogen. International 42 Journal of Hydrogen Energy, 46, 17587–17594, https://doi.org/10.1016/j.ijhydene.2020.03.074. 43
Valero, A., A. Valero, G. Calvo, and A. Ortego, 2018: Material bottlenecks in the future development 44 of green technologies. Renewable and Sustainable Energy Reviews, 93, 178–200. 45
Vasic, A.-M., and M. Weilenmann, 2006: Comparison of Real-World Emissions from Two-Wheelers 46 and Passenger Cars. Environmental Science & Technology, 40, 47
ACCEPTED VERSION
SUBJECT TO FIN
AL EDITS
Final Government Distribution Chapter 10 IPCC AR6 WGIII
Do Not Cite, Quote or Distribute 10-149 Total pages: 176
https://doi.org/10.1021/es0481023. 1
Vecchio, G., I. Tiznado-Aitken, and R. Hurtubia, 2020: Transport and equity in Latin America: a critical 2 review of socially oriented accessibility assessments*. 3 https://doi.org/10.1080/01441647.2020.1711828, 40, 354–381, 4 https://doi.org/10.1080/01441647.2020.1711828. 5
Verstraete, D., 2013: Long range transport aircraft using hydrogen fuel. International Journal of 6 Hydrogen Energy, 38, 14824–14831, https://doi.org/10.1016/j.ijhydene.2013.09.021. 7
Viana, M., P. Hammingh, A. Colette, X. Querol, B. Degraeuwe, I. de Vlieger, and J. van Aardenne, 8 2014: Impact of maritime transport emissions on coastal air quality in Europe. Atmospheric 9 Environment, 90, 96–105, https://doi.org/10.1016/j.atmosenv.2014.03.046. 10
Viana, M., and Coauthors, 2015: Environmental and health benefits from designating the marmara sea 11 and the turkish straits as an emission control area (ECA). Environmental Science and Technology, 12 49, 3304–3313, https://doi.org/10.1021/es5049946. 13
Viktorelius, M., and M. Lundh, 2019: Energy efficiency at sea: An activity theoretical perspective on 14 operational energy efficiency in maritime transport. Energy Research & Social Science, 52, 1–9. 15
Virdis, M. R., M. Gaeta, E. De Cian, R. Parrado, C. Martini, and M. C. Tommasino, 2015: Pathways to 16 deep decarbonization in Italy. 17
van Vuuren, D. P., and Coauthors, 2018: Alternative pathways to the 1.5 °C target reduce the need for 18 negative emission technologies. Nature Climate Change, 8, 391–397, 19 https://doi.org/10.1038/s41558-018-0119-8. 20
Wang, M., and Coauthors, 2019: Summary of Expansions and Updates in GREET 2019. 24. 21
Wang, T., Z. Qu, Z. Yang, T. Nichol, D. Dimitriu, G. Clarke, D. Bowden, and P. T. Lee, 2020: Impact 22 analysis of climate change on rail systems for adaptation planning: A UK case. Transportation 23 Research Part D: Transport and Environment, 83, 102324, 24 https://doi.org/10.1016/J.TRD.2020.102324. 25
Wang, T., B. Shen, C. H. Sringer, and J. Hou, 2021: What prevents us from taking low-carbon actions? 26 A comprehensive review of influencing factors affecting low-carbon behaviors. Energy Research 27 & Social Science, 71, 101844. 28
Ward, J. W., J. J. Michalek, and C. Samaras, 2021: Air Pollution, Greenhouse Gas, and Traffic 29 Externality Benefits and Costs of Shifting Private Vehicle Travel to Ridesourcing Services. 30 Environmental Science & Technology, 55, 13174–13185, 31 https://doi.org/10.1021/ACS.EST.1C01641. 32
Wardman, M., J. Toner, N. Fearnley, S. Flügel, and M. Killi, 2018: Review and meta-analysis of inter-33 modal cross-elasticity evidence. Transportation Research Part A: Policy and Practice, 118, 662–34 681, https://doi.org/10.1016/j.tra.2018.10.002. 35
Warnecke, C., L. Schneider, T. Day, S. La Hoz Theuer, and H. Fearnehough, 2019: Robust eligibility 36 criteria essential for new global scheme to offset aviation emissions. Nature Climate Change 2019 37 9:3, 9, 218–221, https://doi.org/10.1038/s41558-019-0415-y. 38
Watson, I., A. Ali, and A. Bayyati, 2019: Freight transport using high-speed railways. International 39 Journal of Transport Development and Integration, 3, 103–116, https://doi.org/10.2495/TDI-V3-40 N2-103-116. 41
WBA, 2019: Climate and Energy Benchmark - World Benchmarking Alliance. 42 https://www.worldbenchmarkingalliance.org/climate-and-energy-benchmark/ (Accessed 43 November 24, 2019). 44
Webb, J., J. Whitehead, and C. Wilson, 2019: Who Will Fuel Your Electric Vehicle in the Future? You 45 or Your Utility? 46
Weis, A., P. Jaramillo, and J. Michalek, 2014: Estimating the potential of controlled plug-in hybrid 47
ACCEPTED VERSION
SUBJECT TO FIN
AL EDITS
Final Government Distribution Chapter 10 IPCC AR6 WGIII
Do Not Cite, Quote or Distribute 10-150 Total pages: 176
electric vehicle charging to reduce operational and capacity expansion costs for electric power 1 systems with high wind penetration. Applied Energy, 115, 190–204, 2 https://doi.org/10.1016/j.apenergy.2013.10.017. 3
Weiss, D. J., and Coauthors, 2018: A global map of travel time to cities to assess inequalities in 4 accessibility in 2015. Nature, 553, 333–336, https://doi.org/10.1038/nature25181. 5
Wenig, J., M. Sodenkamp, and T. Staake, 2019: Battery versus infrastructure: Tradeoffs between battery 6 capacity and charging infrastructure for plug-in hybrid electric vehicles. Applied Energy, 255, 7 113787, https://doi.org/10.1016/J.APENERGY.2019.113787. 8
Wentland, A., 2016: Imagining and enacting the future of the German energy transition: electric 9 vehicles as grid infrastructure. Innovation: The European Journal of Social Science Research, 29, 10 285–302. 11
Weymouth, R., and J. Hartz-Karp, 2015: Deliberative collaborative governance as a democratic reform 12 to resolve wicked problems and improve trust. Journal of Economic & Social Policy, 17, 62–95. 13
Whiston, M. M., I. L. Azevedo, S. Litster, K. S. Whitefoot, C. Samaras, and J. F. Whitacre, 2019: Expert 14 assessments of the cost and expected future performance of proton exchange membrane fuel cells 15 for vehicle. Proceedings of the National Academy of Sciences. 16
White, L. V, and N. D. Sintov, 2017: You are what you drive: Environmentalist and social innovator 17 symbolism drives electric vehicle adoption intentions. Transportation Research Part A: Policy 18 and Practice, 99, 94–113, https://doi.org/10.1016/j.tra.2017.03.008. 19
Whitmarsh, L., S. Capstick, and N. Nash, 2017: Who is reducing their material consumption and why? 20 A cross-cultural analysis of dematerialization behaviours. Philosophical Transactions of the Royal 21 Society A: Mathematical, Physical and Engineering Sciences, 375, 20160376. 22
Williams, J. H., B. Haley, F. Kahrl, and J. Moore, 2015: Pathways to Deep Decarbonization in the 23 United States. 24
Williams, K., 2017: Spatial Planning, Urban Form and Sustainable Transport. 25
Wilson, C., H. Pettifor, E. Cassar, L. Kerr, and M. Wilson, 2019: The potential contribution of disruptive 26 low-carbon innovations to 1.5 {\textdegree}C climate mitigation. Energy Efficiency, 12, 423–440, 27 https://doi.org/10.1007/s12053-018-9679-8. 28
Winebrake, J. J., J. J. Corbett, F. Umar, and D. Yuska, 2019: Pollution Tradeoffs for Conventional and 29 Natural Gas-Based Marine Fuels. Sustainability, 11, 2235, https://doi.org/10.3390/su11082235. 30
Winkel, R., U. Weddige, D. Johnsen, V. Hoen, and S. Papaefthimiou, 2016: Shore Side Electricity in 31 Europe: Potential and environmental benefits. Energy Policy, 88, 584–593, 32 https://doi.org/10.1016/j.enpol.2015.07.013. 33
Winslow, K. M. K. M., S. J. S. J. Laux, and T. G. T. G. Townsend, 2018: A review on the growing 34 concern and potential management strategies of waste lithium-ion batteries. 35
Winther, M., J. H. Christensen, M. S. Plejdrup, E. S. Ravn, Ó. F. Eriksson, and H. O. Kristensen, 2014: 36 Emission inventories for ships in the arctic based on satellite sampled AIS data. Atmospheric 37 Environment, 91, 1–14, https://doi.org/https://doi.org/10.1016/j.atmosenv.2014.03.006. 38
Wise, M., M. Muratori, and P. Kyle, 2017: Biojet fuels and emissions mitigation in aviation: An 39 integrated assessment modeling analysis. Transportation Research Part D: Transport and 40 Environment, 52, 244–253, https://doi.org/10.1016/J.TRD.2017.03.006. 41
Wolfram, P., and T. Wiedmann, 2017: Electrifying Australian transport: Hybrid life cycle analysis of a 42 transition to electric light-duty vehicles and renewable electricity. Applied Energy, 206, 531–540, 43 https://doi.org/10.1016/j.apenergy.2017.08.219. 44
——, Q. Tu, N. Heeren, S. Pauliuk, and E. G. Hertwich, 2020: Material efficiency and climate change 45 mitigation of passenger vehicles. Journal of Industrial Ecology, 1–17, 46 https://doi.org/10.1111/jiec.13067. 47
ACCEPTED VERSION
SUBJECT TO FIN
AL EDITS
Final Government Distribution Chapter 10 IPCC AR6 WGIII
Do Not Cite, Quote or Distribute 10-151 Total pages: 176
World Bank Group, 2017: The Growing Role of Minerals and Metals for a Low Carbon Future. 1 https://openknowledge.worldbank.org/handle/10986/28312. 2
World Health Organization, 2018: Ambient (outdoor) air pollution. 3
Wu, D., F. Guo, F. R. Field, R. D. De Kleine, H. C. Kim, T. J. Wallington, and R. E. Kirchain, 2019: 4 Regional Heterogeneity in the Emissions Benefits of Electrified and Lightweighted Light-Duty 5 Vehicles. Environmental Science and Technology, 53, 10560–10570, 6 https://doi.org/10.1021/acs.est.9b00648. 7
Wu, S., R. Xiong, H. Li, V. Nian, and S. Ma, 2020: The state of the art on preheating lithium-ion 8 batteries in cold weather. Journal of Energy Storage, 27, 9 https://doi.org/10.1016/j.est.2019.101059. 10
Xia, W., and A. Zhang, 2016: High-speed rail and air transport competition and cooperation: A vertical 11 differentiation approach. Transportation Research Part B: Methodological, 94, 456–481. 12
Xie, R., L. Huang, B. Tian, and J. Fang, 2019: Differences in Changes in Carbon Dioxide Emissions 13 among China’s Transportation Subsectors: A Structural Decomposition Analysis. Emerging 14 Markets Finance and Trade, 55, 1294–1311, https://doi.org/10.1080/1540496X.2018.1526076. 15
Xing, H., S. Spence, and H. Chen, 2020: A comprehensive review on countermeasures for CO2 16 emissions from ships. Renewable and Sustainable Energy Reviews, 134, 110222, 17 https://doi.org/10.1016/j.rser.2020.110222. 18
Xu, J., S. A. Ning, G. Bower, and I. Kroo, 2014: Aircraft Route Optimization for Formation Flight. 19 https://doi.org/10.2514/1.C032154, 51, 490–501, https://doi.org/10.2514/1.C032154. 20
Xu, J., J. Bai, and J. Chen, 2019: An Improved Indicator System for Evaluating the Progress of 21 Sustainable Development Goals (SDGs) Sub-Target 9.1 in County Level. Sustainability, 11, 4783, 22 https://doi.org/10.3390/su11174783. 23
Yaïci, W., and H. Ribberink, 2021: Feasibility Study of Medium- and Heavy-Duty Compressed 24 Renewable/Natural Gas Vehicles in Canada. Journal of Energy Resources Technology, 143, 25 https://doi.org/10.1115/ES2020-1617. 26
Yan, W., H. Cao, Y. Zhang, P. Ning, Q. Song, J. Yang, and Z. Sun, 2020: Rethinking Chinese supply 27 resilience of critical metals in lithium-ion batteries. Journal of Cleaner Production, 256, 120719. 28
Yang, H., J. Feng, M. Dijst, and D. Ettema, 2019: Mode choice in access and egress stages of high-29 speed railway travelers in China. Journal of Transport and Land Use, 12, 701–721. 30
Yang, J., A.-O. Purevjav, and S. Li, 2020: The marginal cost of traffic congestion and road pricing: 31 Evidence from a natural experiment in Beijing. American Economic Journal: Economic Policy, 32 12, 418–453. 33
Yang, L., C. Hao, and Y. Chai, 2018a: Life Cycle Assessment of Commercial Delivery Trucks: Diesel, 34 Plug-In Electric, and Battery-Swap Electric. Sustainability 2018, Vol. 10, Page 4547, 10, 4547, 35 https://doi.org/10.3390/SU10124547. 36
Yang, Z., and Coauthors, 2018b: Risk and cost evaluation of port adaptation measures to climate change 37 impacts. Transportation Research Part D: Transport and Environment, 61, 444–458, 38 https://doi.org/10.1016/j.trd.2017.03.004. 39
Yeh, S., G. S. Mishra, L. Fulton, P. Kyle, D. L. McCollum, J. Miller, P. Cazzola, and J. Teter, 2017: 40 Detailed assessment of global transport-energy models’ structures and projections. Transportation 41 Research Part D: Transport and Environment, 55, 294–309, 42 https://doi.org/10.1016/j.trd.2016.11.001. 43
Yin, W., 2019: Integrating Sustainable Development Goals into the Belt and Road Initiative: Would It 44 Be a New Model for Green and Sustainable Investment? Sustainability, 11, 6991. 45
You, Y., and A. Manthiram, 2018: Progress in high‐voltage cathode materials for rechargeable sodium‐46 ion batteries. Advanced Energy Materials, 8, 1701785. 47
ACCEPTED VERSION
SUBJECT TO FIN
AL EDITS
Final Government Distribution Chapter 10 IPCC AR6 WGIII
Do Not Cite, Quote or Distribute 10-152 Total pages: 176
Yuan, M., J. Z. Thellufsen, H. Lund, and Y. Liang, 2021: The electrification of transportation in energy 1 transition. Energy, 236, https://doi.org/10.1016/j.energy.2021.121564. 2
Yue, Y., and Coauthors, 2015: Life cycle assessment of High Speed Rail in China. Transportation 3 Research Part D: Transport and Environment, 41, 367–376, 4 https://doi.org/10.1016/J.TRD.2015.10.005. 5
Zahabi, S. A. H., A. Chang, L. F. Miranda-Moreno, and Z. Patterson, 2016: Exploring the link between 6 the neighborhood typologies, bicycle infrastructure and commuting cycling over time and the 7 potential impact on commuter GHG emissions. Transportation Research Part D: Transport and 8 Environment, 47, 89–103, https://doi.org/10.1016/J.TRD.2016.05.008. 9
Zeng, Y., B. Ran, N. Zhang, and X. Yang, 2021: Estimating the Price Elasticity of Train Travel Demand 10 and Its Variation Rules and Application in Energy Used and CO2 Emissions. Sustainability 2021, 11 Vol. 13, Page 475, 13, 475, https://doi.org/10.3390/SU13020475. 12
Zhang, A., Y. Wan, and H. Yang, 2019a: Impacts of high-speed rail on airlines, airports and regional 13 economies: A survey of recent research. Transport Policy, 81, A1–A19, 14 https://doi.org/10.1016/J.TRANPOL.2019.06.010. 15
Zhang, H., W. Chen, and W. Huang, 2016a: TIMES modelling of transport sector in China and USA: 16 Comparisons from a decarbonization perspective. Applied Energy, 162, 1505–1514. 17
Zhang, R., S. Fujimori, H. Dai, and T. Hanaoka, 2018: Contribution of the transport sector to climate 18 change mitigation: Insights from a global passenger transport model coupled with a computable 19 general equilibrium model. Applied Energy, 211, 76–88, 20 https://doi.org/10.1016/j.apenergy.2017.10.103. 21
Zhang, R., D. Johnson, W. Zhao, and C. Nash, 2019b: Competition of airline and high-speed rail in 22 terms of price and frequency: Empirical study from China. Transport Policy, 78, 8–18. 23
Zhang, X., J. Xie, R. Rao, and Y. Liang, 2014: Policy Incentives for Adoption of Electric Vehicles 24 across countries. Sustainability, 6, 8056–8078. 25
Zhang, Y.-S., E.-J. Yao, and X. Sun, 2017: Impact analysis of HSR fare discount strategy on HSR share 26 in Beijing–Shanghai transportation corridor. Transportation Letters, 9, 215–227. 27
Zhang, Y., and A. Zhang, 2016: Determinants of air passenger flows in China and gravity model: 28 Deregulation, LCCs, and high-speed rail. Journal of Transport Economics and Policy, 50, 287–29 303, https://doi.org/10.2139/ssrn.2775501. 30
Zhang, Y., Q. Meng, and L. Zhang, 2016b: Is the Northern Sea Route attractive to shipping companies? 31 Some insights from recent ship traffic data. Marine Policy, 73, 53–60, 32 https://doi.org/https://doi.org/10.1016/j.marpol.2016.07.030. 33
Zhao, L., X. Zhang, J. Xu, X. Ou, S. Chang, and M. Wu, 2015: Techno-economic analysis of bioethanol 34 production from lignocellulosic biomass in China: Dilute-acid pretreatment and enzymatic 35 hydrolysis of corn stover. Energies, 8, https://doi.org/10.3390/en8054096. 36
Zhao, M., and Coauthors, 2013: Characteristics and ship traffic source identification of air pollutants in 37 China’s largest port. Atmospheric Environment, 64, 277–286, 38 https://doi.org/10.1016/J.ATMOSENV.2012.10.007. 39
Zhao, X., F. Taheripour, R. Malina, M. D. Staples, and W. E. Tyner, 2021: Estimating induced land use 40 change emissions for sustainable aviation biofuel pathways. Science of the Total Environment, 41 779, 146238, https://doi.org/10.1016/j.scitotenv.2021.146238. 42
Zhao, Y., N. C. Onat, M. Kucukvar, and O. Tatari, 2016: Carbon and energy footprints of electric 43 delivery trucks: A hybrid multi-regional input-output life cycle assessment. Transportation 44 Research Part D: Transport and Environment, 47, 195–207, 45 https://doi.org/10.1016/j.trd.2016.05.014. 46
Zhao, Y., B. P. Setzler, J. Wang, J. Nash, T. Wang, B. Xu, and Y. Yan, 2019: An Efficient Direct 47
ACCEPTED VERSION
SUBJECT TO FIN
AL EDITS
Final Government Distribution Chapter 10 IPCC AR6 WGIII
Do Not Cite, Quote or Distribute 10-153 Total pages: 176
Ammonia Fuel Cell for Affordable Carbon-Neutral Transportation. Joule, 3, 2472–2484, 1 https://doi.org/10.1016/j.joule.2019.07.005. 2
Zheng, Y., X. He, H. Wang, M. Wang, S. Zhang, D. Ma, B. Wang, and Y. Wu, 2020: Well-to-wheels 3 greenhouse gas and air pollutant emissions from battery electric vehicles in China. Mitigation and 4 Adaptation Strategies for Global Change, 25, 355–370, https://doi.org/10.1007/s11027-019-5 09890-5. 6
Zhou, C., and J. E. Penner, 2014: Aircraft soot indirect effect on large-scale cirrus clouds: Is the indirect 7 forcing by aircraft soot positive or negative? Journal of Geophysical Research: Atmospheres, 119, 8 11,303-11,320, https://doi.org/10.1002/2014JD021914. 9
Zhou, P., and H. Wang, 2014: Carbon capture and storage - Solidification and storage of carbon dioxide 10 captured on ships. Ocean Engineering, 91, 172–180, 11 https://doi.org/10.1016/j.oceaneng.2014.09.006. 12
Zhou, T., M. J. Roorda, H. L. MacLean, and J. Luk, 2017: Life cycle GHG emissions and lifetime costs 13 of medium-duty diesel and battery electric trucks in Toronto, Canada. Transportation Research 14 Part D: Transport and Environment, 55, 91–98, https://doi.org/10.1016/j.trd.2017.06.019. 15
Zhuk, A., Y. Zeigarnik, E. Buzoverov, and A. Sheindlin, 2016: Managing peak loads in energy grids: 16 Comparative economic analysis. Energy Policy, 88, 39–44, 17 https://doi.org/10.1016/j.enpol.2015.10.006. 18
Staples, M. D., R. Malina, P. Suresh, J. I. Hileman, and S. R. H. Barrett, 2018: Aviation CO2 emissions 19 reductions from the use of alternative jet fuels. Energy Policy, 114, 342–354, 20 https://doi.org/10.1016/j.enpol.2017.12.007. 21
Rose, S. K., N. Bauer, A. Popp, J. Weyant, S. Fujimori, P. Havlik, M. Wise, and D. P. van Vuuren, 22 2020: An overview of the Energy Modeling Forum 33rd study: assessing large-scale global 23 bioenergy deployment for managing climate change. Clim. Change, 163, 24 https://doi.org/10.1007/s10584-020-02945-6. 25
Fotouhi, A., D. Anger, K. Propp, and S. Longo, 2017: Electric vehicle battery parameter identification 26 and SOC observability analysis: NiMH and Li‐S case studies. IET Power Electron., 10, 1289–27 1297, https://doi.org/10.1049/iet-pel.2016.0777. 28
Nicholas, M., G. Tal, and T. Turrentine, 2017: Advanced plug-in electric vehicle travel and charging 29 behavior interim report. https://escholarship.org/uc/item/9c28789j (Accessed August 14, 2020). 30
Després, J., S. Mima, A. Kitous, P. Criqui, N. Hadjsaid, and I. Noirot, 2017: Storage as a flexibility 31 option in power systems with high shares of variable renewable energy sources: a POLES-based 32 analysis. Energy Econ., 64, 638–650, https://doi.org/10.1016/j.eneco.2016.03.006. 33
Gagatsi, E., T. Estrup, and A. Halatsis, 2016: Exploring the Potentials of Electrical Waterborne 34 Transport in Europe: The E-ferry Concept. Transp. Res. Procedia, 14, 1571–1580, 35 https://doi.org/10.1016/J.TRPRO.2016.05.122. 36
Johnson, H., M. Johansson, K. Andersson, and B. Södahl, 2013: Will the ship energy efficiency 37 management plan reduce CO 2 emissions? A comparison with ISO 50001 and the ISM code. 38 Marit. Policy Manag., 40, 177–190, https://doi.org/10.1080/03088839.2012.757373. 39
40
41
ACCEPTED VERSION
SUBJECT TO FIN
AL EDITS
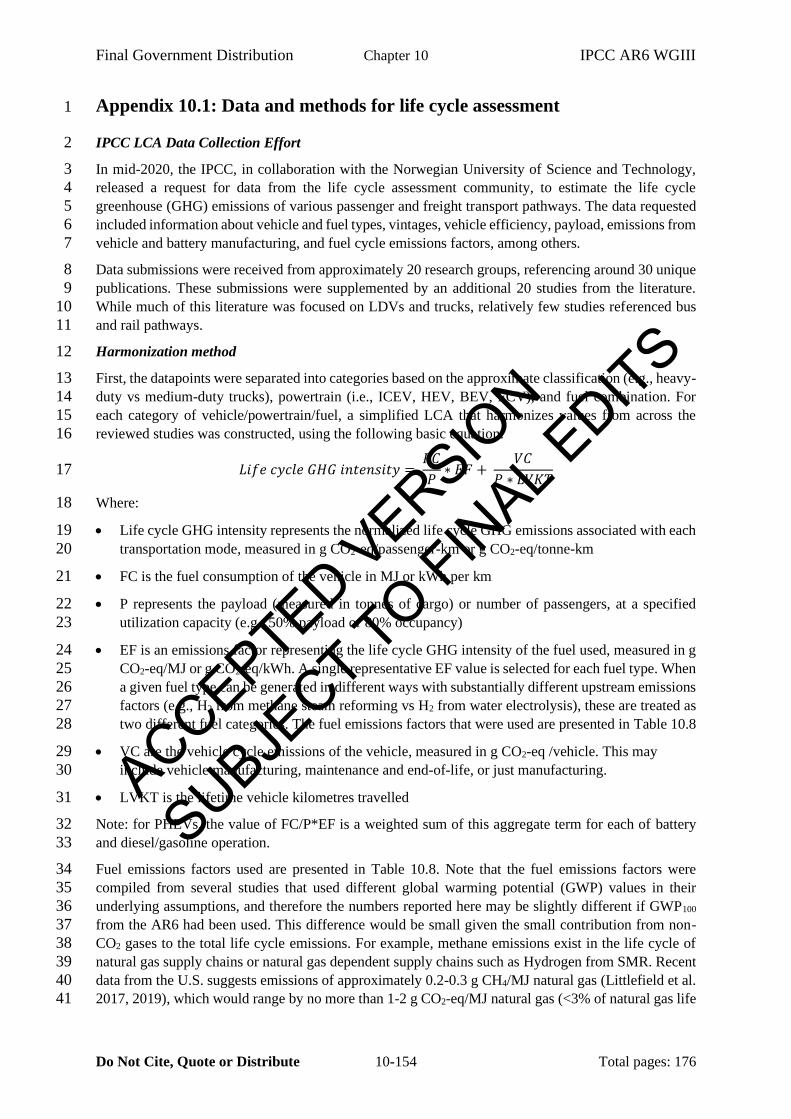
Final Government Distribution Chapter 10 IPCC AR6 WGIII
Do Not Cite, Quote or Distribute 10-154 Total pages: 176
Appendix 10.1: Data and methods for life cycle assessment 1
IPCC LCA Data Collection Effort 2
In mid-2020, the IPCC, in collaboration with the Norwegian University of Science and Technology, 3
released a request for data from the life cycle assessment community, to estimate the life cycle 4
greenhouse (GHG) emissions of various passenger and freight transport pathways. The data requested 5
included information about vehicle and fuel types, vintages, vehicle efficiency, payload, emissions from 6
vehicle and battery manufacturing, and fuel cycle emissions factors, among others. 7
Data submissions were received from approximately 20 research groups, referencing around 30 unique 8
publications. These submissions were supplemented by an additional 20 studies from the literature. 9
While much of this literature was focused on LDVs and trucks, relatively few studies referenced bus 10
and rail pathways. 11
Harmonization method 12
First, the datapoints were separated into categories based on the approximate classification (e.g., heavy-13
duty vs medium-duty trucks), powertrain (i.e., ICEV, HEV, BEV, FCV), and fuel combination. For 14
each category of vehicle/powertrain/fuel, a simplified LCA that harmonizes values from across the 15
reviewed studies was constructed, using the following basic equation: 16
𝐿𝑖𝑓𝑒 𝑐𝑦𝑐𝑙𝑒 𝐺𝐻𝐺 𝑖𝑛𝑡𝑒𝑛𝑠𝑖𝑡𝑦 = 𝐹𝐶
𝑃∗ 𝐸𝐹 +
𝑉𝐶
𝑃 ∗ 𝐿𝑉𝐾𝑇 17
Where: 18
• Life cycle GHG intensity represents the normalized life cycle GHG emissions associated with each 19
transportation mode, measured in g CO2-eq/passenger-km or g CO2-eq/tonne-km 20
• FC is the fuel consumption of the vehicle in MJ or kWh per km 21
• P represents the payload (measured in tonnes of cargo) or number of passengers, at a specified 22
utilization capacity (e.g., 50% payload or 80% occupancy) 23
• EF is an emissions factor representing the life cycle GHG intensity of the fuel used, measured in g 24
CO2-eq/MJ or g CO2-eq/kWh. A single representative EF value is selected for each fuel type. When 25
a given fuel type can be generated in different ways with substantially different upstream emissions 26
factors (e.g., H2 from methane steam reforming vs H2 from water electrolysis), these are treated as 27
two different fuel categories. The fuel emissions factors that were used are presented in Table 10.8 28
• VC are the vehicle cycle emissions of the vehicle, measured in g CO2-eq /vehicle. This may 29
include vehicle manufacturing, maintenance and end-of-life, or just manufacturing. 30
• LVKT is the lifetime vehicle kilometres travelled 31
Note: for PHEVs, the value of FC/P*EF is a weighted sum of this aggregate term for each of battery 32
and diesel/gasoline operation. 33
Fuel emissions factors used are presented in Table 10.8. Note that the fuel emissions factors were 34
compiled from several studies that used different global warming potential (GWP) values in their 35
underlying assumptions, and therefore the numbers reported here may be slightly different if GWP100 36
from the AR6 had been used. This difference would be small given the small contribution from non-37
CO2 gases to the total life cycle emissions. For example, methane emissions exist in the life cycle of 38
natural gas supply chains or natural gas dependent supply chains such as Hydrogen from SMR. Recent 39
data from the U.S. suggests emissions of approximately 0.2-0.3 g CH4/MJ natural gas (Littlefield et al. 40
2017, 2019), which would range by no more than 1-2 g CO2-eq/MJ natural gas (<3% of natural gas life 41
ACCEPTED VERSION
SUBJECT TO FIN
AL EDITS
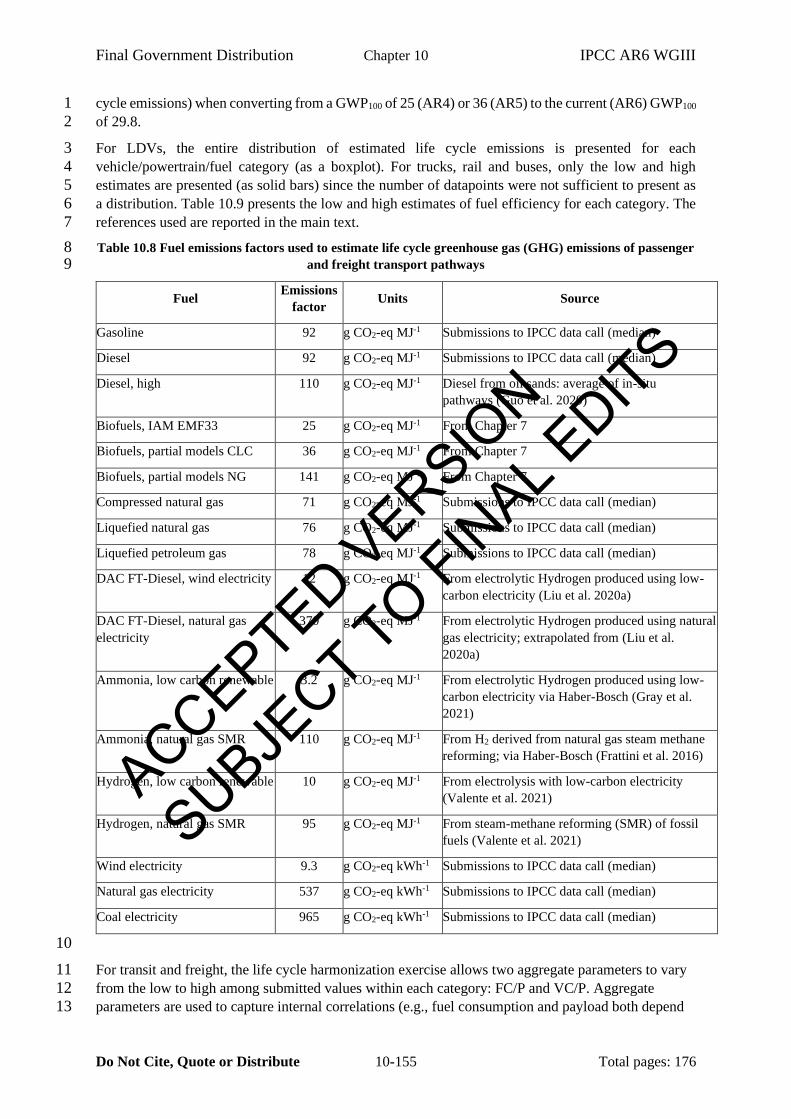
Final Government Distribution Chapter 10 IPCC AR6 WGIII
Do Not Cite, Quote or Distribute 10-155 Total pages: 176
cycle emissions) when converting from a GWP100 of 25 (AR4) or 36 (AR5) to the current (AR6) GWP100 1
of 29.8. 2
For LDVs, the entire distribution of estimated life cycle emissions is presented for each 3
vehicle/powertrain/fuel category (as a boxplot). For trucks, rail and buses, only the low and high 4
estimates are presented (as solid bars) since the number of datapoints were not sufficient to present as 5
a distribution. Table 10.9 presents the low and high estimates of fuel efficiency for each category. The 6
references used are reported in the main text. 7
Table 10.8 Fuel emissions factors used to estimate life cycle greenhouse gas (GHG) emissions of passenger 8 and freight transport pathways 9
Fuel Emissions
factor Units Source
Gasoline 92 g CO2-eq MJ-1 Submissions to IPCC data call (median)
Diesel 92 g CO2-eq MJ-1 Submissions to IPCC data call (median)
Diesel, high 110 g CO2-eq MJ-1 Diesel from oil sands: average of in-situ
pathways (Guo et al. 2020)
Biofuels, IAM EMF33 25 g CO2-eq MJ-1 From Chapter 7
Biofuels, partial models CLC 36 g CO2-eq MJ-1 From Chapter 7
Biofuels, partial models NG 141 g CO2-eq MJ-1 From Chapter 7
Compressed natural gas 71 g CO2-eq MJ-1 Submissions to IPCC data call (median)
Liquefied natural gas 76 g CO2-eq MJ-1 Submissions to IPCC data call (median)
Liquefied petroleum gas 78 g CO2-eq MJ-1 Submissions to IPCC data call (median)
DAC FT-Diesel, wind electricity 12 g CO2-eq MJ-1 From electrolytic Hydrogen produced using low-
carbon electricity (Liu et al. 2020a)
DAC FT-Diesel, natural gas
electricity
370 g CO2-eq MJ-1 From electrolytic Hydrogen produced using natural
gas electricity; extrapolated from (Liu et al.
2020a)
Ammonia, low carbon renewable 3.2 g CO2-eq MJ-1 From electrolytic Hydrogen produced using low-
carbon electricity via Haber-Bosch (Gray et al.
2021)
Ammonia, natural gas SMR 110 g CO2-eq MJ-1 From H2 derived from natural gas steam methane
reforming; via Haber-Bosch (Frattini et al. 2016)
Hydrogen, low carbon renewable 10 g CO2-eq MJ-1 From electrolysis with low-carbon electricity
(Valente et al. 2021)
Hydrogen, natural gas SMR 95 g CO2-eq MJ-1 From steam-methane reforming (SMR) of fossil
fuels (Valente et al. 2021)
Wind electricity 9.3 g CO2-eq kWh-1 Submissions to IPCC data call (median)
Natural gas electricity 537 g CO2-eq kWh-1 Submissions to IPCC data call (median)
Coal electricity 965 g CO2-eq kWh-1 Submissions to IPCC data call (median)
10
For transit and freight, the life cycle harmonization exercise allows two aggregate parameters to vary 11
from the low to high among submitted values within each category: FC/P and VC/P. Aggregate 12
parameters are used to capture internal correlations (e.g., fuel consumption and payload both depend 13
ACCEPTED VERSION
SUBJECT TO FIN
AL EDITS
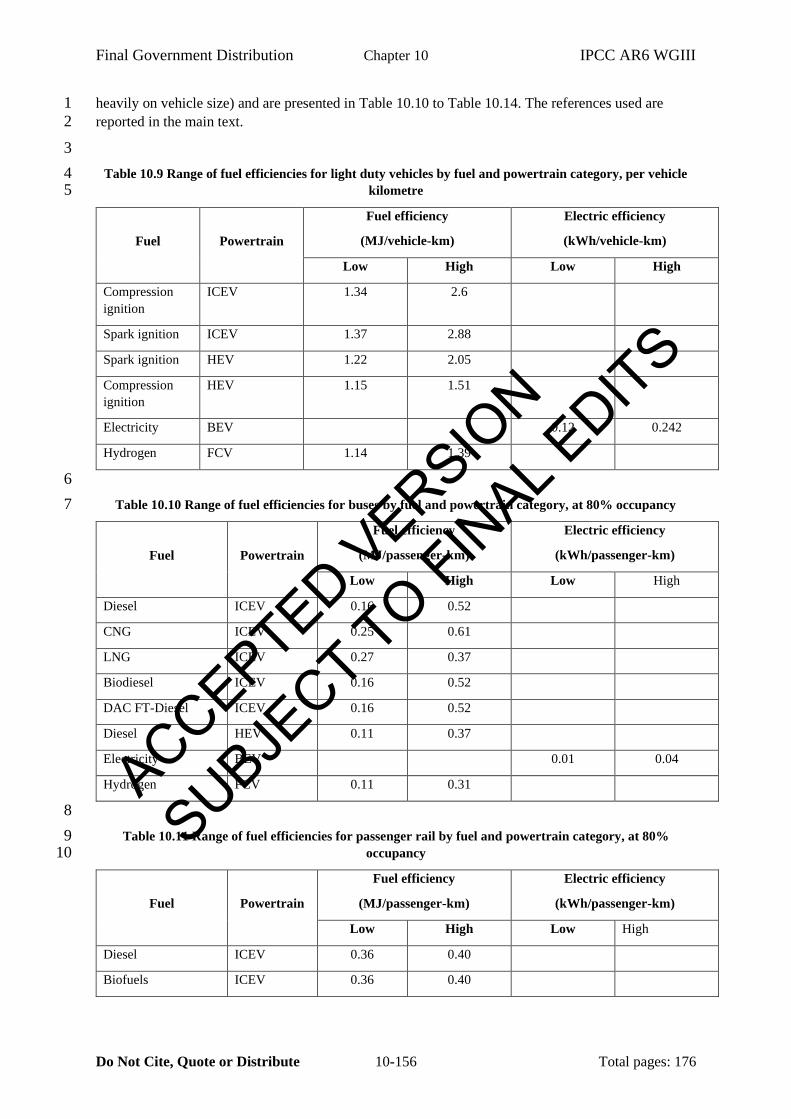
Final Government Distribution Chapter 10 IPCC AR6 WGIII
Do Not Cite, Quote or Distribute 10-156 Total pages: 176
heavily on vehicle size) and are presented in Table 10.10 to Table 10.14. The references used are 1
reported in the main text. 2
3
Table 10.9 Range of fuel efficiencies for light duty vehicles by fuel and powertrain category, per vehicle 4 kilometre 5
Fuel Powertrain
Fuel efficiency
(MJ/vehicle-km)
Electric efficiency
(kWh/vehicle-km)
Low High Low High
Compression
ignition
ICEV 1.34 2.6
Spark ignition ICEV 1.37 2.88
Spark ignition HEV 1.22 2.05
Compression
ignition
HEV 1.15 1.51
Electricity BEV 0.12 0.242
Hydrogen FCV 1.14 1.39
6
Table 10.10 Range of fuel efficiencies for buses by fuel and powertrain category, at 80% occupancy 7
Fuel Powertrain
Fuel efficiency
(MJ/passenger-km)
Electric efficiency
(kWh/passenger-km)
Low High Low High
Diesel ICEV 0.16 0.52
CNG ICEV 0.25 0.61
LNG ICEV 0.27 0.37
Biodiesel ICEV 0.16 0.52
DAC FT-Diesel ICEV 0.16 0.52
Diesel HEV 0.11 0.37
Electricity BEV 0.01 0.04
Hydrogen FCV 0.11 0.31
8
Table 10.11 Range of fuel efficiencies for passenger rail by fuel and powertrain category, at 80% 9 occupancy 10
Fuel
Powertrain
Fuel efficiency
(MJ/passenger-km)
Electric efficiency
(kWh/passenger-km)
Low High Low High
Diesel ICEV 0.36 0.40
Biofuels ICEV 0.36 0.40
ACCEPTED VERSION
SUBJECT TO FIN
AL EDITS
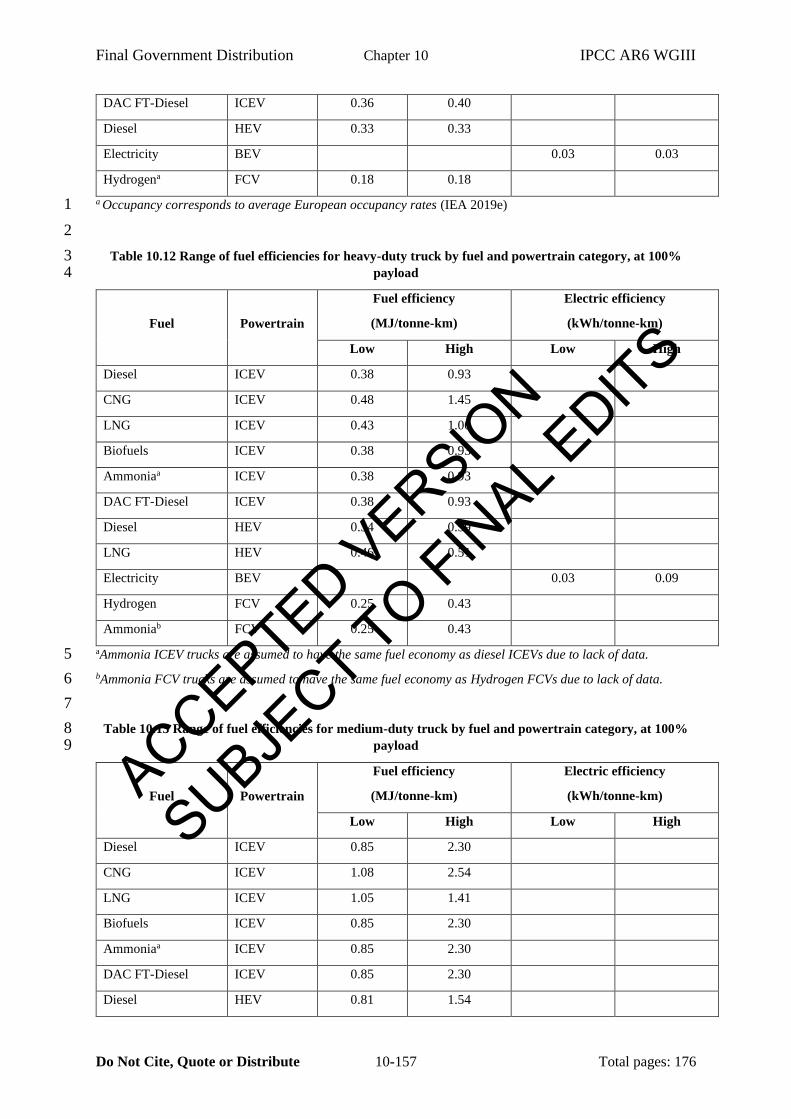
Final Government Distribution Chapter 10 IPCC AR6 WGIII
Do Not Cite, Quote or Distribute 10-157 Total pages: 176
DAC FT-Diesel ICEV 0.36 0.40
Diesel HEV 0.33 0.33
Electricity BEV 0.03 0.03
Hydrogena FCV 0.18 0.18
a Occupancy corresponds to average European occupancy rates (IEA 2019e) 1
2
Table 10.12 Range of fuel efficiencies for heavy-duty truck by fuel and powertrain category, at 100% 3 payload 4
Fuel Powertrain
Fuel efficiency
(MJ/tonne-km)
Electric efficiency
(kWh/tonne-km)
Low High Low High
Diesel ICEV 0.38 0.93
CNG ICEV 0.48 1.45
LNG ICEV 0.43 1.00
Biofuels ICEV 0.38 0.93
Ammoniaa ICEV 0.38 0.93
DAC FT-Diesel ICEV 0.38 0.93
Diesel HEV 0.34 0.59
LNG HEV 0.46 0.51
Electricity BEV 0.03 0.09
Hydrogen FCV 0.25 0.43
Ammoniab FCV 0.25 0.43
aAmmonia ICEV trucks are assumed to have the same fuel economy as diesel ICEVs due to lack of data. 5
bAmmonia FCV trucks are assumed to have the same fuel economy as Hydrogen FCVs due to lack of data. 6
7
Table 10.13 Range of fuel efficiencies for medium-duty truck by fuel and powertrain category, at 100% 8 payload 9
Fuel Powertrain
Fuel efficiency
(MJ/tonne-km)
Electric efficiency
(kWh/tonne-km)
Low High Low High
Diesel ICEV 0.85 2.30
CNG ICEV 1.08 2.54
LNG ICEV 1.05 1.41
Biofuels ICEV 0.85 2.30
Ammoniaa ICEV 0.85 2.30
DAC FT-Diesel ICEV 0.85 2.30
Diesel HEV 0.81 1.54
ACCEPTED VERSION
SUBJECT TO FIN
AL EDITS
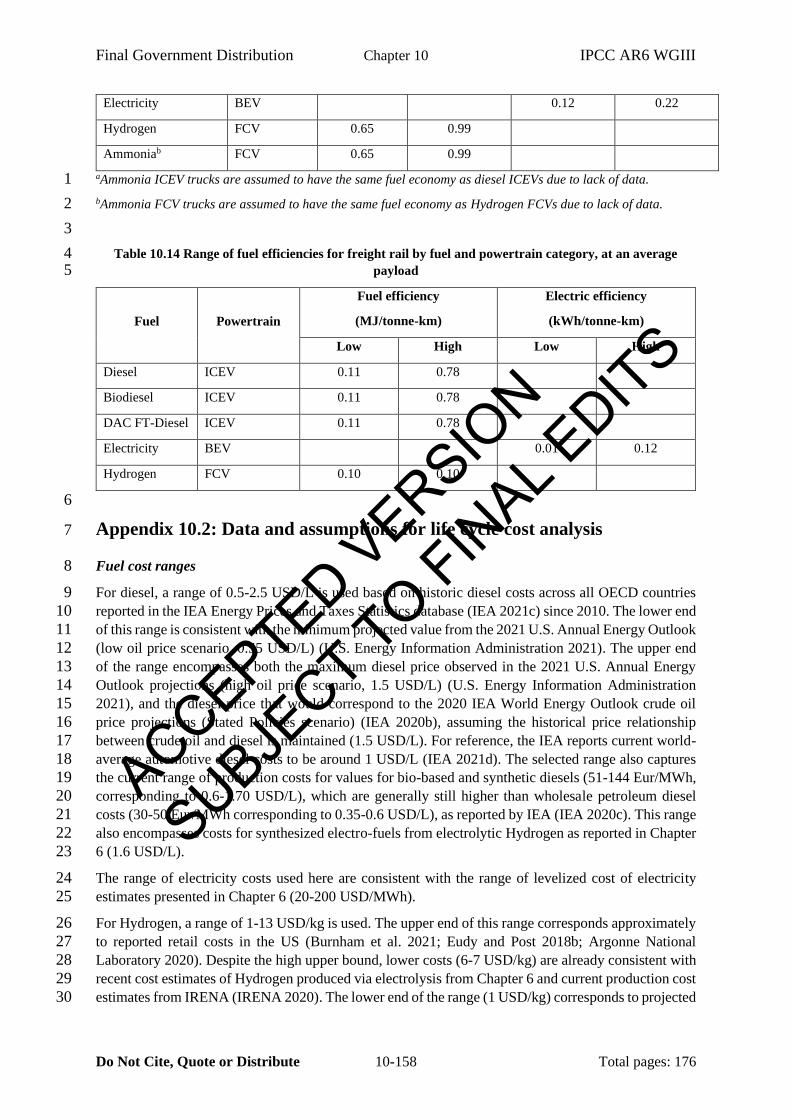
Final Government Distribution Chapter 10 IPCC AR6 WGIII
Do Not Cite, Quote or Distribute 10-158 Total pages: 176
Electricity BEV 0.12 0.22
Hydrogen FCV 0.65 0.99
Ammoniab FCV 0.65 0.99
aAmmonia ICEV trucks are assumed to have the same fuel economy as diesel ICEVs due to lack of data. 1
bAmmonia FCV trucks are assumed to have the same fuel economy as Hydrogen FCVs due to lack of data. 2
3
Table 10.14 Range of fuel efficiencies for freight rail by fuel and powertrain category, at an average 4 payload 5
Fuel Powertrain
Fuel efficiency
(MJ/tonne-km)
Electric efficiency
(kWh/tonne-km)
Low High Low High
Diesel ICEV 0.11 0.78
Biodiesel ICEV 0.11 0.78
DAC FT-Diesel ICEV 0.11 0.78
Electricity BEV 0.01 0.12
Hydrogen FCV 0.10 0.10
6
Appendix 10.2: Data and assumptions for life cycle cost analysis 7
Fuel cost ranges 8
For diesel, a range of 0.5-2.5 USD/L is used based on historic diesel costs across all OECD countries 9
reported in the IEA Energy Prices and Taxes Statistics database (IEA 2021c) since 2010. The lower end 10
of this range is consistent with the minimum projected value from the 2021 U.S. Annual Energy Outlook 11
(low oil price scenario, 0.55 USD/L) (U.S. Energy Information Administration 2021). The upper end 12
of the range encompasses both the maximum diesel price observed in the 2021 U.S. Annual Energy 13
Outlook projections (high oil price scenario, 1.5 USD/L) (U.S. Energy Information Administration 14
2021), and the diesel price that would correspond to the 2020 IEA World Energy Outlook crude oil 15
price projections (Stated Policies scenario) (IEA 2020b), assuming the historical price relationship 16
between crude oil and diesel is maintained (1.5 USD/L). For reference, the IEA reports current world-17
average automotive diesel costs to be around 1 USD/L (IEA 2021d). The selected range also captures 18
the current range of production costs for values for bio-based and synthetic diesels (51-144 Eur/MWh, 19
corresponding to 0.6-1.70 USD/L), which are generally still higher than wholesale petroleum diesel 20
costs (30-50 Eur/MWh corresponding to 0.35-0.6 USD/L), as reported by IEA (IEA 2020c). This range 21
also encompasses costs for synthesized electro-fuels from electrolytic Hydrogen as reported in Chapter 22
6 (1.6 USD/L). 23
The range of electricity costs used here are consistent with the range of levelized cost of electricity 24
estimates presented in Chapter 6 (20-200 USD/MWh). 25
For Hydrogen, a range of 1-13 USD/kg is used. The upper end of this range corresponds approximately 26
to reported retail costs in the US (Burnham et al. 2021; Eudy and Post 2018b; Argonne National 27
Laboratory 2020). Despite the high upper bound, lower costs (6-7 USD/kg) are already consistent with 28
recent cost estimates of Hydrogen produced via electrolysis from Chapter 6 and current production cost 29
estimates from IRENA (IRENA 2020). The lower end of the range (1 USD/kg) corresponds to projected 30
ACCEPTED VERSION
SUBJECT TO FIN
AL EDITS
Final Government Distribution Chapter 10 IPCC AR6 WGIII
Do Not Cite, Quote or Distribute 10-159 Total pages: 176
future price decreases for electrolytic Hydrogen (BNEF 2020; Hydrogen Council 2020; IRENA 2020), 1
and is consistent with projections from Chapter 6 for the low end of long-term future prices for fossil 2
Hydrogen with CCS. 3
Vehicle efficiencies 4
The vehicle efficiencies used in developing the life cycle cost estimates were derived from the 5
harmonized ranges used to develop life cycle GHG estimates and are presented in Table 10.9 to Table 6
10.14. 7
Other inputs to bus cost model 8
For buses, a 40-ft North American transit bus with a passenger capacity of 50, lifetime of 15 years, and 9
an annual mileage of 72,400 km based on data in the ANL AFLEET model (Argonne National 10
Laboratory 2020) is assumed. Maintenance costs were assumed to be 1 USD/mile for ICEV buses and 11
0.6 USD/mile for BEV and ICEV buses, also based on data from the AFLEET model (Argonne National 12
Laboratory 2020). For ICEV and BEV purchase costs, data from the National Renewable Energy 13
Laboratory (Johnson et al. 2020) is used for bounding ranges (430,000 to 500,000 USD for ICEV and 14
579,000 to 1,200,000 USD for BEV), which encompass the default values from AFLEET model 15
(Argonne National Laboratory 2020). Note that wider ranges are available in the literature (e.g., as low 16
as USD120,000 per bus in (Burnham et al. 2021) and (Harris et al. 2020)); but these are not included in 17
the sensitivity analysis to avoid conflating disparate vehicles. For FCV buses, the upper bound of the 18
purchase price range (1,200,000 USD) represents current costs in the U.S. (Argonne National 19
Laboratory 2020; Eudy and Post 2020), and the lower bound represents the target future value from the 20
U.S Department of Energy (Eudy and Post 2020). 21
Other inputs to rail cost model 22
For freight and passenger rail, powertrain and vehicle O&M costs in USD/km from the IEA Future of 23
Rail report (IEA 2019e) (IEA Figure 2.14 for passenger rail and IEA Figure 2.15 for freight rail) are 24
used as a proxy for non-fuel costs. The ranges span conservative and forward-looking cases. In addition, 25
the range for BEV rail ranges encompass short and long-distance trains – corresponding to 100-200 km 26
for passenger rail, and 400-750 km for freight rail. Note that all values exclude the base vehicle costs, 27
but they are expected not to be significant as they are amortized over the lifetime-km travelled. For 28
freight rail, a network that is representative of North America is assumed, with a payload of 2800 tonnes 29
per train (IEA Figure 1.17), assumed to be utilized at 100%, with a lifetime of 10 years, and an average 30
mileage of 120,000 km/year. For BEV freight rail, the range in powertrain costs are driven by battery 31
costs of 250-600 USD/kWh, while for FCV freight rail, the range in powertrain costs are driven by fuel 32
cell stack costs of 50-1000 USD/kW. For passenger rail, a network that is representative of Europe is 33
assumed, with an average occupancy of 180 passengers per train (IEA Figure 1.14), with a lifetime of 34
10 years, and an average mileage of 115,000 km/year. 35
Other inputs to truck cost model 36
Capital cost ranges vary widely in the literature depending on the exact truck model, size and other 37
assumptions. For ICEVs in this analysis, the lower bound (90,000 USD) corresponds to the 2020 38
estimate for China from (Moultak et al. 2017), and the upper bound (250,000 USD) corresponds to the 39
2030 projection for the US from the same study. These values encompass the full range reported by 40
Argonne (Burnham et al. 2021). The lower bound BEV cost (120,000 USD) is taken from 2030 41
projections for China (Moultak et al. 2017) and the upper bound (780,000 USD) is taken from 2020 42
cost estimates in the US (class 8 sleeper cab tractor) (Burnham et al. 2021). The lower bound for FCV 43
trucks (130,000 USD) corresponds to the 2050 estimate for class 8 sleeper cab tractors from Argonne 44
National Laboratory and the upper bound (290,000 USD) corresponds the 2020 estimate from the same 45
ACCEPTED VERSION
SUBJECT TO FIN
AL EDITS
Final Government Distribution Chapter 10 IPCC AR6 WGIII
Do Not Cite, Quote or Distribute 10-160 Total pages: 176
study (Burnham et al. 2021). These values span the full range reported by (Moultak et al. 2017) for the 1
US, Europe and China from 2020-2030. 2
The analysis uses a truck lifetime of 10 years and annual mileage of 140,000 km based on (Burnham et 3
al. 2021). An effective payload of 17 tonnes (80% of maximum payload of 21 tonnes) is assumed based 4
on reported average effective payload submitted by Argonne National Laboratory in response to the 5
IPCC LCA data collection call. A discount rate of 3% is used, based on (Burnham et al. 2021) and 6
consistent with the social discount rate from Chapter 3. Maintenance costs are assumed to be 0.15 7
USD/km for ICEV trucks and 0.09 USD/km for BEV and FCV trucks, as reported in (Burnham et al. 8
2021). 9
ACCEPTED VERSION
SUBJECT TO FIN
AL EDITS
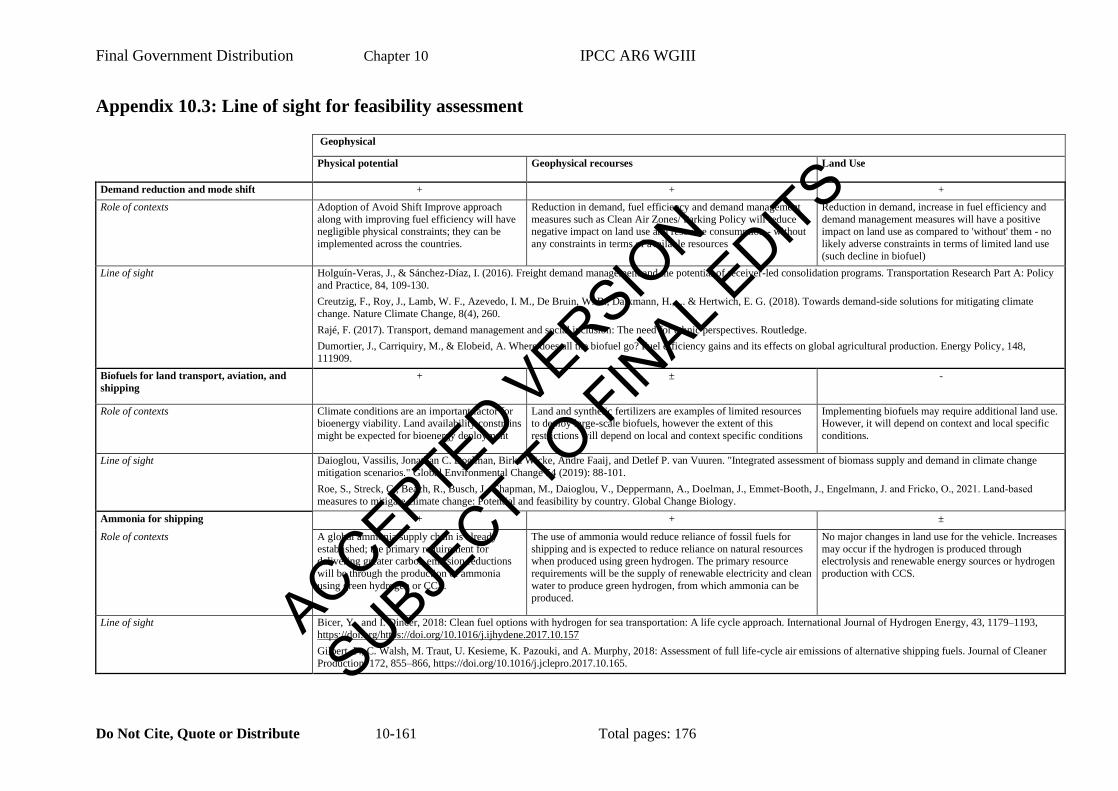
Final Government Distribution Chapter 10 IPCC AR6 WGIII
Do Not Cite, Quote or Distribute 10-161 Total pages: 176
Appendix 10.3: Line of sight for feasibility assessment
Geophysical
Physical potential Geophysical recourses Land Use
Demand reduction and mode shift + + +
Role of contexts Adoption of Avoid Shift Improve approach
along with improving fuel efficiency will have
negligible physical constraints; they can be
implemented across the countries.
Reduction in demand, fuel efficiency and demand management
measures such as Clean Air Zones/ Parking Policy will reduce
negative impact on land use and resource consumption - without
any constraints in terms of available resources
Reduction in demand, increase in fuel efficiency and
demand management measures will have a positive
impact on land use as compared to 'without' them - no
likely adverse constraints in terms of limited land use
(such decline in biofuel)
Line of sight Holguín-Veras, J., & Sánchez-Díaz, I. (2016). Freight demand management and the potential of receiver-led consolidation programs. Transportation Research Part A: Policy
and Practice, 84, 109-130.
Creutzig, F., Roy, J., Lamb, W. F., Azevedo, I. M., De Bruin, W. B., Dalkmann, H., ... & Hertwich, E. G. (2018). Towards demand-side solutions for mitigating climate
change. Nature Climate Change, 8(4), 260.
Rajé, F. (2017). Transport, demand management and social inclusion: The need for ethnic perspectives. Routledge.
Dumortier, J., Carriquiry, M., & Elobeid, A. Where does all the biofuel go? Fuel efficiency gains and its effects on global agricultural production. Energy Policy, 148,
111909.
Biofuels for land transport, aviation, and
shipping
+ ± -
Role of contexts Climate conditions are an important factor for bioenergy viability. Land availability constrains
might be expected for bioenergy deployment
Land and synthetic fertilizers are examples of limited resources to deploy large-scale biofuels, however the extent of this
restrictions will depend on local and context specific conditions
Implementing biofuels may require additional land use. However, it will depend on context and local specific
conditions.
Line of sight Daioglou, Vassilis, Jonathan C. Doelman, Birka Wicke, Andre Faaij, and Detlef P. van Vuuren. "Integrated assessment of biomass supply and demand in climate change
mitigation scenarios." Global Environmental Change 54 (2019): 88-101.
Roe, S., Streck, C., Beach, R., Busch, J., Chapman, M., Daioglou, V., Deppermann, A., Doelman, J., Emmet‐Booth, J., Engelmann, J. and Fricko, O., 2021. Land‐based
measures to mitigate climate change: Potential and feasibility by country. Global Change Biology.
Ammonia for shipping + + ±
Role of contexts A global ammonia supply chain is already
established; the primary requirement for delivering greater carbon emission reductions
will be through the production of ammonia
using green hydrogen or CCS.
The use of ammonia would reduce reliance of fossil fuels for
shipping and is expected to reduce reliance on natural resources when produced using green hydrogen. The primary resource
requirements will be the supply of renewable electricity and clean
water to produce green hydrogen, from which ammonia can be
produced.
No major changes in land use for the vehicle. Increases
may occur if the hydrogen is produced through electrolysis and renewable energy sources or hydrogen
production with CCS.
Line of sight Bicer, Y., and I. Dincer, 2018: Clean fuel options with hydrogen for sea transportation: A life cycle approach. International Journal of Hydrogen Energy, 43, 1179–1193,
https://doi.org/https://doi.org/10.1016/j.ijhydene.2017.10.157
Gilbert, P., C. Walsh, M. Traut, U. Kesieme, K. Pazouki, and A. Murphy, 2018: Assessment of full life-cycle air emissions of alternative shipping fuels. Journal of Cleaner
Production, 172, 855–866, https://doi.org/10.1016/j.jclepro.2017.10.165.
ACCEPTED VERSION
SUBJECT TO FIN
AL EDITS
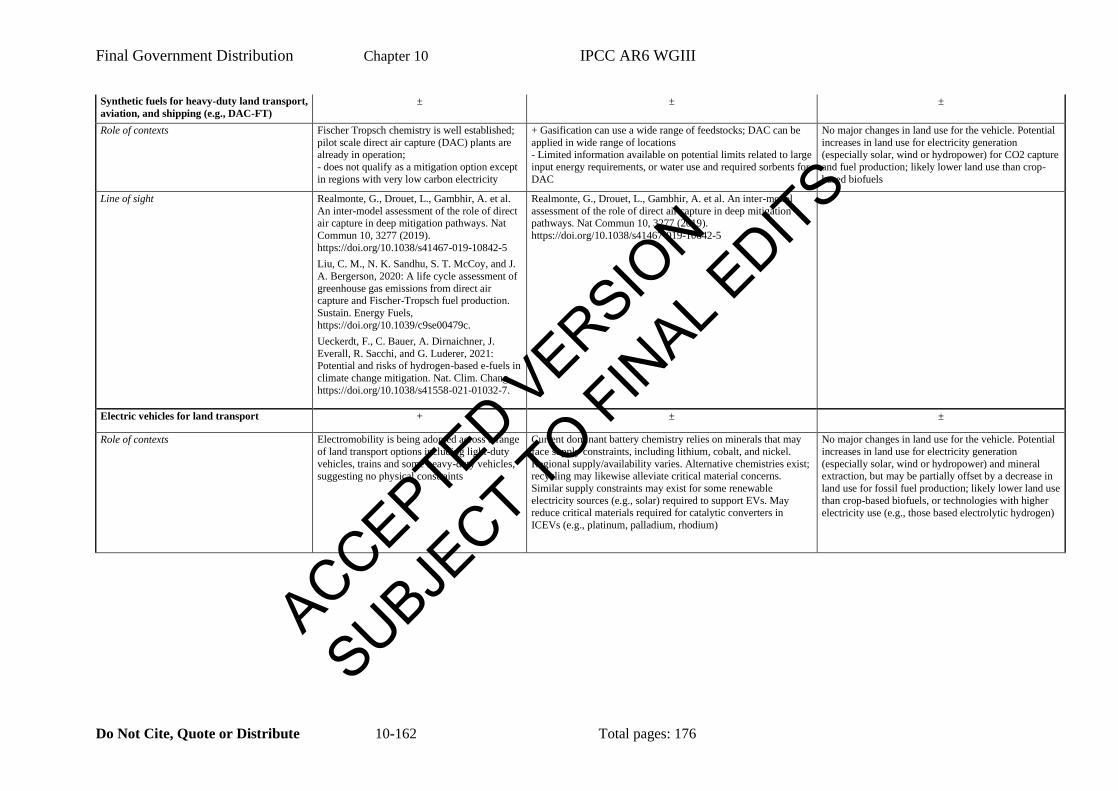
Final Government Distribution Chapter 10 IPCC AR6 WGIII
Do Not Cite, Quote or Distribute 10-162 Total pages: 176
Synthetic fuels for heavy-duty land transport,
aviation, and shipping (e.g., DAC-FT)
± ± ±
Role of contexts Fischer Tropsch chemistry is well established;
pilot scale direct air capture (DAC) plants are already in operation;
- does not qualify as a mitigation option except
in regions with very low carbon electricity
+ Gasification can use a wide range of feedstocks; DAC can be
applied in wide range of locations - Limited information available on potential limits related to large
input energy requirements, or water use and required sorbents for
DAC
No major changes in land use for the vehicle. Potential
increases in land use for electricity generation (especially solar, wind or hydropower) for CO2 capture
and fuel production; likely lower land use than crop-
based biofuels
Line of sight Realmonte, G., Drouet, L., Gambhir, A. et al.
An inter-model assessment of the role of direct air capture in deep mitigation pathways. Nat
Commun 10, 3277 (2019).
https://doi.org/10.1038/s41467-019-10842-5
Liu, C. M., N. K. Sandhu, S. T. McCoy, and J.
A. Bergerson, 2020: A life cycle assessment of
greenhouse gas emissions from direct air capture and Fischer-Tropsch fuel production.
Sustain. Energy Fuels,
https://doi.org/10.1039/c9se00479c.
Ueckerdt, F., C. Bauer, A. Dirnaichner, J.
Everall, R. Sacchi, and G. Luderer, 2021: Potential and risks of hydrogen-based e-fuels in
climate change mitigation. Nat. Clim. Chang.,
https://doi.org/10.1038/s41558-021-01032-7.
Realmonte, G., Drouet, L., Gambhir, A. et al. An inter-model
assessment of the role of direct air capture in deep mitigation pathways. Nat Commun 10, 3277 (2019).
https://doi.org/10.1038/s41467-019-10842-5
Electric vehicles for land transport + ± ±
Role of contexts Electromobility is being adopted across a range
of land transport options including light-duty
vehicles, trains and some heavy-duty vehicles,
suggesting no physical constraints
Current dominant battery chemistry relies on minerals that may
face supply constraints, including lithium, cobalt, and nickel.
Regional supply/availability varies. Alternative chemistries exist; recycling may likewise alleviate critical material concerns.
Similar supply constraints may exist for some renewable
electricity sources (e.g., solar) required to support EVs. May reduce critical materials required for catalytic converters in
ICEVs (e.g., platinum, palladium, rhodium)
No major changes in land use for the vehicle. Potential
increases in land use for electricity generation
(especially solar, wind or hydropower) and mineral extraction, but may be partially offset by a decrease in
land use for fossil fuel production; likely lower land use
than crop-based biofuels, or technologies with higher
electricity use (e.g., those based electrolytic hydrogen)
ACCEPTED VERSION
SUBJECT TO FIN
AL EDITS
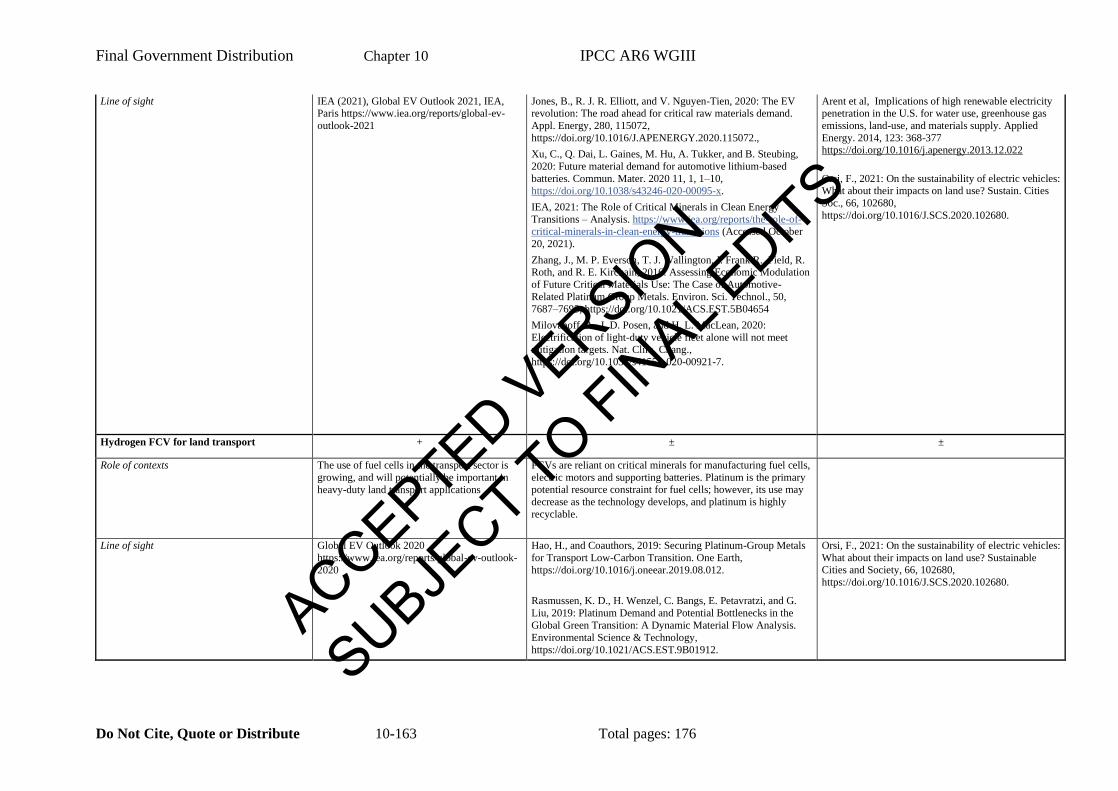
Final Government Distribution Chapter 10 IPCC AR6 WGIII
Do Not Cite, Quote or Distribute 10-163 Total pages: 176
Line of sight IEA (2021), Global EV Outlook 2021, IEA, Paris https://www.iea.org/reports/global-ev-
outlook-2021
Jones, B., R. J. R. Elliott, and V. Nguyen-Tien, 2020: The EV revolution: The road ahead for critical raw materials demand.
Appl. Energy, 280, 115072,
https://doi.org/10.1016/J.APENERGY.2020.115072.,
Xu, C., Q. Dai, L. Gaines, M. Hu, A. Tukker, and B. Steubing,
2020: Future material demand for automotive lithium-based
batteries. Commun. Mater. 2020 11, 1, 1–10,
https://doi.org/10.1038/s43246-020-00095-x.
IEA, 2021: The Role of Critical Minerals in Clean Energy
Transitions – Analysis. https://www.iea.org/reports/the-role-of-
critical-minerals-in-clean-energy-transitions (Accessed October
20, 2021).
Zhang, J., M. P. Everson, T. J. Wallington, I. Frank R. Field, R. Roth, and R. E. Kirchain, 2016: Assessing Economic Modulation
of Future Critical Materials Use: The Case of Automotive-
Related Platinum Group Metals. Environ. Sci. Technol., 50,
7687–7695, https://doi.org/10.1021/ACS.EST.5B04654
Milovanoff, A., I. D. Posen, and H. L. MacLean, 2020:
Electrification of light-duty vehicle fleet alone will not meet mitigation targets. Nat. Clim. Chang.,
https://doi.org/10.1038/s41558-020-00921-7.
Arent et al, Implications of high renewable electricity penetration in the U.S. for water use, greenhouse gas
emissions, land-use, and materials supply. Applied
Energy. 2014, 123: 368-377 https://doi.org/10.1016/j.apenergy.2013.12.022
Orsi, F., 2021: On the sustainability of electric vehicles: What about their impacts on land use? Sustain. Cities
Soc., 66, 102680,
https://doi.org/10.1016/J.SCS.2020.102680.
Hydrogen FCV for land transport + ± ±
Role of contexts The use of fuel cells in the transport sector is
growing, and will potentially be important in
heavy-duty land transport applications
FCVs are reliant on critical minerals for manufacturing fuel cells,
electric motors and supporting batteries. Platinum is the primary potential resource constraint for fuel cells; however, its use may
decrease as the technology develops, and platinum is highly
recyclable.
Line of sight Global EV Outlook 2020
https://www.iea.org/reports/global-ev-outlook-
2020
Hao, H., and Coauthors, 2019: Securing Platinum-Group Metals
for Transport Low-Carbon Transition. One Earth,
https://doi.org/10.1016/j.oneear.2019.08.012.
Rasmussen, K. D., H. Wenzel, C. Bangs, E. Petavratzi, and G.
Liu, 2019: Platinum Demand and Potential Bottlenecks in the
Global Green Transition: A Dynamic Material Flow Analysis.
Environmental Science & Technology,
https://doi.org/10.1021/ACS.EST.9B01912.
Orsi, F., 2021: On the sustainability of electric vehicles:
What about their impacts on land use? Sustainable Cities and Society, 66, 102680,
https://doi.org/10.1016/J.SCS.2020.102680.
ACCEPTED VERSION
SUBJECT TO FIN
AL EDITS
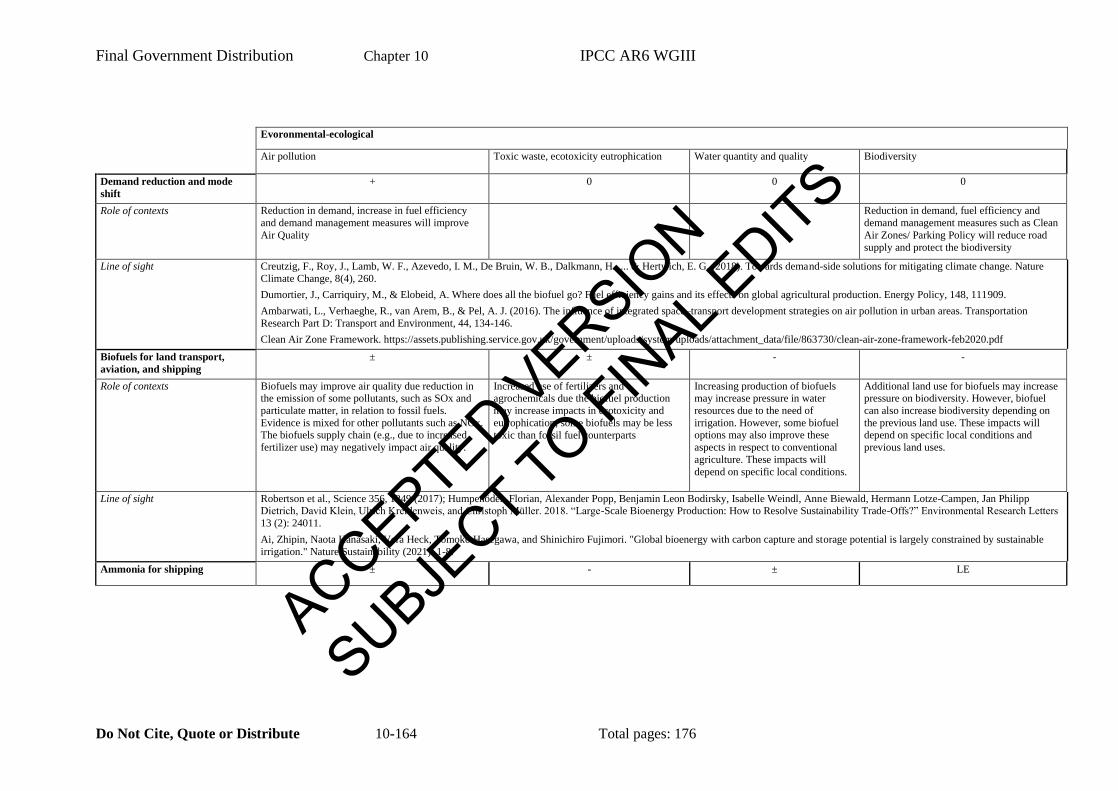
Final Government Distribution Chapter 10 IPCC AR6 WGIII
Do Not Cite, Quote or Distribute 10-164 Total pages: 176
Evoronmental-ecological
Air pollution Toxic waste, ecotoxicity eutrophication Water quantity and quality Biodiversity
Demand reduction and mode
shift
+ 0 0 0
Role of contexts Reduction in demand, increase in fuel efficiency
and demand management measures will improve
Air Quality
Reduction in demand, fuel efficiency and
demand management measures such as Clean
Air Zones/ Parking Policy will reduce road
supply and protect the biodiversity
Line of sight Creutzig, F., Roy, J., Lamb, W. F., Azevedo, I. M., De Bruin, W. B., Dalkmann, H., ... & Hertwich, E. G. (2018). Towards demand-side solutions for mitigating climate change. Nature
Climate Change, 8(4), 260.
Dumortier, J., Carriquiry, M., & Elobeid, A. Where does all the biofuel go? Fuel efficiency gains and its effects on global agricultural production. Energy Policy, 148, 111909.
Ambarwati, L., Verhaeghe, R., van Arem, B., & Pel, A. J. (2016). The influence of integrated space–transport development strategies on air pollution in urban areas. Transportation
Research Part D: Transport and Environment, 44, 134-146.
Clean Air Zone Framework. https://assets.publishing.service.gov.uk/government/uploads/system/uploads/attachment_data/file/863730/clean-air-zone-framework-feb2020.pdf
Biofuels for land transport,
aviation, and shipping
± ± - -
Role of contexts Biofuels may improve air quality due reduction in the emission of some pollutants, such as SOx and
particulate matter, in relation to fossil fuels.
Evidence is mixed for other pollutants such as NOx. The biofuels supply chain (e.g., due to increased
fertilizer use) may negatively impact air quality.
Increased use of fertilizers and agrochemicals due the biofuel production
may increase impacts in ecotoxicity and
eutrophication; some biofuels may be less
toxic than fossil fuel counterparts
Increasing production of biofuels may increase pressure in water
resources due to the need of
irrigation. However, some biofuel options may also improve these
aspects in respect to conventional
agriculture. These impacts will
depend on specific local conditions.
Additional land use for biofuels may increase pressure on biodiversity. However, biofuel
can also increase biodiversity depending on
the previous land use. These impacts will depend on specific local conditions and
previous land uses.
Line of sight Robertson et al., Science 356, 1349 (2017); Humpenöder, Florian, Alexander Popp, Benjamin Leon Bodirsky, Isabelle Weindl, Anne Biewald, Hermann Lotze-Campen, Jan Philipp Dietrich, David Klein, Ulrich Kreidenweis, and Christoph Müller. 2018. “Large-Scale Bioenergy Production: How to Resolve Sustainability Trade-Offs?” Environmental Research Letters
13 (2): 24011.
Ai, Zhipin, Naota Hanasaki, Vera Heck, Tomoko Hasegawa, and Shinichiro Fujimori. "Global bioenergy with carbon capture and storage potential is largely constrained by sustainable
irrigation." Nature Sustainability (2021): 1-8.
Ammonia for shipping ± - ± LE
ACCEPTED VERSION
SUBJECT TO FIN
AL EDITS
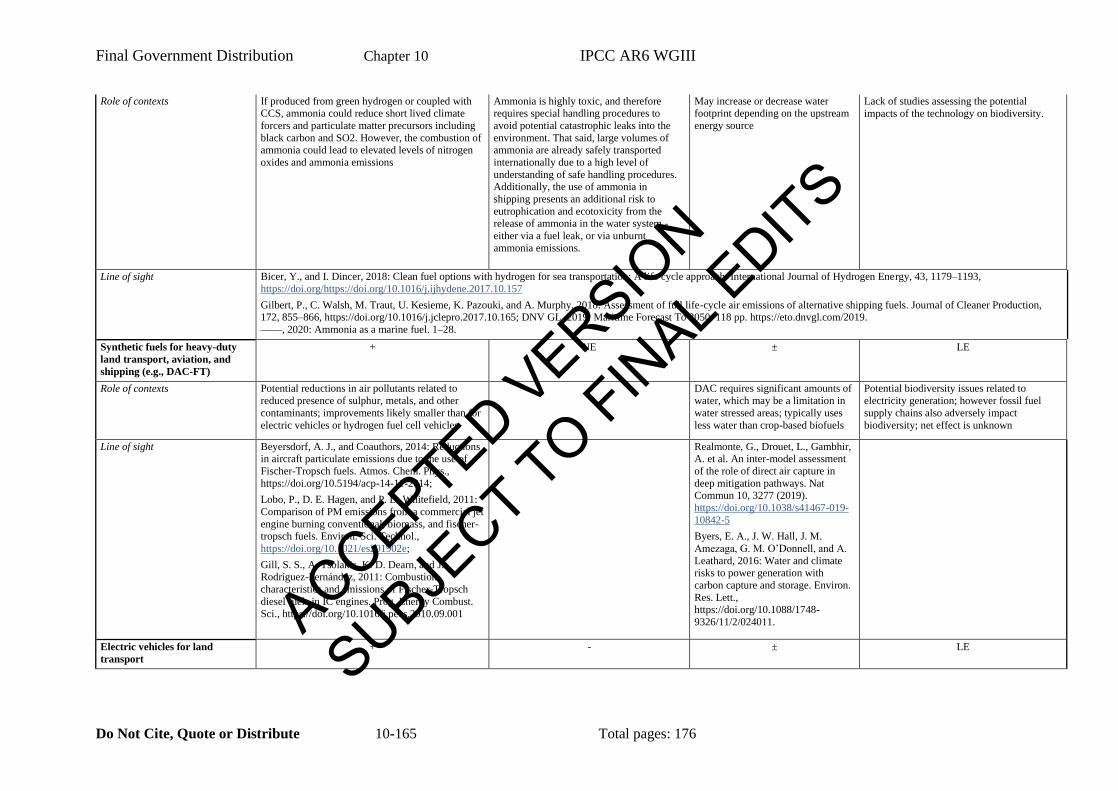
Final Government Distribution Chapter 10 IPCC AR6 WGIII
Do Not Cite, Quote or Distribute 10-165 Total pages: 176
Role of contexts If produced from green hydrogen or coupled with CCS, ammonia could reduce short lived climate
forcers and particulate matter precursors including
black carbon and SO2. However, the combustion of ammonia could lead to elevated levels of nitrogen
oxides and ammonia emissions
Ammonia is highly toxic, and therefore requires special handling procedures to
avoid potential catastrophic leaks into the
environment. That said, large volumes of ammonia are already safely transported
internationally due to a high level of
understanding of safe handling procedures. Additionally, the use of ammonia in
shipping presents an additional risk to
eutrophication and ecotoxicity from the release of ammonia in the water system -
either via a fuel leak, or via unburnt
ammonia emissions.
May increase or decrease water footprint depending on the upstream
energy source
Lack of studies assessing the potential
impacts of the technology on biodiversity.
Line of sight Bicer, Y., and I. Dincer, 2018: Clean fuel options with hydrogen for sea transportation: A life cycle approach. International Journal of Hydrogen Energy, 43, 1179–1193,
https://doi.org/https://doi.org/10.1016/j.ijhydene.2017.10.157
Gilbert, P., C. Walsh, M. Traut, U. Kesieme, K. Pazouki, and A. Murphy, 2018: Assessment of full life-cycle air emissions of alternative shipping fuels. Journal of Cleaner Production, 172, 855–866, https://doi.org/10.1016/j.jclepro.2017.10.165; DNV GL, 2019: Maritime Forecast To 2050. 118 pp. https://eto.dnvgl.com/2019.
——, 2020: Ammonia as a marine fuel. 1–28.
Synthetic fuels for heavy-duty
land transport, aviation, and
shipping (e.g., DAC-FT)
+ NE ± LE
Role of contexts Potential reductions in air pollutants related to
reduced presence of sulphur, metals, and other
contaminants; improvements likely smaller than for
electric vehicles or hydrogen fuel cell vehicles
DAC requires significant amounts of
water, which may be a limitation in
water stressed areas; typically uses
less water than crop-based biofuels
Potential biodiversity issues related to
electricity generation; however fossil fuel
supply chains also adversely impact
biodiversity; net effect is unknown
Line of sight Beyersdorf, A. J., and Coauthors, 2014: Reductions in aircraft particulate emissions due to the use of
Fischer-Tropsch fuels. Atmos. Chem. Phys.,
https://doi.org/10.5194/acp-14-11-2014;
Lobo, P., D. E. Hagen, and P. D. Whitefield, 2011:
Comparison of PM emissions from a commercial jet
engine burning conventional, biomass, and fischer-
tropsch fuels. Environ. Sci. Technol.,
https://doi.org/10.1021/es201902e;
Gill, S. S., A. Tsolakis, K. D. Dearn, and J. Rodríguez-Fernández, 2011: Combustion
characteristics and emissions of Fischer-Tropsch
diesel fuels in IC engines. Prog. Energy Combust.
Sci., https://doi.org/10.1016/j.pecs.2010.09.001
Realmonte, G., Drouet, L., Gambhir, A. et al. An inter-model assessment
of the role of direct air capture in
deep mitigation pathways. Nat Commun 10, 3277 (2019).
https://doi.org/10.1038/s41467-019-
10842-5
Byers, E. A., J. W. Hall, J. M.
Amezaga, G. M. O’Donnell, and A.
Leathard, 2016: Water and climate risks to power generation with
carbon capture and storage. Environ.
Res. Lett., https://doi.org/10.1088/1748-
9326/11/2/024011.
Electric vehicles for land
transport
+ - ± LE
ACCEPTED VERSION
SUBJECT TO FIN
AL EDITS
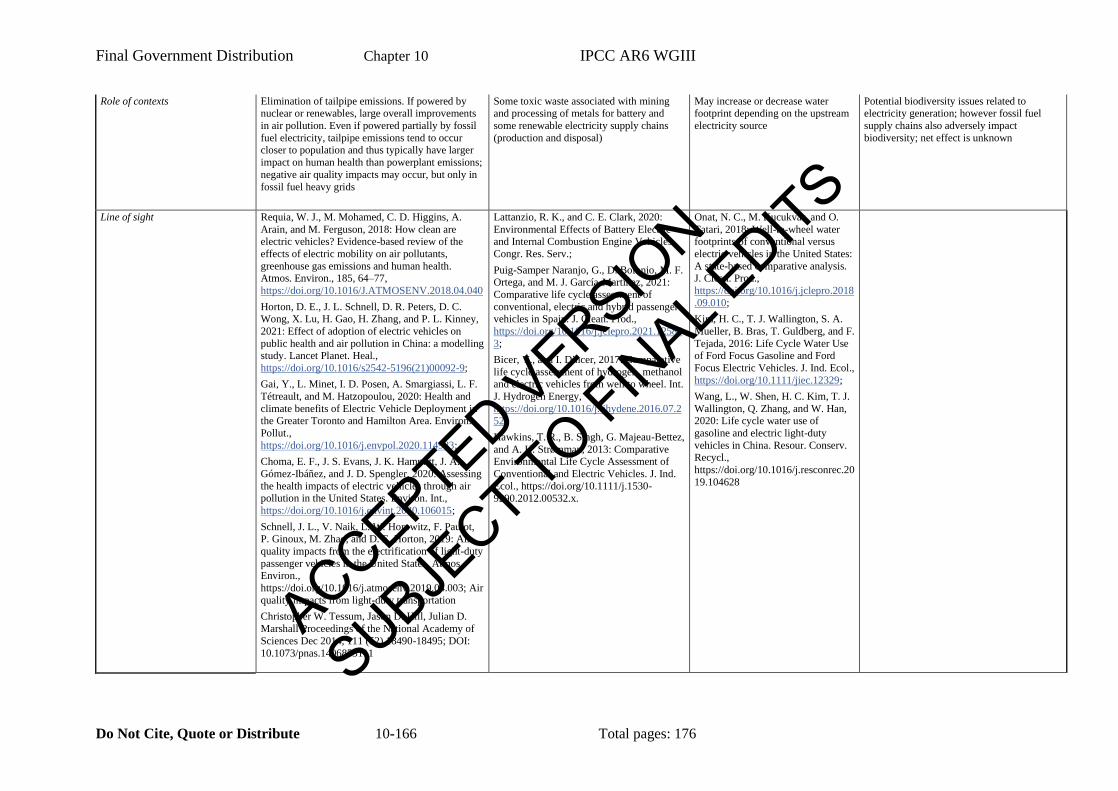
Final Government Distribution Chapter 10 IPCC AR6 WGIII
Do Not Cite, Quote or Distribute 10-166 Total pages: 176
Role of contexts Elimination of tailpipe emissions. If powered by nuclear or renewables, large overall improvements
in air pollution. Even if powered partially by fossil
fuel electricity, tailpipe emissions tend to occur closer to population and thus typically have larger
impact on human health than powerplant emissions;
negative air quality impacts may occur, but only in
fossil fuel heavy grids
Some toxic waste associated with mining and processing of metals for battery and
some renewable electricity supply chains
(production and disposal)
May increase or decrease water footprint depending on the upstream
electricity source
Potential biodiversity issues related to electricity generation; however fossil fuel
supply chains also adversely impact
biodiversity; net effect is unknown
Line of sight Requia, W. J., M. Mohamed, C. D. Higgins, A.
Arain, and M. Ferguson, 2018: How clean are electric vehicles? Evidence-based review of the
effects of electric mobility on air pollutants,
greenhouse gas emissions and human health. Atmos. Environ., 185, 64–77,
https://doi.org/10.1016/J.ATMOSENV.2018.04.040
Horton, D. E., J. L. Schnell, D. R. Peters, D. C. Wong, X. Lu, H. Gao, H. Zhang, and P. L. Kinney,
2021: Effect of adoption of electric vehicles on
public health and air pollution in China: a modelling study. Lancet Planet. Heal.,
https://doi.org/10.1016/s2542-5196(21)00092-9;
Gai, Y., L. Minet, I. D. Posen, A. Smargiassi, L. F.
Tétreault, and M. Hatzopoulou, 2020: Health and
climate benefits of Electric Vehicle Deployment in the Greater Toronto and Hamilton Area. Environ.
Pollut.,
https://doi.org/10.1016/j.envpol.2020.114983;
Choma, E. F., J. S. Evans, J. K. Hammitt, J. A.
Gómez-Ibáñez, and J. D. Spengler, 2020: Assessing
the health impacts of electric vehicles through air pollution in the United States. Environ. Int.,
https://doi.org/10.1016/j.envint.2020.106015;
Schnell, J. L., V. Naik, L. W. Horowitz, F. Paulot,
P. Ginoux, M. Zhao, and D. E. Horton, 2019: Air
quality impacts from the electrification of light-duty
passenger vehicles in the United States. Atmos. Environ.,
https://doi.org/10.1016/j.atmosenv.2019.04.003; Air
quality impacts from light-duty transportation
Christopher W. Tessum, Jason D. Hill, Julian D.
Marshall Proceedings of the National Academy of
Sciences Dec 2014, 111 (52) 18490-18495; DOI:
10.1073/pnas.1406853111
Lattanzio, R. K., and C. E. Clark, 2020:
Environmental Effects of Battery Electric and Internal Combustion Engine Vehicles.
Congr. Res. Serv.;
Puig-Samper Naranjo, G., D. Bolonio, M. F. Ortega, and M. J. García-Martínez, 2021:
Comparative life cycle assessment of
conventional, electric and hybrid passenger vehicles in Spain. J. Clean. Prod.,
https://doi.org/10.1016/j.jclepro.2021.12588
3;
Bicer, Y., and I. Dincer, 2017: Comparative
life cycle assessment of hydrogen, methanol
and electric vehicles from well to wheel. Int.
J. Hydrogen Energy,
https://doi.org/10.1016/j.ijhydene.2016.07.2
52;
Hawkins, T. R., B. Singh, G. Majeau-Bettez,
and A. H. Strømman, 2013: Comparative Environmental Life Cycle Assessment of
Conventional and Electric Vehicles. J. Ind.
Ecol., https://doi.org/10.1111/j.1530-
9290.2012.00532.x.
Onat, N. C., M. Kucukvar, and O.
Tatari, 2018: Well-to-wheel water footprints of conventional versus
electric vehicles in the United States:
A state-based comparative analysis. J. Clean. Prod.,
https://doi.org/10.1016/j.jclepro.2018
.09.010;
Kim, H. C., T. J. Wallington, S. A.
Mueller, B. Bras, T. Guldberg, and F.
Tejada, 2016: Life Cycle Water Use of Ford Focus Gasoline and Ford
Focus Electric Vehicles. J. Ind. Ecol.,
https://doi.org/10.1111/jiec.12329;
Wang, L., W. Shen, H. C. Kim, T. J.
Wallington, Q. Zhang, and W. Han, 2020: Life cycle water use of
gasoline and electric light-duty
vehicles in China. Resour. Conserv. Recycl.,
https://doi.org/10.1016/j.resconrec.20
19.104628
ACCEPTED VERSION
SUBJECT TO FIN
AL EDITS
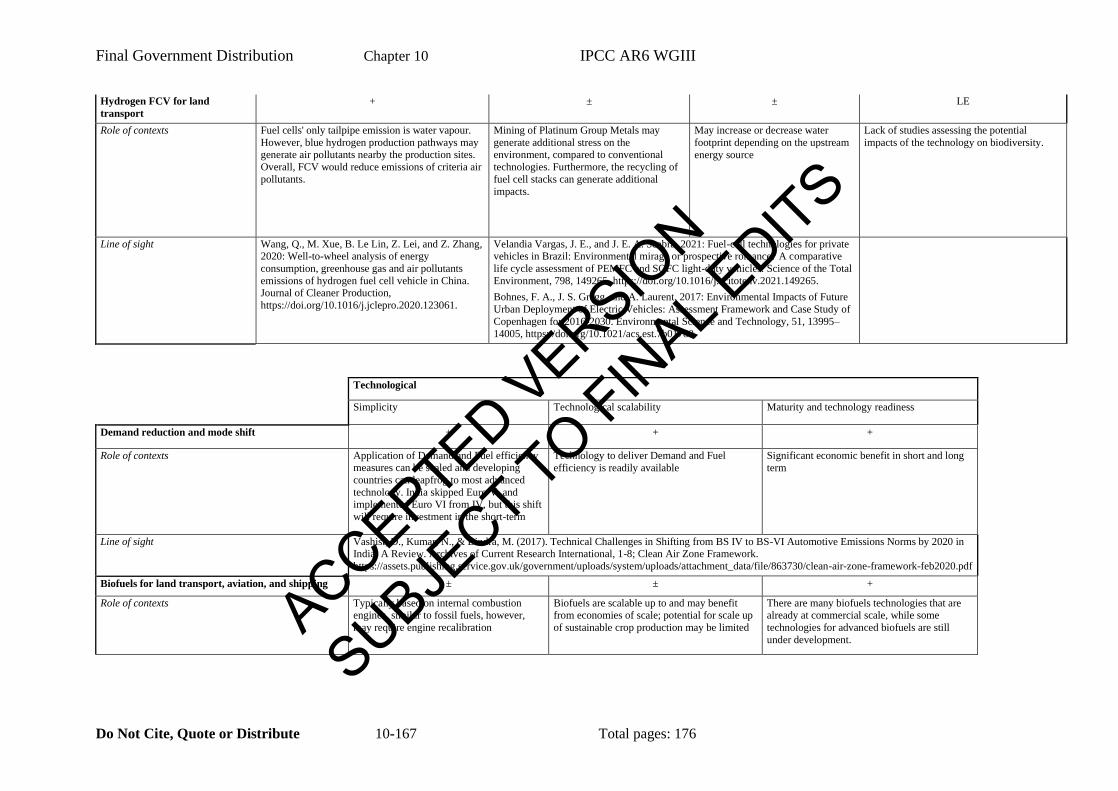
Final Government Distribution Chapter 10 IPCC AR6 WGIII
Do Not Cite, Quote or Distribute 10-167 Total pages: 176
Hydrogen FCV for land
transport
+ ± ± LE
Role of contexts Fuel cells' only tailpipe emission is water vapour.
However, blue hydrogen production pathways may generate air pollutants nearby the production sites.
Overall, FCV would reduce emissions of criteria air
pollutants.
Mining of Platinum Group Metals may
generate additional stress on the environment, compared to conventional
technologies. Furthermore, the recycling of
fuel cell stacks can generate additional
impacts.
May increase or decrease water
footprint depending on the upstream
energy source
Lack of studies assessing the potential
impacts of the technology on biodiversity.
Line of sight Wang, Q., M. Xue, B. Le Lin, Z. Lei, and Z. Zhang, 2020: Well-to-wheel analysis of energy
consumption, greenhouse gas and air pollutants
emissions of hydrogen fuel cell vehicle in China. Journal of Cleaner Production,
https://doi.org/10.1016/j.jclepro.2020.123061.
Velandia Vargas, J. E., and J. E. A. Seabra, 2021: Fuel-cell technologies for private vehicles in Brazil: Environmental mirage or prospective romance? A comparative
life cycle assessment of PEMFC and SOFC light-duty vehicles. Science of the Total
Environment, 798, 149265, https://doi.org/10.1016/j.scitotenv.2021.149265.
Bohnes, F. A., J. S. Gregg, and A. Laurent, 2017: Environmental Impacts of Future
Urban Deployment of Electric Vehicles: Assessment Framework and Case Study of
Copenhagen for 2016-2030. Environmental Science and Technology, 51, 13995–
14005, https://doi.org/10.1021/acs.est.7b01780.
Technological
Simplicity Technological scalability Maturity and technology readiness
Demand reduction and mode shift + + +
Role of contexts Application of Demand and Fuel efficiency measures can be scaled and developing
countries can leapfrog to most advanced
technology. India skipped Euro V, and implemented Euro VI from IV, but this shift
will require investment in the short-term
Technology to deliver Demand and Fuel
efficiency is readily available
Significant economic benefit in short and long
term
Line of sight Vashist, D., Kumar, N., & Bindra, M. (2017). Technical Challenges in Shifting from BS IV to BS-VI Automotive Emissions Norms by 2020 in India: A Review. Archives of Current Research International, 1-8; Clean Air Zone Framework.
https://assets.publishing.service.gov.uk/government/uploads/system/uploads/attachment_data/file/863730/clean-air-zone-framework-feb2020.pdf
Biofuels for land transport, aviation, and shipping ± ± +
Role of contexts Typically based on internal combustion engines, similar to fossil fuels, however,
may require engine recalibration
Biofuels are scalable up to and may benefit from economies of scale; potential for scale up
of sustainable crop production may be limited
There are many biofuels technologies that are already at commercial scale, while some
technologies for advanced biofuels are still
under development. ACCEPTED VERSIO
N
SUBJECT TO FIN
AL EDITS
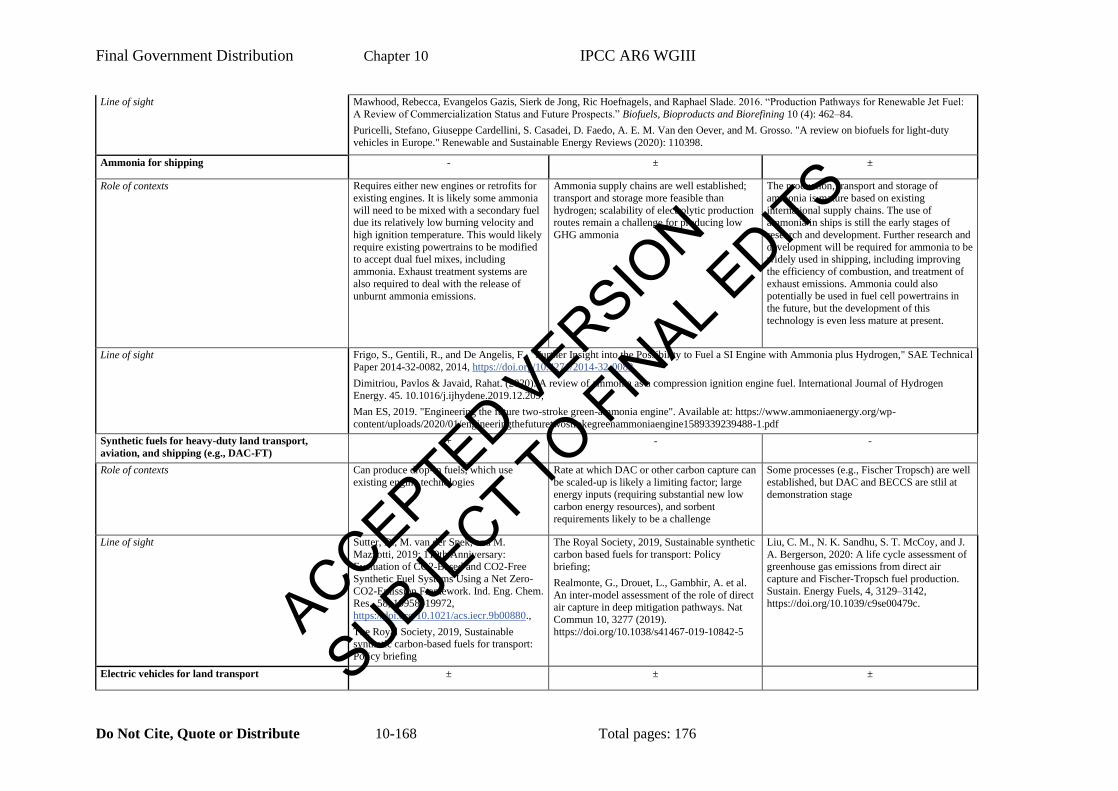
Final Government Distribution Chapter 10 IPCC AR6 WGIII
Do Not Cite, Quote or Distribute 10-168 Total pages: 176
Line of sight Mawhood, Rebecca, Evangelos Gazis, Sierk de Jong, Ric Hoefnagels, and Raphael Slade. 2016. “Production Pathways for Renewable Jet Fuel:
A Review of Commercialization Status and Future Prospects.” Biofuels, Bioproducts and Biorefining 10 (4): 462–84.
Puricelli, Stefano, Giuseppe Cardellini, S. Casadei, D. Faedo, A. E. M. Van den Oever, and M. Grosso. "A review on biofuels for light-duty
vehicles in Europe." Renewable and Sustainable Energy Reviews (2020): 110398.
Ammonia for shipping - ± ±
Role of contexts Requires either new engines or retrofits for
existing engines. It is likely some ammonia
will need to be mixed with a secondary fuel due its relatively low burning velocity and
high ignition temperature. This would likely
require existing powertrains to be modified to accept dual fuel mixes, including
ammonia. Exhaust treatment systems are
also required to deal with the release of
unburnt ammonia emissions.
Ammonia supply chains are well established;
transport and storage more feasible than
hydrogen; scalability of electrolytic production routes remain a challenge for producing low
GHG ammonia
The production, transport and storage of
ammonia is mature based on existing
international supply chains. The use of ammonia in ships is still the early stages of
research and development. Further research and
development will be required for ammonia to be widely used in shipping, including improving
the efficiency of combustion, and treatment of
exhaust emissions. Ammonia could also potentially be used in fuel cell powertrains in
the future, but the development of this
technology is even less mature at present.
Line of sight Frigo, S., Gentili, R., and De Angelis, F., "Further Insight into the Possibility to Fuel a SI Engine with Ammonia plus Hydrogen," SAE Technical
Paper 2014-32-0082, 2014, https://doi.org/10.4271/2014-32-0082.
Dimitriou, Pavlos & Javaid, Rahat. (2020). A review of ammonia as a compression ignition engine fuel. International Journal of Hydrogen
Energy. 45. 10.1016/j.ijhydene.2019.12.209;
Man ES, 2019. "Engineering the future two-stroke green-ammonia engine". Available at: https://www.ammoniaenergy.org/wp-
content/uploads/2020/01/engineeringthefuturetwostrokegreenammoniaengine1589339239488-1.pdf
Synthetic fuels for heavy-duty land transport,
aviation, and shipping (e.g., DAC-FT)
+ - -
Role of contexts Can produce drop-in fuels, which use
existing engine technologies
Rate at which DAC or other carbon capture can
be scaled-up is likely a limiting factor; large energy inputs (requiring substantial new low
carbon energy resources), and sorbent
requirements likely to be a challenge
Some processes (e.g., Fischer Tropsch) are well
established, but DAC and BECCS are stlil at
demonstration stage
Line of sight Sutter, D., M. van der Spek, and M.
Mazzotti, 2019: 110th Anniversary: Evaluation of CO2-Based and CO2-Free
Synthetic Fuel Systems Using a Net Zero-
CO2-Emission Framework. Ind. Eng. Chem. Res., 58, 19958–19972,
https://doi.org/10.1021/acs.iecr.9b00880.,
The Royal Society, 2019, Sustainable synthetic carbon-based fuels for transport:
Policy briefing
The Royal Society, 2019, Sustainable synthetic
carbon based fuels for transport: Policy
briefing;
Realmonte, G., Drouet, L., Gambhir, A. et al.
An inter-model assessment of the role of direct air capture in deep mitigation pathways. Nat
Commun 10, 3277 (2019).
https://doi.org/10.1038/s41467-019-10842-5
Liu, C. M., N. K. Sandhu, S. T. McCoy, and J.
A. Bergerson, 2020: A life cycle assessment of greenhouse gas emissions from direct air
capture and Fischer-Tropsch fuel production.
Sustain. Energy Fuels, 4, 3129–3142,
https://doi.org/10.1039/c9se00479c.
Electric vehicles for land transport ± ± ±
ACCEPTED VERSION
SUBJECT TO FIN
AL EDITS
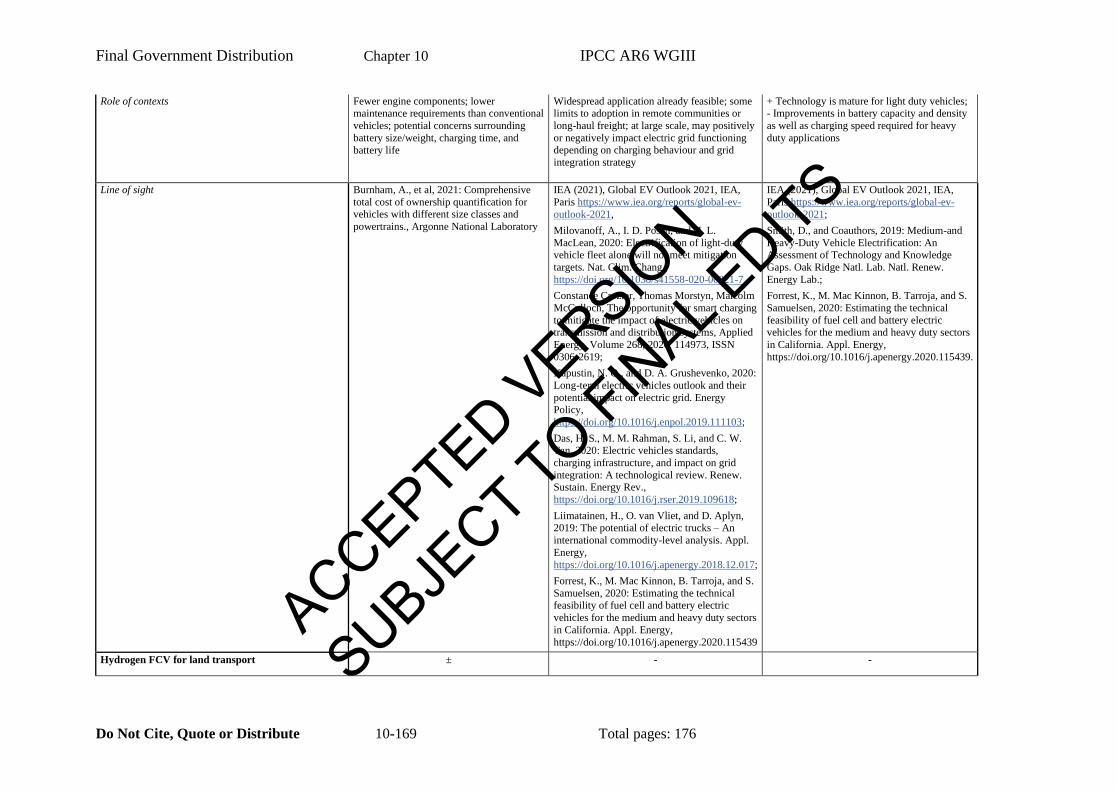
Final Government Distribution Chapter 10 IPCC AR6 WGIII
Do Not Cite, Quote or Distribute 10-169 Total pages: 176
Role of contexts Fewer engine components; lower maintenance requirements than conventional
vehicles; potential concerns surrounding
battery size/weight, charging time, and
battery life
Widespread application already feasible; some limits to adoption in remote communities or
long-haul freight; at large scale, may positively
or negatively impact electric grid functioning depending on charging behaviour and grid
integration strategy
+ Technology is mature for light duty vehicles; - Improvements in battery capacity and density
as well as charging speed required for heavy
duty applications
Line of sight Burnham, A., et al, 2021: Comprehensive
total cost of ownership quantification for vehicles with different size classes and
powertrains., Argonne National Laboratory
IEA (2021), Global EV Outlook 2021, IEA,
Paris https://www.iea.org/reports/global-ev-
outlook-2021,
Milovanoff, A., I. D. Posen, and H. L.
MacLean, 2020: Electrification of light-duty vehicle fleet alone will not meet mitigation
targets. Nat. Clim. Chang.,
https://doi.org/10.1038/s41558-020-00921-7.,
Constance Crozier, Thomas Morstyn, Malcolm
McCulloch, The opportunity for smart charging
to mitigate the impact of electric vehicles on transmission and distribution systems, Applied
Energy, Volume 268, 2020, 114973, ISSN
0306-2619;
Kapustin, N. O., and D. A. Grushevenko, 2020:
Long-term electric vehicles outlook and their
potential impact on electric grid. Energy Policy,
https://doi.org/10.1016/j.enpol.2019.111103;
Das, H. S., M. M. Rahman, S. Li, and C. W. Tan, 2020: Electric vehicles standards,
charging infrastructure, and impact on grid
integration: A technological review. Renew. Sustain. Energy Rev.,
https://doi.org/10.1016/j.rser.2019.109618;
Liimatainen, H., O. van Vliet, and D. Aplyn, 2019: The potential of electric trucks – An
international commodity-level analysis. Appl.
Energy,
https://doi.org/10.1016/j.apenergy.2018.12.017;
Forrest, K., M. Mac Kinnon, B. Tarroja, and S.
Samuelsen, 2020: Estimating the technical feasibility of fuel cell and battery electric
vehicles for the medium and heavy duty sectors
in California. Appl. Energy,
https://doi.org/10.1016/j.apenergy.2020.115439
IEA (2021), Global EV Outlook 2021, IEA,
Paris https://www.iea.org/reports/global-ev-
outlook-2021;
Smith, D., and Coauthors, 2019: Medium-and
Heavy-Duty Vehicle Electrification: An Assessment of Technology and Knowledge
Gaps. Oak Ridge Natl. Lab. Natl. Renew.
Energy Lab.;
Forrest, K., M. Mac Kinnon, B. Tarroja, and S.
Samuelsen, 2020: Estimating the technical
feasibility of fuel cell and battery electric vehicles for the medium and heavy duty sectors
in California. Appl. Energy,
https://doi.org/10.1016/j.apenergy.2020.115439.
Hydrogen FCV for land transport ± - -
ACCEPTED VERSION
SUBJECT TO FIN
AL EDITS
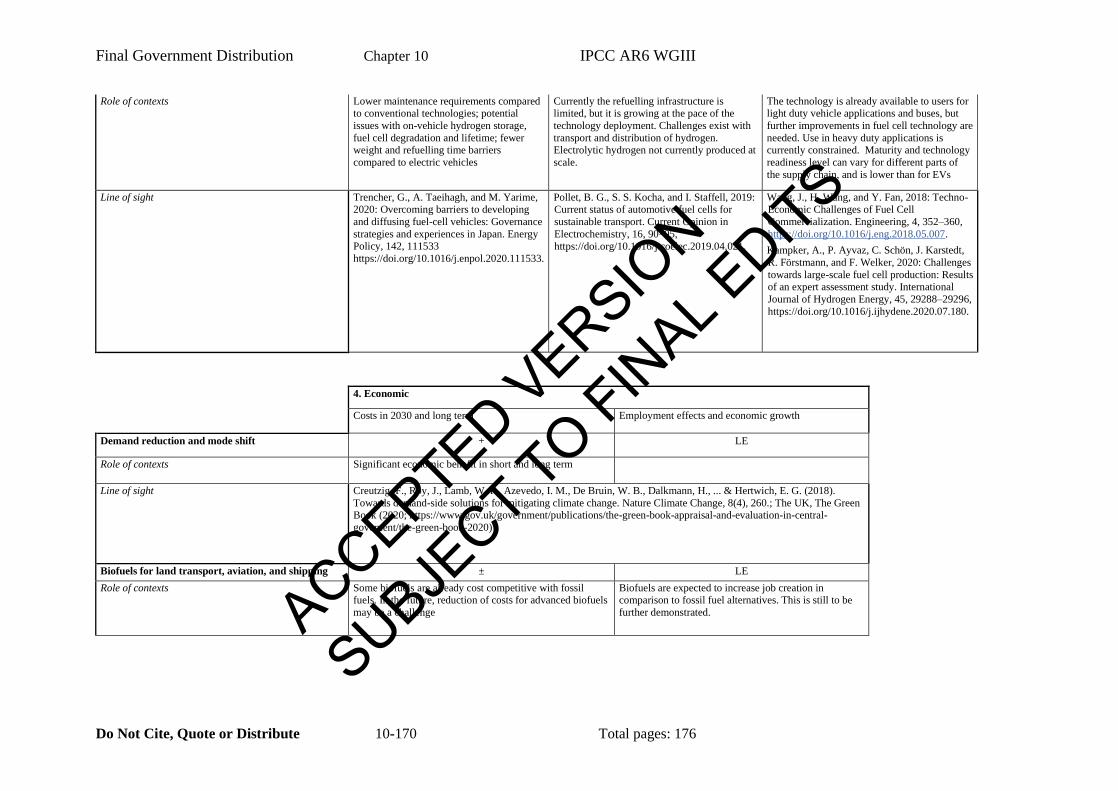
Final Government Distribution Chapter 10 IPCC AR6 WGIII
Do Not Cite, Quote or Distribute 10-170 Total pages: 176
Role of contexts Lower maintenance requirements compared to conventional technologies; potential
issues with on-vehicle hydrogen storage,
fuel cell degradation and lifetime; fewer weight and refuelling time barriers
compared to electric vehicles
Currently the refuelling infrastructure is limited, but it is growing at the pace of the
technology deployment. Challenges exist with
transport and distribution of hydrogen. Electrolytic hydrogen not currently produced at
scale.
The technology is already available to users for light duty vehicle applications and buses, but
further improvements in fuel cell technology are
needed. Use in heavy duty applications is currently constrained. Maturity and technology
readiness level can vary for different parts of
the supply chain, and is lower than for EVs
Line of sight Trencher, G., A. Taeihagh, and M. Yarime, 2020: Overcoming barriers to developing
and diffusing fuel-cell vehicles: Governance
strategies and experiences in Japan. Energy Policy, 142, 111533
https://doi.org/10.1016/j.enpol.2020.111533.
Pollet, B. G., S. S. Kocha, and I. Staffell, 2019: Current status of automotive fuel cells for
sustainable transport. Current Opinion in
Electrochemistry, 16, 90–95,
https://doi.org/10.1016/j.coelec.2019.04.021.
Wang, J., H. Wang, and Y. Fan, 2018: Techno-Economic Challenges of Fuel Cell
Commercialization. Engineering, 4, 352–360,
https://doi.org/10.1016/j.eng.2018.05.007.
Kampker, A., P. Ayvaz, C. Schön, J. Karstedt,
R. Förstmann, and F. Welker, 2020: Challenges
towards large-scale fuel cell production: Results of an expert assessment study. International
Journal of Hydrogen Energy, 45, 29288–29296,
https://doi.org/10.1016/j.ijhydene.2020.07.180.
4. Economic
Costs in 2030 and long term Employment effects and economic growth
Demand reduction and mode shift + LE
Role of contexts Significant economic benefit in short and long term
Line of sight Creutzig, F., Roy, J., Lamb, W. F., Azevedo, I. M., De Bruin, W. B., Dalkmann, H., ... & Hertwich, E. G. (2018).
Towards demand-side solutions for mitigating climate change. Nature Climate Change, 8(4), 260.; The UK, The Green Book (2020; https://www.gov.uk/government/publications/the-green-book-appraisal-and-evaluation-in-central-
governent/the-green-book-2020)
Biofuels for land transport, aviation, and shipping ± LE
Role of contexts Some biofuels are already cost competitive with fossil fuels. In the future, reduction of costs for advanced biofuels
may be a challenge
Biofuels are expected to increase job creation in comparison to fossil fuel alternatives. This is still to be
further demonstrated. ACCEPTED VERSION
SUBJECT TO FIN
AL EDITS
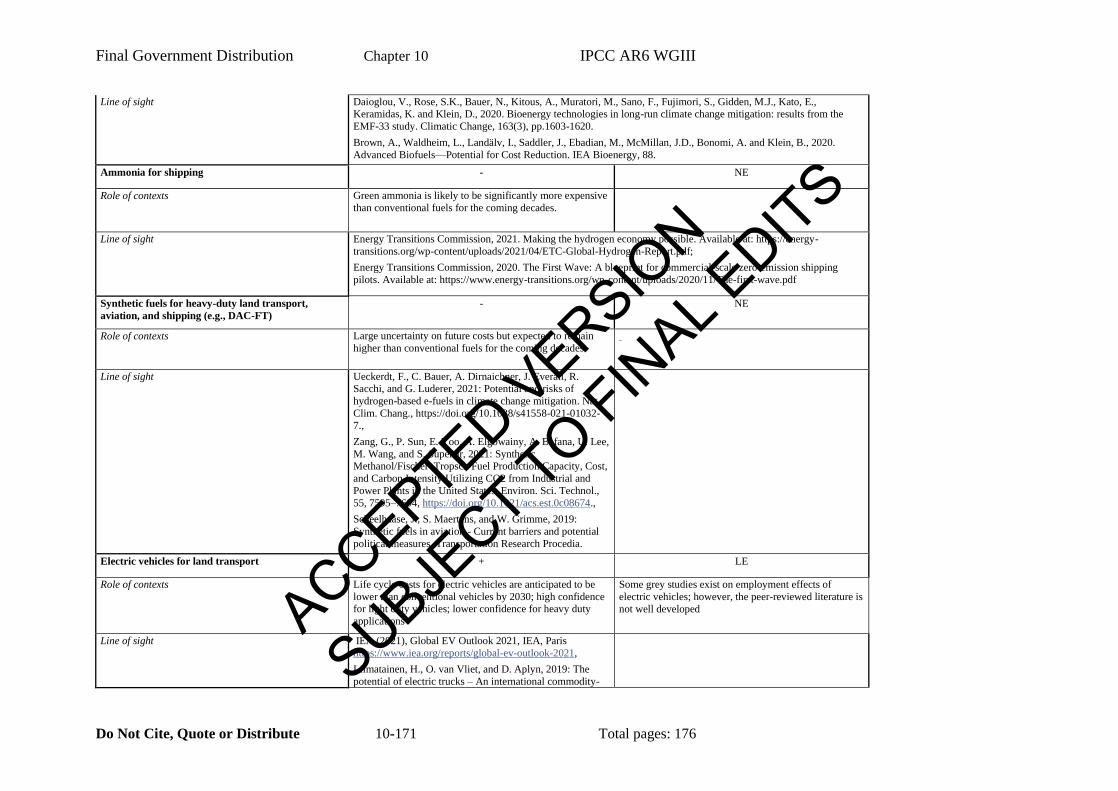
Final Government Distribution Chapter 10 IPCC AR6 WGIII
Do Not Cite, Quote or Distribute 10-171 Total pages: 176
Line of sight Daioglou, V., Rose, S.K., Bauer, N., Kitous, A., Muratori, M., Sano, F., Fujimori, S., Gidden, M.J., Kato, E., Keramidas, K. and Klein, D., 2020. Bioenergy technologies in long-run climate change mitigation: results from the
EMF-33 study. Climatic Change, 163(3), pp.1603-1620.
Brown, A., Waldheim, L., Landälv, I., Saddler, J., Ebadian, M., McMillan, J.D., Bonomi, A. and Klein, B., 2020.
Advanced Biofuels—Potential for Cost Reduction. IEA Bioenergy, 88.
Ammonia for shipping - NE
Role of contexts Green ammonia is likely to be significantly more expensive
than conventional fuels for the coming decades.
Line of sight Energy Transitions Commission, 2021. Making the hydrogen economy possible. Available at: https://energy-
transitions.org/wp-content/uploads/2021/04/ETC-Global-Hydrogen-Report.pdf;
Energy Transitions Commission, 2020. The First Wave: A blueprint for commercial-scale zero-emission shipping
pilots. Available at: https://www.energy-transitions.org/wp-content/uploads/2020/11/The-first-wave.pdf
Synthetic fuels for heavy-duty land transport,
aviation, and shipping (e.g., DAC-FT)
- NE
Role of contexts Large uncertainty on future costs but expected to remain
higher than conventional fuels for the coming decades
Line of sight Ueckerdt, F., C. Bauer, A. Dirnaichner, J. Everall, R.
Sacchi, and G. Luderer, 2021: Potential and risks of
hydrogen-based e-fuels in climate change mitigation. Nat.
Clim. Chang., https://doi.org/10.1038/s41558-021-01032-
7.,
Zang, G., P. Sun, E. Yoo, A. Elgowainy, A. Bafana, U. Lee,
M. Wang, and S. Supekar, 2021: Synthetic Methanol/Fischer–Tropsch Fuel Production Capacity, Cost,
and Carbon Intensity Utilizing CO2 from Industrial and
Power Plants in the United States. Environ. Sci. Technol.,
55, 7595–7604, https://doi.org/10.1021/acs.est.0c08674.,
Scheelhaase, J., S. Maertens, and W. Grimme, 2019:
Synthetic fuels in aviation - Current barriers and potential
political measures. Transportation Research Procedia.
Electric vehicles for land transport + LE
Role of contexts Life cycle costs for electric vehicles are anticipated to be
lower than conventional vehicles by 2030; high confidence for light duty vehicles; lower confidence for heavy duty
applications
Some grey studies exist on employment effects of
electric vehicles; however, the peer-reviewed literature is
not well developed
Line of sight IEA (2021), Global EV Outlook 2021, IEA, Paris
https://www.iea.org/reports/global-ev-outlook-2021,
Liimatainen, H., O. van Vliet, and D. Aplyn, 2019: The
potential of electric trucks – An international commodity-
ACCEPTED VERSIO
N
SUBJECT TO FIN
AL EDITS
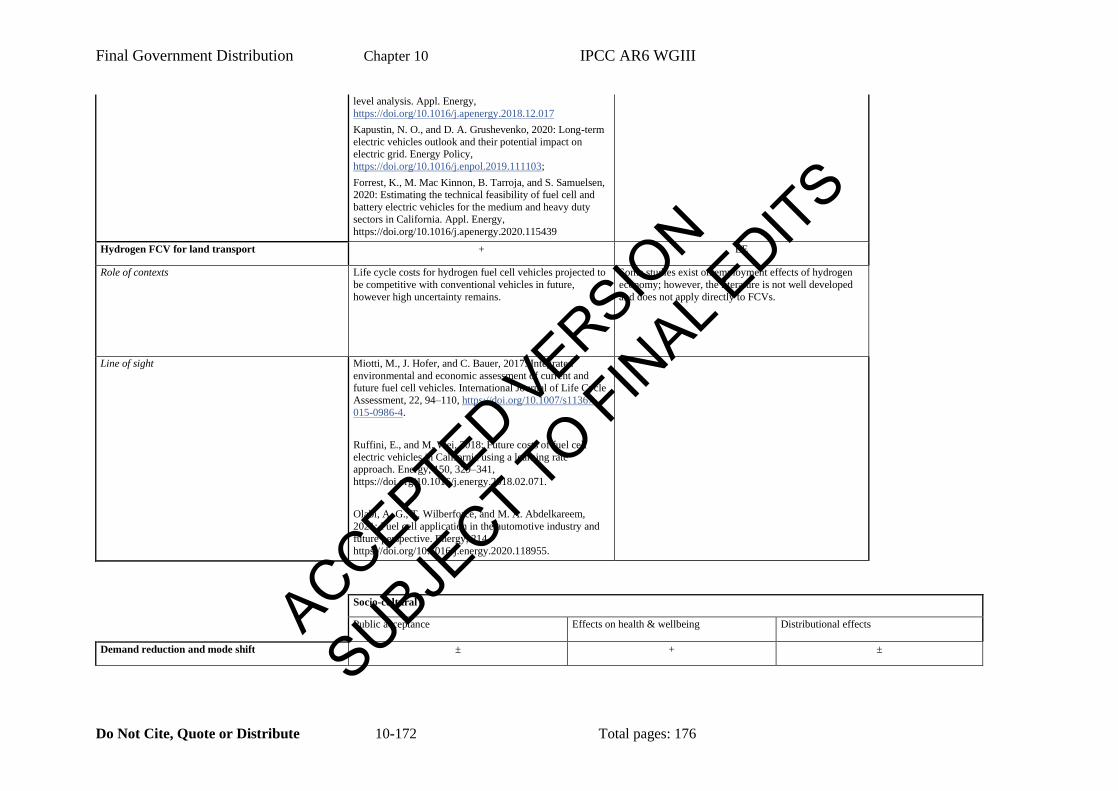
Final Government Distribution Chapter 10 IPCC AR6 WGIII
Do Not Cite, Quote or Distribute 10-172 Total pages: 176
level analysis. Appl. Energy,
https://doi.org/10.1016/j.apenergy.2018.12.017
Kapustin, N. O., and D. A. Grushevenko, 2020: Long-term
electric vehicles outlook and their potential impact on electric grid. Energy Policy,
https://doi.org/10.1016/j.enpol.2019.111103;
Forrest, K., M. Mac Kinnon, B. Tarroja, and S. Samuelsen, 2020: Estimating the technical feasibility of fuel cell and
battery electric vehicles for the medium and heavy duty
sectors in California. Appl. Energy,
https://doi.org/10.1016/j.apenergy.2020.115439
Hydrogen FCV for land transport + LE
Role of contexts Life cycle costs for hydrogen fuel cell vehicles projected to
be competitive with conventional vehicles in future,
however high uncertainty remains.
Some studies exist on employment effects of hydrogen
economy; however, the literature is not well developed
and does not apply directly to FCVs.
Line of sight Miotti, M., J. Hofer, and C. Bauer, 2017: Integrated
environmental and economic assessment of current and
future fuel cell vehicles. International Journal of Life Cycle
Assessment, 22, 94–110, https://doi.org/10.1007/s11367-
015-0986-4.
Ruffini, E., and M. Wei, 2018: Future costs of fuel cell
electric vehicles in California using a learning rate approach. Energy, 150, 329–341,
https://doi.org/10.1016/j.energy.2018.02.071.
Olabi, A. G., T. Wilberforce, and M. A. Abdelkareem,
2021: Fuel cell application in the automotive industry and
future perspective. Energy, 214,
https://doi.org/10.1016/j.energy.2020.118955.
Socio-cultural
Public acceptance Effects on health & wellbeing Distributional effects
Demand reduction and mode shift ± + ±
ACCEPTED VERSION
SUBJECT TO FIN
AL EDITS
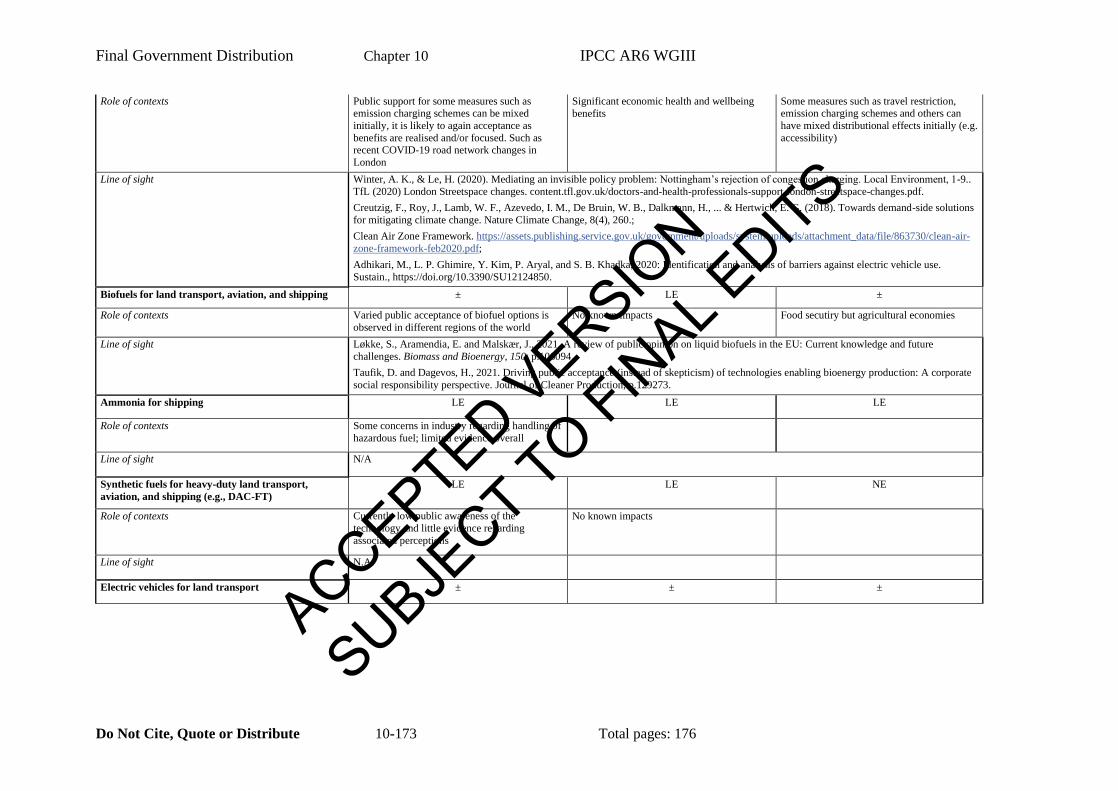
Final Government Distribution Chapter 10 IPCC AR6 WGIII
Do Not Cite, Quote or Distribute 10-173 Total pages: 176
Role of contexts Public support for some measures such as emission charging schemes can be mixed
initially, it is likely to again acceptance as
benefits are realised and/or focused. Such as recent COVID-19 road network changes in
London
Significant economic health and wellbeing
benefits
Some measures such as travel restriction, emission charging schemes and others can
have mixed distributional effects initially (e.g.
accessibility)
Line of sight Winter, A. K., & Le, H. (2020). Mediating an invisible policy problem: Nottingham’s rejection of congestion charging. Local Environment, 1-9..
TfL (2020) London Streetspace changes. content.tfl.gov.uk/doctors-and-health-professionals-support-london-streetspace-changes.pdf.
Creutzig, F., Roy, J., Lamb, W. F., Azevedo, I. M., De Bruin, W. B., Dalkmann, H., ... & Hertwich, E. G. (2018). Towards demand-side solutions
for mitigating climate change. Nature Climate Change, 8(4), 260.;
Clean Air Zone Framework. https://assets.publishing.service.gov.uk/government/uploads/system/uploads/attachment_data/file/863730/clean-air-
zone-framework-feb2020.pdf;
Adhikari, M., L. P. Ghimire, Y. Kim, P. Aryal, and S. B. Khadka, 2020: Identification and analysis of barriers against electric vehicle use.
Sustain., https://doi.org/10.3390/SU12124850.
Biofuels for land transport, aviation, and shipping ± LE ±
Role of contexts Varied public acceptance of biofuel options is
observed in different regions of the world
No known impacts Food secutiry but agricultural economies
Line of sight Løkke, S., Aramendia, E. and Malskær, J., 2021. A review of public opinion on liquid biofuels in the EU: Current knowledge and future
challenges. Biomass and Bioenergy, 150, p.106094.
Taufik, D. and Dagevos, H., 2021. Driving public acceptance (instead of skepticism) of technologies enabling bioenergy production: A corporate
social responsibility perspective. Journal of Cleaner Production, p.129273.
Ammonia for shipping LE LE LE
Role of contexts Some concerns in industry regarding handling of
hazardous fuel; limited evidence overall
Line of sight N/A
Synthetic fuels for heavy-duty land transport,
aviation, and shipping (e.g., DAC-FT)
LE LE NE
Role of contexts Currently low public awareness of the
technology and little evidence regarding
associated perceptions
No known impacts
Line of sight N.A.
Electric vehicles for land transport ± ± ±
ACCEPTED VERSION
SUBJECT TO FIN
AL EDITS
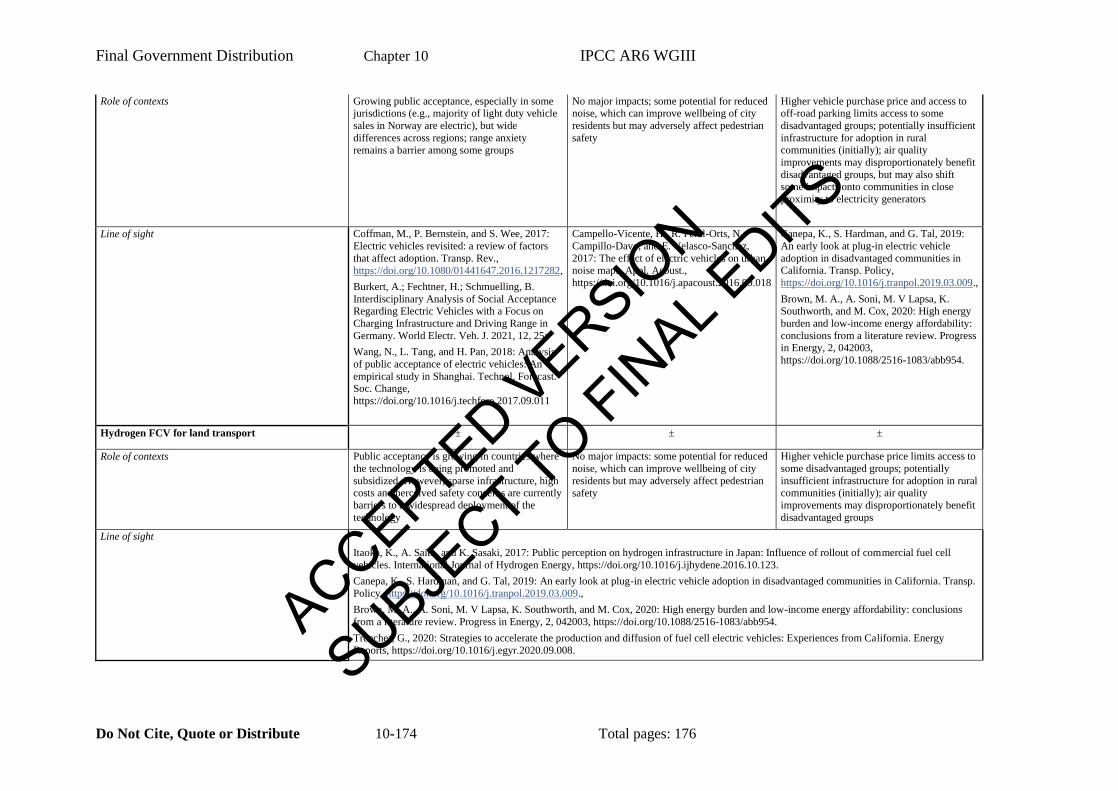
Final Government Distribution Chapter 10 IPCC AR6 WGIII
Do Not Cite, Quote or Distribute 10-174 Total pages: 176
Role of contexts Growing public acceptance, especially in some jurisdictions (e.g., majority of light duty vehicle
sales in Norway are electric), but wide
differences across regions; range anxiety
remains a barrier among some groups
No major impacts; some potential for reduced noise, which can improve wellbeing of city
residents but may adversely affect pedestrian
safety
Higher vehicle purchase price and access to off-road parking limits access to some
disadvantaged groups; potentially insufficient
infrastructure for adoption in rural communities (initially); air quality
improvements may disproportionately benefit
disadvantaged groups, but may also shift some impacts onto communities in close
proximity to electricity generators
Line of sight Coffman, M., P. Bernstein, and S. Wee, 2017:
Electric vehicles revisited: a review of factors
that affect adoption. Transp. Rev.,
https://doi.org/10.1080/01441647.2016.1217282,
Burkert, A.; Fechtner, H.; Schmuelling, B.
Interdisciplinary Analysis of Social Acceptance Regarding Electric Vehicles with a Focus on
Charging Infrastructure and Driving Range in
Germany. World Electr. Veh. J. 2021, 12, 25;
Wang, N., L. Tang, and H. Pan, 2018: Analysis
of public acceptance of electric vehicles: An
empirical study in Shanghai. Technol. Forecast.
Soc. Change,
https://doi.org/10.1016/j.techfore.2017.09.011
Campello-Vicente, H., R. Peral-Orts, N.
Campillo-Davo, and E. Velasco-Sanchez,
2017: The effect of electric vehicles on urban noise maps. Appl. Acoust.,
https://doi.org/10.1016/j.apacoust.2016.09.018
Canepa, K., S. Hardman, and G. Tal, 2019:
An early look at plug-in electric vehicle
adoption in disadvantaged communities in California. Transp. Policy,
https://doi.org/10.1016/j.tranpol.2019.03.009.,
Brown, M. A., A. Soni, M. V Lapsa, K. Southworth, and M. Cox, 2020: High energy
burden and low-income energy affordability:
conclusions from a literature review. Progress in Energy, 2, 042003,
https://doi.org/10.1088/2516-1083/abb954.
Hydrogen FCV for land transport ± ± ±
Role of contexts Public acceptance is growing in countries where
the technology is being promoted and
subsidized. However, sparse infrastructure, high costs and perceived safety concerns are currently
barriers to a widespread deployment of the
technology
No major impacts: some potential for reduced
noise, which can improve wellbeing of city
residents but may adversely affect pedestrian
safety
Higher vehicle purchase price limits access to
some disadvantaged groups; potentially
insufficient infrastructure for adoption in rural communities (initially); air quality
improvements may disproportionately benefit
disadvantaged groups
Line of sight
Itaoka, K., A. Saito, and K. Sasaki, 2017: Public perception on hydrogen infrastructure in Japan: Influence of rollout of commercial fuel cell
vehicles. International Journal of Hydrogen Energy, https://doi.org/10.1016/j.ijhydene.2016.10.123.
Canepa, K., S. Hardman, and G. Tal, 2019: An early look at plug-in electric vehicle adoption in disadvantaged communities in California. Transp.
Policy, https://doi.org/10.1016/j.tranpol.2019.03.009.,
Brown, M. A., A. Soni, M. V Lapsa, K. Southworth, and M. Cox, 2020: High energy burden and low-income energy affordability: conclusions
from a literature review. Progress in Energy, 2, 042003, https://doi.org/10.1088/2516-1083/abb954.
Trencher, G., 2020: Strategies to accelerate the production and diffusion of fuel cell electric vehicles: Experiences from California. Energy
Reports, https://doi.org/10.1016/j.egyr.2020.09.008.
ACCEPTED VERSION
SUBJECT TO FIN
AL EDITS
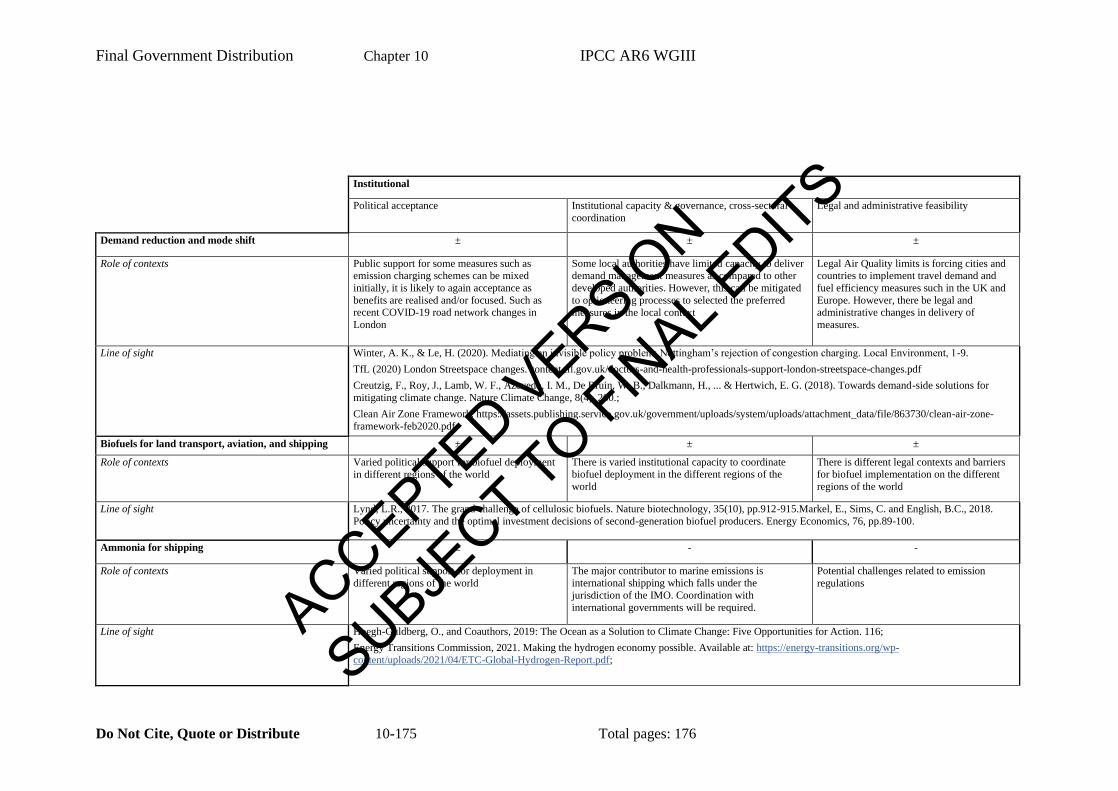
Final Government Distribution Chapter 10 IPCC AR6 WGIII
Do Not Cite, Quote or Distribute 10-175 Total pages: 176
Institutional
Political acceptance Institutional capacity & governance, cross-sectoral
coordination
Legal and administrative feasibility
Demand reduction and mode shift ± ± ±
Role of contexts Public support for some measures such as emission charging schemes can be mixed
initially, it is likely to again acceptance as
benefits are realised and/or focused. Such as recent COVID-19 road network changes in
London
Some local authorities have limited capacity to deliver demand management measures as compared to other
developed authorities. However, this can be mitigated
to optioneering processes to selected the preferred
measures in the local context
Legal Air Quality limits is forcing cities and countries to implement travel demand and
fuel efficiency measures such in the UK and
Europe. However, there be legal and administrative changes in delivery of
measures.
Line of sight Winter, A. K., & Le, H. (2020). Mediating an invisible policy problem: Nottingham’s rejection of congestion charging. Local Environment, 1-9.
TfL (2020) London Streetspace changes. content.tfl.gov.uk/doctors-and-health-professionals-support-london-streetspace-changes.pdf
Creutzig, F., Roy, J., Lamb, W. F., Azevedo, I. M., De Bruin, W. B., Dalkmann, H., ... & Hertwich, E. G. (2018). Towards demand-side solutions for
mitigating climate change. Nature Climate Change, 8(4), 260.;
Clean Air Zone Framework. https://assets.publishing.service.gov.uk/government/uploads/system/uploads/attachment_data/file/863730/clean-air-zone-
framework-feb2020.pdf
Biofuels for land transport, aviation, and shipping ± ± ±
Role of contexts Varied political support for biofuel deployment
in different regions of the world
There is varied institutional capacity to coordinate biofuel deployment in the different regions of the
world
There is different legal contexts and barriers for biofuel implementation on the different
regions of the world
Line of sight Lynd, L.R., 2017. The grand challenge of cellulosic biofuels. Nature biotechnology, 35(10), pp.912-915.Markel, E., Sims, C. and English, B.C., 2018.
Policy uncertainty and the optimal investment decisions of second-generation biofuel producers. Energy Economics, 76, pp.89-100.
Ammonia for shipping ± - -
Role of contexts Varied political support for deployment in
different regions of the world
The major contributor to marine emissions is international shipping which falls under the
jurisdiction of the IMO. Coordination with
international governments will be required.
Potential challenges related to emission
regulations
Line of sight Hoegh-Guldberg, O., and Coauthors, 2019: The Ocean as a Solution to Climate Change: Five Opportunities for Action. 116;
Energy Transitions Commission, 2021. Making the hydrogen economy possible. Available at: https://energy-transitions.org/wp-
content/uploads/2021/04/ETC-Global-Hydrogen-Report.pdf;
ACCEPTED VERSION
SUBJECT TO FIN
AL EDITS
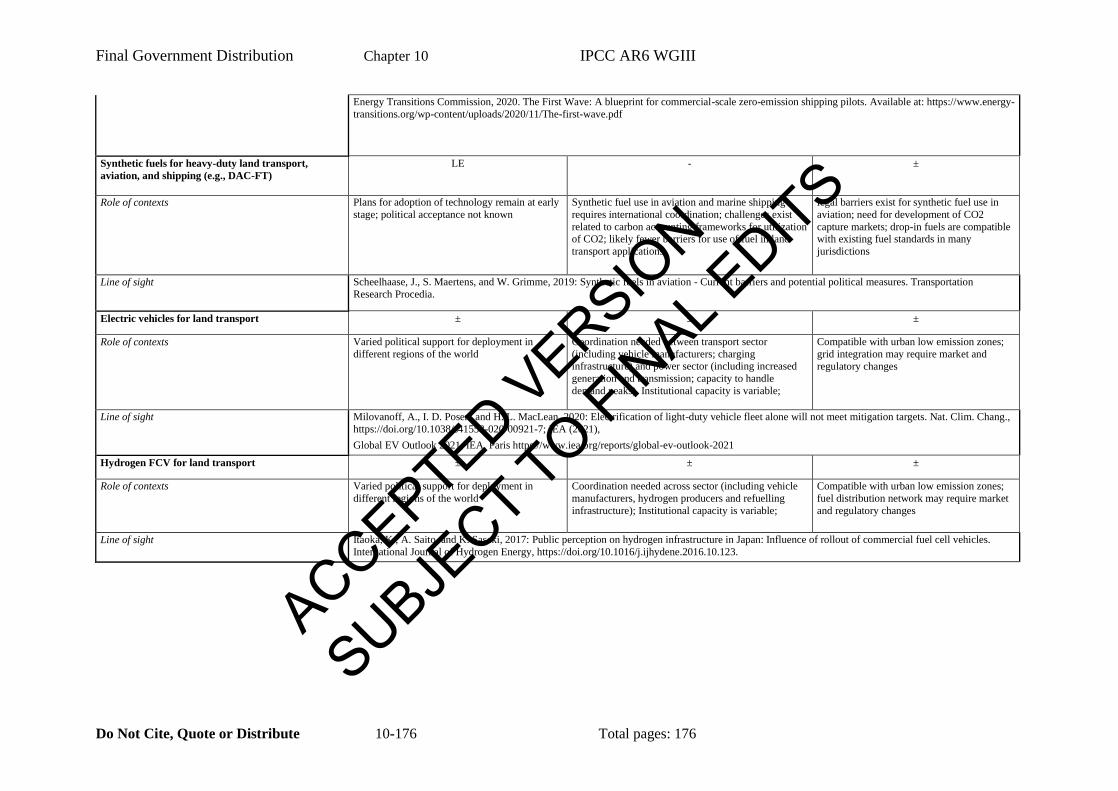
Final Government Distribution Chapter 10 IPCC AR6 WGIII
Do Not Cite, Quote or Distribute 10-176 Total pages: 176
Energy Transitions Commission, 2020. The First Wave: A blueprint for commercial-scale zero-emission shipping pilots. Available at: https://www.energy-
transitions.org/wp-content/uploads/2020/11/The-first-wave.pdf
Synthetic fuels for heavy-duty land transport,
aviation, and shipping (e.g., DAC-FT)
LE - ±
Role of contexts Plans for adoption of technology remain at early
stage; political acceptance not known
Synthetic fuel use in aviation and marine shipping
requires international coordination; challenges exist
related to carbon accounting frameworks for utilization of CO2; likely fewer barriers for use of fuel in land
transport applications
legal barriers exist for synthetic fuel use in
aviation; need for development of CO2
capture markets; drop-in fuels are compatible with existing fuel standards in many
jurisdictions
Line of sight Scheelhaase, J., S. Maertens, and W. Grimme, 2019: Synthetic fuels in aviation - Current barriers and potential political measures. Transportation
Research Procedia.
Electric vehicles for land transport ± ± ±
Role of contexts Varied political support for deployment in
different regions of the world
Coordination needed between transport sector
(including vehicle manufacturers; charging infrastructure) and power sector (including increased
generation and transmission; capacity to handle
demand peaks). Institutional capacity is variable;
Compatible with urban low emission zones;
grid integration may require market and
regulatory changes
Line of sight Milovanoff, A., I. D. Posen, and H. L. MacLean, 2020: Electrification of light-duty vehicle fleet alone will not meet mitigation targets. Nat. Clim. Chang.,
https://doi.org/10.1038/s41558-020-00921-7; IEA (2021),
Global EV Outlook 2021, IEA, Paris https://www.iea.org/reports/global-ev-outlook-2021
Hydrogen FCV for land transport ± ± ±
Role of contexts Varied political support for deployment in
different regions of the world
Coordination needed across sector (including vehicle
manufacturers, hydrogen producers and refuelling
infrastructure); Institutional capacity is variable;
Compatible with urban low emission zones;
fuel distribution network may require market
and regulatory changes
Line of sight Itaoka, K., A. Saito, and K. Sasaki, 2017: Public perception on hydrogen infrastructure in Japan: Influence of rollout of commercial fuel cell vehicles.
International Journal of Hydrogen Energy, https://doi.org/10.1016/j.ijhydene.2016.10.123.
ACCEPTED VERSION
SUBJECT TO FIN
AL EDITS