wet and dry weather toxicity in the san gabriel river
TRANSCRIPT

Kenneth SchiffBeth BaxPhil MarkleTerry FlemingJennifer Newman
Sout
hern
Califo
rnia Coastal Water ResearchProject
Established 1969
Southern California Coastal Water Research Project
��������� ��� � ���
������ ����
WET AND DRY WEATHER TOXICITY IN THE SAN GABRIEL RIVER

WET AND DRY WEATHER TOXICITY IN THE SAN GABRIEL RIVER
Kenneth Schiff1 Beth Bax2
Phil Markle2 Terry Fleming3
Jennifer Newman4
1 Southern California Coastal Water Research Project, Westminster, CA 2 Los Angeles County Sanitation Districts, Whittier, CA
3 US Environmental Protection Agency, San Francisco, CA 4 Los Angeles Regional Water Quality Control Board, Los Angeles, CA
October 15, 2006
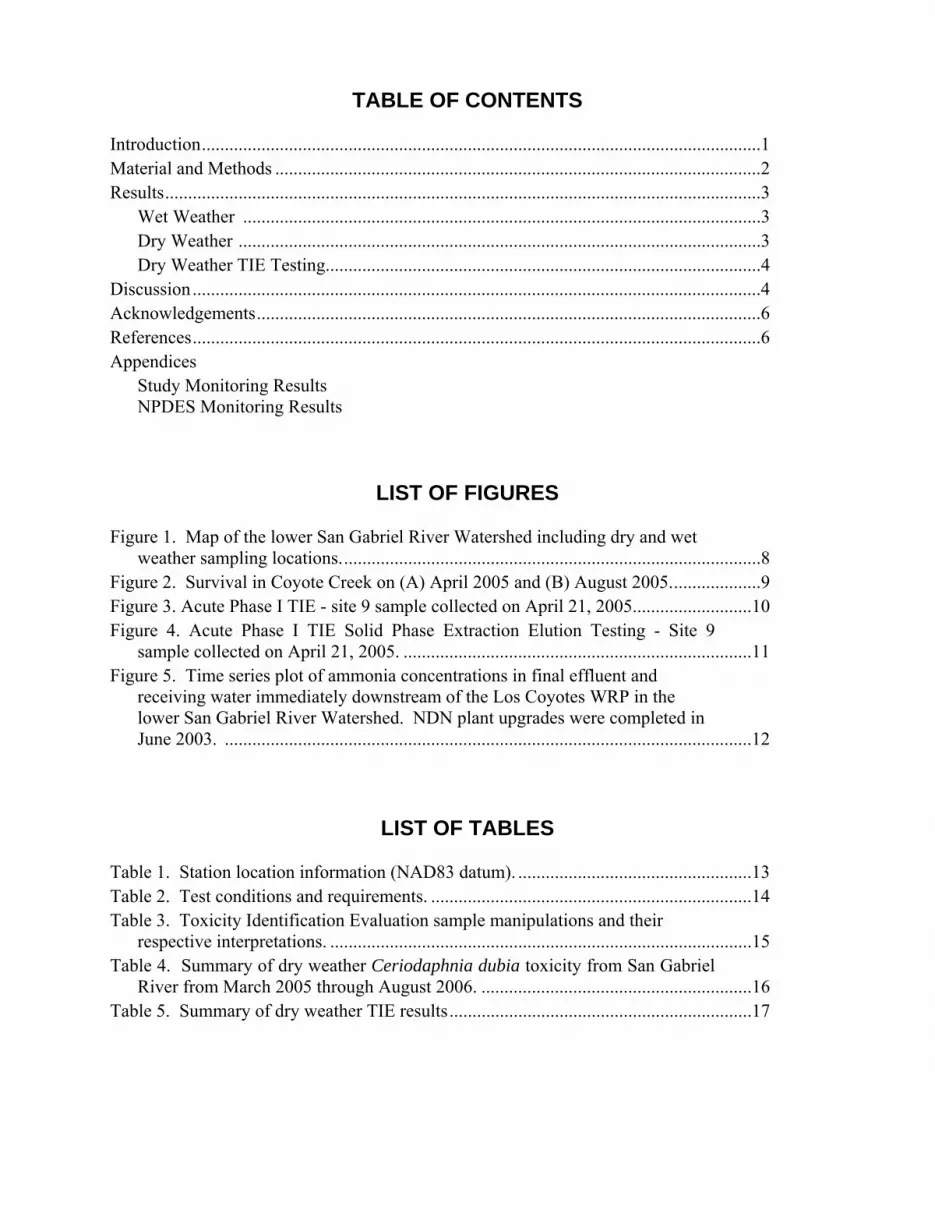
TABLE OF CONTENTS Introduction..........................................................................................................................1 Material and Methods ..........................................................................................................2 Results..................................................................................................................................3 Wet Weather .................................................................................................................3 Dry Weather ..................................................................................................................3 Dry Weather TIE Testing...............................................................................................4 Discussion............................................................................................................................4 Acknowledgements..............................................................................................................6 References............................................................................................................................6 Appendices Study Monitoring Results NPDES Monitoring Results
LIST OF FIGURES Figure 1. Map of the lower San Gabriel River Watershed including dry and wet
weather sampling locations............................................................................................8 Figure 2. Survival in Coyote Creek on (A) April 2005 and (B) August 2005....................9 Figure 3. Acute Phase I TIE - site 9 sample collected on April 21, 2005..........................10 Figure 4. Acute Phase I TIE Solid Phase Extraction Elution Testing - Site 9
sample collected on April 21, 2005. ............................................................................11 Figure 5. Time series plot of ammonia concentrations in final effluent and
receiving water immediately downstream of the Los Coyotes WRP in the lower San Gabriel River Watershed. NDN plant upgrades were completed in June 2003. ...................................................................................................................12
LIST OF TABLES Table 1. Station location information (NAD83 datum). ...................................................13 Table 2. Test conditions and requirements. ......................................................................14 Table 3. Toxicity Identification Evaluation sample manipulations and their
respective interpretations. ............................................................................................15 Table 4. Summary of dry weather Ceriodaphnia dubia toxicity from San Gabriel
River from March 2005 through August 2006. ...........................................................16 Table 5. Summary of dry weather TIE results..................................................................17

1
INTRODUCTION Urban watersheds receive a multitude of potential pollutants that can affect aquatic life (Bay et al. 1996, Ackerman et al. 2005, Tiefenthaler and Stein 2005). The San Gabriel River, located on the border between Los Angeles and Orange Counties in southern California, is an ideal example of the ways in which aquatic life may be impacted by potential pollutants. Sources of potential pollutants include treated sanitary wastewaters from five Water Reclamation Plants (WRPs) and untreated urban runoff from approximately 350 km2 of developed land discharged into the river via a municipal separate storm sewer system, as well as once-through cooling waters from two power generating stations that is mixed with low volume industrial and sanitary wastes then discharged into the watershed’s estuary. To complicate the fate and transport of anthropogenic pollutants and their resultant effects on aquatic life, the hydrology of many urban watersheds is often highly modified. For example, three major dams were constructed in the upper undeveloped reaches of the San Gabriel River watershed in order to capture, retain, and utilize wet season runoff for potable water use during the dry season. While this provides much needed water for the citizens of Los Angeles, the upper watershed is now hydrologically disconnected from the urbanized lower watershed. The result is that natural waters are unavailable for mixing and dispersion of anthropogenic discharges downstream. Even greater hydromodification exists in the urbanized lower San Gabriel River watershed. Many miles of the river in this portion of the watershed are lined with concrete in an effort to reduce flooding and property damage, but this modification also results in the maximum exposure of pollutants to aquatic life through the loss of natural stream and treatment processes. Where unlined channels exist in the lower watershed, temporary dams are inflated to enhance groundwater recharge. In response to pollutant inputs and hydrologic modification, many urban watersheds have been the focus of water quality regulatory efforts. Urban Los Angeles once again provides a good example. More than 180 waterbodies in the Los Angeles region have been placed on the United States Environmental Protection Agency’s (EPA’s) list of impaired waters. This list, also referred to as the 303(d) list (referring to section 303d of the Clean Water Act), identifies locations impacted by specific pollutants that can result in toxicity to aquatic life and other impacts. The effect of the 303(d) list is the mandate for future regulation (termed a total maximum daily load or TMDL), which will require the mitigation of these pollutant inputs. In the San Gabriel River watershed, managers have been implementing mitigation to negate the effects of these pollutant inputs. Over the past 10 years, WRPs in the San Gabriel River watershed have installed additional treatment processes, costing over $40 million, that have dramatically improved the water quality of their discharges. Controlling pollutant impacts due to urban runoff has been more difficult. Up to $10 million has been spent on structural best management practices (BMPs) in the San Gabriel River, yet few (if any) trends in concetrations of toxic constituents monitored have been observed (LACDPW 2005). Unlike WRPs, urban runoff discharges are diffuse and, as a result, perhaps more difficult to treat and/or control. The objective of this study was to evaluate the impact of pollutants on aquatic life in the highly urbanized lower watershed of the San Gabriel River. Impact to aquatic life was assessed through the use of toxicity testing. Four specific goals were identified: 1) assess the magnitude of toxicity at selected locations throughout the San Gabriel River watershed; 2) determine whether or not this magnitude changes seasonally; 3) if toxicity exists, identify the responsible toxicants;

2
and 4) compare the magnitude of toxicity in this study to studies conducted historically in the San Gabriel River watershed to evaluate the effectiveness of watershed management actions. MATERIAL AND METHODS Toxicity in the San Gabriel River watershed was evaluated by separating the study into wet weather and dry weather components (Figure 1; Table 1). The wet weather component consisted of four sampling sites located at the downstream end of major reaches that receive urban runoff. Twenty-liter flow weighted composites were sampled during three storm events on December 29, 2004 (5.3 cm precipitation), April 22, 2005 (2.2 cm precipitation), and January 1, 2006 (3.7 cm precipitation). The dry weather component consisted of sampling a total of 10 sites that included the same four sites sampled during wet weather, plus an additional six sites strategically located in the immediate vicinity of WRP discharges or urban runoff inputs. Dry weather samples were collected at least three days after rain events. Twenty-liter samples were collected from each site during dry weather on a monthly basis from March 2005 to February 2006. Within seven months of this study’s initiation, an additional six sites were added for dry weather sampling, all in a single tributary (North Coyote Creek), as a result of observed toxicity. All sites from the Coyote Creek subwatershed, including the additional sites in North Coyote Creek, were sampled until August 2006. All samples were tested for toxicity using Ceriodaphnia dubia examining both acute (lethality) and chronic (reproductive success) endpoints. Testing was initiated within 36 hours of sample collection using undiluted sample and a negative control following standard EPA protocols (EPA 2003a; Table 2). Test organisms were obtained from in-house brood cultures and test duration/exposure lasted until 60% of the surviving females in the control had released three broods (typically between six and seven days). Test solutions were renewed daily. Toxicity was defined as a 25%, or greater, organism response in the sample exposure relative to control organism response (i.e., <75% survival or reproduction in the 100% sample exposure). In addition, hypothesis testing was conducted following EPA guidelines (EPA 2003a). Hypothesis testing consisted of the nonparametric Fisher’s Exact Test for the survival endpoint and an analysis of variance (ANOVA) followed by a multiple comparison procedure for the reproduction endpoint. The parametric Dunnet’s Test was used to identify statistically significant differences from the control for reproduction data that were normally distributed with homogeneous variances. The nonparametric Steel’s Many-One Test was employed when the data failed normal distribution or equality of variance assumptions. If a sample was toxic, a toxicity identification evaluation (TIE) was initiated (EPA 1991, 1993b). TIE testing used the remaining sample, stored at 4o C, within seven days of baseline test conclusion. For those samples in which only the reproductive endpoint elicited a toxic response, only 100% and control concentrations were evaluated in the TIE. In these cases, the TIE consisted of a full seven-day chronic test with each sample manipulation consisting of 10 replicates, with daily renewals. For those samples where the survival endpoint elicited a toxic response, three dilutions (25%, 50%, 100%) and a control were evaluated using four replicates containing five test organisms each. In the case of a TIE in response to survival, the exposure duration was 96 hours, with renewal after 48 hours. The TIE manipulations focused on both characterization and identification phases (EPA 1991, 1993b). These manipulations included: 1) pH adjustment; 2) aeration; 3) Ethylenedinitrilo-Tetraacetic Acid (EDTA); 4) Sodium thiosulfate (STS); 5) filtration; 6) piperonyl butoxide

3
(PBO); 7) anion exchange column; 8) solid phase extraction (SPE); 9) SPE elution; and 10) no manipulation. By conducting each of these manipulations, the results, alone or in combination, can help to identify the responsible toxicant(s) (Table 3). All quality assurance/quality control criteria were met for this study. These criteria included all of the test acceptability criteria (Table 2). In addition, positive control samples using reference toxicants (copper chloride) confirmed the relative sensitivity and stability of test organisms during the course of the study. RESULTS Wet Weather None of the storms sampled during this study were acutely or chronically toxic to Ceriodaphnia. At all four sites, during all three storms, survival and reproduction were greater than 75% relative to controls. Dry Weather Eighteen of 196 (9%) total dry weather samples exhibited chronic toxicity during this study (Table 4). Twelve of 196 (6%) total dry weather samples exhibited acute toxicity during this study . All of the dry weather samples that exhibited acute toxicity also exhibited chronic toxicity. In only one case was statistically significant toxicity observed when the response was less than 25% relative to controls (Station 15, Jan 2006). Only once was toxicity greater than 25% relative to controls and not statistically significant (Station 15, Mar 2006). All observed toxicity during this study was from Coyote Creek (Table 4). No toxicity was observed in Walnut Creek, San Jose Creek, or San Gabriel River Reaches 1 or 3. Widespread toxicity in Coyote Creek was observed in April 2005. As a result, an additional six stations upstream were added between July and October 2005. Widespread toxicity was observed again in August 2005. Widespread toxicity was not observed again for the remaining 12 months (September 2005 to August 2006). In the two events for which widespread toxicity was observed in Coyote Creek (April and August 2005), the toxicity appeared to originate in the upper portions of the tributary (Figure 2). In April 2005, 100% reproductive impairment was observed at the site sampled furthest upstream (site 10) and reproductive success remained minimal moving downstream. Ceriodaphnia survival was also severely impacted at the furthest upstream station, then survival slowly increased downstream of the WRP discharge (Sites 7 and 6) indicating a potential dilution effect from the WRP effluent. The WRP in this reach was discharging 13 mgd of effluent to Coyote Creek upstream of Site 6 during this sampling event. In August 2005, severe reproductive impairment was again observed at the site sampled furthest upstream (site 14) and reproductive success remained minimal moving downstream. The WRP in this reach was not discharging effluent to Coyote Creek during this sampling event. Ceriodaphnia survival was more sporadic moving downstream during August 2005. Seventy eight percent survival was measured at site 14 and decreased to 0% survival for downstream Sites 13 and 12. Survival increased to 100% at site 11, but fell back to 0% survival for the remaining seven miles of Coyote Creek. The sudden increase in survival at Site 11 remains unexplained.

4
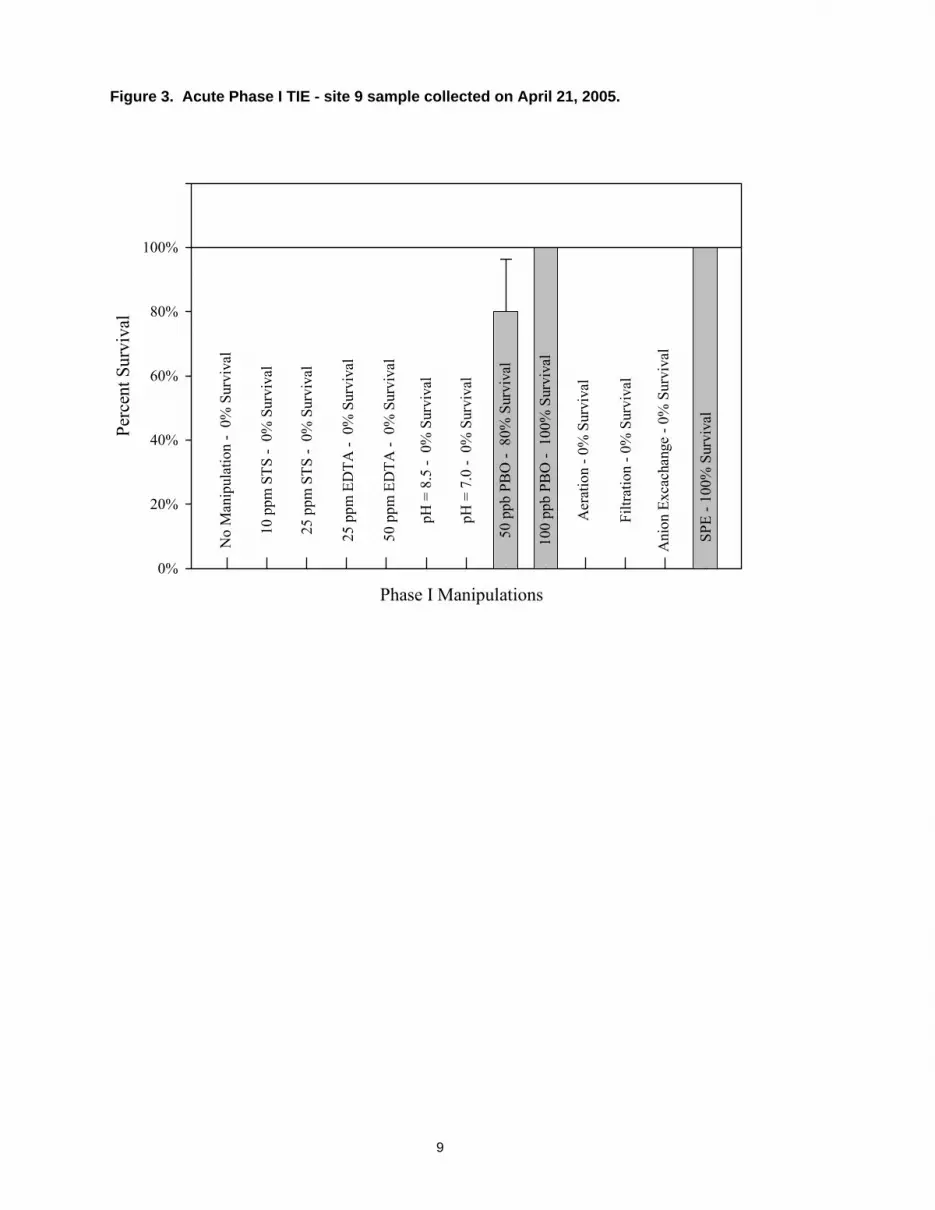
Dry Weather TIE Testing Seven TIEs were initiated during the study on dry weather samples exhibiting a 25% or greater effect (Table 5). Toxicity was no longer present for three of the samples (sites 9 and 10 March 2005, site 15 March 2006);consequently, no toxicant was identified. Organophosphorus pesticides, most likely diazinon, were identified as the causative agent in one sample (site 9 April 2005). This result was based on the exclusive removal of toxicity using SPE and the addition of PBO, which removes non-polar organic toxicants and inhibits toxicity due to diazinon, respectively (Figure 3). The SPE was sequentially eluted and these fractions were subsequently tested. Toxicity was recovered in the 80% methanol elution of the SPE column, a fraction associated with many organophosphorus pesticides including diazinon (Figure 4). Finally, 1,700 μg/L diazinon was quantified in the sample using Enzyme-Linked Immuno-Sorbant Assay (ELISA) techniques. A non-polar organic toxicant(s), possibly a surfactant(s), was identified as the causative agent in the remaining three samples (site 10 April, June, and August 2005). This result was based on the removal of toxicity using SPE. Toxicity was recovered in the 75% methanol elution, a fraction commonly associated with organophosphorus pesticides with surfactant toxicity recovery also documented (Norberg-King et al. 2005). An anion exchange column was used on two samples, with complete removal of toxicity observed in one sample (June 2005) and partial removal in the other (August 2005). This may be indicative of anionic surfactants, but might also suggest the presence of some trace metals. Elution of the anion column would help to confirm anionic surfactant toxicity, but attempts to recover toxicity from the anion column were not successful. However, other treatments to identify trace metals did not reduce toxicity (i.e., EDTA), which helps to rule-out metals as a major source of toxicity. Aeration partially removed toxicity in the April 2005 sample. Some surfactants can be removed or partially removed through aeration. Finally, PBO did not reduce toxicity, and levels of diazinon in these three samples were low (<100 μg/L). DISCUSSION Toxicity was not widespread in the San Gabriel River watershed over the 18 months examined during this study. No toxicity was observed at any site during any of the storm events sampled. Similarly, no toxicity was observed in four of the five major reaches in the lower watershed during dry weather. In Coyote Creek where toxicity was observed, the toxicity was intermittent and occurred only during six of the 18 sampling periods. This was despite an adaptive monitoring strategy, in which the number of sites sampled in Coyote Creek was doubled and the sampling period was extended by six months. The lack of toxicity observed in this study was in direct contrast to historical studies in this watershed. While 9% of the samples were toxic in 2005/06, 55% of the samples collected for a similar study in 1992/93 were toxic (Bailey et al. 1995). Moreover, toxicity was observed in only a single reach (Coyote Creek) in 2005/06, while Bailey et al. (1995) identified toxicity in all five major reaches in the lower San Gabriel River watershed. The difference in toxicity from tests conducted 14 years ago is likely due to changes in water quality. Bailey et al. (1995) concluded that toxicity in the San Gabriel River watershed was likely due to non-polar organics and possibly ammonia. This is not unexpected as there are multiple WRPs discharging to the San Gabriel River; these treated effluent discharges comprise

5
roughly 80% of flow during the dry season, contributing as much as 99% of the total ammonia input (Ackerman et al., 2005). In 1992/93, ammonia levels averaged over 10 mg/L. In 2003, however, the WRPs fully implemented nitrification and denitrification treatment (NDN) processes, which subsequently reduced discharged ammonia levels more than 80% to an average of less than 2 mg/L (Figure 5). Thus, a reduction in toxicity for reaches in the San Gabriel River watershed dominated by WRP effluents can be easily explained. The lack of toxicity observed in the current study is consistent with other toxicity data collected in recent years. In 2005, a probability-based watershed survey was conducted in the entire San Gabriel River watershed, and 7% of the stream-miles were considered toxic to Ceriodaphnia (Stein and Bernstein, in prep). Even this toxicity, however, was eliminated after a TIE and subsequent follow-up investigations helped identify and eliminate the illicit discharge responsible. A second example of reduced toxicity in recent years was observed in routine toxicity monitoring required in the vicinity of the WRPs as a part of their National Pollutant Discharge Elimination System (NPDES) permit requirements (Appendix B). Between June 2003 and June 2006, only 14% of the 269 total samples from 14 different sites exhibited toxicity (i.e., greater than 25% response relative to controls). For this period, toxicity was largely constrained to Coyote Creek (6% of total number of samples) and the uppermost portions of San Jose Creek (6% of total number of samples). Coyote Creek is the same tributary in which the current study found intermittent toxicity. The uppermost section of San Jose Creek was not monitored during the current study. In contrast to the main stem of the San Gabriel River where significant resources have been expended to reduce pollutant inputs and minimize toxicity, much less effort has been spent on identifying and remediating sources of toxic pollutants in the Coyote Creek subwatershed. As a result, the toxicity in Coyote Creek has remained. The frequency of toxicity in Coyote Creek has remained similar between 1992/93 and 2004/05; roughly 12% to 22% of the samples were considered toxic. Pesticides available for application by homeowners continue to be one toxicant of concern. Diazinon was identified in 2004/05 (this study), as well as in the 1992/93 study (Bailey et al. 1995). The toxicity observed in urban runoff-dominated reaches during this study was intermittent, which is consistent with contributions by homeowner pesticide use (Schiff and Tiefenthaler 2003), illegal/illicit discharges, and observations in other dry weather runoff toxicity studies (Greenstein et al. 2004). ACKNOWLEDGEMENTS Toxicity testing was conducted by the Los Angeles County Sanitation Districts (Jay P. Bottomley and the staff of the San Jose Creek Water Quality Laboratory) and Nautilus Environmental, Inc. (Chris Stransky, Howard Bailey and staff). Wet weather sampling was conducted by Mactec Engineering, Inc. (Jay Shrake and staff). Dry weather sampling was conducted by the Los Angeles County Sanitation Districts (Misty Rogalski and Jeaneal Davis) and the Southern California Coastal Water Research Project (Dario Diehl, David Tsukada, Dawn Petschauer and Diana Young). Information management was provided by Southern California Coastal Water Research Project (Jeff Brown and Larry Cooper). This project was partially supported by the Los Angeles Regional Water Quality Control Board.

6
REFERENCES Ackerman, Drew, E.D. Stein and K.C. Schiff. 2005. Dry-season water quality in the San Gabriel River watershed. Bulletin of the Southern California Academy of Sciences 104:125-145. Bailey, H., A. Villalobos, E. Gottl, L. Brattin, D. Hanes, and D. Hinton. 1995. Site specific study for effluent dominated streams (San Gabriel River, Santa Clara River, Calleguas Creek). Prepared for the California Regional Water Quality Control Board, Los Angeles Region. University of California, Davis. Davis, CA. Bay, S.M., D.J. Greenstein, S.-L. Lau, M.K. Stenstrom and C.G. Kelley. 1996. Toxicity of dry weather flow from the Santa Monica Bay Watershed. Bulletin of Southern California Academy of Sciences 95:33-45 Brown, J. and S. Bay. 2003. Organophosphorus pesticides in the Malibu Creek watershed. Technical Report 403. Southern California Coastal Water Research Project. Westminster, CA. Greenstein, Darrin J., L. Tiefenthaler and S. Bay. 2004. Toxicity of parking lot runoff after application of simulated rainfall. Environmental Contamination and Toxicology 47:199-206. LACDPW. 2005. Los Angeles County 1994-2005 integrated receiving water impact report. Los Angeles County Department of PublicWorks. Alhambra, CA Norberg-King, T.J., L.W. Ausley, D.T. Burton, W.L. Goodfellow, J.L. Miller and W.T. Waller. 2005. Toxicity reduction and toxicity identification evaluations for effluents, ambient waters, and other aqueous media. Society of Environmental Toxicology and Chemistry (SETAC) Press. Pensacola, FL. . Schiff, K. and L. Tiefenthaler. 2003. Contributions of organophosphorus pesticides from residential land uses during dry and wet weather. Technical Report 406. Southern California Coastal Water Research Project. Westminster, CA. Stein, E. and L.L. Tiefenthaler. 2004. Characterization of dry weather metals and bacteria in Ballona Creek. Technical Report 427. Southern California Coastal Water Research Project. Westminster, CA. EPA. 1991. Methods for aquatic toxicity identification evaluation: Phase I toxicity characterization procedures, Second Edition. EPA 600/6-91/003. US Environmental Protection Agency, Environmental Research Laboratory. Duluth, MN. EPA. 1993a. Methods for measuring acute toxicity of effluents and receiving waters to freshwater and marine organisms, Fourth Edition. EPA 600/4-90/027. US Environmental Protection Agency, Environmental Research Laboratory, Duluth, MN. US EPA. 1993b. Methods for aquatic toxicity identification evaluation: Phase II toxicity identification procedures for acute and chronic toxicity, Second Edition. EPA 600/R-92/080. US Environmental Protection Agency, Environmental Research Laboratory, Duluth, MN.

7
Figure 1. Map of the lower San Gabriel River Watershed including dry and wet weather sampling locations.

8
Figure 2. Survival in Coyote Creek April 2005 and August 2005.
4 8
kilometers0
San Gabriel R
iver
Coyote
Cree
k
6
7
8
9
10
Survival (% control adjusted)April 2005
75 to 10050 to 7530 to 50
0 to 30
4 8
kilometers0
Coyote
Cree
k 9
1011
12
1314
8
San Gabriel R
iver
6
7
Survival (% control adjusted)August 2005
75 to 11250 to 7530 to 50
0 to 30
A
B
9
Figure 3. Acute Phase I TIE - site 9 sample collected on April 21, 2005.
Phase I Manipulations
Perc
ent S
urvi
val
0%
20%
40%
60%
80%
100%N
o M
anip
ulat
ion
- 0%
Sur
viva
l
Aer
atio
n - 0
% S
urvi
val
10 p
pm S
TS -
0%
Sur
viva
l
25 p
pm S
TS -
0%
Sur
viva
l
25 p
pm E
DTA
- 0
% S
urvi
val
50 p
pm E
DTA
- 0
% S
urvi
val
pH =
8.5
- 0
% S
urvi
val
pH =
7.0
- 0
% S
urvi
val
50 p
pb P
BO
- 8
0% S
urvi
val
100
ppb
PBO
- 1
00%
Sur
viva
l
Filtr
atio
n - 0
% S
urvi
val
Ani
on E
xcac
hang
e - 0
% S
urvi
val
SPE
- 100
% S
urvi
val

10
Figure 4. Acute Phase I TIE Solid Phase Extraction Elution Testing - Site 9 sample collected on April 21, 2005.
Methanol Elutions
50% 75% 80% 85% 90% 95% 100%
Perc
ent S
urvi
val
0%
20%
40%
60%
80%
100%

11
Figure 5. Time series plot of ammonia concentrations in final effluent and receiving water
immediately downstream of the Los Coyotes WRP in the lower San Gabriel River Watershed. NDN plant upgrades were completed in June 2003.
1996 1997 1998 1999 2000 2001 2002 2003 2004 2005 2006 2007
Amm
onia
(mg-
N/L
)
02468
101214161820
Final EffluentReceiving Water

12
Table 1. Station location information (NAD83 datum).
Site # Water Body Location Latitude
Longitude
1 Walnut Creek Walnut Creek At Merced Ave N34° 03’53.1” W117° 57’09.6”
2 Walnut Creek At Baldwin Park Blvd N34° 03’47.7” W117° 58’54.5”
3 San Jose Creek Reach 1
San Jose Creek at access gate from SJCWRP/JAO – Upstream of SJCWRP, approximately 100 yards
downstream of Workman Mill Rd
N34º 02’06.7” W118º 01’14.9”
4 San Gabriel River Reach 3
San Gabriel River at Peck Rd - Downstream of confluence of SGR with SJC
N34º 02’02.9” W118º 02’20.2”
5 San Gabriel River Reach 1
San Gabriel River at Spring St - Downstream of LCWRP outfall 001
N33º 48’38.9” W118º 05’26.8”
6 Coyote Creek Coyote Creek at pedestrian foot bridge south of LBWRP -
Downstream of LBWRP outfall 001 and upstream of estuary
N33º 47’41.9” W118º 05’22.0”
7 Coyote Creek Coyote Creek at Cerritos Ave -
Upstream of LBWRP outfall; downstream of entrance of Carbon Creek into Coyote Creek
N33º 48’36.9” W118º 04’33.3”
8 Coyote Creek Coyote Creek at Centralia Ave -
Downstream of confluence with Fullerton Creek and an industrial drain
N33º 50’19.3” W118º 03’37.9”
9 Coyote Creek Coyote Creek at Artesia Blvd- Downstream of Brea Creek/Coyote Creek confluence
N33º 52’23.7” W118º01’08.0”
10 Coyote Creek (North Fork)
North fork of Coyote Creek at Alondra Blvd- Downstream of La Mirada Creek
N33º 53’15.4” W118º 01’58.9”
11 Coyote Creek (North Fork)
Coyote Creek North Fork at La Mirada Creek/Coyote Creek confluence
N 33º 53.731' W 118º 02.155'
12 Coyote Creek (North Fork) Coyote Creek North Fork- 1.0 mile upstream of Alondra N 33º 54.133'
W 118º 02.488'
13 Coyote Creek (North Fork) Coyote Creek North Fork - 2.0 miles upstream of Alondra N 33º 54.862'
W 118º 02.346'
14 Coyote Creek (North Fork) Coyote Creek North Fork - 2.5 miles upstream of Alondra N 33º 55.411'
W 118º 02.138'
15 La Mirada Creek La Mirada Creek before entering Coyote Creek North Fork N 33º 53.503' W 118º 01.846'
16 Milan Creek Milan Creek before entering Coyote Creek North Fork N 33º 54.369' W 118º 02.422'

13
Table 2. Test conditions and requirements. Test Organism: Ceriodaphnia dubia
Organism Source: In-house Cultures
Organism Age at Initiation: <24 hours old and released within an eight hour period
Test Duration: Until 60% or ore of the surviving females have three broods
Concentrations Tested: 0% and 100%
Solution Renewal: Daily
Feeding: 0.1 ml YCT and 0.1 Selenastrum algal suspension daily
Test Chamber: 50 ml Disposable
Solution Volume: 15 ml
Control Water: Either diluted mineral water (8 parts deionized water: 2 parts Perrier® water) or Reconstituted deionized water (hard)
Number of Replicates: 10
Organisms per Replicate: 1 assigned by blocking by known parentage
Photoperiod: 16 hours light (50-100 ft-c), 8 hours dark
Test Temperature: 25 + 1o C.
Endpoints Measured: Survival and Reproduction
Test Acceptability Criteria: 80% or greater survival with an average of 15 or more young per surviving female in the control organisms. 60% of surviving females in the controls must produce three broods within 8 days.

14
Table 3. Toxicity Identification Evaluation sample manipulations and their respective interpretations.
TIE Sample Manipulation Expected response
pH Adjustment (pH 7 and 8.5)
Alters toxicity in pH sensitive compounds (i.e., ammonia and some trace metals)
Aeration Reduces toxicity attributable to volatile, sublatable, and/or easily oxidizable compounds
Ethylenedinitrilo-Tetraacetic Acid (EDTA) Addition
Chelates trace metals, particularly divalent, cationic metals
Sodium thiosulfate (STS) Addition
Reduces toxicants attributable to oxidants (i.e., chlorine) and some trace metals
Filtration
Removes toxicity related to and/or associated with particulates
Solid Phase Extraction (SPE) with C18
Removes toxicity associated with non-polar organics (i.e., pesticides, surfactants)
Sequential Solvent Extraction of with C18 Column
SPE extraction can be used to confirm toxicity due to nonpolar organic compounds. Sequential extraction using solvents of gradually decreasing polarity can separate these compounds into fractions providing further toxicant resolution and isolation for chemical analysis
Piperonyl Butoxide (PBO) Removes toxicity caused by metabolically activated pesticides (i.e., organophosphorous pesticides). Increases toxicity attributable to pyrethroid pesticides
Anion Exchange Removes toxicity associated with anionic compounds, including some trace metals and surfactants
No Manipulation For comparing the relative effectiveness of other manipulations and quantifies the persistence of toxicity in the stored sample

15
Table 4. Summary of dry weather Ceriodaphnia dubia toxicity from San Gabriel River from March 2005 through August 2006. Shaded areas = samples not collected. “-” represents not toxic with effects less than 25% relative to control. L = Lethal effect with toxicity less than 75% relative to control. S = Sub-lethal effect; reproduction less than 75% relative to control. “1” = statistically significant from control.
Month of Sample Collection
Mar. Apr. May Jun. Jul. Aug. Sept. Oct. Nov. Dec. Jan. Feb. Mar. Apr. May Jun. Jul. Aug. Location 2005 2005 2005 2005 2005 2005 2005 2005 2005 2005 2006 2006 2006 2006 2006 2006 2006 2006
Walnut Creek
1 - - - - - - - - - - - - -
2 - - - - - - - - - - - - -
San Jose Creek Reach 1
3 - - - - - - - - - - - -
San Gabriel River Reach 3
4 - - - - - - - - - - - -
San Gabriel River Reach 1
5 - - - - - - - - - - - -
Coyote Creek
6 - S1 - - - L1S1 - - - - - -
7 - L1S1 - - - L1S1 - - - - - -
8 - L1S1 - S1 - L1S1 - - - - - -
9 S1 - - - - - L1S1 - - - - - - - - - - -
10 S1 L1S1 - L1S1 - L1S1 - - - - - - - - - - - -
11 - S1 - - - - - - - - - - - -
12 - L1S1 - - - - - - - - - - - -
13 - L1S1 - - - - - - - - - - - -
14 - L1S1 - - - - - - - - - - - - 15 - - - -1 - S - - - - - 16 - - - - - - - - - - -

16
Table 5. Summary of dry weather TIE results.
TIE RESULTS (Survival in 100% Sample) Site #
Sample Date
No Manipulation STSa EDTAb pH 7.0 pH 8.5 PBOc Aeration Filtration Centrifuge SPE Anion
9 Mar 2005 Sample No longer Toxic 10 Mar 2005 Sample No longer Toxic 10 Apr 2005 0% 0% 0% 0% 0% 0%d 35% 0% NT 87.5%e NT 10 Jun 2005 0% 0% 0% 0% 0% 0% 10% 10% 30% 100% e 100% 10 Aug 2005 0% 0% 0% 0% 0% 0% 0% 0% NT 100% e 0%f 9 Sep 2005 0% 0% 0% 0% 0% 100%g 0% 0% NT 100% e 0% 15 Mar 2006 Sample No longer Toxic
NT = Not tested a – Sodium thiosulfate addition, two treatments of 10 and 25 ppm b – Ethylenedinitrilo-tetraacetic acid addition, two treatments of 25 and 50 ppm c – Piperonyl butoxide addition, two treatments of 50 and 100 ppb d – 5% survival observed in the 50 ppb treatment with 0% survival in the 100 ppb treatment e – Toxicity recovered in only the 75% methanol elution f – Survival observed in lower concentrations of the sample indicating partial toxicity removal g – 80% survival observed in 50 ppb treatment and 100% survival in 100 ppb treatment

17
Appendix A
Study Monitoring Results
18
Table A 1. Dry weather baseline chronic toxicity testing results for Sites #3 through #10 using grab samples collected on March 31, 2005.
Sample Mean
Survival (Std. Dev.)
Survival Response Relative to Control
(Std. Dev.)
Mean Reproduction
(Std. Dev.)
Reproduction Response Relative to
Control (Std. Dev.)
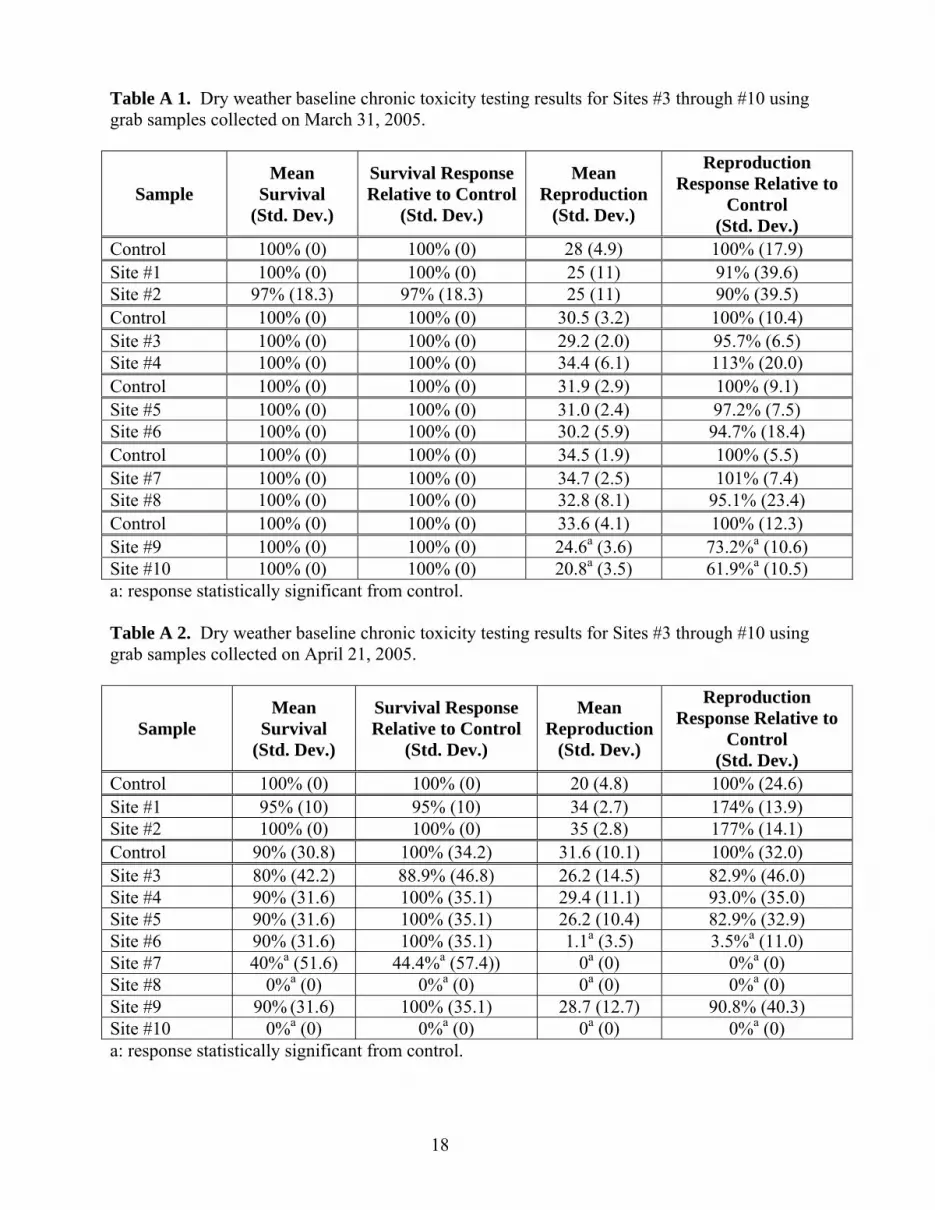
Control 100% (0) 100% (0) 28 (4.9) 100% (17.9) Site #1 100% (0) 100% (0) 25 (11) 91% (39.6) Site #2 97% (18.3) 97% (18.3) 25 (11) 90% (39.5) Control 100% (0) 100% (0) 30.5 (3.2) 100% (10.4) Site #3 100% (0) 100% (0) 29.2 (2.0) 95.7% (6.5) Site #4 100% (0) 100% (0) 34.4 (6.1) 113% (20.0) Control 100% (0) 100% (0) 31.9 (2.9) 100% (9.1) Site #5 100% (0) 100% (0) 31.0 (2.4) 97.2% (7.5) Site #6 100% (0) 100% (0) 30.2 (5.9) 94.7% (18.4) Control 100% (0) 100% (0) 34.5 (1.9) 100% (5.5) Site #7 100% (0) 100% (0) 34.7 (2.5) 101% (7.4) Site #8 100% (0) 100% (0) 32.8 (8.1) 95.1% (23.4) Control 100% (0) 100% (0) 33.6 (4.1) 100% (12.3) Site #9 100% (0) 100% (0) 24.6a (3.6) 73.2%a (10.6) Site #10 100% (0) 100% (0) 20.8a (3.5) 61.9%a (10.5) a: response statistically significant from control. Table A 2. Dry weather baseline chronic toxicity testing results for Sites #3 through #10 using grab samples collected on April 21, 2005.
Sample Mean
Survival (Std. Dev.)
Survival Response Relative to Control
(Std. Dev.)
Mean Reproduction
(Std. Dev.)
Reproduction Response Relative to
Control (Std. Dev.)
Control 100% (0) 100% (0) 20 (4.8) 100% (24.6) Site #1 95% (10) 95% (10) 34 (2.7) 174% (13.9) Site #2 100% (0) 100% (0) 35 (2.8) 177% (14.1) Control 90% (30.8) 100% (34.2) 31.6 (10.1) 100% (32.0) Site #3 80% (42.2) 88.9% (46.8) 26.2 (14.5) 82.9% (46.0) Site #4 90% (31.6) 100% (35.1) 29.4 (11.1) 93.0% (35.0) Site #5 90% (31.6) 100% (35.1) 26.2 (10.4) 82.9% (32.9) Site #6 90% (31.6) 100% (35.1) 1.1a (3.5) 3.5%a (11.0) Site #7 40%a (51.6) 44.4%a (57.4)) 0a (0) 0%a (0) Site #8 0%a (0) 0%a (0) 0a (0) 0%a (0) Site #9 90% (31.6) 100% (35.1) 28.7 (12.7) 90.8% (40.3) Site #10 0%a (0) 0%a (0) 0a (0) 0%a (0) a: response statistically significant from control.

19
Table A 3. Dry weather baseline chronic toxicity testing results for Sites #3 through #10 using grab samples collected on May 19, 2005.
Sample Mean
Survival (Std. Dev.)
Survival Response Relative to Control
(Std. Dev.)
Mean Reproduction
(Std. Dev.)
Reproduction Response Relative to
Control (Std. Dev.)
Control 90% (20) 100% (22.2) 17 (4.6) 100% (27.7) Site #1a 100% (0) 111% (0) 27 (4.4) 164% (26.3) Site #2a 100% (0) 111% (0) 24 (2.3) 146% (13.9) Control 95% (22.9) 100% (24.1) 34.35 (5.8) 100% (17.0) Site #3 100% (0) 105% (0) 38.3 (2.5) 112% (7.3) Site #4 100% (0) 105% (0) 39.4 (2.2) 115% (7.0) Site #5 100% (0) 105% (0) 39.3 (2.9) 114% (8.6) Site #6 100% (0) 105% (0) 38 (2.5) 111% (7.4) Site #7 100% (0) 105% (0) 37.4 (3.0) 109% (8.6) Site #8 100% (0) 105% (0) 36.9 (3.6) 107% (10.6) Site #9 100% (0) 105% (0) 36.6 (2.9) 107% (8.5) Site #10 100% (0) 105% (0) 34.2 (2.4) 99.6% (7.1) A – Samples collected on May 26, 2005 Table A 4. Dry weather baseline chronic toxicity testing results for Sites #3 through #10 using grab samples collected on June 23, 2005.
Sample Mean
Survival (Std. Dev.)
Survival Response Relative to Control
(Std. Dev.)
Mean Reproduction
(Std. Dev.)
Reproduction Response Relative to
Control (Std. Dev.)
Control 100% (0) 100% (0) 20 (8.1) 100% (40.2) Site #1 95% (10) 95% (10) 31 (4.5) 151% (22) Site #2 100% (0) 100% (0) 29 (4.7) 143% (23.1) Control 100% (0) 100% (0) 20.6 (6.6) 100% (32.2) Site #3 100% (0) 100% (0) 20.4 (7.3) 99.3% (35.4) Site #4 100% (0) 100% (0) 23.7 (5.7) 115% (27.8) Site #5 100% (0) 100% (0) 21.2 (5.8) 103% (28.1) Site #6 100% (0) 100% (0) 19 (7.3) 92.5% (35.4) Site #7 100% (0) 100% (0) 16.8 (4.2) 81.8% (20.6) Site #8 100% (0) 100% (0) 0.7a (1.1) 3.4%a (5.2) Site #9 100% (0) 100% (0) 27.5 (6.5) 134% (31.8) Site #10 0%a (0) 0%a (0) 0.5a (1.6) 2.4%a (7.7) a: response statistically significant from control..

20
Table A 5. Dry weather baseline chronic toxicity testing results for Sites #3 through #14 using grab samples collected on July 28, 2005.
Sample Mean
Survival (Std. Dev.)
Survival Response Relative to Control
(Std. Dev.)
Mean Reproduction
(Std. Dev.)
Reproduction Response Relative to
Control (Std. Dev.)
Control 100% (0) 100% (0) 17 (9.2) 100% (56) Site #1 100% (0) 100% (0) 29 (3.1) 175% (19) Site #2 95% (10) 95% (10) 31 (5) 185% (30.1) Control 100% (0) 100% (0) 25.4 (6.1) 100% (24.2%) Site #3 100% (0) 100% (0) 33.5 (1.6) 132% (6.5%) Site #4 90% (31.6%) 90% (31.6%) 26.2 (10.3) 103% (40.5%) Site #5 80% (42.2%) 80% (42.2%) 21.2 (12.1) 83.5% (47.7%) Site #6 100% (0) 100% (0) 31.2 (4.1) 123% (16.2%) Site #7 100% (0) 100% (0) 35.4 (3.4) 139% (13.4%) Site #8 90% (31.6%) 90% (31.6%) 35.5 (7.2) 140% (28.3%) Site #9 100% (0) 100% (0) 34.3 (2.8) 135% (10.8%) Site #10 100% (0) 100% (0) 35.6 (5.6) 140% (22.2%) Site #11 90% (31.6%) 90% (31.6%) 29.5 (13.6) 116% (53.6%) Site #12 100% (0) 100% (0) 32.2 (2.4) 127% (9.4%) Site #13 100% (0) 100% (0) 32.6 (5.6) 128% (22.1%) Site #14 100% (0) 100% (0) 31.9 (11.6) 126% (45.9%) Table A 6. Dry weather baseline chronic toxicity testing results for Sites #3 through #14 using grab samples collected on August 18, 2005.
Sample Mean
Survival (Std. Dev.)
Survival Response Relative to Control
(Std. Dev.)
Mean Reproduction
(Std. Dev.)
Reproduction Response Relative to
Control (Std. Dev.)
Control 95% (10) 100% (10.5) 20 (4.9) 100% (24.5) Site #1 100% (0) 105% (0) 28 (5.6) 138% (27.8) Site #2 100% (0) 105% (0) 35 (3.5) 171% (17.5) Control 90% (31.5) 100% (35.0) 18.2 (10.3) 100% (56.6) Site #3 100% (0) 111.1% (0) 20.7 (7.5) 114% (41.0) Site #4 90% (31.6) 100% (35.1) 22.6 (11.6) 124% (64.0) Site #5 80% (42.2) 88.9% (46.8) 17.1 (9.6) 93.6% (52.7) Site #6 0%a (0) 0%a (0) 0a (0) 0%a (0) Site #7 0%a (0) 0%a (0) 0a (0) 0%a (0) Site #8 0%a (0) 0%a (0) 0a (0) 0%a (0) Site #9 100% (0) 111.1% (0) 24.1 (6.0) 132% (32.8) Site #10 0%a (0) 0%a (0) 0a (0) 0%a (0) Site #11 90% (31.6) 100% (35.1) 0.9a (1.7) 5.0%a (9.1) Site #12 0%a (0) 0%a (0) 0a (0) 0%a (0)

21
Site #13 0%a (0) 0%a (0) 0a (0) 0%a (0) Site #14 70%a (48.3) 77.8% a (53.7) 1.1a (2.6) 6.0%a (14.3) a: response statistically significant from control.

22
Table A 7. Dry weather baseline chronic toxicity testing results for Sites #3 through #16 using grab samples collected on September 29, 2005. Sites #3 through #9 were initiated with the Control #1 set of neonates, and sites #10 through #16 were initiated with the Control #2 set of neonates, and statistics for each site were run relative to the control set.
Sample Mean
Survival (Std. Dev.)
Survival Response Relative to Control
(Std. Dev.)
Mean Reproduction
(Std. Dev.)
Reproduction Response Relative to
Control (Std. Dev.)
Control 100% (0) 100% (0) 19 (6) 100% (32.1) Site #1 100% (0) 100% (0) 31 (3.5) 164% (18.8) Site #2 100% (0) 100% (0) 30 (4.3) 163% (23.2) Control 100% (0) 100% (0) 29.8 (2.7) 100% (8.9) Site #3 100% (0) 100% (0) 38.4 (6.0) 129% (20.2) Site #4 100% (0) 100% (0) 34.4 (3.9) 115% (13.2) Site #5 100% (0) 100% (0) 31.0 (4.5) 104% (15.3) Site #6 100% (0) 100% (0) 30.0 (4.4) 101% (14.8) Site #7 90% (31.6) 90% (31.6) 33.0 (5.7) 111% (19.2) Site #8 100% (0) 100% (0) 32.5 (7.7) 109% (26.0) Site #9 0%a (0) 0%a (0) 0a (0) 0%a (0) Control 90% (31.6) 100% (35.1) 22.3 (11.3) 100% (50.8) Site #10 90% (31.6) 100% (35.1) 25.4 (13.5) 114% (60.7) Site #11 100% (0) 111% (0) 31.7 (5.2) 142% (23.4) Site #12 100% (0) 111% (0) 23.7 (7.3) 106% (32.8) Site #13 100% (0) 111% (0) 22.2 (7.0) 99.6% (31.3) Site #14 90% (31.6) 100% (35.1) 24.3 (9.1) 109% (41.0) Site #15 90% (31.6) 100% (35.1) 26.8 (10.0) 120% (11.3) Site #16 90% (31.6) 100% (35.1) 28.5 (11.3) 128% (50.8) a: response statistically significant from control.
23
Table A 8. Dry weather baseline chronic toxicity testing results for Sites #3 through #16 (including the site designated “Site 11.5”) using grab samples collected on October 27, 2005.
Sample Mean
Survival (Std. Dev.)
Survival Response Relative to Control
(Std. Dev.)
Mean Reproduction
(Std. Dev.)
Reproduction Response Relative to
Control (Std. Dev.)
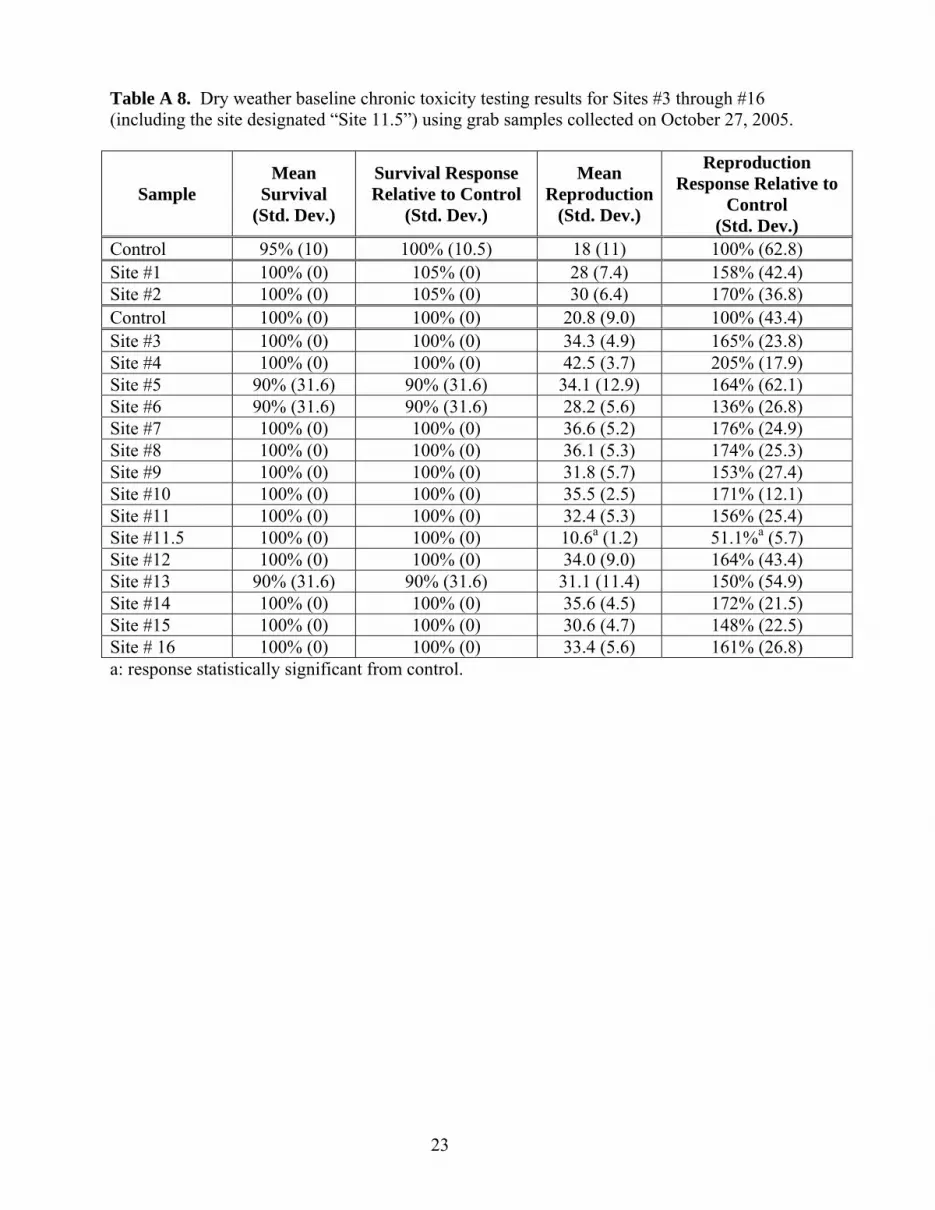
Control 95% (10) 100% (10.5) 18 (11) 100% (62.8) Site #1 100% (0) 105% (0) 28 (7.4) 158% (42.4) Site #2 100% (0) 105% (0) 30 (6.4) 170% (36.8) Control 100% (0) 100% (0) 20.8 (9.0) 100% (43.4) Site #3 100% (0) 100% (0) 34.3 (4.9) 165% (23.8) Site #4 100% (0) 100% (0) 42.5 (3.7) 205% (17.9) Site #5 90% (31.6) 90% (31.6) 34.1 (12.9) 164% (62.1) Site #6 90% (31.6) 90% (31.6) 28.2 (5.6) 136% (26.8) Site #7 100% (0) 100% (0) 36.6 (5.2) 176% (24.9) Site #8 100% (0) 100% (0) 36.1 (5.3) 174% (25.3) Site #9 100% (0) 100% (0) 31.8 (5.7) 153% (27.4) Site #10 100% (0) 100% (0) 35.5 (2.5) 171% (12.1) Site #11 100% (0) 100% (0) 32.4 (5.3) 156% (25.4) Site #11.5 100% (0) 100% (0) 10.6a (1.2) 51.1%a (5.7) Site #12 100% (0) 100% (0) 34.0 (9.0) 164% (43.4) Site #13 90% (31.6) 90% (31.6) 31.1 (11.4) 150% (54.9) Site #14 100% (0) 100% (0) 35.6 (4.5) 172% (21.5) Site #15 100% (0) 100% (0) 30.6 (4.7) 148% (22.5) Site # 16 100% (0) 100% (0) 33.4 (5.6) 161% (26.8) a: response statistically significant from control.

24
Table A 9. Dry weather baseline chronic toxicity testing results for Sites #3 through #16 using grab samples collected on November 15, 2005. Sites #3 through #9 were initiated with the Control #1 set of neonates, and sites #10 through #16 were initiated with the Control #2 set of neonates, and statistics for each site were run relative to the control set.
Sample Mean
Survival (Std. Dev.)
Survival Response Relative to Control
(Std. Dev.)
Mean Reproduction
(Std. Dev.)
Reproduction Response Relative to
Control (Std. Dev.)
Control 100% (0) 100% (0) 21 (2.8) 100% (13.1) Site #1 100% (0) 100% (0) 30 (5.8) 143% (27.4) Site #2 100% (0) 100% (0) 30 (3.9) 142% (18.5) Control 100% (0) 100% (0) 32.5 (3.0) 100% (9.1) Site #3 100% (0) 100% (0) 29.0 (5.6) 89.2% (17.2) Site #4 100% (0) 100% (0) 37.4 (2.9) 115% (8.8) Site #5 90% (31.6) 90% (31.6) 34.9 (5.9) 107% (18.2) Site #6 90% (31.6) 90% (31.6) 26.4 (9.2) 81.2% (28.2) Site #7 100% (0) 100% (0) 37.2 (4.0) 114% (12.5) Site #8 90% (31.6) 90% (31.6) 31.5 (11.4) 97.0% (35.0) Site #9 100% (0) 100% (0) 34.2 (5.9) 105% (18.1) Control 100% (0) 100% (0) 27.5 (4.5) 100% (16.5) Site #10 100% (0) 100% (0) 35.9 (6.6) 130% (24.0) Site #11 100% (0) 100% (0) 39.5 (3.3) 144% (12.0) Site #12 100% (0) 100% (0) 36.0 (4.2) 131% (15.3) Site #13 100% (0) 100% (0) 34.8 (3.7) 126% (13.5) Site #14 100% (0) 100% (0) 33.5 (4.7) 122% (17.1) Site #15 100% (0) 100% (0) 32.2 (4.4) 117% (16.1) Site #16 100% (0) 100% (0) 38.9 (2.9) 142% (10.5)

25
Table A 10. Dry weather baseline chronic toxicity testing results for Sites #3 through #16 using grab samples collected on December 8, 2005. Sites #3 through #9 were initiated with the Control #1 set of neonates, and sites #10 through #16 were initiated with the Control #2 set of neonates, and statistics for each site were run relative to the control set.
Sample Mean
Survival (Std. Dev.)
Survival Response Relative to Control
(Std. Dev.)
Mean Reproduction
(Std. Dev.)
Reproduction Response Relative to
Control (Std. Dev.)
Control 100% (0) 100% (0) 19 (9.1) 100% (48.8) Site #1 100% (0) 100% (0) 27 (9.7) 142% (51.9) Site #2 100% (0) 100% (0) 26 (2.4) 141% (12.9) Control 100% (0) 100% (0) 32.4 (2.6) 100% (8.2) Site #3 100% (0) 100% (0) 31.6 (4.0) 97.5% (12.3) Site #4 100% (0) 100% (0) 30.1 (3.1) 92.9% (9.6) Site #5 100% (0) 100% (0) 28.6 (2.8) 88.3% (8.6) Site #6 100% (0) 100% (0) 29.9 (3.3) 92.3% (10.3) Site #7 100% (0) 100% (0) 32.9 (2.9) 102% (9.0) Site #8 100% (0) 100% (0) 32.0 (4.8) 98.8% (14.7) Site #9 100% (0) 100% (0) 31.0 (3.6) 95.7% (11.1) Control 100% (0) 100% (0) 32.1 (2.7) 100% (8.5) Site #10 100% (0) 100% (0) 33.9 (3.3) 106% (10.3) Site #11 90% (31.6) 90% (31.6) 31.2 (4.6) 87.5% (33.6) Site #12 100% (0) 100% (0) 31.5 (2.4) 98.1% (7.4) Site #13 100% (0) 100% (0) 27.6 (5.8) 85.8% (18.2) Site #14 100% (0) 100% (0) 29.8 (6.6) 92.8% (20.5) Site #15 90% (31.6) 90% (31.6) 26.2 (3.1) 81.7% (9.6) Site #16 90% (31.6) 90% (31.6) 31.0 (3.9) 96.6% (12.3)

26
Table A 11. Dry weather baseline chronic toxicity testing results for Sites #3 through #16 using grab samples collected on January 19, 2006. Sites #3 through #9 were initiated with the Control #1 set of neonates, and sites #10 through #16 were initiated with the Control #2 set of neonates, and statistics for each site were run relative to the control set.
Sample Mean
Survival (Std. Dev.)
Survival Response Relative to Control
(Std. Dev.)
Mean Reproduction
(Std. Dev.)
Reproduction Response Relative to
Control (Std. Dev.)
Control 100% (0) 100% (0) 27 (2) 100% (7.5) Site #1 100% (0) 100% (0) 33 (3.9) 121% (14.5) Site #2 100% (0) 100% (0) 33 (4.4) 122% (16.2) Control 100% (0) 100% (0) 33.7 (3.3) 100% (9.8) Site #3 100% (0) 100% (0) 31.4 (5.9) 93.2% (17.4) Site #4 100% (0) 100% (0) 34.4 (2.7) 102% (8.1) Site #5 100% (0) 100% (0) 37.4 (2.7) 111% (7.9) Site #6 90% (31.6) 90% (31.6) 30.4 (11.2) 90.2% (33.1) Site #7 100% (0) 100% (0) 35.6 (3.5) 106% (10.4) Site #8 100% (0) 100% (0) 35.4 (3.5) 105% (10.5) Site #9 100% (0) 100% (0) 30.7 (5.1) 91.1% (15.0) Control 100% (0) 100% (0) 33.5 (2.0) 100% (6.0) Site #10 100% (0) 100% (0) 34.5 (3.2) 103% (9.5) Site #11 100% (0) 100% (0) 30.3 (10.9) 90.4% (32.6) Site #12 80% (42.2) 80% (42.2) 30.6 (12.1) 91.3% (36.2) Site #13 100% (0) 100% (0) 30.2 (4.5) 90.1% (13.3) Site #14 100% (0) 100% (0) 29.4 (4.1) 87.8% (12.4) Site #15 100% (0) 100% (0) 26.5a (2.0) 79.1%a (5.8) Site #16 100% (0) 100% (0) 29.4 (3.6) 87.8% (10.8) a: response statistically significant from control.

27
Table A 12. Dry weather baseline chronic toxicity testing results for Sites #3 through #16 using grab samples collected on February 23, 2006. Sites #3 through #9 were initiated with the Control #1 set of neonates, and sites #10 through #16 were initiated with the Control #2 set of neonates, and statistics for each site were run relative to the control set.
Sample Mean
Survival (Std. Dev.)
Survival Response Relative to Control
(Std. Dev.)
Mean Reproduction
(Std. Dev.)
Reproduction Response Relative to
Control (Std. Dev.)
Control 95% (10) 100% (10.5) 27 (5.7) 100% (21) Site #1 80% (16.3) 84% (17.2) 30 (5) 110% (18.1) Site #2 100% (0) 105% (0) 33 (2.8) 122% (10.4) Control #1 90% (31.6) 100% (35.1) 23.8 (10.4) 100% (43.9) Site #3 100% (0) 111.1% (0) 31.4 (3.2) 132% (13.6) Site #4 100% (0) 111.1% (0) 35.7 (3.1) 150% (12.8) Site #5 90% (31.6) 100% (35.1) 30.6 (11.4) 129% (47.7) Site #6 70% (48.3) 77.8% (31.6) 23.6 (16.4) 99.2% (68.8) Site #7 100% (0) 111.1% (0) 28.5 (5.5) 120% (23.0) Site #8 90% (31.6) 100% (35.1) 25.6 (11.1) 108% (46.7) Site #9 100% (0) 111.1% (0) 30.1 (4.8) 126% (20.3) Control #2 100% (0) 100% (0) 26.2 (6.4) 100% (24.4) Site #10 90% (31.6) 90% (31.6) 31.0 (12.6) 118% (48.0) Site #11 90% (31.6) 90% (31.6) 24.9 (11.3) 95.0% (43.1) Site #12 90% (31.6) 90% (31.6) 27.6 (11.3) 105% (43.1) Site #13 100% (0) 100% (0) 30.6 (7.8) 117% (29.8) Site #14 100% (0) 100% (0) 29.6 (7.4) 113% (28.3) Site #15 90% (31.6) 90% (31.6) 28.8 (11.9) 110% (45.6) Site #16 80% (42.2) 80% (42.2) 26.3 (14.3) 100% (54.5)

28
Table A 13. Dry weather baseline chronic toxicity testing results for Sites #9 through #16 using grab samples collected on March 24, 2006.
Sample Mean
Survival (Std. Dev.)
Survival Response Relative to Control
(Std. Dev.)
Mean Reproduction
(Std. Dev.)
Reproduction Response Relative to
Control (Std. Dev.)
Control 100% (0) 100% (0) 23 (4.2) 100% (18.2) Site #1a 95% (10) 95% (10) 32 (7.3) 138% (31.7) Site #2a 100% (0) 100% (0) 37 (3.9) 160% (17.1) Control 100% (0) 100% (0) 24.9 (8.0) 100% (43.9) Site #9 100% (0) 100% (0) 20.4 (9.9) 81.9% (39.7) Site #10 100% (0) 100% (0) 24.7 (13.8) 99.2% (55.3) Site #11 100% (0) 100% (0) 21.6 (15.9) 86.7% (63.8) Site #12 100% (0) 100% (0) 26.0 (12.1) 104% (48.5) Site #13 100% (0) 100% (0) 23.5 (10.9) 95.1% (44.1) Site #14 100% (0) 100% (0) 22.7 (14.1) 91.2% (56.6) Site #15 100% (0) 100% (0) 17.2 (15.5) 72.3% (65.1) Site #16 90% (31.6) 90% (31.6) 24.6 (12.0) 98.8% (48.3) a – Samples collected on March 23, 2006 Table A 14. Dry weather baseline chronic toxicity testing results for Sites #9 through #16 using grab samples collected on April 27, 2006.
Sample Mean
Survival (Std. Dev.)
Survival Response Relative to Control
(Std. Dev.)
Mean Reproduction
(Std. Dev.)
Reproduction Response Relative
to Control (Std. Dev.)
Control 100% (0) 100% (0) 28.4 (2.5) 100% (8.9) Site #9 100% (0) 100% (0) 30.2 (6.1) 106% (21.6) Site #10 100% (0) 100% (0) 36.4 (4.1) 128% (14.5) Site #11 100% (0) 100% (0) 38.8 (4.5) 137% (15.9) Site #12 90% (31.6) 90% (31.6) 38.4 (3.7) 135% (13.1) Site #13 100% (0) 100% (0) 36.1 (8.5) 127% (29.9) Site #14 100% (0) 100% (0) 30.2 (8.4) 106% (29.4) Site #15 100% (0) 100% (0) 34.0 (4.1) 120% (14.6) Site #16 100% (0) 100% (0) 30.7 (2.9) 108% (10.2)

29
Table A 15. Dry weather baseline chronic toxicity testing results for Sites #9 through #16 using grab samples collected on May 19, 2006.
Sample Mean
Survival (Std. Dev.)
Survival Response Relative to Control
(Std. Dev.)
Mean Reproduction
(Std. Dev.)
Reproduction Response Relative
to Control (Std. Dev.)
Control 100% (0) 100% (0) 28.4 (4.4) 100% (15.6) Site #9 90% (31.6) 90% (31.6) 23.6 (8.2) 83.1% (29.0) Site #10 100% (0) 100% (0) 28.8 (5.4) 101% (19.0) Site #11 100% (0) 100% (0) 29.2 (5.3) 103% (18.5) Site #12 100% (0) 100% (0) 29.2 (5.3) 103% (18.5) Site #13 100% (0) 100% (0) 34.2 (3.3) 120% (11.7) Site #14 100% (0) 100% (0) 33.8 (3.2) 119% (11.1) Site #15 100% (0) 100% (0) 34.1 (2.8) 120% (9.7) Site #16 100% (0) 100% (0) 32.0 (3.9) 113% (13.7) Table A 16. Dry weather baseline chronic toxicity testing results for Sites #9 through #16 using grab samples collected on June 20, 2006.
Sample Mean
Survival (Std. Dev.)
Survival Response Relative to Control
(Std. Dev.)
Mean Reproduction
(Std. Dev.)
Reproduction Response Relative
to Control (Std. Dev.)
Control 90% (31.6) 100% (31.6) 27.5 (8.3) 100% (30.3) Site #9 100% (0) 111% (0) 25.6 (3.9) 93.1% (14.3) Site #10 100% (0) 111% (0) 31.8 (6.4) 116% (23.3) Site #11 100% (0) 111% (0) 31.5 (10.6) 114% (38.7) Site #12 100% (0) 111% (0) 34.7 (2.9) 126% (10.6) Site #13 100% (0) 111% (0) 31.9 (4.6) 116% (16.7) Site #14 100% (0) 111% (0) 36.2 (3.6) 132% (13.3) Site #15 100% (0) 111% (0) 35.2 (3.6) 128% (13.0) Site #16 90% (31.6) 100% (31.6) 347 (3.3) 126% (12.1)

30
Table A 17. Dry weather baseline chronic toxicity testing results for Sites #9 through #16 using grab samples collected on July 27, 2006.
Sample Mean
Survival (Std. Dev.)
Survival Response Relative to Control
(Std. Dev.)
Mean Reproduction
(Std. Dev.)
Reproduction Response Relative
to Control (Std. Dev.)
Control 100% (0) 100% (0) 27.2 (4.3) 100% (15.8) Site #9 90% (31.6) 90% (31.6) 33.7 (2.3) 124% (8.3) Site #10 100% (0) 100% (0) 33.9 (3.3) 125% (12.3) Site #11 100% (0) 100% (0) 36.1 (3.0) 133% (10.9) Site #12 90% (31.6) 90% (31.6) 29.4 (10.2) 108% (37.5) Site #13 100% (0) 100% (0) 31.7 (4.8) 117% (17.8) Site #14 100% (0) 100% (0) 32.5 (4.1) 119% (15.2) Site #15 100% (0) 100% (0) 32.4 (3.9) 119% (14.4) Site #16 100% (0) 100% (0) 29.6 (7.7) 108% (28.4) Table A 18. Dry weather baseline chronic toxicity testing results for Sites #9 through #16 using grab samples collected on August 22, 2006.
Sample Mean
Survival (Std. Dev.)
Survival Response Relative to Control
(Std. Dev.)
Mean Reproduction
(Std. Dev.)
Reproduction Response Relative to
Control (Std. Dev.)
Control 100% (0) 100% (0) 18.7 (4.2) 100% (22.6) Site #9 100% (0) 100% (0) 25.9 (3.4) 138% (18.4) Site #10 100% (0) 100% (0) 22.1 (8.0) 118% (42.9) Site #11 100% (0) 100% (0) 29.9 (3.5) 160% (18.9) Site #12 100% (0) 100% (0) 29.5 (3.5) 158% (18.7) Site #13 100% (0) 100% (0) 22.9 (3.1) 122% (16.8) Site #14 100% (0) 100% (0) 23.1 (17.5) 124% (17.5) Site #15 90% (31.6) 90% (31.6) 25.5 (3.7) 136% (20.0) Site #16 90% (31.6) 90% (31.6) 32.7 (4.6) 175% (24.6)

31
Table A 19. Wet weather chronic toxicity testing results collected by flow-weighted composite on December 28, 2004.
Sample Mean Survival (Std. Dev.)
Survival Response
Relative to Control
(Std. Dev.)
Mean Reproduction
(Std. Dev.)
Survival Response
Relative to Control
(Std. Dev.) Control 100% (0) 100% (0) 27 (4.6) 100% (17) Site #2 100% (0) 100% (0) 32 (6.6) 119% (24.4) Site #3 97% (18.3) 97% (18.3) 27 (8.7) 98% (32) Control 100% (0) 100% (0) 29 (5.1) 100% (18) Site #5 97% (18.3) 97% (18.3) 35 (8.8) 121% (30.7) Site #7 100% (0) 100% (0) 32 (6.5) 111% (22.7) Table A 20. Wet weather chronic toxicity testing results collected by flow-weighted composite on February 11, 2005.
Sample Mean Survival (Std. Dev.)
Survival Response
Relative to Control
(Std. Dev.)
Mean Reproduction
(Std. Dev.)
Survival Response
Relative to Control
(Std. Dev.) Control 90% (31.6) 100% (35.1) 24 (4) 100% (17) Site #2 100% (0) 111% (0) 30 (4.4) 125% (18.6) Site #3 100% (0) 111% (0) 27 (3.8) 115% (15.9) Site #5 100% (0) 111% (0) 32 (3.9) 134% (16.5) Site #7 100% (0) 111% (0) 33 (4.4) 139% (18.5) Table A 21. Wet weather chronic toxicity testing results collected by flow-weighted composite on January 1, 2006.
Sample Mean Survival (Std. Dev.)
Survival Response
Relative to Control
(Std. Dev.)
Mean Reproduction
(Std. Dev.)
Survival Response
Relative to Control
(Std. Dev.) Control 100% (0) 100% (0) 31 (3.8) 100% (12.5) Site #2 97% (18.3) 97% (18.3) 32 (7.1) 105% (23.1) Site #3 100% (0) 100% (0) 32 (4.3) 105% (14) Site #5 100% (0) 100% (0) 33 (4.8) 108% (15.8) Site #7 100% (0) 100% (0) 36 (3.5) 117% (11.6)

32
Appendix B
NPDES Chronic Toxicity Monitoring Conducted from June 2003 through June 2006 in the
San Gabriel River Watershed

33
INTRODUCTION The Sanitation Districts of Los Angeles County own and operate five Water Reclamation Plants (WRPs) that discharge in the San Gabriel River Watershed. Each WRP operates under an individual NPDES permit. These permits require toxicity tests be conducted at a number of receiving water stations within the watershed at defined frequencies. Results of recent chronic toxicity monitoring conducted as part of the NPDES monitoring program are presented in this appendix. Toxicity results for receiving waters before June 2003 are not presented; the WRPs in the watershed added nitrification and denitrification (NDN) to their respective facilities in the first half of 2003. Before NDN, the effluent from the plants often had ammonia concentrations above 10 mg/L. After the addition of NDN, the ammonia effluent concentration from each plant averages less than 2 mg/L. Since ammonia concentrations at pre-NDN levels can cause toxicity and that potential source of toxicity has been greatly lessened (ammonia concentrations of 2 mg/L or less are not expected to cause chronic toxicity), only results from after the initiation of NDN is presented herein. In that way, it is known the ammonia contribution to toxicity has been minimized and other potential causes of toxicity can be investigated.
MATERIALS AND METHODS
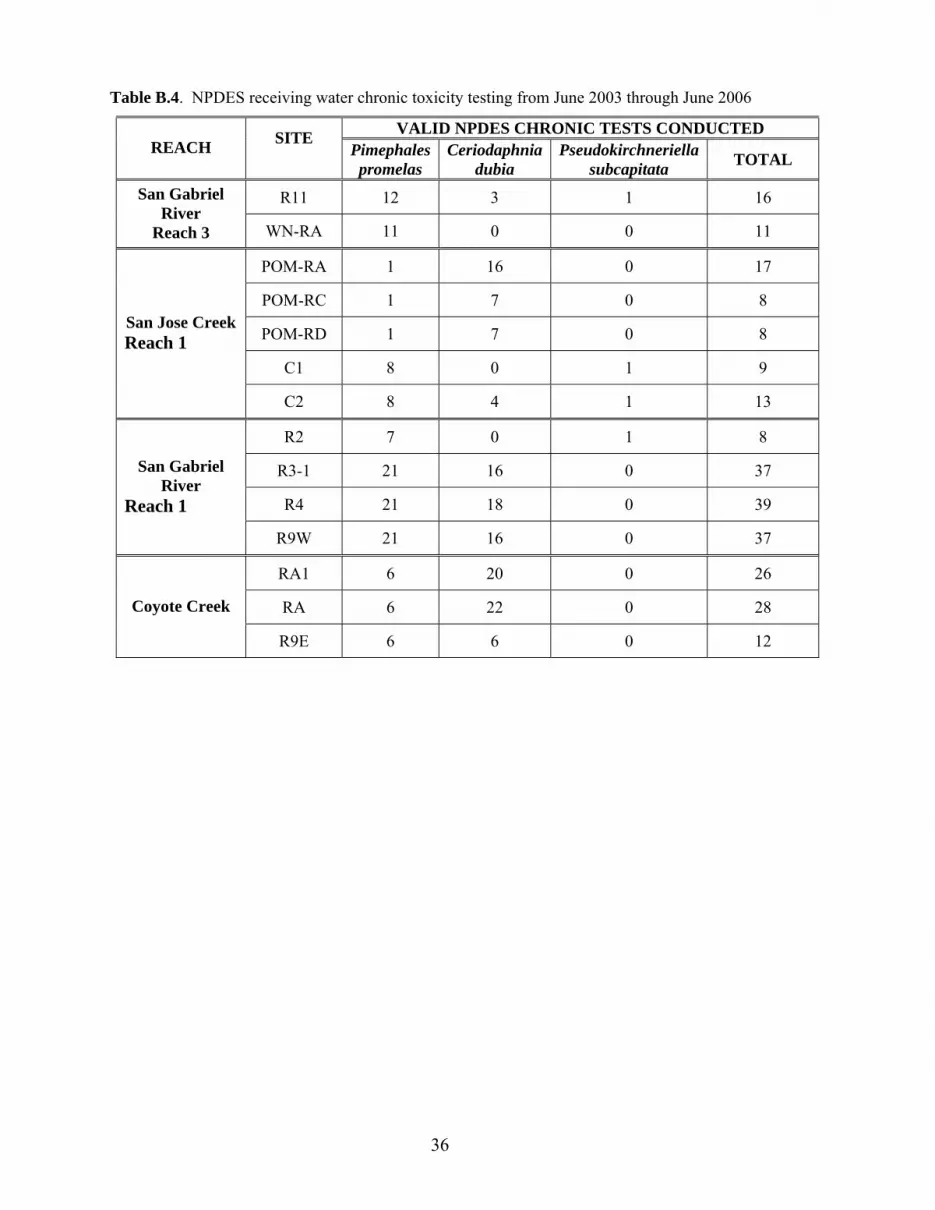
Chronic toxicity test results are presented for four reaches within the San Gabriel River Watershed. Three different species were used at various times for the chronic toxicity tests during the June 2003 to June 2006 testing period. The test conditions and requirements followed for all these tests are contained in Table B.1, B.2, and B.3. The locations of receiving water stations in the San Gabriel River Watershed are shown on Figure A.1. The tests conducted as part of NPDES chronic toxicity monitoring are listed in Table B.4. This data set consisted of 269 chronic toxicity tests using receiving water samples collected from San Gabriel River Reach 3 (27 tests), San Jose Creek Reach 1 (55 tests), San Gabriel River Reach 1 (121 tests), and Coyote Creek (66 tests). All receiving water was monitored in dry weather conditions with no samples collected within 48 hours of any significant rain event. Testing was conducted by a California Department of Heath Services-certified laboratory using USEPA Short-term Methods for Estimating the Chronic Toxicity of Effluents and Receiving waters to Freshwater Organisms, 3rd or 4th Edition. Concurrent positive control reference toxicant testing meeting all required test acceptability criteria were conducted with each test. Acute (lethality) and chronic (reproduction or growth) endpoints were evaluated in the Ceriodaphnia dubia and Pimephales promelas tests. The green algae test (Pseudokirchneriella subcapitata) only consisted of a single chronic (cell density) endpoint. One to three receiving water grab samples of 4 to 12 liters were collected depending on the species being tested. For the green algae test, a single grab consisting of 4 liters were collected and used for the entire test. For Ceriodaphnia dubia and Pimephales promelas testing, a minimum of three grab samples (with volumes ranging from 4 to 12 liters) were collected and used during the seven-day test. In all instances, each sample was first used within 36 hours of collection and used for subsequent renewals for no longer than 72 hours after collection. The number of receiving water locations and minimum frequency of testing was specified in the NPDES permits and ranged from monthly to quarterly depending on the permit. The NPDES permits define chronic toxicity as a TUc (toxicity unit) of >1.0 with the TUc calculated as 100/NOEC (the no observable effect concentration (or NOEC) is the highest concentration not statistically significant from the control). NPDES permits require the initiation of weekly accelerated testing for six weeks if the monthly median exceeds 1.0 TUc at the location immediately downstream from a WRP discharge. If two of six weekly accelerated tests exceed 1.0 TUc, the appropriate plant-

34
specific Toxicity Reduction Evaluation workplan is initiated which most often includes the initiation of phase I toxicity identification evaluation (TIE) testing. This protocol was followed in all cases when the monthly median TUc exceeded 1.0. To be consistent with other results included in this study, an effect of greater than 25% in 100% receiving water was identified as “toxicity”. However, statistically significant differences using EPA protocol outlined hypothesis testing methods are also noted. Table B.1. Test conditions and requirements followed for all Ceriodaphnia dubia tests. Test Organism: Ceriodaphnia dubia Organism Source: In-house Cultures Organism Age at Initiation: <24 hours old and released within an eight hour period Test Duration: Until 60% or ore of the surviving females have three broods Concentrations Tested: At least 0% and 100%, in some instances intermediate concentrations
were also tested Solution Renewal: Daily Feeding: 0.1 ml YCT and 0.1 Selenastrum algal suspension daily Test Chamber: 50 ml Disposable Solution Volume: 15 ml Control Water: Reconstituted deionized water (hard or moderately hard) Number of Replicates: 10 Organisms per Replicate: 1 assigned by blocking by known parentage Photoperiod: 16 hours light (50-100 ft-c), 8 hours dark Test Temperature: 25 ∀1o C. Endpoints Measured: Survival and Reproduction Reference Toxicant Testing Concurrent reference toxicant test conducted meeting all test
acceptability requirements Test Acceptability Criteria: 80% or greater survival with an average of 15 or more young per
surviving female in the control organisms. 60% of surviving females in the controls must produce three broods within 8 days.

35
Table B.2. Test conditions and requirements followed for all Pimephales promelas tests.
Test Organism: Pimephales promelas Organism Source: Commercial supplier Organism Age at Initiation: <24 hours old Test Duration: Seven days Concentrations Tested: At least 0% and 100%, in some instances intermediate concentrations
were also tested Solution Renewal: Daily Feeding: 1500 newly hatched artemia per beaker, twice daily Test Chamber: 400 ml glass beakers Solution Volume: 250 ml Control Water: Reconstituted deionized water (hard and moderately hard) Number of Replicates: 4 Organisms per Replicate: 10 Photoperiod: 16 hours light (50-100 ft-c), 8 hours dark Test Temperature: 25 ∀1o C. Endpoints Measured: Survival and Growth (biomass) Reference Toxicant Testing Concurrent reference toxicant test conducted meeting all test
acceptability requirements Test Acceptability Criteria: 80% or greater survival with an average of 0.25 mg/surviving larvae in
the control organisms. Table B.3. Test conditions and requirements followed for all Pseudokirchneriella subcapitata tests.
Test Organism: Pseudokirchneriella subcapitata Organism Source: In-house Cultures and commercial suppliers Organism Age at Initiation: 4 to 7 day-old cultures Test Duration: 96 hours Concentrations Tested: At least 0% and 100%, in some instances intermediate concentrations
were also tested Solution Renewal: None Feeding: None Test Chamber: 50 ml Disposable Solution Volume: 15 ml Control Water: Algal stock medium with EDTA prepared using deionized water Number of Replicates: 4 Organisms per Replicate: 10,000 cells per ml Photoperiod: Continuous (360 - 440-c) Test Temperature: 25 ∀1o C. Endpoints Measured: Growth (chlorophyll fluorescence) Reference Toxicant Testing Concurrent reference toxicant test conducted meeting all test
acceptability requirements Test Acceptability Criteria: Mean cell density of 1 X 10⁶ cells per ml in the controls and control CV
equal to or less than 20%
36
Table B.4. NPDES receiving water chronic toxicity testing from June 2003 through June 2006
VALID NPDES CHRONIC TESTS CONDUCTED REACH SITE
Pimephales promelas
Ceriodaphnia dubia
Pseudokirchneriella subcapitata TOTAL
R11 12 3 1 16 San Gabriel River
Reach 3 WN-RA 11 0 0 11
POM-RA 1 16 0 17
POM-RC 1 7 0 8
POM-RD 1 7 0 8
C1 8 0 1 9
San Jose Creek Reach 1
C2 8 4 1 13
R2 7 0 1 8
R3-1 21 16 0 37
R4 21 18 0 39
San Gabriel River
Reach 1
R9W 21 16 0 37
RA1 6 20 0 26
RA 6 22 0 28 Coyote Creek
R9E 6 6 0 12

37
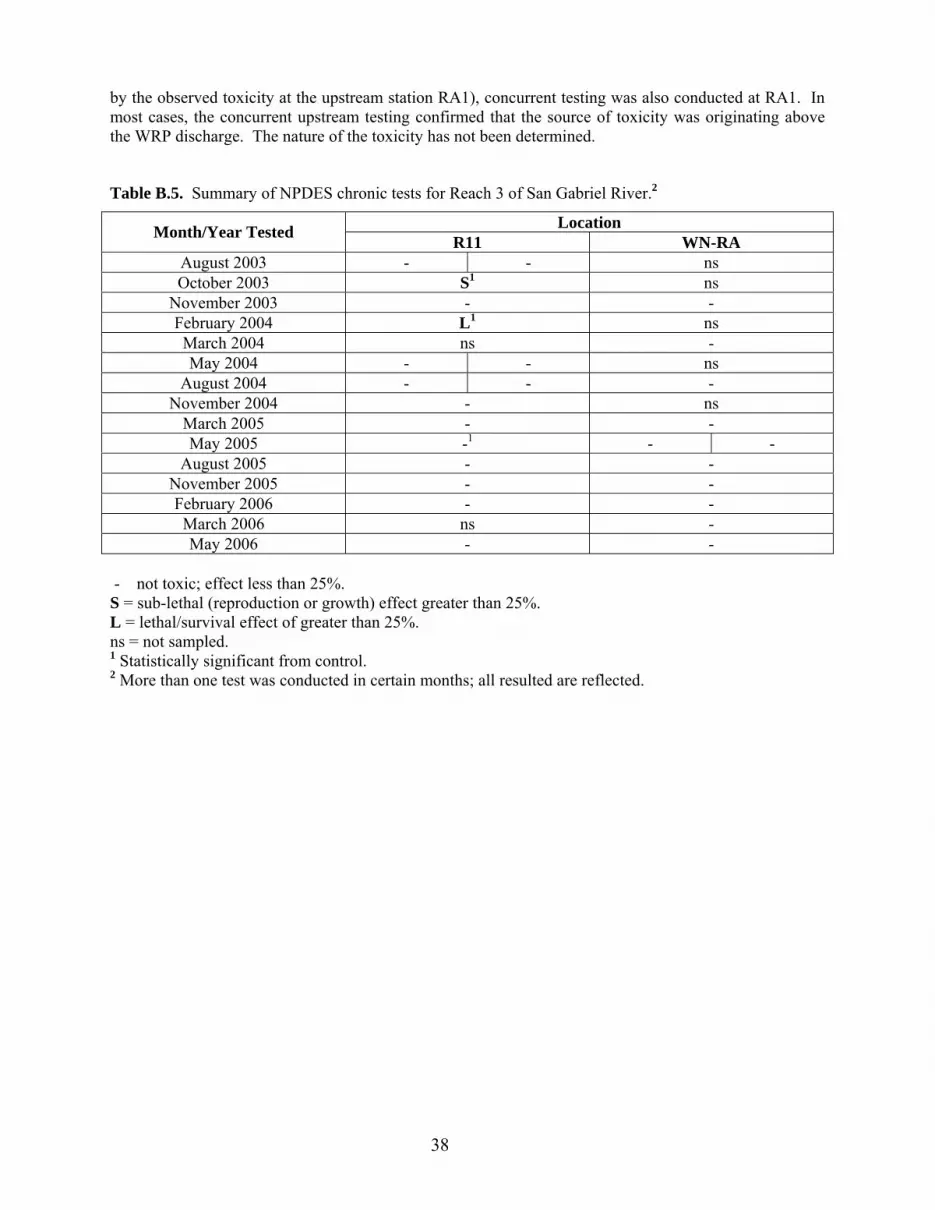
RESULTS Toxicity monitoring results are presented below for the four reaches in the San Gabriel River Watershed for which there are monitoring results. To be consistent with the toxicity results reported in the main report, results in this appendix are reported as not toxic if less than a 25% effect is observed in the site sample relative to the control. However, statistically significant differences are also noted. San Gabriel River Reach 3 A total of 27 valid chronic toxicity tests have been conducted since June 2003 with samples collected at two receiving water stations in Reach 3 of the San Gabriel River (see Figure A.1). Both receiving water stations are located downstream of two discharge points of the San Jose Creek WRP. Effects greater than 25% were observed in only two tests. Statistically significant effects were observed in three of the 29 tests. A summary of these results is contained in Table B.5. No consistent toxicity was observed in this reach. San Jose Creek Reach 1 A total of 55 valid chronic toxicity tests were conducted with samples collected from five receiving water stations in San Jose Creek Reach 1. Effects greater than 25% were observed in 17 of the 55 tests with statistically significant effects observed in 22 of the 55 tests. Most of the observed effects were in the samples from stations POM-RA, POM-RC, and POM-RD and not from stations C1 or C2 (14 tests and 3 tests, respectively). The Pomona WRP discharges upstream of station POM-RA and the San Jose Creek WRP has a discharge downstream of station C1 (and upstream of C2). A summary of the toxicity results is contained in A.6. As shown in the table, the majority of the observed toxicity in this reach has been confined to the upstream area of San Jose Creek. The toxicity testing for stations POM-RA, POM-RC and POM-RD are governed by the NPDES requirements for the Pomona WRP. Accelerated receiving water monitoring and Toxicity Reduction Evaluation workplan initiation has been triggered on a few occasions at POM-RA as the result of observed toxicity but specific causes of the sporadic toxicity has not been identified. However, diazinon quantification conducted (using both enzyme-linked immuno-sorbent assays (ELISA) and EPA method 8141) revealed elevated levels of diazinon in the receiving water but not in the Pomona WRP effluent on at least one occasion. San Gabriel River Reach 1 A total of 121 valid chronic toxicity tests were conducted with samples collected from four receiving water stations in Reach 1 of the San Gabriel River. Receiving water stations R2 and R3-1 are located downstream of a discharge point for the San Jose Creek WRP and upstream of the discharge point for the Los Coyotes WRP. Stations R4 and R9W are located downstream of the discharge point for the Los Coyotes WRP. Effects greater than 25% were observed in only three tests with statistically significant effects observed in six of the 121 tests. A summary of these results is contained in Table B.7. No consistent toxicity was observed in this reach. Coyote Creek A total of 66 valid chronic toxicity tests were conducted with samples collected from three receiving water stations in the lower portion of Coyote Creek. Receiving water station RA1 is located upstream of the discharge from Long Beach WRP and stations RA and R9E are located downstream of the discharge. Effects greater than 25% were observed in 15 of the 66 tests with statistically significant effects observed in 19 of the tests. Toxicity in the lower portion of Coyote Creek was observed much more frequently prior to January 2005 with only two of the 27 tests conducted in or after January 2005 exhibiting effects greater than 25%. Most of the toxicity observed at these stations has been attributed to sources upstream of the Long Beach WRP. A summary of these results is contained in Table B.8. Monthly median and weekly accelerated testing was conducted at station RA on several occasions. Since the source of toxicity appeared to be coming from above the Long Beach WRP discharge (as evidenced
38
by the observed toxicity at the upstream station RA1), concurrent testing was also conducted at RA1. In most cases, the concurrent upstream testing confirmed that the source of toxicity was originating above the WRP discharge. The nature of the toxicity has not been determined.
Table B.5. Summary of NPDES chronic tests for Reach 3 of San Gabriel River.2
Location Month/Year Tested R11 WN-RA August 2003 - - ns October 2003 S1 ns
November 2003 - - February 2004 L1 ns
March 2004 ns - May 2004 - - ns
August 2004 - - - November 2004 - ns
March 2005 - - May 2005 -1 - -
August 2005 - - November 2005 - - February 2006 - -
March 2006 ns - May 2006 - -
- not toxic; effect less than 25%. S = sub-lethal (reproduction or growth) effect greater than 25%. L = lethal/survival effect of greater than 25%. ns = not sampled. 1 Statistically significant from control. 2 More than one test was conducted in certain months; all resulted are reflected.

39
Table B.6. Summary of NPDES chronic tests for San Jose Creek Reach 1. 2
Location Month/Year Tested POM-RA POM-RC POM-RD C1 C2
August 2003 ns ns ns ns - October 2003 ns ns ns ns - February 2004 ns ns ns ns -
May 2004 ns ns ns ns - August 2004 - - - - -
November 2004 L1S1 - - - -1 - - February 2005 S1 -1 S1 S1 - - ns March 2005 - S1 ns ns - - May 2005 ns -1 S1 L1S1 -
August 2005 ns -1 - - - November 2005 S1 S1 L1S1 L1S1 - S1 - - December 2005 L1S1 S1 ns ns ns ns February 2006 - - L1S1 -1 -
May 2006 - - - L1S1 S1 - - not toxic; effect less than 25%. S = sub-lethal (reproduction or growth) effect greater than 25%. L = lethal/survival effect of greater than 25%. ns = not sampled. 1 Statistically significant from control. 2 More than one test was conducted in certain months; all resulted are reflected.

40
Table B.7. Summary of NPDES chronic tests for Reach 1 of San Gabriel River. 2
Month/Year Tested R2 R3-1 R4 R9W
June 2003 ns - - - July 2003 ns - - -
August 2003 ns - - - September 2003 ns - - -
October 2003 ns - - - November 2003 ns - - - December 2003 ns - - -
January 2004 ns - - - February 2004 ns - - - March 2004 ns - - - April 2004 ns - - - May 2004 ns - - - June 2004 ns - - - July 2004 ns S1 - -
August 2004 - - - - September 2004 ns - - -
October 2004 ns - - - November 2004 - - - - December 2004 ns - - -
January 2005 ns - - - February 2005 ns - ns - March 2005 - - - - - April 2005 ns - - - May 2005 - - - - June 2005 ns - - - July 2005 ns - - -
August 2005 - - - - September 2005 ns - - -
October 2005 ns -1 - L1S1 November 2005 - -1 - - December 2005 ns - - -
January 2006 ns - - - February 2006 - - - - March 2006 ns - - - April 2006 ns - -1 - - - May 2006 - - - - June 2006 ns - - S1
- not toxic; effect less than 25%. S = sub-lethal (reproduction or growth) effect greater than 25%. L = lethal/survival effect of greater than 25%. ns = not sampled. 1 Statistically significant from control. 2 More than one test was conducted in certain months; all resulted are reflected.

41
Table B.8. Summary of NPDES chronic tests for Coyote Creek. 2
Location Month/Year Tested RA1 RA R9E July 2003 L1S1 L1S1 L1S1
October 2003 - - - January 2004 - - - April 2004 - - - July 2004 L1S1 -1 - L1S1 S1
August 2004 L1S1 L1S1 L1S1 S1 - S1 ns October 2004 - -1 -
November 2004 L1S1 - - - - - ns December 2004 - - - -1 - - L1S1 - ns
January 2005 S1 - - - - February 2005 - -1 - - - - ns
April 2005 - - - July 2005 ns Ns -
August 2005 L1 - ns October 2005 - - ns
November 2005 ns Ns - January 2006 - - - April 2006 - - -
- not toxic; effect less than 25%. S = sub-lethal (reproduction or growth) effect greater than 25%. L = lethal/survival effect of greater than 25%. ns = not sampled. 1 Statistically significant from control. 2 More than one test was conducted in certain months; all resulted are reflected.