waterman numbered report template - architectse17
TRANSCRIPT

Transport Statement
Project Number: AJT/CIV17058 Document Reference: CIV17058/TR001/A03
\\S-bd\wtdl\Projects\CIV17058\DOCUMENTS\CATEGORY\TR\CIV17058_TR001_A03_161215_2nd Issue_TS_AJT.docx
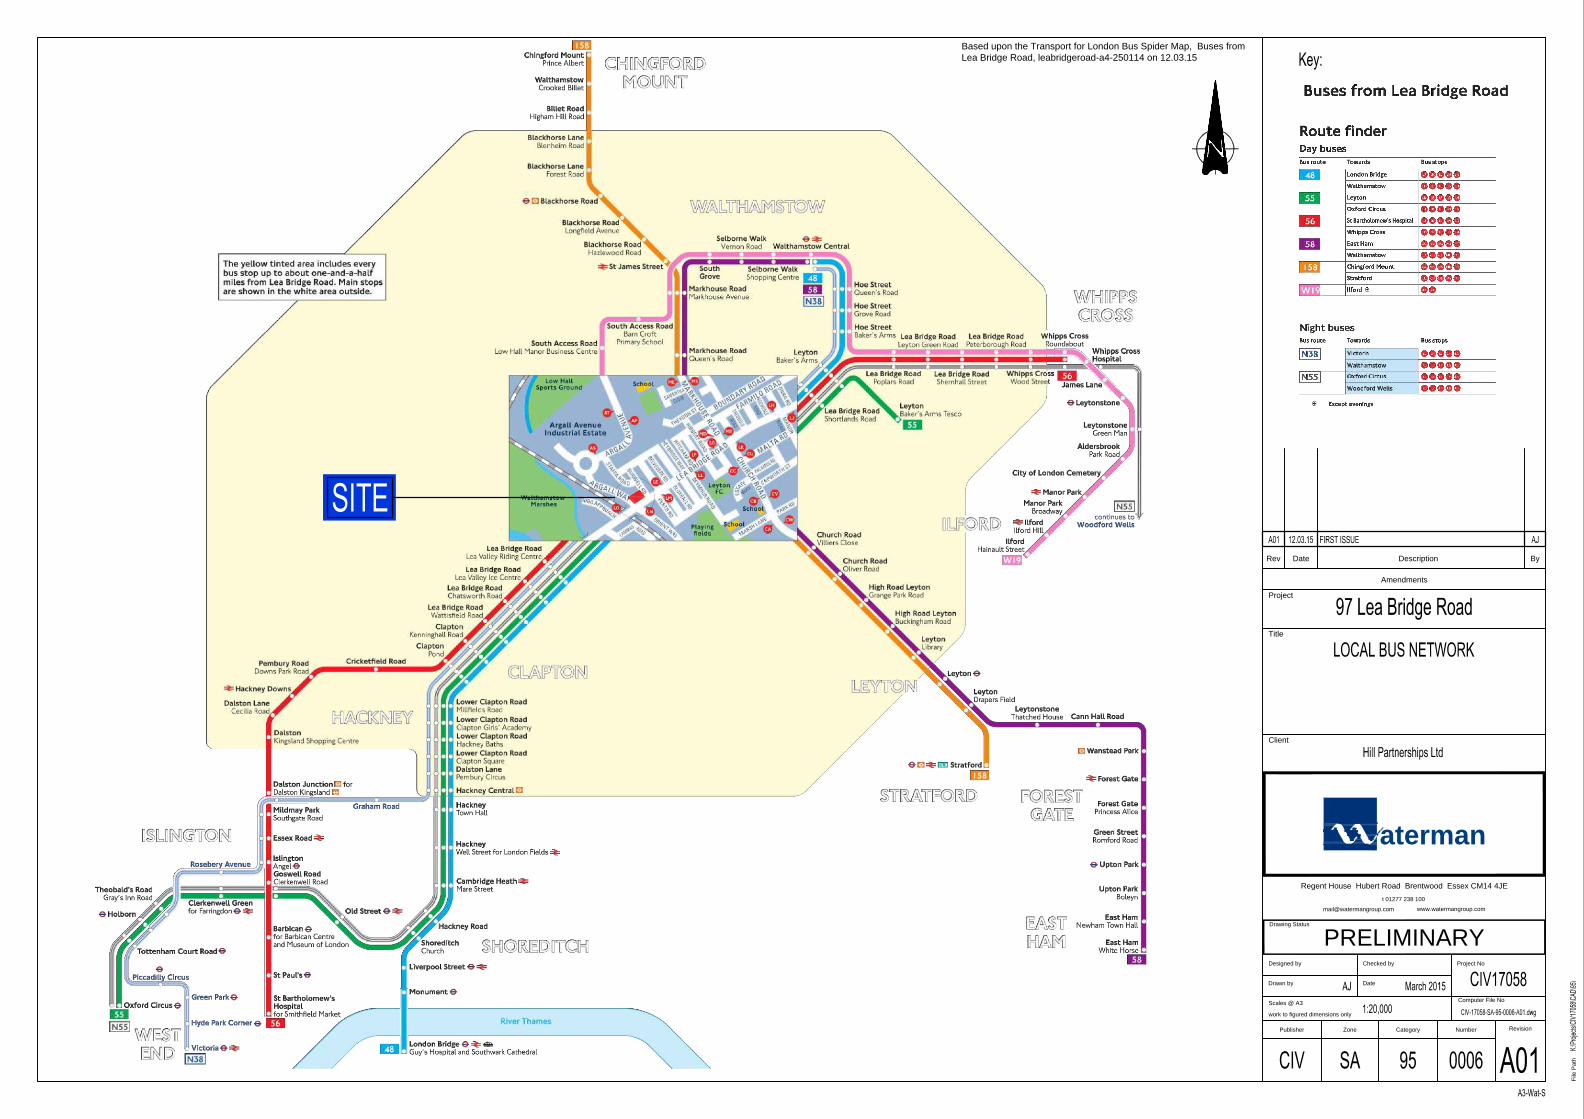
D. Bus Service Details
Amendments
DescriptionDateRev
Title
Client
Designed by
Drawn by
Checked by
Date
Scales @ A3
work to figured dimensions only
By
Project
Drawing Status
Project No
Computer File No
aterman
File
Pat
h
Publisher RevisionZone Category Number
Regent House Hubert Road Brentwood Essex CM14 4JE
t 01277 238 100
PRELIMINARY
Based upon the Transport for London Bus Spider Map, Buses fromLea Bridge Road, leabridgeroad-a4-250114 on 12.03.15

Transport Statement
Project Number: AJT/CIV17058 Document Reference: CIV17058/TR001/A03
\\S-bd\wtdl\Projects\CIV17058\DOCUMENTS\CATEGORY\TR\CIV17058_TR001_A03_161215_2nd Issue_TS_AJT.docx
E. Rail Network Diagram
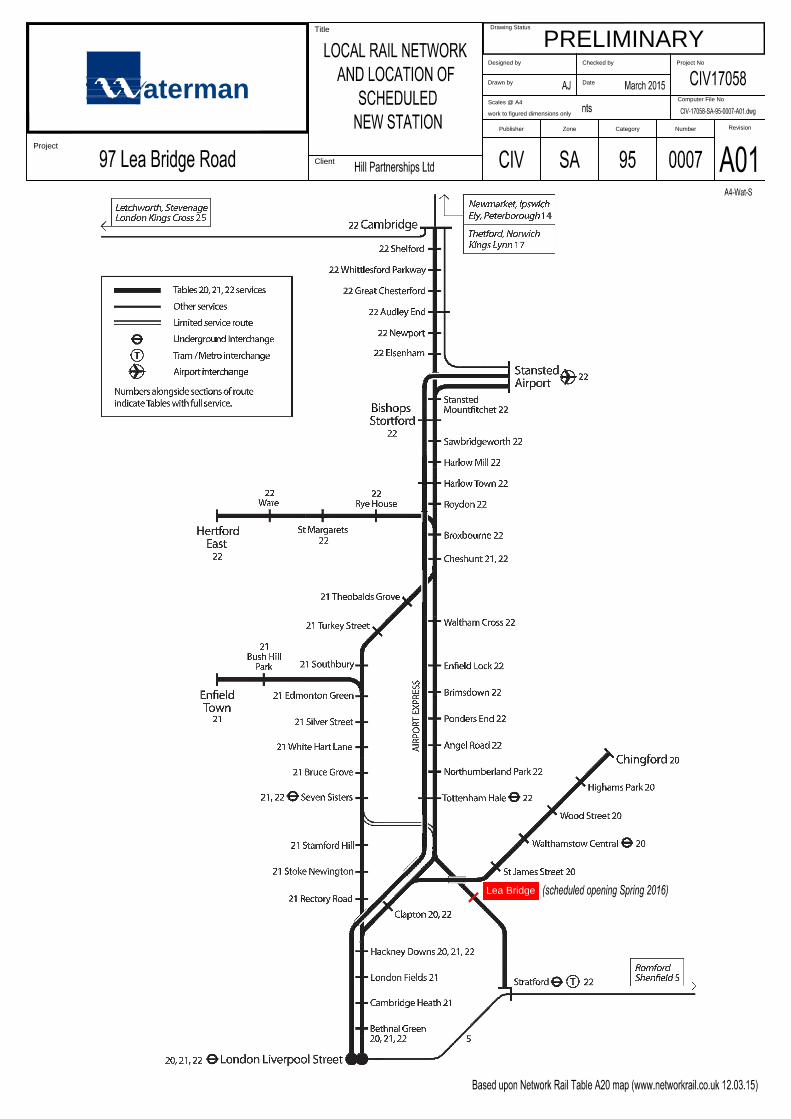
Lea Bridge
PRELIMINARYDesigned by
Drawn by
Checked by
Date
Scales @ A4
work to figured dimensions only
Drawing Status
Project No
Computer File No
Title
Client
Project
atermanPublisher RevisionZone Category Number

Transport Statement
Project Number: AJT/CIV17058 Document Reference: CIV17058/TR001/A03
\\S-bd\wtdl\Projects\CIV17058\DOCUMENTS\CATEGORY\TR\CIV17058_TR001_A03_161215_2nd Issue_TS_AJT.docx
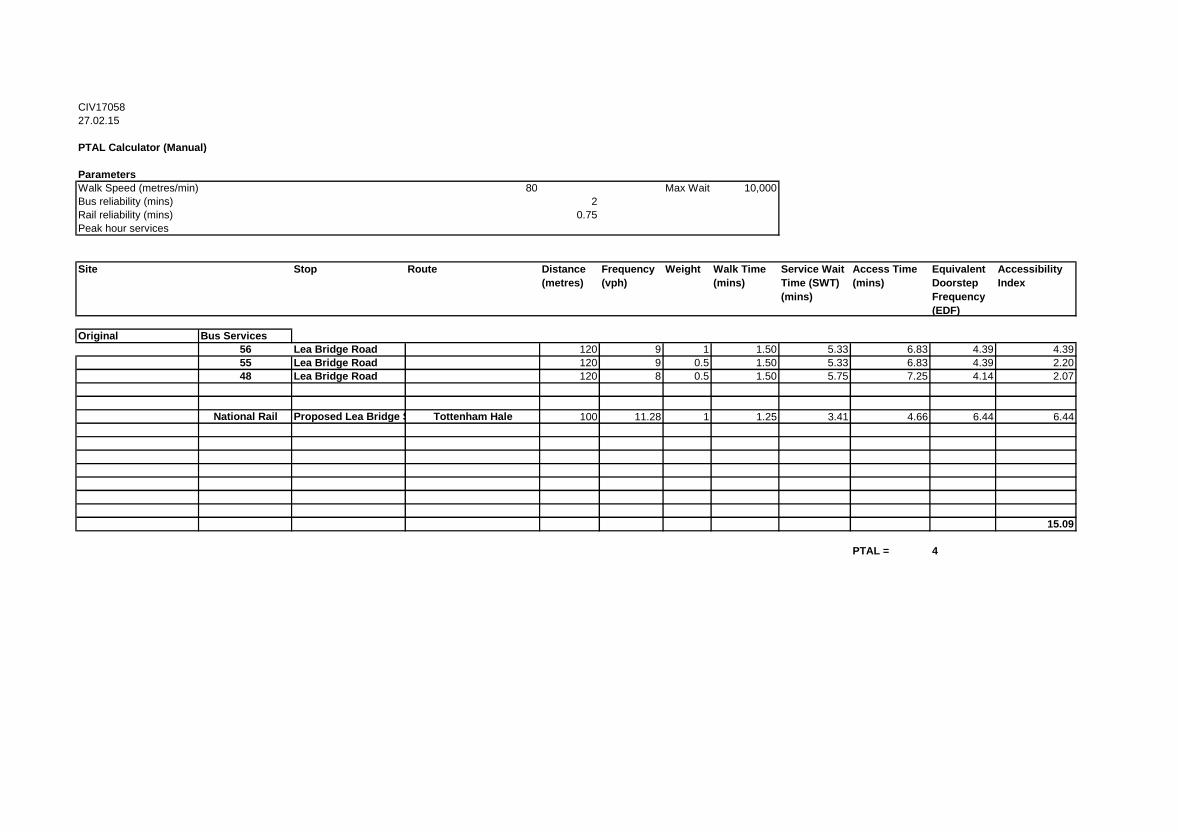
F. PTAL Calculation
CIV1705827.02.15
PTAL Calculator (Manual)
ParametersWalk Speed (metres/min) 80 Max Wait 10,000Bus reliability (mins) 2Rail reliability (mins) 0.75Peak hour services
Site Stop Route Distance (metres)
Frequency (vph)
Weight Walk Time (mins)
Service Wait Time (SWT) (mins)
Access Time (mins)
Equivalent Doorstep Frequency (EDF)
Accessibility Index
Original Bus Services56 Lea Bridge Road 120 9 1 1.50 5.33 6.83 4.39 4.3955 Lea Bridge Road 120 9 0.5 1.50 5.33 6.83 4.39 2.2048 Lea Bridge Road 120 8 0.5 1.50 5.75 7.25 4.14 2.07
National Rail Proposed Lea Bridge StationTottenham Hale 100 11.28 1 1.25 3.41 4.66 6.44 6.44
15.09
PTAL = 4

Transport Statement
Project Number: AJT/CIV17058 Document Reference: CIV17058/TR001/A03
\\S-bd\wtdl\Projects\CIV17058\DOCUMENTS\CATEGORY\TR\CIV17058_TR001_A03_161215_2nd Issue_TS_AJT.docx
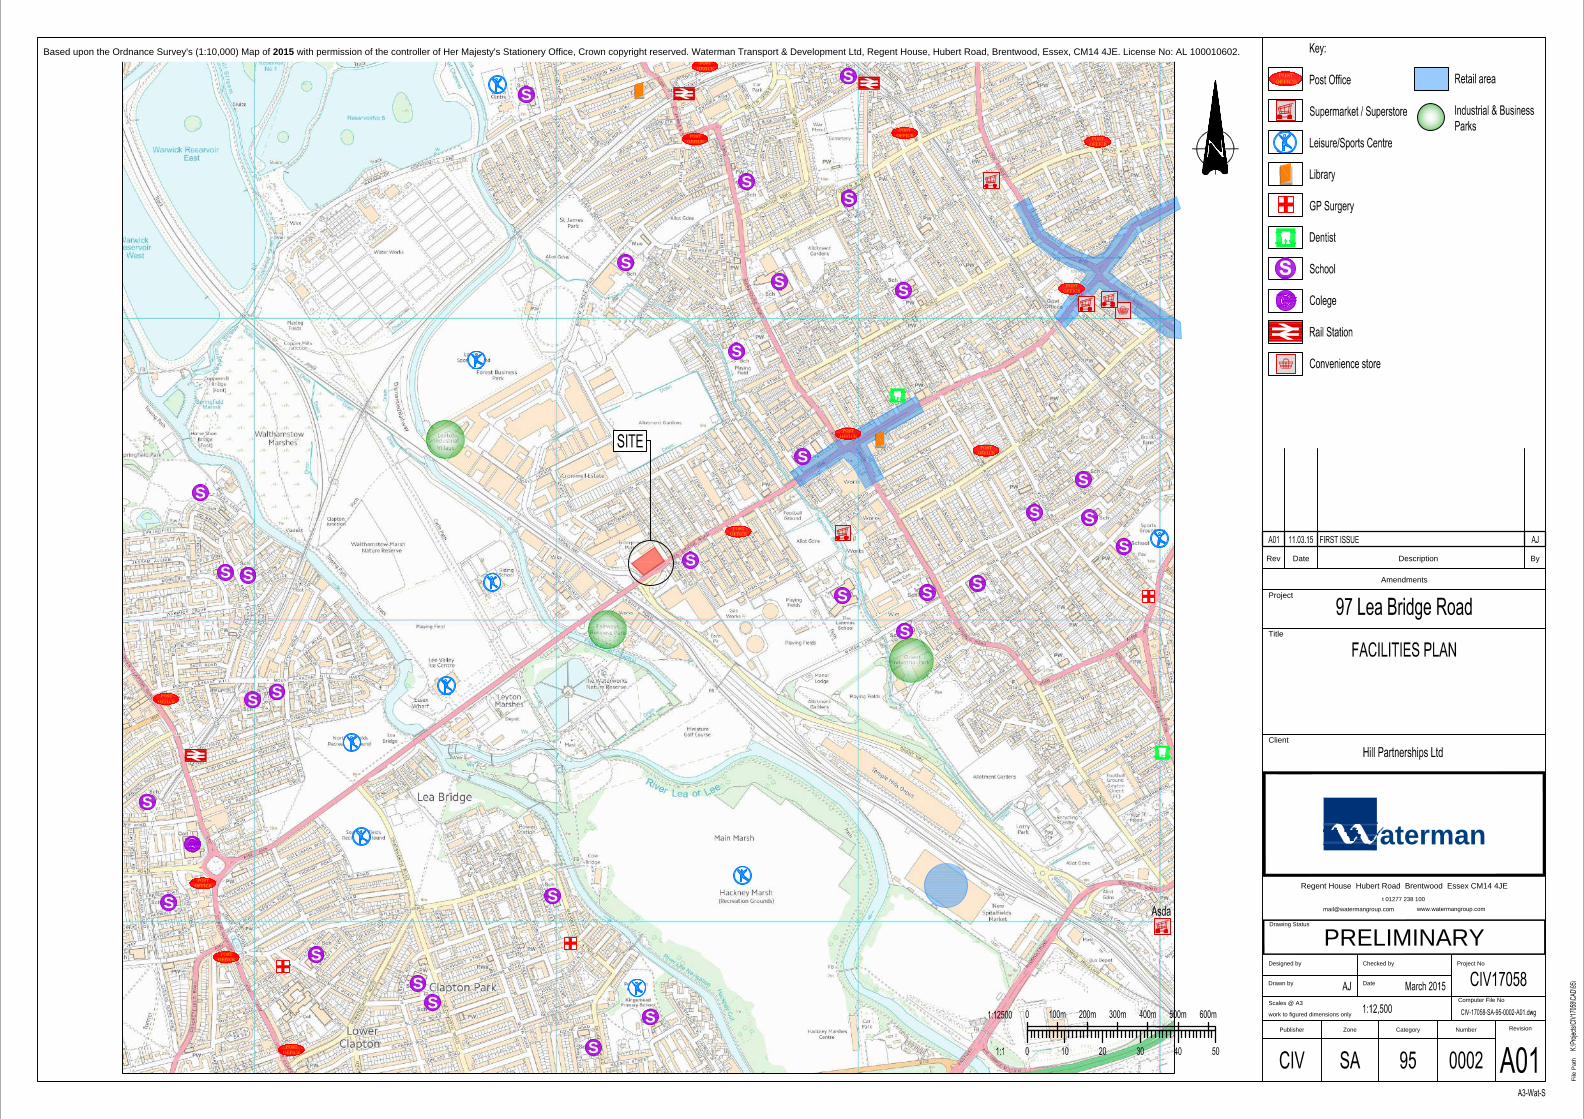
G. Local Facilities Plan
S
S
S
S
S
S
S
S
S
S
S
S
S
SS
S
SS S
S
S
S
S
POSTOFFICE
POSTOFFICE
POSTOFFICE
POSTOFFICE
POSTOFFICE
POSTOFFICE
POSTOFFICE
SS
S
S
S
POSTOFFICE
POSTOFFICE
S
S
POSTOFFICE
POSTOFFICE
S
POSTOFFICE
Amendments
DescriptionDateRev
Title
Client
Designed by
Drawn by
Checked by
Date
Scales @ A3
work to figured dimensions only
By
Project
Drawing Status
Project No
Computer File No
aterman
File
Pat
h
Publisher RevisionZone Category Number
Regent House Hubert Road Brentwood Essex CM14 4JE
t 01277 238 100
PRELIMINARY
Based upon the Ordnance Survey's (1:10,000) Map of 2015 with permission of the controller of Her Majesty's Stationery Office, Crown copyright reserved. Waterman Transport & Development Ltd, Regent House, Hubert Road, Brentwood, Essex, CM14 4JE. License No: AL 100010602.

Transport Statement
Project Number: AJT/CIV17058 Document Reference: CIV17058/TR001/A03
\\S-bd\wtdl\Projects\CIV17058\DOCUMENTS\CATEGORY\TR\CIV17058_TR001_A03_161215_2nd Issue_TS_AJT.docx
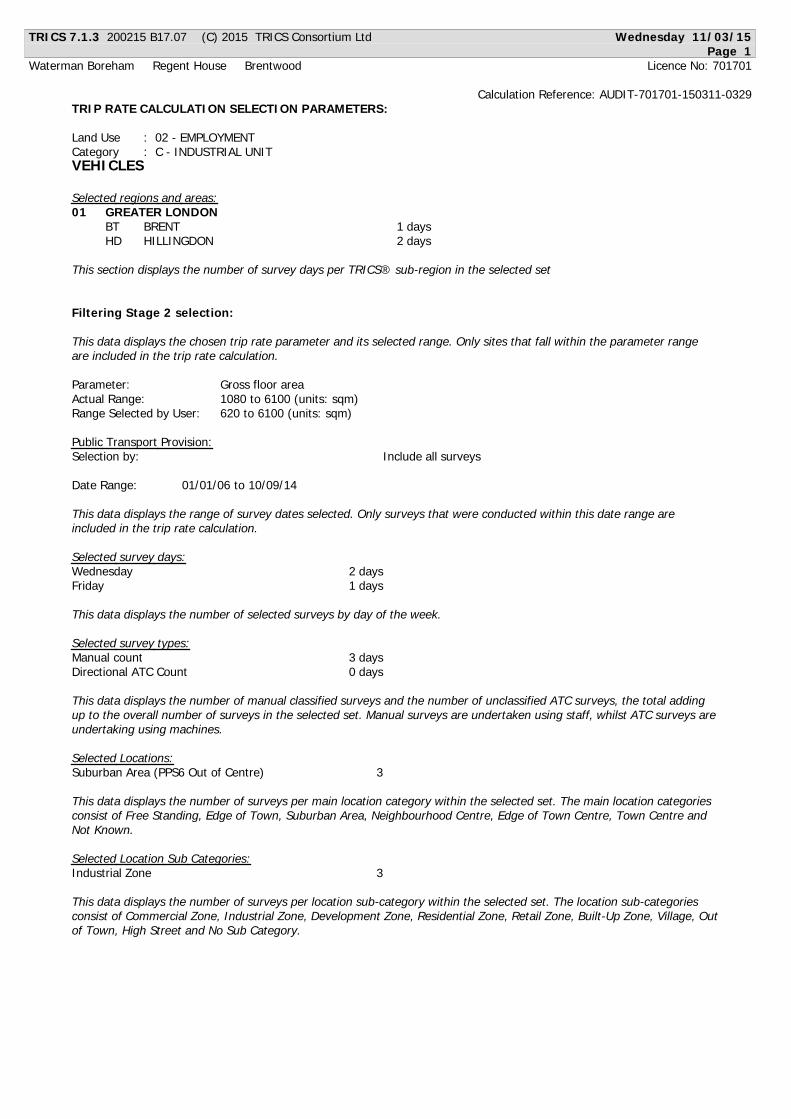
H. TRICS Data – Industrial Units (B2)
TRICS 7.1.3 200215 B17.07 (C) 2015 TRICS Consortium Ltd Wednesday 11/03/15
Page 1
Waterman Boreham Regent House Brentwood Licence No: 701701
Calculation Reference: AUDIT-701701-150311-0329
TRIP RATE CALCULATION SELECTION PARAMETERS:
Land Use : 02 - EMPLOYMENT
Category : C - INDUSTRIAL UNIT
VEHICLES
Selected regions and areas:
01 GREATER LONDON
BT BRENT 1 days
HD HILLINGDON 2 days
This section displays the number of survey days per TRICS® sub-region in the selected set
Filtering Stage 2 selection:
This data displays the chosen trip rate parameter and its selected range. Only sites that fall within the parameter range
are included in the trip rate calculation.
Parameter: Gross floor area
Actual Range: 1080 to 6100 (units: sqm)
Range Selected by User: 620 to 6100 (units: sqm)
Public Transport Provision:
Selection by: Include all surveys
Date Range: 01/01/06 to 10/09/14
This data displays the range of survey dates selected. Only surveys that were conducted within this date range are
included in the trip rate calculation.
Selected survey days:
Wednesday 2 days
Friday 1 days
This data displays the number of selected surveys by day of the week.
Selected survey types:
Manual count 3 days
Directional ATC Count 0 days
This data displays the number of manual classified surveys and the number of unclassified ATC surveys, the total adding
up to the overall number of surveys in the selected set. Manual surveys are undertaken using staff, whilst ATC surveys are
undertaking using machines.
Selected Locations:
Suburban Area (PPS6 Out of Centre) 3
This data displays the number of surveys per main location category within the selected set. The main location categories
consist of Free Standing, Edge of Town, Suburban Area, Neighbourhood Centre, Edge of Town Centre, Town Centre and
Not Known.
Selected Location Sub Categories:
Industrial Zone 3
This data displays the number of surveys per location sub-category within the selected set. The location sub-categories
consist of Commercial Zone, Industrial Zone, Development Zone, Residential Zone, Retail Zone, Built-Up Zone, Village, Out
of Town, High Street and No Sub Category.
TRICS 7.1.3 200215 B17.07 (C) 2015 TRICS Consortium Ltd Wednesday 11/03/15
Page 2
Waterman Boreham Regent House Brentwood Licence No: 701701
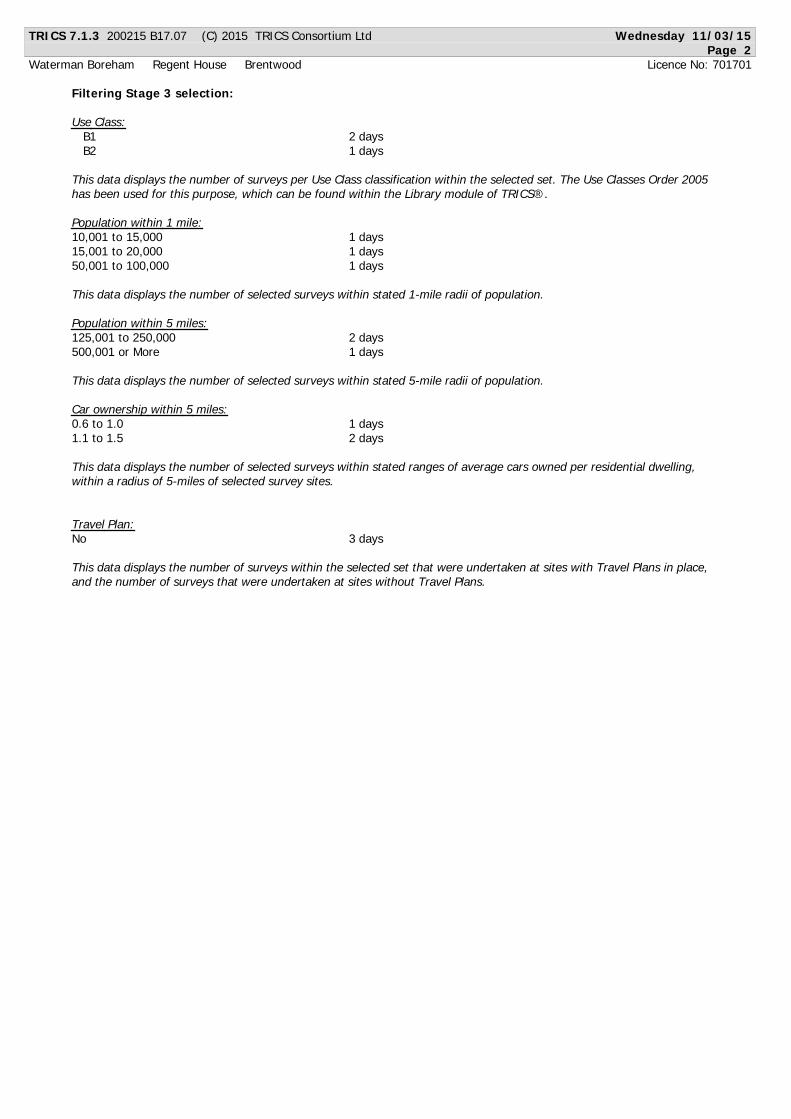
Filtering Stage 3 selection:
Use Class:
B 1 2 days
B 2 1 days
This data displays the number of surveys per Use Class classification within the selected set. The Use Classes Order 2005
has been used for this purpose, which can be found within the Library module of TRICS®.
Population within 1 mile:
10,001 to 15,000 1 days
15,001 to 20,000 1 days
50,001 to 100,000 1 days
This data displays the number of selected surveys within stated 1-mile radii of population.
Population within 5 miles:
125,001 to 250,000 2 days
500,001 or More 1 days
This data displays the number of selected surveys within stated 5-mile radii of population.
Car ownership within 5 miles:
0.6 to 1.0 1 days
1.1 to 1.5 2 days
This data displays the number of selected surveys within stated ranges of average cars owned per residential dwelling,
within a radius of 5-miles of selected survey sites.
Travel Plan:
No 3 days
This data displays the number of surveys within the selected set that were undertaken at sites with Travel Plans in place,
and the number of surveys that were undertaken at sites without Travel Plans.
TRICS 7.1.3 200215 B17.07 (C) 2015 TRICS Consortium Ltd Wednesday 11/03/15
Page 3
Waterman Boreham Regent House Brentwood Licence No: 701701
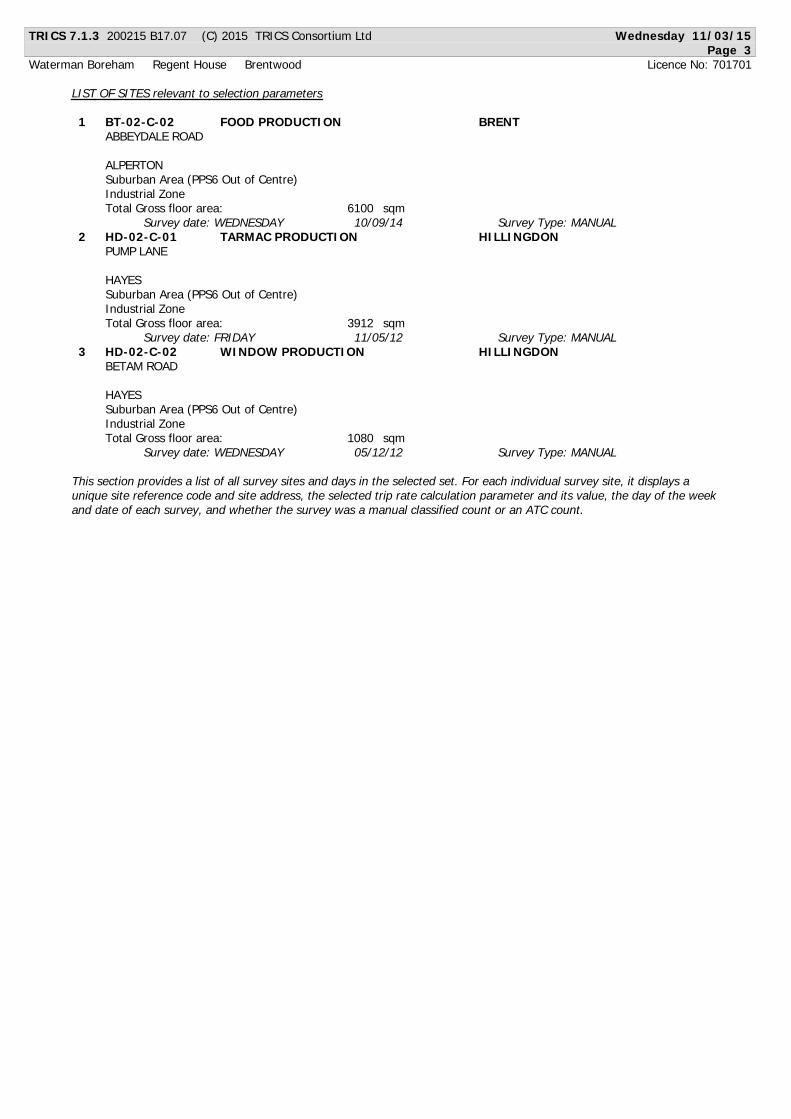
LIST OF SITES relevant to selection parameters
1 BT-02-C-02 FOOD PRODUCTION BRENT
ABBEYDALE ROAD
ALPERTON
Suburban Area (PPS6 Out of Centre)
Industrial Zone
Total Gross floor area: 6 1 0 0 sqm
Survey date: WEDNESDAY 10/09/14 Survey Type: MANUAL
2 HD-02-C-01 TARMAC PRODUCTION HILLINGDON
PUMP LANE
HAYES
Suburban Area (PPS6 Out of Centre)
Industrial Zone
Total Gross floor area: 3 9 1 2 sqm
Survey date: FRIDAY 11/05/12 Survey Type: MANUAL
3 HD-02-C-02 WINDOW PRODUCTION HILLINGDON
BETAM ROAD
HAYES
Suburban Area (PPS6 Out of Centre)
Industrial Zone
Total Gross floor area: 1 0 8 0 sqm
Survey date: WEDNESDAY 05/12/12 Survey Type: MANUAL
This section provides a list of all survey sites and days in the selected set. For each individual survey site, it displays a
unique site reference code and site address, the selected trip rate calculation parameter and its value, the day of the week
and date of each survey, and whether the survey was a manual classified count or an ATC count.
TRICS 7.1.3 200215 B17.07 (C) 2015 TRICS Consortium Ltd Wednesday 11/03/15
Page 4
Waterman Boreham Regent House Brentwood Licence No: 701701
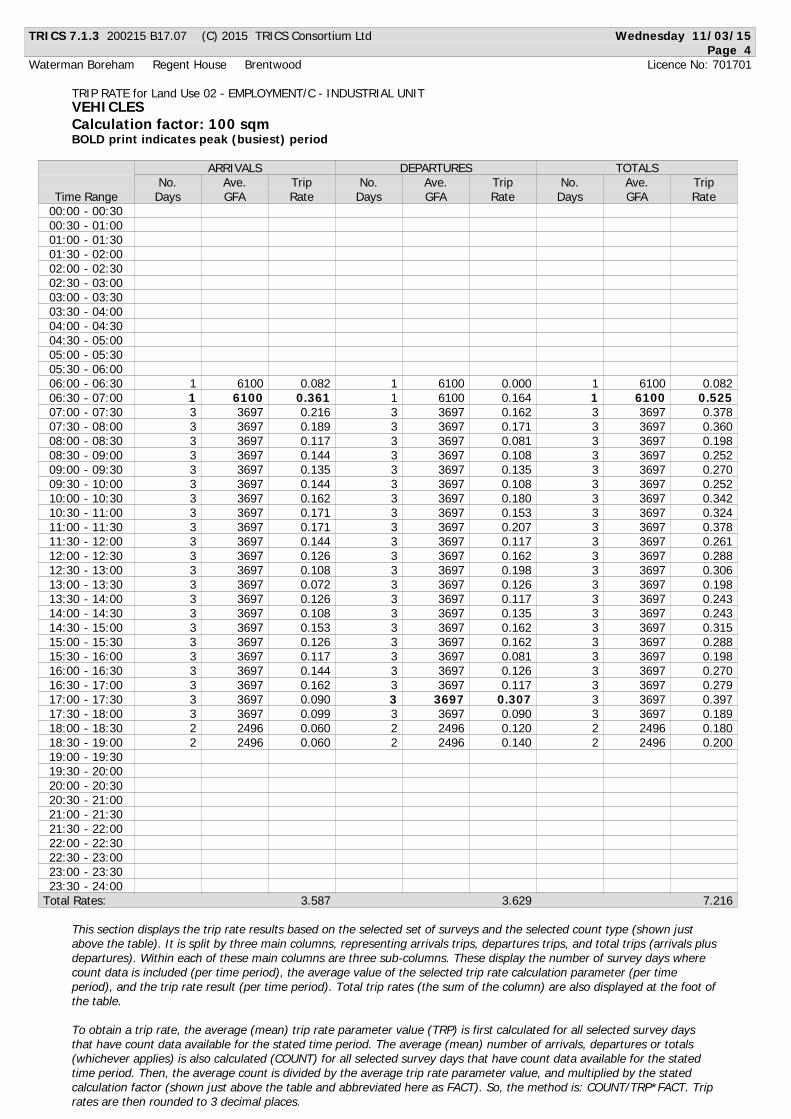
TRIP RATE for Land Use 02 - EMPLOYMENT/C - INDUSTRIAL UNIT
VEHICLES
Calculation factor: 100 sqm
BOLD print indicates peak (busiest) period
ARRIVALS DEPARTURES TOTALS
No. Ave. Trip No. Ave. Trip No. Ave. Trip
Time Range Days GFA Rate Days GFA Rate Days GFA Rate
00:00 - 00:30
00:30 - 01:00
01:00 - 01:30
01:30 - 02:00
02:00 - 02:30
02:30 - 03:00
03:00 - 03:30
03:30 - 04:00
04:00 - 04:30
04:30 - 05:00
05:00 - 05:30
05:30 - 06:00
1 6100 0.082 1 6100 0.000 1 6100 0.08206:00 - 06:30
1 6100 0.361 1 6100 0.164 1 6100 0.52506:30 - 07:00
3 3697 0.216 3 3697 0.162 3 3697 0.37807:00 - 07:30
3 3697 0.189 3 3697 0.171 3 3697 0.36007:30 - 08:00
3 3697 0.117 3 3697 0.081 3 3697 0.19808:00 - 08:30
3 3697 0.144 3 3697 0.108 3 3697 0.25208:30 - 09:00
3 3697 0.135 3 3697 0.135 3 3697 0.27009:00 - 09:30
3 3697 0.144 3 3697 0.108 3 3697 0.25209:30 - 10:00
3 3697 0.162 3 3697 0.180 3 3697 0.34210:00 - 10:30
3 3697 0.171 3 3697 0.153 3 3697 0.32410:30 - 11:00
3 3697 0.171 3 3697 0.207 3 3697 0.37811:00 - 11:30
3 3697 0.144 3 3697 0.117 3 3697 0.26111:30 - 12:00
3 3697 0.126 3 3697 0.162 3 3697 0.28812:00 - 12:30
3 3697 0.108 3 3697 0.198 3 3697 0.30612:30 - 13:00
3 3697 0.072 3 3697 0.126 3 3697 0.19813:00 - 13:30
3 3697 0.126 3 3697 0.117 3 3697 0.24313:30 - 14:00
3 3697 0.108 3 3697 0.135 3 3697 0.24314:00 - 14:30
3 3697 0.153 3 3697 0.162 3 3697 0.31514:30 - 15:00
3 3697 0.126 3 3697 0.162 3 3697 0.28815:00 - 15:30
3 3697 0.117 3 3697 0.081 3 3697 0.19815:30 - 16:00
3 3697 0.144 3 3697 0.126 3 3697 0.27016:00 - 16:30
3 3697 0.162 3 3697 0.117 3 3697 0.27916:30 - 17:00
3 3697 0.090 3 3697 0.307 3 3697 0.39717:00 - 17:30
3 3697 0.099 3 3697 0.090 3 3697 0.18917:30 - 18:00
2 2496 0.060 2 2496 0.120 2 2496 0.18018:00 - 18:30
2 2496 0.060 2 2496 0.140 2 2496 0.20018:30 - 19:00
19:00 - 19:30
19:30 - 20:00
20:00 - 20:30
20:30 - 21:00
21:00 - 21:30
21:30 - 22:00
22:00 - 22:30
22:30 - 23:00
23:00 - 23:30
23:30 - 24:00
Total Rates: 3.587 3.629 7.216
This section displays the trip rate results based on the selected set of surveys and the selected count type (shown just
above the table). It is split by three main columns, representing arrivals trips, departures trips, and total trips (arrivals plus
departures). Within each of these main columns are three sub-columns. These display the number of survey days where
count data is included (per time period), the average value of the selected trip rate calculation parameter (per time
period), and the trip rate result (per time period). Total trip rates (the sum of the column) are also displayed at the foot of
the table.
To obtain a trip rate, the average (mean) trip rate parameter value (TRP) is first calculated for all selected survey days
that have count data available for the stated time period. The average (mean) number of arrivals, departures or totals
(whichever applies) is also calculated (COUNT) for all selected survey days that have count data available for the stated
time period. Then, the average count is divided by the average trip rate parameter value, and multiplied by the stated
calculation factor (shown just above the table and abbreviated here as FACT). So, the method is: COUNT/TRP*FACT. Trip
rates are then rounded to 3 decimal places.

TRICS 7.1.3 200215 B17.07 (C) 2015 TRICS Consortium Ltd Wednesday 11/03/15
Page 5
Waterman Boreham Regent House Brentwood Licence No: 701701
Parameter summary
Trip rate parameter range selected: 1080 - 6100 (units: sqm)
Survey date date range: 01/01/06 - 10/09/14
Number of weekdays (Monday-Friday): 3
Number of Saturdays: 0
Number of Sundays: 0
Surveys manually removed from selection: 0
This section displays a quick summary of some of the data filtering selections made by the TRICS® user. The trip rate
calculation parameter range of all selected surveys is displayed first, followed by the range of minimum and maximum
survey dates selected by the user. Then, the total number of selected weekdays and weekend days in the selected set of
surveys are show. Finally, the number of survey days that have been manually removed from the selected set outside of
the standard filtering procedure are displayed.

Transport Statement
Project Number: AJT/CIV17058 Document Reference: CIV17058/TR001/A03
\\S-bd\wtdl\Projects\CIV17058\DOCUMENTS\CATEGORY\TR\CIV17058_TR001_A03_161215_2nd Issue_TS_AJT.docx
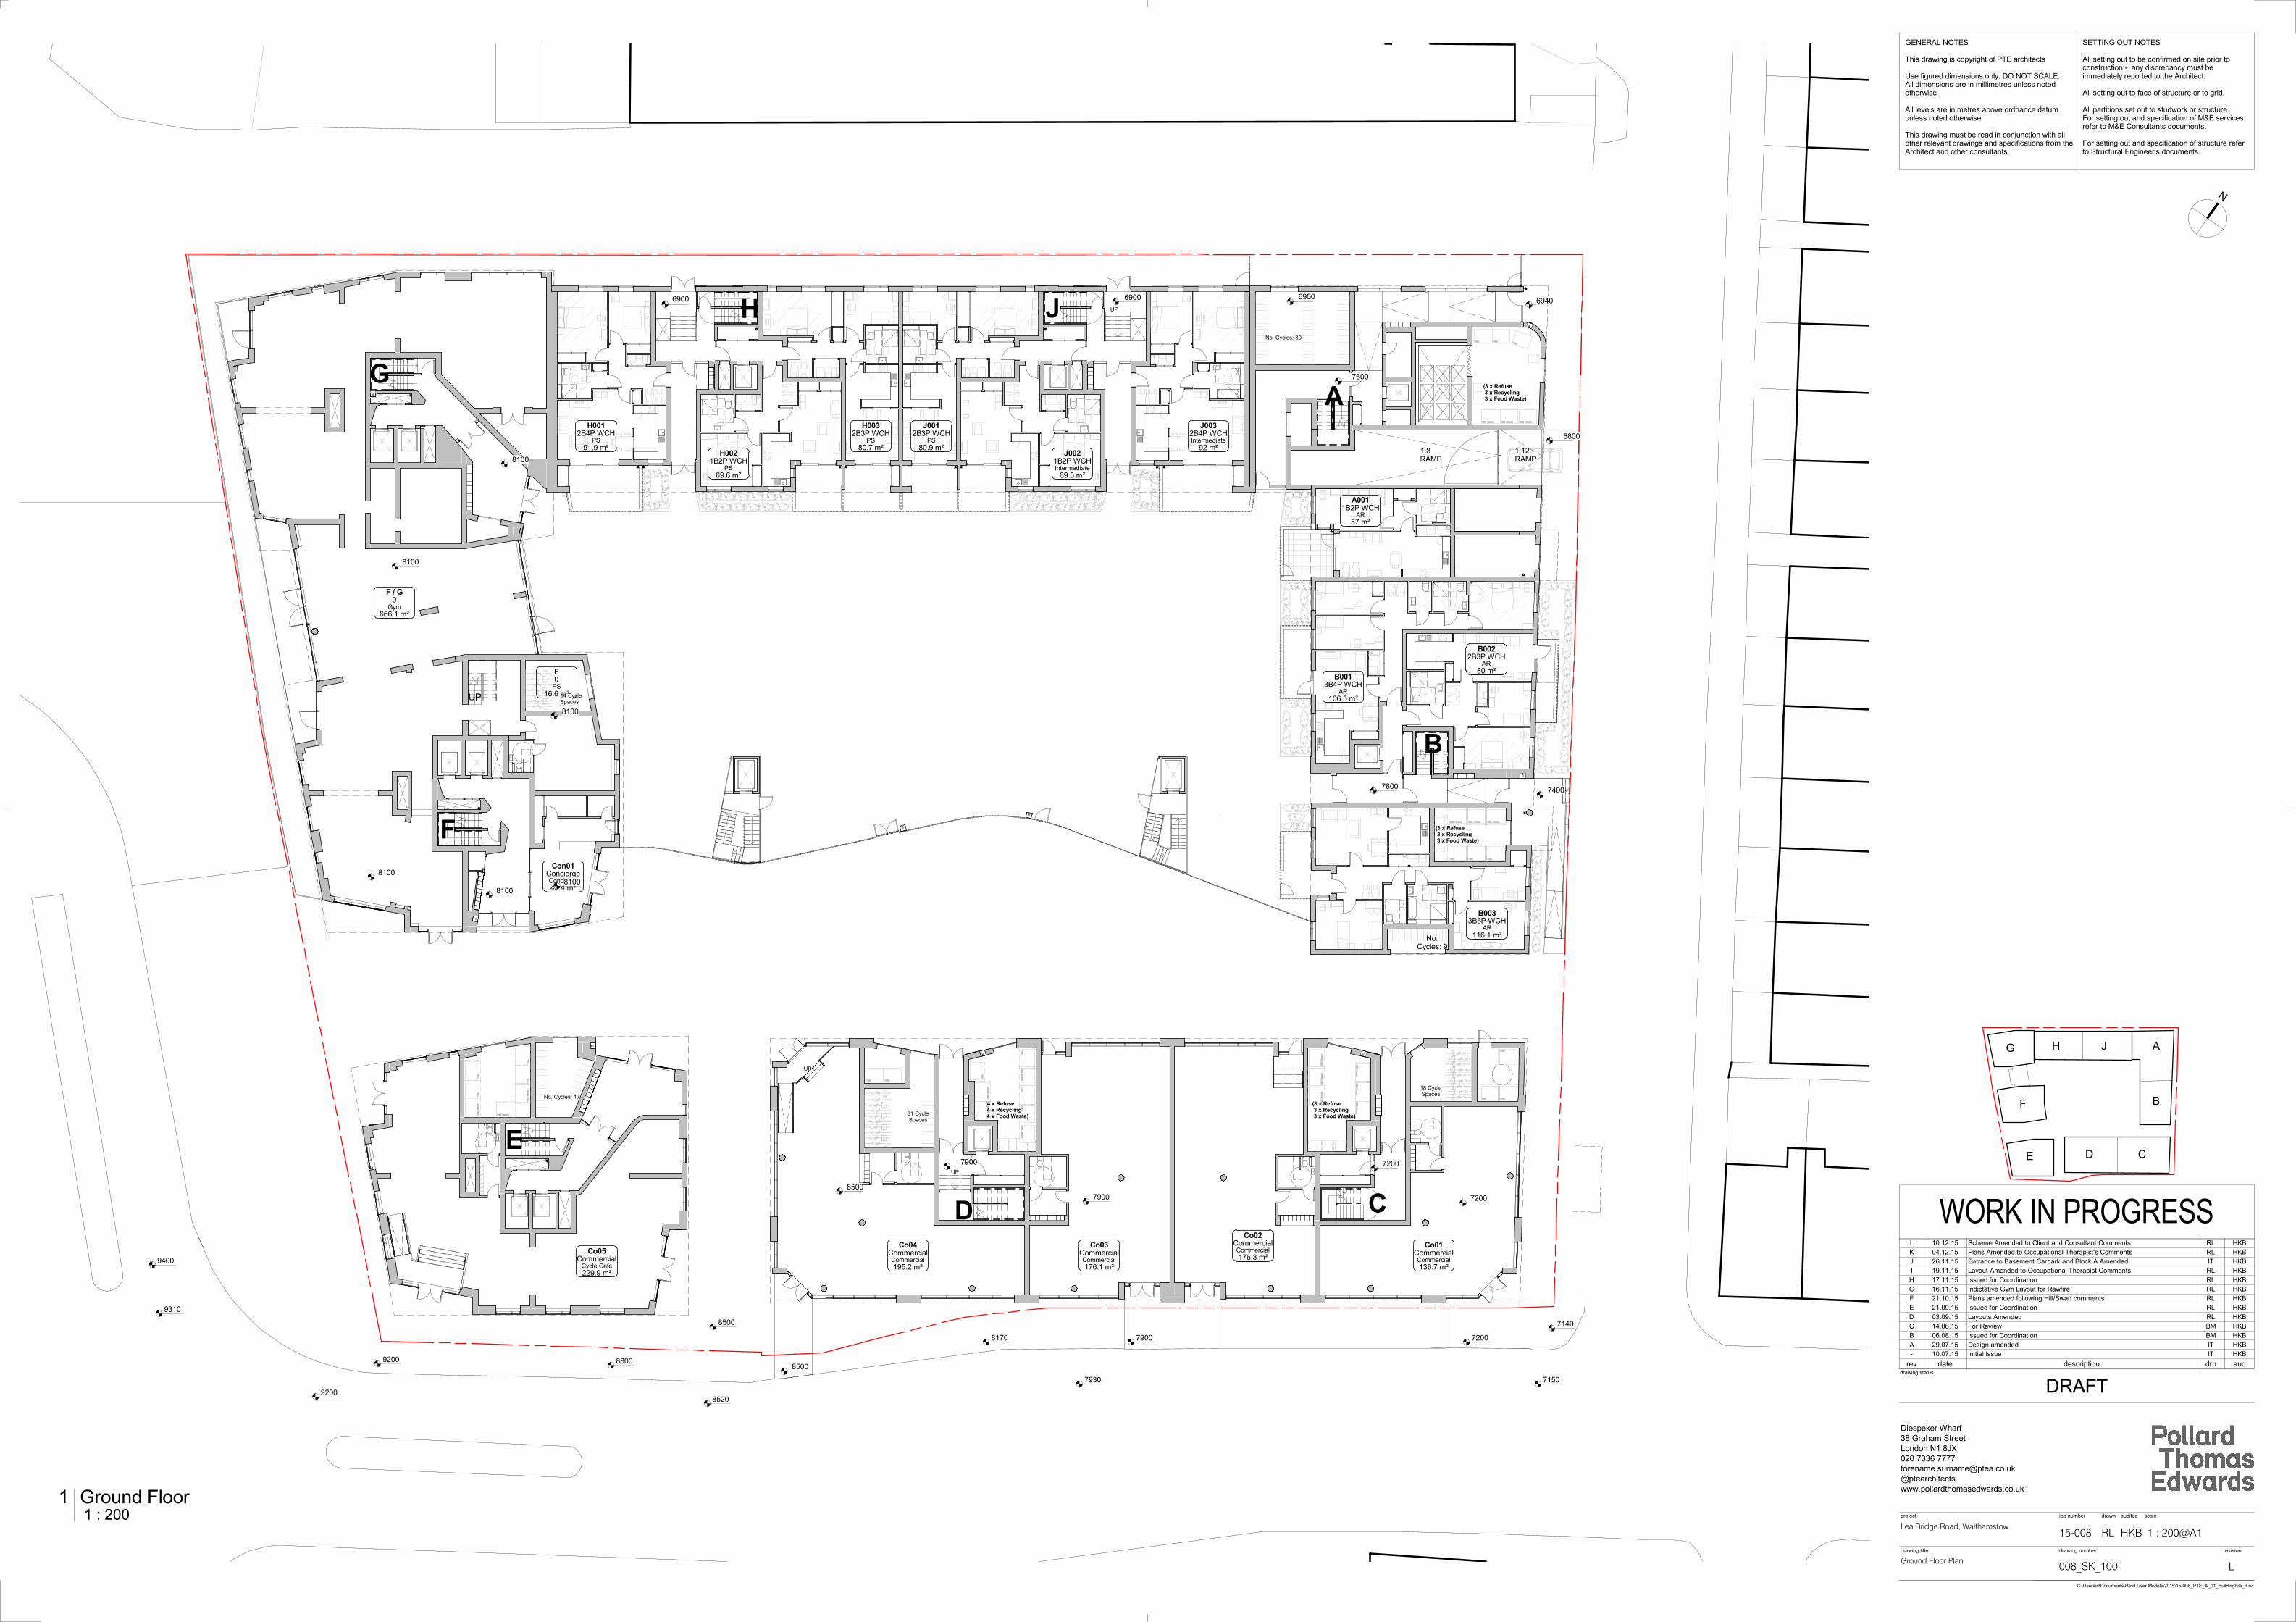
I. Proposed Layout
UP
UP
UP
UP
57 m²
1B2P WCHAR
A001
106.5 m²
3B4P WCHAR
B00180 m²
2B3P WCHAR
B002
116.1 m²
3B5P WCHAR
B003
195.2 m²
CommercialCommercial
Co04
176.3 m²
CommercialCommercial
Co02
229.9 m²
CommercialCycle Cafe
Co05
43.4 m²
ConciergeConcierge
Con01
7900
7200
8500
7900
6940
E
F
H J
G
CD
B
A
8100
8100
8100
8100
8100
8100
9200 8800
8170 72007900
7140
71507930
85209200
9310
9400
8500
69.6 m²
1B2P WCHPS
H00291.9 m²
2B4P WCHPS
H001
80.7 m²
2B3P WCHPS
H003
80.9 m²
2B3P WCHPS
J001
69.3 m²
1B2P WCHIntermediate
J00292 m²
2B4P WCHIntermediate
J003
76007400
176.1 m²
CommercialCommercial
Co03
136.7 m²
CommercialCommercial
Co01
7200
8500
No. Cycles: 17
14 CycleSpaces
31 CycleSpaces
18 CycleSpaces
No.Cycles: 9
No. Cycles: 30
666.1 m²
0Gym
F / G
1:12RAMP
1:8RAMP
(3 x Refuse 3 x Recycling 3 x Food Waste)
(4 x Refuse 4 x Recycling 4 x Food Waste)
(3 x Refuse 3 x Recycling 3 x Food Waste)
(3 x Refuse 3 x Recycling 3 x Food Waste)
6800
7600
69006900 6900
16.6 m²
0PS
F
CD
A
B
H J
E
F
G
N
WORK IN PROGRESS
SETTING OUT NOTES
All setting out to be confirmed on site prior toconstruction - any discrepancy must beimmediately reported to the Architect.
All setting out to face of structure or to grid.
All partitions set out to studwork or structure.For setting out and specification of M&E servicesrefer to M&E Consultants documents.
For setting out and specification of structure referto Structural Engineer's documents.
GENERAL NOTES
This drawing is copyright of PTE architects
Use figured dimensions only. DO NOT SCALE.All dimensions are in millimetres unless notedotherwise
All levels are in metres above ordnance datumunless noted otherwise
This drawing must be read in conjunction with allother relevant drawings and specifications from theArchitect and other consultants
drawing title
project job number
drawing number revision
Diespeker Wharf
38 Graham Street
London N1 8JX
020 7336 7777
drawn audited scale
drawing status
forename [email protected]
@ptearchitects
www.pollardthomasedwards.co.uk
HKB
L
1 : 200@A1
C:\Users\rl\Documents\Revit User Models\2015\15-008_PTE_A_01_BuildingFile_rl.rvt
Lea Bridge Road, Walthamstow
Ground Floor Plan
15-008
008_SK_100
RL
DRAFT
1 : 200Ground Floor1
rev date description drn aud
- 10.07.15 Initial Issue IT HKB
A 29.07.15 Design amended IT HKB
B 06.08.15 Issued for Coordination BM HKB
C 14.08.15 For Review BM HKB
D 03.09.15 Layouts Amended RL HKB
E 21.09.15 Issued for Coordination RL HKB
F 21.10.15 Plans amended following Hill/Swan comments RL HKB
G 16.11.15 Indictative Gym Layout for Rawfire RL HKB
H 17.11.15 Issued for Coordination RL HKB
I 19.11.15 Layout Amended to Occupational Therapist Comments RL HKB
J 26.11.15 Entrance to Basement Carpark and Block A Amended IT HKB
K 04.12.15 Plans Amended to Occupational Therapist's Comments RL HKB
L 10.12.15 Scheme Amended to Client and Consultant Comments RL HKB
UP
1:8RAMP
1:16RAMP
26.1 m²Refuse
Lobby
160.2 m²Plant
26.3 m²Refuse
30
17
3
22
4
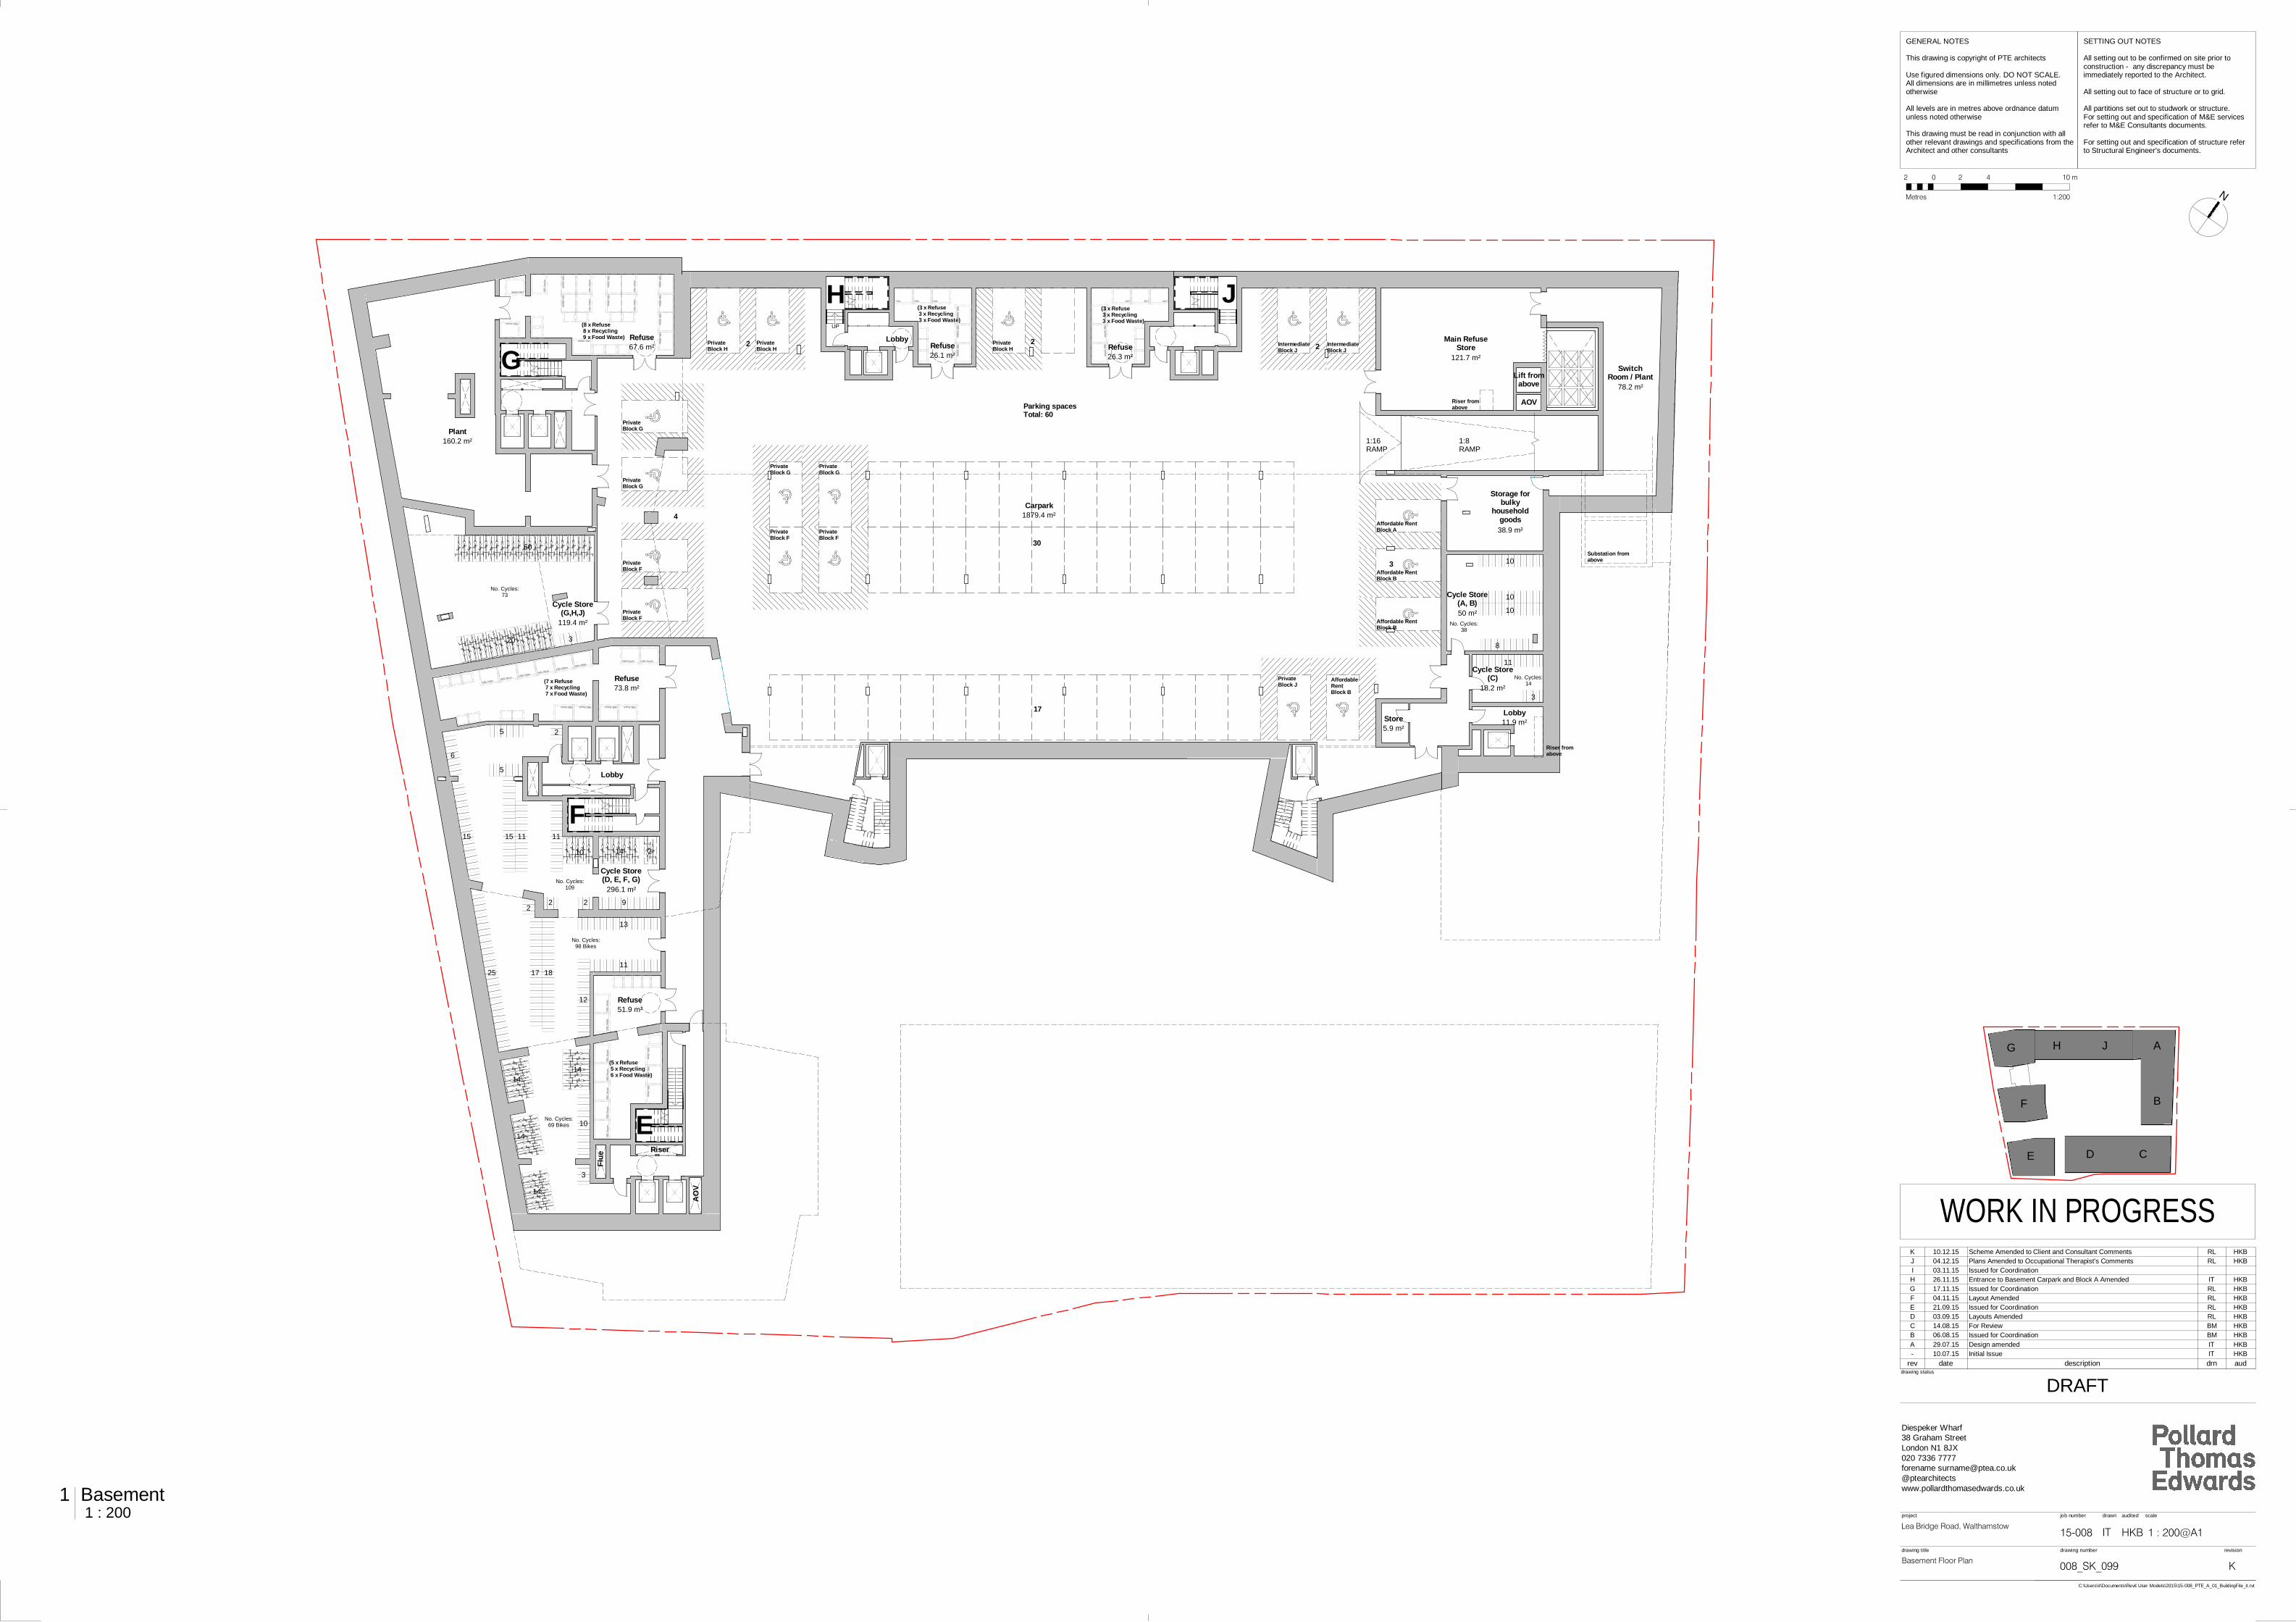
Parking spacesTotal: 60
67.6 m²Refuse
E
H J
G
Lobby
F
Flu
e Riser
AO
V
Substation fromabove
No. Cycles:109
51.9 m²Refuse
73.8 m²Refuse
3
14
14
14
14
12
11
13
181725
2
11111515
5
5 2
6
922
No. Cycles:98 Bikes
No. Cycles:69 Bikes
20
50
No. Cycles:73
119.4 m²
Cycle Store(G,H,J)
296.1 m²
Cycle Store(D, E, F, G)
3
11
8
10
10
10
18.2 m²
Cycle Store(C)
50 m²
Cycle Store(A, B)
11.9 m²Lobby
14 210
Riser fromabove
1879.4 m²Carpark
Riser fromabove
121.7 m²
Main RefuseStore
38.9 m²
Storage forbulky
householdgoods
78.2 m²
SwitchRoom / Plant
2
(5 x Refuse 5 x Recycling 6 x Food Waste)
(7 x Refuse 7 x Recycling 7 x Food Waste)
(8 x Refuse 8 x Recycling 9 x Food Waste)
(3 x Refuse 3 x Recycling 3 x Food Waste)
(3 x Refuse 3 x Recycling 3 x Food Waste)
Lift fromabove
AOV
No. Cycles:38
No. Cycles:14
IntermediateBlock J
Affordable RentBlock A
Affordable RentBlock B
AffordableRentBlock B
PrivateBlock J
IntermediateBlock J
Affordable RentBlock B
PrivateBlock H
PrivateBlock H
PrivateBlock H
PrivateBlock G
PrivateBlock G
PrivateBlock G
PrivateBlock G
PrivateBlock F
PrivateBlock F
PrivateBlock F
PrivateBlock F
5.9 m²Store
10
3
CD
A
B
H J
E
F
G
N
WORK IN PROGRESS
SETTING OUT NOTES
All setting out to be confirmed on site prior toconstruction - any discrepancy must beimmediately reported to the Architect.
All setting out to face of structure or to grid.
All partitions set out to studwork or structure.For setting out and specification of M&E servicesrefer to M&E Consultants documents.
For setting out and specification of structure referto Structural Engineer's documents.
GENERAL NOTES
This drawing is copyright of PTE architects
Use figured dimensions only. DO NOT SCALE.All dimensions are in millimetres unless notedotherwise
All levels are in metres above ordnance datumunless noted otherwise
This drawing must be read in conjunction with allother relevant drawings and specifications from theArchitect and other consultants
drawing title
project job number
drawing number revision
Diespeker Wharf38 Graham StreetLondon N1 8JX020 7336 7777
drawn audited scale
drawing status
forename [email protected]@ptearchitectswww.pollardthomasedwards.co.uk
HKB
K
1 : 200@A1
C:\Users\it\Documents\Revit User Models\2015\15-008_PTE_A_01_BuildingFile_it.rvt
Lea Bridge Road, Walthamstow
Basement Floor Plan
15-008
008_SK_099
IT
DRAFT
1 : 200Basement1
02 4 10 m2
Metres 1:200
rev date description drn aud- 10.07.15 Initial Issue IT HKBA 29.07.15 Design amended IT HKBB 06.08.15 Issued for Coordination BM HKBC 14.08.15 For Review BM HKBD 03.09.15 Layouts Amended RL HKBE 21.09.15 Issued for Coordination RL HKBF 04.11.15 Layout Amended RL HKBG 17.11.15 Issued for Coordination RL HKBH 26.11.15 Entrance to Basement Carpark and Block A Amended IT HKBI 03.11.15 Issued for CoordinationJ 04.12.15 Plans Amended to Occupational Therapist's Comments RL HKBK 10.12.15 Scheme Amended to Client and Consultant Comments RL HKB

Transport Statement
Project Number: AJT/CIV17058 Document Reference: CIV17058/TR001/A03
\\S-bd\wtdl\Projects\CIV17058\DOCUMENTS\CATEGORY\TR\CIV17058_TR001_A03_161215_2nd Issue_TS_AJT.docx
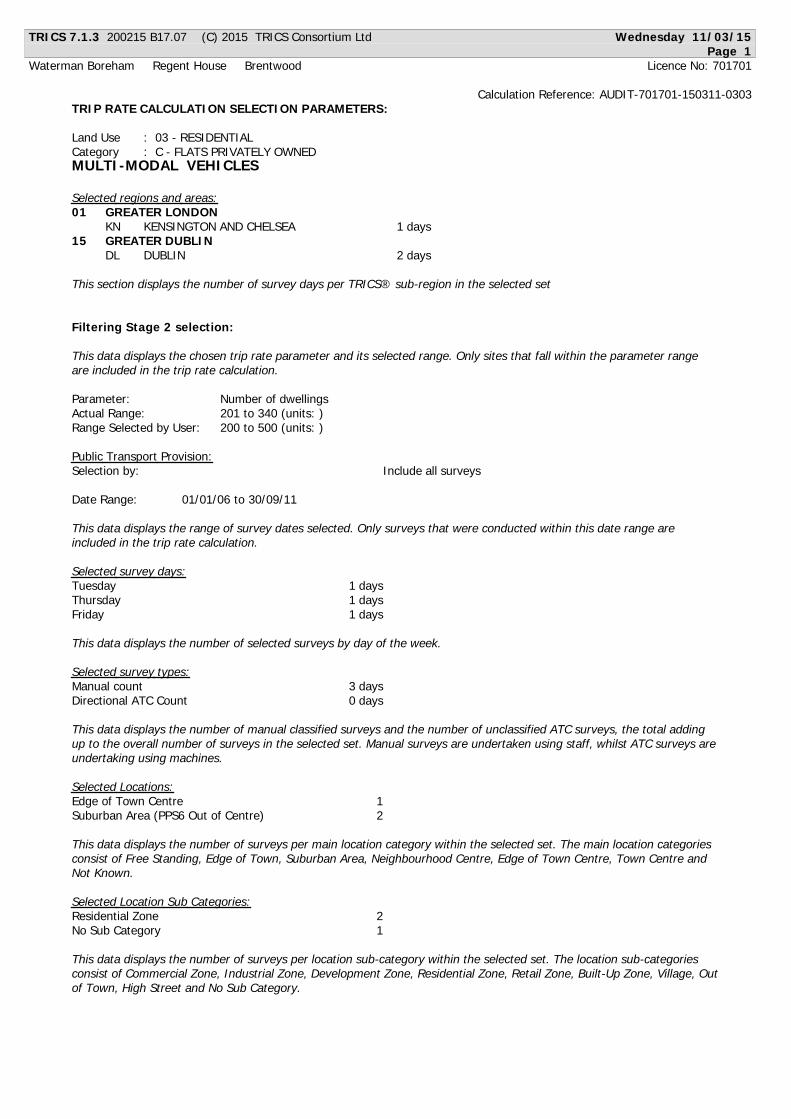
J. TRICS Data – Residential Flats
TRICS 7.1.3 200215 B17.07 (C) 2015 TRICS Consortium Ltd Wednesday 11/03/15
Page 1
Waterman Boreham Regent House Brentwood Licence No: 701701
Calculation Reference: AUDIT-701701-150311-0303
TRIP RATE CALCULATION SELECTION PARAMETERS:
Land Use : 03 - RESIDENTIAL
Category : C - FLATS PRIVATELY OWNED
MULTI-MODAL VEHICLES
Selected regions and areas:
01 GREATER LONDON
KN KENSINGTON AND CHELSEA 1 days
15 GREATER DUBLIN
DL DUBLIN 2 days
This section displays the number of survey days per TRICS® sub-region in the selected set
Filtering Stage 2 selection:
This data displays the chosen trip rate parameter and its selected range. Only sites that fall within the parameter range
are included in the trip rate calculation.
Parameter: Number of dwellings
Actual Range: 201 to 340 (units: )
Range Selected by User: 200 to 500 (units: )
Public Transport Provision:
Selection by: Include all surveys
Date Range: 01/01/06 to 30/09/11
This data displays the range of survey dates selected. Only surveys that were conducted within this date range are
included in the trip rate calculation.
Selected survey days:
Tuesday 1 days
Thursday 1 days
Friday 1 days
This data displays the number of selected surveys by day of the week.
Selected survey types:
Manual count 3 days
Directional ATC Count 0 days
This data displays the number of manual classified surveys and the number of unclassified ATC surveys, the total adding
up to the overall number of surveys in the selected set. Manual surveys are undertaken using staff, whilst ATC surveys are
undertaking using machines.
Selected Locations:
Edge of Town Centre 1
Suburban Area (PPS6 Out of Centre) 2
This data displays the number of surveys per main location category within the selected set. The main location categories
consist of Free Standing, Edge of Town, Suburban Area, Neighbourhood Centre, Edge of Town Centre, Town Centre and
Not Known.
Selected Location Sub Categories:
Residential Zone 2
No Sub Category 1
This data displays the number of surveys per location sub-category within the selected set. The location sub-categories
consist of Commercial Zone, Industrial Zone, Development Zone, Residential Zone, Retail Zone, Built-Up Zone, Village, Out
of Town, High Street and No Sub Category.
TRICS 7.1.3 200215 B17.07 (C) 2015 TRICS Consortium Ltd Wednesday 11/03/15
Page 2
Waterman Boreham Regent House Brentwood Licence No: 701701
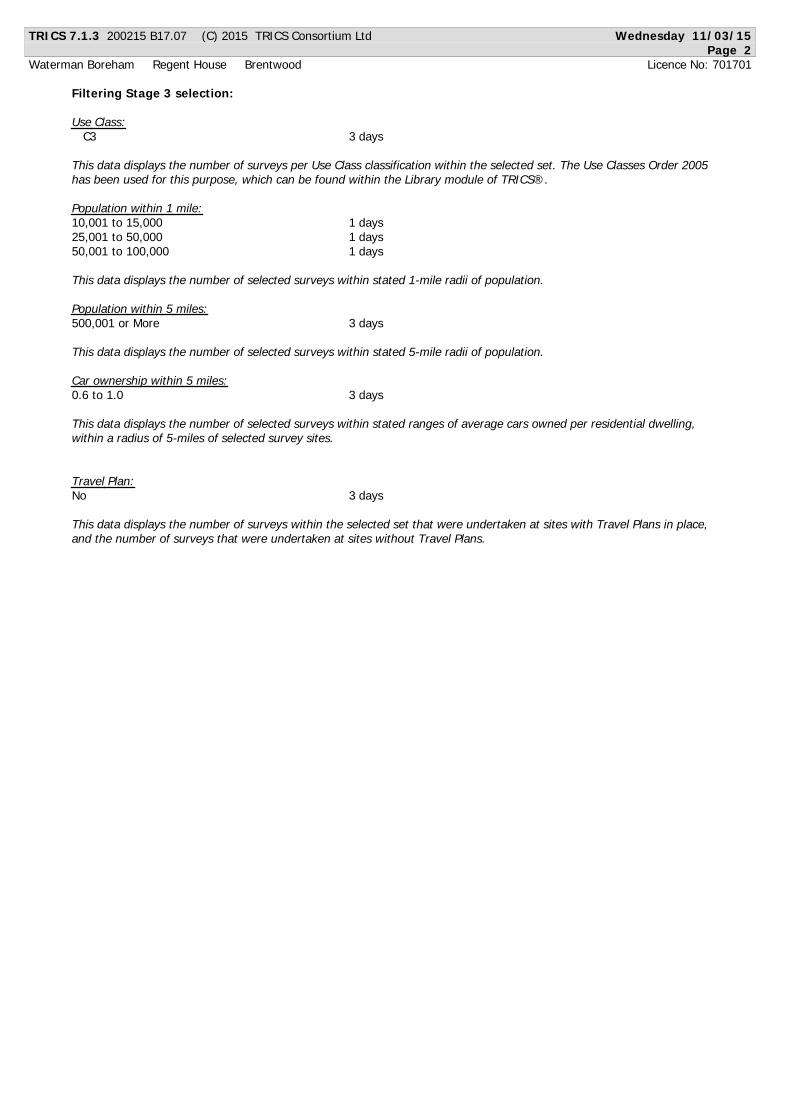
Filtering Stage 3 selection:
Use Class:
C 3 3 days
This data displays the number of surveys per Use Class classification within the selected set. The Use Classes Order 2005
has been used for this purpose, which can be found within the Library module of TRICS®.
Population within 1 mile:
10,001 to 15,000 1 days
25,001 to 50,000 1 days
50,001 to 100,000 1 days
This data displays the number of selected surveys within stated 1-mile radii of population.
Population within 5 miles:
500,001 or More 3 days
This data displays the number of selected surveys within stated 5-mile radii of population.
Car ownership within 5 miles:
0.6 to 1.0 3 days
This data displays the number of selected surveys within stated ranges of average cars owned per residential dwelling,
within a radius of 5-miles of selected survey sites.
Travel Plan:
No 3 days
This data displays the number of surveys within the selected set that were undertaken at sites with Travel Plans in place,
and the number of surveys that were undertaken at sites without Travel Plans.
TRICS 7.1.3 200215 B17.07 (C) 2015 TRICS Consortium Ltd Wednesday 11/03/15
Page 3
Waterman Boreham Regent House Brentwood Licence No: 701701
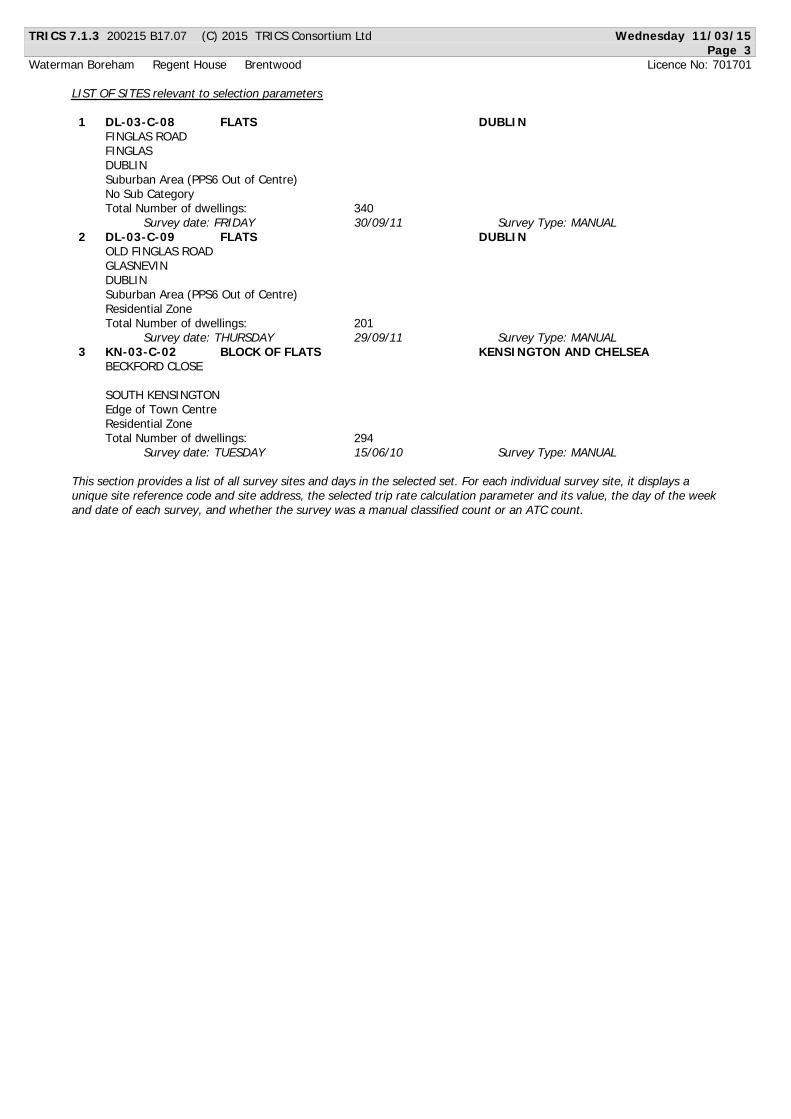
LIST OF SITES relevant to selection parameters
1 DL-03-C-08 FLATS DUBLIN
FINGLAS ROAD
FINGLAS
DUBLIN
Suburban Area (PPS6 Out of Centre)
No Sub Category
Total Number of dwellings: 3 4 0
Survey date: FRIDAY 30/09/11 Survey Type: MANUAL
2 DL-03-C-09 FLATS DUBLIN
OLD FINGLAS ROAD
GLASNEVIN
DUBLIN
Suburban Area (PPS6 Out of Centre)
Residential Zone
Total Number of dwellings: 2 0 1
Survey date: THURSDAY 29/09/11 Survey Type: MANUAL
3 KN-03-C-02 BLOCK OF FLATS KENSINGTON AND CHELSEA
BECKFORD CLOSE
SOUTH KENSINGTON
Edge of Town Centre
Residential Zone
Total Number of dwellings: 2 9 4
Survey date: TUESDAY 15/06/10 Survey Type: MANUAL
This section provides a list of all survey sites and days in the selected set. For each individual survey site, it displays a
unique site reference code and site address, the selected trip rate calculation parameter and its value, the day of the week
and date of each survey, and whether the survey was a manual classified count or an ATC count.

TRICS 7.1.3 200215 B17.07 (C) 2015 TRICS Consortium Ltd Wednesday 11/03/15
Page 4
Waterman Boreham Regent House Brentwood Licence No: 701701
TRIP RATE for Land Use 03 - RESIDENTIAL/C - FLATS PRIVATELY OWNED
MULTI-MODAL VEHICLES
Calculation factor: 1 DWELLS
BOLD print indicates peak (busiest) period
ARRIVALS DEPARTURES TOTALS
No. Ave. Trip No. Ave. Trip No. Ave. Trip
Time Range Days DWELLS Rate Days DWELLS Rate Days DWELLS Rate
00:00 - 01:00
01:00 - 02:00
02:00 - 03:00
03:00 - 04:00
04:00 - 05:00
05:00 - 06:00
06:00 - 07:00
3 278 0.030 3 278 0.169 3 278 0.19907:00 - 08:00
3 278 0.044 3 278 0.211 3 278 0.25508:00 - 09:00
3 278 0.065 3 278 0.092 3 278 0.15709:00 - 10:00
3 278 0.036 3 278 0.053 3 278 0.08910:00 - 11:00
3 278 0.055 3 278 0.042 3 278 0.09711:00 - 12:00
3 278 0.062 3 278 0.067 3 278 0.12912:00 - 13:00
3 278 0.074 3 278 0.069 3 278 0.14313:00 - 14:00
3 278 0.050 3 278 0.066 3 278 0.11614:00 - 15:00
3 278 0.099 3 278 0.065 3 278 0.16415:00 - 16:00
3 278 0.122 3 278 0.049 3 278 0.17116:00 - 17:00
3 278 0.181 3 278 0.047 3 278 0.22817:00 - 18:00
3 278 0.120 3 278 0.050 3 278 0.17018:00 - 19:00
1 294 0.071 1 294 0.058 1 294 0.12919:00 - 20:00
1 294 0.054 1 294 0.034 1 294 0.08820:00 - 21:00
21:00 - 22:00
22:00 - 23:00
23:00 - 24:00
Total Rates: 1.063 1.072 2.135
This section displays the trip rate results based on the selected set of surveys and the selected count type (shown just
above the table). It is split by three main columns, representing arrivals trips, departures trips, and total trips (arrivals plus
departures). Within each of these main columns are three sub-columns. These display the number of survey days where
count data is included (per time period), the average value of the selected trip rate calculation parameter (per time
period), and the trip rate result (per time period). Total trip rates (the sum of the column) are also displayed at the foot of
the table.
To obtain a trip rate, the average (mean) trip rate parameter value (TRP) is first calculated for all selected survey days
that have count data available for the stated time period. The average (mean) number of arrivals, departures or totals
(whichever applies) is also calculated (COUNT) for all selected survey days that have count data available for the stated
time period. Then, the average count is divided by the average trip rate parameter value, and multiplied by the stated
calculation factor (shown just above the table and abbreviated here as FACT). So, the method is: COUNT/TRP*FACT. Trip
rates are then rounded to 3 decimal places.
Parameter summary
Trip rate parameter range selected: 201 - 340 (units: )
Survey date date range: 01/01/06 - 30/09/11
Number of weekdays (Monday-Friday): 3
Number of Saturdays: 0
Number of Sundays: 0
Surveys manually removed from selection: 0
This section displays a quick summary of some of the data filtering selections made by the TRICS® user. The trip rate
calculation parameter range of all selected surveys is displayed first, followed by the range of minimum and maximum
survey dates selected by the user. Then, the total number of selected weekdays and weekend days in the selected set of
surveys are show. Finally, the number of survey days that have been manually removed from the selected set outside of
the standard filtering procedure are displayed.
TRICS 7.1.3 200215 B17.07 (C) 2015 TRICS Consortium Ltd Wednesday 11/03/15
Page 5
Waterman Boreham Regent House Brentwood Licence No: 701701
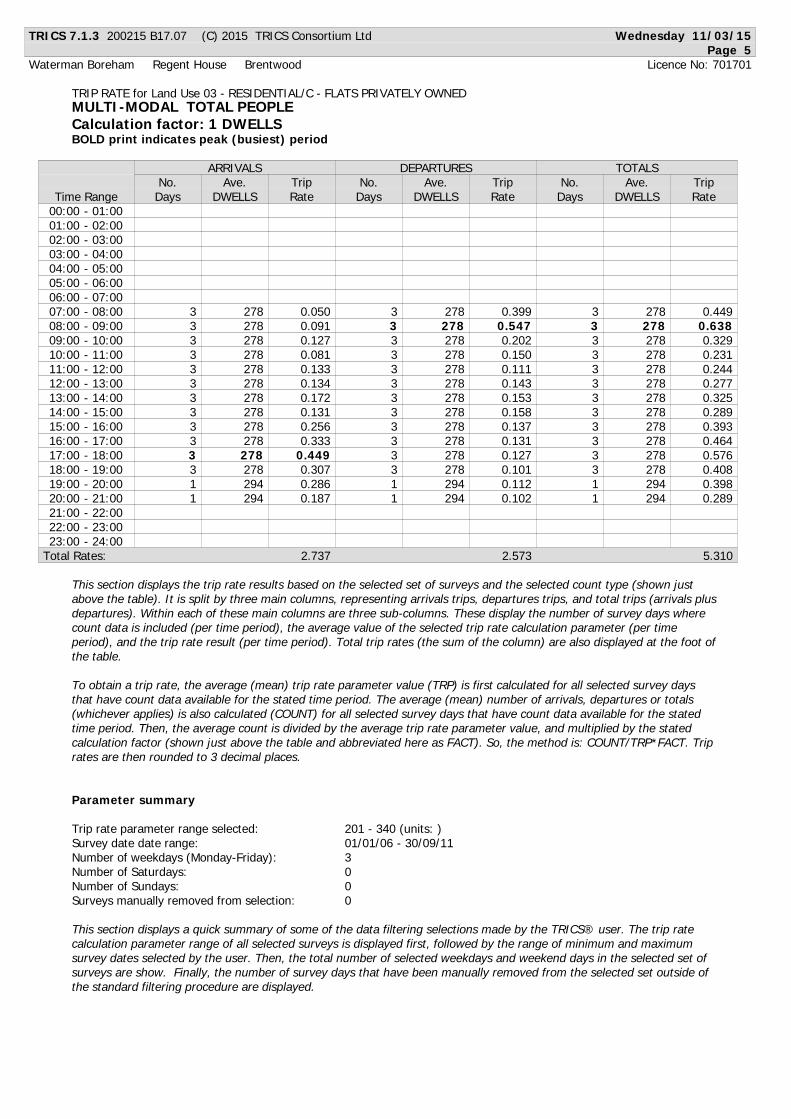
TRIP RATE for Land Use 03 - RESIDENTIAL/C - FLATS PRIVATELY OWNED
MULTI-MODAL TOTAL PEOPLE
Calculation factor: 1 DWELLS
BOLD print indicates peak (busiest) period
ARRIVALS DEPARTURES TOTALS
No. Ave. Trip No. Ave. Trip No. Ave. Trip
Time Range Days DWELLS Rate Days DWELLS Rate Days DWELLS Rate
00:00 - 01:00
01:00 - 02:00
02:00 - 03:00
03:00 - 04:00
04:00 - 05:00
05:00 - 06:00
06:00 - 07:00
3 278 0.050 3 278 0.399 3 278 0.44907:00 - 08:00
3 278 0.091 3 278 0.547 3 278 0.63808:00 - 09:00
3 278 0.127 3 278 0.202 3 278 0.32909:00 - 10:00
3 278 0.081 3 278 0.150 3 278 0.23110:00 - 11:00
3 278 0.133 3 278 0.111 3 278 0.24411:00 - 12:00
3 278 0.134 3 278 0.143 3 278 0.27712:00 - 13:00
3 278 0.172 3 278 0.153 3 278 0.32513:00 - 14:00
3 278 0.131 3 278 0.158 3 278 0.28914:00 - 15:00
3 278 0.256 3 278 0.137 3 278 0.39315:00 - 16:00
3 278 0.333 3 278 0.131 3 278 0.46416:00 - 17:00
3 278 0.449 3 278 0.127 3 278 0.57617:00 - 18:00
3 278 0.307 3 278 0.101 3 278 0.40818:00 - 19:00
1 294 0.286 1 294 0.112 1 294 0.39819:00 - 20:00
1 294 0.187 1 294 0.102 1 294 0.28920:00 - 21:00
21:00 - 22:00
22:00 - 23:00
23:00 - 24:00
Total Rates: 2.737 2.573 5.310
This section displays the trip rate results based on the selected set of surveys and the selected count type (shown just
above the table). It is split by three main columns, representing arrivals trips, departures trips, and total trips (arrivals plus
departures). Within each of these main columns are three sub-columns. These display the number of survey days where
count data is included (per time period), the average value of the selected trip rate calculation parameter (per time
period), and the trip rate result (per time period). Total trip rates (the sum of the column) are also displayed at the foot of
the table.
To obtain a trip rate, the average (mean) trip rate parameter value (TRP) is first calculated for all selected survey days
that have count data available for the stated time period. The average (mean) number of arrivals, departures or totals
(whichever applies) is also calculated (COUNT) for all selected survey days that have count data available for the stated
time period. Then, the average count is divided by the average trip rate parameter value, and multiplied by the stated
calculation factor (shown just above the table and abbreviated here as FACT). So, the method is: COUNT/TRP*FACT. Trip
rates are then rounded to 3 decimal places.
Parameter summary
Trip rate parameter range selected: 201 - 340 (units: )
Survey date date range: 01/01/06 - 30/09/11
Number of weekdays (Monday-Friday): 3
Number of Saturdays: 0
Number of Sundays: 0
Surveys manually removed from selection: 0
This section displays a quick summary of some of the data filtering selections made by the TRICS® user. The trip rate
calculation parameter range of all selected surveys is displayed first, followed by the range of minimum and maximum
survey dates selected by the user. Then, the total number of selected weekdays and weekend days in the selected set of
surveys are show. Finally, the number of survey days that have been manually removed from the selected set outside of
the standard filtering procedure are displayed.

Transport Statement
Project Number: AJT/CIV17058 Document Reference: CIV17058/TR001/A03
\\S-bd\wtdl\Projects\CIV17058\DOCUMENTS\CATEGORY\TR\CIV17058_TR001_A03_161215_2nd Issue_TS_AJT.docx
K. TRICS – Commercial Use
TRICS 7.2.2 160615 B17.20 (C) 2015 TRICS Consortium Ltd Thursday 06/08/15
Page 1
Waterman Boreham Regent House Brentwood Licence No: 701701
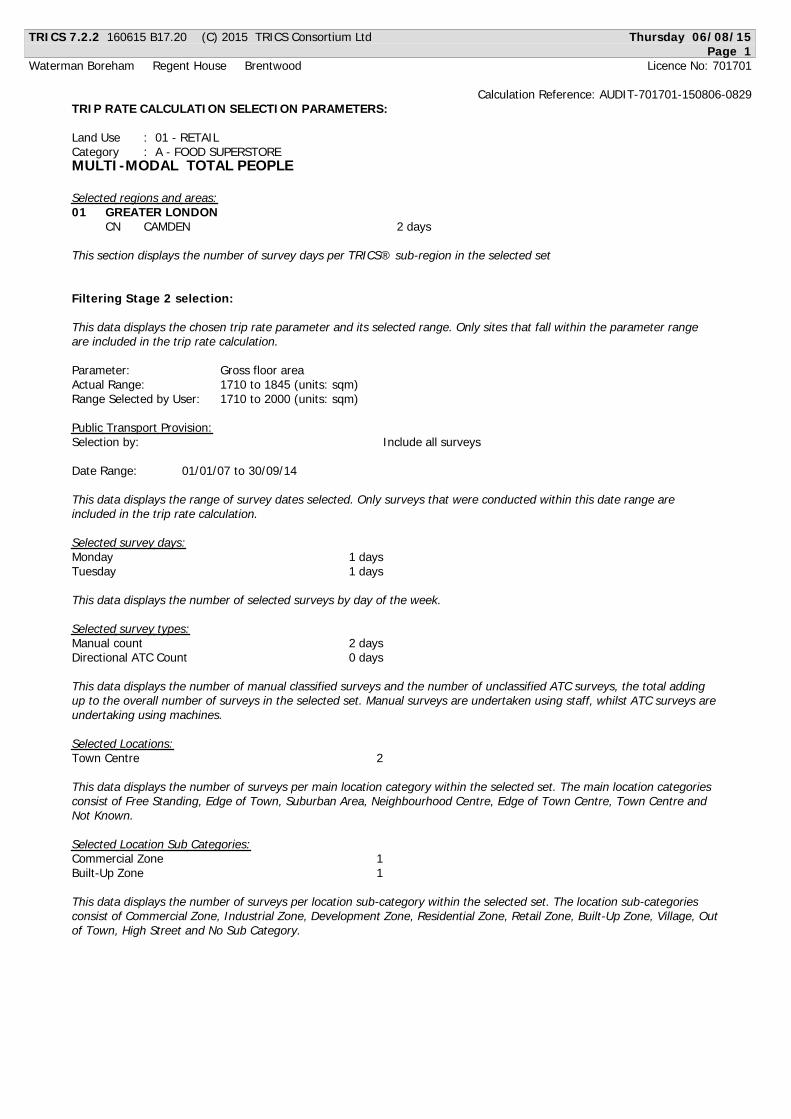
Calculation Reference: AUDIT-701701-150806-0829
TRIP RATE CALCULATION SELECTION PARAMETERS:
Land Use : 01 - RETAIL
Category : A - FOOD SUPERSTORE
MULTI-MODAL TOTAL PEOPLE
Selected regions and areas:
01 GREATER LONDON
CN CAMDEN 2 days
This section displays the number of survey days per TRICS® sub-region in the selected set
Filtering Stage 2 selection:
This data displays the chosen trip rate parameter and its selected range. Only sites that fall within the parameter range
are included in the trip rate calculation.
Parameter: Gross floor area
Actual Range: 1710 to 1845 (units: sqm)
Range Selected by User: 1710 to 2000 (units: sqm)
Public Transport Provision:
Selection by: Include all surveys
Date Range: 01/01/07 to 30/09/14
This data displays the range of survey dates selected. Only surveys that were conducted within this date range are
included in the trip rate calculation.
Selected survey days:
Monday 1 days
Tuesday 1 days
This data displays the number of selected surveys by day of the week.
Selected survey types:
Manual count 2 days
Directional ATC Count 0 days
This data displays the number of manual classified surveys and the number of unclassified ATC surveys, the total adding
up to the overall number of surveys in the selected set. Manual surveys are undertaken using staff, whilst ATC surveys are
undertaking using machines.
Selected Locations:
Town Centre 2
This data displays the number of surveys per main location category within the selected set. The main location categories
consist of Free Standing, Edge of Town, Suburban Area, Neighbourhood Centre, Edge of Town Centre, Town Centre and
Not Known.
Selected Location Sub Categories:
Commercial Zone 1
Built-Up Zone 1
This data displays the number of surveys per location sub-category within the selected set. The location sub-categories
consist of Commercial Zone, Industrial Zone, Development Zone, Residential Zone, Retail Zone, Built-Up Zone, Village, Out
of Town, High Street and No Sub Category.
TRICS 7.2.2 160615 B17.20 (C) 2015 TRICS Consortium Ltd Thursday 06/08/15
Page 2
Waterman Boreham Regent House Brentwood Licence No: 701701
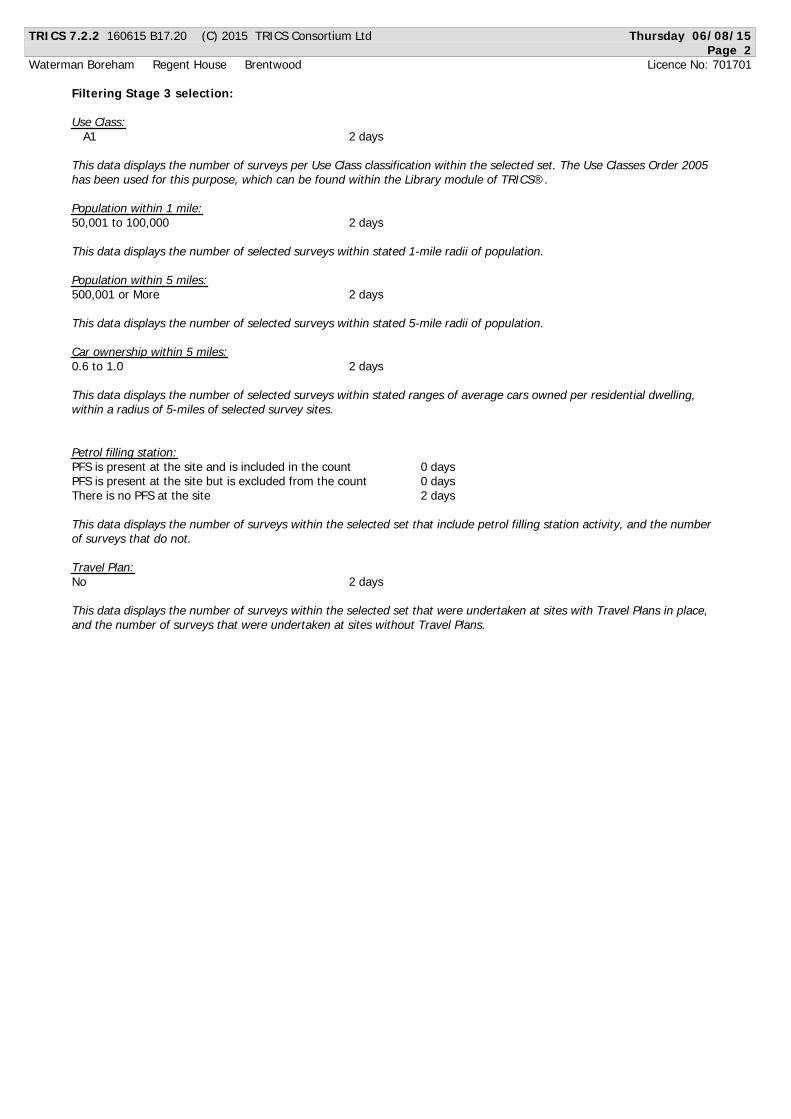
Filtering Stage 3 selection:
Use Class:
A 1 2 days
This data displays the number of surveys per Use Class classification within the selected set. The Use Classes Order 2005
has been used for this purpose, which can be found within the Library module of TRICS®.
Population within 1 mile:
50,001 to 100,000 2 days
This data displays the number of selected surveys within stated 1-mile radii of population.
Population within 5 miles:
500,001 or More 2 days
This data displays the number of selected surveys within stated 5-mile radii of population.
Car ownership within 5 miles:
0.6 to 1.0 2 days
This data displays the number of selected surveys within stated ranges of average cars owned per residential dwelling,
within a radius of 5-miles of selected survey sites.
Petrol filling station:
PFS is present at the site and is included in the count 0 days
PFS is present at the site but is excluded from the count 0 days
There is no PFS at the site 2 days
This data displays the number of surveys within the selected set that include petrol filling station activity, and the number
of surveys that do not.
Travel Plan:
No 2 days
This data displays the number of surveys within the selected set that were undertaken at sites with Travel Plans in place,
and the number of surveys that were undertaken at sites without Travel Plans.
TRICS 7.2.2 160615 B17.20 (C) 2015 TRICS Consortium Ltd Thursday 06/08/15
Page 3
Waterman Boreham Regent House Brentwood Licence No: 701701
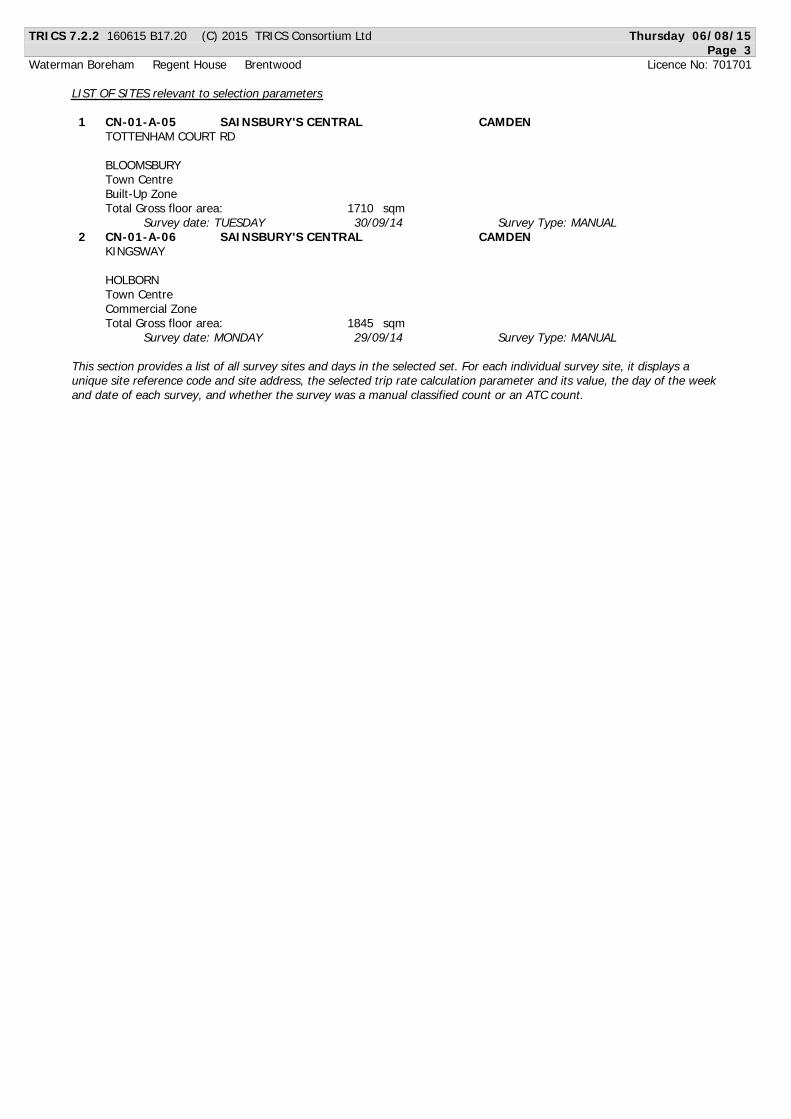
LIST OF SITES relevant to selection parameters
1 CN-01-A-05 SAINSBURY'S CENTRAL CAMDEN
TOTTENHAM COURT RD
BLOOMSBURY
Town Centre
Built-Up Zone
Total Gross floor area: 1 7 1 0 sqm
Survey date: TUESDAY 30/09/14 Survey Type: MANUAL
2 CN-01-A-06 SAINSBURY'S CENTRAL CAMDEN
KINGSWAY
HOLBORN
Town Centre
Commercial Zone
Total Gross floor area: 1 8 4 5 sqm
Survey date: MONDAY 29/09/14 Survey Type: MANUAL
This section provides a list of all survey sites and days in the selected set. For each individual survey site, it displays a
unique site reference code and site address, the selected trip rate calculation parameter and its value, the day of the week
and date of each survey, and whether the survey was a manual classified count or an ATC count.
TRICS 7.2.2 160615 B17.20 (C) 2015 TRICS Consortium Ltd Thursday 06/08/15
Page 4
Waterman Boreham Regent House Brentwood Licence No: 701701
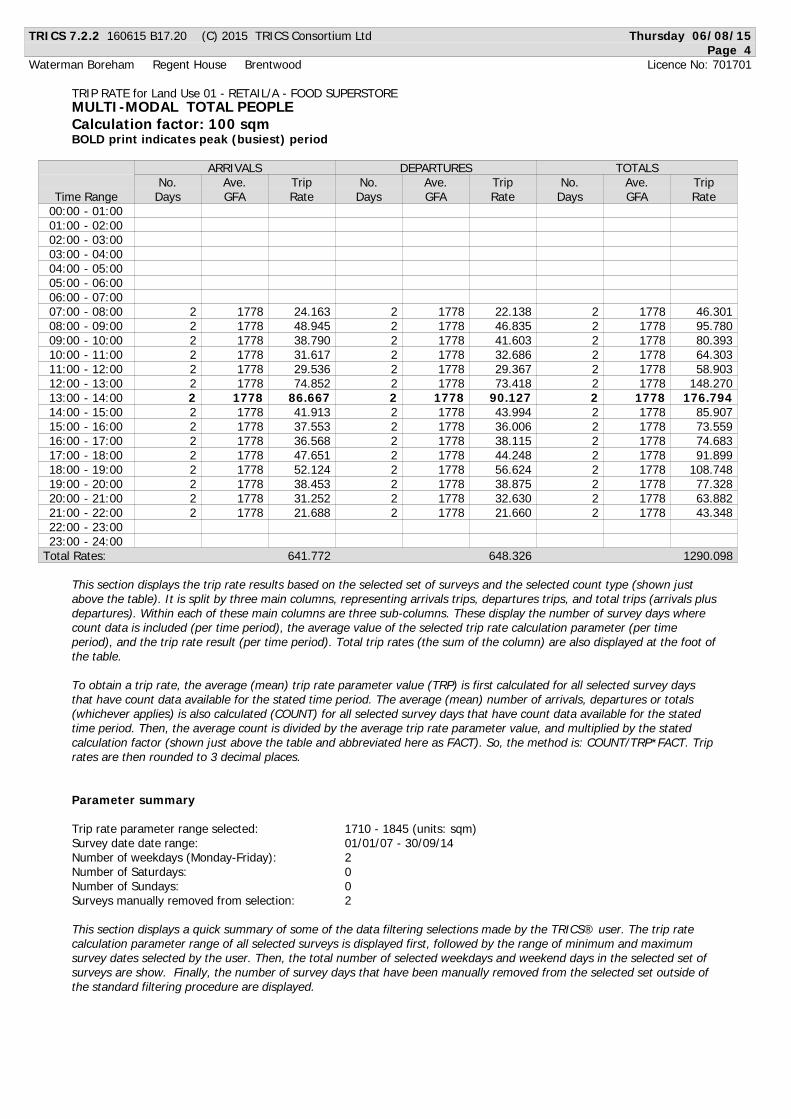
TRIP RATE for Land Use 01 - RETAIL/A - FOOD SUPERSTORE
MULTI-MODAL TOTAL PEOPLE
Calculation factor: 100 sqm
BOLD print indicates peak (busiest) period
ARRIVALS DEPARTURES TOTALS
No. Ave. Trip No. Ave. Trip No. Ave. Trip
Time Range Days GFA Rate Days GFA Rate Days GFA Rate
00:00 - 01:00
01:00 - 02:00
02:00 - 03:00
03:00 - 04:00
04:00 - 05:00
05:00 - 06:00
06:00 - 07:00
2 1778 24.163 2 1778 22.138 2 1778 46.30107:00 - 08:00
2 1778 48.945 2 1778 46.835 2 1778 95.78008:00 - 09:00
2 1778 38.790 2 1778 41.603 2 1778 80.39309:00 - 10:00
2 1778 31.617 2 1778 32.686 2 1778 64.30310:00 - 11:00
2 1778 29.536 2 1778 29.367 2 1778 58.90311:00 - 12:00
2 1778 74.852 2 1778 73.418 2 1778 148.27012:00 - 13:00
2 1778 86.667 2 1778 90.127 2 1778 176.79413:00 - 14:00
2 1778 41.913 2 1778 43.994 2 1778 85.90714:00 - 15:00
2 1778 37.553 2 1778 36.006 2 1778 73.55915:00 - 16:00
2 1778 36.568 2 1778 38.115 2 1778 74.68316:00 - 17:00
2 1778 47.651 2 1778 44.248 2 1778 91.89917:00 - 18:00
2 1778 52.124 2 1778 56.624 2 1778 108.74818:00 - 19:00
2 1778 38.453 2 1778 38.875 2 1778 77.32819:00 - 20:00
2 1778 31.252 2 1778 32.630 2 1778 63.88220:00 - 21:00
2 1778 21.688 2 1778 21.660 2 1778 43.34821:00 - 22:00
22:00 - 23:00
23:00 - 24:00
Total Rates: 641.772 648.326 1290.098
This section displays the trip rate results based on the selected set of surveys and the selected count type (shown just
above the table). It is split by three main columns, representing arrivals trips, departures trips, and total trips (arrivals plus
departures). Within each of these main columns are three sub-columns. These display the number of survey days where
count data is included (per time period), the average value of the selected trip rate calculation parameter (per time
period), and the trip rate result (per time period). Total trip rates (the sum of the column) are also displayed at the foot of
the table.
To obtain a trip rate, the average (mean) trip rate parameter value (TRP) is first calculated for all selected survey days
that have count data available for the stated time period. The average (mean) number of arrivals, departures or totals
(whichever applies) is also calculated (COUNT) for all selected survey days that have count data available for the stated
time period. Then, the average count is divided by the average trip rate parameter value, and multiplied by the stated
calculation factor (shown just above the table and abbreviated here as FACT). So, the method is: COUNT/TRP*FACT. Trip
rates are then rounded to 3 decimal places.
Parameter summary
Trip rate parameter range selected: 1710 - 1845 (units: sqm)
Survey date date range: 01/01/07 - 30/09/14
Number of weekdays (Monday-Friday): 2
Number of Saturdays: 0
Number of Sundays: 0
Surveys manually removed from selection: 2
This section displays a quick summary of some of the data filtering selections made by the TRICS® user. The trip rate
calculation parameter range of all selected surveys is displayed first, followed by the range of minimum and maximum
survey dates selected by the user. Then, the total number of selected weekdays and weekend days in the selected set of
surveys are show. Finally, the number of survey days that have been manually removed from the selected set outside of
the standard filtering procedure are displayed.

Transport Statement
Project Number: AJT/CIV17058 Document Reference: CIV17058/TR001/A03
\\S-bd\wtdl\Projects\CIV17058\DOCUMENTS\CATEGORY\TR\CIV17058_TR001_A03_161215_2nd Issue_TS_AJT.docx
L. Car Park Accumulation
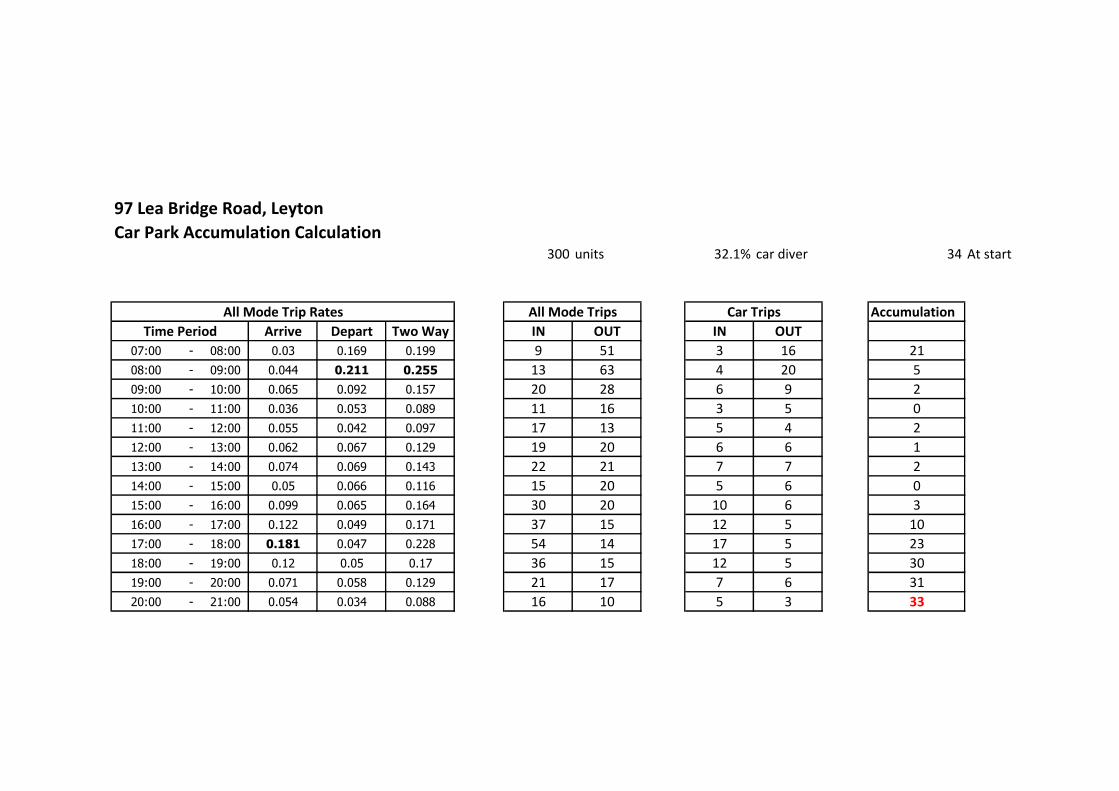
97 Lea Bridge Road, Leyton
Car Park Accumulation Calculation300 units 32.1% car diver 34 At start
Accumulation
Arrive Depart Two Way IN OUT IN OUT
07:00 - 08:00 0.03 0.169 0.199 9 51 3 16 21
08:00 - 09:00 0.044 0.211 0.255 13 63 4 20 5
09:00 - 10:00 0.065 0.092 0.157 20 28 6 9 2
10:00 - 11:00 0.036 0.053 0.089 11 16 3 5 0
11:00 - 12:00 0.055 0.042 0.097 17 13 5 4 2
12:00 - 13:00 0.062 0.067 0.129 19 20 6 6 1
13:00 - 14:00 0.074 0.069 0.143 22 21 7 7 2
14:00 - 15:00 0.05 0.066 0.116 15 20 5 6 0
15:00 - 16:00 0.099 0.065 0.164 30 20 10 6 3
16:00 - 17:00 0.122 0.049 0.171 37 15 12 5 10
17:00 - 18:00 0.181 0.047 0.228 54 14 17 5 23
18:00 - 19:00 0.12 0.05 0.17 36 15 12 5 30
19:00 - 20:00 0.071 0.058 0.129 21 17 7 6 31
20:00 - 21:00 0.054 0.034 0.088 16 10 5 3 33
Time Period
All Mode Trip Rates All Mode Trips Car Trips

Transport Statement
Project Number: AJT/CIV17058 Document Reference: CIV17058/TR001/A03
\\S-bd\wtdl\Projects\CIV17058\DOCUMENTS\CATEGORY\TR\CIV17058_TR001_A03_161215_2nd Issue_TS_AJT.docx
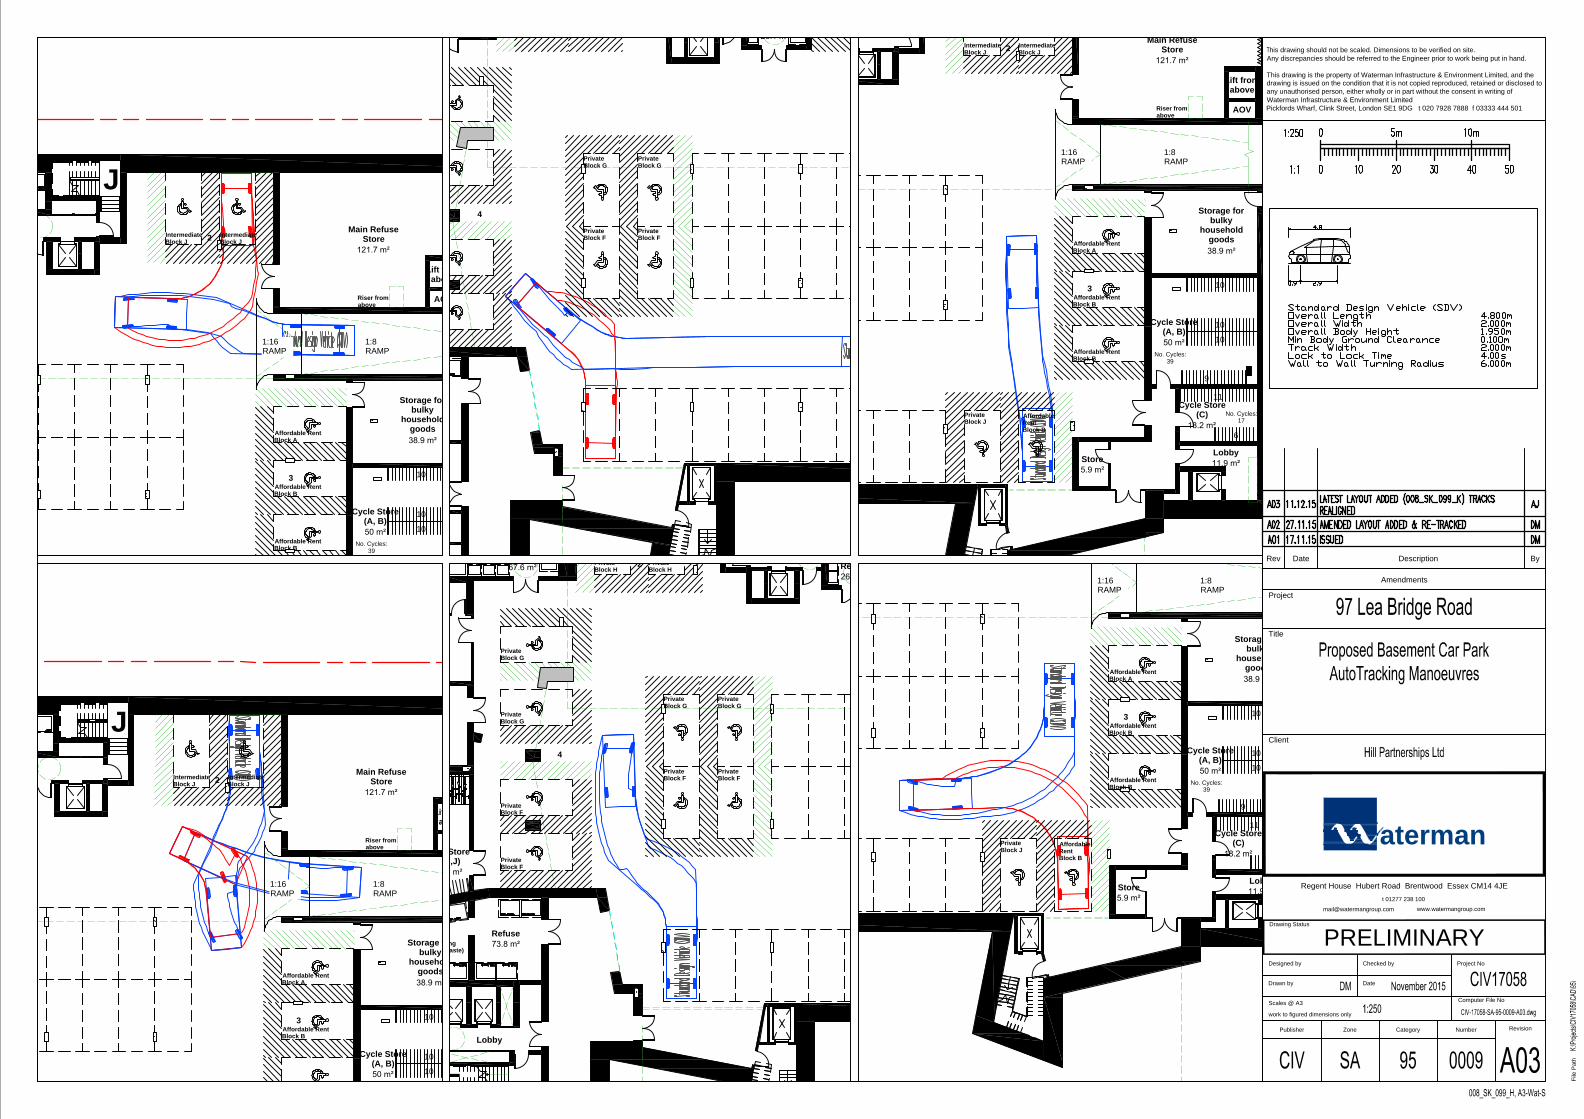
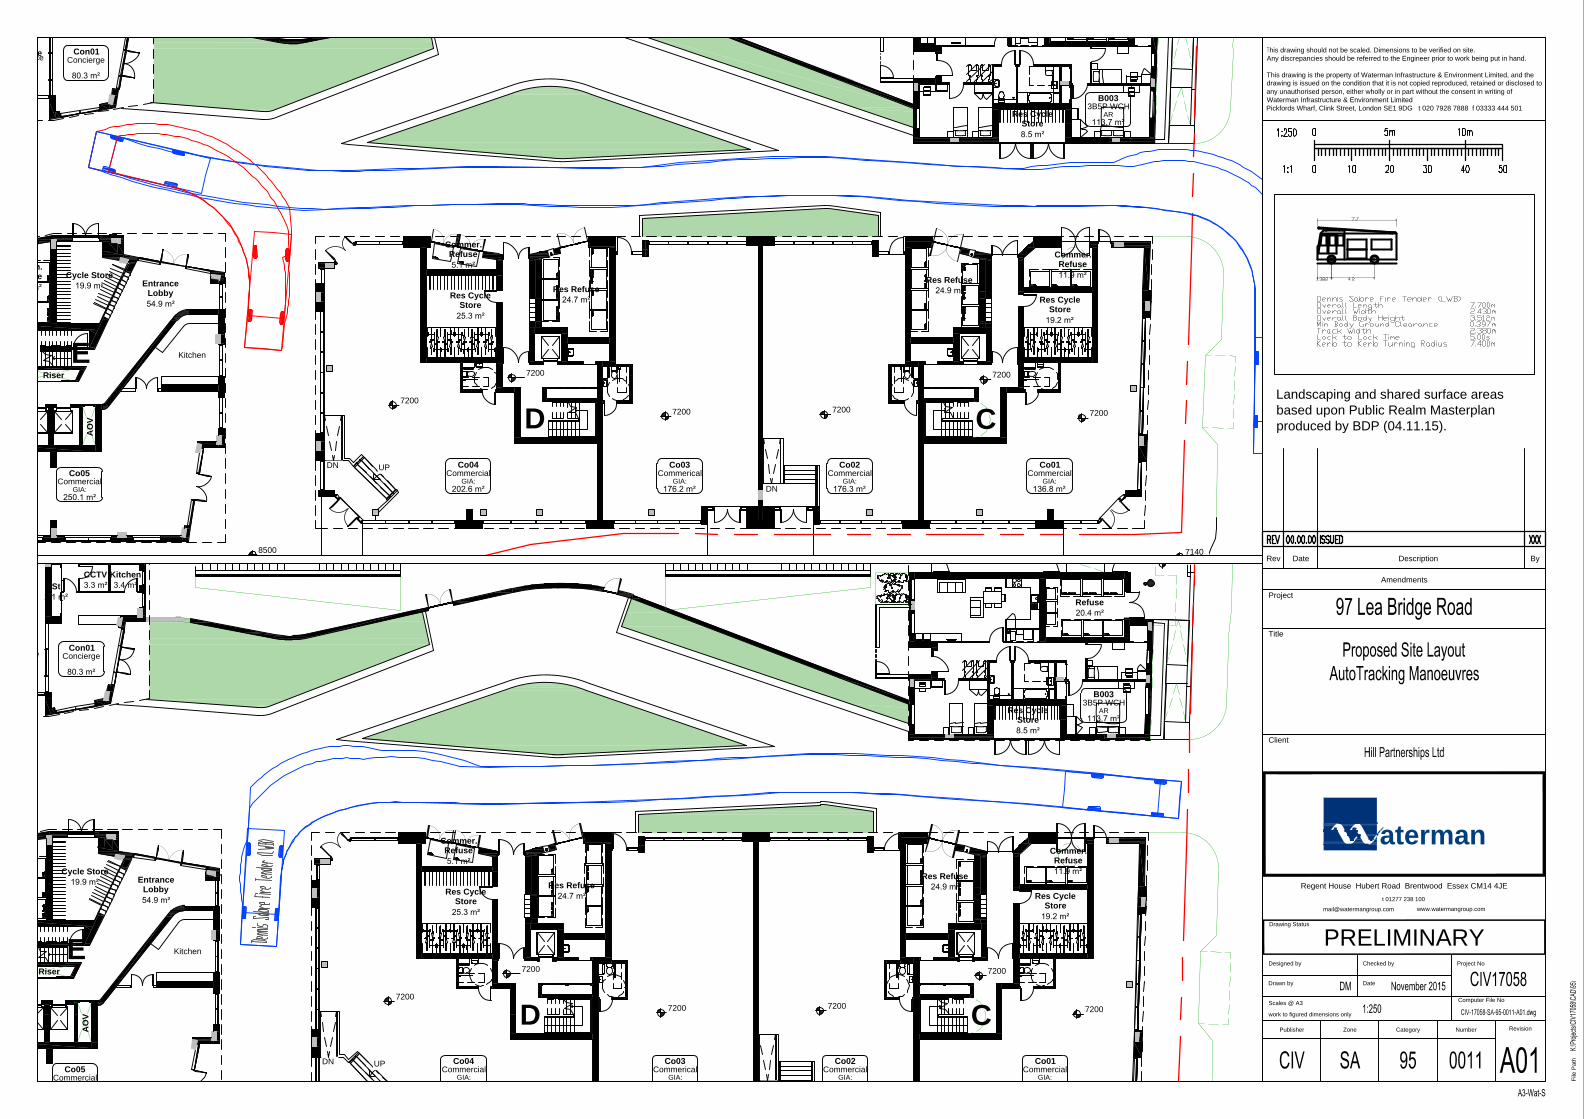
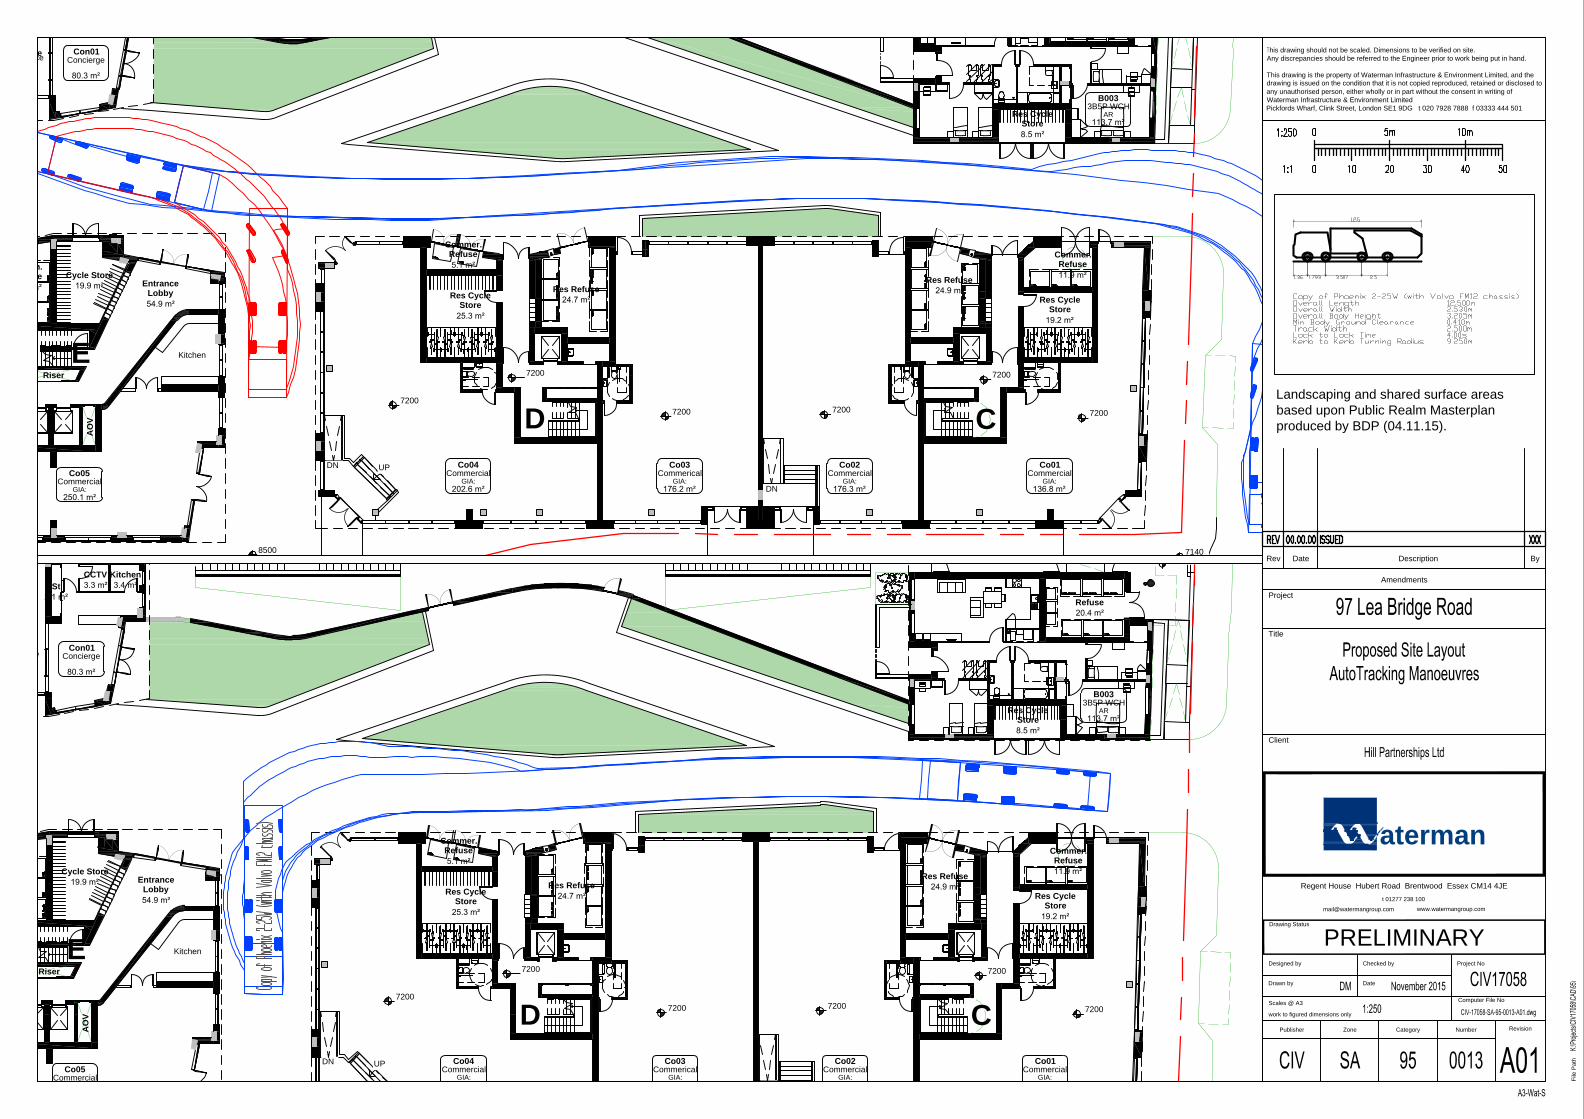
M. Vehicle Tracking
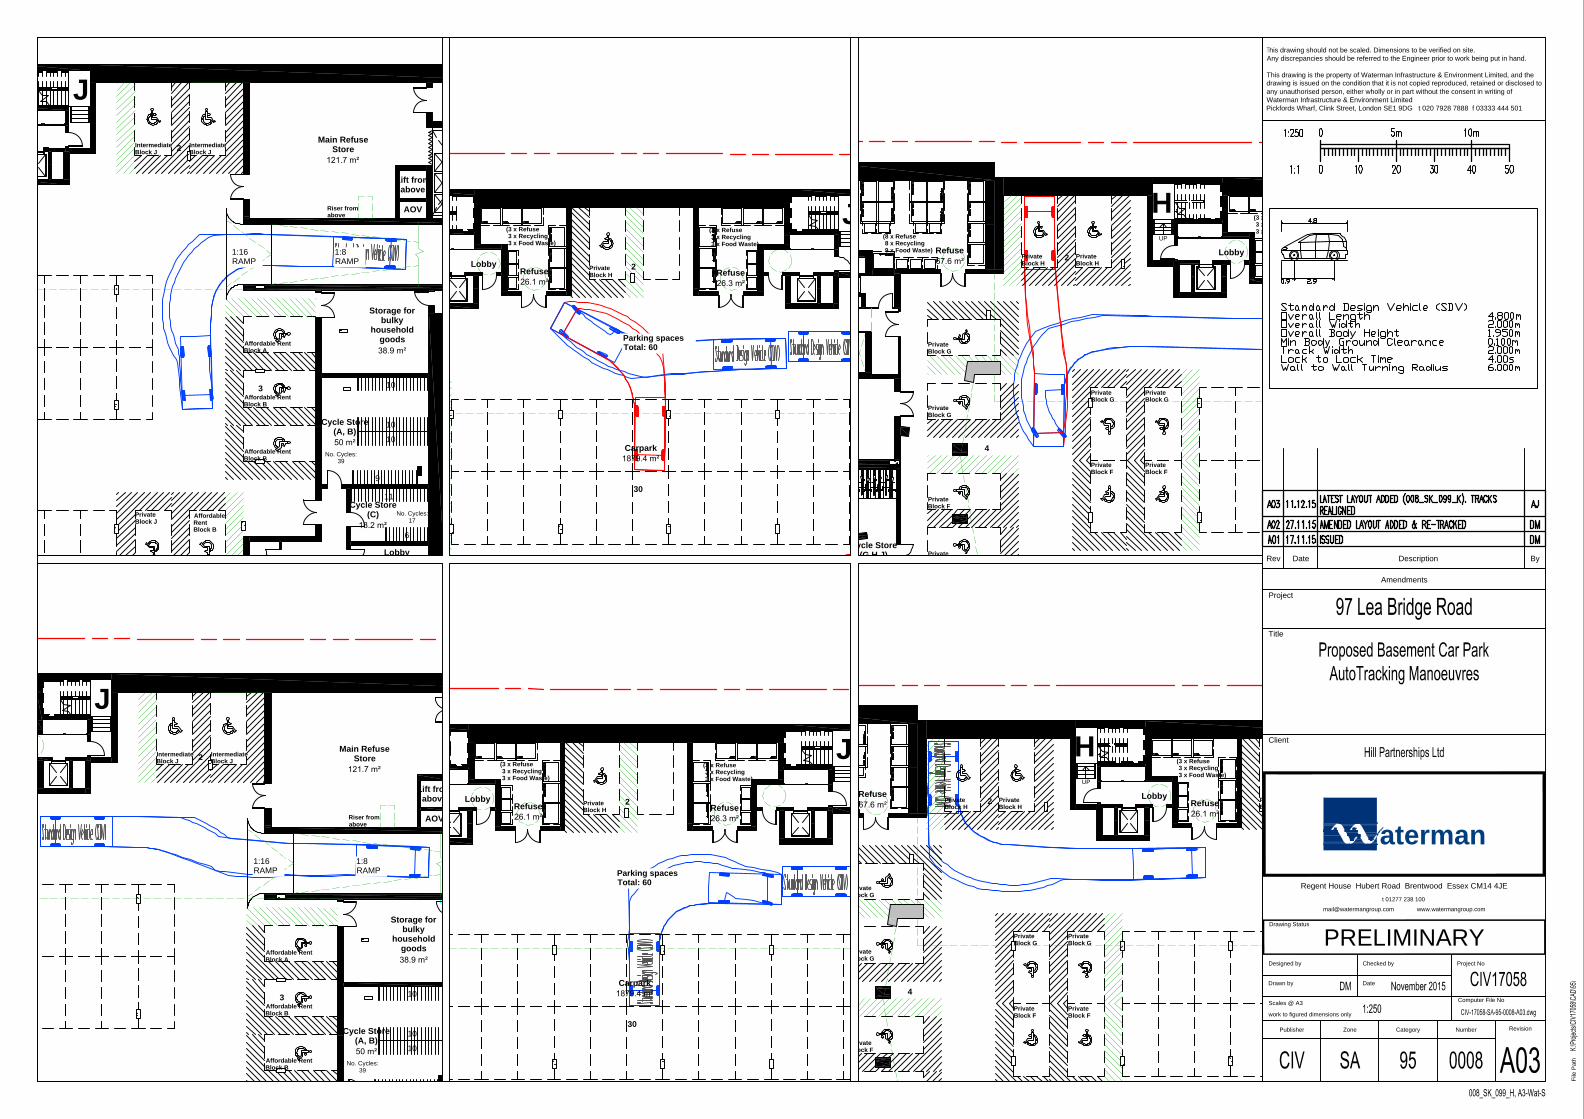
1:8RAMP
1:16RAMP
3
J
6
11
9
10
10
10
Cycle Store(C)
Cycle Store(A, B)
Lobby
Riser fromabove
Main RefuseStore
Storage forbulky
householdgoods
2
Lift fromabove
AOV
No. Cycles:39
No. Cycles:17
IntermediateBlock J
Affordable RentBlock A
Affordable RentBlock B
AffordableRentBlock B
PrivateBlock J
IntermediateBlock J
Affordable RentBlock B
Store
RefuseLobby
Refuse
30
2
Parking spacesTotal: 60
J
Carpark
(3 x Refuse 3 x Recycling 3 x Food Waste)
(3 x Refuse 3 x Recycling 3 x Food Waste)
PrivateBlock H
UP
Lobby2
4
Refuse
H
Cycle Store(G,H,J)
(8 x Refuse 8 x Recycling 9 x Food Waste)
(3 x Refuse 3 x Recycling 3 x Food Waste)
PrivateBlock H
PrivateBlock H
PrivateBlock G
PrivateBlock G
PrivateBlock G
PrivateBlock G
PrivateBlock F
PrivateBlock F
PrivateBlock F
Private
1:8RAMP
1:16RAMP
3
J
10
10
10
Cycle Store(A, B)
Riser fromabove
Main RefuseStore
Storage forbulky
householdgoods
2
Lift fromabove
AOV
No. Cycles:39
IntermediateBlock J
Affordable RentBlock A
Affordable RentBlock B
IntermediateBlock J
Affordable RentBlock B
RefuseLobby
Refuse
30
2
Parking spacesTotal: 60
J
Carpark
(3 x Refuse 3 x Recycling 3 x Food Waste)
(3 x Refuse 3 x Recycling 3 x Food Waste)
PrivateBlock H
UP
RefuseLobby
2
4
Refuse
H(3 x Refuse 3 x Recycling 3 x Food Waste)
PrivateBlock H
PrivateBlock H
PrivateBlock H
PrivateBlock G
PrivateBlock G
PrivateBlock G
PrivateBlock G
PrivateBlock F
PrivateBlock F
PrivateBlock F
Amendments
DescriptionDateRev
Title
Client
Designed by
Drawn by
Checked by
Date
Scales @ A3
work to figured dimensions only
By
Project
Drawing Status
Project No
Computer File No
aterman
his drawing should not be scaled. Dimensions to be verified on site.Any discrepancies should be referred to the Engineer prior to work being put in hand.
This drawing is the property of Waterman Infrastructure & Environment Limited, and thedrawing is issued on the condition that it is not copied reproduced, retained or disclosed toany unauthorised person, either wholly or in part without the consent in writing ofWaterman Infrastructure & Environment LimitedPickfords Wharf, Clink Street, London SE1 9DG t 020 7928 7888 f 03333 444 501
File
Pat
h
Regent House Hubert Road Brentwood Essex CM14 4JE
t 01277 238 100
PRELIMINARY
Publisher RevisionZone Category Number
1:8RAMP
1:16RAMP
3
J
10
10
10
Cycle Store(A, B)
Riser fromabove
Main RefuseStore
Storage forbulky
householdgoods
2
Lift fromabove
AOV
No. Cycles:39
IntermediateBlock J
Affordable RentBlock A
Affordable RentBlock B
IntermediateBlock J
Affordable RentBlock B
4
PrivateBlock G
PrivateBlock G
PrivateBlock F
PrivateBlock F
1:8RAMP
1:16RAMP
3
6
11
9
10
10
10
Cycle Store(C)
Cycle Store(A, B)
Lobby
Riser fromabove
Riser fromabove
Main RefuseStore
Storage forbulky
householdgoods
2
Lift fromabove
AOV
No. Cycles:39
No. Cycles:17
IntermediateBlock J
Affordable RentBlock A
Affordable RentBlock B
AffordableRentBlock B
PrivateBlock J
IntermediateBlock J
Affordable RentBlock B
Store
RefuseLobby
2
4
Lobby
F
Refuse
Cycle Store(G,H,J)
7 x Recycling 7 x Food Waste)
PrivateBlock H
PrivateBlock H
PrivateBlock G
PrivateBlock G
PrivateBlock G
PrivateBlock G
PrivateBlock F
PrivateBlock F
PrivateBlock F
PrivateBlock F
1:8RAMP
1:16RAMP
3
J
10
10
10
Cycle Store(A, B)
Riser fromabove
Main RefuseStore
Storage forbulky
householdgoods
2
Lift fromabove
AOV
IntermediateBlock J
Affordable RentBlock A
Affordable RentBlock B
IntermediateBlock J
Affordable Rent
1:8RAMP
1:16RAMP
3
11
9
10
10
10
Cycle Store(C)
Cycle Store(A, B)
Lobby
Storage forbulky
householdgoods
No. Cycles:39
No. Cycles:
Affordable RentBlock A
Affordable RentBlock B
AffordableRentBlock B
PrivateBlock J
Affordable RentBlock B
Store Regent House Hubert Road Brentwood Essex CM14 4JE
t 01277 238 100
PRELIMINARY
Publisher RevisionZone Category Number
Amendments
DescriptionDateRev
Title
Client
Designed by
Drawn by
Checked by
Date
Scales @ A3
work to figured dimensions only
By
Project
Drawing Status
Project No
Computer File No
aterman
his drawing should not be scaled. Dimensions to be verified on site.Any discrepancies should be referred to the Engineer prior to work being put in hand.
This drawing is the property of Waterman Infrastructure & Environment Limited, and thedrawing is issued on the condition that it is not copied reproduced, retained or disclosed toany unauthorised person, either wholly or in part without the consent in writing ofWaterman Infrastructure & Environment LimitedPickfords Wharf, Clink Street, London SE1 9DG t 020 7928 7888 f 03333 444 501
File
Pat
h
DN
UPDN
3B5P WCHAR
B003
CommercialGIA:
Co04Commercial
GIA:
Co02
CommercialGIA:
Co05
ConciergeCon01
7200 7200
7200
7200
7200
Res CycleStore
Res CycleStore
Comm.Refuse
Res CycleStore
Commer.Refuse
Commer.Refuse
Res RefuseRes Refuse
E
CD
Riser
AO
V
71408500
CommericalGIA:
Co03Commercial
GIA:
Co01
7200
Cycle StoreEntrance
Lobby
Kitchen
EntranceEntrance
UP
DN
UPDN
3B5P WCHAR
B003
CommercialGIA:
Co04Commercial
GIA:
Co02
CommercialCo05
ConciergeCon01
7200 7200
7200
7200
7200
Res CycleStore
Res CycleStore
Comm.Refuse
Res CycleStore
Refuse
Commer.Refuse
Commer.Refuse
Res RefuseRes Refuse
E
CD
Riser
AO
V
7400
CommericalGIA:
Co03Commercial
GIA:
Co01
7200
Cycle StoreEntrance
Lobby
KitchenCCTVSt
Kitchen
Entrance
Amendments
DescriptionDateRev
Title
Client
Designed by
Drawn by
Checked by
Date
Scales @ A3
work to figured dimensions only
By
Project
Drawing Status
Project No
Computer File No
aterman
his drawing should not be scaled. Dimensions to be verified on site.Any discrepancies should be referred to the Engineer prior to work being put in hand.
This drawing is the property of Waterman Infrastructure & Environment Limited, and thedrawing is issued on the condition that it is not copied reproduced, retained or disclosed toany unauthorised person, either wholly or in part without the consent in writing ofWaterman Infrastructure & Environment LimitedPickfords Wharf, Clink Street, London SE1 9DG t 020 7928 7888 f 03333 444 501
File
Pat
h
Regent House Hubert Road Brentwood Essex CM14 4JE
t 01277 238 100
PRELIMINARY
Publisher RevisionZone Category Number
Landscaping and shared surface areasbased upon Public Realm Masterplanproduced by BDP (04.11.15).
DN
UPDN
3B5P WCHAR
B003
CommercialGIA:
Co04Commercial
GIA:
Co02
CommercialGIA:
Co05
ConciergeCon01
7200 7200
7200
7200
7200
Res CycleStore
Res CycleStore
Comm.Refuse
Res CycleStore
Commer.Refuse
Commer.Refuse
Res RefuseRes Refuse
E
CD
Riser
AO
V
71408500
CommericalGIA:
Co03Commercial
GIA:
Co01
7200
Cycle StoreEntrance
Lobby
Kitchen
EntranceEntrance
UP
DN
UPDN
3B5P WCHAR
B003
CommercialGIA:
Co04Commercial
GIA:
Co02
CommercialCo05
ConciergeCon01
7200 7200
7200
7200
7200
Res CycleStore
Res CycleStore
Comm.Refuse
Res CycleStore
Refuse
Commer.Refuse
Commer.Refuse
Res RefuseRes Refuse
E
CD
Riser
AO
V
7400
CommericalGIA:
Co03Commercial
GIA:
Co01
7200
Cycle StoreEntrance
Lobby
KitchenCCTVSt
Kitchen
Entrance
Amendments
DescriptionDateRev
Title
Client
Designed by
Drawn by
Checked by
Date
Scales @ A3
work to figured dimensions only
By
Project
Drawing Status
Project No
Computer File No
aterman
his drawing should not be scaled. Dimensions to be verified on site.Any discrepancies should be referred to the Engineer prior to work being put in hand.
This drawing is the property of Waterman Infrastructure & Environment Limited, and thedrawing is issued on the condition that it is not copied reproduced, retained or disclosed toany unauthorised person, either wholly or in part without the consent in writing ofWaterman Infrastructure & Environment LimitedPickfords Wharf, Clink Street, London SE1 9DG t 020 7928 7888 f 03333 444 501
File
Pat
h
Regent House Hubert Road Brentwood Essex CM14 4JE
t 01277 238 100
PRELIMINARY
Publisher RevisionZone Category Number
Landscaping and shared surface areasbased upon Public Realm Masterplanproduced by BDP (04.11.15).
Transport Statement
Project Number: AJT/CIV17058 Document Reference: CIV17058/TR001/A03
\\S-bd\wtdl\Projects\CIV17058\DOCUMENTS\CATEGORY\TR\CIV17058_TR001_A03_161215_2nd Issue_TS_AJT.docx