water quality assessment and wastewater management in
TRANSCRIPT
Water Quality Assessment and Wastewater Management in Thermal
Power Plants
By
Dr. K. Ranganathan & S. Suresh
Central Pollution Control Board Zonal Office (South), Bangalore
Introduction
Water is a prime natural resource and with out that no life on the earth.
71% percentage of the earth is covered by water but less than 3% is fresh water and less than 0.3% is available for domestic, agricultural and industrial applications.
The water resources such as surface and ground water are being polluted by discharge of wastewaters and about 70% of rivers and streams in India contain polluted water.
GLOBAL FRESH WATER RESOURCE GLANCE
Overall precipitation on the earth provides 5,00,000
BCM of water.
Land alone gets 1,10, 000 BCM and share of our
country is 4000 BCM.
A Country is ‘Water stress’ if per capita water
availability is less than 1700 m3/year
A Country is ‘water scarcity’ if per capita water
availability is less than 1000 m3/year
If the per capita water availability is less than 600
m3/year, it is called ‘Absolute scarcity’
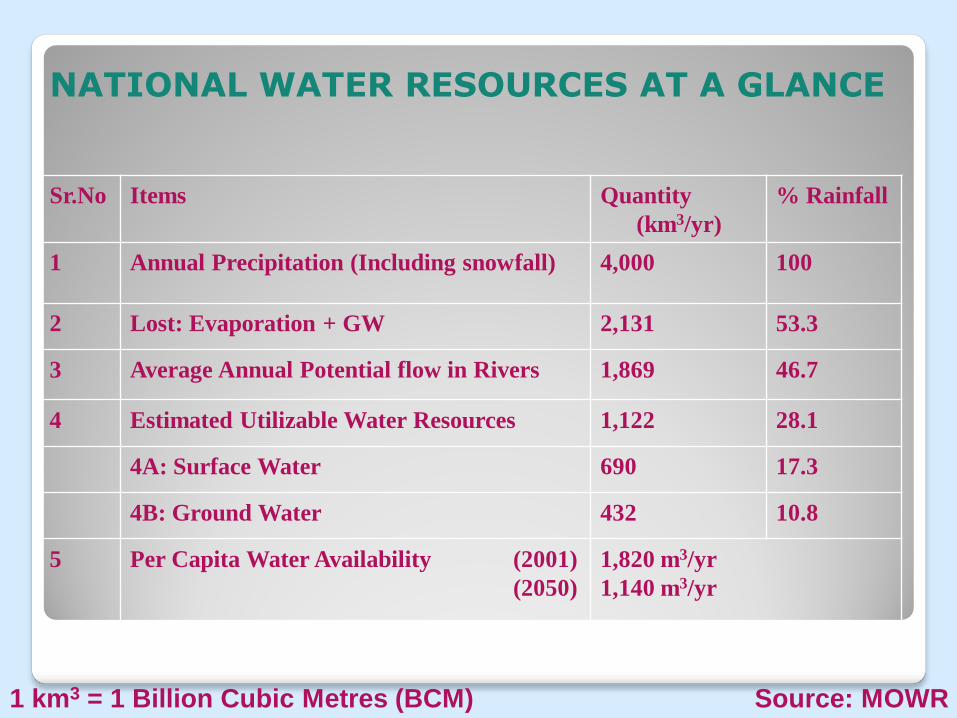
NATIONAL WATER RESOURCES AT A GLANCE
Sr.No Items Quantity
(km3/yr)
% Rainfall
1 Annual Precipitation (Including snowfall) 4,000 100
2 Lost: Evaporation + GW 2,131 53.3
3 Average Annual Potential flow in Rivers 1,869 46.7
4 Estimated Utilizable Water Resources 1,122 28.1
4A: Surface Water 690 17.3
4B: Ground Water 432 10.8
5 Per Capita Water Availability (2001)
(2050)
1,820 m3/yr
1,140 m3/yr
1 km3 = 1 Billion Cubic Metres (BCM) Source: MOWR
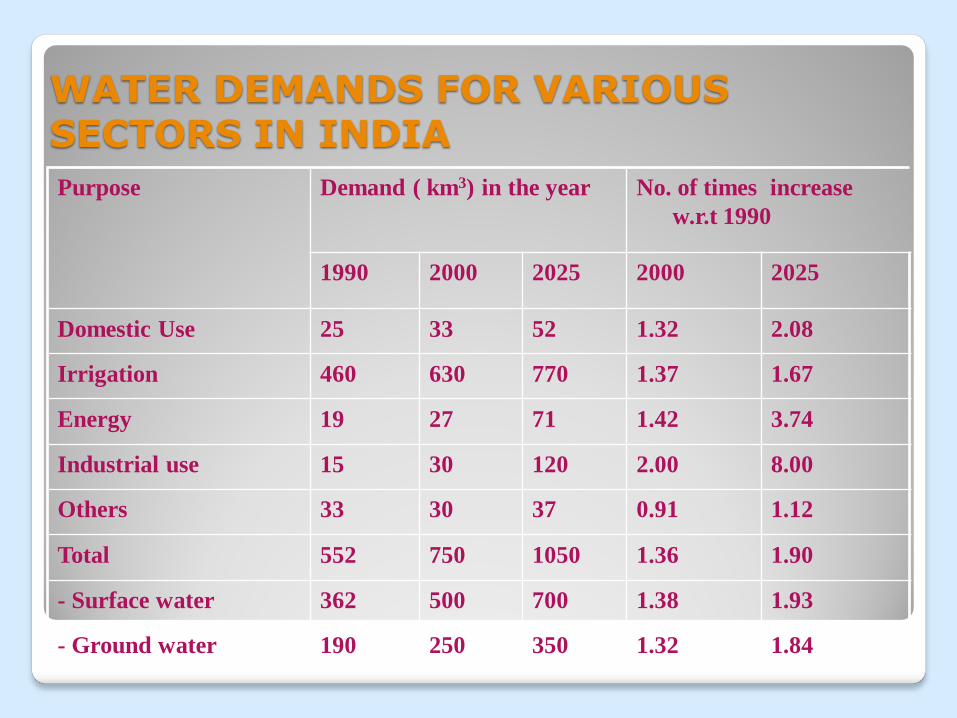
WATER DEMANDS FOR VARIOUS SECTORS IN INDIA
Purpose Demand ( km3) in the year No. of times increase
w.r.t 1990
1990 2000 2025 2000 2025
Domestic Use 25 33 52 1.32 2.08
Irrigation 460 630 770 1.37 1.67
Energy 19 27 71 1.42 3.74
Industrial use 15 30 120 2.00 8.00
Others 33 30 37 0.91 1.12
Total 552 750 1050 1.36 1.90
- Surface water 362 500 700 1.38 1.93
- Ground water 190 250 350 1.32 1.84
Water Requirement for Thermal Power Plant
Thermal power plants are predominant Power sectors and its installation capacity of our country has grown up to 2.25 GW/h, in which thermal power alone constitutes around 68%.
As water is one of the key input requirements in thermal power plants which are used for cooling system, boiler feed and ash disposal along with domestic use and plantation, the demand of water is increasing significantly.
The consumptive water requirement for power plants with wet ash handling system was 7 m3/h per MW and for dry ash based 5 m3/h per MW. In recent years, plants are designed with consumptive water consumption of 3-4 m3/h per MW.
Water Requirement of Power Plants
Boiler feed water is deionised water used to absorb the chemical energy of fuel to heat energy.
Since the boiler water is in circulation and significant loss occurs in the form of evaporation and blow down, only make up water is required. The quantum of blow down water depends on boiler steam parameters and make up DM water.
The quantity of boiler feed blow down can be calculated using the formula B = E x S/ C-S m3/h where B is quantity of blow down in m3/h, S & C are TDS of feed water and boiler drum.
Water Requirements of Power Plants
Around 80% of water consumption in power plants are taking place in the cooling system.
For a typical 500 MW coal fired unit, the amount cooling water required is 60,000 m3/h, with temperature rise across the condenser about 9.5oC.
Generally in case of closed cooing cycle system, water loss results in evaporation of 1.5-1.7 % of cooling water flow for heat removal and drift loss amounts to typically 0.05% and 0.35% blow down of the cooling water flow.
Water Quality Requirement
DM water is used as make up in boiler and its characteristics properties well below the value presented. The specific parameters such as pH (7.5 – 9.6), conductivity ( 1 µS/cm), dissolved oxygen (0.04 mg/l), alkalinity (carbonate free), hardness (0.3 mg/l), silica ( 0.5 mg/l) and Oil and grease (free) are desirable for boiler feed water.
The cooling circulation water should not exceed the corrosion and heat exchange influencing parameters such as pH (6.2-8.2), conductivity (80 µS/cm), chloride (200 mg/l), sulphate (200 mg/l), methyl orange alkalinity (100 mg/l), total hardness 9 200 mg/l), Fe ( 1 mg/l), Cu (0.3 mg/l), ammonia (0.1 mg/l), residual chlorine (0.3 mg/l) and sulphide ( free).
Domestic water has to meet the prescribed standard.
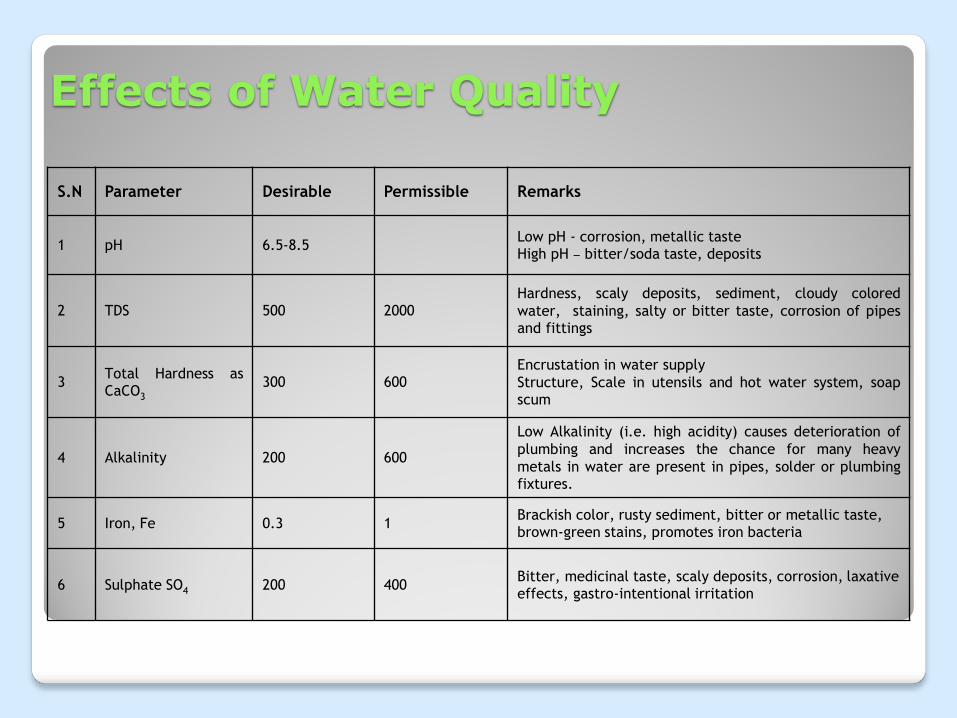
S.N Parameter Desirable Permissible Remarks
1 pH 6.5-8.5 Low pH - corrosion, metallic taste
High pH – bitter/soda taste, deposits
2 TDS 500 2000 Hardness, scaly deposits, sediment, cloudy colored
water, staining, salty or bitter taste, corrosion of pipes and fittings
3 Total Hardness as CaCO3
300 600 Encrustation in water supply
Structure, Scale in utensils and hot water system, soap scum
4 Alkalinity 200 600
Low Alkalinity (i.e. high acidity) causes deterioration of
plumbing and increases the chance for many heavy
metals in water are present in pipes, solder or plumbing fixtures.
5 Iron, Fe 0.3 1 Brackish color, rusty sediment, bitter or metallic taste, brown-green stains, promotes iron bacteria
6 Sulphate SO4 200 400 Bitter, medicinal taste, scaly deposits, corrosion, laxative effects, gastro-intentional irritation
Effects of Water Quality
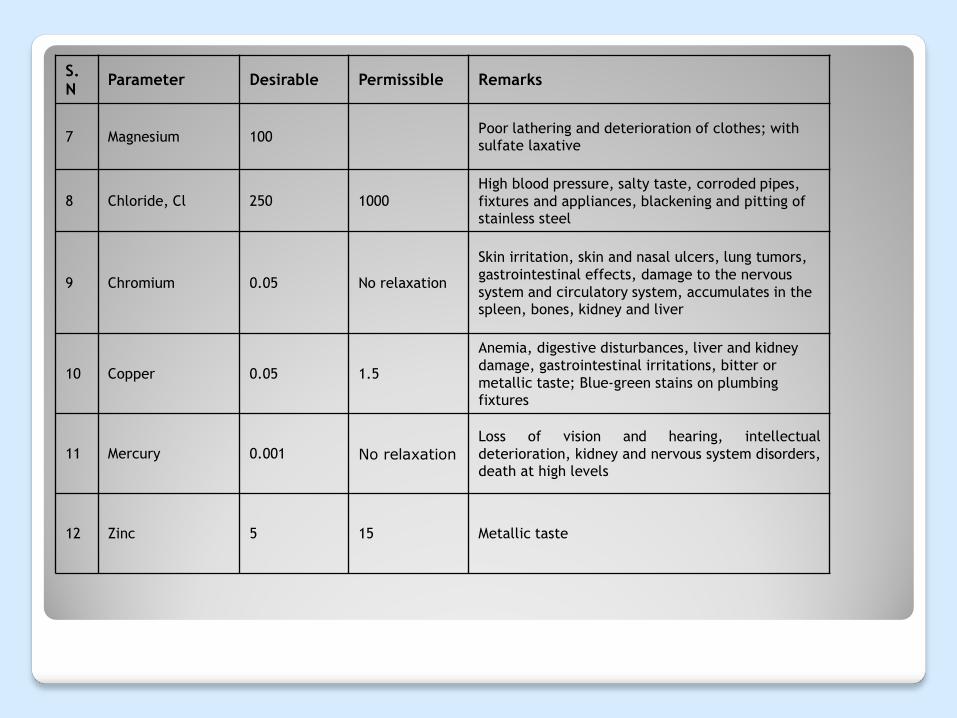
S.N Parameter Desirable Permissible Remarks
7 Magnesium 100 Poor lathering and deterioration of clothes; with sulfate laxative
8 Chloride, Cl 250 1000 High blood pressure, salty taste, corroded pipes,
fixtures and appliances, blackening and pitting of stainless steel
9 Chromium 0.05 No relaxation
Skin irritation, skin and nasal ulcers, lung tumors,
gastrointestinal effects, damage to the nervous
system and circulatory system, accumulates in the spleen, bones, kidney and liver
10 Copper 0.05 1.5
Anemia, digestive disturbances, liver and kidney
damage, gastrointestinal irritations, bitter or
metallic taste; Blue-green stains on plumbing fixtures
11 Mercury 0.001 No relaxation
Loss of vision and hearing, intellectual
deterioration, kidney and nervous system disorders, death at high levels
12 Zinc 5 15 Metallic taste
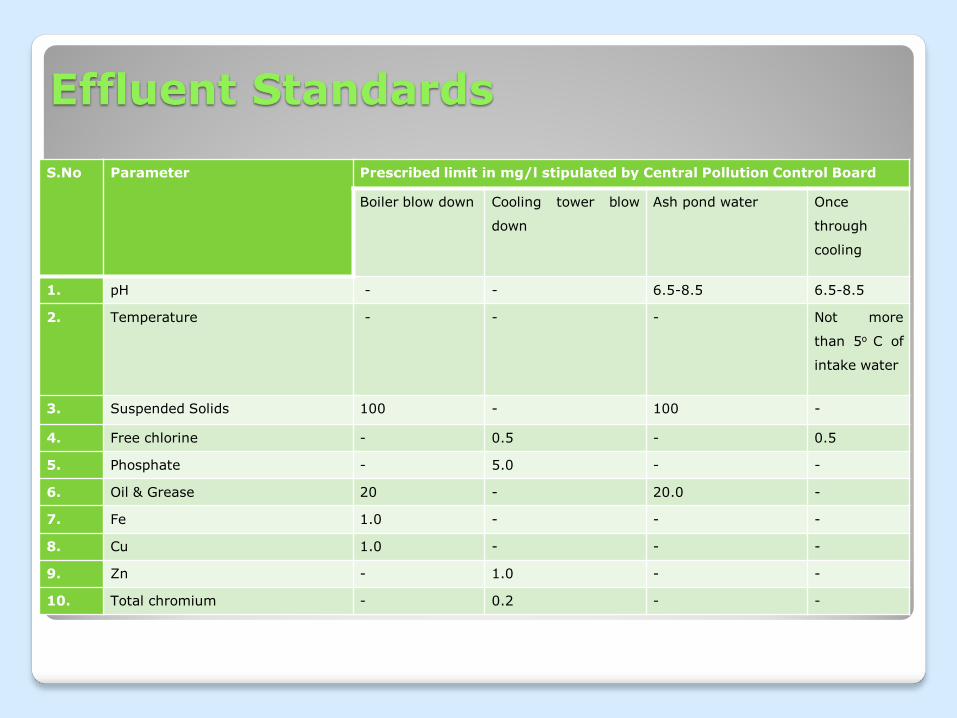
Effluent Standards
S.No Parameter Prescribed limit in mg/l stipulated by Central Pollution Control Board
Boiler blow down Cooling tower blow
down
Ash pond water Once
through
cooling
1. pH - - 6.5-8.5 6.5-8.5
2. Temperature - - - Not more
than 5o C of
intake water
3. Suspended Solids 100 - 100 -
4. Free chlorine - 0.5 - 0.5
5. Phosphate - 5.0 - -
6. Oil & Grease 20 - 20.0 -
7. Fe 1.0 - - -
8. Cu 1.0 - - -
9. Zn - 1.0 - -
10. Total chromium - 0.2 - -
Sample containers like wide mouth glass bottles, glass bottles, plastic cans of 1-2 L capacity and BOD bottles are the required items for sampling.
Cleaning and washing of glassware should be done by using dilute hydrochloric/ nitric acid solutions. Washing power should not be used for samples collected for phosphate analysis.
Concentrated nitric acid, sulphuric acid, sodium hydroxide and zinc acetate solutions are used for preservation of samples.
If the samples are brought to the lab within 6 hours, it need not to be preserved otherwise it has to be transported in ice box to maintain the quality of the wastewater.
If the sampling is planned for different depths, first surface samples have to be collected.
If the sampling is planned for different depths, first surface samples have to be collected.
Sampling Technique
Usually 2 L for general parameters, 1 L for sulphuric acid preserved and I L for nitric acid preserved for heavy metals and 0.5 L for Oil and Grease are required.
Sample preservation and storage is required to minimise physical, chemical and biological changes for which refrigeration and container choices are required.
The containers have to be selected to avoid vaporization, adsorption/absorption and photo-degradation of the analytes.
Always the samples should be collected beneath the surface with the mouth directed towards the current whereas for oil and Grease the samples should be collected at the surface.
Contd..
For organic compounds and sulphides, the containers filled without any air space and for microbiological and inorganic parameters air space required for mixing and the mixing should be at least 1% of the container volume.
Oil and grease sample is half filled in wide mouth glass bottle.
For ground water sampling, used to remove stagnant water in the borehole for representative sample.
Labelling for proper sample identification with details such as location, date of sampling, preservative added if any, nature of sample etc.,
Contd..
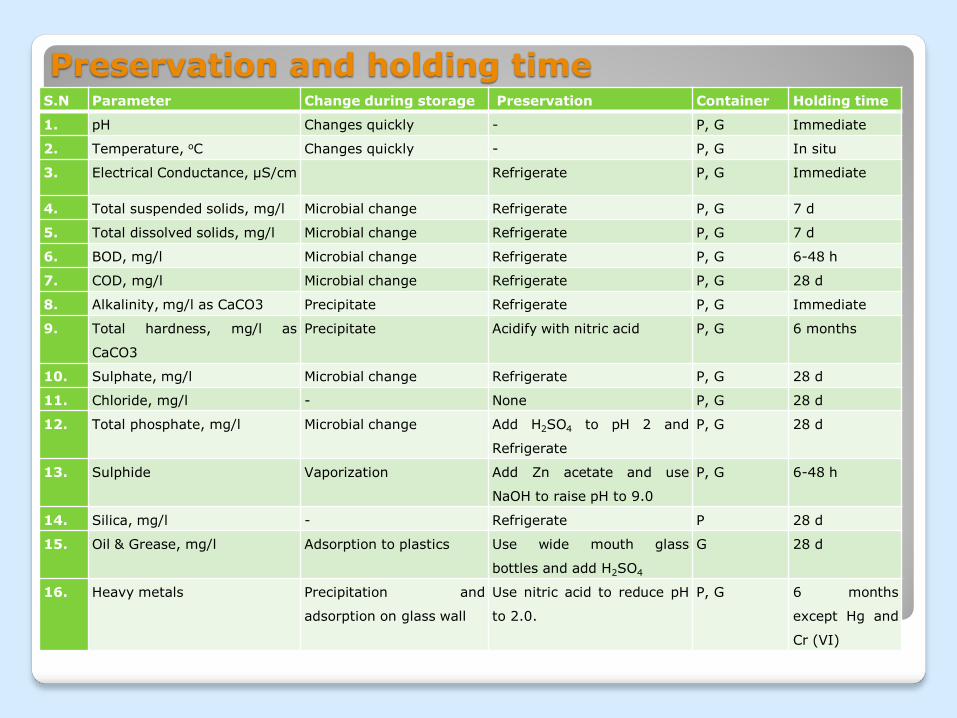
Preservation and holding time S.N Parameter Change during storage Preservation Container Holding time
1. pH Changes quickly - P, G Immediate
2. Temperature, oC Changes quickly - P, G In situ
3. Electrical Conductance, µS/cm Refrigerate P, G Immediate
4. Total suspended solids, mg/l Microbial change Refrigerate P, G 7 d
5. Total dissolved solids, mg/l Microbial change Refrigerate P, G 7 d
6. BOD, mg/l Microbial change Refrigerate P, G 6-48 h
7. COD, mg/l Microbial change Refrigerate P, G 28 d
8. Alkalinity, mg/l as CaCO3 Precipitate Refrigerate P, G Immediate
9. Total hardness, mg/l as
CaCO3
Precipitate Acidify with nitric acid P, G 6 months
10. Sulphate, mg/l Microbial change Refrigerate P, G 28 d
11. Chloride, mg/l - None P, G 28 d
12. Total phosphate, mg/l Microbial change Add H2SO4 to pH 2 and
Refrigerate
P, G 28 d
13. Sulphide Vaporization Add Zn acetate and use
NaOH to raise pH to 9.0
P, G 6-48 h
14. Silica, mg/l - Refrigerate P 28 d
15. Oil & Grease, mg/l Adsorption to plastics Use wide mouth glass
bottles and add H2SO4
G 28 d
16. Heavy metals Precipitation and
adsorption on glass wall
Use nitric acid to reduce pH
to 2.0.
P, G 6 months
except Hg and
Cr (VI)
Analytical techniques (Electro-chemical methods)
Glass electrode pH Meter is allowed for warm up and calibrated using minimum two buffer solutions.
Water samples in beaker are kept under the electrodes to measure the pH.
Specific conductivity is measure of electrical conductance of the water sample under the influence of two electrodes.
The meter is calibrated using the known concentration of KCl solution and water sample is used to measure.
Analytical techniques ( Gravimetric)
The total dissolved solids are portion of solids that passes through a filter of 2 µm nominal pore size and it is measured by measuring the weight difference of known quantity of water after evaporation and drying to obtain constant weight.
Suspended solids are measured by the weight difference after filtration using Whatman filter paper after drying to obtain constant weight.
Oil and Grease also measured by extraction of solvent mixture soluble fraction and completely draining the aqueous phase. The solvent phase is distilled at 85o C to evaporate the solvent and the container is weighed to determine the quantity of O&G.
Parameters such as alkalinity, total hardness, chloride, Sulphide and TKN are measured by volumetric titration methods.
Alkalinity is determined using standardised acid solution in presence of the indicators like methyl orange and phenolphthalein.
Total hardness by calcium and magnesium ions is titrated against the standard solution of EDTA in presence of buffer solution and indicator.
Chloride ions are determined by reaction against standard silver nitrate solution using potassium dichromate as an indicator at neutral pH.
Sulphide precipitate is dissolved in dilute HCl and mixed with iodine solution; the unreacted iodine is titrated against standard thiosulphate using in presence of starch indicator.
The total nitrogen present in the water samples are digested with sulphuric acid in the presence copper sulphate catalyst and potassium sulphate salt. All forms of organic nitrogen are converted to ammonium sulphate and which is distilled in alkaline solution and titrated against standard acid solution.
Analytical techniques (Volumetric methods))
Phosphate and silica make complex with ammonium molybdate in acidic condition and form colour. The blue colour generated for phosphate and yellow colour generated for silica are measured at the wavelengths of 690 nm and 410 nm, respectively.
Heavy metals such as Fe, Cu, Zn and Cr are determined using Atomic Absorption Spectrophotometer or ICP.
The method blank, duplicate/triplicate sample and standard addition methods are followed for AQC. Application of CRM and calibrated glassware and instrument are used to obtain precise and accurate results.
Analytical techniques (Spectrophotometric methods)
Minimization of Boiler blow downs by providing CPU and good boiler and/or it can be treated using DM process/RO process and reused in the process.
The DM plant regeneration wastewater are neutralised and used for bottom ash removal.
Closed cycle cooling systems shall be adopted rather than once through cooling. Despite the evaporation and drift loss the blow down quantity are less than 0.035% of the cooling water flows.
The cooling water blow down can be used for plantations along with treated domestic wastes or suppression of coal dust. Suitability of dry cooling system for condenser is also on going to reduce water consumption.
Implementation of dry ash collection in the entire fly ash area would reduce water consumption and also water pollution.
Water Conservation