water demand management in the mediterranean, progress
TRANSCRIPT
Water demand management in the Mediterranean, progress and policiesZARAGOZA, 19-21/03/2007
Monitoring progress and promotion of water demand management policies
National report of Egypt
Mediterranean Strategy for Sustainable Development
Monitoring progress and promotion of water demand
management policies
Egypt National Report
March, 2007
2
1. INTRODUCTION …............................................................................................................ ..4 2. MAJOR CHANGES IN THE WATER SITUATION IN THE COUNTRY ................................................ .6
2.1 Resources, mobilization and non-conventional water product.......................................... 6 The Nile water system................................................................................................... 6 Groundwater in the Nile Valley and Delta ......................................................................... 7 Drainage water........................................................................................................... 7 Treated wastewater...................................................................................................... 8 Groundwater in the desert areas...................................................................................... 8 Rainfall and flash floods in wadis .................................................................................... 9 Desalination of sea water or brackish water...................................................................... 9 2.2 Water demand and pressure on water resources............................................................ 9 Agriculture Water Requirements………………………………………………………………………….. 10 Municipal Water Requirements........................................................................................ 10 Industrial Water Requirements........................................................................................ 11 Other Requirements ...................................................................................................... 11 Navigation................................................................................................................... 11 Hydropower.......................................... ........................................................................ 12 Ecology and fisheries....................................................................................................... 12 Recreation and health 12 2.3 Degradation and threats affecting the resources, installation, the ecosystems and the populations............................................................................................. ..................... 13 2.4 Access to drinking water and to sanitation and collection and treatment of waste water….......................................................................................................................15 Public Water Supply……………………………………………………………………………………………. 15 Sanitation..................... ................................................. ................................................... 15
3. IMPROVE EFFICIENCY IN THE SECTORS OF ACTIVITY USING THE WATER DEMAND MANAGEMENT POLICIES………………………………………………………………………………………………18
3.1 Data and indicators.................................................................................................... 18 3.2 Retrospective analysis................................................................................................. 22 3.3 Prospective analysis ................................................................................................. 24
4. TOWARDS INTEGRATED POLICIES OF WATER RESOURCES AND DEMAND MANAGEMENT. TAKE INTO ACCOUNT THE ENVIRONMENTAL OBJECTIVES, INTEGRATE WDM IN WATER POLICIES ..................................................................... 29
4.1Taking into account of environmental objectives in the water policies................................... 31 4.2Taking into account of water demand management (WDM) in water policies…………………….. 33
5. TAKING INTO ACCOUNT OF WATER DEMAND MANAGEMENT IN THE COOPERATION AND DEVELOPMENT AID POLICIES.................................................. 34
6. OVERVIEW AND CONCLUSION...............................................................................387
REFERENCES ..............................................................................................................388 APPENDICES .............................................................................................................. 389 ANNEX A: AGRICULTURE HORIZONTAL EXPANSION PROJECTS ………………40
3
Acronyms and abbreviations
APRP Agricultural Policy Reform Project BCM Billion Cubic Metres CAPMAS Central Agency for Public Mobilisation and Statistics EEAA Egyptian Environmental Affairs Agency EPADP Egyptian Public Authority for Drainage Projects Feddan Area unit (0.42 ha) FtC Facing the Challenge (proposed IWRM strategy in National WR Plan) GAFRD General Authority for Fish Resources Development GDP Gross Domestic Production GOFI General Organisation for Industrialisation Governorate 2nd government level (province) HAD High Aswan Dam IIIMP Integrated Irrigation Improvement Management Project IIP Irrigation Improvement Project IMF International Monetary Fund IRU Institutional Reform Unit (of MWRI) IWRM Integrated Water Resources Management LE Egyptian Pound M &I Municipal and Industrial MALR Ministry of Agriculture and Land Reclamation MCM Million Cubic Metres (Mm3) MHUNC Ministry of Housing, Utilities and New Communities MoHP Ministry of Health and Population MoLD Ministry of Local Development MWRI Ministry of Water Resources and Irrigation
NOPWASD National Organisation for Potable Water and Sewage Disposal NWRC National Water Research Centre NWRP National Water Resources Plan PWS Public Water Supply UFW Unaccounted For Water WPRP Water Policy Reform Project WUA Water Users Association
4
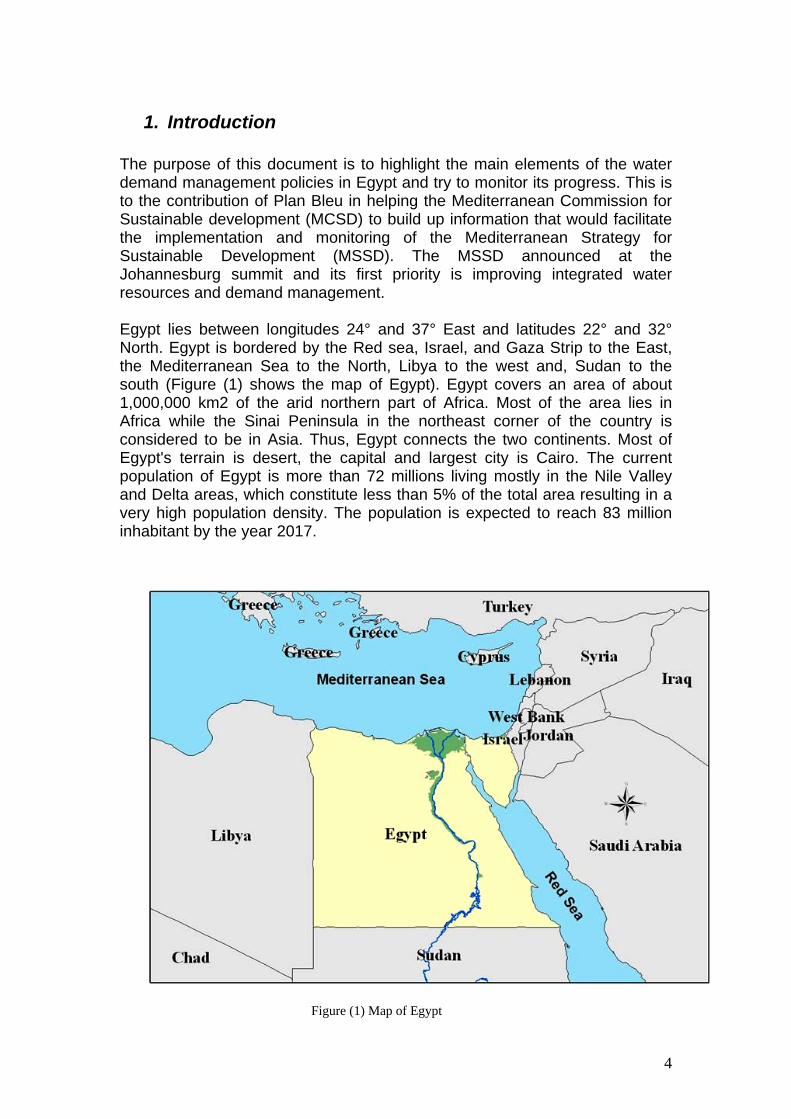
1. Introduction The purpose of this document is to highlight the main elements of the water demand management policies in Egypt and try to monitor its progress. This is to the contribution of Plan Bleu in helping the Mediterranean Commission for Sustainable development (MCSD) to build up information that would facilitate the implementation and monitoring of the Mediterranean Strategy for Sustainable Development (MSSD). The MSSD announced at the Johannesburg summit and its first priority is improving integrated water resources and demand management. Egypt lies between longitudes 24° and 37° East and latitudes 22° and 32° North. Egypt is bordered by the Red sea, Israel, and Gaza Strip to the East, the Mediterranean Sea to the North, Libya to the west and, Sudan to the south (Figure (1) shows the map of Egypt). Egypt covers an area of about 1,000,000 km2 of the arid northern part of Africa. Most of the area lies in Africa while the Sinai Peninsula in the northeast corner of the country is considered to be in Asia. Thus, Egypt connects the two continents. Most of Egypt's terrain is desert, the capital and largest city is Cairo. The current population of Egypt is more than 72 millions living mostly in the Nile Valley and Delta areas, which constitute less than 5% of the total area resulting in a very high population density. The population is expected to reach 83 million inhabitant by the year 2017.
Figure (1) Map of Egypt
5
Egypt lies at the downstream end of the Nile river basin. The country receives hardly any rainfall, and depends on the Nile for almost all its direct water requirements, including agriculture, domestic and industrial supplies, navigation, and tourism. The Ministry of Water Resources and Irrigation is the main body responsible for water resources, with the responsibility to protect, develop, control, and allocate water to different uses. The national water policy has been revised and updated at regular intervals since the first policy was developed in 1975, to accommodate changing objectives and priorities. The most recent policy includes several strategies to ensure that the demands of all water users are met. It is expected that the ongoing process of policy development and updating will continue. Efforts are being directed at increasing the availability of current resources through a variety of approaches, including the development of groundwater, re-use of irrigation drainage water, reduction of pollution and re-use of treated waste water (domestic and, to some extent, industrial), capturing flash floods in wadis, rainwater harvesting in suitable areas, and desalination of sea water where high value uses make this cost effective. It is also considered important to decrease water demands by upgrading and rehabilitating water supply systems to reduce losses. Planning efforts need to take account of the maintenance of flows for navigation and the generation of hydropower. The importance of maintaining suitable river flow conditions and aquatic habitats to preserve biodiversity and fisheries production has been realized. Water quality needs to be improved in order to reduce impacts on human health. Other significant environmental problems include soil erosion, desertification, aquatic weeds, and sea water intrusion in the Nile delta.
6
2. Major changes in the water situation in the country
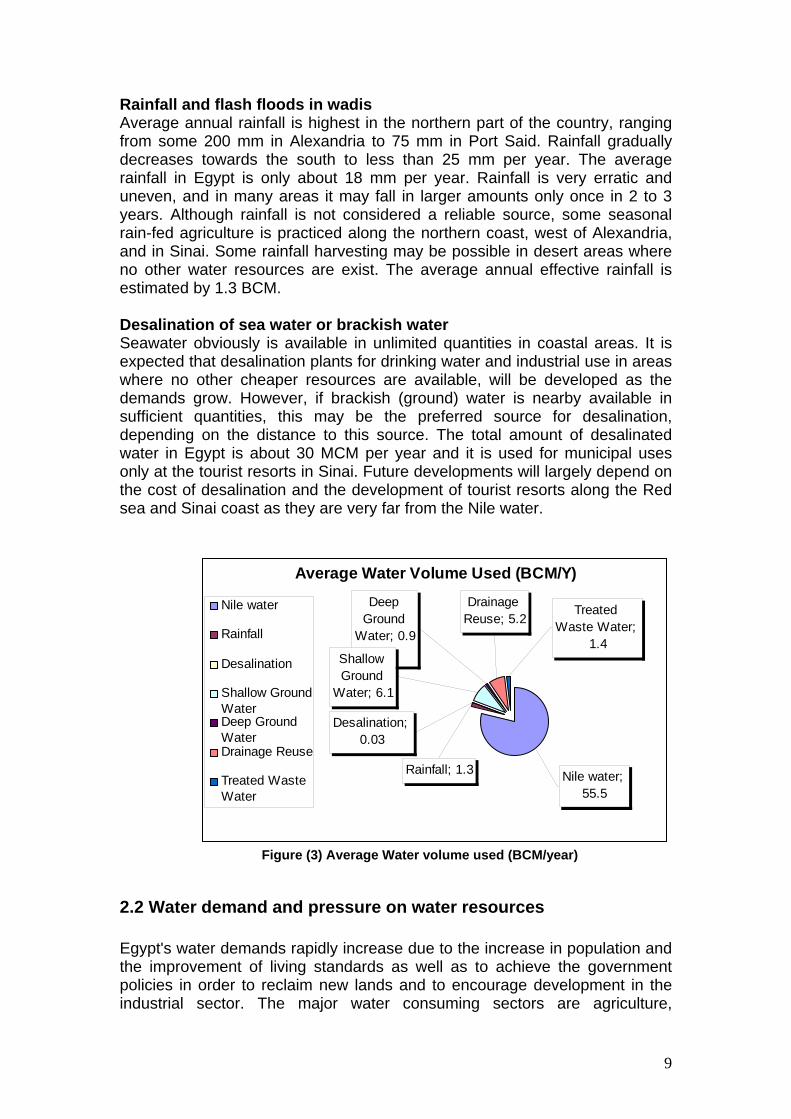
2.1 Resources, mobilization and non-conventional water product The Nile river is the most important water resource for Egypt. Other water resources include deep groundwater in the desert, small amounts of rainfall in the northern part of the country, flash floods in the wadis, and desalinated of sea water. The water resources distribution can be illustrated in the following graph.
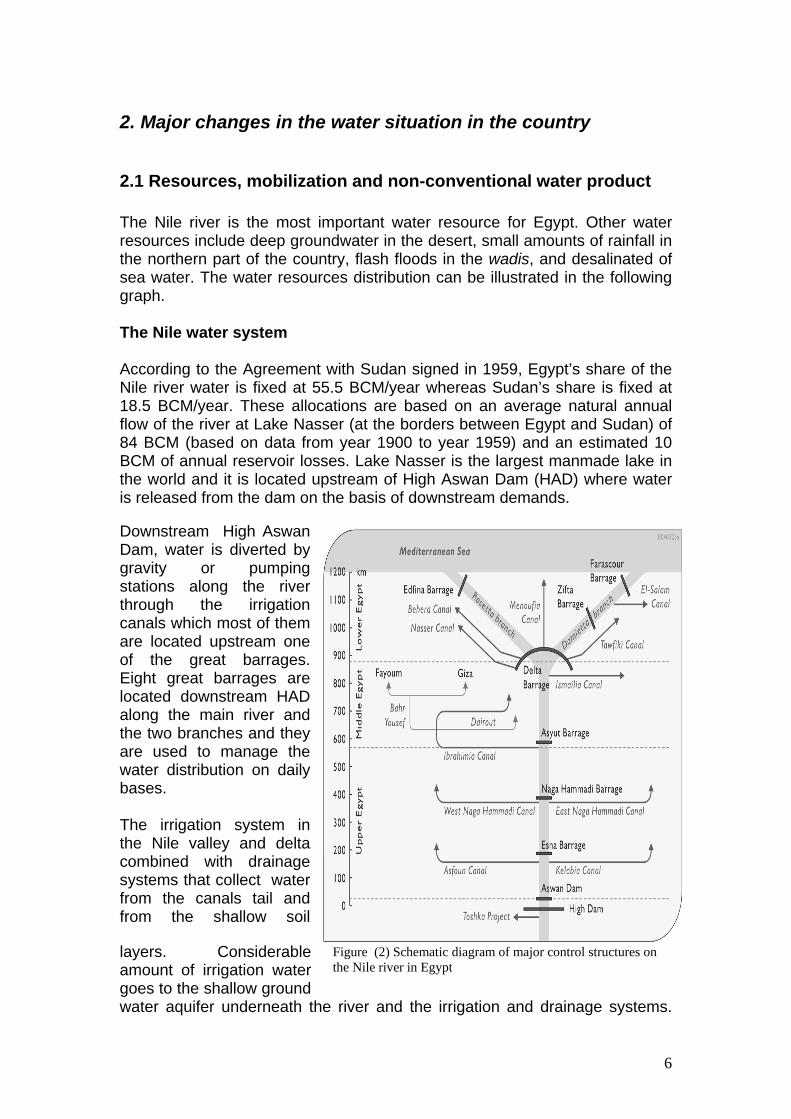
The Nile water system According to the Agreement with Sudan signed in 1959, Egypt’s share of the Nile river water is fixed at 55.5 BCM/year whereas Sudan’s share is fixed at 18.5 BCM/year. These allocations are based on an average natural annual flow of the river at Lake Nasser (at the borders between Egypt and Sudan) of 84 BCM (based on data from year 1900 to year 1959) and an estimated 10 BCM of annual reservoir losses. Lake Nasser is the largest manmade lake in the world and it is located upstream of High Aswan Dam (HAD) where water is released from the dam on the basis of downstream demands. Downstream High Aswan Dam, water is diverted by gravity or pumping stations along the river through the irrigation canals which most of them are located upstream one of the great barrages. Eight great barrages are located downstream HAD along the main river and the two branches and they are used to manage the water distribution on daily bases. The irrigation system in the Nile valley and delta combined with drainage systems that collect water from the canals tail and from the shallow soil
layers. Considerable amount of irrigation water goes to the shallow ground water aquifer underneath the river and the irrigation and drainage systems.
Figure (2) Schematic diagram of major control structures on the Nile river in Egypt
7
Regarding the water balance, the system can be considered as almost closed, with negligible inflow and outflow from or to the deeper aquifers and surrounding desert areas. Therefore, all water in the system (groundwater in the Valley and Delta, drainage water from agriculture, and M&I effluents) originates from water released at High Aswan Dam. Groundwater in the Nile Valley and Delta The Nile aquifer system is not a separate water resource, it is mainly recharged by seepage losses from the surface water system and excess irrigation water. The average annual recharge is estimated at 6.3 BCM, whereas the average annual abstractions amount to 6.1 BCM/year in the year 2000. The difference between recharge and present abstractions will result in increased groundwater levels and/or contribute to the flow in the drainage system. In the year 2017, it is expected that the annual abstraction would reach about 8.4 BCM. Conjunctive use of groundwater and surface water is already being applied locally. In periods of peak irrigation demands, groundwater is abstracted as a supplementary source by farmers in certain areas. The aquifer functions here as a seasonal storage reservoir. The quality of the groundwater varies with location, depending on the vulnerability of the groundwater resource to pollution. Leakage from septic tanks or unprotected wells as well as over-fertilization in agriculture creates problems with respect to bacteria and nitrate. Drainage water A large portion of the water diverted for irrigation eventually flows to the drainage system. The quality of the drainage water depends on the flow path. Direct losses from the canals to the drains will be of good quality, while direct runoff from the fields often has higher concentrations of agro-chemicals. Water reaching the drains through the upper soil layers and deeper strata will be more saline, depending on local conditions, especially in the northern part of the Delta. In addition to the collection of agricultural drainage water, the drains are also used as discharge channels for industrial and domestic wastewater. All existing wastewater treatment systems discharge their effluents into drains, but also most of by-passes (due to limited biological or hydrological capacities) and pumping stations of untreated wastewater reach the drains. Many vacuum trucks serving rural areas that are not connected to sewer system use drains as their dumping destination. As a result, almost all drains have high levels of bacterial pollution. Agricultural drainage water upstream of Cairo returns to the Nile where it mixes with the river water for further downstream use. In Fayoum and Nile Delta, large quantities of water are pumped from the drainage system for reuse in irrigation. This water is either directly used (unofficial reuse by farmers) or pumped to the irrigation canals through larger pumping stations. The total official reuse in the Fayoum and Delta is estimated in 2004 at 5.2
8
BCM/yr. There still is potential for a further increase in water reuse. It is estimated that by the year 2017, drainage water reuse will reach 7.4 BCM. However, increasing the reuse of drainage water in the Delta will decrease the drainage outflow to the Coastal Lakes. Because of the environmental values of these lakes and their economic value for fisheries, the impacts of reduced drainage water inflow on the salinity of the lakes should be carefully considered. Treated wastewater Reuse of treated wastewater (municipal and to some extent also industrial wastewater) is considered an effective water saving measure in areas where this water would otherwise flow to deserts. Thus, the reuse of treated wastewater from the New Industrial Cities in the desert, and the Canal Cities should be considered in the future. Primary uses of treated wastewater are for irrigation of green areas (landscape development) and irrigation of non-food agriculture. Factors that are relevant for the feasibility of treated wastewater reuse for irrigation will largely depend on the type of treatment and the type of industrial pollutants, availability of suitable areas for irrigation, irrigation methods and soil types, cropping pattern, matching of supply and demand, environmental impacts, and costs. The total volume of treated wastewater from the New Cities (in the desert areas) and Cities along Suez canal is in the order of 1.4 BCM per year, of which more than 85% from the New Industrial Cities. The reuse potential obviously will depend on the quality of the wastewater. This depends on the type of treatment of domestic wastewater and, especially, on the industrial pollutants and their removal during the on-site treatment process.
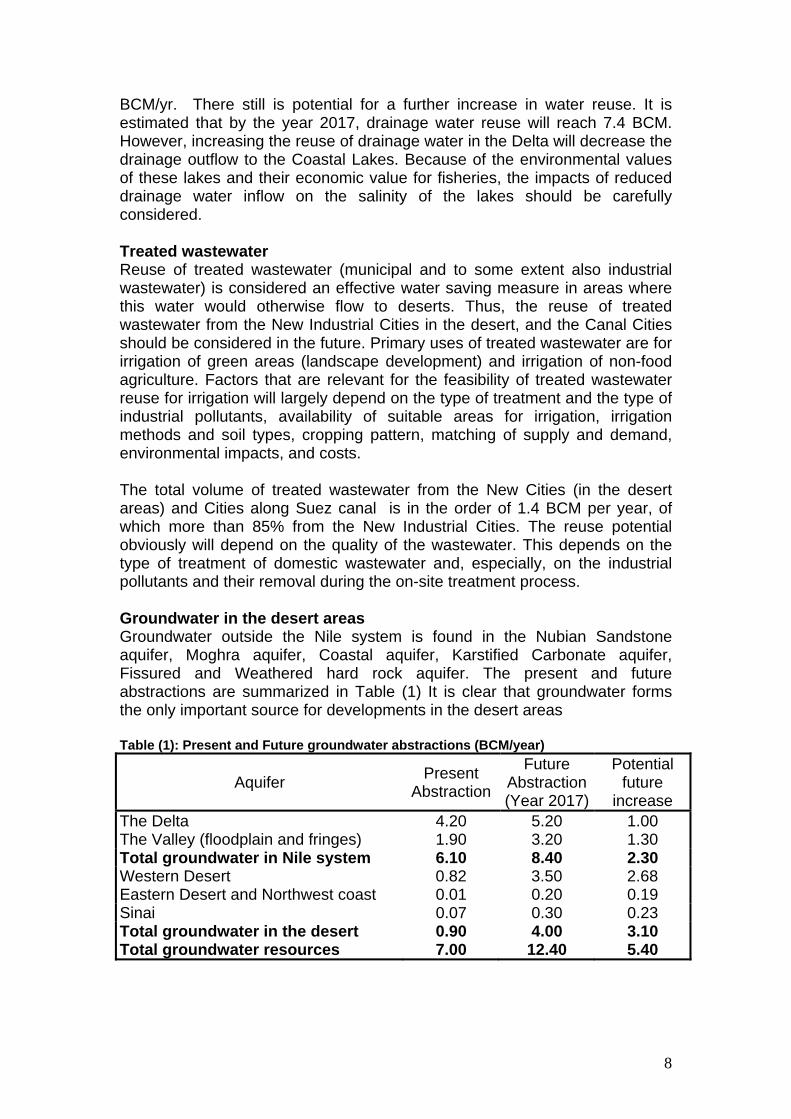
Groundwater in the desert areas Groundwater outside the Nile system is found in the Nubian Sandstone aquifer, Moghra aquifer, Coastal aquifer, Karstified Carbonate aquifer, Fissured and Weathered hard rock aquifer. The present and future abstractions are summarized in Table (1) It is clear that groundwater forms the only important source for developments in the desert areas Table (1): Present and Future groundwater abstractions (BCM/year)
Aquifer Present Abstraction
Future Abstraction (Year 2017)
Potential future
increase The Delta 4.20 5.20 1.00 The Valley (floodplain and fringes) 1.90 3.20 1.30 Total groundwater in Nile system 6.10 8.40 2.30 Western Desert 0.82 3.50 2.68 Eastern Desert and Northwest coast 0.01 0.20 0.19 Sinai 0.07 0.30 0.23 Total groundwater in the desert 0.90 4.00 3.10 Total groundwater resources 7.00 12.40 5.40
9
Rainfall and flash floods in wadis Average annual rainfall is highest in the northern part of the country, ranging from some 200 mm in Alexandria to 75 mm in Port Said. Rainfall gradually decreases towards the south to less than 25 mm per year. The average rainfall in Egypt is only about 18 mm per year. Rainfall is very erratic and uneven, and in many areas it may fall in larger amounts only once in 2 to 3 years. Although rainfall is not considered a reliable source, some seasonal rain-fed agriculture is practiced along the northern coast, west of Alexandria, and in Sinai. Some rainfall harvesting may be possible in desert areas where no other water resources are exist. The average annual effective rainfall is estimated by 1.3 BCM. Desalination of sea water or brackish water Seawater obviously is available in unlimited quantities in coastal areas. It is expected that desalination plants for drinking water and industrial use in areas where no other cheaper resources are available, will be developed as the demands grow. However, if brackish (ground) water is nearby available in sufficient quantities, this may be the preferred source for desalination, depending on the distance to this source. The total amount of desalinated water in Egypt is about 30 MCM per year and it is used for municipal uses only at the tourist resorts in Sinai. Future developments will largely depend on the cost of desalination and the development of tourist resorts along the Red sea and Sinai coast as they are very far from the Nile water.
Average Water Volume Used (BCM/Y)
Nile water; 55.5
Treated Waste Water;
1.4
Drainage Reuse; 5.2
Deep Ground
Water; 0.9
Shallow Ground
Water; 6.1
Rainfall; 1.3
Desalination; 0.03
Nile water
Rainfall
Desalination
Shallow GroundWaterDeep GroundWaterDrainage Reuse
Treated WasteWater
Figure (3) Average Water volume used (BCM/year)
2.2 Water demand and pressure on water resources Egypt's water demands rapidly increase due to the increase in population and the improvement of living standards as well as to achieve the government policies in order to reclaim new lands and to encourage development in the industrial sector. The major water consuming sectors are agriculture,
10
municipalities and industries. The following is a description of the main water requirements of all water using sectors. Ministry of Water Resources and Irrigation, MWRI continuously monitor the changes in water demand trough different measures. Examples of the measures are; recording the issued licenses for the new water users, follow up the implementation of expansion and rehabilitation plans for each sector, and the national development plans. The national objectives for Egypt's development in the period 1997 - 2017 have been described in the document "Egypt and the 21st century" (Cabinet ARE, 1997). The most robust and agreed upon data are collected and analyzed with references to theses years.
Agriculture Water Requirements
The agricultural sector is the largest user, and consumer, of water in Egypt, with its share exceeding 80% of the total gross demand for water. On a consumptive use basis, the share of agricultural demands is even higher at more than 95%. Consumptive use has been steadily increasing from an estimated 29.4 BCM/yr in 1980 to 35.7 BCM/yr in 19971. This increase has been made possible by an increase in drainage water reuse and groundwater abstraction, and a decrease in the fresh water outflow to the sea. The total amount of diverted water for irrigation in 1997 was 58.8 BCM/yr. During the same period (1980-1997) the cultivated land increased from 5.8 Million Feddans to 7.9 Million Feddans and the amount of water consumptively used per Feddan ranged from 4510 to 5070 m3. It is estimated that the Nile water represents about 67% of the water needed to produce food for local consumption while virtual water, rainfall, and groundwater represents about 27%, 2%, and 4%respectively. The future increase in overall irrigation supply will depend on changes in the (priorities) demands for the municipal and industrial sectors, the development of new groundwater resources, and measures to reduce the outflow (terminal drainage) from the Nile system. Any water becoming additionally available will primarily be used to irrigate new development areas and not to increase the supply to existing lands. Based on water inflow of 55.5 BCM/year, it is expected that by the year 2017 agricultural lands will be 10.1 Million Feddans, water required for agriculture will be 67.8 BCM, and total actual water consumption of 38.2 BCM.
Municipal Water Requirements
In the year 2000, public water supply systems covered 100% of the population in urban areas and 38% of the population in rural areas. The total amount of municipal water demand in 2000 reached 4.76 BCM. The largest source for raw drinking water is surface water. Only 17% is abstracted from groundwater. Although the contribution of desalinated brackish- or seawater is a minor part in the national drinking water supply, it is the main source of
1 Egypt National Water Resources Plan has considered year 1997 as the base year for comprehensive data analysis and developing the plan
11
drinking water production in many tourist areas along Red Sea coast and Sinai Peninsula. Although the capacity of drinking water plants more than tripled in the last decades, there still are many people, especially in rural areas, that lack a proper water supply. Low consumption rates in many areas are related to the lack of a sewer system. Highest per capita use of drinking water is in Greater Cairo, Alexandria, and the Canal Cities. This high use is related to wastage induced by the lack of a (properly functioning) metering system, low water charges, and insufficient public awareness on water scarcity. Another problem is related to the high “Unaccounted For Water” (UFW) in the system, which is at present estimated at about 34% of the total drinking water production Future drinking water demands will increase due to a) increase in population, b) increase in per capita demand, related to higher incomes, and c) construction of sewer systems in areas that are now covered by PWS but not yet connected to a sewer system. By the year 2017, it is expected that municipal water demand will reach 6.6 BCM.
Industrial Water Requirements
There was a large growth in industrial water demand during the last decades. Excluding cooling water for power plants (which will be about 14.9 BCM in 2017), the total industrial water use in the year 2000 was estimated at 2.2 BCM of which approximately 53% is abstracted from the Nile and irrigation canals, 28% from the public network and 19% from groundwater. Water consumptive use in industry is about 0.7 BCM. Almost 60% of all industrial water use is in the large urban conglomerates of Cairo, Giza and Alexandria. The total industrial water demand in 2017, excluding cooling water, is expected to increase by about 90% from 2.2 BCM in 2000 to 4.2 BCM in 2017.
Other Requirements
Navigation The river Nile and part of the irrigation network are used for navigation. The main navigation activities are for cruise ships between Aswan and Luxor and for transport of commodities between Upper and Lower Egypt and between the Nile and the coastal harbors. Major problems occurred in the past during the winter closure period when no irrigation water was released from Aswan. Water had to be released exclusively for navigation during the closure period to provide the minimum draft required by ships, especially in the Aswan-Luxor reach. After the change of the winter closure system, affected by dividing the country into 5 instead of 2 regions (Upper Egypt, Middle Egypt, Eastern Delta, Middle Delta, and Western Delta), the amount of water released for navigation dropped to 0.2 BCM in 1997.
12
Hydropower Water has not been released exclusively for the generation of hydropower Since 1990. Hydropower generation therefore depends fully on releases for irrigation, M&I supply and the small release for navigation. This means that the generated hydropower varies strongly during the season. This hydropower contributes to about 16% of the total power produced at present. Ecology and fisheries Living organisms in waterways and lakes require water of a certain quality as habitats. The preservation of water levels, water velocities, depth profiles, and natural bank conditions is essential to keep the ecology in balance and thus to preserve bio-diversity and fisheries production. With respect to the fish production GAFRD statistics for the year 2001 show that the combined marine and inland waters of Egypt are reported to produce some 770,000 tonnes of fisheries products With the addition of 175,000 tonnes of imported fish products, the per capita consumption would be about 10 kg/year. The distribution of the fisheries production shows that 45% produced from fish farming (in streams and inland) and in the rice fields, 14% from the Nile river and canals, 5% from lake Nasser and other inland lakes, 19% from the Northern coastal lakes, and 17% from the Mediterranean and red sea (CAPMAS 2003). Virtually all Egyptian water bodies are fished to the maximum and some are overexploited already. The fishery withdrawal water demand in estimated by 1.3 BCM/year with a return flow of 0.9 BCM/year. With respect to water quality, it can be stated that ‘natural’ conditions should be preserved or restored as much as possible in the Nile river, the irrigation canals, and the coastal lakes. Important parameters in this respect are dissolved oxygen, salinity, nutrients, and toxicity. Recreation and health Population also uses water for hygiene purposes (e.g. washing and bathing) and recreation (e.g. swimming and boating) as well as for drinking water. The indirect contact with open water bodies near settlements also influences the health of the population. These uses therefore also require good water quality. Parameters like color, odor, and prevalence of pathogens are the most important parameters in this respect.
13
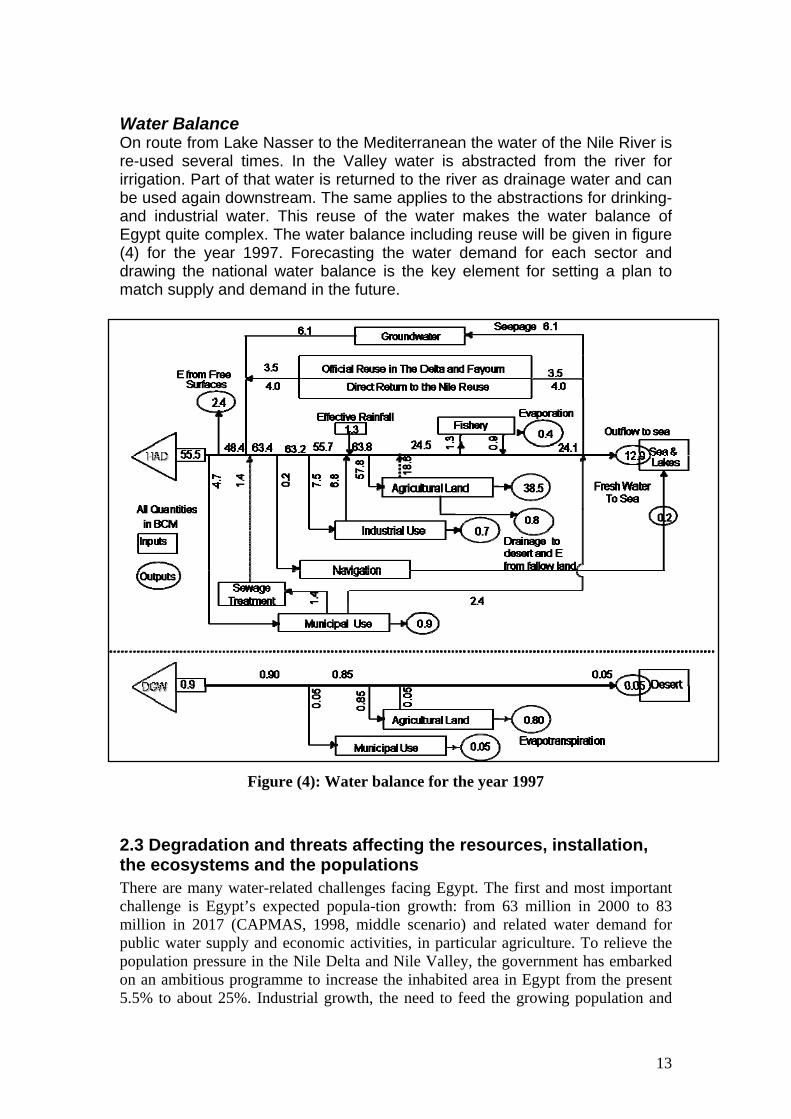
Figure (4): Water balance for the year 1997
Water Balance On route from Lake Nasser to the Mediterranean the water of the Nile River is re-used several times. In the Valley water is abstracted from the river for irrigation. Part of that water is returned to the river as drainage water and can be used again downstream. The same applies to the abstractions for drinking- and industrial water. This reuse of the water makes the water balance of Egypt quite complex. The water balance including reuse will be given in figure (4) for the year 1997. Forecasting the water demand for each sector and drawing the national water balance is the key element for setting a plan to match supply and demand in the future.
2.3 Degradation and threats affecting the resources, installation, the ecosystems and the populations There are many water-related challenges facing Egypt. The first and most important challenge is Egypt’s expected popula-tion growth: from 63 million in 2000 to 83 million in 2017 (CAPMAS, 1998, middle scenario) and related water demand for public water supply and economic activities, in particular agriculture. To relieve the population pressure in the Nile Delta and Nile Valley, the government has embarked on an ambitious programme to increase the inhabited area in Egypt from the present 5.5% to about 25%. Industrial growth, the need to feed the growing population and
14
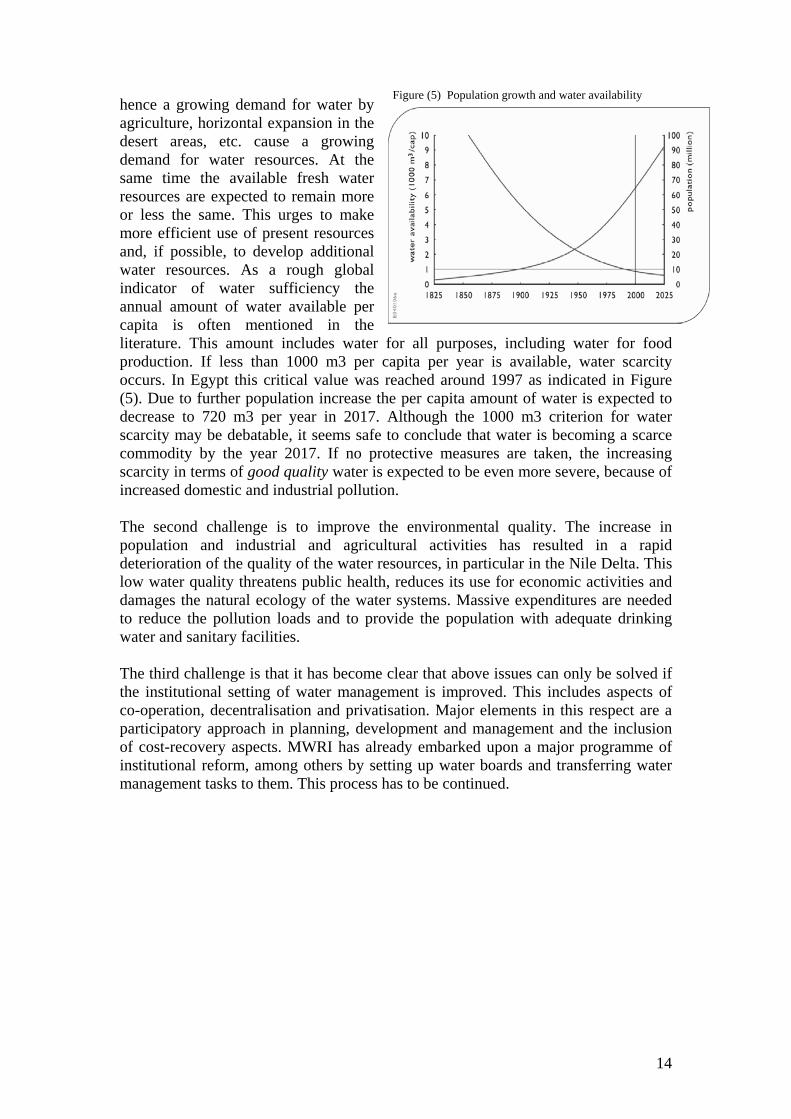
Figure (5) Population growth and water availability hence a growing demand for water by agriculture, horizontal expansion in the desert areas, etc. cause a growing demand for water resources. At the same time the available fresh water resources are expected to remain more or less the same. This urges to make more efficient use of present resources and, if possible, to develop additional water resources. As a rough global indicator of water sufficiency the annual amount of water available per capita is often mentioned in the literature. This amount includes water for all purposes, including water for food production. If less than 1000 m3 per capita per year is available, water scarcity occurs. In Egypt this critical value was reached around 1997 as indicated in Figure (5). Due to further population increase the per capita amount of water is expected to decrease to 720 m3 per year in 2017. Although the 1000 m3 criterion for water scarcity may be debatable, it seems safe to conclude that water is becoming a scarce commodity by the year 2017. If no protective measures are taken, the increasing scarcity in terms of good quality water is expected to be even more severe, because of increased domestic and industrial pollution. The second challenge is to improve the environmental quality. The increase in population and industrial and agricultural activities has resulted in a rapid deterioration of the quality of the water resources, in particular in the Nile Delta. This low water quality threatens public health, reduces its use for economic activities and damages the natural ecology of the water systems. Massive expenditures are needed to reduce the pollution loads and to provide the population with adequate drinking water and sanitary facilities. The third challenge is that it has become clear that above issues can only be solved if the institutional setting of water management is improved. This includes aspects of co-operation, decentralisation and privatisation. Major elements in this respect are a participatory approach in planning, development and management and the inclusion of cost-recovery aspects. MWRI has already embarked upon a major programme of institutional reform, among others by setting up water boards and transferring water management tasks to them. This process has to be continued.
15
2.4 Access to drinking water and to sanitation and collection and treatment of waste water
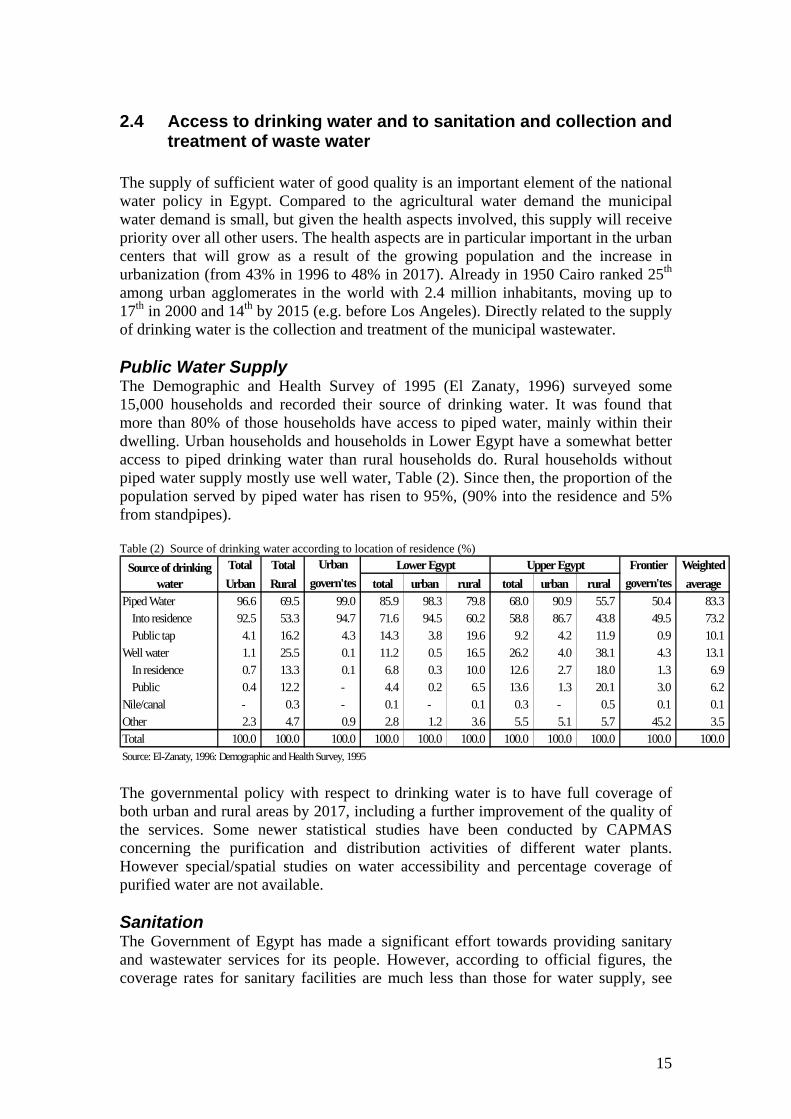
The supply of sufficient water of good quality is an important element of the national water policy in Egypt. Compared to the agricultural water demand the municipal water demand is small, but given the health aspects involved, this supply will receive priority over all other users. The health aspects are in particular important in the urban centers that will grow as a result of the growing population and the increase in urbanization (from 43% in 1996 to 48% in 2017). Already in 1950 Cairo ranked 25th among urban agglomerates in the world with 2.4 million inhabitants, moving up to 17th in 2000 and 14th by 2015 (e.g. before Los Angeles). Directly related to the supply of drinking water is the collection and treatment of the municipal wastewater. Public Water Supply The Demographic and Health Survey of 1995 (El Zanaty, 1996) surveyed some 15,000 households and recorded their source of drinking water. It was found that more than 80% of those households have access to piped water, mainly within their dwelling. Urban households and households in Lower Egypt have a somewhat better access to piped drinking water than rural households do. Rural households without piped water supply mostly use well water, Table (2). Since then, the proportion of the population served by piped water has risen to 95%, (90% into the residence and 5% from standpipes). Table (2) Source of drinking water according to location of residence (%)
Total Total Urban Frontier WeightedUrban Rural govern'tes total urban rural total urban rural govern'tes average
Piped Water 96.6 69.5 99.0 85.9 98.3 79.8 68.0 90.9 55.7 50.4 83.3 Into residence 92.5 53.3 94.7 71.6 94.5 60.2 58.8 86.7 43.8 49.5 73.2 Public tap 4.1 16.2 4.3 14.3 3.8 19.6 9.2 4.2 11.9 0.9 10.1
Well water 1.1 25.5 0.1 11.2 0.5 16.5 26.2 4.0 38.1 4.3 13.1 In residence 0.7 13.3 0.1 6.8 0.3 10.0 12.6 2.7 18.0 1.3 6.9 Public 0.4 12.2 - 4.4 0.2 6.5 13.6 1.3 20.1 3.0 6.2
Nile/canal - 0.3 - 0.1 - 0.1 0.3 - 0.5 0.1 0.1 Other 2.3 4.7 0.9 2.8 1.2 3.6 5.5 5.1 5.7 45.2 3.5 Total 100.0 100.0 100.0 100.0 100.0 100.0 100.0 100.0 100.0 100.0 100.0 Source: El-Zanaty, 1996: Demographic and Health Survey, 1995
Source of drinking water
Lower Egypt Upper Egypt
The governmental policy with respect to drinking water is to have full coverage of both urban and rural areas by 2017, including a further improvement of the quality of the services. Some newer statistical studies have been conducted by CAPMAS concerning the purification and distribution activities of different water plants. However special/spatial studies on water accessibility and percentage coverage of purified water are not available. Sanitation The Government of Egypt has made a significant effort towards providing sanitary and wastewater services for its people. However, according to official figures, the coverage rates for sanitary facilities are much less than those for water supply, see
16
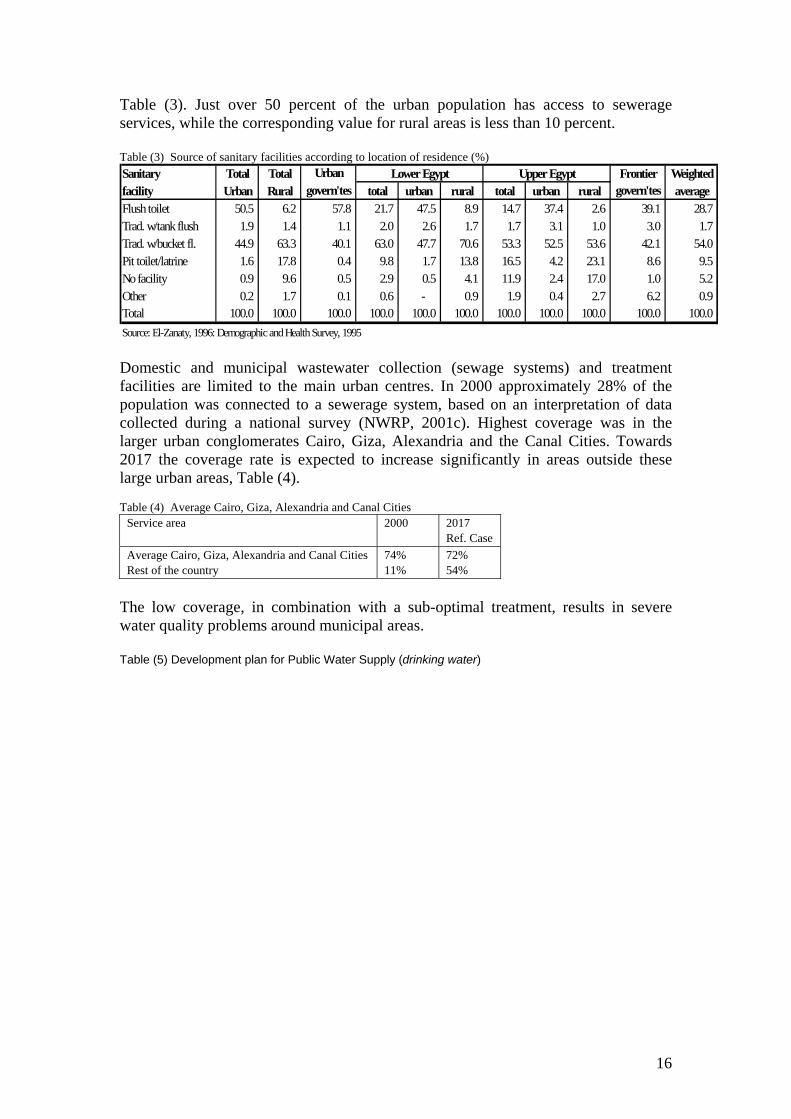
Table (3). Just over 50 percent of the urban population has access to sewerage services, while the corresponding value for rural areas is less than 10 percent. Table (3) Source of sanitary facilities according to location of residence (%) Sanitary Total Total Urban Frontier Weightedfacility Urban Rural govern'tes total urban rural total urban rural govern'tes averageFlush toilet 50.5 6.2 57.8 21.7 47.5 8.9 14.7 37.4 2.6 39.1 28.7 Trad. w/tank flush 1.9 1.4 1.1 2.0 2.6 1.7 1.7 3.1 1.0 3.0 1.7 Trad. w/bucket fl. 44.9 63.3 40.1 63.0 47.7 70.6 53.3 52.5 53.6 42.1 54.0 Pit toilet/latrine 1.6 17.8 0.4 9.8 1.7 13.8 16.5 4.2 23.1 8.6 9.5 No facility 0.9 9.6 0.5 2.9 0.5 4.1 11.9 2.4 17.0 1.0 5.2 Other 0.2 1.7 0.1 0.6 - 0.9 1.9 0.4 2.7 6.2 0.9 Total 100.0 100.0 100.0 100.0 100.0 100.0 100.0 100.0 100.0 100.0 100.0 Source: El-Zanaty, 1996: Demographic and Health Survey, 1995
Lower Egypt Upper Egypt
Domestic and municipal wastewater collection (sewage systems) and treatment facilities are limited to the main urban centres. In 2000 approximately 28% of the population was connected to a sewerage system, based on an interpretation of data collected during a national survey (NWRP, 2001c). Highest coverage was in the larger urban conglomerates Cairo, Giza, Alexandria and the Canal Cities. Towards 2017 the coverage rate is expected to increase significantly in areas outside these large urban areas, Table (4). Table (4) Average Cairo, Giza, Alexandria and Canal Cities
Service area 2000
2017 Ref. Case
Average Cairo, Giza, Alexandria and Canal Cities Rest of the country
74% 11%
72% 54%
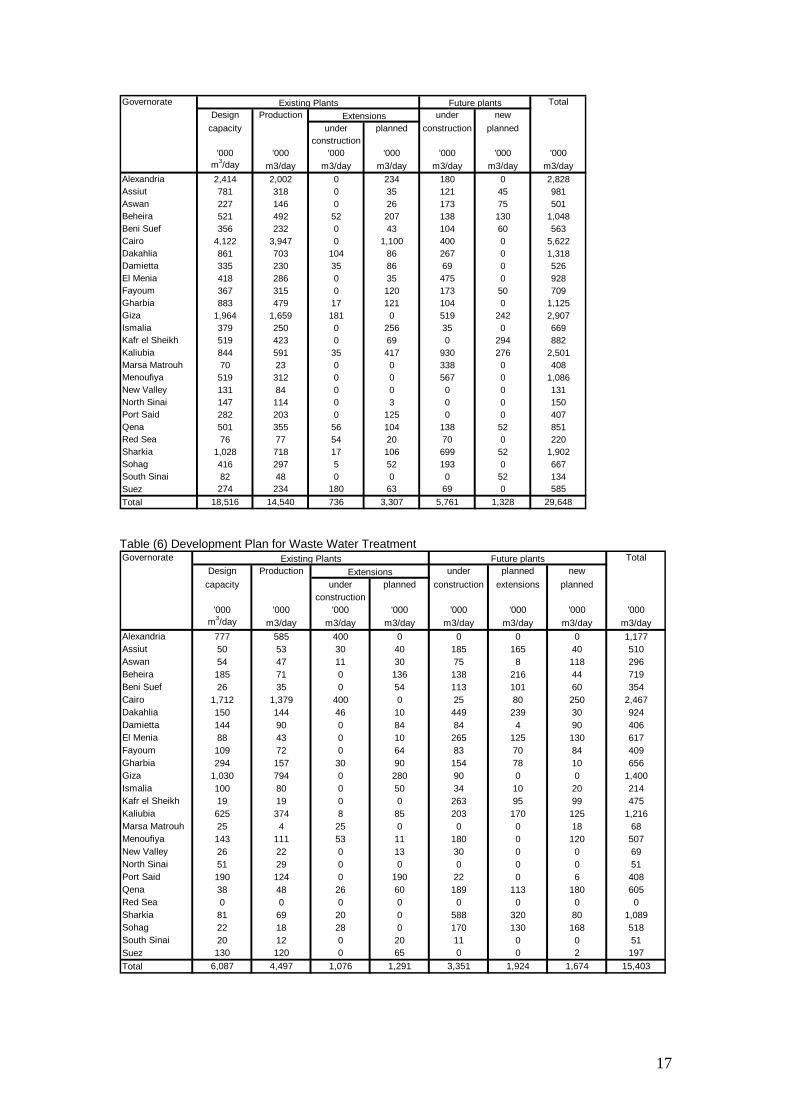
The low coverage, in combination with a sub-optimal treatment, results in severe water quality problems around municipal areas. Table (5) Development plan for Public Water Supply (drinking water)
17
Governorate TotalDesign Production under new
capacity under planned construction plannedconstruction
'000 '000 '000 '000 '000 '000 '000m3/day m3/day m3/day m3/day m3/day m3/day m3/day
Alexandria 2,414 2,002 0 234 180 0 2,828Assiut 781 318 0 35 121 45 981Aswan 227 146 0 26 173 75 501Beheira 521 492 52 207 138 130 1,048Beni Suef 356 232 0 43 104 60 563Cairo 4,122 3,947 0 1,100 400 0 5,622Dakahlia 861 703 104 86 267 0 1,318Damietta 335 230 35 86 69 0 526El Menia 418 286 0 35 475 0 928Fayoum 367 315 0 120 173 50 709Gharbia 883 479 17 121 104 0 1,125Giza 1,964 1,659 181 0 519 242 2,907Ismalia 379 250 0 256 35 0 669Kafr el Sheikh 519 423 0 69 0 294 882Kaliubia 844 591 35 417 930 276 2,501Marsa Matrouh 70 23 0 0 338 0 408Menoufiya 519 312 0 0 567 0 1,086New Valley 131 84 0 0 0 0 131North Sinai 147 114 0 3 0 0 150Port Said 282 203 0 125 0 0 407Qena 501 355 56 104 138 52 851Red Sea 76 77 54 20 70 0 220Sharkia 1,028 718 17 106 699 52 1,902Sohag 416 297 5 52 193 0 667South Sinai 82 48 0 0 0 52 134Suez 274 234 180 63 69 0 585Total 18,516 14,540 736 3,307 5,761 1,328 29,648
Existing Plants Future plantsExtensions
Table (6) Development Plan for Waste Water Treatment Governorate Total
Design Production under planned newcapacity under planned construction extensions planned
construction'000 '000 '000 '000 '000 '000 '000 '000
m3/day m3/day m3/day m3/day m3/day m3/day m3/day m3/dayAlexandria 777 585 400 0 0 0 0 1,177Assiut 50 53 30 40 185 165 40 510Aswan 54 47 11 30 75 8 118 296Beheira 185 71 0 136 138 216 44 719Beni Suef 26 35 0 54 113 101 60 354Cairo 1,712 1,379 400 0 25 80 250 2,467Dakahlia 150 144 46 10 449 239 30 924Damietta 144 90 0 84 84 4 90 406El Menia 88 43 0 10 265 125 130 617Fayoum 109 72 0 64 83 70 84 409Gharbia 294 157 30 90 154 78 10 656Giza 1,030 794 0 280 90 0 0 1,400Ismalia 100 80 0 50 34 10 20 214Kafr el Sheikh 19 19 0 0 263 95 99 475Kaliubia 625 374 8 85 203 170 125 1,216Marsa Matrouh 25 4 25 0 0 0 18 68Menoufiya 143 111 53 11 180 0 120 507New Valley 26 22 0 13 30 0 0 69North Sinai 51 29 0 0 0 0 0 51Port Said 190 124 0 190 22 0 6 408Qena 38 48 26 60 189 113 180 605Red Sea 0 0 0 0 0 0 0 0Sharkia 81 69 20 0 588 320 80 1,089Sohag 22 18 28 0 170 130 168 518South Sinai 20 12 0 20 11 0 0 51Suez 130 120 0 65 0 0 2 197Total 6,087 4,497 1,076 1,291 3,351 1,924 1,674 15,403
ExtensionsExisting Plants Future plants
18
3. Improve efficiency in the sectors of activity using the water demand management policies The growing population and related socio-economic activities require an increasing amount of water. The Nile River is an abundant source of water but also this source has its limitation and at some point in time demand will outgrow the available supply. Efficiency improvement may delay that point in time but sooner or later Egypt will have to face that situation and wise decisions have to be made for reallocating the water resources according to crucial priorities. For the current situation and since the establishment of the High Aswan Dam the Egyptian share of the Nile water is fixed according to the international agreement with Sudan. Therefore more attention was given to water demand management in order to save water and reduce losses to be used for the development activities in the major sectors.
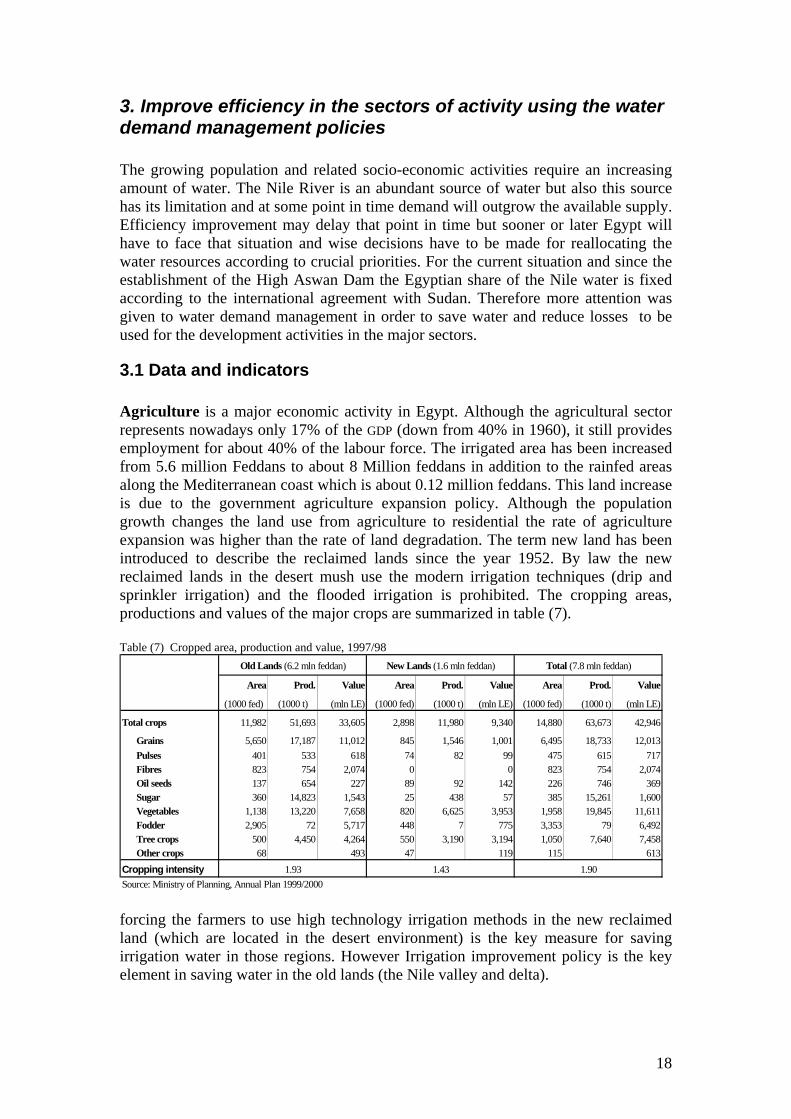
3.1 Data and indicators Agriculture is a major economic activity in Egypt. Although the agricultural sector represents nowadays only 17% of the GDP (down from 40% in 1960), it still provides employment for about 40% of the labour force. The irrigated area has been increased from 5.6 million Feddans to about 8 Million feddans in addition to the rainfed areas along the Mediterranean coast which is about 0.12 million feddans. This land increase is due to the government agriculture expansion policy. Although the population growth changes the land use from agriculture to residential the rate of agriculture expansion was higher than the rate of land degradation. The term new land has been introduced to describe the reclaimed lands since the year 1952. By law the new reclaimed lands in the desert mush use the modern irrigation techniques (drip and sprinkler irrigation) and the flooded irrigation is prohibited. The cropping areas, productions and values of the major crops are summarized in table (7). Table (7) Cropped area, production and value, 1997/98
Area Prod. Value Area Prod. Value Area Prod. Value
(1000 fed) (1000 t) (mln LE) (1000 fed) (1000 t) (mln LE) (1000 fed) (1000 t) (mln LE)
Total crops 11,982 51,693 33,605 2,898 11,980 9,340 14,880 63,673 42,946
Grains 5,650 17,187 11,012 845 1,546 1,001 6,495 18,733 12,013Pulses 401 533 618 74 82 99 475 615 717Fibres 823 754 2,074 0 0 823 754 2,074Oil seeds 137 654 227 89 92 142 226 746 369Sugar 360 14,823 1,543 25 438 57 385 15,261 1,600Vegetables 1,138 13,220 7,658 820 6,625 3,953 1,958 19,845 11,611Fodder 2,905 72 5,717 448 7 775 3,353 79 6,492Tree crops 500 4,450 4,264 550 3,190 3,194 1,050 7,640 7,458Other crops 68 493 47 119 115 613
Cropping intensitySource: Ministry of Planning, Annual Plan 1999/2000
1.93 1.43 1.90
Total (7.8 mln feddan)Old Lands (6.2 mln feddan) New Lands (1.6 mln feddan)
forcing the farmers to use high technology irrigation methods in the new reclaimed land (which are located in the desert environment) is the key measure for saving irrigation water in those regions. However Irrigation improvement policy is the key element in saving water in the old lands (the Nile valley and delta).
19
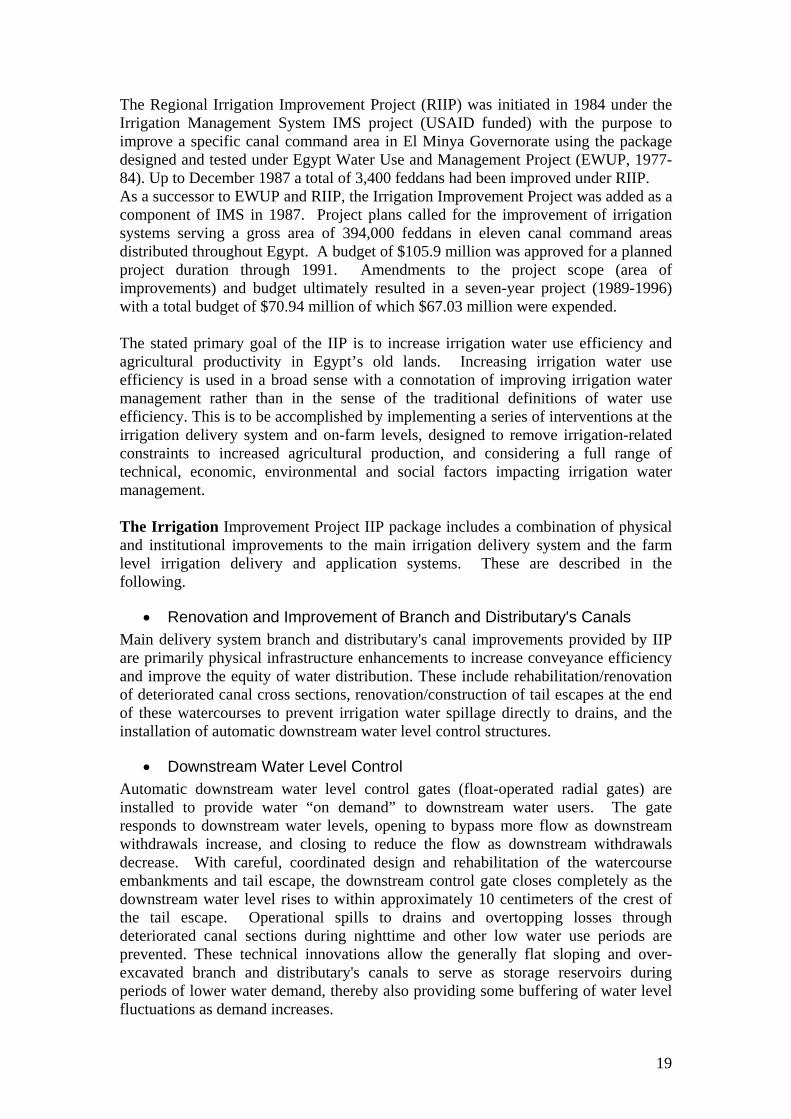
The Regional Irrigation Improvement Project (RIIP) was initiated in 1984 under the Irrigation Management System IMS project (USAID funded) with the purpose to improve a specific canal command area in El Minya Governorate using the package designed and tested under Egypt Water Use and Management Project (EWUP, 1977-84). Up to December 1987 a total of 3,400 feddans had been improved under RIIP. As a successor to EWUP and RIIP, the Irrigation Improvement Project was added as a component of IMS in 1987. Project plans called for the improvement of irrigation systems serving a gross area of 394,000 feddans in eleven canal command areas distributed throughout Egypt. A budget of $105.9 million was approved for a planned project duration through 1991. Amendments to the project scope (area of improvements) and budget ultimately resulted in a seven-year project (1989-1996) with a total budget of $70.94 million of which $67.03 million were expended. The stated primary goal of the IIP is to increase irrigation water use efficiency and agricultural productivity in Egypt’s old lands. Increasing irrigation water use efficiency is used in a broad sense with a connotation of improving irrigation water management rather than in the sense of the traditional definitions of water use efficiency. This is to be accomplished by implementing a series of interventions at the irrigation delivery system and on-farm levels, designed to remove irrigation-related constraints to increased agricultural production, and considering a full range of technical, economic, environmental and social factors impacting irrigation water management. The Irrigation Improvement Project IIP package includes a combination of physical and institutional improvements to the main irrigation delivery system and the farm level irrigation delivery and application systems. These are described in the following.
• Renovation and Improvement of Branch and Distributary's Canals Main delivery system branch and distributary's canal improvements provided by IIP are primarily physical infrastructure enhancements to increase conveyance efficiency and improve the equity of water distribution. These include rehabilitation/renovation of deteriorated canal cross sections, renovation/construction of tail escapes at the end of these watercourses to prevent irrigation water spillage directly to drains, and the installation of automatic downstream water level control structures.
• Downstream Water Level Control Automatic downstream water level control gates (float-operated radial gates) are installed to provide water “on demand” to downstream water users. The gate responds to downstream water levels, opening to bypass more flow as downstream withdrawals increase, and closing to reduce the flow as downstream withdrawals decrease. With careful, coordinated design and rehabilitation of the watercourse embankments and tail escape, the downstream control gate closes completely as the downstream water level rises to within approximately 10 centimeters of the crest of the tail escape. Operational spills to drains and overtopping losses through deteriorated canal sections during nighttime and other low water use periods are prevented. These technical innovations allow the generally flat sloping and over-excavated branch and distributary's canals to serve as storage reservoirs during periods of lower water demand, thereby also providing some buffering of water level fluctuations as demand increases.
20
Volumetric control of the water entering the branch and distributary's canals is intended to be achieved by installing flow control gates at the heads of these canals. Baffle sluice-gate distributors have been tested by the IIP in this regard.
• Conversion from Rotational Flow to Continuous Flow Continuous flow (availability) water delivery in improved branch and distributary's canals is introduced. In combination with the automated downstream flow control gates, farmers are provided with greater flexibility in timing of irrigation applications to meet crop water requirements compared to the rigid rotation schedules of the traditional system. The required canal flow capacity for continuous flow is smaller than that for rotational flow deliveries. For example, in the case of a two-turn rotation, the continuous flow rate is one-half of the rotational flow rate, and in the case of the three-turn rotation, the continuous flow rate is one-third of the rotational flow rate. It is important to note that in each method of water delivery, the same volume of water enters the canal command area over a given rotation period. Thereby, total flow requirements of the primary canals serving these secondary canals do not have to be increased. Water is available in the branch and distributary's canals continuously as a result of this intervention. Farmers along mesqas must still organize and take turns irrigating. Depending upon pumping capacities into improved mesqas, a degree of scheduling coordination and cooperation among mesqas may also be necessary.
• Mesqa Improvements Mesqas are improved by converting from below grade (low level) earthen ditches with multiple pumping/lifting points to elevated and lined, or buried low pressure-pipe, gravity flow mesqas served by a single point pump lift at the head of the new mesqa. Farmers are able to turn water by gravity flow into their farm fields through slide gate or valve turnouts. Mesqa conveyance efficiency (the ratio of total farm turnout water deliveries to total water inflow at the head of the mesqa) is improved by nearly complete elimination of seepage losses (thereby also reducing water logging and high water table problems near these watercourses) and elimination of operational spills. The single point lift pump(s) is meant to be the only means of introducing water to the mesqa and it is operated only to accomplish irrigation. Operation and maintenance costs are reduced (one versus many pumps).
• Organization of Farmers Along Mesqas into WUAs Farmers along improved mesqas are organized into Water User Associations (WUAs). The objectives of WUAs are to:
• build, maintain and control their own WUA, • improve water delivery at the mesqa level, • operate and maintain improved mesqas, and, • improve the efficiency of water use.
21
WUAs are responsible for a number of activities including participating in the mesqa improvement process (selecting the type of mesqa, locating the new mesqa, locating mesqa turnouts, etc.), operating and maintaining the single point lift pump, scheduling turns among water users, resolving disputes, and mesqa maintenance.
• Water Management Technical Assistance through the Irrigation Advisory Service
The primary mission of the Irrigation Advisory Service (IAS) is to facilitate and assist private water users to establish, maintain, and manage their own sustainable water user associations (WUAs) for improving irrigation performance. The Irrigation Advisory Service also provides continuing water management technical assistance to WUAs and farmers in IIP areas. Domestic Water has two aspects drinking water system and sanitation system. Both systems are managed by Ministry of Housing (mhunc) , Utilities and New Communities, in particular NOPWASD. MWRI responsibility is to provide surface water for drinking in the proper time and quality to the plants however MHUNC manage the plants and distribution system in cooperation of local governments and municipalities. It is documented that 95% of the population in Egypt is provided with public water supply but the overall network efficiency is very low and there is a room for development and save water. As mentioned before more than 50 % of the urban population have access to sewerage system while the corresponding value for rural areas is less than 10 percent. Investment in wastewater treatment has increasd from 392 million L.E in the year 1992 to 1,525 million L.E in the year 2000 (NOPWASD) with average annual of 1,308 million L.E. Water for industry is a small portion of the water resources usage in Egypt. Industry is a growing sector in the national economy of Egypt. Further industrial development is expected to play a major role in the socio-economic development of the country, providing employment for a major part of the growing population. Measured in terms of value of public and private industrial output, the petroleum sub-sector is with 35% the largest, followed by the food industry (24%), the textile industry (13%) and the engineering and electrical industries (13%). Each industrial sector has degree of water consumption. There is no good and comprehensive data available for the industrial demand. This is due to the different organizations involved and due to the larg amount of workshops which take the water from the drinking water network and discharge the residuals to the sewerage system. The industrial policy is to create new cities and industrial zones outside of the Nile Valley and Delta. To achieve this policy objective, the industrial areas Borg Al-Arab and Al Sadat have been completed. The Aswan Industrial Area, Asyout Industrial Area and the Sohag Industrial Area are under implementation. Contracts have been signed for the Ismalia Industrial Area and the Asafraa Industrial Area. Studies are under way for additional industrial areas in Beni Suef, Menia, Wadi El Natroun, New Valley (El Dakhla and El Kharga), Fayoum (Kom Oshim). A project for the relocation and development of leather tanneries is located in Badr City. Foundries will be relocated to a new industrial area on the Qattamiya –Ain Sukhna road
22
Reuse of drainage water and treated wastewater and improvement of irrigation efficiencies are major water saving measures, but their overall impact on water savings in the Nile system largely depends on where these measures are applied. For example, improved efficiencies in the Nile Valley will result in lower diversion requirements. However, since practically all inefficiently used water will remain in the Nile system for further downstream use, there hardly would be any impact on the reduction in outflow to sinks. Therefore, major impacts of improved efficiencies on overall water savings are expected in areas where the drainage water would otherwise directly flow to sinks. Improvement of irrigation efficiency and reuse of drainage water are measures that are quite different in nature. In principle increase in irrigation efficiency to reduce losses is preferred due to the possible adverse effects of reuse. By reusing drainage water, poor and good quality water are mixed, which may interfere with the interests of other downstream users that take water from the canal system (notably the intakes for municipal and industrial use). Another negative aspect of drainage water reuse is the risk of groundwater pollution in certain areas. However, the scope for improvement of irrigation efficiencies is limited in the Nile system where traditionally surface irrigation is practiced. This practice is not expected to change in the future. Even if the conveyance-, distribution-, and field application efficiencies are increased there still will be significant quantities of drainage water that will flow to sinks if not captured by downstream reuse pumping stations. Even though efficiencies are increased in the water distribution system and the on-farm level, there still will be a significant quantity of water that is lost if no further measures are taken. The major measure to reduce these losses is through reuse of drainage water, after mixing this water with fresh canal water. Reuse of drainage water has already been practised at a larger scale during the last decades, whereby water from main drains is pumped into main canals. A major problem experienced is the deteriorating water quality in many drains that are polluted from municipal and industrial sources. Mixing of this water with canal water in a number of cases threatened other water users that are located downstream of the mixing points. For this reason a number of main drain reuse stations had to be closed in the past. To bring these pumping stations into operation again, large efforts to reduce the pollution loads would be necessary. Therefore, alternatives for this type of reuse have to be found. As an alternative to the reuse of drainage water from larger drains the reuse could shift to smaller less polluted drains in the upper part of the system. This so-called intermediate reuse would pump drainage water to lower order irrigation canals where it does not have harmful impacts on downstream domestic water intakes. However, attention will be taken in areas where groundwater is vulnerable for pollution in the absence of a protecting clay cap. The major challenge in increasing the drainage reuse will therefore be to find an optimum mix of main drain reuse and intermediate reuse that is both effective in terms of overall water savings and costs, and that has the least negative impacts on the groundwater and other water users.
3.2 Retrospective analysis
23
The Irrigation Improvement Project is a socio-technical irrigation improvement process involving the development of farmer participation in improvements and the subsequent management of improved systems. It is relaxing/removing a number of irrigation-related constraints to agricultural production and water use efficiency in Egypt:
• Irrigation efficiencies (the ratio of water beneficially used to the water delivered) are improved, primarily through reduction of delivery system operational losses. These efficiency improvements translate to water savings (in a global sense) that can be transferred or reallocated to other uses when the improvements occur in areas where irrigation losses and return flows are to salt or pollution sinks. In any situation, these efficiency improvements translate into “local water savings”, meaning the freshwater entering a command area is not lost to drains serving the command area.
• Equity of water distribution is improved. Evidence shows substantial head-end/tail-end inequities are relieved and tail-end farmers previously reliant on pumping of drain water to augment their short water supplies no longer need to perform this activity. Land values at the tail ends of canals and mesqas have increased as a result. Positive environmental and health impacts result since farmers no longer need to pump polluted and/or saline drain water.
• Fresh water losses by direct flows from canals and mesqas to drains are eliminated, thereby preserving fresh water quality and reducing or eliminating the degradation of these waters which occurs when they enter polluted drains,
• Farmers are organized in private, legally-recognized WUAs using a tested and monitored seven phase process which is supported by the Irrigation Advisory Service. There are many examples of functional WUAs actively operating and maintaining their improved mesqas.
• Farmers report high degrees of satisfaction with their improved mesqas. • Farmer’s irrigation costs (labor, pumping and mesqa maintenance) are
substantially reduced. • Farmers report water supply adequacy (availability, reliability, distribution,
etc.) is much improved, • Farmers report less conflicts over water and better communications among
themselves and with irrigation officials, • Increased crop productivity trends are evident, but available data are not
comprehensive enough to support strong conclusions for or against the program. This may in part be due to incomplete implementation of the improvement package as well as incomplete monitoring and evaluation of program impacts. Overall, it is unclear if the combination of inconclusive productivity impacts, but substantial irrigation cost savings, positive equity impacts, positive environmental and health impacts, and positive social impacts result in economically feasible rates of return on improvement investments. It is difficult to assign an economic value to the positive equity impacts, positive environmental and health impacts, and positive social impacts of IIP.
Domestic and Industrial water are growing as a result of population and economic growth. Most of the drinking water networks are not functioning in reasonable efficiency due to lack of maintenance and rehabilitation. The sewerage system is not covering all urban and rural areas, therefore septic tanks are heavily used in rural
24
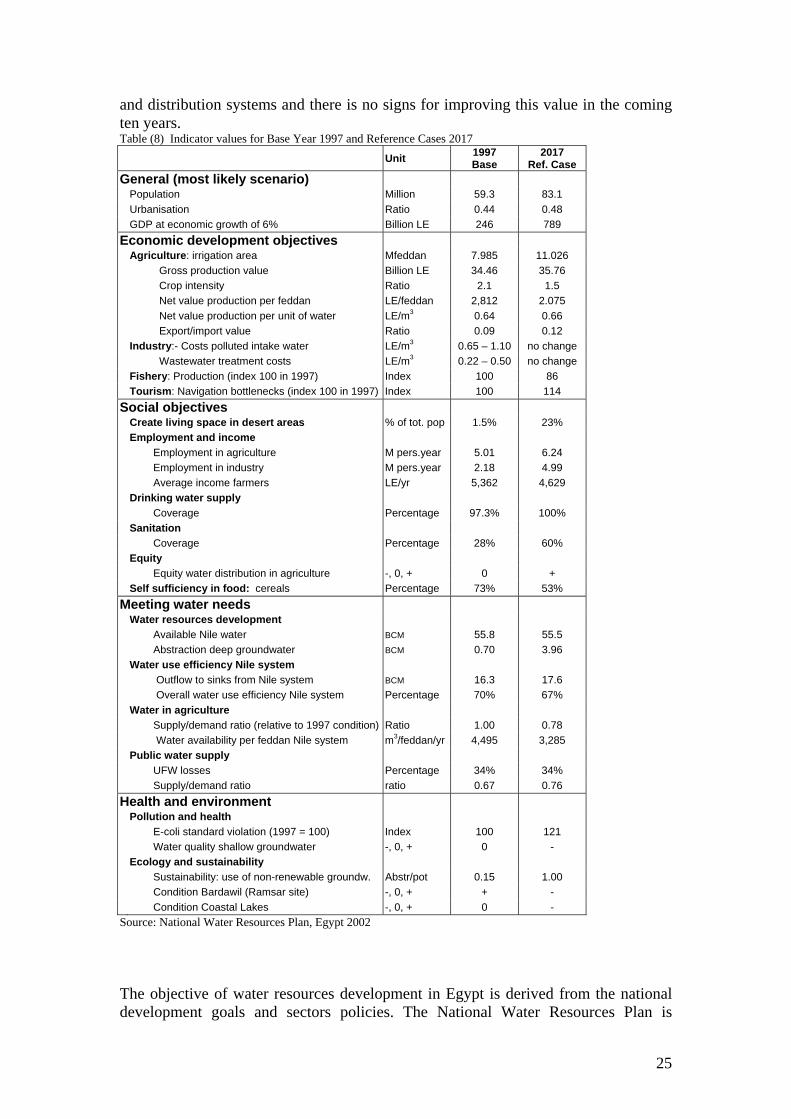
areas. if the septic tanks are not well designed they cause stress on the shallow ground water quality and increase hazard on human health. When septic tanks are full, the municipality use mobile tanks (cars) to drain the septic tank and dump the sewage to any agriculture drain. In most of the cases the treated sewage water goes to the agriculture drains and whenever malfunctioning occur in the treatment plant a bypass flow of the untreated waste water go to the drains. Polluting the agriculture drains by individuals or treatment plants stops the mixing of drainage water with the fresh water for the reuse purpose. In conclusion, the absence of good waste water management not only cause water loss but also contaminate other water resources or prevent using them. The large industrial activities can be monitored and water volume can be measured at the intake and the outlet factory. However the water consumed by small workshops and factories can not be measured completely. Many workshops use the public water services and dump the residuals into the sewerage system. This cause under estimation of the industrial water demand and it also add cost and difficulties at the treatment plants to treat the industrial pollutions which they are not designed to do it. Most of the large industrial entities are using old technologies. Technology can safe water by enhancing the water recycling methods, cooling with other materials than water, and reduce the treatment of the polluted water. MWRI in cooperation with EEAA succeeded to prevent all factories from dumping untreated waste water to the Nile river by implementing the water quality law (law 48) with an effective follow up plan. Increasing water price for the industrial usage has reduced the demand but there is no enough data to compute this reduction. 3.3 Prospective analysis The demand for water in Egypt will increase. In particular the planned Horizontal Expansion program of the government will result in a major increase in the demand for water. Other sectors of which the demand will grow are the municipal and domestic water use and the industrial use. From the experience gained since the establishment of the High Aswan Dam increasing the Nile water share is not easy task and if it happened it will not satisfy the forecasted demand. Egypt realised the need for developing a national plan for water resources to clearly understand the future situation and develop measures (actions) to solve the problems and satisfy the demand. The plan considered the year 1997 is the base year for analysis and year 2017 is the scope of planning. Several scenarios have been developed to anticipate demand based on natural and manmade expectations. Table (8) shows the indicator values for the base year abs the reference case year 2017. The indicators for the reference year 2017 are the values without any management measures applied. As a result we can notice that the agriculture expansion plan will lead to using more water thus increasing the drainage water which goes to the sea however the inflow from High Aswan Dam is constant. Such assumptions lead to decrease of the overall Nile system water use efficiency which represented by the (Inflow–outflow)/inflow. Where the inflow is the release from HAD while the outflows are the water going to sinks (desert areas, inland lakes, coastal lakes/sea and Suez Canal). Unaccounted For Water (UFW) losses amount to 34% as a national average, ranging between Governorates from 15% to 65%. The accuracy of these figures is somewhat questionable since most connections are not properly metered. However, supported by various studies it is concluded that a significant part of the UFW consists of leakage losses in the supply-
25
and distribution systems and there is no signs for improving this value in the coming ten years. Table (8) Indicator values for Base Year 1997 and Reference Cases 2017 Unit 1997
Base 2017
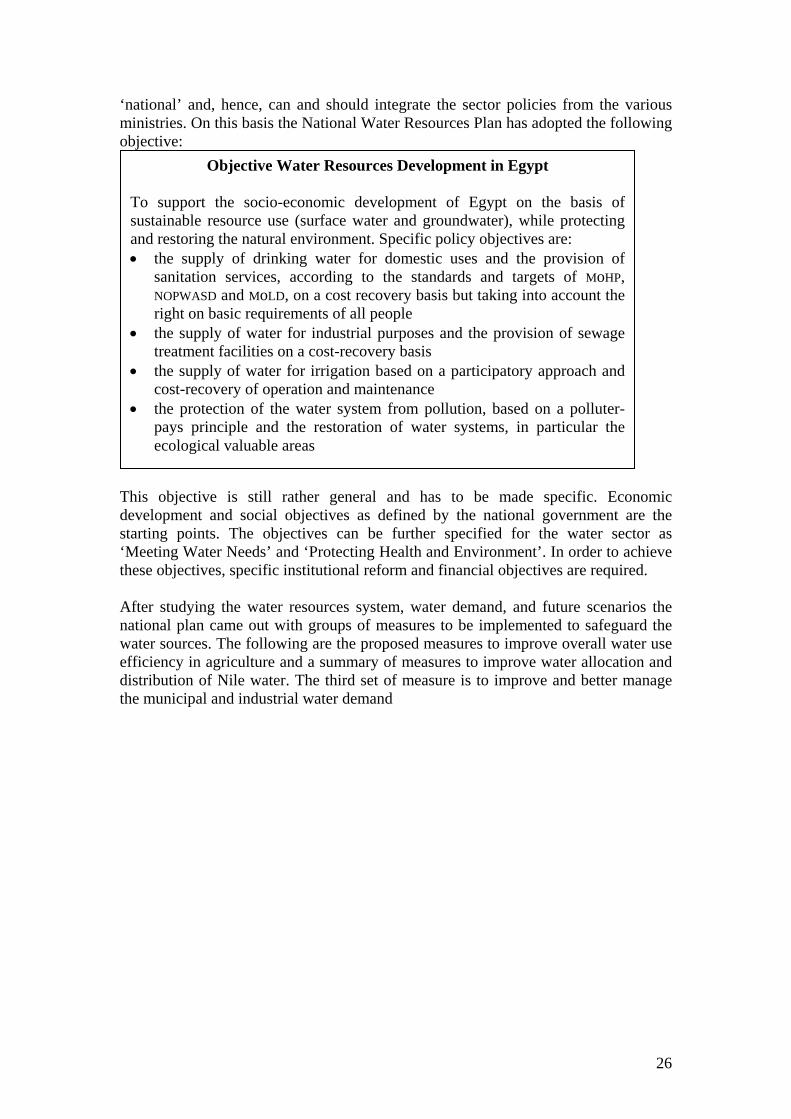
Ref. Case General (most likely scenario) Population Million 59.3 83.1 Urbanisation Ratio 0.44 0.48 GDP at economic growth of 6% Billion LE 246 789 Economic development objectives Agriculture: irrigation area Mfeddan 7.985 11.026 Gross production value Billion LE 34.46 35.76 Crop intensity Ratio 2.1 1.5 Net value production per feddan LE/feddan 2,812 2.075 Net value production per unit of water LE/m3 0.64 0.66 Export/import value Ratio 0.09 0.12 Industry:- Costs polluted intake water LE/m3 0.65 – 1.10 no change Wastewater treatment costs LE/m3 0.22 – 0.50 no change Fishery: Production (index 100 in 1997) Index 100 86 Tourism: Navigation bottlenecks (index 100 in 1997) Index 100 114 Social objectives Create living space in desert areas % of tot. pop 1.5% 23% Employment and income Employment in agriculture M pers.year 5.01 6.24 Employment in industry M pers.year 2.18 4.99 Average income farmers LE/yr 5,362 4,629 Drinking water supply Coverage Percentage 97.3% 100% Sanitation Coverage Percentage 28% 60% Equity Equity water distribution in agriculture -, 0, + 0 + Self sufficiency in food: cereals Percentage 73% 53% Meeting water needs Water resources development Available Nile water BCM 55.8 55.5 Abstraction deep groundwater BCM 0.70 3.96 Water use efficiency Nile system Outflow to sinks from Nile system BCM 16.3 17.6 Overall water use efficiency Nile system Percentage 70% 67% Water in agriculture Supply/demand ratio (relative to 1997 condition) Ratio 1.00 0.78 Water availability per feddan Nile system m3/feddan/yr 4,495 3,285 Public water supply UFW losses Percentage 34% 34% Supply/demand ratio ratio 0.67 0.76 Health and environment Pollution and health E-coli standard violation (1997 = 100) Index 100 121 Water quality shallow groundwater -, 0, + 0 - Ecology and sustainability Sustainability: use of non-renewable groundw. Abstr/pot 0.15 1.00 Condition Bardawil (Ramsar site) -, 0, + + - Condition Coastal Lakes -, 0, + 0 - Source: National Water Resources Plan, Egypt 2002 The objective of water resources development in Egypt is derived from the national development goals and sectors policies. The National Water Resources Plan is
26
‘national’ and, hence, can and should integrate the sector policies from the various ministries. On this basis the National Water Resources Plan has adopted the following objective:
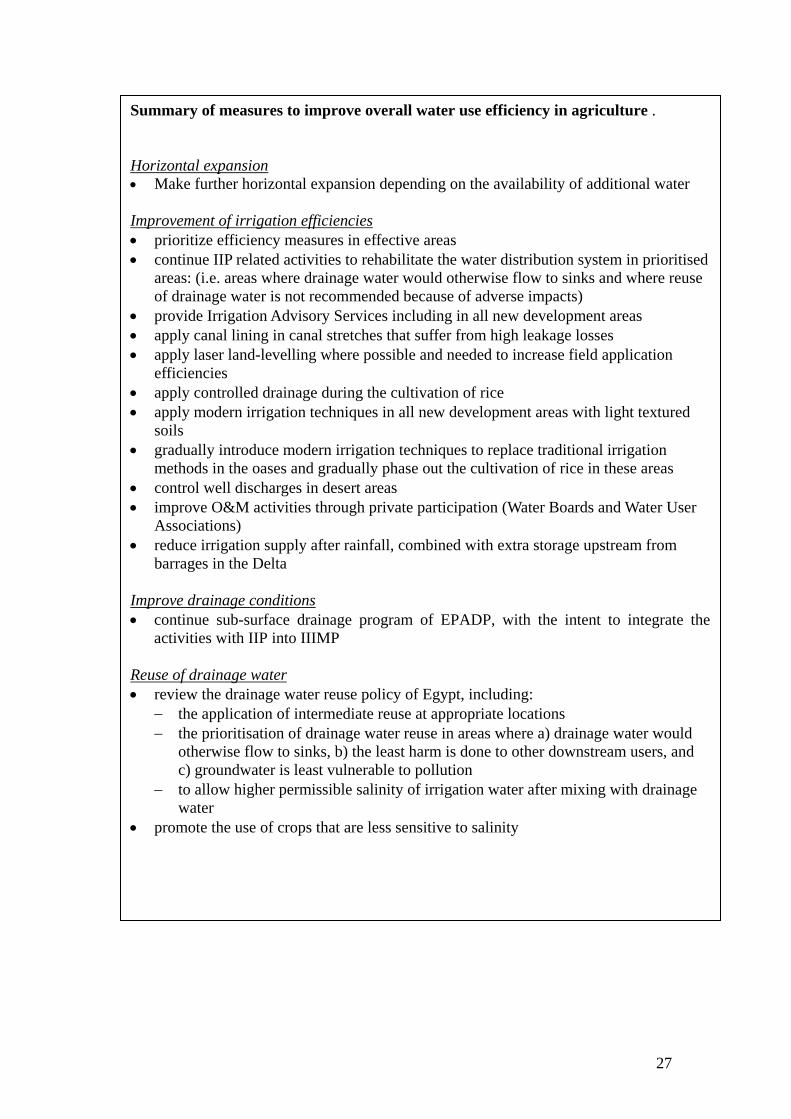
This objective is still rather general and has to be made specific. Economic development and social objectives as defined by the national government are the starting points. The objectives can be further specified for the water sector as ‘Meeting Water Needs’ and ‘Protecting Health and Environment’. In order to achieve these objectives, specific institutional reform and financial objectives are required. After studying the water resources system, water demand, and future scenarios the national plan came out with groups of measures to be implemented to safeguard the water sources. The following are the proposed measures to improve overall water use efficiency in agriculture and a summary of measures to improve water allocation and distribution of Nile water. The third set of measure is to improve and better manage the municipal and industrial water demand
Objective Water Resources Development in Egypt To support the socio-economic development of Egypt on the basis of sustainable resource use (surface water and groundwater), while protecting and restoring the natural environment. Specific policy objectives are: • the supply of drinking water for domestic uses and the provision of
sanitation services, according to the standards and targets of MoHP, NOPWASD and MoLD, on a cost recovery basis but taking into account the right on basic requirements of all people
• the supply of water for industrial purposes and the provision of sewage treatment facilities on a cost-recovery basis
• the supply of water for irrigation based on a participatory approach and cost-recovery of operation and maintenance
• the protection of the water system from pollution, based on a polluter-pays principle and the restoration of water systems, in particular the ecological valuable areas
27
Summary of measures to improve overall water use efficiency in agriculture .
Horizontal expansion • Make further horizontal expansion depending on the availability of additional water Improvement of irrigation efficiencies • prioritize efficiency measures in effective areas • continue IIP related activities to rehabilitate the water distribution system in prioritised
areas: (i.e. areas where drainage water would otherwise flow to sinks and where reuse of drainage water is not recommended because of adverse impacts)
• provide Irrigation Advisory Services including in all new development areas • apply canal lining in canal stretches that suffer from high leakage losses • apply laser land-levelling where possible and needed to increase field application
efficiencies • apply controlled drainage during the cultivation of rice • apply modern irrigation techniques in all new development areas with light textured
soils • gradually introduce modern irrigation techniques to replace traditional irrigation
methods in the oases and gradually phase out the cultivation of rice in these areas • control well discharges in desert areas • improve O&M activities through private participation (Water Boards and Water User
Associations) • reduce irrigation supply after rainfall, combined with extra storage upstream from
barrages in the Delta Improve drainage conditions • continue sub-surface drainage program of EPADP, with the intent to integrate the
activities with IIP into IIIMP Reuse of drainage water • review the drainage water reuse policy of Egypt, including:
− the application of intermediate reuse at appropriate locations − the prioritisation of drainage water reuse in areas where a) drainage water would
otherwise flow to sinks, b) the least harm is done to other downstream users, and c) groundwater is least vulnerable to pollution
− to allow higher permissible salinity of irrigation water after mixing with drainage water
• promote the use of crops that are less sensitive to salinity
28
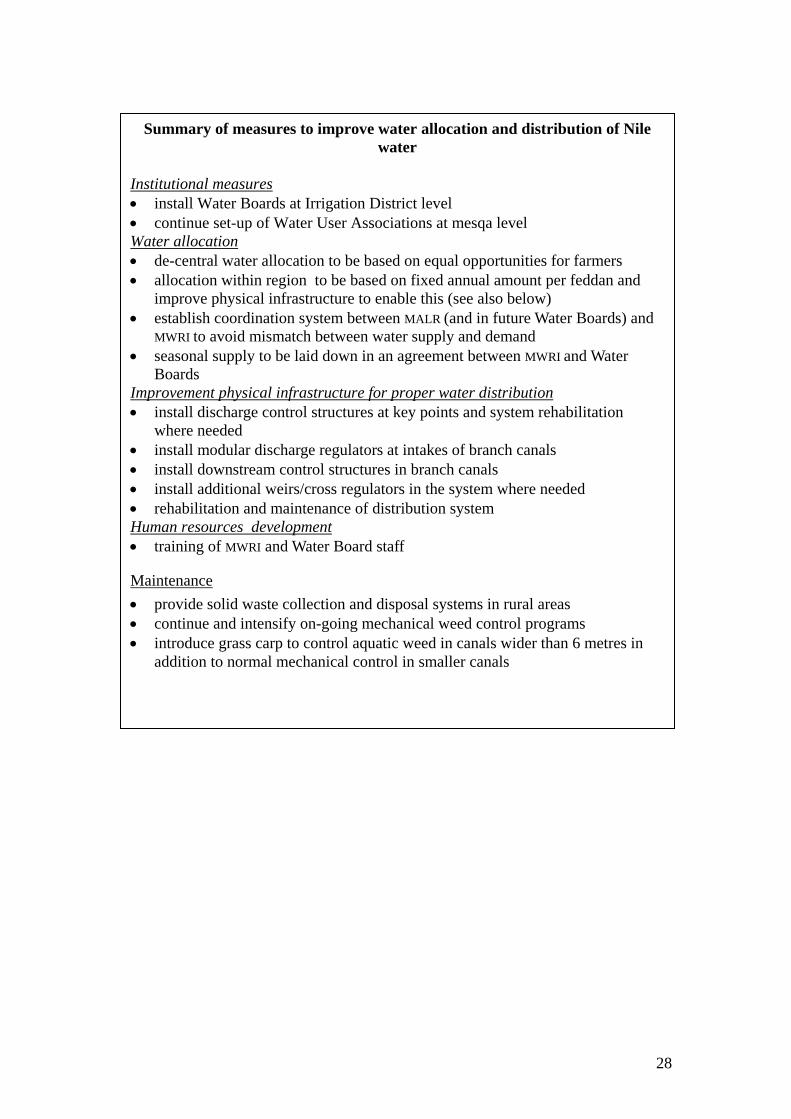
Summary of measures to improve water allocation and distribution of Nile water
Institutional measures • install Water Boards at Irrigation District level • continue set-up of Water User Associations at mesqa level Water allocation • de-central water allocation to be based on equal opportunities for farmers • allocation within region to be based on fixed annual amount per feddan and
improve physical infrastructure to enable this (see also below) • establish coordination system between MALR (and in future Water Boards) and
MWRI to avoid mismatch between water supply and demand • seasonal supply to be laid down in an agreement between MWRI and Water
Boards Improvement physical infrastructure for proper water distribution • install discharge control structures at key points and system rehabilitation
where needed • install modular discharge regulators at intakes of branch canals • install downstream control structures in branch canals • install additional weirs/cross regulators in the system where needed • rehabilitation and maintenance of distribution system Human resources development • training of MWRI and Water Board staff
Maintenance • provide solid waste collection and disposal systems in rural areas • continue and intensify on-going mechanical weed control programs • introduce grass carp to control aquatic weed in canals wider than 6 metres in
addition to normal mechanical control in smaller canals
29
4. Towards integrated policies of water resources and demand management. Take into account the environmental objectives, integrate WDM in water policies The concept of Integrated Water Resources Management (IWRM) has been developing since the beginning of the nineties. IWRM is the response to the growing pressure on our water resources systems as a result of growing population and socio-economic developments. Water shortages and deteriorating water quality have forced many countries in the world, in developed and developing countries alike, to reconsider their options with respect to the management of their water resources. As a result water resources management (WRM) has undergone a drastic change world-wide, moving from a mainly supply-oriented, engineering biased approach towards a demand-oriented, multi-sectoral approach, often labelled Integrated Water Resources Management. A key-aspect of IWRM is that the management and development of the resources should take place in interaction with the users (the socio-economic system), the environment and the institutions involved. IWRM applied in this way considers the use of the resources in relation to the social and economic activities and functions. These also determine the need for laws and regulations for the sustainable use of the water resources. Infrastructure, in relation to regulatory measures and mechanisms, will allow for effective use of the resource, taking due account of the environmental carrying capacity.
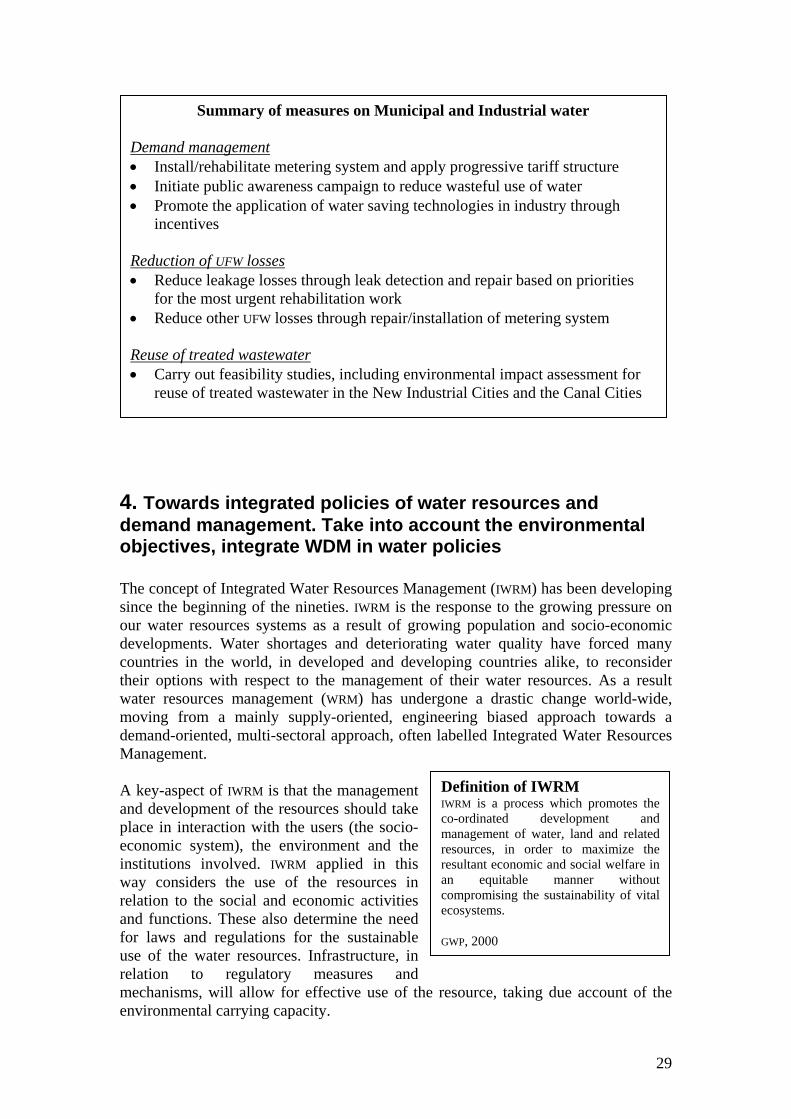
Summary of measures on Municipal and Industrial water
Demand management • Install/rehabilitate metering system and apply progressive tariff structure • Initiate public awareness campaign to reduce wasteful use of water • Promote the application of water saving technologies in industry through
incentives Reduction of UFW losses • Reduce leakage losses through leak detection and repair based on priorities
for the most urgent rehabilitation work • Reduce other UFW losses through repair/installation of metering system Reuse of treated wastewater • Carry out feasibility studies, including environmental impact assessment for
reuse of treated wastewater in the New Industrial Cities and the Canal Cities
Definition of IWRM IWRM is a process which promotes the co-ordinated development and management of water, land and related resources, in order to maximize the resultant economic and social welfare in an equitable manner without compromising the sustainability of vital ecosystems. GWP, 2000
30
The national objectives for Egypt's development in the period 1997 - 2017 have been described in the document "Egypt and the 21st century" (Cabinet ARE, 1997). Essential elements in the policy are the central role of the private sector in Egypt's development, human resources development, the transition to an information-based community, conservation of the environment, and a water conservation culture. Water conservation is considered to play an essential role in the development of natural resources. Conservation should include water use for domestic purposes, in irrigated agriculture and in industry. A proper scientific and economic basis has to be developed for proper water resources management.General development objectives of the national development policy related to water resources development include:
• To increase the economic growth to 6.8% in the period 1997 - 2002 and to 7.6% in the period 2003 - 2017, to increase the per capita GDP from 1,250 USD to 4,100 USD in 2017 and to increase employment to 97-98%.
• To increase the inhabited space of Egypt from 5.5% to 25% of the total area of Egypt. The present policy of developing new cities outside the Nile Valley will be expanded by developing areas in Sinai and the Western Desert.
• The development of Northern Egypt concentrates on El Salam Canal in the Eastern Delta (220,000 feddan) and Sinai (400,000 feddan). Other plans include the development of 250,000 feddan in Middle Sinai and the development of harbours, industry and tourism.
• The basis for the development of Southern Egypt is the construction of the New Valley Canal, that will irrigate some 500,000 feddan and the expansion of oases, where 447,000 feddan are planned to be irrigated using groundwater resources. Support will be given, besides to agriculture, to the development of industry and tourism.
• Protecting the Nile and other fresh water resources from pollution. • Promotion of integrated pest control and limitations on the use of agro-
chemicals. • Extension of sewage networks and wastewater treatment plants. • Promotion of water conservation in domestic use, in agriculture and in
industry. These long-term national objectives are translated into Five-Year plans. The Five-Year Plan 2002-2007 has taken into account the slowing-down of the world economic growth of recent years and has somewhat reduced the growth objective. On the other hand public spending is likely to increase. The Government of Egypt has since long recognised the vital role of water for the economic and social development of the country and has initiated major programmes to improve the performance of the water system. Examples are the ongoing horizontal expansion projects, the Irrigation Improvement Project (iip) and the many drinking water and sewage treatment plants that have been and are being built. The present Water Policy (of January 2000) of the Ministry of Water Resources and Irrigation (MWRI) covers many of the aspects mentioned and follows already an ‘integrated’ water resources management approach. The policy tries to achieve those objectives by:
• Improving the efficiency of the present use of the water resources;
31
• Developing new water resources,, e.g. deep groundwater; and • Protecting environment and reducing water related health hazards.
The expanding economy of Egypt, the limitations in developing new water resources and above described ‘challenges’ necessitates the development of a new policy. This new policy is building upon the present (2000) policy but extends it and includes new aspects. In particular the new policy:
• extends the approach of integrated water management, not only by taking all policy objectives into account, but by making the plan a ‘national’ plan and not a plan of mwri only;
• hence, is based on the involvement and co-operation of all stakeholders; • includes institutional change; • pays specific attention to the implementability of proposed measures; • includes an update of the water availability assessment and an update of the
demand projections by 2017; and finally, • is based on tools (including computational tools) that enable a trade-off
between the various aspects involved
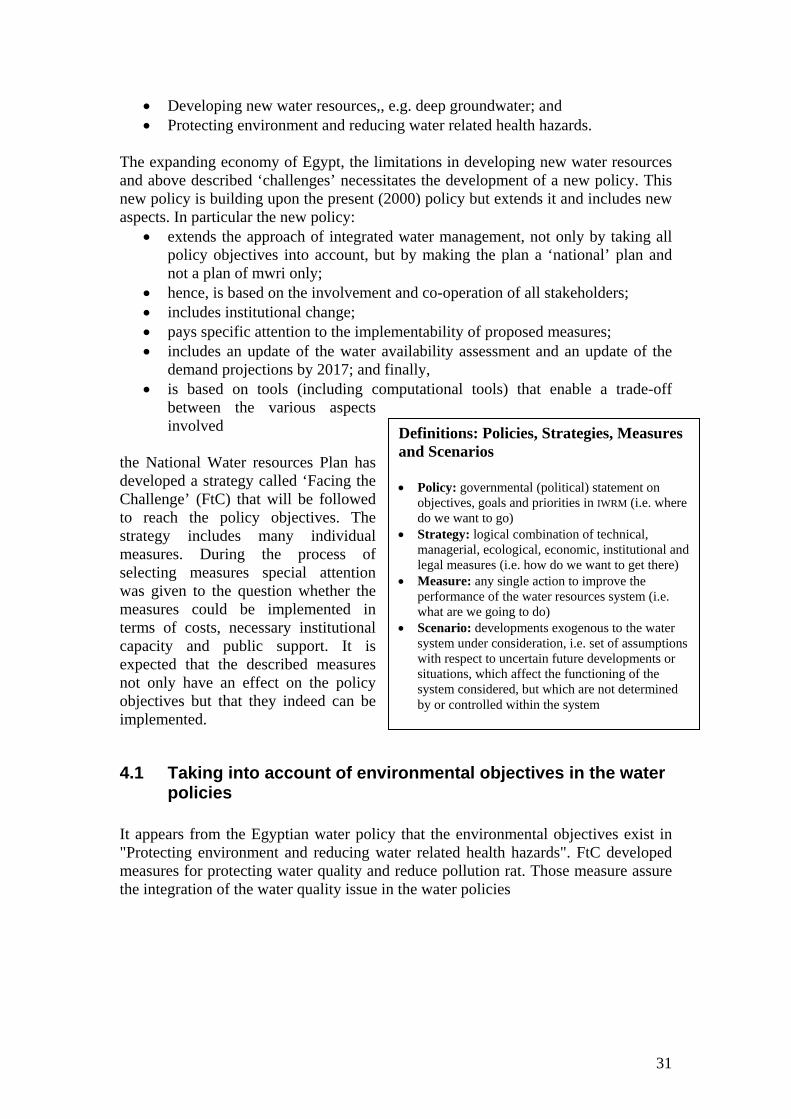
the National Water resources Plan has developed a strategy called ‘Facing the Challenge’ (FtC) that will be followed to reach the policy objectives. The strategy includes many individual measures. During the process of selecting measures special attention was given to the question whether the measures could be implemented in terms of costs, necessary institutional capacity and public support. It is expected that the described measures not only have an effect on the policy objectives but that they indeed can be implemented.
4.1 Taking into account of environmental objectives in the water policies
It appears from the Egyptian water policy that the environmental objectives exist in "Protecting environment and reducing water related health hazards". FtC developed measures for protecting water quality and reduce pollution rat. Those measure assure the integration of the water quality issue in the water policies
Definitions: Policies, Strategies, Measures and Scenarios • Policy: governmental (political) statement on
objectives, goals and priorities in IWRM (i.e. where do we want to go)
• Strategy: logical combination of technical, managerial, ecological, economic, institutional and legal measures (i.e. how do we want to get there)
• Measure: any single action to improve the performance of the water resources system (i.e. what are we going to do)
• Scenario: developments exogenous to the water system under consideration, i.e. set of assumptions with respect to uncertain future developments or situations, which affect the functioning of the system considered, but which are not determined by or controlled within the system
32
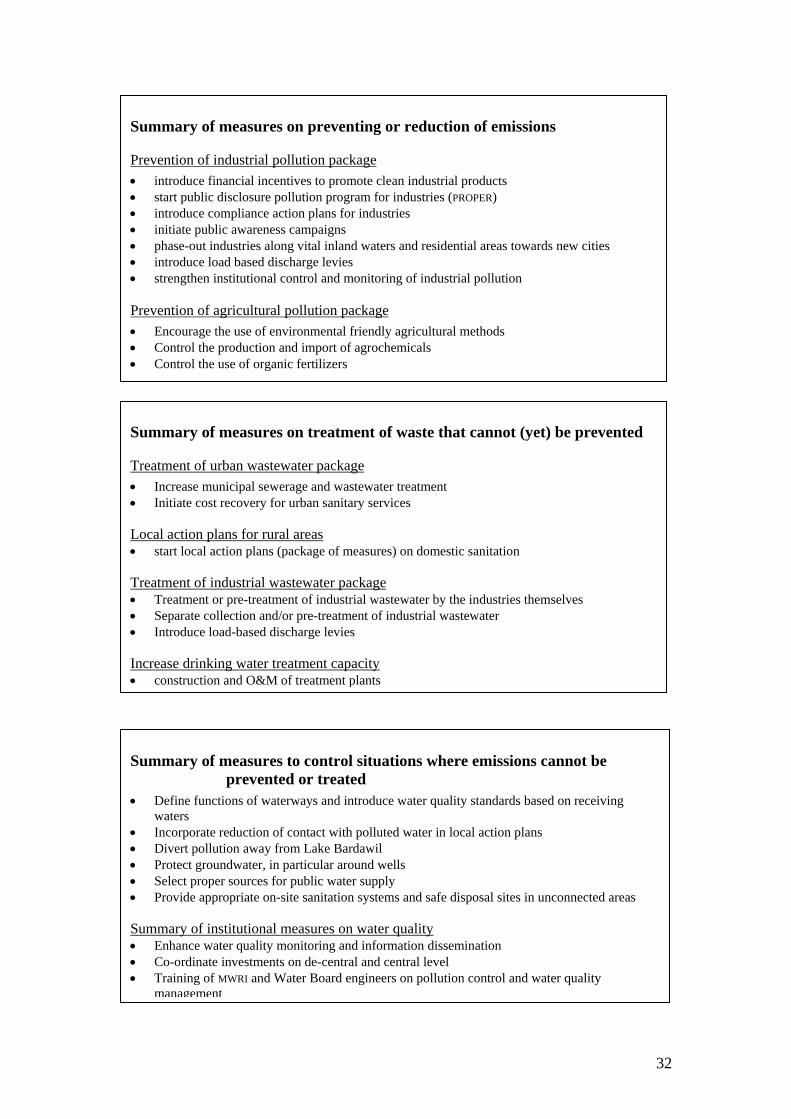
Summary of measures to control situations where emissions cannot be prevented or treated
• Define functions of waterways and introduce water quality standards based on receiving waters
• Incorporate reduction of contact with polluted water in local action plans • Divert pollution away from Lake Bardawil • Protect groundwater, in particular around wells • Select proper sources for public water supply • Provide appropriate on-site sanitation systems and safe disposal sites in unconnected areas Summary of institutional measures on water quality • Enhance water quality monitoring and information dissemination • Co-ordinate investments on de-central and central level • Training of MWRI and Water Board engineers on pollution control and water quality
management
Summary of measures on treatment of waste that cannot (yet) be prevented
Treatment of urban wastewater package • Increase municipal sewerage and wastewater treatment • Initiate cost recovery for urban sanitary services Local action plans for rural areas • start local action plans (package of measures) on domestic sanitation Treatment of industrial wastewater package • Treatment or pre-treatment of industrial wastewater by the industries themselves • Separate collection and/or pre-treatment of industrial wastewater • Introduce load-based discharge levies Increase drinking water treatment capacity • construction and O&M of treatment plants
Summary of measures on preventing or reduction of emissions
Prevention of industrial pollution package • introduce financial incentives to promote clean industrial products • start public disclosure pollution program for industries (PROPER) • introduce compliance action plans for industries • initiate public awareness campaigns • phase-out industries along vital inland waters and residential areas towards new cities • introduce load based discharge levies • strengthen institutional control and monitoring of industrial pollution
Prevention of agricultural pollution package • Encourage the use of environmental friendly agricultural methods • Control the production and import of agrochemicals • Control the use of organic fertilizers
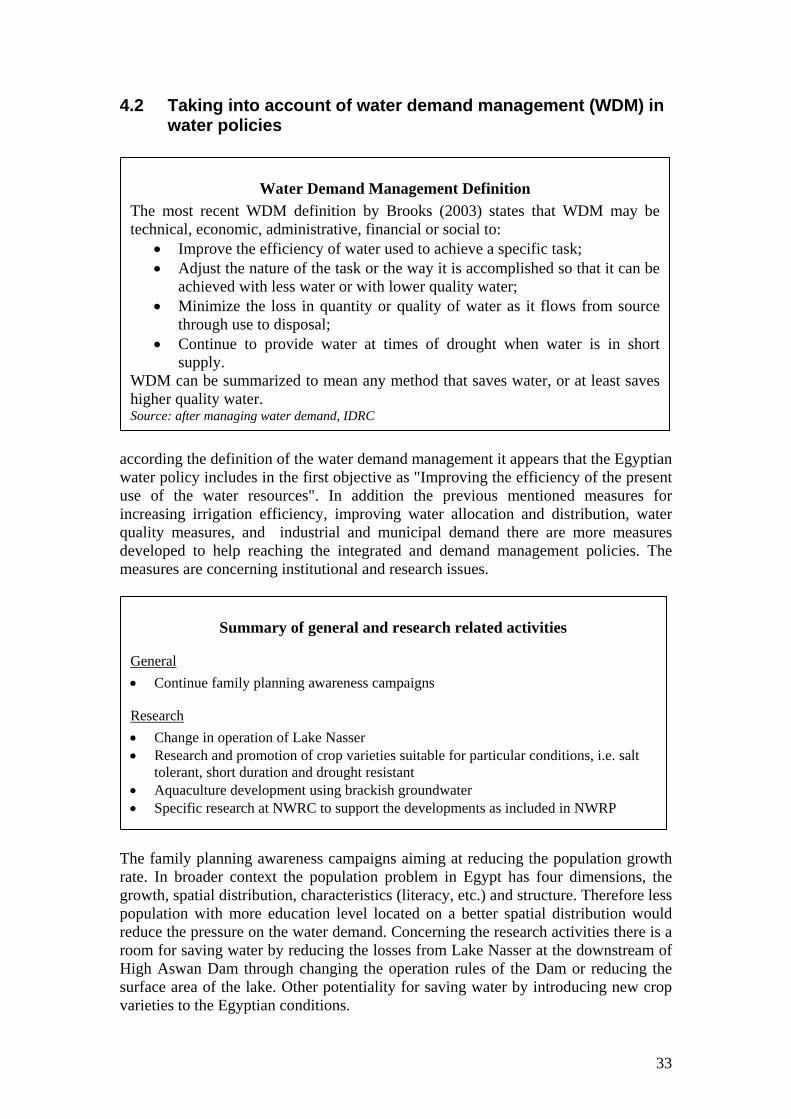
33
4.2 Taking into account of water demand management (WDM) in water policies
according the definition of the water demand management it appears that the Egyptian water policy includes in the first objective as "Improving the efficiency of the present use of the water resources". In addition the previous mentioned measures for increasing irrigation efficiency, improving water allocation and distribution, water quality measures, and industrial and municipal demand there are more measures developed to help reaching the integrated and demand management policies. The measures are concerning institutional and research issues.
The family planning awareness campaigns aiming at reducing the population growth rate. In broader context the population problem in Egypt has four dimensions, the growth, spatial distribution, characteristics (literacy, etc.) and structure. Therefore less population with more education level located on a better spatial distribution would reduce the pressure on the water demand. Concerning the research activities there is a room for saving water by reducing the losses from Lake Nasser at the downstream of High Aswan Dam through changing the operation rules of the Dam or reducing the surface area of the lake. Other potentiality for saving water by introducing new crop varieties to the Egyptian conditions.
Summary of general and research related activities
General • Continue family planning awareness campaigns
Research • Change in operation of Lake Nasser • Research and promotion of crop varieties suitable for particular conditions, i.e. salt
tolerant, short duration and drought resistant • Aquaculture development using brackish groundwater • Specific research at NWRC to support the developments as included in NWRP
Water Demand Management Definition The most recent WDM definition by Brooks (2003) states that WDM may be technical, economic, administrative, financial or social to:
• Improve the efficiency of water used to achieve a specific task; • Adjust the nature of the task or the way it is accomplished so that it can be
achieved with less water or with lower quality water; • Minimize the loss in quantity or quality of water as it flows from source
through use to disposal; • Continue to provide water at times of drought when water is in short
supply. WDM can be summarized to mean any method that saves water, or at least saves higher quality water. Source: after managing water demand, IDRC
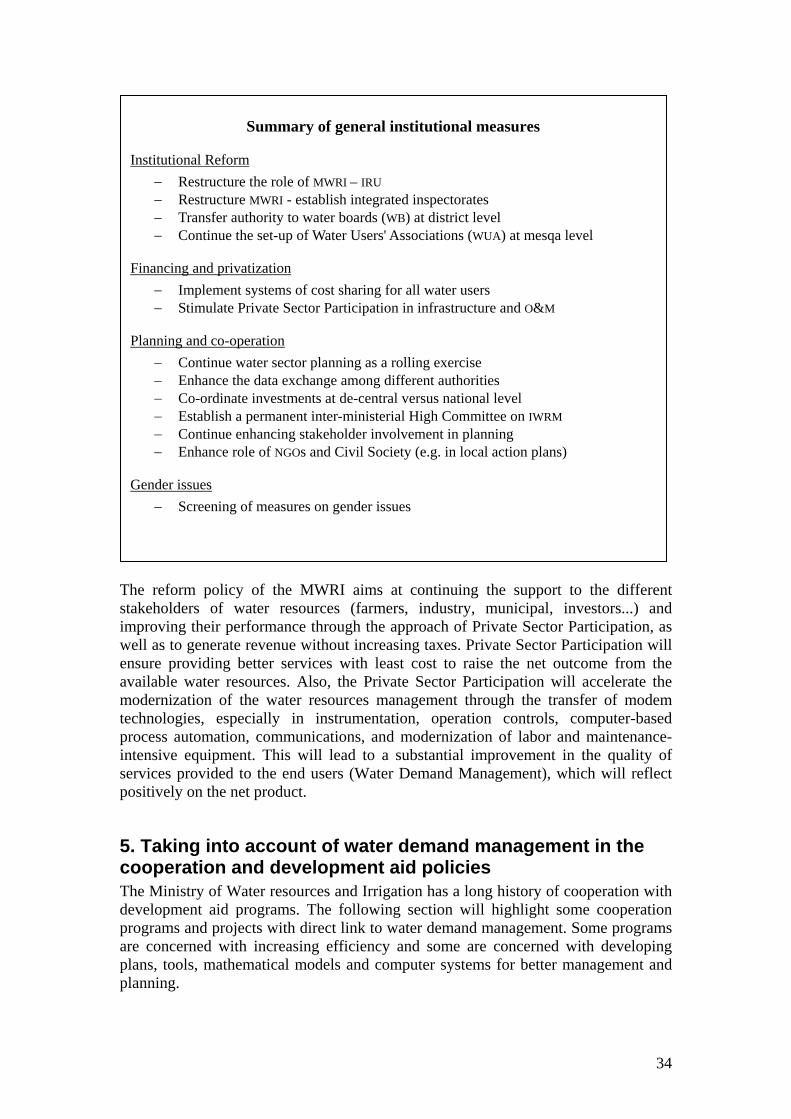
34
The reform policy of the MWRI aims at continuing the support to the different stakeholders of water resources (farmers, industry, municipal, investors...) and improving their performance through the approach of Private Sector Participation, as well as to generate revenue without increasing taxes. Private Sector Participation will ensure providing better services with least cost to raise the net outcome from the available water resources. Also, the Private Sector Participation will accelerate the modernization of the water resources management through the transfer of modem technologies, especially in instrumentation, operation controls, computer-based process automation, communications, and modernization of labor and maintenance-intensive equipment. This will lead to a substantial improvement in the quality of services provided to the end users (Water Demand Management), which will reflect positively on the net product.
5. Taking into account of water demand management in the cooperation and development aid policies The Ministry of Water resources and Irrigation has a long history of cooperation with development aid programs. The following section will highlight some cooperation programs and projects with direct link to water demand management. Some programs are concerned with increasing efficiency and some are concerned with developing plans, tools, mathematical models and computer systems for better management and planning.
Summary of general institutional measures
Institutional Reform − Restructure the role of MWRI – IRU − Restructure MWRI - establish integrated inspectorates − Transfer authority to water boards (WB) at district level − Continue the set-up of Water Users' Associations (WUA) at mesqa level
Financing and privatization − Implement systems of cost sharing for all water users − Stimulate Private Sector Participation in infrastructure and O&M
Planning and co-operation − Continue water sector planning as a rolling exercise − Enhance the data exchange among different authorities − Co-ordinate investments at de-central versus national level − Establish a permanent inter-ministerial High Committee on IWRM − Continue enhancing stakeholder involvement in planning − Enhance role of NGOs and Civil Society (e.g. in local action plans)
Gender issues − Screening of measures on gender issues

35
Type of Cooperation: Bilateral (Egypt and Canada) Funding Agency: CIDA Project title: National Water Quality and Availability Management Start Date: 1999 End Date: 2007 Project description: NAWQAM project consists of four technical components. One component deals with water quality monitoring and analysis, the second component deals with water availability management, the third component developed guidelines for using low quality water in high saline land, the fourth component deals with communication and coordination. Outstanding results:
1- Developing Water Demand Forecasting Model. The model use regression analysis for forecasting the agriculture demand and it uses factors-based models to forecast other sectors' demand. The model includes external effects module where the user can decide what type of interventions can be applied and what the result will be on the demand. although the model is simple but it is very effective tool for testing different scenarios. The effects considered in the model are, technology change, climate change, service charge, population growth, and economic growth.
2- Develop Integrated Water Resources Management Information System. The system consists of a national water resources database as the core entity and several models and tools for water balance calculations, water distribution, and river flow simulation, water quality management, …
3- National Water Quality Monitoring Network. The network includes regular measurements and analysis of water quality parameters in the Nile river, canals and drains network, and ground water aquifers.
Type of Cooperation: Bilateral (Egypt and the Netherlands) Funding Agency: The Netherlands Project title: National Water Resources Plan Start Date: 1999 End Date: 2004 Project description: following a series of successful cooperation between MWRI and the Netherlands this project was designed to develop national water resources plan up to year 2017. the project was implemented in the Planning Sector, MWRI. Outstanding results: a plan for water resources management and how to safeguard Egypt water and optimize the sectoral use. The main feature of the plan is the participatory approach in developing the plan. All stake holders such as other Ministries and research institutes and universities were involved in all levels and steps of developing the plan. Type of Cooperation: International (Nile Basin Initiative) Funding Agency: NBI Project title: Water Policy Good Practice and support Start Date: 2005 Project description: Water Policy Good Practice and support is a project falls under the Water Resources Planning and Management project, which falls under the NBI Shared Vision Program. The project includes all Nile Basin countries and the
36
management unit is located in Addis Ababa, Ethiopia. Other components of the main project is to develop a DSS for the Nile Basin for better planning and management. Outstanding results: Water Policy guidelines and Compendium of Good Practice. The objective of the guidelines is to support stakeholders in the Nile Basin Countries to enhance the formulation and implementation of their national policies with a cooperative regional perspective. Proposed cooperation The developed indicators by MCSD for monitoring the Mediterranean Strategy for Sustainable Development are well defined indicators. These indicators have been considered very carefully in developing this report. However some indicators are difficult to collect their basic data to compute. Some indicators are computed locally in the country by specific party and it is not easy to validate them or recalculate. It is important to assign computing the sustainable development indicators to some agency to compute carefully in a proper time span. Example of the indicators which are difficult to be computed is the drinking water efficiency as it requires the drinking water volume invoiced and paid by consumers and the Total drinking water volume produced and distributed. CAPMAS produce regular statistical reports on the water volume produced and distributed however the volume invoiced and paid by customers are not published. NOPWASD compute the drinking water efficiency and issue the final results. Great doubt and arguments usually occurs when discussing such numbers. The Irrigation efficiency is the responsibility of the Ministry of Water Resources and Irrigation. The absence of flow measurements and calibration of control structures on the branch canals level cause the arguments and allow for assumptions. The water flow is known at the River stream control points and the first order canals (taking water directly from the River). The rest of the irrigation network has been managed on water level bases for decades. This lead to putting more water in the system to maintain the water level not for the actual needs and consumption. The water level is maintained to satisfy the tributary canals' intake levels and the pumping levels. Computing the water demand for different sectors is using WAT_P02 is matching the methodology available in the irrigation and agriculture sectors in Egypt while the terminology might slightly mismatch. The agriculture consumptive use is the actual evapotranspiration for the irrigated crops. The cropping pattern areas for the three seasons Summer, Winter, and Nili are computed and multiplied by the evapotranspiration rates. This ends with the value used in the report, 35.7 BCM however the diverted water to the agriculture lands is 58.8 BCM. This goes inline with the WAT_P02 indicator for water demand for agriculture which includes the withdrawals plus the unconventional water production (desalination +import) plus water reuse. These two definitions lead to the same results. Finally, the indicators developed by MCSD needs more effort to compute them and collect the relevant data on reasonable spatial and temporal variation with comprehensive comparison between them and the available indicators.
37
6. Overview and conclusion The designing and implementation of sustainable development strategy including the indicators, the analytical methods and the integration of water policies are matching the Egyptian case of integrated water policy and the national water resources plan. Moreover the Egyptian example includes more aspects of the demand management such as fish farming, life stock, and environmental demand. For Both cases (the Egyptian and the MSSD methodology) more analysis on the geographical distribution of resources and demands need more attention. Despite that Egypt national water resources plan looks well formulated and developed the implementation plan faces another type of challenges. The financial requirements to implement the plan is huge in particular the budget required for Municipal water development. The budget needed for constructing new plants (drinking water and sewage treatment) to satisfy the demand increase as well as rehabilitation of the old systems to increase efficiency. Egypt applies the Integrated Water Resources (and demand) Management on different levels and aspects. MWRI establish Integrated Water Resources Management districts and directorates. These are the management units in the MWRI structure. The old system was one unit for irrigation management and another unit for drainage management and another unit for ground water management. The integrated units will deal with all possible resources and used in one geographical unit. Water User Associations concept is applied on the smallest irrigation canal (mesqa) which is originally a private canal. MWRI supports the establishment of WUA and provide technical and administrative guide. Another institutional aspect is the Institutional reform policy of MWRI. A special unit has been established to develop a reform vision and assist in the implementation. The reform vision established 8 principals for reform and they are; 1) participation; 2) decentralization; 3) basin organization; 4) water quality; 5) private sector participation; 6) privatization, 7) cost recovery; and 8) inter ministerial coordination. It is expected to implement the reform on stages following the implementation stages of the National Water resources Plan

38
References APRP, 1998. "Egypt's Irrigation Improvement Program", APRP Report No. 7. June.
1998 APRP, 2000, "Policies and Procedures for Improved Urban Waste Water Discharge
and Reuse", APRP Report No. 34, December 2000 APRP, 2001. Matching Irrigation Supplies and Demands, APRP Report No. 45.
Nov. 2001 ARE, Cabinet of Ministers, 1997. "Egypt and the 21st century", March 1997 ARE, MWRI, 2005. "Water for the Future, National Water Resources Plan 2017",
Jan. 2005 CAPMAS, 2005. "Irrigation and Water Resources Bulletin 2004", Ref.No. 71-
12414/2004, December, 2005 CAPMAS, 2006. "Statistics on Water Collection, Purification and Distribution
Activity 2003/2004", Ref.No. 72-1234/2004, Jan 2006 Dorrah, Hassen. "Implementing water Demand Forecasting Model within the Water
Planning Computational framework", NAWQAM Project Report, May 2005.
El-Masry, N., 2005. "Development Of Decision Support System Using Agricultural Sector Model Of Egypt", Ph.D. Thesis, Cairo University, 2005
El-Zanaty, F. 1996. "Egypt Demographic and Health Survey", 1995 El-Zanaty, F. 1998. "Knowledge, Attitudes and Practices of Egyptian Farmers
towards Water Resources: A National Survey", October 1998 IIIMP, 2005. "Preparation Feasibility Phase Study for Integrated Irrigated
Improvement and Management Project", Sogreah consultants, Jan. 2005 IRU, 2005. "Vision and Strategy for MWRI Institutional Reform". IRU Report. May
2005 Kombaz, et al. 2002. "Egypt Agriculture Water Demand Forecasting up to year
2025", ICID congress, Montreal, 2002 Tate, Donald, 2004. "Water Demand Forecasting Models for Egypt", NAWQAM
Project mission reports 2003 and 2004

39
Appendices Annex A: Agriculture Horizontal Expansion Projects
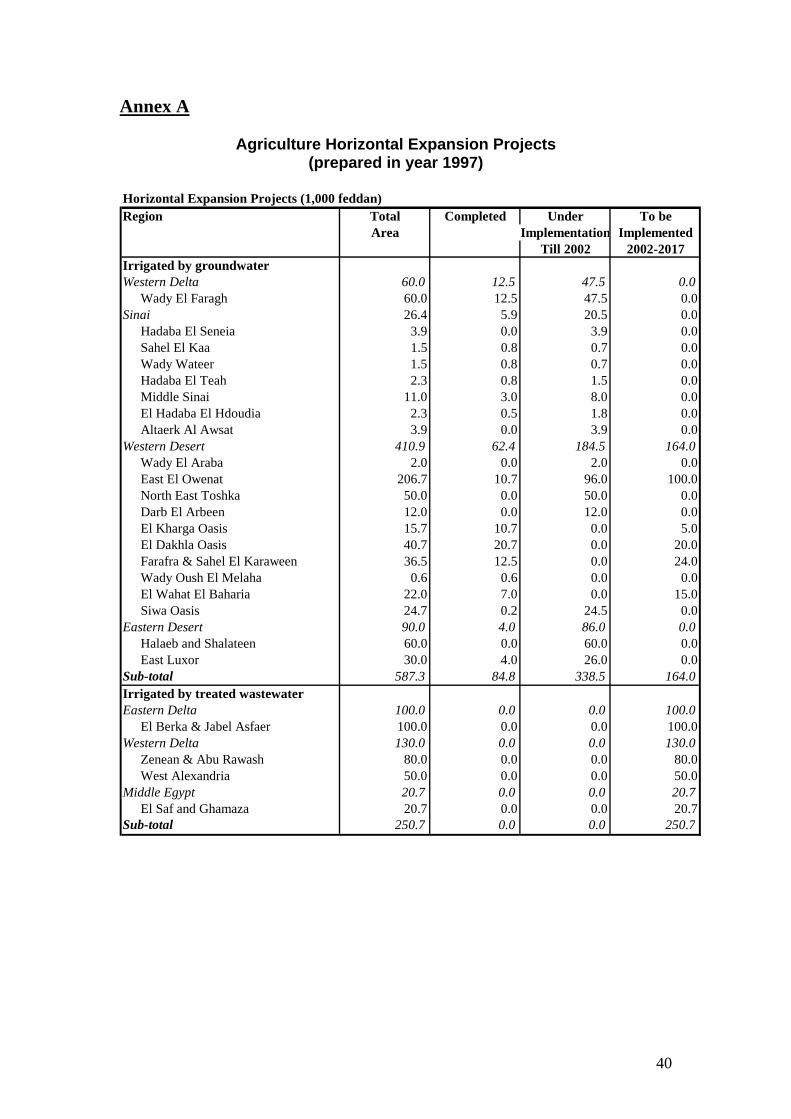
40
Annex A
Agriculture Horizontal Expansion Projects (prepared in year 1997)
Horizontal Expansion Projects (1,000 feddan)Region Total Completed Under To be
Area Implementation ImplementedTill 2002 2002-2017
Irrigated by groundwaterWestern Delta 60.0 12.5 47.5 0.0
Wady El Faragh 60.0 12.5 47.5 0.0Sinai 26.4 5.9 20.5 0.0
Hadaba El Seneia 3.9 0.0 3.9 0.0Sahel El Kaa 1.5 0.8 0.7 0.0Wady Wateer 1.5 0.8 0.7 0.0Hadaba El Teah 2.3 0.8 1.5 0.0Middle Sinai 11.0 3.0 8.0 0.0El Hadaba El Hdoudia 2.3 0.5 1.8 0.0Altaerk Al Awsat 3.9 0.0 3.9 0.0
Western Desert 410.9 62.4 184.5 164.0Wady El Araba 2.0 0.0 2.0 0.0East El Owenat 206.7 10.7 96.0 100.0North East Toshka 50.0 0.0 50.0 0.0Darb El Arbeen 12.0 0.0 12.0 0.0El Kharga Oasis 15.7 10.7 0.0 5.0El Dakhla Oasis 40.7 20.7 0.0 20.0Farafra & Sahel El Karaween 36.5 12.5 0.0 24.0Wady Oush El Melaha 0.6 0.6 0.0 0.0El Wahat El Baharia 22.0 7.0 0.0 15.0Siwa Oasis 24.7 0.2 24.5 0.0
Eastern Desert 90.0 4.0 86.0 0.0Halaeb and Shalateen 60.0 0.0 60.0 0.0East Luxor 30.0 4.0 26.0 0.0
Sub-total 587.3 84.8 338.5 164.0Irrigated by treated wastewaterEastern Delta 100.0 0.0 0.0 100.0
El Berka & Jabel Asfaer 100.0 0.0 0.0 100.0Western Delta 130.0 0.0 0.0 130.0
Zenean & Abu Rawash 80.0 0.0 0.0 80.0West Alexandria 50.0 0.0 0.0 50.0
Middle Egypt 20.7 0.0 0.0 20.7El Saf and Ghamaza 20.7 0.0 0.0 20.7
Sub-total 250.7 0.0 0.0 250.7
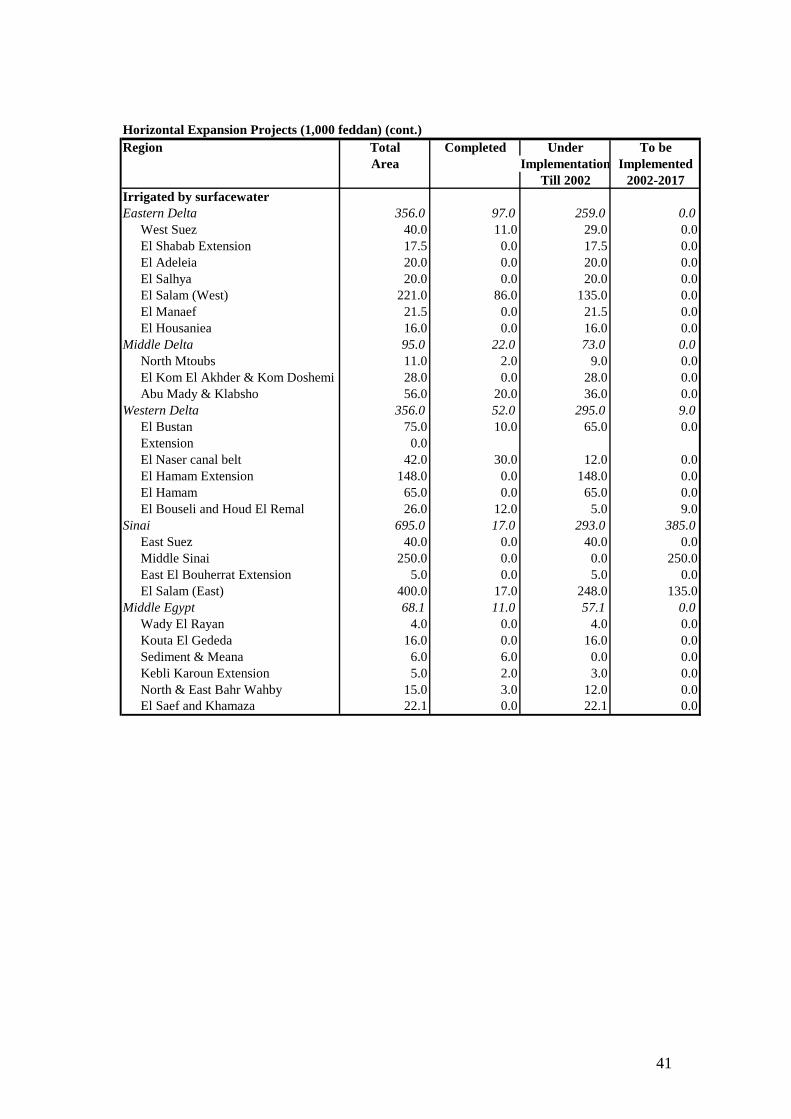
41
Horizontal Expansion Projects (1,000 feddan) (cont.)Region Total Completed Under To be
Area Implementation ImplementedTill 2002 2002-2017
Irrigated by surfacewaterEastern Delta 356.0 97.0 259.0 0.0
West Suez 40.0 11.0 29.0 0.0El Shabab Extension 17.5 0.0 17.5 0.0El Adeleia 20.0 0.0 20.0 0.0El Salhya 20.0 0.0 20.0 0.0El Salam (West) 221.0 86.0 135.0 0.0El Manaef 21.5 0.0 21.5 0.0El Housaniea 16.0 0.0 16.0 0.0
Middle Delta 95.0 22.0 73.0 0.0North Mtoubs 11.0 2.0 9.0 0.0El Kom El Akhder & Kom Doshemi 28.0 0.0 28.0 0.0Abu Mady & Klabsho 56.0 20.0 36.0 0.0
Western Delta 356.0 52.0 295.0 9.0El Bustan 75.0 10.0 65.0 0.0Extension 0.0El Naser canal belt 42.0 30.0 12.0 0.0El Hamam Extension 148.0 0.0 148.0 0.0El Hamam 65.0 0.0 65.0 0.0El Bouseli and Houd El Remal 26.0 12.0 5.0 9.0
Sinai 695.0 17.0 293.0 385.0East Suez 40.0 0.0 40.0 0.0Middle Sinai 250.0 0.0 0.0 250.0East El Bouherrat Extension 5.0 0.0 5.0 0.0El Salam (East) 400.0 17.0 248.0 135.0
Middle Egypt 68.1 11.0 57.1 0.0Wady El Rayan 4.0 0.0 4.0 0.0Kouta El Gededa 16.0 0.0 16.0 0.0Sediment & Meana 6.0 6.0 0.0 0.0Kebli Karoun Extension 5.0 2.0 3.0 0.0North & East Bahr Wahby 15.0 3.0 12.0 0.0El Saef and Khamaza 22.1 0.0 22.1 0.0
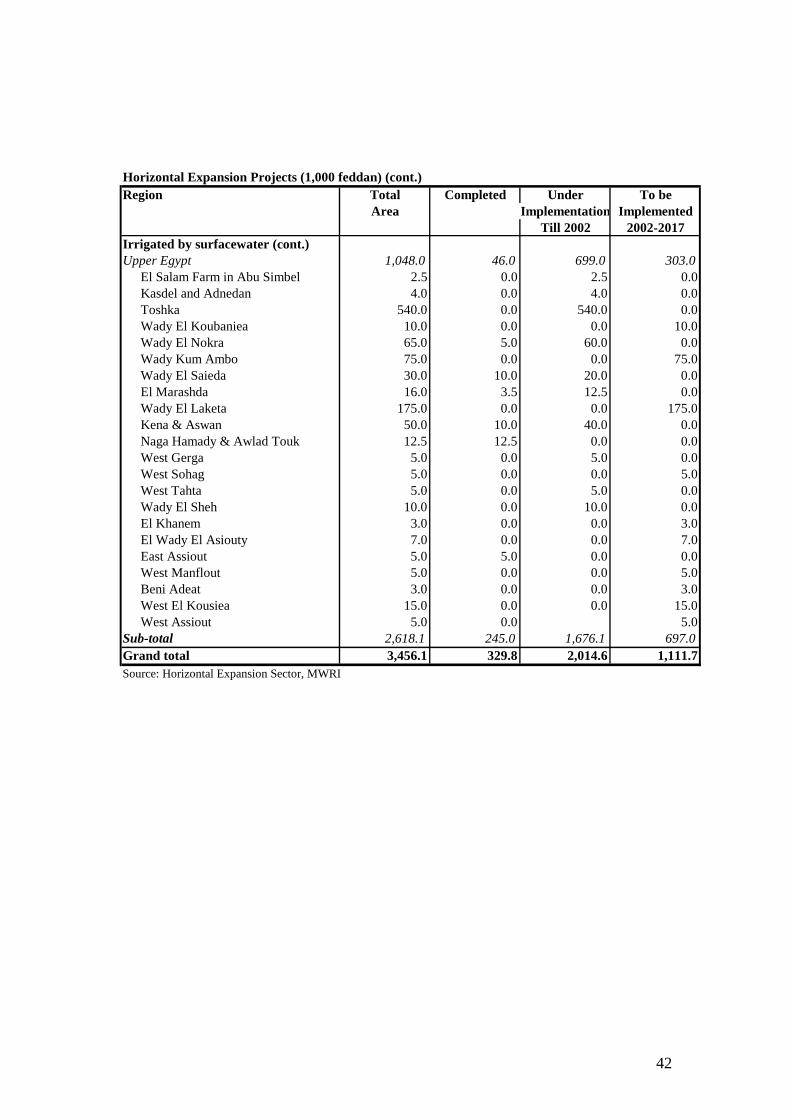
42
Horizontal Expansion Projects (1,000 feddan) (cont.)Region Total Completed Under To be
Area Implementation ImplementedTill 2002 2002-2017
Irrigated by surfacewater (cont.)Upper Egypt 1,048.0 46.0 699.0 303.0
El Salam Farm in Abu Simbel 2.5 0.0 2.5 0.0Kasdel and Adnedan 4.0 0.0 4.0 0.0Toshka 540.0 0.0 540.0 0.0Wady El Koubaniea 10.0 0.0 0.0 10.0Wady El Nokra 65.0 5.0 60.0 0.0Wady Kum Ambo 75.0 0.0 0.0 75.0Wady El Saieda 30.0 10.0 20.0 0.0El Marashda 16.0 3.5 12.5 0.0Wady El Laketa 175.0 0.0 0.0 175.0Kena & Aswan 50.0 10.0 40.0 0.0Naga Hamady & Awlad Touk 12.5 12.5 0.0 0.0West Gerga 5.0 0.0 5.0 0.0West Sohag 5.0 0.0 0.0 5.0West Tahta 5.0 0.0 5.0 0.0Wady El Sheh 10.0 0.0 10.0 0.0El Khanem 3.0 0.0 0.0 3.0El Wady El Asiouty 7.0 0.0 0.0 7.0East Assiout 5.0 5.0 0.0 0.0West Manflout 5.0 0.0 0.0 5.0Beni Adeat 3.0 0.0 0.0 3.0West El Kousiea 15.0 0.0 0.0 15.0West Assiout 5.0 0.0 5.0
Sub-total 2,618.1 245.0 1,676.1 697.0Grand total 3,456.1 329.8 2,014.6 1,111.7Source: Horizontal Expansion Sector, MWRI