vulnerability of urban informal sector: street vendors in yogyakarta, indonesia
TRANSCRIPT
Brata A. G.
VULNERABILITY OF URBAN INFORMAL SECTOR: STREET VENDORS IN YOGYAKARTA, INDONESIA
47
Theor
etica
l and
Empirical Rese
arc
hes
in U
rban
Mana
gement
Num
ber
5(1
4) /
Febru
ary
2010
Theor
etica
l and
Empirica
l Rese
arc
hes
in U
rban
Mana
gement
VULNERABILITY OF URBAN INFORMAL SECTOR: STREET VENDORS IN
YOGYAKARTA, INDONESIA
Aloysius Gunadi BRATA Faculty of Economics, Atma Jaya Yogyakarta University
Jl. Babarsari No. 43, Yogyakarta, Indonesia [email protected]
ABSTRACT This study has been focusing on the vulnerability of street vendors in Java since the time when Java was hit severely by the economic crisis in 1997/1998, which also had reversed the trend of economic formalization in Indonesia. For this aim, a survey was conducted during the month of February 2007 in Yogyakarta and Sleman districts in Yogyakarta Special Province. The survey covered 122 street vendors in several streets in both areas. These samples consist of three groups of street vendors: food seller, non-food seller, and services providers. Based on this survey, vulnerability index of street vendors is measured. The study found that most of street vendors in Yogyakarta experience vulnerability at the medium level. In general, vulnerability of food seller vendors is higher than other vendors. Vulnerability also varies across the locations of vending.
Key words: informal sector, street vendor, vulnerability, Indonesia
1. INTRODUCTION
Indonesia is one of the countries with large informal activities. According to Blunch et. al. (2001),
informal sector in Indonesia absorbs 77.9 percent of non-agricultural employment; meanwhile, in other
Asian countries, contribution of this sector to employment ranges between 73.7 percent in India, 67.1
percent (Pakistan), 66.9 percent (Philipines), and 51.4 percent (Thailand). The role of this sector is
more important when the economic crisis hit Indonesia since 1997 in which the ability of modern-formal
sector to absorb employments decreased. A large number of employees lost their jobs because of
numerous downsizing in manufacturing industries and construction sectors. In this situation, informal
sector is a solution for unemployment problems. Hence, economic crisis also has reversed formalization
of the economy as shown by a decrease in the share of employees in formal sector (Suryahadi et. al.,
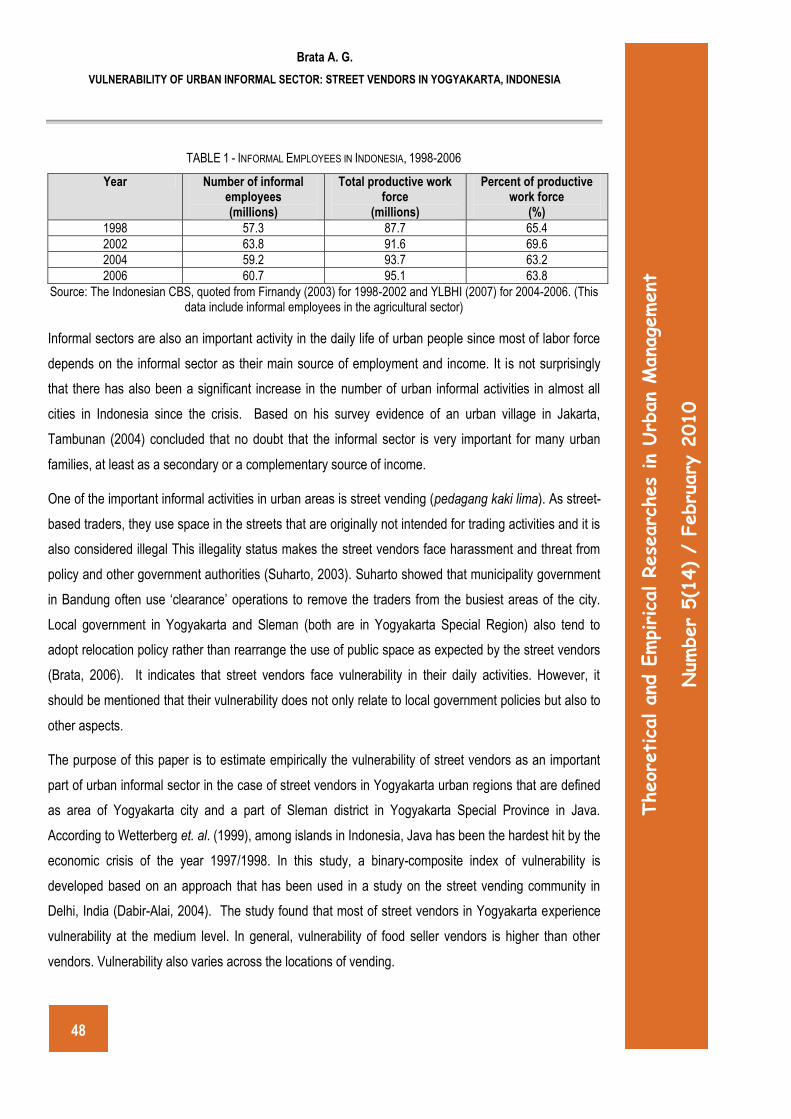
2003). According to the Indonesian Central Bureau of Statistics, the number of informal employees in
1998-2006 were more than 57 millions or about more than 60 percent of productive work force (Table
1). By definition, informal employees in Indonesia refer to own-account workers, self-employed assisted
by family members, and non-wage family workers.
48
Brata A. G.
VULNERABILITY OF URBAN INFORMAL SECTOR: STREET VENDORS IN YOGYAKARTA, INDONESIA
Theor
etica
l and
Empirical Rese
arc
hes
in U
rban
Mana
gement
Num
ber
5(1
4) /
Febru
ary
2010
Theor
etica
l and
Empirica
l Rese
arc
hes
in U
rban
Mana
gement
TABLE 1 - INFORMAL EMPLOYEES IN INDONESIA, 1998-2006
Year Number of informal employees (millions)
Total productive work force
(millions)
Percent of productive work force
(%)
1998 57.3 87.7 65.4
2002 63.8 91.6 69.6
2004 59.2 93.7 63.2
2006 60.7 95.1 63.8
Source: The Indonesian CBS, quoted from Firnandy (2003) for 1998-2002 and YLBHI (2007) for 2004-2006. (This data include informal employees in the agricultural sector)
Informal sectors are also an important activity in the daily life of urban people since most of labor force
depends on the informal sector as their main source of employment and income. It is not surprisingly
that there has also been a significant increase in the number of urban informal activities in almost all
cities in Indonesia since the crisis. Based on his survey evidence of an urban village in Jakarta,
Tambunan (2004) concluded that no doubt that the informal sector is very important for many urban
families, at least as a secondary or a complementary source of income.
One of the important informal activities in urban areas is street vending (pedagang kaki lima). As street-
based traders, they use space in the streets that are originally not intended for trading activities and it is
also considered illegal This illegality status makes the street vendors face harassment and threat from
policy and other government authorities (Suharto, 2003). Suharto showed that municipality government
in Bandung often use „clearance‟ operations to remove the traders from the busiest areas of the city.
Local government in Yogyakarta and Sleman (both are in Yogyakarta Special Region) also tend to
adopt relocation policy rather than rearrange the use of public space as expected by the street vendors
(Brata, 2006). It indicates that street vendors face vulnerability in their daily activities. However, it
should be mentioned that their vulnerability does not only relate to local government policies but also to
other aspects.
The purpose of this paper is to estimate empirically the vulnerability of street vendors as an important
part of urban informal sector in the case of street vendors in Yogyakarta urban regions that are defined
as area of Yogyakarta city and a part of Sleman district in Yogyakarta Special Province in Java.
According to Wetterberg et. al. (1999), among islands in Indonesia, Java has been the hardest hit by the
economic crisis of the year 1997/1998. In this study, a binary-composite index of vulnerability is
developed based on an approach that has been used in a study on the street vending community in
Delhi, India (Dabir-Alai, 2004). The study found that most of street vendors in Yogyakarta experience
vulnerability at the medium level. In general, vulnerability of food seller vendors is higher than other
vendors. Vulnerability also varies across the locations of vending.
Brata A. G.
VULNERABILITY OF URBAN INFORMAL SECTOR: STREET VENDORS IN YOGYAKARTA, INDONESIA
49
Theor
etica
l and
Empirical Rese
arc
hes
in U
rban
Mana
gement
Num
ber
5(1
4) /
Febru
ary
2010
Theor
etica
l and
Empirica
l Rese
arc
hes
in U
rban
Mana
gement
2. LITERATURE REVIEW
According to Dercon (2005), the term „vulnerability‟ actually has been used in a variety of related but
different meanings in several studies that in general related to “a sense of insecurity, of potential harm
people must feel wary of – something bad may happen and spell ruin.” In his paper, Dercon defines
vulnerability “as the existence and the extent of a threat of poverty and destitution; the danger that a
socially unacceptable level of well-being may materialise”.
In developing countries, vulnerability is a concept that is closely related to poverty issues since the poor
faces risks in their daily lives. Although vulnerable is not similar to poor, however the poor is the most
vulnerable group when they are hit by external factors such as economic downturn in Indonesia
(Suryahadi and Sumarto, 2001). Moreover, Dercon (2005) suggests that risk is not just another
expression or dimension of poverty, but it is also an important cause of persistent poverty and poverty
traps. Therefore, deprivation issues of the poor should be related to their risks and vulnerability issues.
The majority of the poor and vulnerable people are in the informal economy, although not all of the
actors in this sector are poor (Becker, 2004). Poor people depend on informal sector as their main
source of income and employment. In other words, since informal sector is a vulnerable group then
vulnerability is also a serious problem in this sector. Therefore, studies on the vulnerability or risk of
urban informal sector tend to focus on poverty or financial/economic issues, this is also mentioned in
Evers and Mehmet (1994) on petty traders in Central Java (Indonesia), Çargoklu and Eder (2006) on
informal sector in Ankara (Turkey) and Floro and Malapit (2007) on urban poor households in Thailand
and Philipines. There are interesting findings of these studies. Çargoklu and Eder (2006) found that
degree of economic vulnerability is closely related to degree of informality. Meanwhile, Floro and
Malapit (2007) suggests that the incidence of vulnerability is rather related to financing-basic-needs
factor than income level per se. Evers and Mehmet (1994) found that in response to vulnerable
situations, petty traders who face high risk and uncertainty have designed several risk-avoiding
strategies.
One of the important informal economic activities of the urban poor is street vending that is also
vulnerable in nature. Among other informal workers in urban areas, the street vendor in general is the
poorest and economically vulnerable (Çargoklu and Eder, 2006) and remains uncomfortably vulnerable
not only as individual-economic agents but also as people (Dabir-Alai, 2004). Other aspects of vendors‟
vulnerability besides insufficient institutional arrangements for vendors are such as having to provide
and care for dependants, working long hours and coping with the debilitating consequences of their
material poverty, or in their relation with their suppliers or creditors.
50
Brata A. G.
VULNERABILITY OF URBAN INFORMAL SECTOR: STREET VENDORS IN YOGYAKARTA, INDONESIA
Theor
etica
l and
Empirical Rese
arc
hes
in U
rban
Mana
gement
Num
ber
5(1
4) /
Febru
ary
2010
Theor
etica
l and
Empirica
l Rese
arc
hes
in U
rban
Mana
gement
The vulnerability of informal sector is an important issue for developing countries. According to Becker
(2004), most effort to reduce poverty will not succeed if the vulnerable people in the informal economy
and their employment needs are not addressed; moreover, the global change adds to the vulnerability
of the poor. High vulnerability will decrease the ability of street vendors to preserve their survival ability.
Unfortunately, studies focusing on the vulnerability of street vendors remain limited (Dabir-Alai, 2004).
Dabir-Alai (2004) filled the literature gap on the empirical measure of vulnerability of street vendors. In
his study on street vendors in Delhi, India, he predicted the rate of vendors‟ vulnerability by employing a
composite index as a new vulnerability measure. There are two groups of vulnerability elements used in
this index. The first group is elements in which vendors have control on such as working hours, and the
second one is elements in which vendors have no control on such as dependants. Method of
constructing the vulnerability index will be discussed in the next section. From his study, Dabir-Alai
found that bullying is the most vulnerability element of vendors, it counts for about 73 percent of
respondents. Meanwhile only one percents of vendors has relation with suppliers or creditors, which
also indicate that most of street vendors use self financing method for their business.
3. CONSTRUCTING VULNERABILITY INDEX
In his study, Dabir-Alai (2004) used seven elements in constructing the vulnerability index that was
based on his own subjective view. These elements are earnings, bullying, dependants, formal
education, long hours, relationship with supplier/credit line, and spatial isolation of kin. Other elements
that he had tried were gender, age, migrant status, and principal/agent status. However, the final index
only covered seven elements.
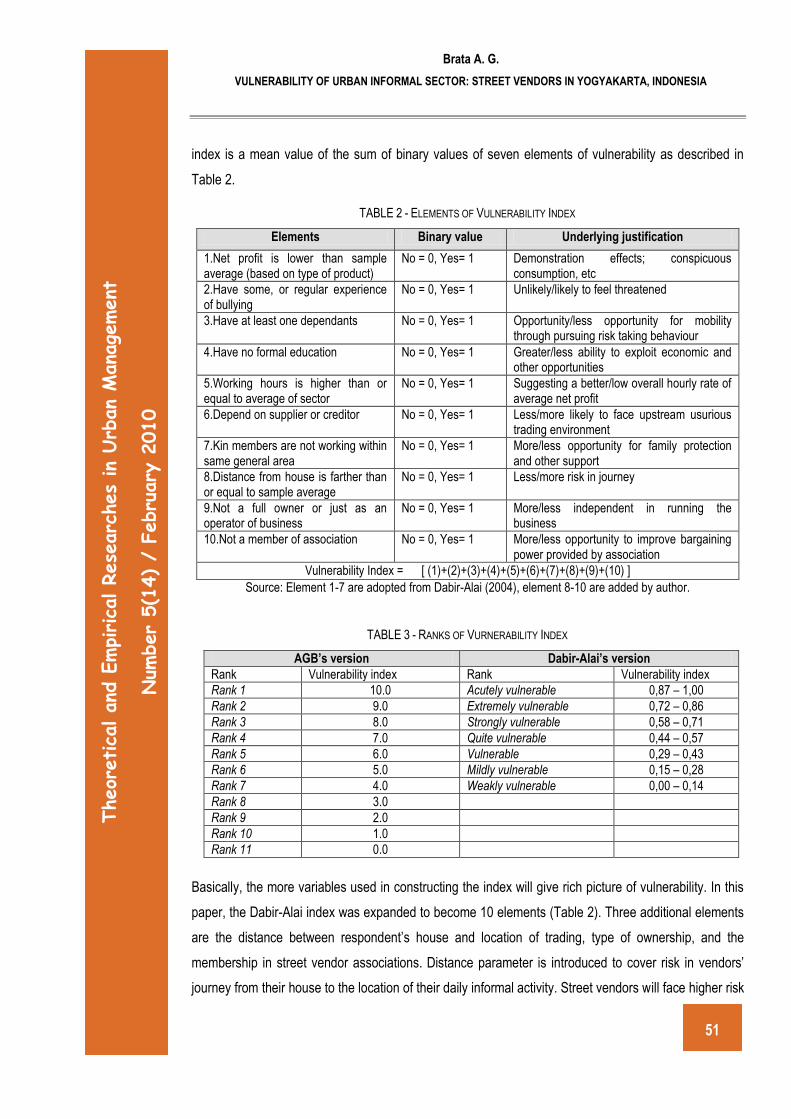
Based on binary counts of vulnerability elements, a simple formula is used to measure a composite
index of vulnerability (Table 2). The index is the sum of binary values for each vendor. For example, if a
vendor‟s value for all elements is 1, then the index is 10. If all elements are 0, then the index is 0. Since
the index consists of ten elements, then this index is classified into eleven ranks of vulnerabilities as
summarized in the column „AGB‟s version‟ in Table 3. The eleventh rank is the lowest vulnerability
(index value: 0) and the opposite is the first rank (10). To make it simple, these ranks could be grouped
into three classes: high vulnerability (an index of 8 or above, medium vulnerability (index of 3-7) and low
vulnerability (index of less than 3). Table 3 also contains the vulnerability index used in Dabir-Alai
(2004) that classified the indexes into seven levels of vulnerability with an assumption that the vendor
has provided information on all parameters used in the index Dabir-Alai‟s version). The Dabir-Alai‟s
Brata A. G.
VULNERABILITY OF URBAN INFORMAL SECTOR: STREET VENDORS IN YOGYAKARTA, INDONESIA
51
Theor
etica
l and
Empirical Rese
arc
hes
in U
rban
Mana
gement
Num
ber
5(1
4) /
Febru
ary
2010
Theor
etica
l and
Empirica
l Rese
arc
hes
in U
rban
Mana
gement
index is a mean value of the sum of binary values of seven elements of vulnerability as described in
Table 2.
TABLE 2 - ELEMENTS OF VULNERABILITY INDEX
Elements Binary value Underlying justification
1.Net profit is lower than sample average (based on type of product)
No = 0, Yes= 1 Demonstration effects; conspicuous consumption, etc
2.Have some, or regular experience of bullying
No = 0, Yes= 1 Unlikely/likely to feel threatened
3.Have at least one dependants No = 0, Yes= 1 Opportunity/less opportunity for mobility through pursuing risk taking behaviour
4.Have no formal education No = 0, Yes= 1 Greater/less ability to exploit economic and other opportunities
5.Working hours is higher than or equal to average of sector
No = 0, Yes= 1 Suggesting a better/low overall hourly rate of average net profit
6.Depend on supplier or creditor No = 0, Yes= 1 Less/more likely to face upstream usurious trading environment
7.Kin members are not working within same general area
No = 0, Yes= 1 More/less opportunity for family protection and other support
8.Distance from house is farther than or equal to sample average
No = 0, Yes= 1 Less/more risk in journey
9.Not a full owner or just as an operator of business
No = 0, Yes= 1 More/less independent in running the business
10.Not a member of association No = 0, Yes= 1 More/less opportunity to improve bargaining power provided by association
Vulnerability Index = [ (1)+(2)+(3)+(4)+(5)+(6)+(7)+(8)+(9)+(10) ]
Source: Element 1-7 are adopted from Dabir-Alai (2004), element 8-10 are added by author.
TABLE 3 - RANKS OF VURNERABILITY INDEX
AGB’s version Dabir-Alai’s version
Rank Vulnerability index Rank Vulnerability index
Rank 1 10.0 Acutely vulnerable 0,87 – 1,00
Rank 2 9.0 Extremely vulnerable 0,72 – 0,86
Rank 3 8.0 Strongly vulnerable 0,58 – 0,71
Rank 4 7.0 Quite vulnerable 0,44 – 0,57
Rank 5 6.0 Vulnerable 0,29 – 0,43
Rank 6 5.0 Mildly vulnerable 0,15 – 0,28
Rank 7 4.0 Weakly vulnerable 0,00 – 0,14
Rank 8 3.0
Rank 9 2.0
Rank 10 1.0
Rank 11 0.0
Basically, the more variables used in constructing the index will give rich picture of vulnerability. In this
paper, the Dabir-Alai index was expanded to become 10 elements (Table 2). Three additional elements
are the distance between respondent‟s house and location of trading, type of ownership, and the
membership in street vendor associations. Distance parameter is introduced to cover risk in vendors‟
journey from their house to the location of their daily informal activity. Street vendors will face higher risk
52
Brata A. G.
VULNERABILITY OF URBAN INFORMAL SECTOR: STREET VENDORS IN YOGYAKARTA, INDONESIA
Theor
etica
l and
Empirical Rese
arc
hes
in U
rban
Mana
gement
Num
ber
5(1
4) /
Febru
ary
2010
Theor
etica
l and
Empirica
l Rese
arc
hes
in U
rban
Mana
gement
in their routine daily journey if the distance is farther. Vendor who owns the business is less vulnerable
than the ones who are just an operator of business. The later vendor might be a subject of intervention
by the ultimate owners. By joining associations, street vendors get an opportunity to improve their
bargaining power, such as in their relation with the government officials (Brata, 2006; see also Cross,
1998 for Mexico City). There is also a question on the competition among vendors in the research
instrument. Varcin (2000) discusses competition among street traders in Turkey. However this study did
not employ the competition aspect since the survey result does not indicate competition in the case of
street vendors in Yogyakarta. In general, as stated by Dabir-Alai (2004), this study also uses subjective
view in selecting the elements of index.
Binary approach was used for each of the elements. For example, score zero of vulnerability will be
applied for vendor who owns the business, meanwhile score one is given to those who is not the owner.
All vulnerability elements follow this method. In his study, Dabir-Alai (2004) used an average value of
scores. However, this study does not follow Dabir-Alai‟s approach; but instead, it uses total value of all
the elements as a value of vulnerability index. This method is rather similar to Çargoklu and Eder (2006)
in measuring informality and economic vulnerability of urban informal sector in Ankara, Turkey.
However, they used different elements in constructing the indexes.
4. A CASE OF STREET VENDOR IN YOGYAKARTA
Survey Method
The data for this study were collected through a field survey conducted in Yogyakarta urban region that
covered Yogyakarta city and urban areas of Sleman district. There was no accurate number of street
vendors in this region. However, according to a report produced by a newspaper, there were about
4.600 street vendors in Yogyakarta Special Province that were concentrated in several streets (Kompas
daily, February 4, 2004). In Sleman, members of the Association of Street Vendors in Sleman (or
Paguyuban Pedagang Kaki Lima Sleman/PPKLS) are about 3.500 vendors (Kurniawan, 2008). There
are regulations on street vendors in both city and district. According to Peraturan Daerah (or “Local
Regulation”) No. 22/2002 of the City of Yogyakarta, street vendor is a seller for goods and services that
operate individually in economic areas that occupies space on public street or facility, operates
temporarily or not permanently and uses movable and unmovable equipments. In the Peraturan Daerah
No. 11/2004 of Sleman District, street vendor refers to a business actor who operates the business
temporarily in a certain period of time occupying the street or public facility, using moveable and
Brata A. G.
VULNERABILITY OF URBAN INFORMAL SECTOR: STREET VENDORS IN YOGYAKARTA, INDONESIA
53
Theor
etica
l and
Empirical Rese
arc
hes
in U
rban
Mana
gement
Num
ber
5(1
4) /
Febru
ary
2010
Theor
etica
l and
Empirica
l Rese
arc
hes
in U
rban
Mana
gement
installable trade equipment. Although the local regulations still defined street vending as a temporarily
activity, perhaps vending is a primary activity for most of street vendors.
Questionnaires for this survey included four groups of questions (characteristics of respondents,
information on the activities in the informal sector, information on the external situation, and information
on the internal situation of vendors) in which many of them are questions with binary response.
Vulnerability index is constructed based on these raw data. The survey was conducted in February
2007 by an enumerator who interviewed 122 street vendors. Locations for survey were spread across
the town as well as time (day and/or night) and type of products. It was taken into account to get a
representative sample of street vendors in Yogyakarta urban region. There were several main streets in
the region surveyed and they were grouped into eight areas (Jl Magelang, Kwarasan-Pingit, Jl
Mangkubumi, Jl Kaliurang, Jl Solo-Langen Sari, Jl Colombo-Sagan-Gejayan, Jl Kusumanegara-Janti-
Gedong Kuning, and Jl. Babarsari-Kledokan-Seturan). These areas did not reflect administrative
boundaries of city and district. Types of products covered in the survey were not only food vendors
(such as fruit, snack foods, and drinking water) but also non-food (such as newspapers, cigarette and
cellular prepaid voucher) and services providers (such as shoes repair and tire repair). Number of
respondents of each group is 57, 46 and 19 respectively.
Main Results
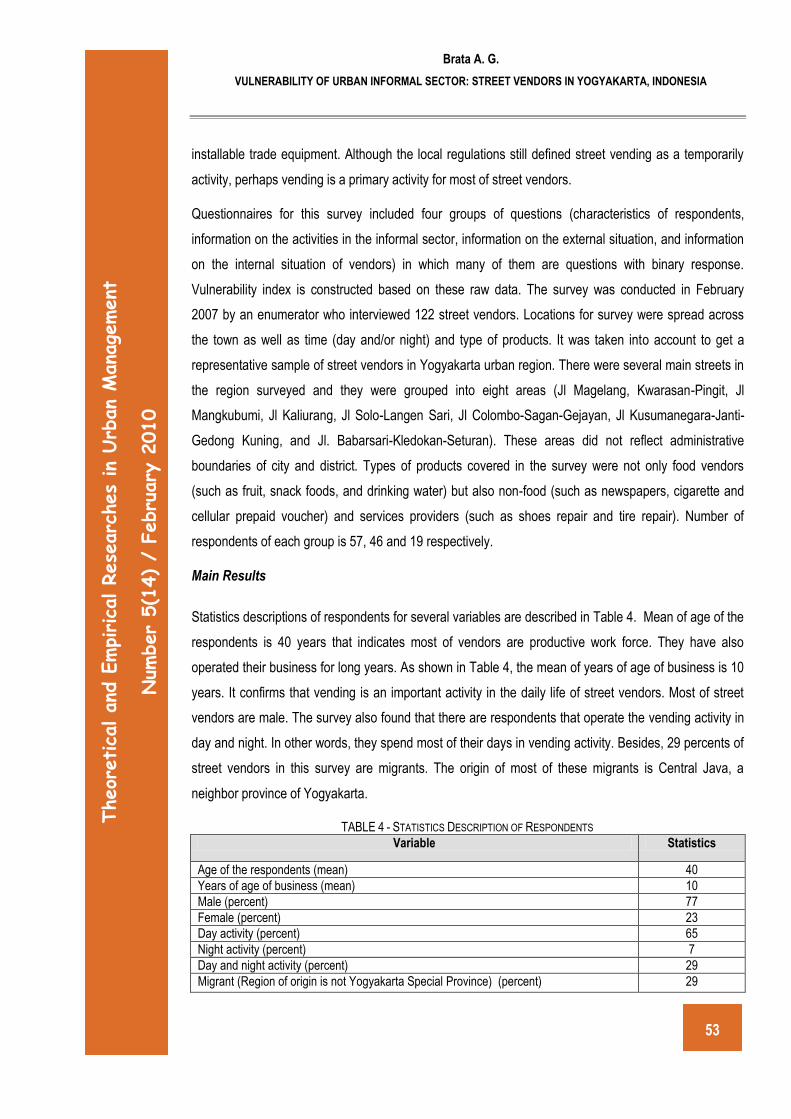
Statistics descriptions of respondents for several variables are described in Table 4. Mean of age of the
respondents is 40 years that indicates most of vendors are productive work force. They have also
operated their business for long years. As shown in Table 4, the mean of years of age of business is 10
years. It confirms that vending is an important activity in the daily life of street vendors. Most of street
vendors are male. The survey also found that there are respondents that operate the vending activity in
day and night. In other words, they spend most of their days in vending activity. Besides, 29 percents of
street vendors in this survey are migrants. The origin of most of these migrants is Central Java, a
neighbor province of Yogyakarta.
TABLE 4 - STATISTICS DESCRIPTION OF RESPONDENTS
Variable Statistics
Age of the respondents (mean) 40
Years of age of business (mean) 10
Male (percent) 77
Female (percent) 23
Day activity (percent) 65
Night activity (percent) 7
Day and night activity (percent) 29
Migrant (Region of origin is not Yogyakarta Special Province) (percent) 29
54
Brata A. G.
VULNERABILITY OF URBAN INFORMAL SECTOR: STREET VENDORS IN YOGYAKARTA, INDONESIA
Theor
etica
l and
Empirical Rese
arc
hes
in U
rban
Mana
gement
Num
ber
5(1
4) /
Febru
ary
2010
Theor
etica
l and
Empirica
l Rese
arc
hes
in U
rban
Mana
gement
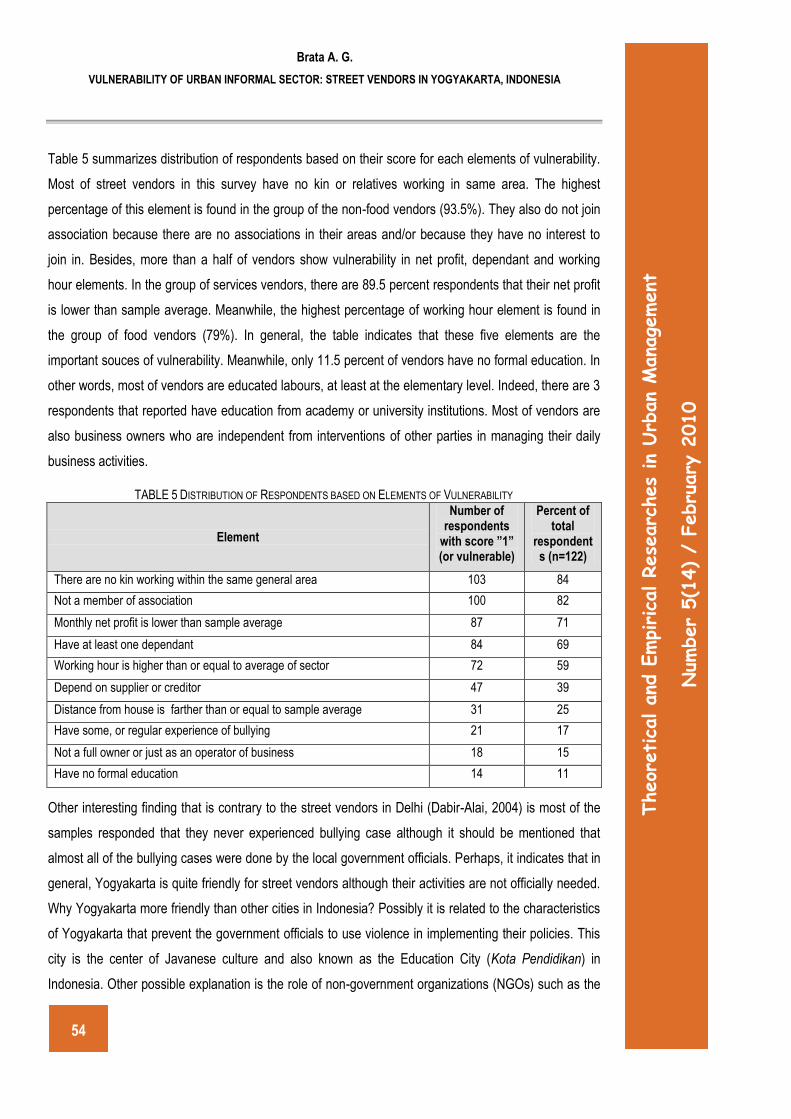
Table 5 summarizes distribution of respondents based on their score for each elements of vulnerability.
Most of street vendors in this survey have no kin or relatives working in same area. The highest
percentage of this element is found in the group of the non-food vendors (93.5%). They also do not join
association because there are no associations in their areas and/or because they have no interest to
join in. Besides, more than a half of vendors show vulnerability in net profit, dependant and working
hour elements. In the group of services vendors, there are 89.5 percent respondents that their net profit
is lower than sample average. Meanwhile, the highest percentage of working hour element is found in
the group of food vendors (79%). In general, the table indicates that these five elements are the
important souces of vulnerability. Meanwhile, only 11.5 percent of vendors have no formal education. In
other words, most of vendors are educated labours, at least at the elementary level. Indeed, there are 3
respondents that reported have education from academy or university institutions. Most of vendors are
also business owners who are independent from interventions of other parties in managing their daily
business activities.
TABLE 5 DISTRIBUTION OF RESPONDENTS BASED ON ELEMENTS OF VULNERABILITY
Element
Number of respondents
with score ”1” (or vulnerable)
Percent of total
respondents (n=122)
There are no kin working within the same general area 103 84
Not a member of association 100 82
Monthly net profit is lower than sample average 87 71
Have at least one dependant 84 69
Working hour is higher than or equal to average of sector 72 59
Depend on supplier or creditor 47 39
Distance from house is farther than or equal to sample average 31 25
Have some, or regular experience of bullying 21 17
Not a full owner or just as an operator of business 18 15
Have no formal education 14 11
Other interesting finding that is contrary to the street vendors in Delhi (Dabir-Alai, 2004) is most of the
samples responded that they never experienced bullying case although it should be mentioned that
almost all of the bullying cases were done by the local government officials. Perhaps, it indicates that in
general, Yogyakarta is quite friendly for street vendors although their activities are not officially needed.
Why Yogyakarta more friendly than other cities in Indonesia? Possibly it is related to the characteristics
of Yogyakarta that prevent the government officials to use violence in implementing their policies. This
city is the center of Javanese culture and also known as the Education City (Kota Pendidikan) in
Indonesia. Other possible explanation is the role of non-government organizations (NGOs) such as the
Brata A. G.
VULNERABILITY OF URBAN INFORMAL SECTOR: STREET VENDORS IN YOGYAKARTA, INDONESIA
55
Theor
etica
l and
Empirical Rese
arc
hes
in U
rban
Mana
gement
Num
ber
5(1
4) /
Febru
ary
2010
Theor
etica
l and
Empirica
l Rese
arc
hes
in U
rban
Mana
gement
UPLINK-Indonesia that provide advocacies for the vendors in facing the government officials (Brata,
2006). There was also a story about vendors that „manipulate‟ their relations with local politicians to
increase their bargaining position in facing the government officials (Brata, 2006). This manipulation is a
strategic effort especially during the political events such as the general election (Pemilihan Umum). All
of these factors may protect the street vendors from bullying practices. In contrary, the government in
other cities such as in Jakarta and Kendari often use the violence, seizing and plundering practices to
remove the street vendors from the public space (i.e Forum Keprihatinan Akademisi, 2003; UPLINK-
Indonesia, 2008).
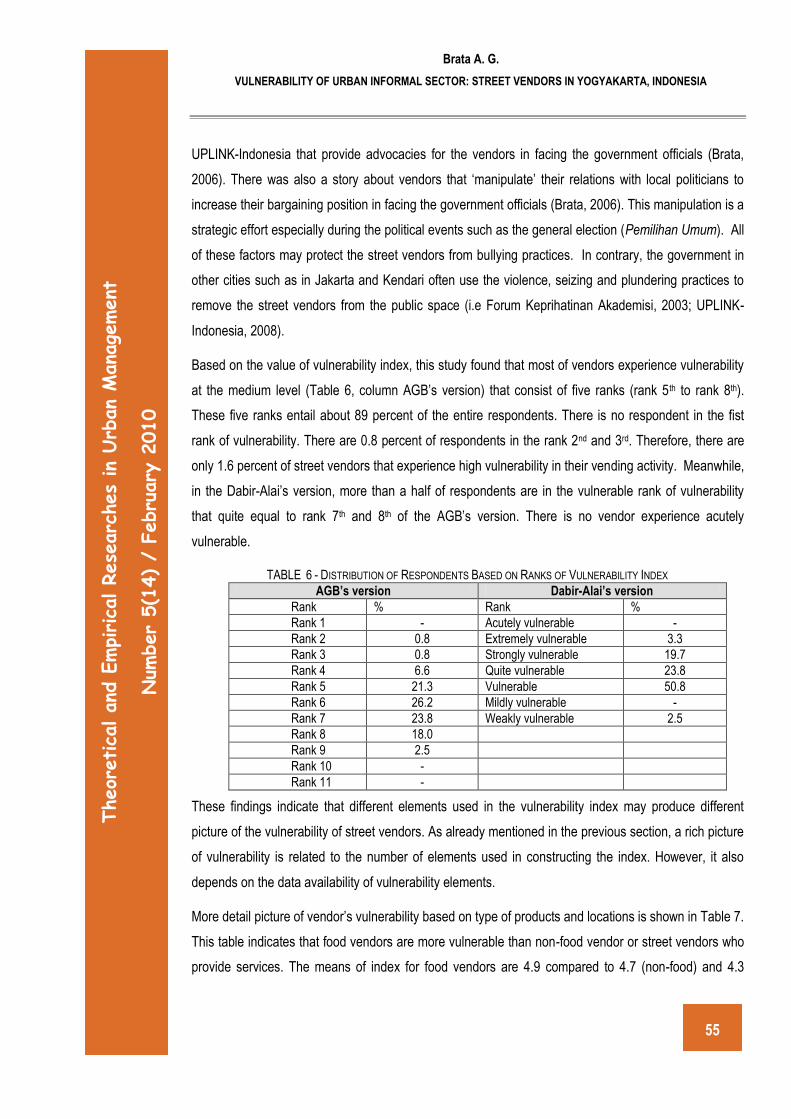
Based on the value of vulnerability index, this study found that most of vendors experience vulnerability
at the medium level (Table 6, column AGB‟s version) that consist of five ranks (rank 5th to rank 8th).
These five ranks entail about 89 percent of the entire respondents. There is no respondent in the fist
rank of vulnerability. There are 0.8 percent of respondents in the rank 2nd and 3rd. Therefore, there are
only 1.6 percent of street vendors that experience high vulnerability in their vending activity. Meanwhile,
in the Dabir-Alai‟s version, more than a half of respondents are in the vulnerable rank of vulnerability
that quite equal to rank 7th and 8th of the AGB‟s version. There is no vendor experience acutely
vulnerable.
TABLE 6 - DISTRIBUTION OF RESPONDENTS BASED ON RANKS OF VULNERABILITY INDEX
AGB’s version Dabir-Alai’s version
Rank % Rank %
Rank 1 - Acutely vulnerable -
Rank 2 0.8 Extremely vulnerable 3.3
Rank 3 0.8 Strongly vulnerable 19.7
Rank 4 6.6 Quite vulnerable 23.8
Rank 5 21.3 Vulnerable 50.8
Rank 6 26.2 Mildly vulnerable -
Rank 7 23.8 Weakly vulnerable 2.5
Rank 8 18.0
Rank 9 2.5
Rank 10 -
Rank 11 -
These findings indicate that different elements used in the vulnerability index may produce different
picture of the vulnerability of street vendors. As already mentioned in the previous section, a rich picture
of vulnerability is related to the number of elements used in constructing the index. However, it also
depends on the data availability of vulnerability elements.
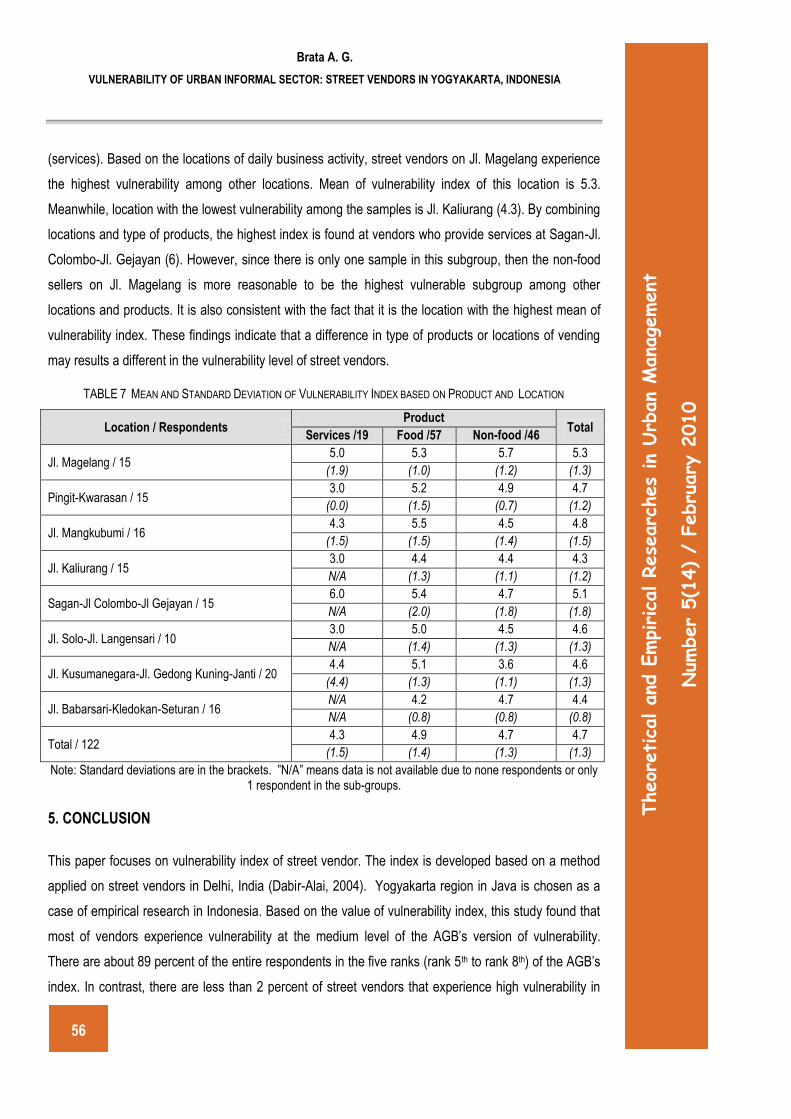
More detail picture of vendor‟s vulnerability based on type of products and locations is shown in Table 7.
This table indicates that food vendors are more vulnerable than non-food vendor or street vendors who
provide services. The means of index for food vendors are 4.9 compared to 4.7 (non-food) and 4.3
56
Brata A. G.
VULNERABILITY OF URBAN INFORMAL SECTOR: STREET VENDORS IN YOGYAKARTA, INDONESIA
Theor
etica
l and
Empirical Rese
arc
hes
in U
rban
Mana
gement
Num
ber
5(1
4) /
Febru
ary
2010
Theor
etica
l and
Empirica
l Rese
arc
hes
in U
rban
Mana
gement
(services). Based on the locations of daily business activity, street vendors on Jl. Magelang experience
the highest vulnerability among other locations. Mean of vulnerability index of this location is 5.3.
Meanwhile, location with the lowest vulnerability among the samples is Jl. Kaliurang (4.3). By combining
locations and type of products, the highest index is found at vendors who provide services at Sagan-Jl.
Colombo-Jl. Gejayan (6). However, since there is only one sample in this subgroup, then the non-food
sellers on Jl. Magelang is more reasonable to be the highest vulnerable subgroup among other
locations and products. It is also consistent with the fact that it is the location with the highest mean of
vulnerability index. These findings indicate that a difference in type of products or locations of vending
may results a different in the vulnerability level of street vendors.
TABLE 7 MEAN AND STANDARD DEVIATION OF VULNERABILITY INDEX BASED ON PRODUCT AND LOCATION
Location / Respondents Product
Total Services /19 Food /57 Non-food /46
Jl. Magelang / 15 5.0 5.3 5.7 5.3
(1.9) (1.0) (1.2) (1.3)
Pingit-Kwarasan / 15 3.0 5.2 4.9 4.7
(0.0) (1.5) (0.7) (1.2)
Jl. Mangkubumi / 16 4.3 5.5 4.5 4.8
(1.5) (1.5) (1.4) (1.5)
Jl. Kaliurang / 15 3.0 4.4 4.4 4.3
N/A (1.3) (1.1) (1.2)
Sagan-Jl Colombo-Jl Gejayan / 15 6.0 5.4 4.7 5.1
N/A (2.0) (1.8) (1.8)
Jl. Solo-Jl. Langensari / 10 3.0 5.0 4.5 4.6
N/A (1.4) (1.3) (1.3)
Jl. Kusumanegara-Jl. Gedong Kuning-Janti / 20 4.4 5.1 3.6 4.6
(4.4) (1.3) (1.1) (1.3)
Jl. Babarsari-Kledokan-Seturan / 16 N/A 4.2 4.7 4.4
N/A (0.8) (0.8) (0.8)
Total / 122 4.3 4.9 4.7 4.7
(1.5) (1.4) (1.3) (1.3)
Note: Standard deviations are in the brackets. ”N/A” means data is not available due to none respondents or only 1 respondent in the sub-groups.
5. CONCLUSION
This paper focuses on vulnerability index of street vendor. The index is developed based on a method
applied on street vendors in Delhi, India (Dabir-Alai, 2004). Yogyakarta region in Java is chosen as a
case of empirical research in Indonesia. Based on the value of vulnerability index, this study found that
most of vendors experience vulnerability at the medium level of the AGB‟s version of vulnerability.
There are about 89 percent of the entire respondents in the five ranks (rank 5th to rank 8th) of the AGB‟s
index. In contrast, there are less than 2 percent of street vendors that experience high vulnerability in
Brata A. G.
VULNERABILITY OF URBAN INFORMAL SECTOR: STREET VENDORS IN YOGYAKARTA, INDONESIA
57
Theor
etica
l and
Empirical Rese
arc
hes
in U
rban
Mana
gement
Num
ber
5(1
4) /
Febru
ary
2010
Theor
etica
l and
Empirica
l Rese
arc
hes
in U
rban
Mana
gement
their vending activity. Meanwhile, in the Dabir-Alai‟s version, more than a half of respondents are in the
vulnerable rank of vulnerability that quite equal to rank 7th and 8th of the AGB‟s version. There is no
vendor experience acutely vulnerable based on the Dabir-Alai‟s approach.
More detail picture of vendor‟s vulnerability is also provided based on type of products and locations.
The study found that food vendors are more vulnerable than non-food vendor or street vendors who
provide services. Meanwhile, based on the locations of daily business activity, street vendors on Jl.
Magelang experience the highest vulnerability among other locations. By combining locations and type
of products, the highest index is found at vendors who provide services at Sagan-Jl. Colombo-Jl.
Gejayan. These findings indicate that a difference in type of products or locations of vending may
results a different in the vulnerability level of street vendors.
Since this study is perhaps the first effort in measuring vulnerability index of street vendor in Indonesia,
limitations of its findings need to be mentioned. Compared to other regions, Yogyakarta appears a more
favourable place that probably related to its characteristics and the role of NGOs in provide advocacy to
the vendors. Therefore, different context of empirical study may give a more comprehensive picture of
vulnerability of street vendors in Indonesia. Furthermore, other limitation of the study may relate to the
construction method of the vulnerability index. As already mentioned, selected elements of vulnerability
are based on the subjective view. Certainly, this approach may reduce the reliability of elements used in
the index. In addition to this note, measuring vulnerability level based on street vendor‟s point of view is
also interesting to be applied.
ACKNOWLEDGMENT: The author wish to thank Parvis Dabir-Alai for his critical reading and comments.
REFERENCES
Becker, K. F. (2004). The Informal Sector. Stockholm: SIDA, Swedia.Retrieved April 25, 2005, from http://rru.worldbank.org/Documents/PapersLinks/Sida.pdf.
Blunch, N.-H., Canagarajah, S., Raju, D. (2001). The Informal Sector Revisited: A Synthesis Across Space and Time, Social Protection Discussion Paper Series No. 0119. The World Bank. Retrieved December 13, 2003, from http://siteresources.worldbank.org/SOCIALPROTECTION/Resources/ SP-Discussion-papers/Labor-Market-DP/0119.pdf.
Brata, A. G. (2006). Relokasi Kaki Lima: Pemerintah, Tanpa PKL. Research Paper. Research Institute of Atma Jaya Yogyakarta University.
Çargoklu, A. and Eder, M. (2006). Urban Informality and Economic Vulnerability: The Case of Turkey. Retrieved April 22, 2007, from http://research.sabanciuniv.edu/28/1/stvkaf01670.pdf.
Cross, J. C. (1998). Co-optation, Competition, and Resistance: State and Street Vendors in Mexico City. Latin American Perspectives, 25(2) pp. 41-61.
Dabir-Alai, P. (2004). The Economics of Street Vending: an empirical framework for measuring vurnerability in Dehli in the late 1990s. Paper presented at the EDGI and UNU-WIDER Conference
58
Brata A. G.
VULNERABILITY OF URBAN INFORMAL SECTOR: STREET VENDORS IN YOGYAKARTA, INDONESIA
Theor
etica
l and
Empirical Rese
arc
hes
in U
rban
Mana
gement
Num
ber
5(1
4) /
Febru
ary
2010
Theor
etica
l and
Empirica
l Rese
arc
hes
in U
rban
Mana
gement
Unlocking Human Potential: Linking Informal and Formal Sectors, 17-18 September 2004, Helsinki, Finland.
Dercon, S. (2005). Vulnerability: a micro perspective . Paper first presented at the ABCDE for Europe World Bank conference in Amsterdam. Retrieved October 13, 2006, from http://www.economics.ox.ac.uk/members/stefan.dercon/vulnerability.pdf.
Ever, H.-D. and Mehmet, O. (1994). The Management of Risk: Informal Trade in Indonesia. World Development , 22(1) pp. 1-9.
Firnandy (2003). Studi Pekerja di Sektor Informal dan Arah Kebijakan Ke Depan. Direktorat Ketenagakerjaan dan Analisis Ekonomi Bappenas. Retrieved August 30, 2005, from http://www.bappenas.go.id/.../&view=85/Studi-Pekerja_Acc.pdf.
Floro, M. S. and Malapit, H. (2007). Making Ends Meet: Vulnerability among Urban Informal Sector Households. Retrieved May 26, 2008, from https://editorialexpress.com/cgi-bin/conference/download.cgi?db_name=IAFFE2008&paper_id=43.
Forum Keprihatinan Akademisi (2003). Menata Kembali Hak Warga Negara: Belajar dari Kasus Penggusuran di DKI Jakarta. Retrieved June 6, 2008, from stream.plasa.com/.../application/poverty-reduction/Poverty/FORUM%20KEPRIHATINAN%20AKADEMISI.doc
Kurniawan, B. (2008). PKL Sleman Tolak Penggusuran. Retrieved February 25, 2008, from http://www.detiknews.com/index.php/detik.read/tahun/2008/bulan/02/tgl/24/time/180151/idnews/899106/idkalan/10.
Suharto, E. (2003). Accommodating the Urban Informal Sector in the Public Policy Process: A Case Study of Street Enterprises in Bandung Metropolitan Region (BMR), Indonesia. Research paper International Policy Fellow. Retrieved August 29, 2005, from http://www.policy.hu/suharto/finalresearchpaper.html.
Suryahadi, A. and Sumarto, S. (2001). The Chronic Poor, the Transient Poor, and the Vulnerable in Indonesia Before and After the Crisis. SMERU Working Paper. Retrieved September 5, 2003, from http://www.smeru.or.id.
Suryahadi, A., Widyanti, W., Perwira, D. and Sumarto, S. (2003). Minimum Wage Policy and Its Impact on Employment in the Urban Formal Sector. Bulletin of Indonesian Economic Studies, 39(1) pp. 29-50.
Tambunan, T. (2004). Urban Poverty, Informal Sector and Poverty Alleviation Policies in Indonesia. Paper presented at the EDGI and UNU-WIDER Conference Unlocking Human Potential: Linking Informal and Formal Sectors, 17-18 September 2004, Helsinki, Finland.
UPLINK-Indonesia (2008). Hentikan Penggusuran dan Premanisme yang Dilakukan oleh Walikota Kendari. (Press Release UPLINK-Indonesia). Retrieved July 10, 2008, from http://uplink.or.id/v2/press-release/hentikan-penggusuran-dan-premanisme-yang-dilakukan-oleh-walikota-kendari.html.
Varcin, R. (2000). Competition in the Informal Sector of the Economy: the Case of Market Traders in Turkey. International Journal of Sociology and Social Policy, 20(3-4) pp. 5-33.
Wetterberg, A., Sumarto, S. and Prittchett, L. (1999). A National Snapshot of the Social Impact of Indonesia‟s Crisis. Bulletin of Indonesian Economic Studies, 35(3) pp. 145-152.
YLBHI (2007). Legal Empowerment of the Poor: Lessons Learned from Indonesia. Jakarta: YLBHI.