volume 3 issue 4 october 2019 issn 2587-1366
TRANSCRIPT

VOLUME 3 ISSUE 4 OCTOBER 2019
ISSN 2587-1366

EDITOR IN CHIEF
Prof. Dr. Murat YAKAR
Mersin University Engineering Faculty
Turkey
CO-EDITORS
Prof. Dr. Erol YAŞAR
Mersin University Faculty of Art and Science
Turkey
Prof. Dr. Cahit BİLİM
Mersin University Engineering Faculty
Turkey
Assist. Prof. Dr. Hüdaverdi ARSLAN
Mersin University Engineering Faculty
Turkey
ADVISORY BOARD
Prof. Dr. Orhan ALTAN
Honorary Member of ISPRS, ICSU EB Member
Turkey
Prof. Dr. Armin GRUEN
ETH Zurih University
Switzerland
Prof. Dr. Hacı Murat YILMAZ
Aksaray University Engineering Faculty
Turkey
Prof. Dr. Artu ELLMANN
Tallinn University of Technology Faculty of Civil Engineering
Estonia
Assoc. Prof. Dr. E. Cağlan KUMBUR
Drexel University
USA
TECHNICAL EDITORS
Prof. Dr. Roman KOCH
Erlangen-Nurnberg Institute Palaontologie
Germany
Prof. Dr. Hamdalla WANAS
Menoufyia University, Science Faculty
Egypt
Prof. Dr. Turgay CELIK
Witwatersrand University
South Africa
Prof. Dr. Muhsin EREN
Mersin University Engineering Faculty
Turkey
Prof. Dr. Johannes Van LEEUWEN
Iowa State University
USA

Prof. Dr. Elias STATHATOS
TEI of Western Greece
Greece
Prof. Dr. Vedamanickam SAMPATH
Institute of Technology Madras
India
Prof. Dr. Khandaker M. Anwar HOSSAIN
Ryerson University
Canada
Prof. Dr. Hamza EROL
Mersin University Engineering Faculty
Turkey
Prof. Dr. Ali Cemal BENIM
Duesseldorf University of Aplied Sciences
Germany
Prof. Dr. Mohammad Mehdi RASHIDI
University of Birmingham
England
Prof. Dr. Muthana SHANSAL
Baghdad University
Iraq
Prof. Dr. Ibrahim S. YAHIA
Ain Shams University
Egypt
Assoc. Prof. Dr. Kurt A. ROSENTRATER
Iowa State University
USA
Assoc. Prof. Dr. Christo ANANTH
Francis Xavier Engineering College
India
Prof. Dr. Bahadır K. KÖRBAHTİ
Mersin University Engineering Faculty
Turkey
Assist. Prof. Dr. Akın TATOGLU
Hartford University College of Engineering
USA
Assist. Prof. Dr. Şevket DEMİRCİ
Mersin University Engineering Faculty
Turkey
Assist. Prof. Dr. Yelda TURKAN
Oregon State University
USA
Assist. Prof. Dr. Gökhan ARSLAN
Mersin University Engineering Faculty
Turkey
Assist. Prof. Dr. Seval Hale GÜLER
Mersin University Engineering Faculty
Turkey
Assist. Prof. Dr. Mehmet ACI
Mersin University Engineering Faculty
Turkey

Dr. Ghazi DROUBI
Robert Gordon University Engineering Faculty
Scotland, UK
JOURNAL SECRETARY
Nida DEMİRTAŞ
TURKISH JOURNAL OF ENGINEERING (TUJE)
Turkish Journal of Engineering (TUJE) is a multi-disciplinary journal. The Turkish Journal of Engineering (TUJE) publishes
the articles in English and is being published 4 times (January, April, July and October) a year. The Journal is a multidisciplinary
journal and covers all fields of basic science and engineering. It is the main purpose of the Journal that to convey the latest
development on the science and technology towards the related scientists and to the readers. The Journal is also involved in
both experimental and theoretical studies on the subject area of basic science and engineering. Submission of an article implies
that the work described has not been published previously and it is not under consideration for publication elsewhere. The
copyright release form must be signed by the corresponding author on behalf of all authors. All the responsibilities for the
article belongs to the authors. The publications of papers are selected through double peer reviewed to ensure originality,
relevance and readability.
AIM AND SCOPE
The Journal publishes both experimental and theoretical studies which are reviewed by at least two scientists and researchers
for the subject area of basic science and engineering in the fields listed below:
Aerospace Engineering
Environmental Engineering
Civil Engineering
Geomatic Engineering
Mechanical Engineering
Geology Science and Engineering
Mining Engineering
Chemical Engineering
Metallurgical and Materials Engineering
Electrical and Electronics Engineering
Mathematical Applications in Engineering
Computer Engineering
Food Engineering
PEER REVIEW PROCESS
All submissions will be scanned by iThenticate® to prevent plagiarism. Author(s) of the present study and the article about the
ethical responsibilities that fit PUBLICATION ETHICS agree. Each author is responsible for the content of the article. Articles
submitted for publication are priorly controlled via iThenticate ® (Professional Plagiarism Prevention) program. If articles that
are controlled by iThenticate® program identified as plagiarism or self-plagiarism with more than 25% manuscript will return
to the author for appropriate citation and correction. All submitted manuscripts are read by the editorial staff. To save time for
authors and peer-reviewers, only those papers that seem most likely to meet our editorial criteria are sent for formal review.
Reviewer selection is critical to the publication process, and we base our choice on many factors, including expertise,
reputation, specific recommendations and our own previous experience of a reviewer's characteristics. For instance, we avoid
using people who are slow, careless or do not provide reasoning for their views, whether harsh or lenient. All submissions will
be double blind peer reviewed. All papers are expected to have original content. They should not have been previously
published and it should not be under review. Prior to the sending out to referees, editors check that the paper aim and scope of
the journal. The journal seeks minimum three independent referees. All submissions are subject to a double blind peer review;
if two of referees gives a negative feedback on a paper, the paper is being rejected. If two of referees gives a positive feedback
on a paper and one referee negative, the editor can decide whether accept or reject. All submitted papers and referee reports are
archived by journal Submissions whether they are published or not are not returned. Authors who want to give up publishing
their paper in TUJE after the submission have to apply to the editorial board in written. Authors are responsible from the writing
quality of their papers. TUJE journal will not pay any copyright fee to authors. A signed Copyright Assignment Form has to
be submitted together with the paper.

PUBLICATION ETHICS
Our publication ethics and publication malpractice statement is mainly based on the Code of Conduct and Best-Practice
Guidelines for Journal Editors. Committee on Publication Ethics (COPE). (2011, March 7). Code of Conduct and Best-Practice
Guidelines for Journal Editors. Retrieved from http://publicationethics.org/files/Code%20of%20Conduct_2.pdf
PUBLICATION FREQUENCY
The TUJE accepts the articles in English and is being published 4 times (January, April, July and October) a year.
CORRESPONDENCE ADDRESS
Journal Contact: [email protected]

CONTENTS Volume 3 – Issue 4
ARTICLES
CLOSED LOOP SUPPLY CHAIN MANAGEMENT PERFORMANCE EVALUATION CRITERIA
Emel Yontar and Süleyman Ersöz ........................................................................................................................................... 157
AUTOMATIC DETECTION OF CYBERBULLYING IN FORMSPRING.ME, MYSPACE AND YOUTUBE SOCIAL
NETWORKS
Çiğdem İnan Acı, Eren Çürük and Esra Saraç Eşsiz............................................................................................................... 168
BEHAVIOR OF R/C FRAMES WITH CONCRETE PLATE BONDED INFILLS
Mehmet Baran ......................................................................................................................................................................... 179
LOGIC THRESHOLD FOR MICRORING RESONATOR-BASED BDD CIRCUITS: PHYSICAL AND
OPERATIONAL ANALYSES
Ozan Yakar and İlke Ercan ..................................................................................................................................................... 189
EXPERIMENTAL INVESTIGATION OF A NOVEL FRICTION MODIFIER IN COMPOSITE MATERIALS
İlker Sugözü and Mücahit Güdük ............................................................................................................................................ 197
REMOVAL OF COLOUR POLLUTIONS IN DYE BATHS WITH MORDANTS
Aslıhan Koruyucu .................................................................................................................................................................... 201
FLEXURAL BEHAVIOR OF HYBRID FRP-CONCRETE BRIDGE DECKS
İlker Fatih Kara, Ashraf F. Ashour and Cahit Bilim ............................................................................................................... 206
Turkish Journal of Engineering
157
Turkish Journal of Engineering (TUJE)
Vol. 3, Issue 4, pp. 157-167, October 2019
ISSN 2587-1366, Turkey
DOI: 10.31127/tuje.503959
Research Article
CLOSED LOOP SUPPLY CHAIN MANAGEMENT PERFORMANCE
EVALUATION CRITERIA
Emel Yontar *1 and Süleyman Ersöz 2
1 Tarsus University, Vocational High School, 33400 Mersin, Turkey
ORCID ID: 0000-0001-7800-2960
2 Kırıkkale University, Faculty of Engineering, Department of Industrial Engineering, 71450 Kırıkkale, Turkey
ORCID ID: 0000-0002-7534-6837
* Corresponding Author
Received: 27/12/2018 Accepted: 11/02/2019
ABSTRACT
Evaluating chain performance to develop an effective supply chain has become a necessity because it plays a critical role
in the success of businesses. The most important decision to evaluate the chain performance is the correct selection of
indicators. The closed-loop supply chain method consists of a whole of forward and reverse logistics activities. For this
reason, advanced supply chain management and reverse supply chain management performances are handled separately in
this study. The performance evaluation criteria which are discussed by the authors who work on the supply chain
management performance evaluation issues are analyzed and it is stated that the authors make a study by taking into
consideration the evaluation criteria. At the same time, the articles examined in reverse supply chain management
performance evaluation studies are examined and all criteria are summarized as a table. In the light of these studies, the
planned criteria for the use of closed loop supply chain management performance evaluation of the enterprises have
emerged. With the main criteria being divided into Economic, Social and Environmental headings, which are supposed to
bring innovation to the literature, the sub-criteria are detailed. These titles were brought together both for the first time in
closed loop supply chain management performance evaluation and as a main topic in advanced supply chain management.
The performance criteria reduced to subheadings will help the experts to continue their studies, and it is thought that they
will guide the future studies.
Keywords: Closed Loop, Supply Chain Management, Performance Evaluation
Turkish Journal of Engineering (TUJE)
Vol. 3, Issue 4, pp. 157-167, October 2019
158
1. INTRODUCTION
The closed loop supply chain concept was first
described by Thierry et al.. made in 1995 by "strategic
issues related to product recovery" is at study "integrated
systems" has been defined as. Closed loop supply chain
management is a concept that emerges when product
recovery is both economically and environmentally
valuable and growing in importance. Research on the
subject has a history of about 20 years and the origin of
this concept stems from the reverse logistics literature.
Closed loop supply chain is expressed as the
implementation and re-introduction of the end-of-life
products (End-Of-Life) from the end-use point and to
recycle them to make them re-valued. (Thierry et al.
1995, Guide et al. 2003).
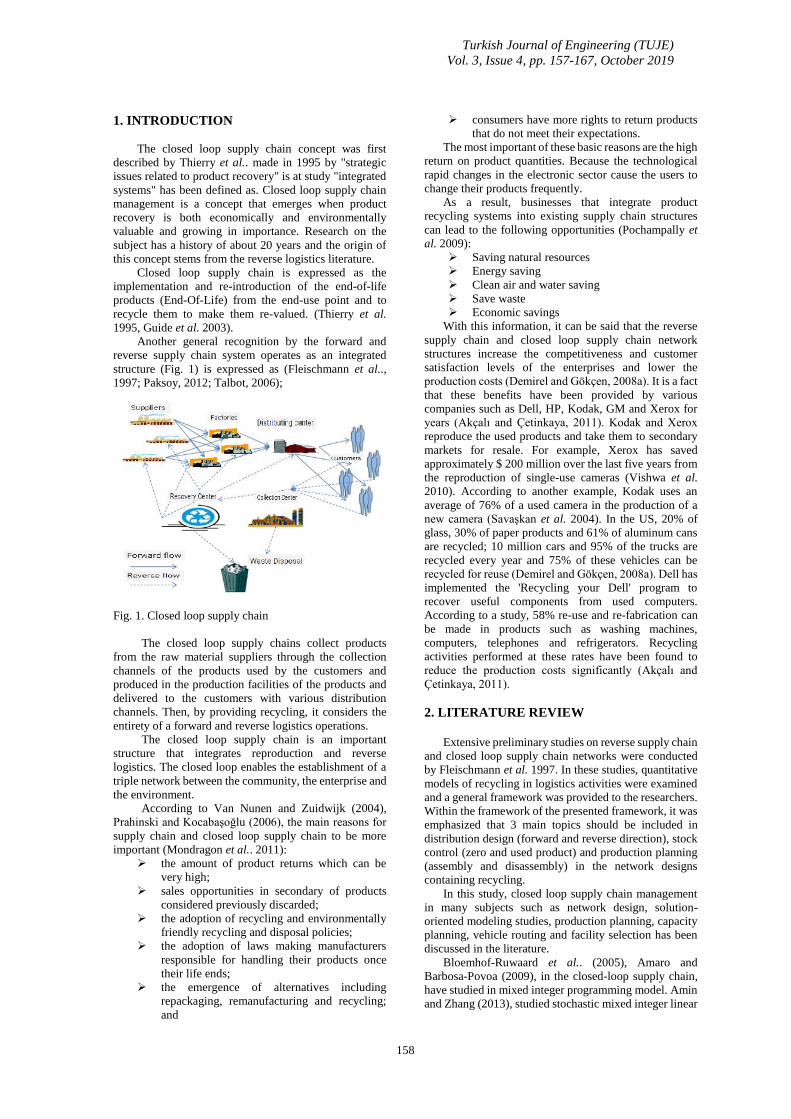
Another general recognition by the forward and
reverse supply chain system operates as an integrated
structure (Fig. 1) is expressed as (Fleischmann et al..,
1997; Paksoy, 2012; Talbot, 2006);
Fig. 1. Closed loop supply chain
The closed loop supply chains collect products
from the raw material suppliers through the collection
channels of the products used by the customers and
produced in the production facilities of the products and
delivered to the customers with various distribution
channels. Then, by providing recycling, it considers the
entirety of a forward and reverse logistics operations.
The closed loop supply chain is an important
structure that integrates reproduction and reverse
logistics. The closed loop enables the establishment of a
triple network between the community, the enterprise and
the environment.
According to Van Nunen and Zuidwijk (2004),
Prahinski and Kocabaşoğlu (2006), the main reasons for
supply chain and closed loop supply chain to be more
important (Mondragon et al.. 2011):
➢ the amount of product returns which can be
very high;
➢ sales opportunities in secondary of products
considered previously discarded;
➢ the adoption of recycling and environmentally
friendly recycling and disposal policies;
➢ the adoption of laws making manufacturers
responsible for handling their products once
their life ends;
➢ the emergence of alternatives including
repackaging, remanufacturing and recycling;
and
➢ consumers have more rights to return products
that do not meet their expectations.
The most important of these basic reasons are the high
return on product quantities. Because the technological
rapid changes in the electronic sector cause the users to
change their products frequently.
As a result, businesses that integrate product
recycling systems into existing supply chain structures
can lead to the following opportunities (Pochampally et
al. 2009):
➢ Saving natural resources
➢ Energy saving
➢ Clean air and water saving
➢ Save waste
➢ Economic savings
With this information, it can be said that the reverse
supply chain and closed loop supply chain network
structures increase the competitiveness and customer
satisfaction levels of the enterprises and lower the
production costs (Demirel and Gökçen, 2008a). It is a fact
that these benefits have been provided by various
companies such as Dell, HP, Kodak, GM and Xerox for
years (Akçalı and Çetinkaya, 2011). Kodak and Xerox
reproduce the used products and take them to secondary
markets for resale. For example, Xerox has saved
approximately $ 200 million over the last five years from
the reproduction of single-use cameras (Vishwa et al.
2010). According to another example, Kodak uses an
average of 76% of a used camera in the production of a
new camera (Savaşkan et al. 2004). In the US, 20% of
glass, 30% of paper products and 61% of aluminum cans
are recycled; 10 million cars and 95% of the trucks are
recycled every year and 75% of these vehicles can be
recycled for reuse (Demirel and Gökçen, 2008a). Dell has
implemented the 'Recycling your Dell' program to
recover useful components from used computers.
According to a study, 58% re-use and re-fabrication can
be made in products such as washing machines,
computers, telephones and refrigerators. Recycling
activities performed at these rates have been found to
reduce the production costs significantly (Akçalı and
Çetinkaya, 2011).
2. LITERATURE REVIEW
Extensive preliminary studies on reverse supply chain
and closed loop supply chain networks were conducted
by Fleischmann et al. 1997. In these studies, quantitative
models of recycling in logistics activities were examined
and a general framework was provided to the researchers.
Within the framework of the presented framework, it was
emphasized that 3 main topics should be included in
distribution design (forward and reverse direction), stock
control (zero and used product) and production planning
(assembly and disassembly) in the network designs
containing recycling.
In this study, closed loop supply chain management
in many subjects such as network design, solution-
oriented modeling studies, production planning, capacity
planning, vehicle routing and facility selection has been
discussed in the literature.
Bloemhof-Ruwaard et al.. (2005), Amaro and
Barbosa-Povoa (2009), in the closed-loop supply chain,
have studied in mixed integer programming model. Amin
and Zhang (2013), studied stochastic mixed integer linear
Turkish Journal of Engineering (TUJE)
Vol. 3, Issue 4, pp. 157-167, October 2019
159
programming model, Paydar et al.. (2017), studied a
mixed integer linear programming model.
In addition to these modeling studies, other studies
that have been published in the literature that Hu et al..
(2002), a model of discrete / continuous analytical
structure, Krikke et al.. (2003), a model development in
which both product design and logistics network design
are discussed, Sheu et al.. (2005) have developed a multi-
purpose inventory model with a multi-purpose
optimization model, Özceylan et al.. (2014) developed an
integrated model that optimizes both strategic and tactical
decisions of a closed loop supply chain, Shakourloo et al..
(2016) developed with a general network model for
closed loop procurement management.
Another area of work in closed loop supply chain
management is network design. Qiang et al.. (2013),
Aldemir (2016), have studied the issue of network design.
At the same time Paksoy et al.. (2011) examined the
network design for multiple product closed loop supply
chain. Özceylan et al.. (2017) ELV realized a network
design for the recycling system.
The literature gains increased with different studies.
Schultmann et al.. (2006) worked on vehicle routing
problem in closed loop supply chain management. Kenne
et al.. (2012), Otay (2015) studied production planning.
Chen et al.. (2017), also performed inventory control
studies.
Lu and Bostel (2007) addressed the problem of plant
layout in closed loop supply chain management. Tsao et
al.. (2016) covered the literature by examining the effects
of RFID in closed loop supply chain management.
Finally, Olugu and Wang (2011) conducted a
performance evaluation study on closed-loop supply
chain management for the automotive sector.
After a detailed literature review of the closed loop
supply chain management, it was observed that many
subjects were studied. However, due to the low number
of studies conducted with performance evaluation, it is
thought that our study will have an important place in the
literature.
3. PERFORMANCE EVALUATION
CRITERIA AT CLOSED LOOP SUPPLY
CHAIN MANAGEMENT
Performance is a qualitative or quantitative
expression of what an individual, a group, or an
organization doing a job can achieve and what they can
achieve in order to achieve that goal (Karakaş et al.,
2003).
Evaluation of operational performance; is a sequence
of operations that determines the extent to which
businesses have reached their predetermined objectives,
olup, determining performance objectives, performance
measurement, feedback and motivation stages of the
performance management process (Zerenler, 2005). It is
difficult to analyze the target and the current situation for
a process that cannot be evaluated, and identify the points
that are open to improvement and direct the resources to
these points. An effective management depends on an
effective evaluation of performance results.
In this respect, it is a necessity to evaluate the chain
performance in order to develop an effective and effective
supply chain, as enterprises play a critical role in their
success.
Closed-loop supply chain method, because it is a
totality of forward and reverse of the logistics activities,
it is necessary to combine performance criteria with
forward supply chain management and reverse supply
chain management performances, taking into account the
studies conducted in the literature.
Supply chain performance has many elements in it.
These elements are composed of many variables that can
be measured by quantitative and qualitative methods.
There are a number of studies on supply chain
performance in the literature, and a significant part of
them has been focused on the evaluation of supply chain
performance and the criteria used in performance
evaluation. However, there are few studies conducted for
closed loop supply chain management performance
evaluation.
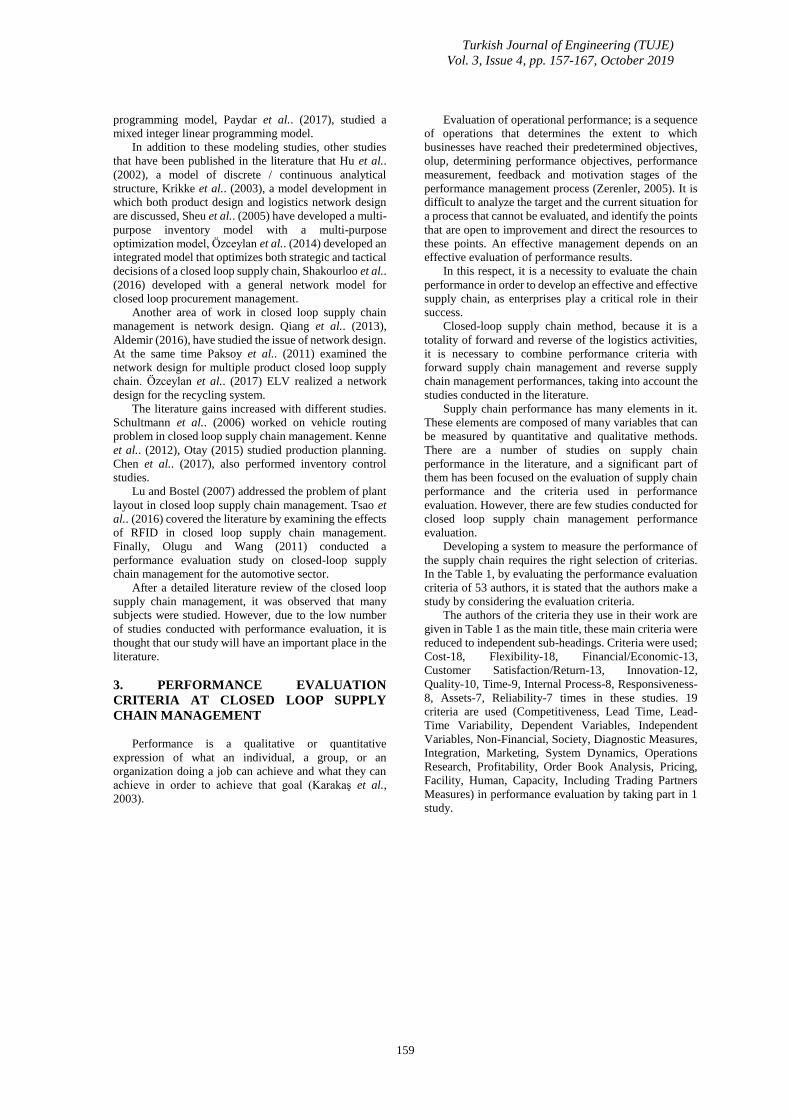
Developing a system to measure the performance of
the supply chain requires the right selection of criterias.
In the Table 1, by evaluating the performance evaluation
criteria of 53 authors, it is stated that the authors make a
study by considering the evaluation criteria.
The authors of the criteria they use in their work are
given in Table 1 as the main title, these main criteria were
reduced to independent sub-headings. Criteria were used;
Cost-18, Flexibility-18, Financial/Economic-13,
Customer Satisfaction/Return-13, Innovation-12,
Quality-10, Time-9, Internal Process-8, Responsiveness-
8, Assets-7, Reliability-7 times in these studies. 19
criteria are used (Competitiveness, Lead Time, Lead-
Time Variability, Dependent Variables, Independent
Variables, Non-Financial, Society, Diagnostic Measures,
Integration, Marketing, System Dynamics, Operations
Research, Profitability, Order Book Analysis, Pricing,
Facility, Human, Capacity, Including Trading Partners
Measures) in performance evaluation by taking part in 1
study.
Turkish Journal of Engineering (TUJE)
Vol. 3, Issue 4, pp. 157-167, October 2019
160
Table 1. Forward Supply Chain Performance evaluation metrics according to the authors
(1-Quality 2-Time 3-Cost 4-Assets 5-Flexibility 6-Resource 7-Output 8-Innovation 9-Financial/Economic 10-Customer Satisfaction/Return 11-Internal
Process 12-Responsiveness 13-Reliability 14-Plan 15-Make 16-Deliver 17-Strategic Measures 18-Tactical/Structural Measures 19-Operational Measures
20-Qualitative Measures 21-Quantitative Measures 22-Efficiency 23-Resource Utilisation 24-Information/Information Sharing Degree/Information
Technology 25-Logistics Level/Transportation 26-Inventory 27-Service 28-Customer Services 29-Managerial Analysis/Corporate Management 30-
Competitiveness 31-Lead Time 32-Lead Time Variability 33-Dependent Variables 34-Independent Variables 35-Non-Financial 36-Society 37-Diagnostic
Measures 38-Integration 39-Marketing 40-System Dynamics 41-Operations Research 42-Profitability 43-Order Book Analysis 44-Pricing 45-Facility 46-
Human 47-Capacity 48-Including Trading Partners Measures)
Following the forward supply chain management
performance evaluation criteria, reverse supply chain
management performance evaluation criteria have also
been the subject of studies.
Evaluating the performance of reverse supply chain
performance over the last decade has become a real
necessity. In this study, 20 articles examined in reverse
Author Metrics 1 2 3 4 5 6 7 8 9 10 11 12 13 14 15 16 17 18 19 20 21 22 23 24 25 26 27 28 29 30 31 32 33 34 35 36 37 38 39 40 41 42 43 44 45 46 47 48
Fitzgerald et. al. (1991) o o o o o o
Neely et. al. (1995) o o o o
Bagchi (1996) o o o o
Kaplan and Norton (1997) o o o o
Beamon (1998) o o
Narasihman and Jayaram (1998) o o
Van Hoek (1998) o o o
Beamon (1999) o o o
Brewer and Speh (2000) o o o o
Bierlein and Miller (2000) o o o o
Pires and Aravechia (2001) o o o
Gunasekaran et. al. (2001) o o o o
De Toni and Tonchia (2001) o o
Persson and Olhager (2002) o o o o o
Bullinger et. al. (2002) o o o o
Chan et. al.(2003) o o
Otto and Kotzab (2003) o o o o o o
Gunasekaran et. al. (2004) o o o
Author Metrics 1 2 3 4 5 6 7 8 9 10 11 12 13 14 15 16 17 18 19 20 21 22 23 24 25 26 27 28 29 30 31 32 33 34 35 36 37 38 39 40 41 42 43 44 45 46 47 48
Fleisch and Tellkamp (2005) o o
Angerhofer and Angelides (2006) o o o
Sen (2006) o o
Shepherd and Günter (2006) o o o o o o
Li et. al. (2007) o o
Aramyan (2007) o o o o
Yeong –Dong Hwang et. al. (2008) o o o o o
Tao (2009) o o o o
Stock and Mulki (2009) o o o o
Chimhamhiwa et. al. (2009) o o o o o o
Cai et. al. (2009) o o o o o
Chae (2009) o o o o
Kocaoğlu (2009) o o o o o
Xu et. al.(2009) o o o o o
Rodriguez-Rodriguez et. al. (2010) o o o o
Ağar (2010) o o o o o
Özbakır (2010) o o o o
Zhu (2010) o o o o
Author Metrics 1 2 3 4 5 6 7 8 9 10 11 12 13 14 15 16 17 18 19 20 21 22 23 24 25 26 27 28 29 30 31 32 33 34 35 36 37 38 39 40 41 42 43 44 45 46 47 48
Ganga and Carpinetti (2011) o o o o o
Aydoğdu (2011) o o o o o
Shafiee and Shams-e-alam (2011) o o o o o o o
Carvalho and Azevedo (2012) o o
Cho et. al. (2012) o o o
Yavuz and Ersoy (2013) o o o
Elrod et. al.. (2013) o o o o
Golrizgashti (2014) o o o o
Arif-Uz-Zaman and Ahsan (2014) o o o o
Alomar and Pasek (2014) o o o o
Anand and Grover (2015) o o o o
Sillanpaa (2015) o o o o
Gamme and Johnson (2015) o o o o o o
Sellitto et. al. (2015) o o o o
Ayçın and Özveri (2015) o o o o o
Shi and Gao (2016) o o o o
Özalp (2016) o o o o o
Turkish Journal of Engineering (TUJE)
Vol. 3, Issue 4, pp. 157-167, October 2019
161
supply chain management performance evaluation
studies are discussed.
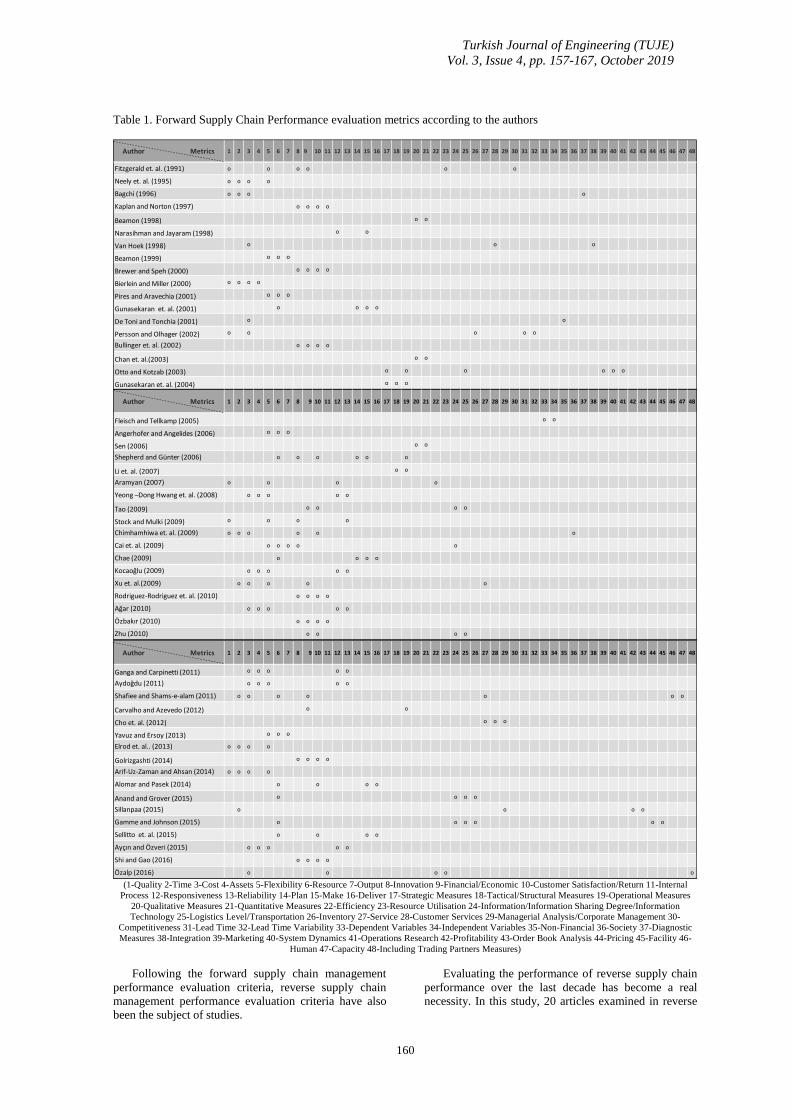
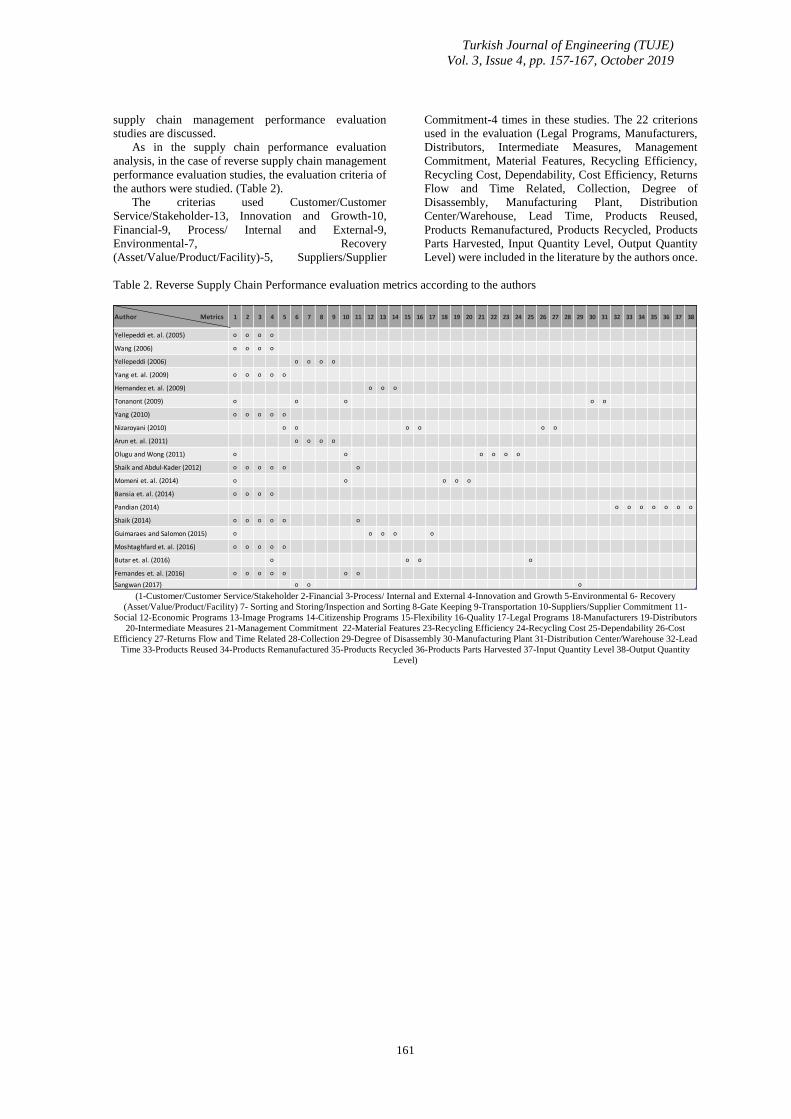
As in the supply chain performance evaluation
analysis, in the case of reverse supply chain management
performance evaluation studies, the evaluation criteria of
the authors were studied. (Table 2).
The criterias used Customer/Customer
Service/Stakeholder-13, Innovation and Growth-10,
Financial-9, Process/ Internal and External-9,
Environmental-7, Recovery
(Asset/Value/Product/Facility)-5, Suppliers/Supplier
Commitment-4 times in these studies. The 22 criterions
used in the evaluation (Legal Programs, Manufacturers,
Distributors, Intermediate Measures, Management
Commitment, Material Features, Recycling Efficiency,
Recycling Cost, Dependability, Cost Efficiency, Returns
Flow and Time Related, Collection, Degree of
Disassembly, Manufacturing Plant, Distribution
Center/Warehouse, Lead Time, Products Reused,
Products Remanufactured, Products Recycled, Products
Parts Harvested, Input Quantity Level, Output Quantity
Level) were included in the literature by the authors once.
Table 2. Reverse Supply Chain Performance evaluation metrics according to the authors
(1-Customer/Customer Service/Stakeholder 2-Financial 3-Process/ Internal and External 4-Innovation and Growth 5-Environmental 6- Recovery
(Asset/Value/Product/Facility) 7- Sorting and Storing/Inspection and Sorting 8-Gate Keeping 9-Transportation 10-Suppliers/Supplier Commitment 11-
Social 12-Economic Programs 13-Image Programs 14-Citizenship Programs 15-Flexibility 16-Quality 17-Legal Programs 18-Manufacturers 19-Distributors
20-Intermediate Measures 21-Management Commitment 22-Material Features 23-Recycling Efficiency 24-Recycling Cost 25-Dependability 26-Cost
Efficiency 27-Returns Flow and Time Related 28-Collection 29-Degree of Disassembly 30-Manufacturing Plant 31-Distribution Center/Warehouse 32-Lead
Time 33-Products Reused 34-Products Remanufactured 35-Products Recycled 36-Products Parts Harvested 37-Input Quantity Level 38-Output Quantity
Level)
Author Metrics 1 2 3 4 5 6 7 8 9 10 11 12 13 14 15 16 17 18 19 20 21 22 23 24 25 26 27 28 29 30 31 32 33 34 35 36 37 38
Yellepeddi et. al. (2005) o o o o
Wang (2006) o o o o
Yellepeddi (2006) o o o o
Yang et. al. (2009) o o o o o
Hernandez et. al. (2009) o o o
Tonanont (2009) o o o o o
Yang (2010) o o o o o
Nizaroyani (2010) o o o o o o
Arun et. al. (2011) o o o o
Olugu and Wong (2011) o o o o o o
Shaik and Abdul-Kader (2012) o o o o o o
Momeni et. al. (2014) o o o o o
Bansia et. al. (2014) o o o o
Pandian (2014) o o o o o o o
Shaik (2014) o o o o o o
Guimaraes and Salomon (2015) o o o o o
Moshtaghfard et. al. (2016) o o o o o
Butar et. al. (2016) o o o o
Fernandes et. al. (2016) o o o o o o o
Sangwan (2017) o o o
Turkish Journal of Engineering (TUJE)
Vol. 3, Issue 4, pp. 157-167, October 2019
162
As a result of these studies, the performance criteria
in forward supply chain and reverse supply chain
management were analyzed in detail and the criteria that
are planned to be used in performance evaluation in
closed loop supply chain management are determined in
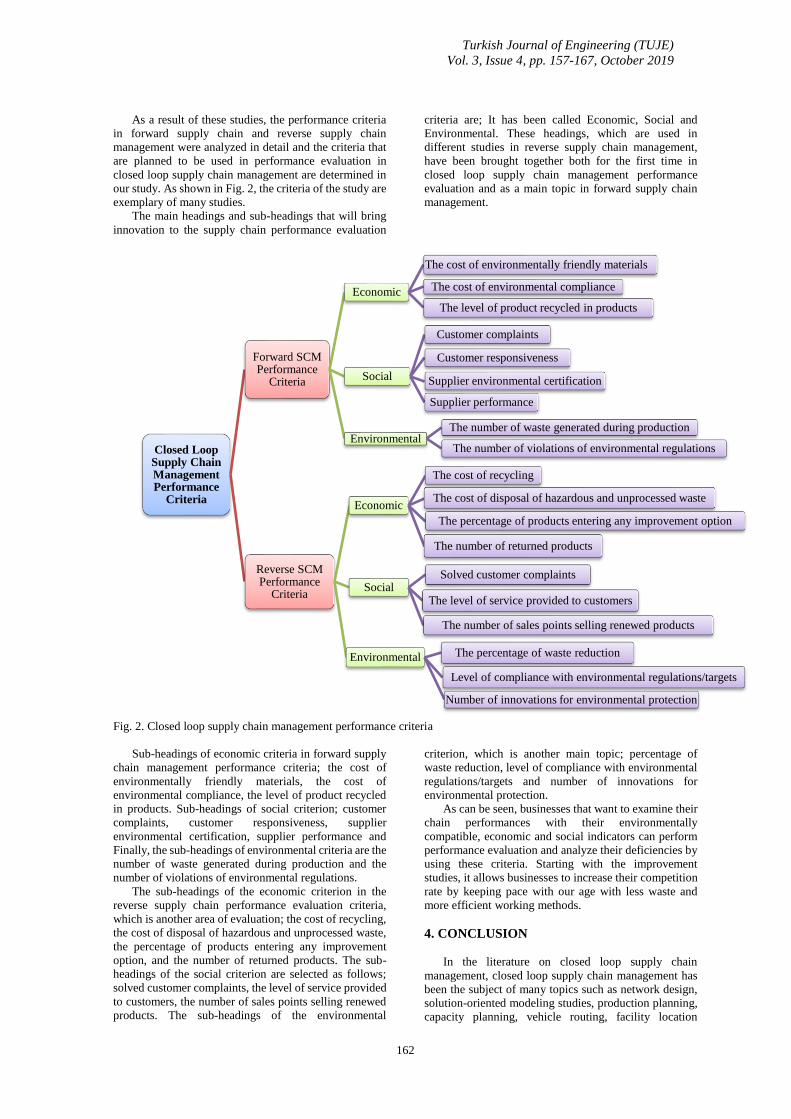
our study. As shown in Fig. 2, the criteria of the study are
exemplary of many studies.
The main headings and sub-headings that will bring
innovation to the supply chain performance evaluation
criteria are; It has been called Economic, Social and
Environmental. These headings, which are used in
different studies in reverse supply chain management,
have been brought together both for the first time in
closed loop supply chain management performance
evaluation and as a main topic in forward supply chain
management.
Fig. 2. Closed loop supply chain management performance criteria
Sub-headings of economic criteria in forward supply
chain management performance criteria; the cost of
environmentally friendly materials, the cost of
environmental compliance, the level of product recycled
in products. Sub-headings of social criterion; customer
complaints, customer responsiveness, supplier
environmental certification, supplier performance and
Finally, the sub-headings of environmental criteria are the
number of waste generated during production and the
number of violations of environmental regulations.
The sub-headings of the economic criterion in the
reverse supply chain performance evaluation criteria,
which is another area of evaluation; the cost of recycling,
the cost of disposal of hazardous and unprocessed waste,
the percentage of products entering any improvement
option, and the number of returned products. The sub-
headings of the social criterion are selected as follows;
solved customer complaints, the level of service provided
to customers, the number of sales points selling renewed
products. The sub-headings of the environmental
criterion, which is another main topic; percentage of
waste reduction, level of compliance with environmental
regulations/targets and number of innovations for
environmental protection.
As can be seen, businesses that want to examine their
chain performances with their environmentally
compatible, economic and social indicators can perform
performance evaluation and analyze their deficiencies by
using these criteria. Starting with the improvement
studies, it allows businesses to increase their competition
rate by keeping pace with our age with less waste and
more efficient working methods.
4. CONCLUSION
In the literature on closed loop supply chain
management, closed loop supply chain management has
been the subject of many topics such as network design,
solution-oriented modeling studies, production planning,
capacity planning, vehicle routing, facility location
Closed Loop Supply Chain Management Performance
Criteria
Forward SCM Performance
Criteria
Economic
The cost of environmentally friendly materials
The cost of environmental compliance
The level of product recycled in products
Social
Customer complaints
Customer responsiveness
Supplier environmental certification
Supplier performance
EnvironmentalThe number of waste generated during production
The number of violations of environmental regulations
Reverse SCM Performance
Criteria
Economic
The cost of recycling
The cost of disposal of hazardous and unprocessed waste
The percentage of products entering any improvement option
The number of returned products
SocialSolved customer complaints
The level of service provided to customers
The number of sales points selling renewed products
Environmental The percentage of waste reduction
Level of compliance with environmental regulations/targets
Number of innovations for environmental protection
Turkish Journal of Engineering (TUJE)
Vol. 3, Issue 4, pp. 157-167, October 2019
163
selection. However, performance evaluation in closed
loop supply chain management is quite low. As a result
of this, forward and reverse supply chain management
performance evaluation studies were investigated. In our
study; supply chain management issues 53 articles
evaluating employee performance, employee
performance evaluation reverse supply chain
management issues 20 articles were discussed. The
performance evaluation criteria discussed by these
studies were analyzed. It is stated that the authors are
working by taking into account the evaluation criteria. In
73 articles analyzed, performance criteria are summarized
by converting them into tables. As a result of these
studies, the criteria that are planned to be used in closed
loop supply chain management performance evaluation
of the enterprises are determined in our study.
The study's criteria are sufficient to be an example to
many studies. The main topics that will bring innovation
to the supply chain performance evaluation criteria,
which are composed of main headings and sub-headings,
have economic, social and environmental headings.
These main criteria are handled separately by different
authors in the literature. In the studies Yellepeddi et al..
(2005), Wang (2006) Yang (2010), Shaik and Abdul-
Kader (2012), Bansia et al.. (2014), Shaik (2014),
Moshtaghfard et al.. (2016), Fernandes et al.. (2016)
studied this heading in reverse supply chain management.
Likewise, in the forward supply chain management
Fitzgerald et al.. (1991), Kaplan and Norton (1997),
Brewer and Speh (2000), Bullinger et al.. (2002), Tao
(2009), Xu et al.. (2009), Rodriguez-Rodriguez et al..
(2010), Özbakır (2010), Zhu (2010) Shafiee and Shams-
e-alam (2011), Carvalho and Azevedo (2012)
Golrizgashti (2014), Shi and Gao (2016) studied as the
main criteria of the economic title. The environmental
main criteria has not been studied as a head of forward
supply chain management, as it involves more recycling
issues. As a result, Yang et al.. (2009), Yang (2010),
Nizaroyani (2010) Shaik and Abdul-Kader (2012), Shaik
(2014), Moshtaghfard et al.. (2016), Fernandes et al..
(2016) considered environmental criteria in their studies.
Although the social criteria is less preferred, Shaik and
Abdul-Kader (2012), Shaik (2014), Fernandes et al..
(2016), Chimhamhiwa et al.. (2009) were used by.
In our study, economic, environmental and
social criteria are compiled together. The main topics that
will bring innovation to the supply chain performance
evaluation criteria consisting of main headings and
subheadings have been economic, social and
environmental headings. These headings are put together
for the first time in closed loop supply chain management
performance evaluation. Innovations were made to the
literature by using it as the main topic in forward supply
chain management. The performance criteria, which are
then reduced to subheadings, have been detailed to help
the experts to continue their study. For this purpose,
businesses that want to examine chain performances can
perform performance evaluation using these criteria and
they can analyze our deficiencies and implement
improvement studies.
REFERENCES
Ağar F., Tedarik zinciri yönetiminde scor modeli, tedarik
süreci performans değerlendirmesi ve scorcard
uygulaması, İstanbul Teknik Üniversitesi, Fen Bilimleri
Enstitüsü Yüksek Lisans Tezi, İstanbul, 2010.
Akçalı, E. and Çetinkaya, S., Quantitative models for
inventory and production planning in closed-loop supply
chains, International Journal Of Production Research, 49
(8), 2373–2407, 2011.
Aldemir G., A Closed loop sustainable supply chain
network design for waste electrical & electronic
equipment, Yüksek Lisans Tezi, İstanbul Teknik
Üniversitesi, İstanbul, 2016.
Alomar, Madani, and Zbigniew J. Pasek. "Linking supply
chain strategy and processes to performance
improvement." Procedia CIRP 17 (2014): 628-634.
Amaro, A. C. S., and Barbosa-Povoa, A. P. F. D.. The
effect of uncertainty on the optimal closed-loop supply
chain planning under different partnerships structure.
Computers & Chemical Engineering, 33(12), 2144–2158,
2009.
Amin, S. H., Zhang, G., A Multi-Objective facility
location model for closed-loop supply chain network
under uncertain demand and return, Applied
Mathematical Modelling, 37 (2013) 4165–4176, 2013.
Anand, Neeraj, and Neha Grover. "Measuring retail
supply chain performance: Theoretical model using key
performance indicators (KPIs)." Benchmarking: An
international journal 22.1 (2015): 135-166.
Angerhofer, Bernhard J., and Marios C. Angelides. "A
model and a performance measurement system for
collaborative supply chains." Decision support
systems 42.1 (2006): 283-301.
Aramyan, Lusine H., et al.. "Performance measurement
in agri-food supply chains: a case study." Supply Chain
Management: An International Journal 12.4 (2007): 304-
315.
Arif-Uz-Zaman, Kazi, and A. M. M. Nazmul Ahsan.
"Lean supply chain performance
measurement." International Journal of Productivity and
Performance Management 63.5 (2014): 588-612.
Arun Vasantha Geethan, K., S. Jose, and C. Sunil
Chandar. "Methodology for performance evaluation of
reverse supply chain." International Journal of
Engineering and Technology 3.3 (2011): 213-224
Ayçın E., Özveri O., Bulanık modelleme ile tedarik
zinciri performansının değerlendirilmesi ve imalat
sektöründe bir uygulama, Journal of Economics and
Administrative Sciences-Volume: XVII Issue:1, 51-60,
2015.
Aydoğdu F., Tedarik Zinciri Yönetiminde SCOR Modeli
ve veri zarflama analizi entegrasyonu, Yüksek Lisans
Tezi, Endüstri Mühendisliği, Gazi Üniversitesi, Fen
Bilimleri Enstitüsü, Ankara, 2011.
Bagchi, Prabir K. "Role of benchmarking as a
competitive strategy: the logistics

Turkish Journal of Engineering (TUJE)
Vol. 3, Issue 4, pp. 157-167, October 2019
164
experience." International Journal of Physical
Distribution & Logistics Management 26.2 (1996): 4-22.
Bansia, Milind, Jayson K. Varkey, and Saurabh Agrawal.
"Development of a Reverse Logistics Performance
Measurement System for a battery
manufacturer." Procedia Materials Science6 (2014):
1419-1427.
Beamon, Benita M. "Measuring supply chain
performance." International journal of operations &
production management19.3 (1999): 275-292.
Beamon, Benita M. "Supply chain design and analysis:
Models and methods." International journal of
production economics55.3 (1998): 281-294.
Beierlein, James G., and Christopher A. Miller.
"Performance Measures, and Measurement in Supply
Chains in the Food System." Food Industry
Report (2000).
Bloemhof-Ruwaard, J.M., Van Wassenhove, L.N.,
Gabel, H.L. And Weaver, P.M., An environmental life
cycle optimization model for the European pulp and paper
industry, Omega, 24 (6), 615–629, 2005.
Brewer, Peter C., and Thomas W. Speh. "Using the
balanced scorecard to measure supply chain
performance." Journal of Business logistics 21.1 (2000):
75.
Bullinger, Hans-Jörg, Michael Kühner, and Antonius Van
Hoof. "Analysing supply chain performance using a
balanced measurement method." International Journal of
Production Research 40.15 (2002): 3533-3543.
Butar, Maulida Butar, David Sanders, and Regina Frei.
"Measuring performance of reverse supply chains in a
carpet manufacturer." Journal of Advanced Management
Science 4.2 (2016): 152-158.
Cai, Jian, et al.. "Improving supply chain performance
management: A systematic approach to analyzing
iterative KPI accomplishment." Decision support
systems 46.2 (2009): 512-521.
Carvalho, Helena, Susana Garrido Azevedo, and Virgilio
Cruz-Machado. "Agile and resilient approaches to supply
chain management: influence on performance and
competitiveness." Logistics research 4.1-2 (2012): 49-
62.
Chae, Bongsug. "Developing key performance indicators
for supply chain: an industry perspective." Supply Chain
Management: An International Journal 14.6 (2009): 422-
428.
Chan, Felix TS, et al.. "A conceptual model of
performance measurement for supply
chains." Management decision 41.7 (2003): 635-642.
Chen Vd., Inventory management in a closed-loop supply
chain with advance demand information, Operations
Research Letters 45, 175–180, 2017.
Chimhamhiwa, Dorman, et al.. "Towards a framework
for measuring end to end performance of land
administration business processes–A case
study." Computers, environment and urban systems 33.4
(2009): 293-301.
Cho, Dong Won, et al.. "A framework for measuring the
performance of service supply chain
management." Computers & Industrial Engineering 62.3
(2012): 801-818.
De Toni, Alberto, and Stefano Tonchia. "Performance
measurement systems-models, characteristics and
measures." International Journal of Operations &
Production Management21.1/2 (2001): 46-71.
Demirel, N. and Gökçen, H., A Mixed integer
programming model for remanufacturing in reverse
logistics environment, International Journal of Advanced
Manufacturing Technology, 39 (11–12), 1197–1206,
2008a.
Easwaran, G. and Üster, H., A Closed-Loop supply chain
network design problem with integrated forward and
reverse channel decisions, IIE Transactions, 42 (11), 779–
792, 2010.
Elrod, Cassandra, Susan Murray, and Sundeep Bande. "A
review of performance metrics for supply chain
management." Engineering Management Journal 25.3
(2013): 39-50.
Fernandes, Sheila Mendes, et al.. "Systematic literature
review on the ways of measuring the of reverse logistics
performance." Gestão & Produção AHEAD (2017): 0-0.
Fitzgerald, L., Johnston, R., Brignall, S., Silvestro, R. and
Voss, C., "Performance measurement in service
businesses." Management Accounting 69.10 (1991): 34-
36.
Fleisch, Elgar, and Christian Tellkamp. "Inventory
inaccuracy and supply chain performance: a simulation
study of a retail supply chain." International journal of
production economics 95.3 (2005): 373-385.
Fleischmann, M., Bloemhof-Ruwaard, J.M., Dekker, R.,
Van Der Laan, E., Van Nunen, J.A.E.E. And Van
Wassenhove, L.N., Quantitative models for reverse
logistics: a review, European Journal Of Operational
Research, 103 (1), 1–17, 1997.
Gamme N., Johansson M., Measuring Supply Chain
Performance Through KPI Identification and Evaluation,
Department of Technology Management and Economics,
Master’s thesis in “Supply Chain Management” and
"Quality and Operations Management”, Chalmers
University of Technology, Gothenburg, Sweden 2015.
Ganga, Gilberto Miller Devós, Luiz Cesar Ribeiro
Carpinetti, and Paulo Rogério Politano. "A fuzzy logic
approach to supply chain performance management."
Gestão & Produção 18.4 (2011): 755-774.

Turkish Journal of Engineering (TUJE)
Vol. 3, Issue 4, pp. 157-167, October 2019
165
Golrizgashti, Seyedehfatemeh. "Supply chain value
creation methodology under BSC approach." Journal of
Industrial Engineering International 10.3 (2014): 67.
Guide, V. D. R.,, Jayaraman V., Linton J. D., Building
Contingency Planning For Closed-Loop Supply Chains
With Product Recovery, Journal Of Operations
Management, 21 (2003) 259–279, 2003.
Guimarães da Silveira, José Leonardo, and Valério
Antonio Pamplona Salomon. "ANP applied to the
evaluation of performance indicators of reverse logistics
in footwear industry." Procedia Computer Science 55
(2015): 139-148.
Gunasekaran, Angappa, Chaitali Patel, and Ercan
Tirtiroglu. "Performance measures and metrics in a
supply chain environment." International journal of
operations & production Management 21.1/2 (2001): 71-
87.
Gunasekaran, Angappa, Christopher Patel, and Ronald E.
McGaughey. "A framework for supply chain
performance measurement." International journal of
production economics 87.3 (2004): 333-347.
Hernández, Cecilia Toledo, et al.. "Using AHP and ANP
to evaluate the relation between reverse logistics and
corporate performance in Brazilian automotive
industry." Proceeding of Proceedings of the 10th
International Symposium on the Analytic
Hierarchy/Network Process Multi-criteria Decision
Making held at Pennsylvania, USA. 2009.
Hu, T., Sheu, J. And Huan, K., A Reverse logistics cost
minimization model for the treatment of hazardous
wastes, Transportation Research Part E, 38 (6), 457–473,
2002.
Kaplan, R.S., Norton, D.P., Balanced scorecard:
translating strategy into action. 4 th Edition. Harvard
Business School Press, Boston, 1997.
Karakaş, B. and Ak R., “Kamu yönetiminde performans
yönetimi önemli midir?”, Kamu Yönetiminde Kalite 3.
Ulusal Kongresi Bildirileri, TODAİE Yayınları No: 319,
Ankara, 2003, ss. 337-351.
Kenne, J.-P., Dejax, P. and Gharbi, A., Production
planning of a hybrid manufacturing-remanufacturing
system under uncertainty within a closed-loop supply
chain, International Journal Of Production Economics,
135 (1), 81–93, 2012.
Kocaoğlu B., Tedarik zinciri performansı ölçümü için
stratejik ve operasyonel hedefleri bütünleştiren SCOR
modeli temelli bir yapı, Doktora Tezi, Yıldız Teknik
Üniversitesi, Fen Bilimleri Enstitüsü, İstanbul, 2009.
Krikke, H., Bloemhof-Ruwaard, J. and Van Wassenhove,
L.N., 2003, Concurrent product and closed-loop supply
chain design with an application to refrigerators,
International Journal of Production Research, 41 (16),
3689–3719, 2003.
Li, Zhengping, Xiaoxia Xu, and Arun Kumar. "Supply
chain performance evaluation from structural and
operational levels." Emerging Technologies and Factory
Automation, 2007. ETFA. IEEE Conference on. IEEE,
2007.
Lu, Z., and Bostel, N., A Facility location model for
logistics systems including reverse flows: the case of
remanufacturing activities. Computers & Operations
Research, 34(2), 299–323, 2007.
Momeni, Ehsan, et al.. "A new fuzzy network slacks-
based DEA model for evaluating performance of supply
chains with reverse logistics." Journal of Intelligent &
Fuzzy Systems 27.2 (2014): 793-804.
Mondragon, A.E.C., Lalwani, C. And Mondragon,
C.E.C., Measures for auditing, performance and
integration in closed-loop supply chains, Supply Chain
Management: An International Journal, 16 (1), 43–56,
2011.
Moshtaghfard R., Arbabshirani B., Alinaghian M.,
Reverse Logistics Performance Measurement by
Integrated Balanced Scorecard and Data Envelopment
Analysis (Case Study in Pak Dairy Co.), International
Journal of Advances in Management Science (IJ-AMS),
Volume 5, 2016.
Narasımhan, Ram, Jayaram Jayanth, Causal linkages in
supply chain management: an exploratory study of north
American manufacturing firms”, Decision Sciences,
Volume 29, Number 3, Summer, 1998.
Neely, Andy, Mike Gregory, and Ken Platts.
"Performance measurement system design: a literature
review and research agenda." International journal of
operations & production management 15.4 (1995): 80-
116.
Nizaroyani, Saibani, Performance measurement for
reverse and closed-loop supply chains. Diss. University
of Nottingham, 2010.
Olugu E. U. and Wong K. Y., Fuzzy logic evaluation of
reverse logistics performance in the automotive industry,
Scientific Research and Essays Vol. 6(7), pp. 1639-1649,
4 April, 2011.
Otay İ., Geri kazanımlı kapalı çevrim tedarik zinciri için
dağıtım planlama, Doktora Tezi, İstanbul Teknik
Üniversitesi, Fen Bilimleri Enstitüsü, İstanbul, 2015.
Otto, Andreas, and Herbert Kotzab. "Does supply chain
management really pay? Six perspectives to measure the
performance of managing a supply chain." European
Journal of Operational Research 144.2 (2003): 306-320.
Özalp Ö., Tedarik zinciri performansının ölçümü:
ekonomik katma değer yönteminin analizi, Dokuz Eylül
Üniversitesi, Sosyal Bilimler Enstitüsü, Yüksek Lisans
Tezi, İzmir, 2016.
Özbakır S., Tedarik zincirinde dengeli performans kartı
yaklaşımı, İstanbul Üniversitesi, Sosyal Bilimler

Turkish Journal of Engineering (TUJE)
Vol. 3, Issue 4, pp. 157-167, October 2019
166
Enstitüsü, İsletme Anabilim Dalı, Yüksek Lisans Tezi,
İstanbul, 2010.
Özceylan E. et al.., A Closed-Loop supply chain network
design for automotive industry in Turkey, Computers &
Industrial Engineering Xxx, Xxx–Xxx, 2017.
Özceylan, E., Paksoy, T., Ve Bektaş, T., Modeling and
optimizing the integrated problem of closed-loop supply
chain network design and disassembly line balancing,
Transportation Research Part E: Logistics and
Transportation Review, 61, 142-164, 2014.
Paksoy, T. and Özceylan, E., Supply chain optimization
with u-type assembly line balancing, International
Journal of Production Research, 50 (18), 5085– 5105,
2012.
Paksoy, T., Bektaş, T. and Özceylan, E., Operational and
environmental performance measures in a multi-product
closed-loop supply chain, Transportation Research Part
E, 47 (4), 532–546, 2011.
Pandian G., Performance Evaluation of a Reverse
Logistics Enterprise-An Agent-Based Modelling
Approach, A Thesis the Degree of Master of Applied
Science University of Windsor, Department of Industrial
and Manufacturing Systems Engineering, Windsor,
Ontario, Canada, 2014.
Paydar vd., An engine oil closed-loop supply chain design
considering collection risk, Computers And Chemical
Engineering 104, 38–55, 2017.
Persson, Fredrik, and Jan Olhager. "Performance
simulation of supply chain designs." International journal
of production economics 77.3 (2002): 231-245.
Pires, Sílvio RI, and Carlos HM Aravechia. "Measuring
supply chain performance." Anais da XII annual
conference of POMS. 2001.
Pochampally, K.K., Nukala, S. And Gupta, S.M.,
Strategic planning models for reverse and closed-loop
supply chains, CRC Press, U.S.A, 2009.
Prahinski, C. and Kocabaşoğlu, C., Empirical research
opportunities in reverse supply chains, Omega, 34 (6),
519–32, 2006.
Qiang, Q., Ke, K., Anderson, T. and Dong, J., The
Closed-Loop supply chain network with competition,
Distribution Channel Investment, And Uncertainties,
Omega, 41 (2), 186–194, 2013,
Rodriguez-Rodriguez, Raul, et al.. "Building internal
business scenarios based on real data from a performance
measurement system." Technological Forecasting and
Social Change 77.1 (2010): 50-62.
Sangwan, Kuldip Singh. "Key activities, decision
variables and performance indicators of reverse
logistics." Procedia CIRP 61 (2017): 257-262.
Savaşkan, R.C., Bhattacharya, S. And Van Wassenhove,
L.N.V., Closed-Loop supply chain models with product
remanufacturing, Management Science, 50 (2), 239–252,
2004.
Schultmann, F., Zumkeller, M. Ve Rentz, O., Modeling
Reverse logistic tasks within closed-loop supply chains:
an example from the automotive industry, European
Journal of Operational Research, 171, 1033–1050, 2006.
Sellitto, Miguel Afonso, et al.. "A SCOR-based model for
supply chain performance measurement: application in
the footwear industry." International Journal of
Production Research 53.16 (2015): 4917-4926.
Shafiee, Morteza, and N. Shams-e-Alam. "Supply chain
performance evaluation with rough data envelopment
analysis." 2010 International Conference on Business
and Economics Research. Vol. 1. 2011.
Shaik, Mohammed Najeeb, and Walid Abdul-Kader.
"Comprehensive performance measurement and causal-
effect decision making model for reverse logistics
enterprise." Computers & Industrial Engineering 68
(2014): 87-103.
Shakourloo A. Vd., A New Model For More Effective
Supplier Selection And Remanufacturing Process İn A
Closed-Loop Supply Chain, Applied Mathematical
Modelling 40, 9914–9931, 2016.
Shepherd, Craig, and Hannes Günter. "Measuring supply
chain performance: current research and future
directions." Behavioral Operations in Planning and
Scheduling. Springer, Berlin, Heidelberg, 2010. 105-121.
Sheu, J.B., Chou, Y.H. and Hu, C.C., An Integrated
logistics operational model for green supply chain
management, Transportation Research Part E, 41 (4),
287–313, 2005.
Shi, Wenli, and Tianbao Gao. "Supply Chain
Performance Evaluation Model Based on Unascertained
Clustering." Rev. Téc. Ing. Univ. Zulia. Vol. 39, Nº 6,
195- 201, 2016.
Sillanpää, Ilkka. "Empirical study of measuring supply
chain performance." Benchmarking: An International
Journal 22.2 (2015): 290-308.
Stock, James R., and Jay P. Mulki. "Product returns
processing: an examination of practices of manufacturers,
wholesalers/distributors, and retailers." Journal of
business logistics 30.1 (2009): 33-62.
Şen, E., Kobilerin Uluslararası Rekabet Güçlerini
Artırmada Tedarik Zinciri Yönetiminin Önemi”, İGEME
Yayınları, Ankara, 1-56, 2006.
Talbot, S., Lefebvre, E., & Lefebvre, L. A. Closed-Loop
supply chain activities and derived benefits in
manufacturing SMES. Journal Of Manufacturing
Technology Management, 18(6), 627–658, 2007.
Tao, Xiaoyan. "Performance evaluation of supply chain
based on fuzzy matter-element theory." Information
Management, Innovation Management and Industrial

Turkish Journal of Engineering (TUJE)
Vol. 3, Issue 4, pp. 157-167, October 2019
167
Engineering, 2009 International Conference on. Vol. 1.
IEEE, 2009.
Thierry, M., Salomon, M. And Van Wassenhove L.,
Strategic Issues in Product Recovery Management,
California Management Review, 37 (2), 114–135, 1995.
Tonanont, Ake. Performance evaluation in reverse
logistics with data envelopment analysis. Diss. Thesis for
Degree of PhD, Faculty of the Graduate School,
University of Texas at Arlington, 2009.
Tsao Vd., Closed-Loop Supply Chain Network Designs
Considering RFID Adoption, Computers & Industrial
Engineering Xxx, Xxx–Xxx, 2016.
Van Hoek, Remko I. "“Measuring the unmeasurable”-
measuring and improving performance in the supply
chain." Supply Chain Management: An International
Journal 3.4 (1998): 187-192.
Van Nunen, J.A.E.E. And Zuidwijk, R.A., E-Enabled
Closed-Loop Supply Chains, California Management
Review, 46 (2), 40–53, 2004.
Vishwa, V.K. Chan, F.T.S., Mishra, N. And Kumar, V.,
Environmental İntegrated Closed Loop Logistics Model:
An Artificial Bee Colony Approach, 8th International
Conference On Supply Chain Management And
Information Systems, 1–7, 2010.
Wang, Jui-Chi, and H. Wu. "Corporate performance
efficiency investigated by data envelopment analysis and
balanced scorecard." The Journal of American Academy
of Business 9.2 (2006): 312-318.
Xu, Jiuping, Bin Li, and Desheng Wu. "Rough data
envelopment analysis and its application to supply chain
performance evaluation." International Journal of
Production Economics 122.2 (2009): 628-638.
Yang, Jianhua, Lidong Zang, and Zhangang Hao. "Study
on the performance evaluation system of reverse supply
chain based on BSC and triangular fuzzy number
AHP." Information Engineering and Computer Science,
2009. ICIECS 2009. International Conference on. IEEE,
2009.
Yang, Jianhua. "On the construction and implementation
methods for performance measurement of reverse supply
chain." Fuzzy Systems and Knowledge Discovery
(FSKD), 2010 Seventh International Conference on. Vol.
2. IEEE, 2010.
Yavuz O., Ersoy A., Tedarik zinciri performansının
değerlendirilmesinde kullanılan değişkenlerin yapay sinir
ağı yöntemiyle değerlendirilmesi, Gazi Üniversitesi
İktisadi ve İdari Bilimler Fakültesi Dergisi 15 /2, 209-
256, 2013.
Yellepeddi, S. S., S. Rajagopalan, and D. H. Liles. "A
balanced scorecard approach for an effective reverse
supply chain in electronics industry." Proceedings of the
Annual Conference of International Journal of Industrial
Engineering, Clearwater, Florida, USA, December.
2005.
Yellepeddi, Srikanth. "An Analytical Network Process
(ANP) approach for the development of a reverse supply
chain performance index in consumer electronics
industry." Faculty of the Graduate School of the
University of Texas at Arlington in Partial Fulfillment of
the Requirements for the Degree of Doctor of Philosophy,
The University of Texas at Arlington (2006).
Yeong-Dong Hwang, Yi-Ching Lin, and Jung Lyu Jr.
"The performance evaluation of SCOR sourcing
process—The case study of Taiwan's TFT-LCD
industry." International Journal of Production
Economics 115.2 (2008): 411-423.
Zerenler, M. Performans ölçüm sistemleri tasarımı ve
üretim sistemlerinin performansının ölçümüne yönelik
bir araştırma. Ekon. ve Sos. Araştırmalar Dergisi, 1: 1-36,
2005.
Zhu, Jiulong. "Notice of Retraction Evaluation of supply
chain performance based on BP neural
network." Computer Engineering and Technology
(ICCET), 2010 2nd International Conference on. Vol. 1.
IEEE, 2010.
Turkish Journal of Engineering
168
Turkish Journal of Engineering (TUJE)
Vol. 3, Issue 4, pp. 168-178, October 2019
ISSN 2587-1366, Turkey
DOI: 10.31127/tuje.554417
Research Article
AUTOMATIC DETECTION OF CYBERBULLYING IN FORMSPRING.ME,
MYSPACE AND YOUTUBE SOCIAL NETWORKS
Çiğdem İnan Acı *1, Eren Çürük 2 and Esra Saraç Eşsiz 3
1 Department of Computer Engineering, Mersin University, 33340, Mersin, Turkey
ORCID ID 0000-0002-0028-9890
2 Department of Electrical-Electronics Engineering, Mersin University, 33340, Mersin, Turkey
ORCID ID 0000-0002-4631-7834
3 Department of Computer Engineering, Adana Alparslan Türkeş Science and Technology University, 01250, Adana,
Turkey
ORCID ID 0000-0002-2503-0084
* Corresponding Author
Received: 16/04/2019 Accepted: 03/05/2019
ABSTRACT
Cyberbullying has become a major problem along with the increase of communication technologies and social media
become part of daily life. Cyberbullying is the use of communication tools to harass or harm a person or group. Especially
for the adolescent age group, cyberbullying causes damage that is thought to be suicidal and poses a great risk. In this study,
a model is developed to identify the cyberbullying actions that took place in social networks. The model investigates the
effects of some text mining methods such as pre-processing, feature extraction, feature selection and classification on
automatic detection of cyberbullying using datasets obtained from Formspring.me, Myspace and YouTube social network
platforms. Different classifiers (i.e. multilayer perceptron (MLP), stochastic gradient descent (SGD), logistic regression
and radial basis function) have been developed and the effects of feature selection algorithms (i.e. Chi2, support vector
machine-recursive feature elimination (SVM-RFE), minimum redundancy maximum relevance and ReliefF) for
cyberbullying detection have also been investigated. The experimental results of the study proved that SGD and MLP
classifiers with 500 selected features using SVM-RFE algorithm showed the best results (F_measure value is more than
0.930) by means of classification time and accuracy.
Keywords: Cyberbullying, Automatic Detection, Social Networks, Feature Selection, Classification.
Turkish Journal of Engineering (TUJE)
Vol. 3, Issue 4, pp. 168-178, October 2019
169
1. INTRODUCTION
Traditional bullying is defined as aggressive acts that
repeatedly occur between individuals with power
imbalances that cause harm or distress. Cyberbullying is
defined as deliberate and continuous actions that are
aggressive towards vulnerable people by using many
electronic methods such as internet, e-mail, blog, text and
social media message (Snakenborg et al., 2011).
Traditional bullying and cyberbullying have similarities,
such as power imbalance among individuals,
aggressiveness, and the introduction of negative actions.
In a study conducted in 2012, the researcher has identified
two different types of cyberbullying, as indirect and direct
(Langos, 2012). While direct cyberbullying is the only act
between the victim and attacker who performs the action,
in the indirect cyberbullying, the attacker uses many
electronic media to carry action into platforms that can be
accessed by more and more people. In addition to these
types of actions, cyberbullying actions that may be of
different types are still being investigated by researchers
(Kowalski et al., 2019). Cyberbullying actions are
different in content and contain many features. However,
in general, the most common cyberbullying activities
include sexuality, gender differences, disability, racism,
terrorism, personal character, belief, behavior, external
appearance, and weight. The realization of cyberbullying
acts, to be able to hide the identity in cyberspace, can be
expressed as the key to cyberbullying. Thus, the
individuals who cannot make any bullying in real life can
turn into cyberbullies (Poland, 2010).
Cyberbullying is carried out in different species
depending on the aggressors of attackers and the gender
and age of the victim. It has been found that the social-
emotional consequences of cyber victimization are
comparable to the victimization of traditional bullying
(Diamanduros et al., 2008). Initial research has shown
that exposure to cyberbullying can negatively affect
physical and social development. It can also lead to
psychological, emotional and academic problems
(Hinduja et al., 2008; Li, 2005; Wolak et al., 2007;
Ybarra et al., 2007). In addition, it has been observed that
victims of cyberbullying were adversely affected by
violence, loneliness, suicidal tendencies (Andreou, 2004).
The work done so far, they show that cyberbullying is
increasingly occurring and that it causes many negative
effects. Therefore, it is necessary to take some
precautions to detect and prevent cyberbullying. So the
first and most important part of the fight against
cyberbullying is the reporting of cyber action. Informing
should be done after reporting and detection. In this
process, the information of both the victim and the
attacker should be shared by informing the official units
and internet service providers first. However, reporting
gives us information about only bullying acts, and we
cannot prevent action. This means that the situation
requires online software to automatically detect and
prevent cyberbullying.
In this study, automatic detection of cyberbullying
was performed on datasets obtained from YouTube,
Formspring.me and Myspace social network platforms. A
method consisting of four main steps has been identified
and implemented on the datasets. First, upper/lower-case
conversion, stemming and stopwords removal were used
for pre-processing. In the second step, feature extraction
was performed and the performances of Multilayer
Perceptron (MLP), Stochastic Gradient Descent (SGD),
Logistic Regression (LR) and Radial Basis Function
(RBF) classifiers were measured using the obtained
features. Then, the performances of classifiers are tested
using Chi2, Support Vector Machine-Recursive Feature
Elimination (SVM-RFE), Minimum Redundancy
Maximum Relevance (MRMR) and ReliefF feature
selection algorithms to reduce classification time. The
best results are achieved by an SVM-RFE algorithm using
the selected 500 features. The performance criteria (i.e.
F_measure) for test data classification is 0.953, 0.911 and
0.988 for YouTube, Formspring.me and Myspace
datasets respectively. In addition, classification durations
after applying feature selection algorithms were reduced
by 20 times for YouTube, 2.5 times for Formspring.me
and 10 times for Myspace datasets.
The remainder of this article follows as Section 2
presents related work on cyberbullying detection. Section
3 gives the details of materials and methods used to detect
cyberbullying. Section 4 describes the comparison of the
results obtained from experimental studies. Section 5
concludes the study.
2. RELATED WORK
In recent years, a number of studies have been
performed for the analysis of cyberbullying detection.
When some of these studies are examined, it is seen that
classifiers like SVM, k Nearest Neighbours (kNN), Naïve
Bayes (NB), J48 decision tree were used frequently
(Dadvar and Jong, 2012a; Dinakar et al., 2011; Eşsiz,
2016; Kontostathis, 2009; Ozel et al., 2017).
Noviantho and Ashianti (2017) compared the
performances of SVM and NB classifiers as a
classification method for cyberbullying detection.
Average accuracy of 92.81% was measured for the NB
classifier while the SVM had 97.11% accuracy on
average in the study conducted. In other steps of the study,
the performances of the kNN and J48 decision tree
methods were also measured and the best values were
obtained as a result of the classification with SVM
classifier.
Different labeling and weighting methods are used in
addition to cyberbullying detection and text mining
classification methods. N-gram method was used for
labeling and term frequency * inverse document
frequency (tf * idf) method was used for weighting by Yin
et al. (2009). A supervised machine learning approach
was applied, YouTube comments were collected,
manually tagged, and binaries and multi-class
classifications were applied on three different topics:
sexuality, physical appearance, intelligence, and
perception by Dinakar et al. (2011). In the test results,
80.2% accuracy was achieved in binary classifications
and 66.7% accuracy in multi-class tests. In a study
conducted at the Massachusetts Institute of Technology,
a system has been developed that performs cyberbullying
detection in textual contexts from YouTube video
comments. The system defines the interpretation as a
sequence of classes in sensitive subjects such as sexuality,
culture, intelligence, and physical characteristics, and
identifies which interpretation belongs to which class
(Dadvar et al., 2012b). In a study of the basic text mining
system using the bad-of-word approach, an accuracy of
61.9% was achieved in a model that was developed by
developing emotional and contextual features (Yin et al.,
Turkish Journal of Engineering (TUJE)
Vol. 3, Issue 4, pp. 168-178, October 2019
170
2009). Bullying traces were defined using a variety of
natural language processing techniques by Dadvar and
Jong (2012a). Online and offline cyberbullying patterns
were examined and emotion analysis system and secret
Dirichlet discrimination methods were used to determine
the type of bullying. In this method, bullying patterns
were not correctly detected.
Cyberbullying has recently been recognized as a
serious health problem among online social network users
and has an enormous influence in developing an effective
perception model. In order to increase the accuracy of the
cyberbullying detection studies and to obtain faster
methods, feature selection methods are used in the
detection of cyberbullying. By Algaradi et al. (2016), a
set of attributes based on the content of the network,
activity, user, and tweet produced from Twitter data is
proposed for feature selection. A supervised machine
learning method has been developed to detect cybercrime
on Twitter and three different feature selection algorithms,
Chi2 test, information gain, and Pearson correlation, have
been used. As a result of the experiments, a F_measure
value of 0.936 was reached in the model developed based
on the proposed features. These results show that the
proposed model provides a suitable solution for detecting
cyberbullying in online communication environments.
An effective approach to identify cyberbullying messages
from social media by weighting the feature selection was
proposed by Nahar et al. (2012). Datasets contain data
collected from three different social networks:
Kongregate, Slashdot, and MySpace. The weighted tf *
idf scheme is used on bullying contained attributes. The
number of bad words is scaled by two factors. LibSVM
has been applied to the classification problem of two
classes. For the MySpace dataset, 0.31 and 0.92
F_measure values were obtained for the basic and
weighted tf * idf approximations. In another study
conducted in this area, the Ant Colony Optimization
algorithm was used in selecting subsets of attributes.
Formspring.me, YouTube, MySpace and Twitter datasets
by combining a novel method is proposed by Eşsiz (2016).
In the experimental results, it is observed that the
proposed method gives better results than the classical
feature selection methods such as information gain and
Chi2.
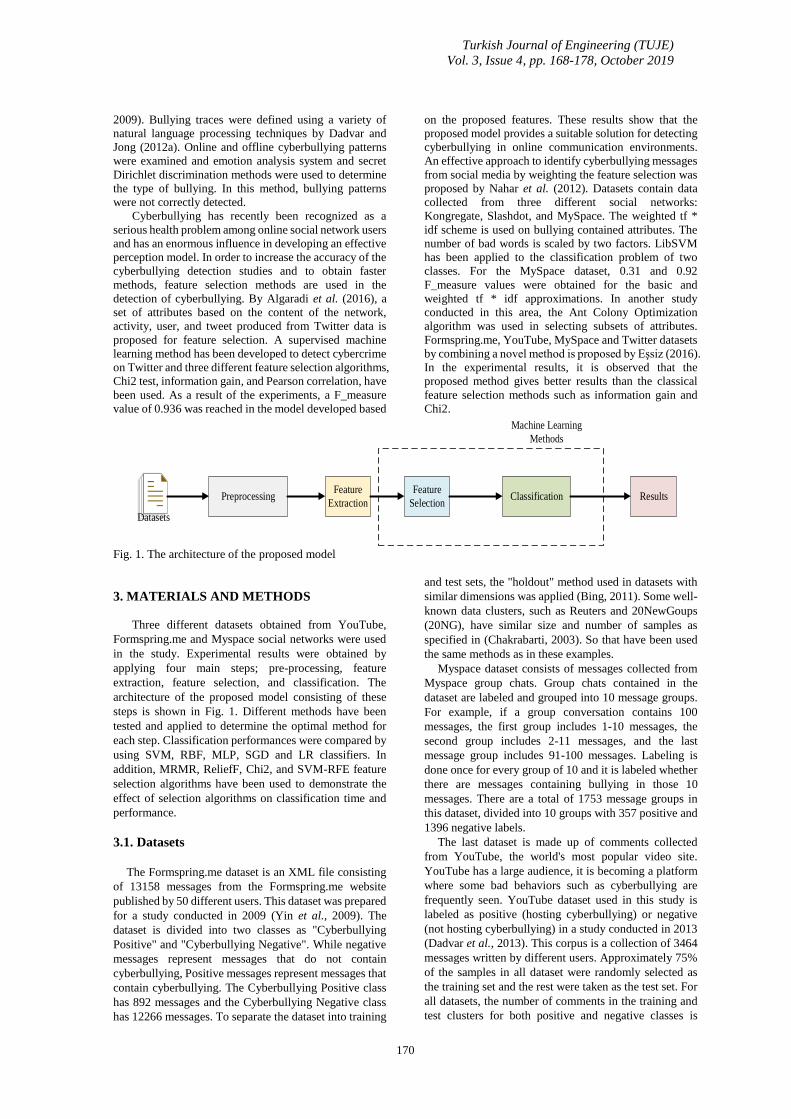
Fig. 1. The architecture of the proposed model
3. MATERIALS AND METHODS
Three different datasets obtained from YouTube,
Formspring.me and Myspace social networks were used
in the study. Experimental results were obtained by
applying four main steps; pre-processing, feature
extraction, feature selection, and classification. The
architecture of the proposed model consisting of these
steps is shown in Fig. 1. Different methods have been
tested and applied to determine the optimal method for
each step. Classification performances were compared by
using SVM, RBF, MLP, SGD and LR classifiers. In
addition, MRMR, ReliefF, Chi2, and SVM-RFE feature
selection algorithms have been used to demonstrate the
effect of selection algorithms on classification time and
performance.
3.1. Datasets
The Formspring.me dataset is an XML file consisting
of 13158 messages from the Formspring.me website
published by 50 different users. This dataset was prepared
for a study conducted in 2009 (Yin et al., 2009). The
dataset is divided into two classes as "Cyberbullying
Positive" and "Cyberbullying Negative". While negative
messages represent messages that do not contain
cyberbullying, Positive messages represent messages that
contain cyberbullying. The Cyberbullying Positive class
has 892 messages and the Cyberbullying Negative class
has 12266 messages. To separate the dataset into training
and test sets, the "holdout" method used in datasets with
similar dimensions was applied (Bing, 2011). Some well-
known data clusters, such as Reuters and 20NewGoups
(20NG), have similar size and number of samples as
specified in (Chakrabarti, 2003). So that have been used
the same methods as in these examples.
Myspace dataset consists of messages collected from
Myspace group chats. Group chats contained in the
dataset are labeled and grouped into 10 message groups.
For example, if a group conversation contains 100
messages, the first group includes 1-10 messages, the
second group includes 2-11 messages, and the last
message group includes 91-100 messages. Labeling is
done once for every group of 10 and it is labeled whether
there are messages containing bullying in those 10
messages. There are a total of 1753 message groups in
this dataset, divided into 10 groups with 357 positive and
1396 negative labels.
The last dataset is made up of comments collected
from YouTube, the world's most popular video site.
YouTube has a large audience, it is becoming a platform
where some bad behaviors such as cyberbullying are
frequently seen. YouTube dataset used in this study is
labeled as positive (hosting cyberbullying) or negative
(not hosting cyberbullying) in a study conducted in 2013
(Dadvar et al., 2013). This corpus is a collection of 3464
messages written by different users. Approximately 75%
of the samples in all dataset were randomly selected as
the training set and the rest were taken as the test set. For
all datasets, the number of comments in the training and
test clusters for both positive and negative classes is
PreprocessingFeature
Extraction
Feature
SelectionClassification Results
Datasets
Machine Learning
Methods
Turkish Journal of Engineering (TUJE)
Vol. 3, Issue 4, pp. 168-178, October 2019
171
presented in Table 1.
Table 1. The number of training and test messages of
datasets
Dataset Label Training Test
Formspring.me Positive 669 223
Negative 9199 3067
Myspace Positive 267 90
Negative 1047 349
YouTube Positive 312 105
Negative 2285 762
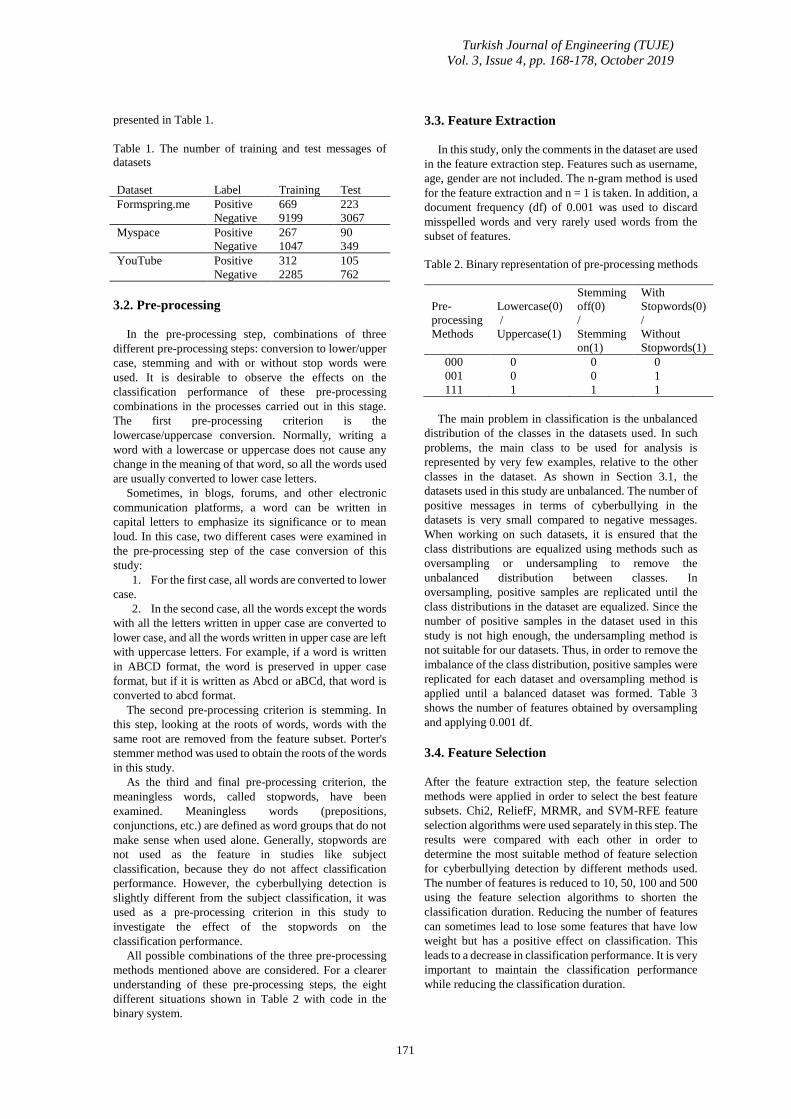
3.2. Pre-processing
In the pre-processing step, combinations of three
different pre-processing steps: conversion to lower/upper
case, stemming and with or without stop words were
used. It is desirable to observe the effects on the
classification performance of these pre-processing
combinations in the processes carried out in this stage.
The first pre-processing criterion is the
lowercase/uppercase conversion. Normally, writing a
word with a lowercase or uppercase does not cause any
change in the meaning of that word, so all the words used
are usually converted to lower case letters.
Sometimes, in blogs, forums, and other electronic
communication platforms, a word can be written in
capital letters to emphasize its significance or to mean
loud. In this case, two different cases were examined in
the pre-processing step of the case conversion of this
study:
1. For the first case, all words are converted to lower
case.
2. In the second case, all the words except the words
with all the letters written in upper case are converted to
lower case, and all the words written in upper case are left
with uppercase letters. For example, if a word is written
in ABCD format, the word is preserved in upper case
format, but if it is written as Abcd or aBCd, that word is
converted to abcd format.
The second pre-processing criterion is stemming. In
this step, looking at the roots of words, words with the
same root are removed from the feature subset. Porter's
stemmer method was used to obtain the roots of the words
in this study.
As the third and final pre-processing criterion, the
meaningless words, called stopwords, have been
examined. Meaningless words (prepositions,
conjunctions, etc.) are defined as word groups that do not
make sense when used alone. Generally, stopwords are
not used as the feature in studies like subject
classification, because they do not affect classification
performance. However, the cyberbullying detection is
slightly different from the subject classification, it was
used as a pre-processing criterion in this study to
investigate the effect of the stopwords on the
classification performance.
All possible combinations of the three pre-processing
methods mentioned above are considered. For a clearer
understanding of these pre-processing steps, the eight
different situations shown in Table 2 with code in the
binary system.
3.3. Feature Extraction
In this study, only the comments in the dataset are used
in the feature extraction step. Features such as username,
age, gender are not included. The n-gram method is used
for the feature extraction and n = 1 is taken. In addition, a
document frequency (df) of 0.001 was used to discard
misspelled words and very rarely used words from the
subset of features.
Table 2. Binary representation of pre-processing methods
Pre-
processing
Methods
Lowercase(0)
/
Uppercase(1)
Stemming
off(0)
/
Stemming
on(1)
With
Stopwords(0)
/
Without
Stopwords(1)
000 0 0 0
001 0 0 1
…
…
…
…
111 1 1 1
The main problem in classification is the unbalanced
distribution of the classes in the datasets used. In such
problems, the main class to be used for analysis is
represented by very few examples, relative to the other
classes in the dataset. As shown in Section 3.1, the
datasets used in this study are unbalanced. The number of
positive messages in terms of cyberbullying in the
datasets is very small compared to negative messages.
When working on such datasets, it is ensured that the
class distributions are equalized using methods such as
oversampling or undersampling to remove the
unbalanced distribution between classes. In
oversampling, positive samples are replicated until the
class distributions in the dataset are equalized. Since the
number of positive samples in the dataset used in this
study is not high enough, the undersampling method is
not suitable for our datasets. Thus, in order to remove the
imbalance of the class distribution, positive samples were
replicated for each dataset and oversampling method is
applied until a balanced dataset was formed. Table 3
shows the number of features obtained by oversampling
and applying 0.001 df.
3.4. Feature Selection
After the feature extraction step, the feature selection
methods were applied in order to select the best feature
subsets. Chi2, ReliefF, MRMR, and SVM-RFE feature
selection algorithms were used separately in this step. The
results were compared with each other in order to
determine the most suitable method of feature selection
for cyberbullying detection by different methods used.
The number of features is reduced to 10, 50, 100 and 500
using the feature selection algorithms to shorten the
classification duration. Reducing the number of features
can sometimes lead to lose some features that have low
weight but has a positive effect on classification. This
leads to a decrease in classification performance. It is very
important to maintain the classification performance
while reducing the classification duration.
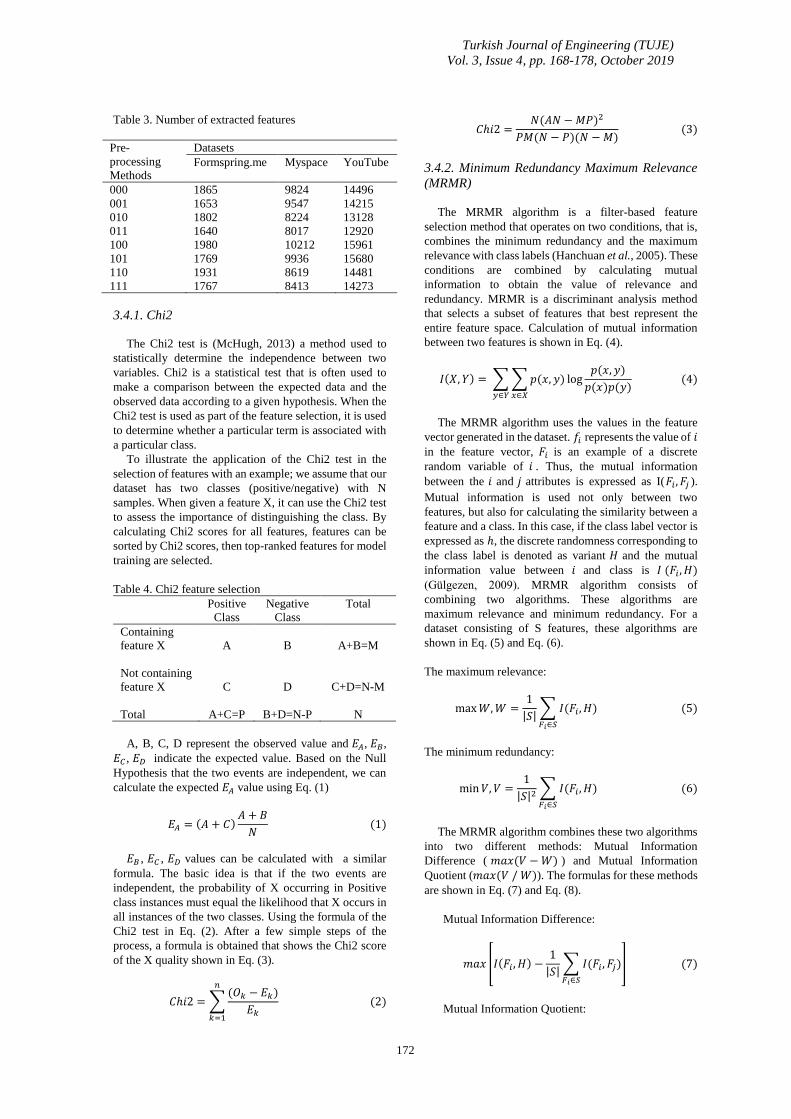
Turkish Journal of Engineering (TUJE)
Vol. 3, Issue 4, pp. 168-178, October 2019
172
Table 3. Number of extracted features
Pre-
processing
Methods
Datasets
Formspring.me Myspace YouTube
000 1865 9824 14496
001 1653 9547 14215
010 1802 8224 13128
011 1640 8017 12920
100 1980 10212 15961
101 1769 9936 15680
110 1931 8619 14481
111 1767 8413 14273
3.4.1. Chi2
The Chi2 test is (McHugh, 2013) a method used to
statistically determine the independence between two
variables. Chi2 is a statistical test that is often used to
make a comparison between the expected data and the
observed data according to a given hypothesis. When the
Chi2 test is used as part of the feature selection, it is used
to determine whether a particular term is associated with
a particular class.
To illustrate the application of the Chi2 test in the
selection of features with an example; we assume that our
dataset has two classes (positive/negative) with N
samples. When given a feature X, it can use the Chi2 test
to assess the importance of distinguishing the class. By
calculating Chi2 scores for all features, features can be
sorted by Chi2 scores, then top-ranked features for model
training are selected.
Table 4. Chi2 feature selection
Positive
Class
Negative
Class
Total
Containing
feature X
A B A+B=M
Not containing
feature X
C D C+D=N-M
Total A+C=P B+D=N-P N
A, B, C, D represent the observed value and 𝐸𝐴, 𝐸𝐵,
𝐸𝐶 , 𝐸𝐷 indicate the expected value. Based on the Null
Hypothesis that the two events are independent, we can
calculate the expected 𝐸𝐴 value using Eq. (1)
𝐸𝐴 = (𝐴 + 𝐶)𝐴 + 𝐵
𝑁 (1)
𝐸𝐵 , 𝐸𝐶 , 𝐸𝐷 values can be calculated with a similar
formula. The basic idea is that if the two events are
independent, the probability of X occurring in Positive
class instances must equal the likelihood that X occurs in
all instances of the two classes. Using the formula of the
Chi2 test in Eq. (2). After a few simple steps of the
process, a formula is obtained that shows the Chi2 score
of the X quality shown in Eq. (3).
𝐶ℎ𝑖2 = ∑(𝑂𝑘 − 𝐸𝑘)
𝐸𝑘
𝑛
𝑘=1
(2)
𝐶ℎ𝑖2 =𝑁(𝐴𝑁 − 𝑀𝑃)2
𝑃𝑀(𝑁 − 𝑃)(𝑁 − 𝑀) (3)
3.4.2. Minimum Redundancy Maximum Relevance
(MRMR)
The MRMR algorithm is a filter-based feature
selection method that operates on two conditions, that is,
combines the minimum redundancy and the maximum
relevance with class labels (Hanchuan et al., 2005). These
conditions are combined by calculating mutual
information to obtain the value of relevance and
redundancy. MRMR is a discriminant analysis method
that selects a subset of features that best represent the
entire feature space. Calculation of mutual information
between two features is shown in Eq. (4).
𝐼(𝑋, 𝑌) = ∑ ∑ 𝑝(𝑥, 𝑦) log𝑝(𝑥, 𝑦)
𝑝(𝑥)𝑝(𝑦)𝑥∈𝑋𝑦∈𝑌
(4)
The MRMR algorithm uses the values in the feature
vector generated in the dataset. 𝑓𝑖 represents the value of 𝑖 in the feature vector, 𝐹𝑖 is an example of a discrete
random variable of 𝑖 . Thus, the mutual information
between the 𝑖 and 𝑗 attributes is expressed as I(𝐹𝑖 , 𝐹𝑗 ).
Mutual information is used not only between two
features, but also for calculating the similarity between a
feature and a class. In this case, if the class label vector is
expressed as ℎ, the discrete randomness corresponding to
the class label is denoted as variant 𝐻 and the mutual
information value between 𝑖 and class is 𝐼 (𝐹𝑖 , 𝐻)
(Gülgezen, 2009). MRMR algorithm consists of
combining two algorithms. These algorithms are
maximum relevance and minimum redundancy. For a
dataset consisting of S features, these algorithms are
shown in Eq. (5) and Eq. (6).
The maximum relevance:
max 𝑊, 𝑊 =1
|𝑆|∑ 𝐼(𝐹𝑖 , 𝐻)
𝐹𝑖∈𝑆
(5)
The minimum redundancy:
min 𝑉, 𝑉 =1
|𝑆|2 ∑ 𝐼(𝐹𝑖 , 𝐻)
𝐹𝑖∈𝑆
(6)
The MRMR algorithm combines these two algorithms
into two different methods: Mutual Information
Difference ( 𝑚𝑎𝑥(𝑉 − 𝑊) ) and Mutual Information
Quotient (𝑚𝑎𝑥(𝑉 / 𝑊)). The formulas for these methods
are shown in Eq. (7) and Eq. (8).
Mutual Information Difference:
𝑚𝑎𝑥 [𝐼(𝐹𝑖 , 𝐻) −1
|𝑆|∑ 𝐼(𝐹𝑖 , 𝐹𝑗)
𝐹𝑖∈𝑆
] (7)
Mutual Information Quotient:
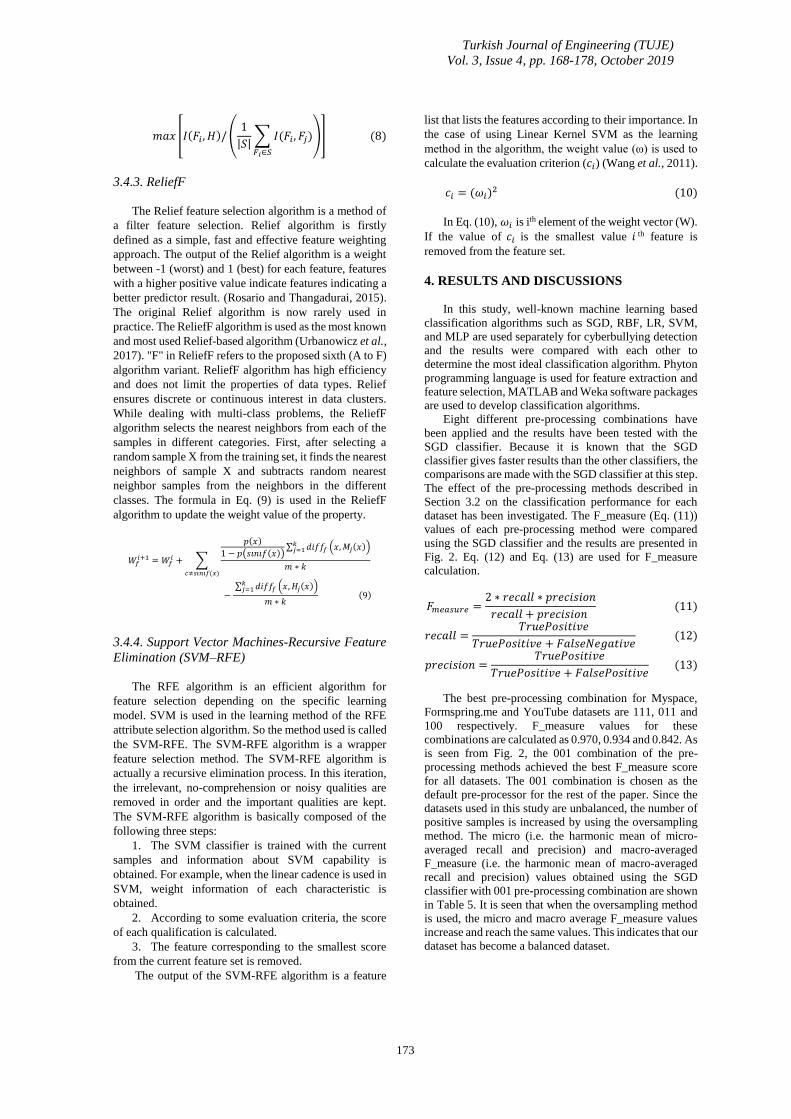
Turkish Journal of Engineering (TUJE)
Vol. 3, Issue 4, pp. 168-178, October 2019
173
𝑚𝑎𝑥 [𝐼(𝐹𝑖 , 𝐻)/ (1
|𝑆|∑ 𝐼(𝐹𝑖 , 𝐹𝑗)
𝐹𝑖∈𝑆
)] (8)
3.4.3. ReliefF
The Relief feature selection algorithm is a method of
a filter feature selection. Relief algorithm is firstly
defined as a simple, fast and effective feature weighting
approach. The output of the Relief algorithm is a weight
between -1 (worst) and 1 (best) for each feature, features
with a higher positive value indicate features indicating a
better predictor result. (Rosario and Thangadurai, 2015).
The original Relief algorithm is now rarely used in
practice. The ReliefF algorithm is used as the most known
and most used Relief-based algorithm (Urbanowicz et al.,
2017). "F" in ReliefF refers to the proposed sixth (A to F)
algorithm variant. ReliefF algorithm has high efficiency
and does not limit the properties of data types. Relief
ensures discrete or continuous interest in data clusters.
While dealing with multi-class problems, the ReliefF
algorithm selects the nearest neighbors from each of the
samples in different categories. First, after selecting a
random sample X from the training set, it finds the nearest
neighbors of sample X and subtracts random nearest
neighbor samples from the neighbors in the different
classes. The formula in Eq. (9) is used in the ReliefF
algorithm to update the weight value of the property.
𝑊𝑓𝑖+1 = 𝑊𝑓
𝑖 + ∑
𝑝(𝑥)
1 − 𝑝(𝑠𝚤𝑛𝚤𝑓(𝑥))∑ 𝑑𝑖𝑓𝑓𝑓 (𝑥, 𝑀𝑗(𝑥))𝑘
𝑗=1
𝑚 ∗ 𝑘𝑐≠𝑠𝚤𝑛𝚤𝑓(𝑥)
− ∑ 𝑑𝑖𝑓𝑓𝑓 (𝑥, 𝐻𝑗(𝑥))𝑘
𝑗=1
𝑚 ∗ 𝑘 (9)
3.4.4. Support Vector Machines-Recursive Feature
Elimination (SVM–RFE)
The RFE algorithm is an efficient algorithm for
feature selection depending on the specific learning
model. SVM is used in the learning method of the RFE
attribute selection algorithm. So the method used is called
the SVM-RFE. The SVM-RFE algorithm is a wrapper
feature selection method. The SVM-RFE algorithm is
actually a recursive elimination process. In this iteration,
the irrelevant, no-comprehension or noisy qualities are
removed in order and the important qualities are kept.
The SVM-RFE algorithm is basically composed of the
following three steps:
1. The SVM classifier is trained with the current
samples and information about SVM capability is
obtained. For example, when the linear cadence is used in
SVM, weight information of each characteristic is
obtained.
2. According to some evaluation criteria, the score
of each qualification is calculated.
3. The feature corresponding to the smallest score
from the current feature set is removed.
The output of the SVM-RFE algorithm is a feature
list that lists the features according to their importance. In
the case of using Linear Kernel SVM as the learning
method in the algorithm, the weight value (ω) is used to
calculate the evaluation criterion (𝑐𝑖) (Wang et al., 2011).
𝑐𝑖 = (𝜔𝑖)2 (10)
In Eq. (10), 𝜔𝑖 is ith element of the weight vector (W).
If the value of 𝑐𝑖 is the smallest value 𝑖 th feature is
removed from the feature set.
4. RESULTS AND DISCUSSIONS
In this study, well-known machine learning based
classification algorithms such as SGD, RBF, LR, SVM,
and MLP are used separately for cyberbullying detection
and the results were compared with each other to
determine the most ideal classification algorithm. Phyton
programming language is used for feature extraction and
feature selection, MATLAB and Weka software packages
are used to develop classification algorithms.
Eight different pre-processing combinations have
been applied and the results have been tested with the
SGD classifier. Because it is known that the SGD
classifier gives faster results than the other classifiers, the
comparisons are made with the SGD classifier at this step.
The effect of the pre-processing methods described in
Section 3.2 on the classification performance for each
dataset has been investigated. The F_measure (Eq. (11))
values of each pre-processing method were compared
using the SGD classifier and the results are presented in
Fig. 2. Eq. (12) and Eq. (13) are used for F_measure
calculation.
𝐹𝑚𝑒𝑎𝑠𝑢𝑟𝑒 =2 ∗ 𝑟𝑒𝑐𝑎𝑙𝑙 ∗ 𝑝𝑟𝑒𝑐𝑖𝑠𝑖𝑜𝑛
𝑟𝑒𝑐𝑎𝑙𝑙 + 𝑝𝑟𝑒𝑐𝑖𝑠𝑖𝑜𝑛 (11)
𝑟𝑒𝑐𝑎𝑙𝑙 =𝑇𝑟𝑢𝑒𝑃𝑜𝑠𝑖𝑡𝑖𝑣𝑒
𝑇𝑟𝑢𝑒𝑃𝑜𝑠𝑖𝑡𝑖𝑣𝑒 + 𝐹𝑎𝑙𝑠𝑒𝑁𝑒𝑔𝑎𝑡𝑖𝑣𝑒 (12)
𝑝𝑟𝑒𝑐𝑖𝑠𝑖𝑜𝑛 =𝑇𝑟𝑢𝑒𝑃𝑜𝑠𝑖𝑡𝑖𝑣𝑒
𝑇𝑟𝑢𝑒𝑃𝑜𝑠𝑖𝑡𝑖𝑣𝑒 + 𝐹𝑎𝑙𝑠𝑒𝑃𝑜𝑠𝑖𝑡𝑖𝑣𝑒 (13)
The best pre-processing combination for Myspace,
Formspring.me and YouTube datasets are 111, 011 and
100 respectively. F_measure values for these
combinations are calculated as 0.970, 0.934 and 0.842. As
is seen from Fig. 2, the 001 combination of the pre-
processing methods achieved the best F_measure score
for all datasets. The 001 combination is chosen as the
default pre-processor for the rest of the paper. Since the
datasets used in this study are unbalanced, the number of
positive samples is increased by using the oversampling
method. The micro (i.e. the harmonic mean of micro-
averaged recall and precision) and macro-averaged
F_measure (i.e. the harmonic mean of macro-averaged
recall and precision) values obtained using the SGD
classifier with 001 pre-processing combination are shown
in Table 5. It is seen that when the oversampling method
is used, the micro and macro average F_measure values
increase and reach the same values. This indicates that our
dataset has become a balanced dataset.
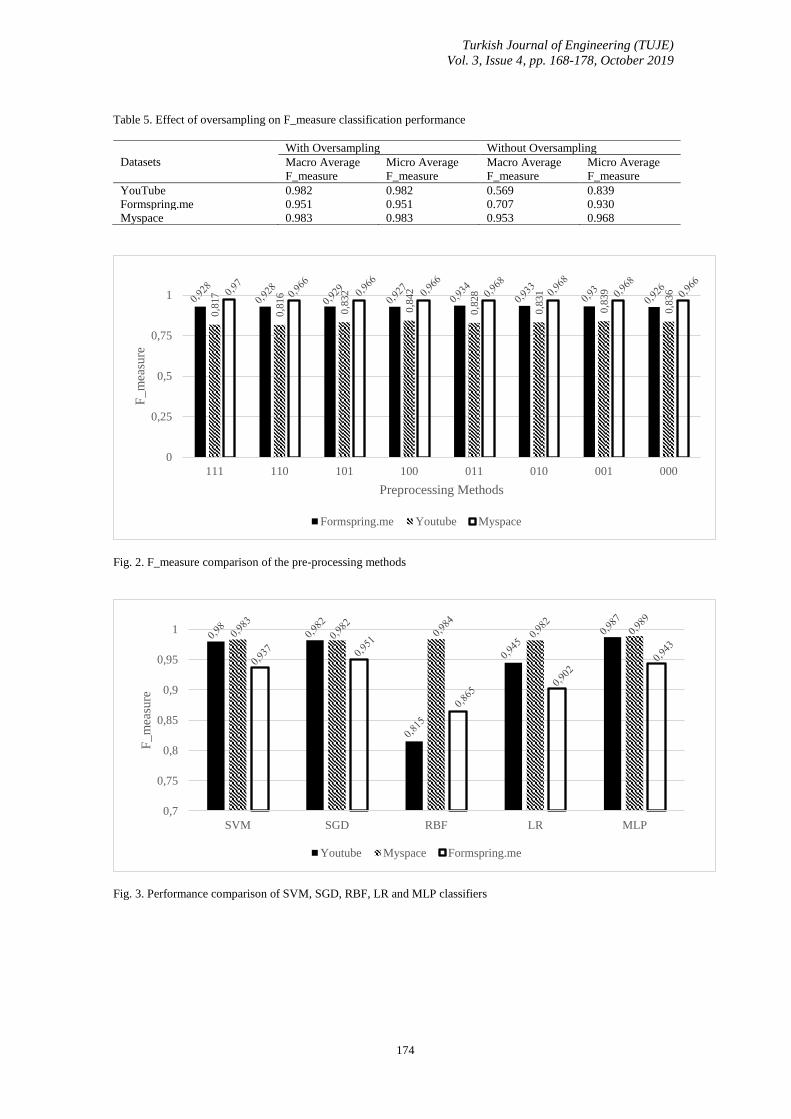
Turkish Journal of Engineering (TUJE)
Vol. 3, Issue 4, pp. 168-178, October 2019
174
Table 5. Effect of oversampling on F_measure classification performance
Fig. 2. F_measure comparison of the pre-processing methods
Fig. 3. Performance comparison of SVM, SGD, RBF, LR and MLP classifiers
0,8
17
0,8
16
0,8
32
0,8
42
0,8
28
0,8
31
0,8
39
0,8
36
0
0,25
0,5
0,75
1
111 110 101 100 011 010 001 000
F_
mea
sure
Preprocessing Methods
Formspring.me Youtube Myspace
0,7
0,75
0,8
0,85
0,9
0,95
1
SVM SGD RBF LR MLP
F_
mea
sure
Youtube Myspace Formspring.me
Datasets
With Oversampling Without Oversampling
Macro Average
F_measure
Micro Average
F_measure
Macro Average
F_measure
Micro Average
F_measure
YouTube 0.982 0.982 0.569 0.839
Formspring.me 0.951 0.951 0.707 0.930
Myspace 0.983 0.983 0.953 0.968
Turkish Journal of Engineering (TUJE)
Vol. 3, Issue 4, pp. 168-178, October 2019
175
4.1. Performance Analysis of Classifiers
RBF, SVM, LR, MLP, and SGD classifiers have been
tested to have a correct classification method for
cyberbullying detection problem. 0.001 df and 001 pre-
processing combinations were used in the experiments. A
single intermediate layer consisting of 10 neurons was
used in the MLP algorithm and the scaled conjugate
gradient (trainscg) back propagation method was used as
the learning method. The classification results are shown
in Fig. 3 for all datasets.
MLP and RBF classifiers give the best results for the
Myspace dataset. The F_measure values for these
classifiers are 0.989 and 0.984 respectively. The best
results were obtained in the MLP and SGD classifiers
with F_measure values of 0.987 and 0.982 for YouTube
dataset; 0.951 and 0.943 for Formspring.me dataset as is
presented in Fig. 3. As a result of these experiments, it has
been found out that the most suitable classifications for
the detection of cyberbullying are SGD and MLP
classifiers.
It may be erroneous to evaluate only the classifier's
accuracy when comparing classifier performances. The
classification speed is also an important parameter as well
as the accuracy of classification. Classification times
(sec.) of classifiers are shown in Table 6. It can be seen
that the LR and SVM algorithms are very slow and the
RBF classifier is the fastest algorithm. The SGD and MLP
classifiers generally appear to have both a high degree of
accuracy and a classification duration at an acceptable
level. Given the speed and accuracy of classification at
the same time, SGD and MLP algorithms can be
considered as the best classifiers.
4.2. The Effects of Feature Selection Algorithms
When you are working on problems where the feature
set is too large such as cyberbullying detection problems,
the classification time is quite high. In order to decrease
the time of classification in such problems, the best sub-
features in the feature set are selected. When this method
is applied, some important features are lost and the
classification performance decreases. Therefore, we have
identified the most appropriate feature selection
algorithm that preserves the classification performance.
The number of features was selected as 50, 100, 250 and
500 using Chi2, ReliefF, SVM-RFE and MRMR
algorithms in the experiments and their performances
were compared.
Since the comparison results are generally similar, the
results obtained from only the YouTube dataset are
presented in Fig. 4. The results of all datasets are also
summarized in Table 7. In Fig. 4, it can be seen that the
best classification accuracy is achieved from the MLP
classifier for all feature selection algorithms. The highest
F_measure value (i.e. 0.953) is obtained from the SVM-
RFE algorithm with 500 attributes.
As is seen from Table 7, the ReliefF algorithm gives
lower results than the other feature selection algorithms
by means of F_measure. While the MRMR and Chi2
algorithms show accuracy performance with close results,
the highest results for all datasets are obtained from the
SVM-RFE algorithm. It can be seen that the feature
selection paradigm leads to a decrease in classification
accuracy. This is because some unselected features have
an important role in the training of classification
algorithms. However, when the classification time
analysis shown in Fig. 5 is examined, it is seen that the
feature selection algorithms significantly reduce the
classification time. Choosing of 500 as the number of
features has the least effect on classification performance
and the best results have achieved in terms of time and
classification accuracy.
5. CONCLUSION
In this study, a feature-based model is developed on
the datasets obtained from YouTube, Formspring.me and
Myspace social network platforms. The developed model
performs a classification according to whether the
comments in the datasets contain cyberbullying. SVM,
RBF, MLP, LR, and SGD algorithms are used as
classifiers. SGD and MLP classifiers showed better
results than other classifiers by giving a F_measure value
above 0.930. In order to overcome high classification
time problem, MRMR, ReliefF, SVM-RFE and Chi2
algorithms are used as feature selection methods. The
SVM-RFE method with 500 selected features reduced the
classification time by 20 times for Youtube, 2.5 times for
Formspring.me, and 10 times for Myspace datasets while
preserving the classification performance.
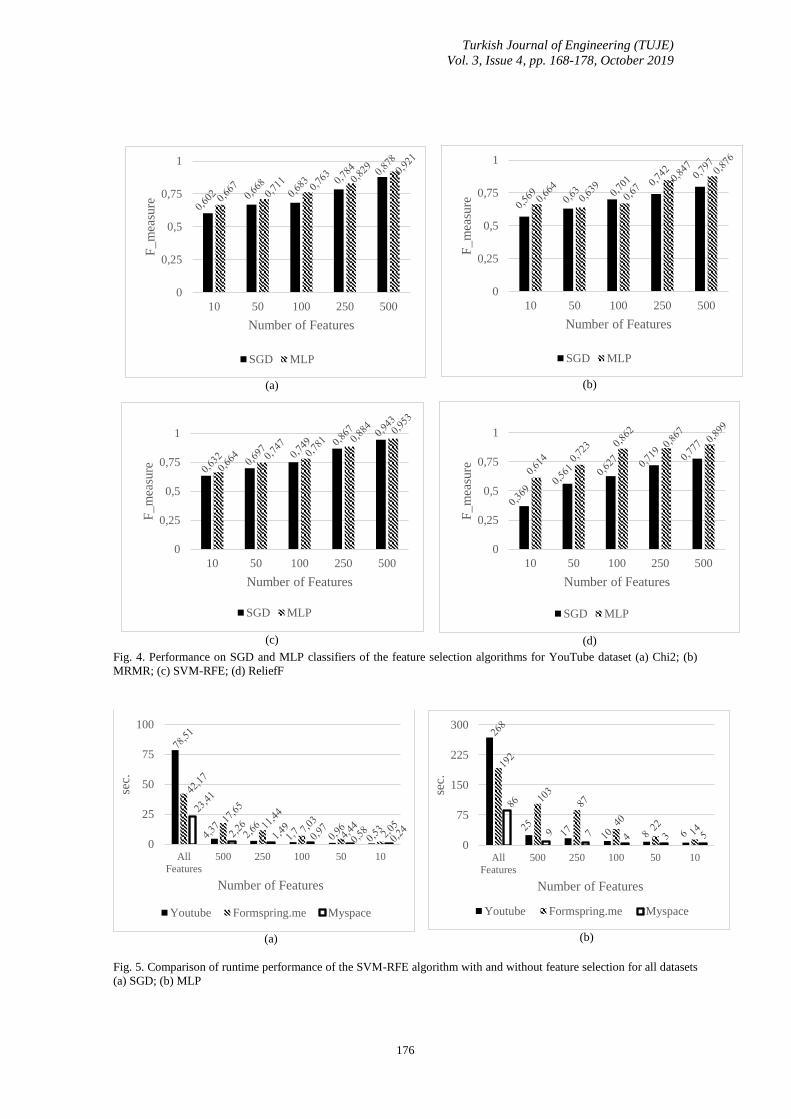
Turkish Journal of Engineering (TUJE)
Vol. 3, Issue 4, pp. 168-178, October 2019
176
Fig. 4. Performance on SGD and MLP classifiers of the feature selection algorithms for YouTube dataset (a) Chi2; (b)
MRMR; (c) SVM-RFE; (d) ReliefF
Fig. 5. Comparison of runtime performance of the SVM-RFE algorithm with and without feature selection for all datasets
(a) SGD; (b) MLP
(a)
(c)
(b)
(d)
(a) (b)
0
0,25
0,5
0,75
1
10 50 100 250 500
F_
mea
sure
Number of Features
SGD MLP
0
0,25
0,5
0,75
1
10 50 100 250 500
F_
mea
sure
Number of Features
SGD MLP
0
0,25
0,5
0,75
1
10 50 100 250 500
F_
mea
sure
Number of Features
SGD MLP
0
0,25
0,5
0,75
1
10 50 100 250 500
F_
mea
sure
Number of Features
SGD MLP
0
25
50
75
100
All
Features
500 250 100 50 10
sec.
Number of Features
Youtube Formspring.me Myspace
0
75
150
225
300
All
Features
500 250 100 50 10
sec.
Number of Features
Youtube Formspring.me Myspace
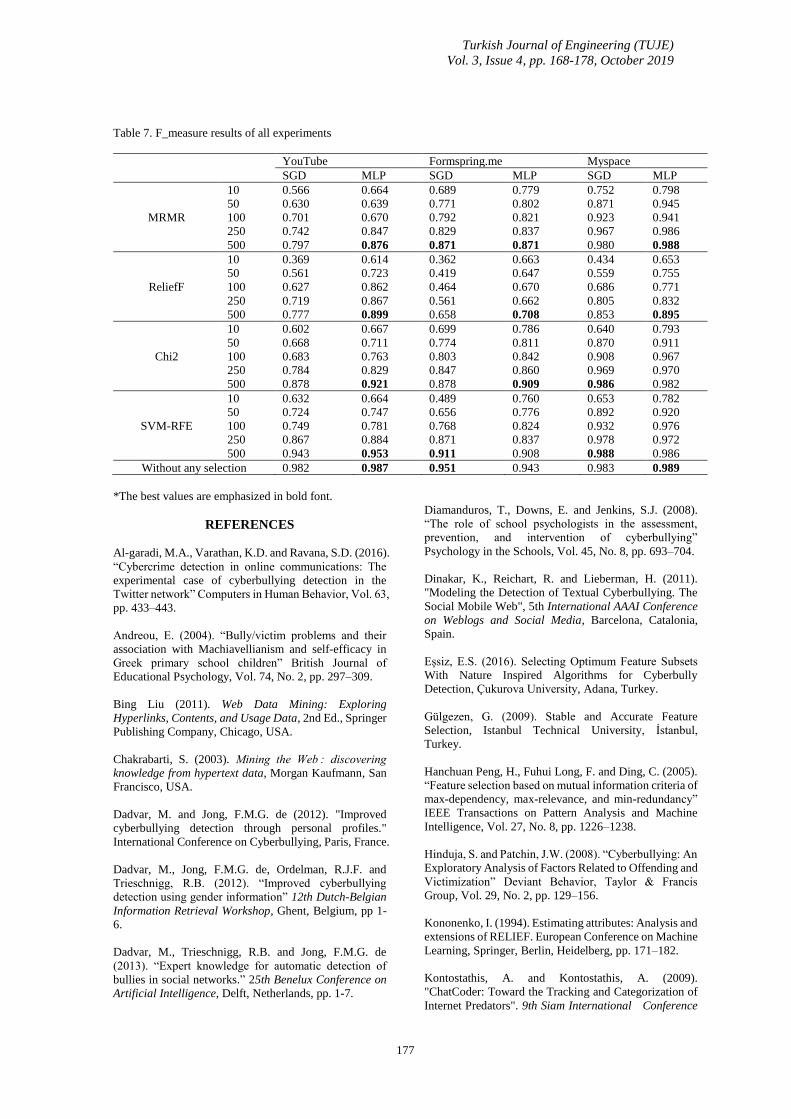
Turkish Journal of Engineering (TUJE)
Vol. 3, Issue 4, pp. 168-178, October 2019
177
Table 7. F_measure results of all experiments
YouTube Formspring.me Myspace
SGD MLP SGD MLP SGD MLP
MRMR
10 0.566 0.664 0.689 0.779 0.752 0.798
50 0.630 0.639 0.771 0.802 0.871 0.945
100 0.701 0.670 0.792 0.821 0.923 0.941
250 0.742 0.847 0.829 0.837 0.967 0.986
500 0.797 0.876 0.871 0.871 0.980 0.988
ReliefF
10 0.369 0.614 0.362 0.663 0.434 0.653
50 0.561 0.723 0.419 0.647 0.559 0.755
100 0.627 0.862 0.464 0.670 0.686 0.771
250 0.719 0.867 0.561 0.662 0.805 0.832
500 0.777 0.899 0.658 0.708 0.853 0.895
Chi2
10 0.602 0.667 0.699 0.786 0.640 0.793
50 0.668 0.711 0.774 0.811 0.870 0.911
100 0.683 0.763 0.803 0.842 0.908 0.967
250 0.784 0.829 0.847 0.860 0.969 0.970
500 0.878 0.921 0.878 0.909 0.986 0.982
SVM-RFE
10 0.632 0.664 0.489 0.760 0.653 0.782
50 0.724 0.747 0.656 0.776 0.892 0.920
100 0.749 0.781 0.768 0.824 0.932 0.976
250 0.867 0.884 0.871 0.837 0.978 0.972
500 0.943 0.953 0.911 0.908 0.988 0.986
Without any selection 0.982 0.987 0.951 0.943 0.983 0.989
*The best values are emphasized in bold font.
REFERENCES
Al-garadi, M.A., Varathan, K.D. and Ravana, S.D. (2016).
“Cybercrime detection in online communications: The
experimental case of cyberbullying detection in the
Twitter network” Computers in Human Behavior, Vol. 63,
pp. 433–443.
Andreou, E. (2004). “Bully/victim problems and their
association with Machiavellianism and self-efficacy in
Greek primary school children” British Journal of
Educational Psychology, Vol. 74, No. 2, pp. 297–309.
Bing Liu (2011). Web Data Mining: Exploring
Hyperlinks, Contents, and Usage Data, 2nd Ed., Springer
Publishing Company, Chicago, USA.
Chakrabarti, S. (2003). Mining the Web : discovering
knowledge from hypertext data, Morgan Kaufmann, San
Francisco, USA.
Dadvar, M. and Jong, F.M.G. de (2012). "Improved
cyberbullying detection through personal profiles."
International Conference on Cyberbullying, Paris, France.
Dadvar, M., Jong, F.M.G. de, Ordelman, R.J.F. and
Trieschnigg, R.B. (2012). “Improved cyberbullying
detection using gender information” 12th Dutch-Belgian
Information Retrieval Workshop, Ghent, Belgium, pp 1-
6.
Dadvar, M., Trieschnigg, R.B. and Jong, F.M.G. de
(2013). “Expert knowledge for automatic detection of
bullies in social networks.” 25th Benelux Conference on
Artificial Intelligence, Delft, Netherlands, pp. 1-7.
Diamanduros, T., Downs, E. and Jenkins, S.J. (2008).
“The role of school psychologists in the assessment,
prevention, and intervention of cyberbullying”
Psychology in the Schools, Vol. 45, No. 8, pp. 693–704.
Dinakar, K., Reichart, R. and Lieberman, H. (2011).
"Modeling the Detection of Textual Cyberbullying. The
Social Mobile Web", 5th International AAAI Conference
on Weblogs and Social Media, Barcelona, Catalonia,
Spain.
Eşsiz, E.S. (2016). Selecting Optimum Feature Subsets
With Nature Inspired Algorithms for Cyberbully
Detection, Çukurova University, Adana, Turkey.
Gülgezen, G. (2009). Stable and Accurate Feature
Selection, Istanbul Technical University, İstanbul,
Turkey.
Hanchuan Peng, H., Fuhui Long, F. and Ding, C. (2005).
“Feature selection based on mutual information criteria of
max-dependency, max-relevance, and min-redundancy”
IEEE Transactions on Pattern Analysis and Machine
Intelligence, Vol. 27, No. 8, pp. 1226–1238.
Hinduja, S. and Patchin, J.W. (2008). “Cyberbullying: An
Exploratory Analysis of Factors Related to Offending and
Victimization” Deviant Behavior, Taylor & Francis
Group, Vol. 29, No. 2, pp. 129–156.
Kononenko, I. (1994). Estimating attributes: Analysis and
extensions of RELIEF. European Conference on Machine
Learning, Springer, Berlin, Heidelberg, pp. 171–182.
Kontostathis, A. and Kontostathis, A. (2009).
"ChatCoder: Toward the Tracking and Categorization of
Internet Predators". 9th Siam International Conference

Turkish Journal of Engineering (TUJE)
Vol. 3, Issue 4, pp. 168-178, October 2019
178
on Data Mining, Nevada, USA.
Kowalski, R.M., Limber, S.P. and McCord, A. (2018). “A
developmental approach to cyberbullying: Prevalence
and protective factors” Aggression and Violent Behavior,
Vol. 45, pp. 20-32.
Langos, C. (2012). “Cyberbullying: The Challenge to
Define” Cyberpsychology, Behavior, and Social
Networking, Vol. 15, No. 6, pp. 285–289.
Li, T.B.Q. (2005). “Cyber-Harassment: A Study of a New
Method for an Old Behavior” Journal of Educational
Computing Research, Vol. 32, No. 3, pp. 265–277.
McHugh, M.L. (2013). “The Chi-square test of
independence” Biochemia Medica, Medicinska naklada,
Vol. 23, No. 2, pp. 143–149.
Nahar, V., Unankard, S., Li, X. and Pang, C. (2012).
"Sentiment Analysis for Effective Detection of Cyber
Bullying." 14th Asia-Pacific international conference on
Web Technologies and Applications, Springer-Verlag,
Beijing, China, pp. 767–774.
Noviantho, Isa, S.M. and Ashianti, L. (2017).
"Cyberbullying classification using text mining." 1st
International Conference on Informatics and
Computational Sciences, IEEE, Semarang, Indonesia, pp.
241–246.
Ozel, S.A., Sarac, E., Akdemir, S. and Aksu, H. (2017).
"Detection of cyberbullying on social media messages in
Turkish." International Conference on Computer Science
and Engineering, IEEE, Antalya, Turkey, pp. 366–370.
Poland, S. (2010). “Cyberbullying Continues to
Challenge Educators” District Administration, Vol. 46,
No. 5, p. 55.
Rosario, S.F. and Thangadurai, K. (2015). “RELIEF:
Feature Selection Approach” International Journal of
Innovative Research and Development, Vol. 4, No. 11.
Snakenborg, J., Van Acker, R. and Gable, R.A. (2011).
“Cyberbullying: Prevention and Intervention to Protect
Our Children and Youth” Preventing School Failure, Vol.
55, No. 2, pp. 88–95.
Urbanowicz, R.J., Meeker, M., LaCava, W., Olson, R.S.
and Moore, J.H. (2017). “Relief-Based Feature Selection:
Introduction and Review” Journal of Biomedical
Informatics, Vol. 85, pp. 189-203.
Wang, J., Shan, G., Duan, X. and Wen, B. (2011).
"Improved SVM-RFE feature selection method for multi-
SVM classifier." International Conference on Electrical
and Control Engineering, IEEE, Yichang, China, pp.
1592–1595.
Wolak, J., Mitchell, K.J. and Finkelhor, D. (2007). “Does
Online Harassment Constitute Bullying? An Exploration
of Online Harassment by Known Peers and Online-Only
Contacts” Journal of Adolescent Health, Vol. 41, No. 6,
pp. S51–S58.
Ybarra, M.L., Diener-West, M. and Leaf, P.J. (2007).
“Examining the Overlap in Internet Harassment and
School Bullying: Implications for School Intervention”
Journal of Adolescent Health, Vol. 41, No. 6, pp. S42–
S50.
Yin, D., Xue, Z., Hong, L., Davison, B.D., Kontostathis,
A. and Edwar, L. (2009). "Detection of Harassment on
Web 2.0.", Content Analysis in the WEB 2.0, Madrid,
Spain, pp. 1–7.
Turkish Journal of Engineering
179
Turkish Journal of Engineering (TUJE)
Vol. 3, Issue 4, pp. 179-188, October 2019
ISSN 2587-1366, Turkey
DOI: 10.31127/tuje.555268
Research Article
BEHAVIOR OF R/C FRAMES WITH CONCRETE PLATE BONDED INFILLS
Mehmet Baran *1
1 Ankara Yıldırım Beyazıt University, Engineering and Natural Sciences Faculty, Civil Engineering Department, Ankara,
Turkey
ORCID ID 0000-0001-6674-7308
* Corresponding Author
Received: 17/04/2019 Accepted: 09/05/2019
ABSTRACT
A practical, economic and effective as well as occupant friendly seismic strengthening technique had been developed for
reinforced concrete (RC) framed buildings lacking sufficient lateral stiffness. In this technique, high strength concrete
plates are bonded onto the existing plastered hollow brick infill walls using a thin layer of epoxy mortar in order that infill
walls are converted into lateral load resisting shear walls resulting from the composite action of infill wall with the plates
bonded onto it. By this way, the building gains sufficient lateral stiffness. To analyze the behavior of RC frames
strengthened by the aforementioned technique, results of eight one-third scale, one-bay, one or two storey deficient RC
frames tested under reverse-cyclic lateral loading until failure are given in detail. Three different types of plates were used
to strengthen the frames. Test results showed that the proposed strengthening technique considerably increased the lateral
load capacities as well as the initial stiffness and energy dissipation capacities of the strengthened specimens, for both types
of frames. Additionally, present study focuses on the comparison results of one-storey specimens with those of equivalent
two-storey specimens to well-understand the behavior of such strengthened frames under lateral load, and infill walls under
compressive and shear forces as well as tensile forces.
Keywords: Epoxy Mortar, High Strength Concrete Plate, Reverse-cyclic Lateral Loading, Seismic Strengthening, Shear
Force
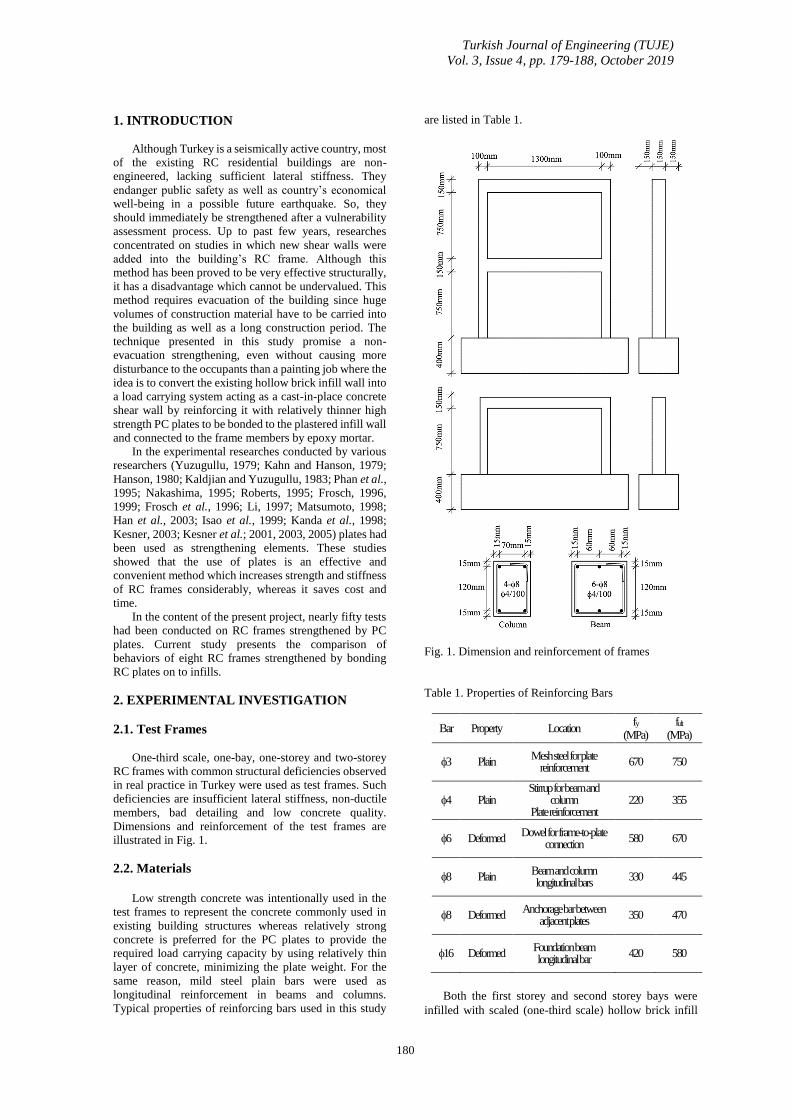
Turkish Journal of Engineering (TUJE)
Vol. 3, Issue 4, pp. 179-188, October 2019
180
1. INTRODUCTION
Although Turkey is a seismically active country, most
of the existing RC residential buildings are non-
engineered, lacking sufficient lateral stiffness. They
endanger public safety as well as country’s economical
well-being in a possible future earthquake. So, they
should immediately be strengthened after a vulnerability
assessment process. Up to past few years, researches
concentrated on studies in which new shear walls were
added into the building’s RC frame. Although this
method has been proved to be very effective structurally,
it has a disadvantage which cannot be undervalued. This
method requires evacuation of the building since huge
volumes of construction material have to be carried into
the building as well as a long construction period. The
technique presented in this study promise a non-
evacuation strengthening, even without causing more
disturbance to the occupants than a painting job where the
idea is to convert the existing hollow brick infill wall into
a load carrying system acting as a cast-in-place concrete
shear wall by reinforcing it with relatively thinner high
strength PC plates to be bonded to the plastered infill wall
and connected to the frame members by epoxy mortar.
In the experimental researches conducted by various
researchers (Yuzugullu, 1979; Kahn and Hanson, 1979;
Hanson, 1980; Kaldjian and Yuzugullu, 1983; Phan et al.,
1995; Nakashima, 1995; Roberts, 1995; Frosch, 1996,
1999; Frosch et al., 1996; Li, 1997; Matsumoto, 1998;
Han et al., 2003; Isao et al., 1999; Kanda et al., 1998;
Kesner, 2003; Kesner et al.; 2001, 2003, 2005) plates had
been used as strengthening elements. These studies
showed that the use of plates is an effective and
convenient method which increases strength and stiffness
of RC frames considerably, whereas it saves cost and
time.
In the content of the present project, nearly fifty tests
had been conducted on RC frames strengthened by PC
plates. Current study presents the comparison of
behaviors of eight RC frames strengthened by bonding
RC plates on to infills.
2. EXPERIMENTAL INVESTIGATION
2.1. Test Frames
One-third scale, one-bay, one-storey and two-storey
RC frames with common structural deficiencies observed
in real practice in Turkey were used as test frames. Such
deficiencies are insufficient lateral stiffness, non-ductile
members, bad detailing and low concrete quality.
Dimensions and reinforcement of the test frames are
illustrated in Fig. 1.
2.2. Materials
Low strength concrete was intentionally used in the
test frames to represent the concrete commonly used in
existing building structures whereas relatively strong
concrete is preferred for the PC plates to provide the
required load carrying capacity by using relatively thin
layer of concrete, minimizing the plate weight. For the
same reason, mild steel plain bars were used as
longitudinal reinforcement in beams and columns.
Typical properties of reinforcing bars used in this study
are listed in Table 1.
Fig. 1. Dimension and reinforcement of frames
Table 1. Properties of Reinforcing Bars
Bar Property Location fy
(MPa) fult
(MPa)
3 Plain Mesh steel for plate
reinforcement 670 750
4 Plain Stirrup for beam and
column Plate reinforcement
220 355
6 Deformed Dowel for frame-to-plate
connection 580 670
8 Plain Beam and column longitudinal bars
330 445
8 Deformed Anchorage bar between
adjacent plates 350 470
16 Deformed Foundation beam longitudinal bar
420 580
Both the first storey and second storey bays were
infilled with scaled (one-third scale) hollow brick infill
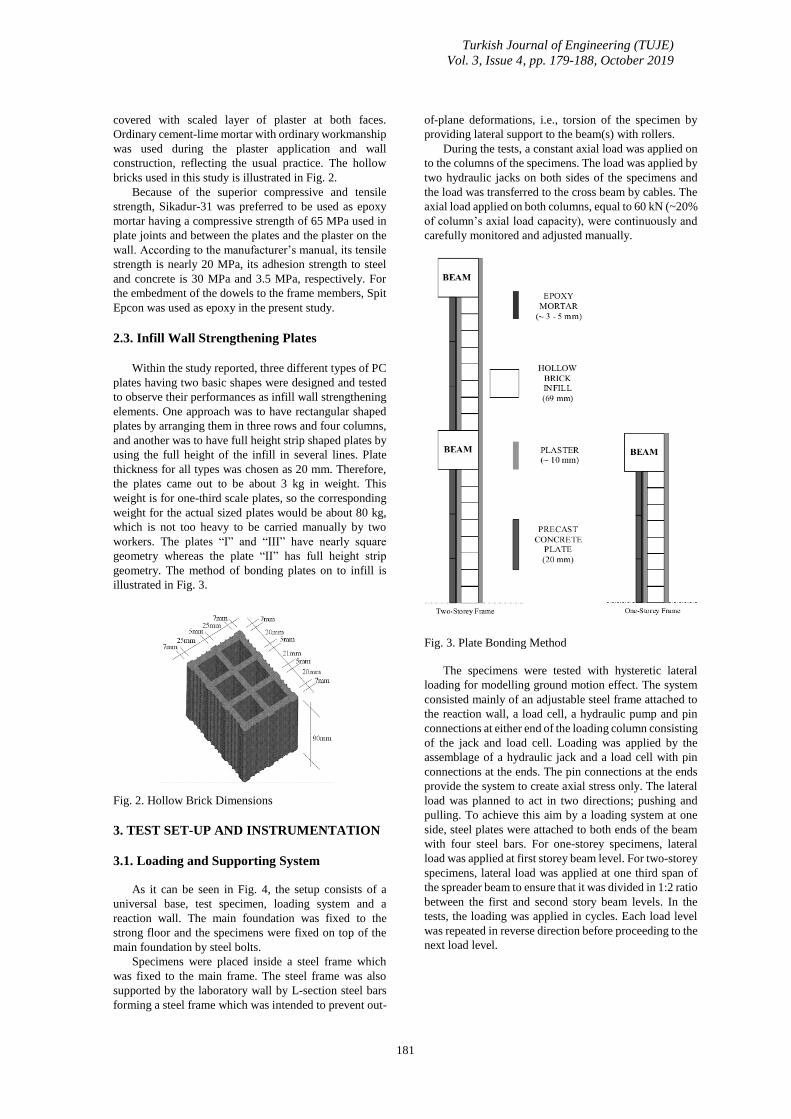
Turkish Journal of Engineering (TUJE)
Vol. 3, Issue 4, pp. 179-188, October 2019
181
covered with scaled layer of plaster at both faces.
Ordinary cement-lime mortar with ordinary workmanship
was used during the plaster application and wall
construction, reflecting the usual practice. The hollow
bricks used in this study is illustrated in Fig. 2.
Because of the superior compressive and tensile
strength, Sikadur-31 was preferred to be used as epoxy
mortar having a compressive strength of 65 MPa used in
plate joints and between the plates and the plaster on the
wall. According to the manufacturer’s manual, its tensile
strength is nearly 20 MPa, its adhesion strength to steel
and concrete is 30 MPa and 3.5 MPa, respectively. For
the embedment of the dowels to the frame members, Spit
Epcon was used as epoxy in the present study.
2.3. Infill Wall Strengthening Plates
Within the study reported, three different types of PC
plates having two basic shapes were designed and tested
to observe their performances as infill wall strengthening
elements. One approach was to have rectangular shaped
plates by arranging them in three rows and four columns,
and another was to have full height strip shaped plates by
using the full height of the infill in several lines. Plate
thickness for all types was chosen as 20 mm. Therefore,
the plates came out to be about 3 kg in weight. This
weight is for one-third scale plates, so the corresponding
weight for the actual sized plates would be about 80 kg,
which is not too heavy to be carried manually by two
workers. The plates “I” and “III” have nearly square
geometry whereas the plate “II” has full height strip
geometry. The method of bonding plates on to infill is
illustrated in Fig. 3.
Fig. 2. Hollow Brick Dimensions
3. TEST SET-UP AND INSTRUMENTATION
3.1. Loading and Supporting System
As it can be seen in Fig. 4, the setup consists of a
universal base, test specimen, loading system and a
reaction wall. The main foundation was fixed to the
strong floor and the specimens were fixed on top of the
main foundation by steel bolts.
Specimens were placed inside a steel frame which
was fixed to the main frame. The steel frame was also
supported by the laboratory wall by L-section steel bars
forming a steel frame which was intended to prevent out-
of-plane deformations, i.e., torsion of the specimen by
providing lateral support to the beam(s) with rollers.
During the tests, a constant axial load was applied on
to the columns of the specimens. The load was applied by
two hydraulic jacks on both sides of the specimens and
the load was transferred to the cross beam by cables. The
axial load applied on both columns, equal to 60 kN (~20%
of column’s axial load capacity), were continuously and
carefully monitored and adjusted manually.
Fig. 3. Plate Bonding Method
The specimens were tested with hysteretic lateral
loading for modelling ground motion effect. The system
consisted mainly of an adjustable steel frame attached to
the reaction wall, a load cell, a hydraulic pump and pin
connections at either end of the loading column consisting
of the jack and load cell. Loading was applied by the
assemblage of a hydraulic jack and a load cell with pin
connections at the ends. The pin connections at the ends
provide the system to create axial stress only. The lateral
load was planned to act in two directions; pushing and
pulling. To achieve this aim by a loading system at one
side, steel plates were attached to both ends of the beam
with four steel bars. For one-storey specimens, lateral
load was applied at first storey beam level. For two-storey
specimens, lateral load was applied at one third span of
the spreader beam to ensure that it was divided in 1:2 ratio
between the first and second story beam levels. In the
tests, the loading was applied in cycles. Each load level
was repeated in reverse direction before proceeding to the
next load level.
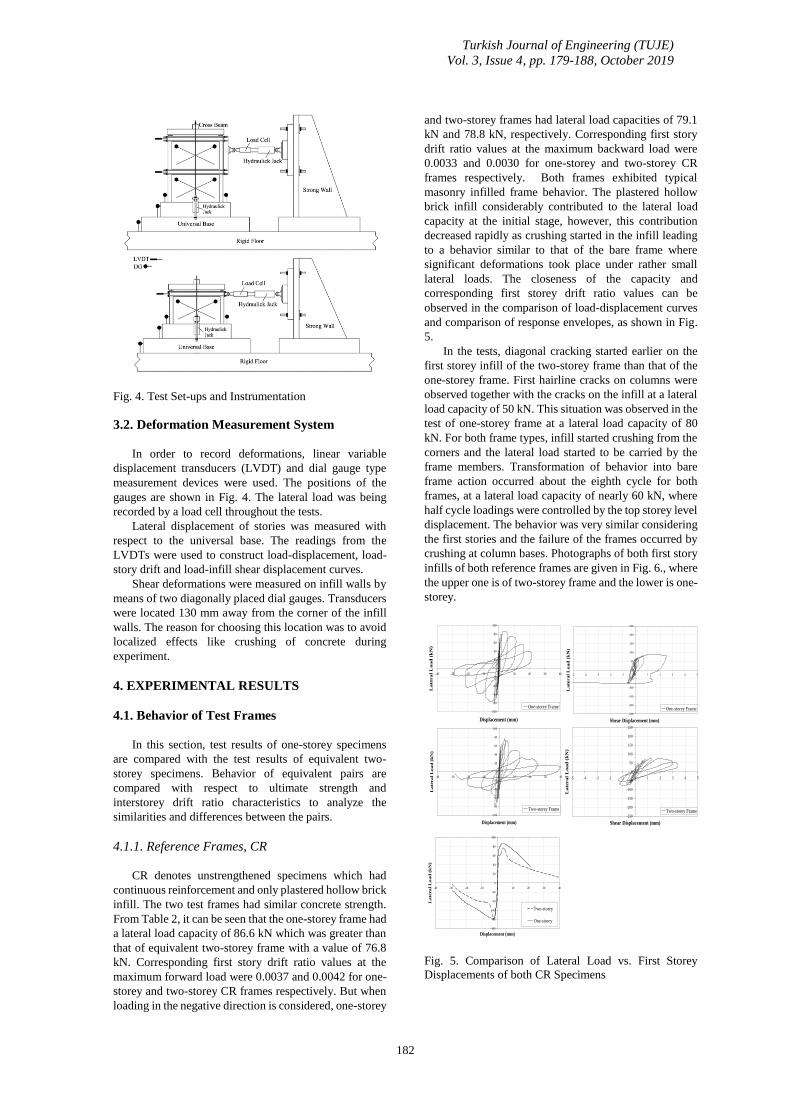
Turkish Journal of Engineering (TUJE)
Vol. 3, Issue 4, pp. 179-188, October 2019
182
Fig. 4. Test Set-ups and Instrumentation
3.2. Deformation Measurement System
In order to record deformations, linear variable
displacement transducers (LVDT) and dial gauge type
measurement devices were used. The positions of the
gauges are shown in Fig. 4. The lateral load was being
recorded by a load cell throughout the tests.
Lateral displacement of stories was measured with
respect to the universal base. The readings from the
LVDTs were used to construct load-displacement, load-
story drift and load-infill shear displacement curves.
Shear deformations were measured on infill walls by
means of two diagonally placed dial gauges. Transducers
were located 130 mm away from the corner of the infill
walls. The reason for choosing this location was to avoid
localized effects like crushing of concrete during
experiment.
4. EXPERIMENTAL RESULTS
4.1. Behavior of Test Frames
In this section, test results of one-storey specimens
are compared with the test results of equivalent two-
storey specimens. Behavior of equivalent pairs are
compared with respect to ultimate strength and
interstorey drift ratio characteristics to analyze the
similarities and differences between the pairs.
4.1.1. Reference Frames, CR
CR denotes unstrengthened specimens which had
continuous reinforcement and only plastered hollow brick
infill. The two test frames had similar concrete strength.
From Table 2, it can be seen that the one-storey frame had
a lateral load capacity of 86.6 kN which was greater than
that of equivalent two-storey frame with a value of 76.8
kN. Corresponding first story drift ratio values at the
maximum forward load were 0.0037 and 0.0042 for one-
storey and two-storey CR frames respectively. But when
loading in the negative direction is considered, one-storey
and two-storey frames had lateral load capacities of 79.1
kN and 78.8 kN, respectively. Corresponding first story
drift ratio values at the maximum backward load were
0.0033 and 0.0030 for one-storey and two-storey CR
frames respectively. Both frames exhibited typical
masonry infilled frame behavior. The plastered hollow
brick infill considerably contributed to the lateral load
capacity at the initial stage, however, this contribution
decreased rapidly as crushing started in the infill leading
to a behavior similar to that of the bare frame where
significant deformations took place under rather small
lateral loads. The closeness of the capacity and
corresponding first storey drift ratio values can be
observed in the comparison of load-displacement curves
and comparison of response envelopes, as shown in Fig.
5.
In the tests, diagonal cracking started earlier on the
first storey infill of the two-storey frame than that of the
one-storey frame. First hairline cracks on columns were
observed together with the cracks on the infill at a lateral
load capacity of 50 kN. This situation was observed in the
test of one-storey frame at a lateral load capacity of 80
kN. For both frame types, infill started crushing from the
corners and the lateral load started to be carried by the
frame members. Transformation of behavior into bare
frame action occurred about the eighth cycle for both
frames, at a lateral load capacity of nearly 60 kN, where
half cycle loadings were controlled by the top storey level
displacement. The behavior was very similar considering
the first stories and the failure of the frames occurred by
crushing at column bases. Photographs of both first story
infills of both reference frames are given in Fig. 6., where
the upper one is of two-storey frame and the lower is one-
storey.
Fig. 5. Comparison of Lateral Load vs. First Storey
Displacements of both CR Specimens
-100
-80
-60
-40
-20
0
20
40
60
80
100
-40 -30 -20 -10 0 10 20 30 40
Displacement (mm)
Late
ra
l L
oa
d (
kN
)
Two-storey
One-storey
-100
-80
-60
-40
-20
0
20
40
60
80
100
-40 -30 -20 -10 0 10 20 30 40
Displacement (mm)
La
tera
l L
oa
d (
kN
)
One-storey Frame
-250
-200
-150
-100
-50
0
50
100
150
200
250
-5 -4 -3 -2 -1 0 1 2 3 4 5
Shear Displacement (mm)
Late
ral
Load
(k
N)
One-storey Frame
-100
-80
-60
-40
-20
0
20
40
60
80
100
-40 -30 -20 -10 0 10 20 30 40
Displacement (mm)
La
tera
l L
oa
d (
kN
)
Two-storey Frame
-250
-200
-150
-100
-50
0
50
100
150
200
250
-5 -4 -3 -2 -1 0 1 2 3 4 5
Shear Displacement (mm)
La
tera
l L
oa
d (
kN
)
Two-storey Frame
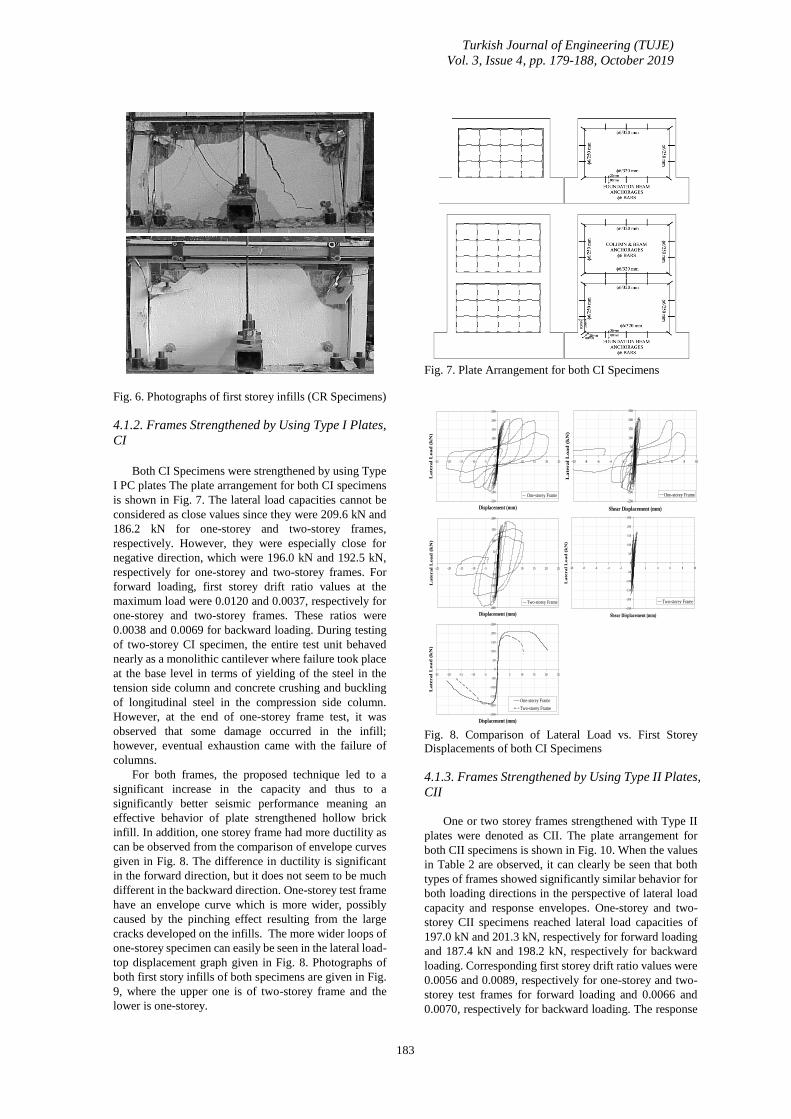
Turkish Journal of Engineering (TUJE)
Vol. 3, Issue 4, pp. 179-188, October 2019
183
Two-Storey Frame Two-Storey Frame
Fig. 6. Photographs of first storey infills (CR Specimens)
4.1.2. Frames Strengthened by Using Type I Plates,
CI
Both CI Specimens were strengthened by using Type
I PC plates The plate arrangement for both CI specimens
is shown in Fig. 7. The lateral load capacities cannot be
considered as close values since they were 209.6 kN and
186.2 kN for one-storey and two-storey frames,
respectively. However, they were especially close for
negative direction, which were 196.0 kN and 192.5 kN,
respectively for one-storey and two-storey frames. For
forward loading, first storey drift ratio values at the
maximum load were 0.0120 and 0.0037, respectively for
one-storey and two-storey frames. These ratios were
0.0038 and 0.0069 for backward loading. During testing
of two-storey CI specimen, the entire test unit behaved
nearly as a monolithic cantilever where failure took place
at the base level in terms of yielding of the steel in the
tension side column and concrete crushing and buckling
of longitudinal steel in the compression side column.
However, at the end of one-storey frame test, it was
observed that some damage occurred in the infill;
however, eventual exhaustion came with the failure of
columns.
For both frames, the proposed technique led to a
significant increase in the capacity and thus to a
significantly better seismic performance meaning an
effective behavior of plate strengthened hollow brick
infill. In addition, one storey frame had more ductility as
can be observed from the comparison of envelope curves
given in Fig. 8. The difference in ductility is significant
in the forward direction, but it does not seem to be much
different in the backward direction. One-storey test frame
have an envelope curve which is more wider, possibly
caused by the pinching effect resulting from the large
cracks developed on the infills. The more wider loops of
one-storey specimen can easily be seen in the lateral load-
top displacement graph given in Fig. 8. Photographs of
both first story infills of both specimens are given in Fig.
9, where the upper one is of two-storey frame and the
lower is one-storey.
Fig. 7. Plate Arrangement for both CI Specimens
Fig. 8. Comparison of Lateral Load vs. First Storey
Displacements of both CI Specimens
4.1.3. Frames Strengthened by Using Type II Plates,
CII
One or two storey frames strengthened with Type II
plates were denoted as CII. The plate arrangement for
both CII specimens is shown in Fig. 10. When the values
in Table 2 are observed, it can clearly be seen that both
types of frames showed significantly similar behavior for
both loading directions in the perspective of lateral load
capacity and response envelopes. One-storey and two-
storey CII specimens reached lateral load capacities of
197.0 kN and 201.3 kN, respectively for forward loading
and 187.4 kN and 198.2 kN, respectively for backward
loading. Corresponding first storey drift ratio values were
0.0056 and 0.0089, respectively for one-storey and two-
storey test frames for forward loading and 0.0066 and
0.0070, respectively for backward loading. The response
-250
-200
-150
-100
-50
0
50
100
150
200
250
-25 -20 -15 -10 -5 0 5 10 15 20 25
Displacement (mm)
La
tera
l L
oa
d (
kN
)
One-storey Frame-250
-200
-150
-100
-50
0
50
100
150
200
250
-10 -8 -6 -4 -2 0 2 4 6 8 10
Shear Displacement (mm)
La
tera
l L
oa
d (
kN
)
One-storey Frame
-200
-150
-100
-50
0
50
100
150
200
-25 -20 -15 -10 -5 0 5 10 15 20 25
Displacement (mm)
Late
ral
Load
(k
N)
Two-storey Frame-250
-200
-150
-100
-50
0
50
100
150
200
250
-10 -8 -6 -4 -2 0 2 4 6 8 10
Shear Displacement (mm)
Late
ra
l L
oa
d (
kN
)
Two-storey Frame
-250
-200
-150
-100
-50
0
50
100
150
200
250
-25 -20 -15 -10 -5 0 5 10 15 20 25
Displacement (mm)
La
tera
l L
oa
d (
kN
)
One-storey Frame
Two-storey Frame
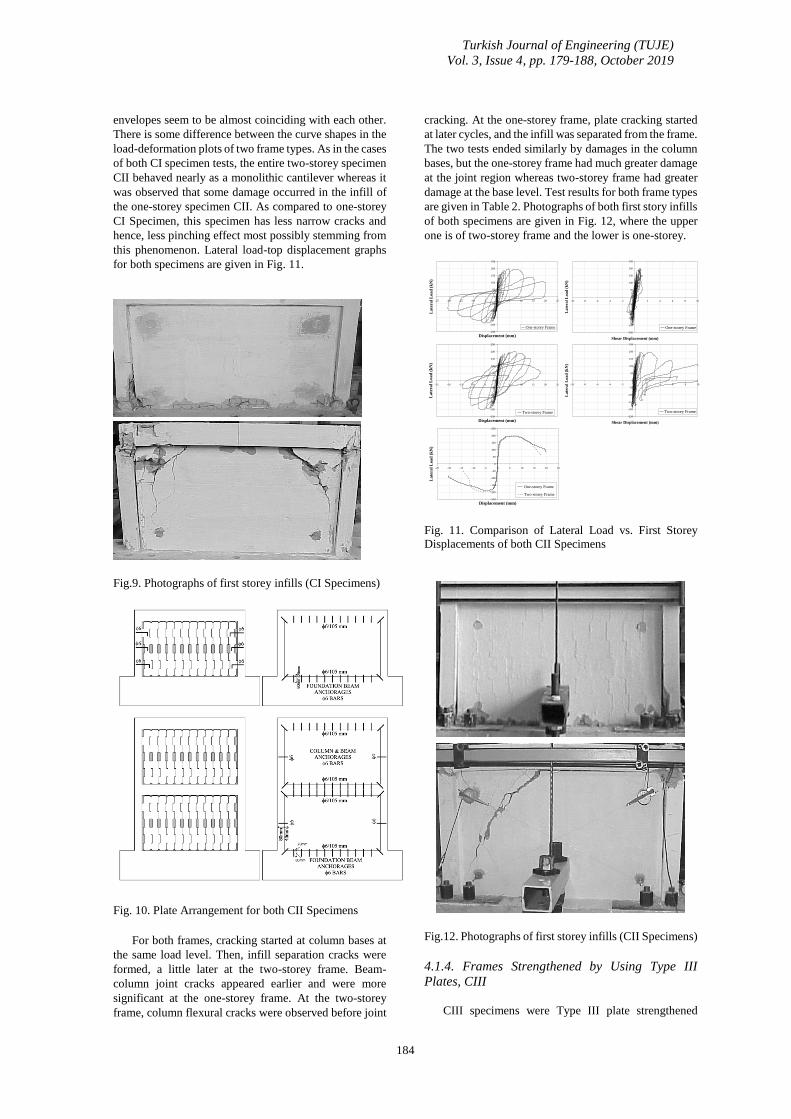
Turkish Journal of Engineering (TUJE)
Vol. 3, Issue 4, pp. 179-188, October 2019
184
envelopes seem to be almost coinciding with each other.
There is some difference between the curve shapes in the
load-deformation plots of two frame types. As in the cases
of both CI specimen tests, the entire two-storey specimen
CII behaved nearly as a monolithic cantilever whereas it
was observed that some damage occurred in the infill of
the one-storey specimen CII. As compared to one-storey
CI Specimen, this specimen has less narrow cracks and
hence, less pinching effect most possibly stemming from
this phenomenon. Lateral load-top displacement graphs
for both specimens are given in Fig. 11.
Fig.9. Photographs of first storey infills (CI Specimens)
Fig. 10. Plate Arrangement for both CII Specimens
For both frames, cracking started at column bases at
the same load level. Then, infill separation cracks were
formed, a little later at the two-storey frame. Beam-
column joint cracks appeared earlier and were more
significant at the one-storey frame. At the two-storey
frame, column flexural cracks were observed before joint
cracking. At the one-storey frame, plate cracking started
at later cycles, and the infill was separated from the frame.
The two tests ended similarly by damages in the column
bases, but the one-storey frame had much greater damage
at the joint region whereas two-storey frame had greater
damage at the base level. Test results for both frame types
are given in Table 2. Photographs of both first story infills
of both specimens are given in Fig. 12, where the upper
one is of two-storey frame and the lower is one-storey.
Fig. 11. Comparison of Lateral Load vs. First Storey
Displacements of both CII Specimens
Fig.12. Photographs of first storey infills (CII Specimens)
4.1.4. Frames Strengthened by Using Type III
Plates, CIII
CIII specimens were Type III plate strengthened
-250
-200
-150
-100
-50
0
50
100
150
200
250
-25 -20 -15 -10 -5 0 5 10 15 20 25
Displacement (mm)
Late
ral
Load
(k
N)
One-storey Frame
-250
-200
-150
-100
-50
0
50
100
150
200
250
-25 -20 -15 -10 -5 0 5 10 15 20 25
Displacement (mm)
Late
ral
Load
(k
N)
Two-storey Frame
-250
-200
-150
-100
-50
0
50
100
150
200
250
-25 -20 -15 -10 -5 0 5 10 15 20 25
Displacement (mm)
La
tera
l L
oa
d (
kN
)
One-storey Frame
Two-storey Frame
-250
-200
-150
-100
-50
0
50
100
150
200
250
-10 -8 -6 -4 -2 0 2 4 6 8 10
Shear Displacement (mm)
La
tera
l L
oa
d (
kN
)
One-storey Frame
-250
-200
-150
-100
-50
0
50
100
150
200
250
-10 -8 -6 -4 -2 0 2 4 6 8 10
Shear Displacement (mm)
Late
ral
Lo
ad
(k
N)
Two-storey Frame
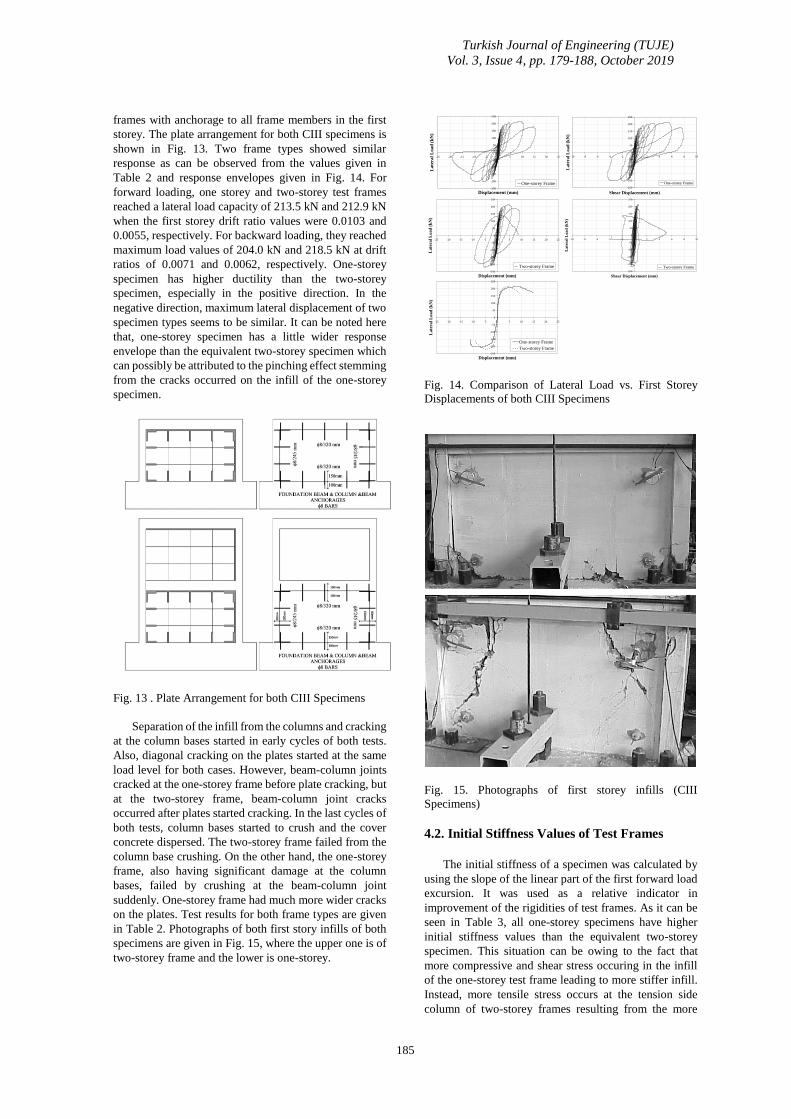
Turkish Journal of Engineering (TUJE)
Vol. 3, Issue 4, pp. 179-188, October 2019
185
frames with anchorage to all frame members in the first
storey. The plate arrangement for both CIII specimens is
shown in Fig. 13. Two frame types showed similar
response as can be observed from the values given in
Table 2 and response envelopes given in Fig. 14. For
forward loading, one storey and two-storey test frames
reached a lateral load capacity of 213.5 kN and 212.9 kN
when the first storey drift ratio values were 0.0103 and
0.0055, respectively. For backward loading, they reached
maximum load values of 204.0 kN and 218.5 kN at drift
ratios of 0.0071 and 0.0062, respectively. One-storey
specimen has higher ductility than the two-storey
specimen, especially in the positive direction. In the
negative direction, maximum lateral displacement of two
specimen types seems to be similar. It can be noted here
that, one-storey specimen has a little wider response
envelope than the equivalent two-storey specimen which
can possibly be attributed to the pinching effect stemming
from the cracks occurred on the infill of the one-storey
specimen.
Fig. 13 . Plate Arrangement for both CIII Specimens
Separation of the infill from the columns and cracking
at the column bases started in early cycles of both tests.
Also, diagonal cracking on the plates started at the same
load level for both cases. However, beam-column joints
cracked at the one-storey frame before plate cracking, but
at the two-storey frame, beam-column joint cracks
occurred after plates started cracking. In the last cycles of
both tests, column bases started to crush and the cover
concrete dispersed. The two-storey frame failed from the
column base crushing. On the other hand, the one-storey
frame, also having significant damage at the column
bases, failed by crushing at the beam-column joint
suddenly. One-storey frame had much more wider cracks
on the plates. Test results for both frame types are given
in Table 2. Photographs of both first story infills of both
specimens are given in Fig. 15, where the upper one is of
two-storey frame and the lower is one-storey.
Fig. 14. Comparison of Lateral Load vs. First Storey
Displacements of both CIII Specimens
Fig. 15. Photographs of first storey infills (CIII
Specimens)
4.2. Initial Stiffness Values of Test Frames
The initial stiffness of a specimen was calculated by
using the slope of the linear part of the first forward load
excursion. It was used as a relative indicator in
improvement of the rigidities of test frames. As it can be
seen in Table 3, all one-storey specimens have higher
initial stiffness values than the equivalent two-storey
specimen. This situation can be owing to the fact that
more compressive and shear stress occuring in the infill
of the one-storey test frame leading to more stiffer infill.
Instead, more tensile stress occurs at the tension side
column of two-storey frames resulting from the more
-250
-200
-150
-100
-50
0
50
100
150
200
250
-25 -20 -15 -10 -5 0 5 10 15 20 25
Displacement (mm)
La
tera
l L
oa
d (
kN
)
One-storey Frame
-250
-200
-150
-100
-50
0
50
100
150
200
250
-25 -20 -15 -10 -5 0 5 10 15 20 25
Displacement (mm)
La
tera
l L
oa
d (
kN
)
Two-storey Frame
-250
-200
-150
-100
-50
0
50
100
150
200
250
-25 -20 -15 -10 -5 0 5 10 15 20 25
Displacement (mm)
La
tera
l L
oa
d (
kN
)
One-storey Frame
Two-storey Frame
-250
-200
-150
-100
-50
0
50
100
150
200
250
-10 -8 -6 -4 -2 0 2 4 6 8 10
Shear Displacement (mm)
La
tera
l L
oa
d (
kN
)
Two-storey Frame
-250
-200
-150
-100
-50
0
50
100
150
200
250
-10 -8 -6 -4 -2 0 2 4 6 8 10
Shear Displacement (mm)
La
tera
l L
oa
d (
kN
)
One-storey Frame
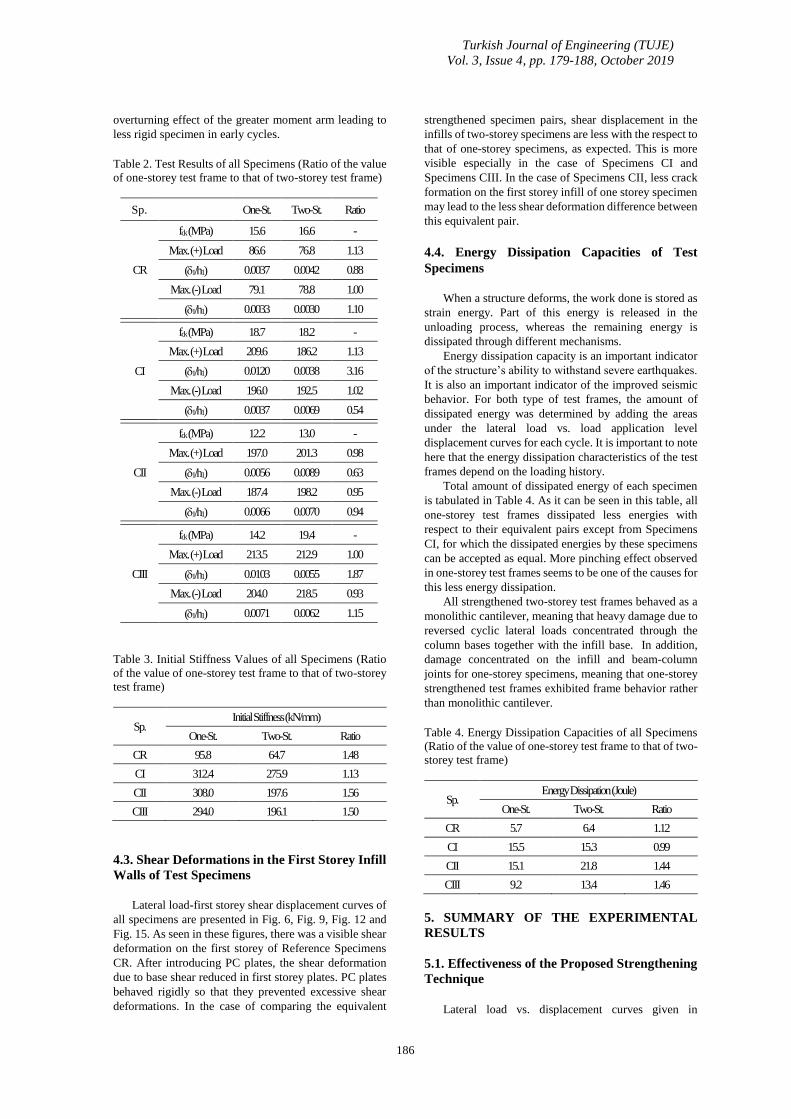
Turkish Journal of Engineering (TUJE)
Vol. 3, Issue 4, pp. 179-188, October 2019
186
overturning effect of the greater moment arm leading to
less rigid specimen in early cycles.
Table 2. Test Results of all Specimens (Ratio of the value
of one-storey test frame to that of two-storey test frame)
Sp. One-St. Two-St. Ratio
CR
fck (MPa) 15.6 16.6 -
Max. (+) Load 86.6 76.8 1.13
(1/h1) 0.0037 0.0042 0.88
Max. (-) Load 79.1 78.8 1.00
(1/h1) 0.0033 0.0030 1.10
CI
fck (MPa) 18.7 18.2 -
Max. (+) Load 209.6 186.2 1.13
(1/h1) 0.0120 0.0038 3.16
Max. (-) Load 196.0 192.5 1.02
(1/h1) 0.0037 0.0069 0.54
CII
fck (MPa) 12.2 13.0 -
Max. (+) Load 197.0 201.3 0.98
(1/h1) 0.0056 0.0089 0.63
Max. (-) Load 187.4 198.2 0.95
(1/h1) 0.0066 0.0070 0.94
CIII
fck (MPa) 14.2 19.4 -
Max. (+) Load 213.5 212.9 1.00
(1/h1) 0.0103 0.0055 1.87
Max. (-) Load 204.0 218.5 0.93
(1/h1) 0.0071 0.0062 1.15
Table 3. Initial Stiffness Values of all Specimens (Ratio
of the value of one-storey test frame to that of two-storey
test frame)
Sp. Initial Stiffness (kN/mm)
One-St. Two-St. Ratio
CR 95.8 64.7 1.48
CI 312.4 275.9 1.13
CII 308.0 197.6 1.56
CIII 294.0 196.1 1.50
4.3. Shear Deformations in the First Storey Infill
Walls of Test Specimens
Lateral load-first storey shear displacement curves of
all specimens are presented in Fig. 6, Fig. 9, Fig. 12 and
Fig. 15. As seen in these figures, there was a visible shear
deformation on the first storey of Reference Specimens
CR. After introducing PC plates, the shear deformation
due to base shear reduced in first storey plates. PC plates
behaved rigidly so that they prevented excessive shear
deformations. In the case of comparing the equivalent
strengthened specimen pairs, shear displacement in the
infills of two-storey specimens are less with the respect to
that of one-storey specimens, as expected. This is more
visible especially in the case of Specimens CI and
Specimens CIII. In the case of Specimens CII, less crack
formation on the first storey infill of one storey specimen
may lead to the less shear deformation difference between
this equivalent pair.
4.4. Energy Dissipation Capacities of Test
Specimens
When a structure deforms, the work done is stored as
strain energy. Part of this energy is released in the
unloading process, whereas the remaining energy is
dissipated through different mechanisms.
Energy dissipation capacity is an important indicator
of the structure’s ability to withstand severe earthquakes.
It is also an important indicator of the improved seismic
behavior. For both type of test frames, the amount of
dissipated energy was determined by adding the areas
under the lateral load vs. load application level
displacement curves for each cycle. It is important to note
here that the energy dissipation characteristics of the test
frames depend on the loading history.
Total amount of dissipated energy of each specimen
is tabulated in Table 4. As it can be seen in this table, all
one-storey test frames dissipated less energies with
respect to their equivalent pairs except from Specimens
CI, for which the dissipated energies by these specimens
can be accepted as equal. More pinching effect observed
in one-storey test frames seems to be one of the causes for
this less energy dissipation.
All strengthened two-storey test frames behaved as a
monolithic cantilever, meaning that heavy damage due to
reversed cyclic lateral loads concentrated through the
column bases together with the infill base. In addition,
damage concentrated on the infill and beam-column
joints for one-storey specimens, meaning that one-storey
strengthened test frames exhibited frame behavior rather
than monolithic cantilever.
Table 4. Energy Dissipation Capacities of all Specimens
(Ratio of the value of one-storey test frame to that of two-
storey test frame)
Sp. Energy Dissipation (Joule)
One-St. Two-St. Ratio
CR 5.7 6.4 1.12
CI 15.5 15.3 0.99
CII 15.1 21.8 1.44
CIII 9.2 13.4 1.46
5. SUMMARY OF THE EXPERIMENTAL
RESULTS
5.1. Effectiveness of the Proposed Strengthening
Technique
Lateral load vs. displacement curves given in
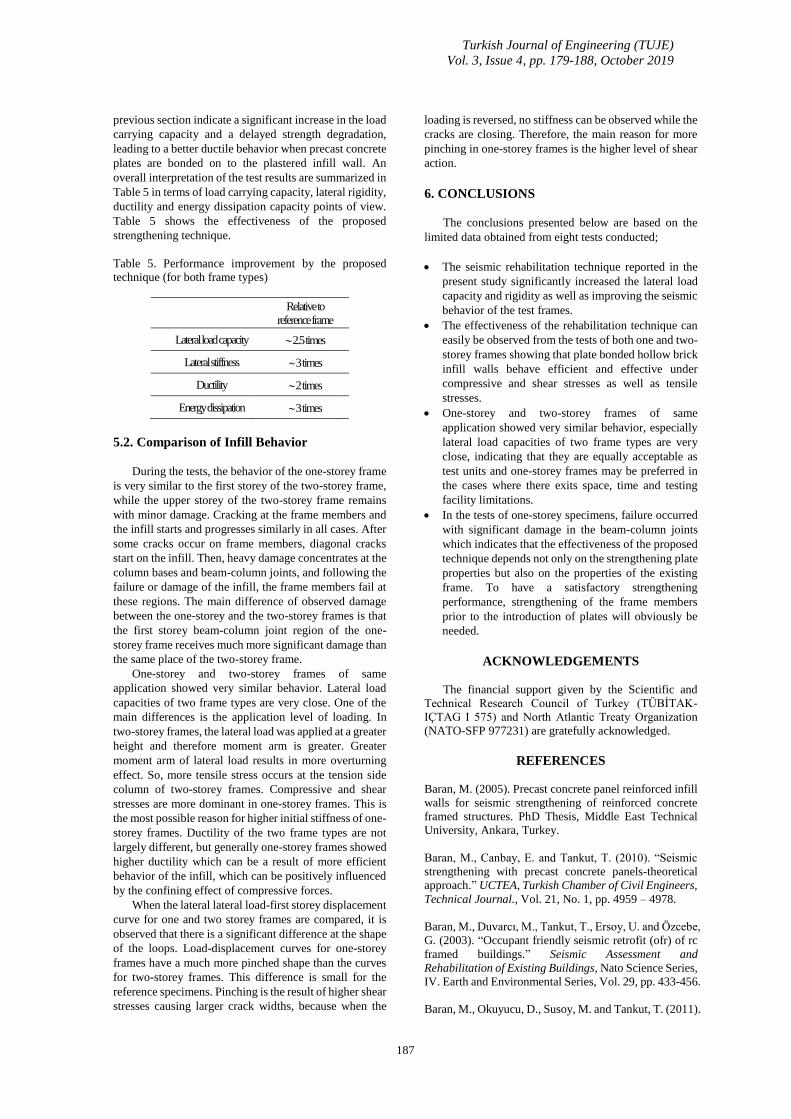
Turkish Journal of Engineering (TUJE)
Vol. 3, Issue 4, pp. 179-188, October 2019
187
previous section indicate a significant increase in the load
carrying capacity and a delayed strength degradation,
leading to a better ductile behavior when precast concrete
plates are bonded on to the plastered infill wall. An
overall interpretation of the test results are summarized in
Table 5 in terms of load carrying capacity, lateral rigidity,
ductility and energy dissipation capacity points of view.
Table 5 shows the effectiveness of the proposed
strengthening technique.
Table 5. Performance improvement by the proposed
technique (for both frame types)
Relative to
reference frame
Lateral load capacity 2.5 times
Lateral stiffness 3 times
Ductility 2 times
Energy dissipation 3 times
5.2. Comparison of Infill Behavior
During the tests, the behavior of the one-storey frame
is very similar to the first storey of the two-storey frame,
while the upper storey of the two-storey frame remains
with minor damage. Cracking at the frame members and
the infill starts and progresses similarly in all cases. After
some cracks occur on frame members, diagonal cracks
start on the infill. Then, heavy damage concentrates at the
column bases and beam-column joints, and following the
failure or damage of the infill, the frame members fail at
these regions. The main difference of observed damage
between the one-storey and the two-storey frames is that
the first storey beam-column joint region of the one-
storey frame receives much more significant damage than
the same place of the two-storey frame.
One-storey and two-storey frames of same
application showed very similar behavior. Lateral load
capacities of two frame types are very close. One of the
main differences is the application level of loading. In
two-storey frames, the lateral load was applied at a greater
height and therefore moment arm is greater. Greater
moment arm of lateral load results in more overturning
effect. So, more tensile stress occurs at the tension side
column of two-storey frames. Compressive and shear
stresses are more dominant in one-storey frames. This is
the most possible reason for higher initial stiffness of one-
storey frames. Ductility of the two frame types are not
largely different, but generally one-storey frames showed
higher ductility which can be a result of more efficient
behavior of the infill, which can be positively influenced
by the confining effect of compressive forces.
When the lateral lateral load-first storey displacement
curve for one and two storey frames are compared, it is
observed that there is a significant difference at the shape
of the loops. Load-displacement curves for one-storey
frames have a much more pinched shape than the curves
for two-storey frames. This difference is small for the
reference specimens. Pinching is the result of higher shear
stresses causing larger crack widths, because when the
loading is reversed, no stiffness can be observed while the
cracks are closing. Therefore, the main reason for more
pinching in one-storey frames is the higher level of shear
action.
6. CONCLUSIONS
The conclusions presented below are based on the
limited data obtained from eight tests conducted;
• The seismic rehabilitation technique reported in the
present study significantly increased the lateral load
capacity and rigidity as well as improving the seismic
behavior of the test frames.
• The effectiveness of the rehabilitation technique can
easily be observed from the tests of both one and two-
storey frames showing that plate bonded hollow brick
infill walls behave efficient and effective under
compressive and shear stresses as well as tensile
stresses.
• One-storey and two-storey frames of same
application showed very similar behavior, especially
lateral load capacities of two frame types are very
close, indicating that they are equally acceptable as
test units and one-storey frames may be preferred in
the cases where there exits space, time and testing
facility limitations.
• In the tests of one-storey specimens, failure occurred
with significant damage in the beam-column joints
which indicates that the effectiveness of the proposed
technique depends not only on the strengthening plate
properties but also on the properties of the existing
frame. To have a satisfactory strengthening
performance, strengthening of the frame members
prior to the introduction of plates will obviously be
needed.
ACKNOWLEDGEMENTS
The financial support given by the Scientific and
Technical Research Council of Turkey (TÜBİTAK-
IÇTAG I 575) and North Atlantic Treaty Organization
(NATO-SFP 977231) are gratefully acknowledged.
REFERENCES
Baran, M. (2005). Precast concrete panel reinforced infill
walls for seismic strengthening of reinforced concrete
framed structures. PhD Thesis, Middle East Technical
University, Ankara, Turkey.
Baran, M., Canbay, E. and Tankut, T. (2010). “Seismic
strengthening with precast concrete panels-theoretical
approach.” UCTEA, Turkish Chamber of Civil Engineers,
Technical Journal., Vol. 21, No. 1, pp. 4959 – 4978.
Baran, M., Duvarcı, M., Tankut, T., Ersoy, U. and Özcebe,
G. (2003). “Occupant friendly seismic retrofit (ofr) of rc
framed buildings.” Seismic Assessment and
Rehabilitation of Existing Buildings, Nato Science Series,
IV. Earth and Environmental Series, Vol. 29, pp. 433-456.
Baran, M., Okuyucu, D., Susoy, M. and Tankut, T. (2011).

Turkish Journal of Engineering (TUJE)
Vol. 3, Issue 4, pp. 179-188, October 2019
188
“Seismic strengthening of R/C frames by precast concrete
panels.” Magazine of Concrete Research, Vol. 63, No. 5,
pp. 321-332.
Baran, M., Susoy, M. and Tankut, T. (2011).
“Strengthening of deficient RC frames with high strength
concrete panels : an experimental study.” Structural
Engineering and Mechanics, Vol. 37, No. 2, pp. 177-196.
Baran, M. and Tankut, T. (2011). “Experimental study on
seismic strengthening of RC frames by precast concrete
panels” ACI Structural Journal, Vol. 108, No. 2, pp. 227-
237.
Frosch, R.J., (1996). Seismic rehabilitation using precast
infill walls. PhD Thesis, The University of Texas at
Austin, USA.
Frosch, R..J., (1999). “Panel Connections for Precast
Concrete Infill Walls.” ACI Structural Journal, Vol. 96,
No. 4, pp. 467-474.
Frosch, R.J., Li, W., Jirsa, J.O. and Kreger, M.E. (1996).
“Retrofit of non-ductile moment-resisting frames using
precast infill wall panels.” Earthquake Spectra, Vol. 12,
No. 4, pp. 741-760.
Frosch, R.J., Li, W., Kreger, M.E. and Jirsa, J.O. (1996).
“Seismic strengthening of a nonductile rc frame using
precast infill panels.” Eleventh World Conference on
Earthquake Engineering, Acapulco, Mexico.
Han, T. S., Feenstra, P. H. and Billington, S. L. (2003).
“Simulation of highly ductile fiber-reinforced cement-
based composite components under cyclic loading.” ACI
Structural Journal, Vol. 100, No. 6, pp. 749-757.
Hanson, R.D. (1980). “Repair and strengthening of
buildings.” Proceedings of the 7th WCEE, İstanbul,
Turkey, Vol. 9, pp.71-74.
Isao, M., Hiroshi, T. and Ryoji, H.A. (1999). “A Seismic
Strengthening Method for Existing R/C Buildings by
Shear Walls Installed Precast Concrete Panel.” Japan
Science and Technology Agency, Concrete Journal, Vol.
37, No. 11, pp. 20-26.
Kahn, L.F., Hanson, R.D. (1979). “infilled walls for
earthquake strengthening.” Proc. of the ASCE, Vol. 105
(ST2), pp. 283-296.
Kaldjian, M.J. and Yuzugullu, O. (1983). “Efficiency of
bolt connected shear panels to strengthen building
structures.” The First International Conference on
Concrete Technology for Developing Countries,
Yarmouk University, 16-19 Oct., Irbid, Jordan.
Kanda, T., Watanabe, W., Li, V. C. (1998). “Application
of pseudo strain hardening cementitious composites to
shear resistant structural elements.” Fracture Mechanics
of Concrete Structures. Proceedings of FRAMCOS-3,
Freiburg, Germany, pp. 1477-1490.
Kesner, K., E. (2003). Development of seismic
strengthening and retrofit strategies for critical facilities
using engineered cementitious composite materials. PhD
Dissertation, Cornell University, Ithaca, NY.
Kesner, K. E., Billington, S. L. and Douglas, K., S. (2003).
“Cyclic response of highly ductile fiber-reinforced
cement-based composites.” ACI Materials Journal, Vol.
100, No. 5, pp. 381-390.
Kesner, K. and Billington, S.L. (2005). “Investigation of
infill panels made from engineered cementitious
composites for seismic strengthening and retrofit.” ASCE
Journal of Structural Engineering, Vol. 131, No. 11, pp.
712-1720.
Kesner, K. E. and Billington, S. L. (2001). “Investigation
of ductile cementbased composites for seismic
strengthening and retrofit.” Fracture Mechanics of
Concrete Structures, de Borst et al (eds), Swats &
Zaltlinger, Lisse, pp. 65-72.
Li, W. (1997). Experimental evaluation and computer
simulation of post tensioned precast infill wall system.
PhD Thesis, The University of Texas at Austin, USA.
Matsumoto, T. (1998). “Structural Performance of SRC
Multi-storey Shear Walls with Infilled Precast Concrete
Panels.” Japan Concrete Institute, Tokyo.
Nakashima, M., (1995). “Strain hardening behavior of
shear panels made of low-yield steel, I: test.” Journal of
Structural Engineering, Vol. 121, No. 12, pp. 1742-1749.
Phan, T.L., Cheok, S.G. and Todd, R.D. (1995).
“Strengthening methodology for lightly reinforced
concrete specimens.” Recommended Guidelines for
Strengthening With Infill Walls. Building and Fire
Research Laboratory, National Institute of Standards and
Technology (NIST), Gaithersburg.
Roberts, T. M. (1995). “Seismic resistance of steel plate
shear walls.” Engineering Structures, Vol. 17, No. 5, pp.
344-351.
Sevil, T., Baran, M. and Canbay, E. (2010). “Tuğla dolgu
duvarlarin B/A çerçeveli yapilarin davranişina etkilerinin
incelenmesi; deneysel ve kuramsal çalişmalar.”
International Journal of Research and Development
(IJERAD), Vol. 2, No.2 pp. 35-42.
Susoy, M. (2004). Seismic strengthening of masonry
infilled R/C frames with precast concrete panel infills.
MSc. Thesis, Middle East Technical University, Ankara,
Turkey.
Tankut, T., Ersoy, U., Özcebe, G., Baran, M. and
Okuyucu, D. (2005). “In service seismic strengthening of
RC framed structures.” Seismic Assessment and
Rehabilitation of Existing Buildings. International
Closing Workshop, NATO Project SfP 977231, Istanbul,
Turkey.
Yuzugullu, O. (1979). “Strengthening of Reinforced
Concrete Frames Damaged by Earthquake Using Precast
Panel Elements.” Turkish Scientific and Technical
Council, Project No. MAG-494 (in Turkish), Ankara,
Turkey.

Turkish Journal of Engineering
189
Turkish Journal of Engineering (TUJE)
Vol. 3, Issue 4, pp. 189-196, October 2019
ISSN 2587-1366, Turkey
DOI: 10.31127/tuje.537871
Research Article
LOGIC THRESHOLD FOR MICRORING RESONATOR-BASED BDD
CIRCUITS: PHYSICAL AND OPERATIONAL ANALYSES
Ozan Yakar *1 and İlke Ercan 2
1 Boğaziçi University, Engineering Faculty, Electrical & Electronics Engineering Department, İstanbul, Turkey
ORCID ID 0000-0003-1357-8920
2 Boğaziçi University, Engineering Faculty, Electrical & Electronics Engineering Department, İstanbul, Turkey
ORCID ID 0000-0003-1339-9703
* Corresponding Author
Received: 10/03/2019 Accepted: 18/06/2019
ABSTRACT
Moore’s Law has been the fuel of expansive innovation in computing. The chip industry kept the Moore’s law extant for
almost four decades. However, the halt of the rapid progress of the silicon technology is incipient by reason of the physical
limitations. Emerging computing proposals suggest several alternatives to current computing paradigms and technology-
bases. The photonic circuitry is one of the most promising candidates with its high operation speed, energy efficient passive
components, low crosstalk and appropriateness for parallel computation. Among various approaches to photonic logic,
microring resonator-based Binary-Decision Diagram (BDD) architectures have a special place due to their small circuit
footprint. However, the physical limitations imposed on their logic implementation has not been studied in depth to enable
design of efficient circuits. In this paper, we study the physical structure and operational details of a microring resonator-
based Half-Adder (HA) circuit and outline the conditions under which the performance and accuracy of information
processing is compromised due to its physical characteristics. Our analyses significantly contribute to determining key
physical features and operations concerning logic implementation of microring resonator based BDD HA, which informs
the future design and operational optimization of the microring resonator-based BDD logic circuits.
Keywords: Binary Decision Diagrams, Ring Resonators, Optical Processing, Photonic Logic
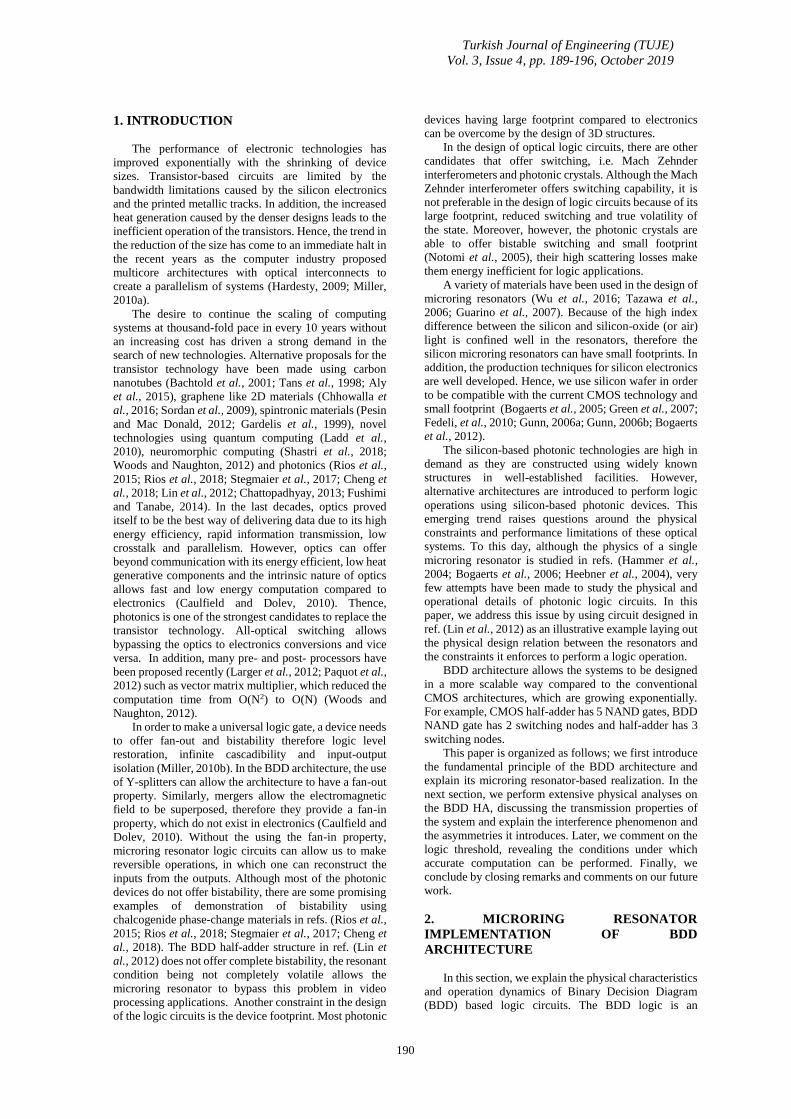
Turkish Journal of Engineering (TUJE)
Vol. 3, Issue 4, pp. 189-196, October 2019
190
1. INTRODUCTION
The performance of electronic technologies has
improved exponentially with the shrinking of device
sizes. Transistor-based circuits are limited by the
bandwidth limitations caused by the silicon electronics
and the printed metallic tracks. In addition, the increased
heat generation caused by the denser designs leads to the
inefficient operation of the transistors. Hence, the trend in
the reduction of the size has come to an immediate halt in
the recent years as the computer industry proposed
multicore architectures with optical interconnects to
create a parallelism of systems (Hardesty, 2009; Miller,
2010a).
The desire to continue the scaling of computing
systems at thousand-fold pace in every 10 years without
an increasing cost has driven a strong demand in the
search of new technologies. Alternative proposals for the
transistor technology have been made using carbon
nanotubes (Bachtold et al., 2001; Tans et al., 1998; Aly
et al., 2015), graphene like 2D materials (Chhowalla et
al., 2016; Sordan et al., 2009), spintronic materials (Pesin
and Mac Donald, 2012; Gardelis et al., 1999), novel
technologies using quantum computing (Ladd et al.,
2010), neuromorphic computing (Shastri et al., 2018;
Woods and Naughton, 2012) and photonics (Rios et al.,
2015; Rios et al., 2018; Stegmaier et al., 2017; Cheng et
al., 2018; Lin et al., 2012; Chattopadhyay, 2013; Fushimi
and Tanabe, 2014). In the last decades, optics proved
itself to be the best way of delivering data due to its high
energy efficiency, rapid information transmission, low
crosstalk and parallelism. However, optics can offer
beyond communication with its energy efficient, low heat
generative components and the intrinsic nature of optics
allows fast and low energy computation compared to
electronics (Caulfield and Dolev, 2010). Thence,
photonics is one of the strongest candidates to replace the
transistor technology. All-optical switching allows
bypassing the optics to electronics conversions and vice
versa. In addition, many pre- and post- processors have
been proposed recently (Larger et al., 2012; Paquot et al.,
2012) such as vector matrix multiplier, which reduced the
computation time from O(N2) to O(N) (Woods and
Naughton, 2012).
In order to make a universal logic gate, a device needs
to offer fan-out and bistability therefore logic level
restoration, infinite cascadibility and input-output
isolation (Miller, 2010b). In the BDD architecture, the use
of Y-splitters can allow the architecture to have a fan-out
property. Similarly, mergers allow the electromagnetic
field to be superposed, therefore they provide a fan-in
property, which do not exist in electronics (Caulfield and
Dolev, 2010). Without the using the fan-in property,
microring resonator logic circuits can allow us to make
reversible operations, in which one can reconstruct the
inputs from the outputs. Although most of the photonic
devices do not offer bistability, there are some promising
examples of demonstration of bistability using
chalcogenide phase-change materials in refs. (Rios et al.,
2015; Rios et al., 2018; Stegmaier et al., 2017; Cheng et
al., 2018). The BDD half-adder structure in ref. (Lin et
al., 2012) does not offer complete bistability, the resonant
condition being not completely volatile allows the
microring resonator to bypass this problem in video
processing applications. Another constraint in the design
of the logic circuits is the device footprint. Most photonic
devices having large footprint compared to electronics
can be overcome by the design of 3D structures.
In the design of optical logic circuits, there are other
candidates that offer switching, i.e. Mach Zehnder
interferometers and photonic crystals. Although the Mach
Zehnder interferometer offers switching capability, it is
not preferable in the design of logic circuits because of its
large footprint, reduced switching and true volatility of
the state. Moreover, however, the photonic crystals are
able to offer bistable switching and small footprint
(Notomi et al., 2005), their high scattering losses make
them energy inefficient for logic applications.
A variety of materials have been used in the design of
microring resonators (Wu et al., 2016; Tazawa et al.,
2006; Guarino et al., 2007). Because of the high index
difference between the silicon and silicon-oxide (or air)
light is confined well in the resonators, therefore the
silicon microring resonators can have small footprints. In
addition, the production techniques for silicon electronics
are well developed. Hence, we use silicon wafer in order
to be compatible with the current CMOS technology and
small footprint (Bogaerts et al., 2005; Green et al., 2007;
Fedeli, et al., 2010; Gunn, 2006a; Gunn, 2006b; Bogaerts
et al., 2012).
The silicon-based photonic technologies are high in
demand as they are constructed using widely known
structures in well-established facilities. However,
alternative architectures are introduced to perform logic
operations using silicon-based photonic devices. This
emerging trend raises questions around the physical
constraints and performance limitations of these optical
systems. To this day, although the physics of a single
microring resonator is studied in refs. (Hammer et al.,
2004; Bogaerts et al., 2006; Heebner et al., 2004), very
few attempts have been made to study the physical and
operational details of photonic logic circuits. In this
paper, we address this issue by using circuit designed in
ref. (Lin et al., 2012) as an illustrative example laying out
the physical design relation between the resonators and
the constraints it enforces to perform a logic operation.
BDD architecture allows the systems to be designed
in a more scalable way compared to the conventional
CMOS architectures, which are growing exponentially.
For example, CMOS half-adder has 5 NAND gates, BDD
NAND gate has 2 switching nodes and half-adder has 3
switching nodes.
This paper is organized as follows; we first introduce
the fundamental principle of the BDD architecture and
explain its microring resonator-based realization. In the
next section, we perform extensive physical analyses on
the BDD HA, discussing the transmission properties of
the system and explain the interference phenomenon and
the asymmetries it introduces. Later, we comment on the
logic threshold, revealing the conditions under which
accurate computation can be performed. Finally, we
conclude by closing remarks and comments on our future
work.
2. MICRORING RESONATOR
IMPLEMENTATION OF BDD
ARCHITECTURE
In this section, we explain the physical characteristics
and operation dynamics of Binary Decision Diagram
(BDD) based logic circuits. The BDD logic is an
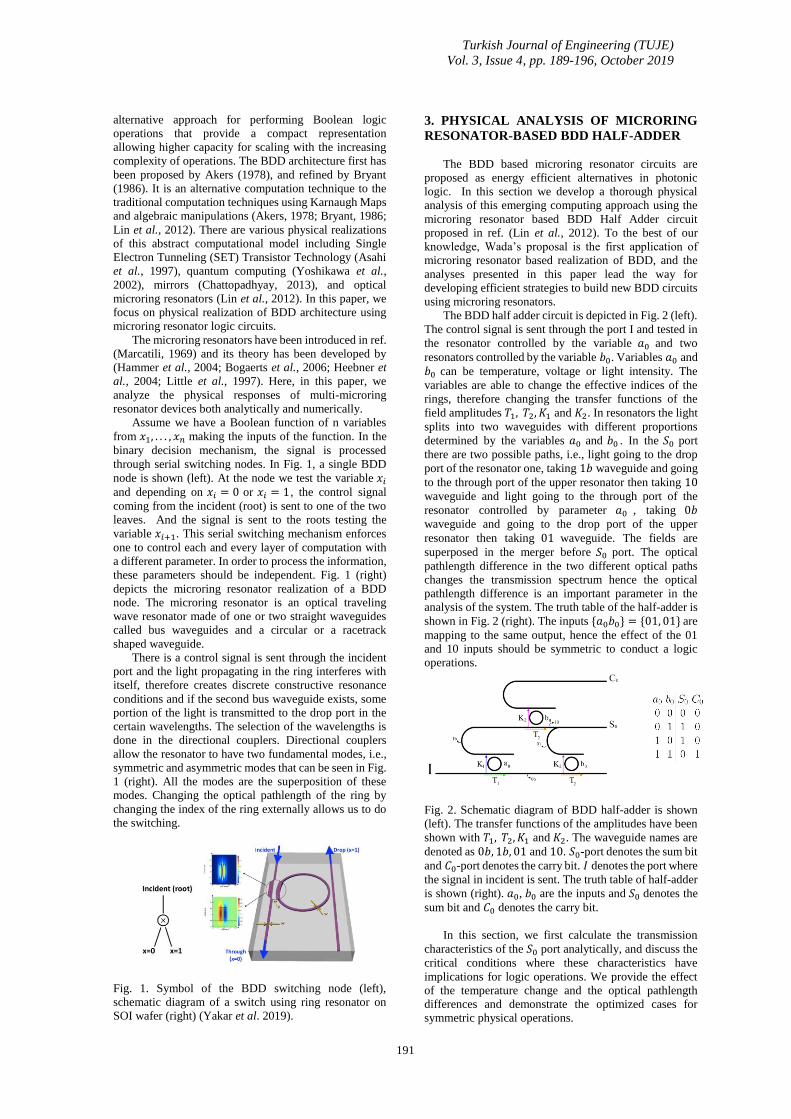
Turkish Journal of Engineering (TUJE)
Vol. 3, Issue 4, pp. 189-196, October 2019
191
alternative approach for performing Boolean logic
operations that provide a compact representation
allowing higher capacity for scaling with the increasing
complexity of operations. The BDD architecture first has
been proposed by Akers (1978), and refined by Bryant
(1986). It is an alternative computation technique to the
traditional computation techniques using Karnaugh Maps
and algebraic manipulations (Akers, 1978; Bryant, 1986;
Lin et al., 2012). There are various physical realizations
of this abstract computational model including Single
Electron Tunneling (SET) Transistor Technology (Asahi
et al., 1997), quantum computing (Yoshikawa et al.,
2002), mirrors (Chattopadhyay, 2013), and optical
microring resonators (Lin et al., 2012). In this paper, we
focus on physical realization of BDD architecture using
microring resonator logic circuits.
The microring resonators have been introduced in ref.
(Marcatili, 1969) and its theory has been developed by
(Hammer et al., 2004; Bogaerts et al., 2006; Heebner et
al., 2004; Little et al., 1997). Here, in this paper, we
analyze the physical responses of multi-microring
resonator devices both analytically and numerically.
Assume we have a Boolean function of n variables
from 𝑥1, . . . , 𝑥𝑛 making the inputs of the function. In the
binary decision mechanism, the signal is processed
through serial switching nodes. In Fig. 1, a single BDD
node is shown (left). At the node we test the variable 𝑥𝑖
and depending on 𝑥𝑖 = 0 or 𝑥𝑖 = 1, the control signal
coming from the incident (root) is sent to one of the two
leaves. And the signal is sent to the roots testing the
variable 𝑥𝑖+1. This serial switching mechanism enforces
one to control each and every layer of computation with
a different parameter. In order to process the information,
these parameters should be independent. Fig. 1 (right)
depicts the microring resonator realization of a BDD
node. The microring resonator is an optical traveling
wave resonator made of one or two straight waveguides
called bus waveguides and a circular or a racetrack
shaped waveguide.
There is a control signal is sent through the incident
port and the light propagating in the ring interferes with
itself, therefore creates discrete constructive resonance
conditions and if the second bus waveguide exists, some
portion of the light is transmitted to the drop port in the
certain wavelengths. The selection of the wavelengths is
done in the directional couplers. Directional couplers
allow the resonator to have two fundamental modes, i.e.,
symmetric and asymmetric modes that can be seen in Fig.
1 (right). All the modes are the superposition of these
modes. Changing the optical pathlength of the ring by
changing the index of the ring externally allows us to do
the switching.
Fig. 1. Symbol of the BDD switching node (left),
schematic diagram of a switch using ring resonator on
SOI wafer (right) (Yakar et al. 2019).
3. PHYSICAL ANALYSIS OF MICRORING
RESONATOR-BASED BDD HALF-ADDER
The BDD based microring resonator circuits are
proposed as energy efficient alternatives in photonic
logic. In this section we develop a thorough physical
analysis of this emerging computing approach using the
microring resonator based BDD Half Adder circuit
proposed in ref. (Lin et al., 2012). To the best of our
knowledge, Wada’s proposal is the first application of
microring resonator based realization of BDD, and the
analyses presented in this paper lead the way for
developing efficient strategies to build new BDD circuits
using microring resonators.
The BDD half adder circuit is depicted in Fig. 2 (left).
The control signal is sent through the port I and tested in
the resonator controlled by the variable 𝑎0 and two
resonators controlled by the variable 𝑏0. Variables 𝑎0 and
𝑏0 can be temperature, voltage or light intensity. The
variables are able to change the effective indices of the
rings, therefore changing the transfer functions of the
field amplitudes 𝑇1, 𝑇2, 𝐾1 and 𝐾2. In resonators the light
splits into two waveguides with different proportions
determined by the variables 𝑎0 and 𝑏0 . In the 𝑆0 port
there are two possible paths, i.e., light going to the drop
port of the resonator one, taking 1𝑏 waveguide and going
to the through port of the upper resonator then taking 10
waveguide and light going to the through port of the
resonator controlled by parameter 𝑎0 , taking 0𝑏
waveguide and going to the drop port of the upper
resonator then taking 01 waveguide. The fields are
superposed in the merger before 𝑆0 port. The optical
pathlength difference in the two different optical paths
changes the transmission spectrum hence the optical
pathlength difference is an important parameter in the
analysis of the system. The truth table of the half-adder is
shown in Fig. 2 (right). The inputs {𝑎0𝑏0} = {01, 01} are
mapping to the same output, hence the effect of the 01
and 10 inputs should be symmetric to conduct a logic
operations.
Fig. 2. Schematic diagram of BDD half-adder is shown
(left). The transfer functions of the amplitudes have been
shown with 𝑇1, 𝑇2, 𝐾1 and 𝐾2. The waveguide names are
denoted as 0𝑏, 1𝑏, 01 and 10. 𝑆0-port denotes the sum bit
and 𝐶0-port denotes the carry bit. 𝐼 denotes the port where
the signal in incident is sent. The truth table of half-adder
is shown (right). 𝑎0, 𝑏0 are the inputs and 𝑆0 denotes the
sum bit and 𝐶0 denotes the carry bit.
In this section, we first calculate the transmission
characteristics of the 𝑆0 port analytically, and discuss the
critical conditions where these characteristics have
implications for logic operations. We provide the effect
of the temperature change and the optical pathlength
differences and demonstrate the optimized cases for
symmetric physical operations.
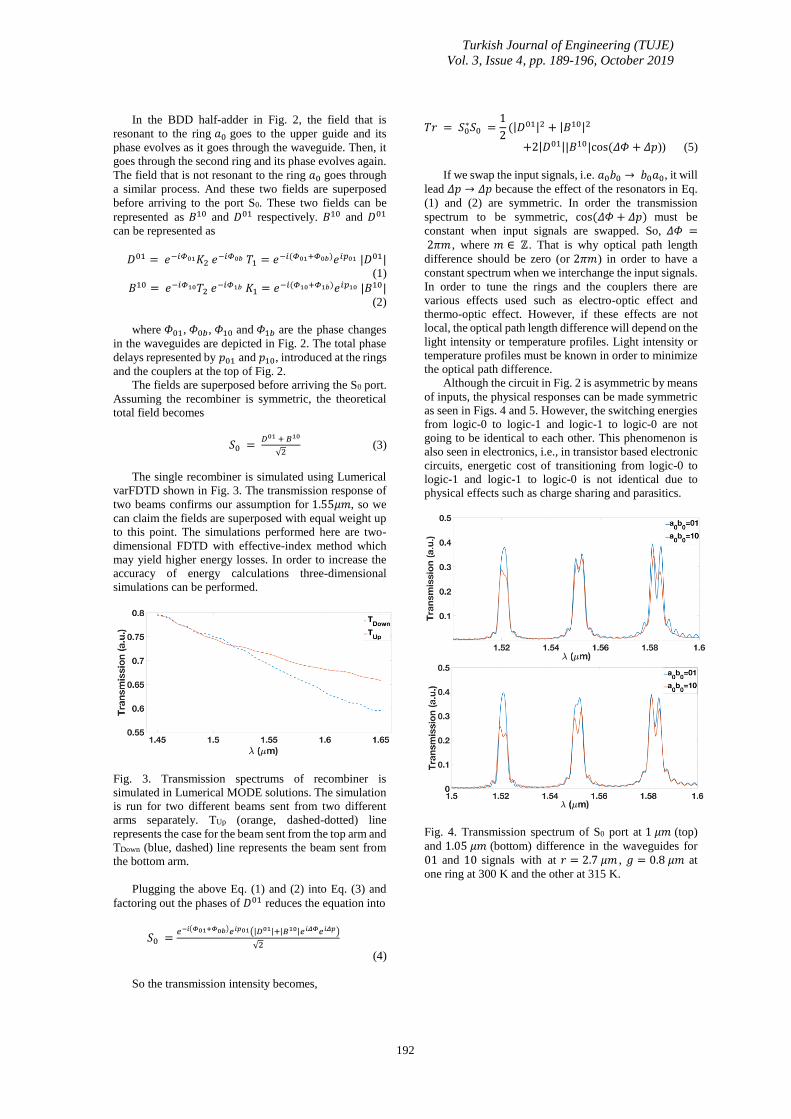
Turkish Journal of Engineering (TUJE)
Vol. 3, Issue 4, pp. 189-196, October 2019
192
In the BDD half-adder in Fig. 2, the field that is
resonant to the ring 𝑎0 goes to the upper guide and its
phase evolves as it goes through the waveguide. Then, it
goes through the second ring and its phase evolves again.
The field that is not resonant to the ring 𝑎0 goes through
a similar process. And these two fields are superposed
before arriving to the port S0. These two fields can be
represented as 𝐵10 and 𝐷01 respectively. 𝐵10 and 𝐷01
can be represented as
𝐷01 = 𝑒−𝑖𝛷01𝐾2 𝑒−𝑖𝛷0𝑏 𝑇1 = 𝑒−𝑖(𝛷01+𝛷0𝑏)𝑒𝑖𝑝01 |𝐷01| (1)
𝐵10 = 𝑒−𝑖𝛷10𝑇2 𝑒−𝑖𝛷1𝑏 𝐾1 = 𝑒−𝑖(𝛷10+𝛷1𝑏)𝑒𝑖𝑝10 |𝐵10| (2)
where 𝛷01, 𝛷0𝑏, 𝛷10 and 𝛷1𝑏 are the phase changes
in the waveguides are depicted in Fig. 2. The total phase
delays represented by 𝑝01 and 𝑝10, introduced at the rings
and the couplers at the top of Fig. 2.
The fields are superposed before arriving the S0 port.
Assuming the recombiner is symmetric, the theoretical
total field becomes
𝑆0 = 𝐷01 + 𝐵10
√2 (3)
The single recombiner is simulated using Lumerical
varFDTD shown in Fig. 3. The transmission response of
two beams confirms our assumption for 1.55𝜇𝑚, so we
can claim the fields are superposed with equal weight up
to this point. The simulations performed here are two-
dimensional FDTD with effective-index method which
may yield higher energy losses. In order to increase the
accuracy of energy calculations three-dimensional
simulations can be performed.
Fig. 3. Transmission spectrums of recombiner is
simulated in Lumerical MODE solutions. The simulation
is run for two different beams sent from two different
arms separately. TUp (orange, dashed-dotted) line
represents the case for the beam sent from the top arm and
TDown (blue, dashed) line represents the beam sent from
the bottom arm.
Plugging the above Eq. (1) and (2) into Eq. (3) and
factoring out the phases of 𝐷01 reduces the equation into
𝑆0 =𝑒−𝑖(𝛷01+𝛷0𝑏)𝑒𝑖𝑝01(|𝐷01|+|𝐵10|𝑒𝑖𝛥𝛷𝑒𝑖𝛥𝑝)
√2
(4)
So the transmission intensity becomes,
𝑇𝑟 = 𝑆0∗𝑆0 =
1
2(|𝐷01|2 + |𝐵10|2
+2|𝐷01||𝐵10|cos (𝛥𝛷 + 𝛥𝑝)) (5)
If we swap the input signals, i.e. 𝑎0𝑏0 → 𝑏0𝑎0, it will
lead 𝛥𝑝 → 𝛥𝑝 because the effect of the resonators in Eq.
(1) and (2) are symmetric. In order the transmission
spectrum to be symmetric, cos (𝛥𝛷 + 𝛥𝑝) must be
constant when input signals are swapped. So, 𝛥𝛷 = 2𝜋𝑚 , where 𝑚 ∈ ℤ. That is why optical path length
difference should be zero (or 2𝜋𝑚) in order to have a
constant spectrum when we interchange the input signals.
In order to tune the rings and the couplers there are
various effects used such as electro-optic effect and
thermo-optic effect. However, if these effects are not
local, the optical path length difference will depend on the
light intensity or temperature profiles. Light intensity or
temperature profiles must be known in order to minimize
the optical path difference.
Although the circuit in Fig. 2 is asymmetric by means
of inputs, the physical responses can be made symmetric
as seen in Figs. 4 and 5. However, the switching energies
from logic-0 to logic-1 and logic-1 to logic-0 are not
going to be identical to each other. This phenomenon is
also seen in electronics, i.e., in transistor based electronic
circuits, energetic cost of transitioning from logic-0 to
logic-1 and logic-1 to logic-0 is not identical due to
physical effects such as charge sharing and parasitics.
Fig. 4. Transmission spectrum of S0 port at 1 𝜇𝑚 (top)
and 1.05 𝜇𝑚 (bottom) difference in the waveguides for
01 and 10 signals with at 𝑟 = 2.7 𝜇𝑚 , 𝑔 = 0.8 𝜇𝑚 at
one ring at 300 K and the other at 315 K.
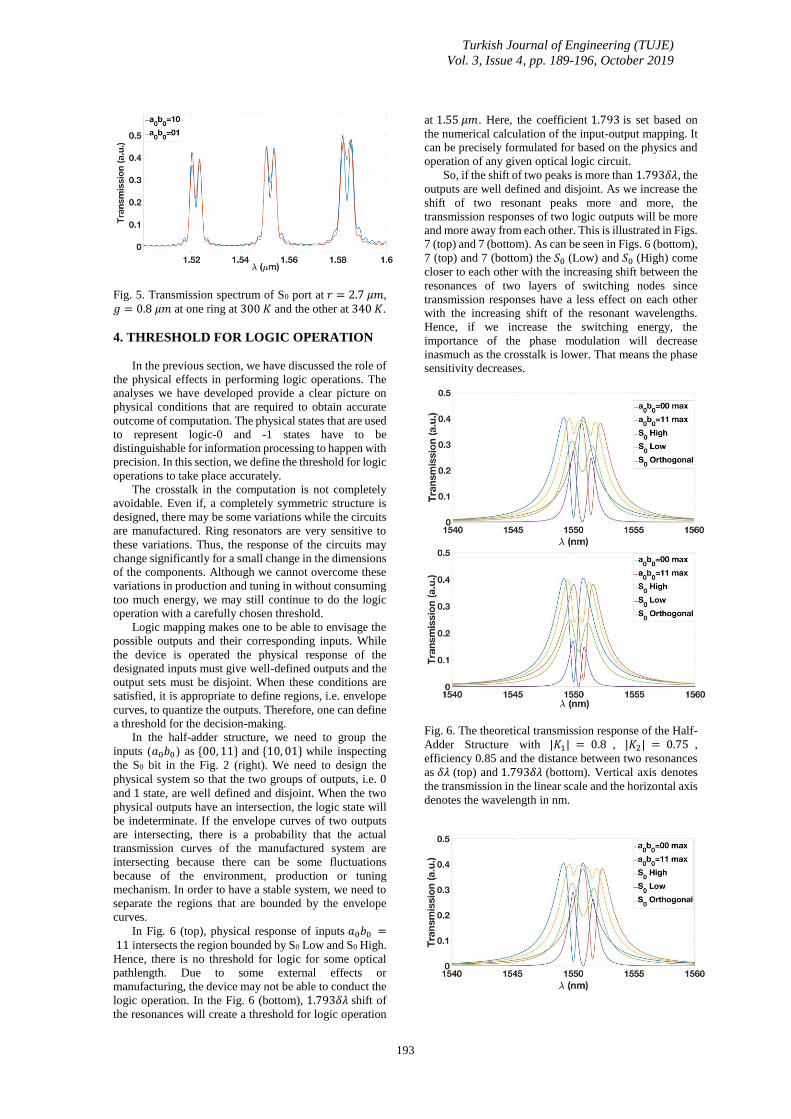
Turkish Journal of Engineering (TUJE)
Vol. 3, Issue 4, pp. 189-196, October 2019
193
Fig. 5. Transmission spectrum of S0 port at 𝑟 = 2.7 𝜇𝑚,
𝑔 = 0.8 𝜇𝑚 at one ring at 300 𝐾 and the other at 340 𝐾.
4. THRESHOLD FOR LOGIC OPERATION
In the previous section, we have discussed the role of
the physical effects in performing logic operations. The
analyses we have developed provide a clear picture on
physical conditions that are required to obtain accurate
outcome of computation. The physical states that are used
to represent logic-0 and -1 states have to be
distinguishable for information processing to happen with
precision. In this section, we define the threshold for logic
operations to take place accurately.
The crosstalk in the computation is not completely
avoidable. Even if, a completely symmetric structure is
designed, there may be some variations while the circuits
are manufactured. Ring resonators are very sensitive to
these variations. Thus, the response of the circuits may
change significantly for a small change in the dimensions
of the components. Although we cannot overcome these
variations in production and tuning in without consuming
too much energy, we may still continue to do the logic
operation with a carefully chosen threshold.
Logic mapping makes one to be able to envisage the
possible outputs and their corresponding inputs. While
the device is operated the physical response of the
designated inputs must give well-defined outputs and the
output sets must be disjoint. When these conditions are
satisfied, it is appropriate to define regions, i.e. envelope
curves, to quantize the outputs. Therefore, one can define
a threshold for the decision-making. In the half-adder structure, we need to group the
inputs (𝑎0𝑏0) as {00, 11} and {10, 01} while inspecting
the S0 bit in the Fig. 2 (right). We need to design the
physical system so that the two groups of outputs, i.e. 0
and 1 state, are well defined and disjoint. When the two
physical outputs have an intersection, the logic state will
be indeterminate. If the envelope curves of two outputs
are intersecting, there is a probability that the actual
transmission curves of the manufactured system are
intersecting because there can be some fluctuations
because of the environment, production or tuning
mechanism. In order to have a stable system, we need to
separate the regions that are bounded by the envelope
curves.
In Fig. 6 (top), physical response of inputs 𝑎0𝑏0 = 11 intersects the region bounded by S0 Low and S0 High.
Hence, there is no threshold for logic for some optical
pathlength. Due to some external effects or
manufacturing, the device may not be able to conduct the
logic operation. In the Fig. 6 (bottom), 1.793𝛿𝜆 shift of
the resonances will create a threshold for logic operation
at 1.55 𝜇𝑚. Here, the coefficient 1.793 is set based on
the numerical calculation of the input-output mapping. It
can be precisely formulated for based on the physics and
operation of any given optical logic circuit.
So, if the shift of two peaks is more than 1.793𝛿𝜆, the
outputs are well defined and disjoint. As we increase the
shift of two resonant peaks more and more, the
transmission responses of two logic outputs will be more
and more away from each other. This is illustrated in Figs.
7 (top) and 7 (bottom). As can be seen in Figs. 6 (bottom),
7 (top) and 7 (bottom) the 𝑆0 (Low) and 𝑆0 (High) come
closer to each other with the increasing shift between the
resonances of two layers of switching nodes since
transmission responses have a less effect on each other
with the increasing shift of the resonant wavelengths.
Hence, if we increase the switching energy, the
importance of the phase modulation will decrease
inasmuch as the crosstalk is lower. That means the phase
sensitivity decreases.
Fig. 6. The theoretical transmission response of the Half-
Adder Structure with |𝐾1| = 0.8 , |𝐾2| = 0.75 ,
efficiency 0.85 and the distance between two resonances
as 𝛿𝜆 (top) and 1.793𝛿𝜆 (bottom). Vertical axis denotes
the transmission in the linear scale and the horizontal axis
denotes the wavelength in nm.
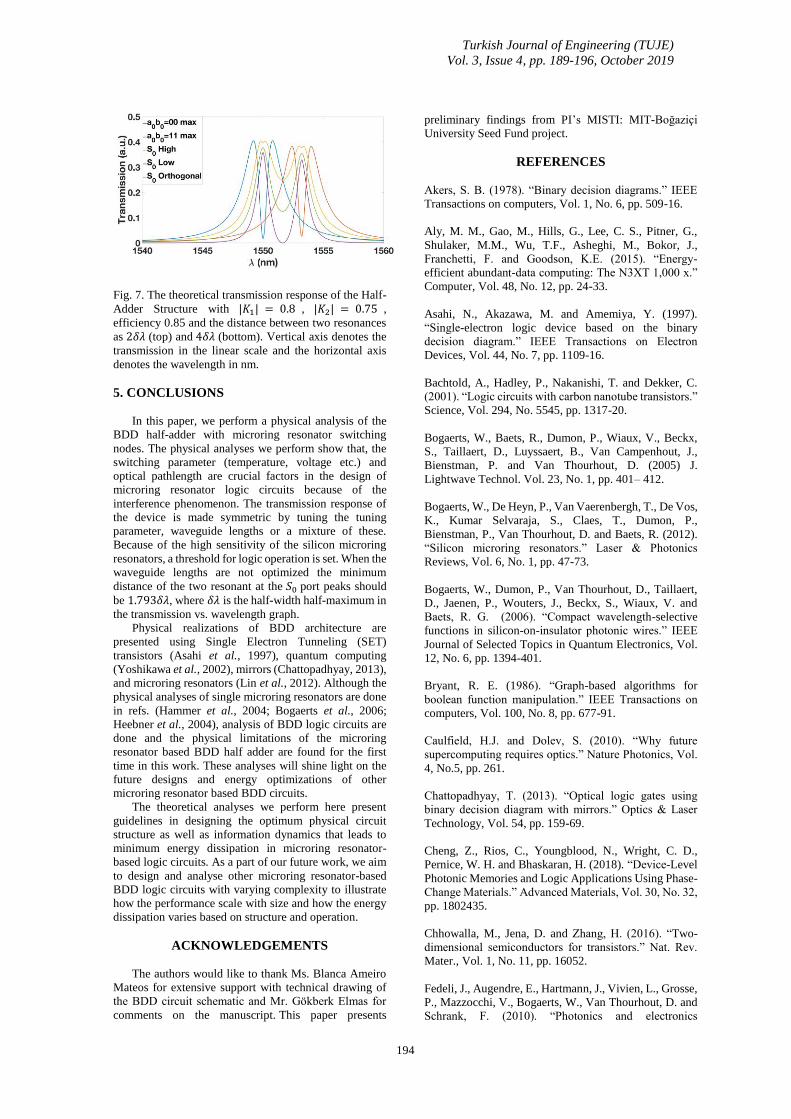
Turkish Journal of Engineering (TUJE)
Vol. 3, Issue 4, pp. 189-196, October 2019
194
Fig. 7. The theoretical transmission response of the Half-
Adder Structure with |𝐾1| = 0.8 , |𝐾2| = 0.75 ,
efficiency 0.85 and the distance between two resonances
as 2𝛿𝜆 (top) and 4𝛿𝜆 (bottom). Vertical axis denotes the
transmission in the linear scale and the horizontal axis
denotes the wavelength in nm.
5. CONCLUSIONS
In this paper, we perform a physical analysis of the
BDD half-adder with microring resonator switching
nodes. The physical analyses we perform show that, the
switching parameter (temperature, voltage etc.) and
optical pathlength are crucial factors in the design of
microring resonator logic circuits because of the
interference phenomenon. The transmission response of
the device is made symmetric by tuning the tuning
parameter, waveguide lengths or a mixture of these.
Because of the high sensitivity of the silicon microring
resonators, a threshold for logic operation is set. When the
waveguide lengths are not optimized the minimum
distance of the two resonant at the 𝑆0 port peaks should
be 1.793𝛿𝜆, where 𝛿𝜆 is the half-width half-maximum in
the transmission vs. wavelength graph.
Physical realizations of BDD architecture are
presented using Single Electron Tunneling (SET)
transistors (Asahi et al., 1997), quantum computing
(Yoshikawa et al., 2002), mirrors (Chattopadhyay, 2013),
and microring resonators (Lin et al., 2012). Although the
physical analyses of single microring resonators are done
in refs. (Hammer et al., 2004; Bogaerts et al., 2006;
Heebner et al., 2004), analysis of BDD logic circuits are
done and the physical limitations of the microring
resonator based BDD half adder are found for the first
time in this work. These analyses will shine light on the
future designs and energy optimizations of other
microring resonator based BDD circuits.
The theoretical analyses we perform here present
guidelines in designing the optimum physical circuit
structure as well as information dynamics that leads to
minimum energy dissipation in microring resonator-
based logic circuits. As a part of our future work, we aim
to design and analyse other microring resonator-based
BDD logic circuits with varying complexity to illustrate
how the performance scale with size and how the energy
dissipation varies based on structure and operation.
ACKNOWLEDGEMENTS
The authors would like to thank Ms. Blanca Ameiro
Mateos for extensive support with technical drawing of
the BDD circuit schematic and Mr. Gökberk Elmas for
comments on the manuscript. This paper presents
preliminary findings from PI’s MISTI: MIT-Boğaziçi
University Seed Fund project.
REFERENCES
Akers, S. B. (1978). “Binary decision diagrams.” IEEE
Transactions on computers, Vol. 1, No. 6, pp. 509-16.
Aly, M. M., Gao, M., Hills, G., Lee, C. S., Pitner, G.,
Shulaker, M.M., Wu, T.F., Asheghi, M., Bokor, J.,
Franchetti, F. and Goodson, K.E. (2015). “Energy-
efficient abundant-data computing: The N3XT 1,000 x.”
Computer, Vol. 48, No. 12, pp. 24-33.
Asahi, N., Akazawa, M. and Amemiya, Y. (1997).
“Single-electron logic device based on the binary
decision diagram.” IEEE Transactions on Electron
Devices, Vol. 44, No. 7, pp. 1109-16.
Bachtold, A., Hadley, P., Nakanishi, T. and Dekker, C.
(2001). “Logic circuits with carbon nanotube transistors.”
Science, Vol. 294, No. 5545, pp. 1317-20.
Bogaerts, W., Baets, R., Dumon, P., Wiaux, V., Beckx,
S., Taillaert, D., Luyssaert, B., Van Campenhout, J.,
Bienstman, P. and Van Thourhout, D. (2005) J.
Lightwave Technol. Vol. 23, No. 1, pp. 401– 412.
Bogaerts, W., De Heyn, P., Van Vaerenbergh, T., De Vos,
K., Kumar Selvaraja, S., Claes, T., Dumon, P.,
Bienstman, P., Van Thourhout, D. and Baets, R. (2012).
“Silicon microring resonators.” Laser & Photonics
Reviews, Vol. 6, No. 1, pp. 47-73.
Bogaerts, W., Dumon, P., Van Thourhout, D., Taillaert,
D., Jaenen, P., Wouters, J., Beckx, S., Wiaux, V. and
Baets, R. G. (2006). “Compact wavelength-selective
functions in silicon-on-insulator photonic wires.” IEEE
Journal of Selected Topics in Quantum Electronics, Vol.
12, No. 6, pp. 1394-401.
Bryant, R. E. (1986). “Graph-based algorithms for
boolean function manipulation.” IEEE Transactions on
computers, Vol. 100, No. 8, pp. 677-91.
Caulfield, H.J. and Dolev, S. (2010). “Why future
supercomputing requires optics.” Nature Photonics, Vol.
4, No.5, pp. 261.
Chattopadhyay, T. (2013). “Optical logic gates using
binary decision diagram with mirrors.” Optics & Laser
Technology, Vol. 54, pp. 159-69.
Cheng, Z., Rios, C., Youngblood, N., Wright, C. D.,
Pernice, W. H. and Bhaskaran, H. (2018). “Device-Level
Photonic Memories and Logic Applications Using Phase-
Change Materials.” Advanced Materials, Vol. 30, No. 32,
pp. 1802435.
Chhowalla, M., Jena, D. and Zhang, H. (2016). “Two-
dimensional semiconductors for transistors.” Nat. Rev.
Mater., Vol. 1, No. 11, pp. 16052.
Fedeli, J., Augendre, E., Hartmann, J., Vivien, L., Grosse,
P., Mazzocchi, V., Bogaerts, W., Van Thourhout, D. and
Schrank, F. (2010). “Photonics and electronics

Turkish Journal of Engineering (TUJE)
Vol. 3, Issue 4, pp. 189-196, October 2019
195
integration in the helios project.” Proc., Proceedings of
the 7th IEEE International Conference on Group IV
Photonics (GFP), Beijing, China, pp. 356–358.
Fushimi, A. and Tanabe, T. (2014). “All-optical logic
gate operating with single wavelength.” Optics express,
Vol. 22, No. 4, pp. 4466-79.
Gardelis, S., Smith, C. G., Barnes, C. H., Linfield, E. H.
and Ritchie, D. A. (1999). “Spin-valve effects in a
semiconductor field-effect transistor: A spintronic
device.” Physical Review B., Vol. 60, No. 11, pp. 7764.
Green, W. M., Rooks, M. J., Sekaric, L. and Vlasov, Y.
A. (2007). “Ultra-compact, low RF power, 10 Gb/s
silicon Mach-Zehnder modulator.” Optics express, Vol.
15, No. 25, pp. 17106-17113.
Guarino, A., Poberaj, G., Rezzonico, D., Degl'Innocenti,
R. and Gunter, P. (2007). “Electro–optically tunable
microring resonators in lithium niobate.” Nature
photonics, Vol. 1, No. 7, pp. 407.
Gunn, C. (2006). “CMOS photonics for high-speed
interconnects.” IEEE micro, Vol. 26, No. 2, pp. 58-66.
Gunn, C. (2006). “Silicon Photonics: Poised to Invade
Local Area Networks." Photonics Spectra, Vol. 40, No. 3,
pp. 62-69.
Hammer, M., Hiremath, K. R. and Stoffer, R. (2004).
“Analytical approaches to the description of optical
microresonator devices.” Proc., AIP conference
proceedings, AIP, Melville, NY, USA, Vol. 709, No. 1,
pp. 48-71.
Hardesty L. MIT News. 2009.,
http://news.mit.edu/2009/optical-computing [Accessed
23 Oct 2018].
Heebner, J. E., Wong, V., Schweinsberg, A., Boyd, R. W.
and Jackson, D. J. (2004). “Optical transmission
characteristics of fiber ring resonators.” IEEE journal of
quantum electronics, Vol. 40, No. 6, pp. 726-30.
Ladd, T. D., Jelezko, F., Laflamme, R., Nakamura, Y.,
Monroe, C. and O'Brien, J. L. (2010). “Quantum
computers.” Nature, Vol. 464, No. 7285, pp. 45.
Larger, L., Soriano, M. C., Brunner, D., Appeltant, L.,
Gutierrez, J. M., Pesquera, L., Mirasso, C. R. and Fischer,
I. (2012). “Photonic information processing beyond
Turing: an optoelectronic implementation of reservoir
computing.” Optics express, Vol. 20, No. 3, pp. 3241-9.
Lin, S., Ishikawa, Y. and Wada, K. (2012).
“Demonstration of optical computing logics based on
binary decision diagram.” Optics Express, Vol. 20, No. 2,
pp. 1378-84.
Little, B. E., Chu, S. T., Haus, H. A., Foresi, J. and Laine,
J. P. (1997). “Microring resonator channel dropping
filters.” Journal of lightwave technology, Vol. 15, No. 6,
pp. 998-1005.
Marcatili, E. A. (1969). “Bends in optical dielectric
guides.” Bell System Technical Journal, Vol. 48, No. 7,
pp. 2103-32.
Miller, D., (2010). “Device requirements for optical
interconnects to CMOS silicon chips.” Proc., Integrated
Photonics Research, Silicon and Nanophotonics,
Monterey, California, USA, pp. PMB3.
Miller, D.A. (2010). “Are optical transistors the logical
next step?” Nature Photonics, Vol. 4, No.1, pp. 3.
Notomi, M., Shinya, A., Mitsugi, S., Kira, G.,
Kuramochi, E. and Tanabe, T. (2005). “Optical bistable
switching action of Si high-Q photonic-crystal
nanocavities.” Optics Express, Vol. 13, No. 7, pp. 2678-
87.
Paquot, Y., Duport, F., Smerieri, A., Dambre, J.,
Schrauwen, B., Haelterman, M. and Massar, S. (2012).
“Optoelectronic reservoir computing.” Scientific reports,
Vol. 2, pp. 287.
Pesin, D. and MacDonald, A. H. (2012). “Spintronics and
pseudospintronics in graphene and topological
insulators.” Nat. Mater., Vol. 11, No. 5, pp. 409.
Rios, C., Stegmaier, M., Cheng, Z., Youngblood, N.,
Wright, C. D., Pernice, W. H. and Bhaskaran, H. (2018).
“Controlled switching of phase-change materials by
evanescent-field coupling in integrated photonics.”
Optical Materials Express, Vol. 8, No. 9, pp. 2455-70.
Rios, C., Stegmaier, M., Hosseini, P., Wang, D., Scherer,
T., Wright, C. D., Bhaskaran, H. and Pernice, W. H.
(2015). “Integrated all-photonic non-volatile multi-level
memory.” Nature Photonics, Vol. 9, No. 11, pp. 725.
Shastri, B. J., Tait, A. N., Ferreira de Lima, T., Nahmias,
M. A., Peng, H. T. and Prucnal, P. R. (2018). Principles
of neuromorphic photonics. Unconventional Computing:
A Volume in the Encyclopedia of Complexity and
Systems Science, Second Edition, Springer Berlin,
Heidelberg, Germany, pp. 83-118.
Sordan, R., Traversi, F. and Russo, V. (2009). “Logic
gates with a single graphene transistor.” Applied Physics
Letters, Vol. 94, No. 7, pp. 51.
Stegmaier, M., Rios, C., Bhaskaran, H., Wright, C. D. and
Pernice, W. H. (2017). “Nonvolatile All‐Optical 1× 2
Switch for Chipscale Photonic Networks.” Advanced
Optical Materials, Vol. 5, No. 1, pp. 1600346.
Tans S. J., Verschueren, A.R. and Dekker C. (1998).
“Room-temperature transistor based on a single carbon
nanotube.” Nature, Vol. 393, No. 6680, pp. 49.
Tazawa, H., Kuo, Y. H., Dunayevskiy, I., Luo, J., Jen, A.
K., Fetterman, H. R. and Steier, W. H. (2006) “Ring
resonator-based electrooptic polymer traveling-wave
modulator.” Journal of lightwave technology, Vol. 24,
No. 9, pp. 3514.

Turkish Journal of Engineering (TUJE)
Vol. 3, Issue 4, pp. 189-196, October 2019
196
Woods, D. and Naughton, T. J. (2012). “Optical
computing: Photonic neural networks.” Nature Physics,
Vol. 8, No.4, pp. 257.
Wu, Z., Chen, Y., Xu, P., Shao, Z., Zhang, T., Zhang, Y.,
Liu, L., Yang,C., Zhou, L., Chen, H. and Yu, S. (2016).
“Graphene-on-silicon nitride microring resonators with
high modulation depth.” Proc., Asia Communications and
Photonics Conference, Optical Society of America,
Wuhan, China, pp. AF2A-10.
Yakar, O., Nie, Y. Wada, K., Agarwal, A., and Ercan, İ.,
(2019). “Energy Efficiency of Microring Resonator
(MRR)-Based Binary Decision Diagram (BDD)
Circuits.” Submitted.
Yoshikawa, N., Matsuzaki, F., Nakajima, N. and Yoda,
K. (2002). “Design and component test of a 1-bit RSFQ
microprocessor.” Physica C: Superconductivity, Vol.
378, pp. 1454-60.

Turkish Journal of Engineering
197
Turkish Journal of Engineering (TUJE)
Vol. 3, Issue 4, pp. 197-200, October 2019
ISSN 2587-1366, Turkey
DOI: 10.31127/tuje.563939
Research Article
EXPERIMENTAL INVESTIGATION OF A NOVEL FRICTION MODIFIER IN
COMPOSITE MATERIALS
İlker Sugözü *1 and Mücahit Güdük 2
1 Mersin University, Faculty of Engineering, Department of Mechanical Engineering, Mersin, Turkey
ORCID ID 0000-0001-8340-8121
2 Mersin University, Institute of Natural and Applied Sciences, Department of Manufacturing Engineering, Mersin,
Turkey
ORCID ID 0000-0003-0745-856X
* Corresponding Author
Received: 13/05/2019 Accepted: 24/06/2019
ABSTRACT
In this study, waste banana tree powder was turned into powder and its use in automotive brake lining was investigated.
For this purpose, 3 different samples were produced by using powder metallurgy production techniques. Waste banana tree
powder (WBTP) was added in different rates (3%, 6% and 9% by weight), keeping the determined content constant. Firstly,
homogenous mixtures of the ingredients are provided and then final shapes are given by hot pressing method. The friction,
wear, hardness and density analysis of the brake lining samples and the effects of the use of WBTP on the brake lining
were evaluated.
Keywords: Composite Materials, Brake Lining, Friction, Wear
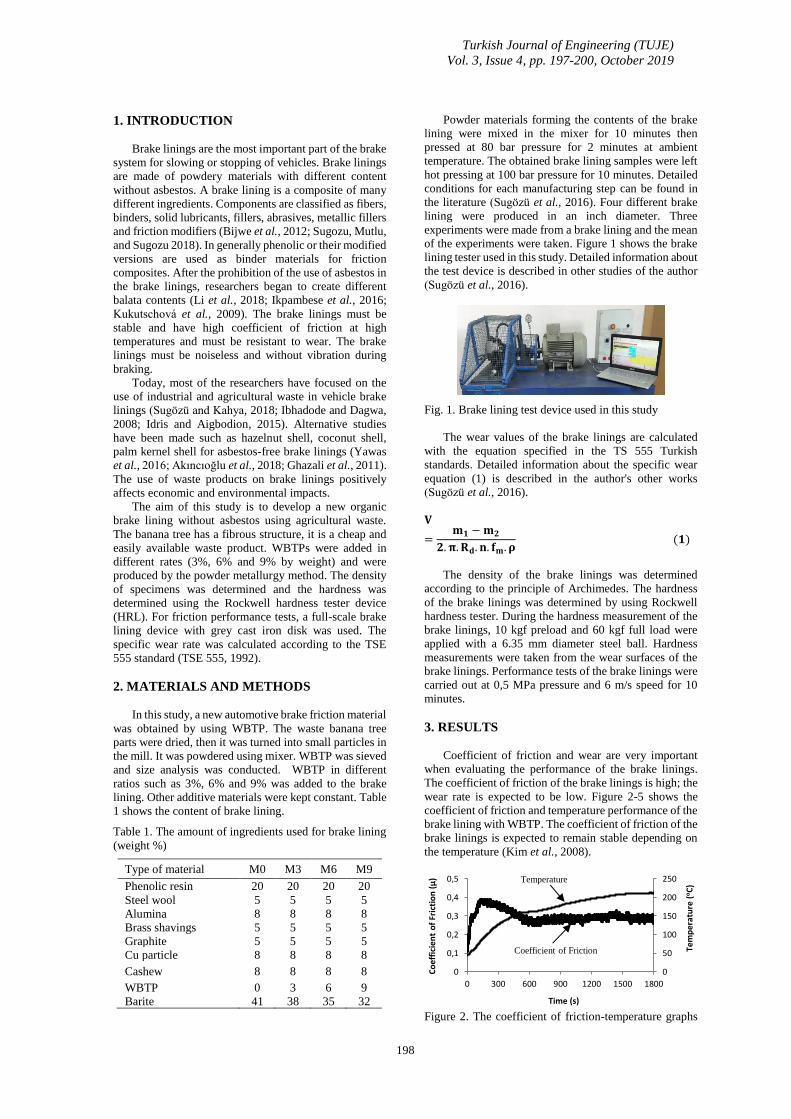
Turkish Journal of Engineering (TUJE)
Vol. 3, Issue 4, pp. 197-200, October 2019
198
1. INTRODUCTION
Brake linings are the most important part of the brake
system for slowing or stopping of vehicles. Brake linings
are made of powdery materials with different content
without asbestos. A brake lining is a composite of many
different ingredients. Components are classified as fibers,
binders, solid lubricants, fillers, abrasives, metallic fillers
and friction modifiers (Bijwe et al., 2012; Sugozu, Mutlu,
and Sugozu 2018). In generally phenolic or their modified
versions are used as binder materials for friction
composites. After the prohibition of the use of asbestos in
the brake linings, researchers began to create different
balata contents (Li et al., 2018; Ikpambese et al., 2016;
Kukutschová et al., 2009). The brake linings must be
stable and have high coefficient of friction at high
temperatures and must be resistant to wear. The brake
linings must be noiseless and without vibration during
braking.
Today, most of the researchers have focused on the
use of industrial and agricultural waste in vehicle brake
linings (Sugözü and Kahya, 2018; Ibhadode and Dagwa,
2008; Idris and Aigbodion, 2015). Alternative studies
have been made such as hazelnut shell, coconut shell,
palm kernel shell for asbestos-free brake linings (Yawas
et al., 2016; Akıncıoğlu et al., 2018; Ghazali et al., 2011).
The use of waste products on brake linings positively
affects economic and environmental impacts.
The aim of this study is to develop a new organic
brake lining without asbestos using agricultural waste.
The banana tree has a fibrous structure, it is a cheap and
easily available waste product. WBTPs were added in
different rates (3%, 6% and 9% by weight) and were
produced by the powder metallurgy method. The density
of specimens was determined and the hardness was
determined using the Rockwell hardness tester device
(HRL). For friction performance tests, a full-scale brake
lining device with grey cast iron disk was used. The
specific wear rate was calculated according to the TSE
555 standard (TSE 555, 1992).
2. MATERIALS AND METHODS
In this study, a new automotive brake friction material
was obtained by using WBTP. The waste banana tree
parts were dried, then it was turned into small particles in
the mill. It was powdered using mixer. WBTP was sieved
and size analysis was conducted. WBTP in different
ratios such as 3%, 6% and 9% was added to the brake
lining. Other additive materials were kept constant. Table
1 shows the content of brake lining.
Table 1. The amount of ingredients used for brake lining
(weight %)
Type of material M0 M3 M6 M9
Phenolic resin 20 20 20 20
Steel wool 5 5 5 5
Alumina 8 8 8 8
Brass shavings 5 5 5 5
Graphite 5 5 5 5
Cu particle 8 8 8 8
Cashew 8 8 8 8
WBTP 0 3 6 9
Barite 41 38 35 32
Powder materials forming the contents of the brake
lining were mixed in the mixer for 10 minutes then
pressed at 80 bar pressure for 2 minutes at ambient
temperature. The obtained brake lining samples were left
hot pressing at 100 bar pressure for 10 minutes. Detailed
conditions for each manufacturing step can be found in
the literature (Sugözü et al., 2016). Four different brake
lining were produced in an inch diameter. Three
experiments were made from a brake lining and the mean
of the experiments were taken. Figure 1 shows the brake
lining tester used in this study. Detailed information about
the test device is described in other studies of the author
(Sugözü et al., 2016).
Fig. 1. Brake lining test device used in this study
The wear values of the brake linings are calculated
with the equation specified in the TS 555 Turkish
standards. Detailed information about the specific wear
equation (1) is described in the author's other works
(Sugözü et al., 2016).
𝐕
=𝐦𝟏 − 𝐦𝟐
𝟐. 𝛑. 𝐑𝐝. 𝐧. 𝐟𝐦. 𝛒 (𝟏)
The density of the brake linings was determined
according to the principle of Archimedes. The hardness
of the brake linings was determined by using Rockwell
hardness tester. During the hardness measurement of the
brake linings, 10 kgf preload and 60 kgf full load were
applied with a 6.35 mm diameter steel ball. Hardness
measurements were taken from the wear surfaces of the
brake linings. Performance tests of the brake linings were
carried out at 0,5 MPa pressure and 6 m/s speed for 10
minutes.
3. RESULTS
Coefficient of friction and wear are very important
when evaluating the performance of the brake linings.
The coefficient of friction of the brake linings is high; the
wear rate is expected to be low. Figure 2-5 shows the
coefficient of friction and temperature performance of the
brake lining with WBTP. The coefficient of friction of the
brake linings is expected to remain stable depending on
the temperature (Kim et al., 2008).
Figure 2. The coefficient of friction-temperature graphs
0
50
100
150
200
250
0
0,1
0,2
0,3
0,4
0,5
0 300 600 900 1200 1500 1800
Tem
pe
ratu
re (
oC
)
Co
effi
cien
t o
f Fr
icti
on
(µ
)
Time (s)
Temperature
Coefficient of Friction
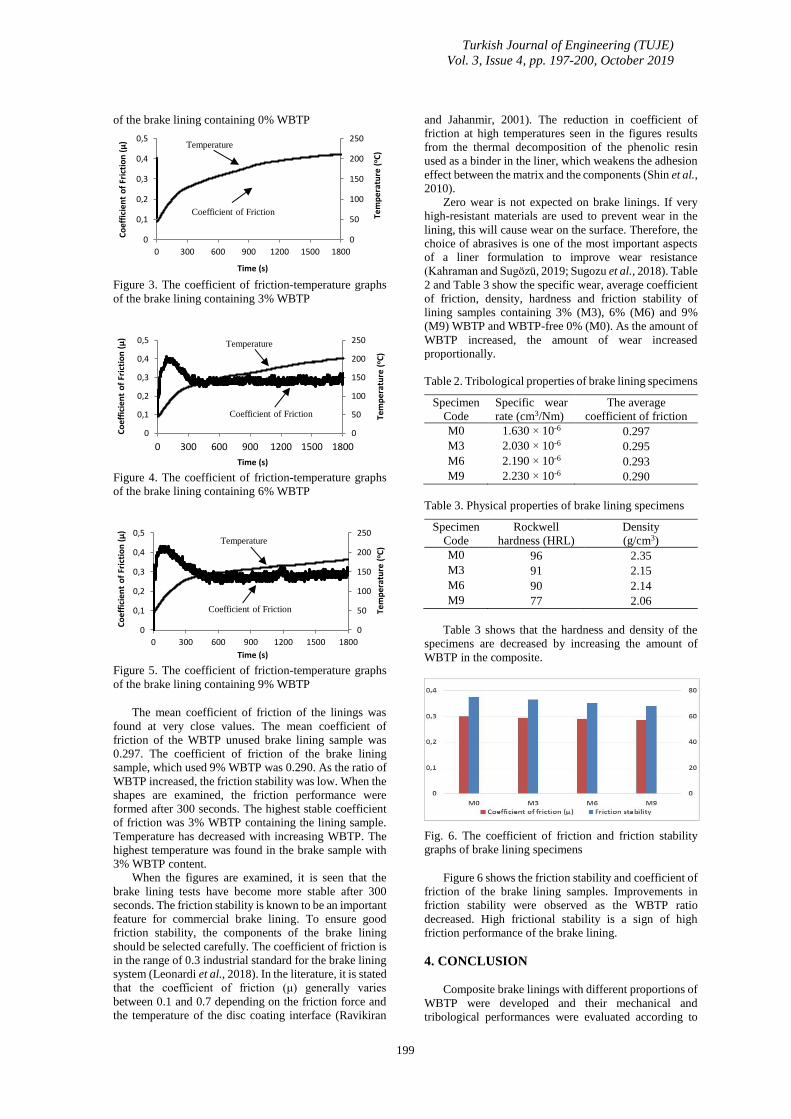
Turkish Journal of Engineering (TUJE)
Vol. 3, Issue 4, pp. 197-200, October 2019
199
of the brake lining containing 0% WBTP
Figure 3. The coefficient of friction-temperature graphs
of the brake lining containing 3% WBTP
Figure 4. The coefficient of friction-temperature graphs
of the brake lining containing 6% WBTP
Figure 5. The coefficient of friction-temperature graphs
of the brake lining containing 9% WBTP
The mean coefficient of friction of the linings was
found at very close values. The mean coefficient of
friction of the WBTP unused brake lining sample was
0.297. The coefficient of friction of the brake lining
sample, which used 9% WBTP was 0.290. As the ratio of
WBTP increased, the friction stability was low. When the
shapes are examined, the friction performance were
formed after 300 seconds. The highest stable coefficient
of friction was 3% WBTP containing the lining sample.
Temperature has decreased with increasing WBTP. The
highest temperature was found in the brake sample with
3% WBTP content.
When the figures are examined, it is seen that the
brake lining tests have become more stable after 300
seconds. The friction stability is known to be an important
feature for commercial brake lining. To ensure good
friction stability, the components of the brake lining
should be selected carefully. The coefficient of friction is
in the range of 0.3 industrial standard for the brake lining
system (Leonardi et al., 2018). In the literature, it is stated
that the coefficient of friction (μ) generally varies
between 0.1 and 0.7 depending on the friction force and
the temperature of the disc coating interface (Ravikiran
and Jahanmir, 2001). The reduction in coefficient of
friction at high temperatures seen in the figures results
from the thermal decomposition of the phenolic resin
used as a binder in the liner, which weakens the adhesion
effect between the matrix and the components (Shin et al.,
2010).
Zero wear is not expected on brake linings. If very
high-resistant materials are used to prevent wear in the
lining, this will cause wear on the surface. Therefore, the
choice of abrasives is one of the most important aspects
of a liner formulation to improve wear resistance
(Kahraman and Sugözü, 2019; Sugozu et al., 2018). Table
2 and Table 3 show the specific wear, average coefficient
of friction, density, hardness and friction stability of
lining samples containing 3% (M3), 6% (M6) and 9%
(M9) WBTP and WBTP-free 0% (M0). As the amount of
WBTP increased, the amount of wear increased
proportionally.
Table 2. Tribological properties of brake lining specimens
Specimen
Code
Specific wear
rate (cm3/Nm)
The average
coefficient of friction
M0 1.630 × 10⁻⁶ 0.297
M3 2.030 × 10⁻⁶ 0.295
M6 2.190 × 10⁻⁶ 0.293
M9 2.230 × 10⁻⁶ 0.290
Table 3. Physical properties of brake lining specimens
Specimen
Code
Rockwell
hardness (HRL)
Density
(g/cm3)
M0 96 2.35
M3 91 2.15
M6 90 2.14
M9 77 2.06
Table 3 shows that the hardness and density of the
specimens are decreased by increasing the amount of
WBTP in the composite.
Fig. 6. The coefficient of friction and friction stability
graphs of brake lining specimens
Figure 6 shows the friction stability and coefficient of
friction of the brake lining samples. Improvements in
friction stability were observed as the WBTP ratio
decreased. High frictional stability is a sign of high
friction performance of the brake lining.
4. CONCLUSION
Composite brake linings with different proportions of
WBTP were developed and their mechanical and
tribological performances were evaluated according to
0
50
100
150
200
250
0
0,1
0,2
0,3
0,4
0,5
0 300 600 900 1200 1500 1800
Tem
per
atu
re (
oC
)
Co
effi
cien
t o
f Fr
icti
on
(µ
)
Time (s)
Temperature
Coefficient of Friction
0
50
100
150
200
250
0
0,1
0,2
0,3
0,4
0,5
0 300 600 900 1200 1500 1800
Tem
per
atu
re (
oC
)
Co
effi
cien
t o
f Fr
icti
on
(µ
)
Time (s)
Temperature
Coefficient of Friction
0
50
100
150
200
250
0
0,1
0,2
0,3
0,4
0,5
0 300 600 900 1200 1500 1800
Tem
per
atu
re (
oC
)
Co
effi
cien
t o
f Fr
icti
on
(µ
)
Time (s)
Temperature
Coefficient of Friction
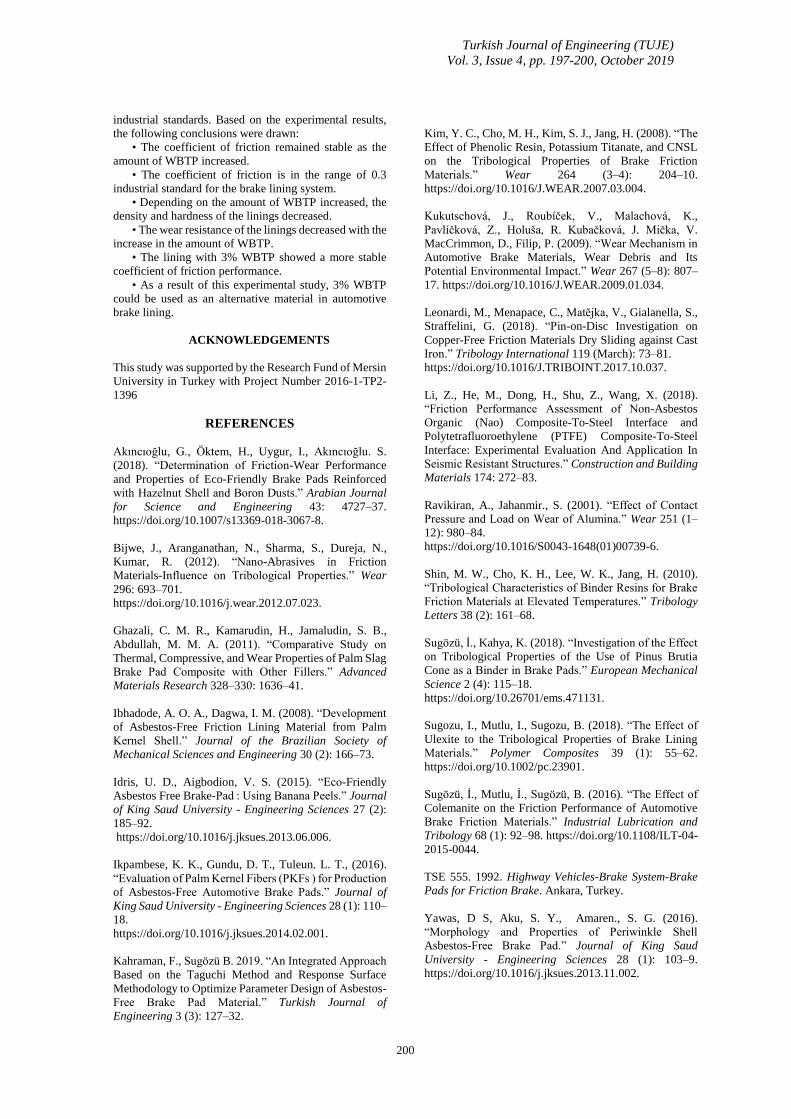
Turkish Journal of Engineering (TUJE)
Vol. 3, Issue 4, pp. 197-200, October 2019
200
industrial standards. Based on the experimental results,
the following conclusions were drawn:
• The coefficient of friction remained stable as the
amount of WBTP increased.
• The coefficient of friction is in the range of 0.3
industrial standard for the brake lining system.
• Depending on the amount of WBTP increased, the
density and hardness of the linings decreased.
• The wear resistance of the linings decreased with the
increase in the amount of WBTP.
• The lining with 3% WBTP showed a more stable
coefficient of friction performance.
• As a result of this experimental study, 3% WBTP
could be used as an alternative material in automotive
brake lining.
ACKNOWLEDGEMENTS
This study was supported by the Research Fund of Mersin
University in Turkey with Project Number 2016-1-TP2-
1396
REFERENCES
Akıncıoğlu, G., Öktem, H., Uygur, I., Akıncıoğlu. S.
(2018). “Determination of Friction-Wear Performance
and Properties of Eco-Friendly Brake Pads Reinforced
with Hazelnut Shell and Boron Dusts.” Arabian Journal
for Science and Engineering 43: 4727–37.
https://doi.org/10.1007/s13369-018-3067-8.
Bijwe, J., Aranganathan, N., Sharma, S., Dureja, N.,
Kumar, R. (2012). “Nano-Abrasives in Friction
Materials-Influence on Tribological Properties.” Wear
296: 693–701.
https://doi.org/10.1016/j.wear.2012.07.023.
Ghazali, C. M. R., Kamarudin, H., Jamaludin, S. B.,
Abdullah, M. M. A. (2011). “Comparative Study on
Thermal, Compressive, and Wear Properties of Palm Slag
Brake Pad Composite with Other Fillers.” Advanced
Materials Research 328–330: 1636–41.
Ibhadode, A. O. A., Dagwa, I. M. (2008). “Development
of Asbestos-Free Friction Lining Material from Palm
Kernel Shell.” Journal of the Brazilian Society of
Mechanical Sciences and Engineering 30 (2): 166–73.
Idris, U. D., Aigbodion, V. S. (2015). “Eco-Friendly
Asbestos Free Brake-Pad : Using Banana Peels.” Journal
of King Saud University - Engineering Sciences 27 (2):
185–92.
https://doi.org/10.1016/j.jksues.2013.06.006.
Ikpambese, K. K., Gundu, D. T., Tuleun. L. T., (2016).
“Evaluation of Palm Kernel Fibers (PKFs ) for Production
of Asbestos-Free Automotive Brake Pads.” Journal of
King Saud University - Engineering Sciences 28 (1): 110–
18.
https://doi.org/10.1016/j.jksues.2014.02.001.
Kahraman, F., Sugözü B. 2019. “An Integrated Approach
Based on the Taguchi Method and Response Surface
Methodology to Optimize Parameter Design of Asbestos-
Free Brake Pad Material.” Turkish Journal of
Engineering 3 (3): 127–32.
Kim, Y. C., Cho, M. H., Kim, S. J., Jang, H. (2008). “The
Effect of Phenolic Resin, Potassium Titanate, and CNSL
on the Tribological Properties of Brake Friction
Materials.” Wear 264 (3–4): 204–10.
https://doi.org/10.1016/J.WEAR.2007.03.004.
Kukutschová, J., Roubíček, V., Malachová, K.,
Pavlíčková, Z., Holuša, R. Kubačková, J. Mička, V.
MacCrimmon, D., Filip, P. (2009). “Wear Mechanism in
Automotive Brake Materials, Wear Debris and Its
Potential Environmental Impact.” Wear 267 (5–8): 807–
17. https://doi.org/10.1016/J.WEAR.2009.01.034.
Leonardi, M., Menapace, C., Matějka, V., Gialanella, S.,
Straffelini, G. (2018). “Pin-on-Disc Investigation on
Copper-Free Friction Materials Dry Sliding against Cast
Iron.” Tribology International 119 (March): 73–81.
https://doi.org/10.1016/J.TRIBOINT.2017.10.037.
Li, Z., He, M., Dong, H., Shu, Z., Wang, X. (2018).
“Friction Performance Assessment of Non-Asbestos
Organic (Nao) Composite-To-Steel Interface and
Polytetrafluoroethylene (PTFE) Composite-To-Steel
Interface: Experimental Evaluation And Application In
Seismic Resistant Structures.” Construction and Building
Materials 174: 272–83.
Ravikiran, A., Jahanmir., S. (2001). “Effect of Contact
Pressure and Load on Wear of Alumina.” Wear 251 (1–
12): 980–84.
https://doi.org/10.1016/S0043-1648(01)00739-6.
Shin, M. W., Cho, K. H., Lee, W. K., Jang, H. (2010).
“Tribological Characteristics of Binder Resins for Brake
Friction Materials at Elevated Temperatures.” Tribology
Letters 38 (2): 161–68.
Sugözü, İ., Kahya, K. (2018). “Investigation of the Effect
on Tribological Properties of the Use of Pinus Brutia
Cone as a Binder in Brake Pads.” European Mechanical
Science 2 (4): 115–18.
https://doi.org/10.26701/ems.471131.
Sugozu, I., Mutlu, I., Sugozu, B. (2018). “The Effect of
Ulexite to the Tribological Properties of Brake Lining
Materials.” Polymer Composites 39 (1): 55–62.
https://doi.org/10.1002/pc.23901.
Sugözü, İ., Mutlu, İ., Sugözü, B. (2016). “The Effect of
Colemanite on the Friction Performance of Automotive
Brake Friction Materials.” Industrial Lubrication and
Tribology 68 (1): 92–98. https://doi.org/10.1108/ILT-04-
2015-0044.
TSE 555. 1992. Highway Vehicles-Brake System-Brake
Pads for Friction Brake. Ankara, Turkey.
Yawas, D S, Aku, S. Y., Amaren., S. G. (2016).
“Morphology and Properties of Periwinkle Shell
Asbestos-Free Brake Pad.” Journal of King Saud
University - Engineering Sciences 28 (1): 103–9.
https://doi.org/10.1016/j.jksues.2013.11.002.

Turkish Journal of Engineering
201
Turkish Journal of Engineering (TUJE)
Vol. 3, Issue 4, pp. 201-205, October 2019
ISSN 2587-1366, Turkey
DOI: 10.31127/tuje.556349
Research Article
REMOVAL OF COLOUR POLLUTIONS IN DYE BATHS WITH MORDANTS
Aslıhan Koruyucu *1
1 Namık Kemal University, Çorlu Faculty of Engineering, Department of Textile Engineering, Tekirdağ, Türkiye
ORCID ID 0000-0002-8443-5188
* Corresponding Author
Received: 20/04/2019 Accepted: 05/07/2019
ABSTRACT
In the current study, the colour vitality, wash, rubbing and diaphoresis fastness were evaluated for cotton substrates with
and without anionic (tannin) mordanting.It was found that pre-mordanting with tannic acid affect both the colour
characteristics and fastness properties of the cationic dye. Overall, mordanting with tannic acid gave the best results in
terms of both colour vitality and fastness properties.
Keywords: Mordant, Tannic Acid, Cationic Dyes, Fastness Properties, Cotton
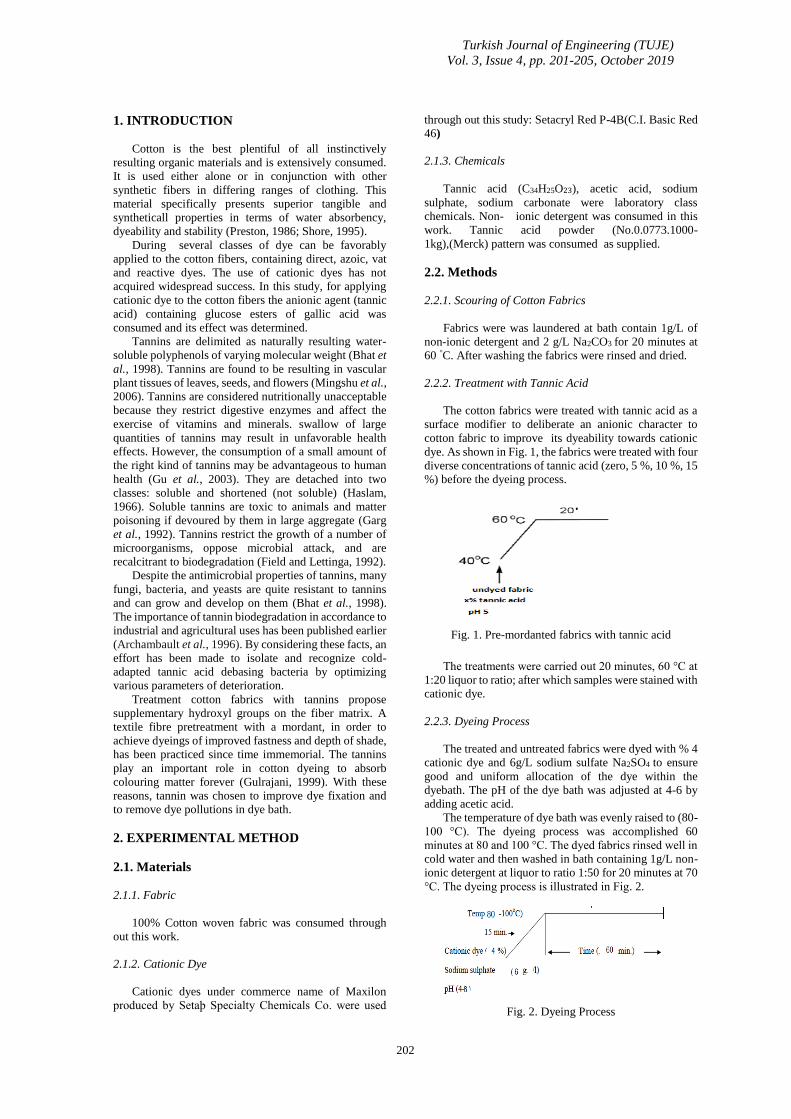
Turkish Journal of Engineering (TUJE)
Vol. 3, Issue 4, pp. 201-205, October 2019
202
1. INTRODUCTION
Cotton is the best plentiful of all instinctively
resulting organic materials and is extensively consumed.
It is used either alone or in conjunction with other
synthetic fibers in differing ranges of clothing. This
material specifically presents superior tangible and
syntheticall properties in terms of water absorbency,
dyeability and stability (Preston, 1986; Shore, 1995).
During several classes of dye can be favorably
applied to the cotton fibers, containing direct, azoic, vat
and reactive dyes. The use of cationic dyes has not
acquired widespread success. In this study, for applying
cationic dye to the cotton fibers the anionic agent (tannic
acid) containing glucose esters of gallic acid was
consumed and its effect was determined.
Tannins are delimited as naturally resulting water-
soluble polyphenols of varying molecular weight (Bhat et
al., 1998). Tannins are found to be resulting in vascular
plant tissues of leaves, seeds, and flowers (Mingshu et al.,
2006). Tannins are considered nutritionally unacceptable
because they restrict digestive enzymes and affect the
exercise of vitamins and minerals. swallow of large
quantities of tannins may result in unfavorable health
effects. However, the consumption of a small amount of
the right kind of tannins may be advantageous to human
health (Gu et al., 2003). They are detached into two
classes: soluble and shortened (not soluble) (Haslam,
1966). Soluble tannins are toxic to animals and matter
poisoning if devoured by them in large aggregate (Garg
et al., 1992). Tannins restrict the growth of a number of
microorganisms, oppose microbial attack, and are
recalcitrant to biodegradation (Field and Lettinga, 1992).
Despite the antimicrobial properties of tannins, many
fungi, bacteria, and yeasts are quite resistant to tannins
and can grow and develop on them (Bhat et al., 1998).
The importance of tannin biodegradation in accordance to
industrial and agricultural uses has been published earlier
(Archambault et al., 1996). By considering these facts, an
effort has been made to isolate and recognize cold-
adapted tannic acid debasing bacteria by optimizing
various parameters of deterioration.
Treatment cotton fabrics with tannins propose
supplementary hydroxyl groups on the fiber matrix. A
textile fibre pretreatment with a mordant, in order to
achieve dyeings of improved fastness and depth of shade,
has been practiced since time immemorial. The tannins
play an important role in cotton dyeing to absorb
colouring matter forever (Gulrajani, 1999). With these
reasons, tannin was chosen to improve dye fixation and
to remove dye pollutions in dye bath.
2. EXPERIMENTAL METHOD
2.1. Materials
2.1.1. Fabric
100% Cotton woven fabric was consumed through
out this work.
2.1.2. Cationic Dye
Cationic dyes under commerce name of Maxilon
produced by Setaþ Specialty Chemicals Co. were used
through out this study: Setacryl Red P-4B(C.I. Basic Red
46)
2.1.3. Chemicals
Tannic acid (C34H25O23), acetic acid, sodium
sulphate, sodium carbonate were laboratory class
chemicals. Non- ionic detergent was consumed in this
work. Tannic acid powder (No.0.0773.1000-
1kg),(Merck) pattern was consumed as supplied.
2.2. Methods
2.2.1. Scouring of Cotton Fabrics
Fabrics were was laundered at bath contain 1g/L of
non-ionic detergent and 2 g/L Na2CO3 for 20 minutes at
60 °C. After washing the fabrics were rinsed and dried.
2.2.2. Treatment with Tannic Acid
The cotton fabrics were treated with tannic acid as a
surface modifier to deliberate an anionic character to
cotton fabric to improve its dyeability towards cationic
dye. As shown in Fig. 1, the fabrics were treated with four
diverse concentrations of tannic acid (zero, 5 %, 10 %, 15
%) before the dyeing process.
Fig. 1. Pre-mordanted fabrics with tannic acid
The treatments were carried out 20 minutes, 60 °C at
1:20 liquor to ratio; after which samples were stained with
cationic dye.
2.2.3. Dyeing Process
The treated and untreated fabrics were dyed with % 4
cationic dye and 6g/L sodium sulfate Na2SO4 to ensure
good and uniform allocation of the dye within the
dyebath. The pH of the dye bath was adjusted at 4-6 by
adding acetic acid.
The temperature of dye bath was evenly raised to (80-
100 °C). The dyeing process was accomplished 60
minutes at 80 and 100 °C. The dyed fabrics rinsed well in
cold water and then washed in bath containing 1g/L non-
ionic detergent at liquor to ratio 1:50 for 20 minutes at 70
°C. The dyeing process is illustrated in Fig. 2.
Fig. 2. Dyeing Process
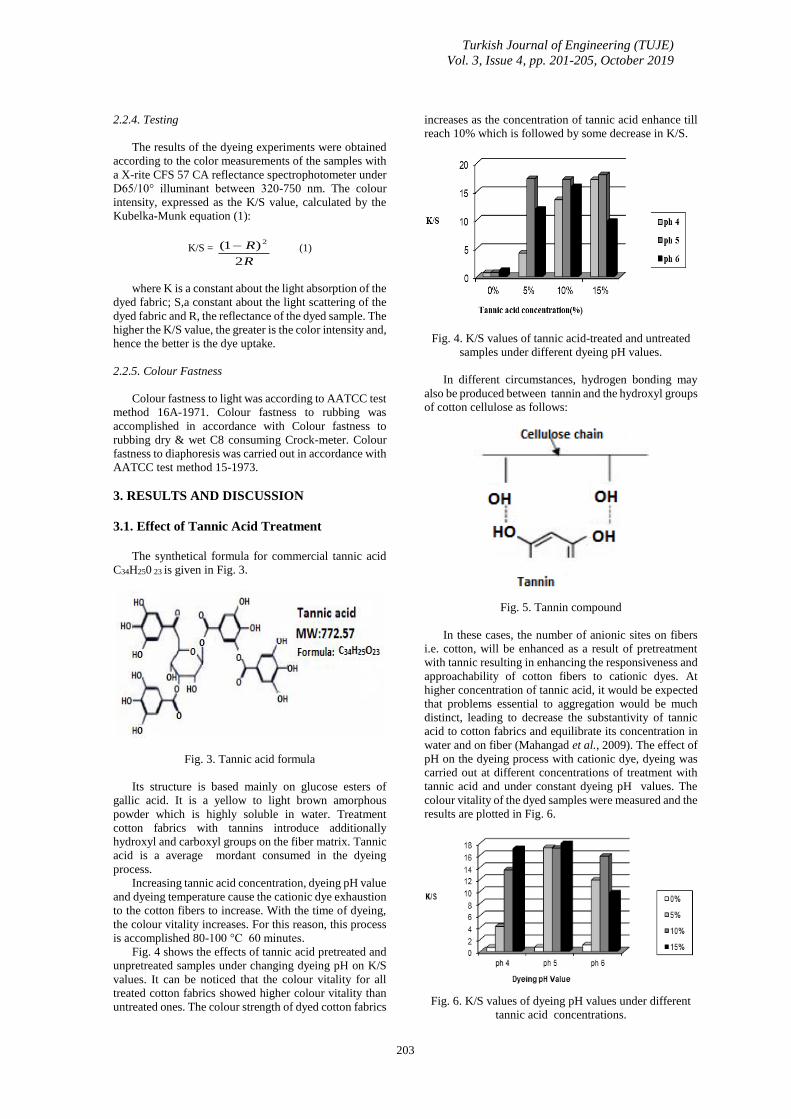
Turkish Journal of Engineering (TUJE)
Vol. 3, Issue 4, pp. 201-205, October 2019
203
2.2.4. Testing
The results of the dyeing experiments were obtained
according to the color measurements of the samples with
a X-rite CFS 57 CA reflectance spectrophotometer under
D65/10° illuminant between 320-750 nm. The colour
intensity, expressed as the K/S value, calculated by the
Kubelka-Munk equation (1):
K/S =
R
R
2
)1( 2− (1)
where K is a constant about the light absorption of the
dyed fabric; S,a constant about the light scattering of the
dyed fabric and R, the reflectance of the dyed sample. The
higher the K/S value, the greater is the color intensity and,
hence the better is the dye uptake.
2.2.5. Colour Fastness
Colour fastness to light was according to AATCC test
method 16A-1971. Colour fastness to rubbing was
accomplished in accordance with Colour fastness to
rubbing dry & wet C8 consuming Crock-meter. Colour
fastness to diaphoresis was carried out in accordance with
AATCC test method 15-1973.
3. RESULTS AND DISCUSSION
3.1. Effect of Tannic Acid Treatment
The synthetical formula for commercial tannic acid
C34H250 23 is given in Fig. 3.
Fig. 3. Tannic acid formula
Its structure is based mainly on glucose esters of
gallic acid. It is a yellow to light brown amorphous
powder which is highly soluble in water. Treatment
cotton fabrics with tannins introduce additionally
hydroxyl and carboxyl groups on the fiber matrix. Tannic
acid is a average mordant consumed in the dyeing
process.
Increasing tannic acid concentration, dyeing pH value
and dyeing temperature cause the cationic dye exhaustion
to the cotton fibers to increase. With the time of dyeing,
the colour vitality increases. For this reason, this process
is accomplished 80-100 °C 60 minutes.
Fig. 4 shows the effects of tannic acid pretreated and
unpretreated samples under changing dyeing pH on K/S
values. It can be noticed that the colour vitality for all
treated cotton fabrics showed higher colour vitality than
untreated ones. The colour strength of dyed cotton fabrics
increases as the concentration of tannic acid enhance till
reach 10% which is followed by some decrease in K/S.
Fig. 4. K/S values of tannic acid-treated and untreated
samples under different dyeing pH values.
In different circumstances, hydrogen bonding may
also be produced between tannin and the hydroxyl groups
of cotton cellulose as follows:
Fig. 5. Tannin compound
In these cases, the number of anionic sites on fibers
i.e. cotton, will be enhanced as a result of pretreatment
with tannic resulting in enhancing the responsiveness and
approachability of cotton fibers to cationic dyes. At
higher concentration of tannic acid, it would be expected
that problems essential to aggregation would be much
distinct, leading to decrease the substantivity of tannic
acid to cotton fabrics and equilibrate its concentration in
water and on fiber (Mahangad et al., 2009). The effect of
pH on the dyeing process with cationic dye, dyeing was
carried out at different concentrations of treatment with
tannic acid and under constant dyeing pH values. The
colour vitality of the dyed samples were measured and the
results are plotted in Fig. 6.
Fig. 6. K/S values of dyeing pH values under different
tannic acid concentrations.
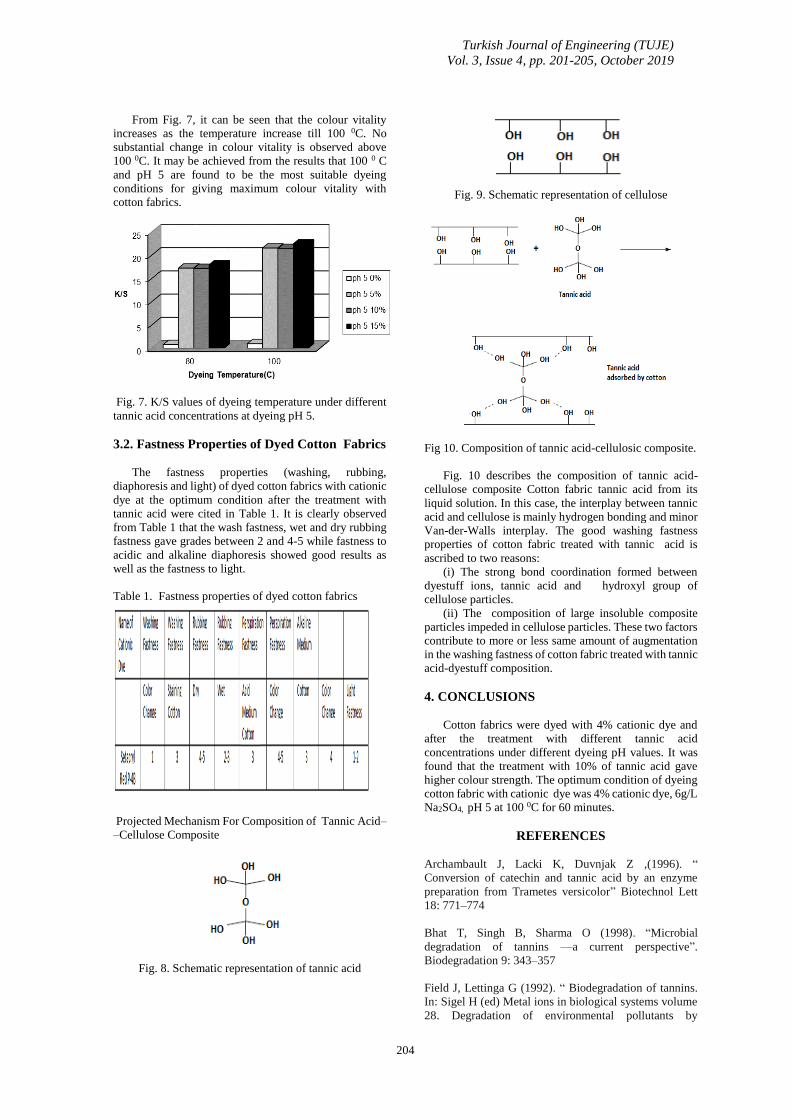
Turkish Journal of Engineering (TUJE)
Vol. 3, Issue 4, pp. 201-205, October 2019
204
From Fig. 7, it can be seen that the colour vitality
increases as the temperature increase till 100 0C. No
substantial change in colour vitality is observed above
100 0C. It may be achieved from the results that 100 0 C
and pH 5 are found to be the most suitable dyeing
conditions for giving maximum colour vitality with
cotton fabrics.
Fig. 7. K/S values of dyeing temperature under different
tannic acid concentrations at dyeing pH 5.
3.2. Fastness Properties of Dyed Cotton Fabrics
The fastness properties (washing, rubbing,
diaphoresis and light) of dyed cotton fabrics with cationic
dye at the optimum condition after the treatment with
tannic acid were cited in Table 1. It is clearly observed
from Table 1 that the wash fastness, wet and dry rubbing
fastness gave grades between 2 and 4-5 while fastness to
acidic and alkaline diaphoresis showed good results as
well as the fastness to light.
Table 1. Fastness properties of dyed cotton fabrics
Projected Mechanism For Composition of Tannic Acid–
–Cellulose Composite
Fig. 8. Schematic representation of tannic acid
Fig. 9. Schematic representation of cellulose
Fig 10. Composition of tannic acid-cellulosic composite.
Fig. 10 describes the composition of tannic acid-
cellulose composite Cotton fabric tannic acid from its
liquid solution. In this case, the interplay between tannic
acid and cellulose is mainly hydrogen bonding and minor
Van-der-Walls interplay. The good washing fastness
properties of cotton fabric treated with tannic acid is
ascribed to two reasons:
(i) The strong bond coordination formed between
dyestuff ions, tannic acid and hydroxyl group of
cellulose particles.
(ii) The composition of large insoluble composite
particles impeded in cellulose particles. These two factors
contribute to more or less same amount of augmentation
in the washing fastness of cotton fabric treated with tannic
acid-dyestuff composition.
4. CONCLUSIONS
Cotton fabrics were dyed with 4% cationic dye and
after the treatment with different tannic acid
concentrations under different dyeing pH values. It was
found that the treatment with 10% of tannic acid gave
higher colour strength. The optimum condition of dyeing
cotton fabric with cationic dye was 4% cationic dye, 6g/L
Na2SO4, pH 5 at 100 0C for 60 minutes.
REFERENCES
Archambault J, Lacki K, Duvnjak Z ,(1996). “
Conversion of catechin and tannic acid by an enzyme
preparation from Trametes versicolor” Biotechnol Lett
18: 771–774
Bhat T, Singh B, Sharma O (1998). “Microbial
degradation of tannins —a current perspective”.
Biodegradation 9: 343–357
Field J, Lettinga G (1992). “ Biodegradation of tannins.
In: Sigel H (ed) Metal ions in biological systems volume
28. Degradation of environmental pollutants by

Turkish Journal of Engineering (TUJE)
Vol. 3, Issue 4, pp. 201-205, October 2019
205
microorganisms and their metalloenzymes. Marcel
Dekker, New York, pp 61–97.
Garg S, Makkar H, Nagal K, Sharma S, Wadhwa D,
Singh B (1992). “ Toxicological investigations into oak
(Quercus incana) leaf poisoning in cattle”. Vet Hum
Toxicol 34: 161–164.
Gu L, Kelm M, Hammerstone J, Beecher G, Holden J,
Haytowitz D, Prior R (2003). “Screening of foods
containing proanthocyanidins and their structural
characterization using LC-MS/MS and thiolytic
degradation”. J Agric Food Chem 51: 7513–7521.
M.L.Gulrajani,1999. “ Natural dye: part I-present status
of natural dyes”; Colourage,7 (1999), pp.19-28.
Haslam E (1966). “The scope of vegetable tannin
chemistry. Chemistry of vegetable tannins”. Academic,
London, pp 1–13.
Mahangad ,P.R.; Varadarajan,P.V. , Verma, J.K. & Bosco
H. ;"Indian Journal of Fibre and Textile Research",
Vol.34, p.279-282 (2009).
Mingshu L, Kai Y, Qiang H, Dongying J, (2006)
“Biodegradation of gallotanins and ellagitannins”. J Basic
Microbiol 46: 68–84.
Preston C.;1986. “ The dyeing of cellulosic fibres.” West
Yorkshire: Dyers’ Company Publications Trust.
Shore J.;1995. Cellulosics dyeing. West Yorkshire:
Society of Dyers and Colourists
Turkish Journal of Engineering
206
Turkish Journal of Engineering (TUJE)
Vol. 3, Issue 4, pp. 206-217, October 2019
ISSN 2587-1366, Turkey
DOI: 10.31127/tuje.554075
Research Article
FLEXURAL BEHAVIOR OF HYBRID FRP-CONCRETE BRIDGE DECKS
İlker Fatih Kara 1, Ashraf F. Ashour 2 and Cahit Bilim *3
1 Mersin University, Engineering Faculty, Civil Engineering Department, Mersin, Turkey
ORCID ID 0000-0002-5663-1595
2 University of Bradford, School of Engineering, Department of Structural Engineering, Bradford, UK
ORCID ID 0000-0002-4800-6060
3 Mersin University, Engineering Faculty, Civil Engineering Department, Mersin, Turkey
ORCID ID 0000-0002-0975-1391
*Corresponding Author
Received: 15/04/2019 Accepted: 23/07/2019
ABSTRACT
The main aim of this study is to investigate the behaviour of hybrid FRP-concrete decks. The hybrid FRP-concrete bridge
systems consisting of different FRP cell units available on the market such as trapezoidal, triangular, honeycomb,
rectangular with alternating diagonal, half-depth trapezoidal, hexagonal and arch cell units were computationally
compared and examined using the finite element (FE) analysis to decide the most appropriate FRP composite deck for
bridge systems. Design criteria such as the deflections were considered in selecting the most effective unit system.
Different FRP bridge deck panels were analysed under static loading representing the standard European truck wheel.
The finite element analysis of bridge deck systems was performed using a general purpose finite element analysis
package ABAQUS, and the behaviour of these systems was then be compared in terms of stiffness and strength criteria.
The results showed that Delta, Super and ASSET hybrid decks are stiffer than other deck systems. The results from FEA
approach also indicated that the layer of concrete on the top surface of bridge deck reduces the vertical displacement of
FRP bridge systems approximately 60%.
Keywords: FRP Composites; Concrete; Bridge Decks; Hybrid Design; Finite element analysis
Turkish Journal of Engineering (TUJE)
Vol. 3, Issue 4, pp. 206-217, October 2019
207
1. INTRODUCTION
It is well known that bridges deteriorate with age.
For example, reinforced concrete bridges slowly
deteriorate during the first few decades of their design
life (typically 50 years), followed by a rapid decline
thereafter. In many North European countries,
deterioration, caused by de-icing salts, is creating an
increasing maintenance workload due to their corrosive
effect on steel reinforcement of concrete bridges. A
2002 Federal Highway Administration and United States
Department of Transportation (FHWA/USDOT) (2002)
study estimates the direct cost of repairing corrosion on
highway bridges to be $8.3 billion annually, including
$3.8 billion over the next 10 years to replace structurally
deficient bridges and $2.0 billion for maintenance of
concrete bridge decks. Longer design life structures,
using the latest materials and design technologies, are
needed to maintain a functional transportation network,
provide longer service life, and improve the safety of the
highway network. Among new construction materials,
fiber reinforced polymers (FRP) composites are very
attractive materials to structural engineers, due to their
superior material properties such as high stiffness, high
strength, high corrosion resistance, light weight, and
durability.
Bridge decks have been considered as the most
critical component in bridges that could significantly
benefit from the appropriate use of FRP composite
materials. FRP bridge decks have many advantages
including light weight, corrosion resistance, quick
installation, high strength and low life cycle
maintenance cost (Hollaway, 2010; Bakis et al., 2002;
Keller, 2002). FRP bridge decks are approximately
weigh 20% of the structurally equivalent reinforced
concrete decks, that can produce massive savings
throughout the bridge, in particular bridge foundations.
The modular form of FRP bridge decks offers several
benefits including minimum traffic disruption, safer and
cheaper installation. In spite of all these advantages,
large displacement can occur under concentrated point
loads in FRP bridge decks. It has been reported that the
local deformation under concentrated point loads
resulting from vehicle wheels is large for all FRP
composite bridge decks due to the relatively low
stiffness of FRP composites. Therefore, a thin layer of
concrete on top of the FRP bridge deck enhances the
overall stiffness of the deck, reduces the local
deformation of the deck top flange and improve the
overall serviceability of the wearing surface. In addition,
FRP deck can act as a permanent formwork to cast the
concrete layer. Sebastian et al. (2013) showed that a
30mm thick layer of polymer concrete surfacing
significantly improved the load carrying capacity of
glass fiber reinforced polymer (GFRP) bridge deck by
261% in comparison to the un-surfaced GFRP deck.
However, this increase was only 90% when the plan
dimensions of the applied load were increased.
Davalos et al. (2001) presented a combined
analytical and experimental characterization of FRP
honeycomb deck panels. The authors concluded that the
equivalent orthotropic properties developed in their
study could be used for the analysis and design of the
FRP sandwich panels.
Keller and Gurtler (2006) tested Duraspan and Asset
FRP decks. In-plane compression and in-plane shear
tests were carried out on panels made of three
adhesively bonded components with all bending test.
The failure mode of ASSET deck was brittle and linear
elastic up to failure, while Duraspan deck exhibited
some ductility.
Saiidi et al. (1994) carried out an experimental and
analytical study of hybrid beams that consist of
graphite/epoxy (G/E) sections and reinforced concrete
(RC) slabs. They concluded that the use of epoxy resin
to bond concrete to G/E sections was found to be only
partially effective. Kitane et al. (2004) developed a basic
concept of a hybrid FRP-concrete bridge superstructure.
The structural type was a trapezoidal box sections. A
thin layer of concrete was placed in the compressive
zone of the section, and was surrounded with GFRP.
They concluded that concrete bridge superstructure is
very promising, from structural engineering view point.
The main aim this study is to investigate the
behaviour of hybrid FRP-concrete decks. The hybrid
FRP-concrete bridge systems consisting of different FRP
cell units available on the market such as trapezoidal,
triangular, honeycomb, rectangular with alternating
diagonal, half-depth trapezoidal, hexagonal and arch cell
units were computationally compared and examined
using the finite element (FE) analysis to decide the most
appropriate FRP composite deck for bridge systems.
Design criteria such as the deflections were considered
in selecting the most effective unit system. Different
FRP bridge deck panels were analysed under static
loading representing the standard European truck wheel.
The finite element analysis of bridge deck systems was
performed using a general purpose finite element
analysis package ABAQUS (Hibbit, Karlsson&
Sorensen, Inc., 2006), and the behaviour of these
systems was then be compared in terms of stiffness and
strength criteria.
2. ANALYSIS OF FRP DECK SYSTEMS
There are many different types of FRP deck
solutions available on the market, each one having
different geometric and physical properties and suitable
for different uses. Table 1 shows seven typical bridge
decks types, each from a different manufacturer. These
FRP bridge decks were considered and a thin layer of
concrete was placed on the top surface of the FRP deck
for the formation of the hybrid deck systems (see Fig. 1
(a-b)) for EZ span deck). The interface between the
concrete and the FRP plate was assumed perfectly
bonded. All the hybrid decks were analysed and
compared using the finite element (FE) analysis to
decide the most appropriate two FRP composite decks
for bridge systems. Design criteria such as the global
deflection was considered in selecting the most effective
two system. Different FRP bridge deck panels were
analysed under static loading representing the standard
European truck wheel.

Turkish Journal of Engineering (TUJE)
Vol. 3, Issue 4, pp. 206-217, October 2019
208
Table 1. FRP deck types and properties (Brown and Zureick (2001)
To evaluate these systems, a bridge superstructure
was designed as a simply supported single span one-lane
bridge with a length of 2.7 m as suggested by Keller and
Schollmayer (2004) for serviceability states in designing
process. As all decks have different geometry, the width
of the bridge deck systems varies between 950 mm to
1200 mm. The concrete layers reduces the local
deformation of the top surface of the bridge under
concentrated loads that represent truck wheel loads
(Alnahhal et al. (2007)). The thickness of the concrete
layer is a key design parameter to optimize the hybrid
structural system. According to Kitane (2004), concrete
can be used efficiently to increase the flexural rigidity
until the concrete thickness equals about 10% of the
bridge depth. Thefore, as the depth of the decks changes
between 195 and 216 mm, the same concrete thickness
of 2 cm was selected for all hybrid FRP deck systems.
Deck
System
Deck
Thickness
(mm)
Deck
Weight
(kN/m2)
Manufacturer Illustration of the Deck
EZ Span
Deck
216 0.96 Creative
Pultrusion Inc.
USA
Superdeck 203 1,01 Creative
Pultrusion Inc.
USA
Strongwell 170 1.08 Strongwell, USA
DuraSpan 195 0.95 Martin Marietta
Composites, USA
Asset 225 0.93 Fiberline,
Denmark
Delta
Deck
200 1.76 Korea
Holes
Deck
216 0.9 Spare
Composites
Corp. at
Nanjing, China
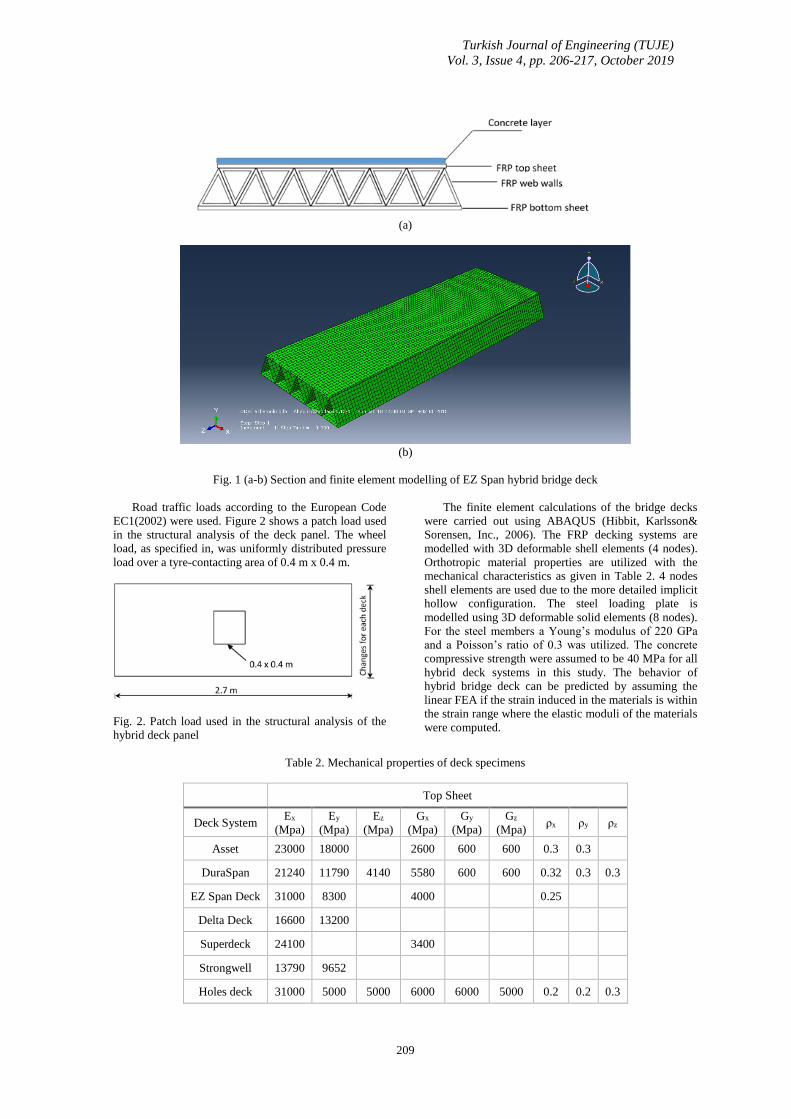
Turkish Journal of Engineering (TUJE)
Vol. 3, Issue 4, pp. 206-217, October 2019
209
(a)
(b)
Fig. 1 (a-b) Section and finite element modelling of EZ Span hybrid bridge deck
Road traffic loads according to the European Code
EC1(2002) were used. Figure 2 shows a patch load used
in the structural analysis of the deck panel. The wheel
load, as specified in, was uniformly distributed pressure
load over a tyre-contacting area of 0.4 m x 0.4 m.
Fig. 2. Patch load used in the structural analysis of the
hybrid deck panel
The finite element calculations of the bridge decks
were carried out using ABAQUS (Hibbit, Karlsson&
Sorensen, Inc., 2006). The FRP decking systems are
modelled with 3D deformable shell elements (4 nodes).
Orthotropic material properties are utilized with the
mechanical characteristics as given in Table 2. 4 nodes
shell elements are used due to the more detailed implicit
hollow configuration. The steel loading plate is
modelled using 3D deformable solid elements (8 nodes).
For the steel members a Young’s modulus of 220 GPa
and a Poisson’s ratio of 0.3 was utilized. The concrete
compressive strength were assumed to be 40 MPa for all
hybrid deck systems in this study. The behavior of
hybrid bridge deck can be predicted by assuming the
linear FEA if the strain induced in the materials is within
the strain range where the elastic moduli of the materials
were computed.
Table 2. Mechanical properties of deck specimens
Top Sheet
Deck System Ex
(Mpa)
Ey
(Mpa)
Ez
(Mpa)
Gx
(Mpa)
Gy
(Mpa)
Gz
(Mpa) ρx ρy ρz
Asset 23000 18000 2600 600 600 0.3 0.3
DuraSpan 21240 11790 4140 5580 600 600 0.32 0.3 0.3
EZ Span Deck 31000 8300 4000 0.25
Delta Deck 16600 13200
Superdeck 24100 3400
Strongwell 13790 9652
Holes deck 31000 5000 5000 6000 6000 5000 0.2 0.2 0.3

Turkish Journal of Engineering (TUJE)
Vol. 3, Issue 4, pp. 206-217, October 2019
210
Web
Deck System Ex
(Mpa)
Ey
(Mpa)
Ez
(Mpa)
Gx
(Mpa)
Gy
(Mpa)
Gz
(Mpa) ρx ρy ρz
Asset 17300 22700 3150 600 600 0.3 0.3
DuraSpan 17380 9650 4140 7170 600 600 0.3 0.3 0.3
EZ Span Deck 8300 31000 4000 0.3
Delta Deck 28800 10100
Superdeck 24100 3400
Strongwell 11000 5516
Holes deck 31000 5000 5000 6000 6000 5000 0.2 0.3 0.2
Bottom Sheet
Deck System Ex
(Mpa)
Ey
(Mpa)
Ez
(Mpa)
Gx
(Mpa)
Gy
(Mpa)
Gz
(Mpa) ρx ρy ρz
Asset 16500 25600 2000 600 600 0.3 0.3
DuraSpan 21240 11790 4140 5580 600 600 0.32 0.3 0.3
EZ Span Deck 31000 8300 4000 0.25
Delta Deck 16600 13200
Superdeck 24100 3400
Strongwell 13790 9652
Holes deck 31000 5000 5000 6000 6000 5000 0.2 0.2 0.3
3. RESEARCH RESULTS
The load combination specified in the European
Code EC1 (2002) for the serviceability and ultimate
limit state was applied to all hybrid bridge systems. The
maximum midspan vertical displacements for
serviceability limit state (SLS) are presented in Table 3.
The deflected shape and displacement result of finite
element method for all concrete decks considered here
are shown in Fig. 3. The variation of longitudinal
deflections is also obtained for all deck systems. Fig. 4
presents the comparison of these deflections for hybrid
deck systems. It can be seen from Fig. 4 and Table 3, the
displacements in Delta, ASSET and Super hybrid FRP-
concrete decks are smaller than the other deck systems.
These three hybrid decks have also smaller deflection
than the deflection limit of L/300 (9 mm) suggested by
Keller and Schollmayer (2004). All the deck systems
were also analyzed without placing of concrete on the
top surface. The variation of midspan section
displacement in longitudinal direction for hybrid and
non-hybrid specimens are given in Figs. 5. As seen in
Figs. and Table 3, the placement of thick layer concrete
on the top surface reduces the maximum displacement of
FRP bridge decks approximately 60%.
Table 3. Maximum vertical displacement in SLS
Maximum Vertical Displacement (mm)
Hybrid FRP Concrete Deck FRP Deck
FRP Deck Systems
DuraSpan 10.14 16.47
Asset Deck 8.162 11.83
Superdeck 8.58 13.05
EZ Span Deck 12.16 16.39
Strongwell 13.61 23.29
Delta Deck 5.81 10.0
Holes deck 9.76 18.18
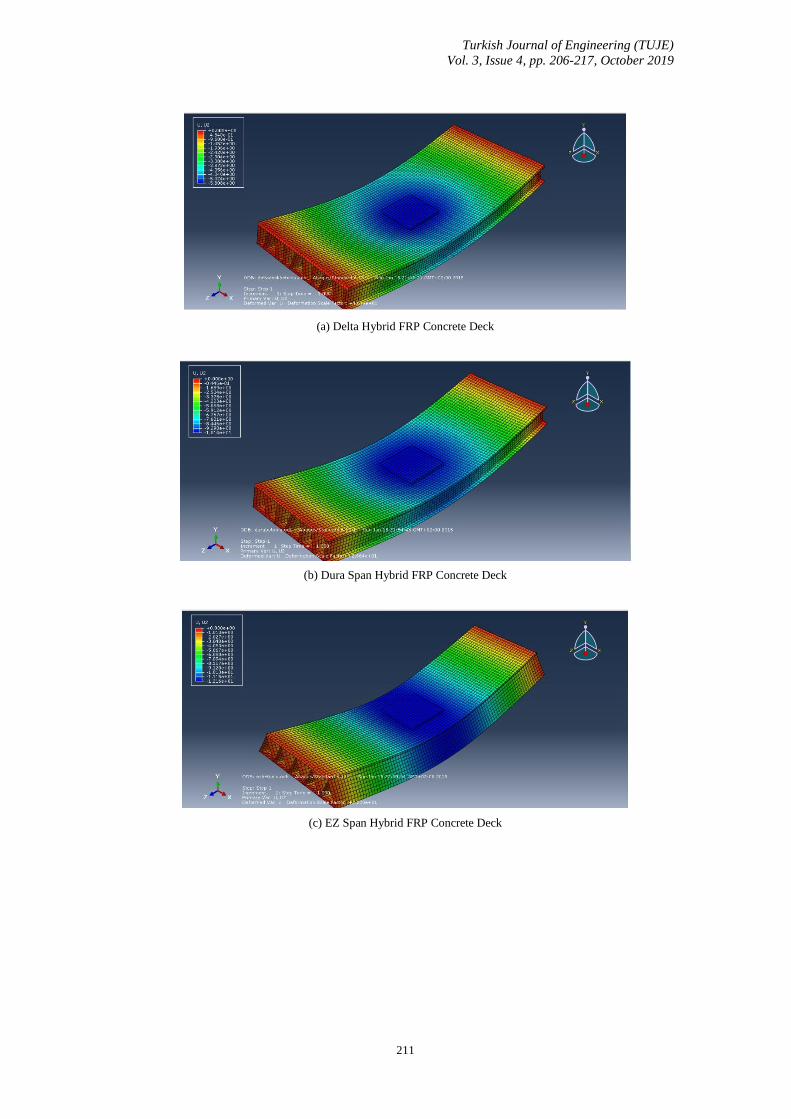
Turkish Journal of Engineering (TUJE)
Vol. 3, Issue 4, pp. 206-217, October 2019
211
(a) Delta Hybrid FRP Concrete Deck
(b) Dura Span Hybrid FRP Concrete Deck
(c) EZ Span Hybrid FRP Concrete Deck
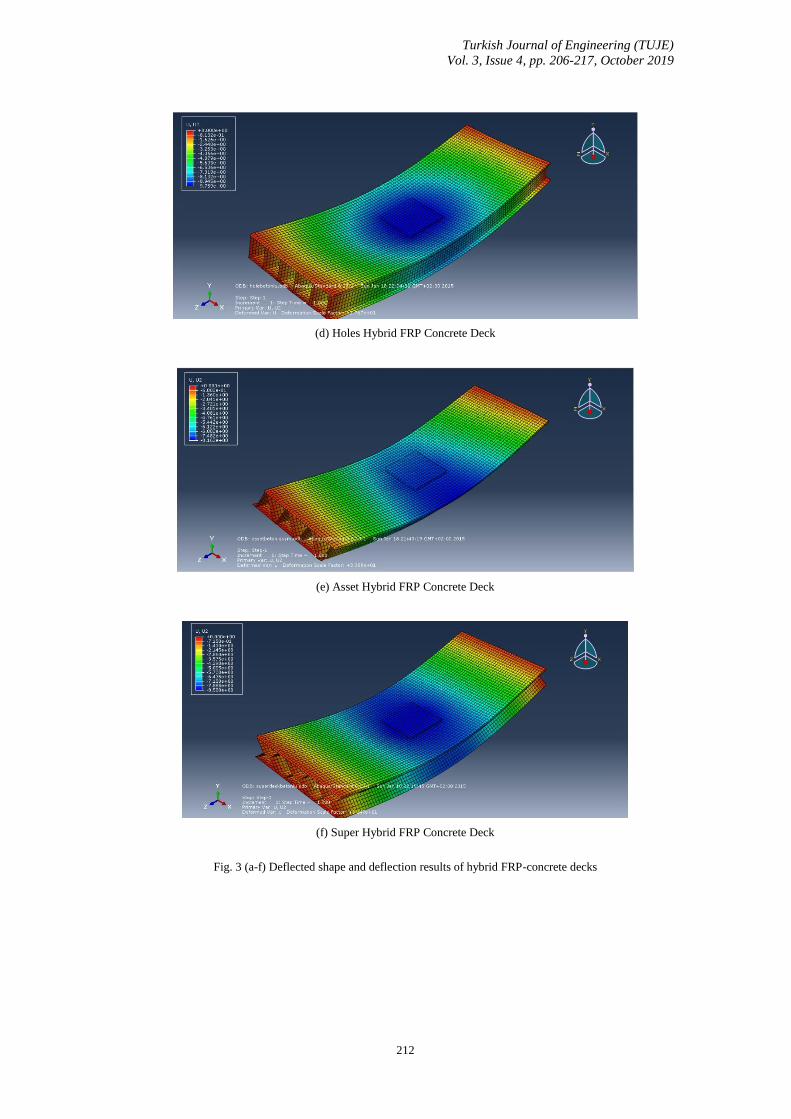
Turkish Journal of Engineering (TUJE)
Vol. 3, Issue 4, pp. 206-217, October 2019
212
(d) Holes Hybrid FRP Concrete Deck
(e) Asset Hybrid FRP Concrete Deck
(f) Super Hybrid FRP Concrete Deck
Fig. 3 (a-f) Deflected shape and deflection results of hybrid FRP-concrete decks
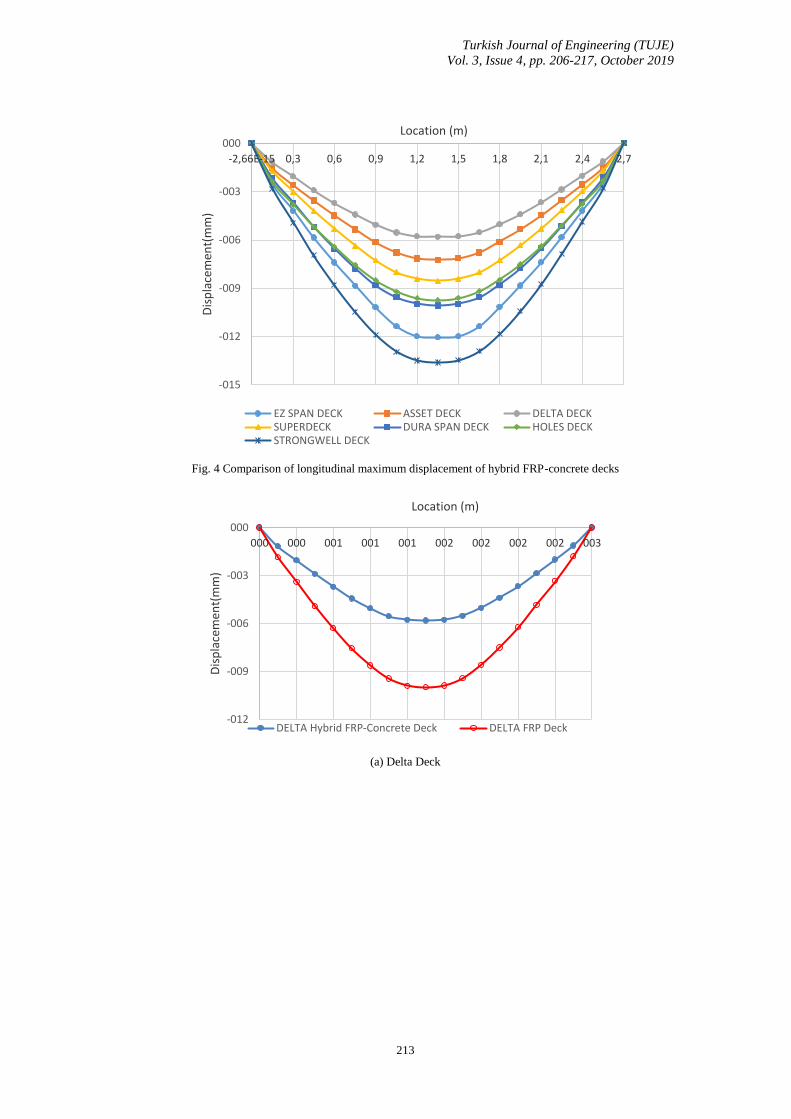
Turkish Journal of Engineering (TUJE)
Vol. 3, Issue 4, pp. 206-217, October 2019
213
Fig. 4 Comparison of longitudinal maximum displacement of hybrid FRP-concrete decks
(a) Delta Deck
-015
-012
-009
-006
-003
000
-2,66E-15 0,3 0,6 0,9 1,2 1,5 1,8 2,1 2,4 2,7
Dis
pla
cem
ent(
mm
)
Location (m)
EZ SPAN DECK ASSET DECK DELTA DECKSUPERDECK DURA SPAN DECK HOLES DECKSTRONGWELL DECK
-012
-009
-006
-003
000
000 000 001 001 001 002 002 002 002 003
Dis
pla
cem
ent(
mm
)
Location (m)
DELTA Hybrid FRP-Concrete Deck DELTA FRP Deck
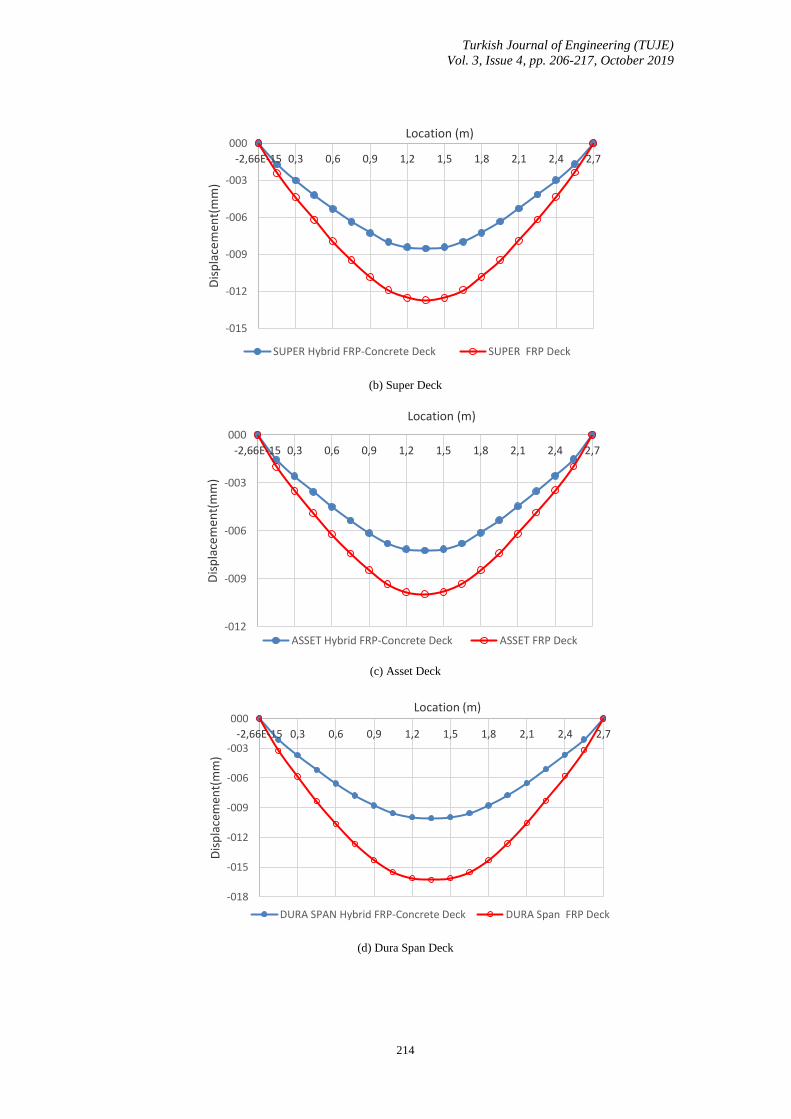
Turkish Journal of Engineering (TUJE)
Vol. 3, Issue 4, pp. 206-217, October 2019
214
(b) Super Deck
(c) Asset Deck
(d) Dura Span Deck
-015
-012
-009
-006
-003
000
-2,66E-15 0,3 0,6 0,9 1,2 1,5 1,8 2,1 2,4 2,7
Dis
pla
cem
ent(
mm
)
Location (m)
SUPER Hybrid FRP-Concrete Deck SUPER FRP Deck
-012
-009
-006
-003
000
-2,66E-15 0,3 0,6 0,9 1,2 1,5 1,8 2,1 2,4 2,7
Dis
pla
cem
ent(
mm
)
Location (m)
ASSET Hybrid FRP-Concrete Deck ASSET FRP Deck
-018
-015
-012
-009
-006
-003
000
-2,66E-15 0,3 0,6 0,9 1,2 1,5 1,8 2,1 2,4 2,7
Dis
pla
cem
ent(
mm
)
Location (m)
DURA SPAN Hybrid FRP-Concrete Deck DURA Span FRP Deck
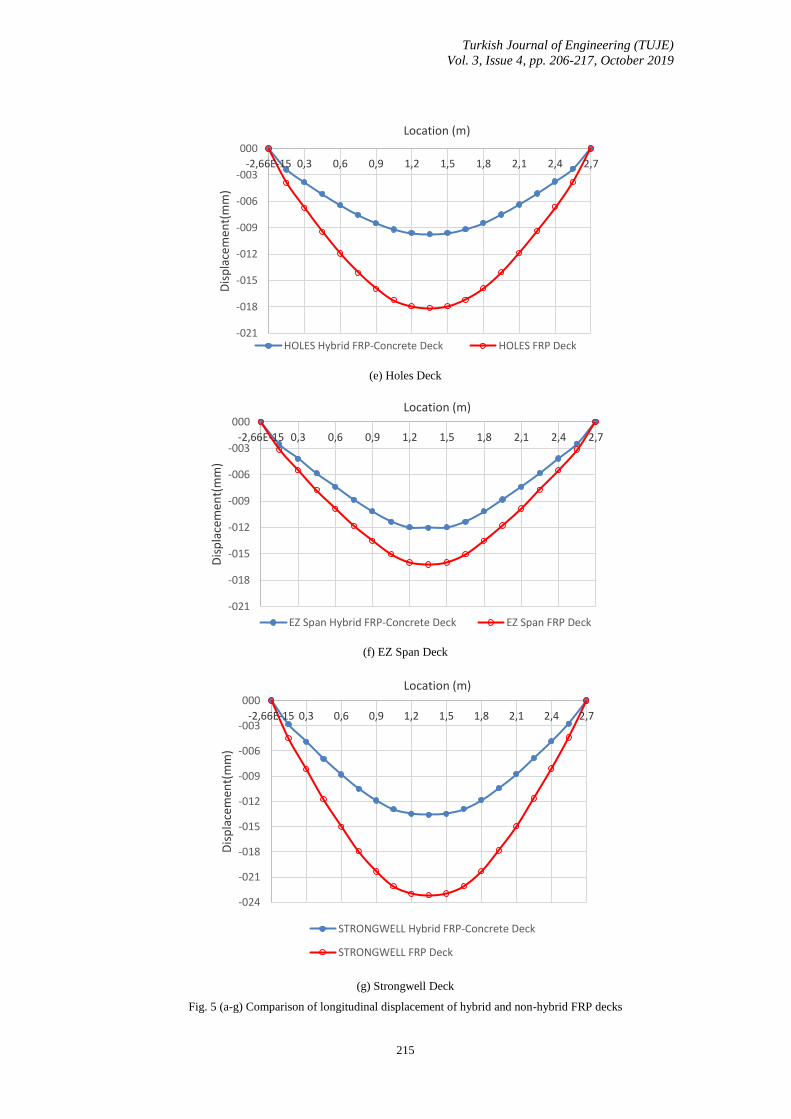
Turkish Journal of Engineering (TUJE)
Vol. 3, Issue 4, pp. 206-217, October 2019
215
(e) Holes Deck
(f) EZ Span Deck
(g) Strongwell Deck
Fig. 5 (a-g) Comparison of longitudinal displacement of hybrid and non-hybrid FRP decks
-021
-018
-015
-012
-009
-006
-003
000
-2,66E-15 0,3 0,6 0,9 1,2 1,5 1,8 2,1 2,4 2,7
Dis
pla
cem
ent(
mm
)
Location (m)
HOLES Hybrid FRP-Concrete Deck HOLES FRP Deck
-021
-018
-015
-012
-009
-006
-003
000
-2,66E-15 0,3 0,6 0,9 1,2 1,5 1,8 2,1 2,4 2,7
Dis
pla
cem
ent(
mm
)
Location (m)
EZ Span Hybrid FRP-Concrete Deck EZ Span FRP Deck
-024
-021
-018
-015
-012
-009
-006
-003
000
-2,66E-15 0,3 0,6 0,9 1,2 1,5 1,8 2,1 2,4 2,7
Dis
pla
cem
ent(
mm
)
Location (m)
STRONGWELL Hybrid FRP-Concrete Deck
STRONGWELL FRP Deck

Turkish Journal of Engineering (TUJE)
Vol. 3, Issue 4, pp. 206-217, October 2019
216
Table 4 shows the maximum concrete compressive
stress as well as tensile stresses in concrete element of
hybrid deck systems. As seen in Table 4, the
compressive stresses in concrete elements were all
smaller than its compressive strength limit (0.85*fc) in
all bridge systems, which is located at the top of the
concrete under the load area. The maximum
compressive stress in Delta, Asset and Super decks are
smaller than the other hybrid deck systems. On the other
hand the maximum tensile stresses (fr) exceeds the
tensile strength of concrete for the decks systems except
that EZ span hybrid deck. As expected the maximum
tensile strength occurs at the bottom of the concrete
layer in all bridge decks.
Table 4. Maximum concrete stress in SLS
Maximum Concrete Stress
Compressive
Stress (MPa)
Tensile
Stress
(MPa)
FRP Deck
Systems
DuraSpan 22.22 7.26
Asset Deck 20.94 5.20
Superdeck 21.16 4.99
EZ Span
Deck
22.37 1.47
Strongwell 27.17 10.28
Delta Deck 13.07 4.94
Holes deck 22.14 6.22
The load combination for the ultimate state was also
applied to all the bridge systems. The results of the
maximum vertical displacement is presented in Table 5.
As seen in Table 5, the displacements in Delta, ASSET
and Super hybrid FRP-concrete decks are smaller than
the other deck systems as in the case of the SLS. The
similar results for the variation of deflections, and also
the maximum longitudinal stress in FRP decks were also
obtained with that of SLS.
Table 5. Maximum vertical displacement for ultimate
limit state (ULS)
Maximum Vertical
Displacement (mm)
Hybrid FRP
Concrete Deck
FRP
Deck
FRP Deck
Systems
DuraSpan 13.68 22.24
ASET Deck 11.02 15.98
Superdeck 11.58 17.61
EZ Span
Deck
16.42 22.13
Strongwell 18.38 31.44
Delta Deck 7.841 13.51
Holes deck 13.17 24.55
4. CONCLUSION
Different hybrid FRP-concrete bridge decks were
investigated numerically by using finite element (FE)
analysis. A simplified FEM approach, which uses a
single layer of thick shell elements to simulate a FRP
deck, that has top and bottom face sheets and web, was
proposed. The structural performance of the hybrid deck
panels were compared with that of the non-hybrid deck
panels. The comparisons among these bridge systems
were also carried out to select the most efficient two
decks. The results showed that Delta, Super and ASSET
hybrid decks are stiffer than other deck systems. The
results from FEA approach also indicated that the layer
of concrete on the top surface of bridge deck reduces the
vertical displacement of FRP bridge systems
approximately 60%. The FEA results also show that
Delta, ASSET and Super hybrid decks were more
efficient than other FRP decks considered here.
REFERENCES
Federal Highway Administration and United States
Department of Transportation (FHWA/USDOT). (2002).
"Corrosion costs and preventative strategies in the
United States." A Supplement to Materials Performance
(MP), NACE International, Houston.
Hollaway, L. C. (2010), “A review of the present and
future utilisation of FRP composites in the civil
infrastructure with reference to their important in-service
properties”, Construction and Building Materials, Vol.
24, pp. 2419–2445.
Bakis C.E., Bank L.C., Brown V.L., Cosenza E.,
Davalos J.F., Lesko J.J. (2002), ‘’Fiber-reinforced
polymer composites for construction-state-of-art
review’’, J. Compos. Construct., ASCE;6(2):73–87.
Keller, T. (2002), ‘‘Overview of Fibre-Reinforced
Polymers in Bridge Construction’’, In: Structural
Engineering International , May, No. 2, p. 66–70.
Alnahhal W., Aref A., Alampalli S. (2007), ‘‘Composite
behavior of hybrid FRP-concrete bridge deck on steel
girders’’, Compos. Struct., 84, 29-43.
Kitane, Y. and Aref, A. (2004), “Static and fatigue
testing of hybrid fiber-reinforced polymer-concrete
bridge superstructure”, J. Compos. for Const., 8(2),182-
190.
Sebastian, W.M., Keller, T. and Ross, J. (2013)
“Influences of polymer concrete surfacing and localised
load distribution on behaviour up to failure of an
orthotropic FRP bridge deck,” Composites: Part B, Vol.
45, pp. 1234–1250.
Brown RT, Zureick AH. Lightweight composite truss
section decking. Marine Struct 2001;14:115–32.
Davalos, J. F., Qiao, P., Xu, X. F., Robinson, J., and
Barth, K. E. (2001). "Modeling andcharacterization of
fiber-reinforced plastic honeycomb sandwich panels for
highway bridgeapplications." Composite Structures,
52(3-4), 441-452.
Keller T. and Schollmayer M., Plate bending behavior of
a pultruded GFRP bridge deck system, Composite
Structures 64, 285–295, 2004.
Keller T, Gürtler H. 2006. In-plane compression and
shear performance of FRP bridge decks acting as top
chord of bridge girders. Compos. Struct .;72(2):151–62.

Turkish Journal of Engineering (TUJE)
Vol. 3, Issue 4, pp. 206-217, October 2019
217
Saiidi, M., Gordaninejad, F., and Wehbe, N. (1994),
“Behavior of Graphite/Epoxy Concrete Composite
Beams”, Journal of Structural Engineering, Vol. 120, No.
10, pp. 2958-2976.
European Committee for Standardization (CEN):
Eurocode 1–– Actions on Structures, part 2: traffic loads
on bridges. Pr EN 1991-2, 2002.
Hibbit, Karlsson& Sorensen, Inc. (2006),
ABAQUS/Standard User’s Manual, Version 6.6, Hibbit,
Karlsson& Sorensen, Inc.

VOLUME 3 ISSUE 4 OCTOBER 2019
ISSN 2587-1366
CONTENTS
CLOSED LOOP SUPPLY CHAIN MANAGEMENT PERFORMANCE
EVALUATION CRITERIA
Emel Yontar and Süleyman Ersöz ..................................................................... 157
AUTOMATIC DETECTION OF CYBERBULLYING IN FORMSPRING.ME,
MYSPACE AND YOUTUBE SOCIAL NETWORKS
Çiğdem İnan Acı, Eren Çürük and Esra Saraç Eşsiz ....................................... 168
BEHAVIOR OF R/C FRAMES WITH CONCRETE PLATE BONDED
INFILLS
Mehmet Baran ..................................................................................................... 179
LOGIC THRESHOLD FOR MICRORING RESONATOR-BASED BDD
CIRCUITS: PHYSICAL AND OPERATIONAL ANALYSES
Ozan Yakar and İlke Ercan ............................................................................... 189
EXPERIMENTAL INVESTIGATION OF A NOVEL FRICTION MODIFIER
IN COMPOSITE MATERIALS
İlker Sugözü and Mücahit Güdük ..................................................................... 197
REMOVAL OF COLOUR POLLUTIONS IN DYE BATHS WITH
MORDANTS
Aslıhan Koruyucu ............................................................................................... 201
FLEXURAL BEHAVIOR OF HYBRID FRP-CONCRETE BRIDGE DECKS
İlker Fatih Kara, Ashraf F. Ashour and Cahit Bilim ....................................... 206