vol. 42 no. 2, july 2018 - dr. panjabrao deshmukh krishi
TRANSCRIPT
Vol. 42 No. 2, July 2018
1
Phytophthora spp. are the most destructive plantpathogens known to have a wide host range and severelyaffect citrus orchards and nurseries throughout the world(Erwin and Ribeiro, 1996 and Das et al., 2013).Phytophthora spp. are mainly responsible for widedestruction, causing varied symptoms viz. damping off,seedling rot, collar rot, fruit and root rot, leaf fall and fruitdrop. More than 20 per cent seedling mortality has beenreported in Central India due to Phytophthora spp. (Naqvi,2000). Fungi of the genus phytophthora, a causal agentof gummosis are worldwide known as primary parasitesof fine roots. Phytophthora root rot and gummosis arethe most important soil borne diseases of Nagpurmandarin causing mortality, slow decline and yield loss ofmature trees (Graham and Menge, 1999). Citrus spp. areprone to attack by more than 150 pathogens and disorderscaused by fungal, viral and few bacterial pathogens rightfrom nursery level to bearing stage resulting in severelosses. All citrus orchards in central India and other citruscultivation belts of India are infected by Phytophthoradisease. (Gade and Koche, 2012).
Phytophthora spp. cause the most serious andeconomically important soil borne diseases of citrus crop.
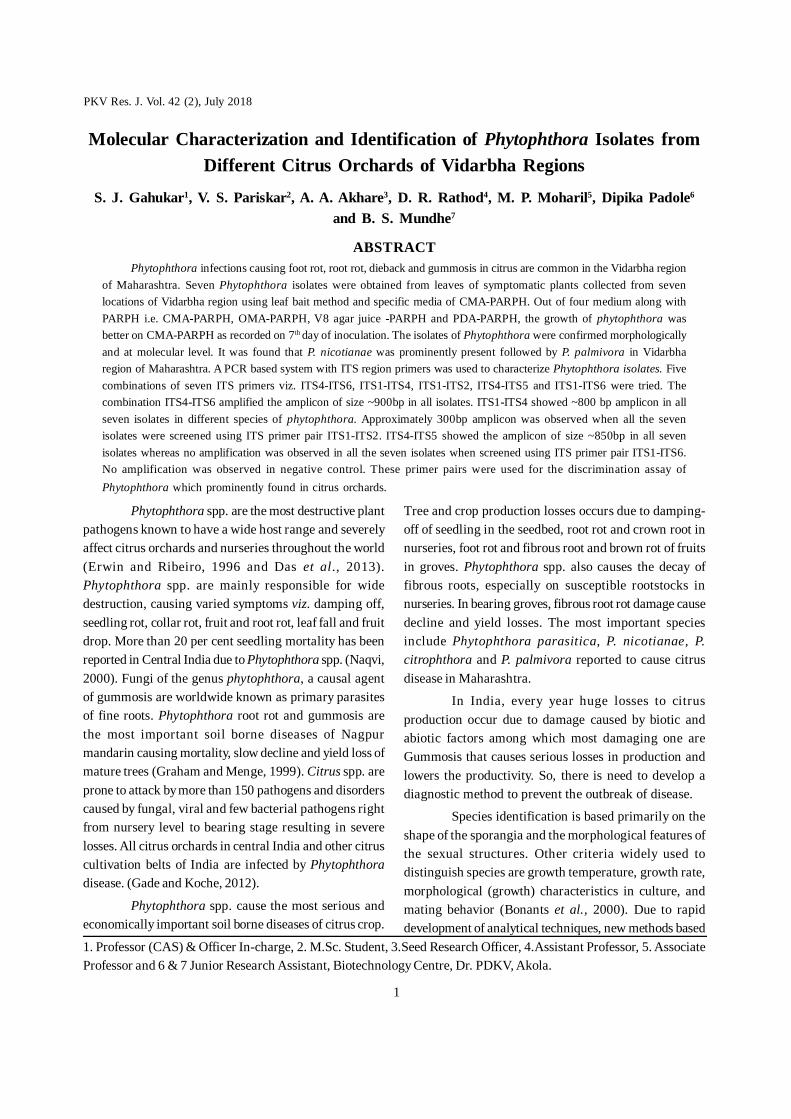
Molecular Characterization and Identification of Phytophthora Isolates fromDifferent Citrus Orchards of Vidarbha Regions
S. J. Gahukar1, V. S. Pariskar2, A. A. Akhare3, D. R. Rathod4, M. P. Moharil5, Dipika Padole6
and B. S. Mundhe7
ABSTRACTPhytophthora infections causing foot rot, root rot, dieback and gummosis in citrus are common in the Vidarbha region
of Maharashtra. Seven Phytophthora isolates were obtained from leaves of symptomatic plants collected from sevenlocations of Vidarbha region using leaf bait method and specific media of CMA-PARPH. Out of four medium along withPARPH i.e. CMA-PARPH, OMA-PARPH, V8 agar juice -PARPH and PDA-PARPH, the growth of phytophthora wasbetter on CMA-PARPH as recorded on 7th day of inoculation. The isolates of Phytophthora were confirmed morphologicallyand at molecular level. It was found that P. nicotianae was prominently present followed by P. palmivora in Vidarbharegion of Maharashtra. A PCR based system with ITS region primers was used to characterize Phytophthora isolates. Fivecombinations of seven ITS primers viz. ITS4-ITS6, ITS1-ITS4, ITS1-ITS2, ITS4-ITS5 and ITS1-ITS6 were tried. Thecombination ITS4-ITS6 amplified the amplicon of size ~900bp in all isolates. ITS1-ITS4 showed ~800 bp amplicon in allseven isolates in different species of phytophthora. Approximately 300bp amplicon was observed when all the sevenisolates were screened using ITS primer pair ITS1-ITS2. ITS4-ITS5 showed the amplicon of size ~850bp in all sevenisolates whereas no amplification was observed in all the seven isolates when screened using ITS primer pair ITS1-ITS6.No amplification was observed in negative control. These primer pairs were used for the discrimination assay ofPhytophthora which prominently found in citrus orchards.
1. Professor (CAS) & Officer In-charge, 2. M.Sc. Student, 3.Seed Research Officer, 4.Assistant Professor, 5. AssociateProfessor and 6 & 7 Junior Research Assistant, Biotechnology Centre, Dr. PDKV, Akola.
Tree and crop production losses occurs due to damping-off of seedling in the seedbed, root rot and crown root innurseries, foot rot and fibrous root and brown rot of fruitsin groves. Phytophthora spp. also causes the decay offibrous roots, especially on susceptible rootstocks innurseries. In bearing groves, fibrous root rot damage causedecline and yield losses. The most important speciesinclude Phytophthora parasitica, P. nicotianae, P.citrophthora and P. palmivora reported to cause citrusdisease in Maharashtra.
In India, every year huge losses to citrusproduction occur due to damage caused by biotic andabiotic factors among which most damaging one areGummosis that causes serious losses in production andlowers the productivity. So, there is need to develop adiagnostic method to prevent the outbreak of disease.
Species identification is based primarily on theshape of the sporangia and the morphological features ofthe sexual structures. Other criteria widely used todistinguish species are growth temperature, growth rate,morphological (growth) characteristics in culture, andmating behavior (Bonants et al., 2000). Due to rapiddevelopment of analytical techniques, new methods based
PKV Res. J. Vol. 42 (2), July 2018
2
on DNA amplification are often brought into practice, forexample PCR, which is a relatively quick, cheap and easymethod. These techniques are characterized by a simpleprocedure and do not require previous knowledge aboutthe DNA sequences to be amplified or a high quality orquantity of DNA. In this study PCR using variouscombinations of ITS primers was used to characterizePhytopthora spp.
MATERAIL AND METHODS
In the present study, the leaf samples from citrusplants showing characteristic symptoms of Phytophthorawere collected in order to isolate phytophthora sspecies.The phytophthora showing gummosis, root rot, barkscracking etc. are common symptoms that were observedfrom all locations of Vidarbha region.
Source of pathogen- Seven Phytophthora isolates wereisolated and purified from leaf samples collected fromsymptomatic plants by leaf bait method and soilsuspension method (Das et al., 2013) from differentlocations of Vidarbha region which involved Main GardenCitrus Nursery, Akola, AICRP on Tropical Fruits, Dr. PDKV,Akola, Regional Research Station on Tropical Fruits Katol,Chargaon, Tiwasa Ghat, Shendurjana Ghat and Achalpur.The samples were placed in plastic bags to maintain soilmoisture, transported to laboratory (Timmer et al., 1988).
The inoculated plates were incubated at 280C for2-3 days and number of colonies of Phytophthora werecounted. Soil in the second core was flooded with water,baited with pieces of citrus leaves, and placed in theincubator for 48 hr (Grimm and Alexander, 1973). The leaveswere transferred to Petri dishes and examined for thepresence of papillate sporangia. Subculture ofPhytophthora from infected leaf pieces was easilyidentified by submerging infected leaf pieces in PARPH-CMA medium and transferring hyphal tips as they grewin the medium. Cultures were purified using hyphal tipmethod and maintained on selective medium and CMA atroom temperature by adopting subsequent subculturingat regular intervals. The isolated phytophthora isolateswere confirmed on the basis of morphological characters,sporangia, sporangiospores and swelling of the vegetativemycelium and seven days old mycelial growth was takenfor DNA isolation and for further study.
DNA Extraction:- DNA was isolated from pure cultureusing standard protocol with some modifications(Sambrook, 1989) whereas DNA from soil sample wasextracted using DNA Extraction Kit (Genetix BiotechMake). DNA was quantified after RNase treatment onNanophotometer (Eppendorf Make).
Polymerase Chain Reaction (PCR):- Polymerase ChainReaction (PCR) amplification of the ITS region of thetemplate DNA was performed using primers ITS1 to ITS7in various combinations as described by Cooke et al., 2000.PCR was conducted in 20µl reaction volume using 0.2mlPCR tubes. Each reaction mixture contained: dNTPs(10mM), MgCl2 (25mM), forward primer (10pmol/µl),reverse primer (10pmol/µl), 10X PCR buffer, Taq DNApolymerase (1U) and 1µl template DNA. Different PCRconditions were used for different primer sets.Amplification was carried out using mastercycler PCRmachine (Applied Biosystem Make). The PCR profilingfor each primer pair was optimized. Initial denaturation forall the primer pair was 940C for 3-5 min, then denaturationwas carried out at 940C for 30 sec- 1min. Annealingtemperature for primer pair ITS4-ITS5 and ITS4-ITS6 was500C, for ITS1-ITS2 and ITS1-ITS6 was standardized at540C whereas for ITS1-ITS4 annealed at 550C. PCR wasdone for 35 cycles at given temperature for 30 sec. Theextension of annealed product was carried out at 720C for30 sec and for 5-10 min respectively. The amplified DNA(PCR products) was electrophoresed on 1% agarose gelstained with ethidium bromide. The gel was observedunder a Gel Doc system (Biovis, Mumbai).
RESULTS AND DISCUSSIONIsolation, Purification and MorphologicalCharacterization of the isolates
The leaf samples were collected from plantsshowing characteristics symptoms of phytophthora fromvarious region of Vidarbha. The common symptoms shownby phytophthora are dieback, gummosis, root rot, barkcracking, damping off (except Akola region), brown rot offruits, reduction in fruit size, etc. from all locations ofVidharbha region. The expression of symptoms dependson the epidemiology of disease. There is variation inenvironmental parameters as well as availability ofresources e.g. temperature, irrigation facilities, fungicidaluse etc. An infected seedling rapidly shows drying
PKV Res. J. Vol. 42 (2), July 2018
3
symptoms, when moisture is abundant and temperature isfavorable for fungal growth. Favorable conditions ofoptimum temperature (25-270C) and long periods of wetting(18 plus hours) continue, disease spreads to fruitthroughout the canopy.
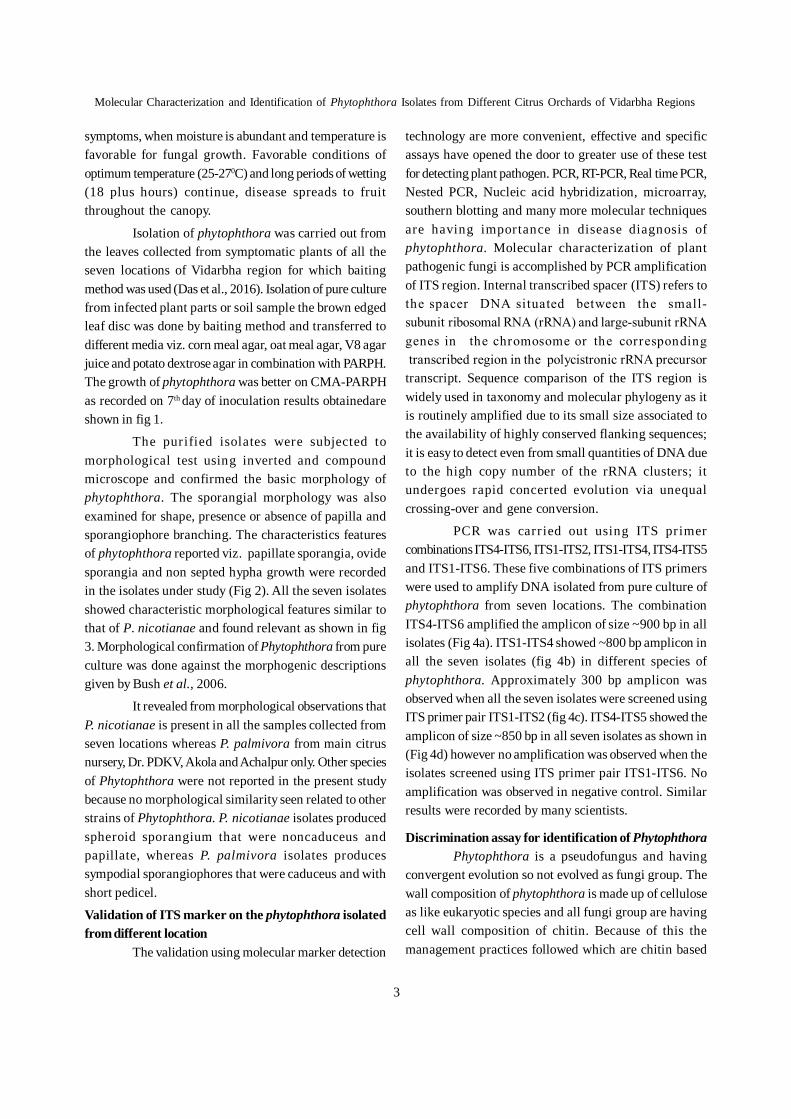
Isolation of phytophthora was carried out fromthe leaves collected from symptomatic plants of all theseven locations of Vidarbha region for which baitingmethod was used (Das et al., 2016). Isolation of pure culturefrom infected plant parts or soil sample the brown edgedleaf disc was done by baiting method and transferred todifferent media viz. corn meal agar, oat meal agar, V8 agarjuice and potato dextrose agar in combination with PARPH.The growth of phytophthora was better on CMA-PARPHas recorded on 7th day of inoculation results obtainedareshown in fig 1.
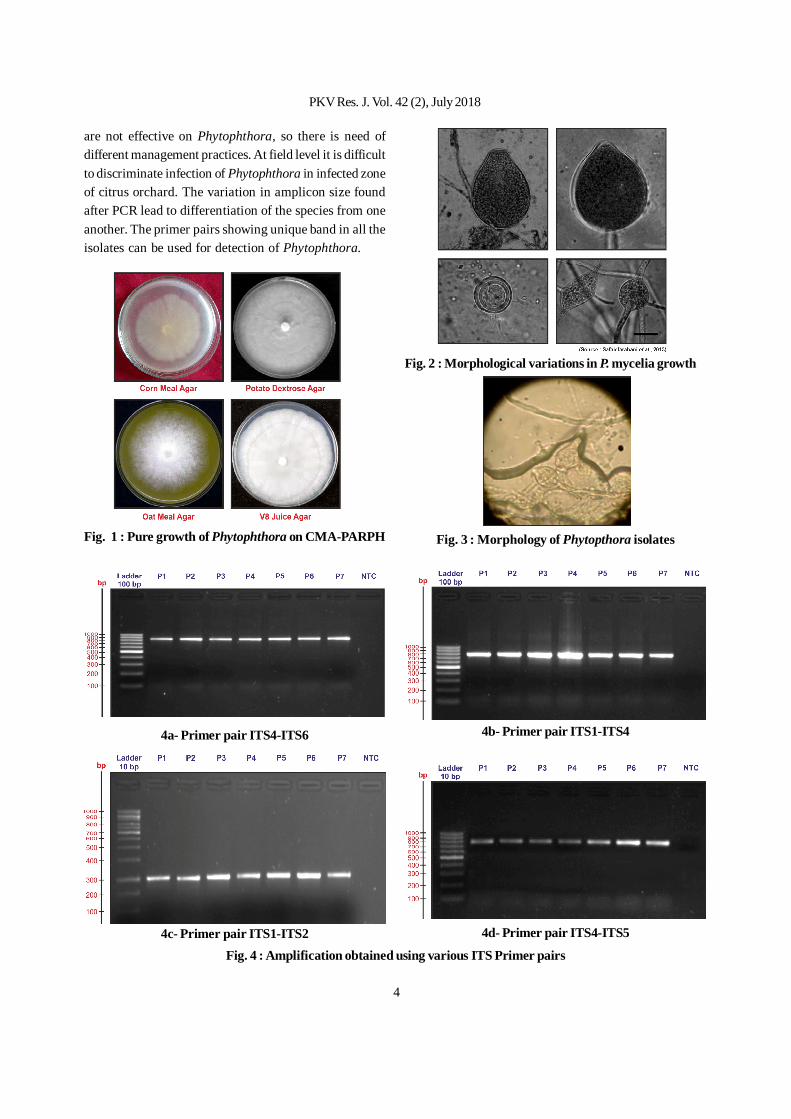
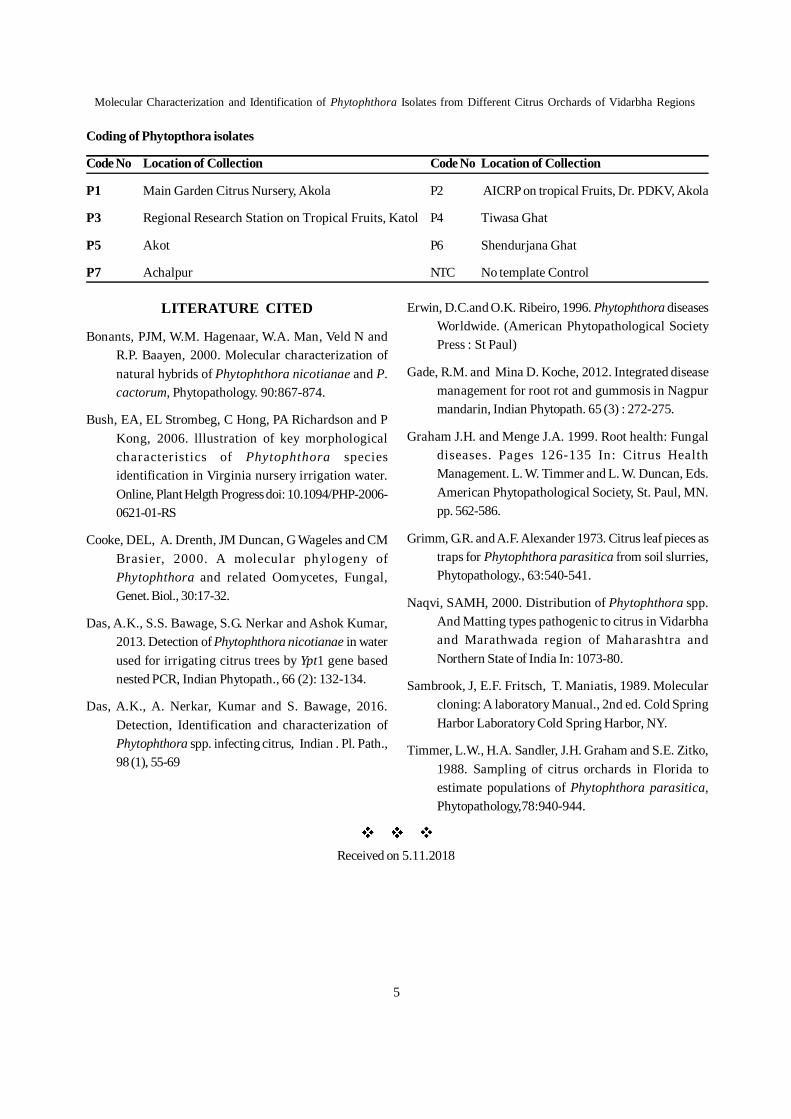
The purified isolates were subjected tomorphological test using inverted and compoundmicroscope and confirmed the basic morphology ofphytophthora. The sporangial morphology was alsoexamined for shape, presence or absence of papilla andsporangiophore branching. The characteristics featuresof phytophthora reported viz. papillate sporangia, ovidesporangia and non septed hypha growth were recordedin the isolates under study (Fig 2). All the seven isolatesshowed characteristic morphological features similar tothat of P. nicotianae and found relevant as shown in fig3. Morphological confirmation of Phytophthora from pureculture was done against the morphogenic descriptionsgiven by Bush et al., 2006.
It revealed from morphological observations thatP. nicotianae is present in all the samples collected fromseven locations whereas P. palmivora from main citrusnursery, Dr. PDKV, Akola and Achalpur only. Other speciesof Phytophthora were not reported in the present studybecause no morphological similarity seen related to otherstrains of Phytophthora. P. nicotianae isolates producedspheroid sporangium that were noncaduceus andpapillate, whereas P. palmivora isolates producessympodial sporangiophores that were caduceus and withshort pedicel.
Validation of ITS marker on the phytophthora isolatedfrom different location
The validation using molecular marker detection
technology are more convenient, effective and specificassays have opened the door to greater use of these testfor detecting plant pathogen. PCR, RT-PCR, Real time PCR,Nested PCR, Nucleic acid hybridization, microarray,southern blotting and many more molecular techniquesare having importance in disease diagnosis ofphytophthora. Molecular characterization of plantpathogenic fungi is accomplished by PCR amplificationof ITS region. Internal transcribed spacer (ITS) refers tothe spacer DNA situated between the small-subunit ribosomal RNA (rRNA) and large-subunit rRNAgenes in the chromosome or the corresponding transcribed region in the polycistronic rRNA precursortranscript. Sequence comparison of the ITS region iswidely used in taxonomy and molecular phylogeny as itis routinely amplified due to its small size associated tothe availability of highly conserved flanking sequences;it is easy to detect even from small quantities of DNA dueto the high copy number of the rRNA clusters; itundergoes rapid concerted evolution via unequalcrossing-over and gene conversion.
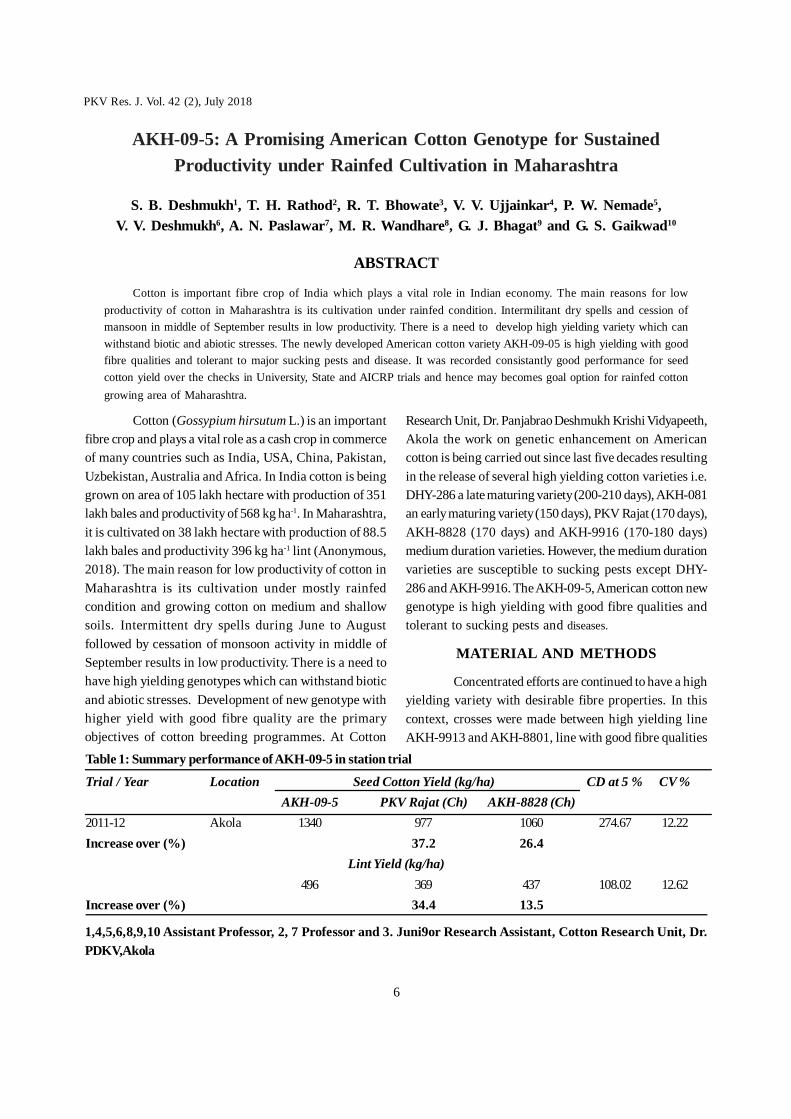
PCR was carr ied out using ITS primercombinations ITS4-ITS6, ITS1-ITS2, ITS1-ITS4, ITS4-ITS5and ITS1-ITS6. These five combinations of ITS primerswere used to amplify DNA isolated from pure culture ofphytophthora from seven locations. The combinationITS4-ITS6 amplified the amplicon of size ~900 bp in allisolates (Fig 4a). ITS1-ITS4 showed ~800 bp amplicon inall the seven isolates (fig 4b) in different species ofphytophthora. Approximately 300 bp amplicon wasobserved when all the seven isolates were screened usingITS primer pair ITS1-ITS2 (fig 4c). ITS4-ITS5 showed theamplicon of size ~850 bp in all seven isolates as shown in(Fig 4d) however no amplification was observed when theisolates screened using ITS primer pair ITS1-ITS6. Noamplification was observed in negative control. Similarresults were recorded by many scientists.
Discrimination assay for identification of PhytophthoraPhytophthora is a pseudofungus and having
convergent evolution so not evolved as fungi group. Thewall composition of phytophthora is made up of celluloseas like eukaryotic species and all fungi group are havingcell wall composition of chitin. Because of this themanagement practices followed which are chitin based
Molecular Characterization and Identification of Phytophthora Isolates from Different Citrus Orchards of Vidarbha Regions
4
are not effective on Phytophthora, so there is need ofdifferent management practices. At field level it is difficultto discriminate infection of Phytophthora in infected zoneof citrus orchard. The variation in amplicon size foundafter PCR lead to differentiation of the species from oneanother. The primer pairs showing unique band in all theisolates can be used for detection of Phytophthora.
Fig. 1 : Pure growth of Phytophthora on CMA-PARPH
Fig. 2 : Morphological variations in P. mycelia growth
Fig. 3 : Morphology of Phytopthora isolates
Fig. 4 : Amplification obtained using various ITS Primer pairs
4a- Primer pair ITS4-ITS6 4b- Primer pair ITS1-ITS4
4c- Primer pair ITS1-ITS2 4d- Primer pair ITS4-ITS5
PKV Res. J. Vol. 42 (2), July 2018
5
LITERATURE CITED
Bonants, PJM, W.M. Hagenaar, W.A. Man, Veld N andR.P. Baayen, 2000. Molecular characterization ofnatural hybrids of Phytophthora nicotianae and P.cactorum, Phytopathology. 90:867-874.
Bush, EA, EL Strombeg, C Hong, PA Richardson and PKong, 2006. lllustration of key morphologicalcharacteristics of Phytophthora speciesidentification in Virginia nursery irrigation water.Online, Plant Helgth Progress doi: 10.1094/PHP-2006-0621-01-RS
Cooke, DEL, A. Drenth, JM Duncan, G Wageles and CMBrasier, 2000. A molecular phylogeny ofPhytophthora and related Oomycetes, Fungal,Genet. Biol., 30:17-32.
Das, A.K., S.S. Bawage, S.G. Nerkar and Ashok Kumar,2013. Detection of Phytophthora nicotianae in waterused for irrigating citrus trees by Ypt1 gene basednested PCR, Indian Phytopath., 66 (2): 132-134.
Das, A.K., A. Nerkar, Kumar and S. Bawage, 2016.Detection, Identification and characterization ofPhytophthora spp. infecting citrus, Indian . Pl. Path.,98 (1), 55-69
Coding of Phytopthora isolates
Code No Location of Collection Code No Location of Collection
P1 Main Garden Citrus Nursery, Akola P2 AICRP on tropical Fruits, Dr. PDKV, Akola
P3 Regional Research Station on Tropical Fruits, Katol P4 Tiwasa Ghat
P5 Akot P6 Shendurjana Ghat
P7 Achalpur NTC No template Control
Erwin, D.C.and O.K. Ribeiro, 1996. Phytophthora diseasesWorldwide. (American Phytopathological SocietyPress : St Paul)
Gade, R.M. and Mina D. Koche, 2012. Integrated diseasemanagement for root rot and gummosis in Nagpurmandarin, Indian Phytopath. 65 (3) : 272-275.
Graham J.H. and Menge J.A. 1999. Root health: Fungaldiseases. Pages 126-135 In: Citrus HealthManagement. L. W. Timmer and L. W. Duncan, Eds.American Phytopathological Society, St. Paul, MN.pp. 562-586.
Grimm, G.R. and A.F. Alexander 1973. Citrus leaf pieces astraps for Phytophthora parasitica from soil slurries,Phytopathology., 63:540-541.
Naqvi, SAMH, 2000. Distribution of Phytophthora spp.And Matting types pathogenic to citrus in Vidarbhaand Marathwada region of Maharashtra andNorthern State of India In: 1073-80.
Sambrook, J, E.F. Fritsch, T. Maniatis, 1989. Molecularcloning: A laboratory Manual., 2nd ed. Cold SpringHarbor Laboratory Cold Spring Harbor, NY.
Timmer, L.W., H.A. Sandler, J.H. Graham and S.E. Zitko,1988. Sampling of citrus orchards in Florida toestimate populations of Phytophthora parasitica,Phytopathology,78:940-944.
Received on 5.11.2018
Molecular Characterization and Identification of Phytophthora Isolates from Different Citrus Orchards of Vidarbha Regions
6
Cotton (Gossypium hirsutum L.) is an importantfibre crop and plays a vital role as a cash crop in commerceof many countries such as India, USA, China, Pakistan,Uzbekistan, Australia and Africa. In India cotton is beinggrown on area of 105 lakh hectare with production of 351lakh bales and productivity of 568 kg ha-1. In Maharashtra,it is cultivated on 38 lakh hectare with production of 88.5lakh bales and productivity 396 kg ha-1 lint (Anonymous,2018). The main reason for low productivity of cotton inMaharashtra is its cultivation under mostly rainfedcondition and growing cotton on medium and shallowsoils. Intermittent dry spells during June to Augustfollowed by cessation of monsoon activity in middle ofSeptember results in low productivity. There is a need tohave high yielding genotypes which can withstand bioticand abiotic stresses. Development of new genotype withhigher yield with good fibre quality are the primaryobjectives of cotton breeding programmes. At Cotton
AKH-09-5: A Promising American Cotton Genotype for SustainedProductivity under Rainfed Cultivation in Maharashtra
S. B. Deshmukh1, T. H. Rathod2, R. T. Bhowate3, V. V. Ujjainkar4, P. W. Nemade5,V. V. Deshmukh6, A. N. Paslawar7, M. R. Wandhare8, G. J. Bhagat9 and G. S. Gaikwad10
ABSTRACT
Cotton is important fibre crop of India which plays a vital role in Indian economy. The main reasons for lowproductivity of cotton in Maharashtra is its cultivation under rainfed condition. Intermilitant dry spells and cession ofmansoon in middle of September results in low productivity. There is a need to develop high yielding variety which canwithstand biotic and abiotic stresses. The newly developed American cotton variety AKH-09-05 is high yielding with goodfibre qualities and tolerant to major sucking pests and disease. It was recorded consistantly good performance for seedcotton yield over the checks in University, State and AICRP trials and hence may becomes goal option for rainfed cottongrowing area of Maharashtra.
Research Unit, Dr. Panjabrao Deshmukh Krishi Vidyapeeth,Akola the work on genetic enhancement on Americancotton is being carried out since last five decades resultingin the release of several high yielding cotton varieties i.e.DHY-286 a late maturing variety (200-210 days), AKH-081an early maturing variety (150 days), PKV Rajat (170 days),AKH-8828 (170 days) and AKH-9916 (170-180 days)medium duration varieties. However, the medium durationvarieties are susceptible to sucking pests except DHY-286 and AKH-9916. The AKH-09-5, American cotton newgenotype is high yielding with good fibre qualities andtolerant to sucking pests and diseases.
MATERIAL AND METHODS
Concentrated efforts are continued to have a highyielding variety with desirable fibre properties. In thiscontext, crosses were made between high yielding lineAKH-9913 and AKH-8801, line with good fibre qualities
Table 1: Summary performance of AKH-09-5 in station trial
Trial / Year Location Seed Cotton Yield (kg/ha) CD at 5 % CV %AKH-09-5 PKV Rajat (Ch) AKH-8828 (Ch)
2011-12 Akola 1340 977 1060 274.67 12.22Increase over (%) 37.2 26.4
Lint Yield (kg/ha)496 369 437 108.02 12.62
Increase over (%) 34.4 13.5
1,4,5,6,8,9,10 Assistant Professor, 2, 7 Professor and 3. Juni9or Research Assistant, Cotton Research Unit, Dr.PDKV,Akola
PKV Res. J. Vol. 42 (2), July 2018
7
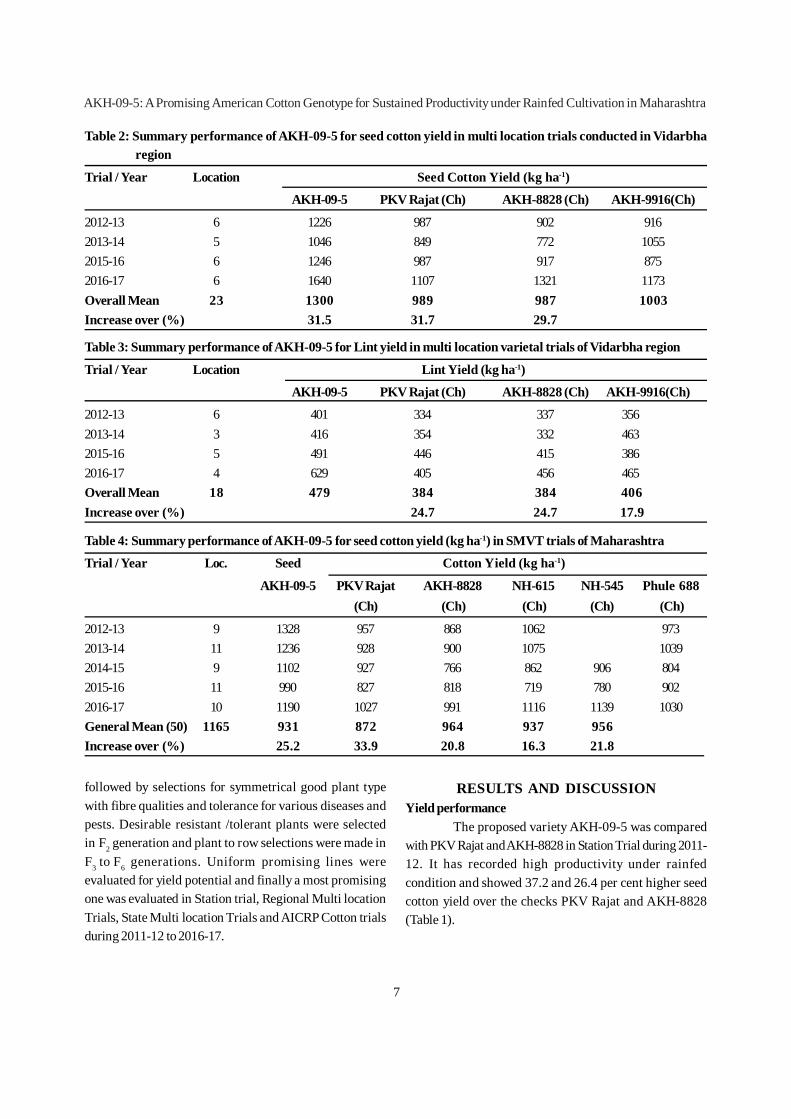
Table 2: Summary performance of AKH-09-5 for seed cotton yield in multi location trials conducted in Vidarbharegion
Trial / Year Location Seed Cotton Yield (kg ha-1)
AKH-09-5 PKV Rajat (Ch) AKH-8828 (Ch) AKH-9916(Ch)
2012-13 6 1226 987 902 9162013-14 5 1046 849 772 10552015-16 6 1246 987 917 8752016-17 6 1640 1107 1321 1173Overall Mean 23 1300 989 987 1003Increase over (%) 31.5 31.7 29.7
Table 3: Summary performance of AKH-09-5 for Lint yield in multi location varietal trials of Vidarbha region
Trial / Year Location Lint Yield (kg ha-1)
AKH-09-5 PKV Rajat (Ch) AKH-8828 (Ch) AKH-9916(Ch)
2012-13 6 401 334 337 3562013-14 3 416 354 332 4632015-16 5 491 446 415 3862016-17 4 629 405 456 465Overall Mean 18 479 384 384 406Increase over (%) 24.7 24.7 17.9
Table 4: Summary performance of AKH-09-5 for seed cotton yield (kg ha-1) in SMVT trials of Maharashtra
Trial / Year Loc. Seed Cotton Yield (kg ha-1)
AKH-09-5 PKV Rajat AKH-8828 NH-615 NH-545 Phule 688(Ch) (Ch) (Ch) (Ch) (Ch)
2012-13 9 1328 957 868 1062 9732013-14 11 1236 928 900 1075 10392014-15 9 1102 927 766 862 906 8042015-16 11 990 827 818 719 780 9022016-17 10 1190 1027 991 1116 1139 1030General Mean (50) 1165 931 872 964 937 956Increase over (%) 25.2 33.9 20.8 16.3 21.8
followed by selections for symmetrical good plant typewith fibre qualities and tolerance for various diseases andpests. Desirable resistant /tolerant plants were selectedin F2 generation and plant to row selections were made inF3 to F6 generations. Uniform promising lines wereevaluated for yield potential and finally a most promisingone was evaluated in Station trial, Regional Multi locationTrials, State Multi location Trials and AICRP Cotton trialsduring 2011-12 to 2016-17.
RESULTS AND DISCUSSIONYield performance
The proposed variety AKH-09-5 was comparedwith PKV Rajat and AKH-8828 in Station Trial during 2011-12. It has recorded high productivity under rainfedcondition and showed 37.2 and 26.4 per cent higher seedcotton yield over the checks PKV Rajat and AKH-8828(Table 1).
AKH-09-5: A Promising American Cotton Genotype for Sustained Productivity under Rainfed Cultivation in Maharashtra
8
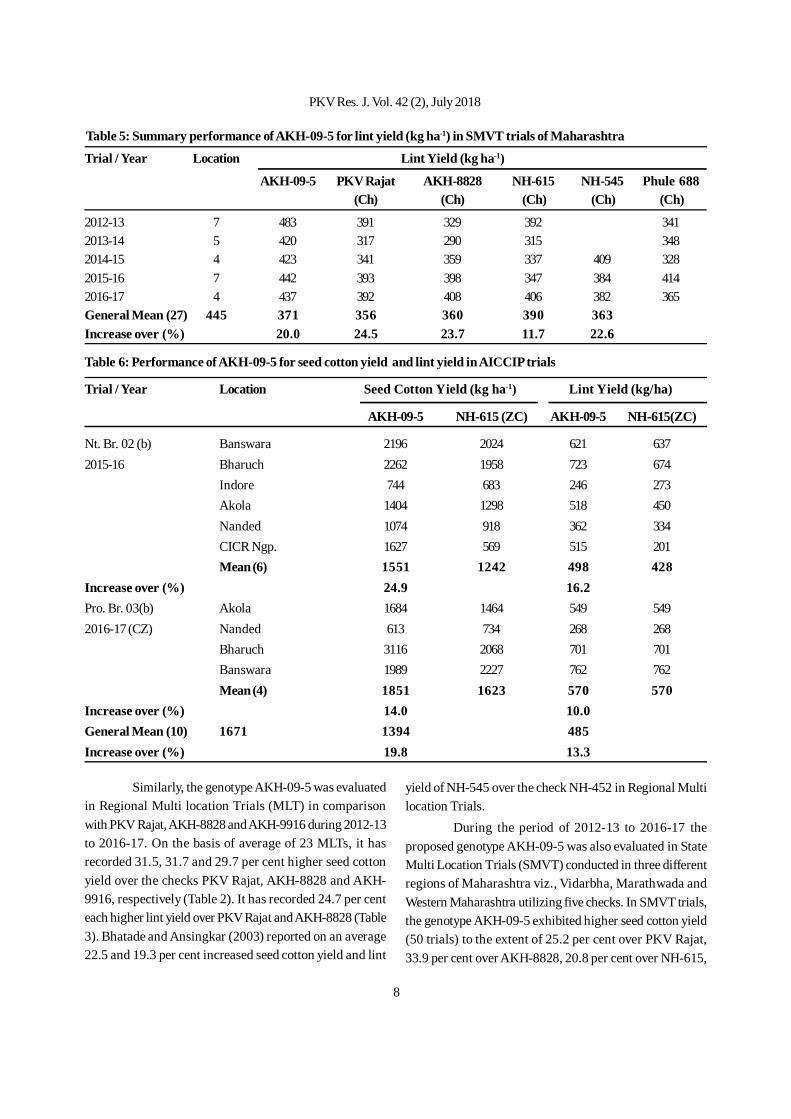
Table 5: Summary performance of AKH-09-5 for lint yield (kg ha-1) in SMVT trials of Maharashtra
Trial / Year Location Lint Yield (kg ha-1)
AKH-09-5 PKV Rajat AKH-8828 NH-615 NH-545 Phule 688(Ch) (Ch) (Ch) (Ch) (Ch)
2012-13 7 483 391 329 392 3412013-14 5 420 317 290 315 3482014-15 4 423 341 359 337 409 3282015-16 7 442 393 398 347 384 4142016-17 4 437 392 408 406 382 365General Mean (27) 445 371 356 360 390 363Increase over (%) 20.0 24.5 23.7 11.7 22.6
Table 6: Performance of AKH-09-5 for seed cotton yield and lint yield in AICCIP trials
Trial / Year Location Seed Cotton Yield (kg ha-1) Lint Yield (kg/ha)
AKH-09-5 NH-615 (ZC) AKH-09-5 NH-615(ZC)
Nt. Br. 02 (b) Banswara 2196 2024 621 6372015-16 Bharuch 2262 1958 723 674
Indore 744 683 246 273Akola 1404 1298 518 450Nanded 1074 918 362 334CICR Ngp. 1627 569 515 201Mean (6) 1551 1242 498 428
Increase over (%) 24.9 16.2Pro. Br. 03(b) Akola 1684 1464 549 5492016-17 (CZ) Nanded 613 734 268 268
Bharuch 3116 2068 701 701Banswara 1989 2227 762 762Mean (4) 1851 1623 570 570
Increase over (%) 14.0 10.0General Mean (10) 1671 1394 485Increase over (%) 19.8 13.3
Similarly, the genotype AKH-09-5 was evaluatedin Regional Multi location Trials (MLT) in comparisonwith PKV Rajat, AKH-8828 and AKH-9916 during 2012-13to 2016-17. On the basis of average of 23 MLTs, it hasrecorded 31.5, 31.7 and 29.7 per cent higher seed cottonyield over the checks PKV Rajat, AKH-8828 and AKH-9916, respectively (Table 2). It has recorded 24.7 per centeach higher lint yield over PKV Rajat and AKH-8828 (Table3). Bhatade and Ansingkar (2003) reported on an average22.5 and 19.3 per cent increased seed cotton yield and lint
yield of NH-545 over the check NH-452 in Regional Multilocation Trials.
During the period of 2012-13 to 2016-17 theproposed genotype AKH-09-5 was also evaluated in StateMulti Location Trials (SMVT) conducted in three differentregions of Maharashtra viz., Vidarbha, Marathwada andWestern Maharashtra utilizing five checks. In SMVT trials,the genotype AKH-09-5 exhibited higher seed cotton yield(50 trials) to the extent of 25.2 per cent over PKV Rajat,33.9 per cent over AKH-8828, 20.8 per cent over NH-615,
PKV Res. J. Vol. 42 (2), July 2018
9
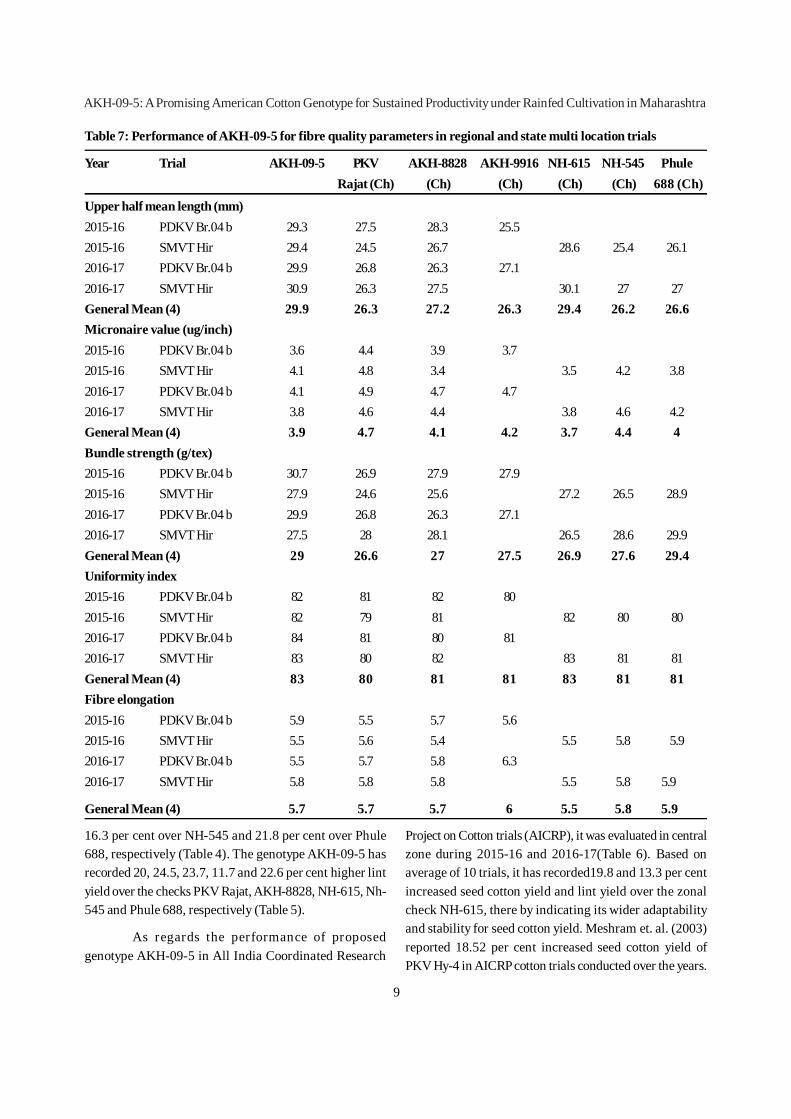
Table 7: Performance of AKH-09-5 for fibre quality parameters in regional and state multi location trials
Year Trial AKH-09-5 PKV AKH-8828 AKH-9916 NH-615 NH-545 PhuleRajat (Ch) (Ch) (Ch) (Ch) (Ch) 688 (Ch)
Upper half mean length (mm)2015-16 PDKV Br.04 b 29.3 27.5 28.3 25.5 2015-16 SMVT Hir 29.4 24.5 26.7 28.6 25.4 26.12016-17 PDKV Br.04 b 29.9 26.8 26.3 27.1 2016-17 SMVT Hir 30.9 26.3 27.5 30.1 27 27General Mean (4) 29.9 26.3 27.2 26.3 29.4 26.2 26.6Micronaire value (ug/inch)2015-16 PDKV Br.04 b 3.6 4.4 3.9 3.7 2015-16 SMVT Hir 4.1 4.8 3.4 3.5 4.2 3.82016-17 PDKV Br.04 b 4.1 4.9 4.7 4.7 2016-17 SMVT Hir 3.8 4.6 4.4 3.8 4.6 4.2General Mean (4) 3.9 4.7 4.1 4.2 3.7 4.4 4Bundle strength (g/tex)2015-16 PDKV Br.04 b 30.7 26.9 27.9 27.9 2015-16 SMVT Hir 27.9 24.6 25.6 27.2 26.5 28.92016-17 PDKV Br.04 b 29.9 26.8 26.3 27.1 2016-17 SMVT Hir 27.5 28 28.1 26.5 28.6 29.9General Mean (4) 29 26.6 27 27.5 26.9 27.6 29.4Uniformity index2015-16 PDKV Br.04 b 82 81 82 80 2015-16 SMVT Hir 82 79 81 82 80 802016-17 PDKV Br.04 b 84 81 80 81 2016-17 SMVT Hir 83 80 82 83 81 81General Mean (4) 83 80 81 81 83 81 81Fibre elongation2015-16 PDKV Br.04 b 5.9 5.5 5.7 5.6 2015-16 SMVT Hir 5.5 5.6 5.4 5.5 5.8 5.92016-17 PDKV Br.04 b 5.5 5.7 5.8 6.3 2016-17 SMVT Hir 5.8 5.8 5.8 5.5 5.8 5.9
General Mean (4) 5.7 5.7 5.7 6 5.5 5.8 5.9
16.3 per cent over NH-545 and 21.8 per cent over Phule688, respectively (Table 4). The genotype AKH-09-5 hasrecorded 20, 24.5, 23.7, 11.7 and 22.6 per cent higher lintyield over the checks PKV Rajat, AKH-8828, NH-615, Nh-545 and Phule 688, respectively (Table 5).
As regards the performance of proposedgenotype AKH-09-5 in All India Coordinated Research
Project on Cotton trials (AICRP), it was evaluated in centralzone during 2015-16 and 2016-17(Table 6). Based onaverage of 10 trials, it has recorded19.8 and 13.3 per centincreased seed cotton yield and lint yield over the zonalcheck NH-615, there by indicating its wider adaptabilityand stability for seed cotton yield. Meshram et. al. (2003)reported 18.52 per cent increased seed cotton yield ofPKV Hy-4 in AICRP cotton trials conducted over the years.
AKH-09-5: A Promising American Cotton Genotype for Sustained Productivity under Rainfed Cultivation in Maharashtra
10
Table 8: Performance of AKH-09-5 for fibre qualities in AICCIP Trials
Trial/Year Location Upper half mean Micronaire value Bundle strength length (UHML) (ug inch-1) (g tex-1)
AKH-09-5 NH-615(ZC) AKH-09-5 NH-615(ZC) AKH-09-5 NH-615(ZC)
Nt. Br. 02 (b) Banswara 30.9 27.2 4.2 3.5 25.0 26.82015-16 Bharuch 29.9 29.4 4.8 4.3 25.5 25.6 Indore 27.5 28.4 2.6 3.2 22.6 27.5 Akola 29.3 30.1 4.3 4.1 27.8 27.7 Nanded 27.4 26.6 4.1 3.3 25.5 28.1 CICR Ngp. 27.9 27.4 4.1 3.7 26.5 27.6 Mean (6) 28.8 28.2 4.0 3.7 25.5 27.2Pro Br. 03 (b) Akola 29.6 29.7 4 3.6 30.4 29.5
Bharuch 30.3 29.7 4.6 4.5 32.1 31.7Banswara 30.3 29.6 4.2 4.3 23.7 25.5 Mean (3) 30.1 29.7 4.3 4.1 28.7 28.9
General Mean (9) 29.2 28.7 4.1 3.8 26.6 27.8
Table 9: Reaction of AKH-09-5 to Sucking pests and Boll worm complex in AICCIP trial (Pro Br. 03 2016-17)
Insect Pests AKH-09-5 DCH-32 (SC) DHY-286 (RC)Jassids Grade Count Grade Count Grade CountAkola I 3.70 (1.92) I 6.00 (2.43) I 3.00 (1.68)Nanded III 8.10 (2.93) III 8.6 (3.01) II 11.75 (3.49)Bharuch 1.2 (MR) 4.0 (2.12) 4 (HS) 22.40 (4.78) 1.1 (MR) 3.60 (2.02)Banswara II 9.33 (3.05) IV 13.67 (3.70) I 4.33 (2.08)White flies/3 leavesAkola 9.80 (3.09) 3.80 (1.91) 13.70 (3.68)Nanded 10.90(3.37) 13.30 (3.69) 11.20 (3.41)Bharuch 20.90 (4.57) 9.60 (3.17) 35.40 (5.98)Banswara 15 (3.86) 18.67 (4.32) 6.0 (2.44)Av. loculi damage at harvestAkola 9.54 (17.96) 2.09 (8.20) 13.55 (21.53)Nanded 6.30 (14.51) 8.20 (16.63) 8.70 (17.15)Bharuch 10.86(19.20) 23.29 (28.79) 17.06 (24.33)Banswara N.A. N.A. N.A.
The fibre quality of AKH-09-5 was evaluated indifferent trials and presented in Table 7 and 9. The resultsindicated that it has good fibre qualities, superior for
Upper Half Mean Length, Fibre Strength, Micronaire valueand Uniformity Index over the check varieties.
Reaction to pest and diseases:
As regards the field reaction to the pest anddiseases (Table 9 and 10), the genotype AKH-09-5 found
tolerant to jassids, Myrothecium leaf spot, grey mildewand Bacterial Leaf Blight disease.
PKV Res. J. Vol. 42 (2), July 2018
11
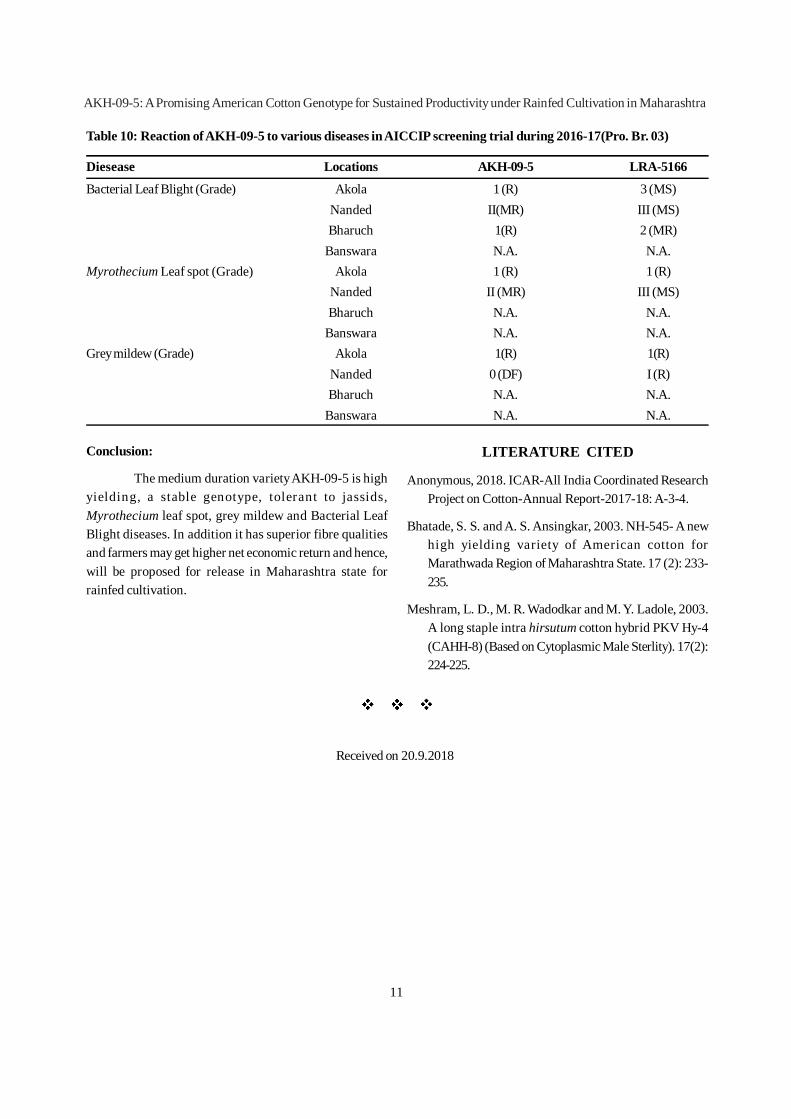
Table 10: Reaction of AKH-09-5 to various diseases in AICCIP screening trial during 2016-17(Pro. Br. 03)
Diesease Locations AKH-09-5 LRA-5166
Bacterial Leaf Blight (Grade) Akola 1 (R) 3 (MS)Nanded II(MR) III (MS)Bharuch 1(R) 2 (MR)
Banswara N.A. N.A.Myrothecium Leaf spot (Grade) Akola 1 (R) 1 (R)
Nanded II (MR) III (MS)Bharuch N.A. N.A.
Banswara N.A. N.A.Grey mildew (Grade) Akola 1(R) 1(R)
Nanded 0 (DF) I (R)Bharuch N.A. N.A.
Banswara N.A. N.A.
Conclusion:
The medium duration variety AKH-09-5 is highyielding, a stable genotype, tolerant to jassids,Myrothecium leaf spot, grey mildew and Bacterial LeafBlight diseases. In addition it has superior fibre qualitiesand farmers may get higher net economic return and hence,will be proposed for release in Maharashtra state forrainfed cultivation.
LITERATURE CITED
Anonymous, 2018. ICAR-All India Coordinated ResearchProject on Cotton-Annual Report-2017-18: A-3-4.
Bhatade, S. S. and A. S. Ansingkar, 2003. NH-545- A newhigh yielding variety of American cotton forMarathwada Region of Maharashtra State. 17 (2): 233-235.
Meshram, L. D., M. R. Wadodkar and M. Y. Ladole, 2003.A long staple intra hirsutum cotton hybrid PKV Hy-4(CAHH-8) (Based on Cytoplasmic Male Sterlity). 17(2):224-225.
Received on 20.9.2018
AKH-09-5: A Promising American Cotton Genotype for Sustained Productivity under Rainfed Cultivation in Maharashtra
12
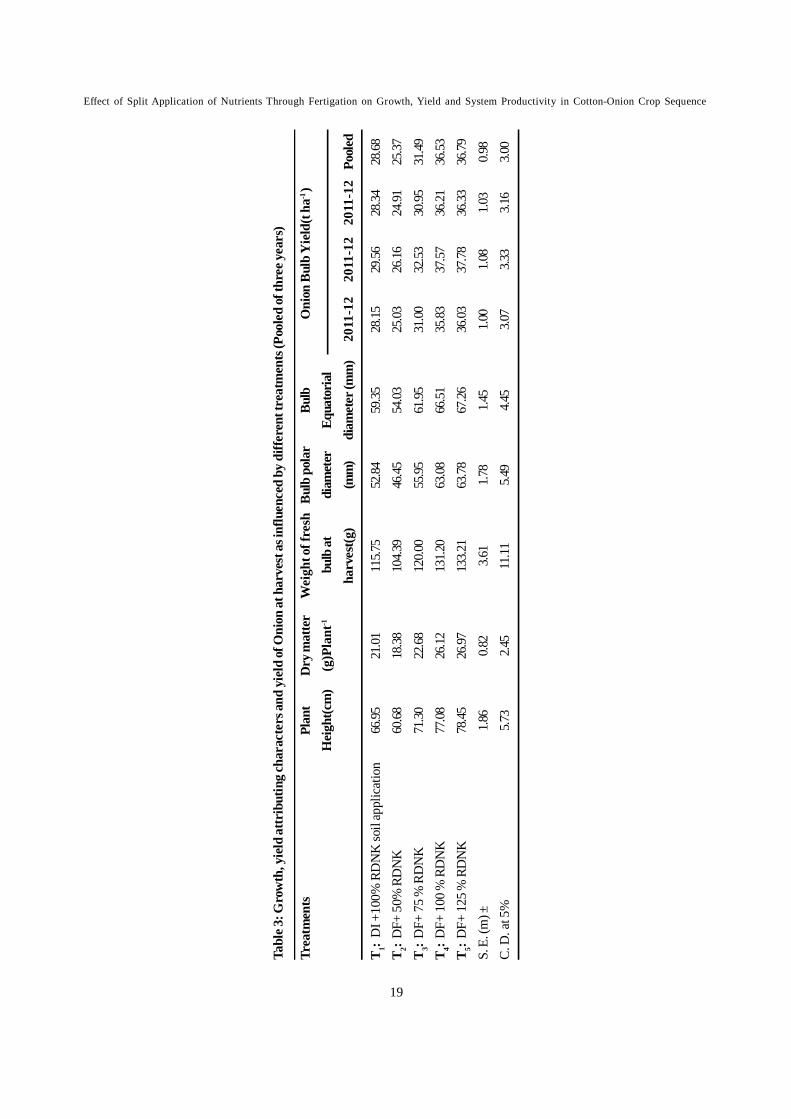
Experimental results revealed that, in cotton allthe growth parameters viz. plant height, dry matteraccumulation per plant, sympodial branches and yieldattributes viz. bolls picked and seed cotton yield per plantwere substantially enhanced by drip fertigation level at125 per cent recommended dose of N and K than lowerfertigation levels (50, 75 and 100 per cent) and overconventional soil application with 100 per cent RDNK Kgha-1. As a consequence of better growth and yieldattributes, drip fertigation at 125 per cent RDNK ha-1 hadrecorded higher seed cotton yield of 3680 Kg ha-1 , 3326Kg ha-1 and 3184 Kg ha-1 during 2011-12 , 2012-13 and2013-14 respectively. Application of 125 per centrecommended dose of N and K through fertigationsignificantly increased all the growth attributes and yieldattributing components of onion viz. Bulb polar diameter,equatorial diameter and weight of fresh bulb which wasfound comparable with 100 per cent level of N and Kthrough fertigation. Drip fertigation at 125 per centrecommended dose of N and K applied through fertigationrecorded significantly higher onion bulb yield of 36.03 tha-1, 37.78 t ha-1 and 36.33 t ha-1 during 2011-12 ,2012-13and 2013-14 respectively. Drip fertigation at 75 per centrecommended dose of N and K ha -1 did not differsignificantly in relation to growth, yield and uptake ofnutrients compared to 100 per cent RDNK ha-1 applied
Effect of Split Application of Nutrients Through Fertigation on Growth, Yieldand System Productivity in Cotton-Onion Crop Sequence
S. U. Kakade1, V. M. Bhale2, J. P. Deshmukh3 and S. B. Wadatkar4
ABSTRACT
A field experiment was conducted during the year 2011-12, 2012-2013 and 2013-14 at Department of Agronomy,Dr.PanjabraoDeshmukhKrishiVidyapeeth, Akola to study the effect of split application of N and K fertilizers on growth,yield attributes of cotton and onion, system productivity and to economize the fertilizer requirement for cotton-onionsequence under fertigation. The experiment was laid out in randomized block design with four replications and fivetreatments imposed for both cotton and onion crop having four different levels of drip fertigation in five splits at 50 percent, 75 per cent, 100 per cent and 125 per cent of recommended dose of N and K given through fertigation and P as basalcompared with 100 per cent soil application of fertilizers. The experimental site was established with inline drip irrigationsystem (16 mm) lateral laid out at 120 cm with 60 cm dripper spacing.
through soil by conventional method indicating 25 percent fertilizer saving through fertigation in individual cropof cotton and onion. The NPK uptake was favourablyincreased with higher level of fertigation compared withlower levels and soil application method; however, nutrientuse efficiency (NUE) showed a declining trend withincreasing level of N and K fertilizer by drip fertigationirrespective of different doses. Drip fertigation was foundbetter in increasing NUE compared to conventional soilapplication of fertilizers in both cotton and onion crops.Split application of N and K through fertigation at 125 percent recommended dose ha-1 significantly improved thecotton equivalent yield ,GMR, NMR and economicefficiency of the cotton-onion sequence under fertigation,whereas, B:C ratio of the system was maximum at 100 percent fertigation of RDNK ha-1. It could be concluded thatapplication of 100 per cent recommended dose of N and Kin five splits found to be best for maximizing the yield andbeneficial in increasing the system productivity andeconomic returns of cotton-onion sequence.
Cotton and Onion are the most importantcommercial crops grown in irrigated area of India and thesecrops are grown under diverse agro-climatic conditions.Improper irrigation and nutrient management are the mainreason of low productivity of both these crops.As acommercial crop, cotton (GossypiumhirsutumL.) is the
1. Assistant Professor, 2. Vice Chancellor, 3. Associate Professor and 4. Head (SWC), Department of Agronomy, Dr.PDKV, Akola
PKV Res. J. Vol. 42 (2), July 2018
13
most important fibre crop of India and it is grown in about9.59 million hectares under diverse agroclimatic conditionsas a white gold and king of fibre and also aptly called as“white gold”.Bt cotton hybrids now constitute more than90 per cent of the cotton area sown in thecountry.Maharashtra is the leading state in respect of area(41.46 lakh hectare) under cotton cultivation, which shares35.21 per cent of total cotton growing area of the country(117.73 lakh hectare) but ranks third in production and10th in productivity (303 kg ha-1). (Cotton Advisory BoardReport,2013).Bt cotton being highly exhaustive crop withregard to plant nutrients, fairly large quantities of nutrientsare required (SatyanarayanaRao and Setty, 2002). Amongthe many strategies to improve the cotton productivity,split application of fertilizers especially nitrogen andpotassium has proven more productive and profitable(Mahmood-ul-Hasanet al., 2003).
Similar to cotton, onion is also the major cashcrop giving high return within short period. It is the onlycrop which will fit after cotton under high inputmanagement like drip irrigation and fertigation. India isthe second largest producer of onion in the world, though;India significantly lags behind in the per hectareproductivity of the onion. Drip fertigation provides anefficient method of fertilizer delivery and the availabilityof soil moisture and nutrients at root zone of the cropswhich influences the uptake of nutrients, growth and yieldof the crop. Among the various factors responsible forhigh crop yield, the use of appropriate quantity of fertilizerat proper time plays a vital role in enhancing theproductivity of onion. Onion requires higher level of N, Pand K fertilizer for maximum yields than most othervegetable crops. The shallow roots and dense populationof onion make them responsive to fertilizers. Applicationof fertilizers at appropriate stages of crop growth ensuresa regular flow of both water and nutrients resulting inincreased growth rates and higher yields.
Increasing demand for irrigation water coupledwith depleting ground water sources calls for efficientuse of water. Therefore, there is need for efficient irrigationmethods to both these crops. The present scenario offlood irrigation should give away to controlled irrigation,such as drip irrigation which offers enormous for economyof irrigation water and fertilizer chemicals. In conventional
method, there is a heavy loss of nutrients due to leaching,denitrification, evaporation and fixation in the soil. Dripirrigation and fertigation are technologies which improveboth water and fertilizer use efficiency to a great extent.Fertigation gives flexibility of fertilizer application, whichenables the specific nutritional requirement of the crop tobe met at different stages of its growth. Split applicationof fertilizers ensures required nutrients in right time and inright quantity for getting higher yield with minimum lossof nutrients. Nitrogen and potassium fertilizers are watersoluble and play a major role in the growth anddevelopment of both these crops.Drip irrigation andfertigation are technologies which improve both water andfertilizer use efficiency to a great extent. In general, injectionof fertilizers into irrigation water gives a better cropresponse than either band or broadcasting. Fertigationgives flexibility of fertilizer application, which enables thespecific nutritional requirement of the crop to be met atdifferent stages of its growth. Split application of fertilizersensures required nutrients in right time and in rightquantity for getting higher yield with minimum loss ofnutrients.
Traditionally onion is taken as a second cropafter kharif crops like Pearl Millet and Groundnut. Most ofthe farmers are taking wheat crop after harvesting of earlyduration Bt Cotton or any early duration hybrid cotton.But when the cotton crop is taken under fertigation inkharif season, it is the alternative to the farmer to grow thesecond crop of onion under the same set of drip irrigationsystem to make the sequence cropping more profitable asboth the crop are cash crop and the system will be moreprofitable when the resources like fertilizers and water willbe utilised more efficiently under precision agriculture.The inclusion of vegetable crop like onion in a sequenceafter kharif crop like cotton will be more remunerative. Inview of the above, it was felt appropriate to study theeffect of split application of nutrients on growth,yield andsystem productivity in cotton-onion crop sequence..
MATERIAL AND METHODS
A field experiment was conducted during the year2011-12, 2012-2013 and 2013-14 at Department ofAgronomy, Dr.PanjabraoDeshmukhKrishiVidyapeeth,Akola to study the effect of split application of N and K
Effect of Split Application of Nutrients Through Fertigation on Growth, Yield and System Productivity in Cotton-Onion Crop Sequence
14
fertilizers on growth, yield attributes,quality, nutrientuptake, system productivity and to economize the fertilizerrequirement in Bt cotton-onion crop sequence underfertigation. The experiment was laid out in randomizedblock design with four replications and five treatmentsimposed having four different levels of drip fertigation infive splits at 50 per cent, 75 per cent, 100 per cent and 125per cent of recommended dose of N and K given throughfertigation and P as basal compared with 100 per cent soilapplication of fertilizers for cotton and onion.
The soil of experimental plot was clayey intexture, low in organic carbon, slightly alkaline in reaction,low in available nitrogen and phosphorus and fairly highin available potassium. The soil had 32.96 per centmoisture at field capacity and 16.40 per cent at permanentwilting point with a bulk density of 1.21 g cc-1.Croppinghistory of the experimental plot was almost practicallyuniform before conducting the experiment. Theexperimental site was established with inline drip irrigationsystem (16 mm) with emitters of 4 lph capacity lateral laidout at 120 cm with 60 cm dripper spacing. The averageemission uniformity of drip irrigation system was estimatedas 91 per cent for all the treatments.The recommendeddose of fertilizers (N&K) was applied as per the treatmentsthrough fertigation tank of 90 lit. capacity.Phosphorus(50 Kgha-1) was applied as basal and N and K as urea andmurate of potash respectively through drip irrigation infive splits as per the treatments and growth stages ofcotton(10 % at basal, 20 % at 20 DAS, 25% at 40 DAS,25% at 60 DAS and 20 % at 80 DAS.) and onion (10 % at10 DAT, 20 % at 20 DAT, 25% at 40 DAT, 25% at 60 DATand 20 % at 80 DAT).In conventional soil applicationmethod, half nitrogen and full dose of P and K were appliedas basal at sowing and remaining half dose of N was topdressed at 30 DAS and 60 DAS in cotton. However inonion half of the nitrogen and full dose of phosphorusand potash were applied as basal application at the timeof sowing in the conventional methods. Remaining halfdose of nitrogen was top-dressed at 30 and 60 days aftertransplanting as per the treatments. Irrigation water wasapplied through drip irrigation on alternate day at the rateof 100 per cent crop evapotranspiration level to both thecrop. The Bt cotton variety ACH-155 and Agri Found LightRed variety of onion was used for experimentation. The
recommended dose of fertilizers for cotton and onion was100:50:50 NPK Kg ha-1 and 100:50:80 NPK Kg ha-1
respectively. The Onion crop was raised under dripfertigation on raised bed. Immediately after sowing,irrigation was given uptosoaking of entire bed andsubsequent irrigations were scheduled once in two days.The total quantity of water applied (including effectiverainfall) to cotton was 469.22 mm, 622.3 mm and 652.8 mm, and for onion it was 564.90 mm,479.19 mm and 523.55 mmduring the year 2011-12,2012-13 and 2013-14 respectively.
RESULTS AND DISCUSSION
The results of the present study as well asrelevant discussion have been summarized underfollowing heads:
Growth and yield attributes of cotton
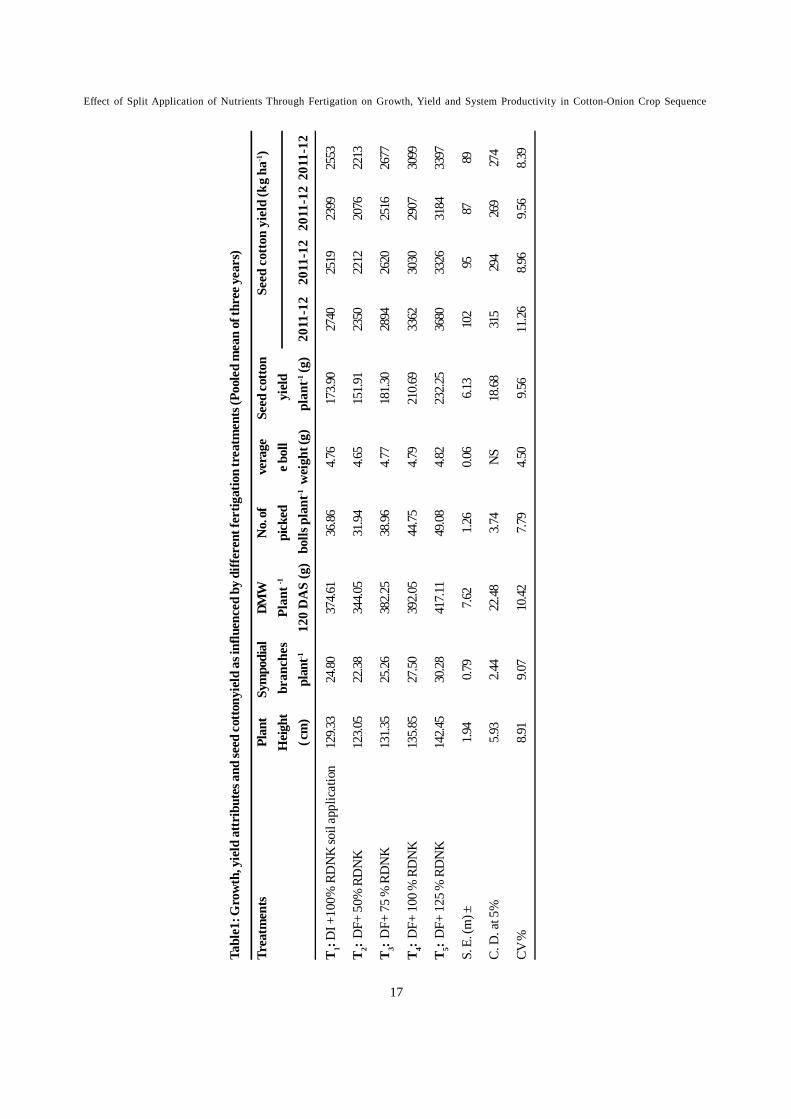
Pooled mean of threeyears (Table 1) revealed thatconcomitant increase in all the growth attributes werenoticed with each increasing level of drip fertigation ofrecommended dose of N and K from 50 to 125 per cent. Incotton, among the drip fertigation levels drip fertigationat 125 per cent recommended dose of N and K (P as basal)significantly improved the plant height, dry matteraccumulation per plant and sympodial branches atharvest. Drip fertigation of N and K fertilizers with higherlevels of 125 per cent RDNK ha-1 registered their superiorityin enhancing all the growth attributes over lowerfertigation levels (50, 75 and 100 per cent) and overconventional method of soil application with 100 per centrecommended dose of NPK Kg ha-1.However the plantheight at 100 per cent N and K through soil application(T1) was found comparable with 75 per cent drip fertigation.The plants were taller when the fertilizers were appliedthrough drip fertigation in split doses as compared to soilapplication of fertilizers. Higher frequency of irrigationand increased availability of soil moisture under dripirrigation coupled with fertigation might have led toeffective absorption and utilization of nutrients and betterproliferation of roots resulting in better canopy growth.The favourable increase in growth attributes in terms ofplant height and dry matter accumulation due to dripfertigation was reported by Bhaleraoet al.(2011) , andAyyaduraiet al. (2014). The limited root zone and the
PKV Res. J. Vol. 42 (2), July 2018
15
reduced amount of mineralization in the restricted wettingzone might be the probable reason for the reduced nutrientavailability and reduction in growth of cotton under dripirrigation combined with soil application of fertilizers.Increased growth parameters with 125 per centrecommended N and K ha-1 might be due to presence offavourable microclimate to the plants and application ofsufficient nutrients in readily available form would haveaccelerated the proliferation of growth regulators such asauxin (IAA) and cytokinin which in turn stimulated theaction of cell elongation and cell division and resulted inincreased growth of cotton. Similar findings were reportedby Kavithaet al.(2007) in tomato and Anitta (2010) in maize.Fertilizer application through irrigation water takes thenutrients in dissolved state throughout the root zone. Thedissolved nutrients have the distribution along the wettingsoil volume. This might have resulted in more uptake ofnutrients and growth resulting in higher dry matterproduction.Veeraputhiran (2000), Sathyaprakash (2007),Bhaleraoet al.(2011) reported higher dry matteraccumulation when fertilizers were applied throughfertigation in splits. Nalayaniet al. (2012), Gokila (2012)and Ayyaduraiet al. (2014) also reported that splitapplication of N and K in more split enhanced the drymatter production.
Higher number of sympodia per plant infertigation of N and K splits might be due to higher uptakeof nutrients and further vegetative growth of the cottonplant. Veeraputhiran (2000),Sathyaprakash (2007),Bhaleraoet al.(2011), and Gokila (2012) have reported thebeneficial effect of higher level of N and K fertigation onsympodial branches in cotton which indicated that Btcotton required more nutrients for enhancing the yieldattributes (Sankarnarayananet al.,2004).
As indicated in Table1 ,the yield attributingcharacters like number of bolls picked per plant and seedcotton yield per plant influenced significantly due to splitapplication of recommended dose of nitrogen andpotassium ha-1 through fertigation and higher level ofRDNK ha -1 through fertigation at 125 per centrecommended dose of N and K favourably increased theseyield attributes than other lower level of fertigation andsoil application method of applying fertilizers.However,75
per cent fertigation and 100 per cent soil application ofrecommended N and K ha-1 were equally effective inenhancing number of picked bolls per plant and seedcotton yield per plant. Average boll weight was found atpar among the treatments during the course ofinvestigation. Lower values of all the yield attributingcharacters were observed at lower levels of 50 per centfertigation.The substantial increase in number of pickedbolls per plant and seed cotton weight per plant due tohigher levels of fertigation than lower level andconventional method was associated with theimprovement in various growth attributes viz. plant height,number of sympodial branches and dry matteraccumulation per plant and its subsequent translocationto sink. The cumulative effect of these finally improvedthe number of picked bolls per plant and seed cotton yieldper plant, because the ability of cotton crop to produceand support more number of bolls depends on dry matteraccumulation and its translocation to sink. The increasein more number of bolls per plant under higher level offertigation might be due to enhanced availability anduptake of nutrients to enhance photosynthesis, expansionof leaves and translocation of nutrients to reproductiveparts as compared to lower rate of N and K given throughfertigation and over conventional soil application offertilizers. Similar advantage of higher level of fertigationof nutrients in improving the number of picked bolls perplant and weight of seed cotton per plant were reportedearlier Bhattooet al.(2008), Sahadeva Reddy and Aruna(2010) Bhaleraoet al.(2011) and Gokila (2012).
Seed cotton yieldDrip fertigation levels had marked and favourable
influence on growth and yield parameters viz. plant height,number of sympodial branches plant -1, dry matterproduction, number of picked bolls per plant and seedcotton yield per plant of cotton during three years of study.These favourable influences on these parameters werereflected on seed cotton yield due to various treatments.(Table2).
The perceptible effect of higher levels offertigation at 125 per cent RDNK ha-1 in promoting thegrowth and yield parameters of the crop had definite sayon the final seed cotton yield. The seed cotton yield linearly
Effect of Split Application of Nutrients Through Fertigation on Growth, Yield and System Productivity in Cotton-Onion Crop Sequence
16
increased with increasing levels of fertilizers appliedthrough fertigation. Drip fertigation at 125 per cent RDNKha-1 had recorded higher seed cotton yield of 3680 Kg ha-
1, 3326 Kg ha-1,3184 Kg ha- during 2011-12, 2012-13 and2013-14 respectively and3397 Kg ha-1 in pooled meanwhich was followed by 100 per cent drip fertigation ofRDNK ha-1 with seed cotton yield of 3362 Kg ha-1, 3030Kg ha-1,2907 Kg ha-1and 3099 Kg ha-1respectively. Dripfertigation at higher level of 125 per cent fertigationrecorded an increased yield of 24.85 per cent overconventional soil application in pooled yield of threeyears.Increased nutrient availability and absorption bythe crop at the optimum moisture supply coupled withfrequent and higher nutrient supply by fertigation andconsequent better formation and translocation ofassimilates from source to sink might have increased seedcotton yield under fertigation. Fertilizer application of 100per cent N and K through drip increased yield significantlyover 100 per cent NPK through soil indicating benefit ofdrip for better utilization of applied nutrients. The resultsare in conformity with the findings of Hadoleet al.(2012)and Nalayaniet al.(2012).
Drip fertigation at 75 per cent RDNK ha-1
recorded comparable yield with 100 per cent recommendeddose of fertilizers applied through soil by conventionalmethod during the study and indicating 25 per cent fertilizersaving through fertigation when compared toconventional soil application of fertilizers. The saving offertilizers might be due to reduction in losses of nutrientsthrough volatilization and leaching and better movementof nutrients under drip fertigation as against soilapplication of fertilizers as reported by Yendeet al.(2003)and Pawaret al.(2013). The seed cotton yield under dripirrigation with soil application of recommended dose of Nand K was significantly lower and inferior over higher-level of drip fertigation. Soil application of fertilizers underdrip irrigation might have restricted the mineralization ofnutrients and enhanced the losses due to volatilizationand this might be the probable reason for the lower yieldunder drip irrigation with soil application of nutrients.Nalayaniet al. (2012),Singh et al.(2012) and Ayyaduraietal.(2014) also reported that drip fertigation had greateradvantages and increased seed cotton yield as comparedto broadcast application of fertilizer nutrients.
Nutrients uptake and nutrients use efficiency
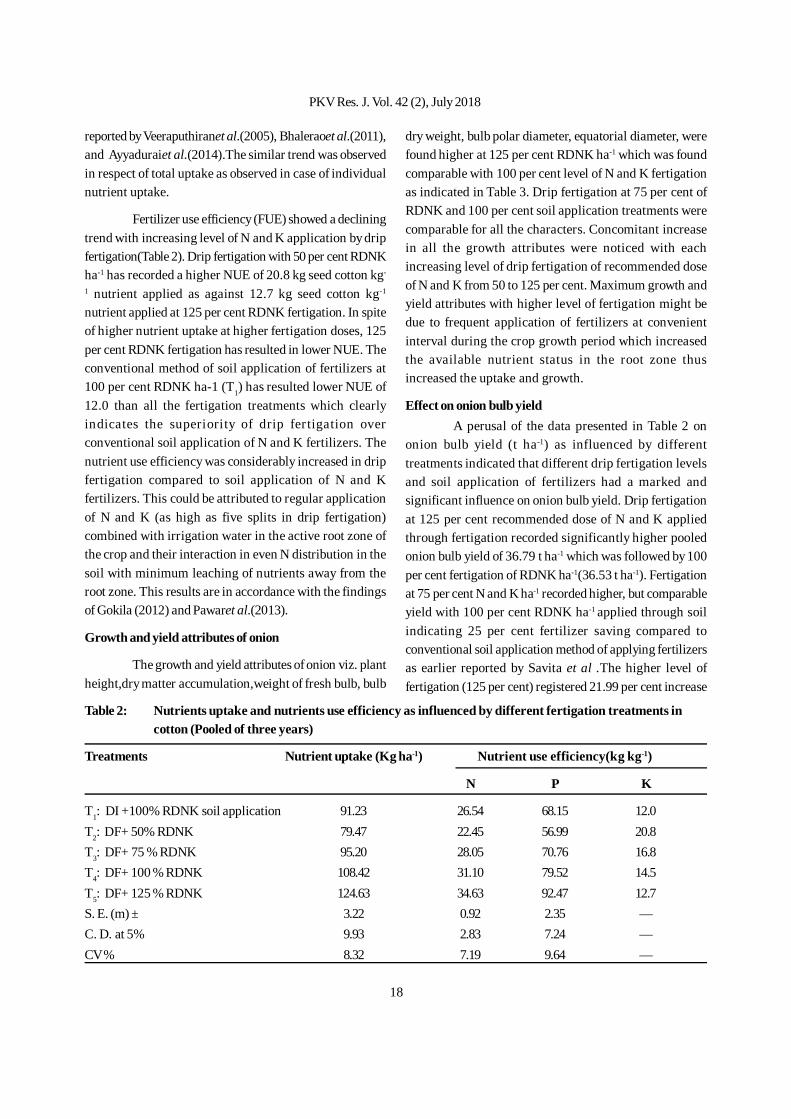
As indicated in Table 2,it was observed that,different fertigation levels and soil application methodshowed significant influence on nutrients (N,P and K)uptake by plant. The nutrient uptake was favourablyincreased with higher level of fertigation compared withlower levels and soil application method. Higher uptakeof N, P and K were observed at 125 per cent levels of Nand K fertigation. Progressive increase in applied level ofN and K correspondingly increased the nutrient uptakeand lower uptake was noticed at lower level of fertigation(50 per cent) However, drip fertigation at 75 per cent RDNKha-1 and soil application method (T1) were comparable inrespect of N,P and K uptake. The higher available soilmoisture provided due to continuous water supply atalternate days under drip irrigation led to higheravailability of nutrients in the soil and thereby increasedthe nutrient uptake under drip fertigation levels in splitswas the result of increased biomass production due tocontinuous availability of water and nutrients to the crop.
An application of N given through fertigationnot only stimulated vegetative growth and foragingcapacity of roots, but also encouraged the absorptionand translocation of more nutrients under higher dripfertigation levels. Due to improved growth characters, theplants tend to take more nutrients from the soil since itwas available nearer to root zone at required level.Reducing the fertilizer dose resulted in reduced availabilityof nutrients which might be the reason for lower uptake ofnutrients by crop at lower doses of fertilizers as indicatedin the present study.In conventional method of soilapplication of fertilizers, application of large quantity offertilizers as a single dose resulted in higher volatilizationlosses of nutrients and resulted lower the availability ofnutrients during later growth stages of crop. This mightbe the reason for lower uptake of nutrients by crop, whenfertilizers are applied by conventional method .Furtherapplication of nutrients in more number of splits throughdrip irrigation resulted in minimum or no wastage ofnutrients either through deep percolation or volatilizationultimately led to higher uptake of all the nutrients asreported by Raskar (2004).Higher nutrient uptake withhigher level of fertigation over soil application was also
PKV Res. J. Vol. 42 (2), July 2018
17
Tabl
e1: G
row
th, y
ield
attr
ibut
es a
nd se
ed co
ttony
ield
as i
nflu
ence
d by
diff
eren
t fer
tigat
ion
trea
tmen
ts (P
oole
d m
ean
of th
ree y
ears
)
Trea
tmen
tsPl
ant
Sym
podi
alDM
WN
o. of
vera
geSe
ed co
tton
See
d co
tton
yie
ld (k
g ha
-1)
Hei
ght
bra
nche
sPl
ant -1
pick
ede b
oll
yiel
d( c
m)
plan
t-112
0 D
AS
(g)
bol
ls pl
ant-1
wei
ght (
g) p
lant
-1 (g
)20
11-1
220
11-1
220
11-1
220
11-1
2
T1:
DI +
100%
RD
NK
soil
appl
icat
ion
129.3
324
.8037
4.61
36.86
4.76
173.9
027
4025
1923
9925
53
T 2: D
F+ 5
0% R
DN
K12
3.05
22.38
344.0
531
.944.6
515
1.91
2350
2212
2076
2213
T3:
DF+
75
% R
DN
K13
1.35
25.26
382.2
538
.964.7
718
1.30
2894
2620
2516
2677
T 4: D
F+ 1
00 %
RD
NK
135.8
527
.5039
2.05
44.75
4.79
210.6
933
6230
3029
0730
99
T 5: D
F+ 1
25 %
RD
NK
142.4
530
.2841
7.11
49.08
4.82
232.2
536
8033
2631
8433
97
S. E
. (m
) ±1.9
40.7
97.6
21.2
60.0
66.1
310
295
8789
C. D
. at 5
%5.9
32.4
422
.483.7
4NS
18.68
315
294
269
274
CV %
8.91
9.07
10.42
7.79
4.50
9.56
11.26
8.96
9.56
8.39
Effect of Split Application of Nutrients Through Fertigation on Growth, Yield and System Productivity in Cotton-Onion Crop Sequence
18
reported by Veeraputhiranet al.(2005), Bhaleraoet al.(2011),and Ayyaduraiet al.(2014).The similar trend was observedin respect of total uptake as observed in case of individualnutrient uptake.
Fertilizer use efficiency (FUE) showed a decliningtrend with increasing level of N and K application by dripfertigation(Table 2). Drip fertigation with 50 per cent RDNKha-1 has recorded a higher NUE of 20.8 kg seed cotton kg-
1 nutrient applied as against 12.7 kg seed cotton kg-1
nutrient applied at 125 per cent RDNK fertigation. In spiteof higher nutrient uptake at higher fertigation doses, 125per cent RDNK fertigation has resulted in lower NUE. Theconventional method of soil application of fertilizers at100 per cent RDNK ha-1 (T1) has resulted lower NUE of12.0 than all the fertigation treatments which clearlyindicates the superiority of drip fertigation overconventional soil application of N and K fertilizers. Thenutrient use efficiency was considerably increased in dripfertigation compared to soil application of N and Kfertilizers. This could be attributed to regular applicationof N and K (as high as five splits in drip fertigation)combined with irrigation water in the active root zone ofthe crop and their interaction in even N distribution in thesoil with minimum leaching of nutrients away from theroot zone. This results are in accordance with the findingsof Gokila (2012) and Pawaret al.(2013).
Growth and yield attributes of onion
The growth and yield attributes of onion viz. plantheight,dry matter accumulation,weight of fresh bulb, bulb
dry weight, bulb polar diameter, equatorial diameter, werefound higher at 125 per cent RDNK ha-1 which was foundcomparable with 100 per cent level of N and K fertigationas indicated in Table 3. Drip fertigation at 75 per cent ofRDNK and 100 per cent soil application treatments werecomparable for all the characters. Concomitant increasein all the growth attributes were noticed with eachincreasing level of drip fertigation of recommended doseof N and K from 50 to 125 per cent. Maximum growth andyield attributes with higher level of fertigation might bedue to frequent application of fertilizers at convenientinterval during the crop growth period which increasedthe available nutrient status in the root zone thusincreased the uptake and growth.
Effect on onion bulb yieldA perusal of the data presented in Table 2 on
onion bulb yield (t ha-1) as influenced by differenttreatments indicated that different drip fertigation levelsand soil application of fertilizers had a marked andsignificant influence on onion bulb yield. Drip fertigationat 125 per cent recommended dose of N and K appliedthrough fertigation recorded significantly higher pooledonion bulb yield of 36.79 t ha-1 which was followed by 100per cent fertigation of RDNK ha-1(36.53 t ha-1). Fertigationat 75 per cent N and K ha-1 recorded higher, but comparableyield with 100 per cent RDNK ha-1 applied through soilindicating 25 per cent fertilizer saving compared toconventional soil application method of applying fertilizersas earlier reported by Savita et al .The higher level offertigation (125 per cent) registered 21.99 per cent increase
Table 2: Nutrients uptake and nutrients use efficiency as influenced by different fertigation treatments incotton (Pooled of three years)
Treatments Nutrient uptake (Kg ha-1) Nutrient use efficiency(kg kg-1)
N P K
T1: DI +100% RDNK soil application 91.23 26.54 68.15 12.0T2: DF+ 50% RDNK 79.47 22.45 56.99 20.8T3: DF+ 75 % RDNK 95.20 28.05 70.76 16.8T4: DF+ 100 % RDNK 108.42 31.10 79.52 14.5T5: DF+ 125 % RDNK 124.63 34.63 92.47 12.7S. E. (m) ± 3.22 0.92 2.35 —C. D. at 5% 9.93 2.83 7.24 —CV % 8.32 7.19 9.64 —
PKV Res. J. Vol. 42 (2), July 2018
19
Tabl
e 3: G
row
th, y
ield
attr
ibut
ing
char
acte
rs an
d yi
eld
of O
nion
at h
arve
st a
s inf
luen
ced
by d
iffer
ent t
reat
men
ts (P
oole
d of
thre
e yea
rs)
Trea
tmen
tsPl
ant
Dry
mat
ter
Wei
ght o
f fre
shB
ulb
pola
rBu
lbO
nion
Bul
b Y
ield
(t ha
-1 )
Hei
ght(c
m)
(g)P
lant
-1 b
ulb
atdi
amet
erEq
uato
rial
harv
est(g
)(m
m)
diam
eter
(mm
)20
11-1
220
11-1
220
11-1
2Po
oled
T1:
DI +
100%
RD
NK
soil
appl
icat
ion
66.95
21.01
115.7
552
.8459
.3528
.1529
.5628
.3428
.68T 2:
DF+
50%
RD
NK
60.68
18.38
104.3
946
.4554
.0325
.0326
.1624
.9125
.37T
3: D
F+ 7
5 %
RD
NK
71.30
22.68
120.0
055
.9561
.9531
.0032
.5330
.9531
.49T 4:
DF+
100
% R
DN
K77
.0826
.1213
1.20
63.08
66.51
35.83
37.57
36.21
36.53
T 5: D
F+ 1
25 %
RD
NK
78.45
26.97
133.2
163
.7867
.2636
.0337
.7836
.3336
.79S.
E. (
m) ±
1.86
0.82
3.61
1.78
1.45
1.00
1.08
1.03
0.98
C. D
. at 5
%5.7
32.4
511
.115.4
94.4
53.0
73.3
33.1
63.0
0
Effect of Split Application of Nutrients Through Fertigation on Growth, Yield and System Productivity in Cotton-Onion Crop Sequence
20
in onion bulb yield over soil application of fertilizersshowing the superiority of fertigation over conventionalsoil application of fertilizers.
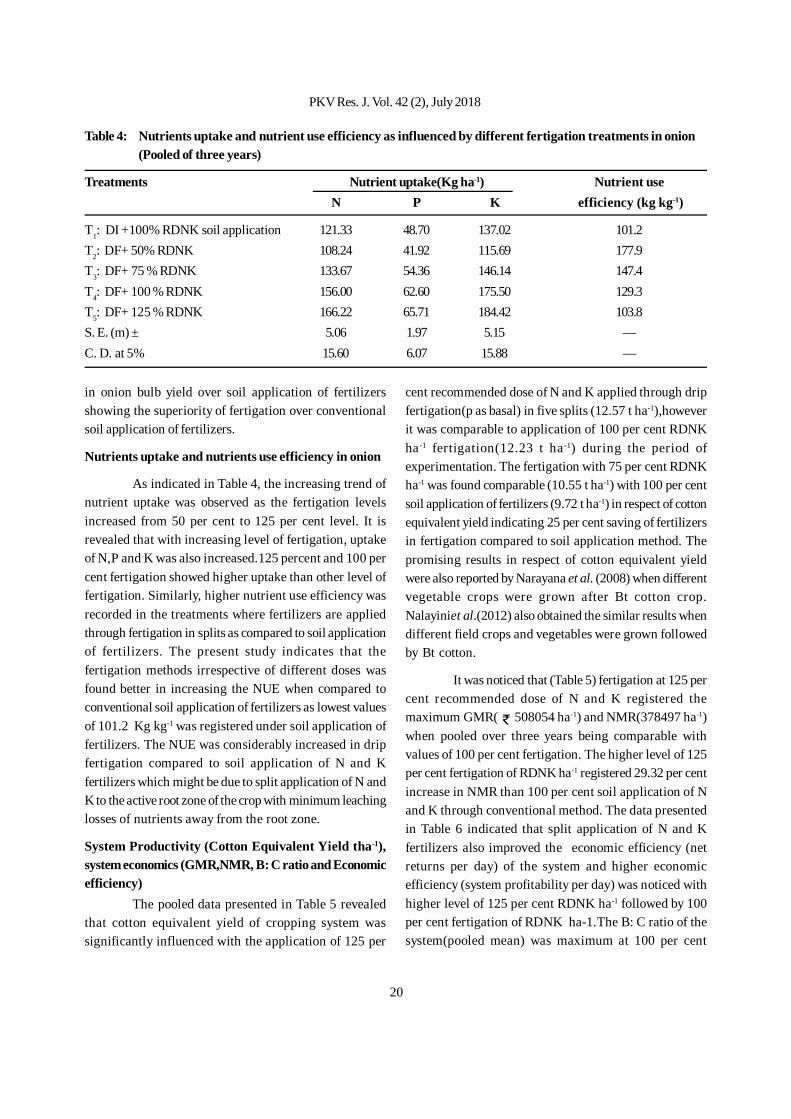
Nutrients uptake and nutrients use efficiency in onion
As indicated in Table 4, the increasing trend ofnutrient uptake was observed as the fertigation levelsincreased from 50 per cent to 125 per cent level. It isrevealed that with increasing level of fertigation, uptakeof N,P and K was also increased.125 percent and 100 percent fertigation showed higher uptake than other level offertigation. Similarly, higher nutrient use efficiency wasrecorded in the treatments where fertilizers are appliedthrough fertigation in splits as compared to soil applicationof fertilizers. The present study indicates that thefertigation methods irrespective of different doses wasfound better in increasing the NUE when compared toconventional soil application of fertilizers as lowest valuesof 101.2 Kg kg-1 was registered under soil application offertilizers. The NUE was considerably increased in dripfertigation compared to soil application of N and Kfertilizers which might be due to split application of N andK to the active root zone of the crop with minimum leachinglosses of nutrients away from the root zone.
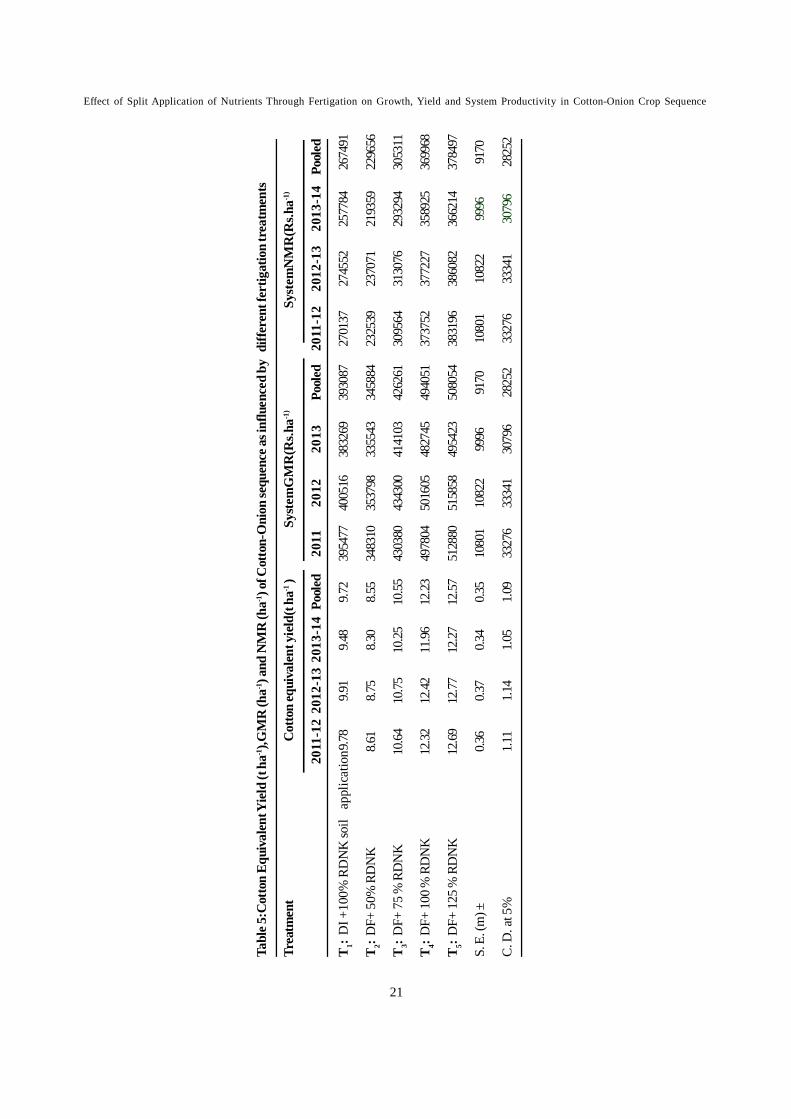
System Productivity (Cotton Equivalent Yield tha-1),system economics (GMR,NMR, B: C ratio and Economicefficiency)
The pooled data presented in Table 5 revealedthat cotton equivalent yield of cropping system wassignificantly influenced with the application of 125 per
cent recommended dose of N and K applied through dripfertigation(p as basal) in five splits (12.57 t ha-1),howeverit was comparable to application of 100 per cent RDNKha-1 fertigation(12.23 t ha -1) during the period ofexperimentation. The fertigation with 75 per cent RDNKha-1 was found comparable (10.55 t ha-1) with 100 per centsoil application of fertilizers (9.72 t ha-1) in respect of cottonequivalent yield indicating 25 per cent saving of fertilizersin fertigation compared to soil application method. Thepromising results in respect of cotton equivalent yieldwere also reported by Narayana et al. (2008) when differentvegetable crops were grown after Bt cotton crop.Nalayiniet al.(2012) also obtained the similar results whendifferent field crops and vegetables were grown followedby Bt cotton.
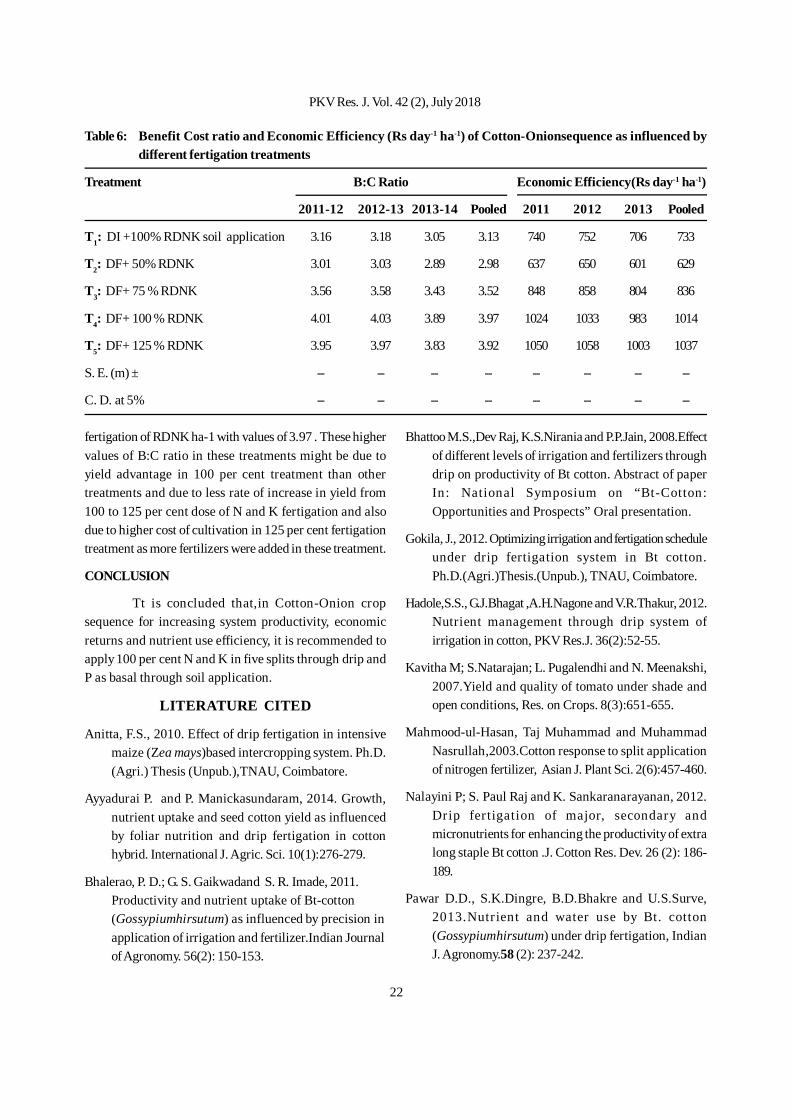
It was noticed that (Table 5) fertigation at 125 percent recommended dose of N and K registered themaximum GMR( 508054 ha-1) and NMR(378497 ha-1)when pooled over three years being comparable withvalues of 100 per cent fertigation. The higher level of 125per cent fertigation of RDNK ha-1 registered 29.32 per centincrease in NMR than 100 per cent soil application of Nand K through conventional method. The data presentedin Table 6 indicated that split application of N and Kfertilizers also improved the economic efficiency (netreturns per day) of the system and higher economicefficiency (system profitability per day) was noticed withhigher level of 125 per cent RDNK ha-1 followed by 100per cent fertigation of RDNK ha-1.The B: C ratio of thesystem(pooled mean) was maximum at 100 per cent
Table 4: Nutrients uptake and nutrient use efficiency as influenced by different fertigation treatments in onion(Pooled of three years)
Treatments Nutrient uptake(Kg ha-1) Nutrient useN P K efficiency (kg kg-1)
T1: DI +100% RDNK soil application 121.33 48.70 137.02 101.2T2: DF+ 50% RDNK 108.24 41.92 115.69 177.9T3: DF+ 75 % RDNK 133.67 54.36 146.14 147.4T4: DF+ 100 % RDNK 156.00 62.60 175.50 129.3T5: DF+ 125 % RDNK 166.22 65.71 184.42 103.8S. E. (m) ± 5.06 1.97 5.15 —C. D. at 5% 15.60 6.07 15.88 —
PKV Res. J. Vol. 42 (2), July 2018
21
Tabl
e 5:C
otto
n Eq
uiva
lent
Yie
ld (t
ha-1
),GM
R (h
a-1) a
nd N
MR
(ha-1
) of C
otto
n-O
nion
sequ
ence
as in
fluen
ced
by d
iffer
ent f
ertig
atio
n tr
eatm
ents
Trea
tmen
tC
otto
n eq
uiva
lent
yie
ld(t
ha-1 )
S
yste
mG
MR
(Rs.h
a-1)
Sy
stem
NM
R(R
s.ha-1
)
2011
-12
2012
-13
2013
-14
Pool
ed20
1120
1220
13Po
oled
2011
-12
2012
-13
2013
-14
Pool
ed
T1:
DI +
100%
RD
NK
soil
app
licat
ion9
.789.9
19.4
89.7
239
5477
4005
1638
3269
3930
8727
0137
2745
5225
7784
2674
91
T 2: D
F+ 5
0% R
DN
K8.6
18.7
58.3
08.5
534
8310
3537
9833
5543
3458
8423
2539
2370
7121
9359
2296
56
T3:
DF+
75
% R
DN
K10
.6410
.7510
.2510
.5543
0380
4343
0041
4103
4262
6130
9564
3130
7629
3294
3053
11
T 4: D
F+ 1
00 %
RD
NK
12.32
12.42
11.96
12.23
4978
0450
1605
4827
4549
4051
3737
5237
7227
3589
2536
9968
T 5: D
F+ 1
25 %
RD
NK
12.69
12.77
12.27
12.57
5128
8051
5858
4954
2350
8054
3831
9638
6082
3662
1437
8497
S. E
. (m
) ±0.3
60.3
70.3
40.3
510
801
1082
299
9691
7010
801
1082
299
9691
70
C. D
. at 5
%1.1
11.1
41.0
51.0
933
276
3334
130
796
2825
233
276
3334
130
796
2825
2
Effect of Split Application of Nutrients Through Fertigation on Growth, Yield and System Productivity in Cotton-Onion Crop Sequence
22
fertigation of RDNK ha-1 with values of 3.97 . These highervalues of B:C ratio in these treatments might be due toyield advantage in 100 per cent treatment than othertreatments and due to less rate of increase in yield from100 to 125 per cent dose of N and K fertigation and alsodue to higher cost of cultivation in 125 per cent fertigationtreatment as more fertilizers were added in these treatment.
CONCLUSION
Tt is concluded that,in Cotton-Onion cropsequence for increasing system productivity, economicreturns and nutrient use efficiency, it is recommended toapply 100 per cent N and K in five splits through drip andP as basal through soil application.
LITERATURE CITED
Anitta, F.S., 2010. Effect of drip fertigation in intensivemaize (Zea mays)based intercropping system. Ph.D.(Agri.) Thesis (Unpub.),TNAU, Coimbatore.
Ayyadurai P. and P. Manickasundaram, 2014. Growth,nutrient uptake and seed cotton yield as influencedby foliar nutrition and drip fertigation in cottonhybrid. International J. Agric. Sci. 10(1):276-279.
Bhalerao, P. D.; G. S. Gaikwadand S. R. Imade, 2011.Productivity and nutrient uptake of Bt-cotton(Gossypiumhirsutum) as influenced by precision inapplication of irrigation and fertilizer.Indian Journalof Agronomy. 56(2): 150-153.
Bhattoo M.S.,Dev Raj, K.S.Nirania and P.P.Jain, 2008.Effectof different levels of irrigation and fertilizers throughdrip on productivity of Bt cotton. Abstract of paperIn: National Symposium on “Bt-Cotton:Opportunities and Prospects” Oral presentation.
Gokila, J., 2012. Optimizing irrigation and fertigation scheduleunder drip fertigation system in Bt cotton.Ph.D.(Agri.)Thesis.(Unpub.), TNAU, Coimbatore.
Hadole,S.S., G.J.Bhagat ,A.H.Nagone and V.R.Thakur, 2012.Nutrient management through drip system ofirrigation in cotton, PKV Res.J. 36(2):52-55.
Kavitha M; S.Natarajan; L. Pugalendhi and N. Meenakshi,2007.Yield and quality of tomato under shade andopen conditions, Res. on Crops. 8(3):651-655.
Mahmood-ul-Hasan, Taj Muhammad and MuhammadNasrullah,2003.Cotton response to split applicationof nitrogen fertilizer, Asian J. Plant Sci. 2(6):457-460.
Nalayini P; S. Paul Raj and K. Sankaranarayanan, 2012.Drip fertigation of major, secondary andmicronutrients for enhancing the productivity of extralong staple Bt cotton .J. Cotton Res. Dev. 26 (2): 186-189.
Pawar D.D., S.K.Dingre, B.D.Bhakre and U.S.Surve,2013.Nutrient and water use by Bt. cotton(Gossypiumhirsutum) under drip fertigation, IndianJ. Agronomy.58 (2): 237-242.
Table 6: Benefit Cost ratio and Economic Efficiency (Rs day-1 ha-1) of Cotton-Onionsequence as influenced bydifferent fertigation treatments
Treatment B:C Ratio Economic Efficiency(Rs day-1 ha-1)
2011-12 2012-13 2013-14 Pooled 2011 2012 2013 Pooled
T1: DI +100% RDNK soil application 3.16 3.18 3.05 3.13 740 752 706 733
T2: DF+ 50% RDNK 3.01 3.03 2.89 2.98 637 650 601 629
T3: DF+ 75 % RDNK 3.56 3.58 3.43 3.52 848 858 804 836
T4: DF+ 100 % RDNK 4.01 4.03 3.89 3.97 1024 1033 983 1014
T5: DF+ 125 % RDNK 3.95 3.97 3.83 3.92 1050 1058 1003 1037
S. E. (m) ± -- -- -- -- -- -- -- --
C. D. at 5% -- -- -- -- -- -- -- --
PKV Res. J. Vol. 42 (2), July 2018
23
Raskar, B.S., 2004. Effect of irrigation methods, fertilizerlevels and green manuring on yield and nutrientbalance in summer cotton, J. Cotton Res. Dev. 18(2):180-183.
Sahadeva Reddy and E. Aruna, 2010. Effect of doses andsplit application of nutrients through fertigation inBtcotton(Gossypiumhirsutum L.), J. Cotton Res. Dev.24 (1) : 59-63.
Sathyaprakash ,D. 2007. Drip fertigation and bio fertigationstudies on cotton hybrid. M.Sc. (Agri.)Thesis(Unpub.) TNAU, Coimbatore.
SatyanarayanaRao and R.A Setty,2002.Response of hybridcotton to levels and times of nitrogen and potashapplication under irr igatedcondition.J.CottonRes.Dev. 16:188-189.
Shanmugham, P. M., R. K. Selavaraj, K. Ramamoorthy, T.Chideshwari and P. Subbian, 2007. Performanceevaluation of drip irrigation and fertigation on theyield and water use efficiency of cotton. National
Academy of Agricultural Science. 8thAgriculturalScience Congress, February 15-17, held at TNAU,Coimbatore. Pp 131-132.
ShilpaYende, B. N.DahatondeandJ.S.Vyas, 2003.Responseof pre-monsoon hybrid cotton to NPK fertilizationthrough fertigation.Annals of PlantPhysiol.17(2):211-212.
Singh Jagvir, ShilpaBabar, RachanaDeshmukh,P.R.Bharmbe and R.B.Singandhupe, 2012. Dripfertigation effect on yield, water use efficiency andeconomics of Bt cotton in semi-arid region. PKV. Res.J. 36(2):52-55.
Veeraputhiran, R. and C.Chinnusamy, 2005.Productionpotential, water and nitrogen use efficiency of hybridcotton as influenced by drip irrigation and nitrogenfertigation. J. CottonRes.Dev. 19(1):61-65.
Veeraputhiran, R., 2000. Drip fertigation studies in hybridcotton. Ph.D. Thesis (Unpub.), TNAU, Coimbatore.
Received on 16.10.2018
Effect of Split Application of Nutrients Through Fertigation on Growth, Yield and System Productivity in Cotton-Onion Crop Sequence
24
In most multiple cropping systems developedby small holders, productivity in terms of harvestableproducts per unit area is higher than under sole croppingwith the same level of management. Yield advantages canrange from 20 to 60% and achieve due to reduction ofpest incidence and more efficient use of nutrients, waterand solar radiation. Enhanced yields in diversifiedcropping systems may result from a variety of mechanismssuch as more efficient use of resources like (light, water,nutrients) or reduced pest damage. Intercropping, whichbreaks down the monoculture structure, can provide pestcontrol benefits, weed control advantages, reduced winderosion, and improved water infiltration.
Indian agriculture is now facing secondgeneration problems like rising or lowering of water table,nutrient imbalance, soil degradation, salinity, resurgenceof pest and diseases, environmental pollution and declinein farm profit. Crop diversification shows lot of promisein alleviating these problems through fulfilling the basicneeds and regulating farm income, withstanding weatheraberrations, controlling price fluctuation, ensuringbalanced food supply, conserving natural resources,reducing the chemical fertilizer and pesticide loads,
Diversification in Cotton + Soybean (4:10) – Rabi Strip Intercropping Systemunder Mechanization in Rainfed Condition of Vidarbha Region of
Maharashtra
A. B. Turkhede1, M. B. Nagdeve2, A. P. Karunakar3, V. V. Gabhane4 and R. S. Mali5
1,3. Associate Professor, 2. Chief Scientist, 4. Professor and 5. Research Fellow, AICRP for Dryland Agriculture, Dr.PDKV, Akola (Maharashtra), India
ABSTRACT
An experiment was conducted during 2013-14 to 2016-17 at All India Coordinator Research Project for DrylandAgriculture, Dr. Panjabrao Deshmukh Krishi Vidyapeeth, Akola (M.S.). Treatments consist of seven cropping patternsand two nutrients management levels tested in split plot design with three replications. On the basis of pooled analysis, theresults revealed that, among the various treatments combination Cotton + soybean (4:10)- safflower and an application of100% RDF (through inorganic fertilizer) recorded significantly higher cotton equivalent yield (2103 and 1824 kg ha- 1), netmonetary returns (Rs. 45850 and 33394 ha-1), B:C ratio (2.01 and 1.75), RWUE (2.91 and 2.52 kg ha-1mm-1), sustainablevalue and yield index (0.94 & 0.81 and 0.85 & 0.61), crop productivity and system productivity (8.25 & 7.43 and 5.76& 5.00 kg ha-1 day-1) and (179.80 & 136.28 and 125.62 &91.46 Rs ha-1 day-1) than the rest of the treatment combinations.Chemical properties of the soil were found non-significant. However, integrated nutrient management and chemicalnutrient management were found to be non-significant in respect of organic carbon content of soil and available nitrogeni.e.4.89 & 4.85 g kg ha-1 and 192.95 & 194.90 kg ha-1, respectively.
environmental safety and creating employmentopportunity and to maintain soil health.
Crop diversification through intercropping hasbeen shown to improve crop productivity and profitability,conservation of resources and provide a kind of biologicalinsurance against risks and aberrant rainfall behaviour inrainfed condition (Dutta and Bandyopadhyay, 2006). Stripcropping is a form of intercropping comprises growing ofsoil conservation and soil depleting crops in alternatestrips. Besides increasing overall productivity and income,intercropping of legumes with cereals/ millets/oilseeds/pulses helps in improving physical properties of soil andbuilding up of soil fertility.
It also acts as a powerful tool in minimization ofrisk in farming. These considerations make a strong casefor farm/crop diversification in India. Crop diversificationin India is generally viewed as a shift from traditionallygrown; less remunerative crops to more remunerativecrops. Market infrastructure development and certain otherprice related supports also induced to crop shift. Higherprofitability and the resilience/stability in production alsoinduced crop diversification. Crop diversification and large
PKV Res. J. Vol. 42 (2), July 2018

25
number of crops are practiced in rainfed areas also reducedthe risk factor of crop failures due to drought.
Thus, the present investigation was undertakento “Diversification in cotton+ soybean (4:10)-rabi stripintercropping system under mechanization in rainfedcondition with the objectives of to intensify and diversifythe system to meet out domestic needs of small andmarginal farmers with find out the most suitable rabi cropfor cotton-soybean based sequence cropping and toevaluate the economics of different cropping system.
MATERIAL AND MEHTHODS
The field study was carried out during the kharifseason of 2013-14 to 2016-17 at All India CoordinatorResearch Project for Dryland Agriculture, Dr. PanjabraoDeshmukh Krishi Vidyapeeth, Akola (M.S.) on a clayeysoil with FC 34.2 (%), PWP 14.2 (%), BD 1.36 (Mg M-3) anddepth of soil was 132 cm. Soil was medium in availablenitrogen (182 kg ha-1) and phosphorus (19.8 kg ha-1) andhigh in available potassium (341.6 kg ha-1) with pH 7.8, EC0.2 dsm-1 and organic carbon of soil 4.7g kg-1. Experimentconsists of seven cropping pattern treatments in mainplot C1- Sole cotton, C2-Sole soybean-chickpea, C3- Solesoybean-linseed, C4-Sole soybean - safflower, C5- Cotton+ soybean (4:10)-chickpea, C6-Cotton + soybean (4:10)-linseed and C7-Cotton + soybean (4:10)-safflower and withtwo nutrients management treatments i.e. F1- 100 % RDFand F2 - 50 % N +100 % P and K applied through inorganicfertilizer + 50 % N through gliricidia leaves lopping afterone month after sowing.
After the harvest of soybean crop, land wasprepared with the help of tractor drawn rotavator and inrabi season crops are sown with tractor drawn seed drill.An application of 100 per cent RDF applied to the treatmentof sole cotton/soybean/chickpea/linseed/safflower and 55per cent RDF (on area basis) applied to the treatment ofcotton + soybean (4:10)-chickpea /linseed/safflower crops.In kharif season, 45:55:30 kg ha-1 NPK was applied to thetreatment of cotton + soybean (4:10) row proportions inrabi season 55 % RDF was applied to the sequence cropof chickpea, linseed and safflower crops respectively. Totalrainfall received during the experimentation period was860.7, 518.7 and 724.1 in 45, 26 and 43 rainy days in theyears 2013-14, 2015-16 and 2016-17 respectively.
RESULTS AND DISCUSSION
i. Yield
On the basis of three years data, results showedthat, seed cotton yield, seed yield of soybean, chickpea,linseed and safflower was recorded higher in sole croppingsystem than yield obtained in the treatment of cotton +soybean (4:10) row proportion (i.e. 1550, 1825, 668,119and 1078 kg ha-1, respectively (Tables 1, 2 and 3).
An application of 100% RDF recorded higherseed cotton and soybean yield (1129 and 1479 kg ha-1).The results showed that yield of soybean, chickpea,linseed and safflower were more or less equal in seed aswell as in fodder yield. Reduction in yield of cotton /soybean/chickpea/linseed/safflower crops in treatment ofcotton + soybean (4:10) row proportion can be attributedto the less number of plants per unit area. Similar, trend ofresults also recorded in the stalk yield of cotton and strawyield of soybean and also in straw yield of rabi crops.
ii. Cotton equivalent yield:Pooled results showed that, the treatments of
cotton + soybean (4:10) – safflower and sole soybean –safflower was being at par with each other andsignificantly superior than rest of treatments i.e. 2103 and2041 kg ha-1 (Table 4). This might be due to favourableeffect of soybean and succeeding rabi crops on cottongrowth as there was no intercrop competition for growthdue to the strip sowing. When cotton sown with soybeanin kharif season and safflower in rabi season, thisattributed to better productivity of cotton, soybean andsafflower recorded the higher cotton equivalent yield dueto the higher remunerative and better market prices.Increase productivity of cotton with additional yield ofmixed crops of soybean and rabi crops specially the yieldof safflower helped in increasing the cotton equivalentyield over treatments of sole cotton. These results are inconformity with the findings of Gill and Ahlawat, (2006)and Sankaranarayanan et al., (2012). They reported thatMaize + soybean - French bean cropping system gavehigher equivalent yield compared to other croppingsystems.
On the basis of pooled, results showed that anapplication of 100% RDF recorded significantly higher
Diversification in Cotton+Soybean (4:10)–Rabi Strip Intercropping System under Mechanization in Rainfed Condition of Vidarbha Region of Maharashtra
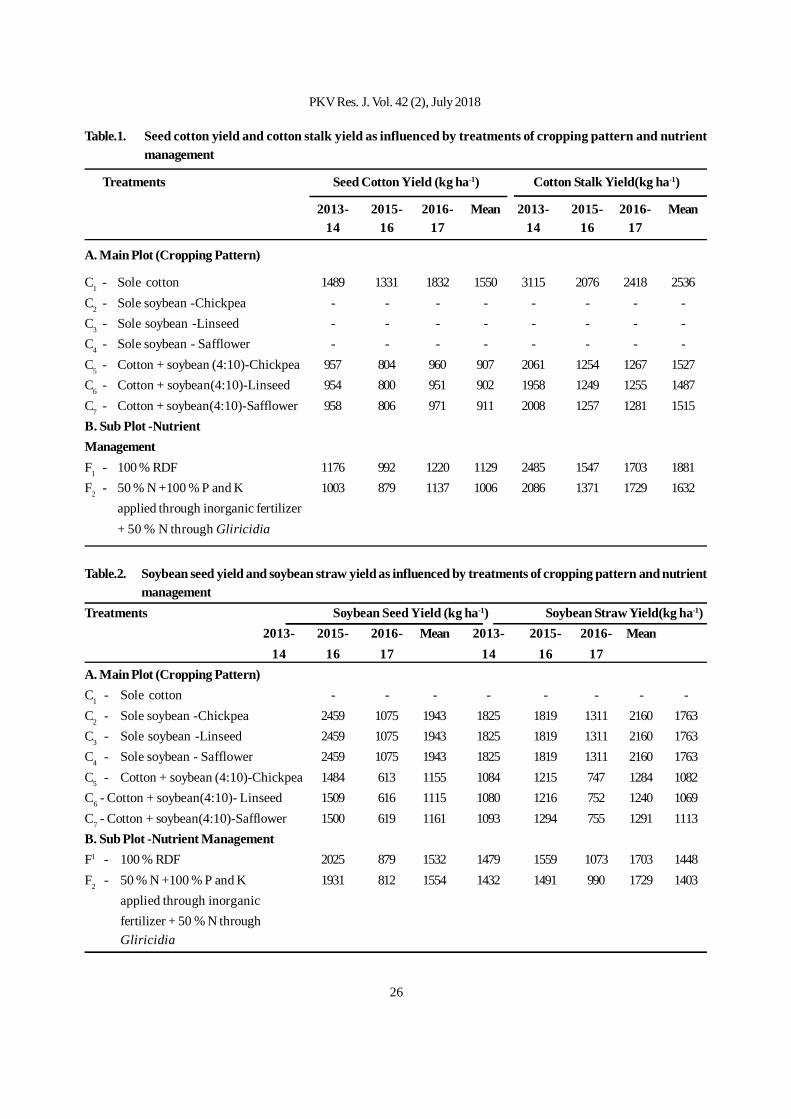
26
Table.1. Seed cotton yield and cotton stalk yield as influenced by treatments of cropping pattern and nutrientmanagement
Treatments Seed Cotton Yield (kg ha-1) Cotton Stalk Yield(kg ha-1)
2013- 2015- 2016- Mean 2013- 2015- 2016- Mean14 16 17 14 16 17
A. Main Plot (Cropping Pattern)
C1 - Sole cotton 1489 1331 1832 1550 3115 2076 2418 2536C2 - Sole soybean -Chickpea - - - - - - - -C3 - Sole soybean -Linseed - - - - - - - -C4 - Sole soybean - Safflower - - - - - - - -C5 - Cotton + soybean (4:10)-Chickpea 957 804 960 907 2061 1254 1267 1527C6 - Cotton + soybean(4:10)-Linseed 954 800 951 902 1958 1249 1255 1487C7 - Cotton + soybean(4:10)-Safflower 958 806 971 911 2008 1257 1281 1515B. Sub Plot -NutrientManagementF1 - 100 % RDF 1176 992 1220 1129 2485 1547 1703 1881F2 - 50 % N +100 % P and K 1003 879 1137 1006 2086 1371 1729 1632
applied through inorganic fertilizer+ 50 % N through Gliricidia
Table.2. Soybean seed yield and soybean straw yield as influenced by treatments of cropping pattern and nutrientmanagement
Treatments Soybean Seed Yield (kg ha-1) Soybean Straw Yield(kg ha-1)2013- 2015- 2016- Mean 2013- 2015- 2016- Mean
14 16 17 14 16 17A. Main Plot (Cropping Pattern)C1 - Sole cotton - - - - - - - -C2 - Sole soybean -Chickpea 2459 1075 1943 1825 1819 1311 2160 1763C3 - Sole soybean -Linseed 2459 1075 1943 1825 1819 1311 2160 1763C4 - Sole soybean - Safflower 2459 1075 1943 1825 1819 1311 2160 1763C5 - Cotton + soybean (4:10)-Chickpea 1484 613 1155 1084 1215 747 1284 1082C6 - Cotton + soybean(4:10)- Linseed 1509 616 1115 1080 1216 752 1240 1069C7 - Cotton + soybean(4:10)-Safflower 1500 619 1161 1093 1294 755 1291 1113B. Sub Plot -Nutrient ManagementF1 - 100 % RDF 2025 879 1532 1479 1559 1073 1703 1448F2 - 50 % N +100 % P and K 1931 812 1554 1432 1491 990 1729 1403
applied through inorganicfertilizer + 50 % N throughGliricidia
PKV Res. J. Vol. 42 (2), July 2018
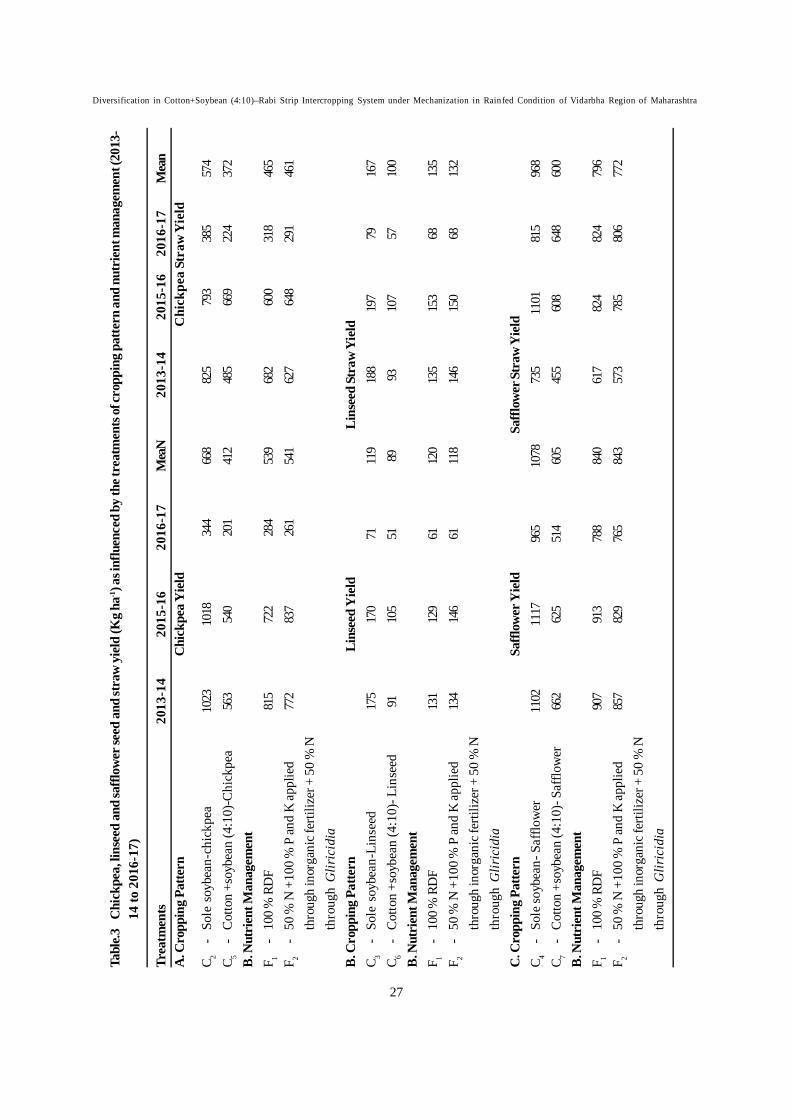
27
Tabl
e.3C
hick
pea,
lins
eed
and
saffl
ower
seed
and
stra
w y
ield
(Kg
ha-1) a
s inf
luen
ced
by th
e tre
atm
ents
of cr
oppi
ng p
atte
rn a
nd n
utri
ent m
anag
emen
t (20
13-
14 to
201
6-17
)
Trea
tmen
ts20
13-1
420
15-1
620
16-1
7M
eaN
2013
-14
2015
-16
2016
-17
Mea
nA
. Cro
ppin
g Pa
ttern
Chi
ckpe
a Yie
ld
C
hick
pea
Stra
w Y
ield
C 2-
Sole
soy
bean
-chi
ckpe
a10
2310
1834
466
882
579
338
557
4C 5
-C
otto
n +s
oybe
an (4
:10)
-Chi
ckpe
a56
354
020
141
248
566
922
437
2B
. Nut
rien
t Man
agem
ent
F 1-
100 %
RD
F81
572
228
453
968
260
031
846
5F 2
-50
% N
+10
0 %
P an
d K
appl
ied
772
837
261
541
627
648
291
461
thro
ugh
inor
gani
c fer
tiliz
er +
50
% N
thro
ugh
Glir
icid
iaB
. Cro
ppin
g Pa
ttern
Lins
eed
Yie
ldLi
nsee
d St
raw
Yie
ldC 3
-So
le s
oybe
an-L
inse
ed17
517
071
119
188
197
7916
7C 6
-C
otto
n +s
oybe
an (4
:10)
- Lin
seed
9110
551
8993
107
5710
0B
. Nut
rien
t Man
agem
ent
F 1-
100 %
RD
F13
112
961
120
135
153
6813
5F 2
-50
% N
+10
0 %
P an
d K
appl
ied
134
146
6111
814
615
068
132
thro
ugh
inor
gani
c fer
tiliz
er +
50
% N
thro
ugh
Glir
icid
iaC
. Cro
ppin
g Pa
ttern
Saffl
ower
Yie
ldSa
fflow
er S
traw
Yie
ldC 4
-So
le so
ybea
n- S
afflo
wer
1102
1117
965
1078
735
1101
815
968
C 7-
Cot
ton
+soy
bean
(4:1
0)- S
afflo
wer
662
625
514
605
455
608
648
600
B. N
utri
ent M
anag
emen
tF 1
-10
0 % R
DF
907
913
788
840
617
824
824
796
F 2-
50 %
N +
100
% P
and
K ap
plie
d85
782
976
584
357
378
580
677
2th
roug
h in
orga
nic f
ertil
izer
+ 5
0 %
Nth
roug
h G
liric
idia
Diversification in Cotton+Soybean (4:10)–Rabi Strip Intercropping System under Mechanization in Rainfed Condition of Vidarbha Region of Maharashtra
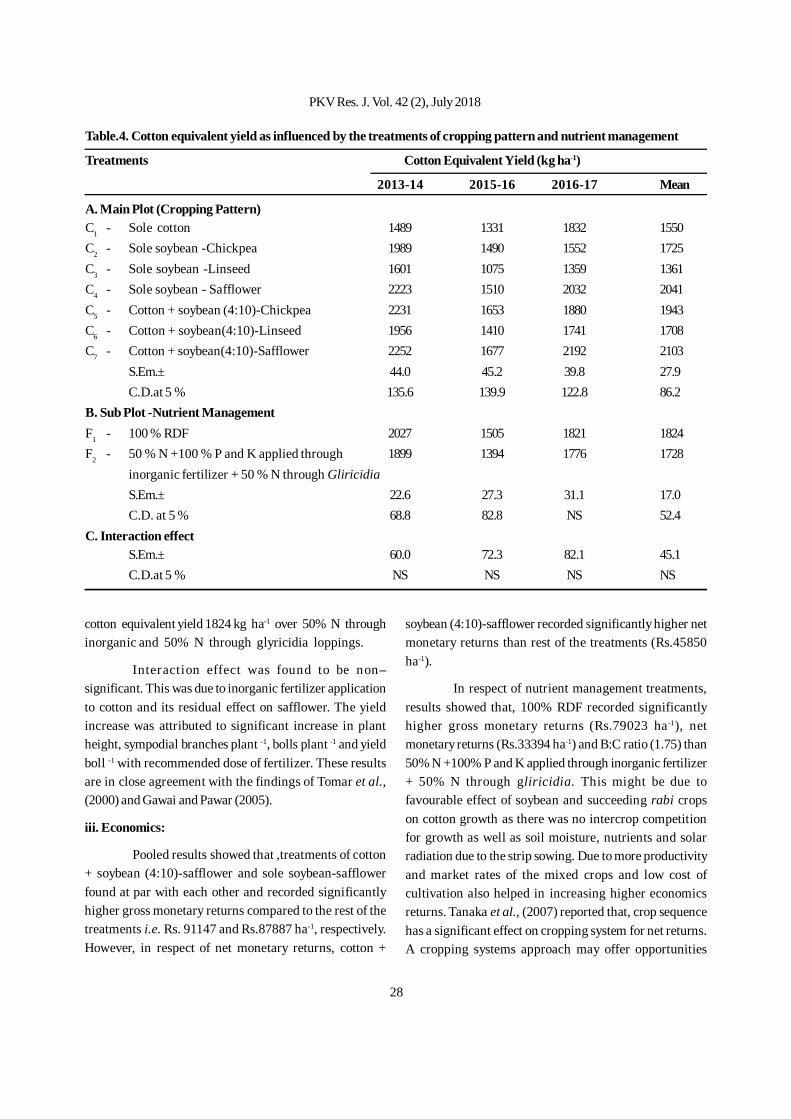
28
cotton equivalent yield 1824 kg ha-1 over 50% N throughinorganic and 50% N through glyricidia loppings.
Interaction effect was found to be non–significant. This was due to inorganic fertilizer applicationto cotton and its residual effect on safflower. The yieldincrease was attributed to significant increase in plantheight, sympodial branches plant -1, bolls plant -1 and yieldboll -1 with recommended dose of fertilizer. These resultsare in close agreement with the findings of Tomar et al.,(2000) and Gawai and Pawar (2005).
iii. Economics:
Pooled results showed that ,treatments of cotton+ soybean (4:10)-safflower and sole soybean-safflowerfound at par with each other and recorded significantlyhigher gross monetary returns compared to the rest of thetreatments i.e. Rs. 91147 and Rs.87887 ha-1, respectively.However, in respect of net monetary returns, cotton +
soybean (4:10)-safflower recorded significantly higher netmonetary returns than rest of the treatments (Rs.45850ha-1).
In respect of nutrient management treatments,results showed that, 100% RDF recorded significantlyhigher gross monetary returns (Rs.79023 ha-1), netmonetary returns (Rs.33394 ha-1) and B:C ratio (1.75) than50% N +100% P and K applied through inorganic fertilizer+ 50% N through gliricidia. This might be due tofavourable effect of soybean and succeeding rabi cropson cotton growth as there was no intercrop competitionfor growth as well as soil moisture, nutrients and solarradiation due to the strip sowing. Due to more productivityand market rates of the mixed crops and low cost ofcultivation also helped in increasing higher economicsreturns. Tanaka et al., (2007) reported that, crop sequencehas a significant effect on cropping system for net returns.A cropping systems approach may offer opportunities
Table.4. Cotton equivalent yield as influenced by the treatments of cropping pattern and nutrient management
Treatments Cotton Equivalent Yield (kg ha-1)
2013-14 2015-16 2016-17 Mean
A. Main Plot (Cropping Pattern)C1 - Sole cotton 1489 1331 1832 1550C2 - Sole soybean -Chickpea 1989 1490 1552 1725C3 - Sole soybean -Linseed 1601 1075 1359 1361C4 - Sole soybean - Safflower 2223 1510 2032 2041C5 - Cotton + soybean (4:10)-Chickpea 2231 1653 1880 1943C6 - Cotton + soybean(4:10)-Linseed 1956 1410 1741 1708C7 - Cotton + soybean(4:10)-Safflower 2252 1677 2192 2103
S.Em.± 44.0 45.2 39.8 27.9C.D.at 5 % 135.6 139.9 122.8 86.2
B. Sub Plot -Nutrient ManagementF1 - 100 % RDF 2027 1505 1821 1824F2 - 50 % N +100 % P and K applied through 1899 1394 1776 1728
inorganic fertilizer + 50 % N through GliricidiaS.Em.± 22.6 27.3 31.1 17.0C.D. at 5 % 68.8 82.8 NS 52.4
C. Interaction effectS.Em.± 60.0 72.3 82.1 45.1C.D.at 5 % NS NS NS NS
PKV Res. J. Vol. 42 (2), July 2018
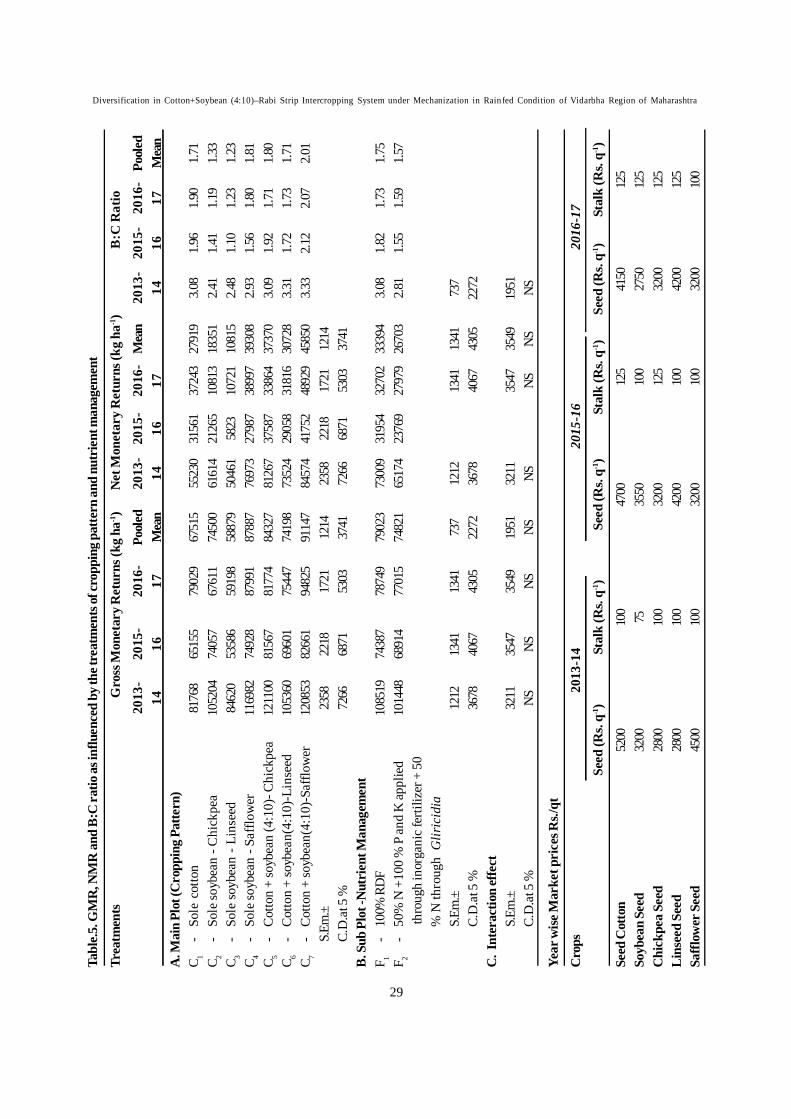
29
Tabl
e.5.
GM
R, N
MR
and
B:C
ratio
as i
nflu
ence
d by
the t
reat
men
ts of
crop
ping
pat
tern
and
nut
rien
t man
agem
ent
Trea
tmen
tsG
ross
Mon
etar
y R
etur
ns (k
g ha
-1)
N
et M
onet
ary
Ret
urns
(kg
ha-1)
B
:C R
atio
2013
-20
15-
2016
-Po
oled
2013
-20
15-
2016
-M
ean
2013
-20
15-
2016
-Po
oled
1416
17M
ean
1416
1714
1617
Mea
nA
. Mai
n Pl
ot (C
ropp
ing
Patte
rn)
C 1-
Sole
cot
ton
8176
865
155
7902
967
515
5523
031
561
3724
327
919
3.08
1.96
1.90
1.71
C 2-
Sole
soyb
ean
- Chi
ckpe
a10
5204
7405
767
611
7450
061
614
2126
510
813
1835
12.4
11.4
11.1
91.3
3C 3
-So
le so
ybea
n - L
inse
ed84
620
5358
659
198
5887
950
461
5823
1072
110
815
2.48
1.10
1.23
1.23
C 4-
Sole
soyb
ean
- Saf
flow
er11
6982
7492
887
991
8788
776
973
2798
738
997
3930
82.9
31.5
61.8
01.8
1C 5
-C
otto
n +
soyb
ean
(4:1
0)- C
hick
pea
1211
0081
567
8177
484
327
8126
737
587
3386
437
370
3.09
1.92
1.71
1.80
C 6-
Cot
ton
+ so
ybea
n(4:
10)-
Lins
eed
1053
6069
601
7544
774
198
7352
429
058
3181
630
728
3.31
1.72
1.73
1.71
C 7-
Cot
ton
+ so
ybea
n(4:
10)-
Saffl
ower
1208
5382
661
9482
591
147
8457
441
752
4892
945
850
3.33
2.12
2.07
2.01
S.Em
.±23
5822
1817
2112
1423
5822
1817
2112
14C.
D.a
t 5 %
7266
6871
5303
3741
7266
6871
5303
3741
B. S
ub P
lot -
Nut
rien
t Man
agem
ent
F 1-
100%
RD
F10
8519
7438
778
749
7902
373
009
3195
432
702
3339
43.0
81.8
21.7
31.7
5F 2
-50
% N
+10
0 %
P an
d K
appl
ied
1014
4868
914
7701
574
821
6517
423
769
2797
926
703
2.81
1.55
1.59
1.57
thro
ugh
inor
gani
c fer
tiliz
er +
50
% N
thro
ugh
Glir
icid
iaS.
Em.±
1212
1341
1341
737
1212
1341
1341
737
C.D
.at 5
%36
7840
6743
0522
7236
7840
6743
0522
72C
. Int
erac
tion
effe
ctS.
Em.±
3211
3547
3549
1951
3211
3547
3549
1951
C.D
.at 5
%NS
NSNS
NSNS
NSNS
NS
Year
wise
Mar
ket p
rice
s Rs./
qt
Cro
ps
2013
-14
201
5-16
20
16-1
7
Seed
(Rs.
q-1)
Stal
k (R
s. q-1
)Se
ed (R
s. q-1
)St
alk
(Rs.
q-1)
Seed
(Rs.
q-1)
Stal
k (R
s. q-1
)
Seed
Cot
ton
5200
100
4700
125
4150
125
Soyb
ean
Seed
3200
7535
5010
027
5012
5C
hick
pea
Seed
2800
100
3200
125
3200
125
Lin
seed
See
d28
0010
042
0010
042
0012
5Sa
fflow
er S
eed
4500
100
3200
100
3200
100
Diversification in Cotton+Soybean (4:10)–Rabi Strip Intercropping System under Mechanization in Rainfed Condition of Vidarbha Region of Maharashtra
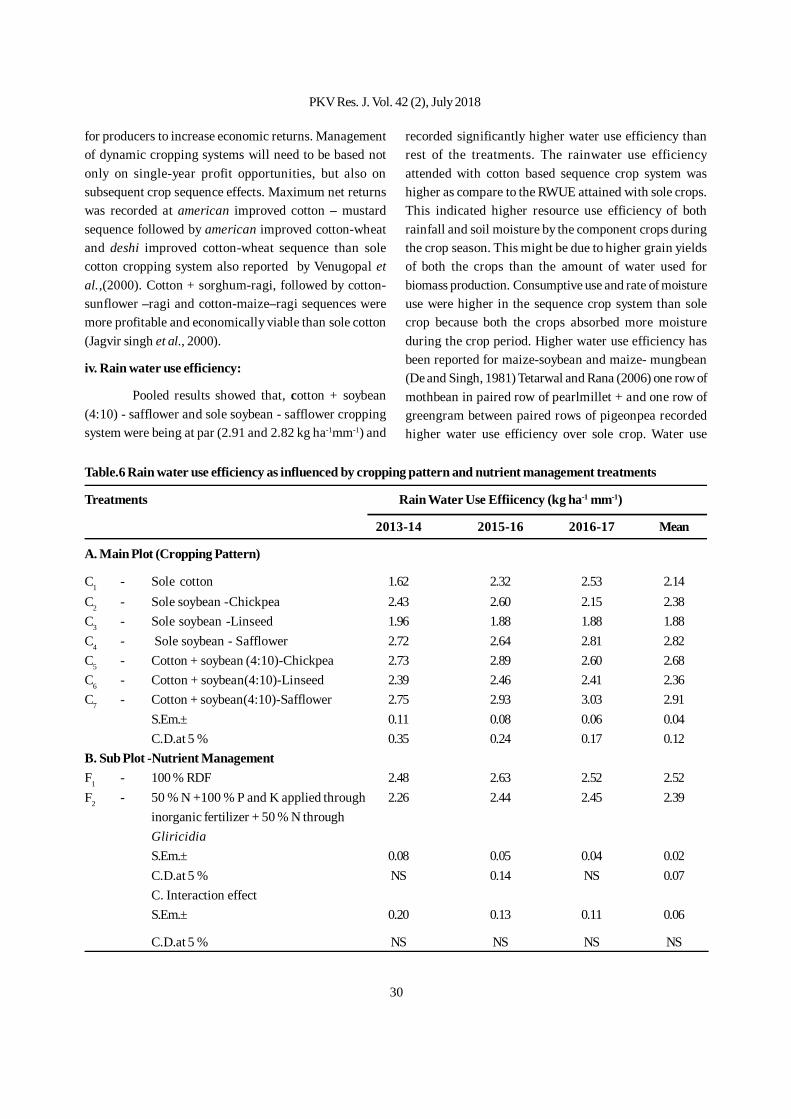
30
for producers to increase economic returns. Managementof dynamic cropping systems will need to be based notonly on single-year profit opportunities, but also onsubsequent crop sequence effects. Maximum net returnswas recorded at american improved cotton – mustardsequence followed by american improved cotton-wheatand deshi improved cotton-wheat sequence than solecotton cropping system also reported by Venugopal etal.,(2000). Cotton + sorghum-ragi, followed by cotton-sunflower –ragi and cotton-maize–ragi sequences weremore profitable and economically viable than sole cotton(Jagvir singh et al., 2000).
iv. Rain water use efficiency:
Pooled results showed that, cotton + soybean(4:10) - safflower and sole soybean - safflower croppingsystem were being at par (2.91 and 2.82 kg ha-1mm-1) and
recorded significantly higher water use efficiency thanrest of the treatments. The rainwater use efficiencyattended with cotton based sequence crop system washigher as compare to the RWUE attained with sole crops.This indicated higher resource use efficiency of bothrainfall and soil moisture by the component crops duringthe crop season. This might be due to higher grain yieldsof both the crops than the amount of water used forbiomass production. Consumptive use and rate of moistureuse were higher in the sequence crop system than solecrop because both the crops absorbed more moistureduring the crop period. Higher water use efficiency hasbeen reported for maize-soybean and maize- mungbean(De and Singh, 1981) Tetarwal and Rana (2006) one row ofmothbean in paired row of pearlmillet + and one row ofgreengram between paired rows of pigeonpea recordedhigher water use efficiency over sole crop. Water use
Table.6 Rain water use efficiency as influenced by cropping pattern and nutrient management treatments
Treatments Rain Water Use Effiicency (kg ha-1 mm-1)
2013-14 2015-16 2016-17 Mean
A. Main Plot (Cropping Pattern)
C1 - Sole cotton 1.62 2.32 2.53 2.14C2 - Sole soybean -Chickpea 2.43 2.60 2.15 2.38C3 - Sole soybean -Linseed 1.96 1.88 1.88 1.88C4 - Sole soybean - Safflower 2.72 2.64 2.81 2.82C5 - Cotton + soybean (4:10)-Chickpea 2.73 2.89 2.60 2.68C6 - Cotton + soybean(4:10)-Linseed 2.39 2.46 2.41 2.36C7 - Cotton + soybean(4:10)-Safflower 2.75 2.93 3.03 2.91
S.Em.± 0.11 0.08 0.06 0.04C.D.at 5 % 0.35 0.24 0.17 0.12
B. Sub Plot -Nutrient ManagementF1 - 100 % RDF 2.48 2.63 2.52 2.52F2 - 50 % N +100 % P and K applied through 2.26 2.44 2.45 2.39
inorganic fertilizer + 50 % N throughGliricidiaS.Em.± 0.08 0.05 0.04 0.02C.D.at 5 % NS 0.14 NS 0.07C. Interaction effectS.Em.± 0.20 0.13 0.11 0.06
C.D.at 5 % NS NS NS NS
PKV Res. J. Vol. 42 (2), July 2018
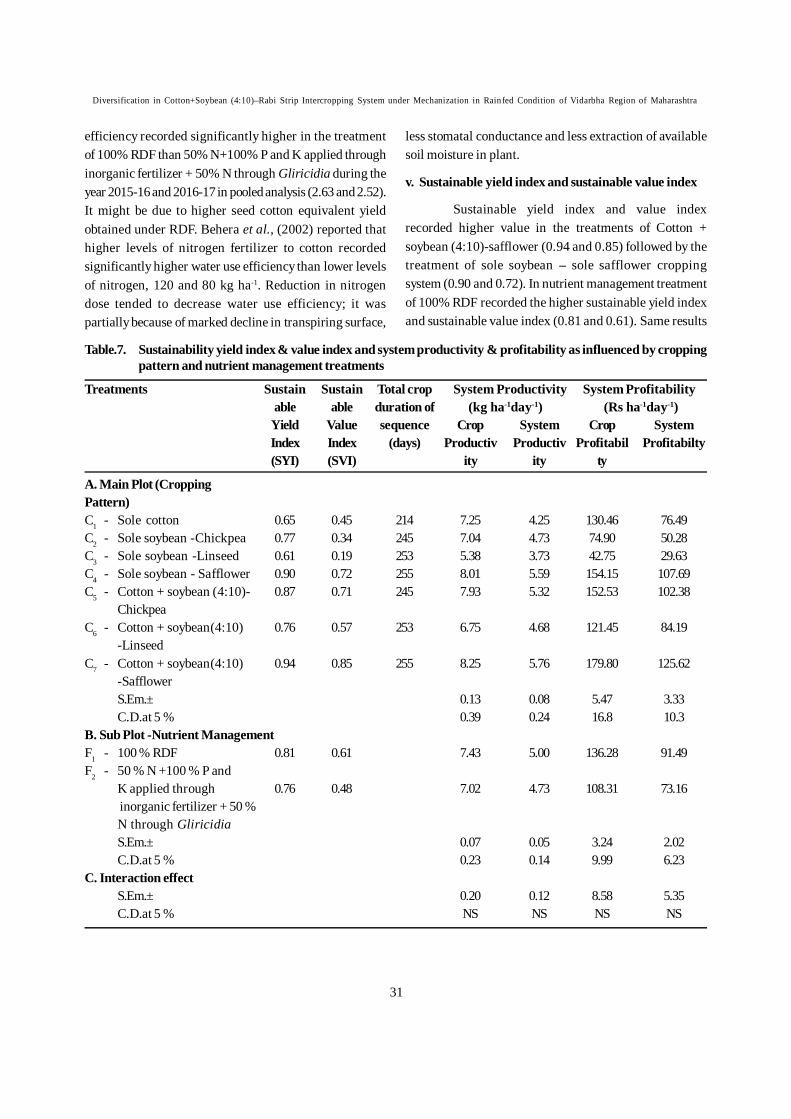
31
efficiency recorded significantly higher in the treatmentof 100% RDF than 50% N+100% P and K applied throughinorganic fertilizer + 50% N through Gliricidia during theyear 2015-16 and 2016-17 in pooled analysis (2.63 and 2.52).It might be due to higher seed cotton equivalent yieldobtained under RDF. Behera et al., (2002) reported thathigher levels of nitrogen fertilizer to cotton recordedsignificantly higher water use efficiency than lower levelsof nitrogen, 120 and 80 kg ha-1. Reduction in nitrogendose tended to decrease water use efficiency; it waspartially because of marked decline in transpiring surface,
less stomatal conductance and less extraction of availablesoil moisture in plant.
v. Sustainable yield index and sustainable value index
Sustainable yield index and value indexrecorded higher value in the treatments of Cotton +soybean (4:10)-safflower (0.94 and 0.85) followed by thetreatment of sole soybean – sole safflower croppingsystem (0.90 and 0.72). In nutrient management treatmentof 100% RDF recorded the higher sustainable yield indexand sustainable value index (0.81 and 0.61). Same results
Table.7. Sustainability yield index & value index and system productivity & profitability as influenced by croppingpattern and nutrient management treatments
Treatments Sustain Sustain Total crop System Productivity System Profitabilityable able duration of (kg ha-1day-1) (Rs ha-1day-1)Yield Value sequence Crop System Crop SystemIndex Index (days) Productiv Productiv Profitabil Profitabilty(SYI) (SVI) ity ity ty
A. Main Plot (CroppingPattern)C1 - Sole cotton 0.65 0.45 214 7.25 4.25 130.46 76.49C2 - Sole soybean -Chickpea 0.77 0.34 245 7.04 4.73 74.90 50.28C3 - Sole soybean -Linseed 0.61 0.19 253 5.38 3.73 42.75 29.63C4 - Sole soybean - Safflower 0.90 0.72 255 8.01 5.59 154.15 107.69C5 - Cotton + soybean (4:10)- 0.87 0.71 245 7.93 5.32 152.53 102.38
ChickpeaC6 - Cotton + soybean(4:10) 0.76 0.57 253 6.75 4.68 121.45 84.19
-LinseedC7 - Cotton + soybean(4:10) 0.94 0.85 255 8.25 5.76 179.80 125.62
-SafflowerS.Em.± 0.13 0.08 5.47 3.33C.D.at 5 % 0.39 0.24 16.8 10.3
B. Sub Plot -Nutrient ManagementF1 - 100 % RDF 0.81 0.61 7.43 5.00 136.28 91.49F2 - 50 % N +100 % P and
K applied through 0.76 0.48 7.02 4.73 108.31 73.16 inorganic fertilizer + 50 %N through GliricidiaS.Em.± 0.07 0.05 3.24 2.02C.D.at 5 % 0.23 0.14 9.99 6.23
C. Interaction effectS.Em.± 0.20 0.12 8.58 5.35C.D.at 5 % NS NS NS NS
Diversification in Cotton+Soybean (4:10)–Rabi Strip Intercropping System under Mechanization in Rainfed Condition of Vidarbha Region of Maharashtra
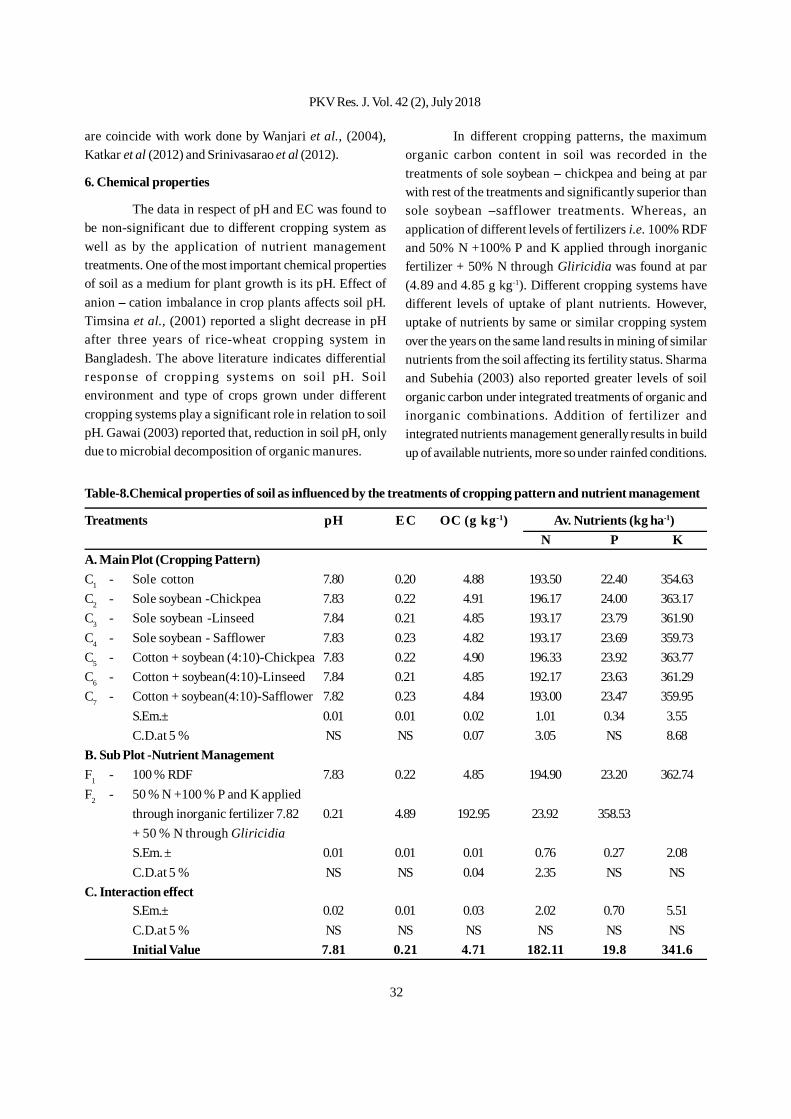
32
are coincide with work done by Wanjari et al., (2004),Katkar et al (2012) and Srinivasarao et al (2012).
6. Chemical properties
The data in respect of pH and EC was found tobe non-significant due to different cropping system aswell as by the application of nutrient managementtreatments. One of the most important chemical propertiesof soil as a medium for plant growth is its pH. Effect ofanion – cation imbalance in crop plants affects soil pH.Timsina et al., (2001) reported a slight decrease in pHafter three years of rice-wheat cropping system inBangladesh. The above literature indicates differentialresponse of cropping systems on soil pH. Soilenvironment and type of crops grown under differentcropping systems play a significant role in relation to soilpH. Gawai (2003) reported that, reduction in soil pH, onlydue to microbial decomposition of organic manures.
In different cropping patterns, the maximumorganic carbon content in soil was recorded in thetreatments of sole soybean – chickpea and being at parwith rest of the treatments and significantly superior thansole soybean –safflower treatments. Whereas, anapplication of different levels of fertilizers i.e. 100% RDFand 50% N +100% P and K applied through inorganicfertilizer + 50% N through Gliricidia was found at par(4.89 and 4.85 g kg-1). Different cropping systems havedifferent levels of uptake of plant nutrients. However,uptake of nutrients by same or similar cropping systemover the years on the same land results in mining of similarnutrients from the soil affecting its fertility status. Sharmaand Subehia (2003) also reported greater levels of soilorganic carbon under integrated treatments of organic andinorganic combinations. Addition of fertilizer andintegrated nutrients management generally results in buildup of available nutrients, more so under rainfed conditions.
Table-8.Chemical properties of soil as influenced by the treatments of cropping pattern and nutrient management
Treatments p H E C OC (g kg-1) Av. Nutrients (kg ha-1)N P K
A. Main Plot (Cropping Pattern)C1 - Sole cotton 7.80 0.20 4.88 193.50 22.40 354.63C2 - Sole soybean -Chickpea 7.83 0.22 4.91 196.17 24.00 363.17C3 - Sole soybean -Linseed 7.84 0.21 4.85 193.17 23.79 361.90C4 - Sole soybean - Safflower 7.83 0.23 4.82 193.17 23.69 359.73C5 - Cotton + soybean (4:10)-Chickpea 7.83 0.22 4.90 196.33 23.92 363.77C6 - Cotton + soybean(4:10)-Linseed 7.84 0.21 4.85 192.17 23.63 361.29C7 - Cotton + soybean(4:10)-Safflower 7.82 0.23 4.84 193.00 23.47 359.95
S.Em.± 0.01 0.01 0.02 1.01 0.34 3.55C.D.at 5 % NS NS 0.07 3.05 NS 8.68
B. Sub Plot -Nutrient ManagementF1 - 100 % RDF 7.83 0.22 4.85 194.90 23.20 362.74F2 - 50 % N +100 % P and K applied
through inorganic fertilizer 7.82 0.21 4.89 192.95 23.92 358.53+ 50 % N through GliricidiaS.Em. ± 0.01 0.01 0.01 0.76 0.27 2.08C.D.at 5 % NS NS 0.04 2.35 NS NS
C. Interaction effectS.Em.± 0.02 0.01 0.03 2.02 0.70 5.51C.D.at 5 % NS NS NS NS NS NSInitial Value 7.81 0.21 4.71 182.11 19.8 341.6
PKV Res. J. Vol. 42 (2), July 2018
33
In our present investigation it was found that organiccarbon increased with addition of 50 % N throughgliricidia leaves. This is because of very good uptakesof nutrients by cotton and soybean crops. Available Nstatus indicates that the N status of the soil was found tobe high as compared to initial value (182.11 kg ha-1).Maximum available N obtained was 196.33 and 196.17 kgha-1 recorded in the treatment of sole soybean-chickpeaand Cotton + soybean (4:10)-chickpea and being at parwith the rest of the treatments. Treatments of soybean +chickpea and cotton +soybean (4:10)-chickpea recordedsignificantly higher available N than by sole cottontreatments, it means there was more mining of nutrientsfrom directly available nutrient from fertilizer. Similar resultshave also been reported by Singh et al., (2001).
An application of treatment 100 % RDF whichwas significantly higher over other treatment. The lowestvalue of available N (192.95 kg ha-1) was observed in theINM plot. Hence, it is clear that application of chemicalfertilizers increased the available N of soil, which may beattributed to mineralization of N.
Available P and K status of the surface soil didnot shown the significant differences in cropping patternsand also in nutrients management treatments. The valueof available phosphorus and potassium increased thaninitial value with application of RDF as well as by INM.Vertisols are generally rich in K content, and applicationof potassic fertilizers is not recommended in some pocketsto these soils. Nevertheless, the importance of K inregulating and improving water functions in plant systemand enabling the crop to withstand drought under rainfedconditions where intermittent dry spells are usual, cannotbe undermined. Similar, observation was made byBharadwaj et al. (1994).
Hence, it is recommended that, among the varioustreatments combination cotton + soybean (4:10)-safflowercropping sequence sown with tractor drawn seed drill withapplication of 100% RDF through inorganic (45:55:30 kgha-1NPK) applied in kharif season and 22:13.75:00 kg ha-1
NPK through inorganic fertilizer to safflower in rabi seasonrecorded significantly higher cotton equivalent yield, netmonetary returns, B:C ratio, RWUE, sustainable value andyield index, system productivity and profitability than restof the treatment combinations.
LITERATURE CITED
Behera, U.K., Ruwali, K.N., Verma, P.K. and Pandey, H.N.2002. Productivity and water use efficiency ofmacaroni (Triticum durum) and bread wheat(Triticum aestivum) under varying irrigation levelsand schedules in the vertisols of central India. IndianJ. Agron. 47 (4), 518-525.
Bharadwaj, R. B. L., and Tandon, H. L. S. 1981. Fertilizeruse research in some wheat based cropping system.Fertilizer News. 26(9): 23-32.
De, Rajat and Singh, S.1981. Management practices forintercropping systems. In International Workshopon Intercropping, ICRISAT, Hyderabad. India. Pp.17-24.
Dutta, D., and Bandyopadhyay, P. 2006. Productionpotential of groundnut with pigeonpea and maizeunder various row proportions in rainfed Alfisols ofWest Bengal. Indian Journal of Agronomy 51(2):103-106.
Gawai, P. P., and Pawar, V.S.2005.Yield and yieldcomponents of sorghum (Sorghum bicolor) asinfluenced by integrated nutrient managementsystem and its residual effect on chickpea (Cicerarietinum). Ann. Agric. Res., 26(3): 378-382.
Gill, M.S., and Ahlawat, I.P.S. 2006. Crop diversificationand its role towards sustainability and rofitability.Indian Journal of fertilizers.2 (9):125-138, 150.
Jagvirsingh, Venugopal M.V., and Kairon M.S. 2000. Effectof cotton based cropping system and nutrientmanagement in the productivity and soil fertility ofrainfed vertisols. Extended summaries. Internationalconference on managing natural resources, February14-18, New Delhi, India, Vol 3:945-946.
Katkar, R.N., V. K. Kharche, B. A. Sonune, R. H. WanjariAnd MuneshwarSingu 2012. Long term effect ofnutrient management on soil quality and sustainableproductivity under sorghum-wheat crop sequencein Vertisol of Akola. Agropedology, 22 (2): J03-JJ4
Sankaranarayanan, K., Nalayini P. and Praharaj 2012.Multitier cropping system to enhance resource
Diversification in Cotton+Soybean (4:10)–Rabi Strip Intercropping System under Mechanization in Rainfed Condition of Vidarbha Region of Maharashtra
34
utilization, profitability and sustainability of Bt.cotton (Gossypium hirsutum) production system.Indian Journal of Agricultural Science 82 (12):1044-1050.
Sharma, S. P., and Subehia S. K. 2003. Effects of twenty-five years of fertilizer use on maize and wheat yieldsand quality of an acidic soil in the western Himalayas.Experimental Agric., 39:55–63.
Singh S.K., Verma S.C. and Singh R.P. 2001. Effect ofintergrated nutrient management of yield, nutrienton productivity, nutrient uptake, water use andprofitability of pearl millet under rainfed condition.Ind. Journal of Agronomy, 51 (4): 263-266.
Srinivasarao, Ch., Venkateswarlu, B., Lal, R., Singh, A. K.,Kundu, S., Vittal, K. P. R., Sharma, S. K., Sharma, R.A., Jain, M. P. and Chary, G. R. 2012. Sustainingagronomic productivity and quality of a VertisolicSoil (Vertisol) under soybean-safflower croppingsystem in semi-arid central India. Can. J. Soil Sci. 92:771-785.
Tanaka, D.L., J.M. Krupinsky, S.D. Merrill, M.A. Liebig,and J.D. Hanson 2007. Dynamic cropping systems .
Timsina, J., Singh, U., Badaruddin, M., Meisner, C., Amin,M.R.2001. Cultivar, nitrogen, and water effects onproductivity, and nitrogen-use efficiency and balancefor rice-wheat sequences of Bangladesh. Field CropsRes. 72, 143-161.
Tomar, R.S.S., Kushwaha A.L., Julka R. and Madloi K.C.2000. Productivity of upland cotton genotypes underuptake and changes in soil fertility under rice - lentilcropping system. Indian J. of Agron, 36(2): 191-197.
Tetarwal, J.P and Rana K.S.2006. Impact of croppingsystem, fertility levels and moisture conservationpractices.
Venugopal, K., Gopalkrishnan N and GuruanajanK.N.2000.Sustainability of production potential ofcotton and cotton based cropping system. Extendedsummaries. International conference on managingnatural resources, February 14-18, New Delhi, India,Vol 3:947-949.
Wanjari, R. H., M. V.Singh and P.K.Ghosh 2004. Sustainableyield index: An approach to evaluate thesustainability of long term intensive croppingsystems in India. Journal of Sustainable Agriculture24 (4): 39-56.
Received on 16.10.2018
PKV Res. J. Vol. 42 (2), July 2018
35
The share of oilseeds is 14.1 per cent out of thetotal cropped area in India, rapeseed-mustard accountsfor 3 per cent of it. India contributes 28.3 per cent acreageand 19.8 per cent production in world, (Kapila Shekhawatet al., 2012). Water management warrants the need fordeciding suitable irrigation scheduling which creates afavourable soil moisture environment for maximizing yieldby conserving moisture, reducing weed growth andimproving crop growth and yield promotional factors.Heavy soils are characterized as poor in drainage. Excessirrigation cause water logging condition which ultimatelyaffects crop growth and further the crop yield. In thepresent day of scarcity, proper scheduling of irrigationplay a vital role in economizing irrigation water andenhancing crop yield. Irrigation is an important factor whichgoverns yield, consumptive use and water use efficiencyof a crop.
Soils in arid and semiarid regions are poor in waterholding capacity. The poor irrigation cause deficit soil
Effect of Irrigation Scheduling and Hydrogel on Growth, Yield, Economics,Water Requirement and Water Use Efficiency of Indian Mustard
D. D. Mankar1 and Beena M. Nair2
ABSTRACT
A field experiment with a objective of judging the optimum IW/CPE ratio for irrigation scheduling and optimumhydrogel dose for Indian mustard was conducted at College of Agriculture, Nagpur during rabi season of 2014-15 and 2015-16. The number of siliqua plant-1, seed yield plant-1, stover yield plant-1, seed yield ha-1 (873.2 kg, 665.7 kg and pooled 769kg ), stover yield ha-1, gross monetary returns (Rs 26633, 20304 and pooled 23469 ha-1) and net monetary returns ( Rs 14315,7986 and pooled 11151 ha-1) were maximum and significantly higher when irrigation applied at 0.8 IW/CPE ratio duringboth the year of experimentation and in pooled mean respectively and irrigation scheduled at 0.6 IW/CPE ratio was at parwith 0.8 ratio. The test weight and harvest index were also higher at 0.8 IW/CPE ratio. The consumptive use was more(233.4, 222 and pooled 227.7 ha-mm) when irrigation applied at 0.8 IW/CPE ratio followed by 0.6 IW/CPE ratio. The wateruse efficiency was also significantly higher due to 0.8 IW/CPE ratio (3.78, 3.06 and pooled 3.42 kg ha-mm-1) during 2014-15, 2015-16 and in pooled mean respectively.
Application of hydrogel @ 5 kg ha-1 recorded maximum and significantly higher, number of siliqua plant-1, seed yieldplant-1, seed yield ha-1 and gross monetary returns during 2014-15, 2015-16 and in pooled mean, but the hydrogel dose @ 2.5kg ha-1 was at par with it. However the stover yield plant-1 and stover yield ha-1 and net monetary returns were notinfluenced significantly by the hydrogel application. The consumptive use with hydrogel application at the rate of 5 kg ha-
1 ( 184.9, 175 and pooled 180 ha-mm ) was reduced compared to no use of hydrogel with significantly higher water useefficiency (4.07, 4.0 and pooled 4.04 kg/ha-mm) followed by 2.5 kg ha-1 hydrogel. The interaction effect was not significant.
moisture condition which ultimately affects crop growthand further the crop yield. This condition can be improvedby using hydrogel. The application of hydrogel not onlyimprove soil water holding capacity but also leads toefficient use of limited water for profitable crop production.Hydrogel absorbs water 350 times of its dry weight in waterand gradually increases it. Low rate of application (1-1.5kg per acre) exhibits absorbency at high temperature (40-50 0C), is suitable for semi arid and arid regions. Hydrogelis effective in soil for a minimum period of one crop season.It improves physical properties of the soil and the soil lessmedia. It improves seed germination and the rate ofseedling emergence. It reduces leaching of agro inputssuch as herbicides and fertilizers. It reduces irrigation andfertigation requirement of crops. It also reduces nurseryestablishment period. Based on the farmers field trials andfeedback obtained through interaction with licensees andthe applicators, hydrogel application in all most all thetested crops, such as cereals, oilseeds, spices, flowers, etchas resulted significant improvement in the quality of
1 & 2. Associate Professor, College of Agriculture, Nagpur
PKV Res. J. Vol. 42 (2), July 2018
36
agricultural produce. Hydrogel reduce the frequency ofirrigation. Thus reducing drudgery in terms of labourinvolved in frequent irrigations .
In view of importance of irrigation water and unpredictablerainfall, water stress situation in mustard cultivation is ofprime importance. Therefore, the experiment was plannedwith objectives to study the effect of hydrogel dose andIW/CPE ratio based irrigation scheduling on growth, yield,economics, water requirement and water use efficiency ofmustard.
MATERIAL AND METHODS
A field experiment with a objective of judging theoptimum IW/CPE ratio for irrigation scheduling andoptimum hydrogel dose for Indian mustard was conductedat College of Agriculture, Nagpur during rabi season of2014-15 and 2015-16. The experiment was laid out in splitplot design replicated thrice with four irrigation scheduleas main plot treatments viz., no irrigation, irrigation at 0.4IW/CPE, at 0.6 IW/CPE and at 0.8 IW/CPE and threehydrogel doses as subplot treatments viz., no hydrogel,2.5 kg hydrogel ha-1 and 5 kg hydrogel ha-1. The soil wasclayey in texture with normal pH(7.6), medium in soilorganic carbon (5.36 g kg-1), low in available nitrogen(219 kg ha-1), very low in available P2O5 (12.82 kg ha-1) andvery high in available K2O (370 kg ha-1). The soil fieldcapacity was 31.12% and permanent wilting point 14.15 %with bulk density of 1.5 g cm-3. The effective rooting depthwas 50 cm. The crop variety Pusa bold was sown withspacing of 30 cm × 10 cm. The observations were taken inrespect of plant height, number of branches plant-1 andtotal dry matter accumulation plant-1 (g), number ofsiliquae plant-1, number of seeds siliquae-1, seed yield plant-
1 (g), test weight plant-1 (g), seed yield (kg ha-1) and stoveryield (q ha-1). The harvest index was also calculated. Fiveplants of mustard from each net plot were selectedrandomly, were labelled and used for various biometricobservations on growth and post harvest studies. For theobservation on dry matter accumulation plant-1, tworepresentative plants from each net plot were selected andused for the observation. The crop economics wasestimated with the prevailing market prices and minimumsupport price of the crop. Water requirement was estimatedfrom the observation of soil moisture content at sowing, at
harvest and before each irrigation. The water economy(Rs/(kg/ha-mm) in terms of net monetary returns (Rs) perunit of water use efficiency (kg/ha-mm) was worked out.
RESULTS AND DISCUSSION
Effect of Irrigation schedule :
The growth attributes viz., plant height andnumber of branches plant -1 were not influencedsignificantly by the irrigation schedule during both theyear of investigation (Table 1). The number of siliqua plant-
1 (193.9 and 102.4), seed yield plant-1 (3.8 and 4.1 g ), stoveryield plant-1 (12.1 and 15.6 g), stover yield ha-1 (36.3 and46.8 q/ha), were maximum and significantly higher whenirrigation applied at 0.8 IW/CPE ratio and was at par withirrigation scheduled at 0.6 IW/CPE ratio during both theyear of experimentation.
The seed yield ha-1 (873.2, 665.7 and 769 kg ha-1),gross monetary returns (Rs 26633, 20304 and 23469 ha-1),net monetary returns (Rs 14315, 7986 and 11151 ha-1 )during 2014-15, 2015-16 and in pooled results respectivelywere maximum and significantly higher when irrigationapplied at 0.8 IW/CPE ratio during individual year as wellas on pooled basis which in turn was at par with 0.8 IW/CPE ratio. The benefit cost ratio (2.2, 1.62 and 1.91 during2014-15, 2015-16 and in pooled respectively) were maximumdue to irrigation applied at 0.8 IW/CPE ratio. The significantyield increase by 0.8 IW/CPE ratio might be attributed tohigher growth parameter viz., plant height, dry matter,higher number of siliquae plant-1, more test weight andhigher yield plant-1, more number of seeds siliquae-1, whichmight be shown better due to less stress for availability ofmoisture to crop. DRMR (2015) also reported significantyield increase due to irrigation at 0.8 IW/CPE ratio overcontrol. These results are also in conformity with thepresent investigation. The test weight during both the yearwas maximum due to irrigation at 0.8 IW/CPE ratio andharvest index was maximum during first year due to 0.8ratio while during second year it was maximum due to 0.6ratio.
The consumptive use was more (233.4, 222 and227.7 ha-mm during 2014-15 and 2015-16 and in pooledrespectively) when irrigation applied at 0.8 IW/CPE ratioclosely followed by 0.6 IW/CPE. The water use efficiency
PKV Res. J. Vol. 42 (2), July 2018
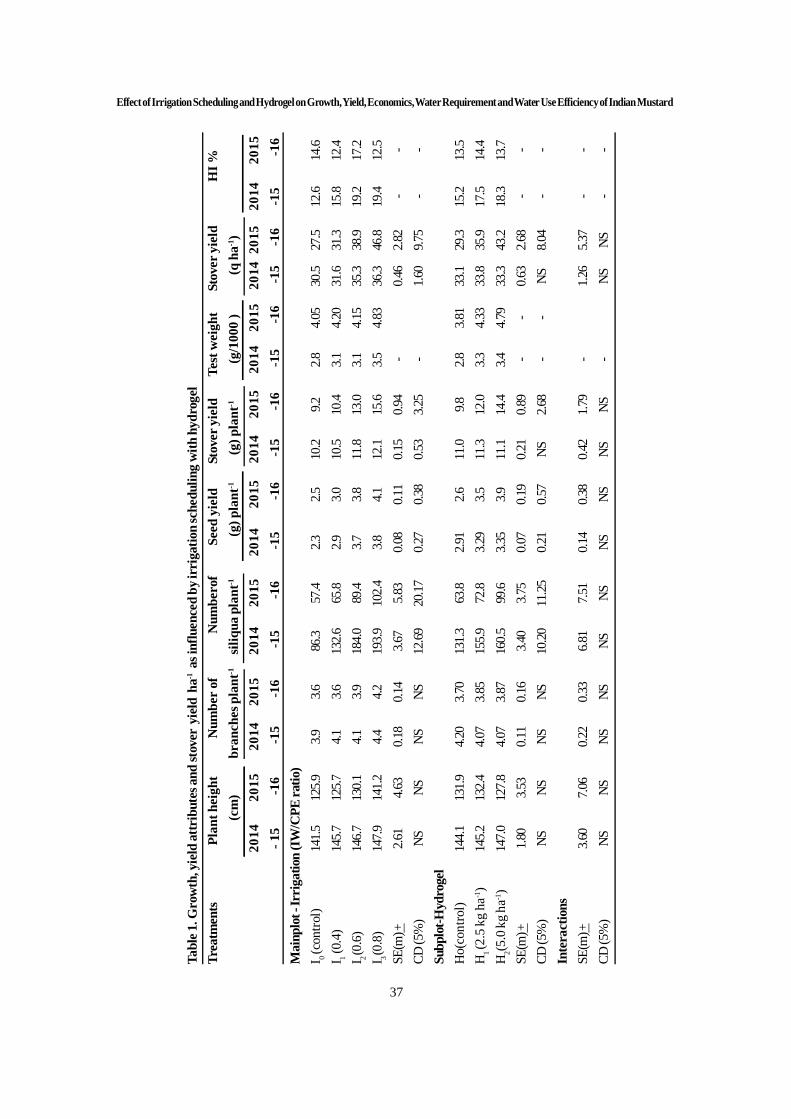
37
Tabl
e 1. G
row
th, y
ield
attr
ibut
es a
nd st
over
yie
ld h
a-1 a
s inf
luen
ced
by ir
riga
tion
sche
dulin
g w
ith h
ydro
gel
Trea
tmen
ts
Plan
t hei
ght
N
umbe
r of
Num
bero
f
S
eed
yiel
d
St
over
yie
ld
Te
st w
eigh
t
Sto
ver y
ield
HI %
(
cm)
bra
nche
s pla
nt-1
si
liqua
pla
nt-1
(g)
pla
nt-1
(
g) p
lant
-1
(g
/100
0 )
(q
ha-1
)20
1420
1520
1420
1520
1420
1520
1420
1520
1420
1520
1420
1520
1420
1520
1420
15- 1
5 -1
6 -1
5 -
16 -1
5 -
16 -1
5 -
16 -1
5 -
16 -1
5 -
16 -1
5 -
16-1
5 -
16M
ainp
lot -
Irri
gatio
n (I
W/C
PE ra
tio)
I 0 (c
ontro
l)14
1.512
5.93.9
3.686
.357
.42.3
2.510
.29.2
2.84.0
530
.527
.512
.614
.6I 1
(0.4
)14
5.712
5.74.1
3.613
2.665
.82.9
3.010
.510
.43.1
4.20
31.6
31.3
15.8
12.4
I 2 (0.6
)14
6.713
0.14.1
3.918
4.089
.43.7
3.811
.813
.03.1
4.15
35.3
38.9
19.2
17.2
I 3 (0.8
)14
7.914
1.24.4
4.219
3.910
2.43.8
4.112
.115
.63.5
4.83
36.3
46.8
19.4
12.5
SE(m
) +2.6
14.6
30.1
80.1
43.6
75.8
30.0
80.1
10.1
50.9
4-
0.46
2.82
--
CD (5
%)
NSNS
NSNS
12.69
20.17
0.27
0.38
0.53
3.25
-1.6
09.7
5-
-Su
bplo
t-Hyd
roge
lH
o(co
ntro
l)14
4.113
1.94.2
03.7
013
1.363
.82.9
12.6
11.0
9.82.8
3.81
33.1
29.3
15.2
13.5
H1 (2
.5 k
g ha
-1)
145.2
132.4
4.07
3.85
155.9
72.8
3.29
3.511
.312
.03.3
4.33
33.8
35.9
17.5
14.4
H2(5
.0 k
g ha
-1)
147.0
127.8
4.07
3.87
160.5
99.6
3.35
3.911
.114
.43.4
4.79
33.3
43.2
18.3
13.7
SE(m
) +1.8
03.5
30.1
10.1
63.4
03.7
50.0
70.1
90.2
10.8
9-
-0.6
32.6
8-
-CD
(5%
)NS
NSNS
NS10
.2011
.250.2
10.5
7NS
2.68
--
NS8.0
4-
-In
tera
ctio
nsSE
(m) +
3.60
7.06
0.22
0.33
6.81
7.51
0.14
0.38
0.42
1.79
-1.2
65.3
7-
-CD
(5%
)NS
NSNS
NSNS
NSNS
NSNS
NS-
NSNS
--
Effect of Irrigation Scheduling and Hydrogel on Growth, Yield, Economics, Water Requirement and Water Use Efficiency of Indian Mustard
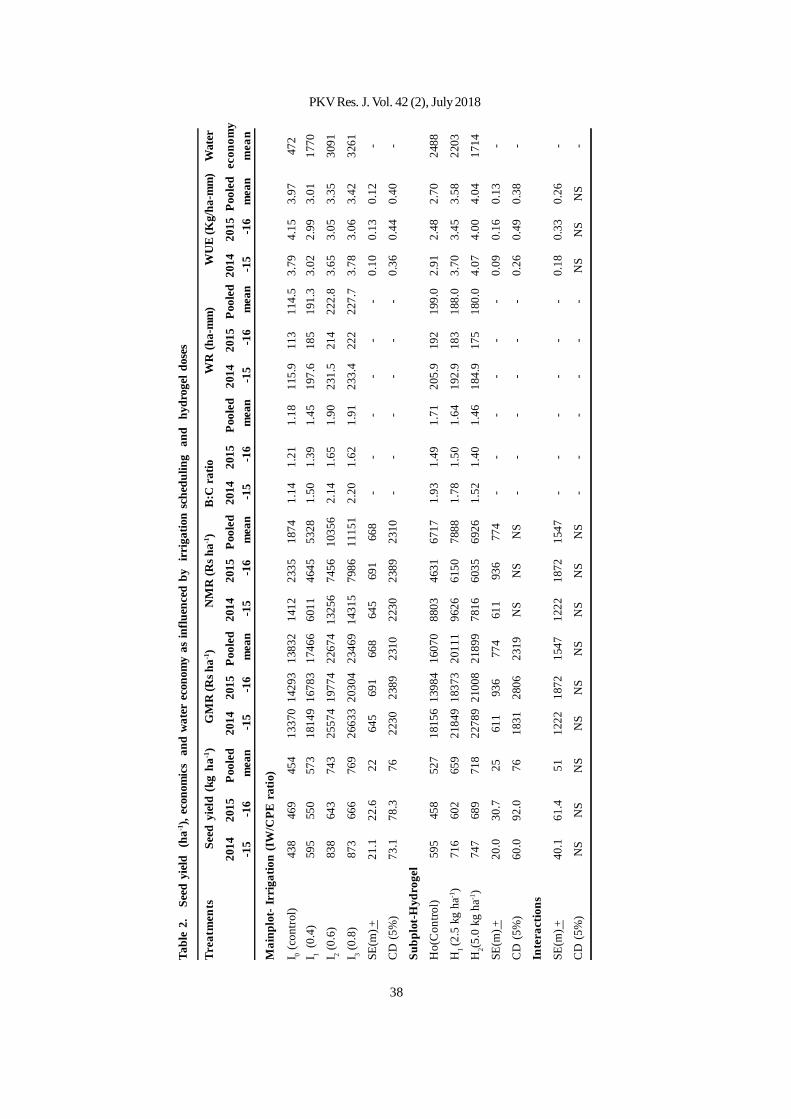
38
Tabl
e 2.
S
eed
yiel
d (
ha-1),
econ
omic
s a
nd w
ater
eco
nom
y as
influ
ence
d by
ir
riga
tion
sche
dulin
g a
nd
hydr
ogel
dos
es
Trea
tmen
tsSe
ed y
ield
(kg
ha-1
)G
MR
(Rs h
a-1)
NM
R (R
s ha-1
)
B
:C r
atio
WR
(ha-
mm
)W
UE
(Kg/
ha-m
m)
Wat
er
2014
2015
Pool
ed20
1420
15Po
oled
2014
2015
Pool
ed20
1420
15Po
oled
2014
2015
Pool
ed20
1420
15Po
oled
econ
omy
-15
-16
mea
n -1
5 -
16 m
ean
-15
-16
mea
n -1
5 -
16 m
ean
-15
-16
mea
n -1
5 -
16 m
ean
mea
n
Mai
nplo
t- Ir
riga
tion
(IW
/CPE
rat
io)
I 0 (c
ontro
l)43
846
945
413
370
1429
313
832
1412
2335
1874
1.14
1.21
1.18
115.
911
311
4.5
3.79
4.15
3.97
472
I 1 (0
.4)
595
550
573
1814
916
783
1746
660
1146
4553
281.
501.
391.
4519
7.6
185
191.
33.
022.
993.
0117
70
I 2 (0
.6)
838
643
743
2557
419
774
2267
413
256
7456
1035
62.
141.
651.
9023
1.5
214
222.
83.
653.
053.
3530
91
I 3 (0
.8)
873
666
769
2663
320
304
2346
914
315
7986
1115
12.
201.
621.
9123
3.4
222
227.
73.
783.
063.
4232
61
SE(m
) +21
.122
.622
645
691
668
645
691
668
--
--
--
0.10
0.13
0.12
-
CD
(5%
)73
.178
.376
2230
2389
2310
2230
2389
2310
--
--
--
0.36
0.44
0.40
-
Subp
lot-
Hyd
roge
l
Ho(
Con
trol)
595
458
527
1815
613
984
1607
088
0346
3167
171.
931.
491.
7120
5.9
192
199.
02.
912.
482.
7024
88
H1 (2
.5 k
g ha
-1)
716
602
659
2184
918
373
2011
196
2661
5078
881.
781.
501.
6419
2.9
183
188.
03.
703.
453.
5822
03
H2(5
.0 k
g ha
-1)
747
689
718
2278
921
008
2189
978
1660
3569
261.
521.
401.
4618
4.9
175
180.
04.
074.
004.
0417
14
SE(m
) +20
.030
.725
611
936
774
611
936
774
--
--
--
0.09
0.16
0.13
-
CD
(5%
)60
.092
.076
1831
2806
2319
NS
NS
NS
--
--
--
0.26
0.49
0.38
-
Inte
ract
ions
SE(m
) +40
.161
.451
1222
1872
1547
1222
1872
1547
--
--
--
0.18
0.33
0.26
-
CD
(5%
)N
SN
SN
SN
SN
SN
SN
SN
SN
S-
--
--
-N
SN
SN
S-
PKV Res. J. Vol. 42 (2), July 2018
39
was maximum and significantly higher due to no irrigationtreatment during both the year and in pooled mean followedby 0.8 IW/CPE ratio. The higher water use efficiency in noirrigation treatment might be due to less water requirementand comparatively more seed yield.
Effect of hydrogel doses :
The plant height and number of branches plant-1
were not influenced significantly by the hydrogelapplication during both the year. The number of siliquaplant -1 and seed yield plant -1 were maximum andsignificantly higher due to application of hydrogel @ 5 kgha-1 during both the year of investigation, but the hydrogeldose @ 2.5 kg ha-1 was at par with it during year 2014-15.This might be due to better availability of moisture due tohydrogel. The stover yield plant-1 and stover yield ha-1
were maximum and significantly higher due to applicationof hydrogel @ 5 kg ha-1 in 2015-16 but were not influencedsignificantly by the hydrogel application during the year2014-15. The test weight was also maximum due toapplication of hydrogel @ 5 kg ha-1 during both the year.
The seed yield (747, 689 and 718 kg ha-1) andgross monetary returns (Rs 22789, 21008 and 21899 ha-1)during 2014-15, 2015-16 and in pooled mean respectivelywere maximum and significantly higher due to applicationof hydrogel @ 5 kg ha-1, but the hydrogel dose at the rateof 2.5 kg ha was at par with it. However the net monetaryreturns were not influenced significantly by the hydrogelapplication during both the year of experimentation. Thismight be due to higher cost of hydrogel application withcomparatively lesser increment in yield as evidenced fromthe data. The benefit cost ratio was better with nohydrogel application during both year as well as in pooledmean. The consumptive use with hydrogel application atthe rate of 5 kg ha-1 ( 184.9, 175 and 180 ha-mm) was reducedcompared to no use of hydrogel (205.9, 192 and 199 ha-mm) with significantly higher water use efficiency (4.07,4.0 and 4.04 kg/ha-mm) during 2014-15, 2015-16 and in
pooled mean respectively followed by 2.5 kg ha-1 hydrogel.Tripathi et al. (1997) and Rana et al. (2001) reported moreseed yield due to application of product similar to hydrogeli.e. Jalshakti @ 5 kg ha-1 and 2.5 kg ha-1 being at par ascompared to control. DRMR (2015) Bharatpur also recordedsimilar results with hydrogel.
Interaction effect :
The interaction effect were not significant.
CONCLUSIONS
Thus from the two year data it can be concludedthat irrigation may be applied at 0.8 or 0.6 IW/CPE ratio toIndian mustard under Vidarbha condition for significantyield increase, monetary returns and water economy (NMR/WUE). As regards to hydrogel @ 5 kg ha-1 increased theyield and gross monetary returns, reduced the waterrequirements and water economy but the net monetaryreturns was not influenced significanly. The watereconomy (Rs/(kg/ha-mm)) was also less.
LITERATURE CITED
DRMR, 2015. Enhancing water use efficiency of Indianmustard Annual Report-2014-15. Directorate ofRapeseed- Mustard Research (ICAR), Bharatpur,India
Kapila Shekhawat, S. S. Rathore, O. P. Premi, B. K. Kandpaland J. S. Chauhan, 2012. Advances in AgronomicManagement of Indian Mustard (Brassica juncea(L.) Czern. Cosso): an overview. Int. J. Agron.,Hindawi Publishing Corporation, pg 14.
Rana, K. S., Ashok Kumar and R. C. Gautam, 2001. Effect ofstarch polymer (Jalshakti) on yield attributes, yieldand water use efficiency of mustard (Brassica junceaL.) under rainfed conditions. Crop Res., 22(3): 395-397.
Tripathi, M. L., S. M. Kurmvanshi and K. N. Namdeo, 1997.Effect of starch polymer and N-triacontanol on growthand yield of Indian mustard (Brassica juncea) IndianJ. Agron., 42(1): 194-195.
Received on 15.5.2018
Effect of Irrigation Scheduling and Hydrogel on Growth, Yield, Economics, Water Requirement and Water Use Efficiency of Indian Mustard
40
One of the main reasons of low yield of Chickpeais improper population. Too low and high plant populationbeyond a certain limit often adversely affects the cropyield. Number of plants per unit area influences plant size,yield components and ultimately the seed yield. Moreover,plant spacing in the field is also very important to facilitateaeration and light penetration in to plant canopy foroptimizing rate of photosynthesis. There is very littleinformation available on the relative contribution of variousplant spacing towards yield and yield components andalso their interaction. It is reported that row spacing of45cm increased chickpea yield compared to 30 and 50cmspacing while others indicated that row spacing had nosignificant effect on seed yield (Panwar et al. 1980, Parihar1996). Production and productivity of the crop is governedby environmental, genotypic trait of the crop and cropmanagement. Determining appropriate crop geometry istherefore one of the most important crop managementactivities which improves the performance andproductivity of plants. The planting density of chickpeain Maharashtra is 30×10 cm spacing for desi type chickpeaand 45x10 cm for kabuli type, however, the green seedcoat chickpea requires protective irrigation and has verymeagre area under cultivation. Various studies indicatedthat chickpea varieties and population densities havesignificant effects on the growth as well as yieldparameters.There is no varietal specific recommendation
Effect of Planting Geometry and Fertilizer on Growth and Yield of GreenSeed Coated Chickpea Under Irrigated Condition
V. V. Goud1 and A. K. Sadavarte2
ABSTRACT
A field experiment was conducted during rabi season to study the crop geomtery and fertilizer levels forgreen seed coated chickpea varieties under protective irrigation. The treatment comprises of two varieties(AKGS 1 and AKG 9303-12), three spacing’s (30x10 cm, 45x10 cm and 60x10 cm) andfour levels offertilizers(Absolute control, 25:50 N:P2O5kg ha-1, 30:60 N:P2O5kg ha-1, 35:70 N:P2O5kg ha-1. The experiment waslaid out in a factorial randomized block design (FRBD) with three replications. Planting of chickpea varieties at45x10 cm was found optimum. AKG9303-12 recorded higher crop growth and productivity over AKGS 1. Amongfertilizer levels application of 35:70:00 NPK kg ha-1 recorded significantly higher seed yield over lower levels offertilizers under imigation condition.
1. Assistant Professor and 2. Associate Professor, Pulses Research Unit, Dr.PDKV, Akola
on the plantpopulation density of chickpeacultivars inMaharashtra; there is blanket recommendation of 30×10cmspacing. Therefore the objective of this study was todetermine the effect of spacing and fertilizer levels onyield components and yield of green seed coatedchickpea.
MATERIAL AND METHODS
A field experiment was conducted at the farm ofthe Pulses Research Unit, Dr. Panjabrao Deshmukh KrishiVidyapeeth, Akola during rabi 2009-10. The texture of theexperimental soil was clay loam. The soil pH was 7.72 with5.20% organic carbon, available nitrogen 214 kg ha-1,available P 21.05 kg ha-1, available K2O 343 kg ha-1. Theplot size was 4.0×3.6m. Fertilizer was applied in the form ofurea and di-ammonium phosphate. Sowing was done10thOctober 2008 and harvesting on 25thJanuary 2009.Irrigation was done first as pre sowing, second at budinitiation stage and third at pod filling stage.
RESULTS AND DISCUSSION
Growth parameters:The data revealed that cultivars differed
significantly from one cultivar to another with respect toplant height. Significantly more plant height was recordedin variety AKG 9303-12 as compared to variety AKGS 1.Previously similar results have been reported by Kasole
PKV Res. J. Vol. 42 (2), July 2018
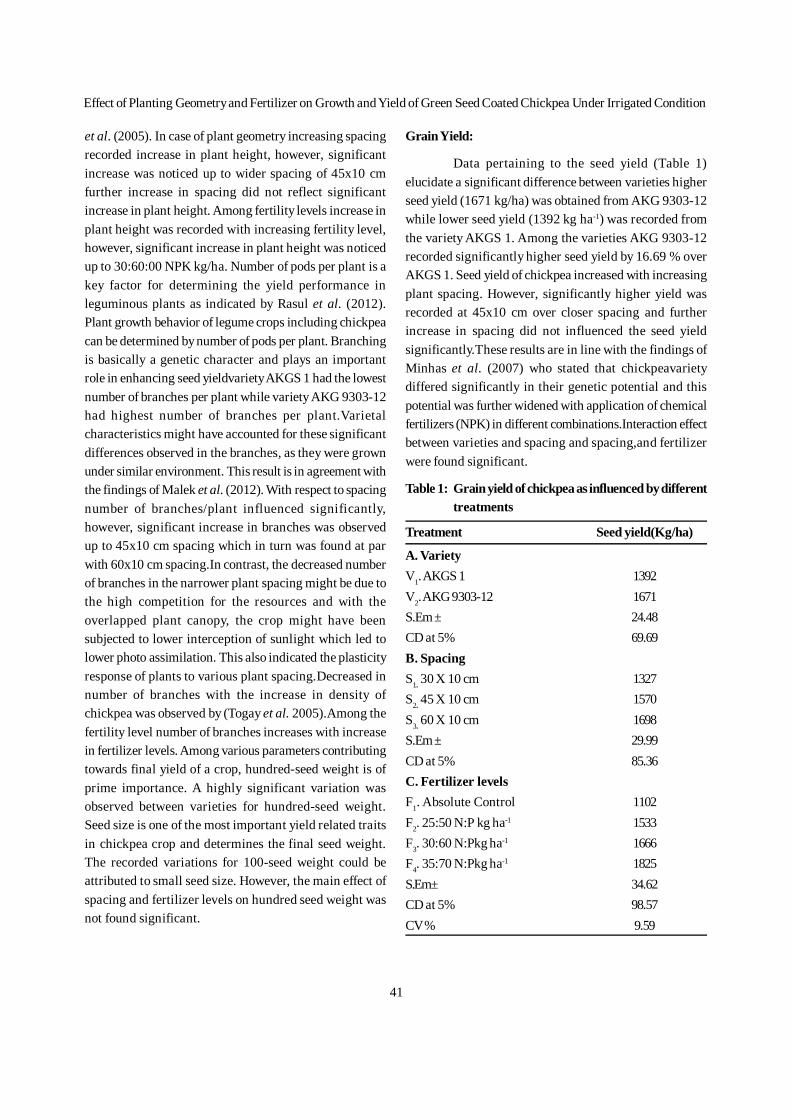
41
et al. (2005). In case of plant geometry increasing spacingrecorded increase in plant height, however, significantincrease was noticed up to wider spacing of 45x10 cmfurther increase in spacing did not reflect significantincrease in plant height. Among fertility levels increase inplant height was recorded with increasing fertility level,however, significant increase in plant height was noticedup to 30:60:00 NPK kg/ha. Number of pods per plant is akey factor for determining the yield performance inleguminous plants as indicated by Rasul et al. (2012).Plant growth behavior of legume crops including chickpeacan be determined by number of pods per plant. Branchingis basically a genetic character and plays an importantrole in enhancing seed yieldvariety AKGS 1 had the lowestnumber of branches per plant while variety AKG 9303-12had highest number of branches per plant.Varietalcharacteristics might have accounted for these significantdifferences observed in the branches, as they were grownunder similar environment. This result is in agreement withthe findings of Malek et al. (2012). With respect to spacingnumber of branches/plant influenced significantly,however, significant increase in branches was observedup to 45x10 cm spacing which in turn was found at parwith 60x10 cm spacing.In contrast, the decreased numberof branches in the narrower plant spacing might be due tothe high competition for the resources and with theoverlapped plant canopy, the crop might have beensubjected to lower interception of sunlight which led tolower photo assimilation. This also indicated the plasticityresponse of plants to various plant spacing.Decreased innumber of branches with the increase in density ofchickpea was observed by (Togay et al. 2005).Among thefertility level number of branches increases with increasein fertilizer levels. Among various parameters contributingtowards final yield of a crop, hundred-seed weight is ofprime importance. A highly significant variation wasobserved between varieties for hundred-seed weight.Seed size is one of the most important yield related traitsin chickpea crop and determines the final seed weight.The recorded variations for 100-seed weight could beattributed to small seed size. However, the main effect ofspacing and fertilizer levels on hundred seed weight wasnot found significant.
Grain Yield:
Data pertaining to the seed yield (Table 1)elucidate a significant difference between varieties higherseed yield (1671 kg/ha) was obtained from AKG 9303-12while lower seed yield (1392 kg ha-1) was recorded fromthe variety AKGS 1. Among the varieties AKG 9303-12recorded significantly higher seed yield by 16.69 % overAKGS 1. Seed yield of chickpea increased with increasingplant spacing. However, significantly higher yield wasrecorded at 45x10 cm over closer spacing and furtherincrease in spacing did not influenced the seed yieldsignificantly.These results are in line with the findings ofMinhas et al. (2007) who stated that chickpeavarietydiffered significantly in their genetic potential and thispotential was further widened with application of chemicalfertilizers (NPK) in different combinations.Interaction effectbetween varieties and spacing and spacing,and fertilizerwere found significant.
Table 1: Grain yield of chickpea as influenced by differenttreatments
Treatment Seed yield(Kg/ha)
A. VarietyV1. AKGS 1 1392V2. AKG 9303-12 1671S.Em ± 24.48CD at 5% 69.69B. SpacingS1. 30 X 10 cm 1327S2. 45 X 10 cm 1570S3. 60 X 10 cm 1698S.Em ± 29.99CD at 5% 85.36C. Fertilizer levelsF1. Absolute Control 1102F2. 25:50 N:P kg ha-1 1533F3. 30:60 N:Pkg ha-1 1666F4. 35:70 N:Pkg ha-1 1825S.Em± 34.62CD at 5% 98.57CV % 9.59
Effect of Planting Geometry and Fertilizer on Growth and Yield of Green Seed Coated Chickpea Under Irrigated Condition
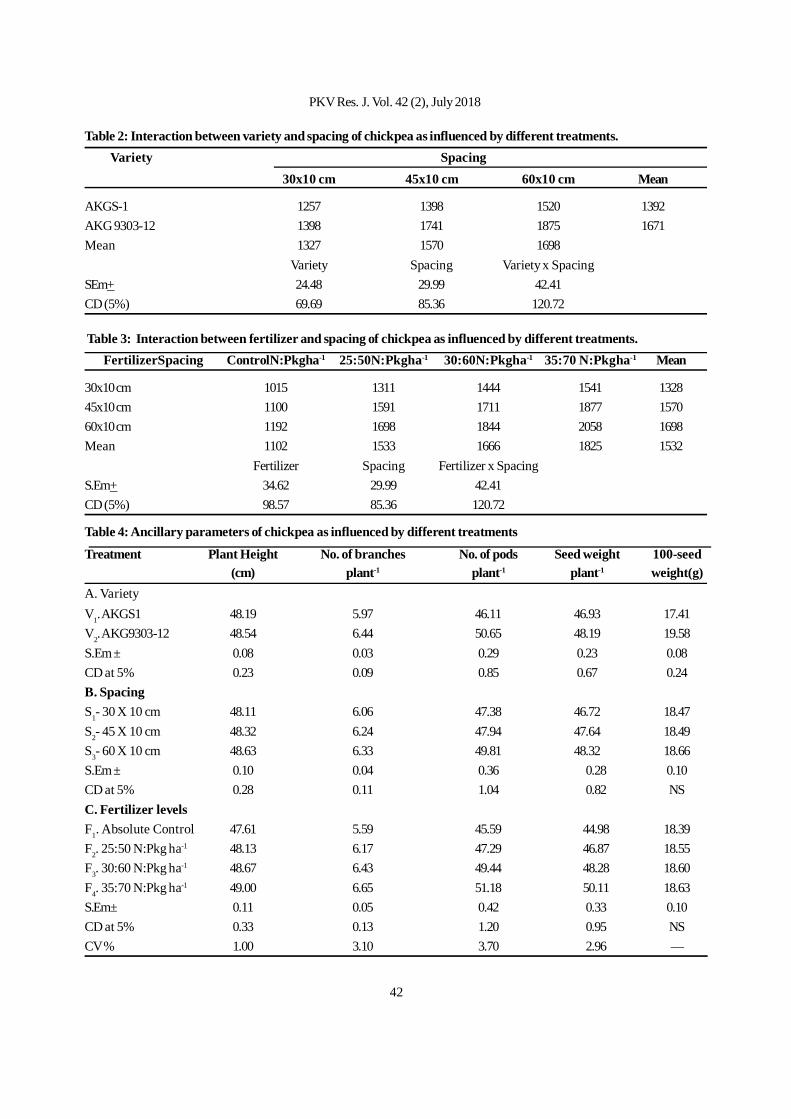
42
Table 2: Interaction between variety and spacing of chickpea as influenced by different treatments. Variety Spacing
30x10 cm 45x10 cm 60x10 cm Mean
AKGS-1 1257 1398 1520 1392AKG 9303-12 1398 1741 1875 1671Mean 1327 1570 1698
Variety Spacing Variety x SpacingSEm+ 24.48 29.99 42.41CD (5%) 69.69 85.36 120.72
Table 3: Interaction between fertilizer and spacing of chickpea as influenced by different treatments. FertilizerSpacing ControlN:Pkgha-1 25:50N:Pkgha-1 30:60N:Pkgha-1 35:70 N:Pkgha-1 Mean
30x10 cm 1015 1311 1444 1541 132845x10 cm 1100 1591 1711 1877 157060x10 cm 1192 1698 1844 2058 1698Mean 1102 1533 1666 1825 1532
Fertilizer Spacing Fertilizer x SpacingS.Em+ 34.62 29.99 42.41CD (5%) 98.57 85.36 120.72
Table 4: Ancillary parameters of chickpea as influenced by different treatments
Treatment Plant Height No. of branches No. of pods Seed weight 100-seed(cm) plant-1 plant-1 plant-1 weight(g)
A. VarietyV1. AKGS1 48.19 5.97 46.11 46.93 17.41V2. AKG9303-12 48.54 6.44 50.65 48.19 19.58S.Em ± 0.08 0.03 0.29 0.23 0.08CD at 5% 0.23 0.09 0.85 0.67 0.24B. SpacingS1- 30 X 10 cm 48.11 6.06 47.38 46.72 18.47S2- 45 X 10 cm 48.32 6.24 47.94 47.64 18.49S3- 60 X 10 cm 48.63 6.33 49.81 48.32 18.66S.Em ± 0.10 0.04 0.36 0.28 0.10CD at 5% 0.28 0.11 1.04 0.82 NSC. Fertilizer levelsF1. Absolute Control 47.61 5.59 45.59 44.98 18.39F2. 25:50 N:Pkg ha-1 48.13 6.17 47.29 46.87 18.55F3. 30:60 N:Pkg ha-1 48.67 6.43 49.44 48.28 18.60F4. 35:70 N:Pkg ha-1 49.00 6.65 51.18 50.11 18.63S.Em± 0.11 0.05 0.42 0.33 0.10CD at 5% 0.33 0.13 1.20 0.95 NSCV % 1.00 3.10 3.70 2.96 —
PKV Res. J. Vol. 42 (2), July 2018
43
Interaction between Variety and spacing
There was significant variation in yield due todifferent spacing (Table 2).However, wider spacing of 60x10cm was found very promising as it produced 1698 kg ha-
1yield. Currently recommended 30x10 cm spacing gave only1327 kg ha-1 yield. It is further concluded that for gettinghighest yield of green seed coated chickpea sowing atspacing of 60x10 cm is more useful.
Interaction between spacing and fertilizer
The data mentioned in Table 3 recordedsignificantly higher grain yield (1825 kg ha-1) with the ofapplication of 35:70 N:P2O5 kg/ha over lower doses offertilizer at all the spacing except at 30x10 cm which inturn was found at par with subsequent lower dose offertilizer i.e.30:60 N:P2O5 kg/ha.
Correlation studies
The analysis of correlation (r) (Table 5) revealedpositive and significant correlation of grain yield with grainweight/plant followed by number of branches/plant,number of pods/plant, plant height and 100-seed weight.
Table 5: Correlation studies between yield and yieldattributes in chickpea
Yield attributes ‘r’ value
100 seed weight +0.489**Plant height at maturity +0.829**No. of pods plant-1 +0.874**No. of Branches plant-1 +0.891**Grain weight plant-1 +0.904**
CONCLUSION
It is concluded that planting of checkpea varietiesat 45 x 10 cm recorded higher yield while AKG 9303registered highest seed yield under fertilizer dose of 35:70N and P2O5 kg ha-1 under irrigation condition.
LITERATURE CITED
Kasole, K E, S. D.Kalke, S.M.Kareepa and K.K.Khade,2005. Response of chickpea to different fertilizerlevels, plant population and weed management oncultivators field in north eastern part ofKohlapur,Maharashtara, Indian J. Agron., 40(2): 217-219
Malek, M.A., M. Shafiquzzaman, M.S. Rahman, M.R.Ismail, and M.M.A. Mondal,2012.Standardization ofsoybean row spacing 8 Advances in Agriculturebased on morpho-physiological characters, LegumeRes., 35(2):138–143.
Minhas, R.S., R.S.Jaggi and P.Sharma, 2007. Response ofgram to NPK application in wet temperature zone ofHimachal Pradesh, Indian J. Agri. Chemistry., 20: 95-99
Panwar, K.S., A.S. Faroda, D.S. Malik, L.P.S. Ahlawat, K.K.Dhingra, M.R. Rao, R.C. Singh, D.R. Dahiya, Singh,Atar and R.P. Roy Sharma, 1980. Response ofchickpea varieties to seed rates and row spacing’s,Silver Jubilee Society of Agronomy, 9:54-55.
Parihar, S.S. 1996. The effect of row and plant spacing’son the growth and yield of chickpea. Indian J.Agron.,41(4):604-607.
Rasul, F., M. A. Cheema, A. Sattar, M. F. Saleem, and M. A.Wahid, 2012. Evaluating the performance of threemungbean varieties grown under varying inter-rowspacing, J. Animal and Plant Sci., 22 (4):1030–1035.
Togay N, Y. Togay,M.Erman, D.Yusuf, F.Cig, 2005. Theeffects of different plant densities on yield and yieldcomponents in some chickpea (CicerarietinumL.)cultivars in dry and irrigated conditions. J.Agril. Sci.,11(4): 417-421.
Received on 15.12.2018
Effect of Planting Geometry and Fertilizer on Growth and Yield of Green Seed Coated Chickpea Under Irrigated Condition
44
The main concept of intercropping is toincreasing total productivity per unit area and time, aswell as equitable and judicious utilization of land resourcesand inputs. One of the main reasons for getting higheryields from intercropping systems are mainly due to thecomponent crops are able to use face natural resourcesthan grown separately (Willey, 1979). A careful selectionof crops having different growth habits can reduce themutual competition to a considerable extent. Hence, choiceof component crops in intercropping needs to be suitablymaneuvered to harvest the synergism among them towardsefficient utilization of resource base and to increase overallproductivity (Mandal, 1986).
Chlorophytum borivilianum is a perennialimportant herb known as ‘Safed musli’ which is a rootcrop belonging to the family Liliaceae. The roots ofChlorophytum borivilianum have great medicinal valuedue to saponin content and used extensively in Ayurvedicmedicines. The economic part of the herb is root and iswell known tonic and aphrodisiac drug given to curegeneral debility. Tribals in central India use leaves of thisherb for vegetable purpose. The species of Chlorophytumborivilanum contains more saponin and good yielding
Effect of Safed Musli + Pigeonpea Intercropping System on Growth, Yieldand Root Quality of Safed Musli
S. S. Wanjari1, S. G. Wankhade2, Yogita Gore3 , Praksah Ghatol 4and Pravin Deshmukh5
ABSTRACT
The present investigation entitled “Effect of safed musli + pigeonpea intercropping system on growth, yield androot quality of Safed musli” was carried out at Nagarjun Medicinal Plants Garden, Dr. Panjabrao Deshmukh KrishiVidyapeeth, Akola (M.S.) to find out the effect of safed musli and pigeonpea intercropping on soil fertility and evaluate theyield and quality of safed musli. The experiment was under Safed musli+ Pigeonpea intercropping with various rowproportions T1 – Safed musli + Pigeonpea 2:1 row proportion, T2 – Safed musli+ Pigeonpea 3:1 row proportion, T3 –Safed musli + Pigeonpea 2:2 row proportion, T4 – Safed musli + Pigeonpea 1:2 row proportion, T5 – Sole Safed musli, T6
– Sole Pigeonpea. The experiment was laid in Randomized Block Design with four replications and six treatments. Theintercropping of safed musli with pigeonpea at 3:1 row proportion was found superior for fresh root yield and dry rootyield. Saponin content and yield was significantly influenced under Safed musli + Pigeonpea 3:1 row proportion. Proteincontent was significantly influenced under Safed musli + Pigeonpea 2:2 row proportion. However, the uptake of nutrientscrop productivity and net monetary returns was recorded under safed musli pigeonpea intercropping 3:1 row proportion.
potentials as compared to other species of Safed musliand therefore having commercial value. Due to its vastdemand it is very costly and become a hot cake amongmedicinal plants.
Pigeonpea is an important legume food anddrought tolerant crop and having potential to sustainproductivity and profitability in drought prone areas.Being a legume, the residual nitrogen available tosubsequent crop is estimated to around 40 kg ha -1.Intercropping with Pigeonpea provides an opportunityto grow them together as they have different growth habitsand maturity period. The Pigeonpea being deep rootedand comparatively slow growing in its early growth stage,during which the more rapidly growing crops like Safedmusli can be conveniently intercropped to utilize naturalresources more efficiently. The sole cropping of safedmusli has a risk. The replacement of traditional crops withalternative crops like Safed musli may be unsustainable inlarge context and therefore it is necessary to explore thepossibilities of the growing these crops as an intercropwith the traditional crop in efficient cropping systems. Inorder to generate useful information for such type ofpotential areas, present investigations to study the soil
1. Associate Professor. 2. Professor (SSAC), 4. Assistant Professor and 3 & 5. PG student, Department of Agronomy,Dr. PDKV, Akola
PKV Res. J. Vol. 42 (2), July 2018
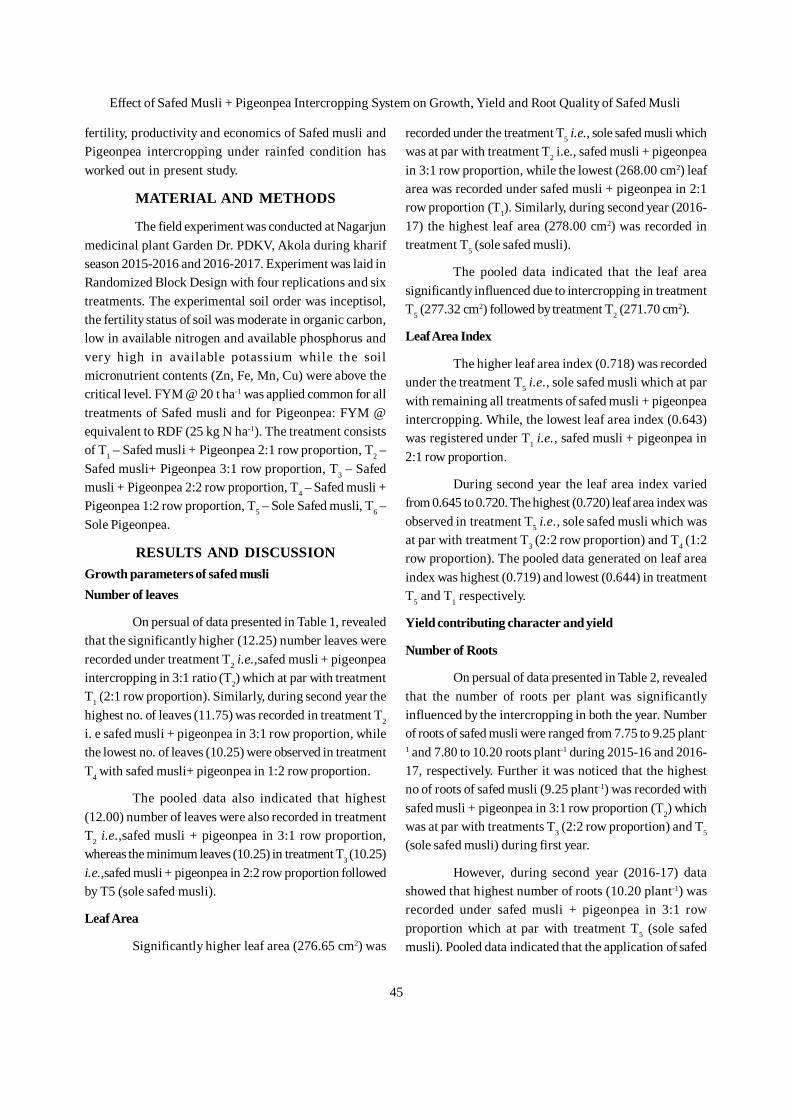
45
fertility, productivity and economics of Safed musli andPigeonpea intercropping under rainfed condition hasworked out in present study.
MATERIAL AND METHODS
The field experiment was conducted at Nagarjunmedicinal plant Garden Dr. PDKV, Akola during kharifseason 2015-2016 and 2016-2017. Experiment was laid inRandomized Block Design with four replications and sixtreatments. The experimental soil order was inceptisol,the fertility status of soil was moderate in organic carbon,low in available nitrogen and available phosphorus andvery high in available potassium while the soilmicronutrient contents (Zn, Fe, Mn, Cu) were above thecritical level. FYM @ 20 t ha-1 was applied common for alltreatments of Safed musli and for Pigeonpea: FYM @equivalent to RDF (25 kg N ha-1). The treatment consistsof T1 – Safed musli + Pigeonpea 2:1 row proportion, T2 –Safed musli+ Pigeonpea 3:1 row proportion, T3 – Safedmusli + Pigeonpea 2:2 row proportion, T4 – Safed musli +Pigeonpea 1:2 row proportion, T5 – Sole Safed musli, T6 –Sole Pigeonpea.
RESULTS AND DISCUSSIONGrowth parameters of safed musliNumber of leaves
On persual of data presented in Table 1, revealedthat the significantly higher (12.25) number leaves wererecorded under treatment T2 i.e.,safed musli + pigeonpeaintercropping in 3:1 ratio (T2) which at par with treatmentT1 (2:1 row proportion). Similarly, during second year thehighest no. of leaves (11.75) was recorded in treatment T2
i. e safed musli + pigeonpea in 3:1 row proportion, whilethe lowest no. of leaves (10.25) were observed in treatmentT4 with safed musli+ pigeonpea in 1:2 row proportion.
The pooled data also indicated that highest(12.00) number of leaves were also recorded in treatmentT2 i.e.,safed musli + pigeonpea in 3:1 row proportion,whereas the minimum leaves (10.25) in treatment T3 (10.25)i.e.,safed musli + pigeonpea in 2:2 row proportion followedby T5 (sole safed musli).
Leaf Area
Significantly higher leaf area (276.65 cm2) was
recorded under the treatment T5 i.e., sole safed musli whichwas at par with treatment T2 i.e., safed musli + pigeonpeain 3:1 row proportion, while the lowest (268.00 cm2) leafarea was recorded under safed musli + pigeonpea in 2:1row proportion (T1). Similarly, during second year (2016-17) the highest leaf area (278.00 cm2) was recorded intreatment T5 (sole safed musli).
The pooled data indicated that the leaf areasignificantly influenced due to intercropping in treatmentT5 (277.32 cm2) followed by treatment T2 (271.70 cm2).
Leaf Area Index
The higher leaf area index (0.718) was recordedunder the treatment T5 i.e., sole safed musli which at parwith remaining all treatments of safed musli + pigeonpeaintercropping. While, the lowest leaf area index (0.643)was registered under T1 i.e., safed musli + pigeonpea in2:1 row proportion.
During second year the leaf area index variedfrom 0.645 to 0.720. The highest (0.720) leaf area index wasobserved in treatment T5 i.e., sole safed musli which wasat par with treatment T3 (2:2 row proportion) and T4 (1:2row proportion). The pooled data generated on leaf areaindex was highest (0.719) and lowest (0.644) in treatmentT5 and T1 respectively.
Yield contributing character and yield
Number of Roots
On persual of data presented in Table 2, revealedthat the number of roots per plant was significantlyinfluenced by the intercropping in both the year. Numberof roots of safed musli were ranged from 7.75 to 9.25 plant-
1 and 7.80 to 10.20 roots plant-1 during 2015-16 and 2016-17, respectively. Further it was noticed that the highestno of roots of safed musli (9.25 plant-1) was recorded withsafed musli + pigeonpea in 3:1 row proportion (T2) whichwas at par with treatments T3 (2:2 row proportion) and T5
(sole safed musli) during first year.
However, during second year (2016-17) datashowed that highest number of roots (10.20 plant-1) wasrecorded under safed musli + pigeonpea in 3:1 rowproportion which at par with treatment T5 (sole safedmusli). Pooled data indicated that the application of safed
Effect of Safed Musli + Pigeonpea Intercropping System on Growth, Yield and Root Quality of Safed Musli
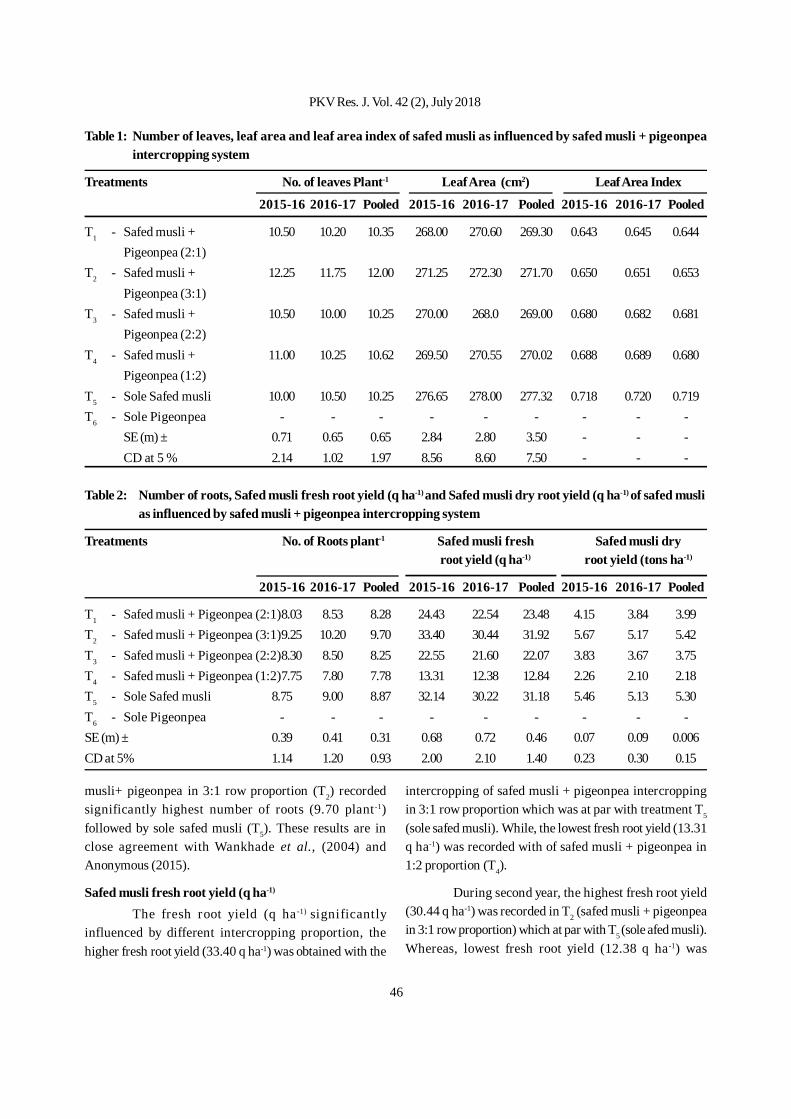
46
Table 1: Number of leaves, leaf area and leaf area index of safed musli as influenced by safed musli + pigeonpeaintercropping system
Treatments No. of leaves Plant-1 Leaf Area (cm2) Leaf Area Index
2015-16 2016-17 Pooled 2015-16 2016-17 Pooled 2015-16 2016-17 Pooled
T1 - Safed musli + 10.50 10.20 10.35 268.00 270.60 269.30 0.643 0.645 0.644Pigeonpea (2:1)
T2 - Safed musli + 12.25 11.75 12.00 271.25 272.30 271.70 0.650 0.651 0.653Pigeonpea (3:1)
T3 - Safed musli + 10.50 10.00 10.25 270.00 268.0 269.00 0.680 0.682 0.681Pigeonpea (2:2)
T4 - Safed musli + 11.00 10.25 10.62 269.50 270.55 270.02 0.688 0.689 0.680Pigeonpea (1:2)
T5 - Sole Safed musli 10.00 10.50 10.25 276.65 278.00 277.32 0.718 0.720 0.719T6 - Sole Pigeonpea - - - - - - - - -
SE (m) ± 0.71 0.65 0.65 2.84 2.80 3.50 - - -CD at 5 % 2.14 1.02 1.97 8.56 8.60 7.50 - - -
Table 2: Number of roots, Safed musli fresh root yield (q ha-1) and Safed musli dry root yield (q ha-1) of safed muslias influenced by safed musli + pigeonpea intercropping system
Treatments No. of Roots plant-1 Safed musli fresh Safed musli dryroot yield (q ha-1) root yield (tons ha-1)
2015-16 2016-17 Pooled 2015-16 2016-17 Pooled 2015-16 2016-17 Pooled
T1 - Safed musli + Pigeonpea (2:1)8.03 8.53 8.28 24.43 22.54 23.48 4.15 3.84 3.99T2 - Safed musli + Pigeonpea (3:1)9.25 10.20 9.70 33.40 30.44 31.92 5.67 5.17 5.42T3 - Safed musli + Pigeonpea (2:2)8.30 8.50 8.25 22.55 21.60 22.07 3.83 3.67 3.75T4 - Safed musli + Pigeonpea (1:2)7.75 7.80 7.78 13.31 12.38 12.84 2.26 2.10 2.18T5 - Sole Safed musli 8.75 9.00 8.87 32.14 30.22 31.18 5.46 5.13 5.30T6 - Sole Pigeonpea - - - - - - - - -SE (m) ± 0.39 0.41 0.31 0.68 0.72 0.46 0.07 0.09 0.006CD at 5% 1.14 1.20 0.93 2.00 2.10 1.40 0.23 0.30 0.15
musli+ pigeonpea in 3:1 row proportion (T2) recordedsignificantly highest number of roots (9.70 plant -1)followed by sole safed musli (T5). These results are inclose agreement with Wankhade et al., (2004) andAnonymous (2015).
Safed musli fresh root yield (q ha-1)
The fresh root yield (q ha -1) significantlyinfluenced by different intercropping proportion, thehigher fresh root yield (33.40 q ha-1) was obtained with the
intercropping of safed musli + pigeonpea intercroppingin 3:1 row proportion which was at par with treatment T5
(sole safed musli). While, the lowest fresh root yield (13.31q ha-1) was recorded with of safed musli + pigeonpea in1:2 proportion (T4).
During second year, the highest fresh root yield(30.44 q ha-1) was recorded in T2 (safed musli + pigeonpeain 3:1 row proportion) which at par with T5 (sole afed musli).Whereas, lowest fresh root yield (12.38 q ha-1) was
PKV Res. J. Vol. 42 (2), July 2018
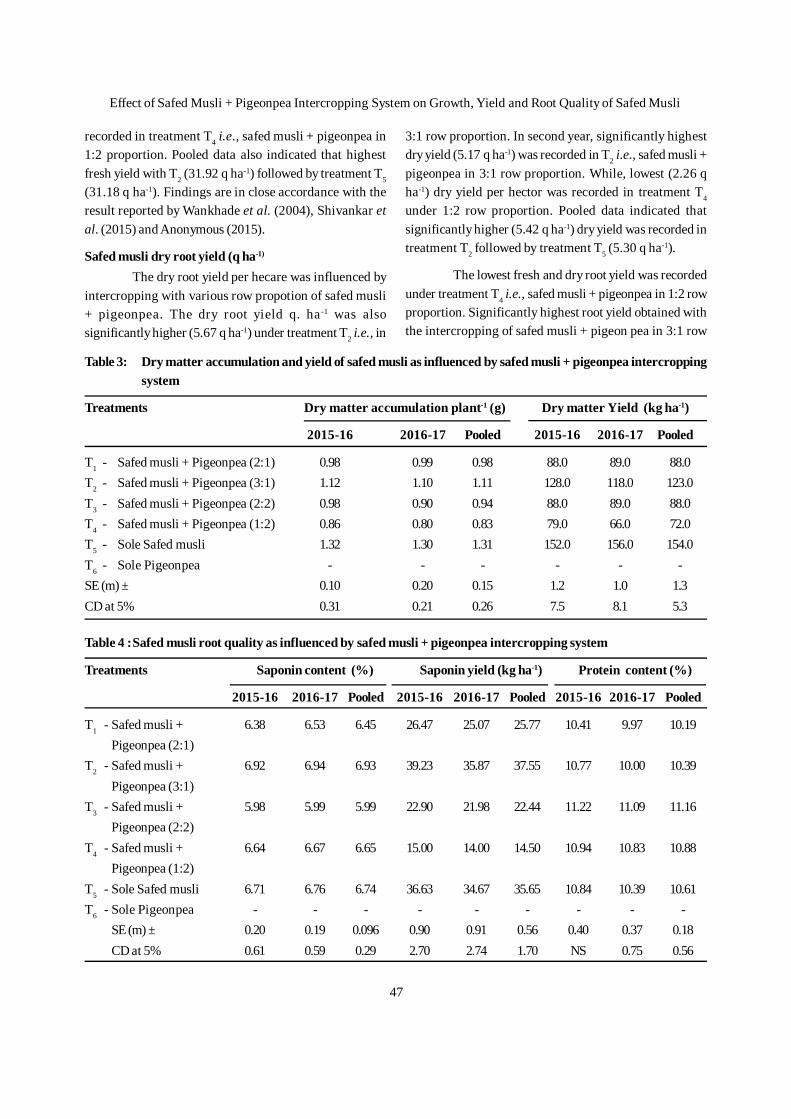
47
recorded in treatment T4 i.e., safed musli + pigeonpea in1:2 proportion. Pooled data also indicated that highestfresh yield with T2 (31.92 q ha-1) followed by treatment T5
(31.18 q ha-1). Findings are in close accordance with theresult reported by Wankhade et al. (2004), Shivankar etal. (2015) and Anonymous (2015).
Safed musli dry root yield (q ha-1)
The dry root yield per hecare was influenced byintercropping with various row propotion of safed musli+ pigeonpea. The dry root yield q. ha -1 was alsosignificantly higher (5.67 q ha-1) under treatment T2 i.e., in
3:1 row proportion. In second year, significantly highestdry yield (5.17 q ha-1) was recorded in T2 i.e., safed musli +pigeonpea in 3:1 row proportion. While, lowest (2.26 qha-1) dry yield per hector was recorded in treatment T4
under 1:2 row proportion. Pooled data indicated thatsignificantly higher (5.42 q ha-1) dry yield was recorded intreatment T2 followed by treatment T5 (5.30 q ha-1).
The lowest fresh and dry root yield was recordedunder treatment T4 i.e., safed musli + pigeonpea in 1:2 rowproportion. Significantly highest root yield obtained withthe intercropping of safed musli + pigeon pea in 3:1 row
Table 3: Dry matter accumulation and yield of safed musli as influenced by safed musli + pigeonpea intercroppingsystem
Treatments Dry matter accumulation plant-1 (g) Dry matter Yield (kg ha-1)
2015-16 2016-17 Pooled 2015-16 2016-17 Pooled
T1 - Safed musli + Pigeonpea (2:1) 0.98 0.99 0.98 88.0 89.0 88.0T2 - Safed musli + Pigeonpea (3:1) 1.12 1.10 1.11 128.0 118.0 123.0T3 - Safed musli + Pigeonpea (2:2) 0.98 0.90 0.94 88.0 89.0 88.0T4 - Safed musli + Pigeonpea (1:2) 0.86 0.80 0.83 79.0 66.0 72.0T5 - Sole Safed musli 1.32 1.30 1.31 152.0 156.0 154.0T6 - Sole Pigeonpea - - - - - -SE (m) ± 0.10 0.20 0.15 1.2 1.0 1.3CD at 5% 0.31 0.21 0.26 7.5 8.1 5.3
Table 4 :Safed musli root quality as influenced by safed musli + pigeonpea intercropping system
Treatments Saponin content (%) Saponin yield (kg ha-1) Protein content (%)
2015-16 2016-17 Pooled 2015-16 2016-17 Pooled 2015-16 2016-17 Pooled
T1 - Safed musli + 6.38 6.53 6.45 26.47 25.07 25.77 10.41 9.97 10.19Pigeonpea (2:1)
T2 - Safed musli + 6.92 6.94 6.93 39.23 35.87 37.55 10.77 10.00 10.39Pigeonpea (3:1)
T3 - Safed musli + 5.98 5.99 5.99 22.90 21.98 22.44 11.22 11.09 11.16Pigeonpea (2:2)
T4 - Safed musli + 6.64 6.67 6.65 15.00 14.00 14.50 10.94 10.83 10.88Pigeonpea (1:2)
T5 - Sole Safed musli 6.71 6.76 6.74 36.63 34.67 35.65 10.84 10.39 10.61T6 - Sole Pigeonpea - - - - - - - - -
SE (m) ± 0.20 0.19 0.096 0.90 0.91 0.56 0.40 0.37 0.18CD at 5% 0.61 0.59 0.29 2.70 2.74 1.70 NS 0.75 0.56
Effect of Safed Musli + Pigeonpea Intercropping System on Growth, Yield and Root Quality of Safed Musli
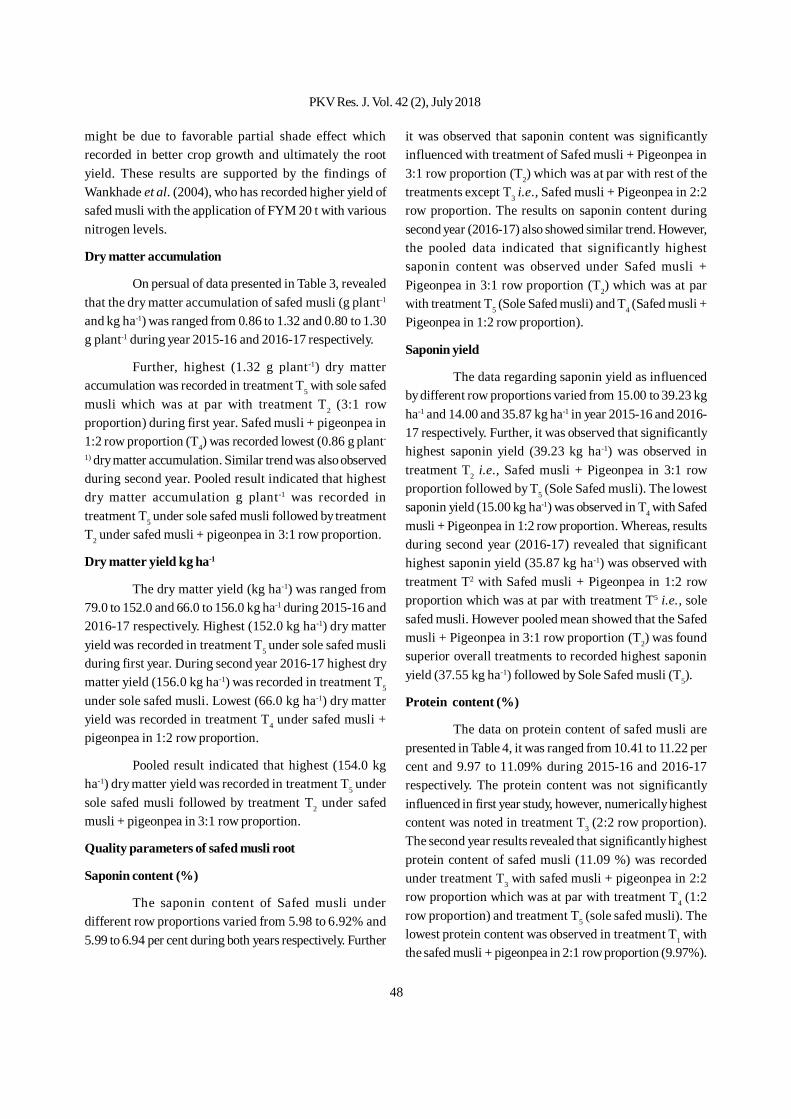
48
might be due to favorable partial shade effect whichrecorded in better crop growth and ultimately the rootyield. These results are supported by the findings ofWankhade et al. (2004), who has recorded higher yield ofsafed musli with the application of FYM 20 t with variousnitrogen levels.
Dry matter accumulation
On persual of data presented in Table 3, revealedthat the dry matter accumulation of safed musli (g plant-1
and kg ha-1) was ranged from 0.86 to 1.32 and 0.80 to 1.30g plant-1 during year 2015-16 and 2016-17 respectively.
Further, highest (1.32 g plant-1) dry matteraccumulation was recorded in treatment T5 with sole safedmusli which was at par with treatment T2 (3:1 rowproportion) during first year. Safed musli + pigeonpea in1:2 row proportion (T4) was recorded lowest (0.86 g plant-
1) dry matter accumulation. Similar trend was also observedduring second year. Pooled result indicated that highestdry matter accumulation g plant-1 was recorded intreatment T5 under sole safed musli followed by treatmentT2 under safed musli + pigeonpea in 3:1 row proportion.
Dry matter yield kg ha-1
The dry matter yield (kg ha-1) was ranged from79.0 to 152.0 and 66.0 to 156.0 kg ha-1 during 2015-16 and2016-17 respectively. Highest (152.0 kg ha-1) dry matteryield was recorded in treatment T5 under sole safed musliduring first year. During second year 2016-17 highest drymatter yield (156.0 kg ha-1) was recorded in treatment T5
under sole safed musli. Lowest (66.0 kg ha-1) dry matteryield was recorded in treatment T4 under safed musli +pigeonpea in 1:2 row proportion.
Pooled result indicated that highest (154.0 kgha-1) dry matter yield was recorded in treatment T5 undersole safed musli followed by treatment T2 under safedmusli + pigeonpea in 3:1 row proportion.
Quality parameters of safed musli root
Saponin content (%)
The saponin content of Safed musli underdifferent row proportions varied from 5.98 to 6.92% and5.99 to 6.94 per cent during both years respectively. Further
it was observed that saponin content was significantlyinfluenced with treatment of Safed musli + Pigeonpea in3:1 row proportion (T2) which was at par with rest of thetreatments except T3 i.e., Safed musli + Pigeonpea in 2:2row proportion. The results on saponin content duringsecond year (2016-17) also showed similar trend. However,the pooled data indicated that significantly highestsaponin content was observed under Safed musli +Pigeonpea in 3:1 row proportion (T2) which was at parwith treatment T5 (Sole Safed musli) and T4 (Safed musli +Pigeonpea in 1:2 row proportion).
Saponin yield
The data regarding saponin yield as influencedby different row proportions varied from 15.00 to 39.23 kgha-1 and 14.00 and 35.87 kg ha-1 in year 2015-16 and 2016-17 respectively. Further, it was observed that significantlyhighest saponin yield (39.23 kg ha-1) was observed intreatment T2 i.e., Safed musli + Pigeonpea in 3:1 rowproportion followed by T5 (Sole Safed musli). The lowestsaponin yield (15.00 kg ha-1) was observed in T4 with Safedmusli + Pigeonpea in 1:2 row proportion. Whereas, resultsduring second year (2016-17) revealed that significanthighest saponin yield (35.87 kg ha-1) was observed withtreatment T2 with Safed musli + Pigeonpea in 1:2 rowproportion which was at par with treatment T5 i.e., solesafed musli. However pooled mean showed that the Safedmusli + Pigeonpea in 3:1 row proportion (T2) was foundsuperior overall treatments to recorded highest saponinyield (37.55 kg ha-1) followed by Sole Safed musli (T5).
Protein content (%)
The data on protein content of safed musli arepresented in Table 4, it was ranged from 10.41 to 11.22 percent and 9.97 to 11.09% during 2015-16 and 2016-17respectively. The protein content was not significantlyinfluenced in first year study, however, numerically highestcontent was noted in treatment T3 (2:2 row proportion).The second year results revealed that significantly highestprotein content of safed musli (11.09 %) was recordedunder treatment T3 with safed musli + pigeonpea in 2:2row proportion which was at par with treatment T4 (1:2row proportion) and treatment T5 (sole safed musli). Thelowest protein content was observed in treatment T1 withthe safed musli + pigeonpea in 2:1 row proportion (9.97%).
PKV Res. J. Vol. 42 (2), July 2018
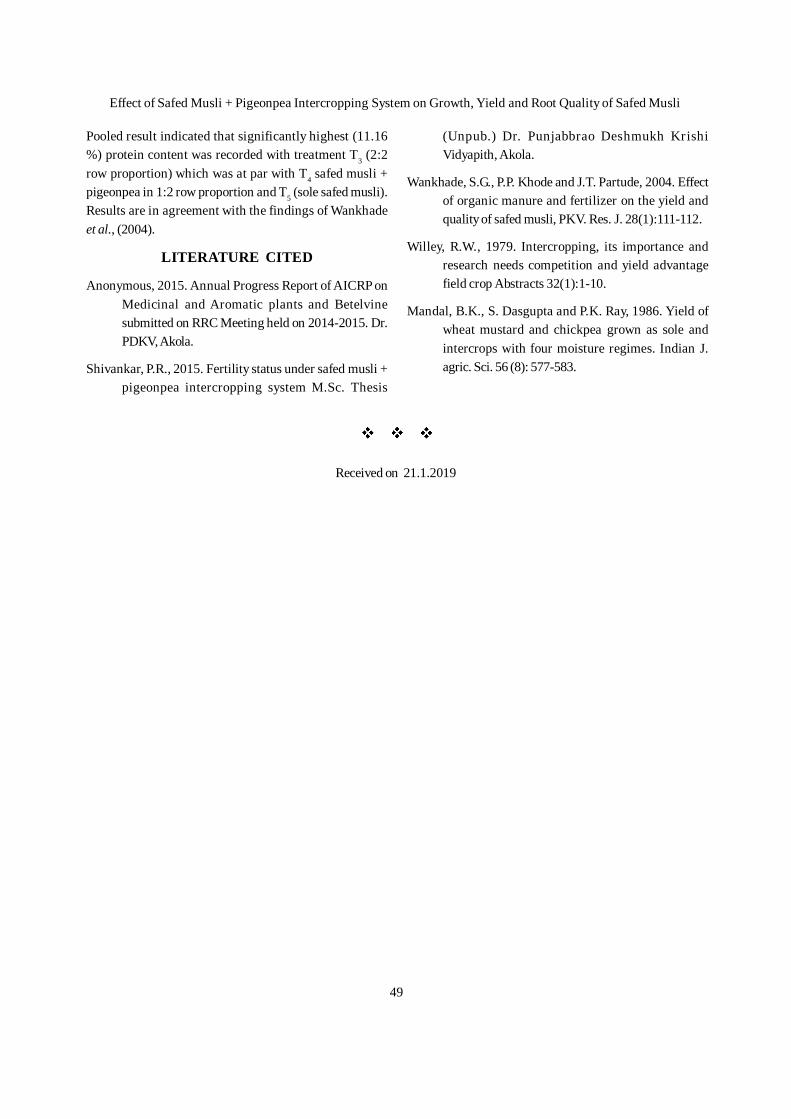
49
Pooled result indicated that significantly highest (11.16%) protein content was recorded with treatment T3 (2:2row proportion) which was at par with T4 safed musli +pigeonpea in 1:2 row proportion and T5 (sole safed musli).Results are in agreement with the findings of Wankhadeet al., (2004).
LITERATURE CITED
Anonymous, 2015. Annual Progress Report of AICRP onMedicinal and Aromatic plants and Betelvinesubmitted on RRC Meeting held on 2014-2015. Dr.PDKV, Akola.
Shivankar, P.R., 2015. Fertility status under safed musli +pigeonpea intercropping system M.Sc. Thesis
(Unpub.) Dr. Punjabbrao Deshmukh KrishiVidyapith, Akola.
Wankhade, S.G., P.P. Khode and J.T. Partude, 2004. Effectof organic manure and fertilizer on the yield andquality of safed musli, PKV. Res. J. 28(1):111-112.
Willey, R.W., 1979. Intercropping, its importance andresearch needs competition and yield advantagefield crop Abstracts 32(1):1-10.
Mandal, B.K., S. Dasgupta and P.K. Ray, 1986. Yield ofwheat mustard and chickpea grown as sole andintercrops with four moisture regimes. Indian J.agric. Sci. 56 (8): 577-583.
Received on 21.1.2019
Effect of Safed Musli + Pigeonpea Intercropping System on Growth, Yield and Root Quality of Safed Musli
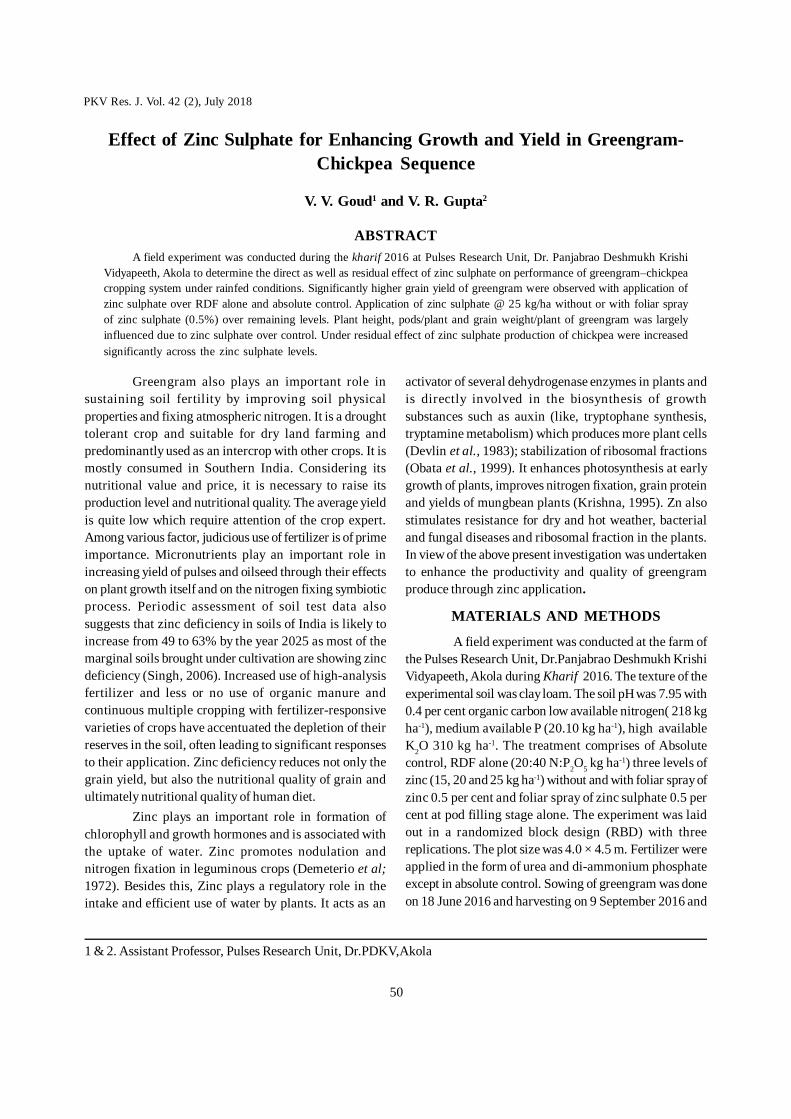
50
Greengram also plays an important role insustaining soil fertility by improving soil physicalproperties and fixing atmospheric nitrogen. It is a droughttolerant crop and suitable for dry land farming andpredominantly used as an intercrop with other crops. It ismostly consumed in Southern India. Considering itsnutritional value and price, it is necessary to raise itsproduction level and nutritional quality. The average yieldis quite low which require attention of the crop expert.Among various factor, judicious use of fertilizer is of primeimportance. Micronutrients play an important role inincreasing yield of pulses and oilseed through their effectson plant growth itself and on the nitrogen fixing symbioticprocess. Periodic assessment of soil test data alsosuggests that zinc deficiency in soils of India is likely toincrease from 49 to 63% by the year 2025 as most of themarginal soils brought under cultivation are showing zincdeficiency (Singh, 2006). Increased use of high-analysisfertilizer and less or no use of organic manure andcontinuous multiple cropping with fertilizer-responsivevarieties of crops have accentuated the depletion of theirreserves in the soil, often leading to significant responsesto their application. Zinc deficiency reduces not only thegrain yield, but also the nutritional quality of grain andultimately nutritional quality of human diet.
Zinc plays an important role in formation ofchlorophyll and growth hormones and is associated withthe uptake of water. Zinc promotes nodulation andnitrogen fixation in leguminous crops (Demeterio et al;1972). Besides this, Zinc plays a regulatory role in theintake and efficient use of water by plants. It acts as an
Effect of Zinc Sulphate for Enhancing Growth and Yield in Greengram-Chickpea Sequence
V. V. Goud1 and V. R. Gupta2
ABSTRACTA field experiment was conducted during the kharif 2016 at Pulses Research Unit, Dr. Panjabrao Deshmukh Krishi
Vidyapeeth, Akola to determine the direct as well as residual effect of zinc sulphate on performance of greengram–chickpeacropping system under rainfed conditions. Significantly higher grain yield of greengram were observed with application ofzinc sulphate over RDF alone and absolute control. Application of zinc sulphate @ 25 kg/ha without or with foliar sprayof zinc sulphate (0.5%) over remaining levels. Plant height, pods/plant and grain weight/plant of greengram was largelyinfluenced due to zinc sulphate over control. Under residual effect of zinc sulphate production of chickpea were increasedsignificantly across the zinc sulphate levels.
activator of several dehydrogenase enzymes in plants andis directly involved in the biosynthesis of growthsubstances such as auxin (like, tryptophane synthesis,tryptamine metabolism) which produces more plant cells(Devlin et al., 1983); stabilization of ribosomal fractions(Obata et al., 1999). It enhances photosynthesis at earlygrowth of plants, improves nitrogen fixation, grain proteinand yields of mungbean plants (Krishna, 1995). Zn alsostimulates resistance for dry and hot weather, bacterialand fungal diseases and ribosomal fraction in the plants.In view of the above present investigation was undertakento enhance the productivity and quality of greengramproduce through zinc application.
MATERIALS AND METHODS
A field experiment was conducted at the farm ofthe Pulses Research Unit, Dr.Panjabrao Deshmukh KrishiVidyapeeth, Akola during Kharif 2016. The texture of theexperimental soil was clay loam. The soil pH was 7.95 with0.4 per cent organic carbon low available nitrogen( 218 kgha-1), medium available P (20.10 kg ha-1), high availableK2O 310 kg ha-1. The treatment comprises of Absolutecontrol, RDF alone (20:40 N:P2O5 kg ha-1) three levels ofzinc (15, 20 and 25 kg ha-1) without and with foliar spray ofzinc 0.5 per cent and foliar spray of zinc sulphate 0.5 percent at pod filling stage alone. The experiment was laidout in a randomized block design (RBD) with threereplications. The plot size was 4.0 × 4.5 m. Fertilizer wereapplied in the form of urea and di-ammonium phosphateexcept in absolute control. Sowing of greengram was doneon 18 June 2016 and harvesting on 9 September 2016 and
1 & 2. Assistant Professor, Pulses Research Unit, Dr.PDKV,Akola
PKV Res. J. Vol. 42 (2), July 2018
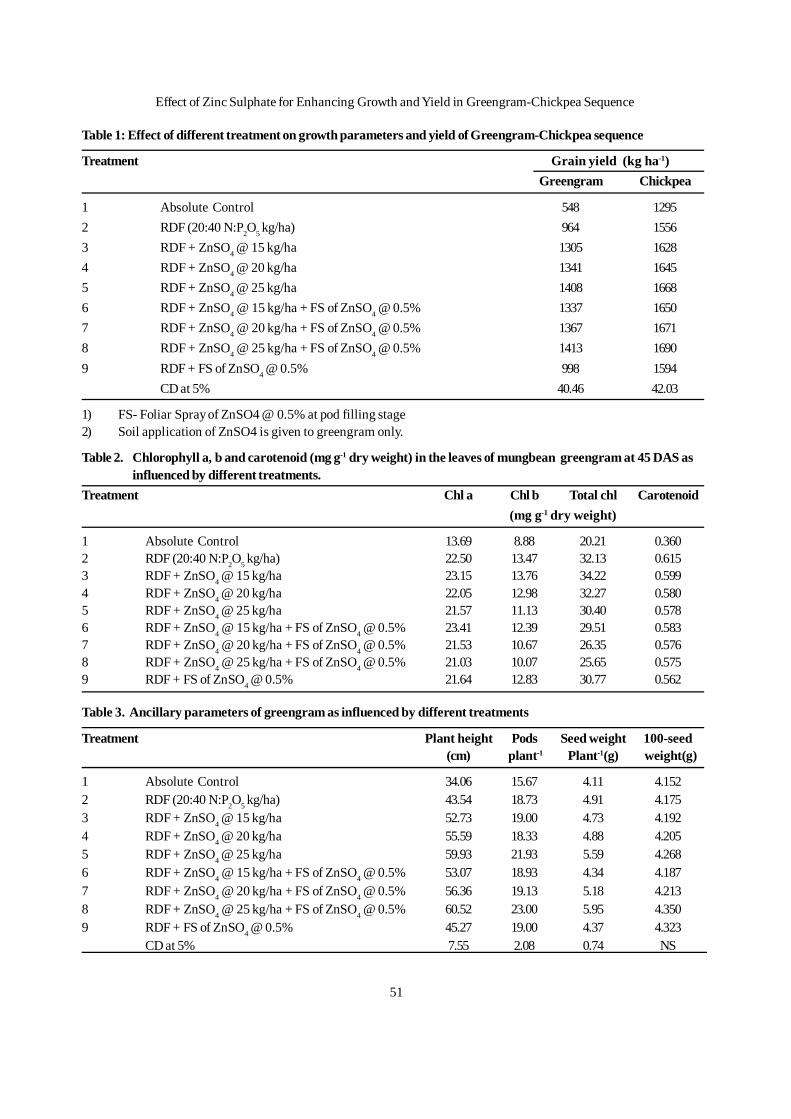
51
Table 1: Effect of different treatment on growth parameters and yield of Greengram-Chickpea sequence
Treatment Grain yield (kg ha-1)Greengram Chickpea
1 Absolute Control 548 12952 RDF (20:40 N:P2O5 kg/ha) 964 15563 RDF + ZnSO4 @ 15 kg/ha 1305 16284 RDF + ZnSO4 @ 20 kg/ha 1341 16455 RDF + ZnSO4 @ 25 kg/ha 1408 16686 RDF + ZnSO4 @ 15 kg/ha + FS of ZnSO4 @ 0.5% 1337 16507 RDF + ZnSO4 @ 20 kg/ha + FS of ZnSO4 @ 0.5% 1367 16718 RDF + ZnSO4 @ 25 kg/ha + FS of ZnSO4 @ 0.5% 1413 16909 RDF + FS of ZnSO4 @ 0.5% 998 1594
CD at 5% 40.46 42.03
1) FS- Foliar Spray of ZnSO4 @ 0.5% at pod filling stage2) Soil application of ZnSO4 is given to greengram only.
Table 2. Chlorophyll a, b and carotenoid (mg g-1 dry weight) in the leaves of mungbean greengram at 45 DAS asinfluenced by different treatments.
Treatment Chl a Chl b Total chl Carotenoid (mg g-1 dry weight)
1 Absolute Control 13.69 8.88 20.21 0.3602 RDF (20:40 N:P2O5 kg/ha) 22.50 13.47 32.13 0.6153 RDF + ZnSO4 @ 15 kg/ha 23.15 13.76 34.22 0.5994 RDF + ZnSO4 @ 20 kg/ha 22.05 12.98 32.27 0.5805 RDF + ZnSO4 @ 25 kg/ha 21.57 11.13 30.40 0.5786 RDF + ZnSO4 @ 15 kg/ha + FS of ZnSO4 @ 0.5% 23.41 12.39 29.51 0.5837 RDF + ZnSO4 @ 20 kg/ha + FS of ZnSO4 @ 0.5% 21.53 10.67 26.35 0.5768 RDF + ZnSO4 @ 25 kg/ha + FS of ZnSO4 @ 0.5% 21.03 10.07 25.65 0.5759 RDF + FS of ZnSO4 @ 0.5% 21.64 12.83 30.77 0.562
Table 3. Ancillary parameters of greengram as influenced by different treatments
Treatment Plant height Pods Seed weight 100-seed(cm) plant-1 Plant-1(g) weight(g)
1 Absolute Control 34.06 15.67 4.11 4.1522 RDF (20:40 N:P2O5 kg/ha) 43.54 18.73 4.91 4.1753 RDF + ZnSO4 @ 15 kg/ha 52.73 19.00 4.73 4.1924 RDF + ZnSO4 @ 20 kg/ha 55.59 18.33 4.88 4.2055 RDF + ZnSO4 @ 25 kg/ha 59.93 21.93 5.59 4.2686 RDF + ZnSO4 @ 15 kg/ha + FS of ZnSO4 @ 0.5% 53.07 18.93 4.34 4.1877 RDF + ZnSO4 @ 20 kg/ha + FS of ZnSO4 @ 0.5% 56.36 19.13 5.18 4.2138 RDF + ZnSO4 @ 25 kg/ha + FS of ZnSO4 @ 0.5% 60.52 23.00 5.95 4.3509 RDF + FS of ZnSO4 @ 0.5% 45.27 19.00 4.37 4.323
CD at 5% 7.55 2.08 0.74 NS
Effect of Zinc Sulphate for Enhancing Growth and Yield in Greengram-Chickpea Sequence
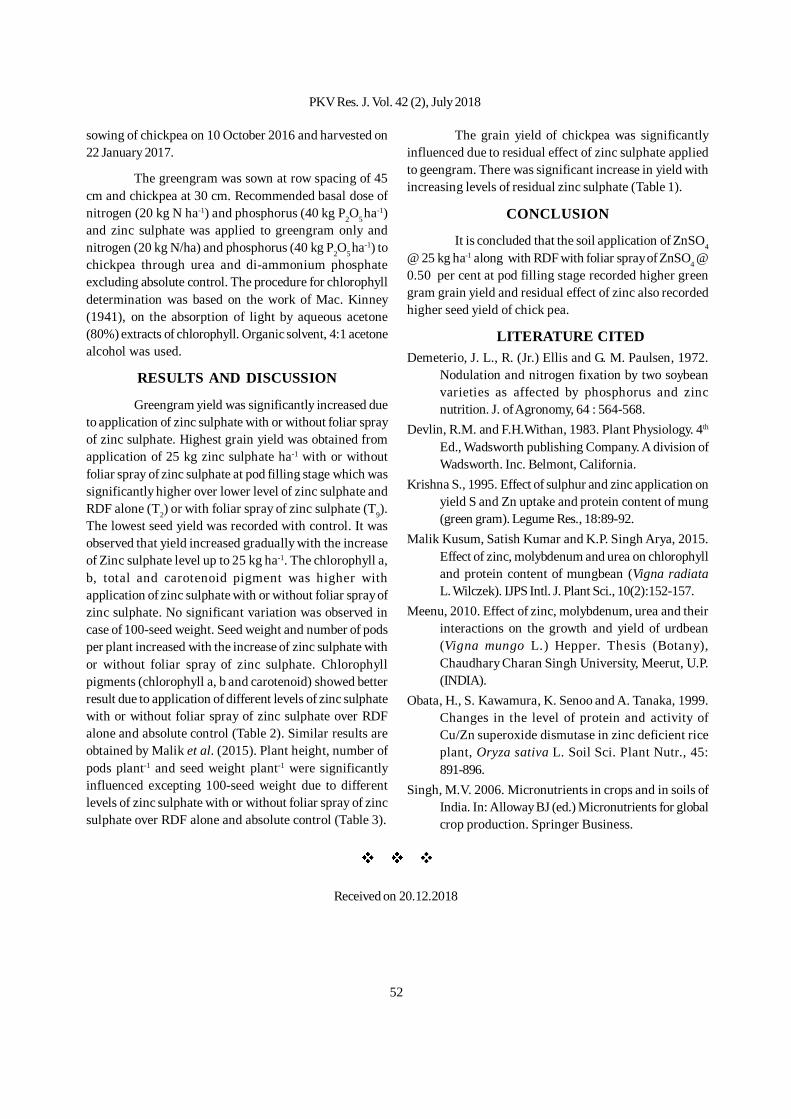
52
sowing of chickpea on 10 October 2016 and harvested on22 January 2017.
The greengram was sown at row spacing of 45cm and chickpea at 30 cm. Recommended basal dose ofnitrogen (20 kg N ha-1) and phosphorus (40 kg P2O5 ha-1)and zinc sulphate was applied to greengram only andnitrogen (20 kg N/ha) and phosphorus (40 kg P2O5 ha-1) tochickpea through urea and di-ammonium phosphateexcluding absolute control. The procedure for chlorophylldetermination was based on the work of Mac. Kinney(1941), on the absorption of light by aqueous acetone(80%) extracts of chlorophyll. Organic solvent, 4:1 acetonealcohol was used.
RESULTS AND DISCUSSION
Greengram yield was significantly increased dueto application of zinc sulphate with or without foliar sprayof zinc sulphate. Highest grain yield was obtained fromapplication of 25 kg zinc sulphate ha-1 with or withoutfoliar spray of zinc sulphate at pod filling stage which wassignificantly higher over lower level of zinc sulphate andRDF alone (T2) or with foliar spray of zinc sulphate (T9).The lowest seed yield was recorded with control. It wasobserved that yield increased gradually with the increaseof Zinc sulphate level up to 25 kg ha-1. The chlorophyll a,b, total and carotenoid pigment was higher withapplication of zinc sulphate with or without foliar spray ofzinc sulphate. No significant variation was observed incase of 100-seed weight. Seed weight and number of podsper plant increased with the increase of zinc sulphate withor without foliar spray of zinc sulphate. Chlorophyllpigments (chlorophyll a, b and carotenoid) showed betterresult due to application of different levels of zinc sulphatewith or without foliar spray of zinc sulphate over RDFalone and absolute control (Table 2). Similar results areobtained by Malik et al. (2015). Plant height, number ofpods plant-1 and seed weight plant-1 were significantlyinfluenced excepting 100-seed weight due to differentlevels of zinc sulphate with or without foliar spray of zincsulphate over RDF alone and absolute control (Table 3).
The grain yield of chickpea was significantlyinfluenced due to residual effect of zinc sulphate appliedto geengram. There was significant increase in yield withincreasing levels of residual zinc sulphate (Table 1).
CONCLUSION
It is concluded that the soil application of ZnSO4
@ 25 kg ha-1 along with RDF with foliar spray of ZnSO4 @0.50 per cent at pod filling stage recorded higher greengram grain yield and residual effect of zinc also recordedhigher seed yield of chick pea.
LITERATURE CITEDDemeterio, J. L., R. (Jr.) Ellis and G. M. Paulsen, 1972.
Nodulation and nitrogen fixation by two soybeanvarieties as affected by phosphorus and zincnutrition. J. of Agronomy, 64 : 564-568.
Devlin, R.M. and F.H.Withan, 1983. Plant Physiology. 4th
Ed., Wadsworth publishing Company. A division ofWadsworth. Inc. Belmont, California.
Krishna S., 1995. Effect of sulphur and zinc application onyield S and Zn uptake and protein content of mung(green gram). Legume Res., 18:89-92.
Malik Kusum, Satish Kumar and K.P. Singh Arya, 2015.Effect of zinc, molybdenum and urea on chlorophylland protein content of mungbean (Vigna radiataL. Wilczek). IJPS Intl. J. Plant Sci., 10(2):152-157.
Meenu, 2010. Effect of zinc, molybdenum, urea and theirinteractions on the growth and yield of urdbean(Vigna mungo L.) Hepper. Thesis (Botany),Chaudhary Charan Singh University, Meerut, U.P.(INDIA).
Obata, H., S. Kawamura, K. Senoo and A. Tanaka, 1999.Changes in the level of protein and activity ofCu/Zn superoxide dismutase in zinc deficient riceplant, Oryza sativa L. Soil Sci. Plant Nutr., 45:891-896.
Singh, M.V. 2006. Micronutrients in crops and in soils ofIndia. In: Alloway BJ (ed.) Micronutrients for globalcrop production. Springer Business.
Received on 20.12.2018
PKV Res. J. Vol. 42 (2), July 2018
53
Rice is grown in about 114 countries on around158.4 million ha area and 701.9 million metric tonnesproduction during 2015-16 in the world (Anonymous,2015b). Amongst the rice growing countries, China andIndia contributes more than half of the total production.Thus, rice is staple food and contributes to a great extentin livelihood security of the farmers and almost everyhousehold in India. In our country, rice contributes to30.9 per cent in terms of area and 39.5 per centproduction to the food basket as food grain in thecountry (Anonymous, 2015a). In order to safeguard, thefood security in India, it is important to raise the yieldlevels of rice. Rice being an important staple food cropof India extensively grown across the country. In orderto enhance the productivity and production highyielding varieties were introduced along with highanalysis fertilizer such as nitrogen (N) and phosphorus(P)that led to extra mining of native potassium (K) fromsoil. That eventually resulted in decline of soil availableK-status in many soils including Vertisols andassociated soils. Data emanated from long-termexperiments in India indicated that there is response toapplied K by several crops. In general, majority offarmers in our country do not apply K, and even if K isapplied, it is in a meager quantity. However, average K-removalby majority of field crops is very large to theextent of 120-130 kg ha-1by single crop (Singh andWanjari, 2012) and thus, hidden hunger of potassiumwas observed in many crops including rice grown onvarious soils including red soils, sandy light textured
Effect of Potassium on Productivity of Rice in Vertisols of Central India
R.H. Wanjari1, Muneshwar Singh2, B.L. Lakaria3, Abhay Shirale4, Vinod Birla5, Shweta Jamra5
and R.C. Jatav6
ABSTRACTThe experiment on farmer’s field was conducted to study the effect of potassium application on productivity of rice
(cv Pusa Basmati-1) in Vertisols during kharif 2016-17 and 2017-18. There were four treatments with graded doses ofpotassium (K) viz., K0, K40, K80 and KFP (farmers’ practice) with five replications in randomized block design. Resultsindicated that application of K has significant effect on yield and yield attributes of rice. Increase in number of tillers, filledgrains per panicle, test weight, stover and grain yield of rice was recorded with K80 (96 kg K2O ha-1) followed by K40 (48kg K2O ha-1) over control (0 kg K2O/ha) and farmers’ practice (without K).The magnitude of response in rice yield wasmore withK80 (96 kg K2O ha-1) compared to K40 (48 kg K2O ha-1) that indicates higher dose of K is essential to maximizethe crop productivity of rice in Vertisols.
soi ls, degraded lands and shal low black soils(Srinivasarao et al., 2011). Under this situation K couldpose a threat not only to sustainability but also to foodsecurity as whole. Vertisols are although considered tobe rich in K status but crops started showing responsegradually to applied K may be due to larger removal of Kfrom soils than the applied (Singh and Wanjari, 2012).Theresults emerged from long-term fertilizer experiments alsoopined that there is gradual response to K in Vertisolsand associated soils even though soils are having Kcontent more than the yardstick (280 kg K/ha). Thus, inthe present study an attempt has been made to study theresponse of rice to applied K in Vertisols with varying Kcontent in major soils of central India.
MATERIALS AND METHODS
The experiment was conducted during kharif2016-17 and 2017-18 on farmers’ field at Khamkheda(23o23’N and 77o25’ at 489 m above mean sea level) nearBhopal (Madhya Pradesh, India) to study the effect ofvariable doses of K application on yield and yieldattributing parameters of rice. The four treatments wereimposed on five farmers’s field and considered one farmeras one replication. The experiment was laid out inrandomized block design (RBD). The treatment comprisedof K0 (0 kg K2O ha-1), K40 (48 kg K2O ha-1); K80(96 kg K2Oha-1) and KFP (farmers’ practice). The seed of rice @ 25 kgha-1 (cv. Pusa Basmati-1) was sown in the nursery andtransplanted after 30 DAS in the bunded field at thespacing of 20 cm x 25 cm. Recommended doses of fertilizers
ICAR-Indian Institute of Soil Science, Nabibagh, Berasia Road, Bhopal Madhya Pradesh
PKV Res. J. Vol. 42 (2), July 2018
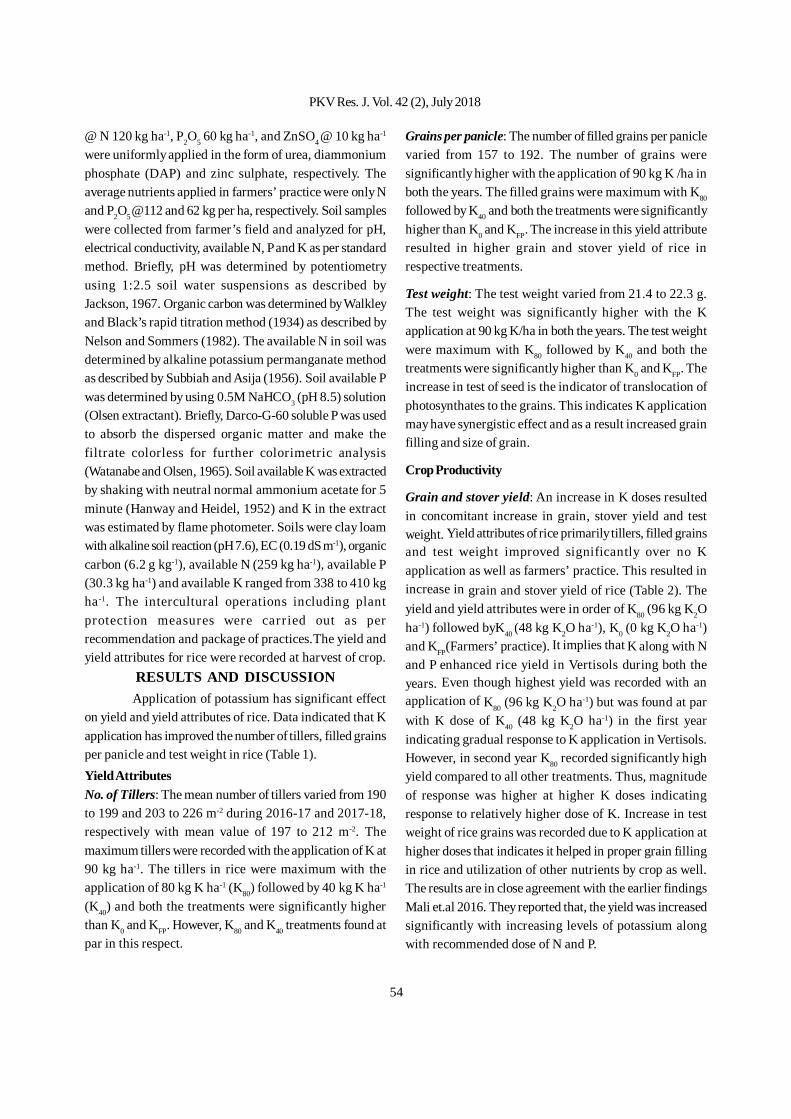
54
@ N 120 kg ha-1, P2O5 60 kg ha-1, and ZnSO4 @ 10 kg ha-1
were uniformly applied in the form of urea, diammoniumphosphate (DAP) and zinc sulphate, respectively. Theaverage nutrients applied in farmers’ practice were only Nand P2O5 @112 and 62 kg per ha, respectively. Soil sampleswere collected from farmer’s field and analyzed for pH,electrical conductivity, available N, P and K as per standardmethod. Briefly, pH was determined by potentiometryusing 1:2.5 soil water suspensions as described byJackson, 1967. Organic carbon was determined by Walkleyand Black’s rapid titration method (1934) as described byNelson and Sommers (1982). The available N in soil wasdetermined by alkaline potassium permanganate methodas described by Subbiah and Asija (1956). Soil available Pwas determined by using 0.5M NaHCO3 (pH 8.5) solution(Olsen extractant). Briefly, Darco-G-60 soluble P was usedto absorb the dispersed organic matter and make thefiltrate colorless for further colorimetric analysis(Watanabe and Olsen, 1965). Soil available K was extractedby shaking with neutral normal ammonium acetate for 5minute (Hanway and Heidel, 1952) and K in the extractwas estimated by flame photometer. Soils were clay loamwith alkaline soil reaction (pH 7.6), EC (0.19 dS m-1), organiccarbon (6.2 g kg-1), available N (259 kg ha-1), available P(30.3 kg ha-1) and available K ranged from 338 to 410 kgha-1. The intercultural operations including plantprotection measures were carr ied out as perrecommendation and package of practices.The yield andyield attributes for rice were recorded at harvest of crop.
RESULTS AND DISCUSSIONApplication of potassium has significant effect
on yield and yield attributes of rice. Data indicated that Kapplication has improved the number of tillers, filled grainsper panicle and test weight in rice (Table 1).Yield AttributesNo. of Tillers: The mean number of tillers varied from 190to 199 and 203 to 226 m-2 during 2016-17 and 2017-18,respectively with mean value of 197 to 212 m-2. Themaximum tillers were recorded with the application of K at90 kg ha-1. The tillers in rice were maximum with theapplication of 80 kg K ha-1 (K80) followed by 40 kg K ha-1
(K40) and both the treatments were significantly higherthan K0 and KFP. However, K80 and K40 treatments found atpar in this respect.
Grains per panicle: The number of filled grains per paniclevaried from 157 to 192. The number of grains weresignificantly higher with the application of 90 kg K /ha inboth the years. The filled grains were maximum with K80
followed by K40 and both the treatments were significantlyhigher than K0 and KFP. The increase in this yield attributeresulted in higher grain and stover yield of rice inrespective treatments.
Test weight: The test weight varied from 21.4 to 22.3 g.The test weight was significantly higher with the Kapplication at 90 kg K/ha in both the years. The test weightwere maximum with K80 followed by K40 and both thetreatments were significantly higher than K0 and KFP. Theincrease in test of seed is the indicator of translocation ofphotosynthates to the grains. This indicates K applicationmay have synergistic effect and as a result increased grainfilling and size of grain.
Crop Productivity
Grain and stover yield: An increase in K doses resultedin concomitant increase in grain, stover yield and testweight. Yield attributes of rice primarily tillers, filled grainsand test weight improved significantly over no Kapplication as well as farmers’ practice. This resulted inincrease in grain and stover yield of rice (Table 2). Theyield and yield attributes were in order of K80 (96 kg K2Oha-1) followed byK40 (48 kg K2O ha-1), K0 (0 kg K2O ha-1)and KFP(Farmers’ practice). It implies that K along with Nand P enhanced rice yield in Vertisols during both theyears. Even though highest yield was recorded with anapplication of K80 (96 kg K2O ha-1) but was found at parwith K dose of K40 (48 kg K2O ha-1) in the first yearindicating gradual response to K application in Vertisols.However, in second year K80 recorded significantly highyield compared to all other treatments. Thus, magnitudeof response was higher at higher K doses indicatingresponse to relatively higher dose of K. Increase in testweight of rice grains was recorded due to K application athigher doses that indicates it helped in proper grain fillingin rice and utilization of other nutrients by crop as well.The results are in close agreement with the earlier findingsMali et.al 2016. They reported that, the yield was increasedsignificantly with increasing levels of potassium alongwith recommended dose of N and P.
PKV Res. J. Vol. 42 (2), July 2018
55
CONCLUSIONThe study inferred that application of K
increased the yield and yield attributes of rice (cv PusaBasmati-1) grown in Vertisols. The increase in effectivegrains as well as test weight indicated that K is essentialfor proper grain filling and also to attain optimum grainsize. Thus, in order to ensure the sustainability and foodsecurity balanced application of potassium along withnitrogen and phosphorus is essential.
LITERATURE CITEDAnonymous, 2015a. Economic Survey, Government of India
(2015-16) : A1 – A163.Anonymous, 2015b. International Rice Research Institute
World rice statistics online query. International RiceResearch Institute, Los Banos, Philippines.
Hanway, J. J. and H. Heidel, 1952. Soil Analysis Methods,as used in Iowa State. College Soil Testing Laboratory,Iowa, Agriculture. 57: 1-31.
Jackson, M. L., 1967. Soil Chemical Analysis. Prentice HallPublication Pvt. Ltd., New Delhi, India. pp 452.
Mali, D.V., T. Lokia, Jadhao, S. D., Gabhane V.V., Kadu,P.R. and Sonune B.A. (2016). Effect of various levels
of potassium on potassium fractions under soybeangrown on farmers field in Vertisols. The Ecoscan, IX(115-119)
Nelson, D.W. and L.E. Sommers, 1982. Total carbon,organic carbon and organic matter. In: Methods of SoilAnalysis Part-II. Page, A.L. (Ed.). American Society ofAgronomy. Inc. Soil Sci. Soc. Am. Madison, Wisconsin,USA, pp. 539-577.
Singh Muneshwar and R. H. Wanjari, 2012. Potassiumresponses and requirement of crops grown in Vertisols:Experiences from Long Term Fertilizer Experiment.Indian Journal of Fertilisers 8(3): 26-32.
Srinivasarao, Ch., 2011. Nutrient ratio and crop responsein relation to non-exchangeable K in differentAgroecological regions of India. Indian Journal ofFertilizer 7 (7):32-45.
Subbiah, B.V. and G.L. Asija,1956. A rapid procedure forthe estimation of available nitrogen in soils. CurrentScience 25: 259-260.
Watanabe, F.S. and S.R., Olsen, 1965. Test of ascorbicacid method for determining phosphorus in water andsodium bicarbonate extracts of soils. Proc. Soil Sci.Soc. Am., 29: 677-678.
Table 1. Effect of potassium application on yield attributes of rice (cv Pusa Basmati-1)Treatments Tillers (No./m2) Filled grains (No./panicle) Test weight (g)
2016 2017 Mean 2016 2017 Mean 2016 2017 Mean
K0 191 222 207 207 109 158 21.01 21.90 21.46K40 196 224 210 217 126 172 21.58 22.18 21.88K80 199 226 212 233 151 192 22.05 22.64 22.35KFP 190 203 197 206 107 157 21.14 21.96 21.55CD (0.05) 3.41 17.2 - 11.5 12.7 - 0.32 0.46 -NS, non-significant at 0.05
Table 2. Effect of potassium application on rice yield (cv Pusa Basmati-1)Treatments Yield (kg ha-1) Stover (kg ha-1) Harvest index (%)
2016 2017 Mean 2016 2017 Mean 2016 2017 Mean
K0 5473 4181 4827 6142 5900 6021 46.8 41.41 44.11K40 5690 4310 5000 6327 6692 6510 47.28 39.14 43.21K80 5784 5213 5499 6374 6709 6542 47.72 43.77 45.75KFP 5072 4020 4546 5908 4262 5085 46.58 48.85 47.72CD (0.05) 151.6 421.4 - 213.9 574.7 - NS 0.028 -NS, non-significant at 0.05
Received on 15.2.2019
Effect of Potassium on Productivity of Rice in Vertisols of Central India
56
The declined availability of FYM is beingexperienced in semi arid areas like Vidarbha consequentupon tendency of limiting farm animals due to increasingfarm mechanization. Moreover, the commonly adoptedpractice of burning wheat residue has led to the decline insoil organic matter, pollution of the environment andlowering biological activity. The promotion of turningwheat residues into phosphocompost during the time lagof about two and half months between the harvest ofwheat and planting kharif soybean and its utilization asalternate to FYM is a feasible option. The enriched organicmanure prepared by using indigenous rock phosphate isa potential alternative to FYM which can be used as acomponent of INM.
Natural Resources Management to Improve Soil Health and Increased CropProductivity
S. D. Jadhao1, B. A. Sonune2, D. V. Mali3, S. M. Bhoyar4, V. K. Kharche5, P. W. Deshmukh6 andA. B. Aage7
ABSTRACT The value added compost was prepared from low grade rock phosphate and various crop residues to assess the impacton soil health and crop productivity at Akola. Various crop residues (wheat straw and shredded cotton stalk) along withindigenous low grade rock phosphate (as a source of P) and urea (as a source of N) were used to prepare value addedcompost. The compost was prepared by pit method with intermittent turning at regular intervals. The changes in physical,chemical and biological properties were monitored during decomposition of crop residues up to 120 days. The colour ofcompost was rated as brown to greyish brown (Hue-10YR, Value-5 and Chroma-3 and 2) as per Munsell colour chart. Thecompost prepared from various crop residues along with various levels of rock phosphate have organic carbon in the rangeof 25.41 -28.25%, total N (1.17 - 1.34), C: N ratio (19.91-23.02), total P (1.48-1.94%) and total K (0.58-0.78%). TheDTPA extractable micronutrient content was higher in compost prepared from wheat straw along with rock phosphate @12%. The microbial count was improved in compost prepared from wheat straw along with rock phosphate @12%. Thecompost prepared from wheat straw along with rock phosphate @ 12% was among the best in terms of various physical,chemical and biological parameters. Hence, the impact of value added compost prepared from wheat straw along with rockphosphate @ 12% on soil health and productivity of soybean and cotton-soybean rotation was assessed by combiningvarious fertilizer treatments along with value added compost. The application of 100 % RDF (23.78 q ha-1) and 50% RD+ 50 % P through value added compost (22.51 q ha-1) found at par and equally beneficial in producing higher grain yield ofsoybean when compared with 100 % RDF + FYM @ 5 t ha-1. The application of chemical fertilizers along with value addedcompost and organics alone (100 % RD through FYM + remaining P through value added compost) helps in overallimprovement of soil physical, chemical and biological condition. The soil quality index (SQI) was increased with theapplication of 50% RD + 50 % P through PC (3.47). In soybean-cotton rotation, application of 100 % recommended N ofcotton and soybean through FYM (11 t ha-1 to cotton and 5 t ha-1 to soybean) and remaining dose of P and K throughphosphocompost to cotton (80 kg ha-1) and soybean (3.8 t ha-1) was found to increase significantly the grain yield ofsoybean as well as seed and stalk yield of cotton. The higher SQI was obtained with the application of 100 % N throughFYM + P compensation through phosphocompost.
1 & 6. Associate Professor, 2,3 & 7 Assistant Professor, 4. Head of the Department and 5. Director of Research,Department of Soil Science and Agril. Chemistry, Dr. PDKV, Akola
Phosphorus is an element that is widely distributed innature and occurs together with nitrogen and potassium,as a primary constituent of life. Under continuouscultivation, P inputs must be added to either maintain thesoil P status of fertile soils or increase that of soil withinherent lower P fertility. Superphosphates are commonlyrecommended for correcting P deficiencies. However, Indiaimports these fertilizers, which are often in limited supplyand represent a major outlay resource-poor farmer. Inaddition, intensification of agricultural production in theseregions necessitates the addition of P input not only toincrease crop production but also to improve soil P statusin order to avoid further soil degradation. India has reserveof 14.7 million tonnes of high grade rock phosphate (30
PKV Res. J. Vol. 42 (2), July 2018
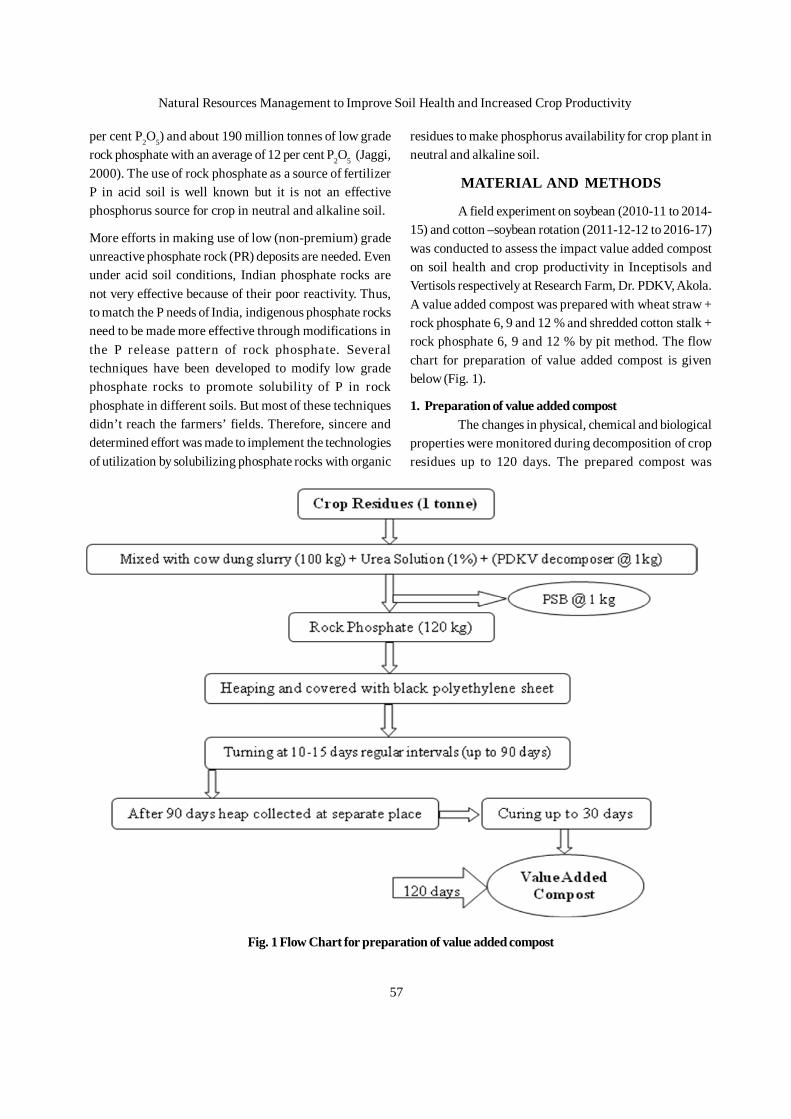
57
per cent P2O5) and about 190 million tonnes of low graderock phosphate with an average of 12 per cent P2O5 (Jaggi,2000). The use of rock phosphate as a source of fertilizerP in acid soil is well known but it is not an effectivephosphorus source for crop in neutral and alkaline soil.
More efforts in making use of low (non-premium) gradeunreactive phosphate rock (PR) deposits are needed. Evenunder acid soil conditions, Indian phosphate rocks arenot very effective because of their poor reactivity. Thus,to match the P needs of India, indigenous phosphate rocksneed to be made more effective through modifications inthe P release pattern of rock phosphate. Severaltechniques have been developed to modify low gradephosphate rocks to promote solubility of P in rockphosphate in different soils. But most of these techniquesdidn’t reach the farmers’ fields. Therefore, sincere anddetermined effort was made to implement the technologiesof utilization by solubilizing phosphate rocks with organic
residues to make phosphorus availability for crop plant inneutral and alkaline soil.
MATERIAL AND METHODS
A field experiment on soybean (2010-11 to 2014-15) and cotton –soybean rotation (2011-12-12 to 2016-17)was conducted to assess the impact value added composton soil health and crop productivity in Inceptisols andVertisols respectively at Research Farm, Dr. PDKV, Akola.A value added compost was prepared with wheat straw +rock phosphate 6, 9 and 12 % and shredded cotton stalk +rock phosphate 6, 9 and 12 % by pit method. The flowchart for preparation of value added compost is givenbelow (Fig. 1).
1. Preparation of value added compostThe changes in physical, chemical and biological
properties were monitored during decomposition of cropresidues up to 120 days. The prepared compost was
Fig. 1 Flow Chart for preparation of value added compost
Natural Resources Management to Improve Soil Health and Increased Crop Productivity
58
analyzed for various chemical parameters. Chemicalcomposition of value added compost is given in Table 1.In order to assess the impact of value added compost afield experiment were conducted on soybean and cotton–soybean rotation for five years in Inceptisol and Vertisol,respectively.
2. Experiment on SoybeanThe experiment was laid in Randomized Block
Design (RBD) with eight treatments replicated three times.The treatments were absolute control, 100% RDF, 100%RDF + FYM @ 5 t ha-1, 50% RDF + 50% P throughphosphocompost, 75% RDF of N & P2O5 + 25% N through
cotton stalk and 100% RDF through FYM and remainingP added through phosphocompost.
3. Experiment on Cotton –Soybean rotationThe experiment was laid in Randomized Block
Design (RBD) with nine treatments replicated three times.The experiment was conducted to study the impact ofphosphocompost in comparison with various resourceconservation technologies on soybean –cotton rotationin Vertisol. The details of treatment imposed are givenbelow (Table 2). Data generated were subjected tostatistical analysis in RBD as per Panse and Sukhatme(1971).
Table 1: Chemical composition of value added compost
Particulars Composition Particulars Composition
pH 7.44 Bulk Density, g kg-1 0.713EC (dS m-1) 0.76 Colour BrownOrganic Carbon (%) 25.41 DTPA-Micronutrients (mg kg-1)Total N (%) 1.23 DTPA-Zn (mg kg-1) 2.35C:N ratio 20.45 DTPA-Fe (mg kg-1) 7.17Total P (%) 1.94 DTPA-Mn (mg kg-1) 3.68Citrate Soluble P (%) 0.92 DTPA-Cu (mg kg-1) 0.34Citrate Soluble P (%) 0.069 Boron (mg kg-1) 0.58Total Potassium (%) 0.78 Microbial Count, CFU g-1 SoilTotal S (%) 0.24 Bacteria (x 107) 39NH4 -N (mg kg-1) 948 Fungi (x 107) 25NO3 -N (mg kg-1) 768 Actinomycetes (x 107) 28
Table 2: Treatment details under cotton –soybean rotation
Tr. Treatment details Cotton Soybean
T1 RDF RDFT2 Dhaincha loppings 25 % N + Compensation of RDF RDFT3 Cotton Stalk 25 % N composted with Trichoderma viride + RDF
Compensation of RDFT4 Wheat straw 25 % N + Compensation of RDF RDFT5 Bio mulch (Farm waste) 25 % N + Compensation of RDF RDFT6 Conc. Organics ( Neemcake ) 25 % N + Compensation of RDF RDFT7 100 % N through FYM + Compensation of P through phosphocompost RDF through FYM+ compensation of
P through phosphocompostT8 50 % N through FYM + compensation of P through phosphocompost RDF through FYM+ compensation of
P through phosphocompostT9 Leucaena loppings 50% N + compensation of P from phosphocompost RDF through FYM+ compensation of
P through phosphocompost
PKV Res. J. Vol. 42 (2), July 2018
59
Surface soil samples were collected at harvest of eachcrops and analyzed for various physical and chemicalproperties following standard methods. The soil sampleswere collected at critical growth stages for biologicalproperties.
Results and DiscussionProductivity of soybean
The grain yield of soybean are presented in Table3. The application of 100% NPK + FYM recordedsignificantly highest grain and stover yield during 2010-11 to 2014-15. The mean yield of soybean was higher inthe NPK+ FYM @ 5 t ha-1 (26.14 q ha-1) followed by 100%NPK (23.78 q ha-1) and 50% RD + 50 % P throughphosphocompost (22.51 g ha-1). However, treatments viz;100 % RD and 50 % RD + 50 % P through PC were foundat par and equally beneficial in producing higher grainand stover yield.
Productivity of Cotton in Cotton –Soybean rotation
Seed cotton and stalk yield
The data in respect of seed cotton yield asinfluenced by various resource conservation treatmentswas found significant (Table 4). The pooled results
revealed that significantly highest seed cotton yield (13.27q ha-1) was recorded with 25 % N through neem cake +compensation of RDF followed by 100 % RDF throughchemical fertilizers (13. 18 q ha-1), 25 % N through dhainchaloppings + compensation of RDF (12.50 q ha-1) and 100 %N through FYM + Compensation of P throughphosphocompost (12.33 q ha-1) which were found to be atpar with each other. The lower seed cotton yield wasobserved with the application of 50 % N through Leucaenaloppings + compensation of P from phosphocompost.
Productivity of Soybean in Cotton –Soybean rotation
The data in respect of yield of soybean asinfluenced by various resource conservation treatmentswas found significant (Table 5). The pooled resultsrevealed that significantly highest grain yield of soybean(22.46 q ha-1) was observed with the application of 100 %N through FYM + remaining P & K throughphosphocompost followed by 25 % N through dhainchalopping, composted cotton stalk + compensation of RDFthrough chemical fertilizers and 100 % RDF throughchemical fertilizers which were found to be on par witheach other.
Table 3: Effect of different treatments on grain yield of soybean
Tr Soybean Grain Yield (q ha-1)
2010-11 2011-12 2012-13 2013-14 2014-15 Mean
T1 Control 14.91 17.75 17.67 16.75 12.06 15.83
T2 100 % RD 28.99 24.90 24.68 24.75 15.59 23.78
T3 100 % RD + FYM @ 5 t ha-1
29.57 27.08 27.42 28.27 18.37 26.14
T4 50% RD + 50 % P through PC 20.85 24.33 23.93 25.72 17.74 22.51
T5 75% RD+ 25 % N through CS 21.89 21.18 21.33 21.92 15.12 20.29
T6 100 % RD through FYM + remaining 18.67 19.65 20.45 25.20 15.62 19.92
P through PC
SE (m±) 0.25 0.54 0.81 1.02 0.68 0.66
CD at 5% 0.72 1.41 2.37 2.98 1.99 1.89
Natural Resources Management to Improve Soil Health and Increased Crop Productivity
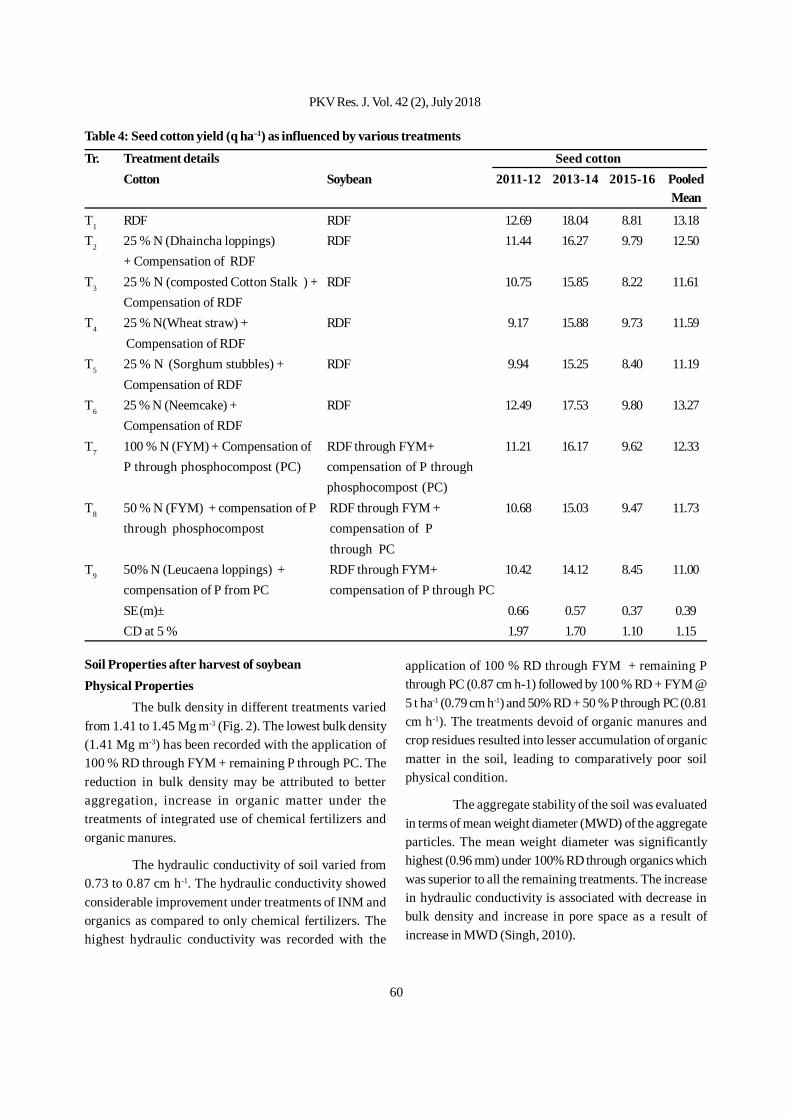
60
application of 100 % RD through FYM + remaining Pthrough PC (0.87 cm h-1) followed by 100 % RD + FYM @5 t ha-1 (0.79 cm h-1) and 50% RD + 50 % P through PC (0.81cm h-1). The treatments devoid of organic manures andcrop residues resulted into lesser accumulation of organicmatter in the soil, leading to comparatively poor soilphysical condition.
The aggregate stability of the soil was evaluatedin terms of mean weight diameter (MWD) of the aggregateparticles. The mean weight diameter was significantlyhighest (0.96 mm) under 100% RD through organics whichwas superior to all the remaining treatments. The increasein hydraulic conductivity is associated with decrease inbulk density and increase in pore space as a result ofincrease in MWD (Singh, 2010).
Table 4: Seed cotton yield (q ha–1) as influenced by various treatments
Tr. Treatment details Seed cottonCotton Soybean 2011-12 2013-14 2015-16 Pooled
Mean
T1 RDF RDF 12.69 18.04 8.81 13.18T2 25 % N (Dhaincha loppings) RDF 11.44 16.27 9.79 12.50
+ Compensation of RDFT3 25 % N (composted Cotton Stalk ) + RDF 10.75 15.85 8.22 11.61
Compensation of RDFT4 25 % N(Wheat straw) + RDF 9.17 15.88 9.73 11.59
Compensation of RDFT5 25 % N (Sorghum stubbles) + RDF 9.94 15.25 8.40 11.19
Compensation of RDFT6 25 % N (Neemcake) + RDF 12.49 17.53 9.80 13.27
Compensation of RDFT7 100 % N (FYM) + Compensation of RDF through FYM+ 11.21 16.17 9.62 12.33
P through phosphocompost (PC) compensation of P throughphosphocompost (PC)
T8 50 % N (FYM) + compensation of P RDF through FYM + 10.68 15.03 9.47 11.73through phosphocompost compensation of P
through PCT9 50% N (Leucaena loppings) + RDF through FYM+ 10.42 14.12 8.45 11.00
compensation of P from PC compensation of P through PCSE (m)± 0.66 0.57 0.37 0.39CD at 5 % 1.97 1.70 1.10 1.15
Soil Properties after harvest of soybeanPhysical Properties
The bulk density in different treatments variedfrom 1.41 to 1.45 Mg m-3 (Fig. 2). The lowest bulk density(1.41 Mg m-3) has been recorded with the application of100 % RD through FYM + remaining P through PC. Thereduction in bulk density may be attributed to betteraggregation, increase in organic matter under thetreatments of integrated use of chemical fertilizers andorganic manures.
The hydraulic conductivity of soil varied from0.73 to 0.87 cm h-1. The hydraulic conductivity showedconsiderable improvement under treatments of INM andorganics as compared to only chemical fertilizers. Thehighest hydraulic conductivity was recorded with the
PKV Res. J. Vol. 42 (2), July 2018
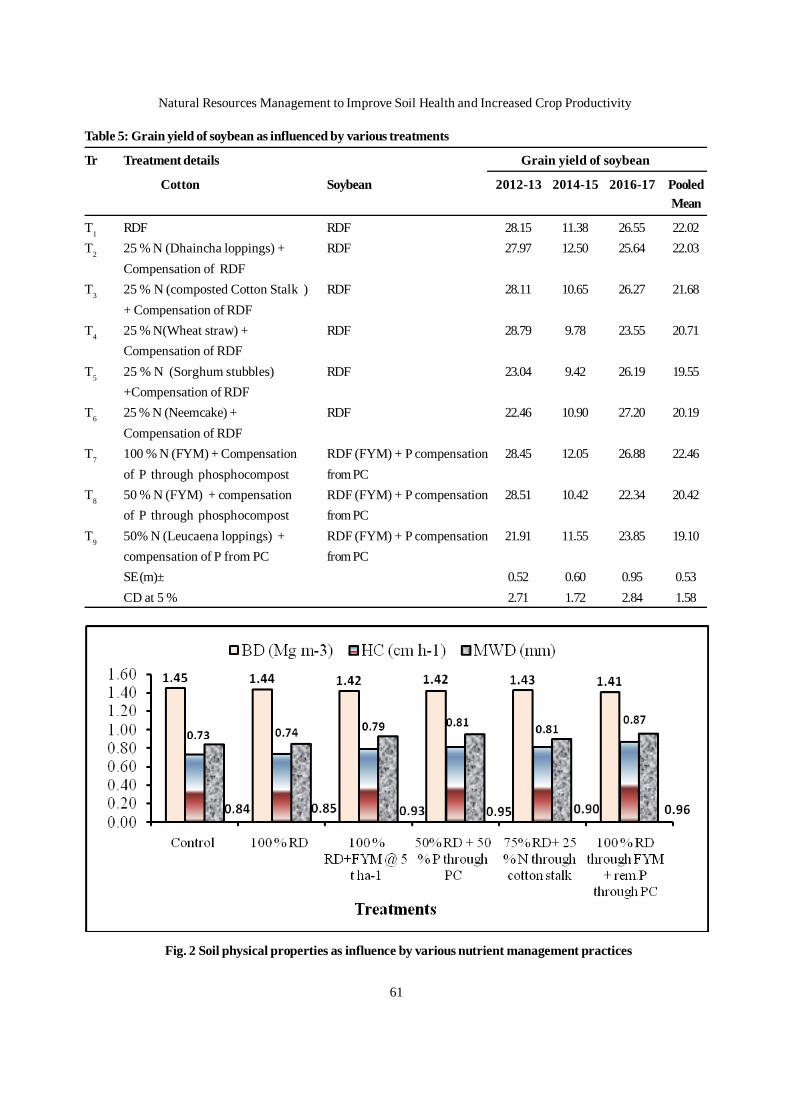
61
Table 5: Grain yield of soybean as influenced by various treatments
Tr Treatment details Grain yield of soybean
Cotton Soybean 2012-13 2014-15 2016-17 PooledMean
T1 RDF RDF 28.15 11.38 26.55 22.02T2 25 % N (Dhaincha loppings) + RDF 27.97 12.50 25.64 22.03
Compensation of RDFT3 25 % N (composted Cotton Stalk ) RDF 28.11 10.65 26.27 21.68
+ Compensation of RDFT4 25 % N(Wheat straw) + RDF 28.79 9.78 23.55 20.71
Compensation of RDFT5 25 % N (Sorghum stubbles) RDF 23.04 9.42 26.19 19.55
+Compensation of RDFT6 25 % N (Neemcake) + RDF 22.46 10.90 27.20 20.19
Compensation of RDFT7 100 % N (FYM) + Compensation RDF (FYM) + P compensation 28.45 12.05 26.88 22.46
of P through phosphocompost from PCT8 50 % N (FYM) + compensation RDF (FYM) + P compensation 28.51 10.42 22.34 20.42
of P through phosphocompost from PCT9 50% N (Leucaena loppings) + RDF (FYM) + P compensation 21.91 11.55 23.85 19.10
compensation of P from PC from PCSE (m)± 0.52 0.60 0.95 0.53CD at 5 % 2.71 1.72 2.84 1.58
Fig. 2 Soil physical properties as influence by various nutrient management practices
Natural Resources Management to Improve Soil Health and Increased Crop Productivity
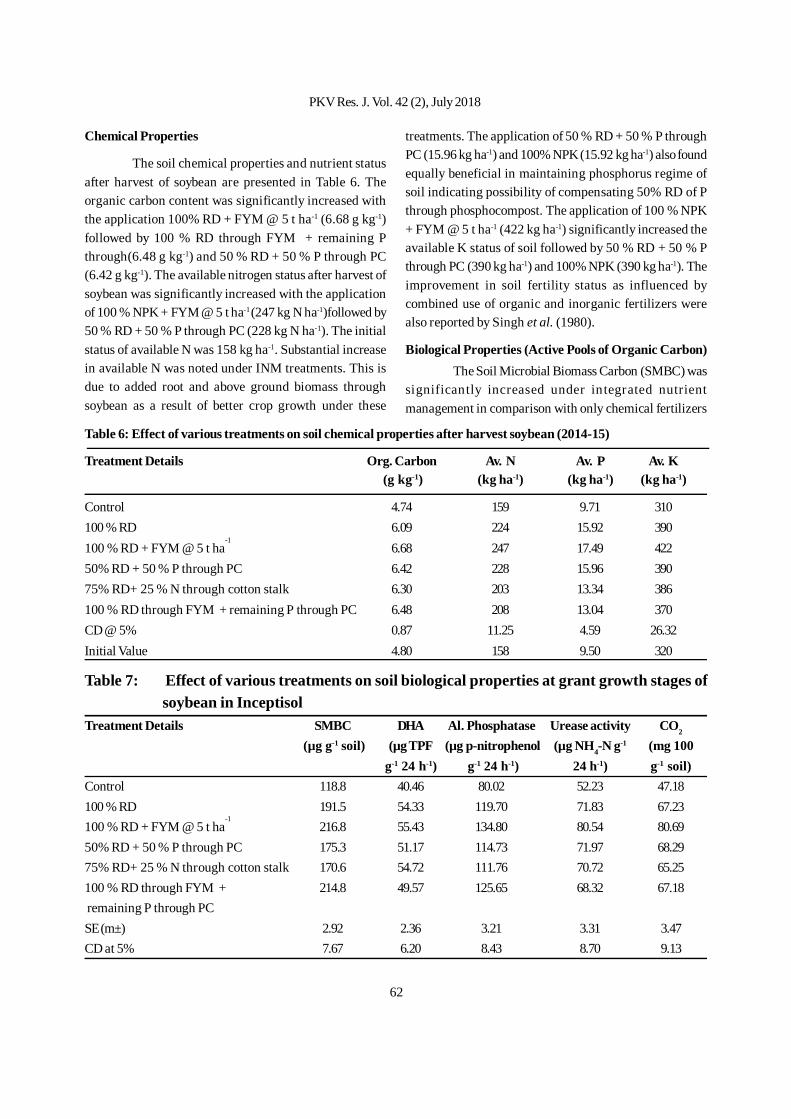
62
Chemical Properties
The soil chemical properties and nutrient statusafter harvest of soybean are presented in Table 6. Theorganic carbon content was significantly increased withthe application 100% RD + FYM @ 5 t ha-1 (6.68 g kg-1)followed by 100 % RD through FYM + remaining Pthrough(6.48 g kg-1) and 50 % RD + 50 % P through PC(6.42 g kg-1). The available nitrogen status after harvest ofsoybean was significantly increased with the applicationof 100 % NPK + FYM @ 5 t ha-1 (247 kg N ha-1)followed by50 % RD + 50 % P through PC (228 kg N ha-1). The initialstatus of available N was 158 kg ha-1. Substantial increasein available N was noted under INM treatments. This isdue to added root and above ground biomass throughsoybean as a result of better crop growth under these
treatments. The application of 50 % RD + 50 % P throughPC (15.96 kg ha-1) and 100% NPK (15.92 kg ha-1) also foundequally beneficial in maintaining phosphorus regime ofsoil indicating possibility of compensating 50% RD of Pthrough phosphocompost. The application of 100 % NPK+ FYM @ 5 t ha-1 (422 kg ha-1) significantly increased theavailable K status of soil followed by 50 % RD + 50 % Pthrough PC (390 kg ha-1) and 100% NPK (390 kg ha-1). Theimprovement in soil fertility status as influenced bycombined use of organic and inorganic fertilizers werealso reported by Singh et al. (1980).
Biological Properties (Active Pools of Organic Carbon)The Soil Microbial Biomass Carbon (SMBC) was
significantly increased under integrated nutrientmanagement in comparison with only chemical fertilizers
Table 6: Effect of various treatments on soil chemical properties after harvest soybean (2014-15)
Treatment Details Org. Carbon Av. N Av. P Av. K (g kg-1) (kg ha-1) (kg ha-1) (kg ha-1)
Control 4.74 159 9.71 310100 % RD 6.09 224 15.92 390100 % RD + FYM @ 5 t ha
-16.68 247 17.49 422
50% RD + 50 % P through PC 6.42 228 15.96 39075% RD+ 25 % N through cotton stalk 6.30 203 13.34 386100 % RD through FYM + remaining P through PC 6.48 208 13.04 370CD @ 5% 0.87 11.25 4.59 26.32Initial Value 4.80 158 9.50 320
Table 7: Effect of various treatments on soil biological properties at grant growth stages ofsoybean in Inceptisol
Treatment Details SMBC DHA Al. Phosphatase Urease activity CO2
(µg g-1 soil) (µg TPF (µg p-nitrophenol (µg NH4-N g-1 (mg 100g-1 24 h-1) g-1 24 h-1) 24 h-1) g-1 soil)
Control 118.8 40.46 80.02 52.23 47.18100 % RD 191.5 54.33 119.70 71.83 67.23100 % RD + FYM @ 5 t ha
-1216.8 55.43 134.80 80.54 80.69
50% RD + 50 % P through PC 175.3 51.17 114.73 71.97 68.2975% RD+ 25 % N through cotton stalk 170.6 54.72 111.76 70.72 65.25100 % RD through FYM + 214.8 49.57 125.65 68.32 67.18 remaining P through PCSE (m±) 2.92 2.36 3.21 3.31 3.47CD at 5% 7.67 6.20 8.43 8.70 9.13
PKV Res. J. Vol. 42 (2), July 2018
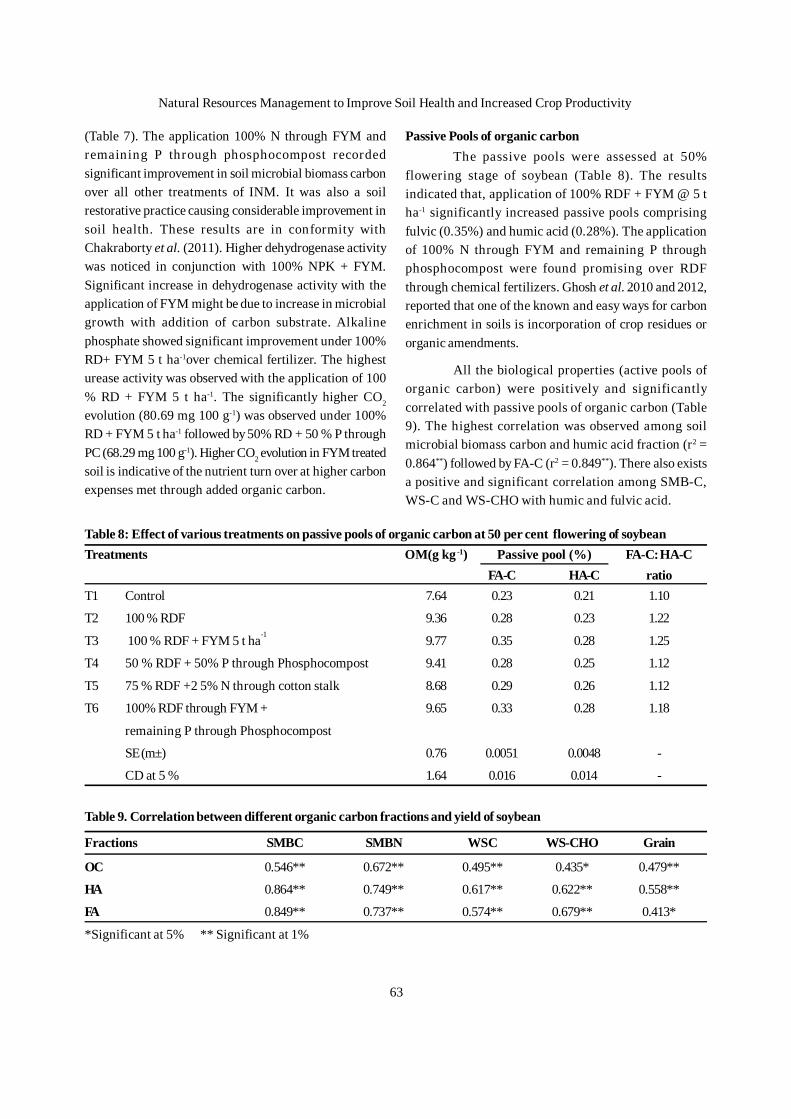
63
(Table 7). The application 100% N through FYM andremaining P through phosphocompost recordedsignificant improvement in soil microbial biomass carbonover all other treatments of INM. It was also a soilrestorative practice causing considerable improvement insoil health. These results are in conformity withChakraborty et al. (2011). Higher dehydrogenase activitywas noticed in conjunction with 100% NPK + FYM.Significant increase in dehydrogenase activity with theapplication of FYM might be due to increase in microbialgrowth with addition of carbon substrate. Alkalinephosphate showed significant improvement under 100%RD+ FYM 5 t ha-1over chemical fertilizer. The highesturease activity was observed with the application of 100% RD + FYM 5 t ha-1. The significantly higher CO2
evolution (80.69 mg 100 g-1) was observed under 100%RD + FYM 5 t ha-1 followed by 50% RD + 50 % P throughPC (68.29 mg 100 g-1). Higher CO2 evolution in FYM treatedsoil is indicative of the nutrient turn over at higher carbonexpenses met through added organic carbon.
Passive Pools of organic carbonThe passive pools were assessed at 50%
flowering stage of soybean (Table 8). The resultsindicated that, application of 100% RDF + FYM @ 5 tha-1 significantly increased passive pools comprisingfulvic (0.35%) and humic acid (0.28%). The applicationof 100% N through FYM and remaining P throughphosphocompost were found promising over RDFthrough chemical fertilizers. Ghosh et al. 2010 and 2012,reported that one of the known and easy ways for carbonenrichment in soils is incorporation of crop residues ororganic amendments.
All the biological properties (active pools oforganic carbon) were positively and significantlycorrelated with passive pools of organic carbon (Table9). The highest correlation was observed among soilmicrobial biomass carbon and humic acid fraction (r2 =0.864**) followed by FA-C (r2 = 0.849**). There also existsa positive and significant correlation among SMB-C,WS-C and WS-CHO with humic and fulvic acid.
Table 8: Effect of various treatments on passive pools of organic carbon at 50 per cent flowering of soybeanTreatments OM(g kg -1) Passive pool (%) FA-C: HA-C
FA-C HA-C ratioT1 Control 7.64 0.23 0.21 1.10
T2 100 % RDF 9.36 0.28 0.23 1.22
T3 100 % RDF + FYM 5 t ha-1 9.77 0.35 0.28 1.25
T4 50 % RDF + 50% P through Phosphocompost 9.41 0.28 0.25 1.12
T5 75 % RDF +2 5% N through cotton stalk 8.68 0.29 0.26 1.12
T6 100% RDF through FYM + 9.65 0.33 0.28 1.18
remaining P through Phosphocompost
SE (m±) 0.76 0.0051 0.0048 -
CD at 5 % 1.64 0.016 0.014 -
Table 9. Correlation between different organic carbon fractions and yield of soybean
Fractions SMBC SMBN WSC WS-CHO Grain
OC 0.546** 0.672** 0.495** 0.435* 0.479**
HA 0.864** 0.749** 0.617** 0.622** 0.558**
FA 0.849** 0.737** 0.574** 0.679** 0.413*
*Significant at 5% ** Significant at 1%
Natural Resources Management to Improve Soil Health and Increased Crop Productivity
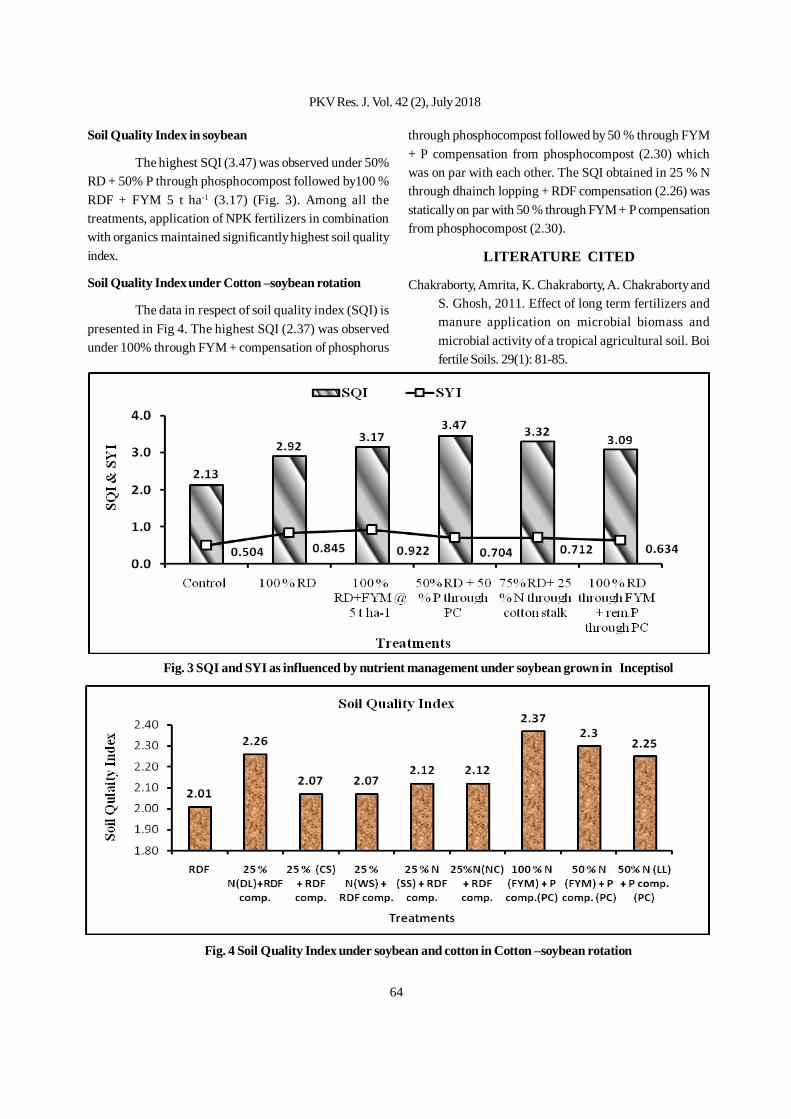
64
Soil Quality Index in soybean
The highest SQI (3.47) was observed under 50%RD + 50% P through phosphocompost followed by100 %RDF + FYM 5 t ha-1 (3.17) (Fig. 3). Among all thetreatments, application of NPK fertilizers in combinationwith organics maintained significantly highest soil qualityindex.
Soil Quality Index under Cotton –soybean rotation
The data in respect of soil quality index (SQI) ispresented in Fig 4. The highest SQI (2.37) was observedunder 100% through FYM + compensation of phosphorus
through phosphocompost followed by 50 % through FYM+ P compensation from phosphocompost (2.30) whichwas on par with each other. The SQI obtained in 25 % Nthrough dhainch lopping + RDF compensation (2.26) wasstatically on par with 50 % through FYM + P compensationfrom phosphocompost (2.30).
LITERATURE CITED
Chakraborty, Amrita, K. Chakraborty, A. Chakraborty andS. Ghosh, 2011. Effect of long term fertilizers andmanure application on microbial biomass andmicrobial activity of a tropical agricultural soil. Boifertile Soils. 29(1): 81-85.
Fig. 3 SQI and SYI as influenced by nutrient management under soybean grown in Inceptisol
Fig. 4 Soil Quality Index under soybean and cotton in Cotton –soybean rotation
PKV Res. J. Vol. 42 (2), July 2018
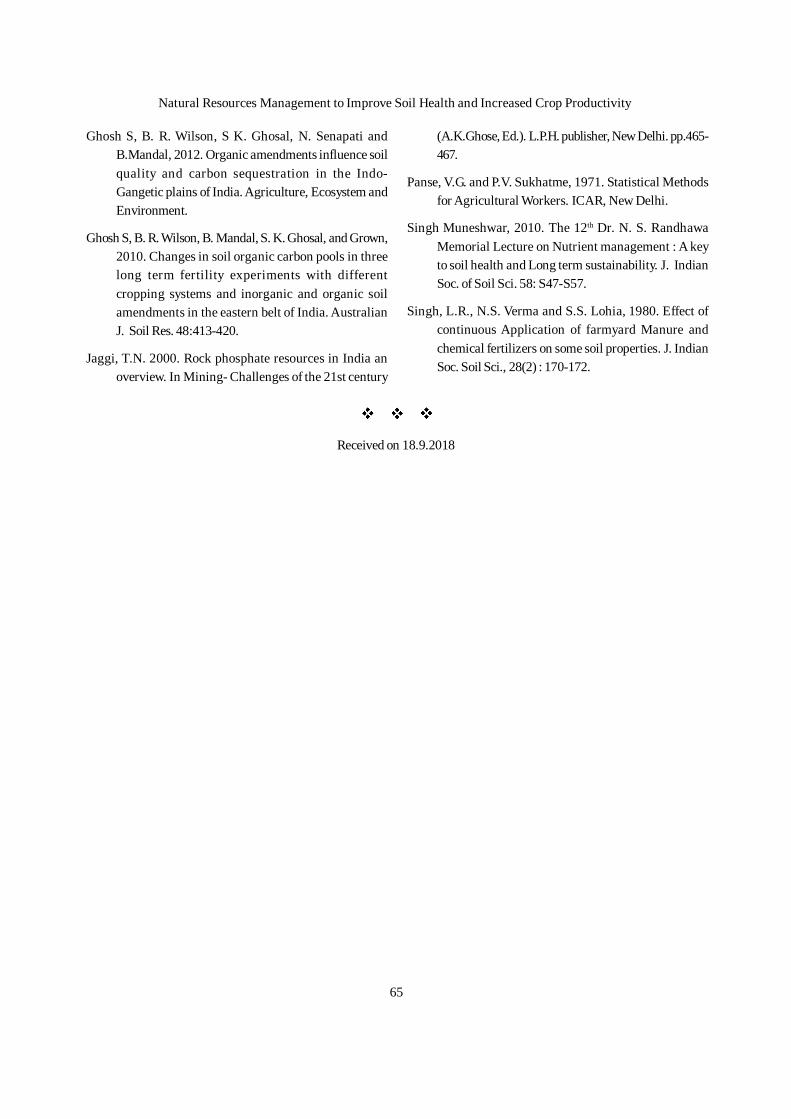
65
Ghosh S, B. R. Wilson, S K. Ghosal, N. Senapati andB.Mandal, 2012. Organic amendments influence soilquality and carbon sequestration in the Indo-Gangetic plains of India. Agriculture, Ecosystem andEnvironment.
Ghosh S, B. R. Wilson, B. Mandal, S. K. Ghosal, and Grown,2010. Changes in soil organic carbon pools in threelong term fertility experiments with differentcropping systems and inorganic and organic soilamendments in the eastern belt of India. AustralianJ. Soil Res. 48:413-420.
Jaggi, T.N. 2000. Rock phosphate resources in India anoverview. In Mining- Challenges of the 21st century
(A.K.Ghose, Ed.). L.P.H. publisher, New Delhi. pp.465-467.
Panse, V.G. and P.V. Sukhatme, 1971. Statistical Methodsfor Agricultural Workers. ICAR, New Delhi.
Singh Muneshwar, 2010. The 12th Dr. N. S. RandhawaMemorial Lecture on Nutrient management : A keyto soil health and Long term sustainability. J. IndianSoc. of Soil Sci. 58: S47-S57.
Singh, L.R., N.S. Verma and S.S. Lohia, 1980. Effect ofcontinuous Application of farmyard Manure andchemical fertilizers on some soil properties. J. IndianSoc. Soil Sci., 28(2) : 170-172.
Received on 18.9.2018
Natural Resources Management to Improve Soil Health and Increased Crop Productivity
66
Molybdenum is an important trace element foundin the soil and is required for growth of most biologicalorganisms including plants and animals. Molybdenum isan exception among micronutrients, in that, it is readilytranslocated in an ionic form and its deficiency symptomsare generally yellowing and stunting of the plant like Ndeficiency and inter venal mottling and cupping of theolder leaves followed by leaves tips and margins. Rootinterception and mass flow are considered to be theimportant mechanisms controlling the movement ofmolybdenum to the plants roots. Without molybdenumplants cannot perform the biochemical process of makingessential nitrogen compound. Molybdenum is involvedin enzyme systems relating to nitrogen fixation by bacteriagrowing symbiotically with legumes.
Molybdenum is unusual among micronutrientsand is becoming less available to plants at low pH.Availability of molybdenum for plants increases togetherwith increasing soil pH. Available molybdenum showssignificant positive correlation with soil pH (Adhikari andPatel, 2013). Molybdenum deficiency is usually associatedwith acid soils. (pH< 5.5), particularly those which aregeologically old and highly leached soil. Soils with pHvalues more than 6.0 to 6.5 rarely require molybdenum
Assessment of Molybdenum Status in Soils of Raigad District of Maharashtra
S. S. Hadole1, R. N. Katkar2, P. A.Sarap3, S. R. Lakhe4 and Shamna K. Muhammed5
ABSTRACT
The present study entitled “Assessment of molybdenum status in soils of Raigad district of Maharashtra” wasconducted during 2016-17 at Department of Soil Science & Agricultural Chemistry, Dr. Panjabrao Deshmukh KrishiVidyapeeth, Akola, Maharashtra with objective to assess the molybdenum status in soils of Raigad district and to studythe relationship of molybdenum with soil properties. Geo-referenced surface soil samples representing different tehsilswere collected from Raigad district during 2015-16. pH of soils of Raigad district varied from 5.80 to 7.11 indicates acidicto neutral in reaction. Organic carbon lies in the range of 4.19 to 11.21 g kg-1 and electrical conductivity ranged from 0.08to 0.49 dS m-1. Calcium carbonate content found in the range of 1.00 to 3.87 percent. Available nitrogen content of thedistrict varied from 100.06 to 298.87 kg ha-1. Available molybdenum lies in the range of 0.01 to 0.64 mg kg-1. The nutrientindex for molybdenum is 1.87 for Raigad district. It is also noticed that 37.62 percent soil samples are deficient in availablemolybdenum. It can be observed that there is a positive correlation between pH and available molybdenum (r=+0.714**).Available soil molybdenum increase with increase in soil pH. Available molybdenum was found to have significant andnegetive correlation with organic carbon content r= -0.815 and decrease with increase in organic carbon content.
MATERIALS AND METHODS
Location : Raigad district lies between 170 51’ and 190 80’ Nlatitude and 720 50’ and 730 40’ E longitude with an altitudeof 10 to 50 meters above mean sea level (MSL). Raigaddistrict is surrounded by Sahayadri ranges (Western Ghat)in the east and the Arabian sea on the west and formnatural boundaries.
Soil type : The soil of the Raigad district are essentiallyderived from the Deccan trap which is the predominantrock formation of the district. The main types of soil foundin the district are black soil, khar or salt soil, coastalalluvium and literate soils. The predominant soil in thedistrict is laterite which varies in colour from bright red tobrownish red owing to the preponderance of hydratediron oxides. They are always acidic and fairly well suppliedwith nitrogen and organic matter.
Climate and Weather Condition: Climate of Raigaddistrict is typical hot and humid that of the west coast ofIndia characterized with plentiful and regular monsoonrainfall. The period from March to May is one of increasingtemperatures The average minimum temperature is 17.7°Cand maximum average temperature is 31.8°C. The averageannual rainfall in the district is 2484.32 mm.
1.& 3. Assistant Professor, 2. Professor, 4. Senior Research Fellow and 5. M.Sc. Student, Department of Soil Scienceand Agricultural Chemistry, Dr. PDKV, Akola
PKV Res. J. Vol. 42 (2), July 2018
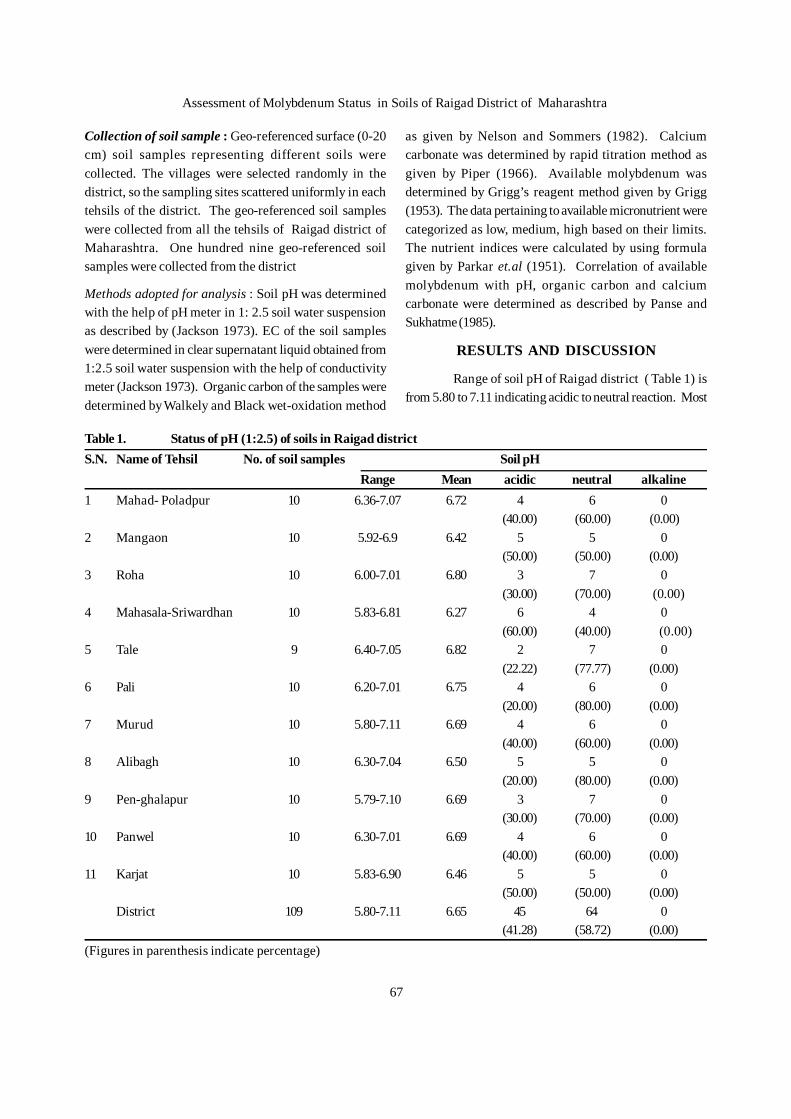
67
Collection of soil sample : Geo-referenced surface (0-20cm) soil samples representing different soils werecollected. The villages were selected randomly in thedistrict, so the sampling sites scattered uniformly in eachtehsils of the district. The geo-referenced soil sampleswere collected from all the tehsils of Raigad district ofMaharashtra. One hundred nine geo-referenced soilsamples were collected from the district
Methods adopted for analysis : Soil pH was determinedwith the help of pH meter in 1: 2.5 soil water suspensionas described by (Jackson 1973). EC of the soil sampleswere determined in clear supernatant liquid obtained from1:2.5 soil water suspension with the help of conductivitymeter (Jackson 1973). Organic carbon of the samples weredetermined by Walkely and Black wet-oxidation method
as given by Nelson and Sommers (1982). Calciumcarbonate was determined by rapid titration method asgiven by Piper (1966). Available molybdenum wasdetermined by Grigg’s reagent method given by Grigg(1953). The data pertaining to available micronutrient werecategorized as low, medium, high based on their limits.The nutrient indices were calculated by using formulagiven by Parkar et.al (1951). Correlation of availablemolybdenum with pH, organic carbon and calciumcarbonate were determined as described by Panse andSukhatme (1985).
RESULTS AND DISCUSSION
Range of soil pH of Raigad district ( Table 1) isfrom 5.80 to 7.11 indicating acidic to neutral reaction. Most
Table 1. Status of pH (1:2.5) of soils in Raigad districtS.N. Name of Tehsil No. of soil samples Soil pH
Range Mean acidic neutral alkaline1 Mahad- Poladpur 10 6.36-7.07 6.72 4 6 0
(40.00) (60.00) (0.00)2 Mangaon 10 5.92-6.9 6.42 5 5 0
(50.00) (50.00) (0.00)3 Roha 10 6.00-7.01 6.80 3 7 0
(30.00) (70.00) (0.00)4 Mahasala-Sriwardhan 10 5.83-6.81 6.27 6 4 0
(60.00) (40.00) (0.00)5 Tale 9 6.40-7.05 6.82 2 7 0
(22.22) (77.77) (0.00)6 Pali 10 6.20-7.01 6.75 4 6 0
(20.00) (80.00) (0.00)7 Murud 10 5.80-7.11 6.69 4 6 0
(40.00) (60.00) (0.00)8 Alibagh 10 6.30-7.04 6.50 5 5 0
(20.00) (80.00) (0.00)9 Pen-ghalapur 10 5.79-7.10 6.69 3 7 0
(30.00) (70.00) (0.00)10 Panwel 10 6.30-7.01 6.69 4 6 0
(40.00) (60.00) (0.00)11 Karjat 10 5.83-6.90 6.46 5 5 0
(50.00) (50.00) (0.00)District 109 5.80-7.11 6.65 45 64 0
(41.28) (58.72) (0.00)(Figures in parenthesis indicate percentage)
Assessment of Molybdenum Status in Soils of Raigad District of Maharashtra
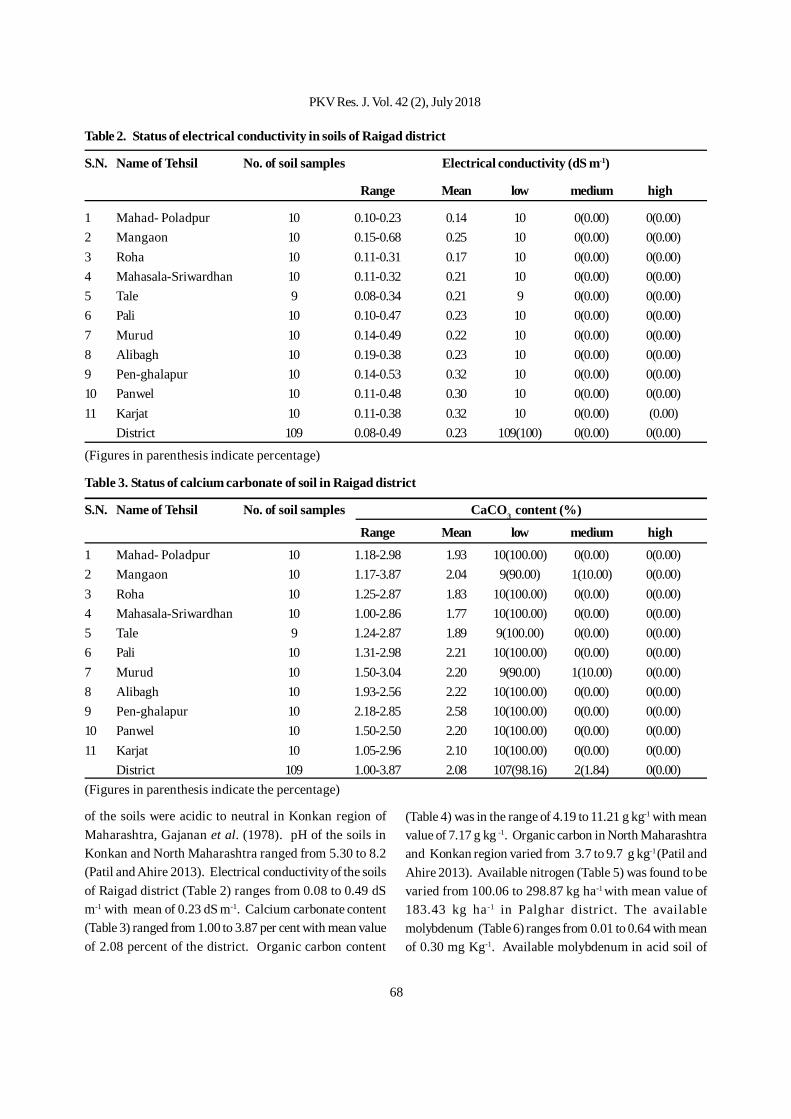
68
Table 2. Status of electrical conductivity in soils of Raigad district
S.N. Name of Tehsil No. of soil samples Electrical conductivity (dS m-1)
Range Mean low medium high
1 Mahad- Poladpur 10 0.10-0.23 0.14 10 0(0.00) 0(0.00)2 Mangaon 10 0.15-0.68 0.25 10 0(0.00) 0(0.00)3 Roha 10 0.11-0.31 0.17 10 0(0.00) 0(0.00)4 Mahasala-Sriwardhan 10 0.11-0.32 0.21 10 0(0.00) 0(0.00)5 Tale 9 0.08-0.34 0.21 9 0(0.00) 0(0.00)6 Pali 10 0.10-0.47 0.23 10 0(0.00) 0(0.00)7 Murud 10 0.14-0.49 0.22 10 0(0.00) 0(0.00)8 Alibagh 10 0.19-0.38 0.23 10 0(0.00) 0(0.00)9 Pen-ghalapur 10 0.14-0.53 0.32 10 0(0.00) 0(0.00)10 Panwel 10 0.11-0.48 0.30 10 0(0.00) 0(0.00)11 Karjat 10 0.11-0.38 0.32 10 0(0.00) (0.00)
District 109 0.08-0.49 0.23 109(100) 0(0.00) 0(0.00)
(Figures in parenthesis indicate percentage)
Table 3. Status of calcium carbonate of soil in Raigad district
S.N. Name of Tehsil No. of soil samples CaCO3 content (%)
Range Mean low medium high
1 Mahad- Poladpur 10 1.18-2.98 1.93 10(100.00) 0(0.00) 0(0.00)2 Mangaon 10 1.17-3.87 2.04 9(90.00) 1(10.00) 0(0.00)3 Roha 10 1.25-2.87 1.83 10(100.00) 0(0.00) 0(0.00)4 Mahasala-Sriwardhan 10 1.00-2.86 1.77 10(100.00) 0(0.00) 0(0.00)5 Tale 9 1.24-2.87 1.89 9(100.00) 0(0.00) 0(0.00)6 Pali 10 1.31-2.98 2.21 10(100.00) 0(0.00) 0(0.00)7 Murud 10 1.50-3.04 2.20 9(90.00) 1(10.00) 0(0.00)8 Alibagh 10 1.93-2.56 2.22 10(100.00) 0(0.00) 0(0.00)9 Pen-ghalapur 10 2.18-2.85 2.58 10(100.00) 0(0.00) 0(0.00)10 Panwel 10 1.50-2.50 2.20 10(100.00) 0(0.00) 0(0.00)11 Karjat 10 1.05-2.96 2.10 10(100.00) 0(0.00) 0(0.00)
District 109 1.00-3.87 2.08 107(98.16) 2(1.84) 0(0.00)(Figures in parenthesis indicate the percentage)
of the soils were acidic to neutral in Konkan region ofMaharashtra, Gajanan et al. (1978). pH of the soils inKonkan and North Maharashtra ranged from 5.30 to 8.2(Patil and Ahire 2013). Electrical conductivity of the soilsof Raigad district (Table 2) ranges from 0.08 to 0.49 dSm-1 with mean of 0.23 dS m-1. Calcium carbonate content(Table 3) ranged from 1.00 to 3.87 per cent with mean valueof 2.08 percent of the district. Organic carbon content
(Table 4) was in the range of 4.19 to 11.21 g kg-1 with meanvalue of 7.17 g kg -1. Organic carbon in North Maharashtraand Konkan region varied from 3.7 to 9.7 g kg-1 (Patil andAhire 2013). Available nitrogen (Table 5) was found to bevaried from 100.06 to 298.87 kg ha-1 with mean value of183.43 kg ha -1 in Palghar district. The availablemolybdenum (Table 6) ranges from 0.01 to 0.64 with meanof 0.30 mg Kg-1. Available molybdenum in acid soil of
PKV Res. J. Vol. 42 (2), July 2018
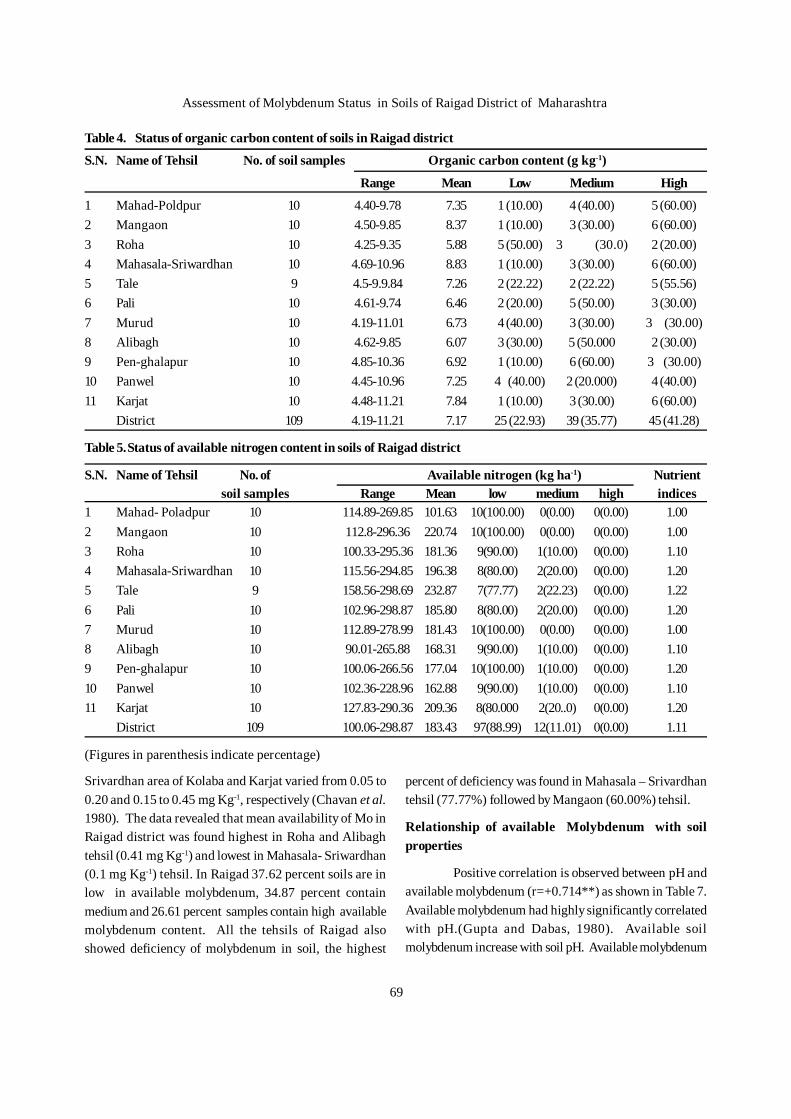
69
Table 4. Status of organic carbon content of soils in Raigad district
S.N. Name of Tehsil No. of soil samples Organic carbon content (g kg-1)
Range Mean Low Medium High
1 Mahad-Poldpur 10 4.40-9.78 7.35 1 (10.00) 4 (40.00) 5 (60.00)2 Mangaon 10 4.50-9.85 8.37 1 (10.00) 3 (30.00) 6 (60.00)3 Roha 10 4.25-9.35 5.88 5 (50.00) 3 (30.0) 2 (20.00)4 Mahasala-Sriwardhan 10 4.69-10.96 8.83 1 (10.00) 3 (30.00) 6 (60.00)5 Tale 9 4.5-9.9.84 7.26 2 (22.22) 2 (22.22) 5 (55.56)6 Pali 10 4.61-9.74 6.46 2 (20.00) 5 (50.00) 3 (30.00)7 Murud 10 4.19-11.01 6.73 4 (40.00) 3 (30.00) 3 (30.00)8 Alibagh 10 4.62-9.85 6.07 3 (30.00) 5 (50.000 2 (30.00)9 Pen-ghalapur 10 4.85-10.36 6.92 1 (10.00) 6 (60.00) 3 (30.00)10 Panwel 10 4.45-10.96 7.25 4 (40.00) 2 (20.000) 4 (40.00)11 Karjat 10 4.48-11.21 7.84 1 (10.00) 3 (30.00) 6 (60.00)
District 109 4.19-11.21 7.17 25 (22.93) 39 (35.77) 45 (41.28)
Table 5.Status of available nitrogen content in soils of Raigad district
S.N. Name of Tehsil No. of Available nitrogen (kg ha-1) Nutrientsoil samples Range Mean low medium high indices
1 Mahad- Poladpur 10 114.89-269.85 101.63 10(100.00) 0(0.00) 0(0.00) 1.002 Mangaon 10 112.8-296.36 220.74 10(100.00) 0(0.00) 0(0.00) 1.003 Roha 10 100.33-295.36 181.36 9(90.00) 1(10.00) 0(0.00) 1.104 Mahasala-Sriwardhan 10 115.56-294.85 196.38 8(80.00) 2(20.00) 0(0.00) 1.205 Tale 9 158.56-298.69 232.87 7(77.77) 2(22.23) 0(0.00) 1.226 Pali 10 102.96-298.87 185.80 8(80.00) 2(20.00) 0(0.00) 1.207 Murud 10 112.89-278.99 181.43 10(100.00) 0(0.00) 0(0.00) 1.008 Alibagh 10 90.01-265.88 168.31 9(90.00) 1(10.00) 0(0.00) 1.109 Pen-ghalapur 10 100.06-266.56 177.04 10(100.00) 1(10.00) 0(0.00) 1.2010 Panwel 10 102.36-228.96 162.88 9(90.00) 1(10.00) 0(0.00) 1.1011 Karjat 10 127.83-290.36 209.36 8(80.000 2(20..0) 0(0.00) 1.20
District 109 100.06-298.87 183.43 97(88.99) 12(11.01) 0(0.00) 1.11
(Figures in parenthesis indicate percentage)
Srivardhan area of Kolaba and Karjat varied from 0.05 to0.20 and 0.15 to 0.45 mg Kg-1, respectively (Chavan et al.1980). The data revealed that mean availability of Mo inRaigad district was found highest in Roha and Alibaghtehsil (0.41 mg Kg-1) and lowest in Mahasala- Sriwardhan(0.1 mg Kg-1) tehsil. In Raigad 37.62 percent soils are inlow in available molybdenum, 34.87 percent containmedium and 26.61 percent samples contain high availablemolybdenum content. All the tehsils of Raigad alsoshowed deficiency of molybdenum in soil, the highest
percent of deficiency was found in Mahasala – Srivardhantehsil (77.77%) followed by Mangaon (60.00%) tehsil.
Relationship of available Molybdenum with soilproperties
Positive correlation is observed between pH andavailable molybdenum (r=+0.714**) as shown in Table 7.Available molybdenum had highly significantly correlatedwith pH.(Gupta and Dabas, 1980). Available soilmolybdenum increase with soil pH. Available molybdenum
Assessment of Molybdenum Status in Soils of Raigad District of Maharashtra
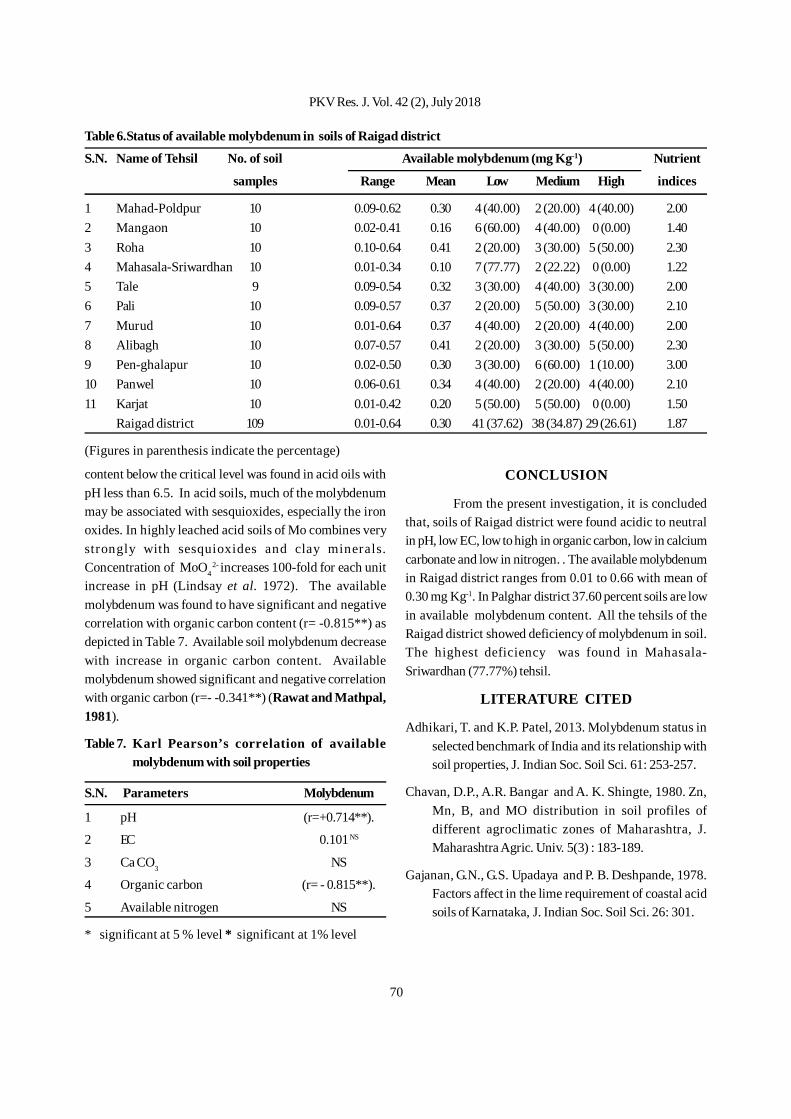
70
content below the critical level was found in acid oils withpH less than 6.5. In acid soils, much of the molybdenummay be associated with sesquioxides, especially the ironoxides. In highly leached acid soils of Mo combines verystrongly with sesquioxides and clay minerals.Concentration of MoO4
2- increases 100-fold for each unitincrease in pH (Lindsay et al. 1972). The availablemolybdenum was found to have significant and negativecorrelation with organic carbon content (r= -0.815**) asdepicted in Table 7. Available soil molybdenum decreasewith increase in organic carbon content. Availablemolybdenum showed significant and negative correlationwith organic carbon (r=- -0.341**) (Rawat and Mathpal,1981).
Table 7. Karl Pearson’s correlation of availablemolybdenum with soil properties
S.N. Parameters Molybdenum
1 pH (r=+0.714**).
2 EC 0.101 NS
3 Ca CO3 NS
4 Organic carbon (r= - 0.815**).
5 Available nitrogen NS
* significant at 5 % level * significant at 1% level
CONCLUSION
From the present investigation, it is concludedthat, soils of Raigad district were found acidic to neutralin pH, low EC, low to high in organic carbon, low in calciumcarbonate and low in nitrogen. . The available molybdenumin Raigad district ranges from 0.01 to 0.66 with mean of0.30 mg Kg-1. In Palghar district 37.60 percent soils are lowin available molybdenum content. All the tehsils of theRaigad district showed deficiency of molybdenum in soil.The highest deficiency was found in Mahasala-Sriwardhan (77.77%) tehsil.
LITERATURE CITED
Adhikari, T. and K.P. Patel, 2013. Molybdenum status inselected benchmark of India and its relationship withsoil properties, J. Indian Soc. Soil Sci. 61: 253-257.
Chavan, D.P., A.R. Bangar and A. K. Shingte, 1980. Zn,Mn, B, and MO distribution in soil profiles ofdifferent agroclimatic zones of Maharashtra, J.Maharashtra Agric. Univ. 5(3) : 183-189.
Gajanan, G.N., G.S. Upadaya and P. B. Deshpande, 1978.Factors affect in the lime requirement of coastal acidsoils of Karnataka, J. Indian Soc. Soil Sci. 26: 301.
Table 6.Status of available molybdenum in soils of Raigad district
S.N. Name of Tehsil No. of soil Available molybdenum (mg Kg-1) Nutrient
samples Range Mean Low Medium High indices
1 Mahad-Poldpur 10 0.09-0.62 0.30 4 (40.00) 2 (20.00) 4 (40.00) 2.002 Mangaon 10 0.02-0.41 0.16 6 (60.00) 4 (40.00) 0 (0.00) 1.403 Roha 10 0.10-0.64 0.41 2 (20.00) 3 (30.00) 5 (50.00) 2.304 Mahasala-Sriwardhan 10 0.01-0.34 0.10 7 (77.77) 2 (22.22) 0 (0.00) 1.225 Tale 9 0.09-0.54 0.32 3 (30.00) 4 (40.00) 3 (30.00) 2.006 Pali 10 0.09-0.57 0.37 2 (20.00) 5 (50.00) 3 (30.00) 2.107 Murud 10 0.01-0.64 0.37 4 (40.00) 2 (20.00) 4 (40.00) 2.008 Alibagh 10 0.07-0.57 0.41 2 (20.00) 3 (30.00) 5 (50.00) 2.309 Pen-ghalapur 10 0.02-0.50 0.30 3 (30.00) 6 (60.00) 1 (10.00) 3.0010 Panwel 10 0.06-0.61 0.34 4 (40.00) 2 (20.00) 4 (40.00) 2.1011 Karjat 10 0.01-0.42 0.20 5 (50.00) 5 (50.00) 0 (0.00) 1.50
Raigad district 109 0.01-0.64 0.30 41 (37.62) 38 (34.87) 29 (26.61) 1.87
(Figures in parenthesis indicate the percentage)
PKV Res. J. Vol. 42 (2), July 2018
71
Grigg, J.L., 1953. Determination of available molybdenumin soils, N.Z. Soil News, 3: 37-40.
Gupta, V.K. and Dabas, 1980. Distribution of molybdenumin some saline- sodic soils from Haryana, J. IndianSoc. Soil Sci. 28: 28-30.
Jackson, M. L., 1973. Soil chemical analysis (Eds) PrenticeHall of India Pvt. Ltd., New Dehi. pp: 69-182.
Lindsay, W.L., 1972. Inorganic phase equilibria ofmicronutrients in soils. In: J JMortvedt, P M Giordanoand W L Lindsay (eds), Micronutrients inAgriculture. Soil Science Society of America,Madison, Wisconsin, USA. pp 41–57.
Nelson, D.W and L.E.Sommers, 1982. In Methods of soilanalysis, Part II, Chemical and microbial methods byPages, A.L. , R.H .Miller and D. R. Keeney (Eds)Agronomy monograph No.9 (2nd edition) American
Society of Agronomy and Soil Science society ofAmerica, Madison, Wisconsin, USA : 570-572.
Panse, V.G. and P.V. Sukhatme , 1985. Statistical Methodsfor Agriculture Workers. (ICAR, New Delhi).
Parker, F.W. E., E. Nelson winters and K. F. Miles, 1951.The broad interpretation and application of soil testinformation. Agron.J. 43: 105-112.
Patil, A.A. and D.V. Ahire, 2013. Studies on correlation ofelectrical properties of red soils with their physicaland chemical parameters, J. of Chemical, Biologicaland Physical Sciences. 3(1) 840- 848.
Piper, C.S., 1966. Soil and plant analysis, Hans.Pub.Bombey. Asian Ed. : 368-374.
Rawat, P.S. and K.N. Mathpal, 1981. Micronutrient statusof some soils of U.P hills, J. Indian Soc. Soil Sci. 29(2): 208-214
Received on 22.10.2018
Assessment of Molybdenum Status in Soils of Raigad District of Maharashtra
72
India is the largest producer of pulses in the worldwith 24% share in the global production. The major pulsecrops of the country are chickpea (48%), pigeonpea (15%),mungbean (7%), urdbean (7%), lentil (5%) and field pea(5%) (IIPR, 2011). In the country, the major pulse-growingstates are Madhya Pradesh, Maharashtra, Rajasthan, UttarPradesh, Karnataka and Andhra Pradesh, which togetheraccount for about 80% of the total production (Ali andGupta, 2012). Despite the increase in the production,average pulse yields in India are much lower than theworld average. The requirement of pulses has beenprojected to reach 32 million tonnes by 2050 taking intoaccount with the estimated growth of the population to1.69 billion by 2050.
Pigeonpea which is also known as red gram orarhar, is second most important crop of the country afterchickpea. It is mainly used as split dal for making sour orcurry. Pigeonpea is a major and cheap source of proteincompared to animal protein. It accounts for about 15% oftotal pulses produced in the country. Similar to the caseof other pulses, India is the major pigeonpea producingcountry, contributing almost 80% of the total productionand area in the world (Annonymous, 2018).
A number of biotic and abiotic factors limitrealization of the true potential of pigeonpea. The
Effect of Foliar Application of Gibbrellic Acid on Pigeonpea [Cajanuscajan (L.)] under Rainfed Conditions
M. D. Giri1, C. P. Jaybhaye2, D. G. Kanwade3 and A. N. Patil4
ABSTRACT
A field experiment was conducted at the Agriculture Research Station (Dr. PDKV), Buldana during 2016 and 2017,to study the effect of foliar application of gibbrellic acid on pigeonpea [Cajanus cajan (L.)] under rainfed conditions. Inpigeonpea, ten treatments comprising gibbrellic acid–management practices (application of 25, 50, 75 ppm GA3 at flowering,pod development stages and control) were tested. Results indicated that two applications of 50 and 75 ppm GA3 atflowering and pod development stages recorded significantly higher number of branches per plant, number of pods perplant, seed index and grain yield than no application of the GA3. The effect of the various GA3 management treatments onthe protein content (%) was found non significant during 2016 and 2017. Two applications of 50 and 75 ppm GA3 atflowering, pod development stages recorded higher rain water use efficiency and higher gross monetary returns.
1. Assistant Professor, 2. Associate Professor, 3. Assistant Professor and 4. Senior Research Scientist, Pulses ResearchUnit, Dr. PDKV, Akola
economic loss in pigeonpea production from abioticconstraints is higher than that from biotic constraints.Frequent droughts are a major abiotic constraint toenhancing productivity and production. Frequentdroughts in the low-rainfall, semi-arid areas causeconsiderable loss in pigeonpea production. In the semi-arid tropics, pigeonpea is often grown as an intercrop inthe rainy season and its reproductive growth occurs onresidual moisture left after the harvest of a companioncrop. Lack of moisture during the reproductive phase,especially in regions where farmers grow medium-to-longduration varieties, often leads to a situation of terminaldrought, affecting crop yield substantially (Parthasarathy,et al., 2010).
In pigeonpea vegetative and reproductive stage,occurs side by side and hence always there is competitionfor available assimilates between vegetative andreproductive sinks. On the other hand, always there is alimitation of source particularly at flowering and poddevelopment stages. Apart from its genetic makeup, themajor physiological constraints limiting pigeonpea’s yieldare flower and fruit drop (Ojeaga and Ojehomon, 1972).There is possibility to overcome these constraints byagronomic interventions such as the use of plant growthregulators. Plant hormones are group of structurally
PKV Res. J. Vol. 42 (2), July 2018
73
unrelated compounds which plays diverse and vital rolein plant growth and development. Almost all thedevelopmental stages of plant are controlled by planthormones. Plant growth regulators are known to improvephysiological efficiency including photosynthetic abilityof plant and offer significant role in realizing higher cropyields. The plant growth regulators are also known toenhance the source sink relationship and stimulate thetranslocation of photo assimilates and thereby increasethe productivity.
Gibberellic acid (GA3), a plant hormonestimulating plant growth and development, is a tetracyclicdi-terpenoid com-pound. Gibbrellic Acids stimulates seedgermination, trigger transitions from meristem to shootgrowth, juvenile to adult leaf stage, vegetative to flowering,determines sex expression and grain development alongwith an interaction of different environmental factors viz.,light, temperature and water (Gupta and Chakrabarty, 2013).
With this background in view, the present investigationwas planned to assess the effect of Gibbrellic Acid (GA3)on growth, yield and economics of pigeonpea production.
MATERIAL AND METHODS
The present experiment was conducted at theAgriculture Research Station (Dr. PDKV), Buldana,Maharashtra, India during 2016 and 2017. The soil ofexperimental plot was clayey and slightly alkaline (pH 8.0),with available nitrogen (232 kg ha-1), phosphorus (21 kgha-1) and potassium (358 kg ha-1) content. GeographicallyBuldana is situated between 20032’07.27N 76011’24.43Eand its mean height above sea level is 654 m. It receivesmost of the rainfall from South-West monsoon,commencing from middle of June. The normal monsoonseason precipitation approximates to about 720 mmreceives in about 40 to 45 rainy days from the middle ofJune to September. The pigeonpea crop received a rainfallof 690mm and 1009 mm during 2016 and 2017, respectively.For studying the effect of foliar application of gibbrellicacid on pigeonpea [Cajanus cajan (L.)] under rainfedconditions, randomized block design was used. The detailsof the treatments and symbols used are given in Table 1.In all, there were ten treatments replicated three times.The experimental field was laid out in 30 unit plots, eachplot measuring 43.20 m2 (7.2m x 6.0m). There were twelve
rows of pigeonpea crop in each plot and twenty plants ineach row. One row of crop from both sides of length andalso both sides of breadth were left as guard rows. Thenet plot consisted of ten rows with eighteen plants perrow (6.0 m x 5.4 m).
Seeds of pigeonpea variety TAT-9629 popularlyknown as PDKV- Tara were sown with the spacing of 60cm between rows and 30 cm between plants on 8th July2016 and 28th June, 2017. A fertilizer dose of 25 kg N, 50 kgP2O5 and 20 kg K2O ha-1 through urea, single superphosphate and muriate of potash was applied at the timeof sowing (basal application) to all the plots. Foliarapplication of gibberellic acid was done as per thetreatments. For the foliar application of gibberellic acid astock solution of 1000 ppm was prepared by using 1.1ggibberellic acid technical (90%) along with solventdissolved in distilled water and made the volume to 1000ml using volumetric flask and from this stock solutionrequired amount of the gibbrellic acid as per the treatmentswas utilized for foliar application (Table 1).
Timely recommended plant-protection measuresfor pigeonpea crop were followed to save the crop frompests and diseases. The pigeonpea crop was harvestedmanually on 16th January 2017 during first year and 15th
January 2018 during second year. Different growth andyield components were recorded periodically.
The data on various parameters recorded fromexperimental plots were statistically analyzed as suggestedby Panse and Sukhatme (1995) by using ‘F’ test at P=0.05.
RESULTS AND DISCUSSION
Growth and yield parameters
The effect of foliar application of GA3 on plantheight in pigeonpea was found non- significant duringboth the years (Table 2). However, two applications of 75ppm GA3 at flowering and pod development stagesrecorded the highest plant height in pigeonpea (158.87cm) during 2016 and two applications of 50 ppm GA3 atflowering and pod development stages recorded highestplant height in pigeonpea (227.13 cm) during 2017, whereasno application of GA3 (control) recorded the lowest plantheight in pigeonpea (147.87 cm and 211 cm during, 2016and 2017 respectively) during both the years.
Effect of Foliar Application of Gibbrellic Acid on Pigeonpea [Cajanus cajan (L.)] under Rainfed Conditions
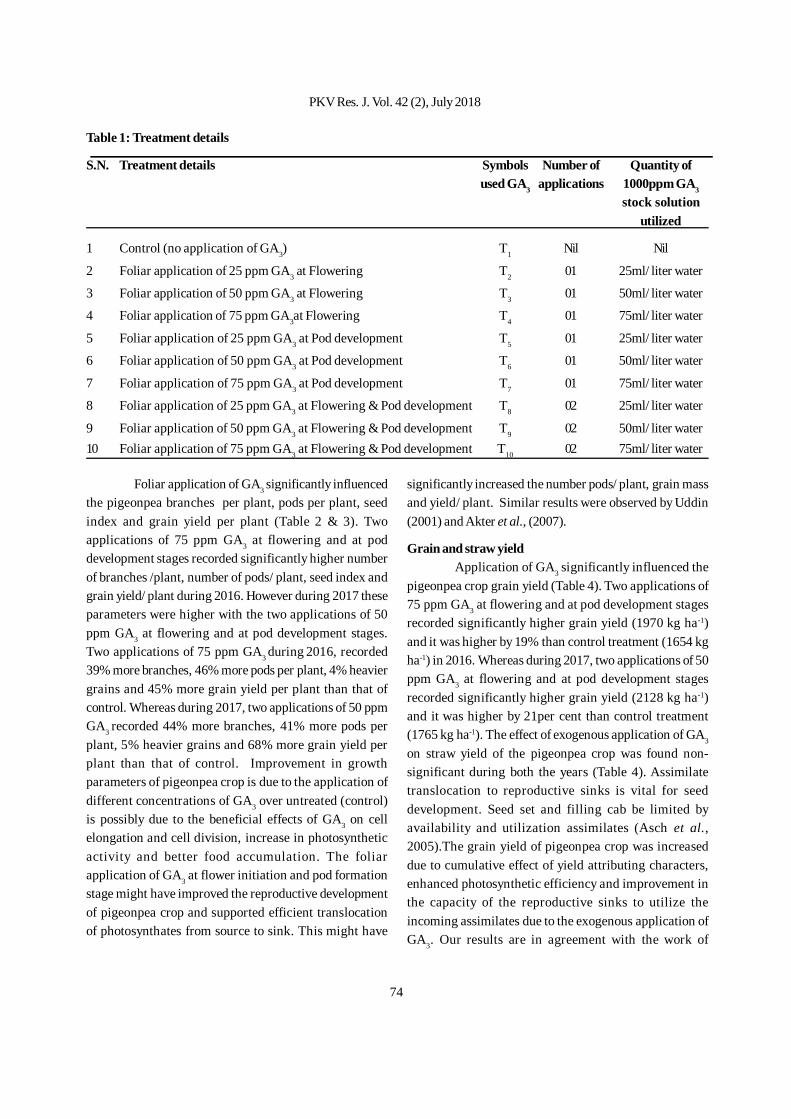
74
Foliar application of GA3 significantly influencedthe pigeonpea branches per plant, pods per plant, seedindex and grain yield per plant (Table 2 & 3). Twoapplications of 75 ppm GA3 at flowering and at poddevelopment stages recorded significantly higher numberof branches /plant, number of pods/ plant, seed index andgrain yield/ plant during 2016. However during 2017 theseparameters were higher with the two applications of 50ppm GA3 at flowering and at pod development stages.Two applications of 75 ppm GA3 during 2016, recorded39% more branches, 46% more pods per plant, 4% heaviergrains and 45% more grain yield per plant than that ofcontrol. Whereas during 2017, two applications of 50 ppmGA3 recorded 44% more branches, 41% more pods perplant, 5% heavier grains and 68% more grain yield perplant than that of control. Improvement in growthparameters of pigeonpea crop is due to the application ofdifferent concentrations of GA3 over untreated (control)is possibly due to the beneficial effects of GA3 on cellelongation and cell division, increase in photosyntheticactivity and better food accumulation. The foliarapplication of GA3 at flower initiation and pod formationstage might have improved the reproductive developmentof pigeonpea crop and supported efficient translocationof photosynthates from source to sink. This might have
significantly increased the number pods/ plant, grain massand yield/ plant. Similar results were observed by Uddin(2001) and Akter et al., (2007).
Grain and straw yieldApplication of GA3 significantly influenced the
pigeonpea crop grain yield (Table 4). Two applications of75 ppm GA3 at flowering and at pod development stagesrecorded significantly higher grain yield (1970 kg ha-1)and it was higher by 19% than control treatment (1654 kgha-1) in 2016. Whereas during 2017, two applications of 50ppm GA3 at flowering and at pod development stagesrecorded significantly higher grain yield (2128 kg ha-1)and it was higher by 21per cent than control treatment(1765 kg ha-1). The effect of exogenous application of GA3
on straw yield of the pigeonpea crop was found non-significant during both the years (Table 4). Assimilatetranslocation to reproductive sinks is vital for seeddevelopment. Seed set and filling cab be limited byavailability and utilization assimilates (Asch et al.,2005).The grain yield of pigeonpea crop was increaseddue to cumulative effect of yield attributing characters,enhanced photosynthetic efficiency and improvement inthe capacity of the reproductive sinks to utilize theincoming assimilates due to the exogenous application ofGA3. Our results are in agreement with the work of
Table 1: Treatment details
S.N. Treatment details Symbols Number of Quantity ofused GA3 applications 1000ppm GA3
stock solutionutilized
1 Control (no application of GA3) T1 Nil Nil
2 Foliar application of 25 ppm GA3 at Flowering T2 01 25ml/ liter water
3 Foliar application of 50 ppm GA3 at Flowering T3 01 50ml/ liter water
4 Foliar application of 75 ppm GA3at Flowering T4 01 75ml/ liter water
5 Foliar application of 25 ppm GA3 at Pod development T5 01 25ml/ liter water
6 Foliar application of 50 ppm GA3 at Pod development T6 01 50ml/ liter water
7 Foliar application of 75 ppm GA3 at Pod development T7 01 75ml/ liter water
8 Foliar application of 25 ppm GA3 at Flowering & Pod development T8 02 25ml/ liter water
9 Foliar application of 50 ppm GA3 at Flowering & Pod development T9 02 50ml/ liter water10 Foliar application of 75 ppm GA3 at Flowering & Pod development T10 02 75ml/ liter water
PKV Res. J. Vol. 42 (2), July 2018
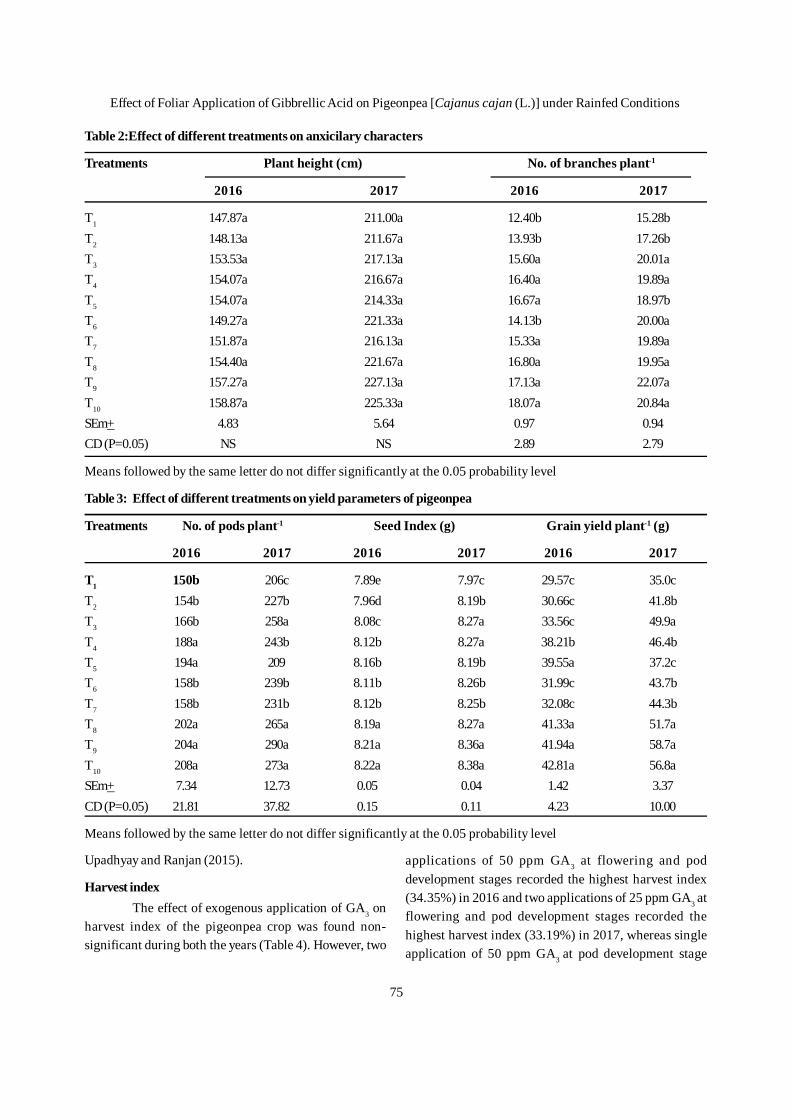
75
Table 2:Effect of different treatments on anxicilary characters
Treatments Plant height (cm) No. of branches plant-1
2016 2017 2016 2017
T1 147.87a 211.00a 12.40b 15.28bT2 148.13a 211.67a 13.93b 17.26bT3 153.53a 217.13a 15.60a 20.01aT4 154.07a 216.67a 16.40a 19.89aT5 154.07a 214.33a 16.67a 18.97bT6 149.27a 221.33a 14.13b 20.00aT7 151.87a 216.13a 15.33a 19.89aT8 154.40a 221.67a 16.80a 19.95aT9 157.27a 227.13a 17.13a 22.07aT10 158.87a 225.33a 18.07a 20.84aSEm+ 4.83 5.64 0.97 0.94CD (P=0.05) NS NS 2.89 2.79
Means followed by the same letter do not differ significantly at the 0.05 probability level
Table 3: Effect of different treatments on yield parameters of pigeonpea
Treatments No. of pods plant-1 Seed Index (g) Grain yield plant-1 (g)
2016 2017 2016 2017 2016 2017
T1 150b 206c 7.89e 7.97c 29.57c 35.0cT2 154b 227b 7.96d 8.19b 30.66c 41.8bT3 166b 258a 8.08c 8.27a 33.56c 49.9aT4 188a 243b 8.12b 8.27a 38.21b 46.4bT5 194a 209 8.16b 8.19b 39.55a 37.2cT6 158b 239b 8.11b 8.26b 31.99c 43.7bT7 158b 231b 8.12b 8.25b 32.08c 44.3bT8 202a 265a 8.19a 8.27a 41.33a 51.7aT9 204a 290a 8.21a 8.36a 41.94a 58.7aT10 208a 273a 8.22a 8.38a 42.81a 56.8aSEm+ 7.34 12.73 0.05 0.04 1.42 3.37CD (P=0.05) 21.81 37.82 0.15 0.11 4.23 10.00
Means followed by the same letter do not differ significantly at the 0.05 probability level
Upadhyay and Ranjan (2015).
Harvest indexThe effect of exogenous application of GA3 on
harvest index of the pigeonpea crop was found non-significant during both the years (Table 4). However, two
applications of 50 ppm GA3 at flowering and poddevelopment stages recorded the highest harvest index(34.35%) in 2016 and two applications of 25 ppm GA3 atflowering and pod development stages recorded thehighest harvest index (33.19%) in 2017, whereas singleapplication of 50 ppm GA3 at pod development stage
Effect of Foliar Application of Gibbrellic Acid on Pigeonpea [Cajanus cajan (L.)] under Rainfed Conditions
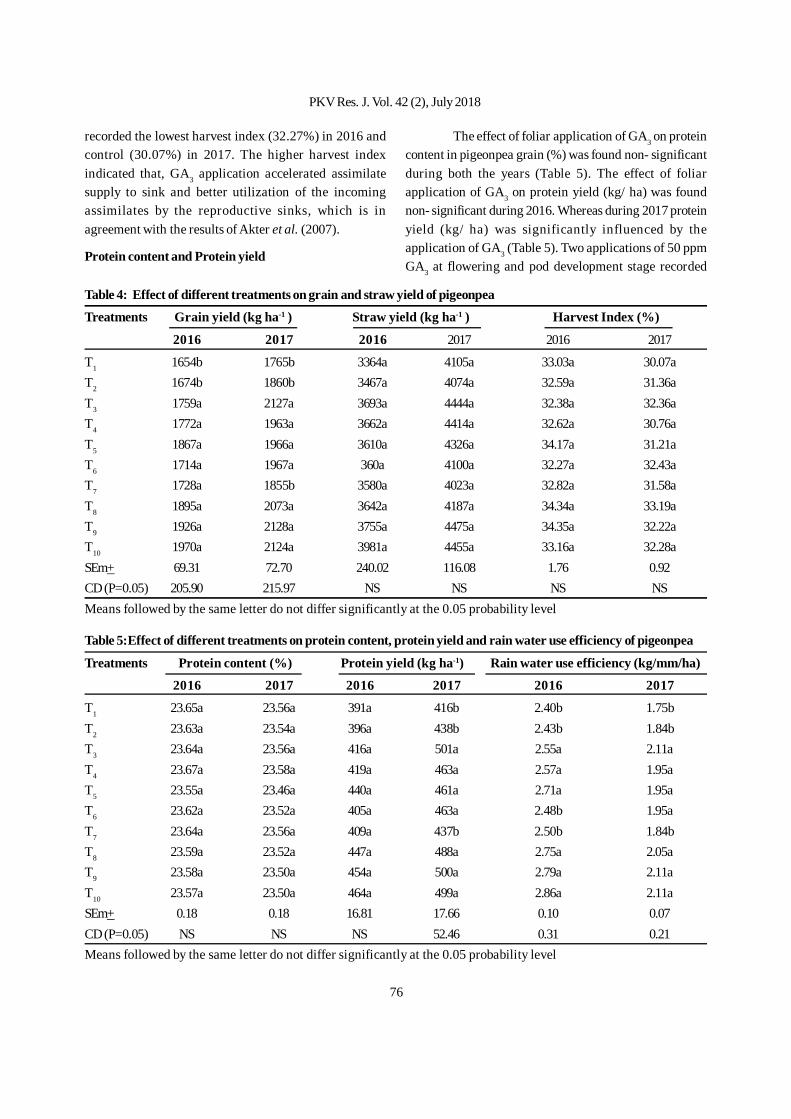
76
Table 4: Effect of different treatments on grain and straw yield of pigeonpea
Treatments Grain yield (kg ha-1 ) Straw yield (kg ha-1 ) Harvest Index (%)
2016 2017 2016 2017 2016 2017
T1 1654b 1765b 3364a 4105a 33.03a 30.07aT2 1674b 1860b 3467a 4074a 32.59a 31.36aT3 1759a 2127a 3693a 4444a 32.38a 32.36aT4 1772a 1963a 3662a 4414a 32.62a 30.76aT5 1867a 1966a 3610a 4326a 34.17a 31.21aT6 1714a 1967a 360a 4100a 32.27a 32.43aT7 1728a 1855b 3580a 4023a 32.82a 31.58aT8 1895a 2073a 3642a 4187a 34.34a 33.19aT9 1926a 2128a 3755a 4475a 34.35a 32.22aT10 1970a 2124a 3981a 4455a 33.16a 32.28aSEm+ 69.31 72.70 240.02 116.08 1.76 0.92CD (P=0.05) 205.90 215.97 NS NS NS NSMeans followed by the same letter do not differ significantly at the 0.05 probability level
Table 5:Effect of different treatments on protein content, protein yield and rain water use efficiency of pigeonpea
Treatments Protein content (%) Protein yield (kg ha-1) Rain water use efficiency (kg/mm/ha)
2016 2017 2016 2017 2016 2017
T1 23.65a 23.56a 391a 416b 2.40b 1.75bT2 23.63a 23.54a 396a 438b 2.43b 1.84bT3 23.64a 23.56a 416a 501a 2.55a 2.11aT4 23.67a 23.58a 419a 463a 2.57a 1.95aT5 23.55a 23.46a 440a 461a 2.71a 1.95aT6 23.62a 23.52a 405a 463a 2.48b 1.95aT7 23.64a 23.56a 409a 437b 2.50b 1.84bT8 23.59a 23.52a 447a 488a 2.75a 2.05aT9 23.58a 23.50a 454a 500a 2.79a 2.11aT10 23.57a 23.50a 464a 499a 2.86a 2.11aSEm+ 0.18 0.18 16.81 17.66 0.10 0.07CD (P=0.05) NS NS NS 52.46 0.31 0.21Means followed by the same letter do not differ significantly at the 0.05 probability level
recorded the lowest harvest index (32.27%) in 2016 andcontrol (30.07%) in 2017. The higher harvest indexindicated that, GA3 application accelerated assimilatesupply to sink and better utilization of the incomingassimilates by the reproductive sinks, which is inagreement with the results of Akter et al. (2007).
Protein content and Protein yield
The effect of foliar application of GA3 on proteincontent in pigeonpea grain (%) was found non- significantduring both the years (Table 5). The effect of foliarapplication of GA3 on protein yield (kg/ ha) was foundnon- significant during 2016. Whereas during 2017 proteinyield (kg/ ha) was significantly influenced by theapplication of GA3 (Table 5). Two applications of 50 ppmGA3 at flowering and pod development stage recorded
PKV Res. J. Vol. 42 (2), July 2018
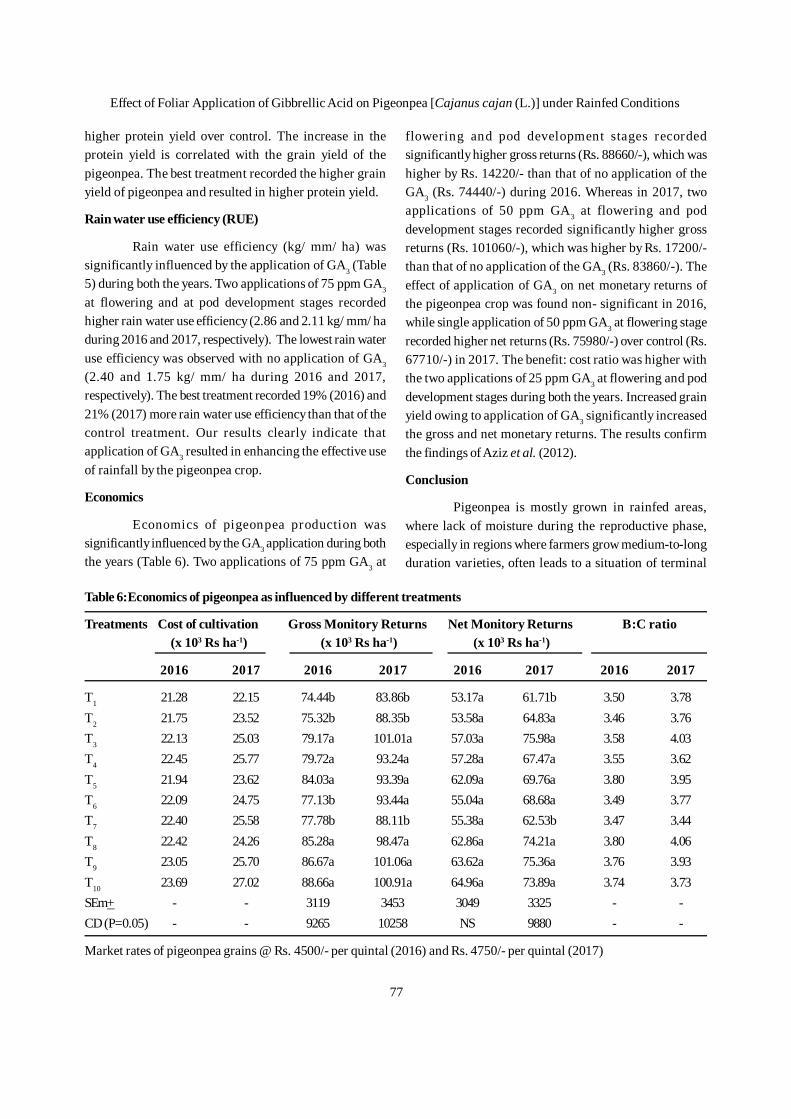
77
higher protein yield over control. The increase in theprotein yield is correlated with the grain yield of thepigeonpea. The best treatment recorded the higher grainyield of pigeonpea and resulted in higher protein yield.
Rain water use efficiency (RUE)
Rain water use efficiency (kg/ mm/ ha) wassignificantly influenced by the application of GA3 (Table5) during both the years. Two applications of 75 ppm GA3
at flowering and at pod development stages recordedhigher rain water use efficiency (2.86 and 2.11 kg/ mm/ haduring 2016 and 2017, respectively). The lowest rain wateruse efficiency was observed with no application of GA3
(2.40 and 1.75 kg/ mm/ ha during 2016 and 2017,respectively). The best treatment recorded 19% (2016) and21% (2017) more rain water use efficiency than that of thecontrol treatment. Our results clearly indicate thatapplication of GA3 resulted in enhancing the effective useof rainfall by the pigeonpea crop.
Economics
Economics of pigeonpea production wassignificantly influenced by the GA3 application during boththe years (Table 6). Two applications of 75 ppm GA3 at
flowering and pod development stages recordedsignificantly higher gross returns (Rs. 88660/-), which washigher by Rs. 14220/- than that of no application of theGA3 (Rs. 74440/-) during 2016. Whereas in 2017, twoapplications of 50 ppm GA3 at flowering and poddevelopment stages recorded significantly higher grossreturns (Rs. 101060/-), which was higher by Rs. 17200/-than that of no application of the GA3 (Rs. 83860/-). Theeffect of application of GA3 on net monetary returns ofthe pigeonpea crop was found non- significant in 2016,while single application of 50 ppm GA3 at flowering stagerecorded higher net returns (Rs. 75980/-) over control (Rs.67710/-) in 2017. The benefit: cost ratio was higher withthe two applications of 25 ppm GA3 at flowering and poddevelopment stages during both the years. Increased grainyield owing to application of GA3 significantly increasedthe gross and net monetary returns. The results confirmthe findings of Aziz et al. (2012).
Conclusion
Pigeonpea is mostly grown in rainfed areas,where lack of moisture during the reproductive phase,especially in regions where farmers grow medium-to-longduration varieties, often leads to a situation of terminal
Table 6:Economics of pigeonpea as influenced by different treatments
Treatments Cost of cultivation Gross Monitory Returns Net Monitory Returns B:C ratio (x 103 Rs ha-1) (x 103 Rs ha-1) (x 103 Rs ha-1)
2016 2017 2016 2017 2016 2017 2016 2017
T1 21.28 22.15 74.44b 83.86b 53.17a 61.71b 3.50 3.78T2 21.75 23.52 75.32b 88.35b 53.58a 64.83a 3.46 3.76T3 22.13 25.03 79.17a 101.01a 57.03a 75.98a 3.58 4.03T4 22.45 25.77 79.72a 93.24a 57.28a 67.47a 3.55 3.62T5 21.94 23.62 84.03a 93.39a 62.09a 69.76a 3.80 3.95T6 22.09 24.75 77.13b 93.44a 55.04a 68.68a 3.49 3.77T7 22.40 25.58 77.78b 88.11b 55.38a 62.53b 3.47 3.44T8 22.42 24.26 85.28a 98.47a 62.86a 74.21a 3.80 4.06T9 23.05 25.70 86.67a 101.06a 63.62a 75.36a 3.76 3.93T10 23.69 27.02 88.66a 100.91a 64.96a 73.89a 3.74 3.73SEm+ - - 3119 3453 3049 3325 - -CD (P=0.05) - - 9265 10258 NS 9880 - -
Market rates of pigeonpea grains @ Rs. 4500/- per quintal (2016) and Rs. 4750/- per quintal (2017)
Effect of Foliar Application of Gibbrellic Acid on Pigeonpea [Cajanus cajan (L.)] under Rainfed Conditions
78
drought, affecting crop yield substantially. Results of ourstudy indicated that GA3 management practices arepromising in controlling the decline in productivity ofpigeonpea crop in rainfed areas.
LITERATURE CITED
Annymous, 2018. Annual Report 2017-2018. All IndiaCoordinated Research Project on Pigeonpea.
Akter, A., E.Ali, M.M.Z.Islam, R.Karim, and A.H.M.Razzaque, 2007. Effect of GA3 on growth and yieldof mustard, Int. J. of Sust. Crop Prod. 2(2): 16-20.
Ali, M. and Gupta, Sanjeev. 2012. Carrying capacity ofIndian agriculture : pulse crops. Current Science.102 (6): 874–81
Asch, F., M. Dngluhnb , A.Sow, A. Audebert, 2005.Drought- induced changes in rooting patterns andassimilate partitioning between root and shoot inuplant rice. Field Crop Res. 93: 223-236.
Azizi K, J. Moradii, S. Heidari, A. Khalili and M.Feizian,2012. Effect of different concentrations of gibberellicacid on seed yield and yield components of soybeangenotypes in summer intercropping. Int. J. Agric.Sci. 2: 291-301.
Gupta, Ramwant, and S.K. Chakrabarty, 2013. Gibbrellicacid in plant still a mystery unresolved. PlantSignaling and Behavior 8-9.
IIPR. 2011. IIPR Vision, 2030. Indian Institute of PulsesResearch (ICAR), Kanpur, Uttar Pradesh, India.
Ojeaga, O., and Ojehomon,1972. Fruit abscission in cowpea(Vigna unquiculata (L). Wasp). J. Exp. Bot. 23: 751-761.Panse, V.G. and Sukhatme, P.V. 1995. StatisticalMethods for Agricultural Workers, ICAR, New Delhi.
Parthasarathy Rao P, P.S. Birthal, S. Bhagavatula andM.C.S. Bantilan, 2010. Chickpea and PigeonpeaEconomies in Asia: Facts, Trends and Outlook.Patancheru 502 324, Andhra Pradesh, India:International Crops Research Institute for the Semi-Arid Tropics. 76
Uddin, A. 1999. Effect of growth regulators on growth,yield and quality of mungbean. Sarhad J. Agric.15:441-445.
Upadhyay, R.G. and R. Ranjan, 2015. Effect of growthhormones on morphological parameters, yield andquality of soybean (Glycine max L.) during changingscenario of climate under midhill conditions ofUttarakhand. Int. J. of Trop. Agric. 33: 1899-1904.
Received on 17.8.2018
PKV Res. J. Vol. 42 (2), July 2018
79
The Prime Minister’s vision of doubling farmer’sincome by 2022 is worth serious attention. This laudableobjective could not only improve the well being of ourfarmers but can also be a trigger to boost agri-basedmanufacturing growth in rural India. The diversificationto more productive and remunerative crops has becomethe new milestone to be achieved in Indian Agriculture. Ashift in favour of horticultural crops as a more viable andattractive alternative is a part of such diversification driveand strategy. (Malhotra S.K., 2017). In India about 88819thousand tonnes of fruits are produced annually (Anon.,2016).
But hardly 1.2% of this is utilised for processingand preservation and about 30-33% of the total productionis wasted due to spoilage during handling, transportationand lack of cold storage facility (Baisya, 1980). In order tominimise postharvest losses and to avoid market glut,fruits are need to be effectively utilised in processingindustry (Sahota and Sunil, 2006). Jamun is also one ofthe underutilized fruit which is highly seasonal (May toJune), highly perishable and short storability (upto 2-3days under ambient temperature), and due to lesspopularity this fruit is considered as an unexploited fruitcrop in India. The exploitation of underutilized fruits can
Preparation of Wine from Jamun: A transition for Doubling Farmer’s Income
Kuntal Satkar1, S. G. Bharad2and P. K. Nagre3
ABSTRACT
Jamun wine production is an alternative fordeployment of highly seasonal (May to June), highly perishableunderutilized jamun fruits with short storability (upto 2-3 days under ambient temperature). The exploitation of underutilizedfruits of jamun can provide a solution to nutrition, livelihood and economic security of tribals by using available traditionalwisdom as well as modern processing technology. Setting up of fruit wineries could result in the economic upliftment ofthetribals by generating employment opportunities. Keeping this scenario in view an investigation was undertaken forpreparation of jamun wine at Department of Fruit Science, College of Horticulture, Dr.PDKV, Akola during 2015-17 withobjectives to prepare the wine from jamun fruit juice with the wine yeast (Saccharomyces cerevisiae var. ellipsoideus) asa transition for Doubling Farmer’s Income. Amongst the combination tried for different levels of yeast and fermentationduration, treatment combination S1F3 (Saccharomyces cerevisiae var. ellipsoideus inoculated at 0.20 g/l for 21 days offermentation) was found best in respect of TSS, anthocyanin content, ethyl alcohol and anti oxidant activity.Consideringthe findings of investigation and highest net monitory returns (5.86 B:C ratio) obtained from jamun wine production itcould be concluded that, the appropriate combination of levels of yeast and fermentation duration is needed for qualityjamun wine production.
1. Ph.D. Scholar, 2. Head and 3. Dean, Fuaculy of Horticulture, Dr. PDKV, Akola
provide a solution to nutrition, livelihood and economicsecurity of tribals by using available traditional wisdomas well as modern processing technology. Setting up offruit wineries could result in the livelihood and economicsecurity of tribal farmers by using available traditionalwisdom as well as modern processing technology bygenerating employment opportunities.Eastern Vidarbharegion viz.,Gadchiroli district of Maharashtra is a treasureof underutilized jamun fruits. If exploited properly, has thepotential of transforming the economy of this tribaldominated region.
The world production of jamun is estimated at13.5 million tonnes out of which 15.4 % is contributed byIndia (Anon, 2014). The Eastern Vidarbha, Melghat andKonkan region of Maharashtra are known to have largenumber of jamun trees. However, large quantities of jamunare lost either through rainfall or in sorting and grading tomeet quality standards for fresh fruit export market, whichcould otherwise be used for wineprocessing. In Indiaalone wastage of Jamun is 0.5 - 2MT. A large quantity ofmarketable surplus fruit is available in all jamun growingregions which need to be processed and converted intovalue added products (Patilet al., 2012) like jamun wine.
PKV Res. J. Vol. 42 (2), July 2018
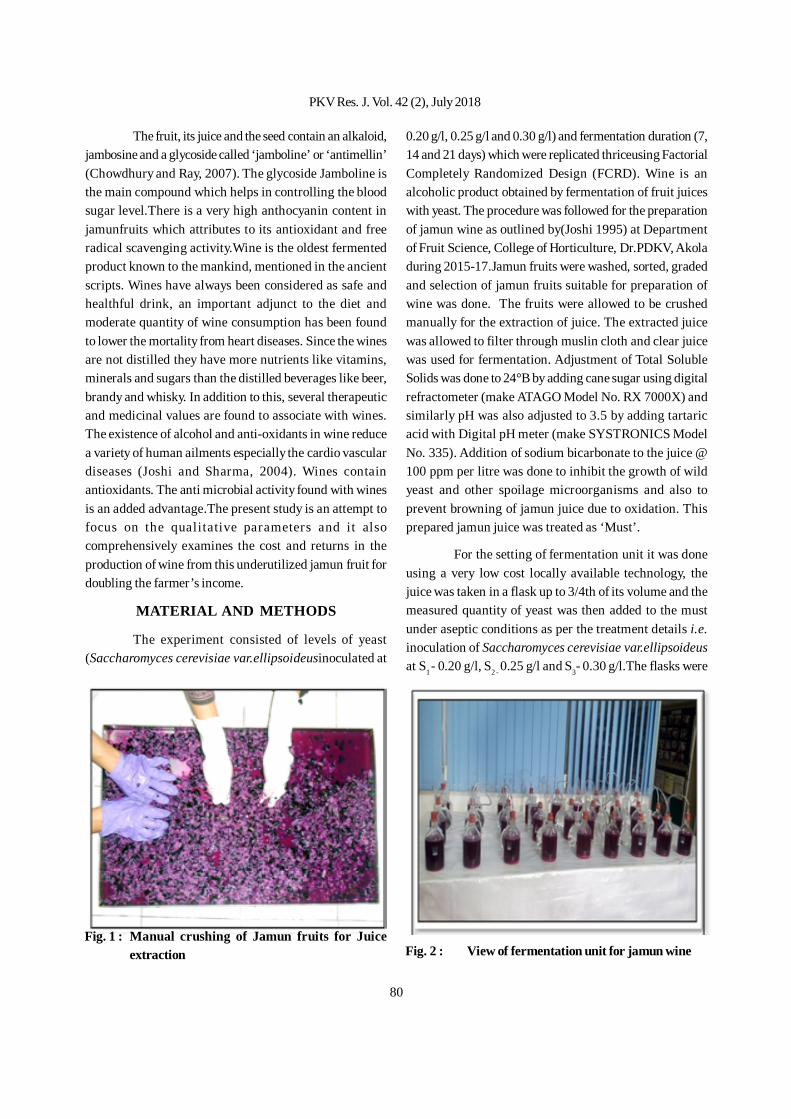
80
The fruit, its juice and the seed contain an alkaloid,jambosine and a glycoside called ‘jamboline’ or ‘antimellin’(Chowdhury and Ray, 2007). The glycoside Jamboline isthe main compound which helps in controlling the bloodsugar level.There is a very high anthocyanin content injamunfruits which attributes to its antioxidant and freeradical scavenging activity.Wine is the oldest fermentedproduct known to the mankind, mentioned in the ancientscripts. Wines have always been considered as safe andhealthful drink, an important adjunct to the diet andmoderate quantity of wine consumption has been foundto lower the mortality from heart diseases. Since the winesare not distilled they have more nutrients like vitamins,minerals and sugars than the distilled beverages like beer,brandy and whisky. In addition to this, several therapeuticand medicinal values are found to associate with wines.The existence of alcohol and anti-oxidants in wine reducea variety of human ailments especially the cardio vasculardiseases (Joshi and Sharma, 2004). Wines containantioxidants. The anti microbial activity found with winesis an added advantage.The present study is an attempt tofocus on the qualitative parameters and it alsocomprehensively examines the cost and returns in theproduction of wine from this underutilized jamun fruit fordoubling the farmer’s income.
MATERIAL AND METHODS
The experiment consisted of levels of yeast(Saccharomyces cerevisiae var.ellipsoideusinoculated at
0.20 g/l, 0.25 g/l and 0.30 g/l) and fermentation duration (7,14 and 21 days) which were replicated thriceusing FactorialCompletely Randomized Design (FCRD). Wine is analcoholic product obtained by fermentation of fruit juiceswith yeast. The procedure was followed for the preparationof jamun wine as outlined by(Joshi 1995) at Departmentof Fruit Science, College of Horticulture, Dr.PDKV, Akoladuring 2015-17.Jamun fruits were washed, sorted, gradedand selection of jamun fruits suitable for preparation ofwine was done. The fruits were allowed to be crushedmanually for the extraction of juice. The extracted juicewas allowed to filter through muslin cloth and clear juicewas used for fermentation. Adjustment of Total SolubleSolids was done to 24°B by adding cane sugar using digitalrefractometer (make ATAGO Model No. RX 7000X) andsimilarly pH was also adjusted to 3.5 by adding tartaricacid with Digital pH meter (make SYSTRONICS ModelNo. 335). Addition of sodium bicarbonate to the juice @100 ppm per litre was done to inhibit the growth of wildyeast and other spoilage microorganisms and also toprevent browning of jamun juice due to oxidation. Thisprepared jamun juice was treated as ‘Must’.
For the setting of fermentation unit it was doneusing a very low cost locally available technology, thejuice was taken in a flask up to 3/4th of its volume and themeasured quantity of yeast was then added to the mustunder aseptic conditions as per the treatment details i.e.inoculation of Saccharomyces cerevisiae var.ellipsoideusat S1 - 0.20 g/l, S2 - 0.25 g/l and S3- 0.30 g/l.The flasks were
Fig. 1 : Manual crushing of Jamun fruits for Juiceextraction Fig. 2 : View of fermentation unit for jamun wine
PKV Res. J. Vol. 42 (2), July 2018
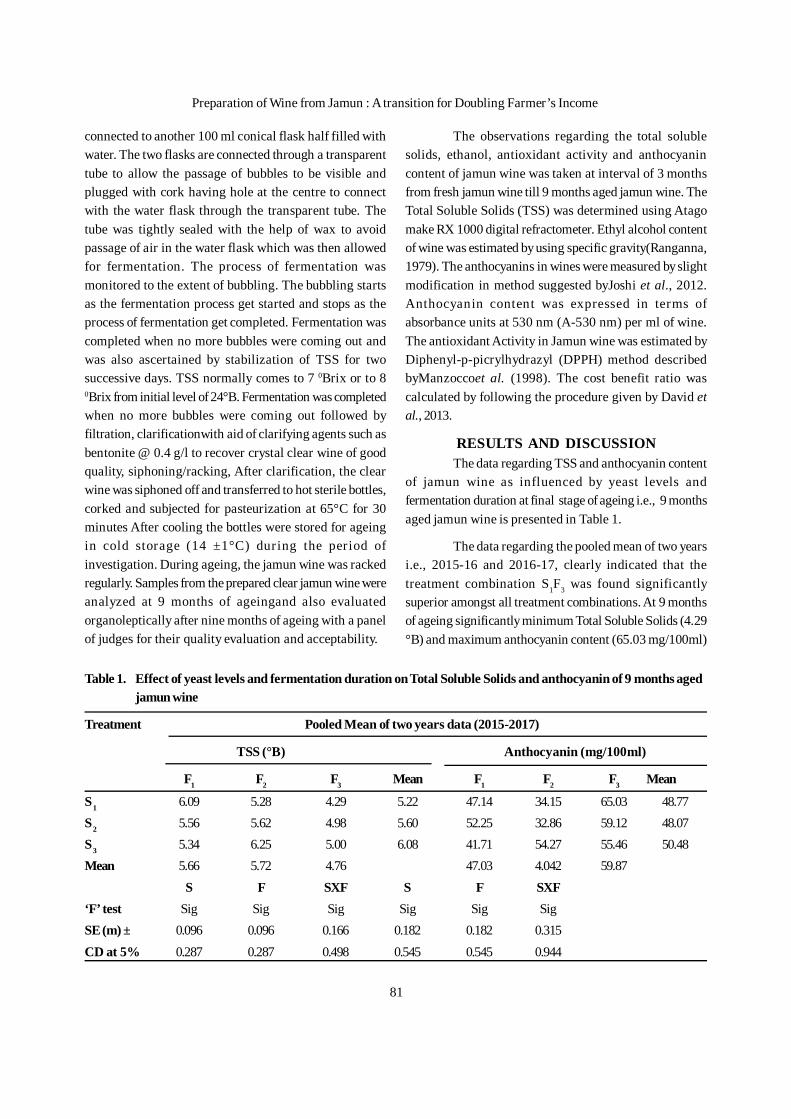
81
connected to another 100 ml conical flask half filled withwater. The two flasks are connected through a transparenttube to allow the passage of bubbles to be visible andplugged with cork having hole at the centre to connectwith the water flask through the transparent tube. Thetube was tightly sealed with the help of wax to avoidpassage of air in the water flask which was then allowedfor fermentation. The process of fermentation wasmonitored to the extent of bubbling. The bubbling startsas the fermentation process get started and stops as theprocess of fermentation get completed. Fermentation wascompleted when no more bubbles were coming out andwas also ascertained by stabilization of TSS for twosuccessive days. TSS normally comes to 7 0Brix or to 80Brix from initial level of 24°B. Fermentation was completedwhen no more bubbles were coming out followed byfiltration, clarificationwith aid of clarifying agents such asbentonite @ 0.4 g/l to recover crystal clear wine of goodquality, siphoning/racking, After clarification, the clearwine was siphoned off and transferred to hot sterile bottles,corked and subjected for pasteurization at 65°C for 30minutes After cooling the bottles were stored for ageingin cold storage (14 ±1°C) during the period ofinvestigation. During ageing, the jamun wine was rackedregularly. Samples from the prepared clear jamun wine wereanalyzed at 9 months of ageingand also evaluatedorganoleptically after nine months of ageing with a panelof judges for their quality evaluation and acceptability.
The observations regarding the total solublesolids, ethanol, antioxidant activity and anthocyanincontent of jamun wine was taken at interval of 3 monthsfrom fresh jamun wine till 9 months aged jamun wine. TheTotal Soluble Solids (TSS) was determined using Atagomake RX 1000 digital refractometer. Ethyl alcohol contentof wine was estimated by using specific gravity(Ranganna,1979). The anthocyanins in wines were measured by slightmodification in method suggested byJoshi et al., 2012.Anthocyanin content was expressed in terms ofabsorbance units at 530 nm (A-530 nm) per ml of wine.The antioxidant Activity in Jamun wine was estimated byDiphenyl-p-picrylhydrazyl (DPPH) method describedbyManzoccoet al. (1998). The cost benefit ratio wascalculated by following the procedure given by David etal., 2013.
RESULTS AND DISCUSSIONThe data regarding TSS and anthocyanin content
of jamun wine as influenced by yeast levels andfermentation duration at final stage of ageing i.e., 9 monthsaged jamun wine is presented in Table 1.
The data regarding the pooled mean of two yearsi.e., 2015-16 and 2016-17, clearly indicated that thetreatment combination S1F3 was found significantlysuperior amongst all treatment combinations. At 9 monthsof ageing significantly minimum Total Soluble Solids (4.29°B) and maximum anthocyanin content (65.03 mg/100ml)
Table 1. Effect of yeast levels and fermentation duration on Total Soluble Solids and anthocyanin of 9 months agedjamun wine
Treatment Pooled Mean of two years data (2015-2017)
TSS (°B) Anthocyanin (mg/100ml)
F1 F2 F3 Mean F1 F2 F3 Mean
S1 6.09 5.28 4.29 5.22 47.14 34.15 65.03 48.77S2 5.56 5.62 4.98 5.60 52.25 32.86 59.12 48.07S3 5.34 6.25 5.00 6.08 41.71 54.27 55.46 50.48Mean 5.66 5.72 4.76 47.03 4.042 59.87
S F SXF S F SXF‘F’ test Sig Sig Sig Sig Sig SigSE (m) ± 0.096 0.096 0.166 0.182 0.182 0.315CD at 5% 0.287 0.287 0.498 0.545 0.545 0.944
Preparation of Wine from Jamun : A transition for Doubling Farmer’s Income
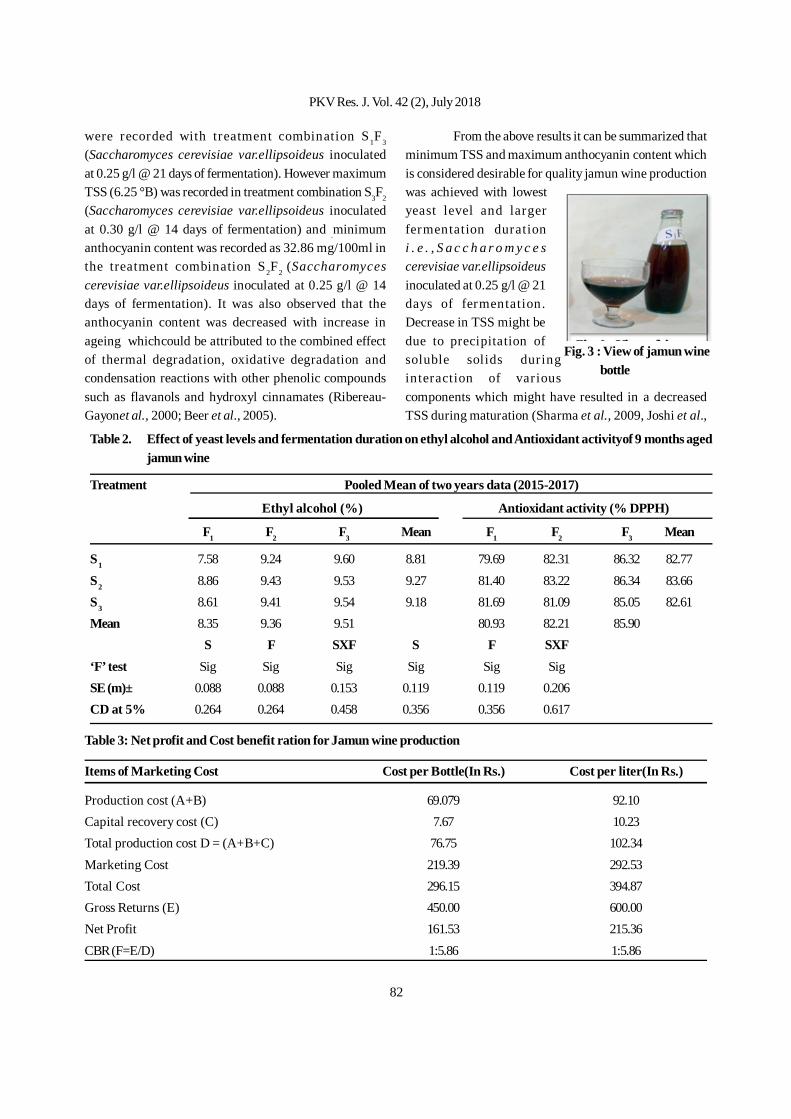
82
were recorded with treatment combination S1F3
(Saccharomyces cerevisiae var.ellipsoideus inoculatedat 0.25 g/l @ 21 days of fermentation). However maximumTSS (6.25 °B) was recorded in treatment combination S3F2
(Saccharomyces cerevisiae var.ellipsoideus inoculatedat 0.30 g/l @ 14 days of fermentation) and .minimumanthocyanin content was recorded as 32.86 mg/100ml inthe treatment combination S2F2 (Saccharomycescerevisiae var.ellipsoideus inoculated at 0.25 g/l @ 14days of fermentation). It was also observed that theanthocyanin content was decreased with increase inageing whichcould be attributed to the combined effectof thermal degradation, oxidative degradation andcondensation reactions with other phenolic compoundssuch as flavanols and hydroxyl cinnamates (Ribereau-Gayonet al., 2000; Beer et al., 2005).
From the above results it can be summarized thatminimum TSS and maximum anthocyanin content whichis considered desirable for quality jamun wine productionwas achieved with lowestyeast level and largerfermentation durationi . e . , S a c c h a r o m y c e scerevisiae var.ellipsoideusinoculated at 0.25 g/l @ 21days of fermentation.Decrease in TSS might bedue to precipitation ofsoluble solids duringinteraction of variouscomponents which might have resulted in a decreasedTSS during maturation (Sharma et al., 2009, Joshi et al.,
Table 3: Net profit and Cost benefit ration for Jamun wine production
Items of Marketing Cost Cost per Bottle(In Rs.) Cost per liter(In Rs.)
Production cost (A+B) 69.079 92.10Capital recovery cost (C) 7.67 10.23Total production cost D = (A+B+C) 76.75 102.34Marketing Cost 219.39 292.53Total Cost 296.15 394.87Gross Returns (E) 450.00 600.00Net Profit 161.53 215.36CBR (F=E/D) 1:5.86 1:5.86
Table 2. Effect of yeast levels and fermentation duration on ethyl alcohol and Antioxidant activityof 9 months agedjamun wine
Treatment Pooled Mean of two years data (2015-2017)
Ethyl alcohol (%) Antioxidant activity (% DPPH)
F1 F2 F3 Mean F1 F2 F3 Mean
S1 7.58 9.24 9.60 8.81 79.69 82.31 86.32 82.77S2 8.86 9.43 9.53 9.27 81.40 83.22 86.34 83.66S3 8.61 9.41 9.54 9.18 81.69 81.09 85.05 82.61Mean 8.35 9.36 9.51 80.93 82.21 85.90
S F SXF S F SXF‘F’ test Sig Sig Sig Sig Sig SigSE (m)± 0.088 0.088 0.153 0.119 0.119 0.206CD at 5% 0.264 0.264 0.458 0.356 0.356 0.617
Fig. 3 : View of jamun winebottle
PKV Res. J. Vol. 42 (2), July 2018
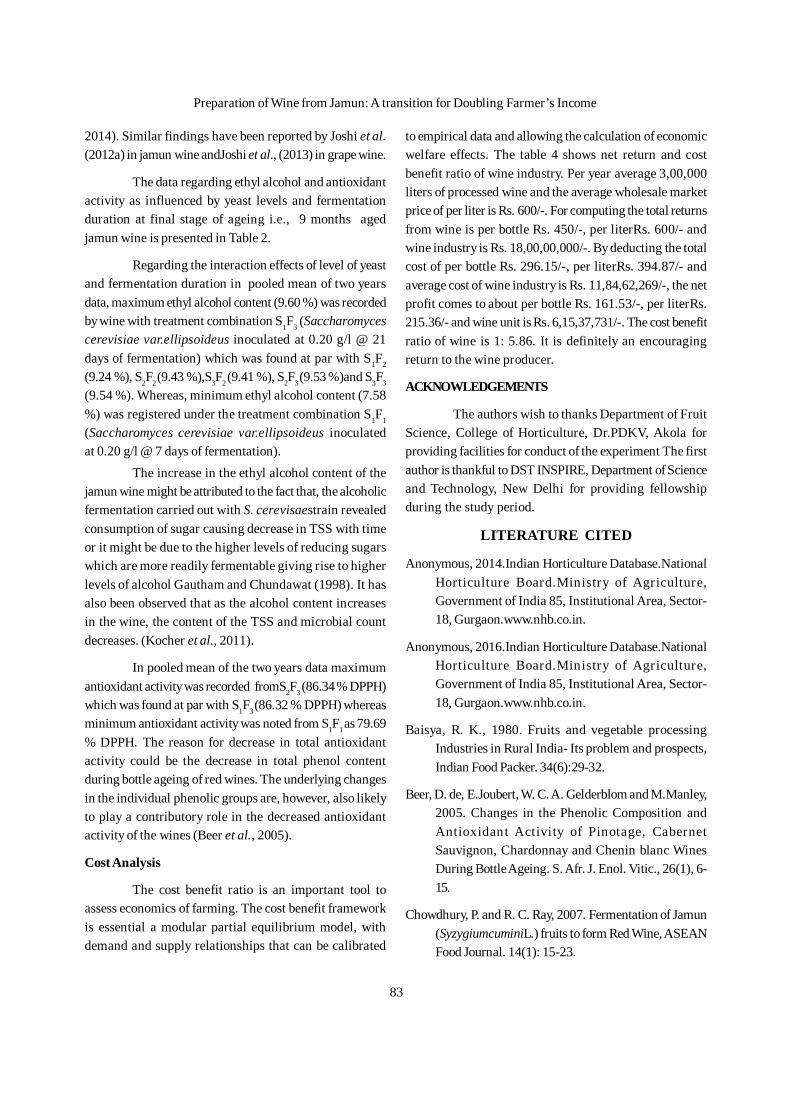
83
2014). Similar findings have been reported by Joshi et al.(2012a) in jamun wine andJoshi et al., (2013) in grape wine.
The data regarding ethyl alcohol and antioxidantactivity as influenced by yeast levels and fermentationduration at final stage of ageing i.e., 9 months agedjamun wine is presented in Table 2.
Regarding the interaction effects of level of yeastand fermentation duration in pooled mean of two yearsdata, maximum ethyl alcohol content (9.60 %) was recordedby wine with treatment combination S1F3 (Saccharomycescerevisiae var.ellipsoideus inoculated at 0.20 g/l @ 21days of fermentation) which was found at par with S1F2
(9.24 %), S2F2 (9.43 %),S3F2 (9.41 %), S2F3 (9.53 %)and S3F3
(9.54 %). Whereas, minimum ethyl alcohol content (7.58%) was registered under the treatment combination S1F1
(Saccharomyces cerevisiae var.ellipsoideus inoculatedat 0.20 g/l @ 7 days of fermentation).
The increase in the ethyl alcohol content of thejamun wine might be attributed to the fact that, the alcoholicfermentation carried out with S. cerevisaestrain revealedconsumption of sugar causing decrease in TSS with timeor it might be due to the higher levels of reducing sugarswhich are more readily fermentable giving rise to higherlevels of alcohol Gautham and Chundawat (1998). It hasalso been observed that as the alcohol content increasesin the wine, the content of the TSS and microbial countdecreases. (Kocher et al., 2011).
In pooled mean of the two years data maximumantioxidant activity was recorded fromS2F3 (86.34 % DPPH)which was found at par with S1F3 (86.32 % DPPH) whereasminimum antioxidant activity was noted from S1F1 as 79.69% DPPH. The reason for decrease in total antioxidantactivity could be the decrease in total phenol contentduring bottle ageing of red wines. The underlying changesin the individual phenolic groups are, however, also likelyto play a contributory role in the decreased antioxidantactivity of the wines (Beer et al., 2005).
Cost Analysis
The cost benefit ratio is an important tool toassess economics of farming. The cost benefit frameworkis essential a modular partial equilibrium model, withdemand and supply relationships that can be calibrated
to empirical data and allowing the calculation of economicwelfare effects. The table 4 shows net return and costbenefit ratio of wine industry. Per year average 3,00,000liters of processed wine and the average wholesale marketprice of per liter is Rs. 600/-. For computing the total returnsfrom wine is per bottle Rs. 450/-, per literRs. 600/- andwine industry is Rs. 18,00,00,000/-. By deducting the totalcost of per bottle Rs. 296.15/-, per literRs. 394.87/- andaverage cost of wine industry is Rs. 11,84,62,269/-, the netprofit comes to about per bottle Rs. 161.53/-, per literRs.215.36/- and wine unit is Rs. 6,15,37,731/-. The cost benefitratio of wine is 1: 5.86. It is definitely an encouragingreturn to the wine producer.
ACKNOWLEDGEMENTS
The authors wish to thanks Department of FruitScience, College of Horticulture, Dr.PDKV, Akola forproviding facilities for conduct of the experiment The firstauthor is thankful to DST INSPIRE, Department of Scienceand Technology, New Delhi for providing fellowshipduring the study period.
LITERATURE CITED
Anonymous, 2014.Indian Horticulture Database.NationalHorticulture Board.Ministry of Agriculture,Government of India 85, Institutional Area, Sector-18, Gurgaon.www.nhb.co.in.
Anonymous, 2016.Indian Horticulture Database.NationalHorticulture Board.Ministry of Agriculture,Government of India 85, Institutional Area, Sector-18, Gurgaon.www.nhb.co.in.
Baisya, R. K., 1980. Fruits and vegetable processingIndustries in Rural India- Its problem and prospects,Indian Food Packer. 34(6):29-32.
Beer, D. de, E.Joubert, W. C. A. Gelderblom and M.Manley,2005. Changes in the Phenolic Composition andAntioxidant Activity of Pinotage, CabernetSauvignon, Chardonnay and Chenin blanc WinesDuring Bottle Ageing. S. Afr. J. Enol. Vitic., 26(1), 6-15.
Chowdhury, P. and R. C. Ray, 2007. Fermentation of Jamun(SyzygiumcuminiL.) fruits to form Red Wine, ASEANFood Journal. 14(1): 15-23.
Preparation of Wine from Jamun: A transition for Doubling Farmer’s Income
84
David, R. , P. Ngulube and Dube. 2013. A cost- benefitanalysis of document management strategies usedat a financial institution in Zimbabwe: A case study.South African J. of Information Management. 15 (2):540-550.
Joshi Veena, B. Srinivas Rao and R. Subhash Reddy,2013.Studies on the physico-chemical properties onwine in different varieties of grapes.The Asian J.Hort. 8(1):174-178.
Joshi, V. K. and S. Sharma, 2004.Contribution ofWines.Beverage and Food World. pp 41-44.
Joshi, V. K. 1995.General methods of wine preparation.Fruitwine. 1st Ed., 25-33.
Joshi, V. K., Rakesh Sharma, AmanGirdher andGhanShyamAbrol,2012.Effect of dilution andmaturation on physio-chemical and sensory qualityof Jamun (Black plum) wine.Indian J. of NaturalProducts and Resources. 3(2): 222-227.
Joshi, V. K., R.Sharma, A.Girdher and Abrol G. S.,2012.Effect of dilution and maturation on physio-chemical and sensory quality of Jamun (Black plum)wine. Indian J. of Natural Products andResources,3(2), 222-227.
Kocher, G. S., R. P. Phutela and M. I. S. Gill, 2011. Preparationand Evaluation of Red wine from Punjab purple(Syn.H.516) variety of grapes. Int. J.Food andFermentation Technol. 1(1):133-136.
Malhotra S. K., 2017. Initiatives and option in transitionfor doubling farmers income.ShodhGranth. Nat.Conf. on Technological Changes and Innovationsin Agriculture for Enhancing Farmers’ Incomeorganized by JAU, Junagadh, Gujarat, 28-30 May,2017, pp 1-13.
Manzocco, L., M.Anese andM. C. Nicoli, 1998.Antioxidant properties of tea extracts as affected byprocessing. Lebens-mittel-Wissenschaft Und-Technologie. 31(7-8), 694-698.
Ranganna, S., 1979.Manual of Analysis of Fruit andVegetable products.Tata McGraw Hill PublishingCompany Limited,New Delhi. 317-318.
Ribereau-Gayon, Glories P., Y., A.Maujean andD.Dubourdieu,2000. Phenolic compounds. In:Handbook of Enology. IINew York, USA, 129-185.
Sahota, P.P. and Sunil, 2006. Preparation of non-alcoholicnaturally carbonated plum beverage after optimizingthe fermentation conditions. Bev.and Food World.33(2):54-58.
Sharma S., V. K Joshi.andG.Abrol, 2009. An overview onstrawberry [Fragaria x ananassa (Weston) Duchesneex Rozier ] wine production technology,composition, maturation and quality evaluation.Natural Product Radiance, 8(4), 356-365.
Received on 22.9.2018
PKV Res. J. Vol. 42 (2), July 2018
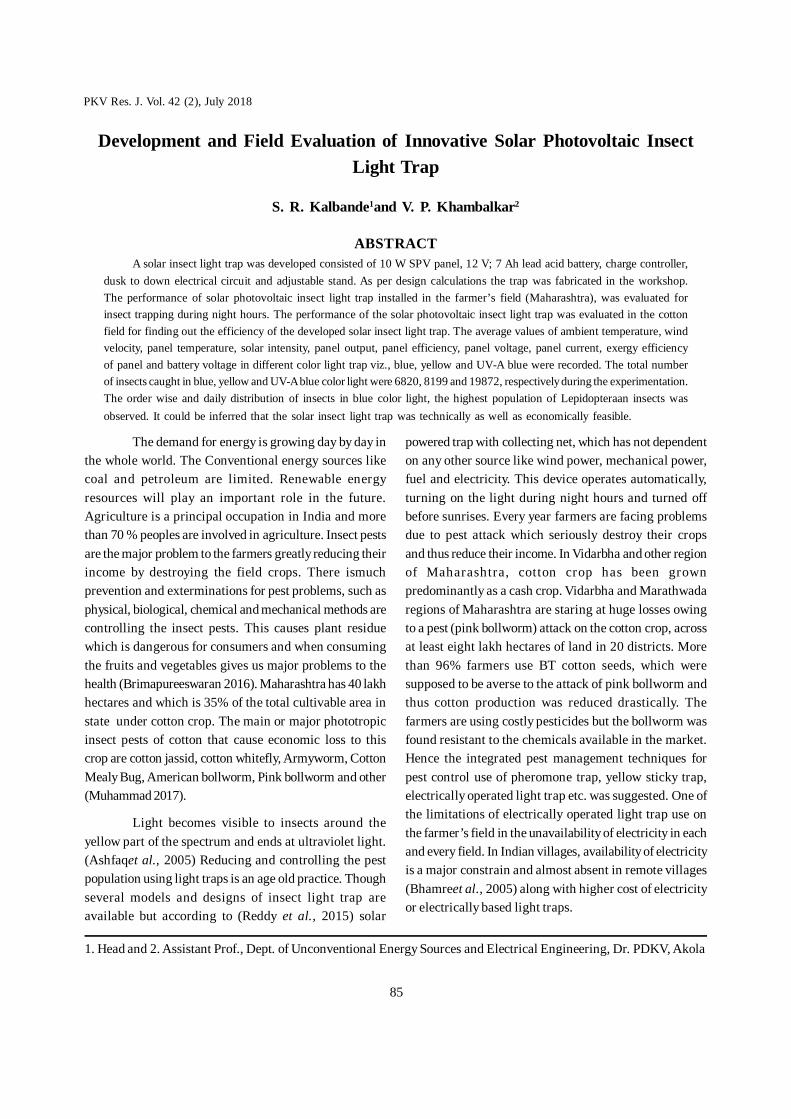
85
The demand for energy is growing day by day inthe whole world. The Conventional energy sources likecoal and petroleum are limited. Renewable energyresources will play an important role in the future.Agriculture is a principal occupation in India and morethan 70 % peoples are involved in agriculture. Insect pestsare the major problem to the farmers greatly reducing theirincome by destroying the field crops. There ismuchprevention and exterminations for pest problems, such asphysical, biological, chemical and mechanical methods arecontrolling the insect pests. This causes plant residuewhich is dangerous for consumers and when consumingthe fruits and vegetables gives us major problems to thehealth (Brimapureeswaran 2016). Maharashtra has 40 lakhhectares and which is 35% of the total cultivable area instate under cotton crop. The main or major phototropicinsect pests of cotton that cause economic loss to thiscrop are cotton jassid, cotton whitefly, Armyworm, CottonMealy Bug, American bollworm, Pink bollworm and other(Muhammad 2017).
Light becomes visible to insects around theyellow part of the spectrum and ends at ultraviolet light.(Ashfaqet al., 2005) Reducing and controlling the pestpopulation using light traps is an age old practice. Thoughseveral models and designs of insect light trap areavailable but according to (Reddy et al., 2015) solar
Development and Field Evaluation of Innovative Solar Photovoltaic InsectLight Trap
S. R. Kalbande1and V. P. Khambalkar2
ABSTRACTA solar insect light trap was developed consisted of 10 W SPV panel, 12 V; 7 Ah lead acid battery, charge controller,
dusk to down electrical circuit and adjustable stand. As per design calculations the trap was fabricated in the workshop.The performance of solar photovoltaic insect light trap installed in the farmer’s field (Maharashtra), was evaluated forinsect trapping during night hours. The performance of the solar photovoltaic insect light trap was evaluated in the cottonfield for finding out the efficiency of the developed solar insect light trap. The average values of ambient temperature, windvelocity, panel temperature, solar intensity, panel output, panel efficiency, panel voltage, panel current, exergy efficiencyof panel and battery voltage in different color light trap viz., blue, yellow and UV-A blue were recorded. The total numberof insects caught in blue, yellow and UV-A blue color light were 6820, 8199 and 19872, respectively during the experimentation.The order wise and daily distribution of insects in blue color light, the highest population of Lepidopteraan insects wasobserved. It could be inferred that the solar insect light trap was technically as well as economically feasible.
1. Head and 2. Assistant Prof., Dept. of Unconventional Energy Sources and Electrical Engineering, Dr. PDKV, Akola
powered trap with collecting net, which has not dependenton any other source like wind power, mechanical power,fuel and electricity. This device operates automatically,turning on the light during night hours and turned offbefore sunrises. Every year farmers are facing problemsdue to pest attack which seriously destroy their cropsand thus reduce their income. In Vidarbha and other regionof Maharashtra, cotton crop has been grownpredominantly as a cash crop. Vidarbha and Marathwadaregions of Maharashtra are staring at huge losses owingto a pest (pink bollworm) attack on the cotton crop, acrossat least eight lakh hectares of land in 20 districts. Morethan 96% farmers use BT cotton seeds, which weresupposed to be averse to the attack of pink bollworm andthus cotton production was reduced drastically. Thefarmers are using costly pesticides but the bollworm wasfound resistant to the chemicals available in the market.Hence the integrated pest management techniques forpest control use of pheromone trap, yellow sticky trap,electrically operated light trap etc. was suggested. One ofthe limitations of electrically operated light trap use onthe farmer’s field in the unavailability of electricity in eachand every field. In Indian villages, availability of electricityis a major constrain and almost absent in remote villages(Bhamreet al., 2005) along with higher cost of electricityor electrically based light traps.
PKV Res. J. Vol. 42 (2), July 2018
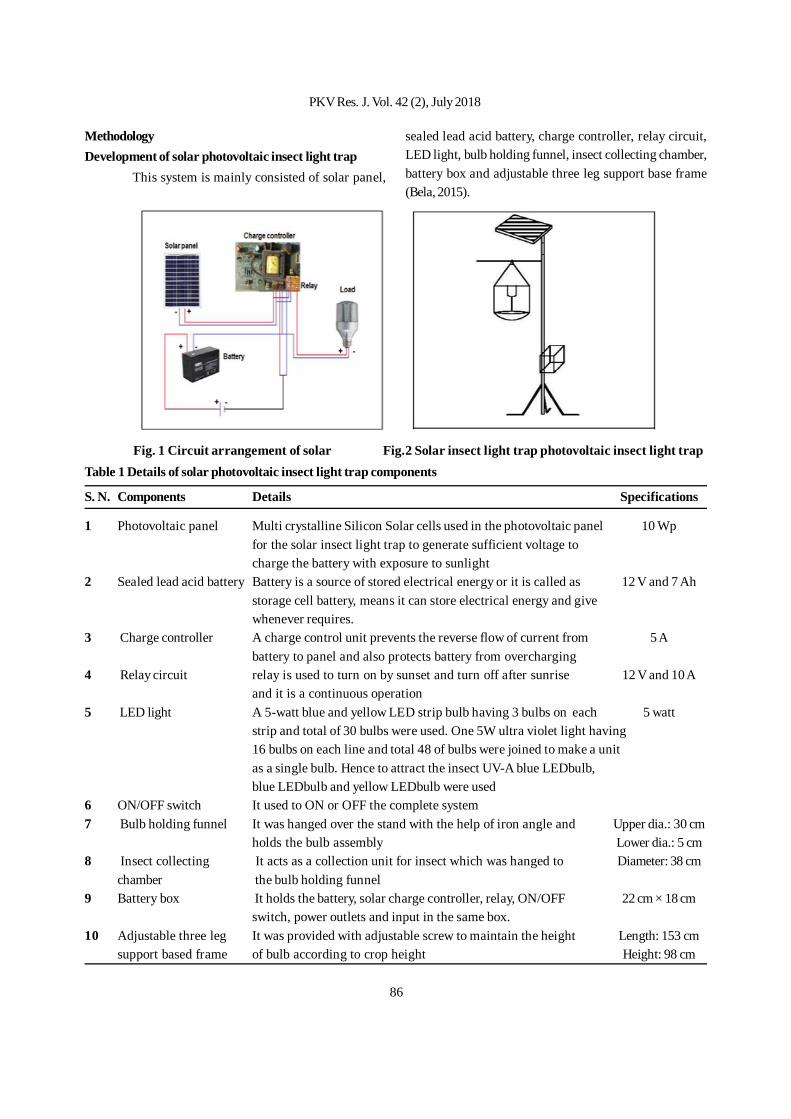
86
MethodologyDevelopment of solar photovoltaic insect light trap
This system is mainly consisted of solar panel,
sealed lead acid battery, charge controller, relay circuit,LED light, bulb holding funnel, insect collecting chamber,battery box and adjustable three leg support base frame(Bela, 2015).
Table 1 Details of solar photovoltaic insect light trap components
S. N. Components Details Specifications
1 Photovoltaic panel Multi crystalline Silicon Solar cells used in the photovoltaic panel 10 Wpfor the solar insect light trap to generate sufficient voltage tocharge the battery with exposure to sunlight
2 Sealed lead acid battery Battery is a source of stored electrical energy or it is called as 12 V and 7 Ahstorage cell battery, means it can store electrical energy and givewhenever requires.
3 Charge controller A charge control unit prevents the reverse flow of current from 5 Abattery to panel and also protects battery from overcharging
4 Relay circuit relay is used to turn on by sunset and turn off after sunrise 12 V and 10 Aand it is a continuous operation
5 LED light A 5-watt blue and yellow LED strip bulb having 3 bulbs on each 5 wattstrip and total of 30 bulbs were used. One 5W ultra violet light having16 bulbs on each line and total 48 of bulbs were joined to make a unitas a single bulb. Hence to attract the insect UV-A blue LEDbulb,blue LEDbulb and yellow LEDbulb were used
6 ON/OFF switch It used to ON or OFF the complete system7 Bulb holding funnel It was hanged over the stand with the help of iron angle and Upper dia.: 30 cm
holds the bulb assembly Lower dia.: 5 cm8 Insect collecting It acts as a collection unit for insect which was hanged to Diameter: 38 cm
chamber the bulb holding funnel9 Battery box It holds the battery, solar charge controller, relay, ON/OFF 22 cm × 18 cm
switch, power outlets and input in the same box.10 Adjustable three leg It was provided with adjustable screw to maintain the height Length: 153 cm
support based frame of bulb according to crop height Height: 98 cm
Fig. 1 Circuit arrangement of solar Fig.2 Solar insect light trap photovoltaic insect light trap
PKV Res. J. Vol. 42 (2), July 2018
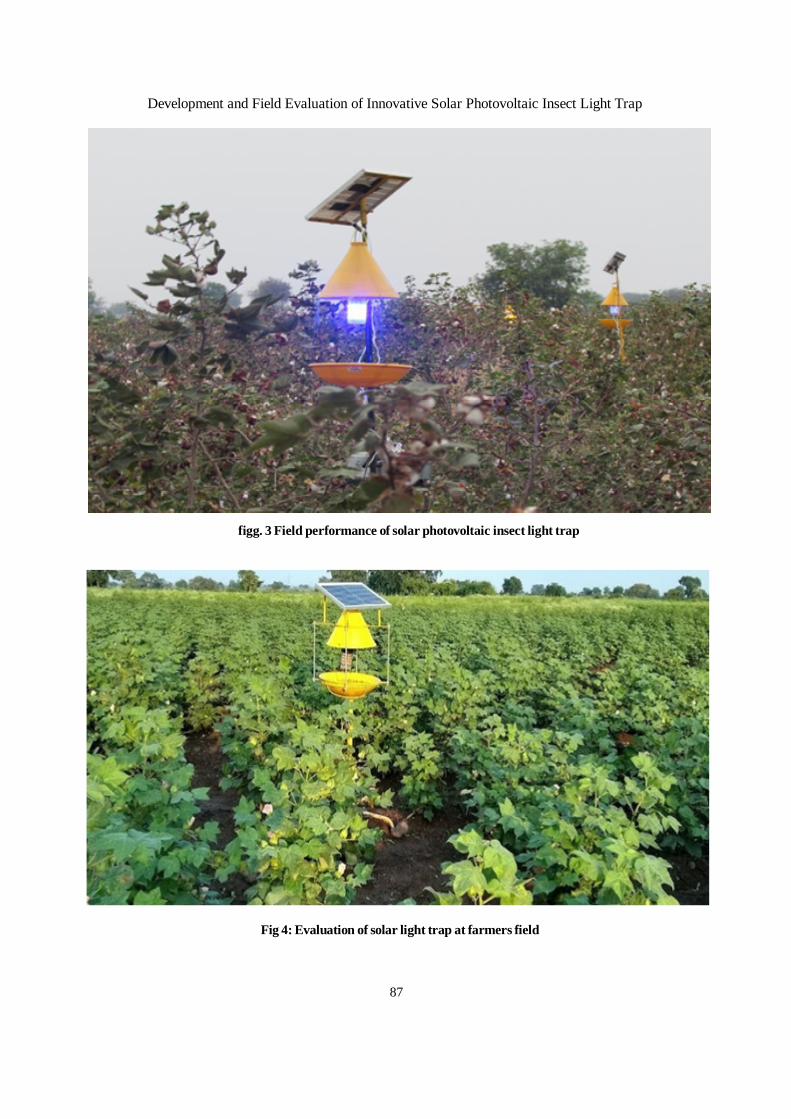
87
figg. 3 Field performance of solar photovoltaic insect light trap
Fig 4: Evaluation of solar light trap at farmers field
Development and Field Evaluation of Innovative Solar Photovoltaic Insect Light Trap
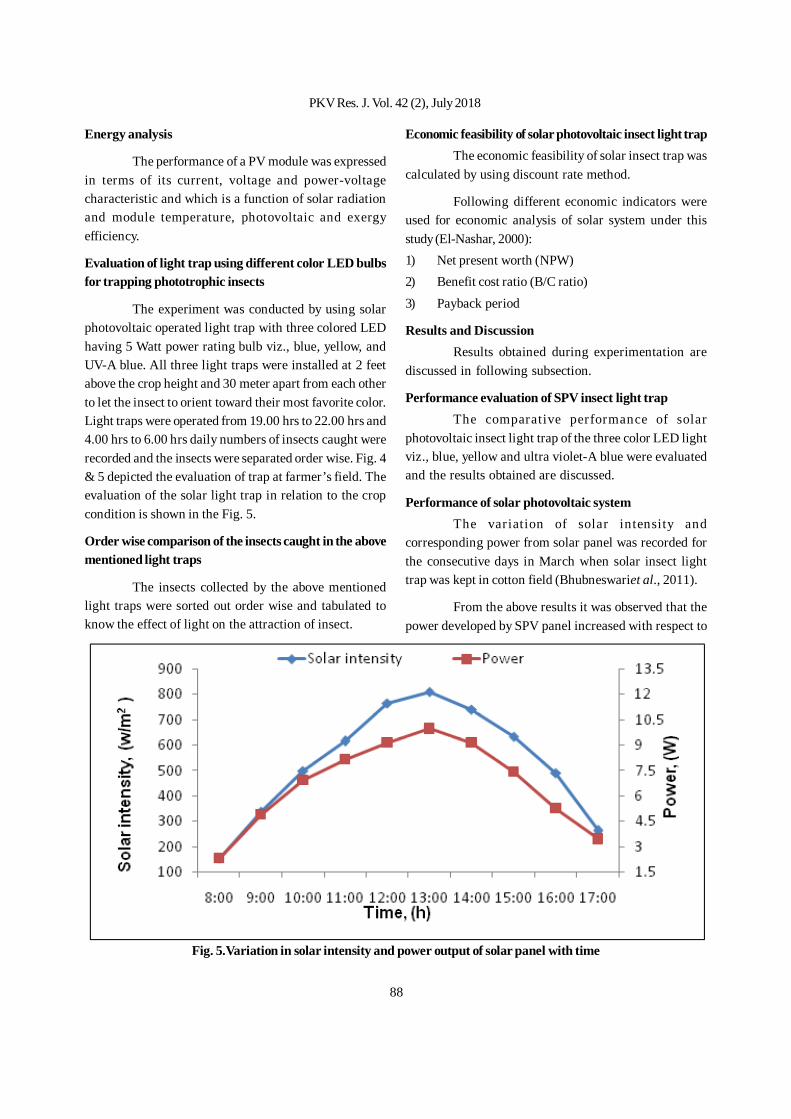
88
Energy analysis
The performance of a PV module was expressedin terms of its current, voltage and power-voltagecharacteristic and which is a function of solar radiationand module temperature, photovoltaic and exergyefficiency.
Evaluation of light trap using different color LED bulbsfor trapping phototrophic insects
The experiment was conducted by using solarphotovoltaic operated light trap with three colored LEDhaving 5 Watt power rating bulb viz., blue, yellow, andUV-A blue. All three light traps were installed at 2 feetabove the crop height and 30 meter apart from each otherto let the insect to orient toward their most favorite color.Light traps were operated from 19.00 hrs to 22.00 hrs and4.00 hrs to 6.00 hrs daily numbers of insects caught wererecorded and the insects were separated order wise. Fig. 4& 5 depicted the evaluation of trap at farmer’s field. Theevaluation of the solar light trap in relation to the cropcondition is shown in the Fig. 5.
Order wise comparison of the insects caught in the abovementioned light traps
The insects collected by the above mentionedlight traps were sorted out order wise and tabulated toknow the effect of light on the attraction of insect.
Economic feasibility of solar photovoltaic insect light trapThe economic feasibility of solar insect trap was
calculated by using discount rate method.
Following different economic indicators wereused for economic analysis of solar system under thisstudy (El-Nashar, 2000):1) Net present worth (NPW)2) Benefit cost ratio (B/C ratio)3) Payback period
Results and DiscussionResults obtained during experimentation are
discussed in following subsection.
Performance evaluation of SPV insect light trapThe comparative performance of solar
photovoltaic insect light trap of the three color LED lightviz., blue, yellow and ultra violet-A blue were evaluatedand the results obtained are discussed.
Performance of solar photovoltaic systemThe variation of solar intensity and
corresponding power from solar panel was recorded forthe consecutive days in March when solar insect lighttrap was kept in cotton field (Bhubneswariet al., 2011).
From the above results it was observed that thepower developed by SPV panel increased with respect to
Fig. 5.Variation in solar intensity and power output of solar panel with time
PKV Res. J. Vol. 42 (2), July 2018
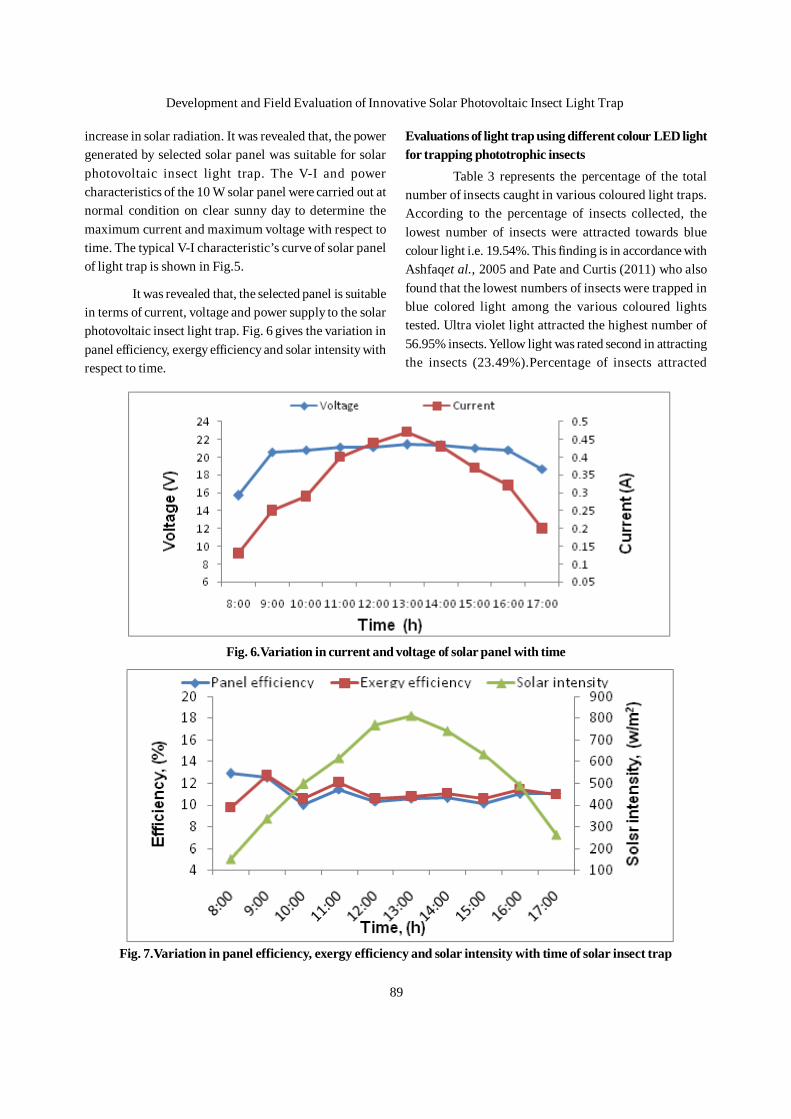
89
increase in solar radiation. It was revealed that, the powergenerated by selected solar panel was suitable for solarphotovoltaic insect light trap. The V-I and powercharacteristics of the 10 W solar panel were carried out atnormal condition on clear sunny day to determine themaximum current and maximum voltage with respect totime. The typical V-I characteristic’s curve of solar panelof light trap is shown in Fig.5.
It was revealed that, the selected panel is suitablein terms of current, voltage and power supply to the solarphotovoltaic insect light trap. Fig. 6 gives the variation inpanel efficiency, exergy efficiency and solar intensity withrespect to time.
Evaluations of light trap using different colour LED lightfor trapping phototrophic insects
Table 3 represents the percentage of the totalnumber of insects caught in various coloured light traps.According to the percentage of insects collected, thelowest number of insects were attracted towards bluecolour light i.e. 19.54%. This finding is in accordance withAshfaqet al., 2005 and Pate and Curtis (2011) who alsofound that the lowest numbers of insects were trapped inblue colored light among the various coloured lightstested. Ultra violet light attracted the highest number of56.95% insects. Yellow light was rated second in attractingthe insects (23.49%).Percentage of insects attracted
Fig. 7.Variation in panel efficiency, exergy efficiency and solar intensity with time of solar insect trap
Fig. 6.Variation in current and voltage of solar panel with time
Development and Field Evaluation of Innovative Solar Photovoltaic Insect Light Trap
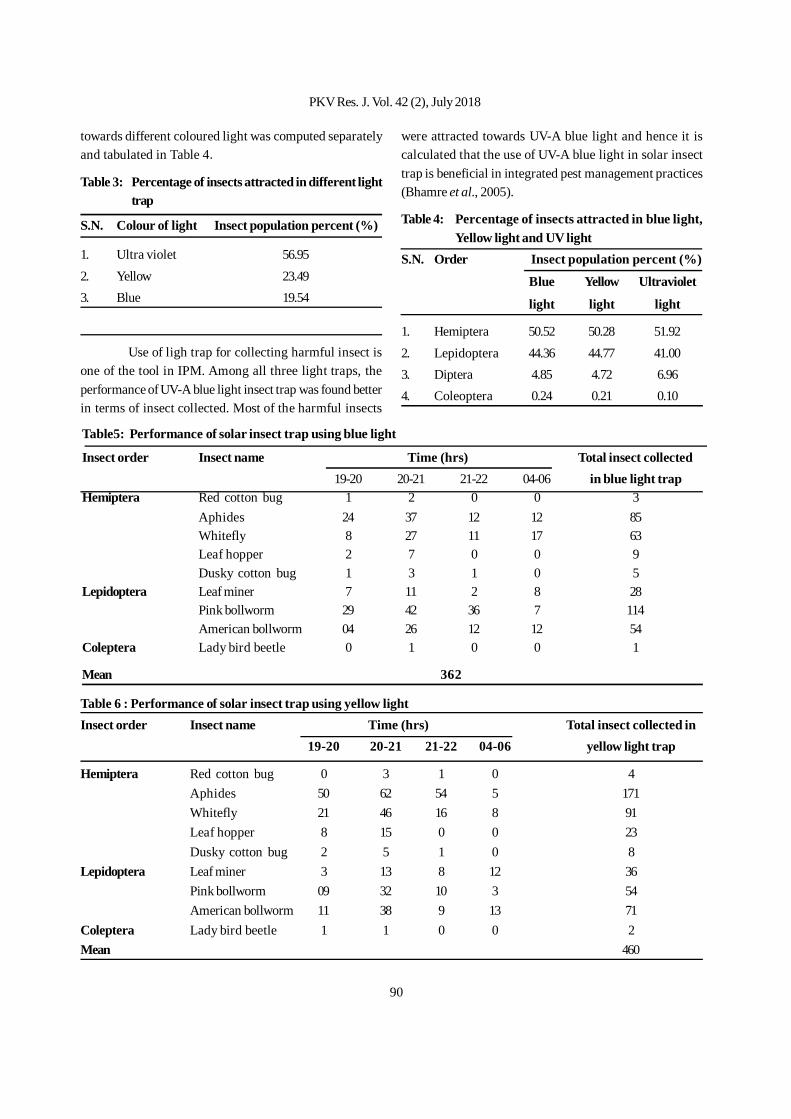
90
towards different coloured light was computed separatelyand tabulated in Table 4.
Table 3: Percentage of insects attracted in different lighttrap
S.N. Colour of light Insect population percent (%)
1. Ultra violet 56.952. Yellow 23.493. Blue 19.54
Use of ligh trap for collecting harmful insect isone of the tool in IPM. Among all three light traps, theperformance of UV-A blue light insect trap was found betterin terms of insect collected. Most of the harmful insects
were attracted towards UV-A blue light and hence it iscalculated that the use of UV-A blue light in solar insecttrap is beneficial in integrated pest management practices(Bhamre et al., 2005).
Table 4: Percentage of insects attracted in blue light,Yellow light and UV light
S.N. Order Insect population percent (%)
Blue Yellow Ultraviolet
light light light
1. Hemiptera 50.52 50.28 51.922. Lepidoptera 44.36 44.77 41.003. Diptera 4.85 4.72 6.964. Coleoptera 0.24 0.21 0.10
Table5: Performance of solar insect trap using blue light
Insect order Insect name Time (hrs) Total insect collected19-20 20-21 21-22 04-06 in blue light trap
Hemiptera Red cotton bug 1 2 0 0 3Aphides 24 37 12 12 85Whitefly 8 27 11 17 63Leaf hopper 2 7 0 0 9Dusky cotton bug 1 3 1 0 5
Lepidoptera Leaf miner 7 11 2 8 28Pink bollworm 29 42 36 7 114American bollworm 04 26 12 12 54
Coleptera Lady bird beetle 0 1 0 0 1
Mean 362
Table 6 : Performance of solar insect trap using yellow lightInsect order Insect name Time (hrs) Total insect collected in
19-20 20-21 21-22 04-06 yellow light trap
Hemiptera Red cotton bug 0 3 1 0 4Aphides 50 62 54 5 171Whitefly 21 46 16 8 91Leaf hopper 8 15 0 0 23Dusky cotton bug 2 5 1 0 8
Lepidoptera Leaf miner 3 13 8 12 36Pink bollworm 09 32 10 3 54American bollworm 11 38 9 13 71
Coleptera Lady bird beetle 1 1 0 0 2Mean 460
PKV Res. J. Vol. 42 (2), July 2018
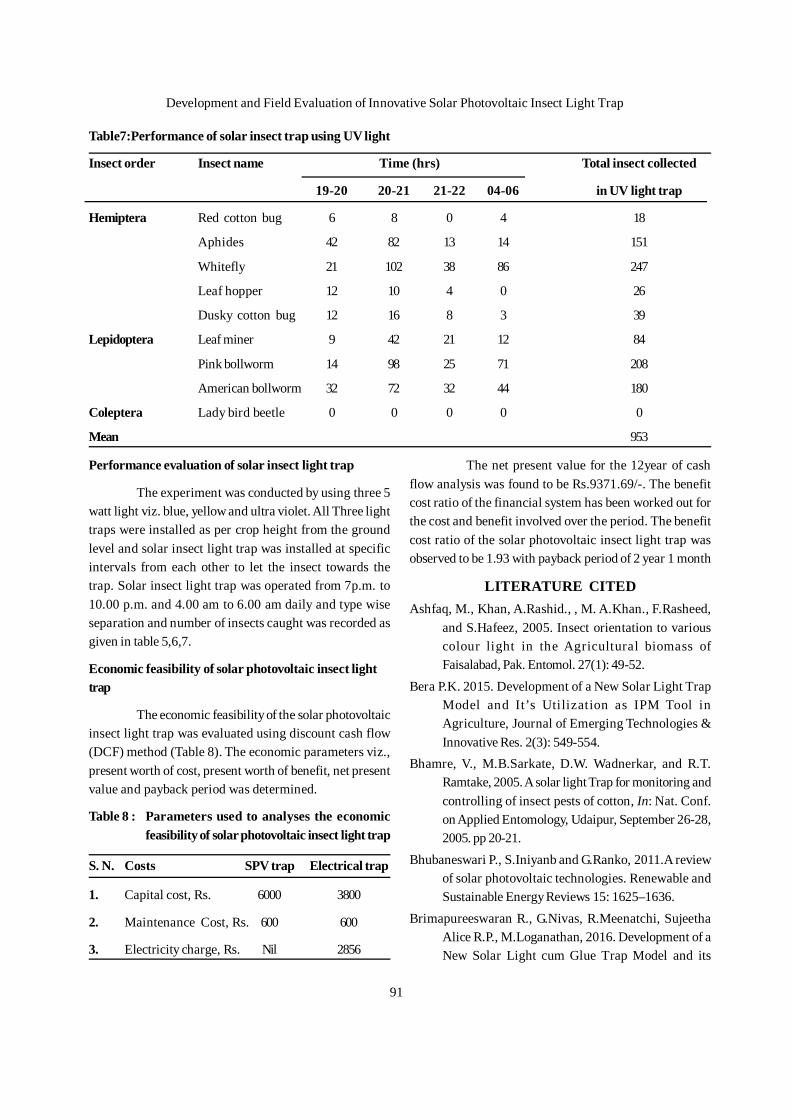
91
Performance evaluation of solar insect light trap
The experiment was conducted by using three 5watt light viz. blue, yellow and ultra violet. All Three lighttraps were installed as per crop height from the groundlevel and solar insect light trap was installed at specificintervals from each other to let the insect towards thetrap. Solar insect light trap was operated from 7p.m. to10.00 p.m. and 4.00 am to 6.00 am daily and type wiseseparation and number of insects caught was recorded asgiven in table 5,6,7.
Economic feasibility of solar photovoltaic insect lighttrap
The economic feasibility of the solar photovoltaicinsect light trap was evaluated using discount cash flow(DCF) method (Table 8). The economic parameters viz.,present worth of cost, present worth of benefit, net presentvalue and payback period was determined.
Table 8 : Parameters used to analyses the economicfeasibility of solar photovoltaic insect light trap
S. N. Costs SPV trap Electrical trap
1. Capital cost, Rs. 6000 3800
2. Maintenance Cost, Rs. 600 600
3. Electricity charge, Rs. Nil 2856
The net present value for the 12year of cashflow analysis was found to be Rs.9371.69/-. The benefitcost ratio of the financial system has been worked out forthe cost and benefit involved over the period. The benefitcost ratio of the solar photovoltaic insect light trap wasobserved to be 1.93 with payback period of 2 year 1 month
LITERATURE CITEDAshfaq, M., Khan, A.Rashid., , M. A.Khan., F.Rasheed,
and S.Hafeez, 2005. Insect orientation to variouscolour light in the Agricultural biomass ofFaisalabad, Pak. Entomol. 27(1): 49-52.
Bera P.K. 2015. Development of a New Solar Light TrapModel and It’s Utilization as IPM Tool inAgriculture, Journal of Emerging Technologies &Innovative Res. 2(3): 549-554.
Bhamre, V., M.B.Sarkate, D.W. Wadnerkar, and R.T.Ramtake, 2005. A solar light Trap for monitoring andcontrolling of insect pests of cotton, In: Nat. Conf.on Applied Entomology, Udaipur, September 26-28,2005. pp 20-21.
Bhubaneswari P., S.Iniyanb and G.Ranko, 2011.A reviewof solar photovoltaic technologies. Renewable andSustainable Energy Reviews 15: 1625–1636.
Brimapureeswaran R., G.Nivas, R.Meenatchi, SujeethaAlice R.P., M.Loganathan, 2016. Development of aNew Solar Light cum Glue Trap Model and its
Table7:Performance of solar insect trap using UV light
Insect order Insect name Time (hrs) Total insect collected
19-20 20-21 21-22 04-06 in UV light trap
Hemiptera Red cotton bug 6 8 0 4 18
Aphides 42 82 13 14 151
Whitefly 21 102 38 86 247
Leaf hopper 12 10 4 0 26
Dusky cotton bug 12 16 8 3 39
Lepidoptera Leaf miner 9 42 21 12 84
Pink bollworm 14 98 25 71 208
American bollworm 32 72 32 44 180
Coleptera Lady bird beetle 0 0 0 0 0
Mean 953
Development and Field Evaluation of Innovative Solar Photovoltaic Insect Light Trap
92
Utilization in Agriculture, Int. J. of EmergingTechnology and Innovative Engineering. 2(3): 37-41.
El-Nashar, M.Ali, 2000. Economics of small solar-assistedmultiple-effect stack distillation plants, Desalination130, 201–215.
Muhammad S. (2017). Biological Parameters of PinkBollworm pectinophoragossypiella (Saunders)(Lepidoptera:Gelechiidae): A looming Threat forCotton and its Eradication Opportunity. Int. J. Res.Agric.& For,. 4(7): 25-36.
Pate, J. and A.Curtis, 2001.Insects response to differentwavelengths of light in New River state Park, AshCounty, North Carolina, Field Biol.Ecol., 12(2): 4-8
Reddy H.L., A.V.Reddy, S.Hemanth and P.J. Durga Prasad,2015. Modelling and Optimization of Solar Light TrapFor “Reducing and Controlling” The PestPopulation. In. J. of Engg. Technol., Managementand Applied Sci., 3(4): 224-234.
Received on 12.10.2018
PKV Res. J. Vol. 42 (2), July 2018
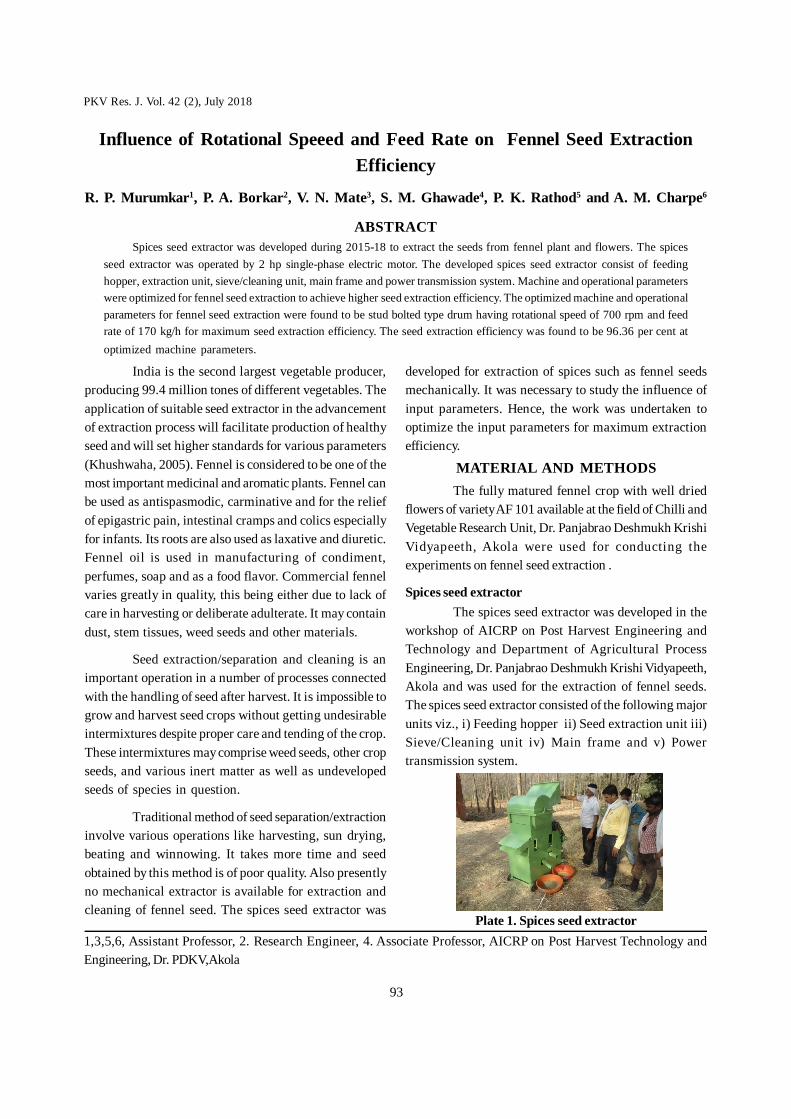
93
India is the second largest vegetable producer,producing 99.4 million tones of different vegetables. Theapplication of suitable seed extractor in the advancementof extraction process will facilitate production of healthyseed and will set higher standards for various parameters(Khushwaha, 2005). Fennel is considered to be one of themost important medicinal and aromatic plants. Fennel canbe used as antispasmodic, carminative and for the reliefof epigastric pain, intestinal cramps and colics especiallyfor infants. Its roots are also used as laxative and diuretic.Fennel oil is used in manufacturing of condiment,perfumes, soap and as a food flavor. Commercial fennelvaries greatly in quality, this being either due to lack ofcare in harvesting or deliberate adulterate. It may containdust, stem tissues, weed seeds and other materials.
Seed extraction/separation and cleaning is animportant operation in a number of processes connectedwith the handling of seed after harvest. It is impossible togrow and harvest seed crops without getting undesirableintermixtures despite proper care and tending of the crop.These intermixtures may comprise weed seeds, other cropseeds, and various inert matter as well as undevelopedseeds of species in question.
Traditional method of seed separation/extractioninvolve various operations like harvesting, sun drying,beating and winnowing. It takes more time and seedobtained by this method is of poor quality. Also presentlyno mechanical extractor is available for extraction andcleaning of fennel seed. The spices seed extractor was
Influence of Rotational Speeed and Feed Rate on Fennel Seed ExtractionEfficiency
R. P. Murumkar1, P. A. Borkar2, V. N. Mate3, S. M. Ghawade4, P. K. Rathod5 and A. M. Charpe6
ABSTRACTSpices seed extractor was developed during 2015-18 to extract the seeds from fennel plant and flowers. The spices
seed extractor was operated by 2 hp single-phase electric motor. The developed spices seed extractor consist of feedinghopper, extraction unit, sieve/cleaning unit, main frame and power transmission system. Machine and operational parameterswere optimized for fennel seed extraction to achieve higher seed extraction efficiency. The optimized machine and operationalparameters for fennel seed extraction were found to be stud bolted type drum having rotational speed of 700 rpm and feedrate of 170 kg/h for maximum seed extraction efficiency. The seed extraction efficiency was found to be 96.36 per cent atoptimized machine parameters.
developed for extraction of spices such as fennel seedsmechanically. It was necessary to study the influence ofinput parameters. Hence, the work was undertaken tooptimize the input parameters for maximum extractionefficiency.
MATERIAL AND METHODSThe fully matured fennel crop with well dried
flowers of variety AF 101 available at the field of Chilli andVegetable Research Unit, Dr. Panjabrao Deshmukh KrishiVidyapeeth, Akola were used for conducting theexperiments on fennel seed extraction .
Spices seed extractorThe spices seed extractor was developed in the
workshop of AICRP on Post Harvest Engineering andTechnology and Department of Agricultural ProcessEngineering, Dr. Panjabrao Deshmukh Krishi Vidyapeeth,Akola and was used for the extraction of fennel seeds.The spices seed extractor consisted of the following majorunits viz., i) Feeding hopper ii) Seed extraction unit iii)Sieve/Cleaning unit iv) Main frame and v) Powertransmission system.
Plate 1. Spices seed extractor1,3,5,6, Assistant Professor, 2. Research Engineer, 4. Associate Professor, AICRP on Post Harvest Technology andEngineering, Dr. PDKV,Akola
PKV Res. J. Vol. 42 (2), July 2018
94
Optimization of parameters for extraction of ajwain seeds
Three types of extraction drums were fabricatedfor the experiments. The developed spices seed extractorwas tested as per standard procedures for combination ofvarious treatments. Based on feeler trials, some of themachine and operational parameters such as concaveclearance, sieve aperture size and blower/fan speed werefinalized for fennel crop and were kept constantthroughout the complete experimentation. Experimentswere conducted to optimize the design parameters suchas type of seed extraction mechanism (stud bolted drum,loop type drum, leather flap drum) and the operationalparameters such as rotational speed and feed rate. Fennelcrop samples each weighing 2 kg and having about 10 ±0.5 % moisture content (w.b.) were used for extractionusing the developed spices seed extractor. After seedextraction all the fractions at each outlet were collected inthe separate containers. Each of the sample was analyzedfor extracted seed, unextracted seed, chaff, etc. Care wastaken to obtain all the fractions without any loss.
The variables of seed extraction experiments wereoptimized using Response Surface Methodologytechnique, since this is useful statistical technique forinvestigation of complex processes. The studies ofoptimization have been carried out by various researchworkers (Pokharkar, 1994; Vijayan and et al., 1995;Chowdhary et al., 2000; Kar and Gupta, 2001; Liyana-Pathirana and Shahidi, 2005; Eren and Kaymak-Ertekin,2007; Jain, 2007; Altan et al., 2008; Corzo et al., 2008;Mestdagh et al., 2008; Shi et al., 2008 and Borkar, 2011).
Optimization of Seed Extraction Unit
The type of seed extraction drum, rotationalspeed and feed rate were optimized for maximum extractionefficiency and minimum seed damage.
Treatment Details
Independent variables
Categoric factors
Types of seed extraction drums-Stud bolted drum ii. Looptype drum iii. Leather flap drum
Rotational speed of seed extraction drum (R), rpm - 600 ii.650 iii. 700 iv. 750 v. 800
Feed rate (F), kg/h - 60 ii. 120 iii. 180 iv. 240 v. 300
Dependent variable
i. Extraction efficiency
The extraction efficiency was calculated usingthe following formula.
Extraction efficiency, % = 100 – un-extracted seed
Optimization of seed extraction drum for fennel seedextraction
The experimental layout for two variable fivelevels response surface analysis as shown in Table 1 wasused.
Design of experiments
Response Surface Methodology (RSM) wasapplied to the experimental data using Design-Expertversion 9 (Statease Inc, Minneapolis, USA, Trial version,2017). The Central Composite Design of two variables andfive levels including thirteen trials was used for each typeof extraction drum. As per this design, total 39 trials wereperformed for all the three type of seed extraction drums.
Table 1. Levels of independent variables for fennel seedextraction
Independent variables Symbols LevelsCoded Decoded Coded Decoded
Rotational speed, rpm x1 X1 2 8001 7500 700-1 650-2 600
Feed rate, kg/h x2 X2 2 3001 2400 180-1 120-2 60
RESULTS AND DISCUSSION
During preliminary experiments, extractionefficiency was found to be dependent on the machine
PKV Res. J. Vol. 42 (2), July 2018
95
and operational parameters. Based on feeler trials,concave clearance and blower/fan speed were finalizedand were kept constant throughout the completeexperimentation. Moisture content at the appropriate timeof extraction was measured and was in the range of 10 +0.5 per cent on wet basis.
Effect of variables on fennel seed extraction efficiency
The results obtained during the experimentationon fennel seed extraction using the developed spices seedextractor are revealed that the extraction efficiency wasobserved to be ranging from 84.55 to 96.82 per centdepending upon the extraction treatments. The maximumextraction efficiency was observed in case of treatmenthaving the combination of stud bolted drum, rotationalspeed of 700 rpm and feed rate of 180 kg/h. The minimumseed extraction efficiency was found for treatment havingthe combination of leather flap drum, rotational speed of800 rpm and feed rate of 300 kg/h. The fennel seed
extraction efficiency was found to be dependent on thetype of seed extraction drum, rotational speed and feedrate.
The data for extraction efficiency were analyzedfor stepwise regression analysis and the analysis ofvariance (ANOVA) is shown in Table 2. The responsesurface reduced cubic model was fitted to the experimentaldata and statistical significance for linear, interaction andquadratic effects were analyzed for extraction efficiencywhich gives the effect of various parameters on extractionefficiency.
For fennel extraction efficiency, the model F-value of 21.86 implies that the model is significant (P<0.01).The linear terms (R and F) are significant (P<0.01). Thelack of fit F-value was non significant, which indicatesthat the developed model was adequate for predicting theresponse. Moreover, the predicted R2 of 0.7170 was inreasonable agreement adjusted R2 of 0.9032. This revealed
Table 2: ANOVA for effect of variables on fennel seed extraction efficiency
Source Sum of Squares df Mean Square F-value p-valueProb>F
Model 443.20 17 26.07 21.86 < 0.0001 significantA-Speed 3.71 1 3.71 3.11 0.0925B-Feed rate 0.0800 1 0.0800 0.0671 0.7981C-Type of roller 252.61 2 126.30 105.91 < 0.0001AB 0.4840 1 0.4840 0.4058 0.5310AC 0.3982 2 0.1991 0.1669 0.8474BC 0.1237 2 0.0619 0.0519 0.9496A² 50.95 1 50.95 42.72 < 0.0001B² 141.71 1 141.71 118.82 < 0.0001ABC 0.5391 2 0.2696 0.2260 0.7996A²C 1.37 2 0.6845 0.5740 0.5719B²C 11.23 2 5.62 4.71 0.0204Residual 25.04 21 1.19Lack of Fit 16.83 9 1.87 2.73 0.0538 not significantPure Error 8.21 12 0.6845Cor Total 468.24 38
Std. Dev. 1.09 R² 0.9465Mean 89.56 Adjusted R² 0.9032C.V. % 1.22 Predicted R² 0.7170PRESS 132.52 Adeq Precision 14.9636
Influence of Rotational Speeed and Feed Rate on Fennel Seed Extraction Efficiency
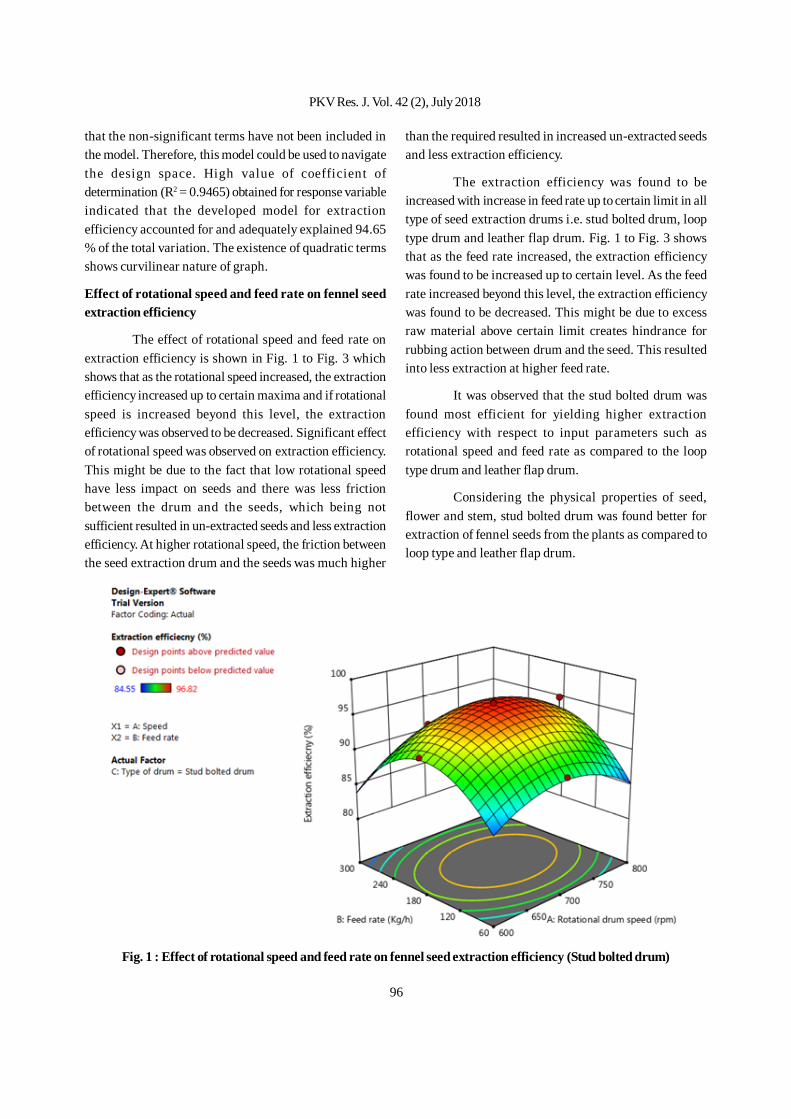
96
that the non-significant terms have not been included inthe model. Therefore, this model could be used to navigatethe design space. High value of coefficient ofdetermination (R2 = 0.9465) obtained for response variableindicated that the developed model for extractionefficiency accounted for and adequately explained 94.65% of the total variation. The existence of quadratic termsshows curvilinear nature of graph.
Effect of rotational speed and feed rate on fennel seedextraction efficiency
The effect of rotational speed and feed rate onextraction efficiency is shown in Fig. 1 to Fig. 3 whichshows that as the rotational speed increased, the extractionefficiency increased up to certain maxima and if rotationalspeed is increased beyond this level, the extractionefficiency was observed to be decreased. Significant effectof rotational speed was observed on extraction efficiency.This might be due to the fact that low rotational speedhave less impact on seeds and there was less frictionbetween the drum and the seeds, which being notsufficient resulted in un-extracted seeds and less extractionefficiency. At higher rotational speed, the friction betweenthe seed extraction drum and the seeds was much higher
than the required resulted in increased un-extracted seedsand less extraction efficiency.
The extraction efficiency was found to beincreased with increase in feed rate up to certain limit in alltype of seed extraction drums i.e. stud bolted drum, looptype drum and leather flap drum. Fig. 1 to Fig. 3 showsthat as the feed rate increased, the extraction efficiencywas found to be increased up to certain level. As the feedrate increased beyond this level, the extraction efficiencywas found to be decreased. This might be due to excessraw material above certain limit creates hindrance forrubbing action between drum and the seed. This resultedinto less extraction at higher feed rate.
It was observed that the stud bolted drum wasfound most efficient for yielding higher extractionefficiency with respect to input parameters such asrotational speed and feed rate as compared to the looptype drum and leather flap drum.
Considering the physical properties of seed,flower and stem, stud bolted drum was found better forextraction of fennel seeds from the plants as compared toloop type and leather flap drum.
Fig. 1 : Effect of rotational speed and feed rate on fennel seed extraction efficiency (Stud bolted drum)
PKV Res. J. Vol. 42 (2), July 2018
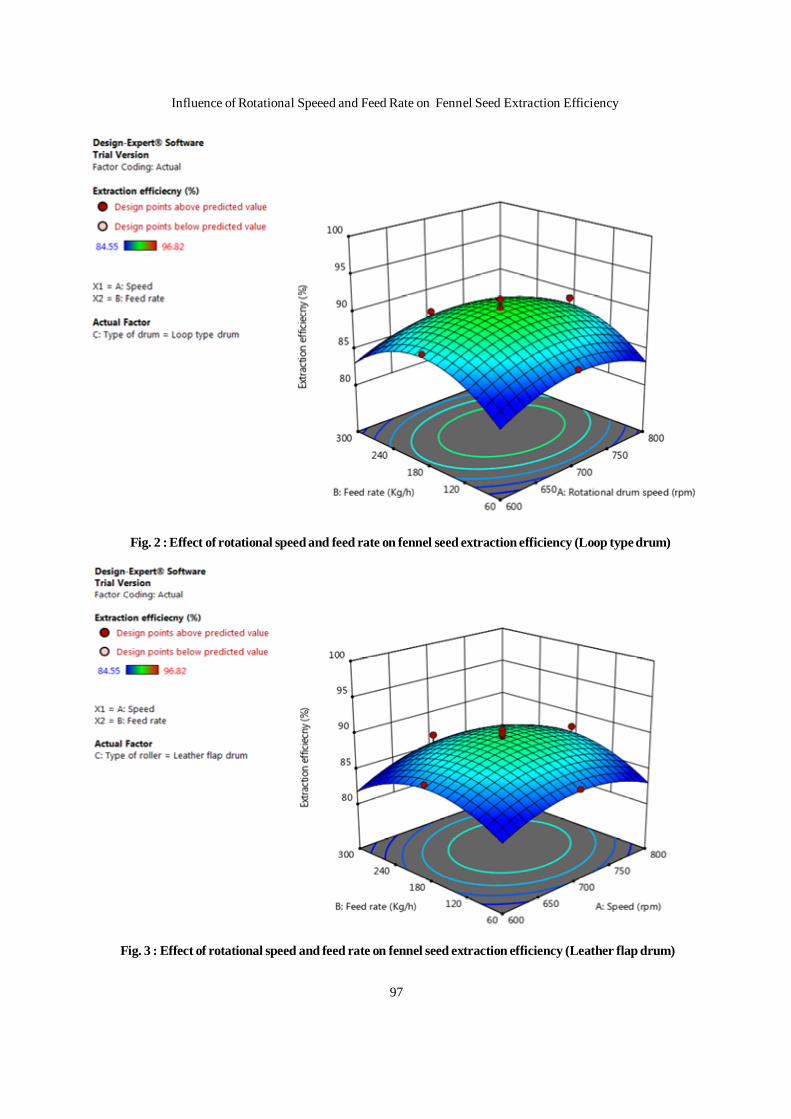
97
Fig. 2 : Effect of rotational speed and feed rate on fennel seed extraction efficiency (Loop type drum)
Fig. 3 : Effect of rotational speed and feed rate on fennel seed extraction efficiency (Leather flap drum)
Influence of Rotational Speeed and Feed Rate on Fennel Seed Extraction Efficiency
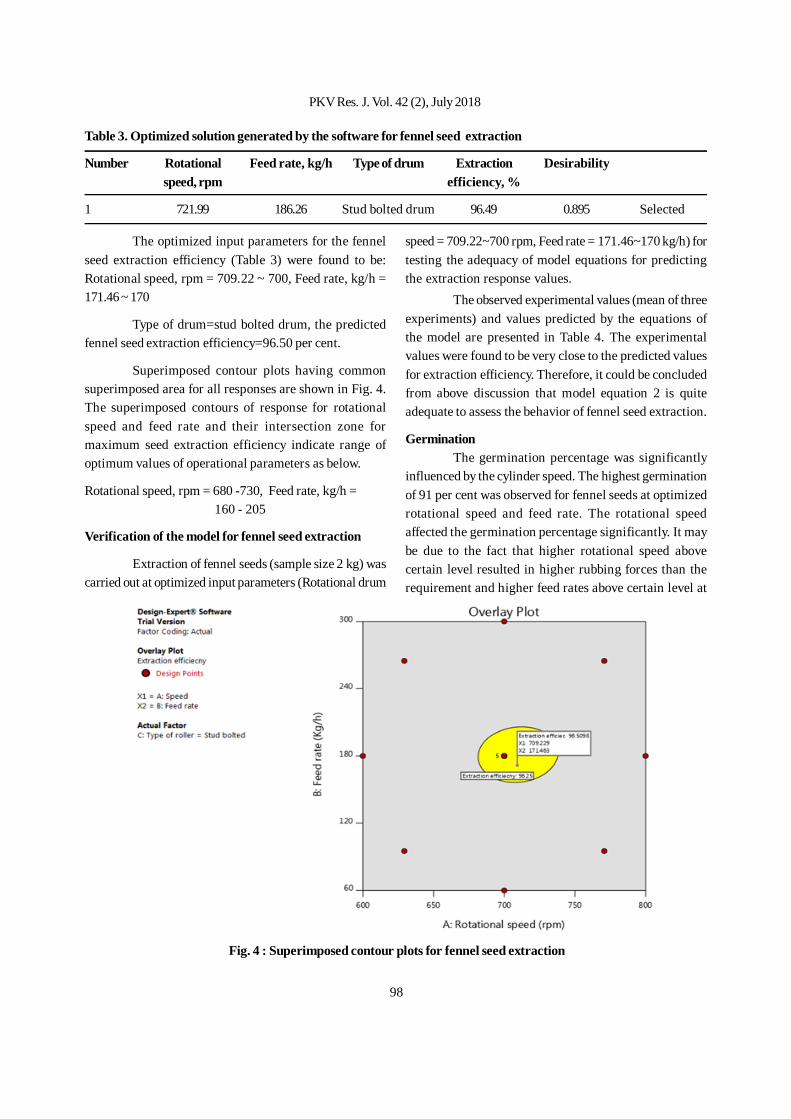
98
The optimized input parameters for the fennelseed extraction efficiency (Table 3) were found to be:Rotational speed, rpm = 709.22 ~ 700, Feed rate, kg/h =171.46 ~ 170
Type of drum=stud bolted drum, the predictedfennel seed extraction efficiency=96.50 per cent.
Superimposed contour plots having commonsuperimposed area for all responses are shown in Fig. 4.The superimposed contours of response for rotationalspeed and feed rate and their intersection zone formaximum seed extraction efficiency indicate range ofoptimum values of operational parameters as below.
Rotational speed, rpm = 680 -730, Feed rate, kg/h = 160 - 205
Verification of the model for fennel seed extraction
Extraction of fennel seeds (sample size 2 kg) wascarried out at optimized input parameters (Rotational drum
speed = 709.22~700 rpm, Feed rate = 171.46~170 kg/h) fortesting the adequacy of model equations for predictingthe extraction response values.
The observed experimental values (mean of threeexperiments) and values predicted by the equations ofthe model are presented in Table 4. The experimentalvalues were found to be very close to the predicted valuesfor extraction efficiency. Therefore, it could be concludedfrom above discussion that model equation 2 is quiteadequate to assess the behavior of fennel seed extraction.
GerminationThe germination percentage was significantly
influenced by the cylinder speed. The highest germinationof 91 per cent was observed for fennel seeds at optimizedrotational speed and feed rate. The rotational speedaffected the germination percentage significantly. It maybe due to the fact that higher rotational speed abovecertain level resulted in higher rubbing forces than therequirement and higher feed rates above certain level at
Table 3. Optimized solution generated by the software for fennel seed extraction
Number Rotational Feed rate, kg/h Type of drum Extraction Desirabilityspeed, rpm efficiency, %
1 721.99 186.26 Stud bolted drum 96.49 0.895 Selected
Fig. 4 : Superimposed contour plots for fennel seed extraction
PKV Res. J. Vol. 42 (2), July 2018
99
fixed concave clearance caused internal seed damagewhich resulted in decreased germination percentage. Theresults are in agreement with the researchers Bansal andLohan (2009).
CONCLUSIONThe optimized parameters for fennel seed
extraction were found to be stud bolted drum havingrotational speed of 700 rpm and feed rate of 170 kg/h. Theextraction efficiency was found to be 96.36 per cent atoptimized conditions.
LITERATURE CIRTEDAltan ,A, KL McCarthy and M. Maskan, 2008. Twin-screw
extrusion of barley-grape pomace blends : Extrudatecharacteristics and determination of optimumprocessing conditions, J. Food Engg., 89 : 24–32.
Bansal, N. K. and Shiv Kumar Lohan, 2009. Design andDevelopment of an Axial Flow Thresher for Seed Crops,J. Agril. Engg. 46 (1).
Borkar, P.A., 2011. Studies on osmotic and air drying ofaloe vera gel. Ph.D. Thesis (Unpub) submitted toMaharana Pratap University of Agricultural andTechnology, Udaipur.
Chowdhury, M.M., R.I. Sarkar, B.K. Bal and M.A. Hossain, 2000. Physical properties of gram as function ofmoisture content, International J. Food Products. 4 :297-310.
Corzo, O, N Bracho, A Vasquez and A Pereira, 2008.Optimization of a thin layer drying process for corobaslices, J. Food Engg., 85 : 372-380.
Eren, I and v Kaymak-Ertekin, 2007. Optimization ofosmotic dehydration of potato using response surfacemethodology, J. Food Proc. Engg., 79 : 344-352.
Jain, S. K., 2007. Studies on osmotic and air drying ofpapaya. Ph.D. Thesis (Unpub) submitted to MaharanaPratap University of Agriculture and Technology,Udaipur.
Kar, A. and D.K. Gupta, 2001. Osmotic dehydrationcharacteristics of button mushrooms, J of Food Sci.Technology, 38 : 352-357.
Kushwaha, H. L., A. P. Srivastava, H. Singh, 2005.Development and performance evaluation of an Okraseed extractor, Agric. Eng. International, The CIGRe-journal,Manuscript PM 05 001, 7 : 1-12.
Liyana-Pathirana CM and F Shahidi, 2005. Optimizationof extraction of phenolic compounds from wheat usingresponse surface methodology, Food Chem, 93:47-56.
Mestdagh F, De Wilde T, S Fraselle , Y Govaert , W Ooghe,JM Degroodt, R Verhe, CC Van Peteghem and DeMeulenaer B, 2008. Optimization of the blanchingprocess to reduce acrylamide in fried potatoes. LWT– Food Science and Technology, 41 : 1648-1654.
Mohsenin, N. N., 1986. Physical properties of plant andanimal materials, New York: Gordon and breach SciencePublishers.
Myers R.H., D.C. Montgomery and C.M. Anderson-Cook,2009. Response surface methodology: Process andproduct optimization using designed experiments.John Wiley and Sons, Inc., New York.
Pokharkar S. M., 1994. Studies on osmotic concentrationand air drying of pineapple slices, Ph.D. Thesis(Unpub) submitted to Indian Institute of Technology,Kharagpur.
Shi HN, S Yusof, S.A. Hamid and A. Rahman, 2008.Optimization of hot water extraction for sapodilla juiceusing response surface methodology, J. Food Engg.,74: 352–358.
USDA., 1970, Official grain standards of United States.U.S. Dept. Agri. Consumer and marketing Service, graindivision Washington, D. C., USA.
Vijayan, P., Chand N and W.E. Eipeson, 1995. Optimizationof osmotic dehydration of cauliflower, J. Food Proc.and Preser., 19 : 229–242.
Table 4 Predicted and experimental values of response at optimum process conditions for fennel seed extraction
Response Predicted value Experimental value + SD
Extraction efficiency, % 96.50 97.28* + 1.16
*Average of three replications
Received on 8.2.2019
Influence of Rotational Speeed and Feed Rate on Fennel Seed Extraction Efficiency
100
Safflower (Carthamus tinctorius L.)is an important rabioilseed crop. Safflower oil contains 55-81 per cent linoleicacid, 7.42 per cent oleic acid, 1-10 per cent stearic acid and1-10 per centpalmitic acid with 90 per cent unsaturatedand 10 per cent saturated fatty acids. In field several bioticand abiotic factors are responsible for reducing yield ofsafflower. Insect pest is one of the important biotic factorscontributed in reducing yield. Number of insect pestsreported in Safflower, of these, aphid (Uroleuconcompositae Theobald) is a serious threat to the safflowerproduction. The infestation of aphid starts from the rosettestage ofthecrop andit attains its peak when the crop is atstem elongation stage. The aphids suck the cell sap fromtender parts of the crop with a result the plants fade, dryup thereby causing heavy damage to the crop. Aphid candevelop high populations on leaves and terminalsofplants,the pest continuesinfestingthe safflowerthroughout the crop growth. Both nymphs and adultssuck sap from succulent plant parts i.e. foliage and flowers.Moreover, honey dew secreted by the aphids facilitatesthe occurrence of black sooty mould on foliage whichhampers the photosynthetic activity of the plant. Anaverage of 37 per cent loss in seed yield due to aphid wasreported.The aphids can be managed by using chemicalinsecticides. Considering several unintended repercussionof insecticides on agro ecosystem, there is a large scopefor developing effective and an ecologically sound pest
Reaction of Safflower Carthamus tinctorius L. Lines Against AphidsUroleucon compositae (Theobald)
P. N. Mane1, S. B. Sakhare2, Sangeeta Fatak3, M. Y. Ladole4, B. K. Farkade5 and N. J. Wankhade6
ABSTRACT
The field experiment was conducted at Oilseed Research Unit, Dr. Panjabrao Deshmukh Krishi Vidyapeeth, Akola inRandomized Block Design during rabi 2016-17. In all, thirteen safflower varieties alongwith AI as tolerant and CO-1 assusceptible check replicated thrice were screened for aphid infestation. Foliage drying due to aphids was recorded fromeach row when plants of CO-1 (Susceptible check) were completely killed. Based on A.I.I., the screening material wascategorized in the different aphid reaction. Among the safflower varieties screened against aphids, safflower lines viz;AKS-340, AKS-341, AKS-342, AKS-343, AKS-344, AKS-345, A-1, PBNS 12, PKV Pink, AKS-322, AKS-325 and AKS-326were found tolerant to aphids recording 1.67, 1.31, 1.33, 1.82, 1.58,1.38,1.54,1.15, 1.87, 1.13 and 2.00 aphid infestationindex. AKS-41 and AKS-33 were moderately tolerant, recorded 2.08 and 2.57 aphid infestation index.
1,4&5. Assistant Professor, 2. SRS (Oilseeds) 3. JRA, and 6. Agril. Assistant, Oilseeds Research Unit, Dr. PDKV, Akola
management approach. Therefore, development of aphidtolerant variety is one of the aspects which can beincorporated in integrated pest management. The insectpest tolerant cultivar is the most suitable minimum cashinput for marginal farmers. Hence, through presentinvestigation efforts are being made to study and identifythe tolerant sources against aphids.
MATERIAL AND METHODSThe field experiment was conducted at Oilseed
Research Unit, Dr. Panjabrao Deshmukh Krishi Vidyapeeth,Akola during rabi 2016-17. Experiment was laid out inrandomized block design with three replications. In all,thirteen varieties along with AI as tolerant and CO-1 assusceptible check were screened. Separate block ofsusceptible “CO-1” variety as infester block was sownone month before sowing of screening material. Screeningmaterial was planted in single row of 2 meter length with45 cm spacing between rows and 20 cm with in plants. Assoon as screening material attained vulnerable stage i.estem elongation stage, the plants with aphids in infesterblock were uprooted and shaked over the screening rowsto maintain aphid population uniformly. Foliage dryingdue to aphids was recorded from each row when CO-1(Susceptible check) was completely killed andcategorizedinto 1 - 5 grade (table 1) (Kavitha and DharmaReddy, 2012).
PKV Res. J. Vol. 42 (2), July 2018
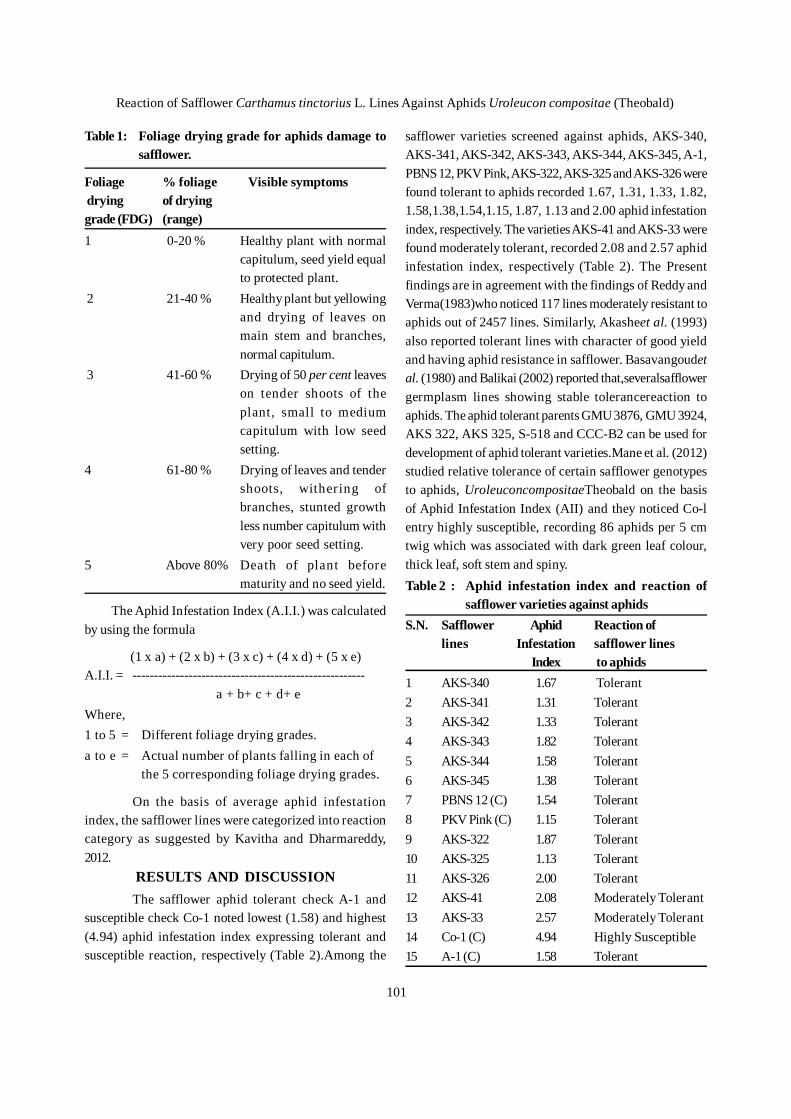
101
Table 1: Foliage drying grade for aphids damage tosafflower.
Foliage % foliage Visible symptoms drying of dryinggrade (FDG) (range)1 0-20 % Healthy plant with normal
capitulum, seed yield equalto protected plant.
2 21-40 % Healthy plant but yellowingand drying of leaves onmain stem and branches,normal capitulum.
3 41-60 % Drying of 50 per cent leaveson tender shoots of theplant, small to mediumcapitulum with low seedsetting.
4 61-80 % Drying of leaves and tendershoots, withering ofbranches, stunted growthless number capitulum withvery poor seed setting.
5 Above 80% Death of plant beforematurity and no seed yield.
The Aphid Infestation Index (A.I.I.) was calculatedby using the formula
(1 x a) + (2 x b) + (3 x c) + (4 x d) + (5 x e)A.I.I. = ------------------------------------------------------ a + b+ c + d+ eWhere,1 to 5 = Different foliage drying grades.a to e = Actual number of plants falling in each of
the 5 corresponding foliage drying grades.
On the basis of average aphid infestationindex, the safflower lines were categorized into reactioncategory as suggested by Kavitha and Dharmareddy,2012.
RESULTS AND DISCUSSIONThe safflower aphid tolerant check A-1 and
susceptible check Co-1 noted lowest (1.58) and highest(4.94) aphid infestation index expressing tolerant andsusceptible reaction, respectively (Table 2).Among the
safflower varieties screened against aphids, AKS-340,AKS-341, AKS-342, AKS-343, AKS-344, AKS-345, A-1,PBNS 12, PKV Pink, AKS-322, AKS-325 and AKS-326 werefound tolerant to aphids recorded 1.67, 1.31, 1.33, 1.82,1.58,1.38,1.54,1.15, 1.87, 1.13 and 2.00 aphid infestationindex, respectively. The varieties AKS-41 and AKS-33 werefound moderately tolerant, recorded 2.08 and 2.57 aphidinfestation index, respectively (Table 2). The Presentfindings are in agreement with the findings of Reddy andVerma(1983)who noticed 117 lines moderately resistant toaphids out of 2457 lines. Similarly, Akasheet al. (1993)also reported tolerant lines with character of good yieldand having aphid resistance in safflower. Basavangoudetal. (1980) and Balikai (2002) reported that,severalsafflowergermplasm lines showing stable tolerancereaction toaphids. The aphid tolerant parents GMU 3876, GMU 3924,AKS 322, AKS 325, S-518 and CCC-B2 can be used fordevelopment of aphid tolerant varieties.Mane et al. (2012)studied relative tolerance of certain safflower genotypesto aphids, UroleuconcompositaeTheobald on the basisof Aphid Infestation Index (AII) and they noticed Co-lentry highly susceptible, recording 86 aphids per 5 cmtwig which was associated with dark green leaf colour,thick leaf, soft stem and spiny.Table 2 : Aphid infestation index and reaction of
safflower varieties against aphidsS.N. Safflower Aphid Reaction of
lines Infestation safflower linesIndex to aphids
1 AKS-340 1.67 Tolerant2 AKS-341 1.31 Tolerant3 AKS-342 1.33 Tolerant4 AKS-343 1.82 Tolerant5 AKS-344 1.58 Tolerant6 AKS-345 1.38 Tolerant7 PBNS 12 (C) 1.54 Tolerant8 PKV Pink (C) 1.15 Tolerant9 AKS-322 1.87 Tolerant10 AKS-325 1.13 Tolerant11 AKS-326 2.00 Tolerant12 AKS-41 2.08 Moderately Tolerant13 AKS-33 2.57 Moderately Tolerant14 Co-1 (C) 4.94 Highly Susceptible15 A-1 (C) 1.58 Tolerant
Reaction of Safflower Carthamus tinctorius L. Lines Against Aphids Uroleucon compositae (Theobald)
102
LITERATURE CITED
Akashe, V. B., R. V. Datkhile., R. C.Patil., V. D.ShendeandC. D. Deokar, 1993. Field screening of safflower entriesagainst aphids, J. Maharashtra Agric. Univ., 18 (2):268-69.
Balikai, R. A. 2002. Evaluation of promising safflowercultivars for resistance to aphids (Uroleuconcompositae Theobald) Agris. Sci. Digest, 20(1): 39-41.
Basavangoud, K., K. A.Kulkarni and T. S.Thontadarya,1980. Safflower varietal reaction to the aphids,Dactynotus compositae, Theobald and the differencesin biochemical constituents in resistant and
susceptible varieties, Mysore J.Agri. Sci., 14(4): 512-515.
Kavitha, K. and K.Dharmareddy, 2012. Screeningtechniques for different insect pests in crop plants.Int. J. Bio-resource and Stress Management, 3(2):188-195.
Mane, P.N., P. K.Rathod., K. L.Balode., S. N. Deshmukhand P. A. Sarap, 2012. Relative tolerance of certainsafflower genotypes to safflower aphids,Uroleuconcompositae Theobald. J.Oilseeds Res., 29:365-370.
Reddy, K. andA.Verma. 1983. Field screening of safflowergenotypes for resistance against aphid and capsuleborer. Agric. Reviews,23:2,127-133.
Received on 15.1.2019
PKV Res. J. Vol. 42 (2), July 2018
103
There is a close relationship and interactionbetween the environmental conditions and animal healthwith their productivity. The environment includes allexternal conditions and influence the animal health andproductivity. The most important component ofenvironment is climate which comprises temperature andhumidity. A number of other factors like year and seasonof calving, length of lactation are known to exert influenceon the performance of dairy animal. Seasonal variation inanimal performance in tropics is expected to be primarily amanifestation of variation in feed quality and quantity(Forman et al., 2008).
Most of the research work is diverted to studythe effect of environmental factors in the dairy animal.Considering the effect of global warming in all livingbeings this study has great importance. Hence presentresearch work was proposed and carried to study the effectof environmental temperature on milk production ofIndigenous and Crossbred cows, with major objectives,to study the effect of different seasons on the milkproduction of crossbred cows and indigenous cows.
Seasonal Effect on the Milk Production of Indigenous and Crossbred Cows
S. D. Chavan1, R. R. Shelke2, A. S. Ingole3 and R. V. Pawar4
ABSTRACT
The present research work was carried to study the seasonal effect of environmental temperature on milkproduction of Indigenous and Crossbred cows at Livestock Instructional farm, Department of Animal Husbandryand Dairy Science, Dr. PDKV., Akola with the objectives to study the effect of different seasons on the milkproduction of indigenous and crossbred cows and to observe the changes in physiological reactions over theseason. Meteorological data and milk yield data of indigenous cow and crossbred cow was recorded at UniversityLivestock Instructional Farm and on the basis of interpretation of data the results are concluded. Hot humidclimate of rainy season favored the milk production in Indigenous cows, whereas cold humid climate showedincrease milk production in Crossbred cows. Increase of humidity showed decrease in milk yield while cold dryclimate showed enhanced milk production in crossbred cows in winter season but hot dry winter climate wasfavorable for milk production of Indigenous cows. Physiological reactions in respect of Indigenous andCrossbred cows exhibited higher pulse rate, lower respiration and higher rectal temperature, during winterseason.
1. Associate Professor, 2. Assistant Professor, 3. Head of the Department,4. SRA, Department of Animal Husbandryand Dairy Science, Dr. PDKV, Akola
MATERIAL AND METHODS
It was a medium term project for three years.Meteorological data for the year 2010-11, 2011-12 and2012-13 was recorded from the Department of Agronomy.Similarly the milk yield data of indigenous and crossbredcow were also recorded for the period June 2010 to May2013. During this period the observation on milk yield ofindigenous and crossbred cows was recorded. Theavailable meteorological and milk yield data were dividedin three seasons namely rainy from June to September,winter from October to January, and summer from Februaryto May, for the year 2010-11, 2011-12 and 2012-13.
The correlation between milk yield and climaticfactor i.e. ambient temperature and relative humidity wereestimated as per prescribed methods and formulas assuggested by Singh and Choudhary (1977).
RESULTS AND DISCUSSION The results of three years data are presented in this report.
1. Calving distributionsThe month wise distribution of calving of
PKV Res. J. Vol. 42 (2), July 2018
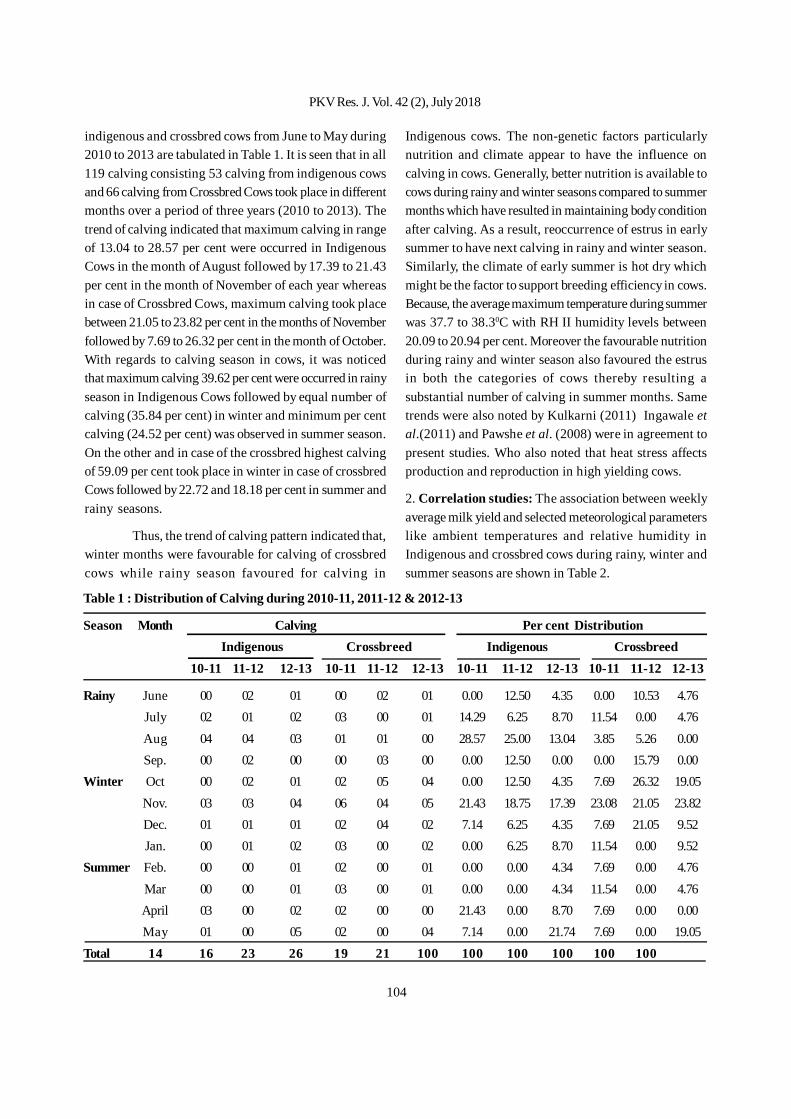
104
indigenous and crossbred cows from June to May during2010 to 2013 are tabulated in Table 1. It is seen that in all119 calving consisting 53 calving from indigenous cowsand 66 calving from Crossbred Cows took place in differentmonths over a period of three years (2010 to 2013). Thetrend of calving indicated that maximum calving in rangeof 13.04 to 28.57 per cent were occurred in IndigenousCows in the month of August followed by 17.39 to 21.43per cent in the month of November of each year whereasin case of Crossbred Cows, maximum calving took placebetween 21.05 to 23.82 per cent in the months of Novemberfollowed by 7.69 to 26.32 per cent in the month of October.With regards to calving season in cows, it was noticedthat maximum calving 39.62 per cent were occurred in rainyseason in Indigenous Cows followed by equal number ofcalving (35.84 per cent) in winter and minimum per centcalving (24.52 per cent) was observed in summer season.On the other and in case of the crossbred highest calvingof 59.09 per cent took place in winter in case of crossbredCows followed by 22.72 and 18.18 per cent in summer andrainy seasons.
Thus, the trend of calving pattern indicated that,winter months were favourable for calving of crossbredcows while rainy season favoured for calving in
Indigenous cows. The non-genetic factors particularlynutrition and climate appear to have the influence oncalving in cows. Generally, better nutrition is available tocows during rainy and winter seasons compared to summermonths which have resulted in maintaining body conditionafter calving. As a result, reoccurrence of estrus in earlysummer to have next calving in rainy and winter season.Similarly, the climate of early summer is hot dry whichmight be the factor to support breeding efficiency in cows.Because, the average maximum temperature during summerwas 37.7 to 38.30C with RH II humidity levels between20.09 to 20.94 per cent. Moreover the favourable nutritionduring rainy and winter season also favoured the estrusin both the categories of cows thereby resulting asubstantial number of calving in summer months. Sametrends were also noted by Kulkarni (2011) Ingawale etal.(2011) and Pawshe et al. (2008) were in agreement topresent studies. Who also noted that heat stress affectsproduction and reproduction in high yielding cows.
2. Correlation studies: The association between weeklyaverage milk yield and selected meteorological parameterslike ambient temperatures and relative humidity inIndigenous and crossbred cows during rainy, winter andsummer seasons are shown in Table 2.
Table 1 : Distribution of Calving during 2010-11, 2011-12 & 2012-13
Season Month Calving Per cent Distribution Indigenous Crossbreed Indigenous Crossbreed
10-11 11-12 12-13 10-11 11-12 12-13 10-11 11-12 12-13 10-11 11-12 12-13
Rainy June 00 02 01 00 02 01 0.00 12.50 4.35 0.00 10.53 4.76July 02 01 02 03 00 01 14.29 6.25 8.70 11.54 0.00 4.76Aug 04 04 03 01 01 00 28.57 25.00 13.04 3.85 5.26 0.00Sep. 00 02 00 00 03 00 0.00 12.50 0.00 0.00 15.79 0.00
Winter Oct 00 02 01 02 05 04 0.00 12.50 4.35 7.69 26.32 19.05Nov. 03 03 04 06 04 05 21.43 18.75 17.39 23.08 21.05 23.82Dec. 01 01 01 02 04 02 7.14 6.25 4.35 7.69 21.05 9.52Jan. 00 01 02 03 00 02 0.00 6.25 8.70 11.54 0.00 9.52
Summer Feb. 00 00 01 02 00 01 0.00 0.00 4.34 7.69 0.00 4.76Mar 00 00 01 03 00 01 0.00 0.00 4.34 11.54 0.00 4.76April 03 00 02 02 00 00 21.43 0.00 8.70 7.69 0.00 0.00May 01 00 05 02 00 04 7.14 0.00 21.74 7.69 0.00 19.05
Total 14 16 23 26 19 21 100 100 100 100 100 100
PKV Res. J. Vol. 42 (2), July 2018
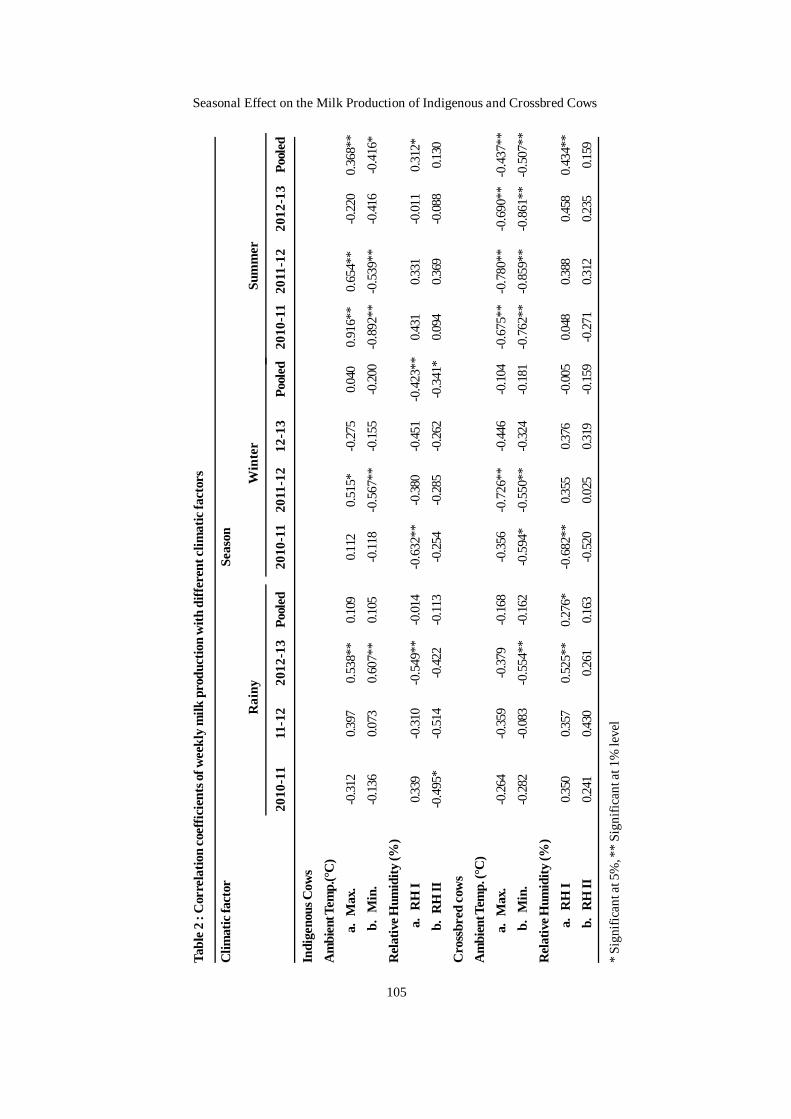
105
Tabl
e 2 :
Cor
rela
tion
coef
ficie
nts o
f wee
kly
milk
pro
duct
ion
with
diff
eren
t clim
atic
fact
ors
Clim
atic
fact
orSe
ason
R
ainy
W
inte
r
Sum
mer
2010
-11
11-1
220
12-1
3Po
oled
2010
-11
2011
-12
12-1
3Po
oled
2010
-11
2011
-12
2012
-13
Pool
ed
Indi
geno
us C
ows
Am
bien
t Tem
p.(°
C)
a. M
ax.
-0.31
20.3
970.
538*
*0.1
090.1
120.
515*
-0.27
50.0
400.
916*
*0.
654*
*-0
.220
0.36
8**
b.
Min
.-0
.136
0.073
0.60
7**
0.105
-0.11
8-0
.567
**-0
.155
-0.20
0-0
.892
**-0
.539
**-0
.416
-0.4
16*
Rel
ativ
e Hum
idity
(%)
a.
RH
I0.3
39-0
.310
-0.5
49**
-0.01
4-0
.632
**-0
.380
-0.45
1-0
.423
**0.4
310.3
31-0
.011
0.31
2* b
. R
H II
-0.4
95*
-0.51
4-0
.422
-0.11
3-0
.254
-0.28
5-0
.262
-0.3
41*
0.094
0.369
-0.08
80.1
30C
ross
bred
cow
sA
mbi
ent T
emp.
(°C
)a.
Max
.-0
.264
-0.35
9-0
.379
-0.16
8-0
.356
-0.7
26**
-0.44
6-0
.104
-0.6
75**
-0.7
80**
-0.6
90**
-0.4
37**
b.
Min
.-0
.282
-0.08
3-0
.554
**-0
.162
-0.5
94*
-0.5
50**
-0.32
4-0
.181
-0.7
62**
-0.8
59**
-0.8
61**
-0.5
07**
Rel
ativ
e Hum
idity
(%)
a.
RH
I0.3
500.3
570.
525*
*0.
276*
-0.6
82**
0.355
0.376
-0.00
50.0
480.3
880.4
580.
434*
* b
. R
H II
0.241
0.430
0.261
0.163
-0.52
00.0
250.3
19-0
.159
-0.27
10.3
120.2
350.1
59
* Si
gnifi
cant
at 5
%,*
* Si
gnifi
cant
at 1
% le
vel
Seasonal Effect on the Milk Production of Indigenous and Crossbred Cows
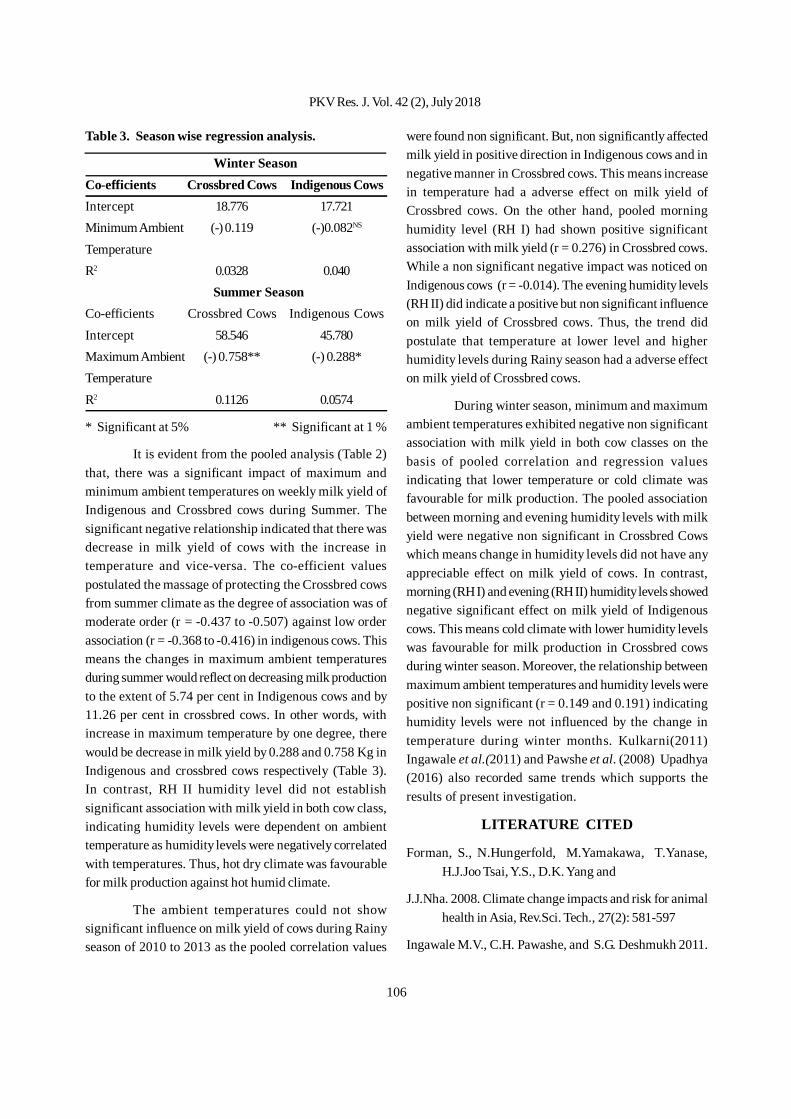
106
Table 3. Season wise regression analysis.
Winter SeasonCo-efficients Crossbred Cows Indigenous CowsIntercept 18.776 17.721Minimum Ambient (-) 0.119 (-)0.082NS
TemperatureR2 0.0328 0.040 Summer SeasonCo-efficients Crossbred Cows Indigenous CowsIntercept 58.546 45.780Maximum Ambient (-) 0.758** (-) 0.288*TemperatureR2 0.1126 0.0574
* Significant at 5% ** Significant at 1 %
It is evident from the pooled analysis (Table 2)that, there was a significant impact of maximum andminimum ambient temperatures on weekly milk yield ofIndigenous and Crossbred cows during Summer. Thesignificant negative relationship indicated that there wasdecrease in milk yield of cows with the increase intemperature and vice-versa. The co-efficient valuespostulated the massage of protecting the Crossbred cowsfrom summer climate as the degree of association was ofmoderate order (r = -0.437 to -0.507) against low orderassociation (r = -0.368 to -0.416) in indigenous cows. Thismeans the changes in maximum ambient temperaturesduring summer would reflect on decreasing milk productionto the extent of 5.74 per cent in Indigenous cows and by11.26 per cent in crossbred cows. In other words, withincrease in maximum temperature by one degree, therewould be decrease in milk yield by 0.288 and 0.758 Kg inIndigenous and crossbred cows respectively (Table 3).In contrast, RH II humidity level did not establishsignificant association with milk yield in both cow class,indicating humidity levels were dependent on ambienttemperature as humidity levels were negatively correlatedwith temperatures. Thus, hot dry climate was favourablefor milk production against hot humid climate.
The ambient temperatures could not showsignificant influence on milk yield of cows during Rainyseason of 2010 to 2013 as the pooled correlation values
were found non significant. But, non significantly affectedmilk yield in positive direction in Indigenous cows and innegative manner in Crossbred cows. This means increasein temperature had a adverse effect on milk yield ofCrossbred cows. On the other hand, pooled morninghumidity level (RH I) had shown positive significantassociation with milk yield (r = 0.276) in Crossbred cows.While a non significant negative impact was noticed onIndigenous cows (r = -0.014). The evening humidity levels(RH II) did indicate a positive but non significant influenceon milk yield of Crossbred cows. Thus, the trend didpostulate that temperature at lower level and higherhumidity levels during Rainy season had a adverse effecton milk yield of Crossbred cows.
During winter season, minimum and maximumambient temperatures exhibited negative non significantassociation with milk yield in both cow classes on thebasis of pooled correlation and regression valuesindicating that lower temperature or cold climate wasfavourable for milk production. The pooled associationbetween morning and evening humidity levels with milkyield were negative non significant in Crossbred Cowswhich means change in humidity levels did not have anyappreciable effect on milk yield of cows. In contrast,morning (RH I) and evening (RH II) humidity levels showednegative significant effect on milk yield of Indigenouscows. This means cold climate with lower humidity levelswas favourable for milk production in Crossbred cowsduring winter season. Moreover, the relationship betweenmaximum ambient temperatures and humidity levels werepositive non significant (r = 0.149 and 0.191) indicatinghumidity levels were not influenced by the change intemperature during winter months. Kulkarni(2011)Ingawale et al.(2011) and Pawshe et al. (2008) Upadhya(2016) also recorded same trends which supports theresults of present investigation.
LITERATURE CITED
Forman, S., N.Hungerfold, M.Yamakawa, T.Yanase,H.J.Joo Tsai, Y.S., D.K. Yang and
J.J.Nha. 2008. Climate change impacts and risk for animalhealth in Asia, Rev.Sci. Tech., 27(2): 581-597
Ingawale M.V., C.H. Pawashe, and S.G. Deshmukh 2011.
PKV Res. J. Vol. 42 (2), July 2018
107
Advance reproduction techniques in livestockproduction, Compendium on Climate Change:protecting environment through improved animalhusbandry practices, Deptt. of LPM, PGIVAS,Akola, 25- 32
Kulkarni S.S. 2011. Adaption of Indian livestock toimpending climate change, Compendium on ClimateChange: protecting environment through improvedanimal husbandry practices, Deptt. of LPM,PGIVAS, Akola, 01-09.
Pawashe, C.H., S.R.Kale, M.D. Pawashe, V.K. Mundhe,M.V.Ingawale and S. G. Deshmukh, 2011. Farm
animal fertility under adverse agro climaticconditions, Compendium on Climate Change:protecting environment through improved animalhusbandry practices, Deptt. of LPM, PGIVAS,Akola, 01-09.
Singh,R.K. and B.D. Chaudhary. 1977. Biometric Methodsin Quantitative Genetics Analysis, KalyaniPublishers, New Delhi.
Upadhya, R.C., 2016. Climate Change: commitments andopportunities Indian Livestock Sector, Souvenir,44th dairy Industry Conference, NDRI :54-60.
Received on 10.9.2018
Seasonal Effect on the Milk Production of Indigenous and Crossbred Cows
108
The Purna valley of Vidarbha region is an East –West elongated basin with slight convexity to the south.The Purna valley of the Vidarbha region covers parts ofAmaravati (1738 sq km), Akola (1939 sq km.) and Buldhana(1015 sq km.) districts. This tract spreads on both sides ofPurna river , affecting about 892 villages, covering an areaabout 4.69 lakh ha. Purna river starts from southern slopesof Govilgarh hills of Satpuda range which is the principaldrain joining to Tapi river. The major tributaries are Pedhi,Sarapi, Shahanur, Katepurna, Uma, Morna, Man, Mas,Nirguna, Nalganga and Dnyanganga. Locally it is saidthat there are about 360 tributaries joining Purna river. Ofthe 4.69 lakh ha area in the affected tract, very little portionis irrigated. Surface irrigation sources are negligible here.The main crops of the saline tract are cotton, sorghum,pigeon pea, black gram and green gram. In the small doublecropped pockets wheat, gram and safflower are cultivated.
Rainfed area in Purna river valley are highly diverseranging from resource rich area with good agriculturalpotential to resource poor area with much more restrictedpotential with salinity and sodicity. The soil managementin the saline tract of Purna valley is difficult due to thesevere erosion rate, swelling, cracking and seizing
Impact of various rainwater management systems on productivity,profitability and rainwater use efficiency in saline tract of Purna river valley
S. M. Taley1 and K. A. Jadhav2
ABSTRACTThe study was conducted on two tier system of rainwater management in saline tract of Purna river valley during
2014-15 to 2017-18 with objectives to increase the productivity, profitability and water use efficiency through suitabledouble cropping system. In double cropping system of Green gram-Chickpea, the yield of Green gram was found significantlyhigher (i.e. 5.53 qha-1) under two tier system of rainwater management (contour cultivation with protective irrigation) overthe yield recorded in conventional rainwater management systems. Chickpea grown after green gram under two tier systemrecorded significantly higher yield of 16.77 qha-1 in comparison to conventional rainwater management practices. Soybeanunder two tier system recorded significantly higher yield of 11.52 qha-1 as compared with yield recorded in mono tiersystem (contour and across the slope cultivation) and conventional system of rainwater management. Chickpea yield afterharvesting of Soybean was significantly superior over conventional practices of soil moisture management. The significantlyhigher chickpea equivalent yield of 11.31 qha-1 was found in Soybean–Chickpea cropping system as compared with thechickpea equivalent yield of 9.92 qha-1 recorded in Green gram–Chickpea cropping system under two tier rainwatermanagement system. The higher net returns of Rs. 58354 per ha was recorded in Green gram-Chickpea cropping systemunder two tier rainwater management system and the lowest net return of Rs. 7188 was recorded in Soybean–Chickpeacropping system under mono-tier system. Double cropping system of Green gram - Chickpea and Soybean-Chickpeaobserved statistically at par in B: C ratio.
1 Director and 2 JRA, Agro-ecology and Environment Centre, Dr. P.D.K.V., Akola.
characteristics. In India over 40% of the agricultural landis located in arid region and the farmers are not even ableto recover their investments in agriculture. It has beenreported that hardly 35% of the rainwater is usedeffectively while the remaining 65% goes as runoff,causing severe soil erosion, flooding of rivers and siltationof water bodies. Hence, this valuable asset has turnedout to be a liability.
The erosion hazards are greater under cerealsand millets crops cultivation. Jat et al. (2008) reportedthat, the black gram was found effective in controlling runoff and soil loss as compare to cereals and millet crops.Hence the present investigation was carried out to studythe productivity, profitability and water use efficiencythrough suitable double cropping system (two tier system)in saline tract of Purna river valley in Amravati district ofVidarbha.
MATERIALS AND METHODS
Design
The experiment was carried out in RandomizedBlock Design with five replications.
PKV Res. J. Vol. 42 (2), July 2018
109
Treatments (Rain Water Management System)
The treatments A) comprised conventionalsystem, control (T1), B) Mono tier system cultivationacross the slope (T2) and contour cultivation (T3), C) Twotier system, cultivation across the slope with protectiveirrigation (T4) and contour cultivation with protectiveirrigation (T5) system of rain water management (RWM).The rainfall received during the experimental years was571.9 mm, 622.3 mm, 718.1 mm and 427.9 mm, respectivelyduring 2014-15, 2015-16, 2016-17 and 2017-18.
Cropping System and Cultural Practices
The cropping system i.e. Green gram – Chickpea(C1) and Soybean - Chickpea (C2) were followed undereach rainwater management system. Green gram andSoybean sown during last week of June to first week ofJuly and harvested after 60 to 110 days, respectively duringeach seasons. Crop varieties Nirmal for Green gram, Jaki-9218 for Chickpea and JS-335 for Soybean were selected.The recommended doses of NPK were applied @ 25:50:20Kg ha-1 to Green gram, 25:50:30 Kg ha-1 to Chickpea and30:75:30 Kg ha-1 to Soybean.
Economics and Statistical Analysis
The net returns, benefits cost ratio and productionefficiency value in terms of Kg ha-1 day-1 and Rs. ha-1
day-1 were calculated with following formulae:
(i) Net Profit = Gross return – cost of cultivation
Total gross return(ii) Benefit: cost ratio = -----------------------------
Total cost of production
Chickpea equivalent yield incrop rotation
(iii) Production Efficiency = ----------------------------------- Value (kg ha-1 day-1) Total duration of crops in
that RotationWater Use Efficiency
Water use efficiency was calculated with the helpof following formula.
Grain Yield (kg ha-1)Water use efficiency = ------------------------------------ (kg ha -1 mm) Total Water applied (mm)
The individual year’s data and pooled data werestatistically analysed with the standard methods describedby Gomez and Gomez (1984). The results of the studydiscussed year wise and based on mean value of fiveyears.
RESULTS AND DISCUSSION
Productivity of Cropping System
The pooled data (Table-1) revealed that underthe double cropping system of Green gram–Chickpea,Green gram gave significantly higher yield of 5.53 qha-1
under two tier system of rainwater management i.e. contourcultivation with protective irrigation followed by acrossthe slope cultivation with protective irrigation (4.59 qha-1)over the yield recorded in mono tier systems of rainwatermanagement. Chickpea grown after green gram under twotier system of rainwater harvesting gave significantlyhigher yield of 16.77 qha-1 in comparison to other moisturemanagement practices. Two tier system of rain watermanagement recorded significantly higher yield ofSoybean 11.52 qha-1 as compared with yield recorded inmono tier (contour and across the slope cultivation) andconventional system of rain water management. Similarlyhighest Chickpea yield of 15.52 qha-1 was recorded in twotier system of rain water management after harvesting ofsoybean which was significantly superior over otherpractices of soil moisture management. The doublecropping system of Soybean-Chickpea was found superiorfollowed by Green gram-Chickpea in mono and two tiersystem of rainwater management. The highest net returnof Rs. 58354 per ha was obtained from Green gram-Chickpea cropping system which was highest over to thenet returned received from Soybean - Chickpea (Rs. 53539per ha.) under two tier system of rain water management.Double cropping system of Green gram + Chickpea andSoybean + chickpea observed statistically at par in B: Cratio.
The highest production efficiency (5.67 kg ha-1
per day) was observed in Green gram – Chickpea croppingsystem followed by Soybean - Chickpea(5.52 kg ha-1 perday) cropping system under two tier system over mono-tier system of rainwater management. Similarly highestB:C ratio and Water use efficiency was recorded in Greengram-Chickpea cropping system followed by Soybean-
Impact of various rainwater management systems on productivity, profitability and rainwater use efficiency in saline tract of Purna river valley
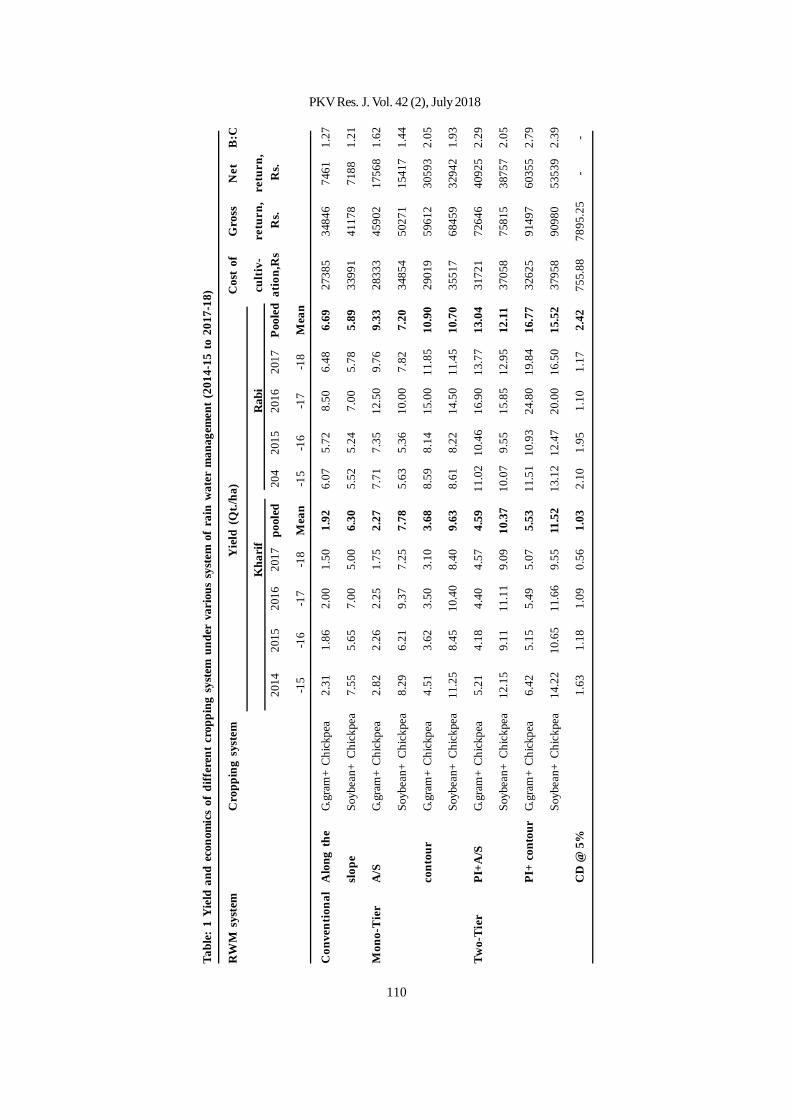
110
Tabl
e: 1
Yie
ld a
nd e
cono
mic
s of
diff
eren
t cr
oppi
ng s
yste
m u
nder
var
ious
sys
tem
of
rain
wat
er m
anag
emen
t (2
014-
15 t
o 20
17-1
8)
RW
M s
yste
mC
ropp
ing
syst
emY
ield
(Q
t./ha
)C
ost
ofG
ross
Net
B:C
Kha
rif
Rab
icu
ltiv
-re
turn
,re
turn
,20
1420
1520
1620
17po
oled
204
2015
2016
2017
Pool
edat
ion,
Rs
Rs.
Rs.
-15
-16
-17
-18
Mea
n-1
5-1
6-1
7-1
8M
ean
Con
vent
iona
lA
long
the
G.gr
am+
Chi
ckpe
a2.
311.
862.
001.
501.
926.
075.
728.
506.
486.
6927
385
3484
674
611.
27
slop
eSo
ybea
n+ C
hick
pea
7.55
5.65
7.00
5.00
6.30
5.52
5.24
7.00
5.78
5.89
3399
141
178
7188
1.21
Mon
o-T
ier
A/S
G.gr
am+
Chi
ckpe
a2.
822.
262.
251.
752.
277.
717.
3512
.50
9.76
9.33
2833
345
902
1756
81.
62
Soyb
ean+
Chi
ckpe
a8.
296.
219.
377.
257.
785.
635.
3610
.00
7.82
7.20
3485
450
271
1541
71.
44
cont
our
G.gr
am+
Chi
ckpe
a4.
513.
623.
503.
103.
688.
598.
1415
.00
11.8
510
.90
2901
959
612
3059
32.
05
Soyb
ean+
Chi
ckpe
a11
.25
8.45
10.4
08.
409.
638.
618.
2214
.50
11.4
510
.70
3551
768
459
3294
21.
93
Two-
Tie
rPI
+A/S
G.gr
am+
Chi
ckpe
a5.
214.
184.
404.
574.
5911
.02
10.4
616
.90
13.7
713
.04
3172
172
646
4092
52.
29
Soyb
ean+
Chi
ckpe
a12
.15
9.11
11.1
19.
0910
.37
10.0
79.
5515
.85
12.9
512
.11
3705
875
815
3875
72.
05
PI+
cont
our
G.gr
am+
Chi
ckpe
a6.
425.
155.
495.
075.
5311
.51
10.9
324
.80
19.8
416
.77
3262
591
497
6035
52.
79
Soyb
ean+
Chi
ckpe
a14
.22
10.6
511
.66
9.55
11.5
213
.12
12.4
720
.00
16.5
015
.52
3795
890
980
5353
92.
39
CD
@ 5
%1.
631.
181.
090.
561.
032.
101.
951.
101.
172.
4275
5.88
7895
.25
--
PKV Res. J. Vol. 42 (2), July 2018
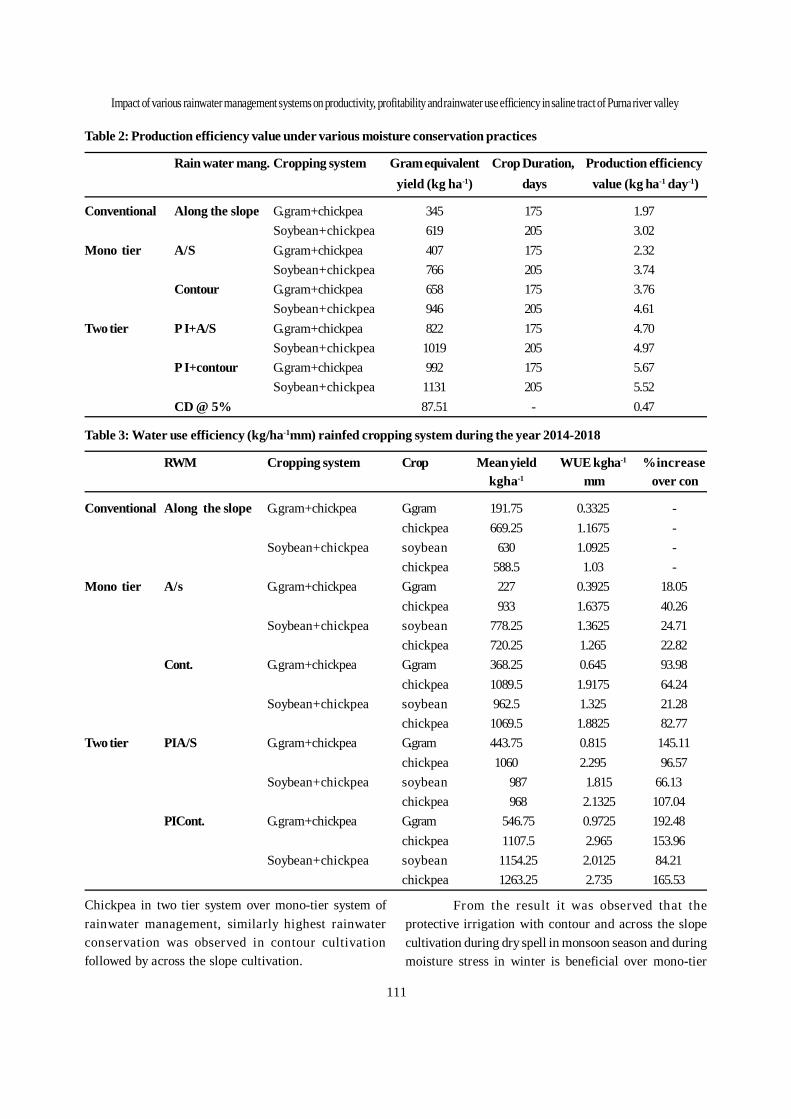
111
Table 2: Production efficiency value under various moisture conservation practices
Rain water mang. Cropping system Gram equivalent Crop Duration, Production efficiencyyield (kg ha-1) days value (kg ha-1 day-1)
Conventional Along the slope G.gram+chickpea 345 175 1.97Soybean+chickpea 619 205 3.02
Mono tier A/S G.gram+chickpea 407 175 2.32Soybean+chickpea 766 205 3.74
Contour G.gram+chickpea 658 175 3.76Soybean+chickpea 946 205 4.61
Two tier P I+A/S G.gram+chickpea 822 175 4.70Soybean+chickpea 1019 205 4.97
P I+contour G.gram+chickpea 992 175 5.67Soybean+chickpea 1131 205 5.52
CD @ 5% 87.51 - 0.47
Table 3: Water use efficiency (kg/ha-1mm) rainfed cropping system during the year 2014-2018
RWM Cropping system Crop Mean yield WUE kgha-1 %increasekgha-1 mm over con
Conventional Along the slope G.gram+chickpea G.gram 191.75 0.3325 -chickpea 669.25 1.1675 -
Soybean+chickpea soybean 630 1.0925 -chickpea 588.5 1.03 -
Mono tier A/s G.gram+chickpea G.gram 227 0.3925 18.05chickpea 933 1.6375 40.26
Soybean+chickpea soybean 778.25 1.3625 24.71chickpea 720.25 1.265 22.82
Cont. G.gram+chickpea G.gram 368.25 0.645 93.98chickpea 1089.5 1.9175 64.24
Soybean+chickpea soybean 962.5 1.325 21.28chickpea 1069.5 1.8825 82.77
Two tier PIA/S G.gram+chickpea G.gram 443.75 0.815 145.11chickpea 1060 2.295 96.57
Soybean+chickpea soybean 987 1.815 66.13chickpea 968 2.1325 107.04
PICont. G.gram+chickpea G.gram 546.75 0.9725 192.48chickpea 1107.5 2.965 153.96
Soybean+chickpea soybean 1154.25 2.0125 84.21chickpea 1263.25 2.735 165.53
Chickpea in two tier system over mono-tier system ofrainwater management, similarly highest rainwaterconservation was observed in contour cultivationfollowed by across the slope cultivation.
From the result it was observed that theprotective irrigation with contour and across the slopecultivation during dry spell in monsoon season and duringmoisture stress in winter is beneficial over mono-tier
Impact of various rainwater management systems on productivity, profitability and rainwater use efficiency in saline tract of Purna river valley
112
system of rain water management.
Economics of cropping system
The economics of Green gram-Chickpea andSoybean-Chickpea were studied and presented in Table1. The expenditure of Rs. 31,721 ha-1 was incurred on thecultivation of Green gram-Chickpea and Rs. 37,058 ha-1
was incurred on Soybean–Chickpea cropping system withcultivation across the slope and protective irrigation.While, Green gram-Chickpea cropping system incurredRs. 32,625 ha-1 and in Soybean-Chickpea, it was Rs. 37,958for contour cultivation with protective irrigation.
The highest Gross returns of Rs. 91,497 and Netreturn of Rs. 60,355 was obtained from the Green gram –Chickpea in two tier system of rain water management.The lowest Gross returns of Rs. 34,846 with net return ofRs. 7461 was found in the Green gram-Chickpea croppingsystem with Conventional system of moisture management(i.e. along the slope cultivation).
Production Efficiency
The production efficiency value was worked outon equivalent yield basis and results are given in Table 2.Production efficiency value in terms of kg ha-1 day-1 wasincreased with increasing combination of moisturemanagement practices under both the cropping systems.Production efficiency 5.67 kg ha-1 day-1 was recorded inGreen gram-Chickpea cropping system over Soybean–Chickpea (5.52 kg ha-1 day-1) cropping system.
B: C ratio
The Green gram –Chickpea followed by Soybean- Chickpea double cropping system were found best forhigher production efficiency and net returns undercontour cultivation with protective irrigation followed byacross the slope cultivation with protective irrigation indeep black soil (Table-1). The Benefit cost ratio of Greengram-Chickpea (1:2.79) and Soybean-Chickpea (1:2.41)double cropping system showed that the management ofrain water with contour and across the slope cultivationsupported with protective irrigation from pond (two tiersystem) is economically viable in the deep black soil ofSaline tract Purna river valley.
Water Use EfficiencyIn two tier system the water use efficiency was
recorded 2.01 kg ha -1 mm -1 in Soybean and 2.735 kg ha-1
mm-1 in Chickpea under Soybean-Chickpea croppingsystem in treatment contour cultivation with protectiveirrigation (Table- 3). The water use efficiency of 2.97 kg ha-1 mm-1was recorded in Chickpea and 0.97 kg ha-1 mm -1
was recorded in Green gram in Green gram-Chickpeacropping system. The water use efficiency was recordedin all tested crops under two tier system was higher overother moisture management system.
CONCLUSIONFrom the results it is concluded that the two tier
system i.e. contour and across the slope cultivation withprotective irrigation during dry spell in monsoon andmoisture stress in rabi is beneficial over mono tier systemof rain water management in vertisols of Saline tract.
LITERATURE CITED
Dhruva Narayana, V.V. 1993. Soil and Water ConservationResearch in India, ICAR , New DelhiPublication,pp.120.
Gomez, K.A. and A.A.Gomez, 1984, Statistical Proceduresfor Agricultural Research. Johnwiley and Sons,New York.
Goyal, R.K., T.K. Bhatti, and P.R.Ojasvi, 2007. Performanceevaluation of some soil and water conservationmeasures in hot arid zone of India. Indian J. SoilCons., 35(1):58-63
Goyal, R.K., P.R.Ojasvi and J.P. Gupta, 1997. Farm ponds:A Key to survival in arid areas. ASIANWATMANET, News Letter No.11:12-13.
Goyal, R.K. and A.K.Sharma, 2000. Farm Pond: A well ofwealth for the dryland dwellers. IntensiveAgriculture, 38 (5-6):12-14&26.
Jat, M.L., A.K.Kothari, S.K.Sharma and J.K. Balyan, 2008.Relative efficiency of different cropping system andland treatment on runoff and soil loss and cropyield under dry land ecosystem. J. MaharashtraAgri.Univ. 33(3):306-308.
Singh, R.A.1992. Engineering rain water to bring in moreprosperity. Intensive Agriculture, 30(9-10):29-30.
Received on 15.9.2018
PKV Res. J. Vol. 42 (2), July 2018
113
Mechanized agriculture is the process whichinitiates the use of agricultural machinery to mechanizethe work of agriculture and to reduce the human effortsand the drudgery. Farm machines have played aparamount role in increasing the agriculture productionand have grown to a sizable industry in India. The key toeconomic development lies in raising agriculturalproductivity which directly involves the utilization of moreenergy resources (Jekayinfa, 2006). The continuousincrease in wages of labour, unavailability of labours,bullocks, stipulation of time period to perform agriculturaloperation in lowest span of time, weather conditions, etc.,are the factors which makes necessity for use of farmmechanization (Kumar, 2011). Farm mechanization has
Farm Mechanization Knowledge, Attitude and Requirements of Farmers:A Step Towards Enhancing Farmers’ Income
V. S. Tekale1, R. D.Gawande2 and S. D. Sarnaik3
ABSTRACT
The research endeavor was ascertained in the Nagpur district of Maharashtra State. An exploratory research designof social science was used. The two tehsils from the district were selected purposively on the basis of most of the workregarding farm mechanization was underwent due to intervention of Department of Agriculture. Five villages from eachtehsil and ten respondents from each village were randomly selected. Total 100 respondents were considered for theresearch study. The purpose of the study was to analyze the farmer’s knowledge towards farm mechanization as well asto assess the farmer’s requirement with regard to farm mechanization. The findings with regard to knowledge level of therespondents about improved farm implements and machinery revealed that 53.00 per cent of the respondents had mediumlevel of knowledge followed by 37.00 per cent and 10.00 per cent of the respondents were observed in high and lowknowledge level category respectively. The knowledge of respondents about various farm implements and machineriesutilized in different farm operations were ascertained and it was found that respondents were familiar with the working ofmould board plough, harrow, dibbler, weeder, tractor and bullock cart and it were known to cent per cent respondents.Whereas complete knowledge about power sprayer (88.00%), thresher (87.00%), seed cum fertilizer drill (81.00%), poweroperated rotavator (80.00%), hand compressed sprayer (78.00%) and mini dal mill (68.00%) were noticed. Attitude is keydeterminant in the adoption process of any improved technology, hence attitude towards farm mechanization was judgewith help of teacher made attitude test and the findings revealed that 62.00 per cent of respondents had shown moderatelyfavourable attitude while 22.00 per cent and 13.00 per cent of respondents recorded in highly favourable and lessfavourable attitude category respectively. Farmer’s requirements regarding farm mechanization were access and provisionof credit facility (88.00%), provision of subsidies with low interest rate (83%), development of hand (86.00%) &multipurpose farm implements (78.00%) and provision of continuous electric supply at subsidized rate for farm work(75.00%) were some of major requirements quoted by respondents about farm mechanization. To enhance farmers’ incomeby 2022, multi-agency approach needs to be adopted by research and extension in a consistent and planned manner, as thecontributions to increase the farm incomes come not only from technological innovations, but also significantly frominstitutional support, infrastructural facilitation and policy intervention.
been helpful to bring about a significant improvement inagricultural productivity. Thus, there is strong need formechanization in agricultural operation (Starkey, 1998).
Farm mechanization provides the technology tofacilitate agricultural growth through efficient utilizationof inputs. Adoption of mechanizations ensures timelinessof agricultural operation reduces cost of production aswell as reduces drudgery. The farmers with small andmarginal land holding can able to utilize the machineriesin different operation through the custom hiring.Government of India, as well as Maharashtra Governmentthrough their various agencies, schemes promoting thefarm mechanization for the socio-economic developmentof the farming community. As efforts were initiated from
1 Head, 2. Post Graduate Student, 3. Ph.D. Scholar, Department of Extension Education, Dr. PDKV, Akola
PKV Res. J. Vol. 42 (2), July 2018
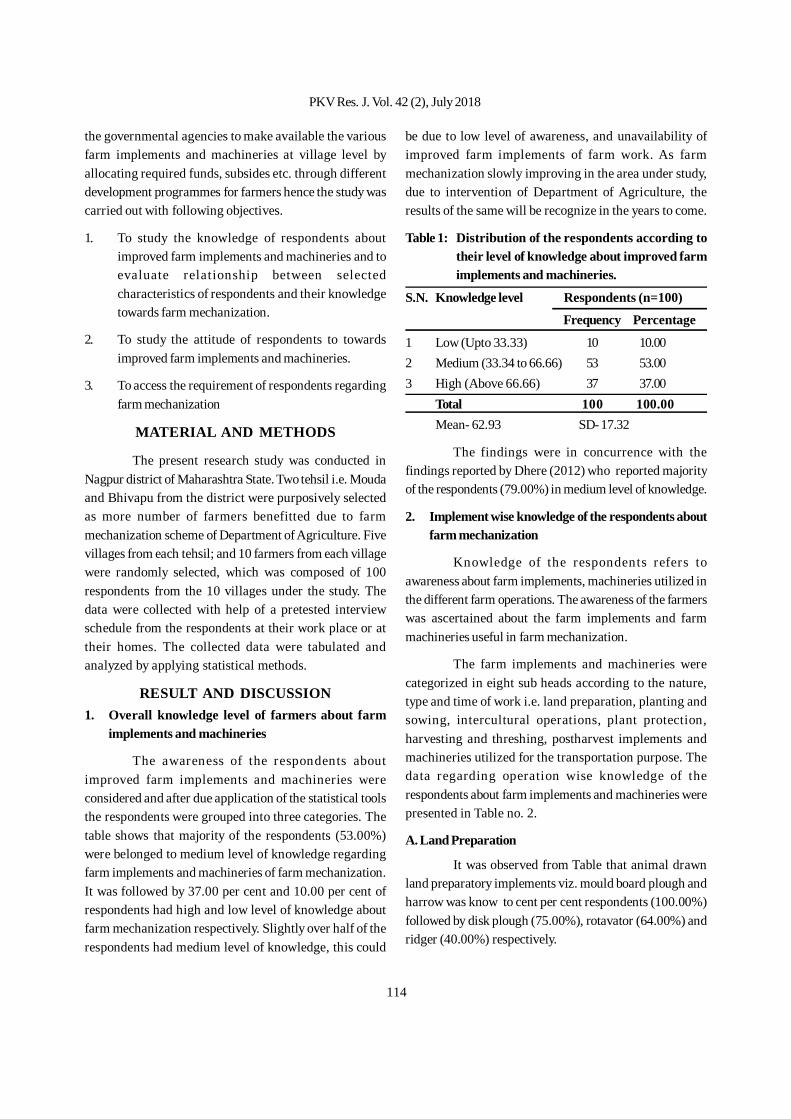
114
the governmental agencies to make available the variousfarm implements and machineries at village level byallocating required funds, subsides etc. through differentdevelopment programmes for farmers hence the study wascarried out with following objectives.
1. To study the knowledge of respondents aboutimproved farm implements and machineries and toevaluate relationship between selectedcharacteristics of respondents and their knowledgetowards farm mechanization.
2. To study the attitude of respondents to towardsimproved farm implements and machineries.
3. To access the requirement of respondents regardingfarm mechanization
MATERIAL AND METHODS
The present research study was conducted inNagpur district of Maharashtra State. Two tehsil i.e. Moudaand Bhivapu from the district were purposively selectedas more number of farmers benefitted due to farmmechanization scheme of Department of Agriculture. Fivevillages from each tehsil; and 10 farmers from each villagewere randomly selected, which was composed of 100respondents from the 10 villages under the study. Thedata were collected with help of a pretested interviewschedule from the respondents at their work place or attheir homes. The collected data were tabulated andanalyzed by applying statistical methods.
RESULT AND DISCUSSION1. Overall knowledge level of farmers about farm
implements and machineries
The awareness of the respondents aboutimproved farm implements and machineries wereconsidered and after due application of the statistical toolsthe respondents were grouped into three categories. Thetable shows that majority of the respondents (53.00%)were belonged to medium level of knowledge regardingfarm implements and machineries of farm mechanization.It was followed by 37.00 per cent and 10.00 per cent ofrespondents had high and low level of knowledge aboutfarm mechanization respectively. Slightly over half of therespondents had medium level of knowledge, this could
be due to low level of awareness, and unavailability ofimproved farm implements of farm work. As farmmechanization slowly improving in the area under study,due to intervention of Department of Agriculture, theresults of the same will be recognize in the years to come.
Table 1: Distribution of the respondents according totheir level of knowledge about improved farmimplements and machineries.
S.N. Knowledge level Respondents (n=100)
Frequency Percentage
1 Low (Upto 33.33) 10 10.002 Medium (33.34 to 66.66) 53 53.003 High (Above 66.66) 37 37.00
Total 100 100.00Mean- 62.93 SD- 17.32
The findings were in concurrence with thefindings reported by Dhere (2012) who reported majorityof the respondents (79.00%) in medium level of knowledge.
2. Implement wise knowledge of the respondents aboutfarm mechanization
Knowledge of the respondents refers toawareness about farm implements, machineries utilized inthe different farm operations. The awareness of the farmerswas ascertained about the farm implements and farmmachineries useful in farm mechanization.
The farm implements and machineries werecategorized in eight sub heads according to the nature,type and time of work i.e. land preparation, planting andsowing, intercultural operations, plant protection,harvesting and threshing, postharvest implements andmachineries utilized for the transportation purpose. Thedata regarding operation wise knowledge of therespondents about farm implements and machineries werepresented in Table no. 2.
A. Land Preparation
It was observed from Table that animal drawnland preparatory implements viz. mould board plough andharrow was know to cent per cent respondents (100.00%)followed by disk plough (75.00%), rotavator (64.00%) andridger (40.00%) respectively.
PKV Res. J. Vol. 42 (2), July 2018
115
Table 2 : Distribution of the respondents according to their implement and farm machineries wise knowledge aboutfarm mechanization.
S. N. Farm implements and farm Knowledge of the respondents (n=100)machineries Complete Partial Unknown
Freq. % Freq. % Freq. %A Land preparation- Animal drawn1 Mould board plough 100 100.00 00 00.00 00 00.002 Disk plogh 75 75.00 13 13.00 12 12.003 Harrow 100 100.00 00 00.00 00 00.004 Ridger 40 40.00 32 32.00 28 28.005 Rotavator 64 64.00 17 17.00 19 19.00
Land preparation- Power operated6 Rotavator 80 60.00 14 14.00 6 6.007 Mould board plough 88 88.00 8 8.00 4 4.008 Ridger 60 60.00 10 10.00 30 30.009 Furrow opener 60 60.00 20 20.00 20 20.00B Planting and sowing-Manual10 Dibbler 100 100.00 00 00.00 00 00.0011 Seed cum fertilizer drill 80 80.00 20 20.00 20 20.00
Planting and sowing-Animal drawn12 Seed cum fertilizer drill 81 81.00 9 9.00 10 10.0013 Seed drill over plough 66 66.00 24 24.00 10 10.0014 Rice planter 45 45.00 40 40.00 15 15.0015 Sugarcane planter 30 30.00 40 40.00 30 30.00C Intercultural operation- Manual16 Weeder /Hoe 95 95.00 5 5.00 0 0.00
Intercultural operation- Power operated17 Power weeder 55 55.00 40 40.00 5 5.0018 Grass weed splashier 35 35.00 25 25.00 40 40.00D Plant protection equipment-Manual19 Hand compressed sprayer 78 78.00 12 12.00 10 10.0020 Knapsack sprayer 67 67.00 25 25.00 8 8.0021 Foot sprayer 45 45.00 25 25.00 30 30.00E Plant protection equipment- Power operated22 Tractor operated sprayer 40 40.00 38 38.00 22 22.0023 Power sprayer 88 88.00 12 12.00 00 00.00E Harvesting & threshing- Power operated21 Groundnut pod striper 30 30.00 22 22.00 48 48.0022 Chaff cutter 55 55.00 37 37.00 8 8.0023 Thresher 87 87.00 13 13.00 00 00.00F Post-harvest equipment’s24 Mini rice mill 60 60.00 35 35.00 5 5.0025 Mini dal mill 68 68.00 22 22.00 10 10.0026 Extractor 5 5.00 20 20.00 75 75.0027 Grinder/Pulveriser/Polisher 24 24.00 36 36.0 40 40.00G Transportation28 Bullock cart 100 100.00 00 00.00 00 00.0029 Tractor trolley 100 100.00 00 00.00 00 00.00
Farm Mechanization Knowledge, Attitude and Requirements of Farmers:A Step Towards Enhancing Farmers’ Income
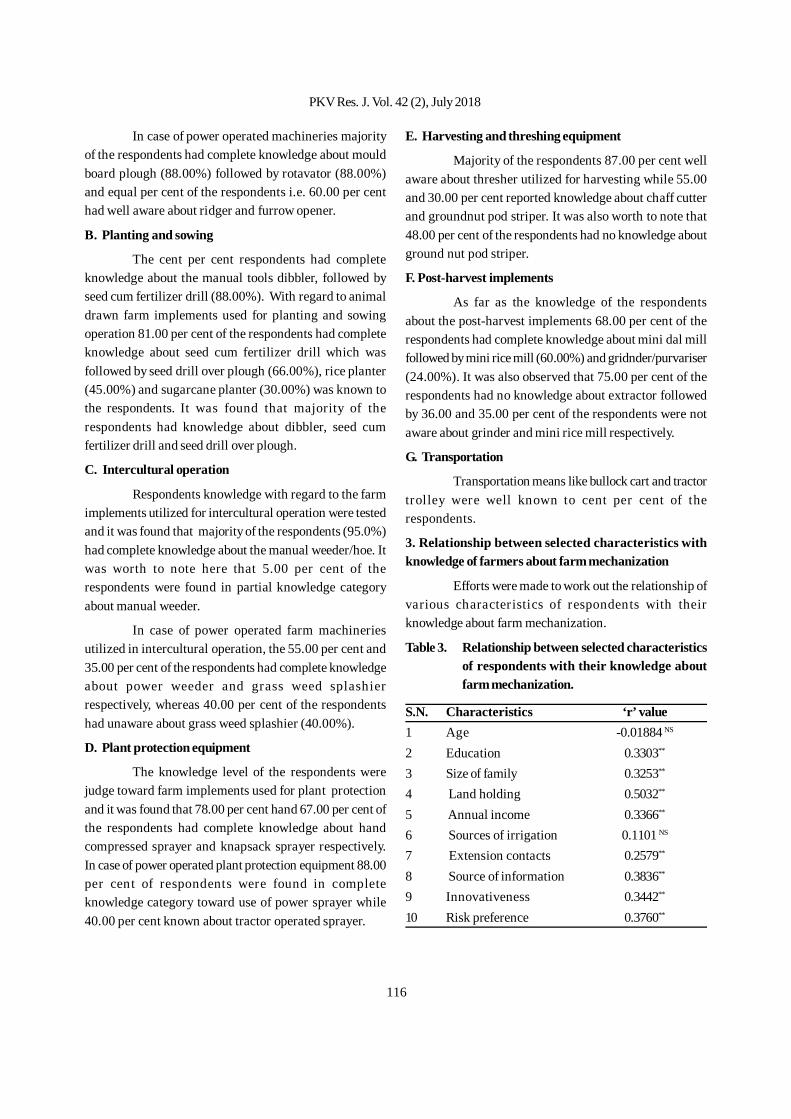
116
In case of power operated machineries majorityof the respondents had complete knowledge about mouldboard plough (88.00%) followed by rotavator (88.00%)and equal per cent of the respondents i.e. 60.00 per centhad well aware about ridger and furrow opener.
B. Planting and sowing
The cent per cent respondents had completeknowledge about the manual tools dibbler, followed byseed cum fertilizer drill (88.00%). With regard to animaldrawn farm implements used for planting and sowingoperation 81.00 per cent of the respondents had completeknowledge about seed cum fertilizer drill which wasfollowed by seed drill over plough (66.00%), rice planter(45.00%) and sugarcane planter (30.00%) was known tothe respondents. It was found that majority of therespondents had knowledge about dibbler, seed cumfertilizer drill and seed drill over plough.
C. Intercultural operation
Respondents knowledge with regard to the farmimplements utilized for intercultural operation were testedand it was found that majority of the respondents (95.0%)had complete knowledge about the manual weeder/hoe. Itwas worth to note here that 5.00 per cent of therespondents were found in partial knowledge categoryabout manual weeder.
In case of power operated farm machineriesutilized in intercultural operation, the 55.00 per cent and35.00 per cent of the respondents had complete knowledgeabout power weeder and grass weed splashierrespectively, whereas 40.00 per cent of the respondentshad unaware about grass weed splashier (40.00%).
D. Plant protection equipment
The knowledge level of the respondents werejudge toward farm implements used for plant protectionand it was found that 78.00 per cent hand 67.00 per cent ofthe respondents had complete knowledge about handcompressed sprayer and knapsack sprayer respectively.In case of power operated plant protection equipment 88.00per cent of respondents were found in completeknowledge category toward use of power sprayer while40.00 per cent known about tractor operated sprayer.
E. Harvesting and threshing equipment
Majority of the respondents 87.00 per cent wellaware about thresher utilized for harvesting while 55.00and 30.00 per cent reported knowledge about chaff cutterand groundnut pod striper. It was also worth to note that48.00 per cent of the respondents had no knowledge aboutground nut pod striper.
F. Post-harvest implements
As far as the knowledge of the respondentsabout the post-harvest implements 68.00 per cent of therespondents had complete knowledge about mini dal millfollowed by mini rice mill (60.00%) and gridnder/purvariser(24.00%). It was also observed that 75.00 per cent of therespondents had no knowledge about extractor followedby 36.00 and 35.00 per cent of the respondents were notaware about grinder and mini rice mill respectively.
G. Transportation
Transportation means like bullock cart and tractortrolley were well known to cent per cent of therespondents.
3. Relationship between selected characteristics withknowledge of farmers about farm mechanization
Efforts were made to work out the relationship ofvarious characteristics of respondents with theirknowledge about farm mechanization.
Table 3. Relationship between selected characteristicsof respondents with their knowledge aboutfarm mechanization.
S.N. Characteristics ‘r’ value1 Age -0.01884 NS
2 Education 0.3303**
3 Size of family 0.3253**
4 Land holding 0.5032**
5 Annual income 0.3366**
6 Sources of irrigation 0.1101 NS
7 Extension contacts 0.2579**
8 Source of information 0.3836**
9 Innovativeness 0.3442**
10 Risk preference 0.3760**
PKV Res. J. Vol. 42 (2), July 2018
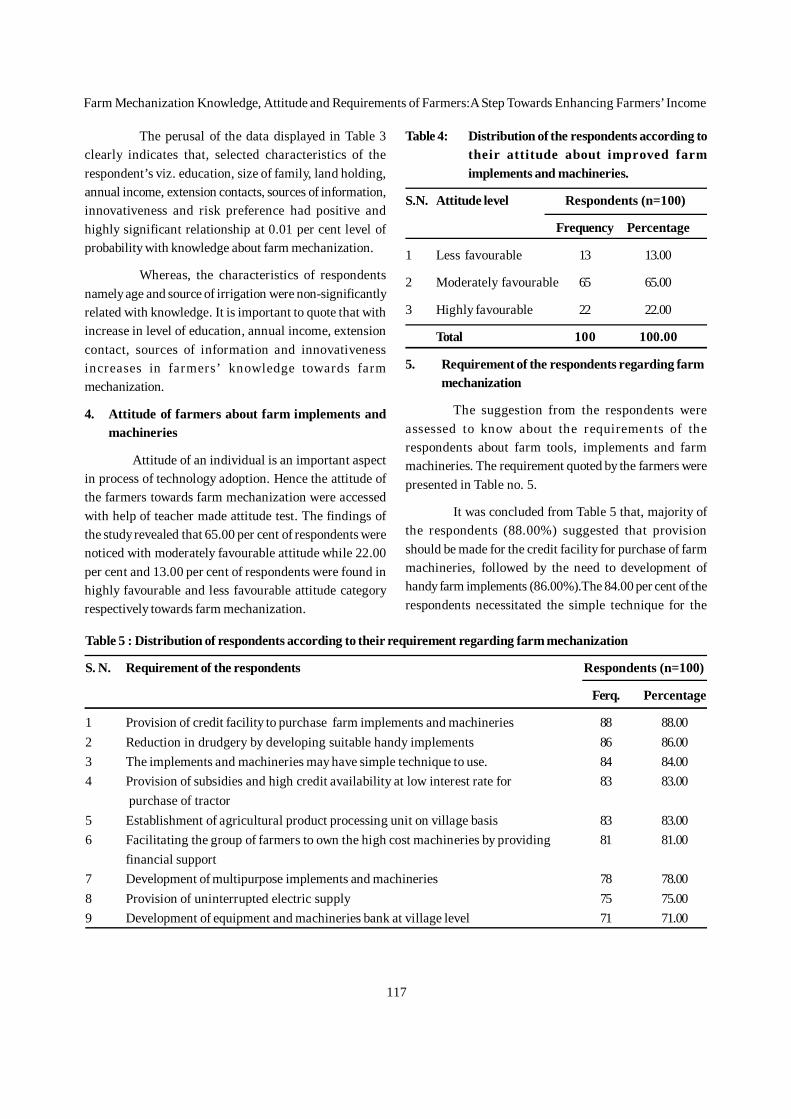
117
The perusal of the data displayed in Table 3clearly indicates that, selected characteristics of therespondent’s viz. education, size of family, land holding,annual income, extension contacts, sources of information,innovativeness and risk preference had positive andhighly significant relationship at 0.01 per cent level ofprobability with knowledge about farm mechanization.
Whereas, the characteristics of respondentsnamely age and source of irrigation were non-significantlyrelated with knowledge. It is important to quote that withincrease in level of education, annual income, extensioncontact, sources of information and innovativenessincreases in farmers’ knowledge towards farmmechanization.
4. Attitude of farmers about farm implements andmachineries
Attitude of an individual is an important aspectin process of technology adoption. Hence the attitude ofthe farmers towards farm mechanization were accessedwith help of teacher made attitude test. The findings ofthe study revealed that 65.00 per cent of respondents werenoticed with moderately favourable attitude while 22.00per cent and 13.00 per cent of respondents were found inhighly favourable and less favourable attitude categoryrespectively towards farm mechanization.
Table 4: Distribution of the respondents according totheir attitude about improved farmimplements and machineries.
S.N. Attitude level Respondents (n=100)
Frequency Percentage
1 Less favourable 13 13.00
2 Moderately favourable 65 65.00
3 Highly favourable 22 22.00
Total 100 100.00
5. Requirement of the respondents regarding farmmechanization
The suggestion from the respondents wereassessed to know about the requirements of therespondents about farm tools, implements and farmmachineries. The requirement quoted by the farmers werepresented in Table no. 5.
It was concluded from Table 5 that, majority ofthe respondents (88.00%) suggested that provisionshould be made for the credit facility for purchase of farmmachineries, followed by the need to development ofhandy farm implements (86.00%).The 84.00 per cent of therespondents necessitated the simple technique for the
Table 5 : Distribution of respondents according to their requirement regarding farm mechanization
S. N. Requirement of the respondents Respondents (n=100)
Ferq. Percentage
1 Provision of credit facility to purchase farm implements and machineries 88 88.002 Reduction in drudgery by developing suitable handy implements 86 86.003 The implements and machineries may have simple technique to use. 84 84.004 Provision of subsidies and high credit availability at low interest rate for 83 83.00
purchase of tractor5 Establishment of agricultural product processing unit on village basis 83 83.006 Facilitating the group of farmers to own the high cost machineries by providing 81 81.00
financial support7 Development of multipurpose implements and machineries 78 78.008 Provision of uninterrupted electric supply 75 75.009 Development of equipment and machineries bank at village level 71 71.00
Farm Mechanization Knowledge, Attitude and Requirements of Farmers:A Step Towards Enhancing Farmers’ Income
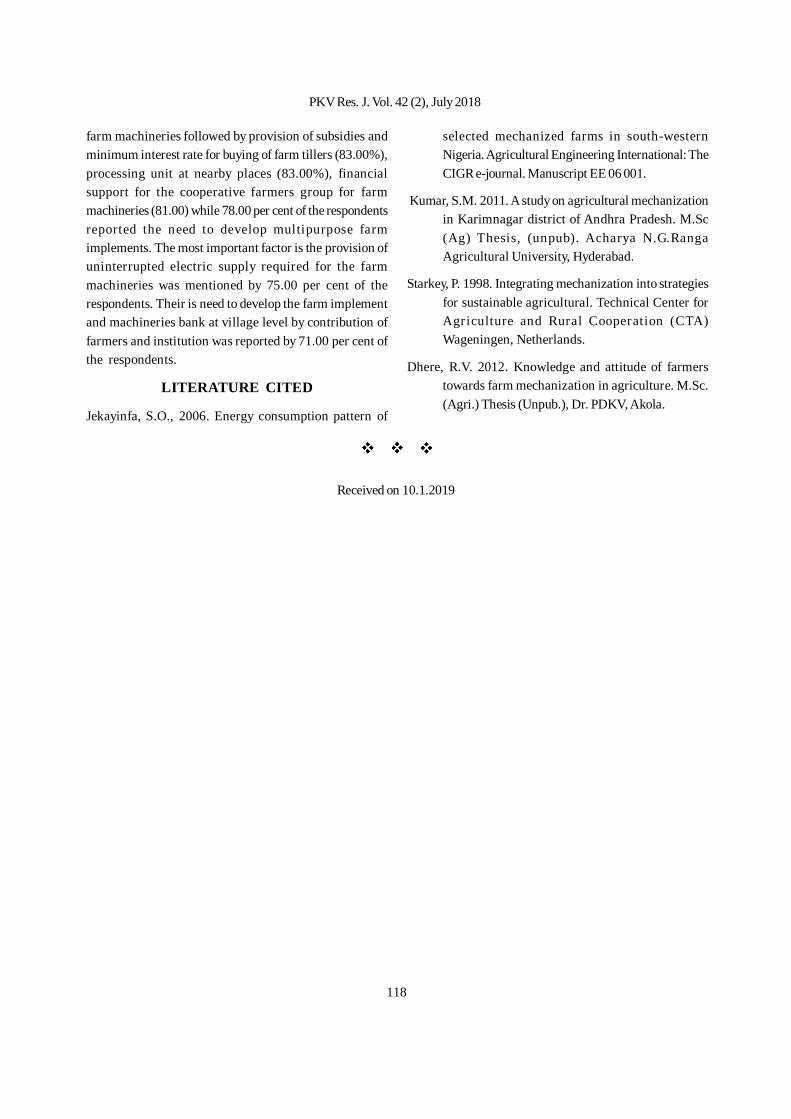
118
farm machineries followed by provision of subsidies andminimum interest rate for buying of farm tillers (83.00%),processing unit at nearby places (83.00%), financialsupport for the cooperative farmers group for farmmachineries (81.00) while 78.00 per cent of the respondentsreported the need to develop multipurpose farmimplements. The most important factor is the provision ofuninterrupted electric supply required for the farmmachineries was mentioned by 75.00 per cent of therespondents. Their is need to develop the farm implementand machineries bank at village level by contribution offarmers and institution was reported by 71.00 per cent ofthe respondents.
LITERATURE CITED
Jekayinfa, S.O., 2006. Energy consumption pattern of
selected mechanized farms in south-westernNigeria. Agricultural Engineering International: TheCIGR e-journal. Manuscript EE 06 001.
Kumar, S.M. 2011. A study on agricultural mechanizationin Karimnagar district of Andhra Pradesh. M.Sc(Ag) Thesis, (unpub). Acharya N.G.RangaAgricultural University, Hyderabad.
Starkey, P. 1998. Integrating mechanization into strategiesfor sustainable agricultural. Technical Center forAgriculture and Rural Cooperation (CTA)Wageningen, Netherlands.
Dhere, R.V. 2012. Knowledge and attitude of farmerstowards farm mechanization in agriculture. M.Sc.(Agri.) Thesis (Unpub.), Dr. PDKV, Akola.
Received on 10.1.2019
PKV Res. J. Vol. 42 (2), July 2018
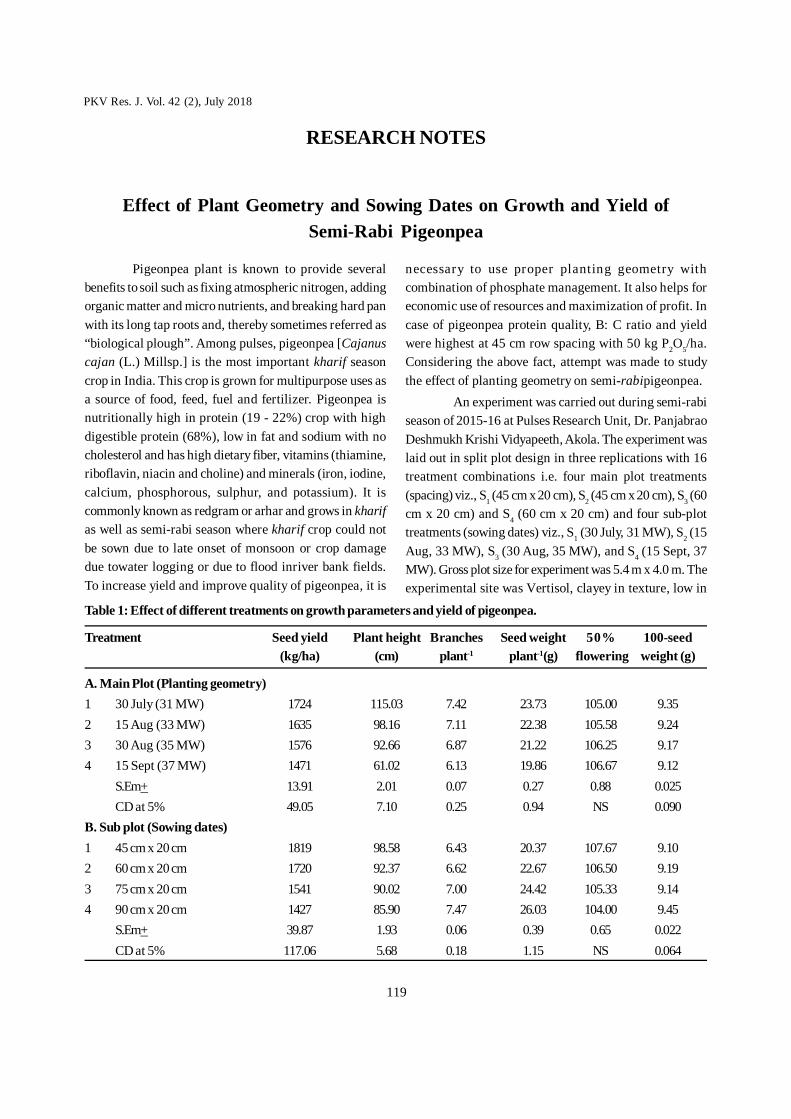
119
Pigeonpea plant is known to provide severalbenefits to soil such as fixing atmospheric nitrogen, addingorganic matter and micro nutrients, and breaking hard panwith its long tap roots and, thereby sometimes referred as“biological plough”. Among pulses, pigeonpea [Cajanuscajan (L.) Millsp.] is the most important kharif seasoncrop in India. This crop is grown for multipurpose uses asa source of food, feed, fuel and fertilizer. Pigeonpea isnutritionally high in protein (19 - 22%) crop with highdigestible protein (68%), low in fat and sodium with nocholesterol and has high dietary fiber, vitamins (thiamine,riboflavin, niacin and choline) and minerals (iron, iodine,calcium, phosphorous, sulphur, and potassium). It iscommonly known as redgram or arhar and grows in kharifas well as semi-rabi season where kharif crop could notbe sown due to late onset of monsoon or crop damagedue towater logging or due to flood inriver bank fields.To increase yield and improve quality of pigeonpea, it is
Effect of Plant Geometry and Sowing Dates on Growth and Yield ofSemi-Rabi Pigeonpea
necessary to use proper planting geometry withcombination of phosphate management. It also helps foreconomic use of resources and maximization of profit. Incase of pigeonpea protein quality, B: C ratio and yieldwere highest at 45 cm row spacing with 50 kg P2O5/ha.Considering the above fact, attempt was made to studythe effect of planting geometry on semi-rabipigeonpea.
An experiment was carried out during semi-rabiseason of 2015-16 at Pulses Research Unit, Dr. PanjabraoDeshmukh Krishi Vidyapeeth, Akola. The experiment waslaid out in split plot design in three replications with 16treatment combinations i.e. four main plot treatments(spacing) viz., S1 (45 cm x 20 cm), S2 (45 cm x 20 cm), S3 (60cm x 20 cm) and S4 (60 cm x 20 cm) and four sub-plottreatments (sowing dates) viz., S1 (30 July, 31 MW), S2 (15Aug, 33 MW), S3 (30 Aug, 35 MW), and S4 (15 Sept, 37MW). Gross plot size for experiment was 5.4 m x 4.0 m. Theexperimental site was Vertisol, clayey in texture, low in
Table 1: Effect of different treatments on growth parameters and yield of pigeonpea.
Treatment Seed yield Plant height Branches Seed weight 50% 100-seed(kg/ha) (cm) plant-1 plant-1(g) flowering weight (g)
A. Main Plot (Planting geometry)1 30 July (31 MW) 1724 115.03 7.42 23.73 105.00 9.352 15 Aug (33 MW) 1635 98.16 7.11 22.38 105.58 9.243 30 Aug (35 MW) 1576 92.66 6.87 21.22 106.25 9.174 15 Sept (37 MW) 1471 61.02 6.13 19.86 106.67 9.12
S.Em+ 13.91 2.01 0.07 0.27 0.88 0.025CD at 5% 49.05 7.10 0.25 0.94 NS 0.090
B. Sub plot (Sowing dates)1 45 cm x 20 cm 1819 98.58 6.43 20.37 107.67 9.102 60 cm x 20 cm 1720 92.37 6.62 22.67 106.50 9.193 75 cm x 20 cm 1541 90.02 7.00 24.42 105.33 9.144 90 cm x 20 cm 1427 85.90 7.47 26.03 104.00 9.45
S.Em+ 39.87 1.93 0.06 0.39 0.65 0.022CD at 5% 117.06 5.68 0.18 1.15 NS 0.064
RESEARCH NOTES
PKV Res. J. Vol. 42 (2), July 2018

120
nitrogen content, medium in phosphorus and rich inpotash. Soil reaction was found to be slightly alkaline.The pigeonpea variety ICPL 87119 (Asha) was used inexperimentation.
The seed yield of sole pigeonpea was influencedsignificantly with varying plant geometry. The seed yielddecreased with increasing plant geometry. The highestseed yield of pigeonpea was recorded with closer spacingof 45 cm x 20 cm over wider spacing of 60 cm x 20 cmspacing of 75 cm x 20 cm and 90 cm x 20 cm. The seed yieldinfluenced due to different plant geometry was found atpar with each other. Different date of sowing influencedthe seed yield significantly; however, the advancement insowing dates reduces the grain yield. The similar trendwas observed with respect to ancillary parameters. Theplant height of sole pigeonpea was highest at 45 cm x 20
cm row spacing and gradually decreased up to 90 cm x 20cm. However, the number of branches was highest withwider spacing at 90 cm x 20 cm than closer row spacing of45 cm x 20 cm and 75 cm x 20 cm. On the contrary the seedweight per plant was higher at closer spacing anddecreased consequently with wider spacing. The testweight did not influenced significantly with plantspacing’s. Various spacing treatments did not differsignificantly in respect of days to 50% flowering. Theresults are in conformity with Sathe and Patil(2012).Interaction effect of planting geometry and date ofsowing was found to be non-significant.
The highest seed yield was recorded with plantgeometry of 45 cm x 20 cm and / or 60 cm x 20 cm across thedate of sowing.
LITERATURE CITED
Sathe, H. D. and D. B. Patil, 2012. Effect of plantinggeometry and phosphate management on quality
Pulses Research Unit, V. V. GoudDr. PDKV, Akola
and economics of semi-rabipigeonpea. Crop Res.,44 (3): 335-337.
Received on 8.1.2019
Maharashtra has a major area of pigeonpea(medium duration) under rainfed condition. It is grownlargely as intercropped with short duration crops.Intercropping is an age-old practice being followed bysubsistence farmers to achieve their domestic needs. Themain advantage of the intercropping is that the componentcrops are able to use the growth resources more efficiently(Willey, 1979).The initial growth of pigeonpea is very slowand the accompanying intercrops enjoy unrestrictedgrowth, and experience almost no competition frompigeonpea during the first two months. By the time, theintercrop is ready for harvest in October-November, thepigeonpea crop gets well established with the rootspenetrating deep down into the soil profile. It provide fullopportunity for the long duration pigeonpea crop to grow
Performance of Different Greengram Genotypes in Intercropping withPigeonpea
during the next four to five months making morecomprehensive use of land than by any alternate croppingsystem under rain fed condition. Greengram (Vigna radiateL.) is also an important kharifpulse crop of India. It is anexcellent source of high quality protein. As short durationcrop it fit well in various multiple and intercroppingsystems (Pujari and Sheelvantar, 2002).
The experiment was conducted at the PulsesResearch Unit, Dr.PanjabraoDeshmukhKrishiVidyapeeth,Akoladuring kharif2011. The experiment was laid out inrandomized block design with pigeonpeaassole and inintercrop with greengram(1:2). Sowing of pigeonpeacv.PKV TARA and greengram different genotypes was doneon 4thJulyin 45 cm apart rows.The soil of the experimentalunit was clayey and the soil pH was 8.04, while the EC
PKV Res. J. Vol. 42 (2), July 2018
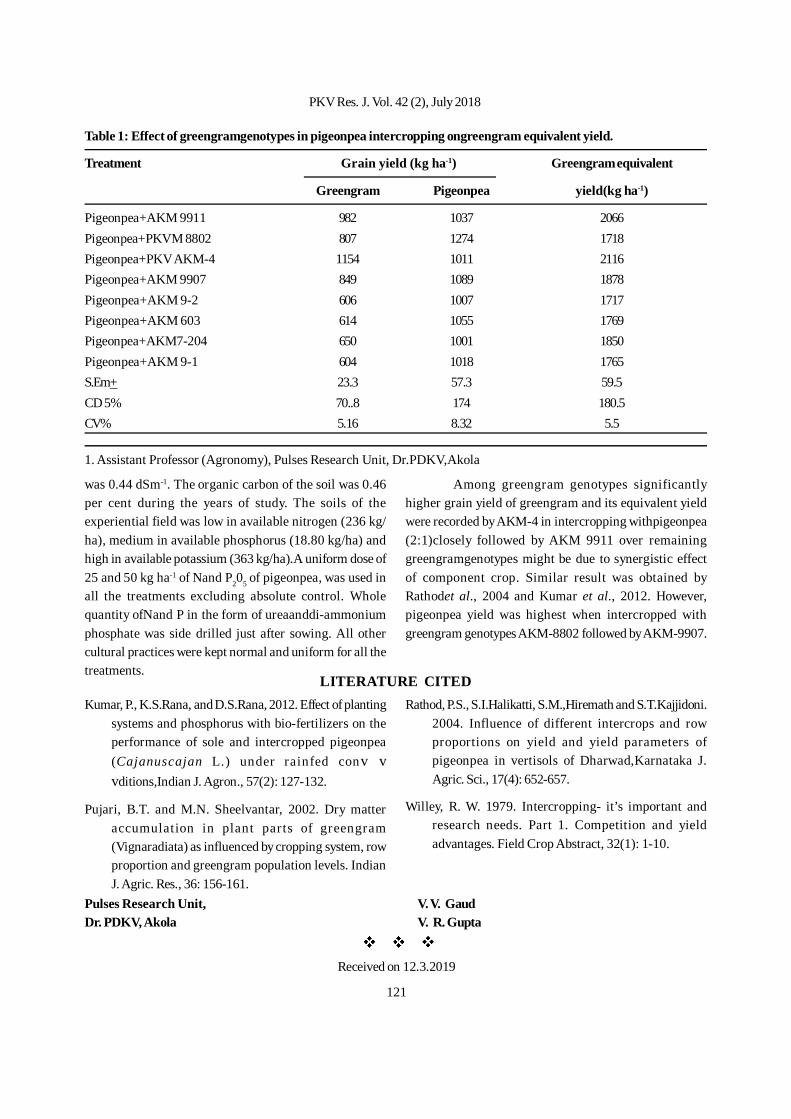
121
1. Assistant Professor (Agronomy), Pulses Research Unit, Dr.PDKV,Akola
Table 1: Effect of greengramgenotypes in pigeonpea intercropping ongreengram equivalent yield.
Treatment Grain yield (kg ha-1) Greengram equivalent
Greengram Pigeonpea yield(kg ha-1)
Pigeonpea+AKM 9911 982 1037 2066Pigeonpea+PKVM 8802 807 1274 1718Pigeonpea+PKV AKM-4 1154 1011 2116Pigeonpea+AKM 9907 849 1089 1878Pigeonpea+AKM 9-2 606 1007 1717Pigeonpea+AKM 603 614 1055 1769Pigeonpea+AKM7-204 650 1001 1850Pigeonpea+AKM 9-1 604 1018 1765S.Em+ 23.3 57.3 59.5CD 5% 70..8 174 180.5CV% 5.16 8.32 5.5
was 0.44 dSm-1. The organic carbon of the soil was 0.46per cent during the years of study. The soils of theexperiential field was low in available nitrogen (236 kg/ha), medium in available phosphorus (18.80 kg/ha) andhigh in available potassium (363 kg/ha).A uniform dose of25 and 50 kg ha-1 of Nand P205 of pigeonpea, was used inall the treatments excluding absolute control. Wholequantity ofNand P in the form of ureaanddi-ammoniumphosphate was side drilled just after sowing. All othercultural practices were kept normal and uniform for all thetreatments.
Among greengram genotypes significantlyhigher grain yield of greengram and its equivalent yieldwere recorded by AKM-4 in intercropping withpigeonpea(2:1)closely followed by AKM 9911 over remaininggreengramgenotypes might be due to synergistic effectof component crop. Similar result was obtained byRathodet al., 2004 and Kumar et al., 2012. However,pigeonpea yield was highest when intercropped withgreengram genotypes AKM-8802 followed by AKM-9907.
LITERATURE CITEDKumar, P., K.S.Rana, and D.S.Rana, 2012. Effect of planting
systems and phosphorus with bio-fertilizers on theperformance of sole and intercropped pigeonpea(Cajanuscajan L.) under rainfed conv vvditions,Indian J. Agron., 57(2): 127-132.
Pujari, B.T. and M.N. Sheelvantar, 2002. Dry matteraccumulation in plant parts of greengram(Vignaradiata) as influenced by cropping system, rowproportion and greengram population levels. IndianJ. Agric. Res., 36: 156-161.
Rathod, P.S., S.I.Halikatti, S.M.,Hiremath and S.T.Kajjidoni.2004. Influence of different intercrops and rowproportions on yield and yield parameters ofpigeonpea in vertisols of Dharwad,Karnataka J.Agric. Sci., 17(4): 652-657.
Willey, R. W. 1979. Intercropping- it’s important andresearch needs. Part 1. Competition and yieldadvantages. Field Crop Abstract, 32(1): 1-10.
Pulses Research Unit, V. V. GaudDr. PDKV, Akola V. R. Gupta
Received on 12.3.2019
PKV Res. J. Vol. 42 (2), July 2018
Particulars about PKV Research Journalas per Press and Regulation of Book Act (Clause 8)
FORM IV
1. Place of Publication : Dr. Panjabrao Deshmukh Krishi Vidyapeeth, Akola
2. Periodicity of Publication : Six monthly
3. Printer’s Name : Mr. Mohan G. Thakre
4. Nationality : Indian
5. Address : Tanvi Graphics,
Ranpise Nagar, Akola
6. Publisher’s Name : Dr. V. K. Kharche
7. Nationality : Indian
8. Address : Director of Research, Dr. PDKV,
P.O. Krishi Nagar, Akola
9. Editor-in-Chief : Dr. V. K. Kharche
10. Nationality : Indian
11. Address : Editor-in-Chief
Dr. PDKV, P.O. Krishi Nagar,
Akola - 444 104 (Maharashtra)
12. Owner’s Name : Dr. Panjabrao Deshmukh Krishi
Vidyapeeth, Akola
I, V. K. Kharche declare that the particulars given above are true to the best of myknowledge and belief.
Date : April, 2019 Dr. V. K. KharchePublisher
General : The PKV Research Journal is publishedtwice a year to promote the cause of research anddisseminate the knowledge in the field of agriculturalsciences. Subject matter should fall in the categories of(i) Original research articles (ii) Research notes and (iii)Review papers.
Manuscript : It should be typed on full scape goodquality, double spaced, on one side of the page only,with sufficient margin, 5 cm on the left side and 2.5 cmon each of the remaining sides. The author(s) may submitpaper in duplicate. He may not type his name, designationand acknowledgement on the first copy. All sheets in thecopy should be of one side only and should not ordinarilyexceed 10 in numbers including tables. Writing styleshould be simple, concise and precise. Presentation ofarticle should have the components in the followingsequence : TITLE, NAME (S) OF AUTHOR(S), FOOTNOTE, ABSTRACT, INTRODUCTION (without heading),MATERIAL AND METHODS, RESULTS ANDDISCUSSION, ACKNOWLEDGEMENT if any andLITERATURE CITED. Format of Research note may beas per the pattern of PKV Res. J. Vol. 17 No. 2 of 1992.All calculations, tables, figures, names, quotations,citations, etc. should be carefully verified beforesubmission.
The metric system of measurements should befollowed and standard abbreviations be used.
The paper need necessarily to be accompanied byan undertaking that it is not published earlier in any journal.The author(s) are advised to adhere to the format of thisjournal strictly. In the event of not following the format, thepaper(s) may not be attended to.
Title : The title of the article should be short andprecise and should be followed in the next line, by name(s)of author(s). Foot note on the first page should includethe department(s) contributing the article, designation andpresent address of author(s).
Abstract : Concise summation of findings notexceeding 200 words should be written at the beginningof the papers. The abstract should start with the objective.It should be intelligible without reference to the originalpaper. It should be written in such a way that will facilitateabstracting of the paper in the world of abstracts.
Table : Type each table on a separate sheet. Theyshould be numbered in arabic numerals with title of thetable in the same line. Table should be placed at the endof the manuscript, but its place in the text should beindicated.
SUGGESTIONS FOR AUTHORSFigures : Identify graphs, line drawings and
photographs with consecutive arabic numbers as Fig. 1,Fig. 2. Place figures after tables. Photographs must beclear, glossy prints, original graphs and drawing must bein Indian ink or equivalent on plain white drawing paper.Lettering should be large and bold enough to permitreduction. Each figure number should placed on the backof each figure in pencil for identification.
Nomenclature : The latin binomial or trinomial andauthority must be should for all plants, insects andpathogens at first listing either in the title or when firstmentioned in the text. Crop varieties (not experimentallines and strains) should be identified by a single quotationmark at first listing only. Generic and specific namesshould be in italic e.g. Lycopersium esculentum MilMorgtobe.
Reference : They should be double spacethroughout and arranged alphabetically according toauthor’s names and should be placed under the heading“LITERATURE CITED” at the end of the article. Eachreference should contain the name of author with initials,the year of publication, title of article, the abbreviated titleof publication, volume and page e.g.Sarode, S.V. and U.S. Kulkarni, 1998. Sustanability of
Helicoverpa armigera (Hubner) on weed partheninumhysterophorous, Indian J. Entomol., 60 (4) : 421-422
Kawarkhe, V.J., R.N. Jane and Manisha Deshmukh,2003.Effect of nitrogen and specing levels on growthand flower yield of China Aster, PKV Res. J., 27 (2) :163-165.
In the text, the reference should be indicated byauthor’s name followed by year of publication. When morethan one paper by the same author appears in a singleyear they should be distinguished as a, b, c,......
Please refer to annexure of PKV Res. J. Volume11(2), 1987 for abbreviation of journals to be given underLITERATURE CITED.
Correspondence : Manuscripts should be sent induplicate directly to Editor-in-Chief, PKV Research Journal,Director of Research, Dr. Panjabrao Deshmukh KrishiVidyapeeth, Akola - 444 104 (Maharashtra). Manuscriptsare examined by the Editorial Board and referred tocompetent referees.
The Editorial Board takes no responsibility for thefacts of the opinions expressed in the journal which restswith the authors.
Published by Dr. V. K. Kharche, Director of Research, Dr. PDKV, Akola for and on behalf of Dr. PanjabraoDeshmukh Krishi Vidyapeeth, Akola, Maharashtra, India in 2019 and Printed by him at Tanvi Graphics,Ranpise Nagar, Akola
125
I N D E X
Vol 42 No. (2) July, 2018
Molecular Characterization and Identification of Phytophthora Isolates from Different Citrus Orchardsof Vidarbha Regions, S. J. Gahukar, V. S. Pariskar, A. A. Akhare, D. R. Rathod, M. P. Moharil,Dipika Padole and B. S. Mundhe
AKH-09-5: A Promising American Cotton Genotype for Sustained Productivity under RainfedCultivation in Maharashtra, S. B. Deshmukh, T. H. Rathod, R. T. Bhowate, V. V. Ujjainkar, P. W.Nemade, V. V. Deshmukh, A. N. Paslawar, M. R. Wandhare, G. J. Bhagat and G. S. Gaikwad
Effect of Split Application of Nutrients Through Fertigation on Growth, Yield and System Productivityin Cotton-Onion Crop Sequence, S. U. Kakade, V. M. Bhale, J. P. Deshmukh and S. B. Wadatkar
Diversification in Cotton + Soybean (4:10) – Rabi Strip Intercropping System under Mechanization inRainfed Condition of Vidarbha Region of Maharashtra, A. B. Turkhede, M. B. Nagdeve,A. P. Karunakar, V. V. Gabhane and R. S. Mali
Effect of Irrigation Scheduling and Hydrogel on Growth, Yield, Economics, Water Requirement andWater Use Efficiency of Indian Mustard , D. D. Mankar and Beena M. Nair
Effect of Planting Geometry and Fertilizer on Growth and Yield of Green Seed Coated Chickpea UnderIrrigated Condition, V. V. Goud and A. K. Sadavarte
Effect of Safed Musli + Pigeonpea Intercropping System on Growth, Yield and Root Quality of SafedMusli, S. S. Wanjari, S. G. Wankhade, Yogita Gore, Praksah Ghatol and Pravin Deshmukh
Effect of Zinc Sulphate for Enhancing Growth and Yield in Greengram-Chickpea Sequence, V. V. Goudand V. R. Gupta
Effect of Potassium on Productivity of Rice in Vertisols of Central India, , R.H. Wanjari, MuneshwarSingh, B.L. Lakaria, Abhay Shirale, Vinod Birla, Shweta Jamra and R.C. Jatav
Natural Resources Management to Improve Soil Health and Increased Crop Productivity,S. D. Jadhao, B. A. Sonune, D. V. Mali, S. M. Bhoyar, V. K. Kharche, P. W. Deshmukh and A. B. Aage
Assessment of Molybdenum Status in Soils of Raigad District of Maharashtra, S. S. Hadole,R. N. Katkar, P. A.Sarap, S. R. Lakhe and Shamna K. Muhammed
Effect of Foliar Application of Gibbrellic Acid on Pigeonpea [Cajanus cajan (L.)] under RainfedConditions, M. D. Giri, C. P. Jaybhaye, D. G. Kanwade and A. N. Patil
Preparation of Wine from Jamun: A transition for Doubling Farmer’s Income, Kuntal Satkar,S. G. Bharad and P. K. Nagre
Development and Field Evaluation of Innovative Solar Photovoltaic Insect Light Trap, S. R. Kalbandeand V. P. Khambalkar
Influence of Rotational Speeed and Feed Rate on Fennel Seed Extraction Efficiency, R. P. Murumkar,P. A. Borkar, V. N. Mate, S. M. Ghawade, P. K. Rathod and A. M. Charpe
Reaction of Safflower Carthamus tinctorius L. Lines Against Aphids Uroleucon compositae(Theobald), P. N. Mane, S. B. Sakhare, Sangeeta Fatak, M. Y. Ladole, B. K. Farkade andN. J. Wankhade
1
6
12
24
35
40
44
50
53
56
66
72
79
85
93
100
126
Seasonal Effect on the Milk Production of Indigenous and Crossbred Cows, S. D. Chavan,R. R. Shelke, A. S. Ingole and R. V. Pawar
Impact of various rainwater management systems on productivity, profitability and rainwater useefficiency in saline tract of Purna river valley, S. M. Taley and K. A. Jadhav
Farm Mechanization Knowledge, Attitude and Requirements of Farmers: A Step Towards EnhancingFarmers’ Income, V. S. Tekale, R. D.Gawande and S. D. Sarnaik
Research NotesEffect of Plant Geometry and Sowing Dates on Growth and Yield of Semi-Rabi Pigeonpea, V. V. Goud
Performance of Different Greengram Genotypes in Intercropping with Pigeonpea, V.V. Gaud andV. R. Gupta
103
108
113
119
120