vlt/x-shooter survey of near-infrared diffuse interstellar bands
TRANSCRIPT
Astronomy & Astrophysics manuscript no. aa23061cox c© ESO 2014July 2, 2014
VLT/X-shooter survey of near-infrared diffuse interstellar bands ?
N. L. J. Cox1, J. Cami2,3, L. Kaper4, P. Ehrenfreund5, B. H. Foing6, B. B. Ochsendorf7, S. H. M. van Hooff4, andF. Salama8
1 Instituut voor Sterrenkunde, KU Leuven, Celestijnenlaan 200D, Bus 2401, B-3001 Leuven, Belgiume-mail: [email protected]
2 Department of Physics and Astronomy, The University of Western Ontario, London, ON N6A 3K7, Canada3 SETI Institute, 189 Bernardo Ave, Suite 100, Mountain View, CA 94043, USA4 Sterrenkundig Instituut Anton Pannekoek, Universiteit van Amsterdam, Science Park 904, NL-1098, Amsterdam, The Netherlands5 Space Policy Institute, 1957 E Street, 20052 Washington DC, USA6 ESTEC, European Space Agency, Keplerlaan 1, NL-2201 AZ Noordwijk ZH, The Netherlands7 Leiden Observatory, Leiden University, Niels Bohrweg 2, NL-2333 CA Leiden, The Netherlands8 NASA AMES Research Centre, CA, United States
Submitted to A&A.
ABSTRACT
Context. The unknown identity of the diffuse interstellar band (DIB) carriers poses one of the longest standing unresolved problemsin astrophysics. While the presence, properties and behaviour of hundreds of optical DIBs between 4000 Å and 9000 Å have beenwell established, information on DIBs in both the ultra-violet and (near)-infrared (NIR) ranges is limited.Aims. Here, we present a spectral survey of the NIR range, from 0.9 to 2.5 µm. Our observations were designed to detect new DIBs,confirm previously proposed NIR DIBs, and characterise their behaviour with respect to known line-of-sight properties (including theoptical DIBs present in our spectra).Methods. Using the X-shooter instrument mounted at the ESO Very Large Telescope (VLT) we obtained medium-resolution spectraof eight known DIB targets and one telluric reference star, from 3000 Å to 25 000 Å in one shot.Results. In addition to the known 9577, 9632, 11797, and 13175 Å NIR DIBs, we confirm 9 out of the 13 NIR DIBs that werepresented by Geballe and co-workers in 2011.Furthermore, we report 12 new NIR DIB candidates. The strengths of the strongest NIRDIBs show a general correlation with reddening, E(B−V), but with a large scatter. Several NIR DIBs are more strongly correlated withthe 5780 Å DIB strength than with E(B−V); this is especially the case for the 15268 Å DIB. The NIR DIBs are strong: the summedequivalent widths of the five strongest NIR DIBs represent a few percent of the total equivalent width of the entire average DIBspectrum (per unit reddening). The NIR DIBs towards the translucent cloud HD 147889 are all weak with respect to the general trend.No direct match was found between observed NIR DIBs and laboratory matrix-isolation spectroscopic data of PAHs.Conclusions. The strong correlation between the 5780-15268 DIB pair implies that (N f )5780 / (N f )15268 = 14. However, the reducedstrength of the 15268 Å DIB in HD 147889 rules out a common carrier for these two DIBs. Since the ionisation fraction for smallPAHs in this translucent cloud is known to be low compared to diffuse clouds, the weakness of the 15268 Å DIB suggests that anionised species could be the carrier of this NIR DIB.
Key words. ISM: lines and bands – ISM: dust, extinction – Line: identification – Line: profiles – ISM: molecules
1. Introduction
Diffuse interstellar bands (DIBs) are observed throughout theUniverse, and represent a major, albeit unidentified, fraction ofinterstellar matter in the Milky Way and beyond (e.g. Snow2002, Cordiner 2014 and references therein). Several hundredsof strong and weak DIBs have been reported between 4000 Åand 9000 Å (Jenniskens & Desert 1994; Tuairisg et al. 2000;Hobbs et al. 2009), while only a few are known in the NIR long-wards of 9000 Å (Joblin et al. 1990; Foing & Ehrenfreund 1994;Geballe et al. 2011). Despite intensive study - and debate - of anumber of propositions and reported laboratory matches, not asingle DIB carrier has been unambiguously identified. For a re-view of the various proposed candidate carriers see the seminalwork by Herbig (1995); Sarre (2006) provides a detailed dis-
? Based on observations obtained with the VLT (ESO Programme385.C-0720).
cussion on more recent developments in the quest for the DIBcarriers.
One important question arising from DIB studies is whetherDIB features are also present at shorter ultra-violet (UV) andlonger IR wavelengths. The presence/absence of DIBs in the UVand IR is important for testing the PAH-DIB hypothesis (Salamaet al. 1996, Ehrenfreund et al. 1995, Cox 2011), because chargedpolycyclic aromatic hydrocarbons (PAHs) containing more thanabout 20 carbon atoms are known to have their main electronictransitions in the NIR range, whereas neutral PAHs and smallcharged PAHs absorb predominantly at ultra-violet and visi-ble wavelengths, respectively (c.f. Tielens 2008). Salama et al.(2011) and Gredel et al. (2011) searched for the main transitionof neutral PAHs in astronomical optical spectra, but no matcheswere found and only upper limits could be set to their abundance.On the other hand, PAHs containing more than 40 carbon atomsare quite stable, could be fully hydrogenated (Vuong & Foing2000), and have strong transitions in the (near-)infrared. Hence,
1
arX
iv:1
407.
0370
v1 [
astr
o-ph
.GA
] 1
Jul
201
4

N. L. J. Cox et al.: Near-infrared diffuse interstellar bands
Table 1. Observed targets.
Target Spectral B-V (B-V)0b E(B−V)
c AV vshiftd
Typea (mag) (mag) (mag) (mag) (km s−1)HD 167785 B2 V -0.09 -0.211, -0.242 0.14 0.42 (0.05) -7.0HD 326306 B1 V -0.11 -0.231, -0.262 0.14 0.42 (0.05) 8.0HD 153294 B7 Ib/II +0.03 -0.041, -0.122 0.07, 0.15 0.22 – 0.47 14.0HD 152246 O9 Ib +0.12 -0.271, -0.282 0.39 (0.03) 1.22 (0.03) 6.5HD 161056 B1.5 V +0.38 -0.221, -0.252 0.62 (0.05) 1.90 (0.05) -3.5HD 161061 O+ +0.62 -0.301, -0.292 0.92 (0.03) 2.83 (0.04) 7.5HD 147889 B2 III/IV +0.71 -0.191, -0.242 0.90 (0.06) 3.7 (0.1) 10.0HD 183143 B7 Iae +1.00 -0.041, -0.042 1.04 (0.03) 3.97 (0.05) -5.04U 1907+09 O9 Ia +3.2 -0.281, -0.282 3.48 (0.03) 10.9 (0.05) 25.0
Notes. (a) Spectral types taken from the Simbad database, except for 4U 1907+09 taken from Cox et al. (2005) and HD 161061 taken from Mazzei& Barbaro (2011). (b) Intrinsic colours from (1) Wegner (1994) and (2) Fitzgerald (1970). (c) E(B−V) values are derived from B and V magnitudes(Simbad) and intrinsic colours, (B-V)0. We took the mean of the intrinsic colours from (1) and (2) with uncertainties including inaccuracy, by onestep, in Morgan-Keenan spectral-luminosity classification. We adopt E(B−V)= 0.10 mag for HD 153294.AV = RV × E(B−V). We adopt RV = 3.1except for HD 147889 (RV = 4.1) and HD 183143 (RV = 3.8). Uncertainties in parentheses. (d) The heliocentric radial velocity of the strongestcomponents in the atomic line of K i (λrest = 7698.974 Å) used to shift the spectra to the respective “LSR” rest wavelengths. Corrections wereverified for consistency using additional interstellar lines of the Na iD doublet, CH (λrest = 4300.303 Å), and CH+ (λrest = 4232.548 Å).
NIR spectroscopic (DIB) surveys may reveal their presence inthe interstellar medium. Several ongoing and future large NIRspectroscopic surveys include NIR DIBs and hence an accuratecatalogue of these features, including an understanding of theirbehaviour with respect to other interstellar features, is warranted.For example, Zasowski & Menard (2014) present first results ontwo NIR DIBs in SDSS-III APOGEE spectra and their Galacticdistribution. Notwithstanding this potential importance, the NIRwavelength range (0.9–2.5 µm) received so far little attention.Adamson et al. (1994) have searched, without success, for the13175 Å band in dense environments. Geballe et al. (2011) pre-sented the discovery of a dozen NIR DIB candidates longwardsof 1.5 µm. These new finding have revived interest for this spec-tral range in context of the properties and chemical complexityof the ISM in general, and DIB carriers in particular. Searchesfor DIBs in the near-UV at wavelengths shortwards of 3300 Åhave thus far shown that there are apparently far less DIBs, ifany, in the near-UV than in the optical (Gnacinski et al. 1997;Watson 2001; Bhatt et al. in preparation).
This paper presents the results of an exploratory VLT/X-shooter survey of NIR DIBs in the spectra of a sample of red-dened early-type stars. This works seeks to confirm and ex-tend the results on the presence, properties and behaviour ofNIR DIBs in diffuse/translucent interstellar clouds. The obser-vations and data reduction are briefly discussed in Sect. 2. Then,in Sect. 3 we present spectra, equivalent width and full-width-at-half-maximum (FWHM) measurements of known visible andNIR DIBs; we also identify additional NIR DIBs. The NIR DIBproperties in terms of strength and width are discussed in Sect. 4together with correlations of DIB strengths with dust (redden-ing) and with other DIBs. In Sect. 5 the observations are com-pared with previous laboratory measurements. Section 6 dis-cusses the measured DIB properties for the translucent cloud to-wards HD 147889 in context of the expected PAH population.The main conclusions of this survey are summarised in Sect. 7.
2. Optical and NIR spectroscopy with VLT/X-shooter
We selected a small sample of bright reddened early-type starswhose lines-of-sight give rise to a range in magnitudes of ex-tinction. Also the diffuse clouds in these sightlines are exposedto the interstellar radiation field in varying degrees. This opti-
mizes the ability to detect new NIR DIBs and study their be-haviour in the ISM. The observed targets are listed in Table 1with their interstellar reddening, E(B−V), visual extinction, AV ,and spectral type. To obtain a spectroscopically unbiased view ofNIR DIBs, spectra were obtained with X-shooter, a wide-bandintermediate-resolution spectrograph at the ESO Very LargeTelescope (D’Odorico et al. 2006; Vernet et al. 2011). X-shooterhas three separate arms (optical light paths) - UVB, VIS and NIR- each with their own optimized optical and system design. Inthis way it is possible to obtain in one shot a nearly contigu-ous spectrum from 3000 to 24800 Å. The spectra were reduced,separately for each arm, using the esorex X-shooter pipeline(Modigliani et al. 2010). Standard parameters were adopted forpreparing the calibration files. The final science spectra were re-duced using non-default stricter cosmic ray hit rejection criteriawhich significantly improved the final spectra by removing spu-rious glitches. In this paper we focus on the NIR spectra whichcover the range from 9940 Å to 24790 Å. A 0.4′′ slit, with afixed length of 11′′, was used in the “Auto Nod on Slit Mode”yielding a spectral resolving power of ∼10 000 in the NIR arm.This corresponds to an instrumental FWHM, measured from tel-luric lines, of ∼1.3 Å at 1.1-1.3 µm, ∼1.7 Å at 1.5-1.7 µm, and∼1.9 Å at 1.8 µm1. The telluric correction tool Spextool (seeVacca et al. 2003 and Cushing et al. 2004) was used to removeatmospheric absorption lines from the observed NIR spectra byway of dividing the spectra with a telluric standard spectrum.In order to have an independent verification of the procedureand the final corrected spectrum we use both a computed atmo-spheric model and the spectrum of an unreddened B star (notethat hydrogen lines are removed from the telluric standard aspart of the Spextool telluric correction procedure). The telluriccorrection is prone to introduce significant residuals in regionswith dense forests of strong telluric absorption lines. The fol-lowing regions are most severely affected: 13500 Å – 14800 Å,17900 Å – 19000 Å, 19950 Å – 20250 Å, 20500 Å – 20750 Å23150 Å – 24800 Å. However, even in those cases the narrowresiduals can sometimes be distinguished from intrinsic stellarand interstellar lines.
1 All quoted rest wavelengths are those measured in air unless other-wise specified. Note that DIB rest wavelengths given by Geballe et al.(2011) are in vacuum.
2

N. L. J. Cox et al.: Near-infrared diffuse interstellar bands
Fig. 1. The strong DIBs at 5780 Å and 5797 Å (left), 6613 Å (middle), and 6196 & 6203 Å (right) are shown for the observedtargets. Solid green curves represent the Gaussian model fit to the data.
3. Diffuse interstellar bands
3.1. Measurements of optical diffuse interstellar bands
Before studying the NIR DIBs, we measured the equivalentwidths of several strong DIBs in the optical range (X-shooter VISarm; see Fig. 1 and Table 2). The average equivalent width perunit reddening for the seven strong DIBs at 5780, 5797, 5849,6196, 6203, 6270, and 6613 Å is 1.6 Å/E(B−V).
We also used Na i and K i absorption lines to determine theradial structure of the ISM, providing the opportunity to shift theobserved optical and NIR DIBs to a common restframe. Onceapplied, this correction ensures that wavelength positions of theinterstellar lines coincide between different lines-of-sight, whiletelluric and stellar lines display a shift due to the radial velocitywith respect to the ISM.
3.2. Detection of NIR diffuse interstellar bands
Joblin et al. (1990) reported the first two NIR DIBs at 11797and 13175 Å towards several reddened Galactic lines-of-sight.Next, the NIR DIBs at 9577 Å and 9632 Å were detected in alarger sample of bright OB stars (Foing & Ehrenfreund 1994;Galazutdinov et al. 2000). Recently, Geballe et al. (2011) re-ported the detection of 13 new NIR DIBs, measured towards theGalactic Centre, 4 of which are also present in the average spec-trum of the heavily reddened Cygnus OB2 sightlines. Figs. 2to 4 exhibit most of these NIR DIBs in our sample of low- tomoderately-high reddening lines-of-sight. The spectra have beencorrected for heliocentric motion as well as for the radial veloc-ity of the main interstellar cloud in the line-of-sight according tothe optical atomic absorption lines of Na i and K i (Sect. 3.1).
Due to the limited signal-to-noise and intrinsic weaknessmost of the known NIR DIBs are only detected in the three lines-of-sight with a visual extinction above 2 mag (i.e. HD 161061,HD 183143, 4U 1907+09). The strong and narrow λλ11797,13175, 15268 DIBs are detected in some other sightlines as well.Of the thirteen new NIR DIBs reported in Geballe et al. (2011)we detect three in three or more sightlines. Three others are de-tected in at least two sightlines while another three are detectedonly towards 4U 1907. Four NIR DIBs reported by Geballe andco-workers could not be confirmed (see below). The presenceand absence of NIR DIBs in this X-shooter survey is summarisedas follows:
– The NIR DIBs at 9577 and 9632 Å (Foing & Ehrenfreund1994) are detected in three lines-of-sight (Fig. 2).
– The NIR DIBs at 11797 and 13175 Å (Joblin et al. 1990) aredetected in seven lines-of-sight (Fig. 3).
– The strong NIR DIB at λrest 15267.8 Å reported by Geballeet al. (2011) is detected in nine sightlines (Fig. 3).
– The bands at λrest 15610 and 15665 Å (Geballe et al. 2011)are detected in three lines-of-sight (Fig. 4).
– The λrest 15646 and 16588 Å DIBs (Geballe et al. 2011) areseen in two sightlines (Fig. 4).
– The blended NIR DIB complex at 16560-16590 Å reportedby Geballe et al. (2011) is resolved into three separate com-ponents.
– The NIR DIBs at λrest 16226.7, 16567.0, 16588.0, and17802.7 Å reported by Geballe et al. (2011) are confirmedonly in the spectrum of 4U 1907+09.
– The shallow/broad bands at 15225, 15990, 17758, and17930 Å reported by Geballe et al. (2011) are not detected.The 15990, 17758, and 17930 Å DIBs are situated in regionswith significant telluric line residuals in the X-shooter spec-tra presented here. Note that the 15225, 15990 and 17758 ÅDIBs are among the weakest reported by Geballe et al.(2011), and scaled to the extinction of ∼10 visual magni-tudes towards 4U 1907+09, would have depths of only 1.5,0.5, and 1.5 %, respectively (to be compared to the weak, butnarrow, tentative NIR DIBs detected at a level of 2.0% in thisline-of-sight).
In addition to these previously reported NIR DIBs we report8 new NIR DIB candidates in the spectra of the three most red-dened stars (i.e. HD 161061, HD 18314, 4U 1907+09). Similarto the known NIR DIBs these new candidates are not detectedtowards HD 147889 (Sect. 6). Candidates are listed in Table 2(bottom section) and respective spectra are shown in Fig. 5.These eight DIB candidates have similar strengths per unit red-dening as the known NIR DIBs and their rest wavelengths co-incide in different sightlines. Though the latter criterion pro-vides a strong argument in favour of an interstellar origin, weremain cautious in view of possible limiting factors such as(i) insufficient signal-to-noise for spectra with low reddening,E(B−V) < 1.0 mag, (ii) imperfect removal of telluric lines, (iii)confusion with stellar lines, and (iv) the small number of avail-able sightlines with moderate/high-resolution NIR spectra of ap-propriate interstellar sightlines. Additional possible interstellar
3

N. L. J. Cox et al.: Near-infrared diffuse interstellar bands
Fig. 2. NIR DIBs at 9577 Å and 9632 Å (assigned to thefullerene cation C+
60 by Foing & Ehrenfreund 1994) are shownfor the reddened X-shooter sample of sightlines. The spectrahave been corrected for the radial velocity of the ISM (includ-ing heliocentric correction). The vertical dotted lines indicate therest wavelength for the respective DIBs. Dashed horizontal linescorrespond to the normalised continua. Spectra are vertically off-set for clarity. The atmospheric model spectrum (blue) is shownat the top (normalised and vertically compressed) in order to ap-preciate and evaluate the telluric correction. Solid green curvesshow the Gaussian model fits. The weak feature at 9633 Å to-wards HD 161056 and HD 147889 indicates the presence of aweak stellar Mg ii line. This has been noted before by Foing &Ehrenfreund (1997) and estimated by Galazutdinov et al. (2000)to have an equivalent width of 50 mÅ for spectral type B2 III and80 mÅ for B7 I. These authors assigned two additional featuresat 9603 Å and 9625 Å, present also in our spectra, to stellar He i.
features at 12336 Å, 20428 Å, 21387 Å, and 21843 Å are presentin the spectrum of 4U 1907+09, but not, or only marginally, inspectra of HD 183143 and HD 161061. These lines are also notseen in the spectrum of the non-reddened standard star, so that astellar origin can be excluded. For completeness these tentativeinterstellar features are shown in Fig. 6. Further studies at highcontinuum sensitivity for a large sample are needed to providefurther constraints on the presence of DIBs in the NIR rangefrom 1 to 3 µm, though in practice results will be limited byhow accurate both telluric and stellar atmosphere lines can beaccounted for.
3.2.1. Measurements of NIR DIBs
We fitted a Gaussian to the NIR DIBs and determined the equiv-alent width, FWHM and rest-frame wavelength from the best-fitparameters. Equivalent widths were also measured by numericalintegration, yielding similar results within the uncertainties. Theresults for the detected NIR DIBs in each sightline are given inTable 2.
4. NIR DIB properties
Given the number of NIR DIB detections, we can now comparesome of their properties in more detail to those of the opticalDIBs. We will in particular look at their widths, strengths andcorrelations.
4.1. Rest wavelengths and DIB profiles
The moderate resolving power (R ∼ 10 000) of X-shooter isinsufficient to resolve smaller substructure or weak asymme-tries in the NIR DIB absorption line profiles. However, com-pared to the work by Geballe et al. (2011), our lines of sightsuffer much less from line broadening due to blending of mul-tiple velocity components in the line-of-sight. With the excep-tion of 4U 1907, Doppler broadening is not expected to exceed10 km s−1 (or 0.5 Å at 15 000 Å); thus, the observed FWHMfrom 1.9 to 7.0 Å (c.f. Table 3) correspond to intrinsic FHWM2
from 1.4 Å (20 km s−1) to 6.8 Å (77 km s−1).Owing to this lack of Doppler broadening and the precise
measurement of the line-of-sight radial velocity (see 3.1), wecan derive accurate rest wavelengths (reported in air) for the NIRDIBs listed in Table 2. The significant Doppler broadening to-wards 4U 1907 has been discussed in Cox et al. (2005).
The measured widths (FWHM) of the NIR DIBs are listed inTable 3. The NIR DIBs at 15268, 15665, 16567, and 16578 Å arenarrow and have widths comparable to the earlier reported NIRDIBs at 9577, 9632, 11797 and 13175 Å. Note that the widths ofthe 15268 and 15665 Å DIBs are smaller than those reported byGeballe et al. (2011), suggesting that Doppler velocity broaden-ing affects their measurements. This is not the case for the broad15610 and 17800 Å NIR DIBs whose widths are similar to thoseby Geballe et al. (2011). For the three reddened lines-of-sightwith a narrow interstellar velocity structure we furthermore findthat FWHM(11797) = 1.9 ± 0.4 Å (somewhat narrower than the2.7 ± 0.3 Å reported by Joblin et al. 1990) and FWHM(13175) =
4.5 ± 1.2 Å (comparable to the 4.0 ± 0.5 Å measured by Joblinet al. 1990).
Finally, it is interesting to note that the widths of the 11797and 13175 NIR DIBs in the single cloud line-of-sight towardsHD 147889 are similar to those towards the multi-cloud object4U 1907. However, the NIR DIBs are weak in this sightline, andconsequently uncertainties are large.
4.2. DIB strengths
Table 2 lists the equivalent widths for the NIR DIBs in the highlyreddened lines of sight. It is clear that the detected NIR DIBs arefairly strong. The average NIR DIB strength per unit redden-ing, W(DIB)/E(B−V) ranges from 0.07 to 0.35 Å mag−1 in ourlines of sight while the total NIR DIB equivalent width per unitreddening (for the five strongest NIR DIBs) ranges from ∼0.6to 1.4 Å mag−1. This is similar to the total strength of the sevenstrongest optical DIBs, though the wavelength dependence in theequivalent width measurement favours the NIR DIBs equivalentwidth (in wavelength units) by a factor of two to three.
For an effective wavelength of 1.5 µm and assuming opti-cally thin line absorption, we thus find that f × NNIRDIB = 3–7×1011 cm−2 for all NIR DIBs combined; f is then an effectiveoscillator strength. For the strongest optical DIBs (λeffective =
6000 Å), f × NDIB = 5 × 1012 cm−2. Thus, if oscillator strengthsare similar for both optical and NIR DIBs (as is e.g. the case formolecule #25 discussed in Sect. 5), the abundance of NIR DIBcarriers is an order of magnitude lower than that of the carriersof the strongest optical DIBs. If, however, the optical and NIRDIBs arise from the same species in the same state, their respec-tive column densities should be equal and hence the oscillatorstrengths of the NIR DIBs are an order of magnitude smaller.
2 FWHMintrinsic =
√FHWM2
observed − FHWM2instrumental
4

N. L. J. Cox et al.: Near-infrared diffuse interstellar bands
Fig. 3. NIR DIBs at 11797 Å (left panel), 13175 Å (middle panel; Joblin et al. 1990), and 15268 Å (right panel; Geballe et al. 2011)are shown for the X-shooter sample of sightlines. The spectra have been corrected for the presence of telluric lines and subsequentlyfor the radial velocity of the ISM. The dashed lines indicate the rest wavelength for the respective DIBs. Solid green curves showthe Gaussian model fits and the blue solid curve displays the telluric model spectrum.
Fig. 4. Same as Fig. 3 but for the 15610, 15646, and 15666 Å NIR DIBs towards five reddened targets (left panel) and for the 16567,16578, and 16588 Å NIR DIBs in two reddened lines-of-sight (right panel). Solid green curves show the Gaussian model fits andthe blue solid curve displays the telluric model spectrum. In the right panel the original (normalised) spectra are shown in blackwhile the telluric corrected spectrum is overplotted in red.
Note however that such a situation is not likely, given the imper-fect correlation between NIR and optical DIBs (see below).
4.3. DIB strength correlations
In an effort to understand the relation between the NIR DIB car-riers and those of the optical DIBs, we will look at correlationsbetween DIB strengths and reddening, and mutual correlationsbetween the NIR DIBs and optical DIBs. This can only be donein a meaningful way with a large enough sample of sightlines;we therefore only include the λλ11797, 13175, and 15268 NIRDIBs for which we have at least six measurements; there are toofew data points for the other NIR DIBs.
4.3.1. Correlation with reddening
The correlation coefficients3 r between the DIB strengths andreddening range from 0.80 (for the 6203 and 6270 Å DIBs) to0.95 (for the 5797 Å DIB) for the optical DIBs in our sampleconfirming the well established positive but not perfect correla-tion between W and E(B−V) (e.g. Herbig 1993, Cami et al. 1997,Friedman et al. 2011).
Fig. 7 shows the measured equivalent widths for theλλ11797, 13175, and 15268 NIR DIBs as a function of redden-ing, and linear regression fits to the data. For the linear regressionthe 95% confidence interval is also indicated (shaded area). Thecorresponding correlation and linear fit coefficients are given in
3 We always imply Pearson linear correlation coefficients in thiswork.
5

N. L. J. Cox et al.: Near-infrared diffuse interstellar bands
Fig. 5. Candidate NIR DIBs at λλ10360, 10392, 10438, 10503, 10506, 10696, 10780, and 13026 Å for reddened sightlines towardsHD 161061 (green), HD 183143 (blue), and 4U 1907+09 (black). The spectra have been shifted to the interstellar rest frame. Thedotted black lines indicate the rest wavelength for the candidate NIR DIBs. Solid black lines in the bottom panel indicate the positionof stellar lines. The dashed red lines correspond to the laboratory positions of main absorption bands of several mid-sized PAHsreported by Mattioda et al. (2005). Note that the peaks of the stellar lines (at 10422, 10670, 10830, 12969, and 12984 Å) do notcoincide due to differences in radial velocity of the stars. The telluric standard spectrum of HD 153294 (dashed cyan) and stellaratmosphere model of an O9Ia star (solid yellow) are overplotted for reference.
6

N. L. J. Cox et al.: Near-infrared diffuse interstellar bands
Fig. 6. Tentative NIR DIB candidates at 12336.3 Å, 20427.8 Å, 21387.0 Å, 21842.5 Å, and 21887.7 Å (from top to bottom) towardsthe reddened star 4U 1907 (and HD 183143 and HD 161061 where applicable). Dotted vertical lines indicate the position of thetentative NIR DIBs. The telluric standard spectrum of HD 153294 (dashed cyan) and stellar atmosphere model of an O9Ia star(solid yellow) are overplotted for reference. The feature at 21842.5 Å is possibly (a blend with) a stellar He i line.
Table 5. We note that the strength of the 11797 Å NIR DIB fallswell above the linear trend for three lines-of-sight reported inJoblin et al. (1990). At this time we can not confirm if any sys-tematics (such as telluric residuals) affect these measurementsor if they are truly peculiar, though we note that for the onlysightline in common, HD 183143, we report a ∼35% smallerequivalent width. Although the sample is limited, we find formost NIR DIBs a clear, but imperfect, trend of increasing DIBstrength with increasing E(B−V).
4.3.2. DIB families
Table 5 also lists the correlation coefficients between the threeselected NIR DIBs and the optical DIBs (for consistency andavoiding systematics these correlation coefficient only take theX-shooter data into account.
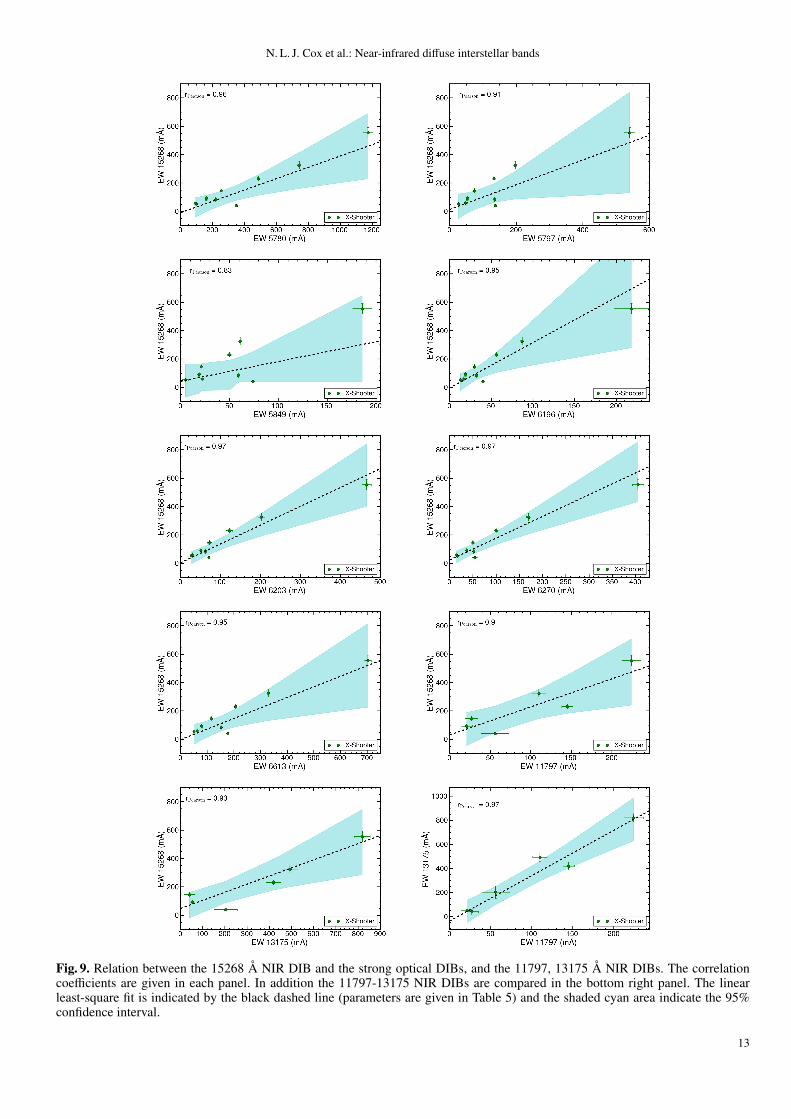
Correlation coefficients are r > 0.8 between the 15268 ÅNIR DIB and the optical DIBs. Note that all optical DIBs weconsider here are also well correlated with each other, r ≥ 0.9.All correlations between the 15268 Å DIB and the optical DIBsare shown in Fig. 9. The 15268 Å NIR DIB is only moderatelycorrelated (r ∼ 0.9) with both the 11797 Å or 13175 Å NIR
7

N. L. J. Cox et al.: Near-infrared diffuse interstellar bands
Table 2. Equivalent widths in mÅ (uncertainties in parentheses) of NIR DIBs in reddened sightlines observed with X-shooter.
λDIBa HD 167785 HD 326306 HD 153294 HD 152246 HD 161056 HD 161061 HD 147889 HD 183143 4U 1907
5780 98 (4) 161 (6) 90 (7) 253 (8) 220 (5) 486 (9) 349 (8) 742 (12) 1172 (31)5797 26 (2) 53 (3) 48 (2) 75 (3) 135 (3) 133 (4) 137 (3) 197 (6) 540 (16)5849 5 (3) 19 (2) 22 (2) 21 (1) 59 (1) 50 (2) 74 (2) 61 (2) 186 (10)6196 13 (1) 19 (1) 17 (2) 30 (1) 32 (1) 56 (2) 40 (2) 87 (2) 218 (21)6203 26 (3) 51 (3) 30 (4) 73 (6) 62 (2) 122 (8) 71 (3) 202 (9) 465 (26)6270 17 (3) 37 (2) 14 (2) 50 (3) 52 (2) 100 (4) 54 (6) 170 (5) 405 (12)6613 50 (3) 79 (2) 62 (2) 115 (2) 152 (2) 207 (5) 177 (4) 329 (5) 703 (13)
9577 – – – – – 180 (5) ≤90 260 (5) 380 (6)9632 – – – – – 195 (4) ≤120 263 (3) 360 (5)11797 – 21 (7) – 27 (8) – 145 (7) 56 (17) 110 (9) 224 (12)13175 – 53 (12) – 40 (24) – 419 (33) 203 (53) 493 (36) 819 (36)15268 54 (14) 93 (15) 60 (16) 146 (18) 85 (19) 231 (17) ≈40 (7) 326 (28) 554 (38)15610 – – – – – 79 (30) – 116 (43) 189 (66)15646 – – – – – – – 153 (88) 174 (57)15666 – – – – – – – 78 (10) 188 (15)16227 – – – – – – – – 696 (148)16567 – – – – – – – – 37 (6)16578 – – – – – – – 30 (10) 53 (8)16588 – – – – – – – – 18 (5)17803 – – – – – – – – 502 (166)
10361 – – – – – 18 (4) – 46 (32) 69 (10)10393 – – – – – 25 (8) – 19 (5) 56 (9)10438 – – – – – 28 (4) – 56 (9) 65 (15)10504 f ,g – – – – – 36 – 58 13610507 f ,g – – – – – 29 – 261 68
– – – – – (66)d (295)d (203)d
10697g – – – – – 127 (19) – 262 (36) 329 (22)10780e,g – – – – – 119 (6) – 149 (8) 175 (13)13027 f – – – – – 71 (15) – 171 (37) 222 (41)
Notes. (a) Measured rest peak wavelengths in air are 9577.1±0.2, 9632.0±0.2, 11797.0±0.5, 13175.0±0.5, 15267.8±0.4, 15610.0±0.5,15645.5±0.5, 15665.5±0.5, 16226.7±0.5, 16567.0±0.5, 16578.0±0.5, 16588.0±0.5, 17802.7±0.5, 10360.5±0.3, 10392.9±0.3, 10438.4±0.1,10504.2±0.2, 10506.6±0.2, 10696.9±0.2, 10780.3±0.2, 13026.7±0.5. (d) Integrated equivalent width for blended “W-shape” features at 10504 Å& 10506 Å. Absorption lines for HD 183143 are contaminated by a strong emission feature. (e) Possibly stellar. C iii at 10790 Å and 10800 Å.( f ) Complex profile; possible blended lines. (g) No sensible uncertainties could be determined for individual components.
DIBs. The latter two are strongly correlated with each other, r =0.97.
Since the number of data points is small (between six andnine) and there is significant scatter on the derived linear regres-sions we caution against over-interpretation of the correlationcoefficients presented here. A larger sample is required for eachdiffuse band to substantiate or invalidate these preliminary rela-tions, which could be nevertheless useful in, for example, prepar-ing follow-up observations. Nonetheless, our measurements re-veal that optical and NIR DIBs display a similar behaviour withrespect to interstellar physical conditions as probed by differ-ent lines-of-sight. Furthermore, the data tentatively suggest thatthe NIR DIB at 15268 Å NIR DIB is moderately well corre-lated with all the optical DIBs. The weakest correlation is foundfor the optical DIBs at 5797 and 5849 Å. The relation betweenNIR DIBs and the 5780 Å DIB (which is considered as a goodtracer of neutral hydrogen; Herbig 1993) is discussed in Sect. 6.Considering the small sample size we do not consider furthersub-division of the sample according to, for example, σ/ζ-type,etcetera.
5. NIR DIBs and large PAH cation bands
In the context of the DIB-PAH proposal, the NIR range couldbe particularly interesting since many PAH ions have strongelectronic transitions in this wavelength range (Mattioda et al.2005). Specifically, these authors measured the spectra of 27PAH cations and anions, ranging in size from C14H10 to C50H22,and found that they have strong and broad absorption bands be-tween 0.7 and 2.5 µm. Smaller PAHs on the other hand have theirstrongest transitions in the optical or UV. Since it is thought thatthe population of interstellar PAHs is dominated by species inthe NC = 50 range (see e.g. Tielens 2008), the NIR is ideallysuited to study and possibly identify these species in space.
The PAH ion absorption spectra presented by Mattioda et al.(2005) are typically characterised by one or two strong tran-sitions accompanied by several weaker transitions. Ten of thePAH cations presented have bands with oscillator strengths f ≤0.02 longwards of 1.0 µm. Here, we make an initial compari-son between these laboratory measurements and the NIR DIBs.Note however that the absorption band wavelengths reported byMattioda et al. (2005) result from matrix-isolation experimentsand hence suffer from an unknown shift in position (by as much
8

N. L. J. Cox et al.: Near-infrared diffuse interstellar bands
Table 3. FWHM (in Å; uncertainties in parentheses) of NIRDIBs in reddened sightlines observed with X-Shooter.
λDIBa FWHM (Å)
HD 161061 HD 147889 HD 183143 4U 1907
9577 3.9 (0.12) – 3.3 (0.07) 4.8 (0.07)9632 2.7 (0.05) – 2.5 (0.03) 3.6 (0.06)11797 1.9 (0.1) 2.2 (0.7) 1.7 (0.1) 2.3 (0.1)13175 4.2 (0.3) 5.5 (1.5) 4.0 (0.3) 4.7 (0.2)15268 3.6 (0.3) 2.2 (0.4) 3.7 (0.3) 4.4 (0.3)15610 7.8 (3.0) – 7.0 (2.6) 7.1 (2.5)15646 – – 11.0 (5.8) 8.3 (2.7)15666 6.3 (1.5) – 2.5 (0.3) 5.1 (0.4)16227 – – – 33 (7)16567 – – – 3.2 (0.5)16578 – – 3.7 (1.2) 3.3 (0.5)16588 – – – 2.9 (0.9)17803 – – – 13 (4)
10361 2.0 (0.5) – 3.3 (2.3) 3.1 (0.5)10393 3.2 (1.0) – 1.4 (0.4) 2.8 (0.5)10438 2.6 (0.4) – 3.5 (0.5) 4.0 (0.9)10504c 1.4 – 1.2 2.310507c 1.5 – 4.8 1.510697 3.8 (0.6) – 3.9 (0.5) 4.9 (0.3)10780b 1.7 (0.1) – 1.8 (0.1) 2.3 (0.2)13027c 4.7 – 5.5 5.7
Notes. (a) Measured rest peak wavelengths in air are given in Table 2.(b) Possibly stellar. C iii at 10790 Å and 10800 Å. (c) Complex profile;possible blended lines or telluric residuals. No sensible uncertaintiescould be determined for (individual) components.
Table 4. Equivalent widths (uncertainties in parentheses) for the11797, 13175, and 15268 Å NIR DIBs reported previously in theliterature.
Target E(B−V) Equivalent widths (mÅ)(mag) 11797 13175 15268
HD 24398b 0.34 32 (9) 50 (20) –HD 223385b 0.59 280 (38) 460 (34) –HD 20041b 0.73 34 (4) 262 (35) –HD 183143b 1.04 169 (29) 451 (37) –HD 194279b 1.22 336 (54) 560 (55) –BD+40 4223a 1.93 – 860 (60) –BD+40 4220b 2.00 394 (44) 870 (60) –GCS3-2a ∼6.5 – – 1500 (100)qF362a 7.0 (0.6) – 3130 (100) –
Notes. (a) Equivalent width measurements from Geballe et al. (2011).Visual extinction for GCS3-2, qF362, and BD+40 4223 is ∼20,21.7±1.7, and 5.97 mag, respectively. (b) Equivalent width measure-ments from Joblin et al. (1990). Note that HD 183143 is the only X-shooter line-of-sight also observed by Joblin et al. The equivalent widthof the 11797 Å DIB observed with X-shooter is 40% smaller, whilethose for the 13175 Å DIB agree within the uncertainties.
as tens of Angstrom) as well as from band broadening due to in-teraction with the solid lattice. Thus, while a direct identificationof PAH cations is not possible with this data set, a comparisonbetween the laboratory data and the NIR DIBs can offer someinsights into this population of carbonaceous species. Here, wepresent some of the more interesting cases; the numbering refersto that used by Mattioda et al. (2005):
Fig. 7. λλ11797, 13175, and 15268 NIR DIB equivalent widths(Å) as a function of reddening, E(B−V)including measurementsfrom Joblin et al. (1990, blue squares); Geballe et al. (2011, seealso Table 2; black diamonds) and this work (green circles). Thelinear least-square fit is indicated by the black dashed line (pa-rameters are given in Table 5) and the shaded cyan area indicatesthe 95% confidence interval.
1. Molecule #10 (C20H+12) has two strong bands at 10510 Å
( f = 0.077) and 9277 Å ( f = 0.008). We identified twonew candidate DIBs at 10504 Å and 10506 Å, but could notverify the presence of the second, weaker band near 9277 Ådue to a strong telluric line forest in this range.
9

N. L. J. Cox et al.: Near-infrared diffuse interstellar bands
Fig. 8. Mutual correlation between the 5780 Å DIB and the λλ11797, 13175, and 15268 NIR DIBs. The correlation coefficientsare given in each panel. The linear least-square fit is indicated bythe black dashed line (parameters are given in Table 5) and theshaded cyan area indicates the 95% confidence interval.
2. Molecule #16 (C36H+16) shows a strong laboratory band at
10520 Å ( f = 0.031), with one order-of-magnitude weakerband at 10220 and 9196 Å. Again, two tentative NIR DIBsare identified at 10504 Å and 10506 Å. No feature is re-vealed at 10220 Å, but a shallow broad feature is suspectedat 9212 Å.
Table 5. Correlation coefficients r and best-fit parameters of thelinear regression y = a ∗ x + b for the listed parameter pairs forthe X-shooter data. Equivalent widths, W, given in mÅ.
paremeter pair y − xa r ab b (mÅ) b
W(11797)-E(B−V) 0.90 70 (17) 29 (19)W(13175)-E(B−V) 0.91 311 (44) 28 (50)W(15268)-E(B−V) 0.90 182 (40) 19 (33)W(13175)-W(11797) 0.97 3.76 (0.42) 37 (43)
W(11797)-W(5780) 0.92 0.20 (0.55) -4 (29)W(13175)-W(5780) 0.98 0.80 (0.91) -84 (37)W(15268)-W(5780) 0.96 0.40 (0.11) -8 (37)
W(15268)-W(5797) 0.91 0.87 (0.35) 14 (44)W(15268)-W(5849) 0.83 1.40 (1.02) 43 (56)W(15268)-W(6196) 0.95 3.20 (0.96) -4 (36)W(15268)-W(6203) 0.97 1.32 (0.24) 4 (24)W(15268)-W(6270) 0.97 1.53 (0.26) 24 (21)W(15268)-W(6613) 0.95 0.74 (0.22) -2 (39)W(15268)-W(11797) 0.90 1.98 (0.56) 31 (54)W(15268)-W(13175) 0.93 0.57 (0.13) 48 (39)
Notes. (a) Equivalent width of the NIR DIB at the given wavelengthor interstellar reddening. (b) The linear regression coefficients includinguncertainties as shown in Figs. 7, 8 and 9.
3. Molecule #18 (C40H+18) has a strong band at 10410 Å ( f =
0.024), near the new candidate at 10438 Å. The weakerbands at 9789 and 8918 Å (laboratory) could not be dis-cerned in the X-shooter spectra.
4. Molecule #19 (C40H+18) has a strong band at 13010 Å ( f =
0.026), near the new candidate at 13026 Å. Secondary labo-ratory bands with f ∼ 0.002 are present at 9233, 7854, and7693 Å. As noted above, a near infrared band may be presentat 9212 Å. Furthermore, strong DIBs have been identified at7686.5, 7705.9, and 7710 Å (Jenniskens & Desert 1994).
5. Molecule #22 (C42H+22) has a strong band at 10790 Å ( f =
0.042), near the new candidate at 10780 Å. The secondarybands at 9386 and 7209 Å ( f ∼ 0.004) are not found.
6. Molecule #25 (C48H+20) has a strong band at 10410 Å ( f =
0.089), near the new candidates at 10392 and 10438 Å. Itsstrongest feature is at 6941 Å ( f = 0.160) which is near astrong broad DIB at 6939 Å with FWHM of 21.3 Å.
We do not find any features in the vicinity of the main tran-sitions reported for molecules #23 (C44H+
20; f = 0.025), #24(C48H+
20; f = 0.061), #26 (C48H+22; f = 0.031).
The above comparison shows several coincidences betweenthe newly detected NIR DIBs and the laboratory spectra ofPAH cations, thus illustrating the potential of this low-congestedrange of the DIB spectrum. However, the measured PAH cationbands are much broader (at least tens of Å) than the rather nar-row NIR DIBs. While part of the measured bandwidth for thePAHs certainly results from matrix broadening effects, it is clearthat PAH cation bands are intrinsically broad as well, and thuspossibly too broad to match the NIR DIBs. A conclusive answercan therefore only come from precise transition wavelengths andinformation on the intrinsic band profiles and widths, obtainedfrom gas-phase spectra of possible carrier molecules as has beenillustrated for DIBs in the optical range (see e.g. Gredel et al.2011; Salama et al. 2011).
10

N. L. J. Cox et al.: Near-infrared diffuse interstellar bands
6. The translucent cloud toward HD 147889
In Sect. 3.2 we found that many of the NIR DIBs towardsHD 147889 are weak compared to sightlines with similar red-dening. On the other hand, strengths of the optical DIBs are con-sistent with those found in similar lines-of-sight. For instance theoptical DIBs toward HD 161061, HD 147889 and HD 183143have similar strengths per unit reddening, while the NIR DIBs at9577, 9632, and 15628 are weaker. The strengths of the 11797and 13175 Å NIR DIBs toward HD 147889 are in line with thegood linear relation with the 5780 Å DIB strength, while the15268 Å NIR DIB is unusally weak compared to the generaltrend (Fig. 8).
The line of sight toward HD 147889 sightline passes througha well known and extensively studied translucent cloud with avisual extinction of ∼4 mag (Ruiterkamp et al. 2005). Its meanhydrogen density and molecular hydrogen fraction are high,nH = 1200 ± 500 cm−3 and fH2 = 0.4. The local interstellar radi-ation field (ISRF) impacting the cloud is 11 times as strong as theaverage ISRF. Ruiterkamp et al. (2005) computed the ionisationbalance of a set of small to intermediate size PAHs to constructa PAH absorption spectrum ranging from the UV to the near-IR. These models showed a non-negligible fraction of anionsand a significant fraction of cations. The prediction for this line-of-sight was that if DIBs are due to compact and non-compactPAHs homologue series (with 10 < C-atoms < 50) then moreDIB features should be present longwards of 10 000 Å. Thus,the absence of NIR DIBs could indicate that for HD 147889large non-compact PAHs are absent or altered, for example dueto substantial hydrogenation, resulting in weak bands. In addi-tion, the ionisation fraction in this translucent cloud is less than30% for small PAHs with less than 30 carbon atoms, while theanion fraction is over 20%. Thus the absence of the NIR DIBs(and 5849 Å DIB) could be related to the low ionisation frac-tion of smaller PAHs in this line-of-sight as compared to that indiffuse clouds. A lower ionisation fraction - basically due to self-shielding - is expected for translucent clouds with a high molec-ular abundance (Snow & McCall 2006). Hence, also the reducedstrength of the 15268 Å NIR DIB with respect to the 5780 Å DIBwhich is known to trace particularly well the amount of neutralhydrogen (Herbig 1995, Friedman et al. 2011). Due to the lowionisation potential of large (>100 C-atoms) PAHs, these wouldhave a large ionisation fraction (≥ 50%) even in this translucentcloud.
7. Summary & Conclusions
This paper presents moderate-resolution optical and NIR spec-tra, using X-shooter at the VLT, for eight Galactic early-typestars with interstellar reddening values (EB−V ) ranging from 0 to3.5 magnitudes (or 10 mag visual extinction correspondingly).We present and discuss the presence and properties of NIR DIBsin these sightlines. Specifically, we have obtained the followingresults for the presence of diffuse interstellar bands:
Detection of NIR DIBs
– We detect nine of the thirteen new NIR DIBs that were re-ported by Geballe et al. (2011), and can confirm their inter-stellar nature from their general correlation with reddeningand from the stationary nature of the rest wavelengths whencorrected for the radial velocity of the interstellar cloud inthe line-of-sight.
– We propose eight new NIR DIB candidates based ontheir detection in the reddened spectra of HD 183143 and4U 1907+09.
Thus, a total of 13 NIR DIBs are confirmed at wavelengthslonger than 9500 Å; and up to 16 new NIR DIB candidates arereported – 12 of which are discussed in this work for the firsttime.
Properties and behaviour of NIR DIBs
– Most of the NIR DIBs are intrinsically fairly narrow withFWHM ∼2–4Å; only the 15610 and 17800Å NIR DIBs arebroader.
– Although the NIR DIBs are fairly strong, their carrier abun-dance is about an order of magnitude smaller than thestrongest optical DIBs.
– The 11797, 13175 and 15268 Å NIR DIBs are found to cor-relate well with the 5780 Å DIB, and by extension corre-late better with H i than with E(B−V). The strength ratio of2 between the 5780 and 15268 DIBs implies that (N f )5780/ (N f )15268 = 14; however, the weak 15268 DIB towardHD 147889 precludes a common carrier for the two DIBs.
– Laboratory spectra of large PAH cations show some coinci-dences with the NIR DIBs; however, their bands are probablyto broad to explain the NIR DIBs.
– The NIR DIBs in the translucent cloud towards HD 147889are nearly absent while most optical DIBs have averagestrength. Since the ionisation fraction of small to medium-sized PAHs is low in this cloud, this hints at ionized speciesas the carriers of the NIR DIBs.
The NIR range has proven a fertile wavelength range tosearch for new DIBs. Given our survey, most strong NIR DIBsbetween 10000 Å and 25000 Å are likely detected. However,numerous more NIR DIBs could be hiding in the noise, in par-ticular in those regions affected most severely by residuals fromtelluric line removal procedures. Undoubtedly, further advancesin technology, instrumentation and modeling of telluric and stel-lar atmospheres will lead to the detection of more NIR DIBs.
The NIR DIBs allows one to study the DIBs in highlyextincted lines-of-sight that are inaccessible to optical spec-troscopy. This offers some prospects to observe NIR DIBs andPAH infrared emission bands in the same environments. Thiswould most certainly provide a critical test for the PAH-DIB hy-pothesis. To connect such studies back to optical DIBs, extensivestudies are required of both optical and NIR DIBs in a large sam-ple of sightlines, including detailed analyses of their relation toknown molecular interstellar species as well.
Acknowledgements. We thank the referee for a thorough reading of themanuscript and several insightful comments that improved the paper. NLJCthanks the staff at Paranal for their help in optimising the execution of ourprogramme, and X-shooter instrument scientists at ESO for assistance in datahandling issues. JC acknowledges support from the Natural Sciences andEngineering Council of Canada (NSERC). We thank Lucas Ellerbroek for guid-ance in using Spextool to correct the data for telluric absorption lines. This re-search has made use of the Simbad database operated by CDS in Strassbourgh.
ReferencesAdamson, A. J., Kerr, T. H., Whittet, D. C. B., & Duley, W. W. 1994, MNRAS,
268, 705Cami, J., Sonnentrucker, P., Ehrenfreund, P., & Foing, B. H. 1997, A&A, 326,
822Cordiner, M. A. 2014, in IAU Symposium, Vol. 297, IAU Symposium, ed.
J. Cami & N. L. J. Cox, 41–50
11
N. L. J. Cox et al.: Near-infrared diffuse interstellar bands
Cox, N. L. J. 2011, in EAS Publications Series, Vol. 46, EAS Publications Series,ed. C. Joblin & A. G. G. M. Tielens, 349–354
Cox, N. L. J., Kaper, L., & Mokiem, M. R. 2005, A&A, 436, 661Cushing, M. C., Vacca, W. D., & Rayner, J. T. 2004, PASP, 116, 362D’Odorico, S., Dekker, H., Mazzoleni, R., et al. 2006, in Society of Photo-
Optical Instrumentation Engineers (SPIE) Conference Series, Vol. 6269,Society of Photo-Optical Instrumentation Engineers (SPIE) ConferenceSeries
Ehrenfreund, P., Foing, B. H., d’Hendecourt, L., Jenniskens, P., & Desert, F. X.1995, A&A, 299, 213
Fitzgerald, M. P. 1970, A&A, 4, 234Foing, B. H. & Ehrenfreund, P. 1994, Nature, 369, 296Foing, B. H. & Ehrenfreund, P. 1997, A&A, 317, L59Friedman, S. D., York, D. G., McCall, B. J., et al. 2011, ApJ, 727, 33Galazutdinov, G. A., Krełowski, J., Musaev, F. A., Ehrenfreund, P., & Foing,
B. H. 2000, MNRAS, 317, 750Geballe, T. R., Najarro, F., Figer, D. F., Schlegelmilch, B. W., & de La Fuente,
D. 2011, Nature, 479, 200Gnacinski, P., Sikorski, J., & Kaczmarczyk, G. 1997, Acta Astronomica, 47, 225Gredel, R., Carpentier, Y., Rouille, G., et al. 2011, A&A, 530, A26Herbig, G. H. 1993, ApJ, 407, 142Herbig, G. H. 1995, ARA&A, 33, 19Hobbs, L. M., York, D. G., Thorburn, J. A., et al. 2009, ApJ, 705, 32Jenniskens, P. & Desert, F.-X. 1994, A&AS, 106, 39Joblin, C., d’Hendecourt, L., Leger, A., & Maillard, J. P. 1990, Nature, 346, 729Mattioda, A. L., Hudgins, D. M., & Allamandola, L. J. 2005, ApJ, 629, 1188Mazzei, P. & Barbaro, G. 2011, A&A, 527, A34Modigliani, A., Goldoni, P., Royer, F., et al. 2010, in Society of Photo-Optical
Instrumentation Engineers (SPIE) Conference Series, Vol. 7737, Society ofPhoto-Optical Instrumentation Engineers (SPIE) Conference Series
Ruiterkamp, R., Cox, N. L. J., Spaans, M., et al. 2005, A&A, 432, 515Salama, F., Bakes, E. L. O., Allamandola, L. J., & Tielens, A. G. G. M. 1996,
ApJ, 458, 621Salama, F., Galazutdinov, G. A., Krełowski, J., et al. 2011, ApJ, 728, 154Sarre, P. J. 2006, Journal of Molecular Spectroscopy, 238, 1Snow, T. P. 2002, in 17th IAP Colloq. on Gaseous Matter in Galaxies and
Intergalactic Space, ed. L. M. D. J. M. R. B. Ferlet, R., 63–68Snow, T. P. & McCall, B. J. 2006, ARA&A, 44, 367Tielens, A. G. G. M. 2008, ARA&A, 46, 289Tuairisg, S. O., Cami, J., Foing, B. H., Sonnentrucker, P., & Ehrenfreund, P.
2000, A&AS, 142, 225Vacca, W. D., Cushing, M. C., & Rayner, J. T. 2003, PASP, 115, 389Vernet, J., Dekker, H., D’Odorico, S., et al. 2011, A&A, 536, A105Vuong, M. H. & Foing, B. H. 2000, A&A, 363, L5Watson, J. K. G. 2001, ApJ, 555, 472Wegner, W. 1994, MNRAS, 270, 229Zasowski, G. & Menard, B. 2014, in IAU Symposium, Vol. 297, IAU
Symposium, ed. J. Cami & N. L. J. Cox, 68–73
12
N. L. J. Cox et al.: Near-infrared diffuse interstellar bands
Fig. 9. Relation between the 15268 Å NIR DIB and the strong optical DIBs, and the 11797, 13175 Å NIR DIBs. The correlationcoefficients are given in each panel. In addition the 11797-13175 NIR DIBs are compared in the bottom right panel. The linearleast-square fit is indicated by the black dashed line (parameters are given in Table 5) and the shaded cyan area indicate the 95%confidence interval.
13