visually based reflections of a learning dispositions framework
TRANSCRIPT
Draft Version
Paper presented at AERA 2008 as part of a symposium: Using Visual Methods in Educational Research: issues in Developing Visual Methodologies
Not to be reproduced without the permission of the authors
[email protected] [email protected] 1
Visually Based Reflections of a Learning Dispositions Framework
Kate Wall and Elaine Hall Research Centre for Learning and Teaching, Newcastle University Research Centre for Learning and Teaching King George VI Building Newcastle University Queen Victoria Road Newcastle upon Tyne NE1 7RU T: 0191 222 6943 F: 0191 222 7534
Paper presented at AERA 2008 as part of a symposium: Using Visual Methods in Educational Research: issues in Developing Visual Methodologies
Not to be reproduced without the permission of the authors
[email protected] [email protected] 2
Visually Based Reflections of a Learning Dispositions Framework
Kate Wall and Elaine Hall Research Centre for Learning and Teaching, Newcastle University
Abstract This paper will be based around the methodological issues inherent in collecting and analysing visual data gathered as part of the base line information for the first year of the ‘Learning to Learn in Schools Phase 4’ research project. This project is funded through the Campaign for Learning and aims to explore how the development of lifelong learning can be fostered in schools. It builds on a dispositions framework of the ‘5Rs’ which was constructed as part of Phases 1 to 3 (Rodd, 2001; 2003; Higgins et al. 2007). These dispositions are Readiness, Resilience, Resourcefulness, Reflectiveness and Responsibility and aim to give schools, teachers and pupils a starting point from which dialogue, enquiry and innovation around learning can happen (for more information on the methodology see Higgins et al. 2007; Baumfield et al. 2008 and Baumfield et al. 2007). The project includes more than 40 schools, including both primary and secondary age phases, from four socio‐geographically different regions in England. This paper present the methodological challenges and initial findings from using visual methods to investigate to what extent students in the project are interpreting these dispositions using a visually based methodology (Prosser, 2007) and will evaluate pupils’ interpretations and understandings of the Rs and how they relate to their learning. Teachers were asked to invite their students to draw their own representations and interpretations of the Rs and submit them to the Campaign for Learning as part of a competition in the first term of the project. All of these drawings will be analysed by the University team. The data for this paper is therefore drawn from the visual representations submitted by the students for the different dispositions. Analysis will be conducted by the authors as an iterative process of theory and construct generation (Glaser, 1992) using the common themes and representations used by the students. These will then be used to create a classification of students’ views of learning as supported by this framework.
Paper presented at AERA 2008 as part of a symposium: Using Visual Methods in Educational Research: issues in Developing Visual Methodologies
Not to be reproduced without the permission of the authors
[email protected] [email protected] 3
Introduction The Learning to Learn in Schools Phase 4 Evaluations is a research project funded through the
independent UK charity, the Campaign for Learning (CfL), and facilitated by a team of researchers from
the Research Centre for Learning and Teaching, Newcastle University, and Durham University. This
project involves 44 primary and secondary schools in four Local Authorities (LAs), representing a wide
range of socio‐economic contexts across England1. This project builds on research completed in Phases 1
to 3 (Rodd, 2001; 2003; Higgins et al. 2007) and throughout it has been characterised by a commitment
to case study based research with a priority placed on the interpretations and definitions of Learning to
Learn (L2L) which are practicable in school. In Phases 3 and 4, however, there has been a move which
has seen the case studies completed by the teachers using an approach based on Stenhouse’s (1981)
model of “systematic enquiry made public”. Within these Phases the teachers have been encouraged to
initiate changes they feel are appropriate and that fit with what they believe is the ethos of Learning to
Learn; and they have completed the first level of evaluation with an emphasis on evidence that is
meaningful to them and colleagues. Thus the locus of control in these latter two phases has been with
the teachers rather than the researchers (Baumfield et al. 2008). The university team complements the
teachers’ focused research by exploring themes that cross school and regional boundaries and drawing
conclusions that can influence practice, theory and policy more generally (Wall and Hall 2005).
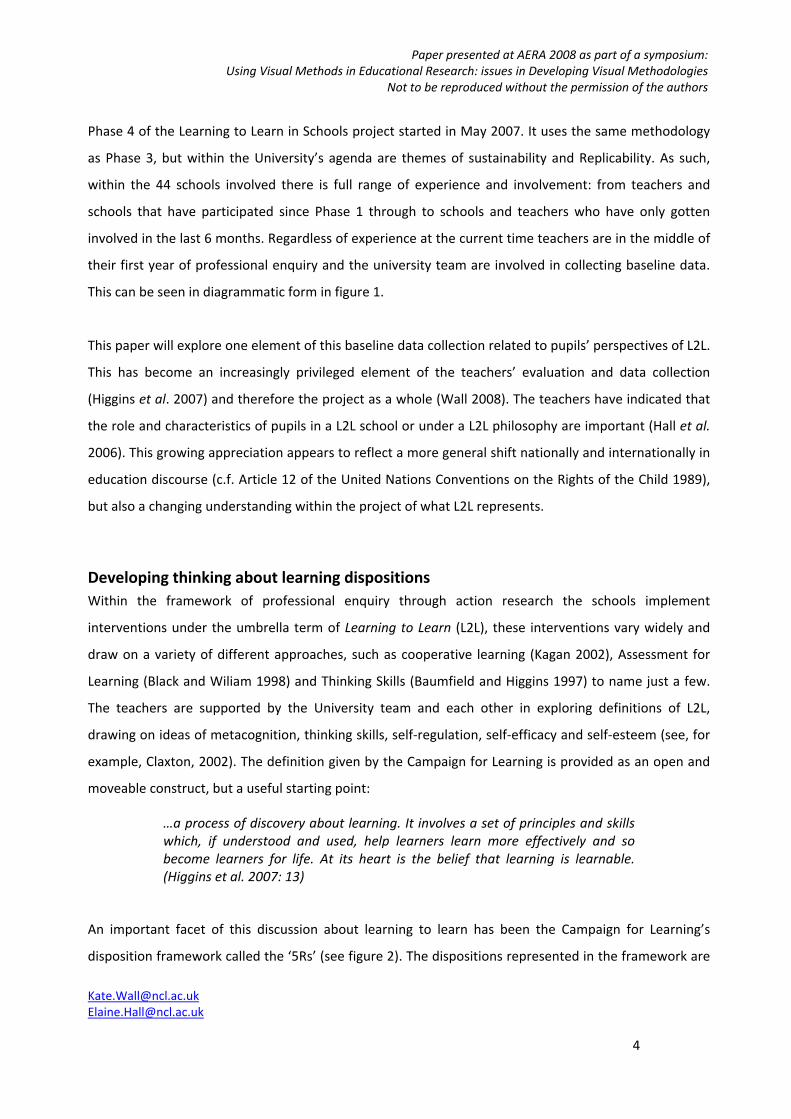
Figure 1: Representation of the Learning to Learn in Schools Project (Phase 1 ‐4)
1 Further information about the project can be found at: www.campaignforlearning.org.uk
Paper presented at AERA 2008 as part of a symposium: Using Visual Methods in Educational Research: issues in Developing Visual Methodologies
Not to be reproduced without the permission of the authors
[email protected] [email protected] 4
Phase 4 of the Learning to Learn in Schools project started in May 2007. It uses the same methodology
as Phase 3, but within the University’s agenda are themes of sustainability and Replicability. As such,
within the 44 schools involved there is full range of experience and involvement: from teachers and
schools that have participated since Phase 1 through to schools and teachers who have only gotten
involved in the last 6 months. Regardless of experience at the current time teachers are in the middle of
their first year of professional enquiry and the university team are involved in collecting baseline data.
This can be seen in diagrammatic form in figure 1.
This paper will explore one element of this baseline data collection related to pupils’ perspectives of L2L.
This has become an increasingly privileged element of the teachers’ evaluation and data collection
(Higgins et al. 2007) and therefore the project as a whole (Wall 2008). The teachers have indicated that
the role and characteristics of pupils in a L2L school or under a L2L philosophy are important (Hall et al.
2006). This growing appreciation appears to reflect a more general shift nationally and internationally in
education discourse (c.f. Article 12 of the United Nations Conventions on the Rights of the Child 1989),
but also a changing understanding within the project of what L2L represents.
Developing thinking about learning dispositions Within the framework of professional enquiry through action research the schools implement
interventions under the umbrella term of Learning to Learn (L2L), these interventions vary widely and
draw on a variety of different approaches, such as cooperative learning (Kagan 2002), Assessment for
Learning (Black and Wiliam 1998) and Thinking Skills (Baumfield and Higgins 1997) to name just a few.
The teachers are supported by the University team and each other in exploring definitions of L2L,
drawing on ideas of metacognition, thinking skills, self‐regulation, self‐efficacy and self‐esteem (see, for
example, Claxton, 2002). The definition given by the Campaign for Learning is provided as an open and
moveable construct, but a useful starting point:
…a process of discovery about learning. It involves a set of principles and skills which, if understood and used, help learners learn more effectively and so become learners for life. At its heart is the belief that learning is learnable. (Higgins et al. 2007: 13)
An important facet of this discussion about learning to learn has been the Campaign for Learning’s
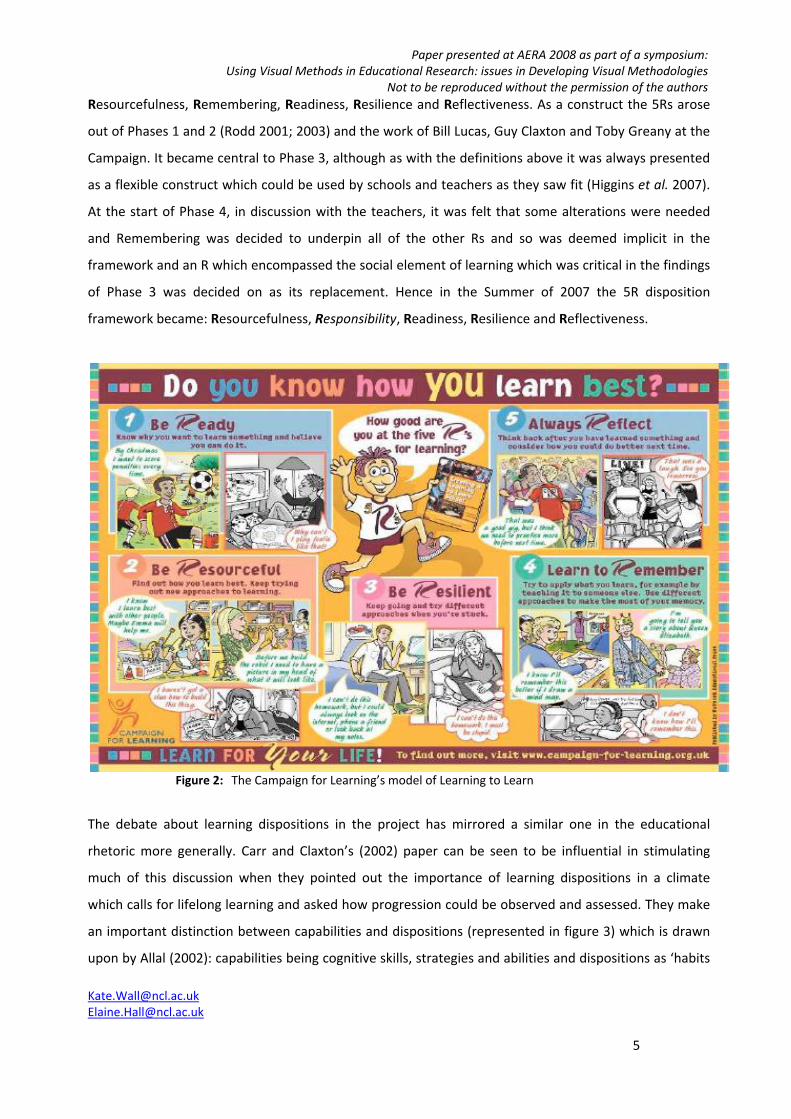
disposition framework called the ‘5Rs’ (see figure 2). The dispositions represented in the framework are
Paper presented at AERA 2008 as part of a symposium: Using Visual Methods in Educational Research: issues in Developing Visual Methodologies
Not to be reproduced without the permission of the authors
[email protected] [email protected] 5
Resourcefulness, Remembering, Readiness, Resilience and Reflectiveness. As a construct the 5Rs arose
out of Phases 1 and 2 (Rodd 2001; 2003) and the work of Bill Lucas, Guy Claxton and Toby Greany at the
Campaign. It became central to Phase 3, although as with the definitions above it was always presented
as a flexible construct which could be used by schools and teachers as they saw fit (Higgins et al. 2007).
At the start of Phase 4, in discussion with the teachers, it was felt that some alterations were needed
and Remembering was decided to underpin all of the other Rs and so was deemed implicit in the
framework and an R which encompassed the social element of learning which was critical in the findings
of Phase 3 was decided on as its replacement. Hence in the Summer of 2007 the 5R disposition
framework became: Resourcefulness, Responsibility, Readiness, Resilience and Reflectiveness.
Figure 2: The Campaign for Learning’s model of Learning to Learn
The debate about learning dispositions in the project has mirrored a similar one in the educational
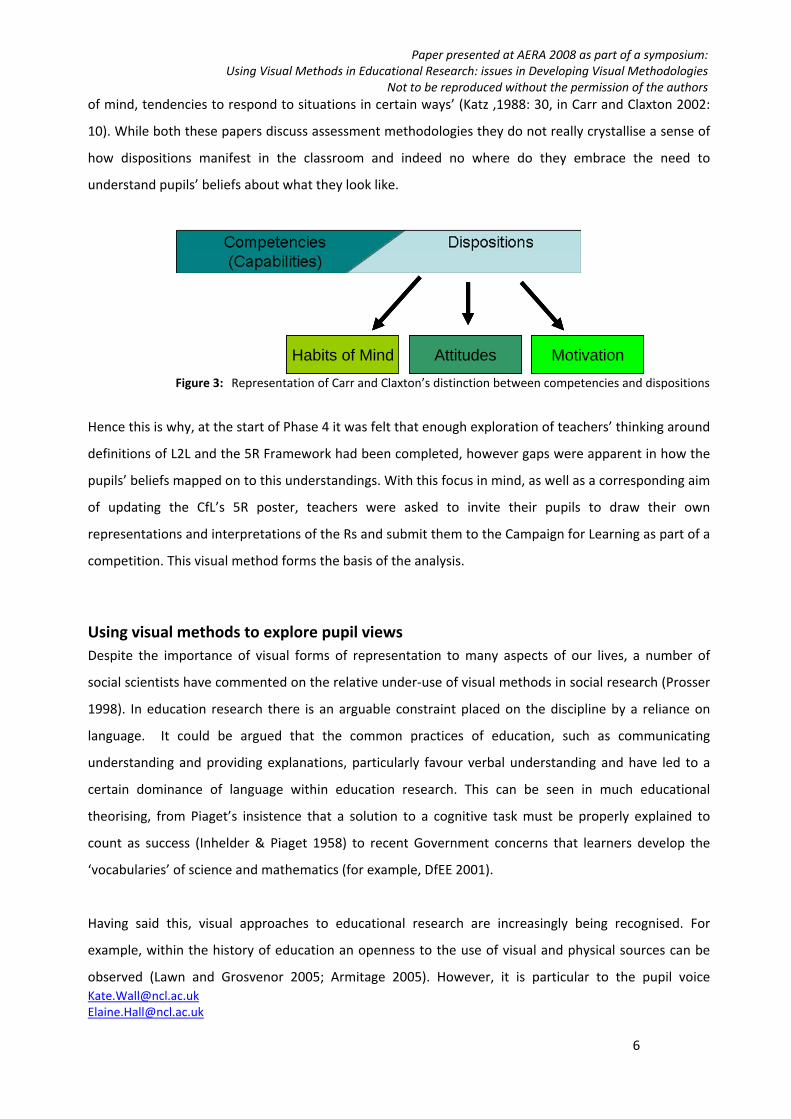
rhetoric more generally. Carr and Claxton’s (2002) paper can be seen to be influential in stimulating
much of this discussion when they pointed out the importance of learning dispositions in a climate
which calls for lifelong learning and asked how progression could be observed and assessed. They make
an important distinction between capabilities and dispositions (represented in figure 3) which is drawn
upon by Allal (2002): capabilities being cognitive skills, strategies and abilities and dispositions as ‘habits
Paper presented at AERA 2008 as part of a symposium: Using Visual Methods in Educational Research: issues in Developing Visual Methodologies
Not to be reproduced without the permission of the authors
[email protected] [email protected] 6
of mind, tendencies to respond to situations in certain ways’ (Katz ,1988: 30, in Carr and Claxton 2002:
10). While both these papers discuss assessment methodologies they do not really crystallise a sense of
how dispositions manifest in the classroom and indeed no where do they embrace the need to
understand pupils’ beliefs about what they look like.
Habits of Mind Attitudes MotivationHabits of Mind Attitudes MotivationHabits of Mind Attitudes Motivation
Figure 3: Representation of Carr and Claxton’s distinction between competencies and dispositions
Hence this is why, at the start of Phase 4 it was felt that enough exploration of teachers’ thinking around
definitions of L2L and the 5R Framework had been completed, however gaps were apparent in how the
pupils’ beliefs mapped on to this understandings. With this focus in mind, as well as a corresponding aim
of updating the CfL’s 5R poster, teachers were asked to invite their pupils to draw their own
representations and interpretations of the Rs and submit them to the Campaign for Learning as part of a
competition. This visual method forms the basis of the analysis.
Using visual methods to explore pupil views Despite the importance of visual forms of representation to many aspects of our lives, a number of
social scientists have commented on the relative under‐use of visual methods in social research (Prosser
1998). In education research there is an arguable constraint placed on the discipline by a reliance on
language. It could be argued that the common practices of education, such as communicating
understanding and providing explanations, particularly favour verbal understanding and have led to a
certain dominance of language within education research. This can be seen in much educational
theorising, from Piaget’s insistence that a solution to a cognitive task must be properly explained to
count as success (Inhelder & Piaget 1958) to recent Government concerns that learners develop the
‘vocabularies’ of science and mathematics (for example, DfEE 2001).
Having said this, visual approaches to educational research are increasingly being recognised. For
example, within the history of education an openness to the use of visual and physical sources can be
observed (Lawn and Grosvenor 2005; Armitage 2005). However, it is particular to the pupil voice
Paper presented at AERA 2008 as part of a symposium: Using Visual Methods in Educational Research: issues in Developing Visual Methodologies
Not to be reproduced without the permission of the authors
[email protected] [email protected] 7
agendas that visual methods seem to offer promise. Recently, praise and theorising has been directed at
the insight provided (Wall and Higgins 2006), the inclusivity (Prosser 2007; Woolner et al., forthcoming)
and the general appropriateness of visual means of expression for children to convey their ideas about
education and learning (Burke 2007).
Since Article 12 of the United Nations Convention on the Rights of the Child (1989), the rationale for
consulting pupils is diversifying and the potential significance of the pupils’ perspective has become
established in the educational research rhetoric. There are many studies now available that investigate
pupils’ perspective of education, school and learning (for example, Pollard 1996; Flutter and Ruddock
2004). However, most data collection methods within this field tend towards the use of interviews,
either one‐to‐one or focus groups (for example, McCallum et al. 2000; Bullock and Muschamp 2006),
although some researchers have used questionnaires, with varying degrees of success (for example,
Black et al. 2006). All of which suffer from the criticism pointed out above, that they are language based
and rely on an element of competence for success.
In this paper, we are interested in how visual methods can be used to elicit pupils’ beliefs about learning
and when the literature is explored two key types of research emerge. These are:
• studies where the visual element is used as a prompt for a mediated interview, therefore it is an
important part of the research process but is not an end itself (for example, Coates and Coates 2006);
and
• studies where a visual product is asked for and is the focus of the research, thus the visual element is
the research output and the focus of the analysis (for example, Lodge 2007; ).
It is important to point out that with the former language remains a fundamental part of the method.
The visual element has been commented on as useful for keeping a (young) child’s attention (Scott
2003), for prompting ideas and providing a non‐verbal stimulus for deeper discussion (Hennessy and
Heary 2006), for regulating any adult‐child power dynamic (Wall and Higgins 2006) and as an elucidating
process which supports communication of ideas (Alerby 2003). In some cases, where children are asked
to produce a visual response in addition to the oral communication, these outputs are analysed side by
side (Coates and Coates 2006; Alerby 2003) but in many cases greater value is placed on the oral and
written communication in achieving the research aims.
Paper presented at AERA 2008 as part of a symposium: Using Visual Methods in Educational Research: issues in Developing Visual Methodologies
Not to be reproduced without the permission of the authors
[email protected] [email protected] 8
Visual objects take a more prominent role in data collection and analysis within the latter type of study.
Here drawings, photographs and/or other types of visual representation are used as the main medium
of communication. Thus, particularly for children of a young age or lower literacy levels, this enables
them to express their thoughts and beliefs about a particular topic without the barrier of language to
hold them back or potentially exclude them from the activity (for example, Prosser 2007). It is important
to be aware however, that in a scenario like this the visual methods can become “an end in themselves”
(Banks 2001: 178; Harper 2002: 20), producing observations “that beg for greater theoretical and
substantive significance” (Harper 2002: 19). There are big implications here within such a developing
field regarding instances of insight without methodological understanding (Banks 2001).
In our research we are looking at pupils drawings and there are some issues which are pertinent to this
output in particular. One of the key problems is how they are interpreted and therefore analysed by
researchers. Children’s drawings have advantages relating to all the points above, but they also are total
in their openness. In other words, when a child is given a piece of paper and a pencil there is no limit
(beyond their beliefs about artistic ability) to restrict them in their response. It also means that,
although having pointed out a major advantage of visual methods is removing the potential barrier that
literacy competence can create, the child can express themselves as they see fit: in pictures and/or
words. In addition, particularly within the primary school and pre‐school years it is also a task with which
the children are familiar with and that they tend to have positive associations (Coates 2002).
When relying on children’s drawing for research purposes, however, it is important to recognise that
each child will have their own artistic quirks that will be reflected in the outputs of the activity. The
extent to which these impact on and influence any analysis is up for debate. As a result of this concern,
some researchers have returned to the children in order to clarify meaning. For example, in Bosacki et
al.’s (2006) study the children drew pictures of a bullying situation and were then asked a
predetermined set of questions relating to the picture to clarify the meaning. This does remove some of
the uncertainty. The decision about using a process like this can be influenced by how ‘close’ the
researchers are to the site of data collection and the extent to which literacy is necessarily removed. It is
also important to note that, as Wakefield and Underwager (2004) point out, pictures might not be
reliable as a guide to an individual’s particular perceptions (particularly not in high stakes situations such
as child abuse cases), but they can arguably suggest general tendencies in perceptions of groups of
children toward aspects of their education (as in this study).
Paper presented at AERA 2008 as part of a symposium: Using Visual Methods in Educational Research: issues in Developing Visual Methodologies
Not to be reproduced without the permission of the authors
[email protected] [email protected] 9
Previous research has shown that children’s drawings can be influenced by gender differences (Cherney
et al. 2006), age and cognitive development (Lambert 2005), and other people’s influence (Rose et al.
2006) and therefore this does need to be kept in mind when exploring images and any resulting analysis.
However, in ascertaining pupils’ views might it not be that elements of these individual characteristics
are fundamental to the beliefs that are represented? Therefore they are intrinsic to the analysis and as
such should be considered in the analysis.
The very open characteristics of images produced by children therefore necessitate the use of
qualitative analysis techniques. Bell (2004) talks about using content analysis to explore visual imagery,
bearing in mind that the images used may be either the imaginative projection of the child or a concrete
reflection of classroom practice (Collier 2004). As discussed earlier, many of these analyses are
entwined with mediated interviews, often in therapeutic or relational settings and therefore avoid the
pitfall of over‐interpretation through distance from the artist. The powerful semiotic charge of images
relating to learning and teaching could seduce the researcher into thinking that a common idea is being
expressed and shared. When, as in this case, analysis takes place at a remove from the students, great
care has to be taken to avoid this unsupported ‘reading in’ of meaning. With a relatively large data set
of images, it is also important to map trends and themes through quantitative analysis, a ‘reading
across’ of the different groups. This analytic process is validated and supported by collaborative work
between the two authors, our colleagues in the wider research team and the teachers in the wider
project who conducted first level analysis at our conference (Wall and Hall, 2005) as well as members of
our project advisory board.
Collecting pupils visual reflections of the 5Rs One of the key elements of Phases 3 and 4 has been the need to support teachers in making their
enquiry practical (Baumfield et al. 2008), therefore research methods that ‘kill two birds with one stone’
are prioritised. In other words, tools which can bridge and provide feedback across two agendas, for
example teaching and learning as well as research (Kuhn and Dean 2004), or that can match more than
one purpose, for example, learning objectives and research are prioritised. This process is talked about
elsewhere (Baumfield et al. 2007) but it is enough to know that within the Learning to Learn in Schools
Project visual methods have been central in fulfilling these multiple agendas. With this duality of
purpose in mind, a poster competition (see figure 4) was organised not only to fulfil the need for a new
Paper presented at AERA 2008 as part of a symposium: Using Visual Methods in Educational Research: issues in Developing Visual Methodologies
Not to be reproduced without the permission of the authors
[email protected] [email protected] 10
dispositions poster for the Campaign for Learning, but also to provide data on pupils’ perspectives of the
5 learning dispositions for the teachers’ own case study research as well as for the University baseline.
Figure 4: Learning disposition competition poster
Using the guise of the competition to collect the data meant that the teachers completed the immediate
data collection and the authors and University researchers undertaking the analysis were one step
removed (as discussed previously). There are recognised advantages and disadvantages because of this.
It did mean that the data was authentic in its generation and the research process did not get in the
way. However, it also meant that there was no control over the administration of the data collection
process: the authors have no knowledge of the way the task was explained, the support that was given
(for example, within the analysis there are certain structures which are specific to schools and therefore
appear to reflect previous discussion) and the way in which the posters were completed (for example,
within the sample some children have used coloured pencil, others collage and others ICT). Moreover,
demographic information has been omitted by some students and where names have been provided it
is often not possible to ascertain gender e.g. Sam. Indeed we have no guarantees that all the schools
that undertook the poster task, passed the posters on to us for analysis. This has all meant that
comparisons across the sample and generalisability of the findings could be considered problematic but
the sample size and spread across the regions helps to mediate this.
Paper presented at AERA 2008 as part of a symposium: Using Visual Methods in Educational Research: issues in Developing Visual Methodologies
Not to be reproduced without the permission of the authors
[email protected] [email protected] 11
Don’t give up
Bounce back
Bounce back
Sporting achievement
WORDS IMAGES
Don’t give up
Bounce back
Bounce back
Sporting achievement
Don’t give up
Bounce back
Bounce back
Sporting achievement
WORDS IMAGES
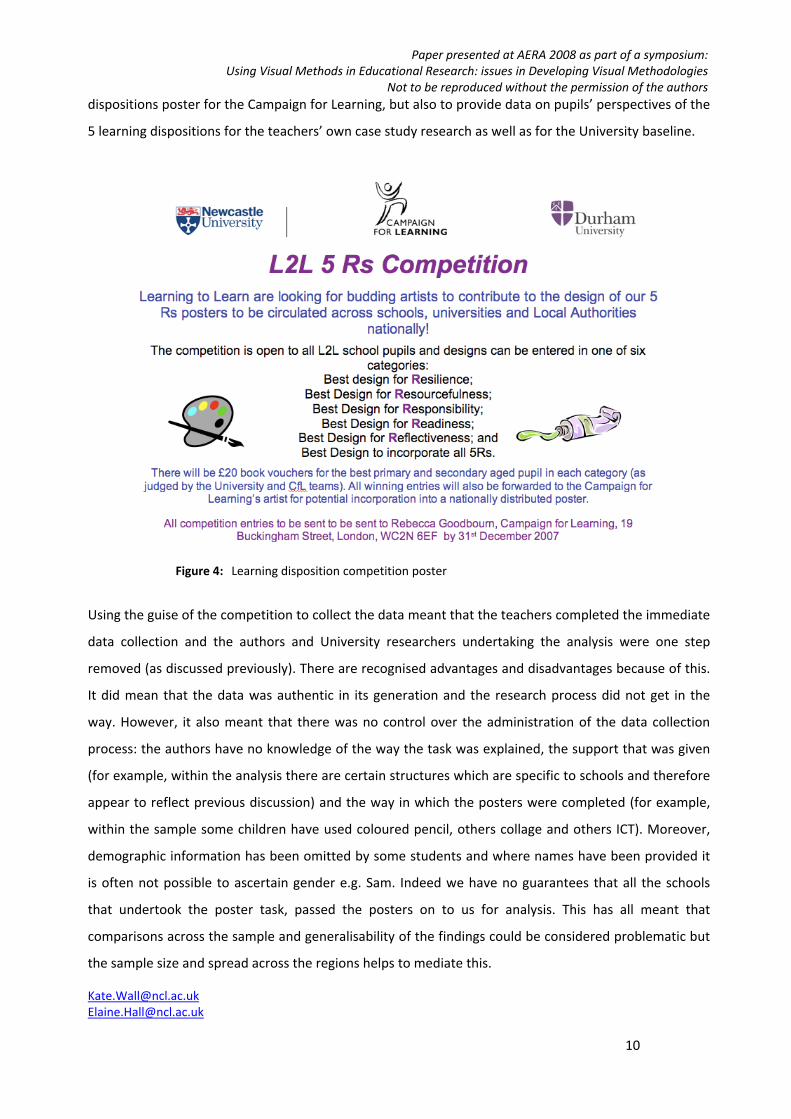
Figure 5: Example of analysis process
Analysis of the posters was completed using a two stage process, firstly using quantitative techniques
(counts), followed up with more qualitative construct generation (exemplified by figure 5). Note was
taken of where children had used images and where they had used words to express similar ideas. In
that the competition asked for posters of individual Rs or a conglomerate of all 5, this analysis
represents only those that chose to design for a single R. The findings below represent the developing
thinking of the project, research team and teachers.
Findings: pupils thinking about learning dispositions The students from five schools across the UK produced 108 posters which focused on single dispositions
and so form the focus for this paper. These schools are infant, first and primary schools2 from
Northumberland (Schools A and B), Cornwall (schools C and D) and Enfield (school E). The choice was
left open to the schools as to which dispositions to focus on and only one school submitted posters in all
categories (see Table i below). Three of the Rs – Readiness, Resilience and Responsibility – were
significantly more popular, suggesting perhaps that these concepts were both well‐understood by the
students and/or that they lent themselves more easily to visual representation.
2 Infant schools serve children aged 3‐7, first schools children aged 3‐9 and primary schools children aged 3‐11. Differences are due to local government organisational factors in the UK.
Paper presented at AERA 2008 as part of a symposium: Using Visual Methods in Educational Research: issues in Developing Visual Methodologies
Not to be reproduced without the permission of the authors
[email protected] [email protected] 12
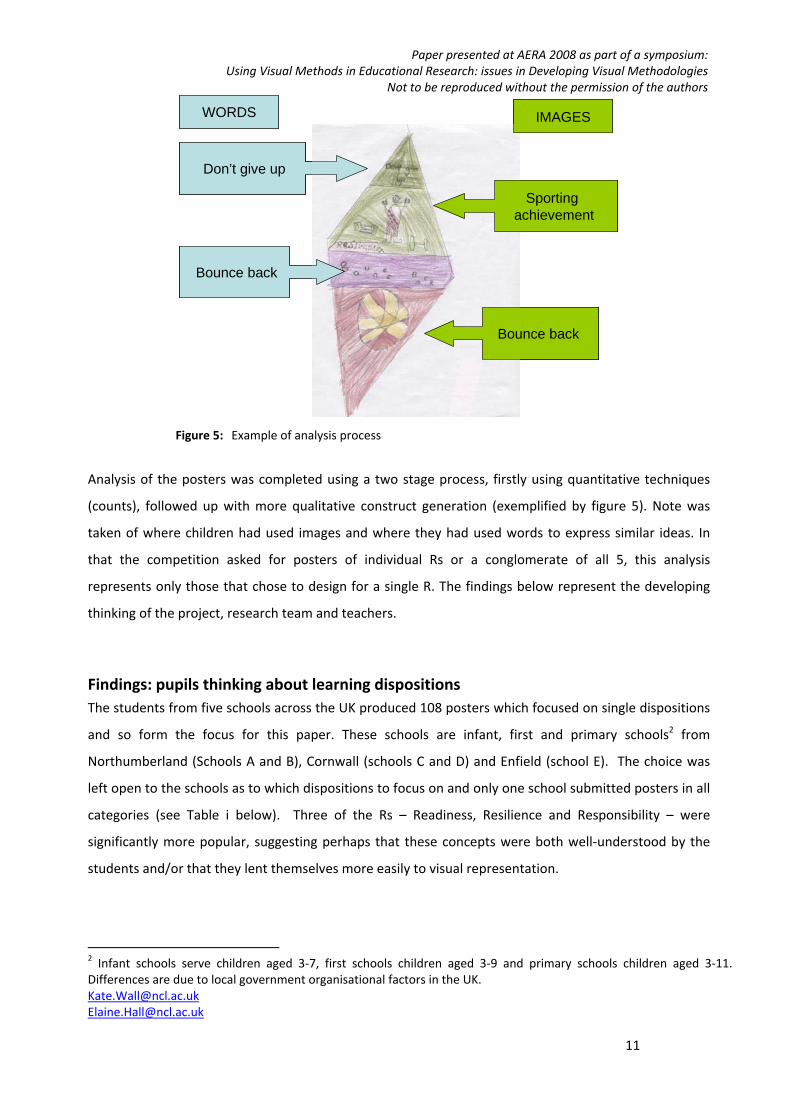
Table i. Sample characteristics: range and geographical spread Disposition Number of posters Number of schools Gender split
M:F:U/K Reflectiveness 14 4 (not C) 5 : 7 : 2 Resourcefulness 4 2 (A and B) 2 : 1 : 1 Readiness 29 5 11 : 16 : 3 Resilience 31 2 (B and E) 11 : 11 : 9 Responsibility 30 2 (A and B) 9 : 9 : 12 TOTAL 108 5 38: 44: 27
Where information on gender was available, it appears that this was not a significant factor in the choice
of disposition to portray. Similarly, there do not appear to be significant effects associated with the age
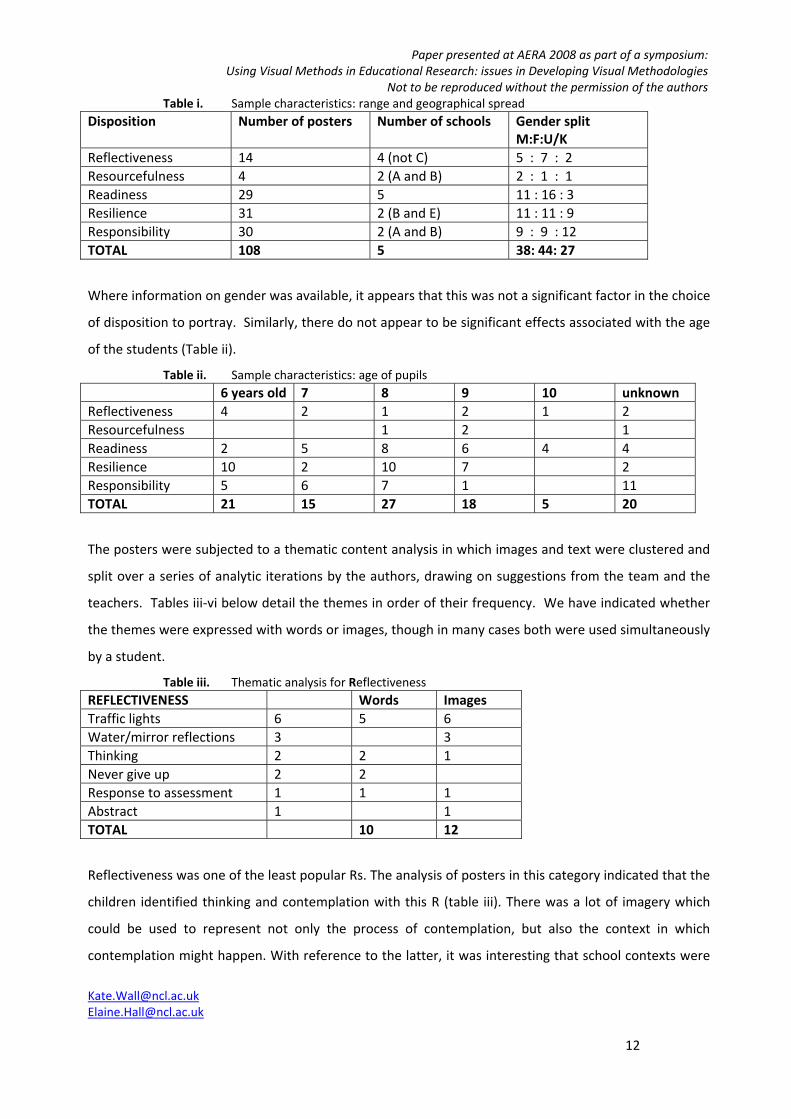
of the students (Table ii).
Table ii. Sample characteristics: age of pupils 6 years old 7 8 9 10 unknown Reflectiveness 4 2 1 2 1 2 Resourcefulness 1 2 1 Readiness 2 5 8 6 4 4 Resilience 10 2 10 7 2 Responsibility 5 6 7 1 11 TOTAL 21 15 27 18 5 20
The posters were subjected to a thematic content analysis in which images and text were clustered and
split over a series of analytic iterations by the authors, drawing on suggestions from the team and the
teachers. Tables iii‐vi below detail the themes in order of their frequency. We have indicated whether
the themes were expressed with words or images, though in many cases both were used simultaneously
by a student.
Table iii. Thematic analysis for Reflectiveness REFLECTIVENESS Words Images Traffic lights 6 5 6 Water/mirror reflections 3 3 Thinking 2 2 1 Never give up 2 2 Response to assessment 1 1 1 Abstract 1 1 TOTAL 10 12
Reflectiveness was one of the least popular Rs. The analysis of posters in this category indicated that the
children identified thinking and contemplation with this R (table iii). There was a lot of imagery which
could be used to represent not only the process of contemplation, but also the context in which
contemplation might happen. With reference to the latter, it was interesting that school contexts were
Paper presented at AERA 2008 as part of a symposium: Using Visual Methods in Educational Research: issues in Developing Visual Methodologies
Not to be reproduced without the permission of the authors
[email protected] [email protected] 13
relatively absent from these images. The only point where school did emerge was in response to
assessment: one child had indicated that this was a prompt for reflection.
Table iv. Thematic analysis for Resourcefulness RESOURCEFULNESS Words Images Scouts 1 1 Be prepared 1 1 Knowing times tables 1 1 Tools 1 1 Ideas 1 1 1 TOTAL 2 4
Resourcefulness was the least popular R with only four posters completed within this category (table iv).
This could be taken to mean that the children found these ideas hard to visualise and draw, or it could
be that the children do not see it as a useful concept in their learning at school. The responses from the
children were varied and no real convincing trends have emerged.
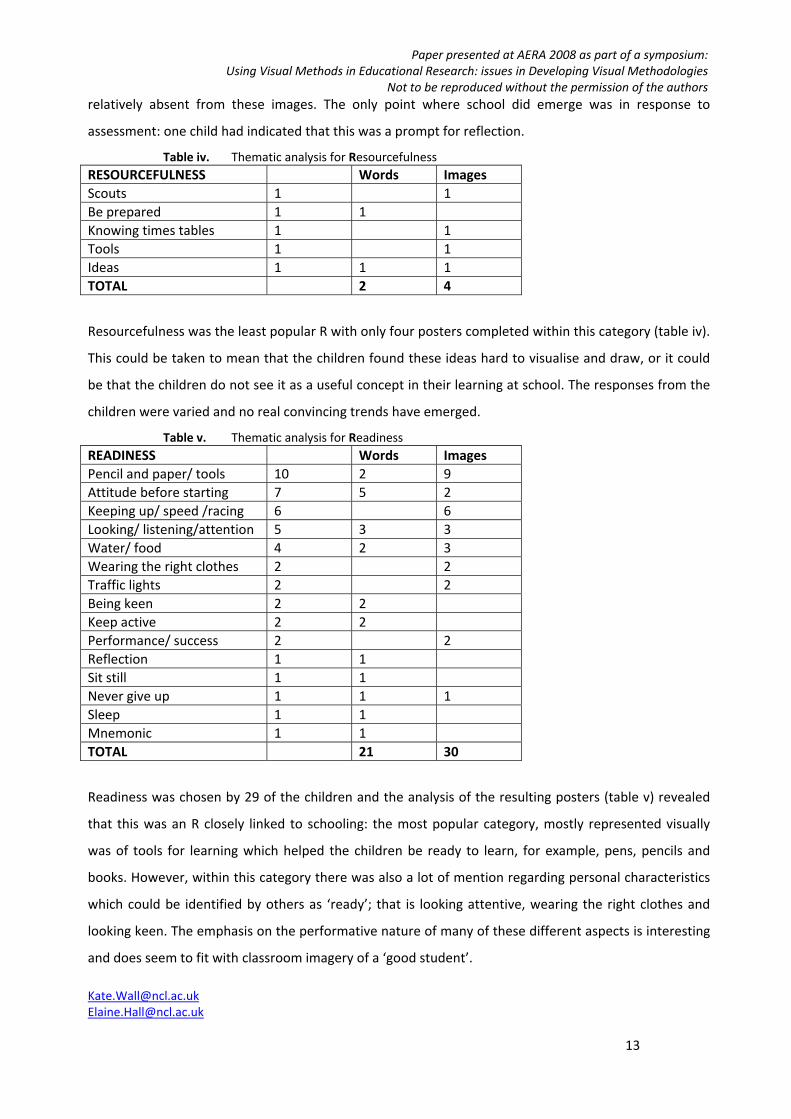
Table v. Thematic analysis for Readiness READINESS Words Images Pencil and paper/ tools 10 2 9 Attitude before starting 7 5 2 Keeping up/ speed /racing 6 6 Looking/ listening/attention 5 3 3 Water/ food 4 2 3 Wearing the right clothes 2 2 Traffic lights 2 2 Being keen 2 2 Keep active 2 2 Performance/ success 2 2 Reflection 1 1 Sit still 1 1 Never give up 1 1 1 Sleep 1 1 Mnemonic 1 1 TOTAL 21 30
Readiness was chosen by 29 of the children and the analysis of the resulting posters (table v) revealed
that this was an R closely linked to schooling: the most popular category, mostly represented visually
was of tools for learning which helped the children be ready to learn, for example, pens, pencils and
books. However, within this category there was also a lot of mention regarding personal characteristics
which could be identified by others as ‘ready’; that is looking attentive, wearing the right clothes and
looking keen. The emphasis on the performative nature of many of these different aspects is interesting
and does seem to fit with classroom imagery of a ‘good student’.
Paper presented at AERA 2008 as part of a symposium: Using Visual Methods in Educational Research: issues in Developing Visual Methodologies
Not to be reproduced without the permission of the authors
[email protected] [email protected] 14
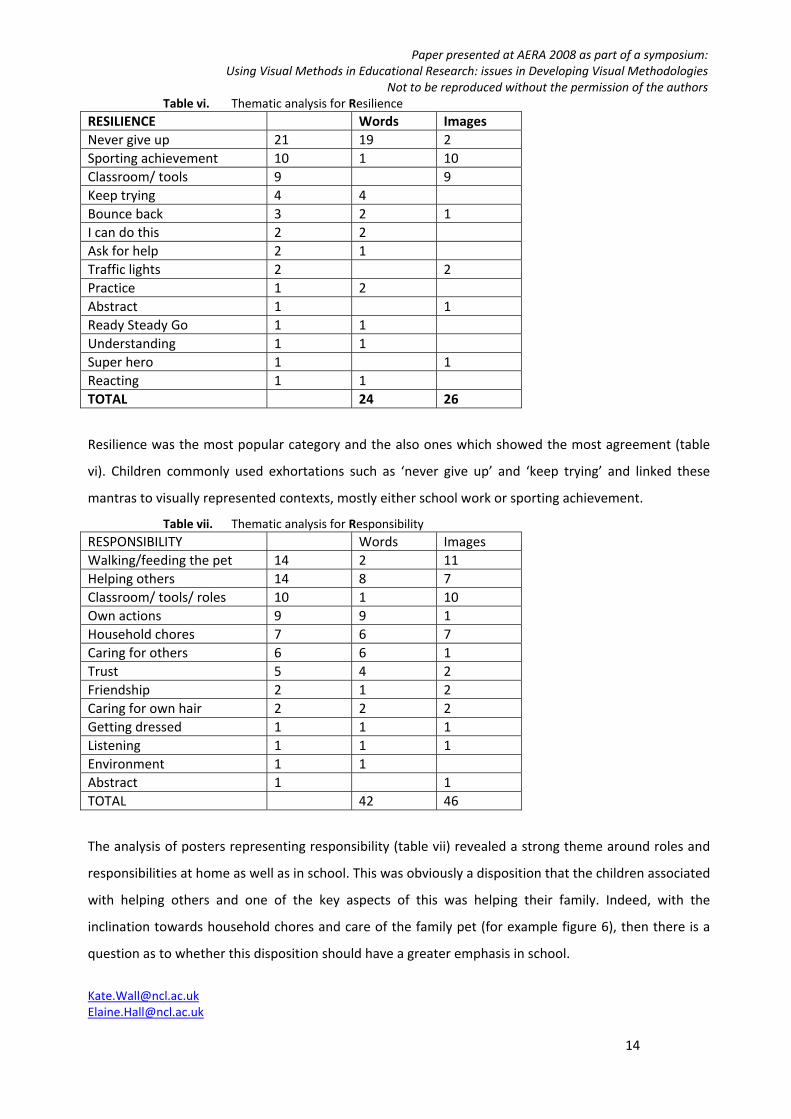
Table vi. Thematic analysis for Resilience RESILIENCE Words Images Never give up 21 19 2 Sporting achievement 10 1 10 Classroom/ tools 9 9 Keep trying 4 4 Bounce back 3 2 1 I can do this 2 2 Ask for help 2 1 Traffic lights 2 2 Practice 1 2 Abstract 1 1 Ready Steady Go 1 1 Understanding 1 1 Super hero 1 1 Reacting 1 1 TOTAL 24 26
Resilience was the most popular category and the also ones which showed the most agreement (table
vi). Children commonly used exhortations such as ‘never give up’ and ‘keep trying’ and linked these
mantras to visually represented contexts, mostly either school work or sporting achievement.
Table vii. Thematic analysis for Responsibility RESPONSIBILITY Words Images Walking/feeding the pet 14 2 11 Helping others 14 8 7 Classroom/ tools/ roles 10 1 10 Own actions 9 9 1 Household chores 7 6 7 Caring for others 6 6 1 Trust 5 4 2 Friendship 2 1 2 Caring for own hair 2 2 2 Getting dressed 1 1 1 Listening 1 1 1 Environment 1 1 Abstract 1 1 TOTAL 42 46
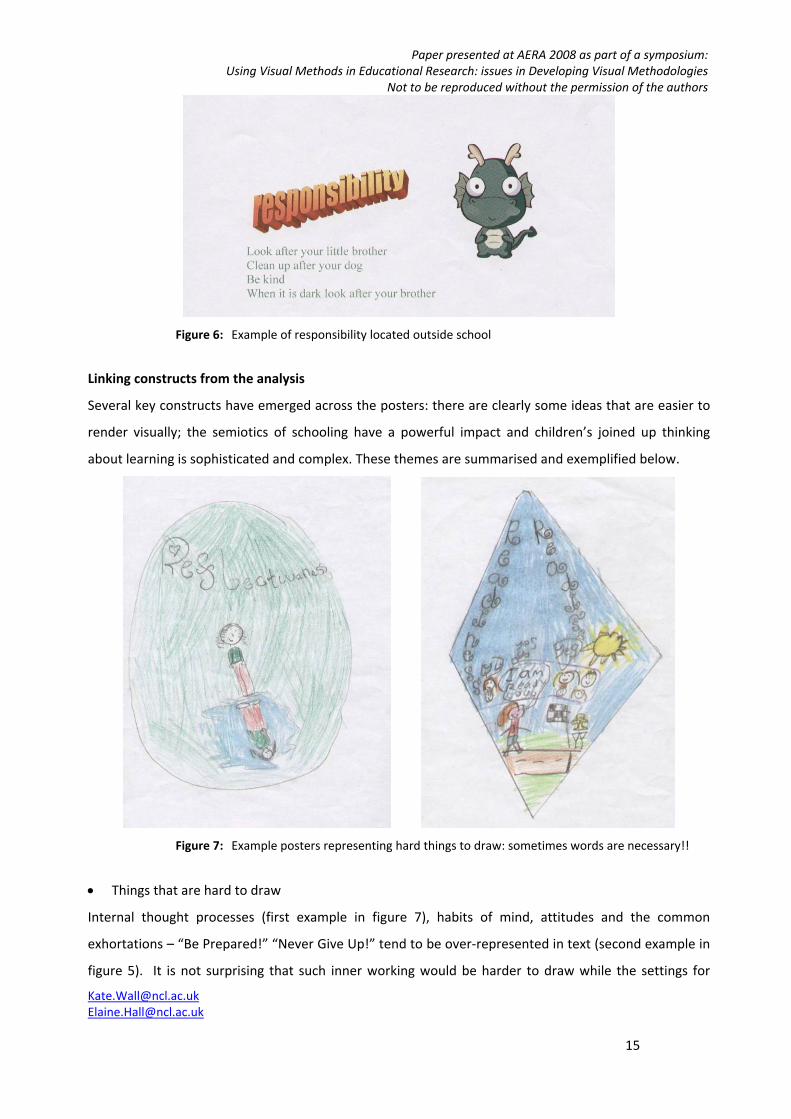
The analysis of posters representing responsibility (table vii) revealed a strong theme around roles and
responsibilities at home as well as in school. This was obviously a disposition that the children associated
with helping others and one of the key aspects of this was helping their family. Indeed, with the
inclination towards household chores and care of the family pet (for example figure 6), then there is a
question as to whether this disposition should have a greater emphasis in school.
Paper presented at AERA 2008 as part of a symposium: Using Visual Methods in Educational Research: issues in Developing Visual Methodologies
Not to be reproduced without the permission of the authors
[email protected] [email protected] 15
Figure 6: Example of responsibility located outside school
Linking constructs from the analysis
Several key constructs have emerged across the posters: there are clearly some ideas that are easier to
render visually; the semiotics of schooling have a powerful impact and children’s joined up thinking
about learning is sophisticated and complex. These themes are summarised and exemplified below.
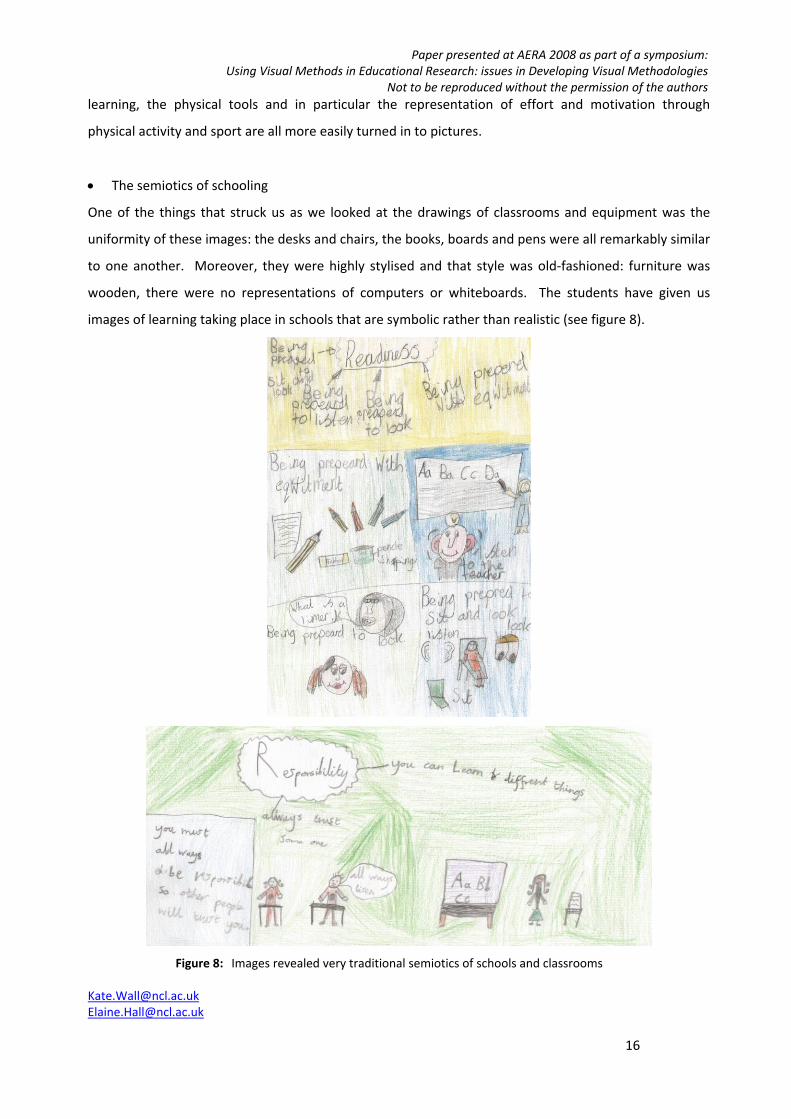
Figure 7: Example posters representing hard things to draw: sometimes words are necessary!!
• Things that are hard to draw
Internal thought processes (first example in figure 7), habits of mind, attitudes and the common
exhortations – “Be Prepared!” “Never Give Up!” tend to be over‐represented in text (second example in
figure 5). It is not surprising that such inner working would be harder to draw while the settings for
Paper presented at AERA 2008 as part of a symposium: Using Visual Methods in Educational Research: issues in Developing Visual Methodologies
Not to be reproduced without the permission of the authors
[email protected] [email protected] 16
learning, the physical tools and in particular the representation of effort and motivation through
physical activity and sport are all more easily turned in to pictures.
• The semiotics of schooling
One of the things that struck us as we looked at the drawings of classrooms and equipment was the
uniformity of these images: the desks and chairs, the books, boards and pens were all remarkably similar
to one another. Moreover, they were highly stylised and that style was old‐fashioned: furniture was
wooden, there were no representations of computers or whiteboards. The students have given us
images of learning taking place in schools that are symbolic rather than realistic (see figure 8).
Figure 8: Images revealed very traditional semiotics of schools and classrooms
Paper presented at AERA 2008 as part of a symposium: Using Visual Methods in Educational Research: issues in Developing Visual Methodologies
Not to be reproduced without the permission of the authors
[email protected] [email protected] 17
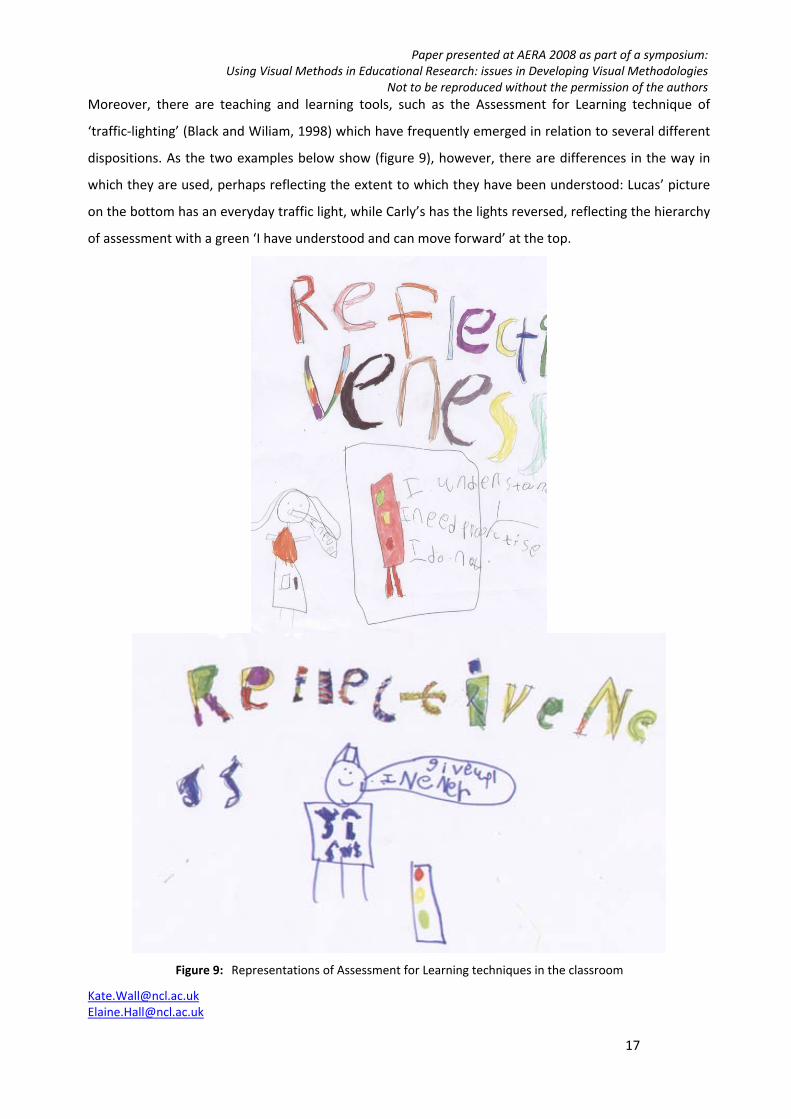
Moreover, there are teaching and learning tools, such as the Assessment for Learning technique of
‘traffic‐lighting’ (Black and Wiliam, 1998) which have frequently emerged in relation to several different
dispositions. As the two examples below show (figure 9), however, there are differences in the way in
which they are used, perhaps reflecting the extent to which they have been understood: Lucas’ picture
on the bottom has an everyday traffic light, while Carly’s has the lights reversed, reflecting the hierarchy
of assessment with a green ‘I have understood and can move forward’ at the top.
Figure 9: Representations of Assessment for Learning techniques in the classroom
Paper presented at AERA 2008 as part of a symposium: Using Visual Methods in Educational Research: issues in Developing Visual Methodologies
Not to be reproduced without the permission of the authors
[email protected] [email protected] 18
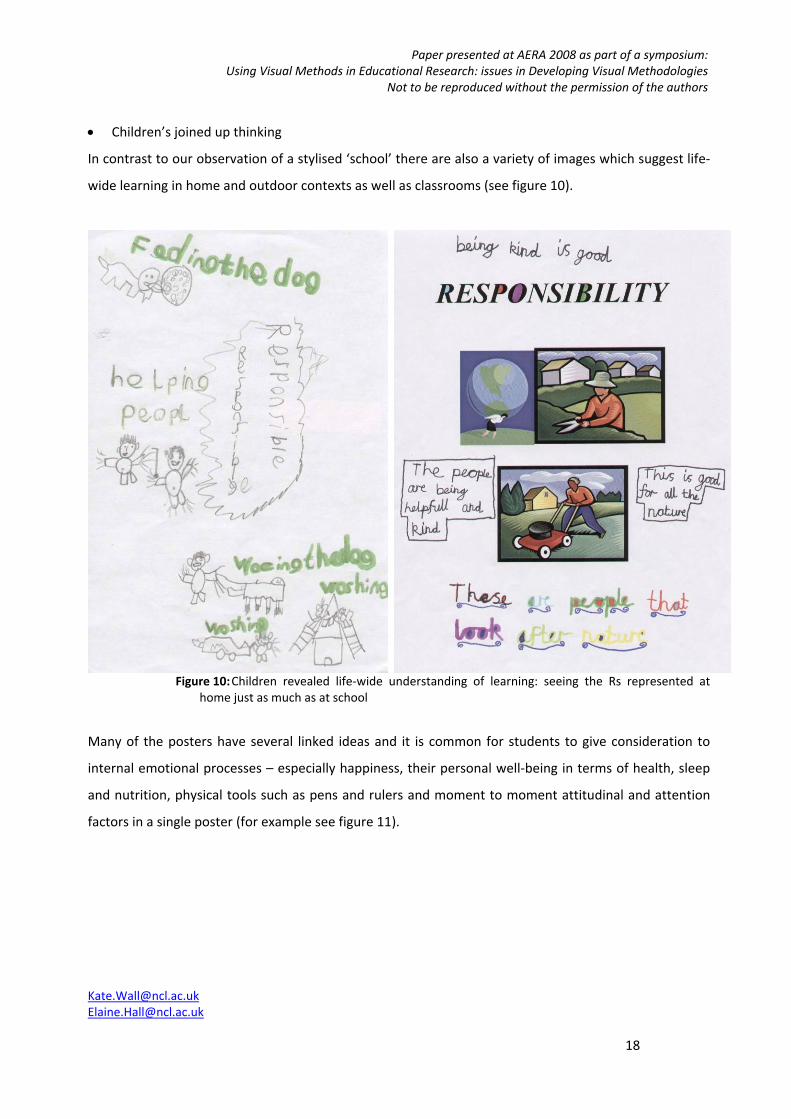
• Children’s joined up thinking
In contrast to our observation of a stylised ‘school’ there are also a variety of images which suggest life‐
wide learning in home and outdoor contexts as well as classrooms (see figure 10).
Figure 10: Children revealed life‐wide understanding of learning: seeing the Rs represented at
home just as much as at school
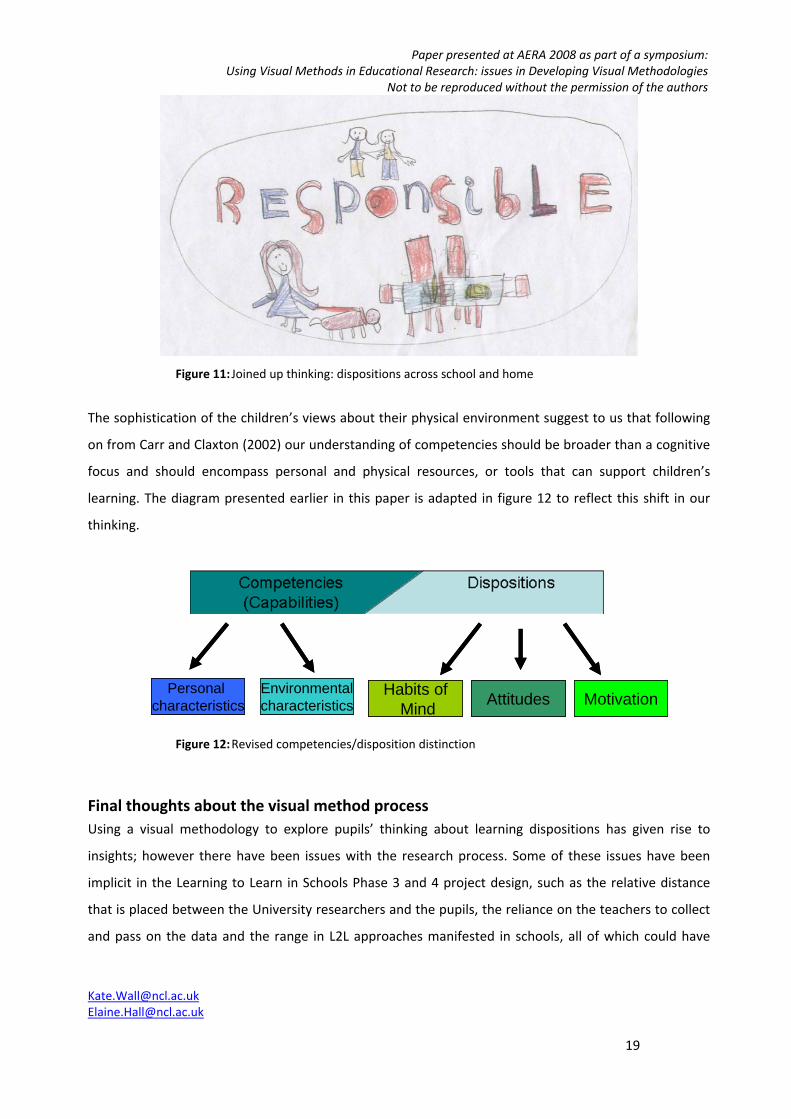
Many of the posters have several linked ideas and it is common for students to give consideration to
internal emotional processes – especially happiness, their personal well‐being in terms of health, sleep
and nutrition, physical tools such as pens and rulers and moment to moment attitudinal and attention
factors in a single poster (for example see figure 11).
Paper presented at AERA 2008 as part of a symposium: Using Visual Methods in Educational Research: issues in Developing Visual Methodologies
Not to be reproduced without the permission of the authors
[email protected] [email protected] 19
Figure 11: Joined up thinking: dispositions across school and home
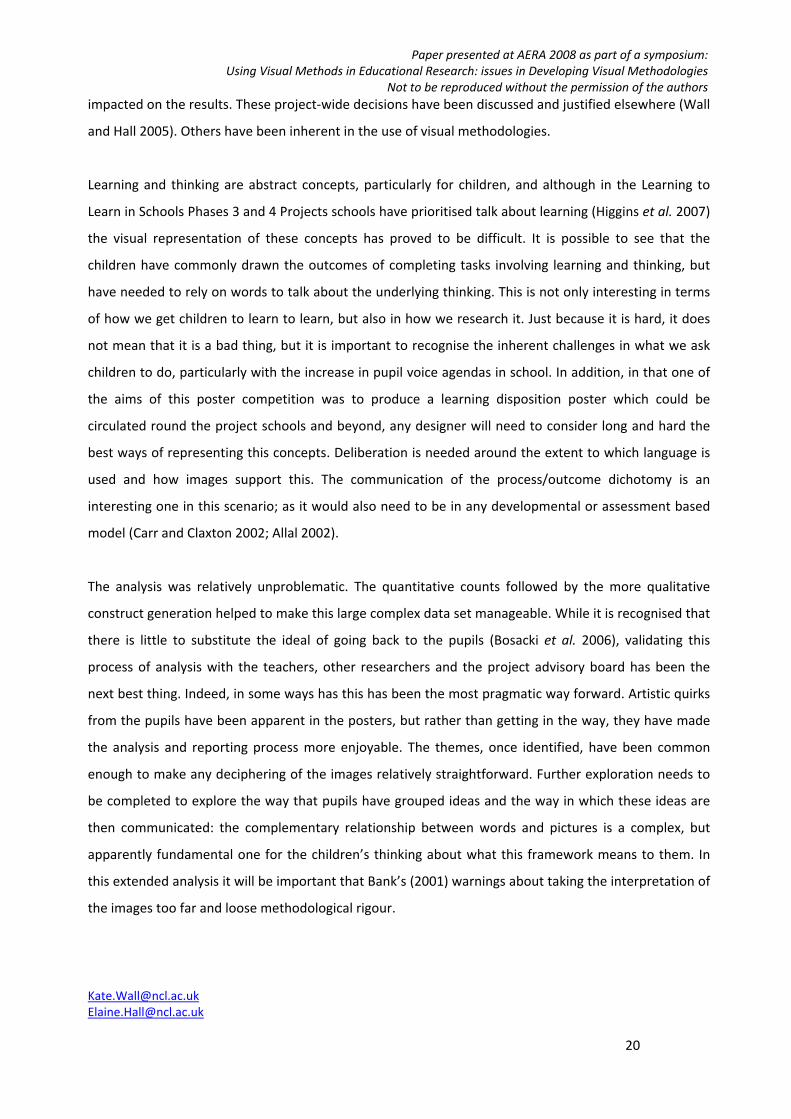
The sophistication of the children’s views about their physical environment suggest to us that following
on from Carr and Claxton (2002) our understanding of competencies should be broader than a cognitive
focus and should encompass personal and physical resources, or tools that can support children’s
learning. The diagram presented earlier in this paper is adapted in figure 12 to reflect this shift in our
thinking.
Habits ofMind Attitudes Motivation
Environmentalcharacteristics
Personal characteristics
Habits ofMind Attitudes Motivation
Environmentalcharacteristics
Personal characteristics
Figure 12: Revised competencies/disposition distinction
Final thoughts about the visual method process Using a visual methodology to explore pupils’ thinking about learning dispositions has given rise to
insights; however there have been issues with the research process. Some of these issues have been
implicit in the Learning to Learn in Schools Phase 3 and 4 project design, such as the relative distance
that is placed between the University researchers and the pupils, the reliance on the teachers to collect
and pass on the data and the range in L2L approaches manifested in schools, all of which could have
Paper presented at AERA 2008 as part of a symposium: Using Visual Methods in Educational Research: issues in Developing Visual Methodologies
Not to be reproduced without the permission of the authors
[email protected] [email protected] 20
impacted on the results. These project‐wide decisions have been discussed and justified elsewhere (Wall
and Hall 2005). Others have been inherent in the use of visual methodologies.
Learning and thinking are abstract concepts, particularly for children, and although in the Learning to
Learn in Schools Phases 3 and 4 Projects schools have prioritised talk about learning (Higgins et al. 2007)
the visual representation of these concepts has proved to be difficult. It is possible to see that the
children have commonly drawn the outcomes of completing tasks involving learning and thinking, but
have needed to rely on words to talk about the underlying thinking. This is not only interesting in terms
of how we get children to learn to learn, but also in how we research it. Just because it is hard, it does
not mean that it is a bad thing, but it is important to recognise the inherent challenges in what we ask
children to do, particularly with the increase in pupil voice agendas in school. In addition, in that one of
the aims of this poster competition was to produce a learning disposition poster which could be
circulated round the project schools and beyond, any designer will need to consider long and hard the
best ways of representing this concepts. Deliberation is needed around the extent to which language is
used and how images support this. The communication of the process/outcome dichotomy is an
interesting one in this scenario; as it would also need to be in any developmental or assessment based
model (Carr and Claxton 2002; Allal 2002).
The analysis was relatively unproblematic. The quantitative counts followed by the more qualitative
construct generation helped to make this large complex data set manageable. While it is recognised that
there is little to substitute the ideal of going back to the pupils (Bosacki et al. 2006), validating this
process of analysis with the teachers, other researchers and the project advisory board has been the
next best thing. Indeed, in some ways has this has been the most pragmatic way forward. Artistic quirks
from the pupils have been apparent in the posters, but rather than getting in the way, they have made
the analysis and reporting process more enjoyable. The themes, once identified, have been common
enough to make any deciphering of the images relatively straightforward. Further exploration needs to
be completed to explore the way that pupils have grouped ideas and the way in which these ideas are
then communicated: the complementary relationship between words and pictures is a complex, but
apparently fundamental one for the children’s thinking about what this framework means to them. In
this extended analysis it will be important that Bank’s (2001) warnings about taking the interpretation of
the images too far and loose methodological rigour.
Paper presented at AERA 2008 as part of a symposium: Using Visual Methods in Educational Research: issues in Developing Visual Methodologies
Not to be reproduced without the permission of the authors
[email protected] [email protected] 21
The openness of the task, to design a poster, has been successful. In parallel to the characteristics of
qualitative research the unrestricted nature of the task to design a poster has meant that the children
have had relatively full reign over the content and scope of the ideas represented. Of course, there are
impacts which have influenced the outcomes, such as peers and friendship groups (Rose et al. 2006) as
well as teacher‐effects. But it has to be pointed out that although demographic data was limited there
does not seem to be any perceptible influence of gender, developmental stage or age on the beliefs
about learning given in the posters. There are differences in the proficiency and characteristics of the
images, as Cherney et al. (2006) and Lambert (2005) would have predicted, but as long as the pupil has
managed to get across their thinking, and this is mostly the case, the overall ideas are powerful and
worthy of note. Indeed, the unconstrained nature of the task used for data collection does seem to have
been influential in allowing the pupils to show joined up thinking in this area of thinking about learning,
which does not appear to be represented in the literature so far.
Acknowledgements Schools, teachers and pupils involved in the Learning to Learn in School Phase 4 Project for undertaking the poster competition and giving up classroom time for this research work. In particular, we would like to thank Hazelbury Infant School in Enfield, Malvin’s Close First School and Hipsburn First School in Northumberland and Marlborough Primary School and Archbishop Benson Primary School in Cornwall who have given us copies of their posters to be used as part of this research.
References Alerby, E. (2003) ‘During the break we have fun’: A Study Concerning Pupils Experiences of School,
Educational Research, 45(1): 17‐28 Allal, L. (2002) The Assessment of Learning Dispositions in the Classroom, Assessment in Education, 9(1):
55‐58 Armitage, M. (2005) The influence of school architecture and design on the outdoor play experience
within the primary school, Paedagogica Historica, 41(4&5): 535‐553. Banks, M. (2001) Visual Methods in Social Research, London, Sage Baumfield, V., Hall, E., and Wall, K. (2008) Action Research in the Classroom, London, SAGE Publications Baumfield, V., Hall, E., Higgins, S. and Wall, K. (2007) Tools for inquiry and the role of feedback in
teachers’ learning, paper presented at the EARLI Conference, Budapest 2007 Baumfield, V. and Higgins, S. (1997) ‘But no one has maths at a party: pupils' reasoning strategies in a
thinking skills programme, Curriculum, 18(3): 140‐148 Bell, P. (2004) Content Analysis of Visual Images, in van Leeuwen, T. and Jewitt, C., Handbook of Visual
Analysis: 10‐34 Black, P. J. and Wiliam, D. (1998) Assessment and classroom learning, Assessment in Education, 5: 7‐73 Black, P., Swann, J. and Wiliam, D. (2006) School pupils’ beliefs about learning, Research Papers in
Education, 21(2): 151‐170 Bosacki, S.L., Zopito, A.M. and Dane, A.V. (2006) Voices from the Classroom: pictorial and narrative
representations of children’s bullying experiences, Journal of Moral Education, 35(2): 231‐245
Paper presented at AERA 2008 as part of a symposium: Using Visual Methods in Educational Research: issues in Developing Visual Methodologies
Not to be reproduced without the permission of the authors
[email protected] [email protected] 22
Bullock, K. and Muschamp, Y. (2006) Learning about Learning in the Primary School, Cambridge Journal of Education, 36(1): 49‐62
Burke, C. (2007) The View of the Child: Releasing "visual voices" in the design of learning environments, Discourse: studies in the cultural politics of education, 28(3): 359‐372.
Carr, M. and Claxton, G. (2002) Tracking the Development of Learning Dispositions, Assessment in Education, 9(1): 9‐37
Cherney, I.D., Seiwert, C.S., Dickey, T.M. and Flichtbeil, J.D. (2006) Children’s Drawings: A mirror to their minds, Educational Psychology, 26(1): 127‐142
Coates, E. (2002) “I forgot the sky!” Children’s Stories Contained within their Drawings, International Journal of Early Years Education, 10(1): 21‐35
Coates, E. and Coates, A. (2006) Young Children Talking and Drawing, International Journal of Early Years Education, 14(3): 221‐241
Collier, M. (2004) Approaches to Analysis in Visual Anthropology, in van Leeuwen, T. and Jewitt, C., Handbook of Visual Analysis: 35‐60
DfEE (2001) Framework for Teaching Mathematics: Years 7, 8 and 9, London, DfEE Flutter, J. and J. Ruddock (2004) Consulting Pupils: What's in it for schools? London, RoutledgeFalmer Glaser, B. (1992) Basics of Grounded Theory Analysis, California, Sociology Press Hall, E., Leat, D., Wall, K., Higgins, S. and Edwards, G. (2006) Learning to Learn: Teacher Research in the
Zone of Proximal Development, Teacher Development, 10(2): 149‐166 Harper, D. (2002) Talking about pictures: a case for photo elicitation, Visual Studies, 17(1): 13‐26 Hennessy, E. and Heary, C. (2006) Exploring Children’s Views through Focus Groups, in Greene, S. and
Hogan D. (Eds.) Researching Children’s Experience: methods and approaches, London, SAGE Publications
Higgins, S., Wall, K., Baumfield, V., Hall, E., Leat, D. and Woolner, P. (2007) Learning to Learn in Schools Phase 3 Evaluation Year Three Final Report. London: Campaign for Learning
Inhelder, B. and Piaget, J. (1958) The Growth of Logical Thinking from Childhood to Adolescence, London, Basic Books
Kagan, S. (2001) Cooperative Learning, Kagan Publishing: www.Kaganonline.com Kuhn, D. and Dean, D. (2004) Metacognition: A Bridge Between Cognitive Psychology and Educational
Practice, Theory into Practice, 43(4): 268‐273 Lambert, E.B. (2005) Children’s Drawing and Painting from a Cognitive Perspective: a longitudinal study,
Early Years: an international journal of research and development, 25(3): 249‐269 Lawn, M. and Grosvenor, I. (Eds.) (2005) Materialities of Schooling, Oxford, Symposium Lodge, C. (2007) Regarding Learning: Children’s drawings of learning in the classroom, Learning
Environment Research, 10: 145‐156 McCallum, B., Hargreaves, E. and Gipps, C. (2000) Learning: the pupils’ voice, Cambridge Journal of
Education, 30(2): 275–289 Pollard, A. (1996) Playing the System: pupil perspectives of curriculum, assessment and pedagogy, in: P.
Croll (Ed) Teachers, Pupils and Primary Schooling: continuity and change, London, Cassell Prosser, J. (2007) Visual methods and the visual culture of schools, Visual Studies, 22(1): 13‐30 Prosser, J. (Ed.) (1998) Image‐based Research, London, RoutledgeFalmer Rodd, J. (2001) Learning to Learn in Schools: Phase 1 project research report, London, Campaign for
Learning Rodd, J. (2002) Learning to Learn in Schools: Phase 2 project research report, London, Campaign for
Learning Rose, S.E., Jolley, R.P. and Burkitt, E. (2006) A Review of Children’s, Teachers’ and Parents’ Influence on
Children’s Drawing Experience, Journal of Art and Design Education, 25(3): 341‐349 Scott, J. (2003) Children as Respondents, in Christensen, P. and James, A. (Eds.), Research with Children:
Perspectives and Practices, London, RoutledgeFalmer
Paper presented at AERA 2008 as part of a symposium: Using Visual Methods in Educational Research: issues in Developing Visual Methodologies
Not to be reproduced without the permission of the authors
[email protected] [email protected] 23
Stenhouse, L. (1981) What counts as research? British Journal of Educational Studies 29(2): 103‐114 Wall, K. (in press) Understanding Metacognition through the use of Pupil Views Templates: Pupil Views
of Learning to Learn, Thinking Skills and Creativity, Volume and issue number to be confirmed Wall, K. and Hall, E. (2005) Learning to Learn: Exploring how teachers can learn about innovation in their
own classrooms, paper presented at the BERA Conference, Glamorgan University, September 2005
Wall, K. and Higgins, S. (2006) Facilitating and supporting talk with pupils about metacognition: a research and learning tool, International Journal of Research and Methods in Education, 29(1): 39‐53
Wakefield, H. and Underwager, R. (2004) The Application of Images in Child Abuse Investigations, in Prosser, J. (Ed.), Image‐Based Research: a source book for qualitative researchers, London, RoutledgeFalmer
Woolner, P., Clark, J., Hall, E., Tiplady, L., Thomas, U. and Wall, K. (forthcoming) Using visual methods to consult users about school design