visual phenotype in williams-beuren syndrome challenges magnocellular theories explaining human...
TRANSCRIPT
Research article
3720 TheJournalofClinicalInvestigation http://www.jci.org Volume 117 Number 12 December 2007
Visual phenotype in Williams-Beuren syndrome challenges magnocellular theories
explaining human neurodevelopmental visual cortical disorders
Miguel Castelo-Branco,1 Mafalda Mendes,1 Ana Raquel Sebastião,1,2 Aldina Reis,1 Mário Soares,1 Jorge Saraiva,3 Rui Bernardes,2 Raquel Flores,4 Luis Pérez-Jurado,4,5 and Eduardo Silva6
1Visual Neuroscience Laboratory, IBILI, Faculty of Medicine, Coimbra, Portugal. 2CNTM, AIBILI, Azinhaga Sta. Comba, Coimbra, Portugal. 3Children’s Hospital, Coimbra, Portugal. 4Genetics Unit and CIBERER, Universitat Pompeu Fabra, Barcelona, Spain.
5Program in Molecular Medicine and Genetics, Hospital Universitari Vall d’Hebron, Barcelona, Spain. 6Centre for Hereditary Eye Diseases, Department of Ophthalmology, University Hospital of Coimbra, Coimbra, Portugal.
Williams-Beurensyndrome(WBS),aneurodevelopmentalgeneticdisorderwhosemanifestationsincludevisuospatialimpairment,providesauniquemodeltolinkgeneticallydeterminedlossofneuralcellpopula-tionsatdifferentlevelsofthenervoussystemwithneuralcircuitsandvisualbehavior.GiventhatseveralofthegenesdeletedinWBSarealsoinvolvedineyedevelopmentandthedifferentiationofretinallayers,weexam-inedtheretinalphenotypeinWBSpatientsanditsfunctionalrelationtoglobalmotionperception.Wediscov-eredalow-levelvisualphenotypecharacterizedbydecreasedretinalthickness,abnormalopticdiskconcavity,andimpairedvisualresponsesinWBSpatientscomparedwithage-matchedcontrolsbyusingelectrophysiol-ogy,confocalandcoherenceinvivoimagingwithcellularresolution,andpsychophysics.Thesemechanismsofimpairmentarerelatedtothemagnocellularpathway,whichisinvolvedinthedetectionoftemporalchangesinthevisualscene.Low-levelmagnocellularperformancedidnotpredicthigh-leveldeficitsintheintegrationofmotionand3Dinformationathigherlevels,therebydemonstratingindependentmechanismsofdysfunc-tioninWBSthatwillrequireremediationstrategiesdifferentfromthoseusedinothervisuospatialdisorders.Thesefindingschallengeneurodevelopmentaltheoriesthatexplaincorticaldeficitsbasedonlow-levelmag-nocellularimpairment,suchasregardingdyslexia.
IntroductionWilliams-Beuren syndrome (WBS) is a genetic neurodevelopmen-tal disorder characterized by a well-defined hemideletion on chro-mosome 7q11.23 and predominant visuospatial impairment with relatively preserved auditory and verbal processing (1, 2).
We and others have previously found consistent impaired per-formance in high-level structure from motion (3D object percep-tion from motion cues) perceptual tasks (3–5), which corroborates previously established anatomical and functional cortical–dorsal stream abnormalities in WBS (6). The cortical–dorsal stream pathway is involved in motion perception and action planning, as opposed to the ventral stream pathway, which is involved in pattern and object recognition and is believed to be less impaired in WBS. The cortical–dorsal stream pathway receives largely pre-dominant input from the retinal magnocellular pathway (see ref. 3 and references therein). This pathway responds with high fidel-ity to local temporal changes in the visual scene. Global motion integration processes seem to be quite specific (3, 7) and may localize to separate independent functional subdivisions within the dorsal stream (3, 8–10). Accordingly, it is essential to define
and understand the correlation of hierarchical structural/func-tional abnormalities at distinct levels of processing, including the retina and the cortex.
Given the expression of several critical genes involved in WBS in the neural retina, it is surprising that a functional and struc-tural characterization of this region has so far, to our knowledge, not been described (reviewed in ref. 6). For example, GTF2I (11) and LIMK1 (12, 13) are expressed in the retina (14) and may play a modulatory role in the visual phenotype.
Furthermore, it has recently been shown that GTF2IRD1 (a mem-ber of the GTF2I transcription factor family) plays a pivotal role in the craniofacial and cognitive phenotype (15), and recent analysis in patients with small deletions has shown that haploinsufficiency of GTF2IRD1 and/or GTF2I may also contribute to the visual phe-notype in WBS (16, 17).
During early retina development in mice, Gtf2ird1 is involved in cell proliferation, thereby influencing eye size as well as the relationship between all neural layers (18). Later in development, the localization of its protein to the outer nuclear layer suggests that it may influence the differentiation of this particular region (18). Further evidence for an important role of that protein in retinal development and the likely modulatory role of other genes is suggested by the fact that the mammalian GTF2IRD1 protein binds to the retinoblastoma (Rb) protein, thereby serv-ing as a positive transcription regulator of development (19). Since disruption of Rb function might result in deficiencies dur-ing the developmental process, it is important to verify whether
Nonstandardabbreviationsused: cd, candela; CS, contrast sensitivity; HRT, Heidelberg retinal confocal tomography; mfERG, multifocal electroretinography; OCT, optical coherence tomography; RNFL, retinal nerve fiber layer; RT, retinal thick-ness; VA, visual acuity; WBS, Williams-Beuren syndrome.
Conflictofinterest: The authors have declared that no conflict of interest exists.
Citationforthisarticle: J. Clin. Invest. 117:3720–3729 (2007). doi:10.1172/JCI32556.
research article
TheJournalofClinicalInvestigation http://www.jci.org Volume 117 Number 12 December 2007 3721
there are functional consequences stemming from an impact on the integrity of multiple retinal cell layers in WBS.
We therefore aimed to identify a retinal phenotype by exam-ining low-level visual processing. This would also help explain our previous findings suggesting separable early (magnocellu-lar) and high-level (dorsal stream) visual deficits in WBS patients well characterized at the molecular level (3). We provide objective anatomical and physiological data, which we believe are novel, by means of noninvasive optical coherence tomography (OCT), confocal scanning laser tomographic imaging (Heidelberg retinal confocal tomography [HRT]), and multifocal electrophysiologi-cal (multifocal electroretinography [mfERG]) techniques that can explain an independent visual phenotype in WBS. Accord-ingly, our results demonstrate that the objectively identified neu-ral phenotype at the level of the retina predicts low-level visual deficits (3) and is independent of higher-level visual cortical–dor-sal stream damage.
ResultsMolecular characterization. Molecular studies showed that all 13 patients had the most common 1.55 Mb deletion mediated by nonallelic homologous recombination between the blocks of seg-mental duplications that flank the WBS locus (20). Therefore, they all are hemizygous for at least 26 genes located in the com-monly deleted interval, including GTF2IRD1 and GTF2I at the telomeric edge (see Supplemental Figure 1; supplemental mate-rial available online with this article; doi:10.1172/JCI32556DS1). Deletion was on the maternal chromosome in 8 patients and on the paternal chromosome in 5. We precisely localized the breakpoints on the blocks of the segmental duplications of the recombinant chromosome of each patient between 2 paralogous sequence variants. Thus, we could determine whether the dele-tion affected the functional copies of 2 genes in the breakpoint
regions, NCF1 and GTF2IRD2 (see Supplemental Figure 1). The finding of a recombinant chromo-some with a gain of telomeric-type paralogous sequence variants per-mitted us to infer that the trans-mitting progenitor was a carrier of an inverted chromosome in just 1 case. The telomeric and functional copy of GTF2IRD2 was affected by the deletion in 3 cases; NCF1 was also deleted in those cases as well as in 2 additional patients. The remaining 8 patients had dele-tions including GTF2I but not affecting the distal 2 genes NCF1 and GTF2IRD2.
In summary, all cases had simi-lar deletion size and were hemi-zygous for GTF2IRD1 and GTF2I. The parental origin of the hemide-letion and the precise location of the breakpoints did not seem to play a major explanatory role in the observed phenotype (see below), which is consistent with the similarity of deletion size.
Baseline craniofacial and ocular phenotypic profile in WBS patients: relative preservation of low-level measurements of visual performance, such as visual acuity. We performed complete eye examinations on our panel of 13 WBS patients. All patients displayed the common facial features of flat midface, periorbital fullness, slight telecan-thus, and variable degrees of epicanthal folds. The characteristic full-blown stellate pattern of the anterior iris leaflet was present in all but 2 subjects (whose 4 eyes showed another consistent pat-tern of abnormality; for details, see Methods). Our WBS subjects had overall preserved best-corrected distance visual acuity (VA) (–8.9/10 ± 1.5 SD), which is consistent with previous reports (6). Stereopsis, which is known to be consistently reduced or absent in WBS, was partially preserved in our sample (for details on these measurements and refractive correction, see Methods). Examina-tion of the fundus of the eye, documented with fundus photogra-phy after papillary dilation, was performed in all cases. We did not observe significant changes in the macula and periphery of the retina. The optic discs showed subtle deviations from their normal appearance, namely a hint of a semitranslucent, membrane-like structure covering the disc surface in 5 cases and slight deviations in cupping patterns. However, the normal appearance of the cen-tral retina and the subtle abnormalities in the optic nerve region did not predict the profound changes that we were able to docu-ment with high-resolution imaging techniques (OCT and HRT).
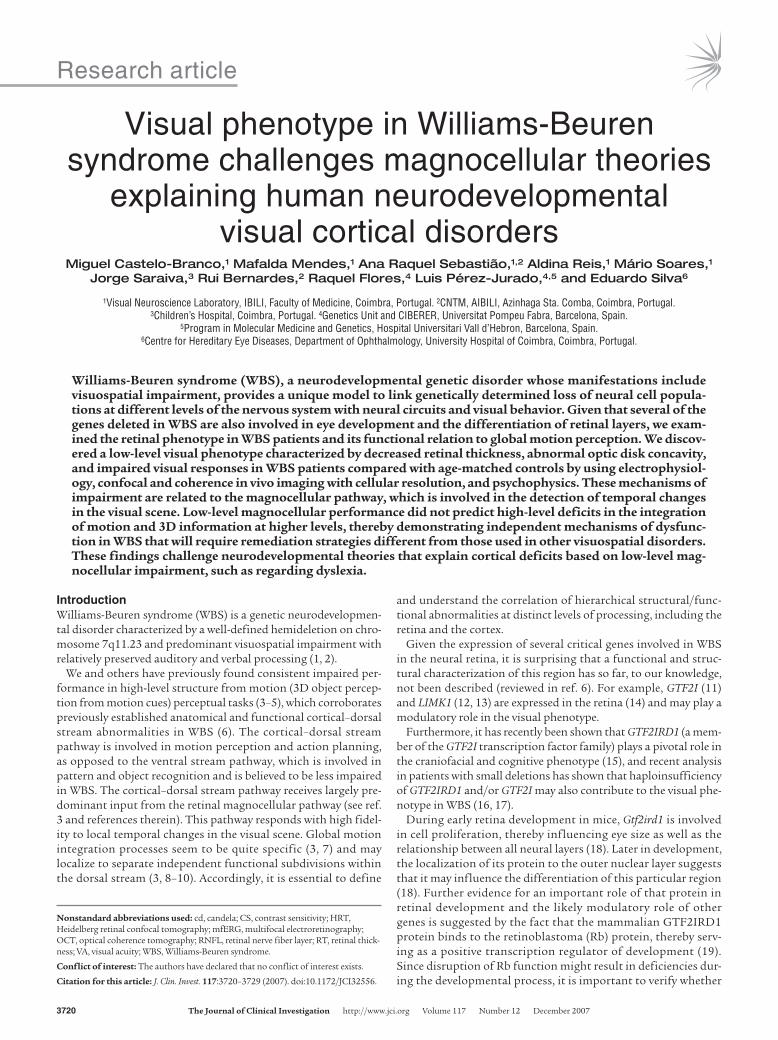
Noninvasive assessment of retinal layers: evidence for loss of inner layers and the ganglion cell retinal nerve fiber layer. We obtained cross-sec-tional images of ocular microstructures using OCT. This optical assessment of the central macular region of the retina revealed an apparently normal pattern of organization of the different retinal layers in all WBS participants. Figure 1A depicts a repre-sentative example in a WBS subject, showing an apparently intact foveomacular depression. However, quantitative morphometry revealed a decrease in retinal thickness (RT) in comparison with
Figure 1Central retinal phenotype in a representative WBS subject. (A) Optical biopsy using OCT of the central macular region of the retina reveals a normal layering of retinal structures in a WBS (WBS1) participant (color-coded log reflectivity map: red, high; black, low). An intact foveomacular depression is visible. However, quantitative morphometry revealed a decrease in RT. The bottom hyperreflective layer cor-responds to the pigment epithelium and the top one to the ganglion cell RNFL. The hyporeflective region represents the photoreceptor layer. Top right inset represents a fundus photograph of the subject’s retina. Arrow in left inset shows axis of depicted OCT image. (B) Color-coded thickness map of the cen-tral 20 degrees of the same retina depicted in A (for details, see Methods). A generalized loss is visible (for statistical details, see text). Numbers indicate regional RT.
research article
3722 TheJournalofClinicalInvestigation http://www.jci.org Volume 117 Number 12 December 2007
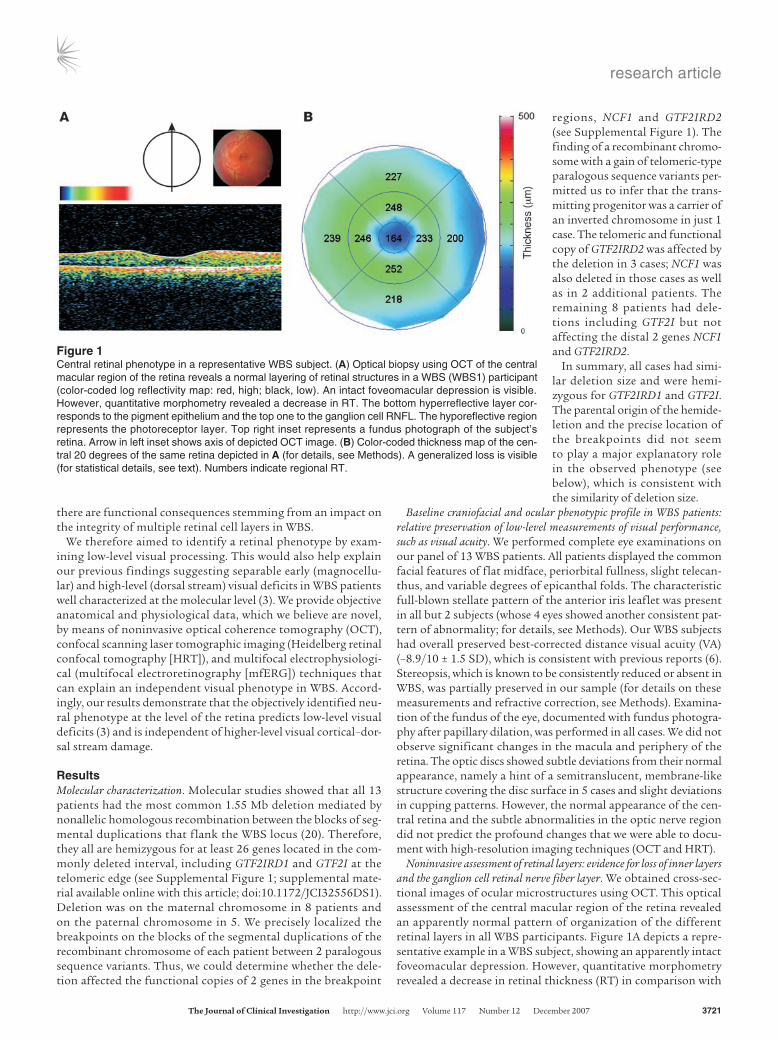
an age-matched control, healthy population (Figures 1 and 2). The OCT maps depicted in Figure 2 further document the gen-eralized loss in thickness across the outer retina in 3 other WBS subjects compared with 3 representative controls. Figure 3 illus-trates the overall reduction in all 9 OCT-defined regions explored in a region covering 20 degrees of the WBS retina in comparison with healthy subjects. In spite of the preserved morphology of the foveomacular pit, RT maps show a significant reduction when compared with age-matched controls (P < 0.0001 for all 9 OCT-defined regions; Mann-Whitney U test).
Figure 3 shows that the ganglion cell retinal nerve fiber layer (RNFL) was more subtly damaged in comparison with the inner reti-nal (photoreceptor and bipolar cell) layers. Regions 6, 7, and 9 (outer contiguous regions with nasal bias) showed significant reduction of the ganglion cell RNFL (P < 0.01; Mann-Whitney U test).
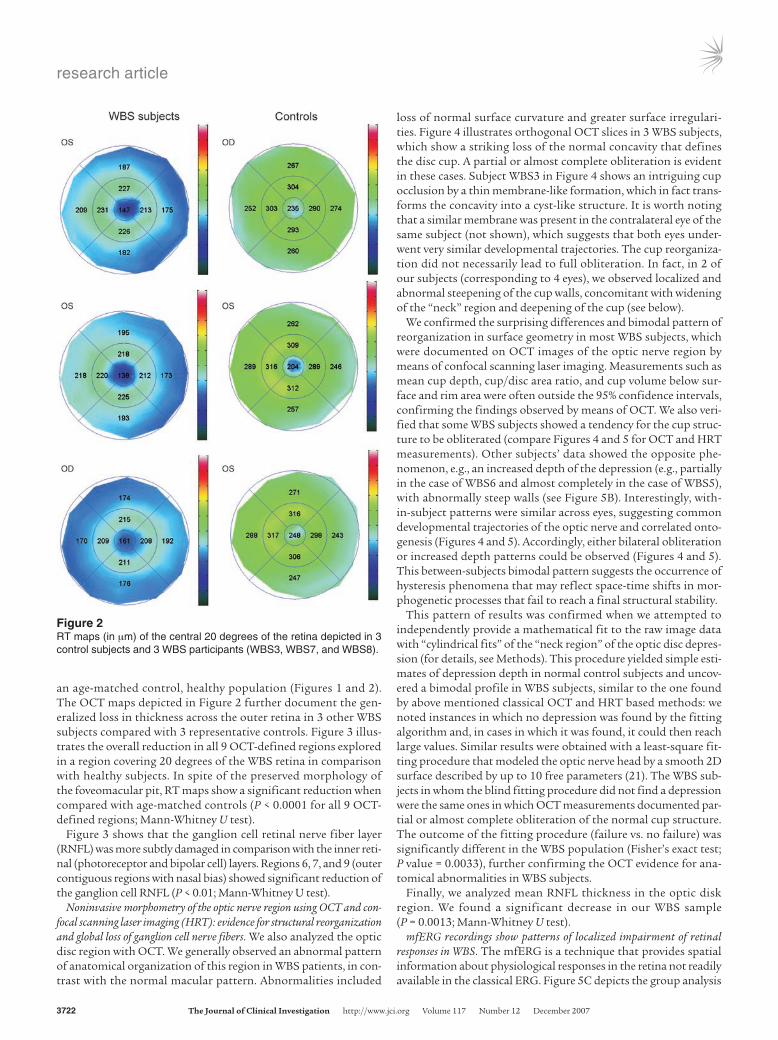
Noninvasive morphometry of the optic nerve region using OCT and con-focal scanning laser imaging (HRT): evidence for structural reorganization and global loss of ganglion cell nerve fibers. We also analyzed the optic disc region with OCT. We generally observed an abnormal pattern of anatomical organization of this region in WBS patients, in con-trast with the normal macular pattern. Abnormalities included
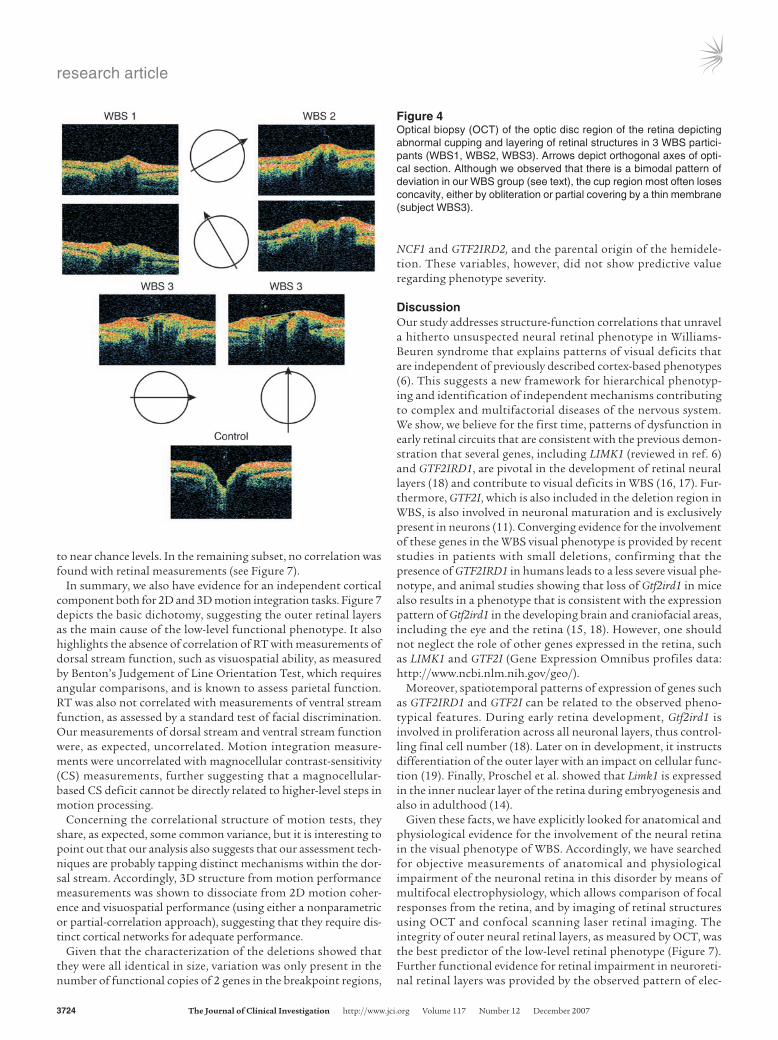
loss of normal surface curvature and greater surface irregulari-ties. Figure 4 illustrates orthogonal OCT slices in 3 WBS subjects, which show a striking loss of the normal concavity that defines the disc cup. A partial or almost complete obliteration is evident in these cases. Subject WBS3 in Figure 4 shows an intriguing cup occlusion by a thin membrane-like formation, which in fact trans-forms the concavity into a cyst-like structure. It is worth noting that a similar membrane was present in the contralateral eye of the same subject (not shown), which suggests that both eyes under-went very similar developmental trajectories. The cup reorganiza-tion did not necessarily lead to full obliteration. In fact, in 2 of our subjects (corresponding to 4 eyes), we observed localized and abnormal steepening of the cup walls, concomitant with widening of the “neck” region and deepening of the cup (see below).
We confirmed the surprising differences and bimodal pattern of reorganization in surface geometry in most WBS subjects, which were documented on OCT images of the optic nerve region by means of confocal scanning laser imaging. Measurements such as mean cup depth, cup/disc area ratio, and cup volume below sur-face and rim area were often outside the 95% confidence intervals, confirming the findings observed by means of OCT. We also veri-fied that some WBS subjects showed a tendency for the cup struc-ture to be obliterated (compare Figures 4 and 5 for OCT and HRT measurements). Other subjects’ data showed the opposite phe-nomenon, e.g., an increased depth of the depression (e.g., partially in the case of WBS6 and almost completely in the case of WBS5), with abnormally steep walls (see Figure 5B). Interestingly, with-in-subject patterns were similar across eyes, suggesting common developmental trajectories of the optic nerve and correlated onto-genesis (Figures 4 and 5). Accordingly, either bilateral obliteration or increased depth patterns could be observed (Figures 4 and 5). This between-subjects bimodal pattern suggests the occurrence of hysteresis phenomena that may reflect space-time shifts in mor-phogenetic processes that fail to reach a final structural stability.
This pattern of results was confirmed when we attempted to independently provide a mathematical fit to the raw image data with “cylindrical fits” of the “neck region” of the optic disc depres-sion (for details, see Methods). This procedure yielded simple esti-mates of depression depth in normal control subjects and uncov-ered a bimodal profile in WBS subjects, similar to the one found by above mentioned classical OCT and HRT based methods: we noted instances in which no depression was found by the fitting algorithm and, in cases in which it was found, it could then reach large values. Similar results were obtained with a least-square fit-ting procedure that modeled the optic nerve head by a smooth 2D surface described by up to 10 free parameters (21). The WBS sub-jects in whom the blind fitting procedure did not find a depression were the same ones in which OCT measurements documented par-tial or almost complete obliteration of the normal cup structure. The outcome of the fitting procedure (failure vs. no failure) was significantly different in the WBS population (Fisher’s exact test; P value = 0.0033), further confirming the OCT evidence for ana-tomical abnormalities in WBS subjects.
Finally, we analyzed mean RNFL thickness in the optic disk region. We found a significant decrease in our WBS sample (P = 0.0013; Mann-Whitney U test).
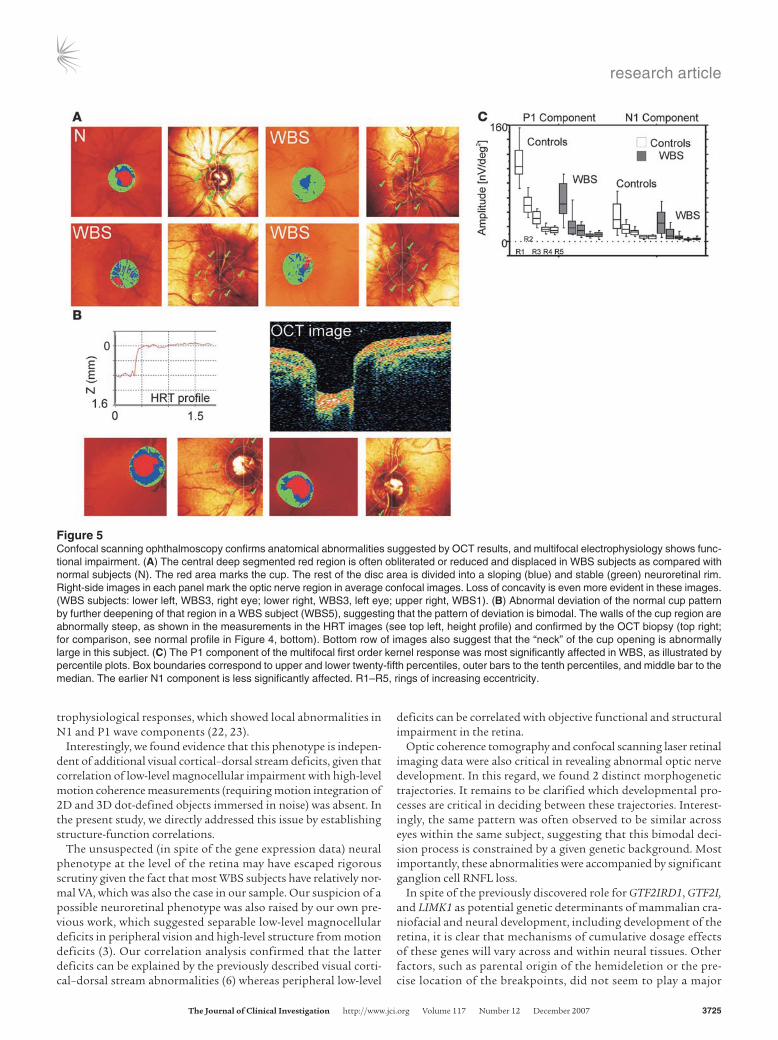
mfERG recordings show patterns of localized impairment of retinal responses in WBS. The mfERG is a technique that provides spatial information about physiological responses in the retina not readily available in the classical ERG. Figure 5C depicts the group analysis
Figure 2RT maps (in μm) of the central 20 degrees of the retina depicted in 3 control subjects and 3 WBS participants (WBS3, WBS7, and WBS8).
research article
TheJournalofClinicalInvestigation http://www.jci.org Volume 117 Number 12 December 2007 3723
(percentile box plots) of multifocal electrophysiological responses in WBS subjects as compared with age-matched controls (for sta-tistical details, see below).
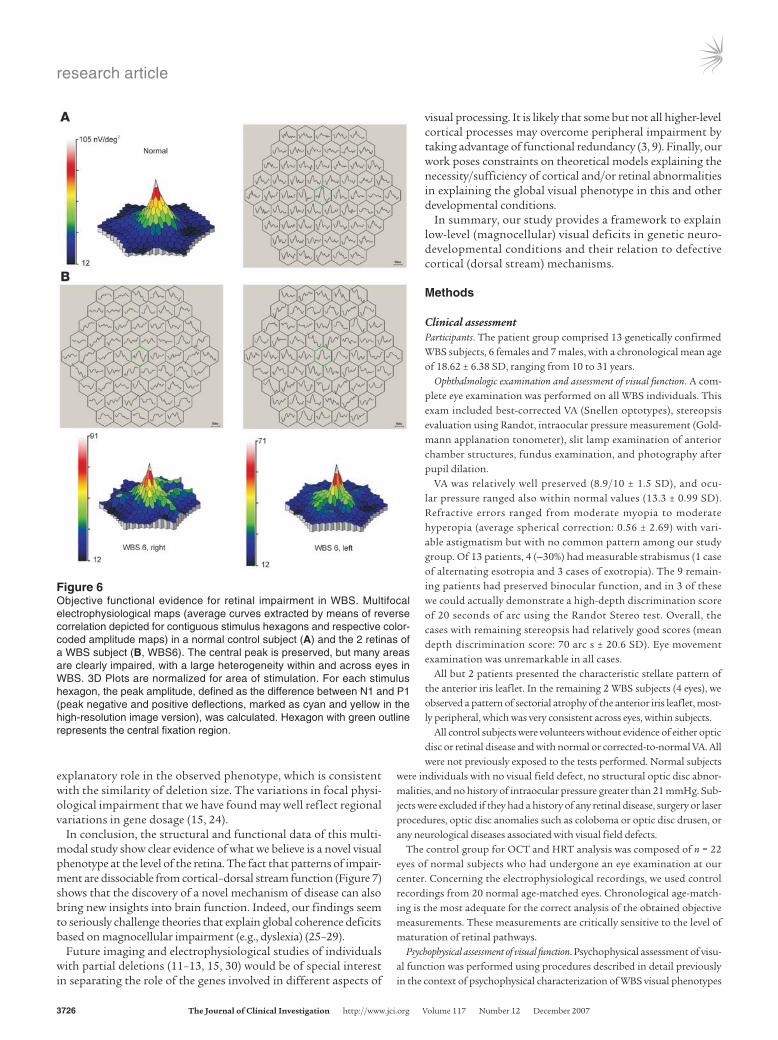
Figure 6A shows the typical pattern of responses observed in a control subject. Central waveforms were in general proportionate-ly larger than in the visual periphery due to the higher cell density, as further documented by the color-coded 3D plot, which shows responses normalized by the area of stimulation. Figure 6B shows responses from the 2 simultaneously recorded eyes of a WBS sub-ject. Both show regions of preserved waveforms and areas with clearly abnormal responses. The retinal (intraocular) pattern of regional asymmetry in response integrity also generalizes to the interocular comparison.
Group analysis (see also Figure 5C) was sorted by rings of increas-ing eccentricity (R1–R5). It was evident that the P1 component was more significantly reduced in WBS than the N1 component. Non-parametric statistics confirmed this observation, with a significant involvement of all rings concerning the P1 response (Mann-Whitney U test: ring 1, P = 0.0001; ring 2, P = 0.0001; ring 3, P = 0.0001; ring 4, P = 0.0001; and ring 5, P = 0.0001). A less dramatic but still signifi-cant effect was found for the N1 component. In this case, we found an overall significant effect that was, however, relatively more mod-est across rings (Mann-Whitney U test: ring 1, ns; ring 2, P = 0.014; ring 3, P = 0.0001; ring 4, P = 0.0001; and ring 5, P = 0.031).
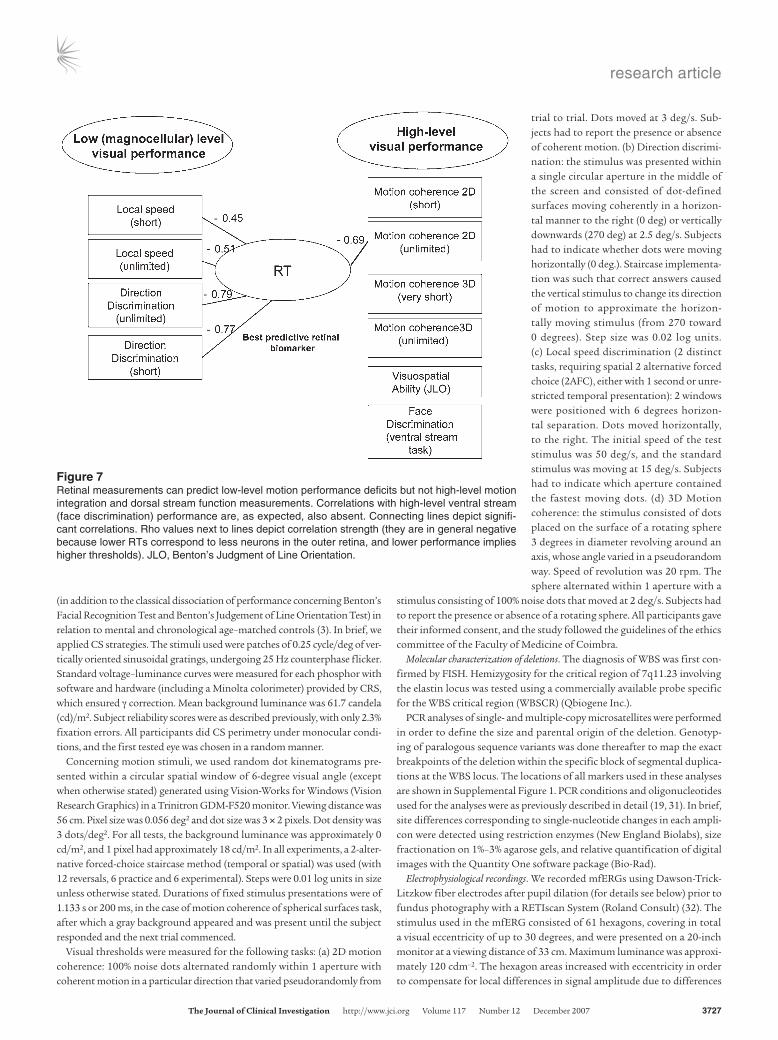
Correlations between structural and functional markers: evidence for inde-pendent sources of retinal damage that predict local psychophysical deficits independently of visual integration performance measurements. Figure 7 illustrates the basic dichotomy identified by our study: a retinal
phenotype can predict local magnocellular deficits but not high-level cognitive function (see below). RT measurements proved to be the best predictive retinal biomarkers and also explained part of the variance associated with the disruption in their efferent gan-glion cell outputs, as revealed by the significant correlation with the reduced thickness of the ganglion cell RNFL (Rho = 0.344; P = 0.001; Spearman’s correlation analysis). On the other hand, no correlations between RNFL thickness and functional measure-ments were observed, indicating a significant involvement of the outer retina in the correlations found.
The sensitivity of RT measurements for explaining low-level (not requiring motion integration) visual performance in WBS subjects is probably due to the more local sampling properties of outer reti-nal neurons (less convergence). Low-level local speed discrimina-tion tasks showed significant correlations with RT measurements for both temporally constrained and unconstrained tasks (Rho = –0.451, P = 0.038; and Rho = –0.509, P = 0.019, respectively; see Figure 7). Note that correlations were negative because low-speed discrimination corresponded to high-threshold velocities that match a standard speed and low outer RT (fewer sampling reti-nal neurons). The same held true for tasks requiring local motion direction discrimination, regardless of whether subjects had unlimited stimulus presentation or stimulation was confined to approximately 1 second (Rho = –0.79, P = 0.0003; and Rho = –0.77, P = 0.0004, respectively; see Figure 7).
Interestingly, and unlike all local tasks, we found that global motion tasks using exactly the same type of local stimuli yielded patterns of performance that were found to be in general inde-pendent of retinal measurements (see Figure 7). Indeed, global motion integration 2D coherence tasks (requiring detection of dot-defined 2D surfaces immersed in noise) did not show any cor-relation with retinal structural measurements for short presenta-tions (which implies relatively limited processing times of up to 1 second for motion integration). These conditions enabled us to isolate a predominant cortical mechanism, unlike the local dis-crimination tasks. For unlimited stimulus presentations, where local sampling could be optimized, cumulative bottom-up retino-cortical processing was probably helpful, since a beneficial effect could then be found (Rho = –0.69, P = 0.0012; see Figure 7).
Concerning 3D motion coherence tasks (requiring detection of dot-defined 3D spheres immersed in noise), extremely time-con-strained (200 ms) stimulus presentations may have led to sub-optimal sampling and a retinal bottleneck for such short time frames. Indeed, in a few cases with low RT, stimulus visibility was probably compromised because performance then dropped
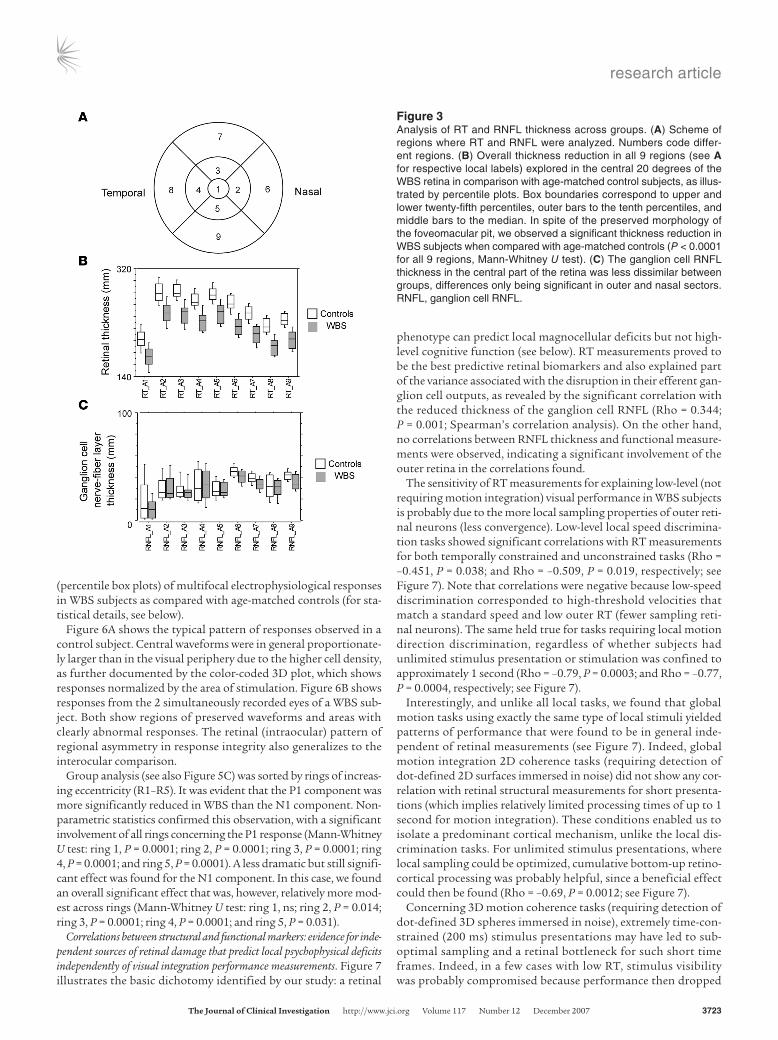
Figure 3Analysis of RT and RNFL thickness across groups. (A) Scheme of regions where RT and RNFL were analyzed. Numbers code differ-ent regions. (B) Overall thickness reduction in all 9 regions (see A for respective local labels) explored in the central 20 degrees of the WBS retina in comparison with age-matched control subjects, as illus-trated by percentile plots. Box boundaries correspond to upper and lower twenty-fifth percentiles, outer bars to the tenth percentiles, and middle bars to the median. In spite of the preserved morphology of the foveomacular pit, we observed a significant thickness reduction in WBS subjects when compared with age-matched controls (P < 0.0001 for all 9 regions, Mann-Whitney U test). (C) The ganglion cell RNFL thickness in the central part of the retina was less dissimilar between groups, differences only being significant in outer and nasal sectors. RNFL, ganglion cell RNFL.
research article
3724 TheJournalofClinicalInvestigation http://www.jci.org Volume 117 Number 12 December 2007
to near chance levels. In the remaining subset, no correlation was found with retinal measurements (see Figure 7).
In summary, we also have evidence for an independent cortical component both for 2D and 3D motion integration tasks. Figure 7 depicts the basic dichotomy, suggesting the outer retinal layers as the main cause of the low-level functional phenotype. It also highlights the absence of correlation of RT with measurements of dorsal stream function, such as visuospatial ability, as measured by Benton’s Judgement of Line Orientation Test, which requires angular comparisons, and is known to assess parietal function. RT was also not correlated with measurements of ventral stream function, as assessed by a standard test of facial discrimination. Our measurements of dorsal stream and ventral stream function were, as expected, uncorrelated. Motion integration measure-ments were uncorrelated with magnocellular contrast-sensitivity (CS) measurements, further suggesting that a magnocellular-based CS deficit cannot be directly related to higher-level steps in motion processing.
Concerning the correlational structure of motion tests, they share, as expected, some common variance, but it is interesting to point out that our analysis also suggests that our assessment tech-niques are probably tapping distinct mechanisms within the dor-sal stream. Accordingly, 3D structure from motion performance measurements was shown to dissociate from 2D motion coher-ence and visuospatial performance (using either a nonparametric or partial-correlation approach), suggesting that they require dis-tinct cortical networks for adequate performance.
Given that the characterization of the deletions showed that they were all identical in size, variation was only present in the number of functional copies of 2 genes in the breakpoint regions,
NCF1 and GTF2IRD2, and the parental origin of the hemidele-tion. These variables, however, did not show predictive value regarding phenotype severity.
DiscussionOur study addresses structure-function correlations that unravel a hitherto unsuspected neural retinal phenotype in Williams-Beuren syndrome that explains patterns of visual deficits that are independent of previously described cortex-based phenotypes (6). This suggests a new framework for hierarchical phenotyp-ing and identification of independent mechanisms contributing to complex and multifactorial diseases of the nervous system. We show, we believe for the first time, patterns of dysfunction in early retinal circuits that are consistent with the previous demon-stration that several genes, including LIMK1 (reviewed in ref. 6) and GTF2IRD1, are pivotal in the development of retinal neural layers (18) and contribute to visual deficits in WBS (16, 17). Fur-thermore, GTF2I, which is also included in the deletion region in WBS, is also involved in neuronal maturation and is exclusively present in neurons (11). Converging evidence for the involvement of these genes in the WBS visual phenotype is provided by recent studies in patients with small deletions, confirming that the presence of GTF2IRD1 in humans leads to a less severe visual phe-notype, and animal studies showing that loss of Gtf2ird1 in mice also results in a phenotype that is consistent with the expression pattern of Gtf2ird1 in the developing brain and craniofacial areas, including the eye and the retina (15, 18). However, one should not neglect the role of other genes expressed in the retina, such as LIMK1 and GTF2I (Gene Expression Omnibus profiles data: http://www.ncbi.nlm.nih.gov/geo/).
Moreover, spatiotemporal patterns of expression of genes such as GTF2IRD1 and GTF2I can be related to the observed pheno-typical features. During early retina development, Gtf2ird1 is involved in proliferation across all neuronal layers, thus control-ling final cell number (18). Later on in development, it instructs differentiation of the outer layer with an impact on cellular func-tion (19). Finally, Proschel et al. showed that Limk1 is expressed in the inner nuclear layer of the retina during embryogenesis and also in adulthood (14).
Given these facts, we have explicitly looked for anatomical and physiological evidence for the involvement of the neural retina in the visual phenotype of WBS. Accordingly, we have searched for objective measurements of anatomical and physiological impairment of the neuronal retina in this disorder by means of multifocal electrophysiology, which allows comparison of focal responses from the retina, and by imaging of retinal structures using OCT and confocal scanning laser retinal imaging. The integrity of outer neural retinal layers, as measured by OCT, was the best predictor of the low-level retinal phenotype (Figure 7). Further functional evidence for retinal impairment in neuroreti-nal retinal layers was provided by the observed pattern of elec-
Figure 4Optical biopsy (OCT) of the optic disc region of the retina depicting abnormal cupping and layering of retinal structures in 3 WBS partici-pants (WBS1, WBS2, WBS3). Arrows depict orthogonal axes of opti-cal section. Although we observed that there is a bimodal pattern of deviation in our WBS group (see text), the cup region most often loses concavity, either by obliteration or partial covering by a thin membrane (subject WBS3).
research article
TheJournalofClinicalInvestigation http://www.jci.org Volume 117 Number 12 December 2007 3725
trophysiological responses, which showed local abnormalities in N1 and P1 wave components (22, 23).
Interestingly, we found evidence that this phenotype is indepen-dent of additional visual cortical–dorsal stream deficits, given that correlation of low-level magnocellular impairment with high-level motion coherence measurements (requiring motion integration of 2D and 3D dot-defined objects immersed in noise) was absent. In the present study, we directly addressed this issue by establishing structure-function correlations.
The unsuspected (in spite of the gene expression data) neural phenotype at the level of the retina may have escaped rigorous scrutiny given the fact that most WBS subjects have relatively nor-mal VA, which was also the case in our sample. Our suspicion of a possible neuroretinal phenotype was also raised by our own pre-vious work, which suggested separable low-level magnocellular deficits in peripheral vision and high-level structure from motion deficits (3). Our correlation analysis confirmed that the latter deficits can be explained by the previously described visual corti-cal–dorsal stream abnormalities (6) whereas peripheral low-level
deficits can be correlated with objective functional and structural impairment in the retina.
Optic coherence tomography and confocal scanning laser retinal imaging data were also critical in revealing abnormal optic nerve development. In this regard, we found 2 distinct morphogenetic trajectories. It remains to be clarified which developmental pro-cesses are critical in deciding between these trajectories. Interest-ingly, the same pattern was often observed to be similar across eyes within the same subject, suggesting that this bimodal deci-sion process is constrained by a given genetic background. Most importantly, these abnormalities were accompanied by significant ganglion cell RNFL loss.
In spite of the previously discovered role for GTF2IRD1, GTF2I, and LIMK1 as potential genetic determinants of mammalian cra-niofacial and neural development, including development of the retina, it is clear that mechanisms of cumulative dosage effects of these genes will vary across and within neural tissues. Other factors, such as parental origin of the hemideletion or the pre-cise location of the breakpoints, did not seem to play a major
Figure 5Confocal scanning ophthalmoscopy confirms anatomical abnormalities suggested by OCT results, and multifocal electrophysiology shows func-tional impairment. (A) The central deep segmented red region is often obliterated or reduced and displaced in WBS subjects as compared with normal subjects (N). The red area marks the cup. The rest of the disc area is divided into a sloping (blue) and stable (green) neuroretinal rim. Right-side images in each panel mark the optic nerve region in average confocal images. Loss of concavity is even more evident in these images. (WBS subjects: lower left, WBS3, right eye; lower right, WBS3, left eye; upper right, WBS1). (B) Abnormal deviation of the normal cup pattern by further deepening of that region in a WBS subject (WBS5), suggesting that the pattern of deviation is bimodal. The walls of the cup region are abnormally steep, as shown in the measurements in the HRT images (see top left, height profile) and confirmed by the OCT biopsy (top right; for comparison, see normal profile in Figure 4, bottom). Bottom row of images also suggest that the “neck” of the cup opening is abnormally large in this subject. (C) The P1 component of the multifocal first order kernel response was most significantly affected in WBS, as illustrated by percentile plots. Box boundaries correspond to upper and lower twenty-fifth percentiles, outer bars to the tenth percentiles, and middle bar to the median. The earlier N1 component is less significantly affected. R1–R5, rings of increasing eccentricity.
research article
3726 TheJournalofClinicalInvestigation http://www.jci.org Volume 117 Number 12 December 2007
explanatory role in the observed phenotype, which is consistent with the similarity of deletion size. The variations in focal physi-ological impairment that we have found may well reflect regional variations in gene dosage (15, 24).
In conclusion, the structural and functional data of this multi-modal study show clear evidence of what we believe is a novel visual phenotype at the level of the retina. The fact that patterns of impair-ment are dissociable from cortical–dorsal stream function (Figure 7) shows that the discovery of a novel mechanism of disease can also bring new insights into brain function. Indeed, our findings seem to seriously challenge theories that explain global coherence deficits based on magnocellular impairment (e.g., dyslexia) (25–29).
Future imaging and electrophysiological studies of individuals with partial deletions (11–13, 15, 30) would be of special interest in separating the role of the genes involved in different aspects of
visual processing. It is likely that some but not all higher-level cortical processes may overcome peripheral impairment by taking advantage of functional redundancy (3, 9). Finally, our work poses constraints on theoretical models explaining the necessity/sufficiency of cortical and/or retinal abnormalities in explaining the global visual phenotype in this and other developmental conditions.
In summary, our study provides a framework to explain low-level (magnocellular) visual deficits in genetic neuro-developmental conditions and their relation to defective cortical (dorsal stream) mechanisms.
Methods
Clinical assessmentParticipants. The patient group comprised 13 genetically confirmed WBS subjects, 6 females and 7 males, with a chronological mean age of 18.62 ± 6.38 SD, ranging from 10 to 31 years.
Ophthalmologic examination and assessment of visual function. A com-plete eye examination was performed on all WBS individuals. This exam included best-corrected VA (Snellen optotypes), stereopsis evaluation using Randot, intraocular pressure measurement (Gold-mann applanation tonometer), slit lamp examination of anterior chamber structures, fundus examination, and photography after pupil dilation.
VA was relatively well preserved (8.9/10 ± 1.5 SD), and ocu-lar pressure ranged also within normal values (13.3 ± 0.99 SD). Refractive errors ranged from moderate myopia to moderate hyperopia (average spherical correction: 0.56 ± 2.69) with vari-able astigmatism but with no common pattern among our study group. Of 13 patients, 4 (~30%) had measurable strabismus (1 case of alternating esotropia and 3 cases of exotropia). The 9 remain-ing patients had preserved binocular function, and in 3 of these we could actually demonstrate a high-depth discrimination score of 20 seconds of arc using the Randot Stereo test. Overall, the cases with remaining stereopsis had relatively good scores (mean depth discrimination score: 70 arc s ± 20.6 SD). Eye movement examination was unremarkable in all cases.
All but 2 patients presented the characteristic stellate pattern of the anterior iris leaflet. In the remaining 2 WBS subjects (4 eyes), we observed a pattern of sectorial atrophy of the anterior iris leaflet, most-ly peripheral, which was very consistent across eyes, within subjects.
All control subjects were volunteers without evidence of either optic disc or retinal disease and with normal or corrected-to-normal VA. All were not previously exposed to the tests performed. Normal subjects
were individuals with no visual field defect, no structural optic disc abnor-malities, and no history of intraocular pressure greater than 21 mmHg. Sub-jects were excluded if they had a history of any retinal disease, surgery or laser procedures, optic disc anomalies such as coloboma or optic disc drusen, or any neurological diseases associated with visual field defects.
The control group for OCT and HRT analysis was composed of n = 22 eyes of normal subjects who had undergone an eye examination at our center. Concerning the electrophysiological recordings, we used control recordings from 20 normal age-matched eyes. Chronological age-match-ing is the most adequate for the correct analysis of the obtained objective measurements. These measurements are critically sensitive to the level of maturation of retinal pathways.
Psychophysical assessment of visual function. Psychophysical assessment of visu-al function was performed using procedures described in detail previously in the context of psychophysical characterization of WBS visual phenotypes
Figure 6Objective functional evidence for retinal impairment in WBS. Multifocal electrophysiological maps (average curves extracted by means of reverse correlation depicted for contiguous stimulus hexagons and respective color-coded amplitude maps) in a normal control subject (A) and the 2 retinas of a WBS subject (B, WBS6). The central peak is preserved, but many areas are clearly impaired, with a large heterogeneity within and across eyes in WBS. 3D Plots are normalized for area of stimulation. For each stimulus hexagon, the peak amplitude, defined as the difference between N1 and P1 (peak negative and positive deflections, marked as cyan and yellow in the high-resolution image version), was calculated. Hexagon with green outline represents the central fixation region.
research article
TheJournalofClinicalInvestigation http://www.jci.org Volume 117 Number 12 December 2007 3727
(in addition to the classical dissociation of performance concerning Benton’s Facial Recognition Test and Benton’s Judgement of Line Orientation Test) in relation to mental and chronological age–matched controls (3). In brief, we applied CS strategies. The stimuli used were patches of 0.25 cycle/deg of ver-tically oriented sinusoidal gratings, undergoing 25 Hz counterphase flicker. Standard voltage–luminance curves were measured for each phosphor with software and hardware (including a Minolta colorimeter) provided by CRS, which ensured γ correction. Mean background luminance was 61.7 candela (cd)/m2. Subject reliability scores were as described previously, with only 2.3% fixation errors. All participants did CS perimetry under monocular condi-tions, and the first tested eye was chosen in a random manner.
Concerning motion stimuli, we used random dot kinematograms pre-sented within a circular spatial window of 6-degree visual angle (except when otherwise stated) generated using Vision-Works for Windows (Vision Research Graphics) in a Trinitron GDM-F520 monitor. Viewing distance was 56 cm. Pixel size was 0.056 deg2 and dot size was 3 × 2 pixels. Dot density was 3 dots/deg2. For all tests, the background luminance was approximately 0 cd/m2, and 1 pixel had approximately 18 cd/m2. In all experiments, a 2-alter-native forced-choice staircase method (temporal or spatial) was used (with 12 reversals, 6 practice and 6 experimental). Steps were 0.01 log units in size unless otherwise stated. Durations of fixed stimulus presentations were of 1.133 s or 200 ms, in the case of motion coherence of spherical surfaces task, after which a gray background appeared and was present until the subject responded and the next trial commenced.
Visual thresholds were measured for the following tasks: (a) 2D motion coherence: 100% noise dots alternated randomly within 1 aperture with coherent motion in a particular direction that varied pseudorandomly from
trial to trial. Dots moved at 3 deg/s. Sub-jects had to report the presence or absence of coherent motion. (b) Direction discrimi-nation: the stimulus was presented within a single circular aperture in the middle of the screen and consisted of dot-defined surfaces moving coherently in a horizon-tal manner to the right (0 deg) or vertically downwards (270 deg) at 2.5 deg/s. Subjects had to indicate whether dots were moving horizontally (0 deg.). Staircase implementa-tion was such that correct answers caused the vertical stimulus to change its direction of motion to approximate the horizon-tally moving stimulus (from 270 toward 0 degrees). Step size was 0.02 log units. (c) Local speed discrimination (2 distinct tasks, requiring spatial 2 alternative forced choice (2AFC), either with 1 second or unre-stricted temporal presentation): 2 windows were positioned with 6 degrees horizon-tal separation. Dots moved horizontally, to the right. The initial speed of the test stimulus was 50 deg/s, and the standard stimulus was moving at 15 deg/s. Subjects had to indicate which aperture contained the fastest moving dots. (d) 3D Motion coherence: the stimulus consisted of dots placed on the surface of a rotating sphere 3 degrees in diameter revolving around an axis, whose angle varied in a pseudorandom way. Speed of revolution was 20 rpm. The sphere alternated within 1 aperture with a
stimulus consisting of 100% noise dots that moved at 2 deg/s. Subjects had to report the presence or absence of a rotating sphere. All participants gave their informed consent, and the study followed the guidelines of the ethics committee of the Faculty of Medicine of Coimbra.
Molecular characterization of deletions. The diagnosis of WBS was first con-firmed by FISH. Hemizygosity for the critical region of 7q11.23 involving the elastin locus was tested using a commercially available probe specific for the WBS critical region (WBSCR) (Qbiogene Inc.).
PCR analyses of single- and multiple-copy microsatellites were performed in order to define the size and parental origin of the deletion. Genotyp-ing of paralogous sequence variants was done thereafter to map the exact breakpoints of the deletion within the specific block of segmental duplica-tions at the WBS locus. The locations of all markers used in these analyses are shown in Supplemental Figure 1. PCR conditions and oligonucleotides used for the analyses were as previously described in detail (19, 31). In brief, site differences corresponding to single-nucleotide changes in each ampli-con were detected using restriction enzymes (New England Biolabs), size fractionation on 1%–3% agarose gels, and relative quantification of digital images with the Quantity One software package (Bio-Rad).
Electrophysiological recordings. We recorded mfERGs using Dawson-Trick-Litzkow fiber electrodes after pupil dilation (for details see below) prior to fundus photography with a RETIscan System (Roland Consult) (32). The stimulus used in the mfERG consisted of 61 hexagons, covering in total a visual eccentricity of up to 30 degrees, and were presented on a 20-inch monitor at a viewing distance of 33 cm. Maximum luminance was approxi-mately 120 cdm–2. The hexagon areas increased with eccentricity in order to compensate for local differences in signal amplitude due to differences
Figure 7Retinal measurements can predict low-level motion performance deficits but not high-level motion integration and dorsal stream function measurements. Correlations with high-level ventral stream (face discrimination) performance are, as expected, also absent. Connecting lines depict signifi-cant correlations. Rho values next to lines depict correlation strength (they are in general negative because lower RTs correspond to less neurons in the outer retina, and lower performance implies higher thresholds). JLO, Benton’s Judgment of Line Orientation.
research article
3728 TheJournalofClinicalInvestigation http://www.jci.org Volume 117 Number 12 December 2007
in cone density across the retina (leading to a 4-fold change in hexagon area size). Each hexagon was temporally modulated between light and dark according to a binary m-sequence (frame rate: 60 Hz).
Observers fixated a small cross in the center of the stimulus during recording sessions of approximately 8 seconds. Fixation was continuously checked by means of online video monitoring. To improve fixation stabil-ity, the sessions were broken into 47-second segments with brief rest peri-ods between segments. Eight trials were recorded for each mfERG session, and the average recording time for each trial was 47 seconds. Signals were amplified with a gain of 100,000 and band pass filtered (5–300 Hz).
The reference and ground electrodes were attached to the ipsilateral outer canthus and forehead, respectively. The surface electrode impedance was less than 10 k ohm. First-order kernels were used for mfERG evaluation. For each hexagon, the peak amplitude, defined as the difference between N1 and P1, was calculated and the implicit time of P1 determined.
Multimodal imaging of retinal structuresSubject preparation. Each eye of each subject was dilated with 1% tropicamide prior to image acquisition. OCT, HRT, and fundus photography were then performed on both eyes. Ophthalmic photographers who were familiar with and trained in the use of the OCT/HRT systems obtained all scans.
Standard operational procedures for fundus photography followed the guidelines of the Fundus Photograph Reading Center (Department of Ophthalmology and Visual Sciences, University of Wisconsin, Madison, Wisconsin, USA).
OCT. OCT is a biomedical optical imaging technique that can provide noninvasive, high-resolution cross-sectional images of ocular microstruc-tures in situ and in real time (33, 34). Low-coherence near-infrared light (820 nm wavelength and 20 nm bandwidth) from a superluminescent diode source is coupled into a fiber-optic Michelson interferometer and split into reference and sample paths: one directed at the retina and one to a reference mirror. Light retroreflected from the variable distance reference mirror is recombined with light backscattered from the eye (35). An A-scan, an axial profile of optical reflectivity versus distance, is obtained by moving the reference mirror while recording the magnitude of the resulting inter-ference signal. This process can be repeated many times while scanning the beam through the eye fundus, thus allowing one to obtain an optical cross-section image, a B-scan (36, 37).
We used an OCT device (Stratus OCT; Carl Zeiss Meditec) to obtain real-time, objective, cross-sectional measurements of various layers of the retina, including the RNFL. Stratus OCT A-scans consisted of 1024 data points for 2-mm depth while B-scans were composed of 128, 256, or 512 adjacent A-scans, therefore generating cross-sectional images of retinal anatomy (optical biopsies) with axial resolution less than or equal to 10 μm, trans-versal resolution of 20 μm, and 2 mm of longitudinal scan range.
Using the Stratus OCT Fast Macular Protocol, 6 radial 6-mm (length) line scans, 30 degrees apart, and of 128 A-scans each were scanned in 1.92 seconds. Two data sets were obtained from the eye fundus at 2 different locations corresponding to 2 different acquisitions: one centered in the macula and one centered in the optic disc.
From the single acquisition centered in the macula, 2 different measure-ments can be obtained, the RNFL thickness information and the RT infor-mation, thus corresponding to 2 different thickness maps. This is achieved by segmenting the retina from other layers with an algorithm detecting the edge of the retinal pigment epithelium and the photoreceptor layer.
Macular RT was calculated by computing the distance between the sig-nal from the vitreoretinal interface and the signal from the anterior bound-ary of the retinal pigment epithelium while the RNFL in the macular and peripapillary region was determined by obtaining the distance between the vitreoretinal interface and its adjacent highly reflective layer, with the
posterior border determined based on threshold reflectivities that are a function of the local maximum reflectance adjusted to variations in opti-cal alignment. The RNFL, visible as a scattering layer originating from the optic disc, became thinner as it approached the fovea. An interpolation algorithm was used to correct for any missing boundaries caused by shad-owing due to blood vessels or exudates (38).
Both the RNFL and RT are presented as a 9-region thickness map, show-ing the interpolated thickness for each area, with a central circle of 500 μm radius and 2 outer circles with radii of 1500 μm and 3000 μm. The interpo-lated thickness is displayed using a false color scale, in which bright colors (red and white) correspond to thickened areas and darker colors (blue and black) are assigned to thinner areas.
In the evaluation protocol of the optic nerve head, the software auto-matically identified the anterior and innermost borders of the second echo-rich structure (e.g., the retinal pigment epithelium/choriocapillaries layer) at each side of the optic disc. The detected position of the end of the retinal pigment epithelium/choriocapillaries reflection was corrected manually when necessary.
To improve OCT thickness mapping accuracy, we used proprietary software to correct for the location of fovea (brought into the center of the thickness map) as well as to perform interscan registration, thus cor-recting for saccades. This was achieved by registering all the 6 radial line scans from the Fast Macular Protocol into an atlas of the human retina (RT-Atlas) built using RT analyzer II (RTA; Talia Technology) to scan a set of 32 healthy volunteers. Principal component analysis was used to cap-ture RT shape and define RT-Atlas, i.e., the one associated with the major spread of data. As for OCT registration, scans were brought into the RT-Atlas space and registered by estimating a total of 24 parameters defining the global position and rotation as well as individual scan fit.
Confocal scanning laser imaging. We used an HRT II device (version 2.01, Heidelberg Engineering), which is a confocal scanning laser ophthalmo-scope that provides topographical images derived from optical sections at consecutive equidistant focal depth planes, yielding equidistant 2D optical section images (with 256 × 256 image resolution) in a 15-degree field of view, enabling the construction of a topographic image. To acquire the digital confocal images, a laser beam with a wavelength of 670 nm was focused in the retina and periodically deflected by oscillat-ing mirrors. The amount of reflected light at each point was measured using a light-sensitive detector.
Two 115-degree field-of-view scans judged to be of acceptable quality were obtained for each eye. Images with significant movement artifacts were rejected. A mean topographic image of these scans was created using HRT software, version 2.01. Mean image topography was generated, and a trained technician outlined the optic disc margin using a mouse-drawn contour line on the mean topographic image while viewing stereoscopic photographs of the optic disc.
All initial analysis on the HRT was performed using HRT software, ver-sion 2.01. Typical optic disc parameters measured with HRT included rim area (area of neuroretinal rim located above the reference plane), mean cup depth, maximum cup depth, height variation in contour, mean height con-tour, cup shape, disc area, cup area, cup/disc area ratio, cup volume below surface, rim volume above reference plane, rim/disc ratio, RNFL thickness, and RNFL cross section (21, 39, 40).
Statistics. Distribution-free nonparametric statistics (Mann-Whitney U tests, Spearman’s rho correlations) were carried out for all tasks to avoid biases due to deviations from normality or lack of data homoscedascity. Each subject’s score was entered as a data point in correlation analyses for binocular tests (when more than one measure was available, an average score was used, yielding up to 13 data points). Concerning monocular tests, data from each eye were entered as data points (yielding up to 26 data points,
research article
TheJournalofClinicalInvestigation http://www.jci.org Volume 117 Number 12 December 2007 3729
although typically 23/24 because cases in which performance fell to chance levels were excluded). Heterogeneity in performance between the 2 groups (normal and WBS) was analyzed by the F test for homogeneity of variance. All statistical analyses were performed with STATVIEW (SAS) or SPSS (ver-sion 12 for Windows; SPSS LEADS Technologies Inc.) software packages.
AcknowledgmentsWe would like to thank the WBS patients and families for their participation and support. This work was supported by the fol-lowing grants: POCI_SAU-OBS_57070_2004, POCI_SAU-NEU_60281_2004, Fundação para a Ciência e Tecnologia, Portugal; Gulbenkian Foundation/Visual Aging, the EVI-GENORET European Network; SAF2004-6382, PI042063 (Spanish Min-
istries of Education and Health), and FP6-2005-LSH7-037627 (the European Commission).
Received for publication May 1, 2007, and accepted in revised form September 19, 2007.
Address correspondence to: Miguel Castelo-Branco, Visual Neuro-science Laboratory, IBILI, Faculty of Medicine, Az. de Sta Comba, 3000-548 Coimbra, Portugal. Phone: 351-239-480286; Fax: 351-239-480280; E-mail: [email protected].
Miguel Castelo-Branco and Mafalda Mendes contributed equally to this work.
1. Bellugi, U., Lichtenberger, L., Jones, W., Lai, Z., and St. George, M. 2000. The neurocognitive profile of Williams syndrome: A complex pattern of strengths and weaknesses. J. Cogn. Neurosci. 12(Suppl.):7–29.
2. Mervis, C.B., et al. 2000. The Williams syndrome cognitive profile. Brain Cogn. 44:604–628.
3. Mendes, M., et al. 2005. Visual magnocellular and structure from motion perceptual deficits in a neu-rodevelopmental model of dorsal stream function. Brain Res. Cogn. Brain Res. 25:788–798.
4. Atkinson, J., et al. 1997. Specific deficit of dorsal stream function in Williams’ syndrome. Neuroreport. 8:1919–1922.
5. Reiss, J.E., Hoffman, J.E., and Landau, B. 2005. Motion processing specialization in Williams syn-drome. Vision Res. 45:3379–3390.
6. Meyer-Lindenberg, A., et al. 2004. Neural basis of genetically determined visuospatial construction deficit in Williams syndrome. Neuron. 43:623–631.
7. Jordan, H., Reiss, J.E., Hoffman, J.E., and Landau, B. 2002. Intact perception of biological motion in the face of profound spatial deficits: Williams syn-drome. Psychol. Sci. 13:162–167.
8. Castelo-Branco, M., et al. 2002. Activity patterns in human motion-sensitive areas depend on the inter-pretation of global motion. Proc. Natl. Acad. Sci. U. S. A. 99:13914–13919.
9. Castelo-Branco, M., et al. 2006. Specific retinotopi-cally based magnocellular impairment in a patient with medial visual dorsal stream damage. Neuropsy-chologia. 44:238–253.
10. Galaburda, A.M., Holinger, D.P., Bellugi, U., and Sherman, G.F. 2002. Williams syndrome: neuronal size and neuronal-packing density in primary visu-al cortex. Arch. Neurol. 59:1461–1467.
11. Morris, C.A., et al. 2003. GTF2I hemizygosity impli-cated in mental retardation in Williams syndrome: genotype-phenotype analysis of five families with deletions in the Williams syndrome region. Am. J. Med. Genet. A. 123:45–59.
12. Frangiskakis, J.M., et al. 1996. LIM-kinase1 hemi-zygosity implicated in impaired visuospatial con-structive cognition. Cell. 86:59–69.
13. Gray, V., Karmiloff-Smith, A., Funnell, E., and Tass-abehji, M. 2006. In-depth analysis of spatial cogni-tion in Williams syndrome: A critical assessment of the role of the LIMK1 gene. Neuropsychologia. 44:679–685.
14. Proschel, C., Blouin, M.J., Gutowski, N.J., Ludwig,
R., and Noble, M. 1995. Limk1 is predominantly expressed in neural tissues and phosphorylates serine, threonine and tyrosine residues in vitro. Oncogene. 11:1271–1281.
15. Tassabehji, M., et al. 2005. GTF2IRD1 in cranio-facial development of humans and mice. Science. 310:1184–1187.
16. Hirota, H., et al. 2003. Williams syndrome deficits in visual spatial processing linked to GTF2IRD1 and GTF2I on chromosome 7q11.23. Genet. Med. 5:311–321.
17. Edelmann, L., et al. 2007. An atypical deletion of the Williams-Beuren syndrome interval implicates genes associated with defective visuospatial pro-cessing and autism. J. Med. Genet. 44:136–143.
18. Bayarsaihan, D., et al. 2003. Expression of BEN, a member of TFII-I family of transcription factors, dur-ing mouse pre- and postimplantation development. Gene Expr. Patterns. 3:579–589.
19. Yan, X., et al. 2000. Characterization and gene structure of a novel retinoblastoma–protein associ-ated protein similar to the transcription regulator TFII–I. Biochem. J. 345:749–757.
20. Bayés, M., Magano, L.F., Rivera, N., Flores, R., and Pérez Jurado, L.A. 2003. Mutational mechanisms of Williams–Beuren syndrome deletions. Am. J. Hum. Genet. 73:131–151.
21. Swindale, N.V., Stjepanovic, G., Chin, A., and Mikel-berg, F.S. 2000. Automated analysis of normal and glaucomatous optic nerve head topography images. Invest. Ophthalmol. Vis. Sci. 41:1730–1742.
22. Hood, D.C., Frishman, L.J., Saszik, S., and Viswana-than, S. 2002. Retinal origins of the primate mul-tifocal ERG: implications for the human response. Invest. Ophthalmol. Vis. Sci. 43:1673–1685.
23. Hood, D.C. 2000. Assessing retinal function with the multifocal technique. Prog. Retin. Eye Res. 19:607–646.
24. Danoff, S.K., Taylor, H.E., Blackshaw, S., and Desiderio, S. 2004. TFII-I, a candidate gene for Wil-liams syndrome cognitive profile: parallels between regional expression in mouse brain and human phenotype. Neuroscience. 123:931–938.
25. Samar, V.J., and Parasnis, I. 2007. Cortical locus of coherent motion deficits in deaf poor readers. Brain Cogn. 63:226–239.
26. Sperling, A.J., Lu, Z.L., Manis, F.R., and Seidenberg, M.S. 2006. Motion-perception deficits and reading impairment: it’s the noise, not the motion. Psychol.
Sci. 17:1047–1053. 27. Sperling, A.J., Lu, Z.L., Manis, F.R., and Seiden-
berg, M.S. 2005. Deficits in perceptual noise exclusion in developmental dyslexia. Nat. Neurosci. 8:862–863.
28. Stein, J. 2001. The magnocellular theory of devel-opmental dyslexia. Dyslexia. 7:12–36.
29. Demb, J.B., Boynton, G.M., and Heeger, D.J. 1998. Functional magnetic resonance imaging of early visu-al pathways in dyslexia. J. Neurosci. 18:6939–6951.
30. Tassabehji, M., et al. 1999. Williams syndrome: use of chromosomal microdeletions as a tool to dissect cognitive and physical phenotypes. Am. J. Hum. Genet. 64:118–125.
31. del Campo, M., et al. 2006. Hemizygosity at the NCF1 gene in patients with Williams-Beuren syn-drome decreases their risk of hypertension. Am. J. Hum. Genet. 78:533–542.
32. Kutschbach, E. 1997. Method for multifocal ERG using short length and corrected M-sequences. Roland Con-sult, Elektrophysiologische Diagnostik Systeme. Wiesbaden, Germany. 11 pp.
33. Brancato, R., and Lumbroso, B. 2004. Guide to opti-cal coherence tomography interpretation. Innovation-News-Communication. Rome, Italy. 75 pp.
34. Bouma, B.E., and Tearney, G.J. 2002. Handbook of optical coherence tomography. Marcel Dekker. New York, New York, USA. 768 pp.
35. Fujimoto, J.G. 2003. Optical coherence tomogra-phy for ultrahigh resolution in vivo imaging. Nat. Biotechnol. 21:1361–1367.
36. Schuman, J.S., Puliafito, C.A., and Fujimoto, J.G. 2004. Optical coherence tomography of ocular diseases. SLACK Incorporated. Thorofare, New Jersey, USA. 768 pp.
37. Hee, M.R., et al. 1995. Optical coherence tomog-raphy of the human retina. Arch. Ophthalmol. 113:325–332.
38. Varma, R., Bazzaz, S., and Lai, M. 2003. Optical tomography-measured retinal nerve fiber layer thickness in normal Latinos. Invest. Ophthalmol. Vis. Sci. 44:3369–3373.
39. Weinreb, R.N., Lusky, M., Bartsch, D.U., and Mors-man, D. 1993. Effect of repetitive imaging on topo-graphic measurements of the optic nerve head. Arch. Ophthalmol. 111:636–638.
40. Schuman, J.S., and Noecker, R.J. 1995. Imaging of the optic nerve head and nerve fiber layer in glaucoma. Ophthalmol. Clin. North Am. 8:259–279.