vietnam development report 2000 attacking poverty
TRANSCRIPT

Report No. 19914-VN
Vietnam Development Report 2000Attacking PovertyCountry Economic Memorandum
November 15, 1999
Poverty Reduction and Economic Management UnitEast Asia and Pacific Region
Document of the World Bank
Pub
lic D
iscl
osur
e A
utho
rized
Pub
lic D
iscl
osur
e A
utho
rized
Pub
lic D
iscl
osur
e A
utho
rized
Pub
lic D
iscl
osur
e A
utho
rized

Currency Equivalents
CURRENCY UNIT = DONGUS$1 = 14 008 DONG (November 1999)
Government Fiscal YearJanuary 1 to December 31
Abbreviations
CCFSC The Central Committee for Flood and Storm ControlCEMMA Comrnittee for Ethnic Minority and Mountainous AreasCIE Centre for International EconomicsCRES Natural Resources and Environmental StudiesDFID Department for International Development, UKDPC Disaster Preparedness CentersGDLA General Department for Land AdministrationGSO General Statistics OfficeHEPR Hunger Eradication and Poverty ReductionIEC Information, Education and CommunicationIDG International Development GoalsIFRC International Federation of Red Cross and Red Crescent SocietiesIRRI International Rice Research InstituteMMR Maternal Mortality RateMOF Ministry of FinanceMOLISA Ministry of Labor, Invalids and Social AffairsMRDP Vietnam-Sweden Mountain Rural Development ProgramnMPDF Mekong Project Development FacilityNEA National Environmental AgencyNCFAW National Committee for the Advancement of WomenPCF People's Credit FundPPA Participatory Poverty AssessmentROSCA Rotating Savings and Credit AssociationsRTCCD Research Training Center for Community DevelopmentSIDA Swedish International Development AgencySOE State-Owned EnterpriseTFR Total Fertility RateVBARD Vietnam Bank for Agriculture and Rural DevelopmentVBP Vietnam Bank for the PoorVLSS Vietnam Living Standard SurveyVNCIDNDR Vietnam National Committee for the International Decade for Natural
Disaster Reduction.VNRC Vietnam Red Cross
Vice President Jean-Michel SeverinoDirector, Country Department Andrew SteerDirector, Sector Management Unit Homi KharasTask Manager Nisha Agrawal

PREFACE
This report has been produced by the Poverty Working Group - a coalition of -government agencies, donors and NGOs working towards the eradication of poverty inVietnam. It is the intention of the Poverty Working Group that this report should present thecritical issues in attacking poverty and so generate policy debate on the way forward overthe coming years. The report, therefore, does not conclude with policy prescriptions butraises questions which the Group hopes will be discussed widely, between all partiesinvolved in the economic and social development of Vietnam. The Poverty Working Grouphas been concerned to make this report as participative as possible, both in tenns of theinformation used as background material and in terms of the process followed.
The report which follows draws heavily and importantly on the lives of poorhouseholds in Vietnam. Part of the basis for the information presented comes from the twonationally representative Vietnam Living Standards Survey carried out by the GeneralStatistics Office (GSO) in 1993 and in 1998. These surveys have been funded by UNDPand SIDA (Sweden), with technical assistance provided by the World Bank. The solidinformation provided from this source is also augmented by in-depth participatory povertyassessments (PPAs) which draw in a further 1000 households. The Vietnam-SwedenMountain Rural Development Program (MRDP) has a long history of operation in thenorthern uplands and is currently working with ethnic minority and Kinh households in fivemountainous provinces in the northern uplands. The Lao Cai PPA presents the concerns andpriorities of poor people from this region. Action Aid Vietnam has been working in HaTinh since 1994 and their PPA provides insights from this poorly-endowed, drought-pronearea. Oxfam GB has been working in the ethnically-mixed Mekong Delta since 1994 andhas been able to bring perspectives of the poor from a region which is generally thought tohave less intense problems of poverty. The PPA in Ho Chi Minh City covers the lives of theurban poor which includes poor migrants without permanent registration in Ho Chi MinhCity. Save the Children Fund (UK), who has worked with vulnerable groups in HCMCsince 1992, carried out this research. In each of the research sites, local authorities havebeen actively involved and hundreds of people and many different agencies, governmentaland non-governmental, from village-level to Ministry-level, have participated in workshopsto disseminate and discuss the findings. In every case, District and Provincial authoritieshave agreed that these studies reflect the realities of poor people's lives.
Far from representing the views of a handful of authors, this report is a product ofnumerous interviews, discussions and meetings. DIFD (UJK) has provided valuableassistance in supporting this participative process. The draft has been distributed inVietnamese and English, circulated widely and the main points debated vigorously. Thisreport represents a serious effort to build some consensus from these debates. The nextimportant phase of this work will involve taking the issues raised here forward anddeveloping and implementing a comprehensive poverty reduction strategy for Vietnam.


Acknowledgements
The Vietnam Development Report 2000 on "Attacking Poverty" was prepared by ajoint Government-donor-NGO working group, with contributions from several other_people. Throughout the process, the group worked very closely with Dr. Nguyen Van Tien,Deputy General Director of the General Statistics Office (GSO) and his team, and Dr.Nguyen Hai Huu, Director of the Social Protection Department, MOLISA, and Director ofthe Secretariat to Vietnam's Hunger Eradication and Poverty Reduction (HEPR) Program,and his team and we are grateful to them for their support. We are also very grateful to thePeople's Committees and other officials of Lao Cai Province, Ha Tinh Province, Ho ChiMinh City, and Tra Vinh Province for their interest and cooperation in carrying out the fourParticipatory Poverty Assessments in those places. And we would also like to thank Mr.Andrew Steer (Director, Vietnam Program, World Bank), Mr. Homi Kharas (Director,Poverty Reduction and Economic Management, East Asia and Pacific Region, WorldBank), Mr. Ravi Kanbur (Director, World Development Report 2000/2001), and Mr. MikeWalton (Director, Poverty Reduction Board, World Bank) for providing ideas andinspiration during the preparation of this Report.
Principal Coordinator: Nisha Agrawal, World Bank.
Members of the Poverty Working Group include:
(i) Government Agencies and Mass Organizations: Nguyen The Ba, Tran Huu Toan, LeThi Thong, Cao Viet Sinh (Ministry of Planning and Investment); Nguyen Lan Huong(Ministry of Finance); Nguyen Thi Kim Thanh (State Bank of Vietnam); Do Van Hoa(Ministry of Agriculture and Rural Development; Nguyen Ngoc Khiem (Ministry of Labor,Invalids and Social Affairs); Nguyen Phong (General Statistics Office); Le Kim Khoi(Committee for Ethnic Minorities and Mountainous Areas); Nguyen Thi Thanh Hoa(Women's Union).
(ii) International NGOs and Other Agencies: Heather Grady, Stefan Nachuk, Than ThiThien Huong (Oxfam, GB); Ramesh Singh, Pham Van Ngoc (Action Aid Vietnam);Joachim Theis, Hoang Thi Huyen (Save the Children, UK); Edwin Shanks, Bui Dinh Toai,Vo Thanh Son, William Smith (Vietnarn-Sweden Mountain Rural Development Program).
(iii) Donor Agencies: Minoli De Bresser, Dagmar Schumacher, Nguyen Tien Phong(UNDP); Henny Anderson (SIDA, Sweden); Julia Hawkins, Alan Johnson (DFID, UK);Nguyen Nguyet Nga, Carrie Turk, Bob Baulch (World Bank).
Other Major Contributors: Paul Glewwe, Dominique Van de Walle (World Bank);Sarah Bales, Patrick Belser (Consultants, World Bank).
Other Contributors: Phung Duc Tung (GSO); Eliane Darbellay, Marion Ginolin, JimCarlson, Suzette Mitchell (UNDP); Jonathan Haughton (Consultant, GSO/UNDP); NguyenVan Thuan, Nguyen Thi Hai, Pushpanath Krishnamurthy (Save the Children, UK); HuynhThi Ngoc Tuyet (Consultant, Save the Children, UK); Ngo Huy Liem (GTZ/MOLISA);Nicolai Ruge, Bill Cuddihy, Chris Shaw, Mai Thi Thanh, Tosca Bruno, Chris Gibbs, KaziMatin, Naoko Ishii, John Clark, Tran Thi Thanh Phuong (World Bank); Anil Deolalikar(Consultant, World Bank).
Peer Reviewers: Valerie Kozel and Andy Mason (World Bank).
Publishing and Other Support: Nguyen Thuy Ngan and Phung Thi Tuyet (World Bank).


TABLE OF CONTENTS
EXECUTIVE SUMMARY ............................................................ i
PART I:ANALYSIS OF POVERTY .......................................................... 1
Chapter 1: Trends and patterns of poverty reduction ...............................................2
1. Trends in Poverty ............................................................ 2
2. Patterns of Poverty Reduction ........................................................... 10
Chapter 2: Characteristics of Poor Households ....................................................... 17
1. Occupation, Employment Status and Education .................................... 17
2. Demographic Characteristics ........................................................... 20
3. Access to Resources ........................................................... 23
4. Vulnerability and Isolation ........................................................... 26
5. Especially Poor and Vulnerable Groups ................................................ 28
PART II: A FRAMEWORK FOR ATTACKING POVERTY .. 36
Chapter 3: Creating Opportunity ........................................................... 37
1. Vietnam's Reform Program ........................................................... 38
2. Patterns of Growth and Employment ..................................................... 39
3. Growth and Diversification in Rural Areas ............................................ 46
4. Promising Trends in the Urban Industrial Sector ................................... 55
Chapter 4: Ensuring Equity ........................................................... 61
1. Trends in Inequality ........................................................... 62
2. Gender Equality ........................................................... 70
3. Governance and Equity ........................................................... 83
Chapter 5: Reducing Vulnerability ........................................................... 91
1. Vulnerability and Poverty ........................................................... 92
2. The Nature of Shocks Affecting Poor Households ................................ 93
3. Coping Strategies ........................................................... 102
4. Public Safety Nets and Targeted Programs .......................................... 109
PART III: MOVING TOWARDS A COMPREHENSIVE POVERTYREDUCTION STRATEGY ........................................................... 118
Chapter 6: Moving towards a Comprehensive Poverty Reduction Strategy ..... 119
1. Designing sectoral and economic policies and programs .................... 121
2. Setting goals and monitoring progress .................................................1 31

Annexes:
Annex 1 :Poverty and Inequality Measures . .................................... 141
Annex 2:Estimating the Poverty 'Lines ........................................................... 144
Annex 3:Vietnam's Untapped Comparative Advantage in Manufacturing Exports 154
Annex 4: Poverty and Female-Headed Households .................................................... 157
Annex 5: Transition Matrix for Vietnam ........................................................... 161
Annex 6: Future Monitoring of Poverty and Living Standards .................................. 163
Bibliography ........................................................... 165
Tables:
Table 1.1: Poverty Line in Vietnam 1993 and 1998 .......................................................4Table 1.2: Social Indicators, 1993 - 1998 ............................................................. 6Table 1.3: Indicators of Poverty as described by Poor Households ...............................9Table 1.4: Depth of Poverty by Region, 1993 and 1998 ............................................... 15Table 1.5: Regional Concentration of Poverty in Vietnam, 1993 and 1998 ................. 16Table 2.1: Principal occupation of the Poor, 1998 ........................................................ 18Table 2.2: Educational Attainment of the Poor, 1998 ................................................... 19Table 2.3: Mean Number of Children Under 15 Years Old per Household ................. 21Table 2.4: Percentage of rural households without allocated or swidden land ............. 24
Table 2.5: Landholdings (m 2 ) for all households with agricultural land by quintile....25Table 2.6: Individuals without access to motorized transport, by expenditure quintile,
1998 ............................................................ 28Table 2.7: Trends in (net) School Enrollment Rates, by Ethnicity ............................... 31Table 3.1: Growth Rates of Output and Employment in Vietnam, 1992-1998 ............ 39Table 3.2: Employment Growth Rates by Type of Main Employment, 1993-1998 ..... 42Table 3.3: Level and Composition of Wage Employment, 1993- 1998 ....................... 43Table 3.4: The Sectoral Composition of Wage Employment, 1993-1998 .................... 43Table 3.5: Hours of Work by Rural/Urban, 1993 and 1998 .......................................... 44Table 3.6: Unemployment Rates in Vietnam by Rural/Urban and Sex, 1993-1998 ..... 45Table 3.7: Sources of Household Incomes in Rural Vietnam, 1993-1998 .................... 46Table 3.8: Growth in Agricultural Revenues, 1993-1998 ............................................. 47Table 3.9: International Paddy Yields (tons/ha) ............................................................ 51Table 3.10: Growth and Employment in the Industrial Sector in Vietnam ................... 56Table 3.11: Foreign Direct Investment Stock by Sector, 1998 ..................................... 57Table 3.12: Pattern of Exports, 1992-97 ............................................................ 58Table 3.13: Share of Manufacturing in Total Exports and Resource Endowments
in East Asia ............................................................ 59Table 4. 1: Some International Comparisons of Inequality .......................................... 64Table 4.2: Decomposition of Inequality by Rural-Urban, 1993-1998 ....................... 66Table 4.3: Decomposition of Inequality by Regions, (Theil L Index of Inequality
1993-1998) ............................................................ 67Table 4.4: Rural-Urban Growth in Real Per Capita Expenditures by Region,1993-199869Table 4.5: Indicators of Welfare disaggregated by sex, 1998 ....................................... 72

Table 4.6: Changes in Women's Responsibility and Authority in Ha Tinh ................. 75Table 4.7: Hours of Work by Gender, 1993-1998 ........................................................ 76Table 4.8: Women in Politics in Vietnam ........................................................... 83Table 4.9: Calculation of Taxes, Fees and Contributions for a poor household with
5 members in Ha Tinh ........................................................... 89Table 4.10: Level and Incidence of Taxes, Fees and Contributions paid by Rural
Households in 1998 ........................................................... 90Table 5.1: Poverty Transition Matrices for Vietnam, 1993 to 1998 ............................. 92Table 5.2: Most Frequently Cited Crises in the PPA Research Areas .......................... 94Table 5.3: Types of Borrowing by Poor Households, Tra Vinh and Lao Cai ............. 105Table 5.4: Incidence of Social Welfare Income, 1998 ................................................ 115Table 5.5: Coverage of Social Welfare System, 1998 ................................................ 116Table 6.1: School Enrollment Rates by Expenditure Quintiles .................................. 123Table 6.2: Coverage of Cost Exemption Program for Basic Education
(Primary and Lower Secondary) 1998 ..................................................... 124Table 6.3 Decomposition of Poverty Reduction in 6 East Asian Countries into Growth
and Redistribution Components ........................................................... 134Table 6.4: International Comparison of Select Health Outcome Indicators ............... 136Table 6.5: Human Development Outcomes, Determinants and Levers for
Public Action ........................................................... 137Table 6.6: Examples of Outcomes and Intermediate Indicators to Monitor Progress 138Table A2.1: Calorie Consumption per Day in 1993 .................................................... 146Table A2.2: Vietnamese Basket of Food Items that Yields 2100 Calories per Day ... 148Table A2.3: Time Deflators for 1993 and 1998 .......................................................... 152Table A2.4: Regional Price Indices for VLSS93 and VLSS98 ................................... 152Table A3. 1: Vietnam's Untapped Export Potential ..................................................... 155Table A3.2: Labor Coefficients for Exports and Import Substitutes .......................... 155Table A4.1: Poverty Measures (%) by Gender of Household Head, 1997/98 ............ 158Table A4.2: Household Expenditure by Sex of Head and Household Size, 1998 ...... 159Table A5.1: Quintile Transition Matrix for Vietnam, 1993-1998 ............................... 162
Boxes:
Box 1.1: The Vietnam Living Standard Surveys ........................................................... 4Box 1.2: The Four Participatory Poverty Assessments for Vietnam ..............................7Box 1.3: Poverty in Ha Tinh ........................................................... 8Box 1.4: How much did VLSS98 Underestimate Urban Poverty? ............................... 12Box 2.1: Dependence on Low and Irregular Incomes in Ho Chi Minh City ................ 19Box 2.2 :Reading their Way Out of Poverty in Ha Tinh ............................................... 20Box 2.3: Eight Children - Poverty in Lao Cai .......................................................... 22Box 2.4: Widowhood and Poverty in Tra Vinh .......................................................... 23Box 2.5: Resource-Poor Household in Ha Tinh .......................................................... 24Box 2.6: The Dilemma of Poor Farmers in Tra Vinh - The Debt Spiral ...................... 26Box 2.7: Children's Perceptions of Threats to Security in Ho Chi M inh City ............. 27Box 2.8: Guarding the interests of the Urban Poor ....................................................... 33Box 2.9: Barriers to Schooling in Lao Cai Province ..................................................... 35Box 3.1: The Early Years of Vietnam's Doi Moi Program ........................................... 38

Box 3.2: Diverse Fortunes in the services sector in Ho Chi Minh City ........................ 41Box 3.3: Paddy cultivation is supplemented by income from aquaculture .................. 48Box 3.4: Vietnam's Rural Banking System ........................................................... 53Box 4.1: National Plan of Action for the Advancement of Women in Vietnam .......... 71Box 4.2: Gender-Based Problems Identified in the PPAs ............................................. 74Box 4.3: Daily Timetable for a Wioman in Lao Cai ...................................................... 77Box 4.4: Domestic Violence in a Highly Educated Family in Thanh Hoa ................... 78Box 4.5:Attitudes Towards Domestic Violence in Vietnam ......................................... 79Box 4.6: Divorced woman of Phu La Minority from Lao Cai Province ....................... 80Box 4.7: Mrs. Ly Thi Lan, Lao Cai Province ........................................................... 81Box 4.8: Vietnam's Grassroots Democracy Decree ...................................................... 84Box 4.9: The Four Pillars of Governance ........................................................... 85Box 4.10: Lack of Information, Consultation and Compensation: Tra Vinh ................ 86Box 4.11: Improving Access to the Mass Media for Ethnic Minority Groups ............. 86Box 5.1: The Costs of Ill Health in Lao Cai Province .................................................. 96Box 5.2: Failure of an Investment: in Watermelon Production in Tra Vinh .................. 99Box 5.3: The Impact of the Recent Floods in Central Vietnam .................................. 100Box 5.4: Destruction by Pests ........................................................... 101Box 5.5: Diseased animals and bad seed: a double crisis for a village in Lao Cai ..... 102Box 5.6: Reducing Vulnerability by Expanding Opportunities for Cash Savings ...... 104Box 5.7: Landlessness in Tra Vinh ........................................................... 107Box 5.8: Using Children to Cope with Hardships ............................................i .......... 108Box 5.9: Policy Initiatives Targeted Towards Poverty Reduction .............................. 112Box 6.1: Vietnam's Development Goals for the Period 1996-2000 ........................... 132Box 6.2: International Development Goals ........................................................... 133
Figures:
Figure 1. 1: Incidence of Poverty in Vietnam, 1993 - 1998 ............................................ 3Figure 1.2: Incidence of Poverty in Vietnam by Rural-Urban Areas ............................ 11Figure 1.3: Poverty Gap Index by Rural - Urban Areas ............................................... 12Figure 1.4: Incidence of Poverty by Regions, 1993 and 1998 ................................... 14Figure 2.1: Incidence of Poverty by Ethnicity ........................................................... 29Figure 2.2: Incidence of Poverty by Age Group ........................................................... 34Figure 3. 1: Sectoral Distribution of Output and Employment in Vietnam,
1993 - 1998 ........................................................... 40Figure 3.2: Price (US$ per ton) and volume (in millions tons) of Vietnam's and
the World's rice exports ............................................................ 49Figure 4.1: Lorenz curves for Vietnam ........................................................... 63Figure 4.2: Growth in Real Per Capita Expenditure by Rural-Urban 1993 - 1998 ...... 65Figure 4.3: Growth in Real Per Capita Expenditure by Region, 1993 - 1998 .............. 67Figure 4.4: Theil L Index, by Region ........................................................... 68Figure 4.5: Linkages Between Income Growth in Urban and Rural Areas .................. 70Figure 5.1: Histogram of Per Capita Expenditures, 1998 ............................................. 93Figure 5.2: Drawing on Capital Resources to Cope with a Health Shock .................... 97Figure 6.1: A Framework for Assessing the Prerequisites for Poverty Reduction and
Equitable Growth .................................................. 120

EXECUTIVE SUMMARY
OVERVIEW
1. Vietnam has made considerable progress in reducing poverty during 1993-98 and yet,poverty remains widespread and deep and much remains to be done in the next five to ten years.Chapters 1 and 2 highlight the multi-dimensional nature of poverty in Vietnam, extending fromlow levels of incomes and consumption, to poor health and lack of education, and to other "non-material" dimensions of well-being, including gender gaps, insecurity, powerlessness and socialexclusion. Chapters 3, 4, and 5 lay out three broad imperatives in the fight against poverty:
* First, opportunities for employment and productivity growth must be created, sothat incomes rise and the poor are able to grow out of poverty;
l Second, measures must be put in place to ensure that growth and access toservices is fair and equitable, so that all citizens benefit from the fruits ofdevelopment;
* Third, special care must be taken to reduce the vulnerability of the poor tounforeseen events (sickness, poor harvests, loss of breadwinner, etc.).
2. Combined, these three elements define development policy. Every country should be ableto articulate a clear strategy for each of these three elements as it seeks to improve the wellbeingof its citizens. Chapters 3-5 describe how the Government of Vietnam is seeking to clarify itsown strategy in each of these areas.
3. These three imperatives also need to guide sectoral and economic policymaking. Inallocating public resources among competing uses, and in establishing laws, regulations andincentives, it is the impact on human wellbeing (and especially that of the poor) that needs todrive decisions. For each sectoral and economic program, therefore, it is important to be able toexplain how the design of the program contributes to creating opportunity, ensuring equity, andreducing vulnerability. Chapter 6 makes an attempt to point in the direction towards how such anexercise might be undertaken, and recommends that this be undertaken (with the assistance ofthe national and international development community) as part of the Government's medium-term planning exercise.

ii
TRENDS AND PATTERNS IN POVERTY REDUCTION (CHAPTER 1)
Poverty, however measured, has declined in Vietnam during 1993-98
4. It is estimated that in the mid-1980's, seven out of every ten Vietnamese were living inpoverty. A little more than a decade later - a decade of rapid economic growth - the incidence ofpoverty has halved. There have been very striking reductions in the incidence of poverty inVietnam during 1993-98. This is reflected in rising per capita expenditure and in widespreadreports of improvements in broad wellbeing. The proportion of people with per capitaexpenditures under the total poverty line has dropped draeatically from 58 percent in 1993 to 37percent in 1998 (Figure 1). The number of people below a "food poverty line", which is lower,has also declined from 25 percent to 15 percent, indicating that even the very poorest segments

iii
of the population have experienced improvements in their living standards during 1993-98.While poverty incidence is still quite high in Vietnam, these declines in poverty and food povertyover a period of only five years are very impressive. In recent years, almost no other country hasrecorded such a sharp decline in poverty in such a short period of time (the possible exceptionsbeing China and Indonesia in the 1980s).
60 4 ; 998
581 - _ 37 -- - :- -- $ . ;:;40 25
20
1 _
Total Poverty Line Food Poverny Line
Figure 1: 'Indednce of Poverty in Vietam, 99-:Sourcex 080 and World Bank cstmates based on VLSS93 and VLSS98.
5. This report tracks trends in poverty, broadly defined, from 1993 to 1998, drawing heavilyand importantly on the lives of poor households in Vietnam. The trends presented are extractedfrom two main sources. Quantitative data comes from the two Vietnam Living StandardsSurveys (VLSS) carried out by the General Statistics Office (GSO) in 1992/93 and again in1997/98. This quantitative information is augmented by in-depth participatory povertyassessments (PPAs) in four provinces of Vietnam-Lao Cai (by Vietnam-Sweden MountainRural Development Program), Ha Tinh (by Action Aid Vietnam), Ho Chi Minh City (by Savethe Children, UK) and Tra Vinh (by Oxfam, GB).
The gains in poverty reduction have been broad and widespread
6. The big gains for poverty reduction have come from growth of per capita expenditures,which have increased on average by 41 percent during 1993-98. The achievements, however, arenot limited to rising per capita expenditures. All indicators of human development, infrastructureaccess, and ownership of consumer durables confirm the story of a rise in living standardsbetween 1993 and 1998:
* Primary school enrollment rates were already high for both girls and boys, buthave improved further-they have increased from 87% to 91% for girls and from86% to 92% for boys;
* Lower secondary enrollment rates have doubled for both girls and boys, and arenow at 61 for girls and 62 for boys. The number of children enrolled in lower

iv
secondary school dipped to a low of 2.7 million in 1990, but this has now climbedto 5 million;
* Upper secondary enrollment rates have increased dramatically for both girls andboys-they have gone up from 6% to 27% for girls and from 8% to 30% for boys.1.6 million children were enrolled in upper secondary school in 1998, reversingthe downturn in enrollments seen in the late 1980's and early 1990's (WorldBank, 1995);
* Malnutrition amongst boys and girls below the age of 5 years remains high, buthas declined from about half the population to a third;
* Access to infrastructure-such as public health centers, clean water, andelectricity-have all increased;
* Ownership of consumer durables-such as radios, television, and bicycles-havealso all gone up. In 1998, 47% of households own a radio, 58% own a television,and 76% own a bicycle.
7. Research also suggests that there have been benefits in less tangible dimensions ofpoverty. Households report a greater sen.se of control over their livelihoods, reduced stress, fewerdomestic and community disputes and express optimism that life will continue to get easier inthe future.
8. These improvements in the material and non-material aspects of well-being are not limitedto a few. The gains have been widespread-all regions and all groups have benefited, albeit atdifferent rates. Both the incidence and depth of poverty has declined in rural and urban areas andin all seven geographic regions of Vietnam. However, while the Report conveys the message thatpoverty has declined during 1993-98, it also conveys another message-that poverty stillremains very high and that almost 40 percent of the population lived below the poverty line in1998.
But the gains in poverty reduction remlain fragile
9. A note of caution, however, is needed in interpreting the gains in poverty reduction(Figure 2). Poverty measurement is not an exact science. In the case of Vietnam, povertyestimates are very sensitive to the exact positioning of the poverty line because much of thepopulation lives in households with per capita expenditures that are close to the poverty line.Sensitivity analysis (in this case, adjusting the poverty line upwards and downwards by 10%)suggests that rather than thinking of the incidence of poverty as one simple number, theincidence of poverty might best be described as lying somewhere in the range between 30-45%.The diagram shows, secondly, that the dramatic gains in poverty reduction in Vietnam during thelast five years remain quite fragile. Because many individuals were positioned close to thepoverty line in 1993, modest improvements have been sufficient to pull them over the povertyline so that they are now bunched just above the poverty. It follows, therefore, that a relativelysmall deterioration in living standards would be sufficient to push them below the poverty lineagain.

-6S'I -Put C6sSPI sanmpmain3ndva in!dv;3 3 itopnqp Zq : aina
ejnmlpuadxa epdeo jed 9661L uir teaU0099 0
S661 _5 1, / 5"00
/ 400
X~~J~~AOc1 jJOA VZul 1 XII^d1OA04-
, & ~~~~~~~~~pool 9L00D'
dII/l .ltjJdA LidlXl /Li / ) t',UlifOiJiSt)Ll J.1)i)Y7 ,7i 0/ dst4!8SLfdX AddA ddII ,?.) I)iAl'.ddllJNd fl.1,s7.tOd
A

vi
KEY CHARACTERISTICS OF POOR HOUSEHOLDS (CHAPTER 2)
The incidence of poverty is higher in certain regions, and certain groups remain vulnerable
10. Poverty in Vietnam is largely a rural phenomenon and about 90 percent of the poor live inrural areas. The incidence of poverty is higher in rural areas (45 percent) than in urban ones (10-15 percent depenading upon what estimate of unregistered migrants in poverty is used) and so isthe depth of poverty. Among the regions, poverty is clearly higher and deeper in the uplandsregions of the Northern Mountains anid the Central Highlands. Vietnam needs to develop astrategy for promoting growth and reducing poverty in these upland regions.
11. The main characteristics of the poor in Vietnam-that they are farmers, they haverelatively low levels of educational attainment, they have a relatively large number of children,they have less access to material resources suchs a an entl access to social and physicalinfrastructure-are commnon characteristics of the poor in many developing countries. Inaddition, in Vietnam, the PPAs highlighted three groups of particularly vulnerable householdswhich warrant attention: ethnic minority groups, unregistered migrants in urban areas, andchildren.
12. Despite active Government support and investmnent, certain ethnic minority groups facemany specific disadvantages, which are underscored by physical and cultural isolation. Thesedisadvantages are reflected in the slow rate of decline of material poverty for ethnic minority

vii
groups, which indicates that, certainly in economic terms, ethnic minority groups are nowlagging some way behind the majority population. Although accounting for only 14% of thepopulation, ethnic minority groups accounted for 29% of the poor in 1998. They live in the-upland regions of Vietnam which, as discussed above, are the poorest regions in Vietnam.Developing and implementing a comprehensive strategy for reducing poverty amongst ethnicminority groups that deals with, among other things, issues of access to improved income-earning opportunities, to physical infrastructure, and to basic social services, is critically neededto prevent these groups from falling further behind.
13. Urban poverty was found in the research to be a particularly harsh and complexphenomenon. While it is not limited to migrants--indeed most of the migrants to urban areas farewell and add to the prosperity of urban areas-the plight of a particular group of poor migrantswas highlighted by the PPAs. These are migrants to urban areas who have not secured permanentregistration. The PPAs found that this group of the urban poor face difficulties in accessingpublic services and may also be socially marginalized. These migrants are probably not fullycaptured in the poverty statistics, with the result that urban poverty estimates may beunderestimated by as much as five percentage points, so that urban poverty could be in the rangeof 10-1S percent. Migration is only likely to increase in the future as urbanization occurs andindeed, for some, it might be the only way out of poverty. The Government needs to develop apolicy on migration so that migrants can also have access to government services and are nottrapped into poverty in the future.
14. Children form a higher proportion of the poor than their share of the population as awhole. The research suggests that children are particularly vulnerable in poverty situations: poorchildren are less able to attend school and are trapped in a cycle of inherited poverty. Child laboris commonly used to help keep poor households afloat and is often relied upon during times ofhardship. The Government needs to revisit its policy of financing basic social services, such asbasic education and health so that the burden on the poor of financing such services for theirchildren is reduced. Greater efforts also need to be made to reduce malnutrition among children.In the context of the upcoming Public Expenditure Review, the Government can design a patternof public spending that is more pro-poor and more child friendly. This need not necessarilyrequire more public expenditures-it may just be an issue of targeting existing expendituresbetter on the poor.
CREATING OPPORTUNITY (CHAPTER 3)
The gains in poverty reduction have been largely due to rapid growth and agriculturaldiversification
15. Labor is commonly regarded as the poor's most abundant asset. In order to raise theliving standards of the able-bodied poor, it is essential to provide them with the opportunities forproductive and remunerative employment. Chapter 3 examines the contribution that growingemployment and income generating opportunities have made to raising living standards inVietnam. Since 80 percent of the poor are farmers, what happens to agriculture still dominatesthe effects on the lives of the poor.

viii
16. Improvements in rural living standards during 1993-98 have been driven predominantlyby a diversification of on-farm activities. To date, this diversification has been most dramaticwithin the agricultural sector, where average household incomes have grow by 60 percent in the-five years to 1998. The Vietnamese rural non-farn sector has grown much more slowly than theagricultural sector, but incomes from non-farm self employment have still grown at 30 percentduring these five years. Further liberalization of the production and trade of farm inputs andagricultural products, removal of the constraints (both actual and perceived) to the developmentof rural non-farm enterprises, and a reform of rural banking are essential if the dynamism of therural sector is to continue.
17. In urban areas, living standards have risen faster than in rural areas, but the opportunitiesprovided by economic growth have been less evenly distributed. The industrial state sector hasgrown rapidly, but created relatively few jobs as it remains dominated by capital-intensiveindustries. A dynamic private light manufacturing sector had been emerging rapidly prior to theonset on the East Asian crisis, with wage employment in the sector growing, albeit from a tinybase, by 50 percent per annum in the five years after 1993.
18. Looking to the future, the rural sector will continue to dominate employment in Vietnamover the short to medium term. Therefore, employment and income growth in agriculture, off-farm enterprises, and services in rural areas will continue to be critical for rapid povertyreduction in the future. However, gains in poverty reduction may not be as easy as they havebeen in the last five years. Landlessness appears to be a growing problem for some and scarcityof land is already appearing as a major issue for others. With some of the easy gains from thetransition to a market economy now exhausted, Vietnam must focus on improving both theproductivity of its existing cropland and providing opportunities for rural workers to diversifyinto other sectors (such as livestock and non-farm enterprises). Greater attention also needs to bepaid to agricultural research and extension in upland and ethnic minority areas.
19. While the impact on poverty reduction of the nascent light industrial sector in urban areashas to date been limited (because of the small size of this sector), it is growing very rapidly andhas the potential to play an increasingly important role in the future. This sector represents asignificant opportunity for employment creation in the coming years. Vietnam's untapped exportpotential could represent around 25% of its current GDP and up to 1.6 million more jobs couldbe created in labor-intensive export manufacturing over the next three to five years. Getting boththe infrastructure and policy environrrment right for Vietnam to capitalize on this untappedcomparative advantage is another major challenge facing policy makers.
ENSURING EQUITY (CHAPTER 4)
The decline in poverty has been accompanied by a modest increase in inequality, largelydue to the widening of rural-urban gaps
20. The promotion of "growth witlh equity" is a principle which is fundamental to thedevelopment path that Vietnam has chosen to follow. The reforms and the rapid growth whichthey have generated have led to very significant economic and social gains for nearly all groupsin all regions. But growth has been more rapid and gains have been more substantial in someareas of the country than in other parts. Although Vietnam still remains a relatively equitable

ix
society by international standards, the 1993-1998 period did record a modest increase ininequality with the Gini Coefficient rising from 0.33 to 0.35.
21. The force behind this growth in inequality comes largely from widening rural-urban gaps.During 1993-98, while rural incomes grew by 30 percent, urban incomes grew by twice as much(61 percent). This has led to the ratio of urban to rural expenditures increasing from 1.8 to 2.2.What is noteworthy, however, is that this period, which followed some very significant policychanges in Vietnam-including distribution of land use back to farming households andliberalization of input and product markets-has seen no increase in inequality within rural areas.In fact, inequality within rural areas has actually declined somewhat during this period. Whileconcern has been raised that the policy reforms initiated in agriculture would lead to risinginequalities, there is no evidence to indicate that this is the case.
22. There has also been some increase in inequality between the seven regions of Vietnam.Regions have grown at different rates: the fastest growing region has been the South East, whichhas been dominated by the fortunes of Ho Chi Minh City, and has grown by a spectacular 78percent during 1993-98. In contrast, the slowest growing region has been the neighboring regionof the Mekong Delta, which grew by only 18 percent during the same period. However, theMekong Delta was starting with a relatively higher base level of expenditures, and despite thispoor performance during the last five years, its levels of expenditures are still higher than thoseof several other regions. The poorest region was and remains the Northern Mountains region andthe richest region was and remains the Southeast. Since expenditures in the Northern MountainsRegion grew by only 31 percent as compared with a 78 percent expenditure increase in theSoutheast, the gap between the poorest and the richest region of Vietnam has widened. The ratioof expenditures in the Southeast to those in the Northern Mountains has gone up from 1.9 to 2.6.
23. This decomposition of inequality is important for policy reasons. The Government ofVietnam has expressed concern about the widening rural-urban gap and has reoriented itsdevelopment strategy to really focus on rural development. These findings reinforce thesignificance of rural development in a strategy for continued equitable growth in Vietnam. Thefindings also further underline the importance of effective targeting of resources towards regionsexperiencing slower growth and higher incidences of poverty. Improved poverty mappingcombined with better skills at the local level for the diagnosis of problems and the identificationof solutions will be necessary to counteract the imbalance between the regions. The targetedprogram to assist the 1715 Poorest Communes shows the Government's commitment to assistingareas with special difficulties.
Gender equality remains an issue-while gains have been made in some areas, furtheractions are required in other, less visible areas
24. Chapter 4 also examines inequality at the household level. Gender analyses show inequalityin the distribution of power within the household and highlights many problems which arespecific to women. These problems include limited decision-making power within thehousehold, extremely heavy workburdens, domestic violence, health problems, limitedrepresentation in institutions, limited access to education for some ethnic minority women, andunequal access to productive assets, such as land and credit. These problems will need to beaddressed in the context of the preparation of the next National Action Plan for the Advancement

x
of Women in Vietnam for the period 2000-2005 that is currently underway. What will berequired is strong leadership at the top levels to change attitudes about existing gender roles andrelations.
Increased participation of the poor ina policymaking would help make public policies andprograms more pro-poor
25. Chapter 4 also examines how issues of governance and equity are linked. The Reporthighlights the importance of information and social connections and networks in the access toresources. The poor are less likely to be inforned about Government policies and programs andthis prevents them from benefiting fully from them. They are also less likely to be able to feedtheir concerns, ideas and priorities into the design of such programs. The research suggests theimportance of improving this two-way flow of information so as to maximize the impact ofgovernment policies and programs on poverty reduction.
The Government's Grassroots Democracy Decree is an exciting initiative for improvinggovernance at local levels
26. The Report finds that although there are mechanisms in place to feed information onGovernment's policies, plans and decisions down to the village level, or back up to higher levelsfrom the village level, they do not always function well. In many cases, the processes which arein place are not allowing the poor households, or the quieter members within households, tocommunicate their concerns and priorities back up through the system. In the announcement ofDecree 29 on Grassroots Democracy, the Government has recognized the importance ofinvolving households fully in decisions which affect their lives and of making localgovernments more transparent and accountable. This is an exciting initiative which has thepotential for mainstreaming the participation of poor and disadvantaged people in decision-making processes and of improving governance in Vietnam.
REDUCING VULNERABILITY (CHAPTER 5)
The poor remain extremely vulnerable to a variety of shocks
27. Poor households' livelihoods are extremely vulnerable to both household-specific andcommunity-wide shocks. The fragility of the economic base of rural households means that theseshocks are thoroughly destabilizing and can take many years before recovery is consolidated.Many households above the poverty line are not much over the poverty line and downwardfluctuations in income or sudden demands for expenditure can easily lead to a slide into poverty.
28. Health shocks, which entail the loss of labor resources and significant costs for curativecare and associated expenditure, are very commonly mentioned as a reason for a household'sslide into poverty. Reducing the direct and indirect costs of curative health care for poorhouseholds could constitute an important safety net. The costs of treating illnesses is relatively amuch greater burden for the poor. A single curative visit to a public hospital can cost a person inthe poorest quintile the equivalent of 22 percent of his/her annual nonfood expenditure.Alleviating the impact of user charges on the poor requires much more than simply exemptingthe social categories of the disabled, victims of war, orphans and the indigent from payment ofuser fees. The evidence indicates that these exemptions are not offered adequately enough by

xi
public health facilities to the poor. Greater efforts will need to be made to provide adequatehealth care for the poor.
29. The risk of failure associated with on-farm investments can deter households fromexpanding their economic base in such a way as would improve their resilience to shocks. Anarrow income base intensifies the problem, making a household less able to manage risks andso more likely to encounter difficulties. Agricultural extension and veterinary services, whichcould help reduce the risk of on-farm investments, do not currently reach the poor systematically.This is particularly the case in the upland areas which suffer particular problems of accessibility.Some also argue that options for sustainable upland agriculture have been under-researched, withgreater emphasis and resources in agricultural research directed towards paddy fanning systems.
Public safety nets and Government poverty programs are small and weakly targeted
30. Formal safety nets have low coverage and are only weakly targeted. As a result,households have to draw largely on their own resources to deal with crises and they fall back ona number of community or household level strategies to cope with the crises. The choice ofstrategy may determine to a large extent the speed and sustainability of a household's recoveryfrom a shock. The expansion of facilities for cash savings could offer poor households animportant mechanism for managing seasonal hardship and unexpected shocks. The formalfinancial sector is underdeveloped in this regard and providing mechanisms for savings to thepoor remains an important priority.
31. The Government's National Target Program for Hunger Eradication and PovertyReduction (HEPR), established in 1998 under Decree 133, provides a framework to addresssome of the most pressing needs of poor households. The framework incorporates many ongoingGovernment services and programs which are of benefit to the poor. The main focus to date,however, has been on the provision of subsidized credit and, more recently, health costexemptions and school fee exemptions. A number of factors seem to constrain the access of thevery poor to these benefits. And many of these programs have not been evaluated and theirimpact on poverty reduction is not clearly understood. Improved coverage and targeting of theHEPR program, and broadening it from providing credit alone, will be needed. Bettercoordination of the many different agencies and ministries that are responsible for povertyreduction policies and for the many different poverty reduction programs is also needed. Andefforts need to be stepped up to improve the short-term monitoring of poverty so that fasteraction can be taken to reach the poor during times of hardship.
MOVING TOWARDS A COMPREHENSIVE POVERTY REDUCTION STRATEGY(CHAPTER 6)
32. Chapter 6 presents a framework for bringing these elements to the heart of developmentplanning for the coming years. The time is right for the Government of Vietnam to put povertyreduction at the center of its policies and programs for the next decade and longer. TheGovernment has just embarked upon a planning exercise from now until the end of the year 2000to formulate the next Five Year plan for the years 2001-2005. Furthermore, in preparation for theNinth Party Congress to be held in the year 2001, the Authorities will be reviewing the long-termprospects of the country. A new 10 year Socio-Economic Development strategy for Vietnam to

xii
the year 2010 will be prepared, and this will be embedded within a longer-term vision up to theyear 2020. These plans for Vietnam could become instruments for putting Vietnam on a path ofdevelopment that is equitable and sustainable and one which continues to give it the kind of-success in poverty reduction that it has seen in the last five years.
Five broad sectoral areas will require attention from policymakers
33. Chapter 6 groups the areas requiring attention from policy-makers into five broadcategories:
* Human and social development;
* Physical infrastructure;
* Economic management;
* Regional (rural and urban) development;
• Good governance.
34. The Government has clearly recognized that continued poverty reduction will requirefirm actions in each of these broad areas, and in the many sub-components of them. But abalanced attack across all fronts does not imply that everything can be done at once. What isneeded to prioritize actions is an identification of the bottlenecks-the hard to solve problemsthat are impediments to success-and to begin by attacking these first. And to ensure that thepriorities that emerge reflect the concerns of the poor, they need to be engaged through aparticipatory planning process.
35. How can Vietnamese policymakers come up with the right package of polices andprograms that will combine what is essenitial in the five broad areas to maximize the impact onpoverty reduction? These are not easy choices and there is no one correct way of making thesedecisions. One approach would be set some overall targets for poverty reduction and to design aprogram of action that is necessary to achieve these targets. As part of its Five Year Planningprocess, Vietnam sets economic, social and environmental goals for itself. As part of thepreparation of the next Five Year Plan, a detailed evaluation is undertaken of the successes andfailures of the previous Plan and revised targets are set for the coming period. These targets arethen monitored closely during the period of implementation of the Five Year Plan.
The level and pattern of growth in the future will determine the pace of poverty reduction
36. If, for example, Vietnam was to adopt one of the International Development Goals-thatof reducing poverty by half by the year 2015--could it attain this goal? Whether or not Vietnamcan replicate its past success at poverty reduction during the next 15 years will depends criticallyon two factors:
* The level of growth it can attain during the next 15 years; and
* The pattern of growth (equitable or inequitable) it can attain during the next 15years.

xiii
37. The importance of economic growth for raising the living standards of the poor inVietnam cannot be overestimated. But both the level of growth and its pattern (or how thebenefits of growth have been distributed) matter for poverty reduction. We can decompose the-poverty reduction in Vietnam into two components: one for economic growth and one fordistributional changes. The results for Vietnam show that poverty has declined substantially inVietnam due to the high growth of the 1993-98 period, and despite the rise in inequality thatoccurred during this period. If inequality had not increased, Vietnam would have been able toreduce poverty by another 8 percentage points: i.e., poverty could have come down from 58percent to around 30 percent instead of 37 percent. Vietnam's pattern of growth and povertyreduction during 1993-98 is different from the patterns observed in Malaysia (1973-89),Indonesia (1978-84) and the Philippines (1991-94), where the growth and redistributional effectsreinforced each other and led to an even stronger impact on poverty reduction.
38. Two factors underlie Vietnam's success in reducing poverty during 1993-98: the highgrowth rate of this period; and the high impact of this growth on poverty. As a result, despite therise in inequality, Vietnam was able to get a big bang for its growth in terms of povertyreduction. But both these factors are now under threat. During the crisis years of 1998 and 1999,Vietnam's growth rate has already fallen by half (to around 4 percent). And in the future, the pastrelationship between the level of growth and the impact on poverty might not hold, as Vietnammight not be able to replicate the land-based, agricultural diversification success story of the lastfive year period, which is now reaching its constraints. Hence, the sources of growth are likely tobe different in the next five years as compared with the last five. Greater reliance will need to beplaced on two other areas of growth in the future: rural off-farn employment and urbanemployment. But for both these, accelerated and urgent reforms are necessary on a broad rangeof structural issues.
Economic reforms will be essential for growth and poverty reduction
39. Continued progress in poverty reduction will, of course, require sound economicmanagement. This involves the promotion of increased domestic savings and foreign capitalinflows. It will also require that these savings are channeled towards investments that willmaximize employment growth and poverty reduction. The Government has recognized that anumber of special issues will need to be addressed if growth is to be restored and greateropportunities provided for Vietnam's citizens to obtain productive jobs. Some of the key issuesthat the Government will need to consider are:
(i) How to improve the climate for enterprise so that more jobs can be created?
(ii) How to provide better financial services and to have a healthy banking system?
(iii) How to address and mitigate the social costs ofpolicy change?
40. There is currently too little recognition as to why the reform measures are essential forrestoring growth and reducing poverty. But there is a strong link between the nature and pace ofreforms, the level and pattern of growth, and the poverty reduction that has been achieved duringthe 1993-98 period. As discussed earlier, in the five years prior to the East Asia crisis, Vietnamwas able to achieve growth rates of around 8 percent per annum. These high growth rates, andthe resulting gains in poverty reduction, were driven by the doi moi reforms undertaken during

xiv
the late 1 980s/early 1 990s. Key elements of the reform program included sound macroeconomicmanagement, combined with dramatic reforms in the agricultural sector. They also included thefirst steps towards integration into the international economy, towards making the state-enterprise sector more viable, and towards having a sustainable banking and financial system.
41. A new phase of reforms is nLow needed to restore the momentum of growth and toimprove the quality of development. IThese economic reforms are necessary not just for creatingopportunities for higher employment and income growth, but also to address issues of equity andvulnerability. The access of the poor to financial services-both credit and savings-isconstrained under the present financial system. If credit constraints prevent the poor fromavailing some of the new opportunities that are being created, future growth in Vietnam is likelyto be less pro-poor and less equitable. Similarly, lack of access to financial savings instrumentsexacerbates the vulnerability of the pcor and makes them less able to cope with shocks. It canalso trap them in a vicious circle of poverty if they resort to selling off other assets like land orlivestock to cope with the shocks.
Vietnam's development partners can assist in designing and implementing acomprehensive poverty reduction strategy
42. This report has been produced by a Poverty Working Group with representatives fromeight Government agencies and mass organizations, three intemational NGOs (working inpartnership with local government officials, local NGOs and research organizations), onegovernment-donor project, and four multilateral and bilateral donors. It has also involvedprovincial authorities in four provinces-Lao Cai, Ha Tinh, Tra Vinh and Ho Chi Minh City. Itis an example of what an effective partnership can accomplish. The process of producing thisreport has led to a shared perspective among the members of the working group on the natureand causes of poverty in Vietnam. For example, by working together, there has been a betterunderstanding-and a shared concern--between the authorities, the international agencies, andthe NGOs on complex and sensitive issues such as ethnic minorities, unregistered urbanmigrants, and gender relations. By working together, GSO and the World Bank have been able toadopt a common methodology for measuring poverty and now have a common poverty line anda common set of poverty estimates that they can both use to track changes in poverty and helpdesign anti-poverty policies.
43. While the process of working on this Report has led to a shared perspective on the natureof poverty-related problems and their causes, there has yet to emerge a shared view on thestrategy needed to move forward. While commonalities exist in many areas, in some areas thereare significant differences in opinion between the Government of Vietnam and its developmentpartners. For examnple, one area where they differ is the appropriate role of the Governmentversus households themselves in financing basic social services. The Government believes thatself-reliance is important and that co-financing of these services is essential to reducedependency. It chooses to assist the poor primarily through subsidized credit. The donors andNGOs believe that a better way to assist the poor would be to channel state subsidies throughbasic social services and to allow credit to be provided at market rates to ensure an efficient useof scarce resources.

xv
44. This report raises a numbers of other, more specific, questions and issues which will alsodemand more research and discussion before consensus can be reached on solutions. Importanttopics which have been raised but left unresolved in the process of producing this povertyassessment include:
* How can agricultural productivity be raised? What role does rice policy have to playin Vietnam's future growth and poverty reduction strategy? What can be done topromote the further diversification of agriculture?
* How can the off-farm rural sector be stimulated to provide the employment andincome-generating opportunities which the rural population will increasingly need?
* What is needed to make urban planning more pro-poor and growing cities more"livable"? What changes are needed to allow migrants to contribute more to theprosperity of cities and how can their basic needs be better protected?
* What is the role of targeting versus broad-based growth in a poverty reductionstrategy for Vietnam? What is the right balance between the two in terms of resourceallocation/policy emphasis?
* What can be done to help the upland regions - and their ethnic minority population -catch up with the rest of the country so that the poverty-reducing effects of growthare spread more evenly?
* How can basic social services be made more affordable to the poor? Can the severefinancial burden of ill-health be lifted? Can existing social safety-net expenditures bemore effectively targeted towards the poor?
* What is the Government's role in addressing equity issues at an intra-householdlevel? How can these issues be tackled most effectively? Who else can play a role inaddressing these issues?
* What help does the Government need to implement the Grassroots DemocracyDecree so that local decision-making processes can be made more participatory andtransparent and local authorities can be made more accountable?
* What institutional arrangements might improve the Government's capacity todevelop and monitor policies for poverty alleviation? What is needed to improvecoordination across Ministries and agencies involved in anti-poverty programming?How could short-term poverty monitoring be improved?
* What has been the impact of some of the major components of the HEPR Programwhich have been operating for some years? How can their impact on povertyreduction be enhanced?
45. More progress will need to be made during the coming year in these and other areas-through joint work in many areas such as public expenditure reviews, banking reform, andthrough further research. The task now is to arrive at a common approach to these issues and to acommon poverty reduction strategy for Vietnam during the next year as the next Five Year planis finalized by the end of the year 2000.


1
PART I
ANALYSIS OF POVERTY
The first part of this report exploresnew information on poverty providedby the 1998 Vietnam Living StandardsSurvey and by four ParticipatoryPoverty Assessments. Chapter Oneexamines trends in per capitaexpenditures and in social indicatorsand also presents trends in wellbeingas perceived and articulated by poorhouseholds. Chapter Two discussesthe characteristics of poor households:who is still poor in Vietnam today?

2
CHAPTER1
TRENDS AND PATTERNS OF POVERTY REDUCTION
AT A GLANCE:POVERTY REDUCTION IN VIETNAM
* Poverty, however measured, has declined in Vietnam between 1993 and 1998. This is representedquantitatively by rising per capita expenditures and improving social indicators and is also reflectedby the perceptions of poor households that overall wellbeing has improved over recent years. Rapid,economic growth lies at the heart of these achievements.
* Poverty remains a largely rural phenomenon, with 90 percent of the poor living in rural areas, andwith 45 percent of the rural population living below the poverty line.
* Although the incidence of poverty in urban areas is less than 10 percent, pockets of severe povertypersist in urban areas. Poor migrant groups may not be fully captured in the statistics. Urban povertyappears to be a particularly complex phenomenon.
* The gains in poverty reduction have been widespread. Poverty has declined in all seven regions ofVietnam, though the rate of declirLe and incidence of poverty varies greatly across regions
* The Northern Uplands, Central Highlands and North Central Coast are the three poorest regions.Poverty gap measures further suggest that poverty is deeper in the upland regions. The South Eastregion, which include Ho Chi Mirnh City, is the wealthiest region by a considerable margin.
* Three regions account for almost 70 percent of Vietnam's poverty: Northern Uplands (28 percent);Mekong Delta (21 percent); and the North Central Coast (18 percent).
* The most dramatic reduction in poverty has occurred in the Red River Delta. The Mekong Delta,conversely, shows the smallest improvement.
* The dramatic gains in poverty reduction in Vietnam between 1993 and 1998 remain quite fragile.Poverty estimates are very sensitive to the exact positioning of the poverty line and the incidence ofpoverty might best be described as lying somewhere in the range between 30-45 percent.
"Most people in Tra Vinh Province are better off than they were ten years ago. Theyhave higher incomes, more savings, better nutrition and health, more governmentservices and more of their children are attending school (and staying there longer).Even when remarking upon their personal problems, most respondents stronglyconfirmed these trends.... In addition, most people in Tra Vinh expect life to continue toget better". Tra Vinh PPA, Oxfa,rn GB (1999).
1.TRENDS IN POVERTY
1.1 Poverty has declined shairply in Vietnam between 1993 and 1998
1. There have been very striking reductions in the incidence of poverty in Vietnamover the last few years. This is reflected in rising per capita expenditure and inwidespread reports of improvements in broad wellbeing. The proportion of people withper capita expenditures under the total poverty line has dropped dramatically from 58

3percent in 1992/93 to 37 percent in 1997/98 (Figure 1.1)1. The number of people belowa "food poverty line", which is lower, has also declined from 25 percent to 15 percent,indicating that even the very poorest segments of the population have experiencedimprovements in their living standards between 1993 and 1998.2 While povertyincidence is still quite high in Vietnam, these declines in poverty and food poverty overa period of only five years are very impressive. In recent years, almost no other countryhas recorded such a sharp decline in poverty in such a short period of time (the possibleexceptions being China and Indonesia in the 1980s).
70 s58 Uj99360 4 Bi9g
50- . 3740
| | ! I ~~~2530~
20
10
Total Poverty Line Food Poverty Line
Figure I:I. Incidence of Poverty in Vietnam, 1993 - 1998Source: GSO and World Bank estiiawes based onVLSS93 and VLSS98.
2. These quantitative indicators of poverty have been based on data collected by theGovernment Statistical Office (GSO) in two household surveys carried out in 1993 and1998 (Box 1.1).
i Data collection for the first Livings Standards Survey took place in 1992/93 between October 1992 andSeptember 1993. For the second survey, data collection took place in 1997/98 between December 1997and December 1998. For the purposes of this report, these surveys will be referred to as VLSS93 andVLSS98 and the survey years 1992/93 and 1997/98 will be referred to as 1993 and 1998.
2 Indicators of the depth and severity of poverty also indicate an improvement in welfare. The PovertyGap index, which measures the depth of poverty, has declined from 19% to 10% between 1993 and 1998.The Squared Poverty Gap, which measures the severity of poverty, has also declined over this period-from 8% to 4%. Calculation of the poverty gap measures is described in Annex 1.

4
3enera Stotistic raltfie withgundis fromete inA (Swedenad l ) hand teecnicalcuasesistnce faonthemWrdfan hsationally acceptntdtmethdlg o sapefng povery. p Thiey d eata snarie thne nufe topis
bais ofper apit expenditures.n oe Teuctio hoealthy fetlitanes nusdtrition;erallopoen iratyion;hosnd g; fo apricutyralaeinies-sall household buinesses, crdt n avns ddto t h
pric qustinnaies nd,for 998 Jmoules 199 schoo a ond heathnaclites So 9e 4,000 houseod
Overe icued 1inte the otens yApoe xpimtuel 4n00 homeholdu _ onlunedini t t t ns sr p i
pane o:f hSO ushorlds B for ankestiatesbe how VLS9 3andr h h o i(
3. The poverty rate figures presented in Figure 1.1 have been calculated using aninternationally accepted rethodology for defining poverty. They measure the number ofpeople (the "headcount index") below some poverty line that has been calculated on thebasis of per capita expenditure. The two poverty lines used-the overall poverty lineand the food poverty line-are presented in Table 1.1.
Tableoo consumptyione suc asecaothin3 and hosn.9oshod98 raov h
poverty lnthrfAnnual Per Capita Expenditures
1993 1998
__________________________ (January 1993 '000 Dong) (Januarv 1998 '000 Dong)
Food Poverty 750 1,287 ($92)
.Overall Poverty 1,160 1,790 ($128)
Note: Expenlditures include home-produced commuodities.
Source: GSO and 'World Bank estimates based on VLSS93 and VLSS98
4. The poverty lines presented in Table 1.1 have been agreed by the GSO and WorldBank as representing an appropriate threshold dividing poor households and non-poorhouseholds3. Households on the lower poverty line - the food poverty line - have percapita expenditures which allows them to consume 210)0 calories per day, but with noallowance for essential non-food expenditures. Thus any non-food expenditure made byhouseholds on or below this poverty line is at the expense of an adequate nutritionalintake. The poverty line that we refer to most frequently has an allowance for essentialnon-food consumption such as clothing and housing. Households on or above thepoverty line therefore have per capita expenditures which are sufficient to cover
3Full details on the poverty lines are g:iven in Annex 2.

5nutritional needs and basic non-food needs. This total poverty line has gone up fromVND 1.2 million ($83) in 1993 to VND 1.8 million ($128) in 1998. The poverty lineshave been calculated to take account of regional price differences and monthly pricechanges over the survey period.
1.2 Social indicators have improved between 1993 and 1998
5. These improvements in living standards as measured by household expendituresare strongly supported by other sources of information and data. Social indicators showimproved access to health and education services. Qualitative information from thePPAs reinforce these findings by identifying a number non-economic improvements inthe lives of poor households in recent years, such as the sense of control that householdsfeel they have over their livelihoods. However poverty is defined and measured, theavailable information demonstrates improvements in living standards.
6. All indicators in Table 1.2 on human development, infrastructure access, andownership of consumer durables confirm the story of a rise in living standards between1993 and 1998.
* Primary school enrollment rates were already high for both girls and boys, buthave improved further-they have increased from 87 percent to 91 percent forgirls and from 86 percent to 92 percent for boys;
* Lower secondary enrollment rates have doubled for both girls and boys, andare now at 61 for girls and 62 for boys. The number of children enrolled inlower secondary school dipped to a low of 2.7 million in 1990, but this hasnow climbed to 5 million;
* Upper secondary enrollment rates have increased dramatically for both girlsand boys-they have gone up from 6 to 27 percent for girls and from 8 to 30percent for boys. 1.6 million children were enrolled in upper secondary schoolin 1998, reversing the downturn in enrollments seen in the late 1980's andearly 1990's (World Bank, 1995);
* Malnutrition amongst boys and girls below the age of 5 years remains high inrelation to other child health indicators, but has declined dramatically fromabout half the population to a third;
* Adult nutritional status has improved slightly, but 28 percent of adults remaineither moderately or severely malnourished. Nutritional status is improvingmore rapidly for men than for women;
* Access to infrastructure-such as public health centers, clean water, andelectricity-have all increased;
* Ownership of consumer durables-such as radios, television, and bicycles-have also all gone up. In 1998, 47 percent of households own a radio, 58percent own a television, and 76 percent own a bicycle.

6
Indicator 1993 1 1998 1Human Development--EducationPrimary enrollment rate (net)
Female 87.1 90.7Male 86.3 92.1
Lower secondary enrollment rate (net)*Female 29.0 62.1Male 31.2 61.3
Upper secondary enrollment rate (net)"'Female 6.1 27.4Male 8.4 30.0
--Child NutritionIncidence of Stunting Among Childrern 0-59 Months 51 34
Female 51 33Male 50 35
-- Adult NutritionIncidence of moderate and severe ma:lnutrition in adults (Body mass index 32 28less than 18.5)
Female (non pregnant) 32 30Male 32 25
Access to infrastructure% of rural population with public health center within the commune 93 97% of rural population with access to clean water** 17 29% of urban population with access to clean water** 60 75% of population using electricity as a main source of lighting 48 77Ownership rates of Consumer Durables% households owing a radio 40 47% households owing a television 25 58% households owing a bicycle 67 76
Footnote: * The rapid increase in secondary enrollment rates reverses a decline in enrollments in the 1987-1992period.
** Clean water is defined to include piped water, deep wells with pumps and rainwater.
Source: World Bank estimates based on VL'SS93 and VLSS98.
1.3 The poor feel that their living standards have improved in recent years
7. The four PPAs used wellbeing rankings and other participative techniques toengage poor communities in discussions and analysis of what constitutes poverty andwellbeing (Box 1.2). Some of the dominant criteria defining poor or vulnerablehouseholds which emerge repeatedly from the wellbeing rankings are shown in Table1.3 below.

7
lBOX 12. The FRour Participatory Poverty Assesments for Vietnam XResearch sites for thet four PP-As werer chosen to represet ihe diversity of geographic physica and socialJcirumstances which poor household face. More than 1000 households were involved with th research.The PPA sites are deserbed below.
Lao Cai Province: Iplemnented by the Vrnam-Sweden Mountai Rurat Development Program, -thisstudy investiates the sitation of poor households in six villages of two quite different Districts, The studyarea has a high proportion of ethnic minority groups - the villages covered have a population of more than12 ethnic groups, including the majoity uih. The topogrphy and tmng systems vary greatly fromvillage to vilage, but include both upland and paddy agrcultue Some vilaes are very remote.
Ha Tihl Province: AcionAM Vienam, in collaboration witl local Goverment partners and a local NGOt(RTOCD), covered 13 vilages of six Distics in this drought-prone and typhoon-prone aea of the north-cental region. The population here is ethically homogeneous and largely dependent on farning very poorquahly: land.
Tra Vinh Province: Oxfn GB compared four villages im a relatively wealthy District and four vilages inthe poorest Distrit in this PPA. The study included vilages which were populated mainly by Khmerhouseholds and vilages which were predominantly Kish. The Mekong Delta is not one of the poorestregions in the country, but it grew relatively slowly in the period 1992-1997. Landless households form aparticularly poor and vulnerable group in this region and appea to be growing in number,
Ho Chi Mink Cty This PPA, carried out by Save Ike C7ldren Pond (04 shows that athough Ho ChiMinh City is the largest urban area in the wealiiest region of Vietnam4 there are still pockets of severepoverty. Poor households in Ho Chi Minh City ae usually dependent on variable mcome frm the infonmalsector and are very vulnerable to fluctuations in the denand for unskilled labor and infora sectorservices. Conmumuies of poor mgrants who lack permanet household reistration are especiallydisadvantaged.
Resources to cany out the PPAs were, provided by the implementing agencies, DFJD (UK) and the WorldBank.
8. The very striking drop in poverty levels indicated by the traditional povertyheadcount measure is strongly reinforced by the PPA findings. In all rural sites, there isconfirmation that wellbeing, which includes non-economic dimensions of poverty, hasimproved for most households over recent years (Box 1.3). The Ha Tinh PPA remindsus, however, how low the base was in the past: "I am terrified when I consider how badour situation was 10 years ago" says one interviewee. Economic improvements werepart of the story that poor, rural households told and generally these were related to thereturn to household-based production systems and the opportunity to engage in new,primarily agricultural, activities and expand their farm bases profitably. These issues areexplored further in Chapter 3.

8
9. As well as increasing incomes, this broadening of the farm base was seen toimprove the resilience of poor households to shocks and crises and improve livelihoodsecurity. In the PPAs, the poor use a variety of economic and non-economic indicatorsof well-being to describe their situation (Table 1.3). Thus, many households commentedduring the PPAs that they now felt they had more control over their lives. Other non-economic improvements over recent years which households noted included:
* Greater domestic harmony as the economic stress diminishes
* Better community cohesion and a reduction in community disputes
* Improvements in infirastructure, especially irrigation and schools
- Greater physical mobility was important to households in one of the studysites and recent years had seen an increase in the volume of out-migrationfrom this poor, rural area.

9
Table 13: Indidators of Pov"rt as described by Poor Housei
Endowment of Respondents in all PPA sites described poor households as those households whonatural, financial and are chronically hungry. Their economic asset endowments are so constrainedmaterial capital that they are unable to cover very basic consumption needs. In rural areas, their
limited resource base means that their household economies are not diversifiedand they are very vulnerable to poor harvests. In the urban site, their limitedresource base means they have few options for generating a stable cash incomeand are generally dependent on the informal service sector to earn a variableincome. Indebtedness (and the high levels of economic and psychological stressthis entails) is seen as a signal of poverty. Small houses with a temporary roof isvery frequently quoted as a defining feature of poverty in the PPAs.
Endowment of Household composition and structure - closely linked to phases of the householdhuman capital life-cycle - are often used for identifying poor households. Having many small
children, which creates an unfavorable dependency ratio, is an indicator in allstudy sites. Similarly, households lacking laborers, through the death, illness ordeparture of an adult member are perceived as being particularly poor. Small,elderly households are identified as poor because of their diminished labor baseand vulnerability to ill health. Households with adults of low levels of educationalattainment and, in ethnic minority areas, limited abilities in Vietnameselanguage are described as having low levels of wellbeing. In all study sites, non-attendance of school-age children at school is a sign of poverty.
Vulnerability to crises The lowest well-being categories in the PPAs include households with memnbersand shocks who are suffering from illness, with members who have recently died and with
members who are drug addicts or alcoholics. They also include households whohave suffered livestock loss or death or failure of an investment. All these implyeither expenditure outlay or income shortfalls which pose enormous problems forresource-poor households.
Cultural and physical The PPAs conducted in areas with high ethnic minority populations suggest aisolation strong ethnic dimension to poverty, with some groups suffering more than others.
Physically remote households are seen as being poorer and, in Ho Chi Minh City,households living on land scheduled for clearance or located off the main alleysare considered poor.
Low levels of social Poor migrant households without permanent residential permits are described ascapital or being a poor group because of the formal exclusion they face from certain services.socially excluded Recent arrivals in Ho Chi Minh City, Tra Vinh and Lao Cai study sites commonly
have fewer assets, worse land and limited social networks and informal safety nets.Households are sometimes placed in lower categories on account of their limitedsocial connections, which both diminishes their capacity to cope with crises andlimits their opportunities for getting ahead.
Note: Phrases in bold type used as criteria in well-being rankings for separating poor households from the better-off.

10
10. The PPA findings suggest that households who have enjoyed the most rapid gainsin well-being over the last few years are likely to have started from a favorable positionin terms of overall household wellbeing. Their circumstances mean that they are well-placed to take advantage of new opportunities which all households see emerging, butnot all households can profit from. In particular, these households are likely to:
* be at a stage in the household life cycle which allows them to invest labor innew activities or in intensification of existing activities
* have access to information about markets and new techniques
* in rural areas, have land and financial endowments which allow them tocover consumption needs without resorting to selling assets or taking loans
* have access to garde,n land and space for sideline occupations
* have access to reserves or formal sector credit to invest in new activities. Inall rural study sites,, there was a clear consensus that access to the latter isgenerally skewed in favor of the wealthy
* in urban areas, have permanent registration and a source of regular income
* in all sites, be healthy
11. The implication is that households facing constraints in these areas are less likelyto take advantage of new opportunities. An interviewee in Ha Tinh reflected that "thereare more opportunities than bejore, but poor people are able to take advantage of themless. "
2. PATTERNS OF POVERTY REDUCTION
12. One key issue is the extent to which this reduction in poverty was shared amongall members of society. This section looks at the differences in the incidence of povertyacross urban and rural sites and across regions. These differences in urban and ruralperformance have translated into a moderate increase in inequality, as discussed inChapter 4.
2.1 Rural and urban poverty have declined between 1993 and 1998, though theurban poverty story is particularly complex
13. Between 1993 and 1998, poverty has declined in both rural and urban areas(Figure 1.2). The percentage of population living below the total poverty line hasdeclined from 66 to 45 percent in rural areas and from 25 percent to 9 percent in urbanones. If we look at the percentage of the population living below the lower "foodpoverty line", we find also find a decline in both rural areas (from 29 percent to 18percent) and in urban ones (from 8 to 2 percent).

66! 1
6 X 45 W199350 1 0199840 i2 93020,o 0 _:
Rural Urban Rural UrbanTotal Poverty Line Food Poverty Line
Figure 1.2; Incidence of Poverty in Vietnam by Rural-Urban AreasSorce: GSO and World Bank estimaes based on VLSS93 and VLSS98.
14. Declines in poverty levels in rural and urban areas have been matched withimprovements in access to education and in access to infrastructure. Between 1993-1998, net primary school enrollment rates in rural areas have gone up from 85 to 91percent. For urban areas, the net primary school enrollment rate has remained more orless unchanged at a very high level (96 percent). There has also been improved access toclean water supplies and sanitation facilities in both urban and rural areas. The ruralpopulation is less dependent now on river or lake water and more people take drinkingwater from drilled wells. In urban areas, more than half the population have access topiped water. Over 90 percent of the urban poor and nearly 60 percent of the rural poorhave access to electric lighting
15. Despite impressive declines in poverty in rural areas in the past five years almostone fifth of the rural population is still food poor and nearly one half is still poor. Evenafter adjustments are made for the possible undercounting of the urban poor (see Box1.4), over 90 percent of the poor are resident in rural areas. The poverty gap index alsoindicates that poverty is much deeper in rural than in urban areas - the poor in ruralareas are further below the poverty line than in urban areas (Figure 1.3). However, inboth rural and urban areas the depth of poverty has declined during the 1993-98 period.

12
inI1993 19
AllVietm Uban RuralV Ev 0.00 P_ I Poverty Line
: g io'o1' 't' 1 60,00 64015.00
25.00 ~~~~~21 .50
Figure 1.3: PvryGpIdxb ua ra ra
16. These figures suggest that future efforts at poverty reduction still need to focus onrural areas, because this is where the poor continue to reside in Vietnam. However, asBox 1.4 indicates, the VLSS98 data might not be fully capturing the status of the poor,new migrants into urban areas, and might therefore be underestimating urban poverty inVietnam. Recent studies suggest that migrants, on average, are better educated andbetter off than the resident population (UJNDP, 1998). The Ho Chi Minh City PPA,however, reveals a group of poor, unregistered migrants who appear to be struggling.
peraen eidenc in ths areas tucb igansaresamon the poorstebr of u-rba ras and
between ~ ~ t 10 peren an IS percent. S vr d
17. It is interesting that the Ho Chi Minh City PPA with its analysis focussing onbroader well-being paints a more ambiguous picture of trends in poverty than thoseemerging from the quantitative work. This PPA covered six wards in three Districts andseveral of these sites had a high proportion of households who did not have permanentregistration in Ho Chi Minh City. These households appear to be disadvantaged in manyrespects, but particularly in their access to Government services directed towards thepoor. For example, these families do not qualify for subsidized loans provided under theGovernment's targeted Hunger Eradication and Poverty Reduction (HEPR) program(see Chapter 5 for details). Nor can they apply for exemptions from health costs and

13school fees as the permanently resident poor community can. These and other poorhouseholds in Ho Chi Minh City were asked to look back over recent years and considerhow their wellbeing had changed over this period. Most of the very poor and poor urbanhouseholds surveyed felt that conditions had either become worse or had remainedunchanged in the recent years. Only amongst the better off urban households did morethan half feel that conditions had improved.
18. The suggestion from the Ho Chi Minh City PPA is that urban poverty is a morecomplex and, in some senses, more brutal phenomenon than rural poverty. The analysisof urban poverty presented in the Ho Chi Minh City describes poor households livingwith very high levels of vulnerability: insecurity of housing and land tenure, livelihoodinsecurity and physical insecurity because of the threat of ill health and violence withinthe household. This PPA illustrates the psychological stresses of poverty, with indebtedhouseholds fearful of moneylenders and poor households describing how the wealthierhouseholds look down on them causing them to lose self-esteem. Even young childrenarticulate a sense of inferiority: "the poor children are looked down upon by others andhave few friends. Children of rich families have many friends."
2.2 Targeting resources for poverty alleviation demands consideration of theincidence of poverty, the depth of poverty and the size of the poor population.
19. Poverty has declined in all 7 Regions of Vietnam, but at different rates --while the incidence of poverty fell by 34 percentage points in the Red River Delta (from63 to 29 percent), it fell by only 10 percentage points in the Mekong Delta (from 47 to37 percent) (Figure 1.4). The proportion of the population living under the poverty linenow varies from 8 percent in the South East to 59 percent in the Northern Uplands,though as discussed above, the poverty rate for the South East region, which includesHCMC, might be underestimated due to the undercounting of unregistered migrants.
20. The three regions with the highest poverty rates in 1993 were Northern Uplands,North Central and the Central Highlands. These three regions still show the highestincidence of poverty, with poverty rates of 59 percent (Northern Uplands), 52 percent(Central Highlands) and 48 percent (North Central Coast). Of these, the North CentralCoast has seen the greatest reduction in poverty and the Northern Uplands the least. Thepersistence of high levels of poverty in the Northern Upland and Central Highlandregions is symptomatic of the many constraints which these regions face in participatingin the growth process. These include a difficult physical environment which limitsagricultural development and which hinders access to infrastructure.

o" 0 Q X
vz. Ri i4. 'l'Wffi
I 'Sf m S///////_W S t :w::P04 -
i t -Jitele;Rme l X= -it~~~~~~~~~~
.l S i l 'SlVfiI L
-o -4~~.X
: ; : 00;kk :t 990XX~~~~~~~~~~~~~

1521. The PPA conducted in Lao Cai Province in the Northern Uplands suggests thatwhile households in the midland areas might be able to benefit from new marketingopportunities, many households living in the highland areas were simply too remote andoften too deprived in terms of land and financial capital endowments to take advantageof the opportunities. Critically, they also lack information on markets and on newtechniques. The population of the Northern Uplands region and Central Highland regionhas a high proportion of ethnic minorities and these ethnic minority groups are generallypoorer than the Kinh majority. While a lot of research has been done on poverty issuesin the Northern Uplands, relatively little is still known about the nature of poverty in theCentral Highlands.
22. Poverty is deeper in the Northern and Central Upland regions of Vietnam -The poverty index measures suggest that poor households in the upland regions ofVietnam are further below the poverty line than is true for the nation's poor as a whole.The depth of poverty has also been reduced in recent years for all regions (Table 1.4).
1.4: Dept of Poverty by1o,13adI9
| ~~~~Poverty Gap IndexRegion |(measuring the depth of poverty)
=E ~~~~~ ~ ~ ~~1993 1998
Northern Uplands 26.8 16.8
Red River Delta 18.8 5.7
North Central 24.7 11.8
Central Coast 16.8 10.6
Central Highlands 26.3 19.1
South East 9.2 1.3
Mekong Delta 13.8 8.1
All Vietnam 18.5 9.5
Source: World Bank estimates based on VLSS93 and VLSS98.
23. The Northern Uplands, the Mekong Delta and the North Central Coastaccount for 70 percent of Vietnam's poor -- For purposes of resource allocation, it ishelpful to look at the contribution different regions make to the overall povertyheadcount in Vietnam. This is interesting because while certain regions have a highincidence (and depth) of poverty, they represent a very small segment of the nation'spoor. The Central Highlands region is the most extreme example of this: although 52percent of its population is poor, these poor households account for only 5 percent of allpoor households in Vietnam. Table 1.5 shows the distribution of the nation's poorpopulation across the 7 regions in Vietnam. The Table shows that almost 70 percent ofVietnam's poverty is accounted for by three regions: Northern Uplands (28 percent);Mekong Delta (21 percent); and the North Central Coast (18 percent).

16
Region ContribuLtion to Total Share of Population l
l Poverty Population (millions) l
(percent) l _l
19923 1998 1998 1998
Northem Uplands 21 28 18 13.5
Red River Delta 23 15 20 14.9
North Central 16 18 14 10.5
CentralCoast 10 10 11 8.1
Central Highlands 4 5 4 2.8
South East | 7 3 13 9.7
Mekong Delta 18 21 21 16.3
All Vietnam 100.0 100.0 100.0 75.8
Source: World Bank estimates based onVLSS93 and VLSS98.
2.3 The dramatic gains in po,verty reduction in Vietnam during the last 5 yearsremain quite fragile
24. The evidence presented in this chapter-from the household expenditures, fromother quantitative indicators of welfare, and from the situation described by the poorthemselves-all convey the same message: that between 1993 and 1998, no matter howyou define and measure it, the:re has been a dramatic decline in poverty. They alsoconvey another message: that poverty still remains very high in Vietnam and that almost40 percent of the population lives below the poverty line.
25. While the overall trend is clear, the exact percentage of those that have grown outof poverty and those that remain in poverty need to be used with caution. It should benoted that the quantitative estimates of poverty presented in this chapter and used in therest of this report are extremely sensitive to the poverty line used. If the poverty line israised by 10 percent, the proportion of the population under the poverty line rises to 45percent. If it is lowered by 10 percent, that proportion falls to 29 percent. The greatsensitivity of poverty incidence to where you draw the poverty line is because a largeproportion of the Vietnam's population were bunched closed to the poverty line in both1993 and 1998 (see Figurel in Executive Summary and Figure 5.1 in Chapter 5). Thus,instead of saying that the poverty rate in Vietnam is 37 percent, a better depictionwould be to say that it lies in thie range of 30-45 percent.

17
CHAPTER 2
CHARACTERISTICS OF POOR HOUSEHOLDS
AT A GLANCE:
KEY CHARACTERISTICS OF POOR HOUSEHOLDS
* The poor are predominantly farmers with low levels of educational attainment and limited access toinformation and functional skills. In 1998, nearly four-fifth of the poor worked mainly in agriculture.
* Poor households have small landholdings and landlessness is becoming more widespread, especiallyin the Mekong Delta. Households who are unable to make a living from the land find fewopportunities for stable income generation off the farm. There is an urgent need for reforms whichwill stimulate greater off-farm employment.
* Households with many children or few laborers are disproportionately poor and are particularlyvulnerable to high and variable health and education costs. Newly-formed households go through aninitial phase of poverty, aggravated by liniited access to land. Poor households are also frequentlycaught in a debt trap.
* Poor households are vulnerable to seasonal hardship and household-specific and community-wideshocks. Poor households may be socially and physically isolated.
* Poverty among ethnic minority groups has declined, but not as rapidly as for the majority population.Ethnic minorities face many specific disadvantages which should be addressed through an EthnicMinority Development Program.
* Migrants to urban areas who are poor and who have not secured permanent registration facedifficulties in accessing public services and may also be socially marginalized. Further work isneeded in identifying the best way to help these groups.
* Children are over-represented in the poor population. Poor children are less able to attend school andare trapped in a cycle of inherited poverty and feel particularly insecure.
This chapter examines some of the characteristics of poor households as described inthe PPAs and the VLSS. Such poverty profiles are frequently used in identifying andtargeting the poor.
1. OCCUPATION, EMPLOYMENT STATUS AND EDUCATION
1.1 The poor are predominantly farmers
1. There has been a gradual change in the 1993-98 period in the shares of thepopulation engaged in different occupations . There has been very slight decreases in theproportion of households with heads engaged in agriculture, manufacturing, andconstruction and small increases in proportions engaged in white-collar occupations orsales services. Falling poverty in Vietnam has been associated with falling poverty rateswithin each occupational category rather than shifts in occupational patterns.

182. In keeping with the finding that poverty is still very much a rural phenomenon,calculations of poverty rates across occupations and types of employers suggest thatthose below the poverty line are likely to live in a household whose head is a farmer(Table 2.1). In 1998, almost 80 percent of the poor worked in agriculture.
Characteristic Poverty Share of Total Share ofIncidence(%) Poverty (%) Population (%)
Primary Occupation
Agriculture 48 79 61
Manufacturi 26 9 13
Sales Services 13 3 9
White collar 10 2 7
Other 6 0 1
Retired 26 4 6
Other not working 30 3 4
Total 37 100 100
Source: VLSS98, GSO (1999).
3. Access to some form of stable income from employment or from social servicetransfers was seen as a very important indicator of wellbeing in the PPA studies (Box2.1). In certain study sites, Ha Tinh and Ho Chi Minh city in particular, being salariedor "having a good job" or being in receipt of a pension were criteria which liftedhouseholds into higher wellbeing categories. Often the amounts earned in these jobswere not great: their main value was in their stability and security. Households in theTra Vinh and Ha Tinh study sites perceived a qualitative difference between having aregular job, which places households in a higher category and selling labor on a dailybasis, which does not. While day 'labor brings in cash at certain times of the year in theserural areas (perhaps VND25,000-30,000 a day for a man and VND15-20,000 a day for awoman for three or four months of the year) it does not seem to bring a sense ofsecurity. In both Ha Tinh and Tra Vinh, demand for day laborers is simply notdependable enough throughout the year to make a sufficient contribution to householdlivelihood security. In Ho Chi Minh City, most of the poor households interviewed hadmain laborers active in the informal sector and were dependent on very irregularincomes.

19
1ks2A:Depndeeeon Lowv and hMeglar lncomes~ in lIo Chi iNab City
Thuy is 30 years old, and lives in a litte house in distrit S with her husband and three cildren aged1L2 10 and 7. She selLs noodle soup on the street, but canot opeme in oute place as s}wc used to becauseof the recent govenment regulations She eamns around 15,000 dong a day. Her husband drives a cyclowhich he rents for 3,000 dong a day. His income is low and irregular, particularly now that cyclos arebecoming less and less popular. Sometimes, when her business capital runs low, Thuy borrows moneyfrom a moneylender.
The way Thuy has found of keeping the family afiloat in times of difficulty is to sell her blood. Shestarted doing this 10 years ago, when her own mother was very ill and money was needed for hertreatnent. Since that time, she has sold blood very often, about twice a month on average. On eachoccsion she earns 140,000 dong.
Source: Ho Chi Minh City PPA, Save the Childert, UK (1999).
1.2 The poor have relatively low levels of educational attainment and lackfunctional skills and information
4. Poverty rates decline with higher levels of education and those with a lowersecondary education or below make up almost 90 percent of the poor. The highestincidence of poverty (57 percent) is for those who have not even completed primaryeducation. By contrast, there is hardly any poverty (4 percent) amongst those with auniversity education (Table 2.2).
Characteristic Poverty Share of Total Share of PopulationIncidence (%) Poverty (%)
Maximum Education
None 57 12 8
Primary 42 39 35
Lower Secondary 38 37 36
Upper Secondary 25 8 12
Vocational 19 3 6
University 4 0 3
Total 37 100 100
Source: VLSS98, GSO (1999).

205. The PPAs find that poor households view education as being an important key toclimbing out of poverty but suggest that wider issues of skill acquisition, general andfunctional knowledge, and access to information are critical. Households were oftenplaced in higher wellbeing categories if the adults were educated and/or if the childrenwere attending school. In Ho Chi Minh City, households commented that it wasnecessary to be educated beyond lower secondary level in order to stand a chance ofsecuring stable employment. In rural areas, households tied the importance of educationto being aware of new opportunities and of understanding new techniques (Box 2.2). Aswell as literacy skills, poor rural households see numeracy, language and technical skillsas important. Contact with extension staff, inter-action with people from outside thecommunity and access to information and the mass media emerged as important priorityareas for poor households (see Chapter 4 for details).
2. DEMOGRAPHIC CHARACTERISTICS
6. There were many issues y eelating to household composition and size which had abearing on household wellbeing which were raised consistently across the four PPAsites and identified in the quantitative analysis. In particular, the infoosnation suggeststhat:
1) Households p ith many children were often ranked as poorer;
2) Households who ghad recently separated from their extended famnilies andhad established new households were often ranked poorer. This groupsright often overlap with group (1);
3) Households who had lost adult laborers through death or desertion wereoften considered psoorelating.to Thosehold comp n-and sizeholds.

21
2.1 Poorer households have a larger number of children
7. Households with young children are described as poor by other households. Notonly do they have fewer laborers in relation to the number of mouths to feed, but theyalso have education expenses to meet and are more likely to incur destabilizing healthexpenditures (Box 2.3). The VLSS data confirn that the number of children is highest inhouseholds in the poorest quintile and drops as per capita expenditure rises (Table 2.3).However, this table figures may overestimate the impact of family size on povertybecause it assumes that the consumption needs of every household member are thesame(i.e, it does not account for the differing consumption needs of children andteenagers or take into account possible economies of scale in household consumption).
Tabl 33 Zfean Number ofChildrenUne YasOdprHulol
Expenditure Quintile
I II III IV V
(Poorest) (Richest)
All Vietnam 2.8 2.2 1.7 1.4 1.2
Rural 2.8 2.2 1.8 1.4 1.3
Urban 2.7 2.9 1.6 1.3 1.1
Source: World Bank estimates based on VLSS98.
8. While part of the poverty problem for these households is an issue of thehousehold life-cycle, it is worth noting the vulnerability of these households to increasesin education and health expenditures. VLSS98 data suggest that a household in thelowest quintile with one child in primary school and two children in lower secondaryschool will be spending 7.3 percent of total household expenditure on education costs(which has increased from 6.5 percent in 1993). These education expenditures wouldamount to 23 percent of non-food (or "discretionary") expenditure. The PPA studiessuggest that withdrawal of children from school is a common response by poorhouseholds to times of hardship or crisis. This cannot be surprising. Three-quarters ofthis quintile is unable to afford 2100 calories per day and any expenditure on non-fooditems is at the expense of nutritional intake. Chapter 5 on Vulnerability will discuss theimpact of unexpected health costs on poor households.

22
2.2 Newly-formLed households go through an initial phase of poverty, aggravatedby a lack of land
9. Newly-formed householeis are often regarded as poor by their neighbors. Likehouseholds with many young children, the poverty problem here is partly a function ofthe household life-cycle, a problem which diminishes over time as the new householdstarts to generate small surpluses, acquires new assets and develops more profitable andstable livelihood systems.
10. The PPAs ioted, however, that these households are becoming more constrainedin their attempts to set their household economies on a stable growth path because theyare receiving smaller and poore:r quality landholdings. Agricultural land has now beenlargely allocated under the 1993 Land Law. In many communes, and this is the case inall the rural PPA study sites, neew households are very dependent on their extendefamilies in accessing agricultural. land. The extent to which productivity gains will allowa stable living to be generated oint of smaller and poorer quality landholdings is a matterfor debate. What is clear, however, is that t here are very few non-agriculturalalteNatives for househoshose lanholdings are now so small that they cannot coverbasic consumption needs. Growth in wagte pove has been very low in rural areas overthe last t years and in no PPA study site did households feel that day-laboring provideda stable alteivative source of income in the face of falling landholdings.

232.3 Households who have lost an adult are particularly vulnerable
11. Households who have lost adult laborers through death, desertion or separationare often placed in the lowest wealth-ranking categories by their communities. Often_they are women-headed households and Box 2.4 below tells a story which is verytypical across the case studies. The VLSS data also show that women living alone aresubstantially poorer than men living alone.
"Poverty accompanies my family. Those who have a man in their house sufferless. " PPA Interview, Ha Tinh PPA, Action Aid Vietnam (1999).
2. Wit"o a IId in Tt S |.i i
Ms. Ngoc is a 37 year old widow whose hubn died in 1997 whe she was, 3 month preat lJ~~~~~Mnauleto ok,btelrt and strggling to raise 2~ oter youn - ^ into{
debt aad had to morge their lamd for about 3 m VND to buy food. Life improved a liitt aier-she wentto work inHo Ci MihCity to work as adestic servantin19, but she is sil -2 liVND in debt Ngoc curendyl goes out t work from 6.30am to 5pm nd lists hermain d ashaving tie money to buy back her land, and then loneliness Her older daughter is now in grade 6 atschoo whble the yonger daughr is Still too young to ated school. When- her husband li,amongst the village insttutions Ngoc cites as havig beeni most useul to her were her pei -& eWomen's Union and then the health care service. Ngoc says that other households With more asstborrowed-EPR fuwds, but she bas been refised. When she has aproached private eundestheyalso have deniedher a loanclaiing that she hasnojoan seurt becauseshehas no landand nohusband. Her dream now is to save enough capital to raise pigs and ducks, while her daugWs *gam:is freedom from debt for her mother.
Source: Tra Vinh PPA, Oxfamn GB (1999).
3. ACCESS TO RESOURCES
3.1 Landlessness is increasing and poor households have less land
12. The PPA research suggests that poor households see the quantity and quality oflandholdings as a critical determinant of wellbeing. Poor, rural households are oftendefined by other households as those who had landholdings which were either so smallor of such poor quality that it cannot support their consumption needs (Box 2.5). Thiswas especially true of newly formed households. In the Lao Cai and Tra Vinh Studysites, it is also true of households who have migrated or have been moving around insearch of land. In the Lao Cai PPA study site, poor households might have sufficientland, but the land might be so far away that farming requires more labor resources thanthe household has available. The composition of landholdings in the Lao Cai study sitevaries from village to village, but poorer households are likely to have a greaterproportion of upland rather than paddy land, more steeply sloping land and more distantplots.

24
13. In the Tra Vinh PPA study site, landlessness and near-landlessness were stronglyassociated with poverty. These eiouseholds are described in the Tra Vinh PPA as beingparticularly vulnerable (Chapter 5). VLSS data confices that landlessness is rising, butthe trends vary across the regions. In Vietnam in 1998, 10 percent of rural householdswere classified as landless. Landlessness is more prevalent in the South: more than onefifth of rural households in the Mekong Delta and 29 percent of rural households in theSouth East region were without agricultural land in 1998 (Table 2.4).
1993 1998 Average Farm SizeRegions (m2 ) in 1998
Northern Uplands 2.0 3.7 8890
RedRiverDelta 3.2 4.5 6491
North Central 3.8 7.7 5001
Central Coast 10.7 5.1 5180
Central Highlands 3.9 2.6 13746
South East 21.3 28.7 13712
Mekong Delta 16.9 21.3 10650
All Vietnam 8.2 10.1 8148
Source: World Bank estimates based on VLsS93 and VLSS98.
Note: The above estimates are for households with no annual or perennial cropland, water surface, forest, swiddenor other land. Land that is borrow or rented-in is excluded.
14. A strong commitment by Government to distribute land use rights equitablyamongst the farmers of Vietnam has resulted in a pattern of land distribution which isremarkably equitable by international standards. Although the differences inlandholdings are small by intern,ational standards, the differences which exist show a
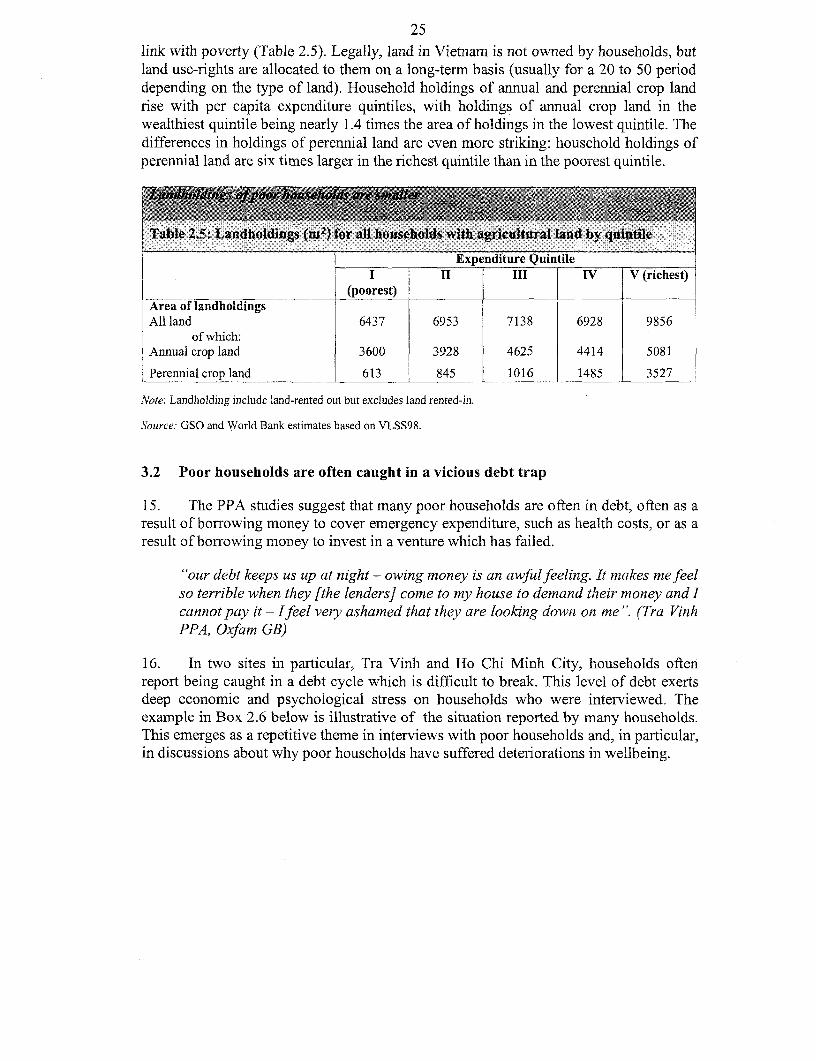
25link with poverty (Table 2.5). Legally, land in Vietnam is not owned by households, butland use-rights are allocated to them on a long-term basis (usually for a 20 to 50 perioddepending on the type of land). Household holdings of annual and perennial crop landrise with per capita expenditure quintiles, with holdings of annual crop land in thewealthiest quintile being nearly 1.4 times the area of holdings in the lowest quintile. Thedifferences in holdings of perennial land are even more striking: household holdings ofperennial land are six times larger in the richest quintile than in the poorest quintile.
Table 2.5- Lan3dholdings (2) for all householdls with agricultural land by quintile
I 1II III IV V (richest)(poorest)
Area of landholdingsAll land 6437 6953 7138 6928 9856 I
of which:Annual crop land 3600 3928 4625 4414 5081
Perennial crop land 613 845 1016 1485 3527
Note: Landholding include land-rented out but excludes land rented-in.
Source: GSO and World Bank estimates based on VLSS98.
3.2 Poor households are often caught in a vicious debt trap
15. The PPA studies suggest that many poor households are often in debt, often as aresult of borrowing money to cover emergency expenditure, such as health costs, or as aresult of borrowing money to invest in a venture which has failed.
"our debt keeps us up at night - owing money is an awfulfeeling. It makes me feelso terrible when they [the lenders] come to my house to demand their money and Icannot pay it - Ifeel very ashamed that they are looking down on me". (Tra VinhPPA, Oxfam GB)
16. In two sites in particular, Tra Vinh and Ho Chi Minh City, households oftenreport being caught in a debt cycle which is difficult to break. This level of debt exertsdeep economic and psychological stress on households who were interviewed. Theexample in Box 2.6 below is illustrative of the situation reported by many households.This emerges as a repetitive theme in interviews with poor households and, in particular,in discussions about why poor households have suffered deteriorations in wellbeing.

26
4. VULNERABILITY AND ISOLATION
4.1 The poor, especially childaren, feel extremely vulnerable
17. Vulnerability to seasonal hardship, to household-specific shocks and tocommunity-wide crises emerges as an important dimension of poverty. Poor householdswho typically have constrained endowments of either capital or land (or both) and whocan barely cover essential food aed non-food expenditure are acutely vulnerable to anysudden development which either demand expenditure or reduce income. Illness of ahousehold member is very often mentioned as an extremely destabilizing shock whichcan take many, many years for a household to recover from. Data from the VLSSsuggests that households in the poorest quintile allocate 30 percent of non-foodexpenditure to health expenses. A failure of a crop or an investment can also causesevere economic stress for a houseShold.
18. Insecurity is not iust an economic matter. Lack of information about urbandevelopment and site clearance arlans mean that many poor households are uncertainabout how long they are able to live in their current residences. Physical security isthreatened by low-hanging electricity cables which cause fires. The intensifyingproblem of drug addiction is of concer to households in Ho Chi Minh City, partlybecause it brings with it a rise in other crime. Poor, urban children in particular seem tobe living with a sense of insecurity, as illustrated in Box 2.7 below.

27
Box 2 1: Children's ecponoflrast euiinH h h t
Housing: House being '"cleared'7; house eoHapsin or ilooding neighborhood fres destroyig} l~~houses; eviction from rental property because parents have defaulted on th reng, low-
hantging electricity cables causing accidents,Education. Being pulled out from school becau parents cannot afford costs; school is closed
down; teachers beatig and huiliatng childrmDomestic' Father drinking and beating mother; shouting and quarreling in the householdSocial Neighborhood fights; drug addictionSetf-esteem: Being considered inferior by wealthier households; being beaten by richer childrenEconomic: Unstable incone; being hungxy; having bad cltesHealth: Concern about mothers' health and inablity to afford good health care for parents
Source: Ho Chi Minh Cty PPA, Save the Childr Fund UK (1 999).
4.2 Poor households feel a sense of social isolation
19. Analysis of how poor households respond to crises and cope with times ofhardship suggest that informal networks of support are extremely important to poorhouseholds. In the remote, highland villages, levels of social capital were found to behigh and characterized by reciprocal arrangements for support. Since these villages aremore homogeneous in socioeconomic terms, there are strong incentives for householdsto offer help when they are able to do so, because they may well need similar support inthe future. This might go some way to offset some of the disadvantages of living in aremote area. In other, midland and lowland PPA study sites, emergency assistance mightstill be available, but it is more likely to be monetized and it is likely to be moreexpensive. In midland and lowland villages, social connections are seen as adeterminant of household well-being. Better-connected households, those close to thelocal leadership, are likely to be in a good position to access Government supportprograms and services.
20. Certain groups of poor households expressed a sense of social isolation from thewider world and from the institutions which represent and serve them. Some aspects ofmarginalization are bound up with ethnicity: linguistic and cultural differencescompounded with real problems of physical accessibility mean that certain ethnicminority people have limited interaction with the outside world and little exposure tonew ideas and information. An urban parallel of this is some of the migrant squattercommunities in Ho Chi Minh city. There are gender dimensions to marginalization, too.Women's workloads are heavier than men's and give them little opportunity forsocializing, informal learning or attendance at village meetings. This intensifies a bias inVietnam which often casts men in the role of household representative at villagemeetings and social occasions. Poor households also express a sense of alienation fromdecisions which involve them.
4.3 Poor households are physically remote and marginalized
21. Data from the commune questionnaire of the VLSS98 indicates that mostindividuals live in accessible villages. Only 4 percent of individuals live in villages

28which are either far from a road (at least 5 kilometers) or have an unreliable road(unpassable for 3 months a year or more) and have no compensating water access. Thepoor, however, are more than twice as likely to fall in this 4 percent than are the non-poor.
22. Although villages seem generally well-served by the road and waterwaynetwork, access to transport services is more problematic. Over 12 percent ofindividuals live in villages whichi have no access to motorized transport (either publictransport or privately hired vehicles). There is a strong inverse relationship betweenliving standards and access to transport services: individuals without access to transportservices are nearly fives times more likely to be found in the poorest quintile than in therichest quintile (Table 2.4). The rpeople who live in villages without access to motorizedtransport are more than one and a half times more likely to be poor than those living invillages with such access. One policy implication of these findings is that it may bemore important to concentrate on providing transport services rather than infrastructureto poor areas.
Expenditure Quintile
_ 11 III IV V Total_(poorest) (richest)
Individuals lacking access topublic or privately hired motorized 37.5 21.3 19.1 14.5 7.5 100transport (%) {
Source: World Bank estimates based on VLSS98.
5. ESPECIALLY POOR AND VULNERABLE GROUPS
23. Certain groups stand out, either in the VLSS data or in the PPAs, as beingparticularly poor and marginalized. These groups often have lower per capitaexpenditures, but they also suffeir from a number of non-quantifiable deprivations. Inaddition to the groups discussed below, the PPAs suggest a number of ways in whichwomen might be vulnerable, even within a non-poor household. Many of theseproblems relate to a problem of inequity within the households and are discussed inmore detail in Chapter 4.
5.1 Poverty amongst ethnic miinority groups has declined, but remains high
"From now to the year 2000, active and steady measures should be taken toachieve the three main targets of eradicating hunger, alleviating poverty andstabilising and improving the living conditions and the health of people of ethnicminorities as well as of inhabitants in mountain and border areas, to wipe outilliteracy, raise the people "s intellectual standards, respect and promote the finecultural identity of ethnic groups; to build up clean and strong political

29foundations and Party officials and members among ethnic groups in all regionsand at all levels. " Development Orientations in Key Fields, VlIIth National PartyCongress Documents.
24. In Vietnam, lowland ethnic Vietnamese, known as Kinh, are the dominant ethnicgroup and make up about 85 percent of the population. There are another 53 ethnicgroups in Vietnam who constitute the category "ethnic minorities". Most of these(except the Chinese, who are largely urban-based) are located in upland areas. 4 Ethnicminorities in Vietnam are significantly poorer than the Kinh majority (Figure 2.1).Between 1993 and 1998, the poverty incidence among for ethnic minorities has comedown from 86 to 75 percent, but it still remains very high. In comparison, the povertyrate for the Kinh majority has fallen from 54 to 31 percent over this period. Thus thesituation of the ethnic minorities is improving, but at a slower rate than of the Kinh, andthey are beginning to lag behind. In 1993, ethnic minority groups constituted 13 percentof the overall population, but 20 percent of the poor. Their share in the total populationhas risen slightly to 14 percent, but they now account for 29 percent of all poor peoplein Vietnam.
5460 - 11~~~~~~~~~19934 -
40, 31 _ Bi9gg
} 20,
0 +
Kinh Majority Ethnic, Minorities
Figure 2.1: Incidene ofPoverty by £tbnicity
Source. Worli Bank estimates based on VLSS93 and VLSS9S.
25. There are many factors associated with the persistent high levels of povertyamongst ethnic minority groups. Since ethnic minorities now represent over one quarterof the nation's poor households, these factors deserve further consideration. The PPA inLao Cai Province suggests four key problem areas for poor households - generallyethnic minority groups - in Lao Cai Province. These problems areas are summarized as:
* Difficulties in land use, food production and income diversification,which are associated with issues of access to land, the poor quality of land,
4 In this report, for analytical purposes, we divide the population into 2 groups: Kinh and Chinese, andother ethnic minorities. The Chinese have been aggregated with the Kinh because their living standardsare closer to those of the Kinh majority than to those of the other ethnic minorities, who are generallypoorer.

30
access to water, access to appropriate credit, and access to information onimproved techniques and access to markets.
* Particular problems of ethnic minority women, including very heavyworkloads, limited decision-making power within the households(particularly on reproductive decisions), high levels of domestic violenceand low access to education and knowledge.
* Poor health (resulting from lack of clean water, unsanitary conditions,malnutrition and lack of basic supplies, such as mosquito nets and warmclothes) and difficulties in covering treatment costs, which for remotehouseholds include substantial indirect costs of transport andaccommodation for accompanying relatives when treatment has to takeplace outside the commune.
* Limited education and knowledge, which includes limited Vietnameselanguage skills and literacy skills, limited exposure to new functional andtechnical skills and 'lack of access to the mass media and low levels ofinteraction with outsiders. Education and linguistic constraints are seen tolimit the degree to which ethnic minority people are represented in localauthorities and reduce their confidence to access public services.
26. Problems of remoteness, inadequate infrastructure and physical and socialisolation are common themes nmning through and aggravating the above problems.Ethnic minority groups covered in the Tra Vinh PPA echoed these findings, particularlythe alienating effect of being unable to speak the national language fluently. The Khmerpeople included in the study also explicitly raised a fifth problem area, which refers tonegative stereotypes of ethnic minority people held by some ethnic Vietnamese people.This goes against official policy, which emphasizes the need to respect culturaldifferences.
27. There have been widespread campaigns to bring ethnic minority children into theeducation system. Although still 'lagging behind the majority population, net enrolmentsin primary school for ethnic minority children has increased from 64 percent to 82percent in the five years between the two surveys (Table 2.5). There has also been afive-fold increase in the proportion of ethnic minority children in lower secondaryschool: while only 7 percent of them continued on to lower secondary school in 1993,five years later, nearly 37 percent of them are enrolled in lower secondary school. Tworecent reports emphasize the important quality issues connected with the provision ofeducation services for ethnic minority children (SCF UK,1999 and Turk, 1999). Theseinclude problems of poor quality teaching, limitations in the curriculum and teaching innon-native language.

31
Table 2.7: Trends in (net) School Enrollment Rates by Ethniity
Percent of target age groups at each level
1993 1998
Kinh Ethnic I Kinh Ethnicmajority minorities majority minorities
Primary 90.6 63.8 93.3 82.2
Lower Secondary 33.6 6.6 66.2 36.5
Upper Secondary 7.9 2.1 31.9 8.1
Post Secondary 3.2 0.8 10.5 1.4
Source: World Bank estimates based on VLSS93 and VLSS98.
28. Given the number of households surveyed in the VLSS, it is not advisable tobreak down the ethnic minority sample into the smaller groups because sample sizesbecome too small to be representative. However, the PPA study in Lao Cai and otherstudies suggests that there are considerable differences between the various ethnicminority groups and between male and female literacy rates. The study found a strongcorrelation between remoteness and literacy rates: indeed there were no literate womenin the two most remote villages studied. In all villages, literacy skills in the pooresthouseholds lagged way behind literacy skills in the households placed in the higherwell-being categories. These differences are reproduced in the degree to which ethnicgroups are represented in commune and district level authorities. Whilst the Kinh, Tayand Nung groups are generally well-represented in local authorities relative to theirshare in the population, the Hmong and the Dao groups are less well-represented. Ethnicminority women are greatly under-represented in the Commune People's Committee.
29. The persistent poverty of ethnic minority groups is not a result of Governmentneglect. There has been a ministerial-level agency with a mandate to address ethnicminority affairs since 1959. Currently the State Committee for Ethnic Minorities andMountainous Areas Affairs (CEMMA) has specific responsibility for:
* Studying and summarising issues on ethnic minorities and proposing anddeveloping policies on ethnic minorities and mountainous areas;
* Working with ministries, sectors and mass organisations in the developmentof specialised policies for ethnic minorities and mountainous areas;
* Monitoring the implementation of policies on ethnic minorities; and
* Implementing specific projects for ethnic minority development.
30. Many initiatives by line ministries have been established to address the specialproblems of ethnic minorities within particular sectors - there are Government-initiated

32interventions for ethnic minority education, for providing health care to ethnicminorities and for the development of upland agriculture. The Center for NaturalResources and Environmental Situdies (CRES) has carried out some very interestingwork on the latter issue. Prime Minister's decision number 135/1998/QD-TTg ("1715Poor Communes Program"), which outlines specific measures for addressing theproblems of particularly poor communes and those communes in remote andmountainous areas, illustrates the importance which Government attributes to povertyalleviation for ethnic minorities. Government officials suggest that the poverty figuresindicate the need for more concerted action, such as an ethnic minority developmentprogram. This is an important area for further work in the near future.
31. Studies and statistics suggest, however, that problems of delivering services toethnic minorities and of service quality persist in the health and education sectors. Manyfurther argue that the challenges of upland development have not been adequatelyaddressed by the programs implemented so far and that ethnic minority livelihoodsystems are increasingly undern,ined by environmental degradation and populationpressure (both natural and due to in-migration). Many international donors and NGOshave supported programs which target ethnic minorities, with a strong emphasis onnatural resources management, primary health care activities, the provision or upgradingof infrastructure and, increasingly, education initiatives.
32. There has been less program emphasis so far on interventions which might helpto improve ethnic minority voice and influence in policy and program formulation atnational arnd local levels. Many ethnic minority groups are still underrepresented in thelocal administration where some of the larger minority groups and the Kinh majoritymay dominate. Many organizations working in ethnic minority areas also stress theimportance of acknowledging the value of indigenous knowledge and traditions indeveloping local-level solutions to poverty. The "Grassroots Democracy Decree" (seeChapter 4) provides an opportannity for improving ethnic minority participation indecision-making.
5.2 Urban migrants without permanent registration lack access to public servicesand face social exclusion
33. Recent media reports suggest that there were possibly 800,000 migrant workersliving in Ho Chi Minh City in early 1998. The PPA in Ho Chi Minh City raised deepconcerns about households who have migrated to Ho Chi Minh City in search oflivelihoods but do not have permanent permission to reside in Ho Chi Minh City. Thisgroup (those without permanent residency) cannot be separated in the VLSS and,indeed, it is not clear the extent to which they have been enumerated at all, either in theVLSS or in the recent Census.
34. The Ho Chi Minh City PPA concentrated on poor groups and so does not capturethe effects of temporary registration status on better off groups. A recent studysuggested it might not be a serious problem for the bulk of migrants who are generallywealthier than the resident population (UNDP, 1998). The Ho Chi Minh City PPA,however, suggests that having temporary registration does indeed pose problems forpoor migrant households. Migranits report difficulties in accessing health and educationservices, in applying for jobs and in securing help under the Government's HungerEradication and Poverty Reduction Program (HEPR) without permanent registration.

33These poor households suffer significant disadvantages because of their residentialstatus.
35. The descriptions of the migrant population in Ho Chi Minh City suggests thatthey face some levels of social exclusion: one site report comrmented on the derogatorynames which were used by permanent residents for migrants from different parts of thecountry. Interviewees from the migrant community describe themselves as "visitors -eating and living in another's place". One site report describes an area known as the"tribal hamlet". This is populated by households with not even temporary registrationalthough they have been resident in Ho Chi Minh City for up to 10 years. It is called thetribal hamlet because it is so infamous for poverty, muggings and drug abuse that nooutsider will allow their sons or daughters to marry anyone from the hamlet. Youngpeople from within the hamlet are forced to marry from within their "tribe".Communities of migrants living on the river ("floating migrants") are also said to havevery little contact with the legally resident population.
36. The issue of whether migrants should continue to be disadvantaged on the basisof their registration status has raised some debate. Government authorities fear anuncontrollable surge of migrants into urban areas if registration requirements arerelaxed. Other members of the Poverty Working Group feel that the flow of migrants torural areas will be guided more by any imbalance in opportunities between rural andurban areas. This is an area for future discussion and research. Even without resolvingthis fundamental issue, the findings so far suggest that there are a number of simpleways in which the livelihoods of poor urban households might be made more secure(Box 2.8).
Poor people need to be consultedand involved in the decision-making; andUrban development interventions should improve poor Pople Is huieIh(ods or, at the very least, nofmake themt1ii worse off.According to these principles~ it was suggested that recent restrictions on roadside trading (Decree,36)and the decision to close certain roads''to cyclos could be adjuted to minimaizc 'the costs to poorpeoples livelhoods. Specific proposals for impoi the livelihood of the urban poor, especia-y theniigrwxts, included:
4 Extending the outreach offHEPRactivities to target poor housebolds Tegardless of residentialstatus;
* Relaxing requirements for c ilr to have bith certificates in order to attend school or providingbirth certificates to those children who do not have thenm;
Retinking current appr oach to, urban development, prioritizing sunm upgrading over slumcIearafice;
* IRvolving poor households fully in the decis:ions which af fect their livelihoods.

345.3 The incidence of poverty among children is declining, but is still higher thanfor other age groups
37. The incidence of poverty among children under 15 years old has declined from66 percent in 1993 to 47 percent in 1998. Though declining, this still means that theincidence of poverty among children is higher than for other age groups and higher thanthe average for the population as a whole (Figure 2.2). In 1998, children under 15 madeup 32 percent of the population, but 41 percent of the poor and 45 percent of the food-poor5. This reflects the tendency for larger households to be poorer in per capitaexpenditure terms as well as the association between poverty and high child dependencyratios. The PPAs noted a number of ways in which children are particularly vulnerablein poverty situations.
~~~~~UUne
w~~~~' s
38. The VLSS shows improvements in Vietnam's already good record ofencouraging children from all socio-economic groups to enroll in school. The PPAsfind, however, that the costs of e ducation are burdensome for poor households and meanthat poorer children are still dr-opping out, either temporarily or permanently, beforeattaining education levels which. might help them to get a stable livelihood in the future.In times of hardship in all locations, children from poor households were at risk of being
5 When children are defined as the age-group under 18, the incidence of poverty among children declinesto 64% in 1993 and 45% in 1998.

35withdrawn from school. Lack of food forces many children to work in order to meetbasic household food needs. Children contribute directly with labor in the field or, intimes of extreme shortage, they collect wild roots and yams. Children, especially girls,often stay at home or follow their mothers to the field and watch younger siblings inorder to free their parents' time for work. A teacher in a highland village covered in theLao Cai PPA says he often hears the following reply when encouraging children toattend classes: "teacher, do you have rice to give me so that I can go to school? "Households have to meet their food needs before they can consider their children'sschooling (Box 2.9). Similarly, the Ho Chi Minh City PPA report notes that "the singlemain reason why children drop out of regular school is poverty".
X 2.: BrriersX to Schooingin L .Cal PE-n=.
Last year, in 1998, the people in one highland village sent 19 children (18 boys and I girl)to the Level 2 primary boarding school in a Commune 20km away. However, 18 of themwere withdrawn from school after a short time because the families did not have enoughfood to support them. Some said they felt embarrassed because they did not even have rice,instead they brought un-husked con.
Source. Lao Cai PPA, MRDP (1999).
39. Two recent reports by Save The Children, UK (1997,1998) highlight the criticalrole which child labor, both inside and outside the home, plays in supporting thelivelihoods of the poor. The PPAs also suggest that during times of hardship childrenmay be used as a strategy to either reduce expenditure by being sent away to live withanother family or to raise income through child labor. Selling babies for adoption wasalso mentioned. The PPAs also exposed some of the emotional and psychological stressthat being poor and being part of a poor community implies for children. Interviewswith children revealed considerable exposure to violence, high levels of anxiety aboutthe insecurity of their housing, worries about their family's physical health, fatigue fromworking, a keen sense of deprivation and resentment and low levels of self esteem.

36
PtART II
A FRIAMEWORK
FOR ATTAC.KING POVERTY
The remainder of this report is structured on thepremise that sustained poverty reduction over thecoming years must focus on three critical areas:creating opportunity, ensuring equity and reducingvulnerability. Part II will first provide an analysis ofthe underlying causes of the levels and trends inpoverty as described in Part I. It will contain threechapters, each dealing with one aspect of this three-pronged framework. Part III will provide suggestionsfor how to attack poverty along these three fronts.
CREATING
OPPORTUNITY
ENSURING REDUCING
EQUITY VULNERABILITY

37
CHAPTER 3
CREATING OPPORTUNITY
AT A GLANCE:
KEY FINDINGS
The doi moi policies initiated in the late 1980's have led to rapid growth in GDP. Between 1992 and 1998,agricultural GDP grew by 4.5 percent, industrial GDP by 13.0 percent and GDP in the services sector by8.3 percent. The opportunities for employment and income generation that such rapid growth has createdexplain much of Vietnam's achievements in poverty reduction.
* While employment on the farm has grown very little, agricultural incomes have risen dramatically by 61percent. This increase is largely attributable to agricultural liberalization and diversification of on-farmactivities.
* Household non-farm employment has grown by more than 5 percent per annum, and has been particularlysignificant in rural areas. Incomes from non-farm enterprises have risen by 30 percent during 1993-98.
* Wage employment is the main form of employment for about 20 percent of Vietnam's workforce since1993. Wage employment has grown by 3.5 percent per annum, with 1.6 million new wage jobs createdduring 1993-98, mostly in industry and services.
* During 1993-98, the main source of poverty reduction has been from agricultural diversification. Butagriculture may not be able to grow as fast in the future. In the future, off-farm employment and urbanemployment growth will need to play a relatively more important role in poverty reduction.
* Stimulating rural off-farn employment and urban employment growth remains a major challenge forVietnam. It will require a host of reforms, including establishing a level playing field with the state sector,removing constraints to accessing capital, establishing a reliable legal framework, and provision ofsupporting infrastructure.
1. In recent years, Vietnam has been one of the 10 fastest growing economies in the world.Its average annual growth rate between 1992 and 1998 was a spectacular 8.4 percent. This highgrowth rate underlies the dramatic reduction in poverty described in Part I. This chapterexamines the level and pattern of growth and looks at how this is linked to employmentopportunities and the poverty reduction described in Part I.
2. Section 1 first looks at Vietnam's reform program and the changes that it has broughtabout in the economy. These reforms have had a critical impact on the level and pattern ofgrowth and employment during the last five years, which are examined in Section 2. The nexttwo sections examine the changes taking place in rural and urban areas, respectively. Section 3examines sources of income growth in rural areas, focusing especially on the agricultural sector.Since this sector employs two-thirds of the Vietnamese workforce and almost 80 percent ofVietnam's poor, what happens to agricultural incomes is critical for an understanding of thefactors underlying poverty reduction. Section 4 examines changes in urban employment,focussing especially on the industrial sector which has a huge potential role to play in jobcreation and poverty reduction in the next five years.

38
1. VIETNAM'S REFORM PROGRAM
3. Since Vietnam introduced its economic renovation policies (doi moi) in the late 1980s,the country has grown quickly. During the last decade, the Government of Vietnam has focusedits attention on macroeconomic and selected structural policy reforms to accelerate the transitionto a market-oriented system. Before adopting major reforms in 1986, the state controlled all landand natural resources and virtually all productive activities. It allocated equipment and rawmaterials for production and organized agriculture under a collective system. It managed thedistribution of agricultural products and consumer goods for personal consumption. The statealso created monopolies in critical industries and in foreign trade. Prices were set by the stateplanning agency at subsidized levels much lower than those of the "free" or 'black" market,thereby creating a two-tiered price system. Jobs were guaranteed for everyone willing to work,but severe restrictions were placed on the size, number of employees, and the capitalization ofnon-state enterprises.
4. This centralized system of management led to severe economic and social problemsduring the 1970s and 1980s. In response, the Sixth Congress of the Vietnam Communist Party in1986 adopted the policy of restructuring (doi moi) in order to move towards a market economy.The major reforms implemented in the early years of the reform program are highlighted in Box3.1.
eor g gPrc Re=mJs siprata h edi fpoet ihswsterfr fpie nrdcdi 99
Refor of thej Macroeao-tr mesue to dtealwt serious; X ;mareooi proeaeams were introduce
in18.Pouto n ntW usde wer elmne fro th bgt At the am tim iners rates0, on,!''lon o tt in e8rasdabv h lvlo inl,,n,,e.at bn .ad at sei- effort tronrl h
growt =fce= iigtefrthl f18.B 91 cei a olne sdt iac h ugtInrae nerto ihteItrainl~oon-_spr f h mi prcs,V_nmoee teft

39
5. These reforms have unleashed the potential of the Vietnamese people and the Vietnameseeconomy. There has been rapid growth during the 1990s, and this has created enormousopportunities for people to improve their lives and livelihoods. Rural incomes have grown and-become more diversified and all indicators of the labor market discussed in the next section pointto a gradual improvement of the situation. Better paying jobs have been created for people inrural and urban areas and for males and females. There has been a gradual tightening up of thelabor market and both underemployment and unemployment have come down.
2. PATTERNS OF GROWTH AND EMPLOYMENT
2.1 Vietnam's economy has grown rapidly during 1992-98
6. Between 1992 and 1998, the average annual GDP growth rate in Vietnam was aspectacular 8.4 percent (Table 3.1). All sectors showed large gains in value-added, albeit atdifferent rates: agricultural GDP grew by a healthy 4.5 percent, industrial GDP grew by asubstantial 13 percent, and GDP in the services sector recorded a growth rate of 8.3 percent.During roughly the same period (1993-1998), overall employment grew by about 1.8 percent perannum. Again, the employment growth rates differed by sector: employment in agriculture grewby only 0.4 percent per annum; in industry it grew by 4 percent per annum; and in services itgrew by almost 6 percent per annum. The services sector has contributed the most toemployment creation: of all new employment created during this five year period, about 56percent was in the services sector; 27 percent was in the industrial sector; and only the remaining17 percent was in the agricultural sector.
t Tale .1: rowh lttesof Outout anld EmpomZiVenm -
t~~~~~~~~~~giutr In w wdustr Services All Sectors
Average annual real growth rate 1992- 4.5 13.0 8.3 8.498
Employment
Average annual real growth rate 1993- 0.4 4.0 5.7 1.81998
Distribution of incremental 16.7 27.0 56.3 100.0employment 1993-1998
Source: GSO (1998) for GDP. World Bank estimates based on VLSS93 and VLSS98 for employment data.
7. What was the nature of these jobs created during the last five years? A growing economylike Vietnam provides new employment opportunities for its workers that compete with existingones. Workers gradually move out of agriculture into industry and services where they can earnmore. This pattern has been observed in many East Asian economies, including Malaysia, Koreaand Indonesia (Agrawal, 1996). It is also emerging in Vietnam (Figure 3.1). During the last fiveyears, there has been a change in the structure of the economy: the share of agriculture in GDP

40
fell by over 6 percentage points (from just below a third to about a quarter of total GDP); theshare of industry expanded by about 6 percentage point, growing from 27 to 33 percent; and theshare of services remained more or less constant at just over 40 percent. This has been-accompanied by a change in the structure of employment in Vietnam: the share of agriculture intotal employment has declined by 5 percentage points from 71 to 66 percent. Correspondingly,the share of industry in ernployment has gone up from 12 to 13 percent and the share of serviceshas gone up from 17 to 21 percent.
. , .a F t g I gVI 9
8. It should be noted that the services sector in Vietnam, as in many developing countries, isa highly diverse sector. Those employed in it range from petty traders and artisans in the

41
informal sector to managers of luxury hotels and wealthy entrepreneurs in the formal sector.Even within the informal services sector, there is a great diversity as illustrated in Box 3.2 below.
Box 3.2: Diverse iFortns in thke servies-sewtor in No Chi Minh Cfty
N ?goe is 45 years old and mgrated tO Ho ChiNh City OVer 20 years ago from Da Nan, At fit shieworked in an office, but for te lat IS years she has worked as a tailor auld dress-maer. As a girl shelearned her tailoring skills from her mother, and now teaches the trade to apprentices. Many of themare migrants so Ngoc and her husband rebuilt and extended their house to provide a place for them toStay. Ngoc likes her app~retices, many of whom come fromlDa NaLngi and are referred to her brelatives and friends, to have completed secondary shol. Some of her former apprentices haveestablished their own businesses, while others have stayed on to work in her driving tailoring shop.She now has seven assistants, who each earn between 500,00 and I millon dong per month, workingin her tailoring shop, Ngoc herself has an income Of more than 10 million dong ($715) per month andcan afford to send her two grpwn-up children to college.
Quyen is 30 years old. She lives in a poor district in Ho Chi MinhCity a eanms her living by sellingnoodle soup. Her husband works as a cycto (rickshaw) driver, but makes very little money most days.Quyen cooks very well but she has no permanent premises. So she has to cany the two large basketscontaining her stove, cooking equipment, and igredients to different street corners to sell her noodles.She cannot stay in one place for long. Everywhere the is someone who chases her out} This makesher lose regular customers and affects her daily income. Quyen says, 'Each day I can earn about15,00 dong ($I.10) but iI had a permanent place to sit and sell my noodles I could eam much moe
| each day".
Source: HCMC PPA, Save the Children UK (1999). -
2.2 Non-farm and wage employment has grown rapidly during 1993-98
9. In Vietnam, as in most developing countries, the usual labor market indicators ofemployment growth and unemployment rates are not very useful as indicators of labor marketchanges. Since most people are engaged in some form of activity and open unemployment is rare(except in urban areas), total employment usually grows at roughly the same annual rate as theworking age population. This is also true in Vietnam where the rate of employment growthduring 1993-98 (1.8 percent per annum) has been approximately equal to the population growthrate (1.7 percent). What is more indicative of changes in the demand for labor is a change inwage employment and the degree of underemployment. We examine both these indicatorsbelow.
10. For the members of the workforce employed within the household, there has been a rapidgrowth in employment in non-farm activities (Table 3.2). These include business enterprises orprofessions organized and managed by the household, such as retailing, food processing,fisheries, or other activities. Employment in these activities has grown by over 5 percent perannum in Vietnam. The growth rate has been considerably higher in rural areas (7 percent) thanin urban ones (4 percent). This issue of diversification of rural incomes is an extremely importantone and will be discussed in more detail in Section 3 below.

42
Type of Main Employment
Household Household Wage TotalFarm Non-Farm Employment Employment
Employment Employment
All Vietnam 0.4 5.4 3.5 1.8
By Rural-Urban_
--Rural 0.8 6.7 3.3 1.7
--Urban -8.7 3.9 3.7 2.0
By Gender_
--Male -0.3 8.3 4.6 2.1
--Female 0.9 3.2 2.0 1.5
Source: World Bank estimates based on VLSS93 aind VLSS98.
11. In Vietnam, wage employment is the main form of employment for about 20 percent ofall workers (Table 3.3). It has grown by 3.5 percent per annum during the period 1993-1988.This translates into 1.6 million new wage jobs created in Vietnam during the last five years. Ofthis, about 1 million (or about 60 percent) were in the services sector and the remaining 600,000(or about 40 percent) were in the industrial sector.
12. The formal sector-which we define simply as wage jobs in urban areas-remains smallin Vietnam. Though it has grown at 3.7 percent per annum, it continues to provide less than 10percent of all employment in Vietnarn. Of total wage employment, about 40 percent is in thepublic sector and the remaining 60 percent is in the private sector. Formal sector jobs are usuallythe best jobs in the economy in terms of earnings and other benefits. While these rates of growthof wage employment and formal sector employment are very promising, they are only half ofwhat Indonesia was able to achieve during the first half of the 1990s, after it embarked on aprogram of reform similar to Vietnarn's doi moi process As discussed below, there is amplescope for Vietnam to double the growth rates of well-paying jobs as a result of faster reforms.

43
-Tbe33: Level anld o osio W tE p ,1w 198-
Percentage share Percentage Share
1993 1998
Share of Wage Employment in Total 17.8 19.4
Employment
Share of Formal Sector Employment in Total 8.1 8.9
Employment
By Public/Private 100.0 100.0
Public Sector 39.5 40.5
Private Sector 60.5 59.5
Source: World Bank estimates based on VLSS93 and VLSS98.
13. If we look at the sectoral composition of wage employment, we find that wageemployment has declined in agriculture by almost 5 percent per annum; it has grown in industryby almost 5 percent per annum; and in services by 7 percent per annum (Table 3.4). The servicessector accounts for 43 percent of all wage jobs and it has been the fastest growing creator ofwell-paying jobs during 1993-98.
Share of Wage Share of Wage Annual Rate ofEGmployment ECmployment Growth of Wage
_______ __ 1993 1998 Employment
All Vietnam 17.8 19.4 3.5
-- Of which:
Agriculture 27 18 -4 .7
Industry 38 39 4.6
Services 35 43 7.0
Total 100 100 3.5
Source: World Bank estimates based on VLSS93 and VLSS98.
2.3 Underemployment has declined in Vietnam during 1993-98
14. In Vietnam, as in other developing countries, there is under-utilization of humanresources-people who want to work cannot find as much work as they would like. In poor ruralareas, this usually takes the form of seasonal and chronic underemployment. Over the course of

44
development, and reflecting the structural transformation of the economy, underemploymentgives way to more open unemploymeent. This transition is partly due to rising incomes andurbanization. As countries grow and household incomes rise, individuals can begin to afford-periods without work while waiting for a job.
15. Underemployment is defined simply as working less than 40 hours per week, and "severeunderemployment", is defined as working less than 15 hours per week. Both severeunderemployment and underemployment have decreased somewhat during the last five years,and this has happened in both rural and urban areas (Table 3.5). In 1993, about 66 percent ofthose employed worked less than 40 hours per week, and this has declined to 57 percent in 1998.In rural areas, where underemployment was a bigger problem, the proportion of the workforceworking less than 40 hours per week has declined from 71 to 61 percent, and in urban areas it hasdeclined from 47 to 40 percent. Underemployment was and remains largely a rural andagricultural phenomenon: the median hours worked per week in rural areas are 35 while in urbanareas they are 44. In agriculture, the median hours worked per week are only 33, while in allother sectors, they are over 40. While trends in working hours are positive, and indicate anincrease in income-earning opportunities for the workforce, there is clearly potential forproviding more opportunities for utilizing more fully the labor of the rural poor.
Proportion of People Employed (percent)
Hours Worked per week 1993 1998
Ru[ral Urban Total Rural: Urban Total
1-15 14 12 13 12 10 12
16-39 5;7 35 53 49 30 45
40-50 17 22 18 18 27 20
51-60 8 16 10 11 16 12
61+ .4 14 6 9 17 10
Total 100 100 100 100 100 100
Source: World Bank estimates based on VLSS93 and VLSS98.
16. Some people in Vietnam are working extremely long hours and this proportion hasincreased during the last five years (Table 3.5). The proportion of people working more than 50hours per week has gone up from 16 percent of the workforce to 22 percent. The bulk of thisincrease has been in rural areas. Those bearing a very severe workburden (more than 60 hoursper week) have also increased from 6 percent to 10 percent of the workforce. The increase hasbeen faster in rural areas, and as a result, workers in rural areas make up 70 percent of thiscategory in 1998, instead of 55 percent. Thus, a reduction in underemployment and an increasein hours worked can explain part of the growth in incomes and expenditures of the last fiveyears. There is clearly still some potential for further gains from reducing underemployment inrural areas.

45
2.4 Unemployment declined in Vietnam during the mid 1980s
17. The rate of open unemployment also declined in Vietnam between 1993 and 1998;6Unemployment in still a relatively minor phenomenon, with only 2.2 percent of the workforceunemployed in 1998, down from 3.7 percent in 1993 (Table 3.6). As discussed earlier,widespread open unemployment in developing countries is usually low and is usually an urbanphenomenon, because lack of work in rural areas manifests itself as underemployment ratherthan open unemployment. Thus, as in Vietnam, the urban unemployment rate is alwaysconsiderably higher than the rural one. Both the urban and rural unemployment rates havedeclined between 1993 and 1998: the urban unemployment rate declined from 7.7 percent to 5.4percent, and the rural rate declined from 2.6 percent to 1.4 percent (Table 3.6). The urbanunemployment rate declined for both men and women and is currently higher for men (6.2percent) than for women (4.5 percent). At least half of the unemployment problem in Vietnam isa transitional one, as students leave their schools and universities and enter the workforce. Theremaining half (of the 879,000 unemployed in 1998) are older and these could be unemployeddue to the structural and cyclical changes that the Vietnamese economy is going (Bales, 1999).
Male 6. Unemp.ym2ent
1993 1998
All Vietnam 3.7 2.2
By RuralWrban
Rural 2.6 1.4
Urban 7.7 5.4
Urban unemployment by sex
Male 9.0 6.2
Female 6.4 4.5
Source: World Bank estimates, based on VLSS93 and VLSS98.
18. More recently, the impact of the East Asian crisis has led to a rise in unemployment inVietnam that is not fully reflected in the VLSS98 data. The Ministry of Labor, Invalids andSocial Insurance (MOLISA) has conducted a labor force survey in July of each year since 1996.This survey shows that urban unemployment increased from 6.0 percent in mid-1997, to 6.9percent in mid-1998, and then to 7.4 percent in mid-1999.
6 We define unemployment as anyone who has not worked in the past 7 days, but who is seeking work, or has notsought work because she is waiting for a new job, think there is no work available, or don't know how to search forwork.

46
3. GROWTH AND DIVERSIFICATION IN RURAL AREAS
19. As discussed above, the share of agriculture in output and employment is declining. For-those living in rural areas, however, agriculture continues to be their main form of employment,though many rural households combine several different fonns of activities and derive incomesfrom several different sources. Below, we examine how household incomes from these differentsources have changed during 1993-98. The results shows that the living standards of ruralhouseholds have improved dramatically during this period, primarily due to rising agriculturalincomes and diversification of agricultural incomes on the fann, but importantly, also through adiversification of off-farm activities.
3.1 Sources of Rural Incomes
20. In rural areas, the most dramatic increases in household incomes have come from withinthe agricultural sector itself, with agricultural incomes growing by 61 percent between 1993 and1998 (Table 3.7). Income from non-farm enterprises grew by a solid 31 percent, while wages andother incomes have remained virtually static. As a result, the share of household income derivedfrom agriculture has gone up from 37 percent to 47 percent; that from household non-farmenterprises has remained more or less the same at about 19 percent; while that of wages andother sources of incomes has declined from 44 percent to 34 percent.
Source of Income Average Household Growth over Share of HouseholdllIncome l5 years ()l Income l
l (constant 1998 '000 VND) l_l_ l
1993 1998 1993-1998 1993 1998
Agriculture 2,867 4,606 60.6 37.2 46.8
Non-farm enterprises 1,443 1,884 30.5 18.7 19.2
Wage income 1,687 1,685 -0.1 21.9 17.1
Other income 1,710 1,663 -2.8 22.2 16.9
Total 7,707 9,838 27.6 100.0 100
Source: World Bank estimates based on VLSS93 and VLSS98.Notes
1. Agriculture includes income from crops, livestock and aquaculture but excludescapture fisheries.
2. Other incomes include rental incomes, pensions, scholarships, remittances, gifts, income from home processing, interest onsavings, and lottery winnings.
3. 1993 incomes inflated using poverty line deflator.4. To remove the effect of outliers, the top percerLtile of each income source have been excluded. For agriculture, where some
livestock costs are problematic, the bottom percentile is also excluded in calculation of. Average household income.

47
21. Assessment of the extent to which the rapid growth in crop incomes has been due todifferent crops is problematic, as the VLSS data do not allow agricultural inputs or land taxes tobe divided between crops. However, gross revenue figures for different categories of agricultural-activities can be calculated (Table 3.8). These show that there has been tremendousdiversification away from rice during 1993-98. The real revenues from rice cultivation haveincreased by about 21 percent over this period compared to 53 percent for livestock andaquaculture; 55 percent for other food crops; 66 percent for industrial crops (such as soyabeans,cotton, and sugar); 127 percent for perennial crops (such as coffee, tea and rubber); and 112percent for fruit trees. These figures confirm the important impact that Decree 10 (which definedfarm households as autonomous economic units) and the 1993 Land Law have had on patterns ofagricultural production. They also confirm the importance of crop diversification in increasingrural living standards that have been raised in many of the PPAs (see Box 3.3).
uacte oRe e Aerae Rvenue PerHousehold 5 years 9evenue
(constant 1998 3000 VND)1993FuTre 194193-1998 1993 1998
Rice 2,629 3,185 21.2 50.9 43.6
Livestock and 1,480 2,269 52.3 28.7 31.1AquacultureOther Food Crops 465 721 55.0 9.0 9.9
Industrial Crops 222 368 65.6 4.3 5.0
Perennial Crops 133 301 127.1 2.6 4.1
Fruit Trees 194 411 112.3 3.8 5.6
Agro-forestry 4 1 4 1 0.6 0.8 0.6
Total 5,164 7,296 41.3 100.0 100.0
Source: World Bank estimates based on VLSS93 and VLSS98.
Notes:1. Rice includes both ordinary, glutinous and speciality rice. Revenues for glutinous and
speciality rice may be underestimated in 1992/93 due to VLSS93's survey design.
2. Livestock includes livestock by-products. Aquaculture excludes capture fisheries.3. Other food crops include maize, root crops, legumes and vegetables.4. Industrial crops include soyabeans, peanuts, sugar, tobacco, cotton, jute and sesame.5. Perennial crops include coffee, tea, rubber, coconut, cashew and mulberry.
6. 1992/93 revenues are adjusted to Jan 1998 terms using poverty lines deflator.7. To better demonstrate trends, outliers above the 99" percentile have been excluded.

48
3Q.00/dy onaveage The alo plnte ~b~t ~e so of!iornge ree. In199 thianre &fis cheid
22. The dramatic increases in household incomes from livestock and aquaculture (althoughfrom a very low base in 1992/93) is arlso remarkable. Although aquaculture is a marginal andrisk-prone activity in many areas, livestock ownership has increased dramatically. Especially fastincreases in the ownership of pigs (22 seercent) and poultry (25 percent) have been experiencedover the last five years (GSO, 1998). The snumber of sheep and goats has also increasedremarkably (46 percent), albeit from a tiny base (353,000 animals) in 1993. Vietnam has evenstarted to export processed meat to neighboring countries. As the demand for meat products isstrongly correlated with rising per capita incomes, the demand for livestock products is likely toincrease substantially (from both domestic and overseas markets) in the near future. If Vietnam'slivestock sector is to fulfill this demand, greater attention needs to be given to improvinglivestock nutrition, health and management by improving the quantity and quality of feedmaterials, the availability of appropriate breeding stock, veterinary and marketing services(Nguyen, 1998).
3.2 Can Rapid Agricultural Growtli be Sustained in the Future?
23. The question that then naturally arises is to what extehnt can his growth in agriculturalincomes be expected to continue into ttae future. Put differently, to what extent have the dramaticgains that agricultural producers have benefited from over the last five-years be attributed tomatone-shot" adjustments associated th e breeto a market economy?
24. Over the last fifteen years, Viet seam has transfow eed itself from a marginal food importerto one of the world's largest exporters of rice. Since its started to export rice in 1989, both the

49
volume and quality of rice exports have grown exponentially reaching 3.6 million tons in 1997and 3.8 million tons in 1998 (Figure 3.2). The quality of Vietnam's rice exports has alsoincreased substantially over this period with the share of exports of medium and high quality-(less than 20 percent broken grows) rising from 7 percent in 1989 to 64 percent in 1998 (NguyenThi Thu Hang, 1999). The share of high-quality rice (less than 10 percent broken) increased fromless than 2 percent to 53 percent over this period. This has allowed the dollar price received forVietnam rice exports to increase by 14.2 percent compared to 1.3 percent for high quality Thaiexports. In 1999 rice exports are projected to reach 4.3 to 4.4 million tons, which would confirmVietnam's position as the second largest rice export (after Thailand) in the world.7
I Vietnam's Q WorldRice's Thai export price Vietnam averageRice export Export (5% brokens) export price5 7 T 400
50~~~~~~~~~~~~~~~~~~045 oio
3530 25
25 20020 13U9T 5
1989 1990 1991 992 193 1994 12.5 1996- 997
5. L7 1.0 2. . 20 2 3. 3.4 50
Figure 3.2: Price (US$ per ton) and votume (in millions tons) of Vietams and theWorld's rice exports.
Source. Adapted from Nguyen Thi Thu Hang (1999).
25. Vietnam's exports of other agricultural products have also grown during the 1990s.Export volumes for coffee and rubber more than doubled between 1992 and 1997. Over the sameperiod, exports of spices (such as anise, cinnamon and pepper) and some other crops (such ascashew nuts and tea) have also grown rapidly. Indeed, Vietnam is now the largest exporter of(robusta) coffee outside Latin America and supplies about one-fifth of the world market for aniseand pepper. There is potential to develop these and other niche export markets (for example, cutflowers, bonsai plants, kumquats and japonica rice in Japan and South Korea) further. However,to maximize export revenues greater attention needs to be paid to product quality and marketing,in addition to ensuring that small niche markets are not over-supplied.
7Note that because of the volatile nature of the international rice market in which exports from certain largecountries, such as China and India, can double or halve from one year to the next, Vietnam's position in worldexport markets can be expected to vary from year to year.

50
26. Vietnam has also started to export livestock products, although the majority of demandcomes from within the country. In all of these markets, Vietnam is well-placed (both because ofcost-advantages and its efforts to improve quality of its export commodities) to continue-exporting substantial volumes. However, the greater the share that Vietnam comes to occupy inworld export market, the more vulnerable it will be to changes in world market conditions, mostespecially in the thinly traded rice market. Improved export performance is therefore likely to beassociated with increased exposure to commodity price shocks. Since they typically lack the"insurance" mechanism or assets to protect themselves again such shocks, Vietnam's smallexport crop producers are likely to be especially vulnerable to such shocks.
27. Since rice accounts for about 55 percent of all crop revenues, it is also important toexamine the extent to which the rise in rice production and exports has been the result ofincreasing productivity on existing paddy land, and to what extent the result of area expansion.According to the GSO statistical yearbooks, the area sown to paddy has increased by 12 percentbetween 1993 and 1998 while paddy yields have increased by almost 14 percent over the sameperiod (from 3.4 tons/hectare to 3.9 tons/hectare) suggesting that yield and areas effects haveboth made important contributions.8 However, nominal rice prices have increased by some 68percent over the same period suggesting that it is price rather than area or yield effects thataccount for the vast majority of the rise in rice revenues. Almost half of this increase is due torealignment of the exchange rate, a fiflh due to increases in international rice prices and theremainder due to improved marketing efficiency and quality (Nguyen, Fetzer and Haughton,forthcoming).
28. Given the shortage of land (especially of paddy land) in Vietnam, the question of howmuch scope there is to increase rice yields is of considerable importance to agricultural growth inthe future. The question of how close is rice production in Vietnam to the yield frontier is acontroversial one. In 1994, paddy yields in Vietnam were, on average, comparable to those inneighboring countries (Table 3.9). Since then the GSO reports that Vietnam's paddy yields haveincreased to 3.9 tons per hectare. However, Vietnam's yields are still below those in Indonesiaand China9. Vietnam's paddy yields also lag those in industrialized countries, such as the USAand Australia, which use capital intensive production methods. Comparisons with these countriesare complicated by the fact that they produce several types of rice. Nonetheless, with some 29percent of annual crop land still not irrigated (GSO, 1999), and only about three-quarters of itspaddy land planted to high - yielding varieties (IRRI, 1993), there is still scope for Vietnam toincrease the productivity of its paddy land.
8 Note that the estimate of paddy yields at 3.9 tons/hectare is very close to the estimate of 3.8 tons/hectare from theVLSS98.
9 It should be noted that China's high rice yields are, in part, due to heavy subsidies on fertilizer and other inputs.

51
Table 3.9: International PadYils(n )
Country Yield
Australia 8.3*
Bangladesh 3.7
China 5.9*
India 2.4+
Indonesia 4.3
Laos 2.6
Pakistan 2.5+
Philippines 3.0
Thailand 2.2
USA 6.7*
Vietnam 3.4
Source: International Rice Research Institute.
Notes: All figures relate to paddy yields in 1994.* Yields for Australia, China, India and the USA include both japonica and indica
varieties. Yields for India and Pakistan include basmati and ordinary indica.
3.3 Policies to Stimulate Rural Development
29. The issue now is how will Vietnam's agricultural growth and rural development take itsnext major step forward? Since many of the easier gains from the agricultural reforms of doi moihave now been exploited, future progress requires new ways to raise farm productivity. Outsidethe Central Highlands, most good agricultural land has been allocated and new farm householdsand rural settlers must make do with the lower quality land. In the Red River delta, farms arealready small and highly fragmented and without further crop diversification and growth in off-farm employment, chronic underemployment will rise. In the Mekong delta, landlessness isbecoming a problem as consolidation of farms occurs. In other locations, particularly in uplandareas, common property resources are being over-exploited, putting their sustainability at risk.Broadly, however, income gains must come from increased agricultural productivity as the farmsector progressively sheds workers into a growing rural non-farm sector. While movement in thisdirection will create opportunities, it also poses risks. Farmn households must cope with the risksof increasing commercialization, including the production risks associated with crop andlivestock pests and disease, and the marketing risks associated with market imperfections, lack ofreliable information and volatile prices. As Chapter 5 argues, the rural poor are especiallyvulnerable to such risk because they usually lack the assets or access to credit that provideprotection from such community-wide shocks.
30. To ensure that agricultural development contributes fully to rural income growth andpoverty reduction in the future, a number of key actions are needed. First, reforms to liberalize

52
further the agricultural sector should be continued and deepened. Doi moi has brought significantgains to rural producers, and Government should continue to liberalize any remaining restrictionson production and trade of agricultural commodities. Restrictions on the use of land, access to-high quality seeds and adequate fertilizer, and the rice export quota system and highly variableexport taxes all prevent Vietnam's farnmers from making the most of their opportunities. Theinfluence of agricultural SOEs over input, output and export marketing should be reduced andfarmers permitted fully to determine the shape of their own enterprises.
31. . Second, Vietnam's land law needs to be fully implemented. The 1993 Land Law gaveland users the ability to transfer, exchange, lease, inherit and mortgage land. But the mechanismsto administer land transactions at the provincial level are still not in place. In addition, a majoreffort is needed to address the special problems of land use rights in the uplands to ensure thatoccupants retain and utilize their property with security.
32. Third, rural finance needs to be overhauled as a key part of overall banking reform.Although there is an extensive network of formal credit providers (see Box 3.4), the PPAs andother studies show that most rural households rely on informal credit sources. The poorest ruralhouseholds and most upland people have no access to formal credit and rely on loan fromrelatives, friends and traders/moneylenders. Use of rural credit will only grow when thedistortions in the credit market, such as caps on lending rates, are removed and the deliverysystem begins to service rural clients more directly. In particular, the formal rural finance systemlacks the mechanisms to serve very small borrowers and the resources to serve remote areas.

53
l ]x 3A4 Viet am's Rura ngBSystemRecenlt estinates (Johnson, 1998) suggest th3t less thian half of all nmral households are served by the formalsector. For those rural households who use the fonalfancial systeni tere are just tee main msittions.th0eVientam Bank for Agricultue and Rural Developrnent (VBARD), the Vietnam Bank fbr tht Poor (V8P), and thePeople's Credit Funds (PCFs). The VBARD has over 2600 branches toughout the oountry and is the only bankin 20 of Vietnam's 61 provinces (World Bank, 1998). However, its netork is strongly correlated withconnunications networks and proximity to district centers. The VBP established in 1996 operates within theinfrastructure of VBARD, and has a specfic mandate to lend to poor households. People's Credit Fund (PCFs),some of them sponsored by NGOs, are also an importaM source of snaXl-scae credit However, both VBARD andPCFs are also more likely to focus first on wealthier customers who ca offer collateral for loan. Thus poorhouseholds can often only borrow from ffie VBP.
Important issues to be addresed by thefinancial sector include:
Poly Environment: In Vietnam, the government is both a regulator of the bankig sector (via the central bank)as well as an active partioipant (via the state-owned commercial baks that dominat the industry). The failure tolearly separate these roles has produced a policy environment that is inconsistet with sstainable financial
intermediation.
Institutional issues and access: The main formal financial institution which should provide services to thepoorer sections of Vietnam. the VBP, suffers from a number of well-documened structural problems. The PPAexercises reveal that the poorest households do not generally use even subsidized VHP credit This may pardy bedue to self-exclusion (because of fears of indebtedness), but also reflect the restricted outreach and limited rangeof products offered by forial institutions. For the poor who do gain access to VBP toans, there is a choice of asingle product: a three year subsidized production loan. However, the needs of rural households are far morecomplex than this.
Recnition of the limits of financial services: The provision of subsidized loans is one of the main elements dfthe govennment's HEPR strategy but the appropriateness of subsidized credit is questioned by many donors andNGOs. Loans in themselves, whether subsidized or not, are only a means to an end. If there are no soundinvestments to be made, or the borrowers are already heavily indebted, it is unlikely that credit provision will bean effective means of increasing household incomes.
33. Fourth, investments need to be made in rural infrastructure. The Government has madethis a priority and donors should support it actively, targeting their resources at Vietnam'spoorest communes in order to improve basic access, provide clean drinking water and sanitation,adequate school classrooms and health centers, and electrification.
34. Fifthly, farmers and fisher-folk require support from an agricultural research andextension system that is focused, client-oriented and better resourced, and that includes a role forthe private sector. Crop, livestock and aquaculture enterprises can be made more productive withaccess to new technologies and better and more timely advice. Agricultural research andextension also needs to pay greater attention to the distinct problems of the mountainous andethnic minority areas, by developing technologies suited to upland conditions and promotingthem in ways that ethnic minorities can understand.
35. Finally, the increasingly urgent issue of water resource management needs to beaddressed. Vietnam has abundant water but its seasonal and geographic concentration (75percent of mean annual total flow in 3-4 months and 75 percent of mean annual discharge in tworivers, the Red river and the Mekong river) require a sophisticated system for allocating water

54
and substantial investment in inter-seasonal storage, flood control, and bulk water distributionfacilities. An important first step in reform has been the 1999 passage of the Law on Water,which sets out the principles for water use and the responsibilities of the stakeholders. The Law-is generally consistent with international best-practices for holistic water resources management.The next, more difficult, step is to develop the decrees, procedures, and guidelines to put theseprinciples into operation. This will require extensive consultation and adaptation to localcircumstances and evolving devolutiorL of local water management, infrastructure operation andmaintenance, and financial responsibility. It will also require substantial building of institutionalcapacity at all levels, from village to highest levels of government, plus substantial investment inriver basin planning and modeling.
36. The policy and institutional changes listed above are necessary for stimulatingagricultural growth and diversification in rural areas. But, in the future, more emphasis will needto be placed on the growth of non-farm, incomes in rural areas. These incomes have grown by 31percent during 1993-98. While this is more than respectable by the standards of most countries inthe region, they have lagged behind the growth of other sources of incomes in Vietnam, such ascrop and livestock incomes. The VLSS data show that non-farm enterprises remain dominated byretailing and food processing, which accounted for 34 percent and 12 percent of all rural non-farm enterprises in 1998.10 Since the majority (85 percent) of rural non-farm enterprises employjust one or two workers, most (92 percent) of their workers are family members, and more thanthree quarters of their workers also engage in agricultural or wage employment, their capacity togenerate employment is still quite limited.
37. Comparisons are frequently drawn between Vietnam's and China's approach to the non-farm rural sector (Perkins 1998; World Bank, 1998). To date, Vietnam has yet to achieve thedramatic growth in rural non-farm enterprises that were associated with the development oftownship and village enterprises (TVEs) in China. Indeed, in the five years between the twoVLSS surveys, the percentage of rural households with at least one non-farm enterprise hasremained stagnant at around 40 percent. In contrast, in urban areas, this proportion has risen from48 to 62 percent. However, differences in firn registration practices mean that many larger non-farm enterprises, which would in China be classified as TVEs (and therefore private sector), areconsidered to be state-owned enterprises in Vietnam (O'Connor, 1998).
38. There is enormous potential for non-farm enterprises to play a more prominent role ingenerating employment and incomes during the next five years of Vietnam's development. Manyobservers would point to administrative constraints (both real and perceived) and shortage ofcapital as the critical constraints to the development of the non-farm rural sector. Since thissector is likely to be the sector that absorbs much of the surplus labor in agriculture, the lack ofunexploited potential in the non-farm sector should be an area of focus of policy makers. IfVietnam's increasing labor force is not to swell the ranks of the rural underemployed and lead togreater distress migration to the cities, greater attention to the development of the non-farm rural
'0 Other important rural non-farm enterprises in 1997/98 include, fisheries (9%), wood, rattan and bamboo products(8%), textiles (6%) and transportation (4%). Some 63% of all non-farm enterprises enumerated in VLSS2 werelocated in rural areas.

55
sector is essential. Indeed, the further development of this sector presents one of the mostsignificant challenges to Vietnam's development and poverty reduction strategy.
4. PROMISING TRENDS IN THE URBAN INDUSTRIAL SECTOR
39. Between 1992 and 1998, the industrial sector grew by 13 percent per annum andincreased its share of GDP from an estimated 27 percent to 33 percent (GSO, 1999). However,Vietnam's strong manufacturing growth and export record has, at least to date, not had a majorimpact on industrial employment, which grew by less than 4 percent per annum between 1992and 1997. This represents less than 30 percent of the rate of industrial growth. In stark contrast,during the 1970s and 1980s, Asian countries which had a more labor-intensive pattern of growth--such as Korea, Singapore and Taiwan--were able to raise industrial employment at annual ratesclose to 80 percent of their industrial growth. The same is true for Indonesia in the early 1990s.
4.1 The Private Sector in Vietnam is Small but Labor-Intensive
40. One explanation for Vietnam's slow growth of industrial employment lies in the capitalintensive nature of much of its industrial sector, which is still dominated by state-ownedenterprises specializing in minerals, petrochemicals, and metals. These enterprises, which drawcapital and other resources away from the private sector, are sheltered from foreign competitionby tariffs and a trade control system which favors import substituting activities and production ofnon-traded goods over exporting activities (CIE, 1998)11. In addition, State enterprises are stillheavily protected against domestic competition from private enterprises. The capital-intensiveand enclave nature of such industries tends to minimize both employment creation and spilloversinto the rest of the economy.
41. During the period 1995-98, the industrial state sector has been growing at more than 10percent per annum and still accounts for almost half of industry's value-added (Table 3.10). Interms of employment, however, the state enterprise sector's contribution is much less impressive.In 1997, it provided jobs for less than one fourth of industrial workers. This contrasts with thesmall but much more labor-intensive Vietnamese non-state sector, which accounted for only 22percent of output but employed more than 64 percent of workers in 1998. This suggests that thelack of industrial employment growth in Vietnam is to an overwhelming extent due to the smallsize of the private sector. In 1998, there were only 457 private registered manufacturers withmore than 100 full-time workers (MPDF, 1999).
' Vietnamn's highest tariffs are imposed on consumer and finished goods with intermediate and capital importattracting lower tariffs. This results in effective rates of protection of over 100% for heavy industrial items such asferrous metals, plastics and paper products (CIE, 1998).

56
Industrial Sae in Share ingrowth (%) industry (%) industrial(1995-98) (1998) employment
(%) (1998)
State Sector 10.2 46.2 24.2
Foreign Investment 22.7 31.8 11.5
Domestic Non -State Sector 9.2 22.0 64.3
--Of which:
-Private and Mixed 21.6 7.9 25.2
-Collective 8.7 0.6 1.3
-Households 4.0 13.5 37.8
Source: Column I and 2 arefrom GSO (1999,1; column 3 based on VLSS98.
4.2 The foreign-investment sector has brought in foreign exchange and new technology toVietnam, but has failed to generate much employment so far
42. The surge of foreign direct investment into Vietnam in the mid- to late 1990s has yet toalter this situation to any significant degree. In 1998 foreign investment accounted for almost onethird of industrial production but only -for 12 percent of employment (Table 3.10). VLSS dataalso shows that while wage employment grew by 50 percent per annum in the five years after1993, it did so starting from a very small base so that the total number of wage jobs in foreignenterprises went up from 39,000 in 1993 to 477,000 in 1998. By 1998, foreign enterprises stillaccounted for only 6 percent of wage jobs, and just over 1 percent of total employment inVietnam.
43. Although the share of foreign capital flowing into light industry has increased in recentyears, by the end of 1998 this sector had received only 12 percent of the total stock of foreigninvestment (Table 3.11). Most foreign investment is either in oil-related production, heavyindustry, or real estate.

57
Tabile 3.11: Foreig tOirect Investmeat Stok b Ser, 1998
Sector FDI Stock as of mid-1998
Total Disbursed Capital (million $) 10,139
Share of FDI by Sector
Heavy Industry 24.1
Oil & Gas 22.2
Real Estate 17.8
Light Industry 12.4
Services, and Transport & Communications 10.3
Others 13.1
Total 100.0
Source: IMF (1999).
44. This structure of foreign investment in large part reflects Vietnam's high barriers to heavyindustrial imports, which not only protect state enterprises but also attract foreign investors intoimport-substituting and capital-intensive activities (often in joint ventures with SOEs). It hasbeen estimated that more than 70 percent of foreign investment occurs in sectors with effectiverates of protection above 50 percent (CIE, 1998). This is generally inefficient. It creates localmonopolies and raises the price of products relative to those that would have prevailed under freeimports. Thus, although foreign investment has boosted local production and contributed toforeign exchange inflows, thus far, it has done little to create employment and alleviate poverty.
4.3 The Asian Crisis and Export-Oriented Growth
45. To what extent can the East Asian crisis be blamed for the failure of industrialemployment to grow over the last two years? This, and indeed the overall impact of the EastAsian crisis on the Vietnamese economy, is a contentious issue. Between 1992 and 1997, realexport earnings had increased by an impressive growth rate of 19 percent per year and the shareof trade in GDP had reached 86 percent. This is a high level by international standards. A largepart of this growth was due to light manufacturing exports (principally footwear, garments andtextiles), which expanded-albeit from a tiny base--at 45 percent per annum and rose from 14percent to 37 percent of total exports (Table 3.12). This performance was largely supported byforeign investment, which accounted for more than 20 percent of light industrial exports in 1998.

58
Export Category Average Annual Real Share in Share in TotalGrowth Rate (%) Total Exports, 1997
(1992-1997) 1992
Total Exports 18.8 100.0 100.0
Agriculture 11.1 49.5 35.3
Heavy Industry and Minerals 12.3 37.0 28.0
Light Industry 45.1 13.5 36.7
--of which:
--Textiles and garments | na 16.4
--Footwear na 10.6
Source: World Bank estimates based on data from GSO and Customs Department.
46. The Asian crisis has interrupted this expansion. Foreign direct investment disbursementsto Vietnam fell from a staggering $2.0 billion in 1997 (or about 10 percent of GDP) to less than$800 million in 1998, with an estimated decline of $612 million in light industry. They havefallen further to about $600-$700 million in 1999. In addition, real manufacturing exportearnings grew by less than one percent in 1998 (though this trend has reversed itself in 1999 andlight manufacturing exports seem to be picking up again).Had exports earnings continued togrow at their pre-crisis rates, Vietnam might have exported at least $1.2 billion or more of lightmanufacturing exports in 1998. Given the labor content of Vietnamese exports, this representsthe loss of up to 300,000 manufacturing jobs that have not been created because of the EastAsian crisis (Belser, 1999).
4.4 Looking Towards the Future
47. Will future growth be more labor-intensive? Vietnam clearly has a lot of untappedcomparative advantage in labor-intensive exports (Table 3.13). Even before the Asian crisis,Vietnam's share of labor-intensive exports was low compared to other countries in East andSouth-East Asia. While the share of manufacturing in total exports is only 37 percent inVietnam, in East Asian countries, on average this share is 83 percent. Furthermore, this sharewas high in East Asia even a decade ago (72 percent), when some of these countries were onlyjust embarking on this export-led growth path.
48. Vietnam's humnan capital and also its availability of labor relative to land is very highrelative to other countries in East Asia (Table 3.13). In terms of its resource endowments,Vietnam undoubtedly satisfies the preconditions to replicate the manufacturing export andemployment success of other East Asian nations.

59
Tablex3.13.c Share OfMnufacringin Tal Exports and ResourVe Endawments In Easthsi
CutryS Shre of Mnufac>tures Average Squalre km ofIn Total Export Years Of Land
Revenues Education Per 100 workers1990 Latest year (1990) (1990)
Vietnam c pn.a 36.7 6.3 0.75
China 72.9 86.7 5.9 1.14
Hong Kong 95.8 95.6 9.2 0.02
Indonesia 35.7 55.4 4.6 1.60
Korea 92.8 88.1 9.9 0.31
Malaysia 54.8 78.5 6.0 3.00
Philippines 67.5 87.6 6.9 0.80
Singapore 72.6 _86.9 5.9 0.03
Taiwan, China 92.7 94.3 8.0 0.24
Thailand 60.5 73.3 5.6 1.36
Average 71.7 82.9 6.9 0.94
(excludinlg Vietnam) I
5 All "latest year" data is from 1997 except Singapore (1998) and Taiwan (1996.)
Source: Export data is from COMTRADE for all countries except Vietnam for which data is from GSO (1998); educationdata from Batro and Lee (x996) and GSO (1998) for Vietam. Land data is from World Bank (World Development Report,various issues).
49. To what extent is Vietnam's comparative advantage in manufacturing exports untappedand what is the cost in terms of forgone manufacturing jobs? Estimates indicate that Vietnam'suntapped export potential could represent roughly 25 percent of its GDP and that up to 1.6million jobs could be created in light manufacturing in the near future through labor-intensiveexports (see Annex 3). With pre-crisis export growth rateshep e se jobs could be created in thenext 3 to 5 years. But the ability of Vietnam to quickly realize this untapped comparativeadvantage and to sustain a labor-intensive pattern of growth in the medium term criticallydepends on Government policies towards trade and investment by the private sector.
50. International experience shows that export-oriented industrialization is impossiblewithout the emergence of a dynamic private sector. Vietnam is not different. The ability to createemployrnent through exports depends on the emergence of a stronger private sector, whichexports on average three quarters of its production (MPDF, 1999). This sharply contrasts withstate-owned enterprises, where it is estimated that no more than 12 percent of output is exported(MOF, 1999). Most useful would be a clear commitment by the Governrent to establish a "levelplaying field'' between the private and the state sector, especially with regard to access to credit,

60
information and markets. Other specific aLctions which could foster stronger growth of the privatesector include:
* Strengthening and liberalizing the financial sector: success in labor-intensivegrowth depends on the financial sector's ability to mobilize savings and allocatecredit efficiently. Allowing market-determined interest rates would encourageboth savings and loans to the private sector.
* Changes to land policies: Vietnam's current land policies starve the private sectorof resources. Land leasing is expensive and procedures are lengthy.
* Establishment of a reliablec legal framework: Rights must be more clearly definedand contracts must be enforceable. Barriers to competition and enterprise creationshould also be removed.
* Provision of supporting infrastructure: Public investment should focus onproviding infrastructure that is complementary to private sector activities.Particular attention should be given to rural areas and export-orientedmanufacturing.
51. To summarize, despite the massive inflows of foreign capital between 1992 and 1997,Vietnam's industrial sector remains a relatively small and capital-intensive one with distinctiveenclave characteristics. Prior to the onset of the East Asian crisis, there were promising signs ofthe emergence of a more labor-intensive, light industrial sector. Ensuring that this sector gets"back on track" and the opportunities for more equitably distributed industrial growth areachieved, presents a major challenge for poverty reduction in Vietnam in the future. Asagricultural growth and diversification reaches its limits in the future, greater reliance will needto be placed on non-agricultural jobs-both in rural and urban areas-for creating opportunitiesand for reducing poverty.

61
CHAPTER 4
ENSURING EQUITY
AT A GLANCE:
EQUITY ISSUES IN VIETNAM
* There has been an small increase in inequality in Vietnam over the 1993-98 period, but inequality is stillmoderate by intemational standards.
* Most of this increase in inequality at the national level can be attributed to an increase in inequality betweenrural and urban areas. Urban growth has outpaced rural growth in all regions, with the exception of the RedRiver Delta.
* Inequality within rural areas has not increased; thus, despite concems, there is no evidence that rural refornshave been associated with rising inequality.
* There has also been some increase in inequality between the regions.
* Gender analyses show inequality in the distribution of power within the household and highlights manyproblems which are specific to women. These problems include limited decision-making power within thehousehold, extremely heavy workburdens, domestic violence, health problems, limited representation ininstitutions, limited access to education for some ethnic minority women, and unequal access to productiveassets, such as land and credit.
* Poor households express a sense of alienation from decision-making processes and feel ill-informed aboutGovernment policies and programs. Often it is the better-off households who know more about Govermmentservices and how to access them.
* Although there is a mechanism to feed information down to the village level, this does not always functionwell. In many cases, the processes which are in place are not allowing the poor households, or the quietermembers within households, to communicate their concerns and priorities back up through the system.
* The "Grassroots Democracy Decree" (Decree No 29) is an exciting initiative which provides an opportunityto improve the transparency of local government and to provide households with more information aboutlocal government activities and finances. This is still in the very early stages of implementation.
"Economic growth must be associated with social progress and equity in each stage aswell as throughout the process of development. Social equity must be reflected in boththe trational distribution of the means of production and distribution of productionoutput, as well as in the provision of conditions for all to have a chance to develop andutilize well their capabilities."
(VIlIth National Party Congress Documents, 1996).

62
1. The Vietnamese society places great emphasis on social equity. Even though the gainsfrom the launch of the doi moi reforms in 1986 are evident in the form of rapid economicgrowth and poverty reduction, the Government has been very concerned about rising inequalityduring the transition to a market economy. While it recognizes that the wellbeing of themajority of the population has improved in the last decade, concerns have arisen over risinginequalities between the rich and poor, between rural and urban areas, between the variousregions, and between different segments of the population. The Government strives to closelyassociate economic growth with social progress and to "step by step achieving social equity andmoving toward enabling everybody and every household to become better off,"
2. This chapter has three sections. The first will present the trends in inequality in Vietnamin the 1993-98 period and examine some of the factors that underlie these trends. It will look atthe overall level of inequality in expenditures and focus on its regional dimensions. The secondwill focus on a major challenge facing Vietnam-that of attaining gender equity. And the thirdsection will highlight some important issues that the poor have raised in the PPAs, relating thequality of governance-participation, transparency, accountability, and predictability-toissues of equity.
1. TRENDS IN INEQUALITY
1.1 Inequality of expenditures has increased slightly
3. The pattern of expenditure growth has resulted in an increase in inequality in Vietnambetween 1993 and 1998. The Gini coefficient12 for per capita expenditures has increased from0.33 to 0.35. The Lorenz curve has shifted out slightly over the between 1993 and 1998,depicting a small rise in inequality (Figure 4.1).
12 The Gini coefficient is a standard measure of inequality that varies between 0 (absolute equality) and 1(maximum inequality). Graphically, it is represented by the ratio of the area between the 45 degree line (whichrepresents equality) and the Lorenz curve and the total area below the 45 degree line (Figure 4.1).

63
100-
80-
60
40-
0-
* 4 60 : - -,
020 40 60 80 1 00Cumulafive % of Population
Figure 41: Lorenz curves for Vietnam.Sowe. Word Bank based on VLSS93 and. VLSS98.
4. Other measures of inequality also show that expenditures have become a little moreunequal between 1993 and 1998. For example, the ratio of the richest to the poorest quintiles'expenditures rose from 4.9 in 1993 to 5.5 in 1998.
5. The PPAs also confirm that the poor feel that inequality has risen and that they care notonly about their absolute levels of welfare, but also about their relative positions in society:
"Economic conditions are improved if we compare our lives with how they were in thepast. But after thinking about it a little more, we find that we are still going downbecause while we have come up one step, the rest of society has gone up ten steps."
Ha Tinh PPA, Action Aid Vietnam (1999).
6. It needs to be kept in mind, however, that while there has been some increase ininequality, by international standards, Vietnam remains a moderately equal society: its levels ofinequality are comparable to those in some South Asian countries but are lower than those insome other East Asian countries (Table 4.1).

64
Country Survey Year Expenditure Gini
Bangladesh 1995/96 0.34
India 1996 0.33
Indonesia 1996 0.37
Pakistan 1996/97 0.31
Peru 1997 0.35
Thailand 1998 0.41
Vietnam 1998 0.35
Source: World Bank.
7. Underlying this widening gap between the poor and the better off is a widening of thegap between rural and urban areas, as well as a complex regional pattern of growth. This isexamined below.
1.2 Reforms have been associated vvith almost no changes in inequality within ruralareas, but a growing gap between urban and rural areas
8. The Government has been concerned for some time now about the unbalanced patternof growth and the widening of the rural-urban gap as a consequence. This gap has indeedwidened considerably between 1993 and 1998 (Figure 4.2)'3. This is because, during thisperiod, while per capita expenditures in rural areas increased by 30 percent (or 5.4 percent perannum), in urban areas they grew twice as fast (61 percent or 9.9 percent per annum). This hasled to the ratio of urban to rural expenditures increasing from 1.8 to 2.2. It has also affected theoverall distribution of expenditures. The bottom three quintiles are largely made up of the ruralpopulation, while the top quintile predorninantly consists of urban dwellers. Since the poor arelargely rural and the better off are largely urban, if the rural/urban gap widens, it will lead to awidening of the gap between the poor and the better off.
13 Note that in Figure 4.2, the numbers in the bars for 1998 represent the percentage increase in real per capitaexpenditures between 1993-98.

65
6000 ;;*1993 1998 4' '7
5000
4000 35
g 300 o Q ~ 2771 X207
t964 22000
0
A.1 Vietnam - ra Urban
Figure 4.2; Growth in Real Per Cit Expenditure by Rural-Urban 1993 -1Sourace: World Bank esdmaies basd on VLSS93 ad VLSS9.-
9. To look at this issue further, we use the Theil L index of inequality, which is an indexthat can be decomposed into a within group component and a between group component and cantherefore be used to understand better the underlying causes of the level and trends in inequality.The level of inequality is less in rural areas than in urban ones (Table 4.2). It also shows thatbetween 1993 and 1998, inequality within rural areas has decreased slightly, while within urbanareas, it has increased somewhat. If we look further at overall inequality in Vietnam, the TheilIndex also shows an increase. Decomposing this increase in inequality, we find that 96 percent ofthe increase in inequality in Vietnam during this period can be attributed to an increase ininequality between rural and urban areas, and only 4 percent was due to an increase in inequalitywithin rural or urban areas. The net within group effect is very small because the inequalitywithin rural and urban areas is moving in opposite directions and more-or-less cancels each otherout.
10. The Government of Vietnam has reoriented its development strategy to really focus onrural development. This is exactly the right thing to do. Policy changes and investments thatsupport rural development will be critical for narrowing the rural- urban gap in the future.

66
THEIL L INDEX OF INEQUALITY 1993 1998 Absolute change between
_________________________________ 1998 and 1993
--Rural 0.128 0.126 -0.002
--Urban 0.187 0.197 +0.010
Decomposition of Inequality
Total Inequality in Vietnam 0.177 0.201 +0.024
_ (100%) (100%) (100%)
--of which
Inequality between rural-urban areas 0.037 0.060 +0.023
_ (21%) (30%) (96%)
Inequality within rural-urban areas 0.140 0.141 +0.001
_ (79%) (70%) (4%)
Source: World Bank estimates based on VLSS93 and VLSS98.
1.3 Inequality between regions has grown more than inequality within regions
11. The Government has also increasingly become concerned about the inequality between
the seven different geographical regions of Vietnam, and about lagging regions. While all
regions have benefited from this growth, the pattern of growth across regions has been quite
uneven (Figure 4.3)14 The fastest and the slowest growing regions are both in the South. The
fastest growing region has been the South East, which has been dominated by the fortunes of
HCMC and has grown by a spectacular 78 percent in the 1993-98 period, while the slowest
growing region has been the neighboring region of the Mekong Delta (18 percent). However,
the Mekong Delta was starting with a relatively higher base level of expenditures, and despite
this poor performance between 1993 and 1998, its levels of expenditures are still higher than
those of several other regions. The poorest region was and remains the Northern Mountains
region and the richest region was and remains the Southeast. Since expenditures in the Northern
Mountains Region grew by only 31 percent as compared with a 78 percent expenditure increase
in the Southeast, the gap between the poorest and the richest region of Vietnam has widened. The
ratio of expenditures in the Southeast to those in the Northern Mountains has gone up from 1.9 to
2.6.
14 Note that in Figure 4.3, the numbers in the bars for 1998 represent the percentage increase in real per capitaexpenditures between 1993-98

67
19924S- M1997-55
2641 2
2197 2051 24 8524§~~~12 '8 194 1
1462t 1| 216 T .A-
rodh UpWtds Refw Noa Certti Cat S E Meko&^g
Figure 4.3: Growth in Real Per Capita Expenditure byRegion, 193 - 1998Source: World Bank estinias bae on VLS9 and VLSS9.
12. Table 4.3 shows that of the total increase in inequality in Vietnam between 1993 and1998, 83 percent can be attributed to the increase in inequality between regions, and theremaining 17 percent is due to increasing inequality within regions. Thus, the evidence seems toindicate that it is the widening rural-urban gap and the differences in growth between regionsthat are the major causes of the increase in inequality in Vietnam.
Tabie 4.3: Decompoiton of Inequfty by Rt%ovs, (Thieil L Index of Inequaty
1993 1998 Absolute changebetween 1998 and 1993
Total Inequality in Vietnam 0.177 0.201 +0.024
--of which (100 %) (100%) (100%)
Inequality between regions 0.026 0.046 +0.020
(15%) (23%) (83%)
Inequality within regions 0.151 0.155 +0.004
(85%) (77%) (17%)
Source: World Bank estimates based on VLSS93 and VLSS98
13. Figure 4.4 sheds more light on the issue of regional inequality. It shows, veryinterestingly, that the three regions that had the lowest inequality in 1993-Northern Uplands,

68
Red River Delta, and North Central Coast-have experienced a slight increase in inequality inthe 1993-98 period, while the opposite is true for the other four southern regions.
:~ ~~19 Hihe 1998 'i
probleswille -n c t imtla al ! rhins 17
Iporoved Riverty mDealtainous communesk t a Mekon ll D lta eded to dentis oftarobletmshe poorinoth1 wr Nrras cebtwee CoasT
Northerevnt Uplorareds fro lagn0uthrbhn.Hoee,ti porr 0gesol h
poor Wnoremdt and stmoautsbase n LsS aomnds AdiinaLforswllbSeee9o dnif,n
Commues h program, wthich targespoeomneasasxml.o h idoiiitv hc

69
15. In six out of the seven regions of Vietnam, urban expenditures have grown atsignificantly faster rates than rural expenditures. The widest gap between urban and ruralexpenditure growth is in the North Central Coast, where the rate of urban expenditure growth (86-percent) is a staggering 49 percentage points higher than the rate of rural expenditure growth (37percent) (Table 4.4). The Red River Delta is the exception-this is the only region in Vietnamwhere the rate of growth of rural expenditures (51 percent) has surpassed the rate of growth ofurban expenditures (47 percent).
Table 4.4A Rural-Urban Growt in Real Per a ad4itures RX egionj"3-1998
Region Growth in Urba1 Growth in Rural Difference in Urban-Expenditures Expenditures Rural Growth Rate of
(Percent) (Percent) Expenditures
All Vietnam 60.5 30.4 30.1
Northern Uplands 65.8 26.9 38.9
Red River Delta 47.2 51.4 -4.2
North Central Coast 86.4 37.2 49.2
Central Coast 39.1 25.5 13.6
Central Highlands Na 24.8 Na
Southeast 78.1 59.1 19.0
Mekong Delta 35.7 10.6 25.1
Source: World Bank estimates based on VLSS93 and VLSS98..
16. Note that for ease of analysis, in this Report, we have used the dichotomy between ruraland urban areas. While this might be helpful for some purposes, it needs to be recognized thatthis is rather a simplistic divide. In reality, there is no social or economic dividing line betweenrural and urban areas as many linkages bind together the fortunes of people residing in theseareas (Figure 4.5). Hence, strategies for addressing poverty alleviation need to recognise thesynergies between rural and urban development. For example, urban demand for food andagricultural products raises the prices of these products, which in turn raises rural incomes.Chapter 3 has demonstrated the importance of rising agricultural prices and incomes in povertyreduction in the 1993-98 period. Conversely, stagnation in agriculture and limited income-generating opportunities in the rural sector can push people to cities in search of a living. If thecities cannot absorb the extra labor, then urban poverty deepens. More work will need to be donein the future to understand better the role of these rural-urban linkages in reducing poverty inVietnam.

70
Figur 4.5: LinkgsetenIcm rthiUraadRuLJAat
2. GENDER EQUALITY
"We must respect women. One of the aims of the revolution is to ensure equality of rightsfor women. Society cannot be totally free so long as the women are not freed Women mustfight for their right to be equal with men. Men must respect them."
President Ho Chi Minh.
17. National and international institutions are increasingly paying attention to the challengeof inclusion-how to have a pattern of growth and development that benefits all members of itssociety, not just the lucky few. We have seen in Chapter 2 how certain groups in Vietnam-especially ethnic minorities and some of the migrants to urban areas-are not sharing fully in thebenefits of growth. This section will examine another challenge facing Vietnam-that ofattaining gender equality.
18. At the 4th United Nations World Conference on Women (held in Beijing in September1995), representatives of member countries-including Vietnam-adopted the Beijing Platformof Action to promote the advancement and empowerment of women around the world. AllGovernments were called upon to design and implement a national plan of action in conformitywith the Beijing Platforn for Action. Following the Beijing Conference, the Government ofVietnam promptly authorized the National Committee for the Advancement of Women(NCFAW) in Vietnam to formulate a National Plan of Action for the Advancement of Women in

71
Vietnam by the Year 2000. This Plan has an overall objective of improving the material andspiritual life of women and 11 specific recommendations of how to bring that about (Box 4.1).
19. Some of the objectives of the National Plan of Action (Box 4.1) have been fulfilled betterthan others. Chapter 1 showed that girls in Vietnam have had equal access to all levels ofeducation and continue to do so (Table 1.2). The level of equality in net enrollment rates acrossall levels of education for boys and girls is indeed striking. Nutrition indicators presented inTable 1.2 also do not suggest a wide disparity between the care of male and female children.
(i} Ovral Objective: to move 4it mateia sphitih K -o f : enhace and bring into full play hrqualifiafion, caacity and rol,e; ure th perfonace by wromen of thieir fimfons and, thirfu and equalparticipation i all sort of activtes,. especialy in poitical, economic, cultual and social fields, in the cause ofindustrialization and modernizatioo a cuntry towards the goal of "wealthy people, a powerful country, a jusitand civilized society-
(2) Specific Objeves:
() Create job opportities, increase icome, contibute to povety aleviation and hunger eradication, andimprove the quality of life foe women;
(i) Create equal opportunities for women in education, training and in imprving their educational levels;
(O) Improve the health care:forand protection of women and cbilden(iv> Enhance the role and position of women in leadership mechanism and decision-making;(v) Protect and promote women's rights and faciitate women's participation in social activities;
(vi) Enhance the role of the family;
(vii) Develop the role of women -in th mnwagement of the environment and natural resources, contributi osustainable development and to the imrovement of the living e;
(viii) ntensify communication activities to enhance the awarenessofe righ ng men and o ;
(ix) Contribute to the preserving and strengting of peace;
(x) Enhance the capacity of the aiona machinery for te advancment of Vietnamese women;
(xi) Protect girl-chilre and facilitate their development in al fields
Sorr: Natnal Committee for Xt Advancement of Women, Government of Vietnam (1997).
2.1 Vietnam has achieved considerable gender equality in many areas
20. Vietnam performs well on many indicators of gender equality. If we look at educationindicators-such as average years of schooling and adult literacy rates--that take into accountpast differences in schooling rather than just examining present enrollment patterns, then somedifferences emerge between the rates for males and females (Table 4.5). On average, femaleshave only 5.6 years of education, while males have 6.8 years. The adult literacy rate for females(79 percent) is also about 11 percentage points lower than for males (90 percent). The healthindicators in Table 4.5 do not show any signs of discrimination against female infants-on thecontrary, both the infant mortality and the child mortality rates are lower for girls than for boys.

72
This pattern is consistent with that of other countries. However, the widening gap between thenutritional status of adult men and women is an area of concern and needs to be examined moreclosely (Table 1.2).
Female Male Total
Education Indicators
Average Years of Schooling (6+) 5.6 6.8 6.2
Adult Literacy Rate (15+) (%) 78.8 89.6 83.5
Health
Children who have received any Vaccination (%) 90.7 90.1 90.4
Infant Mortality Rate 19.2 35.6
Under 5 Mortality Rate 29.2 42.1
Labor Force
Proportion of total employment 51.7 48.3 100.0
--of which
Self-employed farm 54.4 45.6 100.0
Self-employed non-farm 55.2 44.8 100.0
Wage employment 39.8 60.2 100.0
--of which
Agriculture 39.6 60.4 100.0
Manufacturing 37.1 62.9 100.0
Services 42.6 57.4 100.0
--of which Government and social services 49.5 50.5 100.0
Source: All data are from the 1998 VLSS, except the mortality rates which are from the 1997 Demographic and HealthSurvey.
21. Gender differences emerge when examining the labor force characteristics of males andfemales-while women make up more than half of total employment (52 percent), they make uponly 40 percent of wage employment. The main sectors that offer wage employment to womenare agriculture, light industry (especially textiles and garments), and Government and socialservices. The National Plan of Action specifically addresses the issues of job and trainingopportunities for women. Here, the public sector plays an important equalizing role-almost halfof Government jobs go to women. It is in the heavy industries sector-mining, utilities,construction, and transport and communications-that women are underrepresented.
22. Expenditures and incomes cannot be calculated for females and males separately usingthe VLSS as, in common with household surveys in all other countries, they collected

73
information on these variables at the household level. The quantitative data from both surveysshow that people living in female-headed households are usually materially better-off than male-headed households. In 1998, the mean per capita expenditures of female-headed households were-11 percent to 28 percent higher than those of male-headed households depending on thedefinition of sex of headship used (see Annex 4 for details). The incidence and depth of poverty(as measured by the headcount and poverty-gap indices) among members of female-headedhouseholds is also lower than for male-headed ones. However, if one examines household ratherthan per capita expenditures, then female-headed households do have lower mean householdexpenditures than male-headed ones. This is because, on average, female-headed householdshave fewer members. In addition, one sub-group of female-headed households, elderly womenliving on their own, are much poorer (and also more common) than elderly men living alone.
23. The PPAs and other qualitative data present a very different story of female-headedhouseholds. These households are commonly ranked in the very poorest categories by theircommunities and neighbors who emphasize some of the non-material disadvantages they face,such as their vulnerability and loneliness.
2.2 Further efforts are required in other, less visible, areas
24. While these quantitative indicators of access to education, health and employment areextremely important, these traditional indicators miss the more important gender issues. Most ofthese issues relate to intra-household inequality and they relate to inequality in the distribution ofpower rather than incomes within households. It is therefore, difficult to measure themquantitatively. Several issues of this nature have, however, been highlighted by the participatorystudies (Box 4.2). Below we examine each of these issues briefly.

74
2.3 Within households, women have less power than men
(i) Unequal Decision-Making Power in the Household--There are interesting contradictions
in the discussions on financial management in the households. While men often talk aboutwomen being the money managers (for example, in Ha Tinh) and suggest that importantdecisions are shared, this does not rnean that the household is managed in accordance withwomen's priorities (or even shared priorities). Women in both Tra Vinh and Lao Cai commentedon the amount of scarce household resources which are spent on alcohol and tobacco, both itemsused only by men. It seems that even if women are the nominal money managers, they do notactually have the power within the hou.sehold to curtail this expenditure.
25. In Tra Vinh, almost all households reported that men spent a significant portion ofhousehold income on tobacco and alcohol, despite women's disapproval. One man said that hemeets with his friends to drink about 20 times per month, each time spending aroundVND30,000 (or about VND600,000/-n wS$43 per month). One woman said "whenever they makemoney, men in the moneyg manages (or mpley together forTnh) and endtfood - if they havemoney they order a dog, if not, a duck...women do not dare to eat, they save their money in casesomeone in the family gets sick.ht In Lao Cai, a Hmong woman exclaimed: "Men can spendmoney freely on drinking and cards, and yet we women don't dare even spend an extra bit on apiece of candy at the market."

75
26. An important area in which women report having little control is reproductive decisions.In Ha Tinh, the preference for a male child puts considerable pressure on women to keep havingchildren until a boy is delivered: "If you cannot produce a son, your husband will marry anothergirl and you'll be spurned by the people in your village. " In Lao Cai, women reported having tohave more children even though the family could not afford it because the husband wanted morechildren. The PPA study team also listened to women whose husbands had beaten them whenthey found out that their wives had been fitted with IUD's and forced their wives to remove theIUD's. Women in Tra Vinh also reported a lack of control over reproductive decisions. There isincreasing recognition of the need to involve men in reproductive health programs in order toachieve a better balance. UNFPA and the Population Council are both piloting projects on men'sresponsibilities in reproductive health.
27. Discussions about changes over time in Ha Tinh suggest that while women's authoritywithin the household might have improved a little over recent years, men's authority remainsdominant (Table 4.6). This is especially the case for all decisions to do with social affairs, whichremain in the domain of men.
Table 4.6: Changes in Women7s ResponsibUity, and, Authority in Ha Tillh
Average Scores
(2 women's groups, 3 men's groups)
Score of 1 O=most dominant in this role
Past Present
Men Women Men Women
Responsibility for 4.3 10 5 10family/housework
Responsibility in social affairs 10 4.2 10 5.5
Right to decide within family 10 5.3 9.7 6.5
Right to decide in social affairs 10 4 10 5
Source: Ha Tinh PPA, Action Aid Vietnam (1999).
(ii) Disproportionately Heavy Workloads for Women-Several participatory studies haveshown that women in rural Vietnam are typically working about 16-18 hours a day which is, onaverage, about 6-8 hours more than men per day. This is because, in addition to working outsidethe home, the burden of housework falls almost entirely on their shoulders.
"Men discriminate against us and there remains a biased view that women's work isminor. Men don't do anything to help women because of ideas about the differencesbetween what husbands and wives should do."
Ha Tinh PPA, Actionaid (1999).

76
28. VLSS98 data show that 25 percent of women in the workforce (and 21 percent of men)are working more than 50 hours per week in income-generating activities alone (Table 4.7). Andwomen make up a greater proportion of those with heavy workloads (working 51-60 hours perweek) and very heavy workloads (working more than 61 hours per week). While they make up52 percent of the workforce in Vietnam, women make up 54 percent and 57 percent of these twowork categories. This-combined with the fact that they bear almost the entire burden ofhousehold work in Vietnam-leaves them exhausted with no time for anything except work.
Proportion of People Employed (percent)
Hours Worked per 1993 1998week
Male Female Total Male Female Total
1-15 12 15 13 12 12 12
16-39 52 54 53 46 45 45
40-50 20 16 18 22 19 20
51-60 10 9 10 12 13 12
61+ 5 7 6 9 12 10
Total 100 100 100 100 100 100
Source: World Bank estimates based on VLSS93 and VLSS98
29. Discussions both in Ha Tinh and in Lao Cai suggest that men are beginning to contributea little more to the burden of housework. It is clear from a study of their daily schedules,however, that this burden still falls overwhelmingly on the women's shoulders. Where thiscombines with long hours of agricultural or day labor, the total work burden which womenendure is significant. The daily timetalble for women in Lao Cai is illustrative of the work load ofwomen in rural Vietnam (Box 4.3).

77
Bo Dl i | ~Wake up; cok btePalst for wy; p rearel for pigs an chikw
l l l l . collect waw; feed pigs, cicesn horse
Have breakfast and feed the family
Walk to>fields (often 3-101km away)
Work in field
Have lnh and ist in the fields
Continue wokn h fiedsWalk back hor; coUlect feI wood on way; or process henpby hand
Cook dinner for fam_ily and anirwls;:feed all wash clote and children
Grind con and pound vice by band for next day
Emlbroider clothes
Go to bed.
PSoue ,La .Cai PPA. MRDP ,(1999).
30. There are several repercussions from this long working day. The first is that the womenare quite clearly physically overworked, especially since in the upland areas there is a very goodchance that they will also either be pregnant or breastfeeding whilst carrying out all these tasks.Women report a number of health problems which result from this overwork. The secondconsequence is that women have no time for social activities and, by extension, for learning in aninformal environment from the experiences of others. Thirdly, women have no chance toparticipate in evening literacy classes, if available and relevant. Fourthly, women are unable toparticipate in village meetings and decision-making fora.
31. Experience across the world shows that the willingness of men to increase theircontribution to household and childcare tasks clearly lags behind the increase of women'seconomic contributions to the family. Investing in small scale, appropriate householdtechnologies that reduce women's workload, and in rural water and energy projects can beeffective in cutting the domestic workburden. Reinstatement of childcare facilities outside thehousehold, which were cut back because of withdrawal of subsidies after the introduction ofreforms, could assist with tasks routinely performed by women or girls. Over time, publiceducation campaigns regarding the shared household responsibilities of men and women,preferably with the use of high level men as positive examples, may lead to attitude changesamong men.
(iii) Domestic Violence-Recent studies confirm that Vietnam has a relatively good legalframework on this issue: stipulations against domestic violence have been affirmed in theConstitution, and in laws and social policies, especially in the Law on Marriage and the Family,and the Criminal Code. Despite this, domestic violence seems to be widespread. The evidence on

78
whether it is rising or falling, however, remains mixed. (Le Thi Quy, 1999; Population Council,1998; and the World Bank, l999b).
32. There was strong evidence of significant levels of wife-beating in all PPA sites except HaTinh, where respondents suggested ithat husbands were now treating wives better becauselivelihoods had improved and the stress of economic hardship had lessened. In Ho Chi MinhCity, it is the children who talk most about wife-beating when they discuss dimensions ofpoverty. Seeing their fathers beat their mothers causes immense distress for the children. Thewomen themselves complain less about the beatings and the researchers in the Ho Chi Minh Citystudy explained that this is because th.e women believe it is "normal" for husbands to beat uptheir wives.
33. In one highland village in the Lao Cai study, a women's focus group estimated that 70percent of husbands subjected their wives to regular physical violence. In another, lowlandvillage, they estimated that 40 percent of wives were regularly beaten. The section on domesticviolence in the Lao Cai study concludes ominously "that these wife beatings occurred in both aremote, minority village as well as a midland, economically integrated village indicates thatdomestic violence against women cuts across economic and ethnic lines, and may be morewidespread than is realized." Other studies also report that domestic violence-whileexacerbated by the stress of poverty-is not caused by poverty alone. It is a practice that seemsto cut across economic and social classes (Box 4.4).
34. Domestic violence appears to be the outcome of a complex set of factors ranging fromsocio-economic conditions to people's awareness, from the cultural and domestic conditions tomorality and value orientation. Societal attitudes play an important role in the practice ofdomestic violence (Box 4.5). The mass media and mass organizations--such as the Women'sUnion, the Farmer's Union, and the Youth Union--have an important role to play in influencingand changing people's attitudes towards domestic violence and making it less acceptable insociety.

79
O D -~~e s6wi tha do, nes,t v'iolece is a woerldwide pheoeon affecting all estinvite50.t. perceJA a. Owen.- --othe mtost finm t fors affectin its prevalere is a society's
iiaie lowards doedc-violm AfoginVetna m violence is, considered as socay unacVae>-6; women and men,quite often view it as women's fault. In such cases, it is fet that the man wasjutified inbtting is wife.4'P*ople think that this [domesfti conflict] is unavoidable in family life,just likx our ancestors before haves We! bowld spoos in the she me shaken aayfrorx the rit ple et an he
Iz+n-a retio - They think that this i- norma Only trnwcase whn the. we gets be-at-se jf a eati or whe .=she 4 beite rpeatedly do p ak the local authorities to help. If theyare only d adye1lingy do not needhe1p," Female omeis Union Leader.-Ther -e -many times we[wvoenJ are atfault Therefore our hsband beat us. It is airight becase wewere wrong.e Mariad woman, aed 26.
sww, woxre l B* ( --999:.
35. Researchers in Vietnam find it difficult to identify clearly and precisely the main causesof domestic violence, but they have identified some factors that seem to play an important role.These include: economic causes such as hunger and poverty and stress in earning one's living;low education and "vestiges of feudalism" whereby people think more highly of men; culturaland social habits such as drinking, gambling, adultery and jealousy; and mental illness of theperpetuators (Le Thi Quy, 1999).
36. The PPAs report a very strong link between alcohol consumption and domestic violence,as illustrated by this passage from the Tra Vinh PPA. Campaigns which highlight the problemsof excessive driniking might have a favorable impact on domestic harmony.
Another woman complained that these drinking bouts can result in physical abuse whenhusbands come home drunk. "There are 2 men who live near me who beat their wives",said an interviewee who confirmed comments a number of women had made about spatesof drinking/ partying by groups of men. Another woman confided, "Lots of women in thisneighborhood are beaten by their husbands. Lucky for me my brother lives nearby, so ifmy husband starts coming after me I run to my brother's house."
37. An effective advocacy program is needed to heighten awareness of policy-makers at alllevels and create a favorable institutional environment for combating domestic violence. As partof this, high level policy-makers speaking out repeatedly against domestic violence may takeaway part of the current 'sensitivity' of the topic, which hinders public discussion and datagathering on the extent of the problem. Such advocacy activities would need to be coupled withpublic awareness raising to have widespread impact. Training of reconciliation groups (currentlyin charge of mediating in domestic violence cases at the household level), social workers, healthworkers, police, and justice staff in gender-sensitive handling of domestic violence cases is muchneeded. Finally, counseling services need to be expanded beyond the major cities, and temporaryshelters for battered women and their children need to be piloted. The Women's Union, with

80
funding of UNIFEM, is starting a project combining public awareness raising, training and IECmaterial development.
(iv) Women as a Tool in Coping with Hardships--There were several examples of womenbeing "used" as a coping strategy during times of hardship. In Lao Cai, the research team foundthat households might respond to a lack of labor by marrying off their eldest son. This thenbrings a daughter-in-law into the family who will then have to labor for her new household. Onefamily had done this in order to keep their son in school: they could not afford to lose his laborand so found him a wife who could labor for him while he completed school. In Ho Chi MinhCity, there were several cases of women being sold to foreigners for US$1000-3000, whichwould then pull their families out of poverty. There were also cases of men making their wivespregnant so that the babies could be sold for adoption.
2.4 Women may be getting disenfranchised of their land use rights
38. A recent survey of gender issues in land tenure in Lao Cai Province (Nguyen NhatTuyen, 1999) examined land tenure amongst four ethnic groups: Kinh (majority), H'mong, Tayand Dao. Discussions and interviews with households from these four groups indicate a strongtradition for land to be inherited by sons despite the female right to inheritance being protectedunder the 1993 Land Law. Female access to land is described by the respondents in this study interms of her relationship with men. At marriage, a couple often live with the husband's familyand the couple's access to land is determined by the landholdings of the extended family. Shouldthe marriage dissolve, women's access to land becomes more tenuous. The study in Lao Caifound that where women had left their husbands, in no case did they receive any land ascompensation (Box 4.6). In one case where the husband had initiated a divorce, the courts hadbecome involved and allocated some small plots of hill land to the wife, but she was unable tofarm the land because it was in her ex-lhusband's comrnune where she no longer had a home.
39. Widows were more likely to have formal access to land than divorcees, but they stillencountered problems in proving their land use rights. Where there is an adult male in thehousehold it is likely that the man's naie will be on the Land Tenure Certificate rather than thewoman's. Widows interviewed during the PPAs suggested that this caused great difficulties aftertheir husbands' death, because the procedures for changing the name on the land title werehighly complex and elusive. Without the correct name on the land title, it is problematic trying tosecure a loan.

81
40. Revising the format of land certificates, making it possible to have the names of bothwives and husbands registered as land holder, may go some way towards addressing thisproblem. Gender-sensitive training of local level staff of the General Department for LandAdministration (GDLA) could be useful, especially in expediting land transfers for widows,divorced, or separated women. Also useful would be public information dissemination targetedtowards women farmers about their legal entitlements under the Land Law.
2.5 Women have unequal and inadequate access to certain basic social services
(i) Women's Health Issues--Women reported health problems which were caused orexacerbated by their heavy work burdens, limited ante- and post-natal care and gynecologicaldiseases. Their work burdens (see above) mean that in many instances women are workingbeyond their physical capacities, sleeping only 4-6 hours per night and having no time forrelaxation. They reported suffering from back pains, headaches, arthritis and fatigue as a result ofoverwork. There was also an indirect health effect on the rest of the family because women weretoo busy to enforce proper hygiene on their children.
41. In Lao Cai and Ha Tinh, many women give birth at home without medical attendance.Ante-natal and post-natal services are nearly non-existent in many of the more remote villages. Ifthe women are fortunate, they might be able to rest and be looked after by a relative, but this isby no means the norm in poorer households. In Lao Cai, they might have to go back out to thefields within a few days of delivery (Box 4.7). In poor households, they are unlikely to be able toafford the extra nutrients they require while pregnant and breastfeeding.
Box 4.7, Mrs. Ly Thi Lans cat Ca viiw. - - ..
Wen we arrived to intevew, an's, houeold, weifud d t she ha give-birt three das previously to2 hr aughtr -Lan and her hlusband came, to Narawg fast m 199. Lan iS ery resonube forthe agriculhtral work, wiiie her husband does of ffar labor ii other co_munes (7 or $ days at a tie).She pve birth at home= while her husband was awa. The grandi cmes to hel out w cookiet., ind has brought some rice. The bousehold has one chicen, which lays an e oni most days so shecan eat these. But she, appeared to be very weak afer the birt~ Shze said she plansto rest for about 25 days,but if it rains she will go to work sooner becauseiland would need to be planted.
Source: Lao Cai PPA, MRDP (1999).X
42. Unsanitary living conditions and a dependence on IJUDs and abortions as the main formsof contraception lead women to report a high incidence of gynecological problems. Familyplanning campaigns rarely try to engage men or encourage them to take responsibility forcontraception.
(ii) Lack of Access to Education for Ethnic Minority Women and Girls--Ethnic minoritywomen are disadvantaged relative to their menfolk in terms of access to education. This is veryclear in the literacy figures presented in the Lao Cai PPA- in the two most remote villages thatthe PPA was done in, there were no adult women who were literate. Only in the less remote,predominantly Kinh villages were female literacy rates comparable to those of men (actuallythey were higher).

82
43. These very low literacy rates and language skills tend to reinforce the tendency forwomen from these communities to be marginalized and isolated. Without language skills andnumeracy skills, they do not like to go to market, for fear of being cheated. Infornation is not-widely available in a format which they can absorb and their exposure to new ideas is thereforelimited.
44. There is need for more targeted programs to increase school enrollment and achievementfor ethnic minority girl children as well as adult literacy for minority women. In order to accountfor socio-cultural barriers, girl-only classes and provision of better separate boarding schoolfacilities for girl students could help. Revision of the curriculum to ensure relevance to the livesof ethnic minorities might result in higher perceived benefits by parents and the cornmunityalike. The provision of better and more widespread childcare, and pre-school facilities mayalleviate the need for girl children to stay at home caring for younger siblings.
2.6 Women have less influence in the public domain
45. Unequal Access to and Voice in Institutions--Men usually attend village meetings onbehalf of the households. In rural areas, women are poorly represented in the Governmentadministration and there is no perceived need to seek women's views separately from theirhusbands'. This might be partly because the Women's Union is supposed to play the role ofensuring that women's interests are considered. However, the Women's Union does not havegood outreach in some of the more remote parts of the uplands. It does not always have arepresentative constituency, since not all women can afford to be members. And even if theWomen's Union is effective in representing women in a particular area, this does not necessarilyreplace the need for direct mechanisms which allow women to speak for themselves in decision-making arena.
46. The Government of Vietnam has set targets for increased representation of women at alllevels of Government. Currently, women's representation in the National Assembly is at 26percent, up from 19 percent in the previous legislative term, and higher than in many developedcountries. However, although consistent and strong political commitment has elevated the statusand recognition of women and their interests in governance structures, a significant gender gapremains at local levels of Government (Table 4.8). NCFAW is training women candidates for theNovember 1999 People's Council Elections at province, district and commune levels, in order toa) increase their chance of being elected, and b) enhance their awareness of gender issues inpublic policy making. NCFAW is hoping that women will take 25 percent of the seats in theseelections.

83
Political Body | Percent of Women members,
1994-99
National Assembly 26.2
Provincial People's Council 20.4
District People's Council 18.1
Commune People's Council 14.4
Source: UN System (1999)..
47. In addition to addressing gender imbalances in governance structures, attention alsoneeds to be paid to gender issues relating to governance processes. National developmentprograms need to be made gender sensitive through better design and targeting of programs.These programs should also encourage the full participation of women in the planning andimplementation of public programs and policies. This leads us into the next section on otheraspects of governance and equity.
3. GOVERNANCE AND EQUITY
"People know, people discuss, people execute and people supervise."
President Ho Chi Minh.
48. Vietnam is a country in transition on many fronts. After experiencing years of internalstrife and war, it has emerged as a country with a strong national identity, social and politicalstability, and a determination to catch up with the development of modern industrial economies.In this context, the Government recognizes that setting in place an effective governance structureis essential for a well functioning economy and for spreading the benefits of growth widely insociety. It also recognizes the need for reorienting the all-encompassing Government of theplanning era towards a concrete, more selective set of activities that support and complementindividual involvement in economic decision-making at the grass-roots level.
3.1 Vietnam's Grassroots Democracy Decree is an exciting initiative
49. Towards this end, the introduction of the Government Decree No. 29 of May 1998 on theexercise of democracy in communes, popularly known as the "Grass-roots Democracy Decree"is an important move (Box 4.8). This Decree aims to legalize people's direct participation inlocal decision making, as well as to establish transparency and accountability as mechanisms atcommune level and upwards for the supervision of public programs and locally financedprojects. It thus aims to improve "governance" at the local levels.

84
50. "Govemniace" can be defined as the manner in which power is exercised in themanagement of a country's social and economic resources for development (ADB, 1999).Economic govemance-sound development management-is at the core of sustainabledevelopment and the four pillars of governance--transparency, accountability, predictability andparticipation--are universally applicable (Box 4.9). But their application must be country-specificand solidly grounded on the economic, social, and administrative capacity of the country. TheGrassroots Democracy Decree is an important step in implementing these elements of goodgove5ance at the local level in Vietnam. It will serve two very important needs: enhancingparticipation and improving transparency, accountability and predictability of local goveanrnentactions.

85
Bo 4.9 Th ForNasof
RMarn entails the low-cost access to releva£t inormationx, Reliable and tiely ecotiniie andfmlcialinfontnation is a rnust for the pubi (normally throug the filWte of a capabile media). a is essential not only thainformation be provided, but also that it be relevant and in understandable form.
Ace a is the capacity to call public officials to account for their actions. Effective accountability has twocomponents. (i) amswerability and (it) consequences. Anserability is fte requimnent to respond periodically toquestions concernng one s official actions. There is also a need for predictabe and meaningful consequences,without which accoutability is only a time-consuming formality. In addition both internal (administrative) andextmeal accobit are needed. Particularly with the dramtic imovements in, information andcommication teclnloIgy exterl accountability through feedback fron service users and the cftizenry can nowbe obtained at low cost and for a greater variety of government activities, and is an essential adjunct to impovingefficiency and effectiveness of publi service deivety.
PrctditaSbiy results primarily from law and regulations tat are clear, known in advance and uiformly andeffectively enforced Lack of predictability makes it hard for public officials to plan for the provision of services(and is an excellent alibi for nonperformance). Predictability of government economic actions is atso need as an
I indicator on which the private sector can rely to make its own production. marketing, and investment decisions.Most imiportantly, to be predictable, the application of economic regulations must be effective, fair, and uniform.
Paticipation }is needed to obtain reliable informaion and to serve as a reality check and watchdog for governmentaction. Among other things, participation by extemal entities is needed as a spur to government operadonalefficiency, and feedback by users of public services is necessary fornonitoing access to aid qual of theservtices.
Empirical evidence suggests that a strong civil society plays a crtcal role m adacing good goverance.Improving formal rules and organizations without any change in informl customs'and ways of doing businessavails little; importing procedures and mechanisms without referene to the incentive and local capacityframework is likely to be fruitless; gintemating only with central goverment or, indeed, only with government isnot conducive to good implementation of reforms.- Above all, governance intervention should eourage theforation of soci capital, i.e., the sto of trust and information exchage at the base of civil society.
Source: ADB (1999).
3.2 Better information will empower the poor to participate in decision-making
51. The PPAs found that in all sites, people were hungry for a two-way flow of information:from the govemment to them about the nature and timing of public policies and programs thataffect their lives and from them to the government with a view to influencing some of thesepolicies and programs. They felt that there was a strong connection between those that hadaccess to these two-way flows of information and those that had access to other resources, suchas credit, that they could use to improve their lives. PPA participants felt that access to theseinformation channels were limited to a few "well-connected" participants and that a moreequitable access would lead to a more equitable and inclusive pattern of development.
52. The PPAs found that the poor feel ill-informed about government policies and programs,including those that are supposed to be designed to benefit them. Box 4.10 below from Tra Vinhsuggests a certain sense of powerlessness and resignation by a householder who is losing land toa project he has been told nothing about, even though the consequences for his own householdare significant.

86
53. Provi ing people with the ingformation they need in an appropriate format is one of themost powerful ways of helping build up their human and social capital to cope with poverty. Asdiscussed in Chapter 2, poor households in every PPA study site felt they were under-informedabout targeted Government programs and services and that richer households were betterinformed. Where efforts are made to improve information flows (such as by the provision ofradios) the impact can be large and positive (Box 4.11).
54. For rural dwellers, the village manager is the goveilrnent official closest to them and thisperson has a key role in disseminating infonnation to the households in his/her administrativearea. As well as being a disseminator of information from the govemnment to the people, thevillage manager also plays a role in channeling informnation from the people up to the higherlevels of authority. The PPA disietssions suggest that people feel that this upwardcommunication is limited and that their views are not listened to or acted upon by governmentauthorities. Although the mechanisms Tor broad-based participation in decision-making are inplace, these mechanisms do not always work efficiently. There were many quotes in the PPAdocuments along the following lines:

87
"The policy is that the people know, the people discuss, the people do, but here peopleonly implement the last part, which is the people do " (Ha Tinh)
and"I am glad I was invited to a meeting today, but do we get to talk? Usually we do notget to talk, we just come and listen to them talk. " (Tra Vinh)
55. There may be a number of reasons for this feeling of a lack of voice and representation:
1) The village manager is not good at, or may face very serious constraints in,canvassing opinions, or believes them to be irrelevant: "they don't invite me tomeetings, but they invite me to public works", said one poor villager in Tra Vinh;
2) The village manager may be selective in gathering feedback, dismissing the views ofthe poorer households as ill-informed;
3) All village managers in the rural sites were men. There was no evidence from anyrural site that these men thought it necessary to consider women's perspectivesseparately from those of their male relatives;
4) Certain households or people might not have the confidence to speak up;
5) The village manager might be ignored by higher levels of the administration becausethey believe the views he is presenting are irrelevant or because the village managerdoes not speak their language, they are unable to understand him well;
6) The village may be physically remote from the commune headquarters and theinteraction between the village and commune may be limited.
56. These difficulties are compounded in areas, such as the Northern Mountains, where manyethnic groups live and where a significant proportion of the population is not literate in thenational language. But even in ethnically homogeneous and highly literate areas such as Ha Tinh,this was an issue and poor men and women expressed their need for increased participation inaffairs that affect them directly:
"Local people should be entitled to discuss important issues such as the amount of theloans they get, the building of infrastructure, and the division and use of land. "
57. The Grassroots Democracy Decree is still at an early stage of implementation andpresents a significant opportunity for strengthening this two-way dialogue between governmentauthorities and local communities. A study done by SIDA in the four PPA provinces to look atthe early implementation experience shows that local Steering Committees at province, districtand commune levels have already been established to facilitate the implementation of thisDecree (SIDA, 1999). It is worth noting, however, that the study found that the SteeringCommittees at all levels are overwhelmingly dominated by men and the majority Kinh people.The study also notes that "although Vietnamese women account for about 50 percent of the totalpopulation, no woman has been nominated to a post of the head of the Steering Committee".
58. The implementation of Decree 29 following this piloting phase will provide perhaps themost important and significant vehicle for mainstreaming participation of poor anddisadvantaged people. A major information dissemination campaign in appropriate language and

88
form will be fundamental to its success. Focused participation of women, ethnic minority groups,and poorest people who are less likely to be heard will be essential. The successfulimplementation of the Decree will depend much on the willingness and ability of the institutions-and authorities at commune level to change, which in turn will be dependent upon the ability ofdistrict and provincial authorities tc listen to-- and offer flexibility to -- commune levelinstitutions and authorities.
59. There is a growing trend of women and men, including the poor, at the community levelto come together into common interest groups such as savings and credit groups, irrigation waterusers' association, parent-teacher associations or Integrated Pest Management (IPM) groups.Such groups and formations do not only mobilize local resources but also often provide focusedand collective voices of people inclucling those who would otherwise not be heard. More andmore of such groups and forrnations will provide sustainable mechanisms for mainstreaming andinstitutionalizing participation and engendering equity. These groups need formal registrations,recognition and capacity strengthening not only so that they can generate and manage funds andresources but also for them to work in support of the grassroots democratic process promoted bythe State. Moving ahead on the draft Law on Associations could provide a supportive legalenvironment for such groups to emerge and operate effectively.
3.3 Improving the transparency of local government finances
60. The Grassroots Democracy Decree will also help to deal with the important issues oftransparency and accountability at local government levels. It requires that people be inforrned ina transparent way about local government revenues and expenditures. This is an important issue,given the highly decentralized management of a significant proportion of revenues andexpenditures in Vietnam.
61. In Ha Tinh there were considerable complaints about the level of fees and contributionslevied by the local authorities (Action Aid Vietnam, 1999). These contributions are on top oftheir nationally-mandated agriculture tzx, and can take the households' overall burden of taxesand contributions up to about 25-40 percent of their total rice production (Table 4.9).Furthermnore, many of these contributions are levied on a per capita basis and since poorerhouseholds are often bigger, they tend to have a regressive effect. Other studies also have similarfindings (Oxfam UK and Ireland, 1996).

89
ITable 4.9: Calcullation of Taxes, Fees and Contriutions for a poor household with 5- members in Ha -Tial .
Agricultural tax; Commune and village tax and Residential tax 253
Comnmune contributions kgs paddy
Comunune budget 6
Security and defense 20
Natural disaster 3
Transport/irrigation 26
Welfare (tinh nghia) 4
School construction 35
Education promotion fund 35
Other construction fund 35
Tot: 164
Village contributions
Transportation/irrigation 20
Village budget 13
Rat killing 10
Total 43
Total Taxes and Contributions (kgs paddy) .459
% of Total Paddy Production 39%
Source: Ha Tinh PPA, Action Aid Vietnam (1999).
62. Households say that they have little information about what their money is spent on.Where they feel that they are shouldering a high tax burden and yet they see few services andlimited local development in return, there are some allegations about corruption against localleaders. Mechanisms for appeal, if they exist, are ill-defined. People feel they have to pay thetaxes without questioning: "All decisions are top-down. For example, decisions on contributions,fees, taxes and the like... all the people could do is what they are required to do as informed bythe Village Manager". There were reports of officials going to collect taxes with the localmilitia, who threaten to take the house door away if the household does not pay immediately.Households fear theft and dare not refuse.

90
63. It is interesting and notable that this was only an issue in one PPA site. Since ethnicminorities are subject to a preferential tax regime, it is unlikely that this issue would arise in theNorthern Mountains Region. Neither did the households in Tra Vinh mention that the tax burderrwas particularly heavy. It may be, as suggested by another recent study, that this particularproblem of poor households has a regional element to it and is limited to the lowlands ofNorthern Vietnam.
64. The VLSS data confirm that the level and incidence of taxes, fees, and contributions(TFCs) varies significantly between regions and provinces (Table 4.10). The level of TFCs perhousehold are highest in the Red River Delta and lowest in the Northern Uplands. However,when expressed as a percentage of total household expenditure, the incidence of these 'voluntarycontributions" is lowest in the Southeast Region. As far as individual provinces go, the highestTFC incidence is in Thanh Hoa (9.2 percent) and the lowest in Ho Chi Minh City and Tay Ninh(1.8 percent). While the average levels of these TFCs do not appear to be too large, these taxesand fees do appear to be a big burden on the poor, are inequitable (because they are often leviedon a per capita basis), and appear to cause resentment amongst the payees since there is a lack oftransparency and accountability in the way that they are collected and spent.
Taxes, Fee & Contributions TFC as % of HouseholdExpenditure
Location (VND,OOO per household)
All Vietnam 473 4.8
Regions:
Northern Upland 329 3.8
Red River Delta 563 6.6
Northern Central 436 5.4
Central Coast 543 4.9
Central Highland 399 3.4
South East 453 2.6
Mekong Delta 518 4.3
Source: World Bank estimates based on VLSS98.

91
CHAPTER 5
REDUCING VULNERABILITY
AT A GLANCE:
REDUCING VULNERABILITY
. Poor households' livelihoods are extremely vulnerable to both household-specific and conmmunity-wide shocks.The fragility of the economnic base of rural households means that these shocks are thoroughly destabilizing andcan take many years before recovery is consolidated.
. Health shocks, which entail the loss of labor resources and significant costs for curative care and associatedexpenditure, are very commonly mentioned as a reason for a household's poverty. Reducing the direct andindirect costs of curative health care for poor households could constitute an important safety net.
* The risk of failure associated with on-farm investment can deter households from expanding their economicbase in such a way as would improve their resilience to shocks. However, agricultural extension and veterinaryservices, which could help reduce the risk of on-farm investments, do not currently reach the poorsystematically.
. Investments which lower risks of community-wide shocks could be an important means of expanding householdeconomic activities and helping poor households out of poverty.
. Formal safety nets have low coverage and are only weakly targeted. As a result, households fall back on anumber of community or household level strategies to cope with these crises. The choice of strategy maydetermine to a large extent the speed and sustainability of a household's recovery from a shock.
* Rural households have limited access to reliable facilities for saving cash which could be withdrawn in times ofhardship or peak expenditure. This constrains the ability of poor households to cope with shocks.
* The Government's Hunger Eradication and Poverty Reduction (HEPR) program provides a framework toaddress some of the most pressing needs of poor households. This has focussed, to date, on the provision ofsubsidized credit and, more recently, health cost exemptions and school fee exemptions. A number of factorsseem to constrain the access of the very poor to these benefits.
"When a man is standingpermanently up to the neck in water, even a ripple is sufficient todrown him."
1. This well-known proverb from China resonates through rural Vietnam. Although rural inorigin, the analogy is no less appropriate as a description of livelihood systems amongst the poorurban communities. Livelihoods in all four PPA sites are so fragile and finely-balanced that evenminor shocks can destabilize households. While living standards are rising, poor rural and urbanhouseholds still feel very vulnerable in times of crisis.
2. In this chapter we will look at how shocks and crises affect household wellbeing. Section1 begins by exploring the concept of vulnerability and the link between poverty andvulnerability. Section 2 then examines the nature of the shocks that undermine the security ofpoor households. Section 3 examines the ways in which poor households cope with shocks andcrises. It suggests that many households have a hierarchy of coping strategies which Governmentand donor agencies should take account of in designing policy interventions. Finally, Section 4

92
presents an overview of Government programs and safety nets which aim to improve the securityof poor and hungry households.
1. VULNERABILITY AND POVERTY
3. Both quantitative and qualitative data indicate that the poverty status of householdsfluctuates over time. Data from the VLSS indicate that although many more households movedout of poverty than moved into it between 1993 and 1998, the direction of movement is notentirely one way"5. There has been movement amongst all three categories shown in Table 5.1:the very poor (those below the food poverty line), the poor (those below the total poverty line)and the non-poor (those above the total poverty line). While two-thirds of households in the verypoor category in 1998 had also belonged to this category in 1993, one-third had fallen into thiscategory over the five years. Most households that fell into extreme poverty in 1998 were poor tostart with, though a few of the non-poor in 1993 saw a dramatic reversal in their fortunes and fellinto extreme poverty. Similarly, more than half of the households in the poor category in 1998were not in this category in 1993. Some of those entering this category were the very poor whowere getting better off and growing out of extreme poverty while others were entering thiscategory because they were getting worse off and were going from being non-poor to poor. Alarge amount of mobility is also found when the movement of households between expenditurequintiles is examined (see Annex 5).
Total | 12.4 21. 66. 100*.0
Source: World Bank estimates based on VLSS593 and VLSS98.
Note: Dark shaded cells indicate the percentage of panlel households whose poverty status did not change between 1993 and1998.
4. The PPAs clearly demonstrated the links between poverty, vulnerability to shocks andcrises, and dependence on income sources which are highly variable. During wellbeing rankingexercises much of the explanation for a household's vulnerability lay in the composition of itsincome sources. Those households in rural areas with only a narrow range of on-farm activities
About 4300 of the same households were included in both VLSS93 and VLSS98, allowing a panel analysis ofhow individual households' living standards have changed over time. Note, however, that Table 5.1 may overstatetransitions due to measurement errors in household expenditures.

93
were seen as being most vulnerable. Landless households in the Mekong Delta were described asparticularly vulnerable because the demand for day labor was so seasonal and patchy. There wasa strong association between physical isolation and vulnerability, partly because theinaccessibility to markets acts as a disincentive to diversifying livelihoods. In urban areas, thosehouseholds who relied heavily on informal sector work such as portering or rickshaw-drivingfaced particular problems in dealing with any unexpected expenditure demands. By contrast,households receiving social service payments, even if they were very small, were ranked higherbecause of the security which these regular transfers offer. In urban areas, having a regularincome was considered a very important determinant of wellbeing.
5. An important question of relevance to Vietnam is the sustainability of the recentreduction in poverty given the high-risk nature of household income sources and the prevalenceof household level and community level shocks. The histogram in Figure 5.1 below shows a highproportion of the population is now clustered just around and above the poverty line. On the one-hand, this is good news since relatively small increases in mean per capita expenditure willcontinue to move large numbers of households over the poverty line. But on the other hand, sinceit would only take a small reduction in per capita expenditures for some of them to fall backbelow the poverty line again, a large number of people remain vulnerable to falling back intopoverty due to either household-specific or community-wide shocks. The nature of these shocksis examined in the next section.
K Food poverty line
- t Poverty line
2500 5000 7500 100~0Real percpita exenditre (V NO 000s, Jan 1958)
Figure 5.1 l istogramn of Per C~apita Expenditures, 1998
Source. World Bank, bascd on VLSS98.
2. THE NATURE OF SHOCKS AFFECTING POOR HOUSEHOLDS
6. A variety of shocks can undermine the security of household's livelihoods. Although thedistinction is not always clear-cut, it is useful to distinguish between shocks that are household-specific and shocks which are community-wide. When markets and community mechanisms

94
work well, household-specific shocks (such as illness or the loss of livestock) may not requireoutside intervention. In contrast, community-wide shocks (such as crop loss due to poor weatheror natural disasters), since they affect everyone in the community to some degree, require-interventions such as safety-nets and vvorkfare.
2.1 Households and communities in Vietnam are vulnerable to a variety of shocks
7. The most commonly quoted shocks and crises found in the PPAs are presented in Table5.2 below. These are ranked starting with the types of shocks that are most specific to thehousehold and ending with those that are community-wide. Of all of these, household-specificshocks--such as illness or death of a main laborer and failure of an investment--appear to beparticularly prevalent and destabilizing.
. 00 \$? :0\r?tS 0; Type of Crisis Effect
HUMAN+0,, cRISIs i;0000Illness High indirect and direct treatment costsand loss of income through reduced labor
Death of a laborer High cost of funeral expenses and loss ofincome from labor loss
Alcoholism, drug addiction and High expenditure, reduced income fromgambling lost labor
MATERIAL cRisis Theft Loss of assets; reduced incomeDamage to housing (weather; fire) High, unexpected expenditure
020NN-CRO,2.sf 0 .0 Failure of investment Reduced income: inability to repay debts
ECONOMIC SHOCK Unemployment Reduced income
Death of animals/animal epidemic Reduced income; reduced assets andsecurity
CROPFAILURE0 00 t0Crop loss: Rats/mice or other Reduced incomepests
Crop loss: landslide Reduced income
Crop loss: Weather (floods; Reduced incomedroughts; typhoons; storms andhigh winds)
Source: PPA Synthesis Report, World Bank (1999).

95
8. The remainder of this section describes the causes and consequences of the main types ofhousehold-specific and community-wide shocks experienced in Vietnam.
2.2 Household-specific shocks can lead to severe crises for poor households
9. The Dread of Illness --A long term illness or death in the family is one of the mostfrequently-mentioned reasons why households find themselves in severe difficulties. This isespecially the case when the household has to go beyond the commune health centre to thedistrict or further afield in order to get treatment for a serious illness. The cost of treatingillnesses is relatively much greater for the poor. A single curative visit to a public hospital costs aperson in the poorest quintile the equivalent of 22 percent of his/her annual nonfood expenditure.(The corresponding figure for a person in the richest quintile is only 5 percent.) Even a visit tothe commune health center, which is supposed to provide free services, costs the equivalent of 4percent of annual nonfood expenditure for the poorest quintile and less than 1 percent for therichest quintile.
10. The VLSS98 data reveals that households in the lowest quintile allocate 30 percent oftheir non-food expenditure to health costs. On average, an individual belonging to the poorestconsumption quintile faces an opportunity loss (in terms of wages foregone due to non-workingdays) of VND 286,000 or 25 percent of his/her annual per capita consumption expenditure due topoor health. The equivalent wage loss for an individual in the richest quintile is only 6.5percent.The Ha Tinh PPA reports that 57 percent of households becoming worse off, did so dueto illness. Newly formed household are especially vulnerable to this type of crisis when one ofthe laborers is suddenly and unexpectedly incapacitated or dies.
11. The case study in Box 5.1 below shows the kinds of responses which a household mighthave to make in the event of ill health. This example is from a remote highland village in LaoCai, where there is some community support but where there is little opportunity to borrowmoney from banks or moneylenders. Where this family has sold assets and withdrawn childrenfrom school to pay for medical expenses, a family in a more accessible area might havereallocated resources differently. In lowland areas where access to larger loans from the informalsector is a possibility, this might be a first response. This then aggravates the problem as highinterest payments, perhapsIO percent in rural areas and up to 60 percent in Ho Chi Minh City,are added to the family's expenditure requirements in future years. While dealing with a laborloss (because the illness reduces available labor), the household then faces a need to generatehigher incomes than previously in order to cover the debt. In Tra Vinh, the PPA teams foundhouseholds selling land in order to raise cash to cover the costs of ill health. This has clearimplications for future income-generating potential. If a household has to take out a loan as wellas sell productive assets, then the prospects for repaying the loan can be bleak. Both the Tra Vinhand Ho Chi Minh City reports describe a debt spiral which commonly traps the pooresthouseholds.

96
12. The situation of Nha's household in Box 5.1 can be illustrated by looking at the impact ofthe serious illness on the different types of capital that households are endowed with (Figure 5.2).This figure demonstrates the complex eiesource reallocations which a poor household must makein order to cover the labor loss and expenditure on treatrnent which are associated with a healthcrisis.

97
Suc: La Cafllf PP,MD 19
FigNre 5.2: Dawingon Capial Res to Cpe wih a HealthShock
13. Figure 5.2 depicts a common pattern of knock-on effects to a serious illness. First thehousehold must mobilize enough cash to cover the costs of obtaining medical treatment(including transport, food and medicines). It does this by selling assets, borrowing money orselling their labor. This in turns alters the allocation of household labor and crop and investmentdecisions. Thus the impact of a serious illness can have long-termn, and somnetimes irreversible,downward effect on household well-being. In Lao Cai, withdrawing children from school is acommon response to such shocks which, of course, has longer termn consequences for theindividual and household opportunities. As noted above, this mainly happens when a householdneeds to cover the direct and indirect costs of treatment at the district level. To avoid thedownward spiral that may follow, many poor households will not even consider taking this step

98
in the first place. Both the Lao Cai and Ho Chi Minh City PPA teams found people living withill-health on a long term basis because the costs of seeking treatment were simply unaffordable.There are strong grounds for proposing measures which help poor households cope with healthicrises in a way which minimizes the long term impact on the household economy.
14. Alleviating the impact of user charges on the poor requires much more than simplyexempting the usual social categories of disabled, victims of war, orphans and the indigent frompayment of user fees. The evidence indicates that these exemptions are not offered adequatelyenough by public health facilities to the poor. Instead, what may be needed, especially in view ofthe voluntary health insurance system being promoted in the country, is to require districts toearmark funds for purchasing health cards and issuing them free of charge or at subsidizedpremia to the poor. This is already being done, but the local funds earrnarked for free orsubsidized health cards are still too inadequate.
15. It may not be necessary to target additional assistance to all areas. The poor living inricher areas generally pay less for health care and most do not find these expendituresunmanageable. Therefore, a policy that targets, say, the poorest 30-40 percent of communeswould be more effective than one that tries to assist the poor in all communes in the country
16. There are many stories across the PPAs of the destabilizing impact of alcohol or drugabuse. First, there is the effect of redirecting expenditure away from other items in order topurchase the alcohol. Secondly, the mnore severe cases of alcohol abuse lead to a reduction inhousehold labor, which then reduces :household income. Drug abuse, which is most common inHo Chi Minh City, is also associated with family members committing crimes, which leads toincreased expenditure as families have to pay fines. As in many other countries, alcohol abuse isvery often connected to domestic violence in the case studies and this has an impact on domesticharmony and wider well-being.
Failure of an Investment
"A poor harvest makes things unistable for three years. Recovery is only possible if all thecrops are good. " Ha Tinh PPA.
17. While the narrowness of income sources may underpin a household's vulnerability toshocks and crises, the risk of failure can deter a poor household from embarking on investmentswhich would broaden the range of income and thus reduce vulnerability in the future. This isparticularly true when it is necessary to take a loan in order to invest in new activities. If theinvestment fails, the household faces an income deficit which will have to be funded from otherincome sources (if available), taking another loan, or by selling assets. In addition, additionalcash must be raised to fund interest payments and the repayment of the original loan (Box 5.2).The Ha Tinh PPA suggests that 14 percent of households experiencing a deterioration in well-being did so as a result of a failed investment.

99
Box 5,2: liuilue of ani Investment in Wfral P.rodu in CTInbBin and XBy are 62 years old and -have been- livng ia their vilLage for 3 years. he moved tO thisvillage from Tra Vinh town becwe' t}ieir, oldest son Eves here. Bec ause they do not ownII any suitableland, tey have not invested much m slnp raLsng, althoug tey bave cnrbuted to he~ oldet son'sshrimp ponds. Since moving to their vilage, thy have plated three watermelon crps. They spent mostof their savings on hir first watermelon crop, whicb failed. A second watermelon crop ied due topoor weather last year and simultaneously the 5000 shrips their son was raising died For: their 3"'watermelon season they went into debt for the first time in their lives, buying fertilizer on credit. On theday we visited, Xay was alnost in tears becas she, had just realized the seeds they had plantedthis yearwere bad and thatt watXenlons, although ripe, were nuch smaller than she expected This meansthere will be no profit from this third season: their investment of over VNDImillion will only yield salesof between VND6-700,00) and she will be unable to repay the fertilizer supplier. Their daughter-in-lawwas 8 mondis' pregnant at the tiie of our visit and Xay said teaflly, "I don't know what we're going todo".Source' Tra Vinh PPA, Oxfam GB (t99).f
18. Many of the options available to a poor, rural household hoping to diversify the farm basereportedly carry a high risk of failure: livestock is vulnerable to disease and theft; crops are
vulnerable to poor weather, insects and other pests; fishponds may fail because of disease; fruit
trees and coffee bushes can be damaged by frost in the upland areas; and earning a profit from
cultivation of most crops is highly dependent on market conditions.
19. For the poorest households, investment in risk-reducing measures may be at the expense
of meeting very basic consumption needs and therefore not the highest immediate priority. Whilebetter-off households might vaccinate their livestock if vaccinations are available, poorer
households might not be able to afford vaccinations and thus run a higher risk of livestock loss
through disease. Mechanisms to reduce the risk of investing in activities could help poorerhouseholds to break out of a cycle of vulnerability and poverty. These could include better
agricultural research and extension and a wider network of veterinary services. However, poorer
households currently have less contact with extension officers and have less education than
better-off households and so are more likely to lack information on appropriate measures for
managing risk. Data from the VLSS98 show that only 9 percent of rural households in thepoorest quintile live in communes with an agricultural extension agent, suggesting very restrictedaccess to formal training in improved techniques.
2.3 Community-wide shocks and disasters are widely recorded
20. Two major kinds of economic shocks and crises were recorded in the rural study villages
including:
* Loss of crops (and other material possessions) due to drought, flood, storms, wind
damage, landslides and pest damage;
* Loss of livestock due to epidemics.
In addition, in urban areas:

100
* Fluctuations in the labor market added instability to people's lives in Ho ChiMinh City and a change in employment arrangements could leave a householdextremely vulnerable.
21. Loss of Crops--Agricultural losses are often associated with unfavorable climaticconditions or events such as floods, droughts, storms, or typhoons that affect wholecommunities. The Vietnam National Committee for the International Decade for Natural DisasterReduction (VNCIDNDR) assess the relative frequency of floods and typhoons as high anddroughts as medium. On average, fowu to six typhoons strike the coastline of Vietnam each year,with the central and northern provinces most commonly affected. These shocks can inflict a lotof damage: in the period 1971 to 1994, more than 6 million tons of rice production was lost as aresult of flood and typhoon damage in Vietnam (Benson, 1997). Box 5.3 below is illustrative ofthe kind of damage which typhoons can inflict. Typhoon Linda struck the Mekong DeltaProvinces in November 1997, just before VLSS98 data was collected. It is possible that thispartly explains the slower growth seen in this region (see Chapter 1).
heavypansiblt o yecntuto andVmonitoding. Therovicsufghh ii; iathe~m Diandtefrers Maagmperialit
thpit CFSC fiu wr E especibleyfh r withca terleetd tissemina cntor. Ttal
naTioni lses froval sthuctufes for nly etimatnd Storm a iont but melik n iter-slyteria
place and operate effectively. There are clear guidelines and procedures established which arefollowed in response to disasters and which sometimes work well.

101
23. The Vietnam Red Cross (VNRC), with the support of the International Federation of RedCross and Red Crescent Societies (IFRC) also plays a role in preparing households for disastersalthough its function in providing post-disaster relief probably attracts a higher profile. The-VNRC has offices in every Province and nearly every District. There is also a presence at thecommune level, though this may be merged with other local authority functions and may notalways be so visible. They have also established a network of more than 40 DisasterPreparedness Centres (DPCs) in 21 Provinces most commonly experiencing emergencies, with aview to improving community-level training and awareness in disaster-preparedness. Theiractivities still often focus closely on preparing for an imminent disaster rather than fosteringmore general preparedness.
24. There are less clear means of help available to households experiencing community-levellivelihood shocks, such as an epidemic of livestock disease within a village. Where the localVNRC are particularly well-resourced and motivated, they may be able to respond (such as in arecent incident when fire swept through a small community of poor households in HCMC).However, this kind of crisis is generally on too small a scale to attract the attention of disaster-relief agencies or organizations concerned with disaster prevention. The expansion of disaster-preparedness activities to cover smaller-scale emergencies, such as awareness-raising campaignsabout the dangers of fire, or the containment of an epidemic, or methods of limiting damage tocrops from an attack of pests could be extremely valuable in providing greater livelihood securityto poor households.
25. Failure of crops due to climatic conditions and pest infestations was a particular problemin Lao Cai and Ha Tinh. Pests, insects and rats, had caused a serious reduction in crop yields inHa Tinh. Poorer farmers were unable to afford to take protective measures against such losses(Box 5.4).
Box SA: DXestruedon by Pests
Ans household had to leave their garden ;(about 300 nemepty because rats had destroyed so rmuch of it inthe past. A's wiffe said tat there was no income from, potatoes or pe,uts last year dule to ratts Theyrheard about rat prevention mnethods from Ha Tirth-Provincal Television, but they did not,have money toinvest in themn Mrs An said that the 'destrucion by rats nowadays is more severe than air-raids by B52bombers."8 [This area was heavily bombed during the war with the USA.]
Source: Ha Tinh PPA, Action Aid Vietnam (1999).
26. Loss of Livestock--The loss of livestock can have serious consequences on thehousehold economy given the importance of these household assets and the pivotal role playedby livestock in the farming systems of rural Vietnam. Livestock death and disease is consideredto be one of the main factors contributing to poverty in nearly all the villages covered in the LaoCai PPA and was also mentioned in Tra Vinh and Ha Tinh. A family in Ha Tinh reported that"when your buffalo dies, it may take you as long as five years for the household to recover"(Action Aid Vietnam, 1999). The Lao Cai PPA found that the provision of important technicaladvice and training falls into an institutional gap between the mandates of the agriculturalextension station and the veterinary station. As a result, important technical aspects are omittedfrom training exercises. These include:

102
* Basic animal husbandry techniques, such as housing and sanitation
* Herbal and traditional remedies for treating animal diseases
* Improving existing feeiding systems
* Information on quality control - how to tell a diseased animal at market
27. Limited information on sound husbandry practices and low uptake amongst poorerhouseholds of animal vaccination services mean that the whole animal population of a village isat risk if a diseased animal is bought at the market and introduced to the village. Box 5.5 belowillustrates how lack of information and linguistic isolation threaten rural incomes from cropproduction and livestock raising in Lao Cai.
28. Macroeconomic Shocks -- Poor households in rural areas covered by the PPAs seemquite untouched by the slowdown in economic growth in the East Asia region. There has beenvery little foreign investment in the rural areas of Vietnam and poor households in the rural PPAsites are still unlikely to be earning much income off the farm. Nor did households mention thatremittances from urban areas (where they existed) were falling.
29. The Ho Chi Minh City PPA did, however, indicate that some of the poorer urbanhouseholds were suffering from economic stress as a result of the slowdown in national andregional growth. Respondents suggested that competition for unskilled work was becomingtougher and this was described as being a result of both recent cutbacks by local enterprises andof the larger pool of unskilled labor available to employers. In problem-ranking exercises,unemployment was identified as the most pressing problem by all poor and migrant groups.
3. COPING STRATEGIES
30. What is striking about the strategies which poor households adopt to cope with shocksand crises is the overwhelming importance of actions taken by the households themselves. Thecommunity may help to some extent, especially in the case of household-specific shocks, butsince poor households often live in poor communities the level of assistance available fromfriends and relatives and informal networks is often quite limited. Similarly the formal safetynets which do exist seem to operate rather sporadically. Where these have been provided they areundoubtedly appreciated, but their place in the overall picture of responses to shocks is really

103
very limited (see Section 4 below). As far as coping with hardship is concerned, poorhouseholds have to look largely to their own resources.
31. For the poorer households, these resources rarely include cash savings. The provision ofsavings services is often the "forgotten half' of savings and credit interventions. This is true inVietnam, where the formal financial institutions have not really extended deposit services inrural areas. Indicators of the gaps in financial intermediation include the widespread use of non-financial savings instruments, including livestock, gold, housing and reciprocal obligations. Thelatest significant innovation in this area is not from the banking sector at all, but from the PostOffice, which has been using its branch network to accept deposits since 1999.
32. For all households, there is a higher demand for savings services than for loan services.Almost every household will have some savings need, such as managing seasonal changes incash income, building up a financial cushion, saving for regular periodic cash payments (such asschool fees) or saving for a large purchase or investment. In contrast, only some households willdemand a loan at any given time. For poor households, the role of savings services in building upa financial cushion and thus reducing vulnerability is particularly important. Many of the casestudies from the PPAs demonstrate how a single shock, such as illness, or the death of livestockcould cause a rapid deterioration in the well-being of households. Clearly, any form of savingswould be a valuable buffer against such shocks. Another specialized form of savings - insurance- would be even more useful if it were available (Box 5.6).
3.1 A Hierarchy of Coping Strategies?
33. In all four PPA sites, the first point of assistance for most poor households is the family,then friends, then the community, and finally commune or district programs. Most householdswould be able to get some kind of support from within their community. This might includeaccess to small cash or food loans, access to common property, the ability to exchange labor forfood, cash or land, and the ability to borrow labor (for example, for childcare so that the parentscan leave the house to earn money). These various support mechanisms available within thecommunities studied in the PPAs included:
* Borrowing cash, food or labor in times of crisis or hardship
* Membership of savings clubs or ROSCAs (rotating savings and creditassociations)
* Access to mutual or reciprocal assistance such as labor exchange forhousebuilding; exchanging labor for food
* Community contributions to wedding and funeral expenses
* Community-organized handouts or food parcels for the very sick or elderly
* Seeking loans from money-lenders
* Access to common property, for example for livestock grazing or to forestryproducts for housebuilding or food supplements
* Moral support (for example, coming to help when a husband is beating up hiswife)
* Sharing work or contracts.

104
3.2 From liquidrsaings aoun tso c i mdit labor..e.
Cur4nly Anapone aerern of thes savoueods oings seraviges wouktb aiyaalbei ua ra h om ld financial t
inceowingme eyan for iaca ntton, ftoloe inbyz reduings diexpendingurae, w resting lsowaer deporesielin

105
assets, and end with desperate measures such as selling blood, women for marriage, and babiesfor adoption. Each of these strategies is described below.
35. Borrowing Money and Food--This is one of the most commonly mentioned strategiesand is found in all the study areas. As a coping strategy against a temporary drop in well-being,this borrowing is very unlikely to be from a formnal financial service provider: formal sectorloans are not widely available to the poor and even when they are, the application process is tooarduous to make money available quickly. Poor households borrow in a wide range of ways. TheLao Cai PPA list 11 forms of credit which a poor household might try to access. The Tra VinhPPA lists 9 different ways of borrowing. These are illustrated in Table 5.3 below.
-Tra Yinph - --- : i La ea
Mortgage assets such as land Borrowing cash from relatives to repay back loans
Borrow large amounts from relatives or helpful Borrowing food from relatives or neighbors to payneighbors back in kind
Borrow small amounts from relatives or helpful Borrowing cash from relatives at no interestneighbors
Borrow large amounts from private money lenders Borrowing cash from neighbors with interest (4%)
Borrow small amounts from private money lenders Emergency borrowing from money lenders /neighbors (8%, 10%)
Borrowing livestock for ploughing
Join neighborhood hui (ROSCA) Borrowing manure for crop fields
Seasonal borrowing of crop land from relatives or inother villages
Purchase shrimp fry and shrimp food on credit Purchasing food and materials on credit fromshopkeepers
Purchase rice on credit Borrowing from Agriculture Bank
Borrow from preferential government lending Borrowing from HEPR / VBA for livestockprograms (HEPR, WU, VBP, Ethnic minoritiesboard)
Source: PPA Synthesis Report, World Bank (1999).
36. Concerns were raised in the Ho Chi Minh City and Tra Vinh reports that some poorhouseholds were becoming caught in a debt trap. They take a loan to deal with an immediatecrisis, but this loan adds substantially to the household expenditures because of the high interestrates. They are unable to raise the supplementary income needed to pay for the loan repaymentsand have to take another loan to honor the first. In Ho Chi Minh City, some moneylenders mayuse the threat of physical force to extract repayments from defaulting households. Commonly,defaulting householders are taken by moneylenders to hire-purchase shops where they can obtain

106
an item on credit, sell it and use the proceeds to pay off the moneylender. Of course, this thenleaves a larger debt to be repaid at high interest rates. Taking loans in some instances was citedas a reason for poverty and some households were very reluctant to take loans in case they could-not repay them. These more ruthless tactics by moneylenders are not reported in the rural areas.The pressure to repay there comes from the knowledge that if you default, you are unlikely to getanother loan from anyone else.
37. There often seems to be a psychological cost to being in debt. Many households,especially in Ho Chi Minh City, commented on the anxiety and stress that being indebted brings.In Ha Tinh, one respondent commented that women would be sent out to get the local loans fromfriends and neighbors which are often used to cover consumption shortfalls because the men didnot like to appear desperate. They were more inclined to apply for the formal loans, dealing withthe larger sums of money and the outside institutions.
38. Reducing Consumption and Living with Ill-health--Reducing the number of meals,reducing the size of meals and substituting inferior foodstuffs for preferred staples were allcommonly mentioned responses to seasonal food shortages and other crises which meant thathousehold resources were stretched. This generates speculation that overall health may beaffected in the longer term and that the quality of labor might suffer. There was no obviouspattern to certain members of the famnily suffering particular nutritional deprivations: girls didnot seem to be fed less than boys, nor women less than men. Additionally, households in bothLao Cai and Ho Chi Minh City were found to be living with ill-health on a long term basis inorder to avoid consultation and treatment costs which would strain household resources.
39. Laboring --Diverting labor away from agricultural tasks to cash-earning tasks is acommon response to decline in well-being in Lao Cai. A sudden need for cash in the uplandareas, some of which are not highly monetized, requires some reallocation of householdresources. If a household has surplus labor, then this can be used to earn money, usually doingagricultural tasks for wealthier households within the commune. Households who do not havesurplus labor, and this seems to be most, will be laboring possibly at a cost of lower agriculturalreturns at harvest time. Where this labor reallocation leaves a gap in the farming systems, there isan added incentive to withdraw children from school so that they can help. Day laboring is themain source of cash for poor households in Tra Vinh who have sold their land. However, itappears that the demand for labor is seasonal and not at all robust. Day laboring is not so much acoping strategy as a survival strategy in Ho Chi Minh City, where there is no agricultural land tofall back on. Poor households are always in search of jobs which can provide regular income.Migrant households are less likely to find stable work because their lack of permanentregistration in the City constitutes a real handicap when applying for jobs.
40. In areas where local labor markets are yet to generate sufficient demand for unskilledlabor, some migration is evident. This is particularly true in Ha Tinh, where householdscommented that the freedom to migrate was one of the most beneficial changes over the last fewyears. The analysis of the impact of migration on the household was more mixed, however.Whether or not the net result was positive for the remaining household members dependedlargely on the relationship between the remittances sent back (sometimes zero), the reducedexpenditure demands because of the reduction in mouths to feed and the additional workburden

107
(sometimes considerable) generated by the departure of a primary laborer. Some villages hadquite high rates of either seasonal or permanent migration.
41. Withdrawing Children from School--This was a common response to declines in well-being. Indeed, the Lao Cai report found that this was nearly always amongst the first responses toa crisis. There are many references in the PPAs to the cost of education and the burden thisplaces on poor households. These costs include the direct costs of fees, books, pens and thevarious contributions to insurance and construction funds. They also include the cost of clothingand food. There are also opportunity costs in terns of the lost labor, though this varies accordingto the age of the child and across location. Where the perceived returns to education are lowbecause having a few years of often low-quality primary education is thought unlikely to make adifference to future livelihoods, the very tangible costs of sending children to school may soonbegin to outweigh the perceived benefits. This is particularly the case in times of crisis whenresources are so stretched that basic consumption is threatened.
42. Selling Assets--Households who have livestock or land will often have to sell them intimes of crisis, though they may be quite reluctant to do so since these assets represent, often, akey source of cash income. The Lao Cai PPA suggests that households will, as a first response toneeding cash, generally attempt to divert labor away from farming to cash-earning activities inpreference to selling off livestock. In Tra Vinh, poorer households may sell off their land intimes of crisis, with profound repercussions for future productive potential given the lack of day-laboring opportunities (Box 5.7). In Ho Chi Minh City, households in crisis are seen to sell theirhouses, if they have them. They then downgrade either to renting or buy a cheaper house.Significantly, households rarely mention the role of cash savings in helping them to cope withshocks. The facilities for cash savings are very limited in rural areas and households often storesavings in the form of livestock.
Box 5s.7.- Lades tifiir Vifih I -.-------- -- -- s
Poor ladlesspeople in Tra V-in}} ideni~ h nuWy rein%rcing prolems of reliace -on:k-liland bk ti rd uctve r as two of mi ost sernor Glv4a- ihe I vi to -laboring, Xthreutsii an iabilityto save, ordzey X. ffi sllstXbreak out ofot~Larilessness contributes:t cbxonic iidebtedness arid extreme -lerability Many p housed toldteam members that beng ladess is a lose-lose' gime; ie longer eone is Landle, thewssituation becomes. Therefore, the long-term laidless have dropped fi&her dDWn: the economic adr.Poor landless people in both district have difriculty accessing serices, aid have few opportunities tdi}rove their lives& Landless laborers are likely io have less access to health and other servces becausethey are away firM their hones working during daylight hours when cadres visit As many landless peopletravel foi weeks or seasons at a time, they also miss other village4 ide services, such as crdit apications,or extension traini requiring several days involvement.Source, Tra Vinh PPA, Oxfam ( l999).

108
43. Child Labor--For some of the poorest households in both urban and rural areas, childlabor provides extra sources of cash in times of hardship (by working for cash) or providesindirect support by substituting for adult labor when adult labor is displaced from its usual task-(for example, taking on more work inside the house or on the farm in order to release adult laborto earn cash). In Ho Chi Minh City, the most common activities for children included:
* scavenging for food
* selling lottery tickets
* selling noodle soup or other food products on the street
* doing piecework at home or in small workshops (e.g. making toothpicks, plasticobjects, fake paper money for worship and religious rites, packaging incensesticks and polishing copper incense burners)
* working as domestic servants (mainly girls)
* portering
* mason's assistants (mainly older boys).
44. In Lao Cai, children and young laborers from poor households are sometimes sent to livewith other households for a period of 2-3 years (see Box 5.8). In the host household, the childperforms accepted tasks for children, such as watching the buffalo, feeding the pigs and lookingafter younger children. In return, the child is fed and the child's parent may receive younglivestock to raise as payment. This is seen as a mutually beneficial arrangement: one householdreceives needed labor while the poor household is able to minimize expenditures withoutdepriving the child of food and receives payment in form of livestock. After a few years, thechild returns to live with the parents again. Some child laboring was evident in Tra Vinh(sending children away to work as domnestic workers) though the overriding problem in Tra Vinhappears to be lack of demand for labor which perhaps is limiting the extent to which child laboris used as a coping mechanism. In Ho Chi Minh City, households sometimes sent children awayto live in the countryside with relatives.
=hewent isfathr; hse to hehkil 1i wh idadis ea iingteig, dabecausetf t he knew+ hel wa on to die.0 Afte he$ died she faced a lot of di lte fo many yer.-hchlrnweesil on hir oue asdaagd ndthy adnethrufal, pis nr hicen. Thefamily stl ak:odeeyya.Iitmso o4sotaesehst okfrohrfmle o k az
to ea.Sehsas ettescn=hl oWr frarce aiyi eunfrasalc

109
Coping strategies may undermine future livelihoods
45. The PPAs also demonstrated the links between poverty and vulnerability to external-shocks, and confirmed that access to common property is an important coping strategy (such asmaking extra money by going to the forest to cut wood). Poor rural households often findthemselves trapped in a vicious circle of having to over-exploit their natural environment forshort-term benefit to the detriment of the their own long-term sustenance.
46. Unsustainable use of natural resources and a continued decline in natural forest cover iscausing significant government concern. Notable progress has been made with the establishmentof the National Environmental Agency (NEA) and the passing of the Law on EnvironmentalProtection, both in 1993. Particularly, the forestry sector has seen a concerted government effortat addressing the problems. The Re-greening of the Barren Hills Program (Decision 327) wasadopted in September 1991 and followed-up in 1998 by the Five Million Hectares ReforestationProgram (Decision 661, July 1998), which recognised the potential to develop, reforest andprotect a natural resource system through sound and careful management involving localhouseholds. A government - donor partnership group was formed in early 1999 to helpgovernment develop principles, policies and procedures in support of its Five Million HectaresReforestation Program, and to coordinate development assistance. Broad consensus has beenreached on the outlines of a roadmap, with the objective of developing shared principles forforestry development; feasibility of co-financing, sector-program lending and specificinvestments.
4. PUBLIC SAFETY NETS AND TARGETED PROGRAMS
"Besides the government's supportive efforts, the participation of the community bringsinto play the national tradition of "mutual affection and help" and "the richer helps thepoorer" as the leading decisive factor of the HEPR success in recentyears. In this process,the initiatives and creativeness of the localities are very important. "
(Mr. Le Kha Phieu, Secretary General, Communist Party of Vietnam, January 1999).
47. A strong and pervasive view in Government and in mass organizations in Vietnam is thatthe responsibility for poverty reduction must be shared across three key groups: Government, thecommunity, and the poor people themselves. Problems cannot be solved by Government alone--it can act as the catalyst to mobilize resources at the local level, but the community and the poormust bear some of the responsibility. These perspectives have influenced the design andimplementation of the Government's public safety net programs.
48. Prior to 1998, there were a large number of poverty programs in Vietnam, both at thenational and provincial levels (van de Walle, 1998). During 1998, many of these programs(except Social Security) were consolidated into one national poverty program-the HungerEradication and Poverty Reduction (HEPR) Program. The origins and evolution of this programare interesting and it is important to understand them before one can examine the strengths andweaknesses of the HEPR program.

110
4.1 The HEPR evolved from local initiatives into a national program1 6
49. Although for a long time there was no explicit official recognition of the widespread-incidence of hunger and poverty in Vietnam, there were some government programs that weretargeted towards the more difficult segments of the population. In the late 1980s, povertyreduction first emerged as a priority of Party and local officials in some districts faced withextreme poverty. At the Seventh Party Congress in 1991, it was pointed out that hunger andpoverty were persistent problems in mountainous and remote regions and in areas of formerrevolutionary bases. The Congress also stressed that there was a lack of concern amonggovernment authorities in providing support services-such as commune infrastructure, healthcare and education--to the poor, especially to ethnic minorities living in the mountainous andremote communes.
50. In 1992, Ho Chi Minh City (HCMC), which was well ahead of other provinces and citiesin the economic reform process, initiated the first HEPR effort at the provincial level. The publicand local authorities had learnt that the reform efforts benefited different population groups andgeographical areas differently. Those being left behind needed assistance to maintain someminimum living standards. The City's initiative was essentially focussed on hunger eradicationthrough expanding public expenditure lto improve access of the poorest people and communes todirect support. It quickly received wide support from the public. It became clear that, in additionto awareness and commitment of local authorities, bottom-up and self-help approaches weremost critical for any HEPR activities to reach the poor.
51. In 1993, a number of other provinces joined the HEPR initiative. The first nationalpoverty lines were also established in 1993 by MOLISA (Ministry of Labor, Invalids and SocialAffairs) and subsequently revised in 1995. The Government also launched a number ofnationwide HEPR-related initiatives such as the VBARD's (Vietnam Bank for Agriculture andRural Development) non-collateral credit for the poor; Program 327 on "Regreening of barrenhills, wasted land and sedentarization of nomadic ethnic minorities"; and Program 120 for"Employment Generation". The latter two programs piloted the Government's concept ofaddressing socio-economic priorities through targeted programs.
52. The Eight Party Congress in 1996 outlined the future national program for HEPR bydefining its objectives and policy measures and the HEPR became an important national policy.It took the Govemment another two years to clarify the program's institutional arrangements. InJuly 1998, the Government formally established the National Target Program for HEPR(Program 133) for the period 1998-2000. Also in July 1998, it established the related program tosupport the 1715 poorest mountainous and remote communes (Program 135).
53. The HEPR framework embraces nine components and aims to eradicate hunger andreduce the incidence of poverty to 10 percent of the population by 2000. The local HEPRinitiatives have been supported by a number of HEPR-related sectoral policies and interventionsas presented in Box 5.9. The nine program components are: sedentarization, resettlement and
16 This section draws heavily on a UNDP-funded report by Nguyen The Dung (1999) "Capacity Assessment forVietnam's National Target Program for Hunger Eradication and Poverty Reduction".

III
New Economic Zones (implemented by MARD); infrastructure development in poor communesand resettlement (CEMMA); promotion of agriculture and off-farm production (MARD);extension services for agriculture, forestry and fisheries (MARD) and income generation-(MoLISA); training for HEPR staff (MoLISA and CEMMA); assistance to ethnic minoritiesfacing extreme difficulties (CEMMA); credit and saving for the poor (SBV); education for thepoor (MoET); and health for the poor (MoH).
54. A number of the components of the HEPR and other activities which target poverty havebeen running for some time. The national program 120 for Employment Generation, forexample, has been implemented since 1992 and programs to resettle households to NewEconomic Zones and sedentarize ethnic minority groups have been in operation for many years.An evaluation of the impact on poverty of these programs could be useful in indicating waysforward.

112
as2 The Vitp korwantgrater ancd Rr HEPelopmertcs and some vie so t
ot ias oth Vienam wat the po f t c n r has n te
From the PPAs, it became clear that the Goveimrt ent services which conmerned poor households
most of all included:
p Health services
r Education Services

113
* Agricultural, aquacultural, and veterinary services
* Loans provided under the HEPR and by the VBARD
56. These services all receive program attention under the HEPR and the 1715 PoorCommunes Program. In the PPAs, however, people voiced complaints regarding the accessibilityof the poor to these services.
57. Health Services were perceived as being too expensive and of poor quality, even in thehighland villages of Lao Cai where exemptions applied. Many households commented on theirpreference for private services, noting that the private practitioner would come to your house andwould often provide treatment on credit. In some mountainous areas, the distance to cornmunehealth stations demanded a whole day traveling there and back, a high cost in terns of lost labor.Poor households were observed living with ill health on a long term basis in order to avoid thecosts of treatment and consultation. The cost of health care was a particular problem to poor,elderly households.
58. Education Services were also seen to be neglecting some of the poorest groups. AllPPAs noted that poverty or food insecurity was the single most important factor in causingchildren to drop out of school at low levels of attainment. In Ha Tinh householders complainedthat they were encountering problems covering their consumption needs as a result of payingschool fees and costs, which rise as the pupil moves up the educational levels. The link betweenpoverty and school dropouts is not limited to rural areas. Poor families in Ho Chi Minh City arealso having difficulties covering the costs of primary education. This is particularly true for thosewithout pennanent registration, because they are not eligible for fee exemptions as the residentpoor are. All PPAs commented that this association of poverty and lower educational attainmentwould reinforce a tendency for poverty to be inherited by the next generation. This logic couldbe extended to the other groups who are receiving little education: where certain ethnicminorities and women are already disadvantaged, this failure to deliver education servicesequally across all groups will tend to perpetuate their isolation and so their poverty.
59. Agricultural, Aquacultural, and Veterinary Services face difficulties in their outreachto more remote areas. Farmners felt deprived of an opportunity to develop their plots because theylack the skills and knowledge which could lead to important productivity increases. While thislimited outreach is probably substantially due to resource constraints in the District ExtensionStations, there were also concerns about the overall approach to agricultural extension. Therewere certain where poor households felt that they had been overlooked for inclusion in trainingand this was voiced particularly by women. There were also concerns about the directive, plan-led extension activities - although the Government has withdrawn from direct management inagriculture, agricultural promotion activities still seem to be far from demand-led.
60. Formal Financial Services, including those that are targeted to the poor, seem in ruralsites to be bypassing the poorest groups. In Ha Tinh, the PPA suggested that, "most of the poor,and perhaps all of the poorest people in the PPA communes currently have no access to loansthrough official sources", leading poor residents in one poor comrnmune to note, "while the richget loans, the poor get consideration for loans ". The main formal sector financial serviceproviders in rural Vietnam are the VBARD and the VBP, but because the VBP is administeredby the VBARD, many households do not see a difference between the two institutions. As

114
discussed above, the VBP (with the Women's Union, often) is the conduit for subsidized loanfunds from the HEPR and other programs. Because these funds are subsidized, their supply ishighly restricted and loans from this s,ource are in high demand.- Though not as cheap as VBP-loans, VBARD loans are still very much cheaper than the informal sector and, as such, aresought after.
61. It is interesting to note that in Ho Chi Minh City, which is the birthplace of the HEPRprogram, the program is rated most highly by the poor. From the HCMC PPA it seems as if thereis greater access to formal sector credit by poorer households. The PPA reports that, by andlarge, poor households are accessing the loans designed to reach them with the importantexception of the migrants who lack permanent registration.
4.3 Social safety nets are poorly targeted and have low coverage
62. The PPAs indicate that though a large number of government initiatives and programsexist or are planned, their implementation and coverage relies primarily on local authorities andlocal resources, which are rarely sufficient. Thus, the programs are small, have weak coverageand are not necessarily reaching the poor. This is confirmed by data from the VLSS98. Table 5.4presents data on what households report they received as income from government (and NGO)social programs during the last year, expressed on a per capita basis. The largest Governmentpayouts (82 percent of the total in 1998) are from the social insurance fund, covering pensionand disability benefits for civil servants and SOE employees. Social subsidies, which includepayments to war veterans and the families of war martyrs, are much smaller in absolute amountsand make up only 16 percent of total welfare receipts.

115
Table 5A. Ofseeed SWefr- acm "98
Quintile Income Received from the following programs | Total |
(VND per annum per capita) Receipts as
HouseholdIncome
Social Social Poverty NGO Total SocialInsurance Subsidies Alleviation Assistance Welfare
Fund | Programs Income
Quintile 1 15,961 11,282 1,472 1,152 29,868 2.7(Poorest)
Quintile 2 42,020 15,597 2,415 554 60,586 3.7
Quintile3 77,120 24,500 1,053 313 102,986 4.8
Quintile 4 153,840 23,535 869 298 178,542 6.1
Quintile | 207,654 21,776 659 443 230,532 3.8(Richest)
Total 99,352 19,339 1,294 552 120,537 4.4(82.4%) (16.0%) (1.1%) (0.5%) (100%) l _l
Source: World Bank estimates based on VLSS98.
63. The VLSS also asked about transfers received under policies or programs supported bythe Government's poverty alleviation efforts, as well as those received from domestic andinternational NGOs. The amounts involved here are negligible approximating to $0.92 and$0.40 per person per year, respectively.
64. Table 5.5 provides information on percentages of the population in each quintile whosehousehold received social welfare transfers. Coverage of the poverty programs is small: only 2.2percent of the population lives in households that have received a payment from any of thepoverty programs. These figures may well underestimate the coverage of poverty programs ifhouseholds do not know the source of assistance. Nevertheless, both the VLSS and the PPA datasuggest very limited coverage of the welfare programs.

116
Percent of Populationl Living in Households Who Received SocialQuintile Welfare Payments from
Social Social Poverty NGO IncomeInsurance Subsidies Alleviation
Fund Income
Quintile 1 (Poorest) 3.5 9.2 6.7 0.7
Quintile 2 8.1 8.6 1.8 0.9
Quintile 3 10.65 11.7 1.4 0.3
Quintile 4 16.4 10.4 1.0 0.2
Quintile 5 (Richest) 17.5 7.9 0.3 0.1
Total 11.21 9.5 2.2 05
Rural 9.4 10.2 2.6 0.6
Urban 18.3 7.1 0.8 | 0.1
Source: World Bank estimates based on VLSS98.
4.4 Improving the targeting of scarce resources for poverty alleviation is a priority
65. The principles on which the current highly decentralized, community-based assistance
and safety net system is built are threatened by the emerging market economy. In particular,
increasing mobility, without which the market system cannot function properly, renders
community level identification and targeting of the poor less effective and is likely to make the
mobilization of community resources for helping the poor more difficult.
66. In order to improve targeting and better reach the poor, the government first needs to
transform the institutional structures and processes that have guided transfer and safety net
provision in the past. This includes the following:
* Identification and monitoring: National norrns need to be determined for identifying the
poor consistently across regions; survey and other instruments with which to consistently
measure and monitor local needs and program performance need to be designed and
implemented.
* Program coordination: Existingsub-programs need to be better integrated and coordinated
and a set of well-defined and universal rules for implementation at the local level must be
instituted.

117
* Strengthen the safety net function: Efforts are needed to build up a safety net system thatserves an insurance function, both to help individuals deal with individual level risk and toenable households and communities deal with shocks that affect entire localities. The latter-requires a centralized effort and a greater level of risk pooling nationally. The system needsto be flexible in that it is ready to kick in when it is needed.
Pro-poor targeting is often improved by following two principles:
67. Target resources to poor areas: Central poverty budgets and social and other programsshould be targeted to poorer provinces and regions using poverty maps and information frombetter monitoring. The more disaggregated the poverty map information, the more communitylevel targeting is feasible. Even though mobility is increasing, there remains ample scope forbetter geographic targeting in Vietnam.
68. Use self-targeting wherever possible: International experience shows that self-targeting-whereby conditions are built into program design such that only the poor choose toparticipate-is often the most cost effective targeting method for achieving impacts on povertywithin areas, given the constraints faced in underdeveloped rural economies. Self-targeting oftenhas low administration costs, preserves incentives to escape poverty, and is less subject tocapture by local elites or corrupt administrators and officials.
69. Research and international experience shows that there are some quite widely used forrnsof self-targeting that can work well to fulfill both an insurance and transfer function whenproperly designed. Workfare schemes that provide socially useful work to those who need it arean example. The idea is to provide a public guarantee of work on community-initiated projects.The work must be available to anyone at any time (this helps it serve the insurance function), andat a low wage to make it self-targeting. Workfare should be complemented by a set of transfersin cash or food targeted to specific groups who either cannot work, or should not be taken out ofother activities such as school. Food-for-education programs in poor areas have proven effectivein helping keep poor kids in school. Targeting here can rely on community level information andindicators, such as not being able to work or illiteracy, that are easily identified, unlikely to bemanipulated, and are highly correlated with poverty.

118
]PART III
MOVIN-G TOWARDS ACOMPREHENSIVE POVERTY
REDUCTION STRATEGY
The final part of this report lays out anapproach that Vietnam could adopt todevelop and implement a comprehensivepoverty reduction strategy. The essenceof the approach is to build on theunderstanding of poverty and itsdeterminants that has been laid out inParts I and II and to choose publicactions that have the highest povertyimpact in each sector. This needs to becomplemented with outcome indicatorswhich are set and monitored usingparticipatory processes.

119CHAPTER 6
MOVING TOWARDS A COMPREHENSIVEPOVERTY REDUCTION STRATEGY
1. Vietnam has made considerable progress in reducing poverty in the last five yearsand yet, poverty remains widespread and deep and much remains to be done in the nextfive- to ten years. Chapters 1 and 2 have highlighted the multi-dimensional nature ofpoverty in Vietnam, extending from low levels of incomes and consumption, to poor healthand lack of education, and to other "non-material" dimensions of well-being, includinggender gaps, insecurity, powerlessness and social exclusion. Chapters 3, 4, and 5 laid outthree broad imperatives in the fight against poverty:
1) First, opportunities for employment and productivity growth must be created,so that incomes rise and the poor are able to grow out of poverty;
2) Second, measures must be put in place to ensure that growth and access toservices is fair and equitable, so that all citizens benefit from the fruits ofdevelopment;
3) Third, special care must be taken to reduce the vulnerability of the poor tounforeseen events (sickness, poor harvests, loss of income-earner, etc.).
2. Combined, these three elements define development policy. Every country shouldbe able to articulate a clear strategy for each of these three elements as it seeks to improvethe wellbeing of its citizens. Chapters 3-5 described how the Government of Vietnam isseeking to clarify its own strategy in each of these areas, and made suggestions for thefuture.
3. These three imperatives also need to guide sectoral and economic policymaking. Inallocating public resources among competing uses, and in establishing laws, regulations andincentives, it is the impact on human wellbeing (and especially that of the poor) that needsto drive decisions. For each sectoral and economic program, therefore, it is important to beable to explain how the design of the program contributes to creating opportunity, ensuringequity, and reducing vulnerability. Figure 6.1 illustrates this general point for the key broadcategories of development planning. It provides a road-map or a framework for translatingthe analysis presented in this report into sector strategies. In this sectoral framework, cross-sectoral themes such as gender and environment that have been raised earlier in the Reportare not highlighted separately. Instead, it is assumed that these issues cut across all sectoralthemes.
4. This chapter makes no attempt to present comprehensively how policies andprograms in each of the sectors should be designed so as to maximize poverty reduction inVietnam. It does point in the direction towards how such an exercise might be undertaken,and recommends that this be undertaken (with the assistance of the national andinternational development community) as part of the Government's medium-term planningexercise. The chapter also discusses how international and national development goals canhelp clarify objectives and monitor progress. The chapter ends with a discussion of howVietnam's development partners can assist in the design and implementation of its povertyreductionstrategy.

120
00001 (1) (2) (3) (4) (5) (6) (7) (8)
^o: 0a^ Human: Social: - Transport Enterprise Macroeconomic Rural Urban - Public- Education - Safety Nets - Energy Policy: Policy: Development Development Administration- Health - Knowledge - Water - SOE reform - Fiscal Policy including Remote - Legal- Nutrition - Culture - Private - Trade Policy & Mountainous - Transparency
- PopulatIon Sector Area - Participation
- Banking & Development - Anti-corruption-X,Finance
- Create Opportunity
= Ensure Equity
RE0.Reduce Vulnerability
Fg^ .1:AFaeoR o sesn h reusts o oet ~dcIuadEutbeGot

121
1. DESIGNING SECTORAL AND ECONOMIC POLICIES AND PROGRAMS
5. The time is right for the Government of Vietnam to put poverty reduction at the center ofits policies and programs for the next decade and longer. The Government has just embarkedupon a planning exercise from now until the end of the year 2000 to formulate the next Five Yearplan for the years 2001-2005. Furthermore, in preparation for the Ninth Party Congress to beheld in the year 2001, the Authorities will be reviewing the long-term prospects of the country. Anew 10 year Socio-Economic Development strategy for Vietnam to the year 2010 will beprepared, and this will be embedded within a longer-term vision up to the year 2020. These plansfor Vietnam could become instruments for putting Vietnam on a path of development that isequitable and sustainable and one which continues to give it the kind of success in povertyreduction that it has seen in the last five years.
6. There are many ways in which the different elements of policymaking can becategorized. Figure 6.1 groups the areas requiring attention from policy-makers into five broadcategones:
1. Human and social development;
2. Physical infrastructure;
3. Economic management;
4. Regional (rural and urban) development;
5. Good governance.
7. The Government has clearly recognized that continued poverty reduction will requirefirm actions in each of these broad areas, and in the many sub-components of them. There is alsogrowing evidence, both here in Vietnam and around the world that achievement of progress inany indicator of human wellbeing is likely to require actions in several sectors. Effectivelyraising literacy rates among poor ethnic minority communities, for example, requires actions notonly in the field of education (teacher training, curriculum development, textbooks, schools etc),but also in infrastructure (access and electricity), public administration and information, and ruraleconomic policy (to promote greater income earning opportunities). More broadly, even largeinvestments in human development leading to a very healthy and highly educated society willnot be able to fight poverty if economic management is poor and there is no growth and noincome-generating opportunities that will ensure higher incomes. But a balanced attack across allfronts does not imply that everything can be done at once. What is needed to prioritize actions isan identification of the bottlenecks-the hard to solve problems that are impediments tosuccess-and to begin by attacking these first. And to ensure that the priorities that emergereflect the concerns of the poor, they need to be engaged through a participatory planningprocess.
8. Over the coming year, the Government of Vietnam will be preparing revised mediumterm strategies in each of these areas. In this chapter we briefly explore some of the issues andtrade-offs that we would recommend be addressed in this process.

122
1.1 Human and Social Development
9. Investments in human and social development are critical for all three imperatives of -a-sound poverty reduction strategy-creating opportunity, ensuring equity, and reducingvulnerability. While coverage levels in Vietnam are often well above international norms, thequality of healthcare and education needEs to. be improved urgently, as does provision of servicesto the poor. Recent analyses of financial needs in health and education indicate that publicexpenditures remain low by international norms.17 The challenge will be to establish the capacityto absorb the needed resources productively so as to improve quality and access. Below, as anexample, we focus on the education sector. Similar issues apply in the health sector that arediscussed in detail in the forthcoming Health Sector Review (1999).
10. In the education sector, there are three major sets of issues-access, quality andrelevance, and financing issues. During the preparation of the next Five Year Plan, policymakersin the education sector will need to grapple with three sets of issues:
(i) How to provide more equal access to education services? Despite high overall enrollmentsand relatively small differences between males and females, many disadvantaged areas andgroups do not have equality of access to basic education. Of the children that are currently not inschool, 50 percent are from ethnic minorities. In Lai Chau, a poor mountainous province, only 49percent of adult women are literate. The differences between the richer and poorer groups withrespect to primary education are not very large, but they become much more pronounced athigher levels of education. For example, at the primary school level, 82 percent of children in thepoorest quintile compared with 96 percent of those in the richest quintile are enrolled in school(Table 6.1). The difference is much more pronounced even for lower secondary education, withonly 34 percent of children in the poorest quintile but 91 percent of those in the richest enrolledin school. Obviously, ensuring equitable access to basic education for all will be necessary toensure equitable access to opportunities and incomes in the future.
17 See the forthcomning Health Sector Review (1999), and the Vietnamn: Education Financing Report (World Bank,1997).

123
Net Enrollment |Quintile Vietnam Ratell
l I | I t III | IV |V (richest)|l(poorest)
Primary School 81.9 93.2 94.6 96.0 96.4 91.4
Lower Secondary 33.6 53.0 65.5 71.7 91.0 61.7Upper Secondary [IrT-
U 4.5 1 13.3 20.7 36.5 1 64.1 28.6
Post-Secondary 0.4 1 0.6 2.9 8.3 28.9 9.3
Source: World Bank estimates based on VLSS98.
(Ji) How to improve the quality and relevance of education services? Quality and relevance isa growing concern that is perceived differently between rural and urban families. The poor, oftenfrom remote and traditional societies, see little in the curriculum or in the teaching methods thatrelates directly to their living concerns. For them, the medium of instruction in basic education isoften alien, the hours of instruction are limited and sometimes conflict with the rural work cycleand other family obligations. For urban families, there is growing concern that standards areslipping and that the curriculum content and methods need revision.
11. Policymakers are aware that the present curriculum does little to lay the foundation for alearning-society in a market-based economy. Leadership, concerned that the wage advantage ofVietnamese labor is being eroded, have not yet taken the decisions needed to restorecompetitiveness through knowledge, skills and flexibility. They still favor static learning inpredefined vocational fields over more flexible and dynamic learning applied to an evolving andchanging economy. Improving the quality and relevance of education is a key to enablingVietnam to improve the quality of its labor force and to attract investments that can provide jobsand income-eaming opportunities for the workforce.
(ii) How to improve the low efficiency of expenditures in education and to reduce the burdenon the poor of financing education services? Expenditures on education have low efficiencyand effectiveness--overall repetition and drop out rates are high, reducing education achievementlevels and increasing the cost of education for government and families. And an over-reliance onhousehold financing of basic education places a disproportionate burden on low income families.Households currently bear 42 percent of the total expenditures on primary education, and almost50 percent of the total expenditures on basic education (including lower secondary schooling).Exemptions from educational charges for the poor, or other targeted subsidies are too low tooffset the inability of poor households to finance basic education costs. Research shows thatschool fee exemptions in Vietnam have little impact on the poor, primarily because they accountfor only a small proportion of parents' direct outlays to schools and other school-relatedexpenditures (Nguyen Nguyet Nga, forthcoming) and because they also have limited coverage(Table 6.2). Furthermore, because poor households tend to live in poorer communities where lessis spent on schools (both by parents and the state) their children attend lower quality schools.

124
Public expenditures need to be reviewed to see how to reduce the burden of financing basicsocial services on the poor. And HEPR policies can help by using more geographical targeting tochannel education and poverty budgets to poor communities and paying for teachers and schookbuildings and supplies in those areas. Poor households identified by local authorities can also begiven a food transfer in exchange for a child's continuing attendance in school like in traditionalfood-for-education programs. The same principles apply to health care.
Quintile Percentage! of School-Age Children (6-14 years) with Cost Exem ption
Partial Exemption Complete Exemption Either
Quintile 1 (Poorest) 8.9 11.6 20.5I
Quintile 2 10.7 6.5 17.2
Quintile 3 13.4 3.6 17.0
Quintile 4 9.9 3.6 13.6
Quintile 5 (Richest) 8.6 0.9 9.5
Total 10.4 5.8 16.2
Rural 6.8 2.3 1 9.1
Urban 11 .( 6.4 17.5
Source: World Bank estimates based on VLSS98.
1.2 Physical Infrastructure
12. The key issue for policyrnakers is how to expand the quality and quantity ofinfrastructure, while making the right choices and trade-offs with respect to these investments,given the severe budget constraints they face.
13. Infrastructure and Opportuniity. There is substantial evidence that the rightinvestments in infrastructure in Vietnam have very high rates of economic retums. Well designedtransport and energy projects, for example, can have returns of over 30 percent, as bottlenecksare removed, retums to farmers are increased, and competitiveness improved. Taking advantageof these high returns to promote econoimic growth and hence, employment opportunities, willrequire expanded investment, increased design and implementation capacity, and new forns offinance. Investments in physical infrastructure (transport, power, telecommunications, water)will need to be around $4 billion per year for the country as a whole (around 15% of GDP) torestore growth to previous levels. But achieving this will require a pattern of finance that isdifferent to the past. If these investments are not to crowd out even more essential investments inhuman and social programs, it will be necessary for at least half of this sum to come from privateinvestment and SOE retained earnings.

125
14. Infrastructure, Equity and Vulnerability. Access to most kinds of infrastructure hasimproved markedly since 1993, at least in quantity. But analysis of the 1998 VLSS suggests thatthe inequalities in access between poor and non-poor, between regions, and between urban and-rural sectors that were evident in 1993 still persist. The poor and those in rural areas and in moreremote regions are much less well provisioned than others. Access to infrastructure facilities andservices is crucial to improving the human resources of the poor, reducing their vulnerability,and enabling them to partake in, and contribute to, the opportunities for improved livelihoodscreated by a market economy.
15. For example, access to safe water supplies and better sanitation will improve the healthstatus of the poor, which will reduce the costs engendered by ill health, such as lost earnings, andpromote well-being more generally. Better transport and communication facilities in rural areaswill help integrate poor households into the market economy and help develop agricultural aswell as off-farm activities to the benefit of all. Ready access to energy sources and improvedwater management will also boost rural farmn and non-farm development on which most of VietNam's poor directly rely.
16. Recognizing this, the Government has announced plans to extend the reach ofinfrastructure into poor and remote areas. Current plans to bring electricity to 100% of districtcapitals, 80% of commune centers and 60% of households may not be achieved by 2000 ashoped, but are appropriate goals, as are equivalent targets for rural access. These targetedprograms are now being augmented by community-based infrastructure programs. The 1,715Poor Communes Program, which will allow commune residents to decide on the allocation offunds for minor infrastructure works can play a very important role in helping to generate anupward spiral of rural welfare.
17. As the Government now seeks to deepen its commitment to provide infrastructure to thepoor, a number of difficult questions will need to be addressed - and factored into the next five-year plan.
(i) How to allocate resources among and within provinces? In every country, governmentsstruggle with the choice between allocating resources to where the financial returns will be thehighest and where the social needs are the greatest. The trade-off between allocations betweenVietnam's three "growth triangles", where high population densities and high growth potentialsuggest high returns, and the remote northern or central highlands illustrates this choice clearly.There are no easy answers to these choices. Rather they need to be informned with carefulanalytical work including an analysis of both financial and social returns. However, evidencefrom many countries suggests that when such analysis is done carefully, the conclusions areusually that resources should be allocated more towards poorer areas. Generally, infrastructureresource allocation across regions should be negatively related to provincial resources, andpositively related to poverty rates and infrastructure needs. The distribution of funds should aimto compensate poorer provinces with greater needs rather than reinforce current regionaldisparities. Similarly, within provinces, projects should be carefully chosen so as to maximizeimpacts on the poor. Thus, projects should be selected where poverty is high and potential gainsfrom the investments are high.

126
(ii) How to adapt the provision of infrastructure to the needs of the poor? There are tworeasons why the design of investments for poor communities may need to differ from standarddesign. First, the poor are sometimes concentrated in low pot-ential regions or remote areas-where certain investments such as roads or irrigation infrastructure are not cost-effective oraffordable. In such cases, an attempt shiould be made to introduce more cost-effective technologybetter suited to the poor's needs and/or ensure that alternative welfare-enhancing interventionsare explored. For example, experience in many countries shows the welfare benefits of providingsimple earth paths on which animal-driven carts can travel, or of resolving an access-problem bybringing services (such as water access) closer to households rather than building them a road. Inaddition, many investments requiring cost recovery may not be affordable to the poor unlessspecial programs are available to provide credit or the design is simpler. These concerns requirea flexibility in the design of programs that is not always easy in nationwide centrally-managedprograms.
(iii) How to ensure complementarities between policies and investments? In many cases thebenefits from an infrastructure investment are enhanced through complementary policies.Research has shown that the benefits from irrigation are higher for households with higher levelsof education. Similarly, education helps households take advantage of transport andcommunication infrastructure. Access to credit will also enhance a household's ability to benefitfrom better energy provision, and other physical infrastructure investments. It is usually the poorwho are most lacking in these complementary inputs and thus, least well positioned to benefitfrom infrastructure projects. Provision of physical infrastructure alone is not enough. Integrateddevelopment-whereby intervention occurs on a number of complementary policy fronts-willmaximize the poverty benefits from infrastructure spending.
1.3 Economic Management
18. Continued progress in poverty reduction will, of course, require sound economicmanagement. This involves the promotion of increased domestic savings and foreign capitalinflows. It will also require that these savings are channeled towards investments that willmaximize employment growth and poverty reduction. The Government has recognized that anumber of special issues will need to be addressed if growth is to be restored and greateropportunities provided for Vietnam's citizens to obtain productive jobs. Greater clarity on theseissues will be needed as the government prepares its medium term plan.
19. How to improve the climate for enterprise? The ratio of investment to GDP, whichhas fallen to its lowest rate in a decade during the past two years' slowdown, urgently needs tobe restored. But it needs to be the right kind of investment for Vietnam - investment thatgenerates jobs and increases productivity in a sustainable manner, without requiring protection orsubsidy. The recent Enterprise Law offers an important opportunity to create a level playing fieldfor all enterprises - private, foreign and state-owned --in a more user-friendly regulatoryenvironment. So too, the announcement by the government that it will address the problem ofinefficiency of the SOE sector through a combination of divestiture, equitization, closure andrestructuring. These measures are essential for ongoing poverty reduction because as long as theSOEs continue to enjoy regulatory advantages and absorb the current high proportion (60-70%)of banking system credit - without generating new productive employment - other, moreproductive investment will be crowded out. If productive employment is to grow, attitudes

127
toward the non-state sector will need to change, especially at the Provincial and District levels -which will be a major challenge for the Authorities.
20. How to provide better financial services? A healthy banking system is essential forpoverty reduction for two reasons. First, without a trusted banking system, citizens will not bewilling to place their savings so they can be channeled to the most productive uses. Second,without an independent and efficient banking system, resources will not be channeled to the mostproductive uses. The Government's stated plans to restructure the banking industry provides anexcellent opportunity to transforrn the nation's banks into instruments of employment andopportunity creation. One difficult issue that will need to be addressed in the process is the extentto which targeted (or "policy") lending should be used to channel funds to special needs,especially those of the poor. To date, a large proportion of lending has been effectively "guided"to uses that are regarded as beneficial to Vietnam's development. Most countries have found thatit is best to strictly limit such guided credit, and what little is provided should be provided forsocial purposes, and then at unsubsidized rates. As noted earlier in this report, the evidence isstrong from other countries that the poor benefit most when they have access to unsubsidizedcredit. This paradoxical conclusion is due to the fact that with subsidies, the coverage of thecredit programs are necessarily quite limited, and the non-poor tend to squeeze out the poor forsuch subsidized funds.
21. How to address and mitigate the social costs of policy change? While theGovernment has been clear in its long term direction--towards a non-protected SOE system and amore market-oriented economy--it has adopted a gradualist approach on grounds of social equityand potential social disruption. This is an area in which the imperatives of providing opportunityseems to clash with the imperative of ensuring equity and reducing vulnerability. This is anappropriate concern, and one that needs the careful design of a system of social protection, sothat social costs are minimized. Important preparatory work has been undertaken in recentmonths in Vietnam that will enable such a system to be put in place fairly quickly. Donors needto be willing to finance such programs, which will have a high pay-off.
22. There is currently too little recognition as to why these measures are essential forrestoring growth and reducing poverty. But there is a strong link between the nature and pace ofreforms, the level and pattern of growth, and the poverty reduction that has been achieved duringthe 1993-98 period. As discussed earlier, in the five years prior to the East Asia crisis, Vietnamwas able to achieve growth rates of around 8 percent per annum. These high growth rates, andthe resulting gains in poverty reduction, were driven by the doi moi reforms undertaken duringthe late 1980s/early 1990s (as described in Box 3.1). Key elements of the reform programincluded sound macroeconomic management, combined with dramatic reforms in theagricultural sector. They also included the first steps towards integration into the internationaleconomy, towards making the state enterprise sector more viable, and towards having asustainable banking and financial system.
23. A new phase of reforms is now needed to restore the momentum of growth and toimprove the quality of development. These economic reforms are necessary not just for creatingopportunities for higher employment and income growth, but also to address issues of equity andvulnerability. We have seen in earlier chapters how the access of the poor to financial services-both credit and savings-is constrained under the present financial system. If credit constraints

128
prevent the poor from availing some of the new opportunities that are being created, futuregrowth in Vietnam is likely to be less pro-poor and less equitable. Similarly, lack of access tofinancial savings instruments exacerbates the vulnerability of the poor and makes them less ableto cope with shocks. It can also trap them in a vicious circle of poverty if they resort to sellingoff other assets like land or livestock to cope with the shocks.
1.4 Regional Development
24. We have seen in earlier chapters that understanding the spatial dimensions of poverty isimportant and that the incidence and depth of poverty varies a great deal by regions and areas. InVietnam, poverty is more prevalent and deeper in rural areas, especially in the more remote andmountainous areas. And the nature of poverty is also different in different areas. While theincidence of poverty is higher in rural areas, the rural poor appear to have more access to socialcapital and natural resources, and appear to suffer from a less brutal form of poverty than theurban poor. The remote and mountainous areas of Vietnam suffer from poorer naturalendowments and from greater physical isolation than the midland and lowland areas. The ethnicminorities that tend to live in these areas also suffer from greater economic and social isolationthan other people. In the coming years, promoting a pattern of growth that addresses the needs ofboth rural and urban dwellers will be necessary. Policymakers will need to ensure that the threeengines of growth-agricultural growth and diversification, rural off-farm employment, andurban employment--that have led to poverty reduction during 1993-98, continue to do so in thecoming years. Some questions that they will need to address are:
(i) How to support agricultural growth and diversification? The success of doi moi in theearly- and mid-1990s in unleashing productivity and income growth in rural areas is widelyacknowledged. The poverty reduction gains reflected in recent living standards surveys havebeen built on this. But the opportunity exists for a second round of reforms that will makeappropriate agricultural inputs widely available, including high quality seeds, inorganicfertilizers, and market-priced credit. Furthermore, the opportunity for a market in lowland land-use rights now exists, if the institutional infrastructure to track transactions is put in place.Public expenditure priorities in the rural sector also need to be examined. Evidence indicates thatthere would be high returns to increased investments in basic public infrastructure in rural areas,especially transportation and irrigation. The Government will need to make some toughchoices-these investments will only be possible if resources that are currently being channeledto pther less productive uses, such as loss-making SOEs can be directed for more productivepurposes.
(ii) How to promote off-farm employment growth? During 1993-98, off-farm diversification hasbeen considerably slower than on-farm diversification. While there is still some scope foragricultural growth and diversification, in the next five to ten years, this source of growth willbegin to reach its limits (as is already evident from the emerging constraints on access to land)and off-farm employment and income growth will need to play a much bigger role in povertyreduction. Policymakers will need to find ways to remove the attitudinal, administrative andfinancial obstacles that stand in the way of rural off-farm job growth. Vietnam has about twomillion private, household enterprises, engaged in labor-intensive manufacturing or processing.These will need to be encouraged to grow and multiply.

129
(iii) How to reduce poverty in remote and mountainous areas? Closing the most acute povertygaps in rural areas demands a continuing and strong commitment to rural investment indisadvantaged areas. These areas include the uplands and Vietnam's coastal strips, notably in the-Mekong Delta. Protecting the vulnerable from further erosion of their livelihoods will requiresubstantial investments where the human needs are greatest, but where the economic returns arenot necessarily the highest. The first demand is for basic access to infrastructure that connectspeople to commune and district centers. This forms part of the government's current ruraldevelopment and poverty reduction strategy. But the scale of the problem is large and moreresources will be needed in the future. The second demand is for services that are bothappropriate to remote populations and highly cost-effective, especially for education, health, andagricultural extension. Greater investment and creativity are warranted in the design ofsustainable services for remote areas.
25. The new 1,715 Poor Communes Program is a good start to attacking poverty in remoteand mountainous areas, but much more than infrastructure alone will be required in thesecommunes. An integrated area development approach-that combines investments in human andsocial development and physical infrastructure, with better agricultural and financial services,and better governance-will be needed. In this respect, Vietnam could learn from the approachadopted in China, which also has similar problems of concentrations of poor people living inmountainous areas. Recent experience in China suggests that an effective means of assisting thepoor is through an integrated set of interventions in the form of multiyear projects. In mostcases, the multisectoral rural development projects include an integrated program of investmentsin: (i) upland agricultural development to increase upland agricultural productivity; (ii) labor-intensive construction of rural roads, drinking water systems, small scale irrigation, and otherrural infrastructure; (iii) provision of off-farm employment opportunities through a system ofvoluntary labor mobility for the upland poor; (iv) institution building and poverty monitoring;and (v) rural enterprise development. Improved access to basic education and health, andmicrocredit components, are included in some donor-supported projects (World Bank, 1999c).This is the approach that Vietnam is planning to adopt in the Northern Mountains region andwhich could also be adopted in other lagging areas, such as the Central Highlands.
(iv) How to generate morejobs in urban areas and still keep cities livable? During 1993-98, theurban industrial sector grew rapidly, but without contributing much to job creation. The sector isdominated by capital intensive industries which draw resources away from the light-manufacturing and services sectors, which can create more jobs. In the future, urban areas willneed to play a more important role in poverty reduction in Vietnam by providing employmentopportunities for migrants who come from rural areas in search of a better life and by providing amarket for the goods and services being produced by rural dwellers. Without addressing thetremendous land, shelter and infrastructure needs of urban areas, however, these areas are likelyto become a bottleneck to investment and growth in Vietnam. And environmental degradation isa serious problem in Vietnamese cities that will require much greater efforts to address. Theimpact on the poor-of bad water, polluted air, poor drainage-are a matter of concern and needto be addressed urgently. An even more daunting task is to address in a comprehensive way thepressures on environmental resources that will arise with continued urbanization along coastalzones, tourism areas, and delicate or sensitive environments (including cultural assets of thecountry). These concerns will need to be fully integrated into any strategic planning andinvestments for urban development.

130
26. The needs of urban areas are immense and resources are limited. To ensure that urbanareas do not end up absorbing all available public resources, investments in urban developmentwill need to be accompanied by major reforms in land use -policies, in management and-governance of urban areas, and in inter-governmental and local finances (World Bank, 1999d).Such reforms could attract private investments into urban infrastructure and free up limitedpublic resources for rural and other poorer areas. In addition, efforts will need to be made toensure that social development and physical infrastructure investments in urban areas benefit theurban poor more than they do now, for example, through slum-upgrading projects that providebetter housing and other services to the urban poor. Decisions about urban planning will need tobe communicated better to affected communities and populations so as to reduce the uncertaintyand vulnerability about resettlement and relocation that the poor currently face. And theseinvestments will need to be supported by a policy environment that ensures that decisionsaffecting the livelihoods of the urban poor are made with care and do not exacerbate the conflictsover resources that are already apparent between the rich and the poor in urban areas.
1.5 Good Governance
27. Both the VLSS and the PPAs have provided evidence of inequity and exclusion. Thegaps between the rich and the poor, men and women, ethnic minority groups and the Kinhmajority are large not only in terms of their income and expenditures, but also in terms of accessto quantity and quality of information, services and institutions. The issue is not only that a largenumber of people are deprived, but thaLt further real and substantial gains in poverty reduction areunlikely to happen without the benefit of the ideas, energy and actions of poor and disadvantagedwomen, men, girls and boys. Social harmony and stability, as well as sustainable economicgrowth, will be achieved only through real participation of all citizens, especially those with lessof a "voice" now, such as women, ethnic minorities, children and poor people.
28. While the analysis in this Poverty Report has highlighted participation as a key elementof good governance, the other elements-transparency, accountability and predictability of thelegal and regulatory framework-are just as critical. The upcoming Five Year Plan provides anopportunity to grapple with some key issues relating to good governance. Policymakers will needto devise responses to the following key questions:
(i) How to ensure that the design of the Five Year Plan reflects the needs and priorities of thepoor? The Five Year Plan in an irnportant instrument that will provide the framework forguiding policy and investment choices in Vietnam for the next five years. It is important that thisplan reflects the needs and priorities of the poor. This can be done by engaging variousstakeholders through a participatory planning process. Stakeholders need to be involved both inthe design and implementation of the Plan to ensure that it responds to the aspirations of poorpeople. The Grassroots Democracy Decree can play an important role in ensuring that the voicesof the poor are fed upwards into the policy-making and planning process. And it can also play animportant role in monitoring progress in the implementation of the Five Year Plan.
29. To have a pro-poor Five year Plan and to maximize its impact on poverty reduction, theurgent need now is to:
* mainstream promotion, achievement and institutionalization of participation of allcitizens as a key element of a strategy for poverty reduction;

131
* build capacity not only of state institutions and officials as "suppliers" ofparticipation, but also of poor people and communities, at the "demand" end ofthe equation to participate;
* take innovative, practical and targeted actions to promote participation at alllevels and institutions.
(ii) How to improve governance, especially at local levels? Improving the efficiency of publicadministration and the accountability and transparency of Government actions will be essentialfor improving the climate for business and for improving opportunity. It will also reduce thescope for corruption, discretion and bureaucratic interference and the sense of vulnerability andpowerlessness that people feel when dealing with unpredictable and sudden changes in rules andregulations and policies and programs that affect their lives. The Government will need toaccelerate steps to simplify administrative procedures and business registration, along with thereduction in controls and procedures in the trade and exchange systems. Another critical aspectof transparency is the provision of financial information. An important step has been thepublication of the budget information at the start of 1999. The comprehensiveness of these datawill need to be improved over time, including the publication of commune level budgets, asstipulated in the Grassroots Democracy Decree. This will lead to an improvement in theefficiency and equity of public taxation and expenditure policies.
30. How can Vietnamese policymakers come up with the right package of polices andprograms that will combine what is essential in these five broad areas-human and socialdevelopment, physical infrastructure, economic management, regional development, and goodgovernance--to maximize the impact on poverty reduction? These are not easy choices and thereis no one correct way of making these decisions. One approach would be set some overall targetsfor poverty reduction and to design a program of action that is necessary to achieve these targets.How one might go about setting such goals and monitoring progress is discussed in the nextsection.
2. SETTING GOALS AND MONITORING PROGRESS
2.1 The Five Year Planning Process in Vietnam
31. As part of its Five Year Planning process, Vietnam sets economic, social andenvironmental goals for itself. As an illustration, the goals that it set as part of the Five Year Planfor the period 1996-2000 as presented in Box 6.1. Some of these goals have been met, whileothers will need to be reviewed and revised. As part of the preparation of the next Five Year Planfor the period 2001-2005, a detailed evaluation will be undertaken of the successes and failuresof the previous period and revised targets will be set for the coming period. These targets willthen be monitored closely during the period of implementation of the Five Year Plan.

132
* Pouain E:elt and Nutrition;: W|iFT;?|X :Rti
32. During the preparation for the oext Five Year Plan, what poverty reduction targets shouldVietnam set for itself? One can start by examining the Intenational Development Goals (IDGs)that the development community has rallied around and see if these might guide the choices ofVietnamese policysakers. In an effort to focus their efforts better on poverty eradication,members of the developrent community decided to select a limited number of indicators ofsuccess by which their efforts could be judged (OECD, 1996). They proposed a globaldevelopment partnership through which a concerted effort would be made to achieve together theambitious goals laid out in Box 6.2.

133
Box 6, T teonabal GlvlWnn oals
The development commnity has proposed a parfhp that would aim to achieve the following goals:
Economic welbeing:
* A reduction by on0-halfi the proportion of peope living n extremepoverty bythe year 20S.*
Social development:
* Universal prixnary education in all countries by 2015;
* Demonstrated progress toward gender equalty and the empowerment of womn by eliminatinggender disparity in primary and secondary education by 2005;
* A reduction by tw-irds nthe mortality rate forinfants and chid under the ageof 5 yeas andi a reduction by tbree4ourths in matemal mortality, all by 2015;
* Access through the primary health-care system to reproductive health services for all individuals ofappropriae ages as soon as possible and no later than the year 2015.
Environmental snstainability and regenerationt
X The current inplementation of national strategies for sustainable development in all countries by2005. so as to ensure that current trends in the loss of environmental resources are effectivelyreversed at both global and national levels by 2015.
Sowrce: Shaping the 2 V Cenury: The Contribution of Development Cooperation (OECD, 1996).
Note: The IDO defined extreme poverty in terms of the proportion of people with incomes of less than US$1 perday (in 1985 Purchasing Power Parity terms).
2.2 Vietnam and the International Development Goals
33. Economic Wellbeing and Economic Growth--The first International Development Goalrelates to economic wellbeing and the goal is to reduce by one-half the proportion living inextreme poverty by the year 2015. Whether or not Vietnam can replicate its past success duringthe next 15 years will depends critically on two factors:
The level of growth it can attain during the next 15 years; and
The pattern of growth (equitable or inequitable) it can attain during the next 15 years.
34. The importance of economic growth for raising the living standards of the poor inVietnam cannot be overestimated. But both the level of growth and its pattern (or how thebenefits of growth have been distributed) matter for poverty reduction. In fact, changes inpoverty reduction can be decomposed into two components: one for economic growth and onefor distributional changes (Datt and Ravallion, 1992). The results for this decomposition for sixEast Asian countries, including Vietnam, are presented in Table 6.3. The growth component isnot only always positive (as one would expect from the growth record of these countries), but is

134
also generally much larger than the redistribution component, which is more often negative thanpositive. Consequently, the growth component is often larger than the actual measured decline inthe head-count index.
35. The results for Vietnam show that poverty has declined substantially in Vietnam due tothe high growth of the 1993-98 period, and despite the rise in inequality that occurred during thisperiod. However, the sign of the redistribution component shows that the pattern of growth hascounteracted rather than reinforced the poverty reducing impact of growth. Furthermore, the sizeof the redistribution component implies that even though poverty has come down very rapidly inVietnam, it could have come down even faster if the underlying pattern of growth had been amore equitable one. Vietnam's pattern of growth and poverty reduction during 1993-98 isdifferent from the patterns observed in Malaysia (1973-89), Indonesia (1978-84) and thePhilippines (1991-94), where the growth and redistributional effects reinforced each other andled to an even stronger impact on poverty reduction.
Country Period Decline in Growth Redistribution Residualheaid-count component component
i:ndex(percentage
points)Malaysia 1973-89 19.1 16.4 3.9 -1.2Thailand 1975-86 -1.9 6.1 -11.0 3.0
1986-92 10.0 10.0 -1.5 1.5Indonesia 1970-78 3.8 7.6 -2.7 -1.1
1978-84 26.7 18.5 3.4 4.81984-95 23.6 22.4 -3.1 4.3
China (rural) 1985-90 -2.1 2.4 -4.1 -0.41990-93 2.2 5.9 -3.3 -0.4
Philippines 1985-88 5.0 5.2 -0.3 0.11988-91 -1.2 2.9 -4.1 0.01991-94 1.7 0.8 1.0 -0.1
Vietnam 1993-98 20.8 30.7 -7.6 -2.3
Note: Declines in poverty are presented as positive entries; negative numbers indicate increasing poverty.
Source: Ahuja, Bidani, Ferreira, and Walton (1 997) for all countries except Vietnam; for Vietnam, World Bank estimatesbased on VLSS93 and VLSS98.
36. Two factors underlie Vietnam's success in reducing poverty during 1993-98: the highgrowth rate of this period; and the high impact of this growth on poverty. Despite the rise ininequality, Table 6.3 shows that Vietnam was able to get a big bang for its growth in terms ofpoverty reduction. But both these factors are now under threat. During the crisis years of 1998and 1999, Vietnam's growth rate has already fallen by half (to around 4 percent). And in thefuture, the past relationship between the level of growth and the impact on poverty might nothold, as Vietnam might not be able to replicate the land-based, agricultural diversificationsuccess story of the last five year period, which is now reaching its constraints. Hence, thesources of growth are likely to be different in the next five years as compared with the last five.

135
Greater reliance will need to be placed on two other areas of growth in the future: rural off-farmemployment and urban employment. But for both these, accelerated and urgent reforms arenecessary on a broad range of structural issues.
37. Social Development Targets-Looking at the International Development Goals forsocial development, it is clear that many of these might not be the most pressing goals forVietnam and that Vietnam needs to set its own goals that are grounded in its own reality. Forexample in education, the IDG of universal primary education by the year 2015 looks relativelyeasy for Vietnam, which has already achieved a primary school enrollment rate of 91 percent.But as discussed earlier, Vietnam has other problems in primary education--related to access,efficiency, quality and relevance--that need to be addressed systematically. Similarly, while theIDG of attaining gender equality and the empowerment of women is relevant for Vietnam, theinstrument that is suggested for attaining this goal-the elimination of gender disparity inprimary and secondary education by the year 2005-is not. Vietnam has already eliminatedgender disparity in primary and secondary education and yet, as we saw in Chapter 4 earlier, ithas a host of problems relating to gender equality that need to be addressed through a differentstrategy.
38. The IDG for health care are also not the most appropriate ones for Vietnam. WhileVietnam has experienced impressive declines in infant mortality to the point where its infantmortality rate is lower than that of many countries that have significantly higher per capitaincomes (such as Indonesia, see Table 6.4 below), its child malnutrition rates are unusually highin relation to other countries in the region. Further, child malnutrition rates have declined quitesluggishly over the last 15 years in comparison to infant mortality. A recent national survey ofnutrition conducted by the National Institute of Nutrition and UNICEF indicates that 39 percentof children under the age of 5 years are severely undernourished in terms of weight-for-age(underweight) and 34 percent in terms of height for age (stunting). These data suggest thatVietnam has a major problem of high and chronic child malnutrition. The relatively lowindicators on infant and child mortality compared with the relatively high indicators onmalnutrition suggest that while many more children survive than before, their quality of life isless than satisfactory (Dollar, Glewwe, and Litvack, 1998).
39. The same inconsistency between achievements on the quantity and quality front holdswith fertility and reproductive health care. Vietnam's total fertility rate (TFR) began to decline inthe mid 1970s, and has declined sharply from 5.9 in 1970-74 to about 2.7 in 1992-96. Thisexperience puts Vietnam at the forefront of countries that have experienced rapid fertilitydeclines. The contraceptive prevalence rate, which is an indicator that measures the success offamily planning programs, is extraordinarily high in Vietnam (75 percent) in comparison to mostdeveloping countries. And Vietnam's achievements in reducing maternal mortality are alsosignificant: its maternal mortality ratio (at 160) is also relatively low compared with othercountries (Table 6.4). But other indicators suggest that the quality of reproductive healthcare andaccess to appropriate family planning services remain major issues. The choice of contraceptivemethods is limited and there is a predominance of IUDs in the method mix (about 69 percent ofwomen using contraceptives have to rely on IUDs). There is also extensive use of inducedabortions to terminate pregnancies, which can pose substantial risks to women and which can beseen as a measure of lack of accessibility to safe and affordable family planning services.

136
IDG Goal Vietnam India Indonesia
GNP Per Capita $330 $430 $680
(1998 Dollars)
Infant Mortality Rate 45 71 47
(per 1000 live births)
Under Five Mortality Rate 62 88 60
(per 1000 live births)
Matemal Mortality Rate 160 440 390
(per 100,000 live births), 1990-97
Contraceptive Prevalence Rate (% of women aged 75 41 5715-49), 1990-98 I
Source: All data are from the World Development Indicators, 1999, except the MMR for Vietnam which is from UNICEF,1999.
2.3 How can Vietnam Set, Attain, and Monitor its own Goals?
40. As discussed earlier, new goals for Vietnam will be set by policymakers as part of the
next Five Year planning process. Once these goals are set, public policies and programs will
need to be designed to help attain these goals. And progress in attaining these goals will need to
be measured on an annual basis. To design the particular strategies for achieving each target, first
the determinants of the particular outcomes that are targeted will need to be understood so that
the right strategy for achieving the t;argets can be developed. And some set of intermediate
indicators will need to be developed to monitor progress in attaining these goals.
41. As an example of how this could be done, we start with Vietnam's objectives in the
human development area as presented in Box 6.2, and assume that the targets for the Year 2005
are: universal primary education of equal quality for all; and 100 percent literacy for all 15-35
year olds, as before (Column 1 of Table 6.5). To determine the kinds of public actions needed,
one first needs to understand the kinds of factors that influence the outcomes presented in
Colunm 1. Column 2 gives examples of the kinds of factors that will determine these outcomes
for the education and literacy goals. Tlhese factors can be drawn from the extensive literature that
already exists on the topic of primary education in Vietnam. And Column 3 presents some public
actions that can be taken to attain the goals presented in Column 1, based on the analysis
presented in Column 2.

137
~~~~~~~uTcomes, Deten"n i i:Levers for Pbtec AM_-o
Education and Literacy: Household incomes; Targeted school subsidy programs
(1) Universal primary Parental education; and literacy programs;
education of equal quality for Quality of teachers and Teacher training;all schooling;
(2) 100 percent literacy for all Appropriate governance and15-35 year olds Private costs of education; accountability of service providers;
Levels of public spending on Quality monitoring in schools;literacy programs and primaryeducation; Spending/cost recovery policies on
Early childhood development; primary education;
Access to education in remote Investments in early childhoodand mountainous areas; development programs/nutrition
Issues of bilingual education programs;and minority teachers for Infrastructure development;ethnic minority areas;
Heavy workload of women; Appropriate language policies andoutreach programs for ethnic
Quality of education in the minority education;non-formal education system;
Public investments in programs andRelevance of primary school services that reduce the workload ofcurriculum; women;
Demand for children's labor Policies to include migrant andby the household; unregistered children into
Access to education for mainstream primary education;disabled children.
Policies to include disabled childreninto mainstream primary education
42. Monitoring Progress--In addition to setting goals and identifying public policies andprograms that are most likely to help attain those goals, what is also necessary is the monitoringof indicators to track progress. To complement final outcome indicators, policymakers will needintermediate indicators that can be readily monitored and used to reveal changes during theshorter time frames that are typically of interest to governments, electorates, and donors. Forexample, in the education sector, some intermediate indicators, such as those presented in Table6.6, would be appropriate candidates for annual review by governments and their partners. Inaddition to sector-specific indicators, efforts will also need to be made to strengthen the systemof monitoring overall poverty outcomes in the short- and medium-term (Annex 6).

138
Desired Outcome INTERMEDIATE INDICATOR
Education and Literacy:
Net primary school enrollment rate;
(1) Universal primary education of equal quality for all Scoring of students in standard leanling tests;
Net primary school enrollment rate for ethnicminorities;
(2) 100 percent literacy for all 15-35 year olds Scoring of students in standard reading tests.
2.4 Partnerships for Development
43. This report has been produced by a Poverty Working Group with representatives fromeight Government agencies and mass organizations, three international NGOs (working inpartnership with local government officials, local NGOs and research organizations), onegovernment-donor project, and four multilateral and bilateral donors. It has also involvedprovincial authorities in four provinces-Lao Cai, Ha Tinh, Tra Vinh and Ho Chi Minh City. Itis an example of what an effective partnership can accomplish. The process of producing thisreport has led to a shared perspective among the members of the working group on the natureand causes of poverty in Vietnam. For example, by working together, there has been a betterunderstanding-and a shared concern--between the authorities, the international agencies, andthe NGOs on complex and sensitive issues such as ethnic minorities, unregistered urbanmigrants, and gender relations. By working together, GSO and the World Bank have been able toadopt a common methodology for measuring poverty and now have a common poverty line anda common set of poverty estimates that they can both use to track changes in poverty and helpdesign anti-poverty policies. Donors have also benefited from this process-unlike the last timewhen the first VLSS was done in 1993 and several donors produced several different povertyassessments based on the same data source, this time the donors have pooled their resources tocome up with a joint poverty assessment for Vietnam. The pooling of resources has enabled themto undertake much more extensive work than before and to base their analysis on bothquantitative and qualitative sources ofl data. And having the NGOs in the Working Group hasallowed the Group to benefit immensely from their knowledge of working at the grassroots leveland through them, has brought to the Group much more directly the priorities and concerns ofthe poor themselves.
44. While the process of working on this Report has led to a shared perspective on the natureof poverty-related problems and their causes, there has yet to emerge a shared view on thestrategy needed to move forward. While commonalities exist in many areas, in some areas thereare significant differences in opinion between the Government of Vietnam and its developmentpartners. For example, one area where they differ is the appropriate role of the Governmentversus households themselves in finanicing basic social services. The Government believes thatself-reliance is important and that co-financing of these services is essential to reduce

139
dependency. It chooses to assist the poor primarily through subsidized credit. The donors andNGOs believe that a better way to assist the poor would be to channel state subsidies throughbasic social services and to allow credit to be provided at market rates to ensure an efficient use-of scarce resources.
45. This report raises a numbers of other, more specific, questions and issues which will alsodemand more research and discussion before consensus can be reached on solutions. Importanttopics which have been raised but left unresolved in the process of producing this povertyassessment include:
* How can agricultural productivity be raised? What role does rice policy have to playin Vietnam's future growth and poverty reduction strategy? What can be done topromote the further diversification of agriculture?
* How can the off-fann rural sector be stimulated to provide the employment andincome-generating opportunities which the rural population will increasingly need?
* What is needed to make urban planning more pro-poor and growing cities more"livable"? What changes are needed to allow migrants to contribute more to theprosperity of cities and how can their basic needs be better protected?
D What is the role of targeting versus broad-based growth in a poverty reductionstrategy for Vietnam? What is the right balance between the two in terms of resourceallocation/policy emphasis?
* What can be done to help the upland regions - and their ethnic minority population -catch up with the rest of the country so that the poverty-reducing effects of growthare spread more evenly?
* How can basic social services be made more affordable to the poor? Can the severefinancial burden of ill-health be lifted? Can existing social safety-net expenditures bemore effectively targeted towards the poor?
* What is the Government's role in addressing equity issues at an intra-householdlevel? How can these issues be tackled most effectively? Who else can play a role inaddressing these issues?
* What help does the Government need to implement the Grassroots DemocracyDecree so that local decision-making processes can be made more participatory andtransparent and local authorities can be made more accountable?
* What institutional arrangements might improve the Government's capacity todevelop and monitor policies for poverty alleviation? What is needed to improvecoordination across Ministries and agencies involved in anti-poverty programming?How could short-term poverty monitoring be improved?
* What has been the impact of some of the major components of the HEPR Programwhich have been operating for some years? How can their impact on povertyreduction be enhanced?

140
* More progress will need to be made during the coming year in these and other areas-through joint work in many areas such as public expenditure reviews, banking reform, andthrough further research. The task now is to arrive at a common approach to these issues and-to a common poverty reduction strategy for Vietnam during the next year as the next FiveYear plan is finalized by the end of the year 2000.

141
ANNEX 1
POVERTY AND INEQUALITY MEASURES
1. This annex provides a brief description the various quantitative measures of poverty andinequality that are used in this report. Unless otherwise stated, all the poverty and inequalitymeasures presented are based on using per capita expenditures as the welfare measure.18
A. Poverty Measures
2. Once a poverty line has been set (see Annex 2), a number of summary statisticsdescribing the incidence, depth and severity of poverty may be calculated. These include theheadcount index (which measures the incidence of poverty), the poverty gap (which measuresthe depth of poverty) and the squared poverty gap (which measures the severity of poverty).Foster, Greer and Thorbecke (1984) show that these three poverty measures may all becalculated using the following formula:
1 M (z - y)PI,=- 2 -IN j=1 I z IC
where yi is the welfare measure (here per capita expenditure) for person i, z is the poverty line, Nis the number of people in the sample population, M is the number of poor people, and ca can beinterpreted as a measure of inequality aversion.19
3. When a-O, the above equation reduces to M/N, the number of poor people in thepopulation divided by the number of people in the sample population. This very commonly usedmeasure of the incidence of poverty is called the headcount ratio or, when turned into apercentage, the headcount index. Although it is easy to interpret, the headcount index is notsensitive to how far below the poverty line poor people are.
4. When a=l, the poverty gap index is produced, which shows the shortfall of the poor'sexpenditure from the poverty line expressed as an average of all people in the population.20 Thepoverty gap, which is simply the sum of all the poverty gaps in the population, can be used as anindicator of the minimum cost of eliminating poverty using perfectly targeted transfers. The
18 While there are good reasons for using expenditures rather than incomes as the welfare measure, as discussed inAnnex 4, the use of per capita expenditures is a little more controversial. This is because the use of per capitaexpenditures ignores differences in the age-sex composition of households and possible economies of scale inhousehold consumption.
19 Note that because, unlike VLSS93, VLSS98 is not "self-weighting", sampling weights must be applied whenapplying calculating poverty and inequality measures using VLSS98.
20 When the shortfall of the poor's expenditures from the poverty line is expressed as an average of only poorpeople's expenditures, a different poverty measure (the income gap index) is produced. Although some people findthe income-gap easier to understand than the poverty-gap index, it has several undesirable properties, and istherefore not used in this report.

142
targeting of transfers, however, usually involve leakages and administration costs so that it is notunusual for the actual cost of eliminating poverty to be a multiple of the poverty gap.
5. When c=2, the squared poverty gap index-which measures the severity (or intensity) ofpoverty and gives more weight to the poorest of the poor -is produced.
6. Unlike some other poverty measures, these three poverty measures have the usefulproperty of being additively decomposable (i.e., the national poverty headcount will be equal tothe weighted average of headcounts in rural and urban areas or different regions).
B. Inequality Measures
7. Three measure of inequality are used in the report: the ratio of the top to the bottomquintile's expenditures, the Gini coeflicient, and the Theil L index. Like the poverty measuredescribed above, unless otherwise stated, these have all been calculated using per capitaexpenditures are the welfare measure.
8. The ratio of top to bottom quintile's expenditures is a very commonly used summarymeasure of inequality in both industrialized and developing countries (a quintile is simply 20%of the population). The main drawback of this inequality measure is that it ignores theexpenditures of the middle 60% of the population and also the distribution of expenditures withinthe richest and poorest quintiles.
9. The Gini coefficient is a measure of inequality which varies between 0 (when everyonehas the same expenditure, or incomes) and 1 (when one person has everything!). The closer aGini coefficient is to one, the more unequal is the distribution. For most developing countries,Gini coefficients for expenditures or incomes range between 0.3 and 0.6.
10. The Gini coefficient has a graphical interpretation in terms of the area under a Lorenzcurve (see Figure 4.1), divided by the area under the diagonal line of equality. Thus, the furtheris the Lorenz curve from the line of equality, the higher is the Gini coefficient. Although it is avery commonly used measure of inequality, the Gini coefficient has a number of disadvantages.These include: (a) the Gini will not always increase when money is taken away from one personand given to someone who is richer;21 and, (b) the Gini cannot be decomposed for sub-groups(such as rural and urban areas, or the seven administrative regions of Vietnam) and thensomehow "added up" to get the national Gini coefficient.
11. The Theil L index is a measure of inequality that is based on information/ probabilitytheory. The Theil L index various between 0 (absolute equality) and oo (absolute inequality),although it is unusual for it to exceed 1. Like the Gini coefficient, the higher is the Theil indexthe more unequal is the distribution of excpenditures (or incomes). The Theil L index is calculatedas follows:
21 This counter-intuitive result is known as "violating the principle of transfers". The Gini coefficient violates theprinciple of transfers whenever the Lorenz curves for two populations cross.

143
L = Eln -jwhere, as before, yi is the welfare measure for individual i, N is number of
people in the population, and Y is the total of all individuals' welfare measures (i.e., totalexpenditure or income).
12. There are two advantages to the Theil L measure: (a) it gives more weight to those peopletoward the bottom of the income distribution; (b) unlike the Gini coefficient, it can bedecomposed into "sub-groups" (to be precise, the national Theil L is the weighted average of theindex for each sub-group where the weights are population shares). This last property is veryuseful, as it allows one to consider what is driving changes in inequality at the national level.
13. There is a related measure of inequality known as the Theil T index of inequality, whichvarious between zero and log(N). In this report, Theil's L index is used because it is moresensitive to inequality at the lower end of the distribution than the Theil T index.
References:
Cowell, F., 1995, Measuring Inequality, London: Prentice Hall
Deaton, A., 1997, The Analysis of Household Surveys, Baltimore: John Hopkins University Press
Foster, J., Greer, J., and Thorbecke, E., 1984, "A class of decomposable poverty measures",Econometrica, 52: 761-65
Ravallion, M., 1994, Poverty Comparisons, Chur: Harwood Academic Publishers
Theil, H., "1989, The measurement of inequality by components of income", Economics Letters,42:197-199

144
ANNEX 2
ESTIMAlTING THE POVERTY LINES
1. This annex describes how the poverty lines used in this report were estimated. Themethodology used to derive them was worked out by a joint General Statistical Office- WorldBank team. It is similar to the methodology that was used by the World Bank in the 1995Vietnarn Poverty Assessment, which has been used by the World Bank in many other developingcountries.
Choice of Welfare Measure
2. The first step in defining poverty is to choose an indicator of household welfare. In thequantitative work in this report, the most widely used indicator is household consumptionexpenditures per capita. The reason for this frequent use is that this variable summarizes manythings that improve the quality of life, such as food consumption, payments for schooling, andpurchases of medicines and medical services. In fact, the consumption measure used here alsoincludes estimates of the annual "use value" of consumer durable goods and of owner-occupiedhousing.
3. An alternative to using consumrrption expenditure data would be to use income data. Yetthere are two reasons to prefer the expenditure data. First, income only raises welfare when it isused for consumption purposes, as opposed to being saved or used to pay debts. This implies thathousehold consumption expenditures are more closely related to household welfare than ishousehold income. Second, income data tend to be inaccurate, especially in countries such asVietnam where the vast majority of workers are self-employed. A final issue regarding the use ofconsumption expenditures per capita as a welfare indicator is whether allowances should bemade for differences in household composition, such as accounting for the lower needs ofchildren compared to adults. There is a long literature on this issue, which focuses on theestimation of "adult equivalence scales". Yet recent research on this topic has led to the generalconclusion that there is no credible method of estimating such scales (see Deaton, 1997).
Calculation of Poverty Lines
4. Given this measure of household welfare, the rest of this annex describes how povertylines were calculated for this report. The poverty lines used here are based on the 1993 VietnamLiving Standards Survey (VLSS93). The first step was to construct poverty lines for 1993 usingthe data from that survey. The 1993 poverty lines were then updated for 1998 using only data onprice changes. Thus these poverty lines are "absolute" poverty lines. That is, they apply the sameabsolute standard (same "basket of goods") for both years.
5. The key feature of the poverty "lines used in this report is that they refer to a basket offood items that is deemed to be necessary to ensure good nutritional status. This basket of fooditems takes into account the food consumption patterns of Vietnamese households, as calculatedfrom the 1993 VLSS. For both years (1993 and 1998), two poverty lines are calculated. The firstis the amount of money needed to purchase the 1993 basket of food items each day for one year.This is referred to as the "food poverty line". This poverty line is low because it does not allowfor any purchases of non-food items. The second poverty line, referred to as the "general poverty

145
line," allows for the purchase of non-food items. The remainder of this appendix explains indetail how these poverty lines were calculated.
Food Poverty Line for 1993
6. The starting point for constructing a food poverty line is the nutritional needs that are tobe met by the food being consumed. Nutritionists in the World Health Organization (WHO) andother national and international agencies have long made recommendations on the nutritionalintakes that are needed for a healthy life. The most basic indicator of nutritional intake is caloriesconsumed. The WHO and other agencies have constructed minimal calorie requirements fordifferent types of people. Individuals' caloric needs vary depending on their age, sex and theamount and intensity of physical activity they engage in. For the purpose of constructing apoverty line, however, it is useful to take an average requirement over the entire population. Thishas been done many times at the World Bank, and a common figure used is 2100 calories (Kcals)per person per day. Of course, some people need more and others need less, but this is areasonable average amount, and this is the calorie requirement used in this report to constructpoverty lines.
7. How much does it cost a Vietnamese household to purchase a basket of food items thatprovides 2100 calories per person per day? This can be calculated using the food expendituredata (sections lIA and llB of the household questionnaire) from the 1993 VLSS. First, oneobtains a food basket in terrms of the physical quantities of food items that provide 2,100 caloriesper day, and then one uses price data to calculate the total cost of those items. The procedureused here was designed to choose a basket that reflects Vietnamese food consumption patterns.This is done because it is unrealistic to use a basket of goods derived from some other country orfrom some kind of mathematical programming exercise for estimating the minimum cost of foodbaskets. A poverty line derived in that manner would not be very relevant for Vietnam and alsowould not be politically acceptable to Vietnamese policymakers.
8. Quantities in Food Basket: Given the desire to construct a basket of goods that reflectsVietnamese consumption patterns, the following procedure was used. First, total (food + non-food) expenditures per capita were calculated for each of the 4800 households in the 1993survey. Then, these households were divided into the poorest 20% of the population, the nextpoorest 20%, and so forth up to the wealthiest 20%, all in terms of real per capita totalexpenditures. For each of these "quintile" groups, total calories per person per day werecalculated. The results are as follows:

146
1 1568 1598
2 1829 1891
3 1969 2052
4 2065 2237
5 2041 2565
Source: GSO and World Banik estimnates based on VLSS93.
A few comments are needed regarding these calorie numbers. For most food items, oneknows how much was consumed in terms of physical quantities and how much calories arecontained in a kilogram (or some other appropriate unit of measure) of the food item. When thecalories consumedfor these items are summed over allfood items, one gets the numbers shownin the first column of Table A. 2.. Two sets of adjustments now need to be made to these data.The first set of adjustments are needed because these numbers exclude a few items for whichcaloric values could not be calculated and had to be imputed. First, calorie data could not befound for barley/millet (item 3 06). Second, for some categories the physical amount of the goodwas not collected because the consumption of those categories of food is quite irregular. Thiswas the case for "other aquatic product's" (item 320), "cakes, sugared fruit, candy" (item 338),
11~ ~ 1992205
"other beverages " (343), 'food purchased away from home " (344), and "other " (345).2 Forboth cases, -the approach taken was to assume that the amount of calories per Dong spent onthese items was the same as the average calories per Dong spent on the items for which bothexpenditure and caloric value data were available. The figures in the second column of TableA.2. 1 include such "imputed" calories f'rom expenditures on the items for which caloric valuescould not be calculated.
9. After the imputations are done, the quintile in 1993 whose calorie consumption wasclosest to the 2100 calorie benchmark was Quintile 3, as seen in Table A2. 1. Thus, the basket offood items consumed by the households in Quintile 3 was used to construct a basket that gives2100 calories per person per day. But since the calorie consumption of Quintile 3 averaged 2052calories rather than the target of 2100, a second adjustment was required, as follows: thequantities consumed were increased by a small amount to provide a basket that provides exactly2100 calories. This was done by multiplying the average quantities consumed by households inthe third quintile by 2 100/1969. The denfminator used was 1969 instead of 2052 because there isno quantity information (or in the case of barley/millet, no calorie information) for the items for
22 For cakes, sugared fruit and candy (item 338) quantities were collected for consumption during Tet and other
holidays but not for consumption during the rest of the year.

147
which values had to be imputed in step 1. That is, this food basket excludes the items for whichcaloric values could not be calculated (barley/millet, other aquatic products, etc.). This basket offood items is given in Table A.2, in termns of per capita consumption per year. The first column is-actual quantities consumed, which provides 1969 calories, while the second column is inflated asdescribed above to provide 2100 calories.

148
Food Item Quantity Consumed Adjusted Quantity Consumed(Column 1) (Column 2)
Ordinary Rice =159 169.6G~lutinous Rice 5.5 5.9Maize 2 2.1Cassava 8.8 9.4Potato, Sweet Potato 10.7 11.4Bread, Wheat Flour 0.7 0.8Wheat/Egg Noodles 0.6 0.7Fresh Rice Noodles 2.3 2.5Arrowroot Noodles 0.8 0.8Pork 4.9 5.2Beef 0.1 0.1Chicken 2.1 2.3Duck, Other Poultry 0.7 0.7Other Meat 0.2 0.2Processed Meat 0.04 0.04Lard, Cooking Oil 1.4 1.5Fresh Fish, Shrimp 10.3 11Dried Fish, Shrimp 0.7 0.7Eggs 0.4 0.4Tofu 2.9 3.1Peanuts, Sesame Seeds 0.9 0.9Beans 0.9 1Water Moming Glory 14.1 15Kohlrabi 5.6 6Cabbage 5.6 5.9Tomatoes 3.2 3.4Other Vegetables 14.2 15.2Oranges 0.5 0.5Bananas 6.2 6.6Mangoes 0.5 0.6Other Fruit 5.9 6.3Fish Sauce 5.6 6Salt 5.4 5.7Monosodium Glutamate 0.7 0.8Sugar, Molasses 2.4 2.5Cakes, Candies 0.4 0.4Milk and Milk Products 0.04 0.04Alcohol 3.8 4.1Coffee 0.1 0.1Tea 2.4 2.5
Source: GSO and World Bank estimates based on VLSS93.

149
10. Cost of Food Basket: What is the cost of purchasing the basket of food items in the lastcolumn of Table A.2.2, which provides 2100 calories per day per person for one year?Obviously, one needs the prices for these goods. The VLSS93 data provide prices for almost alFof them, but for some items prices are not available. More specifically, the VLSS93 pricequestionnaire does not have prices for bread (item 307), rice noodles (item 309), other meats(315), processed meat (316), cooking oil (317), dried fish (319), other vegetables (329), otherfruit (333), cake and candy (338), coffee (341) and tea (342). Three of these items were deemedto be sufficiently important that "unit value" prices were obtained from the expenditures andquantity information in the household questionnaire. These items were cooking oil (item 317),kohlrabi (326) and tea (342).23 (The exact method used for these three items is explained in thefollowing paragraph). To account for the cost of the food items in Table A.2.2 for which no pricedata are available, the assumption is made that the additional cost of these items is proportionateto the spending on these items among the households in Quintile 3. More precisely, these itemsaccount for about 6.9% of household expenditures on all of the items in the food basket in TableA2.2. Thus, the total cost of the items for which prices were available was multiplied by 1.069 toobtain the overall cost of obtaining the (adjusted) basket of goods in that table.
11. A few comments are needed regarding how prices in both years were obtained from thehousehold questionnaire for the cost of cooking oil, kohlrabi and tea. For consistency, for bothsurveys (1993 and 1998) households were selected whose per capita consumption of calories perday was between 2000 and 2200. Then unit prices (amount spent divided by the quantitypurchased) for these three items were calculated for these households in each survey. Themedian national prices were calculated for each year for each item using these households
12. Using this method, the cost of purchasing the (adjusted) basket of food items in TableA.2.2 was calculated. The prices used were first deflated to January 1993 prices (using regionalprice deflators provided by Vietnam's General Statistical Office, as explained below in detail).Note that the price data obtained from the VLSS93 were market prices for each communesurveyed, and median prices were obtained for Vietnam as a whole, so this cost of a basket ofgoods is a nationwide average cost expressed in January 1993 prices. That cost is 749,723 Dongper person per year. This figure must be compared to household expenditure variables that havealready been adjusted for regional price differences and already expressed in January 1993Dong. In other words, they should not be compared to a household expenditure variable that hasnot yet been adjusted for regional price differences or that is not expressed in terms of January1993 Dong. The method used in this report to adjust for regional price differences and to expresshousehold expenditures in terms of January 1993 prices is explained at the end of this annex.
General Poverty Line for 1993
13. This food poverty line can now be used to calculate the general (food plus nonfood)poverty line. The basic idea is to look at non-food expenditures for the third quintile in 1993,which amounted to 401,291 Dong per person per year (note that this figure includes both explicitexpenditures and imputed use values of durable goods and imputed rent from owner-occupied
23 rn fact, the 1993 price questionnaire did have the price of kohlrabi, but this item was not included in the 1998price questionnaire. For consistency, the prices for both years were obtained from the household questionnaire.

150
housing). 24 This 401,291 number is then adjusted because the households in Quintile 3 did notconsume exactly 2100 calories. Instead, as discussed above, they consumed 2052 calories. Thissuggests that an adjustment of 2100,'2052 (i.e. about 1.023) should be made to non-food items-(just as a similar adjustment was made to food items). Inflating the non-food component by thisratio gives a number of 410,640. The overall poverty line is then 1,160,363.
14. Using these food and general poverty lines one obtains the following figures for theincidence (headcount measure) of poverty in Vietnam in 1993:
All Vietnam Urban Rural
Food Poverty 24.9% 7.9% 29.1%
Overall Poverty 58.1% 25.1% 66.4%
Food and General Poverty Lines for 1998
15. The food and general poverty lines for 1998 were created in a way similar to the 1993poverty lines. For the food poverty line, the cost of the (adjusted) food basket in 1993 wasupdated using prices from the 1998 survey. As with 1993, the process of getting 1998 prices forthis basket of goods is complicated by the fact that the prices of 3 items (cooking oil, kohlrabiand tea) are obtained from the household questionnaire. The method used to get these threeprices is exactly the same as that used for the 1993 survey, except that the households fromwhich unit prices are calculated come from the 1998 survey (again using only those householdswho consumed between 2000 and 2200 calories per day). In addition, there were four items(beef, chicken, fish and pork) which were defined differently in the VLSS93 and VLSS98questionnaires. For these four items, "quality-adjusted" unit values were calculated from thehousehold questionnaire for those households consuming 2000 to 2200 calories per month. Theprice information from the 1998 price questionnaire is then merged with the unit prices for theabove items to obtain the cost, in January 1998 prices, of purchasing the (adjusted) basket offood items shown in Table A.2.2. As in 1993, median prices were calculated for Vietnam as awhole, so the cost of the basket of goods is a nationwide average cost expressed in January 1998prices. That cost is 1286,833 Dong per person per year.
16. As with the 1993 poverty lines,, note that the figures in the previous paragraph must becompared to household expenditure variables that have already been adjusted for regional pricedifferences and have already been expressed in terms of January 1998 prices. Thus, they shouldnot be compared to a household expenditure variable that has not yet been adjusted for regionalprice differences or that is not expressed in terms of January 1998 Dong. The deflators used forregional price differences and changes in prices over time are discussed at the end of this annex.
24 Note that this procedure for estimating the non-food component differs from that used in the previous povertyassessment for Vietnam (World Bank, 1995), whiich used the food-share regression method (Ravallion, 1994).

151
17. The method used to calculate the non-food component of the 1998 poverty lines isextremely simple. The 1993 non-food poverty line was inflated by a factor of 1.225, the rate ofinflation for non-food items, as provided by Vietnam's General Statistical Office (GSO). This-implies a non-food poverty line of 503,038 (=410,640x1.225). Thus the overall poverty line is1,789,871.
18. Calculating the headcount index of poverty using these poverty lines gives the followingincidence of poverty in 1998:
All Vietnam Urban Rural
Food Poverty 15.0% 2.3% 18.3%
Overall Poverty 37.4% 9.0% 44.9%
Regional Deflators and Time Deflators
19. The poverty lines presented above are in terms of January 1993 and January 1998 prices,and these are also national averages. To apply them to the VLSS93 and VLSS98 data, totalhousehold expenditures must be "deflated" for each household so that its expenditures areexpressed in January prices and have been adjusted for regional prices differences. Consider firstgetting expenditures in terms of January prices (either 1993 or 1998) for each survey. Theapproach taken is quite simple. For each household, nominal expenditures have been divided intoexpenditures on rice, expenditures on other food items, and expenditures on non-food items.GSO provided monthly price deflators for each of these three categories of expenditures. Foreach household, expressing current expenditures in terms of January 1993 (for VLSS93households) or January 1998 (for VLSS98 households) prices was done by dividing nominalexpenditures into these three categories, applying the appropriate category-specific GSO deflatorand then adding the three adjusted expenditures. The deflators provided by the GSO are given inTable A2.3.

152
Rice Other ;Non-food Rice Other food Non-foodfood
Oct. 92 0.8909 1.0018 0.9470 Dec.97 0.9853 0.9765 0.9922
Nov.92 0.9305 0.9754 0.9659 Jan.98 1.0000 1.0000 1.0000
Dec.92 0.9368 1.0001 0.9881 Feb.98 1.0375 1.0263 1.0087
Jan. 93 1.0000 1.0000 1.0000 Mar.98 1.0429 1.0113 0.9977
Feb.93 0.9933 1.0710 0.9940 Apr.98 1.1456 0.9971 1.0010
Mar.93 1.0730 1.0315 0.9860 May 98 1.2096 0.9983 1.0042
Apr.93 1.0572 1.0426 0.9791 Jun.98 1.1781 1.0123 1.0045
May.93 1.0398 1.0693 0.9889 JuL.98 1.1674 1.0048 1.0056
Jun.93 0.9884 1.0819 0.9820 Aug.98 1.2176 1.0021 1.0106
Jul.93 0.9780 1.0848 0.9771 Sept.98 1.2651 0.9962 1.0171
Aug.93 0.9884 1.0879 0.9781 Oct.98 1.2534 1.0069 1.0187
Sept. 93 0.9906 1.0794 0.9791 Nov.98 1.2508 1.0050 1.0243
Oct. 93 0.9771 1.0731 0.9781 Dec.98 1.2561 1.0234 1.0267
Source: GSO.
20. Now turn to the regional price deflators. For the seven regions of Vietnam regionaldeflators were calculated for urban and rural areas for both the VLSS93 and the VLSS98. ForVLSS93 these were calculated using the price questionnaire for the 1993 survey. The weightsused for these price indices were the expenditures shares for those food and non-food items forwhich prices were collected in the price questionnaire. The VLSS93 data were used because theGSO did not have regional data going back to 1992 and 1993. For VLSS98, the GSO calculatedregional price deflators specifically for the purpose of preparing this report. The price indices forboth surveys are shown in Table A2.4.
Region 1993 Urban 1993 Rural 1998 Urban 1998 Rural
Northem Uplands 1.1130 0.9681 0.9930 1.0178
Red River Delta 1.0724 0.9342 1.0560 0.9162
North Central 1.0139 0.9121 1.0250 0.9380
Central Coast 1.0661 0.9534 1.0530 0.9742
Central Highlands - 1.0855 - 1.0602
Southeast 1.2230 1.0486 1.1341 0.9654
Mekong Delta 1.1074 0.9996 1.0133 1.0269
Source: GSO.

153
21. For both surveys the index is expressed relative to the national average prices. No priceindex was used for urban areas in the Central Highlands because in both surveys none of thehouseholds came from the urban areas of the Central Highlands. - -
References:
Deaton, A., 1997, The Analysis of Household Surveys, Baltimore: John Hopkins University Press
Ravallion, M., 1994, Poverty Comparisons, Chur: Harwood Academic PublishersWorld Bank, 1995, "Vietnam: Poverty Assessment and Strategy".

154
ANNEX 3
VIETNAM'S UNTAPPED COMPARATIVE ADVANTAGEIN MANUFACTURING EXPORTS
1. Chapter 3 argued that Vietnam has considerable untapped comparative advantage in light(or labor-intensive) manufacturing exports. If Vietnam were to exploit its relative endowmentsof human and natural resources fully, nmanufacturing exports would represent approximately 63%of total exports instead of 37%, and up to 1.6 million jobs could be created in lightmanufacturing in the near future. This annex describes how these calculations were made using athe cross-country regression framework.
2. A recent cross-country study by Wood and Mayer (1998) shows that in open marketeconomies, a high endowment of well educated workers relative to land is strongly correlatedwith a high share of manufacturing exports. Typically, the higher the availability of skilled laborrelative to land, the higher the country's proportion of manufacturing relative to primary exports.This confirms the predictions of the traditional Heckscher-Ohlin theory of comparativeadvantage, according to which open market economies tend to export goods whose productionrequires an intensive use of a country's relatively abundant--and thus cheap--resources.
3. Using Wood and Mayer's (1998) econometric results can provide a rough idea of theextent to which Vietnam's manufacturing potential is under-exploited. Using a sample of 115countries and data from 1990, they estimated the following cross-country log-linear regression:
ln (manufacturing/primary exports) = -5.11 + 1.47.1n (skill/worker) - 0.6.1n (land/worker)(-14.1) (7.18) (- 6.59) R2 = 0.56
where each country's share of manufactures relative to primary exports is related to its "humancapital" (skill/worker) and to its relative endowment of land and labor (land/worker). Allvariables are expressed in natural logarithms. The coefficients estimated by this regression allowany single country's "predicted" share of manufactures in total exports to be estimated, given itshuman and natural resources.
4. Applying these coefficients to Vietnam shows that the country's "predicted" share ofmanufactures in total exports is at arouand 63% instead of 37% in 1997 (Table A3.1). Thisimplies that Vietnam's foregone revenue due to the under-utilization of its comparativeadvantage could be roughly equal to $6.5 billion or about 25% of GDP. This calculation alsoindicates that, with a better allocation of its available resources, Vietnam could rapidly triple itsmanufacturing exports.

155
Source: Be.ser (9ao on Ayerctual Predicted Actubal -Predicted
-Share of manufactures in 36.7% 63% -26.3%total exports-Value of manufacturing 3,372 9,881 -6,509exports ($ million)
Source: Belser (1 999) based on Wood and Mayer (I1998)
5. How would this translate into employment growth? Table A3.2 shows estimates of trade-weighted labor coefficients in exporting and import-substituting sectors. The exporting sector ismore than twice as labor-intensive as the import-substituting sector, indicating that an expansionof trade according to Vietnam's comparative advantage can only be beneficial to labor demand.By using the "factor content" method, which involves calculating the amount of labor embodiedin trade flows, it can be estimated that an extra $6.5 billion of exports would directly createbetween 1.5 and 1.7 million jobs in export sectors, with a best estimate of 1.6 million. Of course,when exports expand, so do imports. The number of jobs lost in import-competing sectors mustalso be estimated. A large share of imports will result from increased demand for intermediatesin export production or will be more technology and skill-intensive than domestic production;these imports will not directly displace any domestic production. However, some of theremaining imports are likely to compete directly with local industries. Taking these elements intoconsideration, Belser (1999) estimates that deeper international integration would lead tobetween 200,000 to 350,000 redundancies in Vietnam's import-substituting sectors. This stillleaves a large net positive employment effect of 1.2 to 1.5 million jobs, suggesting that thepotential to create manufacturing jobs in the near future is very large.
Sector Number of em9oyees per_ _ _ _ __ __ ~~~~~$1,000 worth of outputl
Export industries (SOEs) 0.259
Export industries (FDI) 0.232
Export industries (average) 0.245
Import-substituting industries 0.108
Source: Belser (1999)
6. How long might it take to create these jobs? This all depends on Vietnam's ability torecover from the East Asian crisis and to undertake reforms to reallocate resources to efficientsectors. At pre-crisis manufacturing export growth rates of 45% per year, Vietnam might havecreated these jobs in only 3 years. However, even at only half the pre-crisis rates, 5 years wouldbe enough for Vietnam to triple its earnings from manufacturing exports and increase its share of

156
manufactures in total exports to 63%. This suggests that even at reduced export growth rates,Vietnam has a potential to generate rapid employment growth in the future.
References:
Belser, P. (1999), "Vietnam: On the Road to Labor-Intensive Growth?" Background Paper forVietnam Development Report, 2000.
Wood, A. and Mayer, J. (1998), "Africa's Export Structure in Comparative Perspective", inEconomic Development and Regional Dynamics in Africa: Lessons from the East AsianExperience, UNCTAD, Geneva.

157
ANNEX 4
POVERTY AND FEMALE-HEADED HOUSEHOLDS
1. As is common with many household surveys in developing countries, the two VLSSsshow that members of female-headed households are usually materially better-off than male-headed households. The mean per capita expenditures of members of female-headed householdsare higher than those of male-headed households, while their poverty measures are lower.25 Asthis quantitative result does not accord with the findings of the PPAs (which identified female-headed households among the poorest group of households) or with the intuition of many genderexperts in Vietnam, this annex examines this issue in further detail.
2. The VLSS identifies a household as female-headed if the person identified as the head ofthe household in the first section of the household questionnaire is female. In Vietnamn, the use ofthis standard definition includes a large number of "female-headed" households in which thereare resident husbands. This peculiarity stems from Vietnam's household registration system inwhich its takes some time for migrants to attain residency status and be included in an existinghousehold's registration document (ho khau). For newly married couples who decide to live inthe wife's rather than the husband's commune or ward, it is therefore quite common for the headof the household to be listed as the wife on the household registration documents. And sincesome rural communes and urban wards only update their records periodically, such householdsmay continue to be regarded as female-headed for a number of years. A modified definition ofthe sex of headship can, however, be devised for the VLSS in which all households with female-heads but resident husbands are reclassified as male-headed.
Per Capita Expenditures
3. According to the standard definition of sex of headship, there are 1624 female-headedhouseholds in VLSS98. Mean per capita expenditures of female-headed households (using thestandard definition) are some 28 percent higher than those of male-headed households (VND 3.3million versus VND 2.6 million per person per year). If one reclassifies all households withfemale-heads but resident spouses as male-headed (some 550 households), this narrows theexpenditure gap between members of female and male headed households to 11 percent, butthose living in female headed households are still richer (VND 3.0 million for female-headed andVND 2.7 million for male-headed households, respectively).
4. If one looks at the headcount index of poverty using the standard definition of sex ofheadship, one finds the index (which relates to all the people living in those households, not thehouseholds themselves) is 28 percent for members of female-headed households and 40 percentfor members of male-headed households. When one reclassifies the female-headed householdswith resident male spouses using the modified definition of headship described above, the gapagain narrows without reversing (to 32 percent for members of female-headed and 38 percent formembers of male-headed households). A similar picture emerges when one looks at the depth
25 For VLSS98, similar results on female-headed households were found by the World Bank (Dollar, Glewwe &Litvack, 1998) and UNDP (Desai, 1995) researchers.

158
and severity of poverty using the poverty-gap and squared poverty-gap indices (see Table A4. 1below). Using both the standard and modified definition of headship, the poverty-gap is alsolower for female than male-headed households. The same is true for the squared poverty gap.
Standard Definition Modified Definition |
Female Male Female Male
Headcount 28.2 39.9 32.4 38.1
Poverty Gap 6.9 10.3 8.0 9.8
Squared Poverty Gap 2.5 3.8 2.9 3.6
Source: World Bank estimates based on VLSS98.
Household Expenditures
5. If one examines household rather than per capita expenditures, one finds that female-headed households do have lower mean household expenditures than male headed ones. This isbecause female-headed households are, on average, smaller than male-headed ones (by 1.2members using the standard and 1.6 members using the modified definition of headship). Usingthe standard definition of sex of headship, total household expenditure in VLSS98 was VND12.8 million for female headed households and VND 13.1 million for male headed ones. Usingthe modified definition, this gap increases to VND 10.4 million for female and VND 13.6 millionfor male headed households. Possibly, it is this aspect of material poverty (together with broaderdefinitions of well-being) that the PPAs findings on female-headed households are picking up.
Household Expenditures by Sex of Head and Household Size
6. It is also possible to compare household expenditure levels by sex of head and householdsize. This is done, using the modified definition of headship, in Table A4.2 which shows thatfemale-headed households with one, three or four members are materially poorer than male-headed ones when the modified definition of headship is used.26 However, once households sizeis above four members female-headed households are usually better off than male-headed ones.
26 Using the standard definition of sex of headship, only female-headed households with one member are poorer thanmale headed ones.

159
Household Size |Male |Female
1 5.6 4.2
2 7.3 8.1
3 11.3 10.1
4 13.1 11.1
5 13.6 14.0
6 14.8 15.6
7 16.2 15.6
8+ 18.3 1 23.9
Source: World Bank estimates based on VLSS98.
Adjusting for Household Composition and Economies of Scale in Household Consumption
7. Table A4.2 raises two issues concerning adjusting for the age-sex composition ofhouseholds and adjusting for economies of scale in household consumption. First whenanalyzing household survey data one may want to adjust per capita expenditures to take accountof the fact that infants require less expenditure (both in terms of food and non-food items) thanchildren, who in turn require less expenditure than teenagers and adults. This is done using aseries of weights called an equivalence scale.27 Because of their different body sizes,metabolisms and the types of work they undertake, adult men and adult women may also requiredifferent food intakes and some, though by no means all, equivalence scales give lower weightsto adult females than adult males. Unfortunately, the methods used to estimate such equivalencescales remain controversial and difficult to implement (Deaton, 1997). To date, no equivalencescale has been estimated for Vietnam. This remains an important and interesting question forfuture research. However, Table 2 suggests that an equivalence scale which attached fairly lowweights for women, teenagers, and children would be needed to make mean equivalised (that isper adult equivalent unit) expenditures lower for female than male-headed households.
8. Second, large households may need to spend less to achieve a given standard of livingthan smaller households because of economies of scale in household consumption. A family ofsix probably does not, for example, need one-and-half times as many cooking stoves, latrines orother large non-food items as a family of four. However, as noted above, since female-headedhouseholds in the VLSS are smaller, on average, than male-headed ones, adjusting for household
27 Purely as an example, consider the following equivalence scale for India: infants and children less than 5 years old(0.48); children between 5 and 9 years (0.56); children aged 10 to 14 years (0.6); teenagers and adults (1.0) (Deaton,1997).

160
economies of scale in consumption would tend to reinforce the conclusion in Table A4.2 thatsmall female-headed households are poorer than small male-headed households (and vice-versafor large households).
Special Groups of Female-Headed Households
9. While female-headed households in Vietnam are, on average, materially better off thantheir male-headed counterparts, it is possible that there are specific sub-groups of female headedhouseholds that are particularly poor and/or vulnerable. We examined two categories of thesesub-groups: single parent households and elderly households. For some of these, the samplesize becomes too small to draw meaningful conclusions. But in general, the result seems to holdthat members of female-headed households have higher expenditures than members of male-headed households. But elderly women living on their own are both more common and havelower household expenditures than men living on their own.
References:
Deaton, A., 1997, "The Analysis of H.ousehold Surveys", Baltimore: John Hopkins UniversityPress.
Desai, M., 1995, "Vietnam through the Lens of Gender", Mimeo, UNDP Hanoi.
Dollar, D., Glewwe, and Litvack, J., 1997, "Household Welfare and Vietnam's Transition",World Bank Regional and Sectoral Studies.

161
ANNEX 5
TRANSITION MATRIX FOR VIETNAM
1. A distinctive feature of the Vietnam Living Standard Surveys (VLSS) is that almost 90%of the households that were interviewed in 1993 were re-interviewed in 1998. This panel datacomponent of the VLSS allows changes in the living standards of individual households to betracked over time, which it is not possible to do with most household surveys in other countries.
2. Table A5.1 below is a transition matrix which identifies the expenditure quintiles the4,304 panel households were placed in first in 1993 and then in 1998.2a About 40 percent ofhouseholds were in the same expenditure quintile in both years. These households are shown bythe dark-shaded-cells along the diagonal of the transition matrix. The expenditure ranking ofanother 40 percent of households moved up or down by one-quintile between 1993 and 1998.These households are shown by the light-shaded cells in the transition matrix. The remaining 20percent of households moved up or down by two or more expenditures quintiles, withapproximately the same number of households (424) moving up as moving down (429). A smallnumber of households (16) moved from the richest to the poorest quintile or vice-versa (8households).
28 A panel household is here defned as a household which was living in the same dwelling in the two surveys.Using this definition of a panel household, it is possible for household composition (including the headship of thehousehold) to change between the survey years.

162
cpta eedtrsfrtExpenditure Quintile, 1998 l
3 ~ ~ ~ ~ ~ ~~I. Thr ar seeaIonst oeaotti arx is,i a vrtt h ubro
E itexpenditure Quintile, c 1 2 3 4 5 er TOTAL t
1993 ll
1 12 51 8 861
2 3 _ 1-15 33 861
3 113 _ 93 861
4 47 125 861
5 1 6f 40 88_ 860
Total |861 861 861 861 860 |4304 |
seotes: Quintile I is the poorest and quintile o is the richest. Quintiles are defined on the basis of unweighted percapita expenditures for the 4,304 panel households interviewed in oth VLSS93 and VLSS98.
Source: World Bank estimates based on VLSS93 and VLSS98.
3c There are several points to note about this matrix. First, it may overstate the number ofhouseholds whose quintile ranking changed between 1993 and 1998 because of"measurementerror". In particular, errors in the measurement of per capita expenditures (which, in turn, reflectinaccuracies in the ways that data on the quantities of different foou andb non-food items thathouseholds consume, and their corresponding market prices, were collected) may cause somehouseholds to be incorrectly classified in one year. Unless these errors are the saue in bothsurvey years, this can lead to "false trhnsitions" between quintiles. Note, however, that this is anot a particular problem with the VLSS surveys: measurement error is a feature of the datacollected by all household surveys, and many other types of data too.
4. Second, households along the diagonal and whose quintile ranking is unchanged betweenthe two years, will still have higher per- capita expenditures in 1998 than in 1993. It is only theirrelative living standards (as proxied by expenditures) that are unchanged between the two-years.Indeed, because expenditures have risevn so rapidly, it is possible that some of the householdswho have fallen a quintile have higher expenditures than they did five-years before. Third,although a one-to-one relationship cannot be made between poverty and the quintile ranking ofhouseholds, the transition matrix does serve to underline that the poor and rich are not staticgroups and that living standards vary over time.

163
ANNEX 6
FUTURE MONITORING OF POVERTY AND LIVING STANDARDS
1. The use of the 1993 and 1998 VLSS surveys to draw poverty lines and monitor progressin poverty reduction raises the question of how these tasks will be done in the future. VLSS93and the VLSS98 were implemented five years apart with partial funding from SIDA (Sweden)and UNDP, and technical assistance from the World Bank. Despite the high regard for thecomprehensiveness and quality of these surveys, there are no immediate plans to implement athird VLSS survey.
2. In order to monitor future progress in poverty reduction, Vietnam needs to collecthousehold survey data on a much more regular basis, ideally every year. However, many otherbroader indicators of living standards (e.g., literacy, fertility, or access to safe water) changerelatively slowly so it would not be necessary to collect information on all these topics on anannual basis. The implementation of a core household survey module every year together withadditional modules on supplementary topics in some years has proved a cost-effective andefficient way to collect comprehensive information on poverty living standards in a number ofother Asian countries (such as Bangladesh and Indonesia) and Vietnam could follow theirexample.
3. Since 1994, the GSO has been fielding an annual survey, known as the Multi-PurposeHousehold Survey (MPHS). This survey covers a narrow range of topics (including householdexpenditure and incomes, education, health, housing and other assets, and the ownership ofdurable goods) than the two VLSS surveys but had a much larger sample size (45,000households in 1994 to 1997) designed to produce provincially representative statistics. However,the large size of the MPHS sample has led to delays in the processing, analysis anddissemination of the data that it collected. Concerns have also been expressed regarding itssampling-frame and the accuracy of some of the data it has generated. In response to theseconcerns, GSO has now decided to reduce the sample size of future MPHSs, starting with theone in the year 2000, to 25,000 households, and this should help them improve the quality of thedata being collected and the timeliness of processing this data.
4. Future household survey data collection in Vietnam should aim to combine the strengthsof the VLSS surveys with those of the MPHS to produce high quality data on poverty, preferablyannually, and on other aspects of the living standards of Vietnamese households on a moreregular (but perhaps less frequent) basis. Doing so will probably require further additionaltechnical assistance from the World Bank and other donor agencies. Special attention needs to bepaid to the trade-off between sampling and non-sampling errors, survey management, and theestablishment of permanent and well-trained survey teams (Selzer, 1999). Greaterdecentralization, careful planning, training and re-training of central and provincial staff, andmore accessible and timely dissemination of results have also been recommended (UNDP,1999). The need for a clearer division of responsibilities for data collection between GSO andother line agencies and rationalization of the plethora of existing survey also requires urgentattention.

164
References:
Selzer, W. (1998), "Strengthening Social Statistics in Vietnam. Issues and Needed Initiatives",Presentation to GSO/UNDP seminar on "Strengthening Social Statistics in Vietnam' held inHanoi, 6 and 7th October, 1998.
UNDP, 1999, "Developing the Capacity to Collect and Analyse and Disseminate Social statisticsin Vietnam", Terminal Evaluation Report for Project VIE/95/043, UNDP, Hanoi.

165
Bibliography
Action Aid Vietnam (1999), "Ha Tinh Province: A Participatory Poverty Assessment",Hanoi.
Agrawal, N. (1996), "The Benefits of Growth for Indonesian Workers", Policy ResearchWorking Paper 1637, World Bank.
Ahuja, V. Bidani, B., Ferreira, F, and Walton, M. (1997), "Everyone's Miracle? RevisitingPoverty and Inequality in East Asia ", Directions in Development, World Bank.
Asian Development Bank (1999), "Vietnam: Greater Stability through Good Governance-Key issues for Consideration".
Bales (1999), "Vietnam's Labor Situation: Trends between 1993-98", Background Paperfor the Vietnam Development Report, 2000.
Barro, R. and Lee, J., (1996), "International data on education ", NBER Working Paper.
Belser, P. (1999), "Vietnam: On the Road to Labor-Intensive Growth?" Background Paperfor Vietnam Development Report, 2000.
Benson, C. (1997), "The Economic Impact of Natural Disasters in Vietnam", ODI WorkingPaper No. 98.
Center for International Economic (1998), "Vietnam's Trade Policies", Mimeo, Canberraand Sydney.
Communist Party of Vietnam (1996), "VIlIth National Congress Documents", Hanoi.
Datt, G. and Ravallion, M. (1992), "Growth and Redistribution Components of Changes inPoverty Measures", Journal of Development Economics 38: 275-95.
Dollar, D., Glewwe, P. and Litvack, J. (1998), "Household Welfare and Vietnam'sTransition", World Bank Regional and Sectoral Studies.
General Statistical Office (1999), "Vietnam Living Standards Survey, 1997/98", Hanoi.
General Statistical Office (various years), Statistical Yearbook, Hanoi: StatisticalPublishing House.
Government of Vietnam (1997), "National Plan of Action for the Advancement of Womenin Vietnam by the Year 2000", Women's Publishing House, Hanoi.
Institute for Economic Research of Ho Chi Minh City (1996), "Migration, HumanResources, Employment and Urbanization of Ho Chi Minh City", National PoliticalPublishing House, Hanoi.
International Monetary Fund (1999), Vietnam: Statistical Annexes. IMF Staff CountryReport.
International Rice Research Institute (1993), IRRI Rice Almanac, Manila.
Johnson, A. (1998), "Vietnam: Critical issues in Rural Finance", Presentation on RuralFinance to joint MARD/World Bank Rural Strategy workshop.

166Le Thi Quy (1999), "Domestic Violence in Vietnam", Center for Family and WomenStudies, Hanoi.
Litvack, J.I. and Rondinelli, D.A. (1999), "Market Reform in Vietnam: Building Institutionsfor Development", Quorum Books. U.S.A.
MPDF (1999), "Vietnam's Under-sized Engine: A Survey of 95 Larger PrivateManufacturers", Mekong Project Development Facility, Hanoi.
MRDP (1999), "Lao Cai Province: A Participatory Poverty Assessment", Hanoi: Vietnam-Sweden Mountain Rural Development Program and the Vietnam-Sweden HealthCooperation Program.
Nguyen Nguyet Nga (forthcoming), "Trends in the Education Sector during 1993-98",background paper for the Vietnam Development Report, 2000.
Nguyen Thi Thu Hang (1999), "The International Market for Vietnam's Rice Exports.Opportunities and Challenges", Hanoi.
Nguyen, V. (1998), "Livestock P'roduction in Vietnam" in Lincoln International Ltd,"Strengthening Capacity for the Renewal of Rural Development in Vietnam", UNDP,Hanoi.
Nguyen, N.B., Fetzer, J., and Haughton, J. (forthcoming), "Rice Policy in Vietnam",Mimeo, National Economic University, Hanoi and Suffolk University, Boston.
Nguyen Nhat Tuyen (1999), "Land Legislation Project. A Study of Female-HeadedHouseholds and Land Tenure", SIDA.
O'Connor, D. (1998), "Rural industrial development in Vietnam and China: a Study inContrasts ", OECD Development Center Technical Paper No. 140, Paris.
OECD (1996), "Shaping the 21 't Century: The Contribution of Development Cooperation",Paris.
Oxfam GB (1999), "Tra Vinh Province: A Participatory Poverty Assessment ", Hanoi.
Oxfam UK and Ireland (1996), "Report on the Financing and Delivery of Basic SocialServices at the Commune Level in Ky Anh, Ha Tinh, Vietnam", Hanoi.
Perkins, D. (1998), "Rural industrialization: Vietnam's experience and possible lessonsfrom China" in Lincoln International Ltd. "Strengthening Capacity for the Renewal ofRural Development in Vietnam ", U`NDP, Hanoi.
Population Council (1999), "Report on an Intervention Project: Developing CounselingMaterials on Domestic Violence for the Ho Chi Minh City Hotline", internal paper by LeThi Phuong mai and Katherine Landfield, Hanoi.
Save the Children UK (1997), "From Housework to Gold Mining: Child Labor in RuralVietnam", Hanoi.
Save the Children UK (1998), "Child Labor in Ho Chi Minh City", Hanoi.
Save the Children UK (1999), "Ethnic Minority Education: Problem Analysis and ProgramStrategy", Hanoi.

167Save the Children UK (1999), "Ho Chi Minh City: A Participatory Poverty Assessment",Hanoi.
SIDA (1999), "A Study on the Implementation of Grassroots Democracy Decree inVietnam", draft paper by Dau Hoan Do and SIDA staff; background paper for the VietnamDevelopment Report 2000.
SIDA et. al. (forthcoming), "Health Sector Review", joint Government-donor report, Hanoi.
Turk, C. (1999), "A Review of Recent Literature in English on Education and EthnicMinorities in the Northern Uplands of Vietnam" (draft), Hanoi.
Van de Walle, D. (1998), "Protecting the Poor in Vietnam's Emerging Market Economy",Policy Research Working Paper 1967, World Bank.
UNDP (1998), "The Dynamics of Internal Migration in Vietnam", UNDP Discussion Paper1, Hanoi.
UNDP (1999), "Capacity Assessment for Vietnam's National Target Program for HunderEradication and Poverty Reduction", paper by Nguyen The Dung, UNDP, Hanoi.
UN System (1999), "A Common Country Assessment of Vietnam", Hanoi.
Wood, A. and Mayer, J. (1998), "Africa 's Export Structure in Comparative Perspective", inEconomic Development and Regional Dynamics in Africa: Lessons from the East AsianExperience, UNCTAD, Geneva.
World Bank (1995), "Vietnam: Poverty Assessment and Strategy".
World Bank (1997), "Vietnam: Education Financing Sector Study".
World Bank (1998), "Vietnam: Advancing Rural Development from Vision to Action ".
World Bank (1998), "Vietnam: Rising to the Challenge".
World Bank (1999a), "Voices of the Poor in Vietnam: A Synthesis Report of the FourParticipatory Poverty Assessments", Hanoi.
World Bank (1999b), "Gender Based Violence: The Case of Vietnam", paper by Vu ManhLoi, Vu Tuan Huy, Nguyen Huu Minh (Institute of Sociology) and Jennifer Clement,Hanoi.
World Bank (1999c), "China: Poverty Assessment".
World Bank (1999d), "A Tale of Two Cities. Towards a Strategy for Growth, PovertyReduction, and Environment in the Cities and Regions of Vietnam" (draft).


'>CHINA
J, 5~~~[67, ~ ~7r
5~~~ co"~~~~'A N ~~~~~~2 N 6
-0 ~ ~ ~ 1
Te~0662616 26t-, ~ ~ ~ ~ ~ ~ ~ ~ ~ ~~~~~~~4,76C6R6
LAO EPPLtS&HN 1
DEMOCRATIC REPUBLIC fichi-)~,.6
66 6
' I '3Co
20 ~ ~ ~ ~ ~ , N-. ~ ~ ~ ~ ~ ~ ~ ~ T66I6 0669 ~~~~~~~~~Ti N
LAO PAILES ~ -Aul N D0,4
6, A~~~~~~~~~~~~~~~~~~~~~K
-- ~~~~~~~~~~~~~~~~~~~~~~~~~~~~~~3
* N,~~~~~~~~~~~~~~~~~~~~~~aqN.1~~~~~~~~~~~~~~~~2~~~"- 3
-NO' 30~~~3
VIETNAM~~~~~ '31_
AIRPORTHALNS I >,K 6~
) 6 33 - 6~~~~~~~~;RT'
PORTS 1, C,~~, ~'s >
S, POVICE APIALSe,3 x-
I AILRPORTS 38,... PRTVES C N' D JN':A
PROVINCE CAPITAL S '7 ;1
6
-T - NENATIONAL RAS -- 1
- -PRVCEBOUNDAISAE - -0 t-, - INTLRPSATIONAL Ii ',0666~~~~~~~~~~~~~~~~~~~~~~~~~~~~~~~~~~~~~~~0,R. a
66676, ,-0Ta6066
-12~ ~ ~ ~ ~ ~ ~ ~~~~~4 ½ 4 0' 1-
PROVINCES: C 44 '6 R666 I CT-" ' k6ag
I0660266, 3 ioT6 ro6 ,f 6H /- T6Oo20666 32L66D. N- 7,6679 , 6
3 H.R'G- 33 -- 9gN-n p16-04 C- B-go 340669-66 76pT--3 To,, L. 35 K-606 T66 P6 90
676666., 240616. Y- 5--K 57676660669 376,60660 76 '66~~~~~~~~~~~~~~~~~~~c, 66560P6,0CR
9266026 38 S.T- Pk-666666 "7521497606
Th6 066,06 3942 , 6,606 L- 0Ph
62 Ba, NG,y,, 43 t J7R ThC14066-9660 44 T, N..k H'7 & 10-~ >5 663 66116J, 45 660666 Da-6
~67H6
T., 4766066666 N. 01666 6.518 0669066 48 T PH 06C6h66 W61906606665 496646069666, T.
230 PH-, 66 50 L,66A, "756 C0, (6 2950 705 I0 125 00661,
33 006,66 B 6h 3 26 ,76 7 2I 02 1 LMbl,2,496691660. 54066066 65 0266666 7
25 5666066 55 66661,y k-
27 Ng,6A6 57666K6- - 66666.,6 -666,6- -d ....66666h.,66
6, A-6066
28666 5802676 T6h3666666o'6 61n6666o66h666-6'6 77 2906gB,h T'N 300666466-4-h266-6.-,
817606, 6026~~~~~~t I, I0 06 N