variation in fricative production in malagasy dialects
TRANSCRIPT
University of Pennsylvania WorkingPapers in Linguistics
Volume 20Issue 2 Selected Papers from NWAV 42 Article 8
10-1-2014
Variation in Fricative Production in MalagasyDialectsPenelope [email protected]
This paper is posted at ScholarlyCommons. http://repository.upenn.edu/pwpl/vol20/iss2/8For more information, please contact [email protected].

Variation in Fricative Production in Malagasy Dialects
AbstractThe development of phonological tone has been linked in many languages to consonant voice qualitycontrasts that impart pitch differences to preceding or following vowels. In particular, modal voicing on asyllable-initial consonant has been shown to correlate with low pitch on a following vowel in both tone andnon-tone languages (Hombert et al. 1979). In the Austronesian language Malagasy, a strong relationshipbetween consonant voicing and vowel pitch has been observed in the literature; previous studies state,however, that Malagasy does not have phonological tone. In contrast with these previous descriptions, theresults presented in this paper from a production study of homorganic fricative pairs in several differentdialects of Malagasy suggest that in certain dialects in the center of the country, in and around the capital city,pitch has replaced modal voicing as the primary phonetic cue to fricative voicing category. Based on word listdata from 11 Malagasy speakers, this study finds that the homorganic fricatives of speakers of the Centraldialects are best classified based on the pitch of the following vowel, while those of speakers of non-Centraldialects are best classified based on the duration of modal voicing on the fricative. Secondary phonetic cuestypically associated with a voicing distinction (i.e., duration, frication intensity) appear to be undergoingneutralization among the Central speakers.
This working paper is available in University of Pennsylvania Working Papers in Linguistics: http://repository.upenn.edu/pwpl/vol20/iss2/8
Variation in Fricative Production in Malagasy Dialects
Penelope Howe
1 Introduction
The development of phonological tone has been linked in many languages to consonant voice qualitycontrasts that impart pitch differences to preceding or following vowels. In particular, modal voicingon a syllable-initial consonant has been shown to correlate with low pitch on a following vowel inboth tone and non-tone languages (Hombert et al. 1979). In the Austronesian language Malagasy, astrong relationship between consonant voicing and vowel pitch has been observed in the literature;previous studies state, however, that Malagasy does not have phonological tone. In contrast withthese previous descriptions, the results presented in this paper from a production study of homor-ganic fricative pairs in several different dialects of Malagasy suggest that in certain dialects, pitchhas replaced modal voicing as the primary phonetic cue to fricative voicing category.
2 Background
2.1 Malagasy Language and Dialects
The term MALAGASY refers to a macrolanguage, which is considered to include about 18 individualdialects coinciding with geographically-bounded ethnic groups in Madagascar. The dialect spokenin Antananarivo, the capital city, is called Merina. Other dialects spoken in geographic proximityto the capital have been grouped under the name Plateau Malagasy (Lewis et al. 2013), in referenceto the elevated plateau which distinguishes this central region of the island geographically from thecoastal areas. In addition to Merina, this grouping includes the Betsileo dialect, among others. Inthis paper, the term CENTRAL DIALECT GROUP will be used to refer only to speakers of Merinaand Betsileo, since the area where these groups are located is in the center of the country; this termdoes not encompass all of the dialects designated by the term Plateau Malagasy, as data on all thesedialects was not available for the current study. Other dialects from which data was collected forthis study include Antakarana, Sakalava, and Tsimihety, all spoken in the north of Madagascar andtherefore referred to herein as the NORTHERN DIALECT GROUP. The dialect regions and the areasstudied in this work are indicated on the map in Figure 1.
2.2 Fricative Contrasts in Malagasy
The phonological inventory of Malagasy includes two homorganic fricative pairs: /f/ and /v/ arelabio-dentals, articulated in the canonical place just behind the top of the lower lip (Dahl 1952:175),and /s/ and /z/ are described as displaying interdialectal variation in terms of place and manner ofarticulation, ranging from denti-alveolar to postalveolar and varying between apical and laminalproductions. Dahl (1952:176–7) notes in particular that the Betsileo and sometimes the Merinadialects use an apical articulation, lending these sounds a “hissing” quality.1 In his study of theMerina dialect, Rakotofiringa (1982:522–8) writes that /f/ and /v/ are unremarkable in comparisonto the same phonemes in French and other languages. Like Dahl, he also notes inter- and intra-speaker variability in place of articulation for /s/ and /z/; he states that in general these sounds areproduced further back in the mouth than the /s/ and /z/ of French but that several decades prior tothe time of his work, people in the capital used a more anterior /s/ because the retracted /s/ wasassociated with peasants and indigents. In contrast, Rakotofiringa claims that younger generationsaround 1980 at the time of his work felt the anterior pronunciation to be a pretentious affectationassociated with foreign influence.
1Translated from French “chuintante”.
U. Penn Working Papers in Linguistics, Volume 20.2, 2014

62 PENELOPE HOWE
Figure 1: Map of Madagascar showinggeographic boundaries of ethnic/dialectgroups. Black oval marks the regiontermed “Central” in this study; red ovalmarks the region termed “Northern”.Map from http://en.wikipedia.org/wiki/File:Ethnic groups of Madagascar Map.png.
Both of these previous accounts describe thefricative pairs as primarily distinguished by thepresence or absence of modal voicing. Dahl statesthat /f/ and /s/ are always voiceless and generallyhave greater frication intensity than /v/ and /z/, asexpected for a voiceless fricative in comparisonwith its voiced counterpart. Although he notes that/v/ and /z/ may sometimes be devoiced in the mid-dle, he provides no empirical quantitative indica-tion of the frequency of this devoiced realizationand asserts that realization with modal voicing isthe norm.
2.3 Voicing and Tone
Although they consider modal voicing to be the pri-mary factor distinguishing the pairs /f/-/v/ and /s/-/z/, both works discussed above note that vowelpitch is significantly lower following phonemicallyvoiced fricatives than voiceless fricatives. This dis-tinction is also observed on vowels following otherpairs of voiced and voiceless consonants. Both as-sert, however, that pitch does not play a role inMalagasy phonology; they argue that it is one ofseveral elements involved in the marking of lexicalstress, which can be contrastive, but state that Mala-gasy is not a tone language.
Differences in vowel f0 that correlate withthe voicing class of prevocalic consonants are at-tested in a variety of languages, including English(Lehiste and Peterson 1961, Hombert et al. 1979). Such differences are argued to be physiologicallyrelated to larynx position and vocal fold tension associated with the presence or absence of modalvoicing (Hombert et al. 1979) and more broadly with phonation quality in general. The phoneticcorrelation between f0 and voicing has been widely claimed to be the source of the developmentof phonologically contrastive tone in a variety of South Asian and African languages (Haudricourt1954, Matisoff 1970, Hombert et al. 1979). Under these models of tonogenesis, an original voicequality contrast produces an f0 contrast which acts as a secondary cue to voice quality; the relativeweightings assigned to these cues then undergo a shift, such that f0 becomes the primary contrastivecue and the voice quality distinction becomes secondary. Once the voice quality distinction haslost its critical role in marking phonological contrast, it is often neutralized, leading to the lossof a phonological voice quality contrast in exchange for the introduction of a tone contrast in thelanguage.
2.4 Overview of the Current Study
In a non-tonal language such as English, f0 values on post-obstruent vowels produced by malespeakers differ due to consonant voicing distinctions by an average of about 15–20 Hz at vowelonset and then fairly rapidly converge over the next 100 ms of the vowel (Hombert et al. 1979).The impetus for the present study was the observation of a stronger and more persistent pattern ofphonemic voicing and f0 correlation in the production of post-fricative vowels in stressed syllablesby a female speaker of the Merina (Central) Malagasy dialect. This speaker typically displayed apitch difference of 30 to 50 Hz at vowel onset following voiced versus voiceless fricatives, and thehigh f0 following voiceless fricatives was often sustained throughout most of the vowel; this speakeralso exhibited very little modal voicing on any fricatives. Moreover, the pitch distinction occurred

VARIATION IN FRICATIVE PRODUCTION IN MALAGASY DIALECTS 63
in this speaker’s productions even when the phonemically voiced fricative was produced withoutmodal voicing, indicating that the f0 patterns were not simply a physiological consequence of modalvoicing.
In light of these observations, the present study of fricative production was conducted duringfieldwork in Madagascar in 2012. Acoustic measurements of voiced and voiceless fricatives inrecordings collected from Central and Northern dialect speakers suggest that there is a dialectaldifference in the relative contribution of acoustic cues to fricative voicing, with Central dialectsdistinguishing fricatives primarily through following vowel pitch and Northern dialects primarilythrough presence or absence of modal voicing.
3 Data and Methods
3.1 Speakers and Recordings
Word lists containing 95 items, including target items with stressed fricatives as well as distractoritems, were recorded from ten speakers during fieldwork in Madagascar. In addition, one Malagasyspeaker was recorded producing two tokens each of a subset of 32 of the items in the sound labat Rice University in Houston, TX. Information about the gender, age and dialect region of thesespeakers is listed in Table 1. See the map in Figure 1 for the locations of the dialect regions.
CENTRAL SEX AGE # TOKENS NORTHERN SEX AGE # TOKENSSPEAKERS SPEAKERS
AMAL F 26 53 DFR F 19 55DTR M 24 54 JFR M 30 53LN F 28 54 LV F 25 53OHR F 28 64* MR M 22 52TNH M 25 52 R M 22 53**TNR M 22 53
Table 1: Speaker information and number of tokens measured. *Houston speaker: 2 tokens of eachof 32 lexical items. **Pitch measurements not available for Speaker R due to excessive creakyphonation.
All recordings were made using a Zoom H4n digital recorder at 44.1kHz sampling rate witha Samson SE50 Omnidirectional headworn microphone. Recordings of the Houston speaker weremade in a sound-attenuated booth in the Linguistics Department at Rice University, while fieldrecordings were conducted in the quietest environment available in each location. Field consultantsproduced each word embedded in the carrier phrase Nanoratra teo aho ‘I wrote there’.Words were presented in the same order for each speaker.
3.2 Measurements
Measurements were made in Praat for all fricative-vowel syllables carrying primary stress. Allboundaries were marked at zero-crossings in the waveforms. Table 1 above lists the number ofmeasurable tokens produced by each speaker.
3.2.1 Measurements for Fricatives
Duration Since Malagasy syllables are strictly CV and all phonetic measurements were madeon words embedded in a carrier phrase, all target fricatives were surrounded by vowels. Fricativeboundaries were identified by examining both the sound wave and the spectrogram for the presenceof high-frequency aperiodic noise and for the offset and onset of neighboring vowel formants.
64 PENELOPE HOWE
Percent modal voicing Modal voicing during the fricative was detected following a method usedby Boersma (2006, reproduced in Rivas 2006:48), which examined the fricative in 10 ms windowsand reported the percentage of windows not meeting the standard threshold for modal voicing.
Intensity In order to measure the intensity of high-frequency frication noise excluding contribu-tions due to the glottal source, a high-pass filter with a cutoff of 400 Hz and 100 Hz smoothing wasapplied. The value measured was the mean intensity over the middle 50% of the fricative.
3.2.2 Measurements for Vowels
Duration Vowel onset coincided with fricative offset and was identified according to the criteriaoutlined in Section 3.2.1. Vowel offset was identified as the point where the characteristic periodicityof the vowel diminished in the waveform and formants were no longer evident in the spectrogram.
Fundamental frequency Vowels were divided into ten equal intervals and f0 in Hz was measuredat the midpoint of each. Mean f0 over the first half of each vowel was calculated by averaging thevalues at the midpoints of the first five intervals. In order to perform inter-speaker comparisons, theHz values in each interval were converted to the Bark scale and normalized relative to each speaker’smean reference pitch.
4 Results
4.1 Fricative Percent Modal Voicing
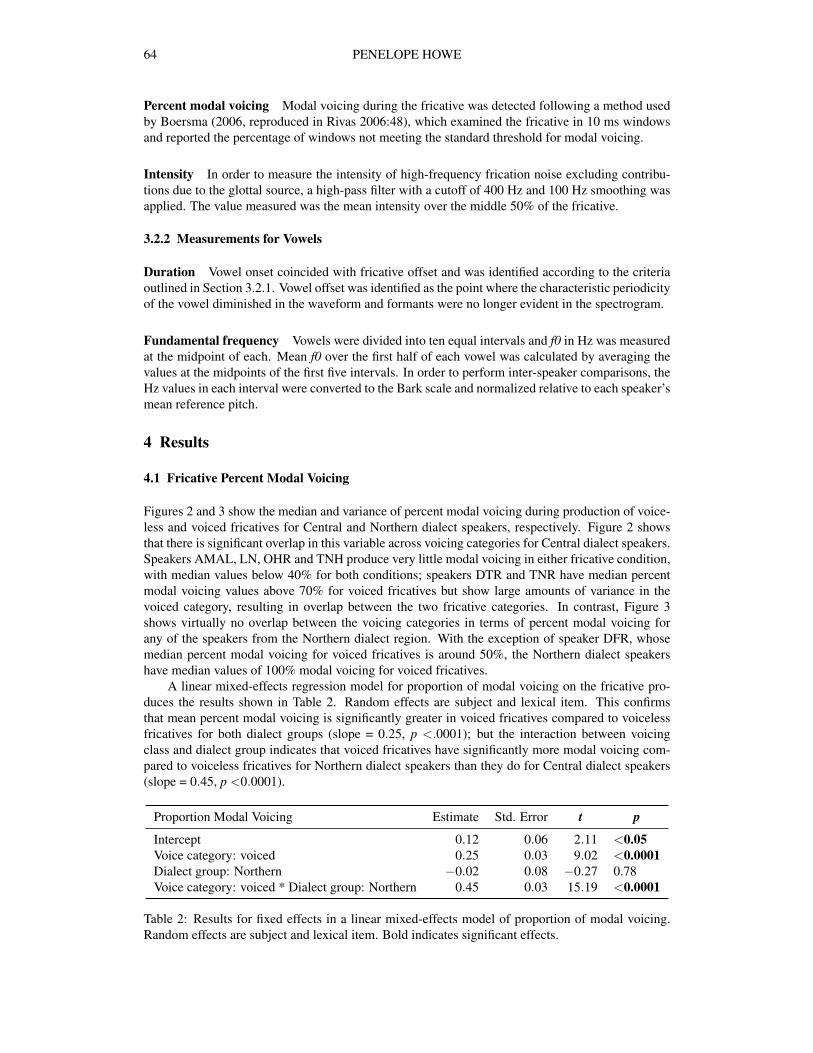
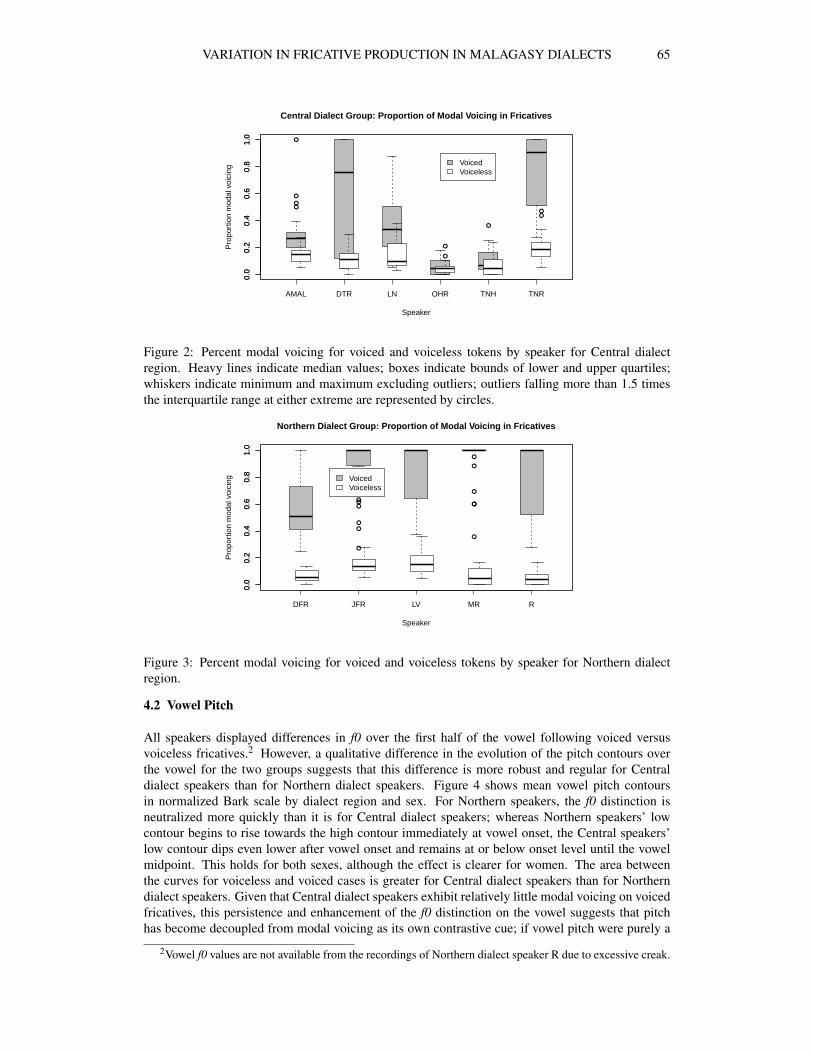
Figures 2 and 3 show the median and variance of percent modal voicing during production of voice-less and voiced fricatives for Central and Northern dialect speakers, respectively. Figure 2 showsthat there is significant overlap in this variable across voicing categories for Central dialect speakers.Speakers AMAL, LN, OHR and TNH produce very little modal voicing in either fricative condition,with median values below 40% for both conditions; speakers DTR and TNR have median percentmodal voicing values above 70% for voiced fricatives but show large amounts of variance in thevoiced category, resulting in overlap between the two fricative categories. In contrast, Figure 3shows virtually no overlap between the voicing categories in terms of percent modal voicing forany of the speakers from the Northern dialect region. With the exception of speaker DFR, whosemedian percent modal voicing for voiced fricatives is around 50%, the Northern dialect speakershave median values of 100% modal voicing for voiced fricatives.
A linear mixed-effects regression model for proportion of modal voicing on the fricative pro-duces the results shown in Table 2. Random effects are subject and lexical item. This confirmsthat mean percent modal voicing is significantly greater in voiced fricatives compared to voicelessfricatives for both dialect groups (slope = 0.25, p <.0001); but the interaction between voicingclass and dialect group indicates that voiced fricatives have significantly more modal voicing com-pared to voiceless fricatives for Northern dialect speakers than they do for Central dialect speakers(slope = 0.45, p <0.0001).
Proportion Modal Voicing Estimate Std. Error t p
Intercept 0.12 0.06 2.11 <0.05Voice category: voiced 0.25 0.03 9.02 <0.0001Dialect group: Northern −0.02 0.08 −0.27 0.78Voice category: voiced * Dialect group: Northern 0.45 0.03 15.19 <0.0001
Table 2: Results for fixed effects in a linear mixed-effects model of proportion of modal voicing.Random effects are subject and lexical item. Bold indicates significant effects.
VARIATION IN FRICATIVE PRODUCTION IN MALAGASY DIALECTS 65
●
●
●●
●
AMAL DTR LN OHR TNH TNR
0.0
0.2
0.4
0.6
0.8
1.0
Central Dialect Group: Proportion of Modal Voicing in Fricatives
Speaker
Pro
port
ion
mod
al v
oici
ng
●
●
●●
0.0
0.2
0.4
0.6
0.8
1.0
VoicedVoiceless
Figure 2: Percent modal voicing for voiced and voiceless tokens by speaker for Central dialectregion. Heavy lines indicate median values; boxes indicate bounds of lower and upper quartiles;whiskers indicate minimum and maximum excluding outliers; outliers falling more than 1.5 timesthe interquartile range at either extreme are represented by circles.
●
●
●
●
●
●
●
●
●
●
●
●
DFR JFR LV MR R
0.0
0.2
0.4
0.6
0.8
1.0
Northern Dialect Group: Proportion of Modal Voicing in Fricatives
Speaker
Pro
port
ion
mod
al v
oici
ng
0.0
0.2
0.4
0.6
0.8
1.0
VoicedVoiceless
Figure 3: Percent modal voicing for voiced and voiceless tokens by speaker for Northern dialectregion.
4.2 Vowel Pitch
All speakers displayed differences in f0 over the first half of the vowel following voiced versusvoiceless fricatives.2 However, a qualitative difference in the evolution of the pitch contours overthe vowel for the two groups suggests that this difference is more robust and regular for Centraldialect speakers than for Northern dialect speakers. Figure 4 shows mean vowel pitch contoursin normalized Bark scale by dialect region and sex. For Northern speakers, the f0 distinction isneutralized more quickly than it is for Central dialect speakers; whereas Northern speakers’ lowcontour begins to rise towards the high contour immediately at vowel onset, the Central speakers’low contour dips even lower after vowel onset and remains at or below onset level until the vowelmidpoint. This holds for both sexes, although the effect is clearer for women. The area betweenthe curves for voiceless and voiced cases is greater for Central dialect speakers than for Northerndialect speakers. Given that Central dialect speakers exhibit relatively little modal voicing on voicedfricatives, this persistence and enhancement of the f0 distinction on the vowel suggests that pitchhas become decoupled from modal voicing as its own contrastive cue; if vowel pitch were purely a
2Vowel f0 values are not available from the recordings of Northern dialect speaker R due to excessive creak.

66 PENELOPE HOWE
coarticulatory phenomenon, we would expect devoicing of voiced fricatives on its own to have theopposite physiological effect of eliminating the f0 difference on following vowels.
●● ● ●
●●
●●
● ●
−0.
40.
00.
4
Vowel F0 Contours: Central Dialects, Women
Progress Through Vowel in % Vowel Duration
Mea
n F
0 [N
orm
aliz
ed B
ark]
●● ● ●
●●
●●
● ●
●●
● ● ● ● ● ● ●●
●●
● ● ● ● ● ● ●●
5 15 25 35 45 55 65 75 85 95
● ● ● ● ● ● ● ● ● ●
−0.
40.
00.
4
Vowel F0 Contours: Central Dialects, Men
Progress Through Vowel in % Vowel Duration
Mea
n F
0 [N
orm
aliz
ed B
ark]
● ● ● ● ● ● ● ● ● ●
●● ● ● ● ● ● ● ● ●
●● ● ● ● ● ● ● ● ●
5 15 25 35 45 55 65 75 85 95
●●
●●
●●
●● ● ●
−0.
40.
00.
4
Vowel F0 Contours: Northern Dialects, Women
Progress Through Vowel in % Vowel Duration
Mea
n F
0 [N
orm
aliz
ed B
ark]
●●
●●
●●
●● ● ●
●● ● ● ● ● ● ●
●●
●● ● ● ● ● ● ●
●●
5 15 25 35 45 55 65 75 85 95
● ● ● ● ● ● ● ● ● ●
−0.
40.
00.
4
Vowel F0 Contours: Northern Dialects, Men
Progress Through Vowel in % Vowel Duration
Mea
n F
0 [N
orm
aliz
ed B
ark]
● ● ● ● ● ● ● ● ● ●
●● ● ● ● ● ● ● ● ●
●● ● ● ● ● ● ● ● ●
5 15 25 35 45 55 65 75 85 95
Figure 4: Mean f0 contours in normalized Bark scale as a function of percent vowel duration fol-lowing voiced (blue) and voiceless (red) fricatives for women and men from the two dialect groups.Error bars indicate standard error of the mean.
Mean 1st 1/2 Vowel Pitch [Norm. Bark] Estimate Std. Error t p
Intercept 0.25 0.02 11.33 <0.0001Voice category: voiced −0.44 0.03 −17.61 <0.0001Dialect group: Northern 0.06 0.03 2.31 <0.05Voice category: voiced * Dialect group: Northern 0.08 0.03 2.90 <0.01
Table 3: Results for fixed effects in a linear mixed-effects model of mean pitch over the first half ofthe vowel. Random effects are subject and lexical item. Bold indicates significant effects.
A linear mixed-effects regression model for mean pitch over the first half of the vowel is pre-sented in Table 3. Random effects are subject and lexical item. The large effect of voicing class(slope = −0.44, p <0.0001) confirms that for all speakers, pitch on the first half of the vowel issignificantly lower following voiced rather than voiceless fricatives. The interaction term, how-ever, indicates that Northern dialect speakers have significantly higher f0 compared to their overallmean f0 over the first half of the vowel following voiced fricatives than do Central dialect speakers(slope = 0.08, p <0.01). This confirms the significance of the qualitative observation concerning thetendency for the pitch contour to begin rising immediately at vowel onset following voiced fricativesfor Northern dialect speakers. The small but significant effect of Northern dialect group alone onmean vowel pitch in the first half of the vowel (slope = 0.06, p <0.05) is also attributable to this fact.
4.3 Interaction of Modal Voicing and Pitch
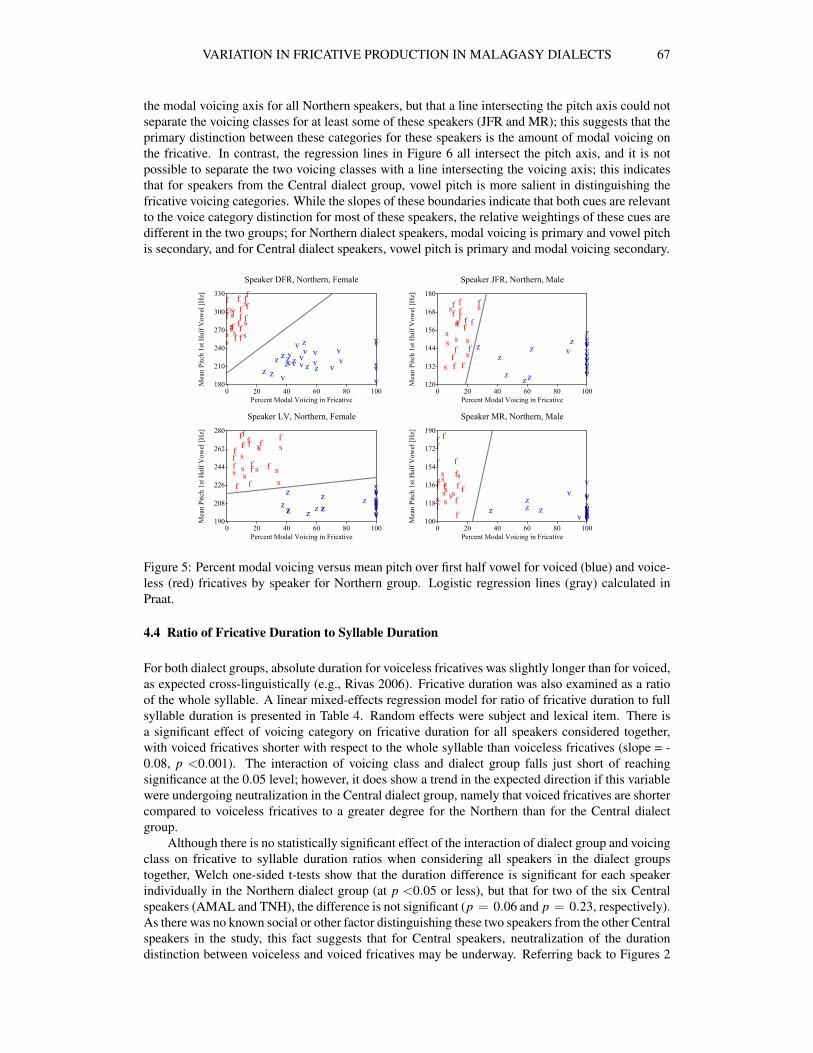
Figures 5 and 6 show percent modal voicing versus mean pitch over the first half of the vowel foreach token for each speaker for the Northern and Central dialect regions, respectively. Regressionlines represent the boundary between the voiced and voiceless fricative classes for each speaker;however, the slopes of these lines are biased low due to the upper bound of 100% on the modal voic-ing variable. In Figure 5, we see that the voicing categories can be separated by a line intersecting
VARIATION IN FRICATIVE PRODUCTION IN MALAGASY DIALECTS 67
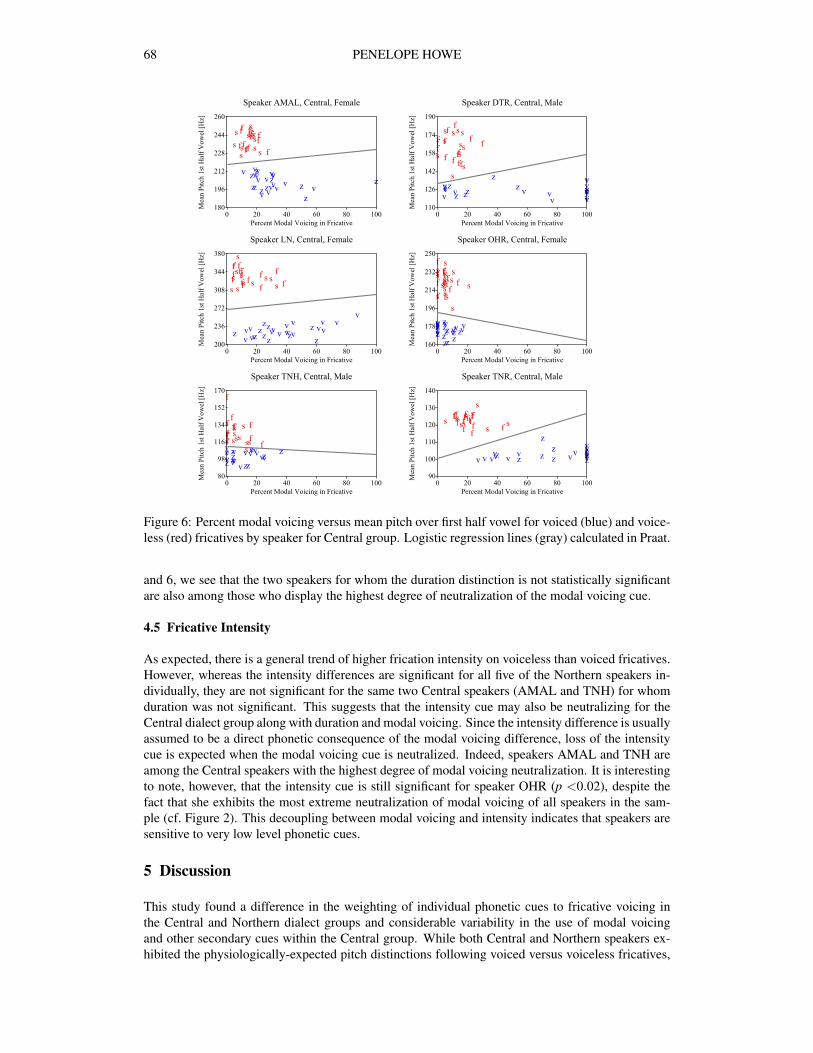
the modal voicing axis for all Northern speakers, but that a line intersecting the pitch axis could notseparate the voicing classes for at least some of these speakers (JFR and MR); this suggests that theprimary distinction between these categories for these speakers is the amount of modal voicing onthe fricative. In contrast, the regression lines in Figure 6 all intersect the pitch axis, and it is notpossible to separate the two voicing classes with a line intersecting the voicing axis; this indicatesthat for speakers from the Central dialect group, vowel pitch is more salient in distinguishing thefricative voicing categories. While the slopes of these boundaries indicate that both cues are relevantto the voice category distinction for most of these speakers, the relative weightings of these cues aredifferent in the two groups; for Northern dialect speakers, modal voicing is primary and vowel pitchis secondary, and for Central dialect speakers, vowel pitch is primary and modal voicing secondary.
fffff
fff
fffff
f
f
ss
s
sss
ss
ss
s
f
vz
vv
zz vvv
v vvv
v v
v v
v vv v
z zz
zz
z
z
Percent Modal Voicing in Fricative
Mea
n Pi
tch
1st H
alf V
owel
[Hz]
Speaker DFR, Northern, Female
180
210
240
270
300
330
0 20 40 60 80 100
f
f
ffff
f
f
f
f
f
f
f
f
ss
s
s
s
s
ss
s
s
fv
z
vv
z
z
v
vvv
vv
vvvvvv
v
vv
z z
zzz
z
z
Percent Modal Voicing in FricativeM
ean
Pitc
h 1s
t Hal
f Vow
el [H
z]
Speaker JFR, Northern, Male
120
132
144
156
168
180
0 20 40 60 80 100
f
f
f
f
f
ff
ff ff f
f
f
s s
s
ss
ss
s ss
f
v
z
vv
zzvvvvvvvvvvv
vvvv
zz zz
zz z
Percent Modal Voicing in Fricative
Mea
n Pi
tch
1st H
alf V
owel
[Hz]
Speaker LV, Northern, Female
190
208
226
244
262
280
0 20 40 60 80 100
f
ff
f
f
f
f
f
f
f
f f f
fs
ss
s s
s
sss s f
vzv
vz
z v
vvvvvvvvvv
vv v
zzzzzzz
Percent Modal Voicing in Fricative
Mea
n Pi
tch
1st H
alf V
owel
[Hz]
Speaker MR, Northern, Male
100
118
136
154
172
190
0 20 40 60 80 100
Figure 5: Percent modal voicing versus mean pitch over first half vowel for voiced (blue) and voice-less (red) fricatives by speaker for Northern group. Logistic regression lines (gray) calculated inPraat.
4.4 Ratio of Fricative Duration to Syllable Duration
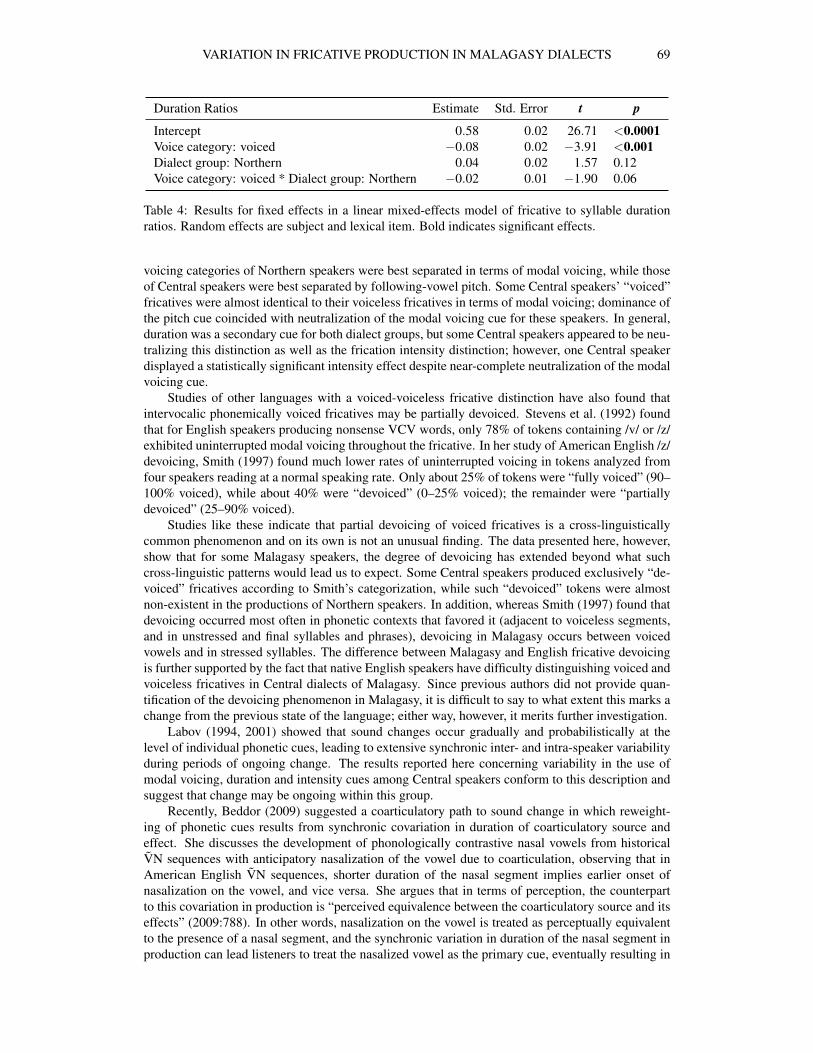
For both dialect groups, absolute duration for voiceless fricatives was slightly longer than for voiced,as expected cross-linguistically (e.g., Rivas 2006). Fricative duration was also examined as a ratioof the whole syllable. A linear mixed-effects regression model for ratio of fricative duration to fullsyllable duration is presented in Table 4. Random effects were subject and lexical item. There isa significant effect of voicing category on fricative duration for all speakers considered together,with voiced fricatives shorter with respect to the whole syllable than voiceless fricatives (slope = -0.08, p <0.001). The interaction of voicing class and dialect group falls just short of reachingsignificance at the 0.05 level; however, it does show a trend in the expected direction if this variablewere undergoing neutralization in the Central dialect group, namely that voiced fricatives are shortercompared to voiceless fricatives to a greater degree for the Northern than for the Central dialectgroup.
Although there is no statistically significant effect of the interaction of dialect group and voicingclass on fricative to syllable duration ratios when considering all speakers in the dialect groupstogether, Welch one-sided t-tests show that the duration difference is significant for each speakerindividually in the Northern dialect group (at p <0.05 or less), but that for two of the six Centralspeakers (AMAL and TNH), the difference is not significant (p = 0.06 and p = 0.23, respectively).As there was no known social or other factor distinguishing these two speakers from the other Centralspeakers in the study, this fact suggests that for Central speakers, neutralization of the durationdistinction between voiceless and voiced fricatives may be underway. Referring back to Figures 2
68 PENELOPE HOWE
fff
ff ff
fff
f
f ffs s
s
ss
s s
ssss f
v zvv
z zv
vv
vvvv
vv
v vvv
v
zz
zzz z
z
Percent Modal Voicing in Fricative
Mea
n Pi
tch
1st H
alf V
owel
[Hz]
Speaker AMAL, Central, Female
180
196
212
228
244
260
0 20 40 60 80 100
fff
f
ff
f
f
fff
ff
fs
s
s
s
s
s
s
sss
sf
vzvv
zzvvv vv
vv
v vvv
v vvv zzzzzz z
Percent Modal Voicing in Fricative
Mea
n Pi
tch
1st H
alf V
owel
[Hz]
Speaker DTR, Central, Male
110
126
142
158
174
190
0 20 40 60 80 100
f
f
fff
fffff f
f
f fss
ss
ss
ss
s
s
s
f
vzv
vz
z vvvv
vv
vv vvvv vv
vzzz z
z zz
Percent Modal Voicing in Fricative
Mea
n Pi
tch
1st H
alf V
owel
[Hz]
Speaker LN, Central, Female
200
236
272
308
344
380
0 20 40 60 80 100
fff
f
f
ff f
fff
ff fs
s
sss
s
s
s
s
ss
sss
s
s
f
f
vvzz
vv
vvvv vv
vvvvvv zzzzzz
zz
zz zzz z
Percent Modal Voicing in Fricative
Mea
n Pi
tch
1st H
alf V
owel
[Hz]
Speaker OHR, Central, Female
160
178
196
214
232
250
0 20 40 60 80 100
f
fff
fff
f
f
f
ff
ffs s
s
ss ss
s
sss
f
vzvv
zzvv
vvv vv
v vv
v vvv zz z
zzz
Percent Modal Voicing in Fricative
Mea
n Pi
tch
1st H
alf V
owel
[Hz]
Speaker TNH, Central, Male
80
98
116
134
152
170
0 20 40 60 80 100
ff fff
f fff
f ff
f
fsss
s
ss s s
s sf
vzv
vz zv
vv v v vvvvvvvv vv z z z
zz
zz
Percent Modal Voicing in Fricative
Mea
n Pi
tch
1st H
alf V
owel
[Hz]
Speaker TNR, Central, Male
90
100
110
120
130
140
0 20 40 60 80 100
Figure 6: Percent modal voicing versus mean pitch over first half vowel for voiced (blue) and voice-less (red) fricatives by speaker for Central group. Logistic regression lines (gray) calculated in Praat.
and 6, we see that the two speakers for whom the duration distinction is not statistically significantare also among those who display the highest degree of neutralization of the modal voicing cue.
4.5 Fricative Intensity
As expected, there is a general trend of higher frication intensity on voiceless than voiced fricatives.However, whereas the intensity differences are significant for all five of the Northern speakers in-dividually, they are not significant for the same two Central speakers (AMAL and TNH) for whomduration was not significant. This suggests that the intensity cue may also be neutralizing for theCentral dialect group along with duration and modal voicing. Since the intensity difference is usuallyassumed to be a direct phonetic consequence of the modal voicing difference, loss of the intensitycue is expected when the modal voicing cue is neutralized. Indeed, speakers AMAL and TNH areamong the Central speakers with the highest degree of modal voicing neutralization. It is interestingto note, however, that the intensity cue is still significant for speaker OHR (p <0.02), despite thefact that she exhibits the most extreme neutralization of modal voicing of all speakers in the sam-ple (cf. Figure 2). This decoupling between modal voicing and intensity indicates that speakers aresensitive to very low level phonetic cues.
5 Discussion
This study found a difference in the weighting of individual phonetic cues to fricative voicing inthe Central and Northern dialect groups and considerable variability in the use of modal voicingand other secondary cues within the Central group. While both Central and Northern speakers ex-hibited the physiologically-expected pitch distinctions following voiced versus voiceless fricatives,
VARIATION IN FRICATIVE PRODUCTION IN MALAGASY DIALECTS 69
Duration Ratios Estimate Std. Error t p
Intercept 0.58 0.02 26.71 <0.0001Voice category: voiced −0.08 0.02 −3.91 <0.001Dialect group: Northern 0.04 0.02 1.57 0.12Voice category: voiced * Dialect group: Northern −0.02 0.01 −1.90 0.06
Table 4: Results for fixed effects in a linear mixed-effects model of fricative to syllable durationratios. Random effects are subject and lexical item. Bold indicates significant effects.
voicing categories of Northern speakers were best separated in terms of modal voicing, while thoseof Central speakers were best separated by following-vowel pitch. Some Central speakers’ “voiced”fricatives were almost identical to their voiceless fricatives in terms of modal voicing; dominance ofthe pitch cue coincided with neutralization of the modal voicing cue for these speakers. In general,duration was a secondary cue for both dialect groups, but some Central speakers appeared to be neu-tralizing this distinction as well as the frication intensity distinction; however, one Central speakerdisplayed a statistically significant intensity effect despite near-complete neutralization of the modalvoicing cue.
Studies of other languages with a voiced-voiceless fricative distinction have also found thatintervocalic phonemically voiced fricatives may be partially devoiced. Stevens et al. (1992) foundthat for English speakers producing nonsense VCV words, only 78% of tokens containing /v/ or /z/exhibited uninterrupted modal voicing throughout the fricative. In her study of American English /z/devoicing, Smith (1997) found much lower rates of uninterrupted voicing in tokens analyzed fromfour speakers reading at a normal speaking rate. Only about 25% of tokens were “fully voiced” (90–100% voiced), while about 40% were “devoiced” (0–25% voiced); the remainder were “partiallydevoiced” (25–90% voiced).
Studies like these indicate that partial devoicing of voiced fricatives is a cross-linguisticallycommon phenomenon and on its own is not an unusual finding. The data presented here, however,show that for some Malagasy speakers, the degree of devoicing has extended beyond what suchcross-linguistic patterns would lead us to expect. Some Central speakers produced exclusively “de-voiced” fricatives according to Smith’s categorization, while such “devoiced” tokens were almostnon-existent in the productions of Northern speakers. In addition, whereas Smith (1997) found thatdevoicing occurred most often in phonetic contexts that favored it (adjacent to voiceless segments,and in unstressed and final syllables and phrases), devoicing in Malagasy occurs between voicedvowels and in stressed syllables. The difference between Malagasy and English fricative devoicingis further supported by the fact that native English speakers have difficulty distinguishing voiced andvoiceless fricatives in Central dialects of Malagasy. Since previous authors did not provide quan-tification of the devoicing phenomenon in Malagasy, it is difficult to say to what extent this marks achange from the previous state of the language; either way, however, it merits further investigation.
Labov (1994, 2001) showed that sound changes occur gradually and probabilistically at thelevel of individual phonetic cues, leading to extensive synchronic inter- and intra-speaker variabilityduring periods of ongoing change. The results reported here concerning variability in the use ofmodal voicing, duration and intensity cues among Central speakers conform to this description andsuggest that change may be ongoing within this group.
Recently, Beddor (2009) suggested a coarticulatory path to sound change in which reweight-ing of phonetic cues results from synchronic covariation in duration of coarticulatory source andeffect. She discusses the development of phonologically contrastive nasal vowels from historicalVN sequences with anticipatory nasalization of the vowel due to coarticulation, observing that inAmerican English VN sequences, shorter duration of the nasal segment implies earlier onset ofnasalization on the vowel, and vice versa. She argues that in terms of perception, the counterpartto this covariation in production is “perceived equivalence between the coarticulatory source and itseffects” (2009:788). In other words, nasalization on the vowel is treated as perceptually equivalentto the presence of a nasal segment, and the synchronic variation in duration of the nasal segment inproduction can lead listeners to treat the nasalized vowel as the primary cue, eventually resulting in
70 PENELOPE HOWE
phonological change in the language.As noted by Beddor, a similar process can be hypothesized as a pathway to tonogenesis. A lan-
guage with a consonantal voice quality contrast may display both inter- and intra-speaker variationin, for example, VOT or the duration of modal voicing produced on these consonants. Beddor’smodel would predict that the extent or duration of modal voicing on a voiced consonant shouldcovary with the persistence and/or magnitude of the f0 contrast on the vowel; thus, a decrease inmodal voicing on a voiced onset consonant should be accompanied by an increase in persistenceand deviation from the mean of low f0 on the vowel. As a result of this variability, coarticulatoryf0 distinctions on following vowels may attain perceptual equivalence with consonant voicing con-trasts. This paves the way for f0 to become the primary phonetic cue and the voicing distinction toneutralize, so that the language comes to contain minimal pairs that differ only in tone.
The production data presented herein demonstrate the presence of considerable synchronic vari-ation in the use of modal voicing on /v/ and /z/ in the Central dialects. Further work is requiredto determine whether there is regular covariation between the modal voicing and pitch cues andwhether pitch (the coarticulatory effect) has achieved equivalence with voicing (the coarticulatorysource) in the perceptions of Central dialect speakers. Additional work is also required to explorethe patterns of variation in production and perception of other consonant types in Malagasy dialects,including stops, affricates, sonorants, and prenasalized stops and affricates. Further analysis of thesefactors should help to illuminate the prevalence of pitch as a phonetic cue in the Central dialects ofMalagasy and the extent of development of a phonological tone contrast. Additional investigation ofthe social salience of fricative production, as touched on by Rakotofiringa (cf. Section 1), may giveinsight into the factors driving such change.
ReferencesBeddor, Patrice Speeter. 2009. A Coarticulatory Path to Sound Change. Language 85:785–821.Dahl, Otto Christian. 1952. Etude de phonologie et de phonetique malgaches. Norsk Tidsskrift for Sprogviden-
skap 16:148–200.Haudricourt, Andre-George. 1954. De l’origine des tons en vietnamien. Journal Asiatique 242:69–82.Hombert, Jean-marie, John J. Ohala, and William G. Ewan. 1979. Phonetic Explanations for the Development
of Tones. Language 55:37–58.Labov, William. 1994. Principles of Linguistic Change Volume 1: Internal Factors. Malden, MA: Blackwell
Publishers Inc.Labov, William. 2001. Principles of Linguistic Change Volume 2: Social Factors. Malden, MA: Blackwell
Publishers Inc.Lehiste, Ilse, and Gordon E. Peterson. 1961. Some Basic Considerations in the Analysis of Intonation. Journal
of the Acoustical Society of America 33:419–425.Lewis, M. Paul, Gary F. Simons, and Charles D. Fennig, ed. 2013. Ethnologue: Languages of the World.
Dallas, TX: SIL International, 17th edition.Matisoff, James A. 1970. Glottal Dissimilation and the Lahu High-Rising Tone : A Tonogenetic Case-Study.
Journal of the American Oriental Society 90:13–44.Rakotofiringa, Hyppolite. 1982. Etude de Phonetique Experimentale. L’Accent et les Unites Phoniques Ele-
mentaires de Base en Malgache-Merina. Phd, Universite de Strasbourg II.Rivas, Marıa Veronica. 2006. Does the perception of fricatives correspond to their production? The case of
Italian vs. Dutch. Ma, University of Amsterdam.Smith, Caroline L. 1997. The devoicing of /z/ in American English: effects of local and prosodic context.
Journal of Phonetics 25:471–500.Stevens, Kenneth N., Sheila E. Blumstein, Laura Glicksman, Martha Burton, and Kathleen Kurowski. 1992.
Acoustic and perceptual characteristics of voicing in fricatives and fricative clusters. Journal of the Acous-tical Society of America 91:2979–3000.
Department of Linguistics, MS 23Rice UniversityP.O. Box 1892Houston, TX [email protected]