the survival of a malagasy lemur species
TRANSCRIPT

The survival of a Malagasy lemur species
Propithecus verreauxi coquereli
in captivity:
The vital role of a self-selected plant diet
Von der Fakultät für Lebenswissenschaften
der Technischen Universität Carolo-Wilhelmina
zu Braunschweig
zur Erlangung des Grades einer
Doktorin der Naturwissenschaften
(Dr. rer. nat.)
genehmigte
D i s s e r t a t i o n
von Annette Abhau
aus Mülheim an der Ruhr

1. Referent: Professor Dr. Thomas Hartmann
2. Referent: Professor Dr. Dieter Strack
3. Referentin: Professor Dr. Joyce A. Powzyk
eingereicht am: 19.12.2006
mündliche Prüfung (Disputation) am: 25.04.2007
Druckjahr 2007

Vorveröffentlichungen der Dissertation
Teilergebnisse aus dieser Arbeit wurden mit Genehmigung der Fakultät fürLebenswissenschaften, vertreten durch den Mentor der Arbeit, in folgenden Beiträgen vorabveröffentlicht:
Vorträge:Abhau, A.: Secondary compounds in the feeding plants of Propithecus verreauxi coquereli.Duke University Lemur Center, N.C., USA (1997).
Abhau, A.: Secondary compounds in the feeding plants of Propithecus verreauxi coquereli.2. Kurt-Mothes-Doktoranden-Workshop, „Sekundärstoffwechsel“,IPB, Halle / Saale, Deutschland (1998).

For Marcella and Tiberius
«C’est principalement le sens de l’odorat, dont l’étude vient de nous occuper, qui guideles Indrisinés dans le choix de leurs aliments; le goût y est peu de chose, car, le plussouvent, c’est après avoir flairé un fruit ou une feuille qu’ils le rejettent sans l’avoirporté à leur bouche. En captivité, il est fort difficile de nourrir ces animaux; ils refusentpresque tous les aliments qu’on leur voit d’abord approcher de leur narines, puisabandonner aussitôt sans y avoir goûté.»
(Milne Edwards A. et A. Grandidier,
1875. Vol. VI. Histoire Naturelle Des Mammifères, p.226)
Acknowledgements i
Acknowledgements
I wish to thank my supervisor Prof. Dr. Thomas Hartmann (Institut für PharmazeutischeBiologie der Technischen Universität Braunschweig), who has always supported my projectand spent many hours discussing my work. I am very happy that he said “yes” to the idea ofmy project, yet the outcome was not clear at the time of starting.
I am greatly indebted to my co-corrector Prof. Dr. Dieter Strack (Leibniz-Institut fürPflanzenbiochemie, IPB, Halle / Saale), who was very generous in supporting my analyticalwork. All HPLC analyses were performed at his laboratory and he provided me with all thenecessary equipment. I would also like to thank his team, especially Dr. Alfred Baumert whowas invaluable in helping to solve any analytical problem, and Dr. Thomas Fester, who wasso kind in assisting with both the executing of the gel-electrophoresis experiments and gettingthings organised in Halle.
My project could not have started without the invitation of Prof. Dr. Ken Glander to visit theDuke University Lemur Center, previously known as Duke University Primate Center, NorthCarolina, USA. His personal support and far-sightedness as director and as researcher weredecisive for the initiation and continuance of my project. I wish to express my extremegratitude to him and his wife Molly, who I knew to be a kind and generous person. I willalways keep Molly in my memory.
This work could not have been completed without the experience and help of numerousresearchers that were integral at various stages of the project:
Prof. Dr. Robert L. Wilbur at the Botany Greenhouses of the Duke University identified theplant species I had collected from the outdoor enclosures at the Primate Center. Much respectfor both his kindness and his straightforwardness in assisting me to identify the plant speciescollected. Dr. Beverly Calhoun at the Botany Greenhouses and Mike McGowan, DukeUniversity Phytotron, collected additional plant material for my analyses when I had alreadyreturned to Germany.
I am largely obliged to all the scientists who took their time and resources for massspectrometric and NMR spectroscopic measurements for structure elucidation of thenumerous compounds I had isolated through HPLC analyses. I am indebted to their kindnessand their willingness to discuss spectra and any other problems:
So, I wish to thank Dr. Jürgen Schmidt (MS-Labor, IPB, Halle / Saale), who performed themajority of mass spectrometric measurements as well as the LC-MS measurements. Variousadditional mass spectrometric measurements were performed by Dr. Hans-Martin Schiebeland Mrs. Doris Döring (MS-Labor der Chemischen Institute der Technischen UniversitätBraunschweig), and by Dr. Thomas Dülcks (MS-Labor, Institut für Organische Chemie,Universität Bremen).
Dr. Schiebel deserves a special note of appreciation for spending innumerable hours insolving sophisticated problems within mass spectrometry, and helping me to get additionalcontacts to solve new raising problems. And least I forget the wonderful tea-time at the masslaboratory which was always a welcome opportunity to take part in fruitful discussions. Dr.Schiebel also lent a hand for me to contact the team of Prof. Dr. D. Leibfritz (Institut fürOrganische Chemie, Universität Bremen), which was closer to my residence and afforded memore time with my family and children’s education. He also assisted me in contacting

ii Acknowledgements
Dr. Manfred Nimtz (Gesellschaft für biotechnologische Forschung, GBF, Braunschweig) andregularly travelled between the Universities of Braunschweig and Bremen, all the whileplying me with much needed support and news from Braunschweig. This allowed me to meetDr. Thomas Dülcks, who performed additional mass spectrometric experiments and waspartner to engaging discussions.
GC and GC-MS measurements were performed by Dr. Ludger Witte (MS-Labor derChemischen Institute der Technischen Universität Braunschweig). I am indebted to hissupport and astute discussions and I was deeply saddened to learn of his untimely death.
For NMR-spectroscopic measurements I am greatly obliged to Prof. Dr. Ludger Ernst (NMR-Labor der Chemischen Institute der Technischen Universität Braunschweig), and his assistantMrs. Petra Holba-Schulz, for performing the majority of the NMR measurements. Prof. Ernstspent much time to solve problems raising during the interpretation of the NMR spectra. Atthe University of Bremen I received additional support from the team of Prof. Leibfritz: andmy thanks go out to Dr. Werner Offermann, Dipl. Ing. Johannes Stelten and Dr. WienandWillker.
For microbiological experiments I wish to thank the PanLabs Inc., and much gratitude to Dr.Ulf Preuschoff and Dr. Samuel David, Solvay Arzneimittel GmbH, for their engagement inmaking these experiments possible. My thanks go also to Dr. Thomas Vieregge (ZentraleEinrichtung für Tierhaltung der Technischen Universität, Braunschweig), for his support inperforming microbiological assays, and it was he who introduced me to Dr. Marie-Luise Enss(Medizinische Hochschule, Hanover, MHH), a most generous woman.
Thanks to Dr. Enss, that the plant mucilage detected in one of the major lemur food plantscould be isolated. We had numerous enlightened discussions on possible pharmacologicalaspects related to the gastrointestinal tract. The initial GC analyses on the plant mucilage werecarried out at the laboratory of Dr. Blaskowitz and Dr. Kownatzki (MHH).
Additionally, I am much obliged to Dr. Manfred Nimtz (GBF, Braunschweig), whoperformed the mass spectrometric experiments on the plant mucilage and took many hoursfrom his busy schedule to introduce me into carbohydrate chemistry.
I am greatly obliged to Prof. Dr. Manfred Coenen (Institut für Tierernährung derTierärztlichen Hochschule, Hanover), and Peter Rust, head of the laboratory, for investigatingthe nutritional components of the food plants. Prof. Coenen provided me with grass meal, thatwas utilised as auxiliary agent to press tablets with the groups of chemical compoundsidentified in the lemur food.
I also wish to thank the team of Prof. Dr. Christel Müller-Goymann (Institut fürPharmazeutische Technologie der Technischen Universität Braunschweig), for providing mewith the support and the equipment needed to further this investigation. And many thanks toMrs. Jahn, who helped me to press tablets for the proposed feeding choice experiments.
For the generous supply of Plantaginis ovatae testa and tannin albuminate and much desirableliterature, I wish to thank Dr. Falk Pharma GmbH, and Knoll Deutschland GmbH / BASFPharma, now Dr. Rentschler Arzneimittel GmbH & Co., respectively. I also wish toacknowledge the pharmaceutical companies Athenstaedt GmbH & Co. KG, Dr. Gustav Klein,and Dr. Loges & Co. GmbH, for providing me with the information needed for dosagecomparisons between their medicaments and the amounts of secondary compounds ingestedby the lemurs. For the provision of isolated chemical plant compounds for analytical purposes(reference compounds) I am much obliged to Prof. Dr. G. G. Gross (Abteilung für AllgemeineBotanik der Universität Ulm), and the team of Prof. Dr. Junei Kinjo (Kumamoto University,Faculty of Pharmaceutical Sciences, Japan).
For all the proofreading and requests for literature, I am much obliged to Prof. Dr. JoycePowzyk, Wesleyan University, C.T., USA, and her husband Dr. Stephen Devoto. I met Joyce

Acknowledgements iii
in Madagascar and enjoyed the visit to her research camp to observe free-ranging Propithecus
diadema diadema and Indri indri. I continue to enjoy all our fruitful discussions onprimatology despite the distance between the continents.
I would also like to thank all people who supported and accompanied my project, which hasdeveloped more like a web than a normal straightforward dissertation. Often, during our manydiscussions, I would be handed an address of who I should contact next.
In this respect I wish to thank Dr. Werner Kaumanns, who made it possible to place my firststeps into the German Primate Center (Deutsches Primatenzentrum, DPZ, Göttingen). There,the team of Prof. Dr. Jörg Ganzhorn and Dr. Peter Kappeler had the idea for my project: theproblem of diarrhoea of lemurs in captivity, who are otherwise thriving when eating specialplant species. And I am still thankful for their hint to contact Dr. Glander and for theirinvitation to their camp in Madagascar. I am obliged to Dr. Stephanie Heiduck at the libraryof the DPZ in providing me with the necessary primate literature so I could spend time athome with my children.
My thanks also go to the staff of the DULC: to Bill Hess, who helped me to get thingsorganised at the DULC, and my very special thanks go to Paige Vinson and Jennifer LouiseCampbell, now graded to Dr. Campbell, who gave me shelter during my first stay. I amgrateful to David Haring, who was always helpful in answering any of my queries, especiallythose questions that arose once I had returned to Germany.
I am much obliged to my husband, Mathias Abhau, who is credited with unending support.He made every endeavour to support my activities. He shared his holidays with me inMadagascar, helped to observe the animals at the Primate Center and visited me at diverselaboratories. He always solved my computer woes and took the children whenever I neededtime for writing. And for all those endless discussions, he granted me patience together withthe intellectual and practical support needed during such an endeavour.
During this dissertation, I found new friends who opened their doors and helped me to getorganised, including Mrs. Doris Döring, Dr. Ludger Witte, and Mr. and Mrs. Weseloh atGöttingen. My father often repaired my car to keep me mobile, and my mother took sometime to look after my children.
Last not least I would like to thank my study animals (Propithecus verreauxi coquereli), andit is remembering their unique beauty and nature that gave me the most unending support toprop me up as I continued to pursue this research project. It is my hope that this dissertationwill contribute to a better understanding of Propithecus feeding ecology, and will serve toimprove their captive living-conditions. And lastly, I hope this research will help to protectthem in the wild, which was my initial inspiration for this study.

iv Abbreviations
Abbreviations
abbr. abbreviation, abbreviated
amu atomic mass units
animal groups: M&T Marcella and TiberiusD&V Drusilla and ValentinianJ&D Julian and DrusillaG Gordian
br. broad
BSTFA N,O-bis[trimethylsilyl]trifluoroacetamide
cAMP cyclic adenosine monophosphate
CI chemical ionisation
conc. concentrated
COSY correlation spectroscopy
d doublet
DAB Deutsches Arzneibuch (German Pharmacopoeia)
DAC Deutscher Arzneimittel Codex (German Drug Codex)
DCI-MS direct chemical ionisation mass spectrometry
dd doublet of doublets
DEPT distortionless enhancement by polarization transfer
dest. destillata
DGE Deutsche Gesellschaft für Ernährung (German society for nutrition)
dHex deoxyhexose
dHex-ol deoxyhexitol
Diast. diastereoisomer
DMSO dimethylsulfoxid
DULC Duke University Lemur Center, previously known as Duke UniversityPrimate Center
EI-MS electron impact ionisation mass spectrometry
ESI-MS electrospray ionisation mass spectrometry
FAB-MS fast atom bombardment mass spectrometry
Gal, gal galactose
GalA galacturonic acid
GBF Gesellschaft für biotechnologische Forschung, Braunschweig
GC gas chromatography
HAB Homöopathisches Arzneibuch (Homeopathic Pharmacopoeia)
Hex hexose (aldohexose)
HexA hexuronic acid
Abbreviations v
Hex-ol hexitol
HMBC heteronuclear multiple bond correlation
HPLC high pressure liquid chromatography
distance between starting line and spothRf 100
distance between starting line and front
HR-MS high resolution mass spectrometry
HSQC heteronuclear single quantum correlation
Hz Hertz
ID identification number
IPB Leibniz-Institut für Pflanzenbiochemie, Halle / Saale
J values for coupling constants
K-gal-rha kaempferol-3-O-α-L-rhamnopyranosyl(1→2) ß-D-galactopyranoside
K-rha kaempferol-3-O-α-L-rhamnopyranoside
LC-MS liquid chromatography mass spectrometry
m mass
M analyt molecule (mass spectrometry)
MHH Medizinische Hochschule, Hanover
min. minute
MS mass spectrometry
MSTFA N-methyl-N-(trimethylsilyl)-2,2,2-trifluoroacetamide
MTBSTFA N-methyl-N-[tert-butyldimethyl-silyl]trifluoroacetamide
MW molecular weight
n.d. not detected
NDF neutral detergent fibre
NHE natural habitat enclosure
NMR nuclear magnetic resonance
No., no. number
ÖAB Österreichisches Arzneibuch (Austrian Pharmacopoeia)
o.l. older (autumn) leaves
org. organic
p.a. pro analysis
PAS periodic acid-Schiff reagent
Ph.Eur. Pharmacopoeia Europaea
Ph.Helv. Pharmacopoeia Helvetica
prob. probability
q quartet
Q-gal-rha quercetin-3-O-α-L-rhamnopyranosyl(1→2)ß-D-galactopyranoside
q.s. (lat.) quantum satis
QZ “Quellungszahl”, swelling number
rs regression coefficient
RDA retro-Diels-Alder reaction
Ref. reference

vi Abbreviations
ret. retention
Rha, rha rhamnose
resp. respectively
rpm rotations per minute
s singlet
sh shoulder
t triplet
TFA trifluoroacetic acid
TLC thin layer chromatography
TMS tetramethylsilan
trace am. trace amounts
u units
USP United States Pharmacopoeia
v volume
v.br. very broad
veg. vegetables
WHO World Health Organization (Report on Infectious Diseases, 1999 & 2000)
xyl xylose
y.l. younger (autumn) leaves

Table of Contents vii
Table of Contents
Acknowledgements i
Abbreviations iv
Table of Contents vii
A General Introduction 11 Subject of the study 12 Systematic and geographic distribution 13 History and response to captivity 43.1 Classification according to gut and dietary needs 53.2 Digestive adaptations 63.3 The phenomenon of diarrhoea 83.4 Implications of morphology 94 Plant secondary metabolism and self-medication 105 Major goals 14
B Empirical study on food selection 161 Introduction 162 Materials and Methods 172.1 Animals 172.2 Feeding conditions 182.3 Holding conditions 202.4 Data collection schedule 232.5 Statistics 253 Results 263.1 Qualitative evaluation of the lemur food 263.2 Classification of plant species according to the feeding behaviour of
P. v. coquereli 333.3 Quantitative evaluation of the food eaten 394 Discussion 515 Conclusion 55
C Chemical investigations on the major food and drug resources 56
C.I Nutritional and energy values of foods selected by P. v. coquereli 561 Introduction 562 Materials and Methods 572.1 Plant material: origin and identification 572.2 Preparation of the dried plant material for chemical investigations 582.3 Nutritional and energy values of the food 583 Results 633.1 Food composition and nutritional values 633.2 Energy values of the food 704 Discussion 725 Conclusion 76

viii Table of Contents
C.II Evaluation of the food plants based on plant chemistry with emphasis onchemotaxonomical and pharmacological aspects: A literature survey 77
C.III Identification of flavonoids and simple phenolics in the leaves of Rhus
copallina and Albizia julibrissin 871 Introduction 872 Materials and Methods 872.1 Plant material 872.2 Thin layer chromatography (TLC) 882.3 Test to discern hydrolysable from condensed tannins 912.4 Polyamide column chromatography and HPLC 912.5 Structure identification 932.6 Chemicals and reference compounds 953 Results and discussion 963.1 Preliminary assays 963.2 Separation and fractionation 983.3 Structure identification 1003.4 Compounds identified 106
C.IV Quantification of flavonoids and tannins in the food plants of P. v. coquereli 1121 Introduction 1122 Materials and Methods 1122.1 Quantitative HPLC analyses 1122.2 Quantification of unhydrolysed flavonoids and tannins 1152.3 Quantification of hydrolysed flavonoids and tannins 1152.4 LC-MS analyses on R. copallina leaf extracts 1172.5 Gravimetric determination of tannins in R. copallina leaves 1173 Results and discussion 1183.1 Quantification of phenolic glycosides 1183.2 Semi-quantitative estimation of gallotannins by LC-MS 1243.3 Quantification of flavonoid aglyca 1253.4 Quantification tannin derived gallic acid 1263.5 Gravimetric determination of tannins in R. copallina leaves 127
C.V Mucilage analyses of Albizia julibrissin 1291 Introduction 1292 Materials and Methods 1302.1 Characterisation of physico-chemical parameters of A. julibrissin leaf
mucilage 1302.2 Isolation and chemical characterisation of A. julibrissin leaf mucilage 1313 Results 1343.1 Swelling number and gelling properties 1343.2 Chemical composition of A. julibrissin leaf mucilage 1354 Discussion 138
C.VI Pharmacological effects of the food plants analysed 1411 Introduction 1412 Materials and Methods 1442.1 Assays on antimicrobial activity 1442.2 Cholera toxin binding assay 1462.3 Calculation of the daily intake of flavonoids and tannins 1473 Results 1473.1 Antimicrobial activity 147

Table of Contents ix
3.2 Antibacterial, antiprotozoal and antifungal properties of R. copallina andA. julibrissin leaf extracts 149
3.3 Binding capacity of various R. copallina leaf extracts to cholera toxin 1503.4 Potential biological and pharmacological properties of the major food
plant chemicals: evidence from the literature and own studies 1533.5 Relevance of food plant selection and daily intake of the major plant
compounds 1654 Discussion and conclusion 171
D General conclusions 173
E Summary 175
F References 178
Appendix I: (related to Part B) 206
Appendix II: (related to Part C) 209
Curriculum vitae 310


A General Introduction 1
A General Introduction
1 Subject of the study
Propithecus verreauxi coquereli, the Coquerel’s sifaka, is a lemur species of the indriidfamily, which inhabits the northwest region of Madagascar: a mixed deciduous and evergreenforest. It is a diurnal, arboreal living primate. The genus Propithecus is one of the mostwidely distributed among lemurs, but is currently listed as “endangered” by the IUCN RedList (Mittermeier et al., 1994) because of severe habitat destruction (Richard, 1978a; Klopferand Boskoff, 1979; Harcourt and Thornback, 1990; Ganzhorn and Abraham, 1991).
The digestive tract of Propithecus species is highly specialised, requiring a mainly folivorousdiet, supplemented with fruits, flowers and to a lesser extent, other plant parts (Richard, 1977;1978a, b; 1979).
Although many efforts have been made to introduce members of the indriid family intocaptivity (Spelman et al., 1989), response of indriid species (and subspecies) has been varied.Until recently, it has been difficult to recognise and to fulfil all dietary needs when held incaptivity and only a few successful breeding colonies exist outside Madagascar. Changes andimbalances in the diet are often answered by gastrointestinal disorders with diarrhoea as aprominent, recurrent symptom. Diet has an essential role in captive management and it is thekey question as to what constitutes a healthy diet (Haring, 1988; Spelman et al., 1989;Harcourt and Thornback, 1990; Powzyk, 1997; Campbell et al., 1999; Campbell et al., 2000).
The only successful breeding colony of captive P. v. coquereli is kept at the Duke UniversityLemur Center (DULC) in North Carolina, USA (previously known as Duke UniversityPrimate Center).
Prior to this study animals were given the chance to select leaf species on their own which ledto surprising effects: animals improved in health and increased activity pattern whileincreasing infant survivalship (Haring, 1988). In this study I will ascertain the full dietaryneeds of captive Coquerel’s sifakas. As health conditions have improved significantly withthe availability of leaves as a large portion of the daily food before the onset of this study, itsbenefit for the sifakas will be surveyed. Hence, both the primary and secondary plantcompounds will be analysed to assess both the nutritional value of the leaves, and the role ofsecondary plant compounds as integral ingredients of plant tissue and presumably crucialaspect to leaf choice of the sifakas.
2 Systematic and geographic distribution
Originally, the order Primates had been subdivided into the suborders Prosimiae, includingthe infraorders Lemuriformes, Lorisiformes and Tarsiiformes, and Simiae comprising OldWorld monkeys, New World monkeys and humans (Sussman, 1979). This classification wasbased extensively on evolutionary theory, while the prevailing view now divides the orderPrimates into the suborders Strepsirhini and Haplorhini with respect to morphology (e.g.rhinarium type).

2 A General Introduction
The suborder Strepsirhini (moist, naked rhinarium) comprises the infraorders Lemuriformes(lemurs) and Lorisiformes (loris and galagos), while Tarsiiformes (tarsiers) shifted to thesuborder Haplorhini, which also includes the infraorder Simiiformes containing the subinfra-orders Platyrrhini (New World primates) and Catarrhini (Old World primates) including apes,and humans (Hominidae), (Petter and Petter-Rousseaux, 1979; Grzimek, 1988).
About 60 million years ago, the prosimians were the earliest primates to appear in the fossilrecord. All living Lemuriformes are endemic to the Island of Madagascar although they weresubsequently introduced to the Comores Islands by humans (Sussman, 1979). TheLemuriformes are divided into 5 families, including 14 genera with 32 species (Mittermeier et
al., 1994). Recent discoveries of new lemur species (Richard and Dewar, 1991), together withthe elevation of several subspecies to species status (Mayor et al., 2004) have increased thetally of extant species on the island. Those prosimians living outside Madagascar havecontinued to embrace a nocturnal lifestyle while among the Lemuriformes there are numerousspecies that maintain diurnal active periods (Sussman, 1979).
The superfamily Lemuroidea comprises five families, including Indriidae with three extantgenera: Indri, Propithecus and Avahi. Avahi is the smallest indriid and is nocturnal, whilemembers of the two larger genera Indri and Propithecus are diurnal.
Recently, the genus Propithecus has been controversially discussed with concepts differing innumbers of species and subspecies (Harcourt and Thornback, 1990; Petter and Petter-Rousseaux, 1979; Tattersall, 1982; 1986; Grzimek, 1988; Mittermeier et al., 1994; Mayor et
al., 2004). According to Mittermeier et al. (1994), Propithecus was once considered to consistof three species, P. verreauxi (Grandidier in 1867), P. diadema (Bennett in 1832) and P.
tattersalli (Simons in 1988), with P. verreauxi and P. diadema containing four subspecieseach. P. d. holomenas was subsumed into P. d. edwardsi (Tattersall, 1986). In a recent survey,some subspecies of P. verreauxi and P. diadema elevated to species status(Mayor et al., 2004), (see Tab. A.1).
Tab. A.1: Species and subspecies of the genus Propithecus according to Mittermeier et al.
(1994) and in brackets with changed species status according to Mayor et al.
(2004).
P. verreauxi P. diadema P. tattersalli
P. v. verreauxi (P. verreauxi) P. d. candidus (P. candidus)P. v. coquereli (P. coquereli) P. d. diadema (P. diadema)P. v. coronatus P. d. edwardsi (P. edwardsi)P. v. deckeni P. d. perrieri (P. perrieri)
Following the eastern-western split of most Malagasy flora and fauna with P. verreauxi spp.which inhabit the drier seasonal western forests, and the P. diadema spp. which inhabit theeastern rainforests (compare Fig. A.1), which ultimately has had a dramatic impact on theavailability of plant species as food plants, especially food choice. Therefore regarding thelink between regionality-food plant availability, and to prevent confusion with previousstudies, I will retain the species concept of Mittermeier et al. (1994) in this study.
To have a closer look on habitat conditions and distribution of Propithecus species inMadagascar (Fig. A.1), it is necessary to keep in mind climatic conditions and zones ofvegetation. Madagascar can be divided into four main climatic regions: the western, easternand southern part, and the central plateau. The western part is mainly covered by drywoodland-savannah that changes into a mixed deciduous and evergreen forest in the north andinto an arid cactuslike Didiereaceae forest and scrub / bush in the extreme south. The easternpart is covered by wet rainforest and the largely deforested central plateau has a temperateclimate (Kuhn, 1971; Richard, 1978a; Hladik, 1980; Richard and Dewar, 1991).

A General Introduction 3
While P. verreauxi subspecies are found along the western border with P. v. coquereli in thenorthwest part, the larger P. diadema inhabit the wet rainforest along the eastern border.P. tattersalli is confined to a restricted area in the northeast of the island. P. verreauxi istherefore one of the most widely distributed lemur species (Richard, 1978a; Klopfer andBoskoff, 1979), albeit highly endangered.
Fig. A.1: Island of Madagascar: Climatic regions (Därr and Wodtcke, 1991) and currentdistribution of Propithecus species and subspecies (Powzyk, 1997).
The term “sifaka” is a Malagasy word and is used for Propithecus species in general withspecial respect to P. verreauxi, which refers to their phonetic representation of an alarm callfor ground predators. In sensu stricto “sifaka” is only appropriate for Propithecus species ofthe dry forest, P. verreauxi and P. tattersalli.
In contrast, the common Malagasy name for P. diadema is “simpona” (Tattersall, 1982), whogive a different vocalisation (i.e. “sisk”) in the same context compared to P. verreauxi (Petterand Charles-Dominique, 1979; Powzyk, 1997).
Native people have attributed medicinal knowledge to the sifakas, e.g. how to heal wounds bymeans of the application of leaves (Milne Edwards and Grandidier, 1875), and they were heldsacred, owing to their sun bathing behaviour in the morning especially after a cold night(Grzimek, 1988). And for many Malagasy people it is still “fady” (tabu) to hunt and killindriid species.

4 A General Introduction
3 History and response to captivity
Early detailed reports on indriid species go back to the 18th and 19th century. In 1781,Sonnerat brought one Avahi and one Indri to France, first as a gift to the Jardin du Roi, andlater exhibited in the Museum National D’Histoire Naturelle de Paris. In 1832, the genusPropithecus was scientifically named by Bennett, while Grandidier named Propithecus
verreauxi in 1867. The subspecies Propithecus verreauxi coquereli, the Coquerel’s sifaka wasnamed by Milne Edwards in 1867, and an era of zoological study commenced (MilneEdwards and Grandidier, 1875).
Even in that early stage of research it was acknowledged that diet was a critical point incaptive management for members of the indriid family (ibid.) and it took an additionalcentury for researchers to finally succeed in captive maintenance, at least with somePropithecus species. The statements of Jolly (1980) that “you will not see a sifaka in zoos ofEurope or America, only in the wild or the National Park of Tananarive” and that “captivesifaka simply look down and never look up again” are fortunately no longer valid for at leastsome of the indriid species / subspecies.
Currently, there are three successful breeding colonies of Propithecus species / subspeciesoutside of Madagascar: a large colony of P. v. coquereli and a smaller colony of Propithecus
tattersalli at the Duke University Lemur Center in North Carolina, USA, and a large colonyof P. v. coronatus at the Vincennes Zoo in Paris, France. However, other members of theindriid family are much more difficult to maintain. Neither of the two subspecies of Avahi,nor any Indri indri have ever been kept for longer than a few months in captivity, not even inMadagascar when caged (Harcourt and Thornback, 1990; Powzyk, 1997). It is most likelythat diet plays a key role as seen when captive Avahi quickly succumb to ill health and deathpredicated by bouts of diarrhoea (Ganzhorn and Razanahoera-Rakotomalala, 1985; Harcourt,1991; Ganzhorn, pers. comm.). Although most lemur species suffer from diarrhoea whenevertheir diets are altered or inappropriate (Bresnahan et al., 1984; Brockman et al., 1988;Ganzhorn, pers. comm.), indriid species are highly problematic in captivity. Wet forestPropithecus species consume a poorer food quality and are more difficult to maintain incaptivity than the smaller dry forest species of western Madagascar (Powzyk, pers. comm.). In1995, two of the three wild caught P. d. diadema died at the DULC of organ calcification dueto an overload of calcium. Subtle differences within the gastrointestinal tract, even amongclosely related species, may be reflected in different dietary needs (Campbell et al., 2000).Despite all relationships among the indriids, digestion and digestibility remains a species-specific feature (Meyer et al., 1993). For Indri indri known as the most folivorous specieswithin the indriid clade, differences in the digestive tract are clearly documented (MilneEdwards and Grandidier, 1875; Hill, 1953), which correspond to a relatively “poorer diet”preference, rich in leaves, when compared to Propithecus’ digestive tract which is best suitedfor a “richer diet” composed of more fruit seeds, whole fruits and flowers together with leaves(Powzyk, 1997; Britt et al., 2002).
P. verreauxi appear to have the least problems with captive management, as they are some-times kept by the Malagasy on a diet of various fruits (Ganzhorn, pers. comm.). Nevertheless,there were two large colonies of P. v. coronatus and P. v. coquereli that had been maintainedoutside Madagascar. Although P. v. verreauxi is not currently maintained in captivity, oneprincipal breeding pair lived for years at the DULC. This pair failed to produce any survivingoffspring which may have been a result of inbreeding (Harcourt and Thornback, 1990). Theeffects of captivity can be difficult to document, especially when individuals of the breedingcolonies are given on loan to other institutions. Overall, the different response of Propithecus
species to captive conditions remains unclear (Campbell et al., 1999; Campbell, pers. comm.).

A General Introduction 5
In previous studies on free-ranging Propithecus species, various aspects of their socialbehaviour and feeding ecology have been investigated; for reviews see Richard (1978a),Pollock (1979), Harcourt and Thornback (1990), Powzyk (1997), and Powzyk and Mowry(2003).
In 1970/71 and 1974, Alison Richard focused on free-ranging P. v. coquereli in the forestryreserve at Ampijoroa in the north and P. v. verreauxi near Hazafotsy in the south ofMadagascar (Richard, 1974; 1977; 1978a, b; 1979). Her field observations and analysis wereused throughout this study to compare captive Coquerel’s sifakas to their free-rangingrelatives. The majority of behavioural studies were conducted on P. v. verreauxi in the southof Madagascar (Jolly, 1972; Jolly et al., 1982; Richard et al., 1991; Richard, 1985; Richard et
al., 1993). Only few studies on Propithecus species have been performed in captivity (Haring,1988; Lopes Santini, 1992; Campbell et al., 1999; 2000, 2001, 2004a and 2004b), yet the twosubspecies P. v. coquereli and P. v. verreauxi resemble each other more morphologically andbehaviourally than either of the remaining subspecies (Richard, 1978a).
Previous experiences at the Duke Lemur CenterMany efforts have been made to overcome various difficulties arising from captivemanagement, which resulted in a successful breeding colony of P. v. coquereli at the DULC.In 1985, a management program was instigated that changed and improved the diet ofPropithecus, in particular to overcome the dramatic weight loss and decrease in activitypatterns that coincided with the winter season (Haring, 1988).
After foregoing and encouraging introduction of other five lemur species to the NorthCarolina forest at the DULC (Glander and Rabin, 1983; Glander, 1986), the sifakas received avariety of browse, which was partly based on the leaf choice taken by the other lemur speciesalready being held in forested outdoor enclosures. Different housing conditions have beendeveloped in which the lemurs may travel from their large indoor cages to forested outdoorenclosure which more closely resembles their wild habitat (Haring, 1988). Over a period oftwo years, different leaf species have been introduced systematically into the diet of thesifakas. To prevent the seasonal crisis of animal’s condition in winter, some selected specieswere frozen in the autumn and fed throughout the winter months. Although non-leaf fooditems changed throughout the years, leaf species chosen by the sifakas remained nearly thesame. Animals who had a history of gastrointestinal disorders with diarrhoea as prominentand recurrent symptom in their anamnesis were doing far better, especially during the winterseason when food was supplemented by special leaf species. Against initial reservations, nosymptoms of self-poisoning occurred, which has already been evidenced for the five otherlemur species housed in forested areas, which were all captive-born (Glander, 1986).
3.1 Classification according to gut and dietary needs
Multifactorial interrelations exist between the gastrointestinal tract of an organism and its diet(Parra, 1978; Savage, 1986; Stevens, 1988; Meyer et al., 1993). On the one hand, mammalianherbivores can be classified as forestomach- or midgut-fermenters1 due to their respectivedigestive system which requires a special food quality (Langer, 1986; 1988; Chivers, 1994).On the other hand, an organism can be classified according to the food ingested regardless itsdigestive strategy (Chivers and Hladik, 1980). Frugivores and frugivores / folivores are less
1 The former term “hindgut” as site of caeco-colic fermentation is revised by Chivers (1994) as “midgut” basedon embryological origin. According to Chivers (1994), “hindgut” refers only to the descending (left) colon andrectum, which are very similar in all mammals, and have a different blood supply from the caecum and rightcolon. The caecum and right colon develop embryologically from the “midgut” loop (Chivers, 1994). So, inthis study, the previously utilised term “hindgut” is replaced by “midgut”.

6 A General Introduction
specialised regarding their respective digestive tract and diet than species which arepredominantly folivorous.
Except for colobines, which have a voluminous sacculated stomach (Ohwaki et al., 1974;Langer, 1988; Stevens, 1988), most primates are midgut-fermenters (caecum and right colon),more or less specialised (Langer, 1986; 1988; Stevens, 1988; Chivers, 1994). Seen from thedietary aspect, most primates can be classified as frugivores that supplement their diet eitherwith leaves or animal matter (Chivers and Hladik, 1980). Depending on the classificationnomenclature, herbivorous species which also prey on animal matter can be called omnivores(Langer, 1986) or faunivores / frugivores (Chivers and Hladik, 1980) based on the dominantfood preference. According to the latter classification, the digestive tract of frugivores isintermediate between the two extremes: faunivores and folivores. In this study the termherbivore is only used in sensu stricto, that is animals which subsist exclusively on planttissue. Therefore, digestive strategy may be in opposition to a species’ respective feedingstrategy or feeding ecology, the latter emphasising the inclusion of additional adaptations ofan herbivore to its environment.
However, climate, soil, seasonal availability of food and food quality are integralenvironmental determinants resulting in numerous specialisations as well as convergentadaptations which have evolved over millions of years (Richard and Dewar, 1991). Finally,both, availability of appropriate food and the functioning of the digestive system predisposean organism to occupy an ecological niche (Langer, 1986; 1988).
3.2 Digestive adaptations
In general, digestion is dependent on dentition, and in turn on the gastrointestinal tract of theanimal. This includes its salivary glands and saliva composition, the enzymatic equipment ofthe digestive tract and associated organs, digestive fluids, pH of different sections of thegastrointestinal tract, the microflora of the gut where fermentation of plant material andespecially of cell wall structures takes place. In addition, the morphology of the gut systemitself (e.g. length of any part, volume, surface area and structure in relation to body weightand size) is also of vital importance (Chivers and Hladik, 1980; Langer 1986; Savage, 1986;Stevens, 1988; Hofmann, 1991). Parameters such as retention time and gut passage rateinfluence the nutritional exploitation of the food ingested but is vice versa influenced by thefood and the microflora of the gut (Warner, 1981; Hofmann, 1983; Marcus and Heaton, 1986;Stevens, 1988; Meyer et al., 1993; Wischusen et al., 1994).
A fibre rich, leafy diet needs more time to be fermented than a more frugivorous diet with lessportions of fibre. Therefore, the mean retention time of the gastrointestinal tract is larger forfolivores than for frugivores. An appropriate capacity for food storage and fermentingchambers are needed either in the forestomach and / or in the midgut. Hence, numerousinvestigations on the digestive tract and diet focus on the relationships between body size,digestive system morphology, and overall diet (Chivers and Hladik, 1980; Warner, 1981;Martin et al., 1985; Demment and Van Soest, 1985; Stevens, 1988; Maisels, 1993; Bruortonand Perrin, 1991; Ford and Davis, 1992).
Other mutual and multifactorial relationships exist between a host’s microflora, the mucosaand the diet ingested. The indigenous microflora both affects and is affected by the rate ofdigesta passage (which slows down e.g. in germfree animals), as well as the turnover of andenzymatic activity in enterocytes of the host and the mucosal surface. The enterohepatic circlewould not function without the enzymatic impact of the microflora catalysing multiplechemical reactions. While the microflora is essential for the deliverance of vitamins, both themicroflora and enterocytes of the mucus layer are engaged in various absorptive processesand provide nutrients and energy for the animal host (Savage, 1986; Stevens, 1988).

A General Introduction 7
Diarrhoea is a cardinal symptom of gastrointestinal disorders and the influence of theindigenous microflora on the absorption of water and electrolytes is noteworthy.
Food composition and environmental factors in turn influence the different microbialcommunities of the mammalian digestive tract in number and species composition, and theirrespective microbial activity (Wolin, 1981; Ehle et al., 1982; Savage, 1986; Stevens, 1988;Meyer et al., 1993; Onderdonk, 1998). Factors such as age and overall health of the animalhost, greatly influence the microbial ecosystem as well as the living conditions: the microbialcolonisation differs enormously between humans living in developing countries and thoseliving in developed countries (Savage, 1986). Microbial enzyme systems are inducible andcan vary significantly in different human populations (Ehle et al., 1982). This is the highlypertinent as microbial colonisation does not start until birth (Hoogkamp-Korstanje et al.,1979; Stevens, 1988; Onderdonk, 1998). Likewise, digestive enzymes of host animal tissuesare inducible and levels of enzymatic activity may vary with environmental and host factors(e.g. animal species, diet, stage of an animal’s development and health condition) (Stevens,1988; Meyer et al., 1993; Onderdonk, 1998).
There are essentially three sets of factors responsible for determining types and numbers oforganisms present within the large intestine. These include: (1) host factors such as anatomy,secretions into the gastrointestinal tract, peristalsis and local immune response; (2) dietaryfactors including both exogenous and endogenous components; and (3) bacterial-relatedfactors including adhesins, bacteriocins, cofactors, synergistic relationships, antagonisticrelationships and commensal relationships (Onderdonk, 1998). In the following analysis, onlythose factors relevant for this study will be discussed.
Both the proportions and the morphology of the gut may change either for individuals or forthe entire species throughout evolution when and if environmental and dietary factors change.For instance, dietary changes have already been evidenced to cause changes in gutproportions of primate species, even after a short time of captivity (Chivers and Hladik,1980). In response to different food qualities, especially fibre contents between seasons(e.g. winter versus summer), drastic adaptations of the digestive tract have been found inruminant species (Hofmann, 1983). Egyptian mummies were found to have a considerablylarger caecum than present-day man, which is construed together with morphological features(i.e. sacculated colon), that the archaic Egyptian gut resembles that of a herbivore rather thana carnivore type (Stevens, 1988).
Hence, a balanced microbial flora is essential for a normal functioning of the gastrointestinaltract and is of great importance for the health of the entire animal host. Herbivores especiallyrely on their microflora in order to break down the cell wall structures while gaining nutrientsfrom a diet high in plant fibre and low in readily available carbohydrates, (high) qualityprotein and vitamins (Stevens, 1988). Therefore the digestion by microbes occurs on both cellwall structures as well as on readily available food components which escaped digestion inthe upper digestive tract. As a result, soluble carbohydrates, starch, proteins and lipids aredigested by gut microorganisms, whether or not the animal has intestinal digestive enzymesthat attack these compounds (Wolin, 1981; Gray, 1984; Mendeloff, 1984; Plaut, 1984).
Important carbohydrate sources such as sugars, starch and structural carbohydrates likecellulose, hemicellulose and pectins are fermented to short-chain organic acids (= volatilefatty acids), principally acetic, propionic, and butyric acids, and the gases hydrogen, methaneand carbon dioxide. Although microbial fermentation is inefficient for soluble carbohydratesand starch, it is the only means to digest cell wall structures like cellulose, hemicellulose andpectins. Moreover, degradation of plant cell walls makes cell contents more readilyaccessible. Furthermore, endogenous non-protein nitrogenous sources such as urea, sloughed-off intestinal epithelium cells and mucopolysaccharides as well as non-protein nitrogen andlow quality protein from food are digested and upgraded by microorganisms to yield high

8 A General Introduction
quality protein. This in turn serves as an important source of protein for the animal (Wolin,1981; Stevens, 1988; Langer, 1988). The benefits of caecotrophy and coprophagy in order togain and preserve nutrients (Stevens, 1988) will not be elaborated on further within thisanalysis.
However, regardless of the exogenous or endogenous origins of carbohydrates, the productionof short-chain fatty acids are important sources of carbon and energy (Savage, 1986; Stevens,1988). The presence of short-chain fatty acids in the midgut of carnivores, omnivores, andherbivorous mammals suggests that microbial fermentation may be ubiquitous to the midgut(hindgut) of all terrestrial vertebrates (Stevens, 1988). Therefore, the type and amount ofdietary fibre has an important impact on composition and quantity of short-chain fatty acidsproduced (Wolin, 1981; Ehle et al., 1982; Hofmann, 1983; Mendeloff, 1984; Stevens, 1988;Cook and Sellin, 1998; Onderdonk, 1998; Campbell et al., 2002). Although microbialdigestion of dietary components is not essential for humans, production of short-chain fattyacids by microbial degradation of various carbohydrate sources largely occurs in the humancolon (Wolin, 1981; Ehle et al., 1982; Mendeloff, 1984; Demling, 1995; Cook and Sellin,1998). In spite of a controversial discussion with respect to whether there is energy gain forhuman host cells from short-chain fatty acids, their beneficial effects on bacterial growth andon the equilibrium of the microbial ecosystem as well as on various intestinal functions areindisputable (Wolin, 1981; Mendeloff, 1984; Stevens, 1988; Cook and Sellin, 1998;Onderdonk, 1998). For instance some short-chain fatty acids inhibit the growth of severalbacterial pathogens that can cause intestinal infections (Wolin, 1981). In case of the human’sdigestive tract, fibres with gelling polysaccharides greatly influence gut motility and interactlargely with absorptive and secretory processes, and influence e.g. blood glucose andcholesterol levels. Furthermore, different fibre types as well as their fermentation products arediscussed in the prevention of various gastrointestinal disorders and diseases such as coloncancer (Wolin, 1981; Ehle et al., 1982; Mendeloff, 1984; Plaut, 1984; Cook and Sellin, 1998).
Therefore, forestomach-fermenting mammals with or without rumination as well as midgut-fermenting herbivores with microbial fermentation either in the caecum or colon or both,house an enormous number of bacteria (and some protozoa) with fermenting propertiescapable of yielding essential nutrients and energy sources.
A well-functioning symbiosis between microflora and their host is indispensable when itcomes to the health and welfare of the animal host as a whole (Savage, 1986; Onderdonk,1998). In that symbiosis, the mucosal barrier of the gut plays an important and multilateralrole. On one hand, the mucus layer and the microflora influence each other, on the other handthey build an important barrier against harmful chemical substances and a barrier tocolonisation and prevent bacteria and viruses from penetrating into the host. The immunesystem of the mucosa has distinct structural and functional features as compared to thesystemic immune system, and represents in many respects a separate immunological entity(Marth and Zeitz, 1998). So, the gut microflora holds protective functions either bystimulation of immune mechanisms, or by direct competition with pathogenic organisms(Stevens, 1988; Gabe et al., 1998; Marth and Zeitz, 1998; Meddings et al., 2003).
3.3 The phenomenon of diarrhoea
All influences that are disruptive to the microbial ecosystem within the gastrointestinal tract,or the equilibrium between microflora and host, often lead to disorders that are either confinedto the digestive tract or include the entire organism.
Reasons for possible disturbances are numerous and often multifactorial. They reach fromexogenous factors such as changes in food composition, invasion of detrimental bacteria andviruses, toxic substances, and antibacterial drugs, to endogenous factors such as auto-immune

A General Introduction 9
diseases and toxic metabolites that are produced by the indigenous microflora. Overall, thesefactors result in gastrointestinal disorders with diarrhoea being the most striking symptom. Ananimal experiencing an acute bout of diarrhoea dehydration is a life threatening conditionrisk, a more chronic affection of absorptive processes leads to malabsorption and nutrientdeficiencies, wasting syndrome and persistent weight loss. Moreover, if the mucosal barrier isseverely affected by infections, an inflammatory bowel disease or cancer may cause adysfunction or degeneration. However, these diseases are more general and impact the overallimmune system of the entire animal rather than a disease which is only confined to thedigestive tract.
3.4 Implications of morphology
All indriid species are well adapted to an arboreal life. They can be described as verticalclingers and leapers of medium to large body size (Richard, 1978a, b; Powzyk, 1997). AdultP. v. coquereli weigh approximately 4 kg (Tattersall, 1982). All indriids are midgut-fermenting primates consuming a predominantly folivorous diet. Within the Indriidae family,Indri indri shows the highest degree of specialisations in regard to folivory (Powzyk, 1997;Powzyk and Mowry, 2003).
One of the first detailed description on indriid morphology was given in 1875 by Grandidier(Milne Edwards and Grandidier, 1875). Both lemurs and lorises show a unique feature in theirdental morphology. The toothcomb of the lower jaw incorporates incisors and canines whichallow for scraping and stripping techniques utilised in the collection of plant tissues such asgum exudates, bark and leaves. Although gum feeding has not been reported for indriids, thecommon ancestor of lemurs and lorises may have subsisted on gum to some extent (Charles-Dominique, 1977; Petter and Petter-Rousseaux, 1979; Martin, 1979). However, the Indriidaehave only four teeth instead of the usual six in their lower toothcomb (Milne Edwards andGrandidier, 1875; Petter and Petter-Rousseaux, 1979; Maier, 1984). The shape of teeth differfor Indri and Propithecus: Indri’s teeth are even more adapted to shearing leaf material(Martin, 1979; Maier, 1984; Powzyk, 1997).
The entire digestive tract of P. v. coquereli is highly specialised. Indriids possess hyper-trophied salivary glands, voluminous stomachs, sacculated ceaca and looped colons (MilneEdwards and Grandidier, 1875; Hill, 1953; Powzyk, 1997). A recent work of Campbell et al.
(2000) on P. v. coquereli and the related species P. tattersalli revealed a spiralled colon and asacculated caecum, possessing three distinct teniae running the entire length of the caecum,with no sacculations present in the colon. Both the colon and the caecum are embedded by anextensive network of blood vessels. Milne Edwards and Grandidier (1875) previouslydescribed the extensive arterial blood vessels embedding the gastrointestinal tract. Althoughthe Propithecus and Avahi, genera exhibit these aforementioned specialisations, it is mostpronounced in the Indri. These physiological consequences together with a (possibly) reducedmetabolic rate may be in evidence for many of the arboreal folivores including the indriids aswell as other prosimian species (McNab, 1978; Müller, 1983; Richard and Dewar, 1991;Ross, 1992; Lopes Santini, 1992) and need further investigation.
The ratio of total intestine length (small intestine + caecum + colon) to body length was foundto be 13.0 : 1 for P. tattersalli and 15.9 : 1 for P. v. coquereli (Campbell et al., 2000).According to measurements by Milne Edwards and Grandidier (1875), the ratio of intestinelength to body length is 14.7 : 1 for P. diadema, 17.9 : 1 for Indri, and 18.9 : 1 for Avahi withdiffering proportions of small intestine length, caecum length and colon length as related tobody length between species. However, ratios within indriids are much greater than any otherlemur species of a non-indriid family that consumes a more frugivorous diet (Campbell et al.,2000). For P. tattersalli and P. v. coquereli, the sacculated caecum is presumed to be the

10 A General Introduction
principle site for microbial fermentation of plant cell wall components resulting in theproduction of short-chain fatty acids (Campbell et al., 2000). However, it is striking that in P.
v. coquereli the length of the small intestine is nearly the same as measured for the colonicsection, which is about 3.5 m respectively (Campbell et al., 2000). This obviously pleads forthe importance of a well functioning colonic ecosystem to contribute to food processing andto maintain a well functioning gastrointestinal system.
Gut passage rates are in the same range found in other folivores, such as howler monkeys. Forboth P. v. coquereli and P. tattersalli, a mean transit time of 17-19 hours with a meanretention time of 31-34 hours was observed under experimental conditions at the DULC(Campbell et al.,1999). Another feeding study on P. v. coquereli, with experimental dietsrevealed a transit time of about 23-26 hours with a mean retention time of 30-38 hours(Campbell et al., 2004b). In a study using different sized radio-opaque barium-impregnatedpolyethylene spheres to characterise gastrointestinal transit times, the animal needed about 10hours until the first small spheres left the stomach while it took nearly 36 hours for the largespheres to depart. The focal animals needed 24 hours in total for the first small spheres toappear in the rectum. The long storage time in the stomach, contributes significantly to theentire transit time and reflects the species-specific manner of food processing byP. v. coquereli (Campbell et al., 2004a).
P. v. coronatus living at the Zoological Park of Paris exhibited a mean retention time of about23 hours under experimental conditions (Lopes Santini, 1992). In comparison, for humans amean transit time of about 37 hours was reported (Clemens and Phillips, 1980).
The olfactory sense is well developed within prosimian species and evidenced by scentmarking behaviour and the presence of scent glands. P. v. coquereli males differ from femalesin their possession of a throat gland. For a discussion of pheromones see Schilling (1979). Asscent-marking is an important feature for communication, social behaviour and rangingpattern, it can be presumed that smell and taste are also important prerequisites for dietselection, as evidenced by feeding trials with Lemur fulvus (Glander and Rabin, 1983).
Hence, the difficulties in maintaining animals of the indriid family in captivity seem to beclosely related to their highly specialised digestive system which requires a specialised diet.As already mentioned, even among closely related species, the digestive system of an animalincluding its associated organs, will dictate the digestibility of its preferred diet.
4 Plant secondary metabolism and self-medication
Secondary plant compounds are widely distributed among the plant kingdom and serve tofulfil numerous functions, which are not initially apparent. While some compounds attractinsects and even primates as pollinators (Gautier-Hion and Maisels, 1994) or as seeddispersers (Garber and Kitron, 1997), most chemical compounds function as a type ofdefence, especially as feeding deterrents against insects. Although plant eating insectsrepresent the most important selective pressure on plants, this has led to a coevolutionbetween the two, yet other compounds may have evolved as a means to resist plant pathogenssuch as fungi, bacteria and / or viruses. The concept that plant secondary compounds are justwaste products has long been discarded (Glander, 1982). From the viewpoint of a plant, itsspecific array of secondary compounds – which often interfere with or function as primarycompounds – have evolved to cope with its surrounding environment, its ecosystem includingall biotic and abiotic factors.
The way primates, especially folivorous primates, cope with the challenge of secondary plantcompounds has yielded a large range of hypotheses and theories, each with a differentappreciation of the impact of secondary compounds on primate’s feeding behaviour.

A General Introduction 11
Early approaches evaluated secondary compounds mainly as toxic substances and beingenergetically-costly as they utilise energy in order to be detoxified. This should result in aheightened avoidance of secondary compounds by herbivores (Schoener, 1971; Freeland andJanzen, 1974; Janzen, 1978; Richard, 1978a). “Consuming plant secondary compounds is apotentially dangerous and metabolically expensive enterprise.” ... “Herbivores shouldtherefore prefer to feed on plant parts containing small amounts of secondary compounds”(Freeland and Janzen, 1974). Thus, sensory capabilities and memory are importantprerequisites to be able to recognise and avoid toxic substances (Freeland and Janzen, 1974).
Hence, two opposing feeding strategies are thought to have evolved within those animals thatconsume large volumes of plant foliage. Generalist herbivores are believed to feed on a widerange of different plants as a means to detoxify an array of small doses of secondary plantcompounds, while not ingesting a large detrimental dosage of a single toxin. Specialists arethought to concentrate on fewer food resources, and in turn become highly specialised in theirability to detoxify the compound(s) that occur in much higher dosages (Freeland and Janzen,1974; Glander, 1982; Glander et al., 1989).
Cases have been documented of specialists such as the koala that consumes substantialamounts of essential oils from Eucalyptus species (Zoidis and Markowitz, 1992), or thegolden bamboo lemur (Hapalemur aureus) which is sympatric with two other bamboolemurs, and is able to consume large amounts of cyanide in its preferred food, emergent tipsof the giant bamboo (Glander et al., 1989). Both of these animal species occupy specialecological niches which require special adaptations e.g. as to detoxification systems. Especial-ly for sympatric species, food partitioning and food selectivity are prerequisites that makecoexistence possible and current studies are increasingly dedicated to that problem (Charles-Dominique, 1979; Ganzhorn, 1985; 1987; 1988; 1989b; Glander et al., 1989; Richard andDewar, 1991; Overdorff, 1992; 1993; Powzyk, 1997; Powzyk and Mowry, 2003).
Although the rather rigid paradigm that an animal feeds to maximise nutrients and energy,while minimising its consumption of energy-costly secondary plant compounds has fallen outof favour, it has not been completely abandoned (Glander, pers. comm.). To current opinion,secondary plant compounds influence primate food choice in that they are more likely to beactively avoided than actively sought out (Glander, 1982). However, an animal will exhibit ahighly selective diet as a result of the highly variable distribution of primary and secondaryplant compounds throughout plant societies and ecosystems. This has been seen in a widerange of Old World and New World primates and prosimian species (Oates et al., 1977;Glander, 1982 (review article); Ganzhorn, 1986; Ganzhorn, 1988; Ganzhorn, 1989a, b; Powerand Oftedal, 1996).
“Since plant secondary compounds are ubiquitous, it is highly probable that they influenceprimate food choice. There is, however, no a priori reason to assume this impact is eithernegative or positive, or that either is mutually exclusive. The challenge lies in determininghow the system works” (Glander, 1982).
As already mentioned, there is a close interdependency between diet and gut structure. Ahealthy animal with good nutrition is closely linked to both a quality and quantity of foodappropriate to that animal’s gastrointestinal tract and the digestive system. According toLanger (1988) “nutritional niches are clearly related to anatomical differentiations of thegastrointestinal tract”. ... “Adaptations of the digestive tract in relation to diet need muchmore appreciation and coevolution between the digestive tract including associated organsand dietary limitations widen or narrow an ecological niche.”
Dentition, digestive fluids, gut morphology, bacterial flora have contributed to the integrity ofa single organismal unit, which is the basis for its diet selection and its metabolism(Savage, 1986; Stevens, 1988). There must have been a coevolution between availability offood, e.g. spatial distribution of trees, seasonal availability of leaves, flowers, fruits and other

12 A General Introduction
plant parts, and the adaptations to food processing and digestion, as well as abilities andtechniques of reaching and handling the desired food items. In short, there are differentfactors that have influenced the requirements necessary for a specific ecological feeding niche(Hladik, 1978; Garber, 1987; Richard and Dewar, 1991; Gautier-Hion and Maisels, 1994;Powzyk, 1997). Behavioural adaptations as well as the daily activity pattern and / or homerange size in relation to diet was the subject of many primatological field studies (Tattersall,1977; Richard, 1978a; Milton and May, 1976; Milton, 1980; Engqvist and Richard, 1991;Strier, 1992; Powzyk, 1997).
However, the digestive tract is a crucial factor in defining the life-style of an organism. Dietmassively influences the well-being of an animal by directly affecting the gastrointestinaltract. Nausea, vomiting, and diarrhoea are essentially uncomfortable disorders supposedlyinfluencing sensory capabilities and learning in regard to food choice (Johns, 1990). Dietarydeficiencies become extremely visible, if captively maintained animals fall ill or die.Folivorous primates, as in members of the strepsirhine indriid clade (Spelman et al., 1989),together with Old World primates like the colobines (Collins and Roberts, 1978) and evenspecies with a more frugivorous diet like the New World primate Saguinus oedipus, thecotton-top tamarin, succumb in captivity to disorders and diseases concerning thegastrointestinal tract and associated organs. Saguinus oedipus easily suffer from ulcerativecolitis, a chronic inflammatory bowel disease, and subsequent colon cancer in captivity, thatseems to be related to dietary and gastrointestinal factors (Chalifoux and Bronson, 1981;Madara et al. 1985; Podolsky et al., 1985; Clapp et al., 1988; Tardif et al., 1988; Watkins et
al., 1988; Winter et al., 1989; Targan et al., 1992; Podolsky et al., 1993; Stonerook et al.,1994; Power and Oftedal, 1996; Wood et al., 1998; 2000; Tobi et al., 2000).
Difficulties in husbandry of folivorous herbivores often show disparate success rates in theiradjustment to a captive diet and this can be extended to arboreal folivorous mammals such asthe folivorous marsupials (e.g. the koala, Phascolarctos), the edentates (e.g. sloths, Bradypus)as well as the panda (Ailurus) (Collins and Roberts, 1978). Adjustment to an appropriate dietin captivity is the prominent challenge for all institutions involved in their maintenance.
Of course, leaf-eating primates rely on primary compounds as carbohydrates, proteins and fatas sources of nutrients and energy as does every animal. There is no doubt that nutrientquality and quantity should be balanced in the diet (Glander, 1982). However, folivoresencounter a rather large variety of secondary compounds in different amounts with differentpharmacological effects inherent to numerous plant species and parts (Janzen, 1978). Theamount of primary and secondary compounds can vary significantly with each plant species,plant parts and climatic season, forcing to a selective feeding behaviour (Fig. A.2). However,the question arises, as to whether the relation between herbivory and secondary compounds isonly of unidirectional quality, resulting in minimising and / or avoidance of secondarycompounds. Or could it be reasonable to assume, that certain classes of secondary compoundsare actively sought out?
The principle of balancing a species primary compound needs should be extended to itssecondary compound needs / tolerances with a possible positive effect on the other.Interactions and synergistic effects between and within both groups of primary and secondarycompounds and their interference with the digestive system of a herbivore are expected tooccur widely (Fig. A.2).
From a pharmacological point of view, primary and secondary compounds are orallyadministered at the same time, e.g. during one meal. While application and release build thepharmaceutical phase and concern all primary and secondary compounds alike; absorption,distribution, storage, metabolism and elimination processes build the pharmacokinetic phasewhich also concerns substances occurring naturally in the animal body. Pharmacologicaleffects and side-effects build the pharmacodynamic phase. Extent and rate at which an agent

A General Introduction 13
is taken up by the body to be available at the site of action, is called bioavailability. Processesof absorption, distribution, metabolism and elimination occur at the same time, and rate andspeed are depending on age, body-size, partly on sex differences, enzymatic equipment andhealth condition of the animal host (including humans) (Mutschler, 1996). The enzymaticequipment may vary between populations as indicated in the occurrence or absence of theenzyme, lactase, in humans (Gray, 1984). Enzyme systems as well as receptors can beinduced or inhibited depending on the agent to be processed.
Digestive processes already commence in the mouth by enzymes contained in the saliva,alleviated by both the chewing and grinding of the food. In monogastric mammals likehumans, the absorptive processes occur mainly at the surface of the intestinal lumen.Metabolic processes predominantly occur in the liver, but also in the mucosa as well as by thegastrointestinal microflora and intestinal enzymes that are produced by the animal host itself.While in humans, the gastrointestinal microflora plays only a minor role in detoxificationprocesses, yet especially in herbivorous mammals, the impact of gut microbes either in theforestomach, midgut or both are of great importance (Langer, 1988; Stevens, 1988).Moreover, the gut participates in the enterohepatic circle, which can prolong the effects ofpharmacologically active compounds which have either been ingested or produced by thebody itself.
In this context, one facet of plant use deserves far more appreciation: the use of medicinalplants. It needs to be emphasised that self-medication by means of secondary plant com-pounds may improve health conditions and life quality, prolong life-span and may ultimatelybe viewed as evolutionary adaptation. While medicinal plants are well accepted in humanmedicine for acute or chronic diseases, called phytotherapy, their role for animal species isjust beginning to be understood. Extensive research has been done on chimpanzees as ourclosest relative and how they utilise certain plants for medicinal purposes (Wrangham andNishida, 1983; Wrangham and Goodall, 1989; Huffman and Seifu, 1989; Dossaji et al., 1989;Mason, 1990; Sears, 1990; Page et al., 1992; Jisaka et al., 1993; Clayton and Wolfe, 1993;Koshimizu et al., 1993; Ohigashi et al., 1994; Huffman, 1995; Huffman et al., 1997; Page et
al., 1997). The special way of ingesting plant tissue like swallowing entire leaves by chim-
metabolism
well-being
feeding ecologydiet
gut system
primary and secondarycompounds primate
primary and secondarycompounds
Fig. A.2: Relationship between an organism such as a primate and its environment.Factors influencing the ecological niche are viewed from the standpoint of theprimate.

14 A General Introduction
panzees and bonobos (Newton and Nishida, 1990; Huffman et al., 1997; Dupain et al., 2002)has quickly attracted the researcher’s attention and ethnobotanical applications in regard tohumans have also been examined. Leaf-swallowing is viewed as a form of drug dose, with theintended pharmacological effects delivered to the gastrointestinal tract as in the removal ofparasites. Indeed, it seems that primates suffer from numerous gastrointestinal parasites(Ohigashi et al., 1994; Landsoud-Soukate et al., 1995; Stuart and Strier, 1995; Huffman et al.,1997; Dupain et al., 2002). With respect to the strong feeling of nausea in gastrointestinaldisorders, it is not surprising that a large range of present day phytopharmaca in human medi-cine is dedicated to gastrointestinal disorders and associated digestive processes within the gutincluding organs such as the bile, liver and pancreas. In this respect the bitter taste is obvious-ly an important clue to chimpanzee’s phytotherapy (Newton, 1991; Koshimizu et al., 1994).
However, while the application of phytotherapy among primates in case of acute disorders isrelatively obvious, long-term use of medicinal plants for chronic disorders or the applicationof subtherapeutic dosages are far more sophisticated and in turn, difficult to analyse. Recentlythere is an increased awareness of the impact of secondary compounds in the human’s diet,and this awareness results in a voluminous market of supplementary products containingextracts or compounds of various plant species.
As the cognitive and perceptive abilities in primates increased during evolution, this too ishighlighted in the development of human medicine and pharmacy. Humans learnt to copewith secondary compounds in plants within their environments, which then led to a selectiveuse of plants for medicinal purposes. Knowing this, it is just a small step to hypothesise thatthe daily food selection of folivorous primates is more likely to select those secondary plantcompounds which exhibit beneficial effects onto their gastrointestinal tract and their well-being rather than just minimise the intake of plant chemicals and subsequent detoxificationprocesses. When substantial amounts of plant tissues are selected and their correspondinghigh levels of secondary compounds are ingested (e.g. essential oils by the koala, cyanidecompounds by Hapalemur aureus), other purposes besides the obvious detoxificationprocesses are to be presumed. If secondary plant compounds are conceived as challenge andchance to occupy a novel niche, they should yield an evolutionary advantage and acontribution to the fitness of the herbivorous animal. With respect to the aforementionedadjustment of the digestive tract to diet and vice versa, the secondary compounds should beincluded in this paradigm and their subsequent impact on niche occupation and health benefitsshould be thoroughly investigated.
5 Major goals
The major goal of this study is to examine the role of the leaves beneficial to the well-being ofP. v. coquereli. On one hand, leaves are an important dietary food item for nutrients andenergy supply, on the other hand, the behaviour of selective leaf choice pleads for additionalfactors influencing food composition. The diversity of secondary plant compounds as integralingredients of any plant tissue, provides numerous ecological functions and pharmacologicaleffects and is therefore predestined to influence the feeding behaviour of herbivores. Based onactive leaf choice of captive Coquerel’s sifakas and the finding that overall health improvedsignificantly when different leaf species had been introduced into the diet, justify the need toexamine the role of the leaves in the sifakas’ diet with particular respect to the occurrence ofsecondary plant compounds and their health benefits.
At the onset of this study, no detailed data have been available on food intake of Coquerel’ssifakas in captivity at the DULC. Consequently, qualitative and quantitative aspects of thediet will be surveyed to assess food composition. Different holding conditions including

A General Introduction 15
access to forested habitat enclosures of the North Carolinian forest and seasonal changes inleaf composition will be scrutinised in their importance that influence food choice.
To assess the seasonal influence on leaf composition, two different study times were chosen:spring (May) and autumn (October). Observation of feeding behaviour will reveal general andindividual food preferences in order to document preferred, less preferred and avoided plantspecies and to take into account seasonal dependencies. Food intake will be based on weightsand measures of food plants as related to body weight of the focal lemurs. Quantitativedeterminations of primary compounds shall reveal food composition of carbohydrates, fat andproteins and caloric needs with special respect to the impact of the leaves.
To determine the leading secondary plant compounds in the most preferred food plants,preparative analyses with subsequent structure elucidation will be conducted. Quantificationof the leading compounds in the diet and subsequent relation to bodyweight shall build thebasis for pharmacological dosage comparisons with human medicine. Pharmacological assayswith special respect to gastrointestinal disorders will complete the beneficial aspects of theselected secondary plant compounds for the sifakas. Less selected or avoided food plants willbe screened for their secondary compounds mainly by literature study to review lessbeneficial or avoided compounds.
This study design implies several advantages: 1. Holding and feeding conditions do not haveto be changed in order to study feeding behaviour, 2. Data collection can start from the firstday on. Therefore, no time is needed for the habituation of animals to this experiment. Themethod of data collection on feeding behaviour within the outdoor enclosures was developedto be applicable to wild field conditions. Two study periods have been chosen, both periodslong enough to gain reliable feeding data, and small enough to analyse the contents of primaryand secondary plant compounds of the respective food species and parts as constant. In orderto determine intended dosage calculations of ingested plant compounds it is advantageous tocollect feeding data on consecutive days. Furthermore, changes in contents of primary and / orsecondary plant compounds (as predicted for the different seasons) are expected to mirrorchanges in the feeding behaviour and hence the consumption of the respective plant tissue.
With respect to qualitative plant analyses, methods will be employed that can easily betransferred to the wild (e.g. thin-layer chromatography). This shall encourage otherresearchers to analyse a focal animal’s food plants within their natural habitat. This will giveresearchers a better understanding of the animal’s food choice, and dietary aspects which willserve to improve an animal’s overall health when captive.
Hence, two short moments in the life of captive Coquerel’s sifakas were chosen to investigatetwo major problems, which will be treated in Part B and C of this study, respectively:
Part B is dedicated to the observation of the feeding behaviour and quantification of foodintake on a fresh weight basis. The investigation of the food choice shall reveal foodpreferences or avoidance of plant species and parts, which might either be based on individualtaste, or overall feeding pattern which may or may not follow seasonal constraints. The basicquestion is: What do the animals eat?
Part C is designed to analyse the main food plants for their contents of primary and secondaryplant compounds. Of course, quantification of the secondary compounds necessitates a seriesof sophisticated analyses for characterisation and structure elucidation of the majorcomponents to know what the sifakas actually ate. Assays will be conducted to revealpossible pharmacological effects of the leading secondary plant compounds. Quantification ofthe major secondary products and calculations of actual dosages ingested by the sifakas willbe the basis for this dosage-corresponding relationships and comparisons to human medicine.Hence, the following question will be assessed:
What dietary factors are responsible for the sifakas’ well-being?

16 B Empirical study on food selection
B Empirical study on food selection
1 Introduction
The following study is designed to monitor the feeding behaviour of captive P. v. coquereli
during two seasons with respect to dietary composition of food species and the respectivequantities eaten. This study was conducted at the Duke University Lemur Center (DULC) inNorth Carolina, USA. Based on previous studies, active food choice has been welldocumented in a variety of lemur species (Milne Edwards and Grandidier, 1875; Glander andRabin, 1983; Glander, 1986; Haring, 1988) and can be used as an important tool to decipherwhich plant species are worthy of analysis.
A total of six animals were studied during two study periods, the first in the spring of 1994and the second in the autumn of 1997. Animals were kept in a variety of enclosures, includingvarious combinations of indoor cages, outdoor cages and / or free-ranging forested habitatenclosures. The focal lemurs received daily feedings of a wide variety of fruits and vegetablesaugmented with commercial leaf-eater primate chow. In addition, a clump of browse was cutfrom various tree species growing proximate to the DULC forest and were then brought intothe animal’s cages on a daily basis. Two of the four study groups have had long standingaccess to forested habitat enclosures. These groups were especially important in observinghow P. v. coquereli responded to the variety of plant species available under naturalconditions.
Observations were conducted during the main feeding times when animals were in their cagesand / or in the outdoor forested enclosures. The sifakas were observed to discriminate betweendifferent food types as seen in their disparate handling of potential food plants from varioustrees, shrubs and climbing plants. The recording of a feeding pattern helped to discern whichfoods were preferred and which were avoided by the focal lemurs. These observationshighlighted the species-specific food requirements for P. v. coquereli as indicated by theirpreferred food specimens. A classification system of the different plant species was thenrecorded to reflect the general behaviour of the animals towards the different plant speciesand plant parts within their environment and in respect to seasonal differences.
The entire food intake is based on each plant’s fresh weight, the parameters of each lemurgroup, together with the lemurs’ kg bodyweight. If no direct weighing of food items waspossible (e.g. feeding on wild browse in outdoor enclosures), the corresponding weight offood intake was estimated. Seasonal variations in dietary preferences were taken into accountas well as any variations attributable to the needs of animals of disparate ages.
Both, the qualitative and quantitative analyses of the important food constituents withparticular respect to those leaves selected by the animals were used to help identify whichsecondary plant compounds are crucial in food choice and may ultimately bear beneficialeffects toward the health of the Coquerel’s sifakas. In summary, observations from Part B willestablish the basis for subsequent nutritional, chemical and pharmacological investigations onthose plant species that prove vital in the maintaining the robust health of the six captiveP. v. coquereli within the four study groups.

B Empirical study on food selection 17
2 Materials and Methods
2.1 Animals
The feeding behaviour of a total of six animals assorted in four groups were studied duringtwo different seasons, spring and autumn (Tab. B.1). Two groups were studied during eachperiod, respectively. The first observation period occurred in spring, lasting from the 5th to23rd of May in 1994. The follow up study was conducted in the autumn from the 30th ofSeptember to the 9th of October in 1997. At periods of observations, the group of Marcellaand Tiberius (M&T) and Julian and Drusilla (J&D) consisted of adult1 animals, respectively.In contrast, the group of Drusilla and Valentinian (D&V) and Gordian (G) consisted ofjuvenile (Drusilla and Gordian) and subadult (Valentinian) sifakas.
Tab. B.1: The table represents the study animals and how they were grouped during bothstudy seasons. Data of birth and bodyweights are included
a.
spring '94 autumn '97
name (abbr.) IDb date of birth weight group weight group
Marcella (M) 6110 f summer 1981c 4830 g
Tiberius (T) 6207 m 20. Jan. 1988 3700 ggroup M&T
Valentinian (V) 6450 m 2. Nov. 1991 3400 gDrusilla (D) 6538 f 6. Apr. 1993 2550 g group D&V
4470 gd
Julian (J) 6518 m 4. Mar. 1993 4060 ggroup J&D
Gordian (G) 6650 m 17. Dec. 1995 3000 g group G a
The bodyweights depicted in Tab. B.1 were treated as being constant throughout the short study times.For fluctuations of bodyweights in captivity and in the wild see Glander et al. (1992).
bIdentification number
cDate of birth was estimated at time of capture; wild caught 11.6.1986.
dAs Drusilla gave birth to an infant on 7th of February 1998 with a presumed gestation period of 160-165days (Campbell, pers. comm.), she was presumed to be pregnant during the observation time in theautumn. Richard (1978a) reported a gestation period in the wild of about 130 days; 162 days are reportedby Tattersall (1982).
Three study groups consisted of two animals, one female and one male, respectively. Thefourth group (G) comprised only one male. As he had a broken foot, he was kept alone.
Whereas group M&T had partial access to the natural habitat enclosure NHE-1 during thespring, in the autumn group J&D was kept in NHE-3 during the entire study period and spentmore hours per day in the forest than group M&T. The other two groups only stayed withinindoor cages during the study periods (see Fig. B.1 and Fig. B.2).
When group M&T was observed, it was the third time for Marcella to be outside in a naturalhabitat enclosure. Tiberius was there for his first time during the observation period in spring1994. In contrast to group M&T, group J&D had already been well habituated to the forestwhen the study was started in the autumn 1997. Marcella and Julian have been collared formost of the study time and could therefore easily be identified in the forest. Otherwise,
1 1-2 years: juvenile; 2-3 years: subadult; > 3 years: adult, although growth may continue (Richard, 1978a).

18 B Empirical study on food selection
animals within the same group could be identified by their appearance regarding size, weightand physiognomy.
Typically, adult females are reported to be the dominant group members within a group’sfeeding hierarchy, with the exception to juveniles and subadults being displaced by adultanimals (Richard, 1978a; Richard and Dewar, 1991). The same behavioural pattern was foundfor the groups of this study. In the group of Drusilla and Valentinian, the juvenile Drusillawas chased away several times during a feeding bout by the older Valentinian. Dominancebehaviour in this study is only important as far as access to food is concerned. It may be thatsome aggression was a means to avoid inbreeding (father-daughter) yet studies of their socialbehaviour lie beyond the scope of this study.
In spring 1994, group M&T was studied for three weeks, group D&V for one week. In theautumn 1997 all study animals were observed for a period of 11 days (Tab. B.2). In May, bothstudy groups were kept during the first week in their indoor cages. For the second week,group M&T moved to a holding cage in NHE-1 to be acclimatised to the surrounding forestand to a group of Eulemur coronatus already residing there. During the third week (17.-23.5.1994) the sifakas were allowed to go out into the forest for several hours per day. Thedaily sojourn terminated abruptly when Marcella vigorously attacked the group of E.
coronatus.
Tab. B.2: Duration of the study periods and number of days used for data record.
Group M&T D&V J&D GNo. of days of study periods 19
a 7 11 11
No. of days for data record of leaves 18 7 11 11No. of days for data record of fruits & vegetables 16 7 11 10a
Group M&T was studied for 6 days in their indoor cage, 6 days in the holding cage of NHE-1 and 7 days inthe forest of the natural habitat enclosure NHE-1.
Discrepancies between the number of days comprising a study period and the number of daysutilised for data collection were due to various intrusions such as when staff interfered withthe procedure of this study, e.g. when the study groups had already been fed by the staffbefore food refusals of the last feeding bout could be collected back, data had to be discarded.
2.2 Feeding conditions
Except for group J&D, all animals were fed twice a day. Food was composed of fruits andvegetables, primate chow, and leaves (Tab. B.3). In the morning, animals received fruits andvegetables including chow; in the evening they received a bunch of leaves, called “browse”.Only group J&D received an evening feeding of all types of food after having spent the dayoutside in the forest.
Fruits & vegetables were offered in feeding bowls, one for each animal, respectively. Browsewas cut in the forest nearby and hung up within the cages. Water was given ad libitum.
While Marcella and Tiberius got a total of 21 different species of fruits and vegetables and 8different leaf species during their study time, the other three groups received a total of 20different species of fruits & vegetables and 6 (group D&V) or 7 (groups J&D and Gordian)different leaf species, respectively (see Tab. B.3). As easily can be seen from this table, plantspecies offered tended to vary.

B Empirical study on food selection 19
Tab. B.3: Food species offered in the cages to the study groups. Figures indicate thefrequency, how often a designated food species was given to the respective studygroup.
fruits & groupvegetables M&T D&V J&D Gapple 12 4 8 6banana 4 2 2 4Brazil nut 3 1broccoli 4 3 1 4cantaloupe
a 7 3carrot 15 4 4 3cauliflower 3 2celery 1 2 2 3chick pea 1 3 7 8chow
b 16 7 11 10cucumber 14 3 10 7French bean 2grape
c 3 2 1
kaled 11 3 7 6
kiwi fruit 1 1 1mango 2 1 1muskmelon
a 3 1mustard, green 1 1onion 1 2orange 8 2pea (pods and
seeds),greene
3 4
pear 4 4plum 1 2red cabbage 2 2sweetcorn 1 2 1sweet potato 13 4 11 10watermelon 1 3white cabbage 2 2 1 1
groupleaf species M&T D&V J&D GRhus copallina 18 7 11 11Albizia
julibrissin18 7 10 10
Robinia
pseudoacacia4 2 2 2
Acer rubrum 17 6Cercis
canadensis14 5 2 2
Liquidambar
styraciflua17 6 5 5
Liriodendron
tulipifera1 3 3
Photinia
glabra1 1
Mangifera
indica1
aBoth the cantaloup(e) and honeydew melon were fed to the animals, and were available in U.S. markets.These melon types can be interpreted in their vernacular names as muskmelon, Cucumis melo L. Toindicate that two different sorts were fed, cantaloupe was recorded as cantaloupe and honeydew melon asmuskmelon.
bMazuri Leaf-eater Primate Diet, No. 5672, Purina Mills, Inc., St. Louis, MO, quality controlled by PMIFeeds, Inc.
cGrape: violet and red sorts were fed.
dKale: frizzy and smooth sorts were fed.
eTwo varieties of peas were fed.
Rhus copallina (sumac) and Albizia julibrissin (mimosa) were the most consistent leaf speciesfed to the study animals. In 1994, additionally Acer rubrum (red maple), Cercis canadensis
(redbud), and Liquidambar styraciflua (sweetgum) represented the bulk of leaves which wereoffered nearly daily to groups M&T and D&V. In 1997, both study groups typically receivedthree out of seven different leaf species per day, yet received four species on a single day

20 B Empirical study on food selection
during observation. Normally, R. copallina and A. julibrissin plus a third leaf species built thebulk of leaves presented to the groups J&D and G. However, regarding the leaf species, bothgroups of the same study period received (with one exception) the same leaf species on daysthey were simultaneously studied.
2.3 Holding conditions
Cages
Basically, “indoor” cages were identical equivalents. Boxes with heating lamps were installedto provide heat during cold days. Half of the cages of groups M&T and D&V were coveredby a roof. Gordian’s cage was totally covered. (Group J&D was not observed in indoorcages.) Several large trunks provided platforms for jumping and sitting. In the cage of groupD&V some bamboo was growing. In each cage, fresh air and UV-light were in abundance.
Holding cages within the natural habitat enclosures were larger, without any roof yet largeboxes were provided for shelter. Detailed descriptions are given by Haring (1988).
Natural habitat enclosures
The feeding behaviour of the Propithecus groups were undertaken in the two natural habitatenclosures of NHE-1 and NHE-3. During the spring, group M&T was studied in NHE-1comprising 0.6 ha (Fig. B.1), and during the autumn, group J&D in NHE-3 had a 1.5 ha area(Fig. B.2). All natural habitat enclosures were surrounded by an electric fence. A broad laneof grassland that was several meters in width, prevented the animals from escaping throughthe trees and jumping over the fence. Within the NHE-1 enclosure, a house was built near theentrance that was used for seminars and was typically closed. It served as preferred sitting andclimbing facilities for the focal lemurs. More details are given by Glander (1986) and Haring(1988).
Both, NHE-1 and NHE-3 were mapped out with particular respect to the species of trees,shrubs and climbing plants, from which the animals were observed to eat from, rest in, orjump through. Climbing vines growing on these designated trees were also noted. Additional-ly, at least one individual tree, shrub or vine of each species growing in the respective NHEwas included on the maps as a review of the species diversity within the forested site of thefocal animals. Based on observed activity patterns, the lemurs preferred the northern aspect ofNHE-1 enclosure while the other group preferred the southern aspect of NHE-3. Thismirrored wild type behaviour as reported by Richard (1978a), who noted that lemurs tend touse certain pathways while travelling within their respective territories. Only the core habitatswithin the enclosures were carefully mapped out, whereas the animals’ tracks were notdepicted on the maps (Fig. B.1 and Fig. B.2). Herbs and additional plant species whichcomprised the ground layer were of minor interest to the feeding sifakas and are not includedon the maps, but are discussed specifically when the animals came down to the ground.
Plant species included on the maps were initially identified using the “Audubon Society fieldguides to North American trees and wildflowers” (Little, 1993; Niering and Olmstead, 1992),with additional verification by Prof. Dr. R. L. Wilbur of the Duke University BotanyDepartment.
The following species were present in the NHE-1 enclosure, but not depicted in the map (Fig.B.1): Rhus radicans (poison ivy; ground layer), Pinus taeda (loblolly pine), Juniperus
virginiana (red juniper), Ailanthus altissima (tree-of-heaven) and Lonicera japonica
(honeysuckle). Pinus taeda was the tallest and most widespread tree, growing up to 30 m,while most of the other trees had a height of approximately 4 m at the time of study.

B Empirical study on food selection 21
Juniperus virginiana was situated within the large bamboo area and was the preferredresidential tree of the Eulemur coronatus group.
__ __ grass area- - - - path for better tracking the animals
NHE-1 comprises 0.6 ha.
legend a = Fraxinus americana
(white ash) b = Cercis canadensis (redbud) c = Vitis cinerea (grape) d = Cornus florida (dogwood) e = Ulmus alata (winged elm) g = Liquidambar styraciflua
(sweetgum) i = Carpinus caroliniana
(American hornbeam) l = Robinia pseudoacacia
(black locust) m = Morus rubra
(red mulberry) n = Ligustrum vulgare
(common privet) o = Quercus stellata (post oak) p = Diospyros virginiana
(common persimmon) r = Acer rubrum (red maple)r* = Vitis rotundifolia (grape) s = Quercus falcata
(southern red oak) t = Liriodendron tulipifera
(tuliptree) v = Viburnum rafinesquianum
(rafinesque viburnum)
1 = bamboo area 2 = Viburnum rafinesquianum
3 = Prunus serotina
4 = Quercus phellos
5 = Cornus florida
6 = Viburnum prunifolium
7 = Diospyros virginiana
8 = Robinia pseudoacacia
9 = Carya tomentosa
10 = Fraxinus americana
11 = Fraxinus pennsylvania
12 = Fraxinus americana
13 = Nyssa sylvatica
Fig. B.1: Map of the natural habitat enclosure No. 1 (NHE-1).Latin and vernacular species names are listed in Tab. B.7. All trees, shrubs and vines that weretasted, eaten or spat out by the sifakas during the time spent in the forest were designated with aletter to mark the species and location. Numbers are used to mark individual trees that were passedby without any contact.

22 B Empirical study on food selection
Of those species which were regularly fed as browse in spring 1994, R. copallina (sumac) andA. julibrissin (mimosa) were not growing within the NHE-1 enclosure (Fig. B.1). The fruitand leaves of Mangifera indica (mango) were fed to the lemurs only once in spring to groupM&T, and neither was growing outside. Although one tree of A. julibrissin was growingwithin NHE-3 (Fig. B.2), this was of minor importance for this study, as animals had alreadydestroyed the tree and had consumed all available leaves before the onset of this study period.Photinia glabra was neither growing within either of the natural habitat enclosures and waspresented once as browse during the autumn study period. Another difference between theenclosure NHE-1 and NHE-3 were the Oxydendrum arboreum (sourwood) trees, which werefound only in NHE-3 and were a preferred food resource for group J&D.
During the follow-up study in the autumn,only the positions of individual trees andspecies type were marked on the map.Occasionally, the identification was confinedto the genus, and this was deemed sufficient.The following genera and species wereidentified:
Carpinus caroliniana (American hornbeam)Robinia pseudoacacia (black locust)Diospyros virginiana (common persimmon)Cornus florida (dogwood)Pinus taeda (loblolly pine)Albizia julibrissin (mimosa)Carya tomentosa (mockernut hickory)Quercus sp. (oak)Juniperus virginiana (red juniper)Acer rubrum (red maple)Oxydendrum arboreum (sourwood)Quercus falcata (southern red oak)Liquidambar styraciflua (sweetgum)Liriodendron tulipifera (tuliptree)Quercus phellos (willow oak)Viburnum sp.Vitis sp., mostly V. cinerea
__ __ grass area- - - - path for better tracking the animals
NHE-3 comprises 1.5 ha.
Fig. B.2: Map of natural habitat enclosure No. 3 (NHE-3).

B Empirical study on food selection 23
2.4 Data collection schedule
Groups M&T, D&V and Gordian were fed twice a day. In the morning, fruits & vegetablesand primate chow were brought into the cages for their first feeding. Refusals of fruits,vegetables and chow from the previous day were removed right before the morning session,and refusals of browse from the previous day were removed after that first feeding bout. In theevening, animals received additional leaves with the remaining fruits & vegetables from themorning feed session. This facilitated a high diversity of available foods during the mainfeeding bouts within the cages. However since the holding cage in NHE-1 with group M&Twas not secure from hungry mice and chipmunks who feed on the fruits and vegetables, I hadto remove uneaten food (fruits & vegetables) in the evening after the second main feedingbout instead of during the next food session which was during the following morning.
A slightly deviant procedure was performed on group J&D, as they were fed only once a dayafter having spent the main portion of the day outside in the forest. Of the latter group, allfood refusals were collected in the morning of the following day.
All food brought into a cage and collected later was weighed, as food intake was based onfresh weight.
It is worth mentioning that animals who had spent the day in the forest, could be easily luredback from the forest into their holding cages by showing them the bunches of browse.Although many different trees were growing within the forest, animals rapidly followed thebrowse back into their cage.
Whereas group M&T spent an average of 3 ± 1 h outside in the forest during one of the threestudy weeks, group J&D spent 6.5 h outside on a daily basis.
During the study period, group J&D was involved in a movie production (4.10.-7.10.).Therefore they received their browse on these days prior to entering their cage. On 8.10. and9.10. some students were allowed to observe that group as part of a research project whichonce again caused a disturbance of the normal activity patterns.
Observational methods
After bringing the food into the cages, the feeding bouts were normally observed for at leastone hour due to all breaks made by the animals between feeding on any food item. Thismethod of “focal-animal sampling”, is based on Altmann (1974). In this study, one feedingbout is defined as the entire time animals have spent feeding including all short breaks andinterruptions for food selection (e.g. for seeking or dropping the food, looking around,chasing each other, or other activities such as jumping, moving, and sunbathing). A feedingbout may commence immediately when the food is brought into the cages, and continues untilthe last animal to feed has stopped all feeding. The feeding bouts when food is brought intothe cages (twice a day for groups M&T, D&V and Gordian; once a day for group J&D) weredeemed the most intensive, and were noted as the “main feeding bouts”.
This aforementioned feeding bout method differs from other feeding bout methods in that thisstudy all the breaks and interruptions are defined as mere intervals of approximately a minute.The time spent feeding and the estimated amount of food ingested (see estimation method)during this time has been recorded for each individual during the main feeding bouts withinthe cages and during all time spent within the forested enclosures (App. I.2). In this study, theterms “feeding bout” and “time spent feeding” are adjusted to the requirements of this studyand are therefore deviant from common usage as given by Richard (1977; 1978a).
During all main feeding bouts within the cages the first ten (different) food species eaten byeach animal were scored, irrespective of how long the animals fed on either food item or whatamount was ingested. These sequences are called ranks (numbering from one to ten) and aresummed over all observation days, respectively for each animal and separately for the feeding

24 B Empirical study on food selection
bouts in the morning and in the evening. In App. I.1 feeding bouts with animals eating leavesare presented. Occasionally, when food species were changed less than ten times by a singleanimal during a feeding bout, that animal had ranks, numbering the first ten different speciescould not be completed until the tenth rank. Therefore, the sum of frequencies per rank doesnot always equal the number of days studied per animal. This way, individual foodpreferences will be discerned from general preferences and seasonal changes. Furthermore,during the main feeding bouts it was recorded what type of food item was selected andestimated as to how much of it was ingested by each individual. Additionally, the method bywhich the animal treated the food and handled the food was recorded.
Outside in the forested enclosures, focal animals were followed all day. This method is basedon “sampling all occurrences...” by Altmann (1974). It was not necessary to define individualfeeding bouts for the time outside. Feeding behaviour in the forest was closely observedregarding food preferences and avoidance. Each food item ingested was recorded andconverted into corresponding weights. Single events of handling plant species like tasting,eating, spitting out or just jumping through a tree were also recorded to yield a “classificationsystem” of plant species and plant parts reflecting the sifaka’s overall feeding behaviour(Tab. B.7). Those characterisations of plant species, which includes observations within thecages, are needed to evaluate secondary plant compounds inherent to all plant species / partswith which the lemurs make contact.
Quantitative methods to evaluate food intake
Two different methods were applied to quantify food intake: the weighing method and theestimation method. While the weighing method could only be applied to the entire group – itwas noted that in the case of Gordian, the weighing method yielded exact information on hisindividual food intake, and therefore the estimation method could then be applied to eachindividual and hence completed aspects of individual food intake. Within the forest, theestimation method was the only possible way to quantify food intake. Hence, estimating theamount of food intake within the forest, completed the amount characterised by the weighingmethod within the cages for those groups who were partly outside and partly fed within thecages.
Weighing method
The daily food intake per group within the cages was determined by the difference of weightbetween the food brought into the cage and the refusals collected back. Regarding treespecies, weight ingested corresponded to the weight of leaves eaten. For subsequentcalculations it was necessary that leaves were stripped off the twigs of the remaining bunchesthat were collected back, whereby the twigs and leaves were weighed separately for eachspecies. To take into account the weight loss of the browse by vaporisation during the timewithin the cage, a leafy bunch comprising the same leaf species, was stored at equal weatherconditions (temperature, wind, shadow, protected from rain) for the same amount of time andtreated the same way as the food browse. The daily weight loss by vaporisation was thenaveraged respectively for each tree species during the study period, and yielded one species-specific factor per season. Hence, for each tree species offered within the cage the amount ofleaves eaten was calculated by multiplying browse refusals by the species-specific, seasonalfactor of vaporisation and subtracting that value from the weight of plant species originallybrought into the cage. To get the amount of mere leaves brought into the cage, the weight oftwigs was multiplied by the vaporisation factor which was then subtracted from the weightbrought into the cage. While the loss of weight by vaporisation was negligible for fruits andvegetables, the more juicy fruits were ultimately preferred, and were eaten quickly andcompletely. These calculation were also performed on leafy vegetables such as kale.

B Empirical study on food selection 25
Calculation of the weight eaten:
weighteaten = weightin - weightout • f
weighteaten Weight of food [g] ingested by the sifakas. In case of tree species, the weighteaten corresponds the weight of leaves eaten.
weightin Weight of food [g] put into the cage.
weightout Weight of food refusals [g] collected back from the cage.
f Factor f gives the weight loss by vaporisation, respectively for each leaf speciesand leafy vegetable per season. Regarding fruits, it was not necessary to calculatesuch factors.
leavesin = weightin - twigsout • f
leavesin Quantity of mere leaves brought originally into the cage, which is calculated bydifference between the weight of browse brought into a cage and the weight oftwigs gained back after the meal while taking into account the loss of weight byvaporisation.
twigsout Weight [g] of the mere twigs got out of the cage; leaves were stripped off.
Estimation method
All food ingested within the cages during the main feeding bouts as well as all plant partsingested outside in the forest were counted and recorded in characteristics such as size andvolume (e.g. number of pieces, bites or mouthfuls of food; number of leaves of a definedsize). That way the selected food items were estimated by eye which were then converted intocorresponding weights. Therefore, different amounts of food which met the same criteria wereweighed several times and then averaged. This method utilised the averaged values on eachfood species.
This method was used to get the amount eaten by each individual within the cages during themain feeding bouts as well as during the time spent in the forest, where weighing wasimpractical. This way, the method was validated within the cages by correlating estimatedweights to weighed weights and corroborating and complete the “weighing method” byobservations of individual food intake.
2.5 Statistics
Due to small data sets, only nonparametric tests were applied (Conover, 1971; Sachs, 1968;Siegel, 1976, Lamprecht, 1992).
The Spearman-rank-correlation test (one-sided) was applied to test for a correlationbetween food eaten and food supplied within the cage with a high correlation expected forpreferred food items.
The Mann-Whitney U-test (two-sided) was used to test for significant differences betweentwo different plant species eaten by one group, and to test for differences in eating onedefinite plant species by two of the four groups, respectively. Absolute amounts used arereferred to kg body weight of each respective group. Weights of plants eaten in the forest areincluded in this test. As this statistical test can be utilised on data concerning the entire group,individual preferences are only indirectly tested for.

26 B Empirical study on food selection
3 Results
3.1 Qualitative evaluation of the lemur food
The following investigation is dedicated to the treatment and handling of different foodspecies and parts with particular respect to the portion of leaves which were consumed by thefocal lemurs.
To evaluate the role of the leaves within the diet, the behaviour was observed in order torecord individual differences in the treatment of plants, and in contrast, to recognise anyfeeding trends exhibited by all study animals. Precise observations shall account for differentholding conditions (e.g. cages, outdoor enclosures), different ages of the study animals anddifferent seasons to reveal any possible dependencies. A set of criteria will be established toevaluate the behaviour of food acceptance, clear preference and avoidance towards differenttree species offered as browse, and especially any preferences regarding the different speciesof trees, shrubs and climbing plants available within the forested habitat enclosures(Tab. B.7). This system serves to classify different plant species according to the animal’sbehaviour and is needed in order to proceed with subsequent investigations on the role ofsecondary plant compounds and whether they impact food choice (Part C).
Treating and handling the foodAn impression of how animals dealt with plant material, handling and processing of the foodduring the main feeding bouts, needs to be established. This is especially vital when animalswere ranging freely in their forested habitat. Apart from fruits and vegetables, the lemurs weregenerally interested in the leaves of a variety of tree, shrub and climbing plant species.Observations in the forested habitat enclosures revealed, that plant species located on theground level of the enclosures were of minor interest.
While resting in a tree, a lemur would often scan the forest and decide which type of leafshould be eaten and then move toward the food plant. Depending on whether the branch couldcarry the weight of the animal(s) and the remaining distance between the lemur and thedesired food, leaves could directly be plucked and chewed or a hand could be extended tograsp the twig or stem, and pull the food to the mouth. Whenever they bit off twigs withleaves attached, the lemur would then consume just the leaves (sometimes) including theleafstalk, or only parts of the leaf blade, or the entire leaf. Whole leaves were consumedtypically when the leaves were young in age, and depending upon the species of leaf. Thisinvolves factors such as leaf age, size, texture, toughness and / or length of the leafstalk.Whenever the lemurs were feeding in an uncomfortable posture, the animals would quicklymove back to a more secure feeding position.
To feed on leafstalks, a lemur would gather one to three leaves with leafstalks, which werethen bitten off, while the leaf blades were held in their hand. Once the stalks were eaten, theleaf blade(s) was (were) dropped. When just the leaf blades were the preferred food, theleaves were bitten off by their teeth, with just the leafstalk remaining in the hand andsubsequently dropped. Except for stalkless species such as Rhus copallina, and the veryyoung leaves of a few other plant species, leafstalks were typically not eaten together with theleaf blade: animals either decided in favour of the leafstalk or the leaf blade. For additionalinformation regarding the harvesting and feeding techniques of P. v. coquereli andP. v. verreauxi in the wild, see Richard (1977, 1978a, 1978b).
Before biting into any food item, the lemurs often sniffed and / or licked the potential fooditem. That procedure, – look, sniff, lick – was especially performed on novel food specimens

B Empirical study on food selection 27
or when animals switched from one food species to another. The procedure of deciding whichplants are food items has already been described in other lemur species (Glander, 1986;Glander and Rabin, 1983) as well as for members of the indriid clade as in differentPropithecus species (Milne Edwards and Grandidier, 1875; Powzyk, 1997), whichcorroborates the inference that food is predominantly chosen by smell and initial taste.Experience translates into knowledge, and these skills as developed by captive-born lemurspecies which were introduced to forested areas at the DULC (Glander, 1986; Glander andRabin, 1983) and have never known their indigenous Malagasy diet. For captive-born Lemur
fulvus, feeding trials revealed that smell and taste were most important in deciding whether anovel plant food could be ingested or not. Vision may play a minor role as one blind animalmade the same choices in the same fashion as her sighted mates (Glander and Rabin, 1983).Of course, normal free-ranging (wild caught) primates learn by their parents what to eat(Richard, 1977), but this was not the case for lemur species who were introduced to unknownnatural habitat conditions such as the North-Carolinian forest.
With respect to fruits and vegetables, there were some species which were eaten in aparticular manner by the study animals (Tab. B.4). In contrast to leaves, all species of fruitsand vegetables were ingested in the same manner by all the study animals.
Tab. B.4: Particular way of eating some species of fruits and vegetables.
food species remarks on the feeding behaviours of food itemsBrazil nuts They were processed until shells were crushed. The inner seed was nearly
consumed. Animals spent much time processing, crushing and eating nuts.cantaloupe,cucumber,muskmelon andwatermelon
The pericarp and 1 cm of the adjacent pulp were not eaten.
celery Leaves were preferred.grape, chick peaand chow
Entire items were eaten, respectively. Grapes and chick peas were the mosthighly preferred food items and were completely consumed during allobserved feeding bouts.
kale andbroccoli
Most stalks or pieces with a stalk were not consumed. Leaves of kale andflowers of broccoli were preferentially eaten.
kiwi Brown peel with some green and yellow fruit bits were not consumed.orange Yellow peel (including the albedo-layer) was not consumed. All juicy pulp
was consumed in its entirety.peas(pods and seeds)
Seeds were preferred. Pods that did not contain any seeds were seldomeaten, sometimes only tasted and then dropped.
sweetcorn Just the inner corn cobs were not consumed.sweet potato Typically, only thin pieces of the outer cortex were not consumed.
There were no other specialised feeding behaviours observed in other species of fruits andvegetables that were consumed by the focal lemurs.
With respect to trees, shrubs and climbing plants growing within the forest of the naturalhabitat enclosures together with the tree branches offered as browse to the animals, themajority of the animals’ interest was granted to the leaves. The selection of leaves and plantparts eaten is described in Tab. B.7 together with the behaviour shown towards the variousplant species.
Species offered as browse or found in a natural habitat enclosure partly revealed that differentlemurs showed disparate food preferences in those animals belonging to the same or to a

28 B Empirical study on food selection
different group. Intergroup differences might be due to different seasons, which will bediscussed for some leaf species.
Observation of the feeding behaviour in the cagesThe feeding behaviour of the main feeding bouts within the cages was recorded regardingfood species chosen, the first ten different species selected and the corresponding weightwhich was estimated as being ingested by each animal per food specimen, respectively(B.2.4).
Results showed that the feeding pattern of the different groups was influenced by differentcage conditions. When animals stayed exclusively within the indoor cages, fruits andvegetables and chow were consumed occasionally in the evening, and were not among thefirst ten selected different species, although all types of these aforementioned foods wereavailable. For instance, only once did “Gordian” consume fruits and vegetables in the eveningamong his first ten different food species, out of all evening feeding observations.
For groups with access to the forest, this behaviour changed markedly from the first day ofobservation. The sequence of selecting the different sources of food (leaves, and fruits &vegetables and chow) in the evening following an active day in the forested enclosures,differed considerably compared to those lemur groups that resided within inside cages.Therefore it is important to note that group J&D was fed only once a day within the cage andspent more time per day in the forest than group M&T. Animals with outdoor access startedto switch to fruits & vegetables during the first ten species right sooner, than those focalanimals that resided within the indoor cages (App. I.1).
Marcella sometimes started from rank 5 on, and Tiberius quite regularly by rank 7 to eat fruits& vegetables. Group J&D regularly started with fruits and vegetables including chow on rank1 or 2, and then switched to leaves of Rhus copallina and Albizia julibrissin subsequently(App. I.1). It is reasonable to assume that the markedly changed sequence of food selection(food item and plant species) within the first ten ranks may be due to nutrient content such asreadily available carbohydrates which have high levels in both sweet potato and chick peas. Infact, a positive correlation between species selected and their contents of solublecarbohydrates and starch, is presumed although this correlation is not statistically significantbased on the small sample size. (For the contents of nutrients provided by the different foodsources see chapter C.I.) Therefore it is not surprising that one group, J&D started eatingfruits and vegetables among their first ten species chosen, earlier than group M&T.
However, it is remarkable that all individuals irrespective of holding conditions showed astrong predilection for both R. copallina and A. julibrissin leaves within the first ten speciesduring the feeding bouts when browse was available (App. I.1). This is even more remarkableconsidering that group J&D spent most of the day in the forest foraging, which naturallyprovides a huge quantity and variety of wild leaves. The preference for these species(R. copallina and A. julibrissin) emphasises their importance within the sifakas’ diet.Furthermore, it is interesting to note that those lemur groups that spent long hours foraging inthe forest could easily be lured back into their holding cages by offering them R. copallina
and A. julibrissin browse.
For those animals that were kept exclusively in indoor cages, early morning would typicallyfind them searching over their old browse for any undetected leaves of R. copallina and A.
julibrissin which would have normally been consumed the day before. This again supports theimportance of R. copallina and A. julibrissin leaves within their diet.
The time spent eating during a feeding bout differed widely between individuals and time ofday. Groups that were fed twice a day, normally needed additional time in the evening toingest all desired food items. The highest difference could be found for “Marcella”, who spent34 ± 9 min. feeding in the evening and only 10 ± 5 min. during the morning. Within the group

B Empirical study on food selection 29
M&T, Marcella ate less food in the morning than Tiberius, (both in feed time and weight offood consumed), but the converse occurred during the evening feeding. Time spent eating inthe morning decreased for Marcella especially when she had access to the forest, whereastime and amount eaten in the evening increased. In addition, Marcella appeared to be morepicky than other animals in selecting the food and was observed to drop more food items thanTiberius.
When feeding within the cages, the first ten different species consumed during the mainfeeding bouts showed a feeding time that typically lasted approximately 10-20 minutes andmost food consumed during a feeding bout was eaten within this time frame. The first six toten different species were eaten very quickly, and than animals commenced to slow down. Ifthe estimated weights of the feeding bouts were compared to the weights eaten that day, itrevealed that most of the preferred food items were eaten during the observed time.
Depending on the degree of hunger and the type of food item, it may take different units oftime to ingest a food item. If the lemurs switched quickly between food species, the first tenfood items were consumed rather quickly but in low quantities. If the focal animals spent aprotracted time feeding on any food item, e.g. on R. copallina, it was observed that not all theranks were completed during the feeding bout although a large amount was consumed. Itcould also occur that much time was spent on a small amount of food, e.g. Brazil nuts, as itnecessitates time to pry the nuts away from their shells. In fact, there is no correlationbetween the amount of food eaten of any food type and the time used to consume that item,which is an enormous dilemma considering that field workers typically measure food intakeaccording to time spent feeding.
Although water was given ad libitum, animals observed in the spring 1994 were never seendrinking. On the contrary, animals were often drinking in the autumn 1997. This may beattributed to the water content of the leaves which is normally higher in younger than inmature leaves. Generally, immature leaves in the spring season were more abundant than inthe autumn season. Furthermore, food supplies differed largely between the spring andautumn in regard to the quantity of fruits, vegetables and chow offered to the focal lemurs. Inthe spring, more juicy fruits and vegetables were offered than in the autumn, and in autumnmore primate chow was given to the lemurs.
However, the estimated weights of foods consumed during the feeding bouts as well as thefirst ten different food species chosen support the role of the leaves, especially the preferredleaf species, within the animals’ diet. Additionally to the preference of leaf species by allfocal animals, individual leaf preferences could be detected. Food items that were eaten inlarge amounts on a daily basis during the observed feeding bouts by all animals weredetermined to be more important than those food items only consumed occasionally.Moreover, with respect to leaves, differences in the seasonal feeding behaviour can be clearlydistinguished. For species of fruits & vegetables it was not possible to detect any preferencesconsidering the large variety and the fluctuation in food composition.
In the morning, except in the case of “Gordian”, two feeding bowls with fruits and vegetableswere placed within each cage. Although each animal had “his own” bowl, Marcella typicallychased the subordinate “Tiberius” away from “his” bowl, and they exchanged the feedingbowls several times. In the evening, animals displayed aggression regarding the desired fooditems, e.g. for leaves of R. copallina and A. julibrissin. Therefore, feeding bouts normallylasted much longer than the feeding time without all the feeding interruptions. Based on ageand dominance relationships, especially in the case of “Tiberius” in group M&T and“Drusilla” in group D&V, certain animals had to wait for their feeding opportunities.
Drusilla could feed uninterrupted when “Valentinian” had already eaten the desired amount ofhis preferred species. If not enough food was provided of a preferred food item e.g. leaves ofR. copallina or A. julibrissin, it was Drusilla that was left without. However, Valentinian was

30 B Empirical study on food selection
also seen searching the branches of R. copallina from which all leaves had been previouslyeaten. Nevertheless, Drusilla predominantly ate the leaves of R. copallina and A. julibrissin
during the evening feed time as the first ten species when enough food was provided.
“Gordian” was kept alone because of his broken foot, and therefore he had a particularsituation. No lemurs chased him away during any feeding bout, but during his feeding activityhe was easily interrupted by neighbouring animals, who screamed or made other vocalisationsor movements. In his behaviour towards the observer he was very cautious yet curious. Halfan hour was the typical observation time per feeding bout which was sufficient to record thefood types and amounts that Gordian consumed. Gordian can best be evaluated regardingfood intake, as he was alone in his cage. Gordian’s feeding pattern resembled that ofindividuals within the groups during the spring of 1994, who were also fed twice daily.
However, with respect to leaf species available within the cages, a general predilection for R.
copallina and A. julibrissin leaves can be stated for all individual sifakas during the observedmain feeding bouts despite different holding conditions, despite particular individualsituations, and despite different seasons. In the following, the feeding behaviour towardstrees, shrubs and climbing plants growing within the forested enclosures will be examined.
Observation of the feeding behaviour in the forestBased on the feeding behaviour of group M&T in NHE-1 in the spring and group J&D inNHE-3 in the autumn, all plant species growing in these enclosures, with special respect to theleaves as most abundant plant parts, shall be classified into three major categories:
1.) tasted and eaten as positive reaction,2.) passed and untouched as sort of indifferent behaviour,3.) refused as negative reaction.
These major categories shall build the basis for subsequent chemotaxonomical reviews onthese plant species and plant parts to assess the pattern of food choice with special respect tothe secondary plant compounds (see chapter C.II and App. II.2). In this respect, eaten andrefused plants are more important than passed or untouched species. Leading compounds incommon within the selected plants and plant parts will then be the basis for subsequentchemical analyses (chapters C.III, IV and V).In the following, the foraging behaviour of both groups shall be described in detail to result inthe “classification system” of plant species according to the aforementioned categories(Tab. B.7; App. II.2). Therefore, animals were followed all the time they had been in theforest.
Group of Marcella and TiberiusWhen animals were released into the NHE-1 (map, see Fig. B.1, p. 21), they first passed a treeof Fraxinus americana (white ash) standing close to the cage and then climbed to the top of aPinus taeda tree (loblolly pine) (24-30 m), pausing there for approximately ten minutes. Pinus
taeda trees were the tallest trees growing in the NHE-1. After descending to approximately 4to 10 m, they started their route, while staying maintaining close contact. The majority of timeoutside was spent in the central part of their core area of the NHE-1 near the house and theirholding cage. Only once were animals observed in the southern part of the NHE-1.
On several occasions, animals came down to sit on the ground. Animals belonging to groupM&T were outside for approximately 3 ± 1 hour. Normally, after two to three hours outside,they then moved to the entrance and were resting in the grass lane, as if waiting for food.
Although they rested in the grass on nine occasions, the grass was tasted only three times, inamounts too low to be estimated. Another ground cover in the NHE-1 was Rhus radicans
(poison ivy). This plant species was never seen to be touched although it was once even stuckinto a bunch of browse. Overall, observations were focused on trees, shrubs and climbingplants as the predominant vertical strata used within their forested habitat.

B Empirical study on food selection 31
A group of Eulemur coronatus also resided within the NHE-1. The large area with bamboo(Rondumaria tecta) and a Juniperus virginiana tree (red juniper tree) were their main site ofresidence. The bamboo area was crossed several times daily more or less quickly by Marcellaand Tiberius. This J. virginiana tree is a vivid example of a plant species that was just“passed” by the focal sifakas, since the majority of encounters with the E. coronatus groupwith Marcella, typically took place near or even in that J. virginiana tree. Within this area,only once Tiberius tasted a woody stump and Marcella gnawed at it.
Tab. B.5 reviews the daily feeding behaviour of group M&T toward plant species growingwithin the natural habitat enclosure NHE-1. Only those plant species that were tasted (lessthan 5 g were ingested) or eaten (more than 5 g were ingested) by the animals are shown.Plant species which were tasted in amounts too low to be assigned to any weight, e.g. Carya
tomentosa, and those which were refused are therefore not listed in Tab. B.5. The ultimate“classification” reflecting the sifaka’s behaviour towards all species of trees, shrubs andclimbing plants growing in the NHE-1 is given in Tab. B.7.
Tab. B.5: Daily intake and averaged amounts [g] ingested by group M&T in the NHE-1.
date (spring)species 17. 18. 19. 20. 21. 22. averagea
Carpinus caroliniana 0.1 0.5 0.2 0.1Robinia pseudoacacia 18.5 0.5 3.2Diospyros virginiana 1.1 0.2Quercus stellata 4.6 0.3 0.9 0.3 1.0Acer rubrum 8.4 2.0 5.3 0.8 9.8 2.8 4.9Morus rubra 2.5 18.4 25.2 2.3 8.1Cercis canadensis 13.0 1.5 28.7 2.4 7.6Quercus falcata 0.2 3.5 3.0 0.2 1.2Liquidambar styraciflua 6.8 10.7 2.1 2.5 3.4 19.4 7.5Liriodendron tulipifera 0.6 13.5 0.5 2.4Vitis sp. 3.0 2.2 1.1 1.1Fraxinus americana 2.0 0.5 0.4
aAverage values include all days being in the forest, since food species were available during the entireobservation time outside.
The amounts ingested in the forest could vary considerably from day to day (Tab. B.5),presumably because the group M&T was not habituated to the forest at the onset of this study.For details regarding the time spent eating in the forest and the estimated weights ingested byeither focal animal of the group, see App. I.2.
Morus rubra, Cercis canadensis, and Liquidambar styraciflua were the most favoured treespecies in the forested enclosure NHE-1. Liquidambar styraciflua and Acer rubrum wereeaten every day when outside, whereas Liriodendron tulipifera and Robinia pseudoacacia
were only occasionally eaten. Other plant species listed in Tab. B.5 were finally classified asbeing “tasted” (Tab. B.7).
According to the “classification system” (Tab. B.7) including all plant species growing in theNHE-1, 6 species were eaten, 7 were tasted and 4 spat out, and approximately 7 species weretasted daily by the group M&T.
Any change of the food begs the problem that animals might react with illness, especiallydiarrhoea. Tiberius had some loose stool on the 20th of May, which seemed to improve afterthree days. Reasons remain to be hypothesised. Faecal samples were analysed but no parasites

32 B Empirical study on food selection
or pathogenic bacteria could be found (staff, pers. comm.). The highly adapted gut systemmay have reacted to the changed environmental and feeding conditions combined with adifferent activity pattern during the day. Physical stress along with an accelerated gut passagerate might have also been reasons (Warner, 1981; Stevens, 1988).
Marcella seemed to loose some weight but did not react with soft stool. Initial loss of bodyweight of animals released into forested enclosures due to more activity combined with abetter physical condition has already been described for other lemur species at the DULC. Onthe other hand, weight fluctuations also occur under natural conditions depending on seasonalfood supply and animals are adapted to it (Charles-Dominique, 1979; Stevens, 1988; Glanderet al., 1992; Powzyk, 1997).
Group of Julian and DrusillaIn contrast to group M&T, group J&D had already been well habituated to the forest when thestudy was started (for a map see Fig. B.2, p. 22). Group J&D spent about 6.5 hours dailyoutside, which is nearly double the time per day of group M&T. Hence, group J&D must havealready well known their territory with its species occurring, as it was not observed, that anyspecies were spat out after being tasted. Therefore, in the autumn the study was focused onthe species eaten. Compared to group M&T, only very few species were tasted by group J&D.Avoided and untouched plant species are not listed in Tab. B.6, but are included in Tab. B.7,and in App. II.2.
Tab. B.6: Daily intake and averaged amounts [g] ingested by group J&D in the NHE-3.
date (autumn)species 04. 05. 06. 07. 08. 09. 10. averagea
Robinia pseudoacacia 2.4 2.0 1.0 0.8Diospyros virginiana 6.5 0.9Albizia julibrissin 0.8 0.1Carya tomentosa 2.5 1.0 1.5 0.7Pinus taeda, dry needles 1.0 0.2 0.2 1.0 1.0 2.0 0.8Quercus sp. 0.6 0.1Acer rubrum, leaves 9.6 9.6 12.8 26.4 16.0 35.2 2.4 16.0Acer rubrum, stalks 0.9 0.1Oxydendrum arboreum, leaves 0.3 1.5 2.5 2.5 1.0Oxydendrum arboreum, bark 15.0 10.0 3.6Liquidambar styraciflua 67.0 54.0 31.2 11.1 32.5 30.6 53.3 39.9Liriodendron tulipifera 40.0 60.0 48.0 20.0 54.0 16.0 46.0 40.6Vitis sp., leaves 2.0 20.0 38.0 5.6 8.0 3.2 11.0Vitis sp., wood 24.0 21.0 18.0 9.0
aAverage values include all days being in the forest, since food species were available during the entireobservation time outside.
Most selected species were Liriodendron tulipifera and Liquidambar styraciflua, followed byVitis sp. wood and leaves. A considerable amount of wood was eaten from Vitis sp. by bothanimals. Acer rubrum leaves and Oxydendrum arboreum bark and leaves were the nextpreferred food items within the forest. O. arboreum was the only tree species, of which moreof the bark was eaten than of the leaves.Quercus sp. leaves were only ingested once by one sifaka of group J&D. Diospyros
virginiana and Vitis sp. were the only plant species that were treated in different ways by thestudy groups during the spring and the autumn season, albeit occurring within both natural

B Empirical study on food selection 33
habitat enclosures (Tab. B.7). The small amount eaten within the forest on the 7th of October,was attributed to the fact that animals were involved in the movie production and too excitedand curious to find the calmness and rest to concentrate on feeding.
Robinia pseudoacacia was less eaten during the autumn than during the spring. Although R.
pseudoacacia can only be categorised as being “tasted” by J&D, some leaves were eaten byGordian. So, R. pseudoacacia is finally categorised as being eaten during the autumn.
3.2 Classification of plant species according to the feeding behaviour ofP. v. coquereli
EventsEvery single event of behaving toward a plant species was recorded. Evaluation of all singleevents concerning one plant species should result finally in the “classification system”(Tab. B.7) to correlate ultimately the feeding behaviour shown by the sifakas to the secondaryplant compounds inherent to the respective plant species and plant parts (chapter C.II, App.II.2).
Single events were recorded as being tasted, spat out, eaten or passed with respect toindividual plant species and their parts. A plant specimen is scored as being tasted, if onlysmall amounts were ingested, normally about one bite, with a supposed weight of less thanone gram. A food item was recorded as being eaten, if definitely more than one bite wasingested by either animal of the group. However, taking some plant part into the mouth doesnot implicitly mean to swallow it. Animals had to take the decision between tasting andswallowing a food item or spitting it out again.
Plants were scored as being passed, if animals were seen in or jumping through a tree but didnot try to put any plant item into their mouth. In these cases, plants were just used as meansfor locomotion, e.g. sitting or climbing facilities.
Ultimately, scored events do not inevitably result into the same frame of “classification”. Allevents had to be evaluated to result in a conclusive “classification system” (Tab. B.7).
Established classificationThe evaluation of all single events results in the “classification system”. The ultimateclassification was performed separately for each season to reveal seasonal differences intreating plant species and plant parts. The following definitions are made to build a simplesystem to characterise all plant species of the forest including the browse species offeredwithin the cages according to their obvious importance for the sifakas:
eaten More than one bite was repeatedly ingested by either animal of a group, sothat at least an estimated weight of 5 g was achieved.
tasted An estimated weight of less than 5 g was finally ingested by one or bothanimals of a group.
refused Plants were spat out by one or both animals of a group. Refusing a plantspecies was consistent for both animals of a respective group. A plant specieswas never more often tasted and swallowed than it was spat out.
passed A tree species was passed, if it was used for locomotion activity such asclimbing and sitting or just jumping through, and therefore being touched. Itwas never seen to be tasted as potential food source.
untouched Plants were never seen to be touched although growing in the natural habitatenclosure of a group, sometimes even on the animal’s track.
The main interest of the sifakas was granted to the leaves, so that this classificationpredominantly regards the leaves, but also other plant parts are included as far as they

34 B Empirical study on food selection
appeared during the observation seasons. It did not happen that one plant part, e.g. the bark,was refused after being tasted while another part, e.g. the leaves, were highly selected fromthe same species. The decision in favour of one or another part of the same species must havebeen taken on an earlier stage of recognition. Of some species, woody twigs were gnawed atbut not to the exclusion of at least immature leaves. Moreover, it could happen, that a specieswas eaten in one season, but not in the other.
The decision how to treat the plant part tasted, e.g. to swallow the leaf or bark item or torefuse it after tasting was consistently taken by the focal lemurs during one season. On theother hand, treating individual parts of the same leaf species (leaf blade, leaf stalk) coulddiffer individually.
The “classification system” (Tab. B.7) reflects the feeding pattern of the focal sifakas andthereby the importance of individual plant species and plant parts for the sifakas. Seasonaldifferences regarding the feeding pattern are indicated. Plants such as grass, herbs andbamboo, which were normally just traversed to reach a different site of the forested habitatenclosure are not included in this table. For the occurrence of these species in either naturalhabitat enclosure, see Fig. B.1, p. 21 and Fig. B.2, p. 22.In Tab. B.7 plant species are listed alphabetically according to their plant family. Latin andvernacular names of each plant species and their respective family are presented. A shortdescription of how the species were treated by the animals is included, and impressive eventsare recorded. Some notes characteristic of the species are added according to the “AudubonSociety field guides to North American trees and wildflowers” (Little, 1993; Niering andOlmstaed, 1992). Notes on the plant’s odour and further characteristics, as well as on speciesnot included in the field guides (Ligustrum vulgare, Viburnum rafinesquianum and Vitis sp.)are additionally given according to their appearance.
Tab. B.7: “Classification” of plant species and parts based on the feeding behaviour of thesifakas. Vernacular names and some important notes are included.
family, genus, species and descriptive notes classifi-cation
Aceraceae: Maple Family
Acer rubrum L.: Red Maple, Scarlet Maple, Swamp MapleTips of stems with young leaves and reddish leaf buds were preferred, albeit animalsate medium sized and older leaves as well, and partly leafstalks and the leaf baseremained at the twigs. Especially Marcella liked older leaves and green leafstalks.Particularly in the autumn it could be differed between eating leaf blades andleafstalks. One was eaten to the exclusion of the other.Height: 18-27 m. Large tree with red flowers, fruit, leafstalks, and autumn foliage. Oppositeleaves; broadly ovate, with 3 shallow short-pointed lobes (sometimes with 2 smaller lobesnear base); irregularly and wavy saw-toothed; long red or green leafstalks. Foliage turning red,orange, and yellow in autumn. Tough wood, no pith.
leaveseaten
Anacardiaceae: Cashew or Sumac Family
Mangifera indica L., leaves: mango leavestasted,
Mangifera indica L., fruits: mangoOnce in May, a branch of Mangifera indica was presented with an unripe fruit asbrowse to group M&T. Leaves of the branch were only tasted and mostly dropped.Both animals of group M&T preferred woody tips of twigs and stems and gnawed atit; and they liked the unripe fruit. Furthermore, animals received occasionallycommercial mango fruits in the morning. Both, the unripe and the ripened fruits wereliked.
fruit eaten

B Empirical study on food selection 35
family, genus, species and descriptive notes classifi-cation
Rhus copallina L.: Shining Sumac, Dwarf Sumac, Winged SumacLeaves of any age were eaten, e.g. leaf buds, young and old leaves, partly includingthe axis, throughout the year; only woody parts were left. Some bark and pith wasnoted to be ingested in autumn. One technique to eat the leaflets of R. copallina wassimilar to that of eating A. julibrissin leaves: stripping off the leaflets by means oftheir tooth comb starting from the stem-side. This was especially exhibited in spring,when leaflets easily came off the axis. Alternatively, the entire axis including theleaflets were eaten up, starting from the upper side. As third variant, especially usedfor autumn leaves, leaflets were bitten off singularly. Sometimes, animals changedtheir technique imperceptible while eating.In the autumn, aged R. copallina leaves were obviously too tough and rigid to stripleaflets easily off the axis. However, animals seemed to have the same problemharvesting the leaflets as I had.Height: 7.6 m. Shrub or small tree with a short trunk and open crown of stout, spreadingbranches. Leaves are pinnately compound; to 30 cm long; with flat broad-winged axis. 7-17leaflets (27 in south-eastern variety), 2.5-8 cm long; lance-shaped; usually without teeth;slightly thickened; stalkless; shiny dark green above, paler beneath. Watery sap. Foliageturning dark reddish-purple in the autumn.Aromatic, resin-like excretions, especially on less lignified parts; pithy stems.
leaveseaten
Rhus radicans L.: Poison IvyHeight: vine. Upright climbing or trailing shrub; compound leaves; divided into three glossyor dull green long leaflets. That plant is extremely variable in form, occurring as a groundcover along roadsides, an erect shrub (especially in sandy coastal areas), or a large vine ontrees. In the NHE-1 poison ivy occurred throughout as ground cover.
untouched
Betulaceae: Birch Family
Carpinus caroliniana Walt: American Hornbeam, Blue-beech,Water-beech, Ironwood
The leaves were tasted four times by Marcella and only once by Tiberius. Marcellabit into reddish young leaves; only small amounts were tasted.Height: 9 m. Elliptical simple leaves, sharply double saw-toothed, long-pointed at tip, turningorange to red in the autumn. The vernacular name ironwood covers both, the indigenous hophornbeam, Ostrya virginiana (most commonly), and the hornbeam, Carpinus caroliniana
(Crellin and Philpott, 1990).
leavestasted
Caesalpiniaceae: Legume Family
Cercis canadensis L.: Eastern Redbud, Judas-treeUpper leaves (young reddish leaf buds) were preferred. Leafstalks including the baseof medium sized and older lower leaves were refused. In spring, pods were occurringon the tree which were also liked by the animals.Height: 12 m. Leaves are 6-11 cm long and broad; heart-shaped, with broad short point;without teeth; long-stalked; turning yellow in the autumn.
leaves andpods eaten
Caprifoliaceae: Honeysuckle Family
Lonicera japonica Thunb.: Japanese HoneysuckleJapanese honeysuckle was often embracing other plants such as R. copallina. Duringthe observation time in spring, Japanese honeysuckle was in flower. That vine wasnot eaten, neither in the cage, nor outside in the forest, not even the sweet tastingflowers in spring. Once Tiberius seemed to lick on the flowers.Height: vine. It has fragrant white tubular flowers, which are turning yellow with age.Flowering occurs from April to July, occasionally into the autumn. Sweet nectar can bemilked from the base of the corolla. Opposite, ovate, untoothed, evergreen leaves.
flowerstasted
Viburnum prunifolium L.: Blackhaw, Stagbush, SweethawShrub or small tree; height: 6 m. Opposite leaves; elliptical; finely saw-toothed. Turning shinyred in the autumn.
untouched

36 B Empirical study on food selection
family, genus, species and descriptive notes classifi-cation
Viburnum rafinesquianum: Rafinesque ViburnumLeaves were tasted twice by Marcella but she did not like them. No leaf was ingested.Shrub or small tree; leaves opposite, ovate; blunt or notched at base; sunken veins ending inlarge teeth; long leafstalks.
leavesrefused
Cornaceae: Dogwood Family
Cornus florida L.: Dogwood, Flowering Dogwood, Eastern FloweringDogwood
The leaves were only tasted by Tiberius and completely ignored by Marcella.Tiberius tried to eat them thrice, but twice they were spat out again.Height: 9 m. Opposite, elliptical simple leaves; edges slightly wavy, appearing not toothed butwith tiny teeth visible under a lens; short-stalked; scarlet autumn foliage.
leavesrefused
Cupressaceae: Cypress Family
Juniperus virginiana L.: Red Juniper, Eastern RedcedarThe tree was passed several times, but never seen to be tasted or eaten.Height: 12-18 m. Evergreen, aromatic tree; leaves opposite in four rows forming slender 4-angled twigs; leaves scalelike, not toothed; dark green, with gland-dot.
passed
Ebenaceae: Ebony Family
Diospyros virginiana L.: Common Persimmon, Simmon, PossumwoodThe leaves were only seen to be ingested once by each animal of group M&T, butmore than 5 g were eaten by group J&D in autumn.Height 6-21 m. Ovate to elliptical, long-pointed leaves; without teeth; slightly thickened;turning yellow in the autumn.
leavestasted inspring,eaten inautumn
Ericaceae: Heath Family
Oxydendrum arboreum (L.) DC.: Sourwood, Sorrel-tree, Lily-of-the-valley-treeLeaves and bark were ingested in the autumn. The bark, the leaves or only theleafstalks were ingested by the animals (event). Sometimes, animals seemed to beastonished because of the strange taste of the leaves. The bark was only scraped offthe younger twigs. O. arboreum did only occur in the NHE-3.Height: 15 m. Elliptical or lance-shaped, finely saw-toothed long leaves. Despite the sour tasteof the foliage, sourwood honey is esteemed. Foliage turning red in the autumn.
leavestasted,bark eaten
Fabaceae: Legume Family
Robinia pseudoacacia L.: Locust, Yellow Locust, Black LocustUpper younger leaves were preferred in contrast to leaves at lower parts of the twigs.This might be due to strong spines growing at nodes, which were only smooth in theupper part of the twig.Height: 12-24 m. Medium-sized, spiny tree. Pinnately compound leaves with 7-19 leaflets;paired (except at end); elliptical; with tiny bristle tip; without teeth; drooping and folding atnight. Twigs with stout paired spines at nodes; very fragrant flowers.
leaveseaten
Fagaceae: Beech Family
Quercus falcata Michx.: Southern Red Oak, Spanish Oak, Swamp Red OakSimilar to Q. stellata, the bark was tasted and occasionally eaten (event). Youngleaves were preferred by both animals of group M&T, occasionally medium sizedleaves were ingested (event). Of older leaves, only the tips were eaten, the base wasleft attached to the tree.In the autumn, preferentially leafstalks were ingested, while the leaf blades weredropped. The leafstalks tasted slightly astringent to me, were moist and of aromaticodour. The sifakas preferred the lower thickened parts of the leafstalks which wereclose to the stem.Height: 15-24 m. Elliptical leaves, deeply divided into long narrow end lobe and 1-3 shortermostly curved lobes on each side, with 1-3 bristle-tipped teeth; sometimes slightly triangular
bark andleavestasted

B Empirical study on food selection 37
family, genus, species and descriptive notes classifi-cation
with bell-shaped base and three broad lobes; turning brown in the autumn.
Quercus phellos L.: Willow Oak, Pin Oak, Peach OakHeight: 15-24 m. Narrow oblong or lance-shaped leaves with tiny bristle-tip; without teeth;edges straight or slightly wavy; turning pale yellow in the autumn.
untouched
Quercus stellata Wangenh.: Post Oak, Iron OakThe bark was tasted once by Tiberius, leaves were ingested in small amounts by bothanimals of group M&T. Mainly young leaves and leaf buds were ingested. Q. stellata
was only tasted once in the autumn.Height: 9-21 m. Obovate simple leaves with 5-7 deep broad rounded lobes, 2 middle lobeslargest, with short-pointed base and rounded tip, slightly thickened, turning brown in autumn.
bark andleavestasted
Hamamelidaceae: Witch-Hazel Family
Liquidambar styraciflua L.: Sweetgum, Redgum, SapgumOnly some leaf buds and upper younger leaves were eaten when L. styraciflua wasoffered within the cage, the base and leafstalk of older leaves remained attached tothe twigs. Occasionally, leaves were spat out again when eaten inadvertently. Greenstems (2-9 cm) were also eaten from the tips downwards. In the forest, the bark wastasted once by Marcella; the small and medium sized leaves were eaten, young leaveswere preferred. Once Tiberius dropped some leaves instead of eating them; Marcelladropped the tips of older leaves; only in the forest she ate the base of older leaves. Inthe autumn, both, coloured and dry leaves were eaten. Finally, eating L. styraciflua
leaves varied considerably, albeit the individual preferences described could only beobserved outside in the forest, not within the cage.Height: 18-30 m. 7.5-15 cm long and wide, star-shaped or maple-like leaves with 5,sometimes 7, long-pointed, finely-saw-toothed lobes; notched base. Resinous odour whencrushed. Slender leafstalks, nearly as long as blades. Leaves are turning reddish in the autumn.Exhibits a strong aromatic odour, especially when leaves were stripped off; in autumn quitelignified, no pith.
leaveseaten
Juglandaceae: Walnut Family
Carya tomentosa (Poir.) Nutt.: Mockernut Hickory, White Hickory, MockernutIn spring, only one leafstalk was ingested by Tiberius. In autumn, leaves were tasted.Height: 15-24 m. Pinnately compound, long leaves, 7 or 9 leaflets, elliptical or lance-shaped,finely saw-toothed; nearly stalkless. Turning yellow in the autumn.
leavestasted
Magnoliaceae: Magnolia Family
Liriodendron tulipifera L.: Tuliptree, Yellow-poplar, Tulip-poplarIn both seasons leaves were eaten. No individual preferences could be observed.Some pith was noted to be eaten additionally in the autumn.Height: 24-37 m. One of the tallest and most beautiful eastern hardwoods. Leaves are 7.5-15cm long and wide; blades of unusual shape, with broad tip and base nearly straight like asquare, and with 4 or sometimes 6 short-pointed paired lobes; long-stalked; turning yellow inthe autumn. Blades have a broad tip, the base is nearly straight like a square; four, sometimessix short-pointed paired lobes. Aromatic, spicy odour when leaves were stripped off; pithystems.
leaveseaten
Mimosaceae: Legume Family
Albiz(z)ia julibrissin Durazzini: Mimosa-Tree, Silktree, Powderpuff-treeIn May all leaves were eaten, but the younger leaves were preferred. In the autumnonly the younger leaves were selected. The sifakas stripped the leaflets off the axis bymeans of their tooth comb starting from the stem-side (lower side of the axis), whilefixing the twig by one of their hands. Axis were mostly refused and dropped whenthey got inadvertently into their mouths. In May, tips of stems with leaf buds were notalways eaten, whereas in the autumn the smooth tips were ingested. In the autumn,leaflets were very firm and depending on age not easy to be stripped off. Obviously,animals had the same difficulties and leaflets were torn off the axis.
leaveseaten(heavilyeaten inspring, lesseaten in theautumn)

38 B Empirical study on food selection
family, genus, species and descriptive notes classifi-cation
Height: 6 m. Native from Iran to China. Small ornamental with short trunk or several trunksand a very broad, flattened crown of spreading branches and with showy pink flower clusters.Leaves are bipinnately compound; 15-38 cm long; fernlike; with 5-12 pairs of side axes; 15-30 pairs of oblong pale green leaflets are attached to each axis which fold up at night.Flowering throughout summer. Strong odour of the firm pith.
Moraceae: Mulberry Family
Morus rubra L.: Red Mulberry, MoralThe tree only occurred within the NHE-1. The leaves were eaten in different ways.Marcella preferred to eat the tips of the leaves or the entire blade, but avoided theleafstalks and “latex”. She was eating both, young and older leaves. On the contrary,Tiberius seldom ate the entire leaf, he typically bit once into the leafstalk includingthe base, licked off the milk coming out of the stalks and dropped that leaf. Forinstance, on one day he bit exactly 38 times into leafstalks and bases, licked off the“latex” and dropped all 38 leaves. Once both were gnawing at the wood of twigs andbranches. However, young leaves were preferred.Height: 18 m. Leaves are in 2 rows, ovate, abruptly long-pointed, with 3 main veins fromoften unequal base, coarsely saw-toothed. Often with two or three lobes on young twigs.Turning yellow in the autumn.
leaveseaten
Nyssaceae (according to Hegnauer (2001)) orCornaceae: Dogwood Family (according to Little (1993))
Nyssa sylvatica Marsh.: Black Tupelo, Blackgum, PepperidgeHeight: 15-30 m. Elliptical or oblong leaves; not toothed (rarely with a few teeth); slightlythickened; turning bright red in early autumn.
untouched
Oleaceae: Olive Family
Fraxinus americana L.: White AshOne tree of that species grew next to the holding cage within the NHE-1, so that thelemurs passed nearly every day that tree for several times on their route through theforest. Nevertheless, it was only eaten once and tasted twice (events).Height: 24 m. Opposite, pinnately compound ovate or elliptical leaves, usually 7 (5-9) leafletspaired, except at end, finely saw-toothed or almost without teeth, turning purple or yellow inthe autumn.
leavestasted
Fraxinus pennsylvanica Marsh.: Green Ash, Swamp Ash, Water AshHeight: 18 m. Opposite, pinnately compound leaves; 5-9 (usually 7) leaflets; paired (except atend); lance-shaped or ovate; coarsely saw-toothed or almost without teeth; turning yellow inthe autumn.
untouched
Ligustrum vulgare: Common Privet, European PrivetThe leaves were tasted once by either animal of group M&T on different days, butwere spat out immediately by both animals.Shrub or small tree; opposite, elliptical or ovate simple leaves; short leafstalks.
leavesrefused
Pinaceae: Pine Family
Pinus taeda L.: Loblolly PineOnly dead brown needles were seen to be ingested, three at once, since the needlesgrow in bundles. Needles were eaten either when fallen into the holding cage, orwhile the sifakas were sitting in the tree.Height 24-30 m. Evergreen conifer, among the fastest-growing southern pines. Long needles;three in bundle; stout, stiff, often twisted; green; fragrant resinous foliage.
tasted (dryneedles)
Rosaceae: Rose Family
Photinia glabra Maxim.: Photinia, Red TipOnly the upper reddish leaves (according to the vernacular name “red tip”) werepreferred.
leaveseaten
Prunus serotina Ehrh.: Black Cherry, Wild Cherry, Rum Cherry untouched

B Empirical study on food selection 39
family, genus, species and descriptive notes classifi-cation
Height: 24 m. Crushed foliage and bark have distinctive cherry-like odour and bitter taste.Elliptical leaves with 1-2 dark red glands at base; finely saw-toothed with curved and bluntteeth; slightly thickened. Turning yellow or reddish in the autumn.
Simaroubaceae: Quassia Family
Ailanthus altissima (Mill.) Swingle: Tree-of-HeavenThis tree was passed three times during 6 days by group M&T. Although it waspassed by both animals, only Marcella seemed to taste some plant tissue. (It could notbe exactly observed.)Height: 15-24 m. Male flowers and crushed foliage have disagreeable odour. Leaves arepinnately compound; 13-25 leaflets (sometimes more), paired (except at end); broadly lance-shaped, with 2-5 teeth near broad 1-sided base and gland-dot beneath each tooth.
passed
Ulmaceae: Elm Family
Ulmus alata Michx.: Winged Elm, Cork Elm, WahooLeaves were only tasted by Marcella, but she did not like it. Once, she spat it out.Height: 12-24 m. Elliptical leaves, often slightly curved with sides unequal, doubly saw-toothed, thick and firm; in two rows; turning yellow in the autumn. The name refers to thedistinctive broad corky wings present on some twigs.
leavesrefused
Vitaceae
Vitis cinerea Engelm.:Vitis rotundifolia Michx.: Vitis sp.: grape
Leaves were eaten of both species. As species could not always be exactlydistinguished when eaten in high trees with dense foliage, the amounts eaten of bothspecies were assigned to Vitis sp.Woody twigs were eaten once by Marcella, presumably V. cinerea. In the autumn,wood and leaves were heavily eaten by both animals of group J&D.Vitis cinerea: Height: vine. Heart-shaped, saw-toothed simple leaves.Vitis rotundifolia: Height: vine. Rounded, coarsely toothed simple leaves.
in spring:wood andleavestasted
in theautumn:wood andleaveseaten
According to Tab. B.7, no special appearance (e.g. leaf texture, toughness, size) of the planttissue selected or refused can be figured out as possible criterion for food selection. The tasteof the preferred leaf species, that were fed in spring as browse, is described in App. I.3.Hence, a literature review on the secondary plant compounds of these plant species dealt with(chapter C.II and App. II.2) will be the basis for subsequent chemical and pharmacologicalanalyses (see chapters C.III-VI).
3.3 Quantitative evaluation of the food eaten
After characterisation of the plant species and plant parts reflected by the feeding behaviour,now food intake will be quantified. The quantities ingested will be monitored on a freshweight basis. During the observation time in the forest every amount eaten was recorded.Hence, the weight eaten in the cages is completed by the weight of plants eaten in the forest.
All weights ingested are referred to the entire group comprising one or two focal lemurs aswell as to bodyweight1. Hence, different bodyweights of individual sifakas and their differentages are taken into account.
1 The amount (g) of any food source eaten by each group is divided by the sum of bodyweights (kg) of all
members of the respective group.

40 B Empirical study on food selection
Rhus
copallina
13%
Albizia
julibrissin
10%
Otherleaves
10%
chow5%
Fruits &Vegetables62%
Group D&V
Rhus
copallina
23%
Albizia
julibrissin
4%
Otherleaves
4%
chow26%
Fruits &Vegetables43%
Group G
Rhus
copallina
13%Albizia
julibrissin
4%
Otherleaves
28%
chow16%
Fruits &Vegetables39%
Group J&D
Rhus
copallina
14%
Albizia
julibrissin
14%
Otherleaves
10%
chow5%
Fruits &Vegetables57%
Group M&T
Quantification of the food composition will be the basis for a subsequent consideration ofnutrient and energy supply of individual food resources (chapter C.I), as well as forpharmacological aspects of the food due to chemical plant compounds inherent to the leaves(chapters C.III-VI).
Food composition of the focal lemur groupsThe food of the sifakas was composed of three major food categories: a portion of leaves, alarge variety of fruits and vegetables and commercial leaf-eater primate chow. In thefollowing consideration, emphasis is put on the overall feeding pattern taking into accountdifferent holding conditions, different ages of the study animals as well as seasonalconstraints. Particular respect is dedicated to the leaf species selected by the animals withrespect to species composition, elucidation of preferentially eaten species and seasonalfluctuations. Although to a minor extent some other plant parts (wood and bark) wereingested as well (Tab. B.7), all plant tissue apart from fruits and vegetables is noted as“leaves” due to their predominance (Fig. B.3).
Fig. B.3: Food composition in weight % of the four study groups on a fresh weight basis,and averaged on the entire study time. “Other leaves” (Tab. B.8) designate all leafspecies except for the leaves of Rhus copallina and Albizia julibrissin, includingthe weights of plant species eaten in the forest.
In Fig. B.3, the weight percentages of the three major food resources are reviewedrespectively for the four study groups. Weights of the plant species ingested in the forest areincluded in this calculation. “Other leaves” give the percentages of all leaf species ingested

B Empirical study on food selection 41
apart from R. copallina and A. julibrissin leaves. Leaf species which were ingested for at least1 % of weight (and more) are explicitly listed in Tab. B.8, whereas amounts of less than 1 %of weight are summarised as “rest”.
Tab. B.8: “Other leaf species” of Fig. B.3 account for the percentages of all other leafspecies ingested by each lemur group apart from the leaves of R. copallina and A.
julibrissin. Leaf species that were ingested for at least 1 % (or more) are explicitlylisted, whereas amounts of less than 1 % are included in the “rest”.
other leaf species M&T D&V J&D GLiquidambar styraciflua 2% 3% 9% 1%Cercis canadensis 2% 4%Acer rubrum 5% 3% 4%Vitis sp. 2%Liriodendron tulipifera 9% 2%Photinia glabra 1%rest 1% 4%
It can be stated that the major portion of the food eaten consisted of fruits, vegetables andprimate chow (Fig. B.3). However, the percentages of the leaves, fruits and vegetables andchow varied considerably between the four study groups.
Considering the entire portion of leaves, it is striking that those groups with access to naturalhabitat enclosures consumed a larger portion and a greater variety of leaves than those groupsexclusively relying on the browse provided within the cages. While an average of 38 % leaveswere consumed by group M&T and 45 % by group J&D, on average 33 % and 31 % wereconsumed by group D&V and Gordian, respectively. Overall, at least one third of the totalfresh food was allotted to the leaves, with no apparent dependence on the animal’s age.
Nearly equal percentages were eaten of R. copallina and A. julibrissin leaves by the groups inspring, while a dramatic decrease for A. julibrissin leaves can be stated for the autumn groups.In contrast, R. copallina was highly selected during both, the spring and the autumn season,which resulted in an overwhelming percentage within Gordian’s diet.
The larger portion of leaves ingested by the lemurs with outdoor access may be due to the factthat the forest builds a more natural environment and animals had the possibility to a moreselective choice as to leaf quality and quantity, than had caged animals. Especially in theautumn younger leaves were more abundant in the forest than could be provided by a bunchof browse within the cages, and animals apparently preferred the younger leaves to older onesof various species. Furthermore, it has to be kept in mind that in contrast to group M&T,group J&D was already well habituated to the forested habitat enclosure at the onset of thisstudy and that they stayed outside for a longer period of time each day than group M&T.
Fig. B.4 reflects the food selection as to the leaf species presented as browse within the cagesduring the spring season. R. copallina and A. julibrissin leaves were clearly preferred.

42 B Empirical study on food selection
L. styraciflua R. copallina A. rubrum A. julibrissin C. canadensis R. pseudoacacia
A. rubrum C. canadensis L. styraciflua R. copallina A. julibrissin R. pseudoacacia
Fig. B.4: Feeding pattern of the focal lemur groups during the spring season: leaves before(upper photo) and after (lower photo) selection of the browse within the cages.
However, relations of weight % do not reflect the actual amounts eaten per group and perbodyweight. Since the weighing method is based on food intake of the entire group, theaveraged quantity ingested is also referred to kg bodyweight (Fig. B.5 and Tab. B.9) to makefood intake of individual animals with different bodyweights comparable to one another.
0
50
100
150
200
g / kg
M&T D&V J&D G
Chow
Fruits & Veg.
Leaves
Fig. B.5: Weight eaten per kg bodyweight and day, respectively for each lemur group.
Thus, according to Fig. B.5 and Tab. B.9 the largest amount of leaves was ingested by groupD&V referred to the entire group as well as to bodyweight. Comparing groups with adult andyoung animals separately to each other, an overall decrease in food intake can be stated forthe groups in the autumn compared to the groups in spring. Referred to bodyweight (Fig. B.5and Tab. B.9), in the autumn nearly half the total amount was eaten compared to spring, if

B Empirical study on food selection 43
groups with animals of comparable age are considered, respectively. If the total weight eatenper bodyweight is compared between adult and juvenile / subadult groups of either season, itis striking that nearly double the amount is eaten by groups with growing animals comparedto adults. Group D&V consumed the largest amount of fruits & vegetables and leaves of allstudy groups. Group J&D being outside in the forest for most hours of each day consumed thesmallest portion of fruits and vegetables per bodyweight of all four groups, and less leaves (byweight) than group M&T, albeit they had the largest percentage of leaves (Fig. B.3).
Tab. B.9: Food intake is given for each designated food source as total intake (g) referred toeach lemur group (left column), and referred to bodyweight (right column).
Estimated weights of food species eaten in the forest are includeda.
total intake in g intake in g per kg bodyweightspring autumn spring autumn
food source M&T D&V J&D G M&T D&V J&D G
R. copallinab 100.6 134.8 59.8 55.7 11.8 22.7 7.0 18.6
A. julibrissinb 100.3 98.7 19.8 11.1 11.8 16.6 2.3 3.7
A. rubrumb 39.4 35.0 16.0 4.6 5.9 1.9
C. canadensisb 18.3 54.8 0.0 2.3 2.1 9.2 0.0 0.8
L. styracifluab 11.9 34.8 39.9 4.7 1.0 2.9 0.1 0.5
R. pseudoacaciab 8.4 17.5 0.8 1.5 1.4 5.9 4.7 1.6
L. tulipiferab 3.7 40.6 19.7 0.4 4.8 6.6
P. glabrab 24.5 28.9 2.9 9.6
total leavesc 276.2 337.6 218.6 76.6 32.4 56.7 25.6 25.5
fruits & vegetablesd 416.9 620.7 179.1 104.0 48.9 104.3 21.0 34.7
chowe 39.1 51.5 73.8 65.0 4.6 8.7 8.7 21.7
totalf 732.3 1009.7 471.5 245.6 85.8 169.7 55.3 81.9
aThis table will be used to calculate dosages of identified plant compounds, that were ingested by thesifakas (see chapter C.VI).
bWeights of leaf species eaten, averaged only on the number of days when the respective food source wasprovided.
cTotal amount of leaves ingested including all leaves irrespective of species, averaged on all study days.“Total leaves” are differently calculated from individual leaf species listed above and the value is notequal to the sum of those species.
dTotal weight of fruits and vegetables eaten, averaged on all study days.
eTotal weight of chow eaten, averaged on all study days.
fTotal amount of fruits & vegetables, chow and leaves eaten, averaged on all study days.
Applying statistical methods to food resources provided and eaten and to compare thedifferent study groups of different ages and different seasons to one another, followingcorrelations can be figured out:
Fruits & vegetables including the portion of chow were statistically differently eaten on a highlevel of likelihood if all groups are compared to one another (p < 0.01, U-test, two-sided).One major reason for the difference in eating varying portions of fruits & vegetables and

44 B Empirical study on food selection
chow is apparently to search in its availability. While the groups in spring ate an average of91 % (group M&T) and 99 % (group D&V) respectively of the chow provided, groups in theautumn could virtually eat chow ad libitum because nearly four times as much were provided.The opposite was valid for the supply of fruits and vegetables. While the groups in springcould eat fruits and vegetables nearly ad libitum, only one third of this quantity was providedfor the groups in the autumn, which resulted in an intake of about 80 % by group J&D and95 % by Gordian. Hence, groups in the autumn obviously compensated the large portion ofchow for the low intake of fruits and vegetables due to the availability of the respective foodresources. The large portions of chow ingested in the autumn resulted in a lower weight ofoverall food intake because of the high nutrient density of the chow. The different weightseaten between groups of spring and autumn and the different food composition chosen asregards portions of chow, fruits and vegetables can be explained if their nutrient and energycontents are taken into account (see chapter C.I).
Comparing the total weights of fruits and vegetables including the primate chow ingested tothe respective amounts brought into the cage, 54 % and 64 % were eaten respectively bygroup J&D and group M&T, while about 80 % were eaten by the groups D&V and G.Applying the Spearman-rank-correlation test to fruits & vegetables including chow offeredrelated to the daily amount eaten, significant correlations are found for the groups D&V andG (rs = 0.928, p < 0.01, n = 7; rs = 0.745, p < 0.01, n = 10, respectively), but not for the groupsM&T and J&D. This corroborates the importance of fruits, vegetables and chow as foodsource for growing animals, as they ate nearly all food provided.
Taking into account observations during the feeding bouts, following results are obtained:All groups ingested nearly half the quantity of fruits & vegetables and chow during theobserved feeding bouts referred to the corresponding amounts eaten during the day.
In consideration of the huge variability in number and quantity of fruits & vegetables offeredto the groups, it is not possible to figure out any general or individual preferences. Of course,juicy fruits were preferred and typically eaten at first which might have to do with their watercontent. In contrast to the autumn observations, in spring animals were never seen drinkingwater.
In contrast to the various species of fruits and vegetables, clear general, seasonal andindividual preferences can be figured out for the different leaf species. In the following, thepattern of leaf selection shall be further investigated. Especially dependencies on supply anddemand, but also on the animal’s age and seasons shall be considered.
Correlations between the amount of individual leaf species brought into the cage and thequantities eaten by the groups are depicted as diagrams in Fig. B.6 to Fig. B.11. As far as theSpearman-rank-correlation test yielded statistically significant dependencies, values areadditionally listed. Applying the Spearman-rank-correlation test, it should be found out,which of the plant species provided as browse within the cages were highly preferred andwhich were just occasionally eaten or selected only in small amounts. In cases of indifference,a correlation would be expected irrespective of the plant species. (The weights eaten in theforest by the groups with outdoor access could not be included in this test, because no valuesdo exist for the quantity of the food available.) The following results reveal a predilection foronly few plant species in general, clear seasonal differences, and corroborate indirectlyindividual food preferences.
Fig. B.6 shows a strong Spearman-rank correlation between the weight offered and ingestedof R. copallina leaves for the four lemur groups. Strongest correlations are found for groupswith juvenile and subadult animals. However, based on bodyweight (Tab. B.9), the absoluteamount eaten of R. copallina leaves decreased slightly for the autumn groups compared to thegroups in spring, which might be interpreted as following the overall trend of eating lessleaves during the autumn. Group J&D ate the least amount of R. copallina leaves, albeit

B Empirical study on food selection 45
sufficient R. copallina leaves had been provided. Group J&D only ingested about 50 % of theR. copallina leaves offered, while all other groups ingested averages between 74 % and 88 %,respectively. Although the reason remains somewhat obscure as to why group J&D ate thesmallest amount of R. copallina leaves per bodyweight, the percentage (m/m) of R. copallina
leaves eaten by J&D is comparable to percentages eaten by the groups in spring (Fig. B.3).The largest portion of R. copallina leaves was consumed by Gordian in the autumn, but thispredominance of R. copallina in his diet may account for the limited choice of leaf speciesoffered to him.
According to the Mann-Whitney U-test applied to weights eaten per bodyweight, differencesin eating R. copallina cannot be found for groups of the same season, but for groups ofdifferent seasons (M&T related to J&D: p < 0.02, U-test, two-sided; D&V related to Gordian:p < 0.01, U-test, two-sided). Overall, R. copallina remained the most preferred leaf speciesduring both seasons by all study groups.
Correlations for A. julibrissin leaves are depicted in Fig. B.7. For A. julibrissin leaves, astrong correlation could only be figured out for the leaves eaten in spring.
Whereas in spring 70-80 % of the A. julibrissin leaves offered were eaten, only less than 20 %were eaten in the autumn. Nevertheless, A. julibrissin was quite often ranking among the firstten species in both, the spring and the autumn season (App. I.1).
The most striking difference is found for the pattern in eating A. julibrissin leaves, if thequantities eaten per bodyweight are compared between the groups of different seasons. Whilestatistically significant differences in eating A. julibrissin leaves are found if each group inspring is paired with each group in the autumn, respectively (p < 0.01, U-test, two-sided), nosignificant difference is found, if groups of the same season are compared to one another. Ifthe amount eaten of A. julibrissin leaves is based on bodyweight, only about one fifth waseaten in the autumn compared to spring. It is reasonable to assume that the remarkabledecrease in eating A. julibrissin leaves in autumn is due to the occurrence of more old leaveswith a changed leaf composition, which was not tolerated by the animals. (Changes in the leafcomposition as to primary and secondary plant compounds will be investigated in chapter C.Iand C.IV, respectively.)While in spring young leaves were abundant, only a small portion of A. julibrissin leaves
group rs prob. of error n
M&T 0.692 p < 0.01 12
D&V 1 p < 0.001 7
J&D 0.809 p < 0.02 8
G 0.918 p < 0.001 11
0 g
50 g
100 g
150 g
200 g
250 g
0 g 50 g 100 g 150 g 200 g 250 g 300 g
weight in
wei
ght
eate
n
M&T
D&V
J&D
G
in = eaten
Fig. B.6: Correlation table and diagram between the weight of Rhus copallina leaves putinto the cage and the amount ingested by each study group.

46 B Empirical study on food selection
during the autumn consisted of younger leaves. Observations of the feeding behaviour supportthe strong predilection for the younger leaves during the autumn. It remains to behypothesised how much A. julibrissin leaves animals would have eaten, if enough of thedesired younger leaves had been provided within the cages.
Comparing the quantities eaten between R. copallina and A. julibrissin within the four lemurgroups, only within groups J&D and G significant differences can be found (p < 0.01, U-test,two-sided, respectively). That means, whereas R. copallina and A. julibrissin were notdifferently eaten from each other in spring by group M&T and group D&V, a statisticalsignificant difference can be figured out for the feeding behaviour of the groups in theautumn.
In spring, both R. copallina and A. julibrissin leaves were generally more eaten than any otherplant species. Especially in spring, on some days the same amount was eaten as offered in thecage and most part of R. copallina and A. julibrissin leaves provided were already eatenduring the main feeding bouts. In both seasons, R. copallina and A. julibrissin leaves weremost often ranking within the first ten different species eaten during the main feeding bouts(App. I.1). Except for individually preferred leaf species, normally less than half the amountof the other leaf species was eaten during the feeding bouts, if the amounts observed as beingeaten are compared to the amounts eaten that day. During the feeding bouts in the autumn,Gordian’s leaf eating consisted typically of R. copallina and A. julibrissin leaves.Observational data about struggles for R. copallina and A. julibrissin leaves and searching forany remaining leaf fragment on otherwise stripped branches corroborate the importance ofboth species within the sifakas’ diet. The weights eaten of these favourites might have beenhigher, if more leaves to their liking had been provided.
Some of the other plant species were individually differently eaten. If the ranks of the first tenspecies are examined for each sifaka (Tab. I.1, p. 206), a predilection for A. rubrum leaves byMarcella (Fig. B.8) as well as for C. canadensis leaves by Valentinian (Fig. B.9) can bestated. Valentinian and Marcella accounted most for the individual leaf preferences revealed.
For group M&T a strong correlation between A. rubrum leaves provided in the cage and theamount eaten can be found (Fig. B.8). Especially Marcella liked to eat the reddish leaf budsand young leaves of A. rubrum tree. Within group M&T, A. rubrum was the next big portionof leaves eaten (5 %; Tab. B.8), when averaged on the study time. Outside in the forest, A.
rubrum leaves were eaten every day, so that the reduction in eating A. rubrum during the last
group rs prob. of error n
M&T 0.846 p < 0.001 12
D&V 1 p < 0.001 7
0 g
50 g
100 g
150 g
200 g
0 g 50 g 100 g 150 g 200 g 250 g 300 g 350 g 400 g
weight in
wei
ght
eate
n
M&T
D&V
J&D
G
in = eaten
Fig. B.7: Correlation table and diagram between the weight of Albizia julibrissin leavesput into the cage and the amount ingested by each study group.

B Empirical study on food selection 47
week within the cage was compensated by the amount selected in the forest. Within the cage,approximately 40 % of A. rubrum leaves offered were eaten by group M&T.
The predilection for A. rubrum leaves by the group M&T is corroborated statistically in manyrespects. Within group M&T, A. rubrum leaves were significantly differently eaten frommost other tree species (from R. copallina, A. julibrissin and L. tulipifera p < 0.01, U-test,two-sided; from R. pseudoacacia p < 0.05, U-test, two-sided).
In contrast to spring, during the autumn session A. rubrum was not provided as browse withinthe cages and only available in the forest. Therefore, a conclusive evaluation for A. rubrum
leaves remains sophisticated. In spring, it was much eaten, equally within the cages andoutside in the forest, and as mentioned, it was a preferred food plant of Marcella. Referred tobodyweight, group J&D ingested nearly half the amount eaten by group M&T (Tab. B.9),although both groups show the same group-bodyweight. On the contrary, if only the feedingbehaviour of the groups M&T and J&D exhibited in the forest is compared, more was eatenduring the autumn than during the spring. In group J&D, A. rubrum contributed on average4 % to the entire food eaten.
group rs prob. of error n
M&T 0.527 p < 0.1 10
D&V 0.9 p < 0.01 5
0 g
50 g
100 g
150 g
0 g 20 g 40 g 60 g 80 g 100 g 120 g 140 g 160 g 180 g
weight in
wei
ght e
aten
M&T
D&V
J&D
G
in = eaten
Fig. B.9: Correlation table and diagram between the weight of Cercis canadensis leavesput into the cage and the amount ingested by each study group.
group rs prob. of error n
M&T 0.754 p < 0.005 11
0 g
50 g
100 g
150 g
200 g
0 g 50 g 100 g 150 g 200 g 250 g 300 g 350 g 400 g
weight in
wei
ght
eate
n
M&T
D&V
J&D
G
in = eaten
Fig. B.8: Correlation table and diagram between the weight of Acer rubrum leaves put intothe cage and the amount ingested by each study group.

48 B Empirical study on food selection
Approximately 80 % of C. canadensis leaves offered were eaten by group D&V.C. canadensis amounted to 4 % within group D&V’s diet and was statistically differentlyeaten only from R. copallina leaves (p<0.05, U-test, two-sided). Within group M&T, onaverage 2 % C. canadensis leaves were eaten (Tab. B.8), and outside in the forest it was oneof the most selected leaf species (Tab. B.5). A significant Spearman-rank correlation isfigured out for both groups in spring.
While C. canadensis was regularly fed to the groups in spring, in the autumn only twice itwas brought into the cages, and no tree was found to grow within the group’s used core areaof NHE-3. However, especially by group J&D only tiny amounts were ingested on those daysC. canadensis branches were provided within the cages.
Another plant species, which was differently eaten between groups of the same season and ofdifferent seasons, was L. styraciflua (Fig. B.10).
Regarding the spring season, despite outdoor access of group M&T, L. styraciflua wasdefinitely more eaten by group D&V within the cage, albeit not statistically significant.
However, L. styraciflua was regularly eaten during the spring, equally inside the cages andoutside in the forest, whereas it was nearly not selected within the cages during the autumn.On the contrary, in autumn it was highly favoured in the forest by group J&D, and comparingthe groups with outdoor access even more was selected during the autumn than during thespring session.With respect to the total amount eaten by group M&T, L. styraciflua constituted an average of2 % (Tab. B.8) and was heavily selected within the forest. Group D&V ingested an averageportion of 3 % of L. styraciflua, while in the autumn L. styraciflua accounted for 9 % withinthe diet of group J&D and 1 % of Gordian. Nevertheless, the largest portion of L. styraciflua
referred to bodyweight was eaten by group D&V in spring, although statistically notsignificant. Statistical significant differences are evidenced in eating L. styraciflua betweenthe groups M&T and J&D (p < 0.01, U-test, two-sided) and on the same level of likelihoodcomparing group J&D to Gordian.
It has to be emphasised that a L. styraciflua tree was the main tree of residence for group J&Dwithin the forest, an indication of the individual predilection for this tree species. However, atthis point, it cannot definitely be concluded why L. styraciflua leaves were much more eatenin the forest than within the cages during the autumn session. Similar to A. julibrissin, the ageof leaves might be an important aspect, which could be selected to their liking in the forest incontrast to caged conditions. On the other hand, if already enough L. styraciflua leaves were
0 g
50 g
100 g
150 g
0 g 50 g 100 g 150 g 200 g
weight in
wei
ght e
aten
M&T
D&V
J&D
G
in = eaten
Fig. B.10: Correlation table and diagram between the weight of Liquidambar styraciflua
leaves put into the cage and the amount ingested by each study group.

B Empirical study on food selection 49
consumed in the forest, there was no need for group J&D to select the leaves within the cage.Hence, reasons for eating L. styraciflua differently are to be searched in its supply,presumably in the age of the leaves available and in personal preferences.
R. pseudoacacia trees were growing in both natural habitat enclosures, but only few leaveswere eaten within the forest during both seasons. In both, the spring and the autumn season, itwas seldom brought into the cages, but once available there, it was more eaten during thespring than during the autumn (Fig. B.11). The only statistically significant correlationbetween leaves brought into the cage and the quantity eaten is figured out for group M&T.However, in spring both groups ingested about 40 % of the leaves provided within the cages,whereas in the autumn only 8 % were eaten by Gordian and nothing by group J&D. GroupJ&D ate R. pseudoacacia leaves only in the forest.
The situation for L. tulipifera (not depicted as diagram) is similarly complicated as for A.
rubrum, but L. tulipifera is more difficult to evaluate in the spring. L. tulipifera was only oncebrought into the cage of group M&T and never to group D&V. Hence, in spring eatingL. tulipifera can only be evaluated for group M&T, and it could be best selected within theforest. While nearly all of the leaves offered within the cage was eaten by group M&T, onlyonce it was eaten in substantial amounts within the forest. On the contrary, in the autumngroup J&D typically ingested every day large amounts of L. tulipifera leaves in the forest, butnot within the cage. Gordian’s food choice only relied on the amount offered within the cage.It remains to be hypothesised, if Gordian ate less leaves than group J&D due to the age ofleaves offered or if he had other reasons for not selecting L. tulipifera the same way as groupJ&D.However, like L. styraciflua leaves, a percentage of 9 % was eaten of L. tulipifera by groupJ&D, while for Gordian it amounted to 2 % (Tab. B.8). In the forest, L. tulipifera leaves weregenerally more eaten by group J&D than by group M&T. Concluded from the set of availabledata, L. tulipifera was obviously more eaten during the autumn session than during the spring,but this may result from the different feeding conditions between the groups.
P. glabra leaves (neither depicted as diagram) were heavily eaten in the autumn whenprovided. As these leaves are typically provided only during the autumn and the winterseason, nothing can be said about other seasons. It has to be noticed that P. glabra builds abig portion of the winter food since the desired reddish leaves at the tip of the stems areavailable throughout winter time (Haring, pers. comm.). Referred to bodyweight, P. glabra
leaves can be classified as preferred food item. It was only once provided to each group
group rs prob. of error n
M&T 0.8 P < 0.05 4
0 g
5 g
10 g
15 g
20 g
25 g
30 g
0 g 10 g 20 g 30 g 40 g 50 g 60 g 70 g
weight in
wei
ght e
aten
M&T
D&V
J&D
G
in = eaten
Fig. B.11: Correlation table and diagram between the weight of Robinia pseudoacacia
leaves put into the cage and the amount ingested by each study group.

50 B Empirical study on food selection
during the autumn session, but then heavily eaten by both groups. The amount eaten byGordian even yielded a percentage of 1 % of the total food eaten (Tab. B.8).
For the groups M&T and J&D, the remaining leaf species within the diet were mainly sharedamong those species, which were vigorously selected in the forest, but not presented in thecages such as leaves of Morus rubra, Vitis sp., and Oxydendrum arboreum (Tab. B.5 andTab. B.6).
Comparing the feeding behaviour seen within the forest during the autumn and the springseason, it is remarkable that the amount eaten by group J&D in NHE-3 is about thrice asmuch as that eaten by group M&T in NHE-1, while the time of group J&D spent in the forestwas nearly double the amount of time as granted to group M&T. Whereas in the autumnapproximately 60 % of the leaves were selected in the forest, only 17 % of leaves wereselected from the forest by the study group in spring. It is obvious that group J&D did notspend much time on tasting any species, presumably because they already knew well theirforested territory.
Furthermore, it has to be kept in mind that during the autumn session typically only 3different leaf species were provided per day within the cages. Hence, except for R. copallina
and A. julibrissin, the feeding pattern for most plant species can best be evaluated consideringthe leaf selection of group J&D within the forest. Observations in the forest are vital for theevaluation of plant species and plant parts. Finally, it can be concluded that holdingconditions, food supply and habituation to food resources have an enormous impact on foodchoice, but despite these factors the portion of leaves, and especially two selected leaf species,play a vital role within the sifakas’ overall diet.

B Empirical study on food selection 51
4 Discussion
Different conditions of captive animal maintenance and small group sizes1 allowed for anintense data collection within this study. Although free ranging forested animals could havebeen problematic, these animals could be closely observed and were followed at all times withfood intake noted that was based on weight. Although feeding behaviour on caged animalstypically are based on weight, the instigation of the estimation method is new for animalsranging in the forest.
Although the methods described by Altmann (1974), which are well established in fieldstudies in order to determine total food intake based on time spent feeding (Richard, 1977 and1978a; Powzyk, 1997) instead on weight, this method of time measurement does not accountfor discrepancies between time needed and amount eaten. As already discussed by Richard(1978a) and corroborated by observations of the feeding bouts in this study (App. I.2),animals may need only a short time to ingest a large portion of e.g. a desired leaf species, bututilise a longer feeding time to gnaw at wood or on dry needles. Conversely, in the case ofnutrients garnered from nuts, nutrient gains parallel the time needed but then shows an anti-parallel trend with the amount of nuts ingested. In other words, animals needed more time toingest small amounts of Brazil nuts, but nutrient and energy gain of this food item is high dueto its high fat content. Another point is that feeding speed depends upon how hungry theanimal is. The observation that animals slowed down their feeding rate during a feeding boutafter having consumed most of the food eaten is corroborated by similar descriptions of free-ranging animals (Richard, 1978a). In captivity, most food was eaten during the first ten totwenty minutes, which were followed by reduced feeding rates, and essentially preferred fooditems which were nearly exhausted.
Of course, the estimation method instigated in this study bears inaccuracies regarding theassignment of an exact weight to an amount (or portion) of food specimen eaten. For example,when focal animals were feeding in the forest, an animal may be partly hidden by a branchwhile feeding. Often it was difficult to make out the type of leaf species that was being con-sumed when the animals were sitting or hanging in a tree while reaching over to eat from anearby tree in an overlapping canopy. There were also difficulties in monitoring caged ani-mals when it proved difficult to count food pieces and parts consumed when animals buriedtheir mouths in the feeding bowls. However, when scoring selected plant species and esti-mating their corresponding weights in the cages provided vital information on the animals’feeding patterns, especially when recording amounts in the forest when weighing of foodconsumed was impractical.
Observational data corroborated the importance of a food species for the animals’ diet andcompleted their overall food preferences. For example, sometimes during the spring season itcould happen that less Rhus copallina and Albizia julibrissin leaves were provided within thecages than were obviously desired by the animals. Typically these leaves were initiallyconsumed during the main feeding bouts yet the animals were observed to search for theseitems for a protracted period of time from the leaf bunches, which emphasises theirimportance within the animals’ diet. The mere weights eaten were in these cases lessmeaningful inasmuch that the desire for the food exceeded the quantity of food provided.
Hence, the combination of the weighing method, the estimation method and additionalobservational data allowed for a determination of the daily food eaten and helped to deciphergeneral, individual and seasonal feeding patterns.
1 Normally, groups of P. verreauxi consist of 2-13 animals (Richard et al., 1991; 1993).

52 B Empirical study on food selection
As in human’s nutrition, all weights ingested are referred to “fresh weight”. To determine thenutritional and energy values of the fruits and vegetable portions (Souci et al., 1994) withrespect to plant specimens ingested in the forest, I preferred to describe all foods to the “freshweight” category instead of “dry weights” which is typically used in animal nutrition (detailedinvestigations see chapter C.I).
The advantage of this study design is that data collection can be applied to field-likeconditions. Methods used are relatively easy to perform and do not need any adjustment to theanimals in regard to a changed feeding regime, holding conditions, or utilisation of equip-ment. This latter point was vital, as the DULC research management would not haveapproved any alterations. Nevertheless, this was disadvantageous insofar, as not even browse,especially the most preferred species R. copallina and A. julibrissin, could be given ad
libitum, to determine the upper level of desired intake. Therefore it was not possible to feedthe same leaf species in the cages on a daily basis during both seasons, so that the forestbecame even more important to evaluate leaf selection. Observations in the forest virtuallycompleted the overall image of the lemurs’ dietary preferences especially of those plantspecies which were not or not regularly given in the cages during either season. For instance,Acer rubrum was regularly offered in the spring but not given in the autumn. Fortunately, itgrew wild in both natural habitat enclosures and I was able to compare both seasons to oneanother. Furthermore, the more natural diet during the spring season was changed in theautumn to a diet superabundant in chow. The data records reflected the feeding regime andholding conditions at the DULC during both study periods. It is notable that both sets of data,which were gained day by day, allowed for an intense insight into the feeding behaviour ofthe focal sifakas, albeit only relatively short moments within their life were documented.Obviously, animals coped with both diets offered and the analyses of nutritional and energyvalues will reveal if they held nutritional and energy contents constant (see chapter C.I).
Yet food supply does influence consumption and the phenomenon of an apparent lower foodintake by animals during the autumn compared to the spring is obviously due to the largerportion of chow offered. Therefore groups in spring consumed more fruits and vegetablescombined with a larger portion of leaves (Fig. B.3, p. 40; Fig. B.5, p. 42) than foods eaten inthe autumn. So, the apparent dependency on the animal’s age of the total weight ingested ismore reflected by the portion of fruits and vegetables plus chow than by the amount of leaves.Despite a different food supply during the spring and autumn, at least one third (31 % and33 %, respectively) of the total fresh foods were allotted to the animals as a portion of leaveswithin the caged groups (Fig. B.3, p. 40), which is in agreement with findings of LopesSantini (1992) on P. v. coronatus at the Zoological Park of Paris and a study performed byCampbell et al. (2001) at Duke on P. v. coquereli. It is notable that both groups with outdooraccess within this study raised the percentage of leaves within their total diets to 38 % and45 %, respectively, which emphasises the importance of the leaves within the sifakas’ diet.
A comparison with previous observations in captivity and on free-ranging P. verreauxi in thewild corroborate that food preferences are dependent on factors such as different seasons,individual food preferences and general food availability. In this study, the availability ofseasonal occurring plant parts such as flowers or seeds was low. However, animals withoutdoor access received a natural-like diet with respect to the availability of different leafspecies, albeit their favourites R. copallina and A. julibrissin were only provided within thecages. Therefore, the feeding behaviour was only referred to plant species and plant parts thefocal lemurs found in their environment during the observation periods.
Based on a different degree of being habituated to the forested enclosures, a lot of plants weretasted and proved positive or rejected by the group M&T, while this behaviour was notobserved for the group J&D. The behaviour of tasting small amounts of unknown foodsources is in accordance with the behaviour postulated by Freeland and Janzen (1974).

B Empirical study on food selection 53
Accordingly, novel foods were treated with caution and sensory capabilities as well asmemory may play a vital role.
Although it can be presumed that the olfactory sense is more developed in prosimians than inhigher primates (Schilling, 1979), and smelling, licking, tasting are important capabilitieswhich are prerequisites to survive in the forest, nearly nothing is known about the exactmechanism how animals decide if a plant species is palatable and beneficial or detrimental.However, this interesting aspect lies beyond the scope of this study and needs furtherinvestigation.
During the winter time at the DULC, the sifakas received approximately 90 % R. copallina
leaves and 10 % A. julibrissin leaves, which were frozen in September. Young, fresh leaves ofPhotinia glabra supplemented the winter diet as “fresh” leaves and are available from autumnthrough the winter time. From April on animals received fresh leaves by providing the speciesof the browse mentioned. Therefore, R. copallina and A. julibrissin could be consumed allyear round (Haring, pers. comm.). The clear preference for R. copallina leaves of Coquerel’ssifakas was already mentioned by Haring (1988). The importance of R. copallina leaves forPropithecus species at Duke was emphasised by the behaviour of two P. tattersalli, whoquarrelled for a bifurcate branch of R. copallina, each sifaka pulling at one side, until thebranch broke into two pieces.
With respect to the seasonal availability of food items and food selection at the DULC,Haring (1988) reported that P. verreauxi spent a lot of time in Carpinus caroliniana and Acer
rubrum with ripened seeds. During the observation periods of this study, seed ingestion wasnot observed except for Cercis canadensis, due to the seasonal availability of these fooditems. While A. rubrum leaves were eaten, the focal lemurs only tasted the leaves of C.
caroliniana within this study. Mango leaves, which are reported to have supplemented winterdiet for some years to overcome the seasonal crisis in the animal’s condition and which weretherefore imported weekly from Florida and frozen (Haring, 1988), were not ingested by thefocal lemurs of this study. The focal lemurs only liked the mango fruits. However, Mangifera
indica is reported to be ingested by P. tattersalli in Madagascar (Meyers, 1993). Liquidambar
styraciflua leaves are reported to be an important food item for the Coquerel’s sifakas at theDULC, which agrees well with own observations. Fresh L. styraciflua leaves are availableduring most time of the year and were frozen to be available during the winter time (Haring,1988). Robinia pseudoacacia leaves were eaten as less preferred food item within this study,albeit they were highly selected by captive P. v. coronatus at the Zoological Park of Paris(Lopes Santini, 1992), which corroborates the variability in food preferences among relatedPropithecus subspecies (Richard, 1978b).
According to Richard (1977, 1978a, b), a high proportion of time was spent eating bark ordead wood at certain times of the year by either P. verreauxi subspecies. P. v. coquereli wasseen to eat bark to the exclusion of dead wood, while P. v. verreauxi was never seen to eatdead wood. Similarly, in captivity Coquerel’s sifakas ate dry needles of Pinus taeda trees andingested occasionally bark or wood.
Some of the plant genera growing in the North Carolinian forest were reported to occur alsowithin the Malagasy forest. According to Richard (1977, 1978a), P. v. verreauxi fed onDiospyros humbertiana, and on Mimosa and Albizia species for considerable amounts of time,which ranked within the most eaten twelve Malagasy species. During Richard’s study, oneMimosa species (Mimosaceae) was chosen by P. v. verreauxi to build an important food itemthroughout the year. The most eaten species belonged to the genus Mimosa (Mimosaceae).Studies performed about 20 years later revealed again the obvious importance of Mimosa
(Mimosa minitifolia) and Diospyros species for P. v. verreauxi living in the arid Didiereaceaeforest in the south of Madagascar (Ranarivelo, pers. comm.).

54 B Empirical study on food selection
While P. verreauxi at Morondava selected the leaves of Albizia greveana and Diospyros
aculeata (Ganzhorn, pers. comm.), P. tattersalli was interested in Albizia gummifera, A.
boivini, A. gaubertiana, A. lebbeck, Diospyrus lokohensis and D. sakalavarum (Meyers,1993). P. d. edwardsi was reported to be very interested in Albizia gummifera (Hemingway,1998). Different species of the genus Albizia were also selected as food source by otherprimate species like chimpanzees (Ganzhorn, pers. comm.) or red colobus monkeys(Struhsaker, 1978). At the DULC, the leaves of both species, A. julibrissin and Diospyros
virginiana, were selected with seasonal differences (see Tabl. B.7, p. 34). Tree species of theAnacardiaceae were found among the 12 most selected plant species of wild Coquerel’ssifakas in Madagascar (Richard, 1978b), while R. copallina was the most selected leaf speciesat the DULC.
In Madagascar, differences in food preferences were also evidenced within neighbouringgroups of the same Propithecus subspecies (Richard, 1977; 1978a, b). Differences reachedfrom using or rejecting an entire tree species to differences in the extent to which a treespecies was used or just to differences in the use of plant parts of the same species. Only eightout of twelve species most commonly eaten by two neighbouring groups of each Propithecus
subspecies were the same (Richard, 1978a). This seems to resemble the findings on individualfood use and different individual food preferences within this study: there was a differentutilisation of Morus rubra leaves by Marcella and Tiberius, and different amounts were eatenof A. rubrum and C. canadensis leaves by the groups M&T and D&V. This aspect is mirroredby findings of Lopes Santini (1992) on preferential food use by individuals of captive P. v.
coronatus.
In Madagascar, seasonal changes markedly influenced the dietary composition and the timespent feeding. All sifakas spent more time feeding in the wet season than in the dry season,while the number of species eaten increased in the dry season (Richard, 1977; 1978a, b). Onegroup of Coquerel’s sifakas was seen feeding on 85 different food species, the other on 98. Ifonly food species diversity is considered on which animals fed more than 1 % of total feedingtime, 22 different food species were counted with a marked decrease in the wet season. Ninefood species were eaten for more than 1 % of the total time spent feeding in both the dry andthe wet season out of 99 different food species, which were eaten in either season by at leastone of her two study groups (Richard, 1978a, b).
More than 65 % of the total feeding time were spent eating on only 12 different plant speciesby both subspecies, P. v. verreauxi and P. v. coquereli, respectively. Almost two-thirds of thetotal number of food species were only rarely eaten, while only few species were primarilyeaten (Richard 1978a, b). However, Richard (1978a) found a large overall long-term stabilityin food choice throughout the years. Food species chosen and the feeding time allotted tothem were found to be much the same, which seems also to be valid for captive conditions(compare Haring, 1988).
Generally, the same pattern of a selective food choice is already well documented for othermembers of the indriid clade like P. d. diadema (Powzyk, 1997), P. d. edwardsi (Hemingway,1996; 1998) and P. tattersalli (Meyers, 1993), which also agrees with findings of this study.Despite a large offer of plant species (including species growing in the forest), only some leafspecies were heavily eaten. Moreover, Richard (1978a) found two patterns in using plants asfood source: both P. verreauxi subspecies used respectively one plant species throughout theentire study time, while a second plant constituted the bulk of the group’s diet during a shortperiod of time, apart from which it was of little or no importance. Similarly, in captivityR. copallina leaves were nearly constantly and heavily eaten throughout both observationperiods and irrespective of seasonal influences, while A. julibrissin leaves were preferentiallyselected during the spring season. Both species were selected even by those animals who hadspent hours within the forest, where a lot of other tree species had been available.

B Empirical study on food selection 55
In contrast to the leaves, a large variety of fruits and vegetables was offered and eaten by thesifakas within this study (see Tab. B.3, p. 19). These findings agree with results found for P.
v. coquereli, P. tattersalli and P. d. diadema in a later study at the DULC despite a differentstudy design and a diet even more pronounced in chow (Campbell et al., 2001).
In Madagascar, proportions between different plant parts within the diet of P. verreauxi
fluctuated seasonally, hence far from being constant (Richard, 1978a, b). Although the overallchange between food parts (immature and mature leaves, flowers, fruits and to a minor extentother plant parts) was similar between both Propithecus subspecies, important differencesemerged. Coquerel’s sifakas ate more immature leaves and less fruits and mature leaves thanVerreaux’s sifakas. However, averaged on the year, time spent feeding was more granted tofruits than to either immature or mature leaves, and only to a lesser extent to flowers and otherplant parts within both subspecies. Hence, although P. verreauxi is classified as leaf-eatingprimate (Richard, 1978a, b) the portions between leaves and fruits within their diet werefound to be largely fluctuating with seasons and forest phenology, which emphasises theability of P. verreauxi to cope with the challenge of fluctuations in food availability. Theavailability of appropriate food is an important determinant to survive in nature and deter-mining an animal’s ecological niche. In captivity, the portions of fruits and vegetables pluschow were nearly constantly available irrespective of the season and built the largest portionwithin the daily food of the focal sifakas. The different portions of leaves, fruits andvegetables within the diet of the four study groups (Fig. B.3, p. 40) obviously lie within anacceptable and tolerated diet.
5 Conclusion
The major goal of this chapter is to evaluate food quality and quantity while taking intoaccount holding conditions, individual food preferences and seasonal factors which mayinfluence lemur food choice. The foods available to the study lemurs consisted of a variety offruits and vegetables, leaf-eater primate chow, together with a selection of leaf species.Noting the individual kg bodyweight of the focal lemurs, the weights of the consumed fruitsand vegetables and leaf-eater primate chow, differed substantially between the four sifakagroups and were dependent on the animal’s age along with distinct seasonal preferences infood consumption during the spring and the autumn data sessions. Although there wasdisparate food availability due to the climate seasons, overall less leaves were consumed inthe autumn compared to the spring, albeit their percentage within the sifakas’ diet remainedrather constant. Despite different feeding and captive holding conditions with the focal lemurswhich also varied in age, at least one third of the entire food intake was allotted to leaves,with an average of 32 % (m/m) noted in the diet of the caged animals, and an average of42 % (m/m) within the diet of those groups with outdoor access.
From the portion of the self-selected leaf species, two leaf species were revealed to beessential for the animal’s preferred diet and observations also revealed a distinct pattern ofleaf choice. Rhus copallina (sumac) and Albizia julibrissin (mimosa) leaves were vigorouslychosen by all lemur study groups irrespective of their holding conditions, independent of theanimal’s age, but with a distinct seasonal difference in selecting A. julibrissin leaves. While R.
copallina leaves were eaten regularly in both seasons, A. julibrissin leaves were eatensignificantly less in the autumn. Apart from some individual leaf preferences, the bulk ofother leaf species consumed seemed to be of minor importance for the sifakas. The mostpreferred plant species, R. copallina and A. julibrissin deserve further investigation withrespect to primary, and secondary plant compounds.

56 C.I Nutritional and energy values of foods selected by P. v. coquereli
C Chemical investigations on the major foodand drug resources
C.I Nutritional and energy values of foodsselected by P. v. coquereli
1 Introduction
The main food resources in the diet of captive Coquerel’s sifakas are leaves from selected treespecies, a variety of fruits and vegetables together with a commercial primate chow.Generally, major nutrients gained from these food specimens are structural and non-structuralcarbohydrates, proteins and fats. Of course, the capability to digest these food components togain nutrients and energy, especially with respect to fibre sources, depends largely on ananimal’s gastrointestinal adaptations together with the microbial flora, which in turndetermines the animal’s food choice and feeding strategies (Hofmann, 1983; Garber, 1987;Langer, 1986; Langer, 1988; Stevens, 1988; Hofmann, 1991). For folivorous midgut-fermenting1 mammals, fibre sources contribute both to the nutrient and energy supply, butalso influence the digestion and digestibility of other dietary components. In addition, they areinvolved in processes which maintain a healthy gut flora (Cook and Sellin, 1998; Onderdonk,1998). Hence, dietary limitations imposed to the animal by its digestive capacities arenormally reflected by feeding selectivity and food quality.
Although the Coquerel’s sifakas in this study live in captivity and do not suffer fromrestrictions in nutrient and energy supply, they exhibit a strong feeding selectivity and diets inprevious years proved to be somewhat detrimental to the animal’s health and well-being(Haring, 1988).
In the following investigation, the composition of primary food constituents in the diet ofP. v. coquereli and their nutritional benefit to the animals is to be assessed. Major questions tobe answered are: What is the food composition of the present diet like with respect to primaryfood compounds? In what way do individual food resources contribute to nutrient and energysupply? With respect to seasonal changes in primary leaf compounds, how do foodpreferences differ in the spring and autumn as to portions of fruits / vegetables and chow?And during these seasonal changes is the composition of primary food constituents heldconstant, or is the nutrient composition altered? Overall, what is the impact of heightened leafconsumption on the health of the sifakas, and why did the focal animals exhibit suchselectivity in their leaf consumption?
1 previously known as hindgut-fermenting mammals

C.I Nutritional and energy values of foods selected by P. v. coquereli 57
2 Materials and Methods
2.1 Plant material: origin and identification
All plant material used for chemical analysis and pharmacological tests was collected near theDuke Lemur Center, North Carolina, USA. It was collected throughout the study in May 1994and October 1997. Leaves were air-dried while still attached to their branches (and shieldedfrom direct sunlight), and were later stripped from their branches and stored in zap-lock bagsto be brought back to Germany (Tab. C.1).
Additional plant material was collected in July 1996, of the two major food plantsR. copallina and A. julibrissin by members of the Duke University Botany Department andwere dried and sent to Germany (about 1 kg dried leaves each).
In 1994 only leaf species given as browse were collected and dried, whereupon the firstchemical analyses started with these initial specimens. During the follow-up study in theautumn of 1997, additional species were collected (Tab. C.1), which were either provided asbrowse or selected from the forest by the study animals.
All plant material collected was first identified by means of the “Audubon Society FieldGuide to North American Trees” (Little, 1993), and later verified by Prof. Dr. Robert L.Wilbur at the Duke University Botany Department.
Tab. C.1: Review on plant species and time of collection.
plant species collected inAlbizia julibrissin May 94 July 96 October 97Rhus copallina May 94 July 96 October 97Cercis canadensis May 94 October 97Robinia pseudoacacia May 94 October 97Acer rubrum May 94 October 97Liquidambar styraciflua May 94 October 97Liriodendron tulipifera October 97Photinia glabra October 97Vitis rotundifolia October 97
The selection of plant species was based on the feeding behaviour of the sifakas observedduring the months of May 1994 and October 1997. Typically, only the leaf blades or leafblade parts were ingested while the stalks were consumed occasionally by some studyindividuals. Therefore, leaf stalks were generally removed from the leaf material beforestarting any analyses. Leaflets of stalkless species such as A. julibrissin and R. copallina werestripped off the axis, similar to the technique observed by the animals. The material harvestedwere comprised primarily of the plant species fed as browse to the caged lemurs and representthose species which had been selected by the sifakas before the onset of this study.
To harvest the leaf material, branches and twigs were cut including upper immature, youngerleaves and lower intermediate and mature leaves. All leaves of that branch were stripped offand mixed for subsequent analyses. Only for A. julibrissin leaves was it necessary todistinguish in spring the immature leafbuds at tips of the bipinnately compound leaves andlower young but mature leaflets, while in autumn a distinction between older, very mature andyounger mature leaflets, was guided by size, colour and texture of the leaflets. Thisdiscrimination in turn was based upon the feeding behaviour exhibited by the sifakas.

58 C.I Nutritional and energy values of foods selected by P. v. coquereli
2.2 Preparation of the dried plant material for chemical investigations
According to the feeding behaviour of the sifakas, the air-dried leaves were stripped off thestems and twigs so that only the leaf blades remained. Depending on the leaf species,leafstalks were only tolerated to the extent they have been ingested by the sifakas. Afterwards,the dried leaves were ground by different methods:
Smooth leaf species containing very fibrous tissue, such as A. julibrissin, C. canadensis andR. pseudoacacia, were first crushed by a mill (Braun®, or most often by Moulinex®) andthen ground by means of a mortar and pistil. In contrast, the tougher leaves such asR. copallina and L. styraciflua, were already sufficiently powdered by the latter method. Toget a uniform particle size of the powdered leaf material, it was finally standardised by usingsieve No. IV (DAB 7, corresponding to 0.80 mm DIN 4188). Standardisation excluded thetougher and more voluminous and fibrous parts of the leaf texture and yielded particle sizesappropriate for the different analytical investigations.
Leaves of P. glabra were quite resistant to most grinding trials so that only few amounts ofpowdered plant material could be provided for assays where fine and uniform leaf materialwas needed. Hence, the number of analyses was limited for this species.
2.3 Nutritional and energy values of the food
The nutritional values of the sifakas’ diet are determined by means of two different sets ofdata. Nutritional values of the leaves were determined experimentally according to methods ofthe Weender analyses (Naumann and Bassler, 1976-1997; Meyer et al., 1993 ). Nutritionalvalues of the large portion of fruits and vegetables were taken from the nutrition tables ofSouci et al. (1994).
Food resources such as leaf-eater primate chow (No. 5672, Purina Mills, Inc. St. Louis, MO)and chick peas were calculated according to information given by the respective productioncompanies. Data missing on the primate chow were completed by methods of the Weenderanalyses, while data missing on chick peas were completed by means of the nutrition tables(Souci et al., 1994).
Nutritional values according to Souci et al. (1994), are adjusted to human’s food use, and theclassification of analytical data is based on the digestibility of the human’s digestive system.In the nutrition tables, primary compounds are referred to fresh food weight and all foodspecimens are referred by their respective edible portion, that is raw products as purchased onthe European market minus waste products (e.g. peels, kernels, shells) to be edible forhumans.
As there was no fundamental difference in processing fruits and vegetables prior toconsumption between humans and sifakas with respect to the species of fruits and vegetablesoffered (chapter B), the large portion of fruits and vegetables was evaluated by means of thenutrition tables of Souci et al. (1994). In consequence, primary compounds analysed for theair-dried leaves had to be converted to fresh weight since all food intake is based on freshfood weight.
While the content of food constituents is normally given in g / kg in animal nutrition(App. II.1), it was preferred to use g / 100 g food specimen in agreement with Souci et al.
(1994) in human nutrition.
Energy values of the various fruits and vegetables were also taken from the nutrition tables.Energy values of the leaves and all other food sources not included in the tables werecalculated by means of the respective energy factors for available carbohydrates, proteins andfat as given by Souci et al. (1994) and listed in Tab. C.2.

C.I Nutritional and energy values of foods selected by P. v. coquereli 59
In this study two different models were used to calculate minimum and maximum energy gainfrom the leaves in the diet of the sifakas: either the fraction of fibres was not regarded, or itwas calculated by means of the respective factor taken from Tab. C.2.
Tab. C.2: Gross energy (Meyer et al.,1993; Biesalski et al., 1995), metabolisable(physiological) energy (Biesalski et al., 1995), and energy factors used in thiswork (Souci et al., 1994) of different nutrients.
energy in kJ / g1
nutrients gross metabolisable factorcarbohydrates 17.2 17.2 17protein 23.8-24.2 17.6 17fat 36.6-39.8 38.9 37organic acids 13fibre 17.2-22.2 (0-)17a
nitrogen free extract 17.0-17.5urea 10.7uric acid 11.5acetic acid 14.6propionic acid 20.8butyric acid 24.9
aFor maximal energy intake the content of fibre and the organic rest of the leaves are calculated by factor 17.
While gross energy is the energy content of nutrients determined as heat by means of a bombcalorimeter, the metabolisable (physiological) energy reflects the actual portion of energygained by the organism. Main energy losses are due to faecal output, urine and the productionof gases (Tab. C.2). In contrast to the metabolisable energy, the digestible energy is defined asgross energy intake minus faecal energy losses. Without further correction for faecal energyof endogenous origin, this digestibility is defined as “apparent digestibility”.
Until now the use of nutrition tables based on human nutrition was well established as thesource of data in primate husbandry (Müller and Schildger, 1992) and is used to calculatemetabolisable energy obtained from the food (Conklin and Wrangham, 1994).
Determination of primary compounds in the leaves (Weender methods)
The following “Weender methods of analyses” (Naumann and Bassler, 1976-1997; Meyeret al., 1993) were applied to determine the nutritional values of the leaves selected by thesifakas. Analyses were performed on the air-dried plant material at the laboratory ofProf. Dr. M. Coenen (Tierärztliche Hochschule, Hanover).
While detailed analyses according to methods listed were only carried out for R. copallina andA. julibrissin, for all other leaf species collected dry substance and crude ash were determined,respectively. The respective contents of crude protein, available carbohydrates (simplesaccharides and starch) and crude fibre were calculated by averaging the respective dataexamined for R. copallina and A. julibrissin of either season. Normally, analyses wereperformed in duplicate (App. II.1).
Determination of dry substance and crude waterApproximately 3 g of air-dried and ground plant material are dried in an oven overnight at105 °C (according to Meyer et al. (1993) for four hours at 103 °C), that is to constancy ofweight.
1 Relation between calorie and Joule: 1 cal = 4.184 J

60 C.I Nutritional and energy values of foods selected by P. v. coquereli
The difference in weight after drying is predominantly due to the loss of water, but includesalso all other substances volatile at the temperature of drying, e.g. volatile fatty acids,essential oils, alcohol etc. The loss of weight is defined as crude water.dry substance = air-dried plant material − crude water
Comment:While the determination of “weight loss by drying” according to DAB 7 and 8 is aconventional method for drugs and extracts, and is used for quality control, the determinationof the dry substance according to Weender analyses is performed to constancy of weight. Allsubsequent analyses of the Weender analyses are referred to dry substance of each plantspecimen.
Crude ashPlant material is put into a muffle furnace at 600 °C (550 °C according to Meyer et al., 1993)for six hours, until constancy of weight. The residue constitutes the crude ash containingminerals, trace elements and other anorganic compounds as silicates.
Crude fibre1 g plant material is refluxed for 30 minutes in 1.25 % aqueous sulphuric acid, and afterremoval of the acidic solution, it is refluxed in 1.25 % aqueous sodium hydroxide and rinsedwith boiled water. The residue is dried overnight at 105 °C, cooled down in an exsiccator andweighed. Finally, that residue is muffled in a furnace at 500 °C for about two hours.
Thereby, crude fibre content is determined by weight difference between the residue afterdrying at 105 °C and the residue after muffling referred to the input of plant material.
Crude fibre means the fat- and ash-free residue of the plant material that is insoluble in acidicand basic solution. It contains insoluble portions of cellulose, hemicellulose (pentosanes,hexosanes), pectin, lignin and other parts of the plant cell wall as waxes (cutin, suberin).
Crude proteinThe determination of the crude protein according to the “Weender analyses” is based on theKjeldahl method (Ph.Eur. I). The plant material is decomposed and oxidised by means ofconc. sulphuric acid, copper sulphate and conc. H2O2. The latter reagents serve as catalysts(Roth and Blaschke, 1981). Hence, all nitrogen is converted into a corresponding amount of(NH4)2SO4. A solution of sodium hydroxide is added in surplus and the volatile ammoniac isdistilled according to Ph.Eur. I into an acidic solution, here 2 % boric acid, which is morelikely to serve as buffer. Unlike Ph.Eur. I, which uses a back-titration of the surplus of acidicsolution, the content of NH4OH is here directly determined by titration with 0.3 M HCl.
Comment:Protein contains an average of 16 % nitrogen. (Crude protein = N x 6.25).Disadvantage of the Kjeldahl method is, that also nitrogen containing compounds of nonprotein nature are included, e.g. acid amides, amines, free amino acids, ammonium salts,alkaloids. Azo-groups cannot be determined by this method as molecular nitrogen is formed.Pyridine- and chinoline- derivatives are difficult to decompose under Kjeldahl conditions andare therefore difficult to quantify (Roth and Blaschke, 1981).Yet, with respect to the well adapted gut system of the sifakas which is probably able to usealso other sources of nitrogen apart from proteins, the determination of nitrogen according toKjeldahl is an appropriate method. However, compounds that may fail to decompose orcannot be determined by this method, yet are not expected to be found in prodigious amountswithin the food plants.
Determination of simple (mono- and di-) saccharidesThe content of mono- and disaccharides (except for lactose and maltose) is determined byiodometric titration following acidic hydrolysis. This procedure determines glucose, which isreferred to sucrose when calculating the content of simple saccharides.

C.I Nutritional and energy values of foods selected by P. v. coquereli 61
The dried plant material is dispersed in 40 % aqueous ethanol to solve selectively mono- anddisaccharides, while starch and related compounds of higher molecular weight are not solvedunder these conditions. Carrez I reagent (ZnAc2 in aqueous acetic acid) and Carrez II reagent(aqueous solution of K4(Fe(CN)6 x 3 H2O) are added to precipitate proteins as well as othercomplexing compounds. (Carrez I precipitates proteins while Carrez II enhancesprecipitation.)
The solution is then filtered, neutralised with hydrochloric acid against methylorange(indicator) and hydrolysed by means of 0.1 M HCl for 30 min. at 100 °C to yield glucose andfructose.
After neutralising the hydrolysed solution with a corresponding quantity of 0.1 M NaOH,Luff-Schoorl reagent (copper II solution) is added to oxidise glucose to gluconic acid bytransferring two electrons.
To quantify the gluconic acid yielded, potassium iodide is added, which reduces againgluconic acid to glucose (and the residual Cu2+ to Cu+) while self being oxidised to iodine (I2).Iodine is titrated with thiosulphate against starch.
Determination of starchThe content of starch is determined by polarimetry, which is performed twice.
First, the entire solution of carbohydrates is hydrolysed for 15 min. at 100 °C in 1.12 %aqueous hydrochloric acid, clarified by Carrez I and II reagents and filtered to be determinedby polarimetry. Second, the optical activity is determined after selective extraction of mono-and disaccharides with 40 % ethanol and subsequent treatment as for the first determination.The entire optical activity is diminished by the optical rotation of carbohydrates soluble in40 % ethanol.
Definition of terms used in this study
WaterThe water content of the fresh leaf material was determined before and after air-drying andwas averaged irrespective of species and season and set constant at 82 % (weight), which is inaccordance with the literature (Lopes Santini, 1992).
CarbohydratesCarbohydrates according to the nutrition tables (“available carbohydrates”, (Souci et al.,1994)) include all mono-, oligo- and polysaccharides (e.g. glucose, fructose, sucrose, lactose,maltose, dextrin, starch) and sugar alcohols (sorbitol, xylitol, glycerol) digestible by thehuman digestive tract.
The determination of carbohydrates according to Weender analyses comprises simplesaccharides (mono- and disaccharides except for lactose and maltose) and starch. The contentsof both were added to be treated in this study as non-structural carbohydrates like the“available carbohydrates” of the nutrition tables.
Comment:The content of non-structural carbohydrates of the leaves contains less components than thoseanalysed for fruits and vegetables according to Souci et al. (1994).
FibresThe fraction of dietary fibres builds a rather heterogeneous group of compounds, raisingdifferent problems regarding their determination. Generally, the total fibre fraction consists oftwo main types: the water-insoluble and water-soluble fibres. While the water-insoluble fibrespredominantly contain cell wall structures like cellulose, hemicellulose (polysaccharide type)and lignin (polyphenolic compounds), the water-soluble fibres comprise cell wall structuressuch as water-soluble hemicellulose and pectins together with cell products such as gum and

62 C.I Nutritional and energy values of foods selected by P. v. coquereli
mucilage, which have gelling properties when soaked in water. Values for the nutrition tables(Souci et al., 1994) were either determined by the difference method, or by enzymaticmethods to identify both: the contents of the water-insoluble and water-soluble fibre typeswhich then yield the total dietary fibres.
Calculation by difference method:total dietary fibres = 100 – (water + protein + fat + minerals + available carbohydrates)
It is noteworthy to mention that the sum of all food constituents may slightly differ from100 %, depending on the determination of the contents of carbohydrates and fibres (Souci et
al.,1994).
Fibres according to Weender analyses (“crude fibre”) contain predominantly water-insolublefibre types with portions of cellulose, hemicellulose, pectins, lignin and other parts of theplant cell wall as waxes (cutin, suberin).
Comment:Available carbohydrate values characterise types of compounds which are digestible by thehuman’s digestive enzymes in contrast to the fraction of dietary fibres, containing allsubstances of high-molecular weight which cannot be split up by enzymes of the humandigestive system, but rely on microbial symbionts for degradation. However, division basedon human’s digestibility basically coincides with a division based on chemical structures, thatis the non-structural, available carbohydrates (“carbohydrates”) and cell wall structures likestructural carbohydrates and lignin (“fibres”).
ProteinThe term “crude protein” according to Weender analyses is termed protein in accordance withSouci et al. (1994).
FatIn the analysis of leaves, the portion of fat is presumed to not exceed more than 1 % of freshleaf weight (Rust, pers. comm.), which is in accordance with literature (Lopes Santini, 1992).
MineralsCrude ash values for leaves are determined according to Weender methods, and is used in asimilar manner as the value of minerals determined for fruits and vegetables (Souci et al.,1994).
Organic restIn this study all remaining compounds not determined for the leaves appear in the “organicrest”, which is calculated by the difference method:
organic rest = 100 – (protein + fat + fibres + ash + starch + simple saccharides).
It contains mainly water-soluble fibres and carbohydrates not determined in either the crudefibre fraction, or in the fraction of soluble carbohydrates.
The content of “available” organic acids like lactic acid, citric acid and malic acid, which areanalysed for fruits and vegetables (Souci et al., 1994), are not investigated for the leaves andappear within the “organic rest”.

C.I Nutritional and energy values of foods selected by P. v. coquereli 63
3 Results
3.1 Food composition and nutritional values
The nutritional values are used to assess the importance of the main food resources - leaves,fruits & vegetables, and chow - and their contribution to animal’s diet with special respect tothe leaves.
The nutritional values of the leaves according to Weender methods are listed in App. II.1,while values of all food species referred to fresh weight are presented in Tab. C.3.
The evaluation of the primary compounds of the leaves reveals some prominent tendenciesduring the course of a year. To complete the insight into seasonal changes, R. copallina and A.
julibrissin leaves harvested in July (which has not been observed) and older autumn leaves ofA. julibrissin (not eaten) were included in the analyses (App. II.1), but excluded when thefeeding behaviour was examined (Tab. C.3).
While the protein level of R. copallina and A. julibrissin leaves is more likely to decreaseduring the year, the fibre content increases. This is in accordance with the general expectationthat mature leaves are more fibrous and contain less protein than immature leaves (Milton,1979; Waterman, 1984; Powzyk, 1997). The decrease in protein and increase in water-insoluble fibres was also corroborated by a later study at Duke on mixed browse species(Campbell et al., 2001). However, old leaves of A. julibrissin harvested in autumn, failed tofollow that trend. Older autumn leaves from A. julibrissin trees, were found to be less fibrousthan younger leaves cut in October, although only the younger leaves if any were eaten duringthat time of year by the sifakas (see results chapter B). Protein values decreased during theyear, and surprisingly the younger October leaves contained less protein than older Octoberleaves (App. II.1).
While animals strongly discriminated between immature and mature leaves of A. julibrissin,R. copallina leaves were eaten in autumn with nearly the same intensity as in the spring.Gordian ate an overwhelming portion of R. copallina in the autumn. Nevertheless, it isremarkable that A. julibrissin leaves exhibit very high protein levels in all seasons.
Starch contents typically decreased for A. julibrissin yet were increasing for R. copallina fromspring to autumn. However, this tendency was not entirely consistent. While levels of simplesaccharides are again somewhat inconsistent for A. julibrissin leaves, levels of mono- anddisaccharides increase for R. copallina leaves during the year. Again, old A. julibrissin leavescollected during the autumn do not fit expectations.
Except for R. copallina and A. julibrissin, detailed nutritional values on the contents ofprotein, carbohydrates and fibres were calculated by averaging the respective data examinedfor R. copallina and A. julibrissin of either season. (Details see App. II.1). To calculate valuesfor the leaves in autumn, only younger leaves of A. julibrissin were taken into account.
When comparing the nutritional values of fruits & vegetables, chow and leaves to oneanother, some major tendencies can be elicited.
In regard to the protein content of the different food sources, it is striking to note that thecommercially designed leaf-eater primate chow contains the largest portion of protein, due infact to the chow being in a pelleted form with a low water content. Brazil nuts also have ahigh protein value, and overall a high nutrient density. Furthermore, protein contents of leavesare generally high and range within upper limits determined for vegetables. In contrast, lowprotein values typically occur in fruits.

64 C.I Nutritional and energy values of foods selected by P. v. coquereli
Tab. C.3: Average nutritional values in gram per 100 g leaf material, edible portion of fruits& vegetables, and chow, respectively. All values are referred to fresh weight offood specimens.
species water protein fat carbo-hydrates
fibres organicresta
minerals /ash
leaves
A. julibrissin May 82.00 6.12 1.00 1.60 2.02 6.23 1.03A. julibrissin Oct. 82.00 3.87 1.00 1.21 2.96 7.80 1.15R. copallina May 82.00 3.13 1.00 1.19 1.57 10.48 0.62R. copallina Oct. 82.00 2.07 1.00 2.40 2.53 9.45 0.55L. styraciflua May 82.00 4.62 1.00 1.40 1.80 8.37 0.81L. styraciflua Oct. 82.00 2.97 1.00 1.80 2.75 8.10 1.38C. canadensis May 82.00 4.62 1.00 1.40 1.80 8.18 1.00C. canadensis Oct. 82.00 2.97 1.00 1.80 2.75 8.14 1.34R. pseudoacacia May 82.00 4.62 1.00 1.40 1.80 8.06 1.12R. pseudoacacia Oct. 82.00 2.97 1.00 1.80 2.75 8.37 1.11A. rubrum May 82.00 4.62 1.00 1.40 1.80 8.53 0.66A. rubrum Oct. 82.00 2.97 1.00 1.80 2.75 8.61 0.87P. glabra Oct. 82.00 2.97 1.00 1.80 2.75 8.45 1.03L. tulipifera Oct. 82.00 2.97 1.00 1.80 2.75 8.18 1.30V. rotundifolia Oct. 82.00 2.97 1.00 1.80 2.75 8.68 0.79
fruits and vegetables
apple 85.30 0.34 0.58 11.43 2.02 0.46 0.32banana 73.90 1.15 0.18 20.03 1.82 0.56 0.83Brazil nut 5.62 13.59 66.80 3.64 6.70 3.65broccoli 89.70 3.30 0.20 2.51 3.00 0.33 1.10cantaloupeb 85.40 0.90 0.10 12.40 0.73 0.08 0.40carrot 88.20 0.98 0.20 4.80 3.63 0.26 0.86cauliflower 91.60 2.46 0.28 2.34 2.92 0.22 0.82celery 92.90 1.20 0.20 2.18 2.55 1.10
chick peac 63.70 6.00 2.00 20.00 7.00 1.30cucumber 96.80 0.60 0.20 1.81 0.54 0.26 0.60French beans 90.30 2.39 0.24 5.09 1.89 0.20 0.72
graped 81.10 0.68 0.28 15.24 1.50 0.35 0.48
kalee 86.30 4.30 0.90 2.54 4.20 0.44 1.70kiwi fruit 83.80 1.00 0.63 9.12 2.12 1.49 0.72mango 82.00 0.60 0.45 12.45 1.70 0.34 0.50
mustard, greenf 86.30 4.30 0.90 2.54 4.20 0.44 1.70onion 87.60 1.25 0.25 4.91 1.81 0.21 0.59orange 85.70 1.00 0.20 8.25 1.60 1.13 0.48pea, pod and seed,greeng
75.22 6.55 0.48 12.30 4.25 0.28 0.92
pear 84.30 0.47 0.29 12.37 3.27 0.31 0.33plum 83.70 0.60 0.17 10.16 1.58 1.25 0.49red cabbage 91.80 1.50 0.18 3.54 2.50 0.67sweetcornh 74.70 3.28 1.23 15.72 4.22 0.05 0.80

C.I Nutritional and energy values of foods selected by P. v. coquereli 65
species water protein fat carbo-hydrates
fibres organicresta
minerals /ash
sweet potato 69.20 1.63 0.60 24.08 3.14 1.12watermelon 90.29 0.60 0.20 8.29 0.22 0.40white cabbage 90.49 1.37 0.20 4.16 2.96 0.23 0.59
chow
chowi 8.83 23.00 5.00 33.06 23.7 6.41a
The organic rest of fruits and vegetables (Souci et al., 1994) consists of organic acids.b
The cantaloup(e) and honeydew melon, both available as such on the U.S. market, were both calculated asmuskmelon (Souci et al., 1994), the more as both sorts could be interpreted as vernacular names ofdifferent languages of Cucumis melo L. To indicate that two melon types were used as feed, cantaloupe wasrecorded as cantaloupe and honeydew melon as muskmelon.
cCanned chick peas (in water, salt and EDTA) were fed to the animals. The nutritional values of protein,carbohydrate, fat and fibre (in gram) are listed according to the declarations on the tag. The value forminerals is taken from Souci et al. (1994) of “chick pea, seed, green”. The water content was calculated bydifference method: 100 - (protein + fat + available carbohydrates + minerals + total dietary fibre).
dGrape: violet and red sorts were fed.
eKale: frizzy and smooth sorts were fed.
fDue to lacking information on nutritive values, mustard green is calculated as kale.
gTwo varieties of peas were fed.
hZea mays L.
iThe “Mazuri leaf-eater primate diet”, No. 5672, Purina Mills, Inc., St. Louis, MO, quality controlled byPMI Feeds, Inc., was used as primate chow. The analyses values on the tag of the bag were as follows:Crude protein not more than 23.0 %; crude fat not more than 5.0 %; crude fibre 11.2 (NDF = neutraldetergent fibre 23.7 %; ADF = acid detergent fibre 15.0 %); ash not more than 8.0 %; added minerals notmore than 3.0 %.For the total dietary fibre value, the NDF value was used. Crude water and ash were determined accordingto the “Weender methods of analyses” at the University of Veterinary Medicine, Hanover. The ash value istaken as value for minerals. The value for carbohydrates is estimated by difference method:100 – (water + protein + fat + NDF + ash).
Contents of water and fat are set constant for fresh leaves, which limits interpretation of thesevalues. However, the content of fat for the leaves is set constant at a maximum value to makesure that leaves are not underestimated so their maximum impact for the diet may beaccurately assessed. Exceptionally high values in fat were recorded for Brazil nuts, with chowshowing much reduced levels of fats. The inclusion of nuts within the lemur diets wassufficient to change the entire nutrient composition of the study groups (see Fig. C.1).Nevertheless, chow was rich in fat due to added soybean oil, which is declared on thenutritional tag. As will be seen in Fig. C.1, chow influences the amount of fat ingested by thesifakas. Other fruits and vegetables are generally low in fat.
The highest levels of “available” carbohydrates, that is non-structural polysaccharides andsoluble saccharides, were found in chow, followed by sweet potato, chick pea and banana.The value of carbohydrates calculated for chow is higher than other values for non-structuralcarbohydrates aside the fruits & vegetables. Although leaves are generally low in solublesaccharides and starch, it is important to note that due to different analytical methods, thefibre fraction and the organic rest of the leaves also need to be taken into account as fractionsmay overlap.
Nevertheless, fruits are generally high in readily digestible carbohydrates, especially in simplesaccharides. Most vegetables range in levels evidenced for the leaves, but depending on theplant part used, differences may occur. Starch was found to be highest in sweet potato,

66 C.I Nutritional and energy values of foods selected by P. v. coquereli
followed by sweetcorn and peas. Detailed values for chow were lacking. However, due toingredients given on the tag such as ground yellow corn, corn gluten meal, ground oats andalfalfa meal, a rather high content of starch can be expected. Moreover, it is notable that A.
julibrissin and R. copallina leaves of both seasons contain more starch than analysed forvegetables (Souci et al., 1994).
0 g
2 g
4 g
6 g
Protein
Fat
Carbohydrates
Fibre
Org. R
est
Chow Fruit&Veg. Leaves
Group M&T
0 g
4 g
8 g
12 g
Protein
Fat
Carbohydrates
Fibre
Org. R
est
Group D&V
0 g
1 g
2 g
3 g
4 g
Protein
Fat
Carbohydrates
Fibre
Org. R
est
Group J&D
0 g
2 g
4 g
6 g
8 g
Protein
Fat
Carbohydrates
Fibre
Org. R
est
Group G
Fig. C.1: Weights (g / kg bodyweight and day) of the primary food constituents gainedfrom the various food sources (based on fresh food weights) by the four groups ofCoquerel’s sifakas.
Apart from chow, chick peas and Brazil nuts were rich in fibres, followed by peas, sweetcornand leafy greens such as kale. Primate chow is a specially designed high fibre food which isable to compete with leaves in this respect (crude fibre: 11.2 %, NDF: 23.7 %). Fibre valuesof the leaves are generally high and normally exceeding those of fruits and vegetables.However, a detailed evaluation of the leaves cannot be performed at that point due to the largeorganic rest with unknown composition.

C.I Nutritional and energy values of foods selected by P. v. coquereli 67
Contents of “crude ash” determined for the leaves range within the upper level of contents forminerals determined for fruits and vegetables (Tab. C.3), indicating that leaves are certainlyan important source of minerals.
As the study groups differed in number of animals and their respective bodyweights, foodintake as well as ingestion of primary compounds was referred to kg bodyweight as thecomparable entity.
In the following, the nutritional contribution of different types of food offered and theirimportance for the diet are scrutinised (Fig. C.1 and Fig. C.2). The composition of foodconstituents of individual food sources is principally reflected by the dietary composition ofthe sifakas. However, as the sifakas chose food sources to their liking, they have been able tomanage an appropriate food composition regarding portions of main organic foodconstituents, such as carbohydrates, protein, fat, and fibres. Selected portions of leaves, fruits,vegetables and chow as the main food categories are ultimately responsible for thecomposition of primary compounds and fibre contents in their diet (Fig. C.1).
While Fig. C.1 shows the amounts ingested of primary food constituents including fibres andthe organic rest gained from the main food categories (chow, fruits & vegetables and leaves),Fig. C.2 gives the percentages of the primary food constituents within the diet. With respect tofood sources utilised, striking differences become visible among the four study groupsobserved.
Org. Rest18%
Protein20%
Carbo-hydrates
41%
Fibre17%
Fat5%
Group M&T
Org. Rest16%
Protein18%
Carbo-hydrates
45%
Fibre16%
Fat4%
Group D&V
Fat9%
Fibre21%
Carbo-hydrates
36%
Protein20%
Org. Rest13%
Group J&D
Org. Rest8%
Protein22%
Carbo-hydrates
39%
Fibre24%
Fat6%
Group G
Fig. C.2: Nutritional composition in g/kg bodyweight (%) and day within each group’s dietreferred to fresh weight of food.

68 C.I Nutritional and energy values of foods selected by P. v. coquereli
During the spring season, the majority of protein was gained from leaves. Non-structuralcarbohydrates were mainly derived from fruits and vegetables. If the dietary fibre without thefraction of the organic rest is considered, chow, fruits and vegetables contain the most fibre.However, as previously mentioned, most water-soluble fibre types are contained in theorganic rest of the leaves. Noting the fibre fraction within the organic rest, leaves are clearlythe major source of fibre in the spring.
On the contrary, the diet in autumn was dominated by chow as the main source of nutrients.This is not surprising, if Fig. C.1 is compared to Fig. B.3 (p. 40) and Fig. B.5 (p. 42). Bothgroups in the autumn ingested rather large amounts of chow, a dry and nutrient richcommercial food source. While only a small portion of chow was given to and ingested by thegroups in spring, large portions of chow were offered in the autumn and nearly half the weightingested of fruits and vegetables was allotted to chow (Fig. B.3, p. 40). Due to its highnutrient density, chow competes with or even exceeds other food resources in nutrient supply.Hence, the diet in the autumn reflects the nutritional composition of chow. In Gordian’s diet,chow clearly constituted the main source of fibre. However, as explained in chapter B,Gordian received few leaf species within his cage and in low amounts. As previouslyindicated, supply and demand constitute the major reason for the different portions consumedof the respective quantities of fruits & vegetables and chow during the spring and autumnmonths.
Levels of fat deserve a separate explanation. While most fat is gained from chow by the studygroups in spring, the rather high fat levels in the diet of J&D and G originate from Brazil nuts,which were offered thrice to J&D and once to G. Moreover, chow contributes enormously tothe supply of fat in autumn.
Despite different ages of the study animals and despite two different seasons, a review onfood components reveals a clear dependence on age (Tab. C.4).
Tab. C.4: Averaged food compositiona in g / kg bodyweight and day:groups of adult animals are placed above the broken line, juvenile and subadultanimals are grouped below.
group water protein fat carbo-hydrates
fibres org.rest
minerals totalb
M&T 70.9 3.3 0.8 6.9 2.8 3.1 0.9 17.8J&D 37.1 3.2 1.5 5.6 3.4 2.1 1.0 16.7
D&V 135.0 6.0 1.4 14.9 5.3 5.1 1.7 34.5G 51.4 6.3 1.8 11.3 6.8 2.4 1.9 30.5
aWeights are referred to fresh food based on Tab. C.3.
bTotal ingested except for the content of water, which represents dry matter.Total = protein + fat + carbohydrates + fibres + org. rest + minerals
Both groups with juvenile and subadult animals consumed nearly double the amount of totaldry matter (“total”, Tab. C.4) than adult animals, which reflects the higher nutrientrequirements of growing animals.
In detail, young animals consumed nearly double the amount of proteins than adult animals.The same tendency nearly holds true for the fraction of available carbohydrates as majorsource of energy. If either the fractions of carbohydrates and fibres are added respectively foreach study group, or if the respective fractions of carbohydrates, fibres and the organic restare added, all calculations reveal that double the amount was ingested by groups with young,developing animals compared to groups of adults. Hence, soluble and structural carbohydratesare obviously essential sources of energy. In contrast, the amount of fat ingested does not

C.I Nutritional and energy values of foods selected by P. v. coquereli 69
reveal that clear dependence on the animal’s age. This finding corroborates the suspicion thatthe amount of fat is more likely to be caused by food quality than by necessity to eat suchamounts. The problem of ingesting “hidden” fats or more fat than needed for bodilymaintenance is a well known cause of obesity in developed countries.
The amount of minerals ingested is likely to be a consequence of the quantity of food intake.Only a weak dependence on the animal’s age becomes visible.
Water gained from food (Tab. C.4) is significantly higher for groups M&T and D&Vobserved in spring than for the study groups in autumn. Group D&V obtained the highestamount of water from the food as they ingested the largest portion of fruits and vegetables ofall four study groups (Fig. B.3, p. 40; Tab. B.9, p. 43). As already indicated in chapter B, thelow water supply for the groups in the autumn is obviously caused by the diet rich in primatechow, a sort of “dry food”, which hardly contains any water. However, in contrast to spring,animals observed in autumn drank water, presumably to compensate for the low water contentof the diet eaten. So, water intake from the food (Tab. C.4) is more likely to reflect the watercontent of the different food composition than actual needs.
Hence, in consideration of the varying food categories used, it is vital to determine whetherthe percentages (weight %) of the nutrients and dietary fibres may vary or are held constant inthe diet, irrespective of food sources chosen and irrespective of the animals’ age (Fig. C.2).
According to Fig. C.2 it is striking how constant percentages are among the study groupsespecially during the same season. Irrespective of the group’s age, about 20 % (weight) wereallotted to protein. While the percentage of fat averaged 4-5 % for the groups in spring, fatlevel raised to about 8 % for the groups in autumn, most likely due to the larger portion ofchow and Brazil nuts ingested by the latter groups.
At first sight, carbohydrate and fibre levels resemble each other more for the groups of thesame season than of different seasons. However, if the large organic rest is taken into account,differences between groups disappear considerably. The organic rest bears mostimponderability as to chemical composition and its digestibility by the animals. It resembleson the one hand the fraction of dietary fibre and structural carbohydrates, and on the otherhand the fraction of non-structural carbohydrates.
If the percentages of the fibre fraction and the respective organic rest are added, on average34 % are consumed of that “enlarged” fibre fraction by all groups. Again, group J&D ingestedthe largest portion of leaves and a substantial amount of chow (Fig. B.3, p. 40), whichcontributes primarily to the quantity of dietary fibres and the organic rest fraction.
If the fractions of carbohydrates and fibres are added, on average 60 % are consumed by eachof the four groups, while about 74 % are consumed if all three fractions, carbohydrates, fibresand organic rest, are added, respectively.
Hence, apart from the larger amount of fat ingested by the groups in autumn compared tospring (Fig. C.1 and Fig. C.2), nearly equal percentages are ingested of the other majororganic compounds, that is protein, available carbohydrates and diverse types of fibre (Fig.C.2). This clearly emphasises the importance of these food constituents within the diet andunderlines the constancy of food composition. Despite the large diversity of food specimens,nearly constant proportions of primary food compounds (including the diverse fibre fractions)could be examined for the diets of the different study groups, irrespective of the animal’s ageand season of the year. The major fraction of food, that is two thirds, are derived from non-structural carbohydrates and different types of fibres, which in turn consist mainly ofpolysaccharides. These findings are in accordance with the percentages recommended for thehuman’s diet. An adult healthy human should consume at least 60 % (weight) of the diet ascarbohydrates, best as starch, and 30-50 g fibres per day, that is (maximal) about 10 %. Theremaining portion should be partitioned among proteins and fats.

70 C.I Nutritional and energy values of foods selected by P. v. coquereli
3.2 Energy values of the food
In the following evaluation, energy requirements of the Coquerel’s sifakas should be assessedwith special emphasis on the contribution of the leaves to the diet. Although exact factors onthe physiological needs of sifakas are still lacking, it was decided to use energy factorsaccording to Souci et al. (1994), which are based on human’s digestibility (C.I.2.3) and bearthe advantage of being directly comparable to the recommended diet of humans. These factorscalculating metabolisable energy are already used differently in animal nutrition (Conklin andWrangham, 1994).
Hence, two different models are instigated to approach the energy supply of the food chosenby the sifakas. One approach is to evaluate the sifakas’ diet like human’s diet based on thecapacities of the human’s digestive tract, yielding minimum energy gain from the foodselected. The other assessment takes into account the capability of midgut-fermentingmonogastric mammals that use fibres as sources of energy, yielding maximum energy valuesfrom the diet chosen (Tab. C.5, Fig. C.3).
The maximum values account first for the capability of the large microbial flora to degradedietary fibres, which contribute to the nutrient and energy supply by producing short-chainfatty acids. Hence, to take into account the fractions of dietary fibres and the organic rest assources of nutrients and energy, both fractions are multiplied by the same factor as thefraction of available carbohydrates (17 kJ / g), which is in accordance with respective factorsgiven by Meyer et al. (1993) for crude fibres and the nitrogen free extract (Tab. C.2). Otherenergy values determined by the bomb calorimeter (Tab. C.2) are not used in this work, asthese values do not reflect the metabolisable energy. So, seen from the standpoint of energysupply, reality will be found between both limits, the minimum and maximum.
Tab. C.5: Energy contribution (%) of the major organic food constituents to nutrition for thefour study groups. Maximum energy supply is calculated.
groups protein fatcarbo-
hydratesdietary
fibreorg.rest
M&T 18 % 9 % 41 % 15 % 17 %J&D 17 % 17 % 36 % 17 % 11 %D&V 17 % 9 % 45 % 15 % 14 %G 19 % 12 % 41 % 20 % 7 %
When comparing the percentages of weight (Fig. C.2) and proportions of energy percentagesbetween individual food constituents, a consistent trend can be seen. As already indicated forthe relation of weight percentages, no dependence on age can be discerned.
The diet of the four study groups consisted of approximately 18 % (energy) protein, which isroughly the same level as evidenced for the percentages of weights.
Energy contribution of fat to the diet is equal for groups in the spring, irrespective of theirage, while it is increasing for the groups in the autumn. While the diet of Gordian contained9 % (energy) fat, the largest amount is evidenced for the adult group J&D. As alreadyindicated, this is more likely to be due to food quality ingested than to age dependent needs ordue to seasonal reasons.
On average, 41 % of energy were contributed by the portion of non-structural carbohydratesto the diet. The lowest percentage of available carbohydrates in the diet is evidenced for groupJ&D, which is compensated by the largest percentage of fat. This is a common phenomenonwithin human’s diet: that a large portion of fat replaces partly the percentage of carbohydrateswhile the portion of protein remains basically untouched. However, if the percentages ofcarbohydrates and fibres are added, these two fractions yield a total of 50-60 % (energy) of

C.I Nutritional and energy values of foods selected by P. v. coquereli 71
the diet. If the organic rest is included additionally, the sum of these respective three fractionsyield a total of 60-70 % energy. In a human’s diet, about 60 % (energy) carbohydrates arerecommended, with the best complex carbohydrates in the form of starches.Fig. C.3 shows the energy contribution to the diet by the main food sources, chow, fruits andvegetables, and leaves. Especially for the groups in the autumn, chow contributed most to theenergy supply of the diet. Again, due to its high nutrient density, chow supplies most energyin the autumn and a considerable amount in the spring to the respective group’s energy budgetdespite its relative low intake. Although food intake per bodyweight differed largely betweengroups and despite varying quantities of different food sources ingested (Fig. B.5, p.42), it isamazing how animals apparently managed in an age dependent manner to achieve equallevels of energy gain (Fig. C.3).
0
200
400
600
kJ / kg
M&T D&V J&D G
Chow
Fruits & Veg.
Leaves
Fig. C.3: Maximum energy intake, in kJ / kg bodyweight and day, respectively for the fourstudy groups.Factors to convert weights of food (g) into their corresponding energy values (kJ) are presented inTab. C.2.
With a total of (262-) 312 and (259-) 316 kJ / kg bodyweight were consumed by the adultgroups M&T and J&D, respectively, energy intake amounted to (509-) 600 and(449-) 561 kJ / kg bodyweight respectively for the groups D&V and Gordian consisting ofjuvenile and subadult sifakas (calculated minimum and maximum energy values are given).Hence, nearly double the energy intake is requested by juvenile and subadult animalscompared to adult groups. Supporting this finding is the fact that children of correspondingage require more than twice the energy than adult humans.
Obviously, in this model the portion of leaves contributes lowest to the energy supply of thetotal diet, although maximum energy values have been calculated in that model.
In a last attempt to evaluate the importance of the leaves in the diet with respect to energysupply, minimum and maximum energy values are calculated and their respective percentagesare opposed to corresponding weight percentages of food intake (Tab. C.6).
Tab. C.6: Review on the portions of leaves (weight %) and their corresponding minimumand maximum energy supply to the diet, calculated respectively for the four studygroups.
groups weight energyM&T 38 % 23 - 35 %D&V 33 % 18 - 30 %J&D 45 % 13 - 24 %G 31 % 7 - 14 %

72 C.I Nutritional and energy values of foods selected by P. v. coquereli
Irrespective of the animal’s age and season, at least 30 % by weight are allotted to the portionof leaves (Tab. C.6). Although their relative energy contribution to the diet variesconsiderably between minimum and maximum calculations, the overall energy contribution tothe diet remains relatively low. Calculating maximum values, at best one third of the overallenergy is delivered by the leaves for groups in spring. The far lower energy contribution ofthe leaves to the diet of groups in the autumn is due to the different food compositioncontaining more food sources with rather high nutrient densities like chow and nuts. Despitethese differences leaves and especially two species, R. copallina and A. julibrissin, remainhighly selected food items.
4 Discussion
There is no doubt that nutrition has to meet the needs for at least minimum amounts of certainnutrients, vitamins and minerals for a given animal species (Milton, 1979; 1980; Langer,1988; Stevens, 1988). On the other hand, the digestive system of the animal host and itsmicrobial flora determine both the food quality and quantity required for the animal’s well-being (Langer, 1988; Stevens, 1988; Hofmann, 1983; 1991; Onderdonk, 1998). Digestion is aspecies-specific process, which depends on an animal’s age, state of health and adaptations ofthe gut microflora to the food (Meyer et al., 1993).
At present, different primary food constituents are discussed that influence food choice.Generally, in a natural diet, leaves are a valuable source of protein, dietary fibres andminerals. For non-structural carbohydrates like simple saccharides and starch, fruits andvegetables are an appropriate source. In the wild, both fruits and nectar rich flowers provideanimals with readily absorbable nutrients and energy (Richard, 1978a, b; Milton, 1979; 1980;Powzyk, 1997). For free-ranging folivores (Milton, 1979; 1980; Glander, 1982) leaf contents(i.e. protein and fibres) tend to be crucial to leaf choice. There is some evidence that acommon feature in the feeding pattern of many herbivores is a preference for immature overmature leaves, which normally contain higher contents of protein and lower levels of dietaryfibres than mature leaves (Milton, 1979; Glander, 1982; Waterman, 1984).
In this study, A. julibrissin leaves of all seasons analysed were high in protein levels, while R.
copallina leaves range in more medium levels (App. II.1), which is supported by recentstudies (Campbell et al., 1999; 2001). Compared to analyses performed on various leafspecies, which are food plants of different free-ranging prosimian species in Madagascar(Ganzhorn, 1988; Powzyk, 1997) and of howler monkeys (Milton, 1979; 1980), it can bestated that the protein contents of A. julibrissin leaves can be classified as extremely high.Surprisingly, values found for protein intake by adult groups of P. v. coquereli (approximately3 g / kg bodyweight per day) equal values found for P. v. coronatus at the Zoological Park ofParis (Lopes Santini, 1992), and those calculated for howler monkeys (Milton, 1979; 1980).The National Research Council (1978) recommends 3.5-4.5 g crude protein per bodyweightfor adult Old World primates. The lower level is in accordance with amounts eaten by adultsifakas in this study. In contrast, for adult humans and children1, 0.8-1.2 g protein per kgbodyweight and day are recommended (Biesalski et al., 1995; DGE 2005). In contrast, thetotal sifakas’ diet is pronounced in absolute amounts of proteins, albeit the respective energycontribution to the diet ranges within recommendations for humans (5-20 %) (Biesalski et al.,1995).
Like a human’s diet, the portion of fat is difficult in its need to be held constant while yieldinghighest energy gain of all nutrients and being highly digestible as evidenced for humans andP. v. coronatus (Lopes Santini, 1992; Biesalski et al., 1995). Compared to P. v. coronatus
1 children older than one year

C.I Nutritional and energy values of foods selected by P. v. coquereli 73
(Lopes Santini, 1992), fat intake resembles more the adult group M&T than J&D. Differencesin fat consumption between groups of spring and autumn are more likely to be due to differentfood specimens used than due to different needs and requirements. However, compared tohuman’s diet with fat contributing 30-35 energy % to the total diet (Biesalski et al., 1995), thesifaka’s diet is extremely low in fat.
It is striking that the largest portion of nutrients is constituted by complex carbohydrates likestarch, and soluble saccharides. Comparable to P. v. coronatus (Lopes Santini, 1992) as wellas to a human’s diet, carbohydrates constitute the major source of energy in this study. Forhumans and presumably for primates in general, carbohydrates are the best source of energy,which should not be replaced by either protein or fat and are directly available to theorganism. Lopes Santini (1992) found an apparent digestibility of 100 % for non-structuralcarbohydrates in P. v. coronatus. Normally, the brain gains nearly all its energy from glucose.Another theory indicates that satiety is only reached if enough carbohydrates are ingested.However, the intake of proteins and available carbohydrates show the clearest dependence onthe animal’s age (Tab. C.4) and resemble in portions the human’s diet.
Fibre values are somewhat sophisticated to be evaluated. Generally, dietary fibres arecomprised predominantly of cell wall structures, namely a polysaccharide-type such ascellulose, hemicellulose, and pectins, but also products like gum and plant mucilage. Thelatter differ in their water solubility and gelling properties, and to lesser extent lignin as water-insoluble phenolic polymer. In this context, it should be noted that cellulose is the majorconstituent of cell walls in higher plants, providing 20-40 % of the dry matter (Stevens, 1988).
The different types of fibres occur in varying amounts in the leaves, depending on season andthe leaf’s age (Milton, 1979; 1980; Glander, 1982; Hofmann, 1983; Ganzhorn, 1988; Powzyk,1997), and reveal important influences on the gut functioning, transit time and the microbialecosystem of the animal host (Wolin, 1981; Plaut, 1984; Marcus and Heaton, 1986; Savage,1986; Stevens, 1988; Carman et al., 1993; Onderdonk, 1998). Different fibre types influencethe digestibility of other nutrients, water and electrolyte absorption and the binding ofendogenous compounds like bile acids and cholesterol (Wolin, 1981; Ehle et al., 1982; Plaut,1984; Marcus and Heaton, 1986; Savage, 1986; Langer, 1988; Milton and Demment, 1988;Stevens, 1988; Meyer et al., 1993; Mendeloff, 1984; Carman et al., 1993; Zentek, 1996).
Regardless of the carbohydrate substrate and the microbial flora of forestomach- and midgut-fermenting mammals, they all produce predominantly short-chain fatty acids and gases. Inturn, short-chain fatty acids produced by the microbial flora have an important influence one.g. absorptive processes, pH of the interior milieu, gut motility, bacterial growth and hencethe microbial ecosystem and state of health of the animal host (Wolin, 1981; Ehle et al.,1982; Mendeloff, 1984; Plaut, 1984; Milton and Demment, 1988; Stevens, 1988; Zentek,1996). The extent and ratio between acetic, propionic and butyric acid, the rate offermentation, the pH in the fermentation chamber that in turn has impact on the microbialcolonies in number and composition, this all is largely influenced by food quality and quantitywith respect to the composition of structural and non-structural carbohydrates. Differentproportions between simple saccharides, starches, and structural carbohydrates in the diethave a massive impact on fermentative and absorptive processes of electrolytes and in manyrespects, the nutrients themselves (Stevens, 1988; Meyer et al., 1993). In humans, short-chainfatty acids play an integral role in maintenance of colonic integrity and metabolism, and areproved to be used as fuel for colonic epithelial cells and to have trophic effects on theepithelium (Cook and Sellin, 1998).
The digestibility of the different fibre types cellulose, hemicellulose, pectins and lignin variesconsiderably between animal species (Lopes Santini, 1992; Campbell et al., 2002; Campbellet al., 2004b), which largely depends on the equipment of the digestive tract and associatedorgans. Normally, digestibility decreases from hemicellulose to cellulose and is lowest for

74 C.I Nutritional and energy values of foods selected by P. v. coquereli
lignin, while pectins and gums are rapidly and fully fermented, yielding different amounts ofshort-chain fatty acids as a source of energy (Milton, 1979; Hoogkamp-Korstanje et al., 1979;Ehle et al., 1982; Stevens, 1988; Van Soest, 1994; Lopes Santini, 1992; Campbell et al.,2002; 2004b). Lopes Santini (1992) found that captive P. v. coronatus had an apparentdigestibility of about 74 % for hemicellulose, 65 % for cellulose and 62 % for lignin.Depending on experimental conditions P. v. coquereli showed an apparent digestibility ofabout 53 % for insoluble fibres and 65 % for soluble fibres, while the digestibility of the aciddetergent and neutral detergent fibre fractions varied greatly (Campbell et al., 1999; 2004b).For P. tattersalli slightly deviant values had been found (Campbell et al., 1999).
In this context the detection of the plant mucilage in A. julibrissin (chapter C.V) becomescritical. Despite its pharmacological properties, which will be discussed in chapter C.VI, itcan be presumed that this pectin-like mucilage will be largely degraded in the fermentationchambers of the midgut by the microbial flora yielding short-chain fatty acids. As in thisstudy the plant mucilage is contained in the organic rest of the leaves, the fraction of fibresplus the organic rest are taken into account for calculations on maximal energy gain from theleaves. The content of dietary fibres thus calculated1 reaches levels that are commonly foundin other leaf species (Milton, 1979; Ganzhorn, 1988; Powzyk, 1997).
Furthermore, it becomes visible, that even lignin is largely degraded by the microbial flora ofthe different Propithecus (sub-)species, which fits to the observation that P. v. coquereli ofthis study ingested dead needles of Pinus taeda and sometimes gnawed at bark or wood.Similar observations are reported from free-ranging P. v. coquereli and P. v. verreauxi inMadagascar (Richard, 1977). In this context, the role of seed ingestion by P. d. edwardsi
(Hemingway, 1996; 1998) and e.g. the cotton-top tamarins (Heymann, 1992; Garber andKitron, 1997), presumably deserves more appreciation for their effects on the gastrointestinaltract.
However, focusing on primary compounds including fibres as source of energy, there aremore reasons to plead for leaf ingestion in general, than for the leaf choice selected by thesifakas. While R. copallina leaves were ingested in spring and autumn alike, animalsdiscriminated between spring and autumn leaves of A. julibrissin. In the cooler months ofautumn, far less A. julibrissin leaves were eaten compared to spring, and if at all, youngerautumn leaves were preferred (see chapter B). This is surprising, as the older autumn leavescontain more protein and less fibre levels than the younger autumn leaves. On the contrary, R.
copallina leaves, which were highly eaten in both seasons studied, contain far less protein andpartly more fibres than accepted by the animals in the case of autumnal A. julibrissin leaves(App. II.1). From the nutritional point of view, neither protein, nor fibre levels of autumnalA. julibrissin leaves explain the decrease in selecting this leaf species by the animals.
Another aspect for the general use of leaves in the diet is their leaf specific composition.Leaves are obviously an appropriate source of food to reach an equilibrium betweenindividual nutrients, as they are low in fat, low in simple saccharides and rich inpolysaccharides. These findings are corroborated by results of Lopes Santini (1992) on thefood composition of captive P. v. coronatus. For captive low-land gorillas, health improvedmuch and regurgitation and coprophagy vanished by supplementing the diet with largeamounts of fibre (Rümpler, 1990; Müller and Schildger, 1992). Increased portions of fibreand a reduction in fat was effective to treat obesity in captive orang-utans, gorillas and toprevent subsequent metabolic diseases similar to those described for overweight humans(Markham, 1990; Müller and Schildger, 1992). Female sifaka tend toward obesity when
1 Compared to gross energies gained from the short-chain fatty acids yielded by microbial degradation
(Tab. C.2), the factor used in this work is at the lower level and in agreement with the fraction ofcarbohydrates and the nitrogen free extract.

C.I Nutritional and energy values of foods selected by P. v. coquereli 75
offered an excess of high-quality foods and could benefit from ingesting leaves as a weightcontrol measure (Glander et al., 1993; Campbell et al., 2001).
The role of certain minerals and vitamins is not further regarded in this study. However,minerals and vitamins are essential for enzymatic processes and deficiency as well as anoverload may be detrimental. Hemosiderosis in lemurs and calcification in P. d. diadema areexamples of dietary overdoses with lethal ending (Spelman et al., 1989, Powzyk, pers.comm.).
Another important aspect of the sifakas’ diet is obviously the intake of water. Drinkingbehaviour seems to build an important clue to understanding feeding behaviour and hence thephysiology of sifakas themselves. In this study, animals were never seen drinking in springand were only sometimes observed drinking in the autumn. Differences in the drinkingbehaviour between spring and autumn might be due to a higher water content of immatureversus mature leaves, a larger supply of juicy fruits, and presumably the lower intake of dryprimate chow in spring compared to autumn.
However, the general feature of a healthy animal with no or only few drinking could be anindication to the capability of nitrogen recycling. In forestomach- and midgut-fermentingmammals, the indigenous microbial flora is capable of converting protein and nonproteinnitrogenous compounds of endogenous and exogenous origin into microbial protein, that issubsequently digested and absorbed by the animal host. One major source of nonproteinnitrogen is urea, which enters the gastrointestinal tract by direct diffusion from the blood. Thisallows for both the synthesis of high-quality protein from low-quality diets and theconservation of nitrogen. In this context it is interesting to note that captive P. v. coquereli
and captive P. tattersalli, showed a remarkable increase in blood urea levels when consumingan experimental diet rich in protein (Campbell et al., 1999). The recycling of urea in turnallows for the conservation of water that would otherwise be required for urinary excretion(Bauchop, 1978; Parra, 1978; Wolin, 1981; Langer, 1988; Stevens, 1988). Furthermore,utilisation of nitrogen and fermentation of carbohydrates are interdependent, and restriction ofwater normally increases the rate at which urea is recycled, as evidenced for temperate,tropical, and desert ruminants (Stevens, 1988). The ability to survive without drinking wateris also reported from other arboreal folivores like langurs (Bauchop, 1978), howler monkeys(Glander, 1982), P. d. diadema and Indri indri (Powzyk, 1997), P. d. edwardsi (Hemingway,1998) and the koala1 (Zoidis and Markowitz, 1992).
In order to assess the dietary role of the leaves in this study, these trends have to be taken intoaccount, that under captive conditions there are less constraints to ingest leaves as a source ofprotein and/ or fibres than in the wild with seasons of fruit scarcity and seasonal fluctuationsin food availability (Richard, 1978a, b). In many respects, commercial primate chow can beregarded as valuable substitute for a range of natural food sources (Tab. C.3). It is high inprotein, fat, available carbohydrates, fibres and minerals compared to most other food items.In autumn, Brazil nuts could be used especially as source of fat. However, except for nuts,chow exhibits the highest nutrient density of all other food sources supplied. Hence, the largerconsumption of chow by animals in autumn compensates for the lower food intake andobviously for the lower leaf intake per bodyweight (Fig. B.5, p. 42; Tab. B.9, p. 43).
In part, vegetables fed to the focal animals compete with or even exceed leaves in contents ofprotein, fat and fibres. Like in the wild, fruits are the main source of readily availablecarbohydrates, especially of simple saccharides (Fig. C.1). Hence, from this point of view,there is actually no need to select leaves in captivity. However, despite a superabundance ofnutrients in captivity, leaves are an indispensable portion of their total food intake with a clearpredilection for two leaf species.
1 Koala is an aborigine name for “animal that does not drink.”

76 C.I Nutritional and energy values of foods selected by P. v. coquereli
Regarding nutrient composition and energy supply to the sifakas of this study, it is strikingthat despite different sources of food that supply different nutrient compositions in quality andquantity, animals were obviously capable to attain nearly constant levels of nutrients andenergy gain per bodyweight with a clear dependence on the animal’s age (compare Fig. B.5,p. 42 versus Fig. C.3; Tab. B.9, p. 43 versus Tab. C.4).
In this study an average of 314 kJ per kg bodyweight has been calculated for adult sifakas,while juvenile and subadult sifakas consumed nearly double the amount, when maximumenergy gain from the leaves was assumed (Fig. C.3). Neglecting energy gain from the portionof fibres, an average of minimal 259 kJ per kg bodyweight has been calculated for adults.These findings for adult P. v. coquereli of this study agree with calculations on metabolisableand digestible energies for captive P. v. coronatus and P. v. coquereli, while for P. tattersalli
even lower values have been found (Lopes Santini, 1992; Campbell et al., 1999). For P. v.
coronatus an average of 355 kJ (metabolisable energy) per bodyweight has been noted (LopesSantini, 1992), 271 kJ (digestible energy) per bodyweight for P. v. coquereli and 225 kJ perbodyweight for P. tattersalli (Campbell et al., 1999). In contrast, except for P. tattersalli,gross energy1 intakes resembled those recommended for Old World primates by the NationalResearch Council (1978) with up to 420 kJ per bodyweight (Lopes Santini, 1992; Campbell et
al., 1999).
Furthermore, for most (if not all) prosimian species (Müller, 1983; Richard and Nicoll, 1987;Richard and Dewar, 1991; Ross, 1992; Lopes Santini, 1992) as well as a range of arborealfolivores such as tree sloths (Bradypus, Choloepus) and marsupial tree kangaroos and koalas(Bauchop, 1978; McNab, 1978; Parra, 1978), a reduced metabolic rate associated with areduced body temperature is in evidence. In these animals, body temperature is moresusceptible to environmental fluctuations than what is found in homeothermic mammals.Presumably, prosimians exhibit an energy expenditure reduced in 10 to 60 %, which isassociated with a lower metabolic rate (Lopes Santini, 1992).
With respect to the portion of leaves, in spring an average of 36 % leaves (by weight) wereconsumed by both groups, which delivered a maximum of 144 kJ per bodyweight andattributed 33 % metabolisable energy to the diet. In the autumn, groups consumed a mean of38 % leaves by weight, gained a maximum of 77 kJ per bodyweight, which contributed with19 % to the energy of the diet. In a study by Campbell et al. (2001) when animals were fed adiet enriched in chow, browse then contributed 30 % by weight to the diet yielding 27 %gross energy. Overall, the energy contribution of the portion of leaves to the diet remainedrather low, irrespective of the animal’s age and irrespective of other food sources available(Tab. C.6).
5 Conclusion
It can be concluded, that leaves were not ingested for reasons of mere nutrient and energygain. Although it can be presumed that leaves are a valuable source of protein, minerals andfibres, there was a superabundance of other sources of food provided to supply nutrients andenergy in this study. The idea that leaves are required to get a balanced food composition as toprimary food constituents including fibres pleads for more overall ingestion of leaves, but didnot support the type of leaf selection exhibited by the sifakas in this study. However, thiswork did reveal a clear predilection for two leaf species, R. copallina and A. julibrissin, withseasonal differences for the latter species. Hence, additional factors with impact on leaf choicewill now be investigated: the role of secondary plant compounds.
1 For calculations of energies see Tab. C.2.

C.II Evaluation of the food plants based on plant chemistry with emphasis on chemotaxonomical and 77pharmacological aspects
C.II Evaluation of the food plants based onplant chemistry with emphasis onchemotaxonomical and pharmacologicalaspects: A literature survey
The investigation of the nutritional and energy values of foods consumed (chapter C.I) did notconclusively explain why animals selected certain leaf species as food sources. Therefore, therole of the secondary plant compounds including possible inherent pharmacological effectswill now be surveyed prior to any analytical investigations. This survey will be categorisedaccording to the groups of secondary plant compounds inherent to the different plant speciesand parts. Special emphasis will be placed on the two major food species, Rhus copallina andAlbizia julibrissin. Relevant chemotaxonomical implications will also be presented.
Chemotaxonomy and its known chemical relationships between species, genera, families andorders is normally a useful means to establish and verify plant systematic. In this work,chemotaxonomy is used as a key to a comprehensive survey on secondary plant compoundsoccurring in each plant species and plant part which are found within the environments of thefocal lemurs (App. II.2). I will also assess the possible impact of these plant compounds onthe animals’ food choice, which is mirrored by their feeding behaviour.
All information gathered in App. II.2 focuses on the plant species ingested, especially theirleaves, but also takes into account those species, that were refused or remained untouchedwithin the natural habitat enclosures. When information was scarce on the level of a definitespecies, the respective genus or family was regarded including general implications of theplant order, keeping in mind that natural products even characteristic on the familial level maynot occur in an individual species or in the respective plant part chosen by the animals (App.II.2; Tab. B.7, p. 34). Hence, for a reliable evaluation of secondary compounds which mightbe actively sought out, merely tolerated, minimised, or avoided by the animals, a mostcomprehensive knowledge of each plant species and its plant parts accessible to the animals,will be indispensable in discerning the necessary requirements of food quality to maintainlemur health. It is presumed that only on the level of chemical groups of secondary plantcompounds, tendencies to feed on plant species or the avoidance of plant species can bediscussed.
Known pharmacological effects of the plant species and their compounds were included withspecial reference to possible benefits for the sifakas (App. II.2). Whenever available, thecontents of chemical plant compounds were included. Furthermore, related plant species of arespective genus growing in Madagascar were also discussed.
Tannins
The ubiquitous group of tannins seems to play a vital role in food choice and overall diet ofmany lemur species (Spelman et al., 1989). Free-ranging members of the indriid familypreferred leaf and fruit galls as food items whenever available. In Madagascar, P. d. diadema
sought out galls from species of the Anacardiaceae and Myrtaceae, while Indri indri ingested

78 C.II Evaluation of the food plants based on plant chemistry with emphasis on chemotaxonomical andpharmacological aspects
galls from members of the Euphorbiaceae and Lauraceae (Powzyk, 1997), which can beinterpreted as an indication of (hydrolysable) tannin selection.
Rhus copallina leaves were the most preferred leaf species by all focal sifakas during bothstudy seasons and are expected to contain large amounts of hydrolysable tannins (App. II.2).Hegnauer (2001; App. II.2) reported high yields from “three geographic races” of R.
copallina, such as 27 %, 33 % and 37 % of gallotannins in their leaves (referred to dryweight), which obviously represents high-yield cultivars that were obtained during acommercial cultivation program initiated in the USA in 1965. This cultivation program wasperformed with Rhus glabra and Rhus copallina as the most common wild Rhus species toyield USP quality tannic acid (Doorenbos, 1976; Doorenbos and Box, 1976; App. II.2).Investigation of leaves, flowers, stems, barks, woods and seeds of eight North American Rhus
species revealed high tannin contents in both the leaves and flowers with lower levelsoccurring in other plant parts (Hegnauer, 2001; App. II.2). The ingestion of leaves from thesehigh-yield cultivars fits well with desired antidiarrhoeal effects and targets the main malady ofcaptive indriids. In addition, flowers have also been reported to be ingested (DULC staff, pers.comm.).
Other preferred leaf species that contain a predominance of hydrolysable tannins (App. II.2),are the leaves of Acer rubrum (Aceraceae) and Liquidambar styraciflua (Hamamelidaceae).
From a chemotaxonomical point of view it is interesting to note that the Aceraceae are relatedto the Anacardiaceae, while the Anacardiaceae are similar in chemical composition to theHamamelidaceae, with all families accumulating tannins (Hegnauer, 2001). Accordingly,leaves of A. rubrum (Aceraceae), R. copallina (Anacardiaceae) and L. styraciflua
(Hamamelidaceae) were highly selected by the focal animals.
In the realm of traditional human medicine, the barks of L. styraciflua, A. rubrum and Cercis
canadensis, have been recommended for gastrointestinal disorders such as dysentery anddiarrhoea or were used as a tonic, for which high contents of condensed tannins were reportedor may be postulated (App. II.2). However, these barks were not ingested by the focal lemurs.This fits with the observation that leaves and barks of oak trees (i.e. different species of thegenus Quercus, Fagaceae) with their known contents of condensed tannins, were just tasted orremained untouched by the focal lemurs. Evidently, the bark and wood of these plant typeswere not selected based on their high content of condensed tannins.
The role of Robinia pseudoacacia leaves is somewhat contradictory and needs furtherinvestigation (compare own chemical analyses, chapter C. IV). For R. pseudoacacia leaves,the occurrence of condensed tannins has been documented (Kumar and Horigome, 1986; App.II.2). While R. pseudoacacia leaves were less preferred by the focal P. v. coquereli at Duke,leaves are reported to be preferred by captive P. v. coronatus at the Zoo of Paris (LopesSantini, 1992). R. pseudoacacia leaves are known to provoke fever, oedema and obstipation,and in homeopathy, fresh barks and young twigs are indicated for gastric disorders, ulcers,obstipation and headache (App. II.2). However, R. pseudoacacia leaves were eaten by bothPropithecus subspecies, albeit with different impetus.
Therefore, it can be concluded, that tannins play an important role in leaf choice with the focalP. v. coquereli and other lemur species. The focal P. v. coquereli show a clear discriminationbetween hydrolysable tannins (gallo- and ellagitannins) and condensed tannins(proanthocyanidins) yet there is a clear preference for the hydrolysable type, albeit condensedtannins may be tolerated to a limited extent. Nevertheless, the content of hydrolysable tanninsmay overrule simultaneously present condensed tannins.
Although both condensed tannins (e.g. Quercus cortex) and hydrolysable tannins have beenused generally as an antidiarrhoeal in traditional human medicine, the German pharmaceutical

C.II Evaluation of the food plants based on plant chemistry with emphasis on chemotaxonomical and 79pharmacological aspects
market utilises the hydrolysable type of tannins predominately in the field of diarrhoeas(tannin albuminate; e.g. Tannalbin®), which is in agreement with the sifaka’s preference forthe hydrolysable tannin type.
Flavonoids
Various flavonoids have been isolated from the stem bark of Albiz(z)ia julibrissin (TribusIngeae, Mimosaceae) (Jung et al., 2004a; App. II.2), albeit it were the leaves that wereselected as one of the most preferred food items by the focal lemurs. Quercitrin andisoquercitrin have been identified within their flowers (Kang et al., 2000; App. II.2). For thelatter two compounds, sedative effects were shown which support the utilisation of flowers asa sedative drug in traditional oriental medicine (Kang et al., 2000). The occurrence ofhyperoside in A. julibrissin is mentioned without giving the exact plant part of origin (App.II.2). Quercitrin and afzelin have recently been reported to occur within the leaves, for whichfree radical scavenging activities have been found, respectively (Jang et al., 2002; App. II.2).
The leaves of Albizia lebbeck, a Malagasy food plant of P. tattersalli (Meyers, 1993), arereported to contain quercetin- and kaempferol-tri-O-glycosides (El-Mousallamy, 1998).Although the exact plant organs ingested are not reported (Meyers, 1993), the knowledge andingestion of flavonoids by free-ranging Propithecus species seem certain.
It is notable that flavonol glycosides, particularly when present with quercetin, kaempferol andto a lesser extent with myricetin as aglyca, and flavone glycosides which contain apigenin orluteolin aglyca, are widely distributed within plant kingdom and were described to occur inmany leaf species selected and not selected by the sifakas (compare App. II.2). In mostselected leaf species, flavonol glycosides especially with quercetin and kaempferol asaglycone moiety seem to be abundant, e.g. in the leaves of A. julibrissin, Liquidambar
styraciflua, Liriodendron tulipifera and in the genus Cercis with C. canadensis as a selectedleaf species (App. II.2), which was verified by subsequent chemical investigations in thisstudy (chapter IV). Various flavone glycosides are expected to occur in the leaves of R.
pseudoacacia (compare App. II.2 and chapter IV).
In this context it is notable to mention the chemotaxonomic proximity between theCaesalpiniaceae, Fabaceae (= Papilionaceae) and Mimosaceae of the order Fabales1 (=Leguminosae), which provided important food plants for the focal lemurs: C. canadensis
(Caesalpiniaceae), R. pseudoacacia (Fabaceae), and A. julibrissin (Mimosaceae). Theproximity of the three families is emphasised by their alternative division into the threesubfamilies Caesalpinioideae, Mimosoideae and Papilionoideae (Hegnauer, 2001).
In contrast, other compounds may overrule the present flavonoids: Carpinus caroliniana
leaves were just tasted, albeit they are known to contain quercetin glycosides. The treeAilanthus altissima was only passed while the leaves contain quercetin, kaempferol, apigeninand luteolin glycosides, and Ulmus alata leaves were refused and contain myricetin glycosides(App. II.2). Moreover, the order Urticales, containing the Moraceae (Morus rubra) andUlmaceae (Ulmus alata), provides an example of an inconsistent feeding behaviour in regardto species acceptance and avoidance and in regard to individual feeding habits of the focallemurs despite a strong chemotaxonomical relationship between the Moraceae and theUlmaceae.
1 The order Fabales is characterised by its rich occurrence of tannins of various types, flavonoids, and thefrequent occurrence of oleoresins, gums and plant mucilage. The large and distinct metabolism of flavonoids inits entity can be evaluated as characteristic of leguminous plants. The flavonol aglyca kaempferol and quercetinare widely occurring and more frequently than myricetin (Hegnauer, XIa, 1994).

80 C.II Evaluation of the food plants based on plant chemistry with emphasis on chemotaxonomical andpharmacological aspects
While the leaves of U. alata had been spat out, M. rubra leaves were eaten differently byMarcella and Tiberius. Whereas Marcella ate the leaf (tip and / or blade), Tiberius ingested thestalk including the white latex. The leaves are reported to contain flavonoids, while nothing isreported about the latex so far. Hydrolysable tannins are largely missing in the Moraceae andhence are not expected to occur in the leaves. Tannins are not typical of this plant order yet ifpresent, the condensed tannins would predominate (App. II.2). Simple phenolics and stilbenesoccur in the wood of M. rubra, while the bark is reported to exhibit laxative and anthelminthicproperties, yet neither part was ingested by the focal lemurs. The leaves of U. alata are knownto contain myricetin glycosides, and condensed tannins may be expected. However, it cannotbe ultimately reasoned as to why the leaves of U. alata were refused.
Therefore, it can be concluded that flavonoid glycosides are among the preferred chemicalcompounds, but may be overruled by other simultaneously occurring compounds decisive forleaf choice. In subsequent chemical investigations a rich occurrence of flavonol glycosideswas found in the leaves of A. julibrissin and other selected leaf species (chapter IV). The roleof flavonoids, their impact on leaf choice, and possible beneficial effects on thegastrointestinal tract will be further surveyed and discussed in chapter VI.
Stilbenes
Stilbenes are documented to occur in the genus Vitis (in leaves and wood) (App. II.2). Whileresveratrol and its derivatives were found to occur in the wood of different Vitis species, theywere only synthesised within the leaves when stressed (after infection with different fungalstrains and exposure to UV-light). The fungitoxic properties, especially of the oligomericresveratrol derived compounds of the leaves have classified them as phytoalexines (Hegnauer,2001). However, leaves and wood of Vitis cinerea and V. rotundifolia (Vitaceae) were tastedin the spring and consumed during the autumn (App. II.2). Hence, the role of stilbenes forfood selection cannot be fully addressed, however these compounds may be of minorimportance.
Simple phenolics (cinnamic acids, urushiols1, naphthoquinones and coumarins)
The group of hydroxycinnamic acids is widely occurring within plant kingdom. Mostcompounds occur as esters, seldom as free acids (Rimpler, 1999). They are often associatedwith tannins and flavonoids and were ingested by the focal animals (App. II.2).
Phenolic compounds with irritating effects such as urushiols were obviously avoided by thefocal lemurs. Rhus radicans (Anacardiaceae) covered the ground level of the natural habitatenclosure No.1 and remained untouched, presumably due to its latex that contains skinirritating phenolics (urushiols) which can cause Rhus dermatitis (App. II.2). A latex withirritating phenolics has been described for Mangifera indica (another Anacardiaceae) and maybe the reason for the careful selection of plant tissue by the animals. In Madagascar, M. indica
is known to be a food plant for P. tattersalli (Meyers, 1993), although the plant partsconsumed were not specified.
The evaluation of plant species and plant parts containing naphthoquinones is somewhatsophisticated as simultaneously occurring chemical compounds such as tannins makeinterpretations more problematic. Furthermore, content information on certain plant parts isoften lacking. Thus the evaluation of Diospyros virginiana leaves (Ebenaceae) is notunequivocal. Naphthoquinone derivatives exhibiting various pharmacological effects andtannins, predominantly of the condensed type, are widespread in Diospyros and occur in manyplant organs, although the naphthoquinones were not explicitly reported in the leaves of D.
1 3-alkyl- and 3-alkenyl-brenzcatechins with C15 or C17 side-chains (Frohne and Jensen, 1992)

C.II Evaluation of the food plants based on plant chemistry with emphasis on chemotaxonomical and 81pharmacological aspects
virginiana (Hegnauer, 2001; App. II.2). The leaves were tasted in spring and eaten in theautumn by the focal lemurs. This raises the question, whether the content of naphthoquinonesfluctuated dramatically according to the season, or whether the study groups had distinct foodpreferences. Conversely, different Diospyros species are reported to be utilised as food plantsin Madagascar by P. tattersalli (Meyers, 1993), by P. verreauxi in Morondava (leaves;Ganzhorn, pers. comm.) and by P. v. verreauxi (young leaves; Ranarivelo, pers. comm.;Richard, 1978a).
Another species, Carya tometosa (Juglandaceae), explicitly leading naphthoquinones in theleaves (Hegnauer, 2001; App. II.2), was merely tasted by the focal lemurs, corroborating theimpression that high contents of naphthoquinones were avoided.
The bark of D. virginiana containing naphthoquinones (Hegnauer, 2001) is known to act asfebrifuge (like cinchona) and as an antiseptic (Crellin and Philpott, 1990; App. II.2). Butcontrary to human’s use, plant parts with anti-malaria and febrifuge effects were not explicitlyselected by the focal animals, as was already shown for the bark of Cornus florida..
No plant part was ingested that is known to contain coumarins (App. II.2).
Lignans and associated compounds
The lignans, syringaresinolmono- to tetrasyccharides, along with some of their degradationproducts, two new lyoresinoldiglucosides, vomifoliolapioglucoside (a ionon-derivative) andthe neolignan icariside-E5 were isolated in amounts of 20-140 ppm from the stem bark of A.
julibrissin (Hegnauer, XIb-1, 1996; Fig. II.2, p. 234). Histamine and related imidazolecompounds were not found in A. julibrissin (Mazzanti et al., 1983), while pyridoxineglycosides with some neurotoxic and arrhythmic activity could be isolated (Higuchi et al.,1992b; App. II.2). The crude methanol extract containing pyridoxine and syringaresinolglycosides exhibited a negative inotropic effect that fits well with the medicinal use as a tonic(see also “saponins”; Kinjo et al., 1991a; Higuchi et al., 1992b). Furthermore, syringaresinoldiglucoside is reported to act as a calcium channel antagonist (Higuchi et al., 1992b). In thiscontext, it is remarkable that the bark of Liriodendron tulipifera also contains syringaresinollignans and has a similar reputation as a tonic, but was neither consumed by the focal animals(App. II.2). However, it cannot yet be determined, whether the avoidance of bark from bothplant species is caused by the syringaresinol glycosides or other compounds such as thecardioactive compound and coumarins in the bark of L. tulipifera, and the pyridoxineglycosides and saponins in the bark of A. julibrissin.
Iridoids and secoiridoids, and essential oils
The group of iridoids and secoiridoids appears to be completely avoided by the focal lemurs.The subclass Cornidae – which contains the orders Cornales (Cornaceae, Nyssaceae),Dipsacales (Caprifoliaceae), Ericales (Ericaceae) and Oleales (Oleaceae) - is characterised bythe rich occurrence of iridoid and / or secoiridoid compounds, and a close chemotaxonomicalrelationship is explicitly discussed between Caprifoliaceae, Cornaceae and Nyssaceae, andbetween Oleaceae1 and Cornales (Frohne and Jensen, 1992; Hegnauer, 2001). Following thischemotaxonomical relationship, nearly all refused plant species can be found in these familiesand no plant tissue was eaten by the sifakas for which the occurrence of iridoids orsecoiridoids was reported.
The only exception to this “species concept” is Oxydendrum arboreum (Ericaceae, Cornidae).While the sour tasting leaves were tasted by the sifakas, the bark was vigorously eaten. The
1
Salidroside (4-hydroxyphenyl-ethanoyl-glucoside) is characteristic of the Oleaceae and precursor of theCornus-quinol-glucoside and its products.

82 C.II Evaluation of the food plants based on plant chemistry with emphasis on chemotaxonomical andpharmacological aspects
leaves were used in traditional human medicine as a tonic, a diuretic, and as refrigerant forfevers (App. II.2), and neither for the leaves, nor for the bark the occurrence of iridoid andsecoiridoid compounds was explicitly described (App. II.2).
The leaves of Cornus florida were spat out by the focal animals, while the bark wascompletely ignored, and both plant parts have been described to contain iridoid compounds(App. II.2). In human medicine, the bark was previously utilised as a cinchona substitute formalaria, fevers, and as a tonic stomachic, and was included as monograph in the USP (App.II.2).
The other leaf species spat out were the leaves of Ligustrum vulgare (Oleaceae). These leavesare known to contain iridoid alkaloids such as cinchonin, cinchonidin and dihydrocinchonidin(App. II.2). Leaves and twigs of Nyssa sylvatica (Nyssaceae) are known to lead iridoidssimilar to those of Cornus florida, and the tree remained untouched by the focal lemurs.
Although iridoids occur in the genus Viburnum (Caprifoliaceae), they are not explicitlydocumented to occur in the bark or leaves of Viburnum prunifolium. Instead, arbutin asantibacterial phenolic glycoside is mentioned. However, the astringent bark (Viburniprunifolii cortex) has been medicinally used by humans, yet neither the bark, nor leaves wereever ingested by the animals; instead, the entire plant remained untouched. Leaves ofViburnum rafinesquianum were even spat out.
The leaves of Fraxinus americana were only tasted, F. pennsylvanica remained untouched.Although the leaves of F. americana were only reported to contain flavonoids, based on thehistory of the plant family and genus Fraxinus iridoid compounds can be expected and may bethe underlying reason why their foliage was not chosen. Perhaps due to the fact that the treegrew next to the holding cage in NHE-1, leaves were occasionally tasted.
Therefore, it may be concluded that plant parts leading iridoid or secoiridoid compounds werelargely avoided and the pharmacological effects inherent to them such as anti-malaria andfebrifuge properties were not required by the focal animals.
Essential oils were ingested to some degree as evidenced by the consumption of leaves fromLiriodendron tulipifera (Magnoliaceae) and Liquidambar styraciflua (Hamamelidaceae), yetthere is no hint that plants were selected because of their essential oils contents (compare App.II.2).
Essential oils and oleoresins are characteristic of the gymnosperm families Cupressaceae andPinaceae, order Pinales. The oil of turpentine of various Pinus species is medicinally used byhumans. While Juniperus virginiana (Cupressaceae) was only passed by the sifakas, the deadbrown needles of Pinus taeda (Pinaceae) were occasionally ingested. It appears that theessential oils of the gymnosperms were not of interest to the animals in this study. Perhaps thefibre of the Pinus needles made them desirable, yet this option has not been investigated.
Bitter tasting compounds (quassinoids1)
Quassinoids, the bitter tasting principle of the Simaroubaceae, presents an unfavourable groupof compounds for the sifakas. Ailanthus altissima (Simaroubaceae) was only passed by thefocal animals. The bitter tasting quassinoids within the leaves of A. altissima presumablyoverruled the simultaneously present flavonoids and hydrolysable tannins. In traditionalhuman medicine, the bark and root bark were used as a nerval tonic and as an antidiarrhoealand anthelminthic (App. II.2). Quassinoid compounds revealed antiprotozoal activity withpossible anti-malarial effects (App. II.2). The non-usage of the bark corroborates the
1
Most quassinoids are decanortriterpenes (C20-quassinoids), but also C18-, C19- and C25-quassinoids occur. Theyare the bitter tasting compounds within the Simaroubaceae (Frohne and Jensen, 1992).

C.II Evaluation of the food plants based on plant chemistry with emphasis on chemotaxonomical and 83pharmacological aspects
hypothesis that animals did not seek compounds with anthelmintic or antiprotozoal effects toprevent diarrhoea.
Alkaloids
Alkaloids were obviously tolerated to a limited extent, presumably depending on the type andcontent. Examples give the leaves of Acer rubrum and Liriodendron tulipifera, which havebeen eaten by the focal lemurs (App. II.2). On the contrary, the bark of L. tulipifera, alsocontaining alkaloids, was not selected by the sifakas. Previously, the bark was medicinallyused as a tonic and a stomachic, for rheumatism and fever, and was included in the U.S.Pharmacopoeia. Perhaps other contents such as coumarins and a cardioactive compound(presumably sesquiterpene lactones) in the bark may have a negative impact in regard tosifakas showing a feeding preference.
In Madagascar, Albizia lebbeck and A. gummifera were utilised as food plants by P. tattersalli
(Meyers, 1993). These species are known to contain spermine alkaloids in some of their plantparts showing e.g. antibacterial effects (Misra et al., 1995; Rukunga and Waterman, 1996a;for details App. II.2), yet it is unclear which plant parts were ingested by the sifakas. During astudy on free-ranging P. v. coquereli in Madagascar, no discrimination was apparent betweenleaf species containing or not containing alkaloids (Ganzhorn and Abraham, 1991), whichcorroborates the findings that a “certain tolerance” of alkaloids was observed in the focallemurs. However, for a final correlation between plant tissue ingested and the type andcontents of alkaloids contained, further investigation is needed.
Cyanogenic compounds
The Rosaceae are an interesting family to assess the group of cyanogenic compounds. Speciesof both subfamilies, Photinia glabra (Maloideae) and Prunus serotina (Prunoideae) containcyanogenic compounds within their leaves, but only those of Photinia glabra were eaten bythe study animals. In addition, the leaves of Liriodendron tulipifera (Magnoliaceae) wereingested, and are known to contain substantial amounts of cyanogenic compounds withseasonally fluctuating levels (App. II.2). So, it can be concluded that cyanogenic compoundsare tolerated by the sifakas and are not the reason for the avoidance of these plant tissues.Either animals possess a highly effective detoxification system, or, together with the feedingbehaviour of the golden bamboo lemur (Hapalemur aureus) (Glander et al., 1989), it can behypothesised that these lemur species utilise cyanogenic compounds as source of nitrogen.Conversely, the entire tree Prunus serotina remained untouched by the focal lemurs. Inprevious human medicine, the bark was used against hepatitis, cirrhosis, fever, and circulatorydisorders and was listed as officinal drug (USP). A syrup obtained from the bark wascommonly used as a cough medicine. Perhaps it is due to the co-occurrence of coumarins andthe contents of condensed tannins (App. II.2) that resulted in ignorance of the bark.
Saponins
The evaluation of saponins in regard to food selection remains problematic. Albiziae cortexand Albiziae flos from A. julibrissin are officinal drugs described in the ChinesePharmacopoeia with saponins as the leading compounds within the bark (Stöger et al., 2001).Extensive analytical work has already been dedicated to the stem bark of A. julibrissin (App.II.2). According to the Chinese Pharmacopoeia, bark and flowers are used as solving andsedative agents, against restlessness, agitation, sleeplessness and despondency. Moreover, thebark is used against ulcerations in the “orbis pulmonalis” and externally against ulcers,swellings, and injuries from falls and strikes.

84 C.II Evaluation of the food plants based on plant chemistry with emphasis on chemotaxonomical andpharmacological aspects
The saponin fraction of the bark contains mono-, bis- and tridesmosides and revealed a stronguterotonic activity by stimulating uterine muscle contractions. Furthermore, cytotoxic effectswith julibroside III as a highly potent compound (see Fig. II.1, p. 233), and anti-tumour effectswere found for several saponins. In part, oligosaccharide moieties were identified asenhancing structures (Ikeda et al., 1995b; Ikeda et al., 1997; Zou et al., 2000a; 2000d; 2005a;2005b; App. II.2). Basic structures of the triterpenoid sapogenols are machaerinic acid andacacic acid lactone. The genuine saponin glycosides julibroside A1 to A4, B1 and C1 weregained in 2-15 ppm from the bark of A. julibrissin.
While antipyretic, anodyne, sedative, and diuretic effects may be due to the saponinglycosides, syringaresinol diglucoside (see also “lignans”) is made responsible for the generaluse as a tonic in China and Japan “to ease the mind and calm the nerves” (Kinjo et al., 1991a,b; Fig. II.2, p. 234). In a recent study, for an aqueous extract of the stem bark anxiolytic-likeeffects were described (Kim et al., 2004).
According to the DULC staff (pers. comm.), also flowers and seeds of A. julibrissin have beeningested by the Coquerel’s sifakas, yet the bark was never been observed to be eaten.However, during the study periods for this project, only the leaves were available and ofinterest to the animals. Therefore, the leaves will be subject of extensive chemicalinvestigations within this work, for which up to date only scarce information is available.
However, it is reasonable to assume that saponins are tolerated to a limited extent, as they arewidely distributed within the plant kingdom. In regard to additional plant species containingsaponins that were ingested by the focal animals, saponins are reported to occur in the leavesof Acer rubrum and Photinia glabra (App. II.2). Although the rate of resorption for saponinsfrom the gastrointestinal tract is generally low, it varies significantly between animal species(Steinegger and Hänsel, 1988). In part, saponins enhance the absorption of other compoundsfrom the intestinal tract (Steinegger and Hänsel, 1988), but in the case of the sifakas, noinformation is available on the metabolism within the gut system.
With respect to free-ranging Propithecus species in Madagascar, four Albizia species(gummifera, boivini, gaubertiana and lebbeck) are reported to be used by P. tattersalli
(Meyers, 1993), while leaves of Albizia greveana are selected by P. verreauxi at Morondava(Ganzhorn, pers. comm.). An unspecified Albizia species was a food plant of free ranging P.
v. coquereli at Ampijoroa (Ganzhorn and Abraham, 1991).
A literature review on Albizia lebbeck revealed saponins to occur in nearly all plant organs:roots, heartwood, bark, leaves, flower, pods and seeds (Hegnauer, XIb-1, 1996; Pal et al.,1995). Isolated saponins showed biological effects on germination and growth of agriculturalcrops (Hegnauer, XIb-1, 1996). Saponins contained in the seeds, exhibited antiovulatoryproperties (Pal et al., 1995), and various drugs are obtained from A. lebbeck for human use(Hegnauer, XIb-1, 1996). For example, saponins from the bark of A. gummifera exhibitedoxytocin-like activities (albitocines). In Uganda, the bark is used to accelerate the actualbirthing process (Hegnauer, XIb-1, 1996).
Thus, it can be inferred that triterpenoid saponins are ingested to some degree, since they areknown to occur in several plant organs of Albizia. However, it remains to be hypothesised,whether the saponins and their pharmacological effects have lead to the avoidance of A.
julibrissin bark or whether this was due to other plant compounds (compare “lignans”).
Polysaccharides
Plant polysaccharides build another group of chemical compounds which became importantduring the course of this study. Although gummosis widely occurs in the genus Albizia, withinthe Mimosaceae even more often than within the Caesalpiniaceae (Hegnauer, XIa, 1994), theoccurrence of high molecular weight polysaccharides in the leaves of A. julibrissin has not

C.II Evaluation of the food plants based on plant chemistry with emphasis on chemotaxonomical and 85pharmacological aspects
been explicitly reported until now, but was detected within this study (see chapter V). Theonly previous indication for the presence of polysaccharides in A. julibrissin was by Moon et
al. (1985), who screened various oriental medicinal plants containing polysaccharides for theirantitumor activity, yet the authors failed to mention which plant part contained thesepolysaccharides. For A. julibrissin, Moon et al., found a relative strong antitumor activity.
The Malagasy species A. lebbeck, was a food plant utilised by P. tattersalli (Meyers, 1993)and produces a gum exudate from the trunk called “siris-gum” (Hegnauer, 1996). However,there are no documented reports that Coquerel’s sifakas obtain gum exudates e.g. by strippingoff the bark of any tree species, or to ingest other plant polysaccharides like mucilage,although their tooth comb could be a suitable tool.
This is corroborated by my own observations: the focal lemurs were never observed to strip(trunk) bark off a tree in order to stimulate gum production. For instance, in previous humanmedicine, the gum exudate of L. styraciflua, the “American Styrax”, was obtained bystripping off the trunk bark. The oleoresin was used medicinally for various external and oralapplications, with e.g. dysentery as indication. However, it was not used by the animals of thisstudy. This fits with the observation that R. copallina bark of the twigs, which sometimessecreted a gluing resin-like exudate, was neither utilised by the focal lemurs.
Free amino acids
It is interesting to note that large amounts of hydroxyprolin occur in the leaves of Vitis cinerea
(App. II.2). If applied orally, prolin and hydroxyprolin may play an important role in theirinteraction with tannins (for further discussion see chapter VI).
Lectins
Lectins may be distributed in various leguminous plants (Frohne and Jensen, 1992; Hegnauer,2001). For instance, lectins were isolated from the inner bark of Robinia pseudoacacia
(Fabaceae) with seasonal changes in contents and a marked increase during the autumn (VanDamme et al., 1995; Nsimba-Lubaki and Peumans, 1986; Yoshida et al., 1994). While highlevels of lectins were found in the seed, lower levels were identified in the flower and rootbark, while the leaves indicated no detectable levels (Van Damme et al., 1995), although itwas the leaves that were consumed by the focal lemurs. Therefore, lectins may have a negativeimpact on food choice.
Conclusion
It can be concluded that some secondary plant compounds were favoured and actively soughtout by the foraging lemurs, while others were clearly avoided, and a series of secondary plantcompounds may be tolerated to some extent, presumably depending on dosage and implicatedpharmacological effects. Simultaneously present chemical compounds may overrule other lessfavoured compounds and vice versa, but not in any case it becomes visible as to why the focallemurs treated the plant tissue the way they did. When leaves were spat out, they undoubtedlycontained chemical compounds that exceeded the tolerance levels of the study animals.Furthermore, it has to be noted that in App. II.2 only available information could be gatheredand further chemical investigations on both the quality and quantity of secondary plantcompounds would help to recognise further criteria to evaluate the food selection of thesifakas. Both the seasonal fluctuation of plant compounds and individual food preferences andeating habits (see chapter B; Richard 1978a, b), make the evaluation of plant tissue in regardto their palatability, rather problematic. However, the information compiled in App. II.2 is auseful means to recognise favoured and less favoured chemical compounds in regard to foodchoice and possible implicated beneficial effects for the well-being of the sifakas.

86 C.II Evaluation of the food plants based on plant chemistry with emphasis on chemotaxonomical andpharmacological aspects
High contents of hydrolysable tannins were obviously sought out by the focal lemurs and canbe expected to occur in the leaves of R. copallina, the most preferred food plant at the DULC.On the contrary, levels of condensed tannins seem to be minimised. Animals apparentlydiscriminated between hydrolysable and condensed tannins.
The role of A. julibrissin leaves, the other highly preferred food species, cannot beconclusively evaluated from the current available literature. Hence, both preferred leafspecies, R. copallina and A. julibrissin, will be extensively investigated within this study as totheir secondary leaf compounds (chapters III to V) with the averaged daily intake of thesecompounds to be discussed in the context of diarrhoea (chapter VI).
Hydroxycinnamic acids are supposed to be ingested inasmuch that they are typicallyassociated with tannins and flavonoids. Essential oils were obviously tolerated, even in largeramounts, while the ingestion of alkaloids appears to be dependent on dosage and inherentpharmacological effects. Saponins are thought to be tolerated at least in small amounts.Coumarins were not proved to be ingested, while unlike expectations, even larger amounts ofcyanogenic glycosides are apparently not toxic for the sifakas (as they are for humans),perhaps due to differing metabolic pathways. Yet conversely, plants leading iridoid andsecoiridoid compounds were consistently refused in accordance with chemotaxonomicalrelationships between the species concerned. Likewise, irritant phenolics were alsoconsistently avoided. Some groups of chemical compounds remain both difficult andequivocal in their evaluation, such as naphthoquinones, stilbenes, lignans, the bittercompounds quassinoids and lectins, which were rather avoided by the focal lemurs.
Chemotaxonomical relationships between the plant species within the animals’ environment,provided a useful means to assess food preferences and food avoidance, since with only fewexceptions, the animals chose their food plants in agreement with chemotaxonomicalprinciples.
Another interesting aspect of this study is the comparison between the medicinal plant use byhumans (previously and currently), and the selection or non-selection of these plant species bythe focal lemurs (App. II.2), which may coincide or diverge.
In particular, those plants with known antidiarrhoeal and beneficial gastrointestinal effectswere observed to be actively selected by the focal lemurs, albeit different plant parts may beused by humans and the sifakas: while in (traditional) human medicine often the barks wereused (with predominantly condensed tannins), the sifakas selected the leaves (withpredominantly hydrolysable tannins) of these species. Plant parts known as “antidiarrhoealdrugs” within human medicine containing hydrolysable tannins were also selected by the focallemurs. This corroborates the discrimination between condensed and hydrolysable tanninswithin the plant tissue ingested. Furthermore, plant organs of species (drugs) with indicationssuch as malaria, fever, antiprotozoal or anthelmintic effects appear to be avoided by the focalanimals.

C.III Identification of flavonoids and simple phenolics in the leaves of R. copallina and A. julibrissin 87
C.III Identification of flavonoids and simplephenolics in the leaves of Rhus copallina
and Albizia julibrissin
1 Introduction
During observations on the feeding behaviour of captive Coquerel’s sifakas at the DukeUniversity Lemur Center (chapter B) two major food plants were recorded, Rhus copallina
and Albizia julibrissin, which subsequently, were submitted to extensive chemicalinvestigations. After an extensive literature survey on their secondary plant compounds,gallotannins are expected to be leading compounds in the leaves of R. copallina, while scarceinformation exists on the content of A. julibrissin leaves (details see chapter C.II and App.II.2).
Some preliminary assays commenced with the leaves of R. copallina and A. julibrissin thatwere harvested during the first observation period in spring with additional plant harvests inJuly to gain preliminary experimental data as to what major classes of chemical compoundswere present. These preliminary assays also included an additional four leaf species that hadbeen offered as browse (Tab. C.1, p. 57). These additional samples were expected to containsome classes of compounds that were in common among the various food plants. Thin-layerchromatography was then used to detect and exclude the classes of compounds occurringwithin these six leaf species.
For further quantitative analyses and pharmacological evaluations of the major chemicalcompounds it was inevitable to isolate them preparatively from the leaves of R. copallina andA. julibrissin and to elucidate their structures by various methods including UV spectroscopy,mass spectrometry and NMR-spectroscopy.
2 Materials and Methods
2.1 Plant material
For origin and identification of the plant material see C.I.2.1.
For preliminary assays, the leaves of R. copallina and A. julibrissin from the May harvestwere used, supplemented with additionally harvested plant material from the July. The otherfour leaf species included were all harvested in May. For preparative isolations, the leaves ofA. julibrissin were collected in May while the leaves of R. copallina were collected in July.
For preliminary assays the leaf material was ground and sieved according to C.I.2.2.

88 C.III Identification of flavonoids and simple phenolics in the leaves of R. copallina and A. julibrissin
2.2 Thin layer chromatography (TLC)
Thin layer chromatography was used in preliminary assays to classify and identify differentclasses of compounds and numerous individual compounds within the leaves of the foodplants offered as well as to control various analytical steps.
Quality of the TLC plates used
Most TLC analyses were performed onTLC aluminium sheets; 20x20 cm; Silica gel 60 F254 (Merck); 0.20 mm (layer thickness).
Reversed phase thin layer chromatography was performed onTLC plates (glass); 20x20 cm; RP-18 F254 S (Merck); 0.25 mm (layer thickness).
TLC-solvent-systems to develop TLC plates
The following TLC-systems were used to develop Silica gel aluminium sheets. All solventswere prepared by mixing the corresponding volumes:
System 1: Ethylacetate / methanol / water / acetic acid (50:8:6:1)System 2: Ethylacetate / methanol / acetic acid / water (60:15:15:10)System 3: Ethylacetate / methanol / water (100:13.5:10)System 4: Ethylacetate / ethylmethylketone / formic acid / water (50:30:10:10)System 5: Ethylformiate / formic acid / water (80:10:10)System 6: Toluene / methanol (90:10)System 7: Toluene / methanol / ethylmethylketone / acetylacetone (40:30:20:10)System 8: Toluene / ethylacetate / diethylamine (70:20:10)System 9: 1-Butanole / acetic acid / water (40:10:50)System 10: Dichloromethane /methanol (80:20)System 11: Dichloromethane /methanol / water (64:50:10)
TLC-systems for Silica gel RP-18 TLC plates (glass):
System 12: Water / methanol / acetic acid (60:40:1)System 13: Water / methanol / acetic acid (50:50:1)
TLC-systems 1 and 3were largely used to examine the leading compounds of R. copallina and A. julibrissin as wellas to review various extraction methods and steps needed to isolate and identify individualcompounds. That way, different extraction methods based on varying pH (Stas-Otto) andsolvent polarity, precipitation experiments, e.g. with lead acetate, and different methods ofhydrolysis (methanolysis and TFA-hydrolysis; see C.IV.2.3) were monitored especially for A.
julibrissin and R. copallina leaves. Once the main compounds of A. julibrissin and R.
copallina were recognised to be flavonoid glycosides and tannins, TLC system 3 was replacedby system 1 by adding acetic acid in order to reduce the tailing effect especially of thehydrolysable tannins. Hence, further evaluation and control of preparative extraction steps (bymeans of a polyamide column and preparative HPLC method) as well as reviews of plantextracts prepared from all food plants for a quantitative determination (by means of a “BitBeater” with and without subsequent hydrolyses) were monitored in TLC system 1.
TLC-system 2 (Jerga, 1989) and 11were used to examine the sugar moieties of flavonoid glycosides after methanolysis (Jerga,1989).
TLC-system 4was predominantly used to separate flavonoid glycosides. A. julibrissin fractions eluting fromthe preparative HPLC column were examined in system 4 as already described for system 1.

C.III Identification of flavonoids and simple phenolics in the leaves of R. copallina and A. julibrissin 89
TLC-system 5,which is like system 4 appropriate to separate flavonoid glycosides, was chosen to examineisolated tannin fractions of R. copallina leaves (C.IV.2.5) to check for their purity. Thatfraction was also investigated in the TLC-systems 3, 11 and 12.
TLC-systems 6 and 7 (Jerga, 1989)were used to look for flavonoid aglyca. Whereas in system 6 unhydrolysed glycosides dogenerally not move and the flavonoid aglyca myricetin, quercetin and kaempferol hardlymove, more lipophilic compounds can be separated. The TLC-system 7 was revealed to bemore appropriate in this study in the need to separate flavonoid glycosides (e.g. of quercetintype) from their corresponding aglyca.
TLC-system 8was used to search for alkaloids (Stahl and Schild, 1981).
TLC-systems 9 and 11were used to look for saponins (Stahl and Schild, 1981). Furthermore, system 9 is appropriateto separate flavonoid glycosides (Stahl and Schild, 1981).
TLC-system 10was used like system 3 to evaluate first extracting experiments based on different solventpolarity.
TLC-systems 12 and 13were assayed for their separating properties on reversed phase glass plates. System 12 yieldeda better resolution compared to system 13 with respect to flavonoid glycosides and tannins.
Apolar, lipophilic solvent systems like 6 and 10 were also useful to search for apolarstructures like terpenoid compounds.
Extracts or solved substances were set on the starting point by means of a glass capillary or anappropriate Eppendorff pipette. Most TLC plates were developed over a distance of about 10cm, but also 6-8 cm led to satisfying results, if only few substance was used. Distancesbetween the points on the starting line were 1.5 cm. Development was performed withoutsolvent saturation in a covered glass chamber of appropriate size.
All plates were first looked at in day-light, then under the UV light at 254 nm and 366 nm andfinally after detection with spray reagents in daylight and - if necessary - under UV light at366 nm (Markham, 1975; Stahl and Schild, 1981).
About 30 ml of solvent was sufficient to develop two TLC plates over a distance of 10 cm,respectively.
Spray reagents
Anisaldehyde / sulphuric acid reagent (= anisaldehyde / H2SO4) (Stahl and Schild, 1981)In the following sequence 0.5 ml anisaldehyde were mixed with 10 ml acetic acid (99-100 %),85 ml methanol and 5 ml sulphuric acid (95-97 %).
After spraying, plates were heated up to 100-110 °C in an oven for about 5 to 10 minutes untilcolours were fully developed. However, in some cases it was necessary to heat up even tohigher temperatures (e.g. 120 °C or even up to 140 °C). Repeatedly heating can reactivatecolours.
The complete reagent cannot be kept for a protracted time. If its colour turns red, it must bediscarded. But it is possible to store a mixture of anisaldehyde, acetic acid and methanol for alength of time in the refrigerator. Just before use, sulphuric acid has to be added.

90 C.III Identification of flavonoids and simple phenolics in the leaves of R. copallina and A. julibrissin
This reagent is appropriate for staining a wide range of natural products (especially terpenoidsof essential oils). However, it was universally used as it yielded characteristic colours withmost compounds tested.
Thymol / sulphuric acid reagent (= Thymol / H2SO4) (Jerga, 1989)0.5 g Thymol, 95 ml ethanol and 5 ml sulphuric acid (95-97 %) were cautiously mixed. TLCplates were sprayed with a freshly prepared reagent and heated up to 120 °C for about5 minutes until colours were totally developed. In part it was necessary to heat up to 140 °C.
This reagent is useful to detect monosaccharides, e.g. as sugar moieties of flavonol glycosidesafter hydrolyses. Furthermore, it is a valuable reagent to stain flavonoid aglyca and glycosides.
Vanillin / sulphuric acid (= Vanillin / H2SO4) (Scholz, 1987)3 g vanillin were solved in 100 ml ethanol, finally 1 ml sulphuric acid (95-97 %) was added.After spraying, TLC plates were heated up to 110 °C for about 5 minutes.
In some cases a second step was incorporated, to spray one reagent over a first reagent.Reagents containing sulphuric acid with subsequent heating were generally suitable to besprayed over other reagents. For instance, a combination of the FeCl3 reagent withanisaldehyde / H2SO4 or vanillin / H2SO4 was possible and revealed to be useful to detect firsttannins and afterwards additional compounds, especially when lying under the tannin fraction.
Diphenylboryloxyethylamine reagent = “Reagent A for natural products according toNeu” (Jerga, 1989)Solution A: 1 % (m/v) solution of diphenylboryloxyethylamine in methanol
Solution B: 5 % (m/v) solution of polyethylene glycol 400 in ethanol
The dried plate was first sprayed with solution A and then with solution B. The evaluationwas performed after 30 min. in day light and under UV light at 366 nm.
The solution of polyethylene glycol (PEG) acts as moistening agent and preserves the colours.It is especially appropriate to detect α- and γ-pyrones (flavonoids).
Ferric chloride reagent (FeCl3 reagent)A solution of 10 % (m/v) FeCl3 in methanol was provided for the following spray reagent:0.5 ml of that solution had to be diluted with 19.5 ml methanol, respectively.
FeCl3 yields coloured complexes with phenolic compounds and hydroxamic acids. In case ofgallic acid and gallic acid derivatives (gallotannins), grey-blue coloured complexes could bedetected on TLC plates.
Some drops of the 10 % methanolic FeCl3-solution are sufficient to test directly forhydrolysable tannins in solution yielding ink-blue to black colours. Condensed tannins yieldgreen coloured complexes (Wagner, 1999).
Molybdenum-phosphoric acid (DAB 9)4 g molybdenum-phosphoric acid were dissolved in 40 ml water; 60 ml sulphuric acid (95-97 %) were added while cooling the solution.
It is a universal reagent for reducing compounds.
Iodine vapour (Markham, 1975; Stahl and Schild, 1981)Some crystalline metallic iodine (10-20 g) was put into a glass chamber appropriate fordeveloping TLC plates. The dry and already developed TLC plate was set into that chamber tobe detected by iodine vapour.
The advantage of this reagent is that compounds, which do not extinguish under UV light,become visible by iodine vapour. But the colour fades after a while as iodine vaporises.Universal reagent.

C.III Identification of flavonoids and simple phenolics in the leaves of R. copallina and A. julibrissin 91
Dragendorff reagent (according to Puech) (Stahl and Schild, 1981)The basic solution consisted of the following ingredients which was placed in a brown bottle:1.7 g basic bismuth nitrate and 20 g tartaric acid were dissolved in 40 ml water. This solutionwas mixed with a solution of 16 g potassium iodide in 40 ml water and stirred for one hour.Finally, the resulting solution was filtered.
The actual spraying reagent has to be freshly prepared each time:5 ml of the basic solution have to be added to 15 ml water. Afterwards, a newly providedsolution of 0.1 % (m/v) Na NO2 in water has to be sprayed over in a second step.
This reagent is appropriate to detect alkaloids.
2.3 Test to discern hydrolysable from condensed tannins
2.5 g powdered plant material were extracted with 40 ml water for 20 min. at 50 °C. 1 gsodium acetate was added to the warm extract. The suspension was left to cool down andfiltered. The residue was rinsed with 10 ml water, and filtrates were unified and filled up to50 ml with water. 25 ml of that solution were refluxed for 30 min. with 2.5 ml conc.hydrochloric acid (36 %) and 5 ml formaldehyde (35 %), cooled down at room temperatureand filtered.
While condensed tannins yield a precipitation of red coloured polymers (phlobaphenes) informaldehyde-hydrochloric acid solution, hydrolysable tannins stay in solution. The latteryield blue coloured complexes with ferric chloride in alcoholic solution (reagent see above),while condensed tannins give green colours (Steinegger and Hänsel, 1988; Wagner, 1999).
A. julibrissin could not be extracted in that manner because of the mucilage contained in theleaves, therefore 50 % (v/v) aqueous methanol was used. The plant material was firstdispersed in methanol and afterwards, the same volume water was added. Otherwise thefraction of soaked mucilage prevented every attempt of filtering the solution.
2.4 Polyamide column chromatography and HPLC
Preparation of the plant extracts
Preparative isolation of individual leaf compounds only concerned R. copallina (harvested inJuly) and A. julibrissin (harvested in May).
Approximately 15 g of either leaf material was used, respectively. Leaflets had been removedpreviously from the stems being attached to as described in C.II.2.2. Furthermore, leaf buds atthe tip of A. julibrissin stems, which had not always been ingested by the study animals inspring, were removed as well.
R. copallina leaves were first ground by means of a mortar and pistil and then pre-extractedwith n-hexan (about 100 ml) to remove highly unpolar and lipophilic compounds, e.g.chlorophyll. However, before discarding the n-hexan fraction, it was checked by TLC for itsspectrum of compounds to prevent any loss of possibly valuable components. Solvent residuesof n-hexan were subsequently evaporated (Rotavapor®).
The further extraction of R. copallina leaves was performed similar to the extraction of A.
julibrissin leaves with 150 ml aqueous methanol (80 % v/v). The dispersed plant material wasground for several minutes in intervals by means of an Ultra-Turrax homogeniser (Ultra-Turrax T 25, Janke und Kunkel, IKA-Labortechnik). The Ultra-Turrax was cleansed withsome millilitre of pure methanol which was then added to the extract. During this time thesuspension was cooled with ice. Then, the suspension was stirred in a covered flask at room
92 C.III Identification of flavonoids and simple phenolics in the leaves of R. copallina and A. julibrissin
temperature for about 1.5 hours (magnetic stirrer). The mixture was filtered under lowpressure using a water jet pump and the remaining plant material was rinsed with somemillilitre of 80 % (v/v) methanol. The extract was concentrated in vacuo (Rotavapor®) at lowtemperature (30-40 °C, water bath). The residue was dispersed in some millilitre 80 % (v/v)methanol (q.s.) and centrifuged for a couple of minutes. The supernatant solution was used forfurther separation on a polyamide column.
Comment:80 % (v/v) aqueous methanol accounted best for the diversity of hydrophilic and lipophilicsecondary plant compounds while a certain reduction of highly lipophilic compounds aschlorophyll could be achieved.
Except for a pre-extraction of R. copallina leaf material with n-hexan no other pre-treatmentwas found to be necessary. A pre-extraction by means of a LiChrolut® column did notachieve any additional surplus in case of subsequent use of a polyamide column with respectto a better resolution.
Separation by means of a polyamide column
The concentrated plant extract of either plant was put onto the column and the eluents wereselected from the hydrophilic, polar end to less polar properties, terminating with methanolicammonia.
Fractionation was checked by means of an Uvicord (Uvicord S II, Pharmacia LKB for peakrecognition associated with REC 101, Pharmacia LKB as recorder) at 254 nm. The fractionsgained were first reviewed by TLC analytic (solvent system 1 and “Naturstoff”-reagent andanisaldehyde / H2SO4 as spraying reagents) and then by analytical HPLC analyses (C.IV.2.1).Finally it was determined, which fractions had to be taken, which should be unified and whichwere discarded.
The first fractions eluted with water, contained predominantly polysaccharides, giving bluefluorescence at 366 nm and staying at the starting position in the solvent system 1. They werenot used for further separations. Fractions with too low amounts of any substance to beisolated or that were too impure for subsequent elucidation of the chemical structure werediscarded as well.
Every fraction used for further separation on the preparative HPLC column was concentratedin vacuo (30-40 °C water bath) and dissolved in few ml of 80 % (v/v) aqueous methanol.
The following eluents were used to fractionate the aqueous plant extracts put onto the column:
de-ionised water (Millipore®); 5 %, 10 %, 30 %, 50 % and 60 % aqueous methanol; puremethanol (100 %); EtOAc/MeOH 70 %; pure EtOAc (100 %), 0.1 % methanolic NH3. Alleluents were prepared by mixing the corresponding volumes.
Size and volume of the glass column44 cm in height; 4.4 cm in diameter; comprising a volume of about 670 ml.
Polyamide materialMN - Polyamide SC 6 (purchased from Macherey and Nagel); particle size 0.05-0.16.
Activation / reactivation of the polyamideThe polyamide material was dispersed in Millipore® water several times and the fines weredecanted each time, until the supernatant solution was clear.
Then the polyamide material was poured into the glass column.
To activate or reactivate the material, it was first treated with 10 % aqueous NH4OH, washedwith water until neutral pH, then treated with 10 % aqueous HCl and finally washed neutral
C.III Identification of flavonoids and simple phenolics in the leaves of R. copallina and A. julibrissin 93
again. Alternatively, 1 N NaOH could be used instead of the ammonium solution to reactivatethe material.
Preparative HPLC separation
The solvent system formic acid / methanol was used for every separation procedure. Everyfraction eluted from the preparative HPLC column was checked by analytical HPLCprocedure (C.IV.2.1) for its purity and then fractionated again preparatively if needed. Finally,every fraction was also reviewed by TLC analysis, using solvent system 1. Pure fractions wereconcentrated again, stored in Eppendorf tubes and brought to near dryness by means of aSpeed Vac centrifuge. These isolated compounds were subsequently identified and elucidatedby their UV spectra, mass spectrometry and NMR spectroscopy. (UV spectra were obtainedby means of the photodiode array detector during the analytical HPLC procedure to verify thesubstance’s purity, see C.IV.2.1).
The preparative HPLC separation was performed on a Liquid Chromatograph (System Gold,Beckman Instruments, USA) as reversed phase chromatography on a Nucleoprep® 100-10 C18
column (Macherey-Nagel, VP 250 / 40 mm). A 136 Pump and a 166 Detector were used. UVdetection of the eluting fractions was performed between 260 and 280 nm. (Fractions gainedfrom A. julibrissin leaves were detected at 260 nm, while fractions from R. copallina leaveswere detected at 270 to 280 nm.)
Solvent system and gradientSolvent A: 1 ‰ aqueous formic acid (pH 3);
Solvent B: methanol.
The following gradient, at a flow rate of 12 ml / min., was used:0-3 min. linear gradient to 90 % A; 3-13 min. linear gradient to 60 % A; 13-113 min. 60 % A;113-120 min. linear gradient to 10 % A; 120-130 min. 10 % A; 130-150 min. linear gradientto 100 % A, which was held constant to 200 min.
For some compounds eluting from the column it was favourable to hold the solventcomposition manually constant for some minutes before continuing the programmed gradient.
2.5 Structure identification
Mass spectrometry
Most mass spectrometric experiments were performed at the IPB (Halle / Saale),supplemented with additional experiments at the University of Braunschweig and at theUniversity of Bremen.
ESI-MSFinnigan MAT TSQ 7000 instrument (electrospray voltage 4.5 kV (positive ions); 3.5 kV(negative ions); heated capillary temperature 200 °C; sheath gas and auxiliary gas: nitrogencoupled with a syringe pump (HARVARD Apparatus); andEsquire-LC, Bruker Daltonik, capillary voltage ± 3.8 kV, dry gas (nitrogen) temperature300 °C, direct inlet via syringe pump (Cole-Parmer), flow rate 2 µl / min., solvent: methanol /DMSO (100:1).
Comment:A priori, ESI-MS is the most soft ionisation technique in mass spectrometry, whichpredominantly yields quasimolecular cations or anions, depending on polarity of the ESImode. However, to some extent fragmentation is inducible and is evidenced in some describedspectra (App. II.3). Normally, both polarities were measured although in most cases only the

94 C.III Identification of flavonoids and simple phenolics in the leaves of R. copallina and A. julibrissin
negative mode contained valuable information, which is in accordance with the findings ofGioacchini et al. (1996) on phenolic compounds.
EI-MSAMD 402 (AMD Intectra GmbH), ionisation energy 70 eV (direct inlet system); sourcetemperature 225 °C; andFinnigan MAT 8200, ionisation energy 70 eV (direct inlet system); source temperature200 °C.
Comment:All isolated fractions gained from R. copallina and A. julibrissin leaves were measured withEI-MS, whether a glycoside or an aglycone was isolated. In case of flavonoid glycosides, theaglyca were released thermally under EI-conditions and were hence detected as such. So,electron impact spectra normally show only the corresponding aglycone. Masses of fragments,which occurred in the EI spectrum but could not be assigned to any reasonable fragment, werelisted in App. II.3 without interpretation.
FAB-MSFinnigan MAT 8200; collision gas: xenon; 8 keV; matrix: glycerol.
DCI-MSFinnigan MAT 8200; reactant gas: NH3; heating rate 8 mA/s; source temperature 200 °C.
HR-MSFinnigan MAT 8200 MS using electron impact ionisation; resolution 10 000 (10 %-valley-definition).
Detailed data of mass spectrometric experiments are presented in App. II.3.
GC-MSGC-MS analyses were performed on hydrolysed plant extracts after methanolysis (Jerga,1989; see C.IV.2.3).
25 µl of each hydrolysed sample were solved in 100 µl methanol. One third was taken,brought to dryness and 50 µl MSTFA were added. The mixture was heated approximately onehour up to 80 °C and injected into the GC apparatus.
GC-conditions: DB1-30 W, 100 kPa helium, injector 250 °C, oven 150-320 °C, 10 °C perminute, detector FID 320 °C.
EI-MS: Finnigan 4500, ionisation energy 70 eV, source temperature200 °C.
NMR-spectroscopy
Nearly all NMR spectra were measured on a Bruker AM-400 or a DRX-400 spectrometer:frequency for 1H: 400.1 MHz; frequency for 13C: 100.6 MHz. Some additional spectra weremeasured on a Bruker AM 360 (frequency for 1H: 360 MHz; for 13C: 90 MHz). For onesample the 13C-spectrum was measured at 150 MHz.Solvent and chemical shift reference: DMSO-d6, delta (H) = 2.50; delta (C) = 39.50.
Chemical shifts are given in ppm, coupling constants (J-values) in Hertz (Hz). Generally,DMSO-d6 was used as solvent; if other solvents were used such as methanol-d4 or D2O, this isindicated in App. II.3.
Parameters for 1H NMR-spectroscopynumber of scans 24spectral width 8064.5 Hznumber of data points 32 K

C.III Identification of flavonoids and simple phenolics in the leaves of R. copallina and A. julibrissin 95
Parameters for 13C NMR-spectroscopynumber of scans 200 to several thousandspectral width 25000 Hznumber of data points 64 KAll 13C spectra were measured with proton decoupling.
DEPTIn edited spectra, CH3- and CH- groups result in a positive peak, while CH2- groups yield anegative peak. Quaternary carbons are not visible.
If a 13C spectrum was measured, always a DEPT experiment was performed to aid in theassignment.
2.6 Chemicals and reference compounds
Reference compounds used for qualitative TLC and HPLC analyses(from the stock of the “Institut für Pharmazeutische Biologie”, Braunschweig)caffeic acid galactose hamamelitannin saponin (Merck)chinidin sulphate galacturonic acid hyperoside xylosechlorogenic acid glucose pyrogallolcoffein glucuronic acid rhamnoseellagic acid glycyrrhetinic acid rutin
Reference substances used for TLC analyses and as standards for qualitative andquantitative HPLC analysesMyricetin (Fluka)[529-44-2]
Cannabiscetin; 3,3’,4’,5,5’,7-HexahydroxyflavonePurity: ∼ 97 % (HPLC)
Quercetin (Merck)[6151-25-3]
3,3’,4’,5,7-Pentahydroxyflavone-2-(3’,4-dihydroxyphenyl)-3,5,7-trihydroxy-4H-1-benzopyran-4-onePurity: ≥ 98 % (HPLC)
Kaempferol (Fluka)[520-18-3]
Robigenin; 3,4’,5,7-TetrahydroxyflavonePurity: ≥ 96 % (HPLC); H2O ≤ 5 %
Quercitrin (Roth)[522-12-3]
Quercetin-3-L-rhamnoside; 3,3’,4’, 5,7-Pentahydroxyflavone-3-L-rhamnopyranosidePurity according to the statement of the company: ≥ 98 % (HPLC)
Gallic acid (Roth)[149-91-7]
Gallic acid monohydrate; 3,4,5-Trihydroxybenzoic acid hydratePurity: ≥ 98 % (HPLC)
Tannic acid1 (Fluka)[72401-53-7]
Gallotannin, Tannin (DAB), Tanninum (Ph.Helv.)synonym: Acidum tannicum
1
Tanninum (Ph.Helv.), tannin (ÖAB), tannic acid (USP), Acidum tannicum (lat.).According to USP “tannic acid is a tannin usually obtained from nutgalls, the excrescences produced on theyoung twigs of Quercus infectoria Oliver, and allied species of Quercus Linné (Fam. Fagaceae), from the seedpods of Tara (Caesalpinia spinosa), or from the nutgalls or leaves of sumac (any of a genus Rhus).”According to European Pharmacopoea (ÖAB, Ph.Helv.) tannin, a yellowish-white to light brownish powder, isextracted from nutgalls, Gallae (Galla ÖAB). (Gallae are excrescences which are induced by insects.) VariousRhus species are the source of Chinese Gallae, e.g. Rhus sinensis, while Turkish Gallae originate from Quercus
infectoria (Rimpler, 1999).According to Doorenbos and Box (1976) commercial gallotannins are obtained from the leaves of Rhus
coriaria (native to Spain and Sicily), and from leaf galls of Rhus semialata growing in China and Korea.During the search for sources of tannins for industrial purposes originating from the USA analyses wereextended to Rhus glabra and Rhus copallina, which both were shown to contain gallotannins of USP quality

96 C.III Identification of flavonoids and simple phenolics in the leaves of R. copallina and A. julibrissin
Following reference compounds were generously supplied
1,2,3,6-tetragalloylglucose,1,2,3,4,6-pentagalloylglucose
Prof. Dr. G. G. Gross, University of Ulm, Germany
julibroside III (Fig. II.1, p. 233)syringaresinol diglucoside(= liriodendrin) (Fig. II.2, p.234)
Prof. Dr. J. Kinjo, faculty of Pharmaceutical sciences,Kumamoto University, Japan
tannin albuminate1 Knoll Deutschland GmbH, BASF Pharma, Germany,(now Dr. Rentschler Arzneimittel GmbH)
Plantaginis ovatae testa(Ispaghula husk, DAC 1986)
Dr. Falk Pharma GmbH, Germany
SolventsFor TLC analyses, solvents like methanol, ethylacetate and dichlormethane were distilledbefore use. Solvents used for preparative isolations or quantitative determinations were of p.a.or HPLC grade.
3 Results and discussion
3.1 Preliminary assays
Thin layer chromatography was an extensively used method to get first information on theclasses of chemical compounds and in a second step, on individual compounds occurring inthe leaves. Different solvent systems combined with varying spray reagents allowed for aneffective and fast screening of a large number of compounds. HPLC runs with photo diodearray detection of UV spectra between 210 and 450 nm supported and verified firstinvestigations (C.IV.2.1). The effectiveness and simple handling of thin-layer chromatographyshall encourage field workers to use this method to screen food plants and non food plants fortheir secondary plant compounds.
In this study, the role of saponins will be illuminated first. As triterpenoid saponin glycosidesbuild the characteristic compounds of the bark of A. julibrissin (App. II.2), they couldprincipally be expected to occur in the leaves. Methanol extracts of A. julibrissin leaves gaveno hint of saponins (TLC-systems 5, 9 and 11 combined with spray reagents likeanisaldehyde / H2SO4 and vanillin / H2SO4; reference compounds: standard saponin(saponinum album) and glycyrrhetinic acid).The foam test (Steinegger and Hensel, 1988; Stöger et al., 2001) was performed on all sixspecies harvested in the spring (see Tab. C.1, p. 57), but results remained ambiguous.
Julibroside III (for structure see Fig. II.1, p. 233), which had been isolated from the stem barkof A. julibrissin (Ikeda et al., 1995a), was used as a reference compound for analytical HPLCruns. Although julibroside III should occur in the leaves (Kinjo, pers. comm.), it remaineddifficult to detect this substance by HPLC analyses in A. julibrissin leaves. If at all, only trace
(Doorenbos, 1976; Doorenbos and Box, 1976).Tannin is a mixture of isomeric and homologous gallotannins with penta- to nonagalloylglucoses as maincomponents. Chinese tannins derive from 1,2,3,4,6-penta-O-galloyl-ß-D-glucose. In contrast, Turkish tanninsderive from two basic structures, the tetra-O-galloyl- and penta-O-galloyl-ß-D-glucose, and containhexahydroxydiphenic acid in addition (Rimpler, 1999; Wagner, 1999).
1 The remedy Tannalbin® for the treatment of diarrhoea consists of an 1:1 tannin : protein complex (= Albuminitannas, tannin albuminate).

C.III Identification of flavonoids and simple phenolics in the leaves of R. copallina and A. julibrissin 97
amounts could be detected. As saponins do apparently not constitute the major class ofcompounds in the leaves of A. julibrissin, no further attempts were undertaken for theirdetermination.
Syringaresinol diglucoside (also called liriodendrin; for structure see Fig. II.2, p. 234), isanother important substance known to occur in the bark and was used as a referencecompound. It could not be detected in A. julibrissin leaves by HPLC analyses in this study.
Thin layer chromatography was used as means to search for alkaloids in R. copallina and A.
julibrissin leaves (TLC-system 8, Dragendorff spray reagent, iodine vapour), but no alkaloidscould be detected.
Most coumarins yield fluorescing spots on TLC plates. As no fluorescing spots could bediscerned, a large number of coumarins were excluded and were not presumed to occur in R.
copallina or A. julibrissin leaves.
Searching for flavonoid glycosides in the food plants was a promising and successfulapproach to get determinant compounds (TLC-systems 1, 2, 3, 4, 12, 13; staining reagents:diphenylboryloxyethylamine reagent; thymol / H2SO4; and especially anisaldehyde / H2SO4).Quercitrin and hyperoside have already been described to occur as flavonol glycosides withinA. julibrissin, but the plant organ of their occurrence was not specified (Kaneta et al., 1980;App. II.2). Furthermore, 3’, 4’, 7-trihydroxyflavone has been shown to occur in the stem bark,while cyanidin-3-monoglucoside was revealed to occur in the flower of A. julibrissin
(App. II.2). Screening on TLC plates and later verification by HPLC analysis revealed thatquercitrin occurred in many of the food plants and constituted the main flavonol glycoside inA. julibrissin leaves. R. pseudoacacia leaves (system 1, anisaldehyde / H2SO4) showed themost deviant pattern of flavonoids on TLC plates of all food plants tested.
Screening for free occurring aglyca such as quercetin, myricetin and kaempferol (TLC-systems 1, 2, 3, 6 and 12; spray reagents like for glycosides) remained negative. Therefore, theA. julibrissin leaves gathered in May were hydrolysed (Jerga, 1989) and subsequentlyanalysed by GC-MS. Quercetin, myricetin and kaempferol were found as aglyca withmyricetin detected, if at all, in only tiny amounts1 (details see chapter IV). Hence, these threeaglyca were used as reference compounds for further quantification assays of flavonol aglycaafter hydrolysis. Furthermore, the flavone acacetin was detected in R. pseudoacacia leaves byGC-MS analyses.
Separations based on different pH (e.g. Stas-Otto separation, Pharmacopoeia-DDR) andsolvent polarity (sequential solvent extraction with solvents of varying polarity, andpartitioning between water and an organic phase like n-butanol, dichlormethane etc.) did notgive any hint to expect any highly lipophilic compounds like essential oils in R. copallina orA. julibrissin leaves (TLC-system 3, 6, 10, 12, 13 combined with various spray reagents,especially anisaldehyde/ H2SO4). During this screening, 80 % (v/v) methanol exhibited bestextracting properties for R. copallina and A. julibrissin leaves, which was thereafter used forall further qualitative and quantitative analyses.
Several assays were performed to characterise the group of tannins that occurred in the foodplants with special respect to R. copallina leaves. For various TLC and subsequent HPLCanalyses commercial tannin (Acidum tannicum, tannic acid), gallic acid, ellagic acid,tetragalloylglucose and pentagalloylglucose were used as reference compounds. On TLCplates the fraction of gallotannins could be detected with ferric chloride reagent yielding grey-blue colours.
1 It has to be noted that the appearance of aglyca in the GC chromatogram (kaempferol, quercetin, myricetin) isreverse compared with the HPLC chromatogram (myricetin, quercetin, kaempferol).

98 C.III Identification of flavonoids and simple phenolics in the leaves of R. copallina and A. julibrissin
The test to discern hydrolysable from condensed tannins remained in part ambiguous. Exceptfor A. julibrissin leaves all plant samples (R. copallina, R. pseudoacacia, L. styraciflua, C.
canadensis, A. rubrum) including commercial tannic acid produced a red to reddish brownprecipitation after treating the aqueous extracts with mineral acid and formaldehyde, althoughthis should only occur in case of condensed tannins (Steinegger and Hänsel, 1988; Rimpler,1999; Wagner, 1999). Testing the filtrated solution for tannins with alcoholic ferric chloridereagent produced a range of mixed colours, which was presumably due to the rich occurrenceof flavonoids, as has been shown on TLC plates (TLC-system 1). Best results were gainedafter separation of the filtrates, and enhanced results utilised hot water extracts, on TLC platesand detection with ferric chloride reagent. Only R. copallina and A. rubrum leaf extractsyielded unambiguously positive results indicating the presence hydrolysable tannins.However, during this assay, a rich occurrence of plant mucilage was discovered in A.
julibrissin leaves, which has not been described before. As it was impossible to filter the hotwater extract of the leaves1 without disturbing this assay, this test method had to be modified(C.III.2.3). At this point it is interesting to recall that the same difficulties in filtering aqueousextracts containing mucilage were already described by Bate-Smith (1977).
It can be summarised that by preliminary assays flavonoids and tannins were shown to be themain groups that occurred in R. copallina leaves, while flavonoids and the plant mucilagewere shown to be the major compounds in A. julibrissin leaves. The ubiquitous groups oftannins and flavonoids (including their major aglyca) were also shown to occur in a limitedextent in the four other food plants offered as browse.
3.2 Separation and fractionation
Separation, purification and identification of the major groups of chemical compounds wereonly performed on the most preferred food plants of captive Coquerel’s sifakas, A. julibrissin
and R. copallina. The subsequent study was then dedicated to the investigation of tannins andflavonoid glycosides within both species (Harborne, 1989; Harborne, 1999; Wollenweber1994; Williams and Harborne, 1994). Hence, it was decided to separate crude plant extracts ofeither plant first, by means of a polyamide column (Markham, 1975; Fig. C.4 and Fig. C.5)and to perform additional steps of fractionation and separation on a reversed phase HPLCcolumn until nearly pure individual plant compounds could be isolated (Tab. C.8; App. II.3).Subsequent structure elucidation should be achieved by information gained from their UVspectra, methods of mass spectrometry and NMR technique. The preparative isolation ofindividual plant compounds with subsequent elucidation of their chemical structure wasnecessary to learn more about the chemical leaf composition, the basis for subsequentquantitative determinations.
Based on the pre-trials it was decided to use leaves of A. julibrissin which had been harvestedin May, and those of R. copallina which had been cut in July. While a total of 24 HPLCfractions were isolated for A. julibrissin (Fig. C.4), 23 HPLC fractions were isolated for R.
copallina (Fig. C.5).
1 The hot water extract of the leaves was a green, adhesive and mucilaginous dispersion producing threads of 1-2cm length.

C.III Identification of flavonoids and simple phenolics in the leaves of R. copallina and A. julibrissin 99
5%10%
30%
50%60%
70%
100%
23-24
21-22
16-17
18-20
15
aqueous
methanol
EtOAc
MeOH
H2O
100%
methanolic
ethylacetate
0.1% meth. NH3
Eluent
Fraction
19-20
18-
19
16-
17
17
23 23-24
A1 A2toA7
A8to
A17
A18to
A21
A22to
A24
HPLCFraction
Fig. C.4: Review of separation of a crude A. julibrissin leaf extract (leaves harvested inMay) by means of a polyamide column (“Fraction”) and subsequent reversedphase HPLC column (“HPLC Fraction”). Fractions not depicted in the schemewere not further separated and discarded.
Polyamide columns exhibit a high capacity for phenolic plant compounds and have beenwidely used to isolate various natural products like flavonoids (Markham, 1975; Hasan et al.,1996; El-Mousallamy, 1998) or hydroxycinnamic acids (Ibrahim and Barron, 1989). In case offlavonoids, all types are separated satisfactorily by polyamide columns (Markham, 1975).
The elution of phenolics from polyamide columns depends either on the ability of the solventto replace the phenol on the hydrogen bonding site by using hydrophilic solvents, or on theability of the solvent to form even stronger bonds with the phenol than does the polyamide(e.g. urea) (Markham, 1975). However, pre-trials on eluents best suitable for separations onpolyamide columns revealed that according to the eluotropic series, starting from the polarhydrophilic end with water and increasing levels of methanol in water, turned out to be morefavourable than starting from the less polar end with ethylacetate and ethylacetate-methanolmixtures. Especially the large diversity of flavonoid glycosides occurring in A. julibrissin
leaves were stepwise and more satisfactorily separated by water and water-methanol mixturesthan by starting with less polar eluents.

100 C.III Identification of flavonoids and simple phenolics in the leaves of R. copallina and A. julibrissin
30%
60%
100%
129-11
3-4 5-8
2
aqueous
methanol
MeOH
H2O
0.1% meth. NH3
Eluent
Fraction
13-19
18-19
13-
18 9-
11
11
R3to
R12
R13to
R19
R20to
R21
R22 R23R1toR2
HPLCFraction
Fig. C.5: Review of separation of a crude R. copallina leaf extract (leaves harvested in July)by means of a polyamide column (“Fraction”) and subsequent reversed phaseHPLC column (“HPLC Fraction”). Fractions not depicted in the scheme were notfurther separated and discarded.
3.3 Structure identification
Elucidation of individual compounds gained by the preceding procedure revealed that mostfractions of A. julibrissin contained flavonoids, while in R. copallina leaves flavonoids andmonomers to dimers of hydrolysable tannins could be identified. (Higher molecular weightcompounds as pentagalloylglucose could only be identified in unhydrolysed plant extracts byanalytical HPLC (coinjection with the respective compound) or LC-MS; for details seechapter IV). In part, the same compounds were found to occur in both plants (Tab. C.8).Chemical structures were elucidated by their UV spectra, by mass spectrometry and NMRspectroscopy. In fractions containing several compounds, or if no NMR spectrum could beobtained due to too low amounts isolated, mass spectrometry was used to determine themolecular weight and to assess the chemical structure (details see App. II.3).
A review on the assignment of A. julibrissin and R. copallina leaf compounds to theirrespective HPLC chromatograms is given in Fig. C.8 and Fig. C.9.
UV SpectraUV spectra were measured by means of a photo diode array that was linked to the analyticHPLC system (C.IV.2.1). Wavelengths between 200 nm and 600 nm were detected. As for allruns on the analytical HPLC column (reversed phase) the same gradient of aqueousphosphoric acid and acetonitril was used, the UV spectra obtained deviate in part from thoseof literature references in which methanol is normally used. As flavones and flavonols werethe most common flavonoids found in the plants investigated, some characteristics of theirUV spectra will be discussed.

C.III Identification of flavonoids and simple phenolics in the leaves of R. copallina and A. julibrissin 101
The methanol spectra of flavones and flavonols generally exhibit two major absorption peaksin the region 240-400 nm. These two peaks are commonly referred to as band I (usually 300-380 nm) and band II (usually 240-280 nm) (Mabry et al., 1970). While band I is mainlyassociated with the cinnamoyl system of the B-ring, band II is predominantly caused by thebenzoyl system of the A-ring with different participation of the pyrone grouping of ring C(Fig. C.6), (Jurd, 1962; Mabry et al., 1970; Markham and Mabry, 1975).
OR
O2
34
5
6
7
89
10
1'
2'
3'
4'
5'
6'
1
A
B
C
benzoylsystem
cinnamoylsystem
flavones
flavonols
3-hydoxyl substitutedflavonols
R = H
R = OH
R = O-glycoside
band I
304 – 350 nm
352 – 385 nm
328 – 357 nm
band II band I240 – 285 nm 300 – 400 nm
Fig. C.6: Range of bands I and II of flavones and flavonols in UV spectroscopy(methanol as solvent).
Increasing oxygenation of the B-ring in flavones and flavonols, like the stepwise introductionof hydroxyl groups, produces an increasing bathochromic shift in band I with each additionaloxygen function. Likewise, increasing oxygenation of the A-ring in flavones and flavonolsproduces a notable bathochromic shift in band II, and a smaller effect on band I. Hence, asdepicted in Fig. C.6, band I absorption and especially its position provides information aboutthe type of flavonoid and its oxygenation pattern (Jurd, 1962; Mabry et al., 1970; Markhamand Mabry, 1975).
Although changes in the B-ring oxygenation pattern usually do not produce a shift in band II,band II may appear as either one or two peaks depending on B-ring oxidation pattern (Mabryet al., 1970). So, band II of flavones and flavonols, which contain only 4’-substituent in the B-ring (e.g. kaempferol), has a single well-defined peak. For flavones and flavonols which havehydroxyl or methoxyl substituents in both the 3’- and 4’-positions (e.g. quercetin), band IIshows two definite peaks or one peak and a pronounced inflection (Jurd, 1962; Mabry et al.,1970). On the other hand, presence or absence of the hydroxyl group at 5 position of flavonesor flavonols has a marked effect on both band I and II in the UV spectra (Mabry et al., 1970).
Methylation or glycosylation of a 3-, 5- or 4’-hydroxyl group of the flavone / flavonol nucleusresults in hypsochromic shifts, especially in band I (Fig. C.6). Substitution of the hydroxylgroups at positions other than 3, 5 and 4’ has little or no effect on the UV spectrum (measuredin methanol) (Mabry et al., 1970).
Mass spectrometryRegular fragmentation patterns in the EI mode of flavonoids, especially flavone and flavonolaglyca, are depicted in Fig. C.7 according to Mabry and Markham (1975). A common andcharacteristic fragmentation is the retro-Diels-Alder reaction (RDA) (Mabry and Markham,1975; Grayer, 1989; Claeys et al., 1996). Fig. C.7 shows diagnostic fragments which occurduring the RDA reaction as well as during the alternative pathway. Corresponding masses of

102 C.III Identification of flavonoids and simple phenolics in the leaves of R. copallina and A. julibrissin
flavone and flavonol aglyca including important fragments are given in Tab. C.7. The schemedepicted in Fig. C.7 combined with the respective masses given in Tab. C.7 was very effectiveand helpful in evaluating the fragments found in the EI spectra of the numerous fractions andcompounds investigated (see App. II.3).
HO
OH
O
O
R3
R1
OH
R2
+•
R1
OH
R2
R3
OHO
OH
CO
OHO
OH
COH
[A1 - CO]+•
C6H4O3 m/z 124
- COH• transfer
[A1 - CO - H]+
C6H3O3 m/z 123
-H•
[A1]+•
C7H4O4 m/z 152
[M]+•
alternatively:
OH
R1
R2
C
[B2]+
- CO
[B2 - CO]+
[A1 + H]+
C7H5O4 m/z 153
- CO
[M - CO]+•
- OH•
[M - OH]+[M - H]+
- H•
[B1]+•
+• +•
+
pathway II
pathway I: RDA
O+
Fig. C.7: Fragmentation of flavones and / or flavonols under EI conditions.Only diagnostic fragments of retro-Diels-Alder reaction (RDA) and the alternativepathway are depicted.

C.III Identification of flavonoids and simple phenolics in the leaves of R. copallina and A. julibrissin 103
Tab. C.7: Masses of fragments obtained by the EI experiment according to Fig. C.7.
m/zsubstance R1 R2 R3 [M]+•••• [B1]
+•••• [B2]+ [B2-CO]+
flavonolsmyricetin OH OH OH 318
C15H10O8
166C8H6O4
153C7H5O4
125C6H5O3
quercetin OH H OH 302C15H10O7
150C8H6O3
137C7H5O3
109C6H5O2
kaempferol H H OH 286C15H10O6
134C8H6O2
121C7H5O2
93C6H5O
flavonesluteolin OH H H 286
C15H10O6
134C8H6O2
137C7H5O3
109C6H5O2
apigenin H H H 270C15H10O5
118C8H6O
121C7H5O2
93C6H5O
Essentially, the molecular ions of the investigated glycosides cannot be detected by EI-MSbecause of their high polarity. However, at increasing sample temperature they aredecomposed releasing their aglyca. Thus EI-MS was used to get structural information on theaglycone of a respective glycoside. This was also true for the analyses of mixtures.
ESI-MS was employed for the identification of glycosides. However, the mass spectraobtained with this ionisation technique showed no fragments and consequently no structure-specific information. In this case collision induced dissociation (CID) and tandem massspectrometry (MS/MS) were used for structural analyses.
The structure and elemental composition of the investigated compounds is predominantlybased on the information obtained by mass spectrometric experiments. High resolutionspectrometry was only performed with maesopsin-glucoside (see App. II.3, No.11).
In fraction R18 an acylated dihydrokaempferol glycoside (M1) was diagnosed, whichrearranged to apigenin under experimental conditions. For the proposed mechanism seeFig. II.7, p. 295.
A recent review on current analysis of flavonoids by means of mass spectrometric methodshas been published by Cuyckens and Clays (2004).
NMR spectroscopyTo elucidate unambiguously the chemical structure of individual compounds, in particulartwo-dimensional experiments were utilised. Since p- and m-digallic acid methyl ester, andmaesopsin-4-O-ß-D-glucopyranoside are rarely occurring compounds, HMBC experimentsgave the decisive hint to structure elucidation (see also notes on maesopsin-glucoside).
Quercetin (App. II.3, No.13) turned out to be a very important and abundant flavonol aglyconein both leaf species, R. copallina and A. julibrissin, and it was investigated by HMBC andHSQC experiments. Therefore, the hydroxyl groups of quercetin could unambigously beassigned to shift values in the 1H spectrum, and C2’ and C5’ to shift values in the 13Cspectrum for the first time. Quercitrin (App. II.3, No.15), the main flavonoid of A. julibrissin
leaves, was also worthy of additional studies in two-dimensional experiments. It was also usedas reference compound for further quercetin-3-O-glycosides including the novel compound.Hence, an unequivocal assignment of all carbon atoms in the 13C spectrum as well as theassignment of all sugar hydroxyl protons in the 1H spectrum could be achieved for quercitrinwhich has not been reported previously.

104 C.III Identification of flavonoids and simple phenolics in the leaves of R. copallina and A. julibrissin
The novel compound A5 (App. II.3, No.17) was elucidated by means of several homonuclearand heteronuclear two-dimensional experiments and discussed in comparison to similar andknown compounds. While details to all investigated compounds are presented in App. II.3,some important notes with special respect to NMR analyses are given in the following.
Notes on the isomers p- and m-digallic acid methyl ester (R16)R16, the m- and p-isomer of digallic acid methyl ester (App. II.3, No.2), produced one peakon TLC plates, but two peaks on reversed phase HPLC. These two peaks could not be furtherseparated by means of preparative reversed phase HPLC technique.
Exhibiting the same molecular weight, both compounds could only be identified by NMRtechniques, unambigously by two-dimensional NMR spectroscopy, as p- and m-dimericcompounds consisting of a gallic acid and gallic acid methyl ester moiety, respectively. Underanalytical HPLC conditions (270 nm detection wavelength) two peaks could be observed witha ratio of peak areas between 1:2 and 1:3. Based on the statistical expectation that the peak ofboth possible m-isomers is believed to be twice as high as the corresponding p- isomer, withthe larger peak was assigned to the m-isomer and the smaller peak to the p-isomer. Thisagrees well with Verzele et al. (1983), who reported that the m-isomer constituted the mainpeak.
The 1H- and 13C-NMR spectra of both isomers in DMSO showed a ratio of 1:1. This findingseems to be in accordance with reports of Verzele et al. (1983) about digallic acid and ofNishizawa et al. (1982) about methyl digallate, showing a solvent dependent equilibrium,respectively. According to Verzele et al. (1983), protonating media produce two peaks onHPLC, aprotic solvents only one peak.
Whereas digallic acid was reported to be isolated after partial hydrolysis of Chinesegallotannin (from Rhus semialata) (Verzele et al., 1983) and methyl digallate after partialmethanolysis of commercial tannic acid or by synthesis (Nishizawa et al., 1982), bothisomeric forms of digallic acid methyl ester could be isolated from R. copallina leaves withoutany further analytical steps. It can be assumed that both isomeric forms occurred genuinely inthe leaves of R. copallina. It could not be detected in tannic acid purchased from Fluka,neither by HPLC, nor by NMR-analysis.Besides, the declared molecular weight for tannic acid purchased from Fluka (1701g / mol) isdifferent from that given for Chinese gallotannin and from that given for Turkish gallotannin.Chinese gallotannin (from Rhus semialata) was an average molecular weight of 1434 whencalculated (Nishizawa et al., 1982), while Turkish gallotannin (from Quercus infectoria) had acalculated molecular weight of 1032 (Nishizawa et al., 1983).
Notes on the maesopsin-4-O-ß-D-glucopyranoside (R2)Maesopsin and its chemically related glycosides belong to the group of aurones, in sensu
stricto to the group of auronols, which both belong to a minor group of flavonoids. In thechemical sense, auronols could be considered as hydrated aurones. While aurones possess a 2-benzylidenecoumaranone structure, auronols are 2-hydroxy-2-benzylcoumaranones (Bohm,1994). Sulfuretin, that is 6,3’,4’-trihydroxyaurone, has already been described to occur in thewood of the genus Rhus (Bohm, 1975). In this study, the auronol maesopsin-4-O-ß-D-glucopyranoside has been detected for the first time in the leaves of R. copallina.
On TLC plates maesopsin-glucopyranoside became visible as a bright red-orange spot withanisaldehyde / H2SO4. As shown on TLC plates, it was not quantitatively removed from theplant extract by casein and there was nearly no precipitation with lead acetate. According toHPLC analyses, trace amounts occurred in the leaves collected in May, with large amounts inthe July leaves and lower, but substantial amounts in the leaves of October.

C.III Identification of flavonoids and simple phenolics in the leaves of R. copallina and A. julibrissin 105
NMR experiments yielded conclusive data in elucidating its structure. Maesopsin-4-glucosideexists as two diastereoisomers which is due to the attachment of a glucosyl moiety to theaglycone, which itself appears as pair of enantioisomers because of the hemiketal at C2, thechiral centre of the maesopsin aglycone (for structure, numbering and analytical data seeApp. II.3, No.11). Therefore, a double set of signals is obtained in the 1H- and 13C-NMRspectra (for a discussion see Yoshikawa et al. (1998b) and Günther (1992)). In this study,58 % and 42 % were found for both diastereoisomers, respectively. As far as signals havebeen resolved, both sets of data are depicted in the respective tables of the 1H-NMR and 13C-NMR experiment (App. II.3). Assignments in the 1H-spectrum are based on 1H and 1H,1H-COSY experiments. Among various two-dimensional experiments conducted, especially theHMBC experiment (App. II.3) gave the decisive hint to the position of the glucoside beingattached to the aglycone.
Notes on the quercetin-3-O-αααα-L-rhamnopyranosyl(1→→→→2)ß-D-xylopyranoside,the novel compound (A5)To elucidate the structure of the novel compound A5 (App. II.3, No.17), several two-dimensional experiments were carried out, such as the homonuclear 1H,1H-COSY, and theheteronuclear HSQC and HMBC correlations.
Coupling constants of the anomeric protons J(C1-H/C2-H) of the sugar moieties as well astheir shift values, give useful information on their mode of attachment to further sugarmoieties as well as to the site (and kind) of the flavonoid aglycone. Values found in this studywill be put into context with shift rules, general observations on primary and terminal sugarmoieties and the attachment to the aglycone (De Bruyn et al., 1979, Altona and Haasnoot,1980; Markham and Geiger, 1994).
With respect to the question of α- or ß-linkage of the sugar moieties, it has been found that thecoupling constant for J(C1-H/C2-H) for e.g. ß-D-glucose, galactose and xylose is about 7-8Hz, while the α-D-configurations show 3-4 Hz (Markham and Geiger, 1994). Altona andHaasnoot (1980) reported 7.9 Hz for the anomeric proton of the ß-D-xylose and 3.3 Hz for theα-anomer. The anomeric proton of the xylose moiety of compound A5 couples with 7.4 Hz,which agrees well with the reported ß-configuration.
On the contrary, for ß-L-rhamnose moieties a coupling constant J(C1-H/C2-H) of 1.1 Hz wasdescribed, while for the α-linked rhamnose 1.8 Hz were given (Altona and Haasnoot, 1980).The 1H-spectrum of compound A5 showed 1.54 Hz, which speaks more for the α-linkedrhamnose than for the ß-anomer. Thus, the α-linkage is proposed for the rhamnose moiety incompound A5.
Chemical shift data relating to the glycosidic H-1 signal can also be of diagnostic value. TheH-1 signal of a sugar attached to another sugar (referred to as “terminal”) can usually bedistinguished from that of a sugar directly attached to a flavonoid (i.e. “primary”) in that itnormally resonates upfield relative to the latter (Markham and Geiger, 1994). Exceptions areC-glycosides (C-glycosides commonly exhibit higher-field anomeric proton signals than do O-glycosides), or when the terminal sugar is apiofuranoside. Moreover, 3- and 7-O-glycosides offlavonoids, other than anthocyanidins, involving the same sugars can generally bedistinguished: e.g. sugar anomeric protons of 3-O-glucosides resonate at 5.35-5.56 ppm, whileanomeric protons of 3-O-rhamnosides resonate at 4.96-5.36 ppm. Furthermore, regardingterminal rhamnosyl moieties, the rhamnosyl-(1→6)-glucosides and -galactosides can bedistinguished from the respective rhamnosyl-(1→2) linked residues by the chemical shift ofthe anomeric rhamnose proton (H-1), in that the latter resonate downfield. The presence ofglycosylation or acylation on the C-2 hydroxyl of a primary sugar in both O- and C-glycosides

106 C.III Identification of flavonoids and simple phenolics in the leaves of R. copallina and A. julibrissin
is generally evidenced by a 0.1-0.4 ppm downfield shift in the H-1 signal of the primary sugar(Markham and Geiger, 1994).
Hence, the terminal rhamnosyl residue of compound A5 with C1-H resonating at 5.08 ppmagrees well with the shift range of 4.90-5.10 ppm reported for the anomeric proton of 2-O-α-L-rhamnosyl residues in DMSO-d6 (Markham and Geiger, 1994). In contrast, terminal 6-O-α-L-rhamnosyl residues resonate at 4.37-4.39 ppm. It has to be further noted, that the C-methylsignal in rhamnoses varies with the site of glycosylation. In 3-O-α-L-rhamnosides the methylsignal appears in the range of 0.72-0.86 ppm, while in terminally bound rhamnoses the methylsignal occurs in the 0.90-0.93 ppm range. The latter range agrees with the 0.88 ppm found forthe C6-H3 signal of the terminal rhamnosyl residue of compound A5. Finally, the reportedshift value of 5.37 ppm for the anomeric proton of the 3-O-ß-D-xyloside (as primary sugar)plus the downfield shift mentioned for glycosylation at the C-2 hydroxyl group (0.1-0.4 ppm)agrees with the 5.51 ppm experimentally found for the primary xylose moiety in compoundA5. This in turn is in accordance with the resonance given for sugar anomeric protons of 3-O-glucosides: 5.35-5.56 ppm. Hence, from coupling constants and shift values found for theanomeric saccharide protons the presence of a 3-O-α-L-rhamnopyranosyl(1→2)ß-D-xylopyranoside disaccharide moiety can be deduced.
As to the aglycone, according to Markham and Geiger (1994), the A-ring protons in flavonesare little influenced by the substitution pattern of the B-ring. With the usual phloroglucinol-type A-ring the substitution of H-3 in flavonols by OH has by itself almost no effect upon thesignals of H-6 and H-8, provided the B-ring is unsubstituted at C2’ and C6’ position. Thus,with the common 5,7-dihydroxy substitution, the shift ranges are 6.16-6.25 ppm for H-6 and6.39-6.56 ppm for H-8 in flavones and flavonols. Glycosylation of the 3-OH in flavonols withmonosaccharides other than rhamnose has little influence on the B-ring resonances. Arhamnose directly linked to the 3-position either as the sole sugar or as part of aglycosidorhamnose invariably causes an upfield shift of the C2’-H and C6’-H signals by about0.2-0.25 ppm.
Hence, comparison of C6-H and C8-H shift values of the unsubstituted quercetin aglycone(App. II.3, No.13) agree well with the aglycone of compound A5, as these protons remainlargely unaffected by the saccharide moieties attached to C3-OH of the flavonol skeleton.Most affected by glycosylation of C3-OH in compound A5 is the C2’-H, while the other B-ring protons experience only little shift changes compared to sole quercetin. So, from 1H-NMR data of A5, this compound is concluded to be quercetin-3-O-α-L-rhamnopyranosyl(1→2)ß-D-xylopyranoside. (For further shift values of the unsubstituted andglycosylated quercetin see App. II.3: quercitrin (No.15), hyperoside (No.14), and quercetin-3-O-α-L-rhamnopyranosyl(1→2)ß-D-galactopyranoside (No.16)).
The assignment of the carbon atoms of the novel compound was obtained by comparison withcompounds containing similar sugar residues without further two-dimensional experiments(for details see App. II.3).
3.4 Compounds identified
Tab. C.8 represents all compounds which could either be conclusively elucidated, or for whichconstituents are proposed by means of UV spectroscopy and mass spectrometry. From the 24fractions isolated from A. julibrissin leaves and the 23 fractions isolated from R. copallina
leaves, 18 compounds could be conclusively and unambiguously elucidated by means of UVspectroscopy associated with HPLC analyses, mass spectrometry and NMR techniqueincluding various two-dimensional experiments. For the other 21 compounds, the chemical

C.III Identification of flavonoids and simple phenolics in the leaves of R. copallina and A. julibrissin 107
formula and the molecular weight could be calculated by means of various mass spectrometricexperiments and their chemical constituents were proposed (Tab. C.8). For most additionalcompounds contained within the same fractions isolated (minor compounds, impurities)molecular weights could also be determined (not depicted in Tab. C.8). A detailed descriptionof all compounds including their impurities and additionally details on these compounds thatwere only characterised by their UV spectra is shown in App. II.3.
Tab. C.8: Identified compounds in the leaves of R. copallina and A. julibrissin: Structures inbold are conclusively elucidated. For other compounds only constituents areproposed. Fractions from which the respective compounds have been isolated arerecorded for either plant. The numbering of compounds refers to App. II.3.
No. identified compoundsR.
copallina
A.
julibrissin
flavonoids: flavones, flavonols and auronols28 dihydrokaempferol + 1 hexose moiety + 1 methoxy gallic
acid moietyR18
7 kaempferol A17, A248 kaempferol-3-O-αααα-L-rhamnopyranoside (syn.: afzelin) R12 A149 kaempferol-3-O-αααα-L-rhamnopyranosyl
(1→→→→2)ß-D-galactopyranosideA4
21 kaempferol + 2 deoxyhexose moieties A722 kaempferol + 1 pentose moiety
(isomer of R19)A13, A21
29 kaempferol + 1 pentose moiety(isomer of A13/A21)
R19
28 kaempferol + 1 hexose moiety R1828 kaempferol + 1 hexose moiety +
1 gallic acid moietyR18
10 luteolin-7-O-ß-D-glucopyranoside R10, R1111 maesopsin-4-O-ß-D-glucopyranoside R2, (R8)24 aglycone (auronol) + 1 gallic acid moiety +
1 hexose moiety (isomer of R9)R7
25 auronol + 1 gallic acid moiety + 1 hexose moiety (isomer ofR7)
R9
13 quercetin A15, A16,A23, R18
14 quercetin-3-O-ß-D-galactopyranoside (syn.: hyperoside) A11, A1915 quercetin-3-O-αααα-L-rhamnopyranoside (syn.: quercitrin) R 11 A1216 quercetin-3-O-αααα-L-rhamnopyranosyl(1→→→→2)ß-D-
galactopyranosideA2
17 quercetin-3-O-αααα-L-rhamnopyranosyl(1→→→→2)ß-D-xylopyranoside, novel substance
A5
18 quercetin + 1 hexose + 2 deoxyhexose (rhamnose) moieties A119 quercetin + 2 hexose + 1 deoxyhexose (rhamnose) moieties A320 quercetin glycoside A621 quercetin + 1 gallic acid moiety A722 quercetin + 2 deoxyhexose moieties A1322 quercetin + 1 deoxyhexose moiety (constitutional isomer of
quercitrin)A13, A21

108 C.III Identification of flavonoids and simple phenolics in the leaves of R. copallina and A. julibrissin
No. identified compoundsR.
copallina
A.
julibrissin
23 quercetin + 1 pentose moiety A2028 quercetin + 1 hexose moiety R1827 quercetin + 1 hexose moiety + 1 gallic acid moiety R17
gallic acid and derivativesa
2 p- and m-digallic acid methyl ester R163 ellagic acid R214 gallic acid R3 A85 gallic acid methyl ester R1, R6,
R15, R20,R22, R23
24 2 gallic acid moieties + 1 hexose moiety, presumablydigalloylglucose
R7
26 gallic acid derivatives (two isomeric compounds) R13/R14other phenolics
1 p-coumaric acid A18, A226 p-hydroxy benzoic acid A107 hydroxycinnamic acid derivative A2412 protocatechuic acid R4, R5 A9a
For compounds determined by semi-quantitative LC-MS analyses see C.IV.3.2.
Free flavonoid aglyca and free organic acids are supposed to be degradation products through storage and / orisolation. Deoxyhexose is supposed to be rhamnose.
Most compounds listed in Tab. C.8 have not been previously shown to occur in the leaves ofR. copallina and / or A. julibrissin. One compound can be classified as exceptionally novel:quercetin-3-O-α-L-rhamnopyranosyl(1→2)ß-D-xylopyranoside, which could be isolated fromA. julibrissin leaves (fraction A5).
According to the literature on leaf composition in the genus Rhus, myricetin, quercetin andkaempferol are mentioned to occur as flavonol aglyca, and the flavone aglyca apigenin andluteolin are mentioned to occur periodically throughout the Anacardiaceae (see App. II.2). So,it is not surprising that flavonoids with kaempferol, quercetin, apigenin and luteolin as aglycawere found in R. copallina leaves in this study. In this context it should be noted, that theaglyca isolated in this study are likely to be an outcome of degradation products and do notoccur genuinely in the free state. However, the exact elucidation and description of thecorresponding glycosides in this study is new. The occurrence of numerous glycosidesacylated with gallic acid seems to be an interesting feature of R. copallina leaf flavonoids andmight be of interest for possible pharmacological effects. The finding of auronols and theelucidation of maesopsin-glucoside was not expected for R. copallina leaves based on theliterature, although aurones and auronols are mentioned to occur in the Anacardiaceae (seeApp. II.2). Furthermore, the detection of a dihydrokaempferol glycoside acylated withmethoxy gallic acid (fraction R18; No. 28) deserves some appreciation. This compound wasidentified by mass spectrometry yielding apigenin under ESI conditions (see Fig. II.7, p. 295).A flavanonol was not expected to occur in the leaves (compare App. II.2).
As to the flavonoids of A. julibrissin, only quercitrin, hyperoside and afzelin could beexpected to occur in the leaves as they were mentioned in the literature, partly without givingthe exact plant part of origin (Jang et al., 2002; App. II.2). However, in this study numerousglycosides with kaempferol and quercetin as aglyca could be identified. Again, their detailed

C.III Identification of flavonoids and simple phenolics in the leaves of R. copallina and A. julibrissin 109
description and elucidation can be claimed as being new for A. julibrissin leaves. Theoccurrence of quercetin acylated with gallic acid is a remarkable and interesting finding.Furthermore, one quercetin glycoside, the quercetin-3-O-α-L-rhamnopyranosyl(1→2)ß-D-xylopyranoside, which was found in this study, can be classified as novel as it has not beendescribed before.
As any Rhus species can be used as source of commercial tannic acid (U.S. Pharmacopoeia,App. II.2), and hydrolysable tannins characterise leaves, barks and galls of the genus Rhus andexplicitly leaves of R. copallina (Doorenbos and Box, 1976; Doorenbos, 1976), a richoccurrence of gallotannins and associated compounds would be expected. Although throughthe isolation procedure of gallotannins there is always the risk of their degradation tomonomers, gallic acid and even more gallic acid methyl ester obviously occur genuinely todifferent extent in R. copallina leaves (compare Fig. C.9). It should be noted, that gallic acidand its methyl ester can be regarded as precursors for gallotannins (Kolodziej and Kayser,1998). Similarly, the occurrence of ellagitannins is not explicitly mentioned for R. copallina
leaves but is described to occur in the Anacadiaceae family. However, ellagic acid as artefactfrom a hexahydroxydiphenoyl residue could be isolated. On the other hand, the isolation of p-and m-digallic acid methyl ester could not be expected. While digallic acid was reported to beisolated by partial hydrolysis of Chinese gallotannin (from Rhus semialata) (Verzele et al.,1983) and methyl digallate after partial methanolysis of commercial tannic acid or bysynthesis (Nishizawa et al., 1982), both isomeric forms of digallic acid methyl ester could begained from R. copallina leaves without any further analytical steps. As depicted in Fig. C.9,both isomeric forms occur in the leaves of R. copallina.
Although tannins occur in barks of different Albizia species (Tab. II.2, p. 210), no tannins aredescribed in the literature to occur in A. julibrissin leaves, and this negative result could beconfirmed in this study. So, the unexpected finding of gallic acid in A. julibrissin leaves ismore likely to originate from e.g. the degradation of acylated flavonoid glycosides than fromreal tannins. However, the presence of gallic acid in A. julibrissin leaves can be considered asnew finding.
The “other” phenolic compounds found in this study (Tab. C.8) are relatively ubiquitous andtheir occurrence has either been previously known or could be expected in part. For instance,esters of p-coumaric acid have already been described to occur in A. julibrissin leaves, so thatthe isolation of the free acid could be expected as degradation product through isolation. Onthe other hand, p-hydroxy benzoic acid and protocatechuic acid have not been explicitlymentioned to occur in A. julibrissin leaves and are hence new findings.For R. copallina leaves, the occurrence of protocatechuic acid is not explicitly mentioned inthe literature, yet its occurrence is often associated with tannins and has been reported in otherAnacardiaceae species (e.g. Mangifera indica, see App. II.2). Therefore, the presence of thiscompound is not a surprise.
Review on assignments of elucidated leaf compounds of A. julibrissin and R. copallina toHPLC chromatogramsIn the following, the HPLC chromatograms of A. julibrissin and R. copallina leaf extracts areshown, to which the isolated and elucidated compounds could be assigned (Fig. C.8 andFig. C.9). For these reviews May leaves of A. julibrissin and July leaves of R. copallina werechosen. To review seasonal changes including additional compounds that were characterisedby further methods, the respective HPLC chromatograms are compared in chapter C.IV (Fig.C.10, p. 122 and C.11, p. 123). The HPLC chromatograms of the other food plants(C. canadensis, R. pseudoacacia, A. rubrum, and L. styraciflua) with respect to seasonalchanges are depicted in App. II.4.

110 C.III Identification of flavonoids and simple phenolics in the leaves of R. copallina and A. julibrissin
ret. time (min) name10.3 gallic acid (A8)19.9 p-coumaric acid derivative (free acid in A18)20.6 quercetin derivative (A1)21.6 quercetin-rhamnopyranosyl-galactopyranoside (A2)22.7 kaempferol-rhamnopyranosyl-galactopyranoside
(A4)23.2 hyperoside (A11)23.4 quercetin derivativea
24.2 quercetin derivativea
24.5 kaempferol derivative (in A6)24.6 quercetin derivativea
24.9 quercetin derivativea
25.1 quercitrin (A12)27.2 afzelin (A14)
anot isolated or elucidated due to low amounts
Fig. C.8: HPLC chromatogram of the A. julibrissin leaf extract (leaves harvested in May):modus: maxplot, UV detection between 210 – 450 nm.

C.III Identification of flavonoids and simple phenolics in the leaves of R. copallina and A. julibrissin 111
ret. time (min) name12.2 gallic acid (R3)15.6 protocatechuic acid (R4, R5)18.4 gallic acid methyl ester (R1, R6, R15, R20, R22, R23)21.2 auronol: maesopsin-4-O-ß-D-glucopyranoside (R2)23.8 p-digallic acid methyl ester (R16)26.3 m-digallic acid methyl ester (R16)
Fig. C.9: HPLC chromatogram of the R. copallina leaf extract (leaves harvested in July;detection at 270 nm).

112 C.IV Quantification of flavonoids and tannins in the food plants of P. v. coquereli
C.IV Quantification of flavonoids and tanninsin the food plants of P. v. coquereli
1 Introduction
The following chapter is dedicated to the quantification of the most common secondary plantcompounds occurring in the food plants, i.e. flavonoids and hydrolysable tannins.
During previous preparative isolations and subsequent structure elucidation (chapter C.III)gallotannins have been characterised as the leading compounds of Rhus copallina leaves andflavonoids as main secondary leaf compounds of Albizia julibrissin. While to lesser extentflavonoids were also occurring in R. copallina leaves, no tannins could be found to occur inthe leaves of A. julibrissin.
For a definitive evaluation of the importance of flavonoids and tannins in the diet of thesifakas, all leaf species ingested by the animals were screened for these aforementionedsecondary compound groups (Tab. C.1, p. 57).
Hence, all plant specimens collected during the observation periods in both the spring andautumn were investigated for their occurrence of flavonoids and hydrolysable tannins bymeans of HPLC analyses. Quantification was initiated with the unhydrolysed plant extracts(Tab. C.13), which was completed by different methods of hydrolyses prior to HPLC runs(Tab. C.16 and Tab. C.17). LC-MS method was chosen to screen especially for mono- topentagalloylglucose in R. copallina leaves. For this purpose the unhydrolysed leaf extracts ofthe different harvests were used (Tab. C.15). A gravimetric method was additionally appliedto determine R. copallina leaf tannins (Tab. C.18).
2 Materials and Methods
2.1 Quantitative HPLC analyses
Analytical HPLC separations were performed as reversed phase chromatography by means ofa RP Nucleosil® C18 cartridge (Macherey-Nagel; 5 µm, 250 x 4mm i.d.), Millipore WatersSystem, Eschborn; associated with a Waters TM 616 Pump and Waters TM 600 S Controller.Injections were performed by a Waters TM 717 Autosampler, detection was carried out by aWaters TM 996 Photodiode Array Detector. The software used was Millennium v 2.00 for dataacquisition and Millennium PDA Review V.2.15 © 1994 for post processing.
(Two HPLC apparatus were used with identical equipment.)

C.IV Quantification of flavonoids and tannins in the food plants of P. v. coquereli 113
Preparation of plant extracts
Plant material (leaf species see Tab. C.1, p. 57) was first ground and sieved according toC.I.2.2. Subsequently, all leaf material was additionally ground by means of a “Bit Beater” tobe investigated by analytical HPLC runs with photodiode array detection.
Approximately 20 mg of the dried and powdered plant material (prepared by means of a mill,mortar and pistil, and sieve No. IV, DAB 7) were weighed exactly into special tubes to beextracted with 1ml 80 % (v/v) aqueous methanol by means of a Bit Beater (Biospec®Products). Tiny zircon balls were added before the tubes had been locked with a screw threadlid and provided a finely dispersed plant-solvent suspension during the shaking process athigh speed.
Leaves collected in May and July were shaken for 25 seconds. When this was not sufficientfor tougher leaves of some lemur food species collected during the autumn, the time in the BitBeater was subsequently increased for all samples up to 1 minute, respectively. Allsuspensions were centrifuged at 14 000 rpm. for 5 minutes at –6 °C. The supernatants weredeposited in Eppendorf® tubes and aliquots of these solutions were taken for qualitative andquantitative examinations by HPLC analyses. At least duplicate analyses were performed.
Comment on the extract preparation by means of a Bit Beater:This method offers several advantages. The procedure yields a fine suspension of smashedplant cells in the appropriate extracting solvent at a given concentration. It is especially usefulfor small amounts of plant material without subsequent processes such as filtering, rinsing,cleaning or evaporating, which may risk the loss of material or may alter the solution’sconcentration. The resulting plant compounds that are sensitive to air and light are notexposed to the harmful effects of oxygen or daylight. The zircon balls are then easily regained.As a “one step procedure”, this type of plant extraction saves time, is effective, can be easilystandardised, and is useful for a wide range of analyses.
Errors can only result from the weighing method or when adding the volume of extractingmedium. Hence, the Bit Beater was used to prepare plant extracts for qualitative andquantitative HPLC analyses because of its advantages for serial examinations when utilisingsmall amounts of plant material.
Solvent system, flow rate and gradient
Solvent A: 1.5 % (v/v) aqueous phosphoric acid;Solvent B: acetonitril (100 %).
The following gradient, at a flow rate of 1 ml / min., was used:start with 100 % A; 0-30 min. linear gradient to 60 % A; 30-40 min. linear gradient to 20 %A; 40-45 min. 20 % A; 45-46 min. linear gradient to 100 % A; 46-56 min. 100 % A.Every run lasted 56 min. To equilibrate the cartridge the first sample was measured twice.
All solvents used for HPLC analyses were of “p.a. grade” or “HPLC quality”.
Detection
For gallic acid and related compounds such as gallotannins, a wavelength of 270 nm waschosen, while for flavonoid glycosides and their aglyca, 350 nm was used. The maximal plotof each HPLC run was screened between 220 and 450 nm and between 210 and 450 nm foradditional investigations. UV spectra of all peaks detected were recorded between 210 and450 nm, and between 200 and 600 nm for additional investigations, respectively.

114 C.IV Quantification of flavonoids and tannins in the food plants of P. v. coquereli
Standard solutions, calibration and formulae to calculate the contents
The following standard solutions were used to calibrate the HPLC-apparatus:Quercitrin was used as standard to calculate the contents of quercitrin itself, flavonol andflavone glycosides and the total content of flavonoid glycosides. The standard for flavonoidaglyca was composed of myricetin, quercetin and kaempferol, which were dissolved togetheras one standard solution.
Gallic acid was taken to quantify the content of gallic acid itself, gallic acid-like compoundsincluding ellagic acid, and the total content of gallotannins.
Approximately 15 mg of each standard substance were weighed exactly and dissolved in100 ml of 100 % methanol. All standard solutions were measured as such and diluted withpure methanol to 4:1, 3:2, 1:1, 2:3 and 1:4. Injection volumes were 20 µl, respectively. Atleast two measurements were performed with each concentration.
As already mentioned, a wavelength of 350 nm was chosen to detect the three flavonoidaglyca, quercitrin and the total of flavonoids. Gallic acid, related compounds and the total oftannins were determined at 270 nm.
Tab. C.9: Following regression lines were found to calculate the contents of the respectivecompounds.
substance regression line standard deviationquercitrin AUC = (1,8736 e / µg + 0,0313) • 106 ± 3 %myricetin AUC = (2,5788 e / µg - 0,0014) • 106 ± 4 %quercetin AUC = (2,8353 e / µg - 0,0017) • 106 ± 4 %kaempferol AUC = (3,2466 e / µg - 0,0252) • 106 ± 4 %gallic acid AUC = (3,1577 e / µg - 0,0506) • 106 ± 5 %
AUC area under the curve in the HPLC chromatogram, which is directly proportional to the content of therespective compound; the value is given in 106.
e injected weight of pure substance; the value is given in µg.
The point for zero concentration was included into the regression lines.
ContentThe content c of secondary plant compounds investigated are referred to dry weight of therespective plant specimen and given in weight %:
f inverse function of regression lineAUC exp area under the curve measured (experimentally determined AUC)
e exp injected weight of plant specimen (dry weight)
Rate of return
AUC exp gives the (experimental) value of the corresponding peak area taken from thechromatogram.
exp
exp
e
)AUC(fc =
calc
expreturnofrate
AUC
AUCr =

C.IV Quantification of flavonoids and tannins in the food plants of P. v. coquereli 115
AUC calc peak area calculated using the corresponding regression line and the injectedamount of the standard solution.
2.2 Quantification of unhydrolysed flavonoids and tannins
Aqueous-methanolic plant extracts were prepared by means of a Bit Beater of each plantspecimen collected at the Duke Lemur Center (C.IV.2.1). Aliquots were taken and dependingon plant specimen 5 or 10 µl were injected into the HPLC apparatus for analytical purposes. Ifnecessary, further dilutions were prepared.
Within the same HPLC run, the total amount of flavonoids and tannins as well as the contentof some individual compounds of either class could be quantified. All flavonoid compoundswere detected at 350 nm and referred to quercitrin. The gallotannins including their monomersand dimers were detected at 270 nm and referred to gallic acid. Assignments of the UVspectra to classes of chemical compounds and individual compounds were based on datagained through previous structure elucidation and, in respect to the class of flavonoids,corroborated by UV spectra given by Mabry et al. (1970). Compounds not identified asbelonging to either class of compounds were not included.
Contents were calculated by means of the “area under the curve” (AUC) of each peakintegrated in the HPLC chromatogram, referred to the amount of the air-dried leaf specimen.(For regression lines used see Tab. C.9).
2.3 Quantification of hydrolysed flavonoids and tannins
Flavonoids
The following methods of methanolysis were developed to quantify the major flavonoidglycosides as their corresponding aglyca myricetin, quercetin and kaempferol. Referencecompounds were commercial myricetin, quercetin and kaempferol, respectively. Bothmethods were based on the method given by Jerga (1989) using a mixture of methanol and 2N hydrochloric acid in a ratio of 1:1.
Method AApproximately 20 mg of the dried and powdered plant material were weighed exactly, 1 ml80 % (v/v) methanol was added and the suspension was smashed by means of the Bit Beaterfor 25 seconds (C.IV.2.1). The suspension was centrifuged and 500 µl of the supernatantsolution were hydrolysed in a mixture of 2 ml methanol and 2.5 ml 2 N HCl in Sovirell®glasses with Teflon® coated thread screw lids for 3 hours at 100 °C in a drying stove.
After hydrolysis the mixture was left to cool down and poured into 25-50 ml glass flasks. TheSovirell® glasses were rinsed twice with 10 % aqueous methanol and once with some puremethanol which was added to the hydrolysed solution. The solution was reduced in vacuo to1-2 ml to evaporate largely the methanol (Rotavapor®, water bath of 30-40 °C) andpartitioned 4 times between 10 ml of ethylacetate, respectively. The unified ethylacetate layerswere washed with water in a separatory funnel (3 times with about 10 ml of water) andevaporated to dryness in vacuo. The residue was dissolved in 2 ml of pure methanol andstored in Eppendorf® tubes. Right before HPLC analyses all samples were centrifuged (14000rpm), 100 µl of each sample were transferred into HPLC test tubes and generally 50 µl, in partalso 20 µl and 10 µl were injected into the HPLC apparatus.
Two samples of each plant specimen were analysed, respectively.

116 C.IV Quantification of flavonoids and tannins in the food plants of P. v. coquereli
For the flavonoid aglyca myricetin, quercetin and kaempferol, and gallic acid, the followingrate of return was found, respectively (Tab. C.10).
Tab. C.10: Rate of return of the standard compounds used.
substance rate of returnmyricetin 93 % ± 3 %quercetin 98 % ± 4 %kaempferol 100 % ± 2 %gallic acid 61 % ± 11 %
Method BSimilar to method A, approximately 20 mg of the dried and powdered plant material wereweighed exactly, 1 ml 80 % (v/v) methanol was added and the suspension was smashed bymeans of the Bit Beater. The suspension was centrifuged and 500 µl of the supernatantsolution were hydrolysed in a mixture of 500 µl pure methanol and 1 ml 2 N HCl for 3 hoursat 100 °C in appropriate Eppendorf® tubes with screw lids. The hydrolysed solution waspoured into glass flasks and the Eppendorf® tubes were rinsed 3 to 4 times with some puremethanol, which was added to the hydrolysed solution and evaporated to dryness in vacuo
(Rotavapor®, water bath of 30-40 °C). To remove any residual moisture, extracts were storedin an oven for 10 min. at 100 °C and, if necessary, evaporated again. The residue wasdissolved in 1 ml of 100 % methanol, stored in Eppendorf® test tubes and centrifuged (5 min.at 14 000 rpm). 100 µl of each sample were filled into HPLC test tubes and generally 50 µl,but in part also 10 µl and 5 µl were injected into the HPLC apparatus.
Two samples of each plant specimen were analysed, respectively.
For the aglyca myricetin, quercetin and kaempferol, the following rate of return was found,respectively (Tab. C.11).
Tab. C.11: Rate of return of the standard compounds used.
substance rate of returnmyricetin 80 % ± 0 %quercetin 94 % ± 3 %kaempferol 96 % ± 3 %gallic acid 104 % ± 6 %
Gallotannins
Plant extracts were prepared according to C.IV.2.1. Aliquots of 500 µl each were taken,transferred into 2 ml plastic tubes and brought to dryness by means of a Speed Vac centrifuge.Then, 2 ml of 4 N aqueous trifluoroacetic acid (TFA) were added to be heated for 4 hours at100 °C in an oven. The hydrolysed plant extracts were left to cool down, poured into 25-50 mlglass flasks and the plastic tubes were rinsed three to four times with some pure methanol,which was added to the extract, respectively. The solution was evaporated to dryness in vacuo
(Rotavapor®, water bath of 45-50 °C). To remove any residual moisture extracts were storedin the oven again for 10 min. at 100 °C and evaporated afterwards. The residue was dissolvedin 1 ml of 100 % methanol, stored in Eppendorf® test tubes and centrifuged (5 min. at14 000 rpm). 100 µl of each sample were filled into HPLC test tubes and generally 50 µl, 10µl and in part 5 µl of different dilutions (1:1; 2:8; 1:9) were injected into the HPLC apparatus.Two samples of each plant specimen were analysed, respectively.

C.IV Quantification of flavonoids and tannins in the food plants of P. v. coquereli 117
Tab. C.12: Rate of return of the standard compounds used.
substance rate of returnmyricetin 69 % ± 13 %quercetin 90 % ± 2 %kaempferol 95 % ± 4 %gallic acid 101 % ± 11 %
2.4 LC-MS analyses on R. copallina leaf extracts
Preparation of plant extractsR. copallina leaves of all three harvests (May, July and October) were extracted according toC.IV.2.1. To remove chlorophyll, these plant extracts were purified by means of a LiChrolut®Merck RP18 cartridge to be analysed by liquid chromatography mass spectrometry.
After equilibration of the cartridge with pure methanol, 500 µl of each previously gainedextract were placed onto the column and eluted with 4 ml 50 % (v/v) methanol, respectively.A 10 ml syringe fixed by means of an adapter to the LiChrolut® column was used to achievethe high pressure needed to press extracts and eluents through the column. Extracts thusgained were evaporated to dryness in vacuo (Rotavapor®, water bath of 30-40 °C) anddissolved in 1 ml 80 % (v/v) methanol to be analysed by LC-MS method. 20 µl of each plantextract were screened by analytical HPLC method to assure that the spectrum of gallotanninswas not significantly altered by this purification step.
Comment:The LiChrolut® RP18 cartridge is very efficient in separating small amounts of compoundswith different hydrophilic and lipophilic properties. The main advantage of this column is itsefficacy and the speed to get an extract without disturbing lipophilic compounds, e.g.chlorophyll.For pre-trials this sort of column was used for various pre-extractions using a mixture ofwater, methanol and acetic acid (50:50:1) as eluent. For reactivation the cartridge was washedwith pure methanol before and after its use, respectively.
LC-MSThe negative ion electrospray spectra were obtained from aFinnigan MAT TSQ 7000 instrument (electrospray voltage 3.5 kV; heated capillarytemperature 220 °C; sheath gas and auxiliary gas: nitrogen) coupled with a Micro-Tech Ultra-Plus MicroLC system equipped with a RP18-column (4 µm, 1x100 mm, Ultrasep).Following HPLC conditions were used: gradient system from H2O : CH3CN 85:15 (each ofthem containing 0.2 % CH3COOH) to H2O : CH3CN 10:90 within 15 min. and then hold atH2O : CH3CN 10:90 for 10 min.; flow rate 70 µl min-1.
2.5 Gravimetric determination of tannins in R. copallina leaves
Approximately 1 g of dried and powdered R. copallina leaves was weighed exactly and stirredat room temperature for 30 minutes in a mixture of 30 ml isobutylmethylketone and 3 mlwater by means of a magnetic stirrer. This suspension was filtered and washed with 10 mlisobutylmethylketone. The filtrate was concentrated in vacuo to a syrup. 25 ml water wereadded and concentration was continued to a volume of about 20 ml to assure completeevaporation of the ketone, until no more smell of isobutylmethylketone was perceptible. Thisconcentrate was washed in a separatory funnel five times with 25 ml dichlormethane,

118 C.IV Quantification of flavonoids and tannins in the food plants of P. v. coquereli
respectively. The aqueous layer was evaporated to dryness, in vacuo, in a tared flask, dried inan oven at 70 °C overnight, cooled down at room temperature in an desiccator and weighed todetermine the content of the tannin residue.
tannin content [%] = weight of tannin residue / weight of the leaves x 100
Comment:This method is based on the analytical procedure of Doorenbos (1976). Since it is highlytoxic, chloroform was replaced by dichlormethane in the method applied.The “Doorenbos method” was developed to facilitate extractions of the gallotannins of Rhus
copallina and Rhus glabra leaves, yielding USP quality tannic acid. According to Doorenbos(1976), this method is useful in isolating tannins for commercial purposes as well as todifferentiate between the growth areas of wild Rhus clones, and the results from this methodare in agreement with those of other methods, e.g. the hide-powder assay.
Test on the purity of the tanninsApproximately 2 mg of a gravimetrically gained tannin extract of R. copallina leaves wereweighed exactly and dissolved in 1 ml pure methanol. An aliquot of 10 µl was analysed onanalytical HPLC column and determined at 270 nm.
In a second step, tannin extracts were hydrolysed by means of TFA (C.IV.2.3, “gallotannins”).To remove last solvent residues, test tubes were dried for 10 min. at 70 °C. The hydrolysedextracts were dissolved in 1 ml pure methanol and diluted 1:10 with the same solvent. 5 µl ofthat solution were injected into the HPLC apparatus to test for their purity.
3 Results and discussion
3.1 Quantification of phenolic glycosides
In a first step the unhydrolysed leaf extracts of all plant specimens collected were analysed bymeans of an HPLC with subsequent photo diode array detection of the UV spectra (C.IV.2.1).Tab. C.13 presents the levels of flavonoid glycosides and hydrolysable tannins within thevarious leaf species. Quercitrin was revealed to be the most common flavonol glycoside in themelange of food plants. Based on the different absorption maxima of flavonol and flavoneglycosides in the UV light (Fig. C.6, p. 101), these two groups of flavonoids were recordedseparately for each food plant. The “total flavonoids” refers to all flavonoids occurring in anyspecies which were detected at 350 nm and were referred to quercitrin as reference compound.“Total tannins” designates all gallic acid and ellagic acid derivatives which could bedetermined at 270 nm and were referred to gallic acid.
It is obvious that A. julibrissin leaves show highest contents in flavonoids, which all belong tothe group of flavonol glycosides. On the contrary, R. copallina leaves are highest inhydrolysable tannins (Tab. C.13).
Not depicted above is that apart from A. julibrissin leaf specimens, hyperoside was tentativelyidentified in the leaves of Acer rubrum harvested in May (0.36 %) and in Photinia glabra
autumn leaves (0.35 %). Kaempferol-rhamnopyranoside (afzelin) was furthermore detected inCercis canadensis leaves collected in spring (0.16 %) and as trace amounts in those leavesharvested in the autumn. It was tentatively identified as trace amounts in A. rubrum leavestaken in the spring.

C.IV Quantification of flavonoids and tannins in the food plants of P. v. coquereli 119
Tab. C.13: Review on the major leaf compounds investigated in unhydrolysed extracts of allleaf specimens collected. Values are given in % dry weight.
flavonoidsflavonol glycosides flavone total total
plant specimen quercitrin total glycosides flavonoids tanninsAlbizia julibrissin
May 1.73 4.85 4.85May, tips 1.78 4.29 4.29July 1.83 2.79 2.79October, young leaves 1.85 3.21 3.21October, old leaves 2.28 2.68 2.68
Rhus copallina
May 0.73 trace am. 0.81 27.85July trace am. 0.71 28.05October 0.57 trace am. 0.57 17.77
Liquidambar styraciflua
May 0.57 1.43 1.91 1.11October 0.65 1.70 1.87 0.45
Cercis canadensis
May 1.12 2.68 3.23 0.19October 1.03 1.85 2.10
Robinia pseudoacacia
May 3.03 3.03October 1.46 1.46
Acer rubrum
May 1.05 2.77 18.02a
October 0.65 1.48 12.28
Liriodendron tulipiferab 2.14 4.35
Vitis rotundifoliab 0.17 0.91 0.91 1.69
Photinia glabrab 0.22c 1.14 5.15
aDue to huge amounts of the main component, HPLC runs measuring different concentrations were used tocalculate the total content of tannins.
bharvested in October
ctentatively identified as quercitrin.
Grey fields indicate that these values were further used to calculate corresponding amounts eaten by theanimals. Plant specimens without grey coloured fields were not ingested during either observation period.The sum of flavonol glycosides referred to quercitrin as standard gives the total of all glycosides identified ascontaining myricetin, quercetin or kaempferol as aglycone as well as compounds showing closely related UVspectra. As flavone glycosides only compounds based on the apigenin- or luteolin-aglycone-type includingrelated compounds (like acacetin (methoxyapigenin) or vitexin (C-glucosyl-apigenin) etc.) were regarded.The total of flavonoids is referred to quercitrin as standard and comprises all compounds identified asflavonoids (Mabry et al., 1970). All flavonoids were measured at 350 nm, while tannins and related compoundswere measured at 270 nm.
The majority of flavonols in all leaf species investigated comprised glycosides of the quercetintype aglycone, followed by kaempferol aglycone. Apart from few exceptions, flavonols builtthe largest group of flavonoids in all plants analysed. Only Robinia pseudoacacia showedhigh contents in flavones.

120 C.IV Quantification of flavonoids and tannins in the food plants of P. v. coquereli
Not all samples were unambiguously identified as containing other types of flavone glycosides(e.g. 4’,7-dihydroxyflavone or 3’,4’,7-trihydroxyflavone as aglyca) based on their UV spectrawhen compared to those given by Mabry et al. (1970). The group of flavone glycosides in thisstudy is confined to those containing apigenin, luteolin and related aglyca.
Another interesting note (not depicted in the table) can be made on the class of aurones.Except for R. copallina leaves, aurones could be detected in Liquidambar styraciflua leavesfrom both seasons. In this context it is interesting to note that those compounds that arepresent yet deemed rare are in evidence among the selected plant species undergoing analysis.
V. rotundifolia was chosen as a plant species, that could only be eaten outside in the naturalhabitat enclosure, as it was not brought into the animals’ cages by the staff. This speciesshould corroborate the aspect of food selectivity in respect to groups of secondary compoundsshown by the sifakas.
In Tab. C.14 the investigation on the contents of flavonoid compounds in A. julibrissin leavesis presented. It is shown that there is a relative overall increase in quercitrin during the year,while there is an overall decrease in hyperoside. Despite that, the absolute content offlavonoids decreases during the year.
Tab. C.14: Relative abundance of individual components and absolute content of flavonoidsin leaves of A. julibrissin of different age referred to dry weight.
relative abundance (%)
flavonoid glycosides May
May
, tip
s
Ju
ly
Oct
ober
, y
oun
g le
aves
Oct
ober
, o
ld le
aves
quercetin triglycoside (A1) 1.8 2.5quercetin-gal-rha 13.2 14.1 trace am.a
kaempferol-gal-rha 3.4 trace am.a
hyperoside 33.9 35.2 14.5 4.6 7.4kaempferol-derivative(in A6) 3.6 trace am.a 3.2quercitrin 35.7 41.4 65.7 57.6 84.9afzelin trace am.a 9.7 6.5 trace am.a
total flavonoids [%] (m/m) 4.85 4.29 2.79 3.21 2.68a
trace amounts indicate that the UV spectrum of the respective substance was monitored but thecorresponding peak was not integrated due to too low amounts. If no value is given, no UV spectrum wasregistered and the respective peak in the HPLC chromatogram was absent or too small for a definiteassignment. Reference compound for all glycosides was quercitrin.
If correlated to feeding data, it can be stated that tips of May leaves were left over andnormally dropped by the animals, although this non-selection, could not be predicted based onthe assayed flavonoid levels.
For leaves harvested in July, no feeding data were recorded. Hence, contents of July leaves areinformative for the overall trend of secondary compounds during the year, but are excludedfrom correlations to feeding data.
In autumn, A. julibrissin leaves were eaten less frequently than in the spring. If at all, onlyyoung leaves were ingested, while old ones were refused. However, with respect to the patternof flavonoids, there is a huge difference between the levels in the spring and autumn leaves. It

C.IV Quantification of flavonoids and tannins in the food plants of P. v. coquereli 121
is tempting to hypothesise that the feeding behaviour is linked to the occurrence and contentof individual flavonoid glycosides.
However, for dosage calculations of flavonoid glycosides ingested by the animals, leavesharvested in May and young leaves of October were used (Tab. C.25, p. 166).
Fig. C.10 presents the corresponding HPLC chromatograms to illustrate seasonal fluctuationsof the flavonoid pattern in the leaves of A. julibrissin. Only the main peaks were assigned tocompounds isolated. As the pattern of flavonoids of the leaf buds (tips) is essentially the sameas shown for the developed leaves of May, the HPLC chromatogram of the tips is not depictedhere. For a detailed assignment of all peaks see chapter C.III, Fig. C.8, p.110.
The tannin levels in R. copallina leaves, in the May and July leaves show a nearly identicalcontent, while autumn leaves are diminished in value. However, the contents of tannins inR. copallina leaves is confined to the total content of the respective season (Tab. C.13) asrepeated measurements showed that during storage, the portion of gallic acid is raised. Othercompounds changing during storage were the contents of ellagic acid and pentagalloylglucose.While initial measurements of pentagalloylglucose could not be unambigously detected inR. copallina leaves of May and July, in subsequent measurements, its occurrence could beproved by coinjection with an authentic sample. In autumn leaves it could be detected duringearly measurements. In the HPLC chromatogram (Fig. C.11), pentagalloylglucose directlyfollowed the para-isomer and preceded the meta-isomer of digallic acid methyl ester(contained in fraction R16), which was corroborated by the coinjection of authenticpentagalloylglucose and the isolated fraction R16. However, with respect to differentinfluences by storage conditions it was relinquished to give detailed information on thecontents of individual components as done for A. julibrissin.
As to ellagic acid, it could only be detected in R. copallina leaves of July with 0.20 %. Apartfrom R. copallina leaves, it could only be found in A. rubrum leaves of spring (0.19 %) and inV. rotundifolia leaves harvested in the autumn (0.95 %). It is reasonable to assume that theoccurrence of free ellagic acid is caused by the degradation processes during storage.
In Fig. C.11 the composition of R. copallina leaves harvested in July and October is depicted.For a detailed assignment of isolated compounds to the peaks detected, see also chapter C.III,Fig. C.9, p. 111.

122 C.IV Quantification of flavonoids and tannins in the food plants of P. v. coquereli
October, old leaves
October, young leaves
July
May
ret. time (min) name20.6 quercetin triglycoside (A 1)21.6 quercetin-rhamnopyranosyl-galactopyranoside22.7 kaempferol-rhamnopyranosyl-galactopyranoside22.9 flavonol glycosidea
23.2 hyperoside24.5 kaempferol derivative (in A 6)25.1 quercitrin27.2 afzelin
aThe flavonol glycoside with a retention time at 22.9 min. emerged first in July leaveswith largest peak in young leaves of October. It could not be detected in leaves of May.
Fig. C.10: HPLC chromatograms, which show the different flavonoid composition in A.
julibrissin leaves of May, July, and young and old leaves of October (from top tobottom, detection at 350 nm).

C.IV Quantification of flavonoids and tannins in the food plants of P. v. coquereli 123
July
October
ret. time (min) name 9.8 gallic acid derivative10.7 gallic acid16.8 gallic acid methyl ester19.4 auronol: maesopsin-4-O-ß-D-
glucopyranoside20.3 auronol22.6 p-digallic acid methyl ester24.1 pentagalloylglucose24.6 m-digallic acid methyl ester
Due to different HPLC apparatus, retention times differed slightly. Assignments oftimes and peaks in the table is depicted for October leaves.
Fig. C.11: HPLC chromatograms, which show the different composition of the majorcompounds in Rhus copallina leaves of July and October. (Detection at 270 nm).
Another interesting observation on the seasonal differences in tree leaves, is the occurrence ofaurones (not depicted here). Only the aurones detected by UV spectra in R. copallina leavesfrom the July were integrated. Its content was reduced in autumn leaves while it was nearlyabsent in the leaves of May. This is in accordance with TLC-detection whereby aurones of thistype yield a bright-red orange spot if detected with reagents containing sulphuric acid.
However, R. copallina leaves were vigorously eaten during both times of observation and cor-relation to the feeding behaviour will show if the amount of tannins is held constantthroughout the year by the animals, or whether the amount ingested fluctuates with leafcontent.
In the following, different methods of hydrolysis were performed to reveal the aglyca whichthe glycosides are based on. Moreover, complementary information gained by different

124 C.IV Quantification of flavonoids and tannins in the food plants of P. v. coquereli
methods corroborate the results already presented above and complete the picture ofcompounds vital to the study animals.
3.2 Semi-quantitative estimation of gallotannins by LC-MS
LC-MS analyses were performed on R. copallina leaf extracts of May, July and October toscreen especially for the occurrence of mono- to pentagalloylglucose while taking into accountpossible seasonal differences (Tab. C.15).
Tab. C.15: R. copallina leaf extracts (of May, July and October leaves) were screened by LC-MS analyses. Measurements were performed in the negative ESI-mode.
harvestcompound May July October
gallic acid n.d. + n.d.gallic acid methyl ester +++ +++ +++protocatechuic acid n.d. n.d. n.d.monogalloylglucose + + +digalloylglucose (+) - -trigalloylglucose - - -tetragalloylglucose + + (+)pentagalloylglucose +++ +++ +++450 ([M-H]−, m/z 449) - + +448 ([M-H]−, m/z 447) - + +valonic acid - - -ellagic acid - - -hexahydroxydiphenicacid
- - -
+++ main component
+ present
(+) trace amounts
- not found
n.d. not detected
In accordance with previous investigations, major components in R. copallina leaves are gallicacid methyl ester and pentagalloylglucose. While mono- and tetra-galloylglucoses could befound in nearly all samples, di- and tri-galloylglucoses were largely lacking.
The fact that gallic acid as such, could not be detected in any case by LS-MS analyses mightbe due to analytical conditions. Obviously, most of the free gallic acid, which was presumedto have been generated through storage conditions, was converted into gallic acid methyl esterduring LC-MS analyses, as HPLC control of prepared extracts clearly showed the occurrenceof more or less free gallic acid in all three provenances.
Protocatechuic acid, which was preparatively isolated from July leaves (chapter C.III, Tab.C.8, p. 107), could not be detected by this method.
The molecular weight of 448 might be ascribed to a flavonoid component like quercitrinwhich could be found in July leaves through preparative isolations. However, during HPLCruns to quantify flavonoid components, quercitrin could not be detected in either leaf sample(see Tab. C.13). However, it is reasonable to assume that MW 448 originates from a flavonoidcompound.

C.IV Quantification of flavonoids and tannins in the food plants of P. v. coquereli 125
The molecular weight of 450 coincides with that of maesopsin-glucopyranoside which couldbe detected by HPLC analyses in the leaves of all three seasons. It remains obscure why it wasnot detected in leaves of May by LC-MS.
Ellagic acid and its precursor hexahydroxydiphenic acid are yielded normally fromellagitannins through methods of hydrolyses and were hence not expected to occur genuinelyin the plant.
It can be summarised that LC-MS resulted in an appropriate method to screen for tannincomponents of higher molecular weight which are far more difficult to determine by e.g.preparative isolations with subsequent mass spectrometry. Another option to detectpentagalloylglucose was coinjection during an analytical HPLC run (see above).
3.3 Quantification of flavonoid aglyca
To analyse the leaves for their occurrence of flavonoid aglyca myricetin, quercetin andkaempferol, a methanolysis was performed on all leaf specimens (Tab. C.16). Referencecompounds were commercial myricetin, quercetin and kaempferol, respectively.
Tab. C.16: Review on all plant extracts after methanolysis (method B).Values are given in % dry weight.
plant specimen myricetin quercetin kaempferol total aglycaAlbizia julibrissin
May 1.63 0.15 1.96May, tips 1.42 0.08 1.60July 1.00 0.19 1.29October, young leaves 0.33 0.83 0.11 1.28October, old leaves 1.02 0.09 1.16
Rhus copallina
May 0.24 0.09 0.45July 0.22 0.07 0.49October 0.25 0.08 0.50
Liquidambar styraciflua
May 0.37 0.21 trace am. 0.60October 0.32 0.22 0.51
Cercis canadensis
May 0.39 0.35 0.05 0.76October 0.29 0.40 trace am. 0.66
Robinia pseudoacacia
May 1.15October 0.44
Acer rubrum
May 1.14 0.11 1.29October 0.71 0.06 0.78
Liriodendron tulipiferaa 0.23 0.12 0.89
Vitis rotundifoliaa 0.43
Photinia glabraa 0.52 trace am. 1.60

126 C.IV Quantification of flavonoids and tannins in the food plants of P. v. coquereli
aharvested in October
Myricetin, quercetin and kaempferol were individually calculated, referred to its respective standard.“Total aglyca” gives the sum of all aglyca integrated referred to quercetin as common standard.
Grey fields indicate that these values were further used to calculate corresponding dosages eaten by thefocal lemurs. Plant specimens without grey coloured fields were not ingested during either observationperiod.
First method A was developed to hydrolyse flavonoid glycosides into their correspondingaglyca myricetin, quercetin and kaempferol showing high rates of return. However, extractionwith ethylacetate bears the risk of losing substantial amounts of more hydrophilic C-glycosyliccompounds like vitexin, which has been criticised (in the comment of DAB 9, monograph of“Crataegi folium cum flore”). In view of the large number of plant specimens to be analysedand with respect to the problem of ethylacetate extraction, method A was replaced bymethod B (C.IV.2.3, “flavonoids”). Regarding contents of the aglyca myricetin, quercetin andkaempferol, both methods yielded comparable results. But as expected, method B, waspreferred in the investigation of other compounds. After methanolysis by method B,anthocyanidins were found in young autumn leaves of A. julibrissin as well as in leaves ofLiriodendron tulipifera, Photinia glabra, and respectively in Robinia pseudoacacia, Cercis
canadensis and Acer rubrum leaves from both seasons. However, as anthocyanidins show aminimum at 350 nm, their content is not included in the contents determined for flavonoidaglyca. As pointed out by Jurd (1962), the intensity and position of the visible maximumshifts considerably with changes in pH and solvent, so it cannot be concluded from literaturereference chromatograms which sort of anthocyanidins were detected in this study.
As expected, the highest contents of aglyca were found in A. julibrissin leaf specimens withquercetin as the main aglycone. Apart from the exceptions already mentioned, quercetinfollowed by kaempferol were generally the most ubiquitous aglyca in the leaf specimensinvestigated.
Initially, the idea to hydrolyse gallotannins together with flavonoids by means of the samehydrolysis method, the methanolysis, was subsequently discarded and deemed highlyproblematic.
According to methanolysis method A, the rate of return for pure gallic acid amounted to61 ± 11 % and between 78 and 100 % of gallic acid was obtained as gallic acid methyl ester.Although omission of the ethylacetate step raised the rate of return up to 104 ± 6 %, and theportion of gallic acid methyl ester was reduced to 70 %, methanolysis in general turned out tobe too soft to break down the hydrolysable tannins, especially those contained in R. copallina
leaves. Hence, tannins were hydrolysed by means of trifluoroacetic acid (C.IV.2.3,“gallotannins”).
3.4 Quantification of tannin derived gallic acid
By means of TFA-hydrolysis (C.IV.2.3, “gallotannins”), hydrolysable tannins were largelybroken down to gallic acid and, as far as occurring, to ellagic acid. Only to a minor extentcould some compounds closely related to gallic acid not be further hydrolysed (identified bytheir UV spectra).
As already found by investigations on the unhydrolysed leaf extracts, R. copallina andA. rubrum leaves contained the largest amounts of gallic acid and total hydrolysable tannins.
Therefore, comparable results were obtained for the total content of hydrolysable tannins afterTFA-hydrolysis as for the unhydrolysed leaf extracts.

C.IV Quantification of flavonoids and tannins in the food plants of P. v. coquereli 127
The method of TFA-hydrolysis itself was validated with R. copallina leaves from July,commercial tannic acid, gallic acid and in addition, all three flavonoid aglyca wereinvestigated. Results showed that aqueous TFA was superior to methanolic TFA, and 4 hoursof hydrolysis were superior to two hours. Furthermore, methanol as solvent led to a range ofmethylation reactions, which did not occur with aqueous TFA, which in turn resulted in areliable content of gallic acid and gallic acid methyl ester after hydrolysis. On the other hand,this method was not appropriate to hydrolyse flavonoids, as compared to methods ofmethanolysis (see above) only reduced contents of flavonoids were obtained.
Tab. C.17: Review on plant extracts after TFA-hydrolysis. Values are given in % dry weight.
plant specimen gallic acid ellagic acid totala
Albizia julibrissin
May 0.08 0.08May, tips 0.07 0.07JulyOctober, young leaves 0.04 0.04October, old leaves trace am. trace am.
Rhus copallina
May 19.77 22.86July 17.06 20.56October 10.79 17.35
Liquidambar styraciflua
May 2.06 0.46 2.50October 1.31 0.48 1.78
Cercis canadensis
May 1.60 1.69October 1.22 1.22
Robinia pseudoacacia
May trace am. trace am.October trace am. trace am.
Acer rubrum
May 13.58 0.18 20.04b
October 10.69 15.73b
Liriodendron tulipiferad 0.07c
Vitis rotundifoliad 0.70 6.95 7.63
Photinia glabrad
a“Total” gives the total content of gallic acid, not completely hydrolysed related compounds and, as far asoccurring, ellagic acid.
bDue to the large amount of gallic acid, HPLC chromatograms using different concentrations were used tocalculate the total content of gallic acid, related compounds and ellagic acid.
cverified by methanolysis
dharvested in October
3.5 Gravimetric determination of tannins in R. copallina leaves
The gravimetric determination of tannins in R. copallina leaves is based on the method ofDoorenbos (1976), a method using selective solvent extraction which has been developed to

128 C.IV Quantification of flavonoids and tannins in the food plants of P. v. coquereli
determine gallotannin levels in leaves of R. copallina and R. glabra. In this study, a slightlymodified procedure has been applied (C.IV.2.5). Two determinations were performed on eachleaf harvest, respectively.
Tab. C.18: Gravimetric determination of leaf tannin contents of Rhus copallina with respectto seasonal differences. Values given are referred to leaf dry weight.
harvest content % (m/m)May 28.02July 28.03October 21.65
In agreement with results of HPLC determinations (C.IV.2.1) of the unhydrolysed andhydrolysed leaf extracts, both the May and July leaf harvests contain nearly the same highcontents of gallotannins, while October leaves exhibit reduced contents.
To test for purity of the obtained extracts, samples were examined by HPLC analysis, and inaddition by various TLC systems (TLC-systems 1 and 3; anisaldehyde / H2SO4; FeCl3-reagent). As usual, HPLC chromatograms were detected at 270 nm for tannins and at 350 nmfor flavonoids.
Viewed at 270 nm, gallic acid was the main component, followed by gallic acid methylester,and to a far lesser extent other gallic acid derivatives occurred. Flavonoids detected at 350 nmoccurred in negligible amounts and were hence not integrated in the HPLC chromatogram.
After additional TFA-hydrolysis (C.IV.2.3, “gallotannins”) leaf tannin extracts werehydrolysed yielding gallic acid and gallic acid methyl ester. While a portion of approximately59 % of gallic acid and gallic acid methyl ester was calculated to occur in the tannin extract ofMay leaves after hydrolysis, about 67 % were calculated for the extract of July leaves and85 % for the extract of October leaves. Differences in the portion of gallic acid and gallic acidmethyl ester indicate seasonal changes in leaf tannin composition.
It can be summarised that the contents of tannins in R. copallina leaves and the contents offlavonoids in A. julibrissin leaves decreased during the year with a marked change in theflavonoid composition. From a review of the literature (chapter C.II), high contents ofhydrolysable tannins could only be expected for R. copallina leaves. Neither the high contentof hydrolysable tannins in A. rubrum leaves, nor the high content of flavonoids in A.
julibrissin leaves could be expected based on the published studies. The special pattern offlavonoid levels and the contents of flavonoids and tannins that changed with seasons areimportant results of this investigation. Correlations of the contents of these compounds toamounts ingested by the animals will show how animals reacted to this challenge (chapterC.VI).

C.V Mucilage analyses of A. julibrissin 129
C.V Mucilage analyses of Albizia julibrissin
1 Introduction
During preliminary assays for this study (C.III.3.1), a third group of secondary plantcompounds has been detected in one of the major food plants. The leaves of Albizia julibrissin
were found to contain a mucilaginous type of compound, consisting of high molecular weightcarbohydrates, that has not been characterised before.
Since mucilage containing phytotherapeutics are already used to cure different gastrointestinaldisorders including diarrhoea for humans, the idea presents itself that this plant’s mucilagemay offer beneficial gastrointestinal properties to the lemurs as well.
Depending on the plant’s site of production, function, storage and secretion, polysaccharidescan be divided into structural polysaccharides (cellulose, hemicellulose and pectins), reservepolysaccharides, and mucilaginous compounds such as gums and neutral or acidic plantmucilages (Steinegger and Hänsel, 1988). While gums are produced and secreted at the site ofa plant wound it will build a pathological process (called gummosis), whereby mucilaginouscompounds in sensu strictu are (pre)stored, e.g. in vacuoles.
Chemically, most gelling and mucilaginous compounds are heteropolysaccharides of eitherneutral or acidic character. For instance, polyuronic acids are characteristic of acidicmucilages, pectins and gums (Steinegger and Hänsel, 1988; Rimpler, 1999). The tertiary andquaternary structure of plant polysaccharides is decisive for their water-binding and gellingcapacity, which in turn determines the viscosity of different concentrated gels. The structurefurther determines their use in medicine, in the pharmaceutical technology and in the foodindustry as emulsifying, stabilising or gelling agents.
Hence, in this study the leaf mucilage of A. julibrissin was first characterised by its physico-chemical properties such as the “swelling number” when the plant material was soaked inwater, its pH and possible interactions with other food compounds such as tannins. Tanninswere simultaneously ingested by the sifakas while eating e.g. R. copallina leaves.
A preliminary chemical characterisation of the leaf mucilage was performed and theirmonosaccharide constituents, their type of linkage and some sequential information wereobtained. This relied mainly on hydrolytic techniques followed by GC/MS analysis of thechemically modified monomers. In a complementary way, the mass spectrometric analysis ofshort oligomeric fragments of the polysaccharide were obtained by partial hydrolysis, whichallowed for the deduction of general sequence patterns. This information was used for theclassification of the polymer to known groups of plant polysaccharides. This characterisationof the plant polysaccharide will be useful to predict its possible usefulness in the treatment ofgastrointestinal disorders.

130 C.V Mucilage analyses of A. julibrissin
2 Materials and Methods
2.1 Characterisation of physico-chemical parameters of A. julibrissin leafmucilage
Swelling number (Quellungszahl, QZ)
The determination of the “swelling number” is a conventional method to characterise thegelling properties of mucilage from plant specimens (Ph.Eur. II; DAB 9; DAC 1986; Stahland Schild, 1981). The “swelling number” gives the volume including the welling mucilagewhich clings to the ground plant tissue, and is measured by leaving it to soak in an aqueoussolution for 4 hours. The value is referred to 1 g plant material (Ph.Eur. II; Stahl and Schild,1981). As this is a conventional method, it needs to be adjusted to individual plant specimenswith respect to the input of weight and the degree of fineness required (compare monographsof DAB 9, DAC 1986).
Definition of the swelling number: QZ = v/w [cm3 / g]
Procedure: The ground and exactly weighed plant material (normally approximately 1 g) isfirst moistened by 1 cm3 ethanol (96 % v/v) and left to soak in 25 cm3 water for 4 hours in asealable 25 cm3 cylinder graduate by 0.5 cm3. The cylinder is shaken or stirred every 10minutes during the first hour. Floating particles are removed after 1.5 hours after starting theassay by turning the cylinder round its longitudinal axis. After a total of 4 hours, the volumeis recorded.
In this study, different mills (Braun® or Moulinex®), a mortar with pistil, and sieve No. IV(DAB 7) were used to grind and sieve the plant specimens. 0.25 g input were used of groundand powdered A. julibrissin leaves, while 0.5 g were used of the other plant specimenscollected at the DULC, respectively.
Normally, assays are performed in triplicates and averaged, but in this study, most plantspecimens had 6 to 9 assays performed.
Reference substancePlantaginis ovatae testa (DAC 1986; Ispaghula husks1) from P. ovata (syn. P. ispaghula)
Gelling properties of A. julibrissin leaves
For the following investigations A. julibrissin leaves collected in May were used.
a) Preparation of a simple gel with A. julibrissin leaves: powdered leaf material was stirredin water (q.s.) yielding a green gel.
b) Based on experiments from Mital and Adotey (1973), emulsions of A. julibrissin gel withparaffin were prepared. First, paraffin (paraffinum subliquidum; q.s.) was added to thesimple A. julibrissin gel. Then, some tannin extract (C.IV.2.5) was dispersed in paraffin(q.s.) to be subsequently added to the A. julibrissin gel emulsion.
c) 4 % and 8 % (m/v) gel preparations: 4 % and 8 % (m/v) aqueous dispersions of ground A.
julibrissin leaves and Plantaginis ovatae testa (Ispaghula husks; reference compound)were respectively left to soak in water to be centrifuged afterwards. Supernatant gels wereused for experiments.
1 Ispaghula Husk, British Pharmaceutical Codex (BCP) 1979; Psyllium Husk, United States Pharmacopoeia(USP) XXI (1985)

C.V Mucilage analyses of A. julibrissin 131
2.2 Isolation and chemical characterisation of A. julibrissin leaf mucilage
Gel filtration and fractionation
The plant mucilage of A. julibrissin was fractionated by gel filtration on a sepharose gel.Carbohydrates were detected by PAS and proteins by Bradford reagent, respectively. Guidedby detection with PAS reagent, fractions were collected and pooled. Prior to further analyses,the pooled fractions were dialysed extensively against distilled water. Aliquots of the pooledfractions were subjected to structural analyses by means of GC, GC-MS and ESI-MS/MSexperiments.
Fractionation of the plant mucilage was performed at the laboratory of Dr. M.-L. Enss(MHH).
Preparation of the plant material50 mg of the dried and powdered leaves of A. julibrissin (harvested in May) were left to soakin 10 ml water for 24 hours. The dispersion was centrifuged and sieved (PM 30) to gain a gelwith a molecular weight of at least 30 000 Dalton. 4 ml of this solution were furtherfractionated on a sepharose gel column.
Column: 300 x 9 mm, packed with sepharose CL-4B (preserved with 20 % ethanol), bufferedand eluted with 0.01 M sodium dihydrogen phosphate solution at pH 8. Amphotericin B(250 µg / ml) was added to the buffer solution to protect against microbial growth.
Flow rate: 8 ml per hour.
Detection wavelength: Proteins were detected photometrically with Bradford reagent at580 nm, carbohydrates were detected with PAS reagent at 550 nm.
Bradford reagent to detect proteins
stock solution: 100 mg Coomassie Blue G, 50 ml ethanol (97 % v/v),100 ml H3PO4 (85 %); temperature during storage: 4 °C;
solution for usage: 3 ml stock solution, 17 ml aqua dest.;
detection: 50 µl sample are detected by 200 µl reagent on a covered microtitreplate after 10 min. at room temperature
detection wavelength: 580 nm.
PAS method to detect carbohydrates
chemicals: fuchsin, periodic acid, acetic acid (7 %), sodium pyrosulphite,1 M HCl, activated charcoal;
periodic acetic acid: 10 mg periodic acid are added to 10 ml acetic acid (7 %)
Schiff reagent: 1 g alkaline fuchsin is solved in 100 ml aqua dest., brought to the boil,left to cool at ca. 50 °C, and 20 ml 1 M HCl and ca. 500 mg activatedcharcoal are added. This suspension is stirred for about 10 min. andfiltrated twice. A clear deep red coloured solution is obtained.
To decolourise the Schiff reagent 100 mg sodium pyrosulphite areadded to 6 ml Schiff reagent and left to stand for about 2 hours in awater bath at 37 °C.
detection: 50 µl periodic acetic acid was added to150 µl sample on a microtitreplate, which is incubated at 37 °C for about 2 hours (the time until theSchiff reagent is decolourised). Then 50 µl decolourised Schiffreagent are added to each sample. The covered plate is left to stand for30 min. at room temperature.
detection wavelength: 550 nm

132 C.V Mucilage analyses of A. julibrissin
Compositional analyses of carbohydrates and amino acids
Aliquots of the pooled mucilage fraction were hydrolysed, lyophilised and trimethylsilylatedprior to amino acid and carbohydrate compositional analyses. These GC analyses wereperformed at the laboratory of Dr. Kownatzki and Dr. Blaskowitz, MHH.
To determine the amino acid composition, the plant mucilage was hydrolysed with 6 N HClfor 24 hours at 110 °C. After drying in a Speed Vac centrifuge, samples weretrimethylsilylated with MTBSTFA.
To determine the monosaccharide composition, hydrolysis was performed with 0.5 Mmethanolic HCl for 15 hours at 75 °C. Volumes were reduced by Speed Vac centrifuge andtrimethylsilylation was performed with BSTFA.
Determination of the dry residue:
Samples of respectively 200 µl were reduced in volume by means of a Speed Vac centrifugeand dried overnight on P2O5 and NaOH in vacuo at 70 °C until constancy of weight.
GC-conditions:AEI MS30 74; column: SE 54; helium; 2 °C per minute; temperature to determine thesaccharides: 70-300 °C; temperature to determine the amino acids: 100-320 °C.
Data collection: Kratos DS 55.
Linkage analysis ( = methylation analysis) and partial hydrolyses
Linkage analysisTo determine linkages between aldoses (here aldohexoses), aliquot solutions containing theintact polysaccharide were permethylated, hydrolysed, and reduced by means of NaBH4 andperacetylated. To determine uronic acids (here hexuronic acids), samples were permethylated,reduced by means of NaBD4, hydrolysed, reduced by means of NaBH4, and peracetylated.
By the permethylation procedure all free hydroxyl groups of the intact polysaccharide aremethylated yielding methyl ethers. The subsequent hydrolysis yields monosaccharide unitswith free hydroxyl groups at positions that had formerly been linked to further sugar units,while the methyl ether groups remain unaffected. Reduction with NaBH4 leads to conversionof aldoses (here aldohexoses) to their corresponding alditols (here only aldohexitols). So, inhexopyranoses, the aldehyde group at the enantiomeric carbon is reduced to an alcohol andtherefore ring opening occurs between C1 and C5 yielding a linear structure. Subsequentperacetylation marks the position of ring fission (C1 and C5 of hexopyranoses) and inaddition all positions where sugar components had been attached, which is the major point ofinterest within the methylation analysis. Thus, open chained sugar alcohols are generatedfrom former aldoses bearing methoxy or acetoxy groups at each carbon atom (see App. II.5).
In case of hexuronic acids, permethylation yields methoxy groups as described for thealdohexoses and one additional methyl ester function at position C6, the former carbonic acid.As in contrast to free carbonic acids, ester groups can be reduced with metal hydrides,reduction is now performed by means of NaBD4, leading to conversion of hexuronic acids tothe corresponding hexose derivative with two deuterium atoms incorporated at C6 position(-CD2OH: isotope tagging). Thus, it becomes possible to distinguish between position 6 of aformer hexuronic acid and the respective hexose. After subsequent hydrolysis to get freemonosaccharides, a further reduction step follows, with NaBH4 to convert the aldehydefunction at position C1 (anomeric carbon atom) into an alcohol function as described foraldohexoses. Finally, peracetylation yields acetoxy groups at C1, C5, C6 and all hydroxygroups to which another sugar moiety had been formerly attached.
The methylation analysis was carried out at the laboratory of Dr. M. Nimtz (GBF,Braunschweig). The procedure was performed according to Nimtz et al. (1996), which isbased on the method of Hakomori (1964).

C.V Mucilage analyses of A. julibrissin 133
Methylation of the unsubstituted hydroxyl groups of all sugar components was achievedusing the methylsulfinyl carbanion as catalysing base, the conjugate base of dimethylsulfoxide (DMSO), generated by dissolving a weighed amount of sodium hydride in DMSO.Excess of methyl iodide was added as methylation reagent. Both, the amount of themethylsulfinyl carbanion and the sodium hydride have to be nearly equivalent to the contentof hydroxyl groups expected. The reaction was carried out as one continuous process(Hakomori, 1964).
A weighed sample of plant mucilage was dissolved in 0.2 ml of DMSO (magnetic stirrer) atslightly elevated temperatures (40-50 °C) under a stream of nitrogen. Under continuousstirring, equal amounts of the methylsulfinyl reagent were added, and finally a 10-fold excessof methyl iodide was added. The reaction mixture was diluted with water and the methylatedproducts were extracted by means of lipophilic solvents, which were in turn purified by gelchromatography on Sephadex LH20 to remove contaminants of low molecular weight.
Reduction with NaBD4 to discern hexuronic acids from native hexoses:
200 µl of a solution of 5 mg NaBD4 in 1 ml 1 % (v/v) ammonia solution in water was addedto the permethylated polysaccharide. To increase solubility, 200 µl of ethanol were added.The reaction mixture was then left to stand overnight. The reaction was interrupted by onedrop of acetic acid; after evaporation of the solvents, the boric acid generated in situ wasremoved by means of 5x evaporation of the sample dissolved in 200 µl of 1 % (v/v)methanolic acetic acid.
The reduction with NaBD4 is omitted for native aldohexoses.
Hydrolysis was performed with 4 N TFA for 2 hours at 100 °C.
Reduction with NaBH4 to reduce the aldehyde function of aldohexoses (includingaldohexuronic acids) at the anomeric carbon atom to the respective alcohol (alditol):1 mg NaBH4 was added per ml sample solution, other conditions were as described for steptwo.
Peracetylation: 100 µl of acetanhydride plus one drop of acetic acid were added to eachsample, which was kept for 2 hours at 100 °C.
For detection GC-MS and ESI-MS/MS analyses were used.
Partial hydrolysesPolysaccharide samples of the leaf mucilage were partially hydrolysed with trifluoroaceticacid at three different concentrations. Each of the resulting oligosaccharide mixtures wasreduced by means of NaBD4 to mark the reduced position C1 from position C6 of formeraldoses by introduction of one deuterium atom at the anomeric C1 (-CHDOH). It should benoted that this time reduction with NaBD4 only leads to a reduction of the aldehyde functionat the anomeric carbon atom of hydrolysed hexose and hexuronic acid moieties, while thecarbonic acid function at C6 of hexuronic acids remains unaffected.
This step allows for a differentiation between position 3 and position 4 in case of substitutedhexoses, as otherwise fragments of like masses would have been produced during massspectrometric fragmentation of the derivatives. Subsequent permethylation yielded methylethers of all hydroxyl functions and a methyl ester at the former carbonic acid group,respectively. Finally, these derivatised oligosaccharide-alditol-1-d samples were directlyanalysed by means of EI-MS (GC-MS and subsequent MS/MS) and positive ESI-MS (andsubsequent MS/MS).
Thus, samples containing native polysaccharides were partially hydrolysed with 0.1 N, 1 Nand 4 N TFA for 1 hour at 100 °C, respectively. Subsequently, samples were then reducedwith NaBD4 and permethylated according to procedures as described for the methylation

134 C.V Mucilage analyses of A. julibrissin
analysis. After purification on Sephadex LH20, samples were directly analysed by GC-MS/MS and ESI-MS/MS.
Detection by mass spectrometryExperiments were performed according to Nimtz et al. (1997).
GC-(EI)MS and MS/MS experiments were performed on a Finnigan GCQ ion-trap massspectrometer (Finnigan MAT Corp.) running in the EI mode equipped with a30-m DB5 capillary column. It was started at a temperature of 80 °C, 2 minutes were runisothermally, then it was heated 10 °C / min. until 340 °C were reached. MS/MS experimentson this instrument were performed by isolating the respective parent ions in the trap andsetting the collision energy to about 0.7 eV.
ESI-MS/MS analyses were performed on a Finnigan MAT TSQ 700 triple-quadrupole massspectrometer equipped with a Finnigan electrospray ion source (Finnigan MAT Corp.). Thereduced and permethylated samples were dissolved in acetonitrile, saturated with NaCl(approximately 10 pmol / µl) and injected at a flow rate of 1-3 µl / min into the electrospraychamber. In the positive-ion mode, a voltage of +5.5 kV was applied to the electrosprayneedle. For fragmentation of the sodium adducts, 40-70 eV were applied to the collision cell.
3 Results
3.1 Swelling number and gelling properties
To characterise the gelling properties of leaf species eaten by the Coquerel’s sifakas, the“swelling number” was determined for all plant species collected during the study times atDuke (Tab. C.19). Although normally triple assays have to be performed, in particular for A.
julibrissin leaves and Plantaginis ovatae testa more tests were carried out.
Tab. C.19: Averaged swelling number of plant specimens.
plant sample May July OctoberAcer rubrum 7 6Albizia julibrissin 9 12-18 9a; 10b
Cercis canadensis 8 12Liquidambar styraciflua 7 8Liriodendron tulipifera 10Photinia glabra
c 8Plantaginis ovatae testa 54Rhus copallina 7 8 7Robinia pseudoacacia 7 8Vitis rotundifolia 8
ayounger leaves
bolder leaves
cDue to insufficient amounts of plant material of Photinia glabra only simple tests could be performed(n=1).
Except for the Plantaginis ovatae testa as reference compound, the highest swelling numberwas found for A. julibrissin leaves harvested in July. Although other plant specimens alsoshowed in part high numbers, only powdered A. julibrissin leaves produced a green gel if theleaf material was soaked in water.

C.V Mucilage analyses of A. julibrissin 135
The Plantaginis ovatae testa material was of premium quality and extremely fine. Hence, therequired soaking number of 40 (DAC 1986) was clearly exceeded. In comparison, accordingto DAB 9 intact Psyllii semen had a swelling number of 10, and for Plantago ovatae semen aswelling number of 9 was prescribed.
Dosage calculations for the amount of plant mucilage eaten by the Coquerel’s sifakas (seechapter C.VI) was based on the swelling number. The swelling number of 9 was used for theleaves ingested in May and the younger autumn leaves, respectively, since for these monthsfeeding data were recorded. It should be remarked that storage conditions may have impactonto the swelling number so that the swelling number for May leaves may be determinedsomewhat low, and a possible difference to the swelling number of younger autumn leavesmay not become visible.
Gelling properties in the presence of tanninsPrincipally during the spring months, R. copallina and A. julibrissin leaves were ingestedwithin one meal time in substantial amounts by the focal sifakas. Hence, the question arose ifthe chemical leaf compounds, respectively the mucilage of A. julibrissin and the gallotanninsof R. copallina leaves, would interact negatively or positively. Viscous solutions and gels areoften disturbed by tannins due to incompatibilities based on differing pH optima. As a result,various gel preparations from A. julibrissin leaves with R. copallina leaves or R. copallina
leaf extracts were used to examine this problem.
a) First, a simple gel was prepared with A. julibrissin leaves, whereby some powdered R.
copallina leaves were added. The gel became significantly stiffer and did not break. Withthe addition of tannins extracted from R. copallina leaves (C.IV.2.5) to the simple A.
julibrissin gel, similar results were obtained.
b) Another experiment was performed using emulsions prepared with paraffin (Mital andAdotey, 1973) which could easily be stirred into the gel. Adding the dispersion of R.
copallina leaf tannins in paraffin to the A. julibrissin gel emulsion, resulted once again ina smooth and stiff gel.
c) Measurements of the pH corroborate the finding that A. julibrissin gel is obviouslycompatible with tannins. While a 4 % (m/v) gel of A. julibrissin leaves yielded a pH ofabout 4, Ispaghula husk gel showed neutral pH (about 7). Addition of some commercialtannic acid to Ispaghula husk gel lowered the pH to 1-2. In contrast, the addition of tannicacid to 4 % and 8 % (m/v) A. julibrissin gel preparations yielded a pH of approximately 3.Obviously, A. julibrissin gel possesses a buffering capacity to some extent and its acidicproperties allow for a compatibility with tannins, which is not the case for neutralmucilages such as preparations with Plantaginis ovatae testa.
3.2 Chemical composition of A. julibrissin leaf mucilage
Polysaccharide fractions of high molecular weight were collected from A. julibrissin leafsamples by gel filtration. These fractions contained polysaccharides with a molecular weightof approximately 2 million Dalton and were used to chemically characterise the leaf mucilage.Guided by detection of carbohydrates with PAS reagent, 40 fractions of 1.3 ml each werecollected, from which fractions 10 to 18 containing high molecular weight polysaccharideswere pooled.
To investigate the composition of monosaccharides and amino acids of A. julibrissin leafmucilage, aliquots of the high molecular weight fractions were hydrolysed and the resultingmonosaccharide and amino acid components were determined by GC analyses. The dryresidue yielded 4.2 % carbohydrates and 0.4 % amino acids.

136 C.V Mucilage analyses of A. julibrissin
The main monosaccharide components were rhamnose (38 %), galacturonic acid (29 %) andgalactose (33 %), that is a molar ratio of nearly 1:1:1. Monosaccharides found during thesubsequent linkage analysis (= methylation analysis) corroborated the occurrence ofrhamnose, galactose and galacturonic acid as major monosaccharides. Amino-groupscontaining sugars were not found.
The following amino acids were detected within the fraction of proteins: glutamic acid(17 %), aspartic acid (11 %), alanine (10 %), serine (10 %), and leucine (10 %) were found byat least or more than 10 %. Valine (8 %), glycine (6 %), isoleucine (5 %), lysine (5 %),tyrosine (5 %), threonine (4 %) and phenylalanine (4 %) occurred by less than 10 %,respectively. Proline (2 %) and methionine (1 %) appeared as minor components. Althoughthe type of binding between the portion of polysaccharides and the portion of proteins was notfurther investigated in this work, at least in part covalent bonds are assumed to appearbetween both like in most gums and mucilages (Hegnauer, XIa, 1994).
According to the identification and quantification of the major components of A. julibrissin
leaf mucilage in this study, A. julibrissin leaf mucilage can be classified as acidic and pectin-like mucilage.
In contrast, the mucilaginous polysaccharides from Plantago seeds, such as the drugPlantaginis ovatae testa (used as reference compound in this study), belong predominantly tothe water-soluble fibre type (hemicelluloses), and consist basically of arabinoxylans (Rimpler,1999). According to the scientific information of Dr. Falk Pharma GmBH on Plantaginisovatae testa, the husks consist of 85 % mucilaginous polysaccharides, which in turn containxylose (63.6 %), arabinose (20.4 %), rhamnose (6.4 %) and galacturonic acid (9.4 %) as majorcomponents.
Linkage of the sugar moieties of the mucilage by methylation analysisA set of complementary techniques was used for a preliminary structural characterisation ofthe polysaccharide isolated from A. julibrissin leaf mucilage. Whereas carbohydratecompositional analysis after total hydrolysis of the polysaccharide revealed the identity of itsmonosaccharide constituents, the linkage type of individual monosaccharide units waselucidated by the methylation analysis. The sequence of monosaccharide units in thecarbohydrate chain and the detection of branching points was achieved by GC/MS analysis ofsmall reduced and permethylated oligosaccharides and the MS/MS analysis of largeroligosaccharide units obtained after partial hydrolysis of the oligosaccharide chain.Complementary aspects of these data allow for a rough description of the overall structuralpatterns to be found in the native polysaccharide. But not all structural parameters likeanomericity of the monomers, the exact definition of branching points, the “decoration” of thenative oligosaccharide chain with acetyl groups etc. could be unambiguously solved by themethods applied.
To determine the linkages between the major monosaccharide units, a methylation analysiswas performed with subsequent GC-(EI)MS analysis.
In this study, two types of linkages have been demonstrated for rhamnose moieties, that is1,2- and 1,2,4-linked rhamnose (deoxymannose) moieties with the largest peak in the GC-spectrum originating from the 1,2-linked rhamnose. For galactose and galacturonic acid 1,4-linkages were found, respectively. For details see App. II.5.
The sequential analyses of oligosaccharide units were performed after partial hydrolyses,reduction and permethylation followed by GC-MS/MS and ESI-MS/MS detection.
Results showed that 4 N TFA was superior to lower concentrated TFA for the partialhydrolysis of the polysaccharide contained in the mucilage.
With respect to mass spectrometry the positive ESI-mode was preferred and gave valuableinformation generating sodium adducts of the hydrolysed oligosaccharide units (App. II.5).

C.V Mucilage analyses of A. julibrissin 137
The sequential analysis yielded disaccharide units consisting of galacturonic acid, which wasbound to deuterium labelled rhamnitol, and galacturonic acid being attached to deuteriumlabelled galactitol, respectively. Based on results of the methylation analysis and fragmentsgenerated through EI-MS experiments, it is concluded that these disaccharide units arecomposed of GalA 1→ 4 Rha-ol-1-d and GalA 1→ 4 Gal-ol-1-d units, respectively (seeApp. II.5). As by linkage analyses only 1,2- and 1,2,4-linked rhamnose has been found, it canbe assumed that during partial hydrolysis obviously the 4-linkage of the rhamnose was moreresistant to hydrolysis conditions than the 2-linkage, which was obviously cleaved beforemethylation. So, it can be assumed that the GalA 1→ 4 Rha unit originates from a branched1,2,4-linked rhamnose moiety which has originally been further substituted in 2-position.
Furthermore, after partial hydrolyses the presence of several linear sequences and onebranched sequence could be shown by applying the EI-MS and ESI-MS techniques.
The linear oligosaccharides were found to consist of four (tetramer), six (hexamer) and eveneight (octamer) saccharide units with alternating galacturonic acid and rhamnose moieties, thelatter exhibiting a molecular weight of 1631 Dalton. For the sequence of the linearoligosaccharides the following structure can be proposed, with []n as repeating disaccharideunit: GalA 1→ 2 Rha 1→ [4 GalA 1→ 2 Rha 1]n → 4 GalA 1→ 2 Rha.
From the total molecular weight of the polysaccharide of 2 Mio Da, it can be calculated that,on average, n must be larger than 1000. Although the 2-linkage of the rhamnose moietieswithin the chain could not be unambigously proved by EI experiments, it is reasonable toassume 1,2-linked rhamnose moieties, as after methylation analyses the largest peak in theGC-spectrum originated from1,2-linked rhamnose.
A branched structure could be found for a tetrasaccharide unit with galactose as third majorcomponent (Fig. C.12). Although the type of linkage between the galacturonic acid and theinitial rhamnose residue was found to be GalA 1→ 4 Rha by fragments generated through EI-MS experiments, attachments of the sugar moieties to the C-2 and C-4 of the initial branchedrhamnose residue cannot be unambigously assigned.
HexA1-O-
4Hex
1-O-
2dHex-ol-1-d
O
1HexA
4
Fig. C.12: Proposed structure for a branched tetrasaccharide unit. Types of linkage are basedon methylation analyses, and may be reversed at the branched site.
Galacturonic acid always built the terminal end, while rhamnose built the initial reducedmoiety. As galacturonic acid has never been found to occur in the reduced form, it can beassumed that the linkage between galacturonic acid and rhamnose was more stable than thelinkage between rhamnose and galacturonic acid.
Hence, A. julibrissin leaf mucilage, which has been investigated for leaves from May, can beclassified as pectic-like polysaccharide, a rhamnogalacturonan with a hypothetical backbonestructure in which galacturonic acid and rhamnose moieties occur as alternating units. Inbranched regions that also contain galactose moieties as third major component, 1,2,4-linkedrhamnose appeared as the site of ramification. Galacturonic acid was found as terminal sidechain component.

138 C.V Mucilage analyses of A. julibrissin
4 Discussion
The mucilaginous polysaccharides in A. julibrissin leaves found in this study werecharacterised by compositional and linkage analyses to determine its chemical structure(App. II.5) and by differing physico-chemical experiments to assess its possible suitability formedicinal purposes.
The structure of alternating 1,4-linked galacturonic acid and 1,2-linked rhamnose residueswere the backbone structure of rhamnogalacturonans with 1,2,4-linked rhamnose residues asthe site of ramification, which agrees with hairy regions in pectins as part of the cell wallstructure and pectin-like polysaccharides as fractions from plant mucilages, which occur indifferent species throughout plant kingdom (Stephen, 1983 (review); Kiyohara et al., 1988;Müller et al., 1989, Yamada et al., 1990; 1991; An et al., 1994; Schols et al., 1994; 1995;Vignon and Garcia-Jaldon, 1996; Rimpler, 1999).
Schols et al. (1994; 1995) isolated rhamnogalacturonan oligomers from hairy regions of applepectin consisting of 4 to 9 sugar units with a backbone of alternating galacturonic acid andrhamnose residues. Despite different analytical methods (compared to this study), some of theoligomers found by Schols et al. (1994; 1995) perfectly agree with structures proposed for thehigh molecular weight fraction of A. julibrissin leaf mucilage. Structures similar to the hairyregions of apple pectin were also found in various fruits and vegetables like potato fibre,carrot, onion, leek, grape and pear tissue (Schols et al., 1994; 1995).
Pectin (Pectinum, ÖAB) itself is a heteroglycan, containing unbranched homogalacturonaneregions, so called smooth regions, which are interrupted by rhamnogalacturonan regionscarrying neutral carbohydrate side chains. These branched regions are called “hairy regions”.While homogalacturonan regions contain α-1,4-linked galacturonic acid residues,rhamnogalacturonan regions consist of α-1,4-linked galacturonic acid and α-1,2-linkedrhamnopyranosyl residues substituted with neutral side chains as arabinans, galactans, orarabinogalactans attached to O-4 of the rhamnopyranosyl residue. In homogalacturonanregions carboxyl groups are in part methylated and hydroxyl groups acetylated, respectively,while in rhamnogalacturonan regions only hydroxyl groups carry in part, acetic acid ester. Insome pectins like apple pectin, homogalacturonan regions may be substituted byxylogalacturonans with xylose residues being attached to the O-3 of galacturonic acidresidues (Rimpler, 1999).
Hence, the high molecular weight fraction of A. julibrissin leaf mucilage can be characterisedas rhamnogalacturonan in agreement with hairy regions in pectins and pectin-likepolysaccharides. However, in contrast to most pectins and pectic polysaccharides, in thisstudy no pentoses such as arabinose or xylose could be found as neutral side chaincomponents.
Of the large number of plant gums that have been examined chemically, the majority aresubstituted arabinogalactans, with most containing uronic acids and rhamnose as well(Stephen, 1983). Focusing on the Mimosaceae, especially gums of the genera Acacia andAlbizia have been most extensively studied with gum Arabic from Acacia senegal and furtherAcacia species as prominent example.
Thus, gums from more than 60 species of Acacia (Anderson and Stoddart, 1966; Andersonand Karamalla, 1966; Anderson and Cree, 1968a and b; Anderson et al., 1968; Anderson andDea, 1969; Anderson et al., 1983; Stephen, 1983; Anderson et al., 1984; Martínez et al.,1992; Rimpler, 1999) and 11 species of Albizia (Anderson et al., 1966; Mital and Adotey,1971; Stephen, 1983; Anderson and Morrison, 1990; Martínez et al., 1995) have been mostextensively investigated. The number of studies on Acacia gums are impressive, the numberof known species exceeds 900 (Stephen, 1983), while the genus Albizia, tribe Ingeae,

C.V Mucilage analyses of A. julibrissin 139
comprises 150 species (Anderson and Morrison, 1990). However, species-specific differencesare significant (Stephen, 1983; Delgobo et al., 1998).
As to chemical peculiarities, gums from investigated Albizia species are reported to containmannose, which does not occur in Acacia gum exudates (Anderson and Morrison, 1990;Hegnauer, XIa, 1994). Depending on the species, Albizia gums consist of 1-16 % 4-O-methylglucuronic acid, which could not be found in this study, 5-29 % glucuronic acid, 14-55 % galactose, 1-13 % mannose, 14-40 % arabinose and 7-29 % rhamnose (Anderson et al.,1966; Anderson and Morrison, 1990). For Albizia zygia gum, galactose, arabinose, glucuronicacid and galacturonic acid were found as components (Mital and Adotey, 1971). In a laterstudy on Albizia lebbeck (Martínez et al., 1995), which is also mentioned as gum Arabicsubstitute, no rhamnose residues have been found. However, Hegnauer (2001) does state thatthe monosaccharide components of Mimosaceae hetreopolysaccharides largely agree, as mostcontain 4-O-methylglucuronic acid, glucuronic acid, galactose, arabinose and rhamnose.
However, in contrast to the aforementioned studies, which cite both Albizia and Acacia gumsas gum exudates from trunks, stems or branches, the polysaccharide of this study is a leafmucilage and quite different in its chemical composition from all other Acacia and Albizia
gums described so far. However, in this study’s analysis of A. julibrissin, mannose occurredin trace amounts, which was evidenced in the GC spectrum during the compositional analysis.This corroborates the occurrence of this monosaccharide in the genus Albizia.
Previously, the only hint to the occurrence of polysaccharides in A. julibrissin is given byMoon et al. (1985), who investigated crude polysaccharides containing extracts of variousmedicinal plants. Although a certain antitumor activity was found for the crude fraction ofpolysaccharides from A. julibrissin, neither the exact plant tissue used, nor any characteristicson the chemical composition of the polysaccharide were reported. Accordingly, the acidicpectin-like mucilage in the leaves of A. julibrissin is first characterised in this study.
As to the amino acid composition of Albizia gum exudates, aspartic acid and hydroxyprolinappear to be the major components in most species, with proline often as third importantamino acid (Anderson and Morrison, 1990). Subsequent discussion will note that proline andhydroxyprolin are important amino acids, and are able to bind to tannins. However, in thisstudy, the content of proline in A. julibrissin leaf mucilage is relatively low, while thepresence of hydroxyprolin could not be detected.
As to physico-chemical properties, a swelling number of 9 has been determined for A.
julibrissin leaves of May and younger October leaves (Tab. C.19). Although the July leavesexhibited much higher swelling numbers, these values have not been used for dosagecalculations (see chapter C.VI), as no feeding data had been recorded during the month ofJuly. Although no direct relation appears to exist between the swelling number of a drug andits suitability in medicine, (e.g. its use as filling, water-binding and antidiarrhoeal agent), theswelling number is used in this work as a marker to calculate therapeutic dosages and tocompare A. julibrissin leaf mucilage’s numbers to the swelling numbers and dosages of otherantidiarrhoeal drugs.
Despite high swelling values for other plants growing in the forest (see Tab. C.19), the gellingpolysaccharides of high molecular weight were only identified in A. julibrissin leaves. In thiscontext it should be mentioned that dried leaves may contain mucilage of a different, albeit alower quality than fresh leaves (Bräutigam and Franz, 1985a and b).
The acidic pH of aqueous dispersions of ground A. julibrissin leaves is thought to beresponsible for its compatibility with tannins. While normally occurring tannins disturbgelling agents as evidenced in the Ispaghula husk gel, this was not the case for the A.
julibrissin leaf mucilage. A. julibrissin gel became stiffer in the presence of hydrolysabletannins while Ispaghula husk gel became more liquid.

140 C.V Mucilage analyses of A. julibrissin
The observed buffering capacity of A. julibrissin gel might also have an impact onphysiological processes within the gut, e.g. bacterial growth. Furthermore, as evidenced forpectin (Janssen and Queisser, 1982), a dependence of the gel viscosity on pH and temperature(highest viscosity of pectin at pH 7.2 and gel thinning with increasing temperature) whichmay also be expected for A. julibrissin leaf mucilage, with an important influence on thegastrointestinal microflora and motility. According to Anderson and Morrison (1990) someAlbizia species have a much higher intrinsic viscosity and higher rhamnose contents than anyrecorded Acacia gum.
In comparison, for a 2 % (m/v) mucilage of Albizia zygia gum a pH of 4.8, for Acacia
mucilage a pH of 4.3 was reported (Mital and Adotey, 1971). Albizia zygia gum exhibited thehighest viscosity at pH of approximately 5. Lower and higher pH values decreased viscositysignificantly. Furthermore, gel viscosity decreased with temperature and aging (Mital andAdotey, 1972 and 1973). The gum exhibited pseudoplastic flow with thixotropy (Mital andAdotey, 1972).
Plantago seed mucilages are reported to yield thixotrope gels at equal or higherconcentrations than 2 % (Rimpler, 1999).
Finally, the view should be extended to food plants occurring in Madagascar and the questionwhether plant polysaccharides are known as secondary plant compounds to Propithecus
species. There are numerous indications that within their natural Malagasy habitat,Propithecus species utilise gum or mucilage producing trees as food plants (Ranarivelo, pers.comm.; Richard, 1978a; Meyers, 1993), although gum feeding has not been reported forPropithecus species until now. However, species of the Combretaceae, especially the generaCombretum and Terminalia (Anderson and Bell, 1976; Anderson and Bell, 1977; Stephen,1983; Hegnauer, 2001), species of the Burseraceae (Stephen, 1983; Hegnauer 2001) and inparticular, species of the Mimosaceae (genera Albizia and Acacia, see above) are known toproduce gum exudates or incorporate plant mucilages, yet some of these aforementionedplants are reported to be food plants by wild populations of Propithecus. Thus, the role ofplant polysaccharides as secondary plant compounds in food items selected by Propithecus
species in the wild needs more appreciation. In this light the use of Albizia lebbeck by P.
tattersalli raises the question of possible “gum feeding”.

C.VI Pharmacological effects of the food plants analysed 141
C.VI Pharmacological effects of the food plantsanalysed
1 Introduction
The major health problem of captive P. v. coquereli has been a history of acute and chronicdiarrhoea prior to conditions whereby they had access to leaf species of their liking. (Haring,1988; Spelman et al., 1989). Phytochemical investigations in this study have been conductedon the most preferred food plants, Rhus copallina and Albizia julibrissin, and the resultinganalysis revealed the occurrence of three major groups of secondary plant compounds:hydrolysable tannins, flavonoids with predominantly quercetin as aglycone, and a pectin-likeplant mucilage (chapters C.III - C.V).
For ethical reasons, it was not approved by the Duke Lemur Center Research Council toconduct feeding choice experiments with the sifakas. But the question was raised, as to whythe focal lemurs selected these special plant species and their specific plant parts. Theanalytical data of the food plants and their inherent secondary compounds (see chapters C.III -V) combined with pharmacological in vitro assays described in this chapter, together with thesymptoms described in the necropsy reports of dead sifakas will be fully utilised to assess thiscentral question.
In this chapter the three analysed major groups of secondary plant compounds will beinvestigated for possible antimicrobial and enterotoxin inhibiting activities in the context ofdiarrhoea.
Thus, various leaf extracts and preparations of R. copallina and A. julibrissin leaves, and inpart, various other food plants, were tested against different bacterial strains, one protozoaland several fungal strains. As hydrolysable tannins are subject to enzymatic hydrolysis in thedigestive tract, they yield gallic acid monomers, and gallic acid itself has been included insome antimicrobial assays within this study. Based on these results, R. copallina leaf extractswere tested additionally for possible enterotoxin inhibiting properties. For this assay, choleratoxin was chosen, which is known to cause massive diarrhoea in humans.
In view of the large amounts of plant material ingested by the sifakas, the question of relevanttherapeutic dosages of their inherent major plant compounds, and dosage-effect relationshipswill be discussed in comparison to known antidiarrhoeal phytotherapeutics and theirrecommended dosages within human medicine. Pharmacological interactions between thesegroups of secondary plant compounds and their possible effects on the gastrointestinalintegrity will be discussed. The necropsy reports describing symptoms that were associatedwith the death of captive sifakas will be considered in the light of pharmacological effectsinherent to these groups of chemical plant compounds. It appears that these compounds werenot sufficiently supplied by the animal’s food until the dietary regime was revised.
Diarrhoea in captive sifakas is an ongoing problem, especially when the food supply fails theneeds of the sifakas. Diarrhoea in human medicine is defined by more than three dailyemptyings of the gut, a diminished stool consistency with more than 90 % water content and astool weight of over 250 g per day. Accompanying symptoms may be abdominal pain,

142 C.VI Pharmacological effects of the food plants analysed
nausea, emesis, fever and / or haemorrhages. The acute diarrhoea is self limiting after 3-4days, while a chronic low grade diarrhoea may persist for more than two weeks (Viegener,1994; Dingermann and Loew, 2003).
Diarrhoea is a symptom based on a variety of causes and is not a disease in itself. If nospecific cause can be found, diarrhoea can be classified as unspecific. While a chronicdiarrhoea is essentially non-infectious, acute diarrhoea may be infections linked with viruses,bacteria, bacterial toxins and / or parasites. In developing countries, toxin producing bacteriasuch as the cholera toxin are one of the main causes of diarrhoea with the highest mortalityrates in children under five years of age (WHO, 1999 and 2000).
Already existing diseases such as chronic inflammatory bowel diseases (e.g. Crohn’s disease,ulcerative colitis (Elson et al., 1995; Kruis et al., 2003)), tumours, organic causes such ashyperthyreosis, the syndrome of malabsorption, together with malnutrition (Sepúlveda et al.,1988; Bhandari et al., 1996; Prasad, 1998), food intolerance, allergies, physical andpsychological phenomena, or undesired side-effects of pharmaceuticals (like antibiotics) arepossible reasons for non-infectious diarrhoeas. Viruses (e.g. Rotaviruses), bacteria and / ortheir toxins, such as enterotoxin producing E. coli (traveller’s diarrhoea; Raedsch et al.,1991), Vibrio cholerae, Staphylococcus aureus, Shigella and Salmonella species, Clostridium
difficile, Cl. perfringens and Cl. botulinum, Campylobacter jejuni, Yersinia enterocolitica
(Bresnahan et al., 1984), and parasites such as Protozoa (amoeba, Giardia lamblia) andparasitic worms are reasons causing acute infectious diarrhoeas (Thorne, 1986; Dingermannand Loew, 2003), albeit their underlying mechanisms and severity for the host animal canvary considerably (Thorne, 1986). Based on different pathophysiological mechanisms,another division of diarrhoeas is known as diarrhoea of malabsorption (osmotic diarrhoea), asecretory diarrhoea and a functional diarrhoea (Dingermann and Loew, 2003).
Generally, the therapy to correct diarrhoea depends on its causation, but overall the cure isserving to ameliorate its symptoms. For an acute and especially unspecific diarrhoearehydration and (antidiarrhoeal) therapeutics are called for (Ruppin, 1994), albeit morespecific antiviral or antibacterial measures may be necessary. Antidiarrhoealphytotherapeutics are often used for acute and chronic diarrhoeas because of their therapeuticbroadness, low or nearly absent toxicity and their “unspecific” mode of action exhibitingmany different desired effects (Dingermann and Loew, 2003; Rote Liste, 2005)
While studying the necropsy reports of the Coquerel’s sifakas from the Duke Lemur Centerand from the San Diego Zoo (Spelman et al., 1989) (most animals had been wild-caught fromMadagascar), two general underlying courses of pathogenesis could be determined. Thesifakas had developed an acute and devastating diarrhoea, followed by death, or they mayhave died from multiple infections including septicaemia following a history of chronic andrecurrent diarrhoea. Both, specific and unspecific diarrhoeas had occurred and in part, thenecropsy reports resembled each other in symptoms. [In the following cases, only the mostsalient features of the maladies will be discussed.] In cases of accelerated deaths, associatedfindings were e.g. necrotic enteritis, renal failure, salmonella infection, pneumonia andgastritis (Spelman et al., 1989).In cases with a history of chronic recurrent diarrhoea (Duke Lemur Center), animalseventually developed in some cases, a protozoal superinfection, a haemorrhagic pancreatitis, awasting syndrome, or a septicaemia with a lethal sickness. The protozoal superinfection hasbeen described as multifocal necrosis with protozoal organisms while the heart, liver andspleen, had acute interstitial pneumonia with protozoal organisms and oedema, multifocalmyofiber atrophy with interstitial fibrosis in the heart, focal, ulcerative enteritis. A diagnosisof septicaemia was described with findings of a vasculitis, vascular thrombosis, necrotisinginterstitial pneumonia, myocardial necrosis and enlarged heart, hypertrophy of the pyloricmuscle and mild and diffuse lipidosis. At least one septicaemia was caused by Yersinia
enterocolitica. One sifaka died from diabetes, another from adenocarcinoma in the small

C.VI Pharmacological effects of the food plants analysed 143
intestine. At the San Diego Zoo, one Coquerel’s sifaka (the others had died within one weekof importation to the zoo) developed a hemosiderosis. Furthermore, it is notable that a highfrequency of dental diseases occurred, such as broken incisors, submandibular swelling oroedema (Duke Lemur Center).
An alteration in primary food composition already improved health conditions of captivesifakas at the Duke Lemur Center before the onset of this study (milk products such as cheese,eggs, cereals and bread, as well as products too rich in simple saccharides such as honey andjuice, had been eliminated from the diet). Furthermore, it is well acknowledged that dietarychanges affect the gastrointestinal microflora and the absorbing processes of essentialnutrients, especially in respect to diarrhoeal incidences of those with water and electrolytes(Stevens, 1988). Considering the human condition, an overload of simple saccharides over aprotracted period of time favours the generation of caries, diabetes, adiposis and relatedmetabolic diseases. Depending on the type of mono- and disaccharides and absorptiveprocesses they rely on, an overload of these compounds may cause osmotic diarrhoea (Gray,1984). Dietary imbalances of this type in this respect may have favoured the genesis of e.g.diabetes of previously captive sifakas.
However the introduction of the browse contributed significantly to improved health of theanimal followed by successful breeding with the noticeable lack of the “traditional winterslump” (Haring, 1988). It should also be noted that before having access to desired leafspecies, the sifakas often died despite anti-infective and rehydrating therapies. This indicates,that the secondary leaf compounds may play a preventive character, to keep the sifakashealthy. In another line of discussion, curative effects may be attributed to the major leafcompounds.
To explain the courses of diseases leading to these lethal episodes for the sifakas, someadditional explanations on the intestinal milieu and their physiological and pathologicalprocesses need to be elucidated.
Normally, the gastrointestinal microflora is within an ecological equilibrium and relativeconstant of a healthy person, yet there are significant influences from physical, biological,chemical, environmental and host factors. Physiologically, the microflora changes with age,and pathologically, such as in diseased persons, e.g. with chronic inflammatory boweldiseases (Onderdonk, 1998; Ahn et al., 1998). Therefore, the state of the microflora dependson the genesis and formation of various diseases (Ahn et al., 1994 and 1998).
The microbial flora, together with their interaction with host cells of the mucosa and theintestinal immune system, build a complicated intestinal ecosystem. The humangastrointestinal tract has a complicated “cross-talk” between the epithelial lining, the mucosalimmune system and the luminal flora. The immune system of the gastrointestinal mucosa hasdistinct structural and functional features in comparison to the systemic immune system, andrepresents in many respects a separate immunological entity (Marth and Zeitz, 1998;Onderdonk, 1998). Many factors, of exogenous and endogenous type, may influence thisecological equilibrium, such as nutritional factors, bacterial-related factors and host factors(Savage, 1986; Onderdonk, 1998). In the human large intestine, the composition and densityof bacterial populations are influenced by external pressures such as available nutrients, pH,the short chain fatty acid concentration (which in turn influences the pH in the colon), bileacids together with host factors. The sum of all these control mechanisms serves to build abarrier to colonisation by these enteric pathogens. In contrast, pathologically, this highlycomplex and sensible equilibrium can easily be disturbed by bacterial and viral infections,which may lead to bacterial overgrowth or to impoverishment of the normal gastrointestinalmicroflora (Onderdonk, 1998). As consequence, the following pathological processes mayarise and will be discussed here.
The “bacterial translocation” eludes to the passage of particles or microorganisms from thegastrointestinal tract across the intestinal mucosal barrier which then appear in extraintestinal

144 C.VI Pharmacological effects of the food plants analysed
sites such as the lymph, mesenteric lymph node complex, liver, spleen, peritoneal cavity, andblood stream. When the ecological equilibrium is disrupted as indicated by a bacterialtranslocation, it may be caused by three major mechanisms: a heightened bacterialovergrowth, increased intestinal permeability or damage to the intestinal mucosa, and animpaired host immune defence (Berg, 1998). A bacterial translocation has been found e.g. indiabetes. Furthermore, experimental models revealed an increased intestinal permeabilityprior to the onset of this metabolic disease (Berg, 1998; Meddings et al., 2003). In addition,the probability of bacterial translocation depends on the bacterial species. So, it was foundthat facultatively anaerobic bacteria translocated faster than the obligately anaerobic bacteria.A bacterial translocation may be the culprit in life-threatening opportunistic infections ofimmunosuppressed patients as well as the case of lethal sepsis (Berg, 1998).
Generally, the mucosal epithelial layer may be penetrated either by the transcellular(intracellular) or by the paracellular (extracellular) route. Different luminal influences arecapable of influencing the rate and size when crossing these lines (Meddings et al., 2003). Inanimal models, in which the intestinal epithelium is not physically damaged, the route oftranslocation of indigenous bacteria from the GI tract is through the intestinal epithelial cells(i.e. an intracellular route) rather than between the enterocytes via the tight junctions (i.e. anextracellular route). If the epithelial cells’ tight junctions or intestinal epithelium arephysically damaged, indigenous bacteria are then able to pass directly through the denuded orulcerated areas to the lamina propria. Using the intracellular route, translocating indigenousbacteria use the lymphatic route to reach extraintestinal sites. In the shock models exhibitingphysical damage to the mucosal barrier, translocating indigenous bacteria can travel by avasculature route directly to the liver, in addition to the usual lymphatic route (Berg, 1998).
This intestinal permeability translates to the passive permeation of normally not absorbablemolecules, macromolecules and bacterial toxins. This condition may be caused by mucosallesions and ulcers. An increased mucosal permeability, or “a leaky gut” is made responsiblefor systemic endotoxinaemia, and endotoxin shock with multiple organ failure (Gardiner,1998; Gabe et al., 1998; Di Leo et al., 2003).
In view of the necropsy reports concerning the sifakas, and in view of the pathologicprocesses and factors discussed above, it can be presumed, that a history of diarrhoea in thesifakas resulted in a damaged mucosal barrier and a weakened immune system. Both favouredthe emergence of various systemic infections such as pneumonia, the development ofmultifocal infections, and finally, a septicaemia with a multiple organ failure. Both, thelymphatic and the blood system seemed to be implicated in this diagnosis. Exceptionallyopportunistic bacteria and a presumed “leaky gut”, can easily be used as port of entry into theanimal host, which increases the risk of severe opportunistic infections. This theory iscorroborated by the fact, that for many sifakas, the veterinarian failed to pinpoint the definitereason for the clinical course of their disease, and they died despite medicinal treatment.
In captivity, the animals became sick and died, albeit with no obvious detrimental or noxiousfood having been ingested. Therefore, the self-selected leaf species are concluded to exertpredominantly diarrhoea-preventive properties onto the gastrointestinal milieu.
2 Materials and Methods
2.1 Assays on antimicrobial activity
The following in vitro assays serve to screen for possible antibacterial, antiprotozoal andantifungal properties within the sifakas’ food plants. The main focus of these assays wereperformed on the leaves and leaf extracts of R. copallina and A. julibrissin.

C.VI Pharmacological effects of the food plants analysed 145
Preliminary antibacterial assays
According to method A, only R. copallina and A. julibrissin leaves were investigated forpossible antibacterial properties. According to method B, four additional leaf species of thebrowse, Robinia pseudoacacia, Cercis canadensis, Liquidambar styraciflua, Acer rubrum,were included. (All leaf species were harvested in May.)
Test strains (“wild type”)Salmonella EdinburghStaphylococcus aureus
Pseudomonas aeruginosa
Reference compounds and solutionsGentamycin test disks (30 µg) (Oxoid);Tannic acid (tannin, Fluka), utilised as solid compound and as 0.2 % (m/v) methanolicsolution;Gallic acid (Roth), utilised as solid compound and as 0.1 % (m/v) methanolic solution.
Method AMethanolic leaf extracts: 1 g of powdered R. copallina and A. julibrissin leaves wereextracted with 3 ml methanol, respectively.
Dry extracts of R. copallina and A. julibrissin leaves: approximately 1 g of the powdered leafmaterial (air-dried leaves) were weighed exactly and stirred in 30 ml methanol for 30 minutesat room temperature. The extracts were evaporated (Rotavapor®) and dried overnight at70 °C in an oven. (A. julibrissin leaves yielded 13.5 % dry extract and R. copallina leavesyielded 55 % dry extract.) The dry extracts were tested as such.
Tannins extracted from R. copallina leaves (C.IV.2.5) were tested as such and as methanolicsolution (0.1 % m/v).
Powdered leaf material of R. copallina and A. julibrissin leaves was tested as such.
The tests were conducted on agar dishes (Müller-Hinden-agar). Liquid extracts and solutions(the solved dry extracts and the solved reference compounds) were tested on paper disks(paper disk test, DAB 9). The dry extracts, the powdered leaf material, and solid compoundswere directly put onto dishes. The solvent methanol was tested as blind. Commercial gallicand tannic acid (reference compounds) were tested as solid compounds and as methanolicsolutions. Gentamycin paper disks were used as an antibiotic reference substance for eachdisc test. The paper disks were soaked several times with the prepared solutions, so that nofinal concentration of the loaded disks was determined. The incubation time lasted for 24hours at 37 °C, respectively.
Method BApproximately 30 mg powdered leaf material were weighed exactly, dispersed in 0.5 mlmethanol and left to stand overnight. The suspension was centrifuged and 50 µl were takenrespectively for each disk diffusion test. Methanol was tested as blind and gentamycin diskswere utilised as reference compound.
The test procedure was adopted from method A. However, based on results from method A,only Staphylococcus aureus and Pseudomonas aeruginosa were utilised as test strains.
Screen on R. copallina and A. julibrissin leaves for antibacterial, antiprotozoal andantifungal properties
Assays were conducted by Solvay Arzneimittel GmbH, Germany, in cooporation withPanlabs (Inc.):
Approximately 4 g of the dried leaf material of R. copallina and A. julibrissin (May harvest)were finely ground and extracted twice with 50 ml ethylacetate overnight at room

146 C.VI Pharmacological effects of the food plants analysed
temperature. The supernatant solution was reduced in vacuo. The residue was re-extractedwith 50 ml methanol overnight, respectively. Both extracts were unified, taken to dryness invacuo and dried for several hours at 40 °C. The test compounds were dissolved in DMSO0.15 % + absolute alcohol 0.3 % in aqueous media.
2.2 Cholera toxin binding assay
The cholera toxin binding assay was performed according to the method adopted from Hör et
al. (1995). The toxin (0.16 µg / µl final concentration) was dissolved in a binding buffer (100mM Tris, pH 6.8, 10 % (v/v) glycerol, 260 mM mercaptoethanol) and incubated for a fewminutes with the various test samples (final concentrations varying from 30 ng / µl to15 µg / µl) at room temperature. The mixture was heated for 5 minutes at 97 °C. Thedenatured proteins were analysed by SDS-PAGE1 according to Laemmli (1970). Theseparating gel contained 14 % (m/v) acrylamide and 0.8 % (m/v) bisacrylamide. Gels werestained as described in the “Plus One Silver Staining Kit, Protein” from Pharmacia. Molecularweights were determined using the prestained SDS-PAGE standard (broad range) from Bio-RAD (approx. 95 % SDS-PAGE).
The assay was used to test tannin extracts from R. copallina leaves that were harvested inMay, July and October. Leaf extractions were performed according to C.IV.2.5. Furthermore,p- and m-digallic acid methyl ester (p- and m-methyl digallate) were tested, which had beenisolated as mixture in fraction R16 by preparative HPLC method (App. II.3, No.2).Commercial tannic acid (Fluka) and tannin albuminate (Knoll Deutschland GmbH / BASFPharma, now Dr. Rentschler Arzneimittel GmbH) were tested as reference compounds.Cholera toxin was purchased from Sigma [9012-63-9]. For the majority of samples, duplicateassays were performed.
Comment:Gelelectrophoresis separates proteins into different fractions according to their mass, electriccharge and tertiary / quaternary structure. In the presence of SDS, proteins are completelyunfolded and the electric charge is masked by the anionic detergent binding to the proteins.Accordingly, the electrophoretic mobility of a given protein is exclusively dependent on itsmass. Under mild conditions, however, the interaction of proteins with certain secondarymetabolites is not completely abolished, and the study of such interactions using SDS-PAGEis possible.
1 Sodium dodecyl sulphate-polyacrylamide gel electrophoresis

C.VI Pharmacological effects of the food plants analysed 147
2.3 Calculation of the daily intake of flavonoids and tannins
To evaluate the significance of the secondary plant compounds ingested by the sifakas, thecontents of the flavonoids and tannins were determined from the air-dried plant material(chapter C.IV, Tab. C.13, p. 119, to determine gallotannins and flavonoid glycosides, andTab. C.16, p. 125, to determine flavonoid aglyca) and were calculated by means of thefollowing formula:
amount ingested the averaged daily amounts [g] of the flavonoids and tannins,respectively ingested by each lemur group;
c fresh the content (m/m) of the flavonoids and tannins referred to the fresh leafspecies;
weight eaten the weight [g] of the fresh leaf species eaten by each respective lemurgroup;
t the number of days of each group’s observation period.
intake per bodyweight the averaged daily amounts of the flavonoids and tannins, respectivelyingested by each lemur group (amount ingested) and divided by eachgroup’s total bodyweight [g / kg];
intake per individual the averaged daily amount of the flavonoids and tannins ingested perbodyweight (amount per bodyweight) and multiplied by the bodyweight ofeach individual lemur of the respective animal group [g].
In this calculation, all browse species, plus the respective amounts ingested within theforested enclosure (Tab. B.9, p. 43) were included. The calculations were performedseparately for each observation period, i.e. the spring and autumn. For each animal’sbodyweight see chapter B, Tab. B.1, p. 17.
3 Results
3.1 Antimicrobial activity
Preliminary studiesDuring a series of preliminary assays, various leaf extracts from R. copallina and A.
julibrissin were investigated for their growth-inhibitory activities against three bacterialstrains, Staphylococcus aureus, Salmonella Edinburgh and Pseudomonas aeruginosa (“wildtypes”), (Tab. C.20). As gallic acid may be hydrolysed from gallotannins during the gutpassage, gallic acid was included in these first assays. Commercial tannic acid, gallic acid andgentamycin were used as reference compounds (method 2.1).
As depicted in Tab. C.20, the methanolic leaf extract and the tannin extract (C.IV.2.5) from R.
copallina leaves showed growth-inhibitory activities against St. aureus and Ps. aeruginosa.No activity could be found against Salmonella E., so it was not utilised in further test series.The same activity pattern was found for methanolic solutions of commercial tannic and gallicacid.
t
weightc
amount
speciesleaf days
eatenfresh
ingested
∑ ∑
×
=

148 C.VI Pharmacological effects of the food plants analysed
Tab. C.20: Growth-inhibitory activity of A. julibrissin and R. copallina leaf preparationsagainst three bacterial strains (“wild types”).
test samples St. aureus Ps. aeruginosa Salmonella E.A. julibrissin leavesa
− − −R. copallina leavesa + + −R. copallina tannin extractb + + −tannic acid (Fluka)c + + −gallic acid (Roth)c + + −gentamycind + + +
aPowdered leaf material, and dry and methanolic leaf extracts were assayed.
bThe tannin extract from R. copallina leaves (C.IV.2.5) was tested as dry extract and as methanolic solution.
cGallic and tannic acid were tested as solid compounds and methanolic solutions.
dgentamycin test disks (30 µg) (Oxoid)
no inhibition zone visible
+ inhibition zone visible
Solid samples as in the dried leaf extract and the dry tannin extract from R. copallina leaves,as well as powdered R. copallina leaves, showed the same inhibitory tendencies, but were lessactive than the methanolic extracts, especially against Ps. aeruginosa. This outcome was alsofound in solid tannic and gallic acid, whereas the latter produced small holes in aspects of theagar surface.
A. julibrissin leaf extracts showed no activity. Gentamycin as a standard showed nearly thesame activity against all three bacterial strains. These results indicate an antibacterial activityfor R. copallina leaves that can be attributed to their content of gallotannins.
To compare antibacterial activities between the different food plants of the browse fed inMay, assays also included the other four leaf species of the browse (Tab. C.21).
Tab. C.21: Antimicrobial assays including all food species of the browse offered in May.
inhibitory zonetest samples content (disc-1) St. aureus Ps. aeruginosa
Rhus copallina 3 mg 2 mm 3 - 4 mmAcer rubrum 3 mg - 2 mmCercis canadensis 3 mg 1 mm -Liquidambar styraciflua 3 mg - -Albizia julibrissin 3 mg - -Robinia pseudoacacia 3 mg - -methanol 50 µl - -gentamycin 30 µg 9 - 11 mm 11 mm
While A. julibrissin, R. pseudoacacia and L. styraciflua tested negative against either bacterialstrain, C. canadensis scored a slightly positive finding against St. aureus, and A. rubrum
against Ps. aeruginosa. R. copallina leaf extracts showed the highest activity against bothbacterial strains (Tab. C.21).
Although A. rubrum leaves were also found to contain large amounts of hydrolysable tannins(see chapter C.IV), they were less effective in this assay than R. copallina leaves.

C.VI Pharmacological effects of the food plants analysed 149
3.2 Antibacterial, antiprotozoal and antifungal properties of R. copallina
and A. julibrissin leaf extracts
In a detailed serial examination conducted by Panlabs Inc., the most preferred leaf species bythe sifakas, R. copallina and A. julibrissin, were tested for possible antimicrobial activitiesagainst different strains of gram positive, gram negative and anaerobe bacteria, one protozoonand several fungal species (Tab. C.22).
In agreement with the aforementioned assays, only plant extracts from R. copallina leavesrevealed any antimicrobial activity, while there was no observed effects for A. julibrissin leafextracts. Therefore, only effects for R. copallina leaf extracts were presented in Tab. C.22.
Tab. C.22: In vitro tests on potential antibacterial properties of R. copallina leaf extracts.Gentamycin was used as reference compound.
minimal inhibitoryconcentration (µµµµg / ml)
bacteria R. copallina gentamycingram positive bacteriaBacillus subtilis (ATCC 43223) > 100 0.03Corynebacterium minutissimum
(ATCC 23347)100 0.1
Mycobacterium ranae (ATCC 110) > 100 0.3Staphylococcus aureus (ATCC 6538 P) 100 0.1Staphylococcus aureus, methycillin resistant (ATCC 33591) 100 1Staphylococcus aureus (Smith) 100 0.1Staphylococcus aureus (Smith + 50 % calf serum) > 100 0.03Staphylococcus faecalis (ATCC 10541) > 100 30gram negative bacteriaEscherichia coli (ATCC 10536) > 100 0.3Escherichia coli (Juhl) > 100 0.3Klebsiella pneumoniae (A 9977) > 100 0.1Proteus vulgaris (A 9539) > 100 0.3Pseudomonas aeruginosa (ATCC 9027) 30 0.3anaerobe bacteriaBacteroides fragilis (ATCC 23745) 100 30Clostridium sporogenes (ATCC 7955) > 100 0.1Corynebacterium acnes (ATCC 6919) 30 1Helicobacter pylori (ATCC 43540) 100 0.3
The minimal relevant inhibitory concentration was set at 100 µg / ml throughout these serialexaminations.
From the bacterial strains tested (Tab. C.22), growth-inhibitory effects could be evidenced forR. copallina leaf extracts at 100 µg / ml against Corynebacterium minutissimum, severalStaphylococcus strains, Bacteroides fragilis and Helicobacter pylori. A minimalconcentration of 30 µg / ml was sufficient to inhibit Pseudomonas aeruginosa andCorynebacterium acnes in growth.
During the search for possible antiprotozoal properties, Trichomonas foetus (Br. M. Strain)was tested. Metronidazole was used as reference compound. At a minimal inhibitoryconcentration of 100 µg / ml, neither R. copallina, nor A. julibrissin leaf compounds exhibitedany observable activity.

150 C.VI Pharmacological effects of the food plants analysed
To screen for possible antifungal properties, a large range of different fungal species wereassayed, but all tested negative by both plant species. Hence, only test species assayed werelisted in the following table (Tab. C.23). Amphotericin B was used as reference substance forthis serial examination.
Tab. C.23: Species of fungi, which were tested negative against leaf extracts of R. copallina
and A. julibrissin.
mammalian pathogensCandida albicans (ATCC 10231) Epidermophyton flocosum (ATCC 18397)Exophilia jeanselmei (ATCC 10224) Microsporum canis (ATCC 36299)Microsporum gypseum (ATCC 14683) Trichophyton mentagrophytes (CDC Atlanta)Trichophyton rubrum (ATCC 10218)generalAspergillus niger (FA 9959) Aspergillus niger (FA 24199)Mucor hiemalis (ATCC 8977a) Paecilomyces varioti (ATCC 22319)Penicillium chrysogenum (ATCC 9480) Pitysporum ovale (ATCC 38593)Saccharomyces cerevisiae (ATCC 9763)plant pathogensAlternaria alternata (foliar) (ATCC 13963) Cochliobolus heterostrophus (foliar)
(ATCC 11534)Fusarium moniliforme (root) (CCRC 30972) Phytophthora capsici (foliar) (ATCC 15399)Rhizopus stolonifera (root) (ATCC 24862) Trichoderma viride (wood) (CCRC 30993)materials degradation, spoilageAureobasidium pullulans (paint)(ATCC 9348)
Stachybotrys chartarum (wool, cotton)(ATCC 16026)
In summary, R. copallina leaf extracts showed dose-dependent antibacterial effects. Acer
rubrum and Cercis canadensis were the only other leaf species of the browse that testedpositive during the preliminary assays, but were less active than R. copallina leaf extracts andtherefore, were not investigated further.
In this study, R. copallina leaf extracts exhibited antibacterial activities againstStaphylococcus aureus, Pseudomonas aeruginosa, Corynebacterium minutissimum, C. acnes,Bacteroides fragilis and Helicobacter pylori (Tab. C.22). On the contrary, neitherantiprotozoal, nor antifungal properties could be found against the strains assayed. A.
julibrissin leaf extracts showed no activity.
Based on these preliminary assays, it may be concluded that the antibacterial activityoriginates primarily from the content of hydrolysable tannins within the R. copallina leaves.In this in vitro assay, gallic acid also showed antibacterial properties. Gallic acid ishypothesised to contribute to a limited extent to the antibacterial effect of the hydrolysabletannins while being released through the gut passage (Tab. C.20). However, this assumedintensification and prolongation of antibacterial effects by gallic acid needs verification underin vivo conditions.
3.3 Binding capacity of various R. copallina leaf extracts to cholera toxin
In the following assay, the cholera exotoxin produced by the bacteria Vibrio cholerae wasused to characterise possible antidiarrhoeal properties of the tannins extracted from R.
copallina leaves. The binding capacity to cholera toxin was screened in vitro by gel-electrophoresis. This assay has been adopted from Hör et al. (1995), who had screenedproanthocyanidins from Guazuma ulmifolia, a plant which is used as antidiarrhoeal by

C.VI Pharmacological effects of the food plants analysed 151
indigenous people of Mexico. It should be noted that the enterotoxin of pathogenic E. coli
strains, are often the cause of traveller’s diarrhoea, and is similar to the cholera toxin in bothstructure and effect (Rimpler, 1999). As tannins of the bark of Guazuma ulmifolia inactivatedthe cholera toxin (Hör et al., 1995), a similar effect was hypothesised for the gallotanninsutilised against traveller’s diarrhoea (Rimpler, 1999). According to Thorne (1986), Vibrio
cholerae and enterotoxigenic Escherichia coli (ETEC) are the prime examples of a bacterialgroup that attach to the mucosa in the proximal small bowel and produce a potententerotoxin(s) that causes fluid secretion but does not destroy the brush border of theintestinal villi.
Cholera toxin is an 87 kDa protein produced by Vibrio cholerae consisting of 5 B subunits of12 kDa each and one A subunit of 27 kDa, the latter being further divided into A1 (22 kDa)and A2 (5 kDa) subunits. The B subunits form a planar pentagonal ring surrounding the Asubunit (Voet and Voet, 1990; Hör et al., 1995).
The B subunits bind the toxin to receptors (GM1 ganglioside) present on the surface ofmucosal enterocytes. As the B subunits bind to GM1 receptors, a conformational change isbelieved to occur by which the A1 subunit gains entry into the enterocyte (receptor-mediatedendocytosis), while the B subunits do not penetrate the cell (Thorne, 1986). This processtriggers cholera toxin activation by proteolytic cleavage and disulfide bond reduction of the Asubunit leading to two fragments, A1 (22 kD) and A2 (5 kD).
In the following, the A1 subunit catalyses activation of an adenylate cyclase, which is lockedin its active state causing a giant increase in intracellular cAMP concentration, which in turninduces the secretion of enormous quantities of digestive fluid, low in protein and rich inelectrolytes (Thorne, 1986; Voet and Voet, 1990).Thus, the toxin stimulates chloride secretionby activating the cAMP second messenger system (Hör et al., 1995).
The binding effect could best be observed for R. copallina tannin extracts (gained accordingto C.IV.2.5) in concentrations varying from 30 ng / µl to 300 ng / µl (see Fig. C.13).
Higher concentrations (1.5 µg / µl and 15 µg / µl) were stained by the silver stainingprocedure which made the detection of proteins difficult.
Highest affinity to the enterotoxin was exhibited by the tannin extract gained from R.
copallina leaves harvested in May. 30 ng / µl already yielded a considerable decrease in the Asubunit band (Fig. C.13, lane 2) if compared to the control lane of mere cholera toxin (lane 1).In this assay, the decrease in the A subunit band was somewhat less pronounced using thesame concentration of tannin extract gained from R. copallina leaves of July. In contrast, 150ng / µl were needed of the tannin extract from October leaves to achieve approximately thesame decrease in A band as shown for 30 ng / µl of the July leaf extract (lane 3 and 4).

152 C.VI Pharmacological effects of the food plants analysed
7 Tannin albuminate 60 ng / µl
6 Tannic acid 1.5 µg / µl5 R 16, 1.5 µg / µl
4 Tannin extract from October leaves, 150 ng / µl3 Tannin extract from July leaves, 30 ng / µl
2 Tannin extract from May leaves, 30 ng / µl1 Cholera toxin without tannin sample (control)
Fig. C.13: Binding of the cholera toxin by tannin extracts gained from R. copallina leaves ofMay, July and October including the isolated fraction R16 in comparison tocommercial tannic acid and tannin albuminate examined by SDS-PAGE.The final concentration of cholera toxin is constant for all lanes (0.16 µg / µl).
In lane 5 (Fig. C.13) the binding capacity of fraction R16 containing p- and m-digallic acidmethyl ester is shown. To observe any binding effect, at least 1.5 µg / µl were required of thisfraction. Similarly, high concentrations of commercial tannic acid were needed to state a firstdecrease in the A band (1.5 µg / µl, lane 6).
As tannin albuminate is a 1:1 tannin to protein complex, twice the concentration was usedwhen compared to other tannin extracts. A slight decrease in the A band could already be seenusing 2 x 30 ng / µl. However, this effect was considerably less pronounced when comparedto the various tannin extracts from R. copallina leaves (Fig. C.13, lane 7 versus 2, 3, 4).
The binding of tannins extracted from October leaves to the cholera enterotoxin inconcentrations of 30, 150 and 300 ng / µl and the gradual disappearance of the A subunit bandis depicted in Fig. C.14. Again, using concentrations higher than 300 ng / µl lead to strongstaining of the gel and the disappearance of the protein bands. The corresponding lanes aretherefore not depicted here.
B band
A band

C.VI Pharmacological effects of the food plants analysed 153
3 300 ng / µl
2 150 ng / µl1 30 ng / µl
Fig. C.14: Binding of the cholera toxin by tannins extracted from Rhus copallina leavesharvested in October. The final concentration of cholera toxin is constant for alllanes (0.16 µg / µl).
In agreement with results of Hör et al. (1995), in this in vitro assay, the tannin samples gainedfrom R. copallina leaves of different seasons have bound to the enzymatically active Asubunit of the cholera exotoxin causing a dose-dependent decrease of this band while the Bsubunit has been largely unaffected. Tannin extracts from R. copallina leaves exhibited betterbinding properties to the A subunit of the cholera toxin than either commercial tannic acid ortannin albuminate. The mixture of purified p- and m-digallic acid methyl ester (fraction R16)was not as effective as the entire leaf tannin extracts. It is reasonable to conclude that seasonaldifferences in the composition of R. copallina leaf extracts are responsible for the differentaffinities in binding to the toxin. It may be concluded that there is a slight difference in thebinding capacity between May and July leaf extracts with a minor enhancement with Mayleaves. Both origins were superior to leaves harvested in October. However, the determinationof exact quantitative binding activities between R. copallina leaf tannin extracts from differentseasons needs further investigation.
3.4 Potential biological and pharmacological properties of the major foodplant chemicals: evidence from the literature and own studies
Flavonoids
Flavonoids constitute the most abundant group of secondary compounds in plant kingdom towhich a large range of ecological, biological and pharmacological effects has been attributed,such as anti-haemorrhagic, anti-oedematous, anti-inflammatory, antimicrobial, spasmolytic,diuretic, hepatoprotective, cardiovascular, antioxidative, radical-scavenging, and enzymeinhibiting as well as enzyme-inducing properties (Barz and Hösel, 1975; Harborne, 1979;Steinegger and Hänsel, 1988; Harborne and Grayer, 1994; Middleton and Kandaswami, 1994;Beil et al., 1995; Harborne, 1999; Wagner, 1999; Cos et al., 2001; Nijveldt et al., 2001).
For quercitrin, afzelin, and luteolin, that have been isolated from A. julibrissin and / or R.
copallina leaves in this study (Tab. C.8, p. 107), a radical scavenging activity has beenreported (Jang et al., 2002; Jung et al., 2004a). In addition, for quercetin it was found that itsuppressed cytotoxicity and prevented cell damage in mammalian and bacterial cells(Nakayama, 1997; Le Marchand, 2002).
B band
A band

154 C.VI Pharmacological effects of the food plants analysed
Concerning diarrhoeal diseases, beneficial effects to the gastrointestinal tract have been foundfor quercetin glycosides such as quercitrin (Gálvez et al., 1993a, b; Gálvez et al., 1995; Rao et
al., 1997), which was found to be the most prevalent flavonoid glycoside in the sifakas’ foodplants in this study. Remarkably, flavonoids were vital when it came to intestinal repair andhad a dramatic impact on gut motility and fluid and electrolyte secretion in a dose-dependentmanner, which depended upon the flavonoid structure (Di Carlo et al., 1993), and thediarrhoea provoking agent (Di Carlo et al., 1993; Gálvez et al., 1993a, b; 1995; Rao et al.,1997).
However, no antidiarrhoeal medicine, that explicitly contains flavonoids, has ever beenintroduced into human medicine as of late (Rote Liste, 2005).
Under experimental conditions, quercitrin was found to delay the transit time of the smallintestine in rats, but only if it had been accelerated by secretagogue agents (e.g. castor oil,prostaglandin E2, sodium picosulfate). Quercitrin was neither active under normal conditions,nor in models, which were not associated with modifications in electrolyte and watertransport, such as osmotic diarrhoea induced by magnesium sulphate (Gálvez et al., 1993a, b).In models with changed fluid transport, quercitrin increased the electrolyte and fluidabsorption by the intestinal and colonic mucosa. While the stool weight and the number offaeces were reduced by quercitrin in castor oil induced diarrhoea, only the stool weightdecreased in the prostaglandin model (Gálvez et al., 1993a).
In lactose induced chronic diarrhoea, rats treated with quercitrin recovered quicker fromdiarrhoea than control animals. The treated rats had a lower number of faecal output and theirgain in body weight was significantly greater compared to rats who did not receive quercitrinafter removal of lactose from the diet. Furthermore, quercitrin effectively helped to restore themucosal weight to normal values, which had been increased during diarrhoea. Mucussecretion is an important protective measure of the colon, which is enhanced whenever themucosa is irritated (Gálvez et al., 1995).
In other models, different flavonoids have been found to influence the intestinal transit timeand gut motility e.g. by decreasing the amplitude of phasic contractions and to antagonisecontractions induced by agents such as prostaglandins, acetylcholine, histamine and serotonin.For instance, quercetin, inhibited anaphylactic contraction of guinea pig ileum in aconcentration-dependent manner (Fanning et al., 1983; Lutterodt, 1989; Meli et al., 1990;Capasso et al., 1991; Di Carlo et al., 1993; Middleton and Kandaswami, 1994; Rao et al.,1997). Some flavonoids were able to prevent gastric mucosal damage to a limited extent indifferent test models when administered in advance (Rao et al., 1997).
One important mechanism of flavonoids (including quercetin) is their manifold interferencewith calcium-dependent processes, which may be responsible for their observed spasmolyticmode of action on gastrointestinal functions (Fanning et al., 1983; Di Carlo et al., 1993;Middleton and Kandaswami, 1994). For example, kaempferol, myricetin, apigenin, and rutindelayed the transit times in the small and the large intestine in mice and rats and reduced (in adose-dependent manner) the intestinal fluid and electrolyte secretion. All these effects couldbe enhanced by verapamil, a calcium-channel blocker (Di Carlo et al., 1993).
Another important mechanism in the context of diarrhoea may be the interference offlavonoids with the arachidonic acid metabolism (Middleton and Kandaswami, 1994; Nijveldtet al., 2001; Dingermann and Loew, 2003; Van Wyk and Wink, 2004). Both the mucosa andmuscle layers of the gut possess the ability to generate all major products of the arachidonicacid metabolism including prostaglandins, which are known to play an important role indiarrhoeal diseases. Many flavonoids such as quercetin and rutin are revealed to be inhibitorsof the cyclooxygenase and lipoxygenase enzyme (Gálvez et al., 1993a; Cos et al., 2001;Dingermann and Loew, 2003). However, an prostaglandin-independent mechanism has alsobeen proposed (Gálvez et al., 1993a; Beil et al., 1995).

C.VI Pharmacological effects of the food plants analysed 155
With respect to the necropsy reports it is interesting to note that some flavones which havebeneficial effects against periodontal diseases have also been described as having anti-inflammatory and tissue regenerating effects (Chung et al., 1995).
In many assays, quercetin exhibited the most potent properties (Di Carlo et al., 1993;Middleton and Kandaswami, 1994) and appeared to be the active principle of quercitrin andother quercetin glycosides, which needed to be metabolised by colonic bacteria in advance(Lutterodt, 1989; Gálvez et al., 1993a; 1995). Hence, some important notes on the knowledgeof pharmacokinetic processes of flavonoids will be presented.
Data on the pharmacokinetic of flavonoids are scarce and sometimes contradictory, but highlyrelevant in assessing their beneficial effects on human and animal health. The rate and extentof intestinal absorption and the nature of the metabolites circulating in the plasma seem todepend on their chemical structure such as hydroxylation and glycosylation, and the type offood source. Since an extensive metabolism is in evidence, the species- and tissue-specificenzymatic equipment of an animal host (depending e.g. on its development) and its microflora(depending e.g. on its population density and diversity) are crucial. Genetic polymorphisms ofenzymes, enzymatic specificity, activity, inducibility, and distribution are of great importance.This helps to explain the enormous difference in interspecies and interindividualbioavailability of (poly)phenolic plant compounds (Hollman and Katan, 1997; Scalbert andWilliamson, 2000).
The first step in the metabolism of flavonoids is assumed to be the enzymatic cleavage of thesugar moieties yielding free aglyca. This deconjugation step is performed by intestinalenzymes from the animal host or those secreted by the gut microflora, especially of the colon.Subsequently, the free aglyca are (re)conjugated, either by intestinal enzymes again and / orlater in the liver and kidneys yielding methylated, sulphated and / or glucuronidatedderivatives. Depending on the applied dosage, free aglyca may also diffuse across the gut wallto enter the blood stream, or may be further degraded by the gut microflora by ring fissionproducing simple phenolics, which can then be easily absorbed. As metabolic pathways maybe dose-dependently saturated, unconjugated free aglyca are more likely to be found in theplasma after the application of high (pharmacological) doses than after low (nutritional)doses. The primary site of metabolism also appears to be dose-dependent, in that the liverplays a subsidiary role to the intestine in the metabolism of small doses, but is more importantif large doses are administered. Therefore, the small intestine-liver pathway is the crucial stepin the first-pass metabolism of flavonoids (Scalbert and Williamson, 2000). Overall, it seemsunlikely that unmetabolised flavonoid glycosides are absorbed through the gut wall (Hollmanand Katan, 1997; Scalbert and Williamson, 2000; Day and Williamson, 2001; Sesink et al.,2001; Day and Williamson, 2001; Németh et al., 2003).
While in humans e.g. glucosides are potential substrates for endogenous ß-glucosidasesexpressed by the human enterocytes, rhamnosides need α-rhamnosidases produced by thecolonic microflora. This helps to explain the differences in human plasmatic maximumconcentrations of metabolites as generated by enterocytes (most often 1-2 h after ingestion offlavonoids) and of metabolites after partial degradation by the colonic microflora (e.g. 9 h forrutin after ingestion). Nonenzymatic declycosylation, such as in the acidic pH of the stomach,does not occur in the human body (Scalbert and Williamson, 2000; Day and Williamson,2001; Németh et al., 2003).
Flavonoids are predominantly eliminated by biliary excretion, and typically only traceamounts are found in the urine (Hollman and Katan, 1997; Scalbert and Williamson, 2000;Day and Williamson, 2001; Németh et al., 2003). The main metabolites of quercetin and rutinwere hydroxylated and methoxylated phenyl acetic acids, which were found in the urine ofguineapigs, rabbits, rats and humans (Dingermann and Loew, 2003). Overall, the polyphenolconcentration in the gut should be much higher than in the plasma (Scalbert and Williamson,2000).

156 C.VI Pharmacological effects of the food plants analysed
As predominantly rhamnose containing flavonoid glycosides were evidenced to occur in themajor food plants of the focal sifakas (Tab. C.8, p. 107), an extensive metabolism by the gutmicroflora can be expected. Beneficial effects are assumed to be confined primarily to the gut.Only to a minor extent are systemic effects to be expected due to a low rate of absorption andan extensive microbial metabolism.
So, it seems reasonable to conclude that flavonoids, especially with quercetin as aglycone likequercitrin, contribute significantly to the repair and restoration of the gastrointestinal mucosaafter being injured from pathological episodes such as acute or chronic diarrhoea.
Tannins
The tannin group can be divided into condensed tannins (proanthocyanidins; catechin orleucocyanidin units) and the hydrolysable tannins (gallotannins and ellagitannins) (Rimpler,1999). While condensed tannins reach molecular weights of up to 20 000 Da, hydrolysabletannins exhibit molecular weights of up to 3000 Da.
Tannins can be characterised as polyphenolic compounds with the ability to complex withalkaloids, multiple charged cations, gelatine, and - most importantly in ecological andpharmacological implications - polysaccharides and proteins. The original meaning of“tannin” is the ability to precipitate hides (collagen of the skin), that is to produce leather,which is based on irreversible covalent bonds between tannins and proteins. The astringentpotency - noticed by a harsh, astringent taste - is due to reversible noncovalent bonds (likehydrogen bonding and even more important hydrophobic associations1) between tannins andglycoproteins of the oral cavity and the gastrointestinal tract (Bate-Smith, 1977; Haslam,1988; Hagerman, 1992; Baxter et al., 1997). However, the astringent potency, which is muchmore relevant for pharmacological interactions, does not parallel the capacity of binding tohides (Steinegger and Hänsel,1988).
Maximum astringent properties are found for tannins of intermediate size with a molecularweight in the range of 500-3000 and 1-2 hydroxyl groups per 100 mass units (Haslam, 1975;1988; Wagner, 1999).
Tannins constitute an ubiquitous group of plant compounds, which is known to possess avariety of ecological (Swain, 1979) and pharmacological activities (Steinegger and Hänsel,1988; Rimpler, 1999; Rote Liste, 2005).
It should be noted that condensed tannins are processed differently from hydrolysable tanninswithin the digestive tract, hydrolysable tannins are subject to enzymatic hydrolysis(Hagerman, 1992; Butler and Rogler, 1992). Bate-Smith (1977) interpreted thehydrolysability and the superior astringent potency of hydrolysable tannins as providing anevolutionary advantage, (hydrolysable tannins are superior to condensed tannins and in turngallotannins are superior to ellagitannins). The dominance of hydrolysable tannins in dicotscompared to ferns and gymnosperms (Bate-Smith, 1977) and the clear predilection of thesifakas for hydrolysable tannins compared to the condensed type may be interpreted asfollowing this “trend of evolution.”
Internally, the prophylaxis and treatment of acute unspecific and chronic diarrhoeas, with andwithout emesis, constitute the classical field for the group of hydrolysable tannins (e.g. inTannalbin®). Externally, drugs containing tannins are used as gargle, for infectionsconcerning the throat and mouth, e.g. gingivitis, for caries prophylaxis, for wounds and skinlesions, itches, haemorrhages and haemorrhoids (Steinegger and Hänsel, 1988; Rimpler,1999; Rote Liste, 2005).
1 According to Haslam et al. (1989) and Hagerman (1992), ionic bondings are unlikely to be involved in theformation of tannin-protein complexes, as tannins do not interact with proteins at pH values above 10,indicating that the phenolate anion is not involved in complex formation.

C.VI Pharmacological effects of the food plants analysed 157
In this study, tannin albuminate is used as a reference compound to discuss the effects ofhydrolysable tannins (see C.VI.3.5). For tannin albuminate, astringent properties areevidenced by a significant protection of the intestinal mucosa, normalisation ofhypersecretory processes, lowering of the gut passage rate and increased faecal consistency(scientific information on Tannalbin®). In the gut, the tannin moiety is continuouslydeliberated from the tannin-protein complex in neutral to alkaline pH conditions. Thus, thetannin moiety can develop its astringent properties proportional to its solubility throughout theentire gut until it reaches the lower parts, such as the colon. The colloidal structure of themucosal surface including the capillaries are compressed, and the absorption of toxins isinhibited. In turn, toxin-induced secretion of water and electrolytes is also inhibited. Intestinalcontents increase in consistency due to the precipitation and gelling processes of the involvedproteins and glycoproteins (Schmid, 1952, Hoppe, 1995).
In early studies on tannin albuminate and tannic acid, a direct anti-inflammatory activity wasfound (Wallbach, 1939). Later, this was corroborated by findings on inhibition oflipoxygenase and prostaglandin H synthase by gallic acid esters in vitro and in vivo (Kroes et
al., 1992). This may in turn emphasise the efficacy of tannin albuminate within inflammatorybowel diseases (Plein et al., 1993; Raedsch, 1995; Fiocchi, 1997). However, the mode of thetannin’s actions can be characterised as a surface phenomenon (Haslam et al., 1989).
While a systemic application of tannins is relatively toxic, orally administered tannins arescarcely absorbed by the gut. Orally administered tannin albuminate does not ensue detectablelevels of tannic acid or gallic acid in the blood serum, and small amounts of tannic acid can befound even in faecal samples. This indicates a continuous deliberation and provision ofgallotannin throughout the entire gut (scientific information on Tannalbin®). In contrast, afteringestion of pure tannic acid, no faecal excretion of intact tannic acid can be detected - anindication of its entire degradation within the upper (human) gastrointestinal tract (scientificinformation on Tannalbin®). Orally administered pure gallic acid rapidly appears as 4-O-methylgallic acid and unmetabolised gallic acid within human plasma and urine (Shahrzadand Bitsch, 1998).
In this study, faecal samples of the Coquerel’s sifakas were analysed by HPLC technique(C.IV.2.1). These samples were found to contain gallic acid1. This finding may indicate theavailability of gallotannins until food reaches the lower aspects of the gut with a “protractedeffect” when continuously released from a tannin-protein complex. For the sifakas this wouldimplicate a tannin-protein complex that may have formed e.g. by complexing with proteinsfrom the saliva.
Further effects found in the hydrolysable type of tannins, appear to possess both antibacterial(Ahn et al. 1994; 1998) and antiviral (Kakiuchi et al., 1985; Nakashima et al., 1992; Hattoriet al., 1995; Kurokawa et al., 1995; Büechi, 1998; Nakano et al., 1998) properties.
To some extent gallic acid may be hydrolysed through the gut passage from the gallotanninand thereby able to exert additional or synergistic pharmacological effects. Thus, itsantibacterial (Richards et al., 1994; Kayser and Kolodziej, 1997; Kolodziej and Kayser, 1998;Ahn et al., 1994; 1998) and anti-inflammatory properties (Liu et al., 1983; Kroes et al., 1992)may become important in this respect.
Moreover it should be mentioned that hydrolysable tannins (including their gallic acidmonomer and derivatives such as gallic acid methyl ester and ellagic acid derivatives) arereported to possess antioxidant and radical scavenging (Hong et al., 1995; Masaki et al.,1994; 1997; Kim et al., 2001), cytoprotective (Kanai, 1996; Kolodziej and Kayser, 1998) andtumor preventing properties (Kashiwada et al., 1992; Perchellet et al., 1992; Gali et al., 1992;
1 After the long storage of the faecal samples in simple test tubes until being analysed, no intact gallotannin wasexpected to be found.

158 C.VI Pharmacological effects of the food plants analysed
Inoue et al., 1994; Inoue et al., 1995; Sakagami and Satoh, 1996; Sakagami et al., 1997;Sakaguchi et al., 1998).
However, many of the pharmacological and ecological effects of tannins strongly depend ontheir molecular size, their structure and stereochemistry (Haslam, 1988; Haslam et al., 1989;Hagerman, 1992; Kashiwada et al., 1992; Nakashima et al., 1992) and the test system used(Hagerman, 1992). The complexing property of tannins produces manifold interactions.Therefore, the discovery of antinutritional and detrimental effects of tannins towardsherbivorous species such as insects, chicks, rats, mice and some ruminants were the mainreasons in the attribution of their “feeding deterrent” and “plant protective” abilities to thegroup of tannins in the evolutionary “arms race” with the predacious herbivores (Freeland andJanzen, 1974; Swain, 1979). The antinutritional effects described for diets high in tannins areknown to comprise growth inhibition, diminished weight gains, lower efficiency in nutrientutilisation (particularly in protein) and increased levels of faecal nitrogen (Butler and Rogler,1992; Baxter et al., 1997).
Conversely, the adaptation to cope with tannins is a powerful force within an animal species(Baxter et al., 1997), and this point is often ignored in the discussions concerning the benefitsof tannins within ecology and pharmacology.
In this respect, the tannin-protein interaction is vital, occurring in vivo and in vitro. Tanninsmay complex with proteins of different origins such as dietary protein (here plant proteins),digestive enzymes, proteins of endogenous origin like salivary proteins, membrane boundproteins of the gastrointestinal mucosa, secretions, or microbial proteins and enzymes. Theseinteractions are influenced by characteristics of the protein (e.g. molecular size, stericproperties, composition, iso-electric point), by characteristics of the tannin (e.g. molecularsize, structure, steric properties), and the reaction conditions (e.g. pH, temperature, time,solvent composition, concentration of both reactants), to form soluble or insoluble complexesby reversible, noncovalent bonds (Haslam, 1988; Haslam et al., 1989; Hagerman, 1992;Baxter et al., 1997). Thus, gallotannins exhibit a stronger astringent potency than the morerigid and compact formed ellagitannins (Haslam, 1988; Haslam et al., 1989). Gallotannins inturn, particularly pentagalloylglucose, bind strongly to proteins which are rich in proline(Haslam, 1988; Haslam et al., 1989; Butler and Rogler, 1992; Charlton et al., 1996; Baxter et
al., 1997). In this context it is notable that the focal lemurs ingested Vitis cinerea leaves,which may contain large amounts of hydroxyprolin (App. II.2).
Furthermore, the saliva of Coquerel’s sifakas was found to be rich in proline (Glander, pers.comm.), which may be interpreted as an important adaptation to a tannin rich diet throughevolution. Principally, proline-rich proteins occur in saliva, but their actual quantity stronglydepends on the animal species and the temporal nutrition. For instance, in human saliva,proline-rich proteins comprise about 70 % of the total proteins (Butler and Rogler, 1992),while their content is inducible in rodents (rats and mice), and completely absent from thesaliva of hamsters (Baxter et al., 1997), which causes increased mortality rate when hamstersare fed tannins (Butler and Rogler, 1992).
The interaction of tannins with enzymes, e.g. their enzyme inhibiting properties, are also stillsubject to controversial discussion (Horigome et al. 1988; Makkar et al., 1988; Butler andRogler, 1992; Hagerman 1992; Tebib et al., 1994-95). In some animals, dietary tannins doinhibit enzymes including proteases, lipases and glycosidases, but increase enzyme activity orinduce enzyme synthesis in others. It was also found that interactions of proteins with tanninswere strongly influenced by pH and detergents (Hagerman, 1992; Tebib et al., 1994-95).Alkalinity of the duodenum, the main site of nutrient absorption in monogastric mammals,prevents the polyphenolic compounds from binding to proteins. Additionally, the pancreaticbiliary juice acted as a detergent and prevented or reversed the tannin-inhibited enzymeactivity in the rat intestine (Tebib et al., 1994-95). Therefore, the observation of increasedfaecal nitrogen, which was first attributed to the protein of dietary origin, is now thought to

C.VI Pharmacological effects of the food plants analysed 159
originate from endogenous proteins within the saliva, the gut mucosa or within secretions ofthe digestive tract (Butler and Rogler, 1992; Tebib et al., 1994-95).
The complexation between polyphenols and polysaccharides (McManus et al., 1985; Haslamet al., 1989) is another important interaction, that depends upon their molecular sizes,conformational flexibility of the polyphenol ligand and the ability of the polysaccharide toform pores, holes or crevices either preformed in their three-dimensional structure ordeveloped in situ during the complexation process. Unlike the complexation with proteins,complexation with polysaccharides is largely independent of the pH (4-7) (Haslam et al.,1989). This seems important for interactions with both, the mucosal and the plantpolysaccharides, i.e. plant mucilage. As tested in this study (chapter C.V), R. copallina leaftannins did not disturb the gelling properties of A. julibrissin leaf polysaccharides. Hence,within the gut, synergistic antidiarrhoeal effects can be expected. Furthermore, a chemicalinteraction between tannins and the gastrointestinal mucus has been proposed by Verhaerenand Lemli (1986): the anti-secretory (i.e. the absorption of water) effect of gallotanninsapplied to the colon of guinea pigs even continued after application of rhein, which normallyinduces a secretagogue diarrhoea in the colon.
The ability of tannins to form complexes with multiple charged metal cations is anotherimportant interaction that also affects the functioning of enzymes. Chelating with metal ionsof metallo-enzymes is one reason for their growth-inhibitory effects upon microorganisms, ormay result in a depletion of essential metal ions (Scalbert, 1991).
The development of hemosiderosis in captive lemurs, that concerned one Coquerel’s sifakaand several other lemur species at the San Diego Zoo (Spelman et al., 1989; see necropsyreports), was attributed to a diet high in iron, high in ascorbic acid, and low in tannins.Correction of these parameters significantly improved their respective health conditions(Spelman et al., 1989).
Both, the intestinal mucosal damage and bacterial translocation (in shocked animals) arereduced by the treatment with e.g. deferoxamine, an iron chelator and antidote againstpoisoning with iron (Berg, 1998), and with e.g. allopurinol, a xanthine oxidase inhibitor.Tannins possess heightened iron chelating properties. Including the other major plantcompounds of this study, a reduction in the bioavailability of dietary iron is also reported formucilaginous polysaccharides, as in the case of Plantago seeds (scientific information).Xanthine oxidase inhibition is reported for tannins (Candan, 2003), and for quercetin andfurther flavonoids, that decreased the oxidative injury (Cos et al., 1998; Nijveldt et al., 2001).
With respect to the development of diabetes (compare necropsy reports), for the group oftannins, antidiabetic properties with a reduction of postprandial blood glucose levels arereported (De Kiesgen and Maurel, 1994; Shim et al., 2003). (Secondarily, diabetes in turnmay cause diarrhoea (Ruppin, 1994; Ruppin and Soergel, 1994)). In addition, tannins havealso been revealed to possess beneficial effects against other metabolic diseases such ashypercholesterolaemia, hypertriglyceridaemia and hypertension (De Kiesgen and Maurel,1994). For gallic acid and galloyl gallic acid a triglyceride-decreasing potency was found(Iwata et al., 1997).
Discussion on antimicrobial effectsThe decision for the three bacterial test strains included in the preliminary assays, Salmonella
E., Staphylococcus aureus, and Pseudomonas aeruginosa, was based on their importance withseveral respects. Salmonella are pathogens that affect predominantly the gastrointestinal tractcausing a devastating diarrhoea. St. aureus is able to multiply in food and to secrete a toxin.This food poisoning may result in a toxin diarrhoea with no bacterial adherence or penetrationthrough gastrointestinal barriers (Thorne, 1986). Furthermore, Staphylococcus andPseudomonas strains are both facultative pathogens and hence responsible for a range ofopportunistic infections (e.g. hospitalism). They are involved in many inflammatory diseases,

160 C.VI Pharmacological effects of the food plants analysed
which in part have their starting point by penetrating through intestinal barriers. Vice versa, adamaged gut mucosa may serve as a port of entry.
Apart from humans, St. aureus occurs in nearly all species of animals. Staphylococcus aureus
strains are able to cause dermatitis, tonsillitis, endocarditis and inflammations of therespiratory tract like pneumonia. Pseudomonas aeruginosa causes wound infections,endocarditis, inflammations of the urogenital and respiratory system, pneumonia andmeningitis. Once penetrated through intestinal barriers, both, Ps. aeruginosa and St. aureus
may affect multiple organs and thus lead to a generalised septicaemia or a lethal septic shockwith multiple organ failure and lethal outcome (Pschyrembel, 1986; Bisping and Amtsberg,1988; Tsai et al., 1996). For these patients with multiple diseases, that are immunodeficientand / or hospitalised, or patients with a damaged intestinal mucosa e.g. after a history ofdiarrhoea, are rather predestined victims to opportunistic germs (Pschyrembel, 1986; Bispingand Amtsberg, 1988; Tsai et al., 1996; Dingermann and Loew, 2003).
This pathogenic mechanism of bacterial infections seems interesting in view of symptomsdescribed in the necropsy reports of captive sifakas. The finding that the most preferred leafspecies R. copallina yielded superior antibacterial results may be interpreted as a preventivemeasure in regard to gastrointestinal mucosal damage and subsequent septicaemia asindicated in the necropsy reports of captive sifakas.
In this study, during the in vitro screening on the antimicrobial efficacy of the preferred leafspecies by the sifakas (Tab. C.22), R. copallina leaves were effective against differentStaphylococcus aureus strains, Corynebacterium minutissimum, Bacteroides fragilis andHelicobacter pylori. An increased antibacterial activity was found against Pseudomonas
aeruginosa and Corynebacterium acnes. To better understand this finding, the bacterialspecies will be briefly characterised in the following.
The genus Corynebacterium contains numerous species of which only a few are pathogenic toanimals or man (Bisping and Amtsberg, 1988). According to its name C. acnes occursoccasionally in acne pustules (Pschyrembel, 1986).
Members of the genus Bacteroides, which are obligate anaerobic gram-negative rods,represent the majority of the resident intestinal flora in humans and animals. They also forman important constituent of the oral and skin flora and they inhabit the mucosa of the genitaltract (Bisping and Amtsberg, 1988; Onderdonk, 1998). There are enormous populations thatpredominate in the human tract and are highly involved in processes such as polymerhydrolysis and energy-yielding metabolism. For instance, gastric mucin is one endogenoussource of carbon and energy for Bacteroides fragilis in the human intestinal tract (Savage,1986). Bacteroides are relatively non-resistant outside the host’s body.
Bacteroides fragilis is another facultative pathogen which may exert a pathogenic action inbody cavities and may involve various organ systems, especially multimorbid persons. Apartfrom various infections, a septicaemia may be generated (Pschyrembel, 1986). Together withother obligate anaerobes or facultatively anaerobic species, they may produce a purulentnecrotising inflammation and the formation of abscesses. In such mixed infections, which aregenerally of endogenous nature, the synergistic interaction of various pathogenic types plays apotentiating role (Bisping and Amtsberg, 1988). With respect to the ecological equilibrium ofthe gastrointestinal microflora it should be noted that R. copallina leaves were effectiveagainst Bacteroides fragilis.
Helicobacter pylori is a spiral-shaped, anaerobic gram-negative bacterium, which colonisesthe epithelial surfaces of the gastric mucosa. In humans it is a major cause of gastrointestinaldiseases such as acute and chronic gastritis, peptic ulcer disease and gastric cancer(Matsukura et al., 1995; Ching and Lam, 1995; Taniguchi et al., 1995; Jaspersen, 1996;Slomiany et al., 1997). It is now accepted that H. pylori causes gastritis in more than half ofthe world’s population and that about 95 % of duodenal ulcers and 70-80 % of gastric ulcers

C.VI Pharmacological effects of the food plants analysed 161
result from infections with H. pylori. Furthermore, this organism may have a causal role inperhaps up to 60-70 % of gastric cancers (Niemelä et al., 1995; Jaspersen, 1996; Lamouliatteet al., 1996; Lee, 1996). Furthermore, Helicobacter spp. have been associated withenterocolitis and inflammatory bowel disease in humans and animals. A novel Helicobacter
species was found in faecal samples of Saguinus oedipus, the cotton-top tamarins, that easilysuccumb in captivity to chronic colitis and subsequent colon cancer (Saunders et al., 1999),yet the pathogenesis is still unclear.
The antibacterial activity of the R. copallina leaf extract against H. pylori found in this study(Tab. C.22) concurs with reports on Rhus javanica gall extracts and gallic acid, which bothinhibited H. pylori growth (Bae et al., 1998).
At present, it should be emphasised that the test system and the test conditions employed haveinfluence on the obtained results, and in vitro conditions may not necessarily mirror in vivo
conditions. Furthermore, leaf extracts containing a variety of secondary plant compoundsoften react differently than isolated single compounds. Additive, synergistic or antagonisticeffects of a mixture of leaf compounds are difficult to assess, but have a major impact on theresulting effect e.g. on the digestive tract. Thus, a comparison of the results obtained in thisstudy to antimicrobial properties reported in the current literature, demands a sophisticatedevaluation. It should be emphasised that the results of the in vitro assays do not claim acomplete inactivity for A. julibrissin leaves when ingested.
For example, in this study no activity could be found for A. julibrissin leaf extracts, albeit ithas already been reported that quercetin inhibits H. pylori in a concentration dependentmanner (Beil et al., 1995). Quercetin was found in this study to be the major flavonoidaglycone in A. julibrissin leaves (Tab. C.16, p. 125). Beil et al. (1995) proved underexperimental conditions that some flavonoids, including quercetin, inhibited the acidproduction in parietal cells by complexing with ATP which inhibited the H+/K+-ATPase, thegastric proton pump. As growth inhibition of H. pylori and blockage of acid production arecrucial factors to the pathogenesis of gastric lesions, drugs containing flavonoids may have atherapeutic potential for the treatment of gastrointestinal diseases associated with H. pylori
infection (Beil et al., 1995).
In this study, the R. copallina leaf extract tested negative under experimental conditionsagainst Bacillus subtilis. Bac. subtilis is another opportunistic bacterium that may causevarious inflammatory diseases, e.g. meningitis and pneumonia, and may lead to sepsis. Gallicacid methyl ester has been reported to possess antibacterial properties against a range ofgram-positive and gram-negative microbes causing inflammatory diseases of thegastrointestinal and respiratory tract (Kayser and Kolodziej, 1997; Kolodziej and Kayser,1998). Gallic acid was reported to show growth-inhibitory effects against Bac. subtilis
(Majinda et al., 1997; Aaku et al., 1998). Both compounds, gallic acid methyl ester and gallicacid, have been found in this study to occur in the R. copallina leaves. Therefore, it may behypothesised, that in vivo gallic acid contributes to the antibacterial potency of thegallotannins after successive hydrolysis within the gastrointestinal tract.
Further reports from the current literature corroborate the findings on antibacterial propertiesof the hydrolysable tannins and their monomers as indicated in this study, and give reason toexpect synergistic effects between single leaf compounds when released during the gutpassage, and the polymeric phenolics. For instance, the antibacterial effect of gallic acidagainst St. aureus found in this study (Tab. C.22), agrees with reports of Richards et al.
(1994) and Majinda et al. (1997). According to Ahn et al. (1994; 1998), a methanolic extractfrom galls of Rhus chinensis as well as isolated methyl gallate and gallic acid showedselective and dose-dependent growth-inhibitory effects in vitro on bacteria of thegastrointestinal microflora. While harmful bacteria such as Clostridium perfringens
(associated e.g. with sudden death and diverse gastrointestinal diseases in humans), Cl.
paraputrificum, Eubacterium limosum, Bacteroides fragilis, St. aureus and E. coli were

162 C.VI Pharmacological effects of the food plants analysed
strongly and dose-dependently inhibited by methyl gallate and gallic acid, beneficial bacterialike bifidobacteria and lactobacilla remained largely unaffected.
Additionally, antibacterial effects against E. coli, Klebsiella pneumoniae and Bacillus cereus,and aflatoxin production inhibiting effects in Aflatoxin strains were reported for simplephenolics such as p-hydroxy benzoic acid, p-coumaric acid, protocatechuic acid and theflavonol aglycone quercetin (Aziz et al., 1998), which have also been isolated from A.
julibrissin and / or R. copallina leaves in this study (Tab. C.8, p. 107). Protocatechuic acid isreported to exhibit similar activities compared to gallic acid (Kroes et al., 1992; Yun-Choi et
al., 1993), and thus, additional or synergistic effects can be expected between simplephenolics and polyphenolic compounds.
With respect to antifungal properties, no antifungal effects could be found for R. copallina
leaf extracts in this study. However, in disc diffusion assays impregnated with methanolicextracts from Rhus glabra branches, it was revealed to possess moderate antifungal activitiesagainst several fungal strains at high concentrations (McCutcheon et al., 1994). Furthermore,in this study R. copallina leaf extracts did not show any activity against the E. coli strainstested, although e.g. tannin albuminate has since long been successfully installed asantidiarrhoeal to prevent or alleviate traveller’s disease which is predominantly caused byE. coli strains (Raedsch et al., 1991). Once again this reveals the discrepancy between in vitro
assays and their relevance for in vivo conditions.
Discussion on toxin inhibiting propertiesThe cholera toxin causes a massive diarrhoea1. Even after a brief intraluminal exposure to thetoxin, directly or indirectly, a marked secretion of electrolytes, glycoproteins and fluids isinduced into the small intestine (Goodgame et al., 1973; Sherr and Mertens, 1979; Townsendet al., 1981; Hör et al., 1995). When untreated, cholera typically leads to death by dehydration(Schultz, 1984; Voet and Voet, 1990). Vibrio cholerae neither invades nor damages tissues,but merely colonises the intestine as does E. coli. However, V. cholerae infection or its toxin,do stimulate the humoral immune response, innate cells and inflammatory mediators withinthe host (Qadri et al., 2004).
The electrophoretic cholera toxin binding assay in this study revealed that R. copallina
tannins are capable of directly interacting with the toxin. As already evidenced for oligomericproanthocyanidins (Hör et al., 1995), the principle of binding to enterotoxins produced bypathogenic bacteria and thereby inactivating the toxins, can obviously be extended to R.
copallina gallotannins which the sifakas are exposed to in this study. Similarly to the resultspresented by Hör et al. (1995), it was shown that R. copallina tannins bind to theenzymatically active A subunit of the cholera toxin which leads to a dose-dependent decreasein the A band as evidenced by gel-electrophoresis (Fig. C.13 and Fig. C.14). Obviously,seasonal influences affect the binding capacity of R. copallina tannins. The isolatedcompounds R16 from R. copallina leaves, p- and m- digallic acid methylester, are incapableof inactivating the cholera toxin. As the mode of action was not investigated further, thereason has yet to be elucidated. The molecular weight and stereochemical factors may becrucial. The reason, as to why commercial tannic acid is far less active in this assay than R.
copallina tannins, is yet another interesting point which needs further investigation. As tanninalbuminate consists of tannin that is already bound to proteins, this in vitro assay may beinappropriate in order to determine its activity as in vivo deliverance from the protein complexprecedes any activity within the gastrointestinal tract.
However, the binding assay to cholera toxin revealed to be a useful means to elucidatepossible antidiarrhoeal and beneficial gastrointestinal effects of R. copallina leaf tannins. This
1 The diarrhoea caused by the Cholera toxin is described as rice-water stool: “a clear solution with flecks ofvisible mucus, resembling water in which rice has been washed”, (Sherr and Mertens, 1979).

C.VI Pharmacological effects of the food plants analysed 163
in vitro assay may give another hint to reasons why R. copallina leaves have been selected soheavily by the Coquerel’s sifakas as shown in this study.
Polysaccharides
The third group of compounds with expected beneficial effects for the gastrointestinal tract,are the polysaccharides (i.e. the pectin-like mucilage; compare chapter C.V) discovered in A.
julibrissin leaves during this study. Generally, mucilaginous and gelling drugs are utilised fortheir soothing and adsorbing properties (Steinegger and Hänsel, 1988).
Externally, gelling agents administered to the skin exhibit cooling effects. Sterile solutions ofpectins are utilised externally for wounds and skin lesions because of their soothing, haemo-styptic and indirect antibacterial effects. Acidic polysaccharides in general exhibithyaluronidase-inhibiting and thereby cause (indirectly) antibacterial effects, while thebacterial propagation is inhibited within the human and animal tissue (Steinegger and Hänsel,1988). Eyedrops containing Tamarindus indica
1 seed polysaccharides are utilised against the“office eye syndrome” and other forms of the dry eye. These polysaccharides are integratedinto the mucin layer of the human eye and are thus able to stabilise and regenerate thelacrimal film (Bruhn, 2005).
Internally, mucilages and pectins are utilised for their soothing, embedding and adsorbingproperties. Depending on the mucilage structure and physico-chemical properties, mucilagesare utilised for coughs (in lozenges and teas), respiratory disorders such as bronchial catarrh,and for gastrointestinal disorders such as diarrhoeal diseases, gastroenteritis, ulcers andhyperacidity of the stomach (Steinegger and Hänsel, 1988).
The activity of plant polysaccharides on the gut motility depends on their structure type,species-specifically on the gut (section) and on the presence of water. The binding of water,(cationic and organic compounds) is thought to increase stool consistency, while secretionsare absorbed and pathological degradation products are neutralised in bouts of diarrhoea. Onthe contrary, an increase in the filling pressure is beneficial in bouts of obstipation. Both, theswelling and fluid and electrolyte absorbing properties, and conversely increasing the fillingpressure, can exert normalising effects on the gut motility and transit time. Furthermore,depending on the contents of water, these compounds either constipate with little water orlubricate with a great deal of water (Steinegger and Hänsel, 1988; Dingermann and Loew,2003). However, constipating and laxative agents act differently depending on the animalspecies2 and their respective gastrointestinal tract.
Moreover, indigestible polysaccharides, including their degradation products, the short-chainfatty acids, exert curative effects on epithelial cells, influence the microbial ecosystem withinthe gut by e.g. lowering the intraluminal pH, and are used as fuel for nutrient and energysupply. Especially pectins and gums are rapidly and fully fermented, yielding differentamounts of short-chain fatty acids (Steinegger and Hänsel, 1988; Dingermann and Loew,2003; Campbell et al., 2004b; for details see chapter C.I). Acid hydrolysis of mucilage ofPlantago seeds (arabinoxylanes, classified as hemicellulose) in the stomach yields monomer,terminal arabinose residues, while products of lower molecular weight including short-chainfatty acids generated through enzymatic degradation by e.g. Bacteroides strains, enhance thecolonic bacterial growth (Hensel and Hose, 2001; Rimpler, 1999). Hence, the benefits ofindigestible polysaccharides such as mucilages and pectins (otherwise classified as dietaryfibres, see chapter C.I) are of dual character, one nutritional and one pharmacological onepithelial cells and the microbial flora and ultimately onto the gastrointestinal integrity.
1 Leaves and fruits of T. indica are preferred food items by wild P. v. verreauxi in the south of Madagascar (NyAndry Ranarivelo, pers. comm.).
2 In this respect, herbivores react differently from carnivores and omnivores such as mice (Schmid, 1952).

164 C.VI Pharmacological effects of the food plants analysed
Drugs such as Plantaginis ovatae semen, and Plantaginis ovatae testa1 (e.g. Metamucilpowder, Mukofalk® granulate), are utilised as basal and adjuvant therapy for acute andchronic obstipation, diarrhoea, irritable bowel syndrome with alternating obstipation anddiarrhoea, diverticulitis, haemorrhoids, Crohn’s disease and in support in metabolic diseasessuch as diabetes, lipaemia and adiposis, as well as in pregnancy (scientific information of Dr.Falk Pharma GmBH; Tomoda et al., 1990; Dingermann and Loew, 2003).
While the neutral mucilage of Plantago species is predominantly indicated for the irritablebowel syndrome and as an adjuvant in diarrhoeal diseases, pectins (e.g. apple pectin) arepredominantly utilised for acute and chronic diarrhoeas (Steinegger and Hänsel, 1988;Dingermann and Loew, 2003; Rote Liste, 2005). Additionally, for pectin-like and acidicpolysaccharides a strong inhibition in gastric lesion formation and preventive anti-ulceractivities have also been found, showing a dose-dependent activity (Yamada et al., 1991; Sunet al., 1992). As with most other indigestible polysaccharides which need gut microflora fordegradation, pectins lower both the blood serum cholesterol levels and postprandial bloodglucose levels (Steinegger and Hensel, 1988).
In this study, the plant mucilage of A. julibrissin leaves was characterised as pectin-likerhamnogalacturonan (see chapter C.V). Therefore, protective effects onto the mucus layer areto be expected. In vitro, pectin showed best creeping properties in that it covered the epithelialsurface of the small intestine and colon, although it did not protrude between the microvilliunder these conditions (Janssen, 1982; Janssen and Queisser, 1982). However, pectinappeared to interact with the bacterial colonisation (Larsen, 1981). Furthermore, a dependenceof the gel viscosity on pH and temperature was found for pectin (Janssen and Queisser, 1982).
In regard to the interaction between pectins and tannins, there are experiments (Gebhardt,1935), that plead for opposite effects of pectin and tannin albuminate in healthy anddiarrhoeal experimental animals with respect to transit time and stool consistency: tanninalbuminate enlarged the gastrointestinal transit time and increased stool consistency byreduced water content, while pectin accelerated gut passage time and diminished stoolconsistency by increasing water content. Furthermore, a mixture of both, pectin and tanninalbuminate, showed properties which resembled more the tannin than the pectin moiety. Asthe sifakas selected a diet mixed in both groups of chemical compounds, normalising effectson their gut motility seemed evident.
It should be noted, that additional effects were described for polysaccharides depending ontheir chemical structure (e.g. anionic charge, steric factors), including those on the immunesystem (Yamada et al., 1986; 1987; Kiyohara et al., 1988; Tomoda et al., 1990; Classen,2005). For instance, polyanion structures revealed in vitro an increased activity compared toneutral polysaccharides. Furthermore, for various polysaccharides a more or less pronouncedantitumor activity has been found with branched glucans and arabinogalactanes being superiorto acidic and pectic polysaccharides (Kraus et al., 1986; Müller et al., 1989; Yamada et al.,1990). In this context it is notable that in vivo experiments with a fraction of crudepolysaccharides from A. julibrissin (neither type of polysaccharide, nor plant organ wasspecified by the authors) revealed a relatively strong antitumor activity (Moon et al., 1985),albeit these effects seem less relevant for the sifakas.
However, a conclusive evaluation of antidiarrhoeal and beneficial properties of the A.
julibrissin leaf polysaccharides onto the gastrointestinal tract of the sifakas needs furtherinvestigation.
1 Psyllii semen (DAB 9) from Plantago psyllium (syn. P. afra) and P. indica (syn. P. arenaria); and Plantaginisovatae semen (DAB 9) and Plantaginis ovatae testa (DAC 1986; Ispaghula husks) from P. ovata (syn. P.
ispaghula).

C.VI Pharmacological effects of the food plants analysed 165
3.5 Relevance of food plant selection and daily intake of the major plantcompounds
The contents of the tannins and flavonoids as determined for each leaf species werereferenced with the daily intake of the sifakas, respectively (C.VI.2.3). The quantities of themajor plant compounds supplied by the different leaf species were summed each day andaveraged for each animal group over the number of observation days. Taking into account thebody weight of each individual lemur, the intake of tannins and flavonoids was calculated perkg bodyweight, or additionally for each individual sifaka (Tab. C.24; Tab. C.25). In thesecalculations, all leaf species supplied by the browse and those selected in the forest wereincluded. This allowed for the amounts of ingested leaf species to then be converted into theamounts of ingested plant compounds. This is the first study design that includes the feedingdata of focal animals collected under “field-like” conditions.
Prior to any dosage calculations, it should be noted that in the group D&V during the springseason, Valentinian was a subadult (pre-puberty) and Drusilla was a juvenile at time of datacollection. In the autumn, Gordian was a juvenile. For calculations related to an individual’sbodyweight, it should be noted, that sifakas weigh far less than humans and in part it seemspreferable to refer dosages per animal, irrespective of their weight. The average daily intakeof gallotannins and flavonoids ingested by the sifakas is now evaluated in comparison totherapeutic dosages common within human medicine (Tab. C.24; Tab. C.25).
TanninsDosage calculations for tannins (Tab. C.24) are based on Tannalbin® tablets (Dr. RentschlerArzneimittel GmBH) containing tannin albuminate, a gallotannin-protein complex in the ratio1:1, which has since long been established in combating diarrhoea in human medicine.According to the scientific literature, in case of acute diarrhoea, every 1-2 hours 1-2 tablets (à500 mg tannin albuminate) or 2-4 capsules (à 250 mg tannin albuminate) are recommendedfor adults, which correspond to a minimum of 250 mg and a maximum of 4-6 g puregallotannins per day. As daily travel prophylaxis 500 mg gallotannins are recommended foradults.Maximum daily dosages for children and babies depend upon the age with 3 g gallotanninsfor children aged 6-14 years, 1.5 g tannins for children aged 1-6 years and 750 mg for babiesolder than three months, respectively.
Tab. C.24: Averaged daily intake of gallotannins [g] per individual sifaka, and recommendeddosages (related to pure gallotannins) for human adults.
spring autumn humanM T D V J D G adults
intake [g] 4.94 3.78 4.65 6.20 1.61 1.77 2.48 0.25 - 6
If these recommendations are compared to the sifakas1 (Tab. C.24), all animals consumedgallotannins in relevant therapeutic dosages, although a clear seasonal difference becomesvisible. While in spring all study animals consumed high averaged daily dosages irrespectiveof their age, between 3.78 g gallotannins (Tiberius) and 6.20 g (Valentinian, subadult), far lesstannins were ingested in the autumn. The adults Julian and Drusilla ate on average 1.61 g and1.77 g gallotannins, respectively, and Gordian consumed approximately 2.48 g. This trendseems more to reflect seasonal constraints and limits in the food supply (offered by the staff)than voluntary food choice. Furthermore, the gallotannin content was reduced in the autumn
1 With respect to dosage calculations, juvenile sifakas correspond to human infants (1-5 years); subadult sifakascorrespond to older children (6-12 years); and adult sifakas correspond to children > 12 years and humanadults.

166 C.VI Pharmacological effects of the food plants analysed
leaves (compare Tab. C.13, p. 119). Conversely, in neither season were R. copallina leavesprovided by the staff ad libitum. Gordian ate all R. copallina leaves he could access andreached the recommended maximum human dosages, yet he appeared to desire more. In thiscontext it is notable, that gallotannins possess an enormous therapeutic broadness, indicating alargely non toxic drug (Scholz, 1994; Dingermann and Loew, 2003).
FlavonoidsThe group of flavonoids is abundant in many food and medicinal plants within humannutrition and medicine. Their daily intake with diet varies greatly and is presumed to rangefrom approximately 50 mg to 1 g (Middleton and Kandaswami, 1994; Wagner, 1999).
Tab. C.25: Average of flavonoid glycosides and major aglyca daily ingested by eachrespective group [g] and per bodyweight [g / kg].
ingested amountsmajor M&T D&V J&D G
compounds g g / kg g g / kg g g / kg g g / kgquercitrin 0.50 0.06 0.58 0.10 0.19 0.02 0.05 0.02total flavonoids 1.90 0.22 2.18 0.37 1.04 0.12 0.27 0.09myricetin 0.03 0.00 0.07 0.01 0.05 0.01 0.01 0.00quercetin 0.59 0.07 0.61 0.10 0.17 0.02 0.06 0.02kaempferol 0.07 0.01 0.08 0.01 0.03 0.00 0.01 0.00total aglyca 0.79 0.09 0.87 0.15 0.35 0.04 0.13 0.04
Since no antidiarrhoeal in human medicine explicitly consists of flavonoids (Rote Liste,2005), no reliable dosage recommendations are available for this specific indication. So, fordosage comparisons of the flavonoid intake within the sifakas, the data from antidiarrhoealexperiments with quercitrin, quercetin and additional flavonoid glycosides and aglyca wereused (Gálvez et al., 1993a, b; Gálvez et al., 1995; Rao et al., 1997). Dosage recommendationsfor flavonoids with indications other than diarrhoea were also noted (Rote Liste, 2005). Butdosages of remedies containing flavonoids are recommended for adults and adolescents olderthan 12 years of age irrespective of their actual bodyweight (Rote Liste, 2005), which makecomparisons difficult, especially of juvenile sifakas to children of comparable age. However,the focus was on quercitrin and additional quercetin glycosides, since quercitrin was thepredominant flavonol glycoside and quercetin the most abundant aglycone analysed in thefood plants of the focal lemurs.
According to the literature, orally administered quercitrin and quercetin were effective on gutmotility, fluid and electrolyte secretion at dosages of 25 and 50 mg per kg bodyweight(Gálvez et al., 1993a, b; Gálvez et al., 1995), while intraperitoneally administered flavonoidsto rats and mice were in part, active at lower levels. For instance, the small intestinal transitwas delayed by apigenin at 25 mg per kg bodyweight, while kaempferol, myricetin and rutinwere active at 12.5 mg per kg bodyweight (Di Carlo et al., 1993). Intraperitoneallyadministered rutin showed gastroprotective effects in rats at a dosage of 50 mg per kgbodyweight (Rao et al., 1997).
Compared to the quercitrin dosages of 50 mg per kg bodyweight which were orallyadministered (Gálvez et al., 1995), the self dosages of the sifakas in the spring came close toor exceeded this value, while the animals in the autumn ranged below this dosage (seeTab. C.25). However, the amount of “total flavonoids” ingested exceeded this value by allanimals.
Considering remedies with flavonoids (with medicinal indications other than diarrhoea), thereare different recommendations for orally administered dosages of flavonoid glycosides (RoteListe, 2005). For instance, quercitrin constitutes the major flavonoid glycoside in Solidago

C.VI Pharmacological effects of the food plants analysed 167
virgaurea extracts, for which diuretic, antiphlogistic, analgesic, antifungal and mildantispasmodic effects are reported (Bongartz, 1995; Van Wyk and Wink, 2004). Mostpharmaceutical preparations containing goldenrod extracts are used for their diuretic andantiphlogistic properties to treat nephritis, nephropathies (in pregnancy), renal oedema, renalhypertension (e.g. Solidagoren® N, liquid), as well as in higher dosages for urinary andkidney gravel and stones (e.g. Cysto Fink Mono, capsules; Urol® mono capsules; Rote Liste,2005). Calculated for quercitrin, the daily recommended dosage for adults varies fromapproximately 4 mg (Solidagoren® N, with 1 mg / ml fluid extract from Solidago virgaurea;Dr. Klein (Pharma), pers. comm.) to over 100 mg (Urol® mono) depending on the remedy(Bongartz, 1995; Rote Liste, 2005).
Rutin, another quercetin glycoside (rutoside, quercetin-3-rutinoside), and its commerciallyused herbal source Fagopyrum esculentum, are extensively studied for their pharmacologicaleffects and dosage recommendations. Rutin and its derivatives are used as mono-preparationsfor the treatment of vascular disorders such as heavy legs, increased permeability of vessels,varicosis, thrombophilia and haemorrhoids (Rote Liste, 2005). This vascular protection(achieved by reduced permeability and compression), vasoconstrictor and anti-haemorrhagiceffects improved the vascular resistance in pregnancy, in hypertonic patients, and retinalhaemorrhages in diabetes (Dingermann and Loew, 2003). Recommended dosages dependupon the degree of ailment and range from e.g. 50 mg rutoside (Rutin-capsules), over 300 mgrutoside (Rutinion® 50 mg, tablets), 600 mg rutoside (Rutinion® FT 100 mg, tablets), 500-1000 mg O-(ß-hydroxy-ethyl)-rutoside (Venoruton® Active and Venoruton® Intens, tablets),and 300-1800 mg troxerutin (Veno SL® 300, capsules) up to 3 g in radiological therapy(hydroxy-ethyl-rutoside; Venoruton® Active / Intens, tablets) (Rote Liste, 2005).
Compared to the individual focal lemurs, in the spring season, the animals averaged dailyingested levels between 220 mg (Tiberius) and 330 mg (Valentinian) of quercitrin irrespectiveof their age. On the contrary, in the autumn season, the adult animals consumed on averagedaily 100 mg (Drusilla) and 90 mg (Julian), respectively and the juvenile Gordian consumedan average of 50 mg. As previously stated for the gallotannins, the difference between thespring and autumn dosage is likely to reflect seasonal constraints in flavonoid contents withinthe food supply provided by the staff than in more voluntary food choice. Although thecontents of quercitrin increased in A. julibrissin leaves from spring to autumn, the overallcontents of flavonol glycosides decreased (Tab. C.13, p. 119). This overall decrease inflavonoid glycosides was also found for the other food plants analysed. When provided,autumnal A. julibrissin leaves were less frequently consumed compared to those same leavesin the spring, presumably due to the predominance of old leaves. However, in both seasons(spring and autumn) quercitrin was consumed in therapeutic dosages as recommended forhumans, and no clear dependence on the sifakas’ age could be determined.
Since quercetin as an aglycone moiety seems to be important for the pharmacological effectsof quercetin glycosides for the animal host (Fanning et al., 1983; Gálvez et al., 1993a),dosage recommendations for quercitrin and rutin as glycosides were converted into quercetinaglycone equivalents 1. Therefore, the total amount of quercetin aglyca could be taken intoaccount, and that also included the other quercetin glycosides other than quercitrin whichwere contained in the food plants and were ingested by the sifakas.
In human medicine, daily recommended dosages of orally administered quercetin range from3 mg (contained in Solidagoren® N), over 145 mg (contained in Rutinion®, tablets) to even1.4 g (corresponding to 3 g O-(ß-hydroxy-ethyl)-rutoside in Venoruton® Active / Intens). Fora hypothetical 60 kg person, a minimum of approximately 0.06 mg with a maximum range of24 mg quercetin per kg bodyweight lies within the therapeutic scope of pharmaceuticalrecommendations. But dosage recommendations are likely to be linked to the age of a person,
1 converted by means of the molecular weights of the respective glycoside and its aglycone

168 C.VI Pharmacological effects of the food plants analysed
not to the bodyweight, and in the case of a hypothetical 100 kg person, much lower values perbodyweight would result: just 0.02 mg up to 14 mg quercetin aglycone. However, this clearlyshows the huge therapeutic broadness of flavonoids and their effects even in low dosages. Forthe extract from Fagopyri herba (from Fagopyrum esculentum, with rutin as leadingflavonoid), the first toxic effects are reported to commence at a dosage of 14.7 g / kgbodyweight, the LD50 at 24.5 g / kg bodyweight, and the lowest lethal dosage at 215 g / kg inmice orally administered, respectively (Friederich et al., 1999; Dingermann and Loew, 2003).Toxic effects found in vivo in different animal models e.g. for tannic acid and gallic acid inrabbits (Dollahite et al., 1962; Pigeon et al., 1962), and for quercetin in mice and rats, seem tobe of little importance for therapeutic dosages in humans (Steinegger and Hänsel, 1988;Dingermann and Loew, 2003), and for the sifakas of this study.
Quercetin intakes of the focal sifakas resemble those of quercitrin intakes (Tab. C.25). Duringthe spring season, animals ingested a daily average between 260 and 350 mg of quercetin,irrespective of their age, while in the autumn, roughly 85 mg was eaten by the adults and just60 mg by Gordian.
Considering the intake of total flavonoids referenced to the individual focal sifakas, during thespring the animals ingested daily average levels between 830 mg (Tiberius) and 1240 mg(Valentinian). In the autumn, Drusilla and Julian (with outdoor access) ingested 550 mg(Drusilla) and 500 mg (Julian) respectively, whereas Gordian amounted to a mere 270 mg.
It can be concluded that the quantity of total flavonoids ingested as well as the quantity ofquercitrin and quercetin lay within the levels of therapeutic recommendations for humans.Within human medicine, dosage-finding assays revealed that the long-term treatment witheven low dosages of e.g. rutin (40-60 mg rutin daily) yielded therapeutic success(Dingermann and Loew, 2003). Low dosed flavonoids (quercetin and quercetin glycosides)and other phenolic compounds (gallic acid and related compounds) showed prolongedpharmacological effects even after a single oral dose (Dorsch et al., 1992; Neszmélyi et al.,1993).
The daily dosages of flavonoids and tannins “dosed” by the sifakas can be classified as long-term therapy. No correlation to the animal’s age could be ascertained.
PolysaccharidesThe polysaccharides of high molecular weight were found only in A. julibrissin leaves (seechapter C.V), and these leaves were only fed as browse within the cages. As experiments on adirect quantification of A. julibrissin leaf mucilage failed, the determination of the swellingnumber (chapter C.V) was used as a reference method to compare the amounts of fresh A.
julibrissin leaves eaten by the sifakas to therapeutic dosages of gelling agents asrecommended within human medicine. Table C.26 presents the averaged daily intake of freshleaves per individual (values were converted from Tab. B.9, p. 43) and the correspondingvolume when balanced with the swelling number and referred to as dry leaf weight.
Tab. C.26: The averaged daily intake of fresh A. julibrissin leaves [g] per individual and thecorresponding volume [ml] when balanced with the swelling number(QZ = 9 referred to dry leaf weight) are presented; recommendations for humanadults are included [ml].
spring autumn humanM T D V J D G adults
intake [g] 57 44 42 56 9.3 10 11volume [ml] 128 99 95 126 21 23 25 10 - 100
For dosage comparisons, some pectin containing remedies were considered.

C.VI Pharmacological effects of the food plants analysed 169
Aplona® granulate contains apple powder1, of which 20-35 g (4-7 sachets) are recommendedfor infants (1-5 years), and 25-40 g (5-8 sachets) for older children and adults on a daily basisfor acute and chronic diarrhoeas. This corresponds to pectin quantities of 700 mg to 1.2 g forinfants and 875 mg to 1.4 g for older children and adults. The swelling number for applepectin was determined as 13-25 ml/g (Athenstaedt GmbH & Co. KG, pers. comm.).
Diarrhoesan® (liquid) contains a fluidextract of Matricariae flos and pectin.Recommendations for an antidiarrhoeal therapy yield a maximum of about 3-4 g pectin perday for older children and adults, about half the dosage for infants and about 1 g for babies(Dr. Loges & Co. GmbH, pers. comm.).
For A. julibrissin leaves eaten in May and the younger leaves eaten in October, a swellingnumber of 9 was determined, respectively (chapter C.V). Since there is no feeding data forJuly, the higher swelling numbers determined for leaves from July were not used in thesecalculations.
In the spring, individual focal animals ate approximately 50 g fresh A. julibrissin leavesirrespective of their age, whereas approximately 10 g were consumed in the autumn by eachfocal lemur. If the corresponding dry weights were balanced with the swelling number of theleaves (QZ = 9 ml/g), the animals in the spring reached an average of 112 ml and in theautumn 23 ml, respectively. Compared to the pectin containing remedies and the balancing ofdosages prescribed with the swelling number of apple pectin (QZ = 13-25 ml/g), 10-100 mlare recommended for adults and older children, and 10-50 ml for infants, respectively.
It may be concluded, that all focal lemurs lay within (or exceeded slightly) dosagerecommendations for adults irrespective of their ages. The clear seasonal difference inconsumption of the polysaccharides obviously originated from the seasonal abundance ofyounger A. julibrissin leaves.
It may be further concluded, that pectin containing remedies are in good agreement with theA. julibrissin leaf mucilage, and this in three respects: physico-chemical properties (chapterC.V), indication, and dosages taken per individual.
Selectivity of the food
To evaluate the importance of R. copallina and A. julibrissin leaves as major source of tanninsand flavonoids in the diet of the sifakas (Fig. C.15), the leaf composition eaten (weight %)was referred to the amount (weight %) of hydrolysable tannins and flavonoids supplied bythese leaf species.
According to Fig. C.15, equal amounts of R. copallina and A. julibrissin leaves were ingestedby Marcella and Tiberius during the spring, while slightly more R. copallina and less A.
julibrissin leaves were eaten by Drusilla and Valentinian. Therefore, in both groups R.
copallina accounted for the majority of hydrolysable tannins, 80 and 87%, respectively.Regarding the group of flavonoids, A. julibrissin leaves accounted for 64 and 55 % of totalflavonoids ingested, respectively. Although in October far less R. copallina was eaten byJulian and Drusilla, (for absolute amounts of fresh leaves eaten see Tab. B.9, p. 43), R.
copallina leaves still supplied 79 % of the hydrolysable tannins in the food. Due to the lowpercentage of A. julibrissin leaves, only 14 % of flavonoids originated from A. julibrissin
leaves and 78 % were delivered by other leaf species. Gordian covered with a portion of 73 %R. copallina leaves his entire requirement for hydrolysable tannins. 13 % A. julibrissin leavesstill supplied 30 % flavonoids.
This portion of mucilage is not depicted in Fig. C.15, as all mucilage ingested in captivityoriginated from A. julibrissin leaves.
1 175 mg pectin are contained per sachet Aplona® granulate with 5 g apple powder each.

170 C.VI Pharmacological effects of the food plants analysed
With respect to seasonal differences in contents of the three groups of compounds in the foodplants combined with the food selecting behaviour of the sifakas, the greatest importance canbe assigned to the group of hydrolysable tannins. They were heavily ingested throughout theyear by selecting R. copallina leaves. Depending on the availability of A. julibrissin leaves,their inherent flavonoids and plant mucilage levels are expected to exert additional orsynergistic beneficial effects resulting in an antidiarrhoeal triple therapy.
64%25%
11%
20%
80%
Group M&T
55%32%
13%
13%
87%
Group D&V
14%
78%
8%
21%
79%
Group J&D
30%
40%
30%
100%
Group G
Fig. C.15: Food selection and supply of hydrolysable tannins and flavonoids by the differentleaf species.The food composition and the supply of the secondary plant compounds is given in weight %. Outerring: leaf species eaten; middle ring: tannins ingested; inner ring: flavonoids ingested. Like colourscorrelate food plant sources with the supply of the respective compounds.
R. copallina
36%A. julibrissin
37%
other27%
R. copallina
40%A. julibrissin
29%
other31%
R. copallina
29%
A. julibrissin
9%
other62%
R. copallina
73%A. julibrissin
13%
other14%

C.VI Pharmacological effects of the food plants analysed 171
4 Discussion and conclusion
Secondary plant compounds exert a range of pharmacological effects and their utilisation formedicinal purposes is the origin of phytotherapy. However, the evaluation of the role ofsecondary plant compounds in the diet of the focal Coquerel’s sifakas is a multifariousproblem, since the daily ingestion of secondary plant compounds equals a long-term therapy.It appears that the lack of chemical compounds essential for their health has emerged as ahealth concern, especially the phenomenon of diarrhoea in captive Coquerel’s sifakas andrelated indriid species. The preventive aspect of this treatment is mirrored by the finding thatdiarrhoea is not observed in wild sifakas (Garell, 1990). However, captive sifakas often fell illwhen deprived of appropriate leaf species browse, without eating any detrimental or noxiousfoods. The curative aspect of this therapy is mirrored by the fact that animals recovered whenhaving the opportunity to self-select special leaf species. Unfortunately sifakas often died ofmultiple infections and metabolic diseases when continuously deprived (see necropsy reports)of leafy browse. In the latter case no veterinary medicinal treatment was effective instemming the final course of diseases after a history of recurrent and chronic diarrhoea.
Based on the selective feeding behaviour shown by the focal lemurs, a strong predilection fortwo food plants became clear, R. copallina and A. julibrissin. R. copallina leaves was themost preferred leaf species throughout the year and yielded most of the hydrolysable tanninsingested. A. julibrissin leaves yielded most of the flavonoid glycosides (characterised by apredominance of quercetin aglyca) and all polysaccharides ingested, (a pectin-like mucilageof high molecular weight). The amount of tannins and flavonoids ingested were supplementedby additional selected leaf species, which corroborate the selectivity in food plant choice.
Hydrolysable tannins possess a direct antidiarrhoeal effect as they are able to interact with thegastrointestinal mucous membrane, in order to reduce hypersecretory processes, to decreasethe gut passage rate and increase stool consistency. With respect to the in vitro assays,extracts from R. copallina leaves, my findings showed antibacterial effects especially againstopportunistic, facultative pathogenic bacteria, such as various Staphylococcus strains andPseudomonas aeruginosa. Furthermore, other bacteria (Corynebacterium minutissimum,C. acnes, Bacteroides fragilis and Helicobacter pylori) were also affected by R. copallina leafextracts. Moreover, tannin extracts from R. copallina leaves were able to bind to choleratoxin, which is still also a key cause for diarrhoeal diseases in developing countries. Sincethese effects can be attributed to the group of hydrolysable tannins, R. copallina leaves werethe most effective leaf species in these assays.
As tannins are acknowledged to have an important impact on bacterial growth andcolonisation, the resulting pharmacological effects of R. copallina leaf tannins are presumedto reduce the risk of an increased gastrointestinal permeability, bacterial translocation andmaintain the equilibrium within the gastrointestinal microflora constant. In particular,opportunistic bacteria are able to cause severe inflammatory diseases with lethalconsequences, if they have penetrated the barriers of a normally functioning immune system(Tsai et al., 1996). Overall, the gallotannins ingested by the sifakas are thought to be able todevelop their antidiarrhoeal potency throughout the entire gut like tannin albuminate (e.g.Tannalbin®). Simple phenolics found in R. copallina and A. julibrissin leaves (Tab. C.8,p.107) and those presumed to be released to some extent during gut passage from phenolicpolymers (e.g. gallic acid) are expected to contribute to the antibacterial and antiseptic effects.
Flavonoids, especially of the quercetin aglycone type, are reported to exhibit spasmolytic andprotective effects within the gut. They are found to reduce capillary permeability, toregenerate absorptive processes, to normalise the gut transit time and to restore the mucousmembrane. These effects are attributed predominantly to A. julibrissin leaves due to their highcontents in flavonoids, albeit these effects were not corroborated by assays in this study.

172 C.VI Pharmacological effects of the food plants analysed
The polysaccharide, a pectin-like rhamnogalacturonan, was found to occur in A. julibrissin
leaves and is expected to influence the gut motility, absorptive processes and to exert curativeeffects on epithelial cells and the gastrointestinal microflora. Mucilaginous compounds mayinfluence bacterial growth, e.g. by influencing the intraluminal pH.
Overall, abnormal absorptive processes of the gut should be normalised and the mucosalbarrier restored by both, the flavonoids and tannins. Gut motility itself seems to be influencedby all three groups of compounds. Interactions of the plant compounds with surfacemucopolysaccharides of the gastrointestinal tract are expected for the tannins and themucilaginous polysaccharides.
The conversion of the contents of these major leaf compounds within the food plant speciesinto averaged daily dosages “self-dosed” by the sifakas, yielded relevant therapeutic dosagesthroughout the year, as utilised in human medicine. The different dosages ingested by theanimals studied in spring and in the autumn appear to reflect seasonal fluctuations in leafcontents, and constraints within the food supply, rather than actual physiological needs. Thehuge therapeutic broadness of these three groups seems to allow for the large dosagevariations as observed between the spring and autumn feeding behaviour.
The benefit from the three major groups of secondary compounds for diarrhoeal diseases ispresumed to lie in their unspecified mode of action onto different processes within thegastrointestinal tract and associated organs.
With respect to human medicine, hydrolysable tannins are already well established for theprevention as well as for the treatment of acute and chronic diarrhoeal diseases. Additionally,mucilaginous compounds and pectins are acknowledged to normalise stool consistency. Inexperimental animal models, flavonoids create preventive and beneficial effects on thegastrointestinal tract and are helpful in diarrhoeal diseases, yet have not been established withthis effect in human medicine.
Furthermore, it should be noted that a species-specific balance between the primary foodconstituents (proteins, fat, carbohydrates and dietary fibres) seems to be a precondition for thehealth of each animal species and humans (the dietary regime was changed prior to the onsetof this study, see chapter C.I). In human medicine, the composition of primary foodconstituents is increasingly discussed in favouring or preventing the generation of metabolicdiseases (such as diabetes, hyperlipidaemia and hypertension). With respect to the sifakas, aspecies-specific balanced diet in primary and secondary food components is essential for theirhealth condition.
Based on the sifakas’ choice of secondary plant compounds inherent to their selected foodplants, and the dosages taken, it may be concluded that the sifakas designed an antidiarrhoeallong-term triple therapy. This concept may also be beneficial for diarrhoeal diseases inhumans.
Finally, it should be added that all three groups of major leaf compounds, hydrolysabletannins, flavonoids (especially of the quercetin aglycone type), and the pectin-like mucilageare rather ubiquitous in plant kingdom. These compounds are presumed to be in abundancewithin lemur ranges on the island of Madagascar and their absence within respective dietsbecame a problem whenever sifakas left their natural habitats. Obviously, taste and smell arethe senses by which sifakas select the “appropriate” plant species despite their foreign livingconditions in zoos and parks outside Madagascar. The focal lemurs exhibited high selectivityin leaf choice, which translated to an active decision for high-yield leaves in tannins by theCoquerel’s sifakas, is a feature that appears to be common and well distributed among lemurs(Spelman et al., 1989). Undoubtedly this heightened selectivity pleads for the hypothesis, thatthis trait provides a strong evolutionary adaptation whether they are residing in a foreign or anative environment.

D General conclusions 173
D General conclusions
A common problem of Coquerel’s sifakas is the development of diarrhoeal diseases incaptivity. Their selective feeding behaviour with respect to leaf choice, the finding of threemajor groups of plant compounds (hydrolysable tannins, flavonoids and a pectin-like plantmucilage) within the selected leaves with their innate antidiarrhoeal effects as well as thetherapeutic dosages ingested are compelling evidence that the Coquerel’s sifakas consumedthese compounds for their pharmacological effects and not for nutritional reasons. It istherefore plausible to conclude that phytotherapy is predestined for self medication especiallyby those animal species which are on the other hand “condemned” to cope with an assortmentof pharmacological active compounds within their environment. In this respect, the ability ofself medication might build an important evolutionary advantage.
To some extent fluctuations in the supply of the secondary plant compounds are tolerated bythe sifakas (e.g. due to seasonal variations and different food supply), but strong alterationsmay lead to disease and death. From necropsy reports it can be concluded that chronicdiarrhoea led to multiple generalised systemic infections and finally to a septicaemia or to ametabolic disease.
Hence, the daily ingestion of antidiarrhoeal agents with preventive and curative properties areobviously needed to maintain the difficult equilibrium between the gastrointestinal microflora,the mucosa and the host immune system. The long-term antidiarrhoeal therapy mirrors therequirements to maintain a well-functioning intestinal barrier. Inherited geneticpredispositions, bacterial, viral, environmental or host factors or a combination of these maycontribute to the impairment of this equilibrium. This raises the central question:What does this equilibrium disturb? In other words, why do the sifakas actually need a long-term therapy of phytotherapeutics with antidiarrhoeal and curative effects on theirgastrointestinal system to stay healthy?
Although reasons may be very complex and multifactorial, it is reasonable to presume anincreased gastrointestinal permeability is a common feature in all these clinical courses.Hence three hypotheses may be formulated:
1.) Lemurs and in particular members of the indriid family, are extremely susceptible togastrointestinal bacterial or viral infections which may lead to bacterial overgrowth andmucosal damage and as consequence may suffer from an increased gastrointestinalpermeability with known development of systemic infections and septicaemia by massivebacterial translocation.
2.) The mucosal immune system is easily impaired by bacterial or viral products which inturn disturb the mucosal barrier leading to diarrhoea and ultimately to an increasedgastrointestinal permeability.
3.) An increased species-specific gastrointestinal permeability is inherent to all lemur speciesand requires mucosal protective agents to reduce the physiologically elevatedgastrointestinal permeability. This third variant is tempting as all lemur species in general,prefer a diet high in tannins (Spelman et al., 1989).
Feeding trials are one possible way to assess more closely the requirements to be supplied bythe food. Prepared feeding trials with pressed tablets containing either tannins (tanninalbuminate) or polysaccharides (Plantaginis ovatae testa) and grass meal (as auxiliary agent)have unfortunately not been approved by the Duke Lemur Center Research Council, andremain a possibility regarding sifakas’ food choice.

174 D General conclusions
Following all efforts to investigate the feeding behaviour of the sifakas, with numerouschemical analyses on preferred food plants (Rhus copallina and Albizia julibrissin) andadditional plant species, and following a series of pharmacological assays to assess theireffects and dosages ingested, I would now recommend the sifakas be investigated by agastroenterologist in order to target the remaining central question.

E Summary 175
E Summary
The investigation of the phenomenon of diarrhoeal diseases in captive Propithecus verreauxi
coquereli (Coquerel’s sifakas), a highly endangered Malagasy lemur species of the indriidfamily, was conducted at the Duke University Lemur Center (DULC), North Carolina, USA.The Indriidae are arboreal living, mainly folivorous primates possessing a highly specialisedgut system, classified as midgut-fermenters1. Acute and recurrent bouts of diarrhoea withlethal episodes are only described for captive conditions despite veterinary treatment andalbeit no obvious detrimental or noxious food had been ingested. As health conditions hadalready improved significantly at the DULC with the introduction of various self-selected leafspecies into their diet, prior to the onset of this study, a strong correlation between the well-being of the sifakas and special dietary needs was hypothesised.
Within this study, the full dietary needs as to the role of primary and secondary plantcompounds with special respect to the selected leaf species, as well as their nutritional andenergy contribution and their impact on health were investigated.
The feeding behaviour of six Coquerel’s sifakas of various ages that comprised four studygroups were investigated during two seasons with one observation session in May, the otherin October. The focal lemurs were kept in a variety of enclosures including combinations ofcaged and free-ranging forested habitat enclosures. On a daily basis, the groups received avariety of fruits and vegetables, out of a possible 27 different food species, leaf-eater primatechow, and 6 to 8 different leaf species cut from trees growing proximate to the DULC. Theentire food intake was based on fresh weight in relation to the parameters of each lemurgroup, together with the lemur’s bodyweight. The weight of food intake on wild browse in theforested enclosures was estimated. By devising new methodology in determining the amountof wild browse consumed, allowed this study to include natural-like feeding conditions in thefeeding assessments.
Overall, 36 ± 8 % (m/m) of the entire food intake was allotted to the portion of leaves,irrespective of the animal’s age, despite different feeding and holding conditions. Theabsolute leaf intake decreased from spring to the autumn. Rhus copallina (Anacardiaceae) andAlbizia julibrissin (Mimosaceae), were the most preferred leaf species, with a significantseasonal decrease in A. julibrissin leaf intake (12 % (m/m) in spring versus 4 % (m/m) in theautumn). Contrarily, R. copallina leaves remained highly preferred with 16 ± 5 % (m/m).
The food composition in primary food components revealed a strong dependency on theanimal’s age in respect to nutrient and energy intake per kg bodyweight despite largevariations in the selected food resources and seasonal fluctuations in all primary leafcompounds as analysed for the browse species. Both groups with juvenile and subadultanimals consumed nearly double the amount of proteins and available carbohydrates per kgbodyweight than the adult groups, while the portion of fat reflected more accurately the foodresources consumed than actual dietary needs. On the other hand, the respective portions(weight %) of the nutritional composition within the diets remained rather constantirrespective of the animal’s age and food selection.
Different models of energy calculations showed a relatively low energy contribution by theleaves to the overall diet. Although the leaves proved to be a valuable source of proteins,dietary fibres and minerals, there was a superabundance of other food resources that couldeasily replace the portion of leaves to supply nutrients and energy. Therefore, the role of the
1 previously known as hindgut-fermenting primates

176 E Summary
secondary leaf compounds should be elucidated with respect to their impact on leaf choiceand possible beneficial pharmacological effects for the sifakas’ well-being.
In reflection to the observed feeding behaviour, a “classification system” was instigated tosurvey the occurrence of secondary plant compounds in all plant species and plant partswithin their environment. Food preferences and avoidance were found to correlate with theoccurrence of secondary plant compound groups and proved to be chemotaxonomicallyconsistent. High levels of hydrolysable tannins were clearly sought out with a discriminationbetween hydrolysable and condensed tannins. The predilection for tannins agrees withprevious observations on other lemur species described in literature.
Preparative isolations and subsequent structure elucidation by means of HPLC analyses, UV-spectroscopy, mass spectrometry and NMR-spectroscopy, elucidated unambigously thestructure of four flavonoid glycosides in R. copallina leaves including a new auronol, and sixflavonoid glycosides in A. julibrissin leaves, with only three to be expected in A. julibrissin asdescribed in the literature. Two flavonoid glycosides were found to occur in both plantspecies. One flavonoid glycoside in A. julibrissin leaves was found to be novel, quercetin-3-O-α-L-rhamnopyranosyl(1→2)ß-D-xylopyranoside. Additional eight flavonoid glycosideswere proposed in structural constituents and molecular weight for R. copallina leaves, andnine for A. julibrissin leaves, with acylated glycosides within both species appearing as a newfeature.
A total of 11 gallic acid derived compounds were identified within R. copallina leavesincluding a new isomeric p- and m-digallic acid methyl ester, while four simple phenoliccompounds were identified within A. julibrissin leaves, with two compounds being incommon within both leaf species. Only in part were these compounds expected fromliterature.
Quantification by HPLC methods revealed gallotannins to be the major compounds within R.
copallina leaves, and quercetin derived flavonol glycosides within A. julibrissin leaves, thatwere also found to occur within additionally selected leaf species. In agreement with thecurrent literature, the highest contents of hydrolysable tannins were found within R. copallina
leaves showing a seasonal decrease from approximately 28 % (m/m) in May leaves to 18 %(m/m) in October leaves, followed by Acer rubrum with approximately 18 % (m/m) in Mayleaves and 12 % (m/m) in October leaves. Highest yields of flavonol glycosides wereanalysed for A. julibrissin in the May leaves with 4.85 % (m/m) with decreasing levels in theOctober leaves. Only the younger October leaves were ingested by the animals with lowerquercitrin levels (approximately 85 % relative abundance of quercitrin in older October leavesversus 58 % in the younger leaves) and overall higher flavonoid contents.
A pectic-like mucilage detected in A. julibrissin leaves was found to consist of rhamnose,galactose and galacturonic acid in nearly equal molar ratios and a molecular weight ofapproximately 2 million Da. This rhamnogalacturonan was characterised for the first time inA. julibrissin leaves and was the third major leaf compound ingested by the sifakas. Linkageanalyses, including various mass spectrometric experiments and partial hydrolysis, yieldedtetramerous, hexamerous and octamerous linear chains, for which a backbone structure withalternating 1,2-linked rhamnose and 1,4-linked galacturonic acid residues was proposed. Inbranched regions that also contain galactose residues as the third major component, 1,2,4-linked rhamnose appeared as the site of ramification. This proposed structure was found to bein agreement with hairy regions in pectins and pectin-like polysaccharides.
The leaf mucilage proved compatible with gallotannins, which is undoubtedly important asA. julibrissin and R. copallina leaves were consumed within one meal time. A swellingnumber (QZ) of 9 was determined for those A. julibrissin leaf harvests, which were utilisedfor subsequent dosage calculations.

E Summary 177
To evaluate the pharmacological relevance of the three major leaf compounds in the lemurdiet with respect to preventive and curative effects in diarrhoeal diseases, differentantimicrobial in vitro assays were performed that targeted possible antibacterial, antifungaland antiprotozoal effects. However, various R. copallina leaf extracts showed best growth-inhibitory effects against several Staphylococcus aureus strains, against Pseudomonas
aeruginosa, Helicobacter pylori, two species of Corynebacterium and Bacteroides fragilis,while no antifungal or antiprotozoal activity was found. A. julibrissin leaf extracts showed noactivity. Furthermore, in a gel-electrophoretic binding assay, tannin extracts from R. copallina
leaves inactivated Cholera toxin by directly interacting with the A subunit of the toxin in adose-dependent manner. Seasonal influences appeared to impact the binding affinities of theleaf extracts to the toxin.
Evidence for antidiarrhoeal, protective and normalising effects onto processes within thegastrointestinal tract was extracted from the literature for all three major groups of leafcompounds, showing each a large therapeutic broadness. To ultimately evaluate the relevanceof these secondary compounds ingested by the sifakas with the daily leaf intake, averagedingested dosages were calculated and compared to therapeutic dosages as utilised withinhuman medicine. It became clear that all dosages ingested by the sifakas lay within thetherapeutic dosage range as recommended for humans. While overall the consumed secondarycompounds decreased parallel to the seasonal decrease in leaf contents and leaf intake; theanimal’s age did not appear to influence dosage intakes.
The three major groups of secondary plant compounds selected by the sifakas are known tooccur ubiquitously in plant-kingdom, and their phytotherapeutic utilisation may be conceivedas a long-term triple therapy. Deprivation of these chemical compounds may risk illness anddeath, an outcome of an animal type that possesses a highly specialised gut system that isadapted to special dietary needs.

178 F References
F References
Aaku E., Office M., Dharani S.P., Majinda R.R.T. and M.S. Motswaiedi, 1998. Chemical andantimicrobial studies on Elephantorrhiza elephantina. Fitoterapia 69, 464-465.
Abe H., Takatsuto S., Okuda R. and T. Yokota, 1995. Identification of catasterone, 6-deoxocatasterone, and typhasterol in the pollen of Robinia pseudoacacia L. Biosci.
Biotech. Biochem. 59, 309-310.
Agrawal P.K., 1989. Studies in organic chemistry 39. Carbon-13 NMR of Flavonoids.Elsevier Amsterdam, Oxford, New York, Tokyo.
Ahn Y.-J., Kwon J.-H., Chae S.-H., Park J.-H. and J.-Y. Yoo, 1994. Growth-inhibitoryresponses of human intestinal bacteria to extracts of oriental medicinal plants. Microbial
Ecology in Health and Disease 7, 257-261.
Ahn Y.-J., Lee C.-O., Kweon J.-H., Ahn J.-W. and J.-H. Park, 1998. Growth-inhibitoryeffects of Galla Rhois-derived tannins on intestinal bacteria. Journal of Applied
Microbiology 84, 439-443.
Altmann J., 1974. Observational study of behaviour: sampling methods. Behaviour 49, 227-267.
Altona C. and C.A.G. Haasnoot, 1980. Prediction of anti and gauche vicinal proton-protoncoupling constants in carbohydrates: a simple additivity rule for pyranose rings. Organic
Magnetic Resonance 13, 417-429.
An J., Zhang L., O’Neill M.A., Albersheim P. and A.G. Darvill, 1994. Isolation and structuralcharacterisation of endo-rhamnogalacturonase-generated fragments of the backbone ofrhamnogalacturonan I. Carbohydrate Research 264, 83-96.
Anderson D.M.W., Cree G.M., Marshall J.J. and S. Rahman, 1966. Studies on uronic acidmaterials. Part XIII. The composition of gum exudates from Albizia sericocephala andAlbizia glaberrima with an appendix on botanical nomenclature in the genus Albizia.Carbohydrate Research 2, 63-69.
Anderson D.M.W. and J.F. Stoddart, 1966. Studies on uronic acid materials. Part XV. The useof molecular-sieve chromatography in studies on Acacia senegal gum (Gum Arabic).Carbohydrate Research 2, 104-114.
Anderson D.M.W. and K.A. Karamalla, 1966. Studies on uronic acid materials. Part XVI.Inter-nodule variation and the acidic components in Acacia nilotica gum. Carbohydrate
Research 2, 403-410.
Anderson D.M.W. and G.M. Cree, 1968a. Studies on uronic acid materials. Part XXVI. Thealdobiouronic acids in gums from Acacia species. Carbohydrate Research 6, 214-219.
Anderson D.M.W. and G.M. Cree, 1968b. Studies on uronic acid materials. Part XXVII. Thestructure of the gum from Acacia nubica Benth. Carbohydrate Research 6, 385-403.
Anderson D.M.W., Dea I.C.M. and E. Hirst, 1968. Studies on uronic acid materials. PartXXXII. Some structural features of the gum exudate from Acacia seyal DEL.Carbohydrate Research 8, 460-476.
Anderson D.M.W. and Dea I.C.M., 1969. Chemotaxonomic aspects of the chemistry ofAcacia gum exudates (review article). Phytochemistry 8, 167-176.

F References 179
Anderson D.M.W. and P.C. Bell, 1976. Analytical and structural features of the gum exudatefrom Combretum hartmannianum Schweinf. Carbohydrate Research 49, 341-349.
Anderson D.M.W. and P.C. Bell, 1977. The composition of the gum exudates from someCombretum species; the botanical nomenclature and systematics of the Combretaceae.Carbohydrate Research 57, 215-221.
Anderson D.M.W., Farquhar J.G.K. and C.G.A. McNab, 1983. Some highly proteinaceousAcacia gum exudates of the subseries Juliflorae. Phytochemistry 22, 2481-2484.
Anderson D.M.W., Bridgeman M.M.E. and G. De Pinto, 1984. Acacia gum exudates fromspecies of the series Gummiferae. Phytochemistry 23, 575-577.
Anderson D.M.W. and N.A. Morrison, 1990. Identification of Albizia gum exudates whichare not permitted food additives. Food Add. Cont. 7, 175-180.
Aziz N.H., Farag S.E., Mousa L.A.A. and M.A. Abo-Zaid, 1998. Comparative antibacterialand antifungal effects of some phenolic compounds. Microbios 93, 43-54.
Bae E.-A., Han M.J., Kim N.-J., and D.-H. Kim, 1998. Anti-Helicobacter pylori activity ofherbal medicines. Biol. Pharm. Bull. 21, 990-992.
Bailey K. and A.G. Butterfield, 1981. Structure of condensation products betweenisonicotinylhydrazine and reducing sugars by 13C nmr spectroscopy. Canadian Journal of
Chemistry 59, 641-646.
Barberá O., Sanz J.F., Sanchez-Parareda J. and J.A. Marco, 1986. Further flavonol glycosidesfrom Anthyllis onobrychioides. Phytochemistry 25, 2361-2365.
Barbosa P., Gross P., Provan G.J., Pacheco D.Y. and F.R. Stermitz, 1990. Allelochemicals infoliage of unfavored tree hosts of the gypsy moth, Lymantria dispar L. 1. Alkaloids andother components of Liriodenderon tulipifera L. (Magnoliaceae), Acer rubrum L.(Aceraceae), and Cornus florida L. (Cornaceae). Journal of Chemical Ecology 16, 1719-1730.
Barz W. and W. Hösel, 1975. Metabolism of Flavonoids. In, The Flavonoids, eds., J.B.Harborne, T.J. Mabry and H. Mabry. Chapman and Hall, London. 916-969.
Bate-Smith E.C., 1954. Leucoanthocyanins: 1. detection and identification of anthocyaninsformed from leucoanthocyanins in plant tissues. The Biochemical Journal 58, 122-125.
Bate-Smith E.C. and N.H. Lerner, 1954. Leucoanthocyanins: 2. systematic distribution ofleucoanthocyanins in leaves. The Biochemical Journal 58, 126-132.
Bate-Smith E.C., 1962. The phenolic constituents of plants and their taxonomic significance.I. Dicotyledons. J. Linn. Soc. (Bot.) 58, 95-173.
Bate-Smith E.C., 1977. Astringent tannins of Acer species. Phytochemistry 16, 1421-1426.
Bate-Smith E.C., 1978. Systematic aspects of the astringent tannins of Acer species.Phytochemistry 17, 1945-1948.
Bauchop T., 1978. Digestion of leaves in vertebrate arboreal folivores. In, The Ecology ofArboreal Folivores, ed., G.G. Montgomery. Smithsonian Institution Press, Washington,D.C. 193-204.
Baxter N.J., Lilley T.H., Haslam E. and M.P. Williamson, 1997. Multiple interactionsbetween polyphenols and a salivary proline-rich protein repeat result in complexation andprecipitation. Biochemistry 36, 5566-5577.
Beil W., Birkholz C. and K.-Fr. Sewing, 1995. Effects of flavonoids on parietal cell acidsecretion, gastric mucosal prostaglandin production and Helicobacter pylori growth.Arzneim-Forsch. / Drug Res. 45 (I), 697-700.
Bennini B., Chulia A.J., Kaouadji M. and F. Thomasson, 1992. Flavonoid glycosides fromErica cinerea. Phytochemistry 31, 2483-2486.

180 F References
Berg R.D., 1998. Bacterial translocation. In, Proceedings of Falk Symposium 100, “Gut andthe liver”, eds., H.E. Blum, C. Bode, J.C. Bode and R.B. Sartor. Kluwer AcademicPublishers, Dordrecht, Boston, London. 47-60.
Bhandari N., Bahl R., Hambidge K.M. and M.K. Bhan, 1996. Increased diarrhoeal andrespiratory morbidity in association with zinc deficiency – a preliminary report. Acta
Paediatr. 85, 148-150.
Biesalski H.-K., Fürst P., Kasper H., Kluthe R., Pölert W., Puchstein C. and H.B. Stähelin,1995. Ernährungsmedizin. Georg Thieme Verlag, Stuttgart, New York.
Bisping W. and G. Amtsberg, 1988. Colour atlas for the diagnosis of bacterial pathogens inanimals. Paul Parey Scientific Publishers, Berlin and Hamburg.
Bocchi C., Careri M., Groppi F., Mangia A., Manini P. and G. Mori, 1996. Comparativeinvestigation of UV, electrochemical and particle beam mass spectrometric detection forthe high-performance liquid chromatographic determination of benzoic and cinnamic acidsand of their corresponding phenolic acids. Journal of Chromatography A 753, 157-170.
Bock K. and H. Thoegersen, 1982. Nuclear magnetic resonance spectroscopy in the study ofmono- and oligosaccharides. Annu. Rep. NMR Spectrosc. 13, 1-57.
Bohm B.A., 1975. Chalcones, aurones and dihydrochalcones. In, The Flavonoids, eds., J.B.Harborne, T.J. Mabry and H. Mabry. Chapman and Hall, London. 442-504.
Bohm B.A., 1994. The minor flavonoids. In, The Flavonoids, Advances in Research since1986, ed., J.B. Harborne. Chapman & Hall, London. 387-440.
Bongartz D., 1995. Analytik und Pharmakokinetik von Quercitrin und anderenPflanzeninhaltsstoffen aus Solidago-Arten. Diss., Bonn.
Bräutigam M. und G. Franz, 1985a. Schleimpolysaccharide aus Spitzwegerichblättern. DAZ
2, 58-62.
Bräutigam M. and G. Franz, 1985b. Structural features of Plantago lanceolata mucilage.Planta Medica, 293-297.
Bresnahan J.F., Whitworth U.G., Hayes Y., Summers E. and J. Pollock, 1984. Yersinia
enterocolitica infection in breeding colonies of ruffed lemurs. Journal of the American
Veterinary Association 185, 1354-1356.
Britt A., Randriamandratonirina N.J., Glassock K.D. and B.R. Iambana, 2002. Diet andfeeding behavior of Indri indri in a low-altitude rain forest. Folia Pimatol. 73, 225-239.
Brockman D.K., Willis M.S. and W.B. Karesh, 1988. Management and husbandry of ruffedlemurs, Varecia variegata, at the San Diego Zoo. III. Medical considerations andpopulation management. Zoo Biology 7, 253-262.
Bruhn C., 2005. Wirkstoff aus Tamarindensamen imitiert Muzin. DAZ 46, 38-40.
Bruorton M.R. and M.R. Perrin, 1991. Comparative gut morphometrics of vervet(Cercopithecus aethiops) and samango (C. mitis erythrarchus) monkeys. Z.
Säugetierkunde 56, 65-71.
Büechi S., 1998. Antivirale Gerbstoffe. DAZ 14, 1265-1274.
Butler L.G., and J.C. Rogler, 1992. Biochemical mechanisms of the antinutritional effects oftannins. In, Phenolic Compounds in Food and Their Effects on Health I: Analysis,Occurrence, and Chemistry. American Chemical Society Symposium Series 506,American Chemical Society, Washington D.C. 298-304.
Campbell J.L., Eisemann J.H., Glander K.E. and S.D. Crissey, 1999. Intake, digestibility, andpassage of a commercially designed diet by two Propithecus species. Am. J. Primatol. 48,237-246.

F References 181
Campbell J.L., Eisemann J.H., Williams C.V. and K.M. Glenn, 2000. Description of thegastrointestinal tract of five lemur species: Propithecus tattersalli, Propithecus verreauxi
coquereli, Varecia variegata, Hapalemur griseus, and Lemur catta. Am. J. Primatol. 52,133-142.
Campbell J.L., Glenn K.M., Grossi B. and J.H. Eisemann, 2001. Use of local North Carolinabrowse species to supplement the diet of a captive colony of folivorous primates(Propithecus sp.). Zoo Biology 20, 447-461.
Campbell J.L., Williams C.V. and J.H. Eisemann, 2002. Fecal inoculum can be used todetermine the rate and extent of in vitro fermentation of dietary fiber sources across threelemur species that differ in dietary profile: Varecia variegata, Eulemur fulvus andHapalemur griseus. J. Nutr. 132, 3073-3080.
Campbell J.L., C.V. Williams and J.H. Eisemann, 2004a. Characterizing gastrointestinaltransit time in four lemur species using barium-impregnated polyethylene spheres (BIPS).Am. J. Primatol. 64, 309-321.
Campbell J.L., C.V. Williams and J.H. Eisemann, 2004b. Use of total dietary fiber across fourlemur species (Propithecus verreauxi coquereli, Hapalemur griseus griseus, Varecia
variegata, and Eulemur fulvus): Does fiber type affect digestive efficiency? Am. J.
Primatol. 64, 323-335.
Candan F., 2003. Effect of Rhus coriaria L. (Anacardiaceae) on superoxide radicalscavenging and xanthine oxidase activity. J. Enzyme Inhib. Med. Chem. 18, 59-62.
Capasso A., Pinto A., Mascolo N., Autore G. and F. Capasso, 1991. Reduction of agonist-induced contractions of guinea pig isolated ileum by flavonoids. Phyther. Res. 5, 85-87.
Carman R.J., Van Tassell R.L. and T.D. Wilkins, 1993. Interactions between dietarycompounds and the colonic microflora. In, Science for the Food Industry of the 21stCentury, biotechnology, supercritical fluids, membranes and other advanced technologiesfor low calorie, healthy food alternatives, ed., M. Yalpani. ATL Press. 313-342.
Carpani G., Orsini F., Sisti M. and L. Verotta, 1989. Saponins from Albizzia anthelmintica.Phytochemistry 28, 863-866.
Chalifoux L.V. and R.T. Bronson, 1981. Colonic adenocarcinoma associated with chroniccolitis in cotton top marmosets, Saguinus oedipus. Gastroenterology 80, 942-946.
Chamsuksai P., Choi J.S. and W.S. Woo, 1981. 3’, 4’, 7-Trihydroxyflavone in Albizzia
julibrissin. Arch. Pharm. Res. 4, 129-131.
Chao L., Yaoqing Z., Yiliang S., Zuping W. and L. Mixin, 1988. Volatile constituents of theflower of Albizzia julibrissin Durazz. Analytical Chemistry (Fenxi Huaxue) 16, 585-589.
Charlton A.J., Baxter N.J., Lilley T.H., Haslam E., McDonald C.J. and M.P. Williamson,1996. Tannin interactions with a full-length human salivary proline-rich protein display astronger affinity than with single proline-rich repeats. FEBS Letters 382, 289-292.
Clapp N.K., Henke M.L., Lushbaugh C.C., Humason G.L., and B.L. Gangaware, 1988. Effectof various biological factors on spontaneous marmoset and tamarin colitis. A retrospectivehistopathologic study. Digestive Diseases and Sciences 33, 1013-1019.
Charles-Dominique P., 1977. Ecology and Behaviour of Nocturnal Primates. Prosimians ofEquatorial West Africa. Translated by R.D. Martin. Columbia University Press, New York.29-52.
Charles-Dominique P., 1979. Ecology and feeding behaviour of five sympatric lorisids inGabon. In, Primate Ecology: Problem-Oriented Field Studies, ed., R.W. Sussman. John.Wiley & Sons, Inc., New York. 5-22.
Ching C.K. and S.K. Lam, 1995. Nonulcer dyspepsia: association with chronic Helicobacter
pylori infection-related gastritis? J. Clin. Gastroenterol. 21 (Suppl. 1), 140-145.

182 F References
Chivers D.J. and C.M. Hladik, 1980. Morphology of the gastrointestinal tract in primates:comparisons with other mammals in relation to diet. Journal of Morphology 166, 337-386.
Chivers D.J., 1994. Functional anatomy of the gastrointestinal tract. In, Colobine Monkeys:Their Ecology, Behaviour and Evolution, eds., J.F. Oates and A.G. Davies. CambridgeUniversity Press, Cambridge. 205-227.
Chung C.-P., Park J.-B. and K.-H. Bae, 1995. Pharmacological effects of methanolic extractfrom the root of Scutellaria baicalensis and its flavonoids on human gingival fibroblast.Planta Med. 61, 150-153.
Claeys M., Li Q.M., Van Den Heuvel H. and L. Dillen, 1996. Mass spectrometric studies onflavonoid glycosides. In, Proceedings of the Phytochemical Society of Europe, 40:Application of Modern Mass Spectrometry in Plant Science Research, eds., R.P. Newtonand T.J. Walton. Clarendon Press, Oxford. 182-194.
Classen B., 2005. Arabinogalaktan-Proteine als Immunstimulanzien. DAZ 1, 53-56.
Clayton D.H. and N.D. Wolfe, 1993. The adaptive significance of self-medication. Trends in
Ecology and Evolution 8, 60-63.
Clemens E. and B. Phillips, 1980. Organic acid production and digesta movement in thegastrointestinal tract of the baboon and sykes monkey. Comp. Biochem. Physiol. 66 A,529-532.
Coetzee J., Steynberg J.P., Steynberg P.J., Brandt E.V. and D. Ferreira, 1995. Oligomericflavanoids. Part 18. Dimeric prorobinetinidins from Robinia pseudacacia. Tetrahedron 51,2339-2352.
Collins L. and M. Roberts, 1978. Arboreal folivores in captivity – maintenance of a delicateminority. In, The Ecology of Arboreal Folivores, ed., G.G. Montgomery. SmithsonianInstitution Press, Washington, D.C. 5-12.
Conklin N.L. and R.W. Wrangham, 1994. The value of figs to a hind-gut fermentingfrugivore: a nutritional analysis. Biochemical Systematics and Ecology 22, 137-151.
Conover W.L., 1971. Practical Nonparametric Statistics. John Wiley & Sons inc., New York,London, Sydney, Toronto.
Cook S.I. and J.H. Sellin, 1998. Review article: short chain fatty acids in health and disease.Aliment. Pharmacol. Ther. 12, 499-507.
Cos P., Ying L., Calomme M., Hu J.P., Cimanga K., Van Poel B., Pieters L., Vlietinck A.J.and D. Vanden Berghe, 1998. Structure-activity relationship and classification offlavonoids as inhibitors of xanthine oxidase and superoxide scavengers. J. Nat. Prod. 61,71-76.
Cos P., Calomme M., Sindambiwe J.-B., De Bruyne T., Cimanga K., Pieters L., Vlietinck A.J.and D. Vanden Berghe, 2001. Cytotoxicity and lipid peroxidation-inhibiting activity offlavonoids. Planta med. 67, 515-519.
Crellin J.K. and J. Philpott, 1990. Herbal Medicine Past and Present. Vol. II. A ReferenceGuide to Medicinal Plants. Duke University Press, Durham and London.
Curir P., Marchesini A., Danieli B. and F. Mariani, 1996. 3-Hydroxyacetophenone incarnations is a phytoanticipin active against Fusarium oxysporum F. SP. Dianthi.Phytochemistry 41, 447-450.
Cuyckens F. and M. Claeys, 2004. Mass spectrometry in the structural analysis of flavonoids.Journal of Mass Spectrometry 39, 1-15.
Därr W. and A. Wodtcke, 1991. “Richtig reisen” Madagaskar, Komoren; Reise-Handbuch.DuMont Buchverlag, Köln.

F References 183
Day A.J. and G. Williamson, 2001. Biomarkers for exposure to dietary flavonoids: a reviewof the current evidence for identification of quercetin glycosides in plasma. British Journal
of Nutrition 86, Suppl. 1, 105-110.
De Bruyn A., Hosten N., Anteunis M.J.O., Claeyssens M. and C.K. De Bruyne, 1979.Stereochemical aspects of proton chemical shifts. IX. Influence of O-alkyl groups on thechemical shift of the glycosidic proton in pyranoid systems. Bull. Soc. Chim. Belg. 88, 43-51.
De Kiesgen R.R. et Maurel J.-C., 1994. Dérivés organométalliques résultant de lacomplexation de tanins ou de mélanges de tanins par des métaux au degré d’oxydation aumoins égal à 3 et composition pharmaceutique les renfennant. Rapport de recherche;Institut National de la Propriété Industrielle, 11.03.94 Bulletin 94/10, 1-33. No. depublication: 2 695 390.
Delgobo C.L., Gorin P.A.J., Jones C. and M. Iacomini, 1998. Gum heteropolysacchride andfree reducing mono- and oligosacchrides of Anadenanthera colubrina. Phytochemistry 47,1207-1214.
Demling L., 1995. Obstipation und Darmflora – Anregung statt Aufregung. Fortschr. Med.
113, 485.
Demment M.W. and P.J. Van Soest, 1985. A nutritional explanation for body-size patterns ofruminant and nonruminent herbivores. The American Naturalist 125, 641-672.
Di Carlo G., Autore G., Izzo A.A., Maiolino P., Mascolo N., Viola P., Diurno M.V. and F.Capasso, 1993. Inhibition of intestinal motility and secretion by flavonoids in mice andrats: structure-activity relationships. J. Pharm. Pharmacol. 45, 1054-1059.
Di Leo V., D’Incà R., Diaz-Granado N., Fries W., Venturi C., D’Odorico A., Martines D. andG.C. Sturniolo, 2003. Lactulose / mannitol test has high efficacy for excluding organiccauses of chronic diarrhoea. The American Journal of Gastroenterology 98, 2245-2252.
Dingermann T. and D. Loew, 2003. Phytopharmakologie. Experimentelle und klinischePharmakologie pflanzlicher Arzneimittel. Wissenschaftliche Verlagsgesellschaft mbH,Stuttgart.
Dollahite J.W., Pigeon R.F. and B.J. Camp, 1962. The toxicity of gallic acid, pyrogallol,tannic acid, and Quercus havardi in the rabbit. Am. J. Vet. Res. 23, 1264-1267.
Doorenbos N.J., 1976. 13. A simple analytical procedure for gallotannins in Rhus species.
Journal of the Mississippi Academy of Sciences 21, 53-55.
Doorenbos N.J. and C.O. Box, 1976. 14. Cultivation of Rhus glabra L. and Rhus copallina L..Journal of the Mississippi Academy of Sciences 21, 55-57.
Dorsch W., Bittinger M., Kaas A., Müller A., Kreher B. und H. Wagner, 1992. Antiasthmaticeffects of Galphimia glauca, gallic acid, and related compounds prevent allergen- andplatelet-activating factor-induced bronchial obstruction as well as bronchial hyperreactivityin guinea pigs. Int. Arch. Allergy Immunol. 97, 1-7.
Dossaji S.F., Wrangham R. and E. Rodriguez, 1989. Selection of plants with medicinalproperties by wild chimpanzees. Fitoterapia 60, 378-380.
Draths K.M. and J.W. Frost, 1991. Conversion of D-glucose into catechol: the not-so-common pathway of aromatic biosynthesis. J. Am. Chem. Soc. 113, 9361-9363.
Dupain J., Van Elsacker L., Nell C., Garcia P., Ponce F. and M.A. Huffman, 2002. Newevidence for leaf swallowing and Oesophagostomum infection in bonobos (Pan paniscus).Int. J. Primatol. 23, 1053-1062.
Ehle F.R., Robertson J.B. and P.J. Van Soest, 1982. Influence of dietary fibers onfermentation in the human large intestine. J. Nutr. 112, 158-166.

184 F References
El-Mousallamy A.M.D., 1998. Leaf flavonoids of Albizia lebbeck. Phytochemistry 48, 759-761.
ElSissi H., Ishak M.S., AbdElWahid M.S. and M.A. ElAnsari, 1971. The gallotannins of Rhus
coriararia and Mangifera indica. Planta Med. 19, 342-351.
Elson C.O., Sartor R.B., Tennyson G.S., and Riddell R.H., 1995. Experimental models ofinflammatory bowel disease. Gastroenterology 109, 1344-1367.
Engqvist A. and A. Richard, 1991. Diet as a possible determinant of cathemeral activitypatterns in primates. Folia Primatol. 57, 169-172.
Fanning M.J., Macander P., Drzewiecki G. and E. Middleton (Jr.), 1983. Quercetin inhibitsanaphylactic contraction of guinea pig ileum smooth muscle. Int. Archs Allergy apl.
Immun. 71, 371-373.
Fiocchi C., 1997. Pathophysiologische Konzepte bei chronisch entzündlichenDarmerkrankungen. In, Falk Symposium 97, „Klinische Aspekte chronisch entzündlicherDarmerkrankungen – Diagnose, Prognose und Therapie“. Kongreßkurzbericht. 9-11.
Ford S.M. and L.C. Davis, 1992. Systematics and body size: Implications for feedingadaptations in New World monkeys. American Journal of Physical Anthropology 88, 415-468.
Freeland W.J. and D.H. Janzen, 1974. Strategies in herbivory by mammals: the role of plantsecondary compounds. The American Naturalist 108, 269-289.
Friederich M., Schiebel-Schlosser G. und C. Theurer, 1999. Buchweizenkraut, einpflanzliches Venentherapeutikum. DAZ 7, 723-728.
Frohne D. and U. Jensen, 1992. Systematik des Pflanzenreichs unter Berücksichtigungchemischer Merkmale und pflanzlicher Drogen. 4. Aufl., Gustav Fischer Verlag, Stuttgart,Jena, New York.
Fukai T. and T. Nomura, 1988. Seven prenylated flavonol glycosides from two Epimedium
species. Phytochemistry 27, 259-266.
Fukunaga T., Nishiya K., Kajikawa I., Watanabe Y, Suzuki N., Takeya K. and H. Itokawa,1988. Chemical studies on the constituents of Hyphaer tanakae Hosokawa from differenthost trees. Chem. Pharm. Bull. 36, 1180-1184.
Gabe S., Jacob M. and I. Bjarnason, 1998. The intestinal permeability barrier – what ismeasured, what does it mean? In, Proceedings of Falk Symposium 100, “Gut and theliver”, eds., H.E. Blum, C. Bode, J.C. Bode and R.B. Sartor. Kluwer Academic Publishers,Dordrecht, Boston, London. 31-46.
Gali H.U., Perchellet E.M., Klish D.S., Johnson J.M. and J.-P. Perchellet, 1992. Antitumor-promoting activities of hydrolysable tannins in mouse skin. Carcinogenesis 13, 715-718.
Gálvez J., Crespo M.E., Jiménez J., Suárez A. and A. Zarzuelo, 1993a. Antidiarrhoeic activityof quercitrin in mice and rats. J. Pharm. Pharmacol. 45, 157-159.
Gálvez J., Zarzuelo A., Crespo M.E., Crespo M.E., Lorente M.D., Ocete M.A. and J. Jiménez,1993b. Antidiarrhoeic activity of Euphorbia hirta extract and isolation of an activeflavonoid constituent. Planta Med. 59, 333-336.
Gálvez J., Sánchez de Medina F., Jiménez J., Torres M.I., Fernández M.I., Núñez M.C., RíosA., Gil A. and A. Zarzuelo, 1995. Effect of quercitrin on lactose-induced chronic diarrhoeain rats. Planta Med. 61, 302-306.
Ganzhorn J.U., 1985. Habitat separation of semifree-ranging Lemur catta and Lemur fulvus.Folia Primatologica 45, 76-88.
Ganzhorn J.U. and M. Razanahoera-Rakotomalala, 1985. Some aspects of the natural historyand food selection of Avahi laniger. Primates 26, 452-463.

F References 185
Ganzhorn, J.U., 1986. The influence of plant chemistry on food selection by Lemur catta andLemur fulvus. Primate Ecology and Conservation, Proceedings of the 10th Congress of theInternational Primatological Society, eds., Else and Lee. Cambridge University Press. Vol.2, 21-29.
Ganzhorn J.U., 1987. Zur Bedeutung pflanzlicher Inhaltsstoffe für die Nischentrennungsympatrischer Lemurenarten im madagassischen Regenwald. Verh. Dt. Zool. Ges., 209.
Ganzhorn J.U., 1988. Food partitioning among Malagasy primates. Oecologia 75, 436-450.
Ganzhorn J.U., 1989a. Primate species separation in relation to secondary plant chemicals.Human Evolution 4, 125-132.
Ganzhorn J.U., 1989b. Niche separation of seven lemur species in the eastern rainforest ofMadagascar. Oecologia 79, 279-286.
Ganzhorn J.U. and J.-P. Abraham, 1991. Possible role of plantations for lemur conservation inMadagascar: Food for folivorous species. Folia Primatol. 56, 171-176.
Garber P.A., 1987. Foraging strategies among living primates. Ann. Rev. Anthropol. 16, 339-364.
Garber P.A. and U. Kitron, 1997. Seed swallowing in tamarins: evidence of a curativefunction or enhanced foraging efficiency? Int. J. Primatol. 18, 523-538.
Gardiner K.R., 1998. Intestinal permeability in inflammatory bowel disease. In, Proceedingsof Falk Symposium 100, “Gut and the liver”, eds., H.E. Blum, C. Bode, J.C. Bode andR.B. Sartor. Kluwer Academic Publishers, Dordrecht, Boston, London. 61-74.
Garell D.M., 1990. Haematology and serum chemistry of free-ranging golden crowned sifaka(Propithecus tattersalli). Proceedings American Association Of Zoo Veterinarians, 143-145.
Gautier-Hion A. and F. Maisels, 1994. Mutualism between a leguminous tree and largeAfrican monkeys as pollinators. Behav. Ecol. Sociobiol. 34, 203-210.
Gebhardt W., 1935. Vergleichende Untersuchungen über die styptische Wirkung von Pektin,Tannalbin und Aplona. Klinische Wochenschrift 41, 1459-1461.
Geiger H., Maier H. and K.R. Markham, 1983. Quercetin-3α-L-(2-O-α-L-rhamnopyranosido-arabopyranosid), ein neues Flavonolglykosid aus den Samen von Brassica nigra (L.) Koch.Zeitschrift für Naturforschung 38 C, 490-491.
Gioacchini A.M., Roda A., Galletti G.C., Bocchini P., Manetta A.C. and M. Baraldini, 1996.High-performance liquid-electrospray mass spectrometric analysis of phenolic acids andaldehydes. Journal of Chromatography A 730, 31-37.
Glander K.E., 1982. The impact of plant secondary compounds on primate feeding behavior.Yearbook Of Physical Anthropology 25, 1-18.
Glander K.E. and D.P. Rabin, 1983. Food choice from endemic North Carolina tree speciesby captive prosimians (Lemur fulvus). American Journal of Primatology 5, 221-229.
Glander K.E., 1986. Prosimian introduction to a North Carolina forest. Duke UniversityLemur Center, publication No. 282.
Glander K.E., Wright P.C., Seigler D.S., Randrianasolo V. and B. Randrianasolo, 1989.Consumption of cyanogenic bamboo by newly discovered species of bamboo lemur.American Journal of Primatology 19, 119-124.
Glander K.E., Wright P.C., Daniels P.S. and A.M. Merelander, 1992. Morphometrics andtesticle size of rainforest lemur species from southeastern Madagascar. J. Hum. Evol. 22,1-17.

186 F References
Glander K.E., Haring D., Campbell J.L., Hess W. and P. Feeser, 1993. Management of anoverweight prosimian. Proceedings 1993, Regional Conference American Association ofZoological Parks and Aquariums, 205-11.
Go J.J., Woo E.-R. and Y.H. Moon, 2004. Phytochemical constituents of the root bark fromAlbizzia julibrissin Durazz. Saengyak Hakhoechi 35, 194-198.
Goodgame J.T., Banwell J.G. and T.R. Hendrix, 1973. The relationship between duration ofexposure to cholera toxin and the secretory response of rabbit jejunal mucosa. Johns
Hopkins Med. J. 132, 117-126.
Gray G.M., 1984. Carbohydrate absorption and malabsorption. In, The Role of theGastrointestinal Tract in Nutrient Delivery, eds., M. Green and H.L. Greene. AcademicPress, Inc., Vol. 3. 133-144.
Grayer R.J., 1989. Flavanoids. In, Methods in Plant Biochemistry, Vol.1, Plant Phenolics,series eds., P.M. Dey and J.B. Harborne; ed., J.B. Harborne. Academic Press, London.283-323.
Grzimek H., 1988. Grzimeks Enzyklopädie, Band 2, Säugetiere. Kindler Verlag, München.
Günther H., 1992. NMR-Spektroskopie. Grundlagen, Konzepte und Anwendungen derProtonen- und Kohlenstoff-13-Kernresonanz-Spektrospopie in der Chemie. 3. Aufl., GeorgThieme Verlag, Stuttgart, New York.
Hagerman A.E., 1992. Tannin-protein interactions. In, Phenolic Compounds in Food andTheir Effects on Health I: Analysis, Occurrence, and Chemistry. American ChemicalSociety Symposium Series 506, American Chemical Society, Washington D.C. 236-247.
Hagers Handbuch der Pharmazeutischen Praxis, 1994. R. Hänsel, K. Keller, H. Rimpler undG. Schneider, (Hrsg.). Springer Verlag. 450-465.
Hakomori S.-I., 1964. A rapid permethylation of glycolipid, and polysaccharide catalyzed bymethylsulfinyl carbanion in dimethyl sulfoxide. J. Biochem. 55, 205-208.
Hamburger M., Gupta M. and K. Hostettmann, 1985. Flavonol glycosides from Securidaca
diversifolia. Phytochemistry 24, 2689-2692.
Hansen M. and H.J. Jakobsen, 1975. Complete analysis of the high-resolution proton coupledcarbon-13 NMR spectra of toluene. Journal of Magnetic Resonance 20, 520-529.
Harborne J.B., 1979. Flavonoid pigments. In, Herbivores. Their interaction with secondaryplant metabolites, eds., G.A. Rosenthal and D.H. Janzen. Academic Press, New York,London, Toronto, Sydney, San Francisco. 619-655.
Harborne J.B., 1989. General procedures and measurement of total phenolics. In, Methods inPlant Biochemistry, Vol.1, Plant Phenolics, series eds., P.M. Dey and J.B. Harborne; ed.,J.B. Harborne. Academic Press, London. 1-28.
Harborne J.B. and R.J. Grayer, 1994. Flavonoids and insects. In, The Flavonoids, Advances inResearch since 1986, ed., J.B. Harborne. Chapman and Hall, London. 589-618.
Harborne J.B., 1999. Phytochemical Dictionary: a handbook of bioactive compounds fromplants. 2nd ed., Taylor & Francis, London.
Harcourt C. and J. Thornback, 1990. Lemurs of Madagascar and the Comores: The IUCN RedData Book. IUCN - The World Conservation Union. Gland, Switzerland and Cambridge,U.K.
Harcourt C., 1991. Diet and behaviour of a nocturnal lemur, Avahi laniger, in the wild.J. Zool., Lond. 223, 667-674.
Haring D.M., 1988. Natural history and captive management of Verreaux’s sifaka.Int. Zoo Yb. 27, 125-134.

F References 187
Hasan A., Ahmed I., Khan M.A. and M.I. Chudhary, 1996. Two flavonol triglycosides fromflowers of Indigofera hebepetala. Phytochemistry 43, 1115-1118.
Haslam E., 1975. Natural proanthocyanidins. In, The Flavonoids, eds., J.B. Harborne, T.J.Mabry and H. Mabry. Chapman and Hall, London. 505-559.
Haslam E., 1988. Plant polyphenols (syn. vegetable tannins) and chemical defense – areappraisal. Journal of Chemical Ecology 14, 1789-1805.
Haslam E., Lilley T.H., Cai Y., Martin R. and D. Magnolato, 1989. Traditional herbalmedicines – the role of polyphenols. Planta Medica 55, 1-8.
Hattori M., Nakabayashi T., Lim Y.A., Miyashiro H., Kurokawa M., Shiraki K., Gupta M.P.,Correa M. and U. Pilapitiya, 1995. Inhibitory effects of various ayurvedic and Panamanianmedicinal plants on the infection of Herpes simplex virus-1 in vitro and in vivo.Phytotherapy Research 9, 270-276.
Hegnauer R., 1962-2001. Chemotaxonomie der Pflanzen. Bd. I - XIb-2. Birkhäuser Verlag,Basel, Boston, Berlin.
Hemingway C.A., 1996. Morphology and phenology of seeds and whole fruit eaten by Milne-Edwards’ sifaka, Propithecus diadema edwardsi, in Ranomafana National Park,Madagascar. International Journal of Primatology 17, 637-659.
Hemingway C.A., 1998. Selectivity and variability in the diet of Milne-Edwards’ sifakas(Propithecus diadema edwardsi): implications for folivory and seed-eating. International
Journal of Primatology 19, 355-377.
Hensel A. und S. Hose, 2001. Indische Flohsamenschalen. DAZ 36, 55-63.
Hertog M.G.L., Hollman P.C.H. and M.B. Katan, 1992. Content of potentiallyanticarcinogenic flavonoids of 28 vegetables and 9 fruits commonly consumed in theNetherlands. J. Agric. Food Chem. 40, 2379-2383.
Heymann E.W., 1992. Seed ingestion and gastrointestinal health in tamarins? Lab. Primate
Newsletter 31, 15-16.
Higuchi H., Fukui K., Kinjo J. and T. Nohara, 1992a. Four new glycosides from AlbizziaeCortex. III. Chem. Pharm. Bull. 40, 534-535.
Higuchi H., Kinjo J. and T. Nohara, 1992b. An arrhythmic-inducing glycoside from Albizzia
julibrissin Durazz. IV. Chem. Pharm. Bull. 40, 829-831.
Hill W.C.O., 1953. Primates: Comparative Anatomy and Taxonomy. Vol. I. IntersciencePublishers Inc., New York.
Hladik A., 1978. Phenology of leaf production in rain forest of Gabon: Distribution andcomposition of food for folivores. In, The Ecology of Arboreal Folivores, ed., G.G.Montgomery. Smithsonian Institution Press, Washington, D.C. 51-71.
Hladik A., 1980. The dry forest of the west coast of Madagascar: climate, phenology, andfood available for prosimians. In, Nocturnal Malagasy Primates. Ecology, Physiology andBehavior, eds., P. Charles-Dominique, H.M. Cooper, A. Hladik, C.M. Hladik, E. Pages,G.F. Pariente, A. Petter-Rousseaux, A. Schilling and J.J. Petter. Academic Press, NewYork, London, Toronto, Sydney, San Francisco. 3-40.
Hör M., Rimpler H. and M. Heinrich, 1995. Inhibition of intestinal chloride secretion byproanthocyanidins from Guazuma ulmifolia. Planta medica 61, 208-212.
Hofmann R.R., 1983. Adaptive changes of gastric and intestinal morphology in response todifferent fibre content in ruminant diets. Royal Society New Zealand Bulletin 20, 51-58.
Hofmann R.R., 1991. Die Wiederkäuer. Ökophysiologisch hochdifferenziert, biologischerfolgreich – in ihrer Vielfalt gefährdet. Eine vergleichend-anatomische Betrachtung derEvolution des Wiederkäuer-Verdauungsapparates. Biologie in unserer Zeit 2, 73-80.

188 F References
Hollman P.C.H. and M.B. Katan, 1997. Absorption, metabolism and health effects of dietaryflavonoids in man. Biomed. Pharmacother. 51, 305-310.
Hong C.-Y., Wang C.-P., Huang S.-S. and F.-L. Hsu, 1995. The inhibitory effect of tanninson lipid peroxidation of rat heart mitochondria. J. Pharm. Pharmacol. 47, 138-142.
Hoogkamp-Korstanje J.A.A., Lindner J.G.E.M., Marcelis J.H., Den Daas-Slagt H. and N.M.De Vos, 1979. Composition and ecology of the human intestinal flora. Antonie van
Leeuwenhock 45, 35-40.
Hoppe K., 1995. Unspezifische Durchfallerkrankungen. Wirkstoffkombination mitpharmakologischer Breite. Therpie Woche (Sonderdruck) 45, 1178-1181.
Horigome T., Kumar R. and K. Okamoto, 1988. Effects of condensed tannins prepared fromleaves of fodder plants on digestive enzymes in vitro and in the intestine of rats. British
Journal of Nutrition 60, 275-285.
Hough’s Encyclopaedia of American Woods, 1958. Ed., E.S. Harrar. R. Spellers and SonsPublishers (Inc.), New York, Vol. 2. 120-130.
Huffman M.A. and M. Seifu, 1989. Observations on the illness and consumption of a possiblymedicinal plant Vernonia amygdalina (Del.), by a wild chimpanzee in the MahaleMountains National Park, Tanzania. Primates 30, 51-63.
Huffman M.A., 1995. The chimpanzee’s pharmacopoeia. Recherche 280, 66-71.
Huffman M.A., Gotoh S., Turner L.A., Hamai M. and K.Yoshida, 1997. Seasonal trends inintestinal nematode infection and medicinal plant use among chimpanzees in the MahaleMountains, Tanzania. Primates 38, 111-125.
Hussein S.A.M., Barakat H.H., Merfort I. and M.A.M. Nawwar, 1997. Tannins from theleaves of Punica granatum. Phytochemistry 45, 819-823.
Ibrahim R. and D. Barron, 1989. Phenylpropanoids. In, Methods in Plant Biochemistry,Vol.1, Plant Phenolics, series eds., P.M. Dey and J.B. Harborne; ed., J.B. Harborne.Academic Press, London. 75-111.
Ikeda T., Fujiwara S., Kinjo J., Nohara T., Ida Y., Shoji J., Shingu T., Isobe R. and T.Kajimoto, 1995a. Three new triterpenoidal saponins acylated with monoterpenic acid fromAlbizziae Cortex. Bull. Chem. Soc. Jpn. 68, 3483-3490.
Ikeda T., Kajimoto T., Nohara T., Kinjo J. and C.-H. Wong, 1995b. Preparation of aneoglycolipid carrying the oligosaccharide component of saponin from Albizzia julibrissin.Tetrahedron Letters 36, 1509-1510.
Ikeda T., Fujiwara S., Araki K., Kinjo J., Nohara T. and T. Miyoshi, 1997. Cytotoxicglycosides from Albizia julibrissin. J. Nat. Prod. 60, 102-107.
Inoue M., Suzuki R., Koide T., Sakaguchi N., Ogihara Y. and Y. Yabu, 1994. Antioxidant,gallic acid, induced apoptosis in HL-60RG cells. Biochemical and Biophysical Research
Communications 204, 898-904.
Inoue M., Suzuki R., Sakaguchi N., Li Z., Takeda T., Ogihara Y., Jiang B.Y. and Y. Chen,1995. Selective induction of cell death in cancer cells by gallic acid. Biol. Pharm. Bull. 18,1526-1530.
Ishikura N., Ito S. and M. Shibata, 1978. Paper chromatographic survey of anthocyanins inLeguminosae. III. Identification and distribution pattern of anthocyanins in twenty-twolegumes. Bot. Mag. 91, 25-30.
Iwata H., Koya S., Miyamoto K. and K. Wakabayashi, 1997. Plasma triglyceride-decreasingcomponents of pine needles. Biol. Pharm. Bull. 20, 656-661.
Jänicke C., Grünwald J und T. Brendler, 2003. Handbuch der Phytotherapie.Wissenschaftliche Verlagsgesellschaft mbH, Stuttgart.

F References 189
Jang K.-G., Oh H., Kang K.-H., Park S.-E., Oh M.-H. and Y.-C. Kim, 2002. Free radicalscavengers from the leaves of Albizzia julibrissin. Saengyak Hakhoechi 33, 18-20.
Janssen H.H., 1982. Histologische Untersuchungen zum Verhalten antidiarrhoisch wirkenderSubstanzen unter in vitro-Bedingungen. Microscopica Acta 85, 387-398.
Janssen H.H. und W. Queisser, 1982. Das Verhalten antidiarrhoisch wirkender Substanzen imExperiment. Microscopica Acta 86, 285-309.
Janzen D.H., 1978. Complications in interpreting the chemical defenses of trees againsttropical arboreal plant-eating vertebrates. In, The Ecology of Arboreal Folivores, ed., G.G.Montgomery. Smithsonian Institution Press, Washington, D.C. 73-84.
Jaspersen D., 1996. Nachweis der Helicobacter pylori-Infektion. Die Medizinische Welt 47,47-50.
Jerga C., 1989. Analyse der Flavonoide und weitere Inhaltsstoffe der Blüten von Heterotheca
inuloides Cass. (“Mexikanische Arnikablüten”). Diss., Düsseldorf.
Jisaka M., Ohigashi H., Takegawa K., Hirota M., Irie R., Huffman M.A. and K. Koshimizu,1993. Steroid glucosides from Vernonia amygdalina, a possible chimpanzee medicinalplant. Phytochemistary 34, 409-413.
Johns T., 1990. With Bitter Herbs They Shall Eat It. Chemical Ecology And The Origins OfHuman Diet And Medicine. The University of Arizona Press, Tucson. 33-70.
Jolly A., 1972. Troop continuity and troop spacing in Propithecus verreauxi and Lemur catta
at Berenty (Madagascar). Folia primat. 17, 335-362.
Jolly A., Gustafson H., Oliver W.L.R. and S.M. O’Connor, 1982. Propithecus verreauxi
population and ranging at Berenty, Madagascar, 1975 and 1980. Folia primat. 39, 124-144.
Jolly A., 1980. A world like our own. Yale University Press, New Haven.
Jung M.J., Kang S.S. and J.S. Choi, 2003. A new (E)-4-hydroxy-dodec-2-enedioic acid fromthe stem bark of Albizzia julibrissin. Arch. Pharm. Res. 26, 207-209.
Jung M.J., Kang S.S., Jung H.A., Kim G.J. and J.S. Choi, 2004a. Isolation of flavonoids and acerebroside from the stem bark of Albizzia julibrissin. Arch. Pharm. Res. 27, 593-599.
Jung M.J., Kang S.S., Jung Y.J. and J.S. Choi, 2004b. Phenolic glycosides from the stem barkof Albizzia julibrissin. Chemical & Pharmaceutical Bulletin 52, 1501-1503.
Jurd L., 1962. Spectral properties of flavonoid compounds. In, The Chemistry of FlavonoidCompounds, ed., T.A. Geissman. Pergamon Press, Oxford, London, New York. 107-155.
Kakiuchi N., Hattori M., Namba T., Nishizawa M., Yamagishi T. and T. Okuda, 1985.Inhibitory effect of tannins on reverse transcriptase from RNA tumor virus. Journal of
Natural Products 48, 614-621.
Kanai S., 1996. Effects of sumac, Rhus javanica, gall extracts and gallic acid on hepaticdamage induced by carbon tetrachloride or D-galactosamine. Acta Med. Kinki Univ. 21,323-332.
Kaneta M., Hikichi H., Endo S. and N. Sugiyama, 1980. Identification of flavones in sixteenLeguminosae species. Agric. Biol. Chem. 44, 1407-1408.
Kang S.S. and W.S. Woo, 1983. Sapogenins from Albizzia julibrissin. Arch. Pharm. Res. 6,25-28.
Kang T.H., Jeong S.J., Kim N.Y., Higuchi R. and Y.C. Kim, 2000. Sedative activity of twoflavonol glycosides isolated from the flowers of Albizzia julibrissin Durazz. J.
Ethnopharmacol. 71, 321-323.
Kashiwada Y., Nonaka G.-I., Nishioka I., Chang J.-J. and K.-H. Lee, 1992. Antitumor agents,129. Tannins and related compounds as selective cytotoxic agents. Journal of Natural
Products 55, 1033-1043.

190 F References
Kayser O. and H. Kolodziej, 1997. Antibacterial activity of extracts and constituents ofPelargonium sidoides and Pelargonium reniforme. Planta Med. 63, 508-510.
Khac D.D., Tran-Van S., Campos A.M., Lallemand J.-Y. and M. Fetizon, 1990. Ellagiccompounds from Diplopanax stachyanthus. Phytochemistry 29, 251-256.
Kim J.-P., Lee I.-K., Yun B.-S., Chung S.-H., Shim G.-S., Koshino H. and I.-D. Yoo, 2001.Ellagic acid rhamnosides from the stem bark of Eucalyptus globulus. Phytochemistry 57,587-591.
Kim W.-K., Jung J.W., Ahn N.Y., Oh H.R., Lee B.K., Oh J.K., Cheong J.H., Chun H.S. andJ.H. Ryu, 2004. Anxiolytic-like effects of extracts from Albizzia julibrissin bark in theelevated plus-maze in rats. Life Sciences 75, 2787-2795.
Kinjo J., Fukui K., Higuchi H. and T. Nohara, 1991a. The first isolation of lignan tri- andtetra-glycosides. Chem. Pharm. Bull. 39, 1623-1625.
Kinjo J., Higuchi H., Fukui K. and T. Nohara, 1991b. Lignoids from Albizziae Cortex. II. Abiodegradation pathway of syringaresinol. Chem. Pharm. Bull. 39, 2952-2955.
Kinjo J., Araki K., Fukui K., Higuchi H., Ikeda T., Nohara T., Ida Y., Takemoto N.,Miyakoshi M. and J. Shoji, 1992. Six new triterpenoidal glycosides including two newsapogenols from Albizziae Cortex. V. Chem. Pharm. Bull. 40, 3269-3273.
Kiyohara H., Cyong J.-C. and H. Yamada, 1988. Structure and anti-complementary activity ofpectic polysaccharides isolated from the root of Angelica acutiloba Kitagawa.Carbohydrate Research 182, 259-275.
Klopfer P.H. and K.J. Boskoff, 1979. Maternal behaviour in prosimians. In, The Study ofProsimian Behavior, eds., G.A. Doyle and R.D. Martin. Academic Press, New York, SanFrancisco, London. 123-156.
Kokwaro J.O., 1976. Medicinal Plants of East Africa. East African Literature Bureau,Nairobi.
Kolodziej H. and O. Kayser, 1998. Pelargonium sidoides DC. Zeitschrift für Phytotherapie
(Sonderdruck) 3, 141-151.
Koshimizu K., Ohigashi H., Huffman M.A., Nishida T. and H. Takasaki, 1993. Physiologicalactivities and the active constituents of potentially medicinal plants used by wildchimpanzees of the Mahale Mountains, Tanzania. International Journal of Primatology 14,345-356.
Koshimizu K., Ohigashi H. and M.A. Huffman, 1994. Use of Vernonia amygdalina by wildchimpanzee: Possible role of its bitter and related constituents. Physiology and Behaviour
56, 1209-1216.
Kraus J., Schneider M. and G. Franz, 1986. Antitumorpolysaccharide aus Solidago sp. DAZ
38, 2045-2049.
Kroes B.H., Van den Berg A.J.J., Quarles Van Ufford H.C., Van Dijk H. and R.P. Labadie,1992. Anti-inflammatory activity of gallic acid. Planta Med. 58, 499-504.
Kruis W., Hoffmann R.M. and D.J. Ziegenhagen, 2003. Specific targets of treatment:diarrhoea. In, Proceedings of Falk Symposium 131, “Targets of treatment in chronicinflammatory bowel diseases”, eds., H. Herfarth, B.G. Feagan, U.R. Fölsch, J.Schölmerich, M.H. Vatn and M. Zeitz. Kluwer Academic Publishers, Dordrecht, Boston,London. 181-187.
Kuhn H.-J., 1971. Die Geschichte der Säugetiere Madagaskars. Vortrag der 45. Versammlungder Deutschen Gesellschaft für Säugetierkunde in Stuttgart. 28-42.
Kumar R. and T. Horigome, 1986. Fractionation, characterization, and protein-precipitatingcapacity of condensed tannins from Robinia pseudo acacia L. leaves. J. Agric. Food Chem.
34, 487-489.

F References 191
Kurokawa M., Nagasaka K., Hirabayashi T., Uyama S.-i., Sato H., Kageyama T., Kadota S.,Ohyama H., Hozumi T., Namba T. and K. Shiraki, 1995. Efficacy of traditional herbalmedicines in combination with acyclovir against herpes simplex virus type 1 infection invitro and in vivo. Antiviral Research 27, 19-37.
Laemmli U.K., 1970. Cleavage of structural proteins during the assembly of the head ofbacteriophage T4. Nature 227, 680-685.
Lamouliatte H., Cayla R. and G. Daskalopoulos, 1996. Upper digestive tract endoscopy andrapid diagnosis of Helicobacter pylori infection. In, Helicobacter pylori: techniques forclinical diagnosis & basic research, eds., A. Lee and F. Mégraud. W.B. Saunders CompanyLtd, 1-16.
Lamprecht J., 1992. Biologische Forschung: Von der Planung bis zur Publikation. VerlagPaul Parey, Berlin und Hamburg.
Landsoud-Soukate J., Tutun C.E.G. and M. Fernandez, 1995. Intestinal parasites of sympatricgorillas and chimpanzees in the Lopé Reserve, Gabon. Annals of Tropical Medicine and
Parasitology 89, 73-79.
Langer P., 1986. Large mammalian herbivores in tropical forests with either hindgut- orforestomach-fermentation. Int. J. Mammal. Biol. = Z. Säugetierkunde 51, 173-187.
Langer P., 1988. The mammalian herbivore stomach. Comparative anatomy, function andevolution. Gustav Fischer, Stuttgart, New York.
Larsen J.L., 1981. Effect of pectin on secretion in pig jejunal loops challenged toenteropathogenic E. coli or enterotoxin (LT). A preliminary report. Nord. Veterinaermed.
33, 218-23.
Lee A., 1996. Introduction. In, Helicobacter pylori: techniques for clinical diagnosis & basicresearch, eds., A. Lee and F. Mégraud. W.B. Saunders Company Ltd, xiii – xiv.
Le Marchand L., 2002. Cancer preventive effects of flavonoids – a review. Biomed.
Pharmacother. 56, 296-301.
Li X.-C., Cai L. and C. D. Wu, 1997. Antimicrobial compounds from Caenothus americanus
against oral pathogens. Phytochemistry 46, 97-102.
Lipkan G.N., Maksyutina N.P., Voitenko G.N. and L.I. Pogodina, 1981. Pharmacologicaction of polyphenols of Robinia pseudoacacia racemes. Farmacevtycnyjzumal 0, 50-53.
Little E.L., 1993. The Audubon Society: Field Guide to North American Trees, EasternRegion. Published by Knopf A.A., Inc., 13th Printing, Chanticleer Press, Inc., New York.
Liu G., Wang Q., Yang H. and Z. Liao, 1983. Pharmacological study of gallic acid fromAmpelopsis brevipedunculata. Nanjing Yaoxueyuan Xuebao 2, 43-47.
Lopes Santini M.-E., 1992. Comportement alimentaire et « gestion énergétique » chez troisespèces de lémuriens folivores Hapalemur simus, H. griseus griseus, et Propithecus
verreauxi coronatus au Parc Zoologique De Paris. Diplôme De Doctorat, l’ UniversitéParis VII.
Lu J., Zhu Q., Wang Y. and Y. Li, 2003. Study on the chemical constituents of the volatile oilfrom the pods of Albizzia julibrissin Durazz. Lanzhou Daxue Xuebao, Ziran Kexueban 39,59-62.
Lutterodt G.D., 1989. Inhibition of gastrointestinal release of acetylcholine by quercetin as apossible mode of action of Psidium guajava leaf extracts in the treatment of acutediarrhoeal disease. Journal of Ethnopharmacology 25, 235-247.
Ma L., Tu G., Chen S., Zhang R., Lai L., Xu X. and Y. Tang, 1996. NMR determination ofthe structure of julibroside J1. Carbohydrate Research 281, 35-46.

192 F References
Mabry T.J., Markham K.R. and M.B. Thomas, 1970. The Systematic Identification ofFlavonoids. Springer-Verlag, Berlin, Heidelberg, New York.
Mabry T.J. and K.R. Markham, 1975. Mass spectrometry of flavonoids. In, The Flavonoids,eds., J.B. Harborne, T.J. Mabry and H. Mabry. Chapman and Hall, London. 78-126.
Madara J.L., Podolsky D.K., King N.W., Sehgal P.K., Moore R. and H.S. Winter, 1985.Characterization of spontaneous colitis in cotton-top tamarins (Saguinus oedipus) and itsresponse to sulfasalazine. Gastroenterology 88, 13-19.
Madaus G., 1976. Lehrbuch der biologischen Heilmittel, Bände I-III. Nachdruck der AuflageLeipzig 1938, Georg Olms Verlag, Hildesheim, New York.
Maier W., 1984. Tooth morphology and dietary specialization. In, Food Acquisition andProcessing in Primates, eds., D.J. Chivers, B.A. Wood and A. Bilsborough. Plenum Press,New York, London. 303-330.
Maisels F., 1993. Gut passage rate in guenons and mangabeys: another indicator of a flexiblefeeding niche? Folia Primatol. 61, 35-37.
Majinda R.R.T., Motswaledi M., Waigh R.D. and P.G. Waterman, 1997. Phenolic andantibacterial constituents of Vahlia capensis. Planta Medica 63, 268-270.
Makkar H.P.S., Singh B. and R.K. Dawra, 1988. Effect of tannin-rich leaves of oak (Quercus
incana) on various microbial enzyme activities of the bovine rumen. British Journal of
Nutrition 60, 287-296.
Mar W., Tan G.T., Cordell G.A. and J.M. Pezzuto, 1991. Biological activity of novelmacrocyclic alkaloids (budmunchiamines) from Albizia amara detected on the basis ofinteraction with DNA. J. Nat. Prod. 54, 1531-1542.
Marcus S.N. and K.W. Heaton, 1986. Effects of a new, concentrated wheat fibre preparationon intestinal transit, deoxycholic acid metabolism and the composition of bile. Gut 27,893-900.
Markham K.R., 1975. Isolation techniques for flavonoids. In, The Flavonoids, eds., J.B.Harborne, T.J. Mabry and H. Mabry. Chapman and Hall, London. 1-44.
Markham K.R. and T.J. Mabry, 1975. Ultraviolet-visible and proton magnetic resonancespectroscopy of flavonoids. In, The Flavonoids, eds., J.B. Harborne, T.J. Mabry and H.Mabry. Chapman and Hall, London. 45-77.
Markham K.R., Ternai B., Stanley R., Geiger H. and T.J. Mabry, 1978. Carbon-13 NMRstudies of flavonoids-III. Naturally occurring flavonoid glycosides and their acylatedderivatives. Tetrahedron 34, 1389-1397.
Markham K.R., 1989. Flavones, Flavonols and their Glycosides. In, Methods in PlantBiochemistry, Vol. 1, Plant Phenolics, series eds., P.M. Dey and J.B. Harborne; ed., J.B.Harborne. Academic Press, London. 197-235.
Markham J.R., 1990. Fighting the flab: ecological energetics applied to orang-utan diets.Australian Primatology 6, 4-7.
Markham K.R., Geiger H. and H. Jaggy, 1992. Kaempferol-3-O-glucosyl(1-2)rhamnosidefrom Ginkgo biloba and a reappraisal of other gluco(1-2, 1-3 and 1-4)rhamnosidestructures. Phytochemistry 31, 1009-1011.
Markham K.R. and H. Geiger, 1994. 1H nuclear magnetic resonance spectroscopy offlavonoids and their glycosides in hexadeuterodimethylsulfoxide. In, The Flavonoids,Advances in Research since 1986, ed., J.B. Harborne. Chapman & Hall, London. 441-497.
Marth T. and M. Zeitz, 1998. The intestinal immune system. In, Proceedings of FalkSymposium 100, “Gut and the liver”, eds., H.E. Blum, C. Bode, J.C. Bode and R.B. Sartor.Kluwer Academic Publishers, Dordrecht, Boston, London. 12-27.

F References 193
Martin R.D., 1979. Phylogenetic aspects of prosimian behavior. In, The Study of ProsimianBehavior, eds., G.A. Doyle and R.D. Martin. Academic Press, New York, San Francisco,London. 45-77.
Martin R.D., Chivers D.J., Maclarnon A.M. and C.M. Hladik, 1985. Gastrointestinalallometry in primates and other mammals. In, Size and Scaling in Primate Biology, ed.,W.L. Jungers. Plenum Press, New York, London. 61-89.
Martínez M.C., De Pinto G.L. and C. Rivas, 1992. Composition of Acacia macracantha gumexudates. Phytochemistry 31, 535-536.
Martínez M., De Pinto G.L., Alvárez S., De Troconis N.G., Ocando E. and C. Rivas, 1995.Composition and properties of Albizia lebbeck gum exudate. Biochemical Systematics and
Ecology 23, 843-848.
Masaki H., Atsumi T. and H. Sakurai, 1994. Hamamelitannin as a new potent active oxygenscavenger. Phytochemistry 37, 337-343.
Masaki H., Okamoto N., Sakaki S. and H. Sakurai, 1997. Protective effects ofhydroxybenzoic acids and their esters on cell damage induced by hydroxyl radicals andhydrogen peroxides. Biol. Pharm. Bull. 20, 304-308.
Mason G., 1990. Do chimps chew leaves as drugs? New Scientist 126, 30.
Matsukura N., Onda M., Tokunaga A., Kato S., Kyono S. and K. Yamashita, 1995. TissueIgA antinody against Helicobacter pylori in patients with gastroduodenal diseases:comparison with bacterial culture, serum IgG antibody, and [13C] urea breath test. J. Clin.
Gastroenterol. 21 (Suppl. 1), 146-150.
Matthes H.D.W., Luu B. and G. Ourisson, 1980. Cytotoxic components of Zingiber zerumbet,Curcuma zedoaria and C. domestica. Phytochemistry 19, 2643-2650.
Mayor M.I., Sommer J.A., Houck M.L., Zaonarivelo J.R., Wright P.C., Ingram C., Engel S.R.and E.E. Louis Jr., 2004. Specific status of Propithecus spp. International Journal of
Primatology 25, 875-900.
Mazzanti G., Erspamer G.F., Mugnè Y. and D. Piccinelli, 1983. Occurrence of histamine andrelated imidazole compounds in extracts from root and trunk barks of Albizzia
adianthifolia, Albizzia anthelmintica and Albizzia julibrissin. Fitoterapia 54, 275-279.
McCutcheon A.R., Ellis S.M., Hancock R.E.W. and G.H.N. Towers, 1994. Antifungalscreening of medicinal plants of British Columbian native peoples. Journal of
Ethnopharmacology 44, 157-169.
McManus J.P., Davis K.G., Beart J.E., Gaffney S.H., Lilley T.H. and E. Haslam, 1985.Polyphenol Interactions. Part 1. Introduction; some observations on the reversiblecomplexation of polyphenols with proteins and polysaccharides. J. Chem. Soc. Perkin
Trans. II 9, 1429-1438.
McNab B.K., 1978. Energetics of arboreal folivores: Physiological problems and ecologicalconsequences of feeding on an ubiquitous food supply. In, The Ecology of ArborealFolivores, ed., G.G. Montgomery. Smithsonian Institution Press, Washington, D.C. 153-162.
Meddings J.B., Gibson P.R. and P. Tagkalidis, 2003. In, Inflammatory bowel diseases, eds., J.Satsangi and L.R. Sutherland. Churchill Livingstone. 63-83.
Meli R., Autore G., Di Carlo G. and F. Capasso, 1990. Inhibitory action of quercetin onintestinal transit in mice. Phyther. Res. 4, 201-202.
Mendeloff A.I., 1984. Dietary fiber and nutrient delivery. In, The Role of the GastrointestinalTract in Nutrient Delivery, eds., M. Green and H.L. Greene. Academic Press, Inc. Vol. 3.209-237.

194 F References
Meyer B.N., Ferrigni N.R., Putnam J.E., Jacobsen L.B., Nichols D.E. and J.L. Mc Laughlin,1982. Brine shrimp: a convenient general bioassay for active plant constituents. Planta
medica 45, 31-34.
Meyer H., Bronsch K. und J. Leibetseder, 1993. Supplemente zu Vorlesungen und Übungenin der Tierernährung. 8. Aufl., Verlag M.&H. Schaper Alfeld-Hannover.
Meyers D.M., 1993. The effects of resource seasonality on behaviour and reproduction in thegolden-crowned sifaka (Propithecus tattersalli, Simons, 1988) in three Malagasy forests.Unpublished Ph.D. dissertation, Duke University, Durham, North Carolina.
Middleton E. and C. Kandaswami, 1994. The impact of plant flavonoids on mammalianbiology: implications for immunity, inflammation and cancer. In, The Flavonoids,Advances in Research since 1986, ed., J.B. Harborne. Chapman and Hall, London. 619-652.
Milne Edwards A. et A. Grandidier, 1875. Vol. VI. Histoire Naturelle Des Mammifères. En,Histoire Physique, Naturelle Et Politique De Madagascar. 1875-1921, 32 Vols., publiée parA. Grandidier. Hachette, Paris.
Milton K. and M.L. May, 1976. Body weight, diet and home range area in primates. Nature
259, 459-462.
Milton K., 1979. Factors influencing leaf choice by howler monkeys: a test of somehypotheses of food selection by generalist herbovores. Am. Nat. 114, 362-378.
Milton K., 1980. The Foraging Strategy of Howler Monkeys. A Study in Primate Economics.Columbia University Press, New York.
Milton K. and M.W. Demment, 1988. Digestion and passage kinetics of chimpanzees fed highand low fiber diets and comparison with human data. J. Nutr. 118, 1082-1088.
Misra L.N., Dixit A.K. and H.Wagner, 1995. N-demethyl budmunchiamines from Albizzia
lebbek seeds. Phytochemistry 39, 247-249.
Mital H.C. and J. Adotey, 1971. Studies on Albizia zygia gum. 1. Certain physico-chemicalproperties. Pharmaceutica Acta Helvetiae 46, 637-642.
Mital H.C. and Adotey J., 1972. Studies on Albizia zygia gum. 2. Rheological properties ofthe mucilage. Pharmaceutica Acta Helvetiae 47, 508-515.
Mital H.C. and J. Adotey, 1973. Studies on Albizia zygia gum. 3. Stabilization of emulsions.Pharmaceutica Acta Helvetiae 48, 412-419.
Mittermeier R.A., Tattersall I., Konstant W.R., Meyers D.M. and R.B. Mast, 1994. Lemurs ofMadagascar. Conservation International, Washington DC.
Mizuno M., Sakakibara N., Hanioka S., Iinuma M., Tanaka T., Liu X.S. and D.W. Shi, 1988.Flavonol glycosides from Epimedium sagittatum. Phytochemistry 27, 3641-3643.
Moon C.K., Park K.S., Lee S.H. and Y.P. Yoon, 1985. Antitumor activities of severalphytopolysaccharides. Arch. Pharm. Res. 8, 42-44.
Müller E.F., 1983. Wärme- und Energiehaushalt bei Halbaffen (Prosimiae). Bonn. zool. Beitr.
34, Heft 1-3, 29-71.
Müller B.M., Kraus J. and G. Franz, 1989. Chemical structure and biological activity ofwater-soluble polysaccharides from Cassia angustifolia leaves. Planta Medica 55, 536-539.
Müller K.-H. und B.-J. Schildger, 1992. Empfehlungen für eine artgerechte Ernährung vonFlachlandgorillas (Gorilla g. gorilla) in menschlicher Obhut auf der Grundlage einerquantitativen Nahrungsanalyse. Zool. Garten N.F. 62, 351-363.
Mutschler E., 1996. Arzneimittelwirkungen: Lehrbuch der Pharmakologie und Toxikologie.7. Aufl., Wissenschaftliche Verlagsgesellschaft mbH, Stuttgart.

F References 195
Nakano M., Kurokawa M., Hozumi T., Saito A., Ida M., Morohashi M., Namba T., KawanaT. and K. Shiraki, 1998. Suppression of recurrent genital herpes simplex virus type 2infection by Rhus javanica in guinea pigs. Antiviral research 39, 25-33.
Nakashima H., Murakami T., Yamamoto N., Sakagami H., Tanuma S.-i., Hatano T., YoshidaT. and T. Okuda, 1992. Inhibition of human immunodeficiency viral replication by tanninsand related compounds. Antiviral research 18, 91-103.
Nakayama T., 1997. Strategy of chemical modification to free radical scavengers forsuppression of hydrogen peroxide-induced cytotoxicity. In, Food Factors Cancer Prev.,[Int. Conf.], Meeting Date 1995, ed., H. Ohigashi. Springer, Tokyo, Japan. 642-646.
Narayanan V. and T.R. Seshadri, 1969. Chemical components of Acer rubrum wood & bark:occurrence of procyanidin dimer & trimer. Indian J. Chem. 7, 213-214.
National Research Council, 1978. Nutritional requirements of nonhuman primates. Number14. Washington D.C., National Academy of Sciences.
Naumann C. und R. Bassler, 1976-1997. Die chemische Untersuchung von Futtermitteln,Methodenbuch Bd. III. VDLUFA-Verlag, Darmstadt.
Nawwar M.A.M., Buddrus J. and H. Bauer, 1982. Dimeric phenolic constituents from theroots of Tamarix nilotica. Phytochemistry 21, 1755-1758.
Nawwar M.A.M., Souleman A.M.A., Buddrus J., Bauer H. and M. Linscheid, 1984a.Polyphenolic constituents of the flowers of Tamarix nilotica: The structure of nilocitin, anew digalloylglucose. Tetrahedron Letters 25, 49-52.
Nawwar M.A.M., Souleman A.M.A., Buddrus J. and M. Linscheid, 1984b. Flavonoids of theflowers of Tamarix nilotica. Phytochemistry 23, 2347-2349.
Nawwar M.A.M., El-Mousallamy A.M.D., Barakat H.H., Buddrus J. and M. Linscheid, 1989.Flavonoid lactates from leaves of Marrubium vulgare. Phytochemistry 28, 3201-3206.
Nawwar M.A.M., Hussein S.A.M., Buddrus J. and M. Linscheid, 1994. Tamarixellagic acid,an ellagitannin from the galls of Tamarix aphylla. Phytochemistry 35, 1349-1354.
Németh K., Plumb G.W., Berrin J.-G., Juge N., Jacob R., Naim H.Y., Williamson G.,Swallow D.M. and P.A. Kroon, 2003. Deglycosylation by small intestinal epithelial cell ß-glucosidases is a critical step in the absorption and metabolism of dietary flavonoidglycosides in humans. Eur. J. Nutr. 42, 29-42.
Neszmélyi A., Kreher B., Müller A., Dorsch W. and H. Wagner, 1993. Tetragalloylquinicacid, the major antiasthmatic principle of Galphimia glauca. Planta Med. 59, 164-7.
Newton P.N. and T. Nishida, 1990. Possible buccal administration of herbal drugs by wildchimpanzees, Pan troglodytes. Animal Behaviour 39, 798-801.
Newton P., 1991. The use of medicinal plants by primates: a missing link? Trends in Ecology
and Evolution 6, 297-299.
Niemelä S., Karttunen T., Kerola T. and R. Karttunen, 1995. Ten year follow up study oflymphocytic gastritis: further evidence on Helicobacter pylori as a cause of lymphocyticgastritis and corpus gastritis. J. Clin. Pathol. 48, 1111-1116.
Niering W.A. and N.C. Olmstead, 1992. The Audubon Society: Field Guide to NorthAmerican Wildflowers, Eastern Region. Published by A.A. Knopf, Inc., 13th Printing,Chanticleer Press, Inc., New York.
Nijveldt R.J., Van Nood E., Van Hoorn D.E.C., Boelens P.G., Van Norren K. and P.A.M.Van Leeuwen, 2001. Flavonoids: a review of probable mechanisms of action and potentialapplications. Am. J. Clin. Nutr. 74, 418-25.

196 F References
Nimtz M., Mort A., Domke T., Wray V., Zhang Y., Qiu F., Coplin D. and K. Geider, 1996.Structure of amylovoran, the capsular exopolysaccharide from the fibre blight pathogenErwinia amylovora. Carbohydrate Research 287, 59-76.
Nimtz M., Wray V., Domke T., Brenneke B., Häussler S. and I. Steinmetz, 1997. Structure ofan acidic exopolysaccharide of Burkholderia pseudomallei. Eur. J. Biochem. 250, 608-616.
Nishizawa M., Yamagishi T., Nonaka G.-i. and I. Nishioka, 1982. Tannins and relatedcompounds. Part 5. Isolation and characterization of polygalloylglucoses from Chinesegallotannin. J. Chem. Soc. Perkin Trans. I, 2963-2968.
Nishizawa M., Yamagishi T., Nonaka G.-i. and I. Nishioka, 1983. Tannins and relatedcompounds. Part 9. Isolation and characterization of polygalloylglucoses from Turkishgalls (Quercus infectoria). J. Chem. Soc. Perkin Trans. I, 961-965.
Nsimba-Lubaki M. and W.J. Peumans, 1986. Seasonal fluctuations of lectins in barks ofelderberry (Sambucus nigra) and black locust (Robinia pseudoacacia). Plant Physiol. 80,747-751.
Oates J.F., Swain T. and J. Zantovska, 1977. Secondary compounds and food selection byColobus monkeys. Biochemical Systematics and Ecology 5, 317-321.
Obatake H. and H. Suzuki, 1985. On the isolation and identification of canavanine andethanolamine contained in the young leaves of black locust Robinia pseudoacacia lethalfor the lady beetle Harmonia axyridis. Kagawa Daigaku Nogakubu Gakujutsu Hokoku 36,107-116.
Odani S., Odani S., Ono T. and T. Ikenaka, 1979. Proteinase inhibitors from a Mimosoideaelegume, Albizia julibrissin. Homologues of soybean trypsin inhibitor (Kunitz). J. Biochem.
86, 1795-1805.
Odani S., Ono T. and T. Ikenaka, 1980. The reactive site amino acid sequences of Silktree(Albizzia julibrissin) seed proteinase inhibitors. J. Biochem. 88, 297-301.
Ohigashi H., Huffman M.A., Izutsu D., Koshimizu K., Kawanaka M., Sugiyama H., KirbyG.C., Warhurst D.C., Allen D., Wright C.W., Phillipson J.D., Timon-David P., Delmas F.,Elias R. and G. Balansard, 1994. Toward the chemical ecology of medicinal plant use inchimpanzees: the case of Vernonia amygdalina, a plant used by wild chimpanzees possiblyfor parasite-related diseases. Journal of Chemical Ecology 20, 541-553.
Ohtani H., 1989. Charakterization of milk-clotting enzymes of rennet from Albizzia
julibrissin. Shokuhin Kogyo (= The food industry) 32, 39-46.
Ohwaki K., Hungate R.E., Lotter L., Hofmann R.R. and G. Maloiy, 1974. Stomachfermentation in East African Colobus monkeys in their natural state. Appl. Microbiol. 27,713-723.
Onderdonk A.B., 1998. Intestinal microflora: control and overgrowth. In, Proceedings of FalkSymposium 100, “Gut and the liver”, eds., H.E. Blum, C. Bode, J.C. Bode and R.B. Sartor.Kluwer Academic Publishers, Dordrecht, Boston, London. 3-11.
Orsini F., Pelizzoni F. and L. Verotta, 1991. Saponins from Albizzia lucida. Phytochemistry
30, 4111-4115.
Overdorff D.J., 1992. Differential patterns in flower feeding by Eulemur fulvus rufus andEulemur rubriventer in Madagascar. American Journal of Primatology 28, 191-203.
Overdorff D.J., 1993. Similarities, differences, and seasonal patterns in the diets of Eulemur
rubriventer and Eulemur fulvus rufus in the Ranomafana National Park, Madagascar.International Journal of Primatoilogy 14, 721-753.
Özipek M., Çalis I., Ertan M. and P. Rüedi, 1994. Rhamnetin 3-p-coumaroylrhamnoside fromRhamnus petiolaris. Phytochemistry 37, 249-253.

F References 197
Page J.E., Balza F., Nishida T. and G.H.N. Towers, 1992. Biologically active diterpenes fromAspilia mossambicensis, a chimpanzee medicinal plant. Phytochemistry 31, 3437-3439.
Page J.E., Huffman M.A., Smith V. and G.H.N. Towers, 1997. Chemical basis for Aspilia
leaf-swallowing by chimpanzees: a reanalysis. Journal of Chemical Ecology 23, 2211-2226.
Pal B.C., Achari B., Yoshikawa K. and S. Arihara, 1995. Saponins from Albizia lebbeck.Phytochemistry 38, 1287-1291.
Parmar V.S., Kumar A., Bisht K.S., Mukherjee S., Prasad A.K., Sharma S.K., Wengel J. andC.E. Olsen, 1997. Novel chemoselective de-esterification of esters of polyacetoxy aromaticacids by lipases. Tetrahedron 53, 2163-2176.
Parra R., 1978. Comparison of foregut and hindgut fermentation in herbivores. In, TheEcology of Arboreal Folivores, ed., G.G. Montgomery. Smithsonian Institution Press,Washington, D.C. 205-229.
Perchellet J.P., Gali H.U., Perchellet E.M., Klish D.S. and A.D. Armbrust, 1992. Antitumor-promoting activities of tannic acid, ellagic acid, and several gallic acid derivatives inmouse skin. Basic Life Sci. 59 (Plant Polyphenols), 783-801.
Petter J.-J. and P. Charles-Dominique, 1979. Vocal communication in prosimians. In, TheStudy of Prosimian Behavior, eds., G.A. Doyle and R.D. Martin. Academic Press, NewYork, San Francisco, London. 247-305.
Petter J.-J. and A. Petter-Rousseaux, 1979. Classification of the prosimians. In, The Study ofProsimian Behavior, eds., G.A. Doyle and R.D. Martin. Academic Press, New York, SanFrancisco, London. 1-44.
Pezzuto J.M., Mar W., Lin L.-Z., Cordell G.A., Neszmélyi A. and H. Wagner, 1992.Budmunchiamines D-I from Albizia amara. Phytochemistry 31, 1795-1800.
Pieroni A., Heimler D., Pieters L., Van Poel B. and A.J. Vlietinck, 1996. In vitro anti-complementary activity of flavonoids from olive (Olea europaea L.) leaves. Pharmazie 51,765-768.
Pigeon R.F., Camp B.J. and J.W. Dollahite, 1962. Oral toxicity and polyhydroxyphenolmoiety of tannin isolated from Quercus havardi (shin oak). Am. J. Vet. Res. 23, 1268-1270.
Plaut A.G., 1984. Gut bacterial metabolism and human nutrition. In, The Role of theGastrointestinal Tract in Nutrient Delivery, eds., M. Green and H.L. Greene. AcademicPress, Inc. Vol. 3. 199-208.
Plein K., Burkard G. and J. Hotz, 1993. Treatment of chronic diarrhea in Crohn disease. Apilot study of the clinical effect of tannin albuminate and ethacridine lactate. Fortschr.
Med. 111, 114-118.
Podolsky D.K., Madara J.L., King N., Sehgal P., Moore R. and H.S. Winter, 1985. Colonicmucin composition in primates. Selective alterations associated with spontaneous colitis inthe cotton-top tamarin. Gastroenterology 88, 20-25.
Podolsky D.K., Lobb R., King N., Benjamin C.D., Pepinsky B., Sehgal P. and M.DeBeaumont, 1993. Attenuation of colitis in the cotton-top tamarin by anti-α 4 integrinmonoclonal antibody. J. Clin. Invest. 92, 372-380.
Pollock J.I., 1979. Spatial distribution and ranging behavior in lemurs. In, The Study ofProsimian Behavior, eds., G.A. Doyle and R.D. Martin. Academic Press, New York, SanFrancisco, London. 359-409.
Power M.L. and O.T. Oftedal, 1996. Differences among captive callitrichids in the digestiveresponses to dietary gum. Am. J. Primatol. 40, 131-144.

198 F References
Powzyk J.A., 1997. The Socio-Ecology of Two Sympatric Indriids: Propithecus diadema
diadema and Indri indri, A Comparison of Feeding Strategies and Their PossibleRepercussions on Species-Specific Behaviours. Diss., Duke University, Durham, NorthCarolina.
Powzyk J.A. and C.B. Mowry, 2003. Dietary and feeding differences between sympatricPropithecus diadema diadema and Indri indri. International Journal of Primatology 24,1143-1162.
Prasad A.S., 1998. Zinc in human health: an update. J. Trace Elem. Exp. Med. 11, 63-87.
Pretsch E., Clerc T., Seibl J. und W. Simon, 1990. Tabellen zur Strukturaufklärungorganischer Verbindungen mit spektroskopischen Methoden. Herausg., W. Fresenius,J.F.K. Huber, E. Pungor, G.A. Rechnitz, W. Simon, G. Tölg und T.S. West. 3. Aufl.,Springer-Verlag, Berlin, Heidelberg, New York.
Pschyrembel Klinisches Wörterbuch, 1986. 255. Aufl., Walter de Gruyter, Berlin, New York.
Qadri F., Bhuiyan T.R., Dutta K.K., Raqib R., Alam M.S., Alam N.H., Svennerholm A.M.and M.M. Mathan, 2004. Acute dehydrating disease caused by Vibrio cholerae serogroupsO1 and O139 induce increases in innate cells and inflammatory mediators at the mucosalsurface of the gut. Gut 53, 62-69.
Raedsch R., 1995. Dickdarmbedingte chronische Diarrhoe. Prospektive Cross-over-Studie.Therapie Woche (Sonderdruck) 45, 1450-1455.
Raedsch R., Walter-Sack I., Galle P.R. and B. Kommerell, 1991. Prophylaxis of traveler’sdiarrhea in Egypt: Results of a double blind controlled study. Klin. Wochenschr. 69, 863-866.
Rao V.S.N., Santos F.A., Sobreira T.T., Souza M.F., Melo C.L. and E.R. Silveira, 1997.Investigations on the gastroprotective and antidiarrhoeal properties of ternatin, atetramethoxyflavone from Egletes viscosa. Planta Med. 63, 146-149.
Richard A., 1974. Intra-specific variation in the social organization and ecology ofPropithecus verreauxi. Folia Primatologica 22, 178-207.
Richard A., 1977. The Feeding Behaviour of Propithecus verreauxi. In, Primate Ecology:Studies of feeding and ranging behaviour in lemurs, monkeys and apes, ed., T.H. Clutton-Brock. Academic Press, London. 71-96.
Richard A.F., 1978a. Behavioral Variation: Case Study of a Malagasy Lemur. Lewisburg:Bucknell Univ. Press.
Richard A.F., 1978b. Variability in the feeding behavior of a Malagasy prosimian,Propithecus verreauxi: Lemuriformes. In, The Ecology of Arboreal Folovores, ed., G.G.Montgomery. Smithsonian Institution Press, Washington D.C. 519-533.
Richard A., 1979. Intra-specific variation in the social organization and ecology ofPropithecus verreauxi. In, Primate Ecology: Problem-Oriented Field Studies, ed., R.W.Sussman. John Wiley & Sons, Inc., New York. 23-51.
Richard A.F., 1985. Social boundaries in a Malagasy prosimian, the sifaka (Propithecus
verreauxi). International Journal of Primatology 6, 553-568.
Richard A.F. and M. Nicoll, 1987. Female social dominance and basal metabolism in aMalagasy primate, Propithecus verreauxi. Am. J. Primatol. 12, 309-314.
Richard A.F. and R.E. Dewar, 1991. Lemur Ecology. Annu. Rev. Ecol. Syst. 22, 145-175.
Richard A.F., Rakotomanga P. and M. Schwartz, 1991. Demography of Propithecus
verreauxi at Beza Mahafaly, Madagascar: Sex ratio, survival, and fertility, 1984-1988.American Journal of Physical Anthropology 84, 307-322.

F References 199
Richard A.F., Rakotomanga P. and M. Schwartz, 1993. Dispersal by Propithecus verreauxi atBeza Mahafaly: 1984-1991. American Journal of Primatology 30, 1-20.
Richards R.M.E., Durham D.G. and X. Liu, 1994. Antibacterial activity of compounds fromRubus pinfaensis. Planta Med. 60, 471-473.
Rimpler H., 1999. Biogene Arzneistoffe. 2. Aufl., Deutscher Apotheker Verlag, Stuttgart.
Ross C., 1992. Basal metabolic rate, body weight and diet in primates: An evaluation of theevidence. Folia Primatol. 58, 7-23.
Rote Liste®, 2005. Arzneimitelverzeichnis für Deutschland (einschließlich EU-Zulassungenund bestimmter Medizinprodukte), ed., Rote Liste® Service GmbH, Frankfurt / Main.Editio Cantor Verlag, Aulendorf.
Roth H.J. und G. Blaschke, 1981. Pharmazeutische Analytik. 2. Aufl., Georg Thieme Verlag,Stuttgart, New York.
Rukunga G.M. and P.G. Waterman, 1996a. New macrocyclic spermine (budmunchiamine)alkaloids from Albizia gummifera: With some observations on the structure-activityrelationships of the budmunchiamines. J. Nat. Prod. 59, 850-853.
Rukunga G.M. and P.G. Waterman, 1996b. Spermine alkaloids from Albizia schimperana.Phytochemistry 42, 1211-1215.
Rümpler U., 1990. Verhaltensänderungen von Flachlandgorillas (Gorilla gorilla gorilla
Savage and Wyman) im Zoologischen Garten Köln nach Futterumstellung. Zeitschr.
Kölner Zoo 33, 75-84.
Ruppin H., 1994. Therapeutischer Leitfaden bei Diarrhoe. Therapeutische Umschau 51, 172-176.
Ruppin H. und K.H. Soergel, 1994. Diagnostischer Leitfaden bei Diarrhoe. Therapeutische
Umschau 51, 166-171.
Sachs L., 1968. Statistische Auswertungsmethoden. Springer-Verlag, Heidelberg.
Sakagami H. and K. Satoh, 1996. The interaction between two antioxidants, sodium ascorbateand gallic acid: radical intensity and apoptosis induction. Anticancer Research 16, 1231-1234.
Sakagami H., Satoh K., Hatano T., Yoshida T. and T. Okuda, 1997. Possible role of radicalintensity and oxidation potential for gallic acid-induced apoptosis. Anticancer Research 17,377-380.
Sakaguchi N., Inoue M. and Y. Ogihara, 1998. Reactive oxygen species and intracellularCa2+, common signals for apoptosis induced by gallic acid. Biochem. Pharmacol. 55,1973-1981.
Sakurai A. and Y. Okuruma, 1983. Chemical studies on the mistletoe. V. The structure oftaxillusin, a new flavonoid glycoside isolated from Taxillus kaempferi. Bull. Chem. Soc.
Jpn. 56, 542-544.
Saunders K.E., Shen Z., Dewhirst F.E., Paster B.J., Dangler C.A. and J.G. Fox, 1999. Novelintestinal Helicobacter species isolated from cotton-top tamarins (Saguinus oedipus) withchronic colitis. J. Clin. Microbiol. 37, 146-151.
Savage D.C., 1986. Gastrointestinal microflora in mammalian nutrition. Ann. Rev. Nutr. 6,155-178.
Scalbert A., 1991. Antimicrobial properties of tannins (review article number 63).Phytochemistry 30, 3875-3883.
Scalbert A. and G. Williamson, 2000. Dietary intake and bioavailability of polyphenols.J. Nutr. 130, 2073 S-2085 S.

200 F References
Schaller G. und H. Schildknecht, 1992. Flavine und Zimtsäurederivat im Zusammenhang mitder lichtinduzierten Blattöffnung bei Albizia julibrissin. J. prakt. Chem. 334, 317-326.
Schilling A., 1979. Olfactory communication in prosimians. In, The Study of ProsimianBehavior, eds., G.A. Doyle and R.D. Martin. Academic Press, New York, San Francisco,London. 461-542.
Schmid W., 1952. Zum Wirkmechanismus diätetischer und medikamentöser Darmmitel.Arzneimittel-Forschung (Drug Res.) 2, 6-20.
Schoener T.W., 1971. Theory of feeding strategies. Annual Review of Ecology and
Systematics 2, 369-404.
Schols H.A., Voragen A.G.J. and I.J. Colquhoun, 1994. Isolation and characterization ofrhamnogalacturonan oligomers, liberated during degradation of pectic hairy regions byrhamnogalacturonase. Carbohydrate Research 256, 97-111.
Schols H.A., Vierhuis E., Bakx E.J. and A.G.J. Voragen, 1995. Different populations ofpectic hairy regions occur in apple cell walls. Carbohydrate Research 275, 343-360.
Scholz E., 1987. Die Gerbstoffe der Ratanhiawurzel. Diss., Freiburg / B.
Scholz E., 1994. Pflanzliche Gerbstoffe, Pharmakologie und Toxikologie. DAZ 34, 3167-3179.
Schultz S.G., 1984. Small intestinal absorption and secretion in health and disease. In, TheRole of the Gastrointestinal Tract in Nutrient Delivery, eds., M. Green and H.L. Greene.Academic Press, Inc., Vol. 3. 119-132.
Scott K.N., 1970. NMR parameters of biologically important aromatic acids. I. Benzoic acidand derivatives. Journal of Magnetic Resonance 2, 361-376.
Scott K.N., 1972. Carbon-13 nuclear magnetic resonance of biologically important aromaticacids. I. Chemical shifts of benzoic acid and derivatives. J. Am. Chem. Soc. 94, 8564-8568.
Sears C., 1990. The chimpanzee’s medicine chest. New Scientist 127, 42-44.
Sepúlveda J., Willett W. and A. Munoz, 1988. Malnutrition and diarrhea. A longitudinal studyamong urban Mexican children. American Journal of Epidemiology 127, 365-376.
Sesink A.L.A., O’Leary K.A. and P.C.H. Hollman, 2001. Quercetin glucuronides but notglucosides are present in human plasma after consumption of quercetin-3-glucoside orquercetin-4’-glucoside. J. Nutr. 131, 1938-1941.
Shahrzad S. and I. Bitsch, 1998. Determination of gallic acid and its metabolites in humanplasma and urine by high-performance liquid chromatography. J. Chromatogr., B: Biomed.
Sci. Appl. 705, 87-95.
Shen C.-C., Chang Y.-S. and L.-K. Ho, 1993. Nuclear magnetic resonance studies of 5,7-dihydroxyflavonoids. Phytochemistry 34, 843-845.
Sherr H.P. and R.B. Mertens, 1979. Cholera toxin-induced glycoprotein secretion in rabbitsmall intestine. Gastroenterology 77, 18-25.
Shigematsu N., Kouno I. and N. Kawano, 1982. Quercetin 3-(6’’-caffeoylgalactoside) fromHydrocotyle sibthorpioides. Phytochemistry 21, 2156-2158.
Shim Y.J., Doo H.K., Ahn S.Y., Kim Y.S., Seong J.K., Park I.S. and B.H. Min, 2003.Inhibitory effect of aqueous extract from the gall of Rhus chinensis on alpha-glucosidaseactivity and postprandial blood glucose. J. Ethnopharmacol. 85, 283-287.
Siegel S., 1976. Nichtparametrische statistische Methoden. Fachbuchhandlung fürPsychologie, Verlagsabteilung Frankfurt am Main.
Slomiany B.L., Piotrowski J. and A. Slomiany, 1997. Anti-Helicobacter pylori activities ofEbrotidine. A review of biochemical and experimental studies and data. Arzneim.-Forsch. /
Drug Res. 47 (I), 476-482.

F References 201
Slowing K., Söllhuber M., Carretero E. and A. Villar, 1994. Flavonoid glycosides fromEugenia jambos. Phytochemistry 37, 255-258.
Souci S.W., Fachmann W. and H. Kraut, 1994. Food Composition and Nutrition Tables, ed.,Deutsche Forschungsanstalt für Lebensmittelchemie, Garching b. München, 5th ed.medpharm Scientific Publishers Stuttgart, CRC Press, Boca Raton.
Spelman L.H., Osborn K.G. and M.P. Anderson, 1989. Pathogenesis of hemosiderosis inlemurs: role of dietary iron, tannin, and ascorbic acid. Zoo Biology 8, 239-251.
Stahl E. und W. Schild, 1981. Pharmazeutische Biologie. 4. Drogenanalyse II: Inhaltsstoffeund Isolierungen. Gustav Fischer Verlag, Stuttgart, New York.
Steinegger E. und R. Hänsel, 1988. Lehrbuch der Pharmakognosie und Phytopharmazie. 4.Aufl., Springer-Verlag, Berlin, Heidelberg, New York.
Stephen A.M., 1983. Other plant polysaccharides. In, Molecular Biology, an InternationalSeries of Monographs and Textbooks, ed., G. O. Aspinall, Vol. 2, The Polysaccharides.Academic Press, Inc. 97-193.
Stevens C.E., 1988. Comparative physiology of the vertebrate digestive system. CambridgeUniversity Press, Cambridge, New York, New Rochelle.
Stöger E.A., Zhicen L., Dawen Z., Yuan S. und F. Friedl, 2001. Arzneibuch der chinesischenMedizin. 2. Aufl., 8. Erg. lieferung 10/2001. Deutscher Apotheker Verlag, Stuttgart.
Stonerook M.J., Weiss H.S., Rodríguez-M. M.A., Rodríguez-M. J.V., Hernández-C. J.I., PeckO.C. and J.D. Wood, 1994. Temperature-metabolism relations in the cotton-top tamarin(Saguinus oedipus) model for ulcerative colitis. J. Med. Primatol. 23, 16-22.
Strier K.B., 1992. Atelinae adaptations: behavioral strategies and ecological constraints.American Journal of Physical Anthropology 88, 515-524.
Struhsaker T.T., 1978. Interrelations of red colobus monkeys and rain-forest trees in theKibale Forest, Uganda. In, The Ecology of Arboreal Folivores, ed., G.G. Montgomery.Smithsonian Institution Press, Washington, D.C. 397-422.
Stuart M.D. and K.B. Strier, 1995. Primates and parasites: a case for a multidisciplinaryapproach. Int. J. Primatol. 16, 577-593.
Sun X.-B., Matsumoto T. and H. Yamada, 1992. Purification of an anti-ulcer polysaccharidefrom the leaves of Panax ginseng. Planta Medica 58, 445-448.
Sussman R.W., 1979. Primate Ecology: Problem-Oriented Field Studies. John Wiley & Sons,Inc., New York. v-4.
Swain T., 1979. Tannins and lignins. In, Herbivores. Their interaction with secondary plantmetabolites, eds., G.A. Rosenthal and D.H. Janzen. Academic Press, New York, London,Toronto. 657-682.
Tanaka N., Sada T., Murakami T., Saiki Y. und C.-M. Chen, 1984. Chemische undChemotaxonomische Untersuchungen der Pterophyten. XLV. Chemische Untersuchungender Inhaltsstoffe von Glaphyropteridopsis erubescens (Wall.) Copel. Chem. Pharm. Bull.
32, 490-496.
Tanaka N., Tanaka T., Fujioka T., Fujii H., Mihashi K., Shimomura K. and K. Ishimaru,2001. An ellagic compound and iridoids from Cornus capitata root cultures.Phytochemistry 57, 1287-1291.
Tang W. and G. Eisenbrand, 1992. Chinese Drugs of Plant Origin. Chemistry, Pharmacologyand Use in Traditional and Moderne Medicine. Springer Verlag.
Taniguchi Y., Kimura K., Satoh K., Yoshida Y., Kihira K., Takimoto T., Saifuku K., Ido K.,Ookawara S. and M. Mato, 1995. Helicobacter pylori detected deep in gastric glands: anultrastructural quantitative study. J. Clin. Gastroenterol. 21 (Suppl. 1), 169-173.

202 F References
Tardif S.D., Clapp N.K., Henke M.A., Carson R.L. and J.J. Knapka, 1988. Maintenance ofcotton-top tamarins fed an experimental pelleted diet versus a highly diverse sweeteneddiet. Laboratory Animal Science 38, 588-591.
Targan S.R., Landers C.J., King N.W., Podolsky D.J. and F. Shanahan, 1992. Ulcerativecolitis-linked antineutrophil cytoplasmatic antibody in the cotton-top tamarin model ofcolitis. Gastroenterology 102, 1493-1498.
Tattersall I., 1977. Ecology and Behaviour of Lemur fulvus mayottensis (Primates,Lemuriformes). Vol. 54, Part 4, Anthropological Papers of the American Museum ofNatural History, New York. 452-458.
Tattersall I., 1982. The Primates of Madagascar. Columbia University Press, New York,Guildford, Surrey.
Tattersall I., 1986. Notes on the distribution and taxonomic status of some subspecies ofPropithecus in Madagascar. Folia Primatol. 46, 51-63.
Tattje D.H.E. and R. Bos, 1979. Valeranone, valeranal and vitispirane in the leaf oil ofLiquidambar styraciflua. Phytochemistry 18, 876.
Tattje D.H.E., Bos R. and A.P. Bruins, 1980. Constituents of essential oil from leaves ofLiquidambar styraciflua L. Planta medica 38, 79-85.
Tebib K., Rouanet J.-M. and P. Besançon, 1994-95. Effect of grape seed tannins on theactivity of some rat intestinal enzyme activities. Enzyme Protein 48, 51-60.
Ternai B. and K.R. Markham, 1976. Carbon-13 NMR of flavonoids - I. flavones andflavonols. Tetrahedron 32, 565-569.
Thorne G.M., 1986. Gastrointestinal infections – dietary interactions. Journal of the American
College of Nutrition 5, 487-499.
Tobi M., Chintalapani S., Kithier K. and N. Clapp, 2000. Gastrointestinal tract antigenicprofile of cotton-top tamarin, Saguinus oedipus, is similar to that of humans withinflammatory bowel disease. Dig. Dis. Sci. 45, 2290-2297.
Tomoda M., Shimizu N., Gonda R., Kanari M., Yamada H. and H. Hikino, 1990. Anti-complementary and hypoglycemic activities of the glycans from the seeds of Malva
verticillata. Planta Medica 56, 168-170.
Tong W., Mi L., Liang H. and Y. Zhao, 2003. Isolation and identification of chemicalconstituents from Albizia julibrissin Durazz. Beijing Daxue Xuebao, Yixueban 35, 180-183.
Townsend W.F., Walter L.G., Kinzie J.L. and H.V. Ammon, 1981. Effect of cholera toxin onileal water and solute transport after resection of the proximal small intestine in the rat. Gut
22, 953-957.
Tsai M.-J., Teng C.-J., Teng R.-J., Lee P.-I. and M.-H. Chang, 1996. Necrotizing bowellesions complicated by Pseudomonas septicaemia in previously healthy infants. Eur. J.
Pediatr. 115, 216-218.
Van Damme E.J.M., Barre A., Smeets K., Torrekens S., Van Leuven F., Rougé P. and W.J.Peumans, 1995. The Bark of Robinia pseudoacacia contains a complex mixture of lectins.– Charakterization of the proteins and the cDNA clones. Plant Physiol. 107, 833-843.
Van Soest P.J., 1994. Nutritional Ecology of the Ruminant. Cornell University Press, NewYork.
Van Sumere C.F., 1989. Phenols and phenolic acids. In, Methods in Plant Biochemistry,Vol.1, Plant Phenolics, series eds., P.M. Dey and J.B. Harborne; ed., J.B. Harborne.Academic Press, London. 29-73.
Van Wyk B.-E. and M. Wink, 2004. Medicinal Plants of the World, ed., R. Ferreira. BrizaPublications, South Africa.

F References 203
Venkataraman K., 1975. Flavones. In, The Flavonoids, eds., J.B. Harborne, T.J. Mabry and H.Mabry. Chapman and Hall, London. 267-295.
Verhaeren E.H.C. and J. Lemli, 1986. The effect of gallotannins and (+)-catechin on thestimulated fluid secretion on the colon, following a rhein perfusion in guinea pigs. Planta
Medica, 269-272.
Vermes B., Farkas L., Nogradi M., Wagner H. and R. Dirscherl, 1976. The synthesis ofafzelin, paeonoside and kaempferol 3-O-ß-rutinoside. Phytochemistry 15, 1320-1321.
Verzele M., Delahaye P. and J. Van Dijck, 1983. Digallic acid. Bull. Soc. Chim. Belg. 92,181-186.
Viegener U., 1994. Tannacomp®: gute Wirksamkeit bei hoher Sicherheit. Zeitschrift für
Allgemeinmedizin 70, 917-920.
Vignon M.R. and C. Garcia-Jaldon, 1996. Structural features of the pectic polysaccharidesisolated from retted hemp bast fibres. Carbohydrate Research 296, 249-260.
Voet D. and J.G. Voet, 1990. Biochemistry. John Wiley and Sons, New York, Chichester,Brisbane, Toronto, Singapore.
Wagner H., 1999. Arzneidrogen und ihre Inhaltsstoffe. Pharmazeutische Biologie Band 2.6. Aufl., Wissenschaftliche Verlagsgesellschaft mbH, Stuttgart.
Wallbach M.G., 1939. Examens histo-physiologiques sur l’effet anti-inflammatoire desastringents. Arch. Mal. App. Digestif. T. 29, 636-648.
Wang Q., Xie L. and J. Zhai, 2000. Tylophorine B benzene solvate. Acta Crystallographica
56 C, 197-198.
Warner A.C.I., 1981. Rate of passage of digesta through the gut of mammals and birds.Nutrition Abstracts and Reviews Series “B” 51, 789-820.
Waterman P.G., 1984. Food acquisition and processing as a function of plant chemistry. In,Food Acquisition and Processing in Primates, eds., D.J. Chivers, B.A. Wood and A.Bilsborough. Plenum Press, New York, London. 177-211.
Watkins D.I., Hodi F.S. and N.L. Letvin, 1988. A primate species with limited majorhistocompatibility complex class I polymorphism. (Saguinus oedipus). Proc. Natl. Acad.
Sci. USA 85, 7714-7718.
Watt J.M. and M.G. Breyer-Brandwijk, 1962. The Medicinal And Poisonous Plants OfSouthern And Eastern Africa. 2nd ed., E. & S. Livingstone LTD., Edinburgh and London.
Williams C.A. and J.B. Harborne, 1994. Flavone and flavonol glycosides. In, The Flavonoids,Advances in Research since 1986, ed., J.B. Harborne. Chapman & Hall, London. 337-385.
Winter H.S., Crum P.M. (Jr.), King N.W., Sehgal P.K. and J.K. Roche, 1989. Expression ofimmune sensitization to epithelial cell-associated components in the cotton-top tamarin: amodel of chronic ulcerative colitis. Gastroenterology 97, 1075-1082.
Wischusen E.W., Ingle N. and M.E. Richmond, 1994. Rate of digesta passage in thePhilippine flying lemur, Cynocephalus volans. J. Comp. Physiol. B 164, 173-178.
Wolin M.J., 1981. Fermentation in the rumen and human large intestine. Science 213, 1463-1468.
Wollenweber E., 1994. Flavones and flavonols. In, The Flavonoids, Advances in Researchsince 1986, ed., J.B. Harborne. Chapman & Hall, London. 259-335.
Woo W.S. and S.S. Kang, 1984. Isolation of a new monoterpene conjugated triterpenoid fromthe stem bark of Albizzia julibrissin. Journal of Natural Products 47, 547-549.

204 F References
Wood J.D., Peck O.C., Tefend K.S., Rodríguez-M. M.A., Rodríguez-M. J.V., Hernández-C.J.I., Stonerook M.J. and H.M. Sharma, 1998. Colitis and colon cancer in cotton-toptamarins (Saguinus oedipus oedipus) living wild in their natural habitat. Dig. Dis. Sci. 43,1443-1453.
Wood J.D., Peck O.C., Tefend K.S., Stonerook M.J., Caniano D.A., Mutabagani K.H., LhotakS. and H.M. Sharma, 2000. Evidence that colitis is initiated by environmental stress andsustained by fecal factors in the cotton-top tamarin (Saguinus oedipus). Dig. Dis. Sci. 45,385-393.
Wrangham R.W. and T. Nishida, 1983. Aspilia spp. leaves: a puzzle in the feeding behaviourof wild chimapnzees. Primates 24, 276-282.
Wrangham R.W. and J. Goodall, 1989. Chimpanzee use of medicinal leaves. In,Understanding Chimpanzees, eds., P. Heltne and L. Marquadt. Harvard University Press,22-37.
Wyllie S.G. and J.J. Brophy, 1989. The leaf oil of Liquidambar styraciflua. Planta medica 55,316-317.
Yadava R.N. and V.M.S. Reddy, 2001. A biologically active flavonol glycoside of seeds ofAlbizzia julibrissin Durazz. Journal of the Institution of Chemists (India) 73, 195-199.
Yamada H., Nagai T., Cyong J.-C. and Y. Otsuka, 1986. Relationship between chemicalstructure and activating potencies of complement by an acidic polysaccharide, Plantago-mucilage A, from the seed of Plantago asiatica. Carbohydrate Research 156, 137-145.
Yamada H., Kiyohara H., Cyong J.-C. and Y. Otsuka, 1987. Structural characterisation of ananti-complementary arabinogalactan from the roots of Angelica acutiloba Kitagawa.Carbohydrate Research 159, 275-291.
Yamada H., Komiyama K., Kiyohara H., Cyong J.-C., Hirakawa Y. and Y. Otsuka, 1990.Structural chracterization and antitumor activity of a pectic polysaccharide from the rootsof Angelica acutiloba. Planta Medica 56, 182-186.
Yamada H., Sun X.-B., Matsumoto T., Ra K.-S., Hirano M. and H. Kiyohara, 1991.Purification of anti-ulcer polysaccharides from the roots of Bupleurum falcatum. Planta
Medica 57, 555-559.
Yasukawa K. and M. Takido, 1987. A flavonol glycoside from Lysimachia mauritiana.Phytochemistry 26, 1224-1226.
Yasukawa K. and M. Takido, 1988. Quercetin 3-rhamnosyl(1→2)galactoside fromLysimachia vulgaris var. davurica. Phytochemistry 27, 3017-3018.
Yoshida K., Baba K., Yamamoto N. and K. Tazaki, 1994. Cloning of a lectin cDNA andseasonal changes in levels of the lectin and its mRNA in the inner bark of Robinia
pseudoacacia. Plant Mol. Biol. 25, 845-853.
Yoshikawa K., Satou Y., Tokunaga Y., Tanaka M., Arihara S. and S.K. Nigam, 1998a. Fouracylated triterpenoid saponins from Albizia procera. J. Nat. Prod. 61, 440-445.
Yoshikawa K., Eiko K., Mimura N., Kondo Y. and S. Arihara, 1998b. Hovetrichosides C-G,five new glycosides of two auronols, two neolignans, and a phenylpropanoid from the barkof Hovenia trichocarea. J. Nat. Prod. 61, 786-790.
Yoshizaki M., Fujino H., Masuyama M., Arisawa M. and N. Morita, 1987. Achemotaxonomic study of flavonoids in the leaves of six Trichosanthes species.Phytochemistry 26, 2557-2558.
You Y.H., Woo W.S., Choi J.S. and S.S. Kang, 1982. Isolation of a new sapogenin fromAlbizzia julibrissin. Arch. Pharm. Res. 5, 33-38.
Yun-Choi H.S., Kang S.S., Kim M.H. and K.H. Jung, 1993. Anti-thrombotic effects ofanalogs of protocatechuic acid and gallic acid. Yakhak Hoechi 37, 453-457.

F References 205
Zentek J., 1996. Cellulose, pectins and guar gum as fibre sources in canine diets. J. Anim.
Physiol. a. Anim. Nutr. 75, 36-45.
Zheng L., Wu G., Wang B., Wu L. and Y. Zhao, 2004. Isolation and identification ofchemical constituents from Albizia julibrissin Durazz. Beijing Daxue Xuebao, Yixueban
36, 421-425.
Zoidis A.M. and H. Markowitz, 1992. Findings from a feeding study of the koala(Phascolarctos cinereus adustus) at the San Francisco Zoo. Zoo Biology 11, 417-431.
Zou K., Zhao Y.Y., Tu G.Z., Guo D.A., Zhang R.Y. and J.H. Zheng, 1999. A triterpenoidsaponin from Albizia julibrissin. J. Asian Nat. Prod. Res. 1, 313-318.
Zou K., Zhao Y., Tu G., Cui J., Jia Z. and R. Zhang, 2000a. Two diastereomeric saponinswith cytotoxic activity from Albizia julibrissin. Carbohydrate Research 324, 182-188.
Zou K., Wang B., Zhao Y.Y., Zhang R.Y.and J.H. Zheng, 2000b. The structure identificationof julibroside J6 from Albizia julibrissin Durazz. Zhongguo Zhongyao Zazhi 25, 96-98.
Zou K., Zhao Y., Tu G., Zhang R. and J. Zheng, 2000c. A new triterpenoid saponin fromAlbizzia julibrissin. Journal of Chinese Pharmaceutical Sciences 9, 125-127.
Zou K., Cui J.R., Zhao Y.Y., Zhang R.Y. and J.H. Zheng, 2000d. A cytotoxic saponin withtwo monoterpenoids from Albizia julibrissin. Chinese Chemical Letters 11, 39-42.
Zou K., Wang B., Zhao Y.Y. and R.Y. Zhang, 2004a. Isolation and identification ofdiastereoisomeric saponins with nine sugar moieties from Albizia julibrissin. Huaxue
Xuebao 62, 625-629.
Zou K., Wang B., Zhao Y.Y., Zheng J.H. and R.Y. Zhang, 2004b. A new triterpenoid saponinjulibroside J24 from the stem bark of Albizia julibrissin. Beijing Daxue Xuebao, Yixueban
36, 18-20.
Zou K., Tong W.-Y., Liang H., Cui J.-R., Tu G.-Z., Zhao Y.-Y. and R.-Y. Zhang, 2005a.Diastereoisomeric saponins from Albizia julibrissin. Carbohydrate Research 340, 1329-1334.
Zou K, Cui J.-R., Ran F.-X., Wang B., Zhao Y.-Y., Zhang R.-Y. and J.-H. Zheng, 2005b.Structures and activity of two novel saponins from Albizia julibrissin. Youji Huaxue 25,654-659.

206 Appendix I Observation and quantification of the food composition
Appendix I Observation and quantification of the foodcomposition
Table of contents
I.1 Scoring the first ten different food species eaten by each individual sifaka 206I.2 Feeding pattern of Marcella and Tiberius in the forest 208I.3 Taste discrimination of plant leaves from foliage included in spring browse 208
I.1 Scoring the first ten different food species eaten by eachindividual sifaka
The first ten different food species selected by each focal animal correspond to ranks(numbering from 1 to 10), which were recorded when a plant species was changed during themain feeding bout inside the cage. The number given per rank in Tab. I.1 is the sum offrequencies over all study days when an individual selected different food species. Theseranks do not infer the amount ingested, nor the time spent feeding on any food type.
Tab. I.1: Tables a-d summarise the frequencies of the first ten different species selected byeach individual sifaka. Except for group J&D, who was only fed once a day, ranksof the second main feeding bout in the evening, are depicted here.
a) Group M&T, who was observed for 17 days:rank Marcella Tiberius
leaves 1 2 3 4 5 6 7 8 9 10 1 2 3 4 5 6 7 8 9 10R. copallina 5 8 4 10 6 6 5 7 4 7 6 5 7 8 5 7 6 4 5 3A. julibrissin 11 6 9 5 6 9 4 5 6 8 11 5 9 6 10 6 3 7 4 5A. rubrum 1 3 2 2 1 1 3 2 4 4 1 2 1 1 2C. canadensis 2 1 1 1 1 1 1 1L. styraciflua 1 1 1 1R. pseudoacacia 1 1 1 1P. glabra not fed not fedL. tulipifera
Mango fruit andleaves
1 1
chow 2 1 1 1 1 1 1 3 1 1fruits&veg. 1 1 2 1 1 1 3 1 3 3

Appendix I Observation and quantification of the food composition 207
b) Group D&V, who was observed for 6 days:rank Drusilla Valentinian
leaves 1 2 3 4 5 6 7 8 9 10 1 2 3 4 5 6 7 8 9 10R. coapllina 1 2 3 2 3 1 2 1 2 1 1 1 1 2 2 2 1 2 2 3A. julibrissin 4 2 3 3 2 2 3 2 3 3 2 2 2 4 2 4 1 2A. rubrum 3 1 1 2 1 1 1 1 1 1C. canadensis 1 1 1 1 2 3 1 1 1 1 1 1 1L. styraciflua 1 1 1 1 1 1R. pseudoacacia 1 1P. glabra not fed not fedL. tulipifera not fed not fedMango fruit andleaves
not fed not fed
chowfruits&veg.
c) Group J&D, who was observed for 11 days:rank Julian Drusilla
leaves 1 2 3 4 5 6 7 8 9 10 1 2 3 4 5 6 7 8 9 10R. copallina 3 2 1 5 3 1 3 3 1 1 1 4A. julibrissin 3 1 1 3 2 2 3 1 1 1 3 2 2A. rubrum not fed not fedC. canadensis
L. styraciflua
R. pseudoacacia
P. glabra 1L. tulipifera 1 1Mango fruit andleaves
not fed not fed
chow 1 2 1 1 1 1 4 3 2fruits&veg. 7 8 8 8 6 2 3 5 2 4 10 10 8 11 8 11 8 7 11 5
d) Gordian, who was observed for 11 days:rank Gordian
leaves 1 2 3 4 5 6 7 8 9 10R. copallina 9 2 9 1 8 2 6 2 5 1A. julibrissin 5 2 6 2 6 2 4 1 4A. rubrum not fedC. canadensis 1L. styraciflua 1 1 1R. pseudoacacia 1 1P. glabra 1 1 1 1L. tulipifera 1 2 3 1 1 1Mango fruit andleaves
not fed
V. rotundifoliaa
chow 1fruits&veg.a
Some Vitis rotundifolia was embracing black locust and given that way to Gordian.

208 Appendix I Observation and quantification of the food composition
I.2 Feeding pattern of Marcella and Tiberius in the forest
The amount of food consumed in the forest (estimated in g, see B.2.4) and the time spentfeeding are differentiated for both Marcella and Tiberius. “Total” designates the total weightingested while feeding in the forest as estimated for both animals; “time outside” designatesthe total hours spent in the forest. The percentages give the portion of time spent feedingrelated to the time spent in the forest.
Tab. I.2: Weight [g] ingested and time spent feeding in relation to the time spent daily inthe forest, respectively for Marcella and Tiberius.
Marcella Tiberius total
date
estimatedweight
[g]
timespent
feeding[min.]
% oftime
outside
estimatedweight
[g]
timespent
feeding[min.]
% oftime
outside
estimatedweight
[g]
timeoutside
[h]17.5. 14.0 12 5.7 9.1 13 6.2 23.1 3.518.5. 21.0 33 14.5 12.8 37 16.2 33.8 3.819.5. 9.6 12 6.7 4.2 8 4.4 13.8 3.020.5. 27.6 39 32.5 15.1 36 30.0 42.7 2.021.5. 48.7 28 11.7 35.3 26 10.8 84.0 4.022.5. 9.9 16 10.7 19.3 24 16.0 29.2 2.5
I.3 Taste discrimination of plant leaves from foliage included inspring browse
R. copallina: absolutely astringent, like black tea brewed too longA. julibrissin: pleasantly slimy, followed by bitter noteL. styraciflua: extremely sourC. canadensis: bitter and astringentA. rubrum: extremely bitter and astringentR. pseudoacacia: sticky, slimy, and bitter; a mild astringent taste
R. copallina and A. julibrissin exhibited the most distinctive tastes (to me) compared to theirintrinsic chemical compounds that were analysed in this study.

Appendix II Chemical investigations on primary and secondary plant compounds 209
Appendix II Chemical investigations on primary andsecondary plant compounds
Table of contents
II.1 Nutritional values 209II.2 Literature review on secondary plant compounds 210II.3 Elucidation of compounds isolated from leaves of A. julibrissin and R. copallina 235II.4 Review on HPLC chromatograms 297II.5 Investigation and characterisation of A. julibrissin leaf mucilage 302
II.1 Nutritional values
Tab. II.1: Nutritional values of the leaves in gram per kg air-dried material according toWeender analyses. Except for the contents of starch and simple saccharidesduplicate analyses were performed.
speciesdrysubstance
crudeprotein starcha
simplesaccharidesa
crudefibre
crudeash
A. julibrissin May 897.5 305.0 41.3 38.3 100.9 51.6A. julibrissin July 908.8 253.4 21.8 27.4 134.7 60.4A. julibrissin Oct., y.l. 907.6 195.3 21.8 39.2 149.3 58.2A. julibrissin Oct., o.l. 911.0 229.3 26.0 48.3 136.5 52.0R. copallina May 849.7 147.7 10.8 45.6 74.3 29.5R. copallina July 914.8 118.9 24.0 71.9 109.3 28.3R. copallina Oct. 915.7 105.1 21.8 100.3 128.8 27.9A. rubrum May 922.4 33.7A. rubrum Oct. 925.8 44.6R. pseudoacacia May 908.0 56.6R. pseudoacacia Oct. 917.9 56.6L. styraciflua May 884.4 39.8L. styraciflua Oct. 915.3 70.1C. canadensis May 912.4 50.7C. canadensis Oct. 909.7 67.6L. tulipifera Oct. 911.5 65.7P. glabra Oct. 903.8 51.9V. rotundifolia Oct. 899.1 39.7chow 911.7 64.1a
simple analyses were performed due to low plant material

210 Appendix II Chemical investigations on primary and secondary plant compounds
II.2 Literature review on secondary plant compounds
Tab. II.2: Review on secondary plant compounds occurring in plant species of the animals’environment including known pharmacological effects, and assignment of theanimals’ behaviour towards these plants / individual plant parts, (called“classification”; see B.3.2). Alphabetical order is based on plant families, offeatured species.
family, genus, species and plant part classificationAceraceae (order: Sapindales)
Maple syrup is gained from Acer saccharum, A. saccharinum and A. rubrum. InAceraceae the ureides allantoin and allantoic acid play an important role innitrogen metabolism.
AcerCondensed and hydrolysable tannins (gallo- and ellagitannins), both occur in
varying amounts depending on Acer species (Bate-Smith, 1962; 1977); especiallyacertannin (2,6-di-O-galloyl-1,5-anhydro-D-sorbit) occurs; quebrachit (a cyclitol)abundant; quercetin and kaempferol glycosides are abundant in leaves. Otherphenolic compounds are sporadically appearing, simple phenolics are common.
Saponins occur in leaves and barks of some species. The bark may containquinones with anti-inflammatory effects (Hegnauer, 2001).
Acer rubrum L.commercial use: Pioneers made ink, cinnamon-brown and black dyes from bark
extracts (Little, 1993).medicinal use: A decoction of Acer rubrum (bark) was used by the Cherokees for
sore eyes. Further indications were linked to its astringency: fever, diarrhoea andgynaecological disorders (Crellin and Philpott, 1990).
leavesalkaloids: gramine (trace amounts) (Barbosa et al., 1990);saponins (Hegnauer, 2001);tannins: predominance of gallo- and ellagitannins (Bate-Smith, 1978); acertannin
and pentagalloylglucose (Hegnauer, 2001)
eaten
fruitsalkaloids: gramine (0.03 % of the dried fruit) (Hegnauer, 2001)
barkcondensed tannins: catechin units (Hegnauer, 2001); procyanidin trimer (Narayanan
and Seshadri, 1969)
woodsterols: ß-sitosterol (Narayanan and Seshadri, 1969);condensed tannins (Narayanan and Seshadri, 1969)
Anacardiaceae (order: Rutales)Anacardiaceae are rich in tannins:
gallo- and ellagitannins predominantly in leaves, barks and galls [→ nutgalls fromvarious Rhus species (Chinese Gallae) contain pure gallotannins (Frohne andJensen, 1992)];condensed tannins predominantly in woods (heartwood: up to 15-25 %): fisetin(5-deoxyflavonol), fustin (5-deoxyflavanonol) and leucofisetinidin (5-deoxyflavan-3,4-diol) as units, aurones and auronols (Hegnauer, 2001).
Biflavonoids occur. Myricetin, quercetin and kaempferol glycosides are abundant,apigenin and luteolin glycosides are sometimes in leaves.
Different types of excretion organs contain: oleoresins, oleoresins plusmucilaginous compounds, or latex. In genera Rhus and Toxicodendron latexoccurs with phenolic compounds causing contact dermatitis (Hegnauer, 2001;Frohne and Jensen, 1992).
Organic acids (quinic acid and shikimi acid) are abundant in leaves.

Appendix II Chemical investigations on primary and secondary plant compounds 211
family, genus, species and plant part classificationMangifera indica L.drugs: Mango-fruits (rich in ß-caroten) (Frohne and Jensen, 1992).
Silica abundant in leaves (Mangiferae). Triterpenoids occur in resins and leaf galls.Latex contains skin irritating alkenylphenolic compounds (alkenylresorcinols),(Hegnauer, 2001).
leavesessential oils: 0.013 % (Hegnauer, 2001);flavonoids: quercetin, kaempferol glycosides (Hegnauer, 2001; ElSissi et al., 1971);tannins: condensed tannins (catechin, epicatechin-3-gallat units); gallo- and
ellagitannins (ElSissi et al., 1971; Hegnauer, 2001);xanthones and associated compounds:
7.1 % mangiferin (1,3,6,7-tetrahydroxyxanthone-2-glucopyranoside); galloylderivatives and 4-hydroxybenzoyl derivatives of mangiferin; 3-C-glucomaclurine(benzophenone), 3-C-glucoiriflophenone; isomangiferin; protocatechuic acid(ElSissi et al., 1971; Hegnauer, 2001)
tasted
flowersessential oils: 0.04 %;gallic acid derivatives: gallic acid ethyl ester (Hegnauer, 2001)
fruitscarotenoids (Hegnauer, 2001)
eaten
barktannins: 10-20 %;xanthones: mangiferin and -3-methylether (homomangiferin) (Hegnauer, 2001)
leaves, bark (see above), wood and fruitxanthone: mangiferin (Hegnauer, 2001)
flowers, fruits, stemsphenolic phytoalexines (Hegnauer, 2001)
seedstannins: 8-9 % (Hegnauer, 2001)
RhusHydrolysable (gallo-)tannins are abundant in leaves and barks of all Rhus species:
contents up to 40 % (referred to dry leaf weight).Chinese Gallae (of Rhus semialata): up to 78 % tannins.
Investigation of eight North American Rhus species revealed high tannin contentsin leaves and flowers, while stems, barks, woods and seeds exhibited relativelylow contents.
Leaflets: high tannin contents; rachis and leafstalks: relatively low tannin contents;Heartwood of Rhus species: condensed tannins (see above) (Hegnauer, 2001).
drugs and medicinal use: According to U.S. Pharmacopoeia, tannic acid isobtained from “nutgalls or leaves of sumac” (any Rhus species). So, commercialtannins are gained either from Chinese Gallae (from various Rhus species, like R.
semialata or R. sinensis), or from leaves of R. coriararia (Doorenbos and Box,1976; Frohne and Jensen, 1992). (For tannins gained from Turkish galls, seeQuercus).
Medicinally, tannin is used as antidiarrhoeal: tannin protein complex (ratio 1:1)(tannin albuminate, Albumini tannas).
leavesflavonoids: myricetin, quercetin and kaempferol glycosides abundant
fruitsorganic acids: predominantly malic acid (6.5-18 %);anthocyanins (Hegnauer, 2001)

212 Appendix II Chemical investigations on primary and secondary plant compounds
family, genus, species and plant part classificationRhus copallina L.
use: The sour fruit can be nibbled or made into a drink like lemonade. Wildlife isknown to eat the fruit, deer browse on the twigs (Little, 1993). Due to high tannincontents of leaves and berries, sumac was recommended as substitute for galls indying, the manufacture of ink and tanning (Crellin and Philpott, 1990).
medicinal use: Rhus species is a source of USP quality tannin: see above.According to Crellin and Philpott (1990), Rhus coriararia, R. glabra and R.
copallina were used the same way in domestic medicine (the vernacular name“red sumac” covers the species R. glabra and R. copallina, while “commonsumach” refers to R. coriararia and R. glabra).Usage of leaves, roots and berries is mainly based on their astringent properties.Hence, sumac species were used for sore throats and mouths, dysentery,diarrhoea, burns and haemorrhoids. Indians used the leaves externally for soresand swellings. Due to its content of vitamin C and malic acid, fruits were used ascooling medicine for fevers and as cough medicine. Currently, leaves and berriesare recommended as antidote for poisons (Crellin and Philpott, 1990).
leavestannins: three geographic races can be discerned with respect to leaf tannin contents
(referred to dry matter):eastern race: 27 %;southern race: 33 %;central race: 36 % (Hegnauer, 2001)
remark: According to Doorenbos and Box (1976) efforts were made to useR. copallina and. R. glabra as native sources of commercial gallotannins. Startingin 1965, tannin content of the dried leaves of individual trees varied enormouslyfrom 4-38 %. Therefore, only plants of clones yielding at least 30 % tannins(referred to dry leaf weight) were used for cultivation trials.
eaten
Rhus radicans L.The latex contains urushiols (3-alkyl- and 3-alkenyl-brenzcatechols) causing
contact dermatitis (poison ivy dermatitis, Rhus dermatitis) (Hegnauer, 2001;Frohne and Jensen, 1992).
medicinal use: In homeopathy fresh roots are used e.g. for skin irritations, neuralgiaand colds (HAB; Hagers Handbuch, 1994).
untouched
Betulaceae (order: Fagales)Accumulation of tannins in barks and leaves; the occurrence of condensed tannins
(leucocyanidin units), hydrolysable (gallo- and ellagi-)tannins andhydroxycinnamic acids varies with genera and species.
triterpenoids: pentacyclic in barks, and penta- and tetracyclic in leaves;flavonoids: mainly hyperosid or myricitrin as glycosides in leaves (Frohne and
Jensen, 1992; Hegnauer, 2001). (see also Fagaceae)
Carpinus
leavesflavonoids: myricetin, quercetin, kaempferol glycosides (Hegnauer, 2001);tannins: gallotannins (?) (Hegnauer, 2001);hydroxycinnamic acids: chlorogenic acid (Hegnauer, 2001)
Carpinus caroliniana Walt.medicinal use: Bark, wood and leaves were used as tonic and for gastric disorders.
Indians used it in preparations for coughs, haemorrhages, kidney problems, andrheumatism (Crellin and Philpott, 1990).
leavesflavonoids: hyperoside and other quercetin glycosides (Hegnauer, 2001)
tasted

Appendix II Chemical investigations on primary and secondary plant compounds 213
family, genus, species and plant part classificationCaesalpiniaceae (order: Fabales)
drugs (selection):Used as laxatives: Sennae folium et fructus (Cassia senna and C. angustifolia).Used as laxative and in the therapy of biliary disorders: Tamarindi pulpafrom fruits of Tamarindus indica (organic acids and a heteropolysaccharide (agalactoxyloglucan with gelling properties), (Frohne and Jensen, 1992; Hegnauer,XIa, 1994; Jänicke at al., 2003).
Gummosis in Caesalpiniaceae species is more seldom than in Mimosaceae, butoccurs (Hegnauer, XIa, 1994).
Cercis
leavestannins: condensed tannins (Hegnauer, XIa, 1994);flavonoids: myricitrin (Hegnauer, XIa, 1994), monoglycosides of quercetin,
myricetin and kaempferol (Hegnauer, XIb-2, 2001)
flowersflavonoids: myricitrin (Hegnauer, XIa, 1994)
Cercis canadensis L.use: The flowers can be eaten as salad, or fried (Little, 1993).medicinal use: The bark has been used as an astringent, for the treatment of
diarrhoea and dysentery, especially when it becomes chronic (Crellin andPhilpott, 1990).
leaves and pods eatenCaprifoliaceae (order: Dipsacales)
Iridoids and secoiridoids abundant in the family, partly as complex esterglycosides;loganin (iridoid) in Lonicera and Viburnum;
caffeic acid as common characteristic (mainly as chlorogenic acid); mono- anddicaffeoyl-quinic acid abundant in leaves; saponins abundant; free ursolic acidmay occur in leaves; the occurrence of flavonoid glycosides and coumarins ischaracteristic of individual genera (Frohne and Jensen, 1992; Hegnauer, 2001).
LoniceraIridoid alkaloids (pseudoalkaloids) occur in Lonicera.
leaveshydroxycinnamic acids: chlorogenic, caffeic, p-coumaric acid;flavonoids: glycosides of apigenin and luteolin predominate, but quercetin and
kaempferol glycosides also occur (Hegnauer, 2001)
barksyringin or coniferin depending on species (Hegnauer, 2001)
Lonicera japonica Thunb.use: Sweet nectar can be milked from the base of the corolla (Niering and
Olmstead, 1992).
flowers tastedleaves
flavonoids: 0.01 % lonicerin (= luteolin-7-rhamnoglucosid) in fresh leaves;saponins (Hegnauer, 2001)
fresh new twigsiridoid compounds: 0.5 % secoxyloganin (Hegnauer, 2001)
ViburnumStorage of dihydrochalcones (Hegnauer, 2001).
leaveshydroxycinnamic acids: chlorogenic, isochlorogenic, neochlorogenic acid;flavonoids: quercetin and kaempferol glycosides abundant (Hegnauer, 2001)
fruitsanthocyanins: cyanidin-glycosides (Hegnauer, 2001)
barkcondensed tannins: (catechin, epicatechin units) (Hegnauer, 2001)

214 Appendix II Chemical investigations on primary and secondary plant compounds
family, genus, species and plant part classificationViburnum prunifolium L. untouched
drug: Viburni prunifolii cortex: the astringent bark was used medicinally; officinaldrug in USA and some European countries (Hegnauer, 2001).
barkViburni prunifolii cortex (see above);flavonoids, coumarins and other phenolics: salicin (glucoside of o-
hydroxybenzylalcohol); amentoflavone (biflavone); scopoletin (coumarin);0.01 % triester of 1,2,3-benzenetricarbonic acid (= 1-methyl-2,3-dibutylhemimellilat), (Hegnauer, 2001)
bark and leavesphenolic glycosides: arbutin (Hegnauer, 2001)
bark, leaves and flowerstriterpenoids: of α- and ß-amyrin type (Hegnauer, 2001)
root barkiridoid glycosides (Hegnauer, 2001)
Viburnum rafinesquianum
leaves refusedCornaceae (order: Cornales)
Iridoid and secoiridoid compounds are characteristic of the family. Galli- andellagitannins are abundant (Tanaka et al., 2001). Ellagitannins: cornusiin-A and -B. Triterpenoids and triperpenoid saponins are abundant (Frohne and Jensen,1992; Hegnauer, 2001).
Cornus
leavesflavonoids: quercetin and kaempferol glycosides abundant;tannins: gallo- and ellagitannins, condensed tannins;hydroxycinnamic acids: caffeic acid abundant;phenolic glucosides: 0.5-1.2 % cornus-quinol-glucoside (= cornoside) and
salidroside (p-hydroxy-phenyl-ethanol-glucoside) (Hegnauer, 2001)
Cornus florida L.medicinal and other use: Indians used aromatic barks and roots as remedy for
malaria and extracted a red dye from roots (Little, 1993). Tree bark and root barkwere included in the USP as cinchona substitute for fevers and bitter tonic /stomachicum (Crellin and Philpott, 1990).
leavesanthocyanins: cyanidin-3-glucosid;iridoid compounds: cornin and dihydrocornin;cyclitols (inositol);triterpenoids: 0.8-1 % free ursolic acid (Hegnauer, 2001);saponins with molluscicidal properties (Barbosa et al., 1990)
refused
flowersflavonoids: quercetin, kaempferol glycosides;tannins: gallotannins;triterpenoids (ursolic acid, nonacosan, betulininic acid);cyclitol (scyllitol, inositol) (Hegnauer, 2001)
fruitsanthocyanins (Hegnauer, 2001)
barksteroid saponin glycosides: filiferin, sarsapogenolglycosides (Hegnauer, 2001)
bark and root barkiridoid compounds: 4 % cornin (= verbenalin; bitter tasting compound) in the bark
(Frohne and Jensen, 1992; Hegnauer, 2001)

Appendix II Chemical investigations on primary and secondary plant compounds 215
family, genus, species and plant part classificationEbenaceae (order: Ebenales)
Tannins and naphthoquinone derivatives are characteristic of the family andabundant in Diospyros, especially in the heartwood (e.g. ebony of D. ebenum)(Frohne and Jensen, 1992; Hegnauer, 2001); but also in other organs like barks,roots, fruits and leaves. Oxidation products of 1,8-dihydroxynaphthaline andcorresponding naphthoquinones cause brown and black pigments found so far,especially in decomposing plant organs. Methyljuglones (like plumbagin) buildbasic structures, while also di-, tri- and tetrameric naphthoquinones occur(Hegnauer, 2001).
Pharmacological effects: ichthyotoxic, insecticidal and anthelminthic; irritations onskin contact; resistance against termites.
Flavonol glycosides (quercetin-3-glycosides) occur in leaves.Condensed tannins (catechin, leucocyanidin and leucodelphinidin units, in part
esterified with gallic acid) predominate in Diospyros species (especially in barksand fruits, partly also in leaves), but gallotannins and coumarins are alsoabundant. Naphthoquinone-5-methylcoumarin dimers and trimers, anthraquinoneglycosides, lignans and ellagic acid derivatives also occur.
Accumulation of free pentacyclic triterpenoids in the family (e.g. oleanolic acid,ursolic acid, lupeol, betulin and betulinic acid) in different organs like roots,barks, woods, leaves, flowers, fruits and seeds. Triterpenoid saponins occur (e.g.in leaves and fruits) which build together with caustic quinones the anthelminthicand ichthyotoxic principle of these plants. ß-sitosterol abundant. Alkaloids (ofunknown structure) may occur in leaves and barks of Diospyros species(Hegnauer, 2001).
Diospyros virginiana L.use: Persimmons are consumed fresh and used to make puddings, cakes, and
beverages. American Indians made persimmon bread and stored the dried fruitlike prunes. Diospyros (Greek) means “fruit of the god Zeus” (Little, 1993).
medicinal use: The bark, especially the inner bark and unripe fruit were used asastringent, tonic, for fevers (like cinchona), and as antiseptic. The unripe fruit wasrecommended for diarrhoea, gastrointestinal disorders and haemorrhage due to itscontent of tannins. Up to 1880 persimmon was included in the U.S.Pharmacopoeia (Crellin and Philpott, 1990).
leavesflavonoids: myricetin, quercetin and kaempferol glycosides (Hegnauer, 2001);tannins: condensed tannins (leucodelphinidin units) (Hegnauer, 2001);hydroxycinnamic acids: p-coumaric acid (Hegnauer, 2001);organic acids: leaves are rich in ascorbic acid (Hegnauer, 2001)
tasted inspring;eaten in theautumn
fruitstannins: condensed tannins (Hegnauer, 2001): up to 18 % in the unripe fruit
(referred to dry weight) (Crellin and Philpott, 1990)
bark and woodnaphthoquinones: isodiospyrin (Hegnauer, 2001)
Ericaceae (order: Ericales)Ericaceae are characterised by polyphenolic compounds of different types: phenolic
glycosides, flavonoids and / or tannins (condensed and / or hydrolysable (ellagi-)tannins) (Frohne and Jensen, 1992). Kaempferol and especially quercetinabundant. Sometimes myricetin is found.
Different hydroxycinnamic acids (p-coumaric acid, caffeic acid etc.) sporadically.Arbutin (a hydroquinone-glucoside, e.g. as antibacterial principle in Uvae ursifolium) abundant in some species.
Some species accumulate essential oils (in glandular hairs) (Hegnauer, 2001). Toxicditerpenes occur in leaves, twigs, wood, flowers and even in nectar (“toxichoney”) of some genera (Hegnauer, 2001).
Iridoid compounds (C10 and C9 type) occur in different genera and species. Cuticlewax of leaves is rich in triterpenoids, especially in ursolic acid, but also othertriterpenoid compounds (like saponins) occur in different organs (Frohne andJensen, 1992; Hegnauer, 2001).
Organic acids occur widely in leaves and fruits (Hegnauer, 2001).

216 Appendix II Chemical investigations on primary and secondary plant compounds
family, genus, species and plant part classificationdrugs: Myrtilli fructus et folium (Vaccinium myrtillus) (predominantly condensed
tannins) are used as antidiarrhoeal agent (Jänicke et al., 2003).
Oxydendrum
leaves and barktannins (Hegnauer, 2001)
Oxydendrum arboreum (L.) DC.use: Sourwood honey is esteemed (Little, 1993).medicinal use: Leaves are said to be tonic, refrigerant and diuretic. In domestic
practice leaves are used in form of infusion or decoction as refrigerant drink forfevers (Crellin and Philpott, 1990).
leaveshydroxycinnamic acids: leaves are rich in caffeic acid (Hegnauer, 2001);no toxic diterpenes (of andromedotoxin-type) (Hegnauer, 2001);organic acids: sour taste of the foliage (Little, 1993; Crellin and Philpott, 1990)
tasted
bark eatenFabaceae (order: Fabales)
Alkaloids occur in the family, but are normally restricted to special tribes or occursporadically.
Saponins (triterpenoid saponins e.g. in Glycyrrhiza glabra; steroid saponins e.g. inTrigonella foenum-graecum) are abundant.
Isoflavonoids (with oestrogen-like effects) and rotenoids (e.g. ichthyotoxic andinsecticidal) have several pharmacological and ecological effects (functioning asphytoalexins, fungitoxic), (characteristic).
Cyanogenic compounds are frequently found (Frohne and Jensen, 1992).Gummosis rarely occurs (Hegnauer, XIa, 1994).drugs (selection):
Oleum Arachidis (Arachis hypogaea); Tragacantha (Tragant, Ph.Eur.; anarabinogalactan), the dried exudate from trunk and twigs of Astragalus species(e.g. A. gummifer), is used as laxative and as stabiliser in the pharmaceuticaltechnology and food chemistry. Guar galactomannanum (Guargalactomannan,Ph.Eur.) is gained from the ground endosperm of seeds of Cyamopsis
tetragonoloba, which is used in the therapy of diabetes and lipaemia, and like theformer polysaccharide as laxative and as stabiliser in the pharmaceuticaltechnology and food chemistry.Further drugs: Balsamum peruvianum (Myroxylon balsamum); Liquiritiae radix etsuccus (Glycyrrhiza glabra); Meliloti herba (different Melilotus species);Ononidis herba (Ononis spinosa); physostigmin (Physostigma venenosum)(Frohne and Jensen, 1992; Rimpler, 1999).
Robinia pseudoacacia L.officinal drug: Robiniae pseudoacaciae flos, (Wagner, 1999; Madaus, 1976).
which were used as anti-spasmodic. Large doses have emetic and purgativeeffects.Compounds within the leaves provoke fever, oedema and obstipation. Inhomeopathy the fresh barks and young twigs are used e.g. against gastricdisorders, ulcers, obstipation and headache (HAB). Notes on plant parts used arenot consistent; for a review see Madaus (1976).
plant part not specifiedflavonoids: kaempferol-3-O-rhamnosyl-galactoside 7-O-rhamnoside;
luteolin-7-O-glucoside; acacetin-7-O-glucoside (Kaneta et al., 1980; Hegnauer,XIa, 1994); robinin (anti-inflammatory activity) (Lipkan et al., 1981)
leavestannins: 8.2 % (Hegnauer, XIb-2, 2001); condensed tannins (leucodelphinidin and
leucocyanidin units, and two unidentified compounds) (Kumar and Horigome,1986); prodelphinidin more than procyanidin (Hegnauer, XIa, 1994)
flavonoids: 1.7 % acacetin-7-glycosides (biosides and triosides, among the latterlinarin); apigenin-7-bioside and –trioside (Hegnauer, XIb-2, 2001)
rare non-protein amino acids (young leaves): canavanin (toxic), ethanolamine(Obatake and Suzuki, 1985)
eaten

Appendix II Chemical investigations on primary and secondary plant compounds 217
family, genus, species and plant part classificationflowers
flavonoids: 4-5 % kaempferol-3-robinobioside1-7-rhamnoside (robinin) with
diuretic properties (Hegnauer, XIb-2, 2001)essential oilssterols in the pollen: catasterone, 6-deoxycatasterone, typhasterol (Abe et al., 1995)
fruits (unripe)flavonoids: quercetin- and kaempferol-3-robinobiosides (Hegnauer, XIb-2, 2001)non-protein amino acids: DOPA (3,4-dihydroxyphenylalanin, toxic); albizziin
(Hegnauer, XIa, 1994)
barktannins: 7 % (Hegnauer, XIa, 1994); 2.8 % (Hegnauer, XIb-2, 2001);two lectins, called RpbAI and RPbAII from the inner bark (= Robinia pseudoacacia
bark agglutinins I and II) (Van Damme et al., 1995);saponinstoxic albumins (robin and phasin)
heartwoodcondensed tannins (monomeric units and biflavanoids):
leucorobinetinidin (flavan-3,4-diol; 3, 3’, 4, 4’, 5’, 7-hexahydroxoflavan), 2.3 %;dihydrorobinetin (flavanonol; 3, 3’,4’, 5’, 7-pentahydroxoflavan-4-on), 20 %;two isomeric robinetinidol-(4ß,6)-leucorobinetinidin (with 4’’α- and ß-hydroxylgroup, resp.);two isomeric robinetinidol-(4α, 2’ )-leucorobinetinidin (with 4’’α- and ß-hydroxyl group, resp.);robinetinidol-(4α, 2’)-dihydrorobinetin;robinetinidol-(4ß,6)-dihydrorobinetin;robinetinidol-(4ß,8)-dihydrorobinetin;robinetinidol-(4α, 2’)-robinetin;robinetinidol-(4ß, 2’)-tetrahydroxy-flavone (Coetzee et al., 1995; Hegnauer,XIb-2, 2001);robinetinidol (flavan-3-ol), trace amounts (Hegnauer, XIb-2, 2001);
associated flavonoids: 1.4 % robinetin (flavonol), 0.5 % robtin (flavanon), traceamounts of 5-deoxyflavonoids (fisetin, fustin, butin) and chalcones (Hegnauer,XIb-2, 2001)
woodtannins: 3 % (Hegnauer, XIa, 1994)
seedslectins: robin (toxic) (Frohne and Jensen, 1992);rare non-protein amino acids: canavanin (toxic) (Frohne and Jensen, 1992;
Hegnauer, XIb-2, 2001)
pods and seedsbenzoquinone: 2,6-dimethoxybenzoquinone (antibiotic), (Hegnauer, XIb-2, 2001)
Fagaceae (order: Fagales)The order Fagales is rich in calcium oxalate, polyphenols and tannins
(characteristics). Triterpenoids are abundant.Both, condensed and hydrolysable (gallo- and ellagi-) tannins are abundant in
leaves, fruits and bark of the Fagaceae. According to Hegnauer (2001), alsomethylated ellagic acids occur. In hydrolysable tannins glucose may be replacedby hamamelose, quercitol, further polyalcohols (shikimi acid, quinic acid, proto-quercitol, scyllo-quercitol, salidroside, 3,4,5-trihydroxybenzylalcohol) orphenolics.
Flavonoid compounds are characteristic of the Fagaceae, even often occurring inthe wood. The pattern of flavonoids strongly depends on the plant partinvestigated. As to the leaves, the flavonoid pattern might change drastically withseasons.
QuercusTannins: Condensed tannins (polymeric and oligomeric proanthocyanidins) are
1 robinobiose = 6-O-(6-deoxy-α-L-mannopyranosyl)-D-galactose; 6-O-α-L-rhamnopyranosyl-D-galactose

218 Appendix II Chemical investigations on primary and secondary plant compounds
family, genus, species and plant part classificationabundant in barks (e.g. Quercus cortex of Quercus robur or Q. petrea). Leavescontain condensed (catechin, gallocatechin, leucodelphinidin and leucocyanidinunits) and hydrolysable (gallo- and ellagi-) tannins. Except for ellagitannins(pedunculagin, vescalagin, castalagin), most polyphenolic compounds of theleaves increase with seasons (from spring to autumn). In some species complextannins (condensation products of catechins with ellagitannins) also occur in freshbarks and leaves. Gallotannins can often occur in the galls. Ellagitannins areabundant in woods (e.g. castalagin and vescalagin) and leaves. Fruits sometimescontain valonea acid. Fruit galls may contain ellagitannins (e.g. pedunculagin).
While quercetin is abundant in leaves, kaempferol and hydroxycinnamic acids(caffeic acid, p-coumaric acid) occur irregularly. The occurrence of 5-deoxyflavones, isoflavones and dihydrochalcones is noticeable (Hegnauer, 2001).
Triterpenoids occur in bark, especially in the cork of Q. suber (cork oak), but alsoin leaves and the coating (resins) of leaf galls of some species. Saponins mayoccur in bark, wood and leaves.
Coumarins (scopoletin) and benzoic acids (vanillin-, syringa-, gentisin-,salicylic-,protocatechuic-, and m-and p-hydroxybenzoic acid) were isolated from twigs ofQ. robur.
Lignans (lyonisid, lyoresinol and syringaresinol), various phenolic glycosides (e.g.galloylarbutin derivatives) and 2,6-dimethoxy-p-benzoquinone are also found inQuercus.
Characteristic of the genus Quercus is quercitol (a cyclitol), (Frohne and Jensen,1992; Rimpler, 1999).
drugs and medicinal use: Turkish galls from Quercus infectoria are used as a sourceof Acidum tannicum. For medicinal use see Rhus.
In domestic medicine, various North American oaks (e.g. Quercus falcata and anumber of other species native to North America) are recommended fordiarrhoea, swellings and skin ailments (bark, leaves, acorns), (Crellin andPhilpott, 1990).
Quercus falcata Michx.leaves and bark tasted
Quercus phellos L. untouchedQuercus stellata Wagenh.
leaves and bark tastedHamamelidaceae (order: Hamamelidales)
Polyphenolic compounds and acids are characteristic of the family: tannins areabundant in leaves, barks and woods.
Both, condensed and hydrolysable (gallo-) tannins occur in leaves and barks: e.g.Hamamelidis cortex (Hamamelis virginiana) contains hamamelitannin (=digalloylhamamelose), monogalloylhamameloses and condensed tannins (totalcontent up to 12 %), (Hegnauer, 2001; Jänicke et al., 2003).
Glycosides of myricetin, quercetin and kaempferol are abundant in leaves(Hegnauer, 2001).
drugs: Hamamelidis cortex et aqua (H. virginiana);Styrax (= Storax) liquidus (Liquidambar orientalis) consists of < 1% essential oilsand non-volatile constituents. The oleoresin styrax is obtained from Liquidambar
formosana;“American Styrax” (or sweet gum) from Liquidambar styraciflua contains 15-20% essential oils (Hegnauer, 2001).
LiquidambarA genus that contains resins and oleoresins which are typically manufactured once
the plant is injured (known as styrax or storax) (Hegnauer, 2001).

Appendix II Chemical investigations on primary and secondary plant compounds 219
family, genus, species and plant part classificationLiquidambar styraciflua L.
drugs: American Styraxmedicinal and other use: In pioneers days, the gum was obtained from the trunks by
peeling the bark and scraping off the resin-like solid. This gum was used forchewing gum (Little, 1993), and medicinally in pharmaceuticals for treating skinlesions, sores, catarrh, and dysentery (Hough´s Encyclopaedia, 1958), and in theCompound Tincture of Benzoin. An ointment containing American gum wasprepared for haemorrhoids, itch, ringworm, catarrh, and other chest ailments.Leaves and bark were recommended for coughs and colds. The bark wasrecommended as tonic and used for upset stomach. A decoction of the inner barkwas used as mucilaginous astringent for e.g. diarrhoea and dysentery (Crellin andPhilpott, 1990).
leavesflavonoids: 1.0 mg myricetin, 1.5 mg quercetin, 0.1 mg kaempferol (referred to 1 g
fresh weight). Myricitrin (myricetin-3-rhamnoside) and quercitrin (quercetin-3-rhamnoside) are abundant.
tannins: gallo- and ellagitannins, bergenin (associated gallic acid derivative) (Hegnauer, 2001);
anthocyaninsessential oils: 0.08 % (dried leaves); 0.125 % (fresh leaves), e.g. α-pinene,
limonene, cineol, 1-terpinen-4-ol, sabinene, vitispirane, valeranone, valerenal andpresumably borneol and bornylacetat (Hegnauer, 2001; Tattje and Bos, 1979;Tattje et al., 1980; Wyllie and Brophy, 1989); the oil consists of about85 % mono- and sesquiterpene hydrocarbons and about 15 % oxygenatedcompounds (Tattje et al., 1980);
cyanogenic compounds: weak cyanogenesis was found in only some of the leafsamples studied (Hegnauer, 2001)
eaten
woodunknown compound: presumably a lipophilic, skin-irritating compound (Hegnauer,
2001)
leaves, barks and fruitsorganic acids: shikimi acid (Hegnauer, 2001)
leaves, barks, wood, flowers, fruitsheteroside (pseudoindikan): monotropein (Hegnauer, 2001)
Juglandaceae (order: Juglandales)The family is characterised by polyphenols, tannins and naphthoquinones.
Condensed and hydrolysable (gallo- and ellagi-) tannins occur differently infruits, seeds, barks and leaves.
Naphthoquinones (especially juglone and the genuine hydrojuglone-ß-glucoside,e.g. abundant in leaves and other organs of Juglans and Carya species) exhibitfungitoxic, phytotoxic and ichthyotoxic effects (Frohne and Jensen, 1992;Hegnauer, 2001). In addition, juglone shows laxative effects and causes pustuleson skin surface (Hegnauer, 2001).
Essential oils occur in leaves (e.g. of Juglans regia; with fungistatic effects; itcontains various terpenoids, phenylpropanoid compounds, alcanes and fatty acids)(Frohne and Jensen, 1992).
Myricetin, quercetin, kaempferol and dihydrokaempferol are abundant, in partmethylated, often as 3-rhamnosid or 3-arabinosid glycosides in barks, twigs andleaves. Also bi- and triflavonoids occur. Hydroxycinnamic acids are found.Cyclitols are abundant in leaves (of genera Juglans and Carya).
Ascorbic acid is abundant in leaves and unripe fruits of J. regia (Hegnauer, 2001).
Carya tomentosa (Poir.) Nutt.leaves
naphthoquinones: 0.5 mg per g dry weight hydrojuglone (Hegnauer, 2001)tasted
barkflavonoids: presumably quercitrin (Hegnauer, 2001)

220 Appendix II Chemical investigations on primary and secondary plant compounds
family, genus, species and plant part classificationMagnoliaceae (order: Magnoliales)
Essential oils are characteristic of the family (monoterpenes, sesquiterpenes,phenylpropanes). Alkaloids derived from phenylalanine are abundant(phenylethylamine derivatives, benzyltetrahydroisochinolin bases, aporphin basesand oxidised derivatives, berberin bases, bisbenzylisochinolin bases andquaternary compounds). Flavonoids (quercetin and kaempferol glycosides),coumarins, hydoxycinnamic acids (caffeic acid) and lignans are abundant.Condensed tannins (leucocyanidin units) occur sometimes. Ellagitannins were notfound. Cyanidin and paeonidin glycosides often occur in flowers. Variouscyclitols are known to occur in leaves (Hegnauer, 2001).
drugs: Barks of various species of the Magnoliaceae are used in China againstgastrointestinal disorders (their alkaloids show in part spasmolytic activity(Hegnauer, 2001).
Liriodenderon
leaves, bark, root bark and / or fruitssesquiterpene lactones (biologically active): parthenolide, custolide and further
constituents of germacranolide-, eudesmanolide-, elemanolide- and guaianolide-type (Hegnauer, 2001)
barktannins (Hegnauer, 2001)
Liriodendron tulipifera L.medicinal use: Bark and root bark have been used as tonic and stomachic, for
rheumatism and fever. The drug was even included in the USP (Crellin andPhilpott, 1990).
protoalkaloids and alkaloids: aporphin-type (several compounds) and their variousoxidation products; proaporphin-type; benzoe acid amide-type; benzylisochinolinbases; tetrahydroprotoberberin-alkaloids (Hegnauer, 2001).
leavesflavonoids: quercetin and kaempferol glycosides are abundant: isoquercitrin, rutin,
kaempferol-3-glucoside and -3-rutinoside (Hegnauer, 2001);hydroxycinnamic acids: caffeic acid; chlorogenic acid (Hegnauer, 2001);bisphenylpropane-derivative: 1-(3,4,5-trimethoxyphenyl)-2-(4-allyl-2,6-
dimethoxy)propane (Barbosa et al., 1990);tannins: condensed tannins (leucocyanidin units) (Hegnauer, 2001);cyanogenic compounds were determined as HCN in fresh leaves. Large amounts
with seasonal differences were found:May: 490 mg / kg HCN; June: 225-248 mg / kg; August: 100 mg / kg.Leaves contained taxiphyllin and triglochinin (Hegnauer, 2001).
saponin-like substances (Hegnauer, 2001);alkaloids (especially aporphin bases and related compounds): glaucin; liridin,
liridinin (Hegnauer, 2001); N-methylcrotsparine (Barbosa et al., 1990);essential oils / sesquiterpene lactones: of germacranolide-, eudesmanolide-,
elemanolide- and guaianolide-type; tulirinol (of germacranolide-type; anantifeedant for the gypsy moth larvae) (Hegnauer, 2001; Barbosa et al., 1990);lipiferolide (Barbosa et al., 1990);
cyclitols: D-ononitol, D-bornesitol (myo-inositol methyl ether, in young leaves);liriodendritol (myo-inositol-1,4-dimethyl ether, in summer leaves); 2-C-methyl-erythritol (in autumn leaves) (Hegnauer, 2001);
compounds not found by leaf analyses: myricetin, leucodelphinidin and ellagicacid; leaves contain absolutely no silica (Hegnauer, 2001)
eaten
leaf, bark, flower, fruitscyclitols: liriodendritol, which is accompanied by low amounts of the 1-
monomethyl and 4-monomethylether (Hegnauer, 2001)

Appendix II Chemical investigations on primary and secondary plant compounds 221
family, genus, species and plant part classificationbark
hydroxycinnamic acids: syringa acid methyl ester;coumarins: aesculetin dimethylether (Hegnauer, 2001);lignans and neolignans: lioresinol diglucoside (isomer of syringaresinol) from the
inner bark; liriodendron, pinoresinol, syringaresinol, lirionol;alkaloids (especially aporphin bases and related compounds): liriodenin; glaucin;
N-nornuciferin, O-methyl-N-norlirinin; benzoe acid amide;cardioactive compounds: presumably sesquiterpene lactones (Hegnauer, 2001)
root barkessential oils: sesquiterpene lactones (types like in leaves) (Hegnauer, 2001)
wood and heartwoodalkaloids (especially aporphin bases and related compounds): liriodenin
(antimicrobial); dehydroglaucin, michelalbin, N-acetyl-N-nornantenin and its 3-methoxy-derivative, liriodendronin (Hegnauer, 2001)
Mimosaceae (order: Fabales)drugs:
Catechu (containing condensed tannins) (Acacia catechu) and barks of otherAcacia species are used as source of tannins;Gummi arabicum, Acaciae gummi (Ph. Eur.; an arabinogalactan) is gained fromAcacia species (e.g. A. senegal) as excretion of the trunk; it is used as emulsifyingagent and stabiliser in the pharmaceutical technology and food chemistry; in theproduction of adhesives and inks (Frohne and Jensen, 1992; Rimpler, 1999).
AlbiziaGummosis and exudates (mostly acidic reacting) were found in some species of the
genus Albizia: A. anthelmintica, glaberrima, lebbeck, procera, sericocephala,zygia. (Anderson et al., 1966; Anderson and Morrison, 1990; Martínez et al.,1995; review given by Hegnauer, XIa, 1994; for A. zygia see Mital and Adotey,1971;1972;1973). Characterisation of the protein moiety revealed that asparticacid and proline were main components, but also hydroxyproline may beimportant (Hegnauer, XIa, 1994).
Barks of some Albizia species (e.g. A. chinensis, granulosa, lebbeck, procera)contain 5-25 % tannins (Hegnauer, XIa, 1994).
Saponins are abundant in the genus Albizia (largely in barks, but also in other plantorgans like leaves, flowers, pods, seeds, wood) exhibiting various ecological andpharmacological properties (Meyer et al., 1982; Carpani et al., 1989; Orsini et al.,1991; Pal et al., 1995; a review is given by Hegnauer, XIb-1, 1996; Yoshikawa et
al., 1998a).Alkaloids (budmunchiamines, that is macrocyclic spermine alkaloids) occur in
some Albizia species; e.g. in the seeds of A. amara (Mar et al., 1991; Pezzuto et
al., 1992), the seeds of A. lebbeck (N-demethyl-budmunchiamine alkaloids; Misraet al., 1995), in the stem bark of A. gummifera and A. schimperana (Rukunga andWaterman, 1996a and b) with e.g. antibacterial and antiviral activity, cytotoxicand immunological effects (Mar et al., 1991; Pezzuto et al., 1992; Rukunga andWaterman, 1996a and b).
medicinal use: The stem bark of A. gummifera is used in traditional Kenyanmedicine for the treatment of coughs, gonorrhoea, fever, malaria, stomach painsand skin diseases (Watt and Breyer-Brandwijk, 1962; Kokwaro, 1976).

222 Appendix II Chemical investigations on primary and secondary plant compounds
family, genus, species and plant part classificationAlbizia julibrissin
drugs:Albiziae cortex (Chinese Pharmacopoeia; Stöger et al., 2001):
Leading compounds are saponins with haemolytic activity.Albiziae flos (Chinese Pharmacopoeia; Stöger et al., 2001):
The Pharmacopoeia tests for lipophilic compounds referenced to authentic plantmaterial.According to Pharmacopoeia, both drugs are used to loose stases and as sedativeagent, against restlessness, agitation, sleeplessness and despondency. Moreover,the bark is used against ulceration in the “orbis pulmonalis” and externallyagainst ulcers, swellings, fall and strike injuries.
The saponin fraction of the stem bark is reported to show a strong uterotonicactivity by stimulating uterine muscle contractions (You et al., 1982; Tang andEisenbrand, 1992). Furthermore, the crude saponin fraction exhibited significantcytotoxicity with julibroside III as most potent compound (Ikeda et al., 1997).
According to Kinjo et al. (1991a and b) the stem bark is used as tonic in Chinaand Japan and it is syringaresinol diglucoside (a lignan glycoside) which ismade responsible for the pharmacological effect “to ease the mind and calm thenerves”. Moreover, the bark is used as antipyretic, anodyne, sedative anddiuretic drug, which might be due to the N-acetyl-D-glucosamine sugar moietyof saponin glycosides (Kinjo et al., 1992).Flowers are used as a sedative drug, for quercitrin and isoquercitrin containedsedative activity has been found (Kang et al., 2000).
remarkThis tree is often called “Mimosa-tree” because the flowers are similar to those ofthe related herbaceous sensitive-plants (genus Mimosa). Silktree (A. julibrissin)leaflets fold up at night; those of sensitive-plants fold up when touched (Little,1993).
plant part not specifiedflavonoids: quercetin-3-O-galactoside (hyperoside); quercetin-3-O-rhamnoside
(quercitrin), (Kaneta et al., 1980; Hegnauer, XIa, 1994);polysaccharides with anti-tumour activity (Moon et al., 1985);enzymes: milk-clotting (protease-like) enzymes (Ohtani, 1989);phenanthrene derivative: tylophorine B (= 2,3,6-trimethoxyphenanthro
[9,10-f]indolizidine (Wang et al., 2000)
leavesflavonoids: quercitrin and afzelin (which both showed free radical scavenging
activity), (Jang et al., 2002);hydroxycinnamic acids: 3-O-(4-hydroxy-trans-cinnamoyl) quinic acid (= p-
cumaroyl quinic acid);3-O-(3,4-dihydroxy-trans-cinnamoyl)-4-O-malonyl-quinic acid (= 3-caffeoyl-4-malonyl quinic acid) (Schaller and Schildknecht, 1992)
eaten (heavilyeaten inspring, lesseaten inautumn)
floweressential oils: linalool; cis- and trans-linalool oxide; α-ocimene; isopentanol; 4-
penten-2-one; 2,2,4-trimethyloxetane (Chao et al., 1988);anthocyanins: cyanidin-3-O-ß-D-glucosopyranoside (Ishikura et al., 1978; Tang
and Eisenbrand, 1992);flavonoids: quercitrin and isoquercitrin (Kang et al., 2000)
stem barkflavonoids: 3’,4’,7-trihydroxyflavone (Chamsuksai et al., 1981);
5-deoxyflavone (geraldone), isookanin, luteolin, an isoflavone (daidzein),prenylated flavonoids (sophoflavescenol, kurarinone, kurarinol, kuraridin,kuraridinol) (Jung et al., 2004a);

Appendix II Chemical investigations on primary and secondary plant compounds 223
family, genus, species and plant part classificationsapogenols (triterpenoid):
machaerinic acid methylester; acacic acid lactone (You et al., 1982);acacigenin B; machaerinic acid lactone (Kang and Woo, 1983);16-deoxyacacigenin B (= 21-[4-(ethylidene)-2-tetrahydrofuranmethacryloyl]machaerinic acid), (Woo and Kang, 1984; Tang andEisenbrand, 1992);julibrogenin B and julibrogenin C, (Kinjo et al., 1992);
saponins (triterpenoid):julibroside A1: acacic acid lactone 3-O-ß-D-xylopyranosyl-(1→2)-ß-D-fucopyranosyl-(1→6) [ß-D-glucopyranosyl-(1→2)]-ß-D-glucopyranoside,(Kinjo et al., 1992);
julibroside A2: acacic acid lactone 3-O-ß-D-xylopyranosyl-(1→2)-ß-D-fucopyranosyl-(1→6)-ß-D-glucopyranoside, (Kinjo et al., 1992);
julibroside A3: acacic acid lactone 3-O-ß-D-xylopyranosyl-(1→2)-ß-D-fucopyranosyl-(1→6)-2-acetylamino-2-deoxy-ß-D-glucopyranoside,(Kinjo et al., 1992);
julibroside A4: 3-O-ß-D-glucopyranosyl-(1→4)-ß-D-glucopyranosyl-acacic acidlactone 16-O-ß-D-glucopyranoside, (Kinjo et al., 1992);
julibroside C1: julibrogenin C 3-O-[ß-D-xylopyranosyl-(1→2)-ß-D-fucopyranosyl-(1→6)] [ß-D-glucopyranosyl-(1→2)]-ß-D-glucopyranoside,(Kinjo et al., 1992);(julibroside A1-A4, B1 and C1: 2-15 ppm, respectively; Hegnauer, XIb-1, 1996)
julibroside I: 21-O-[(6S)-2-trans-2,6-dimethyl-6-O-(4-O-(6S’)-2’-trans-2’,6’-dimethyl-6’-O-ß-D-quinovopyranosyl-2’,7’-octadienoyl-ß-D-quinovopyranosyl)-2,7-octadienoyl]-3-O-{ß-D-glucopyranosyl-(1→2)-[ß-D-xylopyranosyl-(1→2)-ß-D-fucopyranosyl-(1→6)]-ß-D-glucopyranosyl} acacic acid 28-O-α-L-arabinofuranosyl-(1→4)-[ß-D-glucopyranosyl-(1→3)]-α-L-rhamnopyranosyl-(1→2)-ß-D-glucopyranosyl ester; showed anti-tumour activity, (Ikeda et al.,1995b);
julibroside II: 21-O-[(6S)-2-trans-2,6-dimethyl-6-O-(4-O-(6S’)-2’-trans-2’,6’-dimethyl-6’-O-ß-D-quinovopyranosyl-2’,7’-octadienoyl-ß-D-quinovopyranosyl)-2,7-octadienoyl]-3-O-[ß-D-xylopyranosyl-(1→2)-ß-D-fucopyranosyl-(1→6)-ß-D-glucopyranosyl] acacic acid 28-O-α-L- arabinofuranosyl-(1→4)-[ß-D-glucopyranosyl-(1→3)]-α-L-rhamnopyranosyl-(1→2)-ß-D-glucopyranosyl ester,(Ikeda et al., 1995a);
julibroside III: 21-O-[(6S)-2-trans-2,6-dimethyl-6-O-(4-O-(6S’)-2’-trans-2’,6’-dimethyl-6’-O-ß-D-quinovopyranosyl-2’,7’-octadienoyl-ß-D-quinovopyranosyl)-2,7-octadienoyl]-3-O-[ß-D-xylopyranosyl-(1→2)-ß-D-fucopyranosyl-(1→6)-2-acetamido-2-deoxy-ß-D-glucopyranosyl] acacic acid 28-O-α-L-arabinofuranosyl-(1→4)-[ß-D-glucopyranosyl-(1→3)]-α-L-rhamnopyranosyl-(1→2)-ß-D-glucopyranosyl ester, (Ikeda et al., 1995a); showing pronounced cytotoxicactivity (Ikeda et al., 1997);
julibroside J1: 3-O-[ß-D-xylopyranosyl-(1→2)-α-L-arabinopyranosyl-(1→6)-ß-D-glucopyranosyl]-21-O-{(6S)-2-trans-2-hydroxymethyl-6-methyl-6-O-[4-O-((6S)-2-trans-2,6-dimethyl-6-O-(6-deoxy-ß-D-glucopyranosyl)-2,7-octadienoyl)-6-deoxy-ß-D-glucopyranosyl]-2,7-octadienoyl}-acacic acid 28-O-{ß-D-glucopyranosyl-(1→3)-[α-L-arabinofuranosyl-(1→4)]-α-L-rhamnopyranosyl-(1→2)}-ß-D-glucopyranosyl ester, (Ma et al., 1996).
The strucure of julibroside J1 was revised by Zou et al. (2000a) as (6R)-configuration in the outer monoterpene moiety:

224 Appendix II Chemical investigations on primary and secondary plant compounds
family, genus, species and plant part classification3-O-[ß-D-xylopyranosyl-(1→2)-α-L-arabinopyranosyl-(1→6)-ß-D-glucopyranosyl]-21-O-{(6S)-2-trans-2-hydroxymethyl-6-methyl-6-O-[4-O-((6R)-2-trans-2,6-dimethyl-6-O-(ß-D-quinovopyranosyl)-2,7-octadienoyl)-ß-D-quinovopyranosyl]-2,7-octadienoyl}-acacic acid-28-O-ß-D-glucopyranosyl-(1→3)-[α-L-arabinofuranosyl-(1→4)]-α-L-rhamnopyranosyl-(1→2)-ß-D-glucopyranosyl ester.
julibroside J9 was established as the (6S/6S)-diastereoisomer of julibroside J1.Both saponins exhibited cytotoxic activity (Zou et al., 2000a);
julibroside J5: 3-O-[ß-D-xylopyranosyl-(1→2)-ß-D-fucopyranosyl-(1→6)-ß-D-glucopyranosyl]-21-O-{(6S)-2-trans-2-hydroxymethyl-6-methyl-6-O-[4-O-((6R)-2-trans-2,6-dimethyl-6-O-(ß-D-quinovopyranosyl)-2,7-octadienoyl)-ß-D-quinovopyranosyl]-2,7-octadienoyl}-acacic acid-28-O-ß-D-glucopyranosyl-(1→3)-[α-L-arabinofuranosyl-(1→4)]-α-L-rhamnopyranosyl-(1→2)-ß-D-glucopyranosyl ester, (Zou et al., 2005a);
julibroside J6: 3-O-[ß-D-xylopyranosyl-(1→2)-α-L-arabinopyranosyl-(1→6)-ß-D-2-deoxy-2-acetamidoglucopyranosyl]-21-O-{6S-2-trans-2-hydroxymethyl-6-methyl-6-O-[4-O-(6S-2-trans-2-hydroxymethyl-6-methyl-6-hydroxy-2,7-octadienoyl)-ß-D-quinovopyranosyl]-2,7-octadienoyl}-acacic acid-28-O-ß-D-glucopyranosyl-(1→3)-[α-L-arabinofuranosyl-(1→4)]-α-L-rhamnopyranosyl-(1→2)-ß-D-glucopyranosyl ester, (Zou et al., 2000b);
julibroside J8 (Zou et al., 2005a): (6S/6S)-diastereoisomer of julibroside J5.Julibroside J8 showed marked cytotoxic activity;
julibroside J10 and J11 (Zou et al., 2004a): a pair of diastereoisomers;
julibroside J12: 3-O-[ß-D-xylopyranosyl-(1→2)-ß-D-fucopyranosyl-(1→6)-ß-D-2-deoxy-2-acetamidoglucopyranosyl]-21-O-{(6S)-2-trans-2-hydroxymethyl-6-methyl-6-O-[4-O-((6R)-2-trans-2,6-dimethyl-6-O-(ß-D-quinovopyranosyl)-2,7-octadienoyl)-ß-D-quinovopyranosyl]-2,7-octadienoyl}-acacic acid-28-O-ß-D-glucopyranosyl-(1→3)-[α-L-arabinofuranosyl-(1→4)]-α-L-rhamnopyranosyl-(1→2)-ß-D-glucopyranosyl ester, (Zou et al., 2005a);
julibroside J13 (Zou et al., 2005a): (6S/6S)-diastereoisomer of julibroside J12;Julibroside J13 showed marked cytotoxic activity.
julibroside J22: 3-O-[ß-D-xylopyranosyl-(1→2)-α-L-arabinopyranosyl-(1→6)-ß-D-2-deoxy-2-acetamidoglucopyranosyl]-21-O-[(6S)-2-trans-2-hydroxymethyl-6-methyl-6-O-ß-D-quinovopyranosyl-2,7-octadienoyl]-acacic acid-28-O-ß-D-glucopyranosyl-(1→3)-[α-L-arabinofuranosyl-(1→4)]-α-L-rhamnopyranosyl-(1→2)-ß-D-glucopyranosyl ester; showed marked cytotoxic activity, (Zou et al.,2005b);
julibroside J23 (Zou et al., 2000c);
julibroside J24: 3-O-ß-D-xylopyranosyl-(1→2)-α-L-arabinopyranosyl-(1→6)-ß-D-glucopyranosyl-21-O-{(6S)-2-trans-2-hydroxymethyl-6-methyl-6-O-[3-O-(6S)-2-trans-2-hydroxymethyl-6-methyl-6-hydroxy-2,7-octadienoyl-ß-D-xylopyranosyl]-2,7-octadienoyl}-acacic acid-28-O-ß-D-glucopyranosyl-(1→3)-[α-L-arabinofuranosyl-(1→4)]-α-L-rhamnopyranosyl-(1→2)-ß-D-glucopyranosylester, (Zou et al., 2004b);
julibroside J25: 3-O-[ß-D-xylopyranosyl-(1→2)-α-L-arabinopyranosyl-(1→6)-ß-D-glucopyranosyl]-21-O-[(6S)-2-trans-2-hydroxymethyl-6-methyl-6-O-ß-D-quinovopyranosyl-2,7-octadienoyl]-acacic acid-28-O-ß-D-glucopyranosyl-(1→3)-[α-L-arabinofuranosyl-(1→4)]-α-L-rhamnopyranosyl-(1→2)-ß-D-

Appendix II Chemical investigations on primary and secondary plant compounds 225
family, genus, species and plant part classificationglucopyranosyl ester; showed marked cytotoxic activity (Zou et al., 2005b);
julibroside J26: 3-O-[ß-D-xylopyranosyl-(1→2)-α-L-arabinopyranosyl-(1→6)-ß-D-glucopyranosyl]-21-O-[(6S)-2-trans-2-hydroxymethyl-6-methyl-6-O-ß-D-quinovopyranosyl-2,7-octadienoyl]-16-deoxy-acacic acid 28-O-ß-D-glucopyranosyl-(1→3)-[α-L-arabinofuranosyl-(1→4)]-α-L-rhamnopyranosyl-(1→2)-ß-D-glucopyranosyl ester, (Zou et al., 1999);
julibroside J27: 3-O-ß-D-xylopyranosyl-(1→2)-ß-D-fucopyranosyl-(1→6)-ß-D-glucopyranosyl-21-O-{(6S)-2-trans-2-hydroxymethyl-6-methyl-6-O-[4-O-((6S)-2-trans-2-hydroxymethyl-6-methyl-6-hydroxy)-2,7-octadienoyl-ß-D-quinovopyranosyl]-2,7-octadienoyl}-acacic acid-28-O-ß-D-glucopyranosyl-(1→3)-[α-L-arabinofuranosyl-(1→4)]-α-L-rhamnopyranosyl-(1→2)-ß-D-glucopyranosyl ester; showed cytotoxic activity, (Zou et al., 2000d);
3-O-[ß-D-xylopyranosyl-(1→2)-ß-D-fucopyranosyl-(1→6)-ß-D-glucopyranosyl]-21-O-6(S)-2-trans-2-hydroxymethyl-6-methyl-6-O-ß-D-quinovopyranosyl-2,7-octadienoyl-acacic acid-28-O-L-arabinofuranosyl-(1→4)-α-L-rhamnopyranosyl-(1→2)-ß-D-glucopyranosyl ester, (Zheng et al., 2004);
lignan glycosides and related compounds:(according to Hegnauer (XIb-1, 1996) yielding 20-140 ppm, respectively)(-)-syringaresinol-4-O-ß-D-glucopyranoside;(-)-syringaresinol-4,4’-bis-O-ß-D-glucopyranoside (= syringaresinol diglucoside= liriodendrin);(-)-syringaresinol-4-O-ß-D-apiofuranosyl-(1→2)-ß-D-glucopyranoside;(-)-syringaresinol-4-O-ß-D-apiofuranosyl-(1→2)-ß-D-glucopyranosyl-4’-O-ß-D-glucopyranoside, (Kinjo et al., 1991a);
(-)-syringaresinol-4,4’-bis-O-ß-D-apiofuranosyl-(1→2)-ß-D-glucopyranoside,(Kinjo et al., 1991a);
syringic acid methyl ester 4-O-ß-D-apiofuranosyl-(1→2)-ß-D-glucopyranoside;glaberide I 4-O-ß-D-glucopyranoside;glaberide I 4-O-ß-D-apiofuranosyl-(1→2)-ß-D-glucopyranoside, (Kinjo et al.,1991b); (+)-5,5’-dimethoxylariciresinol 4-O-ß-D-apiofuranosyl-(1→2)-ß-D-glucopyranoside (Kinjo et al., 1991b);5,5’-dimethoxy-7-oxolariciresinol 4’-O-ß-D- apiofuranosyl-(1→2)-ß-D-glucopyranoside (the latter 5 compounds were considered as key intermediates inthe biodegradation pathway of syringaresinol, (Kinjo et al., 1991b);5,5’-dimethoxy-7-oxolariciresinol (Tong et al., 2003);
(+)-lyoniresinol 9’-O-ß-D-glucopyranosyl-(1→4)-ß-D-glucopyranoside;(+)-lyoniresinol 4,9’-bis-O-ß-D-glucopyranoside;icariside-E5 ( a neolignan glucoside) (Higuchi et al., 1992a; Hegnauer, XIb-1,1996);
phenolic glycosides:3,4,5-trimethoxyphenol 1-O-ß-D-apiofuranosyl-(1→2)-ß-D-glucopyranoside (aphloroglucin derivative, triketide) (Higuchi et al., 1992a);
albibrissinoside A and B (Jung et al., 2004b);ionon-derivative:
vomifomiol 3’-O-ß-D-apiofuranosyl-(1→6)-ß-D-glucopyranoside (Higuchi et al.,1992a);
pyridoxine derivatives:3-hydroxy-5-hydroxymethyl-4-methoxymethyl-2-methylpyridine 3-O-ß-D-glucopyranoside (a neurotoxin) (Higuchi et al., 1992b; Hegnauer, XIb-1, 1996);
julibrine I: 3-hydroxy-5-hydroxymethyl-4-methoxymethyl-2-methylpyridine 5’-

226 Appendix II Chemical investigations on primary and secondary plant compounds
family, genus, species and plant part classificationO-ß-D-glucuronopyranosyl(1→2)ß-D-glucopyranoside (Higuchi et al., 1992b);
julibrine II (arrhythmic inducing agent): 3-hydroxy-5-hydroxymethyl-4-methoxymethyl-2-methylpyridine 5’-O-ß-D-apiofuranosyl (1→2) ß-D-glucopyranoside (Higuchi et al., 1992b);
sterols: α-spinasteryl-D-glucoside; ∆7-stigmastenol (Chamsuksai et al., 1981);cerebroside: soya-cerebroside I (Jung et al., 2004a);
acids: (E)-4-hydroxy-dodec-2-enedioic acid (unsaturated hydroxy acid; Jung et al.,2003);
(6R)- and 6S-trans-2,6-dimethyl-6-O-ß-D-quinovosyl-2,7-menthiafolic acid2
(Tong et al., 2003)
root barkflavonoids: luteolin-7-O-neohesperidose (Go et al., 2004);lignan glycosides and related compounds: (+)-medioresinol (moderate cytotoxic
activity); (-)-syringaresinol (Go et al., 2004);others: euscaphic acid ester glucoside, (Go et al., 2004)
podsessential oil (Lu et al., 2003)
seedsflavonoids: 3,5,4’-trihydroxy, 7,3’-dimethoxy-3-O-ß-D-glucopyranosyl-α-L-
xylopyranoside (Yadava and Reddy, 2001);enzymes: proteinase inhibitors (Odani et al., 1979; Odani et al., 1980; Ohtani,
1989);non-protein amino acids: S-(ß-carboxyethyl)-cystein, albizziin (Hegnauer, XIb-1,
1996)
Moraceae (order: Urticales)Polyphenolic compounds are characteristic of leaves, barks, woods and fruits with
in part pharmacological effects on various organisms (Hegnauer, 2001):hydroxycinnamic acids, flavonoids, benzophenones, xanthones, stilbenes andcoumarins. (Insecticidal and fungicidal stilbenes and xanthones occur in somewoods. Some phenolic compounds act as phytoalexines.) Condensed tannins arerestricted to some genera, gallo- and ellagitannins are nearly absent. Quercetinand kaempferol glycosides are abundant in leaves. Some rare and typicalflavonoid compounds occur (Hegnauer, 2001).
Latex is a characteristic: which contains finely dispersed polyisoprenoids and isrich in proteins and proteinases. Other compounds of the latex (like cardenolidglycosides) vary considerably between genera and species. Cardenolid glycosidesmay also occur in seeds, barks and woods of individual species. Caoutchouc isgained from some species (Frohne and Jensen, 1992; Hegnauer, 2001).
Mineralisation is characteristic of the entire order Urticales (including Moraceaeand Ulmaceae): calcium oxalate and silicates are abundant in leaves (Frohne andJensen, 1992).
Acidic plant mucilage is abundant in the order (Frohne and Jensen, 1992).Triterpenoids, sterols and waxes occur in part in latices, in part in adjacent plant
tissue (Hegnauer, 2001).Alkaloids may occur (as flavonoidalkaloids in Ficus) (Hegnauer, 2001).usage: Latices leading cardenolid-glycosides are used as arrow poison by native
people.
2 (6R/S)-menthiafolic acid: (6R/S)-2-trans-2,6-dimethyl-6-hydroxy-2,7-octadienoic acid; monoterpene moiety
e.g. in julibrosides

Appendix II Chemical investigations on primary and secondary plant compounds 227
family, genus, species and plant part classificationMorus
drugs: Mori cortex radicis (Morus alba), remedy in China and Japan (prenylatedand geranylated (bi)flavonoids show hypotensive effects) (Hegnauer, 2001).
leavesplant acids: fumaric, succinic, malonic, malic, citric, oxalic acid;flavonoids: moracetin (quercetin-3-triglucoside);hydroxycinnamic acids: chlorogenic acid, p-coumaric acid;sterols: ß-sitosterol and compounds esterified with fatty acids; inokosteron and
ecdysteron (Hegnauer, 2001);polyprenones: bombiprenone (Hegnauer, 2001)
barktriterpenoids: amyrin, amyrinacetat, betulinic acid (Hegnauer, 2001);sterols: sitosterol (Hegnauer, 2001);prenylated flavonoids, benzofuran-derivatives and coumarins (see root bark)
(Hegnauer, 2001);alkaloids: piperidinalkaloid (Hegnauer, 2001)
root barkflavonoids: prenylated and geranylated flavonoids and benzofuran derivatives
(various chalcone-flavone-, chalcone-flavanon-, chalcone-phenylbenzofuran-,flavone-flavone-adducts with in part hypotensive effects) (Hegnauer, 2001);
coumarins: prenylated and methylated compounds;xanthones: prenylated and methylated compounds (Hegnauer, 2001);alkaloids: piperidinalkaloids: nojirimycin exhibiting antibiotic effects; moranolin
(Hegnauer, 2001)
wood (of trunks and / or twigs)flavonoids: morin, dihydromorin, dihydrokaempferol (aglyca);benzophenones and xanthones: maclurin, 2,4,4´,6-tetrahydroxybenzophenone;stilbenes: 2,4,3´,5´-tetrahydroxystilbene;polyphenols: albolactol (Hegnauer, 2001)
Morus rubramedicinal use: In folk medicine laxative and anthelminthic properties are reported
for the fruit and especially the bark (Crellin and Philpott, 1990).
leavesflavonoids: flavonol glycosides, dihydroquercetin (aglycone) (Hegnauer, 2001);latex (Hegnauer, 2001)
eaten
barkflavonoid-benzofuran-adduct: albanol-A = mulberrofuran G (Hegnauer, 2001);flavonoids: rubraflavones A,B,C,D (flavones with C10 side chains). The flavone
itself possesses coronary dilating action. Derivatives have been tested as coronaryvasodilatator. Others have been reported to have antiphlogistic, choleretic,spasmolytic and antihistamine activity (Venkataraman, 1975).
woodsimple phenolic compounds: resorcin, ß-resorcylaldehyd (Hegnauer, 2001);flavonoids: morin, quercetin (aglyca) (Hegnauer, 2001);stilbenes: oxyresveratrol (Hegnauer, 2001)
Nyssaceae (order: Cornales)Iridoid (iridoid-glycosides) and secoiridoid compounds are characteristic of the
family. Galli- and ellagitannins are abundant (Hegnauer, 2001). Hegnauer (2001)stresses the strong relationship to the Cornaceae.
usage: In former times the light and porous wood “ Tupelo lignum ” of Nyssa-species was used as surgical instrument (Hegnauer, 2001).
Nyssa sylvatica Marsh. untouchedleaves
flavonoids: 0.16 % myricitrin in autumn leaves; quercitrin, guajaverin, hyperosideand rutin (Hegnauer, 2001);
tannins: ellagitannins (Hegnauer, 2001);triterpenoids: 0.8 % free ursolic acid (Hegnauer, 2001)

228 Appendix II Chemical investigations on primary and secondary plant compounds
family, genus, species and plant part classificationleaves and twigs (stems):
iridoid compounds: presumably cornin (according to Hegnauer depending on thestudy performed) (Hegnauer, 2001)
Oleaceae (order: Oleales)Iridoid and secoiridoid compounds, iridoid glycosides and iridoid pseudoalkaloids
are characteristic. The bitter tasting secoiridoid oleuropaein in the leaves of Olea
europaea is expected to exert the anti-hypertensive effects of this drug (Frohneand Jensen, 1992). Bitter tasting compounds of the oleuropaein- andswertiamarin-type are abundant in Oleaceae (Hegnauer, 2001).
Main phenolic compounds are ester-glycosides of the verbascosid-type with in parttannin-like effects (verbascosid itself consists of a hydroxycinnamic (caffeic) acidand a 3,4-dihydroxyphenylethanol moiety which are bound to oligosaccharides)(Frohne and Jensen, 1992), while typical tannins (condensed and / orhydrolysable) are absent (Hegnauer, 2001). According to Hegnauer, p-coumaricacid, caffeic acid, ferula acid and isoferula acid build the ester moieties, while 4-hydroxy- and 3,4-dihydroxy-phenylethanol and hydroxycinnamic alcohol buildthe ether moieties which are bound to mono- and oligosaccharides of thesetannin-like compounds, which in turn are abundant in fruits, leaves and flowers.Mere arylalcanol- and arylalcenol-glycosides are also characteristic of the family.
Mannitol is accumulated by most Oleaceae species in many organs (e.g. “manna”of Fraxinus ornus) (Frohne and Jensen, 1992; Hegnauer, 2001). Free triterpenoidacids (oleanolic- and ursolic acid) which often occur along with other triterpenoidcompounds (alcohols) in leaves and fruits (mainly in cuticle waxes), flowers andseeds, and phenolic glycosides characterise the family (Hegnauer, 2001).
Sterols are abundant in leaves, seeds and roots.Syringin (glycoside of a hydroxycinnamic alcohol derivative) is stored in barks and
leaves of many genera and species (e.g. Fraxinus and Ligustrum). In the bark ofFraxinus species syringin and coumarins occur to the exclusion of one another.
Coumarins occur in barks, as minor compounds also in leaves, woods, flowers and /or fruits of many species (Hegnauer, 2001).
Furofuranoid lignans (e.g. phillygenin) and lignan-glucosides (e.g. phillyrin) occurin Oleaceae species (e.g. in leaves, bark, roots and / or twigs).
Quercetin and kaempferol glycosides (especially rutin) are abundant in leaves.Essential oils occur in flowers of many species (Hegnauer, 2001).drugs: Fraxini folium (Fraxinus excelsior) serve as laxative, while Oleae folium
(Olea europaea) is used as hypotensive agent (Hegnauer, 2001).
FraxinusCoumarins, flavonols, flavones, secoiridoid glycosides and lignans are abundant in
Fraxinus. Generally, the coumarins aesculin and fraxin occur predominantly inbarks, while only trace amounts appear in leaves (Hegnauer, 2001).
Fraxinus americana L.leaves
flavonoids: apigenin-7-rutinoside (Hegnauer, 2001)tasted
seedssecoiridoid glycosides: Fraxinus-GI-3 (Hegnauer, 2001)
Fraxinus pennsylvanica Marsh. untouchedLigustrum
Secoiridoid glycosides, flavonoids, lignans and triterpenoids are characteristic ofLigustrum (Hegnauer, 2001).
Ligustrum vulgare
leavesiridoid chinolin-alkaloids: cinchonin, cinchonidin and dihydrocinchonidin, which
are bound to verbascoside-like compounds (Hegnauer, 2001)
refused
fruitssecoiridoid glycosides: nüzhenid, Fraxinus-GI-3 and ligustrosid are the main
compounds, which is accompanied by some oleuropaein (Hegnauer, 2001);iridoid and secoiridoid pseudoalkaloids: presumably all artefacts during extraction
procedure (Hegnauer, 2001)

Appendix II Chemical investigations on primary and secondary plant compounds 229
family, genus, species and plant part classificationRosaceae (order: Rosales)
This family is known for the condensed type of tannins (leucocyanidin and catechinunits). In part, also gallo- and ellagitannins occur (especially in the subfamily ofRosoideae). Ellagitannins are obviously absent in the subfamilies Maloideae andPrunoideae. Quercetin and kaempferol glycosides are abundant (Frohne andJensen, 1992). In addition, flavones, isoflavones, coumarins, hydroxycinnamicacids and simple phenolic glycosides (e.g. arbutin) occur (Hegnauer, 2001).
Pentacyclic triterpenes and saponins occur in cuticle waxes (leaves and fruits),triterpene alcohols and triterpene ketones in barks (Frohne and Jensen, 1992).Tormentol (= tormentill acid-28-ester glucoside) may be characteristic of theRosaceae, which builds water-soluble complexes with tannins exhibitingantibiotic effects (Hegnauer, 2001).
Sitosterol is abundant in the Rosaceae.Organic acids are abundant in fruits (predominantly malic acid and citric acid; but
also succinic acid, ascorbic acid), (Frohne and Jensen, 1992).Cyanogenesis occurs in some subfamilies, e.g. Maloideae (Photinia), Prunoideae
(Prunus): amygdalin is predominantly in seeds and / or prunasin in vegetativeplant parts (Hegnauer, 2001; Frohne and Jensen, 1992).
Epidermal cells containing mucilage often occur in the Maloideae (Hegnauer,2001).
drugs (selection): Due to the occurrence of tannins following drugs are used:Agrimoniae herba (Agrimonia eupatoria); Alchemillae herba (Alchemilla
vulgaris); Anserinae herba (Potentilla anserina); Tormentillae rhizoma(Potentilla erecta) (Frohne and Jensen, 1992).Based on the occurrence of flavonoids and proanthocyanidins, differentCrataegus species are used (Crataegi folium cum flore) against cardiac diseases(Frohne and Jensen, 1992).The bark of Prunus serotina has been officinal in the United States and England(Hegnauer, 2001).
PhotiniaLeaves and twigs contain prunasin as cyanogenic compound. In leaves of Photinia
species ellagitannins and condensed tannins occur. Condensed tannins (catechinunits) are common among the Maloideae (Hegnauer, 2001).
Photinia glabra Maxim.leaves
pentacyclic triterpenes: epifriedelanol;cyanogenic compounds: HCN and benzaldehyde after distillation (Hegnauer, 2001)
eaten
PrunusCyanogenic compounds: prunasin (ß-glucoside of mandelonitrile) often in leaves,
barks, flowers, fruits; amygdalin in seeds. Investigated Prunus species yielded0.1-1.95 % mandelic acid after hydrolysis of dried leaves and twigs.
Flavones, isoflavones, flavanones and coumarins occur in this genus. Quercetin andkaempferol glycosides are abundant in Prunus: e.g. rutin, kaempferitrin, trifolin,quercitrin.
Condensed tannins (leucocyanidin and catechin units), chalcones, flavanones,flavanonoles, flavones, isoflavones and flavonols were found in woods and barks.Coumarins occur in leaves, woods, barks and fruits (Hegnauer, 2001).
Pentacyclic triterpenes: friedelin and epifriedelanol in barks.Gummosis obviously occurs in all Prunus species (trunk and fruit flesh) (Hegnauer,
2001).
Prunus serotina Ehrh.medicinal and other use: The bark of Prunus serotina was used as officinal drug
(USP) in the United States and England. It is mentioned as remedy for hepatitis,cirrhosis, fever and circulatory disorders (Hegnauer, 2001; Crellin and Philpott,1990). Black cherry syrup is obtained from the bark and used as cough medicine.Jelly and wine are prepared from the fruit (Little, 1993).
The cyanogenic compounds and their products may act as allelopathic agentstowards plants growing in their neighbourhood (Hegnauer, 2001).
untouched

230 Appendix II Chemical investigations on primary and secondary plant compounds
family, genus, species and plant part classificationleaves
flavonoids: quercetin glycosides;simple phenolics: benzoic acid, benzoylglucose;cyanogenic compounds: prunasin; 95 % benzaldehyde from fresh leaves (product
originating from prunasin);paraffines, wax-alcohols;triterpenoids: ursolic acid, ursolaldehyde, 2α-hydroxy-3-epiursolic acid;essential oils: 0.4 % (from fresh leaves);sterols (Hegnauer, 2001)
barktannins: condensed tannins (leucocyanidin units);cyanogenic compounds: prunasin;coumarins: scopoletin;simple phenolics: benzoic acid; trimethyl gallic acid;hydroxycinnamic acids: p-coumaric acid;sterols (Hegnauer, 2001)
woodtannins / flavanones: catechin, naringenin, 3-hydroxynaringenin (Hegnauer, 2001)
Simaroubaceae (order: Rutales)In Rutales essential oils, bitter tasting compounds (= quassinoids, especially in
Simaroubaceae) and alkaloids (canthin-6-one-alkaloids, 2-quinolone-alkaloidsand ß-carbolin-type (= pyrido [3,4-b] indol-type) alkaloids) occur. Resins, plantmucilages, gums and mixtures of them are common.
Quassinoids in Simaroubaceae: Quassinoids predominantly consist of a C-20skeleton (decanortriterpenoids), but also C-18, C-19 and C-25 skeletons occur:C25-quassinoids: pentanortriterpenoids, type of simarolid and of soulameolid;C20-quassinoids: decanortriterpenoids, type of quassiin, the largest group ofquassinoidsC19-quassinoids: undecanortriterpenoids, type of eurycomalactone andshinjulactone-B-typeC18-quassinoids: dodecanortriterpenoids, type of samaderine, (Frohne and Jensen,1992; Hegnauer, 2001)
officinal drugs: Quassiae lignum, Simaroubae cortex, Bruccae cortex et fructuspharmacological effects / medicinal use: Quassinoids show insecticidal, cytotoxic
and other biological effects; bitter tasting woods, barks and seeds ofSimaroubaceae are often used as bitter tonic (tonicum amarum) / stomachicum,febrifuge, antiparasitic, anthelminthic, against diarrhoea or against malaria(Crellin and Philpott, 1990; Frohne and Jensen, 1992; Hegnauer, 2001).
Ailanthussterols and triterpenoids: tricarbocyclic triterpenes (Hegnauer, 2001)
Ailanthus altissima (Mill.) Swinglequassinoids (bitter tasting compounds): shinjulactone-B (Hegnauer, 2001)
passed
medicinal use: Bark and root bark are used as tonic for nerves; antidiarrhoeal andanthelminthic effects. Quassinoid constituents revealed antiprotozoal activity withpossibly antimalarial effects (Crellin and Philpott, 1990).
remarkMale flowers have an objectionable odour; some people are allergic to their pollen
(symptoms of hayfever). Roots are classed as poisonous (Little, 1993).
leavesflavonoids: quercetin, kaempferol and apigenin as aglyca; 0.2 % isoquercitrin;
hyperoside, apigenin-7-glucoside, luteolin-7-glucoside;hydroxycinnamic acids: p-coumaric acid, caffeic acid;tannins: 11.9 % tannins, gallo- and ellagitannins;alkaloids: ß-carbolin-type and canthinone-alkaloids;quassinoids (Hegnauer, 2001)

Appendix II Chemical investigations on primary and secondary plant compounds 231
family, genus, species and plant part classificationbarkquassinoids (C-20 skeletons): quassiin, neoquassiin, ailanthone, amarolide,
acetylamarolide;quinones: 2,6-dimethoxy-p-benzoquinone (bacteriostat) (Hegnauer, 2001)
rootsquassinoids: ailanthone;alkaloids: 0.05 % 1-methyl-3-dimethylallyl-4-methoxyquinolone-2 (Hegnauer,
2001)
root barkquassinoids: shinjulactone-C (not bitter in taste); shinjulactone-A and -L;alkaloids: ß-carboline-type and canthinone-alkaloids;coumarins: scopoletin (Hegnauer, 2001)
woodalkaloids: canthinone-alkaloids (Hegnauer, 2001)
seedsquassinoids (C-20 skeletons): chaparrinone, ailanthone, ailantholide;quinones: 2,6-dimethoxy-p-benzoquinone (Hegnauer, 2001)
Ulmaceae (order: Urticales)Gallo- and ellagitannins are nearly absent (like in Moraceae). Low contents of
condensed tannins in leaves, barks and fruits. Barks, flower buds and fruits ofsome species are used as astringent.
General tendency of mineralisation in Urticales, but in Ulmaceae less silicates andmore calcium oxalates occur.
Flavonoids: quercetin and kaempferol glycosides abundant in leaves; flavonoid C-glycosides in leaves and barks show in part pharmacological effects on variousorganisms. Hydroxycinnamic acids occur in leaves.
Acidic plant mucilage occurs in the leaves and barks.Various lignans, 2,6-dimethoxybenzoquinone, different phenolic compoundsincluding aromatic sesquiterpenes were found in woods of different species(Hegnauer, 2001).
Ulmusmedicinal use: Ulmi cortex (from U. carpinifolia, U. glabra and U. rubra) is used
as mucilaginosum and antisepticum in Europe and USA (Frohne and Jensen,1992; Hegnauer, 2001).
leavesflavonoids: rutin; quercetin-3-glycosides abundant in Ulmus; myricetin and
kaempferol also occur as aglyca (Hegnauer, 2001);tannins: condensed tannins (procyanidin, prodelphinidin units) (Hegnauer, 2001)
barktannins: condensed tannins; (+)-catechin-5-ß-xylosid (Hegnauer, 2001);triterpenoids
woodvarious lignans and phenolic compounds (Hegnauer, 2001);sesquiterpenoids: aromatic sesquiterpene-alcohols (7-hydroxycalamenen; cadalin-
derivatives) and quinoid compounds (mansonones); in part these sesquiterpenesfunction as phytoalexins with fungistatic effects (Hegnauer, 2001);
sterols: ß-sitosterol, esterified compounds, cycloartenol and derivatives (Hegnauer,2001)
Ulmus alata Michx.leaves
flavonoids: myricetin-glycosides (e.g. myricitrin) (Hegnauer, 2001)refused
Vitaceae (order: Rhamnales)Condensed and hydrolysable tannins (ellagitannins) characterise the family (Frohne
and Jensen, 1992). Phenolic acids (p-coumaric-, ferula- and caffeic acid) andaldehydes are abundant in Vitis. Hydroxycinnamic acids are often esterified withquinic acid, saccharides or the sugar moiety of anthocyanins. Organic acids(tartaric, oxalic, malic, acetic acid) are abundant in leaves, stalks and fruits.

232 Appendix II Chemical investigations on primary and secondary plant compounds
family, genus, species and plant part classificationVitaceae are rich in ascorbic acid (in leaves, stalks and fruits). Free pentacyclic
triterpenoid acids (oleanolic acid) occur in cuticle waxes especially of fruits(grapes of Vitis vinifera) and only to a lesser extent in the cuticle of leaves andstalks (Hegnauer, 2001).
Vitis
leavestannins: condensed tannins (leucoanthocyanidin, catechin units), and hydrolysable
(ellagi-) tannins (Hegnauer, 2001);flavonoids: quercetin glycosides abundant (quercitrin, isoquercitrin, rutin,
quercetin-3-glucuronide), kaempferol (kaempferol-3-glucoside) and luteolinglycosides also occur, frequently myricetin-3-glucoside (the pattern of flavonoidsdepends on species) (Hegnauer, 2001);
hydroxycinnamic acids: caffeic acid, caffeoyl tartrate, mono-cinnamoyl tartrates,chlorogenic acid (Hegnauer, 2001);
stilbenes: derivatives based on resveratrol act as phytoalexins (viniferins) withfungitoxic effects (only synthesised by infection with fungi and exposure to UV-light) (Hegnauer, 2001)
young leavescyanogenic compounds: partly in large amounts depending on the age of leaves and
sort of Vitis vinifera (Hegnauer, 2001)
fruitsanthocyanins: cyanidin, paeonidin, delphinidin, petunidin, malvidin as aglyca
(Hegnauer, 2001);flavonoids: kaempferol, myricetin and quercetin as aglyca; their occurrence is
depending on sorts of fruits (Hegnauer, 2001);tannins: condensed tannins (catechin, epicatechin, epicatechingallat, gallocatechin
units and dimeric procyanidins) (Hegnauer, 2001)
rootstannins: condensed tannins (catechin units) (Hegnauer, 2001)
woodstilbenes: di- and oligomeric compounds, based on resveratrol
Vitis cinerea Engelm.leaves
flavonoids: vitexin, isovitexin, orientin, isoorientin, isoquercitrin;free amino acids: large amounts of hydroxyprolin (Hegnauer, 2001)
tasted inspring, eatenin autumn
fruitsanthocyanins (aglyca see above) exclusively as 3-monoglucosides (Hegnauer,
2001)
unripe fruitsfree amino acids: large amounts of hydroxyprolin (Hegnauer, 2001)
wood tastedin spring,eaten inautumn
Vitis rotundifolia Michx.leaves tasted in
spring, eatenin autumn
fruitsanthocyanins (aglyca see above) exclusively as 3,5-diglucosides (Hegnauer, 2001)
wood tasted inspring, eatenin autumn
remark: Condensed tannins indicated in Tab. II.2 are often proved to occur by testing for anthocyanidins: asthe interflavan carbon-carbon bond of proanthocyanidins is labile to acidic conditions especially when heated

Appendix II Chemical investigations on primary and secondary plant compounds 233
(acid catalysed decompensation), catechin units and anthocyanidins (coloured products) are yielded. (Bate-Smith, 1954; Bate-Smith and Lerner, 1954; Bate-Smith, 1962; Haslam, 1975; Bate-Smith, 1977; Bate-Smith,1978).
Under these reaction conditions flavonoids are hydrolysed yielding flavonoid aglyca. Hence it has to beemphasised that aglyca mentioned in Tab. II.2 did normally not occur genuinely in plant specimens. As mostreports on hydroxycinnamic acids are based on leaf analyses of Bate-Smith (1962), their occurrence ismentioned although they are normally esterified and not in free state (Ibrahim and Barron, 1989).
Most cited work is the chemotaxonomical review given by Hegnauer (2001). In case of leguminous species hislast three volumes are cited explicitly, in case of the other ten volumes, it was relinquished to cite all respectivevolumes.
OH
OH
OH
OO
OH
OH
CH3
O
OO
OH
OH
O
OH
CO
O
O
OH
OH
O
O
CH3
OO
OH
OH OHO
O
OH
OH
OH
O
OO
O
H3C
OH
O
O
OO
H3C
OH
OH
OH
qui
OH
qui'
21
28
HO
glc''
rha
glc'''
HO
ara(f)
HO
3
NH
C
CH3
O
fuc
xyl
acacic acid
glc: glucopyranose rha: rhamnopyranosefuc: fucopyranose ara (f): arabinofuranosexyl: xylopyranose qui: quinovopyranose
Fig. II.1: Julibroside III is depicted as representative saponin of Albiziae cortex.

234 Appendix II Chemical investigations on primary and secondary plant compounds
O
O
HH
OCH3
H3CO
OO
OH
HO
OH
OH
OCH3
OCH3
O O
OH
OH
OH
HO
1
23
4
7
8
91'
2'
3'4'
Fig. II.2: Syringaresinoldiglucoside (syn. (-)-syringaresinol-4,4’-bis-O-ß-D-glucopyranoside; (-)-syringaresinol-di-ß-D-glucoside), which occurs in Albiziaecortex and in Liriodendron tulipifera.

Appendix II Chemical investigations on primary and secondary plant compounds 235
II.3 Elucidation of compounds isolated from leaves of A. julibrissin
and R. copallina
Compounds, whose structure could be conclusively elucidated, are in alphabetical order. UV-data associated with analytical HPLC analyses, and results of different NMR-spectroscopic andmass-spectrometric experiments are presented, respectively. Compounds of fractions, for whichthe chemical structure could not be conclusively elucidated due to a lack of informative NMRdata are documented according to their numbering of fractions. For these fractions UV andmass data are presented. If possible, the chemical formula calculated from the mass datatogether with a description of the chemical constituents are given. Fractions eluted from thepolyamide column that were not further separated on the HPLC column are merely described bytheir UV data. The numbering of conclusively elucidated compounds and additional fractionsfollows their alphabetical and numerical order. (Some details given in this appendix arediscussed in chapter C.III).
1 p-Coumaric acid
Fractions A18, A22 Formula C9H8O3
IUPAC-Name 2-propenoic acid, 3-(4-hydroxyphenyl)- MW 164
INN-Names 4-hydroxycinnamic acid;trans-p-hydroxycinnamic acid;trans-(4-hydroxy)-cinnamic acid;p-coumaric acid
Cas. No. [501-98-4]
StructureCOOH
HO
12
3
45
6
7
8
Hydroxycinnamic acids often build conjugated forms and seldom occur in the free state(Ibrahim and Barron, 1989). Hence, the question arises, as to whether p-coumaric acid found byHPLC analysis is an artefact due to the extraction procedure, or whether it is genuinelyoccurring in the plant?
HPLCmean retention time UV-Data λ max / nm
24.4 min. 226 sh 300 309Ibrahim and Barron (1989) (MeOH/EtOH) sh 295 312
EI-MS (A18)m/z 164 (100 %) C9H8O3: [M]+ •
m/z 147 (36 %) C9H7O2: - OH•→ [M - OH]+
m/z 119 (24 %) C8H7O: [M - OH - CO]+
m/z 118 (16 %) C8H6O: - H•→ [M - OH - CO - H]+ •
m/z 91 (19 %) C7H7: [M - OH - CO - CO]+,benzyl cation ↔ tropylium ion
m/z 65 (13 %) C5H5: [M - OH- CO - CO - C2H2]+
Search in NIST MS database verified the identification as trans-(4-hydroxy)-cinnamic acid.

236 Appendix II Chemical investigations on primary and secondary plant compounds
Characteristic ions given by Bocchi et al. (1996) [m/z 164 (100 %), m/z 147 (41 %)and m/z 119 (26 %)] agree well with findings of this study.
ESI-MS (A18)negative mode:
m/z 163 (100 %) : [M - H]−
Only the negative mode was used yielding valuable information. As reference, see Gioacchiniet al. (1996).
ESI-MS (A22)positive mode:
m/z 371 (100 %)m/z 209 (67 %) : [Na salt + Na]+
MS/MS of mass 371m/z 371 (9 %)m/z 287 (100 %) : [371 - DMSO-d6]
+
negative mode:m/z 349 (83 %) : [2M - 2H + Na]−
m/z 163 (100 %) : [M - H]−
At least six other compounds were detected in the HPLC chromatogram in addition, althoughno definite structure or molecular weight could be assigned. However, HPLC, UV- and massspectra indicate p-coumaric acid to occur in fraction A22.1H-NMR-Parameters
δ [ppm] multiplicity J [Hz]
AssignmentNo. of
HA18
(DMSO-d6)Ibrahim and Barron, 1989
(MeOD; DMSO-d6)C2-H / C6-H 2 7.51 AA’XX’ N = 8.7 7.45-7.56, d 8.0-8.8C7-H 1 7.48 d 15.8 7.43-7.81, d 16C3-H / C5-H 2 6.78 AA’XX’ N = 8.7 6.79-6.84, d 8.0-8.8C8-H 1 6.28 d 15.8 6.15-6.64, d 16
Ibrahim and Barron (1989) have discussed the effect of Z,E- isomerism of cinnamic acids on1H-NMR-spectroscopy. All values given in the table above are valid for deutero-methanol andDMSO, the most common solvents. The E-cinnamoyl residue is detectable by a pair of doubletswith shift values of 6.15-6.64 ppm for C8-H and 7.43-7.81 ppm for C7-H, the correspondingcoupling constant is about 16 Hz, which agrees well with findings of this study. In the rarelyoccurring Z-isomeric form, the signals for C8-H and C7-H are moved upfield to 5.87-5.99 and6.84-6.95 ppm, respectively. The coupling constant is lowered to roughly 13 Hz. Therefore,proton spectroscopy is an appropriate method to distinguish between both isomeric forms.In addition, the p-hydroxyl substitution and the E-isomeric form in case of an o-hydroxylsubstitution, occurs normally in the Z-form, which results in a spontaneous cyclisation yetyields the chemical class of coumarins. The o-hydroxycinnamic acid is the precursor of theclass of coumarins.In this study, there was not sufficient substance isolated in order to perform a 13C-NMRmeasurement. Reference values for 13C-spectroscopy are given in Ternai and Markham (1976),and Ibrahim and Barron (1989).

Appendix II Chemical investigations on primary and secondary plant compounds 237
2 p- and m-Digallic acid methyl ester
Fractions R16 Formula C15H12O9
INN-Names p- and m-digallic acid methyl esterp- and m-methyl digallate
MW 336
Structure
COOCH3
HO
OH
O
O
OH
OH
OH
m-I
m-II
COOCH3
HO OH
O
HO
OH
OH
O
p-I
p-II
p-I; m-I: gallic acid methyl ester moiety of the corresponding para or metasubstituted compoundp-II; m-II: gallic acid moiety in para or meta position of the gallic acidmethyl ester moiety
HPLCmean retention time UV-Data λ max / nm
23.8 min. (p-isomer of methyl digallate) 214 sh 250 28026.3 min. (m-isomer of methyl digallate) 216 272
EI-MSm/z 184 (30 %) C8H7O5: [M]+ •, gallic acid methyl esterm/z 153 (100 %) C7H5O4: - OCH3
•→ [M - OCH3]+
m/z 125 (19 %) C6H5O3: [M - OCH3 - CO]+, pyrogallol cation
Both of the dimeric substances consist of a gallic acid and a gallic acid methyl ester moiety.Due to the high polarity of these compounds, thermolysis commenced under EI-MS conditions.Hence, the only detectable molecule radical cation and subsequent fragmentation productsoriginated from gallic acid methyl ester. In the gallic acid methyl ester itself (see there), m/z153 is the base peak. The molecule radical cation m/z 336 was not detectable in the EIspectrum. During the procedure of structure elucidation, the information gained by EI-MS wasnot conclusive. Therefore, the following mass spectrometric investigations were undertaken inaddition.
FAB-MSnegative mode:
m/z 335 (100 %) : [M - H]−
DCI-MSpositive mode:
m/z 354 (41 %) : [M + NH4]+
m/z 219 (19 %) : [gallic acid methyl ester moiety + NH4 • NH3]+
m/z 202 (100 %) : [gallic acid methyl ester moiety + NH4]+

238 Appendix II Chemical investigations on primary and secondary plant compounds
negative mode:m/z 336 (54 %) : [M]− •
m/z 152 (100 %) : [C7H4O4]− •, a chinoid keten
Under DCI-MS conditions in the positive mode, the molecule of interest is generally detectableas a so-called quasimolecular ion, i.e. the analyte molecule which is either attached to a reactantgas cation, or occasionally to a cluster ion of the reactant gas. On the contrary, in the negativemode, molecule radical anions may also occur. Polar compounds like the dimeric isomers of theR16, soon experience reactions of pyrolysis. The radical anion m/z 152 is such a product ofpyrolysis and even builds the base peak of that spectrum.1H-NMR-Parameters
No. of δ [ppm] multiplicity J [Hz]Signal Assignment H R16 (DMSO-d6)
A -OH 9.85 s, br.B -OH
10a
9.40 s, br.C m-I/ C2-H 1 7.34 d 2.1D m-I/ C6-H 1 7.17 d 2.1E m-II/ C2/6-H 2 7.10 sF p-II/ C2/6-H 2 7.09 sG p-I/ C2/6-H 2 7.04 sH p/ OCH3 3 3.81 sI m/ OCH3 3 3.78 s
aThe signals A and B are not completely resolved in the spectrum, representing a total of 10 hydroxyl groups.
13C-NMR-Parametersδ [ppm] multiplicity J [Hz]
Signal Assignment R16(DMSO-d6)
Nishizawa et al., 1982(acetone-d6)
a p-I/ COO 166.8 166.8b m-I/ COO 166.6 166.6c m-II/ COO 165.0 164.9d p-II/ COO 164.3 164.2e p-I/ C3/ C5 151.4 151.2f m-I/ C3 147.3 143.3a
g m-II/ C3/5 146.6 146.0h p-II/ C3/5 146.5 145.9i m-I/ C4 143.8 139.4j m-II/ C4 140.0 139.7k p-II/ C4 139.8 138.7b
l m-I/ C5 139.8 146.9m p-I/ C4 132.0 132.4n p-I/ C1 127.7 128.7o m-I/ C1 120.2 120.8c
p p-II/ C1 119.3 120.7d
q m-II/ C1 119.1 121.6r m-I/ C6 116.5 114.5s m-I/ C2 114.4 117.3t p-II/ C2/6 110.2 110.8d
u m-II/ C2/6 110.2 110.7

Appendix II Chemical investigations on primary and secondary plant compounds 239
δ [ppm] multiplicity J [Hz]Signal Assignment R16
(DMSO-d6)Nishizawa et al., 1982
(acetone-d6)v p-I/ C2/6 108.9 109.8w p-I/ -OCH3 52.1 52.4x m-I/ -OCH3 51.9 52.2
a-dRegarding the reference values given by Nishizawa et al. (1982), there are some discrepancies between hisdepicted spectra and the values of his experimental part. Please note the following demarcations:
anot assigned, only listed in the spectrum.
bThis shift is reported in his experimental part, whereas it is identified as 139.3 ppm in his depicted spectrum.
cThis signal is assigned to the m-isomer in the experimental part, but to the p-isomer in his depicted spectrum.
dThese signals are assigned to the p-isomer in the experimental part, but to the m-isomer in the depictedspectrum.
Judging from the signal intensities, assignments of this study are correct as given in the table.The DEPT experiment was performed to reassure the assignment.
HMBC
Tab. II.3: Heterocorrelation between the signals of the 1H and 13C spectrum.
COO C3/5 C4 C5 C4 C1 C2/6 CH3
a b c d e f g h i j k l m n o p q r s t u v w xC X X X X X XD X X X X X XE X X X X XF X X X X XG X X X X XH XI X
1H
13C

240 Appendix II Chemical investigations on primary and secondary plant compounds
O
O
O
O
O
O
OO
II
Ix
b
os
Cr
D
fi
l
cq
E
E
u
ug
gj
O
m-I
m-II
m-methyl digallate
O O
O
O
O
O
O
OO
HHH
w
an
v v
e em
d
pt t
h hk
GG
FF
p-methyl digallate
p-I
p-II
Fig. II.3: Characters (capitals indicate protons, small letters the carbon atoms) are used forassignments gained by two-dimensional experiments.
The HMBC-spectrum (Tab. II.3) yields the correlation of assignments as shown in Fig. II.3.Critical assignments are as follows:Signals C/D. Shift increments of -OH and -OCOPh predict a downfield signal for C2-H(Pretsch et al., 1990).Signals r/s. In HMBC, r does not correlate to D and s not to C. Hence, proton D must be boundto carbon r and proton C to carbon s.Signals f/l. In HMBC, f correlates stronger to C than to D, while for l holds the inverse. It isassumed that two-bond couplings in the phenyl-residue are stronger than four-bond couplings(Hansen and Jakobsen, 1975).Signals t/u. These signals were not resolved by the spectrometer in this study. Therefore, theassignment might be exchanged.Signals of the units m-II and p-II. The carbon shifts of these two units are similar in pairs. Theassignment within a given pair was made using the experimental spectrum of a syntheticmixture of methyl m- and p-digallate reported by Nishizawa et al. (1982). There, thecomponents could easily be identified by signal intensities. The proton signals were thencorrelated by HMBC in this study.
3 Ellagic acid
Fractions R21 Formula C14H6O8
INN-Names ellagic acid MW 302
Structure
OO
O O
OH
OH
HO
OH
1
2
3
4
5
6
7
1'
2'
3'
4'
5'
6'
7'

Appendix II Chemical investigations on primary and secondary plant compounds 241
HPLCmean retention time UV-Data λ max / nm
26.6 min. 253 sh 304 sh 352 367Khac et al., 1990 (EtOH) 254 365Nawwar et al., 1994 (MeOH) 255 362Hussein et al., 1997 (MeOH) 255 362
EI-MSm/z 302 (4%) C14H6O8: [M]+ •
Impurities:m/z 184 (61 %) C8H8O5: [gallic acid methyl ester]+ •
m/z 170 (6 %) C7H6O5: [gallic acid]+ •
m/z 153 (100 %) C7H5O4: - OH• → [gallic acid - OH]+
- OCH3•→ [gallic acid methyl ester - OCH3]
+
m/z 126 (48 %) C6H5O2: [gallic acid - CO2]+ •
m/z 108 (16 %) C6H4O2: [gallic acid - CO2- H2O]+ •
m/z 79 (16 %) C5H3O: [gallic acid - OH- CO - H2O - CO]+;[gallic acid methyl ester - OCH3- CO - H2O - CO]+
As a reference for EI-MS, see Khac et al. (1990): [M]+ •: m/z 302.Ellagic acid, an artefact of the hexahydroxydiphenic acid and is usually generated through theisolation procedure, is a highly symmetrical molecule. The only valuable clue to this compoundin the mass spectrum is m/z 302, the molecule radical cation. A spectrum taken from the library(NIST MS) corroborates that there is no special pattern of fragmentation of ellagic acid, and ifany fragmentation occurs, it is to a lesser extent. Hence, the base peak is normally the moleculeradical cation. Due to impurities in fraction R21, especially of gallic acid methyl ester, themolecule radical ion of ellagic acid just amounts to about 4 %.1H-NMR-Parameters
δ [ppm] multiplicity J [Hz]
AssignmentNo. of
HR21
(DMSO-d6)Khac et al., 1990
(DMSO-d6)Nawwar et al., 1994
(DMSO-d6)C5-H, C5’-H 2 7.42 s 7.50 s 7.5 s
Ellagic acid only gives one signal due to its highly symmetrical structure.
4 Gallic acid
Fractions A8, R3 Formula C7H6O5
IUPAC-Name benzoic acid, 3,4,5-trihydroxy- MW 170
INN-Names gallic acid Cas. No. [149-91-7]
Structure
HO
OH
OH
COOH1
2
34
5
6

242 Appendix II Chemical investigations on primary and secondary plant compounds
HPLCmean retention time UV-Data λ max / nm
11.9 min. 215 271Nawwar et al., 1994 (MeOH) 272Hussein et al., 1997 (MeOH) 272
EI-MSm/z 170 (100 %) C7H6O5: [M]+ •
m/z 153 (66 %) C7H5O4: - OH• → [M - OH]+
m/z 135 (7 %) C7H3O3: [M - OH- H2O]+
m/z 125 (17 %) C6H5O3: [M - OH- CO]+, pyrogallol cationm/z 107 (4 %) C6H3O2: [M - OH- CO - H2O]+
m/z 79 (9%) C5H3O: [M - OH- CO - H2O - CO]+
m/z 53 (20%) C3HO: [M - OH- CO - H2O - CO - C2H2]+
The relative abundance is given as a mean of both fractions (A8 and R3).Characteristic ions and their abundance given by Bocchi et al. (1996) are in accordance withthose detected in this study [m/z 170 (100 %); m/z 153 (81 %)].
ESI-MSnegative mode:
m/z 169 (73 %) : [M - H]−
m/z 125 (100%) : [M - OH- CO - H]−, [pyrogallol - H]−
As reference see Gioacchini et al. (1996).
NMR-Data
In the following, fraction R3 is documented as representative sample.1H-NMR-Parameters
δ [ppm] multiplicity J [Hz]
AssignmentNo. of
HR3
(DMSO-d6)Nawwar et al., 1982 and 1984a
(DMSO-d6)C3,4,5-OH 3 9.2 s, br.C2-H, C6-H 2 6.92 s 6.98 s
The three hydroxyl groups at C3, C4 and C5 yield a highly broad singlet, due to the acidity oftheir protons. It is reasonable to assume a fast proton exchange is taking place. When broadsignals occur, the corresponding integrals are sometimes smaller than expected.13C-NMR-Parameters
δ [ppm] multiplicity J [Hz]
AssignmentR3
(DMSO-d6)Nawwar et al., 1982 and 1994
(DMSO-d6)- COO 167.5 167.7C3/5 145.4 145.5C4 138.0 138.1C1 120.5 120.6
C2/6 108.7 108.8
DEPT experiment: A positive signal at 108.7 ppm verifies the position of both tertiary carbonatoms C2 and C6.

Appendix II Chemical investigations on primary and secondary plant compounds 243
5 Gallic acid methyl ester
Fractions R1, R6, R15, R20, R22, R23 Formula C8H8O5
IUPAC-Name Benzoic acid, 3,4,5-trihydroxy methyl ester MW 184
INN-Names gallic acid methyl estermethyl gallate
Cas. No. [99-24-1]
Structure
OH
OH
1
2
34
5
6
HO
CH3CO O
HPLCmean retention time UV-Data λ max / nm
18.2 min. 216 272Parmar et al., 1997 (MeOH) 218 272
EI-MSm/z 184 (63 %) C8H8O5: [M]+ •
m/z 153 (100 %) C7H5O4: - OCH3• → [M - OCH3]
+
m/z 125 (23 %) C6H5O3: [M - OCH3- CO]+, pyrogallol cationm/z 107 (4 %) C6H3O2: [M - OCH3- CO - H2O]+
m/z 79 (7 %) C5H3O: [M - OCH3- CO - H2O - CO]+
The relative abundance is given as a mean of all fractions.Depending on the temperature, the occurrence of the molecule radical cation in the massspectrum varies between 50 % and 100 % relative abundance. The [M - OCH3]
+ ion, m/z 153,forms the base peak, while m/z 125 yields a mean of 23 % relative abundance, m/z 107 a meanof 4 % and m/z 79 a mean of 7 %, respectively. This fragmentation pattern is also in accordancewith data from the NIST MS data base. Fragmentation resembles that of gallic acid.1H-NMR-Parameters
δ [ppm] multiplicity J [Hz]
AssignmentNo. of
Haverage of 6 fractions
(DMSO-d6)Parmar et al., 1997
(DMSO-d6)C3,4,5-OH 3 9.15 s, br. 8.93 s, br.C2-H, C6-H 2 7.00 s 7.00 s-OCH3 3 3.74 s 3.81 s
As for the gallic acid, the signal for the three hydroxyl groups is very broad because of theacidity of the corresponding protons. Integration of these signals involves the same difficultiesas mentioned for the gallic acid.The averaged values of all fractions containing gallic acid methyl ester (R1, R6, R15, R20, R22and R23) are represented as 1H-NMR-parameters.

244 Appendix II Chemical investigations on primary and secondary plant compounds
13C-NMR-Parametersδ [ppm] multiplicity J [Hz]
AssignmentR1
(DMSO-d6)Sakurai and Okuruma, 1983
(DMSO-d6)-COO 166.3 166.2C3/5 145.6 145.4C4 138.4 138.2C1 119.4 119.2C2/6 108.6 108.4-OCH3 51.6 51.5
DEPT: The signals for the C2/6 and the -OCH3 are visible.The 13C-NMR could only be performed with the R1, the isolated amount of all other fractionswas too small for this experiment.
6 p-Hydroxy-benzoic acid
Fractions A10 Formula C7H6O3
IUPAC-Name Benzoic acid, 4-hydroxy- MW 138
INN-Names p-hydroxy-benzoic acid
Structure
OH
COOH12
3
4
5
6
HPLCmean retention time UV-Data λ max / nm
18.6 min. 255Van Sumere, 1989 (MeOH) 252
The minimum value at 224 nm given by Van Sumere (1989) is the same as found in thespectrum gained in this study.
EI-MSm/z 138 (85 %) C7H6O3: [M]+ •
m/z 121 (100 %) C7H5O2: - OH•→ [M - OH]+
m/z 110 (19 %) C6H6O2: [M - CO]+ •
m/z 93 (41 %) C6H5O: [M - OH- CO]+
m/z 65 (32 %) C5H5: [M - OH- CO - CO]+, pentacyclodienyl cation
As expected for p-hydroxybenzoic acid, base peak is m/z 121, the [M - OH]+ ion. The moleculeradical cation m/z 138 occurs with 85 % relative abundance. The spectrum of an authenticsample was used as reference spectrum.Characteristic ions given by Bocchi et al. (1996) are in accordance with values found in thisstudy [m/z 138 (78 %); m/z 121 (100 %); m/z 93 (30 %)].

Appendix II Chemical investigations on primary and secondary plant compounds 245
1H-NMR-Parametersδ [ppm] multiplicity J [Hz]
AssignmentNo. of
HA10
(DMSO-d6)authentic sample
(DMSO-d6)- COOH 1 12.4 s, br.-OH 1 10.2 s, br.C2-H, C6-H 2 7.78 m, AA’XX’, N=8.7 7.82 m, AA’XX’, N=8.7C3-H, C5-H 2 6.82 m, AA’XX’, N=8.7 6.85 m, AA’XX’, N=8.7
Coupling constants were not explicitly calculated for the AA’XX’system. (N = J2,3 + J2,5 ).
7 Kaempferol
The main compound of the fractions A17 and A24 (A24-1) is kaempferol, which is purported tobe an artefact generated through the isolation process. This is corroborated by the finding thatkaempferol aglyca were detected in two different fractions with a large gap of time betweenthem. As a second compound in A24 (A24-2), a hydroxycinnamic acid derivative was found bymass spectrometry with a molecular weight of 340 Da. It is postulated to consist of a caffeicacid methyl ester (= 3,4-dihydroxycinnamic acid methyl ester) moiety and a p-coumaric acid (=p-hydroxycinnamic acid) moiety.
Fractions A17, A24 (A24-1) Formula C15H10O6
IUPAC MW 2864H-1-Benzopyran-4-one, 3,5,7-trihydroxy-2-(4-hydroxyphenyl)- Cas. No. [520-18-3]
INN-Names kaempferol3,4´,5,7-tetrahydroxyflavone
Structure
OOH
HO
OH
O2
34
5
6
7
89
10
1'
2'
3'
4'
5'
6'
1
OH
hydroxycinnamic acid derivative (A24-2) Formula C19H16O6
proposed structure caffeic acid methyl ester + p-coumaric acid moiety.
MW 340
HPLCmean retention time UV-Data λ max / nm
36.6 min. (kaempferol) sh 245 265 sh 292 sh 320 365Mabry et al., 1970 (MeOH) sh 253 266 sh 294 sh 322 367
The UV-spectrum and the retention time of the substance investigated was in accordance withdata gained from an authentic sample (kaempferol purchased from Fluka), which was submittedto the same analytical conditions.

246 Appendix II Chemical investigations on primary and secondary plant compounds
EI-MS (A17)m/z 286 (100 %)C15H10O6: [M]+ •, kaempferolm/z 258 (5 %) C14H10O5: [M - CO]+ •
m/z 229 (6 %) C13H9O4: [M - CO - CO - H]+
m/z 153 (6 %) C7H5O4: [A1 + H]+
m/z 121 (14 %) C7H5O2: [B2]+
m/z 69 (5 %)
The spectrum described, coincides with the spectrum of kaempferol given by the NISTdatabase.
ESI-MS (A17)negative mode:
m/z 571 (40 %) : [2 M - H]−, dimer of kaempferolm/z 285 (100 %) : [M - H]−, kaempferol
From UV-data and mass spectrometry it is concluded that the substance under investigation iskaempferol. It can be assumed that free kaempferol is more likely to be an artefact throughisolation procedure than to occur as such. This indicates two different natural compounds bothcontaining kaempferol as aglycone moiety.
EI-MS (A24-2)m/z 340 (78 %) : [M]+ •, hydroxycinnamic acid derivativem/z 177 (100 %)C10H9O3: [caffeic acid methyl ester moiety]+
m/z 164 (59 %) C9H8O3: [p-coumaric acid]+ •
m/z 161 (81 %)
According to ion traces fragment m/z 177 and fragment m/z 161 are generated from the sameoriginal molecule.
ESI-MS (A24-2)negative mode:
m/z 339 (100 %) : [M - H]−
MS/MS of mass 339:m/z 339 (14 %) : [M - H]−
m/z 163 (100 %) : [p-coumaric acid - H]−

Appendix II Chemical investigations on primary and secondary plant compounds 247
8 Kaempferol-3-O-αααα-L-rhamnopyranoside
Fractions A14, R12 Formula C21H20O10
MW 432INN-Names kaempferol-3-O-α-L-rhamnopyranoside,afzelin
Structure
OOH
HO
OH
O
O
OOH
OH
OH
2
34
5
6
7
89
10
1'
2'
3'
4'
5'
6'
1''
2''
3''4''
5''
6''
1
Appearance Pale yellowish powder (Fukunaga et al., 1988),or yellow needles (Tanaka et al., 1984).
HPLCmean retention time UV-Data λ max / nm
29.6 min. 263 sh 292 sh 315 342Fukunaga et al., 1988 (EtOH) 263 342Tanaka et al., 1984 (MeOH) 266 344
Mean values of both fractions are presented.The values found for afzelin measured with diode array during the analytical HPLC analysisagree well with the data of Fukunaga et al. (1988).
EI-MS (R12)m/z 286 (100 %)C15H10O6: [M]+ •, kaempferol (aglycone)m/z 258 (7 %) C14H10O5: [M - CO]+ •
m/z 229 (6 %) C13H9O4: [M - CO - CO - H]+
m/z 153 (9 %) C7H5O4: [A1 + H]+
m/z 121 (12 %) C7H5O2: [B2]+
m/z 69 (10 %)impurity:
m/z 302 (8 %) C15H10O7: [quercetin]+ •
ESI-MS (R12)positive mode:
m/z 455 (100 %) : [M + Na]+, kaempferol glycosidem/z 287 (32 %) : [aglycone + H]+, kaempferol
impurity:m/z 603 (24 %) : [M + Na]+

248 Appendix II Chemical investigations on primary and secondary plant compounds
negative mode:m/z 431 (82 %) : [M - H]− of kaempferol glycosidem/z 285 (22 %) : [aglycone - H]-
impurity:m/z 579 (9 %) : [M - H]−
m/z 301 (100 %) : [aglycone - H]−, quercetin
The molecular weight of the impurity is found to be 580 Da by complementary informationgained from the positive and negative ESI-spectrum.
EI-MS (A14)m/z 286 (100 %)C15H10O6: [M]+ •, kaempferol (aglycone)m/z 258 (6 %) C14H10O5: [M - CO]+ •
m/z 229 (5 %) C13H9O4: [M - CO - CO - H]+
m/z 153 (4 %) C7H5O4: [A1 + H]+
m/z 121 (9 %) C7H5O2: [B2]+
m/z 128 (10 %)impurity:
m/z 302 (3 %) C15H10O7: [quercetin]+ •
ESI-MS (A14)positive mode:
m/z 471 (25 %) : [M + K]+, kaempferol glycosidem/z 455 (100 %) : [M + Na]+, kaempferol glycosidem/z 287 (86 %) : [aglycone + H]+, kaempferol
negative mode:m/z 431 (100 %) : [M - H]−, kaempferol glycosidem/z 285 (24 %) : [aglycone - H]−, kaempferol
impurity:m/z 301 (76 %) : [quercetin - H]−
Fragment m/z 153, which is detectable in the EI-spectrum and is corresponding to fragment[A1 + H]+, does not only occur for kaempferol aglycone during the retro-Diels Alder reactionwith subsequent H radical transfer, but also for the impurity quercetin.Data found in the EI-MS spectrum corresponded well with those given by Tanaka et al. (1984).
NMR-Data
Fraction R12 was used as representative spectrum for both, the 1H and 13C experiments.

Appendix II Chemical investigations on primary and secondary plant compounds 249
1H-NMR-Parametersδ [ppm] multiplicity J [Hz]
AssignmentNo. of
HR12
(DMSO-d6)Fukunaga et al.,
1988a (DMSO-d6)Tanaka et al.,
1984b (DMSO-d6)C5-OH 1 12.62 sC2’-H / C6’-H 2 7.75 AA’XX’ N = 8.8 7.76 d 8.8 7.73 d 9C3’-H / C5’-H 2 6.91 AA’XX’ N = 8.8 6.92 d 8.8 6.93 d 9C8-H 1 6.41 d 2.1 6.42 d 2.0 6.46 d 2C6-H 1 6.21 d 2.1 6.22 d 2.0 6.24 d 2C1” -H 1 5.29 d 1.5 5.30 d 1.5 5.30 d 2C2” -H 1 4.25 - 4.00C3” -H 1 4.00 - 3.96C4” -H 1 3.66C5” -H 1 3.34 3.0-4.1, m (4 H)C6” -H3 3 0.79 d 5.8 0.80 d 5.8 0.82 d 4a
Except for the anomeric proton of the rhamnose moiety at C1”, no assignments were presented by Fukunagaet al. (1988).
bNo assignments were presented by Tanaka et al. (1984).
For proton shift values of the kaempferol aglycone and 3-O-α-L-rhamnosides as sugar moietysee Markham and Geiger (1994). Furthermore, quercitrin was used as example of this study tocompare shift values. For a discussion on 1H shift values in flavonol glycosides see chapterC.III. For measurements in acetone-d6 see Matthes et al. (1980).13C-NMR-Parameters
δ [ppm] multiplicity J [Hz]
AssignmentR12
(DMSO-d6)Fukunaga et al., 1988
(DMSO-d6)C4 177.6 177.6C7 164.1 164.2C5 161.2 161.2C4’ 159.9 159.9C2 157.1 157.1C9 156.4 156.4C3 134.1 134.2C2’/C6’ 130.5 130.5C1’ 120.4 120.5C3’/ C5’ 115.3 115.3C10 104.0 104.1C1” 101.7 101.7C6 98.6 98.7C8 93.6 93.7C4” 71.0 71.1C5” 70.5 70.0a
C3” 70.2 70.5a
C2” 70.0 70.3a
C6” 17.3 17.4a
Assignments bearing the same superscript may be reversed (Fukunaga et al., 1988).

250 Appendix II Chemical investigations on primary and secondary plant compounds
For synthesis of afzelin see Vermes et al. (1976).For acetone-d6 as solvent see Matthes et al. (1980).DEPT: Positions of the tertiary carbon atoms were verified by the DEPT experiment.
9 Kaempferol-3-O-αααα-L-rhamnopyranosyl(1→→→→2)ß-D-galactopyranoside
Fractions A4 Formula C27H30O15
INN-Names kaempferol-3-O-α-L-rhamnopyranosyl(1→2)ß-D-galactopyranoside
MW 594
Structure
HO
O
O
OH
O
O
OH
OH
O
O
OH
OH
OH
OH
1
2
3
456
7
89
10
1'
3'4'
5'
6'
2'
1''2''
3''4''
5''
1'''2'''
3'''
4'''
5'''
6'''OH
6''
Appearance Pale yellow needles (Yasukawa and Takido, 1987).
HPLCmean retention time UV-Data λ max / nm
25.2 min. 265 sh 293 sh 318 (weak) 348Yasukawa and Takido, 1987 (EtOH) 262 sh 300 350
EI-MSm/z 286 (100 %)C15H10O6: [M]+ •, kaempferol (aglycone)m/z 258 (7 %) C14H10O5: [M - CO]+ •
m/z 229 (6 %) C13H9O4: [M - CO - CO - H]+
m/z 153 (4 %) C7H5O4: [A1 + H]+
m/z 121 (12 %) C7H5O2: [B2]+
m/z 213 (4 %)m/z 129 (7 %)m/z 85 (11 %)
ESI-MSpositive mode:
m/z 633 (6 %) : [M + K]+, kaempferol glycosidem/z 617 (100 %) : [M + Na]+, kaempferol glycosidem/z 287 (17 %) : [aglycone + H]+, kaempferol
negative mode:m/z 593 (100 %) : [M - H]−, kaempferol glycoside

Appendix II Chemical investigations on primary and secondary plant compounds 251
1H-NMR-Parametersδ [ppm] multiplicity J [Hz]
AssignmentNo. of
HA4
(DMSO-d6)Yasukawa and Takido, 1987
(DMSO-d6)C5-OH 1 12.67 s 12.55C2’-H / C6’-H 2 8.07 AA’XX’ N = 8.9 8.07 d 8.3C3’-H / C5’-H 2 6.85 AA’XX’ N = 8.9 6.85 d 8.3C8-H 1 6.42 d 2.0 6.39 d 1.9C6-H 1 6.19 d 2.0 6.17 d 1.9C1”-H (gal) 1 5.64 d 7.7 5.65 d 7.3C1”’-H (rha) 1 5.05 ca. d 2a 5.04 sC6”’-H3 3 0.73 d 6.2 0.73 d 5.4a
signals were not completely resolved13C-NMR-Parameters (100 MHz)
δ [ppm] multiplicity J [Hz]
AssignmentA4
(DMSO-d6)Yasukawa and Takido, 1987
(DMSO-d6)C4 177.3 177.5C7 164.1 164.8C5 161.1C4’ 159.8 159.8C2 156.2 156.5C9 155.9 156.0C3 132.6 132.9C2’ / C6’ 130.7 130.6C1’ 120.8 121.2C3’ / C5’ 115.0 115.1C10 103.8 104.0C1” (gal) 98.6 99.1C6 98.6 98.9C8 93.5 93.7C4” 68.1 68.2C5” 75.5 75.9C3” 73.9 74.1C2” 75.0 75.6C6” 60.1 60.4C1”’ (rha) 100.5 100.7C2”’ 70.6 70.9C3”’ 70.5 70.8C4”’ 71.8 72.3C5”’ 68.4 68.7C6”’ 17.1 17.2
C1” describes the anomeric proton of the galactose, C1”’ that of the rhamnose moiety.For 1H and 13C shift values of flavonol glycosides of the kaempferol-rhamnopyranosyl-galactopyranoside type with additional sugar residues see Hasan et al. (1996).

252 Appendix II Chemical investigations on primary and secondary plant compounds
10 Luteolin-7-O-ß-D-glucopyranoside
Formula C21H20O11Fractions R10, R11 (The main component of fractionR11 is quercitrin.) MW 448
INN-Names luteolin-7-O-ß-D-glucopyranoside Cas. No. [5373-11-5]
Structure
OOH
O
OH
OH
O2
34
5
6
7
89
10
1'
2'
3'
4'
5'
6'
1
O
OH
OH
OH
OH
1''
2''
3''4''
5''6''
TLC yellow colour with diphenylboric acid aminoethyl ester spray (Pieroni et al.,1996)
Appearance yellow micro-needles, mp 240-245°C (Yoshizaki et al., 1987); yellow-orange powder (Pieroni et al., 1996)
HPLCmean retention time UV-Data λ max / nm
25.8 min. 254 sh 267 348Nawwar et al., 1989 (MeOH) 255 267 346Mabry et al., 1970 (MeOH) 255 sh 267 348Kaneta et al., 1980 (MeOH) 255 sh 267 348Pieroni et al., 1996 (MeOH) 255 sh 265 349Impurities:
25.4 min. (R10) sh 254 261 sh 297 34927.5 min. (R11) [quercitrin, main compound of R11]
255 sh 265 sh 301 349
27.7 min. (R11)[(presumably an apigenin derivative, seealso Mabry et al. (1970)]
266 338
EI-MS (R10)m/z 286 (100 %)C15H10O6: [M]+ •, luteolin (aglycone)m/z 258 (11 %) C14H10O5: [M - CO]+ •
m/z 153 (28 %) C7H5O4: [A1 + H]+
m/z 138 (7 %)m/z 134 (8 %) : [B1]
+ • of kaempferolm/z 121 (14 %) : [B2]
+ of kaempferol and / or apigeninm/z 107 (12 %)m/z 73 (16 %)m/z 60 (21 %)
Impurities in fraction R10 are the following aglyca:m/z 318 (6 %) : [M]+ •, myricetinm/z 302 (1 %) : [M]+ •, quercetinm/z 270 (9 %) : [M]+ •, apigenin

Appendix II Chemical investigations on primary and secondary plant compounds 253
ESI-MSpositive mode:
m/z 449 (51 %) : [M + H]+, luteolin-7-glucosidem/z 471 (34 %) : [M + Na]+
m/z 287 (85 %) : [luteolin + H]+, aglyconeimpurity:
m/z 593 (100%) : [M + Na]+
negative mode:m/z 447 (100 %) : [M - H]−, luteolin-7-glucosidem/z 285 (6 %) : [luteolin - H]−, aglycone
impurity:m/z 569 (19 %) : [M - H]−
Ref.: EI-MS; Kaneta et al. (1980)From complementary information of both the positive and negative ESI-mode, it is presumedthat the unknown substance (impurity) has a molecular weight of 570.
EI-MS (R11)m/z 286 (27 %) C15H10O6: [M]+ •, luteolin (aglycone)
Impurities:m/z 302 (100 %), main compound of this fractionm/z 270 (48 %) C15H10O5: [apigenin]+ •, presumablym/z 242 (6 %) C14H10O4: [apigenin - CO]+ •, presumablym/z 184 (11 %) C8H8O5: [gallic acid methyl ester]+ •
m/z 153 (34 %) C7H5O4: [gallic acid methyl ester - OCH3]+
m/z 107 (14 %) C6H3O2: [gallic acid methyl ester - OCH3- CO - H2O]+
The main compound of fraction R11 is quercitrin according to the UV and NMR spectra. Thecorresponding aglycone quercetin builds the base peak of the mass spectrum. It is reasonable toassume that the molecule radical cation m/z 270 is caused by apigenin which is corroborated bythe corresponding UV spectrum. Apart from the two flavones and the single flavonol in themass spectrum of fraction R11, the occurrence of gallic acid methyl ester can be assumed,especially due to its typical fragmentation pattern. Although fragment m/z 153 could also beinterpreted as [A1+ H]+ fragment resulting from flavone / flavonol cleavage and subsequent H•
transfer, it is more likely to originate from gallic acid methyl ester fragmentation, the more asother characteristic fragments of flavones/ flavonols are lacking (see Mabry and Markham,1975; and Fig. C.7, p. 102).
ESI-MS (R11)positive mode:
m/z 471 (100 %) : [M + Na]+
m/z 487 (41 %) : [M + K]+
m/z 303 (54 %) : [quercetin + H]+
As the molecular weight of quercitrin (quercetin-3-O-α-L-rhamnopyranoside) and of luteolin-7-O-ß-D-glucopyranoside is the same, both molecule cations [M + Na]+ and [M + K]+ mayoriginate from either compound. However, the aglycone detected refers to quercetin.
negative mode:m/z 447 (100 %) : [M - H]−
m/z 431 (4 %) : [apigenin - glucoside - H]−, presumablym/z 301 (13 %) : [quercetin - H]−
Again, the molecule ion [M] may derive from quercitrin or luteolin-7-O-glucoside.

254 Appendix II Chemical investigations on primary and secondary plant compounds
References:Nawwar et al. (1989); FAB-MS, positive mode of luteolin-7-O-ß-D-glucopyranoside:
m/z 449 : [M + H]+
Pieroni et al. (1996); FAB-MS, positive mode:m/z 449 : [M + H]+
m/z 287 : [M + H - glucose]+
1H-NMR-Parametersδ [ppm] multiplicity J [Hz]
Assignment No.
of
H
R10(DMSO-d6)
Markhamand Geiger,
1994(DMSO-d6)
Nawwaret al.,1989
(DMSO-d6)
Pieroniet al.,1996
(DMSO-d6)
C5-OH 1 12.99 s 12.95 br.C6’-H 1 7.45 dd 8.4,
2.47.45 dd 8.1,2.1
7.41 dd 9.1, 2.0
C2’-H 1 7.42 d 2.4 7.43 d 2.1 7.45 dd 8, 2.5(C2’-H / C6’-H)
7.40 d 1.9
C5’-H 1 6.91 d 8.4 6.92 d 8.2 6.94 d 8 6.90 dd 8.1, 1.8C8-H 1 6.80 d 2.2 6.79 d 2.1 6.81 d 2.5 6.54 d 2.1C3-H 1 6.75 s 6.75 s 6.88 s 6.64 sC6-H 1 6.45 d 2.2 6.45 d 2.1 6.44 d 2.5 6.49 d 2.4C1”-H 1 5.08 d 7.3 5.10 d 7.5 5.08 d 7.6sugarprotons
3.1-3.6(6 sugarprotons)
3.30-3.80 m(6 sugar protons)
3.22-3.60 m,(C2”-H to C5”-H)
3.61 br.d 9.2 (C6”-H2)
Shift values found for the substance in fraction R10 agree well with the data given by Markhamand Geiger (1994). Coupling constants given for C2’-H and C6’-H by Nawwar et al. (1989) andC5’-H by Pieroni et al. (1996) are obviously not correct. As shown for quercetin (No.13) andquercitrin (No.15) the proton at C6’ of the B-ring couples with protons at C2’and C5’, while thelatter two protons only couple with one proton, respectively.13C-NMR-Parameters (100 MHz)
δ [ppm] multiplicity J [Hz]
AssignmentR10
(DMSO-d6)
Markham et
al., 1978(DMSO-d6)
Nawwar et al.,1989
(DMSO-d6)
Pieroni et al.,1996
(DMSO-d6)C4 181.7 181.6 181.8 183.7C2 164.3 164.5 164.5 166.7C7 163.0 162.9 163.1 164.6C5 161.0 161.1 161.1 162.7C9 156.8 156.9 157.0 158.7C4’ 149.8 149.7 149.8 151.5C3’ 145.7 145.7 145.8 147.0C1’ 121.3 121.6 121.7 123.0C6’ 119.0 119.0 119.3 120.4C5’ 115.9 116.1 116.2 116.9

Appendix II Chemical investigations on primary and secondary plant compounds 255
δ [ppm] multiplicity J [Hz]
AssignmentR10
(DMSO-d6)
Markham et
al., 1978(DMSO-d6)
Nawwar et al.,1989
(DMSO-d6)
Pieroni et al.,1996
(DMSO-d6)C2’ 113.5 113.7 113.9 114.0C10 105.2 105.5 105.6 107.0C3 103.0 103.2 103.5 103.3C1” 99.8 100.4 100.3 101.5a
C6 99.4 99.7 99.8 101.0a
C8 94.6 94.9 95.0 96.3C5” 77.1 77.3a 77.5 78.4b
C3” 76.3 76.6a 76.6 77.8b
C2” 73.0 73.3 73.3 74.3C4” 69.4 70.0 70.0 70.8C6” 60.5 61.0 61.0 62.4a, b
Assignments bearing the same superscript in any one spectrum may be reversed.
Shift values of fraction R10 of the 13C-NMR spectrum agree perfectly with data found in theliterature. Hence it is concluded, that substance of R10 is luteolin-7-O-ß-D-glucopyranoside.A DEPT experiment was performed which corroborates the assignments depicted in the table.
11 Maesopsin-4-O-ß-D-glucopyranoside
Fractions R2, (R8) Formula C21H22O11
IUPAC-Name 2,4,6-Trihydroxy-2-[(4´-hydroxyphenyl)methyl]-3(2H)-benzofuranone-4-yl-ß-D-glucopyranoside
MW 450
INN-Names maesopsin-4-O-ß-D-glucopyranoside
StructureOH
O
O
O
1
2
34
5
67
8
9 CH2
OH
OH7'
1'
6' 5'
4'
2' 3'
O
OH OH
OH
OH1"
2"
3"4"
5"
TLC spot appearance (TLC, anisaldehyde / H2SO4): bright red-orangehRf in TLC-system 3: 42-49
Characteristically, for maesopsin-glucoside: there was nearly no precipitation with lead acetate.Maesopsin-glucoside is a highly hydrophilic compound.
Maesopsin glucoside belongs to the group of aurones, in sensu stricto to the auronols, bothforming a minor group of flavonoids. Numbering was followed as given by Mabry et al. (1970)and Bohm (1994).

256 Appendix II Chemical investigations on primary and secondary plant compounds
HPLCmean retention time UV-Data λ max / nm
20.7 min. (R2) sh 222 292 sh 34521.9 min. (R8) sh 223 291 sh 343Yoshikawa K. et al., 1998b; (methanol) 210 228 280
Fraction R2 and R8 show nearly the same UV spectra, but different retention times.Furthermore, as will be shown by mass spectrometry, fraction R8 has the same molecularweight and fragmentation pattern as compound of fraction R2. However, as there was too lowsubstance of R8 to get a useful 1H-NMR spectrum, it cannot be unambigously concluded at thispoint whether R8 is the same substance as R2 or an isomer, e.g. concerning the linkage of theglycoside (at C4 or C6) and its sugar moiety.
EI-MS (R2, very pure fraction)m/z 288 (5 %) C15H12O6: [M]+ •, maesopsin (aglycone)m/z 270 (14 %) C15H10O5: [M - H2O]+ •
m/z 242 (3 %) C14H10O4: [M - H2O - CO]+ •
m/z 181 (13 %) C8H5O5: [M - 4-hydroxybenzyl]+, i.e. [288-107]+
m/z 153 (24 %) C7H5O4: [A1 + H]+
m/z 107 (100 %) C7H7O: 4-hydroxybenzyl cationm/z 73 (10 %)m/z 60 (16 %)m/z 51 (21 %)
In accordance with Mabry and Markham (1975) the class of aurones showed a similarfragmentation pattern as did the flavones and flavonols (Fig. C.7, p. 102) under electron impactconditions. In accordance with an EI-MS spectrum on maesopsin aglycone (Li et al., 1997),base peak of this spectrum is constituted by m/z 107, the p-hydroxybenzoyl moiety.Again, the retro-Diels-Alder reaction is apparently a characteristic and predominantly occurringfragmentation pathway for this type of flavonoid.
To verify the atomic composition of the aglycone in this study, a high resolution measurementwas performed.High resolution mass spectrometry gave a precise molecular weight of 288.06292 amu whichwas found to correspond to a molecular composition of C15H12O6, with 288.06339 amucalculated as theoretical mass. Hence, the ratio of observed to calculated mass amounts to1.6 ppm.The molecular weight of the corresponding auronol glycoside was evidenced by complementaryinformation of the positive and negative ESI mode.

Appendix II Chemical investigations on primary and secondary plant compounds 257
ESI-MS (R2)positive mode:
m/z 489 (5 %) : [M + K]+
m/z 473 (100 %) : [M + Na]+
MS/MS of mass 473m/z 473 (31 %) : [M + Na]+
m/z 455 (18 %) : [M - H2O + Na]+
m/z 437 (5 %) : [M -2 H2O + Na]+
m/z 418 (2 %) : [M -3 H2O + Na]+
m/z 311 (100 %) : [aglycone + Na]+
MS3 of mass 311m/z 311 (9 %) : [aglycone + Na]+
m/z 293 (58 %) : [aglycone - H2O + Na]+
m/z 283 (43 %) : [aglycone - CO + Na]+
m/z 175 (100 %) : [A1 + Na]+
negative mode:m/z 449 (100 %) : [M - H]−
MS/MS of mass 449m/z 449 (14 %) : [M - H]−
m/z 431 (9 %) : [M - H2O - H]−
m/z 287 (100 %) : [aglycone - H]−
m/z 269 (20 %) : [aglycone - H2O - H]−
m/z 259 (11 %) : [aglycone - CO - H]−
MS3 of mass 287m/z 287 (12.5 %) : [aglycone - H]−
m/z 259 (100 %) : [aglycone - H - CO]−
ESI-MS (R8)positive mode:
m/z 473 (7 %) : [M + Na]+
m/z 289 (32 %) : [maesopsin + H]+, aglyconem/z 191 (100 %) : unknown compound (like in fraction R7)
negative mode:m/z 449 (12 %) : [M - H]−
m/z 287 (100 %) : [maesopsin - H]−, aglycone
The molecular weight of the auronol glycoside maesopsin-glucoside is conclusively determinedas 450 Da.
NMR-Data
Maesopsin-4-glucoside exists as two diastereoisomers which is due to the attachment of aglucosyl moiety to the aglycone, which itself appears as pair of enantioisomers because of thehemiketal at C2, the chiral centre of the maesopsin aglycone. Therefore, a double set of signalswas obtained in the 1H- and 13C-NMR spectra. As far as signals have been resolved, both setsof data are depicted in the respective tables of the 1H-NMR and 13C-NMR experiment.Assignments in the 1H spectrum are based on 1H and H,H-COSY experiments.The 13C NMR spectra were first measured in D2O and afterwards in DMSO-d6. In D2O shiftvalues were referenced to methanol (delta (H) = 3.247 ppm and delta (C) = 49.384 ppm).

258 Appendix II Chemical investigations on primary and secondary plant compounds
1H-NMR-Parametersδ [ppm] multiplicity J [Hz]
R2(DMSO-d6)
Assignment No.
of
HDiast. (58%) Diast. (42%)
Yoshikawaet al., 1998b(DMSO-d6)
Yoshikawa et al., 1998b(pyridine-d5)
-OH C6-OH9.25 (1H) s, br.
9.4 v.br.7.77 br.5.75 br.5.22 br.
C4’-OH7.61 (0.4 H) s, br.and7.63 (0.6 H) s, br.
C2’-H/ 2 6.914 6.919 6.93 (2H) d 8.5 7.54 d 8.5 and 7.55 d 8.5C6’-H AA’XX’, N = 8.5C3’-H/ 2 6.543 6.536 6.55 (2H) d 8.5 7.02 d 8.5 and 7.08 d 8.5C5’-H AA’XX’, N = 8.5C5-H 1 5.97 d 1.6a 5.99 d 1.6b 5.98 (0.6 H)
6.02 (0.4 H), eachd 1.5
6.59 d 1.5 and6.67 d 1.5
C7-H 1 5.94 d 1.6a 5.92 d 1.6b 5.92 d 1.5 6.41 d 1.5 and 6.47 d 1.5C1”-H 1 4.85 m 4.91 m 4.88 (0.6 H)
d 8.8 and4.95 (0.4 H) d 8.0
5.50 d 8.0 and 5.60 d 8.0
C6”-H2 (a)(b)
2 3.64 dd 11.8, 6.33.48 dd 11.8, 5.0
4.36 dd 11.0, 2.5;4.27 dd 11.0, 5.5 and4.36 dd 11.0, 2.5;4.27 dd 11.0, 5.5
C2”-H 1 4.35 dd 8.0, 8.0 and4.35 dd 8.0, 8.0
C3”-H 1 4.29 dd 8.0, 8.0 and4.30 dd 8.0, 8.0
C5”-H 1
3.34-3.26 m
4.58 (0.6 H) m4.67 (0.4 H) m
3.92 m and 3.92 m
C4”-H 1 3.21 m 4.22 dd 8.0, 8.0 and4.28 dd 8.0, 8.0
C7’-H (a)(CH2) (b)
2 2.987 d 13.902.921 d 13.90
2.960 d 13.952.903 d 13.95
2.89 and2.96, each 1H andd 14.0
3.69 s (2H) and3.62 d 14.0;3.52 d 14.0
a, b Assignments bearing the same character may be reversed.
C2, C3, C4, C6, C8, C9, C1’ and C4’ are quaternary carbons and hence bearing no protons.13C-NMR-Parameters
δ [ppm] multiplicity J [Hz]Assignment R2 (D2O) R2 (DMSO-d6) Yoshikawa et al., 1998b (pyridine-d5)
C3 196.3 and 196.4 192.5 and 192.9 195.50 and 195.54C8 172.9 and 173.0 172.1 173.79 and 173.70C6 170.1 and 170.2 168.6 170.95 and 170.89C4 156.8 and 156.9 156.9 158.51 and 158.43C4’ 154.9 and 155.0 156.1 157.90 and 157.89

Appendix II Chemical investigations on primary and secondary plant compounds 259
δ [ppm] multiplicity J [Hz]Assignment R2 (D2O) R2 (DMSO-d6) Yoshikawa et al., 1998b (pyridine-d5)
C2’, C6’ 132.16 and 132.17 131.2 132.70 and 132.70C1’ 125.01 and 125.02 124.3 125.65 and 125.57C3’, C5’ 115.39 and 115.41 114.5 115.95 and 115.87C2 106.7 and 106.8 105.6 107.52 and 107.47C9 102.45 and 102.54 101.9 and 102.2 103.25 and 103.25C1” 99.7 and 99.9 99.1 and 99.3 102.05 and 101.72C5 96.8 and 97.0 95.2 and 95.7 97.13 and 97.35C7 93.3 and 93.4 91.4 and 91.6 93.21 and 93.28C5” 76.62 and 76.64 77.0 79.15 and 79.02C3” 75.6 and 75.7 76.5 78.24 and 78.34C2” 72.61 and 72.61 72.8 74.26 and 74.39C4” 69.66 and 69.70 69.1 70.99 and 70.94C6” 60.88 and 60.93 60.2 62.22 and 62.22C7’ 40.7 40.4 41.90 and 42.08
To elucidate the structure of the auronol glycoside, in particular to identify unambigously theposition bearing the glucosyl moiety (i.e. the attachment of the sugar moiety to the C4 or C6hydroxyl of the aglycone), various two-dimensional experiments were performed: DQF-COSY,HSQC, HSQC-TOCSY and HMBC. The majority of information was revealed in the HMBCexperiment, and showed a 4JCH coupling between the quaternary carbon atom C9 and theanomeric proton C1”-H of the glucose as depicted in Fig. II.4.
Fig. II.4: HMBC-spectrum.
C9
C1”- H4JCH

260 Appendix II Chemical investigations on primary and secondary plant compounds
12 Protocatechuic acid
Fractions A9, R4, R5 Formula C7H6O4
IUPAC-Name benzoic acid, 4,3-dihydroxy- MW 154
INN-Names protocatechuic acid Cas. No. [99-50-3]
Structure
OH
OH
COOH
1
2
34
5
6
HPLCUV-Data / nm
mean retention time λmax λmin λmax λmin λmax
14.9 min. 217 235 259 279 294Van Sumere, 1989 (MeOH) 235 258 278 292Impurities:15.6 min. (R4) 215 27416.2 min. (R4) 216 275
EI-MS (average of R4 and R5)m/z 154 (100 %) C7H6O4: [M]+ •
m/z 137 (73 %) C7H5O3: - OH• [M - OH]+
m/z 109 (20 %) C6H5O2: [M - OH- CO]+, brenzcatechin cationm/z 81 (8 %) C5H5O: [M - OH- CO - CO]+
m/z 53 (16 %) C4H5: [M - OH- CO - CO - CO]+
EI-MS (A9)m/z 154 (84 %) C7H6O4: [M]+ •
m/z 137 (100 %) C7H5O3: - OH• [M - OH]+
m/z 109 (46 %) C6H5O2: [M - OH- CO]+, brenzcatechin cationm/z 81 (53 %) C5H5O: [M - OH- CO - CO]+
m/z 63 (54 %) C5H3: [M - OH- CO - CO - H2O]+
m/z 55 (35 %) C3H3O: [M - OH- CO - CO - C2H2]+
m/z 53 (26 %) C4H5: [M - OH- CO - CO - CO]+
While fractions R4 and R5 showed the same fragmentation pattern (the average relativeabundance of both fractions is given, respectively), fraction A9 showed three differentfragments originating from m/z 81. In the latter case, base peak is m/z 137 instead of themolecule radical cation, m/z 154.Characteristic ions given by Bocchi et al. (1996) for the EI experiment are largely in accordancewith those detected in this study [m/z 154 (96 %); m/z 137 (100 %); m/z 109 (29 %)].However, m/z 136 (6 %) for [M - H2O]+ • could not be confirmed by the spectra of fractionsstudied here.

Appendix II Chemical investigations on primary and secondary plant compounds 261
ESI-MS (A9)
negative mode:m/z 153 (66 %) : [M - H]−
m/z 109 (100 %) : [brenzcatechin - H]−
impurity:m/z 169 (24 %) : [gallic acid - H]−
1H-NMR-Parametersδ [ppm] multiplicity J [Hz]
AssignmentNo. of
HA9, R4, R5(DMSO-d6)
Draths andFrost, 1991
(D2O)Scott, 1970(acetone-d6)
C2-H 1 7.33 d 2.0 7.52 d 1.0 7.58 d 2.0C6-H 1 7.28 dd 8.3, 2.0 7.55 dda 7.1 7.52 dd 8.3,
2.0C5-H 1 6.77 d 8.2 6.97 ddb 7.1 6.94 d 8.3a
The second coupling constant is not given in that reference.b
Obvious error in the reference regarding the multiplicity.
Values given for the 1H-NMR-spectrum are mean values of all three fractions.There was insufficient protocatechuic acid isolated to perform a 13C-NMR experiment (for a13C-NMR see Scott (1972, in acetone-d6).
13 Quercetin
Fractions A15, A16, A23, R18 Formula C15H10O7
IUPAC-Name 2-(3,4-Dihydroxyphenyl)-3,5,7-trihydroxy-4H-1-benzopyran-4-one
MW 302
INN-Names quercetin Cas. No. [117-39-5]
Structure
OOH
HO
OH
OH
O2
34
5
6
7
89
10
1'
2'
3'
4'
5'
6'
1
OH
Quercetin is the main component of fraction A15, with a side-compound is afzelin.It can be presumed that quercetin is an artefact generated through analytical procedures, as nofree aglyca could be found by other methods (see chapter C.III.3.1).

262 Appendix II Chemical investigations on primary and secondary plant compounds
HPLCmean retention time UV-Data λ max / nm
32.5 min. 255 sh 269 sh 297 370Mabry et al., 1970 (MeOH) 255 sh 269 sh 301 370impurity:
29.4 min. (A15, afzelin, like A14) 263 sh 292 sh 315 343
UV-data given are average values of all three fractions.
Mass spectrometry
In the following, fractions A15 and A16 are documented as representative fractions.
EI-MS (data averaged on A15 and A16)m/z 302 (100 %)C15H10O7: [M]+ •, quercetinm/z 274 (4 %) C14H10O6: [M - CO]+ •
m/z 273 (4 %) C14H9O6: [M - CO - H]+
m/z 257 (2 %)m/z 245 (4 %) C13H9O5: [M - CO - CO - H]+
m/z 229 (4 %)m/z 153 (5 %) C7H5O4: [A1 + H]+
m/z 142 (4 %)m/z 137 (6 %) C7H5O3: [B2]
+
m/z 128 (6 %)m/z 109 (3 %) C6H5O2: [B2 - CO]+
m/z 69 (6 %)impurity of A15 and A16:
m/z 286 (6 %) C15H10O6: [kaempferol]+ •
ESI-MSpositive mode (A16):
m/z 303 (80 %) : [M + H]+
impurity:m/z 471 (24 %) : [afzelin + K]+, kaempferol glycosidem/z 455 (100 %) : [afzelin + Na]+, kaempferol glycoside
positive mode (A15 and A23):m/z 303 (100 %) : [M + H]+
impurity of A15:m/z 455 (20 %) : [afzelin + Na]+, kaempferol glycosidem/z 287 (27 %) : [kaempferol + H]+, aglycone
negative mode (all three fractions):m/z 301 (100 %) : [M - H]−
NMR-Data
Fraction A16 was used as a representative spectrum to document the 1H experiment, while the13C experiment could only be performed with an authentic sample (quercetin purchased fromMerck) as not enough substance was isolated. Commercial quercetin was also used to verify the1H-NMR spectrum and to perform two-dimensional spectra.1H-NMR-ParametersThe authentic sample was measured at 360 MHz.

Appendix II Chemical investigations on primary and secondary plant compounds 263
δ [ppm] multiplicity J [Hz]S
igna
l
Assign-ment N
o. o
f H
A16(DMSO-d6)
authenticsample
(quercetin,Merck;
DMSO-d6)
Barberáet al.,1986
(DMSO-d6)
Shenet al., 1993(DMSO-d6)
Markhamand Geiger,
1994(DMSO-d6)
A C5-OH 1 12.5 s, br. 12.49 12.5-12.7 s, br. 12.42 s 12.45B C7-OH 1 10.76 -OHC C4’-OH 1 9.57 -OHD C3-OH 1 9.34 -OHE C3’-OH 1 9.28 -OHF C2’-H 1 7.67
d 2.27.67d 2.3
7.67d 2.2
7.67d 2.2
7,69d 2.1
G C6’-H 1 7.54dd 8.6, 2.2
7.54dd 8.4, 2.3
7.54dd 8.5, 2.2
7.53dd 8.6, 2.2
7.55dd 8.5, 2.1
H C5’-H 1 6.88d 8.6
6.88d 8.4
6.90d 8.5
6.89d 8.3
6.90d 8.5
I C8-H 1 6.40d 2.0
6.40d 2.0
6.40d 2.0
6.40d 2.0
6.42d 2.1
K C6-H 1 6.18d 2.0
6.14d 2.0
6.20d 2.0
6.18d 2.0
6.20d 2.1
The assignments of the hydroxyl groups at C3, C5, C7 of ring A and C, and C3’ and C4’of ringB were found by two-dimensional NMR-spectroscopy and could be unambigously assigned inthis study for the first time. Furthermore, C5’ and C2’ could be unambiguously assigned by 13Cspectroscopy.
OO
O
O
O
O
O
E
C
H
G
A
B
D
FI
Ka
b
c
d
e
f
g
h
ik
l
m
no
p
Fig. II.5: Characters (capitals indicate protons, small letters the carbon atoms) are used forassignments gained by two-dimensional experiments.

264 Appendix II Chemical investigations on primary and secondary plant compounds
13C-NMR-ParametersThe authentic sample was measured at 90 MHz.
δ [ppm] multiplicity J [Hz]
Sig
nal
Assignment
authenticsample(Merck)
(DMSO-d6)
Shenet al.,1993
(DMSO-d6)
Shigematsuet al.,1982
(DMSO-d6)
Nawwaret al.,1984b
(DMSO-d6)
Markhamet al.,1978
(DMSO-d6)a C4 175.7 175.7 175.8 175.8 175.8b C7 163.8 163.8 163.8 163.9 163.9c C5 160.6 160.6 160.6 160.7 160.7d C9 156.0 156.1 156.1 156.2 156.2e C4’ 147.6 147.6 147.6 147.6 147.6f C2 146.7 146.8 146.7 146.9 146.9g C3’ 145.0 145.0 145.0 145.0 145.0h C3 135.6 135.6 135.6 135.5 135.5i C1’ 121.9 121.9 122.0 122.1 122.1k C6’ 119.9 119.9 120.0 120.0 120.0l C5’ 115.5 115.5 115.5 115.6 115.6a
m C2’ 115.0 115.1 115.0 115.3 115.3a
n C10 102.9 103.0 102.9 103.1 103.1o C6 98.1 98.1 98.1 98.2 98.2p C8 93.2 93.3 93.3 93.3 93.3
aShift values bearing the same superscript may be reversed.
Fig. II.6: HSQC-spectrum of quercetin.
Couplings over a short (HSQC) and long distance (HMBC) between proton and carbon atomsare summarised in Tab. II.4.
K

Appendix II Chemical investigations on primary and secondary plant compounds 265
Tab. II.4: H-C heterocorrelations of quercetin based on HSQC and HMBC experiments(DMSO-d6, 360 MHz).
C5-OHA
C7-OHB
C4’-OHC
C3-OHD
C3’-OHE
C2’-HF
C6’-HG
C5’-HH
C8-HI
C6-HK
C4 a 4;2b 3 4c 4c
C7 b 4c 2 2 2C5 c 2 2C9 d 2C4’ e 2 3 3 3 2C2 f 3 3 3 4C3’ g 3 2 2 4d 3C3 h 2C1’ i 2 e 3C6’ k 3 1 e
C5’ l 3 e 1C2’ m 3 1 3 4ad
C10 n 3 3 3C6 o 3 3 3 1C8 p 3 1 3a
weak correlationb
dual coupling pathway through intramolecular H-bondc
w-couplingd
dual coupling pathwaye
missing two-bond correlation
Correlations crucial to the OH assignments are shaded.
C-H shift correlations (Tab. II.4) across one bond (HSQC, Fig. II.6) or more bonds (HMBC, thespectrum is not depicted here) are in perfect agreement with the assignments reported in theliterature and in addition, yield the hitherto unknown assignments of the hydroxyl protons B toE. All expected vicinal correlations are observed. Of the 15 possible geminal correlations,which are usually weaker than vicinal ones, three were not detected. The seven visible, four-bond correlations are either transmitted across dual coupling pathways or fixed w-configurations. Each hydroxyl proton shows at least one correlation that allows an unequivocalassignment.
13C
1H

266 Appendix II Chemical investigations on primary and secondary plant compounds
14 Quercetin-3-O-ß-D-galactopyranoside= Hyperoside
Fractions A11, A19 Formula C21H20O12
MW 464INN-Names quercetin-3-O-ß-D-galactopyranoside,hyperoside,hyperin
Cas. No. [482-36-0]
Structure
HO
O
O
OH
OH
O
O
OH
OH
OHOH
1
2
3
456
7
89
10
1'
3'4'
5'
6'
2'
1''2''
3''4''
5''
OH
6''
Appearance Yellow needles (Yasukawa and Takido, 1987).
HPLCmean retention time UV-Data λλλλ max / nm
25.4 min. 255 sh 266 sh 293 354Yasukawa and Takido, 1987 (EtOH) 258 sh 270 sh 293 364Shigematsu et al., 1982 (EtOH) 260 367Mabry et al., 1970 (MeOH) 257 sh 269 sh 299 362Kaneta et al., 1980 (MeOH) 257 sh 270 sh 300 360impurity:
26.3 min. (A19, quercetin glycoside) 255 sh 266 sh 293 355
EI-MS (A11)m/z 302 (100 %)C15H10O7: [M]+ •, quercetin (aglycone)m/z 273 (4 %) C14H9O6: [M - CO - H]+
m/z 257 (2 %)m/z 245 (3 %) C13H9O5: [M - CO - CO - H]+
m/z 229 (3 %)m/z 153 (5 %) C7H5O4: [A1 + H]+
m/z 137 (7 %) C7H5O3: [B2]+
m/z 73 (10 %)
ESI-MS (A11)positive mode:
m/z 503 (10 %) : [M + K]+, quercetin glycosidem/z 487 (69 %) : [M + Na]+
m/z 465 (7 %) : [M + H]+
m/z 303 (100 %) : [aglycone + H]+, quercetin

Appendix II Chemical investigations on primary and secondary plant compounds 267
negative mode:m/z 463 (100 %) : [M - H]−, quercetin glycosidem/z 301 (9 %) : [aglycone - H]−, quercetin
EI-MS (A19)m/z 302 (100 %)C15H10O7: [M]+ •, quercetin (aglycone)m/z 285 (3 %) C15H9O6: [M - OH]+
m/z 245 (4 %) C13H9O5: [M - CO - CO - H]+
m/z 144 (13 %)m/z 114 (10 %)m/z 97 (21 %)m/z 73 (55 %)m/z 69 (30 %)m/z 60 (71 %)
ESI-MS (A19)positive mode:
m/z 503 (13 %) : [M + K]+, quercetin glycosidem/z 487 (100 %) : [M + Na]+
m/z 303 (20 %) : [aglycone + H]+, quercetinnegative mode:
m/z 463 (100 %) : [M - H]−, quercetin glycosidem/z 301 (46 %) : [aglycone - H]−, quercetin
Ref.: EI-MS: Kaneta et al., 1980.
NMR-Data
Fraction A11 was used as representative sample.1H-NMR-Parameters
δ [ppm] multiplicity J [Hz]
AssignmentNo. of
HA11
(DMSO-d6)
Yasukawaand Takido,
1987(DMSO-d6)
Benniniet al.,1992
(DMSO-d6)
Barberáet al.,1986
(DMSO-d6)
Markhamand Geiger,
1994(DMSO-d6)
C5-OH 1 12.63 s, br. 12.65, s 12.60 12.61C6’-H 1 7.67
dd 8.5, 2.17.60dd 8.3, 2.0
7.65dd 8.3, 2.2
7.66dd 8.5, 2.2
7.68dd 8.5, 2.0
C2’-H 1 7.54d 2.1
7.59d 2.0
7.52d 2.2
7.55d 2.2
7.55d 2.0
C5’-H 1 6.82d 8.5
6.86d 8.3
6.80d 8.3
6.83d 8.5
6.84d 8.5
C8-H 1 6.41ca. d 2a
6.42d 1.9
6.38d 1.9
6.41d 2.0
6.42d 1.9
C6-H 1 6.20ca. d 2a
6.21d 1.9
6.18d 1.9
6.21d 2.0
6.22d 1.9
C1”-H 1 5.38d 7.7
5.52d 7.3
5.35d 7.6
5.36d 7.6
C2”-H 1 3.58ca. t 8.6a
3.56dd 9.4, 7.6
C3”-H 1 of 3 3.4-3.3 3.36dd 9.4, 3.2

268 Appendix II Chemical investigations on primary and secondary plant compounds
δ [ppm] multiplicity J [Hz]
AssignmentNo. of
HA11
(DMSO-d6)
Yasukawaand Takido,
1987(DMSO-d6)
Benniniet al.,1992
(DMSO-d6)
Barberáet al.,1986
(DMSO-d6)
Markhamand Geiger,
1994(DMSO-d6)
C4”-H 1 3.66d 3.0
3.65, bd 3.2
C5”-H 1 of 3 3.4-3.3 3.33, mC6”-Ha 1 of 3 3.4-3.3C6”-Hb 1 3.46
dd 9.5, 5.13.33, m and3.46dd 9.5, 5.1
asignals were not completely resolved
As protons at the C6” of the galactose moiety have a different chemical environment due to thechiral centre at C5”, depending on the degree of resolution two signals can be expected. Hence,two signals could be ascertained in this study and were reported by Bennini et al. (1992).13C-NMR-Parameters
δ [ppm] multiplicity J [Hz]
Assignment
A11(DMSO-d6)
Shigematsuet al.,1982
(DMSO-d6)
Yasukawaand Takido,
1987(DMSO-d6)
Markhamet al.,1978
(DMSO-d6)
Benniniet al.,1992
(DMSO-d6)
Barberáet al.,1986
(DMSO-d6)C4 177.5 177.4 177.6 177.5 177.4 177.37C7 164.3 164.0 164.2 164.0 164.2 164.05C5 161.2 161.1 161.3 161.2 161.1 161.10C9a 156.3 156.3 156.5,
(C2/C9)156.3 156.2 156.20a
C2a 156.2 156.3 156.5,(C2/C9)
156.3 156.2 156.18a
C4’ 148.5 148.4 148.4 148.3 148.4 148.31C3’ 144.9 144.7 144.8 144.7 144.7 144.66C3 133.5 133.4 133.8 133.8 133.4 133.49C6’ 122.0 121.9; C1´ 121.9 121.8 121.9 121.79C1’ 121.1 121.0; C6´ 121.4 121.3 121.0 121.05C2’ 116.0 115.9; C5´ 116.4; C5´ 116.2, C5´ a 115.1, C2´ 115.08, C2´C5’ 115.2 115.1; C2´ 115.3; C2´ 115.2, C2´ a 115.9, C5´ 115.94, C5´C10 103.9 103.9 104.2 104.0 103.8 103.82C1” 101.8 101.9 102.6 102.3 101.8 101.93C6 98.7 98.6 98.8 98.6 98.6 98.56C8 93.5 93.5 93.6 93.4 93.4 93.38C5” 75.9 75.7 75.9 75.8 75.7 75.69C3” 73.2 73.2 73.6 73.4 73.2 73.17C2” 71.2 71.2 71.5 71.3 71.2 71.15C4” 67.9 67.9 68.2 68.0 67.9 67.84C6” 60.1 60.1 60.4 60.8 60.1 60.04
aAssignments bearing the same superscripts in either column may be reversed.

Appendix II Chemical investigations on primary and secondary plant compounds 269
The assignments for C1´and C6´ in the spectrum of Shigematsu et al. (1982) should beinterchanged, because the DEPT-spectrum of that substance only showed a signal at 121.995ppm, indicating that there must be a primary or tertiary carbon atom, which is true for the C6´as tertiary carbon atom. The C1´carbon is a quaternary carbon atom and therefore not visible inthe DEPT-spectrum. These findings are in accordance with the assignments of other citedauthors.
15 Quercetin-3-O-αααα-L-rhamnopyranoside= Quercitrin
Fractions A12, R11For evaluation of fraction R11 see above(see for luteolin-7-O-glucopyranoside).
Formula C21H20O11
IUPAC-Name 4H-1-benzopyran-4-one, 3-[(6-deoxy-α-L-mannopyranosyl) oxy]-2-(3,4-dihydroxyphenyl)-5,7-dihydroxy
MW 448
INN-Names quercetin-3-O-α-L-rhamnopyranoside,quercitrin
Cas. No. [522-12-3]
Structure
OOH
HO
OH
OH
O
O
OOH
OH
OH
2
34
5
6
7
89
10
1'
2'
3'
4'
5'
6'
1''
2''
3''4''
5''
6''
1
Appearance Pale yellowish powder (Fukunaga et al., 1988) or yellow needles (Tanaka et
al., 1984)
Commercial quercitrin (Roth) was used as authentic sample.
HPLCmean retention time UV-Data λ max / nm
27.2 min. 255 sh 265 sh 298 349Mabry et al., 1970 (MeOH) 256 sh 265 sh 301 350Fukunaga et al., 1988 (EtOH) 255 sh 265 349Tanaka et al., 1984 (MeOH) 257 sh 264 350Curir et al., 1996 (MeOH) 256.0 sh 264.9 sh 301 349.8Kaneta et al., 1980 (MeOH) 256 sh 265 sh 300 350Impurities:
26.6 min. (A12, a kaempferol derivative)For further compounds in R11 seeluteolin-7-O-glucopyranoside)
265 sh 293 sh 318(weak)
347

270 Appendix II Chemical investigations on primary and secondary plant compounds
Mass spectrometry
Fraction A12 was used to document quercitrin representatively.
EI-MSm/z 302 (100 %)C15H10O7: [M]+ •, quercetin aglyconem/z 274 (4 %) C14H10O6: [M - CO]+ •
m/z 257 (2 %) C14H9O5: [M - CO - OH]+
m/z 245 (3 %) C13H9O5: [M - CO - CO - H]+
m/z 229 (4 %) C13H9O4: [M - CO - CO - OH]+
m/z 153 (6 %) C7H5O4: [A1 + H]+, for both aglyca, quercetin and theimpurity kaempferol
m/z 137 (7 %) C7H5O3: [B2]+
m/z 113impurity:
m/z 286 (4 %) C15H10O6: [kaempferol]+ •, aglycone
ESI-MSpositive mode:
m/z 487 (17 %) : [M + K]+, quercitrinm/z 471 (44 %) : [M + Na]+
m/z 449 (5 %) : [M + H]+
m/z 303 (100 %) : [aglycone + H]+, quercetinimpurity:
m/z 287 (21 %) : [aglycone + H]+, kaempferolnegative mode:
m/z 447 (100 %) : [M - H]−, quercitrinm/z 301 (7 %) : [aglycone - H]−, quercetin
For details of fraction R11 see luteolin-7-O-ß-D-glucopyranoside.Ref.: EI-MS: Kaneta et al. (1980).
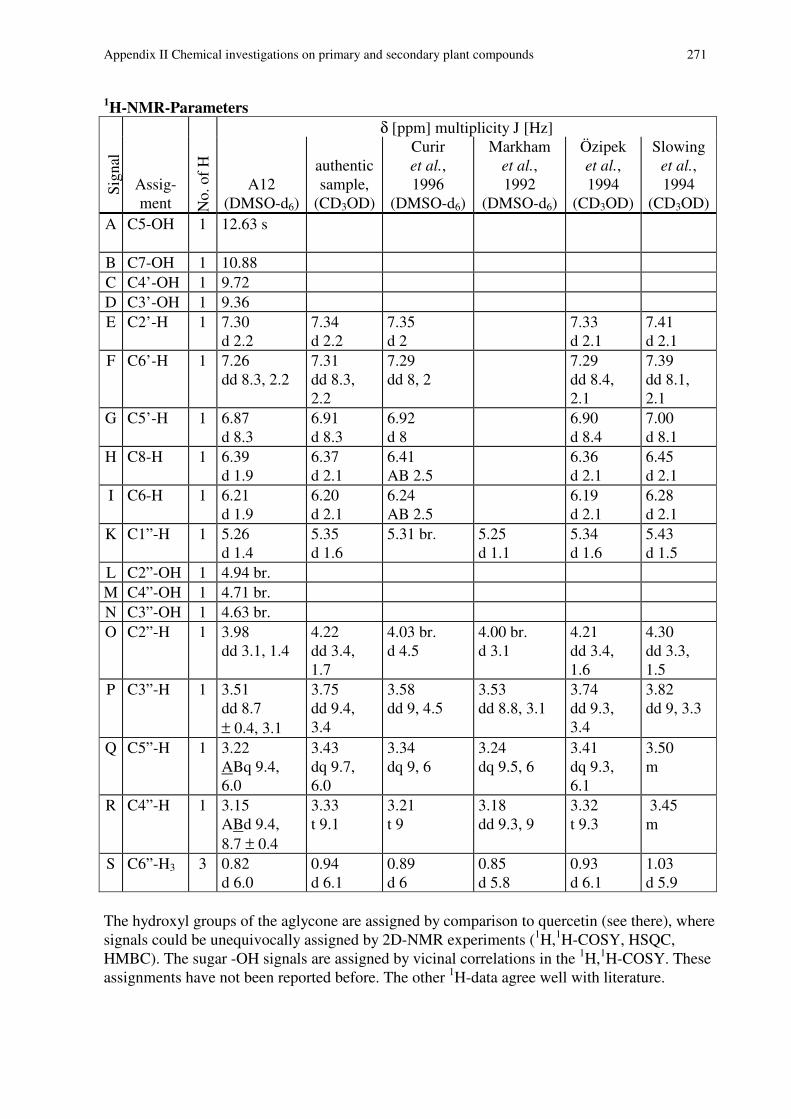
Appendix II Chemical investigations on primary and secondary plant compounds 271
1H-NMR-Parametersδ [ppm] multiplicity J [Hz]
Sig
nal
Assig-ment N
o. o
f H
A12(DMSO-d6)
authenticsample,
(CD3OD)
Curiret al.,1996
(DMSO-d6)
Markhamet al.,1992
(DMSO-d6)
Özipeket al.,1994
(CD3OD)
Slowinget al.,1994
(CD3OD)A C5-OH 1 12.63 s
B C7-OH 1 10.88C C4’-OH 1 9.72D C3’-OH 1 9.36E C2’-H 1 7.30
d 2.27.34d 2.2
7.35d 2
7.33d 2.1
7.41d 2.1
F C6’-H 1 7.26dd 8.3, 2.2
7.31dd 8.3,2.2
7.29dd 8, 2
7.29dd 8.4,2.1
7.39dd 8.1,2.1
G C5’-H 1 6.87d 8.3
6.91d 8.3
6.92d 8
6.90d 8.4
7.00d 8.1
H C8-H 1 6.39d 1.9
6.37d 2.1
6.41AB 2.5
6.36d 2.1
6.45d 2.1
I C6-H 1 6.21d 1.9
6.20d 2.1
6.24AB 2.5
6.19d 2.1
6.28d 2.1
K C1”-H 1 5.26d 1.4
5.35d 1.6
5.31 br. 5.25d 1.1
5.34d 1.6
5.43d 1.5
L C2”-OH 1 4.94 br.M C4”-OH 1 4.71 br.N C3”-OH 1 4.63 br.O C2”-H 1 3.98
dd 3.1, 1.44.22dd 3.4,1.7
4.03 br.d 4.5
4.00 br.d 3.1
4.21dd 3.4,1.6
4.30dd 3.3,1.5
P C3”-H 1 3.51dd 8.7± 0.4, 3.1
3.75dd 9.4,3.4
3.58dd 9, 4.5
3.53dd 8.8, 3.1
3.74dd 9.3,3.4
3.82dd 9, 3.3
Q C5”-H 1 3.22ABq 9.4,6.0
3.43dq 9.7,6.0
3.34dq 9, 6
3.24dq 9.5, 6
3.41dq 9.3,6.1
3.50m
R C4”-H 1 3.15ABd 9.4,8.7 ± 0.4
3.33t 9.1
3.21t 9
3.18dd 9.3, 9
3.32t 9.3
3.45m
S C6”-H3 3 0.82d 6.0
0.94d 6.1
0.89d 6
0.85d 5.8
0.93d 6.1
1.03d 5.9
The hydroxyl groups of the aglycone are assigned by comparison to quercetin (see there), wheresignals could be unequivocally assigned by 2D-NMR experiments (1H,1H-COSY, HSQC,HMBC). The sugar -OH signals are assigned by vicinal correlations in the 1H,1H-COSY. Theseassignments have not been reported before. The other 1H-data agree well with literature.

272 Appendix II Chemical investigations on primary and secondary plant compounds
13C-NMR-Parametersδ [ppm] multiplicity J [Hz]
Sig
nal
Assign-ment
A12(DMSO-d6)
authenticsample,
(CD3OD)
Markham et al.,1978 and
Markham, 1989(DMSO-d6)
Markham et
al., 1992(DMSO-d6)
Slowing et al., 1994(CD3OD)
a C4 177.8 179.7 177.7 179.7b C7 164.3 165.9 164.0 165.9c C5 161.3 163.2 161.2 159.3a
d C2 157.3 159.3a 156.4a 158.5a
e C9 156.5 158.5a 157.0a 163.2f C4’ 148.5 149.8 148.3 149.8g C3’ 145.2 146.4 145.1 146.4h C3 134.2 136.3 134.4 136.2i C6’ 121.1 123.0 121.0 122.8d
k C1’ 120.8 122.9 121.0 122.9d
l C2’ 115.7 116.9b 115.4b 116.9m C5’ 115.5 116.5b 115.8b 116.3n C10 104.1 105.9 104.2 105.9o C1” 101.8 103.6 101.9 101.9 103.5p C6 98.7 99.8 98.6 99.8q C8 93.6 94.7 93.5 94.7r C4” 71.2 73.3 71.5 71.5 73.2s C5” 70.6 72.1c 70.1c 70.6 72.0t C3” 70.4 72.0c 70.6c 70.4 72.1u C2” 70.1 71.9c 70.4c 70.1 71.9v C6” 17.5 17.7 17.3 17.3 17.7a - c
Within one spectrum assignments bearing the same character may be reversed.d
Assignment obviously not correct as revealed by the DEPT experiment of this study.
The signal assignments reported in the literature are in part contradictory including a two-dimensional analysis given by Slowing et al. (1994) with an obviously incorrect assignment forC1’ and C6’ as revealed by DEPT in this study. Hence, in this study HSQC and HMBCheterocorrelations were performed allowing an unequivocal assignment of all carbon signals inthe solvent DMSO-d6.The signal assignments in methanol generally follow the sequence found in DMSO, yet similarshift entries might be interchanged, except for C1’/ C6’, which is unequivocally based onDEPT.
Tab. II.5: H-C heterocorrelations for quercitrin based on HSQC and HMBC experiments(DMSO-d6, 360 MHz).
C5-OHA
C2’-HE
C6’-HF
C5’-HG
C8-HH
C6-HI
C1”-HK
C2”-HO
C3”-HP
C5”-HQ
C4”-HR
C6”-H3
SC4 a 4;2b 4ac 4ac
C7 b 4c 2 2C5 c 2 2C2 d 3 3 4ac
C9 e 2
13C
1H

Appendix II Chemical investigations on primary and secondary plant compounds 273
C5-OHA
C2’-HE
C6’-HF
C5’-HG
C8-HH
C6-HI
C1”-HK
C2”-HO
C3”-HP
C5”-HQ
C4”-HR
C6”-H3
SC4’ f 3 3 2C3’ g 2 3C3 h 3C6’ i 3 1 2?C1’ k 2? g 3C2’ l 1 3 4d?C5’ m 4d? 2 1C10 n 3 3 3C1” o 1 e f
C6 p 3 3 1C8 q 1 3C4” r 3 2 2 1 3C5” s 3 f 1 2 2C3” t 3? 2 1 3? e
C2” u e 1 e 3a
C6” v 1a
weak correlationb
dual coupling pathway through intramolecular H-bondc
w-couplingd
dual coupling pathwaye
missing two-bond correlationf
missing three-bond correlation
For statistical reasons, in Tab. II.6 shift differences between quercetin and quercitrin are listed.
Tab. II.6: Shift differences between quercetin and quercitrin.
carbon quercitrin quercetin quercitrin - quercetinC2 157.297 146.709 10.588C3 134.231 135.629 -1.398C4 177.755 175.736 2.019C5 161.314 160.620 0.694C6 98.724 98.075 0.649C7 164.297 163.780 0.517C8 93.648 93.246 0.402C9 156.470 156.031 0.439C10 104.069 102.919 1.150C1’ 120.752 121.853 -1.101C2’ 115.671 114.973 0.698C3’ 145.224 144.958 0.266C4’ 148.461 147.600 0.861C5’ 115.477 115.504 -0.027C6’ 121.122 119.869 1.253
13C
1H

274 Appendix II Chemical investigations on primary and secondary plant compounds
16 Quercetin-3-O-αααα-L-rhamnopyranosyl(1→→→→2)ß-D-galactopyranoside
Fractions A2 Formula C27H30O16
INN-Names quercetin-3-O-α-L-rhamnopyranosyl(1→2)ß-D-galactopyranoside
MW 610
Structure
HO
O
O
OH
OH
O
O
OH
OH
O
O
OH
OH
OH
OH
1
2
3
456
7
89
10
1'
3'4'
5'
6'
2'
1''2''
3''4''
5''
1'''2'''
3'''
4'''
5'''
6'''OH
6''
HPLCmean retention time UV-Data λ max / nm
24.2 min. 255 sh 267 sh 294 355Yasukawa and Takido, 1988 (EtOH) 258 sh 266 364
EI-MSm/z 302 (100 %)C15H10O7: [M]+ •, quercetin (aglycone)m/z 285 (2 %) C15H9O6: - OH• → [M - OH]+
m/z 274 (5 %) C14H10O6: [M - CO]+ •
m/z 257 (2 %) C14H9O5: [M - CO - OH]+
m/z 245 (4 %) C13H9O5: [M - CO - CO - H]+
m/z 228 (5 %) C13H8O4: [M - CO - CO - H - OH]+
m/z 153 (6 %) C7H5O4: [A1+ H]+
m/z 128 (12 %)m/z 85 (14 %)m/z 73 (17 %)
ESI-MSpositive mode:
m/z 649 (15 %) : [M + K]+, quercetin glycosidem/z 633 (100 %) : [M + Na]+, quercetin glycosidem/z 303 (22 %) : [aglycone + H]+, quercetin
negative mode:m/z 609 (100 %) : [M - H]−, quercetin glycosidem/z 301 (17 %) : [aglycone - H]−, quercetin
1H-NMR-Parametersδ [ppm] multiplicity J [Hz]
AssignmentNo. of
HA2
(DMSO-d6)Yasukawa and Takido, 1988
(DMSO-d6)C5-OH 1 12.70 sC6’-H 1 7.72 dd 8.5, 2.2 7.65 dd 8.8, 1.9C2’-H 1 7.48 d 2.2 7.52 d 1.9C5’-H 1 6.80 d 8.5 6.82 d 8.8

Appendix II Chemical investigations on primary and secondary plant compounds 275
δ [ppm] multiplicity J [Hz]
AssignmentNo. of
HA2
(DMSO-d6)Yasukawa and Takido, 1988
(DMSO-d6)C8-H 1 6.39 d 1.9 6.36 d 1.9C6-H 1 6.19 d 1.9 6.18 d 1.9C1”-H (gal) 1 5.63 d 7.7 5.61 d 7.3C1”’-H (rha) 1 5.06 ca. d 2a 5.09 sOH 1 5.02 s, br.not assigned 1 3.80 dd 9.4, 7.9sugar protons 3.77-3.22 mC4”’-H 1 3.12 t 9.5C6”’-H3 3 0.77 d 6.2 0.86 d 6.3a
signals were not completely resolved13C-NMR-Parameters
δ [ppm] multiplicity J [Hz]
AssignmentA2 (DMSO-
d6)Yasukawa and Takido, 1988
(DMSO-d6)C4 177.3 177.3C7 164.1 163.9C5 161.3 161.3C9 156.2 156.2C2 156.0 156.3C4’ 148.4 148.2C3’ 144.9 144.7C3 133.0 133.1C6’ 122.2 121.5C1’ 121.1 122.0C5’ 115.6 116.0C2’ 115.2 115.3C10 103.9 104.2C1”’ 100.5 100.6C1” 98.8 99.1C6 98.7 98.7C8 93.4 93.5C5” 75.7 75.8C2” 75.0 75.6C3” 74.1 74.0C4”’ 71.9 72.3C2”’ 70.7 70.9C3”’ 70.6 70.7C5”’ 68.6 68.7C4” 68.2 68.1C6” 60.2 60.4C6”’ 17.2 17.1
Identification of compound A2 as quercetin-3-O-α-L-rhamnopyranosyl(1→2)ß-D-galactopyranoside is predominantly based on its 13C-NMR spectrum, which perfectly agreeswith data given by Yasukawa and Takido (1988). Shift values of relevant subspectra of

276 Appendix II Chemical investigations on primary and secondary plant compounds
analogue compounds (not depicted in this table) were used to corroborate the structure:kaempferol-3-O-α-L-rhamnopyranosyl(1→2)ß-D-galactopyranoside (compound No.9);quercetin-3-O-ß-D-apiofuranosyl-(1→2)ß-D-galactopyranoside (Hamburger et al., 1985) andquercetin itself (compound No.13). (For 13C shift values of pyranoses being in the free state orbound with respect to α- and ß-configurations, in D2O and DMSO-d6, see also Bailey andButterfield (1981).) However, data from the 13C-NMR experiment were decisive in determiningthe compound under investigation.
17 Quercetin-3-O-αααα-L-rhamnopyranosyl(1→→→→2)ß-D-xylopyranoside
A novel substanceFraction A5 Formula C26H28O15
IUPAC-Name MW 580
INN-Names quercetin-3-O-α-L-rhamnopyranosyl(1→2)ß-D-xylopyranoside
Structure
HO
O
O
OH
OH
O
O
OH
OH
O
O
OH
OH
OH
OH
1
2
3
456
7
89
10
1'
3'4'
5'
6'
2'
1''2''
3''4''
5''
1'''2'''
3'''
4'''
5'''
6'''
HPLCmean retention time UV-Data λ max / nm
25.8 min. 255 sh 267 sh 294 355
EI-MSm/z 302 (100 %)C15H10O7: [M]+ •, quercetin (aglycone)m/z 273 (5 %) C14H9O6: [M - CO - H]+
m/z 257 (2 %) C14H9O5: [M - CO - OH]+
m/z 245 (4 %) C13H9O5: [M - CO - CO - H]+
m/z 229 (4 %) C13H9O4: [M - CO - CO - OH]+
m/z 153 (6 %) C7H5O4: [A1 + H]+
m/z 142 (5 %)m/z 137 (9 %) C7H5O3: [B2]
+
m/z 128 (13 %)m/z 114 (14 %)m/z 85 (15 %)m/z 73 (13 %)
impurity:m/z 286 : kaempferol aglycone (originating from a preceding
fraction)

Appendix II Chemical investigations on primary and secondary plant compounds 277
ESI-MSpositive mode:
m/z 603 (40 %) : [M + Na]+, quercetin glycosidem/z 303 (100 %) : [aglycone + H]+, quercetin
negative mode:m/z 579 (35 %) : [M - H]−, quercetin glycosidem/z 301 (100 %) : [aglycone - H]−, quercetin
NMR-Data
For the novel compound A5, the assignment of the signals in the 1H- and 13C-spectra to theircorresponding protons and carbon atoms is largely based on various two-dimensionalexperiments. To solve sophisticated problems such as to the type of binding of the anomericsugar protons, suitable reference studies were used for the respective initial and terminal sugarmoieties.1H-NMR-Parameters
No. of δ [ppm] multiplicity J [Hz]Signal Assignment H A5 (DMSO-d6)
A C6’-H 1 7.57 dd 8.4, 2.2B C2’-H 1 7.54 d 2.2C C5’-H 1 6.85 d 8.4D C8-H 1 6.41 d 2.0E C6-H 1 6.19 d 2.0F C1’’-H (xyl) 1 5.51 d 7.4G C1’’’-H (rha) 1 5.08 d 1.4H C5’’’-H 1 3.78 dq 9.4, 6.2I C2’’’-H 1 3.74 dd 3.2, 1.4J C5’’-H 1 3.60 mK C2’’-H 1 3.55 dd 9.0, 7.4L C3’’’-H 1 3.48 ma
M, N C3’’-H, C4’’-H 2 3.34 ma
O C4’’’-H 1 3.15 t 9.5P C5’’-H 1 2.96 mQ C6’’’-H3 3 0.88 d 6.2R C5-OH 1 12.62 s, br.
-OH 0.6 9.3 v.br.-OH ca. 1 5.33 br.-OH ca. 1 5.00 br.-OH ca. 1 4.63 br.-OH ca. 1 4.58 br.-OH ca. 1 4.50 br.
asignals were covered by a large peak of water
Coupling constants J (Hz) determined for the coupling protons of the rhamnose moiety:J (C1’’’-H / C2’’’-H) = 1.4 Hz ; J (C2’’’-H / C3’’’-H) = 3.2 HzJ (C3’’’-H / C4’’’-H) = 9.6 Hz ; J (C4’’’-H / C5’’’-H) = 9.4 HzJ (C5’’’-H / C6’’’-H3) = 6.2 HzCoupling constants J (Hz) determined for the coupling protons of the xylose moiety:J (C1’’-H / C2’’-H) = 7.4 Hz ; J (C2’’-H / C3’’-H, C4’’-H) = 9.0 Hz

278 Appendix II Chemical investigations on primary and secondary plant compounds
The two-dimensional 1H,1H-COSY experiment revealed the coupling protons and corroboratedthe assignment of the signals found in the 1H-spectrum.
1H,1H-COSYproton coupling with
A B, CD E
quercetin
F KK M, NM, N PP J
xylose
Q HH OO LL II G
rhamnose
13C-NMR-Parameters and data of two-dimensional experiments
Signal Assignmentδ [ppm] multiplicity J [Hz]
A5 (DMSO-d6)HSQCwith
HMBC with
a C4 177.2 - -b C7 164.2 - D Ec C5 161.2 - E (R)d C9 156.2 - De C2 156.1 - A Bf C4’ 148.6 - A B (C)g C3’ 145.0 - B C A?h C3 132.8 - (F)i C6’ 121.5 A Bj C1’ 121.0 - Ck C2’ 115.9 B Al C5’ 115.2 Cm C10 103.9 - D E Rn C1”’ (rha) 100.6 Go C1” (xyl) 99.5 F (G) (K)p C6 98.7 E D Rq C8 93.5 D Er C2” 77.0 Ks C3” 76.8 N Jt C4”’ 71.9 O Qu C2”’ 70.62 I Gv C3”’ 70.55 L Gw C4” 69.7 M (N)x C5”’ 68.4 H G Qy C5” 65.7 J+Pz C6”’ 17.4 Q

Appendix II Chemical investigations on primary and secondary plant compounds 279
While C-H couplings over one bonding are indicated by the HSQC experiment, the HMBCexperiment gives couplings over two to four bondings. Thus, most signals could beunambigously assigned. To verify the type of bonding for the anomeric sugar protons as well asthe assignment to the C3’’ and C4’’ atom of the xylose moiety, chemical shift rules and severalreference studies were consulted (see below).Furthermore, the assignments of the carbon atoms were in agreement with information from theDEPT spectrum (not presented here).13C-NMR-Parameters
δ [ppm] multiplicity J [Hz]
AssignmentA5
(DMSO-d6)
Agrawal, 1989;Hamburger et al., 1985
(DMSO-d6)Geiger et al., 1983
(DMSO-d6)C4 177.2 177.3 177.31C7 164.2 164.3 164.17C5 161.2 161.3 161.16C9 156.2 156.2a 156.10a
C2 156.1 155.6a 156.10a
C4’ 148.6 148.4 148.48C3’ 145.0 144.9 144.94C3 132.8 133.2 133.63C6’ 121.5 122.3 122.06C1’ 121.0 121.2 120.81C2’ 115.9 115.6b 115.52b
C5’ 115.2 115.2b 115.25b
C10 103.9 103.8 103.82C1”’ (rha) 100.6 99.94C1” (xyl) 99.5 99.5C6 98.7 98.6 98.65C8 93.5 93.4 93.42C2” 77.0 76.6c
C3” 76.8 76.1c
C4”’ 71.9 71.86C2”’ 70.62 70.55c
C3”’ 70.55 70.55c
C4” 69.7 69.4C5”’ 68.4 68.55C5” 65.7 65.7C6”’ 17.4 17.41
a – cAssignments bearing the same superscript may be reversed.
The reference compound given by Hamburger et al. (1985) is the quercetin-3-O-(2”-O-ß-Dapiofuranosyl-ß-D-xylopyranoside) (= quercetin-3-O-ß-D-apiofuranosyl-(1→2)ß-D-xylopyranoside) with the xylose moiety being directly attached to the quercetin aglycone.Hence, the linkage between the quercetin and the xylose moiety is comparable to the linkage innovel substance A5. It can be stated that the shift values given by Hamburger et al. (1985) forthe aglycone and the xylose moiety are in agreement with those found for the A5. Theassignments of the C3’’ atom and the C4’’ atom are also in agreement with further references

280 Appendix II Chemical investigations on primary and secondary plant compounds
on xylose moieties (Bock and Thoegersen, 1982) and their assignments can thus be deduced tothe xylose moiety in the novel compound A5.
Geiger et al. (1983) described a terminal rhamnose moiety of a disaccharide unit being attachedto quercetin: quercetin-3-O-α-L-(2-O-α-L-rhamnopyranosyl-arabinopyranoside).
As the flavonol A5 with its disaccharide has been isolated for the first time, only referencesubstances could be found with a xylosyl (1→2) rhamnoside moiety, the xylose residue beingterminal (Fukai and Nomura, 1988; Mizuno et al., 1988; Slowing et al., 1994).
18 Fraction A1
quercetin glycoside Proposedformula C33H40O20
Proposed structure: quercetin + 1 hexose moiety + 2deoxyhexose (rhamnose) moieties
MW 756
HPLCmean retention time UV-Data λ max / nm
23.2 min. 255 sh 267 sh 293 354
EI-MSm/z 302 (54 %) C15H10O7: [M]+ •, quercetin aglyconem/z 167 (11 %)m/z 147 (23 %)m/z 137 (18 %) C7H5O3: [B2]
+
m/z 128 (73 %)m/z 113 (27 %)m/z 85 (63 %)m/z 73 (64 %)m/z 57 (100 %)
impurity:m/z 286 (7 %) C15H10O6: [aglycone]+ •, kaempferol or luteolinm/z 229 (6 %) C13H9O4: [286- CO - CO - H]+
ESI-MS:positive mode:
m/z 779 (47 %) : [M + Na]+
m/z 499 (100 %) : contaminationm/z 303 (76 %) : [quercetin + H]+
negative mode:m/z 755 (100 %) : [M - H]−
m/z 301 (31 %) : [quercetin - H]−
impurity:m/z 739 (27 %) : [M - H]−, assumed as kaempferol or luteolin
glycoside
Complementary information of both the positive and negative ESI-mode together withinformation of the aglycone taken from the EI-mass-spectrum, indicate a molecular weight of756 Da for a quercetin glycoside. The UV-spectrum corroborates the presence of a quercetinglycoside. The impurity, exhibiting a molecular weight of 740 Da, possesses a luteolin orkempferol moiety as aglycone.

Appendix II Chemical investigations on primary and secondary plant compounds 281
Based on the 1H NMR-spectrum (not depicted here due to poor resolution) there are hints to theoccurrence of one hexose and two rhamnose moieties (two doublets at 0.80 and 1.05 ppm withJ ca. 6.2 Hz each). Hence, the structure was proposed as indicated above.
19 Fraction A3
Fraction A3 consists primarily of a mixture of three flavonoids. Two compounds wereidentified as quercetin derivatives, while the third flavonoid could not be further elucidated.The UV-spectra of both quercetin derivatives are very similar and according to mass spectra,the molecular weights differ by just 162 mass units, which corresponds to one hexose moiety.Except for the mass difference, both quercetin compounds equal in their constituents: the sameaglycone, one hexose and one deoxyhexose moiety, respectively. The quercetin glycosideexhibiting a molecular weight of 610 Da seems to be the same compound as identified withinfraction A2.
quercetin glycoside; A3-1 (M1) Formula C33H40O21
Structure quercetin + 2 hexose moieties +1 deoxyhexose moiety
MW 772
quercetin glycoside; A3-2 (M2) Formula C27H30O16
Structure quercetin + 1 hexose moiety +1 deoxyhexose moiety
MW 610
HPLCmean retention time UV-Data λ max / nm
23.4 min. sh 247 266 sh 293 34924.0 min. (a quercetin glycoside) 255 sh 267 sh 294 35524.2 min. (a quercetin glycoside) 255 sh 267 sh 294 354
The quercetin glycoside at 24.0 min. builds the main compound of fraction A3.
EI-MSThe fragmentation pattern of the EI-spectrum of fraction A3 resembles that of fraction A1.Mass m/z 302 with a relative abundance of 47 % can be assigned to quercetin aglycone whichis in accordance with expectations from UV-spectra. According to UV-spectra, the maincompound of fraction A3 is a quercetin glycoside. As impurity mass m/z 286 with a relativeabundance of 20 % might be assigned to a flavone aglycone or kaempferol, which cannot beunambiguously resolved from the corresponding UV-spectrum. Base peak in the EI-spectrum ism/z 57.
ESI-MSpositive mode:
m/z 795 (32 %) : [M1 + Na]+
m/z 633 (100 %) : [M2 + Na]+
MS/MS of mass 795 (M1)m/z 633 (82 %) : [M1 - hexose moiety + Na]+
m/z 487 (100 %) : [M1 - hexose moiety - deoxyhexose moiety + Na]+
MS/MS of mass 633 (M2)m/z 487 (49 %) : [M2 - hexose moiety - deoxyhexose moiety + Na]+
m/z 331 (100 %) : [M2 - hexose moiety - quercetin aglycone + Na]+,i.e. m/z 633 minus quercetin moiety (m/z 302).

282 Appendix II Chemical investigations on primary and secondary plant compounds
negative mode:m/z 771 (54 %) : [M1 - H]−
m/z 609 (100 %) : [M2 - H - hexose moiety]−
MS/MS of mass 771 (M1)m/z 609 (100 %) : [M1 - H - hexose moiety]−
m/z 463 (6 %) : [M1 - H - hexose moiety - deoxyhexose moiety]−
m/z 301 (4 %) : [M1 - H - hexose moiety - deoxyhexose moiety -hexose moiety]−, i.e. [quercetin - H]−
MS3 of mass 609 (M1)m/z 301 (100 %) : [quercetin - H]−
MS3 of mass 463 (M1)m/z 301 (100 %) : [M1 - H - 162 - 146 - 162]−, i.e. [quercetin - H]−
MS/MS of mass 609 (M2)m/z 463 (7 %) : [M2 - H - hexose moiety – deoxyhexose moiety]−
m/z 301 (100 %) : [quercetin - H]−
20 Fraction A6
Fraction A6 contains two substances,a kaempferol glycoside as the main compound and a quercetin glycoside as a minor component.
kaempferol glycoside; A6-1 (M1) MW 594
quercetin glycoside; A6-2 (M2) MW 564
HPLCmean retention time UV-Data λ max / nm
27.3 min. (kaempferol glycoside) 265 sh 293 sh 318 (weak) 34827.8 min. (quercetin glycoside) 255 sh 267 sh 295 355
The peak height of the kaempferol glycoside is nearly double the height of the subsequentquercetin glycoside within this fraction.
EI-MSm/z 302 (38 %) C15H10O7: [M]+ •, quercetin aglyconem/z 286 (93 %) C15H10O6: [M]+ •, kaempferol aglyconem/z 267 (48 %) : unknown compound, as evidenced from the ion
chromatogramm/z 229 (9 %)m/z 180 (8 %)m/z 150 (19 %) C8H6O3: [B1]
+ •, quercetin fragmentm/z 137 (23 %) C7H5O3: [B2]
+, quercetin fragmentm/z 128 (66 %)m/z 110 (49 %)m/z 85 (63 %)m/z 73 (59 %)m/z 57 (100 %)

Appendix II Chemical investigations on primary and secondary plant compounds 283
ESI-MSpositive mode:
m/z 701 (100 %) : unknown compoundm/z 617 (13 %) : [M + Na]+, sodium adduct of mass 594m/z 595 (33 %) : [M + H]+
m/z 587 (19 %) : [M + Na]+, sodium adduct of mass 564m/z 303 (12 %) : [quercetin + H]+, aglyconem/z 287 (15 %) : [kaempferol + H]+, aglycone
negative mode:m/z 593 (33 %) : [M - H]−, molecule ion of mass 594m/z 563 (100 %) : [M - H]−, molecule ion of mass 564m/z 301 (39 %) : [quercetin - H]−, aglyconem/z 285 (17 %) : [kaempferol - H]−, aglycone
The base peak of the positive ESI-mode is m/z 701, which does not find any counterpart in themass spectrum of the negative ESI mode. However, there was a range of masses between10 % and 40 % relative abundance, which can be identified by complementary information.In accordance, one compound can be deciphered with a molecular weight of 594, which is thesame as that found in kaempferol-rhamnopyranosyl-galactopyranoside which was contained infraction A4 (No.9). Despite different retention times, the UV-spectrum of the main compoundof fraction A6 resembles that of fraction A4 and both show identical molecular weights.The other component of fraction A6 can be assigned to a molecular weight of 564. Inaccordance with its UV-spectrum and the occurrence of quercetin as aglycone in the massspectra it is concluded to be a quercetin glycoside.
21 Fraction A7
Fraction A7 contains several compounds with a kaempferol glycoside as the main compound.
kaempferol glycoside; A7-1 (M1) Formula C27H30O14
Structure kaempferol + 2 deoxyhexose moieties;main compound
MW 578
A7-2 (M2) MW 540
quercetin glycoside A7-3 (M3) Formula C22H14O11
Structure quercetin + 1 gallic acid moiety MW 454
HPLCmean retention time UV-Data λ max / nm
28.8 min. (kaempferol derivative) 265 sh 293 sh 318 (weak) 348
EI-MSThe electron impact mass spectrum yields two aglyca:
m/z 286 (51 %) C15H10O6: [M]+ •, kaempferol aglyconeimpurity:
m/z 302 (8 %) : [quercetin]+ •, aglyconem/z 302 and m/z 286 occurred at the same time in the ion chromatogram.Base peak in this spectrum is m/z 73.

284 Appendix II Chemical investigations on primary and secondary plant compounds
ESI-MSpositive mode:
m/z 601 (100 %) : [M1 + Na]+
m/z 563 (62 %) : [M2 + Na]+
m/z 455 (40 %) : [M3 + H]+
m/z 169 (37 %) : [146 + 23]+, i.e. [deoxyhexose moiety + Na]+
MS/MS of mass 601 (M1)m/z 455 (9 %) : [601 -146]+, i.e. minus deoxyhexose moietym/z 315 (100 %) : [601 - 286]+, i.e. [M1 - aglycone moiety + Na]+
MS3 of mass 315 (M1)m/z 169 (100 %) : [315 - 146]+, i.e. minus deoxyhexose moiety; hence
[deoxyhexose moiety + Na]+ remains.MS/MS of mass 563 (M2)
m/z 545 (81 %) : [M2 - H2O + Na]+
m/z 479 (100 %) : [563 - 84]+
m/z 394 (48 %) : [563 - 169]+, i.e. minus (deoxyhexose moiety +Na+)
MS/MS of mass 455 (M3)m/z 303 (100 %) : [455 - 152]+, i.e. minus gallic acid moiety, resulting
in [quercetin aglycone + H]+
negative mode:m/z 577 (100 %) : [M - H]−
Additional MS/MS and MS3 experiments on the ion m/z 577 did not yield further informationand were not documented.
Fraction A7 contains several compounds, all in very low amounts. According to HPLC, akaempferol glycoside builds the main component. By means of mass spectrometry threemolecular weights could be deciphered, 578, 540 and 454 Da, respectively.
From the preceding experiments it can be concluded, that compound M1 (m/z 578) consists oftwo deoxyhexose moieties and kaempferol as aglycone. This compound agrees with the UV-spectrum detected during the HPLC run. M2 (m/z 540) obviously contains a deoxyhexosemoiety but cannot be further determined. Compound M3 (m/z 454) consists of a quercetinaglycone which is attached to a galloyl residue.
22 Fractions A13 and A21
A13
The HPLC chromatogram of fraction A13 shows one main compound and several minorcompounds. The UV spectrum as well as the 1H NMR-spectrum indicate that a quercetinglycoside was the main component. By means of mass spectrometry two quercetin glycosideswere detected (MW 594 and 448). While M1 (m/z 594) consists of two deoxyhexose moieties,M2 (m/z 448) contains one. As the UV-spectrum can be assigned to M1, this must be the maincompound. A third substance shows a molecular weight of 418 Da, which belongs to akaempferol aglycone, which in turn is linked to a pentose moiety.
quercetin glycoside; A13-1 (M1) Formula C27H30O15
Structure quercetin aglycone + 2 deoxyhexosemoieties; main compound
MW 594

Appendix II Chemical investigations on primary and secondary plant compounds 285
quercetin glycoside; A13-2 (M2) Formula C21H20O11
Structure quercetin + 1 deoxyhexose moiety MW 448
kaempferol glycoside; A13-3 (M3) Formula C20H18O10
Structure kaempferol + 1 pentose moiety MW 418
HPLCmean retention time UV-Data λ max / nm
28.8 min. (quercetin glycoside,main compound)
255 sh 267 sh 294 356
A21Fraction A21 contains two components: a quercetin glycoside as major compound and akaempferol glycoside as minor compound.
quercetin glycoside; A21-1 (M2) Formula C21H20O11
Structure quercetin + 1 deoxyhexose moiety MW 448
kaempferol glycoside; A21-2 (M1) Formula C20H18O10
Structure kaempferol + 1 pentose moiety MW 418
HPLCmean retention time UV-Data λ max / nm
28.6 min. (quercetin glycoside) 255 sh 267 sh 293 355
28.7 min. (kaempferol glycoside) 264 sh 293 sh 318 (weak) 348
Both fractions, A13 and A21, contain a quercetin glycoside (MW 448) and a kaempferolglycoside (MW 418), respectively. As both glycosides occur only in trace amounts in fractionA13 (for which retention times have therefore not been recorded), HPLC data on thesecompounds are only available for fraction A21. However, due to their close sequence in bothfractions it is reasonable to assume that both fractions contain identical compounds. Asfragmentation patterns in the EI mode as well as data obtained from ESI experiments (includingMS/MS and MS3 experiments) are largely the same, only data from fraction A13 are presentedhere.
Regarding the glycoside identified with a molecular weight of 448, it is necessary to point outthat neither its UV spectrum, nor its retention time agree with data obtained for quercitrin(A12), although the corresponding molecular weights are identical. Therefore, it can beconcluded that the quercitrin and the quercetin glycoside of fractions A13 / A21 areconstitutional isomers.
EI-MS (A13)quercetin
m/z 302 (63 %) C15H10O7: [M]+ •, quercetin aglycone]m/z 273 (5 %) C14H9O6: [M - CO - H]+
m/z 258 (11 %)m/z 213 (6 %)m/z 153 (11 %) C7H5O4: [A1 + H]+, occurring for both aglycam/z 137 (14 %) C7H5O3: [B2]
+, quercetin fragmentm/z 128 (17 %)m/z 73 (23 %)m/z 69 (26 %)

286 Appendix II Chemical investigations on primary and secondary plant compounds
m/z 57 (30 %)kaempferol
m/z 286 (100 %)C15H10O6: [kaempferol]+ •, aglyconem/z 229 (14 %) C13H9O4: [286 - CO - CO - H]+
m/z 121 (19 %) C7H5O2: [B2]+, kaempferol fragment
ESI-MS (A13)positive mode
m/z 617 (10 %) : [M1 + Na]+
m/z 487 (27 %) : [M2 + K]+
m/z 471 (100 %) : [M2 + Na]+
m/z 441 (36 %) : [M3 + Na]+
m/z 169 (2 %) : [deoxyhexose moiety + Na]+
MS/MS of mass 617 (M1)m/z 533 (100 %) : [617 - 84]+
m/z 471 (14 %) : [M1 - deoxyhexose moiety + Na]+
m/z 325 (3 %) : [quercetin aglycone + Na]+
m/z 315 (54 %)MS3 of mass 533 (M1)
m/z 487 (100 %) : [M1 - deoxyhexose moiety + K]+
m/z 415 (43 %)m/z 341 (6 %) : [quercetin aglycone + K]+
MS/MS of mass 471 (M2)m/z 325 (100 %) : [M2 - deoxyhexose moiety + Na]+, i.e. [quercetin
aglycone + Na]+
m/z 303 (5 %) : [quercetin aglycone + H]+
m/z 169 (14 %) : [deoxyhexose moiety + Na]+
MS/MS of mass 441 (M3)m/z 309 (100 %) : [M3 - pentose moiety + Na]+, i.e.
[kaempferol aglycone + Na]+
m/z 155 (6 %) : [pentose moiety + Na]+, i.e. [132 + 23]+
negative mode:m/z 895 (21 %) : [2 x 448 - H]−
m/z 593 (22 %) : [M1 - H]−
m/z 447 (100 %) : [M2 - H]−
m/z 417 (15 %) : [M3 - H]−
MS/MS of mass 593 (M1)m/z 447 (19 %) : [M1 - deoxyhexose moiety - H]−
m/z 301 (100 %) : [M1 - 2 deoxyhexose moieties - H]−, i.e.[quercetin aglycone - H]−
MS3 of mass 447 (M1)m/z 301 (100 %) : [quercetin aglycone - H]−
MS/MS of mass 447 (M2)m/z 301 (100 %) : [M2 - deoxyhexose moiety - H]−, i.e.
[quercetin aglycone - H]−
MS/MS of mass 417 (M3)m/z 285 (100 %) : [M3 - pentose moiety - H]−, i.e.
[kaempferol aglycone - H]−

Appendix II Chemical investigations on primary and secondary plant compounds 287
23 Fraction A20
quercetin glycoside Formula C20H18O11
Structure quercetin + 1 pentose moiety MW 434
HPLCmean retention time UV-Data λ max / nm
26.3 min. 255 sh 266 sh 293 355
EI-MSm/z 302 (100 %)C15H10O7: [M]+ •, quercetinm/z 285 (1 %) C15H9O6: [M - OH]+
m/z 273 (4 %) C14H9O6: [M - CO - H]+
m/z 257 (2 %)m/z 245 (4 %) C13H9O5: [M - CO - CO - H]+
m/z 228 (3 %)m/z 153 (5 %) C7H5O4: [A1 + H]+
m/z 137 (7 %) C7H5O3: [B2]+
ESI-MS:positive mode:
m/z 457 (56 %) : [M + Na]+
m/z 303 (100 %) : [quercetin + H]+
negative mode:m/z 433 (100 %) : [M - H]−
m/z 301 (43 %) : [quercetin - H]−
The molecular weight can be determined as 434 Da by complementary information of the ESIspectra. The aglycone is corroborated by the EI mass spectrum and expected from the UVspectra. Hence, fraction A20 contains a quercetin glycoside with a molecular weight of 434.The mass difference of m/z 132 between the molecular weight and the aglycone pleads for apentose moiety (presumably xylose) being attached to the quercetin aglycone.
24 Fraction R7
acylated auronol glycoside; R7-1 (M1) Formula C28H26O15
Structure aglycone (auronol) + 1 gallic acid moiety+ 1 hexose moiety
MW 602
gallic acid derivative; R7-2 (M2) Formula C20H20O14
Structure 2 gallic acid moieties + 1 hexose moiety,presumably digalloylglucose
MW 484
HPLCmean retention time UV-Data λ max / nm
19.1 min. 216 276
The UV spectrum pleads for a gallic acid derivative, which is assigned to M2, thedigalloylhexose.

288 Appendix II Chemical investigations on primary and secondary plant compounds
EI-MSm/z 184 (43 %) C8H8O5: [M]+ •, gallic acid methyl esterm/z 170 (39 %) C7H6O5: [M]+ •, gallic acidm/z 153 (61 %) C7H5O4: [M - OH]+, according to ion traces originating from
gallic acidm/z 125 (30 %) C6H5O3: pyrogallol cationm/z 110 (21 %)m/z 97 (37 %)m/z 85 (31 %)m/z 69 (60 %)m/z 55 (100 %)
The EI mass spectrum identified masses of gallic acid (m/z 170) and gallic acid methyl ester(m/z 184) and the corresponding typical fragmentation scheme. Their common fragment ispyrogallol. Base peak is m/z 55.
ESI-MSpositive mode:
m/z 625 (19 %) : [M1 + Na]+
m/z 523 (28 %) : [M2 + K]+
m/z 507 (100 %) : [M2 + Na]+
m/z 485 (6 %) : [M2 + H]+
MS/MS of mass 625 (M1)m/z 549 (28 %)m/z 473 (100 %) : [M1 - gallic acid moiety + Na]+
m/z 337 (62 %) : [M1 - aglycone (288) + Na]+, hence[314 + Na]+ remains
m/z 319 (13 %) : [314 + Na - H2O]+
MS3 of mass 337 (M1)m/z 319 (100 %) : [314 + Na - H2O]+
m/z 259 (21 %) : [314 + Na - 18 - 60]+
m/z 185 (2 %) : [314 + Na - gallic acid moiety]+
m/z 175 (12 %) : [314 + Na - hexose moiety]+
MS/MS of mass 507 (M2)m/z 337 (100 %) : [M2 + Na - gallic acid]+, [484 + 23 - 170]+
MS3 of mass 337 (M2)m/z 175 (100 %) : [314 + Na - hexose moiety]+
negative mode:m/z 601 (37 %) : [M1 - H]−
m/z 483 (100 %) : [M2 - H]−
MS/MS of mass 601 (M1)m/z 449 (100 %) : [M1 - gallic acid moiety - H]−
m/z 287 (27 %) : [M1 - gallic acid moiety - hexose moiety - H]−, i.e.[aglycone (288) - H]−
m/z 259 (11 %) : [M1 - gallic acid moiety - hexose moiety -CO - H]−
MS3 of mass 449 (M1)m/z 287 (7 %) : [aglycone - H]−
m/z 271 (100 %)m/z 211 (32 %)m/z 169 (74 %) : [gallic acid - H]−

Appendix II Chemical investigations on primary and secondary plant compounds 289
MS3 of mass 287 (M1)m/z 259 (100 %) : [aglycone - CO - H]−
MS/MS of mass 483 (M2)m/z 423 (12 %) : [483 - 60]−, i.e. [M2 - H - α-hydroxy-
acetaldehyde]−
m/z 331 (27 %) : [483 - gallic acid moiety (152)]−
m/z 313 (28 %) : [483 - gallic acid (170)]−
m/z 271 (100 %) : [483 - 60 - 152]−
m/z 211 (17 %) : [271 – 60]−, i.e. [271 - 1,2-dihydroxy-ethene]−
m/z 169 (12 %) : [gallic acid - H]−
MS3 of mass 313 (M2)m/z 169 (100 %) : [gallic acid - H]−
m/z 125 (18 %) : [pyrogallol - H]−
From the ESI experiments it is concluded that in fraction R7, which contains severalcompounds, two substances can be assigned to a molecular weight of 602 (M1) and 484 (M2),respectively. The ESI spectra of both compounds contain a fragment of m/z 337, consisting of agallic acid moiety and a hexose moiety. In the case of M1 it can be stated that the sugar moietywas esterified by gallic acid and this unit is attached to the aglycone of mass 288, presumablyan auronol (compare especially fragment m/z 337 and its further fragmentation in the positivemode). M2 is concluded to be a digalloylhexose, presumably digalloylglucose. Both, thepositive and negative mode indicate a hexose (presumably glucose) which is esterified by twogalloyl residues at two different positions except for the hydroxyl function at C6 of the sugarmoiety, which in turn is evidenced by neutral loss of 60 Dalton (α-hydroxy-acetaldehyde) in thenegative mode.
25 Fraction R9
acylated auronol glycoside; R9-1 (M1) Formula C28H26O15
Structure auronol (e.g. maesopsin) + 1 gallic acidmoiety + 1 hexose moiety
MW 602
R9-2 (M2) MW 630
HPLCmean retention time UV-Data λ max / nm
26.1 min. 211 290 sh 338
EI-MSm/z 184 (83 %) C8H8O5: [M]+ •, gallic acid methyl esterm/z 153 (100 %) C7H5O4: - OCH3
• → [M - OCH3]+
m/z 120m/z 107 (76 %) C6H3O2: [M - OCH3 - CO - H2O]+
m/z 91 (49 %) C7H7: benzyl cation ↔ tropylium ionm/z 73 (46 %)m/z 60 (73 %)
The EI spectrum shows the typical fragmentation pattern of gallic acid methyl ester.
ESI-MSpositive mode:
m/z 625 (100 %) : [M1 + Na]+

290 Appendix II Chemical investigations on primary and secondary plant compounds
impurity:m/z 669 (6 %) : [M2 + K]+
m/z 653 (14 %) : [M2 + Na]+
MS/MS of mass 625 (M1)m/z 607 (7 %) : [M1 - H2O + Na]+
m/z 463 (100 %) : [M1 - hexose moiety + Na]+
MS3 of mass 463 (M1)m/z 445 (100 %) : [463 - H2O]+
m/z 435 (72 %) : [463 - CO]+
negative mode:m/z 601 (100 %) : [M1 - H]−
impurity:m/z 629 (15 %) : [M2 - H]−
MS/MS of mass 601 (M1)m/z 601 (7 %) : [M1 - H]−
m/z 583 (13 %) : [M1 - H2O - H]−
m/z 439 (100 %) : [M1 - hexose moiety - H]−
m/z 421 (19 %) : [439 - H2O]−
m/z 287 (6 %) : [439 - gallic acid moiety]−, i.e. [aglycone - H]−
m/z 269 (39 %) : [287 - H2O]−
MS3 of mass 439 (M1)m/z 421 (21 %) : [439 - H2O]−
m/z 287 (18 %) : [439 - gallic acid moiety]−
m/z 269 (100 %) : [287 - H2O]−
m/z 259 (6 %) : [287 - CO]−
m/z 243 (4 %) : [287 - CO2]−
Fraction R9 is shown to contain a compound with a molecular weight of 602, which consists ofa hexose moiety, a gallic acid moiety and an aglycone of 288 Da, based on UV spectrum anauronol, presumably maesopsin.As fragments observed under MS/MS conditions differ from those of fraction R7, it isconcluded that both compounds are positional isomers. In compound R9 both the galloyl andthe hexose residue are attached to different positions of the aglycone.The impurity in this fraction is a compound with a molecular weight of 630.
26 Fraction R13, R14
According to UV-spectra and data obtained by mass spectrometry, both fractions contain gallicacid derivatives. Based on NMR experiments, these compounds are isomers.
gallic acid derivatives
proposed structure gallic acid (MW 170) +mass difference of 156 u
MW 326
HPLCmean retention time UV-Data λ max / nm
16.3 min. (R13) 215 27416.6 min. (R14) 216 275
According to UV-spectra gallic acid derivatives are to be expected.

Appendix II Chemical investigations on primary and secondary plant compounds 291
EI-MS (R13 and R14)m/z 170 (97% and 54 %) : [M]+ •, gallic acidm/z 153 (63 % and 25 %):- OH• →[M - OH]+
m/z 138 (100 %) : [156 - H2O]+ •
m/z 126 (69 % and 90 %):[pyrogallol]+ •
m/z 121 (83 % and 81 %):[138 - OH]+
m/z 108 (20 % and 22 %)m/z 94 (44 % and 46 %)m/z 80 (20 and 25 %)
The EI-MS spectra of both fractions show identical fragmentation patterns with gallic acid(m/z 170) as molecule radical cation, respectively.
ESI-MSFraction R14 was used to document the positive mode representatively:positive mode:
m/z 675 (6 %) : [2 M + Na]+
m/z 365 (44 %) : [M + K]+
m/z 349 (95 %) : [M + Na]+
m/z 107 (100 %)MS/MS of mass 349
m/z 179 (100 %) : [156 + Na]+
Most valuable information could be gained by ESI-experiments in the negative mode.Experiments on fraction R13 are documented representatively:negative mode:
m/z 651 (83 %) : [2 M - H]−
m/z 353 (9 %)m/z 325 (100 %) : [M - H]−
MS/MS of mass 325m/z 169 (100 %) : [gallic acid - H]−
m/z 125 (9 %) : [169 - CO2]−, i.e. [pyrogallol - H]−
MS3 of mass 169 corroborates that fragment m/z 125 originates from m/z 169.MS/MS of mass 353
m/z 307 (98 %) : [353 - 46]−
m/z 289 (45 %) : [353 - 46 - 18]−
m/z 245 (49 %) : [353 - 46 – 18 - 44]−
m/z 201 (48 %) : [353 - gallic acid moiety]−
m/z 169 (100 %) : [gallic acid - H]−
m/z 125 (22 %) : [pyrogallol - H]−, pyrogallol anion
Both fractions R13 and R14 contain a compound with a molecular weight of 326, whichconsists of gallic acid (170 Da) as integral constituent and a mass difference of 156 units. TheUV-spectra are nearly identical and also indicate for gallic acid derivatives. NMR experiments(not depicted here) indicate two isomeric compounds.
27 Fraction R17
acylated quercetin glycoside Formula C28H24O16
Structure quercetin + 1 gallic acid moiety+ 1 hexose moiety
MW 616

292 Appendix II Chemical investigations on primary and secondary plant compounds
HPLCmean retention time UV-Data λ max / nm
25.1 min. 262 sh 293 354
Mass spectrometry
In the EI-MS spectrum a quercetin aglycone can be observed as well as masses that are assumedto originate from gallic acid. In case of gallic acid, this is explicitly noted. However, othermasses are identified as fragments of quercetin.
EI-MSm/z 302 (100 %)C15H10O7: [M]+ •, quercetin (aglycone)m/z 274 (6 %) C14H10O6: [M - CO]+ •
m/z 170 (7 %) C7H6O5: [gallic acid]+ •
m/z 153 (37 %) C7H5O4: [A1 + H]+
m/z 137 (9 %) C7H5O3: [B2]+
m/z 107 (11 %) C6H3O2: [gallic acid - OH- CO - H2O]+
m/z 69 (6 %)
ESI-MSpositive mode:
m/z 655 (19 %) : [M + K]+, quercetin glycosidem/z 639 (100 %) : [M + Na]+, quercetin glycosidem/z 487 (4 %) : [639 - gallic acid moiety]+
MS/MS of mass 639:m/z 485 (10 %)m/z 337 (100 %) : [M - quercetin + Na]+
m/z 325 (10 %) : [aglycone + Na]+, quercetinm/z 303 (2 %) : [aglycone + H]+, quercetin
negative mode:m/z 615 (100 %) : [M - H]−, quercetin glycosideMS/MS of mass 615
m/z 463 (100 %) : [615 - galloyl moiety]−
m/z 301 (20 %) : [615 - galloyl moiety - hexose moiety]−, i.e.[quercetin aglycone - H]−
From mass spectrometry it is reasonable to assume a quercetin glycoside with a hexose moietyas a sugar component, and a gallic acid moiety.
28 Fraction R18
Fraction R18 obviously contains one major compound, which was assigned to a kaempferolglycoside, and three minor glycosides (for quercetin contained see A15, A16).
acylated dihydrokaempferol glycoside; R18-1 (M1) Formula C29H28O15
Structure dihydrokaempferol + 1 hexose moiety +1 methoxy gallic acid moiety
MW 616
kaempferol glycoside; R18-2 (M2) Formula C28H24O15
Structure kaempferol + 1 hexose moiety +1 gallic acid moiety
MW 600
quercetin glycoside; R18-3 (M3) Formula C21H20O12
Structure quercetin + 1 hexose moiety MW 464

Appendix II Chemical investigations on primary and secondary plant compounds 293
kaempferol glycoside; R18-4 (M4) Formula C21H20O11
Structure kaempferol + 1 hexose moiety MW 448
HPLCmean retention time UV-Data λ max / nm
26.2 min. 265 sh 293 346
The UV-spectrum is assigned to a kaempferol glycoside as major component.
EI-MSIn the following EI-MS spectrum three flavonoid aglyca are apparent, which are assigned toquercetin (m/z 302) kaempferol (m/z 286) and apigenin (m/z 270) as aglyca. As evidenced byESI experiments, the apigenin aglycone originates from dihydrokaempferol, which rearrangesto apigenin under experimental conditions (see Fig. II.7).The identification of kaempferol is based on the ion chromatogram and the fragmentationpattern of kaempferol in the EI spectrum. In the ion chromatogram, the occurrence of fragmentm/z 121 ([B2]
+ ion) is connected to the occurrence of ion m/z 286, which indicates kaempferolas aglycone. According to fragmentation scheme (Fig. C.7, p. 102), the isomeric compoundluteolin (m/z 286) shows a different fragmentation pattern with m/z 137 as [B2]
+ ion.m/z 302 (11 %) C15H10O7: [M]+ •, quercetin (aglycone)m/z 286 (100 %) C15H10O6: [M]+ •, kaempferol (aglycone)m/z 270 (8 %) C15H10O5: [M]+ •, apigenin (aglycone)m/z 229 (5 %) C13H9O4: [kaempferol- CO - CO - H]+
m/z 184 (5 %) C8H8O5: [methoxy gallic acid]+ •
m/z 170 (5 %) C7H6O5: [M]+ •, gallic acidm/z 153 (26 %) C7H5O4: [A1+ H]+
m/z 121 (11 %) C7H5O2: [B2]+ originating from kaempferol and / or apigenin
m/z 69 (6 %)m/z 65 (6 %)m/z 39 (6 %)According to ion traces, the fragment m/z 153 originated from the flavonoid aglycon m/z286 by RDA reaction and is not a fragment of gallic acid. The assignment of m/z 184 tomethoxy gallic acid is based on results obtained from ESI experiments.
ESI-MSpositive mode:
m/z 639 (38 %) : [M1 + Na]+
m/z 623 (100 %) : [M2 + Na]+
m/z 487 (20 %) : [M3 + Na]+
m/z 471 (28 %) : [M4 + Na]+
MS/MS of mass 639 (M1)m/z 477 (2 %) : [M1 - hexose moiety + Na]+
m/z 456 (100 %) : [M1 - methoxy gallic acid radical + Na]+ •
m/z 294 (1 %) : [456 - hexose moiety]+ •
MS/MS of mass 623 (M2)m/z 595 (9 %) : [M2 - CO + Na]+
m/z 477 (5 %)m/z 471 (2 %) : [M2 - gallic acid moiety + Na]+
m/z 337 (100 %) : [M2 - kaempferol aglycone + Na]+, hence[gallic acid moiety + hexose moiety + Na]+
remains.

294 Appendix II Chemical investigations on primary and secondary plant compounds
m/z 309 (8 %) : [M2 - gallic acid moiety - hexose moiety + Na]+,hence [kaempferol + Na]+ remains.
MS/MS of mass 487 (M3)m/z 325 (100 %) : [M3 - hexose moiety + Na]+, i.e.
[quercetin aglycone + Na]+
m/z 185 (57 %) : [hexose moiety + Na]+
MS/MS of mass 471 (M4)m/z 309 (76 %) : [M4 - hexose moiety + Na]+, i.e.
[kaempferol aglycone + Na]+
m/z 185 (100 %) : [hexose moiety + Na]+
negative mode:m/z 615 (47 %) : [M1 - H]−
m/z 599 (100 %) : [M2 - H]−
m/z 463 (10 %) : [M3 - H]−
m/z 447 (6 %) : [M4 - H]−
MS/MS of mass 615 (M1)m/z 463 (7 %) : [M1 - RDA fragment of dihydrokaempferol - H]−
m/z 453 (20 %) : [M1 - hexose moiety - H]−, i.e. [615 - 162]−
m/z 431 (100 %) : [M1 - methoxy gallic acid - H]−, i.e. [615 - 184]−
m/z 269 (3 %) : [apigenin - H]−
MS3 of mass 453 (M1)m/z 269 (100 %) : [M1 - hexose moiety - methoxy gallic acid - H]−,
i.e. [apigenin - H]−, [453 - 184]−
m/z 183 (9 %) : [methoxy gallic acid - H]−, i.e. [453 - 270]−
MS3 of mass 431 (M1)m/z 269 (100 %) : [M1 - methoxy gallic acid - hexose moiety - H]−,
i.e. [apigenin - H]−
MS/MS of mass 599 (M2)m/z 447 (100 %) : [M2 - gallic acid moiety - H]−
m/z 313 (56 %) : [M2 - kaempferol - H]−
m/z 285 (8 %) : [kaempferol - H]−, which corresponds to[M2 - gallic acid moiety - hexose moiety - H]−
MS3 of mass 447 (M2)m/z 285 (100 %) : [M2 - gallic acid moiety - hexose moiety - H]−, i.e.
[kaempferol - H]−
MS3 of mass 313 (M2)m/z 169 (100 %) : [gallic acid - H]−
m/z 125 (17 %) : [pyrogallol - H]−
MS/MS of mass 463 (M3)m/z 301 (100 %) : [M3 - hexose moiety - H]−, i.e. [quercetin - H]−
m/z 271 (4 %)m/z 179 (4 %) : [hexose - H]−
m/z 151 (2 %) : [gallic acid moiety - H]−
MS3 of mass 301 (M3)m/z 183 (100 %)m/z 151 (69 %) : [gallic acid moiety - H]−
MS/MS of mass 447 (M4)m/z 285 (100 %) : [M4 - hexose moiety - H]−, i.e. [kaempferol or
luteolin- H]−

Appendix II Chemical investigations on primary and secondary plant compounds 295
M1 (MW 616) is concluded to consist of dihydrokaempferol as aglycone, which is esterified atposition 3 by a methoxy gallic acid moiety (which is depicted as 4-methoxy gallic acid residuein Fig. II.7), and to which a hexose residue is attached at 4’-position. Despite ESI conditions,the dihydrokaempferol is supposed to decompose yielding apigenin as aglycone (see Fig. II.7).Both, the methoxy gallic acid and the hexose residue may initially leave the molecule ion andthen yield to m/z 431 and m/z 453, respectively, as evidenced by MS/MS and MS3
experiments (ESI conditions, negative mode). Furthermore, the RDA reaction occurs resultingin m/z 463 and a neutral loss of mass 152, (M1-H-152)−, which corroborates that the aglyconepositions 5 and 7 are unsubstituted. Moreover, it is notable to mention that in spite of ESIconditions (positive mode) a methoxy gallic acid radical is produced resulting in a radicalcation (m/z 456).It should also be mentioned that although the preceding fraction R17 contains a compound ofthe same molecular weight like M1 of R18, both compounds are completely different.
M2 (MW 600) consists of kaempferol as aglycone that is linked to a hexose moiety and a gallicacid moiety.
M3 (MW 464) consists of quercetin as aglycone that is linked to a hexose moiety, whileM4 (MW 448) contains a kaempferol as aglycone linked to a hexose moiety.
HO
O-
O
O
H
OR
O
O
OH
OCH3
OH
HO
O-
O
O
ORHO
O
OH
OCH3
OH
+
1 2
3
4' 4'
[M-H]-
m/z 615[C29H27O15]
-
4-methoxy gallic acid184 DaC8H8O5
m/z 431[C21H19O10]-
- 162 Da
HO
O-
O
O
OH
+
4'
[apigenin - H] -
m/z 269[C15H9O5]
-
dehydroxyhexose162 DaC6H10O5
HO
HO
CH2HO
O
OH
R = hexose
Fig. II.7: Proposed rearrangement and fragmentation of dihydrokaempferol-3-(methoxy gallicacid)-4’-hexose to apigenin (aglycone), methoxy gallic acid and dehydroxyhexoseunder ESI conditions. (The methoxy gallic acid residue is depicted as 4-methoxygallic acid.)

296 Appendix II Chemical investigations on primary and secondary plant compounds
29 Fraction R19
kaempferol glycoside; R19-1 (M1) Formula C20H18O10
Structure kaempferol + 1 pentose moiety MW 418
R19-2 (M2) MW 330
HPLCmean retention time UV-Data λ max / nm
29.0 min. (kaempferol glycoside) 253 264 sh 294 347
EI-MSm/z 286 (100 %)C15H10O6: [M]+ •, kaempferol (aglycone)m/z 258 (8 %) C14H10O5: [M - CO]+ •
m/z 229 (7 %) C13H9O4: [M - CO - CO - H]+
m/z 153 (25 %) C7H5O4: [A1 + H]+
m/z 121 (20 %) C7H5O2: [B2]+
impurity:m/z 184 (12 %) : [M]+ •, presumably gallic acid methyl ester
The molecule radical cation m/z 286 combined with fragment m/z 121 indicate kaempferol asaglycone of the flavonoid compound.
ESI-MSpositive mode:
m/z 441 (65 %) : [M1 + Na]+
m/z 353 (100 %) : [M2 + Na]+
MS/MS of mass 441 (M1)m/z 309 (100 %) : [M1 - pentose moiety + Na]+
m/z 155 (9 %) : [M1 - kaempferol aglycone + Na]+, i.e. [pentosemoiety + Na]+
MS/MS of mass 353 (M2)m/z 338 (100 %) : [M2 - 15 + Na]+
negative mode:m/z 417 (100 %) : [M1 - H]−
m/z 329 (50 %) : [M2 - H]−
MS/MS of mass 417 (M1)m/z 285 (40 %) : [M1 - pentose moiety - H]−, i.e. [aglycone - H]−
m/z 284 (100 %)
From complementary information of the positive and negative ESI-spectra, it can be inferredthat two compounds occurred in fraction R19. One compound has a mass of 418 Da andconsists of a kaempferol aglycone and a pentose moiety. The other substance has a molecularweight of 330 Da and is no flavonoid.
Based on differing UV spectra (with special respect to band II), the kaempferol glycosides offractions A13/A21 and R19 are concluded to be positional isomers.

Appendix II Chemical investigations on primary and secondary plant compounds 297
30 AP23/24
presumably a gallic acid derivative
HPLCmean retention time UV-Data λ max / nm
24.9 min. 277
31 AP25
HPLCmean retention time UV-Data λ max / nm
20.0 min. 217 sh 234 sh 243 sh 297 32622.3 min. 227 sh 297 31122.7 min. 30623.7 min. 227 sh 297 31223.9 min. sh 226 29525.0 min. sh 223 sh 298 31248.5 min. 224 274
II.4 Review on HPLC chromatograms
In Fig. II.8 to Fig. II.15 HPLC chromatograms are shown of Cercis canadensis, Robinia
pseudoacacia, Acer rubrum and Liquidambar styraciflua leaves (unhydrolysed leaf extracts)which take into account the seasonal differences of May and October leaves. Onlychromatograms showing each species’ major group of secondary compounds are depicted here.The wavelength chosen for detection by UV light was dependent upon the major group ofcharacteristic secondary compounds (tannins at 270 nm, flavonoids at 350 nm).

298 Appendix II Chemical investigations on primary and secondary plant compounds
ret. time (min) name16.4 dihydroxyflavone (Mabry et al., 1970)22.9 flavonol25.1 quercitrin26.6 flavonoid27.2 afzelin28.8 flavonoid
Fig. II.8: Cercis canadensis: May leaves (detection at 350 nm).
ret. time (min) name16.4 dihydroxyflavone (Mabry et al., 1970)22.9 flavonol25.1 quercitrin26.6 flavonoid27.2 afzelin28.8 flavonoid
Fig. II.9: Cercis canadensis: October leaves (detection at 350 nm).

Appendix II Chemical investigations on primary and secondary plant compounds 299
ret. time (min) name24.9 flavone25.7 flavone27.0 flavone28.6 flavone
Fig. II.10: Robinia pseudoacacia: May leaves (detection at 350 nm).
ret. time (min) name23.4 luteolin derivative24.9 flavone27.0 flavone28.6 flavone
Fig. II.11: Robinia pseudoacacia: October leaves (detection at 350 nm).

300 Appendix II Chemical investigations on primary and secondary plant compounds
Based on assignments from Mabry et al. (1970), the most common aglycone skeleton in R.
pseudoacacia flavones (Fig. II.10 and Fig. II.11) is the 4’,5,7-trihydroxyflavone, which maydifferently be derived.
ret. time (min) name20.3 gallic acid derivative
Fig. II.12: Acer rubrum: May leaves (detection at 270 nm).
ret. time (min) name19.8 gallic acid derivative
Fig. II.13: Acer rubrum: October leaves (detection at 270 nm).

Appendix II Chemical investigations on primary and secondary plant compounds 301
ret. time (min) name14.5 dihydroxyflavone (Mabry et al., 1970)19.8 flavonoid (tentatively identified as auronol)22.9 flavonol25.1 quercitrin
Fig. II.14: Liquidambar styraciflua: May leaves (detection at 350 nm).
ret. time (min) name19.9 flavonoid (tentatively identified as auronol)21.5 flavonol22.9 flavonol23.4 quercetin derivative25.1 quercitrin
Fig. II.15: Liquidambar styraciflua: October leaves (detection at 350 nm).

302 Appendix II Chemical investigations on primary and secondary plant compounds
II.5 Investigation and characterisation of A. julibrissin leafmucilage
5.1 Linkage analyses of the major monomer monosaccharide units bymeans of methylation analyses and subsequent GC-(EI)MS detection
Methylation analysis and subsequent detection by means of GC-MS analyses revealed theoccurrence of 1,2- and 1,2,4-linked rhamnose as well as 1,4-linked galactose and 1,4-linkedgalacturonic acid units, respectively. Under EI conditions no intact monosaccharide unitsappeared as a molecule radical cation ([M]+ •). In the following, only diagnostic fragments aredepicted.The molecular ions fragmented at their predestined positions between two neighbouringmethoxy groups. The next preferred position for an intramolecular cleavage is generallybetween a neighbouring methoxy and acetoxy group, followed by two neighboured acetoxygroups.
GC-(EI)-MS of 1,2-linked rhamnoseAfter methylation analysis (C.V.2.2) the 1,2-linked rhamnose appeared as 1,2,5-tri-O-acetyl-3,4-di-O-methyl-rhamnitol with a molecular weight of 320 Da (its corresponding moleculeradical cation was not detected in the spectrum). The retention time in the (gas) chromatogramwas 12:12 min.
m/z 320 [M]+ • : n.d. (not detected)m/z 189 (39 %) : [fragment C1-C3]+
m/z 131 (64 %) : [fragment C4-C6]+
m/z 129 (100 %) : [189 - CH3COOH]+
m/z 99 (25 %) : [131 - CH3OH]+
m/z 89 (86 %) : [131 - ketene]+
m/z 43 (56 %) : [CH3CO]+
GC-(EI)MS of 1,2,4-linked rhamnoseAfter methylation analysis the 1,2,4-linked rhamnose appeared as 1,2,4,5-tetra-O-acetyl-3-O-methyl-rhamnitol with a molecular weight of 348 Da. The retention time was 13:14 min.
m/z 348 [M]+ • : n.d.m/z 203 (26 %) : [fragment C3-C6]+
m/z 189 (42 %) : [fragment C1-C3]+
m/z 159 (5 %) : [fragment C4-C6]+
m/z 143 (69 %) : [203 - CH3COOH]+
m/z 129 (100 %) : [189 - CH3COOH]+
m/z 43 (50 %) : [CH3CO]+
After the procedure of methylation analysis, only the hydroxyl group in position 3 wasmethylated, all other hydroxyl functions were acetylated. Therefore, the preferred sites for anintramolecular cleavage under EI-conditions are between C2 and C3, and between C3 and C4,respectively.
GC-(EI)MS of 1,4-linked galactoseAfter methylation analysis the 1,4-linked galactose appeared as 1,4,5-tri-O-acetyl-2,3,6-tri-O-methyl-galactitol with a molecular weight of 350 Da. The retention time was 13:42 min.

Appendix II Chemical investigations on primary and secondary plant compounds 303
m/z 350 [M]+ • : n.d.m/z 233 (43 %) : [fragment C3-C6]+
m/z 173 (49 %) : [233 - CH3COOH]+
m/z 131 (26 %) : [173 - ketene]+
m/z 117 (52 %) : [fragment C1-C2]+
m/z 113 (44 %) : [173 - CH3COOH]+
m/z 99 (81 %) : [131 – CH3OH]+
m/z 43 (100 %) : [CH3CO]+
GC-(EI)MS of 1,4-linked galacturonic acidAfter methylation analysis the 1,4-linked galacturonic acid appeared as 1,4,5,6-tetra-O-acetyl-2,3-di-O-methyl-galactitol-6-d2 with a molecular weight of 380 Da. The retention time was14:57 min.
m/z 380 [M]+ • : n.d.m/z 263 (15 %) : [fragment C3-C6]+
m/z 203 (27 %) : [263 - CH3COOH]+
m/z 161 (16 %) : [203 - ketene]+ or fragment C1-C3m/z 129 (74 %) : [161 - CH3OH]+
m/z 117 (51 %) : [fragment C1-C2]+
m/z 87 (73 %) : [129 - ketene]+
m/z 43 (100 %) : [CH3CO]+
5.2 Sequential analyses of oligosaccharide units by means of GC-MS(including MS/MS experiments) and ESI-MS/MS after partialhydrolyses
Partial hydrolysis with TFA at three different concentrations (0.1 N, 1 N, 4 N TFA, seeC.V.2.2) yielded oligosaccharide units (with best results achieved by 4 N TFA), which werereduced with NaBD4 and permethylated. Hence, oligosaccharide-alditol-1-d units wereobtained, which were directly analysed by GC-MS (including MS/MS) and ESI-MS/MSspectrometry.In the ESI-MS, especially the positive mode yielded valuable information.The compositional and linkage analyses were used as a basis to assign the respectivemonosaccharide units to the monomers of the oligosaccharides investigated. Therefore, HexAwas assigned to GalA (galacturonic acid), Hex to Gal (galactose), and dHex to Rha(rhamnose). Under these conditions alditol-1-d moieties constituted the reducing sugarmoieties, respectively.
GC-(EI)-MS experiments
After hydrolysis of an aliquot of purified A. julibrissin leaf mucilage, four units ofoligosaccharides were detected during the GC run (mainly diagnostic fragments are depictedhere):� HexA-dHex-ol-1-d (GalA→ Rha-ol-1-d); retention time: 18:11 min.;� HexA-Hex-ol-1-d (GalA→ Gal-ol-1-d); retention time: 19:06 min.;� a linear tetrasaccharide; retention time: 28:14 min., and� a branched tetrasaccharide; retention time: 29:37 min. The latter substance only appeared
in trace amounts in the GC spectrum.
Sequences were corroborated and verified by ESI-MS/MS experiments (see below).

304 Appendix II Chemical investigations on primary and secondary plant compounds
EI-MS of HexA-dHex-ol-1-d (GalA 1→→→→ 4 Rha-ol-1-d)m/z 233 (61%) : [HexA moiety]+ (terminal HexA)m/z 206 (100 %) : [dHex-ol-1-d moiety]+ (initial dHex)m/z 201 (67 %) : [HexA moiety - CH3OH]+
m/z 174 (12 %) : [dHex-ol-1-d moiety - CH3OH]+
m/z 169 (19 %) : [HexA moiety - 2 CH3OH]+
m/z 142 (59 %) : [dHex-ol-1-d moiety - 2 CH3OH]+
m/z 134 (12 %) : [fragment C1-C3]+ of dHex moietym/z 101 (29 %) : presumably inner-ring fragmentm/z 75 (24 %) :m/z 59 (20 %) : [COOCH3]
+ or [CH(CH3)OCH3]+
Focus on higher masses; m/z 289 is base peakm/z 289 (100 %) : [455 - 134 - CH3OH]+
m/z 257 (98 %) : [455 - 134 - 2 CH3OH]+
As previously mentioned, masses of the deoxyhexose moiety are assigned to rhamnose, whilemasses of the hexuronic acid moiety are assigned to galacturonic acid, which is based on thecompositional analysis. Fragment m/z 134 of the rhamnose moiety indicates a substitution in4 position. Hence, the disaccharide unit is concluded to be GalA 1→ 4 Rha-ol-1-d (MW 455).However, this finding is not contradictory to the results of the methylation analyses, whereespecially 1,2- and to lesser extent 1,2,4-linked rhamnose has been found. Under reactionconditions of the partial hydrolysis, the obviously weaker 2-linkage of the rhamnose iscompletely cleaved before methylation while the more stable 4-linkage of the rhamnosemoiety remained largely unaffected. So, it can be assumed that the GalA 1→ 4 Rha unitoriginates from a branched 1,2,4-linked rhamnose moiety, that was originally furthersubstituted in 2-position.
In the higher mass range, the following weak but important diagnostic fragments could bedetected:
m/z 455 (< 1 %) : [M]+ •
m/z 396 (3 %) : [M - 59]+ with 59 mass units either due toCOOCH3
• or due to CH(CH3)OCH3•
m/z 377 (2 %) : [M - CHDOCH3 - CH3OH]+
m/z 364 (15 %) : [396 - CH3OH]+
m/z 352 (14 %) :m/z 345 (5 %) : [377 - CH3OH]+
m/z 333 (19 %) : [M - C1-C2 fragment of dHex-ol-1-d moiety -CH3OH]+. This excludes substitution at position 2of the rhamnose residue.
m/z 320 (81 %) : [352 - CH3OH]+
m/z 319 (100 %) : [352 - CH3OD]+

Appendix II Chemical investigations on primary and secondary plant compounds 305
EI-MS of HexA-Hex-ol-1-d (GalA 1→→→→ 4 Gal-ol-1-d)m/z 236 (68 %) : [Hex-ol-1-d moiety]+
m/z 233 (86 %) : [HexA moiety]+
m/z 201 (100 %) : [HexA moiety - CH3OH]+
m/z 172 (50 %) : [236 - 2 CH3OH]+
m/z 141 (42 %) : [201 - CH3COOH]+
m/z 101 (47 %) :m/z 75 (40 %) :m/z 59 (10 %) : [COOCH3]
+
m/z 45 (19 %) : [CH2OCH3]+
Focus on higher masses; m/z 296 is base peakm/z 485 (2 %): : [M]+ •
m/z 426 (4 %) : [M - COOCH3]+
m/z 396 (13 %) : [M - fragment C5-C6 of Hex-ol-1-d moiety]+
m/z 395 (29 %) : [M - fragment C1-C2 of Hex-ol-1-d moiety]+
m/z 394 (9 %) : [426 - CH3OH]+
m/z 363 (13 %) : [395 - CH3OH]+
m/z 319 (5 %) : [M - fragment C1-C3 of Hex-ol-1-d moiety -CH3OH]+
m/z 296 (100 %) :From the EI-MS data, the HexA-Hex-ol-1-d unit combined with the results from thecompositional analysis is therefore concluded to be GalA 1→ 4 Gal-ol-1-d (MW 485). Inagreement with the methylation analysis, the linkage in position 4 of the galactose moiety iscorroborated by the fragmentation pattern of the disaccharide unit.

306 Appendix II Chemical investigations on primary and secondary plant compounds
Monitoring the higher masses, the following fragmentation pattern could be found:m/z 395 (100 %) : [M - C1-C2 fragment of Hex-ol-1-d moiety]+
m/z 376 (20 %) :m/z 363 (55 %) : [395 - CH3OH]+
m/z 335 (17 %) :m/z 319 (29 %) : [M - C1-C3 fragment of Hex-ol-1-d moiety -
CH3OH]+
m/z 307 (60 %) : [335 - CO]+
EI-MS of a HexA-dHex- unit, withHexA being terminal, and dHex fragmenting within the chain (not initially)
m/z 407 (<1 %) : [HexA-dHex]+ with HexA being terminalm/z 375 (6 %) : [HexA-dHex - CH3OH]+
m/z 233 (60%) : [HexA moiety]+ (terminal HexA)m/z 206 (100 %) : [dHex-ol-1-d moiety]+
m/z 201 (58 %) : [HexA moiety - CH3OH]+
m/z 169 (16 %) : [HexA moiety - 2 CH3OH]+
m/z 142 (23 %) :m/z 111 (16 %) :m/z 75 (12 %) :m/z 59 (6 %) : [COOCH3]
+ or [CH(CH3)OCH3]+
After monitoring higher masses, the following could be found:m/z 407 (6 %) : [HexA-dHex]+
m/z 375 (100 %) : [407 - CH3OH]+
m/z 343 (32 %) : [375 - CH3OH]+
Fragment m/z 407 indicates GalA → Rha as repeating unit.
EI-MS of HexA-dHex-HexA-dHex-ol-1-d as linear tetrasaccharide unit
The molecule radical cation [M]+ • with a mass of 831 Da was not detectable in the spectrum.m/z 697 (8 %) : [M - C1-C3 fragment of dHex-ol-1-d moiety]+
m/z 658 (100 %) :m/z 657 (95 %) : [M - dHex moiety]+ • with dHex being within the
chain, not initialm/z 638 (50 %) :m/z 625 (31 %) : [M - dHex-ol-1-d moiety]+
m/z 623 (43 %) :m/z 609 (20 %) : [HexA-dHex-HexA- moiety]+
m/z 595 (20 %) :m/z 593 (16 %) : [625 - CH3OH]+
The linear tetrasaccharide is concluded to be a GalA→ Rha→ GalA→ Rha-ol-1-d unit. Lossof 134 mass units from the molecule radical cation corresponding to fragment C1-C3 of theinitial dHex-ol-1-d moiety indicates a 4-linkage of this rhamnose moiety. No 1,4-linkage wasfound for rhamnose during the methylation analysis, therefore the 2-linkage may have beencleaved before detection by mass spectrometry. However, as noted in the methylationanalyses, the largest peak in the GC spectrum originated from 1,2-linked rhamnose, therhamnose moiety within the chain is thought to be 1,2-linked. Hence, it is reasonable toconclude that the sequence consists of 1,4-linked galacturonic acid, 1,2-linked rhamnose and abranched rhamnose moiety as the initial saccharide unit.

Appendix II Chemical investigations on primary and secondary plant compounds 307
EI-MS of a HexA-Hex-(HexA)-dHex-ol-1-d as branched tetrasaccharide unit
The molecule radical cation [M]+ • exhibits a molecular weight of 877 Da and is not visible inthe mass spectrum.
m/z 628 (4 %) : [HexA-Hex-dHex-ol-1-d unit]+
m/z 424 (40 %) : [HexA-dHex-ol-1-d]+ side chainm/z 265 (12 %) :m/z 233 (100 %) : [HexA moiety]+ (terminal HexA)m/z 201 (77 %) : [HexA moiety - CH3OH]+
m/z 160 (31 %) :m/z 141 (14 %) :m/z 111 (19 %) :m/z 88 (24 %) :m/z 44 (10 %) : [CO2]
+ •
ESI-MS (positive mode)
The following masses occurred in the ESI-MS spectrum following hydrolysis with 4 N TFA,reduction with NaBD4 and permethylation. MS/MS experiments were performed tocorroborate the sequences assigned. All masses corresponded to the respective sodiumadducts.
233- CH3OH
201
233
HexA1-O-
4Hex
1-O-
2dHex-ol-1-d
628
204
424
O
1HexA
4
Fig. II.17: Fragmentation pattern of a branched tetrasaccharide unit under EI conditions.Types of linkage are based on methylation analyses, and may be reversed at the branched site.
HexA1-O-
2dHex
1-O-
4HexA
1-O-
4CH
174
233 609
218
625- CH3OH
593
CHOCH3
CH3
CHOCH3
CHOCH3
1CHDOCH3
206
134
Fig. II.16: Fragmentation pattern of the linear tetrasaccharide unit HexA-dHex-HexA-dHex-ol-1-d under EI conditions.Types of linkage within the chain are based on methylation analyses.

308 Appendix II Chemical investigations on primary and secondary plant compounds
Detection of linear saccharide unitsm/z 1654 (4 %) : [HexA-dHex-(HexA-dHex)2-HexA-dHex-ol-1d +
Na]+; [M1 + Na]+
m/z 1262 (1 %) : [HexA-dHex-HexA-dHex-HexA-dHex-ol-1d +Na]+; [M2 + Na]+
m/z 900 (1 %) : [HexA-Hex-HexA-dHex-ol-1-d + Na]+;[M3 + Na]+
m/z 870 (8 %) : [HexA-dHex-HexA-dHex-ol-1-d + Na]+;[M4 + Na]+
m/z 508 (100 %) : [HexA-Hex-ol-1-d + Na]+; [M5 + Na]+
m/z 478 (66 %) : [HexA-dHex-ol-1-d + Na]+; [M6 + Na]+
MS/MS experiments corroborated the occurrence of following sequences:
MS/MS of mass 1262 [M2 + Na]+
m/z 821 (18 %) : [HexA-dHex-HexA-dHex unit - H2O + Na]+
m/z 464 (100 %) : [HexA-dHex-ol-1d + Na]+ with HexA not beingterminal
m/z 429 (50 %) : [HexA-dHex - H2O + Na]+
M2 is concluded to consist of the sequence HexA-dHex-HexA-dHex-HexA-dHex-ol-1-d aslinear oligosaccharide unit (MW 1239). For masses generated in the ESI spectrum seeFig. II.18.
MS/MS of mass 870 [M4 + Na]+
m/z 464 (100 %) : [HexA-dHex-ol-1d + Na]+ with HexA not beingterminal
m/z 429 (22 %) : [HexA-dHex - H2O + Na]+
m/z 397 (2 %) :m/z 273 (2 %) : [HexA + Na]+ HexA being terminal
Measurement with m/z 397 as base peakm/z 397 (100 %) :m/z 273 (70 %) : [HexA + Na]+ HexA being terminalm/z 246 (51 %) : [dHex-ol-1-d + Na]+
HexA1-O-
2dHex
1-O-
4HexA
1-O-
2dHex
1-O-
4HexA
1-O-dHex-ol-1-d
464 246
- H2O
456
447
429
839
- H2O
821
Fig. II.18: Fragmentation pattern of a linear hexasaccharide, indicates [HexA-dHex]n is arepeating basic structure. The sodium adduct of the molecule ion [M2 + Na]+,exhibits the mass m/z 1262. Likewise, all masses indicated, correspond tohydroxylated ions with sodium as adduct.Types of linkage are based on methylation analyses.

Appendix II Chemical investigations on primary and secondary plant compounds 309
MS/MS of mass 508 [M5 + Na]+
m/z 276 (70 %) : [Hex-ol-1-d Na]+
m/z 273 (39 %) : [HexA + Na]+
m/z 228 (100 %) : 246 - H2OMS/MS of mass 478 [M6 + Na]+
m/z 273 (100 %) : [HexA + Na]+
m/z 255 (19 %) : [HexA - H2O + Na]+
m/z 246 (44 %) : [dHex-ol-1-d + Na]+
HexA-Hex-(HexA)-dHex-ol-1-d as branched oligosaccharide unit(compare Fig. II.17)
MS/MS of mass 900 [M3 + Na]+
m/z 668 (14 %) : [M - HexA + Na]+
m/z 464 (100 %) : [M - HexA-Hex + Na]+
m/z 273 (11 %) : [HexA + Na]+
HexA-dHex as repeating unit
In agreement with the results from GC-MS, HexA-dHex (GalA→ Rha) was found to occur asrepeating unit, which corresponds to a mass difference of 392 units, respectively:
m/z 1654 (2 %), 1262 (18 %), 870 (100 %)m/z 1292 (2 %), 900 (32 %)
It should be further noted that the linkage between galacturonic acid and rhamnose (GalA-Rha) is purported to be more stable than rhamnose to galacturonic acid (Rha-GalA), as areduced galacturonic acid has never been found as an initial sugar moiety of oligosaccharideunits.
HexA1-O-
2dHex
1-O-
4HexA
1-O-dHex-ol-1-d
464 246
273 665447
- H2O
429
Fig. II.19: Fragmentation pattern of [M4 + Na]+, m/z 870. Masses depicted correspond tosodium adducts of hydroxylated ions.Types of linkage are based on methylation analyses.
HexA1-O-
4Hex
1-O-
2dHex-o l-1-d
464
477273
668
273O
1HexA
4
Fig. II.20: Fragmentation pattern of [M3 + Na]+, m/z 900, a branched tetrasaccharide. Allmasses indicated correspond to hydroxylated ions with sodium as adduct.Evidence for the occurrence of branching points.Types of linkage are based on methylation analyses, and may be reversed at the branched site.

310 Curriculum vitae
Curriculum vitae
Name: Annette AbhauDate of birth: 07.03.1966Native town: Mülheim a. d. RuhrParents: Heinz Abhau
Johanna Abhau, nee Schmidt
School education1972 - 1975 Städt. Gemeinschaftsgrundschule am Oemberg in Mülheim a. d. Ruhr
(“Municipal Primary Interdenominational School Oemberg”)
1975 - 1985 Städt. Gymnasium Broich in Mülheim a. d. Ruhr(“Municipal Gymnasium Broich”)
02.05.1985 Abitur (school-leaving exam)
Practical training09.04.1984 - 29.04.1984 Zoologischer Garten Hannover (Zoological Gardens Hanover)
University education01.10.1985 - 31.03.1991 The study of pharmacy at the Heinrich-Heine-Universität Düsseldorf
01.09.1988 1. Staatsexamen (State examination)
04.09.1990 2. Staatsexamen (State examination)
15.01.1992 3. Staatsexamen (State examination)
05.02.1992 Receipt of the “Approbation als Apothekerin” (certificate aspharmacist)
06.04.1993 Receipt of the “Diplom als Diplompharmazeut” at the Martin-Luther-Universität Halle-Wittenberg
Practical year before being certified01.10.1990 - 31.03.1991 St.-Florian Apotheke (Pharmacy) in Düsseldorf
01.04.1991 - 30.09.1991 Institut für Pharmazeutische Biologie der Philipps-Universität inMarburg / Lahn, supervised by Prof. Dr. J. HölzlDuring this time doing a diploma with the subject:“Methode zur Bestimmung der Sesquiterpenlactone beiReihenuntersuchungen von Arnica montana L.”(“Development of a method to determine sesquiterpenlactones inArnica montana L. for series investigations”)
Practical training during the university studies at10.03.1986 - 21.03.1986 Institut für Pflanzenbau und Pflanzenzüchtung der Justus-Liebig-
Universität Giessen, Abteilung Arznei- und Gewürzpflanzenbau,Versuchsstation Rauischholzhausen, supervised by Prof. Dr. A. Vömel
04.08.1986 - 31.08.1986 the WALA-Heilmittel GmbH in Eckwälden / Bad Boll
24.05.1988 - 08.06.1988 the Hospital-Pharmacy of the Klinikum Kalkweg and Bertha-Krankenhaus Rheinhausen, Städtische Kliniken Duisburg(“Municipal Clinics of Duisburg”)

Curriculum vitae 311
07.08.1989 - 19.08.1989 Institut für Pharmazeutische Biologie der Philipps-Universität inMarburg / Lahn, supervised by Prof. Dr. J. Hölzl
During the entire time of the studies I worked as temporary substitute at the Paracelsus-Apotheke (Pharmacy) in Duisburg.
Professional career01.02.1992 - 30.09.1992 Bavier-Apotheke (Pharmacy) in Erkrath
16.01.1993 - 31.12.1993 Apotheke Kattenesch (Pharmacy) in Bremen
01.01.1994 - 01.07.1997 Schauburg-Apotheke (Pharmacy) in Delmenhorst
15.07.1997 - 31.03.1998 Apotheke Kattenesch (Pharmacy) in Bremen
01.04.1998 - 05.07.2002 Victoria-Apotheke (Pharmacy) in Bremen
since 08.1999 teaching pharmacology to midwives at the School Centre “Ev.-luth.Diakonissen Mutterhaus in Rotenburg / Wümme, Staatlich anerkannteHebammenschule”(adaptation course for midwives from foreign countries).
since 01.02.2003 Schloss-Apotheke (Pharmacy) in Syke
Further education17.01.1997 – 26.10.1997 Further education at the “Apothekerkammer Nordrhein” to a nutrition
adviser
28.01.1998 Receipt of the certificate as nutrition adviser
PhD-project01.01.1993 - 19.06.1993 Explored various subjects for a thesis with regular half-weekly stays at
the Deutsches Primatenzentrum in Göttingen (German PrimateCentre): Studying primatology and observing Macaca silenus.
19.06.1993 - 19.07.1993 Sojourn to Madagascar. During this time I visited the research camp ofJoyce Powzyk at the Matadia National Parc. We observed free rangingIndri indri and Propithecus diadema diadema. In the field I also metProf. Dr. K. Glander, who invited me to the Duke University LemurCenter to study the feeding behaviour of Propithecus verreauxi.
12.1993 Prof. Dr. T. Hartmann (Institut für Pharmazeutische Biologie derTechnischen Universität Braunschweig), promised to supervise thepharmaceutical part of my project.
02.05.1994 - 24.05.1994 Observation of the feeding behaviour of Propithecus verreauxi
coquereli at the Duke University Lemur Center, N.C., USA.
01.03.1997 - 15.06.1997 Chemical analyses at the Institut für Pharmazeutische Biologie derTechnischen Universität Braunschweig, supervised by Prof. Dr. T.Hartmann, and at the Leibniz-Institut für Pflanzenbiochemie, IPB,Halle / Saale, supervised by Prof. Dr. D. Strack.
30.09.1997 - 09.10.1997 Follow-up study at the Duke University Lemur Center, N.C., USA.
23.09.1998 - 12.10.1998 Chemical analyses at the IPB, Halle / Saale.
Private career21.06.1996 Marriage to Dipl. phys. Hermann Mathias Abhau, nee Schulz-Methke05.07.1999 Birth of our daughter Anika Florence Abhau
2001 Building of our house and planting the garden19.10.2003 Birth of our second daughter Melissa Katharina Abhau