variability of community structure of copepoda related to el nino 1982-83 and 1987-88 along the west...
TRANSCRIPT
Variability of community structure of Copepoda related
to El Niño 1982-83 and 1987-88 along
the west coast of Baja California Peninsula, Mexico
SERGIO HERNANDEZ, TRUJILLO
Plankton Department (CIClMAR-IPN. COFFIA & BDD
Recipient). PO Box 592, 23000 La Paz. Baja Califomia Sur,
Mexico (e-mail: [email protected])
ABSTRACT
Copepod community structure and abundance of themost abundant species were studied during 15 cruisesmade between 1982 and 1989 along the west coast of theBaja Califomia Peninsula, Mexico. The number ofspecies and species diversity (Shannon's index) for eachsampling station of the oceanographic cruises wereobtained. Though the zone was dominated during theyear by the tropical copepod component, similaritiesbetween El Niño 1982-83 and 1987-88 were observed.Tropical-equatorial populations were added to theregular tropical composition (50% ) of the community ofcopepods resulting in a wide distribution of thosepopulations in 1982-83 and in 1987-88. The scenarioin 1984-89 (without 1987-88) was significantly differ-ent from both El Niños because of the sea surfacetemperature, the species diversity, and the tropicalcopepod component, although 1982 was similar to 1985in diversity index and number of species. Environmen-tal conditions prevailing along the west coast of BajaCalifomia during El Niño indicate that in 1982-83 theeffect on the copepod community was greater thanduring the 1987-88 event.
Key words: Baja Califomia, copepod community,diversity, El Niño
INTRODUCTION
El Niño refers to a periodic climatic fluctuation of trie
sea surface temperatures (SST) centred in the equa-
torial Pacific. The most obvious sign is warming water
off the coast of Ecuador and Peru, which generally
occurs within a few months of Christmas. The nameEl Niño (Christ Child) was originally simply the localname for the seasonal increase in the temperature ofcoastal waters that occurs around Christmas (Brownet al., 1993). Wolter and Timlin (1993) have devel-oped the multivariate ENSO index (MEI) using thesix main observed variables over the tropical Pacific asan analytical tool to detect the variability oninterannual time scales of the El Niño-SouthernOscillation (ENSO) for the 1950-1993 period,updated to 1998 (K. Wolter, pers. comm.).
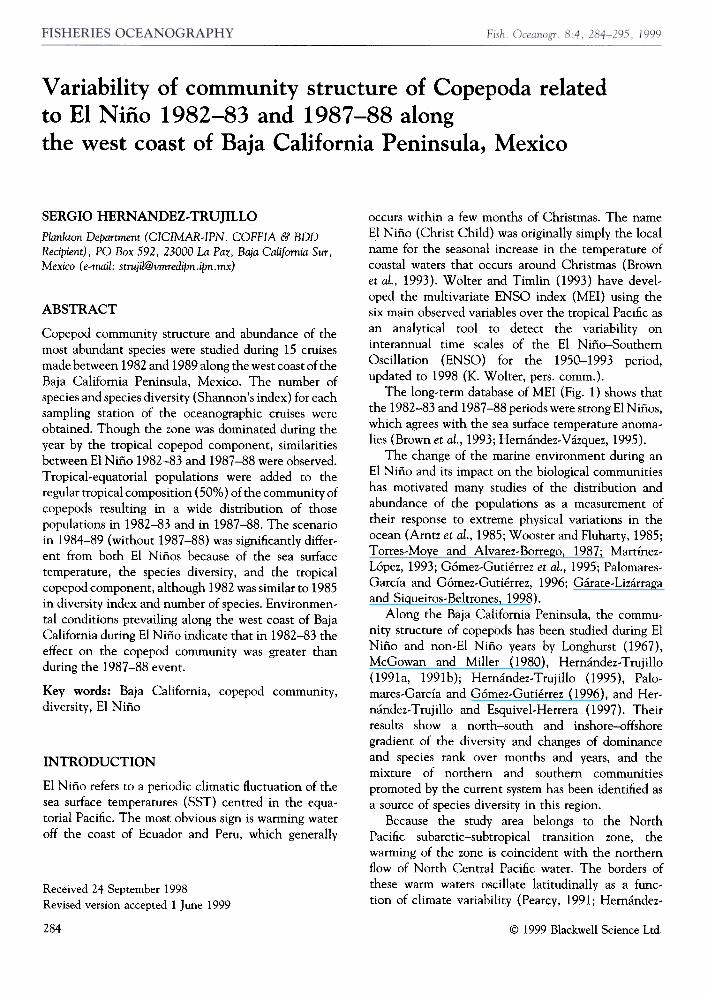
The long-term database of MEI (Fig. 1) shows thatthe 1982-83 and 1987-88 periods were strong El Niños,which agrees with the sea surface temperature anoma-lies (Brown et al., 1993; Hernández-Vázquez, 1995).
The change of the marine environment during anEl N iño and its impact on the biological communitieshas motivated many studies of the distribution andabundance of the populations as a measurement oftheir response to extreme physical variations in theocean (Arntz et al., 1985; Wooster and Fluharty, 1985;Torres-Moye and Alvarez-Borrego, 1987; Martínez-López, 1993; Gómez-Gutiérrez et al., 1995; Palomares-García and Gómez-Gutiérrez, 1996; Gárate-Lizárragaand Siqueiros-Beltrones, 1998).
Along the Baja California Peninsula, the commu-nity structure of copepods has been studied during ElNiño and non-El Niño years by Longhurst (1967),McGowan and Miller (1980), Hernández- Trujillo(1991a, 1991b); Hernández- Trujillo (1995), Palo-mares-García and Gómez-Gutiérrez (1996), and Her-nández- Trujillo and Esquivel-Herrera (1997). Theirresults show a north-south and inshore-offshoregradient of the diversity and changes of dominanceand species rank over months and years, and themixture of northern and southern communitiespromoted by the current system has been identified asa source of species diversity in this region.
Because the study area belongs to the NorthPacific subarctic-subtropical transition zone, thewarming of the zone is coincident with the northernflow of North Central Pacific water. The borders ofthese warm waters oscillate latitudinally as a func-tion of climate variability (Pearcy, 1991; Hernández-
Received 24 September 1998
Revised version accepted 1 June 1999
284 @ 1999 Blackwell Science Ltd.
Copepoda and El Niño 1982-83 and 1987-88 285
Figure I. Multivariate ENSO lndex for the 1950-1998 period.
4
3Q)L.::J
tmo.
~ 1-oQ)N.-
-oL.m
-o -1c:m
+-'00
~
2 +
o
-2
-3
Trujillo, 1991a, c; Lavaniegos et al., 1998). Differentwater types meet and mix in the southem BajaCalifomia area; that well-known feature has beenidentified as promoting copepod species richness(Longhurst, 1967; Palomares-García and Gómez-Gutiérrez, 1996). However, the copepod fauna sim-ilarity between El Niño and non-El Niño periods isunknown.
This study, based on zooplankton samples obtainedduring different years ( 1982-1989) and climaticconditions at the Baja Califomia area, examines (a)how did the copepod fauna in El Niño 1982-83 differfrom El Niño 1987-88, and (b) whether the two ElNiño events were more similar to each other incopepod fauna than they were to intervening non-ElNiño years.
research vessels BIO El Puma, B.H. Mariano Mat-amoros, and B.H. Altair. The sampling protocol wasfrom Smith and Richardson (1977) using an obliquetow of bongo nets having digital tlow meters and meshof 333 and 505 J1.m. The contents of the 505 J1.m netwas analysed following the procedure of sorting,identification, and counting of adult copepodsreported by Hemández- Trujillo (1991a). The seasurface temperature (SST) data were collected at eachsampling station using an Inter-Ocean CTD.
To determine the structure and variation of thecommunity of copepods, the Shannon index (H') ofdiversity (Pielou, 1967; Omori and Ikeda, 1992) wascalculated for each station; to determine how evenlythe total number of individuals was distributed amongthe species present, the evenness (E) of the Shannonindex was calculated (Pielou, 1969); E is constrainedbetween 0 and 1.0 with 1.0 signifying that all speciesare equally abundant. A rank-abundance plot wasmade to present species abundance data (Magurran,1988) and to provide a more direct comparison be-tween communities of copepods with different num-bers of species during the period of the study. One-way
MA TERIAL AND METHODS
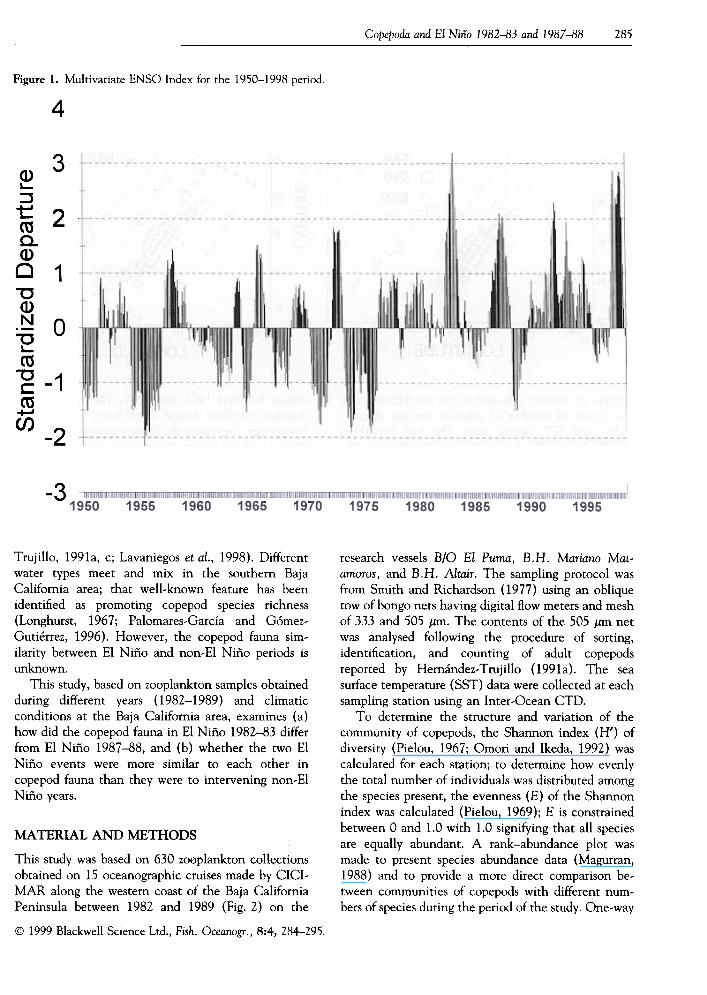
This study was based on 630 zooplankton collectionsobtained on 15 oceanographic cruises made by CICI-MAR along the westem coast of the Baja CalifomiaPeninsula between 1982 and 1989 (Fig. 2) on the
@ 1999 Blackwell Science Ltd., Fish. Oceanogr., 8:4, 284-295.
286 s. Hemandez- Trujillo
Figure 2. Sampling grid of CICIMAR cruises 1982-1989.
+ 8207
:J 8212
,6 8302
O 8305
<) 8309I
( ~~ "
x24- ,22 I 1i8 1i6 1i4 1i2 1io
LONGITUDE
lffi 1 IX>
analysis of variance was used to test the differences inthe means of number of copepod species, diversityindex, and SST among years. The null hypothesistested was no differences of variables by year; thealtemative hypothesis was that there are differences.
T o determine the interannual relations of thediversity index, a principal component analysis (PCA)was applied to a matrix of Shannon indices at eachsampling station. This method was chosen for itsability, as a diagnostic tool, to reduce the multidi-mensional complexity of the observed field to a rela-tively easily visualized low-dimensional representation(Preisendorfer, 1988).
Data of the species composition of the copepodsrecorded in the study area were classified biogeo-graphically according to the criteria in Hemández-Trujillo (1991a, 1991b) The present paper emphasizesthe tropical component of the taxocoenosis.
The data set of the sea surface temperature, cope-pod diversity index, and number of copepod specieswas used to obtain the deviation (D) of each obser-vation (cruise) from the mean (all cruises) as follows:
D = Oí -X, (1
where Oi is the variable value in the ith cruise, and Xis the mean value in the 1982-89 period.
RESULTS
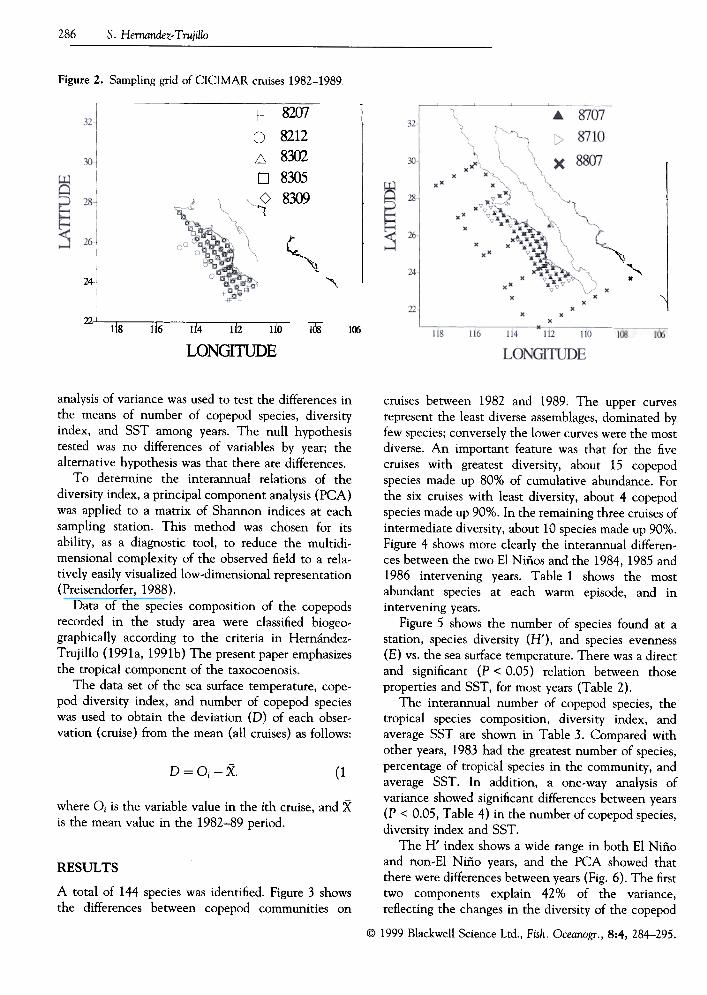
A total of 144 species was identified. Figure 3 shows
the differences between copepod communities on
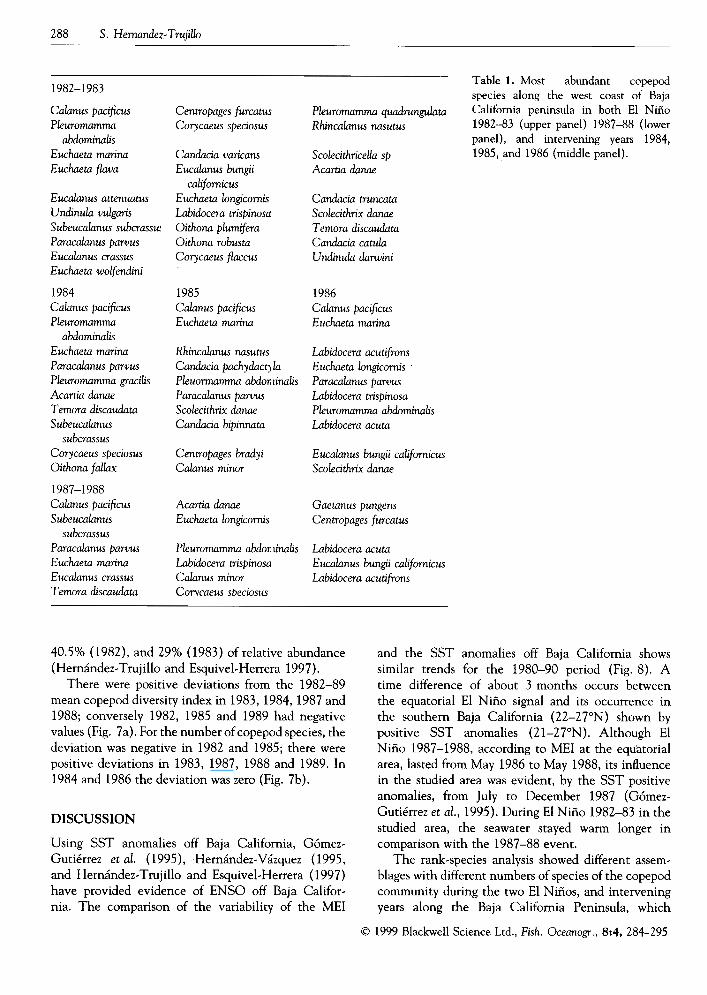
cruises between 1982 and 1989. The upper curvesrepresent the least diverse assemblages, dominated byfew species; conversely the lower curves were the mostdiverse. An important feature was that for the fivecruises with greatest diversity, about 15 copepodspecies made up 80% of cumulative abundance. Forthe six cruises with least diversity , about 4 copepodspecies made up 90%. In the remaining three cruises ofintermediate diversity, about 10 species made up 90%.Figure 4 shows more clearly the interannual differen-ces between the two El Niños and the 1984, 1985 and1986 intervening years. T able 1 shows the mostabundant species at each warm episode, and in
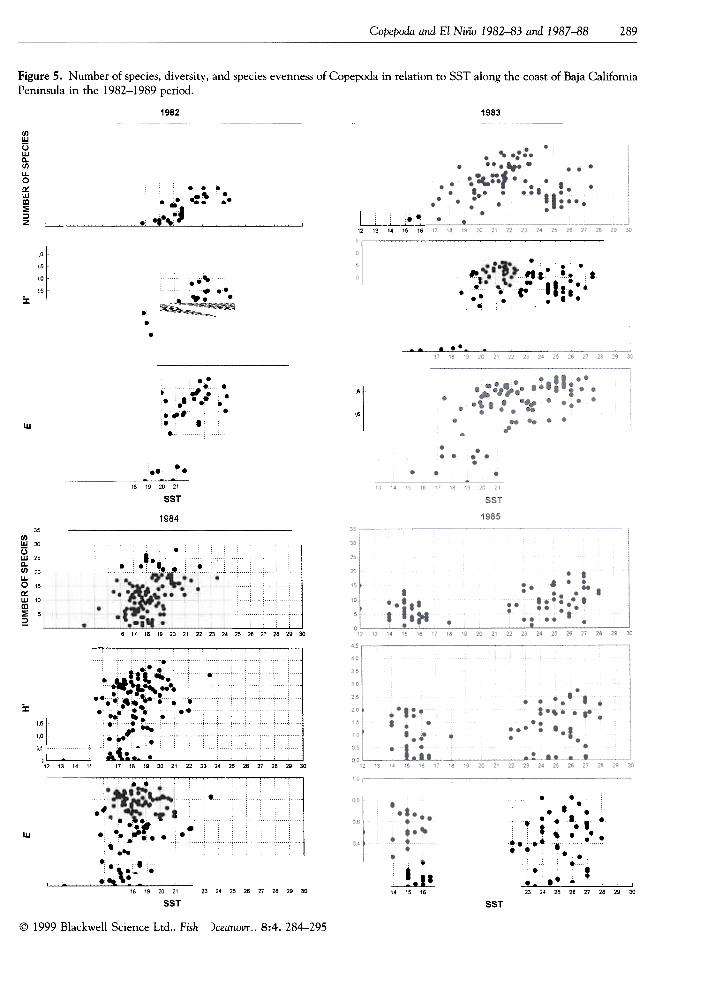
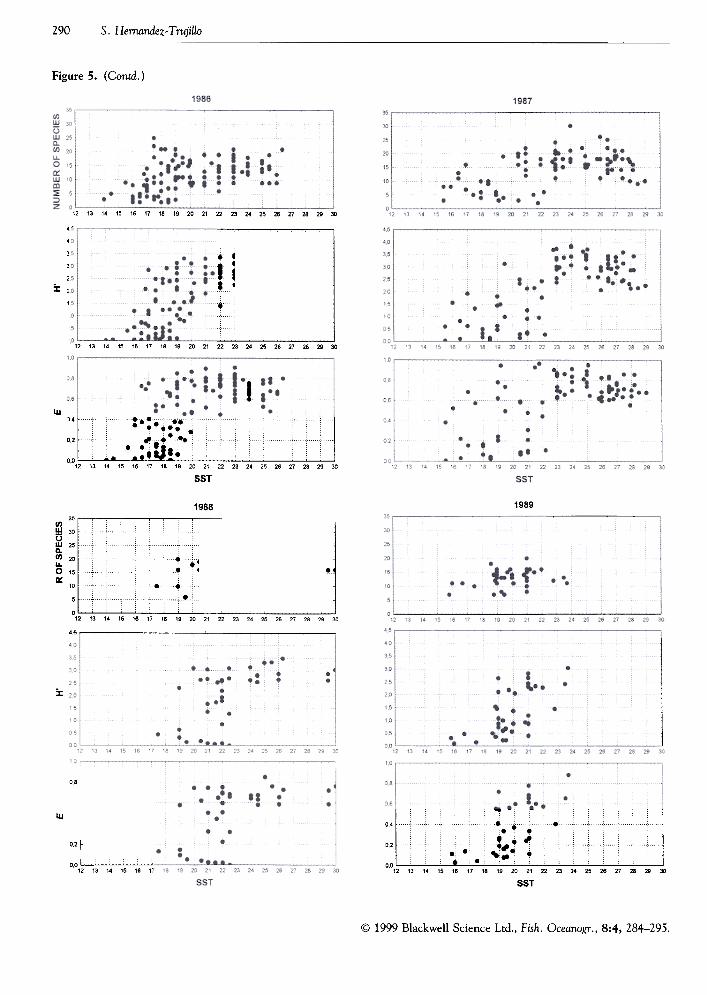
intervening years.Figure 5 shows the number of species found at a
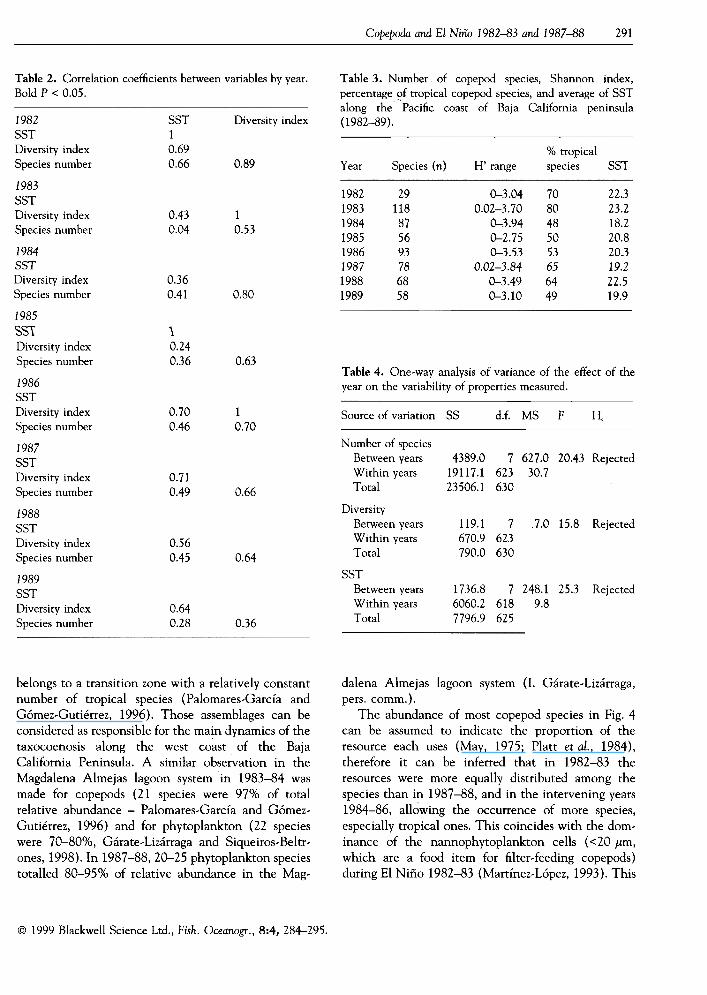
station, species diversity (H'), and species evenness(E) vs. the sea surface temperature. There was a directand significant (P < 0.05) relation between thoseproperties and SST, for most years (Table 2).
The interannual number of copepod species, thetropical species composition, diversity index, andaverage SST are shown in Table 3. Compared withother years, 1983 had the greatest number of species,percentage of tropical species in the community, andaverage SST. In addition, a one-way analysis ofvariance showed significant differences between years(P < 0.05, Table 4) in the number of copepod species,diversity index and SST.
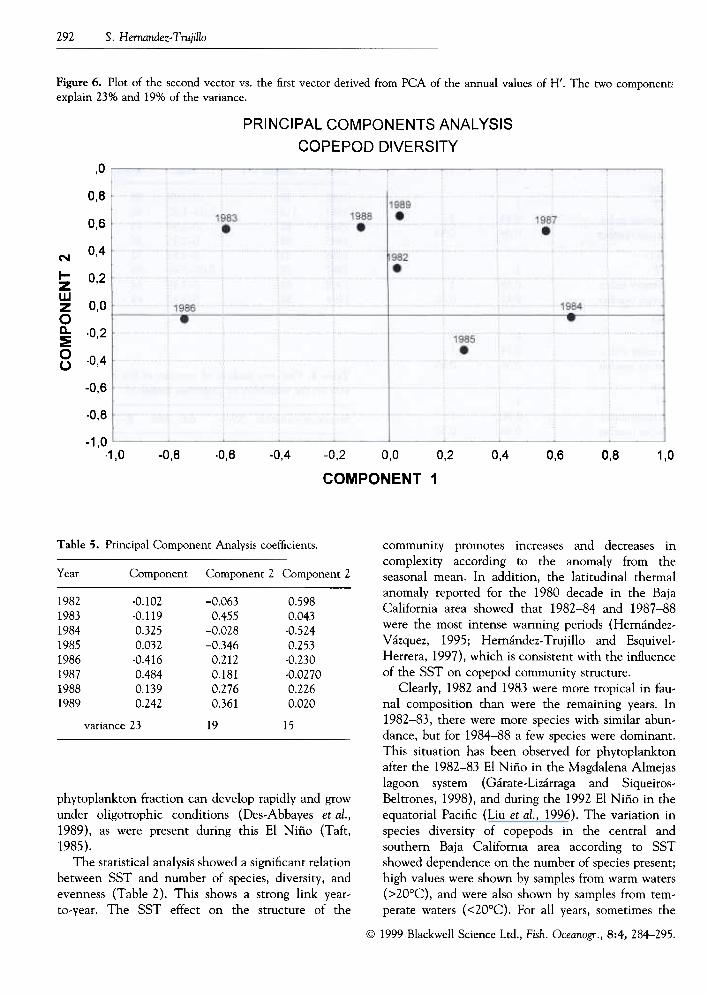
The H' index shows a wide range in both El Niñoand non-El Niño years, and the PCA showed thatthere were differences between years (Fig. 6). The firsttwo components explain 42% of the variance,ret1ecting the changes in the diversity of the copepod
@ 1999 Blackwell Science Ltd., Fish. Oceanogr., 8:4,284-295.
Copepodn and El Niño 1982-83 and 1987-88 287
Figure 3. Rank abundance of copepod species by cruise.
100
80~O)(.)cIU
'OC~
.cIUO)>
:¡:;~~E~
u
60
40
20
o
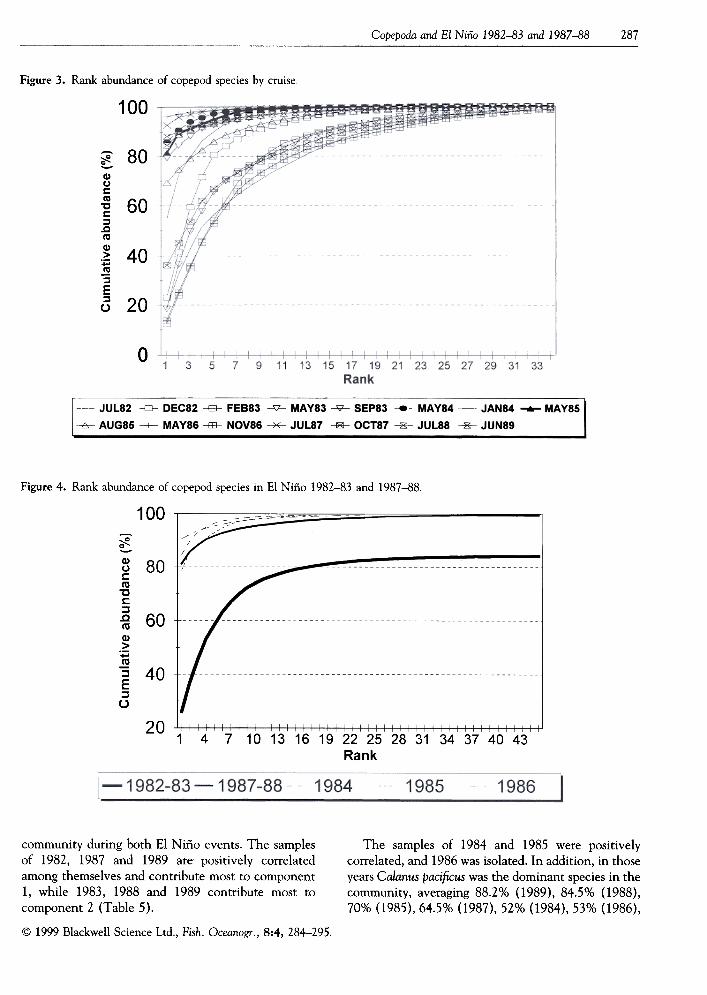
Figure 4. Rank abundance of copepod species in El Niño 1982-83 and 1987-88.
100 ==
:;¡¿:Q-Q)(.)c:!O
-0c::]
.c!OQ)>
~!O:]E:]
U
80
60
40
201 4 7 1013161922252831 34374043
Rank
The samples of 1984 and 1985 were positivelycorrelated, and 1986 was isolated. In addition, in thoseyears Calanus pacificus was the dominant species in thecommunity, averaging 88.2% (1989), 84.5% (1988),70% (1985),64.5% (1987),52% (1984),53% (1986),
community during both El Niño events. The samplesof 1982, 19.87 and 1989 are positively correlatedamong themselves and contribute most to component1, while 1983, 1988 and 1989 contribute most tocomponent 2 (Table 5).
@ 1999 Blackwell Science Ltd., Fish. Oceano)!T., 8:4, 284-295
288 s. Hernandez- Trujillo
Table 1. Most abundant copepodspecies along the west coast of BajaCalifomia peninsula in both El N iño1982-83 (upper panel) 1987-88 (lowerpanel), and intervening years 1984,1985, and 1986 (middle panel).
1982-1983
Calanus pacificus
Pleuromamma
abdominalis
Euchaeta marina
Euchaeta flava
Eucalanus attenuatus
Undinula vulgaris
Subeucalanus subcrassw
Paracalanus parvus
Eucalanus crassus
Euchaeta wolfendini
1984
Calanus pacificus
Pleuromamma
abdominalis
Euchaeta marina
Paracalanus parvus
Pleuromamma gracilis
Acartia di1nae
T emora discaudata
S ubeucalanus
subcrassus
Corycaeus speciosus
Oithona fallax
1987-1988
Calanus pacificus
Subeucalanus
subcrassus
Paracalanus parvus
Euchaeta marina
Eucalanus crassus
T emora discaudata
Centropages furcatus
Corycaeus speciosus
Pleuromamma quadrunguláta
Rhincalánus nasutus
Scolecithricella spAcartia danae
Candacia truncata
Scolecithrix danae
T emora discaudata
Candacia catula
Undinula darwini
1986
Calanus pacificus
Euchaeta marina
¡laninalis
Labidocera acutifrons
Euchaeta longicomis
Paraca~nus parvus
Labidocera trispinosa
Pleuromamma abdominalis
Labidocera acuta
Eucalanus bungii califomicus
Scolecithrix danae
Gaetanus pungens
Centropages furcatus
ninalis Labidocera acuta
Eucalanus bungii califomicus
Labidocera acutifrons
40.5% (1982), and 29% (1983) of relative abundance(Hemández- Trujillo and Esquivel-Herrera 1997).
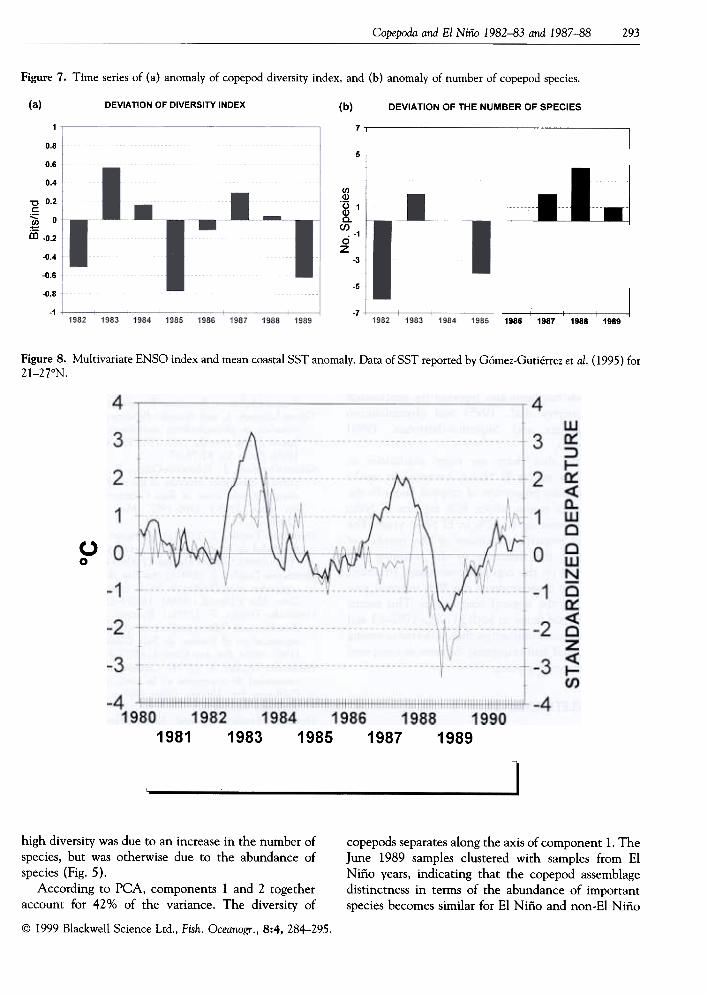
There were positive deviations from the 1982-89mean copepod diversity index in 1983, 1984, 1987 and1988; conversely 1982, 1985 and 1989 had negativevalues (Fig. 7a). For the number of copepod species, thedeviation was negative in 1982 and 1985; there werepositive deviations in 1983, 1987, 1988 and 1989. In1984 and 1986 the deviation was zero (Fig. 7b).
DlSCUSSION
Using SST anomalies off Baja Califomia, Gómez-
Gutiérrez et al. (1995), Hemández-Vázquez (1995,
and Hemández- Trujillo and Esquivel-Herrera (1997)
have provided evidence of ENSO off Baja Califor-
nia. The comparison of the variability of the MEI
and the SST anomalies off Baja Califomia showssimilar trends for the 1980-90 period (Fig. 8). Atime difference of about 3 months occurs betweenthe equatorial El N iño signal and its occurrence inthe southem Baja Califomia (22-27°N) shown bypositive SST anomalies (21-27°N). Although ElNiño 1987-1988, according to MEI at the equatorialarea, lasted from May 1986 to May 1988, its int1uencein the studied area was evident, by the SST positiveanomalies, from July to December 1987 (Gómez-Gutiérrez et al., 1995). During El Niño 1982-83 in thestudied area, the seawater stayed warm longer incomparison with the 1987-88 event.
The rank-species analysis showed different assem-blages with different numbers of species of the copepodcommunity during the two El Niños, and interveningyears along the Baja Califomia Peninsula, which
@ 1999 Blackwell Science Ltd., Fish. Oceanogr.; 8:4, 284-295
Candacia varicans
Euca1anus bungii
califomicusEuchaeta longicomis
Labidocera trispinosa
Oithona plumifera
Oithona robusta
Corycaeus jlaccus
1985
Calanus pacificus
Euchaeta marina
Rhincalanus nasutus
Candacia pachydnct)
Pleuormamma abdor
Paraca1anus parvus
Scolecithrix dnnae
Candacia bipinnata
Centropages bradyiCalanus minor
Acartia dnnae
Euchaeta longicomis
Pleuromamma abdor
Labidocera trisPinosa
Calanus minor
Corvcaeus sbeciosus
Copepoda and El Niño 1982-83 and 1987-88 289
Figure 5. Number of species, diversity, and species evenness of Copepoda in relation to SST along the coast of Baja CalifomiaPeninsula in the 1982-1989 period.
1982 1983
(/)wuw(1.(/)u.o~waJ~:)z
..... .-, .
.c ......
..:, .
: . l.c 8
I. ~
12 13 '4 15 16
~ ;I .,.. .
.~. ..~It/:....; .I.
.
o
5
'O
'5
j:
....'
...c. c.. .
. I.-I ...
...
...:8'. .
..
...
ca
lC6III
....
---'-18 19 20 21
SST
1984
35(/)W 30UW 25no(/) 20...O 15a:
10
~
~c5
1cO
,5 '.I -
)' --
'2 13 14 15 "
.
,., .," ". ".'
.c .
6 17 18 19 20 21 22 23 2. 25 26 27 28 29 30
..;.".
t l .it\;.;:::,~' .
.
'1c 1::'"17 18 19 20 21 22 23 2. 25 26 27 28 29 30
, , , ' , , , -
..-.
,. -K~ .;~.: i;
~~
.'~..~cy..""" o
.. ., .;.
.
". ¡c",,¡"
.
... c..
.., ...8. .
.8 8 8IIJ
,
UJ!14 15 16
.
.......~
.. I 23 24 25
18 19 20 21
SST
23 24 25 2' 27 2' 29 30,
2. 27 26 29 30
SST
@ 1999 Blackwell Science Ltd.. Fish )ceanol!T ..8:4. 284-295
.
I..
..""
s. Hernandez- Trujillo290
Figure 5. (Contd.)
12 13 14 15 16 17 18 19 20 21 22 23 24 25 26 27 28 29 30
45 -
4!
3:
30
2,5
~ 20
1!\
C"Ce ..,"
1 .5 16 17 18 19 20 21 22 23 24 25 26 27 28 29 30
0,8
... .I".."... , ..t....~ .
.c.~':. !...::". :":.:.~.. ;:
...02 ;" , :;";;":;, ...
iJ...00 .
.12 13 ,. 15 15 17 18 19 20 21 22 23 24 25 28 27 28 29 30
SST
I¡¡
19891988
-.. ,- :.c
~ l
"'w 30Ü
~ :: l . ..u. ..
O '5 ...¡.OC 'o. .:
.
: '2 '3 ,. " " '7 " '9
., --,--,-
3'
30
"
:c '0
"
,0
...
~~....
,.,.
.."-
... "...
,.,..
.
.,)...,. ~ .
'.!8 .
..:..-.,.
.
08
IIJ
:':, -8 .
0,4 8.8-c8 8
::12 13 14 15 16 17 '8 19 20 21 22 23 24 2. 26 27 28 29 30
SST
o2f
00 I
12 '3 '4 15 ,. "
@ 1999 Blackwell Science Ltd., Fish. Oceanogr., 8:4, 284-295.
Copepoda and El Niño 1982-83 and 1987-88 291
Table 2. Correlation coefficients between variables by year.
Bold p < 0.05.
Table 3. Number of copepod species, Shannon index,percentage of tropical copepod species, and average of SSTalong the Pacific coast of Baja Califomia peninsula
(1982-89).SST
1
0.69
0.66
Diversity index
% ttopical
species0.89 SSTYear Species (n) H' range
1982
1983
1984
1985
1986
1987
1988
1989
29118875693786858
O-~
0.02-3
o-~
O-¡
o-~
0.02-3
0-3
0-3
7080485053656449
22.3
23.2
18.2
20.8
20.3
19.2
22.5
19.9
0.43
0.04
10.53
0.36
0.41 0.80
\
0.24
0.36
1982
SST
Diversity index
Species number
1983
SST
Diversity index
Species number
1984SST
Diversity index
Species number
1985
SS1
Diversity index
Species number 0.63Table 4. One-way analysis of variance of the effect of the
year on the variability of properties measured.1986
SST
Diversity index
Species number
0.700.46
1
0.70
Source of variation SS d.f. MS F H,
Number of speciesBetween yearsWithin yearsTotal
4389.019117.123506.1
7 627.0 20.43 Rejected
623 30.7
6300.710.49 0.66
DiversityBetween years
Within years
Total
SST
Between years
Within years
Total
119.1 7
670.9 623
790.0 630
7.0 15.8 Rejected
0.560.45 0.64
1736.8 7 248.16060.2 618 9.87796.9 625
25.3 Rejected
1987
SST
Diversiry index
Species number
1988
SST
Diversity index
Species number
1989
SST
Diversity index
Species number
0.640.28 0.36
belongs to a transition zone with a relatively constantnumber of tropical species (Palomares-García andGómez-Gutiérrez, 1996). Those assemblages can beconsidered as responsible for the main dynamics of thetaxocoenosis along the west coast of the BajaCalifornia Peninsula. A similar observation in theMagdalena Almejas lagoon system in 1983-84 wasmade for copepods (21 species were 97% of totalrelative abundance -Palomares-García and Gómez-Gutiérrez, 1996) and for phytoplankton (22 specieswere 70-80%, Gárate-Lizárraga and Siqueiros-Beltr-ones, 1998). In 1987-88,20-25 phytoplankton speciestotalled 80-95% of relative abundance in the Mag-
dalena Almejas lagoon system (I. Gárate-Lizárraga,
pers. comm.).The abundance of most copepod species in Fig. 4
can be assumed to indicate the proportion of theresource each uses (May, 1975; Platt et al., 1984),therefore it can be inferred that in 1982-83 theresources were more equally distributed among thespecies than in 1987-88, and in the intervening years1984-86, allowing the occurrence of more species,especially tropical ones. This coincides with the dom-inance of the nannophytoplankton cells ( <20 .um,which are a food item for filter-feeding copepods)during El Niño 1982-83 (Martínez-López, 1993). This
@ 1999 Blackwell Science Ltd., Fish. OceanogT., 8:4, 284-295.
~.04
1.70
~.94
~.75
~.53
1.84
,.49
,.10
292 s. Hernandez-Trujillo
Figure 6. Plot of the second vector vs. the first vector derived from PCA of the annual values of H'. The two component!explain 23% and 19% of the variance.
PRINCIPAL COMPONENTS ANAL YSIS
COPEPOD DIVERSITY
,o
0,8
0,6
0,4N
1-ZwZono~oU
0,2
0,0
.0,2
.0,4
-0,6
-08,
-1,010, -0,8 .06I -04I -0,2 0,0
COMPONENT 1
0,2 0,4 0,6 0,8 1,0
Table 5. Principal Componenr Analysis coefficients.
Year Component 2 Component 2
0.598
0.043
.0.524
0.253
.0.230
.0.0270
0.226
0.020
Component
1982
1983
1984
1985
1986
1987
1988
1989
-0.102-0.1190.3250.032-0.4160.4840.1390.242
-o.
0.
-0.
-0.
0.
0.
0.
0.
19variance 23 15
phytoplankton fraction can develop rapidly and growunder oligotrophic conditions (Des-Abbayes et al.,1989), as were present during this El Niño (Taft,
1985).The statistical analysis showed a significant relation
between SST and number of species, diversity, andevenness (Table 2). This shows a strong link year-to-year. The SST effect on the structure of the
community promotes increases and decreases incomplexity according to the anomaly from theseasonal mean. In addition, the latitudinal thermalanomaly reported for the 1980 decade in the BajaCalifornia area showed that 1982-84 and 1987-88were the most intense warming periods (Hernández-Vázquez, 1995; Hernández- Trujillo and Esquivel-Herrera, 1997), which is consistent with the inf1uenceof the SST on copepod community structure.
Clearly, 1982 and 1983 were more tropical in fau-nal composition than were the remaining years. In1982-83, there were more species with similar abun-dance, but for 1984-88 a few species were dominant.This situation has been observed for phytoplanktonafter the 1982-83 El Niño in the Magdalena Almejaslagoon system (Gárate-Lizárraga and Siqueiros-Beltrones, 1998), and during the 1992 El Niño in theequatorial Pacific (Liu et al., 1996). The variation inspecies diversity of copepods in the central andsouthern Baja California area according to SSTshowed dependence on the number of species present;high values were shown by samples from warm waters(>20°C), and were also shown by samples from tem-perate waters ( <20°C). For all years, sometimes the
@ 1999 Blackwell Science Ltd., Fish. Oceanogr., 8:4,284-295.
063
455
028
346
212
181
276
361
Copepoda and El Niño 1982-83 and 1987-88 293
Figure 7. Time series of (a) anomaly of copepod diversity index, and (b) anomaly of number of copepod species.
(a) DEVIATION OF DIVERSITY INDEX (b) DEVIATION OF THE NUMBER OF SPECIES
0.8
0.6
0.4
-0 0.2
!::
~ °
i:ñ -0.2
-0.4
~.6
-0.8
-1
7
5
(I)Q)
.u 1Q)o.
~ -1O
Z-3
-5
I I I I1986 1987 1988 1989
-7
Figure 8. Multivariate ENSO index and mean coastal SST anomaly. Data of SST reported by Gómez-Gutiérrez et al. (1995) for21-27°N.
uo
1981 1983 1985 1987 1989
-MEI -SST ANOMAL y
copepods separates along the axis of component 1. TheJune 1989 samples clustered with samples from ElNiño years, indicating that the copepod assemblagedistinctness in terms of the abundance of imponantspecies becomes similar for El Niño and non-El Niño
high diversity was due to an increase in the number ofspecies, but was otherwise due to the abundance of
species (Fig. 5).According to PCA, components 1 and 2 together
account for 42% of the variance. The diversity of
@ 1999 Blackwell Science Ltd.. Fish. Oceanogr., 8:4, 284-295.
294 s. Hernandez-Trujillo
December-January 1950 to July-August 1998. Thanksto Dr Michael Mullin for his editorial help. Thanks toDr Ellis Glazier for editing this English-language text.
at the studied area. In Fig. 6 the lower left and rightquadrants consist of samples from non-El Niño years(1984, 1985 and 1986), which have in common anequivalent proportion of tropical species (about 50%),zero or negative deviation from the mean number ofspecies, and mostly negative deviations of the Shan-non diversity index.
According to Hemández- Trujillo and Esquivel-Herrera (1997), high copepod diversity is related tothe invasion of Central Pacific and Tropical EastemPacific currents, and low diversity is caused by theCalifomia Current ( CC) flowing southward. McGo-wan and Walker (1993) attribute high zooplanktondiversity to the changes associated with frontal sub-arctic and subtropical zones, the borders of which aremodified by flow dynamics (Roden, 1991).
The environmental conditions prevailing during ElNiño 1982-83 promoted more transport of copepodspecies from tropical to more northem latitudes thandid El Niño 1987-88. This 'tropicalizing' of the area bythe copepods has been also reported for euphausiids(Gómez-Gutiérrez et al., 1995) and phytoplankton(Gárate-Lizárraga and Siqueiros-Beltrones, 1998)during El Niño.
We found that there are more similarities incopepod fauna among El N iños, because our resultsindicate a regular proportion of tropical fauna in theBaja Califomia region, about 50% for non-El Niñoyears and increase up to 80% in El Niño years. Thepositive and negative deviations of the number ofspecies reflect the influence of the warming andcooling events on the copepod community structure,reinforcing the observation of the 50% minimal pro-portionality of the tropical components. This meansthat the copepod fauna in both El Niño 1982-83 and1987-88 had more similarities than differences amongthemselves, and had important differences comparedwith the intervening years.
ACKNOWLEDGEMENTS
We thank the technical and scientific staff of thePlankton Department of CICIMAR for their partici-pation in the collection of samples. Thanks to UNAMand the Navy Ministry of Mexico for use of researchvessels El Puma, Mariano Matamoros and Altair. Thisresearch was supported by funds provided by Divisiónde Estudios de Posgrado del IPN (842567, 86804,874264,903361,931318) and the Consejo Nacionalde Ciencia y Tecnología {904620). I am in debt toKlaus Wolter of NOAA-CIRES Climate DiagnosticsCenter of the University of Colorado at Boulder whokindly provided me with the bimonthly MEI values for
REFERENCES
Amtz, W., landa, A. and Terrazona, j. (1985) El Niño. Suimpacto en la fauna marina. Bol. I!lSt. Mar PeTÚ-Callao,222 pp.
Brinton, E. and Reid, j.l. (1986) On the effects of interan-nual variations in circulation and temperature upon eu-phausüds of the Califomia Current. in: PelagicBiogeography. A.C. Pierrot-Bults, S. van der Spoel, B.j.Zahuranec and R.K. johnson (eds). UNESCO Tech. Pap.Mar. Sci. 49:25-34.
Brinton, E., Fleminger, A. and Siegel-Causey, D. (1986) Thetemperate and Tropical planktonic biotas of the Gulf ofCalifomia. CalCOFI Report 27:228-266.
Brown, j., Colling, A., Park, D., Phillips, j., Rothery, D. andWright, j. (1993) Ocean Circulation. Ex eter, England: TheOpen University, BPCC Wheatons ltd. 238 pp.
Des-Abbayes, H., Chadefaud, M., Feldmann, j., De Ferré, Y.,Gaussen, H., Grassé, P.P. and Prévot, A.R. (1989) Botánica,Vegetales Inferiores. Barcelona: Reverté.
Gárate-lizárraga, I. and Siqueiros-Beltrones, D. (1998) Timevariation in phytoplankton assemblages in a sub tropicallagoon system after the 1982-1983 'El Niño' event (1984 to1986). Pacific Sci. 52:79-97.
Gómez-Gutiérrez, j., Palomares-García, R. and Gendron, D.(1995) Community structure of the euphausüd populationsalong the west coast of Baja Califomia, Mexico, duringthe weak ENSO 1986-1987. Mar. Ecol. Prog. Ser.
120:41-51.Hemández- Trujillo, S. (1991a) Variación latitudinal de la
diversidad de copépodos en la costa occidental de B.C.S.(1982-1984). Ciencias Marinas 17(4):83-103.
Hemández- T ruj illo, S. ( 1991 b ) Análisis de la diversidad decopépodos en el Pacífico de B.C.S. (mayo, 1986). An Inst.Cienc. Mar y Limnol. UNAM. 18:279-288.
Hemández- Trujillo, S. (1991c) Patrones de distribución yabundancia de Calanus pacificus, en relación a la temperaturasuperficial en el Pacífico de Baja Califomia Sur, México(1982-1986). Rev. Inv. Cient. UABCS 2:56-64.
Hemández- Trujillo, S. (1995) Cambios interanuales en lacomunidad de copépodos en la costa occidental de BajaCalifomia Sur, México, (julio 1987 y julio 1988). Hid-
robiológica 5:127-134.Hemández-Trujillo, S. and Esquivel-Herrera, A. (1997)
Asociaciones interespecíficas de copépodos en la costa oestede Baja Califomia Sur, México. Hidrobiológica 7:65-74.
Hemández-Vázquez, S. (1995) Distribución y abundancia dehuevos y larvas de sardínay anchoveta en las costas de Cali-fomia y Baja Califomia y su relación con factores ambientales:1951-89.PhD thesis, CICESE, Mexico. 178 pp. + annex.
lavaniegos, B.E., Gómez-Gutiérrez, j., lara-lara, j. and Her-nández-Vázquez, S. (1998) long-term changes of zooplank-ton voJulI\es inthe Caljfomia C;:urrentSystem. -The Baja
Cal\foIniaregio? M,qr.?T\iI.jf:r~~.Ser. 169:55-64.liu, D., Fryxell, G.A. and Kaczmarska, I. (1996) El Niño (1992)
in the equator\al Pacific: low biomass with with a few
dominating spe¿ies in-,tñe 'mícrophytoplankton. J. PlanktonRes 18-1167-'"' 1184 .."¡"~ , ,.-, J , ~
@ 1999 Blackwell Science Ltd.- Fish:Oceunogr., 8:4, 284-295.
Copepoda and El Niño 1982-83 and 1987-88 295
Platt, H.M., Shaw, K.M. and Lambshead, P.J.D. (1984)Nematode species abundance pattem and their use in thedetection of environmental perturbations. Hydrobiologia118:59-66.
Preisendorfer, R.W. (1988) Principal Component Analysis inMeteorology and Oceanography (Developrnents in AtmosphericScience, Vol. 17). Amsterdam: Elsevier. 425 pp.
Roden, G.I. (1991) Subarctic-subtropical transition zone oftheNorth Pacific: large-scale aspects and mesoscale structure. In:
Biology, Oceanography, and Fisheries of the North PacificTransition Zone and Subarctic Frontal Zone. J.A. Wetherall(ed.). NOAA Tech. Rep. NMFS 105:1-38.
Smith, P.E. and Richardson, S.L. (1977) Standard techniquesfor pelagic fish eggs and larval survey. FAO Fish. Tech. Pap.
175:1-100.Taft, B.A. (1985) El Niño of 1982-83 in the Tropical Pacific.
In: El Niño North. Niño effects in the Eastern subarctic PacificOcean. W.S. Wooster and D.L. Fluharty (eds). University ofWashington, Seattle, 8 pp.
Torres-Moye, G. and Alvarez-Borrego, S. (1987) Effects of the1984 El Niño on the summer phytoplankton of a Baja Cal-ifomia upwelling zone. J. Geophys Res. 92(C13):14383-
14386.Wolter, K. and Timlin, M.S. (1993) Monitoring ENSO in
COADS with seasonally adjusted principal componentsindex. Proc. 17th Clirnate Diagnostics Workshop, Norrnan OK.NOAA/NMCICAC, NSSL, Oklahoma Clim. Survey,CIMMS and Norman: School of Meteorology, University of
Oklahoma, pp. 52-57.Wooster, S.W. and Fluharty, L.D. (1985) El Niño North. Niño
Effects in the Eastern Subarctic Pacific Ocean (WashingtonSea Grant Program). Seattle: University of Washington.312 pp.
Longhursr, R.A. (1967) Diversity and trophic structure of zoo-plankton communities in the Califomia Current. Deep-SeaRes. 14:392-408.
McGowan, J.A. and Miller, C.B. (1980) Larval fish and zoo-plankton community structure. CALCOFI Report 21:29-36.
McGowan, J.A. and Walker P.W. (1993) Pelagic diversitypattems. In: Species Diversity in Ecological Communities:
203-214.Magurran, A.E. (1988) Ecological Diversity and its Measurement.
London: Chapman & Hall. 179 pp.Martínez-López, A. (1993) Efectos del evento 'El Niño' 1982-83
en la estructura del fitoplancton en la costa occidentalde Baja Califomia Sur. M.Sc. thesis, Centro Inter-disciplinario de Ciencias Marinas, Instituto PolitécnicoNacional, La Paz, 95 pp.
May, R.M. (1975) Patterns of species abundance and diversity.In: Ecologyand Evolution ofCommunities. M.L. Cody andJ.M.Diamond (eds). Cambtidge, MA: Harvard University Press,pp. 60-120.
Omori, M. and Ikeda, T. (1992) Methods in Marine ZooplanktonEcology. Malabar, FL: Ktieger Publishing Co. 329 pp.
Palomares-García, R. and Gómez-Gutiérrez, J. (1996) Copepodcommunity srructure at Bahia Magdalena, Mexico during ElNiño 1983-84. Estuar. Coastal Shelf Sci. 43:583-595.
Pearcy, W.G. (1991) Biology of the transition region. In: Biol-ogy , Oceanography, and Fisheries of the North Pacific TransitionZone and Subarctic Frontal Zone. J.A. Wetherall (ed.). NOAATech. Rep. NMFS 105:39-55.
Pielou, E.C. (1967) The use of information theory in the studyof the diversity of biological populations. Proc. Fifth BerkeleySymp. Math. Probab. 4:163-177.
Pielou, E.C. (1969) An Introduction to Mathematical Ecology.New York: Wiley & Sons.
@ 1999 Blackwell Science Ltd,. Fish, Oceanof[r" 8:4. 284-295,