vam – situation analysis report food security assessment in bangladesh issues and implications for...
TRANSCRIPT
VAM – Situation Analysis Report
1
Food Security Assessment in Bangladesh Issues and Implications for Vulnerability Analysis and Mapping1
Background:
1. The WFP Country Programme for Bangladesh for the 2001-5 period states that WFP resources will be increasingly concentrated in areas identified through Vulnerability Analysis and Mapping (VAM) assessments of food security and vulnerability in the country. This Situation Analysis represents the first of several such assessments to be carried out under the VAM Standard Analytical Framework for Comprehensive Vulnerability Analysis (CVA).
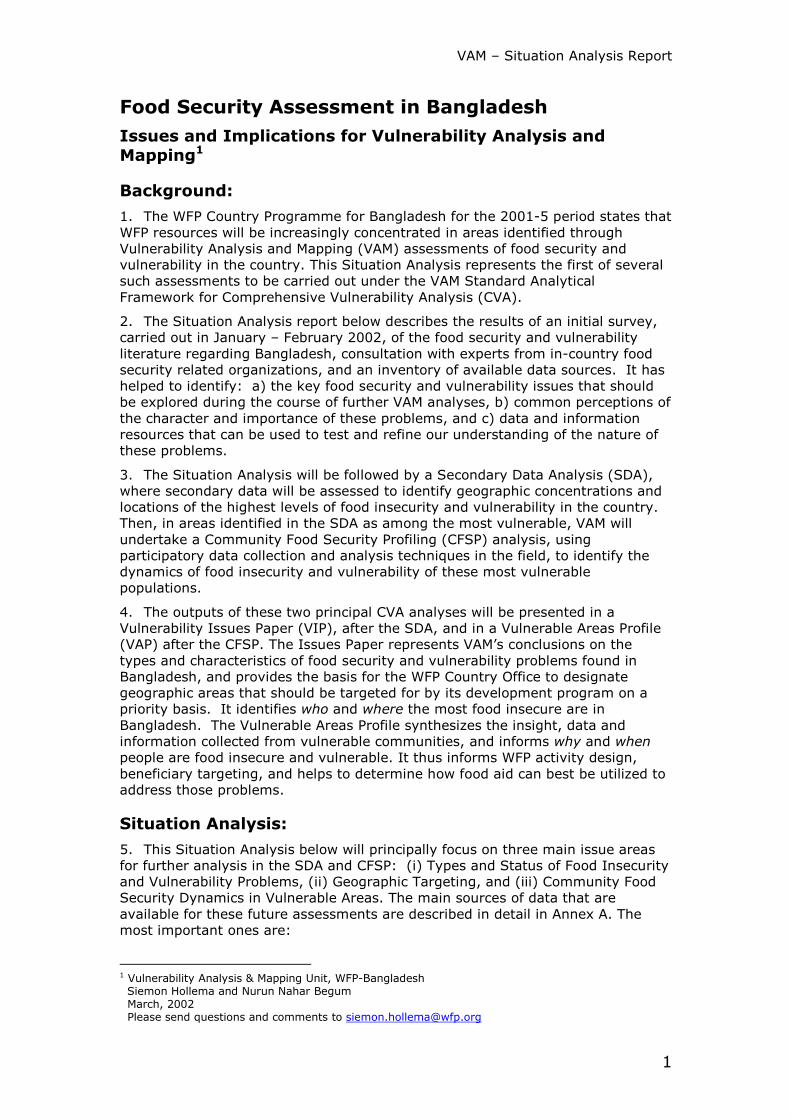
2. The Situation Analysis report below describes the results of an initial survey, carried out in January – February 2002, of the food security and vulnerability literature regarding Bangladesh, consultation with experts from in-country food security related organizations, and an inventory of available data sources. It has helped to identify: a) the key food security and vulnerability issues that should be explored during the course of further VAM analyses, b) common perceptions of the character and importance of these problems, and c) data and information resources that can be used to test and refine our understanding of the nature of these problems.
3. The Situation Analysis will be followed by a Secondary Data Analysis (SDA), where secondary data will be assessed to identify geographic concentrations and locations of the highest levels of food insecurity and vulnerability in the country. Then, in areas identified in the SDA as among the most vulnerable, VAM will undertake a Community Food Security Profiling (CFSP) analysis, using participatory data collection and analysis techniques in the field, to identify the dynamics of food insecurity and vulnerability of these most vulnerable populations.
4. The outputs of these two principal CVA analyses will be presented in a Vulnerability Issues Paper (VIP), after the SDA, and in a Vulnerable Areas Profile (VAP) after the CFSP. The Issues Paper represents VAM’s conclusions on the types and characteristics of food security and vulnerability problems found in Bangladesh, and provides the basis for the WFP Country Office to designate geographic areas that should be targeted for by its development program on a priority basis. It identifies who and where the most food insecure are in Bangladesh. The Vulnerable Areas Profile synthesizes the insight, data and information collected from vulnerable communities, and informs why and when people are food insecure and vulnerable. It thus informs WFP activity design, beneficiary targeting, and helps to determine how food aid can best be utilized to address those problems.
Situation Analysis:
5. This Situation Analysis below will principally focus on three main issue areas for further analysis in the SDA and CFSP: (i) Types and Status of Food Insecurity and Vulnerability Problems, (ii) Geographic Targeting, and (iii) Community Food Security Dynamics in Vulnerable Areas. The main sources of data that are available for these future assessments are described in detail in Annex A. The most important ones are:
1 Vulnerability Analysis & Mapping Unit, WFP-Bangladesh Siemon Hollema and Nurun Nahar Begum March, 2002 Please send questions and comments to [email protected]
VAM – Situation Analysis Report
2
• Household Income and Expenditure Survey 2000 – The HIES 2000 is the main source of poverty data in Bangladesh. Data is presented by division. For targeting a more disaggregated geographical classification is needed. Data from the previous Household expenditure survey in 1995/96 will also be considered.
• Poverty Monitoring Survey, May 1999 – The PMS 1999, provides an excellent additional source of data for food security analysis. Poverty indicators are available separately for urban and rural areas for 21 regions of the country.
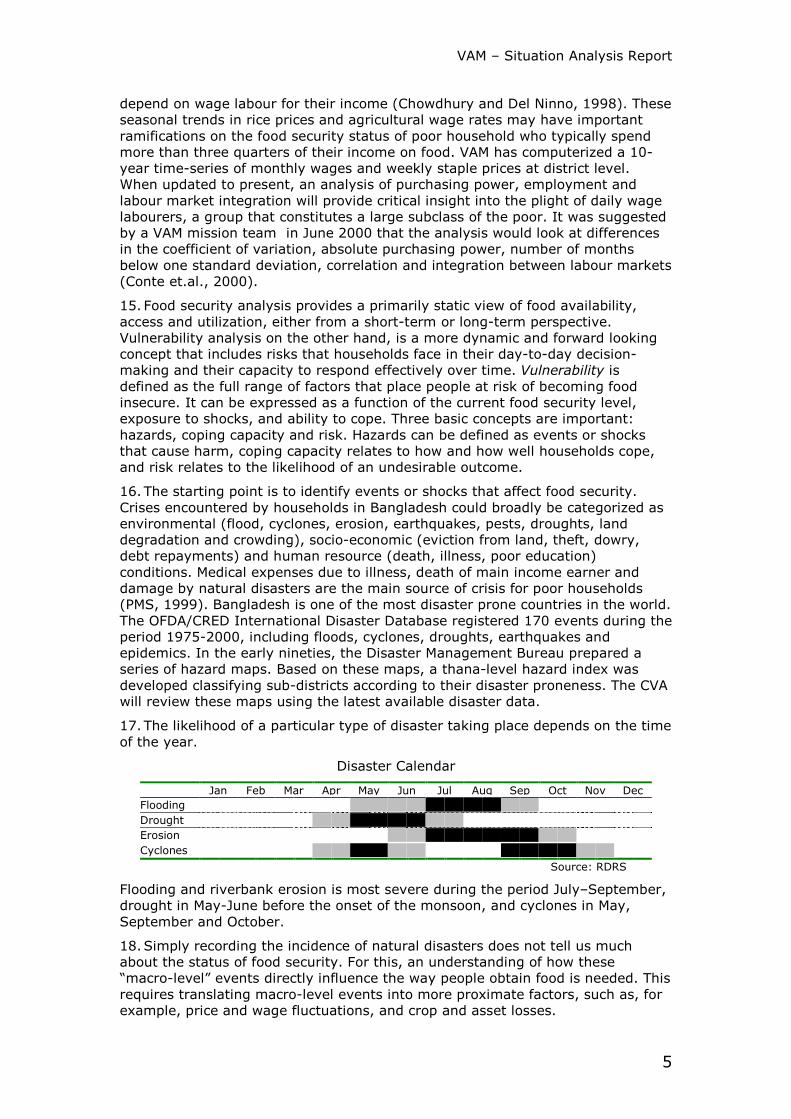
• Child Nutrition Survey 2000 – This survey constitute a component of the HIES 2000. Other sources for nutrition data includes, Helen Keller’s nutrition surveillance system, UNICEF’s Multiple Indicator Cluster survey 2000 and the Demographic and Health Survey of 1999-2000.
• Census of Population 2001 – The census would provide an excellent source of data for small area estimation. It is expected that sub-district level data will become available in phases during the course of the year.
• Disaster data from the Disaster Management Bureau and CARE.
It may proof difficult for VAM to obtain access to all data sets. Data sharing arrangements that were sought in 2000 have never been implemented or are not functional. Timely availability of data is also a point of concern. The population census data is not yet available and it is unsure whether the target of releasing it prior to the end of the year will be met. Results of different surveys are not always consistent and a wide margin exist in the reported data. Careful examination of the data is required.
Types and status of food insecurity and vulnerability problems
6. Food security can be defined as access at all times by all people to sufficient, safe and nutritious food which meet their dietary needs and food preferences for an active and healthy life (World Food Summit, 1996). There is however no easy way of measuring food security; it is a complex problem determined by the interaction of a broad range of agro-ecological, environmental, socio-economic, political and biological factors. To simplify the concept of food security it is broken down into its three key dimensions: (i) availability of food, (ii) access to food, and (iii) utilization of food.
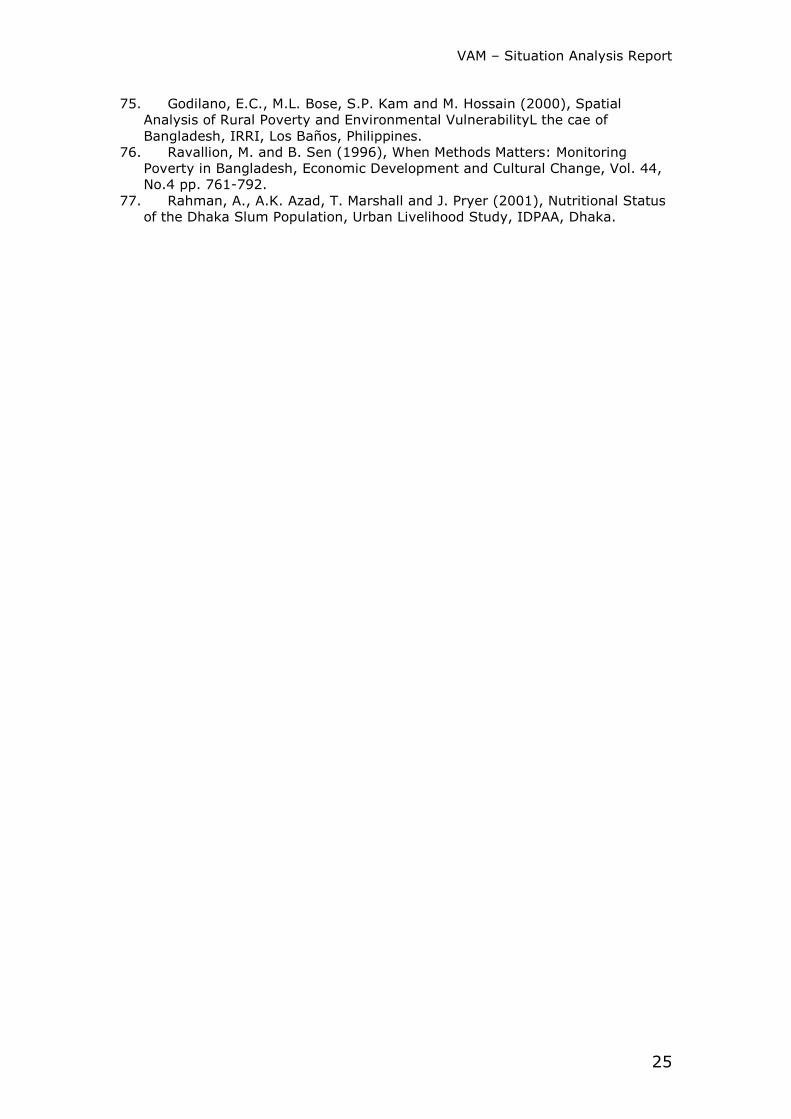
7. An analysis of the availability of food examines whether the aggregate supply of food is sufficient to satisfy the domestic requirement. This can be investigated by either following a supply- or a demand-oriented approach. The supply-oriented approach is embodied in the national food balance sheets. The aggregate supply is the sum of domestic production, imports (public, private and food aid) and changes in the national stock. According to FAO, the total availability of food grain (rice and wheat) in 1999 amounts to 25.3 million MT.
Food Availability (m MT), 1999
Rice Wheat Total
Net Production* 21.2 1.8 23.0
Net Imports 2.2 2.4 4.6
Stock changes - 0.8 - 1.5 -2.3
Food grain availability 22.6 2.6 25.3
* Domestic production minus seeds and losses Source: FAOSTAT, food balance sheet 1999
The requirement for food grains has been fixed at 454 grams per person per day. With a population of roughly 130 million people this translates into an annual
VAM – Situation Analysis Report
3
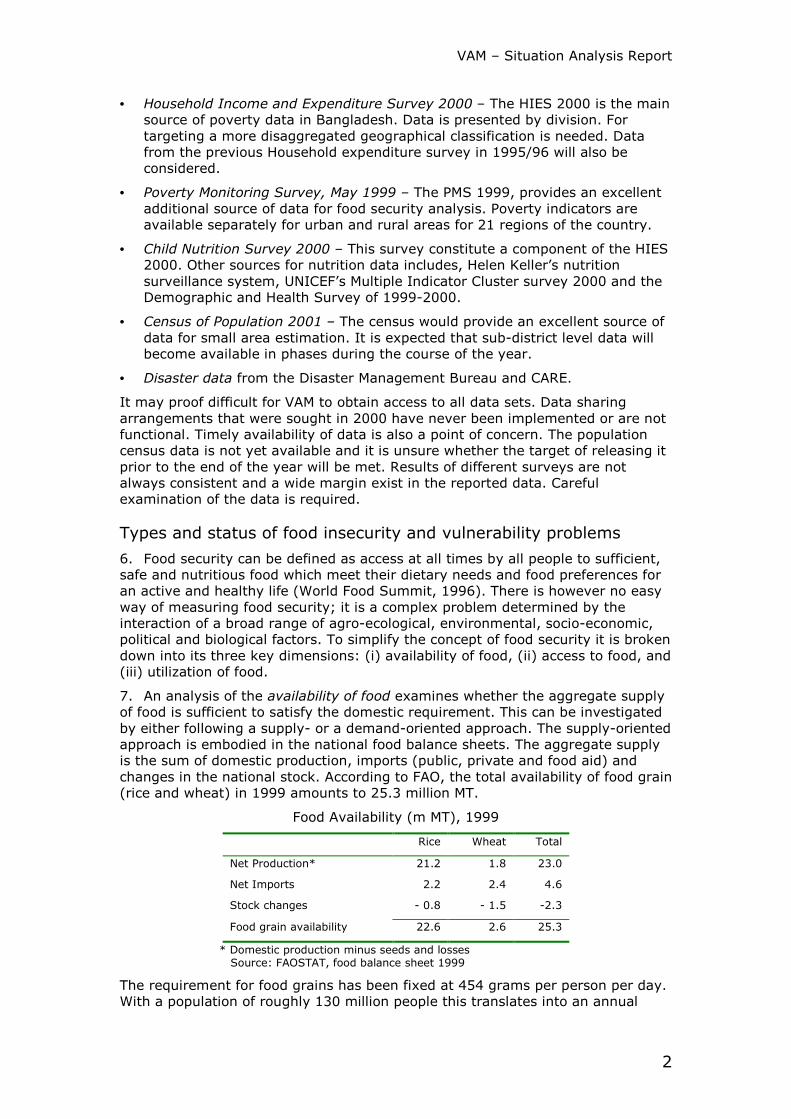
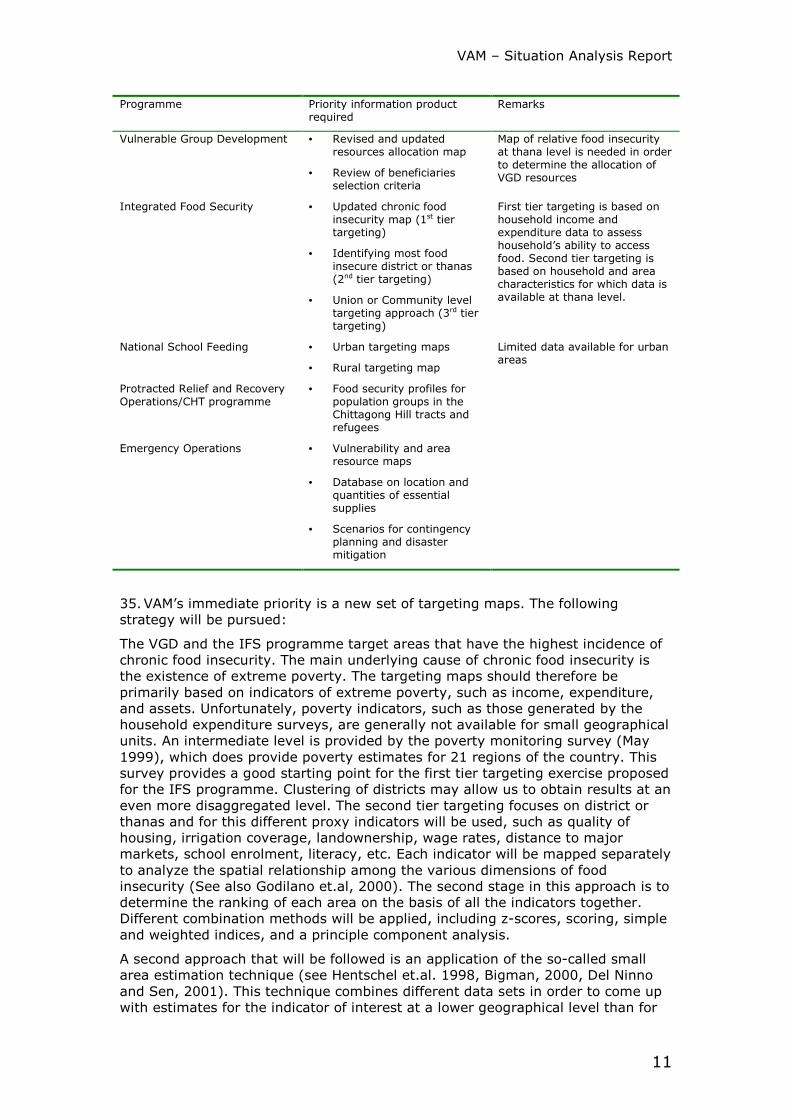
requirement of 21.5 million MT. It therefore appears that the domestic food grain supply is sufficient to cover the requirement and that Bangladesh has reached self-sufficiency in food grain production. The question can be asked if food aid imports are still required? To answer this, let’s have a look at the demand-side of the food grain situation. The household expenditure surveys provide estimates for actual food consumption.
Average daily consumption (k.Cal per person)
Rural Urban National
HES 1991/92 2267 2258 2266
HES 1995/96 2251 2209 2244
HIES 2000 2263 2150 2240
Average daily consumption slightly decreased during the 90s from 2266 k.Cal. in 1991/92 to 2240 k.Cal. in 2000. Rice and wheat provide between 70 – 80 percent of the daily energy intake with a national average daily consumption of 476 grams (~ 1690 k.Cal.) per person (HIES 2000). Taking this figure and observing that there are no major stock increases, exports, or excessive wastage, the total food grain availability can be derived as being 22.6 million MT (daily consumption per person ∗ total population ∗ 365). FAO/WHO recommend a daily energy intake of 2400 k.Cal per person. With on average seventy-five percent derived from food grains this requires a daily consumption of 515 grams. The recommended food grain requirement is therefore 24.4 million MT. The crux lies in the assumption of the daily food grain requirement per person of 454 grams. In the long-term this may be a valid assumption as food grain consumption generally declines when a population becomes more affluent. However, in the short term, there is a deficit of 1.8 million Mt of food grains (22.6 – 24.4 million MT) despite commercial imports and food aid.
8. It is clear that overall production or availability of food is not a very good indicator of what people actually acquire. Access to food, in the sense that people lack sufficient purchasing power to buy the food is the main obstacle to achieving food security. Poverty problems are massive in Bangladesh. Approximately 44 percent of the population fall below the absolute poverty line of 2,122 k.Cal per day. Twenty percent (about 25 million people) consume less than 1,805 k.Cal per person per day (HIES, 2000). Hence, poverty in Bangladesh is very much synonymous with hunger and malnutrition. In a situation like this, access to food by people who lack the necessary purchasing power needs to be ensured by the government (Chowdhury and Del Ninno, 1998). Access to agricultural land, non-agricultural employment, level of education and gender are the main determinants of poverty in rural areas. In urban areas, education, employment and social links are the key determinants. Urban poverty is becoming an increasingly serious problem. According to the HIES 2000, poverty in urban areas increased with 7.2 percent. An influx of poor migrants from rural areas might be the cause. Further information on migration patterns as a livelihoods strategy is needed.
9. Chowdhury (1995) reports that access to food within households vary substantially according to individual characteristics such as age and sex. Mothers and young children are particularly vulnerable. More insight into intra-household distribution of food and the role of different family members in accessing food is needed. An intra-household model as the one piloted by SCF-UK in the Kurigram district might provide some answers.
10. Appropriate utilization of food is also important to guarantee food security. The capacity of an individual to absorb and utilize the nutrients in the food consumed is determined by caring practices, eating habits, hygiene, access to
VAM – Situation Analysis Report
4
health and sanitary facilities, etc. The main source for this type of data is the Bangladesh Demographic and Health Survey and the Child Nutrition Survey. These surveys report that almost 45 percent of children are stunted and 48 percent are underweight. Severe wasting, an indication of acute malnutrition, is relative low, namely 1 percent. However, 10 percent of children are moderately wasted. A much higher rate of children in rural areas are malnourished than in urban areas. However, when urban data is disaggregated to slum and non-slum populations it shows that the nutritional status of children that live in slum areas are worse than in rural areas. Helen Keller also reports high malnutrition figures among the population. Forty-five percent of rural women and one third of mothers in urban slums have a body mass index less than 18.5.
11. The measurement of birth weights is proposed as an outcome measure for the new national nutrition programme implemented by the GoB and supported by World Bank, Unicef and WFP. Low birth weight will also be one of the key indicators used in VAM analysis. Birth weight is a reflection of both the mother’s past and present food security and nutritional status and a measure of the newborn’s opportunities and limitations for child development (Currey, 2000). Although not without its measuring problems, e.g. early childbirth, late measurement, or other complications, the measurement of birth weight will provide an easy understandable indicator of “inter-generational” food security.
12. Diarrhoea incidence rates and acute respiratory infections are among the leading causes of mortality among preschool children (HKI, NSP). Ninety-eight percent of the population has access to clean drinking water. However, recent surveys have detected arsenic in the ground water supply which, according to Unicef (2000), has decreased access to safe drinking water to 70 percent. They estimate that potentially 26 percent of the population are at risk of arsenicosis. Use of sanitary latrine has remained fairly constant at 44 percent of the population.
13. Geographic comparison of nutrition data reveals that nutritional status is worst in Sylhet division. Most likely, this is due to dietary patterns and lack of nutritional knowledge as poverty data reveals that it can not be attributed to a constraint in the access to food.
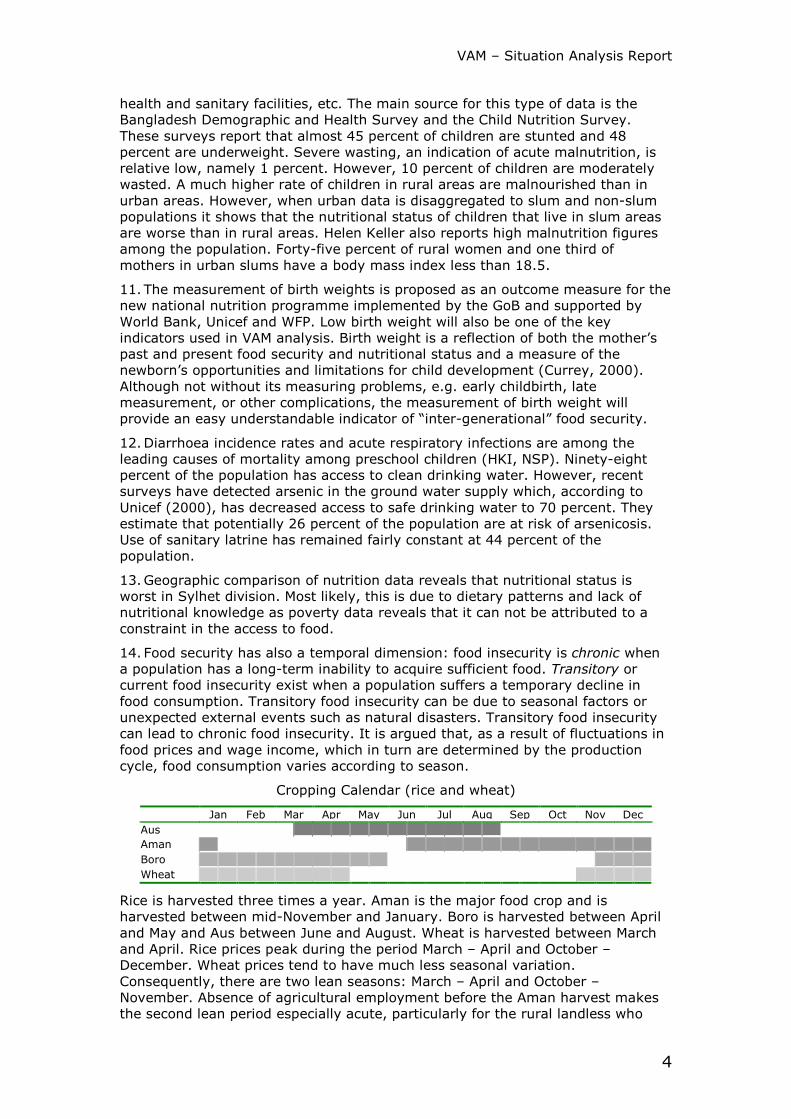
14. Food security has also a temporal dimension: food insecurity is chronic when a population has a long-term inability to acquire sufficient food. Transitory or current food insecurity exist when a population suffers a temporary decline in food consumption. Transitory food insecurity can be due to seasonal factors or unexpected external events such as natural disasters. Transitory food insecurity can lead to chronic food insecurity. It is argued that, as a result of fluctuations in food prices and wage income, which in turn are determined by the production cycle, food consumption varies according to season.
Cropping Calendar (rice and wheat)
Jan Feb Mar Apr May Jun Jul Aug Sep Oct Nov Dec Aus Aman Boro Wheat
Rice is harvested three times a year. Aman is the major food crop and is harvested between mid-November and January. Boro is harvested between April and May and Aus between June and August. Wheat is harvested between March and April. Rice prices peak during the period March – April and October – December. Wheat prices tend to have much less seasonal variation. Consequently, there are two lean seasons: March – April and October – November. Absence of agricultural employment before the Aman harvest makes the second lean period especially acute, particularly for the rural landless who
VAM – Situation Analysis Report
5
depend on wage labour for their income (Chowdhury and Del Ninno, 1998). These seasonal trends in rice prices and agricultural wage rates may have important ramifications on the food security status of poor household who typically spend more than three quarters of their income on food. VAM has computerized a 10-year time-series of monthly wages and weekly staple prices at district level. When updated to present, an analysis of purchasing power, employment and labour market integration will provide critical insight into the plight of daily wage labourers, a group that constitutes a large subclass of the poor. It was suggested by a VAM mission team in June 2000 that the analysis would look at differences in the coefficient of variation, absolute purchasing power, number of months below one standard deviation, correlation and integration between labour markets (Conte et.al., 2000).
15. Food security analysis provides a primarily static view of food availability, access and utilization, either from a short-term or long-term perspective. Vulnerability analysis on the other hand, is a more dynamic and forward looking concept that includes risks that households face in their day-to-day decision- making and their capacity to respond effectively over time. Vulnerability is defined as the full range of factors that place people at risk of becoming food insecure. It can be expressed as a function of the current food security level, exposure to shocks, and ability to cope. Three basic concepts are important: hazards, coping capacity and risk. Hazards can be defined as events or shocks that cause harm, coping capacity relates to how and how well households cope, and risk relates to the likelihood of an undesirable outcome.
16. The starting point is to identify events or shocks that affect food security. Crises encountered by households in Bangladesh could broadly be categorized as environmental (flood, cyclones, erosion, earthquakes, pests, droughts, land degradation and crowding), socio-economic (eviction from land, theft, dowry, debt repayments) and human resource (death, illness, poor education) conditions. Medical expenses due to illness, death of main income earner and damage by natural disasters are the main source of crisis for poor households (PMS, 1999). Bangladesh is one of the most disaster prone countries in the world. The OFDA/CRED International Disaster Database registered 170 events during the period 1975-2000, including floods, cyclones, droughts, earthquakes and epidemics. In the early nineties, the Disaster Management Bureau prepared a series of hazard maps. Based on these maps, a thana-level hazard index was developed classifying sub-districts according to their disaster proneness. The CVA will review these maps using the latest available disaster data.
17. The likelihood of a particular type of disaster taking place depends on the time of the year.
Disaster Calendar
Jan Feb Mar Apr May Jun Jul Aug Sep Oct Nov Dec Flooding Drought Erosion Cyclones
Source: RDRS
Flooding and riverbank erosion is most severe during the period July–September, drought in May-June before the onset of the monsoon, and cyclones in May, September and October.
18. Simply recording the incidence of natural disasters does not tell us much about the status of food security. For this, an understanding of how these “macro-level” events directly influence the way people obtain food is needed. This requires translating macro-level events into more proximate factors, such as, for example, price and wage fluctuations, and crop and asset losses.
VAM – Situation Analysis Report
6
19. Various population groups are affected differently by specific events. For example, increased rice prices are beneficially to rice farmers while they negatively affect the purchasing power of the landless and urban poor. To determine the level of vulnerability, the CVA will profile household economies in the most disaster prone areas in order to establish who will be affected by what event and to what degree.
20. The FMRP/IFPRI studies provide some insight in how poor households cope with floods. Borrowing money was the most frequently used coping strategy followed by consumption and sale of assets during the 1998 floods. Tufts University with support from USAID’s fanta project is developing a coping strategy index which is based on people’s own perception of food security and investigates particular patterns that people adopt in times of food stress. The short questionnaire that is developed could be adopted by VAM for a quick assessment of the food security situation during emergencies.
21. To determine the risk of becoming food insecure, it will be necessary to agree on a scale against which to measure an outcome and to agree on a threshold. For example, food intake expressed in kcal with a minimum food requirement of 2122 kcal (upper poverty line). To assess food needs, the CVA will take a wide range of scenarios into account using the Household Food Economy Analysis as framework for analysis.
Geographic targeting
22. The 1995 Basic Needs Survey of BBS reveals that there is considerable variation between districts in food consumption. For example, the average calorie intake varies from 2470 Kcal in Dinajpur to a low of 1819 in Bagerhat. IFPRI (June 1998) argues that the differences in productivity of land are the main reason for the regional variation in food consumption. Whether this is the case can easily be examined by correlating food intake with the average crop yield by district. It is more likely that regional variation in food consumption can be explained by regional differences in poverty. The World Bank (April 2000) concludes that there is considerable variation in poverty from one part of the country to another. They do find (Ravallion, 1997) that a great part of this variation can be attributed to differences in geographical characteristics: “poor areas are not poor just because poor household concentrate in these areas.” Geographical indicators, such as land use and productivity, infrastructure, electricity, distance to rivers, roads, urban areas could thus provide a first indication of areas with a higher incidence of extreme poverty. The CVA will include a set of geographical indicators for targeting at thana level.
23. Currently, two different targeting maps direct the resource allocation of WFP’s main development programmes. These are (i) the resource allocation map for food-assisted development, and (ii) a chronic food insecurity cluster map.
24. The resource allocation map for food-assisted development is one of the most widely used maps for programme resource targeting in Bangladesh. The map was developed jointly by WFP and the Planning Commission between 1995-97. Allocations to each thana for the nationwide Vulnerable Group Development (VGD) programme are made on the basis of this map. The thanas are classified as having very high, high, moderate or low food insecurity using a composite index based on the following seven indicators: (i) incidence of natural disasters, (ii) food-grain deficit/surplus, (iii) agricultural wage rate, (iv) proporation of households not owning land, (v) proporation of unemployed persons, (vi) proportion of widowed, divorced and separated women, and (vii) proportion of literate women. Data for deriving the index are mainly obtained from the 1991 population census. Disaster data comes from the disaster management bureau and agricultural statistics are supplied by the agricultural statistics wing of BBS.
VAM – Situation Analysis Report
7
There is clearly scope for improvement. It appears that the outcome is heavily influenced by the incidence of natural disasters and whether the sub-district is a food grain surplus or deficit area. These are not necessarily good indicators of chronic food insecurity. People living in disaster prone areas have sometimes developed successful strategies for coping with recurrent threats in such a way that they do not necessarily suffer from chronic food insecurity. On the other hand, people living in areas that produce more than enough food may not have sufficient access to that food due to a lack of income or assets. The incidence of natural disasters also has its repercussion on crop production, agricultural wage rates and employment and as such is double counted. Not surprisingly then, the most food insecure thanas can be observed along the Jamuna and Padma rivers, in the northwest, the coastal zones and the northeast (see Annex C). All are areas frequently hit by either floods, droughts, or cyclones. A third limitation is that the data on which the map is based are presently more than 10 years old. The completion of the 2001 population census provides an opportunity to update the resource allocation map and produce a revised food insecurity targeting map at thana level.
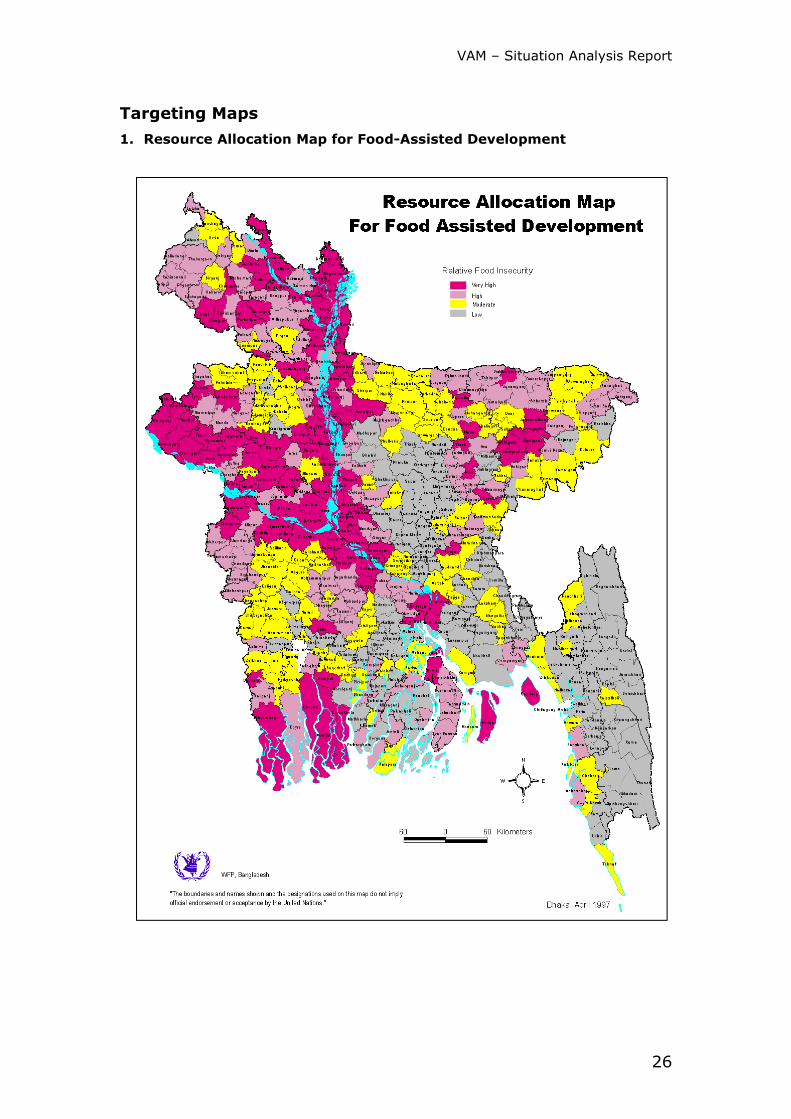
25. In 2000 a VAM Mission produced a chronic food insecurity cluster map based on data from the Household Expenditure Survey 1995/96. The map is intended as a first level geographic targeting map for the Integrated Food Security Programme. As the HES only reports data at divisional level, which are too large for meaningful geographical analysis, and no data was available at district level, an intermediate level of geographical classification was adopted similar to the method used by the World Bank. Fourteen clusters were drawn. This was done by grouping contiguous districts based on their level of similarity with respect to extreme poverty. Subsequently, a principal component analysis was conducted to identify households that had inadequate access to sufficient food. The following indicators were included:
• Income and assets: total per caput income, income from own agricultural production, land owned
• Food intake: daily calorie intake, percentage of calories from cereals • Expenditure: per caput expenditure, share of expenditure on food
As a last step, quintiles of the proportion of the food insecure households among the cluster were mapped. According to this analysis, the Barisal and Kurigram clusters exhibit the highest incidence of chronic food insecurity, followed by the Mymensingh and Kusthia clusters (see Annex C). The main limitation of this work is that the method used in the analysis is not easily understood by everyone. The rational for targeting or not targeting certain areas is neither transparent nor defendable to government and partners. The grouping of districts into geographical clusters excludes a number of districts known to be extremely food insecure (for example, Jamalpur) for priority targeting. Why this is the case is not directly evident from the analysis. A second limitation is the geographical level of aggregation. Each cluster has a population size of approximately 10 million. This requires further geographic targeting up to the district or thana level to be meaningful for the targeting of WFP’s development programmes.
26. The CVA needs to resolve which analysis method and what geographical aggregation would be most applicable given the data available. Acceptance of the analytical products by WFP staff, GoB and partner agencies also needs to be ensured. VAM will seek collaboration with the Planning Commission for the purpose of updating and revising a food insecurity map at thana level.
27. At this point, it might be important to note that the targeting exercises within the CVA do not intend to develop an alternative poverty map. The objective is to identify those areas with a significant elevated incidence of food insecure people to whom food aid would make the most sense. Naturally, there will be overlap
VAM – Situation Analysis Report
8
between the different mapping efforts that are underway in Bangladesh and they will be used by VAM to validate its outcomes. Related mapping efforts can be listed as:
• Poverty maps as an input into the Poverty Reduction Strategy Paper (PRSP). The status of which is unknown to VAM.
• World Bank’s poverty targeting exercise based on HES 1995/96 data. The results show that the highest incidence of poverty appears to be in the north-western corner (Kurigram, Lalmonirhat, Nilphamari, and Panchagarh), followed by adjoining northern districts of Jamalpur, Mymensingh, Sherpur, and Tangail. It further shows that households living in districts South of Dhaka (Faridpur, Gopalganj, Madaripur, Rajbari, Shariatpur) are among the poorest of the poor. Barisal Division also has a high incidence of poverty.
• The Bangladesh Human Development Report 2000, includes poverty maps (income and human poverty). The districts Jamalpur, Sherpur and Kusthia in the Northwest of the country show the worst incidence of poverty.
• UNICEF has developed a child risk measure2 at district level. According to this index, children living in Sunamganj and Bhola are most at risk.
• FAO/BARC has produced a map of economically depressed areas, classifying thanas according to their famine proneness.
• IRRI intends to undertake a study into the geographical distribution of poverty and food security. The project will be implemented as part of the CSI/FAO/GRID poverty project.
28. The CVA will include an urban targeting exercise required for the expansion phase of the National School Feeding programme that is to commence in March 2002 in two urban slums of Dhaka city. According to Helen Keller International there is a large difference in living conditions between slums in different cities as well as between slums within the same city. A survey conducted in 15 slums in two city wards of Dhaka showed a wide range in the percentage of underweight mothers, ranging from 10 to 45 percent. This suggests that some slum areas suffer much more from acute food insecurity than others despite being relatively close to each other (HKI, NSP). Apart from nutritional indicators, data on primary education such as, school enrolment, attendance, drop-out and teacher/pupil ratios together with local NGO capabilities will be important determinants for targeting which need to be mapped. Data from the census of slum areas and the survey on socio-demographic characteristics of slum dwellers will be analysed, together with available reports from NGOs. As a first step, an urban targeting map will be developed for Dhaka city.
29. The incidence of chronic food security in particular areas is not the only consideration that determines the targeting of WFP development programmes. The nature of the development programme, logistical issues (accessibility and cost effectiveness), presence of partner capacities, political (donor preferences) and security considerations (relevant for example for the Chittagong Hill Tracts) are also important. The CVA will produce a series of area resource maps, particularly focused on mapping programming costs and NGO capabilities by geographical area in order to assist WFP management in the decision of where to target its food-aid development programmes. A consideration such as cost-effectiveness becomes especially important when with the same amount of resources, more people living in equal poverty - but surviving in areas falling outside the ones identified as having the highest incidence of food insecurity -could be assisted.
2 The child risk measure is a composite of five basic indicators: Under-five mortality rate, measles immunization, primary school net enrolment, use of sanitary latrine, and gender gap (MUAC girls – boys)
VAM – Situation Analysis Report
9
Community food security dynamics in vulnerable areas
30. The community food security analysis is intended to describe the livelihood and food security strategies of vulnerable groups in the identified geographic target areas. A starting point is the creation of livelihood zones. These are areas where the same food and cash options tend to be available and relied upon to varying degrees by various wealth groups3. The structure of the food economy is very much similar throughout Bangladesh, which can be characterized by a huge army of landless poor who depend on a wage income for their livelihood. However, using agro-ecological zones as a first cut, Bangladesh could broadly be divided into 7 livelihood zones:
• Northwest highlands: This area is highly populated. Agriculture is the principal source of employment. Small-scale agriculture is common and the crop intensity is high. Eighty percent of the country’s wheat is produced in this region. Other important crops are rice and tobacco. The area is vulnerable to droughts. Infrastructure is good and the building of the Jamuna Bridge had a great impact on the local economy. There are relatively less NGO activities in this area. Seasonal migration to other rural and urban areas in Bangladesh is a common household livelihood strategy. Smuggling is also prevalent.
• Char lands: Chars are unstable lands, unprotected by embankment, that form and erode in the major rivers of Bangladesh. It is estimated that around 5 million people live on char lands throughout the country. The population living on chars are constantly exposed to risk of flooding and erosion and are considered among those most vulnerable to food insecurity. Land tenure is peculiar in the sense that only influential people own land. Most families are engaged in sharecropping. Infrastructure (physical as well as social) is inadequate and public facilities are non-existent. Accessibility is poor and consequently exploitation by middlemen is common. Agricultural employment and little fishing are the local sources of income. Seasonal migration is the main livelihood strategy.
• Coastal zones: The coastal areas are less heavily populated. The area is vulnerable to cyclones and tidal waves. Landholdings are generally large and small-scale agriculture is not much practiced. Apart from some small coastal islands, accessibility is not a problem. Fishing and agriculture are main sources of income. Forest resources (Sundarbans) are also important. Two main ports (Chittagong and Mongla) provide much economic activity to the region, as does the production of salt and shrimp cultivation. The latter, however, has also negative impacts by creating scarcity of cultivable paddy land and increased salinization of the soils. (BIDS, 2001)
• Chittagong Hill Tracts: This area is the homeland to various ethnic groups. Landownership issues between immigrant Bangladeshis and the indigenous population of the Hill Tracts triggered a conflict situation. As a result, many indigenous people were displaced. A peace agreement was signed in 1996 but security and political considerations still hold back the engagement of many NGOs and international organizations in this area. Pockets of extreme food insecurity can be found. There is limited infrastructure and the accessibility to some areas is extremely difficult. Agriculture, forestry and fishery are the main sectors of employment.
3 The World Bank report consultation with the poor (1999) distinguishes five wealth groups of which three can be classified as being poor: (i) The rich – large landowners in rural areas and/or house-owners in urban slums, (ii) The middle – have access to moderate amount of land, own cattle and draught power, (iii) The social poor – are characterised by seasonal food deficits. They commonly combine sharecropping with wage labour and can borrow from neighbours and financial institutions, (iv) The helpless poor – have no access to land. Many do not have homesteads. Wage labour is the main source of livelihood, (v) The bottom poor – do not own land nor homestead. Household is women headed or headed by elderly men having no income-earning members. They have no access to loans.
VAM – Situation Analysis Report
10
• Sylhet tea estates: Main economic activities are tea production and gas exploitation. Physical infrastructure is good and so are public facilities. Migration to Europe (mainly to the UK) provides a large source of income. There’s an influx of migrants from the northwest to work on the tea estates. The society very conservative; women are often restricted in their mobility and purdah is practiced. Malnutrition rates are high which might be explained by cultural practices, limited nutritional knowledge and eating habits.
• Haor areas: Haor areas are flooded about 6 months of the year which limits the crop intensity to about one a year. Land is primarily owned by rich absentee landlords. Population density is relative low, although there’s a large influx of seasonal labour. Main economic activities are agriculture and fish cultivation. There are limited public facilities.
• Flood plains: Flooding is a recurring phenomenon but in general people have developed successful coping strategies that limits the impact of floods on their livelihoods. Agricultural land is fertile and cropping intensity is high. Infrastructure is relatively well developed and there are good public facilities. People are generally better educated and small-scale entrepreneurship is more common.
The first two zones are generally considered as being the most food insecure.
31. Female-headed households (~ 5 percent of rural households) are poorer than male-headed households and children are also believed to be more vulnerable to food insecurity. Other vulnerable groups that are important for the community food security analysis are: fishermen, disabled individuals and their families, tribal populations (Quasem, 1997).
32. The community food security analysis intends to apply the Household Food Economy Approach (HEA) as a framework for analysis. This approach has been developed by SCF/UK and is essentially a three step process. First a baseline is developed of how various wealth groups in a particular area normally secure their access to food. As a second step, the approach looks at how households respond when shocks occur that affect a household’s ability to acquire food. And the third step is scenario analysis based on data collected in the first two steps. Numerous studies exist that provide detailed household information at local level. The community food security analysis will gather and analyze these valuable data sets in order to avoid as much as possible duplication of primary data collection by VAM.
33. The main targeting criteria for beneficiaries used by various aid-organizations include land ownership, gender and source of income. Land ownership is no longer used by CARE as a targeting criterion as it is not a uniform measurement of wealth across the country due to differences in land productivity. Access to land is however commonly known as one of the main determinants of poverty. Whether it is a good selection indicator for the targeting of beneficiaries for food aid programmes needs to be seen. Binyak Sen and Sharifa Begum (1998) propose a combination of alternative poverty indicators for targeting the ultra poor, including housing, occupation and landownership. Quality and quantity of meals were found to be the primary food security indicators in the Livelihoods Monitoring and Poverty Profile Baseline of Northern Bangladesh (CARE, DFID). One objective of the community food security analysis is to find a set of targeting criteria suitable for identifying food insecure households at local level.
Implications for VAM analysis
34. VAM Bangladesh has to respond to a demanding development programme. At the same time, VAM is required to provide input into disaster preparedness and contingency planning. WFP’s key information requirements can be summarized as follows:
VAM – Situation Analysis Report
11
Programme Priority information product required
Remarks
Vulnerable Group Development • Revised and updated resources allocation map
• Review of beneficiaries selection criteria
Map of relative food insecurity at thana level is needed in order to determine the allocation of VGD resources
Integrated Food Security • Updated chronic food insecurity map (1st tier targeting)
• Identifying most food insecure district or thanas (2nd tier targeting)
• Union or Community level targeting approach (3rd tier targeting)
First tier targeting is based on household income and expenditure data to assess household’s ability to access food. Second tier targeting is based on household and area characteristics for which data is available at thana level.
National School Feeding • Urban targeting maps
• Rural targeting map
Limited data available for urban areas
Protracted Relief and Recovery Operations/CHT programme
• Food security profiles for population groups in the Chittagong Hill tracts and refugees
Emergency Operations • Vulnerability and area resource maps
• Database on location and quantities of essential supplies
• Scenarios for contingency planning and disaster mitigation
35. VAM’s immediate priority is a new set of targeting maps. The following strategy will be pursued:
The VGD and the IFS programme target areas that have the highest incidence of chronic food insecurity. The main underlying cause of chronic food insecurity is the existence of extreme poverty. The targeting maps should therefore be primarily based on indicators of extreme poverty, such as income, expenditure, and assets. Unfortunately, poverty indicators, such as those generated by the household expenditure surveys, are generally not available for small geographical units. An intermediate level is provided by the poverty monitoring survey (May 1999), which does provide poverty estimates for 21 regions of the country. This survey provides a good starting point for the first tier targeting exercise proposed for the IFS programme. Clustering of districts may allow us to obtain results at an even more disaggregated level. The second tier targeting focuses on district or thanas and for this different proxy indicators will be used, such as quality of housing, irrigation coverage, landownership, wage rates, distance to major markets, school enrolment, literacy, etc. Each indicator will be mapped separately to analyze the spatial relationship among the various dimensions of food insecurity (See also Godilano et.al, 2000). The second stage in this approach is to determine the ranking of each area on the basis of all the indicators together. Different combination methods will be applied, including z-scores, scoring, simple and weighted indices, and a principle component analysis.
A second approach that will be followed is an application of the so-called small area estimation technique (see Hentschel et.al. 1998, Bigman, 2000, Del Ninno and Sen, 2001). This technique combines different data sets in order to come up with estimates for the indicator of interest at a lower geographical level than for
VAM – Situation Analysis Report
12
which it is available. Our concern is the incidence of chronic food security at district or thana level as measured by a household’s inability to acquire sufficient food. This inability can be expressed as the probability that an individual’s income or consumption falls below the hardcore poverty line.4 Other measures of food insecurity, such as malnutrition, calorie deficiency and quality of meals will also be explored. The first step is to estimate a model of income or consumption using household survey data (HIES 2000, PMS 1999, CNS 2000). Separate models will be developed for each region for which survey data is available and, within these, distinction will be made between urban and rural areas. Only those variables that are included both in the household surveys as well as in other data sources, for which exact mapping at district or thana level is possible, can be considered. Values for indicators of chronic food insecurity for each district or thana are then estimated by using the coefficients obtained with the models estimated in the first step but replacing the household survey variables with variables that are available for all areas from any other data source. Ideally, data from the 2001 population census will be used to link the survey data. This would allow us to estimate the incidence of food insecurity at thana or even union level. The last step is to map and rank all areas according to their level of food insecurity. The results of the different approaches will be compared and analyzed.
36. Accessibility and cost effectiveness are also important determinants of targeting food-assisted development programmes. The CVA will develop area resource maps that will provide an overview of geographical differences in transportation cost, (distance to) road and river network, local storage depots, and NGO presence and capabilities. An overlay of area resource maps on food insecurity maps would provide additional insight of where WFP’s food aid could be targeted most effectively.
37. The expansion of the national school feeding programme requires targeting maps for rural and urban areas. A combination of data on primary education, such as, enrolment, drop-out rates, gender differences, teacher/pupil ratios, number of schools, and data on nutrition, such as, stunting, underweight, and MUAC would provide sufficient guidance into which areas to target for the expansion of the school feeding programme. Due to limited availability of data for urban areas, a light survey might be required to produce the requested targeting maps. An alternative would be data from the census of slums areas and floating populations of 1997. This data could be used to provide a first targeting map based on proxy indicators.
38. For emergency operations a set of vulnerability maps is needed. Based on historical disaster data (including floods, droughts, cyclones, epidemics) a map of the most physically affected thanas will be prepared. Within each of these areas we look at the level of food insecurity or extreme poverty. From this “overlay” we select those that are most vulnerable in terms of the likelihood of a natural disaster occurring and their limited coping capacity due to extreme poverty. WFP’s current operations in these areas and the existence of NGO capacities will be mapped. Using the HEA framework, scenarios will be developed that estimate the effect of a shock on household income and food supply and the likely food needs.
Annexes
A. Sources and Characteristics of Food Security Data B. Key Documents and Literature on Food Security and Vulnerability C. Targeting Maps
4 Using the Direct Calorie Intake method for estimating the incidence of extreme poverty the hardcore poverty line is set at 1805 k.Cal per person per day.
VAM – Situation Analysis Report
13
39. Sources and Characteristics of Food Security Data in Bangladesh This Annex provides an overview of censuses and household surveys that have been completed in Bangladesh. They represent the most important sources of data for analysing household food security at a national level. Only nationally representative data sources have been included as they provide the core of the data that will be analysed during the Secondary Data Analysis (SDA). Surveys that have been conducted in only specific areas of the country have been omitted. These will however be used as a key source of data for the Community Food Security Profiling analysis that will investigate the dynamics of food insecurity and vulnerability in the areas identified as being the most food insecure. Regularly collected statistics such as on agricultural production, food prices, wages, and weather conditions as well as various international data sources, e.g. flood forecasting and satellite imagery, will provide useful sources for monitoring the food security and vulnerability situation in the country. The VAM unit intends to include these information sources in the near future.
Censuses:
Population Census, 2001
(Bangladesh Bureau of Statistics) Description/Remarks: In Bangladesh the population census is conducted on a decennial basis. The first census of independent Bangladesh was in 1974, followed by the second one in 1981 and the third in 1991. Except for the preliminary report, which only publishes estimates on population, sex ratios and household size, the results of the 2001 population census are not yet available. It is expected they will be released in phases by division during the course of the year. Features: • Data collection method: Census. • Level of Disaggregation: Household data. • Data content: Household characteristics and housing, population
characteristics, economic participation and occupation, fertility and mortality, and migration.
• Data available in VAM database: The 1991 population census data is available. • Data access: Census data are not yet released • Publications/Format: Preliminary report, August 2001. • Earlier censuses conducted: Every first years of each decade since 1872,
except for the census of 1971 which was held in 1974. Main findings relevant to VAM: • The preliminary findings estimate the population size of Bangladesh to be 123
million. However, it is likely that this figure will be revised to roughly 130 million people. This is an increase of 4 percent, which equals the revision of the preliminary findings of the 1991 census data.
• Average household size is 4.8. VAM contact(s): Mr Md. Nurul Ameen, Assistant Representative, UNFPA, tel. 8123265 Census Wing, BBS
VAM – Situation Analysis Report
14
Census of Slum Areas and Floating Populations, 1997
(Bangladesh Bureau of Statistics) Description/Remarks: The census provides a source of information for mapping food insecurity and vulnerability of slum dwellers in the urban areas of Bangladesh. Features: • Data collection method: The census was conducted in two phases. Phase I
collected basic information on slums (name of slum, households and population) and phase II collected detailed socio-demographic data from 5 percent of the slum households.
• Level of Disaggregation: Household data. Four statistical metropolitan areas (Dhaka, Chittaging, Khulna, Rajshahi), 14 cities and 100 Paurashavas.
• Data content: Slum characteristics, literacy, employment, housing, toilet facilities, rental status, ownership of agricultural land, source of electricity, reason for coming to slum and migration, and information on floating population.
• Data available in VAM database: Basic information on slums as reported in Volume 1 of the census reports.
• Data access: Access to unpublished unit data is unknown. • Publications/Format: Volume 1, Report on the Census of Slum Areas and
Floating Population – 1997. Volume 2, Report on the Socio-demographic Survey of Slum Dwellers – 1997. Unsure whether Volume 2 has been published.
• Earlier censuses conducted: Census of slums, 1985/86. Main findings relevant to VAM: • More than 60 percent of the total slum area in Bangladesh can be found in
Dhaka Megacity providing a home to 186 thousand households (55.6 percent of all slum household)
• The literacy rate of slum dwellers is 14.7 percent which is much lower than the literacy rate found in the 1991 population census of 32.4 percent.
VAM contact(s): BBS, Census Wing.
VAM – Situation Analysis Report
15
Census of Agriculture, 1996
(Bangladesh Bureau of Statistics) Description/Remarks: The agricultural census provides the basic source of information related to the structure and operations of agricultural activities in the country. Small area statistics are provided up to the Mauza level. Features: • Data collection method: The census was organized in two schedules. Schedule
(I) was a 100 percent enumeration of all holdings collecting basic information. Schedule (II) was a probability sample survey collecting detailed supplementary information of farm holdings
• Level of Disaggregation: By division, district, union and mauza, and by farm holding (non-farm and farm holdings – small, medium and large)
• Data content: Full count census contains data on the sex of head of holdings, landownership, land tenure, land use, cropping patterns, irrigation, use of chemical fertilizer, livestock and poultry, agricultural inputs, farm population, rural transport and cottage industry. The sample survey provides detailed information on some of the items in the full count census and includes information on fragmentation of land, pattern of crop sharing, farm forestry, fisheries and storage facilities.
• Data available in VAM database: A subset of the data set has been computerized. The National Series publications are available in the VAM library.
• Data access: Data is made available through a series of national and zila level reports.
• Publications/Format: National Series: Vol. 1, Structure of Agricultural Holdings & Livestock
Population Vol. 2, Agricultural Sample Survey
Zila Series: 64 Zilas Brochures: Brochure I, Summary of District/Zila Agricultural Statistics Brochure II, Key Indicators of Agriculture Sample Survey
• Earlier censuses conducted: Conducted on a sample basis in 1960 and 1977 (10 and 6 percent respectively of agricultural holdings) and on a full count basis in 1983-84 (50 percent in 1983 and 50 percent in 1984)
Main findings relevant to VAM: • To be determined VAM contact(s): Census Wing, BBS
VAM – Situation Analysis Report
16
Surveys:
The Household Income & Expenditure Survey, 2000
(Bangladesh Bureau of Statistics / World Bank) Description/Remarks: The Household Expenditure Survey (HES) series are considered as the main source for estimating poverty in Bangladesh. There have been 8 such surveys since 1973-74. The household expenditure survey 2000 collected information on income as well as on expenditure and consumption and is therefore called Household Income and Expenditure Survey. Data from the HIES 2000 has been analysed by the World Bank for the Poverty Assessment as their input into the Bangladesh Poverty Reduction Strategy Paper. There are some reports of data inconsistencies and the data should therefore be analysed carefully. Features: • Data collection method: A total of 7440 households were interviewed. A two
stage stratified random sampling technique was used in drawing a sample. The design consisted of 252 rural and 190 urban Primary Sampling Units.
• Level of Disaggregation: Division, urban–rural, and by gender • Data content: Household characteristics and housing, assets and income,
consumption, education, health, and agriculture and non-agriculture enterprises.
• Data available in VAM database: The complete data set will be ordered from BBS.
• Data access: Unit data can be ordered via the Secretary, Statistics Division. The complete dataset cost US$1000. A subset of the dataset can be requested. A copy of the questionnaire is available.
• Publications/Format: Preliminary report, Dec 2001. • Earlier surveys conducted: HES 1995/96, 1991/92, 1988/89, 1985/86,
1983/84, 1981/82, 1973/74 Main findings relevant to VAM: • Expenditure on food as percentage of household consumption is 54.6. (rural
59.3 compared to 44.6 in urban areas) • Calorie intake dropped to 2240 kcal/cap/day. • Incidence of poverty as measured by the head count ration using the cost of
basic need method is 33.7 (lower poverty line) and 49.8 (upper poverty line). Rajshahi Division shows the highest incidence of poverty.
• Incidence of poverty has increased in urban areas, while it has decreased in rural areas.
• Incidence of poverty is more than double for illiterate compared to literate VAM contact(s): Mr Faiz Udin Ahmed, Project Director HES, BBS, tel. 9112413 Mr Salman Zaidi, World Bank, [email protected]
VAM – Situation Analysis Report
17
The Poverty Monitoring Survey, May 1999
(Bangladesh Bureau of Statistics / Centre on Integrated Rural Development for Asia and the Pacific - CIRDAP)
Description/Remarks: The poverty monitoring survey (PMS) provides population poverty measures on an annual basis. The first PMS was held in October 1994. So far, six surveys were conducted in rural areas and four in urban areas and data was presented for urban and rural areas separately at the national level. The May 1999 PMS provides for the first time poverty estimates at sub-national level for 21 regions of the country. Poverty estimates were calculated on basis of the Food Energy Intake method and separate urban and rural poverty lines were derived for each region with a threshold calorie intake per person per day for urban population of 2112 k.Cal. and for rural population 2122 k.Cal. Features: • Data collection method: The total number of household sampled was 16,000
(urban 6000, rural 10,000) with a total sample population of 80,411. The list of enumeration areas of the 1991 population census was used as the sample frame. The country was divided into urban and rural strata. Dat was collected from 30 May to 13 June 1999. A one week reference period was used for food items, one month for daily consumption of non-food items and a year for durable goods.
• Level of Disaggregation: Sub-national at the level of 21 regions, rural and urban, poor and non-poor households, and selected poverty indicators by socio-economic groups such as female headed households.
• Data content: Income and expenditure, housing, food intake, health and sanitation, education, occupation, landownership, credit, gender dimension, expenditure saving, crises and coping.
• Data available in VAM database: Hardcopy of report is available. Unit data will be ordered if needed.
• Data access: Unit data can be ordered at a cost of U$1000 via Secretary, Statistics Division.
• Publications/Format: Report of the Poverty Monitoring Survey, May 1999. • Earlier surveys conducted: PMS October 1994, April 1995, April 1996, April
1997 and April 1998. Main findings relevant to VAM: • Incidence of poverty declined in both rural (44.9 percent) and urban (43.3
percent) areas. • Urban poverty was highest in Tangail region, followed by Patuakhali, Rangpur,
Faridpur and Jamalpur. • Rural poverty was highest in Mymensingh, Faridpur, Rangpur and Barisal. • Given the estimates of the depth and severity, poverty seems to be most
acute in the region of Faridpur. • Poor households spend 77.1 percent of total expenditure on food compared to
66.7 percent for non-poor households. • Landownership needs to be carefully used as a targeting criterion. Households
with less than 2 acres of land are almost equally likely to be poor as non-poor. Landless households in rural areas have however a slightly higher chance to fall in the poor household category.
VAM contact(s): Mr Faizuddin Ahmed, Project Director, BBS, tel. 9112413 Dr. Muhammad Solaiman, Director Research, CIRDAP.
VAM – Situation Analysis Report
18
Child Nutrition Survey, 2000
(Bangladesh Bureau of Statistics / UNICEF)
Description/Remarks: The Child Nutrition Survey is a module of the HIES 2000. Features: • Data collection method: The same households were interviewed as in the
HIES 2000, except that only households with children were included. This reduced the sample size with about 50 percent.
• Level of Disaggregation: Division, gender, urban slum and non-slum • Data content: Household information (sex, religion and occupation of HH
head, source of water, use of iodine salt, toilet facilities, homestead, loans), Mother/Caretaker information (hygiene, pregnancy, income, decision-making), Child’s information (breastfeeding, vaccination, diarrhoea, illnesses, anthropometrical data)
• Data available in VAM database: No. • Data access: After publication of the survey finding the unit data can be
acquired if needed from Joint Secretary, Statistics Division, BBS. A copy of the questionnaire is available.
• Publications/Format: Report is currently being finalized. Expected date of publication is end of April 2002
• Earlier surveys conducted: CNS 1989/90, 1992, 1995/96 Main findings relevant to VAM: • Survey findings not yet available. VAM contact(s): Mr Abdus Salam, Project Director, Monitoring the Situation of Children and Women Project, BBS, tel. 8127937. Dr Syeeda Begum, Health and Nutrition Section, UNICEF, tel. 9336701.
VAM – Situation Analysis Report
19
Demographic and Health Survey, 1999-2000
(Bangladesh Bureau of Statistics / National Institute for Population Research and Training - NIPORT)
Description/Remarks: The 1999 –2000 Bangladesh Demographic and Health Survey (BDHS) is part of the international Demographic and Health Surveys programme, MEASURE DHS+ (http://www.measuredhs.com). The survey was conducted in two parts: A household-level survey and a survey of health facilities located around the sample points from which the households were selected. For VAM analysis the BDHS provides an important source for data on childhood mortality, nutrition levels and maternal and child health. Features: • Data collection method: Using the 1991 population census frame, 341 PSUs
were selected (99 in urban areas and 242 in rural areas). In each of these areas a household listing was conducted from which a sample was drawn of 10,268 households. Interviews were carried out in 9,854 households and in total 10,544 women and 2,557 men were interviewed.
• Level of Disaggregation: By division, rural-urban, age group, education level • Data content: Fertility, child mortality, contraceptive knowledge, maternal and
child health, child nutrition. • Data available in VAM database: No. Will submit request for data on child
nutrition and health status. • Data access: Data can be requested from the MEASURE DHS+ website, is
available from NIPORT or Mitra and Associates. • Publications/Format: Preliminary Report, June 2000; online digital datasets,
MEASURE DHS+, 2000 and MEASURE DHS+, SPA, 1999. • Earlier surveys conducted: DHS III, 1996/97, 1993/94. Main findings relevant to VAM: • The total fertility rate of 3.3 has remained almost constant during the 1990s • Prevalence of children suffering from diarrhoea is 6.1 percent. Children in
Barisal and Sylhet are more likely to suffer from diarrhoea (7.8 and 7.0 percent respectively).
• 45 percent of children are stunted, 10 percent are wasted and 48 percent are underweight. Wasting is not such a widespread problem with only 1 percent being severely wasted. Severely stunted are 18.4 percent.
• Malnutrition is more prevalent among rural than urban children. However, when slum areas are considered separately, malnutrition is worse than in rural areas.
• Children living in Sylhet Division are more likely to be undernourished and those in Khulna less.
• Children of better-educated women are less likely to be undernourished. VAM contact(s): NIPORT, tel. 507866 Mitra and Associates, tel. 8118065
VAM – Situation Analysis Report
20
Multiple Indicator Cluster Survey, 2000
(Bangladesh Bureau of Statistics / UNICEF)
Description/Remarks: The Multiple Indicators Cluster Survey (MICS) is carried out as part of a project entitled “Monitoring the world Summit Goals on Child Survival, Development and Protection”. The objective is to provide detailed information on different indicators related to achieving the goals of the World Summit for Children on an annual basis. Results of the MICS are published in reports called Protogir Pathey (On the Road to Progress). The MICS provides an important source of data for VAM on the status of women and children at district level. Features: • Data collection method: The survey consisted of a total sample of 63,200
households in 1024 clusters. Clusters were defined as compact area segments, which were formed by sub-dividing selected mauzas or urban mahallas until they covered an average of around 50 households. Two levels of stratification were used: urban (four metropolitan cities of Dhaka, Khulna, Chittagong and Rajshahi, and other municipalities) and rural (64 districts not including municipal areas.
• Level of Disaggregation: By 64 districts, gender, urban-rural and for the urban areas of Dhaka and Chittagong by slum and non-slum.
• Data content: Health and nutrition indicators (diarrhoea prevalence, malnutrition (MUAC < 12.5), breast feeding practices, vaccinations), water and sanitation indicators (source of drinking water, arsenic contamination, type of latrine, hygiene), and indicators on child education (enrolment, participation in early childhood development programmes)
• Data available in VAM database: Yes (only published district data). Copy of ChildInfo.
• Data access: Unit data is property of BBS and can be purchased if required. UNICEF can assist. Summary data are readily available from UNICEF.
• Publications/Format: Progotir Pathey, 2000, ChildInfo • Earlier surveys conducted: Progotir Pathey 1994, 1995, 1996, 1997, 1999. Main findings relevant to VAM: • Malnutrition (MUAC < 12.5 cm) for children aged 12-59 months is most
prevalent in the districts, Sunamganj, Noakhali, Bhola, Shariyatpur, Gopalganj, and Faridpur, and in the urban slum areas of Dhaka and Chittagong.
• Prevalence of diarrhoea is highest in the south of Bangladesh, especially in the coastal districts.
• Access to safe water is estimated at 70 percent due to arsenic contamination of ground water.
VAM contact(s): Mr Nawshad Ahmed, Planning Officer, UNICEF, tel. 9336701 Ms Naomi Ichikawa, Asst. Programme Officer, Planning Section, UNICEF, tel. 9336701 Mr A.T.M. Rafique Hoque, Project Director, Goals Monitoring Project, BBS.
VAM – Situation Analysis Report
21
Nutritional Surveillance Project
(Helen Keller International / Institute of Public Health Nutrition)
Description/Remarks: The Nutritional Surveillance Project (NSP) was established in 1990. It constitutes one of the richest data sources on health and nutrition of mothers and children in Bangladesh. The surveys of the NSP take place 6 times a year in rural and urban areas throughout Bangladesh. Features: • Data collection method: The NSP uses a multisampling stage that was revised
in 1998 to provide national representative data. In each division four thanas were randomly selected which remain the same from survey to survey. From each of these 24 thanas, 10 clusters are selected with a probability proportionate to size for each survey. Within these clusters 30 households are systematically sampled from one randomly selected village. Only households with at least one physically able child aged 6-59 months and a mother that is present are eligible for inclusion. The sample size per survey is around 7,200 households (1,200 per division).
• Level of Disaggregation: By division, by-monthly, rural-urban, age group, and household vulnerability.
• Data content: Indicators of child nutrition (wasting, stunting, underweight) and health status (diarrhoea, ARI), breast feeding and child feeding practices, food consumption patterns, food prices, agricultural production, household socio-demography, employment status of household earners, parental education and natural disasters.
• Data available in VAM database: No. • Data access: Unit data are not made available. Request for data to be
submitted to HKI. • Publications/Format: Nutritional Surveillance Project Bulletins, published
generally every 2 months; 1998 NSP Annual Report, National and Divisional Trends among Children and Households in Rural Bangladesh; The Nutritional Surveillance Project in Bangladesh in 1999, Towards the Goals of the 1990 World Summit for Children.
• Earlier surveys conducted: Bi-monthly since 1990 with a break in data collection from August to December 1997.
Main findings relevant to VAM: • In 1999 the prevalence of underweight ranged from 53.7 in Khulna to 70.9
percent in Sylhet. Khulna showed also the lowest prevalence of stunting (43.2) and Sylhet the highest (64.9).
• Wasting is highly seasonal. It peaks in the period June-August and is lowest in December-February. The peak of peak in levels of wasting closely follows the peak of diarrhoea prevalence.
• Children aged 6-23 months are most vulnerable to undernutrition. • Over half of the population were landless and almost 70 percent were
functionally landless (less than 0.3 hectares of land). Home gardening is widely practised.
• HKI defines household vulnerability as a composite index of landownership and stability of income.
VAM contact(s): Mr Andrew Hall, Country Director, Helen Keller International, tel. 8121080 Ms Harriet Torlesse, Nutrition Adviser, Helen Keller International.
VAM – Situation Analysis Report
22
Key Documents and Literature on Food Security and Vulnerability in Bangladesh
Government of Bangladesh 1. Ministry of Women and Children Affairs (2000), National Report on Follow-
up to the World Summit for Children, Bangladesh. 2. NIPORT (2000), Preliminary Report Bangladesh Demographic and Health
Survey 1999-2000, Ministry of Health and Family Welfare, Dhaka. 3. BBS (2002), Report of the Poverty Monitoring Survey - May 1999,
Bangladesh Bureau of Statistics, Dhaka. 4. BBS (2001), Preliminary Report of Household Income & Expenditure
Survey 2000, December 2001, Bangladesh Bureau of Statistics, Dhaka. 5. BBS (2000), Rural Poverty Monitoring Survey - April 1998, Bangladesh
Bureau of Statistics, Dhaka. 6. BBS (2000), Urban Poverty Monitoring Survey - April 1998, Bangladesh
Bureau of Statistics, Dhaka. 7. BBS (1997), Child Nutrition Survey of Bangladesh 1995-96, Bangladesh
Bureau of Statistics, Dhaka. 8. BBS (1999), Census of Slum Areas and Floating Population 1997, Vol I,
Bangladesh Bureau of Statistics, Dhaka. 9. BBS (1998), Household Expenditure Survey (1995-96), Bangladesh
Bureau of Statistics, Dhaka. 10. BBS (1997), Rural Poverty Monitoring Survey - April 1997, Bangladesh
Bureau of Statistics, Dhaka. 11. BBS and UNICEF (2000), Progotir Pathey 2000, Dhaka. 12. BBS and UNICEF (1999), Progotir Pathey 1999, Dhaka. 13. Talukder, R.K., A.F.M. Maniruzzaman, K.S. Sarker (2001), Regional
Variation in Production and Requirement of Food Grains in Bangladesh, EWFIS, Ministry of Food, Dhaka
14. Talukder, R.K., K.S. Sarker and M. Islam (2001), Regional Differences in Production and Requirement of Food Grains in Bangladesh, EWFIS, Ministry of Food, Dhaka.
15. FPMU, Ministry of Food (1999), Food Security in Bangladesh: Current Policies and Future Plans, 1999 Paris Meeting.
16. DFID, WFP & EC (1999), Evaluation of the 1998 Flood Emergency Operation, Draft Report, 27 July 1999, Government of Bangladesh, Dhaka
United Nations 17. M.S. Swaminathan Research Foundation & WFP (2001), Food Insecurity
Atlas of Rural India, New Delhi, India. 18. WFP (2002), Contingency Planning Guidelines, Rome, Italy. 19. Conte, A., D. Zalik and N. Morrow (2000), Mission Report, VAM Technical
Support for Targeting, WFP, Dhaka. 20. Currey, B. (2000), Strategic Directions for WFP-VAM in the 21st Century,
Examples from Bangladesh, WFP, Dhaka. 21. WFP (2000), Country Programme Bangladesh (2001-2005), Rome, Italy. 22. WFP (2000), Country Strategy Outline Bangladesh, Rome, Italy. 23. Rahim, Abdur (2000), Logistics Capacity Assessments Bangladesh, WFP,
Dhaka. 24. WFP (1997), Successful Micro-Entrepreneurs: Case Studies of Ex-VGD
Women, Dhaka, Bangladesh. 25. WFP & EC (1999), IFADEP Journal, Vol. 1, 2, 3 & 4, 1999 Quarterly Issues,
WFP, Dhaka. 26. WFP, UNESCO, WHO (1999), School Feeding Handbook, Rome, Italy. 27. FAO (1999), Nutrition Country Profiles – Bangladesh, Rome, Italy. 28. FAO (2001), The State of Food Insecurity in the World 2001, Rome, Italy. 29. FAO (2000), The State of Food Insecurity in the World 2000, Rome, Italy.
VAM – Situation Analysis Report
23
30. FAO (1999), The State of Food Insecurity in the World 1999, Rome, Italy. 31. Sen, B. and S. Begum (1998), Methodology for identifying the Poorest at
Local Level, Technical Paper No. 27, WHO, Geneva. World Bank 32. World Bank and Asian Development Bank (2002), Bangladesh: Progress in
Poverty Reduction, Background Paper, Bangladesh Development Forum, Paris 2002.
33. World Bank (2000), Targeted Food Assistance Programs in Bangladesh, Bangladesh Development Forum, Dhaka.
34. Bigman, D. and H. Fofack (2000), Geographical Targeting for Poverty Alleviation: Methodology and Applications, World Bank, Washington D.C.
35. Galasso, E. and M. Ravallion (2000), Distributional Patterns of a Decentralized Welfare Program, World Bank, Washington, D.C
36. Nabi, R., D. Datta, S. Chakrabarty, M. Begum, N.J. Chaudhury (1999), Consultation with the Poor, Participartory Poverty Assessment in Bangladesh, NGO Working Group on the World Bank Bangladesh.
37. World Bank (1998), Bangladesh: From Counting the Poor to Making the Poor Count, Bangladesh Poverty Assessment Report, The World Bank, Dhaka.
38. Hentschel, J., J.O. Lanjouw, P. Lanjouw, J. Poggi (1998), Combining Census and Survey Data to Study Spatial Dimensions of Poverty, Policy Research Working Paper 1928.
39. Ravallion, M. and Q. Wodon (1997), Poor Areas, Or Only Poor People? Policy Research Working Paper 1798.
IFFRI 40. Del Ninno, C. and B. Sen (2001), Using Household and District Level Data
for Geographical Targeting: A Methodological Exercise with Bangladesh Data, IFPRI, Dhaka
41. Del Ninno, C. and O.H. Chowdhury (1998), Poverty, Household Food Security and Targeted Food Programmes, IFFRI, Dhaka.
42. Del Ninno, C. and O.H. Chowdhury (1998), Efficiency of Targeted Food Program: A Preliminary Investigation of the VGD and RD Programs, FMRSP, IFPRI, Dhaka.
43. Del Ninno, C. and D. Roy (2001), Recovering from the Shock or the 1998 Flood: Household Food Security and Nutritional Status One Year L, FMRSP, IFFRI, Dhaka.
44. Del Ninno, C. and D. Roy (1999), The 1998 Flood and Household Food Security: Evidence from Rural Bangladesh, FMRSP, IFFRI, Dhaka.
45. Del Ninno, C.and D. Roy (1999), Impact of the 1998 Flood on Labour Markets and Food Security and Effectiveness of Relief Operations in Bangladesh, FMRSP, IFFRI, Dhaka.
46. Del Ninno, C. and P. Dorosh (2000), In-kind transfers & household consumption implications for targeted food programs in Bangladesh, IFFRI, Dhaka.
47. Del Ninno, C. and P. Dorosh (1999), Averting a Food Crisis: Private Imports and Public Targeted Distribution in Bangladesh after the 1998 Flood, IFFRI, Dhaka.
48. Del Ninno, C. and P. Dorosh (1998), Government Policy, Markets and Food Security in Bangladesh, IFFRI, Dhaka.
49. Del Ninno, C. and S. Mukherjee (2000), Household Food Security, Welfare Losses and Recovery in the Aftermath of the 1998 Flood in Bangladesh, IFPRI, Dhaka.
50. Dorosh, P. and S. Haggblade (1997), Shifting Sands: The Changing Case for Monetizing Project Food Aid in Bangladesh, World Development, Vol. 25 (12), pp.2093-2104
VAM – Situation Analysis Report
24
51. Chowdhury, O.H. (1995), Nature and Extent of the Food Security Problem in Bangladesh, IFPRI, Dhaka.
52. Ahmed, A.U. and K. Billah (1994), Food for Education Program in Bangladesh: An Early Assessment, FMRSP, IFFRI, Dhaka.
53. Ahmed, A.U. et al. (1994), Options for Targeting Food Intervention in Bangladesh, Paper presented at a seminar on Evolving Food Markets and Food Policy in Bangladesh, IFPRI, Dhaka.
National and International NGOs 54. SCF/UK (2001), Kurigram District Assessment, Household Economy
Approach, Training Course Level 1, Dhaka. 55. SCF/UK (2000), The Household Economy Approach: A Resource Manual for
Practitioners, Save the Children Development Manual No.6, London. 56. HKI (2001), The Nutritional Surveillance Project in Bangladesh in 1999,
Dhaka. 57. HKI (2000 – 2002), Nutritional Surveillance Project Bulletins, Dhaka. 58. HKI (1999), 1998 NSP Annual Report, National and Divisional Trends
among Children and Households in Rural Bangladesh, Dhaka. 59. BRAC (2000), BRAC’s Poverty Eradication Programmes – Focusing on the
Poorest 2001-2005, Dhaka. 60. BRAC (1998), BRAC’s Annual Report- Continuity and Change, BRAC,
Dhaka. 61. Husain, A.M. Muazzam (1998), Poverty Alleviation and Empowerment, The
Second Assessment Study of BRAC’s Rural Development Programme, BRAC, Dhaka.
62. Sutter, P. (2000), Livelihood Security in the Chittagong Hill Tracts, CARE. 63. CARE (2000), Rapid Household Livelihood Security Assessment Report on
Bangladesh Flood 2000 in South West Region, Disaster Management Project. Bilateral Aid Agencies 64. Chung, K., L. Haddad and J. Ramakrishna (1994), Alternative Approaches
to Locating the Food Insecure: Evidence from South India, USAID, IMPACT project.
National and International Research Institutions 65. BIDS (2001), Fighting Human Poverty, Bangladesh Human Development
Report 2000, BIDS, Ministry of Planning and UNDP, Dhaka. 66. Rahman, H.Z., M. Hossain, and B. Sen (1996), Dynamics of Rural Poverty
on Bangladesh, BIDS, Dhaka. 67. Alam, Mahmudul (1999), Socio-Economic Impact of Food for Education
Program (FEEP), mimeo, Bangladesh Institute of Development Studies. 68. Afsar, R. (1999), Identification of the Urban Poorest, WHO and BIDS,
Dhaka. 69. Boudreau, T. (1998), The Food Economy Approach: a Framework for
Understanding Rural Livelihoods, RRN Network Paper 26, ODI, London. 70. BIDS (1997), An Evaluation of the Food for Education Program Enhancing
Accessibility and Retention in Primary Education for the Rural Poor in Bangladesh, Dhaka.
Others 71. EIU (2001), Bangladesh Country Profile 2001, London. 72. Sen, A. (1999), Poverty and Famines, Oxford University Press. 73. Islam, N., N. Huda, F.B. Narayan and P.B. Rana, Addressing the Urban
Poverty Agenda in Bangladesh, Critical Issues and the 1995 Survey Findings, ADB, The University Press Ltd.
74. Quasem, Md.A. (1997), Interventions Towards Attaining Food Security in Bangladesh, World Food Day Seminar, (Mimeo)
VAM – Situation Analysis Report
25
75. Godilano, E.C., M.L. Bose, S.P. Kam and M. Hossain (2000), Spatial Analysis of Rural Poverty and Environmental VulnerabilityL the cae of Bangladesh, IRRI, Los Baños, Philippines.
76. Ravallion, M. and B. Sen (1996), When Methods Matters: Monitoring Poverty in Bangladesh, Economic Development and Cultural Change, Vol. 44, No.4 pp. 761-792.
77. Rahman, A., A.K. Azad, T. Marshall and J. Pryer (2001), Nutritional Status of the Dhaka Slum Population, Urban Livelihood Study, IDPAA, Dhaka.
VAM – Situation Analysis Report
26
Targeting Maps
1. Resource Allocation Map for Food-Assisted Development
VAM – Situation Analysis Report
27
2. Incidence of Extreme Chronic Food Insecurity