using the analytic network process to evaluate the relation between reverse logistics and corporate...
TRANSCRIPT

13
REVISTA INVESTIGACIÓN OPERACIONAL VOL., 33 , NO. 1-13-22, 2012
USING THE ANALYTIC NETWORK PROCESS TO
EVALUATE THE RELATION BETWEEN REVERSE
LOGISTICS AND CORPORATE PERFORMANCE IN
BRAZILIAN COMPANIES Cecilia Toledo Hernández*1, Roberto Cespón Castro**2, Fernando Augusto Silva Marins***, Jorge Alberto
Rodríguez Durán****
*UNESP – São Paulo State University, UFF – Fluminense Federal University
**UCLV - Central University “Las Villas”
***UNESP – São Paulo State University
****UFF – Fluminense Federal University
RESUMEN
Actividades de Logística Inversa son practicadas por empresas brasileñas. Sin embargo, un problema relevante es identificar cómo
los diferentes programas de Logística Inversa pueden afectar los indicadores de desempeño empresarial. El ANP (Analytic Network
Process) es uno de los métodos de análisis, que puede ser usado para la toma de decisión con critérios múltiples y es el único que
puede capturar las interdependencias entre los criterios y alternativas. Este método fue adoptado aquí para estudiar la influencia de
las prácticas de Logística Inversa en el desempeño corporativo. Los resultados preliminares indicaron que el método puede ser
utilizado por mostrar un resultado compatible con la realidad de las empresas brasileñas.
ABSTRACT
Reverse Logistics activities are practiced by most Brazilian companies. However, a relevant problem is to identify how different
Reverse Logistics programs can affect corporate performance indicators. Analytic Network Process is one of the analytical tools,
which can be used to handle a multi-criteria decision-making problem and it is the only one that can capture the interdependencies
between the criteria under consideration. This method was adopted here to study the influence of Reverse Logistics practices in
corporate performance. Preliminary results indicated that the method can be used, reaching a result compatible to the reality of the
Brazilian companies.
KEYWORDS: Analytic Hierarchy Process (AHP); Analytic Network Process (ANP); Reverse Logistics.
MSC: 90C29
1. INTRODUCTION
Today the sustainability theme has acquired great importance in business and academic fields, as well as in
society in general. This concept is basically being introduced in companies by environmental regulations. Clean
production, reduction, re-use, recycling and some others strategies are used in order to satisfy the needs without compromising the future.
Reverse Logistics (RL) is defined as the area of business logistics responsible for planning, operating and controlling of raw materials reverse flows, in-process inventory, finished products, and their information, from
the consumption point to the origin point in order to recapture value or adjust destination (Rogers and Tibben-
Lembke, 1999). It can generate several benefits (including productivity gains) that react on economic, social and
environmental spheres.
Better customer service, reduction of operation costs, increase of brand prestige and corporate image have been identified as potential benefits of RL programs (Daugherty, Autry and Ellinger, 2001) that can be an alternative
source of income, contributing to business sustainability (Braga Junior, Costa and Merlo, 2006). RL in the

14
recycling channel allows reaching economic and corporate image aims, reducing wastes and residues (Souza,
Vasconcelos and Pereira, 2006; Cruz and Ballista, 2006). RL practices affect positively and strongly
performance indicators, which are closely linked to concept of corporate sustainability, but it is still hard to
evaluate this impact quantitatively because there are in general many intangible measures.
Multiple Criteria Decision Aid (MCDA) methods can help in this process. When there are intangible measures, it is necessary to deduce relative scales, through comparison in pairs, using estimations from another numerical
scale, and organizing these relative scales by hierarchic structures (Saaty, 2008).
Brazilian companies does not escape from this reality, there are corporate strategies showing advances in issues of sustainability and corporate social responsibility (Amato Neto, 2008). RL, both in its broader meaning,
defined as all operations related to products and material re-use (Revlog, 2004), and its logistical procedure
meaning, regarding the material flow returning to company for any reason, has been earning its role in that
context, therefore it is necessary to identify and evaluate RL contribution to corporate performance.
This work analyzes sustainable practices identified in companies of automotive and publishing branches operating in Brazil, which can be gotten into groups of different RL programs – economic, image, customer
service and corporate citizenship drivers – in order to evaluate the influence in corporate performance by using
Analytic Network Process (ANP).
The qualitative and exploratory approach used in the research preliminary phase allowed familiarity with the
problem, interviews with specialists were conducted in order to collect and validate data. Finally, a quantitative approach from the modeling allowed obtaining decision criteria and alternatives as well as giving them weight
or importance, establishing dependency relations in the model here proposed.
This paper is organized in 5 sections. It begins by the introduction, in section 2 it is made the relation between RL and corporate performance by Balanced Scorecard (BSC) perspectives. The section 3 describes the research
methodology, being defined and developed the model used, and the section 4 presents the results of the methods
applications. Finally, there are conclusions, restrictions, future researches and references.
2. CORPORATE PERFORMANCE AND RL
The company sustainability and perpetuity in the long term have become aims with the same level of profit necessity in the short term so, besides the pursuit of gain, it is necessary to honor a great variety of social,
environmental and government interests to ensure profitability for a long time.
RL is inserted in this context of multiple satisfactions, since a lot of productivity gains are obtained by RL practices. There are also several strategic drivers that support its implementation: economic factors, legislations,
corporate citizenship, environmental aspects (Rogers and Tibben-Lembke, 1999); economic aspects, marketing
and legal (Fleischman, 2000); economic aspects, corporate citizenship, image, customer service and legal (Leite,
2006).
Although the benefits of RL programs are recognized, the reality of the Brazilian companies shows neither the usual possibility of verifying all their advantages nor how they would be directly linked to performance
indicators, because according to BSC (Kaplan and Norton, 1997) they are a combination of financial and non-
financial indicators.
BSC was designed initially as a solution to measure performance, but subsequently it was proved as a strategic
management tool to formulate or implement strategies (Kaplan and Norton, 1997).
This work employs 4 BSC perspectives to show how RL programs can affect corporate performance indicators in the Brazilian companies. Table 1 summarizes the four perspectives and the indicators that, in authors’
opinion, can be affected by RL practices.
It is important to mention that the effect of RL programs on performance indicators can vary according to several factors, such as the type of business sector, value chain, position of the reverse channel, etc. Then, it
must be developed in-depth studies like this one, specifically to Brazilian companies.

15
Table 1. Corporate performance indicators related to RL.
Perspectives Corporate performance indicators
Financial
Traditional economic-financial indicators
Shareholder value
Access to capital
Customer Customer attraction and retention
Brand value and reputation
Internal processes
Operational efficiency
License to operate Innovation
Learning and Growth Intellectual and human capital
3. RESEARCH METHODOLOGY
According to Lakatos and Marconi (1986), the research problem relates to analysis of a theme or a knowledge
gap still without solution, which can be set out by a question that specifies the subject. In this study the main
question is: how can RL affect corporate performance? Since theoretical knowledge is limited, it needs to touch
on exploratory.
The research method was the mixed one (Creswell, 2007) that combines qualitative and quantitative data survey.
At first, in order to render the research, it has been used a qualitative approach. In this type of research,
researcher is the key instrument and he tends to an inductive data analysis.
Primary data were obtained from unstructured interviews with several managers and specialists of the companies. This way of collection has served as base to elaborate operational of research and identify elements
to be in-depth (Vergara, 2005), reaching specific activities that are developed by the companies to reduce its
environmental impacts and which are part of RL programs as shown in Table 2.
Table 2. RL activities in each type of company.
RL activities in automobile companies. RL activities in publishing companies.
- Value Recapture of disposable packing (VR)
- Development of Returnable Packing (DR) - Reuse of Returnable Packing (RR)
- Partnership for Residue Management (RM)
- Job Creation in recycling activities (JC)
- Development of components using the “recyclability” concept
(DP)
- Effluents Treatment (ET)
- Clean Technologies (CT)
- Correct Destination (CD)
- Reuse in secondary market (RS)
- Recycling (RE) - Reuse of publications (RP)
- Careful Treatment of returned products
(CT)
- Commercial Actions (CA)
- Donation (DO)
- Educational and Social projects (ES)
- Job Creation (JO)
- Customer Service (CS)
The specific model of interview used (laddering technique) has its base in means-end chain theory, employed a
lot in Marketing to study the conduct and behavior of the consumer (Reynold and Gutman, 1988).
This technique allowed construction of hierarchic maps. These maps have allowed identifying how a same
attribute (RL activity) could be able to produce different values (influence on different corporate performance
indicators). It also has shown the existence of dependence relations and influence among elements of the same
hierarchic level, being very important for next steps about quantitative procedures, complementing and
deepening previous results.
For quantitative data survey was used more specific interviews with restrict questions, adjusted to the MCDA
method chosen, the Analytic Network Process (ANP).
4. RESULT ANALYSIS
16
The different MCDA methods use basically the same tool: the decision matrix. They also have the same main
steps: establishment of criteria and alternatives, assignment of weights and synthesis of results. The distinction
between a method and another one is in the way of conduct the steps. Thus, applications of different MCDA
methods in a same decision problem can generate different results. Therefore the choice of which method to use
must be defined in function of specific objectives of quality and efficiency (Salomon, 2004).
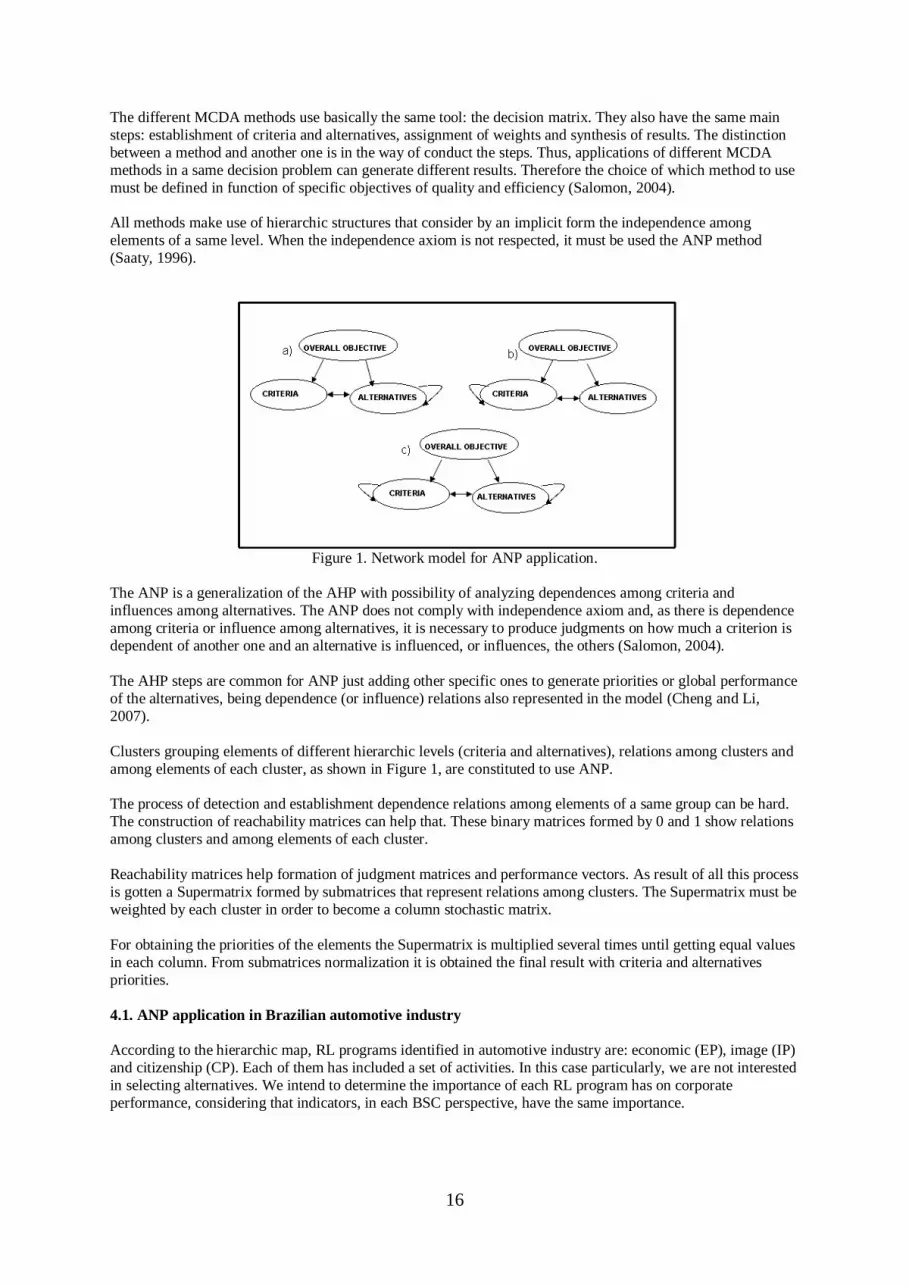
All methods make use of hierarchic structures that consider by an implicit form the independence among
elements of a same level. When the independence axiom is not respected, it must be used the ANP method
(Saaty, 1996).
Figure 1. Network model for ANP application.
The ANP is a generalization of the AHP with possibility of analyzing dependences among criteria and
influences among alternatives. The ANP does not comply with independence axiom and, as there is dependence
among criteria or influence among alternatives, it is necessary to produce judgments on how much a criterion is
dependent of another one and an alternative is influenced, or influences, the others (Salomon, 2004).
The AHP steps are common for ANP just adding other specific ones to generate priorities or global performance
of the alternatives, being dependence (or influence) relations also represented in the model (Cheng and Li,
2007).
Clusters grouping elements of different hierarchic levels (criteria and alternatives), relations among clusters and
among elements of each cluster, as shown in Figure 1, are constituted to use ANP.
The process of detection and establishment dependence relations among elements of a same group can be hard.
The construction of reachability matrices can help that. These binary matrices formed by 0 and 1 show relations
among clusters and among elements of each cluster.
Reachability matrices help formation of judgment matrices and performance vectors. As result of all this process
is gotten a Supermatrix formed by submatrices that represent relations among clusters. The Supermatrix must be
weighted by each cluster in order to become a column stochastic matrix.
For obtaining the priorities of the elements the Supermatrix is multiplied several times until getting equal values
in each column. From submatrices normalization it is obtained the final result with criteria and alternatives
priorities.
4.1. ANP application in Brazilian automotive industry
According to the hierarchic map, RL programs identified in automotive industry are: economic (EP), image (IP)
and citizenship (CP). Each of them has included a set of activities. In this case particularly, we are not interested
in selecting alternatives. We intend to determine the importance of each RL program has on corporate
performance, considering that indicators, in each BSC perspective, have the same importance.

17
Then, it allows us to think about model shown in Figure 2, being ANP the best method to apply. In Figure 2
criteria and alternatives were grouped and arrows in each cluster indicate influence among elements, i.e.,
performance of a criterion or alternatives can influence performance of another criterion or alternatives.
Figure 2. Network structure for RL activities in automotive industry.
The next step for implementation of ANP is realization of the judgments and it needs establishing dependency
relations among clusters and inside clusters.
Table 3. Global reachability matrix.
Clusters Alternatives Criteria
Alternatives 1 1
Criteria 1 1
Even existing dependency relations among elements of each cluster, these one are not total. Table 4 shows the
local reachability matrix formed by relations among all elements of each cluster. It needs a total of 12 matrices with 77 judgments to obtain the vectors of the Supermatrix (Table 5).
Table 4. Local reachability matrix.
Elements CD DR DP JC RM RR VR ET CT CP EP IP
CD 1 0 1 0 1 1 1 1 0 1 0 0
DR 0 1 1 0 0 0 0 0 1 0 1 0
DP 0 1 1 0 0 0 0 0 1 0 0 1
JC 1 0 0 1 1 0 0 0 0 0 0 1 RM 1 0 0 0 1 1 1 0 0 0 0 1
RR 0 0 0 0 0 1 1 0 0 0 1 0
VR 1 0 0 0 1 0 1 0 0 0 1 0
ET 0 0 0 0 1 0 0 1 1 1 0 0
CT 0 1 1 0 0 0 0 1 1 1 0 0
CP 1 1 1 1 1 1 1 1 1 0 0 1
EP 1 1 1 1 1 1 1 1 1 1 0 1
IP 1 1 1 1 1 1 1 1 1 1 1 1
.

18
We need two matrices: the global one (for dependency between clusters) and the local one (for dependency
inside clusters) (Salomon, 2004). Table 3 presents global reachability matrix for network shown in Figure 2. As
criteria and alternatives have dependency between themselves, the components “criteria x criteria” and
“alternatives x alternatives” are 1. The others components relate to AHP application, taking into account criteria
importance (component “criteria x alternative”) and alternative performance according to each criterion (component “alternative x criteria”).
Table 5. Supermatrix.
CD DR DP JC RM RR VR ET CT CP EP IP
CD 0.1028
8
0.0000
0
0.0504
7
0.0000
0
0.1358
2
0.0841
4
0.0591
2
0.0914
1
0.0000
0
0.0841
6
0.0000
0
0.0000
0
DR 0.0000
0
0.6738
1
0.4326
7
0.0000
0
0.0000
0
0.0000
0
0.0000
0
0.0000
0
0.5345
7
0.0000
0
0.7418
4
0.0000
0
DP 0.0000
0
0.2255
4
0.3880
9
0.0000
0
0.0000
0
0.0000
0
0.0000
0
0.0000
0
0.1963
0
0.0000
0
0.0000
0
0.2498
5
JC 0,0563
0
0.0000
0
0.0000
0
1.0000
0
0.0502
7
0.0000
0
0.0000
0
0.0000
0
0.0000
0
0.0000
0
0.0000
0
0.0953
5
R
M
0.2296
9
0.0000
0
0.0000
0
0.0000
0
0.3292
8
0.2109
3
0.1202
9
0.0000
0
0.0000
0
0.0000
0
0.0000
0
0.6548
0
RR 0.0000
0
0.0000
0
0.0000
0
0.0000
0
0.0000
0
0.7049
3
0.2522
9
0.0000
0
0.0000
0
0.0000
0
0.0752
0
0.0000
0
VR 0.6111
4
0.0000
0
0.0000
0
0.0000
0
0.3488
2
0.0000
0
0.5683
0
0.0000
0
0.0000
0
0.0000
0
0.1829
6
0.0000
0
ET 0.0000
0
0.0000
0
0.0000
0
0.0000
0
0.1358
2
0.0000
0
0.0000
0
0.6909
4
0.1963
0
0.7049
1
0.0000
0
0.0000
0
CT 0.0000
0
0.1006
5
0.1287
6
0.0000
0
0.0000
0
0.0000
0
0.0000
0
0.2176
5
0.0728
2
0.2109
3
0.0000
0
0.0000
0
CP 0.1883
9
0.1883
9
0.1883
9
0.1883
9
0.1883
9
0.1883
9
0.1883
9
0.1883
9
0.1883
9
0.0000
0
0.0000
0
0.5000
0
EP 0.7306
4
0.7306
4
0.7306
4
0.7306
4
0.7306
4
0.7306
4
0.7306
4
0.7306
4
0.7306
4
0.5000
0
0.0000
0
0.5000
0
IP 0.0809
6
0.0809
6
0.0809
6
0.0809
6
0.0809
6
0.0809
6
0.0809
6
0.0809
6
0.0809
6
0.5000
0 1.0000
0.0000
0
For results synthesis, the Supermatrix must be weighted in order to become a column stochastic matrix. It is
considered the same weight for each cluster because we know that there is dependence, but not how a criterion
or an alternative influences more than others. The powers of the Weighted Supermatrix converge to a matrix
also stochastic and with all columns equal. This matrix is denominated Limit Matrix (Table 6).
Table 6. Limit Matrix.
CD DR DP JC RM RR VR ET CT CP EP IP
CD 0.0164
0
0.0164
0
0.0164
0
0.0164
0
0.0164
0
0.0164
0
0.0164
0
0.0164
0
0.0164
0
0.0164
0
0.0164
0
0.0164
0
DR 0.1663
0
0.1663
0
0.1663
0
0.1663
0
0.1663
0
0.1663
0
0.1663
0
0.1663
0
0.1663
0
0.1663
0
0.1663
0
0.1663
0
DP 0.0523
9
0.0523
9
0.0523
9
0.0523
9
0.0523
9
0.0523
9
0.0523
9
0.0523
9
0.0523
9
0.0523
9
0.0523
9
0.0523
9
JC 0.0204
3
0.0204
3
0.0204
3
0.0204
3
0.0204
3
0.0204
3
0.0204
3
0.0204
3
0.0204
3
0.0204
3
0.0204
3
0.0204
3
R
M
0.0743
6
0.0743
6
0.0743
6
0.0743
6
0.0743
6
0.0743
6
0.0743
6
0.0743
6
0.0743
6
0.0743
6
0.0743
6
0.0743
6
RR 0.0253
1
0.0253
1
0.0253
1
0.0253
1
0.0253
1
0.0253
1
0.0253
1
0.0253
1
0.0253
1
0.0253
1
0.0253
1
0.0253
1
VR 0.0565
7
0.0565
7
0.0565
7
0.0565
7
0.0565
7
0.0565
7
0.0565
7
0.0565
7
0.0565
7
0.0565
7
0.0565
7
0.0565
7
ET 0.0596
3
0.0596
3
0.0596
3
0.0596
3
0.0596
3
0.0596
3
0.0596
3
0.0596
3
0.0596
3
0.0596
3
0.0596
3
0.0596
3
CT 0.0286
0
0.0286
0
0.0286
0
0.0286
0
0.0286
0
0.0286
0
0.0286
0
0.0286
0
0.0286
0
0.0286
0
0.0286
0
0.0286
0
CP 0.0884
5
0.0884
5
0.0884
5
0.0884
5
0.0884
5
0.0884
5
0.0884
5
0.0884
5
0.0884
5
0.0884
5
0.0884
5
0.0884
5
EP 0.2461
3
0.2461
3
0.2461
3
0.2461
3
0.2461
3
0.2461
3
0.2461
3
0.2461
3
0.2461
3
0.2461
3
0.2461
3
0.2461
3
IP 0.1654
2
0.1654
2
0.1654
2
0.1654
2
0.1654
2
0.1654
2
0.1654
2
0.1654
2
0.1654
2
0.1654
2
0.1654
2
0.1654
2

19
The normalization of the Limit Matrix results the priorities of the criteria and alternatives (Table 7).
Table 7. Priorities of RL programs and activities in Brazilian automotive industry.
Criteria/Alternatives Priorities
Economic Programs (EP) 0.49226
Image Programs (IP) 0.33084
Citizenship Programs (CP) 0.17691
Value Recapture of disposable packing (VR) 0.1131
Development of Returnable Packing (DR) 0.3326
Reuse of Returnable Packing (RR) 0.0506
Partnership for Residue Management (RM) 0.1487
Job Creation in recycling activities (JC) 0.0408
Development of components using the “recyclability” concept (DP) 0.1047
Effluents Treatment (ET) 0.1192
Clean Technologies (CT) 0.0572
Correct Destination (CD) 0.0328
The analysis of these results demonstrates that RL programs with economic purpose have great influence on
corporate performance and how they are gaining increasingly relevance. In general, development of returnable
packing (DR), value recapture of disposable packing (VR) and effluents treatment (ET), by reuse of water in
productive process, are the principal RL programs in automotive industry.
According to Biraes, Prado and Gilioli (2006), the highest priority of automobile assemblers from the environmental point of view is packing and waste reduction, which is reached through use of returnable packing
(that can be recycled at the end of the lifetime). The results of ANP application corroborated these affirmations.
Automotive industry leads investments in research and development of new products/components (DP) that
reduce environmental pollution (PNUMA, 2005). This activity has great importance for being influenced by
activities from other programs and ANP got those dependences.
The increase of importance to residue management (RM) can be a particular case because one of the industries
analyzed belongs to a partnership for solid residue management. However, the waste reduction is among the
priority targets of automobile assemblers and a correct RM can be a way to reach it.
4.1. ANP application in Brazilian publishing companies
The RL programs identified in publishing companies are: economic (EP), image (IP), citizenship (CP) and
customer service (SP). Each of them has included a set of activities. In the same way of previous case, we are
not interested in selecting alternatives. We intend to determine the importance of each RL program has on
corporate performance, considering that indicators, in each BSC perspective, have the same importance. In
Figure 3 criteria and alternatives were grouped and arrows in each cluster indicate influence among elements.
Figure 3. Network structure for RL activities in publishing companies.

20
As previous case, even with existence of dependence relations among elements of each cluster, that one is not
total and it was determined using the same in-depth questions strategy, until determination of the priorities for
each one in parity comparison, and how they are related to themselves.
Final result for publishing branch was obtained using 16 matrices with 50 judgments, as shown in Table 8.
Table 8. Priorities of RL programs and activities in Brazilian publishing companies.
Criteria/Alternatives Priorities
Economic Programs (EP) 0.37050
Image Programs (IP) 0.34875
Citizenship Programs (CP) 0.10715
Customer Service Programs (SP) 0.17360
Reuse in secondary market (RS) 0.08103
Recycling (RE) 0.16738
Reuse of publications (RP) 0.08048
Careful Treatment of returned products (CT) 0.05060
Commercial Actions (CA) 0.28735
Donation (DO) 0.06589
Educational and Social projects (ES) 0.05991
Job Creation (JO) 0.06692
Customer Service (CS) 0.14045
Economic (EP) and image programs (IP) are the ones that more influence in corporate performance, like
happened in automotive industry.
Commercial actions (CA) using returned publications is an essential activity that allows to carry out educational
and social projects (ES), providing access to information for poor people, and it also helps other people to be
interested in the publications (which can be future customers).
Recycling (RE) and customer service (CS) are in second and third positions and both are directly or indirectly
related to economic programs (EP).
So, in a general view, it was demonstrated that RL activities developed by companies have a determined
contribution in each RL program adopted by them, and that programs influence tenable corporate performance
indicators.
5. CONCLUSIONS
Since its origination, the ANP has been successfully used in many real cases (Wu and Lee, 2007; Ravi, Shankar, and Tiwari, 2005; Cheng and Li, 2007; Whitaker, 2007; Hou and Su, 2007; Ustum and Dermitas, 2008; Saaty,
2008).
Other authors prefer the combined use of AHP and ANP, because it allows firstly the construction of a hierarchy that can be used in the network necessary for ANP (Hou and Su, 2007).
The analysis of relevant studies of several authors has shown that, although still without establishing a
quantitative impact, the RL policies and practices affect strongly and positively corporate performance
indicators that are closely linked to the corporate sustainability concept. Therefore, it would be necessary to find methods and tools that allow evaluating this influence.
Thus, for answering the main question of this research, how evaluate the influence that RL has on corporate performance, it was applied the ANP. The method allows catching dependence relations among elements of
clusters, aspect detected in data survey. For the specifics cases here analyzed, it was possible to establish
priorities using ANP method.
The inclusion of dependence analysis among elements of the model improves the reliability of the results, which is more compatible to the reality of the Brazilian companies. So, we can say the ANP offers the best result, but it
has as disadvantage the increase of time consumed when in comparison with other MCDA methods that not
analyze dependency among elements of the same hierarchic level.

21
Although advantages and disadvantages of the method, it is required specific knowledge and familiarity with the processes of the companies to identify correctly all activities and dependence relations between them. It must be
well noted in data collection.
Future researches should analyze companies of different business sector or different type/position of the reverse channel, since these are relevant characteristics related to RL programs and corporate performance indicators.
Acknowledgments
The authors would like to acknowledge to CAPES - Brazilian Federal Agency for supporting this research.
RECEIVED JUNE 2010
REVISED OCTOBER, 2012
REFERENCES
[1] AMATO NETO, J. (2008): Sustainability in the Brazilian automotive productive chain: a multiple case
study. Disponible en: http://www.administradores.com.br/noticias/volkswagen. Consulted 08-08, 2008
[2] BIRAES, A., PRADO, P.B. and GILIOLI, R.R. (2006): The environmental logistics in the Brazilian
automotive sector. National Production Engineering Meeting, Fortaleza, Brazil.
[3] BRAGA JUNIOR, S.S., COSTA, P.R. and MERLO, E.M. (2006): Reverse Logistics as an alternative of gain for the retail: a case study in a medium supermarket. Symposium of Production Administration,
Logistics and International Operations, São Paulo, Brazil.
[4] CHENG, E. W. L. and LI, H. (2007): Application of ANP in process models: An example of strategic
partnering. Building and Environment, .42, 278–287.
[5] CRESWELL, J. W. (2007): Projeto de pesquisa: Métodos qualitativo, quantitativo e misto. Porto Alegre:
Artmed.
[6] CRUZ, M.M. and BALLISTA, B.R. (2006): Reverse Logistics of the health institutions of Grande Vitória.
Symposium of Production Engineering, Bauru, Brazil.
[7] DAUGHERTY, P.J., AUTRY, CH.W. and ELLINGER, A. E. (2001): Reverse Logistics: The relationship
between resource commitment and program performance. Journal of Business Logistics, 22(1), 107-123.
[8] HOU, J. and SU, D. (2007): EJB-MVC oriented supplier selection system for mass customization, Journal
of Manufacturing Technology Management, 18, 54-71.
[9] KAPLAN, R.S.and NORTON, D.P. (1997): The strategy in action. Rio de Janeiro: Campus. (in
Portuguese)
[10] LAKATOS, E.M.and MARCONI, M.A. (1986): Scientific Methodology. São Paulo: Atlas. (in Portuguese)
[11] LEITE, P.R. (2006): Strategic drivers in reverse logistics programs in Brazil. Symposium of Production
Administration, Logistics and International Operations, São Paulo, Brazil.
[12] PNUMA. (2005): Disponible en: http://www.brasilpnuma.org.br Consulted 15-08, 2006.
[13] RAVI, V., SHANKAR, R. and TIWARI, M.K. (2005): Analyzing alternatives in reverse logistics for end-
of-life computers: ANP and balanced scorecard approach. Computers & Industrial Engineering, 48, 327-356.
[14] REVLOG (2004): Reverse Logistics study group. Disponible en:
http://www.fbk.eur.nl/OZ/REVLOG/Introduction.htm Consulted 20-10, 2004.
[15] REYNOLDS, T. J. and GUTMAN, J. (1988): Laddering theory, method, analysis and interpretation,
Journal of Advertising Research, 28, 11-31.

22
[16] ROGERS, D.S. and TIBBEN-LEMBKE, R.S. (1999): Going Backwards: Reverse Logistics trends and
practices. Reno, University of Nevada.
[17] SAATY T. L. (2008): Relative Measurement and Its Generalization in Decision Making Why Pairwise
Comparisons are Central in Mathematics for the Measurement of Intangible Factors The Analytic
Hierarchy/Network Process. RACSAM, 102), 251–318.
[18] SAATY, T.L. (1996): Decision making with dependence and feedback: the analytic network process.
Pittsburgh, PA: RWS Publications.
[19] SALOMON, V. (2004): Performance of decision aid modeling on Production Planning and Control
analysis. (Doctoral dissertation, Polytechnic School of the University of São Paulo, 2004). (in Portuguese)
[20] SOUZA, M.T.S., VASCONCELOS, M.W. and PEREIRA, R.S. (2006): The contribution of Reverse
Logistics to adequacy of the Solid Residue National Policy: a case study in packing sector. Symposium of
Business Management and Strategy, Rio de Janeiro, Brazil.
[21] USTUN, O. and DERMITAS, E. A. (2008): An integrated multi-objective decision-making process for multi-period lot-sizing with supplier selection, Omega - The International Journal of Management Science,
36(4), 509-521.
[22] VERGARA, S.C. (2005): Research methods in business administration. São Paulo: Atlas. (in
Portuguese)
[23] WHITAKER, R. (2007): Validation examples of the Analytic Hierarchy Process and Analytic Network
Process. Mathematical and Computer Modeling, 46, 840-859.
[24] WU, W. W. and LEE, Y. T. (2008): Selecting knowledge management strategies by using The Analytic
Network Process. Expert Systems with Applications, 32, 841–847.