using alos palsar derived high-resolution dinsar to detect slow-moving landslides in tropical...
TRANSCRIPT
Using ALOS PALSAR derived high-resolution DInSAR to detectslow-moving landslides in tropical forest:
Cameron Highlands, Malaysia
MUSTAFA NEAMAH JEBUR, BISWAJEET PRADHAN* and
MAHYAT SHAFAPOUR TEHRANY
Department of Civil Engineering, Facul of Engineering, University Putra Malaysia,
43400 UPM, Serdang, Selangor, Malaysia
(Received 14 July 2013; accepted 24 October 2013)
Landslide is one of the natural hazards that pose maximum threat for human lives
and property in mountainous regions. Mitigation and prediction of this
phenomenon can be done through the detection of landslide-susceptible areas.
Therefore, an appropriate landslide analysis is needed in order to map and
consequently understand the characteristic of this disaster. One of the recent
popular remote sensing techniques in deformation analysis is the differential
interferometric synthetic aperture radar which is popularly known as DInSAR. Due
to the mass vegetation condition in Malaysia, a long-wavelength synthetic aperture
radar (�24 cm) is required in order to be able to penetrate through the forests and
reach the bare land. For that reason, ALOS PALSAR HH imagery was used in this
study to derive a deformation map of the Gunung Pass area located in the tropical
forest of the Cameron Highlands, Malaysia. In this study, the ascending orbit
ALOS PALSAR images were acquired in September 2008, January 2009 and
December 2009. Subsequently the displacement measurements of the study site
(Gunung Pass) were calculated. The accuracy of the result was evaluated through its
comparison with ground truth data using the R2 and root mean square error
(RMSE) methods. The resulted deformation map showed the landslide locations in
the study area from interpretation of the results with 0.84 R2 and 0.151 RMSE. The
DInSAR precision was 11.8 cm which proved the efficiency of the proposed method
in detecting landslides in a tropical country like Malaysia. It is highly recommended
to use the proposed method for any other deformation studies.
1. Introduction
Synthetic aperture radar (SAR) systems have been widely used in the past two deca-des to produce high-resolution mapping and other remote sensing applications
(Calabro et al. 2010; Sun et al. 2011). The ability of penetrating the cloud and day-
and-night operation made the SAR systems unique compared to optical imagery and
in situ measurements. Also, it is known to be unaffected by sun-illumination and
atmospheric conditions (Karjalainen et al. 2012). SAR data are increasingly applied
to geophysical problems, either by themselves or in conjunction with data from other
remote sensing instruments (Biro et al. 2013; Pradhan et al. 2013). Examples of such
applications include polar ice research (Gourmelen et al. 2011; Hassaballa et al.
*Corresponding author. Email: [email protected] or [email protected]
� 2013 Taylor & Francis
Geomatics, Natural Hazards and Risk, 2013
http://dx.doi.org/10.1080/19475705.2013.860407
Dow
nloa
ded
by [
Bis
waj
eet P
radh
an]
at 0
8:07
05
Dec
embe
r 20
13
2013), land use mapping (Mahmoud et al. 2011; Chen et al. 2013), vegetation andbiomass measurements (Lardeux et al. 2011) and natural hazards (e.g. Pradhan et al.
2010b; Billa & Pradhan 2011; Herrera et al. 2013).
In recent years, radars have given a new dimension to the disaster management
research by providing real-time and precise information (Pradhan et al. 2009; Elbialy
et al. 2013). Deformation of the ground surface can occur through man-made or nat-
urally induced factors. Geological phenomena such as earthquakes, subsidence, vol-
canic activity, glacial rebound and landslides are the main contributors of ground
deformation (Pradhan & Lee 2010). Human causes of displacements include miningactivities and excessive groundwater (e.g. water, gas, oil) exploitation, etc. So it is
critical to have a clear understanding about the impacts of each activity in order to
have proper and sustainable management over the area. Landslide is one of the
major natural disasters that cause frequent damage in a steep terrain (Dahal et al.
2012). Thus, mapping, monitoring and analyzing the susceptible areas for these dis-
asters help the governments and agencies to protect lives and property (Pourghasemi
et al. 2013).
DInSAR is a robust method to detect positional changes on the Earth’s surfacecaused by landslides or other natural disasters (Abidin et al. 2012; Jebur et al. 2013;
Idrees et al. 2013a). DInSAR can be generated by calculating the difference between
two interferograms belonging to three data sets acquired at different times. If any
small positional changes occur during this period of data collection, it can be pre-
cisely detected through this technique (Cascini et al. 2010). These surface displace-
ments can be measured through the space by near to centimetre accuracy using the
SAR imagery, covering a vast area. Terrain elevation changes are the main source of
information in many areas of research. The DInSAR technique utilizes the phase dif-ference between pairs of the SAR image acquired from the same area at different
times, which is generally recorded by same observation parameters. At least two
interferograms are needed to be generated, i.e. before and after the event, which
induced the landform variation (Catani et al. 2005). From the computed interfero-
grams, the DInSAR technique allows the estimation of the projection of the displace-
ments along the radar line of sight (LoS).
The principle of DInSAR was first described by Gabriel et al. (1989). For geologi-
cal applications, DInSAR technology was used to examine the deformation made byearthquakes (Massonnet et al. 1993). Over the years, many studies have been carried
out using DInSAR technology on various applications such as tectonic events
(Colesanti et al. 2003), volcanic deformation (Lagios et al. 2005), landslides (e.g.
Farina et al. 2006; Meisina et al. 2008; Guzzetti et al. 2009; Lauknes et al. 2010; Yin
et al. 2010), ground motions due to fluid exploitation (Sarychikhina et al. 2010), geo-
thermal related activities (Manzo et al. 2012), subsidence episodes (Trasatti et al.
2008) and mining subsidence (Casta~neda et al. 2009).The results presented in the aforementioned papers are an evidence of the useful-
ness of DInSAR in various applications including landslide studies. Since the tradi-
tional landslide monitoring methods are time consuming and costly, DInSAR plays
a key role in land displacement monitoring. Yin et al. (2010) used integration of GPS
and DInSAR observations to monitor the Jiaju landslide along the deep-cut valley
in the western Sichuan. In a recent paper, Guzzetti et al. (2009) performed multi-
temporal DInSAR to extract the deformations and their impact, which happened in
the Umbria region from 1992 to 2000. The number and percentage of the landslides
and land subsidence were investigated for that area.
2 M.N. Jebur et al.
Dow
nloa
ded
by [
Bis
waj
eet P
radh
an]
at 0
8:07
05
Dec
embe
r 20
13
In a recently published paper, Idrees et al. (2013b) reviewed some of the popularDInSAR algorithms to monitor the deformations of the ground and stated that all
the methods were able to detect the displacements by different spatial resolutions.
De Agostini et al. (2012) added DInSAR outputs into their prediction analysis to
produce a map consisting of spatial and temporal information on landslides that
occurred in 2010. Ardizzone et al. (2012) stated that landslide analysis cannot be an
efficient using single method, while it needs integration of data and information at
different temporal and spatial scales. They proposed DInSAR as a standard and pre-
cise technique to detect and map the landslide events.Herrera et al. (2013) applied DInSAR using the integration of multi-SAR data of
ALOS PALSAR images (2006–2010), ERS, Envisat (2001–2007) and TerraSAR-X
(2008) data sets. Their results indicated that using multi-SAR data analysis, the com-
plex landslide dynamics will be understood better and thus improved analysis may
be carried out. In another paper, 38% of the landslides in the Tena valley could be
detected and their results were examined using differential GPS (D-GPS) (Herrera
et al. 2013). The same group of authors tried to compare the performance of DIn-
SAR using the single-data type of ALOS PALSAR with the output of multibandDInSAR from a previous study of the same study area (Garc�ıa-Davalillo et al.
2013). Results of the comparison analysis indicated that DInSAR made by one data
type could detect deformation with larger spatial coverage than multiband DInSAR.
However, it could recognize lower number of landslides compared to multiband
DInSAR (9 against 51). The best performance was achieved using a combination of
these two methods, which could map and monitor 68% of the landslides in Tena Val-
ley (Garc�ıa-Davalillo et al. 2013). Roering et al. (2009) utilized a combination of
DInSAR and LiDAR and archived air photos to detect the large, slow-moving land-slides in the Eel River catchment, northern California. They could identify five large
(>1 km long) landslides that occurred between 2007 and 2008. Their results reflected
the potential use of ALOS interferometry and airborne LiDAR to track small
landslides.
The highest penetration of SAR signals through the vegetation cover can be
obtained using the L band of the ALOS PALSAR satellite by its 24 cm wavelength
signal (e.g. Strozzi et al. 2005; Herrera et al. 2013). More recently, with the advent of
a high-resolution SAR sensor such as Terra-SAR-X, it is possible to use a more accu-rate source of data in DInSAR imagery (Liao et al. 2012). Unfortunately, due to its
relatively high cost of data acquisition, it was not used in the current research. Also
other platforms such as ERS 1/2 (Guzzetti et al. 2009), JERS (Alimuddin et al.
2013), Radarsat (Pepe et al. 2011) and Envisat (Pepe et al. 2005) are available, but in
most of the deformation studies ALOS PALSAR is recommended for use (Honda
et al. 2012; Garc�ıa-Davalillo et al. 2013). Furuta et al. (2005) gathered information
about the capabilities of ALOS PALSAR in interferometry studies. They found that
ALOS PALSAR is very useful for producing accurate digital elevation models(DEMs) and deformation monitoring, as well as disaster monitoring and hazard
prevention.
The Cameron Highlands in Malaysia has faced many landslides which caused con-
siderable damage to waterways, property, livestock and pipelines (Pradhan & Lee
2010). The Gunung Pass area, which is located in the Cameron Highlands, is highly
prone to landslides due to heavy rainfall and weak soil structure. Recently the area
has suffered heavy damage from landslides and requires fast and accurate deforma-
tion analysis for implementing preventive measures (Pradhan & Lee 2010).
Geomatics, Natural Hazards and Risk 3
Dow
nloa
ded
by [
Bis
waj
eet P
radh
an]
at 0
8:07
05
Dec
embe
r 20
13
Previously, some landslide susceptibility analysis had been done by some researchersin this area (Pradhan & Lee 2010; Pradhan et al. 2010a; Pradhan et al. 2010b; Rauste
et al. 2012), but there was not any attempt to use deformation analysis through the
DInSAR method. For instance, Pradhan and Lee (2010) used an artificial neural net-
work to generate a landslide susceptibility map of the Cameron Highlands with 83%
accuracy. The aim of this study is to map the landslides which happened in May
2009 using the DInSAR technique to illustrate the efficiency of the proposed method.
2. Study area and data used
The used scenes cover Barisan Titiwangsa Mountains in Malaysia. Banjaran or Bari-
san Titiwangsa is the longer of the two mountain ranges that run through West
Malaysia stretching from Thailand down to Negeri Sembilan. It reaches its highest
altitude of 7138 feet at the peak of Ginning Korbu near the mining town of Ipoh.
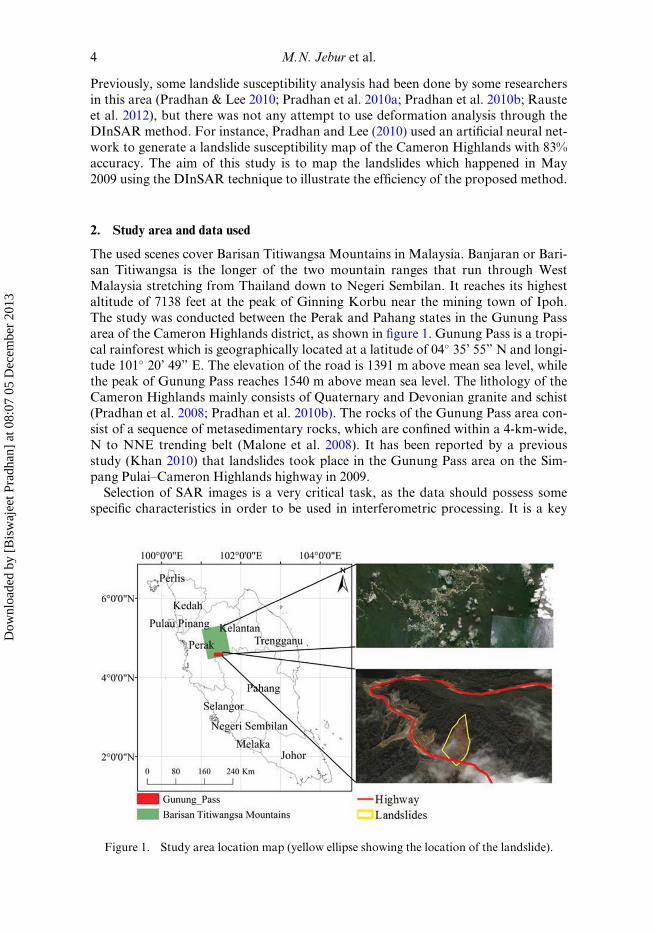
The study was conducted between the Perak and Pahang states in the Gunung Pass
area of the Cameron Highlands district, as shown in figure 1. Gunung Pass is a tropi-
cal rainforest which is geographically located at a latitude of 04� 35’ 55” N and longi-
tude 101� 20’ 49” E. The elevation of the road is 1391 m above mean sea level, whilethe peak of Gunung Pass reaches 1540 m above mean sea level. The lithology of the
Cameron Highlands mainly consists of Quaternary and Devonian granite and schist
(Pradhan et al. 2008; Pradhan et al. 2010b). The rocks of the Gunung Pass area con-
sist of a sequence of metasedimentary rocks, which are confined within a 4-km-wide,
N to NNE trending belt (Malone et al. 2008). It has been reported by a previous
study (Khan 2010) that landslides took place in the Gunung Pass area on the Sim-
pang Pulai–Cameron Highlands highway in 2009.
Selection of SAR images is a very critical task, as the data should possess somespecific characteristics in order to be used in interferometric processing. It is a key
Figure 1. Study area location map (yellow ellipse showing the location of the landslide).
4 M.N. Jebur et al.
Dow
nloa
ded
by [
Bis
waj
eet P
radh
an]
at 0
8:07
05
Dec
embe
r 20
13
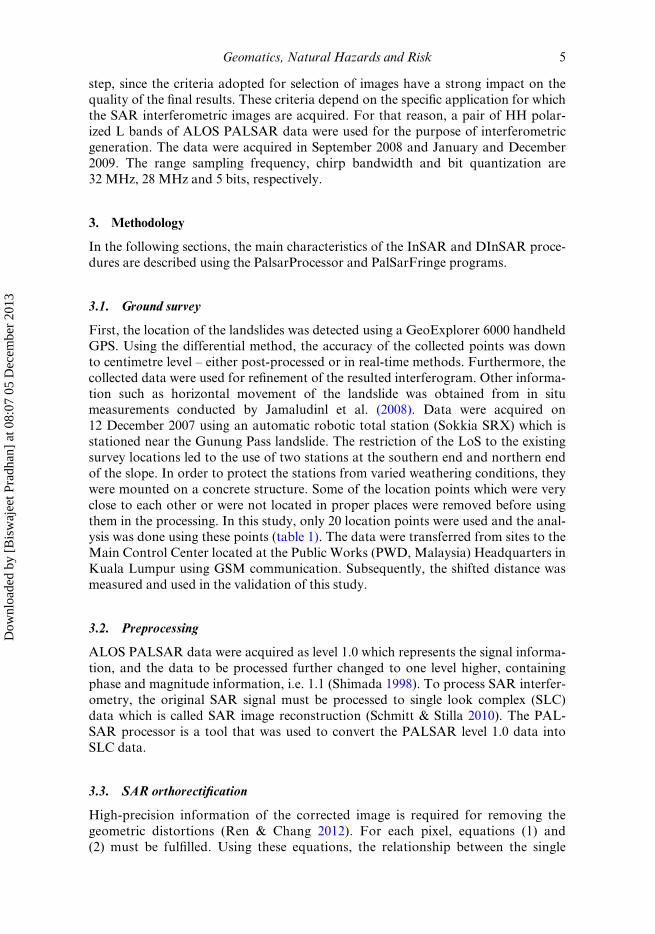
step, since the criteria adopted for selection of images have a strong impact on thequality of the final results. These criteria depend on the specific application for which
the SAR interferometric images are acquired. For that reason, a pair of HH polar-
ized L bands of ALOS PALSAR data were used for the purpose of interferometric
generation. The data were acquired in September 2008 and January and December
2009. The range sampling frequency, chirp bandwidth and bit quantization are
32 MHz, 28 MHz and 5 bits, respectively.
3. Methodology
In the following sections, the main characteristics of the InSAR and DInSAR proce-
dures are described using the PalsarProcessor and PalSarFringe programs.
3.1. Ground survey
First, the location of the landslides was detected using a GeoExplorer 6000 handheld
GPS. Using the differential method, the accuracy of the collected points was down
to centimetre level – either post-processed or in real-time methods. Furthermore, the
collected data were used for refinement of the resulted interferogram. Other informa-
tion such as horizontal movement of the landslide was obtained from in situmeasurements conducted by Jamaludinl et al. (2008). Data were acquired on
12 December 2007 using an automatic robotic total station (Sokkia SRX) which is
stationed near the Gunung Pass landslide. The restriction of the LoS to the existing
survey locations led to the use of two stations at the southern end and northern end
of the slope. In order to protect the stations from varied weathering conditions, they
were mounted on a concrete structure. Some of the location points which were very
close to each other or were not located in proper places were removed before using
them in the processing. In this study, only 20 location points were used and the anal-ysis was done using these points (table 1). The data were transferred from sites to the
Main Control Center located at the Public Works (PWD, Malaysia) Headquarters in
Kuala Lumpur using GSM communication. Subsequently, the shifted distance was
measured and used in the validation of this study.
3.2. Preprocessing
ALOS PALSAR data were acquired as level 1.0 which represents the signal informa-
tion, and the data to be processed further changed to one level higher, containing
phase and magnitude information, i.e. 1.1 (Shimada 1998). To process SAR interfer-
ometry, the original SAR signal must be processed to single look complex (SLC)
data which is called SAR image reconstruction (Schmitt & Stilla 2010). The PAL-
SAR processor is a tool that was used to convert the PALSAR level 1.0 data into
SLC data.
3.3. SAR orthorectification
High-precision information of the corrected image is required for removing the
geometric distortions (Ren & Chang 2012). For each pixel, equations (1) and
(2) must be fulfilled. Using these equations, the relationship between the single
Geomatics, Natural Hazards and Risk 5
Dow
nloa
ded
by [
Bis
waj
eet P
radh
an]
at 0
8:07
05
Dec
embe
r 20
13
backscatter element, sensor and their related velocities is calculated and therefore
the illumination geometry and the processors’ characteristics are extracted. Thiscomplete reconstruction of the imaging and processing geometry took into consid-
eration the topographic effects (foreshortening, layover) as well as the influence of
the Earth rotation and terrain height on the Doppler frequency shift and azimuth
geometry. In this study, an ASTER DEM was used for this purpose with 30 m spa-
tial resolution.
R ¼ S � P; ð1Þ
fD ¼ 2f0ðyb � ysÞRs
cjRsj ; ð2Þ
where Rs, S and P are the slant range, spacecraft and backscatter element position,
respectively. Similarly, vb and vs are the spacecraft and backscatter element veloc-
ity, respectively; f0, c and fD are the carrier frequency, speed of light and processed
Doppler frequency, respectively.
3.4. SAR interferogram generation
After processing the two images, a pair of SLC data were extracted which were uti-
lized in the SAR interferogram generation. For that reason, an InSAR pair consist-
ing of two scenes referred to as a master image and a slave image was used to
construct the interferogram (Ren & Chang 2012). One of the scenes was used as a
master image, and the other data were used to overlay on that as a slave image. In
order to increase the phase of the fringe with respect to the height, the slave orbit
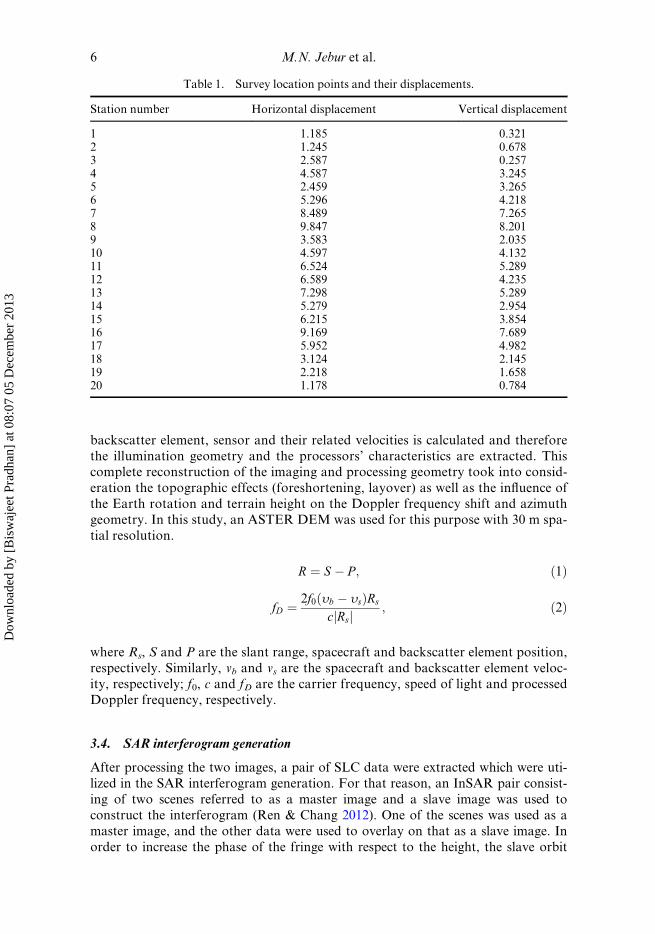
Table 1. Survey location points and their displacements.
Station number Horizontal displacement Vertical displacement
1 1.185 0.3212 1.245 0.6783 2.587 0.2574 4.587 3.2455 2.459 3.2656 5.296 4.2187 8.489 7.2658 9.847 8.2019 3.583 2.03510 4.597 4.13211 6.524 5.28912 6.589 4.23513 7.298 5.28914 5.279 2.95415 6.215 3.85416 9.169 7.68917 5.952 4.98218 3.124 2.14519 2.218 1.65820 1.178 0.784
6 M.N. Jebur et al.
Dow
nloa
ded
by [
Bis
waj
eet P
radh
an]
at 0
8:07
05
Dec
embe
r 20
13
position must be at the right side of the master orbit position (Yu & Ge 2010). The
difference between r1 and r2 (Dr) can be measured by the phase difference (f) between
two complex SAR images using equation (3) (Sousa et al. 2011). This is performed by
multiplying one image by the complex conjugate of the other one, which resulted in
the formation of the interferogram. The phase of the interferogram contains fringes
that trace the topography like contour lines. These images should have a suitablebaseline, according to the image selection criteria (Navarro-Sanchez et al. 2010). The
baseline between the master and slave images for the first and second interferograms
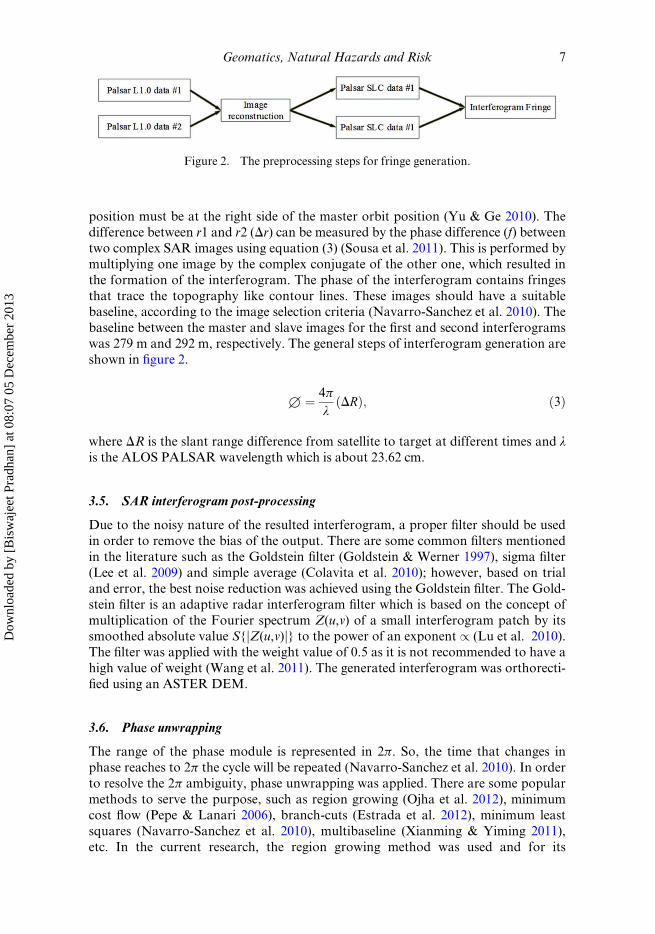
was 279 m and 292 m, respectively. The general steps of interferogram generation are
shown in figure 2.
1 ¼ 4p
λðDRÞ; ð3Þ
where DR is the slant range difference from satellite to target at different times and λis the ALOS PALSAR wavelength which is about 23.62 cm.
3.5. SAR interferogram post-processing
Due to the noisy nature of the resulted interferogram, a proper filter should be used
in order to remove the bias of the output. There are some common filters mentioned
in the literature such as the Goldstein filter (Goldstein & Werner 1997), sigma filter
(Lee et al. 2009) and simple average (Colavita et al. 2010); however, based on trial
and error, the best noise reduction was achieved using the Goldstein filter. The Gold-
stein filter is an adaptive radar interferogram filter which is based on the concept of
multiplication of the Fourier spectrum Z(u,v) of a small interferogram patch by itssmoothed absolute value S{jZ(u,v)j} to the power of an exponent / (Lu et al. 2010).
The filter was applied with the weight value of 0.5 as it is not recommended to have a
high value of weight (Wang et al. 2011). The generated interferogram was orthorecti-
fied using an ASTER DEM.
3.6. Phase unwrapping
The range of the phase module is represented in 2p. So, the time that changes in
phase reaches to 2p the cycle will be repeated (Navarro-Sanchez et al. 2010). In order
to resolve the 2p ambiguity, phase unwrapping was applied. There are some popular
methods to serve the purpose, such as region growing (Ojha et al. 2012), minimum
cost flow (Pepe & Lanari 2006), branch-cuts (Estrada et al. 2012), minimum least
squares (Navarro-Sanchez et al. 2010), multibaseline (Xianming & Yiming 2011),
etc. In the current research, the region growing method was used and for its
Figure 2. The preprocessing steps for fringe generation.
Geomatics, Natural Hazards and Risk 7
Dow
nloa
ded
by [
Bis
waj
eet P
radh
an]
at 0
8:07
05
Dec
embe
r 20
13
parameters level 1 decomposition and 0.15 thresholds were selected. It is recom-mended to use a low coherence threshold (0.15–0.2) in order to have enough freedom
during the analysis (Ojha et al. 2012).
3.7. SAR differential interferogram
The temporal separation in repeat-pass interferometry of days, months or even years
can be used for long-term monitoring of geodynamic phenomena such as glacial or
lava-flow movements (Sumantyo et al. 2012). However, it is also useful to analyze
the results of single events, such as earthquakes. As such, the observed phase (Øint)
is the sum of several contributions. The objective of DInSAR is to extract informa-
tion from the different components so that the displacement (ØMovement) can be cal-
culated using equation (4); the displacement sensitivity of DInSAR is given in
equation (5).
1int ¼ 4pR1 � R2
λ¼ 1Topography þ1Change þ1movement þ1Atmosphere þ1Noise � � � ;
ð4Þ
@1d
@ξ¼ 4p
λ; ð5Þ
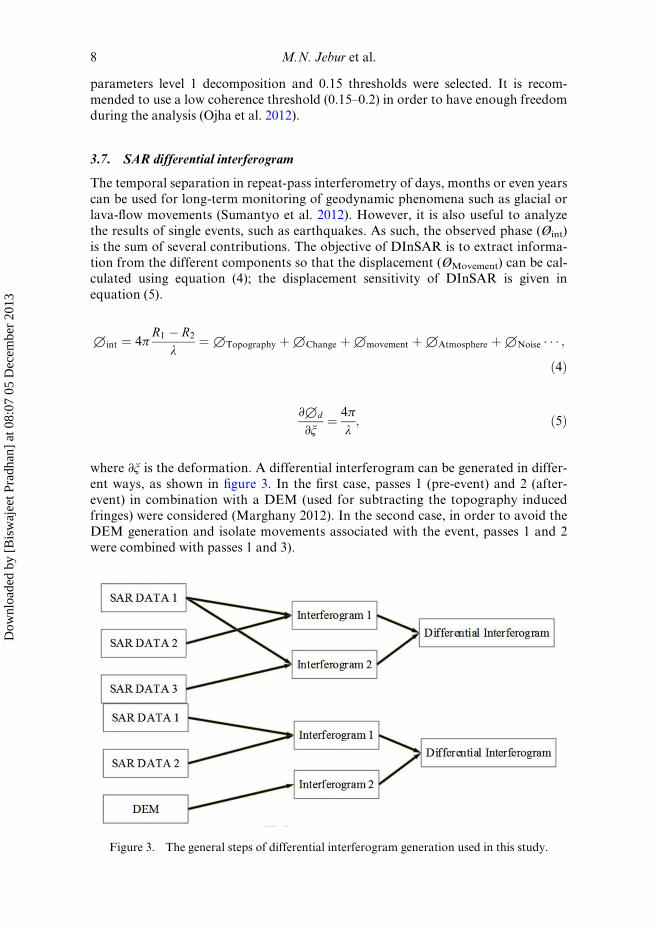
where @ξ is the deformation. A differential interferogram can be generated in differ-
ent ways, as shown in figure 3. In the first case, passes 1 (pre-event) and 2 (after-
event) in combination with a DEM (used for subtracting the topography inducedfringes) were considered (Marghany 2012). In the second case, in order to avoid the
DEM generation and isolate movements associated with the event, passes 1 and 2
were combined with passes 1 and 3).
Figure 3. The general steps of differential interferogram generation used in this study.
8 M.N. Jebur et al.
Dow
nloa
ded
by [
Bis
waj
eet P
radh
an]
at 0
8:07
05
Dec
embe
r 20
13
3.8. Validation
The efficiency and quality of the developed interferogram should be examined using
a proper method. The results can be validated using the statistical method of R2 and
RMSE (Askne et al. 2003). The validation has been done by comparing in situ meas-urements (table 1) with the displacement results using equations (6) and (7).
RMSE ¼ffiffiffiffiffiffiffiffiffiffiffiffiffiffiffiffiffiffiffiffiffiffiffiffiffiffiffiffiffiffiffiffiffiffiffiffiffiffiffi1
N�XNi¼1
ðMi � OiÞ2vuut ; ð6Þ
where N is the number of verifying points, Mi are the points measured using the
resulted interferogram and Oi are the points collected by in situ measurement.
R2 ¼ 1� SSres
SStot; ð7Þ
where SSres is the residual sum of the squares and SStot is the total sum of the
squares.
4. Results and discussion
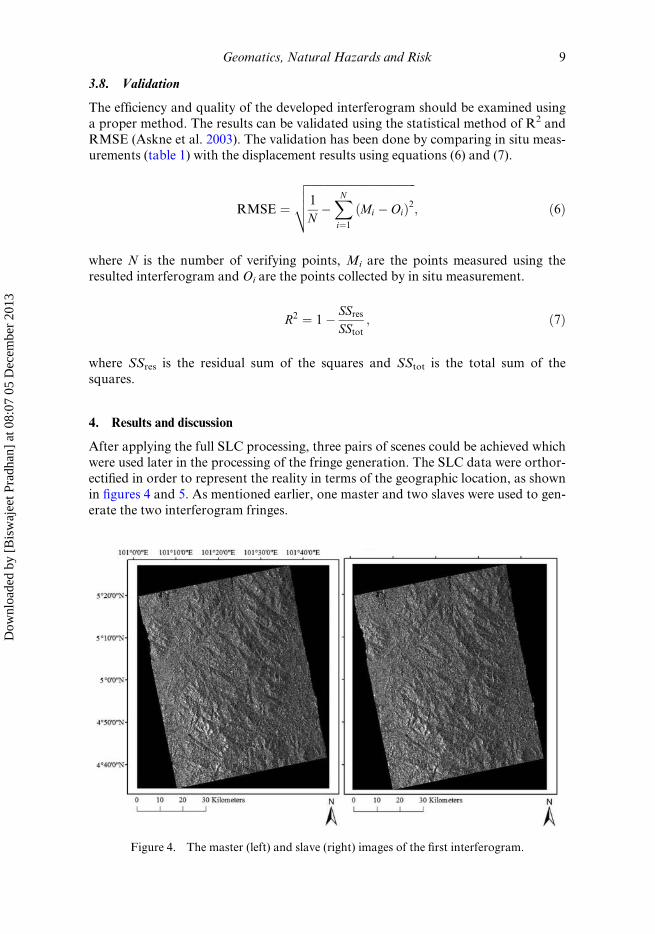
After applying the full SLC processing, three pairs of scenes could be achieved which
were used later in the processing of the fringe generation. The SLC data were orthor-
ectified in order to represent the reality in terms of the geographic location, as shown
in figures 4 and 5. As mentioned earlier, one master and two slaves were used to gen-
erate the two interferogram fringes.
Figure 4. The master (left) and slave (right) images of the first interferogram.
Geomatics, Natural Hazards and Risk 9
Dow
nloa
ded
by [
Bis
waj
eet P
radh
an]
at 0
8:07
05
Dec
embe
r 20
13
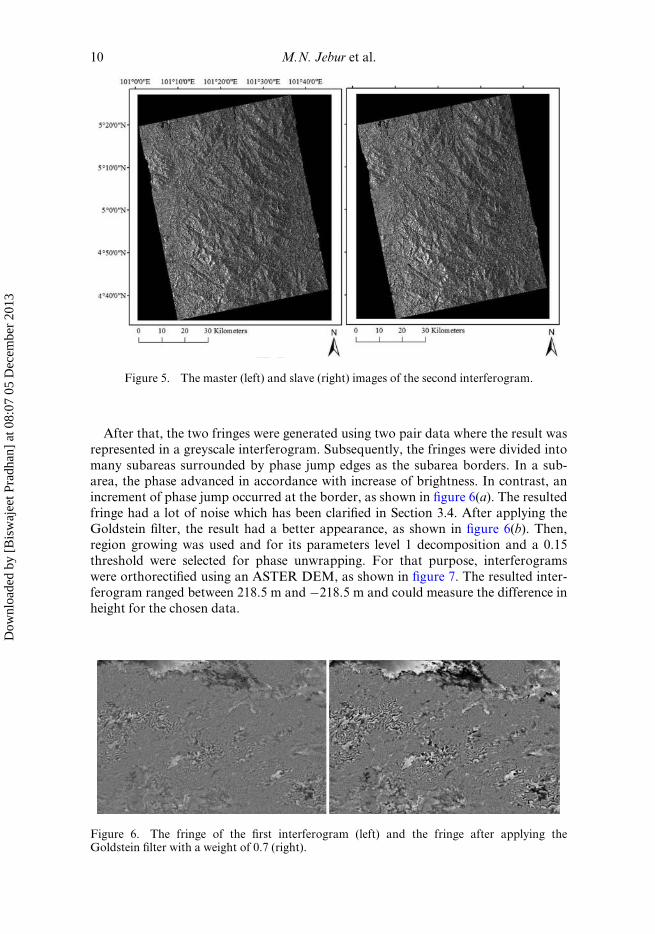
After that, the two fringes were generated using two pair data where the result was
represented in a greyscale interferogram. Subsequently, the fringes were divided into
many subareas surrounded by phase jump edges as the subarea borders. In a sub-area, the phase advanced in accordance with increase of brightness. In contrast, an
increment of phase jump occurred at the border, as shown in figure 6(a). The resulted
fringe had a lot of noise which has been clarified in Section 3.4. After applying the
Goldstein filter, the result had a better appearance, as shown in figure 6(b). Then,
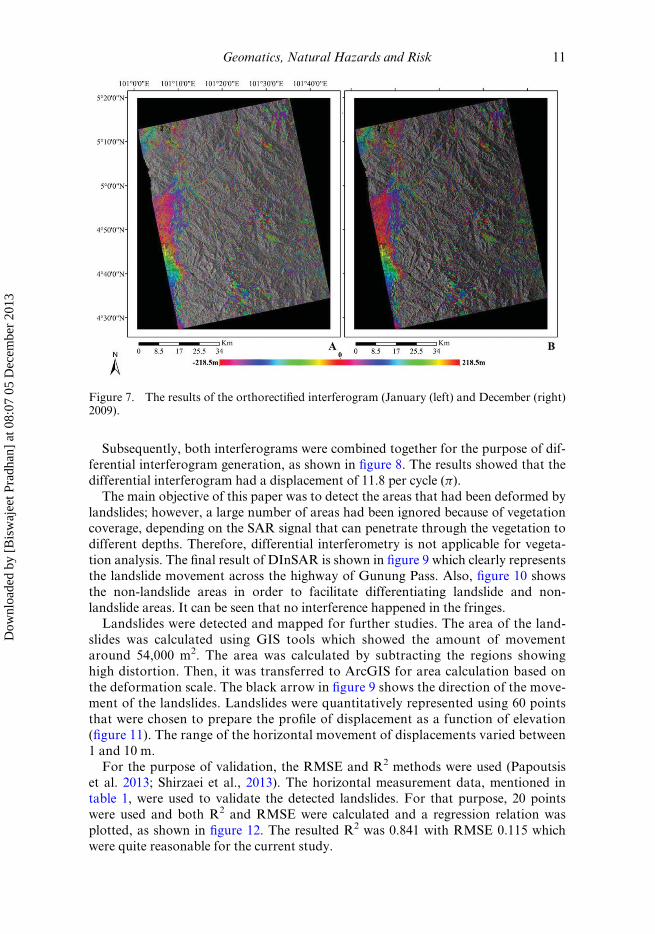
region growing was used and for its parameters level 1 decomposition and a 0.15
threshold were selected for phase unwrapping. For that purpose, interferograms
were orthorectified using an ASTER DEM, as shown in figure 7. The resulted inter-
ferogram ranged between 218.5 m and �218.5 m and could measure the difference inheight for the chosen data.
Figure 5. The master (left) and slave (right) images of the second interferogram.
Figure 6. The fringe of the first interferogram (left) and the fringe after applying theGoldstein filter with a weight of 0.7 (right).
10 M.N. Jebur et al.
Dow
nloa
ded
by [
Bis
waj
eet P
radh
an]
at 0
8:07
05
Dec
embe
r 20
13
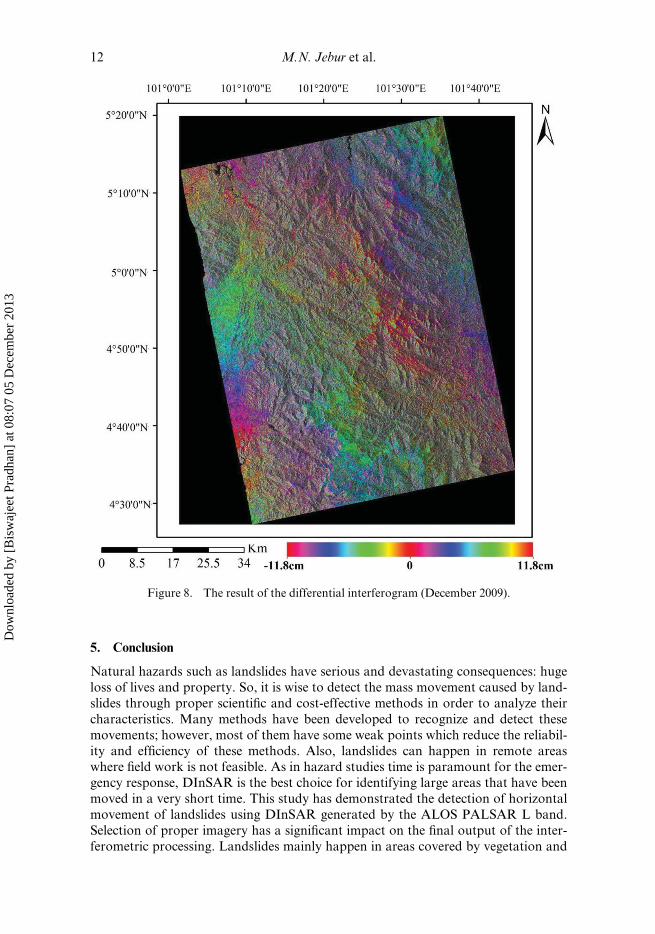
Subsequently, both interferograms were combined together for the purpose of dif-
ferential interferogram generation, as shown in figure 8. The results showed that the
differential interferogram had a displacement of 11.8 per cycle (p).
The main objective of this paper was to detect the areas that had been deformed by
landslides; however, a large number of areas had been ignored because of vegetationcoverage, depending on the SAR signal that can penetrate through the vegetation to
different depths. Therefore, differential interferometry is not applicable for vegeta-
tion analysis. The final result of DInSAR is shown in figure 9 which clearly represents
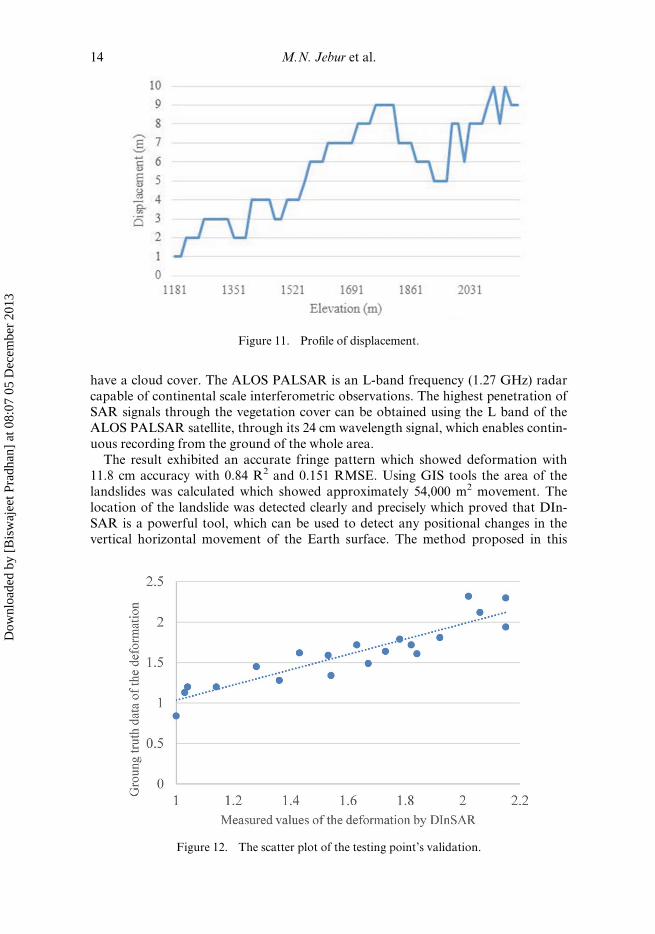
the landslide movement across the highway of Gunung Pass. Also, figure 10 shows
the non-landslide areas in order to facilitate differentiating landslide and non-
landslide areas. It can be seen that no interference happened in the fringes.
Landslides were detected and mapped for further studies. The area of the land-
slides was calculated using GIS tools which showed the amount of movementaround 54,000 m2. The area was calculated by subtracting the regions showing
high distortion. Then, it was transferred to ArcGIS for area calculation based on
the deformation scale. The black arrow in figure 9 shows the direction of the move-
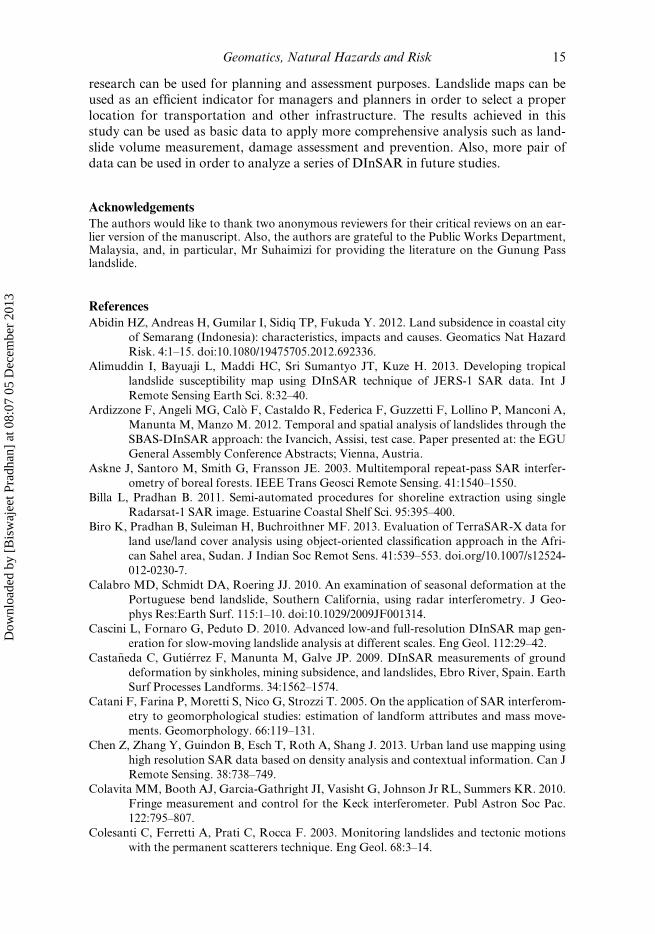
ment of the landslides. Landslides were quantitatively represented using 60 points
that were chosen to prepare the profile of displacement as a function of elevation
(figure 11). The range of the horizontal movement of displacements varied between
1 and 10 m.
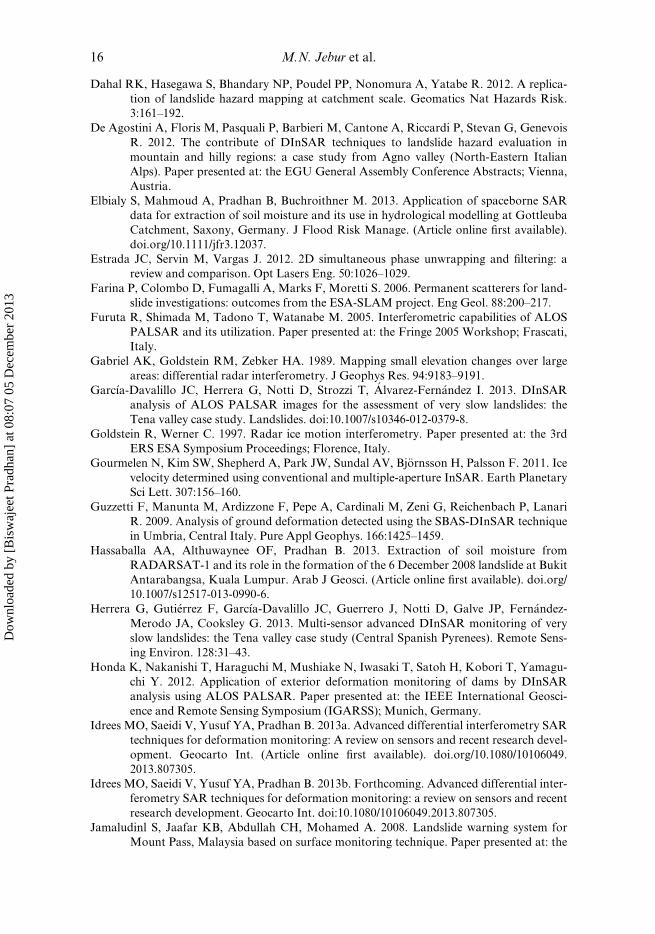
For the purpose of validation, the RMSE and R2 methods were used (Papoutsiset al. 2013; Shirzaei et al., 2013). The horizontal measurement data, mentioned in
table 1, were used to validate the detected landslides. For that purpose, 20 points
were used and both R2 and RMSE were calculated and a regression relation was
plotted, as shown in figure 12. The resulted R2 was 0.841 with RMSE 0.115 which
were quite reasonable for the current study.
Figure 7. The results of the orthorectified interferogram (January (left) and December (right)2009).
Geomatics, Natural Hazards and Risk 11
Dow
nloa
ded
by [
Bis
waj
eet P
radh
an]
at 0
8:07
05
Dec
embe
r 20
13
5. Conclusion
Natural hazards such as landslides have serious and devastating consequences: huge
loss of lives and property. So, it is wise to detect the mass movement caused by land-
slides through proper scientific and cost-effective methods in order to analyze their
characteristics. Many methods have been developed to recognize and detect these
movements; however, most of them have some weak points which reduce the reliabil-
ity and efficiency of these methods. Also, landslides can happen in remote areaswhere field work is not feasible. As in hazard studies time is paramount for the emer-
gency response, DInSAR is the best choice for identifying large areas that have been
moved in a very short time. This study has demonstrated the detection of horizontal
movement of landslides using DInSAR generated by the ALOS PALSAR L band.
Selection of proper imagery has a significant impact on the final output of the inter-
ferometric processing. Landslides mainly happen in areas covered by vegetation and
Figure 8. The result of the differential interferogram (December 2009).
12 M.N. Jebur et al.
Dow
nloa
ded
by [
Bis
waj
eet P
radh
an]
at 0
8:07
05
Dec
embe
r 20
13
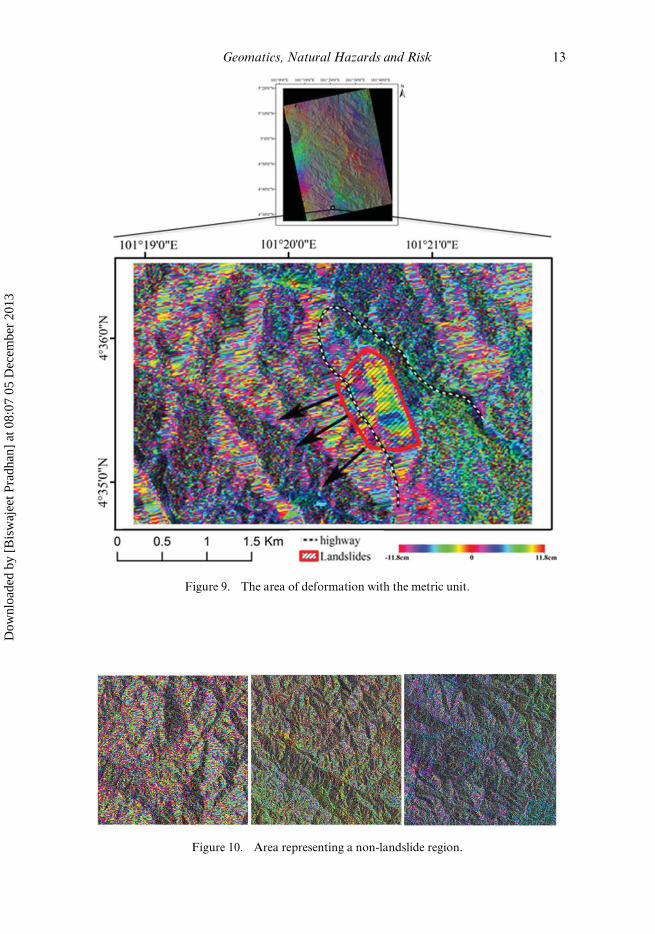
Figure 9. The area of deformation with the metric unit.
Figure 10. Area representing a non-landslide region.
Geomatics, Natural Hazards and Risk 13
Dow
nloa
ded
by [
Bis
waj
eet P
radh
an]
at 0
8:07
05
Dec
embe
r 20
13
have a cloud cover. The ALOS PALSAR is an L-band frequency (1.27 GHz) radar
capable of continental scale interferometric observations. The highest penetration ofSAR signals through the vegetation cover can be obtained using the L band of the
ALOS PALSAR satellite, through its 24 cm wavelength signal, which enables contin-
uous recording from the ground of the whole area.
The result exhibited an accurate fringe pattern which showed deformation with
11.8 cm accuracy with 0.84 R2 and 0.151 RMSE. Using GIS tools the area of the
landslides was calculated which showed approximately 54,000 m2 movement. The
location of the landslide was detected clearly and precisely which proved that DIn-
SAR is a powerful tool, which can be used to detect any positional changes in thevertical horizontal movement of the Earth surface. The method proposed in this
Figure 11. Profile of displacement.
Figure 12. The scatter plot of the testing point’s validation.
14 M.N. Jebur et al.
Dow
nloa
ded
by [
Bis
waj
eet P
radh
an]
at 0
8:07
05
Dec
embe
r 20
13
research can be used for planning and assessment purposes. Landslide maps can beused as an efficient indicator for managers and planners in order to select a proper
location for transportation and other infrastructure. The results achieved in this
study can be used as basic data to apply more comprehensive analysis such as land-
slide volume measurement, damage assessment and prevention. Also, more pair of
data can be used in order to analyze a series of DInSAR in future studies.
Acknowledgements
The authors would like to thank two anonymous reviewers for their critical reviews on an ear-lier version of the manuscript. Also, the authors are grateful to the Public Works Department,Malaysia, and, in particular, Mr Suhaimizi for providing the literature on the Gunung Passlandslide.
References
Abidin HZ, Andreas H, Gumilar I, Sidiq TP, Fukuda Y. 2012. Land subsidence in coastal city
of Semarang (Indonesia): characteristics, impacts and causes. Geomatics Nat Hazard
Risk. 4:1–15. doi:10.1080/19475705.2012.692336.
Alimuddin I, Bayuaji L, Maddi HC, Sri Sumantyo JT, Kuze H. 2013. Developing tropical
landslide susceptibility map using DInSAR technique of JERS-1 SAR data. Int J
Remote Sensing Earth Sci. 8:32–40.
Ardizzone F, Angeli MG, Cal�o F, Castaldo R, Federica F, Guzzetti F, Lollino P, Manconi A,
Manunta M, Manzo M. 2012. Temporal and spatial analysis of landslides through the
SBAS-DInSAR approach: the Ivancich, Assisi, test case. Paper presented at: the EGU
General Assembly Conference Abstracts; Vienna, Austria.
Askne J, Santoro M, Smith G, Fransson JE. 2003. Multitemporal repeat-pass SAR interfer-
ometry of boreal forests. IEEE Trans Geosci Remote Sensing. 41:1540–1550.
Billa L, Pradhan B. 2011. Semi-automated procedures for shoreline extraction using single
Radarsat-1 SAR image. Estuarine Coastal Shelf Sci. 95:395–400.
Biro K, Pradhan B, Suleiman H, Buchroithner MF. 2013. Evaluation of TerraSAR-X data for
land use/land cover analysis using object-oriented classification approach in the Afri-
can Sahel area, Sudan. J Indian Soc Remot Sens. 41:539–553. doi.org/10.1007/s12524-
012-0230-7.
Calabro MD, Schmidt DA, Roering JJ. 2010. An examination of seasonal deformation at the
Portuguese bend landslide, Southern California, using radar interferometry. J Geo-
phys Res:Earth Surf. 115:1–10. doi:10.1029/2009JF001314.
Cascini L, Fornaro G, Peduto D. 2010. Advanced low-and full-resolution DInSAR map gen-
eration for slow-moving landslide analysis at different scales. Eng Geol. 112:29–42.
Casta~neda C, Guti�errez F, Manunta M, Galve JP. 2009. DInSAR measurements of ground
deformation by sinkholes, mining subsidence, and landslides, Ebro River, Spain. Earth
Surf Processes Landforms. 34:1562–1574.
Catani F, Farina P, Moretti S, Nico G, Strozzi T. 2005. On the application of SAR interferom-
etry to geomorphological studies: estimation of landform attributes and mass move-
ments. Geomorphology. 66:119–131.
Chen Z, Zhang Y, Guindon B, Esch T, Roth A, Shang J. 2013. Urban land use mapping using
high resolution SAR data based on density analysis and contextual information. Can J
Remote Sensing. 38:738–749.
Colavita MM, Booth AJ, Garcia-Gathright JI, Vasisht G, Johnson Jr RL, Summers KR. 2010.
Fringe measurement and control for the Keck interferometer. Publ Astron Soc Pac.
122:795–807.
Colesanti C, Ferretti A, Prati C, Rocca F. 2003. Monitoring landslides and tectonic motions
with the permanent scatterers technique. Eng Geol. 68:3–14.
Geomatics, Natural Hazards and Risk 15
Dow
nloa
ded
by [
Bis
waj
eet P
radh
an]
at 0
8:07
05
Dec
embe
r 20
13
Dahal RK, Hasegawa S, Bhandary NP, Poudel PP, Nonomura A, Yatabe R. 2012. A replica-
tion of landslide hazard mapping at catchment scale. Geomatics Nat Hazards Risk.
3:161–192.
De Agostini A, Floris M, Pasquali P, Barbieri M, Cantone A, Riccardi P, Stevan G, Genevois
R. 2012. The contribute of DInSAR techniques to landslide hazard evaluation in
mountain and hilly regions: a case study from Agno valley (North-Eastern Italian
Alps). Paper presented at: the EGU General Assembly Conference Abstracts; Vienna,
Austria.
Elbialy S, Mahmoud A, Pradhan B, Buchroithner M. 2013. Application of spaceborne SAR
data for extraction of soil moisture and its use in hydrological modelling at Gottleuba
Catchment, Saxony, Germany. J Flood Risk Manage. (Article online first available).
doi.org/10.1111/jfr3.12037.
Estrada JC, Servin M, Vargas J. 2012. 2D simultaneous phase unwrapping and filtering: a
review and comparison. Opt Lasers Eng. 50:1026–1029.
Farina P, Colombo D, Fumagalli A, Marks F, Moretti S. 2006. Permanent scatterers for land-
slide investigations: outcomes from the ESA-SLAM project. Eng Geol. 88:200–217.
Furuta R, Shimada M, Tadono T, Watanabe M. 2005. Interferometric capabilities of ALOS
PALSAR and its utilization. Paper presented at: the Fringe 2005 Workshop; Frascati,
Italy.
Gabriel AK, Goldstein RM, Zebker HA. 1989. Mapping small elevation changes over large
areas: differential radar interferometry. J Geophys Res. 94:9183–9191.
Garc�ıa-Davalillo JC, Herrera G, Notti D, Strozzi T, �Alvarez-Fern�andez I. 2013. DInSAR
analysis of ALOS PALSAR images for the assessment of very slow landslides: the
Tena valley case study. Landslides. doi:10.1007/s10346-012-0379-8.
Goldstein R, Werner C. 1997. Radar ice motion interferometry. Paper presented at: the 3rd
ERS ESA Symposium Proceedings; Florence, Italy.
Gourmelen N, Kim SW, Shepherd A, Park JW, Sundal AV, Bj€ornsson H, Palsson F. 2011. Ice
velocity determined using conventional and multiple-aperture InSAR. Earth Planetary
Sci Lett. 307:156–160.
Guzzetti F, Manunta M, Ardizzone F, Pepe A, Cardinali M, Zeni G, Reichenbach P, Lanari
R. 2009. Analysis of ground deformation detected using the SBAS-DInSAR technique
in Umbria, Central Italy. Pure Appl Geophys. 166:1425–1459.
Hassaballa AA, Althuwaynee OF, Pradhan B. 2013. Extraction of soil moisture from
RADARSAT-1 and its role in the formation of the 6 December 2008 landslide at Bukit
Antarabangsa, Kuala Lumpur. Arab J Geosci. (Article online first available). doi.org/
10.1007/s12517-013-0990-6.
Herrera G, Guti�errez F, Garc�ıa-Davalillo JC, Guerrero J, Notti D, Galve JP, Fern�andez-Merodo JA, Cooksley G. 2013. Multi-sensor advanced DInSAR monitoring of very
slow landslides: the Tena valley case study (Central Spanish Pyrenees). Remote Sens-
ing Environ. 128:31–43.
Honda K, Nakanishi T, Haraguchi M, Mushiake N, Iwasaki T, Satoh H, Kobori T, Yamagu-
chi Y. 2012. Application of exterior deformation monitoring of dams by DInSAR
analysis using ALOS PALSAR. Paper presented at: the IEEE International Geosci-
ence and Remote Sensing Symposium (IGARSS); Munich, Germany.
Idrees MO, Saeidi V, Yusuf YA, Pradhan B. 2013a. Advanced differential interferometry SAR
techniques for deformation monitoring: A review on sensors and recent research devel-
opment. Geocarto Int. (Article online first available). doi.org/10.1080/10106049.
2013.807305.
Idrees MO, Saeidi V, Yusuf YA, Pradhan B. 2013b. Forthcoming. Advanced differential inter-
ferometry SAR techniques for deformation monitoring: a review on sensors and recent
research development. Geocarto Int. doi:10.1080/10106049.2013.807305.
Jamaludinl S, Jaafar KB, Abdullah CH, Mohamed A. 2008. Landslide warning system for
Mount Pass, Malaysia based on surface monitoring technique. Paper presented at: the
16 M.N. Jebur et al.
Dow
nloa
ded
by [
Bis
waj
eet P
radh
an]
at 0
8:07
05
Dec
embe
r 20
13
International Conference on Management of Landslide Hazard in the Asia-Pacific
Region; Japan.
Jebur MN, Pradhan B, Tehrany MS. 2013. Detection of vertical slope movement in highly
vegetated tropical area of Gunung pass landslide, Malaysia, using L-band InSAR tech-
nique. Geosci J. (Article on-line first available). doi.org/10.1007/s12303-013-0053-8.
Karjalainen M, Kankare V, Vastaranta M, Holopainen M, Hyypp€a J. 2012. Prediction of
plot-level forest variables using Terrasar-X Stereo SAR data. Remote Sensing Envi-
ron. 117:338–347.
Khan YA. 2010. Monitoring of hill-slope movement due to rainfall at Gunung Pass of
Cameron Highland district of Peninsular Malaysia. Int J Earth Sci Eng. 03:06–12.
Lagios E, Sakkas V, Parcharidis IS, Dietrich V. 2005. Ground deformation of Nisyros Vol-
cano (Greece) for the period 1995–2002: results from DInSAR and DGPS observa-
tions. Bull Volcanol. 68:201–214.
Lardeux C, Frison PL, Tison C, Souyris JC, Stoll B, Fruneau B, Rudant JP. 2011. Classifica-
tion of tropical vegetation using multifrequency partial SAR polarimetry. IEEE Geo-
sci Remote Sensing Lett. 8:133–137.
Lauknes TR, Piyush Shanker A, Dehls JF, Zebker HA, Henderson IHC, Larsen Y. 2010.
Detailed rockslide mapping in northern Norway with small baseline and persistent
scatterer interferometric SAR time series methods. Remote Sensing Environ.
114:2097–2109.
Lee JS, Wen JH, Ainsworth TL, Chen KS, Chen AJ. 2009. Improved sigma filter for speckle
filtering of SAR imagery. IEEE Trans Geosci Remote Sensing. 47:202–213.
Liao MS, Tang J, Wang T, Balz T, Zhang L. 2012. Landslide monitoring with high-resolution
SAR data in the three gorges region. Sci China Earth Sci. 55:590–601.
Lu Y, Lei Z, Li H, Ni W, Yan W, Bian H. 2010. A modification to Goldstein algorithm for
TerraSAR-X interferometic phase filter. Paper presented at: the 2nd International
Conference on Computer and Automation Engineering (ICCAE); Singapore.
Mahmoud A, Elbialy S, Pradhan B, Buchroithner MF. 2011. Field-based landcover classifica-
tion using TerraSAR-X texture analysis. Adv Space Res. 48:799–805. doi.org/10.1016/
j.asr.2011.04.005.
Malone AW, Hansen A, Hencher SR, Fletcher CJN. 2008. Post-failure movements of a large
slow rock slide in schist near Pos Selim, Malaysia. In: Proceedings of the 10th Interna-
tional Symposium on Landslides and Engineered Slopes; Xi’an, China.
Manzo M, Berardino P, Bonano M, Casu F, Manunta M, Pepe A, Pepe S, Sansosti E, Solaro
G, Tizzani P, et al. 2012. A quantitative assessment of DInSAR time series accuracy in
volcanic areas: from the first to second generation SAR sensors. Paper presented at:
the Geoscience and Remote Sensing Symposium (IGARSS), 2012 IEEE International;
Munich.
Marghany M. 2012. DEM reconstruction of coastal geomorphology from DINSAR. In:
Murgante B, Gervasi O, Misra S, Nadia N, Rocha AC, Taniar D, Apduhan BO,
editors. Computational science and its applications – ICCSA 2012. Berlin Heidelberg:
Springer; p. 435–446.
Massonnet D, Rossi M, Carmona C, Adragna F, Peltzer G, Feigl K, Rabaute T. 1993. The
displacement field of the landers earthquake mapped by radar interferometry. Nature.
364:138–142.
Meisina C, Zucca F, Notti D, Colombo A, Cucchi A, Savio G, Giannico C, Bianchi M. 2008.
Geological interpretation of Psinsar data at regional scale. Sensors. 8:7469–7492.
Navarro-Sanchez VD, Lopez-Sanchez JM, Vicente-Guijalba F. 2010. A contribution of polar-
imetry to satellite differential SAR interferometry: increasing the number of pixel can-
didates. IEEE Geosci Remote Sensing Lett. 7:276–280.
Ojha C, Manunta M, Pepe A, Paglia L, Lanari R. 2012. An innovative region growing algo-
rithm based on minimum cost flow approach for phase unwrapping of full-resolution
Geomatics, Natural Hazards and Risk 17
Dow
nloa
ded
by [
Bis
waj
eet P
radh
an]
at 0
8:07
05
Dec
embe
r 20
13
differential interferograms. In: Geoscience and Remote Sensing Symposium
(IGARSS), 2012 IEEE International; IEEE.
Papoutsis I, Papanikolaou X, Floyd M, Ji KH, Kontoes C, Paradissis D, Zacharis V. 2013.
Mapping inflation at Santorini Volcano, Greece, using GPS and InSAR. Geophysic
Res Lett. 40:267–272.
Pepe A, Berardino P, BonanoM, Euillades LD, Lanari R, Sansosti E. 2011. SBAS-based satel-
lite orbit correction for the generation of DInSAR time-series: application to Radar-
sat-1 data. IEEE Trans Geosci Remote Sensing. 49:5150–5165.
Pepe A, Lanari R. 2006. On the extension of the minimum cost flow algorithm for phase
unwrapping of multitemporal differential SAR interferograms. IEEE Trans Geosci
Remote Sensing. 44:2374–2383.
Pepe A, Sansosti E, Berardino P, Lanari R. 2005. On the generation of ERS/ENVISAT DIn-
SAR time-series via the SBAS technique. IEEE Geosci Remote Sensing Lett. 2:265–
269.
Pourghasemi H, Pradhan B, Gokceoglu C, Moezzi KD. 2013. A comparative assessment of
prediction capabilities of Dempster–Shafer and weights-of-evidence models in land-
slide susceptibility mapping using GIS. Geomatics Nat Hazard Risk. 4:93–118.
Pradhan B, Hagemann U, Tehrany M, Prechtel N. 2013. An easy to use ArcMap based texture
analysis program for extraction of flooded areas from TerraSAR-X satellite image.
Comput Geosci. (Article online first available). doi.org/10.1016/j.cageo.2013.10.011.
Pradhan B, Lee S. 2010. Regional landslide susceptibility analysis using back-propagation
neural network model at Cameron Highland, Malaysia. Landslides. 7:13–30.
Pradhan B, Lee S, Buchroithner MF. 2010a. Remote sensing and GIS-based landslide suscep-
tibility analysis and its cross-validation in three test areas using a frequency ratio
model. Photogrammetrie-Fernerkundung-Geoinformation. 2010:17–32.
Pradhan B, Lee S, Mansor S, Buchroithner M, Jamaluddin N, Khujaimah Z. 2008. Utilization
of optical remote sensing data and geographic information system tools for regional
landslide hazard analysis by using binomial logistic regression model. J Appl Remote
Sensing. 2:1–11. doi:10.1117/1.3026536.
Pradhan B, Sezer EA, Gokceoglu C, Buchroithner MF. 2010b. Landslide susceptibility map-
ping by neuro-fuzzy approach in a landslide-prone area (Cameron Highlands, Malay-
sia). IEEE Trans Geosci Remote Sensing. 48:4164–4177.
Pradhan B, Shafie M, Pirasteh S. 2009. Maximum flood prone area mapping using RADAR-
SAT images and GIS: Kelantan river basin. Int J Geoi. 5:11–23.
Rauste Y, Lateh HB, Wan Mohd MWI, Lonnqvist A, Hame T. 2012. TerraSAR-X data in cut
slope soil stability monitoring in Malaysia. IEEE Trans Geosci Remote Sensing.
50:3354–3363.
Ren S, Chang W. 2012. Influence of geometric distortion on SAR image matching and its cor-
rection. J Remote Sensing. 16:467–481.
Roering JJ, Stimely LL, Mackey BH, Schmidt DA. 2009. Using DInSAR, airborne LiDAR,
and archival air photos to quantify landsliding and sediment transport. Geophys Res
Lett. 36:L19402. doi:10.1029/2009GL040374.
Sarychikhina O, Glowacka E, Suarez-Vidal F, Mellors R. 2010. DInSAR analysis of land sub-
sidence caused by geothermal fluid exploitation in the Mexicali Valley, BC, Mexico.
IAHS-AISH Publ. 339:268–273.
Schmitt M, Stilla U. 2010. A concept for reconstruction of urban surface models from airborne
multi-aspect InSAR data. Paper presented at: the 8th European Conference on Syn-
thetic Aperture Radar (EUSAR); Aachen, Germany.
Shimada M. 1998. User’s guide to NASDA’s SAR products. 2nd ed. Tokyo: Earth Observa-
tion Research Centre (EORC)-National Space Development Agency (NASDA).
Shirzaei M, B€urgmann R, Foster J, Walter TR, Brooks BA. 2013. Aseismic deformation
across the Hilina fault system, Hawaii, revealed by wavelet analysis of InSAR and
GPS time series. Earth Planetary Sci Lett. 376:12–19. doi:10.1016/j.epsl.2013.06.011.
18 M.N. Jebur et al.
Dow
nloa
ded
by [
Bis
waj
eet P
radh
an]
at 0
8:07
05
Dec
embe
r 20
13
Sousa JJ, Hooper AJ, Hanssen RF, Bastos LC, Ruiz AM. 2011. Persistent scatterer InSAR: a
comparison of methodologies based on a model of temporal deformation vs. spatial
correlation selection criteria. Remote Sensing Environ. 115:2652–2663.
Strozzi T, Farina P, Corsini A, Ambrosi C, Th€uring M, Zilger J, Wiesmann A, Wegm€uller U,
Werner C. 2005. Survey and monitoring of landslide displacements by means of
L-band satellite SAR interferometry. Landslides. 2:193–201.
Sumantyo JTS, Shimada M, Mathieu P, Abidin HZ. 2012. Long-term consecutive DInSAR
for volume change estimation of land deformation. IEEE Trans Geosci Remote Sens-
ing. 50:259–270.
Sun G, Ranson KJ, Guo Z, Zhang Z, Montesano P, Kimes D. 2011. Forest biomass mapping
from LiDAR and Radar synergies. Remote Sensing Environ. 115:2906–2916.
Trasatti E, Casu F, Giunchi C, Pepe S, Solaro G, Tagliaventi S, Berardino P, Manzo M, Pepe
A, Ricciardi GP. 2008. The 2004–2006 uplift episode at Campi Flegrei Caldera (Italy):
constraints from SBAS-DInSAR Envisat data and Bayesian source inference.
Geophys Res Lett. 35:L07308.
Wang Q, Huang H, Yu A, Dong Z. 2011. An efficient and adaptive approach for noise filtering
of SAR interferometric phase images. Geosci Remote Sensing Lett. 8:1140–1144.
Xianming X, Yiming P. 2011. Multi-baseline phase unwrapping algorithm based on the
unscented Kalman filter. Radar Son Nav. 5:296–304.
Yin Y, Zheng W, Liu Y, Zhang J, Li X. 2010. Integration of GPS with InSAR to monitoring
of the Jiaju landslide in Sichuan, China. Landslides. 7:359–365.
Yu JH, Ge L. 2010. Automatic exclusion of surface deformation in InSAR Dem generation
using differential radar interferometry. Paper presented at: the Geoscience and Remote
Sensing Symposium (IGARSS), 2010 IEEE International; Honolulu, HI.
Geomatics, Natural Hazards and Risk 19
Dow
nloa
ded
by [
Bis
waj
eet P
radh
an]
at 0
8:07
05
Dec
embe
r 20
13