crustal deformation associated with the 8 june 2008 earthquake (mw6.4) in greece: seismological...
TRANSCRIPT

Crustal deformation associated with east Mediterranean strike–slip earthquakes:The 8 June 2008 Movri (NW Peloponnese), Greece, earthquake (Mw6.4)
Gerassimos A. Papadopoulos a,⁎, Vassilis Karastathis a, Charalambos Kontoes b, Marinos Charalampakis a,Anna Fokaefs a, Ioannis Papoutsis b
a Institute of Geodynamics, National Observatory of Athens, Athens 11810, Greeceb Institute for Space Applications and Remote Sensing, National Observatory of Athens, Athens 15236, Greece
a b s t r a c ta r t i c l e i n f o
Article history:
Received 23 July 2009
Received in revised form 8 June 2010
Accepted 17 June 2010
Available online 27 June 2010
Keywords:
Strike–slip
Crustal deformation
Elastic dislocation
DInSAR analysis
Movri 2008 earthquake
The 2008mainshock (Mw=6.4) was the first modern, strong strike–slip earthquake in the Greekmainland. The
fault strikes NE–SW, dips ∼85°NWwhile the motion was right-lateral with small reverse component. Historical
seismicity showed no evidence that the fault ruptured in the last 300 years. For rectangular planar fault we
estimated fault dimensions from aftershock locations. Dimensions are consistent with that a buried fault was
activated, lateral expansion occurred only along length and the rupture stopped at depth ∼20 km implying that
more rupture along lengthwas favoured.Weconcluded that nomajor asperities remained unbroken and that the
aftershock activity was dominated rather by creeping mechanism than by the presence of locked patches. For
Mo=4.56×1025 dyn cm we calculated average slip of 76 cm and stress drop Δσ∼13 bars. This Δσ is high for
Greek strike–slip earthquakes, due rather to increased rigidity because of the relatively long recurrence
(ΤN300 years) of strong earthquakes in the fault, than to high slip. Values of Δσ and Τ indicated that the fault is
neither a typical strong nor a typicalweak fault. Dislocationmodeling of a buried fault showeduplift of∼8.0 cm in
Kato Achaia (Δ∼20 km) at the hangingwall of the reverse fault component. DInSAR analysis detected co-seismic
motiononly inKatoAchaiawhere interferogram fringes pattern showedvertical displacement from3.0 to6.0 cm.
Fromfield-surveysweestimatedmaximumintensity ofVIII inKatoAchaia. Themost important liquefaction spots
were also observed there. These observations are attributable neither to surface fault-breaksnor to site effects but
possibly to high ground acceleration due to the co-seismic uplift. The causal association between displacement
and earthquake damage in the hanging wall described for dip–slip faults in Taiwan, Greece and elsewhere,
becomes possible also for strike–slip faults with dip–slip component, as the 2008 earthquake.
© 2010 Elsevier B.V. All rights reserved.
1. Introduction
A seismotectonic feature in the east Mediterranean region is the
occurrence of large strike–slip earthquakes. Recent examples were the
1999 Izmit (Mw=7.4) and Duzce (Mw=7.2) earthquakes which
ruptured in the western segment of the North Anatolian Fault with
very clear surface fault-breaks (Reilinger et al., 2000; Duman et al.,
2005). Historical sources provide documentation for the occurrence of
large strike–slip earthquakeswith surface fault-breaks along theEastern
Anatolian Fault and theDeadSea Fault too (e.g. Guidoboni andComastri,
2005; Daëron et al., 2007). Due to that those earthquakes have clear
surface expressions, the crustal deformation patterns were studied not
only by InSAR, GPSmeasurements and dislocationmodeling but also by
palaeoseismological and other geological methods.
Strike–slip faults associated with earthquakes of M∼7.0 were
observed in the Aegean Sea and the Ionian Sea aswell (e.g. Drakopoulos
and Ekonomides, 1972; Papazachos et al., 1984; Kiratzi et al., 1991;
Taymaz et al., 1991; Louvari et al., 1999; Papadopoulos et al., 2001, 2003;
Roumelioti et al., 2004). However, clues for the deformation patterns
were provided only by the earthquake focal mechanisms due to that
these earthquakes occurred under the sea and no submarine surveys
were conducted so far. The only exception was the earthquake of 19
February 1968 (Ms=7.1) which had surface fault expression in the
Agios Efstratios Is., North Aegean Sea (Pavlides and Tranos, 1991).
On8 June2008, the strongmainshock that rupturedNWPeloponnese,
along the Morvi Mountain foothills (Fig. 1) was the first modern, strong
strike–slip earthquake occurring in the Greek mainland. Calculated
seismic moment ranges from 3.10×1025 dyn cm to 6.50×1025 dyn cm
(Table 1). Considerabe damage and ground failures were the two main
elements of the macroseismic field. No strong, historical events were
known to have occurred in the 2008 earthquake area. Therefore, there
was a noteworthy lack of knowledge with respect to the crustal
deformation of the area. In fact, neither focal mechanisms of significant
earthquakes nor GPS measurements nor geologic offset were available
until the occurrence of the 2008 earthquake. Consequently,
that earthquake shed new light for the enhanced understanding of the
Tectonophysics 492 (2010) 201–212
⁎ Corresponding author.
E-mail address: [email protected] (G.A. Papadopoulos).
0040-1951/$ – see front matter © 2010 Elsevier B.V. All rights reserved.
doi:10.1016/j.tecto.2010.06.012
Contents lists available at ScienceDirect
Tectonophysics
j ourna l homepage: www.e lsev ie r.com/ locate / tecto

deformation associated with strike–slip earthquakes not only in the area
of NW Peloponnese but in the entire Greek mainland.
In a geological study (Koukouvelas et al., 2009), the earthquake
was attributed to a dextral, high-angle blind fault. Gallovič et al.
(2009) found that predominantly unilateral rupture propagation to
the north-east took place with two or three main patches. The major
part of seismic moment, however, was released only in one patch. A
study of the earthquake was also published by Ganas et al. (2009). A
“storm” of four strong mainshocks (MwN6) occurring in Greece in the
first seven months of 2008 was examined and attributed to remote
triggering effects (Papadopoulos et al., 2009). The Movri earthquake
was one of the four mainshocks involved in the “storm”.
To study the 2008 earthquake we were based on the space–time–
size distribution of aftershocks, on modeling of the co-seismic elastic
dislocation, on DInSAR analysis as well as on the evaluation of the
earthquake effects. The possible causal link between the field of
crustal deformation and the features of macroseismic field was also
investigated and discussed. Previous studies of strong earthquakes in
Greece and elsewhere based on similar approaches proved quite
successful (e.g. Kontoes et al., 2000; Papadopoulos et al., 2004;
Talebian et al., 2004; Kobayashi et al., 2009).
2. Historical seismicity and seismotectonic setting
Historical seismicity is of importance in studies of co-seismic
ground deformation since it may provide information about ground
failures associated with the earthquake activity. From an investigation
in the rich historical earthquake record of western Greece it resulted
that the earthquakes of 28 July 1714 (Ms=6.3), 10 February 1785
(Ms=6.4), 7 June 1804 (Ms=6.4) and 23 January 1806 (Ms=6.2)
(Fig. 1) might be considered as regards its possible association with
the fault zone activated with the 2008 earthquake. Based on
documentary sources and on previous studies and catalogues (e.g.
Mallet, 1853; Sathas, 1867; Galanopoulos, 1960, 1981; Papazachos
and Papazachou, 1997; Spyropoulos, 1997; Ambraseys and Finkel,
1999), Papadopoulos et al. (2000) assignedmaximum intensity of VIII,
VIII–IX, IX and VII–VIII at Patras for the 1714, 1785, 1804 and 1806
earthquakes, respectively. A common feature of the four earthquakes
is that apart from the damage caused in the today historical center of
Fig. 1. Plots of epicenters (circles) of earthquakes discussed in the text. Historical earthquakes: 28 July 1714 (Ms6.3), 10 February 1785 (Ms6.4), 7 June 1804 (Ms6.4), 23 January 1806
(Ms6.2) (data after Papadopoulos et al., 2000). Recent earthquakes: 2 December 2002 (Mw5.6), 14 August 2003 (Ms6.2) and 18 January 2010 (Mw5.5) (epicenters after the
earthquake catalogue of the National Observatory of Athens, http://www.gein.noa.gr/services/cat.html; magnitudes after the catalogue of Harvard (HRV), http://www.globalcmt.
org/). Star illustrates the epicenter of the 2008 mainshock.
Table 1
Focal parameters and elements of the focal mechanism of the 8 June 2008 mainshock as
determined by several seismological institutes. Key: φΝo=geographic latitude, λΕ
o=
geographic longitude, h=focal depth, Mw=moment magnitude, Mo=seismic moment,
HRV=Harvard University (USA), USGS=United States Geological Survey (USA), NOA=-
National Observatory of Athens (Greece), INGV=National Institute of Geophysics and
Volcanology (Italy), ETHZ: Swiss Federal Institute of Technology Zurich, AUTH: Aristotle
University of Thessaloniki (Greece).
φΝ° λΕ° h
(km)
Mw Mo
(dyn cm)
Strike Dip Rake Institute/
authors
37.93 21.63 24.7 6.4 4.56e+25 209 83 164 HRV (1)
38.15 21.59 10.0 6.3 3.10e+25 30 89 −160 USGS (2)
37.98 21.48 22.0 6.4 4.49e+25 210 82 175 NOA (3)
37.99 21.52 10.0 6.5 6.01e+25 210 85 179 INGV (4)
38.01 21.44 31.0 6.4 5.71e+25 213 81 165 ETHZ (5)
37.97 21.49 32.0 6.5 6.50e+25 29 89 −178 AUTH (6)
(1) http://www.globalcmt.org/.
(2) http://neic.usgs.gov/neis/eq_depot/2008/.
(3) http://bbnet.gein.noa.gr/MT.htm.
(4) http://www.bo.ingv.it/RCMT/searchRCMT.html.
(5) http://www.seismo.ethz.ch/mt/.
(6) http://geophysics.geo.auth.gr/the_seisnet/WEBSITE_2005/station_index_en.html.
202 G.A. Papadopoulos et al. / Tectonophysics 492 (2010) 201–212

Patras, damage was also noted away the 2008 fault zone. For example,
in Nafpaktos town (Fig. 1) intensity as high as VIII was also
experienced because of the 1714 shock. Therefore, Papadopoulos
et al. (2000) located the four earthquakes in the area of Patras Gulf.
Similar are the epicentral determinations by Papazachos and
Papazachou (1997). Allowing for some error of no more than 20 km
involved in the epicenters, we concluded that the evidence available
disfavours the suggestion that the 1714, 1785, 1804 and 1806
earthquakes ruptured the fault segment activated with the 2008
earthquake.
The 2008 earthquake is the first to provide clear evidence about the
stress-field dominating the area ruptured. Fault plane solutions (Fig. 2,
Table 1) are consistent in that nearly pure dextral strike–slip motion
occurred at depth. The preferred fault plane is a high-angle one dipping
to NW with dip ranging from 81° to 89° and striking NE–SW, which is
also themain direction of the aftershock zone. Small reverse component
was involved in the seismic faulting.
From seismotectonic point of view the 2008 earthquake is a
transition from the highly seismogenic areas of Patras Gulf and
Corinth rift to the NE and the Ionian Sea to the SW (Fig. 1). Extensional
stress-field striking nearly N–S prevails in the areas of Patras Gulf and
Corinth rift (Doutsos et al., 1988). On the contrary, in the Ionian Sea to
the SW extension of the 2008 rupture zone the stress-field becomes
compressional along NE–SW (e.g. Louvari et al., 1999), which is due to
the convergence between the African lithospheric plate and the
southwestern termination of the Eurasian plate along the Hellenic Arc
and Trench. However, several years ago a review on earthquake focal
mechanisms and neotectonic observations showed that the fields of
compression and extension are separated by a narrow zone of strike–
slip motions which runs parallel to the Hellenic Arc (Papadopoulos,
1985). In fact, the rupture zones of both the 2008 and the Mw=5.6
strike–slip mainshock of 2 December 2002 fall within that strike–slip
zone (Fig. 1).
3. Aftershock activity and co-seismic deformation
The 2008 mainshock was followed by numerous aftershocks the
locations of which were precisely determined by the seismograph
network of the National Observatory of Athens (NOA; http://www.
gein.noa.gr/services/cat.html) given that in the area affected by the
earthquake the network is dense enough. Up to 16 November 2008
about 730 aftershocks were determined with local magnitude, ML,
ranging from 2.2 to 4.3. Statistically the magnitude, M1, of the largest
aftershock equals to M −1.2 (±1) (Båth, 1983), where M is the
mainshock magnitude. This implies that the maximum magnitude
observed in the 2008 aftershock sequence is rather low.
Dimensions of the seismic fault as well as of the aftershock area
were determined from aftershock locations. The method which was
introduced by Abe (1975) is simple and effective provided that
accurate fault dimensions are calculated. The dimensions of the
aftershock area and of the seismic fault were determined from lateral
and vertical plots of aftershock locations determined by NOA and
Fig. 2. The mainshock of 8 June 2008 (star) and its aftershocks (colour dots) recorded up to end of November 2008 (see text for details). Straight line is the hypothetical intersection
of the fault surface with the Earth's surface. Beach-balls illustrate the earthquake focal mechanism determined by HRV, USGS and NOA (for explanations see Table 1). Localities and
types of ground failures observed are shown.
203G.A. Papadopoulos et al. / Tectonophysics 492 (2010) 201–212
occurring within 1-day, 3-day, 10-day and 5-month time intervals from
the mainshock occurrence (Fig. 2). From the 1-day and 3-day plots the
calculatedaftershock zone lengthwas found Lc (1)≈Lc (3)≈30 kmwhile
the lateral aftershock zonewidthwasWcl (1)≈Wcl (3)≈10 km. Thefinal
widthWcldidnot changed in the10-dayand5-monthplots either, but the
final length Lc increased to about 42 km. The aftershock area length,
determined by aftershocks relocated by the double-difference method
was found about 40 km (Gallovič et al., 2009) or 48 km (Ganas et al.,
2009). The mainshock focal depth determined by NOA is 22 km. Gallovič
et al. (2009) and Ganas et al. (2009) relocated the mainshock at depth
19 km and 18 km, respectively. Relocation results obtained from other
authors are nearly identical with the locations produced by theNOAdaily
routine epicentral determinations, with the exception of the aftershock
area length foundbyGanas et al. (2009)whichmaybe anoverestimation.
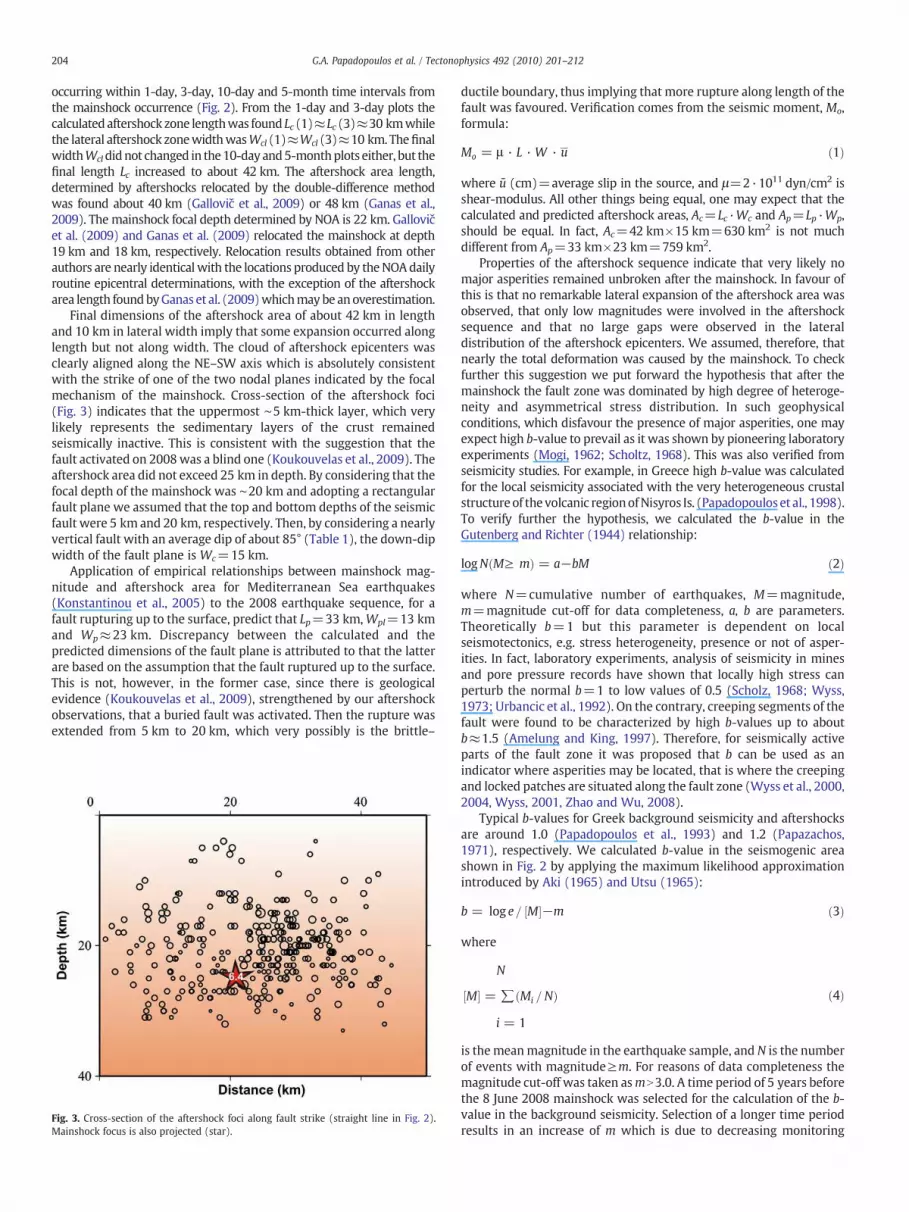
Final dimensions of the aftershock area of about 42 km in length
and 10 km in lateral width imply that some expansion occurred along
length but not along width. The cloud of aftershock epicenters was
clearly aligned along the NE–SW axis which is absolutely consistent
with the strike of one of the two nodal planes indicated by the focal
mechanism of the mainshock. Cross-section of the aftershock foci
(Fig. 3) indicates that the uppermost ∼5 km-thick layer, which very
likely represents the sedimentary layers of the crust remained
seismically inactive. This is consistent with the suggestion that the
fault activated on 2008was a blind one (Koukouvelas et al., 2009). The
aftershock area did not exceed 25 km in depth. By considering that the
focal depth of the mainshock was ∼20 km and adopting a rectangular
fault plane we assumed that the top and bottom depths of the seismic
fault were 5 km and 20 km, respectively. Then, by considering a nearly
vertical fault with an average dip of about 85° (Table 1), the down-dip
width of the fault plane is Wc=15 km.
Application of empirical relationships between mainshock mag-
nitude and aftershock area for Mediterranean Sea earthquakes
(Konstantinou et al., 2005) to the 2008 earthquake sequence, for a
fault rupturing up to the surface, predict that Lp=33 km,Wpl=13 km
and Wp≈23 km. Discrepancy between the calculated and the
predicted dimensions of the fault plane is attributed to that the latter
are based on the assumption that the fault ruptured up to the surface.
This is not, however, in the former case, since there is geological
evidence (Koukouvelas et al., 2009), strengthened by our aftershock
observations, that a buried fault was activated. Then the rupture was
extended from 5 km to 20 km, which very possibly is the brittle–
ductile boundary, thus implying that more rupture along length of the
fault was favoured. Verification comes from the seismic moment, Mo,
formula:
Mo = μ · L · W · u ð1Þ
where ū (cm)=average slip in the source, and μ=2·1011 dyn/cm2 is
shear-modulus. All other things being equal, one may expect that the
calculated and predicted aftershock areas, Ac=Lc·Wc and Ap=Lp·Wp,
should be equal. In fact, Ac=42 km×15 km=630 km2 is not much
different from Ap=33 km×23 km=759 km2.
Properties of the aftershock sequence indicate that very likely no
major asperities remained unbroken after the mainshock. In favour of
this is that no remarkable lateral expansion of the aftershock area was
observed, that only low magnitudes were involved in the aftershock
sequence and that no large gaps were observed in the lateral
distribution of the aftershock epicenters. We assumed, therefore, that
nearly the total deformation was caused by the mainshock. To check
further this suggestion we put forward the hypothesis that after the
mainshock the fault zone was dominated by high degree of heteroge-
neity and asymmetrical stress distribution. In such geophysical
conditions, which disfavour the presence of major asperities, one may
expect high b-value to prevail as it was shown by pioneering laboratory
experiments (Mogi, 1962; Scholtz, 1968). This was also verified from
seismicity studies. For example, in Greece high b-value was calculated
for the local seismicity associated with the very heterogeneous crustal
structureof the volcanic regionofNisyros Is. (Papadopoulos et al., 1998).
To verify further the hypothesis, we calculated the b-value in the
Gutenberg and Richter (1944) relationship:
logNðM≥ mÞ = a−bM ð2Þ
where N=cumulative number of earthquakes, M=magnitude,
m=magnitude cut-off for data completeness, a, b are parameters.
Theoretically b=1 but this parameter is dependent on local
seismotectonics, e.g. stress heterogeneity, presence or not of asper-
ities. In fact, laboratory experiments, analysis of seismicity in mines
and pore pressure records have shown that locally high stress can
perturb the normal b=1 to low values of 0.5 (Scholz, 1968; Wyss,
1973; Urbancic et al., 1992). On the contrary, creeping segments of the
fault were found to be characterized by high b-values up to about
b≈1.5 (Amelung and King, 1997). Therefore, for seismically active
parts of the fault zone it was proposed that b can be used as an
indicator where asperities may be located, that is where the creeping
and locked patches are situated along the fault zone (Wyss et al., 2000,
2004, Wyss, 2001, Zhao and Wu, 2008).
Typical b-values for Greek background seismicity and aftershocks
are around 1.0 (Papadopoulos et al., 1993) and 1.2 (Papazachos,
1971), respectively. We calculated b-value in the seismogenic area
shown in Fig. 2 by applying the maximum likelihood approximation
introduced by Aki (1965) and Utsu (1965):
b = log e= ½M�−m ð3Þ
where
N
M½ � = ∑ Mi =Nð Þ
i = 1
ð4Þ
is themeanmagnitude in the earthquake sample, and N is the number
of events with magnitude≥m. For reasons of data completeness the
magnitude cut-off was taken asmN3.0. A time period of 5 years before
the 8 June 2008 mainshock was selected for the calculation of the b-
value in the background seismicity. Selection of a longer time period
results in an increase of m which is due to decreasing monitoringFig. 3. Cross-section of the aftershock foci along fault strike (straight line in Fig. 2).
Mainshock focus is also projected (star).
204 G.A. Papadopoulos et al. / Tectonophysics 492 (2010) 201–212

capabilities of the area as time goes back. Besides, the last strong
earthquake in the area of NW Peloponnese before the occurrence of
the 2008 mainshock was that of 2 December 2002 (Mw=5.6) which
was associated with foreshock and aftershock sequences. Therefore,
the selection of a time period of no longer than 5 years before the
2008 mainshock secures the use of a catalogue segment which is not
influenced by the 2002 sequence. The 5-year catalogue was
declustered with a Greek version (Latoussakis and Stavrakakis,
1992) of the Gardner and Knopoff (1974) algorithm.
For background seismicity preceding by 5 years the 2008 main-
shock we found b=1.55. However, much higher b-values of 2.25, 1.89
and 1.77 were found for the 1-day, 10-day and 5-month aftershock
periods, respectively. This result, verifies the assumption that nomajor
asperities remained unbroken after the mainshock. These features
make the 2008 aftershock sequence different from other Greek
sequences associated with the same type of faulting and nearly the
same mainshock magnitude. For example, the Lefkada mainshock
(Mw=6.2) of 14 August 2003 which ruptured in the Ionian Sea,
was associated with dextral strike–slip faulting producing aftershocks
of maximum Mw=5.2 and of b=1.1, with epicenters spatially
distributed in two clusters separated by a 15-km-long asperity
(Papadopoulos et al., 2003).
4. Modeling of co-seismic ground displacement
The field of static, co-seismic ground displacement caused by the
2008 earthquake wasmodelled by applying the dislocationmodel in an
elastic half-space (Okada, 1985) by utilizing the Mirone (ver. 1.4.0)
framework tool (Luis, 2007). We calculated ground displacement, d, as
either uplift or subsidence. Strike, dip and slip for the preferred fault
plane were adopted from the centroid-moment tensor solution of
Harvard which determined magnitude Mw=6.4 (Table 1). Focal depth
of h=20 kmwas adopted for the mainshock. Displacement amplitude,
however, is sensitive to seismicmoment and, hence, to variations of the
average slip in the source. Average slip,ū, was calculated fromEq. (1) for
three seismic moment estimates corresponding to Mw=6.3, Mw=6.4
andMw=6.5, respectively (Table 1). Length Lc (1)=20 km and down-
dip width Wc=15 km were considered as fault dimensions. It was
found that seismic slip ū equals to 108 cm, 76 cm and 56 cm for
Mo=6.50×1025 dyn cm,Mo=4.56×1025 andMo=3.10×1025, respec-
tively. Then, absolute d values ranged from −9.4 to +11.4 cm for
Mw=6.5, and from −4.9 to +5.9 for Mw=6.3, where (−) and (+)
denote subsidence and uplift, respectively. For our preferredmagnitude
estimate ofMw=6.4 the displacement d ranged from−6.6 to+8.0 cm,
the maximum displacement amplitude being equal to 14.6 cm.
From the ground displacement field (Fig. 4) it comes out that uplift
occupied the NW and SE parts of the rupture zone while subsidence
was observed in the NE and SW parts. The maximum displacement
amplitude was found in Kato Achaia in the NW part of the dislocation
field, which is situated at the hanging wall domain of the reverse
component of the fault motion.
Calculation of the static stress drop is of particular importance for
understanding the mode of deformation and mechanical aspects of
the 2008 seismic fault. Assuming a simple rectangular planar fault, the
average static stress drop Δσ was calculated from
Δσ = Cμ u =Wcð Þ ð5Þ
The nondimensional constant C is taken as C=2/π for rectangular
surface strike–slip fault (Knopoff, 1958) and as C=4/π for rectangular
buried strike–slip fault (Aki, 1972) which is the present case. For average
seismic slip ū of 108 cm and of 56 cm, stress drop values of 18.4 and
8.8 bars were found, respectively. For our preferred seismic slip of 76 cm,
Δσ=13 bars was calculated. In strong, strike–slip earthquakes occurring
Fig. 4. The field of vertical co-seismic ground deformation caused by the 8 June 2008 mainshock. Dislocation modeling was performed for mainshock magnitude Mw=6.4 (see text
for details). Negative deformation means subsidence, otherwise uplift is meant. Maximum amplitude of deformation (uplift) by ∼8.0 cm is observed in the area of Kato Achaia.
205G.A. Papadopoulos et al. / Tectonophysics 492 (2010) 201–212

in the North Aegean Sea lower stress drop has been determined as a rule
(e.g. Kiratzi et al., 1991). In the Ionian Sea,we applied Eq. (5)with C=4/π
and calculated stress drop for the strike–slip Lefkada Is. earthquake of 14
August 2003 for two alternative seismic fault dimensions suggested by
Papadopoulos et al. (2003) and Benetatos et al. (2007). Nearly similar
results were obtained for the two alternatives: ū∼20 cm and
Δσ∼3.5 bars, which is lower than that found for the 2008 earthquake.
Large Pacific Ocean earthquakes are characterized, on the average,
by Δσ≈30 bars and L≈2 W, independently on the earthquake size
(Abe, 1975). For major earthquakes Δσ≈60 bars and L≈2 W.
Kanamori and Anderson (1975) also found that Δσ≈30 bars,
Δσ≈100 bars and Δσ≈60 bars for interplate, intraplate and “aver-
age” earthquakes, respectively. For intraplate earthquakes it was
found that Δσ ranges between 2 and 70 bars (Richardson and
Solomon, 1977). Based on a much higher number of global observa-
tions, Allmann and Shearer (2009) found that Δσ estimates for
individual earthquakes range from about 3 to 500 bars, but the
median stress drop of ∼40 bars does not vary with moment, implying
earthquake self-similarity over theMw=5.2 to 8.3 range of their data.
They found also a dependence of median stress drop on focal
mechanism, with a factor of 3–5 times higher Δσ for strike–slip
earthquakes and with a factor of 2 times higher Δσ for intraplate
earthquakes compared to interplate ones. The Movri earthquake is
discussed later as for its Δσ in relation to fault mechanics.
5. DInSAR processing
DInSAR analysis is a well established technique (Massonet and
Feigl, 1998) for remotely sensing co-seismic ground deformation. The
method requires a pair of SAR scenes, depicting the affected area of
interest, and the corresponding Digital Elevation Model (DEM) of the
region. The processing of the phase of the complex input data results
in a Line Of Sight (LOS) ground displacement pattern, represented in
the final interferometric product as a set of deformation fringes.
Regarding the distressed area of NWPeloponnese, 21 ENVISAT SAR
scenes were obtained from the European Space Agency (Table 2).
These came from two adjacent parallel ENVISAT satellite tracks in
both descending and ascending modes of operation (asc. tracks 186,
415 and desc. tracks 279, 50). The DEM used was created by
combining Shuttle Radar Topography Mission (SRTM) elevation data
with a higher quality DEM, which was derived from the digitization of
the 20 m-contour lines from 1:50,000 topographic maps. Moreover,
the interferometric processing of the SAR data was performed using
the ROI-PAC (2008) and DIAPASON (CNES, 1996) software packages.
Finally, the exact SAR sensor position for all the acquired scenes
became available through the precise satellite orbit state vectors,
provided by ESA DORIS system. Hence, using the above data and set of
tools 51 interferograms were compiled (Papoutsis et al., 2008) in an
attempt to map the ground displacement incurred by the 2008
mainshock. Fig. 5 shows the baselines of the interferograms.
The area of NW Peloponnese is quite challenging to perform a
DInSAR analysis, as it is highly vegetated. This induced significant
temporal signal decorrelation and thus the coherence between the
scenes was degraded (Fig. 6a). To suppress decorrelation noise a
procedure involving a two-stage process was adopted. Firstly, the two
interferograms with the best coherence statistics were identified and
stacked, in order to obtain their mean phase values for each pixel. This
step presumed the accurate geo-referencing of the interferograms.
Secondly, a 3×3 pixels rectangular averaging window was applied as
a smoothing filter to constrain the noise to an acceptable level, with
simultaneous spatial resolution degradation.
A typical co-seismic stacked interferogram (Fig. 6b) was formed
by using the interferometric pairs created from three ENVISAT SAR
scenes with orbit numbers 30894 and 32397 in the pre-seismic stage
and 32898 in the post-seismic stage. For the 30994–32898 co-
seismic pair the perpendicular baseline was 3 m, whereas for the
32397–32898 pair the corresponding value was 80 m. In this stacked
interferometric product it is obvious that there is no typical co-
seismic deformation fringe pattern, as one would expect for an
earthquake of relatively high magnitude. This is in accordance with
that the earthquake focus was relatively deep and the activated fault
was a blind one. However, in a closer look to the Kato Achaia area, a
set of fringes with limited extent emerged (Fig. 6c). This fringe
pattern was not observed in any of the available pre-seismic (Fig. 6d,
formed by scenes 31896–32397 with perpendicular baseline of
345 m) or post-seismic interferograms. In addition, these fringes
could not be associated with DEM errors not only due to that the area
is relatively flat, the average Altitude of Ambiguity being sufficiently
high (∼65 m), but also because the fringes are absent in both the
pre-seismic and post-seismic interferograms with even lower
Altitude of Ambiguity. Moreover, they cannot be attributed to
atmospheric and/or tropospheric disturbances which usually show
strong spatial correlation and hence they appear as uniformly
colored areas. If they were attributed to atmospheric disturbances
of the signal in any of the images used, they would also appear in all
pre-seismic and post-seismic interferograms created using the same
image. Nonetheless, this was never observed. Lastly, the detected
fringes can neither be linked with orbital errors, as these would
create vertical fringes of linear type crossing the interferogram from
north to south.
Table 2
ENVISAT scenes acquired in NW Peloponnese (ASAR Image Mode, Swath 2, Incidence
angle 29°, VV Polarisation).
Νο. Orbit Date Flight direction Track
1 22785 09/07/2006 Ascending 186
2 26793 15/04/2007 Ascending 186
3 31803 30/03/2008 Ascending 186
4 33306 13/07/2008 Ascending 186
5 33807 17/08/2008 Ascending 186
6 22649 30/06/2006 Descending 50
7 26657 06/04/2007 Descending 50
8 31667 31/03/2008 Descending 50
9 28389 05/08/2007 Descending 279
10 30894 27/01/2008 Descending 279
11 31896 06/04/2008 Descending 279
12 32397 11/05/2008 Descending 279
13 32898 15/06/2008 Descending 279
14 33399 20/07/2008 Descending 279
15 33900 24/08/2008 Descending 279
16 34401 28/09/2008 Descending 279
17 25519 16/01/2007 Ascending 415
18 26020 20/02/2007 Ascending 415
19 31531 11/03/2008 Ascending 415
20 32032 15/04/2008 Ascending 415
21 33535 29/07/2008 Ascending 415
Fig. 5. Perpendicular baselines of the SARpairs used for the generation of the interferograms.
206 G.A. Papadopoulos et al. / Tectonophysics 492 (2010) 201–212

The low coherency values that are dominant in Kato Achaia
prevent us from making accurate estimation of the deformed area.
However, one can confidently suggest that an area of about 35 to
40 km2 presented a LOS groundmovement of about one to two fringes
(Fig. 6c). This is equivalent to LOS uplift from 2.8 cm to 5.6 cm or,
assuming that the displacement is purely vertical, from 3.0 cm to
6.0 cm vertical uplift, taking into consideration the 23° incidence
angle, which is absolutely consistent with the amplitude of vertical
displacement calculated by the elastic dislocation modeling.
6. The macroseismic field
Studies performed in several seismogenic areas of the world have
shown that seismic ground motion and the patterns of earthquake
damage can be correlated with the faulting parameters and the co-
seismic displacement. There is observational evidence that the seismic
motion of the hanging wall of the seismic fault is larger than that of
the footwall for dip–slip earthquakes (e.g. Allen et al., 1998).
Numerical simulation results indicated that the particle motions on
Fig. 6. (a) Coherence map of the affected area. White stands for high coherency while black for low. (b) Co-seismic stacked interferogram project on a political map. Altitude of
ambiguity is 65 m. (c) Zoom of the previous co-seismic stacked interferogram in the Kato Achaia area, to highlight the fringe pattern. (d) Pre-seismic interferogram with 29 m
altitude of ambiguity. The dot is the mainshock epicenter, while the box confines the Kato Achaia area.
207G.A. Papadopoulos et al. / Tectonophysics 492 (2010) 201–212

the hanging wall are larger than those on the footwall, and that
particle motions decrease rapidly on the footwall and less rapidly on
the hanging wall (Shi et al., 2003). In the vicinity of the seismic fault
outcrop, the particle motion increases rapidly, both on the hanging
wall and footwall. Chang et al. (2004) showed that accelerometric
records of the 1999 Chi-Chi, Taiwan, earthquake (Mw=7.6), from
sites on the hanging wall exhibit larger acceleration than those from
the footwall, that these effects cannot be simply accounted for by a
proper choice of distance metric and that rather, seismic waves
trapped in the hanging wall wedge may have been involved. For the
same earthquake it was found that the surface damage was
predominantly caused by co-seismic deformation (Shieh et al., 2001).
In Greece, the static displacement field of the Athens 1999
earthquake (Mw=5.9) associatedwithnormal faultingwas determined
by numerical dislocation modeling and by analysis from InSAR images
(Papadopoulos et al., 2004). Consistent results were obtained from the
two approaches: maximum amplitude of vertical displacement was
found in the hanging wall equal to 7 cm for a fault that reaches the
surface and to 1.8 cm for a blind fault. It was found also that the
macroseismic field pattern is controlled by the static displacement
pattern. Themajority of the highest seismic intensities were distributed
within the hanging wall but very close to the fault, with a gradual
decreasewith the distance from the fault. Because of this, thehypothesis
was made that in dip–slip earthquakes the characteristics of the static
displacement predicts well enough the characteristics of the macro-
seismic field, although ground displacement is dominated by relatively
low frequency as compared to the ground acceleration. This hypothesis
was verified later by Fokaefs (2007)whoexamined systematicallymore
Greek earthquakes of normal faulting.
There is no clear evidence that the correlation described above for
dip–slip earthquakes is also valid for strike–slip earthquakes. The
involvement of a small reverse component in the faulting of the 2008
mainshock motivated the examination of such a possible correlation.
We analysed themain elements of the 2008macroseismic field, that is
ground failures and building damage. In the next section we discuss
them with regard to its possible correlation with the ground
deformation pattern. Particular attention was given in Kato Achaia
since both elastic dislocation modeling and DInSAR analysis showed
some uplift anomaly there.
In two post-event field-surveys performed during the first week
following the mainshock we observed (Fig. 2) surface fault-breaks,
ground fissures and cracks, rockfalls and liquefaction in soil in many
observation points (Papadopoulos et al., 2008). Similar observations
were published by others as well (e.g. Kokkalas et al., 2008; Lekkas
et al., 2008; Papathanassiou et al., 2008; Koukouvelas et al., 2009;
Ganas et al., 2009).
Three are the main surface fault-breaks observed: the Nisi, Michoi
and Vithoulkas ones, having lengths of 5–6 kmand vertical offset on the
order of 25 cm, 10 cmand 5 cm, respectively (Koukouvelas et al., 2009).
It remains doubtful, however, if they (e.g. in Fig. 7a) represent surface
expressions of the seismic fault segment activated in depth. In fact, none
of the fault-breaks follow the NE–SW strike of the seismic fault. Besides,
the surface fault-breaks were tectonically attributed to an upwards
partitioning of a buried strike–slip fault into several minor faults
(Koukouvelas et al., 2009). Observations in Italyhave shownthat even in
cases where surface ruptures concentrate in narrow bands along the
fault direction, they arenot always thedirect result of primary rupture at
depth (e.g. Cinti et al., 1999). In Bam, Iran, themain rupture of the 2003
earthquake did not occur on faults beneath the obvious surface traces,
but on a fault furtherwest, in a regionwhere there is a complete absence
of surface features (Talebian et al., 2004). Similarly, very fresh results
from palaeoseismological trenching showed that (Zygouri et al.,
submitted for publication) the Nisi surface fault-break should not be
attributed to a gravity-driven rupture, as suggested by Ganas et al.
(2009), but it should be genetically related to an unknown seismotec-
tonic structure with an average late Quaternary slip rate of 1.5 mm/yr.
In the train station of Kato Achaia clear bending of the WNW–ESE
trending railwaywas observed (Fig. 7b), which should not be attributed
to co-seismic surface break given that no ground break, fissure or crack
were observed on either sides of the railway. Our favoured explanation
is that the railway bending was due to the vibration caused by surface
waves of SH type. This is a physically plausible explanation since during
the passage of the horizontally polarized Swaves (SH) all particles of the
substance move horizontally. Then, the railway bending does not
provide information about the geometry and kinematics of the seismic
fault at depth. Groundfissures and cracks observed in other observation
points (Fig. 2) are of no tectonic importance since they were caused by
local openings of loosed surface material.
Fig. 7. Groundbreaksnear thewest bankofVergasRiver (a; photo courtesy byG.A. Papadopoulos). Railwaybendingobserved in theKatoAchaia train stationafter the earthquake(b; photo
courtesy by I. Koukouvelas). Our favoured explanation is that railway bending is due rather to horizontal ground shaking because of SH waves than to surface fault-break.
208 G.A. Papadopoulos et al. / Tectonophysics 492 (2010) 201–212

Liquefaction in soil were observed in several pointsmainly along the
earthquake rupture zone (Fig. 2). The most extensive liquefaction was
produced in two spots of the Kato Achaia coastal area at epicentral
distance of Δ∼20 km. Surface manifestations of liquefaction included
sand boils and ejections of water mixed with soft sand along numerous
ground fissures and local depressions (Fig. 8a). Massive rockfalls
occurred particularly along theMovrimountainous village of Santomeri
(Fig. 8b). Isolated rockfalls occurred also in other localities.
The maximum epicentral distance, Re, at which liquefaction or
rockfall may occur, is a function of the earthquake magnitude Ms or
Mw. Maximum distance, Re, at which liquefaction and rockfalls were
observed are ∼27 km and 18 km (Fig. 1), respectively, which fall
clearly within the respective limiting distances of 52 km and 66 km
predicted by empirical Ms/R relationships for Ms≈Mw=6.4, which is
the mainshock magnitude:
1:584 logRe = −3:686 + Ms; Ms≥5:9ðRe in kmÞ ð6Þ
for liquefaction in soil (Papadopoulos and Lefkopoulos, 1993) and
logRe = −2:98 + 0:75Ms; Ms≥5:3 ðRe in kmÞ ð7Þ
for landslides and rockfalls (Papadopoulos and Plessa, 2000).
Damagewasobservedparticularly in single-housebuildings inmany
villages of the Elia and Achaia provinces but no massive building
collapses were reported. Two persons were killed and about 265 were
injured. Total or partial collapsewas observed in tenths of single,mainly
old non-reinforced concrete, one-storey houses and other buildings,
such as churches, particularly in the villages of Nisi, Valmi, Fostaina, and
Santomeri. In these villages we assigned macroseismic intensity VII or
VII+at maximum in the EMS-98 scale. Damage was also caused in
residential and other buildings in important cities, such as Patras and
Amaliada, situated to the north and south ends of the rupture zone,
respectively. Noticeable damage was also caused in the industrial zone
of Patras, e.g. in a brewery factory atΔ∼20 km, where the predominant
destructionwas the collapse of three silot bearingweight of 1500 t each
(Fig. 9a). However, the highest intensity of VIII degree was assigned to
Kato Achaia given that many masonry buildings and several concrete-
Fig. 8. Ground break and sand blows due to liquefaction in soil near the coastal zone of Kato Achaia (a; photo courtesy by I. Koukouvelas). Rockfall near Santomeri village (b; photo
courtesy by G.A. Papadopoulos). The size of the rock is 2.7 m in height and 2.9 m in width.
Fig. 9. Collapse of three silots in a brewery factory in the industrial zone of Patras
(a) and partial collapse of house building in the Kato Achaia town (b) (photo courtesy
by G.A. Papadopoulos).
209G.A. Papadopoulos et al. / Tectonophysics 492 (2010) 201–212

reinforced buildings suffered serious damage or even damage beyond
repair (Fig. 9b).
7. Discussion
The determination of the seismic fault dimensions and of the co-
seismic slip is of critical importance since other parameters and
calculations depend directly on them. We selected best estimates for
the fault dimensions basedonboth the routine aftershockdeterminations
of NOA and the relocations performed by others. The co-seismic uplift
detected in Kato Achaia by elastic dislocationmodelingwas verified from
DInSAR analysis, which is a strong evidence that the fault dimensions and
other parameters introduced in the dislocationmodeling are correct. The
fringe pattern in the interferogram from which the co-seismic uplift in
KatoAchaia becomes evident, is true for a number of reasons explained in
Section 5. For a preferred seismic moment Mo=4.56×1025 dyn cm
(Mw=6.4) stress drop ofΔσ=13 barswas foundwhich is relatively high
for Greek strike–slip earthquakes. This may be due rather to relatively
increased rigidity, as a possible result of the long repeat time of
earthquakes in the area of the 2008 earthquake, than to high seismic
slip in the fault. It is appropriate to discus here the classification of the
seismic fault of 2008 earthquake in relation to the repeat time of strong
earthquakes on it. Kanamori and Allen (1986) have related differences in
Δσ for largeearthquakes to their repeat times, T. ForMw=6.4, fault length
L=20 km, fault width W=11 km and intermediate Δσ, which are
exactly the parameters of the 2008 earthquake, the expected T ranges
from 300 to 2000 years. Very likely no strong earthquake ruptured the
2008 Movri fault at least in the last 300 years. Romanowicz and Ruff
(2002) examined the moment-length scaling of large strike–slip earth-
quakes in relation to the strength of faults and found that most
continental interplate strike–slip earthquakes occur on weak faults, and
most events on relatively old oceanic crust or in intraplate settings occur
on strong faults. They concluded that earthquakes with T occur on
stronger faults, and result in larger moments than earthquakes with
shorter T, for the same length of rupture.
A possible explanation for the Δσ differences between intraplate
and interplate earthquakes come from numerical simulations of faults
(Kato, 2009). Namely, in a model intraplate fault assumed to be
loaded uniformly, Δσ is uniform over the fault with a larger average
value. On the contrary, stress concentration is generated at a plate
boundary region between locked area and aseismic sliding area for a
model interplate earthquake. This stress concentration hastens
earthquake occurrence, resulting in lower average Δσ (Kato, 2009).
Allmann and Shearer (2009) speculated that the cause for the
observed stress drop variations of Δσ may be due to possible
mechanisms such as lateral variations in rigidity, variations in the
material between different plate boundaries, and variations in the
absolute values of the principal stresses or the orientation of plate
boundaries with respect to the direction of the principal stresses.
In the above context, the fault of Movri earthquake was neither a
typical weak nor a typical strong fault. In the classification of Kanamori
and Allen (1986) the T's in weak faults are less than 300 years while in
strong faults T's exceed 2000 years. In this scheme the Movri seismic
fault could be considered as a strong one. However, assuming that the
Movri earthquake was of the continental interplate type, one may
expect a rather weak fault according to Romanowicz and Ruff (2002).
But the interpretation they proposed in terms of differences in Δσ is
clear only for events with MoN0.50×1027 dyn.cm. For smaller events,
such as the Movri earthquake, even though the average Δσ is higher in
intraplate than in interplate settings, the dispersion in the data is very
large. This may be due to the proportionately larger variability in fault
width and strength for smaller events.
Elastic dislocationmodeling andDInSAR analysis have shown that in
KatoAchaia, situated atΔ∼20 km in thefield of uplift at thehangingwall
domain of the reverse fault component, constitutes a spot of maximum
vertical co-seismic displacement. At the same time, Kato Achaia is a spot
of maximum seismic intensity. This coincidence could not be explained
neither by surface fault-breaks nor by site effects.
In the light of the findings in Greece, Taiwan and elsewhere that in
dip–slip faults seismic ground motion and the patterns of earthquake
damage can be correlated with the faulting parameters and the co-
seismic displacement, onemay argue that the co-seismic uplift detected
in Kato Achaia was the main factor that contributed for the maximum
intensity to be felt there. Unfortunately, no accelerometric data are
available fromKatoAchaia. Peakgroundacceleration PGA=0.237 gwas
recorded in Amaliada (Δ∼20 km) to the SW (NOA, http://www.gein.
noa.gr/English/new-accelnet-eng/list-of-earthquakes.htm). Thenearest
to Kato Achaia PGA's were recorded in Patras (Δ∼35 km) to the NE:
0.16 g (NOA, http://www.gein.noa.gr/English/new-accelnet-eng/list-
of-earthquakes.htm) 0.13, 0.11 and 0.09 g (ITSAK, http://www.itsak.
gr/documents/AchaiaIlia/Achaia-Ilia_Jun2008_2ndReport.pdf). Appli-
cation of an empirical rule (Ambraseys, 1988), which predicts the
critical ground acceleration, Kc, needed to cause liquefaction as a
function of magnitude and distance inserted in Eq. (6), showed that for
the liquefied site of Kato Achaia beach Kc≈0.08 g, which is the
minimum PGA that one may expect in Kato Achaia.
8. Conclusions
The mainshock of 8 June 2008 was the first modern, strong strike–
slip earthquake in the Greek mainland. Therefore, it is of particular
importance for understanding better the co-seismic deformation
associated with strike–slip earthquakes in the east Mediterranean Sea.
The causative fault was striking NE–SW and dipping ∼85°NW. It was of
right-lateral slip with small reverse component. This fault acts as a
transition between the extensional area of Patras Gulf–Corinth rift and
the compressional area of the Ionian Sea. There is no historical evidence
that the 2008 fault segment was ruptured by strong earthquake in at
least the last 300 years.
The uppermost crustal layer of ∼5 km remained seismically
inactive, while the aftershock focal depths did not exceed 25 km.
These observations are consistent with geological field observations
(Koukouvelas et al., 2009) indicating that a buried fault was activated
with the mainshock.
Assuming a rectangular planar seismic fault, we estimated fault
dimensions: mainshock rupture L=20 km; aftershock area length
Lc≈42 km; lateral aftershock zonewidthWcl≈10 km;mainshock focal
depth, h=20 km; seismic fault depth ranging from 5 km to 20 km;
down-dip width W=15 km. The above figures indicate that some
lateral expansion occurred only along length. The aftershock area length
is notably larger than the one (∼33 km) expected from empirical
relationships. Since the seismogenic layer was ruptured from the depth
of 5 km toabout20 km, verypossibly up to thebrittle–ductile transition,
more rupture along length was favoured.
The low aftershock magnitudes (ML≤4.3), that no remarkable
lateral gap in the earthquake epicenters was noted and that no
significant lateral expansion of the aftershock area occurred, could be
interpreted with that no major asperities remained unbroken after the
mainshock. This is consistent with the unusually high b-value (=2.25)
found particularly in the early stage of the aftershock activity, which
indicates rather creeping mechanism than the presence of locked
patches. We assume, therefore, that nearly the total deformation of the
sequence was caused by the mainshock.
Average co-seismic slip of 76 cmand staticΔσ=13 barswere found
for a preferred mainshock seismic moment of Mo=4.56×1025 dyn cm
(Mw=6.4). This Δσ value is less by 2–3 times than the world median
value but higher than the Δσ in strong strike–slip earthquakes in the
North Aegean Sea and the Ionian Sea. The higher Δσ is attributed rather
to increased fault rigidity than to increased seismic slip. Increased fault
rigidity is consistent with the relatively long repeat time of strong
earthquakes in the Movri fault which very possibly exceeds 300 years.
From this point of view that fault is a strong one. Assuming, however,
210 G.A. Papadopoulos et al. / Tectonophysics 492 (2010) 201–212

that the 2008 earthquake was of the continental interplate type, one
may expect a ratherweak fault.We conclude that the faultwas neither a
typical weak nor a typical strong fault.
Dislocation modeling of a buried fault in an elastic half-space
showed maximum uplift of about 8.0 cm in the Kato Achaia area
(Δ∼20 km) at the hanging wall of the reverse component of fault
motion in the NW part of the aftershock area. No co-seismic
movement was detected by DInSAR analysis with the exception of
the Kato Achaia area where again vertical ground displacement
ranging from 3.0 cm to 6.0 cm was calculated.
Themost important spots of liquefaction caused by the earthquake
were observed in the Kato Achaia Beach. We estimated maximum
seismic intensity of VIII degree (EMS-98 scale) in Kato Achaia which is
attributable neither to surface fault-breaks nor to site effects. An
explanation is the possibly high ground acceleration of N0.08 g
estimated in Kato Achaia due to the co-seismic uplift detected there.
From the spatial correlation found between the fields of intensity
and of ground displacement for dip–slip earthquakes in Taiwan,
Greece and elsewhere, it was suggested that the former is controlled
by the latter. Although ground displacement is dominated by
relatively low frequency as compared to seismic ground acceleration,
the causal association between ground displacement and increased
earthquake damage in the hanging wall of motion becomes possible
not only for pure dip–slip earthquakes but also for strike–slip
earthquakes with small dip–slip component, as the Kato Achaia case
indicates for the 2008 earthquake.
Acknowledgements
This work was supported by the project SEAHELLARC, EU-FP6,
contract 037004. ENVISAT SAR scenes were obtained from the ESA in
the framework of the ESA-GREECE AO project 1489OD/11-2003/72.
The first author is thankful to Dr J. Koukouvelas for his help and
guidance in the field.
References
Abe, K., 1975. Reliable estimation of the seismic moment of large earthquakes. J. Phys.Earth 23, 381–390.
Aki, K., 1965. Maximum likelihood estimate of b in the formula log N=a−bM and itsconfidence limits. Bull. Earthquake Res. Inst. Tokyo Univ. 43, 237–239.
Aki, K., 1972. Earthquake mechanism. Tectonophysics 13, 423–446.Allen, C.R., Brune, J.R., Cluff, L.S., Barrows, A.G., 1998. Evidence for unusually strong
near-field ground motion on the hanging wall of the San Fernando fault during the1971 earthquake. Seismol. Res. Lett. 69, 524–531.
Allmann, B.P., Shearer, P.M., 2009. Global variations of stress drop for moderate to largeearthquakes. J. Geophys. Res. 114, B01310. doi:10.1029/2008JB005821.
Ambraseys, N.N., 1988. Engineering seismology. Earthquake Eng. Struct. Dyn. 17, 1–105.Ambraseys, N.N., Finkel, C., 1999. Unpublished Ottoman archival information on the
seismicity of theBalkansduring theperiod 1500–1800. NaturalDisasters in theOttomanEmpire, Institute forMediterraneanStudies,HalcyonDays inCrete III, A Symposiumheldin Rethymnon, 10–12 January 1997. Crete University Press, pp. 89–107.
Amelung, F., King, G., 1997. Earthquake scaling laws for creeping and non-creepingfaults. Geophys. Res. Lett. 24, 507–510.
Båth, M., 1983. The seismology of Greece. Tectonophysics 98, 165–208.Benetatos, Ch., Dreger, D., Kiratzi, A., 2007. Complex and segmented rupture associated
with the 14 August 2003 Mw 6.2 Lefkada, Ionian Islands earthquake. Bull. Seismol.Soc. Am. 97, 35–51.
Chang, T.-Y., Cotton, F., Tsai, Y.-B., Angelier, J., 2004. Quantification of hanging-walleffects on ground motion: some insights from the 1999 Chi-Chi earthquake. Bull.Seismol. Soc. Am. 94, 2186–2197.
Cinti, F.R., Cucci, L., Marra, F., Montone, P., 1999. The 1997 Umbria–Marche (Italy)earthquake sequence: relationship between ground deformation and seismogenicstructure. Geophys. Res. Lett. 26, 895–898.
CNES, 1996. Philosophie et mode d'emploi de la chaine logicielle interferometriqueDIAPASON. Toulouse, France.
Daëron, M., Klinger, Y., Tapponier, P., Elias, A., Jacques, E., Sursock, A., 2007. 12,000-Year-long record of 10 to 13 paleoearthquakes on the Yammoûneh Fault, LevantFault System, Lebanon. Bull. Seismol. Soc. Am. 97, 749–771.
Doutsos, T., Kontopoulos, N., Poulimenos, G., 1988. The Corinth–Patras rift as the initialstage of continental fragmentation behind an active island arc (Greece). Basin Res.1, 177–190.
Drakopoulos, J.C., Ekonomides, A.C., 1972. Aftershocks of February 19, 1968 earthquakein Northern Aegean Sea and related problems. Pageoph 95, 100–115.
Duman, T.Y., Emre, O., Dogan, A., Ozalp, S., 2005. Step-over and bend structures alongthe 1999 Duzce earthquake surface rupture, North Anatolian fault, Turkey. Bull.Seismol. Soc. Am. 95, 1250–1262.
Fokaefs, A., 2007. Surface deformation patterns associated with strong earthquakes ofGreece. MSc Thesis, National and Kapodistrian University of Athens, Greece, 82 pp..
Galanopoulos, A.G., 1960. A catalogue of shocks with Io≥VI orM≥5 for the years 1801–1958. Seismol. Lab. Univ, Athens.
Galanopoulos, A.G., 1981. The earthquake potential of Greece. Ann. Géol. Pays Hellén.30, 648–724 (in Greek).
Gallovič, F., Zahradník, J., Křížová, D., Plicka, V., Sokos, E., Serpetsidaki, A., Tselentis, G.A.,2009. From earthquake centroid to spatial–temporal rupture evolution: Mw 6.3MovriMountain earthquake, June8, 2008, Greece. Geophys. Res. Lett. 36. doi:10.1029/2009GL040283.
Ganas, A., Serpelloni, E., Drakatos, G., Kolligri, M., Adamis, I., Tsimi, Ch., Batsi, E., 2009. TheMw 6.4 SW-Achaia (Western Greece) earthquake of 8 June 2008: seismological, field,GPS observations, and stress modeling. Journal of Earthquake Engineering 13,1101–1124.
Gardner, J.K., Knopoff, L., 1974. Is the sequence of earthquakes in Southern California,with aftershocks removed, Poissonian? Bull. Seismol. Soc. Am. 64, 1363–1367.
Guidoboni, E., Comastri, A., 2005. Catalogue of earthquakes and tsunamis in theMediterraneanarea, 11th–15th century. IstitutoNazionalediGeofisica eVulcanologia,Rome, p. 1037.
Gutenberg, B., Richter, C., 1944. Frequency of earthquakes in California. Bull. Seismol.Soc. Am. 34, 185–188.
Kanamori, H., Allen, C. R., 1986. Earthquake repeat time and average stress drop. In: S.Das, J. Boatwright & C. H. Scholz (Eds.) Earthquake Source Mechanics, Geophys.Monogr. 37, Maurice Ewing v. 6, Am. Geophys. Union, Washington, D. C., 227–235.
Kanamori, H., Anderson, D.L., 1975. Theoretical basis of some empirical relations inseismology. Bull. Seismol. Soc. Am. 65, 1073–1095.
Kato, N., 2009. A possible explanation for difference in stress drop between intraplateand interplate earthquakes. Geophys. Res. Lett. 36. doi:10.1029/2009GL040985.
Kiratzi, A.A., Wagner, G.S., Langston, C.A., 1991. Source parameters of some largeearthquakes in Northern Aegean determined by bodywaveform inversion. PAGEOPH135, 515–527.
Knopoff, L., 1958. Energy release in earthquakes. Geophys. J. 1, 44–52.Kobayashi, T., Takada, Y., Furuya, M., Murakami, M., 2009. Locations and types of
ruptures involved in the 2008 Sichuan earthquake inferred from SAR imagematching. Geophys. Res. Lett. 36, 1–5.
Kokkalas, S., Xypolias, P., Koukouvelas, I.K., 2008. Surface ruptures of the Mw 6.3 (June08, 2008) earthquake event in the Northwest Peloponnese. 31st General Assembly,European Seismological Commission, Hersonissos, Crete, Greece, 7–12 September2008, Programme and Abstracts, p. 319 (abstr.).
Konstantinou, K., Papadopoulos, G.A., Fokaefs, A., Orfanogiannaki, K., 2005. Empiricalrelationships between aftershock area dimensions and magnitude for earthquakesin the Mediterranean Sea region. Tectonophysics 403, 95–115.
Kontoes, C.C., Elias, P., Sykioti, O., Briole, P., Remy, D., Sachpazi, M., Veis, G., Kotsis, I.,2000. Displacement field mapping and fault modeling of the September 7th, 1999Athens earthquake based on ERS-2 satellite radar interferometry. Geophys. Res.Lett. 27, 3989–3992.
Koukouvelas, I.K., Kokkalas, S., Xypolias, P., 2009. Surface deformation during the Mw 6.4(8 June 2008) Movri Mountain earthquake in the Peloponnese, and its implicationsfor the seismotectonics of western Greece. Int. Geol. Rev. 1–20. doi:10.1080/00206810802674329 iFirst Article.
Latoussakis, J., Stavrakakis, G.N., 1992. Times of increased probability of earthquakes ofML≥5.5 in Greece diagnosed by algorithm M8. Tectonophysics 210, 315–326.
Lekkas, E., Fountoulis, I., Danamos, G., Skourtsos, E., Gouliotis, I., Mavroulis, S., Kostaki, I.,2008. Seismic fractures related to the NW Peloponnesus (SW Greece) earthquake(ML=6,5R, 8-6-2008). 31st General Assembly, European Seismological Commis-sion, Hersonissos, Crete, Greece, 7–12 September 2008, Programme and Abstracts,p. 320 (abstr.).
Louvari, E., Kiratzi, A.A., Papazachos, B.C., 1999. The Cephalonia Transform Fault and itsextension to western Lefkada Island (Greece). Tectonophysics 308, 223–236.
Luis, J.F., 2007. Mirone: amulti-purpose tool for exploring grid data. Comput. Geosci. 33,31–41.
Mallet, R., 1853. Third report on the facts of earthquake phenomena, 1. BritishAssociation for the Advancement of Science, London, pp. 1–176.
Massonet, D., Feigl, K., 1998. Radar interferometry and its appication to changes in theearth's surface. Rev. Geophys. 36, 441–500.
Mogi, K., 1962. Study of elastic shocks caused by the fracture of heterogeneousmaterials and its relations to earthquake phenomena. Bull. Earthquake Res. Inst.Tokyo Univ. 40, 125–173.
Okada, Y., 1985. Surface deformation due to shear and tensile faults in a half-space. Bull.Seismol. Soc. Am. 75, 1135–1154.
Papadopoulos, G.A., 1985. Stress-field and shallow seismic activity in the Aegeanregion: their tectonic implications. Quatern. Geod. 6, 65–74.
Papadopoulos, G.A., Lefkopoulos, G., 1993. Magnitude–distance relations for liquefac-tion in soil from earthquakes. Bull. Seismol. Soc. Am. 83, 925–938.
Papadopoulos, G.A., Plessa, A., 2000. Magnitude–distance relations for earthquake-induced landslides in Greece. Eng. Geol. 58, 377–386.
Papadopoulos, G.A., Skafida, H.G., Vassiliou, I.T., 1993. Non-linearity of the magnitude–frequency relation in the Hellenic arc–trench system and the characteristicearthquake model. J. Geophys. Res. 98, 17737–17744.
Papadopoulos, G.A., Sachpazi,M., Panopoulou,G., Stavrakakis,G., 1998. Thevolcanoseismiccrisis of 1996–97 in Nisyros, SE Aegean Sea, Greece. Terra Nova 10, 151–154.
Papadopoulos, G.A., Vassilopoulou, A., Plessa, A., 2000. A new catalogue of historicalearthquakes in the Corinth Rift, Central Greece: 480 B.C.–A.D. 1910. In:
211G.A. Papadopoulos et al. / Tectonophysics 492 (2010) 201–212

Papadopoulos, G.A. (Ed.), Historical Earthquakes and Tsunamis in the Corinth Rift,Central Greece, pp. 9–119.
Papadopoulos, G.A., Ganas, A., Plessa, A., 2001. The Skyros Earthquake (Mw6.5) of 26July 2001 and Precursory Seismicity Patterns in the North Aegean Sea. Bull. Seismol.Soc. Am. 92, 1141–1145, 2002.
Papadopoulos, G.A., Karastathis, V., Ganas, A., Pavlides, S., Fokaefs, A., Orfanogiannaki,K., 2003. The Lefkada, Ionian Sea (Greece), shock (Mw 6.2) of 14 August 2003:evidence for the characteristic earthquake from seismicity and ground failures.Earth Planet. Space 55, 713–718.
Papadopoulos, G.A., Matsumoto, H., Ganas, A., Karastathis, V., Pavlides, S., 2004.Deformation patterns associated with the M5.9 Athens (Greece) earthquake of 7Sept. 1999. J. Seismol. 8, 381–394.
Papadopoulos, G.A., Karastathis, V., Kontoes, C., Papoutsis, I., Daskalaki, E., Diakogianni, G.,Fokaefs,A., 2008. Theearthquakeof 8 June2008(Mw=6.3) inNWPeloponnese,Greece:first results. 31st General Assembly, European Seismological Commission, Hersonissos,Crete, Greece, 7–12 September 2008, Programme and Abstracts, pp. 323–324 (abstr.).
Papadopoulos, G.A., Karastathis, V., Ganas, A., Charalambakis, M., Fokaefs, A., 2009. Astorm of strong earthquakes in Greece during 2008. EOS Trans. Am. Geophys. Union90 (46), 425–426 17 Nov. 2009.
Papathanassiou, G., Valkaniotis, S., Chatzipetros, A., Neofotistos, P., Sboras, S., Pavlides,S., 2008. Liquefaction-induced ground disruption triggered by the earthquake ofJune 8, 2008 in NW Peloponnesus, Greece. 31st General Assembly, EuropeanSeismological Commission, Hersonissos, Crete, Greece, 7–12 September 2008,Programme and Abstracts, p. 330 (abstr.).
Papazachos, B.C., 1971. Aftershock activity and aftershock risk in the area of Greece.Ann. Geofis. 24, 439–456.
Papazachos, B.C., Papazachou, C.B., 1997. The Earthquakes of Greece. Ziti Publ.,Thessaloniki. 304 pp.
Papazachos, B.C., Kiratzi, A.A., Voidomatis, Ph., Papaioannou, Ch., 1984. A study on theDecember 1981–January 1982 seismic activity in Northen Aegean Sea. Boll. Geofis.Teor. Appl. XXVI, 101–102.
Papoutsis, I., Kontoes, C., Papadopoulos, G.A., 2008. DInSAR study of the 8 June 2008earthquake in NW Peloponnese. 31st General Assembly, European SeismologicalCommission, Hersonissos, Crete, Greece, 7–12 September 2008, Programme andAbstracts, p. 323 (abstr.).
Pavlides, S.B., Tranos, M.D., 1991. Structural characteristics of two strong earthquakes in theNorth Aegean: Ierissos (1932) and Agios Efstratios (1968). J. Struct. Geol. 13, 205–214.
Reilinger, R.E., Ergintav, S., Bürgmann, R., McClusky, S., Lenk, O., Barka, A., Gurkan, O.,Hearn, L., Feigl, K.L., Cakmak, R., Aktug, B., Ozener, H., Töksoz, M.N., 2000. Coseismicand postseismic fault slip for the 17 August 1999, M=7.5, Izmit, Turkey earthquake.Science 289, 1519–1524.
Richardson, R.M., Solomon, S.C., 1977. Apparent stress and stress drop for intraplateearthquakes and tectonic stress in the plates. PAGEOPH 115, 317–331.
ROI_PAC, 2008. Jet Propulsion Laboratory (JPL) and the California Institute ofTechnology (Caltech). http://www.roipac.org/.
Romanowicz, B., Ruff, L.J., 2002. Onmoment-length scaling of large strike slip earthquakesand the strength of faults. Geophys. Res. Lett. 29. doi:10.1029/2001GL014479.
Roumelioti, Z., Benetatos, Ch., Kiratzi, A., Stavrakakis, G., Melis, N., 2004. A study of the 2December 2002 (M5.5) Vartholomio (western Peloponnese, Greece) earthquakeand of its largest aftershocks. Tectonophysics 387, 65–79.
Sathas, K.N., 1867. Messeonikon Seismologion tis Ellados kai idios tis Kefallinias kaiLefkados. Aion, Athens.
Scholz, C.H., 1968. Microfractures, aftershocks, and seismicity. Bull. Seismol. Soc. Am.58, 1117–1130.
Shi, B., Brune, J.N., Zeng, Y., Anooshehpoor, A., 2003. Dynamics of earthquakenormal faulting:two-dimensional lattice particle model. Bull. Seismol. Soc. Am. 93, 1179–1197.
Shieh, C.-F., Sheu, S.-Y., Shih, R.-C., 2001. Correlation between surface damage and thecoseismic displacement and stress relaxation of the 1999 Chi-Chi, Taiwanearthquake. Geophys. Res. Lett. 28, 3381–3384.
Spyropoulos, P.J., 1997. Chronicle of the Earthquakes in Greece from the Ancient Timetill Now. 453 pp. (In Greek).
Talebian, M., Fielding, E.J., Funning, G.J., Ghorashi, M., Jackson, J., Nazari, H., Parsons, B.,Priestley, K., Rosen, P.A., Walker, R., Wright, T.J., 2004. The 2003 Bam (Iran)earthquake: rupture of a blind strike–slip fault. Geophys. Res. Lett. 31. doi:10.1029/2004GL020058.s.
Taymaz, T., Jackson, J., McKenzie, D., 1991. Active tectonics of the north and centralAegean Sea. Geophys. J. Int. 106, 433–490.
Urbancic, T.I., Trifu, C.I., Long, J.M., Young, R.P., 1992. Space–time correlations of b-values with stress release. Pure Appl. Geophys. 139, 449–462.
Utsu, T., 1965. A method for determining the value of b in a formula log N=a−bM
showing the magnitude–frequency relation for earthquakes. Geophys. Bull.Hokkaido Univ. 13, 99–103 (in Japanese with Engl. abstr.).
Wyss, M., 1973. Towards a physical understanding of the earthquake frequencydistribution. Geophys. J. R. Astron. Soc. 31, 341–359.
Wyss, M., 2001. Locked and creeping patches along the Hayward fault, California.Geophys. Res. Lett. 28, 3537–3540.
Wyss, M., Schorlemmer, D., Wiemer, S., 2000. Mapping asperities by minima of localrecurrence time: theSan Jacinto–Elsinore fault zones. J. Geophys. Res. 105, 7829–7844.
Wyss, M., Sammis, C.G., Nadeau, R.M., Wiemer, S., 2004. Fractal dimension and b-valueon creeping and locked patches of the San Andreas Fault near Parkfield, California.Bull. Seismol. Soc. Am. 94, 410–421.
Zhao, Y.Z., Wu, Z.L., 2008. Mapping the b-values along the Longmenshan fault zonebefore and after the 12 May 2008, Wenchuan, China, Ms 8.0 earthquake. Nat. Haz.Earth Syst. Sci. 8, 1375–1386.
Zygouri, V., Kokkalas, S., Xypolias, P., Koukouvelas, I.K., Papadopoulos, G.A., submittedfor publication. Paleoseismological evidence from an emerging structure above ablind fault: the Nisi fault (NW–Peloponnese, Greece) as a case example.
212 G.A. Papadopoulos et al. / Tectonophysics 492 (2010) 201–212