urinary fluoride levels among canadians and the association
TRANSCRIPT

URINARY FLUORIDE LEVELS AMONG CANADIANS AND THE ASSOCIATION
BETWEEN FLUORIDE EXPOSURE AND ATTENTION DEFICIT HYPERACTIVITY DISORDER
JULIA KRISTENE RIDDELL
A DISSERTATION SUBMITTED TO THE FACULTY OF GRADUATE STUDIES IN PARTIAL FULFILLMENT OF THE REQUIREMENTS FOR THE DEGREE OF
DOCTOR OF PHILOSOPHY
GRADUATE PROGRAM IN PSYCHOLOGY YORK UNIVERSITY
TORONTO, ONTARIO
February 2020
© JULIA KRISTENE RIDDELL, 2020
ii
ABSTRACT
Fluoride has been identified as a developmental neurotoxin – a claim that is uncontested at high
exposure levels, but remains debated at low exposure levels. In Canada, 39% of municipalities
add fluoride to their drinking water at a recommended level of 0.7ppm. Exposure to fluoride has
been linked with increased prevalence of attention deficit hyperactivity disorder (ADHD) in the
United States and symptoms of inattention in Mexican children. This dissertation consists of one
study examining the association between fluoride exposure and symptoms of ADHD in youth,
and a second study examining the predictors of an individual’s level of urinary fluoride. Study 1
used cross-sectional data on youth 6 to 17 years of age from the Canadian Health Measures
Survey (CHMS, Cycles 2 and 3). Urinary fluoride concentrations were measured in spot samples
and adjusted for specific gravity (UFSG, n=1877) and water fluoride concentrations were
measured in tap water samples (n=980). We used logistic regression to test the association
between fluoride exposure and ADHD diagnosis and linear regression to examine the
relationship between fluoride exposure and the hyperactive-inattention subscale score on the
Strengths and Difficulties Questionnaire (SDQ). UFSG did not predict ADHD diagnosis or SDQ
score, whereas a 1 mg/L increase in tap water fluoride level was associated with 6.1 times higher
odds of an ADHD diagnosis (95% CI = 1.60, 22.8) and a 1.5 increase in SDQ score for
adolescents. Study 2 used data from Cycle 3 of the CHMS to examine factors that influence
urinary fluoride levels in a sample of 1629 individuals aged 3 to 79 years. In the linear regression
models, tap water fluoride level, community water fluoridation status, age, sex, BMI, smoking
allowed in the home, and tea consumption were significant predictors of UFSG. Community
water fluoridation and tap water fluoride were associated with higher levels of fluoride excretion
and with an increased risk of ADHD symptoms and diagnosis among Canadian youth. These
findings highlight the need to identify subgroups who may have especially high levels of
exposure and to further investigate the potential for fluoride-mediated developmental
neurotoxicity in populations with community water fluoridation.
iii
ACKNOWLEDGEMENTS There are so many people who have walked with me on this journey that it is impossible to name
them all. I am grateful to my grandfather Gustav Kliwer for sharing his passion for mathematics
with me, and to my mother for encouraging a curiosity and appreciation for the natural world.
Throughout my elementary school years, a number of my teachers nurtured my interest in the
sciences. In particular, I will never forget my Grade 8 teacher Mr. Noventa who taught me about
the scientific method and supported me in collecting data related to the physiological signs of
lying. I feel very fortunate that so many of my high school teachers took extra time to support me
with the subjects I excelled at (like psychology, of course) and the subjects I struggled with
(Grade 12 calculus!). My professors and peers in Peace Studies at McMaster University
profoundly influenced the person I am today and made me believe that a better world is possible.
I am grateful to my undergraduate thesis supervisor Dr. Jennifer Ostovich who took a risk and
supported me in completing an unconventional project that matched my values and interests. To
all of my wonderful friends, thank you for the coffee shop work parties, your words of support
and encouragement, and your love through the years. You are the treasures for which I am most
grateful. To my siblings Grant, Liam, and Gill and to my partner Cole, thank you for reminding
me of the importance of taking breaks, playing games, and enjoying life. I am most grateful for
the unwavering support of Dr. Michael Teschuk during my residency. He was the most
wonderful director of clinical training imaginable and did everything in his power to make
Winnipeg feel like home. To my residency cohort, I will never forget all of the laughter, tears,
dissertation work sessions, and food truck festivals. Thank you to Dr. Christine Till and Dr.
Dave Flora for your mentorship and detailed comments on this dissertation, I have learned so
much from you. I am also grateful to my oral defense committee (Dr. Maggie Toplak, Dr. Carlin
Miller and Dr. Christo El Morr) for your thoughtful perspectives on this project. Most of all,
thank you to my graduate advisor Dr. Debra Pepler, who has walked beside me for the past 8
years. Deb, you taught me how to do truly collaborative research and to believe in myself. I am
most grateful for the opportunity to do this research and to everyone who made this project
possible.
iv
TABLE OF CONTENTS Abstract............................................................................................................................................ii Acknowledgments..........................................................................................................................iii Table of Contents............................................................................................................................iv List of Tables..................................................................................................................................vi List of Figures................................................................................................................................vii Chapter One: Introduction...............................................................................................................1
Environmental Exposures and Neurodevelopmental Disorders…………………………..1 Development of ADHD…………………………………………………………………...2 Artificial Water Fluoridation in Canada…………………………………………………..5 Debate about Water Fluoridation………………………………………………………….7 Fluoride Exposure…………………………………………………………………………8 Pharmacokinetics of Fluoride……………………………………………………………10 Experimental Neurotoxicity……………………………………………………………...12 Potential Impacts of Fluoridation on Human Health…………………………………….15 Study Aims and Hypotheses..............................................................................................18
Chapter Two: Association of water fluoride and urinary fluoride concentrations with Attention Deficit Hyperactivity Disorder in Canadian Youth…………………….......................20
Rationale............................................................................................................................20 Abstract..............................................................................................................................21 Introduction........................................................................................................................23 Methods .............................................................................................................................25
Data Source and Participants.................................................................................25 Measurement of Urinary Fluoride Concentration..................................................27 Measurement of Water Fluoride Concentration....................................................28 Measurement of Outcome Variables…………………………….........................28 Covariates..............................................................................................................29 Statistical Analysis ................................................................................................30
Results ...............................................................................................................................31 Descriptive Statistics..............................................................................................31 Fluoride Measurements..........................................................................................34 Association Between Fluoride Exposure and ADHD Diagnosis………………...35 Association Between Fluoride and SDQ Hyperactive/Inattentive Scores……….37
Discussion .........................................................................................................................38 Chapter Three: Urinary fluoride levels among Canadians with and without community water fluoridation……………………………………….........................................................................44
Rationale............................................................................................................................44 Abstract..............................................................................................................................45 Introduction .......................................................................................................................47 Methods .............................................................................................................................49
Data Source and Participants ................................................................................49 Measurement of Water Fluoride Concentration....................................................51
v
Measurement of Urinary Fluoride Concentration..................................................51 Drinking Water Habits...........................................................................................52 Modifiers of Exposure Levels................................................................................52 Other Sources of Fluoride Exposure......................................................................52 Statistical Analysis ................................................................................................53
Results ...............................................................................................................................54 Descriptive Statistics..............................................................................................54 Urinary Fluoride Measurements............................................................................57 Differences in UFSG by drinking water habits and dental product use..…………58 Predictors of Urinary Fluoride Concentration………………...............................60
Discussion .........................................................................................................................62 Demographic Predictors of Exposure………………............................................64 Other Exposure Factors……………..………………............................................65 Strengths and Limitations…………..………………............................................67
Chapter Four: General Discussion ................................................................................................70
Inflammation as a Potential Mechanism in the Association Between Fluoride Exposure and Attention Outcomes............................................................74
Limitations…………..………………...................................................................76 Conclusions and Implications for Public Policy....................................................77
References .....................................................................................................................................80 Appendix: CWF status by site in Cycles 2 and 3 of the CHMS..................................................110
vi
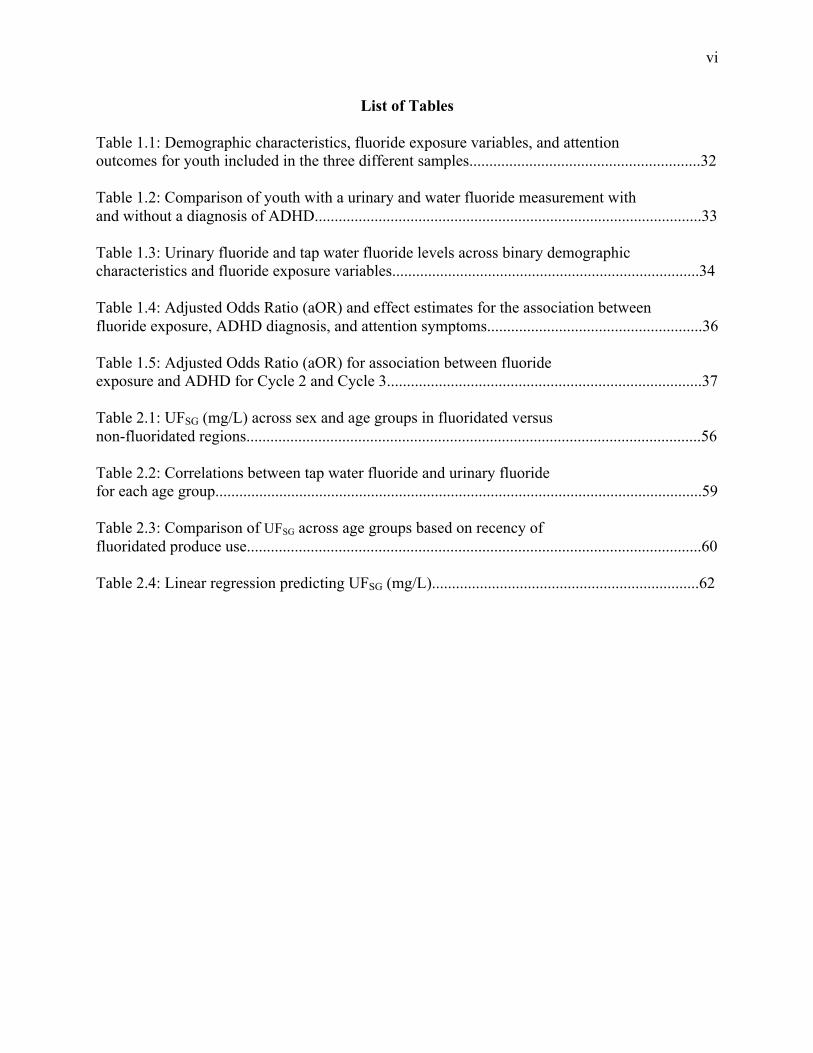
List of Tables Table 1.1: Demographic characteristics, fluoride exposure variables, and attention outcomes for youth included in the three different samples..........................................................32 Table 1.2: Comparison of youth with a urinary and water fluoride measurement with and without a diagnosis of ADHD.................................................................................................33 Table 1.3: Urinary fluoride and tap water fluoride levels across binary demographic characteristics and fluoride exposure variables.............................................................................34 Table 1.4: Adjusted Odds Ratio (aOR) and effect estimates for the association between fluoride exposure, ADHD diagnosis, and attention symptoms......................................................36 Table 1.5: Adjusted Odds Ratio (aOR) for association between fluoride exposure and ADHD for Cycle 2 and Cycle 3...............................................................................37 Table 2.1: UFSG (mg/L) across sex and age groups in fluoridated versus non-fluoridated regions..................................................................................................................56 Table 2.2: Correlations between tap water fluoride and urinary fluoride for each age group..........................................................................................................................59 Table 2.3: Comparison of UFSG across age groups based on recency of fluoridated produce use..................................................................................................................60 Table 2.4: Linear regression predicting UFSG (mg/L)...................................................................62
vii
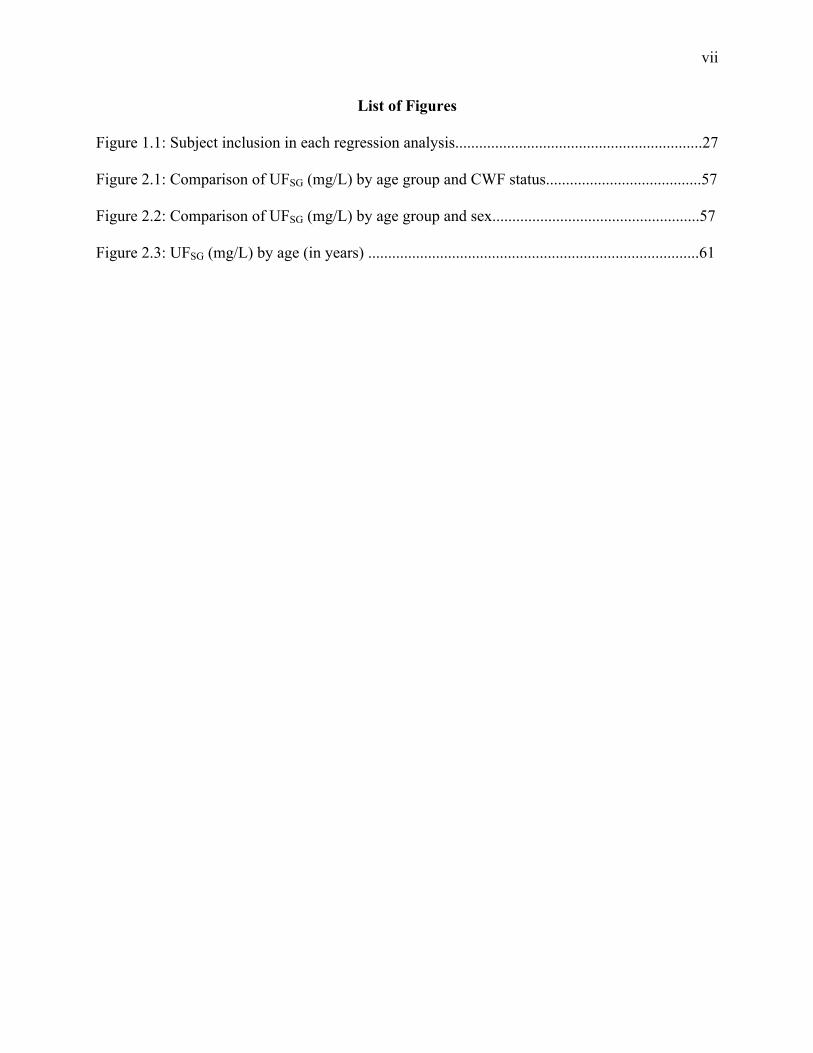
List of Figures Figure 1.1: Subject inclusion in each regression analysis..............................................................27 Figure 2.1: Comparison of UFSG (mg/L) by age group and CWF status.......................................57 Figure 2.2: Comparison of UFSG (mg/L) by age group and sex....................................................57 Figure 2.3: UFSG (mg/L) by age (in years) ...................................................................................61
1
Chapter One: Introduction Environmental Exposures and Neurodevelopmental Disorders
The developing brain is particularly vulnerable to environmental toxins, including known
neurotoxins such as mercury, polychlorinated biphenyls (PCBs), and lead (Eubig, Aguiar, &
Schantz, 2010; Jacobson & Jacobson, 1996; Lanphear, 2015; Sagiv et al., 2010; Sagiv, Thurston,
Bellinger, Amarasiriwardena, & Korrick, 2012). The effects of early exposure to environmental
toxins appear to be longlasting. For example, lead exposure in early childhood has been linked to
reduced school performance and behavioural difficulties in adolescence and adulthood
(Fergusson, Boden, & Horwood, 2008; Wright et al., 2008; Zhang et al., 2013). A
comprehensive report from the National Research Council (2006) raised concerns about potential
adverse neurobehavioural effects of fluoride in drinking water and concluded that additional
research is warranted, particularly for early life exposure. A meta-analysis found that children
living in high-fluoride areas, mainly in China where fluoride exists as a natural contaminant, had
substantially lower intellectual ability than those who lived in low-fluoride areas (Choi, Sun,
Zhang, & Grandjean, 2012). In a review, Grandjean and Landrigan (2014) listed fluoride as a
developmental neurotoxin – a claim that is uncontested at high exposure levels, but remains
debated at low exposure levels. Most recently, a draft report by the National Toxicology Program
(NTP; 2019) concluded that there is a moderate level of evidence that exposure to fluoride is
associated with cognitive neurodevelopmental effects in children. This NTP report also stated
that there are few available studies that evaluate whether fluoride exposure in humans is
associated with other neurodevelopmental effects beyond IQ. The goal of the current dissertation
was to better understand the levels of exposure in Canadian individuals and to examine the
relationship between fluoride exposure and Attention Deficit Hyperactivity Disorder (ADHD).
2
Development of ADHD
ADHD is a neurodevelopmental disorder characterized by impairments in attention,
organization, and hyperactivity-impulsivity. The newest edition of the Diagnostic and Statistical
Manual of Mental Disorders (DSM-5; American Psychiatric Association (2013) describes three
subtypes of ADHD: predominantly inattentive, predominantly hyperactive/impulsive, and
combined presentation. ADHD is one of the most common mental health conditions in children
as it occurs in approximately 3% to 10% of the childhood population across countries (Davids &
Gastpar, 2005; Biederman, 2005). The estimated prevalence of ADHD in adults ranges from 3
to 5% (Biederman, 2005). A recent meta-analysis of 175 studies found an overall point
prevalence rate of 7.2% for ADHD across the lifespan (Thomas, Sanders, Doust, Beller, &
Glasziou, 2015). Boys are three times more likely to develop ADHD compared to girls (Barkley,
2014). To meet diagnostic criteria for ADHD, symptoms must be present before 12 years of age
and in two different settings (American Psychiatric Association, 2013; Friedman & Rapoport,
2015). ADHD is most often identified during elementary school years as difficulties with
inattention become more prominent and impairing (American Psychiatric Association, 2013).
The course of the disorder is persisent, with approximately 65% to 75% of individuals diagnosed
in childhood continuing to meet criteria for the disorder through adolescence (Faraone,
Biederman, & Mick, 2006; Davids & Gastpar, 2005) and over half continuing into adulthood
(Davids & Gastpar, 2005). A family history of ADHD, psychiatric comorbidity, and
psychosocial adversity all predict greater likelihood that the disorder will persist into adulthood
(Biederman, 2005). Inattentive symptoms tend to persist from childhood through adolescence,
whereas children with high levels of hyperactive symptoms tend to experience a reduction in
these symptoms over time (Holbrook et al., 2016). In Canada, ADHD is more frequently
3
diagnosed by general practitioners (such as a family doctor) followed by either psychiatrists or
pediatricians depending on the province (Vasiliadis et al., 2017).
Recent data suggest that the prevalence of ADHD has been increasing over time. A 5.4-
fold increase in the prevalence of ADHD diagnosis in children was observed in the United States
between 1979 and 1996 (Kelleher, McInerny, Gardner, Childs, & Wasserman, 2000). Similarly,
the estimated prevalence of diagnosed ADHD in US children and adolescents increased from
6.1% in 1997-1998 to 10.2% in 2015-2016 (Xu, Strathearn, Liu, Yang, & Bao, 2018). A
Canadian study using data from the National Longitudinal Survey on Children and Youth found
that the prevalance of ADHD in school-age children doubled between 1994 and 2007 (Brault &
Lacourse, 2012).
Although the cause of ADHD is currently unknown, numerous genetic and environmental
factors have been linked to an increased risk of developing ADHD. The heritability of ADHD
has been estimated to range from 30% to as high as 88% (Boomsma et al., 2010; Larsson et al.,
2013; Larsson, Chang, D’Onofrio, & Lichtenstein, 2014; Larsson, Dilshad, Lichtenstein, &
Barker, 2011; Lichtenstein, Carlström, Råstam, Gillberg, & Anckarsäter, 2010; Reiersen,
Constantino, Grimmer, Martin, & Todd, 2008; van den Berg, Willemsen, de Geus, & Boomsma,
2006). Earlier heritability studies identified a two- to eight-fold increase in the risk for ADHD in
children whose parents and siblings have ADHD (Biederman, 2005). In terms of environmental
risk factors, a birth weight of less than 1,500 grams is associated with a two- to three-fold risk for
ADHD (American Psychiatric Association, 2013). Smoking and alcohol use during pregnacy,
diet, infections (e.g., encephalitis), and child abuse or neglect have all been linked to an increase
risk of ADHD (American Psychiatric Association, 2013). A study using Rutter’s indicators of
adversity (i.e., severe marital discord, low social class, large family size, paternal criminality,

4
maternal mental disorder, foster care placement) found that the risk of an ADHD diagnosis
increased significantly with each increase in the number of adversity indicators (Biederman et al.,
1995).
Childhood exposure to neurotoxins has also been associated with an increased risk of
ADHD, including Bisphenol A (BPA), lead, polybrominated diphenyl ethers (PBDEs), and
fluoride. In a cross-sectional study, Tewar and colleagues (2016) reported that higher levels of
urinary BPA were associated with a diagnosis of ADHD in children ages 8 to 15 from the United
States. A meta-analysis on the association between lead exposure and ADHD revealed a small
correlation between inattention symptoms and lead exposure (r = .16) and a similar correlation
between hyperactivity/impulsivity symptoms and lead exposure (r = .13) across 33 studies and a
total sample size 10,232 children and adolescents (Goodlad, Marcus, & Fulton, 2013). An
updated systematic review on the association between lead and ADHD was completed recently
by Donzelli and colleagues (2019). They found that 12 out of the 17 studies included showed a
positive association between lead exposure and ADHD diagnosis, even at low levels of exposure
(Donzelli et al., 2019).
Mixed findings have also been found between exposure to PBDEs and ADHD. Zhang et
al. (2017) found that each 10-fold increase in serum PBDE concentration was associated with a
3.5-point increase in externalizing problems scores on the BASC-2 (Behavioral Assessment
System for Children-2). Sagiv and colleagues (2015) reported associations of higher prenatal
serum concentrations of PBDEs with decrements in attention on the Conners CPT II task
(Conners et al., 2000), as well as with increased ADHD Index scores at both 9 and 12 years of
age. Further, they found that higher prenatal PBDE exposure was associated with higher parent
reported ADHD symptoms for 9 year-old children but not 12 year-old children. However, a
5
systematic review by Lam and colleagues (2017) commented that based on the heterogeneity of
association estimates reported by a small number of studies and the fact that chance, bias, and
confounding variables could not be ruled out, the current level of evidence to support an
association between PBDEs and ADHD is considered to be low at this time.
Only two studies have examined the association between fluoride exposure and ADHD
(Maliln & Till, 2015; Bashash et al., 2018). The first study examined the prevalence of ADHD
among youth in the United States using data from the CDC (Malin & Till, 2015). Results showed
that state-level prevalence of artificial water fluoridation in 1992 predicted state-level prevalence
of ADHD in 2003, 2007, and 2011, controlling for socioeconomic status (Malin & Till, 2015). In
particular, each 1% increase in artificial fluoridation prevalence in 1992 was associated with
approximately 67,000 to 131,000 additional ADHD diagnoses from 2003 to 2011. The second
study reported an association between fluoride exposure during pregnancy and more inattentive
symptoms and total ADHD symptoms in Mexican children aged 6 to 12 years (Bashash et al.,
2018). Participants in this study were exposed to fluoride added to salt at 250 ppm and to varying
levels of naturally occurring fluoride in drinking water. More research is needed to understand
the potential association between fluoride exposure and ADHD among Canadians exposed to
fluoridated drinking water.
Artificial Water Fluoridation in Canada
While fluoride can be a natural contaminant in water and soil, fluoridation refers to the
controlled practice of adding fluoridation chemicals (usually hexafluorosilicic acid) to drinking
water for the purpose of preventing tooth decay (Jones, Riley, Couper & Dwyer, 1999). In 2009,
approximately 45% of Canadians received artificially fluoridated water (Rabb-Waytowich,
2009); today, this prevalence has decreased to about 39% as some municipalities opt against
6
community water fluoridation (Public Health Agency of Canada, 2017). In the United States,
73.9% of the public water supplies are artificially fluoridated, compared with only 3% of
European water supplies (Centers for Disease Control and Prevention, 2014). In Canada, each
municipality decides whether to add fluoride to its water supplies, with the federal government
setting the guidelines regarding the optimal concentration (0.7 mg/L) and maximum acceptable
level (1.5 mg/L; Health Canada, 2010a). Within Canada, fluoridation varies considerably across
the provinces. The lowest proportion of communities receiving fluoridated water are in the
Yukon (0% of communities adding fluoride), followed by Newfoundland and Labrador (1.5%),
British Columbia (1.2%), New Brunswick (1.2%) and Quebec (2.5%; Health Canada, 2017).
Ontario has the highest proportion of communities receiving fluoridated water (71%), followed
by Manitoba (69%) and the Northwest Territories (65%; Health Canada, 2017).
The optimal level of fluoride was determined based on studies conducted in the 1940s
that examined the association between dental caries (cavities) and dental fluorosis
(discolouration of tooth enamel) at different fluoride concentrations in drinking water (Health
Canada, 2010a). However, an optimal concentration of fluoride has been disputed since it was
first introduced into drinking water because of concerns related to differences in dose resulting
from the indiscriminant delivery of fluoride through drinking water. The optimal concentration
for fluoride does not consider individual variables that contribute to total intake, such as age,
weight, and water consumption habits. These variables result in an uncontrolled dose of fluoride
whereby young children, people with low BMI, kidney dysfunction, or those who drink more
water (or have a higher exposure per kg of body weight) may be receiving a higher than
recommended dose of fluoride per day.
7
Debate about Water Fluoridation
Fluoride is not an essential element in the human diet and there are no negative
consquences from not ingesting enough fluoride; however, it is beneficial in the prevention of
dental caries (Health Canada, 2010b). Numerous studies have shown water fluoridation to be
effective for preventing dental decay (Horowitz, 1996; Ripa, 1993; Rugg-Gunn & Do, 2012;
Truman et al., 2002). Based on studies conducted over the past 70 years, children living in
communities with fluoridated water are estimated to have on average 1.8 fewer baby teeth and
1.2 fewer permanent teeth affected by dental decay (Iheozor-Ejiofor et al., 2015). In part due to
the introduction of fluoridated toothpaste in the early 1970s, the benefits of community water
fluoride (CWF) are recognized as being smaller today than in the past (Centers for Disease
Control and Prevention, 2001).Despite widespread exposure to fluoride in drinking water and
fluoride-containing dental products, dental decay remains a major public health problem,
especially for socioeconomically disadvantaged populations for whom resources for oral hygiene
and formal dental care are limited.
The Centers for Disease Control and Prevention (CDC) has named water fluoridation as
one of the ten great public health achievements in the United States due to its role in reducing
tooth decay and tooth loss (Centers for Disease Control and Prevention, 1999). Further, Health
Canada has endorsed CWF as “the most cost effective and equitable method to deliver fluoride
to the population” (Health Canada, 2017, p.3). Similarly, the Chief Public Health Officer and
Chief Dental Officer of Canada released a position statement calling CWF a “safe, cost effective
and equitable public health practice and an important tool in protecting and maintaining the
health and well-being of Canadians” (Taylor & Taylor, 2016).
8
Recent studies have challenged the benefits of CWF because of the overall weak level of
contemporary evidence supporting its effectiveness (Cheng, Chalmers, & Sheldon, 2007;
Iheozor-Ejiofor et al., 2015; Wilson & Sheldon, 2006) and growing body of evidence suggesting
potential negative health effects (discussed below). Some individuals object to the practice of
water fluoridation in that it is a medical intervention which they perceive as imposed on them by
the state and an infringement on their freedom of choice (Hileman, 1988; Cross & Carton 2003).
A final concern relates to the source of the fluoride used in water fluoridation. Unlike the
fluoride salts used in dental products (such as sodium fluoride and stannous fluoride), the main
fluoride chemicals that are added to drinking water are not pharmaceutical grade or naturally
occurring compounds. Silicofluorides, which are commonly used for water fluoridation, are a by-
product from the manufacturing of phosphate fertilizers (National Research Council, 2006).
Concerns have been raised about other contaminants that may arise from the use of these
chemicals, such as arsenic. However, water safety standards monitor these additives to ensure
they fall below permissible levels (Brown, Cornwell, & MacPhee, 2004; Centers for Disease
Control and Prevention, 2014; NSF International, 2019).
Fluoride Exposure
Research from the United States has identified several sources of fluoride exposure,
including beverages made with fluoridated water, tea, processed foods (e.g. mechanically
deboned meat), fluoridated dental products (toothpastes, mouth rinses, fluoride gels, and
fluoride varnishes), soil, pesticides, and air (National Research Council, 2006). Most
toothpastes sold in North America contain fluoride, usually at 1,000-1,100 parts per million,
which is equivalent to 1 to 1.1 mg fluoride ion per gram of toothpaste (National Research
Council, 2006). For children, fluoridated toothpastes are a special consideration because many

9
children tend to use greater amounts of toothpaste than advised (Thornton-Evans et al., 2019)
and their ability to expectorate toothpaste is not as well developed as that of adults. Moreover,
many children under the care of a dentist undergo fluoride treatments (National Research
Council, 2006) whereby unintended ingestion of fluoride may occur. Children ages 1 to 4 have
the highest estimated fluoride intake from toothpaste (0.34 mg/day), followed by children ages
4 to 7 (0.22 mg/day); fluoridated toothpaste accounts for roughly 11 to 22% of total daily
fluoride intake among young children (United States Environmental Protection Agency, 2010,
p.98). The single largest contributing source of fluoride for all age groups is drinking water,
which accounts for between 40% and 70% of total fluoride intake (United States
Environmental Protection Agency, 2010, p.98).
The single largest contributing source of fluoride for all age groups is drinking water,
which accounts for between 40% and 70% of total fluoride intake (United States
Environmental Protection Agency, 2010, p.98). On average, young children ages 1 to 5 are
exposed to twice as much fluoride (0.063 mg/kg/day) as adults (0.031 mg/kg/day) relative to
their body weight (National Research Council, 2006). The exception to this age difference is a
subgroup of adults who are exposed to high levels of fluoride, including those who work in
coal-burning plants or in factories that manufacture phosphate fertilizer. This difference in
dietary fluoride intake between children and adults occurs partly because children drink more
water than adults relative to their body weight. Dietary fluoride intake is approximately 70
times higher among infants who are formula-fed using fluoridated water and powdered milk-
or soy-based powdered formula than exclusively breastfed infants (Fomon, Ekstrand, & Ziegler,
2000; National Research Council, 2006; Zohoori, Omid, Sanderson, Valentine, & Maguire,
2019). In contrast, fluoride is found in extremely small amounts in breastmilk, regardless of
10
water fluoridation status (Brothwell & Limeback, 2003; Dabeka, Karpinski, McKenzie, &
Bajdik, 1986; Ekstrand, Boreus, & De Chateau, 1981; Zohoori et al., 2019). A recent study
found that 65% of fluoride intake in infants is retained in the body (deposited in calcifying
tissues) (Zohoori et al., 2019). This is partly due to the fact that infants are limited in their
ability to metabolize and excrete substances through the kidneys, which do not reach full
capacity until age 2 (Zohoori et al., 2019). This level of fluoride exposure and retention
increases the risk of developing dental fluorosis, which has been increasing over the past 40
years (Fomon et al., 2000). The critical period for development of fluorosis is from 4 months in
utero until 11 months of age, and has been associated with higher water fluoride concentration,
but not with the use of dentifrice or fluoride supplements (Warren, Levy, & Kanellis, 2001;
Zohoori et al., 2019).
Pharmacokinetics of Fluoride
There are many ways in which individuals can be exposed to fluoride, although ingestion
is the main method of absorption. Fluoride found in food or water enters the body through the
gums, stomach, and intestinal lining, with most being absorbed by the small intestine (Martinez-
Mier, 2012). Once absorbed, fluoride is rapidly distributed (i.e., within 10 minutes) throughout
the body by the blood, with plasma fluoride levels reaching peak levels at 60 minutes following
exposure and returning to baseline within 11 to 15 hours (Martinez-Mier, 2012; Whitford, 1996).
About 50% of the fluoride ingested each day is excreted through the kidneys, and the remaining
50% accumulates in bones, the pineal gland, and other tissues (Chouhan & Flora, 2008). Fluoride
readily penetrates cell membranes by simple diffusion and leads to a variety of effects on cell
metabolism and function (Chouhan & Flora, 2008). Further, fluoride readily passes through the
placenta to the developing fetus (Opydo-Szymaczek & Borysewicz-Lewickaa, 2007; Sastry,
11
Mohanty, & Rao, 2010). There is also some evidence that fluoride can cross the blood-brain
barrier (Bhatnagar, Rao, Jain, & Bhatnagar, 2002; Gori et al., 2015; Hu & Wu, 1988; Jones &
Iagaru, 2014; Luke, 2001; Pereira et al., 2011; Salgarello et al., 2016; Wu, Zhu, & Ji, 2013). Hu
& Wu (1988) found that fluoride concentrations in adult cerebrospinal fluid are similar to those
found in serum. Case reports of cancer patients have shown that radioactive fluoride used in
treatment reaches the brain (Gori et al., 2015; Jones & Iagaru, 2014; Salgarello et al., 2016; Wu,
Zhu, & Ji, 2013). Once in the brain, it is thought to accumulate within the hippocampus, which is
responsible for memory and learning (Bhatnagar et al., 2002; Pereira et al., 2011). Finally, one
study examining human cadavors found that fluoride accumulates in the pineal gland of adults
(Luke, 2001).
Fluoride levels in plasma and urine have been shown to vary as a function of
demographic variables including sex, age, Body Mass Index (BMI) and ethnicity (Aylward et
al., 2015; Health Canada, 2015; Jain, 2017). In a report from Health Canada (2015) using data
from the Canadian Health Measures Survey (CHMS) Cycle 3, females aged 3 to 79 had higher
urinary fluoride (UF) adjusted for creatinine than males of the same age (0.53 mg/g for females
and 0.40 mg/g for males). In addition to sex-based differences, the Health Canada (2015)
report showed a number of differences by age; for example, children ages 3 to 5 had the
highest UF concentration (0.76 mg/g) whereas adolescents ages 12 to 19 had the lowest UF
concentration (0.29 mg/g). The values for adults also varied by age; mean UF concentration
was 0.40 mg/g for those ages 20 to 39 and 0.52 mg/g for those ages 40 to 79. These age related
differences may reflect differences in fluoride intake, as older adults consume more green,
black and white tea which contains fluoride (Malinowska, Inkielewicz, Czarnowski, & Szefer,
2008), or differences in toxicokinetics. An individual’s BMI has also been shown to be related
12
to an individual’s level of fluoride exposure (Das & Mondal, 2016). Regarding ethnic
differences, Jain and colleagues (2017) found that Hispanic adolescents aged 12–19 years from
the United States had significant lower fluoride in plasma samples than non-Hispanic whites.
Given that few studies examine fluoride levels across different demographic groups (e.g., sex,
age, ethnicity), and even fewer studies present separate values for individuals who live in areas
with and without CWF, more biomonitoring studies are needed to understand how fluoride
levels (measured in urine) may vary based on demographic characteristics and CWF status.
Experimental Neurotoxicity
A systematic review on the effects of fluoride on learning and memory in animal studies
was conducted with 32 studies that met the inclusion criteria (National Toxicology Program,
2016). Although the authors identified several methodological limitations with the studies, they
concluded that there is a moderate level of evidence for negative impacts on learning and
memory when animals are exposed to fluoride as adults, and a low level of evidence for
developmental exposure. The exposure level for the included studies ranged from 0.45 to 272
ppm, and the authors noted limited evidence for lower levels of exposure that would be
comparable to levels used for water fluoridation. It is important to note that rodents require
approximately five times more fluoride in their water to achieve the same level of fluoride in
their blood as humans. Thus, high levels of fluoride exposure in rats are necessary to ensure
comparable exposure levels to those of humans (Dunipace et al., 1995; National Toxicology
Program, 2016).
It is notable that the 2016 systematic review by the NTP noted a lack of animal studies
examining sex effects. In an early study, Mullenix and colleagues (1995) injected pregnant rats
with 0.13 mg/L of sodium fluoride two or three times daily, exposed juvenile rats to fluoridated
13
drinking water at concentrations of 0, 75, 100, and 125 mg/L, and exposed adult rats to drinking
water with 100 mg/L of fluoride. Male, but not female, rats exposed prenatally to sodium
fluoride demonstrated changes in behaviour such as symptoms of hyperactivity; in contrast,
female rats demonstrated similar behavioural changes when fluoride exposure occurred in
adulthood. In a more recent study, pregnant and lactating female mice received different doses of
sodium fluoride (0, 25, 50, 100 mg/L NaF), and impairment in learning and memory was
observed in male and female offspring (Wang et al., 2018). Bartos and colleagues (2018) found
that exposure to low levels of fluoride during the gestational and lactation periods resulted in
decreased memory in adult female rat offspring. Thus, further study examining sex effects
associated with early-life exposure to fluoride is warranted.
As an attempt to address some of the methodological limitations noted by the 2016 NTP
review, McPherson and colleagues (2018) conducted a behavioural study of male rats that were
fed either a standard diet or a low fluoride diet, and were exposed to fluoride in drinking water at
0, 10, or 20 ppm. They did not observe any significant differences in motor, sensory, or learning
and memory performance across the different levels of fluoride exposure. However, this study
has been critiqued for beginning the exposure period at day 6 of gestation and for using Long
Evans rats, a strain that has been previously shown to be more resistant to fluoride toxicity
(Spencer & Limeback, 2018). Several other animal studies with rats have reported a negative
impact of fluoride on attention, learning, and problem solving (Bartos et al., 2018; Chen et al.,
2018; Liu, 2014; Sun, Zhang, Xue, Niu, & Wang, 2018; Wang et al., 2018; Zhao et al., 2019;
Zhou et al., 2019).
Numerous mechanisms for impaired attention, learning, and memory due to fluoride have
been proposed based on animal models. Chen, Shan, Wang, Nordberg, and Guan (2003) found
14
that rats with fluorosis have substantial decreases in neural nicotinic acetylcholine receptors
(nAChR) and inhibited cholinesterase expression. Nicotinic acetylcholine receptors and
cholinesterase expression both appear to play a role in attentional processes (Levin, Bushnell, &
Rezvani, 2011). In particular, abnormalities at the α4 nAChR subunit have been implicated in all
ADHD subtypes (Lee et al., 2008; Todd, Lobos, Sun, & Neuman, 2003). Several animal studies
have found evidence of notable decreases in protein expression of α4 and α7 nAChR subunit
genes in rats with fluorosis (Liu et al., 2010; Chen et al., 2003, Long et al., 2002). For example, a
recent study found that low levels of fluoride exposure led to decreased mRNA expression of the
α7 nicotinic receptor (nAChR) and decreased catalase activity in the hippocampus (Bartos et al.,
2018).
Other neurological changes discovered through animal studies include alterations in
neurotransmitters or their receptors (Chouhan et al., 2010; Liu et al., 2010; Reddy, 2014),
reduced mRNA expression of glutamate receptor subunits (Sun et al., 2018), morphological
changes in neurons (Bhatnagar, 2011; Zhao et al., 2019), increased catalase immunoreactivity
(Güner, Uyar-Bozkurt, Haznedaroğlu, & Menteş, 2016), increased calcium inside the neuron (Yu,
Shao, Zhang, Ouyang, & Zhang; 2019), excessive apoptosis (Jiang et al., 2019; Zhao et al., 2019;
Zhou et al., 2019), abnormal mitochondrial dynamics (Lou, 2014; Lou, 2013), decreased
neurogenesis and neuronal number (Jiang et al., 2019; Zhou et al., 2019), and the impairment of
synaptogenesis (Chen et al., 2018). Finally, numerous studies have demonstrated greater
oxidative stress in rats exposed to low levels of fluoride (Banala & Karnati, 2015; Bartos et al.,
2018; Chouhan, Lomash, & Flora, 2010; Reddy et al., 2014; Zhang, 2015). For example,
Chouhan and colleagues (2010) found that rats exposed to fluoridated water at a concentration of
15
1 mg/L for four months showed more oxidative stress and alterations in neurotransmitters
compared to rats exposed to non-fluoridated water.
Potential Impacts of Fluoridation on Human Health
Evidence is accumulating that fluoride exposure may be neurotoxic and a cognitive
developmental hazard to humans (National Toxicology Program, 2019). In epidemiological
studies, exposure to fluoride in drinking water has been associated with lowered intellectual
ability (Das & Mondal, 2016; Green, et al., 2019; Jiménez et al., 2017; Seraj, et al., 2012;
Xiang et al., 2003; Zhao, Liang, Zhang, & Wu, 1996) as well as altered thyroid function (Malin,
Riddell, McCague, & Till, 2018; Peckham, Lowery, & Spencer, 2015) and increased blood
lead levels (Coplan, Patch, Masters, & Bachman, 2007), which may also influence intellectual
ability. Studies examining high levels of fluoride in areas with endemic fluorosis have
consistently found adverse effects on children’s cognitive development. For example, Rocha-
Amador, Navarro, Carrizales, Morales, and Calderón (2007) examined the concentration of
fluoride in the drinking water of three rural communities in Mexico, which ranged from 0.8 to
9.4 mg/L. The authors tested the IQ of 132 children and found lower Verbal and Full Scale IQ
scores in children exposed to higher levels of fluoride in their drinking water (as well as higher
levels of urinary fluoride). Similarly, Seraj and colleagues (2012) classified villages in Iran as
having low fluoride (0.8 ± 0.3 ppm), medium fluoride (3.1 ± 0.9 ppm), or high fluoride (5.2 ±
1.1 ppm) concentrations in the ground water. They found that children in the low fluoride
group had higher IQ scores (mean IQ = 98) compared to children in the medium and high
fluoride groups (mean IQ = 89 and 88, respectively). Recently, Jiménez and colleagues (2017)
conducted a study with 65 mother-infant pairs in Mexico and found a relation between in utero
fluoride exposure and impaired mental development. The authors found that each 1 mg/L
16
increase in maternal urinary fluoride corresponded to a decrease of 19.5 points on the Mental
Development Index (MDI) of the Bayley Scales of Infant Development.
A meta-analysis of 27 studies indicated that children who lived in areas with high
fluoride exposure had lower intelligence (equivalent to approximately seven IQ points)
compared with those who lived in low-exposure areas (Choi, Sun, Zhang, & Grandjean, 2012).
However, information on important covariates was not available for many of these studies. For
example, the child’s sex and parental education were not reported in over 80% of the studies
and only 7% of the studies reported household income. As a result, Choi and colleagues (2012)
were only able to account for two covariates: year of publication and mean age of the children
in the study. Moreover, fluoride exposure from most studies included in the review was higher
(> 2.0 mg/L) than recommended fluoride concentration levels in Canada (0.7 mg/L) making
the results non-generalizable to North America. Other limitations include a lack of sufficient
comparison groups and omission of important procedural details, such as whether the person
administering the IQ test was blinded to participant condition.
Findings of research specifically focused on the health effects of community water
fluoridation (CWF) have been mixed. Broadbent and colleagues (2015) studied the relationship
between fluoride and intelligence by measuring the IQ of 992 children in New Zealand at ages 7,
9, 11 and 13 years, and again at age 38. They calculated fluoride exposure by examining
residence in an area that received CWF as well as personal use of fluoride dentifrice and fluoride
tablets prior to age 5 years. The authors did not find any statistically significant differences in
intelligence linked to fluoride intake in this sample. However, Hirzy, Connett, Xiang, Spittle, and
Kennedy (2016) criticized this study, stating that the difference in fluoride intake between the
fluoridated and non-fluoridated communities (which was estimated to be 0.3 mg/day) was too
17
small to adequately detect a link between fluoride and intellectual ability. Other shortcomings
included a failure to control for maternal tea consumption during pregnancy (an important source
of fluoride in New Zealand), and lack of control for formula- versus breast-feeding.
A report from the National Research Council (NRC; 2006) in the United States warned
that developmental toxicity and neurotoxicity may be associated with fluoride exposures at
levels that are allowable in drinking water in the United States (the maximum allowable level
is 4 mg/L in the United States versus 1.5 mg/L in Canada). This report highlighted the
consistency of available evidence and recommended further research to address these potential
concerns. In 2019, a number of public health organizations (e.g., the O’Brien Institute for
Public Health, the National Toxicology Program of the U.S. Department of Health and Human
Services, Canadian Agency for Drugs and Technologies in Health) reviewed scientific
information given the large number of studies that have been conducted addressing the
concerns raised in the 2006 NRC report. Although these independent scientific committees
generally reviewed the same set of studies, including the results of four recent prospective
cohort studies (Bashash et al., 2017; 2018; Green et al., 2019; Jimenez et al., 2017), the
conclusions made in each report were quite different regarding risk of adverse effects on
cognitive neurodevelopmental effects. In order to make evidence-based policy
recommendations, further research is needed to elucidate potential risks of fluoride exposure
and to address the limitations of the studies previously discussed. Few studies have been
conducted at the individual level (i.e., those that collect individual biomarker data) and many
previous studies did not include important covariates such as child age, sex, and socioeconomic
status. Previous studies relied almost exclusively on global metrics such as general intellectual
ability and did not examine specific domains of cognitive functioning such as learning,
18
memory, and attention. Finally, there are few fluoride studies examining behavioural outcomes
related to fluoride exposure. The current study aims to address these gaps in the research and
advance our understanding of the effects of fluoride exposure on Canadian children’s
behavioural functioning with a specific focus on ADHD.
Study Aims and Hypotheses
Fluoride is listed as an “emerging neurotoxic substance” that requires further in-depth
study, especially for exposures that occur during sensitive periods for brain development such as
prenatally and during childhood (Grandjean & Landrigan, 2014). Consistently, the draft report of
the NTP released in October 2019 concluded that “fluoride is presumed to be a cognitive
developmental hazard to humans” and that the level of evidence was judged to be moderate.
Some past human studies have shown that higher levels of fluoride exposure are associated with
lower intellectual ability, reduced attention and working memory, and increased risk of
developing ADHD (Bashash et al., 2018; Choi et al., 2012; Malin & Till, 2015). Other studies
have not found a relationship between fluoride and adverse outcomes such as learning
disabilities (Barberio, Quiñonez, Hosein, & McLaren, 2017) or lower IQ (Broadbent et al., 2015).
Given widespread exposure to fluoridated water among Canadians, rigorous research is needed
to address the current controversy about the safety of water fluoridation, with a focus on
vulnerable populations such as children and with sensitive outcomes. The specific aims of this
dissertation are to (1) examine the association between fluoride exposure and attention outcomes
in a representative Canadian sample of youth, and (2) characterize urinary fluoride (UF) levels
by age, sex, and CWF status and determine how different factors impact UF. Of note, both
studies were planned at the same time (as opposed to the results of the first study informing the
design and hypotheses of the second study).
19
For study 1, it was hypothesized that UF, tap water concentration, and CWF status would
predict a diagnosis of ADHD and symptoms of hyperactivity and inattention on the Strengths
and Difficulties Questionnaire (SDQ score; Goodman, 1997). For study 2, it was hypothesized
that UF would be higher among individuals with higher tap water fluoride levels and,
accordingly, among those who live in cities with CWF compared to individuals who live in non-
fluoridated cities. It was also hypothesized that UF will differ by both age and sex; specifically,
adult women living in fluoridated regions will have the highest levels of urinary fluoride as
found by a previous Canadian study (Health Canada, 2015). We also predicted that individuals
who consume more tea (green, black, or white) will have higher levels of urinary fluoride.
Exploratory analyses examined how the recency of dental product use impacts UF for
individuals of different age groups.
20
Chapter Two: Association of water fluoride and urinary fluoride concentrations with
Attention Deficit Hyperactivity Disorder in Canadian Youth
Rationale
Fluoride is listed as an “emerging neurotoxic substance” (Grandjean & Landrigan, 2014),
and past human studies from Mexico and the United States have shown that higher levels of
fluoride exposure are associated with increased risk of developing ADHD (Bashash et al., 2018;
Malin & Till, 2015). Malin & Till (2015) used U.S. state-level measures of water fluoridation
and ADHD prevalance. In the study by Bashash and colleagues (2018) with Mexican mother-
child pairs, fluoride, which is added to salt, was measured in urine spot samples of pregnant
mothers and compared with parent-rated symptoms of attention and hyperactivity using a
questionnaire. In a Canadian study, using data from the Canadian Health Measures Survey
(CHMS; Statistics Canada, 2013; 2015) Barberio and colleagues (2017) did not find an
association between urinary fluoride and a diagnosis of a learning disability or a diagnosis of
ADHD. Barberio and colleagues restricted their sample to youth ages 3 to 12, whereas we
included youth between ages 6 and 17. This is because ADHD is not reliably diagnosed until age
6 (Kessler et al., 2005), and because changes produced by early and cumulative exposure to
environmental toxins may manifest later in development. The upper limit of 17 years old was
chosen because the SDQ was administered up until that age in the CHMS. Further, Barberio and
colleagues focused their study on those with learning disabilities instead of selecting only those
with a diagnosis of ADHD, as we did. Finally, the current study accounted for whether youth
drink unfiltered municipal tap water, and controlled for many covariates that have been omitted
from the studies described above (e.g., BMI, exposure to cigarette smoke and lead, etc.). Our
study also built on previous work, such as the Malin & Till (2015) study, by using individual
21
biomonitoring data (e.g., urinary fluoride and the household level of tap water fluoride) to
understand whether fluoride is associated with an increased risk of an ADHD diagosis in
Canadian youth. Since 39% of Canadians currently receive CWF (Public Health Agency of
Canada, 2017), it is essential to understand whether fluoride is associated with adverse outcomes
at the level found in CWF.
Publication Status
The work contained in this chapter has been published under the following citation:
Riddell, J. K., Malin, A. J., Flora, D., McCague, H., & Till, C. (2019). Association of water
fluoride and urinary fluoride concentrations with attention deficit hyperactivity disorder
in Canadian youth. Environment International, 133 (105190), 1-8.
https://doi.org/10.1016/j.envint.2019.105190
Author Contributions
As the first author of this manuscript, I selected the research questions, analyzed the data,
and wrote the manuscript. The fifth author of this study, Dr. Christine Till, was my supervisor for
this project. She provided input on the research questions and aims, helped select the dataset to
use, and provided input on numerous drafts of this paper. The second author, Dr. Ashley Malin,
provided input on the manuscript drafts. The third and fourth authors, Dr. Dave Flora and Dr.
Hugh McCague, provided consultation on the statistical methods and provided input on the
drafting of the manuscript.
Abstract
Background: Exposure to fluoride has been linked with increased prevalence of attention
deficit hyperactivity disorder (ADHD) in the United States and symptoms of inattention in
22
Mexican children. We examined the association between fluoride exposure and attention
outcomes among youth living in Canada.
Method: We used cross-sectional data collected from youth 6 to 17 years of age from the
Canadian Health Measures Survey (Cycles 2 and 3). Urinary fluoride concentration adjusted for
specific gravity (UFSG) was available for 1877 participants. Water fluoride concentration
measured in tap water samples was available for 980 participants. Community water fluoridation
(CWF) status was determined by viewing reports on each city’s website or contacting the water
treatment plant. We used logistic regression to test the association between the three measures of
fluoride exposure and ADHD diagnosis. Linear regression was used to examine the relationship
between the three measures of fluoride exposure and the hyperactivity/inattention score on the
Strengths and Difficulties Questionnaire (SDQ).
Results: UFSG did not significantly predict ADHD diagnosis or hyperactive/inattentive
symptoms. A 1 mg/L increase in tap water fluoride level was associated with 6.1 times higher
odds of an ADHD diagnosis (95% CI = 1.60, 22.8). A significant interaction between age and tap
water fluoride level (p = .03) indicated a stronger association between tap water fluoride and
hyperactivity/inattention symptoms among older youth. A 1 mg/L increase in water fluoride
level was associated with a 1.5 SDQ score increase (95% CI: 0.23, 2.68, p = .02) for youth at the
75th percentile of age (14 years old). Similarly, there was a significant interaction between age
and CWF. At the 75th percentile of age (14 years old), those living in a fluoridated region had a
0.7-point higher SDQ score (95% CI = 0.34, 1.06, p < .01) and the predicted odds of an ADHD
diagnosis was 2.8 times greater compared with youth in a non-fluoridated region (aOR = 2.84,
95% CI: 1.40, 5.76, p < .01).
23
Discussion: Exposure to higher levels of fluoride in tap water is associated with an
increased risk of ADHD symptoms and diagnosis of ADHD among Canadian youth, particularly
among adolescents. Prospective studies are needed to confirm these results.
Introduction Fluoride is beneficial in the prevention of dental caries (Health Canada, 2010b). It can
naturally occur in water, but often at levels that are too low to prevent tooth decay. In the middle
of the 20th century, the concept of adding fluoridation chemicals (usually hexafluorosilicic acid)
to water supplies was introduced. Currently, approximately 39% of Canadians on public water
supplies receive community water fluoridation (CWF; Public Health Agency of Canada, 2017)
compared with 74% of Americans and only 3% of Europeans (Centers for Disease Control and
Prevention, 2014). Consumption of optimally fluoridated water (i.e., 0.7 mg fluoride per liter of
water) accounts for approximately 40 to 70% percent of daily fluoride ingestion (United States
Environmental Protection Agency, 2010).
Fluoride has been classified as a developmental neurotoxin (Grandjean & Landrigan,
2014) – a claim that is uncontested at high exposure levels, but remains debated at the exposure
levels associated with water fluoridation. Epidemiological studies conducted in endemic
fluorosis areas (i.e., naturally occuring water fluoride concentrations >1.5 mg/L) have reported a
negative association between fluoride concentrations in drinking water and intellectual ability in
children (Das & Mondal, 2016; Rocha-Amador, Navarro, Carrizales, Morales, & Calderón,
2007; Seraj, et al., 2012; Xiang et al., 2003; Zhao, Liang, Zhang, & Wu, 1996). A meta-analysis
of 27 studies concluded that children who lived in areas with high fluoride exposure had IQ
scores that were approximately seven points lower than those who lived in low-exposure areas
(Choi, Sun, Zhang, & Grandjean, 2012). Most of the studies included in this review were cross-
24
sectional and had deficient reporting of key information; however, the consistency of their
findings supports the potential for fluoride-mediated developmental neurotoxicity at elevated
levels of exposure. Recently, three longitudinal birth cohort studies addressed these limitations
by examining the associations between maternal fluoride exposure indicators in pregnancy and
offspring cognitive abilities. These prospective studies reported a negative association between
prenatal fluoride exposure and cognitive development in infants (Jiménez et al., 2017), children
living in Mexico (Bashash et al., 2017), and children living in Canada (Green et al., 2019).
Experimental and epidemiologic studies have also revealed an association between early-
life fluoride exposure and adverse behavioural outcomes. One study demonstrated that prenatal
fluoride exposure caused greater hyperactivity in male rat pups whereas females were more
sensitive to postnatal exposures (Mullenix, Den Besten, Schunior, & Kernan, 1995). In an
ecological study, higher prevalence of water fluoridation was associated with increased
prevalence of Attention Deficit Hyperactivity Disorder (ADHD) diagnoses among youth in the
United States (Malin & Till, 2015). In a cohort study, higher levels of fluoride exposure during
pregnancy were associated with more inattentive symptoms and total ADHD symptoms in
Mexican children aged 6 to 12 years (Bashash et al., 2018). In contrast, a study using data from
the Canadian Health Measures Survey (CHMS; Statistics Canada, 2013; 2015) did not find an
association between urinary fluoride corrected for dilution and a diagnosis of a learning
disability in children aged 3 to 12 years (Barberio et al., 2017).
We examined the relationship between urinary and tap water fluoride concentrations and
inattentive-hyperactive symptoms in a national sample of Canadian youth aged 6 to 17 years. We
hypothesized that higher levels of urinary and water fluoride would be associated with increased
odds of an ADHD diagnosis and more symptoms of hyperactivity and inattention.
25
Methods Data Source and Participants
We used data from Cycle 2 (2009-2011) and Cycle 3 (2012-2013) of the CHMS
collected by Statistics Canada. All aspects of the CHMS were reviewed and approved by
Health Canada’s Research Ethics Board (Day, Langlois, Tremblay, & Knoppers, 2006); the
current study was approved by the York University Research Ethics Board.
The CHMS randomly selected participants aged 3 to 79 years who lived in private
households across Canada. A total of 6395 people participated in Cycle 2 of the CHMS, with
2520 people providing urine samples analyzed for fluoride concentration. Among those who
provided urine samples, 909 (36%) were between 6 and 17 years of age. For Cycle 3, 5785
people were enrolled, with 2667 people providing urine samples analyzed for fluoride
concentration; 968 (36%) were between 6 and 17 years of age. In Cycle 3 only, 980 youth ages
6 to 17 were selected to provide a tap water sample to be analyzed for fluoride content. Full
details about the survey can be found at www.statcan.gc.ca.
Approximately half of the sites included in Cycles 2 and 3 received CWF, which was
determined by viewing reports on each city’s website or contacting the water treatment plant
(see Supplemental Table 1). In total, 13 of 25 sites received CWF (eight from Cycle 2 and five
from Cycle 3), corresponding to approximately 1,400 (51.9%) of 2,700 participants included in
the study (rounded due to Statistics Canada data release requirements). Nine additional sites
were considered to have mixed fluoridation status, corresponding to approximately 650
(24.0%) participants. A site was classified as mixed for one of five reasons: unclear site
boundaries (n=150), having some municipalities within the site add fluoride while others did
not (n=250), and stopping CWF during the period spanning CHMS data collection (n=50). We
excluded all mixed sites from any analysis using city fluoridation status as a variable. We also
26
excluded sites which were labeled as fluoridated or non-fluoridated, but had an average water
fluoride level that was either 2.5 times lower (n=100) or higher (n=100) than other fluoridated
or non-fluoridated sites, respectively.
We utilized three participant samples for our analyses; see Figure 1.1 for a participant
flow chart. The first sample, collapsed across both cycles, included 1877 youth ages 6 to 17 who
had urinary fluoride measurements. The second sample categorized 1722 youth who were on a
municipal water system (instead of a well) as either living in a fluoridated region (n=932; 54.1%)
or a non-fluoridated region (n=790; 45.9%). This sample only included youth who primarily
drank tap water (instead of bottled water), did not have a home filtration system that removes
fluoride (i.e., reverse osmosis or distillation), and have lived in their current residence for three
or more years. The third sample consisted of 710 youth from Cycle 3 who primarily drank tap
water (instead of bottled water) and had fluoride levels measured in their tap water.

27
Figure 1.1 Subject inclusion in each regression analysis
Measurement of Urinary Fluoride Concentration
Urine spot samples were collected under normal (non-fasting) conditions and were not
standardized with respect to collection time. Fluoride concentrations in spot urine samples
were analyzed using an Orion PH meter with a fluoride ion selective electrode after being
diluted with an ionic adjustment buffer (Statistics Canada, 2013). Urinary analyses were
performed at the Human Toxicology Laboratory of the Institut National de Santé Publique du
Québec (INSPQ; accredited under ISO 17025) under standardized operating procedures
(Statistics Canada, 2013; 2015). The precision and accuracy of the fluoride analyses, including
28
quality control measures and quality assurance reviews, are described in previous publications
(Health Canada, 2015). The limit of detection (LoD) for urinary fluoride was 20 µg/L for Cycle
2 and 10 µg/L for Cycle 3 (Health Canada, 2015). No urinary fluoride values in the Cycle 2 or
Cycle 3 samples were below the LoD. Urinary fluoride concentrations were adjusted for
specific gravity (UFSG; mg/L); specific gravity shows no systematic variation within a day and
is less dependent on body size, age, and sex than creatinine (Nermell et al., 2008; Moriguchi et
al., 2005; Suwazono, Åkesson, Alfven, Järup, & Vahter, 2005).
Measurement of Water Fluoride Concentration Tap water samples were collected at respondents’ homes and were available for Cycle 3
only. Samples were analyzed for fluoride concentrations (mg/L) via a basic anion exchange
chromatography procedure with a LoD of 0.006 mg/L. Concentrations at the LoD were assigned
a missing value code by Statistics Canada, and these values were subsequently replaced with an
imputed value of LoD/Ö2 (Hornung & Reed, 1990); 150 of 980 (16%) water samples had
fluoride levels below the LoD.
Measurement of Outcome Variables Primary outcomes included the hyperactivity/inattention subscale score from the
Strengths and Difficulties Questionnaire (SDQ; Goodman, 2001) and a physician-made
diagnosis of ADHD; these outcomes were measured in both Cycles 2 and 3. Data are presented
for youth ages 6 to 17 because the SDQ was only administered to youth under age 18 and 90%
of youth with ADHD are diagnosed after age 6 (Kessler et al., 2005). For children aged 6 to 11
years, information about ADHD diagnosis and SDQ ratings were provided by parents or
guardians, whereas youth aged 12 to 17 years completed the questionnaire themselves,
including the question about having a diagnosis of ADHD.

29
The SDQ consists of 25 items with a 3-point response scale (0 = not true, 1 = somewhat
true, and 2 = certainly true). These items are divided among five subscales: emotional
problems, conduct problems, hyperactivity-inattention, peer problems, and prosocial behaviour.
Possible scores on each subscale range from 0 to 10. The five-item hyperactivity-inattention
subscale was used in the current study to test the association between fluoride and ADHD-like
symptoms.
The item pertaining to a physician-made diagnosis of ADHD differed between Cycles 2
and 3. In Cycle 2, respondents were asked Do you have a learning disability?, and if they
responded yes, they were asked to specify the type of learning disability from among four
options: (1) Attention Deficit Disorder, no hyperactivity [ADD]; (2) Attention Deficit
Hyperactivity Disorder [ADHD]; (3) Dyslexia; and (4) Other. In Cycle 3, parents of children
aged 6 to 11 were asked directly whether their child had ADHD, and if so, which subtype.
Similarly, youth age 12 or older were asked whether they have received a physician-diagnosis of
ADHD, and if so, which subtype. Across both cycles, all subtypes were combined into a single
dichotomous variable of ADHD diagnosis (no = 0, yes = 1) as per current diagnostic
classification schemes (American Psychiatric Association, 2013).
Covariates Covariates related to ADHD diagnosis and to fluoride metabolism were selected based on
literature review and consultation with an ADHD expert. The following covariates were included
in each regression model: sex, age of child at household interview, ethnicity (white or ethnic
minority), Body Mass Index (BMI), highest level of education obtained by either parent (less
than a bachelor’s degree vs. bachelor’s degree or greater), total household income (Canadian
dollars), exposure to cigarette smoke inside the home (yes or no), and log10-transformed value of
concurrent level of blood lead (µg/dL).
30
Statistical analysis Outliers that had high Cook’s distance values were removed from all analyses with
UFSG as a predictor; these outliers (0.27% of values) represented individuals with urinary
fluoride levels that were over 30 times the mean UFSG level, likely representing an acute
fluoride ingestion (e.g., swallowing toothpaste). Further, individuals with the highest incomes
were identified as extreme observations; these values were replaced with the next highest
income value (only 0.01% of income values were adjusted).
We used robust logistic regression to examine the associations between each fluoride
exposure measure (UFSG, CWF status, tap water fluoride) and ADHD diagnosis with the same
set of covariates in each model. Box-Tidwell tests were used to check the linearity of the
relationship between the log-odds of the dependent variable (ADHD diagnosis) and all
continuous predictors; none of the non-linear terms were significant. Next, we used robust
linear regression models with the same set of covariates to examine the associations between
the three measures of fluoride exposure and the SDQ hyperactivity/inattention subscale score.
Because the regression models produced heteroscedastic and non-normal residuals, all
significance tests and confidence intervals were based on robust Huber-White standard errors.
No issues with multicollinearity were detected from variance inflation factor (VIF) statistics.
All regression analyses tested interactions between age and fluoride and between sex and
fluoride, as hyperactivity is more common in younger boys and sex-dependent fluoride effects
have been previously reported (Mullenix et al., 1995; Green et al., 2019). If an interaction with
age was significant, we probed the interaction by calculating the predicted association between
fluoride and the outcome at the 25th and 75th percentiles of age. When a tested interaction was
non-significant, the model was re-estimated without the interaction term and the overall
associations were interpreted. Finally, we conducted sensitivity analyses to test whether the
31
associations between the fluoride exposure variables and ADHD diagnosis differed between
cycles given that the question about ADHD diagnosis was posed differently across the two
cycles. A two-tailed a = .05 was used as the threshold for statistical significance.
Results
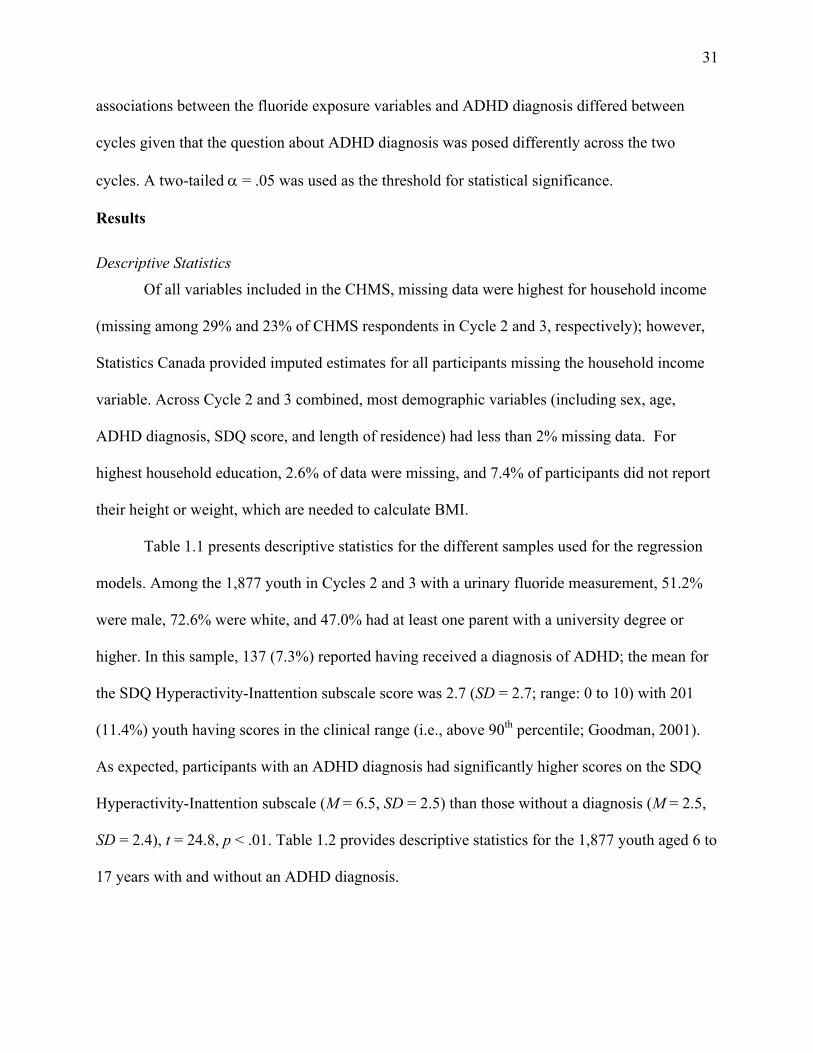
Descriptive Statistics
Of all variables included in the CHMS, missing data were highest for household income
(missing among 29% and 23% of CHMS respondents in Cycle 2 and 3, respectively); however,
Statistics Canada provided imputed estimates for all participants missing the household income
variable. Across Cycle 2 and 3 combined, most demographic variables (including sex, age,
ADHD diagnosis, SDQ score, and length of residence) had less than 2% missing data. For
highest household education, 2.6% of data were missing, and 7.4% of participants did not report
their height or weight, which are needed to calculate BMI.
Table 1.1 presents descriptive statistics for the different samples used for the regression
models. Among the 1,877 youth in Cycles 2 and 3 with a urinary fluoride measurement, 51.2%
were male, 72.6% were white, and 47.0% had at least one parent with a university degree or
higher. In this sample, 137 (7.3%) reported having received a diagnosis of ADHD; the mean for
the SDQ Hyperactivity-Inattention subscale score was 2.7 (SD = 2.7; range: 0 to 10) with 201
(11.4%) youth having scores in the clinical range (i.e., above 90th percentile; Goodman, 2001).
As expected, participants with an ADHD diagnosis had significantly higher scores on the SDQ
Hyperactivity-Inattention subscale (M = 6.5, SD = 2.5) than those without a diagnosis (M = 2.5,
SD = 2.4), t = 24.8, p < .01. Table 1.2 provides descriptive statistics for the 1,877 youth aged 6 to
17 years with and without an ADHD diagnosis.
32
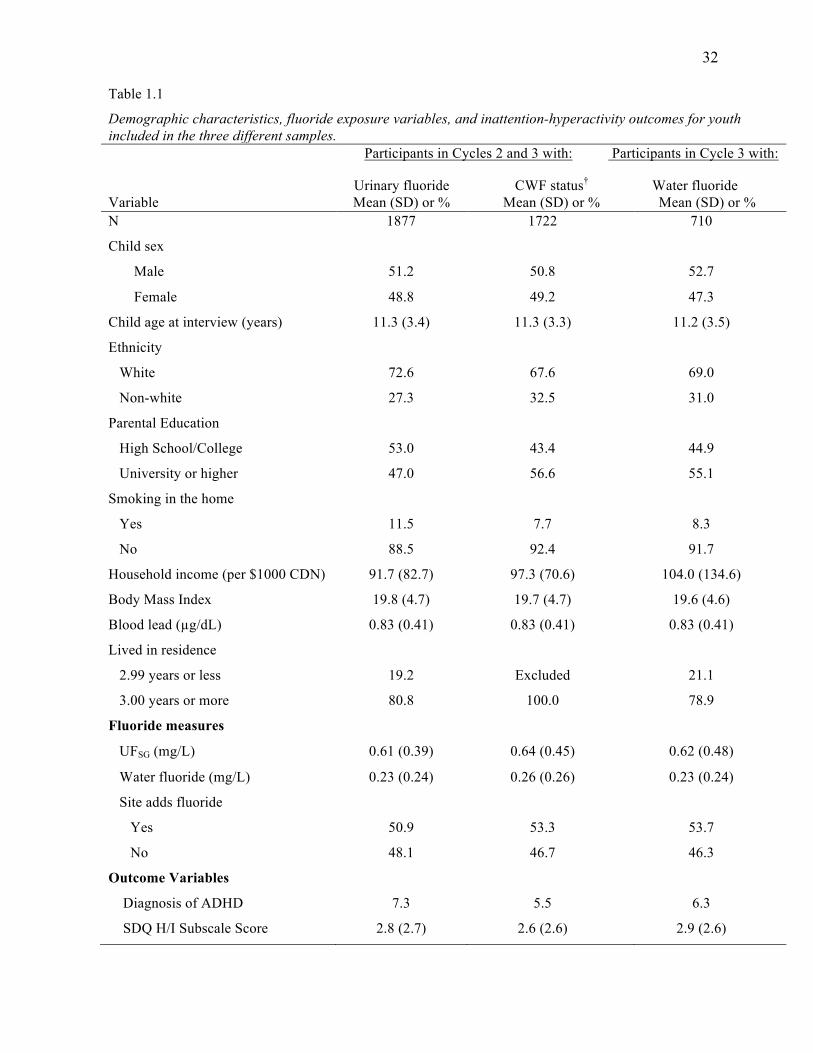
Table 1.1
Demographic characteristics, fluoride exposure variables, and inattention-hyperactivity outcomes for youth included in the three different samples. Participants in Cycles 2 and 3 with: Participants in Cycle 3 with:
Variable
Urinary fluoride Mean (SD) or %
CWF status† Mean (SD) or %
Water fluoride Mean (SD) or %
N 1877 1722 710
Child sex
Male 51.2 50.8 52.7
Female 48.8 49.2 47.3
Child age at interview (years) 11.3 (3.4) 11.3 (3.3) 11.2 (3.5)
Ethnicity
White 72.6 67.6 69.0
Non-white 27.3 32.5 31.0
Parental Education
High School/College 53.0 43.4 44.9
University or higher 47.0 56.6 55.1
Smoking in the home
Yes 11.5 7.7 8.3
No 88.5 92.4 91.7
Household income (per $1000 CDN) 91.7 (82.7) 97.3 (70.6) 104.0 (134.6)
Body Mass Index 19.8 (4.7) 19.7 (4.7) 19.6 (4.6)
Blood lead (µg/dL) 0.83 (0.41) 0.83 (0.41) 0.83 (0.41)
Lived in residence
2.99 years or less 19.2 Excluded 21.1
3.00 years or more 80.8 100.0 78.9
Fluoride measures
UFSG (mg/L) 0.61 (0.39) 0.64 (0.45) 0.62 (0.48)
Water fluoride (mg/L) 0.23 (0.24) 0.26 (0.26) 0.23 (0.24)
Site adds fluoride
Yes 50.9 53.3 53.7
No 48.1 46.7 46.3
Outcome Variables
Diagnosis of ADHD 7.3 5.5 6.3
SDQ H/I Subscale Score 2.8 (2.7) 2.6 (2.6) 2.9 (2.6)
33
Abbreviations: ADHD = Attention Deficit Hyperactivity Disorder; BMI = Body Mass Index; SD = standard deviation; UFSG = urinary fluoride adjusted for specific gravity; SDQ H/I= Strengths and Difficulties Questionnaire Hyperactivity Inattention. † Youth who drink tap water and have a stable residence
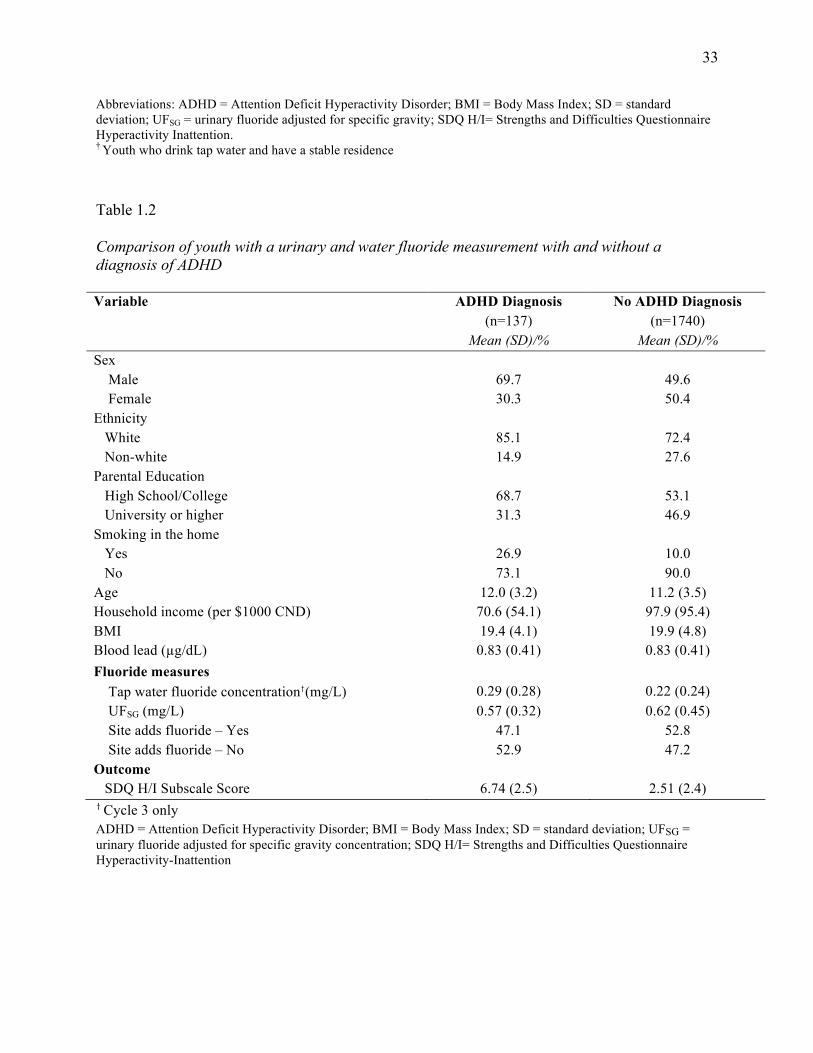
Table 1.2
Comparison of youth with a urinary and water fluoride measurement with and without a diagnosis of ADHD Variable ADHD Diagnosis
(n=137) Mean (SD)/%
No ADHD Diagnosis (n=1740)
Mean (SD)/% Sex Male
69.7
49.6
Female 30.3 50.4 Ethnicity White 85.1 72.4 Non-white 14.9 27.6 Parental Education High School/College 68.7 53.1 University or higher 31.3 46.9 Smoking in the home Yes 26.9 10.0 No 73.1 90.0 Age 12.0 (3.2) 11.2 (3.5) Household income (per $1000 CND) 70.6 (54.1) 97.9 (95.4) BMI 19.4 (4.1) 19.9 (4.8) Blood lead (µg/dL) 0.83 (0.41) 0.83 (0.41) Fluoride measures Tap water fluoride concentration†(mg/L)
0.29 (0.28)
0.22 (0.24)
UFSG (mg/L) 0.57 (0.32) 0.62 (0.45) Site adds fluoride – Yes 47.1 52.8 Site adds fluoride – No 52.9 47.2 Outcome SDQ H/I Subscale Score
6.74 (2.5)
2.51 (2.4)
† Cycle 3 only ADHD = Attention Deficit Hyperactivity Disorder; BMI = Body Mass Index; SD = standard deviation; UFSG = urinary fluoride adjusted for specific gravity concentration; SDQ H/I= Strengths and Difficulties Questionnaire Hyperactivity-Inattention
34
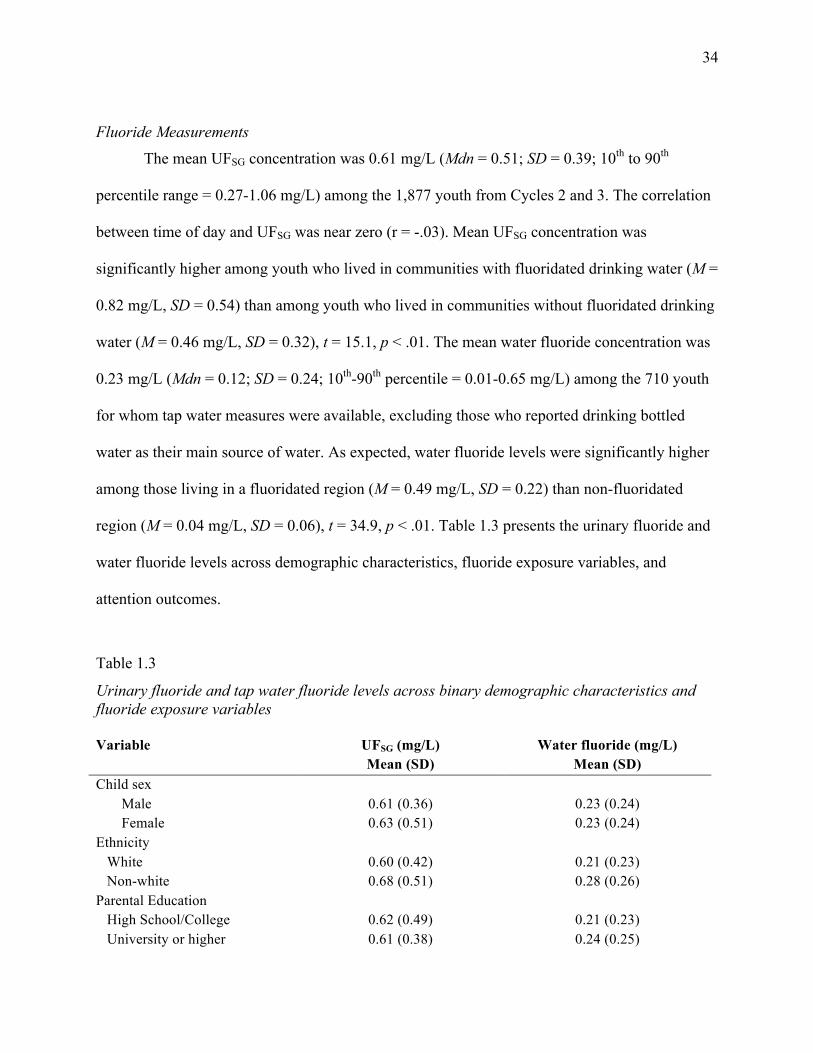
Fluoride Measurements
The mean UFSG concentration was 0.61 mg/L (Mdn = 0.51; SD = 0.39; 10th to 90th
percentile range = 0.27-1.06 mg/L) among the 1,877 youth from Cycles 2 and 3. The correlation
between time of day and UFSG was near zero (r = -.03). Mean UFSG concentration was
significantly higher among youth who lived in communities with fluoridated drinking water (M =
0.82 mg/L, SD = 0.54) than among youth who lived in communities without fluoridated drinking
water (M = 0.46 mg/L, SD = 0.32), t = 15.1, p < .01. The mean water fluoride concentration was
0.23 mg/L (Mdn = 0.12; SD = 0.24; 10th-90th percentile = 0.01-0.65 mg/L) among the 710 youth
for whom tap water measures were available, excluding those who reported drinking bottled
water as their main source of water. As expected, water fluoride levels were significantly higher
among those living in a fluoridated region (M = 0.49 mg/L, SD = 0.22) than non-fluoridated
region (M = 0.04 mg/L, SD = 0.06), t = 34.9, p < .01. Table 1.3 presents the urinary fluoride and
water fluoride levels across demographic characteristics, fluoride exposure variables, and
attention outcomes.
Table 1.3
Urinary fluoride and tap water fluoride levels across binary demographic characteristics and fluoride exposure variables Variable UFSG (mg/L)
Mean (SD) Water fluoride (mg/L)
Mean (SD) Child sex Male 0.61 (0.36) 0.23 (0.24) Female 0.63 (0.51) 0.23 (0.24) Ethnicity White 0.60 (0.42) 0.21 (0.23) Non-white 0.68 (0.51) 0.28 (0.26) Parental Education High School/College 0.62 (0.49) 0.21 (0.23) University or higher 0.61 (0.38) 0.24 (0.25)
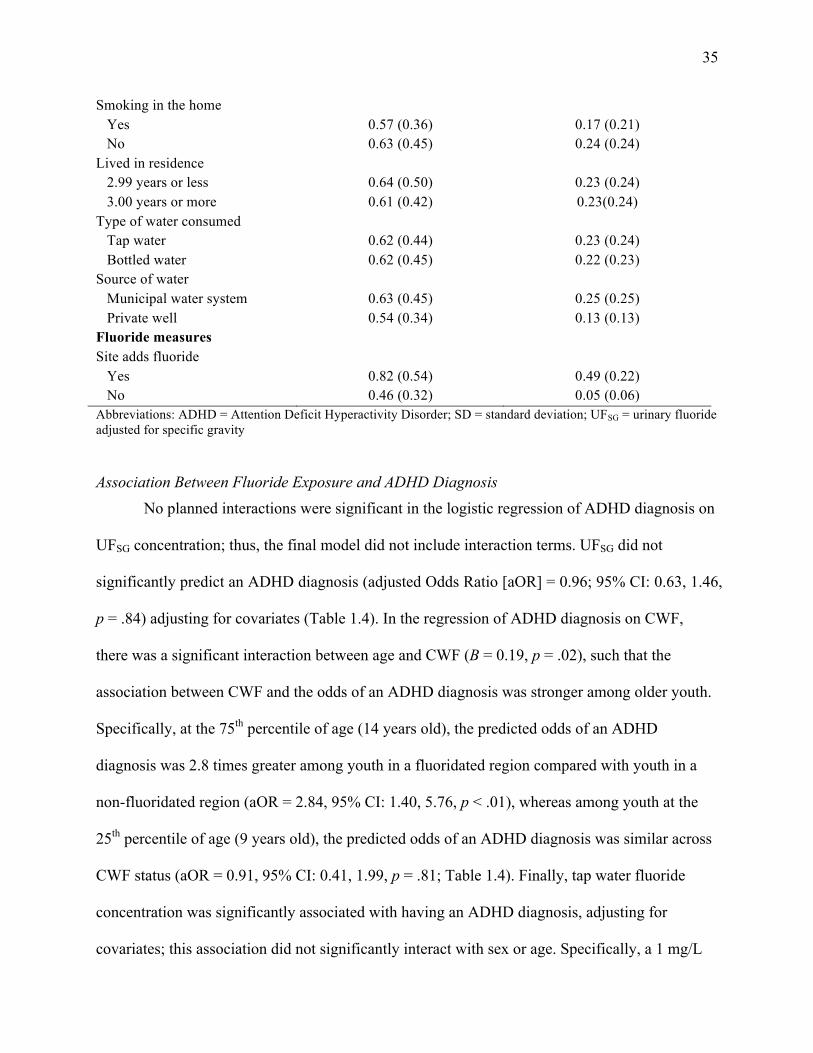
35
Smoking in the home Yes 0.57 (0.36) 0.17 (0.21) No 0.63 (0.45) 0.24 (0.24) Lived in residence 2.99 years or less 0.64 (0.50) 0.23 (0.24) 3.00 years or more 0.61 (0.42) 0.23(0.24) Type of water consumed Tap water 0.62 (0.44) 0.23 (0.24) Bottled water 0.62 (0.45) 0.22 (0.23) Source of water Municipal water system 0.63 (0.45) 0.25 (0.25) Private well 0.54 (0.34) 0.13 (0.13) Fluoride measures Site adds fluoride Yes 0.82 (0.54) 0.49 (0.22) No 0.46 (0.32) 0.05 (0.06) Abbreviations: ADHD = Attention Deficit Hyperactivity Disorder; SD = standard deviation; UFSG = urinary fluoride adjusted for specific gravity
Association Between Fluoride Exposure and ADHD Diagnosis No planned interactions were significant in the logistic regression of ADHD diagnosis on
UFSG concentration; thus, the final model did not include interaction terms. UFSG did not
significantly predict an ADHD diagnosis (adjusted Odds Ratio [aOR] = 0.96; 95% CI: 0.63, 1.46,
p = .84) adjusting for covariates (Table 1.4). In the regression of ADHD diagnosis on CWF,
there was a significant interaction between age and CWF (B = 0.19, p = .02), such that the
association between CWF and the odds of an ADHD diagnosis was stronger among older youth.
Specifically, at the 75th percentile of age (14 years old), the predicted odds of an ADHD
diagnosis was 2.8 times greater among youth in a fluoridated region compared with youth in a
non-fluoridated region (aOR = 2.84, 95% CI: 1.40, 5.76, p < .01), whereas among youth at the
25th percentile of age (9 years old), the predicted odds of an ADHD diagnosis was similar across
CWF status (aOR = 0.91, 95% CI: 0.41, 1.99, p = .81; Table 1.4). Finally, tap water fluoride
concentration was significantly associated with having an ADHD diagnosis, adjusting for
covariates; this association did not significantly interact with sex or age. Specifically, a 1 mg/L

36
increase in tap water fluoride was associated with a 6.1 times higher odds of ADHD diagnosis
(95% CI: 1.60, 22.8, p < .01; Table 1.4).
Table 1.4. Adjusted Odds Ratio (aOR) and effect estimates for the association between fluoride exposure, ADHD diagnosis, and inattentive-hyperactive symptoms ADHD diagnosis SDQ H/I subscale score
aORa 95% CI Ba 95% CI
UFSG (mg/L) b 0.96 0.63, 1.46 0.31 -0.04, 0.66
Fluoride in tap water (mg/L)c 6.10* 1.60, 22.8 0.31* 0.04, 0.58
75th percentile age --d -- 1.52* 0.23, 2.80
25th percentile age -- -- -0.33 -1.51, 0.84
CWF statuse 1.21* 1.03, 1.42 0.11* 0.02, 0.20
75th percentile age 2.84* 1.40, 5.76 0.70* 0.34, 1.06
25th percentile age 0.91 0.41, 1.99 0.04 -0.38, 0.46
Abbreviations: ADHD = Attention Deficit/Hyperactivity Disorder; CWF = community water fluoridation;
aOR = adjusted odds ratio; SDQ H/I= Strengths and Difficulties Questionnaire Hyperactivity-Inattention
* p < .05 aAdjusted for child’s sex, age at interview, ethnicity (white or other), Body Mass Index, highest level of
parental education, total household income, exposure to cigarette smoke inside the home (yes/no),
concurrent blood lead level (log10-transformed). b Non-significant main effect of urinary fluoride level predicting ADHD diagnosis (B=-0.04, p=.84,
N=119/1635 with ADHD/total sample) or SDQ subscale score (B=0.31, p=.08, N=1532). c Interaction between age and water fluoride level predicting SDQ subscale score (B=0.31, p=.03, N=588). d Since the interaction between age and water fluoride was not significant, only the main effects are
presented for the logistic regression predicting ADHD diagnosis from fluoride in tap water (mg/L; N =
39/626 with ADHD/total sample). e Significant interaction between age and CWF status predicting ADHD diagnosis (B=0.19, p=.03, N=
65/1173 with ADHD/total sample) and SDQ subscale score (B=0.11, p=.01, N = 1118).
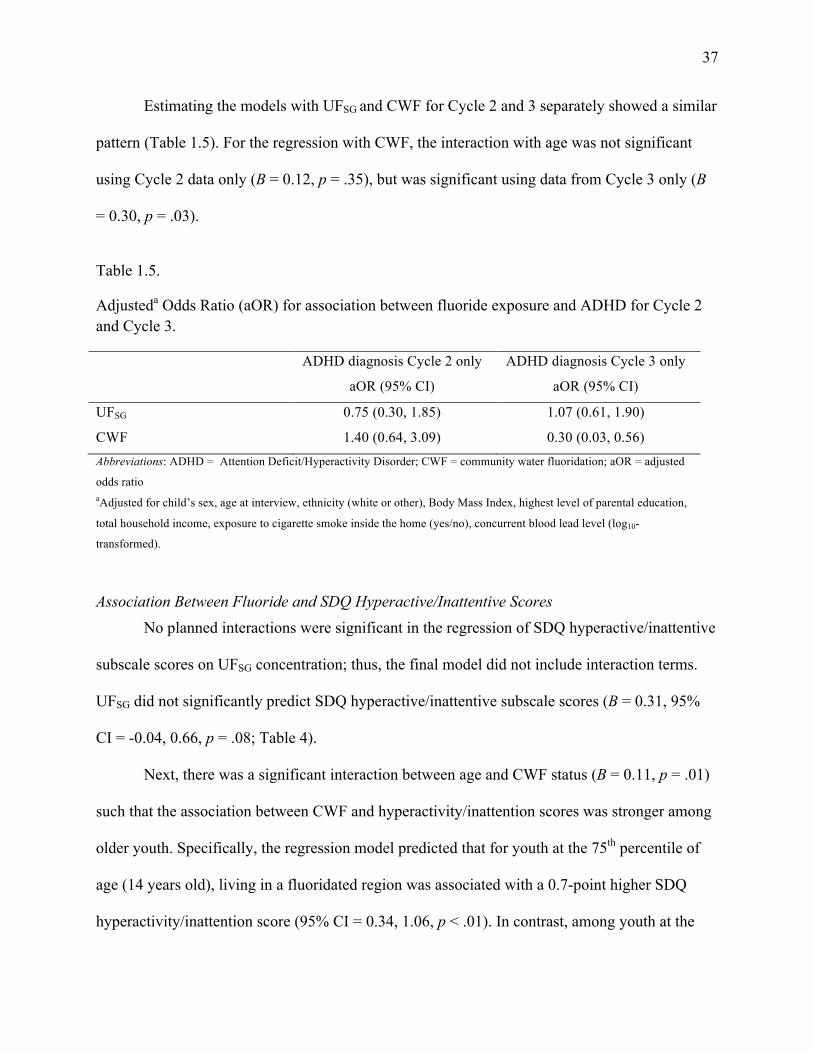
37
Estimating the models with UFSG and CWF for Cycle 2 and 3 separately showed a similar
pattern (Table 1.5). For the regression with CWF, the interaction with age was not significant
using Cycle 2 data only (B = 0.12, p = .35), but was significant using data from Cycle 3 only (B
= 0.30, p = .03).
Table 1.5.
Adjusteda Odds Ratio (aOR) for association between fluoride exposure and ADHD for Cycle 2 and Cycle 3.
ADHD diagnosis Cycle 2 only
aOR (95% CI)
ADHD diagnosis Cycle 3 only
aOR (95% CI)
UFSG 0.75 (0.30, 1.85) 1.07 (0.61, 1.90)
CWF 1.40 (0.64, 3.09) 0.30 (0.03, 0.56)
Abbreviations: ADHD = Attention Deficit/Hyperactivity Disorder; CWF = community water fluoridation; aOR = adjusted
odds ratio aAdjusted for child’s sex, age at interview, ethnicity (white or other), Body Mass Index, highest level of parental education,
total household income, exposure to cigarette smoke inside the home (yes/no), concurrent blood lead level (log10-
transformed).
Association Between Fluoride and SDQ Hyperactive/Inattentive Scores No planned interactions were significant in the regression of SDQ hyperactive/inattentive
subscale scores on UFSG concentration; thus, the final model did not include interaction terms.
UFSG did not significantly predict SDQ hyperactive/inattentive subscale scores (B = 0.31, 95%
CI = -0.04, 0.66, p = .08; Table 4).
Next, there was a significant interaction between age and CWF status (B = 0.11, p = .01)
such that the association between CWF and hyperactivity/inattention scores was stronger among
older youth. Specifically, the regression model predicted that for youth at the 75th percentile of
age (14 years old), living in a fluoridated region was associated with a 0.7-point higher SDQ
hyperactivity/inattention score (95% CI = 0.34, 1.06, p < .01). In contrast, among youth at the
38
25th percentile of age (9 years old), CWF status was not significantly associated with SDQ
hyperactivity/inattention scores (B = 0.04, 95% CI = -0.38, 0.46, p =.85).
Finally, the interaction between age and tap water fluoride level was also significant (B =
0.31, p = .03) such that the association between tap water fluoride and SDQ
hyperactivity/inattention score was stronger among older youth. In particular, among youth at the
75th percentile of age (14 years old), an increase of 1 mg/L in water fluoride level was associated
with a 1.52 increase in the SDQ hyperactivity/inattention subscale score (95% CI: 0.23, 2.68, p
= .02). However, for youth at the 25th percentile of age (8 years old), the association between
water fluoride level and SDQ hyperactivity/inattention subscale score was not significant (B = -
0.33, 95% CI: -1.51, 0.84, p = .58).
Discussion
We found that Canadian youth exposed to higher tap water fluoride levels had a higher
risk of receiving an ADHD diagnosis and reported more symptoms of hyperactivity and
inattention. Specifically, an increase of 1.0 mg/L in water fluoride concentration was associated
with 6.1 times higher odds of an ADHD diagnosis after accounting for potential confounding
variables, such as exposure to second-hand smoke, household income, and blood lead level.
Likewise, water fluoride concentration was positively associated with hyperactive/inattentive
symptoms, especially among older youth. To contextualize these results, the difference in water
fluoride concentration between cities with and without fluoridation is approximately 0.5 mg/L.
Our finding of a 1.5-point increase in the SDQ hyperactive/inattentive symptom subscale for
each increase of 1 mg/L in water fluoride level implies a 0.75-point increase per 0.5 mg/L water
fluoride; this result is consistent with our finding of a 0.7-point increase on the SDQ’s
39
hyperactivity/inattention subscale observed among older youth living in a fluoridated versus non-
fluoridated region.
In contrast, urinary fluoride levels were not significantly associated with a diagnosis of
ADHD or hyperactive/inattentive symptoms. Water fluoride concentration and CWF status may
be more strongly associated with hyperactivity/inattention than urinary fluoride levels because
fluoride concentrations in municipal water supplies vary within a limited range and therefore
may serve as a proxy for early-life and chronic fluoride exposure. In contrast, urinary fluoride
levels in spot samples are more likely to fluctuate due to the rapid elimination kinetics of fluoride.
Additionally, urinary fluoride values may capture acute exposures due to behaviours that were
not controlled in this study, such as professionally applied varnish, consumption of beverages
with high fluoride content (e.g., tea), or swallowing toothpaste prior to urine sampling. Finally,
the association between UF and hyperactivity/inattention could be obscured due to reduced
fluoride excretion (i.e., increased fluoride absorption) during a high growth spurt stage (Jha,
Mishra, Sharma, & Damodaran, 2011; World Health Organization, 1997). Despite these
limitations, use of individualized biomarkers is considered an improvement over past ecologic
studies (Malin & Till, 2015) examining the association between ADHD and fluoride exposure
and it has the advantage of examining all sources of fluoride exposure, not just from drinking
water.
Our findings are consistent with earlier studies showing a relationship between fluoride
exposure and ADHD. In particular, Malin and Till (2015) found that a 1% increase in
community water fluoridation prevalence in 1992 was associated with approximately 67,000 to
131,000 additional ADHD diagnoses from 2003 to 2011 among children and adolescents in the
United States. Conversely, Barberio and colleagues (2017) did not find a significant relationship
40
between fluoride exposure and learning disabilities (including ADHD) using data from the
CHMS Cycles 2 and 3. A direct comparison of our results to the results found by Barberio and
colleagues is challenged by the differences in how the data were analyzed between the two
studies. Our sample included youth between ages 6 and 17, whereas Barberio and colleagues
restricted their sample to youth ages 3 to 12. Further, Barberio and colleagues included
participants with learning disabilities instead of selecting only those with a diagnosis of ADHD.
Finally, the current study accounted for whether youth in both Cycles 2 and 3 drank unfiltered
municipal tap water. It may be that the effects of fluoride exposure are most pronounced in older
youth, or that fluoride is specifically associated with ADHD-related behaviours as opposed to
learning disabilities. Finally, inclusion of learning disabilities may also introduce selection bias
due to differences in how learning disabilities and ADHD are diagnosed in Canada.
Our findings showed that age modified the association between fluoride exposure and
the likelihood of ADHD diagnosis and symptoms of hyperactivity and inattention, such that the
associations were stronger among older youth. This is surprising given that most studies of the
association between fluoride exposure and lower IQ have focused on prenatal and early
postnatal exposures, and it has been suggested that the prenatal period may be a key window of
neurological vulnerability (Bashash et al., 2017; Grandjean, 2019; Green et al., 2019). The
method used in the CHMS may not be as sensitive for young children who are at risk of an
ADHD diagnosis but have not yet been diagnosed; given that 90% of youth with ADHD are
diagnosed after age 6 (Kessler et al., 2005), we restricted our minimum age to 6 years.
Cumulative exposure to fluoride over time may also impact neurobehavioural development
such that youth show more symptoms as they age. Alternatively, because the developing brain
is highly sensitive to environmental toxins (Grandjean & Landrigan, 2006; 2014) and because
41
gene expression later in life is impacted by epigenetic changes that occur earlier in
development (Roth, 2012), changes produced by early exposure to environmental toxins may
manifest later in development.
While ADHD is known to have a strong genetic component with an estimated
heritability of 70% to 80% (Larsson, Chang, D'Onofrio, & Lichtenstein, 2014), environmental
risk factors are also believed to contribute to the development of ADHD. Prenatal substance
exposures, heavy metal and chemical exposures, and nutritional factors have been proposed to
contribute to the rise in ADHD in the United States (Xu, Strathearn, Liu, Yang, & Bao, 2018;
Sciberras, Mulraney, Silva, & Coghill, 2017) and an increase in behavioural difficulties as
assessed by the SDQ (Philippat et al., 2017; Oulhote, Steuerwald, Debes, Weihe, & Grandjean,
2016; Luk et al., 2018). A recent systematic review (Donzelli et al., 2019) reported a
significant association between lead exposure and risk of ADHD in 12 out of 17 studies; the
adjusted odds ratios ranged from 1.09 to 7.25, which is within the range of the current study
findings. Although the precise mechanism by which fluoride affects neurodevelopment is
unclear, several possible mechanisms have been proposed. Animal studies have shown
alterations in acetylcholine or cholinergic receptors due to fluoride exposure (Chouhan et al.,
2010; Liu et al., 2010; Reddy, 2014). In particular, both nicotinic acetylcholine receptors and
cholinesterase expression appear to play a role in attentional processes (Levin, Bushnell, &
Rezvani, 2011). Other studies have shown morphological changes in neurons (Bhatnagar,
2011), mitochondria (Zhao et al., 2019), increased catalase immunoreactivity (Güner, Uyar-
Bozkurt, Haznedaroğlu, & Menteş, 2016), more oxidative stress (Zhang, Lou, & Guan, 2015),
and increases in apoptotic neurons and abnormal mitochondrial dynamics (Lou, Guan, Peic, &
Guiyang, 2014; Lou et al., 2013). Further, some studies have suggested that fluoride may
42
suppress thyroid function (Trabelsi, Guermazi, & Zeghal, 2001); subclinical hypothyroidism
during pregnancy has been linked with increased risk for attention disorders (Modesto et al.,
2015; Päkkilä et al., 2014).
Our study has some limitations. First, tap water fluoride was measured in Cycle 3 only,
which decreased the sample size for analyses using this predictor. However, we were able to
determine CWF status for participants in both Cycle 2 and 3, which permitted examining the
concordance between the effects associated with tap water fluoride level, CWF status, and
urinary fluoride level. Second, use of exposure metrics obtained at the same time as the
outcome of interest (cross-sectional data) is limited for making conclusions about the causal
association between fluoride and ADHD. Exposure misclassification may have occurred for
some participants due to changes in a city’s water fluoridation status over the youth’s lifetime.
Tap water samples were collected between 2012 and 2013 when approximately 37.4% of
Canadians had access to fluoridated water as compared with 42.6% in 2007 (Public Health
Agency of Canada, 2017). Thus, water fluoride measures obtained at the time of CHMS data
collection may not be consistent with water fluoride levels that were antecedent to the
outcomes in our study. Because the CHMS only measured postnatal fluoride exposure, we
were not able to distinguish the effects of fluoride exposure during different developmental
periods (e.g., prenatal versus postnatal). Recent studies have identified pregnancy as a critical
period during which fluoride exposure is linked to lowered IQ (Bashash et al., 2017; Green et
al., 2019) and attention-related behaviours (Bashash et al., 2018) in offspring. Third, the
method used by CHMS may not completely capture true ADHD prevalence. The CHMS relied
on youth or parent report of a physician-made diagnosis of ADHD, whereas the gold standard
for ADHD assessment would be a diagnostic interview with confirmation that symptoms began

43
before age 12 and occur in multiple settings. Further, because of the way that the CHMS items
were phrased, the Cycle 2 sample may identify youth with a comorbid learning disability and
ADHD, but not those who have ADHD and no learning disability. Nonetheless, the prevalence
of ADHD in the current study (7.3%) is similar to the prevalence rate found in other studies. A
meta-analysis including 175 studies from across the world obtained an overall ADHD
prevalence rate of 7.2% (Thomas, Sanders, Doust, Beller, & Glasziou, 2015). In a 2012 sample
of Canadian youth under age 24, the prevalence of ADHD was 5.4% (Hauck, Lau, Wing,
Kurdyak, & Tu, 2017). Relatedly, the number of youth with ADHD in our study was relatively
small, ranging from approximately 45 to 140 depending on the sample used for a given
analysis, which limited statistical power and precision. Finally, the SDQ relies on youth or
parent perceptions of symptoms. Future studies would benefit from prospective designs and
more rigorous symptom assessment, particularly a structured diagnostic interview that assesses
DSM-5 criteria for ADHD.
In conclusion, we found that higher tap water fluoride levels and fluoridation of
municipal water supplies were associated with a higher risk of an ADHD diagnosis as well as
increased symptoms of hyperactivity and inattention, especially among adolescents. These
findings, which point to a potential cumulative effect of fluoride exposure, highlight the need
for further investigation of the potential for fluoride-mediated developmental neurotoxicity in
populations with water fluoridation.
44
Chapter Three: Urinary fluoride levels among Canadians with and without community
water fluoridation
Rationale
In our first study, tap water fluoride and community water fluoridation (CWF) were
associated with attention outcomes in youth, whereas urinary fluoride (UF) was not. To better
understand this finding, we investigated the factors that influence UF. To understand how much
UF is impacted by behaviours prior to urine sampling, we compared individuals who used a
fluoridated product within 6 hours of urine sampling to those who used a fluoridated product
more than 6 hours prior to urine sampling. Further, UF levels have been shown to vary as a
function of demographic variables including sex, age, Body Mass Index (BMI) and ethnicity
(Aylward et al., 2015; Barberio, Quiñonez, Hosein, & McLaren, 2017; Health Canada, 2015;
Jain, 2017). However, prior studies of the differences in UF across demographic characteristics
do not account for whether individuals live in areas with or without CWF. To address this gap,
the current study presents UF concentration by age group, sex, and CWF status. Further, to build
on previous literature on the contribution of water fluoride to UF (National Research Council,
2006; United States Environmental Protection Agency, 2010), we present the correlation
between water fluoride and UF by age group. Finally, we assessed how numerous predictors
identified from previous research impact UF levels. These predictors include water fluoride
concentration, CWF, tea consumption, type of water consumed (tap or bottle), and recency of
fluoride treatment at the dentist. Whether smoking is allowed in the home was also included, as
cigarette smoke may modify fluoride metabolism and excretion (Jain, 2017). A strength of this
study is that we controlled for numerous demographic characteristics including sex, age,
ethnicity, income, and highest household education, as well as modifiers of exposure, including
45
BMI, in models examining the association between fluoride exposures and UF. Evidence is
accumulating that fluoride exposure may be neurotoxic and a cognitive developmental hazard to
humans (National Toxicology Program, 2019). Thus, it is essential to understand predictors of
UF and identify subgroups who may have higher levels.
Publication Status
The work contained in this chapter has not yet been submitted for publication. When it is
submitted, the authors will include: Julia Riddell, Ashley Malin, David Flora, Hugh McCague,
and Christine Till.
Author Contributions
As the first author of this manuscript, I selected the research questions, analyzed the data, and
wrote the manuscript. The fifth author of this study, Dr. Christine Till, was my supervisor for this
project. She provided input on the research questions and aims, helped select the dataset to use,
and provided input on numerous drafts of this paper. The second author, Dr. Ashley Malin,
provided input on the manuscript drafts. The third and fourth authors, Dr. Dave Flora and Dr.
Hugh McCague, provided consultation on the statistical methods and provided input on the
drafting of the manuscript.
Abstract
Background: Urinary fluoride levels can vary as a function of demographic variables
including sex, age, Body Mass Index (BMI) and ethnicity, as well as whether an individual lives
in a fluoridated or non-fluoridated region. This study examines factors that may influence urinary
fluoride levels in a Canadian population.
46
Method: We measured urinary fluoride and tap water fluoride levels in 1629 individuals
aged 3 to 79 years participating in Cycle 3 (2012-2013) of the Canadian Health Measures Survey.
We measured urinary fluoride adjusted for specific gravity (UFSG) by age and sex, taking
community water fluoridation (CWF) status into consideration. We also examined numerous
predictors of UFSG, including tap water fluoride levels, use of fluoridated dental products,
smoking in the home, and tea consumption, while controlling for ethnicity, BMI, income, and
highest household education.
Results: UFSG concentration was significantly higher among participants who received
fluoridated drinking water (M = 1.06 mg/L, SD = 0.83) than among those who did not (M = 0.58
mg/L, SD = 0.47), t = -13.7, p < .01. Females had significantly higher UFSG concentration (M =
0.89 mg/L, SD = 0.76) than males (M = 0.77 mg/L, SD = 0.67), t = -3.4, p < .01. Females aged
60 to 79 living in fluoridated regions had the highest level of UFSG at 1.56 mg/L, followed by
females aged 40 to 59 at 1.51 mg/L. Participants who reported that they used a fluoridated
product (such as toothpaste) less than six hours before the urine sample was collected had
significantly higher levels of UFSG (M = 0.94 mg/L, SD = 0.79) than those who did not (M = 0.74
mg/L, SD = 0.61), t = 4.0, p <.001. In the linear regression model estimated, we found a
significant non-linear effect of age and UFSG such that UFSG remains relatively stable across
childhood (ages 3 to 18), but increases over adulthood (ages 19 to 79). Further, CWF status
predicted UFSG concentration such that those who live in an area with CWF have a 0.39 mg/L
higher level of UFSG (95% CI = 0.24 to 0.53, p < .01) compared with those who live in an area
without CWF. Further, tap water fluoride, sex, and tea consumption were significantly and
positively associated with UFSG, while BMI and smoking allowed in the home were significantly
and negatively associated with UFSG.
47
Conclusions: CWF and tap water fluoride are major sources of contemporary fluoride
exposure for Canadian individuals across the lifespan. Lifestyle factors including tea
consumption, as well as demographic variables such as age and sex, also predict an individual’s
level of UF, and may help identify groups at risk of fluoride overexposure.
Introduction
Since the 1940s, fluoride has been added to public drinking water supplies because of its
ability to protect against dental caries. About three-fourths of the U.S. population receives
fluoridated water as compared with one-third of Canadians (Public Health Agency of Canada,
2017) and only 3% of Europeans (Centers for Disease Control and Prevention, 2014). In the U.S.
and Canada, 0.7 mg/L is the recommended concentration of fluoride in drinking water to prevent
dental caries (U.S. Department of Health and Human Services, 2015; Health Canada, 2010a). In
addition to water, tea is also an important source of fluoride (Li et al., 2009; Waugh, Potter,
Limeback, & Godfrey, 2016; Yadav et al., 2007) via absorption of fluoride through soil ( Fung,
Zhang, Wong, Wong, 1999; Malinowska, Inkielewicz, Czarnowski, & Szefer, 2008). Other
sources of fluoride include fluoridated dental products, supplements, and certain foods that
contain naturally occurring fluoride (e.g., sardines) or are sprayed with fluoride-containing
pesticides (e.g. grapes). Today, the Canadian population is exposed to more sources of fluoride
compared to when fluoridation was first introduced in drinking water.
Water fluoride concentrations are moderately (Rango et al., 2014; Till et al., 2018) to
strongly correlated (Kumar et al., 2016) with urinary fluoride levels and blood plasma levels
(Jain, 2017). In adults (McLaren, 2016; Singh, Gaur, & Garg, 2007; Till et al., 2018) and
children (Barberio, Quiñonez, Hosein, & McLaren, 2017; Kumar et al., 2016), urinary fluoride

48
levels typically approximate the concentration of fluoride found in water with average levels
ranging from 0.46 mg/L to 2.48 mg/L. Fluoride levels in drinking water can vary from one
geographic location to another depending on whether fluoride is added to public water supplies
or because of variations in the concentration of naturally occurring fluoride (Ahmed et al., 2012;
McLauren, 2016). Among individuals living in regions with water fluoridation, drinking water is
the main source of fluoride intake, accounting for 25 to 70% of total fluoride intake (Jean,
Wassef, Gagnon, & Valcke, 2018; United States Environmental Protection Agency, 2010). It is
therefore important for surveillance studies to consider variability in water fluoride levels when
assessing population fluoride levels.
Population-based biomonitoring studies examining fluoride exposure levels, such as the
Canadian Health Measures Survey (CHMS; Saravanabhavan et al, 2017) and the National Health
and Nutrition Examination Survey (NHANES; Jain, 2017), provide nationally representative
reference values for fluoride, but do not present separate values for those who live in an area
with community water fluoridation (CWF) and those who do not. This is important given that a
bimodal distribution of fluoride exposure is expected. Likewise, the Human Biomonitoring
Report (Health Canada, 2015) provides urinary fluoride levels by age and sex, but collapses
across participants living in fluoridated and non-fluoridated regions. It is important to analyze
exposure levels by CWF status in order to identify groups at risk of overexposure or fluoride-
related health effects (e.g. dental fluorosis). Biomonitoring studies that do report urinary fluoride
levels by CWF status show that levels of urinary fluoride are approximately 1.5 to 2 times higher
in fluoridated regions compared to non-fluoridated regions (Green et al., 2019; McLaren, 2016;
Till et al., 2018). Adverse health outcomes including dental fluorosis have been shown to be
higher in areas with CWF (National Research Council, 2006). Because of multiple fluoride

49
exposure sources and growing concerns about the safety of CWF, it is critical for risk assessment
studies to examine the relation between contemporary fluoride exposure levels as a function of
water fluoride levels.
Plasma fluoride levels reach peak levels at 60 minutes following absorption and return to
baseline within 11 to 15 hours, making the half-life between 5 and 8 hours (Martínez-Mier,
2012; Whitford, 1996). Fluoride is excreted in urine by the kidneys (Jain, 2017; Buzalaf &
Whitford, 2011). Many factors can modify fluoride metabolism and excretion, including sex, age,
skeletal growth, body mass index (BMI), ethnicity, and cigarette smoking (Aylward et al., 2015;
Environmental Protection Agency, 2010; Jain, 2017; National Research Council, 2006). Medical
conditions such as diabetes, kidney dysfunction, and iodine decificency can also modify fluoride
absorption and metabolism (Buzalaf & Whitford, 2011; Malin, Riddell, McCague, & Till, 2018).
Knowledge about how these factors are associated with exposure measurements is crucial for
research aimed at understanding examining health outcomes associated with fluoride exposure.
The objective of this study was to describe how urinary fluoride levels differ by age,
sex, and CWF, and to examine the association between water fluoride and urinary fluoride
levels by age and CWF. We also examined sources of fluoride exposure, including tap water
fluoride and tea consumption, and how they impact UF levels, while controlling for covariates
such as age, sex, BMI, ethnicity, income, highest household education, and exposure to
cigarette smoke.
Methods
Data Source and Participants
We used data from Cycle 3 (2012-2013) of the CHMS collected by Statistics Canada.
All aspects of the CHMS were reviewed and approved by Health Canada’s Research Ethics
50
Board (Day, Langlois, Tremblay, & Knoppers, 2006); the current study was approved by the
York University Research Ethics Board.
The CHMS randomly selected participants aged 3 to 79 years who live in private
households across Canada. Analyses were based on 2671 participants for whom water fluoride
and urinary fluoride data were available (46% of the full environmental urine subsample). Tap
water samples were collected in the home during the initial questionnaire and urine samples
were collected at a mobile lab (Statistics Canada, 2017). Full details can be found at
www.statcan.gc.ca.
Community water fluoridation (CWF) status was determined by viewing reports on
each city’s website or contacting the water treatment plant (see Supplemental Table 1). Of the
16 sites in total, 5 received CWF and 5 did not receive CWF between 2012-2013,
corresponding to approximately 600 (22%) and 550 (21%) of 2617 participants included in the
study, respectively (rounded due to Statistics Canada data release requirements). Six additional
sites were considered to have mixed fluoridation status, corresponding to about 850 (31%)
participants, and were excluded from all analyses. A site was classified as mixed for one of five
reasons: unclear site boundaries (n=150), having some municipalities within the site add
fluoride while others do not (n=150), and stopping water fluoridation during the period
spanning CHMS data collection (n=150). We excluded all participants from sites that were
labeled as fluoridated or non-fluoridated, but had an average water fluoride level that was
either 2.5 times lower (n = 250) or higher (n = 150) than other fluoridated or non-fluoridated
sites. We excluded all participants from mixed sites, leading to a final sample size of 1629.
51
Measurement of Water Fluoride Concentration
Tap water samples were collected at respondents’ homes. Samples were analyzed for
fluoride concentrations (mg/L) via a basic anion exchange chromatography procedure with a
LoD of 0.006 mg/L. Concentrations at the LoD were assigned a missing value code by Statistics
Canada, and these values were subsequently replaced with an imputed value of LoD/Ö2
(Hornung & Reed, 1990); 435 of 1629 (27%) water samples had fluoride levels below the LoD.
Measurement of Urinary Fluoride Concentration
Urine spot samples were collected under normal (non-fasting) conditions and were not
standardized with respect to collection time. Fluoride concentrations in spot urine samples
were analyzed using an Orion pH meter with a fluoride ion selective electrode after being
diluted with an ionic adjustment buffer (Statistics Canada, 2013). Urinary analyses were
performed at the Human Toxicology Laboratory of the Institut National de Santé Publique du
Québec (INSPQ; accredited under ISO 17025) under standardized operating procedures
(Statistics Canada, 2013; 2015). The precision and accuracy of the fluoride analyses, including
quality control measures and quality assurance reviews, are described in previous publications
(Health Canada, 2015). The limit of detection (LoD) for urinary fluoride was 10 µg/L for Cycle
3 (Health Canada, 2015). No urinary fluoride values were below the LoD. Urinary fluoride
concentrations were adjusted for specific gravity (UFSG; mg/L) because specific gravity shows
no systematic variation within a day and is less dependent on body size, age, and sex than
creatinine (Barr et al., 2005; Nermell et al., 2008; Moriguchi et al., 2005; Suwazono, Åkesson,
Alfven, Järup, & Vahter, 2005).
52
Drinking Water Habits
Participants were asked the following questions: When you drink water at home, what is
your primary source of drinking water? (tap water, bottled water, or other); and What is the
source of the tap water in this home? (municipal, private well, or other). Of the total sample of
1629, 461 people did not answer these questions on drinking water habits, whereas 930 of 1168
(80%) participants reported drinking primarily tap water at home and 197 (17%) reported
drinking primarily bottled water at home.
Modifiers of Exposure Levels
Variables that may modify fluoride metabolism and excretion were selected based on
literature review (Aylward et al., 2015; Buzalaf, Leite, & Buzalaf, 2015; Buzalaf & Whitford,
2011; Jain, 2017). We examined the following covariates: sex, age at household interview,
ethnicity (white or ethnic minority), BMI, highest household level of education (less than a
bachelor’s degree vs. bachelor’s degree or greater), total household income (per $1000
Canadian), and whether smoking is allowed inside the home (yes/no).
Other Sources of Fluoride Exposure
Regarding tea consumption, 670 out of 1629 participants (41%) stated that they drink
green, black, or white tea at least once per year. Those who responded that they drink tea at least
once a year were asked follow-up questions, including the number of cups they typically drink
(less than one cup, one to two cups, or more than two cups) and the last time they drank green,
black, or white tea (within 24 hours of the urinary fluoride sample collection or more than 24
hours ago). Given that 959 participants (59%) reported that they do not drink tea or did not
answer the question, tea consumption was coded as a binary variable (yes = 1, no = 0) for
inclusion in the regression model.

53
Participants were asked about the last time they used a fluoride-containing product out of
four options (less than 6 hours ago, 6 to less than 12 hours ago, 12 to less than 24 hours ago, and
24 hours ago or more). Due to the short half-life of fluoride, the response options were combined
to create a binary variable (less than 6 hours ago = 1, 6 or more hours ago = 2). Participants were
also asked about the last time they received fluoride treatments at the dentist out of five possible
response options (less than 3 months ago, 3 to less than 6 months ago, 6 to less than 9 months
ago, 9 to less than 12 months ago, and 12 or more months ago); these response options were
combined to create a binary variable (less than 3 months ago vs. 3 months ago or more).
Statistical Analysis
One case was identified as an outlier based on a Cook’s Distance greater than 4/N. This
individual had the largest value of UFSG, which was about 7 times greater than the mean for
their age group. The Cook’s Distance value and UFSG cannot be reported due to Statistics
Canada policies regarding the release of individual data points. This outlying case was
removed from all analyses. Individuals with the highest incomes were identified as extreme
observations; these values were replaced with the next highest income value (only 0.01% of
income values were adjusted). Consistent with previous publications (e.g., Health Canada,
2015; Jain, 2017), UFSG values are presented for six age groups: 3 to 6, 7 to 11, 12 to 18, 19 to
39, 40 to 59, and 60 to 79 years. These age groups were also used when examining the
correlation between UFSG and tap water fluoride. For all other analyses, age was treated as a
continuous variable. We used independent samples Welch t-tests to examine whether UFSG
differed by sex or CWF.
We used Spearman rank correlations to explore the relationship between UFSG and tap
water fluoride in the age groups described above. We then used linear regression to examine
54
the associations between UFSG and predictors of fluoride exposure (CWF status, tap water
fluoride, tea consumption, primary source of drinking water, time since last fluoride treatment
at dentist, and time since use of a fluoride-containing dental product), controlling for covariates
(age, sex, ethnicity, BMI, education, income, and exposure to smoking). Plots of the residuals
by fitted values were examined, as well as plots of the residuals for specific variables such as
age. Because age appeared to have a non-linear relation with UFSG, the quadratic age effect was
included in the regression model. No issues with multicollinearity were detected from variance
inflation factor (VIF) statistics. We planned to test two interactions based on a priori
hypotheses: age by sex and CWF by type of drinking water (tap or bottled). A two-sided a
= .05 was used as the threshold for statistical significance.
Results
Descriptive Statistics
For participants with non-missing tap water, UF measurements, and CWF status, most
demographic variables (including sex, age, and highest household education) had less than 5%
missing data. For ethnicity, 11% of data were missing and 15% of participants did not report
their BMI.
In this sample, the proportion of males and females was approximately equal (49% male
and 51% female). The mean age was 32 years old (range 3 to 79 years) and 73% were white.
Regarding the highest level of household education, half of the sample (50%) had a high school,
trade school, or college degree, while the other half (50%) had a university degree or higher. The
mean household income was $87,700 (median = $73,000) and the mean BMI was 24. About half
of participants (49%) reported that they drink green, black or white tea at least once per year,
while the other half (51%) reported that they never drink any of these types of tea. Of those who
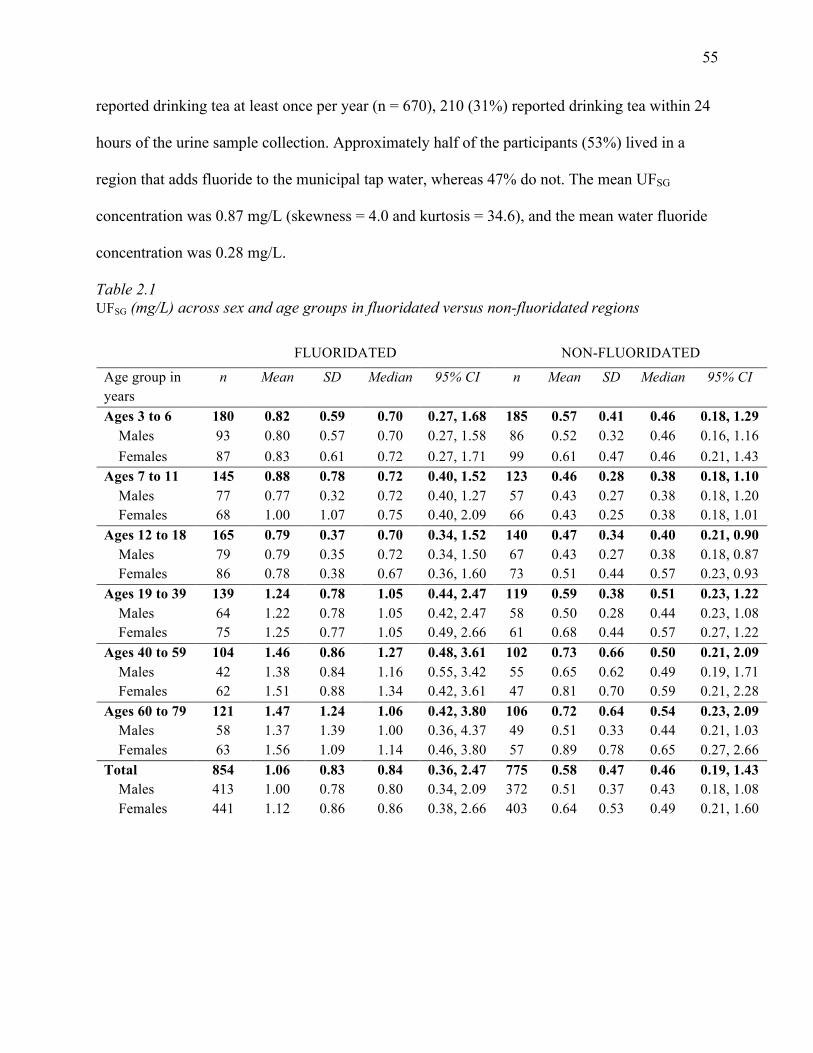
55
reported drinking tea at least once per year (n = 670), 210 (31%) reported drinking tea within 24
hours of the urine sample collection. Approximately half of the participants (53%) lived in a
region that adds fluoride to the municipal tap water, whereas 47% do not. The mean UFSG
concentration was 0.87 mg/L (skewness = 4.0 and kurtosis = 34.6), and the mean water fluoride
concentration was 0.28 mg/L.
Table 2.1 UFSG (mg/L) across sex and age groups in fluoridated versus non-fluoridated regions
FLUORIDATED NON-FLUORIDATED
Age group in years
n Mean SD Median 95% CI n Mean SD Median 95% CI
Ages 3 to 6 180 0.82 0.59 0.70 0.27, 1.68 185 0.57 0.41 0.46 0.18, 1.29 Males 93 0.80 0.57 0.70 0.27, 1.58 86 0.52 0.32 0.46 0.16, 1.16 Females 87 0.83 0.61 0.72 0.27, 1.71 99 0.61 0.47 0.46 0.21, 1.43 Ages 7 to 11 145 0.88 0.78 0.72 0.40, 1.52 123 0.46 0.28 0.38 0.18, 1.10 Males 77 0.77 0.32 0.72 0.40, 1.27 57 0.43 0.27 0.38 0.18, 1.20 Females 68 1.00 1.07 0.75 0.40, 2.09 66 0.43 0.25 0.38 0.18, 1.01 Ages 12 to 18 165 0.79 0.37 0.70 0.34, 1.52 140 0.47 0.34 0.40 0.21, 0.90 Males 79 0.79 0.35 0.72 0.34, 1.50 67 0.43 0.27 0.38 0.18, 0.87 Females 86 0.78 0.38 0.67 0.36, 1.60 73 0.51 0.44 0.57 0.23, 0.93 Ages 19 to 39 139 1.24 0.78 1.05 0.44, 2.47 119 0.59 0.38 0.51 0.23, 1.22 Males 64 1.22 0.78 1.05 0.42, 2.47 58 0.50 0.28 0.44 0.23, 1.08 Females 75 1.25 0.77 1.05 0.49, 2.66 61 0.68 0.44 0.57 0.27, 1.22 Ages 40 to 59 104 1.46 0.86 1.27 0.48, 3.61 102 0.73 0.66 0.50 0.21, 2.09 Males 42 1.38 0.84 1.16 0.55, 3.42 55 0.65 0.62 0.49 0.19, 1.71 Females 62 1.51 0.88 1.34 0.42, 3.61 47 0.81 0.70 0.59 0.21, 2.28 Ages 60 to 79 121 1.47 1.24 1.06 0.42, 3.80 106 0.72 0.64 0.54 0.23, 2.09 Males 58 1.37 1.39 1.00 0.36, 4.37 49 0.51 0.33 0.44 0.21, 1.03 Females 63 1.56 1.09 1.14 0.46, 3.80 57 0.89 0.78 0.65 0.27, 2.66 Total 854 1.06 0.83 0.84 0.36, 2.47 775 0.58 0.47 0.46 0.19, 1.43 Males 413 1.00 0.78 0.80 0.34, 2.09 372 0.51 0.37 0.43 0.18, 1.08 Females 441 1.12 0.86 0.86 0.38, 2.66 403 0.64 0.53 0.49 0.21, 1.60
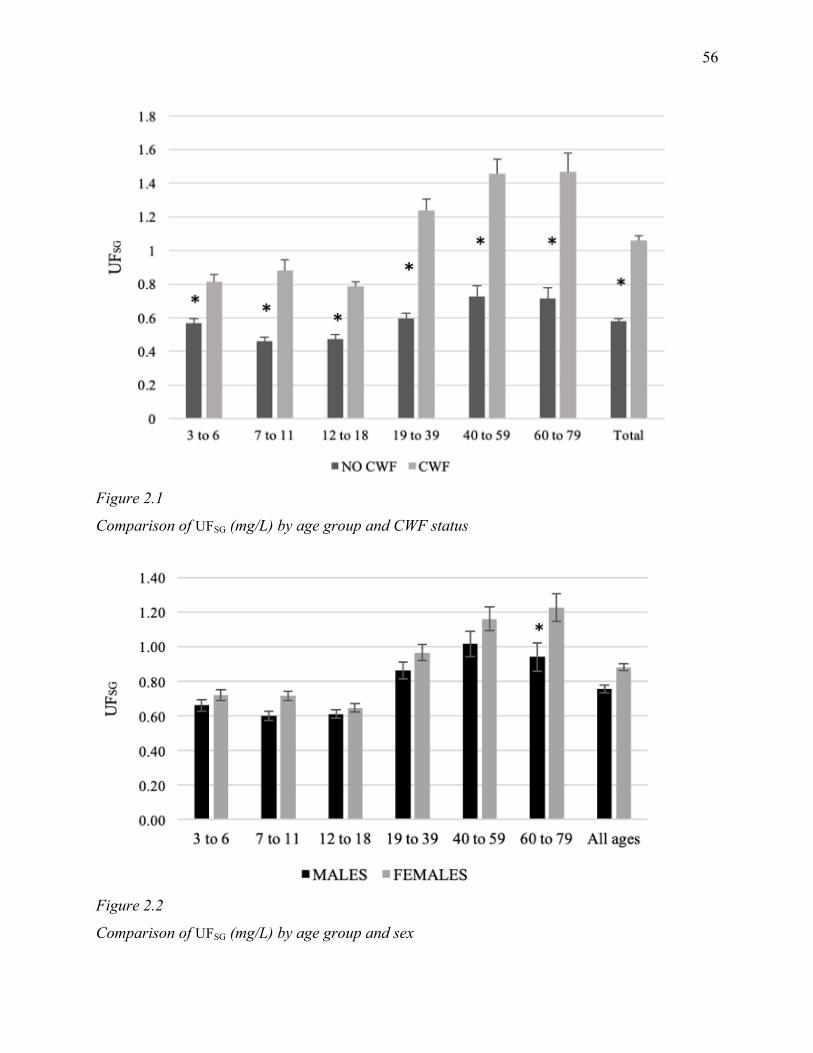
56
Figure 2.1
Comparison of UFSG (mg/L) by age group and CWF status
Figure 2.2
Comparison of UFSG (mg/L) by age group and sex
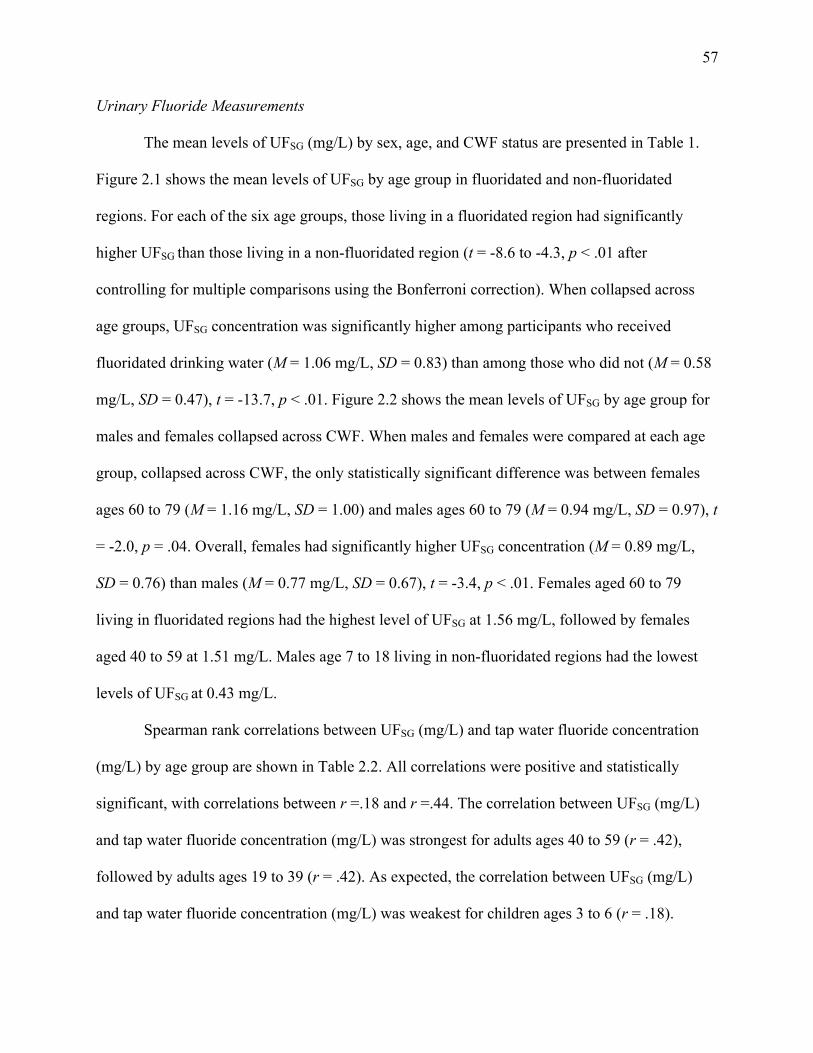
57
Urinary Fluoride Measurements
The mean levels of UFSG (mg/L) by sex, age, and CWF status are presented in Table 1.
Figure 2.1 shows the mean levels of UFSG by age group in fluoridated and non-fluoridated
regions. For each of the six age groups, those living in a fluoridated region had significantly
higher UFSG than those living in a non-fluoridated region (t = -8.6 to -4.3, p < .01 after
controlling for multiple comparisons using the Bonferroni correction). When collapsed across
age groups, UFSG concentration was significantly higher among participants who received
fluoridated drinking water (M = 1.06 mg/L, SD = 0.83) than among those who did not (M = 0.58
mg/L, SD = 0.47), t = -13.7, p < .01. Figure 2.2 shows the mean levels of UFSG by age group for
males and females collapsed across CWF. When males and females were compared at each age
group, collapsed across CWF, the only statistically significant difference was between females
ages 60 to 79 (M = 1.16 mg/L, SD = 1.00) and males ages 60 to 79 (M = 0.94 mg/L, SD = 0.97), t
= -2.0, p = .04. Overall, females had significantly higher UFSG concentration (M = 0.89 mg/L,
SD = 0.76) than males (M = 0.77 mg/L, SD = 0.67), t = -3.4, p < .01. Females aged 60 to 79
living in fluoridated regions had the highest level of UFSG at 1.56 mg/L, followed by females
aged 40 to 59 at 1.51 mg/L. Males age 7 to 18 living in non-fluoridated regions had the lowest
levels of UFSG at 0.43 mg/L.
Spearman rank correlations between UFSG (mg/L) and tap water fluoride concentration
(mg/L) by age group are shown in Table 2.2. All correlations were positive and statistically
significant, with correlations between r =.18 and r =.44. The correlation between UFSG (mg/L)
and tap water fluoride concentration (mg/L) was strongest for adults ages 40 to 59 (r = .42),
followed by adults ages 19 to 39 (r = .42). As expected, the correlation between UFSG (mg/L)
and tap water fluoride concentration (mg/L) was weakest for children ages 3 to 6 (r = .18).
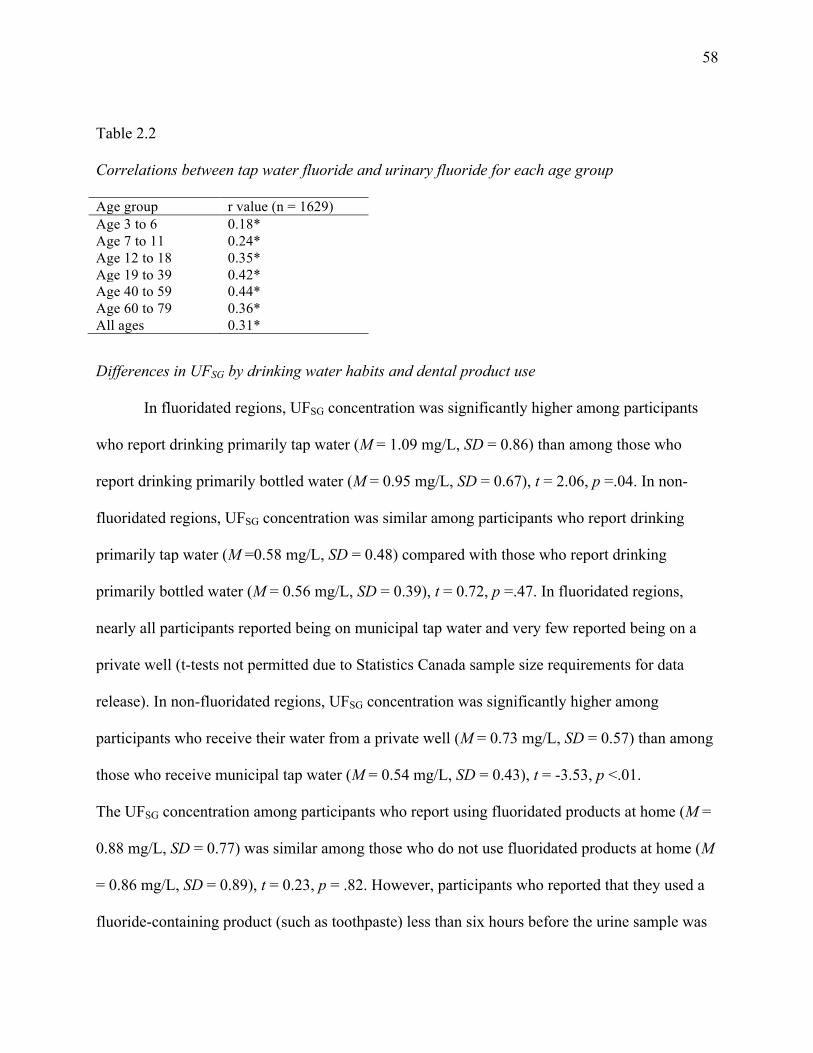
58
Table 2.2
Correlations between tap water fluoride and urinary fluoride for each age group
Age group r value (n = 1629) Age 3 to 6 0.18* Age 7 to 11 0.24* Age 12 to 18 0.35* Age 19 to 39 0.42* Age 40 to 59 0.44* Age 60 to 79 0.36* All ages 0.31*
Differences in UFSG by drinking water habits and dental product use
In fluoridated regions, UFSG concentration was significantly higher among participants
who report drinking primarily tap water (M = 1.09 mg/L, SD = 0.86) than among those who
report drinking primarily bottled water (M = 0.95 mg/L, SD = 0.67), t = 2.06, p =.04. In non-
fluoridated regions, UFSG concentration was similar among participants who report drinking
primarily tap water (M =0.58 mg/L, SD = 0.48) compared with those who report drinking
primarily bottled water (M = 0.56 mg/L, SD = 0.39), t = 0.72, p =.47. In fluoridated regions,
nearly all participants reported being on municipal tap water and very few reported being on a
private well (t-tests not permitted due to Statistics Canada sample size requirements for data
release). In non-fluoridated regions, UFSG concentration was significantly higher among
participants who receive their water from a private well (M = 0.73 mg/L, SD = 0.57) than among
those who receive municipal tap water (M = 0.54 mg/L, SD = 0.43), t = -3.53, p <.01.
The UFSG concentration among participants who report using fluoridated products at home (M =
0.88 mg/L, SD = 0.77) was similar among those who do not use fluoridated products at home (M
= 0.86 mg/L, SD = 0.89), t = 0.23, p = .82. However, participants who reported that they used a
fluoride-containing product (such as toothpaste) less than six hours before the urine sample was

59
collected had significantly higher levels of UFSG (M = 0.94 mg/L, SD = 0.79) than those who
reported using a fluoride-containing product six or more hours before the sample collection (M =
0.74 mg/L, SD = 0.61), t = 4.0, p <.001. Table 3 compares UFSG across age groups based on the
recency of their use of fluoridated products. Children age 3 to 6 years old who used fluoride-
containing products within six hours of the sample collection had significantly higher levels of
UFSG than those who did not, t = 3.6, p <.001. Similarly, adults age 19 to 39 years old (t = 2.6, p
=.01) and age 40 to 59 years old (t = 2.3, p =.02) who used fluoride-containing products within
six hours of the sample collection had significantly higher levels of UFSG than those who did not.
Table 2.3
Comparison of UFSG across age groups based on recency of fluoridated produce use
Age group
Used a fluoridated product (e.g., fluoridated toothpaste or mouthwash) less than 6 hours before sample collection
Used a fluoridated product (e.g., fluoridated toothpaste or mouthwash) 6 or more hours before sample collection
n Mean (95% CI) SD Median n Mean (95% CI) SD Med-ian
t p
Age 3 to 6
94 0.81 (0.72, 0.93) 0.62 0.72 144 0.62 (0.56, 0.67) 0.39 0.51 3.60 <.001
Age 7 to 11
88 0.64 (0.58, 0.69) 0.32 0.57 129 0.68 (0.55, 0.69) 0.67 0.53 0.28 .78
Age 12 to 18
136 0.65 (0.55, 0.64) 0.34 0.58 110 0.64 (0.54, 0.65) 0.37 0.55 0.04 .97
Age 19 to 39
139 1.01 (0.83, 0.99) 0.70 0.84 86 0.83 (0.66, 0.84) 0.58 0.67 2.65 .01
Age 40 to 59
93 1.27 (0.96, 1.18) 0.86 1.10 61 0.93 (0.73, 1.00) 0.85 0.67
2.27 .02
Age 60 to 79
103 1.29 (1.02, 1.40) 1.29 0.91 53 1.07 (0.81, 1.14) 0.85 0.84
1.88 .06
Total 653 0.94 0.79 0.72 583 0.74 0.61 0.59 4.00 <.001
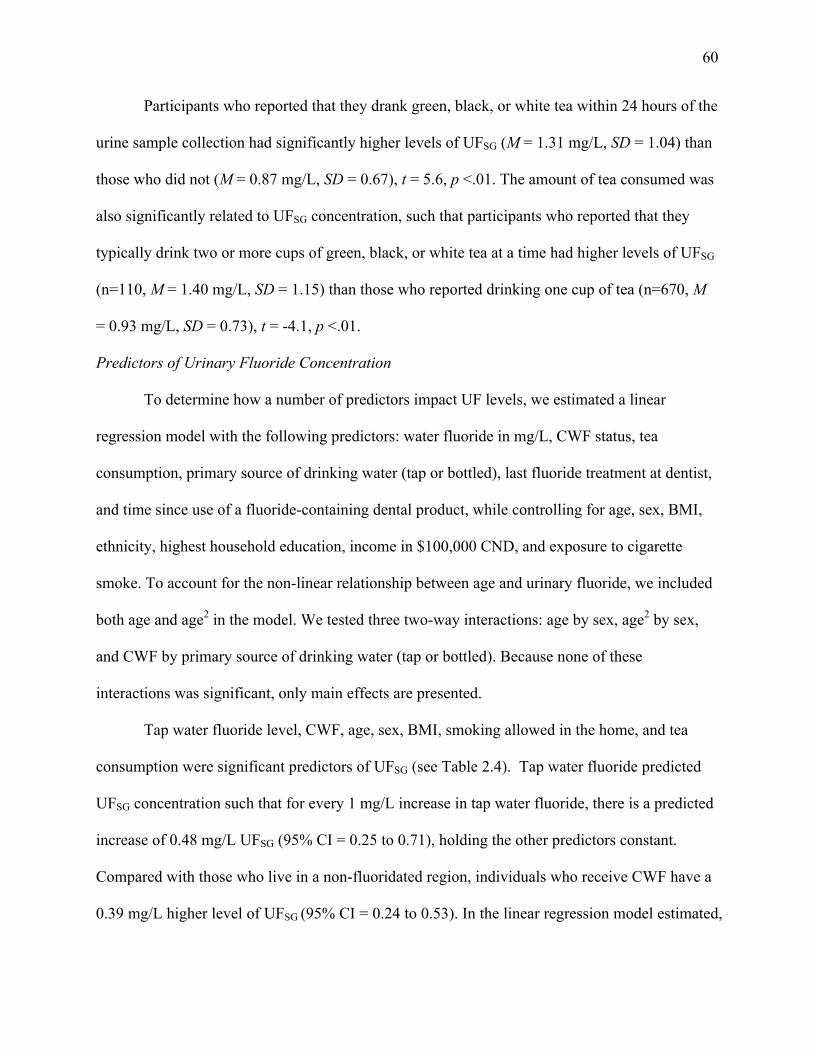
60
Participants who reported that they drank green, black, or white tea within 24 hours of the
urine sample collection had significantly higher levels of UFSG (M = 1.31 mg/L, SD = 1.04) than
those who did not (M = 0.87 mg/L, SD = 0.67), t = 5.6, p <.01. The amount of tea consumed was
also significantly related to UFSG concentration, such that participants who reported that they
typically drink two or more cups of green, black, or white tea at a time had higher levels of UFSG
(n=110, M = 1.40 mg/L, SD = 1.15) than those who reported drinking one cup of tea (n=670, M
= 0.93 mg/L, SD = 0.73), t = -4.1, p <.01.
Predictors of Urinary Fluoride Concentration
To determine how a number of predictors impact UF levels, we estimated a linear
regression model with the following predictors: water fluoride in mg/L, CWF status, tea
consumption, primary source of drinking water (tap or bottled), last fluoride treatment at dentist,
and time since use of a fluoride-containing dental product, while controlling for age, sex, BMI,
ethnicity, highest household education, income in $100,000 CND, and exposure to cigarette
smoke. To account for the non-linear relationship between age and urinary fluoride, we included
both age and age2 in the model. We tested three two-way interactions: age by sex, age2 by sex,
and CWF by primary source of drinking water (tap or bottled). Because none of these
interactions was significant, only main effects are presented.
Tap water fluoride level, CWF, age, sex, BMI, smoking allowed in the home, and tea
consumption were significant predictors of UFSG (see Table 2.4). Tap water fluoride predicted
UFSG concentration such that for every 1 mg/L increase in tap water fluoride, there is a predicted
increase of 0.48 mg/L UFSG (95% CI = 0.25 to 0.71), holding the other predictors constant.
Compared with those who live in a non-fluoridated region, individuals who receive CWF have a
0.39 mg/L higher level of UFSG (95% CI = 0.24 to 0.53). In the linear regression model estimated,
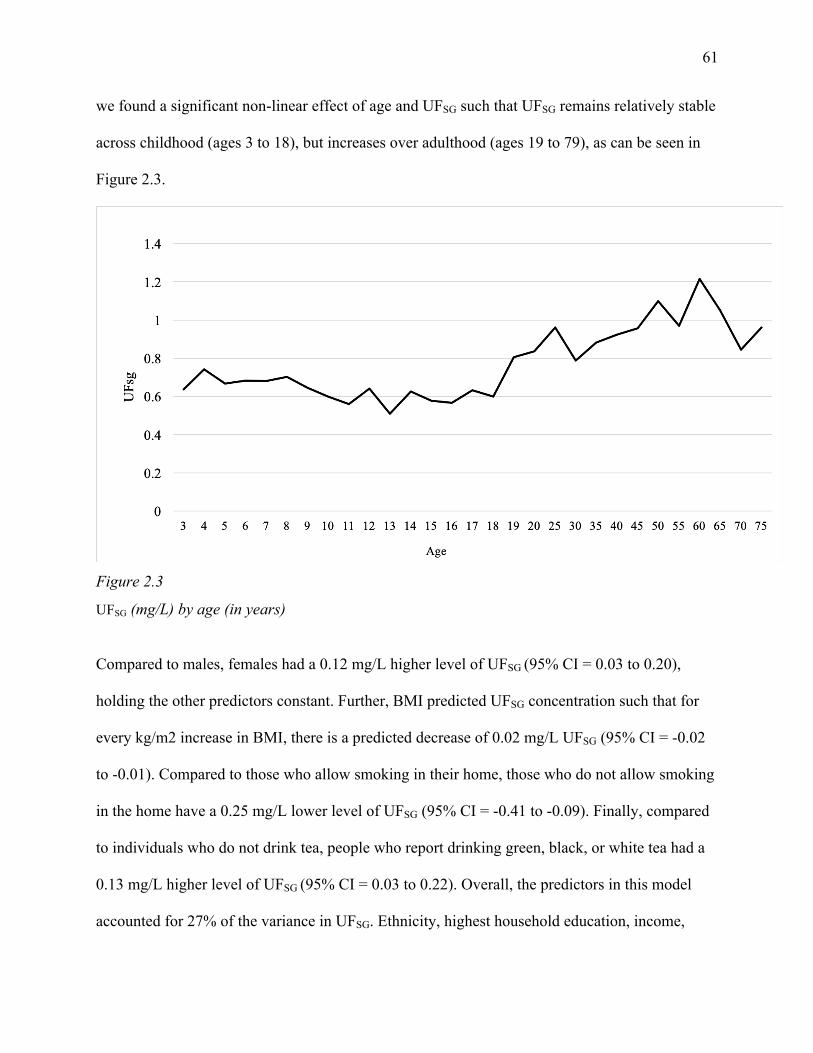
61
we found a significant non-linear effect of age and UFSG such that UFSG remains relatively stable
across childhood (ages 3 to 18), but increases over adulthood (ages 19 to 79), as can be seen in
Figure 2.3.
Figure 2.3
UFSG (mg/L) by age (in years)
Compared to males, females had a 0.12 mg/L higher level of UFSG (95% CI = 0.03 to 0.20),
holding the other predictors constant. Further, BMI predicted UFSG concentration such that for
every kg/m2 increase in BMI, there is a predicted decrease of 0.02 mg/L UFSG (95% CI = -0.02
to -0.01). Compared to those who allow smoking in their home, those who do not allow smoking
in the home have a 0.25 mg/L lower level of UFSG (95% CI = -0.41 to -0.09). Finally, compared
to individuals who do not drink tea, people who report drinking green, black, or white tea had a
0.13 mg/L higher level of UFSG (95% CI = 0.03 to 0.22). Overall, the predictors in this model
accounted for 27% of the variance in UFSG. Ethnicity, highest household education, income,
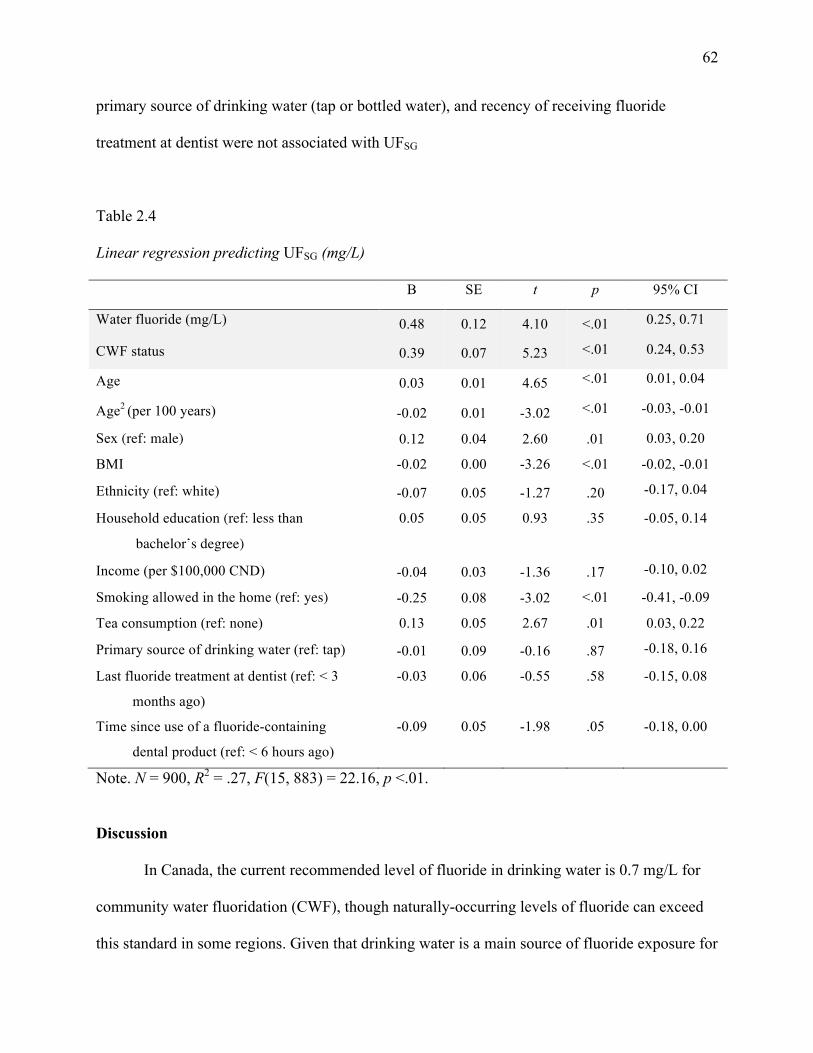
62
primary source of drinking water (tap or bottled water), and recency of receiving fluoride
treatment at dentist were not associated with UFSG
Table 2.4
Linear regression predicting UFSG (mg/L)
B SE t p 95% CI
Water fluoride (mg/L) 0.48 0.12 4.10 <.01 0.25, 0.71
CWF status 0.39 0.07 5.23 <.01 0.24, 0.53
Age 0.03 0.01 4.65 <.01 0.01, 0.04
Age2 (per 100 years) -0.02 0.01 -3.02 <.01 -0.03, -0.01
Sex (ref: male) 0.12 0.04 2.60 .01 0.03, 0.20
BMI -0.02 0.00 -3.26 <.01 -0.02, -0.01
Ethnicity (ref: white) -0.07 0.05 -1.27 .20 -0.17, 0.04
Household education (ref: less than
bachelor’s degree)
0.05 0.05 0.93 .35 -0.05, 0.14
Income (per $100,000 CND) -0.04 0.03 -1.36 .17 -0.10, 0.02
Smoking allowed in the home (ref: yes) -0.25 0.08 -3.02 <.01 -0.41, -0.09
Tea consumption (ref: none) 0.13 0.05 2.67 .01 0.03, 0.22
Primary source of drinking water (ref: tap) -0.01 0.09 -0.16 .87 -0.18, 0.16
Last fluoride treatment at dentist (ref: < 3
months ago)
-0.03 0.06 -0.55 .58 -0.15, 0.08
Time since use of a fluoride-containing
dental product (ref: < 6 hours ago)
-0.09 0.05 -1.98 .05 -0.18, 0.00
Note. N = 900, R2 = .27, F(15, 883) = 22.16, p <.01.
Discussion
In Canada, the current recommended level of fluoride in drinking water is 0.7 mg/L for
community water fluoridation (CWF), though naturally-occurring levels of fluoride can exceed
this standard in some regions. Given that drinking water is a main source of fluoride exposure for
63
most individuals (Jean et al., 2018; United States Environmental Protection Agency, 2010), this
study sought to describe differences in urinary fluoride adjusted for specific gravity (UFSG) as a
function of CWF status, age, and sex. As expected, the mean UFSG concentration was
significantly higher among participants receiving fluoridated drinking water (M = 1.06 mg/L, SD
= 0.83) than those receiving non-fluoridated water (M = 0.58 mg/L, SD = 0.47). This difference
is consistent with other Canadian studies reporting that individuals living in fluoridated regions
have between 1.5 and 2 times greater UF concentration than individuals living in non-fluoridated
regions (Green et al., 2019; McLaren, 2016; Till et al., 2018). These findings underscore the
importance of measuring exposure levels as a function of CWF status, especially in the context
of risk assessment studies. For example, the Canadian Health Measures Survey 2007-2009 Oral
Health Component reports a prevalence of less than 13% for mild to more severe forms of
fluorosis (Health Canada, 2010b). However, given the strong influence of CWF on overall
fluoride exposure, is it essential to understand what proportion of children with and without
CWF have fluorosis.
Tap water fluoride predicted UFSG concentration such that for every 1 mg/L increase in
tap water fluoride, there is a predicted increase of 0.48 mg/L UFSG, after controlling for
covariates. However, the correlation between tap water fluoride and UFSG was strongest for
adults ages 19 to 39 (r = .42) and adults ages 40 to 59 (r = .44) and weakest for children ages 3 to
6 (r = .18). These results suggest that young children (i.e., those ages 3 to 6 years old) receive
fluoride from sources other than CWF or are more likely to absorb fluoride into developing bone.
These sources may include fluoride-containing products (e.g., Teflon), pharmaceuticals,
pesticides, dental products (e.g., toothpaste, mouth rinses) or beverages such as soda and juice
made with fluoridated water. For example, white grape juice has the highest level of fluoride
64
among juices (with a mean of 1.45 mg/L) due to the use of cryolite as a pesticide on grapes
(United States Environmental Protection Agency, 2010). Another study found that a town
receiving CWF at 1.08 mg/L had higher levels of fluoride in home-prepared juices, soups, tea,
coffee, and other foods and beverages prepared with tap water than a Canadian town with low
levels of naturally occurring fluoride at 0.23 mg/L (Clovis & Hargreaves, 1988 as cited in United
States Environmental Protection Agency, 2010). A relative source contribution analysis by the
United States Environmental Protection Agency (2010) determined that water and other
beverages account for approximately 60% of dietary fluoride intake among adults, but only 40%
of dietary fluoride intake for children 1 to 10 years old. Therefore, it is possible that tap water
fluoride was only weakly correlated with UFSG in young children because they receive most of
their fluoride from other sources, such as commercially prepared juices and fluoridated dental
products.
Demographic Predictors of Exposure
Demographic characteristics such as age and sex were related to important differences in
urinary fluoride levels. For example, we found children and adolescents living in both
fluoridated and non-fluoridated regions had lower levels of fluoride excretion compared with
adults. Previous studies have found that young children (aged 1 to 4 years) have a higher daily
intake of fluoride from various sources as compared with adults, regardless of CWF status
(Health Canada, 2010a), suggesting that lower excretion of fluoride in children may be due to
increased fluoride absorption during periods of bone growth (Jha, Mishra, Sharma, &
Damodaran, 2011; World Health Organization, 1997). Further, women aged 60 to 79 living in
fluoridated regions had the highest level of UFSG at 1.56 mg/L, followed by women aged 40 to
59 at 1.51 mg/L. Men age 7 to 18 living in non-fluoridated regions had the lowest levels of UFSG

65
at 0.43 mg/L. The overall finding that women have higher UF than men is consistent with the
Canadian Health Measures Survey (CHMS) Cycle 3 Biomonitoring Report (Health Canada,
2015). One reason that older women have higher UFSG than men is due to increased fluoride
release from bone after menopause (Itai et al., 2010), as well as consuming more tea, which
contains high levels of fluoride (Malinowska et al., 2008).
Urinary fluoride levels have also been shown to vary by ethnicity. In one study, Hispanic
adolescents from the United States aged 12 to 19 years had significant lower fluoride in plasma
samples than non-Hispanic whites (Jain, 2017). Our study did not find that ethnicity significantly
predicted UF, although this could be due to the fact that our sample was 73% white.
Other Exposure Factors
Tea consumption over the past year predicted UFSG concentration such that compared
with individuals who did not drink tea, people who reported drinking green, black, or white tea
had a 0.13 mg/L higher level of UFSG, controlling for covariates. This finding is consistent with
previous research which demonstrates the contribution of tea to urinary fluoride levels (Fung et
al., 1999, Malinowska et al., 2008; Till et al., 2018).
Further, smoking cigarettes has been found to modify fluoride metabolism such that
individuals who smoke cigarettes have been reported to have significantly higher levels of
fluoride in plasma (Jain, 2017). Consistent with this finding, we found that individuals who live
in homes in which smoking is not permitted have 0.25 mg/L lower UFSG compared with those
who live in homes in which smoking is permitted inside.
We found that participants who reported using a fluoridated product (such as toothpaste
or mouthwash) less than six hours before the urine sample was collected had higher levels of
UFSG than those who did not. As expected, this effect was especially strong for children ages 3 to
66
6, who had a mean UF of 0.81 mg/L if they used a fluoridated product less than six hours before
the sample compared with a mean UF of 0.62 mg/L if they had not used a fluoridated product
within six hours of the sample. This result is consistent with a study from Nigeria which found
that diet and toothpaste ingestion were the primary sources of fluoride intake in children ages 4
to 8 years old (Ibiyemi, Zohoori, Valentine, & Maguire, 2018). These findings show that urinary
fluoride varies substantially depending on participant behaviour prior to sampling. To account
for this variation, future studies that use urinary fluoride as a biomarker would benefit from the
use of multiple spot samples whenever possible, especially if the sample includes young children.
Relatedly, because only a single spot sample was taken, it is also possible that the urinary
fluoride levels reported were influenced by behaviours prior to sampling and may not be
representative of long-term fluoride exposure; these behaviours include having varnish
professionally applied or swallowing toothpaste prior to urine sampling. To further investigate
this possibility, we examined urinary fluoride concentration by age and recency of toothpaste
use. Young children (ages 3 to 6) who reportedly used a fluoridated product (such as toothpaste
or mouthwash) less than six hours before the urine sample collection had significantly higher
levels of UFSG compared to those who reported using a fluoridated product more than six hours
before the sample collection. This result is consistent with previous research on the impact of
accidental toothpaste ingestion on urinary fluoride levels in young children whose spitting reflex
is not fully developed (Ibiyemi et al., 2018; Thornton-Evans et al., 2019). Our findings also
concur with previous studies showing increases in urinary fluoride in children aged 5–8 years
after using fluoride containing-dental varnishes (García-Hoyos, Barbería, García-Camba, &
Varela, 2012). These findings underscore the importance of inquiring about recent behaviours
when measuring urinary fluoride levels.
67
Strengths and Limitations
A strength of this study was the use of biomarkers, corrected for dilution, and assessment
of various sources of fluoride to understand how different factors contribute to fluoride levels
across the lifespan. Other strengths include the large sample size and the fact that multiple sites
were recruited. The relatively even sampling of sites that do and do not receive CWF facilitated
our use of CWF status as a predictor.
One limitation of the current study is that the CHMS used only a single urinary fluoride
spot sample. Because urinary fluoride levels in spot samples can fluctuate due to the rapid
elimination kinetics of fluoride and also due to differences in lifestyle factors such as beverage
consumption and use of fluoridated dental products, it would be ideal to obtain multiple urine
samples over time to calculate more stable estimates of fluoride excretion. Further, we did not
measure the amount of water each participant consumes per day to estimate total exposure
(intake) from water consumption. Additional studies are needed to assess the relationship
between fluoride intake, absorption, and excretion across demographic characteristics such as
age and sex. We also cannot rule out the possibility that urinary fluoride values may capture
acute exposures to very high fluoride exposures, such as professionally applied varnish or
fluoridated anaesthetics. This study was also cross-sectional, examining contemporaneous
fluoride excretion and predictors such as age. To better understand how urinary fluoride
changes over the lifespan, it would be helpful to conduct longitudinal research with the same
participants over time.
In conclusion, CWF was associated with UFSG, demonstrating that fluoride in drinking
water supplies is an important contributor to overall fluoride exposure for both children and
adults. However, depending on age, there are other factors that impact UF concentration, such
68
as the recency of dental product use. There are multiple sources of fluoride exposure, including
CWF, and a growing number of studies raise the possibility of adverse health effects from
fluoride exposure in the developing fetus (Bashash et al., 2017; Green et al., 2019) young
children (Choi et al., 2015; Riddell, Malin, Flora, McCague, & Till, 2019), and in other
vulnerable populations, such as those who are iodine deficient (Malin, Riddell, McCague, &
Till, 2018). The mean UFSG levels in our sample (0.58 mg/L to 1.06 mg/L, depending on CWF
status) are within the range reported by studies showing adverse effects. For example, Green
and colleagues (2019) found that pregnant women living in areas with fluoridated tap water
had a mean UFSG concentration of 0.69 mg/L, and that each 1 mg/L higher maternal UFSG was
associated with a 4.49-point lower IQ score in boys. Similarly, Bashash and colleagues (2017)
found that mothers in Mexico had mean UF levels of 0.9 mg/L, and each 0.5 mg/L higher
maternal UFSG was associated with 3.15-point lower IQ in their children.
More research is needed to understand fluoride intake and circulating fluoride levels in
elderly populations, including those with disorders that may impact fluoride metabolism such as
kidney dysfunction. Important questions remain regarding differences in UF across demographic
groups (e.g. sex, age, ethnicity, etc.), and whether the levels of UF in the present study are
associated with adverse outcomes for these groups. Further research is needed to quantify human
fluoride exposure levels and identify subgroups who may have especially high levels of exposure,
such as elderly women. This information is critical for informing public health
recommendations and weighing the benefits of fluoride for the prevention dental caries with
potential health risks associated with ingestion.
69
Chapter Four: General Discussion
This dissertation used Canadian biomonitoring data to examine urinary fluoride levels by
fluoridation status and demographic variables and to assess the relationship between fluoride
excretion and attention outcomes. In the first study, we found that Canadian youth exposed to
higher tap water fluoride levels had a higher risk of receiving an ADHD diagnosis and reported
more symptoms of hyperactivity and inattention. Specifically, an increase of 1.0 mg/L in water
fluoride concentration was associated with 6.1 times higher odds of an ADHD diagnosis and a
1.5 increase in the SDQ hyperactivity/inattention subscale score while controlling for known
predictors of ADHD such as child sex, lead exposure, and smoking in the home. Importantly,
most of the participants had water fluoride levels lower than 1 mg/L, with the 95th percentile at
0.7 mg/L. To contextualize these results, the difference in water fluoride concentration between
cities with and without community water fluoridation (CWF) is approximately 0.5 mg/L. An
increase of 0.5 mg/L in water fluoride concentration would be associated with 2.5 times higher
odds of an ADHD diagnosis. The prevalence of ADHD in Canada ranges from 4.8% to 6.1%
depending on the study (Charach, Lin, & To, 2010), which is an average prevalence of 5.5%. In
our study, the mean water fluoride level was 0.23 mg/L, which is much lower than the
recommended level of 0.7 mg/L. Our findings suggest that if the average water fluoride level in
Canada was raised from 0.23 mg/L to 0.73 mg/L, we could expect the prevalence rate of ADHD
to rise from 5.5% to 14%.
Our second study examined how urinary fluoride levels differ by sex and age and as a
function of living in fluoridated and non-fluoridated regions. Previous research has compared
urinary fluoride concentration by sex, age, and ethnicity but has rarely separated by CWF status
(Barberio, Quiñonez, Hosein, & McLaren, 2017;Jain, 2017). For those living in a fluoridated
70
region, women’s average level of UFSG was 1.12 mg/L, whereas men’s average level of UFSG
was 1.00 mg/L. Similarly, women living in a non-fluoridated region had a higher level of UFSG
at 0.64 mg/L compared to men at 0.51 mg/L. Our finding that women have higher urinary
fluoride than males is consistent with a recent Canadian study using urinary fluoride adjusted for
creatinine (Health Canada, 2015).
Further, our study found that children ages 7 to 11 living in non-fluoridated regions had
the lowest levels of UFSG (0.46 mg/L), followed closely by children ages 12 to 18 with a mean
UFSG of 0.47 mg/L. Further, we found that adults age 60 to 79 living in a non-fluoridated region
had 1.5 times the UFSG level of children at 0.72 mg/L. To our knowledge, no other studies have
examined differences in UFSG by age and CWF. The human biomonitoring report produced by
Health Canada (2015) also reported that children ages 12 to 19 have the lowest level of UF
adjusted for creatinine at 0.29 mg/g. However, they reported that children ages 6 to 11 had a
higher level of UF adjusted for creatinine (0.50 mg/g) compared to adults ages 20 to 39 (at 0.40
mg/g). Part of this discrepancy may be due to the use of creatinine instead of specific gravity to
control for dilution, as creatinine has been shown to vary more than specific gravity by body
size, age, and sex (Nermell et al., 2008; Moriguchi et al., 2005). This discrepancy may also be
due to the lack of separation by CWF in the Health Canada (2015) report.
In our first study, we found that water fluoride concentration was more strongly
associated with attention and hyperactivity than UF levels. This could be because UF levels in
spot samples are more likely to fluctuate due to the rapid elimination kinetics of fluoride. It could
also be the case that fluoride has an impact during particular critical periods of development,
such as the prenatal period, and contemporaneous fluoride exposure may not represent the level
of exposure during sensitive periods of development. In our second study, we found large
71
variability in urinary fluoride levels, particularly for adults (SD = 1.24 mg/L for adults ages 60 to
79 years old living in a fluoridated region compared to SD = 0.37 mg/L for children ages 12 to
18 years old living in a fluoridated region). This discrepancy is consistent with previous studies
showing greater variability in the average daily fluoride excretion of adults compared with
children (Villa et al., 2010).
Because UF only measures fluoride excretion, it is unclear whether sex and age
differences in urinary fluoride levels are due to differences in fluoride intake, fluoride absorption,
or both. In their review, the National Research Council (2006) estimated the total fluoride
exposure level of different age groups if they were to receive fluoridated tap water at 1mg/L.
They calculated the lowest fluoride exposures to occur in youth ages 13 to 19 years old (0.028
mg/kg/day) and nursing infants under age 1 (0.030 mg/kg/day). There are numerous factors that
influence fluoride excretion, including age-related differences in excretion of fluoride by kidneys
and increased fluoride absorption during periods of bone growth (Jha, Mishra, Sharma, &
Damodaran, 2011; World Health Organization, 1997). Healthy adults (ages 18 to 75) excrete
about 60% of the fluoride they ingest each day, whereas children under age 7 excrete only 45%
of their daily ingested fluoride (Buzalaf, Leite, & Buzalaf, 2015; Villa et al., 2010). Converging
evidence can be found when comparing age differences in absorption; healthy adults ages 18 to
75 absorb only 36% of daily fluoride intake whereas children under age 7 years absorb 55%
(Buzalaf et al., 2015; Villa et al., 2010). Most fluoride absorption occurs in the small intestine
and renal tubule, and can be influenced by nutritional status and diet composition (Buzalaf et al.,
2015). For example, high dietary concentrations of calcium reduce fluoride absorption (Buzalaf
et al., 2015; Whitford, 1994), resulting in higher excretion. Similarly, higher alkalinity in the
body results in excretion of a higher proportion of ingested fluoride (World Health Organization,
72
2014). A vegetarian-based diet shifts one’s pH towards alkaline, which reduces fluoride
absorption in the small intestine and renal tubule (Buzalaf et al., 2015).
Further, smoking cigarettes has been found to modify fluoride metabolism such that
individuals who smoke cigarettes have been reported to have significantly higher levels of
fluoride in plasma (Jain, 2017). In our second study, we found that individuals ages 3 to 79 who
live in homes in which smoking is not permitted have 0.25 mg/L lower UFSG compared with
those who live in homes in which smoking is permitted inside the home. Conversely, in our first
study, we found that children ages 6 to 17 who live in homes in which smoking is not permitted
have a higher level of UFSG (0.63 mg/L) compared to those who live in homes in which smoking
is permitted inside the home (0.57 mg/L). In this first study, the number of children who live in
homes in which smoking is permitted was very small (n= 216 youth), and thus this finding may
not be generalizable.
For adolescents (age 14) in our first study, living in a fluoridated region was associated
with a 0.7-point higher SDQ hyperactivity/inattention subscale score and 2.8 times greater odds
of being diagnosed with ADHD. The relationship between CWF status and attention outcomes,
however, was not significant for younger children (age 8), even though UF levels were similar
(or lower) among adolescents (0.79 mg/L) compared with younger children (0.88 mg/L) living in
a region with CWF. This finding that the relationship between fluoride and attention outcomes is
present only for adolescents is surprising, given that most studies have found strong relationships
between prenatal/early postnatal fluoride exposure and lower IQ (Bashash et al., 2017;
Grandjean, 2019; Green et al., 2019). It is possible that impairments in attention result from
chronic fluoride exposure, meaning that effects are only evident in older children. Or, deficits in
attentional processes may not emerge until early adolescence when attentional demands increase
73
and synaptic pruning occurs in the frontal lobes, which are responsible for executive functioning
(Willcutt, Doyle, Nigg, Faraone, & Pennington, 2005). It is also possible that the association
between urinary fluoride and attention/hyperactivity could be obscured due to reduced fluoride
excretion (i.e., increased fluoride absorption) during a high growth spurt stage (Jha et al., 2011;
World Health Organization, 1997). For example, Vatanparast, Bailey, Baxter-Jones, and Whiting
(2010) found that boys ages 9 to 18 boys accrued an average of 199 grams bone mineral content
per year, with the most bone growth occurring between of 13 and 14 years old, whereas girls
accrued 138 grams of bone per year, with the most bone growth occurring between 12 and 13
years of age (Vatanparast et al., 2010).
Inflammation as a Potential Mechanism in the Association Between Fluoride Exposure and
Attention Outcomes
It has been well documented in animal models that even low levels of fluoride result in
greater oxidative stress (Banala & Karnati, 2015; Bartos et al., 2018; Chouhan, Lomash, & Flora,
2010; Reddy et al., 2014; Zhang, Lou, & Guan, 2015). For example, Chouhan and colleagues
(2010) found that rats exposed to fluoridated water at a concentration of 1 mg/L for four months
showed more oxidative stress and alterations in neurotransmitters compared to rats exposed to
non-fluoridated water. Further, fluoride has been linked with increased catalase
immunoreactivity in rats (Güner, Uyar-Bozkurt, Haznedaroğlu, & Menteş, 2016) as well as
increases in reactive oxygen species formation and an inflammatory response (Akinrinade,
Memudu, Ogundele, & Ajetunmobi, 2015). According to a recent meta-analysis, inflammation
may play a role in the development of ADHD (Anand, Colpo, Zeni, Zeni, & Teixeira, 2017).
Studies with rats illustrated that the administration of cytokines (e.g., interleukin-1β, interleukin-
2 interleukin-6) can result in increased norepinephrine and reduced dopamine levels; these
74
changes in neurotransmitter levels are also observed in humans with ADHD (Anisman,
Kokkinidis, & Merali, 1996; Zalcman et al., 1994). More recently, it has been suggested that
several genes implicated in ADHD are also implicated in immune function (Dunn, Nigg, &
Sullivan, 2019; Verlaet, Noriega, Hermans, & Savelkoul, 2014). The meta-analysis by Anand
and colleagues (2017) showed elevated cytokine levels in blood or cerebrospinal fluid in
individuals with ADHD compared with those without ADHD (Anand et al., 2017). A study of
40,000 adults from Taiwan found that individuals with ADHD had a significantly greater
prevalence of autoimmune diseases including ankylosing spondylitis, ulcerative colitis, and
autoimmune thyroid disease compared to controls without ADHD (Chen et al., 2017). Several
maternal somatic diseases with immune components, including multiple sclerosis, rheumatoid
arthritis, type 1 diabetes, and hypothyroidism, have been found to increase the risk of ADHD in
offspring (Instanes et al., 2017). In particular, exaggerated central nervous system inflammatory
response in the mother between 32 and 40 weeks gestation has been implicated as a potential
factor in the development of ADHD in offspring (Strickland, 2014). Furthermore, chronic T-cell-
mediated neuroinflammation and oxidative stress could lead to ADHD symptoms in those with
genetic susceptibility (Verlaet et al., 2014). Other research has pointed to the roles of
mitochondrial dysfunction, oxidative stress, inflammation, and decreased melatonin levels in the
relationship between fluoride exposure and Autism Spectrum Disorder (Strunecka & Strunecky,
2019), which commonly co-occurs with ADHD (Antshel, Zhang-James, Wagner, Ledesma, &
Faraone, 2016). More research is needed to explore the possibility of inflammation as a
mechanism by which fluoride exposure leads to ADHD symptoms.
75
Limitations
Although UF is the most commonly used biomarker of fluoride exposure (Zohouri,
Swinbank, Maguire, & Moynihan, 2006), there are several limitations regarding use of UF for
this purpose, even with adjustment for dilution. Measurement error is more likely with one spot
sample than 24-hour urine collection. Further, there is known to be temporal variation in UF
concentrations due to rapid absorption and elimination of fluoride (Martinez-Mier, 2012;
Whitford, 1996). This variation results in UF measuring excretion resulting from recent fluoride
exposure (i.e., within the past 11 to 15 hours). Although the CHMS lacked standardization with
respect to the time that the spot samples were collected, studies comparing first morning spot
samples to 24-hour collections have found good correspondence (r = .83; Zohouri et al., 2006),
and in our sample, the correlation between time of day and UFSG was near zero (r = -.03).
Further, the World Health Organization (2014) states that “plots of daily urinary fluoride
excretion against total daily fluoride intake suggest that daily urinary fluoride excretion is
suitable for predicting fluoride intake for groups of people, but not individuals.” Nonetheless,
uncontrolled lifestyle or environmental factors that were not measured in the current study, such
as consuming low-fluoride bottled water prior to sampling, may have resulted in atypical UF
values for that individual. Urinary fluoride is not a perfect measure of fluoride intake, but it is
considered the optimal biomarker of concurrent fluoride exposure (Rugg-Gunn, Villa, &
Buzalaf, 2011).
The CHMS measured fluoride in spot urine samples (i.e., excretion) and fluoride in tap
water samples. Because fluoride from tap water is only one source of fluoride exposure, we
were not able to examine the association between total fluoride exposure and ADHD. Although
difficult, it would be advantageous to determine the extent of the relationship between overall
76
fluoride intake (i.e. from all sources) and the development of ADHD. It would be especially
useful to conduct a longitudinal study to measure fluoride exposure during critical periods of
brain development, such as prenatally, and subsequent attention outcomes. Future studies could
use gold standard measures of ADHD diagnosis, such as a diagnostic interview and
information from collateral sources to confirm that symptoms are present across settings (e.g.,
home and school). On one hand, the fact that the CHMS is cross-sectional limits our ability to
make causal inferences concerning the development of ADHD due to fluoride exposure.
However, in areas where fluoridation has existed for decades, one can assume that a cross-
sectional study may serve as a proxy to prenatal exposure. Indeed, a recent report by the
National Academy of Sciences used cross-sectional studies of dental fluorosis conducted in
China as being indicative of early-life exposure to fluoride given that the presence of dental
fluorosis is evidence that exposure to fluoride occurred in the first few years of life. Thus, they
consider cross-sectional studies in areas that have had high levels of fluoride over a long period
of time to be functionally prospective (National Toxicology Program, 2019).
Conclusions and Implications for Public Policy
Higher tap water fluoride levels and fluoridation of municipal water supplies were
associated with a higher risk of an ADHD diagnosis as well as increased symptoms of
hyperactivity and inattention, especially among adolescents. Additionally, adolescent boys had
the lowest levels of fluoride excretion, suggesting that they may be absorbing higher levels of
fluoride than adolescent girls or adults. Although this study is cross-sectional, it should be
considered along with other studies showing the adverse neurodevelopmental impact of fluoride
exposure. Higher levels of fetal fluoride exposure have been associated with lower IQ (Choi,
Sun, Zhang, & Grandjean, 2012; Green et al., 2019; Bashash et al., 2017; Jiménez et al., 2017)

77
and increased risk of ADHD symptoms (Bashash et al., 2018). Furthermore, we have carefully
considered numerous potential confounders which have been previously linked with ADHD
diagnoses, including lead exposure and smoking in the home. We have also considered
numerous variables which may modify fluoride excretion, such as age, sex, ethnicity, and BMI.
Tap water fluoride and CWF status uniquely predicted ADHD diagnosis and SDQ score over
and above the effects of these known risk factors for ADHD and covariates.
Due to their body weight, infants may be at particularly high risk of over-exposure to
fluoride. To reduce the likelihood of fluorosis, breast-feeding or use of non-fluoridated water to
reconstitute formula is recommended (Brothwell & Limeback, 2003; Fomon et al., 2000).
However, national organizations across Canada and the United States continue to endorse use of
fluoridated tap water to reconstitute infant formula (because fluorosis is seen as being very mild
to mild and is thus not considered to be an adverse health effect). Health Canada (2013) states
that infant formula can be prepared with water fluoridated at the “optimal” level. Similarly, the
American Dental Association (ADA) recommends that parents use optimally fluoridated water to
reconstitute infant formula, but also also recommends that formula should be reconsituted with
non-fluoridated water if dental fluorisis is a concern (American Dental Association, 2010). This
is where water fluoridation becomes a social justice issue as some families may not have the
means to access non-fluoridated water for their infant. The potential impact of overexposure to
fluoride in infancy is of concern given that about 75% of U.S. mothers who use powdered infant
formula report that they reconstitute the formula using tap water (Centers for Disease Control
and Prevention, 2015). More research and policy work is needed to ensure that infants,
particularly those from families with low socioeconomic status, are not over-exposed to fluoride.
78
Controversy about the safety of water fluoridation has led scientific advisory groups to
recommend additional research on fluoride toxicity. Because of the unique vulnerability of the
developing brain, the potential for adverse neurodevelopmental outcomes as a consequence of
early childhood fluoride exposure is of high public health relevance for Canadians and other
populations. Some groups may be more at risk than others, such as individuals with genetic
susceptibility, those consuming large amounts of fluoridated tap water, infants receiving formula
reconstituted with fluoridated tap water (Till et al., 2020), young children ingesting toothpaste,
postmenopausal women, individuals with renal disorders, and those with immune conditions. To
make policy recommendations regarding CWF, it is essential to differentiate between water
fluoride level and total fluoride exposure, as fluoride from CWF is just one source of exposure.
Further, it is essential to understand how total fluoride exposure is linked with adverse outcomes
such as increased risk of an ADHD diagnosis. Once these associations have been established,
alternatives to this widespread public health intervention can be considered to minimize the risk
of adverse outcomes, particularly among subgroups with higher exposure. When applied
topically, fluoride is effective in reducing the incidence of dental caries, slowing the progression
of existing lesions, and preventing new caries from forming (Centers for Disease Control and
Prevention, 2001). When left untreated, dental caries can result in pain, tooth loss, and may lead
to systemic infection, which has a negative impact on overall health. For example, research has
found a link between oral infections and chronic cardiovascular disease (Slavkin & Baum, 2000).
Thus, policy makers must find a way to promote the benefits of topically-applied fluoride for
dental health while reducing the risks of ingesting fluoride on the developing brain.
79
References Ahmed, I., Rafique, T., Hasan, S.K., Khan, N., Khan, M.H., & Usmani, T.H. (2012). Correlation
of fluoride in drinking water with urine, blood plasma, and serum fluoride levels of
people consuming high and low fluoride drinking water in Pakistan. Fluoride, 45, 384–
388.
Akinrinade, I. D., Memudu, A. E., Ogundele, O. M., & Ajetunmobi, O. I. (2015). Interplay of
glia activation and oxidative stress formation in fluoride and aluminium exposure.
Pathophysiology, 22(1), 39-48.
American Dental Association (2010). Reconstituted Infant Formula and Enamel Fluorosis:
Evidence-based Clinical Recommendations. Available from:
http://ebd.ada.org/~/media/EBD/Files/ADA_Evidence-
based_Infant_Formula_Chairside_Guide.ashx
American Psychiatric Association (2013). Diagnostic and Statistical Manual of Mental
Disorders, Fifth Edition. Washington, USA: American Psychiatric Publishing.
Anand, D., Colpo, G. D., Zeni, G., Zeni, C. P., & Teixeira, A. L. (2017). Attention-
deficit/hyperactivity disorder and inflammation: what does current knowledge tell us? A
systematic review. Frontiers in Psychiatry, 8, 228.
Anisman, H., Kokkinidis, L., & Merali, Z. (1996). Interleukin-2 decreases accumbal dopamine
efflux and responding for rewarding lateral hypothalamic stimulation. Brain research,
731(1-2), 1-11.
Antshel, K. M., Zhang-James, Y., Wagner, K. E., Ledesma, A., & Faraone, S. V. (2016). An
update on the comorbidity of ADHD and ASD: A focus on clinical management. Expert
Review of Neurotherapeutics, 16(3), 279-293.
80
Australian Government (2007). A Systematic Review of the Efficacy and Safety of Fluoridation,
Part A: Review Methodology and Results.
Aylward, L. L., Hays, S. M., Vezina, A., Deveau, M., St-Amand, A., & Nong, A. (2015).
Biomonitoring Equivalents for interpretation of urinary fluoride. Regulatory Toxicology
and Pharmacology, 72(1), 158-167.
Banala, R. R., & Karnati, P. R. (2015). Vitamin A deficiency: an oxidative stress marker in
sodium fluoride (NaF) induced oxidative damage in developing rat brain. International
Journal of Developmental Neuroscience, 47, 298-303.
Barkley, R. A. (Ed.). (2014). Attention-deficit hyperactivity disorder: A handbook for diagnosis
and treatment. Guilford Publications.
Barberio, A. M., Quiñonez, C., Hosein, F. S., & McLaren, L. (2017). Fluoride exposure and
reported learning disability diagnosis among Canadian children: Implications for
community water fluoridation. Canadian Journal of Public Health, 108(3), 229-239.
Barr, D. B., Wilder, L. C., Caudill, S. P., Gonzalez, A. J., Needham, L. L., Pirkle, J. L. (2005).
Urinary creatinine concentrations in the U.S. population: Implications for urinary
biologic monitoring measurements. Environ Health Perspectives, 113(2),192-200.
doi:10.1289/ehp.7337.
Bartos, M., Gumilar, F., Gallegos, C. E., Bras, C., Dominguez, S., Mónaco, N., Esandib, M. C.,
Bouzatb, C., Cancelac, L.M., & Minetti, A. (2018). Alterations in the memory of rat
offspring exposed to low levels of fluoride during gestation and lactation: Involvement of
the α7 nicotinic receptor and oxidative stress. Reproductive Toxicology, 81, 108-114.
Bashash, M., Marchand, M., Hu, H., Till, C., Martinez-Mier, E. A., Sanchez, B. N., Basu, N.,
81
Peterson, K. E., Green, R., Schnaas, L., Mercado-García, A., Hernández-Avila, M., &
María Téllez-Rojoi, M. (2018). Prenatal fluoride exposure and attention deficit
hyperactivity disorder (ADHD) symptoms in children at 6–12 years of age in Mexico
City. Environment International, 121, 658-666.
Bashash, M., Thomas, D., Hu, H., Angeles Martinez-Mier, E., Sanchez, B. N., Basu, N.,
Peterson, K.E., Ettinger, A.S., Wright, R., Zhang, Z., Liu, Y., Schnaas, L., Mercado-
García, A., Téllez-Rojo, M.M., & Hernández-Avila, M. (2017). Prenatal fluoride
exposure and cognitive outcomes in children at 4 and 6–12 years of age in Mexico.
Environmental Health Perspectives, 125(9), 097017.
Bhatnagar, M., Rao, P., Jain, S., & Bhatnagar, R. (2002). Neurotoxicity of fluoride:
neurodegeneration in hippocampus of female mice. Indian Journal of Experimental
Biology, 40, 546-554.
Bhatnagar, M., Sukhwal, P., Suhalka, P., Jain, A., Joshi, C., & Sharma, D. (2011). Effects of
fluoride in drinking water on NADPH-diaphorase neurons in the forebrain of mice: A
possible mechanism of fluoride neurotoxicity. Fluoride, 44(4), 195.
Biederman, J. (2005). Attention-deficit/hyperactivity disorder: a selective overview. Biological
Psychiatry, 57(11), 1215-1220.
Biederman, J., Milberger, S., Faraone, S. V., Kiely, K., Guite, J., Mick, E., & Reed, E. (1995).
Family-environment risk factors for attention-deficit hyperactivity disorder: A test of
Rutter's indicators of adversity. Archives of general psychiatry, 52(6), 464-470.
Boomsma, D. I., Saviouk, V., Hottenga, J. J., Distel, M. A., De Moor, M. H., Vink, J. M., Geels,
L. M., van Beek, J. H. D. A., Bartels, M., de Geus, E. J. C., Willemsen, G. (2010).
Genetic epidemiology of attention deficit hyperactivity disorder (ADHD index) in adults.
82
PloS one, 5(5), e10621.
Brothwell, D., & Limeback, H. (2003). Breastfeeding is protective against dental fluorosis in a
nonfluoridated rural area of Ontario, Canada. Journal of Human Lactation, 19(4), 386-
390.
Brault, M. C., & Lacourse, É. (2012). Prevalence of prescribed attention-deficit hyperactivity
disorder medications and diagnosis among Canadian preschoolers and school-age
children: 1994–2007. The Canadian Journal of Psychiatry, 57(2), 93-101.
Broadbent, J. M., Thomson, W. M., Ramrakha, S., Moffitt, T. E., Zeng, J., Foster Page, L. A., &
Poulton, R. (2015). Community water fluoridation and intelligence: prospective study in
New Zealand. American Journal of Public Health, 105(1), 72-76.
Brown, R. A., Cornwell, D. A., & MacPhee, M. J. (2004). Trace contaminants in water treatment
chemicals: sources and fate. American Water Works Association, 96(12), 111-
125.
Buzalaf, M. A. R., & Whitford, G. M. (2011). Fluoride metabolism. In Fluoride and the Oral
Environment (Vol. 22, pp. 20-36). Karger Publishers.
Buzalaf, C. P., Leite, A. D. L., & Buzalaf, M. A. R. (2015). Fluoride metabolism. In V.R. Preedy
(Ed.), Food and Nutritional Components in Focus No. 6 - Fluorine: Chemistry, Analysis,
Function and Effects (pp. 54 – 72). United Kingdom: Royal Society of Chemistry.
CADTH (2019). Community Water Fluoridation Programs: A Health Technology Assessment.
Available from: https://www.cadth.ca/sites/default/files/pdf/HT0022%20CWF%20-
%20Clinical%20report.pdf
Centers for Disease Control and Prevention (2015). Infant Feeding Practices Study II - Table 3.9.
83
Percent of babies who were put to bed with a bottle of formula, breast milk, juice, juice
drink, or any other kind of milk at each frequency in the past 2 weeks by infant age.
Retrieved February 6 2016 from https://www.cdc.gov/breastfeeding/data/ifps/results.htm.
Centers for Disease Control and Prevention (2014). Fluoridation Statistics. Retrieved from
https://www.cdc.gov/fluoridation/statistics/2014stats.htm
Centers for Disease Control and Prevention (2001). Recommendations for using fluoride to
prevent and control dental caries in the United States. Morbid Mortal Weekly Review,
50(14), 1-42.
Centers for Disease Control and Prevention (1999). Ten great public health achievements-
-United States, 1900-1999. Morbidity and Mortality Weekly Report, 48(12), 241.
Charach, A., Lin, E., & To, T. (2010). Evaluating the hyperactivity/inattention subscale of the
national longitudinal survey of children and youth. Health Reports, 21(2), 45 – 52.
Chen, J., Niu, Q., Xia, T., Zhou, G., Li, P., Zhao, Q., Chunyan, X., Dong, L., Zhang, S., &
Wang, A. (2018). ERK1/2-mediated disruption of BDNF–TrkB signaling causes synaptic
impairment contributing to fluoride–induced developmental neurotoxicity. Toxicology,
410, 222-230.
Chen, J., Shan, K. R., Long, Y. G., Wang, Y. N., Nordberg, A., & Guan, Z. Z. (2003). Selective
decreases of nicotinic acetylcholine receptors in PC12 cells exposed to
fluoride. Toxicology, 183(1), 235-242.
Chen, M. H., Su, T. P., Chen, Y. S., Hsu, J. W., Huang, K. L., Chang, W. H., Chen, T. J., & Bai,
Y. M. (2017). Comorbidity of allergic and autoimmune diseases among patients with ADHD: a nationwide population-based study. Journal of Attention Disorders, 21(3), 219- 227.

84
Cheng, K. K., Chalmers, I., & Sheldon, T.A. (2007). Adding fluoride to water supplies. British
Medical Journal, 335, 699-702.
Choi, A. L., Sun, G., Zhang, Y., & Grandjean, P. (2012). Developmental fluoride neurotoxicity:
a systematic review and meta-analysis. Environmental Health Perspectives, 120(10),
1362-1368. doi:10.1289/ehp.1104912.
Choi, A. L., Zhang, Y., Sun, G., Bellinger, D. C., Wang, K., Yang, X. J., Li, J. S., Zheng, Q., Fu,
Y., & Grandjean, P. (2015). Association of lifetime exposure to fluoride and cognitive
functions in Chinese children: A pilot study. Neurotoxicology and teratology, 47, 96-101.
Chouhan, S., & Flora, S. J. S. (2008). Effects of fluoride on the tissue oxidative stress and
apoptosis in rats: biochemical assays supported by IR spectroscopy
data. Toxicology, 254(1), 61-67.
Chouhan, S., Lomash, V., & Flora, S. J. S. (2010). Fluoride-induced changes in haem
biosynthesis pathway, neurological variables and tissue histopathology of rats. Journal of
Applied Toxicology, 30(1), 63-73.
City of Toronto (2011). Water Fluoridation in Toronto. Retrieved from:
http://www.toronto.ca/legdocs/mmis/2011/hl/bgrd/backgroundfile-36795.pdf.
Conners, C. K., Staff, M. H. S., Connelly, V., Campbell, S., MacLean, M., & Barnes, J. (2000).
Conners’ continuous performance Test II (CPT II v. 5). Multi-Health System Inc, 29,
175-96.
Coplan, M.J., & Masters, R.D. (2001). Silicofluorides and fluoridation. Fluoride 34(3), 161-164.
Coplan, M. J., Patch, S. C., Masters, R. D., & Bachman, M. S. (2007). Confirmation of and
85
explanations for elevated blood lead and other disorders in children exposed to water
disinfection and fluoridation chemicals. Neurotoxicology, 28(5), 1032-1042.
doi:10.1016/j.neuro.2007.02.012.
Cross, D. W., & Carton, R. J. (2003). Fluoridation: A Violation of Medical Ethics and
Human Rights. International Journal of Occupational Environmental Health, 9, 24 – 29.
Dabeka, R. W., Karpinski, K. F., McKenzie, A. D., & Bajdik, C. D. (1986). Survey of lead,
cadmium and fluoride in human milk and correlation of levels with environmental and
food factors. Food and Chemical Toxicology, 24(9), 913-921. doi:10.1016/0278-
6915(86)90318-2.
Das, K., & Mondal, N. K. (2016). Dental fluorosis and urinary fluoride concentration as a
reflection of fluoride exposure and its impact on IQ level and BMI of children of
Laxmisagar, Simlapal Block of Bankura District, WB, India. Environmental Monitoring
and Assessment, 188(4), 1-14.
Davids, E., & Gastpar, M. (2005). Attention deficit hyperactivity disorder and borderline
personality disorder. Progress in Neuro-Psychopharmacology and Biological Psychiatry,
29(6), 865-877.
Day, B., Langlois, R., Tremblay, M., & Knoppers, B. M. (2006). Canadian Health Measures
Survey: ethical, legal and social issues. Health Reports, 18(Suppl), 37-51.
Dela Cruz, G.G., Rozier, R.G., & Bawden, J.W. (2008). Fluoride concentration in dentin of
exfoliated primary teeth as a biomarker for cumulative fluoride exposure. Caries Res 42,
419–428.
Donzelli, G., Carducci, A., Llopis-Gonzalez, A., Verani, M., Llopis-Morales, A., Cioni, L., &
Morales-Suarez-Varela, M. (2019). The Association between Lead and Attention-
86
Deficit/Hyperactivity Disorder: A Systematic Review. International Journal of
Environmental Research and Public Health, 16(3), 382.
Dunipace, A. J., Brizendine, E. J., Zhang, W., Wilson, M. E., Miller, L. L., Katz, B. P., Warrick,
J.M., & Stookey, G. K. (1995). Effect of aging on animal response to chronic fluoride
exposure. Journal of Dental Research, 74(1), 358-368.
Dunn, G. A., Nigg, J. T., & Sullivan, E. L. (2019). Neuroinflammation as a risk factor for
attention deficit hyperactivity disorder. Pharmacology Biochemistry and Behavior, 182, 22-34.
Ekstrand, J., Boreus, L. O., & De Chateau, P. (1981). No evidence of transfer of fluoride from
plasma to breast milk. British Medical Journal (Clinical Research Edition), 283(6294),
761.
Eubig, P. A., Aguiar, A., & Schantz, S. L. (2010). Lead and PCBs as risk factors for attention
deficit/hyperactivity disorder. Environmental health perspectives, 118(12), 1654.
doi:10.1289/ehp.0901852.
Faraone, S. V., Biederman, J., & Mick, E. (2006). The age-dependent decline of attention deficit
hyperactivity disorder: a meta-analysis of follow-up studies. Psychological Medicine,
36(2), 159-165.
Fejerskov, O., Ekstrand, J., & Burt, B. A. (Eds.; 1994). Fluoride in Dentistry, 2nd edition.
Munksgaard International Publishers.
Fergusson, D. M., Boden, J. M., & Horwood, L. J. (2008). Dentine lead levels in childhood and
criminal behaviour in late adolescence and early adulthood. Journal of Epidemiology and
Community Health, 62(12), 1045-1050.
Fomon, S. J., Ekstrand, J., & Ziegler, E. E. (2000). Fluoride intake and prevalence of dental
87
fluorosis: Trends in fluoride intake with special attention to Infants: Review &
commentary. Journal of Public Health Dentistry, 60(3), 131-139.
Friedman, L. A., & Rapoport, J. L. (2015). Brain development in ADHD. Current opinion in
Neurobiology, 30, 106-111.
Fung, K.F., Zhang, Z.Q., Wong J.W., Wong, M.H. (1999). Fluoride contents in tea and soil from
tea plantations and the release of fluoride into tea liquor during infusion. Environ Pollut
104, 197-205.
Gao, Q., Liu, Y. J., & Guan, Z. Z. (2009). Decreased learning and memory ability in rats with
fluorosis: increased oxidative stress and reduced cholinesterase activity in the
brain. Fluoride, 42(4), 266-274.
García-Hoyos, F., Barbería, E., García-Camba, P., & Varela, M. (2012). Renal fluoride excretion
in children following topical application of fluoride varnish. European Journal of
Paediatric Dentist, 13(4), 280-284.
Goodlad, J. K., Marcus, D. K., & Fulton, J. J. (2013). Lead and attention-deficit/hyperactivity
disorder (ADHD) symptoms: A meta-analysis. Clinical Psychology Review, 33(3), 417-
425.
Goodman, R. (2001). Psychometric properties of the strengths and difficulties
questionnaire. Journal of the American Academy of Child & Adolescent
Psychiatry, 40(11), 1337-1345.
Goodman, R. (1997). The Strengths and Difficulties Questionnaire: a research note. Journal of
Child Psychology and Psychiatry, 38(5), 581-586.
Gori, S., Inno, A., Malfatti, V., Severi, F., Alongi, F., Carbognin, G., Romano, L., Pasetto, S., &
Salgarello, M. (2015). 18F-Sodium Fluoride PET–CT for the Assessment of Brain
88
Metastasis from Lung Adenocarcinoma. Journal of Thoracic Oncology, 10(8), e67-e68.
Grandjean, P. (2019). Developmental fluoride neurotoxicity: an updated review. Environmental
Health, 18(1), 1-17.
Grandjean, P., & Landrigan, P. J. (2014). Neurobehavioural effects of developmental toxicity.
The Lancet Neurology, 13(3), 330-338.
Grandjean, P., & Landrigan, P. J. (2006). Developmental neurotoxicity of industrial chemicals.
The Lancet, 368(9553), 2167-2178.
Green, R., Lanphear, B., Hornung, R., Flora, D., Martinez-Mier, A., Neufeld, R., Ayotte, P.,
Muckle, G., & Till, C. (2019). Fluoride exposure during fetal development and
intellectual abilities in a Canadian birth cohort, JAMA Pediatrics,
doi:10.1001/jamapediatrics.2019.1729
Greenland, S. & Brumback, B. (2002). An overview of relations among causal modelling
methods. International Journal Epidemiology,31(5),1030-1037.
doi:10.1093/ije/31.5.1030.
Güner, Ş., Uyar-Bozkurt, S., Haznedaroğlu, E., & Menteş, A. (2016). Dental fluorosis and
catalase immunoreactivity of the brain tissues in rats exposed to high fluoride pre-and
postnatally. Biological Trace Element Research, 174(1), 150-157.
Haddow, J. E., Knight, G. J., Palomaki, G. E., Neveux, L. M., & Chilmonczyk, B. A. (1994).
Replacing creatinine measurements with specific gravity values to adjust urine cotinine
concentrations. Clinical Chemistry, 40(4), 562-564.
Hauck, T. S., Lau, C., Wing, L. L. F., Kurdyak, P., & Tu, K. (2017). ADHD treatment in primary
care: demographic factors, medication trends, and treatment predictors. The Canadian
Journal of Psychiatry, 62(6), 393-402.
Health Canada (2017). The State of Community Water Fluoridation across Canada. Available
89
from: https://www.canada.ca/content/dam/hc-
sc/documents/services/publications/healthy-living/community-water-fluoridation-across-
canada-2017/community-water-fluoridation-across-canada-2017-eng.pdf
Health Canada (2015). Third report on human biomonitoring of environmental chemicals in
Canada - Results of the Canadian Health Measures Survey Cycle 3 (2012–2013).
Retrieved October 16 2016 from http://www.hc-sc.gc.ca/ewh-
semt/pubs/contaminants/chms-ecms-cycle3/index-eng.php.
Health Canada (2013). Second report on human biomonitoring of environmental chemicals in
Canada - Results of the Canadian Health Measures Survey Cycle 2 (2009–2011).
Retrieved October 16 2016 from http://www.hc-sc.gc.ca/ewh-
semt/alt_formats/pdf/pubs/contaminants/chms-ecms-cycle2/chms-ecms-cycle2-eng.pdf
Health Canada (2010a). Guidelines for Canadian Drinking Water Quality: Guideline Technical
Document - Fluoride. doi: Catalogue No. H128-1/11-647E-PDF.
Health Canada (2010b). Report on the findings of the oral health component of the Canadian
Health Measures Survey 2007-2009. Available from:
http://publications.gc.ca/site/eng/369649/publication.html
Heller, K.E., Eklund, S.A., & Burt, B.A. (1997). Dental caries and dental fluorosis at varying
water fluoride concentrations. Journal Public Health Dentistry, 57(3), 136-143.
doi:10.1111/j.1752-7325.1997.tb02964.x.
Hileman, B. (1988). Fluoridation of water: Questions about health risks and benefits remain after
more than 40 years. Chemical Engineering News, 26-42. Available from: http://www.
Fluoridealert.org/hileman.htm.
Hirzy, J. W., Connett, P., Xiang, Q., Spittle, B. J., & Kennedy, D. C. (2016). Developmental
90
neurotoxicity of fluoride: a quantitative risk analysis towards establishing a safe daily
dose of fluoride for children. Fluoride, 49(4), 379-400.
Hodge, H.C., & Smith, F.A. (1965). Biological properties of inorganic fluorides. In: Fluorine
chemistry (pgs.1 to 42) by Simons, H.H. (ed). New York: Academic Press.
Holbrook, J. R., Cuffe, S. P., Cai, B., Visser, S. N., Forthofer, M. S., Bottai, M., Ortaglia, A., &
McKeown, R. E. (2016). Persistence of parent-reported ADHD symptoms from
childhood through adolescence in a community sample. Journal of Attention Disorders,
20(1), 11-20.
Hornung, R. W., & Reed, L. D. (1990). Estimation of average concentration in the presence of
nondetectable values. Applied occupational and environmental hygiene, 5(1), 46-51.
Horowitz, H. S. (1996). The effectiveness of community water fluoridation in the United States.
Journal of Public Health Dentistry, 56(5), 253-258.
Hu, Y. H., & Wu, S. S. (1988). Fluoride in cerebrospinal fluid of patients with fluorosis. Journal
of Neurology, Neurosurgery & Psychiatry, 51(12), 1591-1593.
Ibiyemi, O., Zohoori, F. V., Valentine, R. A., & Maguire, A. (2018). Fluoride intake and urinary
fluoride excretion in 4-and 8-year-old children living in urban and rural areas of
Southwest Nigeria. Community Dentistry and Oral Epidemiology, 46(5), 482-491.
Iheozor-Ejiofor, Z., Worthington, H.V., Walsh, T., O’Malley, L., Clarkson, J.E., Macey, R.,
Alam, R., Tugwell, P., & Welch, V. G. (2015). Water fluoridation for the prevention of
dental caries. Cochrane Database Systematic Review, 6, CD010856. doi:
10.1002/14651858.CD010856.pub2.
Instanes, J. T., Halmøy, A., Engeland, A., Haavik, J., Furu, K., & Klungsøyr, K. (2017).
Attention-deficit/hyperactivity disorder in offspring of mothers with inflammatory and
91
immune system diseases. Biological psychiatry, 81(5), 452-459.
Institute of Medicine (1997). Dietary Reference Intakes for Calcium, Phosphorus, Magnesium,
Vitamin D, and Fluoride. Washington, DC: The National Academies Press.
doi:10.17226/5776.
Itai, K., Onoda, T., Nohara, M., Ohsawa, M., Tanno, K., Sato, T., Kuribayashi, T., & Okayama,
A. (2010). Serum ionic fluoride concentrations are related to renal function and
menopause status but not to age in a Japanese general population. Clinica Chimica Acta,
411(3-4), 263-266.
Jacobson, J. L., & Jacobson, S. W. (1996). Intellectual impairment in children exposed to
polychlorinated biphenyls in utero. New England Journal of Medicine, 335(11), 783-789.
doi:10.1056/NEJM199609123351104.
Jain, R. B. (2017). Concentrations of fluoride in water and plasma for US children and
adolescents: Data from NHANES 2013–2014. Environmental Toxicology and
Pharmacology, 50, 20-31.
Jean, K., Wassef, N., Gagnon, F., & Valcke, M. (2018). A physiologically-based
pharmacokinetic modeling approach using biomonitoring data in order to assess the
contribution of drinking water for the achievement of an optimal fluoride dose for dental
health in children. International Journal of Environmental Research and Public Health,
15(7), 1358.
Jha, S. K., Mishra, V. K., Sharma, D. K., & Damodaran, T. (2011). Fluoride in the environment
and its metabolism in humans. In Reviews of Environmental Contamination and
Toxicology, Volume 211 (pp. 121-142). Springer, New York, NY.
Jiang, P., Li, G., Zhou, X., Wang, C., Qiao, Y., Liao, D., & Shi, D. (2019). Chronic fluoride
92
exposure induces neuronal apoptosis and impairs neurogenesis and synaptic plasticity:
role of GSK-3β/β-catenin pathway. Chemosphere, 214, 430-435.
Jiménez, L. V., Guzmán, O. L., Flores, M. C., Costilla-Salazar, R., Hernández, J. C., Contreras,
Y. A., & Rocha-Amador, D. O. (2017). In utero exposure to fluoride and cognitive
development delay in infants. NeuroToxicology, 59, 65-70.
Jones, G., Riley, M., Couper, D., & Dwyer, T. (1999). Water fluoridation, bone mass and
fracture: a quantitative overview of the literature. Australian and New Zealand Journal of
Public Health, 23(1), 34-40.
Jones, R. P., & Iagaru, A. (2014). 18F NaF brain metastasis uptake in a patient with melanoma.
Clinical nuclear medicine, 39(10), e448-50.
Kelleher, K. J., McInerny, T. K., Gardner, W. P., Childs, G. E., & Wasserman, R. C. (2000).
Increasing identification of psychosocial problems: 1979–1996. Pediatrics, 105(6), 1313-
1321.
Kessler, R. C., Berglund, P., Demler, O., Jin, R., Merikangas, K. R., & Walters, E. E. (2005).
Lifetime prevalence and age-of-onset distributions of DSM-IV disorders in the National
Comorbidity Survey Replication. Archives of General Psychiatry, 62(6), 593-602.
Kumar, S., Lata, S., Yadav, J., & Yadav, J.P. (2016). Relationship between water, urine and
serum fluoride and fluorosis in school children of Jhajjar District, Haryana, India. Appl
Water Sci 7, 3377–3384.
Kundu, H., Basavaraj, P., Singla, A., Gupta, R., Singh, K., & Jain, S. (2015). Effect of fluoride in
drinking water on children's intelligence in high and low fluoride areas of Delhi. Journal
of Indian Association of Public Health Dentistry, 13(2), 116.
Lam, J., Lanphear, B. P., Bellinger, D., Axelrad, D. A., McPartland, J., Sutton, P., Davidson, L.,
93
Daniels, N., Sen, S., & Woodruff, T. J. (2017). Developmental PBDE exposure and
IQ/ADHD in childhood: a systematic review and meta-analysis. Environmental Health
Perspectives, 125(8), 1-20.
Lanphear, B. P. (2015). The Impact of Toxins on the Developing Brain. Annual Review of Public
Health, 36(1):211-230. doi:10.1146/annurev-publhealth-031912-114413.
Larsson, H., Asherson, P., Chang, Z., Ljung, T., Friedrichs, B., Larsson, J. O., & Lichtenstein, P.
(2013). Genetic and environmental influences on adult attention deficit hyperactivity
disorder symptoms: a large Swedish population-based study of twins. Psychological
Medicine, 43(1), 197-207.
Larsson, H., Chang, Z., D'Onofrio, B. M., & Lichtenstein, P. (2014). The heritability of clinically
diagnosed attention deficit hyperactivity disorder across the lifespan. Psychological
Medicine, 44(10), 2223-2229.
Larsson, H., Dilshad, R., Lichtenstein, P., & Barker, E. D. (2011). Developmental trajectories of
DSM-IV symptoms of attention-deficit/hyperactivity disorder: Genetic effects, family
risk and associated psychopathology. Journal of Child Psychology and Psychiatry, 52(9),
954-963.
Lee, J., Laurin, N., Crosbie, J., Ickowicz, A., Pathare, T., Malone, M., Kennedy, J.L., Tannock,
R., Schachar, R., & Barr, C. L. (2008). Association study of the nicotinic acetylcholine
receptor α4 subunit gene, CHRNA4, in attention-deficit hyperactivity disorder. Genes,
Brain and Behavior, 7(1), 53-60.
Levin, E. D., Bushnell, P. J., & Rezvani, A. H. (2011). Attention-modulating effects of cognitive
enhancers. Pharmacology Biochemistry and Behavior, 99(2), 146-154.
Levy, S. M. (1993). A review of fluoride intake from fluoride dentifrice. J. Dent. Child, 60(2),
94
115-124. Levy, S.M. (1994). Review of fluoride exposures and ingestion. Community Dent. Oral
Epidemiology, 22(3), 173-180. Levy, S.M., M.C. Kiritsy, & J.J. Warren (1995) Sources of fluoride intake in children. Journal of
Public Health Dentistry, 55(1), 39-52. Levy, S.M., & Zarei, Z. (1991). Evaluation of fluoride exposures in children. J. Dent. Child,
58(6), 467-473.
Li, H. R., Liu, Q. B., Wang, W. Y., Yang, L. S., Li, Y. H., Feng, F. J., Zhao, X., Hou, K., &
Wang, G. (2009). Fluoride in drinking water, brick tea infusion and human urine in two
counties in Inner Mongolia, China. Journal of Hazardous Materials, 167(1-3), 892-895.
Lichtenstein, P., Carlström, E., Råstam, M., Gillberg, C., & Anckarsäter, H. (2010). The genetics
of autism spectrum disorders and related neuropsychiatric disorders in childhood. American Journal of Psychiatry, 167(11), 1357-1363.
Liu, Y. J., Gao, Q., Wu, C. X., & Guan, Z. Z. (2010). Alterations of nAChRs and ERK1/2 in the
brains of rats with chronic fluorosis and their connections with the decreased capacity of learning and memory. Toxicology Letters, 192(3), 324-329.
Liu, F., Ma, J., Zhang, H., Liu, P., Liu, Y. P., Xing, B., & Dang, Y. H. (2014). Fluoride exposure
during development affects both cognition and emotion in mice. Physiology & Behavior, 124, 1-7.
Long, Y. G., Wang, Y. N., Chen, J., Jiang, S. F., Nordberg, A., & Guan, Z. Z. (2002). Chronic
fluoride toxicity decreases the number of nicotinic acetylcholine receptors in rat brain. Neurotoxicology and Teratology, 24(6), 751-757.
Lou, D. D., Guan, Z. Z., Liu, Y. J., Liu, Y. F., Zhang, K. L., Pan, J. G., & Pei, J. J. (2013). The
95
influence of chronic fluorosis on mitochondrial dynamics morphology and distribution in cortical neurons of the rat brain. Archives of Toxicology, 87(3), 449-457.
Lou, D. D., Guan, Z. Z., Peic, J. J., & Guiyang, P. R. (2014). Alterations of apoptosis and
expressions of Bax and Bcl-2 in the cerebral cortices of rats with chronic fluorosis. Fluoride 47(3):199-207.
Luk, T. T., Wang, M. P., Suen, Y. N., Koh, D. S. Q., Lam, T. H., & Chan, S. S. C. (2018). Early
childhood exposure to secondhand smoke and behavioural problems in preschoolers.
Scientific Reports, 8(1), 15434.
Luke, J. (2001). Fluoride deposition in the aged human pineal gland. Caries Research, 35(2),
125-128.
Malin, A. J., Riddell, J., McCague, H., & Till, C. (2018). Fluoride exposure and thyroid function
among adults living in Canada: Effect modification by iodine status. Environment
International, 121, 667-674.
Malin, A. J., & Till, C. (2015). Exposure to fluoridated water and attention deficit hyperactivity
disorder prevalence among children and adolescents in the United States: an ecological
association. Environmental Health, 14(1), 1. doi:10.1186/s12940-015-0003-1.
Malinowska, E., Inkielewicz, I., Czarnowski, W., & Szefer, P. (2008). Assessment of fluoride
concentration and daily intake by human from tea and herbal infusions. Food Chem
Toxicol, 46, 1055–1061.
Mansfield, P. (1999). The distribution of urinary fluoride concentration in the UK. Fluoride 32, 27–32.
Martínez-Mier, E. A. (2012). Fluoride its metabolism, toxicity, and role in dental health. Journal
of Evidence-Based Complementary & Alternative Medicine, 17(1), 28-32.
McDonagh, M., Whiting, P., Bradley, M., Cooper, J., Sutton, A., Chestnutt, I., Misso, K.,
96
Wilson, P., Treasure, E., & Kleijnen, J. (2000). Fluoridation of Drinking Water: a
systematic review of its efficacy and safety. Research Report. CRD Report (18). NHS
Centre for Reviews and Dissemination , York, UK.
McLaren, L. (2016). Fluoridation exposure status based on location of data collection in the
Canadian health measures survey: is it valid. Journal of Canadian Dental Association,
82(g17), 1-7.
McPherson, C. A., Zhang, G., Gilliam, R., Brar, S. S., Wilson, R., Brix, A., Picut, C. & Harry, G.
J. (2018). An evaluation of neurotoxicity following fluoride exposure from gestational
through adult ages in long-evans hooded rats. Neurotoxicity Research, 34(4), 781-798.
Mick, E., Biederman, J., Faraone, S. V., Sayer, J., & Kleinman, S. (2002). Case-control study of
attention-deficit hyperactivity disorder and maternal smoking, alcohol use, and drug use
during pregnancy. Journal of the American Academy of Child & Adolescent
Psychiatry, 41(4), 378-385.
Modesto, T., Tiemeier, H., Peeters, R. P., Jaddoe, V. W., Hofman, A., Verhulst, F. C., &
Ghassabian, A. (2015). Maternal mild thyroid hormone insufficiency in early pregnancy
and attention-deficit/hyperactivity disorder symptoms in children. JAMA Pediatrics,
169(9), 838-845.
Moriguchi, J., Ezaki, T., Tsukahara, T., Fukui, Y., Ukai, H., Okamoto, S., Shimbo, S., Sakurai,
H. & Ikeda, M. (2005). Decreases in urine specific gravity and urinary creatinine in
elderly women. International Archives of Occupational and Environmental
Health, 78(6), 438-445.
Mullenix, P. J., Denbesten, P. K., Schunior, A., & Kernan, W. J. (1995). Neurotoxicity of sodium
97
fluoride in rats. Neurotoxicology and teratology, 17(2), 169-177. doi:10.1016/0892-
0362(94)00070-T.
National Research Council (2006). Fluoride in Drinking Water: A Scientific Review of EPA’s
Standards. Washington, DC: National Academies Press.
National Toxicology Program (2019). Draft NTP Monograph on the
Systematic Review Of Fluoride Exposure And Neurodevelopmental And Cognitive Health
Effects. US Department of Health and Human Services, United States of America.
Retrieved from: https://www8.nationalacademies.org/pa/projectview.aspx?key=51752
National Toxicology Program (2016). Systematic literature review on the effects of fluoride on
learning and memory in animal studies. NTP Research Report 1. Research Triangle Park,
NC: National Toxicology Program. Retrieved from:
https://ntp.niehs.nih.gov/ntp/ohat/pubs/ntp_rr/01fluoride_508.pdf
Nermell, B., Lindberg, A. L., Rahman, M., Berglund, M., Persson, L. Å., El Arifeen, S., &
Vahter, M. (2008). Urinary arsenic concentration adjustment factors and
malnutrition. Environmental Research, 106(2), 212-218.
Neurath, C. (2005). Tooth decay trends for 12 year olds in nonfluoridated and fluoridated
countries. Fluoride, 38, 324-325.
NSF International (2019). Fact Sheet on Fluoridation Products and Fluoride. Available from:
http://www.nsf.org/newsroom_pdf/Fluoride_Fact_Sheet_2019.pdf O’Brien Institute for Public Health (2019). Community Water Fluoridation: A Report For
Calgary City Council. Available from: http://fluoridealert.org/wp- content/uploads/calgary.obrien-report.july2019.pdf
Opydo-Szymaczek, J., & Borysewicz-Lewicka, M. (2007). Transplacental passage of fluoride in
98
pregnant Polish women assessed on the basis of fluoride concentrations in maternal and
cord blood plasma. Fluoride, 40(1), 46-50.
Oulhote, Y., Steuerwald, U., Debes, F., Weihe, P., & Grandjean, P. (2016). Behavioral
difficulties in 7-year old children in relation to developmental exposure to perfluorinated
alkyl substances. Environment International, 97, 237-245.
Päkkilä, F., Männistö, T., Pouta, A., Hartikainen, A. L., Ruokonen, A., Surcel, H. M., Bloigu, A.,
Vääräsmäki, M., Järvelin, M. R., Moilanen, I., & Suvanto, E. (2014). The impact of
gestational thyroid hormone concentrations on ADHD symptoms of the child. The
Journal of Clinical Endocrinology & Metabolism, 99(1), E1-E8.
Peckham, S., Lowery, D., & Spencer, S. (2015). Are fluoride levels in drinking water associated
with hypothyroidism prevalence in England? A large observational study of GP practice
data and fluoride levels in drinking water. Journal of Epidemiology and Community
Health, 69(7), 619-624. doi:10.1136/jech-2014-204971.
Pelham, W. E., Foster, E. M., & Robb J.A. (2007). The economic impact of attention-
deficit/Hyperactivity disorder in children and adolescents. Ambulatory Pediatrics, 7(1
suppl), 121-131.
Pereira, M., Dombrowski, P. A., Losso, E. M., Chioca, L. R., Da Cunha, C., & Andreatini, R.
(2011). Memory impairment induced by sodium fluoride is associated with changes in
brain monoamine levels. Neurotoxicity Research, 19(1), 55-62.
Philippat, C., Nakiwala, D., Calafat, A. M., Botton, J., De Agostini, M., Heude, B., Slama, R., &
EDEN Mother–Child Study Group. (2017). Prenatal exposure to nonpersistent endocrine
disruptors and behavior in boys at 3 and 5 years. Environmental Health Perspectives,
125(9), 1-9.
99
Public Health Agency of Canada (2017). The State of Community Water Fluoridation across
Canada. Available from: https://www.canada.ca/en/services/health/publications/healthy-
living/community-water-fluoridation-across-canada-2017.html
Rabb-waytowich, D. (2009). Professional Water Fluoridation in Canada : Past and Present.
Journal of the Canadian Dental Association (Tor), 75(6):451-454.
Rango, T., Vengosh, A., Jeuland, M., Tekle-Haimanot, R., Weinthal, E., Kravchenko, J., Paul,
C., & McCornick, P. (2014). Fluoride exposure from groundwater as reflected by urinary
fluoride and children's dental fluorosis in the Main Ethiopian Rift Valley. Science of the
Total Environment, 496, 188-197.
Reddy, Y. P., Tiwari, S. K., Shaik, A. P., Alsaeed, A., Sultana, A., & Reddy, P. K. (2014). Effect
of sodium fluoride on neuroimmunological parameters, oxidative stress and antioxidative
defenses. Toxicology Mechanisms and Methods, 24(1), 31-36.
Reiersen, A. M., Constantino, J. N., Grimmer, M., Martin, N. G., & Todd, R. D. (2008).
Evidence for shared genetic influences on self-reported ADHD and autistic symptoms in
young adult Australian twins. Twin Research and Human Genetics, 11(6), 579-585.
Riddell, J. K., Malin, A. J., Flora, D., McCague, H., & Till, C. (2019). Association of water
fluoride and urinary fluoride concentrations with attention deficit hyperactivity disorder
in Canadian youth. Environment International, 133, 105190.
Ripa, L. W. (1993). A half-century of community water fluoridation in the United States: review
and commentary. Journal of Public Health Dentistry, 53(1), 17-44.
Rocha-Amador, D., Navarro, M. E., Carrizales, L., Morales, R., & Calderón, J. (2007).
Decreased intelligence in children and exposure to fluoride and arsenic in drinking
water. Cadernos de saúde pública, 23, S579-S587.

100
Roth, T. L. (2012). Epigenetics of neurobiology and behavior during development and
adulthood. Developmental psychobiology, 54(6), 590-597.
Rugg-Gunn, A. J., & Do, L. (2012). Effectiveness of water fluoridation in caries prevention.
Community Dentistry and Oral Epidemiology, 40, 55-64.
Rugg-Gunn, A. J., Villa, A. E., & Buzalaf, M. R. A. (2011). Contemporary biological markers of
exposure to fluoride. In Fluoride and the Oral Environment (Vol. 22, pp. 37-51). Karger
Publishers.
Sagiv, S. K., Kogut, K., Gaspar, F. W., Gunier, R. B., Harley, K. G., Parra, K., Villasenor, D.,
Bradman, A., Holland, N., & Eskenazi, B. (2015). Prenatal and childhood
polybrominated diphenyl ether (PBDE) exposure and attention and executive function at
9–12 years of age. Neurotoxicology and Teratology, 52, 151-161.
Sagiv, S. K., Thurston, S. W., Bellinger, D. C., Amarasiriwardena, C., & Korrick, S. A. (2012).
Prenatal exposure to mercury and fish consumption during pregnancy and attention-
deficit/hyperactivity disorder–related behavior in children. Archives of Pediatrics &
Adolescent Medicine, 166(12), 1123-1131. doi:10.1001/archpediatrics.2012.1286
Sagiv, S. K., Thurston, S. W., Bellinger, D. C., Tolbert, P. E., Altshul, L. M., & Korrick, S. A.
(2010). Prenatal organochlorine exposure and behaviors associated with attention deficit
hyperactivity disorder in school-aged children. American Journal of Epidemiology,
171(5):593-601. doi:10.1093/aje/kwp427
Salgarello, M., Lunardi, G., Inno, A., Pasetto, S., Severi, F., Gorgoni, G., & Gori, S. (2016). 18F-
NaF PET/CT Imaging of Brain Metastases. Clinical nuclear medicine, 41(7), 564-565.
Saravanabhavan, G., Werry, K., Walker, M., Haines, D., Malowany, M., & Khoury, C. (2017).

101
Human biomonitoring reference values for metals and trace elements in blood and urine
derived from the Canadian Health Measures Survey 2007–2013. International Journal of
Hygiene and Environmental Health, 220(2), 189-200.
Sastry, M. G., Mohanty, S., & Rao, P. (2010). Role of placenta to combat fluorosis (in fetus) in
endemic fluorosis area. National Journal of Integrated Research in Medicine, 1(4), 16-19.
Sawan, R. M., Leite, G. A., Saraiva, M. C., Barbosa, F., Tanus-Santos, J. E., & Gerlach, R. F.
(2010). Fluoride increases lead concentrations in whole blood and in calcified tissues
from lead-exposed rats. Toxicology, 271(1), 21-26.
Sciberras, E., Mulraney, M., Silva, D., & Coghill, D. (2017). Prenatal risk factors and the
etiology of ADHD—review of existing evidence. Current Psychiatry Reports, 19(1),
doi:10.1007/s11920-017-0753-2.
Seraj, B., Shahrabi, M., Shadfar, M., Ahmadi, R., Fallahzadeh, M., Eslamlu, H. F., &
Kharazifard, M. J. (2012). Effect of high water fluoride concentration on the intellectual
development of children in makoo/iran. Journal of Dentistry of Tehran University of
Medical Sciences, 9(3), 221-9.
Singh, B., Gaur, S., & Garg, V.K. (2007). Fluoride in drinking water and human urine in
Southern Haryana, India. Journal of Hazardous Material, 144, 147–151.
Slavkin, H. C., & Baum, B. J. (2000). Relationship of dental and oral pathology to systemic
illness. Jama, 284(10), 1215-1217.
Spencer, K. F., & Limeback, H. (2018). Blood is thicker than water: Flaws in a National
Toxicology Program study. Medical hypotheses, 121, 160-163.
Statistics Canada (2017). Canadian Health Measures Survey - Cycle 3. Available from:
https://www.statcan.gc.ca/eng/statistical-programs/instrument/5071_Q1_V3#a98
102
Statistics Canada (2015). Canadian Health Measures Survey (CHMS) Data User Guide – Cycle
3. Ottawa, ON.
Statistics Canada (2013). Canadian Health Measures Survey (CHMS) Data User Guide – Cycle
2. Ottawa, ON.
Strickland, A. D. (2014). Prevention of cerebral palsy, autism spectrum disorder, and attention
deficit–Hyperactivity disorder. Medical Hypotheses, 82(5), 522-528.
Strunecka, A., & Strunecky, O. (2019). Chronic Fluoride Exposure and the Risk of Autism
Spectrum Disorder. International Journal of Environmental Research and Public Health,
16(18), 3431.
Sun, Z., Liu, F., Wu, L. N., Lu, Y., & Yu, D. (2008). Effects of high fluoride drinking water on
the cerebral function of mice. Fluoride, 41(2), 148-151.
Sun, Z., Zhang, Y., Xue, X., Niu, R., & Wang, J. (2018). Maternal fluoride exposure during
gestation and lactation decreased learning and memory ability, and glutamate receptor
mRNA expressions of mouse pups. Human & Experimental Toxicology, 37(1), 87-93.
Suwazono, Y., Åkesson, A., Alfven, T., Järup, L., & Vahter, M. (2005). Creatinine versus
specific gravity-adjusted urinary cadmium concentrations. Biomarkers, 10(2-3), 117-126.
Taylor, G., & Taylor, J. (2016). Position statement on Community Water Fluoridation. Available
from: https://www.canada.ca/en/services/health/publications/healthy-living/fluoride-
position-statement.html.
Tewar, S., Auinger, P., Braun, J. M., Lanphear, B., Yolton, K., Epstein, J. N., Ehrlich, S., &
Froehlich, T. E. (2016). Association of bisphenol A exposure and attention-
deficit/hyperactivity disorder in a national sample of US children. Environmental
Research, 150, 112-118.
103
Thomas, R., Sanders, S., Doust, J., Beller, E., & Glasziou, P. (2015). Prevalence of attention-
deficit/hyperactivity disorder: a systematic review and meta-analysis. Pediatrics, 135(4),
e994-e1001.
Thornton-Evans, G., Junger, M. L., Lin, M., Wei, L., Espinoza, L., & Beltran-Aguilar, E. (2019).
Use of Toothpaste and Toothbrushing Patterns Among Children and Adolescents—
United States, 2013–2016. Morbidity and Mortality Weekly Report, 68(4), 87.
Till, C., Green, R., Grundy, J.G., Hornung, R., Neufeld, R., Martínez-Mier, E.A.,
Ayotte, P., Muckle, G., & Lanphear, B. (2018). Community water fluoridation and
urinary fluoride concentrations in a national sample of pregnant women in Canada.
Environmental Health Perspectives, 126(10), 1 – 13.
Till, C., Green, R., Flora, D., Hornung, R., Martinez-Mier, E. A., Blazer, M., Farmus, L., Ayotte,
P., Muckle, G., & Lanphear, B. (2020). Fluoride exposure from infant formula and child
IQ in a Canadian birth cohort. Environment International, 134, 105315, 1-8.
Todd, R. D., Lobos, E. A., Sun, L. W., & Neuman, R. J. (2003). Mutational analysis of the
nicotinic acetylcholine receptor alpha 4 subunit gene in attention deficit/hyperactivity
disorder: evidence for association of an intronic polymorphism with attention
problems. Molecular psychiatry, 8(1), 103-108.
Trabelsi, M., Guermazi, F., & Zeghal, N. (2001). Effect of fluoride on thyroid function and
cerebellar development in mice. Fluoride, 34, 165-73.
Truman, B. I., Gooch, B. F., Sulemana, I., Gift, H. C., Horowitz, A. M., Evans Jr, C. A., Griffin,
S.O., Carande-Kulis, V. G., & Task Force on Community Preventive Services. (2002).
Reviews of evidence on interventions to prevent dental caries, oral and pharyngeal
104
cancers, and sports-related craniofacial injuries. American Journal of Preventive
Medicine, 23(1), 21-54.
United States Environmental Protection Agency (2010). Fluoride: relative source contribution
analysis (820-R-10-015). Health and Ecological Criteria Division, Office of Water.
Retrieved from: nepis.epa.gov/Exe/ZyPURL.cgi?Dockey=P100N49K.TXT
U.S. Department of Health and Human Services (2015). U.S. public health service
recommendation for fluoride concentration in drinking water for the prevention of dental
caries. Public Health Rep, 130, 1–14.
van den Berg, S. M., Willemsen, G., de Geus, E. J., & Boomsma, D. I. (2006). Genetic etiology
of stability of attention problems in young adulthood. American Journal of Medical
Genetics Part B: Neuropsychiatric Genetics, 141(1), 55-60.
Vasiliadis, H. M., Diallo, F. B., Rochette, L., Smith, M., Langille, D., Lin, E., Kisely, S.,
Fombonne, E., Thompson, A. H., Renaud, J., & Lesage, A. (2017). Temporal trends in
the prevalence and incidence of diagnosed ADHD in children and young adults between
1999 and 2012 in Canada: a data linkage study. The Canadian Journal of Psychiatry,
62(12), 818-826.
Vatanparast, H., Bailey, D. A., Baxter-Jones, A. D., & Whiting, S. J. (2010). Calcium
requirements for bone growth in Canadian boys and girls during adolescence. British Journal of Nutrition, 103(4), 575-580.
Verlaet, A. A., Noriega, D. B., Hermans, N., & Savelkoul, H. F. (2014). Nutrition,
immunological mechanisms and dietary immunomodulation in ADHD. European Child & Adolescent Psychiatry, 23(7), 519-529.
Villa, A., Anabalon, M., Zohouri, V., Maguire, A., Franco, A. M. and Rugg-Gunn, A. (2010).
105
Relationships between fluoride intake, urinary fluoride excretion and fluoride retention in children and adults: an analysis of available data. Caries Research, 44, 60–68.
Wang, J., Zhang, Y., Guo, Z., Li, R., Xue, X., Sun, Z., & Niu, R. (2018). Effects of perinatal
fluoride exposure on the expressions of miR-124 and miR-132 in hippocampus of mouse
pups. Chemosphere, 197, 117-122.
Warren, J. J., Levy, S. M., & Kanellis, M. J. (2001). Prevalence of dental fluorosis in the primary
dentition. Journal of Public Health Dentistry, 61(2), 87-91.
Waugh, D., Potter, W., Limeback, H., & Godfrey, M. (2016). Risk Assessment of fluoride intake
from tea in the Republic of Ireland and its implications for public health and water
fluoridation. Int J Environ Res Public Health 13, 259.
Whitford, G.M. (1996). The Metabolism and Toxicity of Fluoride (2nd Ed). Basel, Switzerland:
Karger.
Whitford, G. M. (1994). Intake and metabolism of fluoride. Advances in Dental
Research, 8, 5–14.
Wilson, P. M., & Sheldon, T. A. (2006). Muddy waters: evidence-based policy making,
uncertainty and the 'York review' on water fluoridation. Evidence & Policy: A Journal of
Research, Debate and Practice, 2(3), 321-331.
Willcutt, E. G., Doyle, A. E., Nigg, J. T., Faraone, S. V., & Pennington, B. F. (2005). Validity of
the executive function theory of attention-deficit/hyperactivity disorder: a meta-analytic review. Biological Psychiatry, 57(11), 1336-1346.
World Health Organization (2014). Basic methods for assessment of renal fluoride excretion in
community prevention programmes for oral health. Available from: https://www.who.int/oral_health/publications/9789241548700/en/

106
World Health Organization (1997). Guideline for drinking water quality health criteria and
other supporting information (2nd edition), Volume 2. World Health Organization,
Geneva.
Wright, J. P., Dietrich, K. N., Ris, M. D., Hornung, R. W., Wessel, S. D., Lanphear, B. P., Ho,
M., & Rae, M. N. (2008). Association of prenatal and childhood blood lead
concentrations with criminal arrests in early adulthood. PLoS Medicine, 5(5), e101. doi:
10.1371/journal.pmed.0050101
Wu, J., Zhu, H., & Ji, H. (2013). Unexpected detection of brain metastases by 18F-NaF PET/CT
in a patient with lung cancer. Clinical nuclear medicine, 38(11), e429-32.
Xia, Y., Wong, L. Y., Bunker, B. C., & Bernert, J. T. (2014). Comparison of Creatinine and
Specific Gravity for Hydration Corrections on Measurement of the Tobacco-Specific
Nitrosamine 4-(Methylnitrosamino)-1-(3-Pyridyl)-1-Butanol (NNAL) in Urine. Journal
of Clinical Laboratory Analysis, 28(5), 353-363.
Xiang, Q., Liang, Y., Chen, L., Wang, C., Chen, B., Chen, X., & Zhou, M. (2003). Effect of
fluoride in drinking water on children's intelligence. Fluoride, 36(2), 84-94.
Xu, G., Strathearn, L., Liu, B., Yang, B., & Bao, W. (2018). Twenty-year trends in diagnosed
attention-deficit/hyperactivity disorder among US children and adolescents, 1997-2016.
JAMA network open, 1(4), e181471-e181471.
Yadav, A.K., Kaushik, C.P., Haritash, A.K., Singh, B., Raghuvanshi, S.P., & Kansal, A. (2007).
Determination of exposure and probable ingestion of fluoride through tea, toothpaste,
tobacco and pan masala. Journal of Hazardous Materials, 142, 77–80.
Yeung, C. A. (2008). A systematic review of the efficacy and safety of fluoridation. Evidence-
based Dentistry, 9(2), 39-43.
107
Yu, Q., Shao, D., Zhang, R., Ouyang, W., & Zhang, Z. (2019). Effects of drinking water
fluorosis on L-type calcium channel of hippocampal neurons in mice. Chemosphere, 220,
169-175.
Zalcman, S., Green-Johnson, J. M., Murray, L., Nance, D. M., Dyck, D., Anisman, H., &
Greenberg, A. H. (1994). Cytokine-specific central monoamine alterations induced by interleukin-1,-2 and-6. Brain research, 643(1-2), 40-49.
Zhang, H., Yolton, K., Webster, G. M., Sjödin, A., Calafat, A. M., Dietrich, K. N., Xu, Y., Xie,
C., Braun, J. M., Lanphear, B. P., & Chen, A. (2017). Prenatal PBDE and PCB exposures
and reading, cognition, and externalizing behavior in children. Environmental Health
Perspectives, 125(4), 746-752.
Zhang, K. L., Lou, D. D., & Guan, Z. Z. (2015). Activation of the AGE/RAGE system in the
brains of rats and in SH-SY5Y cells exposed to high level of fluoride might connect to
oxidative stress. Neurotoxicology and Teratology, 48, 49-55.
Zhang, N., Baker, H. W., Tufts, M., Raymond, R. E., Salihu, H., & Elliott, M. R. (2013). Early
childhood lead exposure and academic achievement: evidence from Detroit public
schools, 2008–2010. American Journal of Public Health, 103(3), e72-e77.
Zhao, L. B., Liang, G. H., Zhang, D. N., & Wu, X. R. (1996). Effect of a high fluoride water
supply on children's intelligence. Fluoride, 29(4), 190-192.
Zhao, Q., Niu, Q., Chen, J., Xia, T., Zhou, G., Li, P., Dong, L., Xu, C., Tian, Z., Lou, C., Liu, L.,
Zhang, S., & Wang, A. (2019). Roles of mitochondrial fission inhibition in
developmental fluoride neurotoxicity: mechanisms of action in vitro and associations
with cognition in rats and children. Archives of Toxicology, 93(3), 709-726.
Zhou, G., Tang, S., Yang, L., Niu, Q., Chen, J., Xia, T., Wang, S., Wang, M., Zhao, Q., Liu, L.,

108
Li, P., Dong, L., Yang, K., Zhang, S., & Wang, A. (2019). Effects of long-term fluoride
exposure on cognitive ability and the underlying mechanisms: Role of autophagy and its
association with apoptosis. Toxicology and Applied Pharmacology, 378, 1-13.
doi:10.1016/j.taap.2019.114608
Zohoori, F. V., Omid, N., Sanderson, R. A., Valentine, R. A., & Maguire, A. (2019). Fluoride
retention in infants living in fluoridated and non-fluoridated areas: effects of weaning.
British Journal of Nutrition, 121(1), 74-81.
Zohouri F. V., Swinbank, C.M., Maguire, A., & Moynihan, P.J. (2006). Is the fluoride/creatinine
ratio of a spot urine sample indicative of 24-h urinary fluoride? Community Dentistry
and Oral Epidemiology, 34(2):130-138. doi:10.1111/j.1600-0528.2006.00269.x.
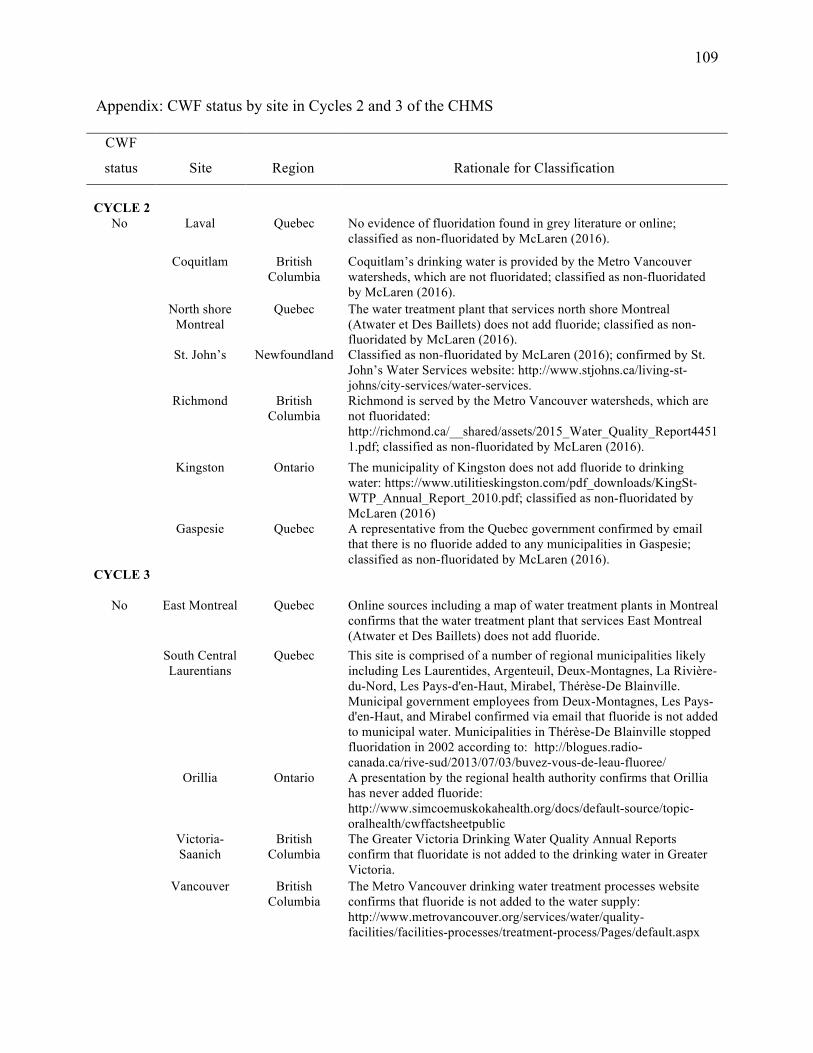
109
Appendix: CWF status by site in Cycles 2 and 3 of the CHMS
CWF
status
Site
Region
Rationale for Classification
CYCLE 2
No
Laval Quebec No evidence of fluoridation found in grey literature or online; classified as non-fluoridated by McLaren (2016).
Coquitlam British Columbia
Coquitlam’s drinking water is provided by the Metro Vancouver watersheds, which are not fluoridated; classified as non-fluoridated by McLaren (2016).
North shore Montreal
Quebec The water treatment plant that services north shore Montreal (Atwater et Des Baillets) does not add fluoride; classified as non-fluoridated by McLaren (2016).
St. John’s Newfoundland Classified as non-fluoridated by McLaren (2016); confirmed by St. John’s Water Services website: http://www.stjohns.ca/living-st-johns/city-services/water-services.
Richmond British Columbia
Richmond is served by the Metro Vancouver watersheds, which are not fluoridated: http://richmond.ca/__shared/assets/2015_Water_Quality_Report44511.pdf; classified as non-fluoridated by McLaren (2016).
Kingston Ontario The municipality of Kingston does not add fluoride to drinking water: https://www.utilitieskingston.com/pdf_downloads/KingSt-WTP_Annual_Report_2010.pdf; classified as non-fluoridated by McLaren (2016)
Gaspesie Quebec A representative from the Quebec government confirmed by email that there is no fluoride added to any municipalities in Gaspesie; classified as non-fluoridated by McLaren (2016).
CYCLE 3
No East Montreal Quebec Online sources including a map of water treatment plants in Montreal confirms that the water treatment plant that services East Montreal (Atwater et Des Baillets) does not add fluoride.
South Central Laurentians
Quebec This site is comprised of a number of regional municipalities likely including Les Laurentides, Argenteuil, Deux-Montagnes, La Rivière-du-Nord, Les Pays-d'en-Haut, Mirabel, Thérèse-De Blainville. Municipal government employees from Deux-Montagnes, Les Pays-d'en-Haut, and Mirabel confirmed via email that fluoride is not added to municipal water. Municipalities in Thérèse-De Blainville stopped fluoridation in 2002 according to: http://blogues.radio-canada.ca/rive-sud/2013/07/03/buvez-vous-de-leau-fluoree/
Orillia Ontario A presentation by the regional health authority confirms that Orillia has never added fluoride: http://www.simcoemuskokahealth.org/docs/default-source/topic-oralhealth/cwffactsheetpublic
Victoria-Saanich
British Columbia
The Greater Victoria Drinking Water Quality Annual Reports confirm that fluoridate is not added to the drinking water in Greater Victoria.
Vancouver British Columbia
The Metro Vancouver drinking water treatment processes website confirms that fluoride is not added to the water supply: http://www.metrovancouver.org/services/water/quality-facilities/facilities-processes/treatment-process/Pages/default.aspx
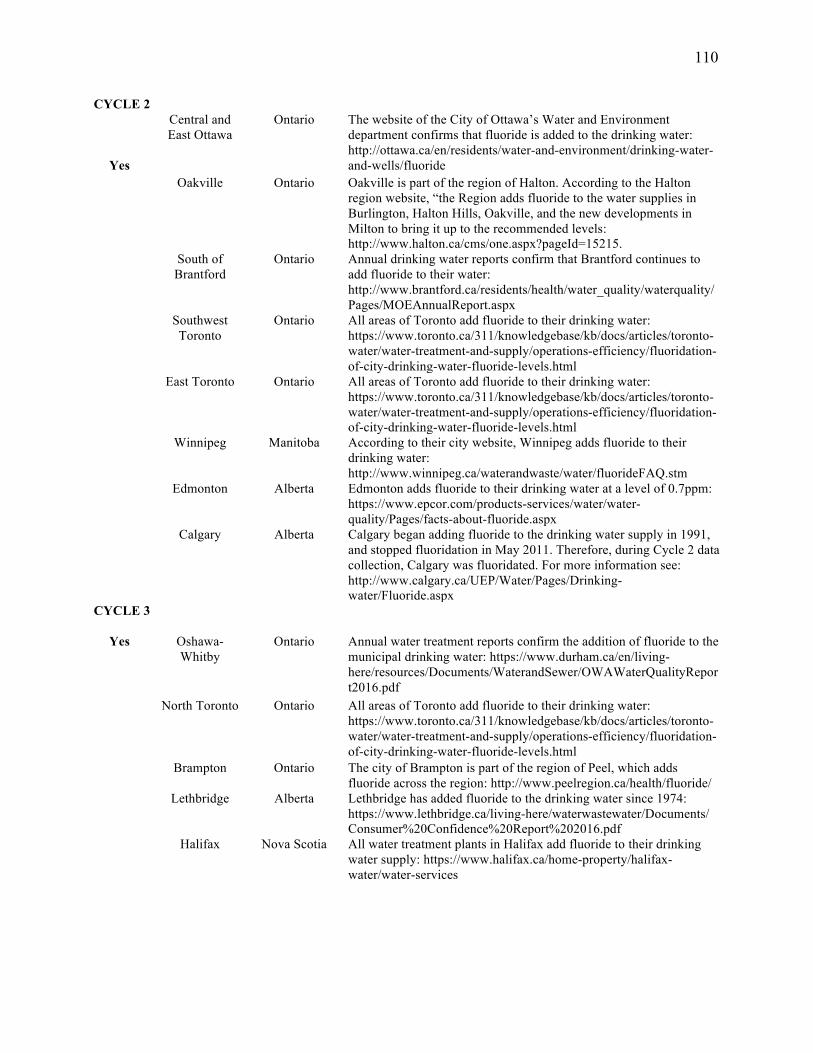
110
CYCLE 2
Yes
Central and East Ottawa
Ontario The website of the City of Ottawa’s Water and Environment department confirms that fluoride is added to the drinking water: http://ottawa.ca/en/residents/water-and-environment/drinking-water-and-wells/fluoride
Oakville Ontario Oakville is part of the region of Halton. According to the Halton region website, “the Region adds fluoride to the water supplies in Burlington, Halton Hills, Oakville, and the new developments in Milton to bring it up to the recommended levels: http://www.halton.ca/cms/one.aspx?pageId=15215.
South of Brantford
Ontario Annual drinking water reports confirm that Brantford continues to add fluoride to their water: http://www.brantford.ca/residents/health/water_quality/waterquality/Pages/MOEAnnualReport.aspx
Southwest Toronto
Ontario All areas of Toronto add fluoride to their drinking water: https://www.toronto.ca/311/knowledgebase/kb/docs/articles/toronto-water/water-treatment-and-supply/operations-efficiency/fluoridation-of-city-drinking-water-fluoride-levels.html
East Toronto Ontario All areas of Toronto add fluoride to their drinking water: https://www.toronto.ca/311/knowledgebase/kb/docs/articles/toronto-water/water-treatment-and-supply/operations-efficiency/fluoridation-of-city-drinking-water-fluoride-levels.html
Winnipeg Manitoba According to their city website, Winnipeg adds fluoride to their drinking water: http://www.winnipeg.ca/waterandwaste/water/fluorideFAQ.stm
Edmonton Alberta Edmonton adds fluoride to their drinking water at a level of 0.7ppm: https://www.epcor.com/products-services/water/water-quality/Pages/facts-about-fluoride.aspx
Calgary Alberta Calgary began adding fluoride to the drinking water supply in 1991, and stopped fluoridation in May 2011. Therefore, during Cycle 2 data collection, Calgary was fluoridated. For more information see: http://www.calgary.ca/UEP/Water/Pages/Drinking-water/Fluoride.aspx
CYCLE 3
Yes Oshawa-Whitby
Ontario Annual water treatment reports confirm the addition of fluoride to the municipal drinking water: https://www.durham.ca/en/living-here/resources/Documents/WaterandSewer/OWAWaterQualityReport2016.pdf
North Toronto Ontario All areas of Toronto add fluoride to their drinking water: https://www.toronto.ca/311/knowledgebase/kb/docs/articles/toronto-water/water-treatment-and-supply/operations-efficiency/fluoridation-of-city-drinking-water-fluoride-levels.html
Brampton Ontario The city of Brampton is part of the region of Peel, which adds fluoride across the region: http://www.peelregion.ca/health/fluoride/
Lethbridge Alberta Lethbridge has added fluoride to the drinking water since 1974: https://www.lethbridge.ca/living-here/waterwastewater/Documents/ Consumer%20Confidence%20Report%202016.pdf
Halifax Nova Scotia All water treatment plants in Halifax add fluoride to their drinking water supply: https://www.halifax.ca/home-property/halifax-water/water-services
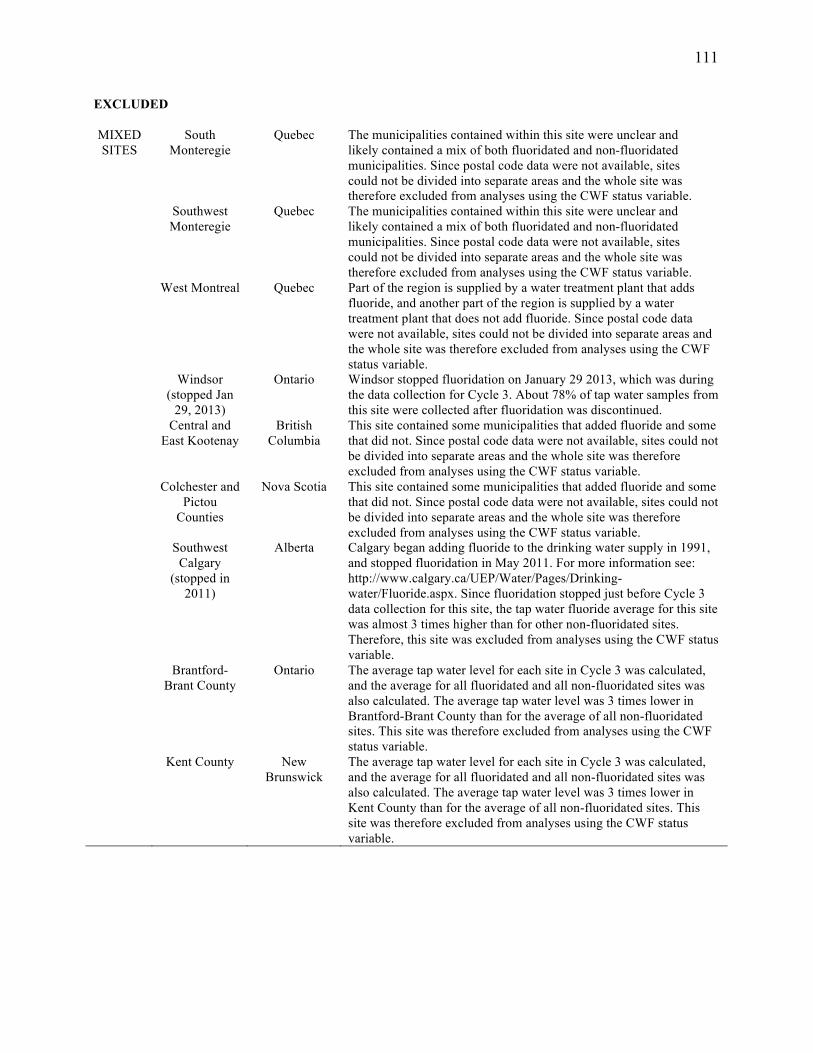
111
EXCLUDED MIXED SITES
South Monteregie
Quebec The municipalities contained within this site were unclear and likely contained a mix of both fluoridated and non-fluoridated municipalities. Since postal code data were not available, sites could not be divided into separate areas and the whole site was therefore excluded from analyses using the CWF status variable.
Southwest Monteregie
Quebec The municipalities contained within this site were unclear and likely contained a mix of both fluoridated and non-fluoridated municipalities. Since postal code data were not available, sites could not be divided into separate areas and the whole site was therefore excluded from analyses using the CWF status variable.
West Montreal Quebec Part of the region is supplied by a water treatment plant that adds fluoride, and another part of the region is supplied by a water treatment plant that does not add fluoride. Since postal code data were not available, sites could not be divided into separate areas and the whole site was therefore excluded from analyses using the CWF status variable.
Windsor (stopped Jan
29, 2013)
Ontario Windsor stopped fluoridation on January 29 2013, which was during the data collection for Cycle 3. About 78% of tap water samples from this site were collected after fluoridation was discontinued.
Central and East Kootenay
British Columbia
This site contained some municipalities that added fluoride and some that did not. Since postal code data were not available, sites could not be divided into separate areas and the whole site was therefore excluded from analyses using the CWF status variable.
Colchester and Pictou
Counties
Nova Scotia This site contained some municipalities that added fluoride and some that did not. Since postal code data were not available, sites could not be divided into separate areas and the whole site was therefore excluded from analyses using the CWF status variable.
Southwest Calgary
(stopped in 2011)
Alberta Calgary began adding fluoride to the drinking water supply in 1991, and stopped fluoridation in May 2011. For more information see: http://www.calgary.ca/UEP/Water/Pages/Drinking-water/Fluoride.aspx. Since fluoridation stopped just before Cycle 3 data collection for this site, the tap water fluoride average for this site was almost 3 times higher than for other non-fluoridated sites. Therefore, this site was excluded from analyses using the CWF status variable.
Brantford-Brant County
Ontario The average tap water level for each site in Cycle 3 was calculated, and the average for all fluoridated and all non-fluoridated sites was also calculated. The average tap water level was 3 times lower in Brantford-Brant County than for the average of all non-fluoridated sites. This site was therefore excluded from analyses using the CWF status variable.
Kent County New Brunswick
The average tap water level for each site in Cycle 3 was calculated, and the average for all fluoridated and all non-fluoridated sites was also calculated. The average tap water level was 3 times lower in Kent County than for the average of all non-fluoridated sites. This site was therefore excluded from analyses using the CWF status variable.