urban water-related environmental transitions in southeast asia
TRANSCRIPT

ORIGINAL ARTICLE
Urban water-related environmental transitions in Southeast Asia
Peter J. Marcotullio
Received: 12 August 2006 / Accepted: 22 November 2006� Integrated Research System for Sustainability Science and Springer 2007
Abstract This article reviews water-related urban
environmental conditions in Southeast Asia. It argues
that the development of urban environmental chal-
lenges in the region follows a unique pattern compared
with those experienced in the now developed world.
The new pattern is defined by the so called time–space
telescoping of the development process. The process of
time–space telescoping reduces the levels of income at
which environmental challenges emerge and forces
their appearance in a simultaneous fashion, as sets of
problems. During previous eras, cities experienced
sequential environmental transitions. Urban water-re-
lated environmental burdens emerged on local scales
and expanded geographically and temporally in im-
pact, with growing levels of affluence. Moreover, certain
environmental challenges appeared later in economic
growth because the technologies and practices that
induced these problems emerged at higher levels of
income. The article has two main findings. First, except
for wealthy urban centers, for example Singapore, cities
in the region are experiencing multi-scaled water
burdens simultaneously. Second, low-income and
middle-income cities are experiencing burdens at lower
levels of income than did their contemporaries in the
north.
Keywords Urban environmental transitions �Water-related environmental burdens � Scale �Time–space telescoping � Southeast Asia
Introduction
In his article ‘‘Ecology Matters: Sustainable Develop-
ment in Southeast Asia’’ Savage (2006) critically
examines very many processes and trends pertinent to
urban development in Southeast Asia. Using population
growth and distribution, the growth and form of capi-
talism in the region, ecological linkages between bio-
physical and socio-cultural spheres, and multi-faceted
aspects that contribute to development, he explores
growth within the region and sets up a discussion on
how its cities can become sustainable. He finds the basis
of current environmental conditions, and therefore the
keys to solutions, in two dominant circuits of urban
dwellers. The first is the lower circuit of ‘‘ecosystem
people’’ who depend on the ecosystems and the services
they provide within and surrounding slums and squatter
dwellings. These citizens suffer from and contribute to
traditional ‘‘brown issues’’, for example poor water
supply, sanitation, and solid waste management, and
indoor air pollution, resulting in morbidity and mortality
from respiratory and infectious diseases. The second
group inhabits the upper circuit of cities and are called
‘‘biosphere people.’’ This group lives in wealthy gated-
communities and high-rise apartment buildings. While
avoiding traditional environmental burdens they suffer
from materialism and high consumption habits, which
reduce ecosystem services in ‘‘distant elsewheres’’ (Rees
2002), produce emissions that generate global systemic
environmental change, for example the greenhouse
effect, and suffer personally from general loss of cultural
values. Essentially, the article points not only to differ-
ent sets of environmental burdens faced by those living
in the same city, but also to the notion that different
burdens have different scales of impact.
P. J. Marcotullio (&)UNU Office at the United Nations,United Nations University Institute of Advanced Studies,2 UN Plaza, DC2-2060, New York, NY 10017, USAe-mail: [email protected]
123
Sustain Sci
DOI 10.1007/s11625-006-0019-0

I believe this argument to be correct and would like
to further expand on this line of thinking. This article
also examines urban environmental conditions in
Southeast Asia. It focuses on the emergence of dif-
ferent scales of urban water-related environmental
burdens previously associated with different income
levels of cities. The main premise is that the patterns of
transitions among different sets of environmental
conditions experienced by those living in cities in the
region are unique, and different from those experi-
enced historically by the now developed world. Spe-
cifically, within cities in Southeast Asia environmental
challenges increasingly appear on all scales simulta-
neously. Compared with the chronological experiences
of now developed cities, environmental burdens are
also emerging at lower levels of income. The analysis
suggests that even for low-income cities, urban man-
agers are faced with a spectrum of issues.
The article is organized in three further sections. In
the next section, I present a basis for understanding the
environmental conditions occurring within cities of
Southeast Asia. Using the concept of urban environ-
mental transitions the article presents a variant of this
theory that addresses how transitions are currently
unfolding within the region. In the third section I
present evidence in support of the claims. In the fourth
section, I briefly discuss the implications of the findings
and conclude the paper.
A perspective on the unique environmental conditions
in Southeast Asian cities
My main argument is that urbanites of cities of the
Southeast Asian region are experiencing several lay-
ered environmental conditions and burdens associated
with varied and complex development forces. Specifi-
cally, in comparison with the historical experiences of
the now developed world, particularly Western Europe
and North America, one finds in Southeast Asia a
collapsing, compression, and telescoping of different
development trends. The results include changes in the
speed, timing, and emergence of transitions and the
changes in the geographic concentration of different
phenomena.
The processes that lead to these changes have
been called time–space telescoping (Marcotullio 2005),
which is composed of changing time-related and
space-related effects. Time-related effects include in-
creases in the speed and efficiency of human activities.
Changes in the speed and intensity of different aspects
of development have been associated with globaliza-
tion, communications and transportation technology
(Dicken 1998; Held et al. 1999). Space-related effects
include processes that concentrate diverse physical,
social, and economic activities in geographically un-
even patterns and in increasingly concentrated areas.
For example, the increasing concentration of different
income classes (Massey 1996) and diversity of tech-
nology used by them, and the infrastructure available
for urban citizens are a result of the space-effects.
Recent work on globalization suggests space-related
effects result from the concentration of certain types of
infrastructure (communication, transportation, finan-
cial and business services, headquarters of transna-
tional companies) in specific locations around the
world (e.g. world cities) (Friedmann 1986; Friedmann
and Wolff 1982; Lo and Yeung 1998; Sassen 1991).
These concentrations have been facilitated by new
transportation and communications technology which
have transformed the ability of information, goods, and
services to move across space (Dicken 1998).
Time–space effects change constraints placed upon
human activities and, therefore, transform our ability
to affect the environment. Janelle (1968, 1969), for
example, identified the increasing speed at which
people move across space and its affects on economic
activity and social relations. His term ‘‘time–space
convergence’’ defined the process of reducing the
friction of distance between places and results in
reducing average amounts of time needed to travel
between them. Processes creating ‘‘time–space con-
vergence’’ have not only made the world smaller, but
have also increased our ability to affect a larger num-
ber of different environments around the world, and
more intensely. Harvey (1989), focused on what he
called ‘‘time–space compression’’ as underpinning the
emergence of the post-modern condition. Time–space
compression includes processes that revolutionize the
objective qualities of space and time and alter, some-
times in quite radical ways, how we see the world.
These notions demonstrate changes in the speed and
location of activities with time, which have thus
transformed human behavior and its environmental
impact.
The argument raises issues about the meaningful-
ness of comparing development patterns across space
and time. Is it fair to compare New York City at the
turn of the twentieth century with 1980s Bangkok?
How, more generally, can urban development patterns
and environmental conditions be justifiably compared?
A current popular view is that the development of
cities and nations can be compared on the basis of their
GDP levels per capita, and the environmental condi-
tions associated with different levels of income can be
meaningfully interpreted. Those that subscribe to this
Sustain Sci
123

perspective often use the Environmental Kuznets
curve (EKC). The EKC compares countries and cities
at similar levels of income and suggests that, irrespec-
tive of when or how they obtained similar levels, they
will follow a similar pathway that is described by the
‘‘inverted-U’’ function of environmental degradation
across income levels. Specifically, they suggest that all
countries undergo environmental degradation to a
threshold level, when processes reverse and environ-
mental degradation decreases. According to this the-
ory, all environmental conditions follow this pathway.
Two limitations of EKC analyses include the equa-
tion of development solely with economic growth and
the notion that all environmental trends follow the
‘‘inverted-U’’ curve. First, to EKC advocates, devel-
opment is equated with the increasing capacity of the
national economy to generate increases in production.
Using per capita indicators demonstrates that increases
in economic growth are different from those of popu-
lation growth. Typical EKC comparisons use purchas-
ing power parity (PPP) per capita indicators, which
enable income standardization across price differences
in goods and services between countries. That is, a PPP
value for income in one country will match the ability
of citizens to purchase the same amount of an exact set
of goods and services in another country and their own.
Although using PPP per capita values is more appro-
priate than simply comparing GDP or GDP per capita
figures, it still leaves much of what development
encompasses out of the picture.
Economic growth does not necessitate changes in
social or political structures, for example. Those
attempting to address these problems often supple-
ment economic data with social indicators including
acquisition of material possessions, for example tele-
phones, televisions, and radios, and the use of banks,
schools, and cinemas, and provision of housing, medi-
cal, or educational services (see any Human Develop-
ment Report of the United Nations Development
Program).
Nor does a focus on economic growth always include
emphasis on the reduction or elimination of poverty,
inequality, and unemployment. Many argue, however,
that development concerns equity and distributive
justice on all scales. Economists have recently turned
toward definitions that include improving the quality of
life for citizens, broadly defined, and, especially, the
poor (World Bank 1991).
These different critiques of using economic growth
as an indicator of development suggest the process is
more than increasing wealth. ‘‘Development must
therefore be conceived a multidimensional process
involving major changes in social structure, popular
attitudes and national institutions, as well as the
acceleration of economic growth, the reduction of
inequality and the eradication of poverty’’ (Todaro
1997, p. 16).
The second critique of the EKC analysis suggests
that different environmental effects have different
relationships with development (World Bank 1992).
EKC studies have been performed on several different
water and air pollutants, for example, with expecta-
tions that trends of these environmental burdens will
follow the ‘‘inverted-U’’ shape with increasing income
(Grossman and Krueger 1995). More recent studies,
however, have found that different environmental
burdens follow different patterns with increasing
wealth (Yandle et al. 2004).
One response to the limitations of EKC notion has
been the development of urban environmental transi-
tion theory. Urban environmental transition theory
suggests that wealth, among other factors, accounts for
a variety of changes in environmental conditions within
cities (McGranahan et al. 2001; McGranahan and
Songsore 1994). As cities increase in wealth, urban
environmental challenges shift in type, scale, and tim-
ing of impact. The theory defines three different sets of
relationships between increasing wealth and environ-
mental burdens. Traditional urban environmental
challenges are the first to emerge. These include those
in the brown agenda. Brown agenda issues are most
clearly seen at the household and neighborhood level.
The key effects of these issues are on human health;
the timing of the effect is immediate and those most
affected are those within lower-income cities
(McGranahan and Satterthwaite 2000).
Environmental challenges that emerge during rapid
development are at the scale of the entire metropolitan
region. These issues have been associated with the gray
environmental agenda (Marcotullio and Lee 2003). The
key effects of these issues are both human health and
the natural and man-made environments. The timing of
the effects can range from immediate to delayed (for
some pollution, years can pass before effects are noted).
Those worst affected are populations living in the city
and, particularly, those in poor neighborhoods.
The environmental burdens associated with wealthy
cities are typically categorized as part of the green
environmental agenda. The key effects of these con-
ditions and trends are on ecosystem health. The timing
of the effects are delayed and the worst affected are
future generations (McGranahan and Satterthwaite
2000). These issues can be observed on internationally
regional or global scales.
The theory also focuses on more than economic
growth as the driving force in environmental change.
Sustain Sci
123

Wealth can be used as a central axis to demonstrate
shifts in the type and scale of impact, but the theory is
valid for other factors complementary to economic
growth as driving forces of change. Indeed, according
to the theory, economic growth is not the only, or even
the major, force driving environmental change. For
example, recent studies in urban environmental tran-
sition theory suggest that agenda setting, environ-
mental crises, risk transfer, and the social construction
of environmental burdens are some of the numerous
factors affecting urban environmental transitions
(Marcotullio and McGranahan 2007). These notions do
not, however, negate the value of environmental
transition theory but rather help to further refine the
approach.
Previous studies of urban environmental conditions
within East and Southeast Asia have, however, been a
variant of urban environmental transition theory and
EKC studies. They suggest, for example, that cities
experience different environmental burdens with eco-
nomic growth. For example, Webster (1995) was the
first to use urban environmental transition theory to
describe urban conditions in Southeast Asia. He di-
vides cities in the region into three categories. Cate-
gory 1 cities are poor and afflicted with largely brown
issues. Hanoi, Ho Chi Minh, and Phnom Penh and
Vientiane belong to this category. Category 2 cities are
middle-income cities with air pollution and congestion
problems as the dominant concerns. These include
Bangkok and Kuala Lumpur. Category 3 cities are
high-income cities that are battling hazardous wastes
and degradation of urban amenities. This category in-
cludes Singapore and Hong Kong. Bai and Imura
(2000) also examine the environmental conditions in
different cities in East Asia and largely follow Web-
ster’s scheme. In their analysis they suggest that cities
undergo staged evolution. According to their scheme,
cities in the region are differentiated into three types.
Type I are cities with poverty-related environmental
problems. Type II cities are those confronted with
rapid growth-related environmental issues. Type III
includes those in which the residents are primarily
concerned with wealthy lifestyle-related complications.
The model also postulates that cities experience three
distinct sets of environmental problems sequentially.
That is, cities ‘‘evolve’’ through ‘‘stages’’ one after
another. Curiously, however, the authors also suggest
that cities can jump between types, although the pro-
cess by which this is possible is not elaborated.
The patterns outlined by these previous studies fol-
low those outlined for the now developed world. In his
study of the history of urban sanitary services, Melosi
(2000) notes that chronologically, US cities developed
infrastructure, scientific theories, and new cultural
adaptations to meet existing problems as they grew
during the nineteenth and twentieth centuries. He
notes that the first challenges were all localized. Sub-
sequent problems progressively grew in geographic
scale because often the solutions to problems simply
displaced the environmental burden. Indeed solutions
for a previous pollution problem often generated new
challenges later, although these challenges took some
time to emerge and they often did so in different
locations and in different environmental media (Tarr
1996). Hence, at any one period of time, cities in the
now developed world addressed environmental bur-
dens on mostly one scale, be they local, regional, or
global.
The environmental transitions between sets of dif-
ferent scaled burdens were not only related to the
solutions of problems but to the limitations of the
standard ways of operating in previous eras. Barriers,
however, only became apparent with new urban
growth, new technology, and new demands by citizens.
As a new urban order developed, it disrupted and even
destroyed the former, as a response to its limitations
(Peterson 1982). These changes occurred over long
periods of time. Sometimes the shifts took 50–70 years
to occur (Kondratieff 1979). For example, Newman
and Kenworthy (1999) have identified specific urban
forms associated with different type of transport as
they evolved in the developed world. Given the shift in
environmental challenges over long periods of time
and the distinctness of the urban orders that emerged,
it is easy to see why the environmental histories of now
developed cities are written as stages related to the
dominant environmental challenges of the period
(Berry 1990; Melosi 2000; Yeates 1998).
The notion of time–space telescoping challenges the
underlying understanding of development portrayed
by the EKC, and versions of environmental transition
history, that have been applied previously to cities in
Southeast Asia. Rather than following sequential pat-
terns, contemporary time-related and space-related
effects associated with the current development con-
text are strong enough to produce a new and unique
pattern for newly developing cities. Some of the basic
differences between the forces that created previous
histories and those creating the emerging patterns
found in Asia include:
• Processes that unfolded over long periods of time in
developed world history are now revealed rapidly
in the contemporary developing world context;
• Conditions that were once seen over large areas
during any given historical period in developed
Sustain Sci
123

world history are now seen within increasingly
concentrated spaces and particularly within cities in
the developing world;
• Patterns of social, economic, environmental, and
institutional development, that were once regarded
as sequential and which previously occurred in
stages in developed world cities are now occurring
simultaneously in developing world cities;
• Technology, information, goods, services, etc., that
were historically associated with wealthy societies
and associated with environmental problems in
those cities, are now increasingly found in cities at
all levels of income;
• Urban forms that once defined different economic
and social activities of cities at different stages of
development are now enmeshed and evolving
together in developing world cities.
These processes hypothetically force environmental
conditions of rapidly developing cities to:
1. appear sooner (at lower levels of income);
2. rise faster (over time); and
3. emerge in a more simultaneous fashion than they
did in previous urban history.
It would be difficult to demonstrate all these trends
in a study that focuses only on cities in the rapidly
developing world. It is possible, however, to show
through a cross-sectional examination of urban envi-
ronmental burdens of cities in the region that envi-
ronmental effects on different scales are now
important to most cities, irrespective of their income
level. Demonstrating multi-scaled environmental con-
cerns in cities at low or medium levels of income is
arguably direct evidence of the telescoping notion. The
task of this article is to show that there are numerous
water-related burdens within all cities of the region and
that these burdens appear on different scales within
individual cities, even those of low-income and middle-
income.
Cities awash in water-related burdens
Water-related urban environmental challenges can be
divided into categories on the basis of their scale of
impact (Table 1). This section provides evidence that
urban water decision-makers in the region are
increasingly forced to address similar sets of water-re-
lated challenges, on all scales and at lower levels of
income than experienced during previous times. It does
so by presenting data for both the state of the envi-
ronment within cities of the region as well as status of
the driving forces affecting the environmental condi-
tions.
Local water issues
Local water-related environmental issues include
access to safe drinking water and sanitation and
appropriate drainage. These are associated with local
environmental health, which in turn are associated with
urban poverty (Hardoy et al. 2001).
Although economic growth in Asia has led to
reductions in both relative inequality and absolute
poverty (Fields 1995), levels of poverty in the ASEAN
region remains high in some countries (Table 2). In
Cambodia, Lao PDR, and Vietnam poverty levels are
between 35 and 40%. For other countries, for example
Indonesia, Myanmar, and the Philippines, the situation
is slightly better with poverty at levels between 17 and
28%. There are also other counties with lower but
significant levels of poverty, for example Thailand
and Malaysia with 10 and 8%, respectively. Brunei
Darussalam and Singapore, on the other hand, can
boast of small populations living in poverty.
Until recently, the problem of poverty throughout
Asia was regarded as predominately rural (Quibria
1993). With increasing urbanization, poverty has
urbanized (see, for example, UN-HABITAT 2003a).
Indeed, in a review of urban poverty in Asia, Mills and
Pernia (1994, p. 2) predict that ‘‘because of continuing
Table 1 Different scales of urban water-related challenges
Water-related challenge Scale of impact
Brown issuesAccess to water supply HouseholdAccess to sanitation HouseholdAdequate drainage Neighborhood
Gray issuesRiver pollution Metropolitan region to
regionalOverdrawn groundwater
suppliesNeighborhood to metropolitan
regionGround subsidence Neighborhood to metropolitan
regionCoastal area degradation Metropolitan region to
regionalFlooding Neighborhood to metropolitan
regionGreen issuesIncreasing water consumption
per capitaMetropolitan region to
regionalWater scarcity Metropolitan region to
regionalIncreased vulnerability because
of climate change/variabilityRegional
Sustain Sci
123

urbanization and urban population growth, poverty
will increasingly become an urban phenomenon and,
regardless of economic growth performance in the
short to medium term, will remain a formidable
problem in many countries for years to come.’’
In the urban setting, the poor typically live in slums
or squatter developments. Globally, there are approx-
imately 900 million people living in slums, including
43% of the urban population in developing regions
(Garau et al. 2005). As there is no simple measure of
slums, this figure probably underestimates the extent of
urban poverty (Satterthwaite 2005).
Conservative estimates of households in poverty in
the region’s cities are listed in Table 3.1 Even these
data suggest that the percentage of households living in
poverty is high in some of the region’s cities. Detailed
case studies suggest that poverty figures alone are not
sufficient to identify slums. Research demonstrates
that Bangkok still has 866 slum areas typically located
along canals or in concentrated nodes, which hold 16%
of the city’s population. In Jakarta, estimates suggest
that 20–25% of the city’s population lives in Kam-
pungs, with another 4–5% squatting illegally. In Manila
526 slum communities house 2.5 million people. Al-
though these communities are fairly discrete, urban
poverty in Metro Manila can be found wherever there
is space and opportunity (UN-HABITAT 2003a). In
the relatively high-income Klang Valley, Malaysia, the
location of Kuala Lumpur, approximately 9.2% of
dwellings are squatter housing (Bunnell et al. 2002).
Poverty and slums are typically known for local
environmental issues associated with ill-health. Two
important indicators of poverty, slums and the brown
agenda, for example, are the numbers of people with-
out access to water and sanitation (UN-HABITAT
2003a). Globally, the number of urban dwellers who
have inadequate access to water and sanitation is
underestimated and reaches into the hundreds of mil-
lions.
International efforts to measure local access to
water and sanitation can be confusing. One set of
indicators suggests there are those who have access to
‘‘improved’’ water and sanitation. For example, 93% of
the urban population in Asia have ‘‘improved’’ water
and 78% have ‘‘improved’’ sanitation (Table 4). Many
of those populations classified as having ‘‘improved
provision’’ may, however, be sharing facilities with
hundreds of people (Garau et al. 2005), so although
provision may be ‘‘improved’’ it may not be ‘‘safe’’ and
‘‘adequate’’ (UN-HABITAT 2003b).
Another important limitation of urban data is the
misleading quality of aggregated statistics, which hide
the scale or depth of deprivation among poor urban
populations. That is, concentrations of middle and
upper-income populations within cities, which have
good access to services, can bring up averages (Garau
et al. 2005). For example, in a review of demographic
change in developing country cities Montgomery et al.
(2003), documented differences between urban poor
and non-poor child health (in terms of height and
weight) and household access to public services (water
supply, sanitation, electricity). The distinctions be-
tween the urban poor and urban non-poor were sim-
ilar among a number of variables. Access for the
urban poor to services is sharply worse than that of
the urban non-poor and childhood health of the urban
poor is worse than that of the urban non-poor. These
authors conclude that it is likely that poverty-related
differences in children’s health are partly because of
different access to environmental and other services.
Table 3 Households below poverty in selected Southeast Asiancities
City Country Households belowpoverty (%)
Phnom Penh Cambodia 16.4Bandung Indonesia 2.0Jakarta Indonesia 6.6Semarang Indonesia 24.8Surabaya Indonesia 0.9Vientiane Lao PDR 19.0Penang Malaysia 6.1Yangon Myanmar –Cebu Philippines –Bangkok Thailand 15.9Chiang Mai Thailand 9.7Hanoi Vietnam 2.1Ho Chi Minh Vietnam 10.6
UN-HABITAT (2003a)
Table 2 Percent of total population living in poverty
Country Poverty (%)
Brunei Darussalam 0Cambodia 36Indonesia 17Lao PDR 39Malaysia 8Myanmar 23Philippines 28Singapore 0Thailand 10Vietnam 37
Source: ASEAN Statistical Yearbook 2004
1 Estimates of the number of people living in slums in SoutheastAsia are as high as 56.7 million or 28% of the total urban pop-ulation in the region (UN-HABITAT 2003a).
Sustain Sci
123

These differences are hidden by averages for entire
cities.
In addition to confusing nomenclature and the
misleading quality of aggregated information, urban
data for water issues are hard to obtain. More often
than not the data are not standardized across cities and
can be used in comparative studies only with care.
Numbers change without adequate explanation or data
cited are old and may be out-of-date. Given this state
of confusion it is not surprising that some have called
for a region-wide assessment of urban conditions so
that policies can be adequately elaborated (Savage
2006; Sonnenfeld and Mol 2006).
Given these caveats, one approach to using data is to
present a number of different datasets for analysis.
Information complied at the regional or national level
may be conservative, but these data can be supple-
mented by figures from more detailed studies of indi-
vidual Southeast Asian cities. Together this
information provides a fairly accurate picture of what
is happening in the region.
As shown in Table 4, the numbers that do not have
access to safe water and sanitation in Asia are in the
hundreds of millions—up to 700 million without access
to safe drinking water and up to 800 million without
access to sanitation. Data at the national level for
Southeast Asian access to water supply reveal
improvement over the last decade (Table 5). The rec-
ognized improvements are probably because of a
number of recent reforms to local environmental gov-
ernance including increased decentralization, commu-
nity participation, and privatization of water facilities
(Memon et al. 2006). Despite the improvements,
however, in countries such as Cambodia, Lao PDR,
Indonesia, and Myanmar more than 69 percent or
more of the urban population still have no household
connection to drinking water. Almost half of the urban
population of Vietnam are without safe access, 40% do
not have safe access in the Philippines, and 20% do not
have safe access in Thailand. Table 5 also illustrates
the difference between those with ‘‘improved’’ provi-
sion of water supply and those with household con-
nections (which might be the basis for a definition of
Table 4 Estimates of the number of urban dwellers lacking provision for water and sanitation in 2000 based on who has ‘‘improved’’provision and who has ‘‘adequate’’ provision
Region Number and proportion of urban dwellerswithout ‘‘improved’’ provision for:
Indicative estimates for the number and proportionof urban dwellers without ‘‘adequate’’ provision for:
Water Sanitation Water Sanitation
Africa 44 million 46 million 100–150 million 150–180 million15% 16% 35–50% 50–60%
Asia 98 million 297 million 500–700 million 600–800 million7% 22% 35–50% 45–60%
Latin America andthe Caribbean
29 million 51 million 80–120 million 100–150 million7% 13% 20–30% 25–40%
Source: UN-HABITAT (2003b)
Table 5 Progress in safe drinking water coverage, national andurban populations (%)
Country Improved drinking water coverage
Total population Urban population
Totalimproved
Withhouseholdconnections
Totalimproved
Withhouseholdconnections
Brunei Darussalam1990 – 97 1002002 99 100 98 100
Cambodia1990 – – – –2002 34 6 58 31
Indonesia1990 71 10 92 262002 78 17 89 31
Lao PDR1990 – – – –2002 43 8 66 25
Malaysia1990 – – 96 –2002 95 – 96 –
Philippines1990 48 3 73 112002 80 8 95 23
Thailand1990 87 21 93 372002 85 44 90 60
Singapore1990 – – 100 1002002 – – 100 100
Thailand1990 81 28 87 692002 85 34 95 80
Vietnam1990 72 11 93 512002 73 14 93 51
Source: UNEP RRCAP (2004), ASEAN (2005)
Sustain Sci
123

‘‘adequate’’). In Indonesia in 2002, for example, al-
though 78% of the total population had ‘‘improved’’
access to water supply, only 17% had household con-
nections.
Data from studies of individual cities within the re-
gion tell a more detailed story (Table 6). Not only does
a large proportion of the population with ‘‘improved’’
services, lack safe, convenient, and adequate services,
but current percentages of those with safe and ade-
quate services may have been overestimated. Within
the major metropolitan centers in the higher-income
countries (except Singapore) there are large differ-
ences between statistics for numbers of people without
access to water. UN-HABITAT (2003b), for example,
reports that although official statistics for Kuala Lum-
pur suggest 100% of the population have access to
water, only 46% have access to outlets in their homes.
The same publication suggests that despite a claim that
82% of the population of Bangkok have access to
water only 63% have taps in their homes. In Manila,
only 38% have taps in their homes and up to 33% do
not have any access to piped water.
For many cities in the region water consumption per
person is, moreover, very low. In Phnom Penh average
water consumption is 32 liters per person per day. In
Hanoi average water consumption is 45 liters per day
and in Yangon water consumption is 67 liters per day.
Given that these are averages for whole city popula-
tions, they probably hide significant proportions of
each city’s population that use less than 20 liters per
person per day (UN-HABITAT 2003b).2 The low
levels of water provision do not necessarily mean that
citizens in these cities are more conserving of the re-
source than others, or that water is scarce. It is more
likely fresh water is not being provided in sufficient
quantities. These statistics emphasize the serious
problems of potable water in many of the region’s
cities (Laquian 2005).
Another side of water supply is sanitation and waste
water removal. This aspect of water management is
crucial, because obnoxious, if not unhealthy, conditions
can result if it is done poorly. Table 7 suggests there
have also been significant increases in access to im-
proved sanitation services throughout the region dur-
ing the 1990s. Thailand has achieved almost complete
coverage. Myanmar’s improvement jumped from 45 to
64% access during the decade (UNEP Regional Re-
source Center for Asia and the Pacific 2004).
Improvements at the urban level have been even more
impressive. Improved sanitation reached 71, 84, and
96% of the urban populations of Indonesia, Vietnam,
and Myanmar. Again, these figures may not tell the
Table 6 Provision of water supplies in selected Southeast Asian cities, mid-1990s
City Populationwith housetaps (%)
Populationserved bypublictaps (%)
Personsperpublictap
Notes
Phnom Penh 83.1 0 17% without piped water; rely on wells and pondsBandung 31.4 10.4 100 58% without piped water: relying mostly on tube wells and dug wellsJakarta 20.5 6.7 300 73% without piped water relying on tube wells, dug wells, and rain collectorsMedan 57.1 5.7 60 37% without piped water; most use tube wells and shallow wellsVientiane 54.2 0.1 16.25 Utility claims 8% without piped water relying on wells, rivers, and rainfallJohor Bahru 99.9 0Kuala Lumpur 45.9 0 Utility claims 100% coveragePenang 100 0.1 50Mandalay 36.6 0.4 50 Utility claims 20% without piped water relying on tube wells or riversYangon 56.4 11.8 180 40% without piped water relying on tube wells, ponds, and rain collectorsCebu 20.9 1.6 128 77% without piped water; 47% relying on wells, rest from vendorsDavao 52 0 48% without piped water relying on tube wells and rain collectorsManila 38 5.7 357 33% without piped water; most depend on wellsSingapore 100Bangkok 62.8 0 Utility claims 18% without piped water relying on wells, ponds, and rain waterChiang Mai 64.8 0 35% without piped water relying on wells and rain waterChonburi 79.8 0 Utility claims 11% not covered relying on tube wells and rain waterHanoi 70.8 4.9 116 24% without piped water relying on wells, ponds and rain waterHo Chi Minh City 50 0.1 1,270 48% without piped water relying on tube wells
Source: UN-HABITAT (2003b)
2 Twenty liters per day per person is regarded as essential andbetween 50 and 60 liters per person per day is needed for suchdomestic needs as washing, food preparation, cooking, cleaninglaundry and personal hygiene (more would be needed if flushtoilets were being used) (UN-HABITAT 2003b). According tothe World Commission on Dams (2000), in 1990, over a billionpeople had access to less than 50 liters of water a day.
Sustain Sci
123

entire story. They are records of ‘‘improved’’ sanita-
tion, not access to safe (i.e. in-household) sanitation.
Within many cities in the region water-supply sys-
tems are not well integrated with sewerage, drainage,
storm water, and flood-control systems. The Asian
Development Bank (2004) has recently reviewed the
performance of utilities in selected cities in Asia. Some
of the findings are presented in Table 8. It is apparent
none of the urban centers of the Lao PDR are serviced
with a sewerage system (UNEP Regional Resource
Center for Asia and the Pacific 2001a). Vientiane’s
small-bore sewage system is not working properly. In
Phnom Penh, only 41% of the city is covered by the
city’s sewerage program. Approximately 12% of
households have no toilet facilities. Ho Chi Minh has
even lower levels of sewerage coverage (approx. 12%).
In Metro Manila, 7% of the population served by
the Metropolitan Waterworks and Sewerage Service
have sewerage connections (Memon 2003).
In Jakarta, there is no comprehensive water sewer
system. Only 2% of the city is currently served with
sewerage. Approximately, 73% of households have
private lavatories in their homes,3 and 16% had shared
private toilets and 12% used public toilets. Of 851
household toilets observed, more than half have no
hand-washing basin in the vicinity. One-third of
respondents report that some people in their neigh-
borhood, mostly children, defecate outside, most
commonly in drains and gutters (UN-HABITAT
2003b).
Trends are similar in other cities in the region. In
Cebu, the Philippines, approximately 45% of house-
holds have access to water-sealed toilets (sharing of
which is common), with 18% relying on pit latrines and
36% having no toilets. For this last group the conve-
nient recourse is defecation in the open (UN-HABI-
TAT 2003b). Even in higher-income Bangkok and
Kuala Lumpur there is not yet full sanitation coverage.
Only 2% of Bangkok’s households are connected to
the city’s sewerage system, 25% rely on septic tanks,
and the rest use pit latrines and other means of dis-
posing of human waste and gray water (Laquian 2005).
In Kuala Lumpur approximately 80% of the city’s
population has access to sewerage; the remainder use
septic tanks.
Many cities in Southeast Asia do not have formal
drainage systems but merge combined sewer overflow
systems with a series of canals, called klongs in Thai-
land or esteros in the Philippines. There are approxi-
mately 1,145 klongs left in Bangkok. These waterways
are remnants of previously extensive systems that ran
throughout the city intimately weaving water into the
urban form. Indeed, Bangkok started as a city of
floating houses, as is still found in some parts of the
region. Only the Grand Palace and the temples were
initially on firm ground. The city initially grew in a
ribbon pattern of settlement which clung to the banks
of the Chao Phraya River. By 1864, there were a few
inland roads. One observer at that time wrote ‘‘Bang-
kok is the Venice of the East and whether bent on
business of pleasure you must go by water’’ (quoted in
Smithies 1986, p. 38).
As Bangkok and other cities close to waterways
grew, however, particularly after the 1950s, they
changed in nature and in regard to these transport and
drainage systems. Inland roads were developed and
canals were filled in as people and activities moved on
Table 7 Progress in safe sanitation coverage, national and urbanpopulations (%)
Country Improved sanitation coverage
Total Urban
Brunei Darussalam1990 – –2000 100 –
Cambodia1995 14 –2000 18 53
Indonesia1990 54 662000 55 71
Lao PDR1990 19 –2000 30 61
Malaysia1990 94 942000 100 –
Myanmar1990 45 392000 64 96
Philippines1990 74 632000 83 81
Singapore1990 100 1002000 100 100
Thailand1990 79 952000 98 97
Vietnam1990 29 462000 47 84
Source: UNEP RRCAP (2004); ASEAN (2005)
Note: For urban coverage all starting dates are 1990 and thelatest date is 2002
3 Cybriwsky and Ford (2001) estimate that approximately half ofJakarta’s residencies lack toilet facilities. Hadiwinoto andLietmann (1994) suggest that among the lowest-income quintileof the city only 6% have piped-in water and 64% share toilets.
Sustain Sci
123

to higher ground. The canals that remain, in cities as
economically diverse as Bangkok, Ho Chi Minh City,
and Jakarta, are now primarily used for drainage. In
Jakarta, this has left entire sections of the city without
formal drainage (Cybriwsky and Ford 2001) and much
of what acts as a drainage system is made up of former
canals and local rivers (Laquian 2005).
In other cities, there is even less adequate drainage.
In Lao PDR, for example, storm-water drainage in
most urban areas consists of roadside ditches leading,
ultimately, to natural streams or rivers. Drains are not
adequately interconnected and do not form networks.
Storm-water drainage is a serious issues in Vientiane
(UNEP Regional Resource Center for Asia and the
Pacific 2001a). Invariably, in all these cities, the canals,
roadside drains, and small streams are contaminated
with fecal matter from latrines and septic tank effluent
and become clogged and overflow during floods, cre-
ating health problems.
In all but the wealthiest cities in the region, for
example Singapore, local brown-water-related chal-
lenges continue to be important. The effects of these
conditions are significant. When provision for water
and sanitation is poor, diarrheal diseases and other
diseases linked to contaminated water or contaminated
food are among the most serious health problems
within urban populations (Hardoy et al. 2001;
UN-HABITAT 2003b; UNESCO 2003).4 In the Asia
Pacific Region in 1999, diarrhea-related diseased killed
more than one million people and accounted for nearly
50% of global reported deaths from diarrhea. Con-
taminated water and poor sanitation were the main
causes of the disease (UNEP Regional Resource
Center for Asia and the Pacific 2004). In Bangkok, for
example, cases of acute diarrhea have varied between
877 and 677 per 100,000 a year for the last 10 years.
The highest-risk groups were those under 4 years of
age and those between 5 and 9 years of age (Panich
2003).
City-wide water issues
Southeast Asia receives abundant rainfall and has
abundant water resources. Annual renewable water
resources per unit of land area range from 2,200 to
14,000 m3 ha–1 throughout most of Southeast Asia.
There are several important river systems in the region
including 200 in Indonesia and 20 in Thailand. The
international Mekong River is approximately 4,600 km
in length and drains approximately 800,000 km2 of
land. Among the largest lakes in the region are
the Tonle Sap (Cambodia), Lake Toba (Indonesia),
Laguna de Bay (Philippines), and Lake Songkhla
(Thailand) (UN ESCAP 2000).
Despite the abundance of water, concerns over the
sustainability of water supply and protection of water
quality have become important issues (UNEP 2002).
Threats to water resources come from many sources,
but one of the most important is pollution. Much of the
region’s river pollution is, moreover, associated with
urbanization. Urbanization and surface water pollution
problems become worse because they are associated
with over-extraction of groundwater and subsequent
ground subsidence. Many cities in the region are also
causing degradation of coastal zones. Finally, almost all
cities in the region are subject to seasonal flooding.
These are the city-wide water-related challenges faced
by most cities at all income levels within the region.
For most Asian countries results from a surface-
water-quality monitoring program under United
Nations Global Environmental Monitoring System
Table 8 Sewerage access in selected Southeast Asian cities
City Coverage(%)
Notes
Vientiane 0 No piped sewerage system in this or any city of the country. The small-bore sewer system currentlyinstalled in limited areas of the municipality is not working because of blockages. In areas with on-sitesanitation, septic tank effluents discharge into storm drains and into watercourses
Phnom Penh 41 37% of households use septic tanks and 12% have no toilet facilitiesHo Chi Minh 12 The sewerage system is combined with the storm drainage system. Coverage is low in new urban (1%)
and rural districts (0.3%). Approximately 79% of households have septic tanksManila 7 Existing system is old without improvement over the last 10 years. Many households rely on individual
septic tanks with effluent that discharges into storm drainsJakarta 2 Sewerage is restricted to high-rise buildings and a small number of households. Approximately 39% of
households use septic tanks and 20% use pit latrinesKuala Lumpur 80 Septic tanks are still in use in the city. All new housing subdivisions are required to provide adequate
hook-ups to the central sewerage system
Source: Asian Development Bank (2004)
4 Diarrheal diseases are still a primary cause of infant and childdeath for large sections of the world’s urban population.
Sustain Sci
123

(GEMS/Water) are available.5 The GEMS/Water
Program provides scientifically-sound data and infor-
mation on the state and trends of inland water quality.
GEMS/Water is a UNEP program which, since 1978,
has been hosted at Environment Canada’s National
Water Research Institute. More than 100 countries
currently participate in the program and data for river
quality start from 1977 to continue to the present.
These data are important sources of information, be-
cause national level data are sometimes difficult to
obtain. This report uses GEMS/Water data to examine
several water pollutants including pathogens, sus-
pended solids, and heavy metals. Regional and global
environmental assessments and individual city case
studies supplement this information.
Urban related river pollution results from discharge
of untreated solid and liquid waste into rivers (from
both domestic and industrial sources), the increase in
silt loads, because of expansion of urban land use into
peri-urban areas, and overflows of wastewater plants
because of high surface runoff associated with in-
creased impermeable areas.
In cities on or close to the coast, untreated sewage
and industrial effluents often flow into the sea with
little or no provision to pipe them far enough out to sea
to protect the beaches and inshore waters, thereby
posing a major health risk to bathers (Savage 2006).
Besides damaging the tourist industry, however, pol-
lution from cities can also negatively effect coastal
fisheries and, therefore, livelihoods and sources of
protein, create serious health problems in downstream
settlements, and reduce the usability of water for
agriculture. Table 9 presents data on the amount of
urban sewage treated by cities in the region before it is
returned to water bodies. These data reveal that within
developing countries of the Asia Pacific only 10% of
urban wastewater undergoes any form of treatment
(UN ESCAP 2000).
Pathogenic bacteria and viruses are found in un-
treated sewage and effluents from animal husbandry,
storm water run-off, and leachate from open waste
dumps. Increases in the number of pathogens in water
bodies are directly proportional to population density,
so numbers of pathogens in streams and lakes are re-
lated to populations of cities. This is particularly true
when waste water is not treated.
Numbers of pathogens are measured by a variant of
either oxygen demand (OD), biological oxygen de-
mand (BOD), and/or chemical oxygen demand
(COD). BOD measures the load of biodegradable
organic substances and COD measures the chemical
degradability of nearly all water-soluble organics. The
higher the BOD or COD, the larger the amount of
oxygen needed to break down material in the water
and so the greater the organic pollution. In a sample
with a fixed supply of oxygen, it is possible to measure
the amount of oxygen consumed over a period of time
(usually 5 days) (Dunne and Leopold 1978).
BOD of Asian rivers are 1.4 times the world aver-
age. Although values declined in the early 1980s, they
increased in the 1990s because of increased organic
waste loading (Asian Development Bank 1997). Asia’s
rivers contain three times as many bacteria from
human waste (fecal coliforms) as the world average,
ten times higher than Organization of Economic
Co-operation and Development (OECD) guidelines;
the median fecal coliform count in Asia’s rivers is fifty
times higher than World Health Organization (WHO)
guidelines (Asian Development Bank 1997). BOD and
fecal coliform counts in Southeast Asia are therefore
rated very severe (UN ESCAP 2000). In Vietnam’s
urban areas, surface water COD and BOD are typi-
cally 2–5 times higher than acceptable limits set
for surface water. In some streams and rivers they are
10–20 times higher than national standards (UNEP
Regional Resource Center for Asia and the Pacific
2001b). In Jakarta, all rivers crossing the city are
heavily polluted from household gray water (Hadiwi-
noto and Leitmann 1994). Approximately 7% of total
nitrogen inflows into Bangkok from food, fertilizer,
animal feed, atmospheric deposition, and waste water
are retained, and 97% of the remaining nutrients are
passed into the Chao Phraya River and result in ele-
vated nitrogen levels (Faerge et al. 2001). For food
alone, nitrogen volumes are approximately 19,400 tons
per year.
Table 9 Amount of wastewater treated in selected SoutheastAsian cities
City Country Waste watertreated (%)
Phnom Penh Cambodia 0.0Bandung Indonesia 23.4Jakarta Indonesia 15.7Semarang Indonesia 0.0Surabaya Indonesia 0.0Vientiane Lao PDR 20.0Penang Malaysia 20.0Yangon Myanmar 0.0Cebu Philippines –Singapore Singapore 100.0Bangkok Thailand –Chiang Mai Thailand 70.0Hanoi Vietnam –Ho Chi Minh Vietnam –
UN-HABITAT (2003b)
5 See http://www.gemstat.org/queryrgn.asp.
Sustain Sci
123

Table 10 presents GEMS/Water data for water
courses near large cities in the region. The measures
presented are for indicators of nutrients, organic mat-
ter, microbiology, and physical characteristics of the
cities. Average BOD levels of 2 mg L–1 are indicative
of limited organic pollution. Much higher values are
found in North American rivers, for example. Average
levels of 5 mg L–1 are indicative of pollution and val-
ues over 10 mg L–1 are indicative of serious pollution.
COD values are typically higher. Average COD levels
in the Klang River are indicative of extreme pollution.
Indeed, the BOD of the Banjir Kanal, in Jakarta, and
the COD of the Klang River, in Malaysia, suggest
these water bodies are devoid of oxygen.6
Bacterial contamination counts are expressed as
number per 100 mL. They vary over several orders of
magnitude at a given point, because they are the most
variable of water-quality measurements. Typically, in
rivers that receive untreated sewage coliform counts
can well exceed 100,000 colonies per liter. Examples
include the Klang River, the Chao Phrya, the Ciliwing,
and Banjir Canal. WHO drinking-water standards
suggest the objective of zero E. coli per 100 mL of
water as the objective for all water supplies (WHO
2004).
Water quality tests performed near Hanoi show that
concentrations of ammonia and nitrites exceed country
standards by a factor of 1.5–2. The BOD of the Saigon
River exceeds Vietnamese standards by a factor of four
and coliform levels are 50–100 times higher than
acceptable (UNEP Regional Resource Center for Asia
and the Pacific, 2001b).
Since the late 1990s there have been improvements
in some of the region’s waters. Although specific
GEMS/Water data are not available for all rivers, there
are enough research studies to suggest general
improvements in the region. Sonnenfeld and Mol
(2006), for example, report that river BOD values
improved dramatically from 1980 to 2000 in Indonesia
(16% decrease in BOD per day per worker) and
Malaysia (27% decrease per day per worker). River
water pollution, particularly biological and nutrient
levels, however, remains an important environmental
concern (UNEP Regional Resource Center for Asia
and the Pacific 2004).
Another urban-related water-polluting activity that
creates river pollution is land clearing for urban land
use construction. This facilitates soil erosion and en-
hances natural siltation processes, particularly in
tropical climates with heavy rainfall (Douglas, 1968).
Siltation is affected by deforestation and urban activity.
Indeed, urban development can generate up to 100
times more soil erosion than natural systems (Douglas,
1986). Although it is difficult to determine the exact
proportion of the region’s river sediment which arises
from urban activity, urban development is not an
insignificant factor in changes in the amounts of sus-
pended solids in rivers.
Amounts of suspended solids in Asia’s rivers have
almost quadrupled since the late 1970s (Asian Devel-
opment Bank 1997) and rivers typically contain four
times the world average and 20 times OECD levels.
This amount of sediment causes critical problems for
most coastal zones and large water bodies (UNEP
2002). Examples of water bodies affected by high sil-
tation in Southeast Asia include Lake Tonle Sap,
Cambodia. Sediment deposits are reducing the lake’s
depth and affecting the yield of the lake’s fisheries. In
Malaysia the Dungun River in Kuala Terrengganu has
Table 10 Selected biological water-quality indicators and measures for rivers in Southeast Asia, annual averages for the last year onrecord
River Nearest majormetropolitancenter
Year Organic matter Microbiology Physical characteristics
COD(mg L–1 O2)
BOD(mg L–1 O2)
Fecal coliformbacteria (no/100 mL)
Suspendedsolids 105�C(mg L–1)
Temperature(�C)
Klang river Kuala Lumpur 1992 42.56 – 606,750 311.3 27.00Mekong Vientiane 1995 1.52 – – 930.0 29.28Pampanga river Metro Manila 1984 – 4.36 2,026 – 29.29Laguna lake Metro Manila 1990 – – – – 27.98Chao Phrya Bangkok 1993 – 5.13 278,000 – 30.63Ciliwing Jakarta 1981 18.24 – 99,999 399.4 29.20Banjir canal 1995 – 8.90 999,999 94.5 27.56Mekong Phnom Penh 1994 3.73 – – 87.3 29.12
Source: UNEP GEMS-water
6 For further information see the GEMS/Water Digital Atlas ofWater Quality at http://www.gemswater.org/atlas-gwq/intro-e.htm.
Sustain Sci
123

also been polluted by sandy sediment exacerbated by
dredging activity along the river (UN ESCAP 2000).
The indicator total suspended solids (TSS) includes
both organic and mineral particles transported in sur-
face water. TSS is closely linked to land erosion and to
erosion of river channels. According to GEMS/Water
suspended solids are frequently poorly measured.
Values higher than 1,000 mg L–1 affect water use by
limiting light penetration and can limit reservoir life. In
1995, in the Mekong near Vientiane levels approached
this value.7
In addition to human and animal waste and sedi-
ments, urban-related water pollution also occurs when
industrial effluent is not treated before release into
waterways. Many rivers and lakes in Southeast Asia
are severely polluted by industry. Asia’s surface water
contains 20 times more lead, mainly from industrial
effluents, than surface waters in OECD countries. The
worst examples are heavy metal and toxic chemical
pollution in the water bodies of Southeast Asia (Asian
Development Bank 1997; UN ESCAP 2000; UNEP
2002). A survey of river water quality in Thailand re-
vealed heavy lead contamination (in several major
rivers including the Pattani and Colok in the south, the
Moon river in the Northeast, the Pa Sak river in the
north, and the Mae Klong in the central region),
mercury contamination (in the lower central region’s
Pranburi River, the Mae Long, Chao Phraya and
Petchburi rivers of the central region and the Wang
River in the Northern region), and high levels of ar-
senic poisoning in the Tambon Ron Phibun (UN ES-
CAP 2000). Urban industrial pollution in Indonesia is
also significant. Of Jakarta’s 30,000 factories, for
example, only 10% have wastewater treatment (Tibb-
etts 2002).
Levels of heavy metals in selected rivers and the
WHO (2004) guideline values are listed in Table 11.
Sources of heavy metals are numerous but many are
related to industrial and urban activity (Table 12). For
the rivers examined, concentrations of heavy metals
reach or exceed those recommended by the WHO. For
example, in some cases concentrations of Arsenic (As),
Cadmium (Cd) and lead (Pb) in the rivers examined
exceed WHO guidelines. For the Klang River, levels of
chromium (Cr) and Manganese (Mn) also exceed
WHO guidelines. Concentrations of iron above
0.3 mg L–1 are likely to give rise to consumer com-
plaints (disagreeable tastes and odors and staining of
laundry and sanitary ware). Zinc (Zn) is not usually a
health concern but may affect water acceptability.
Global attention has recently turned to monitoring
persistent organic pollutants (POPs) in air, land, and
water. POPs encompass many different groups of
anthropogenic chemicals. The United Nations Envi-
ronment Program (UNEP) has listed POPs such as
organochlorine compounds as being of particular con-
cern. Specifically, the twelve high-priority organo-
chlorine compounds (known as the ’’dirty dozen‘‘) are
from four groups:
1. dioxins and furans, which are produced as products
of municipal and medical waste incinerators, open
burning, landfill fires, and during the production of
polyvinyl chloride (PVC) products;
2. polychlorinated biphenyls (PCBs) (industrial
chemicals that have been banned but are still re-
leased to the environment from old sources and as
unintentional byproducts of combustion and pro-
cesses involving the manufacture, use, and disposal
of organochlorine compounds);
3. hexachlorobenzene (HCB), which is used as a
pesticide and in the manufacture of pesticides and
produced as an unwanted by-product of a variety
of industrial processes involving organochlorine
compounds; and
4. organochlorine pesticides, including DDT, chlor-
dane, toxaphene, dieldrin, aldrin, endrin, hepta-
chlor and mirex.
POPs have been identified in Southeast Asian
waters. For example, large amounts of chlordane are
present in the rivers of Southeast Asia and PCBs can
be found in rivers throughout the region (Allsopp and
Johnston 2000).
Data on organochlorine compounds in selected
water bodies in Southeast Asia are presented in
Table 13. These data reveal the amounts of pesticides
found in rivers of the region, particularly those in
Selangor, Malaysia. Comparative work in the region
suggests that POPs are being used increasingly in the
tropical developing areas of Asia rather than in the
7 Paradoxically, although human activities increase sedimentflows in rivers by approximately 20%, reservoirs and waterdiversion projects prevent approximately 30% of sediments fromreaching the oceans, resulting in a total net reduction of sedimentdelivery to coasts of approximately 10% (Agardy et al. 2005;Vorosmarty et al. 2003). In Southeast Asia, dam building beganin the 1950s. In 2000, Thailand had the most dams (204) followedby Indonesia (96), Malaysia (59), the Philippines (15), Myanmar(5), Vietnam (3), Singapore (3), Brunei (2) and Cambodia (2)(World Commission on Dams, 2000). Recent evidence suggeststhat globally both water and energy demand may require moredams and hence dam building may increase from 2000 to 2050(ICOLD-CICB 2006). Several nations in Southeast Asia areconsidering building new large dams, including some on theMekong River (Dore and Yu 2004) (see below). Projected in-creases in dam building in the region may ultimately reduce theamount of sediment reaching the oceans.
Sustain Sci
123

developed parts (Iwata et al. 1994) and that there is
increasingly a shift in the airborne and water distribu-
tion of POPs from Northern to Southern air and water
systems (Iwata et al. 1993). Concentrations and prev-
alence of POPs in water around Singapore are most
likely because of the increasing presence and impor-
tance of the petroleum industry in the city (Basheer
et al. 2003).
The results of these pollution levels are evident in
the quality of the rivers that run through the region’s
cities. High levels of pollution from Phnom Penh
Cambodia are contaminating wetlands nearby. Con-
tamination is from industry, and the result is high levels
of heavy metals. Farmers in the region make a living by
growing vegetables and selling these in local markets.
These vegetable then pose serious health hazards to
consumers in the city (Muong 2004). Water-quality
tests performed near Hanoi and testing of the Saigon
River have detected heavy metals, for example lead,
mercury, chromium, and cadmium (UNEP Regional
Resource Center for Asia and the Pacific 2001b). The
Pasig River in the center of Metro Manila is effectively
dead (UN ESCAP 2000). Studies of Thailand’s Chao
Phraya River suggest this river is also heavily polluted.
The Chao Phraya River contains serious organic and
bacterial pollution that is a threat to many species of
aquatic life. Acute diarrhea and food poisoning are still
increasing, whereas between 1983 and 2001 the inci-
dence of enteric fever, dysentery, and helminths de-
creased. Also alarming is the increasing number of
diseases caused by chemical and toxic substances con-
taminating water resources. These contaminants are of
domestic, industrial, and agricultural origin (UNESCO
2003). In Malaysia, of the 110 rivers monitored for
pollution, 16 were found to be seriously polluted and
71 slightly polluted (Savage 2006). As the figures for
the Klang River (Tables 10, 11) demonstrate, both fe-
cal contamination and chemical pollution are high.
This river is the most polluted in the country and, like
the Pasig, has been characterized as ‘‘dead’’ or no
longer suitable for drinking or habitation by aquatic
species (Hussain and Hassan 2003). The Malaysian
example is interesting, because the country has a rel-
atively high level of income. Notwithstanding its eco-
nomic development, however, it still faces several
different environmental challenges that are reflected
by the quality of its rivers. For example, while, obvi-
ously, there is a need to address wastewater treatment,
the rivers, and general environmental quality, are
threatened by several activities, including palm oil
plantations, logging, housing construction, agriculture,
and industrial activity (including metal finishing, rub-
ber-based production facilities, food and beverageTa
ble
11
Se
lect
ed
he
av
ym
eta
lw
ate
r-q
ua
lity
ind
ica
tors
an
dm
ea
sure
sfo
rri
ve
rsin
So
uth
ea
stA
sia
,a
nn
ua
la
ve
rag
es
for
all
ye
ars
on
reco
rd
Riv
er
Ne
are
stm
ajo
rm
etr
op
oli
tan
cen
ter
Ye
ars
To
tal
ars
en
ic(m
gL
–1)
To
tal
cad
miu
m(m
gL
–1)
To
tal
chro
miu
m(m
gL
–1)
To
tal
cop
pe
r(m
gL
–1)
To
tal
iro
n(m
gL
–1)
To
tal
lea
d(m
gL
–1)
To
tal
ma
ng
an
ese
(mg
L–1)
To
tal
me
rcu
ry(l
gL
–1)
To
tal
nic
ke
l(m
gL
–1)
To
tal
zin
c(m
gL
–1)
Kla
ng
riv
er
Ku
ala
Lu
mp
ur
19
79
–1
99
20
.07
40
20
.00
40
0.0
60
90
.02
00
3.1
40
00
.03
88
0.4
79
40
.00
24
–0
.06
83
Ch
ao
Ph
rya
Ba
ng
ko
k1
99
1–
19
93
–0
.00
36
0.0
37
70
.02
31
0.8
26
50
.05
26
0.2
20
40
.41
63
–0
.17
35
Ba
nji
rC
an
al
Jak
art
a1
98
5–
19
94
0.0
03
00
.00
74
0.0
22
10
.02
70
3.5
91
50
.09
57
0.3
00
00
.20
00
0.0
13
70
.12
47
WH
O2
00
4g
uid
eli
ne
s0
.01
00
0.0
03
00
.05
00
2.0
00
0N
A0
.01
00
0.4
00
00
.02
00
So
urc
e:U
NE
PG
EM
S-W
ate
r(W
HO
20
04
)
Sustain Sci
123

producers, and paper factories). The industries in
Kuala Lumpur, are typically small to medium and
operate without proper wastewater-treatment facilities
(Shapiee 2003). Thus, in this upper-middle income
country, both brown issues and gray issues are impor-
tant to urban water-quality managers.
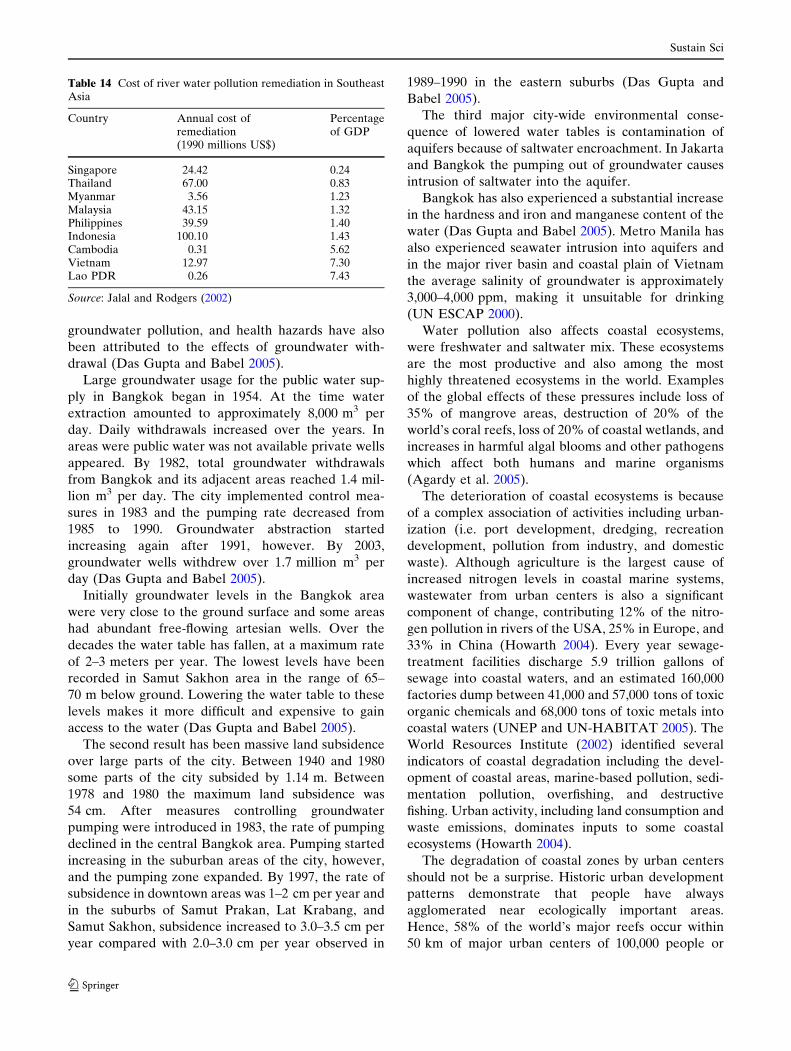
The cost of environmental remediation (COR) for
the region’s rivers varies. The COR is calculated as the
cost to reduce the pollutant load within rivers by
90% in ten years. Calculated costs are presented in
Table 14. Results suggest that the cost of cleaning the
region’s rivers within ten years varies from between
US$ 260,000 for Lao PDR and US$ 100 million for
Indonesia (Jalal and Rodgers 2002). Despite the lower
cost for some countries these amounts are still a sig-
nificant part of the annual GDP. This suggests that
remediation for some countries may necessarily only
be plausible over a longer period of time.
Poor quality river water and low access to piped
water promote the use of groundwater in cities.
According to UNESCO (2003), almost 1.2 billion ur-
ban dwellers rely on groundwater globally. Ground-
water resource availability in the region is typically in
the range of 10–20% of the magnitude of internal
surface water resources (ASEAN 2005). Extensive
groundwater extraction has, however, resulted in seri-
ous problems of subsidence in, for example, Bangkok,
Jakarta, and Metro Manila (Das Gupta and Babel
2005; Hadiwinoto and Leitmann 1994; Laquian 2005).
Bangkok is an example of how groundwater extrac-
tion can have city-wide effects. Unplanned groundwa-
ter extraction in the city has had three major results:
1. depletion of near surface levels of aquifer water;
2. land subsidence; and
3. deterioration of water quality as a result of salt-
water encroachment.
Associated problems, for example flooding, loss of
property, deterioration of infrastructure facilities,
Table 12 Potential sources of heavy metals
Element Source
Arsenic Pesticides, fertilizers, plant desiccants, animal feed additives, copper smelting, sewage sludge, coal combustion,incineration and incineration ash, detergents, petroleum combustion, treated wood, mine tailings, parent rock material
Cadmium Phosphate fertilizers, farmyard manure, industrial processes (electroplating, non-ferrous metal, iron and steelproduction), fossil fuel combustion, incineration, sewage sludge, lead and zinc smelting, mine tailings, pigments forplastics and paint residues, plastic stabilizers, batteries, parent rock material
Chromium Fertilizers, metallurgy, electric arc furnaces, ferrochrome production, refractory brick production, iron and steelproduction, cement, sewage sludge, incineration and incineration ash, chrome-plated products, pigments, leathertanning, parent rock material
Nickel Fertilizers, fuel and residual oil combustion, alloy manufacture, nickel mining and smelting, sewage sludge, incinerationand incineration ash, electroplating, batteries, parent rock material
Copper Fertilizers, fungicides, farmyard manures, sewage sludge, industrial processes, copper dust, incineration ash, mine tailings,parent rock material
Lead Mining, smelting activities, farmyard manures, sewage sludge, fossil fuel combustion, pesticides, batteries, paint pigment,solder in water-pipes, steel mill residues
Manganese Fertilizers, parent rock materialMercury Fertilizers, pesticides, lime, manures, sewage sludge, catalysts for synthetic polymers, metallurgy, thermometers, coal
combustion, parent rock materialZinc Fertilizers, pesticides, coal and fossil fuel combustion, non-ferrous metal smelting, galvanized iron and steel, alloys, brass,
rubber manufacture, oil tires, sewage sludge, batteries, brass, rubber production, parent rock material
Sources: O’Neill (1995), Alloway (1995), McGrath (1995), Baker and Senft (1995), Davies (1995), Smith and Paterson (1995), Steinnes(1995), Kiekens (1995), Brady and Weil (2002)
Table 13 Persistent organic pollutants (organochlorine pesticides) in local water environments in Southeast Asia
Location BHC(ng L–1)
Aldrin(ng L–1)
Dieldrin(ng L–1)
Endrin(ng L–1)
a-Endosulfan(ng L–1)
b-Endosulfan(ng L–1)
Heptachlor(ng L–1)
Lindane(ng L–1)
p,p¢-DDT(ng L–1)
p,p¢-DDE(ng L–1)
Selangor river 884 850 10,970 8.9 12,270 13,710 40,950 44,770 2,310Surabaya river 50Philippine coast 21 7Dampha and
Balat estuaries30
Singapore 7 18 2 2 1 1
Source: Basheer et al. (2003)
Sustain Sci
123
groundwater pollution, and health hazards have also
been attributed to the effects of groundwater with-
drawal (Das Gupta and Babel 2005).
Large groundwater usage for the public water sup-
ply in Bangkok began in 1954. At the time water
extraction amounted to approximately 8,000 m3 per
day. Daily withdrawals increased over the years. In
areas were public water was not available private wells
appeared. By 1982, total groundwater withdrawals
from Bangkok and its adjacent areas reached 1.4 mil-
lion m3 per day. The city implemented control mea-
sures in 1983 and the pumping rate decreased from
1985 to 1990. Groundwater abstraction started
increasing again after 1991, however. By 2003,
groundwater wells withdrew over 1.7 million m3 per
day (Das Gupta and Babel 2005).
Initially groundwater levels in the Bangkok area
were very close to the ground surface and some areas
had abundant free-flowing artesian wells. Over the
decades the water table has fallen, at a maximum rate
of 2–3 meters per year. The lowest levels have been
recorded in Samut Sakhon area in the range of 65–
70 m below ground. Lowering the water table to these
levels makes it more difficult and expensive to gain
access to the water (Das Gupta and Babel 2005).
The second result has been massive land subsidence
over large parts of the city. Between 1940 and 1980
some parts of the city subsided by 1.14 m. Between
1978 and 1980 the maximum land subsidence was
54 cm. After measures controlling groundwater
pumping were introduced in 1983, the rate of pumping
declined in the central Bangkok area. Pumping started
increasing in the suburban areas of the city, however,
and the pumping zone expanded. By 1997, the rate of
subsidence in downtown areas was 1–2 cm per year and
in the suburbs of Samut Prakan, Lat Krabang, and
Samut Sakhon, subsidence increased to 3.0–3.5 cm per
year compared with 2.0–3.0 cm per year observed in
1989–1990 in the eastern suburbs (Das Gupta and
Babel 2005).
The third major city-wide environmental conse-
quence of lowered water tables is contamination of
aquifers because of saltwater encroachment. In Jakarta
and Bangkok the pumping out of groundwater causes
intrusion of saltwater into the aquifer.
Bangkok has also experienced a substantial increase
in the hardness and iron and manganese content of the
water (Das Gupta and Babel 2005). Metro Manila has
also experienced seawater intrusion into aquifers and
in the major river basin and coastal plain of Vietnam
the average salinity of groundwater is approximately
3,000–4,000 ppm, making it unsuitable for drinking
(UN ESCAP 2000).
Water pollution also affects coastal ecosystems,
were freshwater and saltwater mix. These ecosystems
are the most productive and also among the most
highly threatened ecosystems in the world. Examples
of the global effects of these pressures include loss of
35% of mangrove areas, destruction of 20% of the
world’s coral reefs, loss of 20% of coastal wetlands, and
increases in harmful algal blooms and other pathogens
which affect both humans and marine organisms
(Agardy et al. 2005).
The deterioration of coastal ecosystems is because
of a complex association of activities including urban-
ization (i.e. port development, dredging, recreation
development, pollution from industry, and domestic
waste). Although agriculture is the largest cause of
increased nitrogen levels in coastal marine systems,
wastewater from urban centers is also a significant
component of change, contributing 12% of the nitro-
gen pollution in rivers of the USA, 25% in Europe, and
33% in China (Howarth 2004). Every year sewage-
treatment facilities discharge 5.9 trillion gallons of
sewage into coastal waters, and an estimated 160,000
factories dump between 41,000 and 57,000 tons of toxic
organic chemicals and 68,000 tons of toxic metals into
coastal waters (UNEP and UN-HABITAT 2005). The
World Resources Institute (2002) identified several
indicators of coastal degradation including the devel-
opment of coastal areas, marine-based pollution, sedi-
mentation pollution, overfishing, and destructive
fishing. Urban activity, including land consumption and
waste emissions, dominates inputs to some coastal
ecosystems (Howarth 2004).
The degradation of coastal zones by urban centers
should not be a surprise. Historic urban development
patterns demonstrate that people have always
agglomerated near ecologically important areas.
Hence, 58% of the world’s major reefs occur within
50 km of major urban centers of 100,000 people or
Table 14 Cost of river water pollution remediation in SoutheastAsia
Country Annual cost ofremediation(1990 millions US$)
Percentageof GDP
Singapore 24.42 0.24Thailand 67.00 0.83Myanmar 3.56 1.23Malaysia 43.15 1.32Philippines 39.59 1.40Indonesia 100.10 1.43Cambodia 0.31 5.62Vietnam 12.97 7.30Lao PDR 0.26 7.43
Source: Jalal and Rodgers (2002)
Sustain Sci
123

more, and 64% of all mangrove forest and 62% of all
major estuaries occur near such centers (Agardy et al.
2005). This trend is increasing as, in many parts of the
world, giant densely populated coastal cities continue
to grow (Small and Nicholls 2003; Tibbetts 2002).
Coastal populations on every continent have grown
with global trade. Most trade is shipped by boat and
this encourages the growth of international ports,
which create jobs and economic growth. Hence,
urbanization and all that it entails is an important force
driving coastal zone change.
Significant environmental challenges have emerged
in coastal and near marine environments in and around
cities in Southeast Asia (Lebel 2002). Degradation can
be seen in indicators of marine pollution, loss of man-
grove forest, and the degraded condition of coral reefs.
Within the Asia Pacific region coastal and marine pol-
lution has increased, mainly because of discharges of
domestic and industrial effluent, atmospheric deposi-
tion, oil spills, other wastes and contaminants from
shipping, and land development, dredging, and up-
stream river modifications (UN ESCAP 2000; UNEP
2002). Urban and agricultural areas both produce sub-
stantial quantities of organic waste in such concentra-
tions that the nutrient filtering mechanisms of the
coastal zone are unable to neutralize their effects.
Thailand and Cambodia contribute approximately 30%
of the BOD entering the South China Sea (Table 15).
Of all the nitrogen entering these coastal waters, Thai-
land and Cambodia contribute 20%. Vietnam contrib-
utes approximately another 21% (UN ESCAP 2000).
Sewage effluent from urban and tourist areas makes
substantial and increasing contributions to pollutant
loads in the upper Gulf of Thailand (Lebel 2002). Metro
Manila’s sewerage system pumps effluents into Manila
Bay with only rudimentary treatment, and as a result
serious cases of ‘‘red tide’’ disease outbreaks occur each
summer. As a result the Philippines Health Department
has banned the consumption of oysters, clams, mussels,
and other shellfish from the bay (Laquian 2005).
More than 40% of the world’s estimated 18 million
hectares of mangrove forest occur in South and
Southeast Asia (UN ESCAP 2000). Unfortunately,
large areas of mangrove have been removed for
industrial, residential, and leisure developments, and in
particular for establishment of ponds for aquaculture
of fish and prawns. Within Southeast Asia the loss of
original mangrove areas is high; less than 20% in
Brunei, more than 30% in Malaysia, more than 40% in
Indonesia, more than 55% in Myanmar, more than
60% in Vietnam, more than 70% in Singapore, and
more than 80% in Thailand (UN ESCAP 2000). In the
Philippines, 210,500 ha of mangrove (approximately
40% of the country’s mangrove cover) were lost to
aquaculture from 1918 to 1988. By 1993, only
123,000 ha of mangroves were left, equivalent to a loss
of 70% by that time (Agardy et al. 2005; Nickerson
1999; Primavera 2000).
Another measure of coastal zone degradation is the
condition of coral reefs. Southeast Asia is endowed
with over 85,000 km2 of coral reefs (approximately
29% of the world’s total). These reefs have some of the
highest biodiversity in the world, especially coral-reef
fish, mollusks, and crustaceans (World Resources
Institute 2002). The reefs of Indonesia and the Philip-
pines are noted for their extraordinarily high diver-
sity—each contains at least 2,500 species of fish.
Currently, however, only 30% of these reefs are in
good or excellent condition (UN ESCAP 2000). In
Indonesia, moreover, approximately 47% of the reefs
highly threatened (Table 16). In the Philippines 70%
of the coral reefs are highly threatened and in Vietnam
over 73% of the reefs are highly threatened. In the
entire region approximately 46,000 km2 (54%) are
under high risk of degradation (World Resources
Institute 2002).
The climate in Southeast Asia, which is predomi-
nantly wet equatorial, is characterized by substantial
rainfall of approximately 3,800 km3 annually, of which
approximately two-thirds falls on Indonesia (UNEP
Table 15 Pollutant fluxes from rivers in Cambodia and Thailand to the South China Sea
Country/river Annualdischarge(km3)
BOD(tons/year)
Totalnitrogen(tons/year)
Totalphosphorus(tons/year)
Totalsuspendedsolids (tons/year)
CambodiaTonle Sap lake-river system 36.46 6,022 1,084 303 13,250Mekong River, Cambodia section 128.38 4,964 894 255 10,950
ThailandCenter, Eastern Southern Rivers 144.2 299,224 130,044 7,137 12,587
Total South China Sea for Continental Countries 1,015,936 636,840 58,202 58,642,827
Source: UN ESCAP (2000)
Sustain Sci
123

Regional Resource Center for Asia and the Pacific
2000). Given climatic conditions that produce monsoon
rains, flooding is common. In ASEAN, tropical wet/dry
season cycle flooding is exacerbated by the short, steep
nature of many rivers which results in characteristic
short, sharp peaks in stream flows. The seasonal cli-
mate exacerbates water challenges for cities.
Globally, floods affected the lives of, on average,
65 million people annually between 1972 and 1996,
more than any other type of disaster, including war,
drought, and famine (World Commission on Dams
2000). In 2005 alone, floods around the world claimed
the lives of 6,135 people.8 Floods affect a large number
of people throughout Southeast Asia. Between 1990
and 2006 there were approximately 208 flood events,
which affected approximately 58 million people and
killed 9,912 people.9
Flooding continues to be a challenge for most cities
in the region. Some of the flooding challenges for se-
lected cities in the region are listed in Table 17. Floods
are annual occurrences in Vientiane. When the Sap
River, a tributary of the Mekong River, floods during
the rainy season the river reverses course and sewage
discharges from Phnom Penh flow upstream to the
water supply intake (Dany et al. 2000). In Jakarta,
habitual flooding of the northern third of the city oc-
curs as a result of heavy seasonal rains combined with
high tides in Jakarta Bay (Hadiwinoto and Leitmann
1994). Parts of Kuala Lumpur are flooded for short
periods of time. Flooding occurs in Bangkok during the
monsoon season when run-off exceeds the Chao
Phraya River’s drainage capacity. This problem is
exacerbated by infilling of klongs, deforestation up-
stream, and loss of marshes and empty areas that
previously acted as retention ponds (ASEAN 2005;
Panich 2003; UNEP 2002).
This analysis suggests that all cities in the region,
across the income scale spectrum, are affected by city-
wide water challenges. These water-related burdens
include water pollution (biological, nutrients, sus-
pended particles, heavy metals and POPs), over
extraction of groundwater, subsequent ground subsi-
dence, salt water intrusion, coastal zone degradation
(large nutrient and pollution loading, loss of man-
groves and natural habitat, and declining quality of
coral reefs) and flooding. A recent study has also sug-
gested that these issues will only increase in impor-
tance. UN ESCAP (2005) suggests that high levels of
industrial growth, expanding tourism and related
infrastructure, particularly in coastal areas, are envi-
ronmental driving forces that will continue into the
future. Because the costs of remediation of these water
challenges is relatively high, it may take more than
local and national efforts to bring rivers and coastal
systems back to national standards.
Regional and global water issues
Much of the growth and development of the region has
been centered on the major metropolitan centers (Lo
and Yeung 1996). The region’s water supplies are
managed to provide the necessary requirements for
this growth and development. Both economic growth
and previous management schemes have also brought
further water-related environmental effects including
increasing water consumption (both direct and indi-
rect), water shortages (including seasonal physical
Table 16 Coral reefs at risk, by country and risk level
Country Total coralreef area (km2)
Share ofregionaltotal (%)
Risk level
Low Medium High Very high High andvery high
(km2) (%) (km2) (%) (km2) (%) (km2) (%) (%)
Indonesia 50,875 59.4 6,930 13.6 19,809 38.9 23,403 46.0 733 1.4 47.4Philippines 25,819 30.2 559 2.2 7,099 27.5 16,311 63.2 1,850 7.2 70.3Malaysia 4,006 4.7 533 13.3 1,771 44.2 1,541 38.5 161 4.0 42.5Thailand 1,787 2.1 419 23.4 427 23.9 917 51.3 24 1.3 52.7Myanmar 1,686 2.0 742 44.0 604 35.8 336 19.9 4 0.2 20.2Vietnam 1,122 1.3 43 3.8 252 22.5 551 49.1 276 24.6 73.7Brunei 187 0.2 147 78.6 30 16.0 10 5.3 0 0.0 5.3Singapore 54 0.1 0 0.0 0 0.0 54 100.0 0 0.0 100.0Cambodia 42 0.0 0 0.0 0 0.0 38 90.5 4 9.5 100.0Regional totals 85,578 100 9,373 11.0 29,992 35.0 43,161 50.4 3,052 3.6 54.0
Source: World Resources Institute, WRI (2002)
8 See EM-DAT: The OFDA/CRED International DisasterDatabase, http://www.em-dat.net - Universite catholique deLouvain - Brussels, Belgium.9 Ibid.
Sustain Sci
123

water scarcity and economic scarcity) and rising ten-
sions created by use of international waters. Because of
global emissions of greenhouse gases and subsequent
climate variability, some cities within the region have
also become vulnerable to extreme water-related
events (including flooding, droughts, and sea level
rise). These are among the green issues that are typi-
cally on the global environmental agenda.
People need water for a variety of reasons including
drinking, personal hygiene, cooling, lawn watering,
urban agricultural and gardening, household and street
cleaning, fire fighting, recreation, industry, etc. The
result is that the largest flow of material into any city is
water (Decker et al. 2000). In high-income cities,
where there is more or less universal provision of ser-
vices and high consumption of water, the average city
of one million people use approximately 625,000 ton of
water a day (Haughton and Hunter 1994; Wolman
1965).
Per capita water consumption within cities of the
region is not yet a regional issue. Bangkok, for example
has some of the highest water consumption figures for
urban inhabitants within Southeast Asia (352 liters per
capita per day), but consumption is still 43% lower
than current per capita water use in Denver (670 liters
per capita per day) 40% lower than Boston (643 liters
per capita per day) and 25% lower than New York City
(515 liters per capita per day) (Roberts 2006). Despite
this, daily water consumption in Bangkok is more twice
as great as that of Singapore (167 liters per capita per
day) (UN-HABITAT 2003b).
Despite Singapore’s higher income, the city-state
has promoted successful water quality and conserva-
tion policies and as a result water consumption remains
relatively low. Singapore’s policies are in response to
its prevailing natural situation—as a small island it
suffers from water scarcity.
Singapore’s history is an example of efficient water-
supply development. Until 1986 the main thrust of the
country’s water supply management program was
building of reservoirs. By that time approximately 50%
of the island was designated as catchments. Little land
was left for this purpose. Thereafter the City-State
refocused efforts on three fronts: optimizing water
yield from their natural catchments; conservation,
including retarding water demand and reducing wast-
age; and creating access to alterative supplies by
diplomacy and by exploiting modern technology (Long
2001). These strategies produced some of the most
advanced water management schemes in the world
including, inter alia:
1. building the Newater facility, a sewage-to-potable
water recycling plant;
2. reducing system leakage to an internationally rec-
ognized minimum;
3. manipulating water prices to prevent waste; and
4. instituting efficient rain-harvesting infrastructure.
The country is now seriously considering building
desalination plants that will further reduce its depen-
dence on non-domestic water and hence the footprint
of the city (Savage 2006). Although reducing the water
footprint of the city is laudable, creating potable water
from desalinization plants is expensive (approximately
US$ 1–1.6 m–3) and the processes used to make this
water are highly energy intensive, although new, lower-
cost technology is becoming available (Postel 1997).
Although Singapore’s programs have been, and con-
tinue to be, successful, they may not be transferable to
Table 17 Flooding in some Southeast Asian cities
City Notes
Vientiane Long history of inundation problems caused by overflowing of the Mekong River. Drainage is inadequate to carry stormwater runoff and the situation is deteriorating. The districts of Sikhottabong, Sisattanak, and Hatxaiphong are floodedat least once a year
Phnom Penh The city is susceptible to flooding from surrounding river and water back up during peak flood events. Controls includeouter and inner dikes in rings, ten drainage pumping stations, drainage channels and a small sewer network. Dikes areeroded and drainage channels clogged
Ho Chi Minh Parts of Ho Chi Minh City suffer from floods several times each year during the rainy season (June–November) andduring the high tide season (October–January)
Manila Recurrent flooding is related to water flows from Pasig-Marikina River and Laguna Lake basin combined with hightides and inadequate drainage
Jakarta Approximately 50% of the city is prone to flooding when several or all of the 13 rivers in the city overflow.Approximately 40% of the city is below sea level during high tide. Only a quarter of this area is protected by dikesleaving the remaining areas subject to floods
KualaLumpur
Low lying areas of the city are susceptible to flooding during heavy downpours. Flood waters typically subside within5–6 h
Source: Asian Development Bank (2004)
Sustain Sci
123

other locations. For example, not every country in the
region can afford such sharp trade-offs between in-
creases in energy use and increased water consumption
that would be demanded by building desalination
plants.
For other cities in the region the condition of ample
water resources is rapidly changing. Importantly, con-
sumption within the region continues to rise as urban
lifestyles lead to greater demand for water. For
example, between 1995 and 2000 demand for refrig-
eration increased twenty-twofold in both Thailand and
Vietnam (UN ESCAP 2005). Future growth in wealth
will bring increases in water consumption for cooling,
industrial, and domestic household uses.10 Also, as
nations within the region grow in wealth they will
continue to urbanize, adding more and more people to
each city. Given expectations for increases in urbani-
zation in the region, ASEAN (2005) predicts that
overall demand for water will increase by approxi-
mately one-third over the next 20 years.
At least three important constraints face cities in the
region as they battle with increasing water consump-
tion. First, as was mentioned in detail in the previous
section, many of the region’s rivers and water bodies
are contaminated, limiting their use as potable sup-
plies. Pollution alone has reduced the annual per capita
availability of fresh water in developing countries of
the region from 10,000 m3 in 1950 to approximately
4,200 m3 by the early 1990s (UNEP 2002).
But not all the water taken by cities makes it way to
consumers. The second constraint on meeting
increasing demand in cities of Southeast Asia is the
old, poorly maintained water systems and poorly
managed watersheds. The Bangkok waterworks, for
example, was initially constructed in 1914 (Smithies
1986). The water-supply system in Phnom Penh was
originally constructed in 1895 (Dany et al. 2000).
Manila’s waterworks system was built in 1878 by
Spanish colonialist and designed for a city of 300,000
(Laquian 2005). Jakarta’s basic water-supply system
was built by the Dutch between 1900 and 1940 (Argo
1999). It is not unusually for half the water within these
systems to be lost during distribution. Data on water
loss in selected cities in the region are presented in
Table 18. In most cities it is over 40%. In addition,
given the inadequate infrastructure, poor levels of
maintenance, and a large informal sector that taps into
the system, twenty-four-hour service is not always
possible. Together these effects create local and short
term or seasonal water shortages.
Water shortages also occur for a number of other
reasons, related to large-scale anthropogenic activity
within watersheds. For example, in January 2004,
Metro Manila reduced water supply from the Metro-
politan Waterworks and Sewerage System (MWSS) by
5% (increased to 20% in April). This reduction was
caused by a drop in the water level in the Angat res-
ervoir, the main reservoir for the city. Dangerously low
water levels were caused, in part, by logging in the
Marikina watershed reservation, and hence rapid run-
off (Laquian 2005). Development in Peninsular
Malaysia also resulted in water shortage problems in
urbanized areas of Selangor (Jahi et al. 2003).
The third constraint on meeting water demand is
economic water scarcity. Absolute water scarcity, such
as that faced by Singapore, occurs when a country does
not have sufficient annual water resources to meet
reasonable per capita water needs (Seckler et al.
1999).11 Economic water scarcity is the condition were
there is sufficient potential water resources to meet
projected 2025 requirements but expensive water
development projects are needed to develop these re-
sources.12
In a global assessment of physical and economic
water scarcity, several countries in the region were
categorized as falling into the latter group including
Cambodia, Indonesia, Malaysia, and Myanmar which
will need to increase water development by between 25
and 100%. Also suffering from economic water scarcity
are Philippines, Vietnam, and Thailand, although
these three countries have only modest (less than
25%) requirements for additional water development
(Seckler et al. 1999).
The capital investment requirements for advanced
infrastructure to meet water supply access and sanita-
tion and provision for industry, agriculture, energy, and
leisure has major ramifications for ASEAN member
10 Haughton and Hunter (1994) write that in the UK one toiletflush is 10 L, a shower is 30 L, a bath 80 L, one dishwasher cycle50 L and one cycle in a clothes washing machine can be 100 L.Simply leaving the tap running while teeth brushing wastes be-tween 25 and 45 L.
11 Another term is physical water scarcity when the primarywater supply of a country exceeds 60% of its potentially utiliz-able water resources (ASEAN 2005). In physical terms, Singa-pore suffers from water scarcity.12 It should be noted that water scarcity has little to do withaccess to water. As pointed out by UN-HABITAT (2003b) manycountries that have a water scarcity have high percentage accessand those that are located in water-rich areas have low access.Hence, although many cities in the region have a significantpopulation without access and water within many cities is pro-vided for a limited number of hours a day, availability of waterfor drinking is not physically scarce. This global or ‘‘green’’ issueshould not be confused with the local or brown issue. Impor-tantly, increasing access to water for the poor bears little rela-tionship to creating water scarcity.
Sustain Sci
123

countries. Financing these projects will be a major
challenge in the future (ASEAN 2005). In Phnom
Penh, for example, increased demand by 2025, cannot
be met financially by the government alone (Dany
et al. 2000).
One way to circumvent water scarcity is to indirectly
import water by purchase, use, and consumption of
goods and services produced elsewhere that implicate
water use and consumption. ‘‘Virtual water’’, as it is
called, is the amount of water needed to produce a
commodity or service. Trade in primary commodities
and some goods implies flow of this water from one
location to another, sometimes over great distances.
The amount of water needed to produce different
commodities varies. The amount of water needed to
produce 1 kg rice is approximately 3,000 L. The
amount of water required to produce 1 kg beef is
16,000 L. Between 1997 and 2001 the global use of
water amounted to 7,450 Gm3 per year of which
1,625 Gm3 per year was in international virtual water
trade. Approximately 80% of the total ‘‘virtual
water’’ trade is because of trade in agricultural goods
(Chapagain and Hoekstra 2004).13
For the eight countries examined within Southeast
Asia the total external flows were 71.3 Gm3 per year
(Table 19). This is only 1% of the region’s water re-
sources, leaving seemingly little to worry about. Re-
gional averages can hide local differences, however.
Water consumption patterns vary by country, with
some countries, for example Malaysia, meeting signif-
icant levels of water needs (28% in this case) by use of
non-domestic resources whereas Indonesia, a water
rich country, is already one of the world’s largest net
importers of water (Hoekstra and Hung 2005).
As cities and nations grow in wealth we can expect
to see changes in water trade budgets. Dependence on
non-domestic water resources may continue to rise.
Although trade economists may not see this as a
problem, considering that global estimates suggest that
by 2025, absolute water scarcity will affect 1.8 billion
people (Seckler et al. 1999), questions arise about
where water to grow food and help make goods will
come from. Within the next 20 years more than a
quarter of the global population will be living in
countries were water extraction is higher than total
supply by domestic sources. As clean water grows
scarce the prices of goods made with it will rise. The
outcome of these dynamics remains unpredictable, but
has potentially adverse consequences for developing
nations that depend on virtual water.
As water sources will be increasingly sought after,
the management of larger bodies will also increase in
importance. Today, around 3,800 km3 of fresh water is
withdrawn annually from the world’s lakes, rivers, and
aquifers. This is twice the volume extracted 50 years
ago. Given increasing extraction, countries have turned
to creating artificial water bodies by dam building.
Over 45,000 dams have been built in over 150 countries
(World Commission on Dams 2000). In the future, dam
building is expected to continue and most of it will
occur in developing countries. During the 1990s, for
example, an estimated US$ 32–46 billion was spent
annually on large dams, four-fifths of which were lo-
cated in developing countries (World Commission on
Dams 2000).
Dams provide for a variety of water management
needs. Approximately half the world’s large dams are
primarily for providing irrigation water. Globally,
approximately 12% of large dams are to supply water
for drinking and those are related directly to urbani-
zation. Hydropower dams currently provide 19% of
the world’s electricity. Approximately 24% of coun-
tries developing hydropower depend on it for 90% of
their energy (World Commission on Dams 2000). The
trend is that cities need increasingly more water and
energy and this demand translates into demand for
dams.
Dams on rivers that traverse several countries can
cause international tension. In the Mekong River Basin
dramatic changes are occurring and tension in the re-
gion is forecast to increase (World Commission on
Table 18 Water availability and cost in selected cities ofSoutheast Asia, mid-1990s
City Wateravailability(hours a day)
Average tariff(US$ per m3)
Unaccountedfor water (%)
Phnom Penh 12 0.15 61Bandung 6 0.369 43Jakarta 18 0.611 53Medan 24 0.266 27Vientiane 24 0.081 33Johor Bahru 24 0.186 21Kuala Lumpur 24 0.131 36Penang 24 0.208 20Mandalay 24 1.201 60Yangon 12 0.456 60Cebu 18 0.663 38Davao 24 0.271 31Manila 17 0.232 44Singapore 24 0.553 6Bangkok 24 0.313 38Chiang Mai 20 0.299 35Chonburi 16 0.461 37Hanoi 18 0.113 63Ho Chi Minh City 24 0.131 34
Source: UN-HABITAT (2003b)
13 See also http://www.waterfootprint.org.
Sustain Sci
123

Dams 2000). The Mekong is of great interest to five
nations in Southeast Asia—Cambodia, Lao PDR,
Myanmar, Thailand and Vietnam. The Lower Mekong
Basin supports 60 million people. The Mekong River is
an important river for transport, food, water, tourism,
recreation, water management, irrigation, energy,
industry, and biodiversity. The different countries in the
region have different end uses planned for Mekong
River water. Laos wants to use dams to generate elec-
tricity for export, Cambodia wants to secure sustainable
fishery resources, Vietnam seeks to ensure the flow of
water for its rice crops without salinity rising to dan-
gerous levels, and Thailand wants to ensure consump-
tion for its cities. International management of this
water resource is therefore important for all these
countries. Unfortunately, however, management of
this common resource has been difficult. Importantly,
China, from whose boundaries flow up to 20% of the
Mekong’s discharge (Mekong River Commission 2005),
has put in place an aggressive dam program to meet its
water and hydro-electric power needs (Dore and Yu
2004; Liebman 2005).
Current development trends in China have created a
demand for the water. Some of the most fertile areas of
China now face chronic water shortages. The Chinese
government’s decision to build three massive canals
connecting the water-abundant south to the drier north
is indicative of their concern. There are several signs
that water use in China is not sustainable, including the
long period of time the Yellow River runs dry, the
abandonment of old wells, the drilling of 300,000 new
deeper wells per year, the sinking water table, the re-
turn to less efficient rain-based agriculture, and the
decreasing quality of water available to farmers
(Liebman 2005).
China has, moreover, an increasing demand for
energy, particularly modern energy (electricity).
Currently, the country still relies heavily on fossil fuels
for its energy supply, with 70% coming from coal. In 1993,
China became a net importer of oil, importing approx-
imately 100 million tons of crude oil a year, second only
to the US (Liebman 2005). In this context, the Mekong’s
resources are immensely valuable to the country.
There are currently plans to build eight dams on the
river by 2019 (Dore and Yu 2004), helping to fill the
growing gap between electricity demand and supply
through hydropower. Two dams (at Manwan and
Dachaoshan) have already been built; two more
(Xiaowan and Jinghong) have begun construction and
are expected to be complete by 2010; and four more
have been designed. These are large dams and the
major component in the country’s drive to double the
amount of hydro-energy production by 2010 (Dore and
Yu 2004).
The implications of damming the river are eco-
nomically high, because 50% of Vietnamese rice pro-
duction is located in the Mekong delta and 50% of the
protein Cambodians eat (and a large source of
employment) comes from their domestically caught
fish supply. If the Mekong were to fail to reach the sea
for half the year, as the Yellow River currently does,
this would not only impose huge opportunity costs for
lost hydro-power and trade, but immediate economic
losses and dislocations in the riparian states would be
severe (Dore and Yu 2004). Indeed, some argue that
the current damming of the river has already had an
Table 19 Water footprint of selected Southeast Asian nations
Country Total renewablewater resources(Gm3/year)
Internal waterfootprint(Gm3/year)
External waterfootprint(Gm3/year)
Total waterfootprint(Gm3/year)
Waterscarcity(%)
Waterself-sufficiency(%)
Waterimportdependency (%)
Cambodia 476.11 20.45 0.54 20.99 4 97 3Indonesia 2838.00 242.30 27.66 269.96 10 90 10Laos 333.55 7.44 0.21 7.64 2 97 3Malaysia 580.00 38.87 15.01 53.89 9 72 28Myanmar 1045.60 74.38 1.11 75.49 7 99 1Philippines 479.00 104.40 12.45 116.85 24 89 11Thailand 409.94 123.24 11.22 134.46 33 92 8Viet Nam 891.21 100.21 3.12 103.33 12 97 3
Source: Chapagain and Hoekstra (2004)
Water scarcity: The ratio of the total water footprint of a country or region to the total renewable water resources. National waterscarcity percentages can be more than 100% if a nation consumes more water than is domestically available
Water self-sufficiency: The ratio of the internal water footprint to the total water footprint of a country or region. Self-sufficiencyapproaches 100% when national water demand is taken from within domestic boundaries
Water import dependency: The ratio of the external water footprint of the country or region to its total water footprint. Thedependency ratio increases as countries import more of the water demanded by domestic activities
Sustain Sci
123

effect (Dore and Yu 2004; Liebman 2005; Lu and Siew
2005). For example, some have claimed that during the
first quarter of 2004, the Mekong reached record low
flows in the downstream riparian states (Liebman
2005). These claims, however, may be linked to the
previous years’ higher than average low-flows, because
there is no long-term evidence of systematic change in
low-flow hydrology of the river (Mekong River
Commission 2005). Whether Mekong River flows are
affected by water infrastructure will continue to be
debated as each country attempts to use the water in
the river for its own purposes.
Finally, all low-lying cities in the region are facing
the consequences of climate change and its potential
impacts on water. Globally, anthropogenic activities are
changing climates (including temperature increases,
changes in precipitation, and sea level rise), both
regionally and globally, and this, in turn, is affecting
several physical and biological systems. Examples in-
clude shrinkage of glaciers, thawing of permafrost, later
freezing and earlier break-up of ice on rivers and lakes,
lengthening of mid to high-latitude growing seasons,
poleward and altitudinal shifts of plant and animal
ranges, declines of some plant and animal populations,
and earlier flowering of trees and emergence of insects
and egg-laying in birds (Watson et al. 2001).
Some areas of Earth have been affected by increases
in floods and droughts, making them more vulnerable
to extreme events. Projected changes in climate ex-
tremes are also dramatic and could have major con-
sequences. While there are uncertainties attached to
predictions and trends, estimates suggest that the fre-
quency and or severity of extreme events is likely to
increase in some regions (Watson et al. 2001). Impor-
tantly, coastal areas are increasingly physically vul-
nerable and many are already experiencing increased
flooding, accelerated erosion, and seawater intrusion
into fresh water (Agardy et al. 2005).
In Southeast Asia many cities are barely a meter
above sea level and floods and droughts in the region
are increasing. In 2001 the Intergovernmental Panel on
Climate Change (IPCC) estimated that sea-levels will
rise between 0.09 and 0.88 m by 2100, with regional
variations. This places the delta regions of Myanmar,
Vietnam, and Thailand and the low-lying areas of
Indonesia, the Philippines, and Malaysia at risk
(Nicholls et al. 1999). Specific areas identified as vul-
nerable to the effects of extreme events include the
Tonle Sap lake and southern region of Cambodia and
the coastal Koh Kong town, Bangkok, East Bangkok,
Pattaya, Cha-Am, and Hua Hin and those areas in the
sandy coastal plans including Rayong in the eastern
region, the coast north of Songkhla, between Hua Hin
and Cha-am, and the bays on the east coast, for
example Rayong Bay in Thailand, many of the cities in
Metro Manila, and entire provinces in the Philippines
(in the Philippines alone almost 2 million people live in
low-lying areas), Ca Mau province, Ho Chi Minh City,
Vung Tau, and Xuan Thuy sea areas and large parts of
South Vietnam, areas in the Red River delta, and much
of Singapore (ASEAN 2005).14
Many cities in the region are facing green agenda,
global water issues. While those on the upper end of
the scale are experiencing higher levels of water con-
sumption, physical or absolute water scarcity remains
unimportant to all cities but Singapore. Many cities,
however, are experiencing economic water scarcity and
many others are also vulnerable to changes within
international waterways and to the effects of climate
change. Singapore’s most dominant water concerns are
in this category, but other cities, particularly low-lying
coastal cities on the Mekong are also facing such issues.
Discussion and conclusion
This survey has attempted to point out several water-
related issues that cities across the region are currently
experiencing. All cities have multi-scale water chal-
lenges ranging from water supply and sanitation access
to water pollution and threats of future vulnerability
from climate change. Table 20 summarizes the differ-
ent water-related environmental burdens that each set
of cities (based on level of income) currently faces.
Although individual cities may have slightly different
concerns, as a group each faces similar problems and
challenges.
Although these issues have been reported before,
what is new in this analysis is a holistic look and
comparison with the experiences of cities in the now
developed world. Doing so brings a new perspective to
urban environmental history and an understanding of
the relationship between development and the urban
environment. For example, as mentioned, Melosi
(2000) chronicled changes in water supply, sanitation,
and solid-waste management in US cities. His history is
a story of sequential policies that addressed environ-
mental challenges of the period. The solutions to
challenges at any given time lead to, in part, sub-
sequent burdens in later periods. For example, com-
prehensive sewerage systems weren’t even considered
14 Lebel (2002) points out that a 1-m rise in sea level could leadto loss of 34,000 km2 of land in Indonesia, 7,000 km2 in Malaysia,and 5,000 km2 in Vietnam (in the Red River Delta), and 15,000–20,000 km2 of land could be threatened in the Mekong Delta.
Sustain Sci
123

until water-supply systems brought tremendous
amounts of water into the city. When the water was
there, engineers, city planners, and decision-makers
identified the need to remove the wastewater. Hence,
most sewerage systems were built after water-supply
systems were developed (Tarr 1999).
As opposed to this sequential or staged scenario,
many cities in the Southeast Asian region have had to
address all these issues simultaneously. This makes
identification of environmental transitions difficult.
They must also do so with much lower tax revenues
than were available to developed world cities. For
example, as already explained, cities such as Hanoi, Ho
Chi Minh, and Phnom Penh are suffering from the
entire gamut of challenges. When cities in Europe and
North America were at similar levels of income they
had yet to experience all these challenges. National
levels of income in 2000 of some developing countries,
at PPP, are comparable with those in the USA in
during the 1800s (Maddison 2001). This period in US
history was before the implementation of city water-
supply systems (New York City’s first comprehensive
supply system was developed in 1850s and the sewer-
age system in the 1870s). It was only during the early
1900s that New York was able to finance most of its
current water-supply system (Galusha 1999).
Given the challenges they face, it is indeed won-
drous the cities of the Asia Pacific operate as well as
they do. Yet they are in need of new policies and
modes of planning and management to address their
challenges. That is, they must address different water-
related challenges simultaneously and on a range of
different scales. Given this enormous dissimilarity with
the developed world experience, the effectiveness of
policy transfer from North to South is questionable.
Indeed, rather than looking for policies from the
North, some of the most unique and effective policies
to address environmental conditions are now coming
from developing countries (i.e., Singapore’s water and
transportation policies).
The insights provided through time–space telescop-
ing force us to re-think traditional development tra-
jectories and, therefore, ways of addressing
environmental challenges. This perspective identifies a
set of patterns unique to cities within the region. It also
suggests that despite the seemingly chaotic environ-
mental situation in many cities in the region, there are,
nevertheless, structural reasons for the patterns. That
is, because the drivers of the new patterns of sooner
occurrence and more simultaneous emergence of
environmental burdens and the changes in spatial dis-
tribution of phenomena are indirect (i.e. acting on
large geographical and temporal scales), the changes
are structural (i.e. they will also not change easily or
quickly). The structural patterns seen across countries
and cultures suggest that not all conditions within cities
Table 20 Summary of different water related-challenges for cities in different income categories in Southeast Asia by scale of impact
Local City-wide Regional and global
Low-income citiesLow water-supply coverage River and coastal water pollution Economic water scarcityLow sanitation coverage Overdrawn groundwater Vulnerability because of climate changePoor drainage Subsidence
Coastal area degradationFlooding
Middle-income citiesLow water-supply coverage River and coastal water pollution Economic water scarcityLow sanitation coverage Overdrawn groundwater Vulnerability because of climate changePoor drainage Subsidence
Coastal area degradationFlooding
Upper-middle income citiesLow to incomplete sanitation coverage River and coastal water pollution Increasing water consumption per capitaWater supply coverage not complete Overdrawn groundwater Vulnerability because of climate changePoor to inadequate drainage Subsidence
Coastal area degradationFlooding
High income citiesRiver and coastal water pollution Physical water scarcityCoastal area degradation Increasing water consumption per capita
Vulnerability because of climate change
Cities in the low-income category include Vientiane, Phnom Phen, Hanoi, and Ho Chi Minh. Cities in the middle-income categoryinclude Manila and Jakarta. Cities in the upper-middle income category include Bangkok and Kuala Lumpur. Cities in the high-incomecategory include Singapore
Sustain Sci
123

can be reduced to special location geomorphology and
cultural and individualistic characteristics. That is not
to say that these other more proximate effects are not
important, but it does suggest that both the indirect
and proximate forces are working together. Not all
urban challenges can be reduced to local determinants.
The policy implication is that cities alone cannot be
asked to resolve these problems, but rather governance
at all levels is needed to address them successfully.
The theory also suggests that urban decision-makers
in rapidly developing countries face a more complex
set of environmental tasks, with less money than their
developed country counterparts had previously. If,
moreover, trends are changing faster (an issue not
addressed in this article), the window of opportunity to
set cities on a sustainable trajectory is narrower than in
the past.
Despite these constraints, however, cities in region
continue to show signs of viability and growth potential
(Laquian 2005). There are, moreover, examples of how
they have grown with lower levels of environmental
burdens, compared to the now developed world. As
mentioned briefly in this article, this can be seen in
terms of water consumption per capita. Singapore’s
GDP per capita (PPP) is similar to that of the USA
(World Bank 1999), yet water consumption per capita
there is at least 50% lower than in most US cities.
Studies have also shown that per capita amounts of
CO2 emitted from their road transport are lower than
for comparable income levels in the USA (Marcotullio
et al. 2005). Also, all countries in the region use less
energy per capita at similar levels of GDP (PPP)
compared with the USA (Marcotullio and Schulz
2007). What this suggests is that despite the seemingly
daunting challenges of sooner, faster, and more
simultaneous emergence of environmental problems,
other aspects of contemporary development are pro-
moting more environmentally efficient growth. Rapidly
developing cities have arguably taken advantage of
new technologies, information, and knowledge and
have used these tools to their benefit (Angel and Rock
2000). A hypothesis for further study is that the time–
space telescoping of development not only creates new
challenges but also fertile grounds for the develop-
ment, diffusion, adaptation, and adoption of new and
more promising technology (both hard and soft) and
methods for addressing urban environmental burdens.
Acknowledgments This article was written as part of a projectfunded by the Asian Pacific Network for Global EnvironmentalChange Research (# APN2006-02CMY), the UNU-IAS, theAsian Institute of Technology, and the ASEAN Secretariat. Thestaff of Sustainability Science has demonstrated patience andcourteousness during the production of the piece. Two anony-
mous reviewers provided valuable comments and criticisms. Theviewpoints expressed are not those of the funding institutions,but rather, like the mistakes and misinterpretations remaining inthe article, the responsibility of the author.
References
Agardy T, Alder J et al (2005) Coastal systems. In: Hassan R,Scholes R, Ash N (eds) Ecosystems and human well being:current state and trends, vol 1. Island Press, Washington
Alloway BJ (1995) Cadmium. In: Alloway BJ (ed) Heavy metalsin soils, 2nd edn. Blackie, London, pp 122–151
Allsopp M, Johnston P (2000) Unseen poisons in asia, a reviewof persistent organic pollutant levels in South and SoutheastAsia and Oceania. Exeter, UK: Greenpeace ResearchLaboratories, Department of Biological Sciences, Universityof Exeter
Angel DP, Rock MT (eds) (2000) Asia’s clean revolution:industry, growth and the environment. Greenleaf, Sheffield
Argo TA (1999) Thirsty downstream: the provision of cleanwater in Jakarta, Indonesia. Unpublished Dissertation,University of British Columbia, Vancouver
ASEAN (2005) State of water resources management inASEAN. Jakarta: ASEAN Secretariat
Asian Development Bank (1997) Emerging Asia, changes andchallenges. ADB, Manila
Asian Development Bank (2004) Water in Asian Cities, utilities’performance and civil society views. ADB, Manila
Bai X, Imura H (2000) A comparative study of urban environ-ment in East Asia: stage model of urban environmentalevolution. Int Rev Environ Strategies 1(1):135–158
Baker DE, Senft JP (1995) Copper. In: Alloway BJ (ed) Heavymetals in soils, 2nd edn. Blackie, London, pp 179–205
Basheer C, Obbard JP, Lee HK (2003) Persistent organicpollutants in Singapore’s coastal marine environment: PartI, seawater. Water Air Soil Pollut 149(1–4):295–313
Berry BJL (1990) Urbanization. In: Turner BL II, Clark WC,Kates RW, Richards JF, Mathews JT, Meyer WB (eds) TheEarth as transformed by human action: global and regionalchanges in the biosphere over the past 300 Years. Cam-bridge University Press, Cambridge, pp 103–119
Brady NC, Weil RR (2002) The nature and properties of soils,13th edn. Prentice Hall, Upper Saddle River, New Jersey
Bunnell T, Barter P, Morshidi S (2002) City profile, KualaLumpur metropolitan area. Cities 19(5):357–370
Chapagain AK, Hoekstra AY (2004) Water footprints ofNations, Vol. 1: Main Report (Value of Water ResearchReport Series No. 16) Delft: UNESCO-IHE
Cybriwsky R, Ford LR (2001) City profile: Jakarta. Cities18(3):199–210
Dany V, Visvanathan C, Thanh NC (2000) Evaluation of water-supply systems in Phnom Penh City: a review of the presentstatus and future prospects. Int J Water Resour Dev16(4):677–689
Das Gupta A, Babel MS (2005) Challenges for sustainablemanagement of groundwater use in Bangkok, Thailand.Water Resour Dev 21(3):453–464
Davies BE (1995) Lead. In: Alloway BJ (ed) Heavy metals insoils, 2nd edn. Blackie, London, pp 206–223
Decker EH, Elliott S, Smith FA, Blake DR, Rowland FS (2000)Energy and material flow through the urban ecosystem. AnnRev Energy Environ 25(685–740)
Dicken P (1998) Global shift: transforming the world economy,3rd edn. Paul Chapman, London
Sustain Sci
123

Dore J, Yu X (2004) Yunnan hydropower expansion: update onChina’s energy industry reforms and the Nu, Lancang andJinsha hydropower dams. Chiang Mai: Chiang Mai Univer-sity Unit for Social and Environmental Research and GreenWatershed
Douglas I (1968) Erosion in the Sungei Gombak catchment,Selangor. J Trop Geogr 26:1–16
Douglas I (1986) Urban geomorphology. In: Fookes PG,Vaughan PR (eds) A handbook of engineering geomor-phology. Chapman and Hall, New York, pp 273–283
Dunne T, Leopold LB (1978) Water in environmental planning.W. H. Freeman and Company, New York
Faerge J, Magid J, Penning de Vries FWT (2001) Urban nutrientbalance for Bangkok. Ecol Modell 139(1):63–74
Fields GS (1995) Income distribution in developing economies:conceptual, data and policy issues in broad-based growth.In: Quibria MG (ed) Critical issues in Asian development,theories, experiences, policies. Oxford University Press forthe Asian Development Bank, Hong Kong, pp 75–107
Friedmann J (1986) The world city hypothesis. Dev Change17:69–83
Friedmann J, Wolff G (1982) World City Formation: an agendafor research and action. Int J Urban Reg Res 6(3):309–343
Galusha D (1999) Liquid assets: a history of New York City’swater system. Purple Mountain Press, New York
Garau P, Sclar ED, Carolini GY (2005) A home in the city,millennium project task force on improving the lives of slumdwellers. Earthscan, London
Grossman GM, Krueger AB (1995) Economic growth and theenvironment. Q J Econ 110(2):353–377
Hadiwinoto S, Leitmann J (1994) Urban environmental profile,Jakarta. Cities 11(3):153–157
Hardoy JE, Mitlin D, Satterthwaite D (2001) Environmentalproblems in an urbanization world. Earthscan, London
Harvey D (1989) The condition of postmodernity: an enquiryinto the origins of cultural change. Blackwell, Oxford
Haughton G, Hunter C (1994) Sustainable cities. RegionalStudies Association, London
Held D, McGrew A, Goldblatt D, Perraton J (1999) Globaltransformations, politics, economics and culture. PolityPress, Cambridge
Hoekstra AY, Hung PQ (2005) Globalization of water resources:international virtual water flows in relation to crop trade.Global Environ Change 15:45–56
Howarth RW (2004) Human acceleration of the nitrogen cycle:drivers, consequences, and steps toward solutions. Water SciTechnol 49(5/6):7–13
Hussain TPRS, Hassan KH (2003) River pollution in urbanecosystem: lesson to be learnt from Malaysian experience.In: Hashim NM, Rainis R (eds) Urban ecosystem studies inMalaysia. Universal Publishers, Florida, pp 77–92
ICOLD-CICB (2006) Role of dams in the 21st century for thenewsletter. The Dams Newsletter, May2006, pp 2–9
Iwata H, Tanabe S, Sakai N, Nishimura A, Tatsukawa R (1994)Geographical distribution of persistent organochlorine com-pounds in air, water and sediments from Asia and Oceania,and their implications for global redistribution from lowerlatitudes. Environ Pollut 85(1):15–33
Iwata H, Tanabe S, Sakal N, Tatsukawa R (1993) Distributionof persistent organochlorine compounds in the oceanicair and surface seawater and the role of ocean on theirglobal transport and fate. Environ Sci Technol 27(6):1080–1098
Jahi J, Toriman ME, Hashim NM, Aiyub KH (2003) Domesticurban water consumption and integrated water resourcesmanagement of Langat River Basin, Selangor. In: Hashim
NM, Rainis R (eds) Urban ecosystem studies in Malaysia.Universal Publishers, Florida, pp 93–104
Jalal KF, Rodgers PP (2002) Measuring environmental perfor-mance in Asia. Environ Statist 2(1):39–59
Janelle DG (1968) Central place development in a time–spaceframework. Prof Geogr 20:5–10
Janelle DG (1969) Spatial reorganization: a model and concept.Ann Ass Am Geogr 59:348–364
Kiekens L (1995) Zinc. In: Alloway BJ (ed) Heavy metals insoils, 2nd edn. Blackie, London, pp 284–305
Kondratieff ND (1979) The long waves of economic life. ReviewII(4):519–562
Laquian AA (2005) Beyond metropolis, the planning andgovernance of Asia’s mega-urban regions. Woodrow WilsonCenter Press and The Johns Hopkins University Press,Washington DC and Baltimore
Lebel L (2002) Global change and development: a synthesis forSoutheast Asia. In: Tyson P, Fuchs R, Fu C, Level L, Mitra AP,Odada E, Perry J, Steffen W, Virji H (eds) Global-regionallinkages in the earth system. Springer, Berlin, pp 151–184
Liebman A (2005) Trickle-down hegemony? China’s ‘‘Peacefulrise’’ and dam building on the Mekong. ContemporarySoutheast Asia 27(2):281–304
Lo F-c, Yeung Y-m (Eds.) (1996) Emerging world cities inPacific Asia. UNU Press, Tokyo
Lo F-c, Yeung Y-m (Eds.) (1998) Globalization and the world oflarge cities. United Nations University, Tokyo
Long J (2001) Desecuritizing the water issue in Singapore–Malaysia relations. Contemp Southeast Asia 23(3):504–532
Lu XX, Siew RY (2005) Water discharge and sediment fluxchanges in the Lower Mekong River. Hydrol Earth Syst SciDiscuss 2:2287–2325
Maddison A (2001) The world economy, a millennial perspec-tive. OECD, Paris
Marcotullio PJ (2005) Time–space telescoping and urban envi-ronmental transitions in the Asia-Pacific Region (UNU-IASReport) United Nations University Institute of AdvancedStudies, Yokohama
Marcotullio PJ, Lee Y-s F (2003) Urban environmental transi-tions and urban transportation systems: a comparison ofNorth American and Asian experiences. Int Dev Plann Rev25(4):325–354
Marcotullio PJ, McGranahan G (eds) (2007) Scaling urbanenvironmental challenges, from local to global and back.Earthscan, London
Marcotullio PJ, Schulz NB (2007) Comparison between energytransitions in the USA and developing and industrializingeconomies. World Dev (forthcoming)
Marcotullio PJ, Williams E, Marshall JD (2005) Sooner, fasterand more simultaneously: how recent road and aviationtransportation CO2 emission trends in developing countriesdiffer from historic trends in the United States of America.J Environ Dev 14(1):125–148
Massey DS (1996) The age of extremes: concentrated affluenceand poverty in the Twenty-First Century. Demography33(4):395–412
McGranahan G, Jacobi P, Songsore J, Surjadi C, Kjellen M(2001) The citizens at risk, from urban sanitation tosustainable cities. Earthscan, London
McGranahan G, Satterthwaite D (2000) Environmental health orecological sustainability? Reconciling the brown and greenagendas in urban development. In: Pugh C (ed) Sustainablecities in developing countries. Earthscan, London, pp 73–90
McGranahan G, Songsore J (1994) Wealth, health, and the urbanhousehold: weighing environmental burden in Jakarta,Accra, Sao Paulo. Environment 36(6):4–11, 40–45
Sustain Sci
123

McGrath SP (1995) Chromium and nickel. In: Alloway BJ (ed)Heavy metals in soils, 2nd edn. Blackie, London, pp 152–178
Mekong River Commission (2005) Overview of the hydrology ofthe Mekong Basin. MRC, Vientiane
Melosi MV (2000) The sanitary city: urban infrastructure inAmerica from colonial times to the present. Johns HopkinsPress, Baltimore
Memon MA (2003) Implementation of public–private partner-ships for water supply and sanitation services in MetroManila (Philippines) Kitakyushu. Institute for Global Envi-ronmental Strategies
Memon MA, Imura H, Shirakawa H (2006) Reforms formanaging urban environmental infrastructure and servicesin Asia. J Environ Dev 15(2):138–157
Mills ES, Pernia EM (1994) Introduction and overview. In:Pernia EM (ed) Urban poverty in asia. A survey of criticalissues. Oxford University Press, Hong Kong, pp 3–52
Montgomery MR, Stren R, Cohen B, Reed HE (Eds.) (2003)Cities transformed, demographic change and its implicationsin the developing world. National Research Council, Wash-ington
Muong S (2004) Avoiding adverse health impacts from contam-inated vegetables: operations for three wetlands in PhnomPenh, Cambodia (No. 2004-RR5) Singapore: Economy andEnvironment Program for Southeast Asia
Newman P, Kenworthy J (1999) Sustainability and cities. IslandPress, Washington
Nicholls RJ, Hoozemans FMJ, Marchand M (1999) Increasingflood risk and wetland losses due to global sea-level rise:regional and global analyses. Global Environ Change9(Suppl):s69–s87
Nickerson DJ (1999) Trade-offs of mangrove area developmentin the Philippines. Ecol Econ 28(2):279–298
O’Neill P (1995) Arsenic. In: Alloway BJ (ed) Heavy metals insoils, 2nd edn. Blackie, London, pp 105–121
Panich S (ed) (2003) Bangkok State of the Environment, 2003.BMA Metropolitan Administration, Environmental QualityManagement and Control Division, Bangkok
Peterson J (1982) Review essay: environment and technology inthe great city era of American history. J Urban Hist8(3):343–354
Postel SL (1997) Dividing the waters. Technol Rev 100(3):54–62Primavera JH (2000) Development and conservation of Philip-
pine mangroves: institutional issues. Ecol Econ 35(1):91–106Quibria MG (1993) Rural poverty in Asia: priority issues and
policy options. Oxford University Press, Hong KongRees WE (2002) Globalization and sustainability: conflict or
convergence? Bull Sci Technol Soc 22(4):249–268Roberts S (2006) More masses huddling, but they use less water.
New York Times, 3 OctoberSassen S (1991) The global city: New York, London, Tokyo.
Princeton University Press, PrincetonSatterthwaite D (2005) The scale of urban change worldwide
1950–2000 and its underpinnings (Human Settlements Dis-cussion Paper Series. Theme: Urban Change-1). IIED,London
Savage VR (2006) Ecology matters: sustainable development inSoutheast Asia. Sustainability Sci 1(1):37–64
Seckler D, Barker R, Amarasinghe U (1999) Water scarcity inthe twenty-first century. Water Resour Dev 15(1/2):29–42
Shapiee R (2003) Environmental laws and their impact onMalaysian urban governance. In: Hashim NM, Rainis R(eds) Urban ecosystem studies in Malaysia. UniversalPublishers, Florida, pp 45–76
Small C, Nicholls RJ (2003) A global analysis of humansettlements in coastal zones. J Coastal Res 19(3):584–599
Smith KA, Paterson JE (1995) Manganese and cobalt. In:Alloway BJ (ed) Heavy metals in soils, 2nd edn. Blackie,London, pp 224–244
Smithies M (1986) Old Bangkok. Oxford University Press, NewYork
Sonnenfeld DA, Mol APJ (2006) Environmental reform in Asia,comparisons, challenges, next steps. J Environ Dev15(2):112–137
Steinnes E (1995) Mercury. In: Alloway BJ (ed) Heavy metals insoils, 2nd edn. Blackie, London, pp 245–259
Tarr JA (1996) The search for the ultimate sink, urban pollutionin historical perspective. University of Akron Press, Akron
Tarr JA (1999) Decisions about wastewater technology, 1850–1932. In: Roberts GR (ed) The American cities andtechnology readers. Routledge and the Open University,London, pp 154–162
Tibbetts J (2002) Coastal cities, living on the edge. EnvironHealth Perspect 110(11):A674–A681
Todaro MP (1997) Economic development, 6th edn. Longman,London
UN-HABITAT (2003a) The challenge of slums, global reporton human settlements 2003. Earthscan Publications Ltd,London
UN-HABITAT (2003b) Water and sanitation in the World’scities, local action for global goals. Earthscan PublicationsLtd, London
UN ESCAP (2000) State of the environment in the Asia Pacific.UNESCAP, Bangkok
UN ESCAP (2005) State of the Environment in Asia and thePacific 2005-Synthesis. UN ESCAP, Bangkok
UNEP (2002) Global environmental outlook 3, past, present andfuture perspectives. Earthscan Publications, London
UNEP and UN-HABITAT (2005) Coastal area pollution, therole of cities. UNEP and UN-HABITAT, Nairobi
UNEP Regional Resource Center for Asia and the Pacific (2000)Asia Pacific environment outlook 2. UNEP RRC.AP,Pathumthani
UNEP Regional Resource Center for Asia and the Pacific(2001a) State of the Environment Lao PDR, 2001. UnitedNations Environment Program, Pathumthani
UNEP Regional Resource Center for Asia and the Pacific(2001b) State of the Environment Vietnam, 2001. UnitedNations Environment Program, Pathumthani
UNEP Regional Resource Center for Asia and the Pacific (2004)Environmental indicators Southeast Asia. UNEP RRC.AP,Pathumthani
UNESCO (2003) World water development report, water forpeople, water for life. UNESCO, Paris
Vorosmarty CJ, Meybeck M, Fekete B, Sharma K, Green P,Syvitski JPM (2003) Anthropogenic sediment retention:major global impact from registered river impoundments.Global Planet Change 39(1–2):169–190
Watson RT, the Core Writing Team. (2001) Climate change2001: synthesis report. Cambridge University Press,Cambridge
Webster D (1995) The urban environment in Southeast Asia:challenges and opportunities. In: Institute of SoutheastAsian Studies (ed) Southeast Asian Affairs (pp 89–107).ISAS, Singapore
WHO (2004) Guidelines for drinking-water quality, 3rd edn, Vol1. World Health Organization, Geneva
Wolman A (1965) The metabolism of cities. In: ScientificAmerican (ed) Cities. Alfred A. Knopf, New York,pp 156–174
World Bank (1991) World development report. World Bank andOxford University Press, New York
Sustain Sci
123

World Bank (1999) World development report 1999/2000. WorldBank and Oxford University Press, New York
World Commission on Dams (2000) Dams and development, anew framework for decision-making. Earthscan PublicationsLtd, London
World Resources Institute (2002) Reefs at Risk in SoutheastAsia. WRI, Washington
Yandle B, Bhattarai M, Viuayaraghavan M (2004) Environmen-tal kuznets curves: a review of findings, methods and policyimplications (Research Study 02-1). PERC, Bozeman
Yeates M (1998) The North American City, 5th edn. Longman,New York
Sustain Sci
123