unveiling process insights from refactoring practices - uc
TRANSCRIPT
Unveiling process insights from refactoring practices
Joao Caldeira a, Fernando Brito e Abreu a, Jorge Cardoso b,c, Jose
Pereira dos Reis a
aIscte - Instituto Universitario de Lisboa, ISTAR-Iscte, Lisboa, PortugalbCISUC, Dept. of Informatics Engineering
University of Coimbra, PortugalcHuawei Munich Research Center, Germany
Abstract
Context : Software comprehension and maintenance activities, such as refac-toring, are said to be negatively impacted by software complexity. The meth-ods used to measure software product and processes complexity have beenthoroughly debated in the literature. However, the discernment about thepossible links between these two dimensions, particularly on the benefits ofusing the process perspective, has a long journey ahead.Objective : To improve the understanding of the liaison of developers’ activ-ities and software complexity within a refactoring task, namely by evaluatingif process metrics gathered from the IDE, using process mining methods andtools, are suitable to accurately classify different refactoring practices andthe resulting software complexity.Method : We mined source code metrics from a software product after aquality improvement task was given in parallel to (117) software developers,organized in (71) teams. Simultaneously, we collected events from their IDEwork sessions (320) and used process mining to model their processes andextract the correspondent metrics.Results : Most teams using a plugin for refactoring (JDeodorant) reducedsoftware complexity more effectively and with simpler processes than the onesthat performed refactoring using only Eclipse native features. We were ableto find moderate correlations (≈43%) between software cyclomatic complex-ity and process cyclomatic complexity. Using only process driven metrics, wecomputed ≈30,000 models aiming to predict the type of refactoring method
Email addresses: [email protected] (Joao Caldeira ), [email protected]
(Fernando Brito e Abreu ), [email protected] (Jorge Cardoso ),
[email protected] (Jose Pereira dos Reis )
Preprint submitted to Computer Standards and Interfaces October 30, 2020
arX
iv:2
010.
1569
2v1
[cs
.SE
] 2
9 O
ct 2
020
(automatic or manual) teams had used and the expected level of softwarecyclomatic complexity reduction after their work sessions. The best modelsfound for the refactoring method and cyclomatic complexity level predictions,had an accuracy of 92.95% and 94.36%, respectively.Conclusions : We have demonstrated the feasibility of an approach that al-lows building cross-cutting analytical models in software projects, such as theone we used for detecting manual or automatic refactoring practices. Eventsfrom the development tools and support activities can be collected, trans-formed, aggregated, and analyzed with fewer privacy concerns or technicalconstraints than source code-driven metrics. This makes our approach agnos-tic to programming languages, geographic location, or development practices,making it suitable for challenging contexts such as in modern global softwaredevelopment projects. Initial findings are encouraging, and lead us to sug-gest practitioners may use our method in other development tasks, such as,defect analysis and unit or integration tests.
Keywords: Software Complexity, Software Process Complexity, SoftwareDevelopment Process Mining, Refactoring Practices
1. Introduction
“...All things - from the tiniest virus to the greatest galaxy - are, inreality, not things at all, but processes...”1
—Alvin Toffler(1928-2016)2
A process3 is ”a series of actions taken in order to achieve a result”. Inmany business areas, either on delivering products and/or services, the qual-ity of the outcome is very often related with the process followed to buildit [1, 2, 3]. This is expected to be no different in the software developmentdomain. Therefore, to fully comprehend how software quality and improvedmaintainability are achieved, one should look carefully to the process per-spective to complement any code related analysis [4].
Software development is intrinsically a process and, accordingly, it is ablend of activities performed by developers, often working from different
1In ”Future Shock”, Penguin Random House, New York, 1970.2American writer, futurist, and businessman known for his works discussing modern
technologies, including the digital and the communication revolutions, with emphasis ontheir effects on cultures worldwide.
3Adapted from https://dictionary.cambridge.org/dictionary/english/process
2
locations and using a multitude of languages, tools and methodologies inorder to create a new product or maintain an existing one [4]. Since theearly days of software development, it was understood that programming isan inherently complex and error-prone process, and to fully understand it,we should mine, in a timely and proper manner, all facets of that process[5]. Any relevant insights one may obtain should therefore originate fromthe activities and/or artifacts recorded in software repositories during thedevelopment life cycle.
Studies on estimating the effort to develop a certain artifact, the identifi-cation of software defects, the prediction of time to solve bugs or on softwarecomprehension, and the detection of refactoring opportunities, are amongstthe most common use cases for those repositories [6, 7, 8, 9, 10, 11, 12].
Refactoring on its own is still a very challenging activity. The iden-tification of components to refactor and the forecast of which methods toembrace continue to be relevant topics for research [13, 14, 15, 16]. Thesechallenges emerge partially due to the significant functionality limitationssoftware repositories contain and the type of data they use [17].
Some authors confirm that developers perform refactoring tasks manuallymore frequently than automatically [12]. Furthermore, it has been observed,in a real-life scenario, that refactoring can be harmful when done manually,using only IDE native features or simply driven by developers’ skills, as itmay introduce non-expected defects in the code [18].
On trying to comprehend software development processes, including refac-toring practices, many data sources, methods, and tools have been used withvalidated outcomes, but some others are yet to be fully exploited [19]. Forexample, since Version Control Systems (VCS) are widely used by develop-ers, researchers get easy access to historical data of many projects and usefile-based VCSs as the primary source of code evolution data [20]. Althoughit is often convenient to use such repositories, research-based on VCS data isimprecise and incomplete [17].
As such, answering questions that correlate code changes with other ac-tivities (e.g., test runs, refactoring) is often unfeasible. Several reasons maycontribute to it, as for instance:
• developers may not commit all their tests and/or refactorings;
• there are many ways to refactor one version of the code, thereforeit is important to determine the refactoring activities sequences andfrequencies;
• often we cannot distinguish if a refactoring was done manually orthrough a tool, just by comparing source code snapshots [21].
3
1.1. Code vs. Process Analysis
Most published work on software quality-related issues is based on sourcecode metrics, especially on Java systems [22, 23, 24]. Tools for collectingthose metrics upon other frequently used languages, such as JavaScript orPython, are often not available, which expose well the difficulties to repro-duce the same research on projects having diverse languages. In case thosemetric collection tools exist, they often require to share the source code withthird-party organizations [25], particularly on cloud-based platforms. Suchscenarios raise privacy and ownership issues on sensitive data. Source codeobfuscation does not mitigate this problem because developers need to keepcode semantics for interpreting the metrics in context.
Instead, mining the developers’ activities and behaviors, the same is tosay, to mine their development process fragments, may be a more feasibleapproach since it is not specific to any programming language, geographiclocation or development methodology followed.
Event data can be obfuscated without losing the process structure andcoherence, therefore, whoever is responsible to analyze the logs can applyalgorithms to discover process models in very similar ways as if the logs werenot obfuscated [26]. In other words, events from the development tools andsupport activities can be collected, transformed and aggregated with fewerprivacy concerns and technical hurdles. As such, it has been pointed out thatsoftware development event logs can be used to complement, or even replace,source code data in software development analytics-related tasks [27].
1.2. Contributions
It is frequent to find software prediction models using source code andownership metrics [16]. However, periodically this data is not easily accessibleor has imprecisions. Nowadays, development teams use a diversity of lan-guages, methodologies and tools, therefore, the collection and aggregation ofdata from software projects remains a challenge. Additionally, process met-rics have been found to be good predictors for modeling software developmenttasks [28].
Thus, we proposed earlier [29] and are now evaluating deeper the use ofprocess metrics gathered from the IDE (Integrated Development Environ-ment), as a way to enhance existing models or eventually, build new ones.
Software product and process metrics have long been proposed, as well astechniques for their collection [30, 31, 32, 19, 33, 34, 35]. However, the asso-ciation between product and process dimensions is only marginally discussedin the literature [36]. In order to improve our understanding on the liaisonbetween the type of development activities executed and the resulting soft-ware product characteristics, namely to ascertain if developers’ behavior has
4
an impact on software product quality, we collected data during a softwarequality improvement task (application of refactoring operations) given to 71development teams. Regarding developers’ behavior, we recorded all eventscorresponding to the activities/tasks/operations team members performedwithin their IDE and used those events to mine the underlying process andextract their metrics. Regarding software quality, we collected complexitymetrics before and after the refactoring actions took place. The main objec-tives for this work are, therefore:
• to assess the use of software process metrics to facilitate and improvethe analysis and predictions on refactoring tasks and/or other genericsoftware activities;
• to evaluate a possible association between the complexity of the pro-duced code and developers’ practices in different refactoring tasks;
• to build classification models for refactoring practices using only processmetrics and assess the prediction accuracy of such approach.
The rest of this paper is organized as follows: section 2 provides back-ground related to the research area and emphasizes the need for the fol-lowed approach; subsequent section 3 outlines the related work; the researchmethodology and the study setup are presented in section 4; the results,the corresponding analysis and implications can be found in section 5 andthreats to validity are discussed in section 6; the concluding comments andthe outline for future work are produced in section 7.
2. Background
Empirical software engineering and software analytics are now mature re-search areas with substantial contributions to the software development bestpractices [37]. The knowledge base created to support those achievementstook a great advantage from the experience gathered on analyzing past soft-ware projects. Based on the maturity obtained, it was possible to deriveseveral models to measure software complexity, effort and relationships.
2.1. Early models
Lines of Code(LOC ). The identification and quantification of softwaresize/defect relationship did not happen overnight. The first known “size”law, saying the number of defects D was a function of the number of LOC ;specifically, D = 4.86 + 0.018 * i, was the result of decades of experience andwas presented by Fumio Akiyama [38].
5
Cyclomatic Complexity. One of the most relevant propositions to as-sess the difficulty to maintain software was introduced by Thomas McCabewhen he stated that the complexity of the code was more important than thenumber of LOC. He argued that when his “cyclomatic complexity” metricwas over 10, the code is more likely to be defective [39]. This metric, un-derpinned by graph theory, went through thorough validation scrutiny andthen became the first software metric recognized by a standardization body,the NIST [31], what makes it even more relevant in the context of this journal.
Halstead Complexity. On trying to establish an empirical science of soft-ware development, Maurice Howard Halstead, introduced the Halstead com-plexity measures [40]. These metrics, which are computed statically fromthe code, assume that software measurement should reflect the implementa-tion or expression of algorithms in different languages, but be independent oftheir execution on a specific platform. Halstead’s metrics were used, amongother things, to assess programmers’ performance in software maintenanceactivities (measured by the time to locate and successfully correct the bug)[41].
Effort Estimators. Later, Barry Boehm proposed an estimator for devel-opment effort that was exponential on program size: effort = a ∗KLOCb ∗EffortMultipliers, where 2.4 ≤ a ≤ 3 and 1.05 ≤ b ≤ 1.2 [42].
Henry and Kafura Metrics. These two authors defined and validated aset of software metrics based on the measurement of information flow betweensystem components. Specific metrics are defined for procedure complexity,software modules complexity, and module coupling [43].
The above models were the foundation knowledge for what is nowadaysoften categorized as Software Development Analytics [44]. However, currentdevelopment methods, tools and data repositories are very different from thepast. Back in those years, software developers were mainly using a text editorand a compiler. Software projects were essentially built employing a singleprogramming language, following a fairly simple development methodologyand the developers were rarely located in different geographies or acrossmultiple time zones. These workspace conditions have changed.
6

2.2. Modern Days
In 2019, JetBrains4 polled almost 7000 developers about their develop-ment ecosystem. Results show that more than 30 different programminglanguages are being used and confirmed that web back-end, web front-endand mobile applications are the type of applications mostly developed, withfigures of 60%, 46% and 23%, respectively. It was unanimous the adherenceof cross-platform development frameworks and 80% said they use any typeof source code collaboration tool, 75% use a standalone IDE and 71% usea lightweight desktop editor. Almost 50% said they use continuous integra-tion/delivery (CI/CD) and issue tracking tools. Less than 15% respondedthat they use any sort of static analysis, code review and in-cloud IDE tools.Table 1 presents the key takeaways from the mentioned survey.
In summary, currently, a software development ecosystem has to deal withat least the following facets:
• Multi-Language Ecosystem. According to a recent work aboutmulti-language software development [45], the authors present evidencesthat non-trivial enterprise software systems are written in at least 7programming languages and, a previous work showed that in the opensource world alone, the average is 5 languages per project. Amongthese, one may find general-purpose languages(GPL) such as Java orC# and also domain-specific languages(DSL) like SQL and HTML,and cross-language links are also quite common, meaning some codeartifacts are shared between languages. As a result, developers con-firm they find more problems in activities such as implementing newrequirements (78%) and in refactoring (71%).
• IDE Evolution. A substantial change was carried in the IntegratedDevelopment Environments (IDEs). Software development moved awayfrom the early days of the code editor. As confirmed by the Jetbrainspoll, developers now use powerful platforms and frameworks which al-low them to be more productive on their jobs. This results from thecombination of different software development life cycle activities, suchas: requirements elicitation, producing analysis and design models, pro-gramming, testing, configuration management, dependencies manage-ment or continuous integration into one single tool such as Eclipse,IntelliJ IDEA, Netbeans or Visual Studio Code. These tools sup-port the needs of different stakeholders, as they embed a myriad of
4https://www.jetbrains.com/lp/devecosystem-2019/
7
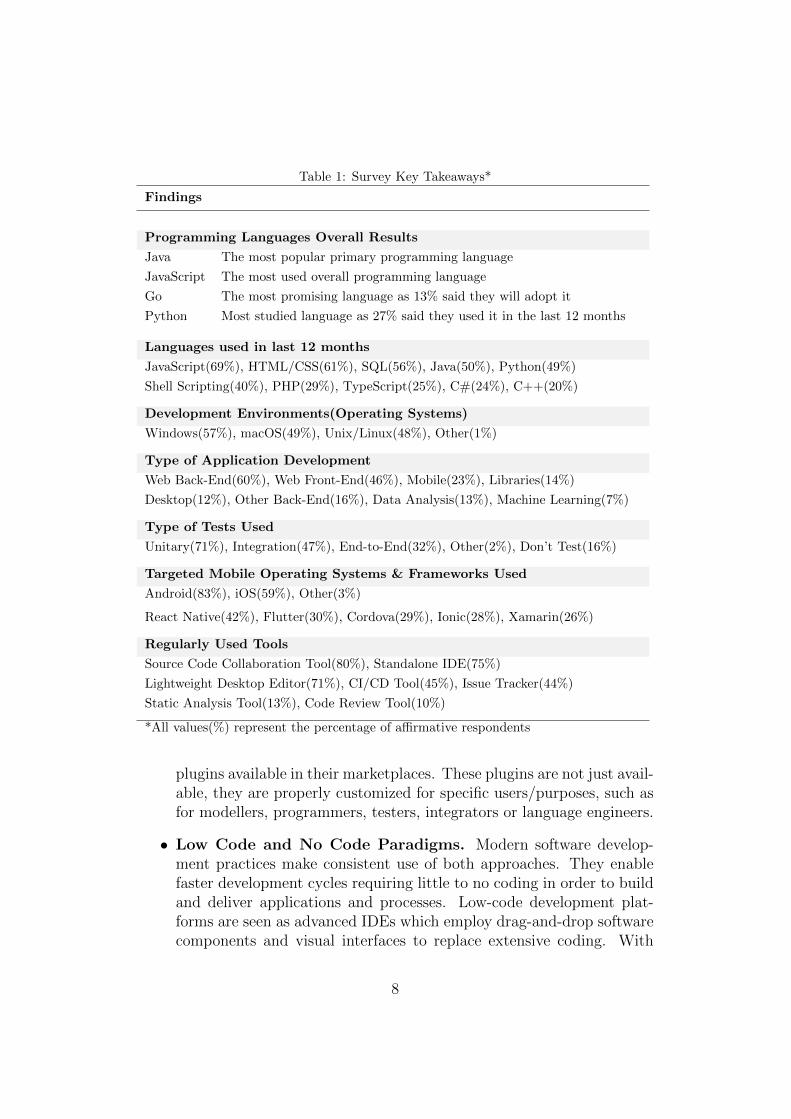
Table 1: Survey Key Takeaways*
Findings
Programming Languages Overall Results
Java The most popular primary programming language
JavaScript The most used overall programming language
Go The most promising language as 13% said they will adopt it
Python Most studied language as 27% said they used it in the last 12 months
Languages used in last 12 months
JavaScript(69%), HTML/CSS(61%), SQL(56%), Java(50%), Python(49%)
Shell Scripting(40%), PHP(29%), TypeScript(25%), C#(24%), C++(20%)
Development Environments(Operating Systems)
Windows(57%), macOS(49%), Unix/Linux(48%), Other(1%)
Type of Application Development
Web Back-End(60%), Web Front-End(46%), Mobile(23%), Libraries(14%)
Desktop(12%), Other Back-End(16%), Data Analysis(13%), Machine Learning(7%)
Type of Tests Used
Unitary(71%), Integration(47%), End-to-End(32%), Other(2%), Don’t Test(16%)
Targeted Mobile Operating Systems & Frameworks Used
Android(83%), iOS(59%), Other(3%)
React Native(42%), Flutter(30%), Cordova(29%), Ionic(28%), Xamarin(26%)
Regularly Used Tools
Source Code Collaboration Tool(80%), Standalone IDE(75%)
Lightweight Desktop Editor(71%), CI/CD Tool(45%), Issue Tracker(44%)
Static Analysis Tool(13%), Code Review Tool(10%)
*All values(%) represent the percentage of affirmative respondents
plugins available in their marketplaces. These plugins are not just avail-able, they are properly customized for specific users/purposes, such asfor modellers, programmers, testers, integrators or language engineers.
• Low Code and No Code Paradigms. Modern software develop-ment practices make consistent use of both approaches. They enablefaster development cycles requiring little to no coding in order to buildand deliver applications and processes. Low-code development plat-forms are seen as advanced IDEs which employ drag-and-drop softwarecomponents and visual interfaces to replace extensive coding. With
8
high-level visual modeling languages, they provide higher levels of ab-straction that allow a major reduction in hand-coding to develop anapplication [46]. In the extreme case we have no-code developmentwhere, by definition, textual programming is banned, giving rise tothe so-called citizen developers. The most notable examples are onlineapplication generators (OAGs) that automate mobile and web app de-velopment, distribution, and maintenance, but this approach is claimedto be pledged with security vulnerabilities [47]. This paradigm shift insoftware development may also require a change in the way we assesscritical properties of a software project, such as, quality, maintainabil-ity, and evolvability.
• Global Software Development. The aforementioned IDE platformsfacilitated collaboration and the adoption of Global Software Develop-ment (GSD). Nowadays, a single software project often has developers,testers and managers located in different time zones and distinct worldregions or countries [48].
• CI/CD and DevOps. Continuous Integration and Continuous De-ployment (CI/CD) have seen an incremental usage in the last few years.However, efficient CI/CD pipelines are rare, particularly in the mobileapps world where developers seem to prefer the execution of ad hoctasks [49]. Whilst CI/CD focuses more on the automation of toolsalong a defined software life cycle, DevOps has major concerns with theresponsiveness, responsibilities and processes within the development,the deployment and the operational phases of software projects. Keep-ing these intertwined processes compliant with organizational rules istherefore a persistent requirement.
• Resource Coordination. It is still one of the fundamental prob-lems in software engineering [50] and it can be characterized as asocio-technical phenomenon. Understanding the dependencies betweendevelopment tasks and discover teams’ behaviours continues to be achallenge in resource allocation and coordination of modern softwareprojects.
Software product repositories have many limitations in terms of the pro-cess data they handle. For example, these repositories usually deal onlywith source code and do not track the developers’ geographic location, theirworkflows within the IDE nor the developers’ environment characteristics. Acomplete repository of process related data with the communications, activi-ties, decisions and actions taken by developers, testers and project managers,
9
are, most of the time, if not always, neglected when the goal is to study adevelopment process. Usually, even if the authors claim they are studying aprocess, they are often doing it using only artifact related data [36].
With the existing diversity of languages, methodologies, tools and thefact that resources are now distributed across the world and originate frommultiple cultures with different skills, it is somewhat an anachronism to keepusing old methods to assess, for example, complexity or build cross-cuttinganalytical models in current software projects. New approaches, supportingmulti-languages, being multi-process aware, and keeping geography diversitytransparent are called for, such as our pioneering approach for mining ofsoftware development processes based on the IDE event logs. That approach,dubbed Software Development Process Mining [29], allows reversing engineera complete software development process, just a process fragment or simplyad hoc activities performed by developers, by mining event logs taken fromreal software development activities.
3. Related Work
To address the incompleteness of data sources related with software repos-itories, we strongly believe that Software Development Process Mining basedat least on the IDE(but not limited to) can play that role and Process Miningtools and methods can be the vehicles to achieve that goal. Many authorshave followed similar paths, bringing not only evidences for its usefulness butalso valid contributions to improve established methods.
A decade ago, [51] mined software repositories to extract knowledge aboutthe underlying software processes, and [52, 53] have learned about user be-havior from software at operations. [54] was able to extract events fromEclipse and have discovered, using a process mining tool, basic developers’workflows. Some statistics were computed based on the activities executedand artifacts edited.
[55] presented an application of mining three software repositories: teamwiki (used during requirement engineering), version control system (devel-opment and maintenance) and issue tracking system (corrective and adap-tive maintenance) in the context of an undergraduate Software Engineeringcourse. Experimentation revealed that not only product but process qualityvaries significantly between student teams and mining process aspects canhelp the instructor in giving directed and specific feedback. However, in thiscase, IDE usage mining was not contemplated.
The working habits and challenges of mobile software developers withrespect to testing were investigated by [49]. A key finding of this exhaustivestudy, using 1000 Android apps, demonstrates that mobile apps are still
10
tested in a very ad hoc way, if tested at all. A another relevant findingof this study is that Continuous Integration and Continuous Deployment(CI/CD) pipelines are rare in the mobile apps world (only 26% of the apps aredeveloped in projects employing CI/CD) - authors argue that one of the mainreasons is due to the lack of exhaustive and automatic testing. Therefore,distinguishing during development sessions the type of tests being done cancontribute to the overall software quality.
[56] explored if one can characterize and identify which commits will bereverted. An identification model (e.g., random forest) was built and evalu-ated on an empirical study on ten open source projects including a total of125,241 commits. The findings show that the ’developer’ is the most deter-minant dimension of features for the identification of reverted commits. Thissuggests that assessing developers behaviors can lead to better understandsoftware products quality.
[57] studied the dialogue between users and developers of free apps in theGoogle Play Store. Evidences found, showed that it can be worthwhile forapp owners to respond to reviews, as responding may lead to an increase inthe given rating and that studying the dialogue between user and developercan provide valuable insights which may lead to improvements in the appstore and the user support process. We believe the same rationale may beapplied to comprehend the workflows and dialogues between developers andproject owners, and how that may impact software products.
Development activities were extracted by [58] from non-instrumented ap-plications and used machine learning algorithms to infer a set of basic de-velopment tasks. However, in this case, no process mining techniques wereused to discover any pattern of application usage. The extraction of usagesmells was the focus of [59], where a semi-automatic approach was adoptedto analyze a large dataset of IDE interactions using cluster analysis. Again,process mining techniques were not used. Process mining was indeed usedby [60] to gain knowledge on software under operation (not under develop-ment) by analyzing the hierarchical events produced by application calls(eg:execution of methods within classes) at runtime.
[61] collected events from the IDE to measure program comprehensionand evaluated the correlation between developers’ activities and the timethey spent on them. Despite the fact that a process was being studied, noevidence of using process mining methods was provided.
A few authors have also followed the route we suggested earlier and re-sumed in [62]. As such, we are witnessing more evidences that it is indeeda valid approach, therefore, [63] used process mining to evaluate developers’coding behavior in software development processes. Process models werediscovered and used to classify the developers as low-performing and high-
11
performing profiles. With a similar goal, in [64], a different miner algorithmwas assessed to obtain complementary results and in [65], developers’ profil-ing was achieved by mining event logs from a web-based cloud IDE.
Finally, [16] highlights the importance of having more fine-grained pro-cess metrics in prediction models and evaluated several machine learning al-gorithms in predicting software refactoring opportunities. This work focuseson deciding when, what and why to refactor, however, it does not addresswhich refactor practice was indeed applied.
The studies mentioned above used a multitude of process mining tech-niques, statistics and machine learning methods. Different data source typeshave been used to extract the information needed to support them. How-ever, to the best of our knowledge, none of these works combine processand product metrics with the aim of assessing potential correlations and/orimpacts between the process and the product. Moreover, none uses only pro-cess metrics to discover work patterns or to predict development behaviors,particularly, refactoring practices.
4. Study Setup
We setup an environment where the same well-defined tasks on softwarequality assurance was performed independently by several teams.
Our research guaranteed that all teams had similar backgrounds and per-formed the same task upon the same software system. This approach wasused to block additional confounding factors in our analysis. The task tar-geted a complex open-source Java system named Jasml (Java Assembling
Language)5.To understand the work developed by each team in each task, we collected
the corresponding IDE events for mining the underlying process. At the endof each task, we also collected the modified Jasml project code for each teamand obtained the corresponding product metrics.
4.1. Subject Selection
Our subjects were the finalists (3rd year) of a B.Sc. degree on computerscience at the ISCTE-IUL university, attending a compulsory software en-gineering course. They had similar backgrounds as they have been trainedacross the same set of courses along their academic path. Teams were as-sembled with up to 4 members each and were requested to complete a codesmells detection assignment, aiming at identifying refactoring opportunitiesand then to apply them.
5http://jasml.sourceforge.net/
12
4.2. Data Collection
The participants were requested to perform the refactoring tasks in twodifferent ways: Automatically and Manually.
The refactoring tasks had the following requirements:
• Automatic Refactoring(AR). This task was executed from March1st to March 20th, using JDeodorant6. This tool suggests refactor-ing opportunities by detecting, among others, the following four well-known code smells: Long Method, God Class, Feature Envy andType Checking [66]. Once participants have detected the occurrencesof those code smells, they were required to apply JDeodorant’s fullyautomated refactoring features to fix the critical ones.
• Manual Refactoring(MR). This task was pursued from March 21st
to 28th and differed from the previous one because JDeodorant auto-matic refactoring capabilities were banned. Instead, subjects could useEclipse’s native interactive refactoring features or perform the refactor-ings manually.
The Eclipse IDE has an internal event bus accessed by the interfaceIEventBroker7 which is instantiated once the application starts. It containsa publishing service to put data in the bus, whilst the subscriber service readswhat’s in that bus. Using this feature we developed an Eclipse plugin8
capable of listening to the actions developers were executing. Before theexperiment, the plugin was installed on each subject’s IDE, and later, allsubjects received an unique username/key pair as credentials.
6https://users.encs.concordia.ca/ nikolaos/jdeodorant/7https://wiki.eclipse.org/Eclipse4/RCP/Event Model8https://github.com/jcaldeir/iscte-analytics-plugins-repository
13
A sample event instance collected with our plugin is presented in listing1. The field tags are self explanatory.
Listing 1: Sample Eclipse Event Instance in JSON format
{”team” : ”Team−10” ,” s e s s i o n ” : ”dkoep74−a jodje5 −63j3k2 ” ,” t imestamp begin ” : ”2019−05−03 16 : 5 3 : 5 2 . 1 44” ,” timestamp end” : ”2019−05−03 16 : 5 4 : 0 4 . 4 68” ,” fu l lname ” : ”John User ” ,”username” : ” john ” ,”workspacename” : ”Workspace1 ” ,” projectname” : ”/ ja sml 0 . 10” ,” f i l ename ” : ”/ ja sml 0 .10/ s r c / jasml . java ” ,” extens i on ” : ” java ” ,”categoryName” : ” Ec l i p s e Editor ” ,”commandName” : ” F i l e Edi t ing ” ,” categoryID” : ” org . e c l i p s e . u i . i n t e r n a l . Ed i torRe fe rence ” ,”commandID” : ” i s c t e . p lug in . e c l i p s e . commands . f i l e . e d i t ” ,” p lat form branch ” : ” Ec l i p s e Oxygen” ,” p l a t f o rm ve r s i on ” : ” 4 . 7 . 3 . M20180330−0640” ,” java ” : ” 1 . 8 . 0 171−b11 ” ,” cont inent ” : ”Europe ” ,” country ” : ”Portugal ” ,” c i t y ” : ”Lisbon ” ,. . . .”hash” : ”00 b7c0ef94e02eb5138d33daf38054e3 ” //To de t ec t event tampering}
4.2.1. Data Storage
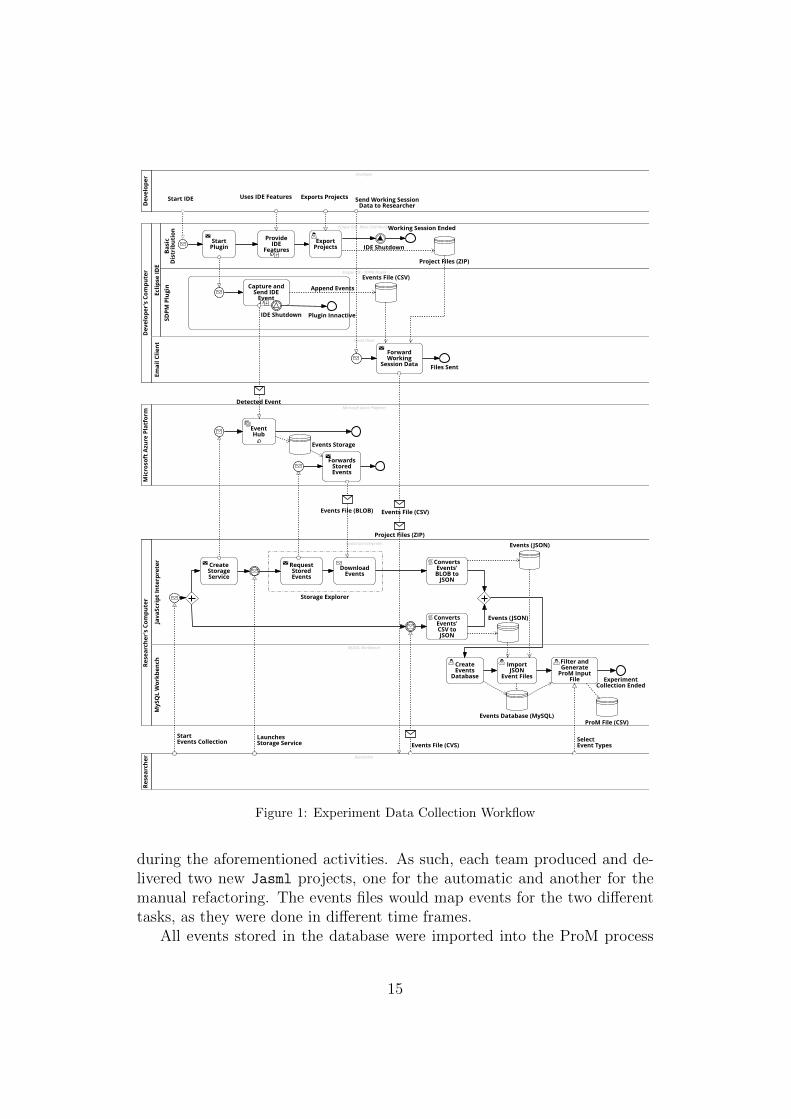
Collected data was stored locally on each subject’s computer in a CSV file.Whenever Internet connection was available, the same data was stored in real-time in the cloud9. This storage replication mechanism allowed for offline andonline collection10. The final dataset, combining the two different sources,was then loaded into a MySQL database table where the username and eventtimestamps that formed the table’s unique key were used to detect and avoidduplicated data insertions. Figure 1 presents the complete schema for thedata collection workflow. We use the BPMN standard process definitionlanguage for that purpose [67].
4.2.2. Data Preparation
When the software quality task ended, we collected from each team theirprojects’ code together with the events files containing the actions performed
9https://azure.microsoft.com/en-us/services/event-hubs/10The plugin currently supports the collection of events locally in CSV and JSON files;
stream events to Azure Event Hub and Kafka remotely; and uses an integration with Trelloto extract project activities which can be triggered as manual events by the developers.Kafka and Trello integrations were not used in this experiment.
14
Experiment Data CollectionM
icro
soft
Azu
re P
latf
orm
Microsoft Azure Platform
EventHub
Events Storage
ForwardsStoredEvents
Dev
elop
er's
Com
pute
r
Emai
l Clie
nt
Email Client
ForwardWorking
Session Data Files Sent
Eclip
se ID
EBa
sic
Dis
trib
utio
n Eclipse IDE - Basic Distribution
StartPlugin
Working Session Ended
IDE ShutdownProvide
IDEFeatures
Project Files (ZIP)
ExportProjects
SDPM
Plu
gin
Eclipse IDE - SDPM Plugin
Capture andSend IDE
Event
Plugin InnactiveIDE Shutdown
Events File (CSV)
Rese
arch
er's
Com
pute
r
Java
Scri
pt In
terp
rete
r
JavaScript Interpreter
RequestStoredEvents
CreateStorageService
DownloadEvents
ConvertsEvents'CSV toJSON
ConvertsEvents'BLOB to
JSON
Events (JSON)
Events (JSON)
MyS
QL
Wor
kben
ch
MySQL Workbench
Events Database (MySQL)
CreateEvents
Database
ImportJSON
Event Files
Filter andGenerate
ProM InputFile Experiment
Collection Ended
ProM File (CSV)
Dev
elop
er
Developer
Rese
arch
er Researcher
Storage Explorer
Events File (BLOB)
Events File (CVS)
Detected Event
Events File (CSV)
Project Files (ZIP)
Append Events
Exports Projects Send Working SessionData to Researcher
Start IDE Uses IDE Features
LaunchesStorage Service
StartEvents Collection Select
Event Types
Figure 1: Experiment Data Collection Workflow
during the aforementioned activities. As such, each team produced and de-livered two new Jasml projects, one for the automatic and another for themanual refactoring. The events files would map events for the two differenttasks, as they were done in different time frames.
All events stored in the database were imported into the ProM process
15
mining tool11 and converted to the IEEE eXtensible Event Stream (XES)standard format [68]. The following event properties were mapped whenconverting to XES format:
• team and session were used as CaseID since we were interested tolook into process instances of teams and their multiple developmentsessions, not of individual programmers.
• Properties filename, categoryName and commandName forming a hi-erarchical structure were used as the Activity in the process.
• The timestamp begin and timestamp end were both used as activityTimestamps.
• Other properties were not used in the process discovery phase, however,they were later used for metrics aggregation and context analysis.
4.3. Data Analysis
4.3.1. Context
All teams started with the same version of Jasml 0.10, therefore, wehad two relevant moments to get measures from:
1. The initial moment (t0), when we extracted the metrics for the initialproduct version. However, we didn’t know how it was built, therefore,we were missing12 the process metrics.
2. The end of the task (t1), when we extracted again the product metricsfor the changed Jasml 0.10 project of each team as they stand afterthe refactoring sessions. In addition, we had also IDE usage eventswhich provide evidences on how the product was changed.
Following data extraction, we computed, for each product metric definedin Table A.7, their relative variance as shown by Equation 1. The relativevariance variables were the ones we used in all RQs.
∆product metrics(t1-t0) =product metrics(t1) − product metrics(t0)
product metrics(t0)∗ 100 (1)
11Version 6.8, available at http://www.promtools.org12In reality we may consider all of them to be zero
16
The relative variance was used in order to generalize our approach, thus,making it applicable in scenarios where different teams work on distinct soft-ware projects.
Process metrics described in Table A.8 were derived from the eventsdataset captured between moments (t0) and (t1), either by summing theevents or using the method described in 4.3.3. These metrics may be seenas a representation of the effort done by each team during the refactoringpractices.
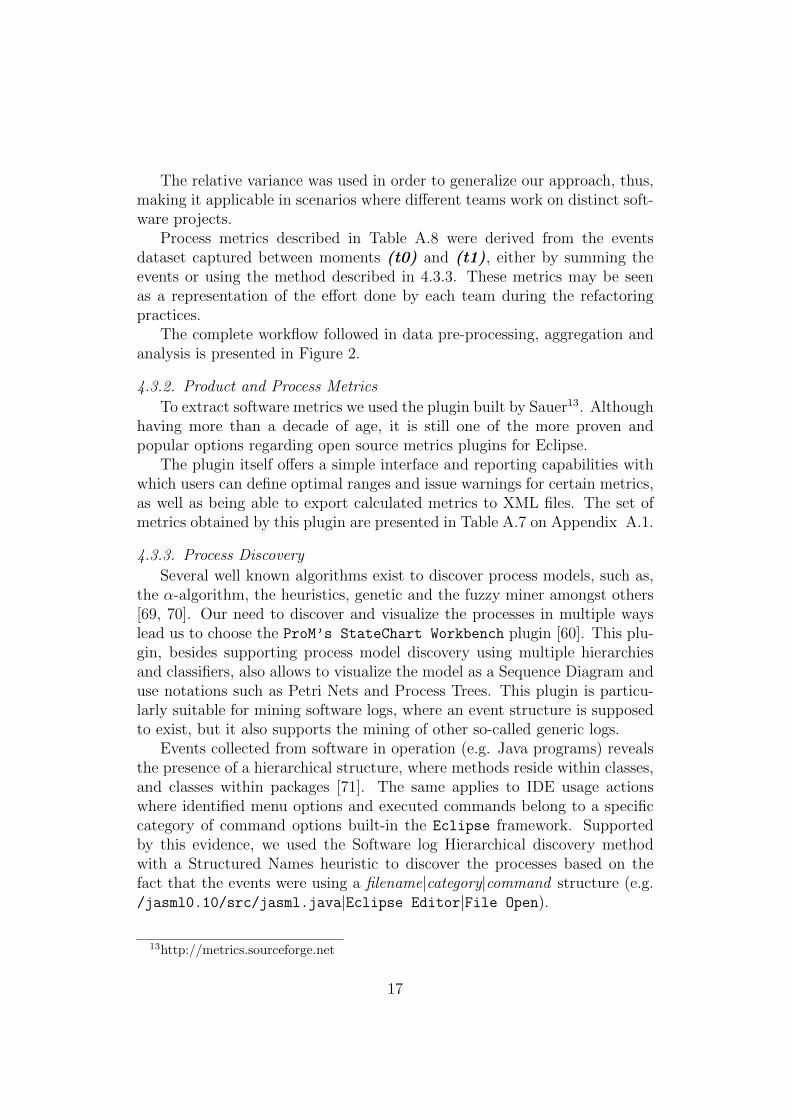
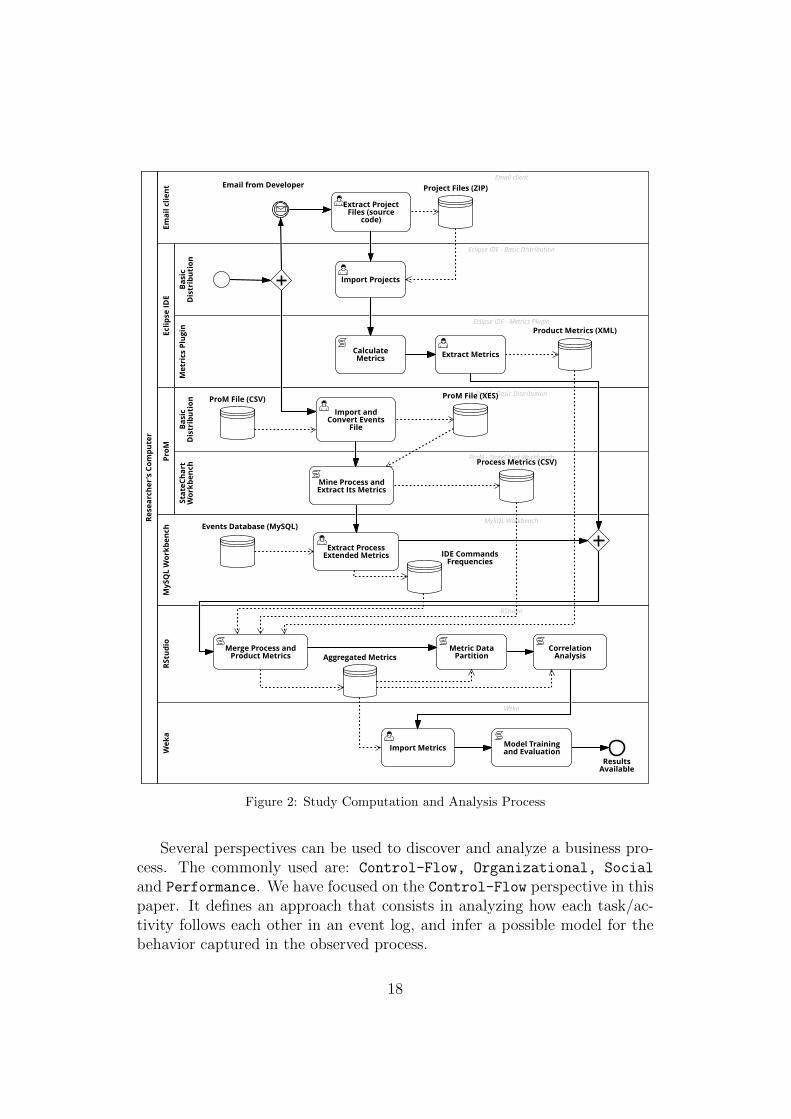
The complete workflow followed in data pre-processing, aggregation andanalysis is presented in Figure 2.
4.3.2. Product and Process Metrics
To extract software metrics we used the plugin built by Sauer13. Althoughhaving more than a decade of age, it is still one of the more proven andpopular options regarding open source metrics plugins for Eclipse.
The plugin itself offers a simple interface and reporting capabilities withwhich users can define optimal ranges and issue warnings for certain metrics,as well as being able to export calculated metrics to XML files. The set ofmetrics obtained by this plugin are presented in Table A.7 on Appendix A.1.
4.3.3. Process Discovery
Several well known algorithms exist to discover process models, such as,the α-algorithm, the heuristics, genetic and the fuzzy miner amongst others[69, 70]. Our need to discover and visualize the processes in multiple wayslead us to choose the ProM’s StateChart Workbench plugin [60]. This plu-gin, besides supporting process model discovery using multiple hierarchiesand classifiers, also allows to visualize the model as a Sequence Diagram anduse notations such as Petri Nets and Process Trees. This plugin is particu-larly suitable for mining software logs, where an event structure is supposedto exist, but it also supports the mining of other so-called generic logs.
Events collected from software in operation (e.g. Java programs) revealsthe presence of a hierarchical structure, where methods reside within classes,and classes within packages [71]. The same applies to IDE usage actionswhere identified menu options and executed commands belong to a specificcategory of command options built-in the Eclipse framework. Supportedby this evidence, we used the Software log Hierarchical discovery methodwith a Structured Names heuristic to discover the processes based on thefact that the events were using a filename|category|command structure (e.g./jasml0.10/src/jasml.java|Eclipse Editor|File Open).
13http://metrics.sourceforge.net
17
Study Computation and AnalysisRe
sear
cher
's C
ompu
ter
RStu
dio
RStudio
Metric DataPartition
CorrelationAnalysis
Merge Process andProduct Metrics Aggregated Metrics
Eclip
se ID
E
Met
rics
Plu
gin
Eclipse IDE - Metrics Plugin
CalculateMetrics Extract Metrics
Product Metrics (XML)
Basi
cD
istr
ibut
ion
Eclipse IDE - Basic Distribution
Import Projects
ProM
Basi
cD
istr
ibut
ion
ProM - Basic DistributionProM File (CSV)
Import andConvert Events
File
ProM File (XES)
Stat
eCha
rtW
orkb
ench
ProM - StateChart Workbench
Mine Process andExtract Its Metrics
Process Metrics (CSV)
MyS
QL
Wor
kben
ch
MySQL WorkbenchEvents Database (MySQL)
Extract ProcessExtended Metrics IDE Commands
Frequencies
Emai
l clie
ntEmail client
Extract ProjectFiles (source
code)
Project Files (ZIP)Email from Developer
Wek
a
Weka
Import Metrics Model Trainingand Evaluation
ResultsAvailable
Figure 2: Study Computation and Analysis Process
Several perspectives can be used to discover and analyze a business pro-cess. The commonly used are: Control-Flow, Organizational, Social
and Performance. We have focused on the Control-Flow perspective in thispaper. It defines an approach that consists in analyzing how each task/ac-tivity follows each other in an event log, and infer a possible model for thebehavior captured in the observed process.
18
Process metrics, shown in Tables A.8 and A.9 on Appendix A.2, were ob-tained using the discovery method described in 4.3.3, and by running queriesinto the events database as presented in Figure 2.
4.3.4. Data Partitioning
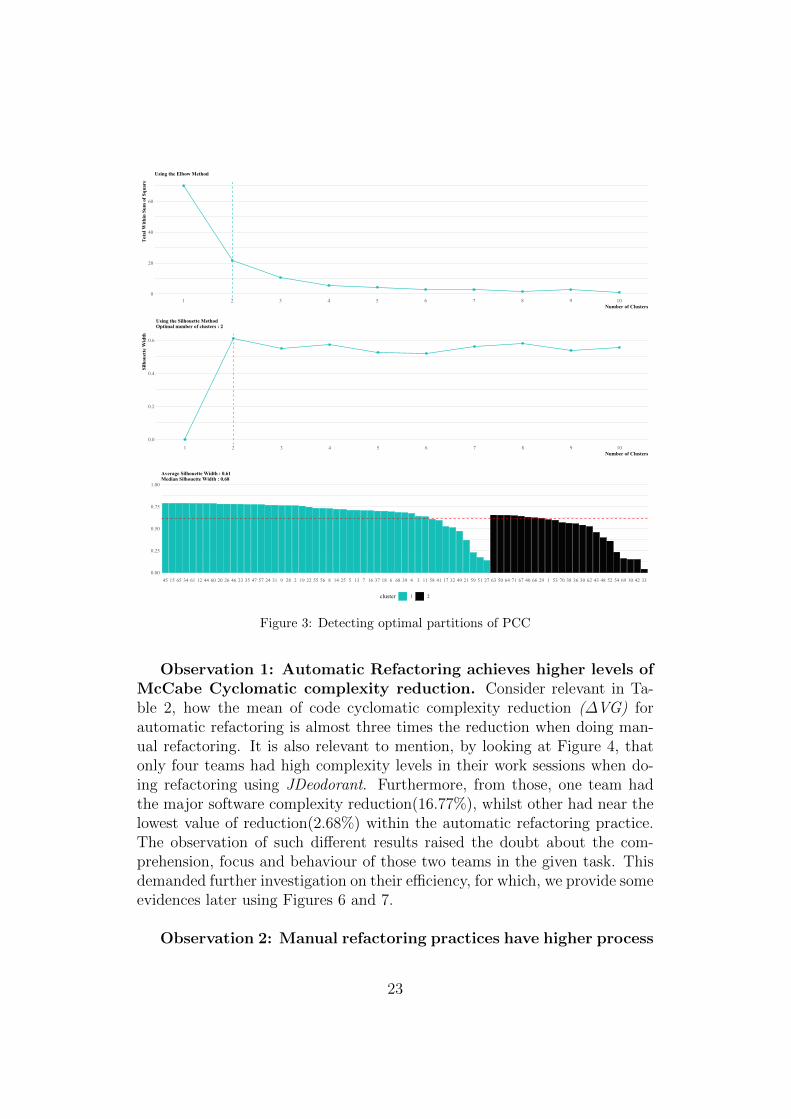
We used the k-means clustering algorithm to compute new variablesbased on the partition of the teams across different levels (clusters) of Pro-cess Cyclomatic Complexity (PCC) and McCabe Cyclomatic Complexityvariance (∆VG) . The decision of how many clusters to use (k) was sup-ported by a detailed analysis of the Elbow and Silhouette methods:
• Elbow Method. It is frequently used to optimize the number of clus-ters in a data set. This heuristic, consists of rendering the explainedvariation as a function of the number of clusters, and picking the el-bow of the curve as the optimal number of clusters to use. In clusteranalysis, the elbow method runs k-means clustering on the dataset fora range of values for k (say from 2-10), and then, for each value of kcomputes an average score for all clusters. The distortion score is com-puted as the sum of square distances from each point to its assignedcenter [72].
• Silhouette Method. It is a commonly used approach of interpre-tation and validation of consistency within clusters of data. Providesa concise graphical representation of how well each object has beenclassified within the corresponding cluster. The Silhouette value is ameasure of how similar an object is to its own cluster (cohesion) com-pared to other clusters (separation). The silhouette can be calculatedwith any distance metric, such as the Euclidean distance or the Man-hattan distance, and ranges from -1 to +1. A high value indicatesthat the object is well matched to its own cluster and poorly matchedto neighboring clusters. The clustering configuration is appropriate ifmost objects have a high value. If many objects have a low or negativevalue, then the clustering configuration may have too many or too fewclusters and, as such, requires further research before a decision on theoptimal number of k clusters is made [73].
4.3.5. Model Selection with Hyperparameter Optimization
To build, tune model parameters as recommended [74, 75], train, evaluateand select the best-fit classification models presented in Tables 5 and 6, we
19
used Weka and the Auto-Weka plugin. Weka (Waikato Environment forKnowledge Analysis) is a popular suite of machine learning software writtenin Java. It’s workbench contains a collection of visualization tools and al-gorithms for data analysis and predictive modeling, together with graphicaluser interfaces for easy access to this functionality [76]. Auto-Weka isa plugin that installs as a Weka package and uses Bayesian optimizationto automatically instantiate a highly optimized parametric machine learningframework with minimum user intervention [77].
4.3.6. Model Evaluation
Several evaluation metrics can be used to assess model quality in terms offalse positives/negatives (FP/FN), and true classifications (TP/TN). How-ever, commonly used measures, such as Accuracy, Precision, Recall andF-Measure, do not perform very well in case of an imbalanced dataset orthey require the use of a minimum probability threshold to provide a defini-tive answer for predictions. For these reasons, we used the ROC14, whichis a threshold invariant measurement. Nevertheless, for general convenience,we kept present in Tables 5 and 6 all the evaluation metrics.
ROC gives us a 2-D curve, which passes through (0, 0) and (1, 1). Thebest possible model would have the curve close to y = 1, with and area underthe curve (AUC) close to 1.0. AUC always yields an area of 0.5 underrandom-guessing. This enables comparing a given model against randomprediction, without worrying about arbitrary thresholds, or the proportionof subjects on each class to predict [28].
4.4. Research Questions
The research questions for this work are:
• RQ1: How different refactoring methods perform when the goal is toreduce complexity, future testing and maintainability efforts?.Methods Used. Process Mining Model Discovery, Descriptive statis-tics and Cluster Analysis.
• RQ2: Is there any association between software complexity and theunderlying development activities in refactoring practices?Methods Used. Process Mining Model Discovery, Correlation Anal-ysis using the Spearman’s rank correlation.
14Receiver operating characteristic (ROC) is a curve that plots the true positive ratesagainst the false positive rates for all possible thresholds between 0 and 1.
20
• RQ3: Using only process metrics, are we able to predict with highaccuracy different refactoring methods?Methods Used. Supervised and Unsupervised Learning Algorithmswith Hyperparameter Optimization.
• RQ4: Using only process metrics, are we able to model accurately theexpected level of complexity variance after a refactoring task?Methods Used. Supervised and Unsupervised Learning Algorithmswith Hyperparameter Optimization.
5. Study Results
In this section, we present the experiment results with respect to ourresearch questions.
5.1. RQ1. How different refactoring methods perform when thegoal is to reduce complexity, future testing and maintainabil-ity efforts?
In this RQ, we used as product metrics, the ones identified in section4.3.2. Since IDE usage is a sequence of actions (it can be seen as a process,or at least, as a process fragment), we used as process metrics the onesidentified in 4.3.3. Notice that both, product and process metrics, have beencomputed to obtain the ∆ between t1 and t0.
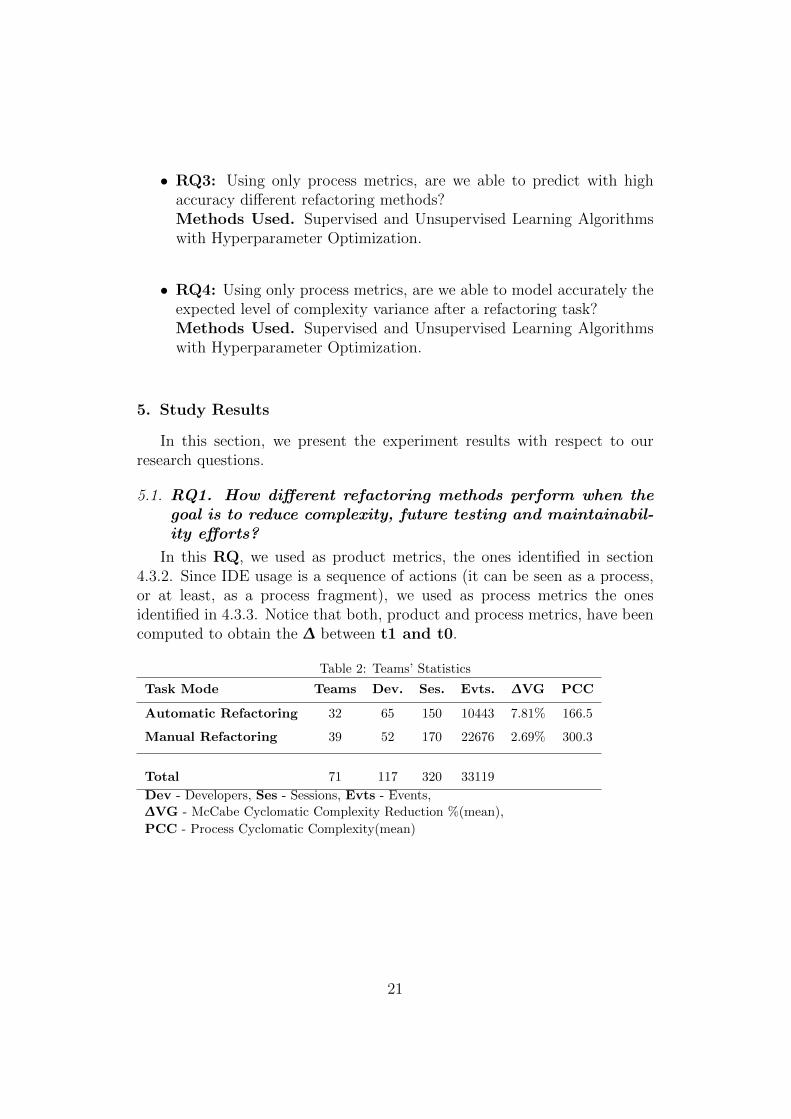
Table 2: Teams’ Statistics
Task Mode Teams Dev. Ses. Evts. ∆VG PCC
Automatic Refactoring 32 65 150 10443 7.81% 166.5
Manual Refactoring 39 52 170 22676 2.69% 300.3
Total 71 117 320 33119
Dev - Developers, Ses - Sessions, Evts - Events,∆VG - McCabe Cyclomatic Complexity Reduction %(mean),
PCC - Process Cyclomatic Complexity(mean)
21

Table 3: Teams’ Refactoring Results
Metric Name Min. 1st Qu. Median Mean 3rd Qu. Max.
Automatic Refactoring
∆VG 2.68% 5.87% 6.95% 7.81% 8.84% 16.77%
PCC 24.0 77.0 168.5 166.5 218.2 407.0
Manual Refactoring
∆VG 0.32% 0.62% 0.94% 2.69% 3.92% 13.98%
PCC 53.0 152.0 275.0 300.3 407.0 738.0
Data Partition
VG LEVEL LOW = [0%, 4%]; MEDIUM = [4.1%, 9%]; HIGH = [>9%]
PCC LEVEL LOW = [0, 285]; HIGH = [>285]
∆VG - McCabe Cyclomatic Complexity Reduction %,PCC - Process Cyclomatic Complexity
We had 32 teams performing automatic refactoring using the JDeodor-ant plugin, and 39 doing manual refactoring supported only by the Eclipsenative features and/or driven by the developers experience and skills. Table2 shows the total number of developers and their activities, here referred asdevelopment sessions. In Table 3 we show measures of central tendency andmeasures of variability regarding the distribution of ∆VG and PCC, togetherwith how both were partitioned.
Figure 3 provides evidence for selecting the optimal number of clustersto partition the data according to LOW or HIGH levels of process cyclo-matic complexity used in Figure 4. The same clustering method was usedto partition the different levels of software cyclomatic complexity as LOW,MEDIUM or HIGH.
22
0
20
40
60
1 2 3 4 5 6 7 8 9 10Number of Clusters
Tot
al W
ith
in S
um
of
Sq
uar
e
Using the Elbow Method
0.0
0.2
0.4
0.6
1 2 3 4 5 6 7 8 9 10Number of Clusters
Sil
hou
ette
Wid
th
Using the Silhouette MethodOptimal number of clusters : 2
0.00
0.25
0.50
0.75
1.00
45 15 65 34 61 12 44 60 20 26 46 23 35 47 57 24 31 9 28 2 19 22 55 56 8 14 25 5 13 7 16 37 18 6 68 39 4 3 11 58 41 17 32 49 21 59 51 27 63 50 64 71 67 40 66 29 1 53 70 38 36 30 62 43 48 52 54 69 10 42 33
cluster 1 2
Average Silhouette Width : 0.61Median Silhouette Width : 0.68
Figure 3: Detecting optimal partitions of PCC
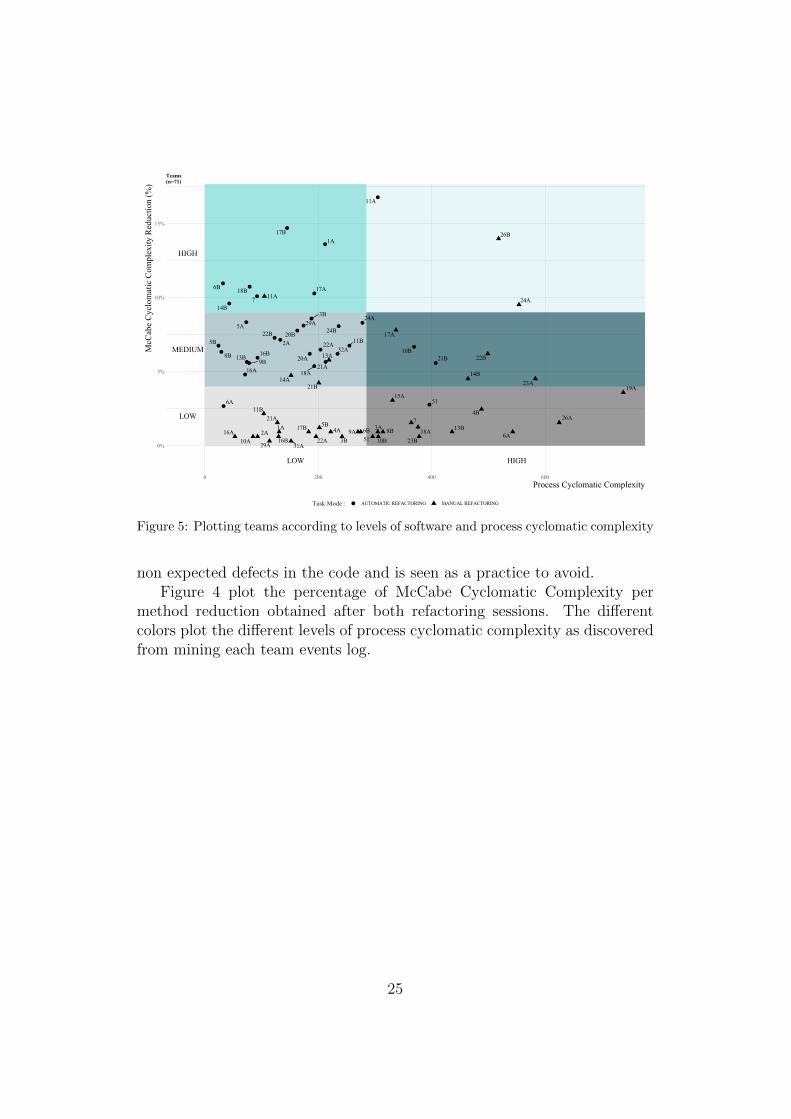
Observation 1: Automatic Refactoring achieves higher levels ofMcCabe Cyclomatic complexity reduction. Consider relevant in Ta-ble 2, how the mean of code cyclomatic complexity reduction (∆VG) forautomatic refactoring is almost three times the reduction when doing man-ual refactoring. It is also relevant to mention, by looking at Figure 4, thatonly four teams had high complexity levels in their work sessions when do-ing refactoring using JDeodorant. Furthermore, from those, one team hadthe major software complexity reduction(16.77%), whilst other had near thelowest value of reduction(2.68%) within the automatic refactoring practice.The observation of such different results raised the doubt about the com-prehension, focus and behaviour of those two teams in the given task. Thisdemanded further investigation on their efficiency, for which, we provide someevidences later using Figures 6 and 7.
Observation 2: Manual refactoring practices have higher process
23

2.68%
5.87%
6.95%
8.84%
16.77%
0.32%0.62%0.94%
3.92%
13.98%
0%
5%
10%
15%
AUTOMATIC REFACTORING MANUAL REFACTORING
McC
abe
Cyc
lom
atic
Com
plex
ity
Red
ucti
on (
%)
Process Cyclomatic Complexity Level : LOW HIGH
Teams(n=71)
Figure 4: Refactoring Practices Comparison
cyclomatic complexity. We observe that teams doing manual refactor-ing almost double the mean of process cyclomatic complexity (PCC), whencompared with the ones using the automatic features of JDeodorant. Beingdeprived of the code smell detection plugin, these teams had to do moremanual work to potentially achieve the same results as the ones doing auto-matic refactoring. This suggest that the refactoring plugin was working asexpected, thus reducing software complexity with less effort simply becauseseveral code snippets may have been introduced automatically.
On the contrary, teams doing the task manually needed to do more code,and therefore, more actions within the IDE to detect and correct the codesmells. As shown earlier in section 1, manual refactoring tasks can introduce
24
51
5A
1A
22A
18A
5B
6A
20A
20B
11A
21A
2A
17A
3B
22B
6B
32A8B
16A
17B
11B
29A
7
18B
14B
16B
24A
13B 21B10B
9B
24B
51
1A
31A
26A
22A
18A5B
6A4A 3A
19A
11A
21A
2A
14A
17A
3B
22B
6B
15A
23A
8B16A17B
10A
13A
9A
11B
29A
74B
14B
16B
24A
13B
21B
10B 23B
26B
LOW HIGH
LOW
MEDIUM
HIGH
0%
5%
10%
15%
0 200 400 600
Process Cyclomatic Complexity
McC
abe
Cyc
lom
atic
Com
plex
ity
Red
ucti
on (
%)
Task Mode : AUTOMATIC REFACTORING MANUAL REFACTORING
Teams(n=71)
Figure 5: Plotting teams according to levels of software and process cyclomatic complexity
non expected defects in the code and is seen as a practice to avoid.Figure 4 plot the percentage of McCabe Cyclomatic Complexity per
method reduction obtained after both refactoring sessions. The differentcolors plot the different levels of process cyclomatic complexity as discoveredfrom mining each team events log.
25

23instant
13instant
1instant
1instant
210.5 mins
11instant
3instant
42instant
44115.3 secs
2instant
1instant
1instant
2115.3 secs
1123.5 secs
123.5 secs
2instant
46instant
2instant
2instant
11instant
14instant
1instant
75instant
1instant
1instant
17instant
2instant
1instant
3instant
2instant
41instant
2
1
1
1
1
1
1
1 1
/jasml_0.10/src/com/jasml/helper/IntegerArray.java40 (37.6 mins)
/jasml_0.10/src/com/jasml/helper/IntegerArrayProduct.java27 (3 mins)
/jasml_0.10/src/com/jasml/decompiler/JavaClassParser.java
56 (9.8 mins)
/jasml_0.10/src/com/jasml/decompiler/SourceCodeBuilder.java
15 (25.6 secs)
/jasml_0.10/src/com/jasml/classes/JavaClass.java6 (3 secs)
/jasml_0.10/src/com/jasml/compiler/ConstantPoolGenerator.java
75 (16.4 mins)
/jasml_0.10/src/com/jasml/compiler/JavaClassDumpper.java
53 (3.5 mins)55 (3.3 mins)
/jasml_0.10/src/com/jasml/compiler/SourceCodeParser.java
83 (46.1 mins)
/jasml_0.10/src/jasml.java
23 (4 mins)
0 20 40 60 80 100
0.6
Activitiy Frequency
0 20 40 60 80 100
0.6
Transition Frequency
Figure 6: Team 11A : High PCC and High VG reduction (20% activities/files, 80% paths)
19
2
1
6
6
1
1
2
11
1
7
1
1
4
1
8
2
2
2
1
1
2
1
2
1
1
1
18
1
8
1
1
4
1
1
1
2
2
1
1
54
3
80
8
1
1
2
1 1
1
1
22
2
1
1
1
1
2
6
1
3
1
2
10
1
4
2
22
28
1
4
1
8
42
2
2
1
16
1
1
2
1
15
1
2
6
1
3
2
4
19
1
1
1
3 1
1
1
1
1
1
1
12
1
1
1
1
1
1
1
/jasml_0.10/src/com/jasml/compiler/ConstantPoolGenerator.java
30
/jasml_0.10/src/com/jasml/helper/IntegerArray.java11
/jasml_0.10/src/com/jasml/helper/IntegerArrayProduct.java10
/jasml_0.10/src/com/jasml/decompiler/JavaClassParser.java
105
/jasml_0.10/src/com/jasml/compiler/ConstantPoolGeneratorProduct.java
28
/jasml_0.10/src/com/jasml/decompiler/JavaClassParserProduct.java
4
/jasml_0.10/src/com/jasml/decompiler/JavaClassParserProduct2.java
5
/jasml_0.10/src/com/jasml/decompiler/I.java4
/jasml_0.10/src/com/jasml/decompiler/AttributeSourcefile.java
4
/jasml_0.10/src/com/jasml/decompiler/AttributeConstantvalue.java
4
/jasml_0.10/src/com/jasml/decompiler/AttributeCode.java31
/jasml_0.10/src/com/jasml/decompiler/AttributeExceptions.java
11
/jasml_0.10/src/com/jasml/decompiler/AttributeInnerclasses.java
10
/jasml_0.10/src/com/jasml/decompiler/AttributeSynthetic.java
3
/jasml_0.10/src/com/jasml/decompiler/AttributeLinenumbertable.java
13
/jasml_0.10/src/com/jasml/decompiler/AttributeLocalvariabletable.java
4
/jasml_0.10/src/com/jasml/decompiler/AttributeDeprecated.java
3
/jasml_0.10/src/com/jasml/classes/Method.java10
/jasml_0.10/src/com/jasml/decompiler/SourceCodeBuilder.java
62
/jasml_0.10/src/com/jasml/classes/JavaClass.java8
/jasml_0.10/src/com/jasml/compiler/JavaClassDumpper.java
18
/jasml_0.10/src/com/jasml/classes/Attribute_LineNumberTable.java
8
/jasml_0.10/src/com/jasml/decompiler/SourceCodeBuilderConfiguration.java
21
/jasml_0.10/src/com/jasml/compiler/SourceCodeParser.java
74
/jasml_0.10/src/jasml.java15
/jasml_0.10/src/com/jasml/compiler/Scanner.java23
/jasml_0.10/src/com/jasml/helper/OpcodeLoader.java27
/jasml_0.10/src/com/jasml/helper/Util.java9
/Teste/src/com/jasml/helper/IntegerArray.java4
/Teste/src/com/jasml/helper/OpcodeHelper.java6
/jasml_0.10.zip_expanded/src/com/jasml/classes/Attribute_Code.java
9
/jasml_0.10.zip_expanded/src/com/jasml/compiler/SourceCodeParser.java
29
/jasml_0.10.zip_expanded/src/com/jasml/decompiler/JavaClassParser.java
16
2
/jasml_0.10.zip_expanded/src/com/jasml/decompiler/SourceCodeBuilder.java
2
Figure 7: Team 51 : High PCC but Low VG reduction (20% activities/files, 80% paths)
Observation 3: Even using JDeodorant, similar work effortsdoes not mean the same level of gains in software complexity re-duction. If it is apparent that, when using JDeodorant, the processes tend
26
to have lower levels of complexity and obtained globally more gains in prod-uct complexity reductions, the same cannot be said for teams doing manualrefactoring. These teams have a more heterogeneous process behavior sincethey were free to apply refactoring functionalities without any guidelinesin detection and correction from a dedicated plugin. Figure 5 identifies allteams and distributes them according to their levels of software and processcomplexity.
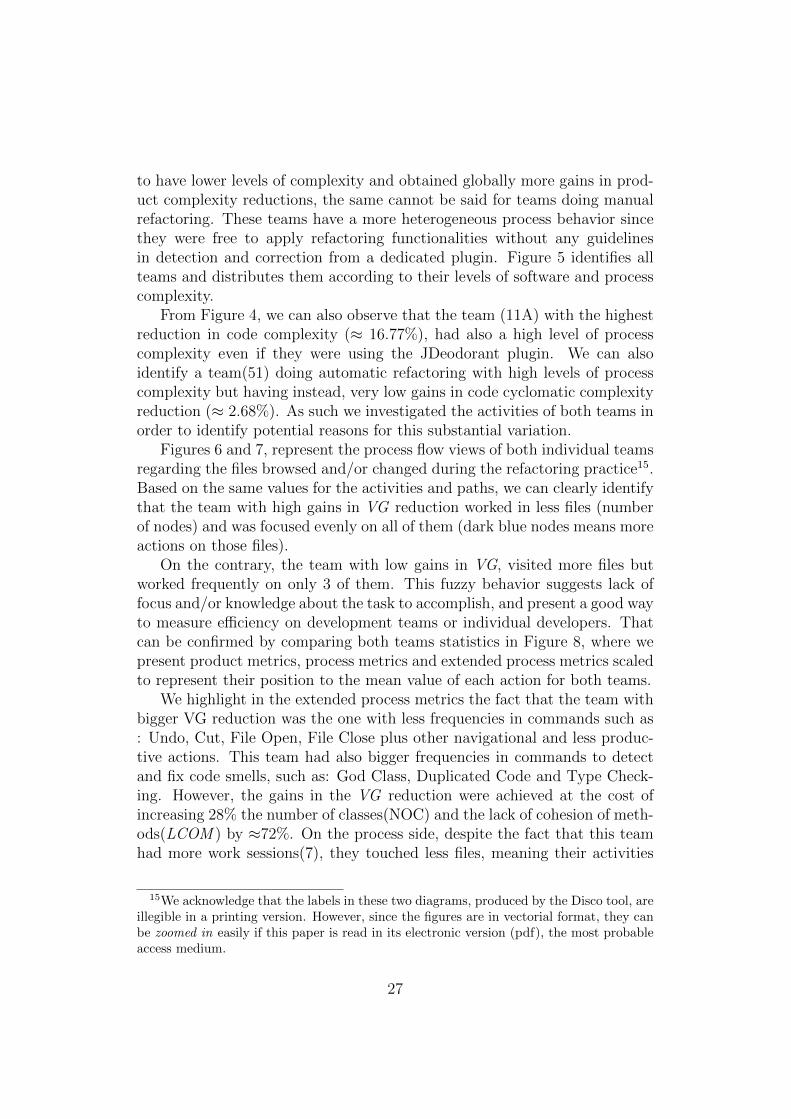
From Figure 4, we can also observe that the team (11A) with the highestreduction in code complexity (≈ 16.77%), had also a high level of processcomplexity even if they were using the JDeodorant plugin. We can alsoidentify a team(51) doing automatic refactoring with high levels of processcomplexity but having instead, very low gains in code cyclomatic complexityreduction (≈ 2.68%). As such we investigated the activities of both teams inorder to identify potential reasons for this substantial variation.
Figures 6 and 7, represent the process flow views of both individual teamsregarding the files browsed and/or changed during the refactoring practice15.Based on the same values for the activities and paths, we can clearly identifythat the team with high gains in VG reduction worked in less files (numberof nodes) and was focused evenly on all of them (dark blue nodes means moreactions on those files).
On the contrary, the team with low gains in VG, visited more files butworked frequently on only 3 of them. This fuzzy behavior suggests lack offocus and/or knowledge about the task to accomplish, and present a good wayto measure efficiency on development teams or individual developers. Thatcan be confirmed by comparing both teams statistics in Figure 8, where wepresent product metrics, process metrics and extended process metrics scaledto represent their position to the mean value of each action for both teams.
We highlight in the extended process metrics the fact that the team withbigger VG reduction was the one with less frequencies in commands such as: Undo, Cut, File Open, File Close plus other navigational and less produc-tive actions. This team had also bigger frequencies in commands to detectand fix code smells, such as: God Class, Duplicated Code and Type Check-ing. However, the gains in the VG reduction were achieved at the cost ofincreasing 28% the number of classes(NOC) and the lack of cohesion of meth-ods(LCOM ) by ≈72%. On the process side, despite the fact that this teamhad more work sessions(7), they touched less files, meaning their activities
15We acknowledge that the labels in these two diagrams, produced by the Disco tool, areillegible in a printing version. However, since the figures are in vectorial format, they canbe zoomed in easily if this paper is read in its electronic version (pdf), the most probableaccess medium.
27

-2.77%-16.77%
-0.43% 22.96%
-1.53%-8.00%
-0.00% 100.00%
-0.00% 130.00%
-0.00% 5.64%
-0.00% 45.45%
-0.00%-9.98%
-1.27% 2.07%
-3.20%-18.03%
-3.75% 7.50%
-3.75%-21.67%
20.00% 72.50%
-2.72%-20.06%
-3.85%-21.88%
-0.52% 2.50%
-0.10%-17.25%
-3.67%-21.56%
4.00% 28.00%
0.82% 6.04%
-3.03%-19.15%
VG
PAR
NBD
CA
CE
RMI
RMA
RMD
DIT
WMC
NSC
NORM
LCOM
NOF
NSF
NOM
NSM
SIX
NOC
TLOC
MLOC
0 50 100
Variation
Pro
duct
Met
rics
2 3
3 7
623563
3528
11
11
386300
7458
1007762
193153
14051069
396305
DEV
SES
EVTS
UF
PCCPF
EC
NOA
NSS
NCS
NOT
PCC
0 500 1000
Pro
cess
Met
rics
-0.50
-0.25
0.00
0.25
0.50
Eclips
e Edit
or-F
ile E
diting
Eclips
e View
-Lon
g Meth
od
Edit-U
ndo
Eclips
e View
-Pac
kage
Exp
lorer
Eclips
e Edit
or-F
ile C
lose
Eclips
e Edit
or-F
ile O
pen
Eclips
e View
-God
Clas
s
File-S
ave
Eclips
e View
-Fea
ture E
nvy
Edit-C
opy
Uncate
goriz
ed-Ja
va E
ditor
Rule
r Sing
le-Clic
k
Eclips
e View
-Dup
licate
d Cod
e
Eclips
e View
-Typ
e Che
cking
Execu
ting T
asks
-Man
ual E
vent
Eclips
e View
-Git
Staging
Eclips
e View
-Cod
e Smell
Visu
aliza
tion
Edit-P
aste
Eclips
e View
-Metr
ics V
iew
Eclips
e View
-Outl
ine
Eclips
e View
-Cod
e Smell
Pac
kage
Exp
lorer
Edit-D
elete
Views-S
how V
iew
File-E
xpor
t
Uncate
goriz
ed-E
clips
e Mark
etplac
e
Refacto
ring-
Delete
Resou
rces
Proce
ss M
ining
Plug
in-Abo
ut
Eclips
e View
-Metr
ics -
src
Edit-C
ut
File-Im
port
Naviga
te-Ope
n Dec
larati
on
TEAM High VG Reduction, High PCC Low VG Reduction, High PCC
Figure 8: Teams(11A vs. 51) with distinct VG variance positioning but similar PCC levels
were less complex, and that is confirmed by the UF, NOA and PCC metrics.
5.2. RQ2. Is there any association between software complex-ity and the underlying development activities in refactoringpractices?
With the evidences shown in RQ1 for the two distinct refactoring meth-ods, one may question if the product complexity reduction gains are mono-tonically correlated with the development activities which originated them.
28
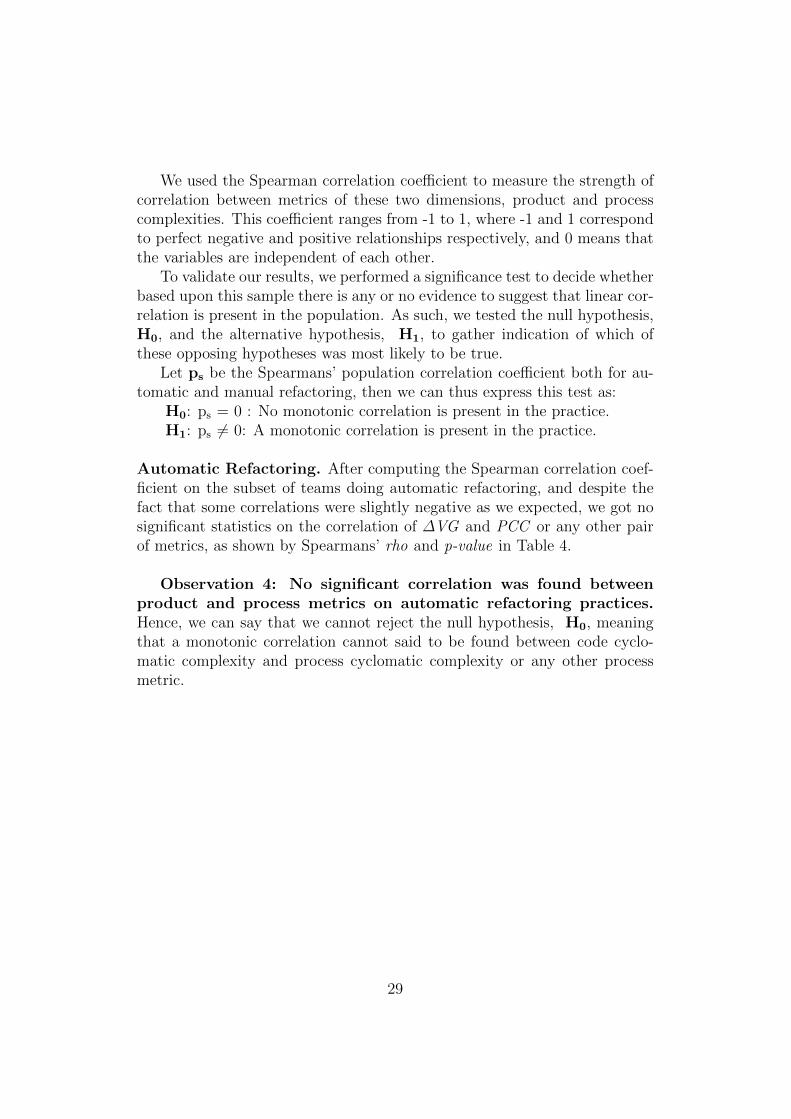
We used the Spearman correlation coefficient to measure the strength ofcorrelation between metrics of these two dimensions, product and processcomplexities. This coefficient ranges from -1 to 1, where -1 and 1 correspondto perfect negative and positive relationships respectively, and 0 means thatthe variables are independent of each other.
To validate our results, we performed a significance test to decide whetherbased upon this sample there is any or no evidence to suggest that linear cor-relation is present in the population. As such, we tested the null hypothesis,H0, and the alternative hypothesis, H1, to gather indication of which ofthese opposing hypotheses was most likely to be true.
Let ps be the Spearmans’ population correlation coefficient both for au-tomatic and manual refactoring, then we can thus express this test as:
H0: ps = 0 : No monotonic correlation is present in the practice.H1: ps 6= 0: A monotonic correlation is present in the practice.
Automatic Refactoring. After computing the Spearman correlation coef-ficient on the subset of teams doing automatic refactoring, and despite thefact that some correlations were slightly negative as we expected, we got nosignificant statistics on the correlation of ∆VG and PCC or any other pairof metrics, as shown by Spearmans’ rho and p-value in Table 4.
Observation 4: No significant correlation was found betweenproduct and process metrics on automatic refactoring practices.Hence, we can say that we cannot reject the null hypothesis, H0, meaningthat a monotonic correlation cannot said to be found between code cyclo-matic complexity and process cyclomatic complexity or any other processmetric.
29
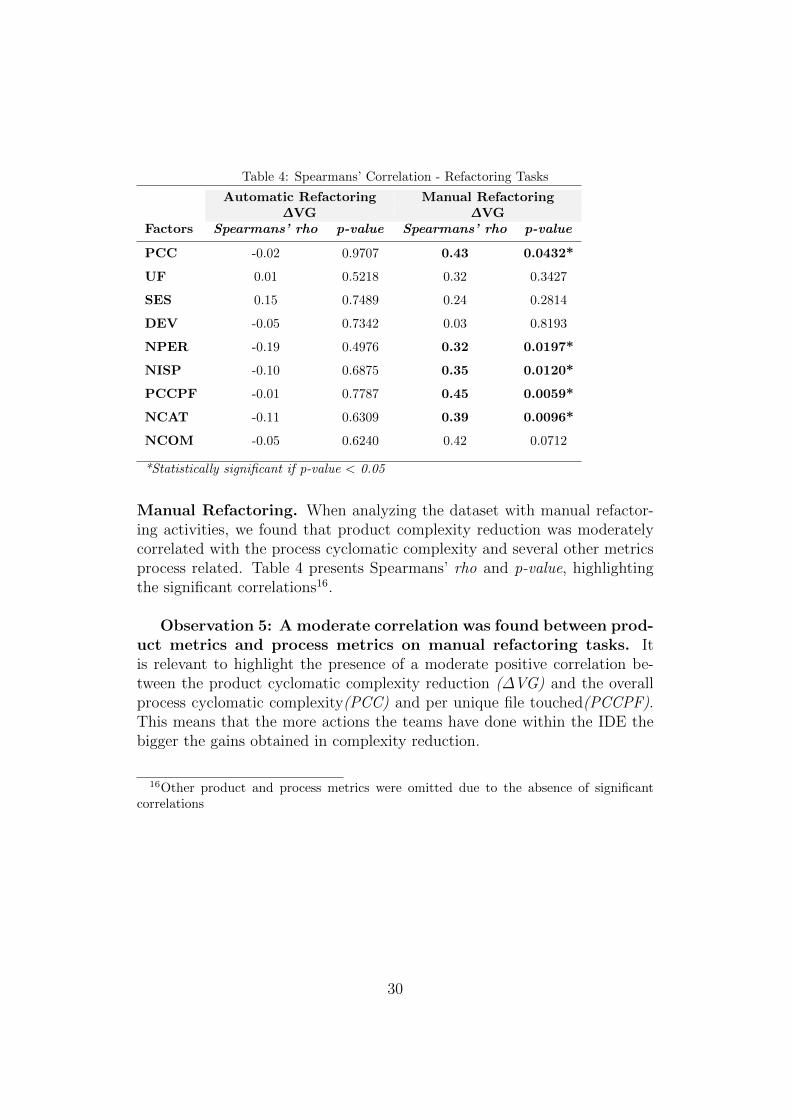
Table 4: Spearmans’ Correlation - Refactoring Tasks
Automatic Refactoring Manual Refactoring∆VG ∆VG
Factors Spearmans’ rho p-value Spearmans’ rho p-value
PCC -0.02 0.9707 0.43 0.0432*
UF 0.01 0.5218 0.32 0.3427
SES 0.15 0.7489 0.24 0.2814
DEV -0.05 0.7342 0.03 0.8193
NPER -0.19 0.4976 0.32 0.0197*
NISP -0.10 0.6875 0.35 0.0120*
PCCPF -0.01 0.7787 0.45 0.0059*
NCAT -0.11 0.6309 0.39 0.0096*
NCOM -0.05 0.6240 0.42 0.0712
*Statistically significant if p-value < 0.05
Manual Refactoring. When analyzing the dataset with manual refactor-ing activities, we found that product complexity reduction was moderatelycorrelated with the process cyclomatic complexity and several other metricsprocess related. Table 4 presents Spearmans’ rho and p-value, highlightingthe significant correlations16.
Observation 5: A moderate correlation was found between prod-uct metrics and process metrics on manual refactoring tasks. Itis relevant to highlight the presence of a moderate positive correlation be-tween the product cyclomatic complexity reduction (∆VG) and the overallprocess cyclomatic complexity(PCC) and per unique file touched(PCCPF).This means that the more actions the teams have done within the IDE thebigger the gains obtained in complexity reduction.
16Other product and process metrics were omitted due to the absence of significantcorrelations
30
0.32 0.3 0.19 0.38 0.34
0.45 0.35 0.43 0.39
0.4 0.43 0.42
0.28 0.32 0.38
0.63 0.64 0.52 0.46 0.54
0.42 0.41 0.37
0.91 0.56 0.68
0.53 0.58
0.77
NPER
VG
PCCPF
DEV
SES
NISP
PCC
NFILES
NCAT
VG
PCCPFDEV
SESNIS
PPCC
NFILES
NCAT
NCOM
-1.0
-0.5
0.0
0.5
1.0 rho
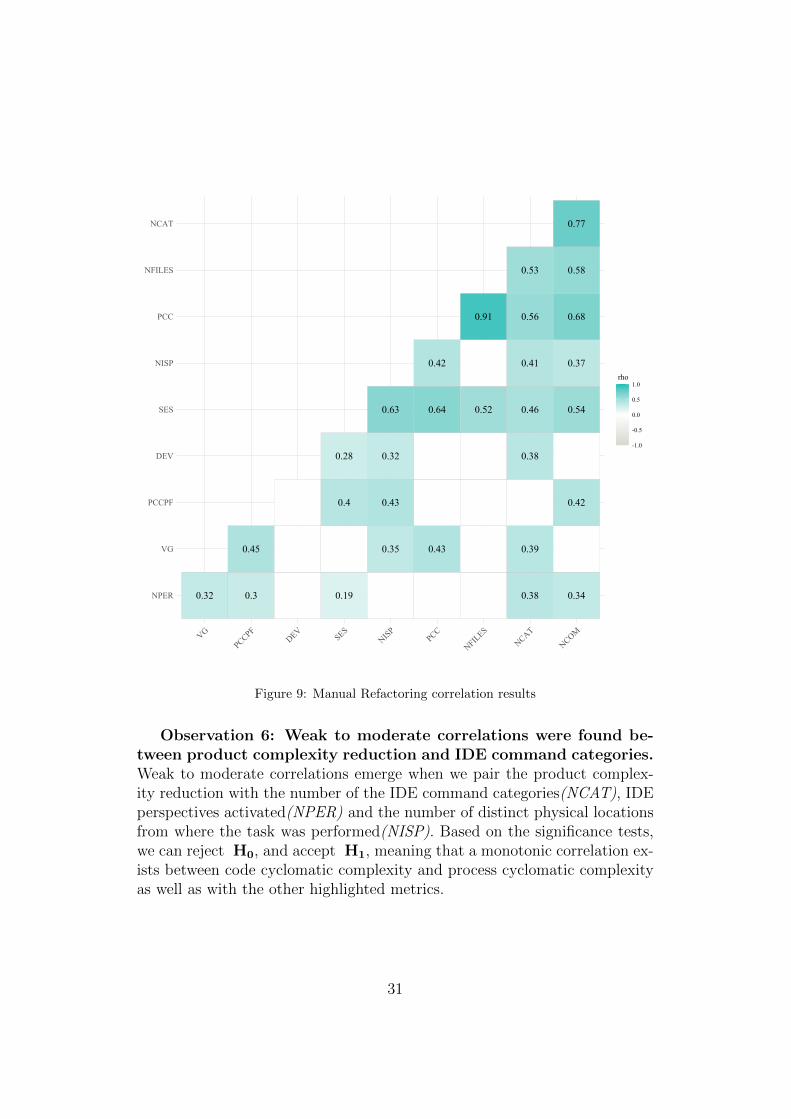
Figure 9: Manual Refactoring correlation results
Observation 6: Weak to moderate correlations were found be-tween product complexity reduction and IDE command categories.Weak to moderate correlations emerge when we pair the product complex-ity reduction with the number of the IDE command categories(NCAT), IDEperspectives activated(NPER) and the number of distinct physical locationsfrom where the task was performed(NISP). Based on the significance tests,we can reject H0, and accept H1, meaning that a monotonic correlation ex-ists between code cyclomatic complexity and process cyclomatic complexityas well as with the other highlighted metrics.
31
Observation 7: No significant correlations were found betweenany process metrics and product metrics, except for ∆VG. All prod-uct and process metrics collected are shown in Tables A.7 and A.8.
Figure 9 plot only the significant correlations17 among all those we stud-ied. As expected, process metrics show strong correlations between them-selves, however, we find this result obvious and not relevant withing thecontext of this study.
5.3. RQ3. Using only process metrics, are we able to predict withhigh accuracy different refactoring methods?.
Process metrics have been confirmed as suitable predictors for many soft-ware development prediction models. They were found not only suitable,they performed significantly better than code metrics across all learning tech-niques in several studies [78, 28].
Our goal was to use the process metrics described in Table A.8, to predictif a refactoring task executed by a group of teams had been done automat-ically, using the JDeodorant features, or manually, using only the Eclipsenative functionalities or driven by developers skills. Each subject in ourdataset has the class to predict labelled as AR and MR for automatic andmanual refactoring, respectively. In this case, we did not use metrics fromTable A.9 because that would introduce bias in our models since the processextended metrics can easily be used to understand if developers used or notIDE built in features or their own skills during a refactoring practice.
Table 5 present the results for the 5 best models we got out of the ≈30,000we evaluated on our research. In this context, the machine learning modelsused were built by assembling and testing supervised or unsupervised al-gorithms adjusted with feature selection and hyperparameter optimization.From the models built, the ones with higher ROC were chosen. A brief ex-planation of each algorithm can be found in Appendix A.3, as well as thecode obtained from training Model 1.
Observation 8: Random Forest confirms its accuracy. RandomForest models were found to be the ones with higher accuracy in predictingrefactoring opportunities in previous studies [16]. We observe the same be-haviour. Random Forest shows twice in the top 5 of our best models, with aROC value of 0.983 and 0.939 for Model 1 and 2, respectively. In both cases,the models were computed by a meta learner which builds an ensemble ofrandomizable base classifiers, the Random Committee.
17Blank squares means non significant values
32
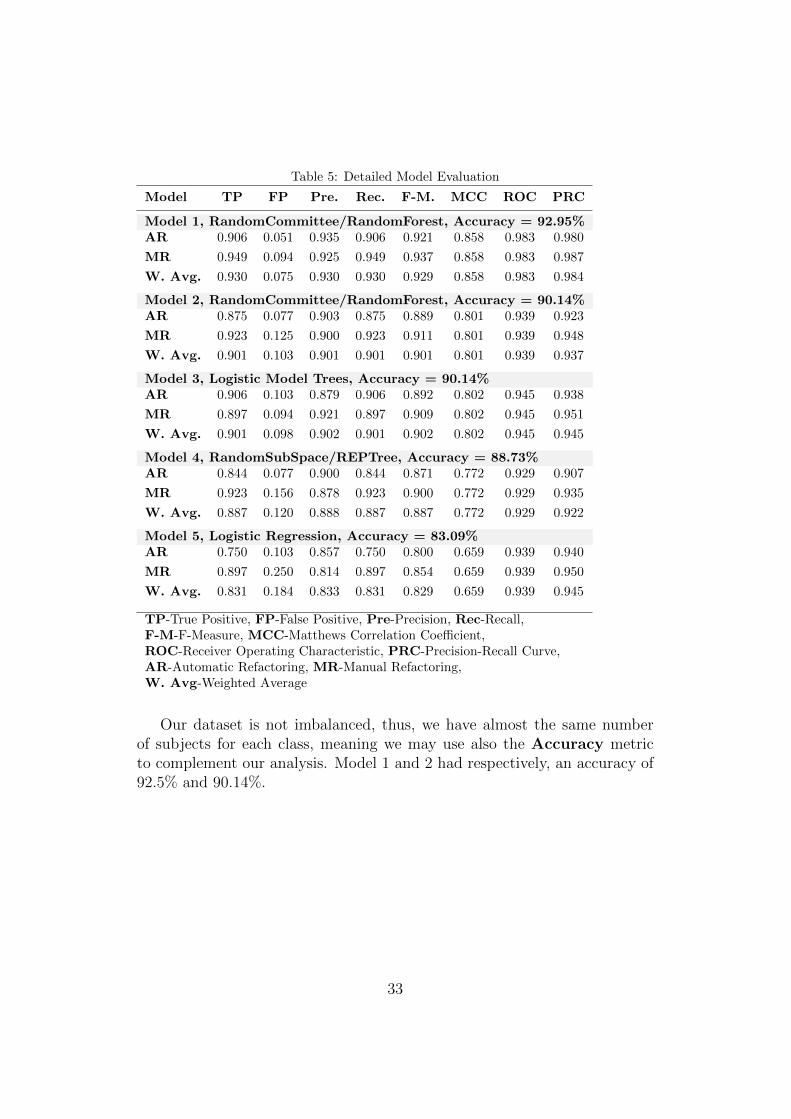
Table 5: Detailed Model Evaluation
Model TP FP Pre. Rec. F-M. MCC ROC PRC
Model 1, RandomCommittee/RandomForest, Accuracy = 92.95%AR 0.906 0.051 0.935 0.906 0.921 0.858 0.983 0.980
MR 0.949 0.094 0.925 0.949 0.937 0.858 0.983 0.987
W. Avg. 0.930 0.075 0.930 0.930 0.929 0.858 0.983 0.984
Model 2, RandomCommittee/RandomForest, Accuracy = 90.14%AR 0.875 0.077 0.903 0.875 0.889 0.801 0.939 0.923
MR 0.923 0.125 0.900 0.923 0.911 0.801 0.939 0.948
W. Avg. 0.901 0.103 0.901 0.901 0.901 0.801 0.939 0.937
Model 3, Logistic Model Trees, Accuracy = 90.14%AR 0.906 0.103 0.879 0.906 0.892 0.802 0.945 0.938
MR 0.897 0.094 0.921 0.897 0.909 0.802 0.945 0.951
W. Avg. 0.901 0.098 0.902 0.901 0.902 0.802 0.945 0.945
Model 4, RandomSubSpace/REPTree, Accuracy = 88.73%AR 0.844 0.077 0.900 0.844 0.871 0.772 0.929 0.907
MR 0.923 0.156 0.878 0.923 0.900 0.772 0.929 0.935
W. Avg. 0.887 0.120 0.888 0.887 0.887 0.772 0.929 0.922
Model 5, Logistic Regression, Accuracy = 83.09%AR 0.750 0.103 0.857 0.750 0.800 0.659 0.939 0.940
MR 0.897 0.250 0.814 0.897 0.854 0.659 0.939 0.950
W. Avg. 0.831 0.184 0.833 0.831 0.829 0.659 0.939 0.945
TP-True Positive, FP-False Positive, Pre-Precision, Rec-Recall,F-M-F-Measure, MCC-Matthews Correlation Coefficient,ROC-Receiver Operating Characteristic, PRC-Precision-Recall Curve,AR-Automatic Refactoring, MR-Manual Refactoring,W. Avg-Weighted Average
Our dataset is not imbalanced, thus, we have almost the same numberof subjects for each class, meaning we may use also the Accuracy metricto complement our analysis. Model 1 and 2 had respectively, an accuracy of92.5% and 90.14%.
33
100.00%
96.75%
92.22%
91.13%
84.25%
77.63%
76.92%
76.90%
70.67%
69.97%
62.11%
56.45%
55.01%
48.73%
44.47%
17.22%
7.31%
0.00%NPER
NOS
NISP
NPLA
NCAT
PCCPF
NVER
SES
NSS
NFILES
PCC
NOT
NCS
NCOM
EVTS
EC
DEV
NOA
0 25 50 75 100
Importance
Features
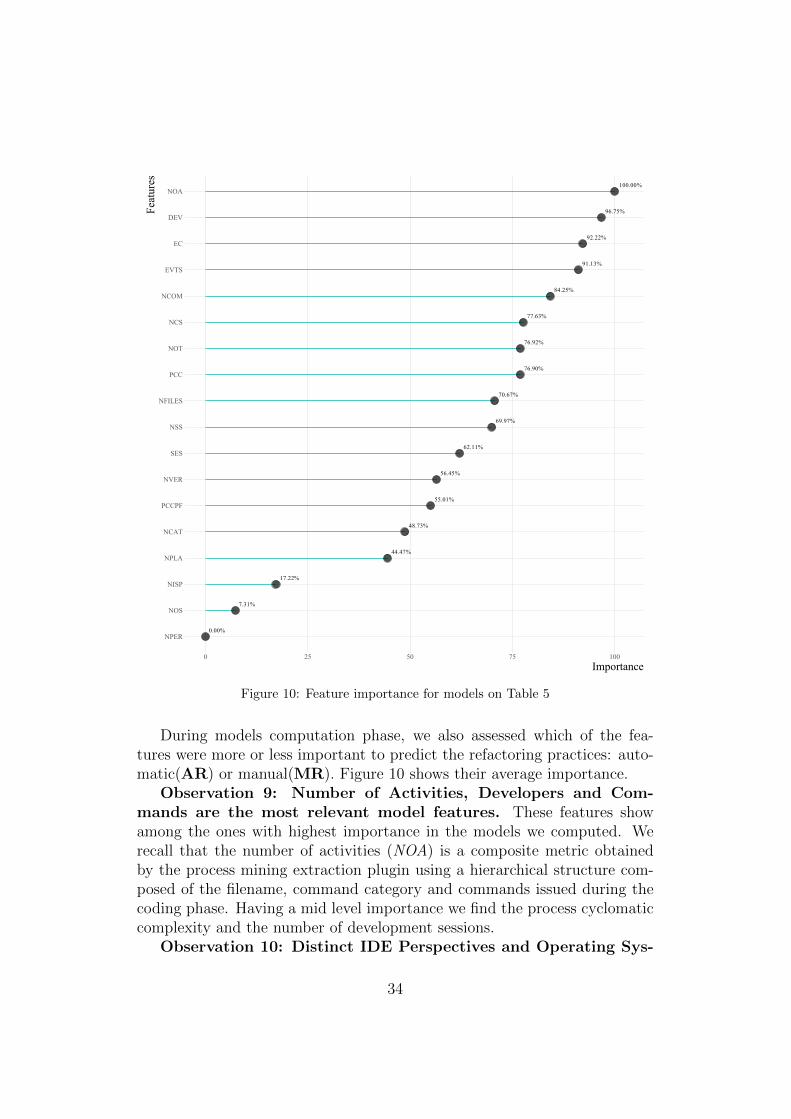
Figure 10: Feature importance for models on Table 5
During models computation phase, we also assessed which of the fea-tures were more or less important to predict the refactoring practices: auto-matic(AR) or manual(MR). Figure 10 shows their average importance.
Observation 9: Number of Activities, Developers and Com-mands are the most relevant model features. These features showamong the ones with highest importance in the models we computed. Werecall that the number of activities (NOA) is a composite metric obtainedby the process mining extraction plugin using a hierarchical structure com-posed of the filename, command category and commands issued during thecoding phase. Having a mid level importance we find the process cyclomaticcomplexity and the number of development sessions.
Observation 10: Distinct IDE Perspectives and Operating Sys-
34
tems have almost irrelevant importance. In our models, the differenttypes operating system used by the developers, the different number of IDEperspectives and number of development locations (NISP) are irrelevant pre-dictors in modeling the type of refactoring performed. We argue that, partic-ularly the number of different locations from where the developers performedtheir work require additional research in order to get any generalized conclu-sions about this insight.
5.4. RQ4: Using only process metrics, are we able to model accu-rately the expected level of complexity variance after a refac-toring task?
To answer this RQ, we used not only the metrics from Table A.8, butalso the ones from Table A.9. During our analysis, it was clear that processextended metrics, representing the commands issued by each developer/team,added significant predictive power to the models computed. Therefore, topredict the expected software cyclomatic complexity we needed to includeindividual commands frequencies in addition to the process metrics used inprevious RQ. By doing this we were able to achieve models with higheraccuracy and good ROC values. However, in general, these models havelower accuracy than the ones in RQ3.
Table 6 shows the top five models computed to predict the complexitylevel gains obtained after a refactoring session, either using a dedicated pluginor simply by using Eclipse features.
Observation 11: Locally Weighted Learning combined with aDecision Table outperforms Random Forrest. Contrary to the pre-vious RQ, in this case the best model is not based on a Random Forrestalgorithm. However, the latter show as the second best model in terms of ac-curacy. The Locally Weighted Learning method uses an instance-based algo-rithm to assign instance weights which are then used by a specified weightedinstances handler. It uses a stack of methods, initially a cluster like mech-anism such as the LinearNNSearch and then a Decision Table to classifythe outcome. This shows up at no surprise since Decision Tables use thesimplest hypothesis spaces possible and usually outperform state-of-the-artclassification algorithms.
35
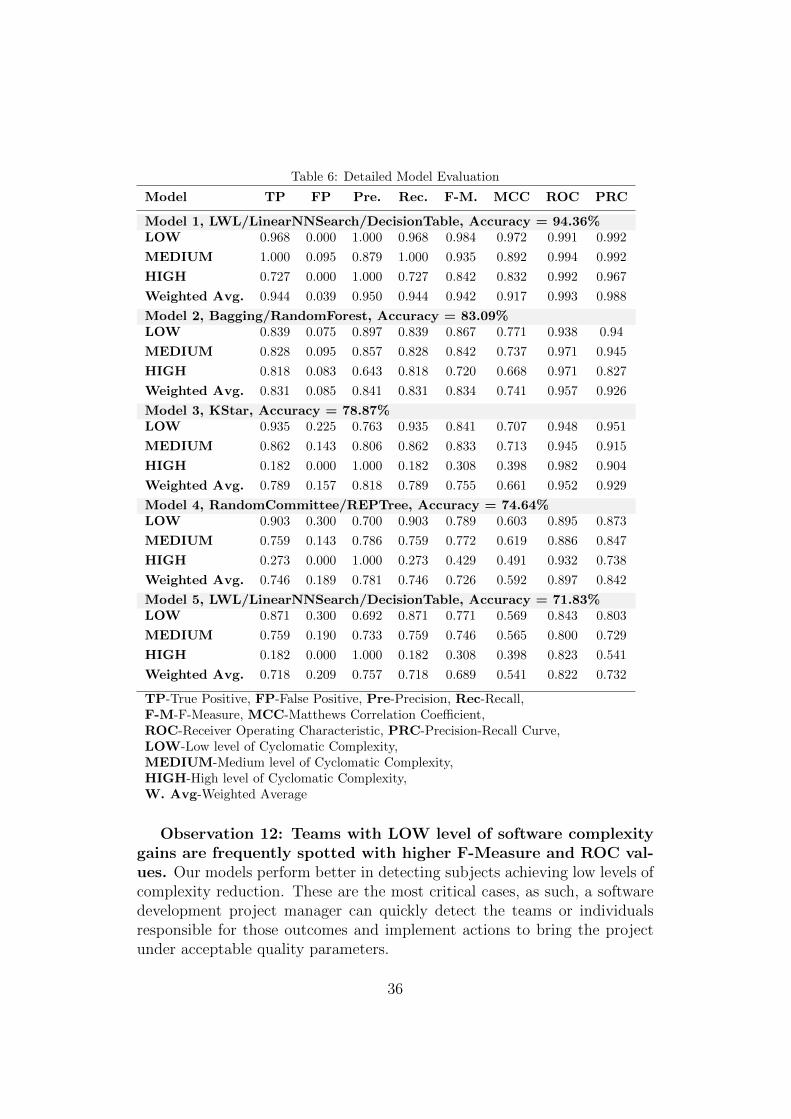
Table 6: Detailed Model Evaluation
Model TP FP Pre. Rec. F-M. MCC ROC PRC
Model 1, LWL/LinearNNSearch/DecisionTable, Accuracy = 94.36%LOW 0.968 0.000 1.000 0.968 0.984 0.972 0.991 0.992
MEDIUM 1.000 0.095 0.879 1.000 0.935 0.892 0.994 0.992
HIGH 0.727 0.000 1.000 0.727 0.842 0.832 0.992 0.967
Weighted Avg. 0.944 0.039 0.950 0.944 0.942 0.917 0.993 0.988
Model 2, Bagging/RandomForest, Accuracy = 83.09%LOW 0.839 0.075 0.897 0.839 0.867 0.771 0.938 0.94
MEDIUM 0.828 0.095 0.857 0.828 0.842 0.737 0.971 0.945
HIGH 0.818 0.083 0.643 0.818 0.720 0.668 0.971 0.827
Weighted Avg. 0.831 0.085 0.841 0.831 0.834 0.741 0.957 0.926
Model 3, KStar, Accuracy = 78.87%LOW 0.935 0.225 0.763 0.935 0.841 0.707 0.948 0.951
MEDIUM 0.862 0.143 0.806 0.862 0.833 0.713 0.945 0.915
HIGH 0.182 0.000 1.000 0.182 0.308 0.398 0.982 0.904
Weighted Avg. 0.789 0.157 0.818 0.789 0.755 0.661 0.952 0.929
Model 4, RandomCommittee/REPTree, Accuracy = 74.64%LOW 0.903 0.300 0.700 0.903 0.789 0.603 0.895 0.873
MEDIUM 0.759 0.143 0.786 0.759 0.772 0.619 0.886 0.847
HIGH 0.273 0.000 1.000 0.273 0.429 0.491 0.932 0.738
Weighted Avg. 0.746 0.189 0.781 0.746 0.726 0.592 0.897 0.842
Model 5, LWL/LinearNNSearch/DecisionTable, Accuracy = 71.83%LOW 0.871 0.300 0.692 0.871 0.771 0.569 0.843 0.803
MEDIUM 0.759 0.190 0.733 0.759 0.746 0.565 0.800 0.729
HIGH 0.182 0.000 1.000 0.182 0.308 0.398 0.823 0.541
Weighted Avg. 0.718 0.209 0.757 0.718 0.689 0.541 0.822 0.732
TP-True Positive, FP-False Positive, Pre-Precision, Rec-Recall,F-M-F-Measure, MCC-Matthews Correlation Coefficient,ROC-Receiver Operating Characteristic, PRC-Precision-Recall Curve,LOW-Low level of Cyclomatic Complexity,MEDIUM-Medium level of Cyclomatic Complexity,HIGH-High level of Cyclomatic Complexity,W. Avg-Weighted Average
Observation 12: Teams with LOW level of software complexitygains are frequently spotted with higher F-Measure and ROC val-ues. Our models perform better in detecting subjects achieving low levels ofcomplexity reduction. These are the most critical cases, as such, a softwaredevelopment project manager can quickly detect the teams or individualsresponsible for those outcomes and implement actions to bring the projectunder acceptable quality parameters.
36
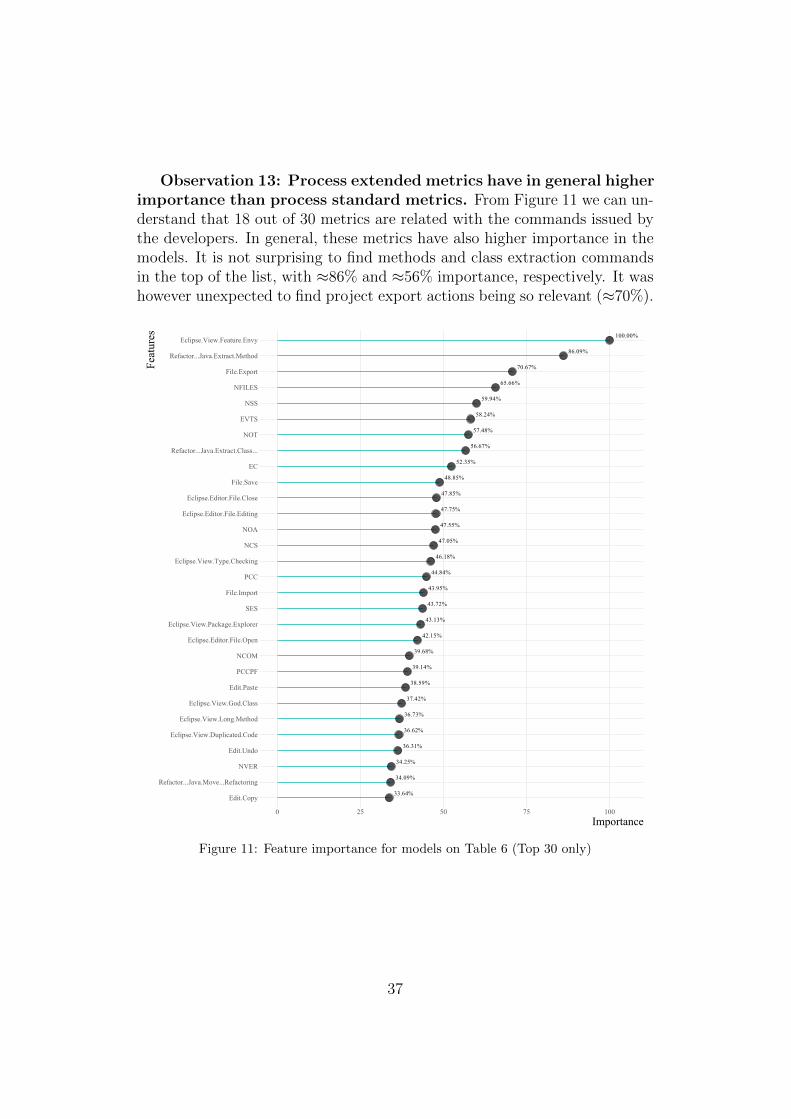
Observation 13: Process extended metrics have in general higherimportance than process standard metrics. From Figure 11 we can un-derstand that 18 out of 30 metrics are related with the commands issued bythe developers. In general, these metrics have also higher importance in themodels. It is not surprising to find methods and class extraction commandsin the top of the list, with ≈86% and ≈56% importance, respectively. It washowever unexpected to find project export actions being so relevant (≈70%).
100.00%
86.09%
70.67%
65.66%
59.94%
58.24%
57.48%
56.67%
52.35%
48.85%
47.85%
47.75%
47.55%
47.05%
46.18%
44.84%
43.95%
43.72%
43.13%
42.15%
39.68%
39.14%
38.59%
37.42%
36.73%
36.62%
36.31%
34.25%
34.09%
33.64%Edit.Copy
Refactor...Java.Move...Refactoring
NVER
Edit.Undo
Eclipse.View.Duplicated.Code
Eclipse.View.Long.Method
Eclipse.View.God.Class
Edit.Paste
PCCPF
NCOM
Eclipse.Editor.File.Open
Eclipse.View.Package.Explorer
SES
File.Import
PCC
Eclipse.View.Type.Checking
NCS
NOA
Eclipse.Editor.File.Editing
Eclipse.Editor.File.Close
File.Save
EC
Refactor...Java.Extract.Class...
NOT
EVTS
NSS
NFILES
File.Export
Refactor...Java.Extract.Method
Eclipse.View.Feature.Envy
0 25 50 75 100
Importance
Features
Figure 11: Feature importance for models on Table 6 (Top 30 only)
37

6. Threats to Validity
The following types of validity issues were considered when interpretingthe results from this article.
6.1. Construct Validity
We acknowledge that this work was supported by an academic environ-ment and using subjects with different maturity and skills which we did notassessed deeply upfront. Additionally, although some work has been donein this domain, we are still just scratching the surface in mining develop-ers’ activities using process mining tools. Some of these tools are not readyyet to automate the complete flow of: collecting data, discover processes,compute metrics and export results. As a consequence, the referred taskswere mostly done manually, thus, introducing margin for errors in the datametrics used in the experiment. To soften this, and to reduced the risk ofhaving incoherent data, we implemented the validation of metric values frommultiple perspectives. Another possible threat is related with the event datapre-processing tasks before using the Process Mining tools to discover theprocesses and associated metrics. Events were stored initially in a database,and from there, queries were issued to filter, aggregate and select some pro-cess related metrics. We used all the best practices in filtering and queryingthe data. However, there is always a small chance for the existence of animprecise query which may have produced incorrect results and therefore,impacted our data analysis.
6.2. Internal Validity
We used a cluster analysis technique supported by the Elbow and Silhou-ette methods. This was used to partition the subjects according to differentsoftware and process cyclomatic complexity levels. Even if this is a validapproach, other strategies could have been followed, thus, results could varydepending on the alternative methods used, since the models computed toaddress RQ3 and RQ4 make use of this data partition approach. As men-tioned earlier, our population was not very large and we had to use it fortraining and test purposes. As such, our prediction models were all trainedusing k-fold cross validation and using feature selection methods.
6.3. External Validity
We understood from the beginning there was a real possibility that eventscollected and stored in CSV/JSON files on developers’ devices could be man-ually changed. We tried to mitigate this threat of having data tampering byusing a hash function on each event at the moment of their creation. As such,
38
each event contain not only information about the IDE activities, but alsoa hash code introduced as a new property in the event for later comparisonwith original event data. For additional precautions regarding data losses,we implemented also real-time event streaming from the IDE to a cloud eventhub.
Our initial dataset contains events collected from a group of teams whenperforming an academic exercise. Each user was provided with a usernameand password to enter in the Eclipse Plugin. With this approach, we caneasily know which user was working on each part of the software and theirrole in the whole development process. However, we cannot guarantee thateach developer used indeed their own username. This does not cause anyinvalid results in the number of activities for example, but may introducesome bias in the number of developers per team18.
6.4. Conclusion Validity
We performed an experiment using data from 71 software teams executingwell defined refactoring tasks. This involved 320 sessions of work from 117developers. Since this is a moderate population size for this type of analysis,we acknowledge this may be a threat to generalize conclusions or make boldassertions. The Spearmmans’ correlation, a nonparametric measure (there-fore having less statistical power) of the strength and direction of associationthat exists between two variables, was done on 32 and 39 teams for automaticand manual refactoring tasks respectively. These figures, although valid, areclose to the minimum admissible number of subjects for this type of analysis.Nevertheless, the insights we unveil in this study should be able to triggeradditional research in order to confirm or invalidate our initial findings.
7. Conclusion
7.1. Main conclusions
Software maintenance activities, such as refactoring, are said to be veryimpacted by software complexity. Researchers are measuring software prod-uct and processes complexities for a long time and the methods used arefrequently debated in the software development realm. However, the com-prehension on the links between these two dimensions has a long journeyahead.
In this work, we tried to understand deeper the liaison of process andsoftware complexity. Moreover, we assessed if process driven metrics and
18A metric used on almost all RQs and identified as having a high importance
39
IDE issued commands are suitable to build valid models to predict differ-ent refactoring methods and/or the expected levels of software cyclomaticcomplexity variance on development sessions.
We mined the software metrics from a software product after a softwarequality improvement task was given to a group of developers organized inteams. At the same time we collected events from those developers duringthe change activities they have performed within the IDE.
To the best of our knowledge, this is the first study where, using provenprocess mining methods, process metrics were gathered and combined withproduct metrics in order to understand deeper the liaison of product andprocess dimensions, particularly the cyclomatic complexities. Furthermore, itbrings to the attention of researchers the possibility to adopt process metricsextracted from the IDE usage as a way to complement or even replace productmetrics in modeling the development process.
We can’t compare our study to any previous works, however, with asmall set of features, we were able to unveil important correlations betweenproduct and process dimensions and obtain good models in terms of accuracyand ROC when predicting the type of refactoring done or the expected levelof cyclomatic complexity variance after multiple sessions of development. Weused a refactoring task as our main use case, however, by taking a snapshotof product and process metrics in different moments in time, one can measureother development practices the same way.
7.2. Relevance for practitioners
This approach can be particularly relevant in cases where product metricsare not available or are difficult to obtain. It can be also a valid approach tomeasure and monitor productivity within and between software teams. Aswe showed by analyzing the sessions complexity and the software cyclomaticcomplexity variance, non efficient teams can easily be detected. Our methodeasily support real-time data collection from individuals located in differ-ent geographic zones and with a multitude of development environments.Because the data collection is not dependent on code repositories and is de-coupled from check-ins and/or commits, process and code analysis can beperformed before repositories are updated. Development organizations canleverage this approach to apply conformance checking methods to verify theadherence of developers’ practices with internally prescribed developmentprocesses. This facilitates mainly the detection of low performance practicesand may trigger quick correction actions from project managers.
40
7.3. Limitations
We are aware that in this work we used only events from the IDE usage.This limits the generalization of the current method. However, our approach,although valid on it’s own, may be used to complement project managementanalysis based on other repositories. Events from tools containing informa-tion about the documentation, project management decisions, communica-tion between developers and managers, Q & A services, test suites and bugtracking systems, together with our method and metrics can build more ro-bust models to comprehend development practices and the relation betweensoftware and processes followed to produce it.
7.4. Future Work
In the short term, we plan to apply a similar research approach, but inanother context. Instead of refactoring an existing product, we will collectboth product and process data for software development from scratch in thecontext of a programming contest. We intend to assess how the adoptedprocess, both in terms of complexity and efficiency, influences effectiveness,as measured by an automatic judge.
In a previous paper [62] we described how we found that even for a well-defined software development task, there may be a great deal of processvariability, due to the human factor. Less focused teams produced morecomplex process models, due to the spurious/non-essential actions that werecarried out and therefore were less efficient. Following this path and us-ing clustering techniques, we expect to derive a catalog of process smellsand/or fingerprints to characterize development behaviors. Then, we willuse that taxonomy in a personal software process dashboard, that throughself-awareness is expected to foster improvement on process efficiency (e.g.less wasted effort) and effectiveness (e.g. yield better deliverables).
We also consider that the following aspects deserve further research ef-forts:
• Software Repository Diversity. Traditional software repositorieshave limitations and imprecisions. To expand the analytics coverageon the mining of software development processes, we should explorenon trivially used repositories, such as the IDE. This is particularly in-teresting to drive studies aiming to combine development perspectives:i) product quality and ii) the underlying development process.
• Software Development Process Mining Pipeline. Many pro-cess mining tools are not ready for non-human intervention. Due to
41
this reality, many metrics in this article had to be extracted semi-automatically, using a tool but not dispensing user interaction. Thisis a strong limitation in advancing research based on event data andcurrent process mining methods. A microservices-based architectureseems to be a good alternative for building a coherent pipeline for soft-ware development process mining.
• Data Sharing. Research combining software product and processdata is scarce and experiments in this area are difficult to design andexecute. To mitigate this problem, we expect an increment in shareddatasets containing this hybrid data, providing that privacy and/oranonymity on sensitive information is guaranteed.
Acknowledgement
This work was partially funded by the Portuguese Foundation for Sci-ence and Technology, under ISTAR-Iscte projects UIDB/04466/2020 andUIDP/04466/ 2020.
42
References
[1] W. E. Deming, Out of the Crisis: Quality, Productivity and CompetitivePosition, Massachusetts Institute of Technology, Center for advancedengineering study, 1986.
[2] K. Ishikawa, What is total quality control? The Japanese way, Prentice-Hall, 1985.
[3] G. Taguchi, Asian Productivity Organization., Introduction to qualityengineering : designing quality into products and processes, The Orga-nization, 1986.
[4] A. Fuggetta, E. Di Nitto, Software process, in: Proceedings of the onFuture of Software Engineering - FOSE 2014, ACM Press, New York,New York, USA, 2014, pp. 1–12. doi:10.1145/2593882.2593883.
[5] W. Van Der Aalst, Process Mining: Data Science in Action, 2ndEdition, Springer-Verlag Berlin Heidelberg, 2016. doi:10.1007/
978-3-662-49851-4.
[6] N. Moha, Y. G. Gueheneuc, P. Leduc, Automatic generation of detec-tion algorithms for design defects, in: 21st IEEE/ACM InternationalConference on Automated Software Engineering, ASE 2006, 2006, pp.297–300. doi:10.1109/ASE.2006.22.
[7] R. Malhotra, A. Sharma, Analyzing machine learning techniques forfault prediction using web applications, Journal of Information Process-ing Systems 14 (3) (2018) 751–770. doi:10.3745/JIPS.04.0077.
[8] H. Karna, L. Vickovic, S. Gotovac, Application of data mining methodsfor effort estimation of software projects, in: Software - Practice andExperience, Vol. 49, John Wiley and Sons Ltd, 2019, pp. 171–191. doi:10.1002/spe.2651.
[9] F. A. Batarseh, A. J. Gonzalez, Predicting failures in agile softwaredevelopment through data analytics, Software Quality Journal 26 (1)(2018) 49–66. doi:10.1007/s11219-015-9285-3.
[10] M. Kersten, G. C. Murphy, Using Task Context to Improve ProgrammerProductivity, in: Proceedings of the 14th ACM SIGSOFT internationalsymposium on Foundations of software engineering, ACM, Portland,Oregon, USA, 2006, pp. 1–11.
43
[11] G. C. Murphy, P. Viriyakattiyaporn, D. Shepherd, Using activity tracesto characterize programming behaviour beyond the lab, IEEE Inter-national Conference on Program Comprehension (2009) 90–94doi:10.1109/ICPC.2009.5090031.
[12] S. Negara, N. Chen, M. Vakilian, R. E. Johnson, D. Dig, A Com-parative Study of Manual and Automated Refactorings, in: Proceed-ings of the 27th European conference on Object-Oriented Program-ming, Springer, Berlin, Heidelberg, 2013, pp. 552–576. doi:10.1007/
978-3-642-39038-8_23.
[13] M. Vakilian, N. Chen, S. Negara, B. Ambresh, R. Roshanak, Z. Moghad-dam, R. E. Johnson, The Need for Richer Refactoring Usage Data, in:Proceedings of the 3rd ACM SIGPLAN workshop on Evaluation and us-ability of programming languages and tools, Association for ComputingMachinery, 2011, pp. 31–38.
[14] M. Vakilian, N. Chen, S. Negara, B. A. Rajkumar, B. P. Bailey, R. E.Johnson, Use, disuse, and misuse of automated refactorings, in: Pro-ceedings - International Conference on Software Engineering, 2012, pp.233–243. doi:10.1109/ICSE.2012.6227190.
[15] J. Ratzinger, T. Sigmund, P. Vorburger, H. Gall, Mining software evo-lution to predict refactoring, in: Proceedings - 1st International Sym-posium on Empirical Software Engineering and Measurement, ESEM2007, IEEE, 2007, pp. 354–363. doi:10.1109/ESEM.2007.9.
[16] M. Aniche, E. Maziero, R. Durelli, V. H. S. Durelli, The Effectiveness ofSupervised Machine Learning Algorithms in Predicting Software Refac-toring, Tech. rep., Delft University of Technology (2020).
[17] S. Negara, M. Vakilian, N. Chen, R. E. Johnson, D. Dig, Is It Danger-ous to Use Version Control Histories to Study Source Code Evolution?,in: European Conference on Object-Oriented Programming, ECOOP2012: ECOOP 2012 – Object-Oriented Programming, Springer, Berlin,Heidelberg, 2012, pp. 79–103. doi:10.1007/978-3-642-31057-7_5.
[18] M. Kim, T. Zimmermann, N. Nagappan, An Empirical Study of Refac-toring Challenges and Benefits at Microsoft, Transactions on SoftwareEngineering (2014) 633–649.
[19] T. Menzies, T. Zimmermann, Software analytics: So what?, IEEE Soft-ware 30 (4) (2013) 31–37. doi:10.1109/MS.2013.86.
44
[20] M. Kim, D. Cai, S. Kim, An Empirical Investigation into the Role ofAPI-Level Refactorings during Software Evolution, in: 2011 33rd In-ternational Conference on Software Engineering (ICSE), Honolulu, HI,USA, 2011, pp. 151–160.
[21] E. Murphy-Hill, C. Parnin, A. P. Black, How We Refactor, and HowWe Know It, in: Proceedings of the 31st International Conference onSoftware Engineering, IEEE Computer Society, 2009, p. 287–297.
[22] J. Finlay, R. Pears, A. M. A. Connor, Data stream mining for predict-ing software build outcomes using source code metrics, Information andSoftware Technology 56 (2) (2014) 183–198. doi:10.1016/j.infsof.
2013.09.001.
[23] P. Lerthathairat, N. Prompoon, An Approach for Source Code Classifi-cation Using Software Metrics and Fuzzy Logic to Improve Code Qualitywith Refactoring Techniques, in: International Conference on SoftwareEngineering and Computer Systems (ICSECS 2011), 2011, p. 830.
[24] T. H. Chen, S. W. Thomas, A. E. Hassan, A survey on the use of topicmodels when mining software repositories, Empirical Software Engineer-ing 21 (5) (2016) 1843–1919. doi:10.1007/s10664-015-9402-8.
[25] F. Peters, On Privacy and Utility while Improving Software Quality, in:International Conference on Current Trends in Theory and Practice ofComputer Science, Vol. 75, SOFSEM SRF, 2017, pp. –.
[26] S. A. Fahrenkrog-Petersen, W. M. van der Aa Hanand, PRIPEL:Privacy-Preserving Event Log Publishing Including Contextual Infor-mation, in: Business Process Management, Springer International Pub-lishing, Cham, 2020, pp. 111–128.
[27] G. Casale, C. Chesta, P. Deussen, E. Di Nitto, P. Gouvas, S. Koussouris,V. Stankovski, A. Symeonidis, V. Vlassiou, A. Zafeiropoulos, Z. Zhao,Current and Future Challenges of Software Engineering for Services andApplications, in: Procedia Computer Science, Vol. 97, Elsevier B.V.,2016, pp. 34–42. doi:10.1016/j.procs.2016.08.278.
[28] F. Rahman, P. Devanbu, How, and Why, Process Metrics Are Better,in: Proceedings of the 2013 International Conference on Software Engi-neering, IEEE Press, San Francisco, CA, USA, 2013, p. 432–441.
[29] J. Caldeira, F. Brito e Abreu, Software development process mining:Discovery, conformance checking and enhancement, in: Proceedings -
45
2016 10th International Conference on the Quality of Information andCommunications Technology, QUATIC 2016, IEEE, 2016, pp. 254–259.doi:10.1109/QUATIC.2016.061.
[30] F. Brito e Abreu, R. Esteves, M. Goulao, The Design of Eiffel Programs:Qualitative Evaluation using the MOOD Metrics, in: R. Ege (Ed.), Proc.of 20th International Conference on Technology of Object Oriented Lan-guages and Systems (TOOLS’96 USA), Zenodo, Santa Barbara, USA,1996, pp. —. doi:10.5281/zenodo.1216932.
[31] A. H. Watson, T. J. Mccabe, D. R. Wallace, Structured Testing: ATesting Methodology Using the Cyclomatic Complexity Metric, Tech.rep., NIST (1996).
[32] F. Brito e Abreu, Using OCL to formalize object oriented metrics defi-nitions, Tech. Rep. ES007/2001, INESC (5 2001).
[33] G. Botterweck, C. Werner (Eds.), Mastering Scale and Complexity inSoftware Reuse, Vol. 10221 LNCS, Springer Verlag, 2017. doi:10.1007/978-3-319-56856-0.
[34] J. Cardoso, J. Mendling, G. Neumann, H. A. Reijers, A discourse oncomplexity of process models, in: International Conference on BusinessProcess Management, Springer, 2006, pp. 117–128.
[35] I. Vanderfeesten, J. Cardoso, J. Mendling, H. A. Reijers, W. VanDer Aalst, Quality Metrics for Business Process Models, Tech. rep.,Technische Universiteit Eindhoven (2007).
[36] T. Menzies, T. Zimmermann, Software Analytics: What’s Next?, IEEESoftware Engineering (2018) 64–70.
[37] D. Zhang, S. Han, Y. Dang, J.-G. Lou, H. Zhang, M. Research Asia,T. Xie, Software Analytics in Practice, IEEE Software (2013) 30–37.
[38] F. Akiyama, An Example of Software System Debugging, in: C. V.Freiman, J. E. Griffith, J. L. Rosenfeld (Eds.), IFIP Congress (1), North-Holland, 1971, pp. 353–359.
[39] T. J. Mccabe, A Complexity Measure, IEEE Transactions on SoftwareEngineering SE-2 (4) (1976) 308–320. doi:10.1109/TSE.1976.233837.
[40] T. Hariprasad, G. Vidhyagaran, K. Seenu, C. Thirumalai, Softwarecomplexity analysis using halstead metrics, in: Proceedings - Interna-tional Conference on Trends in Electronics and Informatics, ICEI 2017,
46
Vol. 2018-January, Institute of Electrical and Electronics Engineers Inc.,2018, pp. 1109–1113. doi:10.1109/ICOEI.2017.8300883.
[41] B. Curtis, S. B. Sheppard, P. Milliman, Third Time Charm: StrongerPrediction of Programmer Performance by Software Complexity Met-rics, in: Proceedings of the 4th International Conference on SoftwareEngineering, ICSE ’79, IEEE Press, 1979, pp. 356–360.
[42] B. W. Boehm, Software Engineering Economics, 1st Edition, PrenticeHall PTR, Upper Saddle River, NJ, United States, 1981.
[43] S. Henry, D. Kafura, Software Structure Metrics Based on InformationFlow, IEEE Trans. Softw. Eng. 7 (5) (1981) 510–518. doi:10.1109/
TSE.1981.231113.
[44] R. P. L. Buse, T. Zimmermann, Analytics for Software Development,Tech. rep., Microsoft Research (2010).
[45] P. Mayer, M. Kirsch, M. A. Le, On multi-language software develop-ment, cross-language links and accompanying tools: a survey of pro-fessional software developers, Journal of Software Engineering Researchand Development 5 (2017) 1. doi:10.1186/s40411-017-0035-z.
[46] H. Henriques, H. Lourenco, V. Amaral, M. Goulao, Improving the de-veloper experience with a low-code process modelling language, in: Pro-ceedings - 21st ACM/IEEE International Conference on Model DrivenEngineering Languages and Systems, MODELS 2018, Association forComputing Machinery, Inc, 2018, pp. 200–210. doi:10.1145/3239372.3239387.
[47] M. Oltrogge, E. Derr, C. Stransky, Y. Acar, S. Fahl, C. Rossow,G. Pellegrino, S. Bugiel, M. Backes, The Rise of the Citizen Devel-oper: Assessing the Security Impact of Online App Generators, in: 2018IEEE Symposium on Security and Privacy (SP), 2018, pp. 634–647.doi:10.1109/SP.2018.00005.
[48] M. Niazi, S. Mahmood, M. Alshayeb, M. R. Riaz, K. Faisal, N. Cerpa,S. U. Khan, I. Richardson, Challenges of project management in globalsoftware development: A client-vendor analysis, Information and Soft-ware Technology 80 (C) (2016) 1–19. doi:10.1016/j.infsof.2016.
08.002.
47
[49] L. Cruz, R. Abreu, D. Lo, To the attention of mobile software developers:guess what, test your app!, Empirical Software Engineering 24 (2019)2438–2468. doi:10.1007/s10664-019-09701-0.
[50] J. Herbsleb, Building a Socio-Technical Theory of Coordination: Whyand How (Outstanding Research Award), in: Proceedings of the 201624th ACM SIGSOFT International Symposium on Foundations of Soft-ware Engineering, FSE 2016, Association for Computing Machinery,New York, NY, USA, 2016, pp. 2–10. doi:10.1145/2950290.2994160.
[51] W. Poncin, A. Serebrenik, M. V. D. Brand, Process Mining SoftwareRepositories, 2011 15th European Conference on Software Maintenanceand Reengineering (2011) 5–14doi:10.1109/CSMR.2011.5.
[52] V. A. Rubin, I. Lomazova, W. M. P. v. d. Aalst, Agile developmentwith software process mining, Proceedings of the 2014 InternationalConference on Software and System Process - ICSSP 2014 (2014) 70–74doi:10.1145/2600821.2600842.
[53] V. A. Rubin, A. A. Mitsyuk, I. A. Lomazova, W. M. P. van der Aalst,Process mining can be applied to software too!, Proceedings of the 8thACM/IEEE International Symposium on Empirical Software Engineer-ing and Measurement - ESEM ’14 (2014) 1–8doi:10.1145/2652524.2652583.
[54] C. Ioannou, A. Burattin, B. Weber, Mining Developers’ Workflows fromIDE Usage, in: Lecture Notes in Business Information Processing, Vol.316, Springer, 2018, pp. 167–179. doi:10.1007/978-3-319-92898-2_
14.
[55] M. Mittal, A. Sureka, MIMANSA : Process Mining Software Reposito-ries from Student Projects in an Undergraduate Software EngineeringCourse Categories and Subject Descriptors, Software Engineering Edu-cation and Training — ICSE 2014 (2014) 344–353.
[56] M. Yan, X. Xia, D. Lo, A. E. Hassan, S. Li, Characterizing and iden-tifying reverted commits, Empirical Software Engineering 24 (4) (2019)2171–2208. doi:10.1007/s10664-019-09688-8.
[57] S. Hassan, C. Tantithamthavorn, C. P. Bezemer, A. E. Hassan, Studyingthe dialogue between users and developers of free apps in the GooglePlay Store, Empirical Software Engineering 23 (3) (2018) 1275–1312.doi:10.1007/s10664-017-9538-9.
48

[58] L. Bao, Z. Xing, X. Xia, D. Lo, A. E. Hassan, Inference of develop-ment activities from interaction with uninstrumented applications, Em-pirical Software Engineering 23 (3) (2018) 1313–1351. doi:10.1007/
s10664-017-9547-8.
[59] K. Damevski, D. C. Shepherd, J. Schneider, L. Pollock, Mining Se-quences of Developer Interactions in Visual Studio for Usage Smells,IEEE Transactions on Software Engineering 43 (4) (2017) 359–371.doi:10.1109/TSE.2016.2592905.
[60] M. Leemans, W. M. P. van der Aalst, M. G. J. van den Brand, TheStatechart Workbench: Enabling scalable software event log analysisusing process mining, in: 2018 IEEE 25th International Conference onSoftware Analysis, Evolution and Reengineering (SANER), IEEE, 2018,pp. 502–506. doi:10.1109/SANER.2018.8330248.
[61] X. Xia, L. Bao, D. Lo, Z. Xing, A. E. Hassan, S. Li, Measuring ProgramComprehension: A Large-Scale Field Study with Professionals, IEEETransactions on Software Engineering 44 (10) (2018) 951–976. doi:
10.1109/TSE.2017.2734091.
[62] J. Caldeira, F. Brito e Abreu, J. Reis, J. Cardoso, Assessing SoftwareDevelopment Teams’ Efficiency using Process Mining, in: 2019 Inter-national Conference on Process Mining (ICPM), Institute of Electricaland Electronics Engineers (IEEE), 2019, pp. 65–72. doi:10.1109/icpm.2019.00020.
[63] P. Ardimento, M. L. Bernardi, M. Cimitile, F. M. Maggi, EvaluatingCoding Behavior in Software Development Processes: A Process MiningApproach, in: 2019 IEEE/ACM International Conference on Softwareand System Processes (ICSSP), IEEE, 2019, pp. 84–93. doi:10.1109/
ICSSP.2019.00020.
[64] P. Ardimento, M. L. Bernardi, M. Cimitile, G. D. Ruvo, Learning analyt-ics to improve coding abilities: A fuzzy-based process mining approach,in: IEEE International Conference on Fuzzy Systems, Vol. 2019-June,Institute of Electrical and Electronics Engineers Inc., 2019, pp. 1–7.doi:10.1109/FUZZ-IEEE.2019.8859009.
[65] P. Ardimento, M. L. Bernardi, M. Cimitile, G. De Ruvo, Mining De-veloper’s Behavior from Web-Based IDE Logs, in: 2019 IEEE 28thInternational Conference on Enabling Technologies: Infrastructure for
49
Collaborative Enterprises (WETICE), IEEE, 2019, pp. 277–282. doi:
10.1109/WETICE.2019.00065.
[66] K. Beck, M. Fowler, J. Brant, W. Opdyke, D. Roberts, Bad Smells inCode, in: Improving the design of existing code, O’Reilly, 1999, Ch. 3,pp. –.
[67] M. Chinosi, A. Trombetta, BPMN: An introduction to the standard,Computer Standards & Interfaces 34 (1) (2012) 124–134.
[68] C. Gunther, E. Verbeek, XES standard definition, Tech. rep., BPMcen-ter. org (2014).
[69] A. R. C. Maita, L. C. Martins, C. R. Lopez Paz, L. Rafferty, P. C. K.Hung, S. M. Peres, M. Fantinato, A systematic mapping study of processmining, Enterprise Information Systems 12 (5) (2018) 505–549. doi:
10.1080/17517575.2017.1402371.
[70] C. d. S. Garcia, A. Meincheim, E. R. Faria Junior, M. R. Dalla-gassa, D. M. V. Sato, D. R. Carvalho, E. A. P. Santos, E. E. Scal-abrin, Process mining techniques and applications – A systematic map-ping study, Expert Systems with Applications 133 (2019) 260–295.doi:10.1016/j.eswa.2019.05.003.
[71] M. Leemans, W. M. P. van der Aalst, M. G. J. van den Brand, Re-cursion aware modeling and discovery for hierarchical software eventlog analysis, in: 2018 IEEE 25th International Conference on SoftwareAnalysis, Evolution and Reengineering (SANER), 2018, pp. 185–196.doi:10.1109/SANER.2018.8330208.
[72] B. Purnima, K. Arvind, EBK-Means: A Clustering Technique based onElbow Method and K-Means in WSN, International Journal of Com-puter Applications 105 (9) (2014) 17–24.
[73] N. Kaoungku, K. Suksut, R. Chanklan, K. Kerdprasop, N. Kerdprasop,The silhouette width criterion for clustering and association mining toselect image features, International Journal of Machine Learning andComputing 8 (1) (2018) 69–73. doi:10.18178/ijmlc.2018.8.1.665.
[74] T. Xia, R. Krishna, J. Chen, G. Mathew, X. Shen, T. Menzies, Hyperpa-rameter Optimization for Effort Estimation, Tech. rep., North CarolinaState University (4 2018).
50
[75] L. L. Minku, S. Hou, Clustering dycom an online cross-company softwareeffort estimation study, in: ACM International Conference ProceedingSeries, Association for Computing Machinery, 2017, pp. 12–21. doi:
10.1145/3127005.3127007.
[76] S. B. Jagtap, B. G. Kodge, Census Data Mining and Data Analysis usingWEKA, in: International Conference in Emerging Trends in Science,Technology and Management-2013, Singapore, 2013, pp. –.
[77] C. Thornton, H. H. Hoos, K. Leyton-Brown, Auto-WEKA 2.0: Au-tomatic model selection and hyperparameter optimization in WEKA,Journal of Machine Learning Research 1 (2017) 429.
[78] L. Madeyski, M. Jureczko, M. Jureczko, Which process metricscan significantly improve defect prediction models? An empiricalstudy, Software Quality Journal 23 (2015) 393–422. doi:10.1007/
s11219-014-9241-7.
51
Appendix A. Appendix
Appendix A.1. Product Metrics
Table A.7: Product Metrics Description
Name Description Scale
VG McCabe Cyclomatic Complexity (Avg. per Method) NumericPAR Number of Parameters (Avg. per Method) NumericNBD Nested Block Depth (Avg. per Method) NumericCA Afferent Coupling (Avg. per Package Fragment) NumericCE Efferent Coupling (Avg. per Package Fragment) NumericRMI Instability (Avg. per Package Fragment) NumericRMA Abstractness (Avg. per Package Fragment) NumericRMD Normalized Distance (Avg. per Package Fragment) NumericDIT Depth of Inheritance Tree (Avg. per Type) NumericWMC Weighted methods per Class (Avg. per Type) NumericNSC Number of Children (Avg. per Type) NumericNORM Number of Overridden Methods (Avg. per Type) NumericLCOM Lack of Cohesion of Methods (Avg. per Type) NumericNOF Number of Attributes (Avg. per Type) NumericNSF Number of Static Attributes (Avg. per Type) NumericSIX Specialization Index (Avg. per Type) NumericNOP Number of Packages NumericNOC Number of Classes (Avg. per Package Fragment) NumericNOI Number of Interfaces (Avg. per Package Fragment) NumericNOM Number of Methods (Avg. per Type) NumericNSM Number of Static Methods (Avg. per Type) NumericMLOC Method Lines of Code (Avg. per Method) NumericTLOC Total Lines of Code NumericTLOC Total Lines of Code Numeric
VG LEVEL Different levels of ∆VG (LOW, MEDIUM, HIGH) Categorical
52
Appendix A.2. Process Metrics
Table A.8: Process Metrics Description
Name Description Scale
DEV Number of Developers NumericSES Number of User/Development Sessions NumericEVTS Number of Events Collected NumericNFILES Number of Unique Files Touched NumericNCOM Number of Unique Commands Issued in IDE NumericPCCPF Process Cyclomatic Complexity per File Touched NumericEC Number of Event Classes NumericNOA Number of Activities NumericNSS Number of Simple States NumericNCS Number of Composite States NumericNOT Number of Transitions NumericPCC Process Cyclomatic Complexity NumericNVER Number of Unique IDE Versions NumericNCAT Number of Unique Command Categories NumericNPLA Number of Unique IDE Platforms NumericNISP Number of Unique Geographic Locations NumericNOS Number of Unique Operating Systems NumericNPER Number of Unique Perspectives used in the IDE Numeric
PCC LEVEL Different levels of PCC (LOW, HIGH) Categorical
53
Table A.9: Process-Extended Metrics Description
Category Name Scale
Refactor
Java-Extract Method NumericJava-Move - Refactoring NumericJava-Extract Class... NumericJava-Rename - Refactoring NumericDelete Resources NumericJava-Encapsulate Field NumericJava-Change Method Signature NumericJava-Move Type to New File Numeric
Eclipse EditorFile Open NumericFile Editing NumericFile Close Numeric
Eclipse View
Project Explorer NumericPackage Explorer NumericLong Method NumericGod Class NumericCode Smell Visualization NumericType Checking NumericFeature Envy NumericDuplicated Code Numeric
Edit
Find and Replace NumericCopy NumericPaste NumericCut NumericDelete NumericUndo NumericRedo Numeric
File
Import NumericRefresh NumericSave NumericSave All Numeric
Source Generate Getters and Setters NumericCompare Select Next Change Numeric
....... //List is truncated on purpose
....... //List size is ≈250
Text Editing Delete Previous Word Numeric
54
Appendix A.3. Algorithms shown in Model EvaluationsRandomCommittee. Method for building an ensemble of randomizable base clas-
sifiers. Each base classifier is built using a different random seed number (but based onethe same data). The final prediction is a straight average of the predictions generated bythe individual base classifiers.
RandomSubSpace. This method constructs a decision tree based classifier that main-tains highest accuracy on training data and improves on generalization accuracy as itgrows in complexity. The classifier consists of multiple trees constructed systematicallyby pseudo-randomly selecting subsets of components of the feature vector, that is, treesconstructed in randomly chosen sub-spaces.
RandomForest. Method for constructing a forest of random trees. It consists of a learn-ing method for classification, regression and other tasks that operates by constructing amultitude of decision trees at training time and outputting the class that is the mode ofthe classes (classification) or mean prediction (regression) of the individual trees.
RepTree. Fast decision tree learner. Builds a decision/regression tree using informationgain/variance and prunes it using reduced-error pruning (with back-fitting). Only sortsvalues for numeric attributes once. Missing values are dealt with by splitting the corre-sponding instances into pieces.
LMT. ’Logistic Model Trees’ are classification trees with logistic regression functions atthe leaves. The algorithm can deal with binary and multi-class target variables, numericand nominal attributes and missing values.
Logistic Regression. Method for building and using a multinomial logistic regressionmodel with a ridge estimator. Logistic regression is a statistical model that in its basicform uses a logistic function to model a binary dependent variable, although more complexextensions exist.
LWL. The Locally Weighted Learning method uses an instance-based algorithm to assigninstance weights which are then used by a specified WeightedInstancesHandler. Can doclassification (e.g. using naive Bayes) or regression (e.g. using linear regression).
LinearNNSearch. This method implements the brute force search algorithm for nearestneighbour search.
DecisionTable. Builds and uses a simple decision table majority classifier.
Bagging. Method for bagging a classifier to reduce variance. Can do classification andregression depending on the base learner.
KStar. Is an instance-based classifier, that is, the class of a test instance is based uponthe class of those training instances similar to it, as determined by some similarity func-tion. It differs from other instance-based learners in that it uses an entropy-based distancefunction.
55
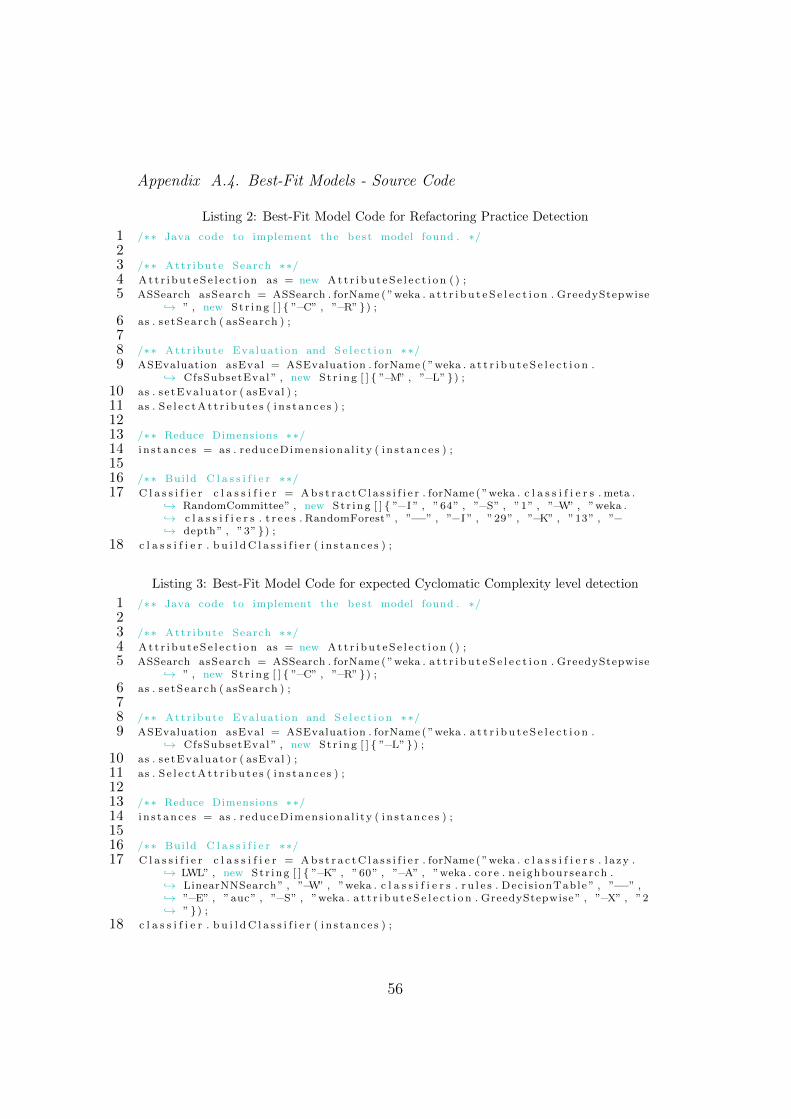
Appendix A.4. Best-Fit Models - Source Code
Listing 2: Best-Fit Model Code for Refactoring Practice Detection
1 /∗∗ Java code to implement the bes t model found . ∗/23 /∗∗ Attr ibute Search ∗∗/4 At t r i bu t eS e l e c t i on as = new At t r i bu t eS e l e c t i on ( ) ;
5 ASSearch asSearch = ASSearch . forName ( ”weka . a t t r i b u t e S e l e c t i o n . GreedyStepwise↪→ ” , new St r ing [ ] { ”−C” , ”−R” }) ;
6 as . s e tSearch ( asSearch ) ;
78 /∗∗ Attr ibute Evaluat ion and S e l e c t i o n ∗∗/9 ASEvaluation asEval = ASEvaluation . forName ( ”weka . a t t r i b u t e S e l e c t i o n .
↪→ CfsSubsetEval ” , new St r ing [ ] { ”−M” , ”−L” }) ;10 as . s e tEva luator ( asEval ) ;
11 as . S e l e c tA t t r i bu t e s ( i n s t an c e s ) ;
1213 /∗∗ Reduce Dimensions ∗∗/14 i n s t an c e s = as . reduceDimens iona l i ty ( i n s t an c e s ) ;
1516 /∗∗ Build C l a s s i f i e r ∗∗/17 C l a s s i f i e r c l a s s i f i e r = Ab s t r a c tC l a s s i f i e r . forName ( ”weka . c l a s s i f i e r s . meta .
↪→ RandomCommittee” , new St r ing [ ] { ”−I ” , ”64” , ”−S” , ”1” , ”−W” , ”weka .↪→ c l a s s i f i e r s . t r e e s . RandomForest” , ”−−” , ”−I ” , ”29” , ”−K” , ”13” , ”−↪→ depth” , ”3” }) ;
18 c l a s s i f i e r . b u i l dC l a s s i f i e r ( i n s t an c e s ) ;
Listing 3: Best-Fit Model Code for expected Cyclomatic Complexity level detection
1 /∗∗ Java code to implement the bes t model found . ∗/23 /∗∗ Attr ibute Search ∗∗/4 At t r i bu t eS e l e c t i on as = new At t r i bu t eS e l e c t i on ( ) ;
5 ASSearch asSearch = ASSearch . forName ( ”weka . a t t r i b u t e S e l e c t i o n . GreedyStepwise↪→ ” , new St r ing [ ] { ”−C” , ”−R” }) ;
6 as . s e tSearch ( asSearch ) ;
78 /∗∗ Attr ibute Evaluat ion and S e l e c t i o n ∗∗/9 ASEvaluation asEval = ASEvaluation . forName ( ”weka . a t t r i b u t e S e l e c t i o n .
↪→ CfsSubsetEval ” , new St r ing [ ] { ”−L” }) ;10 as . s e tEva luator ( asEval ) ;
11 as . S e l e c tA t t r i bu t e s ( i n s t an c e s ) ;
1213 /∗∗ Reduce Dimensions ∗∗/14 i n s t an c e s = as . reduceDimens iona l i ty ( i n s t an c e s ) ;
1516 /∗∗ Build C l a s s i f i e r ∗∗/17 C l a s s i f i e r c l a s s i f i e r = Ab s t r a c tC l a s s i f i e r . forName ( ”weka . c l a s s i f i e r s . l a zy .
↪→ LWL” , new St r ing [ ] { ”−K” , ”60” , ”−A” , ”weka . core . ne ighboursearch .↪→ LinearNNSearch” , ”−W” , ”weka . c l a s s i f i e r s . r u l e s . Dec i s ionTable ” , ”−−” ,↪→ ”−E” , ”auc” , ”−S” , ”weka . a t t r i b u t e S e l e c t i o n . GreedyStepwise ” , ”−X” , ”2↪→ ” }) ;
18 c l a s s i f i e r . b u i l dC l a s s i f i e r ( i n s t an c e s ) ;
56