untitled - dubai press club
TRANSCRIPT
1

2
P O Box 53777Dubai, United Arab EmiratesTel: +971 4 391 4555Fax: +971 4 391 4616www.dmc.ae
P O Box 39333Dubai, United Arab EmiratesTel: +971 4 383 3330Fax: +971 4 383 3331www.dpc.org.ae | dubaipressclub
3
5TH EDITION
MEDIA ARAB MEDIA OUTLOOK 2016-2018 YOUTH... CONTENT... DIGITAL MEDIA ARAB
4
Appreciation for the content team• Abdulhani Aliouat,
Editor websites, Government of Dubai Media Office
• Abhijat Sharma, Project Manager, Strategy&
• Alia Al Theeb, Manager media content development, Dubai Press Club
• Aminah Taher, Executive, activities, Dubai Press Club
• Basel Abdulkarim, Executive, media content development, Dubai Press Cub
• Khalid Jamal, Executive, media relations, Dubai Press Club
• Muna Bu Samra, Former director, Dubai Press Club
• Nadin Allahham, Senior strategy analyst, Government of Dubai Media Office
• Nick Karjalainen, Executive director, corporate strategy & industry development, Tecom Group
• Sahem Al Muheisen, Media strategy consultant, Tecom Group
Review committee• Dr. El Sayed Bekhit,
Director of the Institute for the Arabic Language, Zayed University
• Dr. Essam Nasr, Vice Dean, College of Communication, Sharjah University
• Dr. Khaled Al Khaja, Dean, College of Information, Mass Communication and Humanities, Ajman University of Science and Technology
• Dr. Saif Al Qaydi, Dean, College of Humanities and Social Sciences, United Arab Emirates University (UAEU)
FOREWORD: DUBAI PRESS CLUB AND DUBAI MEDIA CITY ......................i
FOREWORD: STRATEGY& ............................................................................ ii
EXECUTIVE SUMMARY............................................................................... iii
SECTION 1: MACRO-ECONOMIC ENVIRONMENT ..................................... 1
SECTION 2: THE ARAB MEDIA MARKET
1. TELEVISION AND OTT .................................................................. 21
2. DIGITAL AND MOBILE .................................................................. 45
3. PRINT .......................................................................................... 57
4. FILM ............................................................................................. 71
5. MUSIC .......................................................................................... 81
6. GAMING ....................................................................................... 91
7. OTHERS - OOH AND RADIO ......................................................... 99
8. THE MARCOMMS INDUSTRY ..................................................... 107
SECTION 3: UPDATE BY MARKET
1. IN FOCUS COUNTRIES
UAE ............................................................................................ 117
KSA ............................................................................................ 126
EGYPT ........................................................................................ 134
MOROCCO .................................................................................. 143
2. OTHER COUNTRIES
ALGERIA ..................................................................................... 153
BAHRAIN ................................................................................... 157
JORDAN ..................................................................................... 161
KUWAIT ...................................................................................... 165
LEBANON ................................................................................... 171
OMAN ........................................................................................ 175
PALESTINE ................................................................................. 179
QATAR ........................................................................................ 183
SUDAN ....................................................................................... 187
TUNISIA .................................................................................... 191
SECTION 4: THE FUTURE-READY ARAB WORLD
1. SOCIAL MEDIA INFLUENCERS ................................................... 195
2. MULTI CHANNEL NETWORKS .................................................... 201
3. PUBLISHER MOBILE MONETISATION ........................................ 211
4. ALTERNATE PUBLISHING PLATFORMS ...................................... 219
SECTION 5: MIDDLE EAST MEDIA EDUCATION LANDSCAPE .................. 225
METHODOLOGY ....................................................................................... 233
CONTENTS
Dubai Press ClubThe world’s media industry is going through a period of rapid evolution. Over the last two decades, remarkable advances in technology have transformed the sector. The Internet and social media have for example completely changed the way media operates and has altered the way we consume news and information. Today, change is the only permanent reality in the industry.
Technology will continue to change media, perhaps in more ways than we can imagine. To ride the crest of change, it is important that we understand the implications of these changes on the future.
Dubai Press Club’s annual Arab Media Outlook, a comprehensive study of the sector based on extensive research, seeks to help you further understand the dynamics behind these changes. The report tracks key
industry developments and assesses what the future holds in store.
The Arab Media Outlook (2016-2018): Youth..Content..Digital media, takes a deep look at the waves of transformation sweeping over Arab media. While global technical and professional trends are reshaping the way regional media functions, the shifting Arab political, economic and social situation is adding another layer of unprecedented industry change.
This year’s report would not have been possible without the valuable contributions of our partner, Dubai Media City, a global media hub that has been instrumental in transforming the growth of the region’s industry. By creating a vibrant cluster of more than 2,000 media firms from across the world, Dubai Media
City has made both Dubai and the UAE prominent spots on the global media map. Its integrated infrastructure and supportive environment have made it one of the most fertile grounds for the development of free and responsible media.
The report covers the media sector in 14 Arab countries with a wealth of statistics and data that throw light on the drivers of the industry. Among other things, the report examines the impact of technology and the rising demand for qualified and trained human resources.
We have decided to launch the report exclusively in a digital format, which will enable it to reach a wider section of the public in the Arab world and beyond.
The publication of the Arab Media Outlook is part of Dubai Press Club’s commitment to support the development and progress of media in the region.
Our objective is to create a valuable resource that will give you a clear picture of the present and a better understanding of the future.
We hope you will find the report useful, insightful and thought provoking.
Mona G. Al MarriChairperson of Dubai Press Club
Dubai Media CityThe dynamics and trends of the media industry
have always provided valuable insight into consumer
behaviour and have helped shape the thinking of
government and business as to what are the most
effective means of communication with their citizens
and customers. Dubai, as the hub of the region’s media
industry and its champion of innovation, recognises its
importance for sustainable growth and development.
Dubai’s media industry has played a vital role in
transforming our economic ecosystem. It has been
part of the foundation of the Knowledge economy, the
vision of His Highness Sheikh Mohammed bin Rashid
Al Maktoum, Vice President and Prime Minister of the
UAE and Ruler of Dubai. The media industry continues
to have a positive impact on other sectors, through its
constant innovations and development.
TECOM Group has been an integral partner and at the
forefront of all of these developments: with Dubai Media
City and then Dubai Studio City and Dubai Production
City, forming a hub for the region. Strong of 27,000
talents supporting multiple business partners, including
120 TV channels and broadcasters, and 180 production
houses we created the base for the growth. Publishing
companies, advertising agencies and other industry
players have made our communities their home and
have thrived as our partners.
Our knowledge and success have made us natural
partners with the Dubai Press Club and our
collaboration is of great benefit to anyone with an
interest in the Arab world’s media landscape. Our
teams have been able to gather up to date and highly
relevant data from a broad spectrum of creative
industries. I would like to thank the Dubai Press Club
for its continued partnership in this venture and for its
tireless efforts in compiling the fifth and latest edition
of the Arab Media Outlook 2016 – 2018.
It is especially timely and relevant, against a backdrop
of a paradigm shift in the media industry, and
unprecedented change and innovation. This report
enables us to guide our partners in forming their own
strategies for growth.
There is a large amount of information in the report,
supporting some of the major emerging trends. Chief
of these is digitisation, which the report identifies as
the sector’s fastest growing segment, with a CAGR of
more than 14%, fuelling the growth of the industry as
a whole. While digital video and social media spending
are driving the growth, gaming holds the most value
and is expected to cross US$1 billion in revenues by
2018. Focusing on integrating technology partners to
support and leverage our media sector we continue
to grow our business enablement services through
initiatives like In5 Media.
Through Media City, TECOM Group is proud of its
continued participation in the Arab Media Outlook.
I hope you enjoy reading this report and that you find
its contents, insights and conclusions as fascinating
and informative as I do.
Dr Amina Al RustamaniGroup CEO, TECOM Group
Strategy&We welcome you to the fifth edition of the Arab Media
Outlook (2016-18); Youth..Content..Digital Media.
The study provides a comprehensive perspective of the
consumer media industry in the Middle East covering
both Paid and Advertising sources of sector revenues
across 14 countries comprising the Middle East.
The study combines trends with quantitative projections
to provide a unique strategic perspective of media in the
Arab world. The study brings together desktop research
on media consumption and growth drivers with practical
insights from prominent industry leaders across all
major media sectors and largest media companies
around the region.
Media in the region stands at an interesting point
impacted by two counter-veiling forces. Despite the
challenging economic climate in the region, the youth
demographic and the increasing levels of digitization are
expected to provide an impetus for growth. Consumers
in the region are among the most active media users
globally. On an average, each user spends over 10
hours a day consuming media content. Almost half of
that time is spent on digital platforms, which is mostly
incremental. On the whole, there is more audience
time for every type of content including news. While the
growth in nominal advertising expenditure is expected
to slow down, the paid media part is expected to grow
faster than advertising. Digital platforms and paid media
will be the key contributors of growth of the media
sector, with Pay TV and digital gaming as
primary drivers.
Key dynamic changing the media landscape is Youth
engagement on digital, not only as consumers of
content but also as producers of content.
The “amateur” digital only content being produced by Arab youth (‘Youth Media”) has significantly increased the level of local Arabic language content available on digital platforms. Much of this content tells local stories and is resulting in a “cultural boom”. Youth involvement is also transforming the marketing landscape. Social Media Influencers, a community largely dominated by Arab Youth, is becoming an integral part of any marketing campaign in the region
The digital activity in the region is catching the attention of the global digital giants. While most major traditional international media companies have operated in the region from a distance, many of the international digital media players are intimately investing in the region.
The interesting factor during the coming period will be to see how this “Youth Media” integrates within
the mainstream media in the region. The Arab Media
Outlook specifically celebrates Arab Youth’s participation
in media and outlines its impact on every component
of the media sector including an assessment of the
enablers required to sustain and amplify this trend.
We extend our sincere appreciation to all who have
contributed to the development of this report and would
like to specially thank the team at Dubai Press Club and
TECOM Group for their support.
Jayant BhargavaPartner & Head of Digital Media & Entertainment Middle EastStrategy&
12
MMARY EXECUTIVE SUMMARY EXECUTIVE S
ARAB MEDIA EXPOSURE AND TRANSITIONARAB MEDIA OUTLOOK 2016. 2020ARAB MEDIA EXPOSURE AND TRANSITIONARAB MEDIA OUTLOOK 2016. 2020ARAB MEDIA EXPOSURE AND TRANSITIONARAB MEDIA OUTLOOK 2016. 2020
ARAB MEDIA EXPOSURE AND TRANSITIONARAB MEDIA OUTLOOK 2016. 2020ARAB MEDIA EXPOSURE AND TRANSITIONARAB MEDIA OUTLOOK 2016. 2020ARAB MEDIA EXPOSURE AND TRANSITIONARAB MEDIA OUTLOOK 2016. 2020ARAB MEDIA EXPOSURE AND TRANSITIONARAB MEDIA OUTLOOK 2016. 2020ARAB MEDIA EXPOSURE AND TRANSITIONARAB MEDIA OUTLOOK 2016. 2020ARAB MEDIA EXPOSURE AND TRANSITIONARAB MEDIA OUTLOOK 2016. 2020ARAB MEDIA EXPOSURE AND TRANSITION
i
The fifth edition of the Arab Media Outlook 2016-2018
Youth..Content..Digital media, provides a comprehensive view of media across 14 key markets in the Pan Arab region. It covers paid media and advertising funded revenues across all platforms – digital, mobile, print, TV and radio with a strategic and qualitative assessment of each sector, including emerging trends, industry challenges and growth drivers.
The region’s media sector stands at an interesting evolution point. On one end, the unique demographics and the fast pace of digitisation have created a drive for growth. On the other end, on the macro-economic level, depressed oil prices and political conflicts have created a turbulent environment for media, which is typically vulnerable to economic downturns.
On the demographic front, the young (under 24) comprise almost a staggering 50% of the region’s population – which is double that of many developed countries like the United Kingdom and the United States of America.
This ‘demographic dividend’ is getting rarer across the world, and such a youth skew goes beyond just consumption. The millennials interact much more with
media content, making them as much creators as much as consumers.
The future of media led by these “prosumers” or proactive consumers is being fueled by rapid digitisation - to many of whom mobile, apps, the internet and social media are their first touch points and a way of life.
Driving this digitisation is the rapid evolution of access or connectivity, thanks to smartphones, tablets, apps and infrastructure. Smartphone penetration is rising rapidly and is not only limited to the more developed Gulf Cooperation Council (GCC) countries. In many markets like Egypt by 2017, there will be more smartphone buyers than PC’s making the mobile phone the first screen.
This in essence, is what is known as the ‘leap frogging’ phenomenon i.e. such markets will skip or jump ahead to new technology bypassing the route that matured markets had to take.
The internet and broadband penetration has increased – and like most emerging markets, it’s mobile centric. In fact, the number of mobile broadband (3G/4G) users are more than fixed broadband with the GCC already ahead of even developed markets like the US. Hence, we expect 2016-2018 to be an era of many “mobile-first” markets in the MENA region and the stage of content on the
UMMARY EXECUTIVE SUMMARY EXECUTIVEMMARY EXECUTIVE SUMMARY EXECUTIVE S
ARAB MEDIA EXPOSURE AND TRANSITIONARAB MEDIA OUTLOOK 2016. 2020ARAB MEDIA EXPOSURE AND TRANSITIONARAB MEDIA OUTLOOK 2016. 2020ARAB MEDIA EXPOSURE AND TRANSITIONARAB MEDIA OUTLOOK 2016. 2020
ARAB MEDIA EXPOSURE AND TRANSITIONARAB MEDIA OUTLOOK 2016. 2020ARAB MEDIA EXPOSURE AND TRANSITIONARAB MEDIA OUTLOOK 2016. 2020ARAB MEDIA EXPOSURE AND TRANSITIONARAB MEDIA OUTLOOK 2016. 2020ARAB MEDIA EXPOSURE AND TRANSITIONARAB MEDIA OUTLOOK 2016. 2020ARAB MEDIA EXPOSURE AND TRANSITIONARAB MEDIA OUTLOOK 2016. 2020ARAB MEDIA EXPOSURE AND TRANSITIONARAB MEDIA OUTLOOK 2016. 2020ARAB MEDIA EXPOSURE AND TRANSITION
small screen. This is already evident in the share of views on mobile phones which jumped from 11% in 2011 to almost 70% in 2015.
On the macro-economic front, the MENA region already gets considerable attention for its oil dependency. Almost 80% of its GDP is generated by oil exporting countries. While that is true, it is important to understand the positive impact the low oil prices have on large oil importers and economies like Egypt and Morocco.
Within the oil exporters as well, there is a varying degree of oil revenue dependency with key media markets like Saudi Arabia (KSA) having a smaller component
of non-oil GDP (about 56% of GDP in 2014) vs. a more diversified economy like the UAE whose non-oil component is in the low 30% (exhibit no. 1).
It is, however, over simplistic to directly correlate the oil prices to the fortunes of the media industry. As the analysis in the macro-economic section of this report indicates, consumer expenditure drives the paid media sector directly, and its advertising market in an indirect manner.
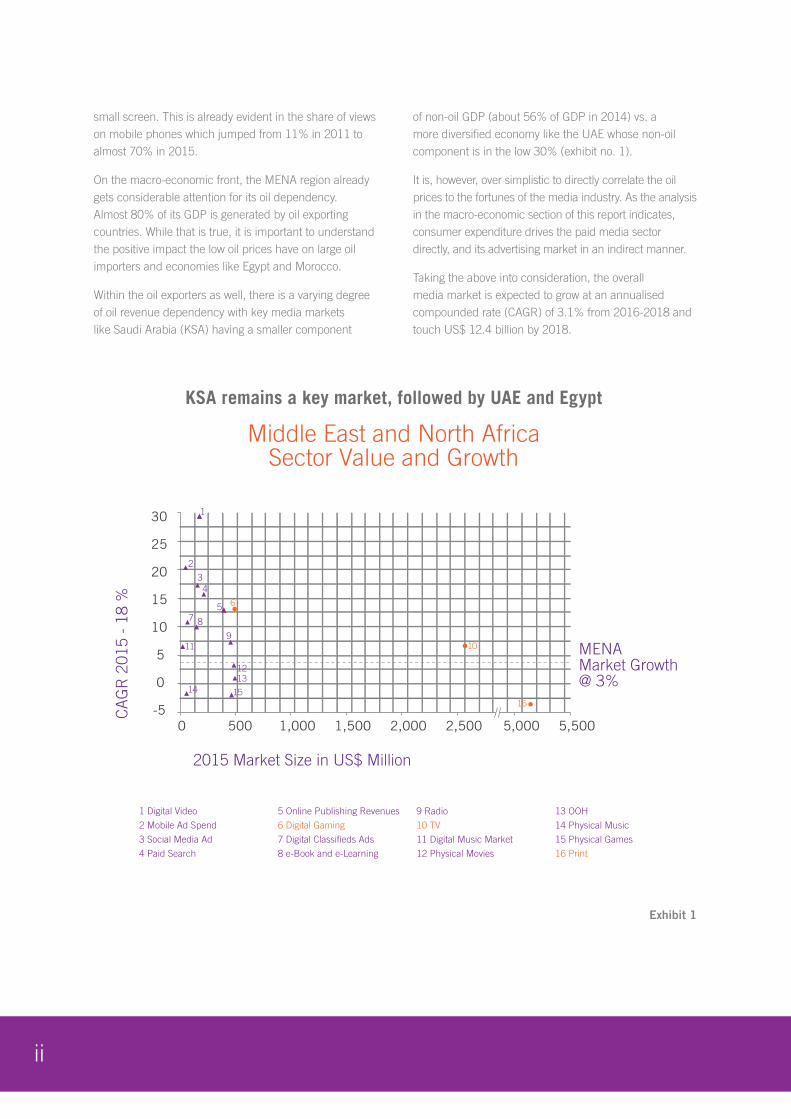
Taking the above into consideration, the overall media market is expected to grow at an annualised compounded rate (CAGR) of 3.1% from 2016-2018 and touch US$ 12.4 billion by 2018.
KSA remains a key market, followed by UAE and Egypt
Middle East and North AfricaSector Value and Growth
-5
0
5
10
15
20
25
30
5,500 1,000 500 0 2,500 1,500 2,000 5,000
CA
GR
201
5 -
18 %
2015 Market Size in US$ Million
1 Digital Video
2 Mobile Ad Spend
3 Social Media Ad
4 Paid Search
5 Online Publishing Revenues
6 Digital Gaming
7 Digital Classifieds Ads
8 e-Book and e-Learning
9 Radio
10 TV
11 Digital Music Market
12 Physical Movies
13 OOH
14 Physical Music
15 Physical Games
16 Print
MENAMarket Growth@ 3%
1
2
34
5 6
8
91011
1213
14 1516
7
ii
Exhibit 1
Paid and Digital Media Fuel the Growth of Media Industry
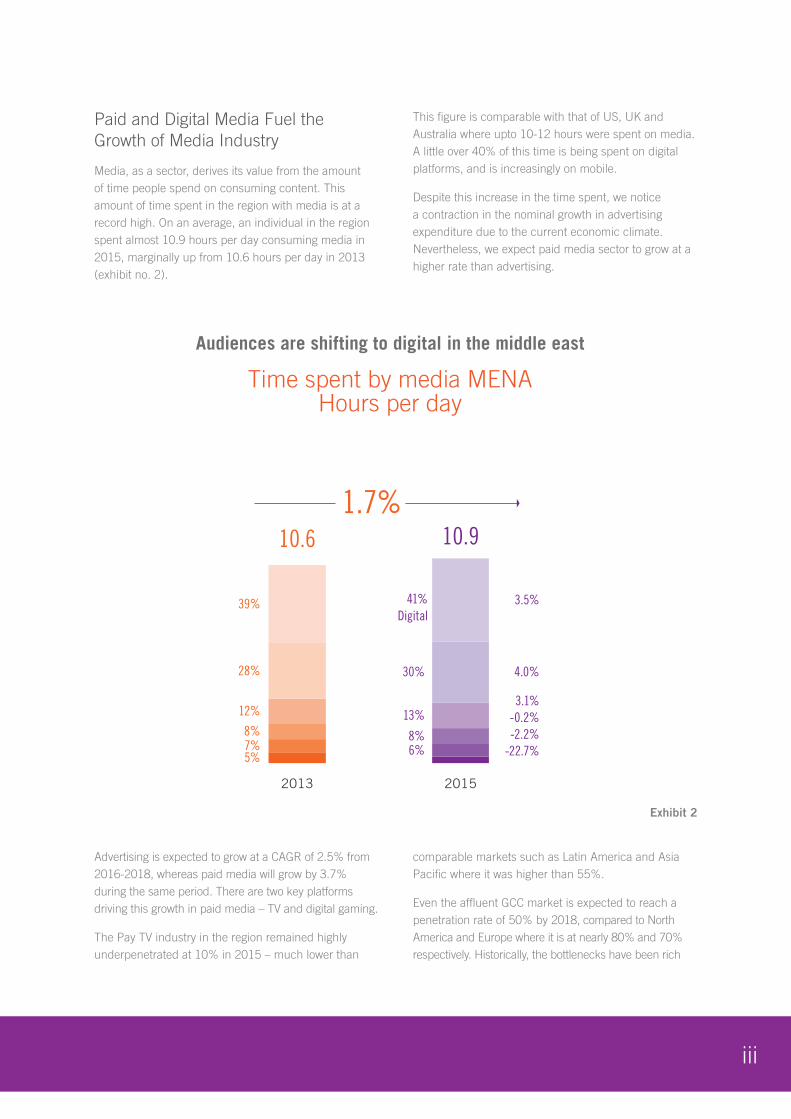
Media, as a sector, derives its value from the amount of time people spend on consuming content. This amount of time spent in the region with media is at a record high. On an average, an individual in the region spent almost 10.9 hours per day consuming media in 2015, marginally up from 10.6 hours per day in 2013 (exhibit no. 2).
This figure is comparable with that of US, UK and Australia where upto 10-12 hours were spent on media. A little over 40% of this time is being spent on digital platforms, and is increasingly on mobile.
Despite this increase in the time spent, we notice a contraction in the nominal growth in advertising expenditure due to the current economic climate. Nevertheless, we expect paid media sector to grow at a higher rate than advertising.
Advertising is expected to grow at a CAGR of 2.5% from 2016-2018, whereas paid media will grow by 3.7% during the same period. There are two key platforms driving this growth in paid media – TV and digital gaming.
The Pay TV industry in the region remained highly underpenetrated at 10% in 2015 – much lower than
comparable markets such as Latin America and Asia Pacific where it was higher than 55%.
Even the affluent GCC market is expected to reach a penetration rate of 50% by 2018, compared to North America and Europe where it is at nearly 80% and 70% respectively. Historically, the bottlenecks have been rich
Audiences are shifting to digital in the middle east
Time spent by media MENAHours per day
2015 2013
6% 8%
-22.7% 5% 7%
-2.2% -0.2% 13%
30%
41%
10.9
8%
4.0%
Digital 3.5%
28%
39%
10.6
12% 3.1%
1.7%
iii
Exhibit 2
premium local content available on Free to Air (FTA) channels and piracy.
However, this is changing due to investments by the large Pay TV operators to upgrade their access technology, adding more premium content and active government efforts to fight piracy. Moreover, premium local content is being increasingly introduced on Pay platforms.
Finally, the online video distribution platforms have seen an interesting uptake led by the entry of global players such as Netflix. Apple’s e-commerce platform selling digital content, is among the top five ecommerce sites despite being compared with sites such as Souq.org and Amazon, which sell physical goods. From an audience standpoint, OTT or ‘over the top’ is growing on TV viewing and not necessarily taking share.
Although time spent on OTT services has been mostly incremental to TV time, the ad budgets have a different story to tell. Ad spending on OTT is growing at a faster rate than TV advertising at a CAGR of 21% over the next three years, maintaining the healthy growth of the overall TV sector at a 3.3% CAGR from 2016-2018.
As the fastest growing segment at a CAGR of 14.4%, digital is clearly at the forefront. While digital video and social media spending are driving the growth, gaming holds the most value and is expected to cross US$1 billion in revenues by 2018. This is due to the fact that social and casual gaming is twice the global rate due to high proportion of youth and smartphone usage.
Even in the traditional gaming market, the delivery is now a digitised process vs. going to a store to buy
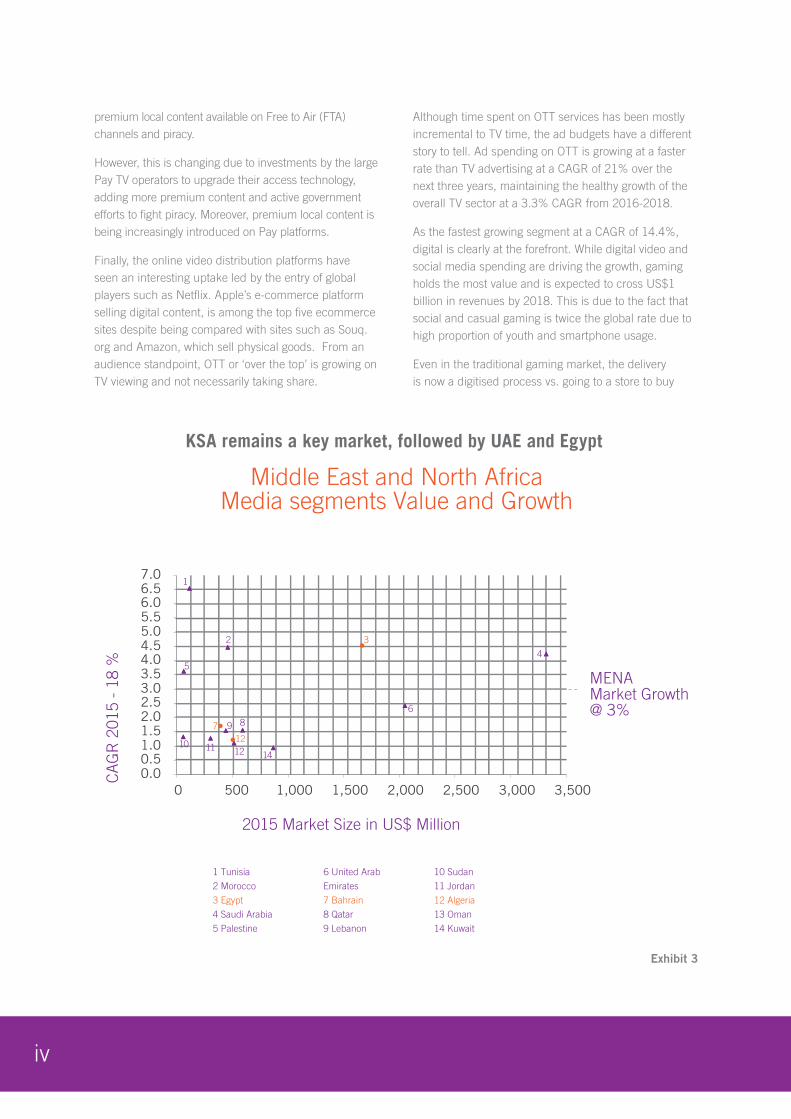
KSA remains a key market, followed by UAE and Egypt
Middle East and North AfricaMedia segments Value and Growth
1 Tunisia
2 Morocco
3 Egypt
4 Saudi Arabia
5 Palestine
6 United Arab
Emirates
7 Bahrain
8 Qatar
9 Lebanon
10 Sudan
11 Jordan
12 Algeria
13 Oman
14 Kuwait
0.00.51.01.52.02.53.03.54.04.55.05.56.06.57.0
0 500 1,000 1,500 2,000 2,500 3,000 3,500
MENAMarket Growth@ 3%
CA
GR
201
5 -
18 %
2015 Market Size in US$ Million
1
2 3
45
6
7 8
10 111212 14
9
iv
Exhibit 3
a gaming DVD. As is the case globally, the industry is dominated by paid games sales, with ‘in-game’ advertising representing a small part. As a result of this, social gaming development has been dominant. The gaming content is also increasingly localised, more so in social gaming. While the pay-to-play numbers in the UAE are at 17%, in Saudi Arabia, it is as high as 42%. Given its vitality, there are several foreign companies such as Peak Games from Turkey, which consider Saudi Arabia as their key market (exhibit no. 3).
The recent purchase of “Kammelna Games” in Saudi Arabia by “Peak Games” demonstrates the potential of local content. If there is an opportunity to be an exporter of media content, it is most likely to emanate from the digital gaming sector. Despite the regions’ emerging credentials in social gaming as well as creation of hubs like the Jordan Gaming Lab, the region has struggled to develop an at-scale gaming studio.
Typical startup funding challenges and lack of talent are two major challenges for the gaming industry besides challenges in credit card payments and content restrictions led by social and cultural mores. The future of the gaming industry remains uncertain unless these challenges are resolved at scale. Digital, however, has also impacted some sectors in a “not-all-positive” manner. For example, two sub-sectors are Publishing and Music. While digital has expanded the number of audiences and time spent as a whole, it has resulted in a “creative destruction” and “substitution effect” for the larger players.
Creative destruction of value refers to a major proportion of the value transferred as the consumer shifts to digital from print. This is already being witnessed, where the lost printed copy sales are being transferred to digital/online readers - in some cases 10 times of their physical circulation. However, since the digital access is free – the value is effectively “destroyed”.
Expectedly, the opportunity here is developing “paid content” revenues, which only a handful of players are experimenting with, as readers are not ready to pay for general news content. Hence, the dependence on ad revenues is rising rapidly, and the competition has become fierce. In the printed world, competition was limited to the local licensed newspapers, but in the digital world they compete with across news portals, start-ups such as sabq.org; aggregators like Pulse, Google News, Yahoo News; social news players like
Vice, BuzzFeed and social networks such as Facebook and Twitter. These “alternate publishing platforms” from technology players are expected to cause further disruption to the publishing sector (for further details, please refer to Chapter 4).
The next trend is “substitution effect”, which is eroding ad revenue at a faster pace than the losses in circulation. As the term suggests, this ‘substitution’ or replacement is being led by advertisers/marketers finding other media that they perceive as more effective and efficient than print. As a result, we notice print platform is also being substituted by radio due to its cost effectiveness. A slower advertising market has expedited the migration away from print.
Another challenge is the monetisation of audiences on mobile devices. The consumption of media is shifting in favor smartphones impacting the audiences on the online websites of print publishers. However, the pace of mobile monetisation is not keeping up with the rapid migration of audiences to mobile interfaces, creating commercial challenges for publishers (for further details, please refer to Chapter 4).
Owing to these challenges, we expect the share of the publishing sector from the total media market to decline from 35% in 2016 to 30% in 2018.
Print publishers will need to transform their content, business and distribution models to navigate through these market forces. Publishers, who have successfully transformed their organizations, have capitalized on either their editorial rigor or the long established relationships and distribution points with their readers
The other sector adversely impacted is Music. Although it is growing at a slower pace than previous years, CAGR of 0.6% over 2016-2018. Record sales continue to shrink while both digital music and live performances are growing they are unable to create new value. The first shift in the music industry was the one of physical to digital downloads and the second one is from owning to streaming digital music. Emerging digital models not only allow consumers to pay for individual songs (as opposed to the entire album) but also stream their favorite music on an ad-funded model.
While the global players like Spotify are firmly placed, the region is developing its players like Anghami and Mazika. But despite the growing streaming market, revenues remain elusive due to tiny value per stream as artists earn less than a cent for every song played
v
or streamed. Piracy has also resulted in lost value for the sector. As a result, globally, music is currently undergoing disintermediation with artists owned streaming services like Tidal.
Globally, live performances have been the savior growing at a rate of 2.3% per annum. In the region, however, live music has only a 40% share of the music revenues (vs. 62% globally). The growth potential is being limited due to the economy of scale and lack of purpose built venues. The future of the region’s music industry is hence focused on creating new sustainable revenues such as value-added services, content rights, licensing, and artist merchandise. Artists too have added new revenue streams, some in combination with their studios or managers which include among others, private performances and TV appearances.
Media Snacking CultureThe most notable impact of access is specifically the smartphone and in the video space. With the majority of time spent on social networks and mobile videos, digital constitutes 40% of their attention span with 80 minutes and 28 minutes of time being spent on social networks and video respectively.
On the social networking side, the “power of communities” is becoming stronger with social plug-ins and recommendation engines. The strongest enablers of these communities are Facebook that has evolved into a ‘Super Apps’ i.e. it is going beyond its core functionality of connecting friends and family to becoming an enabler for the commercial ecosystem to include services like buying, sending money, or even booking a taxi. It is also having a profound impact on the news discovery, development and distribution driving the shift to “breaking views” as opposed to “breaking news”.
On the video side, the fastest growing segment is short-form (few minutes long), amateur digital content – curated by Arab youth and distributed on video platforms, such as YouTube. Such content is dominated by social media influencers (SMIs) and emerging artists under multi-channel networks (MCNs).
Today, MCNs have higher viewership than leading broadcasters on YouTube. The time spent on short-form amateur digital content on channels such as UTurn and Telfaz is growing - faster than Free-to-Air television or Pay TV.
The noticeable difference in the OTT short-form space is the lack of representation from broadcasters. To make up for this, globally, almost all leading MCNs have been acquired by leading broadcasters with many integrating or creating more content into their mainstream TV offerings.
Increasing trend of media consumption on social networks and the growing popularity of short-form video content is driving a culture of media snacking across the region.
Youth Engagement and Cultural BoomThe younger demographics, a potent combination of social media and mobility, and the dominance of short form local content is having a profound impact. One of the main benefits from the uptake of short-form video is the youth engagement. Almost all of the OTT short-form content being produced involves the Arab Youth behind the creation process.
The content is inherently local in nature and represents genres not typically found on mainstream television. Also the social influence of the SMIs has been developed on the back of content expertise providing them with strong credibility. SMIs in the region have thus the potential to be a source of local culture, and develop their influence to leverage far greater social benefit beyond their current marcomms revenue streams.
MCNs play a key role in not only nurturing young creative talent but also helping discover, develop and build SMI audiences. Even though MCNs remain at an early stage of development, they are truly driving an unprecedented cultural boom.
Emerging Talent ParadigmThe majority of media related job profiles with highest growth potential did not exist a decade ago such as social media analysts and digital journalists. Most of these emerging job profiles attract the youth and involve digital skills.
It is not surprising that among the “Top 25 hottest skills in 2015” listed by LinkedIn, only five were non-digital. Of the ones that were non-digital, at least two had some aspect of digital skills as a requirement. This creates a challenge for media education, training and talent development to serve the needs of the media sector.
vi
Globally, governments and education systems are adapting to keep pace. They are focusing on a greater integration with the industry by recruiting industry talent and working closely with them to develop or update curricula that is in sync with the demand.
There is a clear requirement for curricula to be more updated, and have a higher element of analytics and technology built in. The latter two areas are practical sciences and hence require a shift from current teaching and classroom delivery, which still dominates media studies. An analysis of a range of universities and their curricula indicates that positive steps are being taken by some governments. Notable among them is tying up with the best in class universities to bring their specialist skills e.g. New York University Abu Dhabi and the Northwestern University in Qatar. In the UAE, the Mohammed Bin Rashid College of the American University of Dubai is a good example of recruiting experienced industry talent as academia or faculty, as well as the United Arab Emirates University in Abu Dhabi.
To meet this challenge, it is imperative for such collaborations between government, academia and the industry. An example is “TechCity” - a publically funded initiative to develop talent in the UK to provide ‘employment ready’ education through active industry engagement. The region will require such long-term initiatives to successfully adapt to the evolving media sector.
The Digital AwakeningDespite the current depressed economic conditions, digital continues to propel growth in the media sector as time spent by consumers is at a record high. Many of the challenges that have plagued traditional media are being addressed indirectly as digital platforms gain scale. From a talent perspective, Arab youth is actively participating in the production of content. Several start-ups have also received funding from private and
government sectors, helping them grow and extend the value chain. Even the issues related to audience measurement are being solved on digital platforms and specialised media research players. While international broadcasters and studios distributed their international content through Pay TV platforms, digital players such as Netflix and iTunes have plans to create more local content. Also, the reluctance by consumers to pay for premium content in a region dominated by the free-to-air culture is being resolved by the flexibility of online distribution platforms.
The media sector has always had an underpenetrated value, in comparison to the 280 million population base. As digital platforms reach scale, many obstacles could be minimised or solved.
With the correct motivation and institutional support, the Arab youth could unleash the full potential of the region’s media sector. In this economic climate, the governments continue to show a wide diversity in their treatment of the media sector through sector development initiatives as well as regulatory and policy enablers. On the former topic, media cities continue to be launched in the region with the UAE leading the way, the latest being the announcement of the Sharjah Media City in early 2016.
While some media cities in Jordan and Egypt have positioned themselves as specialists, the UAE having started its journey much earlier is moving from established comprehensive offerings to sector-specific zones like Dubai Studio City and Dubai Production City, as is the case for twofour 54.
Dubai Creative Clusters Authority (DCCA) is a step forward to increase the efficiency and improve the value for its tenants. With digital growing at double-digits, it will be interesting to see how sector development initiatives will be modified in the coming years to address the unique challenges not served by the current set up.
vii
20
ARAB MEDIA EXPOSURE AND TRANSITIONARAB MEDIA OUTLOOK 2016. 2020ARAB MEDIA EXPOSURE AND TRANSITIONARAB MEDIA OUTLOOK 2016. 2020
ARAB MEDIA OUTLOOK 2016. 2020ARAB MEDIA EXPOSURE AND TRANSITIONARAB MEDIA OUTLOOK 2016. 2020ARAB MEDIA EXPOSURE AND TRANSITIONARAB MEDIA OUTLOOK 2016. 2020ARAB MEDIA EXPOSURE AND TRANSITIONARAB MEDIA OUTLOOK 2016. 2020ARAB MEDIA EXPOSURE AND TRANSITIONARAB MEDIA OUTLOOK 2016. 2020ARAB MEDIA EXPOSURE AND TRANSITIONARAB MEDIA OUTLOOK 2016. 2020ARAB MEDIA EXPOSURE AND TRANSITIONARAB MEDIA OUTLOOK 2016. 2020ARAB MEDIA EXPOSURE AND TRANSITIONARAB MEDIA OUTLOOK 2016. 2020
ENVIRONMENT MACRO-ECONOMIC ENVIRON
1
ARAB MEDIA EXPOSURE AND TRANSITIONARAB MEDIA OUTLOOK 2016. 2020ARAB MEDIA EXPOSURE AND TRANSITIONARAB MEDIA OUTLOOK 2016. 2020
ARAB MEDIA OUTLOOK 2016. 2020ARAB MEDIA EXPOSURE AND TRANSITIONARAB MEDIA OUTLOOK 2016. 2020ARAB MEDIA EXPOSURE AND TRANSITIONARAB MEDIA OUTLOOK 2016. 2020ARAB MEDIA EXPOSURE AND TRANSITIONARAB MEDIA OUTLOOK 2016. 2020ARAB MEDIA EXPOSURE AND TRANSITIONARAB MEDIA OUTLOOK 2016. 2020ARAB MEDIA EXPOSURE AND TRANSITIONARAB MEDIA OUTLOOK 2016. 2020ARAB MEDIA EXPOSURE AND TRANSITIONARAB MEDIA OUTLOOK 2016. 2020ARAB MEDIA EXPOSURE AND TRANSITIONARAB MEDIA OUTLOOK 2016. 2020
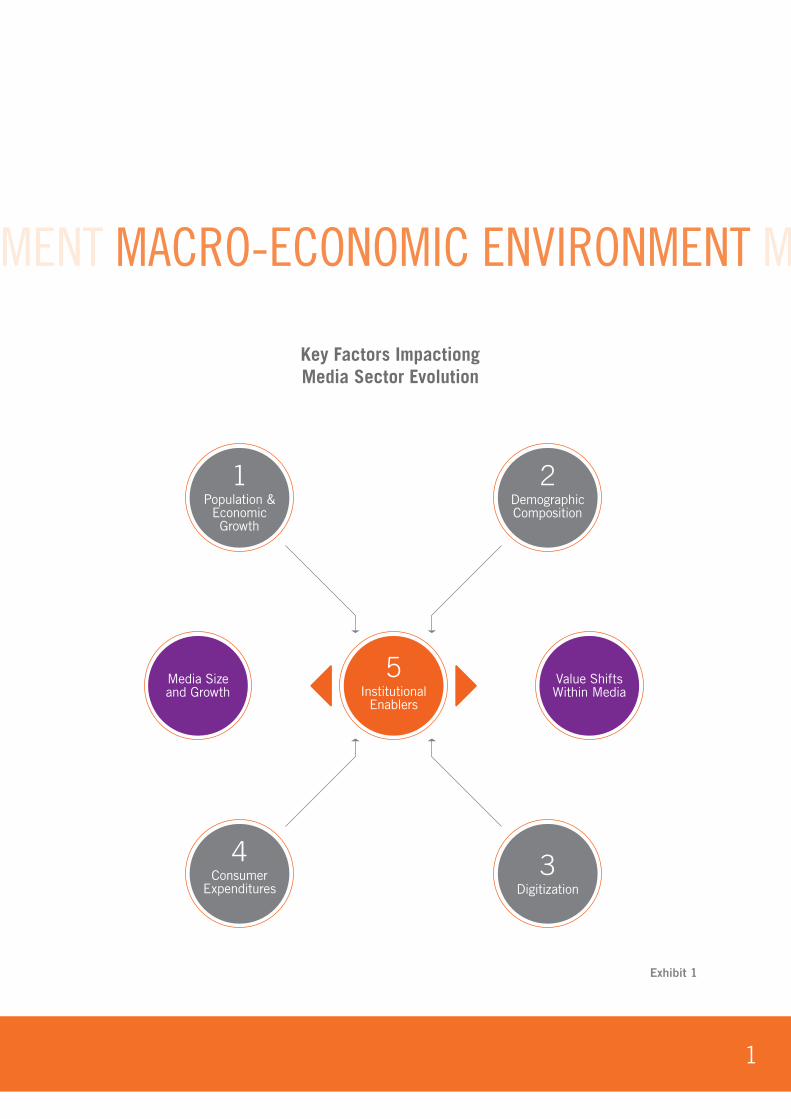
Key Factors ImpactiongMedia Sector Evolution
InstitutionalEnablers
5 Value ShiftsWithin Media
Media Sizeand Growth
Population &EconomicGrowth
1DemographicComposition
2
Digitization3Consumer
Expenditures
4
ENVIRONMENT MACRO-ECONOMIC ENVIRONMENT MACRO-ECONOMIC ENVIRONMENT M
Exhibit 1
2
Overview
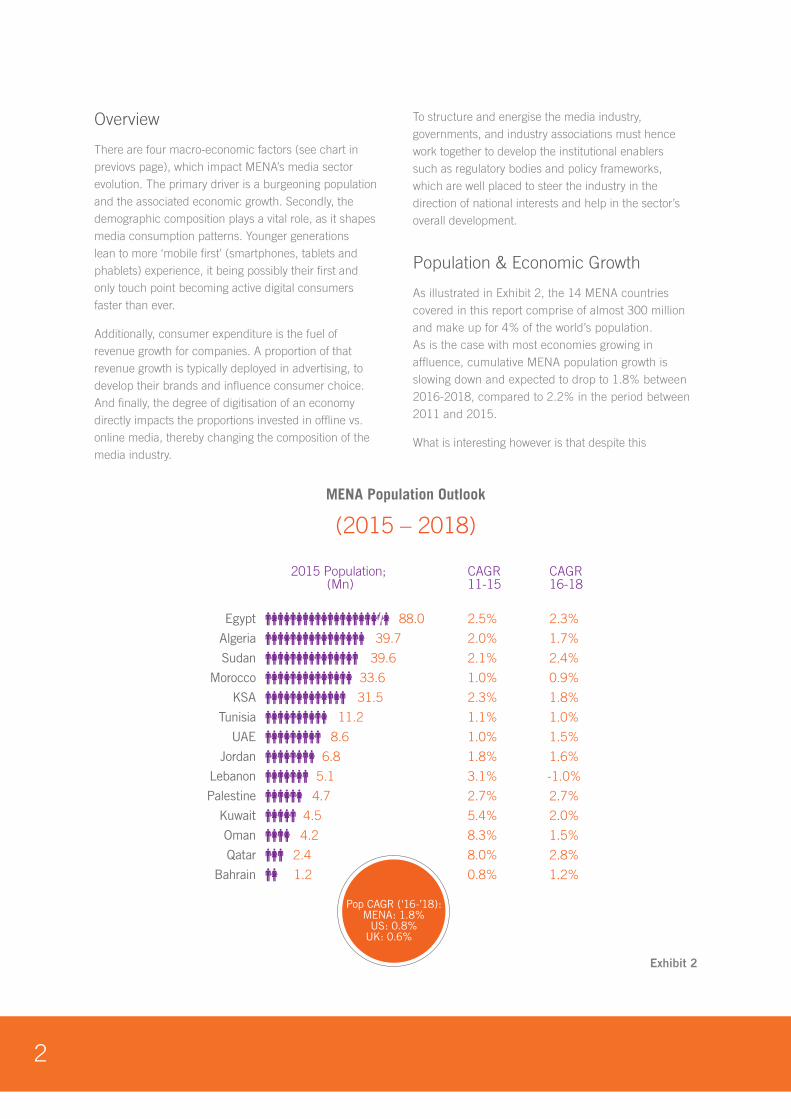
There are four macro-economic factors (see chart in previovs page), which impact MENA’s media sector evolution. The primary driver is a burgeoning population and the associated economic growth. Secondly, the demographic composition plays a vital role, as it shapes media consumption patterns. Younger generations lean to more ‘mobile first’ (smartphones, tablets and phablets) experience, it being possibly their first and only touch point becoming active digital consumers faster than ever.
Additionally, consumer expenditure is the fuel of revenue growth for companies. A proportion of that revenue growth is typically deployed in advertising, to develop their brands and influence consumer choice. And finally, the degree of digitisation of an economy directly impacts the proportions invested in offline vs. online media, thereby changing the composition of the media industry.
To structure and energise the media industry, governments, and industry associations must hence work together to develop the institutional enablers such as regulatory bodies and policy frameworks, which are well placed to steer the industry in the direction of national interests and help in the sector’s overall development.
Population & Economic Growth
As illustrated in Exhibit 2, the 14 MENA countries covered in this report comprise of almost 300 million and make up for 4% of the world’s population. As is the case with most economies growing in affluence, cumulative MENA population growth is slowing down and expected to drop to 1.8% between 2016-2018, compared to 2.2% in the period between 2011 and 2015.
What is interesting however is that despite this
MENA Population Outlook
(2015 – 2018)
2015 Population; (Mn)
CAGR11-15
CAGR16-18
Pop CAGR (‘16-’18):MENA: 1.8%
US: 0.8%UK: 0.6%
2.3% 1.8%
1.0% 0.9%
2.1% 2.4%
2.0% 1.7%
2.5% 2.3%
0.8% 1.2%
8.0% 2.8%
8.3% 1.5%
5.4% 2.0%
2.7% 2.7%
3.1% -1.0%
1.8% 1.6%
1.0% 1.5%
1.1% 1.0%
KSA 31.5
Morocco 33.6
Sudan 39.6
Algeria 39.7
Egypt 88.0
Bahrain 1.2
Qatar 2.4
Oman 4.2
Kuwait 4.5
Palestine 4.7
Lebanon 5.1
Jordan 6.8
UAE 8.6
Tunisia 11.2
Exhibit 2

3
slowdown, these population growth rates remain double that of developed markets such as the US and the UK, which are growing at 0.8% and 0.6% respectively.
While the populations are diverse, it is the countries with large populations, such as Egypt, Algeria, Sudan,
Morocco and KSA that are seeing the highest population growth. These countries will continue to drive the long-term development of the region’s media sector. Markets like KSA are already hubs for media-related investment and economies such as Egypt and Morocco will be the future engines of growth in the region.
Impact of oil on the region’s GDP and future growth
The MENA region comprises of a mix of oil importers and exporters. As illustrated in Exhibit 3, oil exporters have already shown the impact of oil prices on the slowing of GDP growth in 2011-15. The continued fall in oil prices has affected the fiscal balance of many
countries, resulting in them announcing cuts to enforce fiscal discipline. Crude oil (at the time of this report) was US$40 a barrel – which represents a decline of over 50% from January 2014.
On another note, while it is true that the GCC economies dominate the region with their larger nominal GDPs, it is easy to overlook economies like Egypt and Morocco,
MENA Economic Outlook
(2011-2018)
2015 Nominal GDP;(USD Bn)
Oil Exporting Nations
CAGR2011-15
CAGR2016 -18
GDP CAGR (‘16 -’18):MENA: 7.1%
US: 4.1%UK: 5.7%
717.9 1.8% 4.4%KSA
104.5 0.8% 7.1%Morocco
84.0 5.7% 8.9%Sudan
142.3 -3.9% 6.7%Algeria
308.0 7.5% 10.9%Egypt
30.9 1.6% 6.0%Bahrain
192.7 3.2% 10.0%Qatar
62.3 -2.7% 6.8%Oman
119.9 -6.1% 10.0%Kuwait
2.8 5.7% 6.5%Palestine
38.0 7.1% 6.6%Jordan
339.1 -0.7% 7.3%UAE
43.5 -1.3% 3.2%Tunisia
7.7% 4.4%Lebanon 54.0
Exhibit 3
4
which are net oil importers. Egypt, for example, grew at an astonishing rate of 7.5% in 2011-15 playing catch-up to the economic decline it suffered from the ‘Arab spring’ impact, reaping the benefits of low oil prices. Besides, as economies like Morocco increase their productivity, they are expected to be the new growth engines.
To some readers, the projected GDP growth may appear aggressive, but it should be noted that oil prices are driven by market forces vs. pure supply and demand. It is hence difficult for global financial institutions to accurately forecast oil prices and their impact. If current prices prevail or soften, future GDP forecasts are likely to be revised downwards as was done in the past.
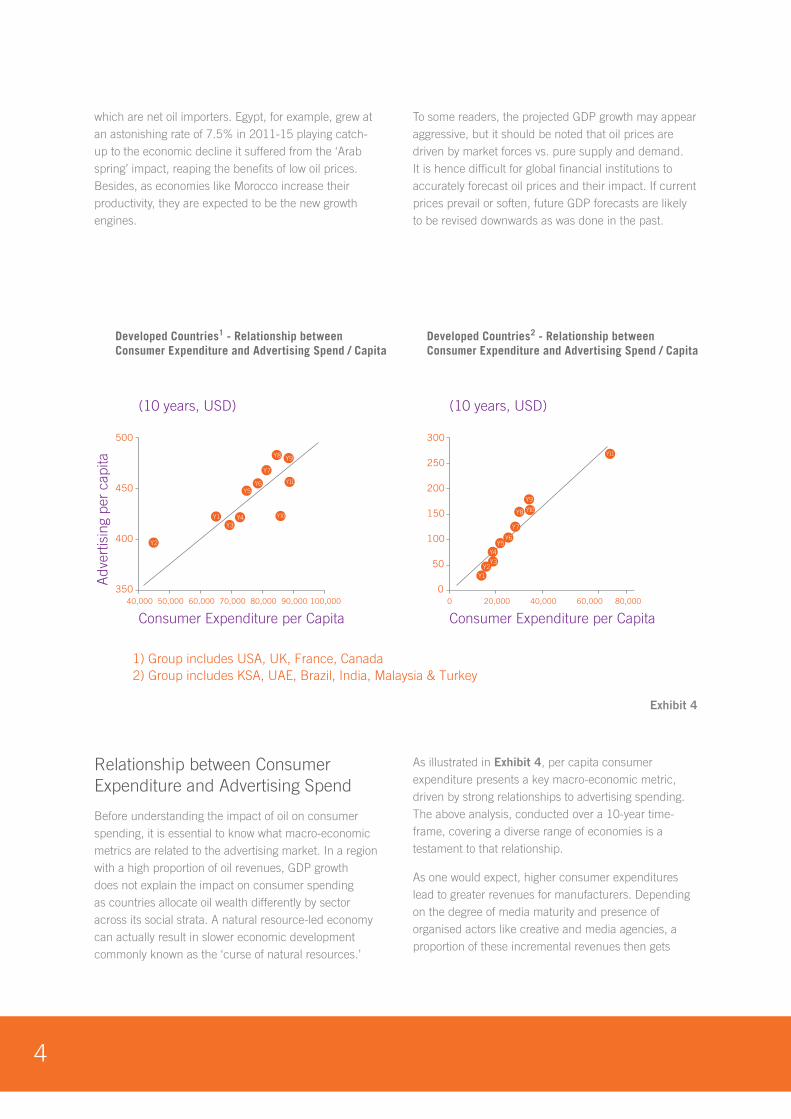
Relationship between Consumer Expenditure and Advertising Spend
Before understanding the impact of oil on consumer spending, it is essential to know what macro-economic metrics are related to the advertising market. In a region with a high proportion of oil revenues, GDP growth does not explain the impact on consumer spending as countries allocate oil wealth differently by sector across its social strata. A natural resource-led economy can actually result in slower economic development commonly known as the ‘curse of natural resources.’
As illustrated in Exhibit 4, per capita consumer expenditure presents a key macro-economic metric, driven by strong relationships to advertising spending. The above analysis, conducted over a 10-year time-frame, covering a diverse range of economies is a testament to that relationship.
As one would expect, higher consumer expenditures lead to greater revenues for manufacturers. Depending on the degree of media maturity and presence of organised actors like creative and media agencies, a proportion of these incremental revenues then gets
80,000
500
450
400
350
Adv
ertis
ing
per
capi
ta
Consumer Expenditure per Capita
Developed Countries1 - Relationship betweenConsumer Expenditure and Advertising Spend / Capita
(10 years, USD)
40,000 50,000 60,000 70,000 80,000 90,000 100,000
Y1Y3
Y4
Y5Y6
Y7
Y11
Y8 Y9
Y10
Y2
Developed Countries2 - Relationship betweenConsumer Expenditure and Advertising Spend / Capita
(10 years, USD)
Consumer Expenditure per Capita
300
250
200
150
100
50
020,0000 40,000 60,000
Y1Y2
Y3
Y4Y5
Y6
Y7
Y8 Y10
Y9
Y11
1) Group includes USA, UK, France, Canada2) Group includes KSA, UAE, Brazil, India, Malaysia & Turkey
Exhibit 4
5
deployed into advertising. The relationship between a manufacturer’s revenue and its advertising spend is simplified as the advertising to sales (A/S) ratio.
A/S Ratio
Despite the increased sophistication in marketing return on investment, ad spending is still largely a near-fixed portion of expected operating revenue for most industries. The degree of branding and media market evolution remain key filters to determine the metric.
Hence if companies witness a consumer-led revenue slowdown, marketing spend is often reduced to manage future profitability. In that sense, it is often perceived as a discretionary expenditure. This rationalisation in ad spend is not typically in sync with actual consumer demand as it is difficult to estimate the actual changes in demand due to the complexity. This often leads the consumer to reduce their spending in the event of uncertainty. As a corollary to the above, restored consumer demand usually results in last financial quarter marketing investments – to ensure marketing investments are not “lost” to the bottom line.
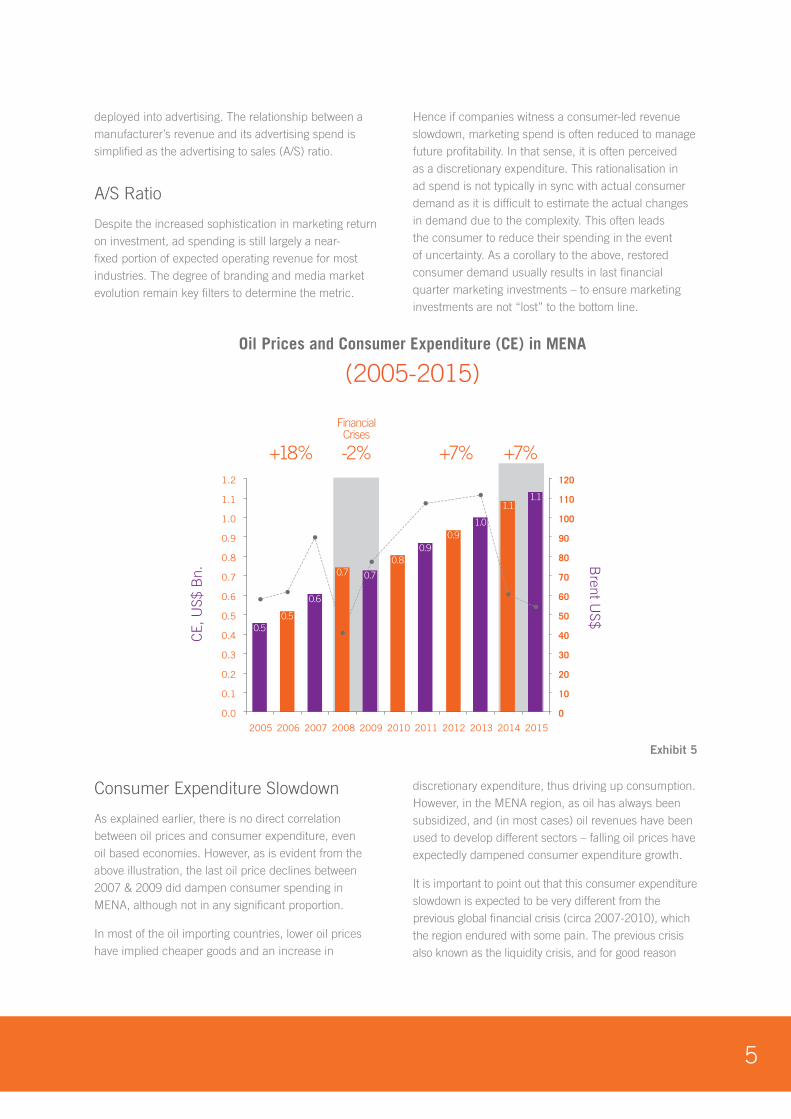
Consumer Expenditure Slowdown
As explained earlier, there is no direct correlation between oil prices and consumer expenditure, even oil based economies. However, as is evident from the above illustration, the last oil price declines between 2007 & 2009 did dampen consumer spending in MENA, although not in any significant proportion.
In most of the oil importing countries, lower oil prices have implied cheaper goods and an increase in
discretionary expenditure, thus driving up consumption. However, in the MENA region, as oil has always been subsidized, and (in most cases) oil revenues have been used to develop different sectors – falling oil prices have expectedly dampened consumer expenditure growth.
It is important to point out that this consumer expenditure slowdown is expected to be very different from the previous global financial crisis (circa 2007-2010), which the region endured with some pain. The previous crisis also known as the liquidity crisis, and for good reason
Oil Prices and Consumer Expenditure (CE) in MENA
(2005-2015)
1.2
1.1
1.0
0.9
0.8
0.7
0.6
0.5
0.4
0.3
0.2
0.1
0.0
CE,
US$
Bn.
Brent U
S$
120
110
100
90
80
70
60
50
40
30
20
10
0
2005 2006 2007 2008 2009
FinancialCrises
+18%
2010 2011 2012 2013 2014 2015
0.50.5
0.6
0.80.9
0.91.0
1.11.1
-2% +7% +7%
0.7 0.7
Exhibit 5
6Source: 1. EIA-AEO-Early 2015,IEA World Energy Outlook 2015; Rystad Energy; Strategy& research
was caused by the fall of global financial institutions triggering in the world’s largest economy and impacted availability of credit to consumers and businesses.
With some of the countries being highly leveraged, the sudden lack of liquidity impacted the economy sharply. It didn’t help that it was also a sharp correction from the previous years (2006-08 showed 18% growth). In that scenario, governments could do little to spur consumer demand directly and most measures taken in response by the government were aimed at restoring confidence in the banking system and in managing debt.
Although we are already witnessing a slowdown in consumer expenditure, this time, the characteristics of this slowdown are different. First, this slowdown is led by market forces than institutional failure. The second is duration - on the demand side, the China also the
world’s largest consumer of oil with a 23%1 share had a significant demand side impact. On the supply side, the excess oil, which started as an OPEC play has now spiraled with many other players joining in. Notable in this is Iraq, Russia, which continue to pump at full tilt despite low prices and sanctions. To further add to this, Iranian oil output is due to rise early 2016 with easing of sanctions. Hence, unless some structural measures are taken by OPEC and the new actors, it is expected that this slowdown will last longer.
In summary, this consumer slowdown can be managed better by the regional governments (compared to the previous activities) provided take long-term structural measures to increase non-oil-based economic activity and deploy the accumulated cash reserves to soften the impact on consumer expenditure.
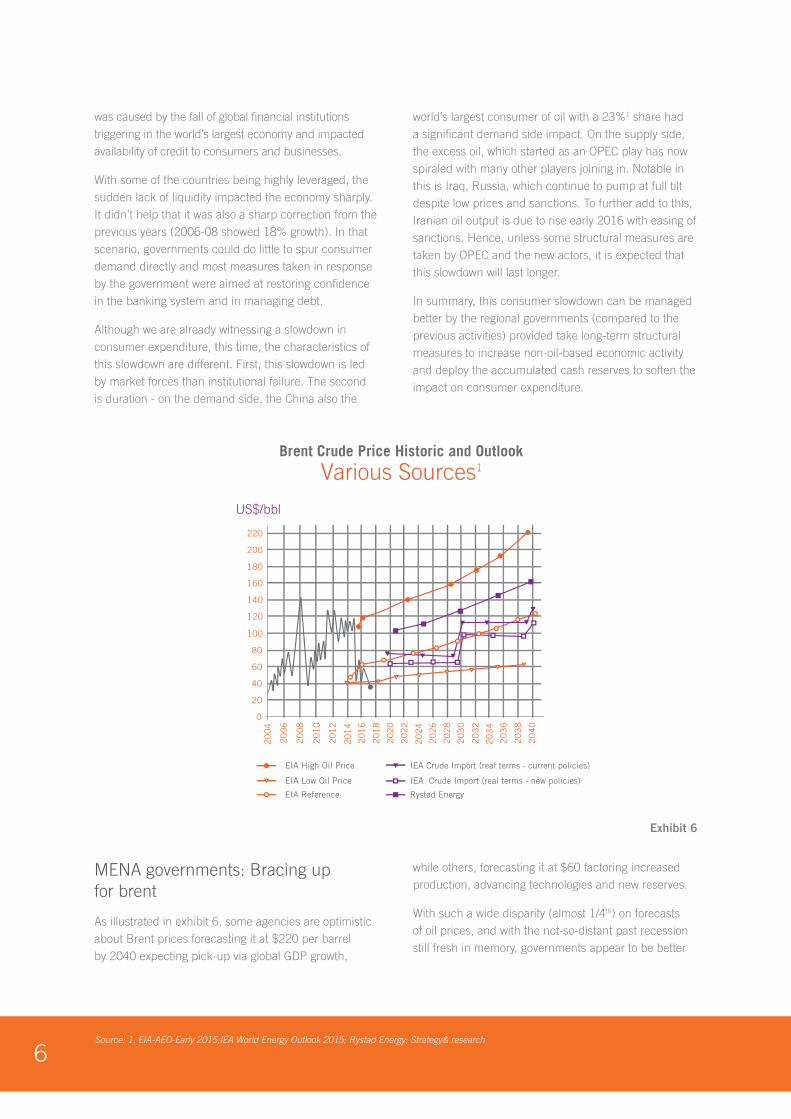
MENA governments: Bracing up for brent
As illustrated in exhibit 6, some agencies are optimistic about Brent prices forecasting it at $220 per barrel by 2040 expecting pick-up via global GDP growth,
while others, forecasting it at $60 factoring increased production, advancing technologies and new reserves.
With such a wide disparity (almost 1/4th) on forecasts of oil prices, and with the not-so-distant past recession still fresh in memory, governments appear to be better
Brent Crude Price Historic and Outlook
Various Sources1
Source: 1) World Bank, IMF, October 2015
0
20
40
60
80
100
120
140
160
180
200
220
20
04
20
06
20
10
20
08
20
12
US$/bbl
20
14
20
20
20
18
20
26
20
24
20
16
20
22
20
28
20
38
20
36
20
30
20
34
20
40
20
32
EIA Low Oil Price
EIA Reference
IEA Crude Import (real terms - new policies)
Rystad Energy
EIA High Oil Price IEA Crude Import (real terms - current policies)
Exhibit 6
7Source: 1. Euromonitor. Strategy& analysis
equipped to face any impact on consumer demand by rolling out a slew of fiscal initiatives to minimise impact.
To brace up, most MENA governments are cutting spending as they account for the lion’s share of footing the bill, which does not bode well for the economy or consumer spending. Several GCC countries have
increased gas prices, announced subsidy reforms and curtailing non-essential spending to impact positively their GDP. A notable exception is Saudi Arabia, the region’s largest economy, which announced large fiscal packages in 2016 drawing on its massive cash reserves.
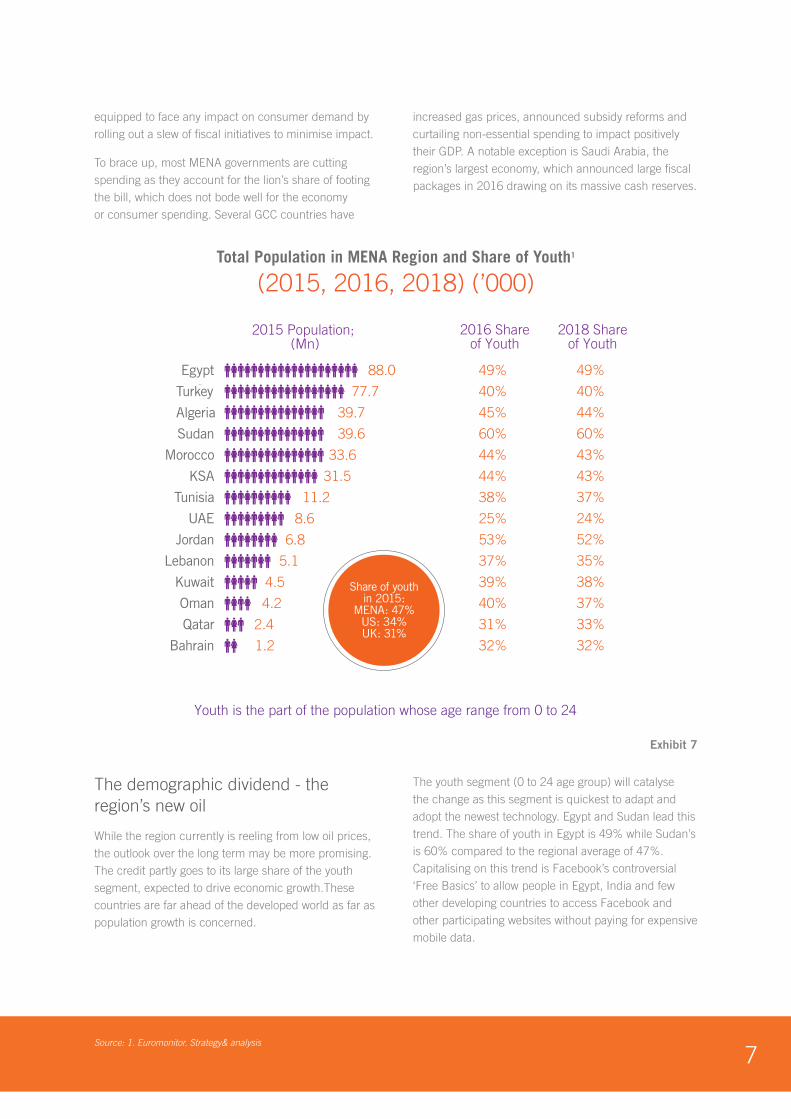
The demographic dividend - the region’s new oil
While the region currently is reeling from low oil prices, the outlook over the long term may be more promising. The credit partly goes to its large share of the youth segment, expected to drive economic growth.These countries are far ahead of the developed world as far as population growth is concerned.
The youth segment (0 to 24 age group) will catalyse the change as this segment is quickest to adapt and adopt the newest technology. Egypt and Sudan lead this trend. The share of youth in Egypt is 49% while Sudan’s is 60% compared to the regional average of 47%. Capitalising on this trend is Facebook’s controversial ‘Free Basics’ to allow people in Egypt, India and few other developing countries to access Facebook and other participating websites without paying for expensive mobile data.
Total Population in MENA Region and Share of Youth1
(2015, 2016, 2018) (’000)
Youth is the part of the population whose age range from 0 to 24
Source: Euromonitor. Strategy& analysis
49%
40%
45%
60%
44%
44%
38%
25%
53%
37%
39%
40%
31%
32%
49%
40%
44%
60%
43%
43%
37%
24%
52%
35%
38%
37%
33%
32%
2016 Shareof Youth
2018 Shareof Youth
Share of youthin 2015:
MENA: 47%US: 34%UK: 31%
2015 Population; (Mn)
Turkey 77.7
Egypt 88.0
Bahrain 1.2
Qatar 2.4
Oman 4.2
Kuwait 4.5
KSA 31.5
Morocco 33.6
Sudan 39.6
Algeria 39.7
Lebanon 5.1
Jordan 6.8
UAE 8.6
Tunisia 11.2
Exhibit 7
8Source 1. BBC News
Facebook claimed three million Egyptians had used the service - a million of those going online for the first time1.
Simultaneously, tech-led innovation is leading to growth in data and digitization, which are finding favor with the
young that in turn will drive wider digitisation benefits for companies to tap into consumer demand and trends resulting in the media sector’s growth.
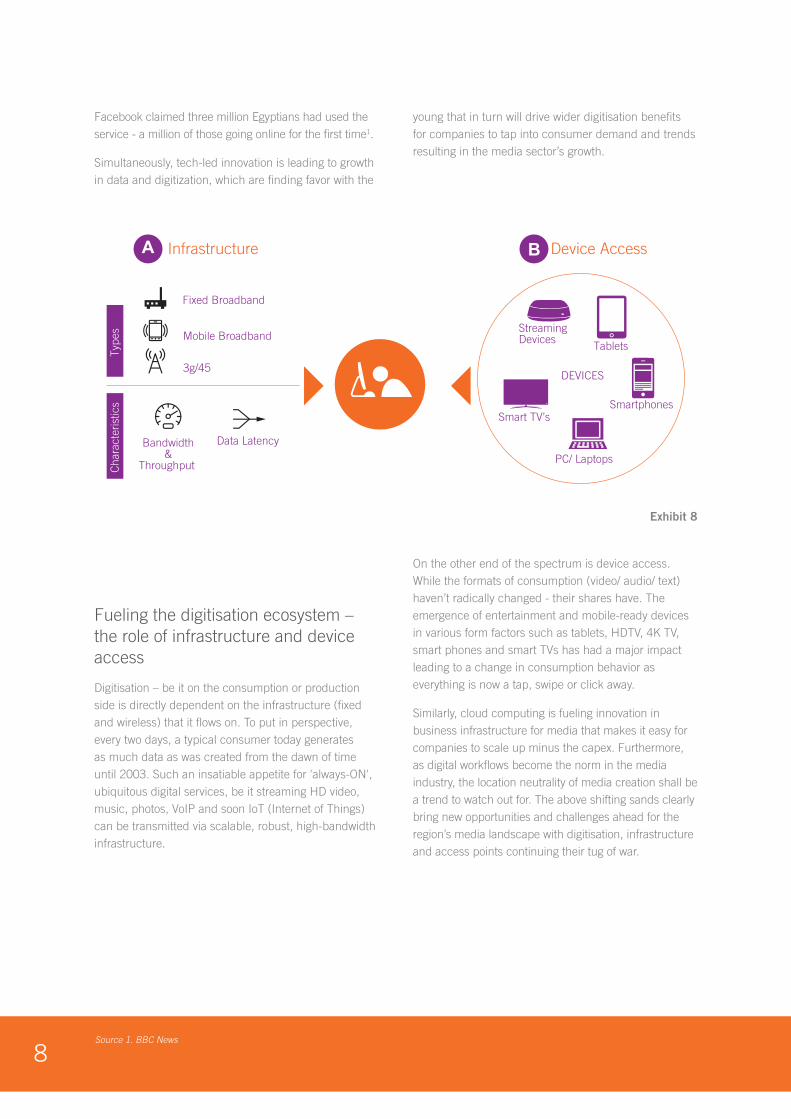
Fueling the digitisation ecosystem – the role of infrastructure and device access
Digitisation – be it on the consumption or production side is directly dependent on the infrastructure (fixed and wireless) that it flows on. To put in perspective, every two days, a typical consumer today generates as much data as was created from the dawn of time until 2003. Such an insatiable appetite for 'always-ON', ubiquitous digital services, be it streaming HD video, music, photos, VoIP and soon IoT (Internet of Things) can be transmitted via scalable, robust, high-bandwidth infrastructure.
On the other end of the spectrum is device access. While the formats of consumption (video/ audio/ text) haven’t radically changed - their shares have. The emergence of entertainment and mobile-ready devices in various form factors such as tablets, HDTV, 4K TV, smart phones and smart TVs has had a major impact leading to a change in consumption behavior as everything is now a tap, swipe or click away.
Similarly, cloud computing is fueling innovation in business infrastructure for media that makes it easy for companies to scale up minus the capex. Furthermore, as digital workflows become the norm in the media industry, the location neutrality of media creation shall be a trend to watch out for. The above shifting sands clearly bring new opportunities and challenges ahead for the region’s media landscape with digitisation, infrastructure and access points continuing their tug of war.
StreamingDevices
Tablets
Smartphones
PC/ Laptops
Smart TV’s
DEVICES
A Infrastructure
Fixed Broadband
Mobile Broadband
3g/45
Bandwidth&
Throughput
Data Latency
Type
s C
hara
cter
istic
s
B Device Access
Exhibit 8
9Source: 1. Strategy& analysis
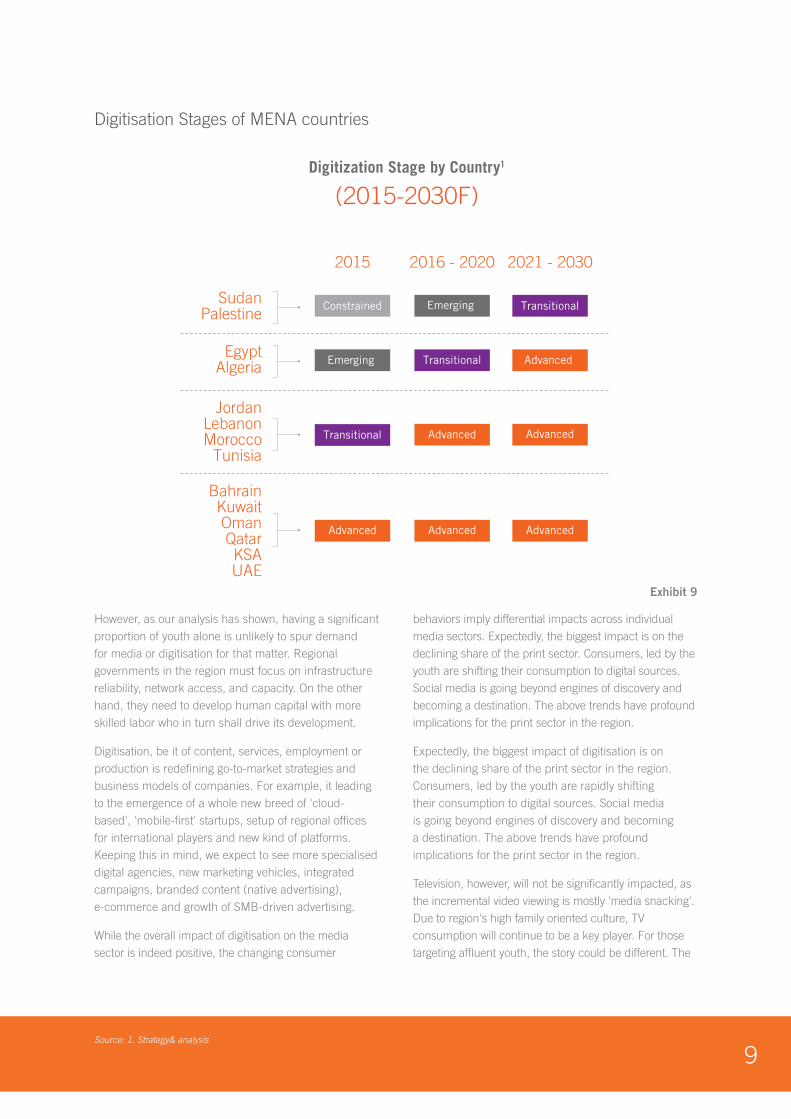
Digitisation Stages of MENA countries
However, as our analysis has shown, having a significant proportion of youth alone is unlikely to spur demand for media or digitisation for that matter. Regional governments in the region must focus on infrastructure reliability, network access, and capacity. On the other hand, they need to develop human capital with more skilled labor who in turn shall drive its development.
Digitisation, be it of content, services, employment or production is redefining go-to-market strategies and business models of companies. For example, it leading to the emergence of a whole new breed of 'cloud-based', 'mobile-first' startups, setup of regional offices for international players and new kind of platforms. Keeping this in mind, we expect to see more specialised digital agencies, new marketing vehicles, integrated campaigns, branded content (native advertising), e-commerce and growth of SMB-driven advertising.
While the overall impact of digitisation on the media sector is indeed positive, the changing consumer
behaviors imply differential impacts across individual media sectors. Expectedly, the biggest impact is on the declining share of the print sector. Consumers, led by the youth are shifting their consumption to digital sources. Social media is going beyond engines of discovery and becoming a destination. The above trends have profound implications for the print sector in the region.
Expectedly, the biggest impact of digitisation is on the declining share of the print sector in the region. Consumers, led by the youth are rapidly shifting their consumption to digital sources. Social media is going beyond engines of discovery and becoming a destination. The above trends have profound implications for the print sector in the region.
Television, however, will not be significantly impacted, as the incremental video viewing is mostly 'media snacking'. Due to region's high family oriented culture, TV consumption will continue to be a key player. For those targeting affluent youth, the story could be different. The
Source: Strategy& analysis
Digitization Stage by Country1
(2015-2030F)
EgyptAlgeria
JordanLebanonMorocco
Tunisia
BahrainKuwaitOmanQatarKSAUAE
SudanPalestine
2015 2016 - 2020 2021 - 2030
Constrained Emerging Transitional
Transitional
Transitional Advanced Advanced
Advanced Advanced Advanced
Emerging Advanced
Exhibit 9
10Source: 1. World Cellular Information Service, Strategy& analysis
incremental video viewing is driven by this demographic and the aggressive growth of OTT , earlier in advertising driven VOD (such as YouTube) and increasingly on subscriber VOD (services like Shahid Plus, OSN GO and recently Netflix) will impact television viewing.
As these changes have had a profound impact especially on marketing and communications, media planning and trading getting increasingly technology enabled with a convergence never seen before. The first impact has been the shift in audiences caused by digitization - impacting allocation of media investments. The second is led by the shifting of trading models getting programmatic leading to greater performance and accontability. We expect these trading behaviors to also impact traditional publishing models or lead to a loss of share as a result of poorer understanding of the returns to marketers.
Another key impact shall be the growth of SMB
advertisers, which may even skip the traditional agency route to work directly with consumer friendly trading platforms of players like Facebook and Google.
In terms of employment, the effects of digitization will be far reaching but not that evenly spread out. The MENA region would split into digital producers and consumers of content. Countries that shall emerge as digital hubs shall drive most of the economic activity and thus gain the benefits. With Arabic language adoption on the internet still lagging, and so regional digital hubs are not yet apparent, although the UAE appears to be a prime contender with established demand side (most regional HQs are now in Dubai, some even covering India), superior infrastructure and successful institutional enablement. That said, markets like Egypt with their strong audio/visual production could emerge as key players, provided these are digitally enabled rapidly.
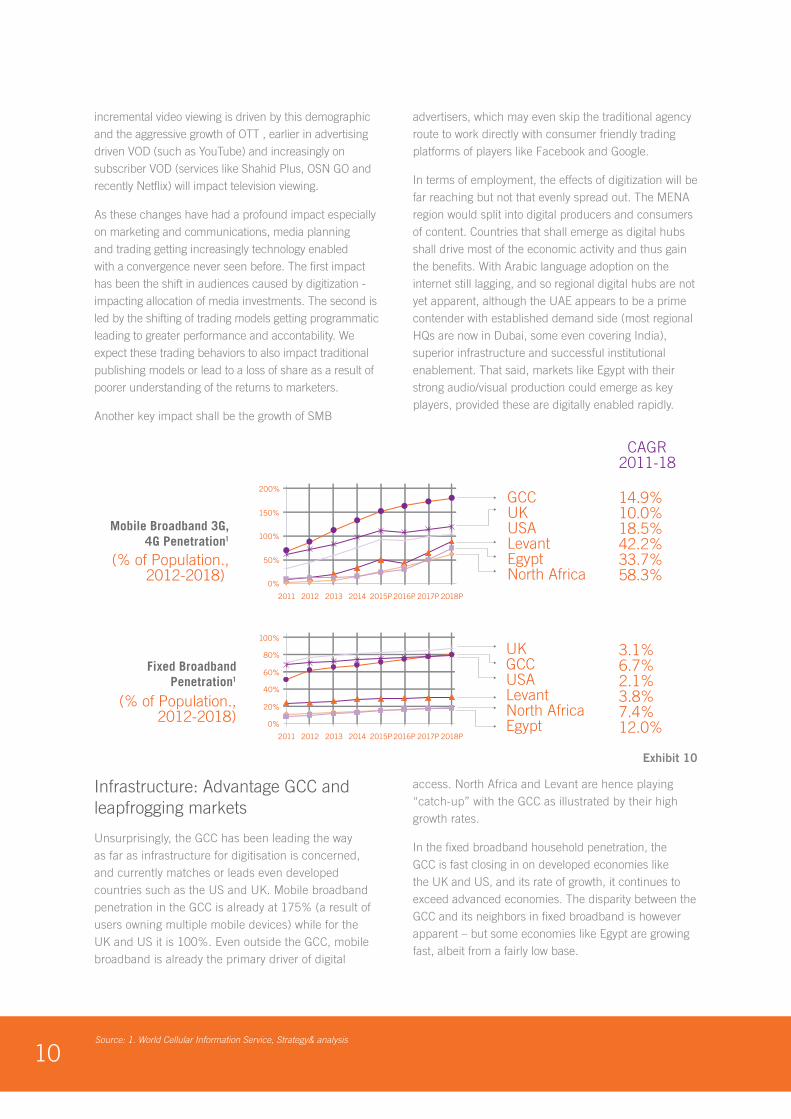
Infrastructure: Advantage GCC and leapfrogging markets
Unsurprisingly, the GCC has been leading the way as far as infrastructure for digitisation is concerned, and currently matches or leads even developed countries such as the US and UK. Mobile broadband penetration in the GCC is already at 175% (a result of users owning multiple mobile devices) while for the UK and US it is 100%. Even outside the GCC, mobile broadband is already the primary driver of digital
access. North Africa and Levant are hence playing “catch-up” with the GCC as illustrated by their high growth rates.
In the fixed broadband household penetration, the GCC is fast closing in on developed economies like the UK and US, and its rate of growth, it continues to exceed advanced economies. The disparity between the GCC and its neighbors in fixed broadband is however apparent – but some economies like Egypt are growing fast, albeit from a fairly low base.
1) GCC countries account for Qatar, Bahrain, Kuwait, Oman, KSA & UAE, Levant countriesaccount for Jordan and Lebanon, North Africa account for Algeria, Morocco, Sudan and Tunisia
0%
50%
100%
150%
200%GCCUKUSALevantEgyptNorth Africa
UKGCCUSALevantNorth AfricaEgypt
14.9%10.0%18.5%42.2%33.7%58.3%
2018P 2017P 2013 2012 2011 2016P 2015P 2014
Mobile Broadband 3G,4G Penetration1
(% of Population.,2012-2018)
0%
20%
40%
60%
80%
100%
2018P 2017P 2016P 2015P 2014 2013 2012 2011
3.1%6.7%2.1%3.8%7.4%12.0%
Fixed BroadbandPenetration1
(% of Population.,2012-2018)
CAGR2011-18
Exhibit 10
11Source: 1. World Cellular Information Service, Euromonitor, Strategy& analysis
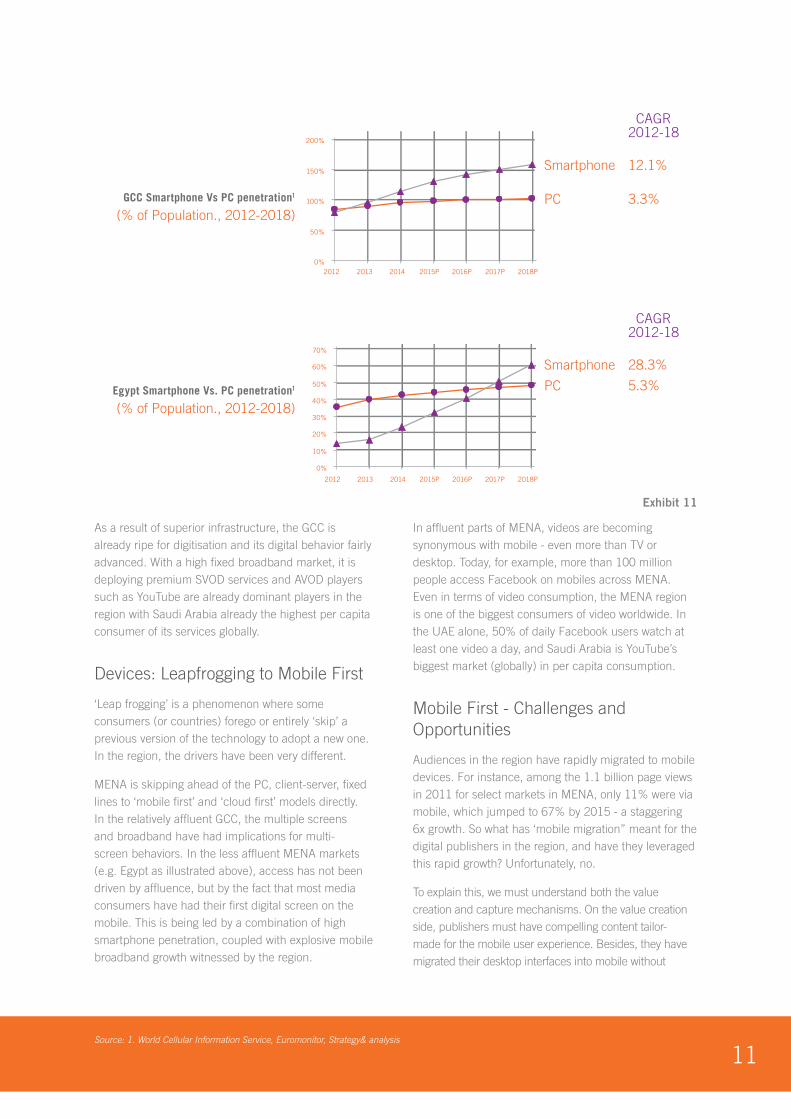
As a result of superior infrastructure, the GCC is already ripe for digitisation and its digital behavior fairly advanced. With a high fixed broadband market, it is deploying premium SVOD services and AVOD players such as YouTube are already dominant players in the region with Saudi Arabia already the highest per capita consumer of its services globally.
Devices: Leapfrogging to Mobile First
‘Leap frogging’ is a phenomenon where some consumers (or countries) forego or entirely ‘skip’ a previous version of the technology to adopt a new one. In the region, the drivers have been very different.
MENA is skipping ahead of the PC, client-server, fixed lines to ‘mobile first’ and ‘cloud first’ models directly. In the relatively affluent GCC, the multiple screens and broadband have had implications for multi-screen behaviors. In the less affluent MENA markets (e.g. Egypt as illustrated above), access has not been driven by affluence, but by the fact that most media consumers have had their first digital screen on the mobile. This is being led by a combination of high smartphone penetration, coupled with explosive mobile broadband growth witnessed by the region.
In affluent parts of MENA, videos are becoming synonymous with mobile - even more than TV or desktop. Today, for example, more than 100 million people access Facebook on mobiles across MENA. Even in terms of video consumption, the MENA region is one of the biggest consumers of video worldwide. In the UAE alone, 50% of daily Facebook users watch at least one video a day, and Saudi Arabia is YouTube’s biggest market (globally) in per capita consumption.
Mobile First - Challenges and Opportunities
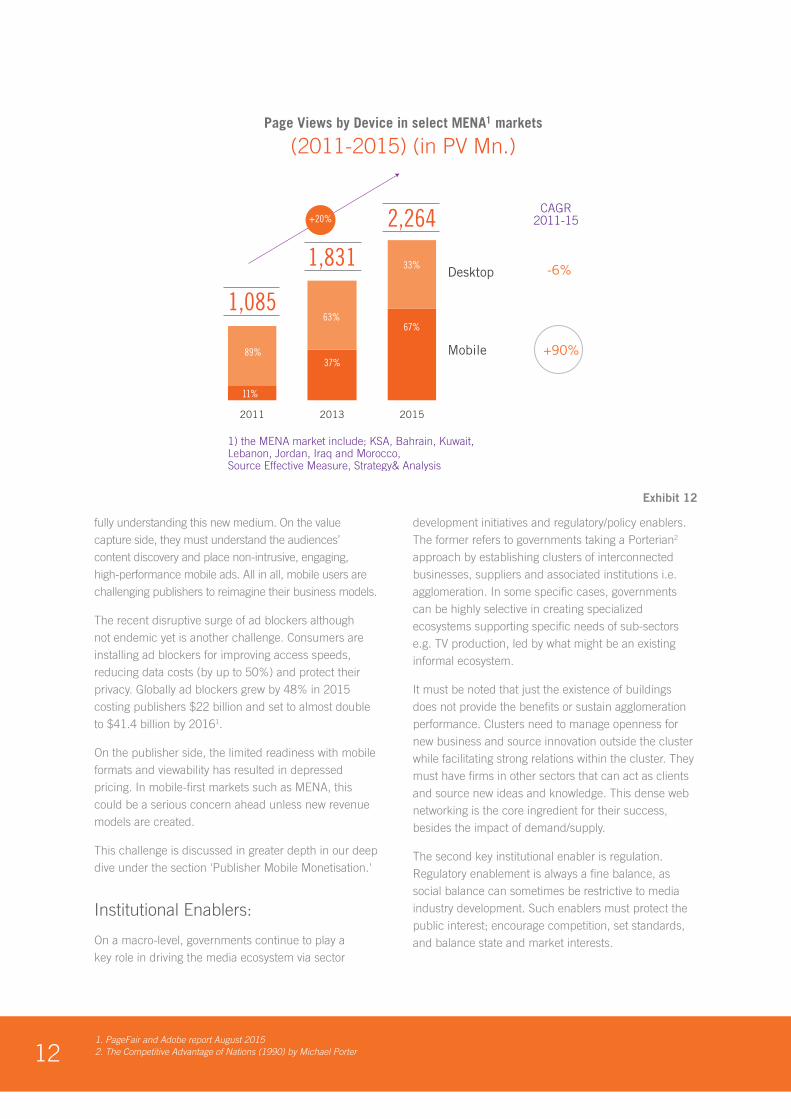
Audiences in the region have rapidly migrated to mobile devices. For instance, among the 1.1 billion page views in 2011 for select markets in MENA, only 11% were via mobile, which jumped to 67% by 2015 - a staggering 6x growth. So what has ‘mobile migration” meant for the digital publishers in the region, and have they leveraged this rapid growth? Unfortunately, no.
To explain this, we must understand both the value creation and capture mechanisms. On the value creation side, publishers must have compelling content tailor-made for the mobile user experience. Besides, they have migrated their desktop interfaces into mobile without
1) GCC countries account for Qatar, Bahrain, Kuwait, KSA & UAE
Source: World Cellular Information Service, Euromonitor, Strategy& analysis
0%
50%
100%
150%
200%
2012
Smartphone 12.1%
PC 3.3%
2018P2017P 2016P 2015P 2014 2013
28.3%
5.3%
0%
10%
20%
30%
40%
50%
60%
70%
Smartphone
PC
2018P2017P 2016P 2015P 2014 2013 2012
CAGR2012-18
CAGR2012-18
GCC Smartphone Vs PC penetration1
(% of Population., 2012-2018)
Egypt Smartphone Vs. PC penetration1
(% of Population., 2012-2018)
Exhibit 11
121. PageFair and Adobe report August 20152. The Competitive Advantage of Nations (1990) by Michael Porter
fully understanding this new medium. On the value capture side, they must understand the audiences’ content discovery and place non-intrusive, engaging, high-performance mobile ads. All in all, mobile users are challenging publishers to reimagine their business models.
The recent disruptive surge of ad blockers although not endemic yet is another challenge. Consumers are installing ad blockers for improving access speeds, reducing data costs (by up to 50%) and protect their privacy. Globally ad blockers grew by 48% in 2015 costing publishers $22 billion and set to almost double to $41.4 billion by 20161.
On the publisher side, the limited readiness with mobile formats and viewability has resulted in depressed pricing. In mobile-first markets such as MENA, this could be a serious concern ahead unless new revenue models are created.
This challenge is discussed in greater depth in our deep dive under the section 'Publisher Mobile Monetisation.'
Institutional Enablers:
On a macro-level, governments continue to play a key role in driving the media ecosystem via sector
development initiatives and regulatory/policy enablers. The former refers to governments taking a Porterian2 approach by establishing clusters of interconnected businesses, suppliers and associated institutions i.e. agglomeration. In some specific cases, governments can be highly selective in creating specialized ecosystems supporting specific needs of sub-sectors e.g. TV production, led by what might be an existing informal ecosystem.
It must be noted that just the existence of buildings does not provide the benefits or sustain agglomeration performance. Clusters need to manage openness for new business and source innovation outside the cluster while facilitating strong relations within the cluster. They must have firms in other sectors that can act as clients and source new ideas and knowledge. This dense web networking is the core ingredient for their success, besides the impact of demand/supply.
The second key institutional enabler is regulation. Regulatory enablement is always a fine balance, as social balance can sometimes be restrictive to media industry development. Such enablers must protect the public interest; encourage competition, set standards, and balance state and market interests.
Page Views by Device in select MENA1 markets
(2011-2015) (in PV Mn.)
1,831
2013
Desktop
Mobile +90%
-6%
37%
63%
2,264
2015
1) the MENA market include; KSA, Bahrain, Kuwait,Lebanon, Jordan, Iraq and Morocco, Source Effective Measure, Strategy& Analysis
1,085
2011
+20%CAGR
2011-15
89%
11%
67%
33%
Exhibit 12
13Source: 1. IPR Strategic Business Information Database, UNDICO
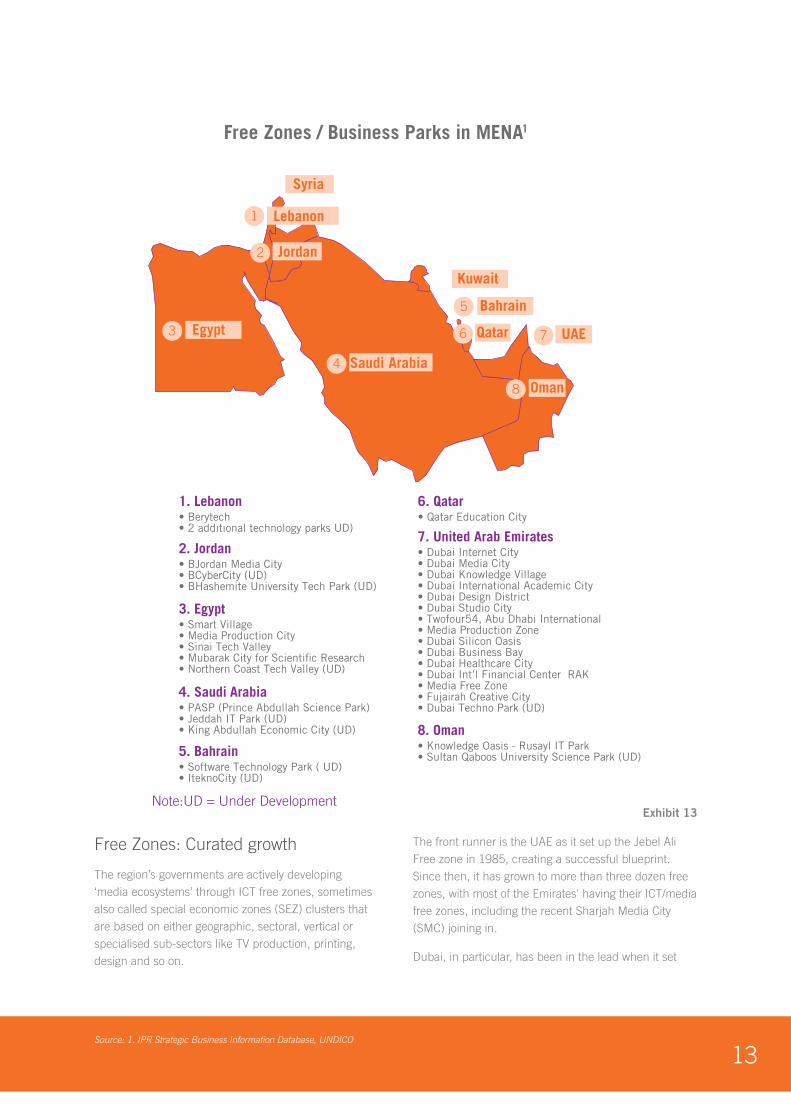
Free Zones: Curated growth
The region’s governments are actively developing ‘media ecosystems’ through ICT free zones, sometimes also called special economic zones (SEZ) clusters that are based on either geographic, sectoral, vertical or specialised sub-sectors like TV production, printing, design and so on.
The front runner is the UAE as it set up the Jebel Ali Free zone in 1985, creating a successful blueprint. Since then, it has grown to more than three dozen free zones, with most of the Emirates' having their ICT/media free zones, including the recent Sharjah Media City (SMC) joining in.
Dubai, in particular, has been in the lead when it set
Note:UD = Under Development
Free Zones / Business Parks in MENA1
Qatar
Kuwait
UAE
Jordan
Lebanon
Syria
Bahrain
4. Saudi Arabia • PASP (Prince Abdullah Science Park)• Jeddah IT Park (UD) • King Abdullah Economic City (UD)
5. Bahrain • Software Technology Park ( UD) • IteknoCity (UD)
1. Lebanon • Berytech • 2 addıtıonal technology parks UD)
2. Jordan• BJordan Media City • BCyberCity (UD) • BHashemite University Tech Park (UD)
3. Egypt • Smart Village • Media Production City • Sinai Tech Valley • Mubarak City for Scientific Research • Northern Coast Tech Valley (UD)
• Knowledge Oasis - Rusayl IT Park• Sultan Qaboos University Science Park (UD)
8. Oman
• Qatar Education City6. Qatar
Egypt
7. United Arab Emirates • Dubai Internet City • Dubai Media City • Dubai Knowledge Village • Dubai International Academic City • Dubai Design District • Dubai Studio City • Twofour54, Abu Dhabi International • Media Production Zone • Dubai Silicon Oasis • Dubai Business Bay • Dubai Healthcare City • Dubai Int’l Financial Center RAK • Media Free Zone • Fujairah Creative City • Dubai Techno Park (UD)
Saudi Arabia
Oman
1
2
3
4
5
6 7
8
Exhibit 13
141. Construction week online2. CB Insights 3. The Statistic Brain Research Institute, Fortune, SBA, NVCA & Gust 2015/2016.
up the Dubai Internet City in 1999. Since then, the UAE free zones have matured and taken a specialised approach. The more recent d3 (Dubai Design district), Dubai Production City (DPC) then International Media Production Zone (IMPZ), Studio City (DSC) are focused on broadcast, movies, and music as their names suggest. Abu Dhabi has a more integrated offering with twofour54 that caters to a range of verticals.
The development of free zones in other countries has been a more specialization approach to support existing and/or emerging sectors. Notable in this space is Egypt’s EMPC (Media Production City) to bolster the country’s already robust film and TV production industry. Jordan’s efforts, much like Egypt, are focused on its current capabilities in the digital sector such as gaming and animation. Where the Jordanian government launched a "Gaming Lab" for companies that operate in game design and development, or in the field of technical innovations.
Based on the level of comprehensiveness, all the free zones offer the typical array of governmental services such as licensing, permits, visas, training, and events with a few providing talent pools and location scouting either via a one-stop shop (single window) or online.
There have been multiple interfaces organized by free zones to help their tenants network and provide business leads through events, and virtual interfaces. In some cases, the governments have gone beyond the role of facilitation to become sources of captive business and encourage zone growth. These practices have been a double-edged sword, as some private sector players see these interventions discouraging to pure market forces.
Given the plethora of free zones, it was a matter of time before unified bodies were founded to manage them. This was achieved with Dubai Creative Clusters Authority (DCCA) to oversee eleven industry-specific clusters and their constituent 5,100 businesses employing over 76,000 people. DCCA’s mandate is to develop the talent pool, entrepreneurship, provide financial support and continue to handle licensing, visa and zoning regulations.
An emerging concern with the creation of more free zones is that it could unleash negative competitive forces that hamper the creation of globally competitive
businesses due to subsidies1. However, the region’s media sector is still at the early stages of evolution, and the Dubai model illustrates that done well, free zones can indeed be drivers of sector development.
New Media: New Vision
Despite the incentives to set up shop in free zones, digital players by the nature of their business model require a different pair of gloves and rule books. Many with their ‘cloud/mobile first’ models, minimal infrastructure needs, IP driven, reliant on offshoring require a different framework and value proposition vs. the typical free zone benefits, which are not sufficient to incubate digital firms.
Many of them being startups, offer digital services versus tangible goods and don’t have the benefit or needs of tax exemptions or require large employment or fixed offices.
Free zones are understanding this and fostering new development enclaves. For example, Flat6Labs and In5 were setups in partnership with Twofour54 and DIC respectively. There are over 40 such hubs, incubators, accelerators, business centers or a hybrid of them that have mushroomed in MENA during the past few years fostering tens and thousands of young companies.
Incubators such as Astro Labs and Impact Hub, to name a few, ‘incubate’ startups, micro-businesses by giving them a favorable environment through partnerships with big companies, seed capital for a minority share, workshops, demo events, pitches to angel and venture investors and flexible co-working space. Similarly, accelerators such as Oasis500, Turn8 ‘accelerate’ the startups’ go-to-market time via 3 to 6 month onsite programs, mentors, resources and seed capital for a minority share.
While this thriving new startup ecosystem is commendable, it’s also important to note the harsh reality that lies ahead for them. Globally, the region being no exception, a staggering nine out of 10 startups fail in the first year of inception. Of those that survive and are lucky to get funded, die within 20 months despite raising an average of $1.3 million2. 50% of those in turn again don't live beyond the four-year mark. Reasons for such low mortality are lack of capital, poor execution, macro-timing, inexperienced team, wrong strategy and other reasons3.
15
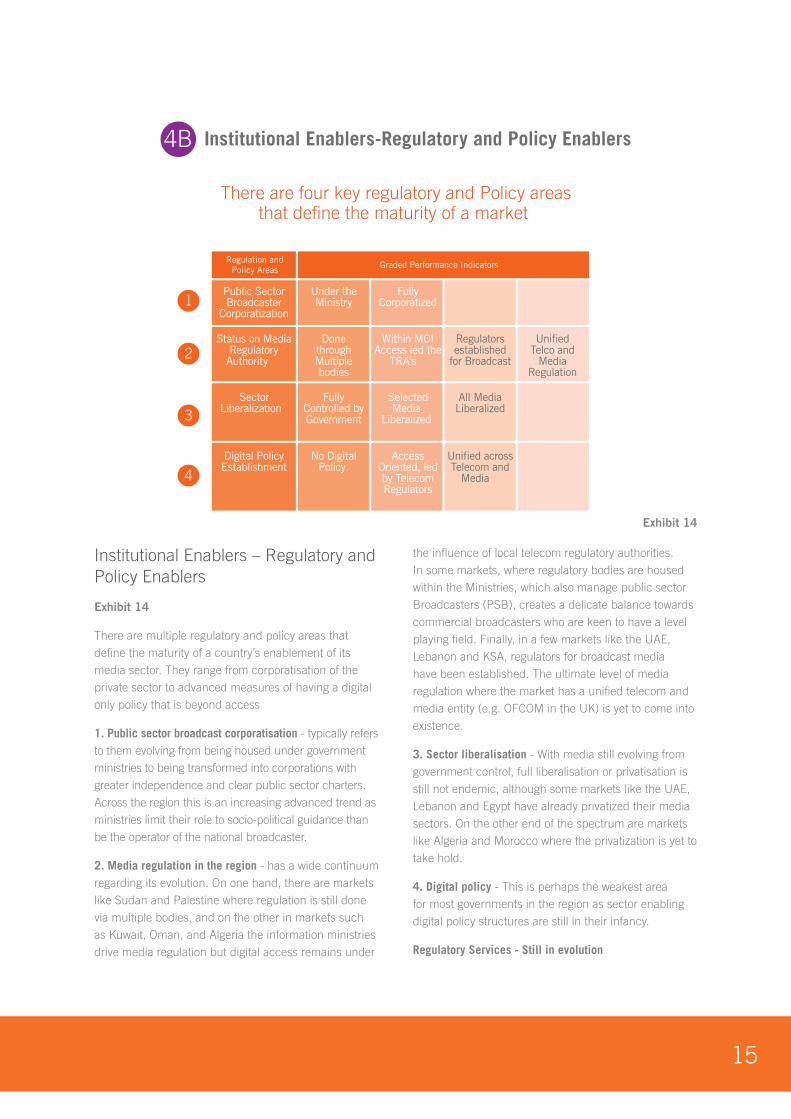
Institutional Enablers – Regulatory and Policy Enablers
Exhibit 14
There are multiple regulatory and policy areas that define the maturity of a country’s enablement of its media sector. They range from corporatisation of the private sector to advanced measures of having a digital only policy that is beyond access
1. Public sector broadcast corporatisation - typically refers to them evolving from being housed under government ministries to being transformed into corporations with greater independence and clear public sector charters. Across the region this is an increasing advanced trend as ministries limit their role to socio-political guidance than be the operator of the national broadcaster.
2. Media regulation in the region - has a wide continuum regarding its evolution. On one hand, there are markets like Sudan and Palestine where regulation is still done via multiple bodies, and on the other in markets such as Kuwait, Oman, and Algeria the information ministries drive media regulation but digital access remains under
the influence of local telecom regulatory authorities. In some markets, where regulatory bodies are housed within the Ministries, which also manage public sector Broadcasters (PSB), creates a delicate balance towards commercial broadcasters who are keen to have a level playing field. Finally, in a few markets like the UAE, Lebanon and KSA, regulators for broadcast media have been established. The ultimate level of media regulation where the market has a unified telecom and media entity (e.g. OFCOM in the UK) is yet to come into existence.
3. Sector liberalisation - With media still evolving from government control, full liberalisation or privatisation is still not endemic, although some markets like the UAE, Lebanon and Egypt have already privatized their media sectors. On the other end of the spectrum are markets like Algeria and Morocco where the privatization is yet to take hold.
4. Digital policy - This is perhaps the weakest area for most governments in the region as sector enabling digital policy structures are still in their infancy.
Regulatory Services - Still in evolution
There are four key regulatory and Policy areasthat define the maturity of a market
Institutional Enablers-Regulatory and Policy Enablers4B
Regulation andPolicy Areas
Graded Performance Indicators
Public SectorBroadcaster
Corporatization
FullyCorporatized
Status on MediaRegulatoryAuthority
DonethroughMultiplebodies
Within MOIAccess led the
TRA's
Regulatorsestablished
for Broadcast
UnifiedTelco and
MediaRegulation
SectorLiberalization
FullyControlled byGovernment
SelectedMedia
Liberalized
All MediaLiberalized
Digital PolicyEstablishment
No DigitalPolicy
AccessOriented, ledby TelecomRegulators
Unified acrossTelecom and
Media
1
2
3
4
Under theMinistry
Exhibit 14
16
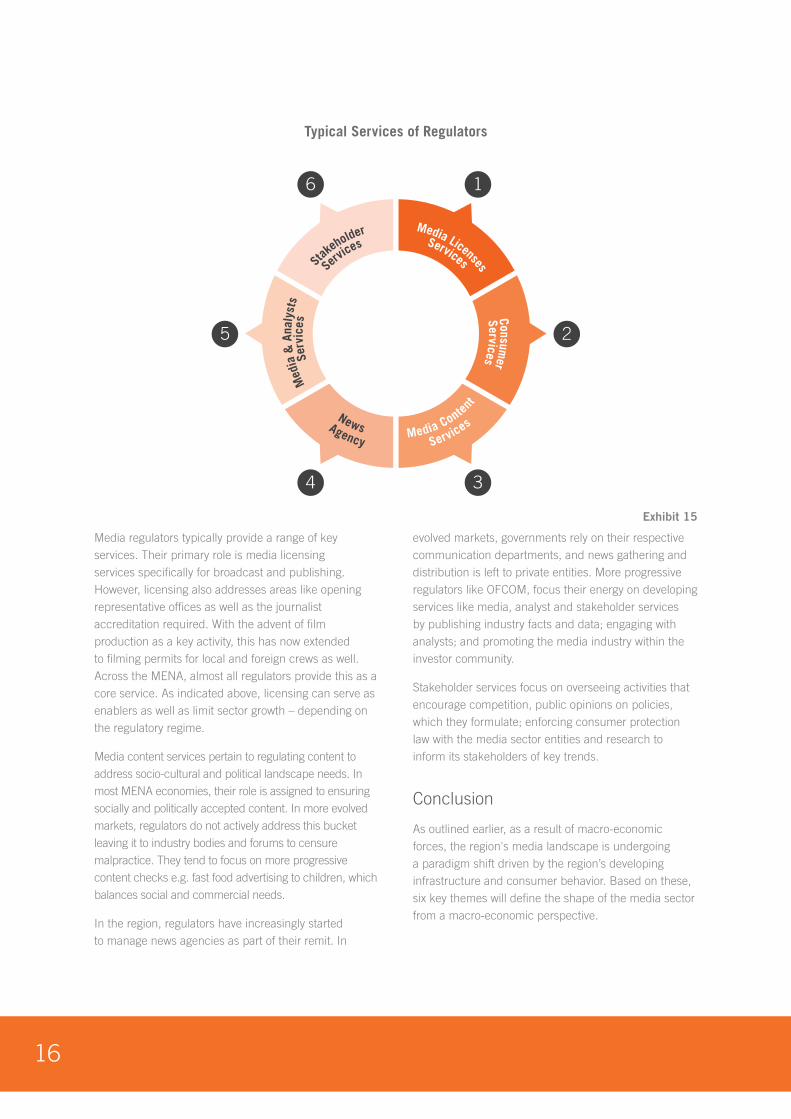
Media regulators typically provide a range of key services. Their primary role is media licensing services specifically for broadcast and publishing. However, licensing also addresses areas like opening representative offices as well as the journalist accreditation required. With the advent of film production as a key activity, this has now extended to filming permits for local and foreign crews as well. Across the MENA, almost all regulators provide this as a core service. As indicated above, licensing can serve as enablers as well as limit sector growth – depending on the regulatory regime.
Media content services pertain to regulating content to address socio-cultural and political landscape needs. In most MENA economies, their role is assigned to ensuring socially and politically accepted content. In more evolved markets, regulators do not actively address this bucket leaving it to industry bodies and forums to censure malpractice. They tend to focus on more progressive content checks e.g. fast food advertising to children, which balances social and commercial needs.
In the region, regulators have increasingly started to manage news agencies as part of their remit. In
evolved markets, governments rely on their respective communication departments, and news gathering and distribution is left to private entities. More progressive regulators like OFCOM, focus their energy on developing services like media, analyst and stakeholder services by publishing industry facts and data; engaging with analysts; and promoting the media industry within the investor community.
Stakeholder services focus on overseeing activities that encourage competition, public opinions on policies, which they formulate; enforcing consumer protection law with the media sector entities and research to inform its stakeholders of key trends.
Conclusion
As outlined earlier, as a result of macro-economic forces, the region's media landscape is undergoing a paradigm shift driven by the region’s developing infrastructure and consumer behavior. Based on these, six key themes will define the shape of the media sector from a macro-economic perspective.
Media Licenses
Services
Consumer
Services
Media Content
Services
NewsAgency
Med
ia &
Ana
lyst
sSe
rvic
es
Servi
ces
St
akeho
lder
1
3
25
4
6
Typical Services of Regulators
Exhibit 15
17
1. Mobile first
Markets in MENA are 'leap frogging’ the traditional path to digital access – by skipping the PC/ fixed broadband access to adopt the 'mobile first' model directly. Such access is creating new consumer behavior which present new opportunities, but mostly are challenges for publishers. As their audiences make mobile their ‘first screen’, their current desktop interface, content development and revenue models are getting challenged. This churn will only continue throughout the coming decade. The winner(s) will be those who embrace this shift as a starting point rather than as a progression.
2. Per capita consumption driven media demand
As illustrated earlier, there is no direct correlation between oil prices and consumer spending even in oil- based economies. However, the current oil prices are expected to dampen consumer expenditure in MENA if they persist for longer. This consumer-led slowdown is expected to be different as it is led by market forces but can be managed better by regional governments. Media players should keep a keen watch on their macroeconomic metrics to assess long term play, as advertisers will continue to show sharper reactions to manage their bottom line.
3. Fiscal Fixes
Oil may have been the breadwinner for the last few decades. However, this does not bode well for the economy or consumer spending with oil price turbulence. Compared to the not-so-distant slowdown in 2008-09, this time around, regional governments appear to be taking proactive measures by tapping into their huge financial reserves, restructuring their fiscal balance through a slew of initiatives and diversifying into non-oil sectors. Governments will hence need to give due priority to the media sector in these times to shelter it from short-term pains. As demonstrated by the UAE, the media sector can be a key employer given the right regulatory environment and sector enablers.
4. Media regulation diversity and its impact
Although media consumption is getting more unified, the regulation and sector development remains a challenging area. In most markets, regulators are still
in the administrative and operational phase. Burdened with traditional governing apparatuses and aging framework, they are finding the changing landscape a challenge while balancing national and market interests. In the region, the future rests with its youth demographics and rapid digitisation. In that light, the region’s regulators are expected to allow greater sector liberalisation, while ensuring the integrity of the state. That might imply vacating or overseeing certain regulatory areas to focus their energy on sector enablement.
5. Demographic dividends and digital Impact
Despite a general slowdown in the horizon, the region’s population growth is double the rate of developed markets such as the US and the UK. It’s not just the growth or the statistics that is important to note - it’s the quality of those numbers such as demographic - 47% of them are young, vibrant, active who will catalyze growth and shape the market by continuing to favor digital platforms.
6. Sector enablement
As digital continues to take a greater share of the media sector, regulators and governments will be challenged to facilitate this capability in its traditional tenant base, as well as attract native digital players. This, as its typical sector enablement initiatives have limited value to digital players, be it start-ups or players undergoing a digital transformation.
Digital players, with their ‘cloud/mobile first’ models, minimal infrastructure needs, IP-driven, reliant on offshoring require a very different framework, regulation, and value proposition vs. the typical or traditional players. Keeping this new dynamic in mind, governments will have to create new digital ecosystems and policies to be future ready.
18
ET THE ARAB MEDIA MARKET THE ARAB MED
ARAB MEDIA EXPOSURE AND TRANSITIONARAB MEDIA OUTLOOK 2016. 2020ARAB MEDIA EXPOSURE AND TRANSITIONARAB MEDIA OUTLOOK 2016. 2020ARAB MEDIA EXPOSURE AND TRANSITIONARAB MEDIA OUTLOOK 2016. 2020
ARAB MEDIA OUTLOOK 2016. 2020ARAB MEDIA EXPOSURE AND TRANSITIONARAB MEDIA OUTLOOK 2016. 2020ARAB MEDIA EXPOSURE AND TRANSITIONARAB MEDIA OUTLOOK 2016. 2020ARAB MEDIA EXPOSURE AND TRANSITIONARAB MEDIA OUTLOOK 2016. 2020ARAB MEDIA EXPOSURE AND TRANSITIONARAB MEDIA OUTLOOK 2016. 2020ARAB MEDIA EXPOSURE AND TRANSITIONARAB MEDIA OUTLOOK 2016. 2020ARAB MEDIA EXPOSURE AND TRANSITIONARAB MEDIA OUTLOOK 2016. 2020
19
ET THE ARAB MEDIA MARKET THE ARAB MED
ARAB MEDIA EXPOSURE AND TRANSITIONARAB MEDIA OUTLOOK 2016. 2020ARAB MEDIA EXPOSURE AND TRANSITIONARAB MEDIA OUTLOOK 2016. 2020ARAB MEDIA EXPOSURE AND TRANSITIONARAB MEDIA OUTLOOK 2016. 2020
ARAB MEDIA OUTLOOK 2016. 2020ARAB MEDIA EXPOSURE AND TRANSITIONARAB MEDIA OUTLOOK 2016. 2020ARAB MEDIA EXPOSURE AND TRANSITIONARAB MEDIA OUTLOOK 2016. 2020ARAB MEDIA EXPOSURE AND TRANSITIONARAB MEDIA OUTLOOK 2016. 2020ARAB MEDIA EXPOSURE AND TRANSITIONARAB MEDIA OUTLOOK 2016. 2020ARAB MEDIA EXPOSURE AND TRANSITIONARAB MEDIA OUTLOOK 2016. 2020ARAB MEDIA EXPOSURE AND TRANSITIONARAB MEDIA OUTLOOK 2016. 2020
IA MARKET THE ARAB MEDIA MARKET THE A

20
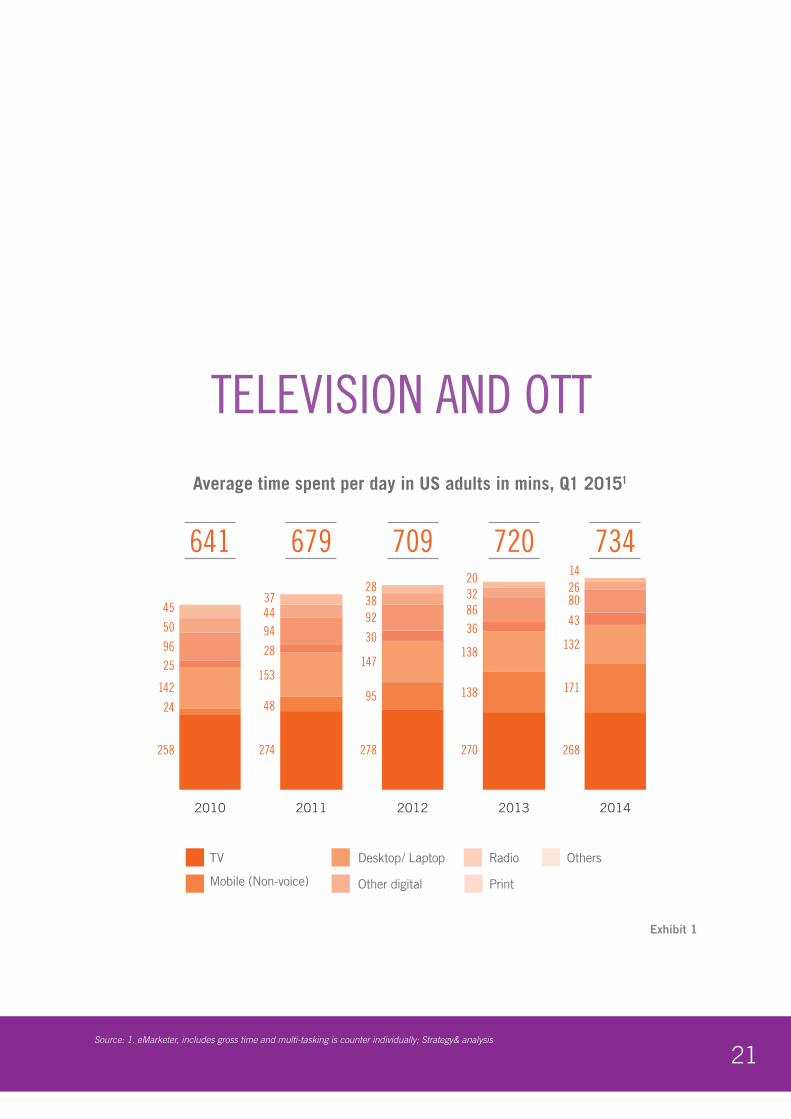
21Source: 1. eMarketer, includes gross time and multi-tasking is counter individually; Strategy& analysis
Exhibit 1
TELEVISION AND OTTTelevision and OTT
679
2011
258
142
96
50
45
24
25
268
171
132
80
43
2614
274
153
944437
28
48
278
95
147
92
30
2838
270
138
138
8636
3220
641
2010
709
2012
720
2013
734
2014
Mobile (Non-voice)
RadioTV OthersDesktop/ Laptop
Other digital Print
Exhibit 1 Source: eMarketer, includes gross time andmulti-tasking is counter individually; Strategy& analysis
Average time spent per day in US adults in mins, Q1 20151
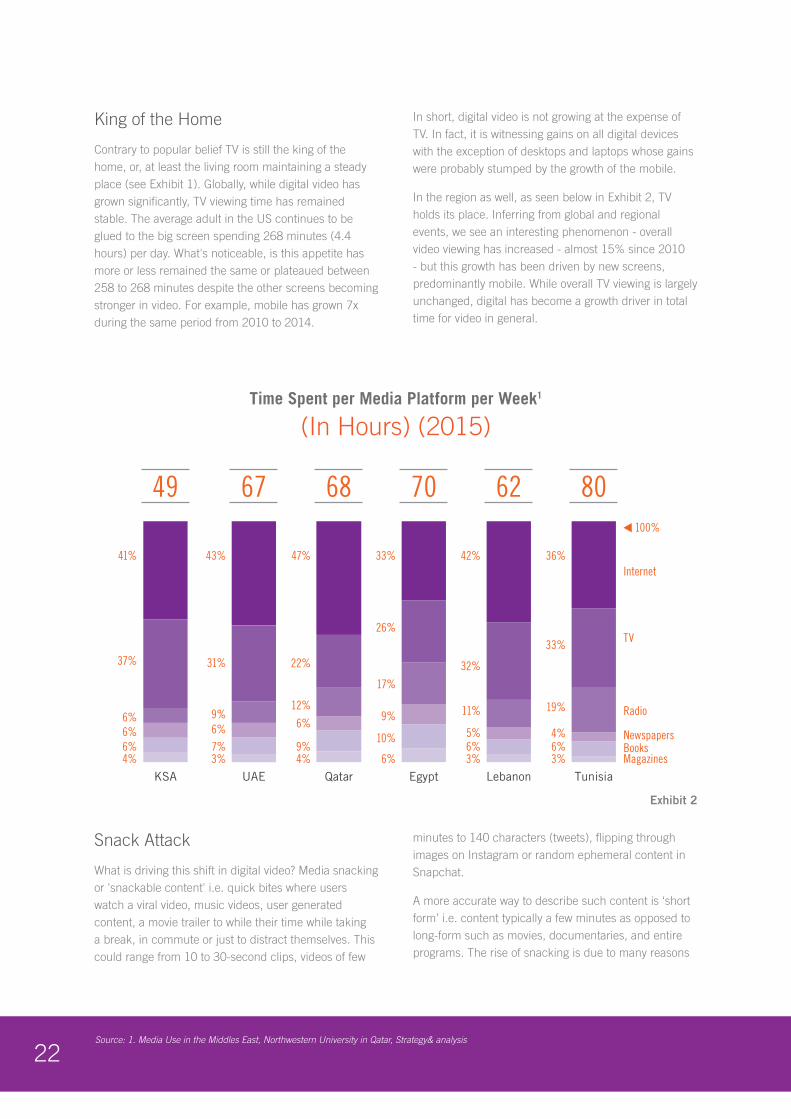
22Source: 1. Media Use in the Middles East, Northwestern University in Qatar, Strategy& analysis
King of the Home
Contrary to popular belief TV is still the king of the home, or, at least the living room maintaining a steady place (see Exhibit 1). Globally, while digital video has grown significantly, TV viewing time has remained stable. The average adult in the US continues to be glued to the big screen spending 268 minutes (4.4 hours) per day. What's noticeable, is this appetite has more or less remained the same or plateaued between 258 to 268 minutes despite the other screens becoming stronger in video. For example, mobile has grown 7x during the same period from 2010 to 2014.
In short, digital video is not growing at the expense of TV. In fact, it is witnessing gains on all digital devices with the exception of desktops and laptops whose gains were probably stumped by the growth of the mobile.
In the region as well, as seen below in Exhibit 2, TV holds its place. Inferring from global and regional events, we see an interesting phenomenon - overall video viewing has increased - almost 15% since 2010 - but this growth has been driven by new screens, predominantly mobile. While overall TV viewing is largely unchanged, digital has become a growth driver in total time for video in general.
Snack Attack
What is driving this shift in digital video? Media snacking or 'snackable content' i.e. quick bites where users watch a viral video, music videos, user generated content, a movie trailer to while their time while taking a break, in commute or just to distract themselves. This could range from 10 to 30-second clips, videos of few
minutes to 140 characters (tweets), flipping through images on Instagram or random ephemeral content in Snapchat.
A more accurate way to describe such content is ‘short form’ i.e. content typically a few minutes as opposed to long-form such as movies, documentaries, and entire programs. The rise of snacking is due to many reasons
Time Spent per Media Platform per Week1
(In Hours) (2015)
49
KSA
67
UAE
68
Qatar
62
Lebanon
70
EgyptMagazines
Internet
Radio
TV
Newspapers10%
9%
17%
6%
26%
33%
Books6%5%
11%
32%
42%
3%
4%6%6%6%
37%
41%
6%
43%
31%
9%
7%3%
9%
6%
47%
4%
12%
22%
80
Tunisia
100%
19%
36%
6%
33%
3%
4%
Exhibit 2
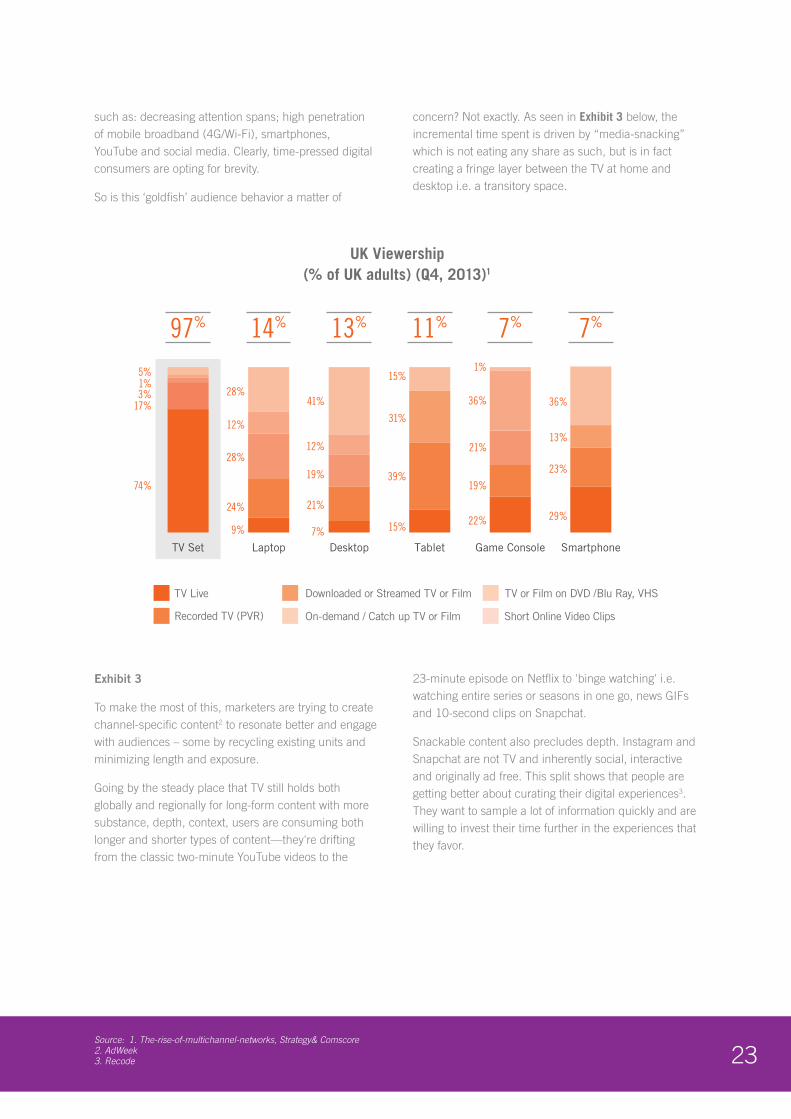
23Source: 1. The-rise-of-multichannel-networks, Strategy& Comscore 2. AdWeek 3. Recode
such as: decreasing attention spans; high penetration of mobile broadband (4G/Wi-Fi), smartphones, YouTube and social media. Clearly, time-pressed digital consumers are opting for brevity.
So is this ‘goldfish’ audience behavior a matter of
concern? Not exactly. As seen in Exhibit 3 below, the incremental time spent is driven by “media-snacking” which is not eating any share as such, but is in fact creating a fringe layer between the TV at home and desktop i.e. a transitory space.
Exhibit 3
To make the most of this, marketers are trying to create channel-specific content2 to resonate better and engage with audiences – some by recycling existing units and minimizing length and exposure.
Going by the steady place that TV still holds both globally and regionally for long-form content with more substance, depth, context, users are consuming both longer and shorter types of content—they're drifting from the classic two-minute YouTube videos to the
23-minute episode on Netflix to 'binge watching' i.e. watching entire series or seasons in one go, news GIFs and 10-second clips on Snapchat.
Snackable content also precludes depth. Instagram and Snapchat are not TV and inherently social, interactive and originally ad free. This split shows that people are getting better about curating their digital experiences3. They want to sample a lot of information quickly and are willing to invest their time further in the experiences that they favor.
UK Viewership(% of UK adults) (Q4, 2013)1
1%
1%
17%
74%
28%
12%
28%
24%
9%
12%
19%
21%
7%
41%
31%
39%
15%
15%
36%
21%
19%
22%
36%
13%
23%
29%
3%
5%
TV Set
97%
Laptop
14%
Desktop
13%
Tablet
11%
Game Console
7%
Smartphone
7%
TV or Film on DVD /Blu Ray, VHSTV Live
Recorded TV (PVR) On-demand / Catch up TV or Film Short Online Video Clips
Downloaded or Streamed TV or Film
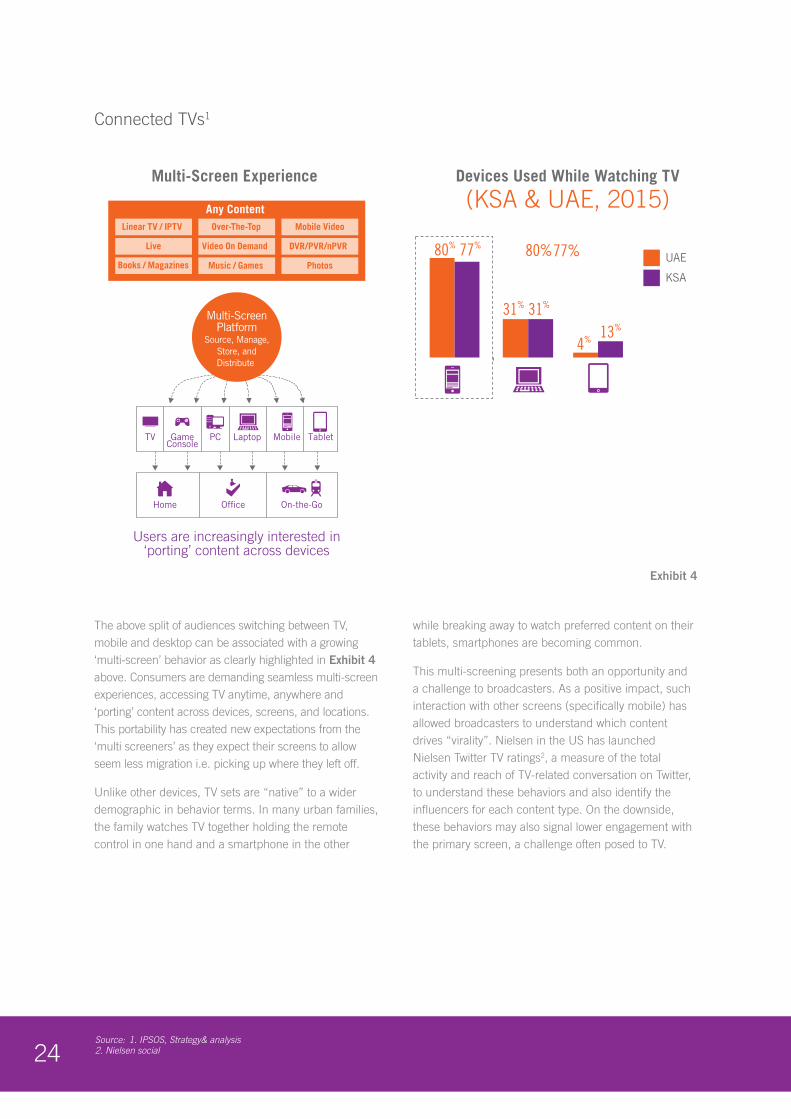
24Source: 1. IPSOS, Strategy& analysis 2. Nielsen social
Connected TVs1
The above split of audiences switching between TV, mobile and desktop can be associated with a growing ‘multi-screen’ behavior as clearly highlighted in Exhibit 4 above. Consumers are demanding seamless multi-screen experiences, accessing TV anytime, anywhere and ‘porting’ content across devices, screens, and locations. This portability has created new expectations from the ‘multi screeners’ as they expect their screens to allow seem less migration i.e. picking up where they left off.
Unlike other devices, TV sets are “native” to a wider demographic in behavior terms. In many urban families, the family watches TV together holding the remote control in one hand and a smartphone in the other
while breaking away to watch preferred content on their tablets, smartphones are becoming common.
This multi-screening presents both an opportunity and a challenge to broadcasters. As a positive impact, such interaction with other screens (specifically mobile) has allowed broadcasters to understand which content drives “virality”. Nielsen in the US has launched Nielsen Twitter TV ratings2, a measure of the total activity and reach of TV-related conversation on Twitter, to understand these behaviors and also identify the influencers for each content type. On the downside, these behaviors may also signal lower engagement with the primary screen, a challenge often posed to TV.
Any Content Linear TV / IPTV Over-The-Top Mobile Video
Books / Magazines Music / Games Photos
Live DVR/PVR/nPVRVideo On Demand
Multi-Screen Experience
Users are increasingly interested in‘porting’ content across devices
Multi-ScreenPlatform
Source, Manage,Store, andDistribute
31% 31%
80% 77%
4% 13%
80%77%
Devices Used While Watching TV
(KSA & UAE, 2015)
UAE
KSA
Home Office On-the-Go
TV GameConsole
PC MobileLaptop Tablet
Exhibit 4
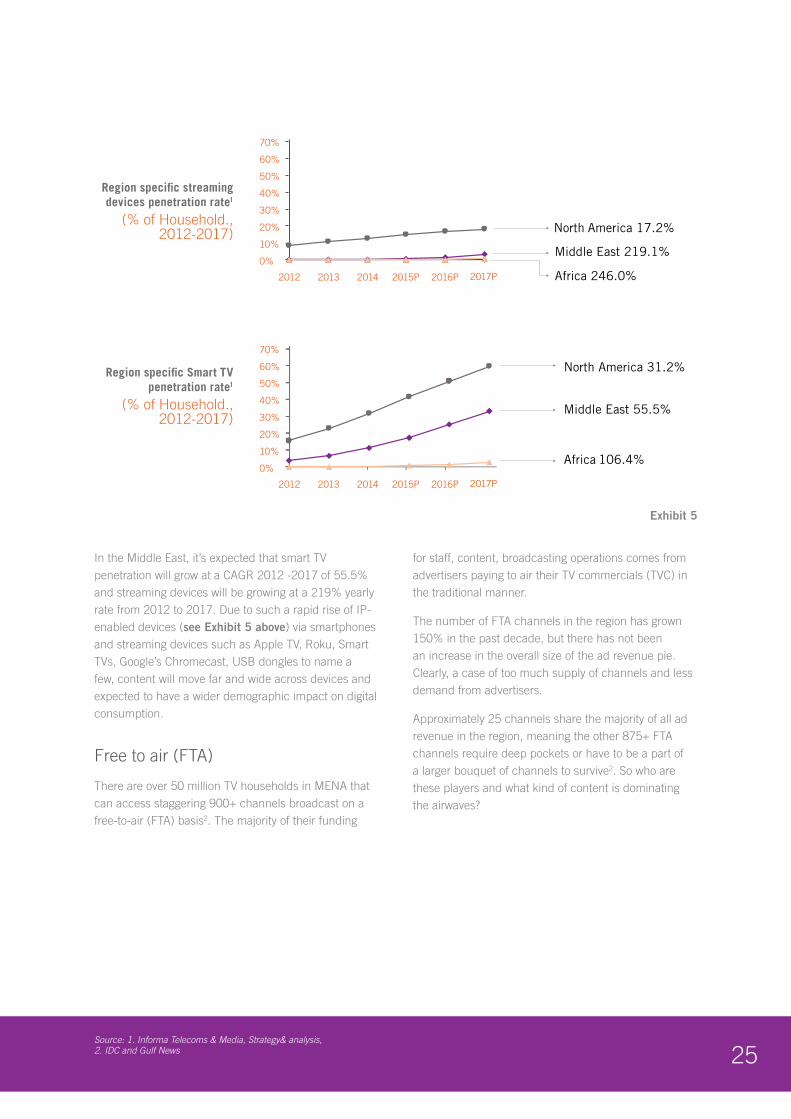
25Source: 1. Informa Telecoms & Media, Strategy& analysis, 2. IDC and Gulf News
In the Middle East, it’s expected that smart TV penetration will grow at a CAGR 2012 -2017 of 55.5% and streaming devices will be growing at a 219% yearly rate from 2012 to 2017. Due to such a rapid rise of IP-enabled devices (see Exhibit 5 above) via smartphones and streaming devices such as Apple TV, Roku, Smart TVs, Google’s Chromecast, USB dongles to name a few, content will move far and wide across devices and expected to have a wider demographic impact on digital consumption.
Free to air (FTA)
There are over 50 million TV households in MENA that can access staggering 900+ channels broadcast on a free-to-air (FTA) basis2. The majority of their funding
for staff, content, broadcasting operations comes from advertisers paying to air their TV commercials (TVC) in the traditional manner.
The number of FTA channels in the region has grown 150% in the past decade, but there has not been an increase in the overall size of the ad revenue pie. Clearly, a case of too much supply of channels and less demand from advertisers.
Approximately 25 channels share the majority of all ad revenue in the region, meaning the other 875+ FTA channels require deep pockets or have to be a part of a larger bouquet of channels to survive2. So who are these players and what kind of content is dominating the airwaves?
1) The middle east countries included in the chart above are Bahrain, Cyprus, Egypt, Iran, Iraq,
Israel, Jordan, Kuwait, Lebanon, Oman Qatar, KSA, UAE, Syria and Turkey
2014 2017P
North America 31.2%
2015P2012 2016P
North America 17.2%
Middle East 219.1%
Middle East 55.5%
Africa 106.4%
Africa 246.0%
70%
60%
50%
40%
30%
20%
10%
0%
2013
2014 2017P2015P2012 2016P
70%
60%
50%
40%
30%
20%
10%
0%
2013
Region specific streamingdevices penetration rate1
(% of Household.,2012-2017)
Region specific Smart TVpenetration rate1
(% of Household.,2012-2017)
Exhibit 5
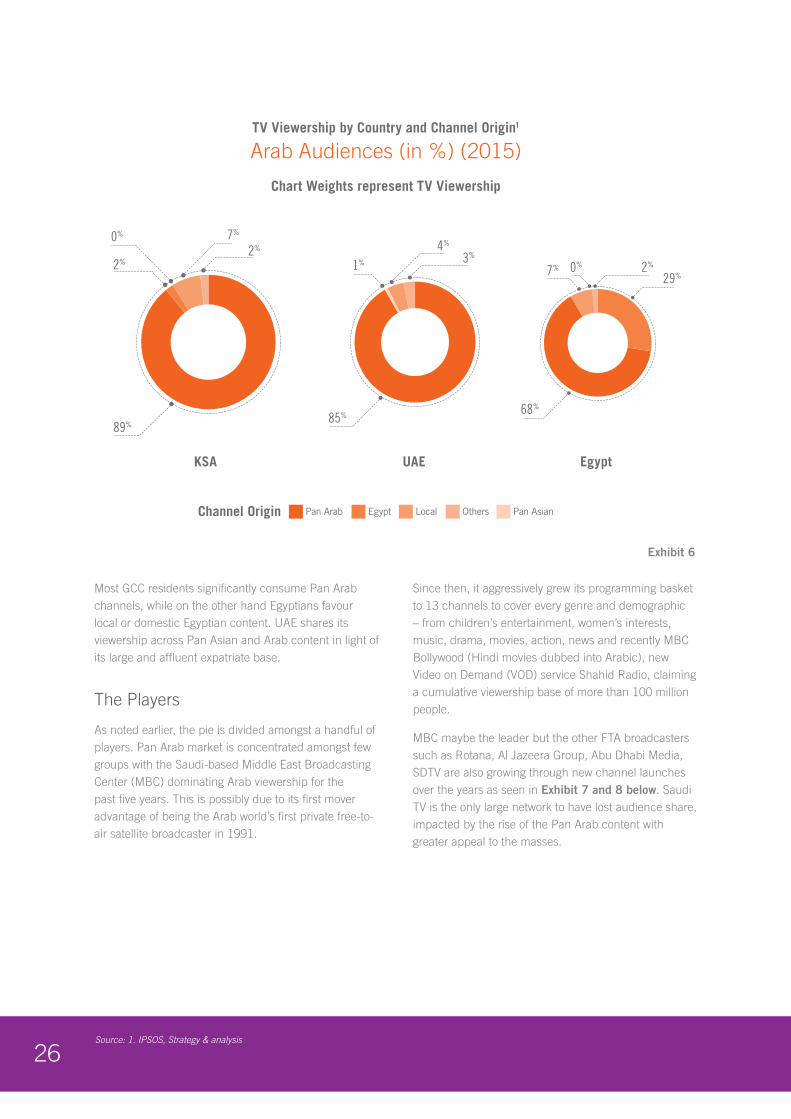
26Source: 1. IPSOS, Strategy & analysis
Most GCC residents significantly consume Pan Arab channels, while on the other hand Egyptians favour local or domestic Egyptian content. UAE shares its viewership across Pan Asian and Arab content in light of its large and affluent expatriate base.
The Players
As noted earlier, the pie is divided amongst a handful of players. Pan Arab market is concentrated amongst few groups with the Saudi-based Middle East Broadcasting Center (MBC) dominating Arab viewership for the past five years. This is possibly due to its first mover advantage of being the Arab world’s first private free-to-air satellite broadcaster in 1991.
Since then, it aggressively grew its programming basket to 13 channels to cover every genre and demographic – from children’s entertainment, women’s interests, music, drama, movies, action, news and recently MBC Bollywood (Hindi movies dubbed into Arabic), new Video on Demand (VOD) service Shahid Radio, claiming a cumulative viewership base of more than 100 million people.
MBC maybe the leader but the other FTA broadcasters such as Rotana, Al Jazeera Group, Abu Dhabi Media, SDTV are also growing through new channel launches over the years as seen in Exhibit 7 and 8 below. Saudi TV is the only large network to have lost audience share, impacted by the rise of the Pan Arab content with greater appeal to the masses.
Chart Weights represent TV Viewership
TV Viewership by Country and Channel Origin1
Arab Audiences (in %) (2015)
OthersLocalEgypt Pan AsianPan ArabChannel Origin
KSA UAE Egypt
0%
89%85%
7%
2%
1%
4%
2%0%7%
68%
29%
3%2%
Exhibit 6
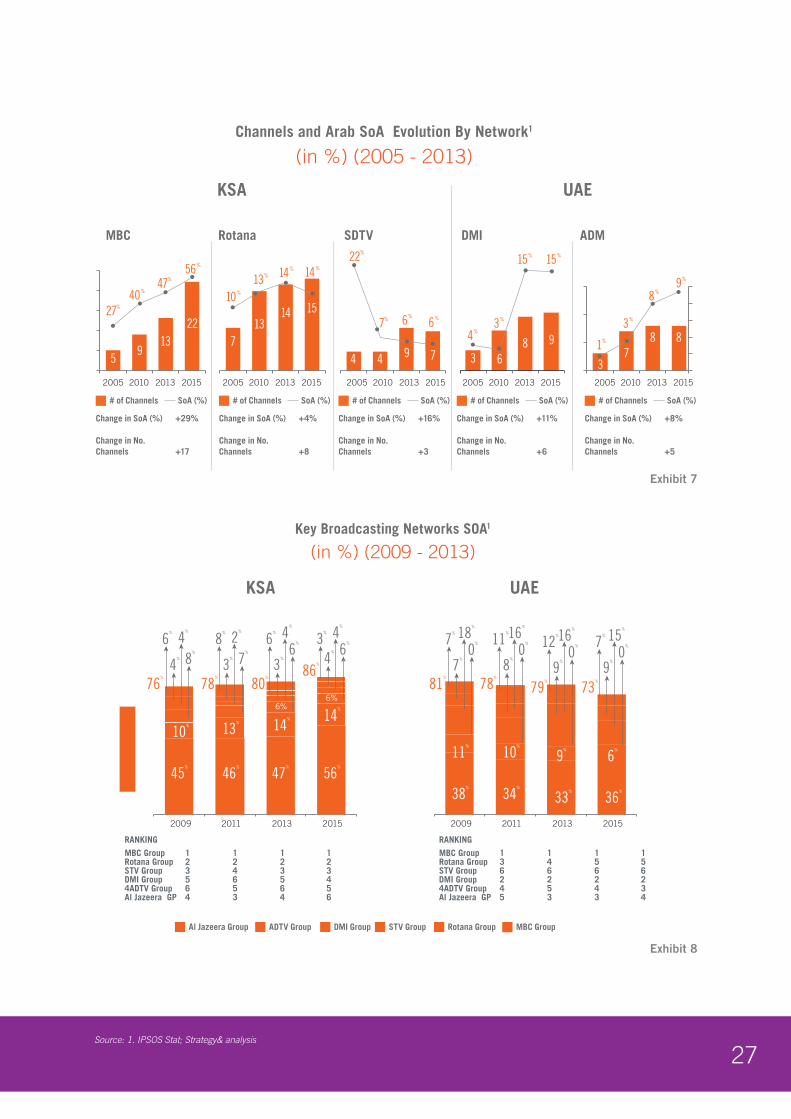
27Source: 1. IPSOS Stat; Strategy& analysis
Key Broadcasting Networks SOA1
(in %) (2009 - 2013)
Channels and Arab SoA Evolution By Network1
(in %) (2005 - 2013)
MBC ADM Rotana DMI SDTV
KSA UAE
# of Channels SoA (%)
Change in SoA (%) +29%
Change in No.Channels +17
# of Channels SoA (%)
Change in SoA (%) +4%
Change in No.Channels +8
# of Channels SoA (%)
Change in SoA (%) +16%
Change in No.Channels +3
# of Channels SoA (%)
Change in SoA (%) +11%
Change in No.Channels +6
# of Channels SoA (%)
Change in SoA (%) +8%
Change in No.Channels +5
Shar
e of
Aud
ienc
e
2011 2015 2013 2009 2015 2011 2009 2013
Al Jazeera Group ADTV Group DMI Group STV Group Rotana Group MBC Group
RANKING
MBC Group 1 1 1 1 Rotana Group 2 2 2 2 STV Group 3 4 3 3 DMI Group 5 6 5 4 4ADTV Group 6 5 6 5 Al Jazeera GP 4 3 4 6
RANKING
MBC Group 1 1 1 1 Rotana Group 3 4 5 5 STV Group 6 6 6 6DMI Group 2 2 2 2 4ADTV Group 4 5 4 3 Al Jazeera GP 5 3 3 4
KSA UAE
2010 2013 2005 201520152013
20102005
27%
40%47%
56%
59
1322
2013 20152005
2010
10%
13% 14% 14%
713
14 15
6%6%
7%
22%
4 4 9 7
2015 2013 2010 2005
15%
3%
4%
15%
3 68 9
2010 2005
2013
2015
9%
8%
3%
1% 887
3
6%6%
76%
45%
46%
47%
56%
10% 13
%
78%
80%
86%
6%
4%
4%
8%
8%
3%
2%
7%
6%
3%
4%
6%
3%
4%
4%
6%
14% 14
%
38%
34%
10%
11%
33%
36%
81%
78%
79%
73%
9%
6%
7%
7%
18%
0%
11%
8%
16%
0%
12%
9%
16%
0%
7%
9%
15%
0%
Exhibit 7
Exhibit 8
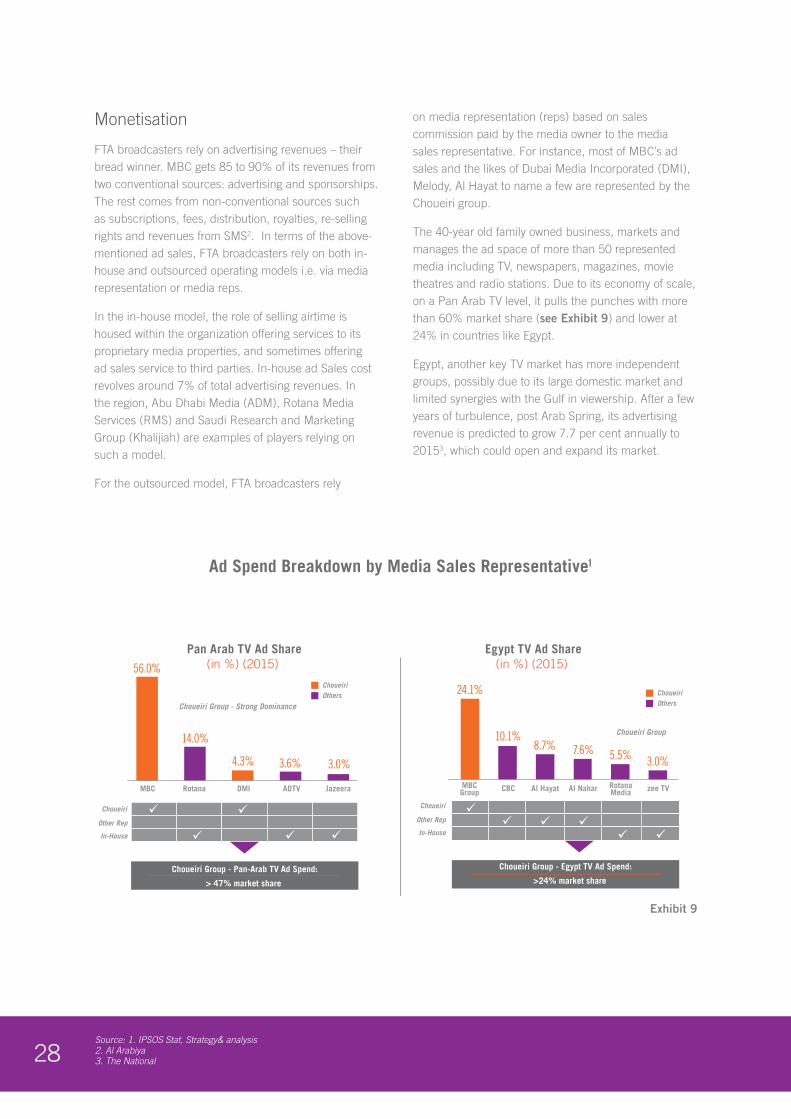
28Source: 1. IPSOS Stat, Strategy& analysis 2. Al Arabiya 3. The National
Monetisation
FTA broadcasters rely on advertising revenues – their bread winner. MBC gets 85 to 90% of its revenues from two conventional sources: advertising and sponsorships. The rest comes from non-conventional sources such as subscriptions, fees, distribution, royalties, re-selling rights and revenues from SMS2. In terms of the above-mentioned ad sales, FTA broadcasters rely on both in-house and outsourced operating models i.e. via media representation or media reps.
In the in-house model, the role of selling airtime is housed within the organization offering services to its proprietary media properties, and sometimes offering ad sales service to third parties. In-house ad Sales cost revolves around 7% of total advertising revenues. In the region, Abu Dhabi Media (ADM), Rotana Media Services (RMS) and Saudi Research and Marketing Group (Khalijiah) are examples of players relying on such a model.
For the outsourced model, FTA broadcasters rely
on media representation (reps) based on sales commission paid by the media owner to the media sales representative. For instance, most of MBC’s ad sales and the likes of Dubai Media Incorporated (DMI), Melody, Al Hayat to name a few are represented by the Choueiri group.
The 40-year old family owned business, markets and manages the ad space of more than 50 represented media including TV, newspapers, magazines, movie theatres and radio stations. Due to its economy of scale, on a Pan Arab TV level, it pulls the punches with more than 60% market share (see Exhibit 9) and lower at 24% in countries like Egypt.
Egypt, another key TV market has more independent groups, possibly due to its large domestic market and limited synergies with the Gulf in viewership. After a few years of turbulence, post Arab Spring, its advertising revenue is predicted to grow 7.7 per cent annually to 20153, which could open and expand its market.
Ad Spend Breakdown by Media Sales Representative1
Pan Arab TV Ad Share(in %) (2015)
Egypt TV Ad Share(in %) (2015)
MBCGroup
RotanaMedia zee TVCBC Al Hayat Al Nahar
Choueiri Group - Strong Dominance
Choueiri Others
3.0%3.6%4.3%
14.0%
56.0%
MBC Rotana DMI ADTV Jazeera
Choueiri Group - Pan-Arab TV Ad Spend:
> 47% market share
Choueiri
In-House
Other Rep
Choueiri Group
3.0%5.5%7.6%8.7%10.1%
24.1% Choueiri Others
Choueiri Group - Egypt TV Ad Spend:
>24% market share
Choueiri
In-House
Other Rep
1. Others include: Business, Documentary, Children, Comedy and Women shows
Source: IPSOS Stat, Strategy& analysis
Exhibit 9
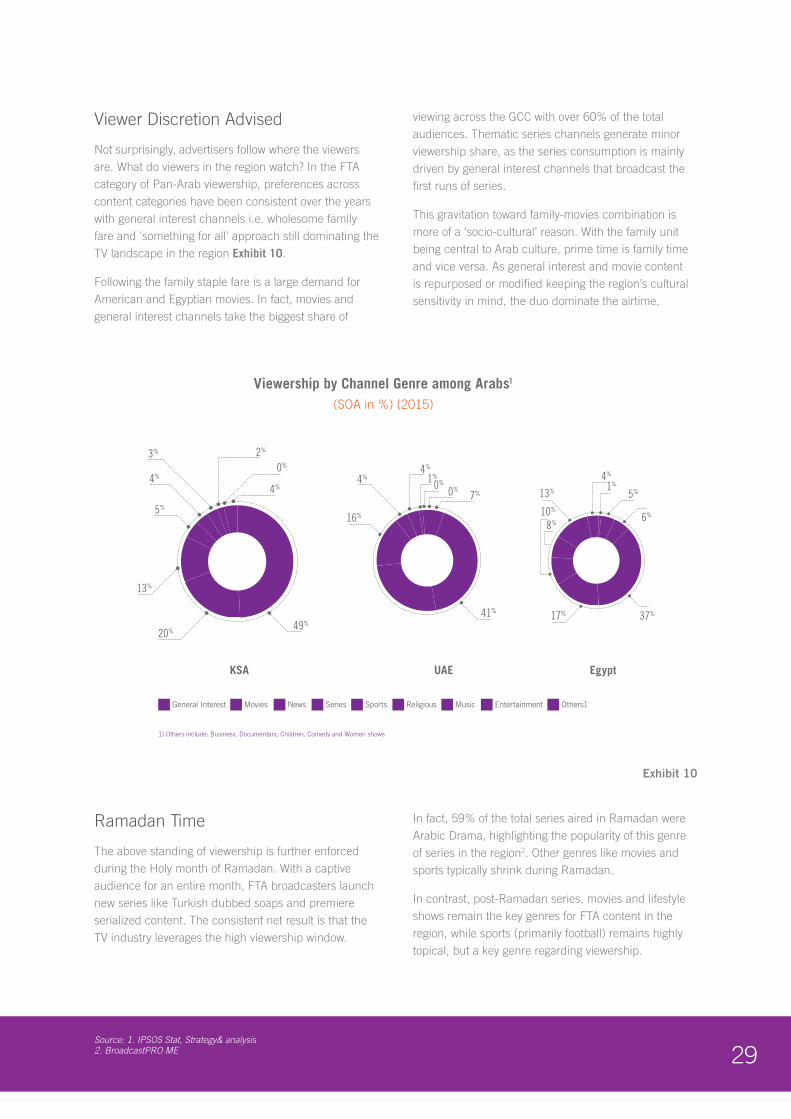
29Source: 1. IPSOS Stat, Strategy& analysis 2. BroadcastPRO ME
Viewer Discretion Advised
Not surprisingly, advertisers follow where the viewers are. What do viewers in the region watch? In the FTA category of Pan-Arab viewership, preferences across content categories have been consistent over the years with general interest channels i.e. wholesome family fare and 'something for all' approach still dominating the TV landscape in the region Exhibit 10.
Following the family staple fare is a large demand for American and Egyptian movies. In fact, movies and general interest channels take the biggest share of
viewing across the GCC with over 60% of the total audiences. Thematic series channels generate minor viewership share, as the series consumption is mainly driven by general interest channels that broadcast the first runs of series.
This gravitation toward family-movies combination is more of a ‘socio-cultural’ reason. With the family unit being central to Arab culture, prime time is family time and vice versa. As general interest and movie content is repurposed or modified keeping the region’s cultural sensitivity in mind, the duo dominate the airtime.
Ramadan Time
The above standing of viewership is further enforced during the Holy month of Ramadan. With a captive audience for an entire month, FTA broadcasters launch new series like Turkish dubbed soaps and premiere serialized content. The consistent net result is that the TV industry leverages the high viewership window.
In fact, 59% of the total series aired in Ramadan were Arabic Drama, highlighting the popularity of this genre of series in the region2. Other genres like movies and sports typically shrink during Ramadan.
In contrast, post-Ramadan series, movies and lifestyle shows remain the key genres for FTA content in the region, while sports (primarily football) remains highly topical, but a key genre regarding viewership.
Viewership by Channel Genre among Arabs1
(SOA in %) (2015)
EgyptUAE KSA
1) Others include: Business, Documentary, Children, Comedy and Women shows
20% 49%41%
4%4%
7%
10%
1%
0%
0%
17%
13%
5%
16%
4%
3% 2%
0%
4%
37%
8%
13%
4%
1%
5%
6%
General Interest Movies News Series Sports Religious Music Entertainment Others1
Exhibit 10

30Source: 1. IPSOS, Strategy& analysis 2. Arab Advisors 3. Informa Telecoms & Media
Within series, GCC is dominated by Arabic and Turkish (dubbed into Arabic) series, whereas Egypt continues to be a highly local market. The majority of productions for 2014 and the first six months of 2015 were of the series genre - constituting 50% and 51% of total productions respectively2.
This is based on the report “TV Series production houses in the Arab world 2015”, which analysed 18 production houses in seven Arab countries, which produced 40 Arabic television series in 2014 and 39 series in the first six months of 2015-time frame.
Pay TV: Show me the money
Pay-TV HH penetration (2014-2019)3
Source: Informa Telecoms & Media
EasternEurope
LatinAmerica
WesternEurope
AsiaPacific
NorthAmerica
Middle East &Africa
2014 2019
79%
79%
69%
73%
55%
59%
55%
65%
63%
67%
29%
40%
Regular Month Ramadan
Channel SOA - Ramadan vs. Non Ramadan1
KSA, 2015
General Interest
News
Series
Religious
Movies
Sports
Women Others
Comedy
Documentary
5%
49%
0%
3%20%
4%
0%
17%
1%1%
10%8%
5%
7%
2%
1%
1%
0%2%
65%
Exhibit 11
Exhibit 12

31Source: 1. Informa Telecoms & Media, Industry Interviews, 2. ABI Research
On the other end of the market spectrum is Pay TV or television that’s paid for as opposed to Free to Air. As seen in Exhibit 13 there is still upside in Pay TV as it continues to ramp up in the GCC markets. It’s not such an Arab scenario, but a global one with half of the world’s households expected to have access to Pay TV service by 2017, representing 1 billion subscribers and driven by emerging markets.2
While the region has traditionally been an FTA market, Pay TV is penetrating rapidly led by the affluent GCC
countries and expected to reach half the TV households in the GCC by 2018.
However, when compared with FTA, Pay TV pales in comparison as seen in Exhibit 14. Its low penetration is compounded by a low evolution audience measurement, resulting in Pay TV showing limited viewership. KSA remains a major market both by its share and its growth followed by the UAE – together these two countries constitute 64% of the region’s market share, skewing it.
On the other hand, at 13% of the value share Egypt is seen as a promising market by Pay TV players. However, it remains constrained by it low ARPU (average revenue per user) and other factors. Another market seen by players as interesting is Jordan. The Kingdom has become home to tens and thousands of
Iraqis and Syrians, immigrating due to unstable political conditions leading to Pay TV adoption - although the market size is still relatively small.
North African markets, namely Tunisia, Algeria, Algeria and Morocco, on the other hand, have not yet been
Tunisia
Kuwait
Egypt
United Arab Emirates
Qatar
Saudi Arabia
36%
1%
Oman1%
0%
28%
13%
7%
4%
Bahrain3%
Morocco2%Algeria
2%
Lebanon
2%Jordan
2%
Palestine
Country shares of Pay TV Revenues1
2015 US$, Mil.
Exhibit 13
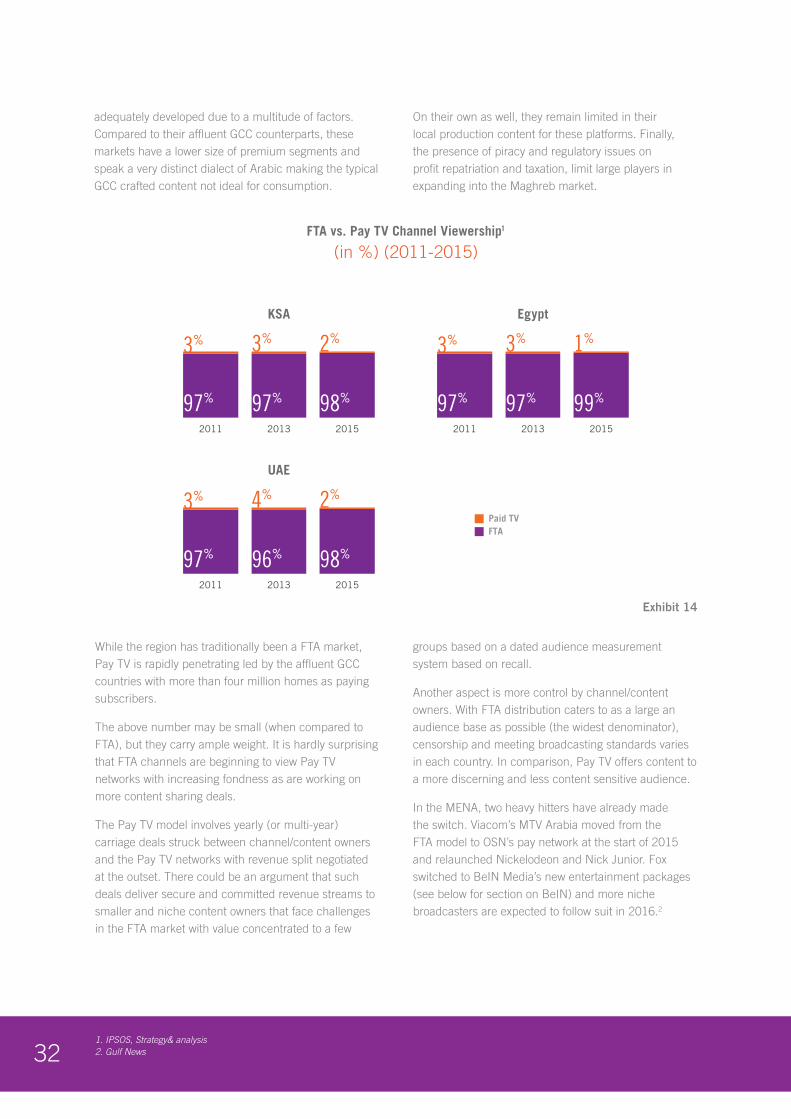
321. IPSOS, Strategy& analysis 2. Gulf News
While the region has traditionally been a FTA market, Pay TV is rapidly penetrating led by the affluent GCC countries with more than four million homes as paying subscribers.
The above number may be small (when compared to FTA), but they carry ample weight. It is hardly surprising that FTA channels are beginning to view Pay TV networks with increasing fondness as are working on more content sharing deals.
The Pay TV model involves yearly (or multi-year) carriage deals struck between channel/content owners and the Pay TV networks with revenue split negotiated at the outset. There could be an argument that such deals deliver secure and committed revenue streams to smaller and niche content owners that face challenges in the FTA market with value concentrated to a few
groups based on a dated audience measurement system based on recall.
Another aspect is more control by channel/content owners. With FTA distribution caters to as a large an audience base as possible (the widest denominator), censorship and meeting broadcasting standards varies in each country. In comparison, Pay TV offers content to a more discerning and less content sensitive audience.
In the MENA, two heavy hitters have already made the switch. Viacom’s MTV Arabia moved from the FTA model to OSN’s pay network at the start of 2015 and relaunched Nickelodeon and Nick Junior. Fox switched to BeIN Media’s new entertainment packages (see below for section on BeIN) and more niche broadcasters are expected to follow suit in 2016.2
adequately developed due to a multitude of factors. Compared to their affluent GCC counterparts, these markets have a lower size of premium segments and speak a very distinct dialect of Arabic making the typical GCC crafted content not ideal for consumption.
On their own as well, they remain limited in their local production content for these platforms. Finally, the presence of piracy and regulatory issues on profit repatriation and taxation, limit large players in expanding into the Maghreb market.
FTA vs. Pay TV Channel Viewership1
(in %) (2011-2015)
KSA Egypt
97%
3%
2011
3%
97%
2013
2%
98%
2015
97%
3%
2011
3%
97%
2013
1%
99%
2015
UAE
97%
3%
2011
4%
96%
2013
2%
98%
2015
Paid TVFTA
Exhibit 14
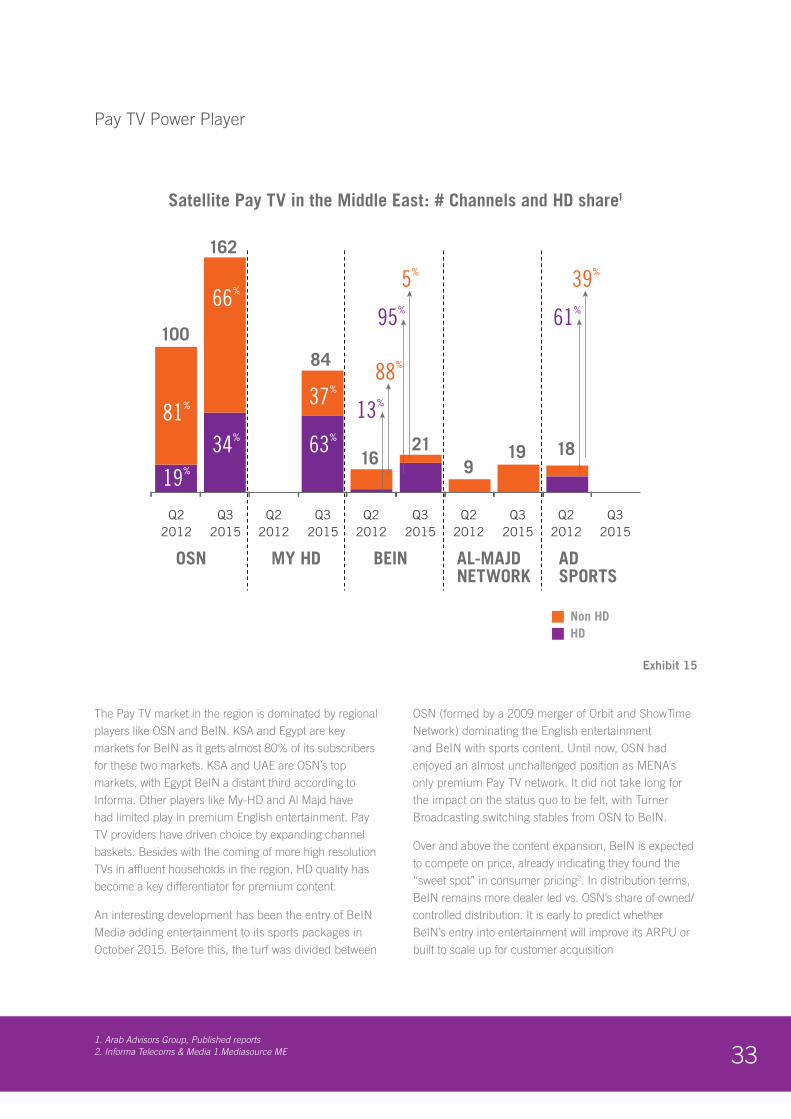
331. Arab Advisors Group, Published reports 2. Informa Telecoms & Media 1.Mediasource ME
Pay TV Power Player
The Pay TV market in the region is dominated by regional players like OSN and BeIN. KSA and Egypt are key markets for BeIN as it gets almost 80% of its subscribers for these two markets. KSA and UAE are OSN’s top markets, with Egypt BeIN a distant third according to Informa. Other players like My-HD and Al Majd have had limited play in premium English entertainment. Pay TV providers have driven choice by expanding channel baskets. Besides with the coming of more high resolution TVs in affluent households in the region, HD quality has become a key differentiator for premium content.
An interesting development has been the entry of BeIN Media adding entertainment to its sports packages in October 2015. Before this, the turf was divided between
OSN (formed by a 2009 merger of Orbit and ShowTime Network) dominating the English entertainment and BeIN with sports content. Until now, OSN had enjoyed an almost unchallenged position as MENA’s only premium Pay TV network. It did not take long for the impact on the status quo to be felt, with Turner Broadcasting switching stables from OSN to BeIN.
Over and above the content expansion, BeIN is expected to compete on price, already indicating they found the “sweet spot” in consumer pricing2. In distribution terms, BeIN remains more dealer led vs. OSN’s share of owned/ controlled distribution. It is early to predict whether BeIN’s entry into entertainment will improve its ARPU or built to scale up for customer acquisition
Satellite Pay TV in the Middle East: # Channels and HD share1
OSN MY HD BEIN AL-MAJDNETWORK
ADSPORTS
95%
100
162
84
1621
919 18
81%
19%
66%
34% 63%
13%37%88%
95%
5%
61%
39%
Non HDHD
2012Q2 Q3
2015 2012Q2 Q3
2015 2012Q2 Q3
2015 2012Q2 Q3
2015 2012Q2 Q3
2015
Exhibit 15
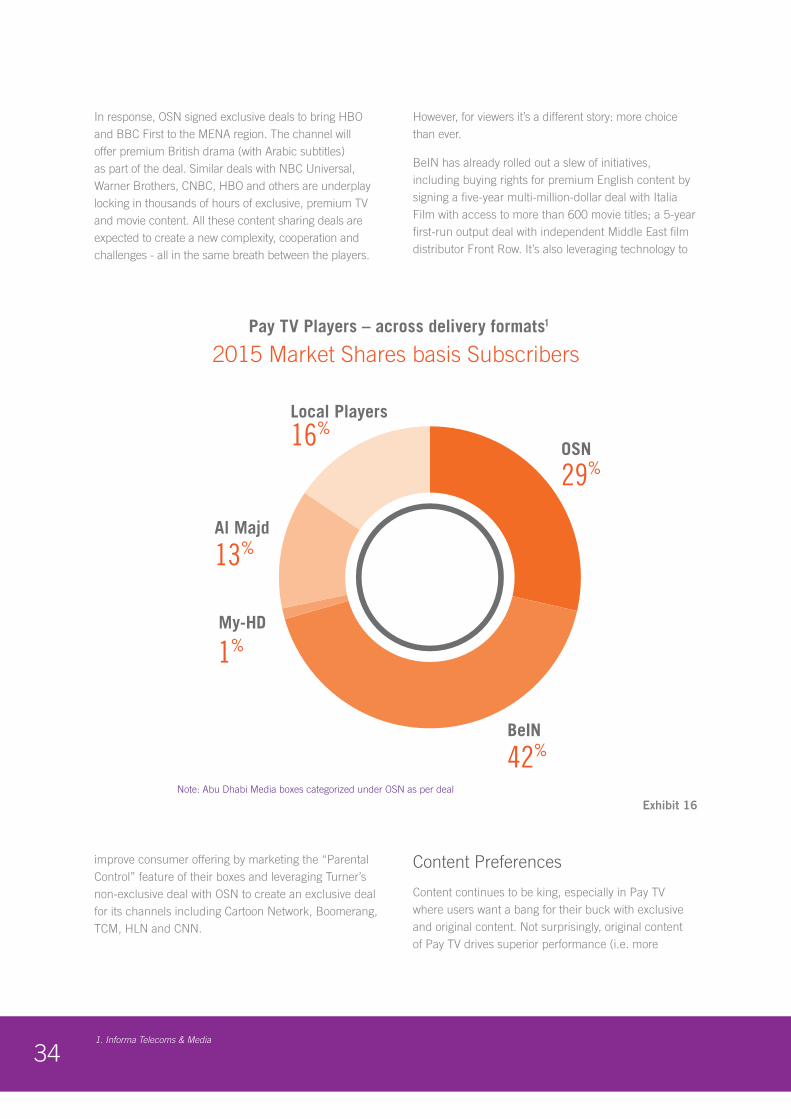
341. Informa Telecoms & Media
In response, OSN signed exclusive deals to bring HBO and BBC First to the MENA region. The channel will offer premium British drama (with Arabic subtitles) as part of the deal. Similar deals with NBC Universal, Warner Brothers, CNBC, HBO and others are underplay locking in thousands of hours of exclusive, premium TV and movie content. All these content sharing deals are expected to create a new complexity, cooperation and challenges - all in the same breath between the players.
However, for viewers it’s a different story: more choice than ever.
BeIN has already rolled out a slew of initiatives, including buying rights for premium English content by signing a five-year multi-million-dollar deal with Italia Film with access to more than 600 movie titles; a 5-year first-run output deal with independent Middle East film distributor Front Row. It’s also leveraging technology to
improve consumer offering by marketing the “Parental Control” feature of their boxes and leveraging Turner’s non-exclusive deal with OSN to create an exclusive deal for its channels including Cartoon Network, Boomerang, TCM, HLN and CNN.
Content Preferences
Content continues to be king, especially in Pay TV where users want a bang for their buck with exclusive and original content. Not surprisingly, original content of Pay TV drives superior performance (i.e. more
Note: Abu Dhabi Media boxes categorized under OSN as per deal
1) Source: Informa Telecoms & Media
Pay TV Players – across delivery formats1
2015 Market Shares basis Subscribers
Al Majd
Local Players
My-HD
OSN
BeIN
42%
29%
13%
1%
16%
Exhibit 16
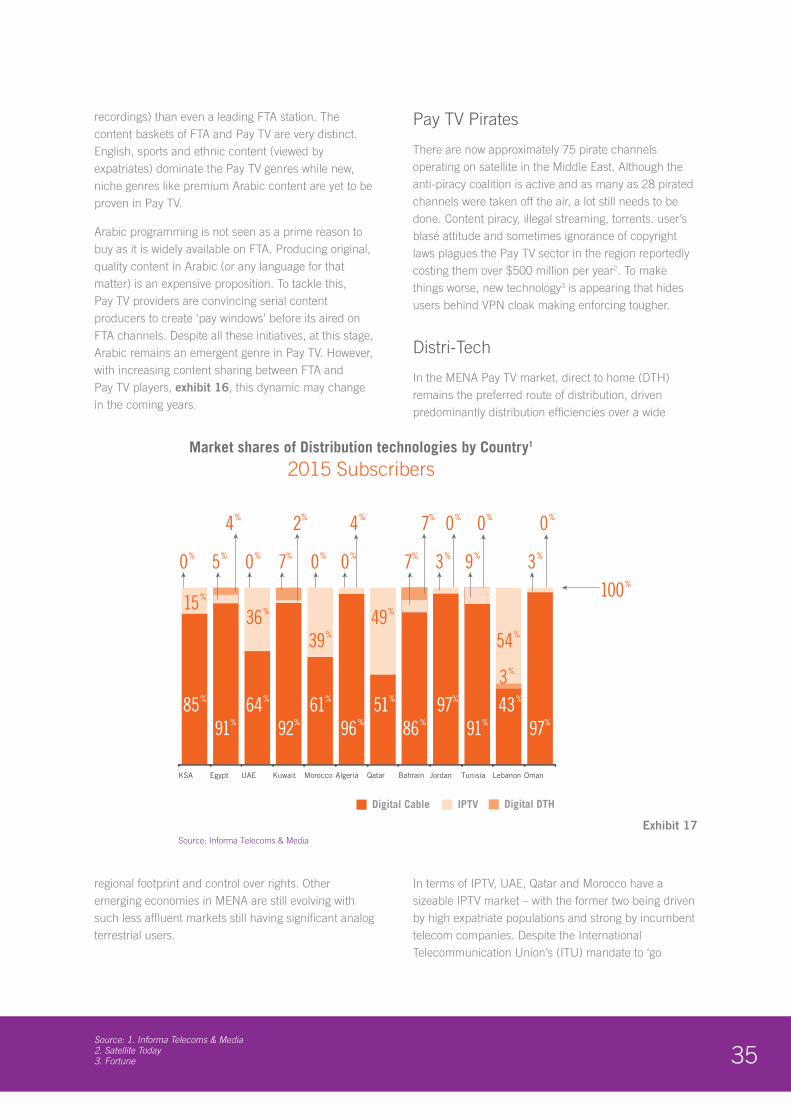
35Source: 1. Informa Telecoms & Media 2. Satellite Today 3. Fortune
recordings) than even a leading FTA station. The content baskets of FTA and Pay TV are very distinct. English, sports and ethnic content (viewed by expatriates) dominate the Pay TV genres while new, niche genres like premium Arabic content are yet to be proven in Pay TV.
Arabic programming is not seen as a prime reason to buy as it is widely available on FTA. Producing original, quality content in Arabic (or any language for that matter) is an expensive proposition. To tackle this, Pay TV providers are convincing serial content producers to create ‘pay windows’ before its aired on FTA channels. Despite all these initiatives, at this stage, Arabic remains an emergent genre in Pay TV. However, with increasing content sharing between FTA and Pay TV players, exhibit 16, this dynamic may change in the coming years.
Pay TV Pirates
There are now approximately 75 pirate channels operating on satellite in the Middle East. Although the anti-piracy coalition is active and as many as 28 pirated channels were taken off the air, a lot still needs to be done. Content piracy, illegal streaming, torrents. user’s blasé attitude and sometimes ignorance of copyright laws plagues the Pay TV sector in the region reportedly costing them over $500 million per year2. To make things worse, new technology3 is appearing that hides users behind VPN cloak making enforcing tougher.
Distri-Tech
In the MENA Pay TV market, direct to home (DTH) remains the preferred route of distribution, driven predominantly distribution efficiencies over a wide
regional footprint and control over rights. Other emerging economies in MENA are still evolving with such less affluent markets still having significant analog terrestrial users.
In terms of IPTV, UAE, Qatar and Morocco have a sizeable IPTV market – with the former two being driven by high expatriate populations and strong by incumbent telecom companies. Despite the International Telecommunication Union’s (ITU) mandate to ‘go
Tunisia
Jordan
Source: Informa Telecoms & Media
Market shares of Distribution technologies by Country1
2015 Subscribers
KSA UAEEgypt QatarAlgeriaMoroccoKuwait LebanonBahrain Oman
85%
91%
15%
0% 0% 0%
0% 0% 0%
100%
0%
4%
7% 7% 3% 9% 3%
3%
7%2%
5%
4%
64%
92%
61%
96%
36%
39%
49%
Digital Cable IPTV Digital DTH
51%
86%
97%
91%
43%
97%
54%
Exhibit 17
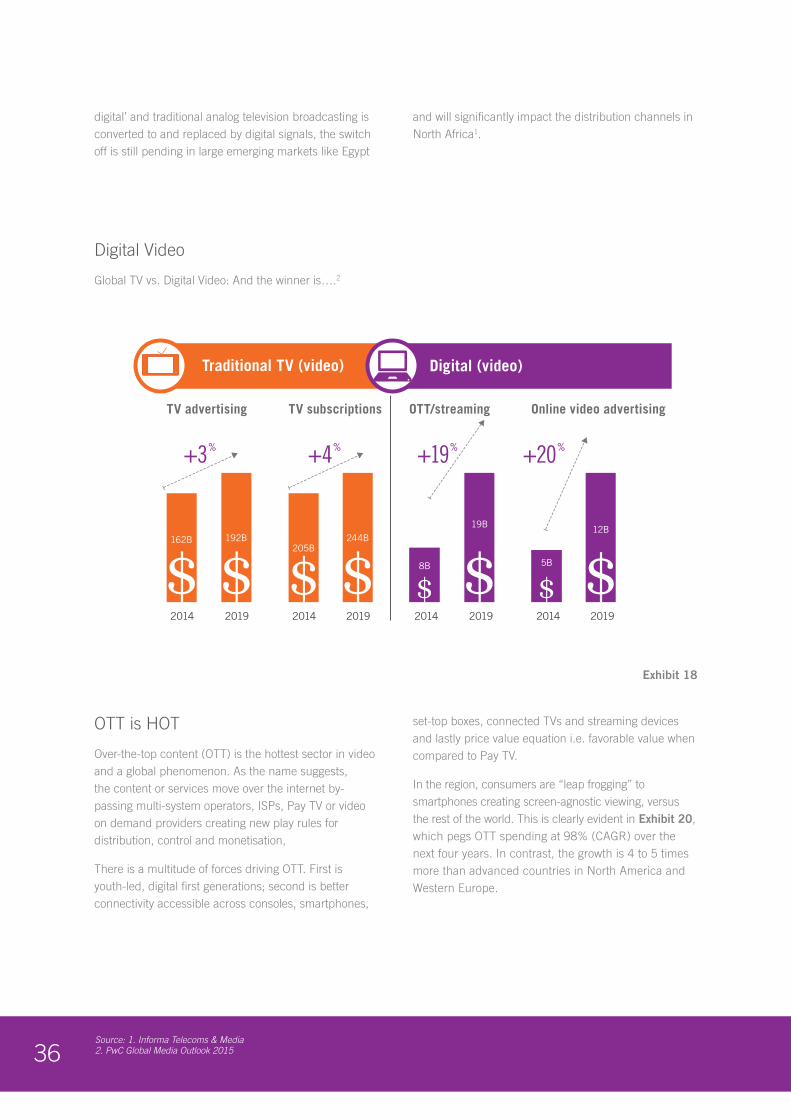
36Source: 1. Informa Telecoms & Media 2. PwC Global Media Outlook 2015
and will significantly impact the distribution channels in North Africa1.
digital’ and traditional analog television broadcasting is converted to and replaced by digital signals, the switch off is still pending in large emerging markets like Egypt
OTT is HOT
Over-the-top content (OTT) is the hottest sector in video and a global phenomenon. As the name suggests, the content or services move over the internet by-passing multi-system operators, ISPs, Pay TV or video on demand providers creating new play rules for distribution, control and monetisation,
There is a multitude of forces driving OTT. First is youth-led, digital first generations; second is better connectivity accessible across consoles, smartphones,
set-top boxes, connected TVs and streaming devices and lastly price value equation i.e. favorable value when compared to Pay TV.
In the region, consumers are “leap frogging” to smartphones creating screen-agnostic viewing, versus the rest of the world. This is clearly evident in Exhibit 20, which pegs OTT spending at 98% (CAGR) over the next four years. In contrast, the growth is 4 to 5 times more than advanced countries in North America and Western Europe.
Digital Video
Global TV vs. Digital Video: And the winner is….2
Traditional TV (video) Digital (video)
192B162B 244B205B
Source: Informa Telecoms & Media
Online video advertising OTT/streamingTV subscriptions TV advertising
2014 2019 2014 2019 2014 2019 2014 2019
8B
19B
5B
12B
+3% +4% +19% +20%
Exhibit 18
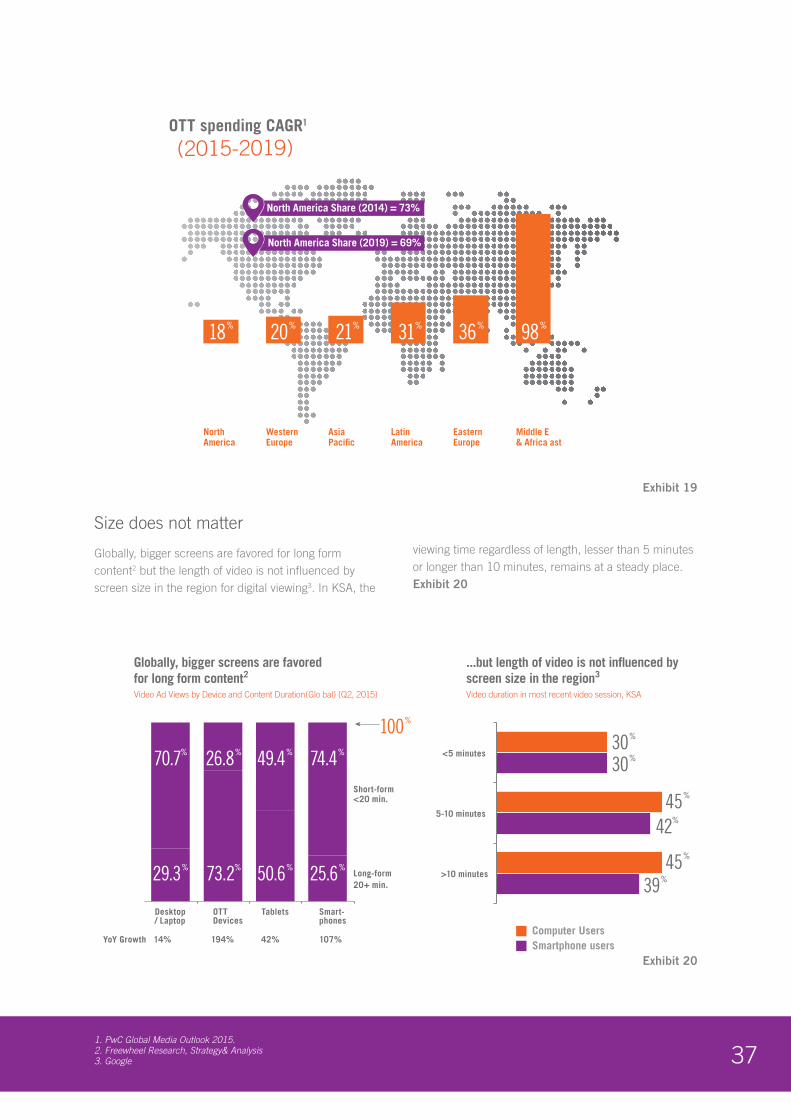
371. PwC Global Media Outlook 2015. 2. Freewheel Research, Strategy& Analysis 3. Google
Size does not matter
Globally, bigger screens are favored for long form content2 but the length of video is not influenced by screen size in the region for digital viewing3. In KSA, the
viewing time regardless of length, lesser than 5 minutes or longer than 10 minutes, remains at a steady place. Exhibit 20
OTT spending CAGR1
(2015-2019)
Middle E& Africa ast
LatinAmerica
AsiaPacific
NorthAmerica
WesternEurope
EasternEurope
Source: PwC Global Media Outlook 2015
North America Share (2014) = 73%
North America Share (2019) = 69%
18% 20% 21% 31% 36% 98%
Globally, bigger screens are favoredfor long form content2 Video Ad Views by Device and Content Duration(Glo bal) (Q2, 2015)
YoY Growth 14% 194% 42% 107%
OTTDevices
Desktop/ Laptop
Tablets Smart-phones
Long-form
Short-form <20 min.
20+ min.
...but length of video is not influenced byscreen size in the region3
Video duration in most recent video session, KSA
>10 minutes
5-10 minutes
<5 minutes
Source 1) GoogleSource: Freewheel Research and Strategy& Analysis
70.7%
29.3% 73.2%
26.8% 49.4% 74.4%30%
30%
45%
42%
39%50.6% 25.6%
100%
45%
Computer UsersSmartphone users
Exhibit 19
Exhibit 20
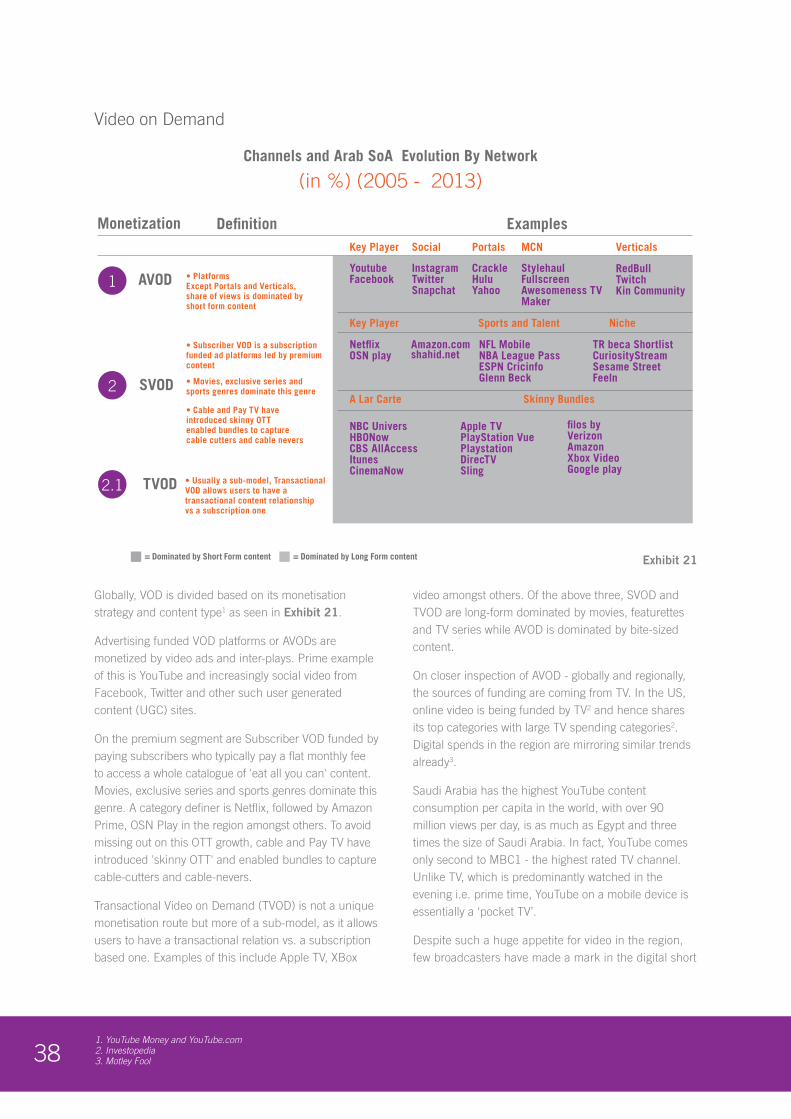
381. YouTube Money and YouTube.com2. Investopedia3. Motley Fool
Video on Demand
Globally, VOD is divided based on its monetisation strategy and content type1 as seen in Exhibit 21.
Advertising funded VOD platforms or AVODs are monetized by video ads and inter-plays. Prime example of this is YouTube and increasingly social video from Facebook, Twitter and other such user generated content (UGC) sites.
On the premium segment are Subscriber VOD funded by paying subscribers who typically pay a flat monthly fee to access a whole catalogue of 'eat all you can' content. Movies, exclusive series and sports genres dominate this genre. A category definer is Netflix, followed by Amazon Prime, OSN Play in the region amongst others. To avoid missing out on this OTT growth, cable and Pay TV have introduced 'skinny OTT' and enabled bundles to capture cable-cutters and cable-nevers.
Transactional Video on Demand (TVOD) is not a unique monetisation route but more of a sub-model, as it allows users to have a transactional relation vs. a subscription based one. Examples of this include Apple TV, XBox
video amongst others. Of the above three, SVOD and TVOD are long-form dominated by movies, featurettes and TV series while AVOD is dominated by bite-sized content.
On closer inspection of AVOD - globally and regionally, the sources of funding are coming from TV. In the US, online video is being funded by TV2 and hence shares its top categories with large TV spending categories2. Digital spends in the region are mirroring similar trends already3.
Saudi Arabia has the highest YouTube content consumption per capita in the world, with over 90 million views per day, is as much as Egypt and three times the size of Saudi Arabia. In fact, YouTube comes only second to MBC1 - the highest rated TV channel. Unlike TV, which is predominantly watched in the evening i.e. prime time, YouTube on a mobile device is essentially a ‘pocket TV’.
Despite such a huge appetite for video in the region, few broadcasters have made a mark in the digital short
Channels and Arab SoA Evolution By Network
(in %) (2005 - 2013)
Source: IPSOS Stat; Strategy& Company analysis
= Dominated by Short Form content = Dominated by Long Form content
SVOD
TVOD
AVOD • Platforms Except Portals and Verticals,share of views is dominated byshort form content
• Subscriber VOD is a subscriptionfunded ad platforms led by premiumcontent
• Movies, exclusive series andsports genres dominate this genre
• Cable and Pay TV haveintroduced skinny OTTenabled bundles to capturecable cutters and cable nevers
Monetization Definition Examples
1
2
2.1 • Usually a sub-model, TransactionalVOD allows users to have a transactional content relationshipvs a subscription one
Key Player Social Portals MCN Verticals
Key Player Sports and Talent Niche
A Lar Carte Skinny Bundles
YoutubeFacebook
NetflixOSN play
NBC UniversHBONowCBS AllAccessItunesCinemaNow
Apple TVPlayStation VuePlaystationDirecTVSling
InstagramTwitterSnapchat
CrackleHuluYahoo
StylehaulFullscreenAwesomeness TVMaker
RedBullTwitchKin Community
Amazon.comshahid.net
NFL MobileNBA League PassESPN CricinfoGlenn Beck
TR beca ShortlistCuriosityStreamSesame StreetFeeln
filos by VerizonAmazonXbox VideoGoogle play
Advertising funded VOD
Exhibit 21
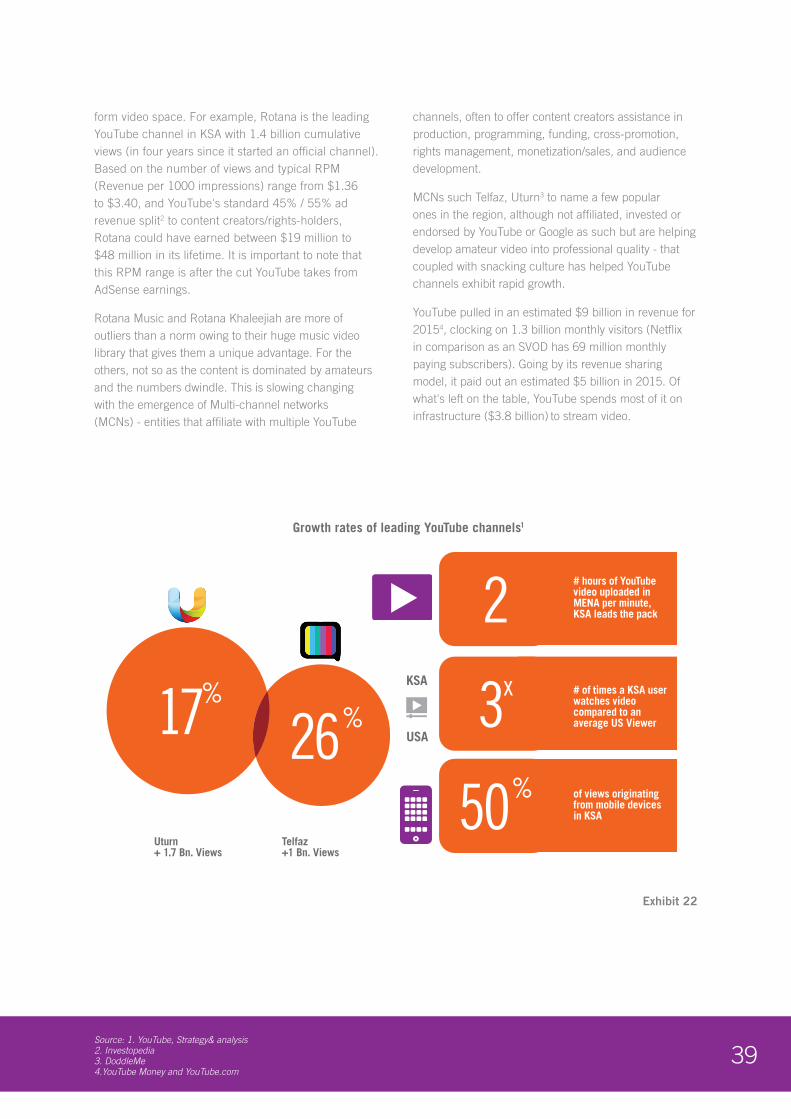
39Source: 1. YouTube, Strategy& analysis 2. Investopedia 3. DoddleMe 4.YouTube Money and YouTube.com
form video space. For example, Rotana is the leading YouTube channel in KSA with 1.4 billion cumulative views (in four years since it started an official channel). Based on the number of views and typical RPM (Revenue per 1000 impressions) range from $1.36 to $3.40, and YouTube's standard 45% / 55% ad revenue split2 to content creators/rights-holders, Rotana could have earned between $19 million to $48 million in its lifetime. It is important to note that this RPM range is after the cut YouTube takes from AdSense earnings.
Rotana Music and Rotana Khaleejiah are more of outliers than a norm owing to their huge music video library that gives them a unique advantage. For the others, not so as the content is dominated by amateurs and the numbers dwindle. This is slowing changing with the emergence of Multi-channel networks (MCNs) - entities that affiliate with multiple YouTube
channels, often to offer content creators assistance in production, programming, funding, cross-promotion, rights management, monetization/sales, and audience development.
MCNs such Telfaz, Uturn3 to name a few popular ones in the region, although not affiliated, invested or endorsed by YouTube or Google as such but are helping develop amateur video into professional quality - that coupled with snacking culture has helped YouTube channels exhibit rapid growth.
YouTube pulled in an estimated $9 billion in revenue for 20154, clocking on 1.3 billion monthly visitors (Netflix in comparison as an SVOD has 69 million monthly paying subscribers). Going by its revenue sharing model, it paid out an estimated $5 billion in 2015. Of what's left on the table, YouTube spends most of it on infrastructure ($3.8 billion) to stream video.
Growth rates of leading YouTube channels1
Source: YouTube, Strategy& analysis
Telfaz+1 Bn. Views
KSA
USA
Uturn+ 1.7 Bn. Views
of views originatingfrom mobile devicesin KSA
# of times a KSA userwatches videocompared to anaverage US Viewer
# hours of YouTubevideo uploaded inMENA per minute,KSA leads the pack
17%
26%
50%
3x
2
Exhibit 22
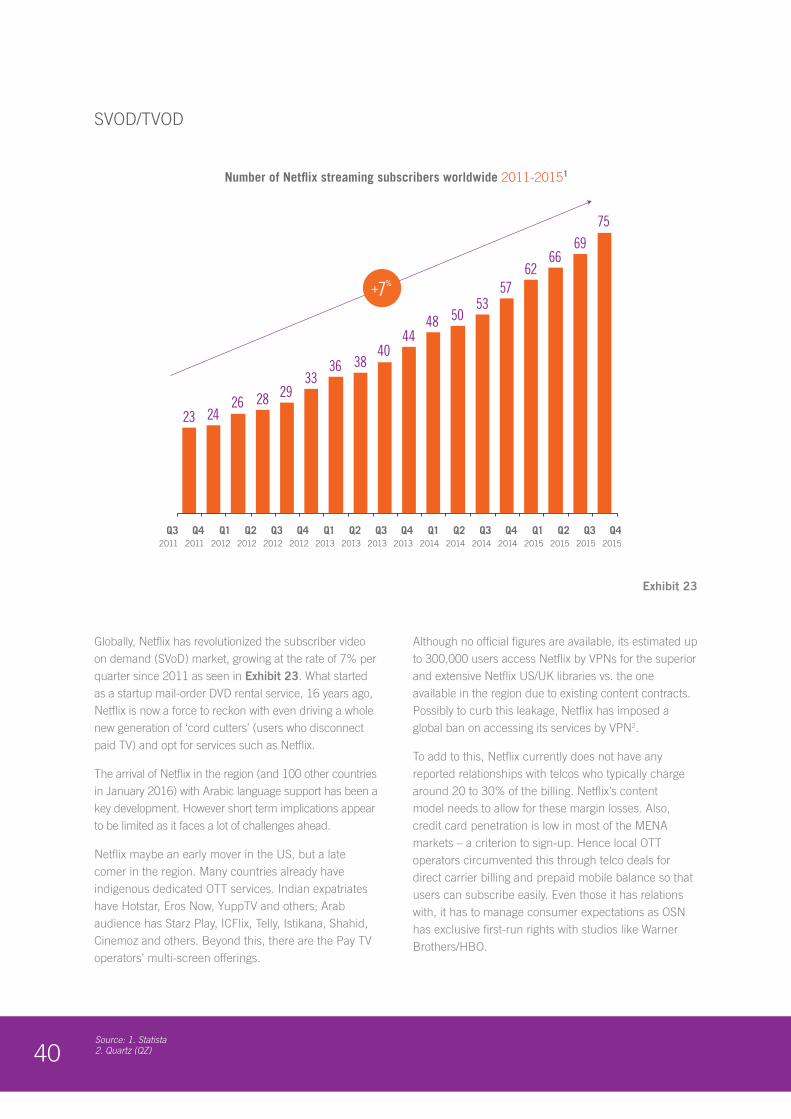
40Source: 1. Statista 2. Quartz (QZ)
SVOD/TVOD
Globally, Netflix has revolutionized the subscriber video on demand (SVoD) market, growing at the rate of 7% per quarter since 2011 as seen in Exhibit 23. What started as a startup mail-order DVD rental service, 16 years ago, Netflix is now a force to reckon with even driving a whole new generation of ‘cord cutters’ (users who disconnect paid TV) and opt for services such as Netflix.
The arrival of Netflix in the region (and 100 other countries in January 2016) with Arabic language support has been a key development. However short term implications appear to be limited as it faces a lot of challenges ahead.
Netflix maybe an early mover in the US, but a late comer in the region. Many countries already have indigenous dedicated OTT services. Indian expatriates have Hotstar, Eros Now, YuppTV and others; Arab audience has Starz Play, ICFlix, Telly, Istikana, Shahid, Cinemoz and others. Beyond this, there are the Pay TV operators’ multi-screen offerings.
Although no official figures are available, its estimated up to 300,000 users access Netflix by VPNs for the superior and extensive Netflix US/UK libraries vs. the one available in the region due to existing content contracts. Possibly to curb this leakage, Netflix has imposed a global ban on accessing its services by VPN2.
To add to this, Netflix currently does not have any reported relationships with telcos who typically charge around 20 to 30% of the billing. Netflix’s content model needs to allow for these margin losses. Also, credit card penetration is low in most of the MENA markets – a criterion to sign-up. Hence local OTT operators circumvented this through telco deals for direct carrier billing and prepaid mobile balance so that users can subscribe easily. Even those it has relations with, it has to manage consumer expectations as OSN has exclusive first-run rights with studios like Warner Brothers/HBO.
24
7569
6662
5753
504844
403836
33292826
23
Q32012
Q42012
Q12013
Q22013
Q32013
Q42013
Q22012
Q12012
Q32015
Q42015
Q12014
Q22014
Q32014
Q42014
Q12015
Q22015
Q42011
Q32011
Number of Netflix streaming subscribers worldwide 2011-20151
Source: Statista
+7%
Exhibit 23
411. Quartz (QZ)
Netflix may also need to apply for licensing on a country-by-country basis, subject to government review and approvals. Also, some markets like Jordan, Egypt and KSA have taxation, which will impact Netflix’s revenue streams1.
Content is king – regardless of the medium. Netflix’s recent success with exclusive rights from its production stable (House of cards, Orange is the new black etc) and algorithm-curated catalogue may have worked well in English-speaking markets, but for Netflix to build up a similarly attractive Arabic proposition, uptake may be slow and limited to niche segments.
To stream long-form video, high speed fixed internet is also expensive, limited or non-existent for a wide base of users. Content piracy, illegal video streaming and account sharing are another fly in the ointment for Netflix and all players alike - as it does around the world.
In the short-term, Netflix remains accessible to affluent, technically savvy users and not the FTA driven mass market. Things will change surely, as in the long run, Netflix plans to boost the platform with Arabic-language acquisitions and original content. For the near-term, Netflix has to position itself carefully between a pre-dominantly free and established Pay TV services before users can ‘Netflix and chill.’
Production:
In the MENA region, production is typically distributed across key hubs on the basis its content genre. The instability of the Syrian market has resulted in multiple producers relocating to UAE1 and Lebanon being housed in their respective media zones. Dubai for one has become active with its Studio City and Dubai Production City (DPC) formerly known as International Media Production Zone (IMPZ). Abu Dhabi similarly has upped the ante with its Twofour54’s integrated production facilities offering a host of incentives.
Despite the uptake from the Gulf countries, Egypt both for historical and large domestic market continues to be a production powerhouse, with coverage across drama and Arabic film content. Lebanon has also become a key hub for format shows development, typically created by Endemol and Freemantle, not the least due to its broadcasting relations with Dubai and resident industry talent.
Markets like the UAE, Kuwait and even KSA are working to leverage the trend of Gulf Series as a key genre to capitalize on local location benefits. Their better infrastructure, stability, access to a diverse pool of audience is working in their favor.
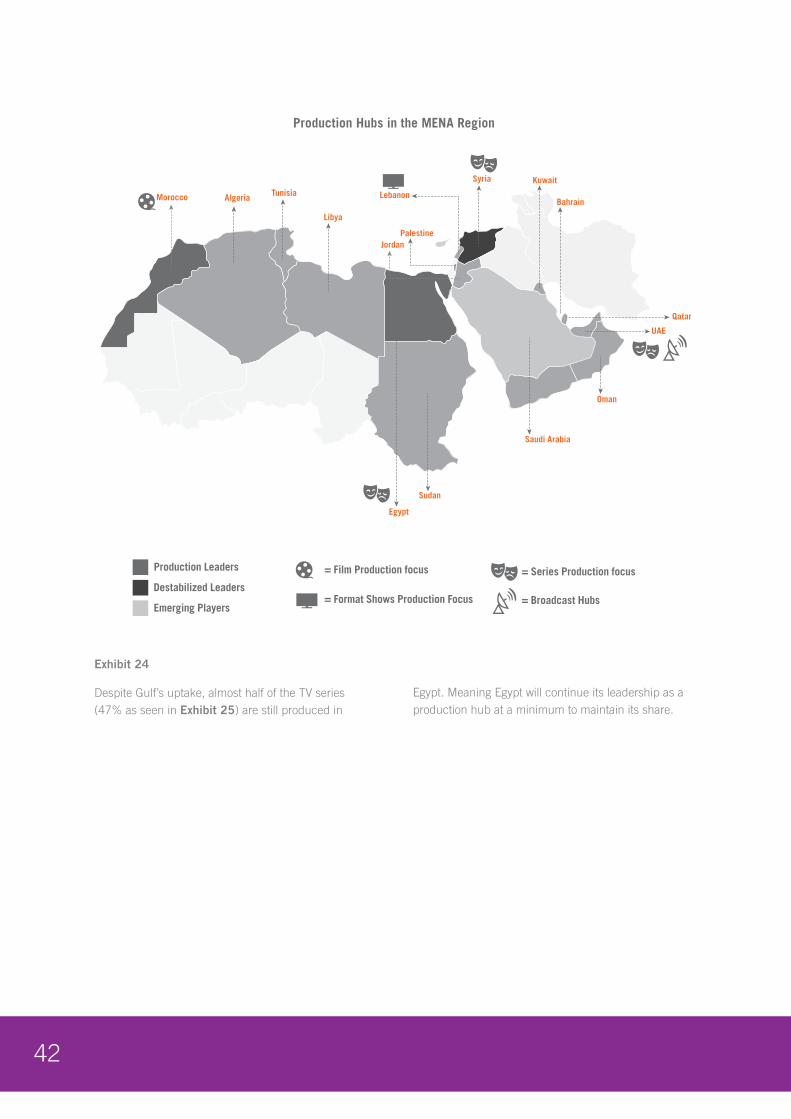
42
Exhibit 24
Despite Gulf’s uptake, almost half of the TV series (47% as seen in Exhibit 25) are still produced in
Egypt. Meaning Egypt will continue its leadership as a production hub at a minimum to maintain its share.
Production Hubs in the MENA Region
Emerging Players
Destabilized Leaders
Production Leaders = Film Production focus = Series Production focus
= Format Shows Production Focus = Broadcast Hubs
Syria
Palestine
Sudan
Egypt
Libya
Algeria Morocco Tunisia
Jordan
Saudi Arabia
Oman
UAE
Qatar
Bahrain
Kuwait
Lebanon

43Source: 1. Strategy& analysis
Exhibit 25
However, not all is ‘lights-action’ on the production side. The recent macro-economic slow-down has indirectly led to a slowdown in the advertising market. In light of the situation, key production players had to do some rethinking.
The region is notorious for producer financed content, with limited commissioned content.
With no increase in budgets and reduced commissioning of original local content has led a lot of channels to manage with more B and C type series versus Class A series. Class A series, as the name
suggests typically have A-listers i.e. top-draw celebrity actors. Also, any high talent fee elements or new buys are being negotiated down.
Pre-financing has also become challenging, which is likely to lead to more co-productions to minimise risk for any one production house. Other coping mechanisms include volume-driven deals to drive down costs; content sharing; newer commissioning models; production companies merging or selling out to bigger players.
Note: Other category includes Jordan and Lebanon includes 120 episodesType A, B and C series refers to the quality of the series and is mainly defined by actors featured
Source: Interviews, Strategy& analysis
Evolution of the Number of Produced Arabic Series in the Region1
(2013-2022E)
2017
2013
112
46%57
45%60
124
30%
1%
5%
7%
3%
44
2015
145
2019
27%33
29%38
19%23
28(20%)
43%62
2022
134
25(19%)
102
Gulf Egypt Syria
+4%
48%49
47%53
24%24
19%19 10%
1019%25 20%
28
19%21 9%
108%10
8%11 8%
11
25%28
Other (Jordan,Lebanon)

44
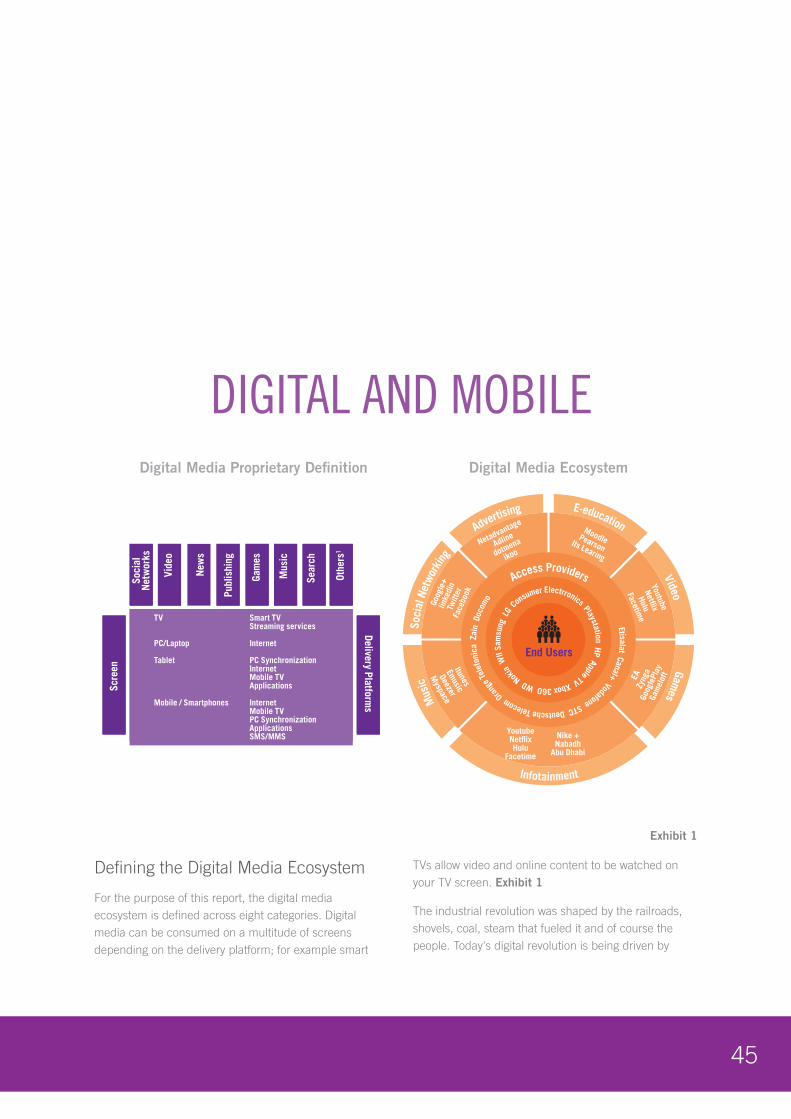
45
Defining the Digital Media Ecosystem
For the purpose of this report, the digital media ecosystem is defined across eight categories. Digital media can be consumed on a multitude of screens depending on the delivery platform; for example smart
TVs allow video and online content to be watched on your TV screen. Exhibit 1
The industrial revolution was shaped by the railroads, shovels, coal, steam that fueled it and of course the people. Today's digital revolution is being driven by
Exhibit 1
DIGITAL AND MOBILEDelivery Platform
s
Scre
en
Publ
ishi
ng
New
s
Sear
ch
Mus
ic
Vide
o
Gam
es
Othe
rs1
Soci
alNe
twor
ks
Digital Media Proprietary Definition
End Users
Consu
mer Electrronics
Etisalat Canal+ Vodafone STC Deutsche Telecom Oran
ge Te
lefo
nica
Zai
n D
ocom
o
Access Providers
Advertising E-education
VideoGam
es
Infotainment
Mus
ic
So
cial
Net
work
ing
Digital Media Ecosystem
TV Smart TV Streaming services
PC/Laptop Internet
Tablet PC Synchronization Internet Mobile TV Applications
Mobile / Smartphones Internet Mobile TV PC Synchronization Applications SMS/MMS
Netadvantage
Adline
dotmena
ikoo
Goog
le+
linke
din
Twitt
erFa
cebo
ok
Itunes
Emusic
Deezer
Myspace
EAZy
nga
Goog
lePl
ayGa
mel
oft
MoodlePearsonIts Learing
Youtube
Netflix
Hulu
Facetime
YoutubeNetflixHulu
Facetime
Nike +Nabadh
Abu Dhabi
Playstation HP Apple TV Xbox 360 WD Nok
ia W
II Sa
msu
ng L
G
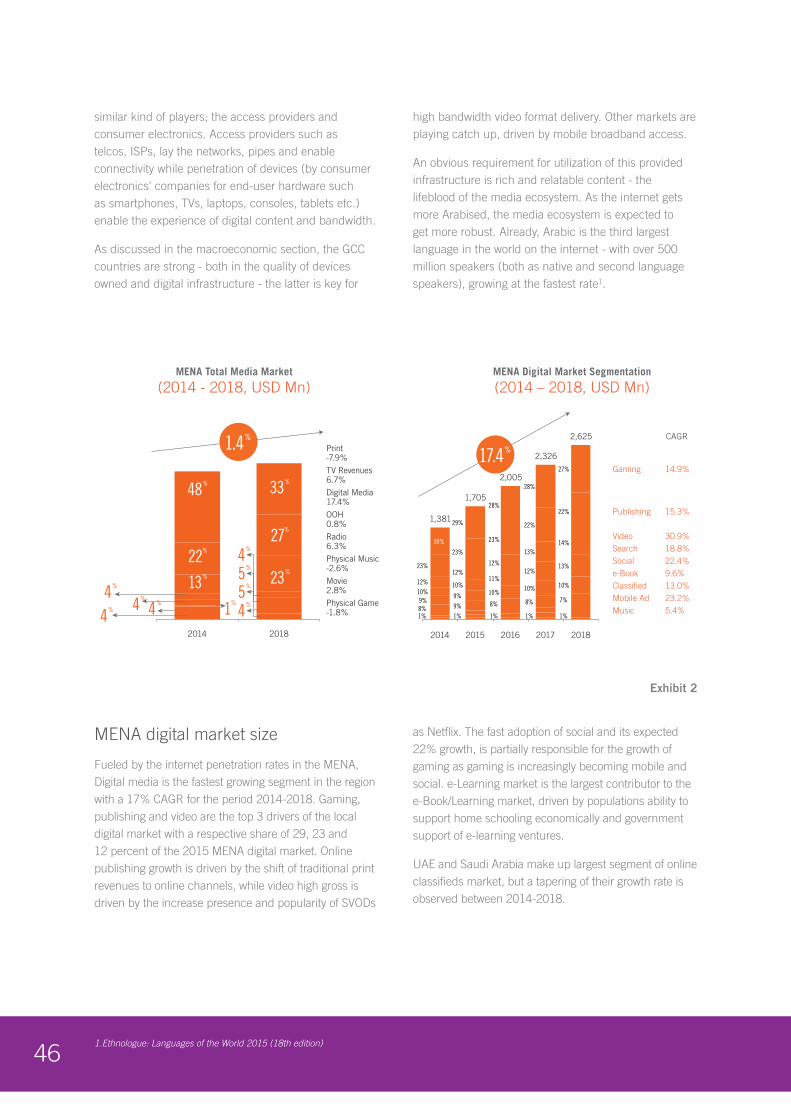
46
similar kind of players; the access providers and consumer electronics. Access providers such as telcos, ISPs, lay the networks, pipes and enable connectivity while penetration of devices (by consumer electronics' companies for end-user hardware such as smartphones, TVs, laptops, consoles, tablets etc.) enable the experience of digital content and bandwidth.
As discussed in the macroeconomic section, the GCC countries are strong - both in the quality of devices owned and digital infrastructure - the latter is key for
high bandwidth video format delivery. Other markets are playing catch up, driven by mobile broadband access.
An obvious requirement for utilization of this provided infrastructure is rich and relatable content - the lifeblood of the media ecosystem. As the internet gets more Arabised, the media ecosystem is expected to get more robust. Already, Arabic is the third largest language in the world on the internet - with over 500 million speakers (both as native and second language speakers), growing at the fastest rate1.
MENA digital market size
Fueled by the internet penetration rates in the MENA, Digital media is the fastest growing segment in the region with a 17% CAGR for the period 2014-2018. Gaming, publishing and video are the top 3 drivers of the local digital market with a respective share of 29, 23 and 12 percent of the 2015 MENA digital market. Online publishing growth is driven by the shift of traditional print revenues to online channels, while video high gross is driven by the increase presence and popularity of SVODs
as Netflix. The fast adoption of social and its expected 22% growth, is partially responsible for the growth of gaming as gaming is increasingly becoming mobile and social. e-Learning market is the largest contributor to the e-Book/Learning market, driven by populations ability to support home schooling economically and government support of e-learning ventures.
UAE and Saudi Arabia make up largest segment of online classifieds market, but a tapering of their growth rate is observed between 2014-2018.
MENA Total Media Market
(2014 - 2018, USD Mn)MENA Digital Market Segmentation
(2014 – 2018, USD Mn)
23%
1%
28%
8%
10%
12%
1,705
10%
1%
23%
29%
9%
9%
12%
1,381
9%
1%
23%
30%
10%
8%
12%
8%
10%
1%
22%
13%
10%
13% 14%
22%
28%
27%
2,625
12%
7%
2,326
11%
1%
2,005
20182014 20152014 2016 20182017
TV Revenues6.7%Digital Media17.4%
Physical Music-2.6%
Print-7.9%
Movie2.8%
Radio6.3%
OOH0.8%
Physical Game-1.8%
Classified 13.0%
Music 5.4%Mobile Ad 23.2%
e-Book 9.6%
Search 18.8%
Publishing 15.3%
Video 30.9%
Gaming 14.9%
Social 22.4%
1.4%
48%
22%
13%
4%
4% 1%
4%
5%
5%
4%4%
4%
33%
27%
CAGR
17.4%
23%
1.Ethnologue: Languages of the World 2015 (18th edition)
Exhibit 2
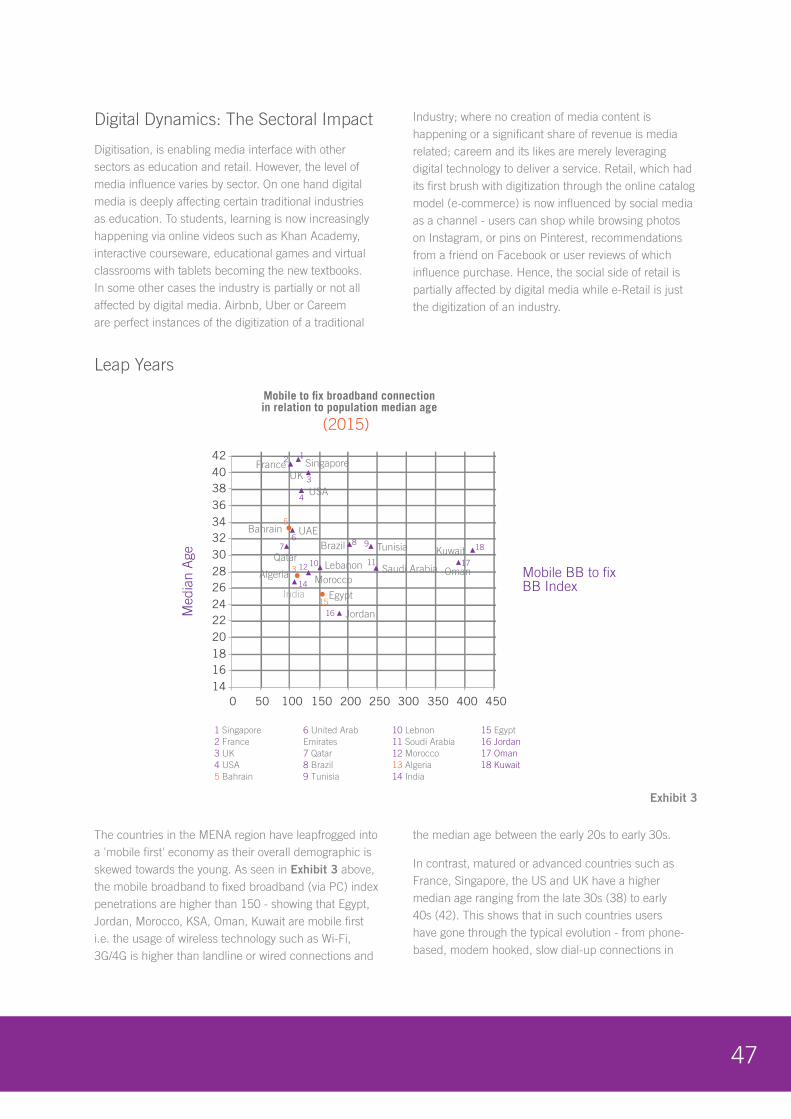
47
Digital Dynamics: The Sectoral Impact
Digitisation, is enabling media interface with other sectors as education and retail. However, the level of media influence varies by sector. On one hand digital media is deeply affecting certain traditional industries as education. To students, learning is now increasingly happening via online videos such as Khan Academy, interactive courseware, educational games and virtual classrooms with tablets becoming the new textbooks. In some other cases the industry is partially or not all affected by digital media. Airbnb, Uber or Careem are perfect instances of the digitization of a traditional
Industry; where no creation of media content is happening or a significant share of revenue is media related; careem and its likes are merely leveraging digital technology to deliver a service. Retail, which had its first brush with digitization through the online catalog model (e-commerce) is now influenced by social media as a channel - users can shop while browsing photos on Instagram, or pins on Pinterest, recommendations from a friend on Facebook or user reviews of which influence purchase. Hence, the social side of retail is partially affected by digital media while e-Retail is just the digitization of an industry.
The countries in the MENA region have leapfrogged into a 'mobile first' economy as their overall demographic is skewed towards the young. As seen in Exhibit 3 above, the mobile broadband to fixed broadband (via PC) index penetrations are higher than 150 - showing that Egypt, Jordan, Morocco, KSA, Oman, Kuwait are mobile first i.e. the usage of wireless technology such as Wi-Fi, 3G/4G is higher than landline or wired connections and
the median age between the early 20s to early 30s.
In contrast, matured or advanced countries such as France, Singapore, the US and UK have a higher median age ranging from the late 30s (38) to early 40s (42). This shows that in such countries users have gone through the typical evolution - from phone-based, modem hooked, slow dial-up connections in
Leap Years
Mobile to fix broadband connectionin relation to population median age
(2015)
1 Singapore2 France3 UK4 USA5 Bahrain
6 United Arab Emirates 7 Qatar8 Brazil9 Tunisia
10 Lebnon11 Soudi Arabia12 Morocco13 Algeria14 India
15 Egypt16 Jordan17 Oman18 Kuwait
141618202224262830323436384042
0 50 100 150 200 250 300 350 400 450
Jordan
Bahrain
Lebanon Algeria
Egypt
Kuwait Qatar
USA
Morocco Saudi Arabia
Tunisia
Singapore UK
Oman
France
UAE
India
Brazil
Med
ian
Age
Mobile BB to fixBB Index
12
3
4
5
67 8 9
10 111213
14
1516
17
18
Exhibit 3
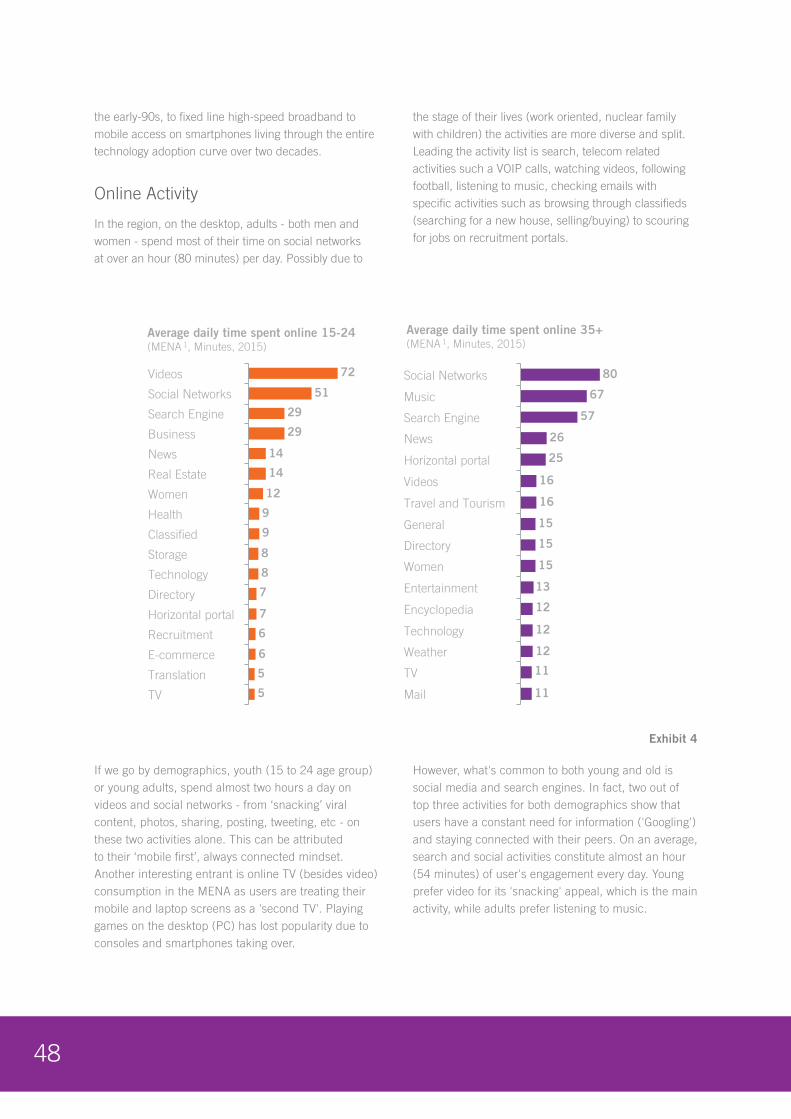
48
the early-90s, to fixed line high-speed broadband to mobile access on smartphones living through the entire technology adoption curve over two decades.
Online Activity
In the region, on the desktop, adults - both men and women - spend most of their time on social networks at over an hour (80 minutes) per day. Possibly due to
the stage of their lives (work oriented, nuclear family with children) the activities are more diverse and split. Leading the activity list is search, telecom related activities such a VOIP calls, watching videos, following football, listening to music, checking emails with specific activities such as browsing through classifieds (searching for a new house, selling/buying) to scouring for jobs on recruitment portals.
If we go by demographics, youth (15 to 24 age group) or young adults, spend almost two hours a day on videos and social networks - from ‘snacking’ viral content, photos, sharing, posting, tweeting, etc - on these two activities alone. This can be attributed to their ‘mobile first’, always connected mindset. Another interesting entrant is online TV (besides video) consumption in the MENA as users are treating their mobile and laptop screens as a 'second TV'. Playing games on the desktop (PC) has lost popularity due to consoles and smartphones taking over.
However, what's common to both young and old is social media and search engines. In fact, two out of top three activities for both demographics show that users have a constant need for information ('Googling') and staying connected with their peers. On an average, search and social activities constitute almost an hour (54 minutes) of user's engagement every day. Young prefer video for its 'snacking' appeal, which is the main activity, while adults prefer listening to music.
5
5
6
6
7
7
8
8
9
9
12
14
14
29
29
51
72
Translation
TV
E-commerce
News
Classified
Women
Business
Health
Real Estate
Search Engine
Videos
Social Networks
Technology
Directory
Storage
Horizontal portal
Recruitment
Average daily time spent online 15-24 (MENA 1, Minutes, 2015)
11
11
12
12
12
13
15
15
15
16
16
25
26
57
67
80
Women
Weather
Entertainment
Videos
Encyclopedia
Travel and Tourism
Directory
Technology
TV
General
Horizontal portal
Search Engine
Music
Social Networks
News
Average daily time spent online 35+ (MENA 1, Minutes, 2015)
Exhibit 4
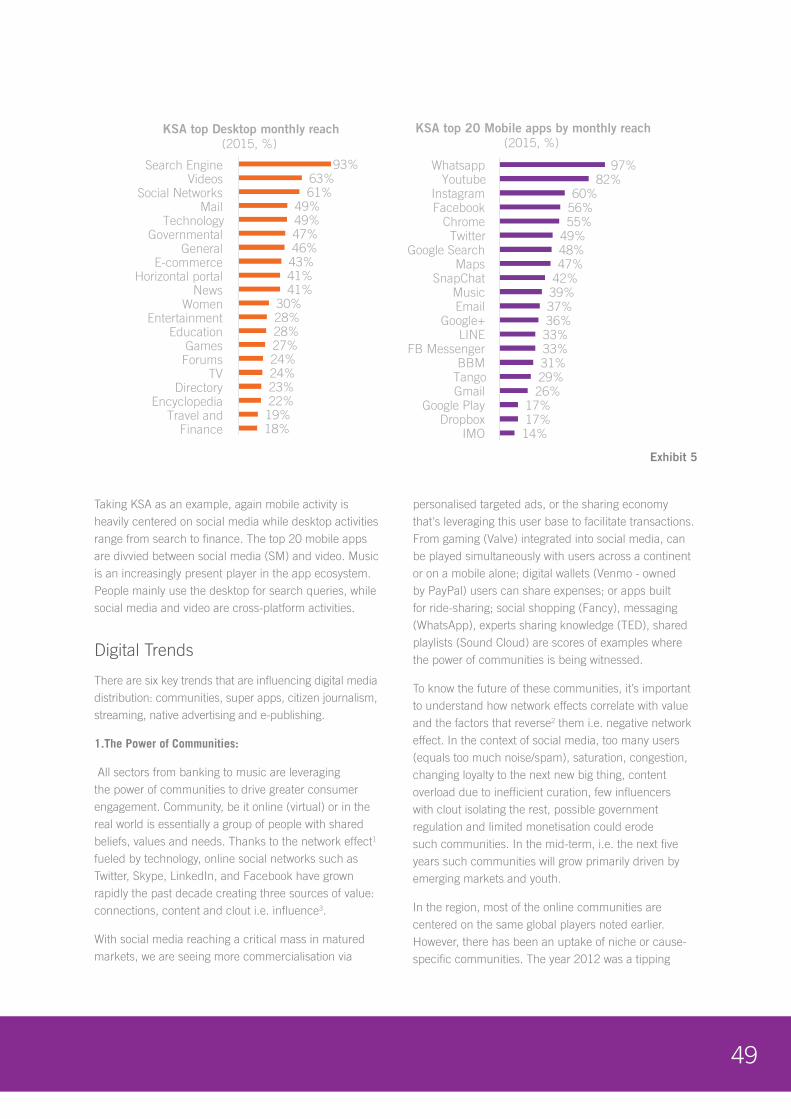
49
Taking KSA as an example, again mobile activity is heavily centered on social media while desktop activities range from search to finance. The top 20 mobile apps are divvied between social media (SM) and video. Music is an increasingly present player in the app ecosystem. People mainly use the desktop for search queries, while social media and video are cross-platform activities.
Digital Trends
There are six key trends that are influencing digital media distribution: communities, super apps, citizen journalism, streaming, native advertising and e-publishing.
1.The Power of Communities:
All sectors from banking to music are leveraging the power of communities to drive greater consumer engagement. Community, be it online (virtual) or in the real world is essentially a group of people with shared beliefs, values and needs. Thanks to the network effect1
fueled by technology, online social networks such as Twitter, Skype, LinkedIn, and Facebook have grown rapidly the past decade creating three sources of value: connections, content and clout i.e. influence3.
With social media reaching a critical mass in matured markets, we are seeing more commercialisation via
personalised targeted ads, or the sharing economy that's leveraging this user base to facilitate transactions. From gaming (Valve) integrated into social media, can be played simultaneously with users across a continent or on a mobile alone; digital wallets (Venmo - owned by PayPal) users can share expenses; or apps built for ride-sharing; social shopping (Fancy), messaging (WhatsApp), experts sharing knowledge (TED), shared playlists (Sound Cloud) are scores of examples where the power of communities is being witnessed.
To know the future of these communities, it’s important to understand how network effects correlate with value and the factors that reverse2 them i.e. negative network effect. In the context of social media, too many users (equals too much noise/spam), saturation, congestion, changing loyalty to the next new big thing, content overload due to inefficient curation, few influencers with clout isolating the rest, possible government regulation and limited monetisation could erode such communities. In the mid-term, i.e. the next five years such communities will grow primarily driven by emerging markets and youth.
In the region, most of the online communities are centered on the same global players noted earlier. However, there has been an uptake of niche or cause-specific communities. The year 2012 was a tipping
93% 63% 61%
49% 49% 47% 46% 43% 41% 41%
30% 28% 28% 27% 24% 24% 23% 22% 19% 18%
Search Engine Videos
Social Networks Mail
Technology Governmental
General E-commerce
Horizontal portal News
Women Entertainment
Education Games Forums
TV Directory
Encyclopedia Travel and
Finance
KSA top Desktop monthly reach (2015, %)
KSA top 20 Mobile apps by monthly reach (2015, %)
97% 82%
60% 56% 55%
49% 48% 47%
42% 39% 37% 36% 33% 33% 31% 29% 26%
17% 17% 14%
Whatsapp Youtube
Instagram Facebook
Chrome Twitter
Google Search Maps
SnapChat Music Email
Google+ LINE
FB Messenger BBM
Tango Gmail
Google Play Dropbox
IMO
Exhibit 5
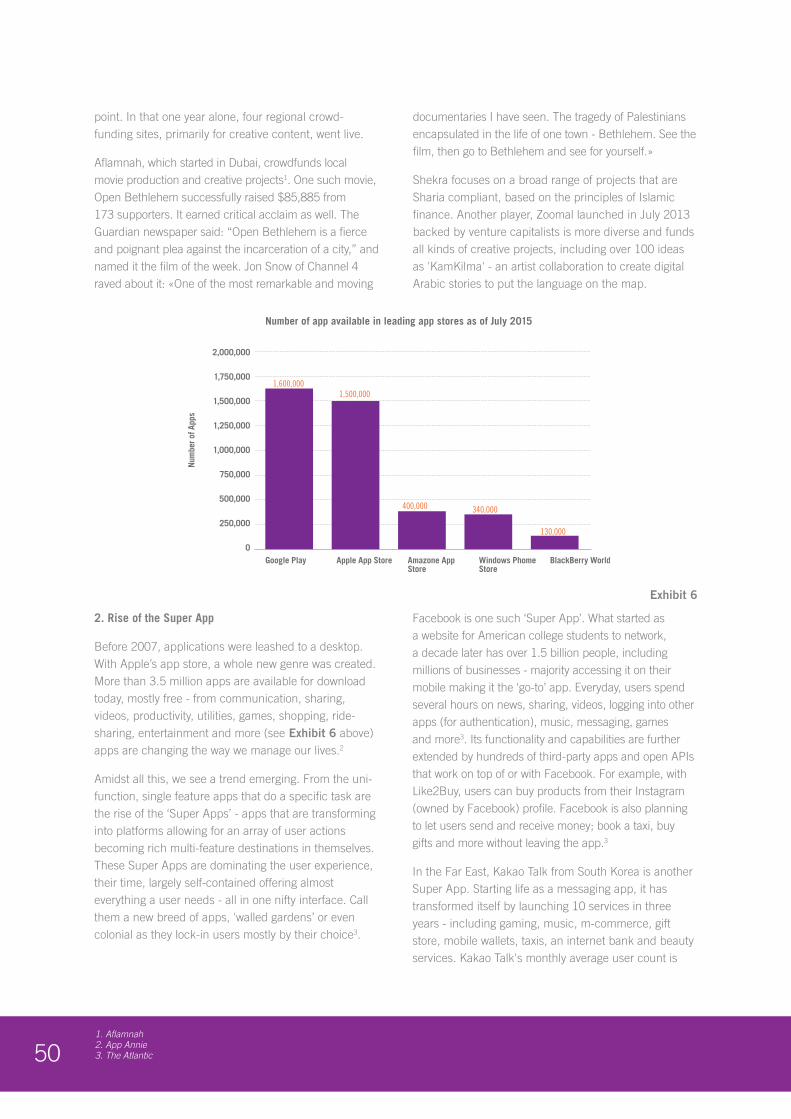
501. Aflamnah2. App Annie3. The Atlantic
point. In that one year alone, four regional crowd-funding sites, primarily for creative content, went live.
Aflamnah, which started in Dubai, crowdfunds local movie production and creative projects1. One such movie, Open Bethlehem successfully raised $85,885 from 173 supporters. It earned critical acclaim as well. The Guardian newspaper said: “Open Bethlehem is a fierce and poignant plea against the incarceration of a city,” and named it the film of the week. Jon Snow of Channel 4 raved about it: «One of the most remarkable and moving
documentaries I have seen. The tragedy of Palestinians encapsulated in the life of one town - Bethlehem. See the film, then go to Bethlehem and see for yourself.»
Shekra focuses on a broad range of projects that are Sharia compliant, based on the principles of Islamic finance. Another player, Zoomal launched in July 2013 backed by venture capitalists is more diverse and funds all kinds of creative projects, including over 100 ideas as 'KamKilma' - an artist collaboration to create digital Arabic stories to put the language on the map.
Exhibit 6
2. Rise of the Super App
Before 2007, applications were leashed to a desktop. With Apple’s app store, a whole new genre was created. More than 3.5 million apps are available for download today, mostly free - from communication, sharing, videos, productivity, utilities, games, shopping, ride-sharing, entertainment and more (see Exhibit 6 above) apps are changing the way we manage our lives.2
Amidst all this, we see a trend emerging. From the uni-function, single feature apps that do a specific task are the rise of the ‘Super Apps’ - apps that are transforming into platforms allowing for an array of user actions becoming rich multi-feature destinations in themselves. These Super Apps are dominating the user experience, their time, largely self-contained offering almost everything a user needs - all in one nifty interface. Call them a new breed of apps, 'walled gardens’ or even colonial as they lock-in users mostly by their choice3.
Facebook is one such ‘Super App’. What started as a website for American college students to network, a decade later has over 1.5 billion people, including millions of businesses - majority accessing it on their mobile making it the ‘go-to’ app. Everyday, users spend several hours on news, sharing, videos, logging into other apps (for authentication), music, messaging, games and more3. Its functionality and capabilities are further extended by hundreds of third-party apps and open APIs that work on top of or with Facebook. For example, with Like2Buy, users can buy products from their Instagram (owned by Facebook) profile. Facebook is also planning to let users send and receive money; book a taxi, buy gifts and more without leaving the app.3
In the Far East, Kakao Talk from South Korea is another Super App. Starting life as a messaging app, it has transformed itself by launching 10 services in three years - including gaming, music, m-commerce, gift store, mobile wallets, taxis, an internet bank and beauty services. Kakao Talk's monthly average user count is
Number of app available in leading app stores as of July 2015
Google Play
Num
ber o
f App
s
2,000,000
1,750,000
1,500,000
1,250,000
1,000,000
750,000
500,000
250,000
0Apple App Store Amazone App
StoreWindows PhomeStore
BlackBerry World
1,600,0001,500,000
400,000 340,000
130,000
511. Kaao2. Wall Street Journal3. Open Democracy4. Oliver & Ohlbaum Advisory5. Arabia Style
40 million, while overseas i.e. outside its home base South Korea is 48 million.1
In the region however, such Super Apps are non-existent at this stage. A handful of global players, such as Facebook, Twitter, What'sApp dominate the screen real estate and user's time. Regional apps have a lot to contend with - lower purchasing power; limited Arabic content/UX; low penetration of credit cards and slower mobile networks.
Apps could well evolve beyond mobile in the coming years and impact other media. In fact, Apple’s CEO Tim Cook proclaimed in late 2015, “We believe the future of TV is apps2.” With the emergence of Smart TVs, wearables (watches, fitness devices, etc) and IoT (Internet of Things), extension of iOS9, Apple Watch and Watch OS shipping in the tens of millions already, Super Apps could be the single platform for users to control most aspects of their life.
3. Citizen journalism
The term 'Citizen Journalism' came into the global dictionary, more so in the region, during the late 2010 ‘Arab Spring’ and recently in some of the region's war-zones. Public citizens, who are not professional journalists affiliated to the media played an active role in collecting, analysing and reporting news - as it happened. This was possible as the citizen became a publisher in his/her capacity - the laptop served as a typewriter, the smartphone as a camera/video recorder for broadcast and social media as a distribution channel.
In the years since then, it has matured and now encompasses user generated content (UGC), reviews, blogs, social media activism and even data-driven journalism. This self-appointed fourth estate is now working closley with traditional media - not as a threat but as an ally and the media landscape has become more collaborative and interactive than ever before. Audience participation at all levels is now a consideration for journalists who harvest content from everywhere, tweet to audiences directly and encourage citizen contributions3. News agencies are integrating citizen journalism through platforms such as the CNN iReport.
Blogs that have built a reputation are investing in training and accreditation of citizen journalists.
Blogger James Wesley Rawles launched the free press credentials for citizen journalists called the Constitution First Amendment Press Association. Similarly, Eliot Higgins another news blogger known for investigating the Syrian Civil War; the 2014–15 Russian military intervention in Ukraine; downing of Malaysian Airlines Flight 17, is working with Universities to provide training in open source citizen journalism.
What was initially an altruist/activist model is now on the path to monetisation. The rise of ‘influencers’ (influential social media users with large audience), reviewers, Instagrammers, videographers with YouTube channels (MCNs as noted in the TV section of the report) are embracing ad networks and becoming content entrepreneurs in their own right. For example, Nura Afia, a 22-year-old beauty vlogger (video blogger), mother and wife finds subsistence making beauty videos to her 200,000 online viewers.5
In terms of engagement, earlier, the conversation would start and end with traditional media. Now, with social media, blogs, videos, real-time channels like Twitter, the conversation carries on. When it comes to traffic and as a source for breaking news, search engines are getting displaced by social media. Based on the type of news and stage of consumption i.e. when the news breaks, verifying, confirming, interpreting, and discussing it - there is a wider spectrum than ever before.
Engagement is one thing, however the level of trust is another - ranging from high, medium to low. Established (or traditional) news outlets are still associated with higher trust and credibility - possibly because of their brand, tenure, reach and context they provide. Despite the high level of social media usage, there is a contrast - with low trust3 levels as objectivity, authenticity can sometimes be questionable. Much of the social news content is unfiltered, not edited or curated, while others believe social media has negative effects on local culture and traditions4.
The advantage for the industry as a whole is wider news coverage; a virtual army of sources alerting the media to breaking news - creating a new kind of collaborative model at least in the content gathering process. For a consumer, it’s clearly more choice, different perspectives and an opportunity to engage with the news than be a passive reader.
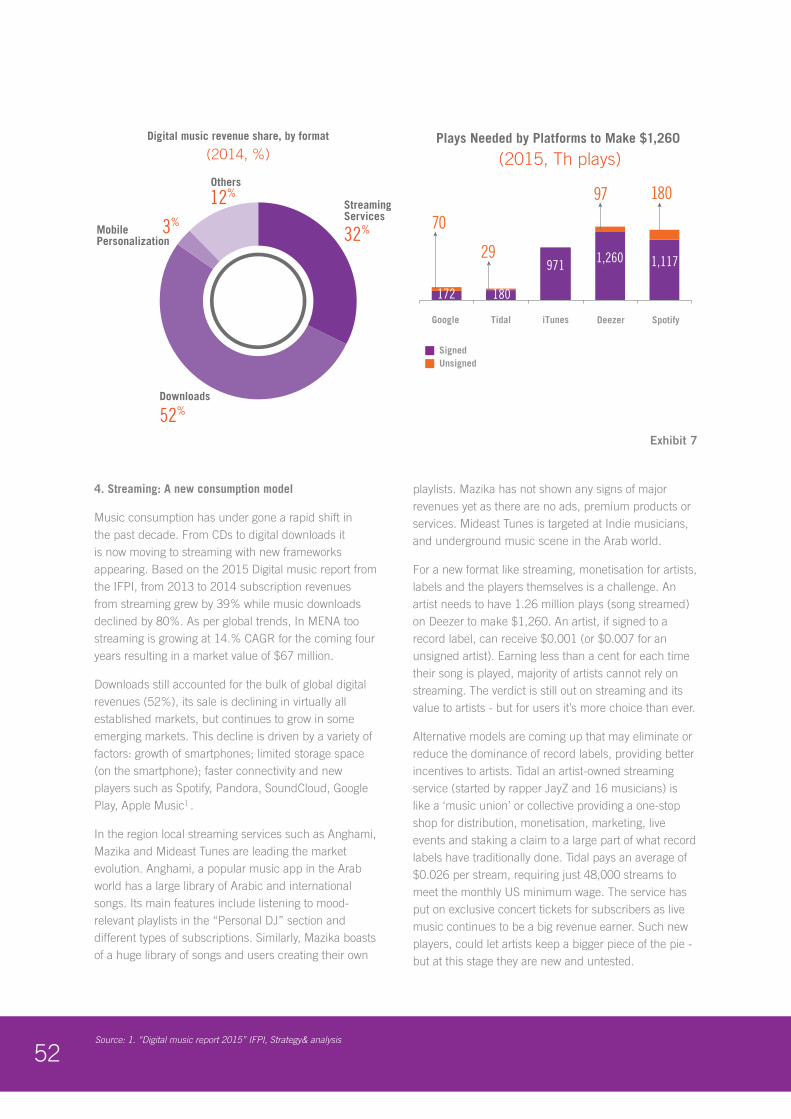
52Source: 1. “Digital music report 2015” IFPI, Strategy& analysis
4. Streaming: A new consumption model
Music consumption has under gone a rapid shift in the past decade. From CDs to digital downloads it is now moving to streaming with new frameworks appearing. Based on the 2015 Digital music report from the IFPI, from 2013 to 2014 subscription revenues from streaming grew by 39% while music downloads declined by 80%. As per global trends, In MENA too streaming is growing at 14.% CAGR for the coming four years resulting in a market value of $67 million.
Downloads still accounted for the bulk of global digital revenues (52%), its sale is declining in virtually all established markets, but continues to grow in some emerging markets. This decline is driven by a variety of factors: growth of smartphones; limited storage space (on the smartphone); faster connectivity and new players such as Spotify, Pandora, SoundCloud, Google Play, Apple Music1 .
In the region local streaming services such as Anghami, Mazika and Mideast Tunes are leading the market evolution. Anghami, a popular music app in the Arab world has a large library of Arabic and international songs. Its main features include listening to mood-relevant playlists in the “Personal DJ” section and different types of subscriptions. Similarly, Mazika boasts of a huge library of songs and users creating their own
playlists. Mazika has not shown any signs of major revenues yet as there are no ads, premium products or services. Mideast Tunes is targeted at Indie musicians, and underground music scene in the Arab world.
For a new format like streaming, monetisation for artists, labels and the players themselves is a challenge. An artist needs to have 1.26 million plays (song streamed) on Deezer to make $1,260. An artist, if signed to a record label, can receive $0.001 (or $0.007 for an unsigned artist). Earning less than a cent for each time their song is played, majority of artists cannot rely on streaming. The verdict is still out on streaming and its value to artists - but for users it’s more choice than ever.
Alternative models are coming up that may eliminate or reduce the dominance of record labels, providing better incentives to artists. Tidal an artist-owned streaming service (started by rapper JayZ and 16 musicians) is like a ‘music union’ or collective providing a one-stop shop for distribution, monetisation, marketing, live events and staking a claim to a large part of what record labels have traditionally done. Tidal pays an average of $0.026 per stream, requiring just 48,000 streams to meet the monthly US minimum wage. The service has put on exclusive concert tickets for subscribers as live music continues to be a big revenue earner. Such new players, could let artists keep a bigger piece of the pie - but at this stage they are new and untested.
Exhibit 7
Downloads
Source: “Digital music report 2015” IFPI, Strategy& analysis
Digital music revenue share, by format
(2014, %)
MobilePersonalization
Others
32%3%
52%
12%StreamingServices
1,260
172
971
180
1,117
97
Plays Needed by Platforms to Make $1,260
(2015, Th plays)
Signed
Google Tidal iTunes Deezer Spotify
Unsigned
180
29
70
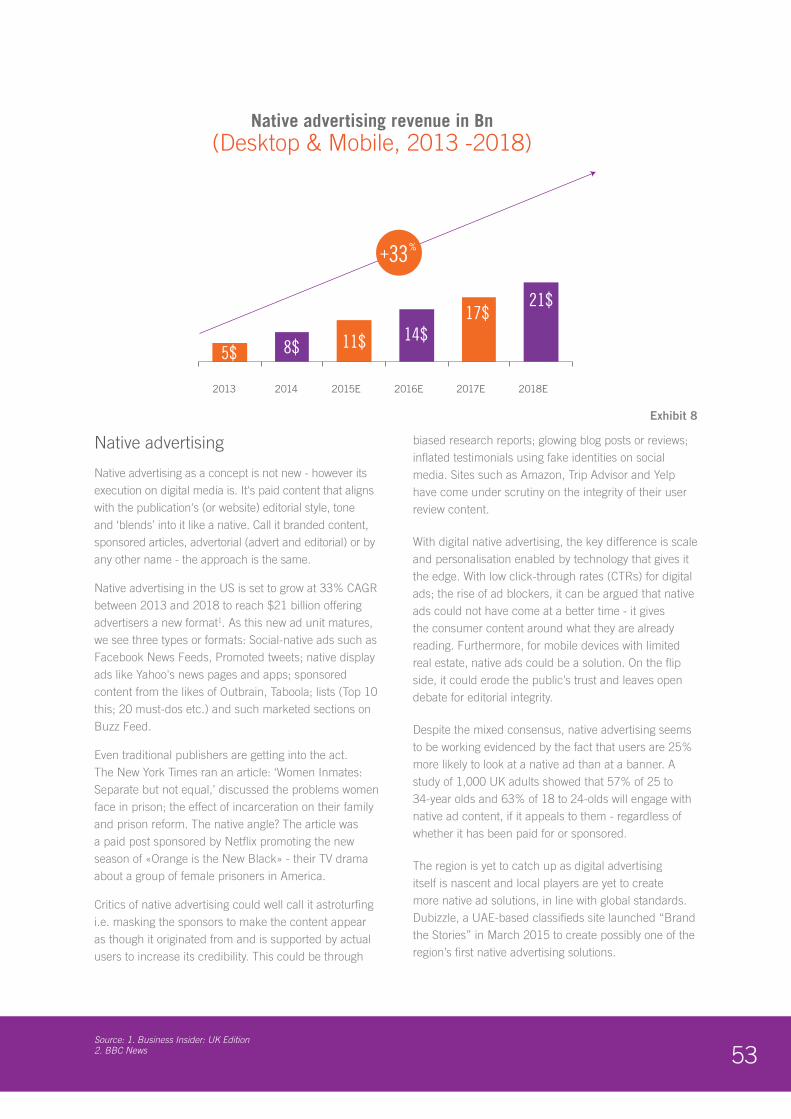
53Source: 1. Business Insider: UK Edition 2. BBC News
Native advertising
Native advertising as a concept is not new - however its execution on digital media is. It's paid content that aligns with the publication's (or website) editorial style, tone and ‘blends’ into it like a native. Call it branded content, sponsored articles, advertorial (advert and editorial) or by any other name - the approach is the same.
Native advertising in the US is set to grow at 33% CAGR between 2013 and 2018 to reach $21 billion offering advertisers a new format1. As this new ad unit matures, we see three types or formats: Social-native ads such as Facebook News Feeds, Promoted tweets; native display ads like Yahoo's news pages and apps; sponsored content from the likes of Outbrain, Taboola; lists (Top 10 this; 20 must-dos etc.) and such marketed sections on Buzz Feed.
Even traditional publishers are getting into the act. The New York Times ran an article: ‘Women Inmates: Separate but not equal,’ discussed the problems women face in prison; the effect of incarceration on their family and prison reform. The native angle? The article was a paid post sponsored by Netflix promoting the new season of «Orange is the New Black» - their TV drama about a group of female prisoners in America.
Critics of native advertising could well call it astroturfing i.e. masking the sponsors to make the content appear as though it originated from and is supported by actual users to increase its credibility. This could be through
biased research reports; glowing blog posts or reviews; inflated testimonials using fake identities on social media. Sites such as Amazon, Trip Advisor and Yelp have come under scrutiny on the integrity of their user review content.
With digital native advertising, the key difference is scale and personalisation enabled by technology that gives it the edge. With low click-through rates (CTRs) for digital ads; the rise of ad blockers, it can be argued that native ads could not have come at a better time - it gives the consumer content around what they are already reading. Furthermore, for mobile devices with limited real estate, native ads could be a solution. On the flip side, it could erode the public’s trust and leaves open debate for editorial integrity.
Despite the mixed consensus, native advertising seems to be working evidenced by the fact that users are 25% more likely to look at a native ad than at a banner. A study of 1,000 UK adults showed that 57% of 25 to 34-year olds and 63% of 18 to 24-olds will engage with native ad content, if it appeals to them - regardless of whether it has been paid for or sponsored.
The region is yet to catch up as digital advertising itself is nascent and local players are yet to create more native ad solutions, in line with global standards. Dubizzle, a UAE-based classifieds site launched “Brand the Stories” in March 2015 to create possibly one of the region’s first native advertising solutions.
Source: BI Intelligence Estimate, Interactive Advertising Bureau, Strategy& analysis
8$ 11$ 14$17$
21$
5$
2017E 2013 2018E 2015E 2014 2016E
(Desktop & Mobile, 2013 -2018)
Native advertising revenue in Bn
+33%
Exhibit 8
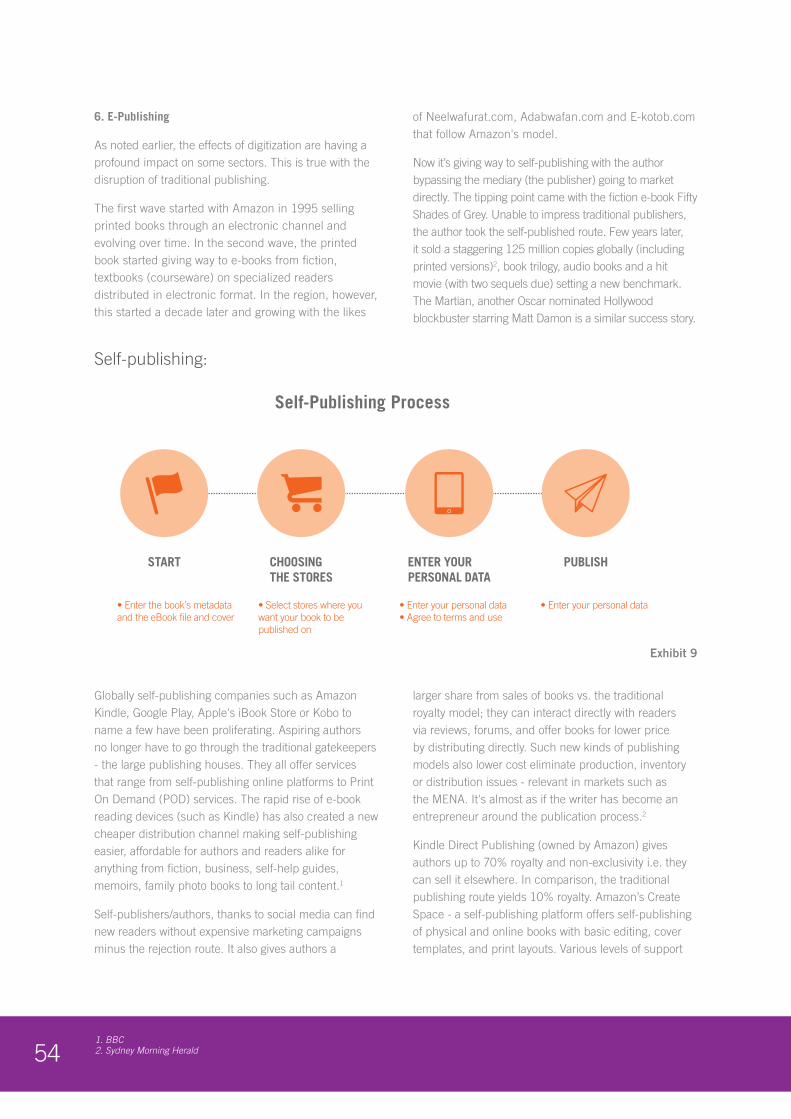
541. BBC2. Sydney Morning Herald
6. E-Publishing
As noted earlier, the effects of digitization are having a profound impact on some sectors. This is true with the disruption of traditional publishing.
The first wave started with Amazon in 1995 selling printed books through an electronic channel and evolving over time. In the second wave, the printed book started giving way to e-books from fiction, textbooks (courseware) on specialized readers distributed in electronic format. In the region, however, this started a decade later and growing with the likes
of Neelwafurat.com, Adabwafan.com and E-kotob.com that follow Amazon's model.
Now it’s giving way to self-publishing with the author bypassing the mediary (the publisher) going to market directly. The tipping point came with the fiction e-book Fifty Shades of Grey. Unable to impress traditional publishers, the author took the self-published route. Few years later, it sold a staggering 125 million copies globally (including printed versions)2, book trilogy, audio books and a hit movie (with two sequels due) setting a new benchmark. The Martian, another Oscar nominated Hollywood blockbuster starring Matt Damon is a similar success story.
Self-Publishing Process
• Enter the book’s metadata and the eBook file and cover
• Select stores where you want your book to be published on
• Enter your personal data• Agree to terms and use
• Enter your personal data
START CHOOSINGTHE STORES
ENTER YOURPERSONAL DATA
PUBLISH
Exhibit 9
Self-publishing:
Globally self-publishing companies such as Amazon Kindle, Google Play, Apple's iBook Store or Kobo to name a few have been proliferating. Aspiring authors no longer have to go through the traditional gatekeepers - the large publishing houses. They all offer services that range from self-publishing online platforms to Print On Demand (POD) services. The rapid rise of e-book reading devices (such as Kindle) has also created a new cheaper distribution channel making self-publishing easier, affordable for authors and readers alike for anything from fiction, business, self-help guides, memoirs, family photo books to long tail content.1
Self-publishers/authors, thanks to social media can find new readers without expensive marketing campaigns minus the rejection route. It also gives authors a
larger share from sales of books vs. the traditional royalty model; they can interact directly with readers via reviews, forums, and offer books for lower price by distributing directly. Such new kinds of publishing models also lower cost eliminate production, inventory or distribution issues - relevant in markets such as the MENA. It's almost as if the writer has become an entrepreneur around the publication process.2
Kindle Direct Publishing (owned by Amazon) gives authors up to 70% royalty and non-exclusivity i.e. they can sell it elsewhere. In comparison, the traditional publishing route yields 10% royalty. Amazon’s Create Space - a self-publishing platform offers self-publishing of physical and online books with basic editing, cover templates, and print layouts. Various levels of support
55
can be purchased, with packages ranging from $700 to $2,000. It’s worth pointing out that Amazon owns not just the world’s largest e-commerce book store, but also controls the self-publishing platform; the access device (e-book readers) increasingly becoming a content player giving it more sway.
Smash Words is another service where authors and indie publishers can upload manuscripts, which is converted into several e-book formats and sold at a price set by the authors.
Despite the early stage of online publishing in the Arab world and the e-commerce channel itself, the e-book market clearly has potential. Kotobna, one such e-book player, the first online self-publishing platform in Egypt and claims the number of its self-published authors is increasing by the year. With an annual subscription fee of 50 LE, authors get 60% (Kotobna keeps the other 40%) of book sales as royalty. Qordoba similarly helps authors and readers convert, publish, distribute and consume content. To protect self-publishers
from piracy, Qordoba has built its own cloud-based, bi-lingual digital rights management (DRM) solution. Similarly Yaqut, claims to offer the largest collection of Arabic eBooks that can be read on any tablet or smartphone.
The fine print that can make the above nonviable is the glut of e-books; low entry-level barriers making it as hard for e-authors as in the real world to stand out. Another challenge is lax copyright laws in the region for electronic content.
Education could be the knight in shining armor. Considering the region’s large digital-first youth demographic, e-textbooks could make a difference. Her Majesty Queen Rania Al Abdullah launched Edraak, a massive open online course (MOOC) platform as an initiative of the Queen Rania Foundation with the non-profit online learning initiative edX to provide an extensive online library of textbooks. Such a grass roots approach could pave the way for a new generation with lower prices, richer, diverse content from new authors.

56
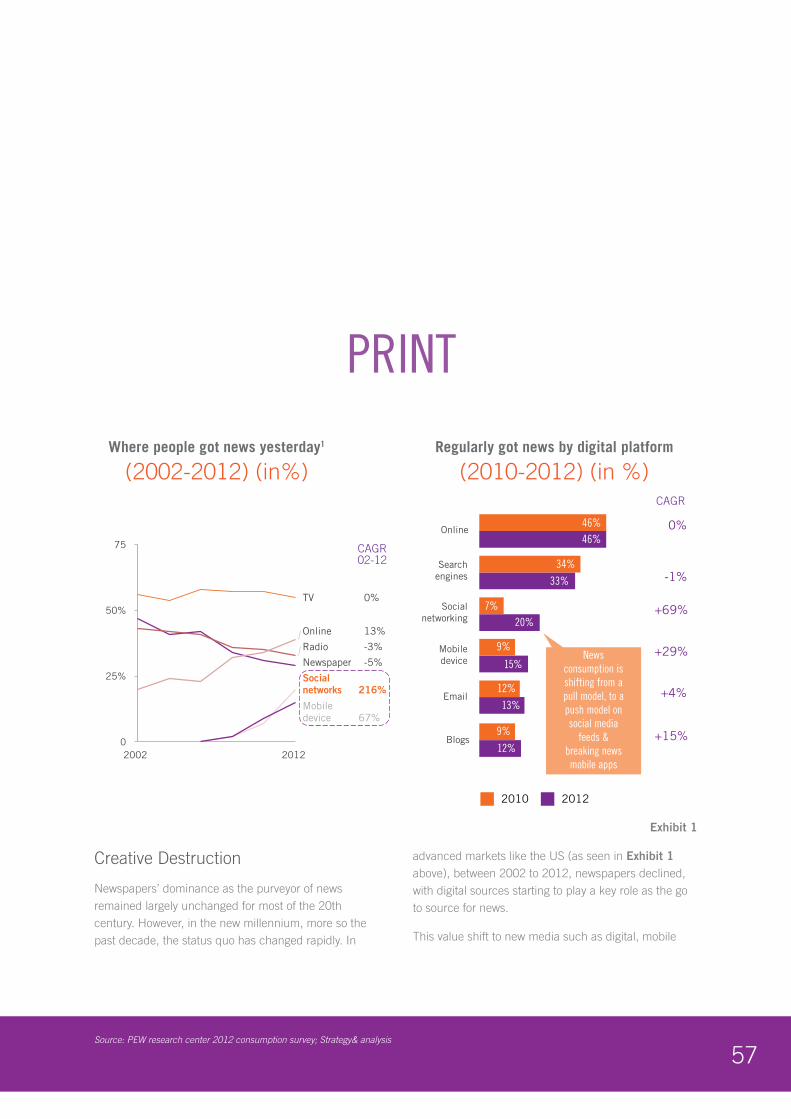
57Source: PEW research center 2012 consumption survey; Strategy& analysis
Creative Destruction
Newspapers’ dominance as the purveyor of news remained largely unchanged for most of the 20th century. However, in the new millennium, more so the past decade, the status quo has changed rapidly. In
advanced markets like the US (as seen in Exhibit 1 above), between 2002 to 2012, newspapers declined, with digital sources starting to play a key role as the go to source for news.
This value shift to new media such as digital, mobile
57
Regularly got news by digital platform
(2010-2012) (in %)Where people got news yesterday1
(2002-2012) (in%)
Blogs
Online
Searchengines
Socialnetworking
Mobiledevice
2010 2012
46%
34%
33%
7%
9%
9%
20%
15%
12%
12%
13%
46%
Newsconsumption isshifting from apull model, to apush model onsocial media
feeds &breaking newsmobile apps
0%
-1%
+69%
+29%
+4%
+15%
CAGR
CAGR02-12
75
50%
25%
0
Mobile device 67%
Social networks 216%
Online 13%
Radio -3%
Newspaper -5%
TV 0%
2012 2002
Exhibit 1
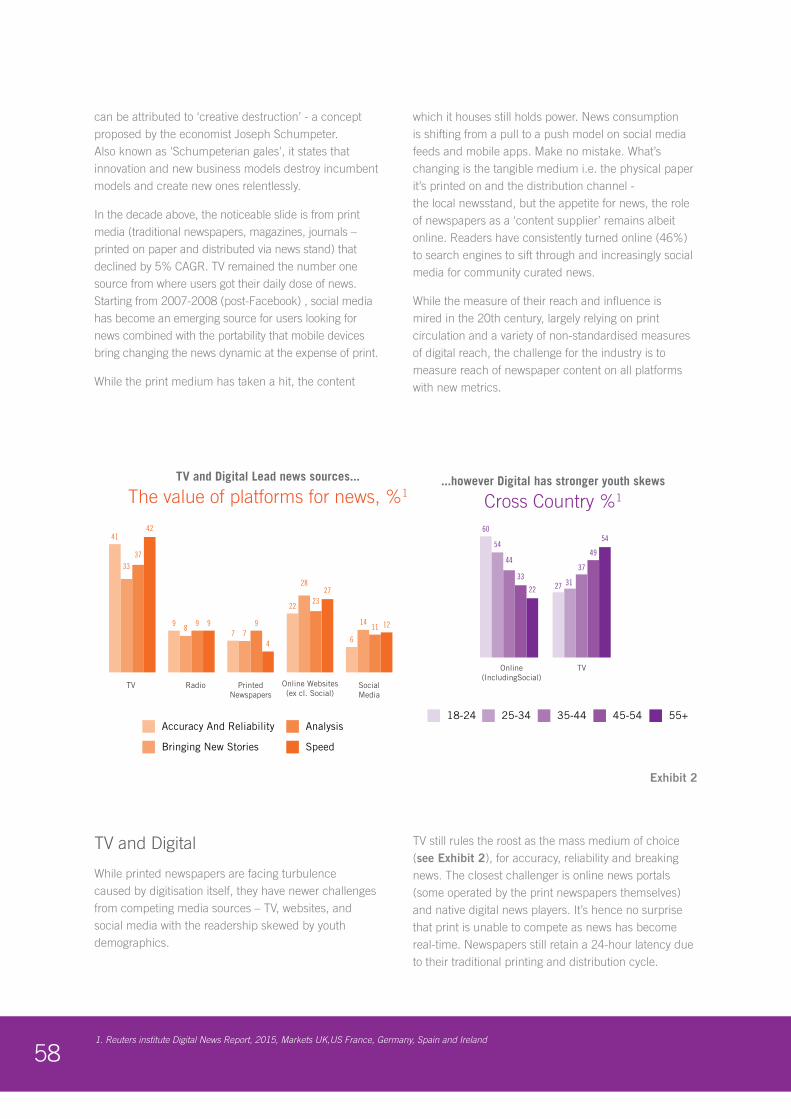
581. Reuters institute Digital News Report, 2015, Markets UK,US France, Germany, Spain and Ireland
can be attributed to ‘creative destruction’ - a concept proposed by the economist Joseph Schumpeter. Also known as 'Schumpeterian gales', it states that innovation and new business models destroy incumbent models and create new ones relentlessly.
In the decade above, the noticeable slide is from print media (traditional newspapers, magazines, journals – printed on paper and distributed via news stand) that declined by 5% CAGR. TV remained the number one source from where users got their daily dose of news. Starting from 2007-2008 (post-Facebook) , social media has become an emerging source for users looking for news combined with the portability that mobile devices bring changing the news dynamic at the expense of print.
While the print medium has taken a hit, the content
which it houses still holds power. News consumption is shifting from a pull to a push model on social media feeds and mobile apps. Make no mistake. What’s changing is the tangible medium i.e. the physical paper it’s printed on and the distribution channel - the local newsstand, but the appetite for news, the role of newspapers as a ‘content supplier’ remains albeit online. Readers have consistently turned online (46%) to search engines to sift through and increasingly social media for community curated news.
While the measure of their reach and influence is mired in the 20th century, largely relying on print circulation and a variety of non-standardised measures of digital reach, the challenge for the industry is to measure reach of newspaper content on all platforms with new metrics.
TV and Digital
While printed newspapers are facing turbulence caused by digitisation itself, they have newer challenges from competing media sources – TV, websites, and social media with the readership skewed by youth demographics.
TV still rules the roost as the mass medium of choice (see Exhibit 2), for accuracy, reliability and breaking news. The closest challenger is online news portals (some operated by the print newspapers themselves) and native digital news players. It’s hence no surprise that print is unable to compete as news has become real-time. Newspapers still retain a 24-hour latency due to their traditional printing and distribution cycle.
58
...however Digital has stronger youth skews
Cross Country %1
Online(IncludingSocial)
TV
60
33
22 27 31
37
49
5454
44
18-24 25-34 35-44 45-54 55+
TV and Digital Lead news sources...
The value of platforms for news, %1
TV Radio
4142
3337
Online Websites(ex cl. Social)
22
2728
23
9 98
9
PrintedNewspapers
764
79
SocialMedia
121411
Accuracy And Reliability
Bringing New Stories
Analysis
Speed
Exhibit 2
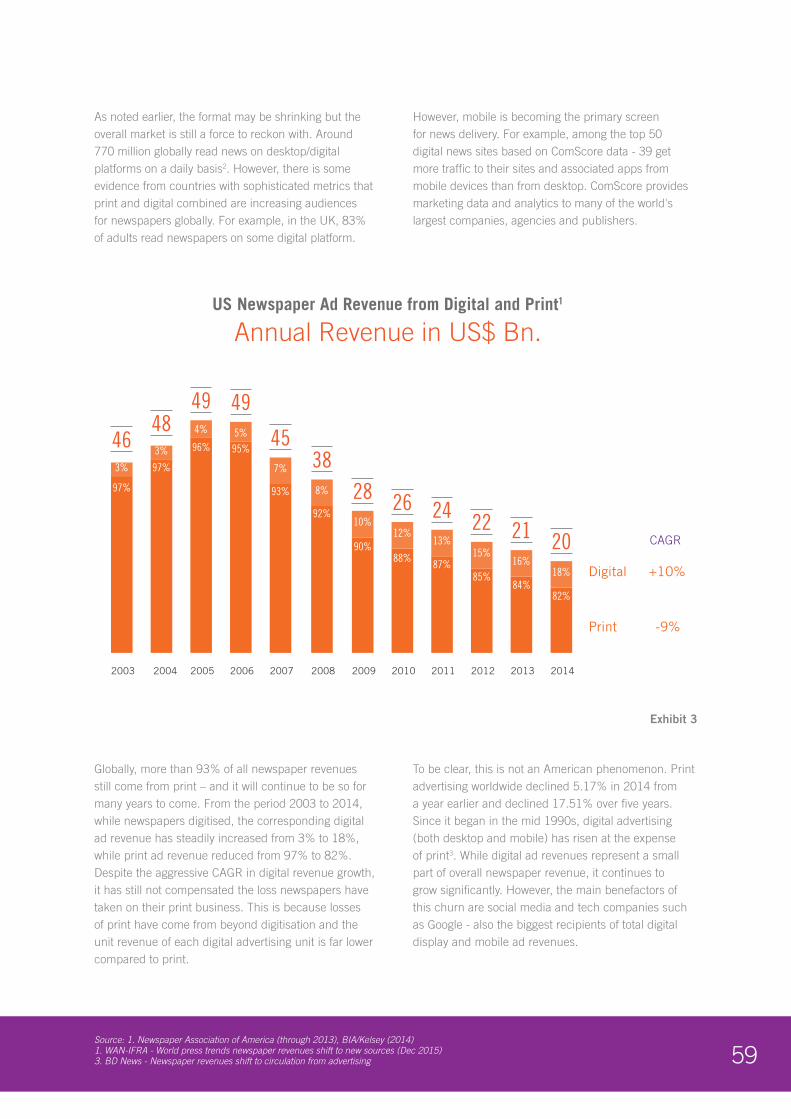
59Source: 1. Newspaper Association of America (through 2013), BIA/Kelsey (2014) 1. WAN-IFRA - World press trends newspaper revenues shift to new sources (Dec 2015) 3. BD News - Newspaper revenues shift to circulation from advertising
As noted earlier, the format may be shrinking but the overall market is still a force to reckon with. Around 770 million globally read news on desktop/digital platforms on a daily basis2. However, there is some evidence from countries with sophisticated metrics that print and digital combined are increasing audiences for newspapers globally. For example, in the UK, 83% of adults read newspapers on some digital platform.
However, mobile is becoming the primary screen for news delivery. For example, among the top 50 digital news sites based on ComScore data - 39 get more traffic to their sites and associated apps from mobile devices than from desktop. ComScore provides marketing data and analytics to many of the world's largest companies, agencies and publishers.
Globally, more than 93% of all newspaper revenues still come from print – and it will continue to be so for many years to come. From the period 2003 to 2014, while newspapers digitised, the corresponding digital ad revenue has steadily increased from 3% to 18%, while print ad revenue reduced from 97% to 82%. Despite the aggressive CAGR in digital revenue growth, it has still not compensated the loss newspapers have taken on their print business. This is because losses of print have come from beyond digitisation and the unit revenue of each digital advertising unit is far lower compared to print.
To be clear, this is not an American phenomenon. Print advertising worldwide declined 5.17% in 2014 from a year earlier and declined 17.51% over five years. Since it began in the mid 1990s, digital advertising (both desktop and mobile) has risen at the expense of print3. While digital ad revenues represent a small part of overall newspaper revenue, it continues to grow significantly. However, the main benefactors of this churn are social media and tech companies such as Google - also the biggest recipients of total digital display and mobile ad revenues.
59
US Newspaper Ad Revenue from Digital and Print1
Annual Revenue in US$ Bn.
2003 2004 2005 2006 2007 2008 2009 2010 2011 2012 2013
97%
3%
3%
4%
97%
96% 95%
93%
92%
90%
85%84%
2014
82%
88% 87%
4648
495%
49
7%
45
8%
38
10%
28
12%
26
13%
24
15%
22
16%
21
18%
20Digital +10%
-9%Print
CAGR
Exhibit 3
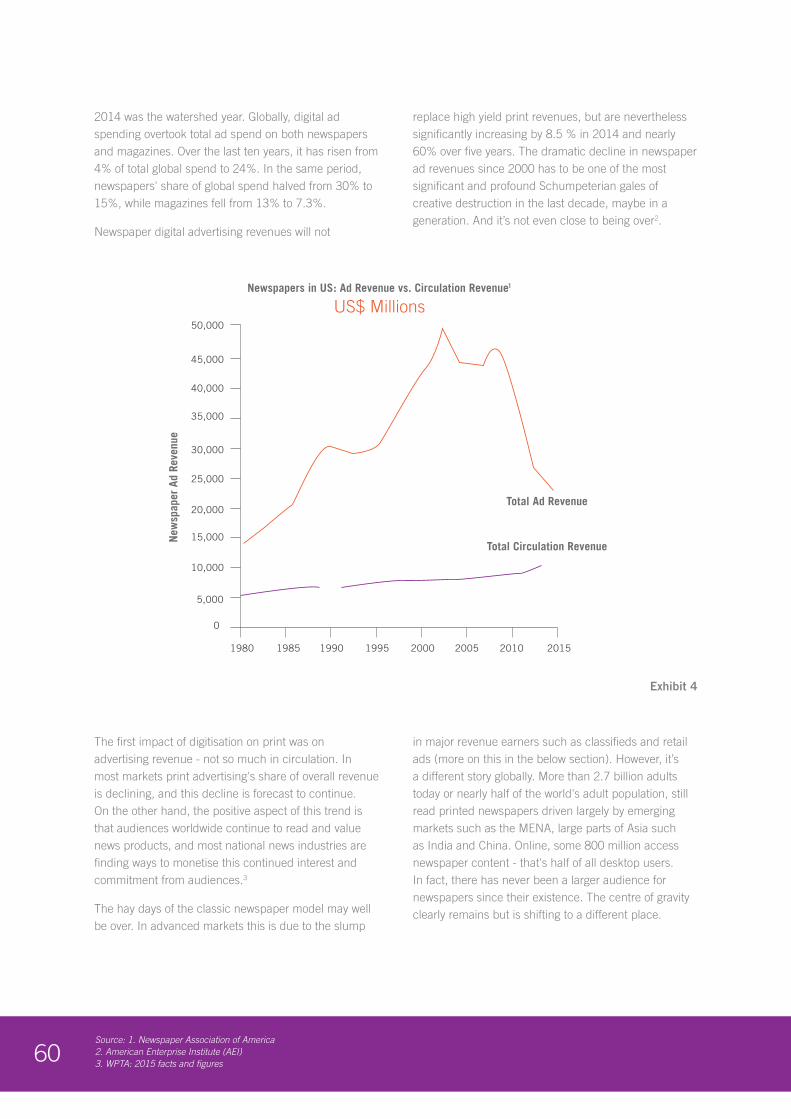
60Source: 1. Newspaper Association of America 2. American Enterprise Institute (AEI) 3. WPTA: 2015 facts and figures
2014 was the watershed year. Globally, digital ad spending overtook total ad spend on both newspapers and magazines. Over the last ten years, it has risen from 4% of total global spend to 24%. In the same period, newspapers' share of global spend halved from 30% to 15%, while magazines fell from 13% to 7.3%.
Newspaper digital advertising revenues will not
replace high yield print revenues, but are nevertheless significantly increasing by 8.5 % in 2014 and nearly 60% over five years. The dramatic decline in newspaper ad revenues since 2000 has to be one of the most significant and profound Schumpeterian gales of creative destruction in the last decade, maybe in a generation. And it’s not even close to being over2.
The first impact of digitisation on print was on advertising revenue - not so much in circulation. In most markets print advertising's share of overall revenue is declining, and this decline is forecast to continue. On the other hand, the positive aspect of this trend is that audiences worldwide continue to read and value news products, and most national news industries are finding ways to monetise this continued interest and commitment from audiences.3
The hay days of the classic newspaper model may well be over. In advanced markets this is due to the slump
in major revenue earners such as classifieds and retail ads (more on this in the below section). However, it’s a different story globally. More than 2.7 billion adults today or nearly half of the world's adult population, still read printed newspapers driven largely by emerging markets such as the MENA, large parts of Asia such as India and China. Online, some 800 million access newspaper content - that's half of all desktop users. In fact, there has never been a larger audience for newspapers since their existence. The centre of gravity clearly remains but is shifting to a different place.
Newspapers in US: Ad Revenue vs. Circulation Revenue1
US$ Millions
Newspaper Classifieds Craiglis
60
1980 1985 1990 1995 2000 2005 2010 2015
45,000
50,000
40,000
35,000
30,000
25,000
20,000
15,000
10,000
5,000
0
New
spap
er A
d Re
venu
e
Total Ad Revenue
Total Circulation Revenue
Exhibit 4
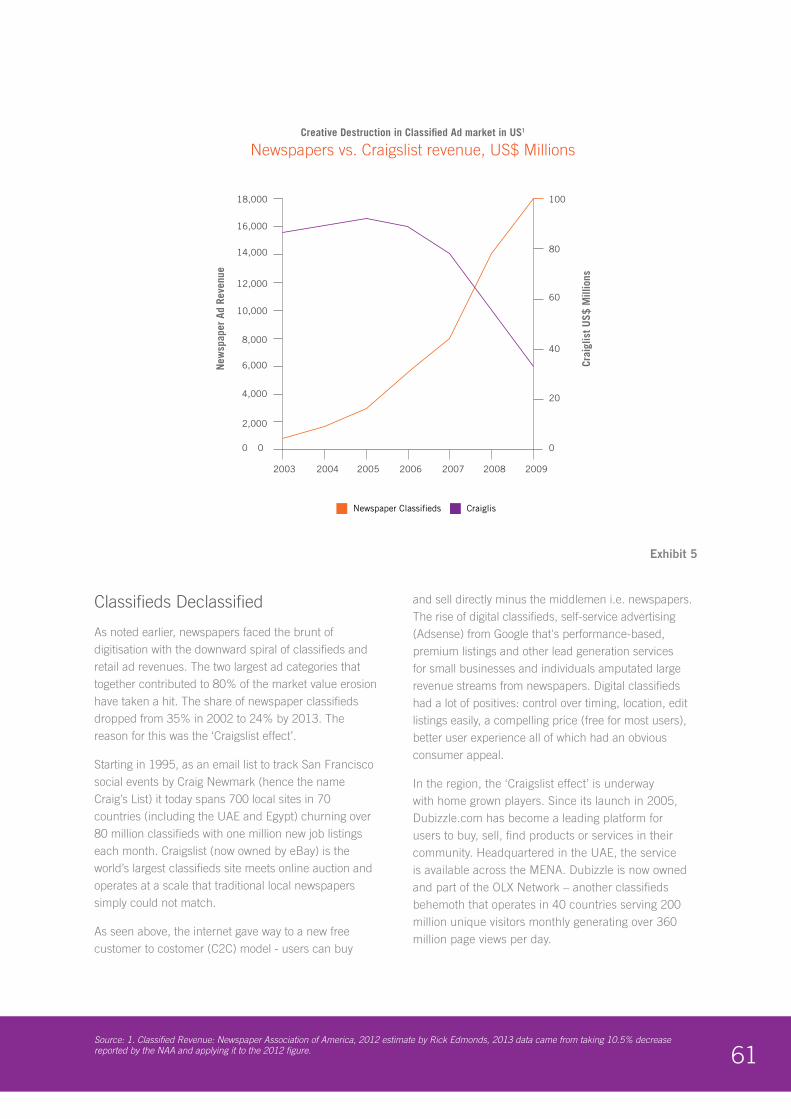
61Source: 1. Classified Revenue: Newspaper Association of America, 2012 estimate by Rick Edmonds, 2013 data came from taking 10.5% decrease reported by the NAA and applying it to the 2012 figure.
Classifieds Declassified
As noted earlier, newspapers faced the brunt of digitisation with the downward spiral of classifieds and retail ad revenues. The two largest ad categories that together contributed to 80% of the market value erosion have taken a hit. The share of newspaper classifieds dropped from 35% in 2002 to 24% by 2013. The reason for this was the ‘Craigslist effect’.
Starting in 1995, as an email list to track San Francisco social events by Craig Newmark (hence the name Craig’s List) it today spans 700 local sites in 70 countries (including the UAE and Egypt) churning over 80 million classifieds with one million new job listings each month. Craigslist (now owned by eBay) is the world’s largest classifieds site meets online auction and operates at a scale that traditional local newspapers simply could not match.
As seen above, the internet gave way to a new free customer to costomer (C2C) model - users can buy
and sell directly minus the middlemen i.e. newspapers. The rise of digital classifieds, self-service advertising (Adsense) from Google that's performance-based, premium listings and other lead generation services for small businesses and individuals amputated large revenue streams from newspapers. Digital classifieds had a lot of positives: control over timing, location, edit listings easily, a compelling price (free for most users), better user experience all of which had an obvious consumer appeal.
In the region, the ‘Craigslist effect’ is underway with home grown players. Since its launch in 2005, Dubizzle.com has become a leading platform for users to buy, sell, find products or services in their community. Headquartered in the UAE, the service is available across the MENA. Dubizzle is now owned and part of the OLX Network – another classifieds behemoth that operates in 40 countries serving 200 million unique visitors monthly generating over 360 million page views per day.
61
Creative Destruction in Classified Ad market in US1
Newspapers vs. Craigslist revenue, US$ Millions
Newspaper Classifieds Craiglis
2003 2004 2005 2006 2007 2008 2009
0
20
40
60
80
10018,000
16,000
14,000
12,000
10,000
8,000
6,000
4,000
2,000
0 0
New
spap
er A
d Re
venu
e
Crai
glis
t US$
Mill
ions
Exhibit 5
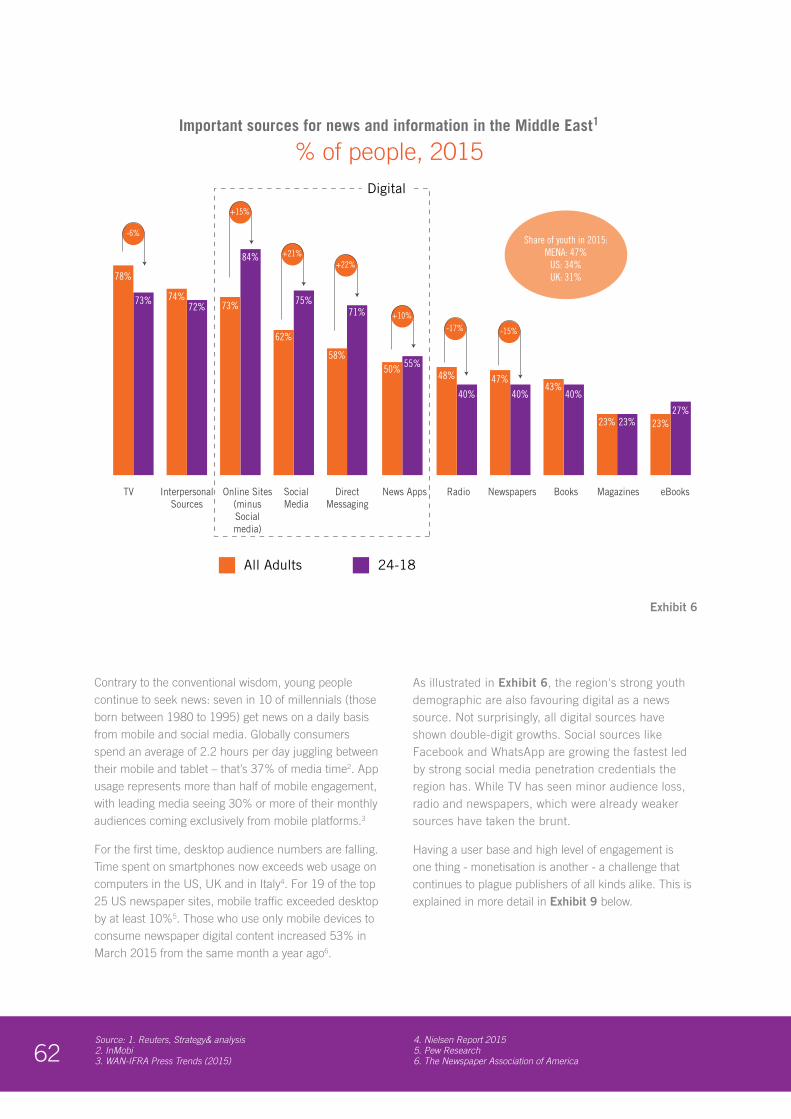
62Source: 1. Reuters, Strategy& analysis 2. InMobi 3. WAN-IFRA Press Trends (2015)
4. Nielsen Report 20155. Pew Research6. The Newspaper Association of America
Contrary to the conventional wisdom, young people continue to seek news: seven in 10 of millennials (those born between 1980 to 1995) get news on a daily basis from mobile and social media. Globally consumers spend an average of 2.2 hours per day juggling between their mobile and tablet – that’s 37% of media time2. App usage represents more than half of mobile engagement, with leading media seeing 30% or more of their monthly audiences coming exclusively from mobile platforms.3
For the first time, desktop audience numbers are falling. Time spent on smartphones now exceeds web usage on computers in the US, UK and in Italy4. For 19 of the top 25 US newspaper sites, mobile traffic exceeded desktop by at least 10%5. Those who use only mobile devices to consume newspaper digital content increased 53% in March 2015 from the same month a year ago6.
As illustrated in Exhibit 6, the region's strong youth demographic are also favouring digital as a news source. Not surprisingly, all digital sources have shown double-digit growths. Social sources like Facebook and WhatsApp are growing the fastest led by strong social media penetration credentials the region has. While TV has seen minor audience loss, radio and newspapers, which were already weaker sources have taken the brunt.
Having a user base and high level of engagement is one thing - monetisation is another - a challenge that continues to plague publishers of all kinds alike. This is explained in more detail in Exhibit 9 below.
62
1) Media Use in the Middle East, Northwestern University, Qatar; Countries – Egypt, Lebanon, Qatar, KSA, Tunisia, UAE
Important sources for news and information in the Middle East1
% of people, 2015
News AppsDirectMessaging
SocialMedia
Online Sites(minusSocialmedia)
InterpersonalSources
TV
78%
Radio Newspapers Books Magazines eBooks
73%72%
75%71%
84%
74%73%
62%
58%50% 55%
48%
40% 40% 40%
23% 23% 23%27%
47%43%
All Adults 24-18
Digital
-6%
+15%
+22%+21%
+10%-17% -15%
Share of youth in 2015:MENA: 47%
US: 34%UK: 31%
Exhibit 6
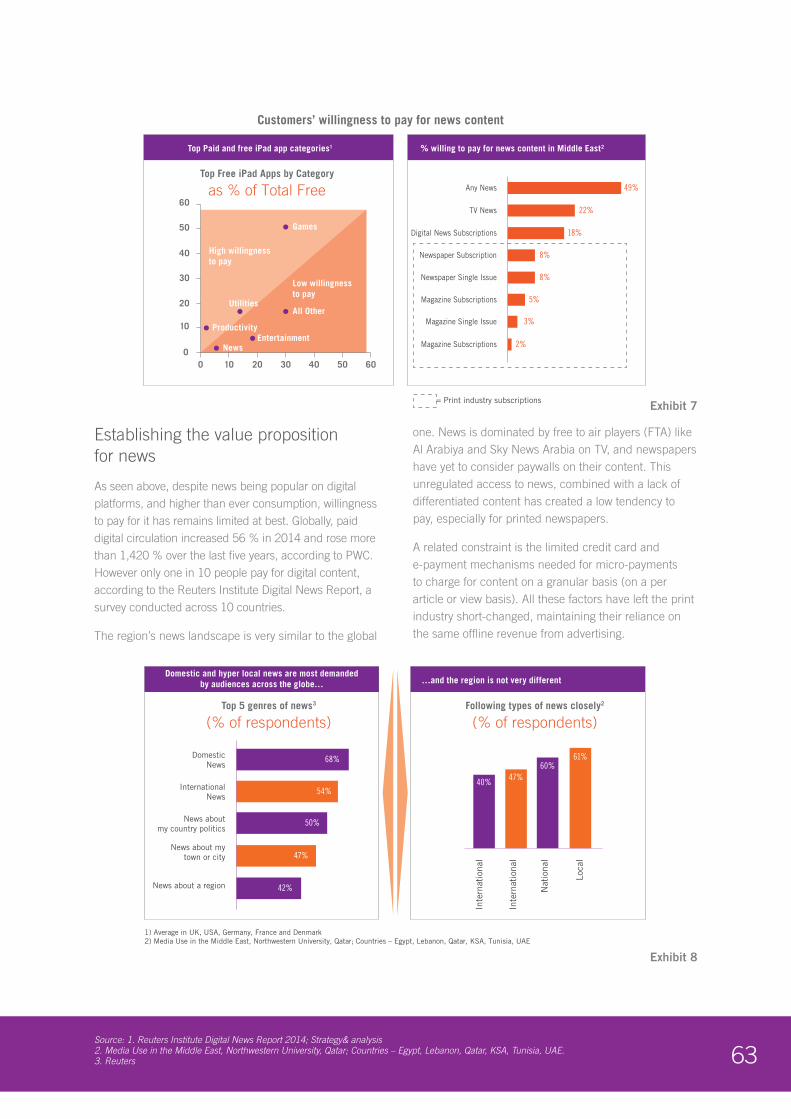
63Source: 1. Reuters Institute Digital News Report 2014; Strategy& analysis2. Media Use in the Middle East, Northwestern University, Qatar; Countries – Egypt, Lebanon, Qatar, KSA, Tunisia, UAE.3. Reuters
Establishing the value proposition for news
As seen above, despite news being popular on digital platforms, and higher than ever consumption, willingness to pay for it has remains limited at best. Globally, paid digital circulation increased 56 % in 2014 and rose more than 1,420 % over the last five years, according to PWC. However only one in 10 people pay for digital content, according to the Reuters Institute Digital News Report, a survey conducted across 10 countries.
The region’s news landscape is very similar to the global
one. News is dominated by free to air players (FTA) like Al Arabiya and Sky News Arabia on TV, and newspapers have yet to consider paywalls on their content. This unregulated access to news, combined with a lack of differentiated content has created a low tendency to pay, especially for printed newspapers.
A related constraint is the limited credit card and e-payment mechanisms needed for micro-payments to charge for content on a granular basis (on a per article or view basis). All these factors have left the print industry short-changed, maintaining their reliance on the same offline revenue from advertising.
Customers’ willingness to pay for news content
63
Top 5 genres of news3
(% of respondents)
Domestic and hyper local news are most demandedby audiences across the globe…
68%DomesticNews
54%InternationalNews
News aboutmy country politics
News about mytown or city
News about a region
50%
47%
42%
Following types of news closely2
(% of respondents)
…and the region is not very different
40% 47%
Inte
rnat
iona
l
Inte
rnat
iona
l
Nat
iona
l
Loca
l60%
61%
Top Free iPad Apps by Category
as % of Total Free
Top Paid and free iPad app categories1 % willing to pay for news content in Middle East2
49%
22%
18%
8%
5%
3%
2%
Any News
TV News
Digital News Subscriptions
Newspaper Single Issue
8%Newspaper Subscription
Magazine Subscriptions
Magazine Single Issue
Magazine Subscriptions
60
50
40
30
20
10
10 20 30 40 50 600
0
High willingnessto pay
Low willingnessto pay
Productivity
Utilities
Entertainment
All Other
News
Games
= Print industry subscriptions
1) Average in UK, USA, Germany, France and Denmark2) Media Use in the Middle East, Northwestern University, Qatar; Countries – Egypt, Lebanon, Qatar, KSA, Tunisia, UAE
Customers’ willingness to pay for news content
63
Top 5 genres of news3
(% of respondents)
Domestic and hyper local news are most demandedby audiences across the globe…
68%DomesticNews
54%InternationalNews
News aboutmy country politics
News about mytown or city
News about a region
50%
47%
42%
Following types of news closely2
(% of respondents)
…and the region is not very different
40% 47%
Inte
rnat
iona
l
Inte
rnat
iona
l
Nat
iona
l
Loca
l
60%61%
Top Free iPad Apps by Category
as % of Total Free
Top Paid and free iPad app categories1 % willing to pay for news content in Middle East2
49%
22%
18%
8%
5%
3%
2%
Any News
TV News
Digital News Subscriptions
Newspaper Single Issue
8%Newspaper Subscription
Magazine Subscriptions
Magazine Single Issue
Magazine Subscriptions
60
50
40
30
20
10
10 20 30 40 50 600
0
High willingnessto pay
Low willingnessto pay
Productivity
Utilities
Entertainment
All Other
News
Games
= Print industry subscriptions
1) Average in UK, USA, Germany, France and Denmark2) Media Use in the Middle East, Northwestern University, Qatar; Countries – Egypt, Lebanon, Qatar, KSA, Tunisia, UAE
Exhibit 7
Exhibit 8
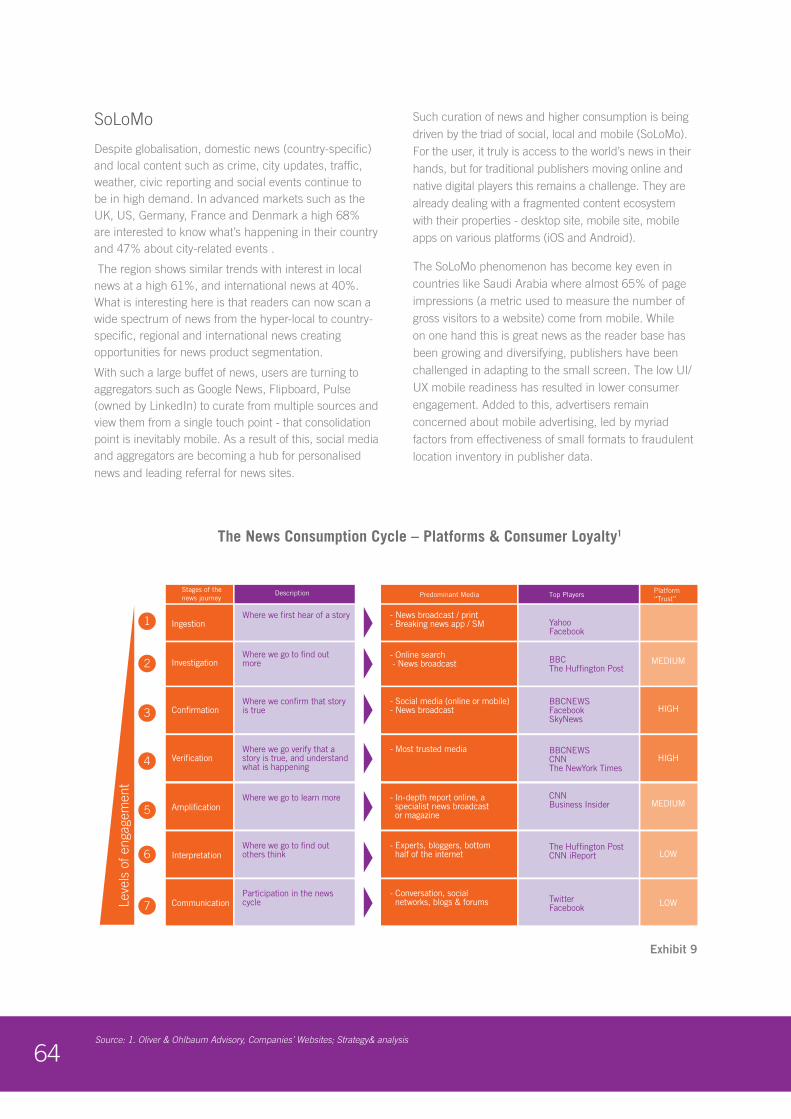
64Source: 1. Oliver & Ohlbaum Advisory, Companies’ Websites; Strategy& analysis
SoLoMo
Despite globalisation, domestic news (country-specific) and local content such as crime, city updates, traffic, weather, civic reporting and social events continue to be in high demand. In advanced markets such as the UK, US, Germany, France and Denmark a high 68% are interested to know what’s happening in their country and 47% about city-related events .
The region shows similar trends with interest in local news at a high 61%, and international news at 40%. What is interesting here is that readers can now scan a wide spectrum of news from the hyper-local to country-specific, regional and international news creating opportunities for news product segmentation.
With such a large buffet of news, users are turning to aggregators such as Google News, Flipboard, Pulse (owned by LinkedIn) to curate from multiple sources and view them from a single touch point - that consolidation point is inevitably mobile. As a result of this, social media and aggregators are becoming a hub for personalised news and leading referral for news sites.
Such curation of news and higher consumption is being driven by the triad of social, local and mobile (SoLoMo). For the user, it truly is access to the world’s news in their hands, but for traditional publishers moving online and native digital players this remains a challenge. They are already dealing with a fragmented content ecosystem with their properties - desktop site, mobile site, mobile apps on various platforms (iOS and Android).
The SoLoMo phenomenon has become key even in countries like Saudi Arabia where almost 65% of page impressions (a metric used to measure the number of gross visitors to a website) come from mobile. While on one hand this is great news as the reader base has been growing and diversifying, publishers have been challenged in adapting to the small screen. The low UI/UX mobile readiness has resulted in lower consumer engagement. Added to this, advertisers remain concerned about mobile advertising, led by myriad factors from effectiveness of small formats to fraudulent location inventory in publisher data.
The News Consumption Cycle – Platforms & Consumer Loyalty1
64
Predominant Media Top PlayersPlatform“Trust”
Ingestion
Investigation
YahooFacebook
BBCThe Huffington Post
The Huffington PostCNN iReport
TwitterFacebook
BBCNEWSFacebookSkyNews
BBCNEWSCNNThe NewYork Times
CNNBusiness Insider
MEDIUM
MEDIUM
LOW
LOW
HIGH
HIGH
Confirmation
Verification
Amplification
Interpretation
Communication
1
2
3
4
5
6
7
Stages of thenews journey
Description
Where we first hear of a story - News broadcast / print- Breaking news app / SM
- Online search - News broadcast
- Social media (online or mobile)- News broadcast
- Most trusted media
- In-depth report online, a specialist news broadcast or magazine
- Experts, bloggers, bottom half of the internet
- Conversation, social networks, blogs & forums
Where we go to find out more
Where we confirm that story is true
Where we go verify that astory is true, and understandwhat is happening
Where we go to learn more
Where we go to find out others think
Participation in the news cycleLe
vels
of e
ngag
emen
t
Exhibit 9
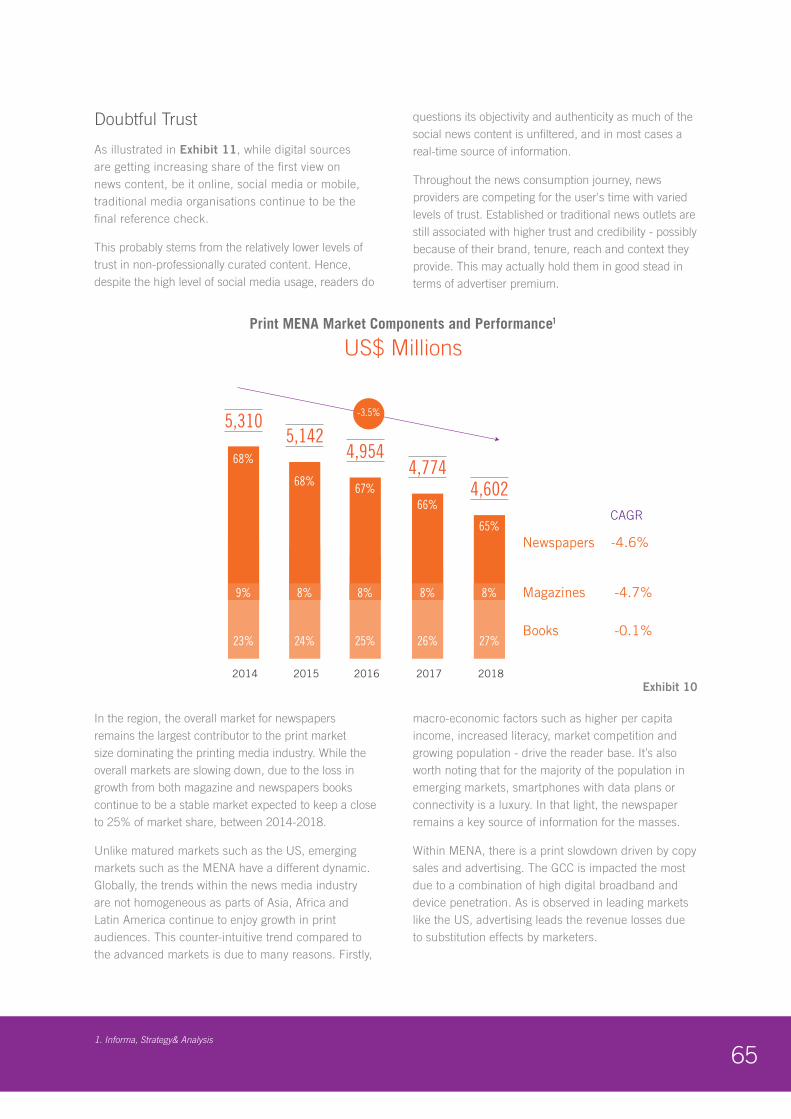
651. Informa, Strategy& Analysis
Doubtful Trust
As illustrated in Exhibit 11, while digital sources are getting increasing share of the first view on news content, be it online, social media or mobile, traditional media organisations continue to be the final reference check.
This probably stems from the relatively lower levels of trust in non-professionally curated content. Hence, despite the high level of social media usage, readers do
questions its objectivity and authenticity as much of the social news content is unfiltered, and in most cases a real-time source of information.
Throughout the news consumption journey, news providers are competing for the user's time with varied levels of trust. Established or traditional news outlets are still associated with higher trust and credibility - possibly because of their brand, tenure, reach and context they provide. This may actually hold them in good stead in terms of advertiser premium.
In the region, the overall market for newspapers remains the largest contributor to the print market size dominating the printing media industry. While the overall markets are slowing down, due to the loss in growth from both magazine and newspapers books continue to be a stable market expected to keep a close to 25% of market share, between 2014-2018.
Unlike matured markets such as the US, emerging markets such as the MENA have a different dynamic. Globally, the trends within the news media industry are not homogeneous as parts of Asia, Africa and Latin America continue to enjoy growth in print audiences. This counter-intuitive trend compared to the advanced markets is due to many reasons. Firstly,
macro-economic factors such as higher per capita income, increased literacy, market competition and growing population - drive the reader base. It’s also worth noting that for the majority of the population in emerging markets, smartphones with data plans or connectivity is a luxury. In that light, the newspaper remains a key source of information for the masses.
Within MENA, there is a print slowdown driven by copy sales and advertising. The GCC is impacted the most due to a combination of high digital broadband and device penetration. As is observed in leading markets like the US, advertising leads the revenue losses due to substitution effects by marketers.
65
Print MENA Market Components and Performance1
US$ Millions
5,142
5,310
23%
68%
9%
2014
24%
68%
2015
4,954
25%
67%
2016
4,774
26%
66%
2017
4,602
27%
65%
2018
-3.5%
Newspapers -4.6%
-0.1%Books
-4.7%Magazines
CAGR
8% 8% 8% 8%
Exhibit 10
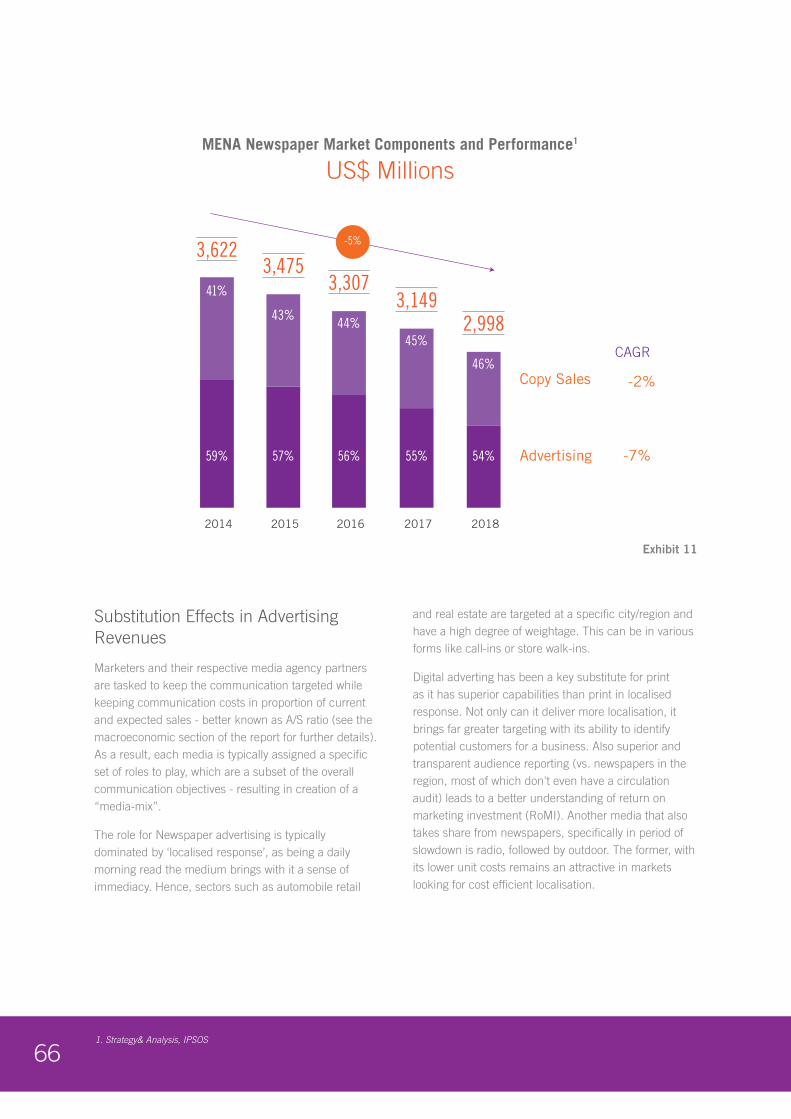
661. Strategy& Analysis, IPSOS
Substitution Effects in Advertising Revenues
Marketers and their respective media agency partners are tasked to keep the communication targeted while keeping communication costs in proportion of current and expected sales - better known as A/S ratio (see the macroeconomic section of the report for further details). As a result, each media is typically assigned a specific set of roles to play, which are a subset of the overall communication objectives - resulting in creation of a “media-mix”.
The role for Newspaper advertising is typically dominated by ‘localised response’, as being a daily morning read the medium brings with it a sense of immediacy. Hence, sectors such as automobile retail
and real estate are targeted at a specific city/region and have a high degree of weightage. This can be in various forms like call-ins or store walk-ins.
Digital adverting has been a key substitute for print as it has superior capabilities than print in localised response. Not only can it deliver more localisation, it brings far greater targeting with its ability to identify potential customers for a business. Also superior and transparent audience reporting (vs. newspapers in the region, most of which don't even have a circulation audit) leads to a better understanding of return on marketing investment (RoMI). Another media that also takes share from newspapers, specifically in period of slowdown is radio, followed by outdoor. The former, with its lower unit costs remains an attractive in markets looking for cost efficient localisation.
66
MENA Newspaper Market Components and Performance1
US$ Millions
3,475
3,622
59%
41%
2014
57%
43%
2015
3,307
56%
44%
2016
3,149
55%
45%
2017
2,998
54%
46%
2018
-5%
Copy Sales -2%
-7%Advertising
CAGR
Exhibit 11
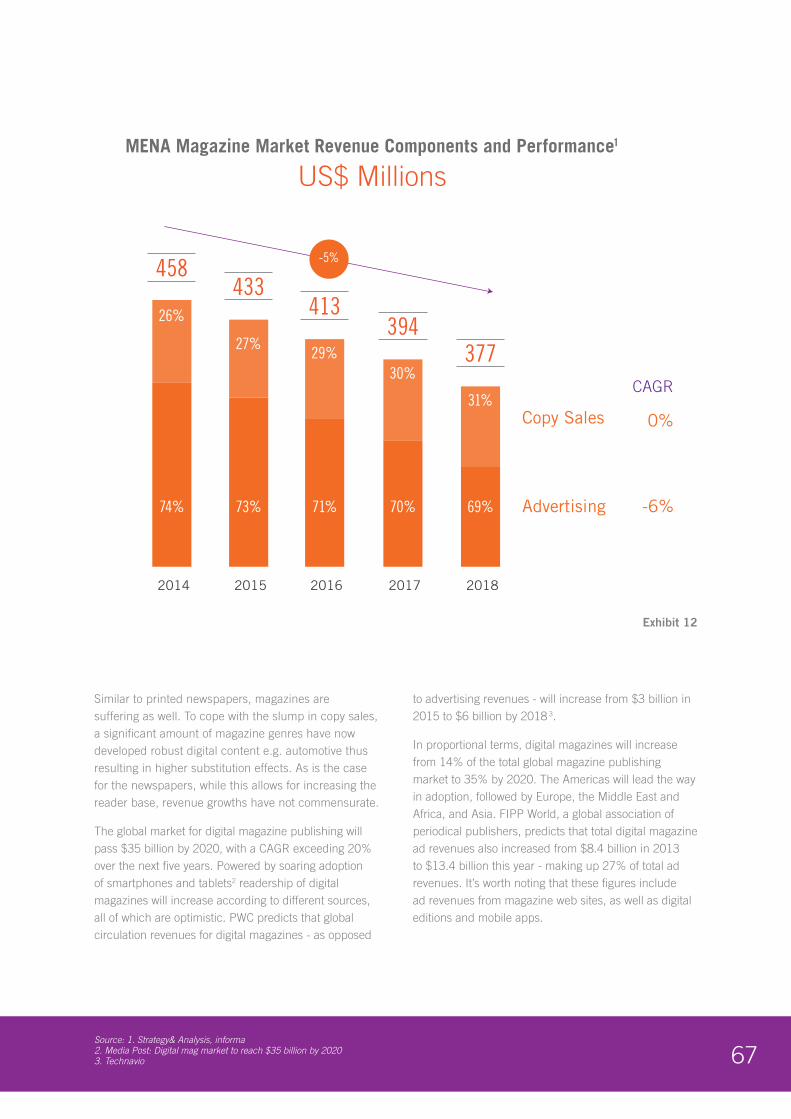
67Source: 1. Strategy& Analysis, informa 2. Media Post: Digital mag market to reach $35 billion by 2020 3. Technavio
Similar to printed newspapers, magazines are suffering as well. To cope with the slump in copy sales, a significant amount of magazine genres have now developed robust digital content e.g. automotive thus resulting in higher substitution effects. As is the case for the newspapers, while this allows for increasing the reader base, revenue growths have not commensurate.
The global market for digital magazine publishing will pass $35 billion by 2020, with a CAGR exceeding 20% over the next five years. Powered by soaring adoption of smartphones and tablets2 readership of digital magazines will increase according to different sources, all of which are optimistic. PWC predicts that global circulation revenues for digital magazines - as opposed
to advertising revenues - will increase from $3 billion in 2015 to $6 billion by 2018 3.
In proportional terms, digital magazines will increase from 14% of the total global magazine publishing market to 35% by 2020. The Americas will lead the way in adoption, followed by Europe, the Middle East and Africa, and Asia. FIPP World, a global association of periodical publishers, predicts that total digital magazine ad revenues also increased from $8.4 billion in 2013 to $13.4 billion this year - making up 27% of total ad revenues. It’s worth noting that these figures include ad revenues from magazine web sites, as well as digital editions and mobile apps.
67
MENA Magazine Market Revenue Components and Performance1
US$ Millions
433
458
74%
26%
2014
73%
27%
2015
413
71%
29%
2016
394
70%
30%
2017
377
69%
31%
2018
-5%
Copy Sales 0%
-6%Advertising
CAGR
Exhibit 12
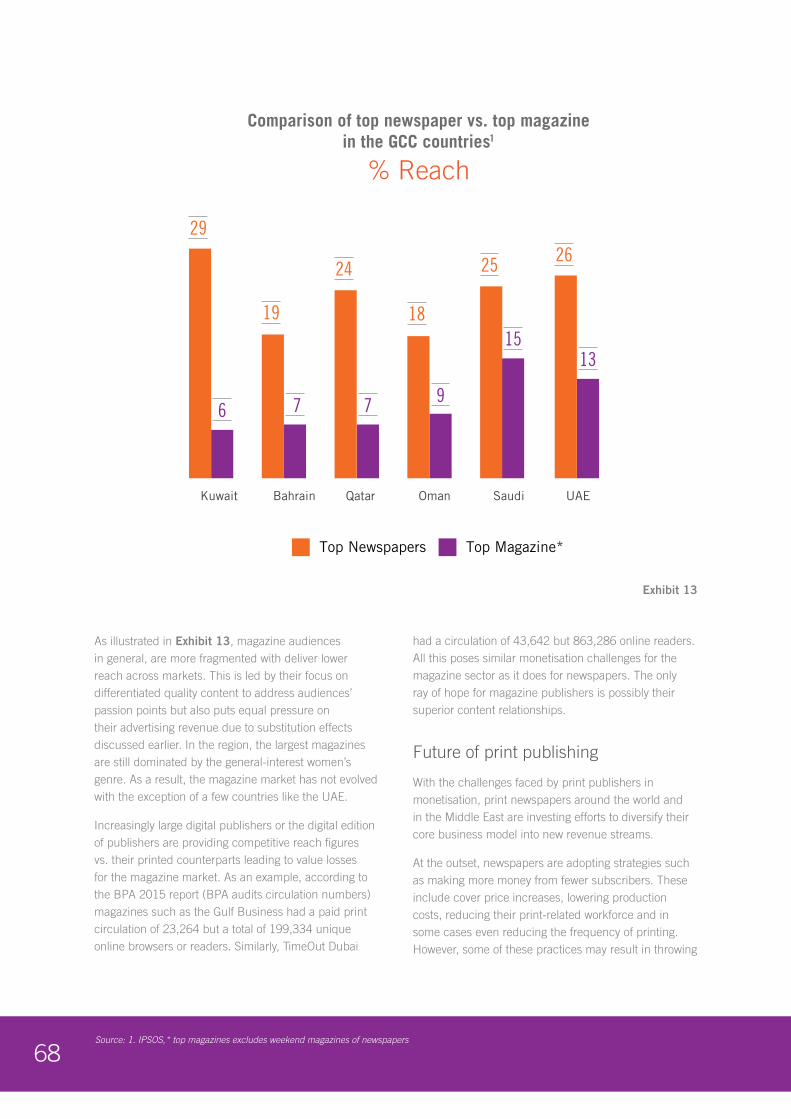
68Source: 1. IPSOS,* top magazines excludes weekend magazines of newspapers
As illustrated in Exhibit 13, magazine audiences in general, are more fragmented with deliver lower reach across markets. This is led by their focus on differentiated quality content to address audiences’ passion points but also puts equal pressure on their advertising revenue due to substitution effects discussed earlier. In the region, the largest magazines are still dominated by the general-interest women’s genre. As a result, the magazine market has not evolved with the exception of a few countries like the UAE.
Increasingly large digital publishers or the digital edition of publishers are providing competitive reach figures vs. their printed counterparts leading to value losses for the magazine market. As an example, according to the BPA 2015 report (BPA audits circulation numbers) magazines such as the Gulf Business had a paid print circulation of 23,264 but a total of 199,334 unique online browsers or readers. Similarly, TimeOut Dubai
had a circulation of 43,642 but 863,286 online readers. All this poses similar monetisation challenges for the magazine sector as it does for newspapers. The only ray of hope for magazine publishers is possibly their superior content relationships.
Future of print publishing
With the challenges faced by print publishers in monetisation, print newspapers around the world and in the Middle East are investing efforts to diversify their core business model into new revenue streams.
At the outset, newspapers are adopting strategies such as making more money from fewer subscribers. These include cover price increases, lowering production costs, reducing their print-related workforce and in some cases even reducing the frequency of printing. However, some of these practices may result in throwing
68
Comparison of top newspaper vs. top magazinein the GCC countries1
% Reach
UAESaudiOmanQatarBahrainKuwait
2625
18
24
19
29
1315
97 76
Top Newspapers Top Magazine*
Exhibit 13
69
out the baby with the bathwater. The digital publishing model produces even greater pressure on superior content and delivery than ever before and some of these practices may compromise the quality of the publications, whatever the platform it is hosted on. Furthermore, any changes to the current model needs careful management, so as to not drain the current user base of loyal readers.
Publishers need to nurture their most prized asset: the readers and drive premiumisation as that allows them to diversify beyond publishing. Specialist content i.e. content not available through search engines but sits behind proprietary databases still carries a premium - such content is mostly dominated by B2B publishers.
Similarly, localised content on specific news, events about the local industry with insights has “place” value as it’s not adequately covered by international media due to limited focus in the region and/or lack of monetisation. Such audience segments are valued by advertisers and complemented by digital presence.
Luxury content with high production (print) quality, that’s exclusive with controlled or limited circulation continues to hold its place for advertisers and readers alike. Typically, such content is dominated by women-oriented magazines and rich lifestyle (high net worth individuals) segment. Even aggregated content, in the form of industry guides, research reports holds longer shelf life and value.
To monetise the above, publishers are turning to cross-platform advertising where the inventory is spread across offline and digital platforms. Such an approach is being used by small and large publishers alike.
Similarly, integrated marketing services that offer advertisers a strategic marketing for advertisers that is end to end is in the uptake. Due to the scale, this approach is primarily taken by large/global advertisers targeting a specific segment. Syndication or licensing rights is small but growing revenue stream with publishers distributing their content to be repurposed by aggregators, apps, portals and other publishers for a fee or ad revenue sharing. Companies such as CNN, ESPN are relying on these models.
Lastly paywalls are being tested globally to develop paying subscribers for the premium digital content, in-depth reports and data. Due to the low uptake of users
paying for content online in general, pay walls rely on high-income, professional users and enterprises. The NYT, Dow Jones, Reuters and Bloomberg to name a few have set up such pay walls. In the region, however, the news content remains free.
Content meets Commerce
Moving beyond subscriptions and ads, publishers are now marrying their content with commerce. For example, as a revenue sharing deal, Vogue magazine curated a fashion marketplace on Yoox’s e-commerce platform. Similar partnerships between Gilt Groupe and GQ to launch Park & Bond; direct commerce sales on Allure.com (publisher of Allure magazine).
Launched in December 2010, Style Find uses technology from Time magazine's Style Feeder acquisition. It powers a shopping site curated by its editorial team and refers traffic to retailers, thereby letting readers (now converted to shoppers) to read the content and purchase with a 'Buy now' buttons in InStyle.com.
The content and publishing play is also no longer restricted to publishers as even e-commerce or non-content companies getting into publishing. As an example, Net-a-Porter launched their exclusive print and digital magazine to complement its online catalogue. Such content marketing initiatives, driven by custom or contract publishing (e.g airline in-flight magazines, corporate magazines, editorial-driven catalogues etc) is becoming common. Rodale, a direct-response marketer with 25 million customers has expanded into books, online subscriptions and creation of magazines.
In the region, with e-commerce and digital advertising still in its early days, traditional publishers such as CPI and ITP to name a few have increased focus on business to business (B2B) with more titles and industry events. It is estimated that publishers generate upwards of 30% of their B2B revenues from such events, conferences and awards ceremonies. Typically, sponsorship is done by the vertical players or their suppliers and remains a key revenue source as participation in of most of these events is free. Bundling of advertising inventory is also common in the sponsorship deals, hence ensuring a share of the advertising income as well.

70
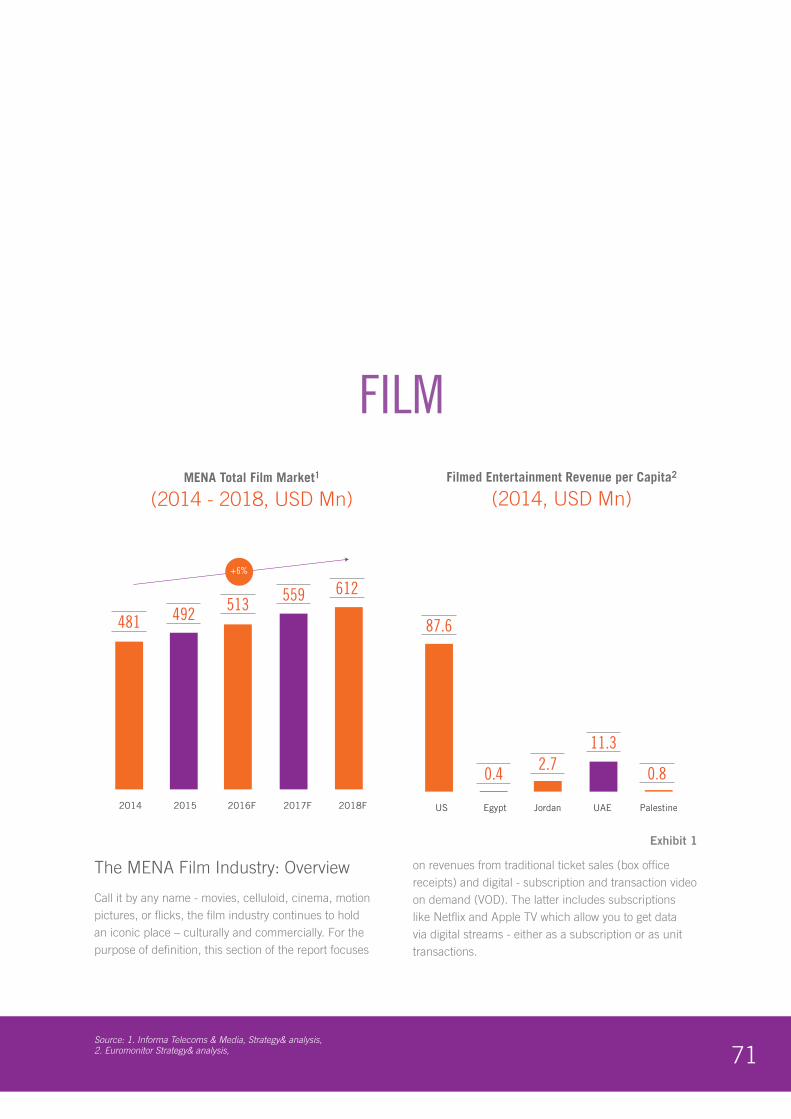
71Source: 1. Informa Telecoms & Media, Strategy& analysis, 2. Euromonitor Strategy& analysis,
The MENA Film Industry: Overview
Call it by any name - movies, celluloid, cinema, motion pictures, or flicks, the film industry continues to hold an iconic place – culturally and commercially. For the purpose of definition, this section of the report focuses
on revenues from traditional ticket sales (box office receipts) and digital - subscription and transaction video on demand (VOD). The latter includes subscriptions like Netflix and Apple TV which allow you to get data via digital streams - either as a subscription or as unit transactions.
FILM
71
MENA Total Film Market1
(2014 - 2018, USD Mn)
492481
2014 2015
513
2016F
559
2017F
612
2018F
+6%
Filmed Entertainment Revenue per Capita2
(2014, USD Mn)
0.4
87.6
US Egypt
2.7
Jordan
11.3
UAE
0.8
Palestine
71
MENA Total Film Market1
(2014 - 2018, USD Mn)
492481
2014 2015
513
2016F
559
2017F
612
2018F
+6%
Filmed Entertainment Revenue per Capita2
(2014, USD Mn)
0.4
87.6
US Egypt
2.7
Jordan
11.3
UAE
0.8
Palestine
71
MENA Total Film Market1
(2014 - 2018, USD Mn)
492481
2014 2015
513
2016F
559
2017F
612
2018F
+6%
Filmed Entertainment Revenue per Capita2
(2014, USD Mn)
0.4
87.6
US Egypt
2.7
Jordan
11.3
UAE
0.8
Palestine
Exhibit 1
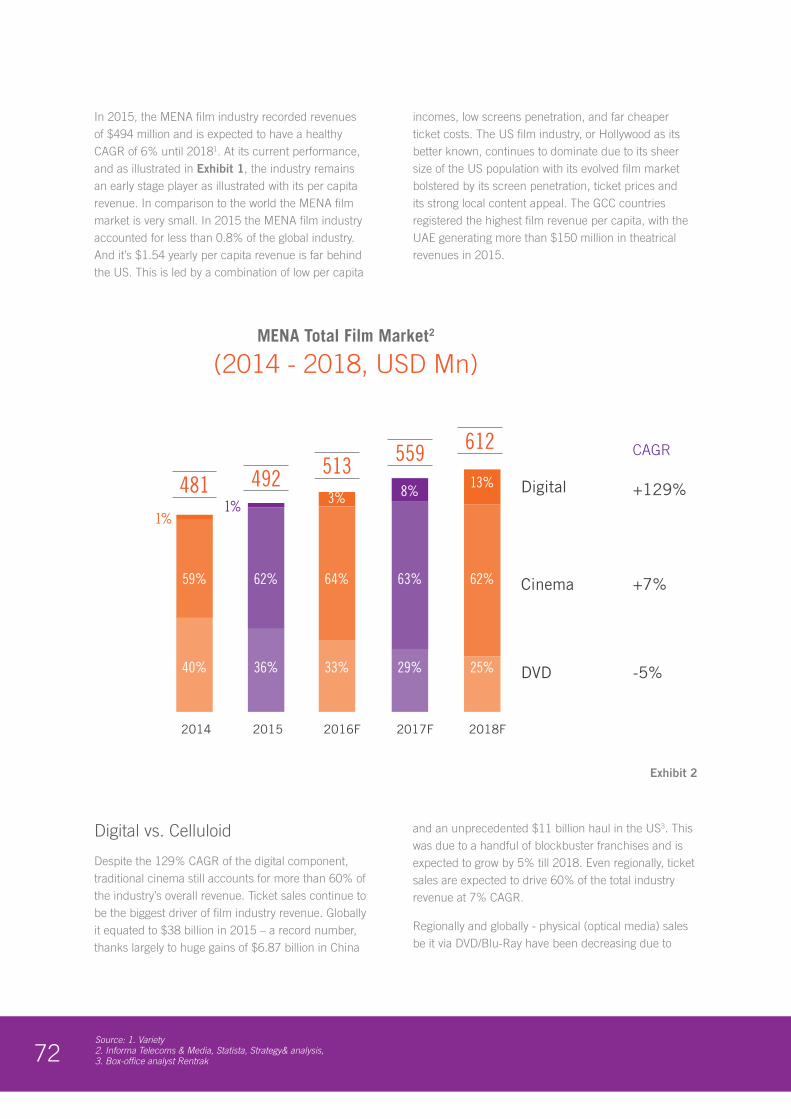
72Source: 1. Variety2. Informa Telecoms & Media, Statista, Strategy& analysis,3. Box-office analyst Rentrak
In 2015, the MENA film industry recorded revenues of $494 million and is expected to have a healthy CAGR of 6% until 20181. At its current performance, and as illustrated in Exhibit 1, the industry remains an early stage player as illustrated with its per capita revenue. In comparison to the world the MENA film market is very small. In 2015 the MENA film industry accounted for less than 0.8% of the global industry. And it’s $1.54 yearly per capita revenue is far behind the US. This is led by a combination of low per capita
incomes, low screens penetration, and far cheaper ticket costs. The US film industry, or Hollywood as its better known, continues to dominate due to its sheer size of the US population with its evolved film market bolstered by its screen penetration, ticket prices and its strong local content appeal. The GCC countries registered the highest film revenue per capita, with the UAE generating more than $150 million in theatrical revenues in 2015.
Digital vs. Celluloid
Despite the 129% CAGR of the digital component, traditional cinema still accounts for more than 60% of the industry’s overall revenue. Ticket sales continue to be the biggest driver of film industry revenue. Globally it equated to $38 billion in 2015 – a record number, thanks largely to huge gains of $6.87 billion in China
and an unprecedented $11 billion haul in the US3. This was due to a handful of blockbuster franchises and is expected to grow by 5% till 2018. Even regionally, ticket sales are expected to drive 60% of the total industry revenue at 7% CAGR.
Regionally and globally - physical (optical media) sales be it via DVD/Blu-Ray have been decreasing due to
72
MENA Total Film Market2
(2014 - 2018, USD Mn)
492481
40%
1%
2014
36%
1%
2015
513
33%
3%
2016F
559
29%
8%
2017F
612
25%
13%
62%63%64%62%59%
2018F
Digital +129%
+7%Cinema
-5%DVD
CAGR
Exhibit 2
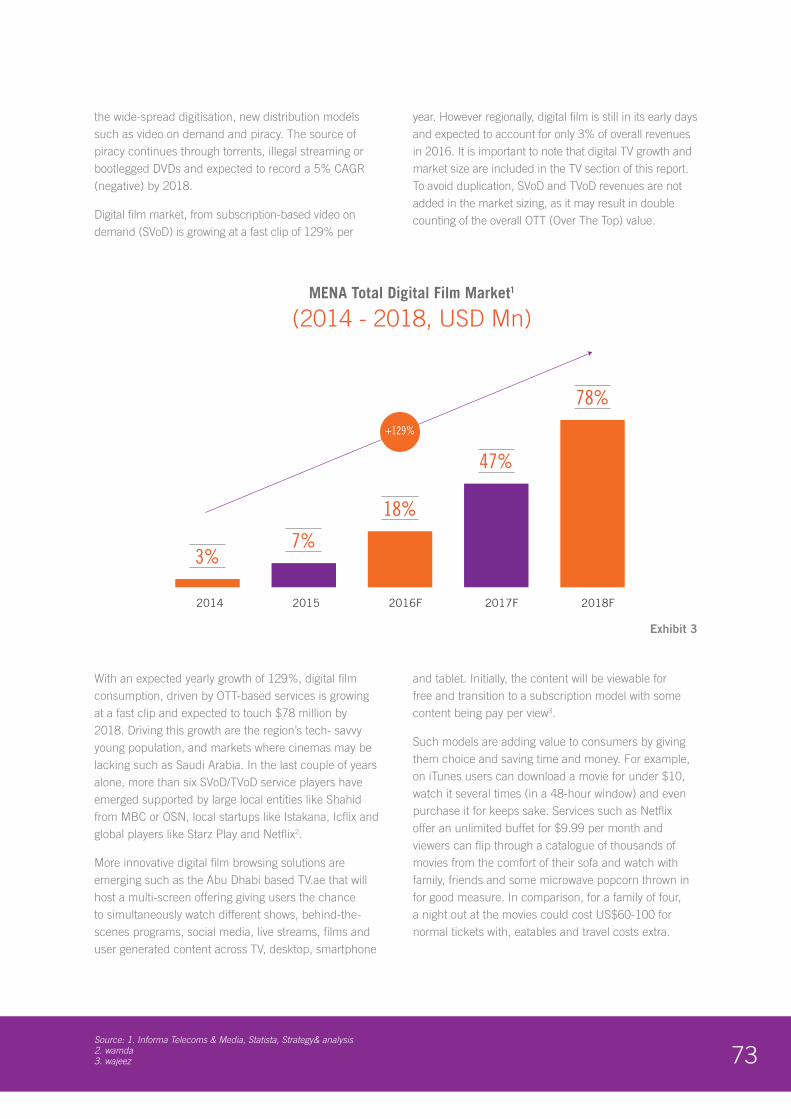
73Source: 1. Informa Telecoms & Media, Statista, Strategy& analysis 2. wamda3. wajeez
the wide-spread digitisation, new distribution models such as video on demand and piracy. The source of piracy continues through torrents, illegal streaming or bootlegged DVDs and expected to record a 5% CAGR (negative) by 2018.
Digital film market, from subscription-based video on demand (SVoD) is growing at a fast clip of 129% per
year. However regionally, digital film is still in its early days and expected to account for only 3% of overall revenues in 2016. It is important to note that digital TV growth and market size are included in the TV section of this report. To avoid duplication, SVoD and TVoD revenues are not added in the market sizing, as it may result in double counting of the overall OTT (Over The Top) value.
With an expected yearly growth of 129%, digital film consumption, driven by OTT-based services is growing at a fast clip and expected to touch $78 million by 2018. Driving this growth are the region’s tech- savvy young population, and markets where cinemas may be lacking such as Saudi Arabia. In the last couple of years alone, more than six SVoD/TVoD service players have emerged supported by large local entities like Shahid from MBC or OSN, local startups like Istakana, Icflix and global players like Starz Play and Netflix2.
More innovative digital film browsing solutions are emerging such as the Abu Dhabi based TV.ae that will host a multi-screen offering giving users the chance to simultaneously watch different shows, behind-the-scenes programs, social media, live streams, films and user generated content across TV, desktop, smartphone
and tablet. Initially, the content will be viewable for free and transition to a subscription model with some content being pay per view3.
Such models are adding value to consumers by giving them choice and saving time and money. For example, on iTunes users can download a movie for under $10, watch it several times (in a 48-hour window) and even purchase it for keeps sake. Services such as Netflix offer an unlimited buffet for $9.99 per month and viewers can flip through a catalogue of thousands of movies from the comfort of their sofa and watch with family, friends and some microwave popcorn thrown in for good measure. In comparison, for a family of four, a night out at the movies could cost US$60-100 for normal tickets with, eatables and travel costs extra.
75
3%
2014
7%
2015
18%
2016F
47%
2017F
78%
2018F
MENA Total Digital Film Market1
(2014 - 2018, USD Mn)
+129%
Exhibit 3
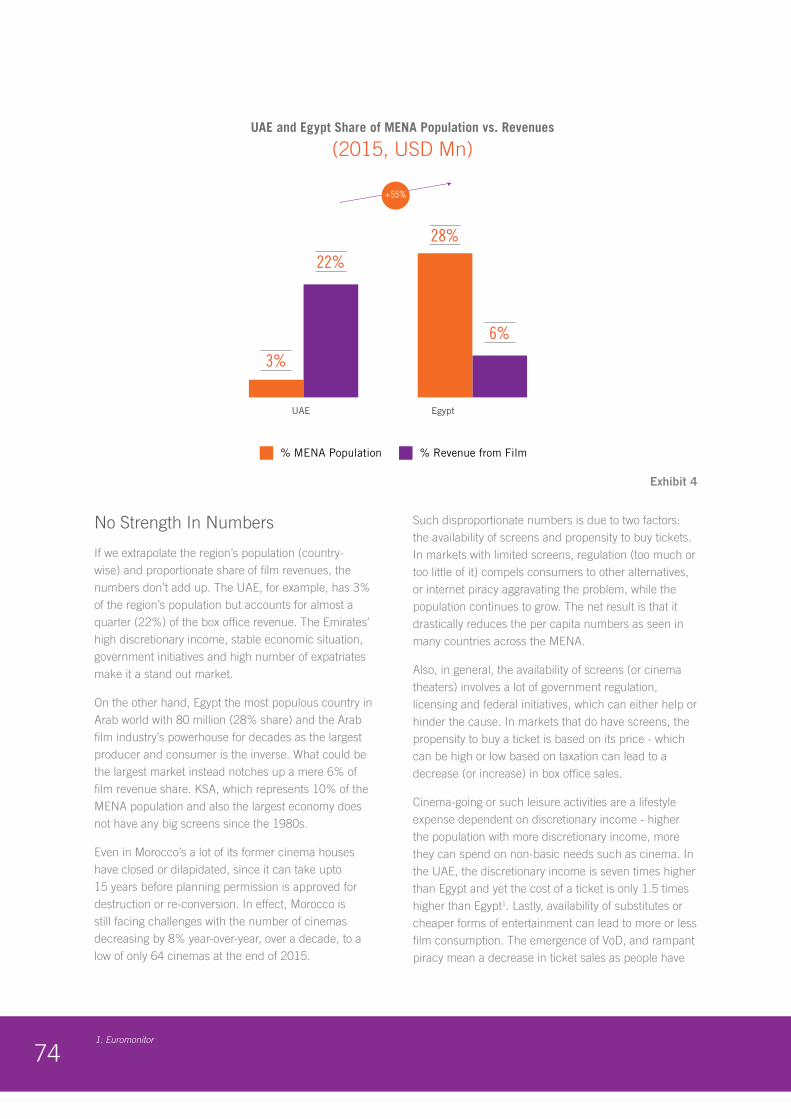
741. Euromonitor
No Strength In Numbers
If we extrapolate the region’s population (country-wise) and proportionate share of film revenues, the numbers don’t add up. The UAE, for example, has 3% of the region’s population but accounts for almost a quarter (22%) of the box office revenue. The Emirates’ high discretionary income, stable economic situation, government initiatives and high number of expatriates make it a stand out market.
On the other hand, Egypt the most populous country in Arab world with 80 million (28% share) and the Arab film industry’s powerhouse for decades as the largest producer and consumer is the inverse. What could be the largest market instead notches up a mere 6% of film revenue share. KSA, which represents 10% of the MENA population and also the largest economy does not have any big screens since the 1980s.
Even in Morocco’s a lot of its former cinema houses have closed or dilapidated, since it can take upto 15 years before planning permission is approved for destruction or re-conversion. In effect, Morocco is still facing challenges with the number of cinemas decreasing by 8% year-over-year, over a decade, to a low of only 64 cinemas at the end of 2015.
Such disproportionate numbers is due to two factors: the availability of screens and propensity to buy tickets. In markets with limited screens, regulation (too much or too little of it) compels consumers to other alternatives, or internet piracy aggravating the problem, while the population continues to grow. The net result is that it drastically reduces the per capita numbers as seen in many countries across the MENA.
Also, in general, the availability of screens (or cinema theaters) involves a lot of government regulation, licensing and federal initiatives, which can either help or hinder the cause. In markets that do have screens, the propensity to buy a ticket is based on its price - which can be high or low based on taxation can lead to a decrease (or increase) in box office sales.
Cinema-going or such leisure activities are a lifestyle expense dependent on discretionary income - higher the population with more discretionary income, more they can spend on non-basic needs such as cinema. In the UAE, the discretionary income is seven times higher than Egypt and yet the cost of a ticket is only 1.5 times higher than Egypt1. Lastly, availability of substitutes or cheaper forms of entertainment can lead to more or less film consumption. The emergence of VoD, and rampant piracy mean a decrease in ticket sales as people have
75
3%
22%
28%
6%
UAE Egypt
UAE and Egypt Share of MENA Population vs. Revenues
(2015, USD Mn)
+55%
% Revenue from Film% MENA Population
Exhibit 4
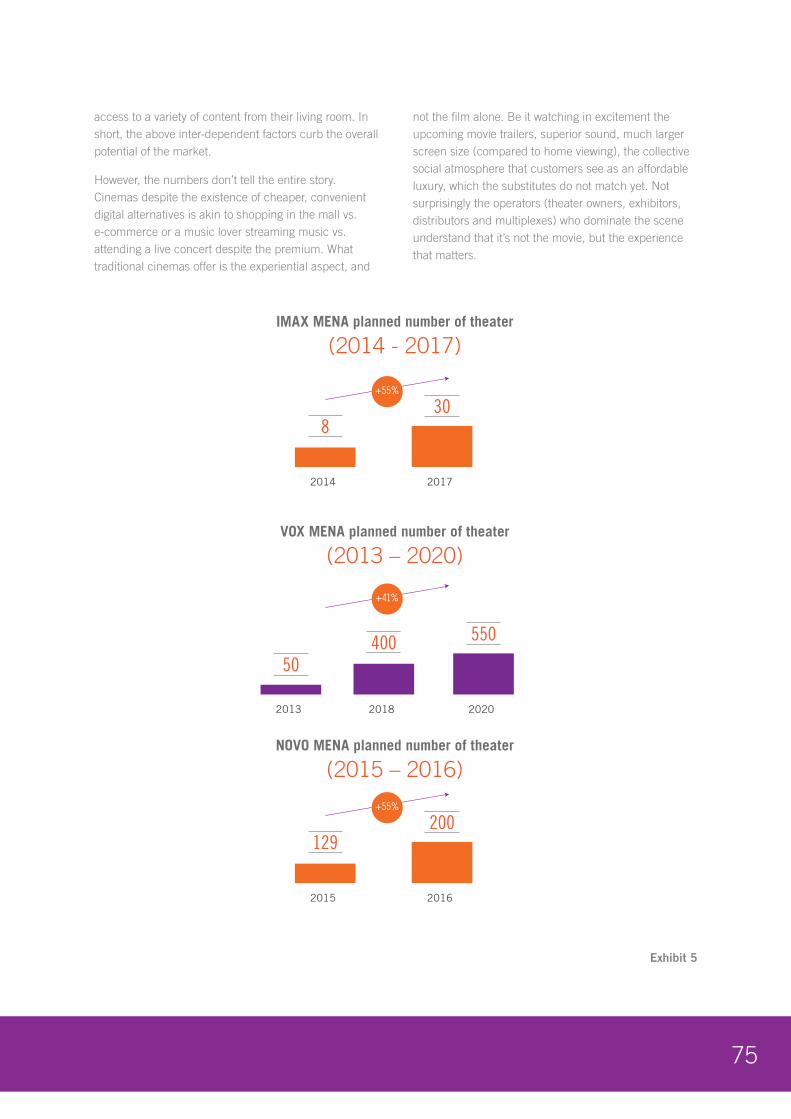
75
access to a variety of content from their living room. In short, the above inter-dependent factors curb the overall potential of the market.
However, the numbers don’t tell the entire story. Cinemas despite the existence of cheaper, convenient digital alternatives is akin to shopping in the mall vs. e-commerce or a music lover streaming music vs. attending a live concert despite the premium. What traditional cinemas offer is the experiential aspect, and
not the film alone. Be it watching in excitement the upcoming movie trailers, superior sound, much larger screen size (compared to home viewing), the collective social atmosphere that customers see as an affordable luxury, which the substitutes do not match yet. Not surprisingly the operators (theater owners, exhibitors, distributors and multiplexes) who dominate the scene understand that it’s not the movie, but the experience that matters.
129200
75
2015 2016
NOVO MENA planned number of theater
(2015 – 2016)
+55%
830
2014 2017
IMAX MENA planned number of theater
(2014 - 2017)
+55%
400 550
2018
50
2013 2020
VOX MENA planned number of theater
(2013 – 2020)
+41%
Exhibit 5
761. Kipp Report 2. Al-Arabiya 3. TimeOut Dubai4. Business Insider and Standford
Big Screen: Big Picture
The theaters themselves maybe dark, but the future is bright. As noted earlier, much of the movie action is centred around the GCC and parts of the Levant. VOX (formerly Cinestar after its rebranding in 2011) expects to spend $272 million over a five-year period (2013-2018) with a 10-fold increase in the number of its screens by 20201 as seen in Exhibit 5 above1. Vox’s new screens will be restricted to few countries in the MENA and the expansion is not uniform at best like the others further skewing the market.
Similarly, Novo (formerly Grand Cinemas) the Middle East’s largest theater chain is expected to increase its screen count from 129 in 2015 to over 200 in 20162. Megarama, the only multiplex operator in Morocco is set to open two more screens in 2016 - increasing the total count to 71. Similarly, for IMAX, with the Middle East amongst its best-performing markets is expected to spend up to $25 million by 2017 taking its total screen count to 302.
In markets that already have a high penetration of screens and saturated audience base - the cinema chains have no way, but to go up. They are doing so by aggressively focusing on upselling, cross-selling and expansion to cater to the existing theater goer. With apps and kiosks to book tickets easily, tie-ins with telcos and banks for loyalty programs, Novo like other theater chains are renovating their cinemas with emphasis on high-end experience, adding even more screens, bigger screens in more locations to keep the audience coming and open their wallets more.
Reel cinema (owned by Emaar Retail) another upcoming multiplex with 38 screens has tickets from $10 to $32 for its 3D Cinema, 4Dx that claims a multi-sensory experience with wind, motion, fogs, mist, scents and all; platinum suites, butler service, VIP lounges, a Picture House that shows art-house films. Some have exclusive screens for kids - each trying outdo the other
promising even a 7-star experience to avid and wealthy cinema goers.
Movie chains such as Vox are going further to bring gourmet food into a dark room. It’s ThEatre - a word play on theater and eat - claims to be the region’s first gold class cinema with a menu devised by celebrity chef, Gary Rhodes. To make it cosier, leather recliners, private seating in sets of two, satin blankets and pillows are included3. It's not the staple bucket of warm popcorn, but a range of gourmet food (truffles and caviar) that can be ordered by credit card right from the seat control – similar to a first-class airline seat.3 At $44 a ticket - four times the price of a normal ticket - a movie night for a couple with the works: $150.5 The experience: arguably priceless.
To be clear, it’s not the love of cinema that’s driving exhibitor ambitions. For the initial period of screening, typically money from ticket sales goes to the studios and/or distributors for big-budget movies with initial-run concessions and percentage of revenue sharing deals. With limited earnings from ticket sales after the payouts, theaters have to fill up seats in the crucial opening week and may sell tickets as loss leaders to drive in the audience4.
To compensate, they rely on concessions (Food and beverages such as popcorn, nachos, candy, soda, merchandise, combo deals etc.) that are low-cost but sold at very high margins (reportedly at 800% for popcorn). Unlike ticket revenues that must be shared with third-parties, 100% of revenue from such concessions, retail sales, on-screen or OOH ad revenues, special promotions, sponsorship packages, foyer options in the theater go straight to their coffers. Although concessions account for only 20% of gross revenues, they represent over 40% of the theaters' profits1 compelling them to sell the experience harder, innovate and expand due in a market with high screen penetration, audience saturation and stiff competition.4
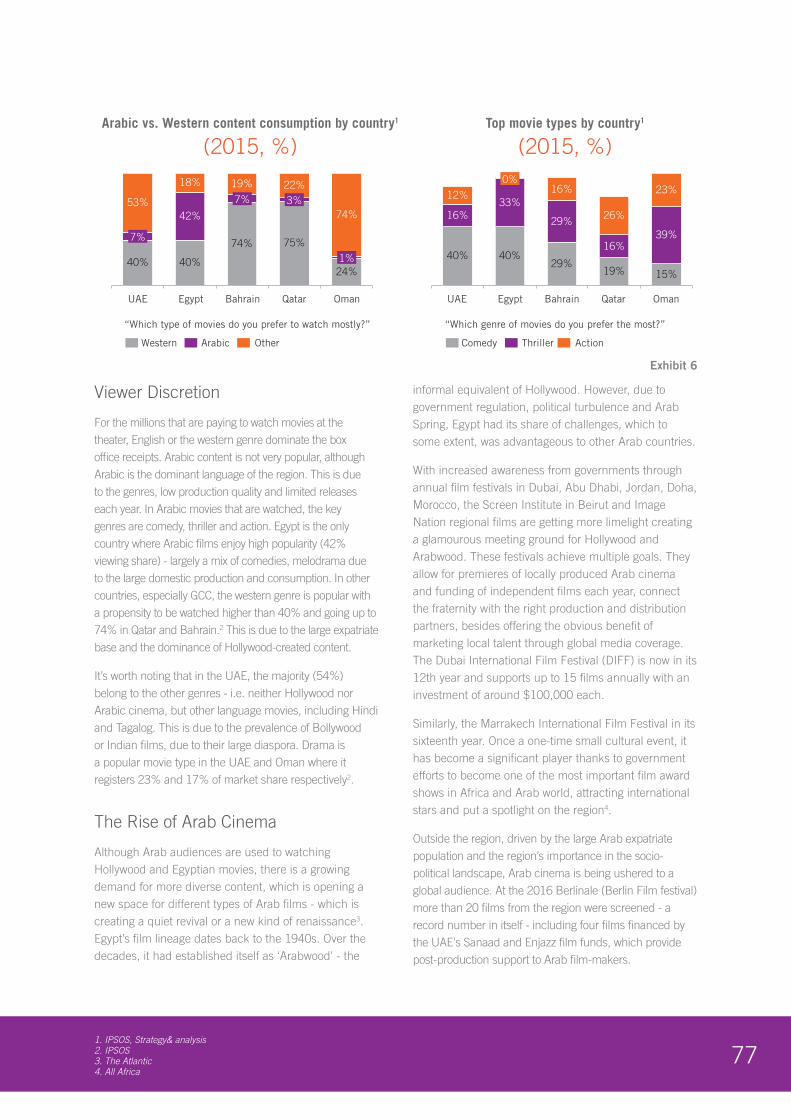
771. IPSOS, Strategy& analysis2. IPSOS3. The Atlantic4. All Africa
Viewer Discretion
For the millions that are paying to watch movies at the theater, English or the western genre dominate the box office receipts. Arabic content is not very popular, although Arabic is the dominant language of the region. This is due to the genres, low production quality and limited releases each year. In Arabic movies that are watched, the key genres are comedy, thriller and action. Egypt is the only country where Arabic films enjoy high popularity (42% viewing share) - largely a mix of comedies, melodrama due to the large domestic production and consumption. In other countries, especially GCC, the western genre is popular with a propensity to be watched higher than 40% and going up to 74% in Qatar and Bahrain.2 This is due to the large expatriate base and the dominance of Hollywood-created content.
It’s worth noting that in the UAE, the majority (54%) belong to the other genres - i.e. neither Hollywood nor Arabic cinema, but other language movies, including Hindi and Tagalog. This is due to the prevalence of Bollywood or Indian films, due to their large diaspora. Drama is a popular movie type in the UAE and Oman where it registers 23% and 17% of market share respectively2.
The Rise of Arab Cinema
Although Arab audiences are used to watching Hollywood and Egyptian movies, there is a growing demand for more diverse content, which is opening a new space for different types of Arab films - which is creating a quiet revival or a new kind of renaissance3. Egypt’s film lineage dates back to the 1940s. Over the decades, it had established itself as ‘Arabwood' - the
informal equivalent of Hollywood. However, due to government regulation, political turbulence and Arab Spring, Egypt had its share of challenges, which to some extent, was advantageous to other Arab countries.
With increased awareness from governments through annual film festivals in Dubai, Abu Dhabi, Jordan, Doha, Morocco, the Screen Institute in Beirut and Image Nation regional films are getting more limelight creating a glamourous meeting ground for Hollywood and Arabwood. These festivals achieve multiple goals. They allow for premieres of locally produced Arab cinema and funding of independent films each year, connect the fraternity with the right production and distribution partners, besides offering the obvious benefit of marketing local talent through global media coverage. The Dubai International Film Festival (DIFF) is now in its 12th year and supports up to 15 films annually with an investment of around $100,000 each.
Similarly, the Marrakech International Film Festival in its sixteenth year. Once a one-time small cultural event, it has become a significant player thanks to government efforts to become one of the most important film award shows in Africa and Arab world, attracting international stars and put a spotlight on the region4.
Outside the region, driven by the large Arab expatriate population and the region’s importance in the socio-political landscape, Arab cinema is being ushered to a global audience. At the 2016 Berlinale (Berlin Film festival) more than 20 films from the region were screened - a record number in itself - including four films financed by the UAE's Sanaad and Enjazz film funds, which provide post-production support to Arab film-makers.
88
Arabic vs. Western content consumption by country1
(2015, %)Top movie types by country1
(2015, %)
UAE
Western Arabic Other
Egypt Bahrain Qatar Oman
“Which type of movies do you prefer to watch mostly?”
Comedy Thriller Action
“Which genre of movies do you prefer the most?”
UAE Egypt Bahrain Qatar Oman
Exhibit 6
781. Khaleej Times2. MAD Solutions3. Atlantic4. IPSOS
Since the #SupportArabCinema hashtag campaign was launched in 2015 on social media, over 11,000 people from around the world including Hany Abu Assad (The Idol, Paradise Now), CEO of Twofour54 Noura Al Kaabi and the Chairman of DIFF Abdulhamid Juma have joined the campaign1 to pledge their support.
2016 was the first year that a Jordanian film, Theeb, was nominated for an Academy Award for Best foreign language film. Following its Jordanian premiere, this low-budget film went on to an outstanding box office run in 11 Arab countries. Post-Oscar buzz, a second Pan-Arab release via the Cairo-based Mad Solutions. Such a second outing of an Arab arthouse movie is a first. MAD released Basil Khalil's Oscar-nominated short ‘Ave Maria’ as a double-billing with Theeb. Of note, is that it's not just the first Arab short to get a theatrical release, it's also been sold to broadcasters, airlines and VoD giving it more audience and billings. Theeb made $195,0002 theatrically in MENA just a few weeks of release and expected to pull in even more through word of mouth, post-Oscar buzz1. Even the UAE, which is unknown for Emirati cinema, is slowly making its mark. ‘Zinzana’ the first genre movie to come out of the UAE by Vox Cinemas giving it a robust wide release across the Middle East, including Egypt and Lebanon, pulling in $180,0003 and further growing with new distribution channels.
The accessibility of affordable production tools such as a digital video recorders, new digital distribution models is helping spur what some scholars and filmmakers tentatively say is the start of a golden age in Arab cinema.4
Protagonists and Antagonists
From an industry perspective, especially for content producers, digital could be the way forward. While yet to be proven, digital distribution platforms could provide a growth platform and showcase Arab films which the traditional channels find challenging to accommodate. For example, Middle East distributor Front Row signed a deal with iTunes to act as an aggregator for hundreds of independent Arab films.
Beyond distribution, a scarcity of talent is impeding productions as movie producers require stable and experienced pool to ensure high-quality production. Making a commercial-grade movie, is similar to running a small industry and requires dozens, sometimes
even hundreds, of technical crew (cameramen, cinematographers) and creative talent (script-writers, actors etc) – both of which are lacking in the region. Efforts to address this are being led by new film production-specific investments that have been such as the Dubai Studio City and Twofour54, but the numbers are far from an industrial scale.
Adding to it, movie making is an expensive business - it requires hundreds of thousand dollars for a low-budget movie, and can run into tens of millions for mid-sized budget movie with a wide release. In its current stage, film financing in the region is in its nascent stage. As a result, drawing on the popularity of film festivals, several film funds have come up. From the Abu Dhabi Film Commission, Morocco Public Fund, Jordan Film Fund, amongst others provide government rebates and development grants ranging from $100,000 per film to $7 million annually to support local production and film talent. Outside the government support, film financing in general is both insufficient and disorganised, hampering growth.
Socio-Economic Dimensions
Such production activity also makes a difference to the hosting country across various five socio-economic dimensions. From an economic angle, it contributes to the GDP and stimulates the local economy. This is more so with big budget movies, which spend millions of dollars on location for a few days of shooting. In terms of tourism, even after a movie is screened, it draws in tourists. Five decades later, Jordan’s wadis are synonymous with the Lawrence of Arabia, or Indiana Jones: The Last Crusade from 1989 still drives in hordes of tourists to Petra each year.
There is further impact with marketing, as when a country is featured in a movie, it is akin to the country launching a global marketing campaign as its indirectly marketed to millions across the world by the film studios at no expense to the location. This is more so in the case of Dubai, when the Burj Khalifa was featured in Mission Impossible 4 showcasing its dizzying height to the world in a crucial scene. Both the location and the movie mutually marketed themselves to each other’s advantage. Recent block-buster movies such as Star Wars (The Force Awakens), Fast and Furious 7 or the Star Trek movie all have positively impacted the nascent UAE film industry in more ways than one.
791. Albawaba2. All Africa3. Albawaba4. Screen Daily5. Bollywood Parks Dubai
Employment-wise there is a positive impact, as production involves hiring hundreds of locals, or even thousands – from building the sets, as extras, for transportation, supplying the props and even catering. Lastly, is the social impact - when an international crew come to a location, they train the local talent, share best practices, even mentor them with new skills that helps them well after the production is over.
Location, Location, Location
Governments in the region, are realizing that the real unsung star may be its location that often goes uncredited. The location of filming has a bigger impact than just a few minutes of screen-time - it draws in investments, attracts more foreign media productions in turn. For any location to become attractive for domestic or international production, it needs to tick a few boxes, which governments are working on amongst other initiatives.
Financial incentives are key as costs define everything. The Moroccan government, for example, approved a 20% cash rebate for foreign shoots – a move that attracted further investments to the tune of $110 million in 2014.1 Such initiatives have attracted major blockbusters such as American Sniper; the new James Bond movie Spectre; 2015: A.D. The Bible Continues. In fact, North Africa (Morocco, Algeria and Tunisia) has been the go-to 'Middle East backdrop' stand-in for a diverse genres – from the biblical, recreating Mars, to exotic themed movies with a desert landscape. The village of Ait Benhaddou has featured in both blockbusters such as The Kingdom of Heaven, Gladiator, Alexander and Game of Thrones, the hit TV series. Interestingly, the first Star Wars movie in 1977 and the recent sequel were both shot in the region2.
A location must also be compatible with the script and adapt so producers don’t need to shoot in multiple locations. Similarly, it must ensure security of the crew – parts of the region with their recent instability forced some overseas productions to look elsewhere. The place must have the right facilities for editing, recording
and sound stages as producers prefer filming in single location. Lastly it must have native talent i.e. local crew who are multi-lingual and experienced in working with international teams. Other factors such as predictable weather (for outdoor shooting), availability of equipment and props that can be leased easily also help.
Egypt with its pyramids and rich history attracts a certain type of international film makers, but focuses on local productions. Jordan - especially Petra, which in 2015, was voted as the second best film destination in an international poll by USA Today3 has played host to several films such as Indian Jones 3 - The Last Crusade, Transformers 3 amongst others. Tunisia has had its share of action with films including, The English Patient, Raiders of the Lost Ark and Star Wars4. With the Arab Spring and general instability, some international business dried up between 2011-2014, but picking up the pace again.
The UAE is positioning itself as a top filming destination providing the stage not just for Hollywood movies such as Star Trek, Mission Impossible 4, The Fast and Furious 7, but also, Arab cinema and Bollywood due to its central location, better infrastructure and regulation. Recent Bollywood hit movies such as ‘Happy New year’ ‘Welcome Back’ and a host of others were shot entirely on location.
To make cinema more experiential, the UAE is set to open in October 2016, a Bollywood Park (part of a $1.6 billion larger project) - spread over 2.1 million square feet with cinema-themed rides, live performances, retail space and Broadway-style Bollywood musicals over five zones5. This is a further addition to the other film-based theme parks underway in the Emirate - Universal and Marvel Studios both of which are cheduled to open in 2017, making it a new location star.
Ticking most of the above boxes is Morocco, which continues to attract film crews. The UAE is also fast catching up with a host of initiatives. Other countries such as Jordan, Lebanon, Tunisia, Egypt and Algeria show potential and continue to serve niche aspects of film production.

80
81
Fast Forward >>
This section focuses on commercially recorded (digital and physical formats) and live music. Digital music includes revenues from streaming, downloads, mobile such as ring tones; physical recorded music includes sale of CDs, long play (LP) records and cassettes. Live music is restricted to ticket or fee-based public or private music events.
If we fast forward a century of the music industry, we can segment it into four distinct phases: From the late 1920s, when records were commercially available to the late 1990s – a span of seven decades was dominated by LPs, cassettes and CDs. The form factor (playing device) ranged from a gramophone, table-top, compact stereos (such as Walkman) to name a few. During this entire period, the industry dynamics was led by record labels, album sales - only the quality of sound and form factor changed.
The CD was the tinder for digitisation as songs became available in a high-quality digital format. That with the PC, broadband, and a new disruptive file format – the MP3 – broke down the album. The music industry
was in state of anarchy as P2P (peer to peer) services such as Napster, LimeWire opened up the world where users could share, download, rip (extract), burn (copy from a CD) millions of music files/songs to a massive community of over 80 million users at its peak – all for free. The high-profit margin album format of record labels gave way. By the end of the 20th century, piracy and digital music sales sounded the death knell for incumbent models.
This led to the emergence of a new model – the online music store. The year was 2003, when Apple launched iTunes and iPod. The album as a collective unit for singles became unbundled and sold a la carte'. Consumers could pay up to 99 cents and record labels were relatively happy some value was monetised (compared to piracy) and extended the exposure of their music catalogue - unfathomable in the CD era. Apple got it right on all sides – they sold the content (music), owned the distribution channel (iTunes) and high-margin proprietary hardware (iPod) upending the music business.
Five years later, with smartphones, mobile broadband and dropping data costs - even downloading singles
The future of music lies in selling the experience
MUSIC
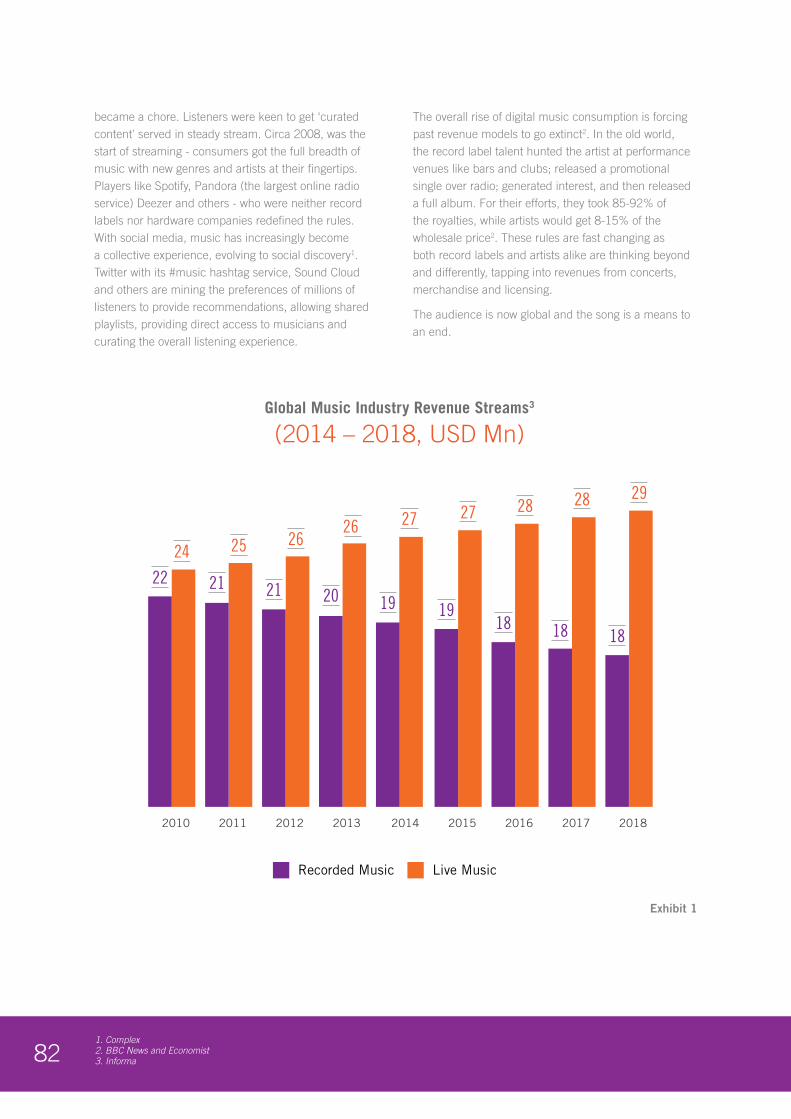
821. Complex2. BBC News and Economist3. Informa
became a chore. Listeners were keen to get ‘curated content' served in steady stream. Circa 2008, was the start of streaming - consumers got the full breadth of music with new genres and artists at their fingertips. Players like Spotify, Pandora (the largest online radio service) Deezer and others - who were neither record labels nor hardware companies redefined the rules. With social media, music has increasingly become a collective experience, evolving to social discovery1. Twitter with its #music hashtag service, Sound Cloud and others are mining the preferences of millions of listeners to provide recommendations, allowing shared playlists, providing direct access to musicians and curating the overall listening experience.
The overall rise of digital music consumption is forcing past revenue models to go extinct2. In the old world, the record label talent hunted the artist at performance venues like bars and clubs; released a promotional single over radio; generated interest, and then released a full album. For their efforts, they took 85-92% of the royalties, while artists would get 8-15% of the wholesale price2. These rules are fast changing as both record labels and artists alike are thinking beyond and differently, tapping into revenues from concerts, merchandise and licensing.
The audience is now global and the song is a means to an end.
Exhibit 1
82
Global Music Industry Revenue Streams3
(2014 – 2018, USD Mn)
201820172016201520142013201220112010
29
181818191920212122
2828272726 262524
Recorded Music Live Music
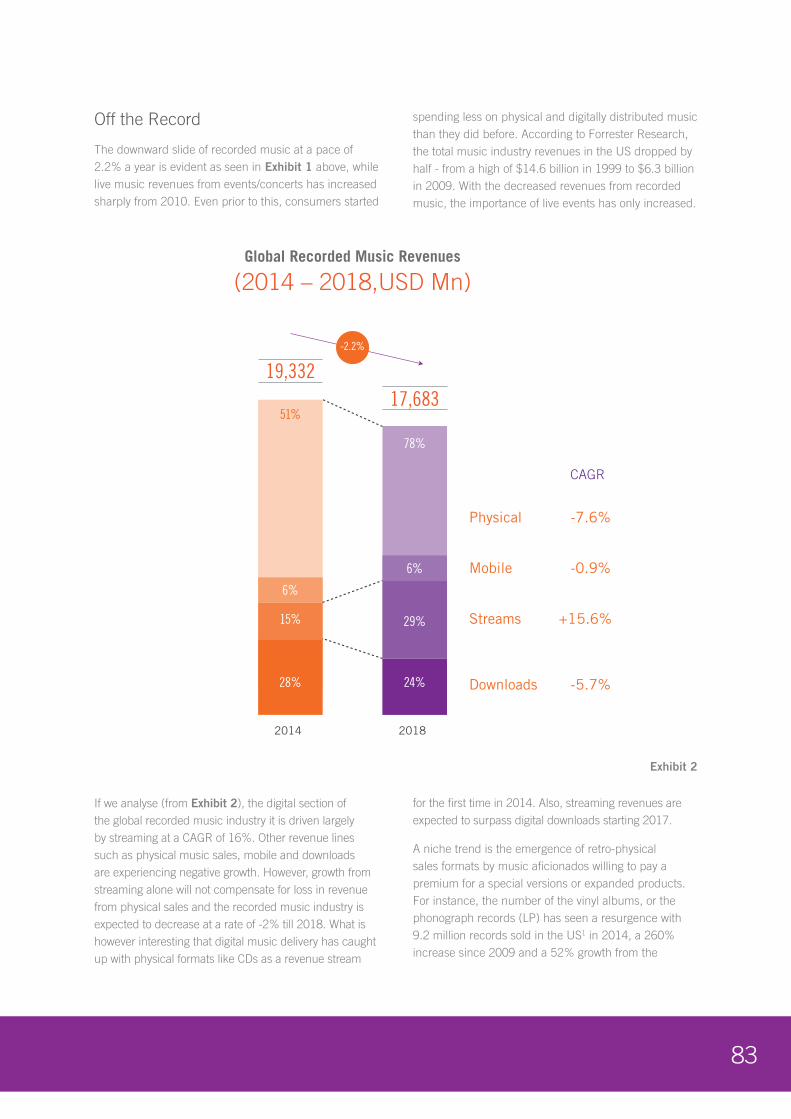
83
Off the Record
The downward slide of recorded music at a pace of 2.2% a year is evident as seen in Exhibit 1 above, while live music revenues from events/concerts has increased sharply from 2010. Even prior to this, consumers started
spending less on physical and digitally distributed music than they did before. According to Forrester Research, the total music industry revenues in the US dropped by half - from a high of $14.6 billion in 1999 to $6.3 billion in 2009. With the decreased revenues from recorded music, the importance of live events has only increased.
If we analyse (from Exhibit 2), the digital section of the global recorded music industry it is driven largely by streaming at a CAGR of 16%. Other revenue lines such as physical music sales, mobile and downloads are experiencing negative growth. However, growth from streaming alone will not compensate for loss in revenue from physical sales and the recorded music industry is expected to decrease at a rate of -2% till 2018. What is however interesting that digital music delivery has caught up with physical formats like CDs as a revenue stream
for the first time in 2014. Also, streaming revenues are expected to surpass digital downloads starting 2017.
A niche trend is the emergence of retro-physical sales formats by music aficionados willing to pay a premium for a special versions or expanded products. For instance, the number of the vinyl albums, or the phonograph records (LP) has seen a resurgence with 9.2 million records sold in the US1 in 2014, a 260% increase since 2009 and a 52% growth from the
83
Global Recorded Music Revenues
(2014 – 2018,USD Mn)
51%
28%
15%
6%
2014
78%
2018
Physical -7.6%
Mobile -0.9%
Streams +15.6%
-5.7%Downloads
CAGR
24%
6%
29%
19,33217,683
-2.2%
Exhibit 2
841. Wired2. Music Business Worldwide3. Apple Music
4. IBS (2016) GMPD5. The Independent
previous year. Likewise in the UK, sales increased five-fold from 2009 to 20141. This is in part due to the ‘hipster’ trend (a subculture of users typically in their 20's and 30's that value independent thinking, counter-culture, progressive politics, an appreciation of art and indie-rock5) and DJs who prefer its rustic quality sound.
The real action is however in streaming. In a few short years (from 2007), upstarts such as Spotify have defined the space. Users can create and listen to playlists for free or subscribe to their premium service with zero ads. Spotify hosts over 30 million songs; 2 billion playlists; 28 million paying subscribers with a total of 100 million users2. Others are fast catching up. Apple Music launched in June 2015, built on Apple's $3 billion acquisition of Beats Electronics (primarily a maker of headsets). Apple Music lets users access millions of songs for under $10 a month and a sharing plan for up to six family members for $14.99 a month. The prices are even lower in the UAE, it costs $5.44 and $8.17 dollars respectively3. Apple Music has signed up more than 10 million paying subscribers around the world till date. Together, just these two streaming players alone, serve more than 58 countries making streaming a force to reckon with.
Implications (Labels vs. Artists)
To remain competitive, record labels have largely abandoned manufacturing of physical albums, except for collector’s items. Few have skipped the typical album promotional cycles, choosing instead to release them on YouTube. Due the industry's low-margins on the optical media itself (the physical CD), the number of enterprises has fallen at an annualised rate of 1.5% to 43,893 over the past five years4. Labels hence, are no longer seeking the offline distribution power (selling CDs in retail stores) as new revenue models are emerging.
From an artist’s perspective, the story is not rosier - they are suffering as well, as the growing digital streaming services barely bring them back any revenue5. At under a cent for each time their song is streamed or played, even with millions of listeners don't add up (more on this in the Digital section of the report).
However, with the growth of streaming and usage of social media, artists are able to leverage their direct connections with fans to build their brand and diversify. For example Brian Buchanon of Jubilee Riots, a folk-rock group from Toronto has used platforms like Google Helpout and StageIt to offer paid-for music lessons to fans.
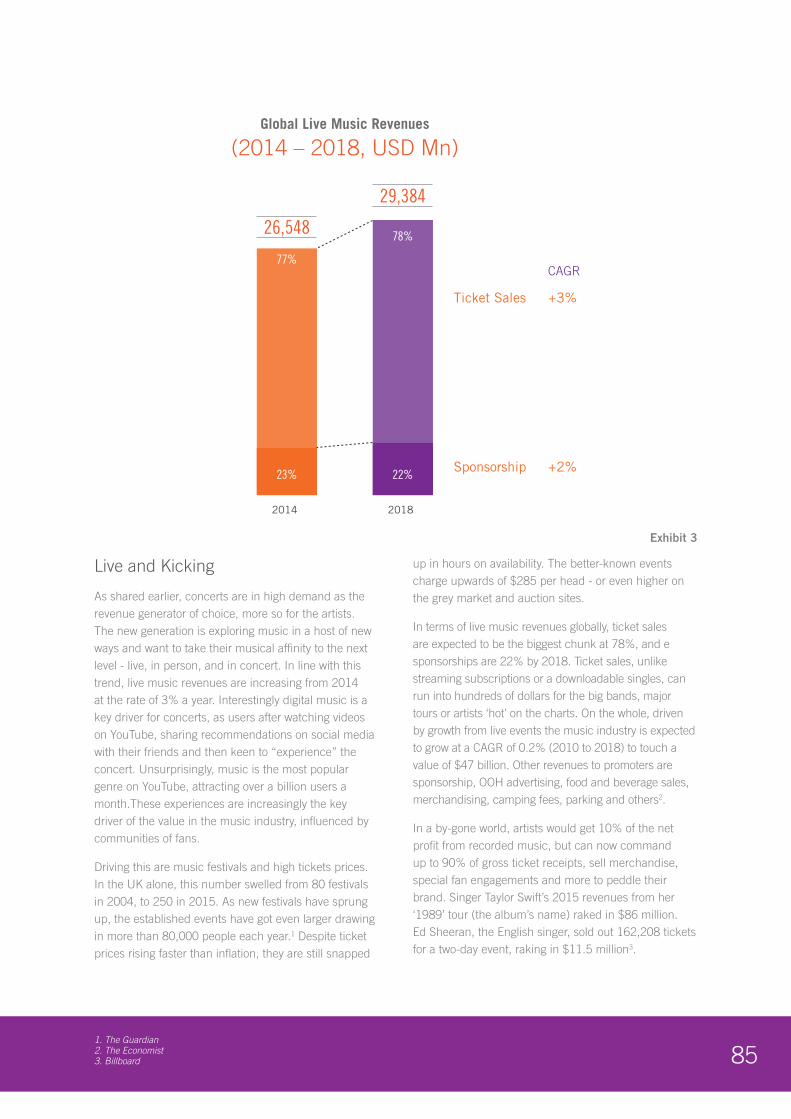
851. The Guardian2. The Economist3. Billboard
Live and Kicking
As shared earlier, concerts are in high demand as the revenue generator of choice, more so for the artists. The new generation is exploring music in a host of new ways and want to take their musical affinity to the next level - live, in person, and in concert. In line with this trend, live music revenues are increasing from 2014 at the rate of 3% a year. Interestingly digital music is a key driver for concerts, as users after watching videos on YouTube, sharing recommendations on social media with their friends and then keen to “experience” the concert. Unsurprisingly, music is the most popular genre on YouTube, attracting over a billion users a month.These experiences are increasingly the key driver of the value in the music industry, influenced by communities of fans.
Driving this are music festivals and high tickets prices. In the UK alone, this number swelled from 80 festivals in 2004, to 250 in 2015. As new festivals have sprung up, the established events have got even larger drawing in more than 80,000 people each year.1 Despite ticket prices rising faster than inflation, they are still snapped
up in hours on availability. The better-known events charge upwards of $285 per head - or even higher on the grey market and auction sites.
In terms of live music revenues globally, ticket sales are expected to be the biggest chunk at 78%, and e sponsorships are 22% by 2018. Ticket sales, unlike streaming subscriptions or a downloadable singles, can run into hundreds of dollars for the big bands, major tours or artists ‘hot’ on the charts. On the whole, driven by growth from live events the music industry is expected to grow at a CAGR of 0.2% (2010 to 2018) to touch a value of $47 billion. Other revenues to promoters are sponsorship, OOH advertising, food and beverage sales, merchandising, camping fees, parking and others2.
In a by-gone world, artists would get 10% of the net profit from recorded music, but can now command up to 90% of gross ticket receipts, sell merchandise, special fan engagements and more to peddle their brand. Singer Taylor Swift’s 2015 revenues from her ‘1989’ tour (the album’s name) raked in $86 million. Ed Sheeran, the English singer, sold out 162,208 tickets for a two-day event, raking in $11.5 million3.
85
Global Live Music Revenues
(2014 – 2018, USD Mn)
77%
23%
2014
78%
2018
Ticket Sales +3%
+2%Sponsorship
CAGR
22%
26,548
29,384
Exhibit 3
861. Business Insider2. Marie Claire 3. Billboard
More than Music
As noted earlier, the low-margins on digital/recorded sales have pushed the music industry and artists alike to newer pastures. The future of money in music lies in selling ‘the experience’ to the fans – not just a ticket or song.
As an example, merchandising, where artists create a custom-range of shoes, t-shirts, caps etc. take a percentage of revenue sales and an additional ‘licensing fee’ to the apparel maker for lending their name. Rita Ora, with only one album to her credit, is already working with Adidas, Rimmel for her range of sports apparel, nail varnish and cosmetics. Some artists are even creating their own clothing lines such as rapper Kanye West, with others selling bottled water. Smelling like the artist, literally, is another big aspect - Taylor Swift has three perfumes to her name and reportedly made $17 per head in merchandise sales on her Red Tour concert. Beyonce' or Queen Bey as she’s known by her fans made $15 million from her fashion line - House of Deréon.
Private performances at birthday parties, weddings, product launches, sitting in the front row of a fashion show, inaugurating a new store keeps their cash register ringing - in between concerts. Indian billionaire Lakshmi Mittal reportedly paid Kylie Minogue $450,000 to belt out a few songs at his daughter’s wedding. Jay-Z and Beyoncé charge $1.4 million to their clients for an appearance as a couple. The fees start at $3,400 for lesser known names and goes up to hundreds and thousands of dollars just to show up1.
Artists are also licensing their music catalogue for ads, movies, games and anywhere it can be heard. Aerosmith reportedly earned more money from the hit video game Guitar Hero - than any of their albums, concerts, or merchandise2. Product endorsements are an additional source of revenue. Beyonce' made $20 million by lending her likeness to Armani, Nintendo, and the L’Oréal brands3. Endorsements, be it tweeting to their millions of fans, sharing a photo (of a product) on Instagram are other earners. In short, especially the big artists, are making money even when they are not singing.
Musical Entrepreneurs
Record Labels held sway for most of part of the music industry's history - from the creation (spotting and nurturing the talent) , recording their songs, loaning them
money, bearing the manufacturing costs of the CD - in short, they handled all aspects of the artist’s persona . To make of their talent roster, record labels also spent high on marketing. However, the artist’s success was the record label’s success but not necessarily the other way round due to archaic royalty models that were skewed.
This fork is due to disgruntlement with traditional record labels and even newer players. Artists are also increasingly unhappvy with streaming services, which they believe are giving a raw deal - case in point, an ongoing $200 million lawsuit by an artist against Spotify. All these have led to creation of new services in digital itself such as Tidal – an artist-owned streaming service.
Digitisation is disintermediating the artist from record labels giving them new options to go directly to their fans. Even record labels, who controlled the ecosystem of listeners and artists are disappearing. Digital is giving artists a new outlet and a choice (to work or not work with the record labels) and to some extent taking over roles historically done by record labels. Many newer artists no longer see a record deal as an integral part of their success and turning to guerilla marketing, social media, online video sites to connect with super fans, doing private ticket sales, selling merchandise, teaching guitar lessons and jamming sessions via live-streaming to monetise their fan base.
Recent discoveries are different from the traditional scouting. Justin Bieber was discovered on YouTube, and Jennifer Hudson was discovered in TV music contest. Upcoming artists ‘waiting to be discovered’ are increasingly going digital to manage their destiny as musical entrepreneurs. This new-found confidence to go alone is due to availability of inexpensive recording hardware that makes quality music (without a studio), distribution on platforms like YouTube and sites like Pandora, Spotify and others. Artists are also turning to the crowds i.e. prospective fans for support. Patreon, a crowdfunding platform, allows patrons to pledge money to support a band or artist and get exclusive or first access to their work, private sessions with the band and other bonus items.
This disintermediation is not restricted to smaller artists who don’t have much choice to start with - it’s also happening with established artists. Radiohead, the popular UK alternative music band left their record label EMI in 2005 and released albums directly and continues to do so.
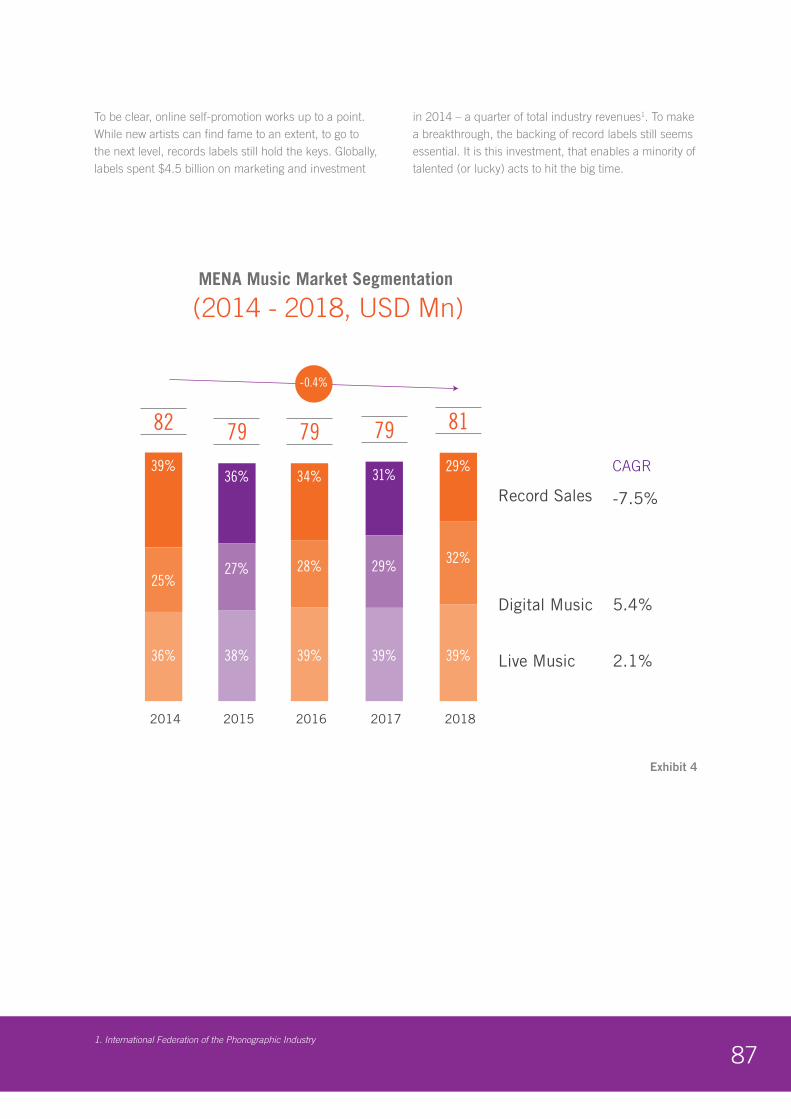
871. International Federation of the Phonographic Industry
To be clear, online self-promotion works up to a point. While new artists can find fame to an extent, to go to the next level, records labels still hold the keys. Globally, labels spent $4.5 billion on marketing and investment
in 2014 – a quarter of total industry revenues1. To make a breakthrough, the backing of record labels still seems essential. It is this investment, that enables a minority of talented (or lucky) acts to hit the big time.
Exhibit 4
87
MENA Music Market Segmentation
(2014 - 2018, USD Mn)
7982
36%
39%
2014
38%
36%
2015
79
39%
34%
2016
79
39%
31%
2017
81
39%
29%
32%29%28%27%25%
2018
-0.4%
Record Sales -7.5%
5.4%Digital Music
2.1%Live Music
CAGR

88
Music in the MENA
The industry pattern in the region is similar to that of global markets. In MENA, overall sales are expected to decrease while digital and live music revenues increase. This increase is however not enough to make up for the overall decrease in physical record sales. In the region, piracy remains a challenge, despite efforts by governments and record labels to curb it.
In digital distribution, streaming is a growing but still not lucrative business for artists. Record Sales are minimal in the region, as like the rest of the industry (globally)
regional artists no longer produce physical records to make profit, but more for its prestige and as novelty. In MENA, more than 50% of record label revenues are via digital channels driven by the growth of streaming services. In the absence of established services such as Spotify, others are taking their place. Apple Music is now available in 113 countries - including most parts of the MENA except Kuwait, and Qatar1 - this could change as Apple expands its reach and Spotify and others enters the region. There are also regional players that have emerged (see the digital for more ) focusing on regional Arabic music, local artists, indie bands to serve a niche.
Exhibit 5
88
Live Music Contribution to the music industry
(2018, %)
40%
Local
62%
Global
Live Music
-35%
1. ITP
89
While digital music is increasing, a key difference between MENA vs. rest of the world is the limited share of live music as a revenue stream - this is evident in Exhibit 5 above. Globally, live events have registered higher contributions than in the region. This low regional contribution is due to limited scale venues and lower attendance by volume of ticket sales.
Live music performances need large purpose-built venues to accommodate tens and thousands of fans. They also demand extensive logistics, high-security, special equipment and government permissions. Globally recognised bands and super-star musicians don’t necessarily prefer to perform at smaller venues due to the impact on their brand, low visibility, availability of dates with limited earnings, which don't make it commercially viable for them. The larger venues, such as stadiums and large auditoriums that exist are expensive to lease, requiring much more ticket sales for which the fan numbers don’t exist or add up. Traditionally, the region had live performances restricted to private concerts. That started changing with the UAE and its large expatriate base with an appetite for Western music. Today the Emirate hosts over 90% of the region’s overall concerts with few big artists coming each year.
The fact that the UAE is a sole venue creates a different challenge for viability. Typically, artists are signed
for a tour that covers multiple cities and countries - hence their costs are defrayed over a wider audience base making it profitable. In the region, a one-city performance (typically Dubai or Abu Dhabi) makes many performances non-viable or increases ticket prices, which puts off prospective fans.
This disparity is evident in the share of revenues in MENA. As per industry estimates, more than 50% of record label revenues are from digital distribution alone and the other 45% come from diverse sources. These sources include value-added service revenues from mobile operators and music rights to radio and TV. Such revenue streams are largely owned by labels such as Rotana, who have a rich music library that they license. Other lines like merchandising are limited due to counterfeiting and licensing models that are still evolving.
In the MENA, artists make most of their revenue from private parties, weddings, and public events. Artists, like their global peers work with talent management agencies to skip the logistics and financial negotiations. Endorsement fees from regional or international brands who perceive MENA as major market is increasing. For instance, performers like George Karadahi have their own perfume line; presenter Alissa or singer Nancy Ajram endorses products, make celebrity appearances on TV contests, award ceremonies as anchors or participants.

90
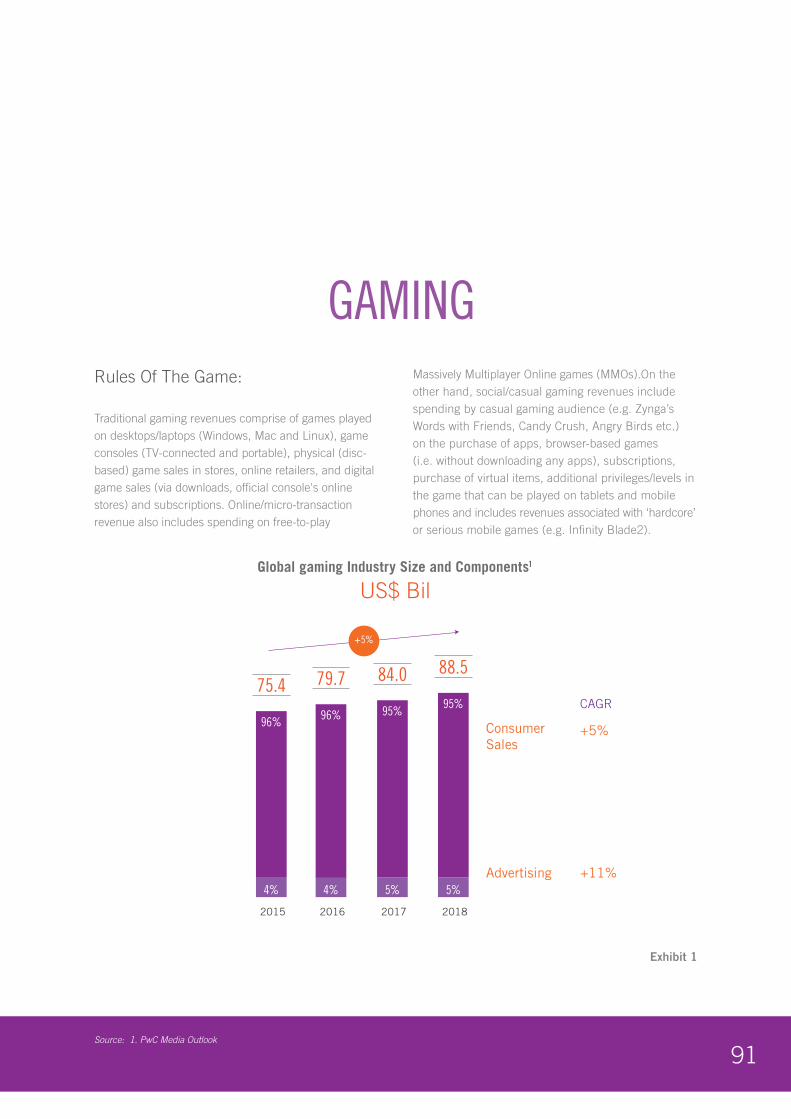
91Source: 1. PwC Media Outlook
Rules Of The Game:
Traditional gaming revenues comprise of games played on desktops/laptops (Windows, Mac and Linux), game consoles (TV-connected and portable), physical (disc-based) game sales in stores, online retailers, and digital game sales (via downloads, official console's online stores) and subscriptions. Online/micro-transaction revenue also includes spending on free-to-play
Massively Multiplayer Online games (MMOs).On the other hand, social/casual gaming revenues include spending by casual gaming audience (e.g. Zynga’s Words with Friends, Candy Crush, Angry Birds etc.) on the purchase of apps, browser-based games (i.e. without downloading any apps), subscriptions, purchase of virtual items, additional privileges/levels in the game that can be played on tablets and mobile phones and includes revenues associated with ‘hardcore’ or serious mobile games (e.g. Infinity Blade2).
Exhibit 1
GAMING
91
Global gaming Industry Size and Components1
US$ Bil
75.4
4%
96%
2015
79.7
4%
96%
2016
84.0
5%
95%
2017
88.5
5%
95%
2018
+5%
ConsumerSales
+5%
+11%Advertising
CAGR
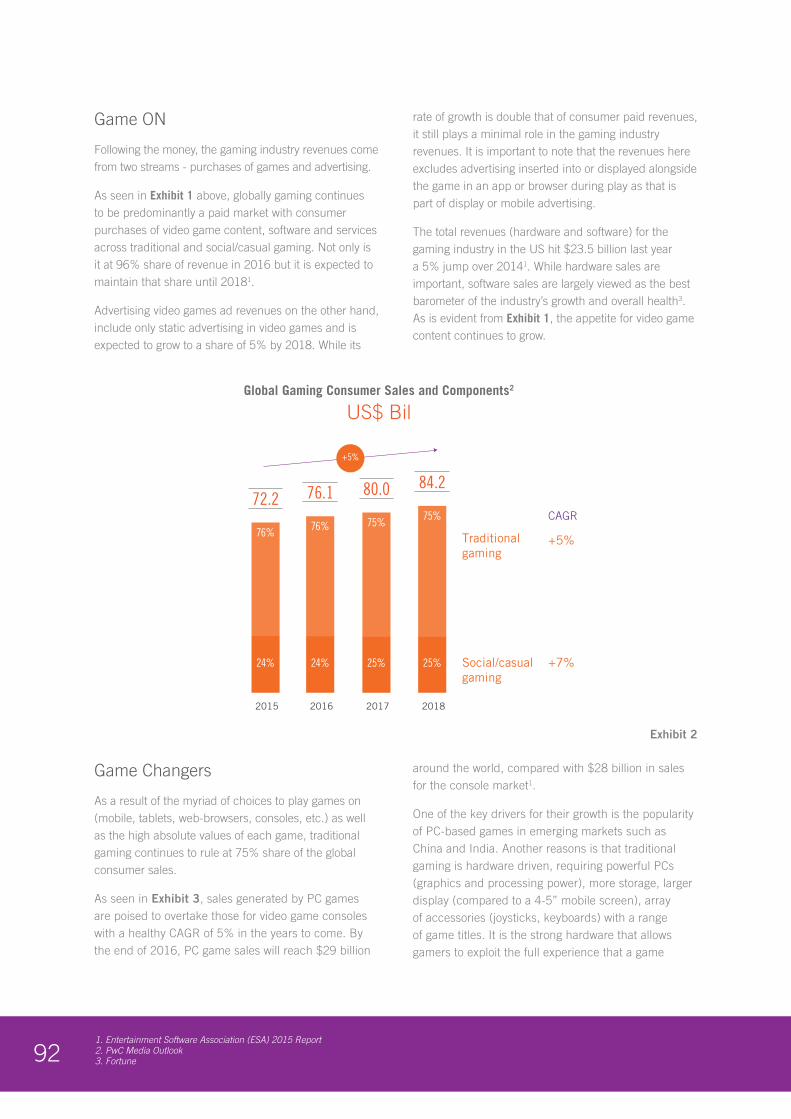
921. Entertainment Software Association (ESA) 2015 Report 2. PwC Media Outlook 3. Fortune
Exhibit 2
Game ON
Following the money, the gaming industry revenues come from two streams - purchases of games and advertising.
As seen in Exhibit 1 above, globally gaming continues to be predominantly a paid market with consumer purchases of video game content, software and services across traditional and social/casual gaming. Not only is it at 96% share of revenue in 2016 but it is expected to maintain that share until 20181.
Advertising video games ad revenues on the other hand, include only static advertising in video games and is expected to grow to a share of 5% by 2018. While its
rate of growth is double that of consumer paid revenues, it still plays a minimal role in the gaming industry revenues. It is important to note that the revenues here excludes advertising inserted into or displayed alongside the game in an app or browser during play as that is part of display or mobile advertising.
The total revenues (hardware and software) for the gaming industry in the US hit $23.5 billion last year a 5% jump over 2014 1. While hardware sales are important, software sales are largely viewed as the best barometer of the industry’s growth and overall health3. As is evident from Exhibit 1, the appetite for video game content continues to grow.
Game Changers
As a result of the myriad of choices to play games on (mobile, tablets, web-browsers, consoles, etc.) as well as the high absolute values of each game, traditional gaming continues to rule at 75% share of the global consumer sales.
As seen in Exhibit 3, sales generated by PC games are poised to overtake those for video game consoles with a healthy CAGR of 5% in the years to come. By the end of 2016, PC game sales will reach $29 billion
around the world, compared with $28 billion in sales for the console market1.
One of the key drivers for their growth is the popularity of PC-based games in emerging markets such as China and India. Another reasons is that traditional gaming is hardware driven, requiring powerful PCs (graphics and processing power), more storage, larger display (compared to a 4-5” mobile screen), array of accessories (joysticks, keyboards) with a range of game titles. It is the strong hardware that allows gamers to exploit the full experience that a game
92
Global Gaming Consumer Sales and Components2
US$ Bil
72.2
24%
76%
2015
76.1
24%
76%
2016
80.0
25%
75%
2017
84.2
25%
75%
2018
+5%
Traditionalgaming
+5%
+7%Social/casualgaming
CAGR
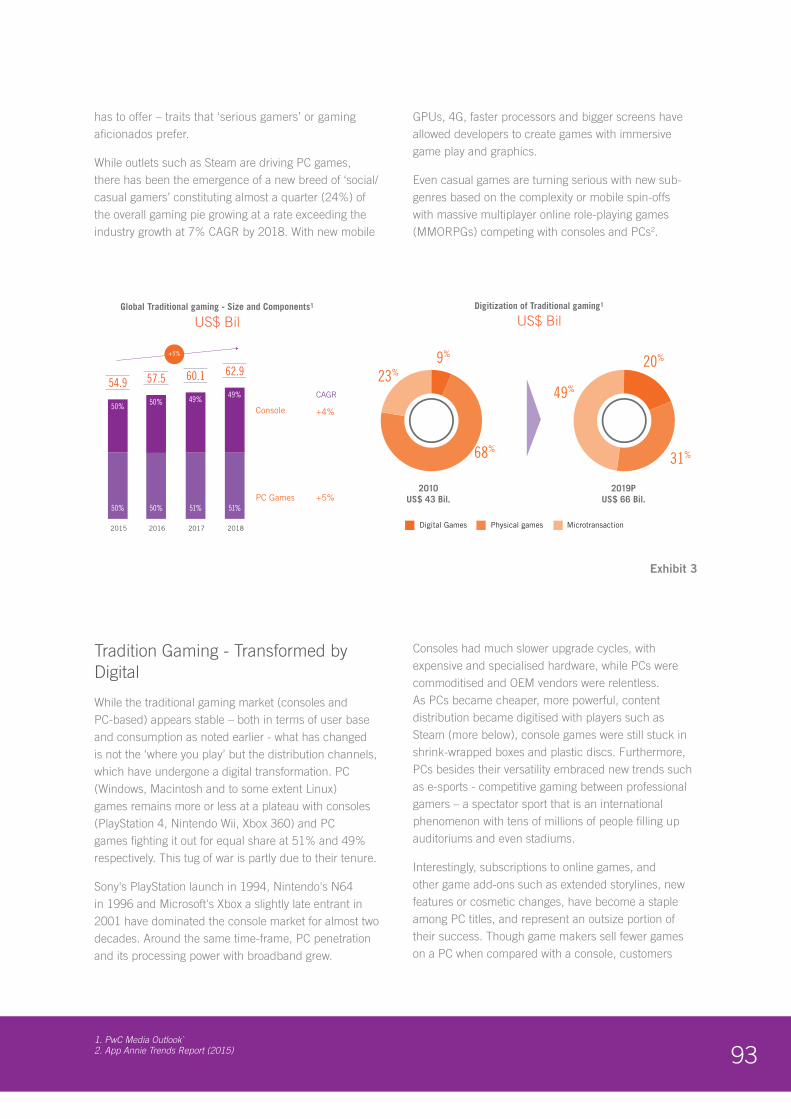
931. PwC Media Outlook` 2. App Annie Trends Report (2015)
has to offer – traits that ‘serious gamers’ or gaming aficionados prefer.
While outlets such as Steam are driving PC games, there has been the emergence of a new breed of ‘social/casual gamers’ constituting almost a quarter (24%) of the overall gaming pie growing at a rate exceeding the industry growth at 7% CAGR by 2018. With new mobile
GPUs, 4G, faster processors and bigger screens have allowed developers to create games with immersive game play and graphics.
Even casual games are turning serious with new sub-genres based on the complexity or mobile spin-offs with massive multiplayer online role-playing games (MMORPGs) competing with consoles and PCs2.
Tradition Gaming - Transformed by Digital
While the traditional gaming market (consoles and PC-based) appears stable – both in terms of user base and consumption as noted earlier - what has changed is not the ‘where you play’ but the distribution channels, which have undergone a digital transformation. PC (Windows, Macintosh and to some extent Linux) games remains more or less at a plateau with consoles (PlayStation 4, Nintendo Wii, Xbox 360) and PC games fighting it out for equal share at 51% and 49% respectively. This tug of war is partly due to their tenure.
Sony's PlayStation launch in 1994, Nintendo's N64 in 1996 and Microsoft's Xbox a slightly late entrant in 2001 have dominated the console market for almost two decades. Around the same time-frame, PC penetration and its processing power with broadband grew.
Consoles had much slower upgrade cycles, with expensive and specialised hardware, while PCs were commoditised and OEM vendors were relentless. As PCs became cheaper, more powerful, content distribution became digitised with players such as Steam (more below), console games were still stuck in shrink-wrapped boxes and plastic discs. Furthermore, PCs besides their versatility embraced new trends such as e-sports - competitive gaming between professional gamers – a spectator sport that is an international phenomenon with tens of millions of people filling up auditoriums and even stadiums.
Interestingly, subscriptions to online games, and other game add-ons such as extended storylines, new features or cosmetic changes, have become a staple among PC titles, and represent an outsize portion of their success. Though game makers sell fewer games on a PC when compared with a console, customers
93
Global Traditional gaming - Size and Components1
US$ Bil
Digitization of Traditional gaming1
US$ Bil
54.9
50%
50%
2015
57.5
50%
50%
2016
60.1
51%
49%
2017
62.9
51%
49%
2018
+5%
Console +4%
+5%PC Games
CAGR
Digital Games MicrotransactionPhysical games
20%
49%
31%
2010US$ 43 Bil.
2019PUS$ 66 Bil.
23%
68%
9%
Exhibit 3
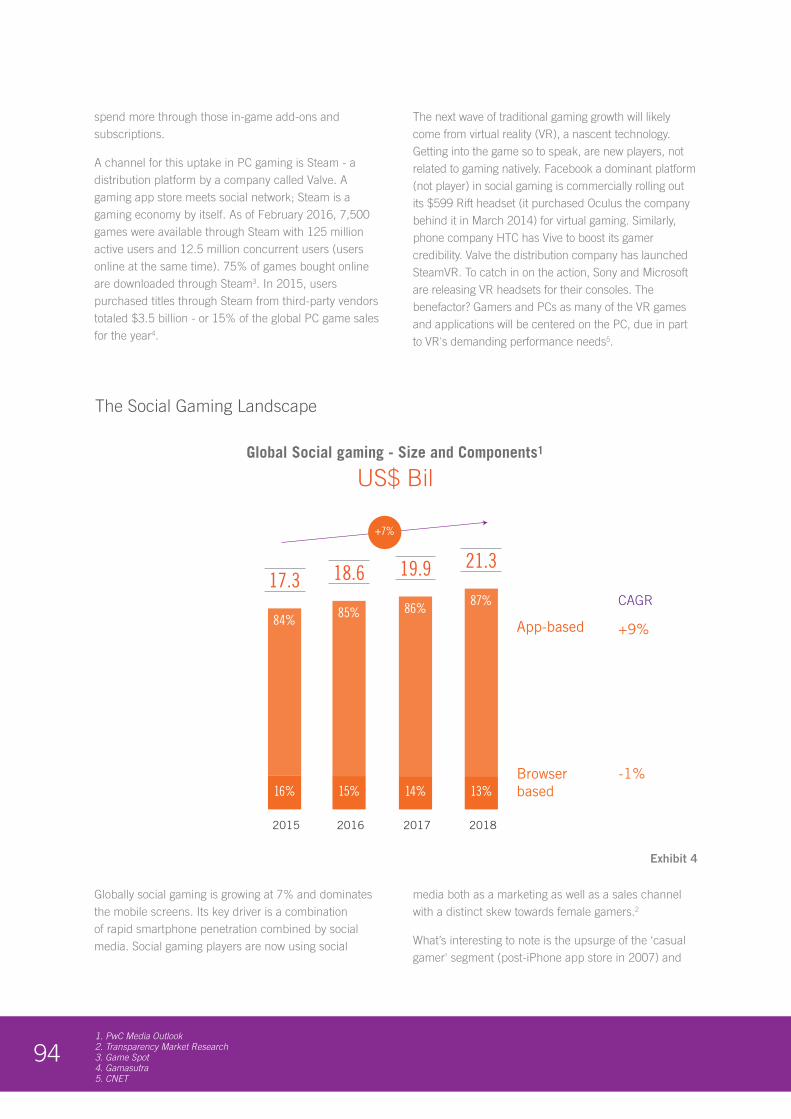
941. PwC Media Outlook 2. Transparency Market Research3. Game Spot 4. Gamasutra 5. CNET
spend more through those in-game add-ons and subscriptions.
A channel for this uptake in PC gaming is Steam - a distribution platform by a company called Valve. A gaming app store meets social network; Steam is a gaming economy by itself. As of February 2016, 7,500 games were available through Steam with 125 million active users and 12.5 million concurrent users (users online at the same time). 75% of games bought online are downloaded through Steam3. In 2015, users purchased titles through Steam from third-party vendors totaled $3.5 billion - or 15% of the global PC game sales for the year4.
The next wave of traditional gaming growth will likely come from virtual reality (VR), a nascent technology. Getting into the game so to speak, are new players, not related to gaming natively. Facebook a dominant platform (not player) in social gaming is commercially rolling out its $599 Rift headset (it purchased Oculus the company behind it in March 2014) for virtual gaming. Similarly, phone company HTC has Vive to boost its gamer credibility. Valve the distribution company has launched SteamVR. To catch in on the action, Sony and Microsoft are releasing VR headsets for their consoles. The benefactor? Gamers and PCs as many of the VR games and applications will be centered on the PC, due in part to VR's demanding performance needs5.
Globally social gaming is growing at 7% and dominates the mobile screens. Its key driver is a combination of rapid smartphone penetration combined by social media. Social gaming players are now using social
media both as a marketing as well as a sales channel with a distinct skew towards female gamers.2
What’s interesting to note is the upsurge of the ‘casual gamer' segment (post-iPhone app store in 2007) and
94
Global Social gaming - Size and Components1
US$ Bil
17.3
16%
84%
2015
18.6
15%
85%
2016
19.9
14%
86%
2017
21.3
13%
87%
2018
+7%
App-based +9%
-1%Browserbased
CAGR
Exhibit 4
The Social Gaming Landscape
951. App Annie 2015 Global Analytics2. Ovum Research 3. The Arab Advisors Group
4. Expert Interviews5. Game Expo Dubai
mobile broadband - and it continues to clip faster than traditional gaming, although the latter remains strong. As opposed to serious gamers, casual gamers typically ‘snack’ - from playing a quick word game with friends, slinging birds on a catapult, solving simple puzzles to while their time or distract themselves. Aimed at the masses, such games are the most downloaded and also the biggest revenue category in the world of apps, accounting for a 90% of Google Play and 75% of Apple’s iOS App Store revenues respectively1.
Social/casual games monetisation is driven via the purchase of the game app to skip the ads, via subscription services or buying virtual items within the app itself (in-app purchases). These include both casual gamers as well as “hardcore” mobile games like Infinity Blade1.
One such casual puzzle game, Candy Crush Saga started its journey in a browser. In three short years, and an IPO later, this seemingly simple yet addictive game moved to the smartphone with players spending $1.33 billion on in-app purchases in 2014 alone. Seeing its success, traditional gaming publisher Activision Blizzard acquired them for $5.9 billion in February 2016 to diversify to a new kind of gamers.
Youth and Infrastructure power Gaming
Of the countries in MENA covered in this report, almost half the population (of 360 million) is younger than 20 years of age. Coupled with the demographic dividend, the region particularly the Gulf countries boast of robust infrastructure and high smart phone penetration. The latter is expected to be higher than 150% by 20182. Even markets like Egypt with over 80 million population are expected to reach almost 30% smartphone penetration by then.
It’s obvious, that the number of mobile gamers has grown substantially due to the above factors. In 2015, in a survey more than 66% of internet users in KSA played games; in Jordan 47% spend between one and three hours a day and 71% of Egyptians spend between one and three hours.3 According to another report by Northwestern University in Qatar and the Doha Film Institute, about two-thirds (63%) in the UAE, closer to three in ten (33%) in Qatar, four in ten in Lebanon, and a quarter in Tunisia play video games. The findings
cut across the whole gamut of games - social, mobile, internet, console across devices, and shows gaming as a form of entertainment has come main-stream, independent of the country.
The numbers are clearly adding up with MENA's gaming revenues expected to be at $1 billion by 20183. Relatively small at 1% of the global video games market, pegged to be worth $93 billion by 2019, it is nevertheless, growing at a faster pace than the rest of the world.
What’s driving this growth? Social and casual gaming with a CAGR of 15% is growing at double the global rate, while traditional gaming remains a key value contributor. Social gaming is the preferred development game type with 90% of the developers in the region focused on the social, browser and mobile space2 due to the low development costs, shorter timelines to ship a game and less censorship.4
It's important note, social games are not changing the status quo of other platforms. PC gaming is more mature than ever and coming together as an ecosystem. Now in its 8th edition, the Dubai World Game Expo (DWGE) has become a mojor industry event for interactive entertainmet developers, publishers, distributors, payment providers, telcos, investors, and retailers in the MENA region attracting 80 companies from over 50 countries and 3000 visitors in 2015.5
Local Content
Most games are generic made for a global audience and lack a regional focus or audience in mind. Addressing this gap, and to tap into the opportunity, there has been a growth of Arabisation i.e. local game content developed from inception based on the culture of the region, with characters that Arab players can relate to and play with friends creating a new kind of social gaming experiences.
Kuwait’s The 99, as an example, is a popular Muslim super-hero comic book series that has expanded into gaming. Digital renditions of the classic board, card, and tabletop games are being adapted as apps and on game portals such as Kammelna, Koutbo6 and Jawaker. Kammelna was recently aquired by Peak Games (see Case study later), a testament to the importance of local content in gaming.
961. The National 2. Forbes 3. AdWeek4. Venture Beat
Such content development has taken a two-pronged approach – those who prefer to develop their games, tailored from the region's tapestry, while others prefer to localise or even clone international games. Localising has proved successful for some games, as the content does not contradict the region's norms or traditions.1
Monetisation: Pay to Play
Unlike the gamers, who can play or buy their way to the next level with relative ease, gaming companies are seeing monetisation challenges to go to the next level. In the casual multiplayer online gaming space, the majority are card games. The majority of gamers spend time downloading free-to-play games [apps] but start paying, via in-app purchases, once they are immersed in the game. Only a small portion users pay in any freemium model. Globally, smartphone users pay up to $26 on apps per month - although gaming is the most popular category, pay-to-play offerings are still quite under-used in the sector.
In Egypt, 30% of internet users are regular online gamers, but just 5% pay for them. In the UAE, 17% of those who play games online pay to do so. In such a situation, gaming companies must either have a large base of players (in the millions) to become sustainable or rely on alternate monetisation models with captive players.1
It’s worth pointing out, KSA is an exception – that’s bucking the trend in terms of gender, purchases, the games itself, localised or not and operating in its own gaming economy. A whopping 42% of total Saudi gamers pay for in-app purchases. Two-thirds pay less than $10 per month - the norm; 22% pay $10 to $50 and 11% pay $50 to $100 per month while 4% pay $100 to $500. And a 1% pay a record $1000 per month1. What more, over half (51%) are female gamers who play several times a day and 10% for at least three hours4. The Saudis spent $350 million in 2015 on mobile games1 ranking it at number 27 in the world in terms of game revenues.
As evident by the success of gaming platforms such as Tencent in China, there has been an evolution of monetisation models. From working with third-party apps for revenue sharing, subscriptions, micro-payments, virtual items (to buy avatars, gifts, privileges, extra levels, etc.), premium memberships, tournament
entry fees, in-game product placement, rewards-based marketing, and white labeling gaming companies are pulling all the stops.
It’s not just in the virtual world; that game monetisation is happening. It’s also happening in movie/TV show tie-ins, destinations, merchandising, licensing and retail experience as well. Hub Zero, by the Dubai Parks & Resorts, based on iconic video games such as Street Fighter, Metal Gear Solid and Final Fantasy is planned to open in the near future. The company behind the project, Meraas Holding, is working with major game developers including Capcom, Konami, Square Enix and Electronic Arts to feature 18 attractions, and a section for e-sports. Billed as the world’s the first indoor video game theme park - Hub Zero could add a few more points to gamers and the industry alike.
The Players Behind the Players
There has also been an uptake of regional game developers, catering to local audience fueled by social/mobile gaming2. Peak Games, for example, founded in November 2010, has become the world’s third-largest social gaming player and a key player regionally. With regional offices and game studios in Istanbul and Ankara in Turkey, Amman, Dammam and Abu Dhabi it pulls in more than 30 million monthly active users (9 million of them play daily) from 150+ countries with 275 million users in total who have installed their games over the years.
In-app purchases generate 95% of Peak’s revenues, and ads 5% - more than half of its revenues come from mobile. In ad revenues alone, they run 175 different marketing campaigns every day. Peak Games has over 100 employees engaged in game creation. Distribution and business development of its titles such as Okey Plus and 101 Plus, which are consistently in top-grossing lists. To expand into the most lucrative market, KSA, Peak bought Kammelna Games for their Baloot game3 as Saudi Arabia sees the highest average revenue per user (ARPU) by region4.
Similarly, Jawaker is a multi-player social card gaming network - hosting Middle Eastern card games including Tarneeb, Trix, Hand, Baloot, and Estimation it serves out games to hundreds and thousands of users every month. Jordan has also emerged as one of the hot spots for gaming content development for multiplayer portals
971. The National 2. IDG Connect
such as Tarneeb (card game), Fuzztak (table game) and Happy Oasis (farm game).
Global players are taking notice. Ubisoft, which set up shop in Abu Dhabi in 2012 to cater to the region today employs 60 people in its UAE studio and created CSI Hidden Crimes (based on the hit TV show) amongst others. Since its launch in May 2014, the game has racked up 30 million downloads, making it one of the most successful mobile apps produced in the Arab world.1
Gaming Challenges
gaming continues to be challenged on a couple of fronts, thus limiting its growth potential.The lack of trained talent and facilities for game production remains by far the region's biggest challenge. Gaming as an industry requires a mix of creativity and technical talent at scale and in the proximity of large consuming markets. In the region, these three sub-criteria are highly dispersed and have not thrived in the proximity of each other. Markets like Jordan are taking initiatives with the Gaming Lab funded by the King Abdullah II Fund for Development. However, wide imbalances in salaries have resulted in talent migration of from Jordan to well-paying markets like the GCC.
Gaming is very similar to movie production in both its gestation cycle between creation and monetisation,
we well as blockbuster production model. The latter referring to portfolio managing success rather than depending on one title to succeed. As a result of both these reasons, investments are a key element of keeping the sector vibrant. While the investments into local gaming firms is growing, but the funds remain limited to grow into an industrial scale. There is obviously no shortage of capital in the region, but many investors remain reluctant to invest in technology and prefer tangible sectors such as real estate, or traditional energy, trading, retail or the financial markets. Governments are stepping in a small way, by investing in local gaming companies. Twofour54 has till date invested in 13 early stage such as Tahadi Games, Falafel Games, Jawaker in a few short years. Also lack of market data limits the entry of larger VC firms to ascertain the true market potential.
Finally, the region continues to face some consumer-led challenges such as limited credit card penetration, safety concerns, users content playing with free games, piracy as high as 59% of sales as per some sources2. The lack of standardised content regulation makes it also a challenge to ensure that the content adheres to the region’s cultural and social values and has calibrates with the differences in what is culturally permissible in each country.

98
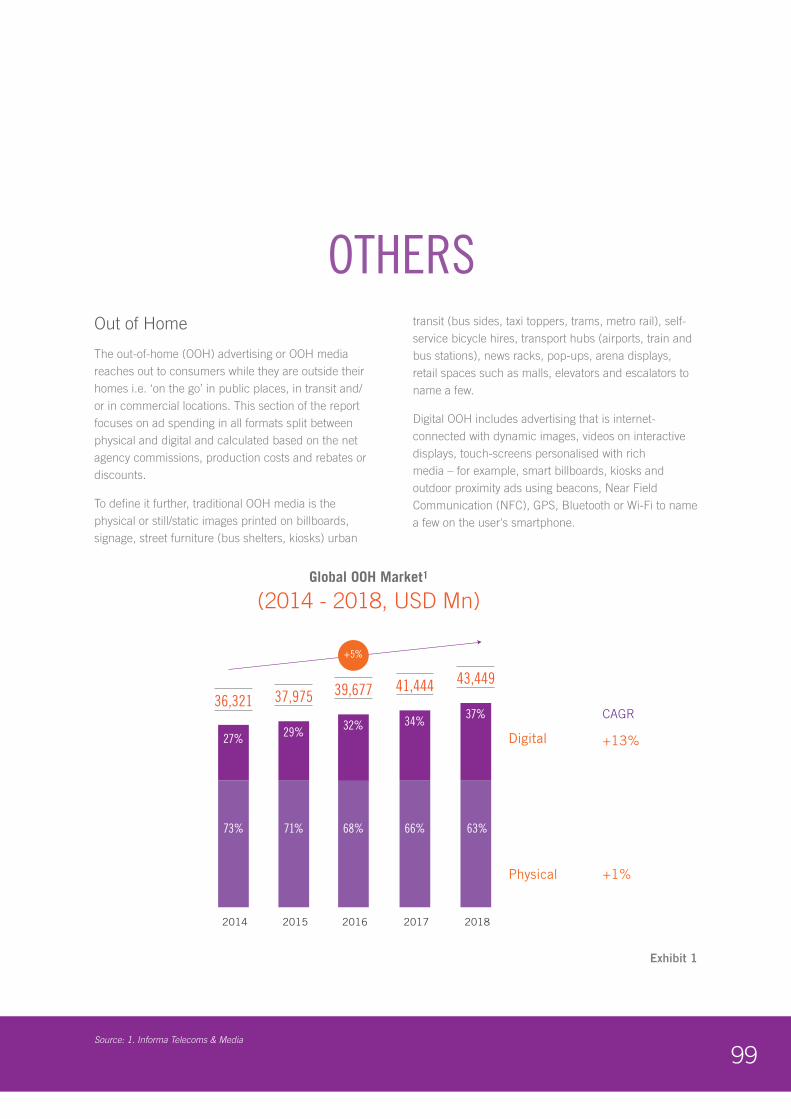
99Source: 1. Informa Telecoms & Media
Out of Home
The out-of-home (OOH) advertising or OOH media reaches out to consumers while they are outside their homes i.e. ‘on the go’ in public places, in transit and/or in commercial locations. This section of the report focuses on ad spending in all formats split between physical and digital and calculated based on the net agency commissions, production costs and rebates or discounts.
To define it further, traditional OOH media is the physical or still/static images printed on billboards, signage, street furniture (bus shelters, kiosks) urban
transit (bus sides, taxi toppers, trams, metro rail), self-service bicycle hires, transport hubs (airports, train and bus stations), news racks, pop-ups, arena displays, retail spaces such as malls, elevators and escalators to name a few.
Digital OOH includes advertising that is internet-connected with dynamic images, videos on interactive displays, touch-screens personalised with rich media – for example, smart billboards, kiosks and outdoor proximity ads using beacons, Near Field Communication (NFC), GPS, Bluetooth or Wi-Fi to name a few on the user's smartphone.
Exhibit 1
OTHERS
99
Global OOH Market1
(2014 - 2018, USD Mn)
37,97536,321
73%
27%
2014
71%
29%
2015
39,677
68%
32%
2016
41,444
66%
34%
2017
43,449
63%
37%
2018
+5%
Digital +13%
+1%Physical
CAGR
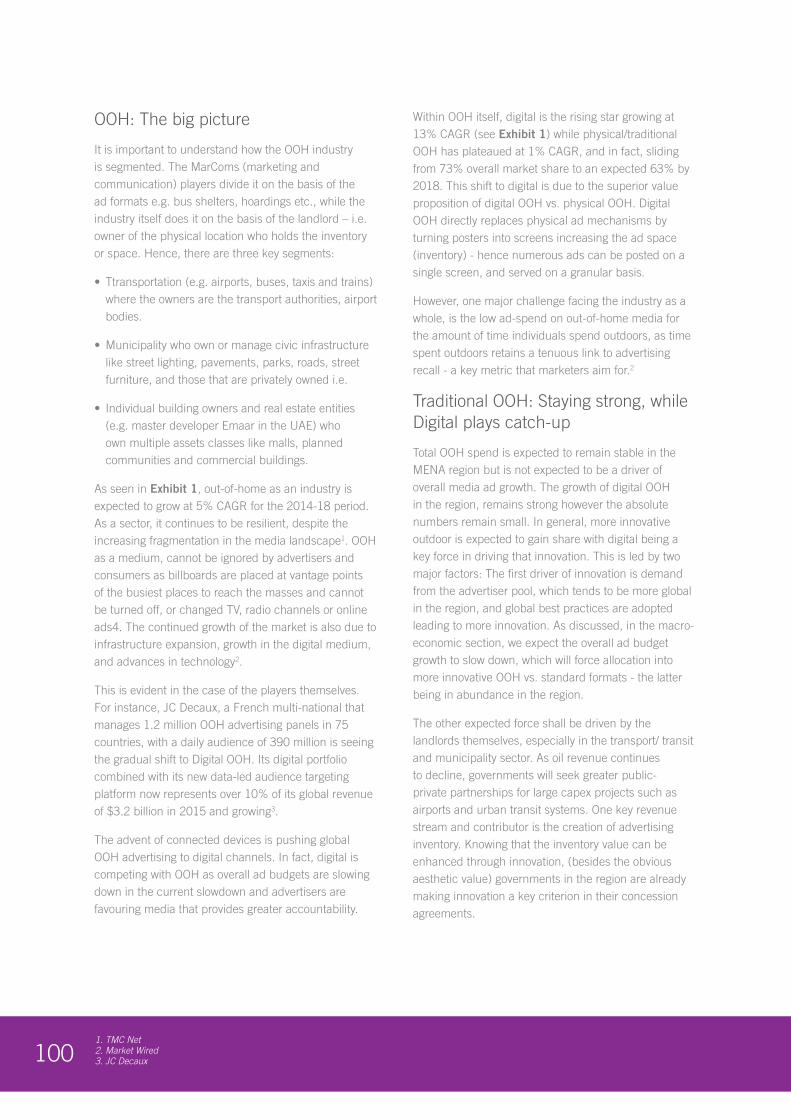
1001. TMC Net 2. Market Wired 3. JC Decaux
OOH: The big picture
It is important to understand how the OOH industry is segmented. The MarComs (marketing and communication) players divide it on the basis of the ad formats e.g. bus shelters, hoardings etc., while the industry itself does it on the basis of the landlord – i.e. owner of the physical location who holds the inventory or space. Hence, there are three key segments:
• Ttransportation (e.g. airports, buses, taxis and trains) where the owners are the transport authorities, airport bodies.
• Municipality who own or manage civic infrastructure like street lighting, pavements, parks, roads, street furniture, and those that are privately owned i.e.
• Individual building owners and real estate entities (e.g. master developer Emaar in the UAE) who own multiple assets classes like malls, planned communities and commercial buildings.
As seen in Exhibit 1, out-of-home as an industry is expected to grow at 5% CAGR for the 2014-18 period. As a sector, it continues to be resilient, despite the increasing fragmentation in the media landscape1. OOH as a medium, cannot be ignored by advertisers and consumers as billboards are placed at vantage points of the busiest places to reach the masses and cannot be turned off, or changed TV, radio channels or online ads4. The continued growth of the market is also due to infrastructure expansion, growth in the digital medium, and advances in technology2.
This is evident in the case of the players themselves. For instance, JC Decaux, a French multi-national that manages 1.2 million OOH advertising panels in 75 countries, with a daily audience of 390 million is seeing the gradual shift to Digital OOH. Its digital portfolio combined with its new data-led audience targeting platform now represents over 10% of its global revenue of $3.2 billion in 2015 and growing3.
The advent of connected devices is pushing global OOH advertising to digital channels. In fact, digital is competing with OOH as overall ad budgets are slowing down in the current slowdown and advertisers are favouring media that provides greater accountability.
Within OOH itself, digital is the rising star growing at 13% CAGR (see Exhibit 1) while physical/traditional OOH has plateaued at 1% CAGR, and in fact, sliding from 73% overall market share to an expected 63% by 2018. This shift to digital is due to the superior value proposition of digital OOH vs. physical OOH. Digital OOH directly replaces physical ad mechanisms by turning posters into screens increasing the ad space (inventory) - hence numerous ads can be posted on a single screen, and served on a granular basis.
However, one major challenge facing the industry as a whole, is the low ad-spend on out-of-home media for the amount of time individuals spend outdoors, as time spent outdoors retains a tenuous link to advertising recall - a key metric that marketers aim for.2
Traditional OOH: Staying strong, while Digital plays catch-up
Total OOH spend is expected to remain stable in the MENA region but is not expected to be a driver of overall media ad growth. The growth of digital OOH in the region, remains strong however the absolute numbers remain small. In general, more innovative outdoor is expected to gain share with digital being a key force in driving that innovation. This is led by two major factors: The first driver of innovation is demand from the advertiser pool, which tends to be more global in the region, and global best practices are adopted leading to more innovation. As discussed, in the macro-economic section, we expect the overall ad budget growth to slow down, which will force allocation into more innovative OOH vs. standard formats - the latter being in abundance in the region.
The other expected force shall be driven by the landlords themselves, especially in the transport/ transit and municipality sector. As oil revenue continues to decline, governments will seek greater public-private partnerships for large capex projects such as airports and urban transit systems. One key revenue stream and contributor is the creation of advertising inventory. Knowing that the inventory value can be enhanced through innovation, (besides the obvious aesthetic value) governments in the region are already making innovation a key criterion in their concession agreements.
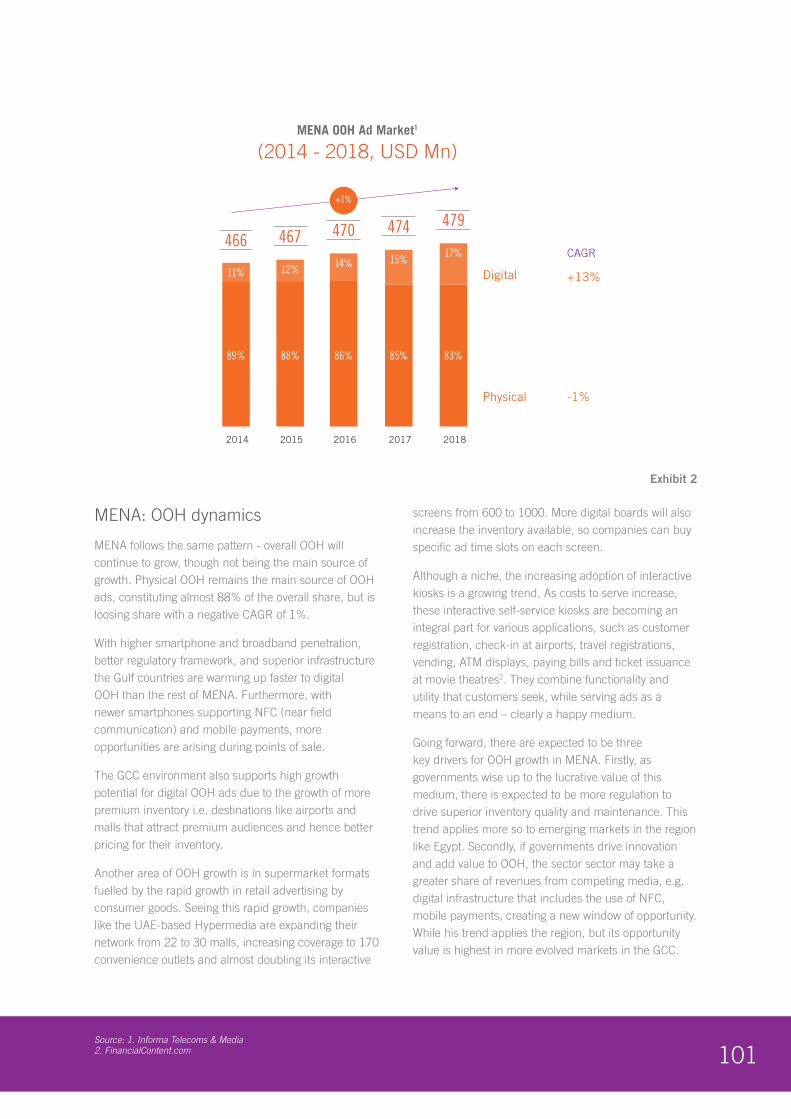
101Source: 1. Informa Telecoms & Media 2. FinancialContent.com
MENA: OOH dynamics
MENA follows the same pattern - overall OOH will continue to grow, though not being the main source of growth. Physical OOH remains the main source of OOH ads, constituting almost 88% of the overall share, but is loosing share with a negative CAGR of 1%.
With higher smartphone and broadband penetration, better regulatory framework, and superior infrastructure the Gulf countries are warming up faster to digital OOH than the rest of MENA. Furthermore, with newer smartphones supporting NFC (near field communication) and mobile payments, more opportunities are arising during points of sale.
The GCC environment also supports high growth potential for digital OOH ads due to the growth of more premium inventory i.e. destinations like airports and malls that attract premium audiences and hence better pricing for their inventory.
Another area of OOH growth is in supermarket formats fuelled by the rapid growth in retail advertising by consumer goods. Seeing this rapid growth, companies like the UAE-based Hypermedia are expanding their network from 22 to 30 malls, increasing coverage to 170 convenience outlets and almost doubling its interactive
screens from 600 to 1000. More digital boards will also increase the inventory available, so companies can buy specific ad time slots on each screen.
Although a niche, the increasing adoption of interactive kiosks is a growing trend. As costs to serve increase, these interactive self-service kiosks are becoming an integral part for various applications, such as customer registration, check-in at airports, travel registrations, vending, ATM displays, paying bills and ticket issuance at movie theatres2. They combine functionality and utility that customers seek, while serving ads as a means to an end – clearly a happy medium.
Going forward, there are expected to be three key drivers for OOH growth in MENA. Firstly, as governments wise up to the lucrative value of this medium, there is expected to be more regulation to drive superior inventory quality and maintenance. This trend applies more so to emerging markets in the region like Egypt. Secondly, if governments drive innovation and add value to OOH, the sector sector may take a greater share of revenues from competing media, e.g. digital infrastructure that includes the use of NFC, mobile payments, creating a new window of opportunity. While his trend applies the region, but its opportunity value is highest in more evolved markets in the GCC.
102
MENA OOH Ad Market1
(2014 - 2018, USD Mn)
467466
89%
11%
2014
88%
12%
2015
470
86%
14%
2016
474
85%
15%
2017
479
83%
17%
2018
+1%
Digital +13%
-1%Physical
CAGR
Exhibit 2
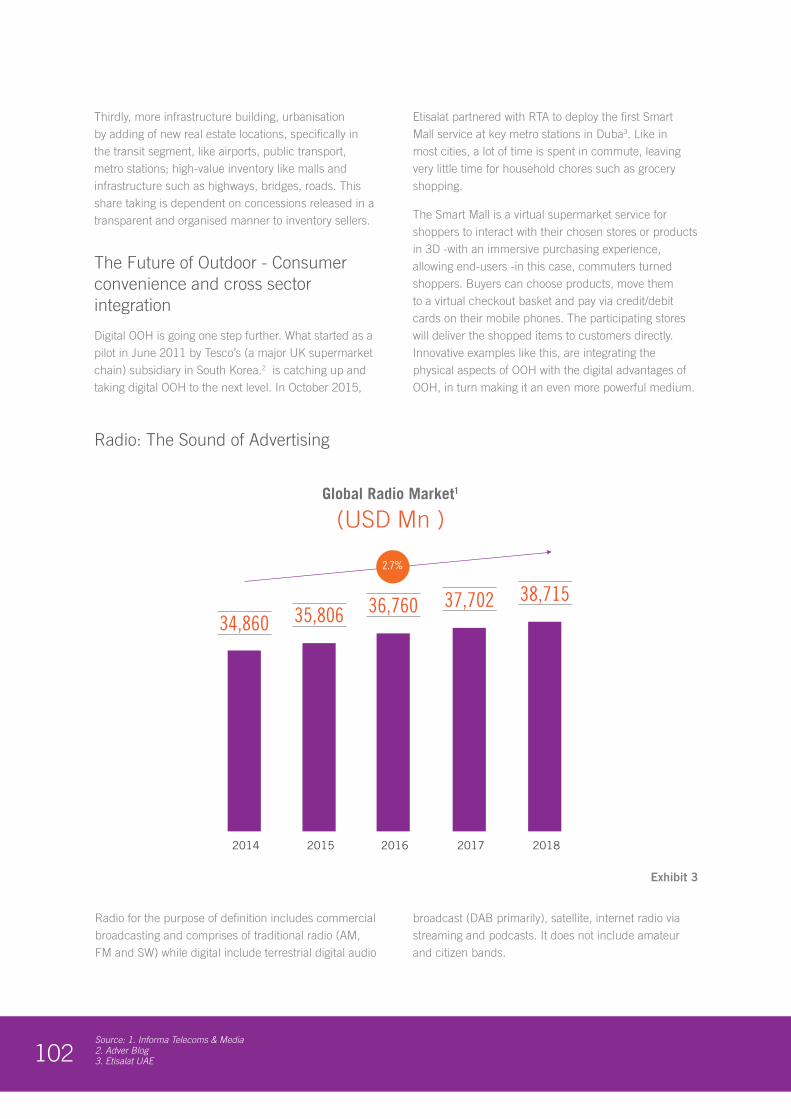
102Source: 1. Informa Telecoms & Media 2. Adver Blog 3. Etisalat UAE
Thirdly, more infrastructure building, urbanisation by adding of new real estate locations, specifically in the transit segment, like airports, public transport, metro stations; high-value inventory like malls and infrastructure such as highways, bridges, roads. This share taking is dependent on concessions released in a transparent and organised manner to inventory sellers.
The Future of Outdoor - Consumer convenience and cross sector integration
Digital OOH is going one step further. What started as a pilot in June 2011 by Tesco’s (a major UK supermarket chain) subsidiary in South Korea.2 is catching up and taking digital OOH to the next level. In October 2015,
Etisalat partnered with RTA to deploy the first Smart Mall service at key metro stations in Duba3. Like in most cities, a lot of time is spent in commute, leaving very little time for household chores such as grocery shopping.
The Smart Mall is a virtual supermarket service for shoppers to interact with their chosen stores or products in 3D -with an immersive purchasing experience, allowing end-users -in this case, commuters turned shoppers. Buyers can choose products, move them to a virtual checkout basket and pay via credit/debit cards on their mobile phones. The participating stores will deliver the shopped items to customers directly. Innovative examples like this, are integrating the physical aspects of OOH with the digital advantages of OOH, in turn making it an even more powerful medium.
Radio: The Sound of Advertising
103
Global Radio Market1
(USD Mn )
35,80634,860
2014 2015
36,760
2016
37,702
2017
38,715
2018
2.7%
Exhibit 3
Radio for the purpose of definition includes commercial broadcasting and comprises of traditional radio (AM, FM and SW) while digital include terrestrial digital audio
broadcast (DAB primarily), satellite, internet radio via streaming and podcasts. It does not include amateur and citizen bands.
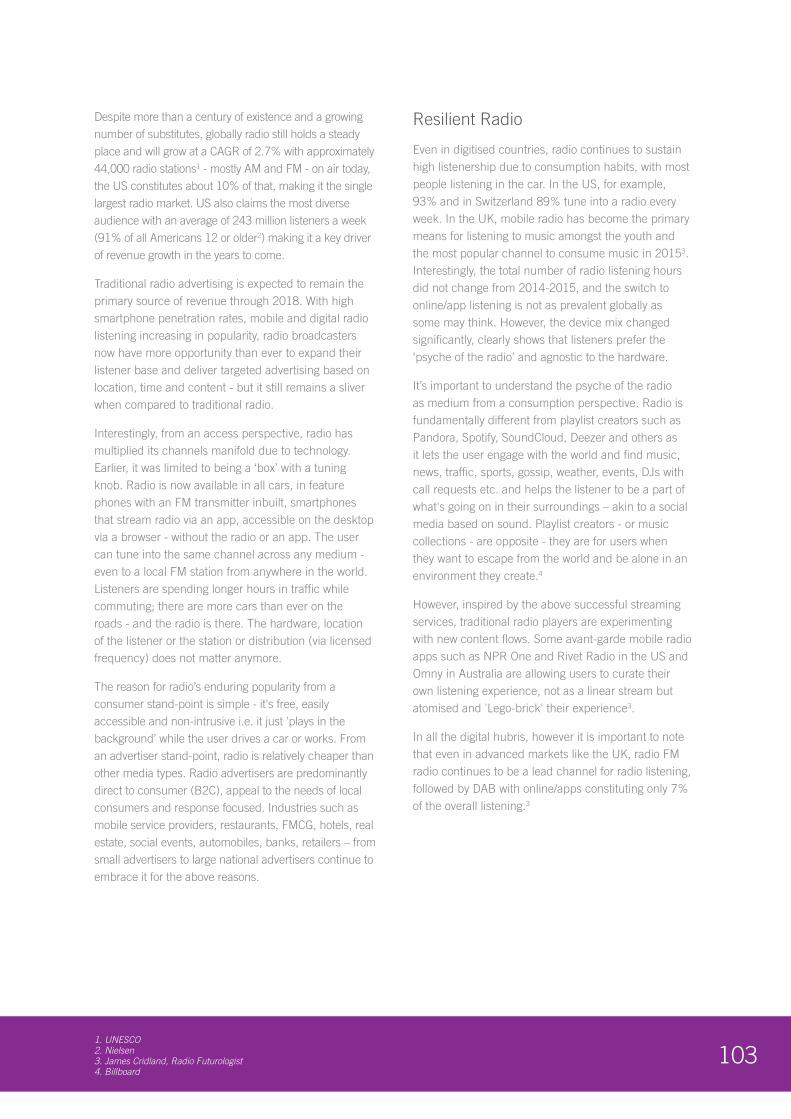
1031. UNESCO2. Nielsen3. James Cridland, Radio Futurologist4. Billboard
Despite more than a century of existence and a growing number of substitutes, globally radio still holds a steady place and will grow at a CAGR of 2.7% with approximately 44,000 radio stations1 - mostly AM and FM - on air today, the US constitutes about 10% of that, making it the single largest radio market. US also claims the most diverse audience with an average of 243 million listeners a week (91% of all Americans 12 or older2) making it a key driver of revenue growth in the years to come.
Traditional radio advertising is expected to remain the primary source of revenue through 2018. With high smartphone penetration rates, mobile and digital radio listening increasing in popularity, radio broadcasters now have more opportunity than ever to expand their listener base and deliver targeted advertising based on location, time and content - but it still remains a sliver when compared to traditional radio.
Interestingly, from an access perspective, radio has multiplied its channels manifold due to technology. Earlier, it was limited to being a ‘box’ with a tuning knob. Radio is now available in all cars, in feature phones with an FM transmitter inbuilt, smartphones that stream radio via an app, accessible on the desktop via a browser - without the radio or an app. The user can tune into the same channel across any medium - even to a local FM station from anywhere in the world. Listeners are spending longer hours in traffic while commuting; there are more cars than ever on the roads - and the radio is there. The hardware, location of the listener or the station or distribution (via licensed frequency) does not matter anymore.
The reason for radio’s enduring popularity from a consumer stand-point is simple - it's free, easily accessible and non-intrusive i.e. it just 'plays in the background’ while the user drives a car or works. From an advertiser stand-point, radio is relatively cheaper than other media types. Radio advertisers are predominantly direct to consumer (B2C), appeal to the needs of local consumers and response focused. Industries such as mobile service providers, restaurants, FMCG, hotels, real estate, social events, automobiles, banks, retailers – from small advertisers to large national advertisers continue to embrace it for the above reasons.
Resilient Radio
Even in digitised countries, radio continues to sustain high listenership due to consumption habits, with most people listening in the car. In the US, for example, 93% and in Switzerland 89% tune into a radio every week. In the UK, mobile radio has become the primary means for listening to music amongst the youth and the most popular channel to consume music in 20153. Interestingly, the total number of radio listening hours did not change from 2014-2015, and the switch to online/app listening is not as prevalent globally as some may think. However, the device mix changed significantly, clearly shows that listeners prefer the ‘psyche of the radio’ and agnostic to the hardware.
It’s important to understand the psyche of the radio as medium from a consumption perspective. Radio is fundamentally different from playlist creators such as Pandora, Spotify, SoundCloud, Deezer and others as it lets the user engage with the world and find music, news, traffic, sports, gossip, weather, events, DJs with call requests etc. and helps the listener to be a part of what's going on in their surroundings – akin to a social media based on sound. Playlist creators - or music collections - are opposite - they are for users when they want to escape from the world and be alone in an environment they create.4
However, inspired by the above successful streaming services, traditional radio players are experimenting with new content flows. Some avant-garde mobile radio apps such as NPR One and Rivet Radio in the US and Omny in Australia are allowing users to curate their own listening experience, not as a linear stream but atomised and 'Lego-brick' their experience3.
In all the digital hubris, however it is important to note that even in advanced markets like the UK, radio FM radio continues to be a lead channel for radio listening, followed by DAB with online/apps constituting only 7% of the overall listening.3
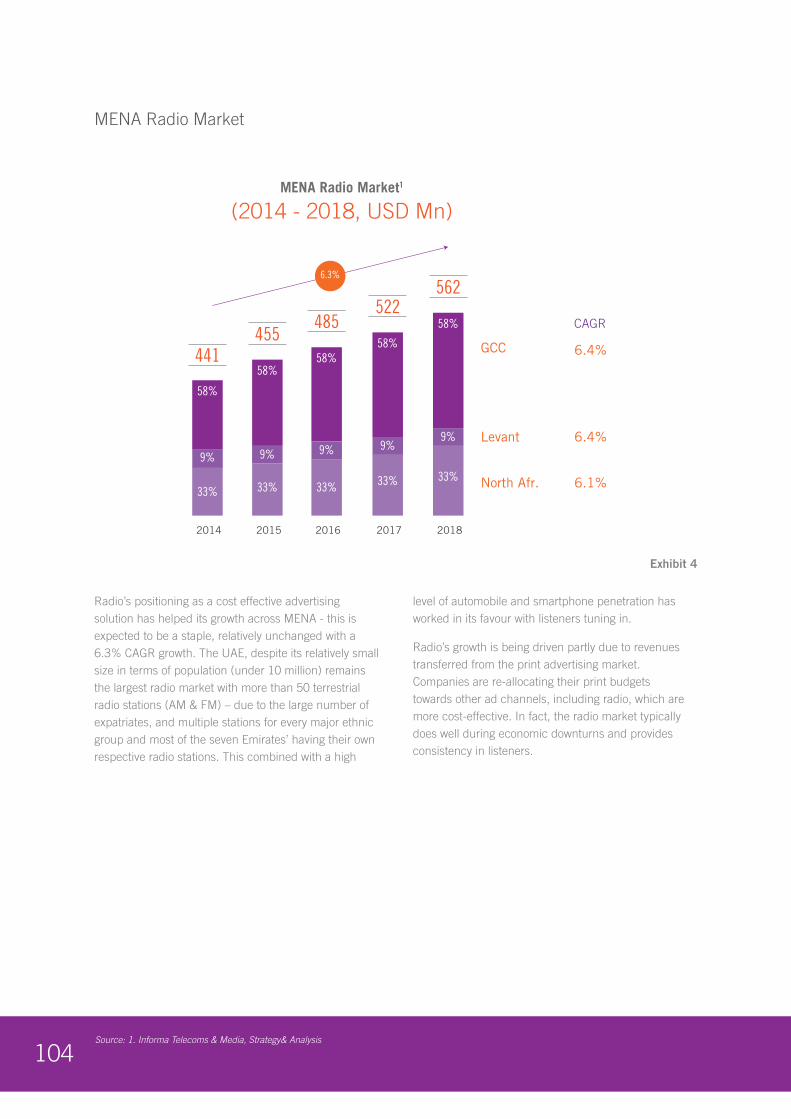
104Source: 1. Informa Telecoms & Media, Strategy& Analysis
Radio’s positioning as a cost effective advertising solution has helped its growth across MENA - this is expected to be a staple, relatively unchanged with a 6.3% CAGR growth. The UAE, despite its relatively small size in terms of population (under 10 million) remains the largest radio market with more than 50 terrestrial radio stations (AM & FM) – due to the large number of expatriates, and multiple stations for every major ethnic group and most of the seven Emirates’ having their own respective radio stations. This combined with a high
level of automobile and smartphone penetration has worked in its favour with listeners tuning in.
Radio’s growth is being driven partly due to revenues transferred from the print advertising market. Companies are re-allocating their print budgets towards other ad channels, including radio, which are more cost-effective. In fact, the radio market typically does well during economic downturns and provides consistency in listeners.
MENA Radio Market
104
MENA Radio Market1
(2014 - 2018, USD Mn)
455
441
33%
58%
2014
33%
58%
2015
485
33%
58%
2016
522
33%
58%
2017
562
33%
58%
9%9%9%9%9%
2018
6.3%
GCC 6.4%
6.4%Levant
6.1%North Afr.
CAGR
Exhibit 4
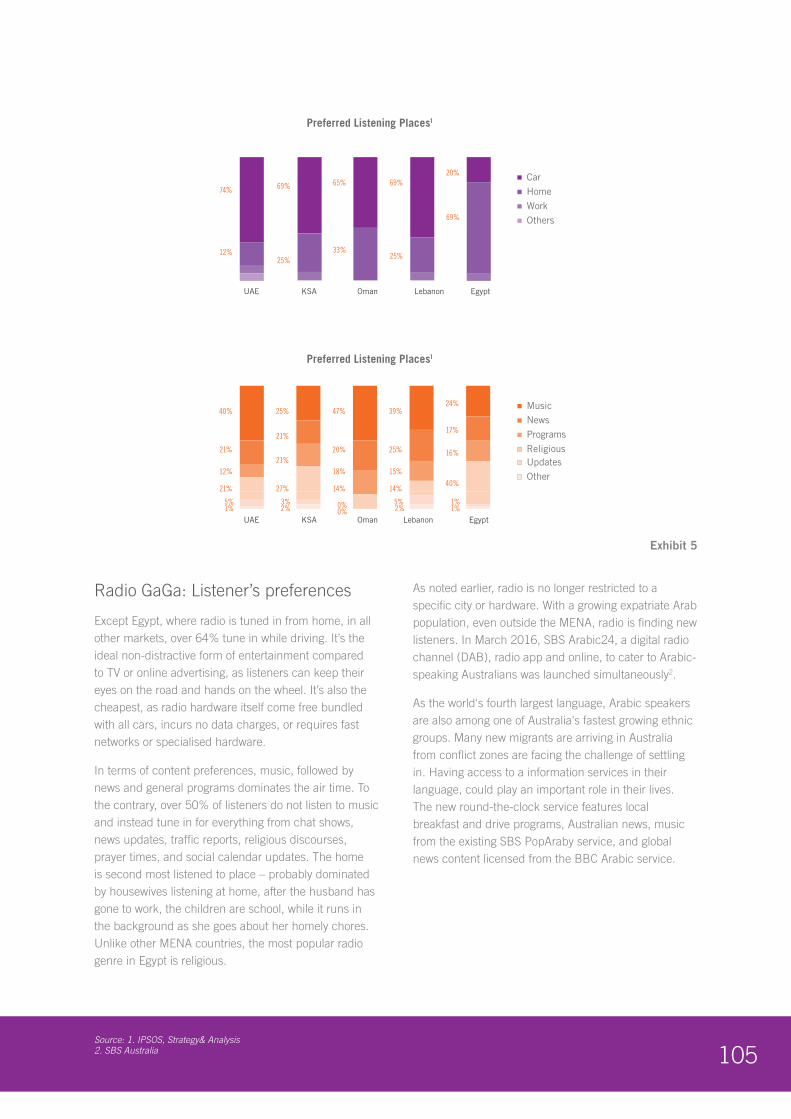
105Source: 1. IPSOS, Strategy& Analysis 2. SBS Australia
Radio GaGa: Listener’s preferences
Except Egypt, where radio is tuned in from home, in all other markets, over 64% tune in while driving. It’s the ideal non-distractive form of entertainment compared to TV or online advertising, as listeners can keep their eyes on the road and hands on the wheel. It’s also the cheapest, as radio hardware itself come free bundled with all cars, incurs no data charges, or requires fast networks or specialised hardware.
In terms of content preferences, music, followed by news and general programs dominates the air time. To the contrary, over 50% of listeners do not listen to music and instead tune in for everything from chat shows, news updates, traffic reports, religious discourses, prayer times, and social calendar updates. The home is second most listened to place – probably dominated by housewives listening at home, after the husband has gone to work, the children are school, while it runs in the background as she goes about her homely chores. Unlike other MENA countries, the most popular radio genre in Egypt is religious.
As noted earlier, radio is no longer restricted to a specific city or hardware. With a growing expatriate Arab population, even outside the MENA, radio is finding new listeners. In March 2016, SBS Arabic24, a digital radio channel (DAB), radio app and online, to cater to Arabic-speaking Australians was launched simultaneously2.
As the world's fourth largest language, Arabic speakers are also among one of Australia's fastest growing ethnic groups. Many new migrants are arriving in Australia from conflict zones are facing the challenge of settling in. Having access to a information services in their language, could play an important role in their lives. The new round-the-clock service features local breakfast and drive programs, Australian news, music from the existing SBS PopAraby service, and global news content licensed from the BBC Arabic service.
108
Egypt
20%
69%
Car
Home
Work
Others
Preferred Listening Places1
Lebanon
69%
25%
Oman
65%
33%
UAE
74%
12%
KSA
69%
25%
Egypt
Music
News
Programs
Religious
Preferred Listening Places1
LebanonOmanUAE
40%
21%
21%
12%
5%1%
25%
21%
27%
21%
3%2%
47%
20%
14%
18%
0%0%
39%
25%
14%
15%
5% 2%
24%
17%
40%
16%
1%1%
KSA
UpdatesOther
Exhibit 5

106
107
Reading Between the Lines
The marketing and communications industry, or marcomms, as its better known, historically had its value chain serving the needs of businesses. Due to its complexity and diversity, it has typically been simplified into two sub-sets: across the line (ATL) and below the line (BTL). Colloquially, ATL referred to advertising via mass media - TV, cinema, radio, print and Out-of-Home for targeting a wide audience and create awareness. Agencies would buy media (inventory i.e. space in the publication or air-time) and sell them to advertisers – this was the breadwinner for over a century due to high visibility and profitability. On the other hand, BTL used direct mail, flyers, point-of-sale, brochures to get its message across. Due to its limited margins, visibility and lower share of the overall revenues, it was treated as below the line. In the past decade, agencies and clients have switched to a hybrid of through the line (TTL) - a mix of ATL and BTL to integrate efforts and maximise returns.
While these definitions still hold good broadly, the industry is realigning itself to expand beyond its core service lines and specialising. To clarify, the core service lines are now more than media buying, PR and advertising. They also include research, data analytics, branding, identity, shopper and retail marketing, activation, experiential marketing and direct marketing. Over time, and across most markets (except the under-developed ones) these service lines have come
to exist as independent companies. Specialisation itself is occurring across three dimensions - by media, by client sector and audience. It's important, when referring to specialisation, this report implies mature and sustainable service lines that exist as independent companies, not as an ancillary service.
Basis industry experts, the region is witnessing six distinct trends that is expected to shape the marcomms space, going forward.
#Trend 1: Glocal Consolidation (Global and Local)
The modern marcomms industry is influenced by a few players - no different from other sectors such as accounting, consulting, banks, pharmaceuticals, automobile sectors - all of which have their own ‘Big 4' or 'Big 5’ that dominate the landscape.
The global agency world is led by - WPP (London-based with $19 billion in revenues for 2015), Omnicom Group (New York, $15.3 billion), Interpublic Group (New York, $7.5 billion), Publicis Groupe (Paris, $9.6 billion), Havas and the Dentsu Aegis Network (Tokyo, $6 billion)1. These agency groups are themselves a byproduct of consolidation over the years and in turn a smörgåsbord of thousands of companies joining in through mergers and acquisitions (M&A). Together, the above Big 5 clocked in around $57 billion in revenues in 2015 and manage even larger client budgets.
MARKETING AND COMMUNICATIONS INDUSTRY (MARCOMMS)
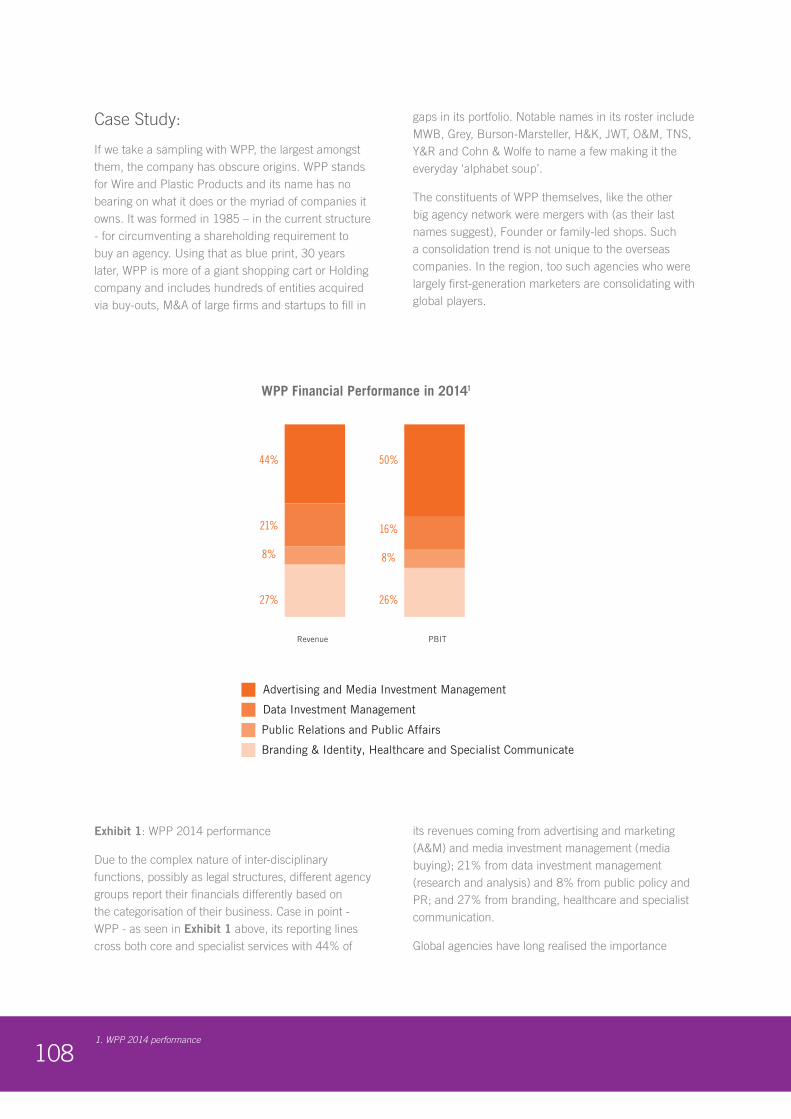
1081. WPP 2014 performance
Case Study:
If we take a sampling with WPP, the largest amongst them, the company has obscure origins. WPP stands for Wire and Plastic Products and its name has no bearing on what it does or the myriad of companies it owns. It was formed in 1985 – in the current structure - for circumventing a shareholding requirement to buy an agency. Using that as blue print, 30 years later, WPP is more of a giant shopping cart or Holding company and includes hundreds of entities acquired via buy-outs, M&A of large firms and startups to fill in
gaps in its portfolio. Notable names in its roster include MWB, Grey, Burson-Marsteller, H&K, JWT, O&M, TNS, Y&R and Cohn & Wolfe to name a few making it the everyday ‘alphabet soup’.
The constituents of WPP themselves, like the other big agency network were mergers with (as their last names suggest), Founder or family-led shops. Such a consolidation trend is not unique to the overseas companies. In the region, too such agencies who were largely first-generation marketers are consolidating with global players.
Exhibit 1: WPP 2014 performance
Due to the complex nature of inter-disciplinary functions, possibly as legal structures, different agency groups report their financials differently based on the categorisation of their business. Case in point - WPP - as seen in Exhibit 1 above, its reporting lines cross both core and specialist services with 44% of
its revenues coming from advertising and marketing (A&M) and media investment management (media buying); 21% from data investment management (research and analysis) and 8% from public policy and PR; and 27% from branding, healthcare and specialist communication.
Global agencies have long realised the importance
WPP Financial Performance in 20141
27%
44%
21%
8%
26%
50%
16%
8%
Revenue PBIT
Branding & Identity, Healthcare and Specialist Communicate
Advertising and Media Investment Management
Public Relations and Public Affairs
Data Investment Management
109
of MENA and followed their client's billings and requirements. The last decade has seen almost all the global agencies taking majority stake in their local operations, which until now existed mostly as minority controlled franchises with their branding. Besides the obvious financial consideration, the sellout was as much led by local shareholders realising the need to get global expertise, and the advertiser pool turning global in nature. Even large local advertisers are aligning with large global groups growing the share of pie for global agency majors e.g. in January 2016, the Al Futtaim Group moved from its in-house agency Gmasco to PHD UAE.
What is encouraging is that even post-sellouts, most Founders maintain active leadership in their new corporatised entities as the first generation of professional management starts to emerge. In some cases, even the regional leadership of the Holding company have had local leadership e.g. WPP appointed Roy Haddad as the first Regional Director of MENA from WPP in 2012.
The jury on the specialisations is still out as efforts to introduce specialist service lines have seen mixed success. Most of these are still new to the region e.g. the launch of SMG Sport and creation of Blue 449 – an open-source social media agency. In most cases, these are not the classic independent specialist companies, but sit as 'embedded services' within the core agency business. The key difference is that now they are branded and claim affiliation with the parent agency. They however remain thinly resourced in that capacity, waiting for the market to mature.
#Trend 2: Better Data + Global Best Practices = Greater accountability
A quote by John Wanamaker on advertising response sums it up best: "Half the money I spend on advertising is wasted - the trouble is I don't know which half". Marcomms historically had a challenge with accountability due to its intangible nature with limited audience measurement capabilities. Unlike sales, which is easier to co-relate with margins, or volume of units sold, return on investment on marcomms has always been trickier. Complicating this are some practices of supplier paybacks that still exist in the region. This coupled with weak agency contracting practices on the Client side have made it challenging at best.
Typically, agency contracting was led by the marketing department (of the advertiser) and lacked independence. On the other side, when led by procurement department, evaluations suffered due to their limited expertise in assessing the agency 'product'. Not helping the process are dated measurement practices like recall-based for TV, which distorts the real viewership vs. People Meters that existed for decades in evolved media markets.
Outside of marcomms industry initiatives, a majority suppliers in the region themselves, remain averse to audits by third-parties. While digital suppliers have had success with more effective measurement, the dominant print sector continues to hold back on audits with entities of the likes of BPA.
Solutions at Play
To tackle the above challenges, advertisers are putting structured solutions into place. One such measure is superior contracting practices with audit access for greater accountability and transparency from agencies. Outside audits, advertisers are forcing 'pitch cycles’. Instead of letting marketing managers decide the timing, procurement departments have designated periods to reassess their agencies for value and global best practices.
On transparency norms, globally-controlled agencies tend to be more transparent than local players as their financial accountability is driven by where they are listed and have stricter compliance and hence perform audits themselves over their local offices. Also, as increasingly more large pitches covering the region are held globally - a common best standard ensures that the local market also upgrades in accountability.
Encouraging this trend are the emergence of specialist independent auditors for procurement and media performance measurement. As an example, Ebiquity, EMM and R3 are being contracted to independently manage marketing analytics, set up KPIs, define marketing ROI with advertisers and agencies, create benchmarks, and ensure guarantees and compliance.
A key non-agency driver has been digital and mobile data that promise real-time data and analytics to usher in more accountability vs. traditional media. With the largest media spend buckets now monitored, agencies can also be held accountable for media delivery in execution.
1101. Huffington Postt2. Campaign Live UK3. Campaign ME
As is always the case, greater data in digital has bought in its own set of issues. With as many as 10-20% fake social media accounts1 (Facebook alone reportedly has over 170 million fake users, and more that they are not aware of), rise of ad blockers and spam. It's now well understood that the digital ad ecosystem has its share of ad fraud - scams where sketchy websites serve real ads to fake traffic but charge marketers’ real money. The severity of this challenge can be assessed by Facebook's recent announcement to discontinue its important new ad-buying platform Atlas, due to 'valueless' inventory2.
#Trend 3: Shrink or Diversify
It is not news that the margins of agencies are shrinking due to lower retainers and more norms for transparency. Led by efforts to build new revenue streams and client's demand for specialised services, agencies are turning to new services - both horizontally and vertically. Examples of such new services as content creation. E.g. Liquid Thread (owned by Starcom) creates technology-based solutions for advertisers to create, curate, and syndicate the content for their brands. Mediacom has MBA; Ogilvy one and Geometry Global specialises in experiential marketing diversified from their parent agencies like Grey Worldwide and O&M respectively. For research, Starcom has Business Compass - its insights arm; Mindshare created Mindsight. Agencies are also spinning off new lines and companies to serve social media management needs of clients.3
Adding to this, with markets opening up again in parts of the MENA. Post-war and post-Arab spring, agency networks are expanding from their hubs in the UAE and KSA to other regional destinations. Mediacom opened its Tunisia operations; Mindshare in Baghdad; Mullins and Lowe in Egypt in 2016 to name a few.
On a macro-level, consumer expenditure slowdown led by oil prices has impacted some sectors more than others e.g. Real estate advertising is expected to significantly slow down in the UAE. But with new scenarios, come new communication challenges and governments are turning to professional help to manage sensitive messaging like removal of subsidies privileges which their citizens had come to expect as basics; possible taxation; market slump due to sliding oil prices. Hence, this new era has spurred demand
for PR services from the regional Government and their departments.
#Trend 4: Conflict of Creativity
With new services, diversification on all fronts, and digital processes, the marcomms industry is seeing more scope conflicts within the classic demarcations. Creative and content services were typically the forte of creative agencies. With digital processes - be it brand identity, search engine optimisation, copywriting, designing brochures or online advertising, can now be done by anyone skilled from any location via sub-contracting, outsourcing or even crowd-sourcing models. This has led to the rapid growth of small suppliers – ranging from freelancers, start-ups or a creative shop in a developing country that works on price arbitrage. Such ‘flattening’ of the creative world is allowing big agencies to sublet more execution, while remaining the single point of client contact maintaining strategic oversight.
Content units like Mediacom’s MBA and SMG’s Liquid Thread are doing content development, mostly in the digital space. An example of this was Liquid Threads's consumer engagement for the F1 in Abu Dhabi. Armed with digital insights, Liquid Thread used Snapchat to engage with the youth. The result: exposure to over seven million unique users, and 141 million story views. It is this combination of consumer insights courtesy digital data that is giving media agencies an edge over their traditional counterparts. While these skills do exist in some planning departments, not having full access to data streams has made it challenging for pure-play creative agencies.
Another instance of scope conflict is community management of social platforms like Facebook, in itself an emerging service line. The market is split between PR, creative agencies and media agencies. Each segment's take on it is relevant but not complete - e.g. PR agencies claim expertise from a reputation management perspective; media agencies demonstrate expertise in data mining and social analytics; creative agencies claim brand custodianship. It is evident that all these parties are true on their own account, leading to service overlaps.
In light of these cross-overs, it is expected that marketers will define clearer service boundaries, tighter contracting
111
and KPIs to avoid conflict of interest. This specially applies if they are served by agencies with independent P&Ls and/or across different agency groups.
#Trend 5 - Specialisation vs. Horizontality
The discussion around specialization vs. horizontality refers to the engagement model advertisers choose to engage with their marcomm partners. Specialisation, as the word explains itself refers to advertisers choosing to work with multiple specialist agencies in each sphere of marcomms. These agencies typically would be owned across multiple agency groups. Horizontality is the exact opposite engagement model, where the advertiser chooses to work with one agency groups' agencies across the multiple disciplines. As described below, there are different forces that are shaping both of these models in the region.
Bring in the Specialists
In the region, media specialist agencies are dominated by digital only players or its subsets like social e.g. Digitas LBi from Publicis is one such company. Client sector specific specialisations are mostly observed around healthcare, although others like sports and financial services are not uncommon. Hence entitles like Common Health from Ogilvy, Finsbury (financial PR) from WPP and Havas Sports and entertainment have established them selves globally.
Advertisers are increasing positioning themselves as best-in-class or specialists in a defined area of marcomms to protect their turf and not lose clients with specialised needs. Furthermore, disciplines, which require a higher degree of expertise and focus (e.g. research, analytics and digital) have faced challenges in the integrated agency solution. Global agency groups have and are acquiring these new capabilities at high prices and are keen to not dilute their key value proposition. They are doing this increasingly by keeping the higher-margin specialist services, and blending it into their main services, only when it fails to deliver the expected value.
This need is being driven equally from the demand-side. Some advertiser have seen a high degree of digitisation and need their marcomms partners to integrate into that chain to track their value. A similar example of
this is the airline industry that require their agencies to be specialised in digital response and analytics. An instance while advertisers like Etihad appointed Starcom for its global media planning and buying and Cheil for digital and social marketing. Another category of advertisers that favour specialisation are the niche or vertical sectors e.g. e-commerce players are turning to performance-based marketing.
The specialist agencies deliver core services housed in a single entity. In many cases, they may work closely or sub-contract some services to their bigger sister agencies, treating the core agency as a mothership. Examples include healthcare agencies, data analytics companies, performance-based marketing agencies etc. Unlike the rest of world where the specialist propositions are matured, the region’s markets are still in the evolution stage. Agency networks are introducing these lines to drive their revenue growth. However, the numbers are not big enough to spin-off independent legal entities and mostly exist as service lines within the bigger agency – a testament to the fact that they are yet to be significant revenue streams.
Specialisation is expected to continue in the region in advanced services like digital, social, analytics etc. A fallout of this is the need to mirror these capabilities on the Client side - and hence hiring of marcomms talent on the client side like media managers, insights managers and social media managers.
The Generalists
On the other end of the spectrum, are marketers who want ‘one window' across marcomm disciplines - this need spans two extreme ends of the advertiser spectrum.
On one end, are early-stage or first time advertisers yet to make marketing services a key part of their value chain. With the exception of the UAE and KSA or large advertisers like telcos, FMCGs, a significant value of the region is still driven by these advertisers. Even in markets like KSA and Qatar, which are fast evolving into specialisation, they remain limited by their own internal marketing talent to oversee the specialists. Hence until marketing evolves, they prefer a single agency to address their needs e.g. JWT Cairo and Mindshare are sister agencies appointed by the Egypt Tourism Authority.
1121. Campaign ME
On the other hand, large global advertisers are consolidating their agency relationships across their networks to create ‘one teams’ for efficiency and greater control. As an example, WPP created Team Air for Emirates Airlines. Such cross-group client teams with specialists in WPP alone, increased from 10 in 2010 to 46 in 2014 demonstrating the needs of larger players with a key difference. These players have specialised internal teams to mirror the sophisticated agency offerings - and the 'one teams' are created to drive value with less friction.1
Horizontality is expected to grow among global accounts as they opt for simpler administration and better reporting. In line with this, large regional agency groups are also re-integrating specialist services for media neutrality. E.g. Social and mobile agency Holler was dissolved and integrated into Leo Burnett. With increasing marcomm costs, procurement departments are expected to consolidate services and enforce greater ‘pay for performance’ terms.
With MENA still evolving, it is too early to take a stance on how both these horizontal or specialised forces will shape the market. It shall depend upon multiple factors including overall market evolution, the advertiser sector mix and structure of the Client's own marketing departments.
#Trend 6: Disintermediation of the Agency
Digitisation of services is creating a new breed: Martech (marketing technology) players like Google, Facebook and host of startups promising everything from marketing automation to automating media buying. This trend is compelling advertisers to challenge marcomms to demand a higher degree of measuring and consumer targeting.
Agency's creative departments are challenged by new forms of content like short-form videos, tweets, user generated photos vs. standard formats they were used to. Besides, they have the challenge of maintaining context across devices, screens in an attention-deficit economy. This has led to emergence of specialist content agencies and departments that focus on
these platforms creating new challenges in integrated communications.
On the positive side, increased digital media spend has translated to new growth areas and higher fees in areas such as performance-based marketing and community management. Powered by client and consumer data, media agencies are creating programmatic solutions. The word “programmatic” refers to real-time bidding i.e. ad inventory is automatically sold and bought at scale (tens of billions of ads per day) and speed (in milliseconds) through arbitrage. Amidst all this 'flash trading', marketers without the technology apparatus are losing power due to limited knowledge on their audiences and relying more on agency and martech companies. Another source of power is increased consumer insights and performance metrics, courtesy digital. As this data is captive to them, evolved marcomms players are playing a greater role in client advisory.
On the flip side, this pushes away lucrative commission-based models that provided some security vs. paid-for-performance models that bring in uncertainty. There is also an increased dependence on martech players like Google and Facebook who (for obvious reasons) have become key sources for consumer insights - an area otherwise the forte of agencies. In the MENA, key advertisers now have direct relations with martech players in areas beyond trading value.
Marketers and governments are also treating sensitive areas like social media as an internal capability for customer service, reputation management and choosing not to outsource.
Potentially, the new digital self-service models created by martech players do everything from audience profiling; run campaigns; provide detailed reports and real-time analytics. They also accommodate almost any budget with no retainers and only touch the advertiser's wallet when they deliver results i.e. clicks or leads. While the region is still at its infancy on this account, SMB players can potentially disintermediate the agency and build these capabilities in-house.

113
114
MARKET UPDATE BY MARKET UPDATE BY MA
ARAB MEDIA EXPOSURE AND TRANSITIONARAB MEDIA OUTLOOK 2016. 2020ARAB MEDIA EXPOSURE AND TRANSITIONARAB MEDIA OUTLOOK 2016. 2020
ARAB MEDIA EXPOSURE AND TRANSITIONARAB MEDIA OUTLOOK 2016. 2020ARAB MEDIA EXPOSURE AND TRANSITIONARAB MEDIA OUTLOOK 2016. 2020ARAB MEDIA EXPOSURE AND TRANSITIONARAB MEDIA OUTLOOK 2016. 2020ARAB MEDIA EXPOSURE AND TRANSITIONARAB MEDIA OUTLOOK 2016. 2020ARAB MEDIA EXPOSURE AND TRANSITIONARAB MEDIA OUTLOOK 2016. 2020ARAB MEDIA EXPOSURE AND TRANSITIONARAB MEDIA OUTLOOK 2016. 2020ARAB MEDIA EXPOSURE AND TRANSITIONARAB MEDIA OUTLOOK 2016. 2020ARAB MEDIA EXPOSURE AND TRANSITION

115
MARKET UPDATE BY MARKET UPDATE BY MA
ARAB MEDIA EXPOSURE AND TRANSITIONARAB MEDIA OUTLOOK 2016. 2020ARAB MEDIA EXPOSURE AND TRANSITIONARAB MEDIA OUTLOOK 2016. 2020
ARAB MEDIA EXPOSURE AND TRANSITIONARAB MEDIA OUTLOOK 2016. 2020ARAB MEDIA EXPOSURE AND TRANSITIONARAB MEDIA OUTLOOK 2016. 2020ARAB MEDIA EXPOSURE AND TRANSITIONARAB MEDIA OUTLOOK 2016. 2020ARAB MEDIA EXPOSURE AND TRANSITIONARAB MEDIA OUTLOOK 2016. 2020ARAB MEDIA EXPOSURE AND TRANSITIONARAB MEDIA OUTLOOK 2016. 2020ARAB MEDIA EXPOSURE AND TRANSITIONARAB MEDIA OUTLOOK 2016. 2020ARAB MEDIA EXPOSURE AND TRANSITIONARAB MEDIA OUTLOOK 2016. 2020ARAB MEDIA EXPOSURE AND TRANSITION
RKET UPDATE BY MARKET UPDATE BY MAR

116

117Strategy& analysis
Exhibit 1: UAE Snapshot
Key Indicators: 2015
Population Size (Millions) 8.7
GDP per Capita ($) 48,108
Area (Square Km) 83,600
Size of the media market ($ million) 2,051
Mobile broadband penetration on population 117%
Fixed broadband penetration on population 129%
IN-FOCUS COUNTRIESUAE

1181. Strategy& analysis2. UAE Government official website
The United Arab Emirates (UAE) has become an important player in both regional and international affairs, since its unification in 19712. Though the country has a population of just 8.7 million as of 2015, it has the region's highest per capita media spend, cementing its position as the media capital. This is thanks to a mix of economic and sector development initiatives that the UAE government has undertaken proactively the last 15 plus years giving it a sustained lead.
On the economic development front, the UAE government initiated significant reforms in its industries and infrastructure with a vision to diversify its sectors early on. On the sectoral side, UAE started developing the media sector, starting as early as 2000 with the inception of the Dubai Media City (DMC). Since then, over the past 16 years, it has grown to now have the highest concentration of media free zones in the region, and evolved into specialist sector-specific zones such as the Dubai Studio City. In a recent development, it launched the Dubai Creative Clusters Authority (DCCA)
to provide superior regulatory oversight over all its free zones and improve efficiency.
Due to the government's efficient policies, the UAE's non-oil sectors now contribute to more than two-third of its GDP making it one of the most diversified economies with strong financial and real estate sector plays. Its stable economic policies have also resulted in many companies making the Emirates' their regional headquarters. For instance, the largest multinationals like Visa, Unilever, Proctor & Gamble, Google, Facebook and hundreds of others are all headquartered out of Dubai with some having a regional footprint covering central Europe.
UAE is also the tourism capital of the region with one of the most mature retail environments. That has spurred many sectors including luxury, retail theme parks, and so on, making it a large advertising market for premium audience.
2018
Print -5%
TV +6%
Digital +16%
OOH Ads -1%
+6%Radio Ads
Physical Music -10%
Physical Movies +1%
Physical Games -2%
UAE Total Media Market
USDmn
2,203
2017
2,149
2016
2,095
2014
50%
17%
16%
5%
5%2%
6%0%
2,016
2015
2,051
CAGR2014-18
+2% +6%
46%
18%
19%
5%
5%2%
6%0%
42%
19%
21%
5%
5%2%
6%0%
39%
19%
24%
4%
5%2%
7%0%
36%
20%
26%
4%
4%2%
7%0%
Exhibit 2
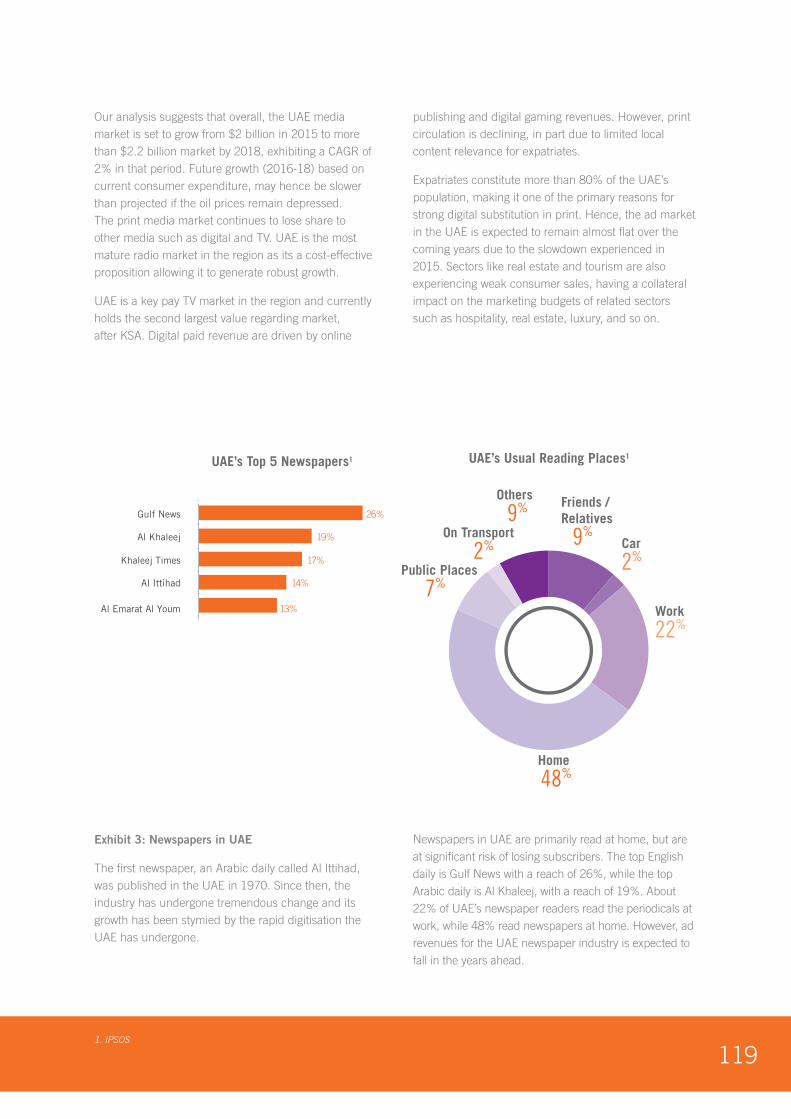
1191. IPSOS
Our analysis suggests that overall, the UAE media market is set to grow from $2 billion in 2015 to more than $2.2 billion market by 2018, exhibiting a CAGR of 2% in that period. Future growth (2016-18) based on current consumer expenditure, may hence be slower than projected if the oil prices remain depressed. The print media market continues to lose share to other media such as digital and TV. UAE is the most mature radio market in the region as its a cost-effective proposition allowing it to generate robust growth.
UAE is a key pay TV market in the region and currently holds the second largest value regarding market, after KSA. Digital paid revenue are driven by online
publishing and digital gaming revenues. However, print circulation is declining, in part due to limited local content relevance for expatriates.
Expatriates constitute more than 80% of the UAE’s population, making it one of the primary reasons for strong digital substitution in print. Hence, the ad market in the UAE is expected to remain almost flat over the coming years due to the slowdown experienced in 2015. Sectors like real estate and tourism are also experiencing weak consumer sales, having a collateral impact on the marketing budgets of related sectors such as hospitality, real estate, luxury, and so on.
Exhibit 3: Newspapers in UAE
The first newspaper, an Arabic daily called Al Ittihad, was published in the UAE in 1970. Since then, the industry has undergone tremendous change and its growth has been stymied by the rapid digitisation the UAE has undergone.
Newspapers in UAE are primarily read at home, but are at significant risk of losing subscribers. The top English daily is Gulf News with a reach of 26%, while the top Arabic daily is Al Khaleej, with a reach of 19%. About 22% of UAE’s newspaper readers read the periodicals at work, while 48% read newspapers at home. However, ad revenues for the UAE newspaper industry is expected to fall in the years ahead.
UAE’s Top 5 Newspapers1
26%
19%
17%
14%
13%
Gulf News
Al Khaleej
Khaleej Times
Al Ittihad
Al Emarat Al Youm
UAE’s Usual Reading Places1
On Transport
2%
Others
9%
Public Places
7%
Car
2%
Friends /Relatives
9%
Home
48%
Work
22%
UAE’s Top 5 Newspapers1
26%
19%
17%
14%
13%
Gulf News
Al Khaleej
Khaleej Times
Al Ittihad
Al Emarat Al Youm
UAE’s Usual Reading Places1
On Transport
2%
Others
9%
Public Places
7%
Car
2%
Friends /Relatives
9%
Home
48%
Work
22%
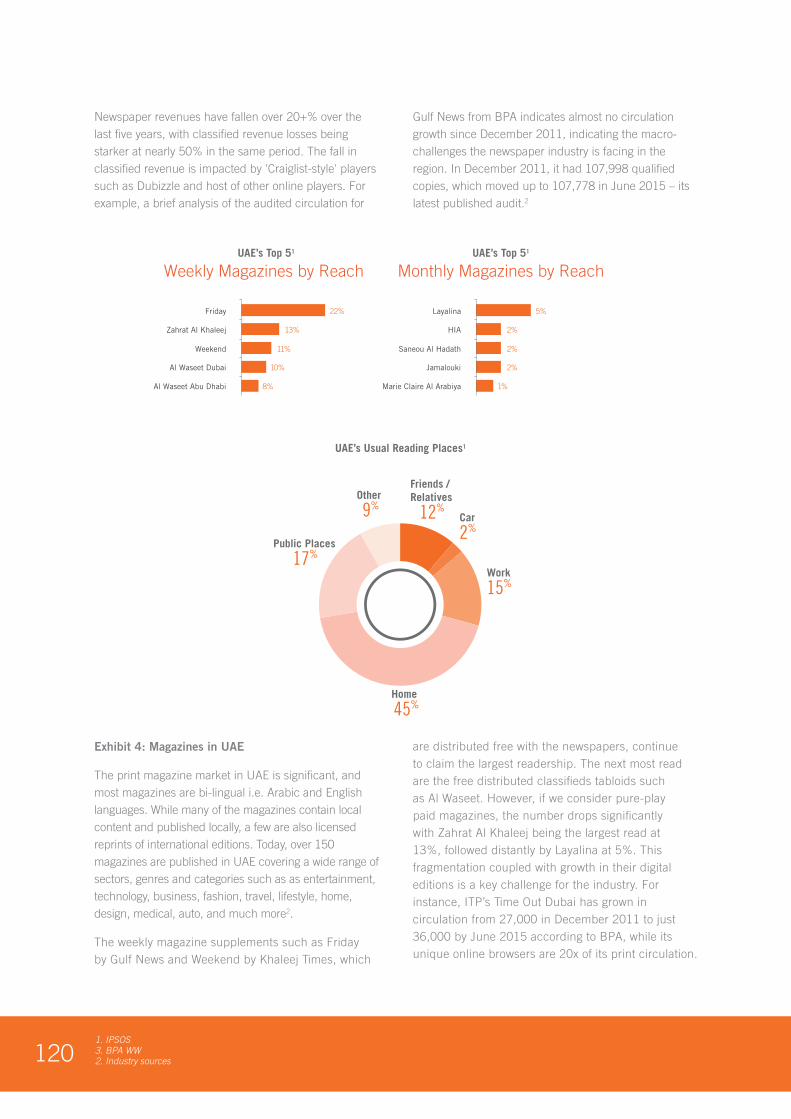
1201. IPSOS 3. BPA WW 2. Industry sources
Newspaper revenues have fallen over 20+% over the last five years, with classified revenue losses being starker at nearly 50% in the same period. The fall in classified revenue is impacted by 'Craiglist-style' players such as Dubizzle and host of other online players. For example, a brief analysis of the audited circulation for
Gulf News from BPA indicates almost no circulation growth since December 2011, indicating the macro-challenges the newspaper industry is facing in the region. In December 2011, it had 107,998 qualified copies, which moved up to 107,778 in June 2015 – its latest published audit.2
Exhibit 4: Magazines in UAE
The print magazine market in UAE is significant, and most magazines are bi-lingual i.e. Arabic and English languages. While many of the magazines contain local content and published locally, a few are also licensed reprints of international editions. Today, over 150 magazines are published in UAE covering a wide range of sectors, genres and categories such as as entertainment, technology, business, fashion, travel, lifestyle, home, design, medical, auto, and much more2.
The weekly magazine supplements such as Friday by Gulf News and Weekend by Khaleej Times, which
are distributed free with the newspapers, continue to claim the largest readership. The next most read are the free distributed classifieds tabloids such as Al Waseet. However, if we consider pure-play paid magazines, the number drops significantly with Zahrat Al Khaleej being the largest read at 13%, followed distantly by Layalina at 5%. This fragmentation coupled with growth in their digital editions is a key challenge for the industry. For instance, ITP’s Time Out Dubai has grown in circulation from 27,000 in December 2011 to just 36,000 by June 2015 according to BPA, while its unique online browsers are 20x of its print circulation.
UAE’s Top 51
Weekly Magazines by Reach
22%
13%
11%
10%
8%
Friday
Zahrat Al Khaleej
Weekend
Al Waseet Dubai
Al Waseet Abu Dhabi
UAE’s Top 51
Monthly Magazines by Reach
5%
2%
2%
2%
1%
Layalina
HIA
Saneou Al Hadath
Jamalouki
Marie Claire Al Arabiya
UAE’s Usual Reading Places1
Other
9%
Public Places
17%
Car
2%
Friends /Relatives
12%
Home
45%
Work
15%
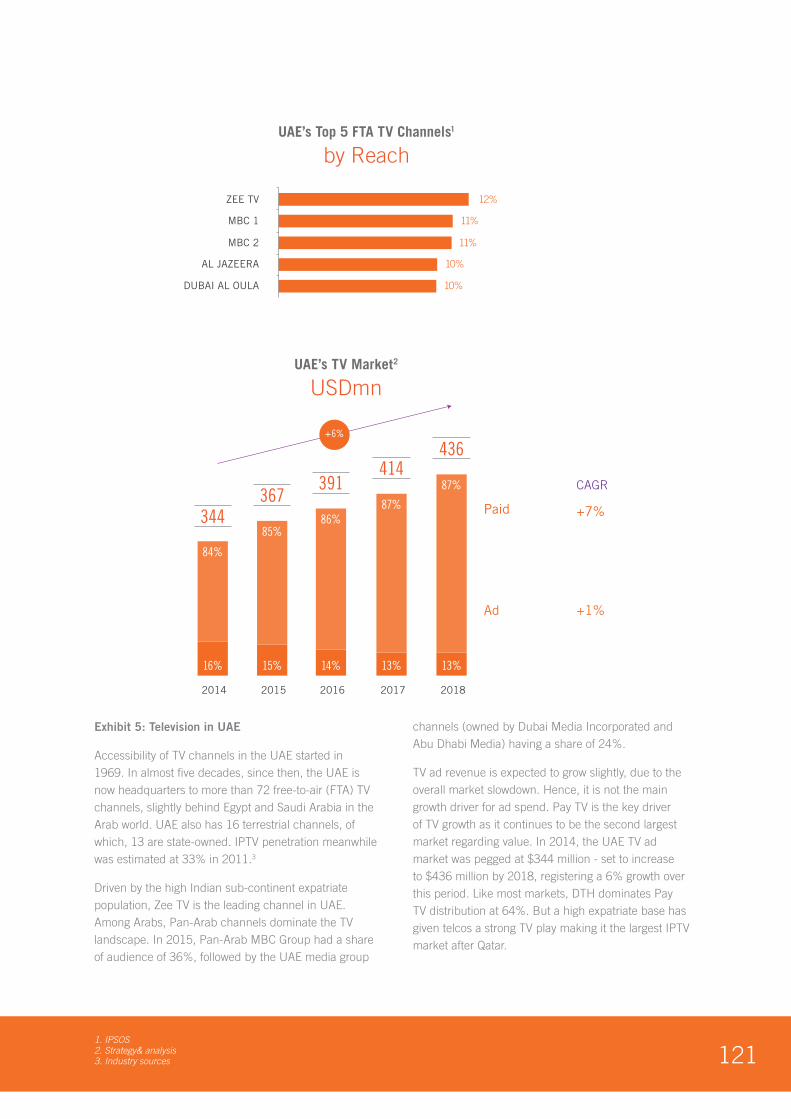
1211. IPSOS2. Strategy& analysis3. Industry sources
Exhibit 5: Television in UAE
Accessibility of TV channels in the UAE started in 1969. In almost five decades, since then, the UAE is now headquarters to more than 72 free-to-air (FTA) TV channels, slightly behind Egypt and Saudi Arabia in the Arab world. UAE also has 16 terrestrial channels, of which, 13 are state-owned. IPTV penetration meanwhile was estimated at 33% in 2011.3
Driven by the high Indian sub-continent expatriate population, Zee TV is the leading channel in UAE. Among Arabs, Pan-Arab channels dominate the TV landscape. In 2015, Pan-Arab MBC Group had a share of audience of 36%, followed by the UAE media group
channels (owned by Dubai Media Incorporated and Abu Dhabi Media) having a share of 24%.
TV ad revenue is expected to grow slightly, due to the overall market slowdown. Hence, it is not the main growth driver for ad spend. Pay TV is the key driver of TV growth as it continues to be the second largest market regarding value. In 2014, the UAE TV ad market was pegged at $344 million - set to increase to $436 million by 2018, registering a 6% growth over this period. Like most markets, DTH dominates Pay TV distribution at 64%. But a high expatriate base has given telcos a strong TV play making it the largest IPTV market after Qatar.
UAE’s Top 5 FTA TV Channels1
by Reach
12%
11%
11%
10%
10%
ZEE TV
MBC 1
MBC 2
AL JAZEERA
DUBAI AL OULA
UAE’s TV Market2
USDmn
367
344
16%
84%
2014
15%
85%
2015
391
14%
86%
2016
414
13%
87%
2017
436
13%
87%
2018
+6%
Paid +7%
+1%Ad
CAGR
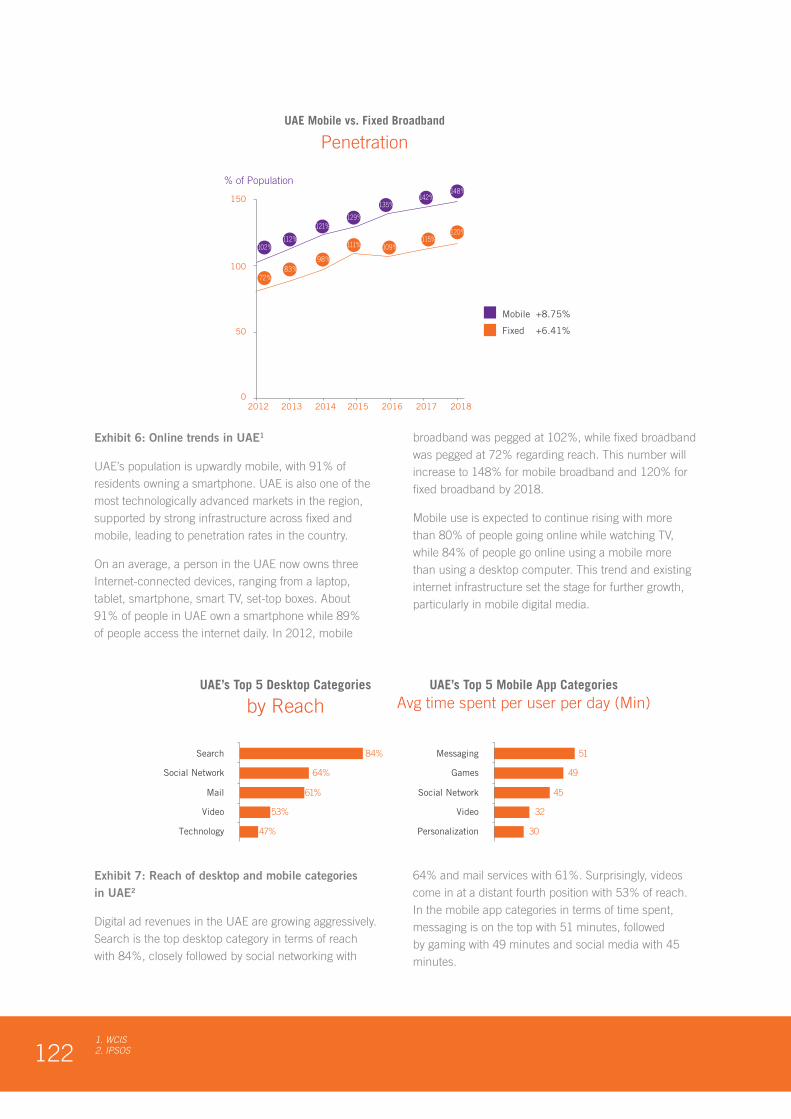
1221. WCIS2. IPSOS
Exhibit 6: Online trends in UAE1
UAE’s population is upwardly mobile, with 91% of residents owning a smartphone. UAE is also one of the most technologically advanced markets in the region, supported by strong infrastructure across fixed and mobile, leading to penetration rates in the country.
On an average, a person in the UAE now owns three Internet-connected devices, ranging from a laptop, tablet, smartphone, smart TV, set-top boxes. About 91% of people in UAE own a smartphone while 89% of people access the internet daily. In 2012, mobile
broadband was pegged at 102%, while fixed broadband was pegged at 72% regarding reach. This number will increase to 148% for mobile broadband and 120% for fixed broadband by 2018.
Mobile use is expected to continue rising with more than 80% of people going online while watching TV, while 84% of people go online using a mobile more than using a desktop computer. This trend and existing internet infrastructure set the stage for further growth, particularly in mobile digital media.
Exhibit 7: Reach of desktop and mobile categories in UAE2
Digital ad revenues in the UAE are growing aggressively. Search is the top desktop category in terms of reach with 84%, closely followed by social networking with
64% and mail services with 61%. Surprisingly, videos come in at a distant fourth position with 53% of reach. In the mobile app categories in terms of time spent, messaging is on the top with 51 minutes, followed by gaming with 49 minutes and social media with 45 minutes.
84%
64%
61%
53%
47%
Search
Social Network
Video
Technology
UAE’s Top 5 Desktop Categories
by Reach
49
51
45
32
30
Messaging
Mobile +8.75%
Fixed +6.41%
Games
Social Network
Video
Personalization
UAE’s Top 5 Mobile App CategoriesAvg time spent per user per day (Min)
2018
% of Population
100
150
50
02012 2013 2014 2015 2016 2017
72%83%
98%
111%112%
121%129%
135%142%
148%
102% 109%115%
120%
UAE Mobile vs. Fixed Broadband
Penetration
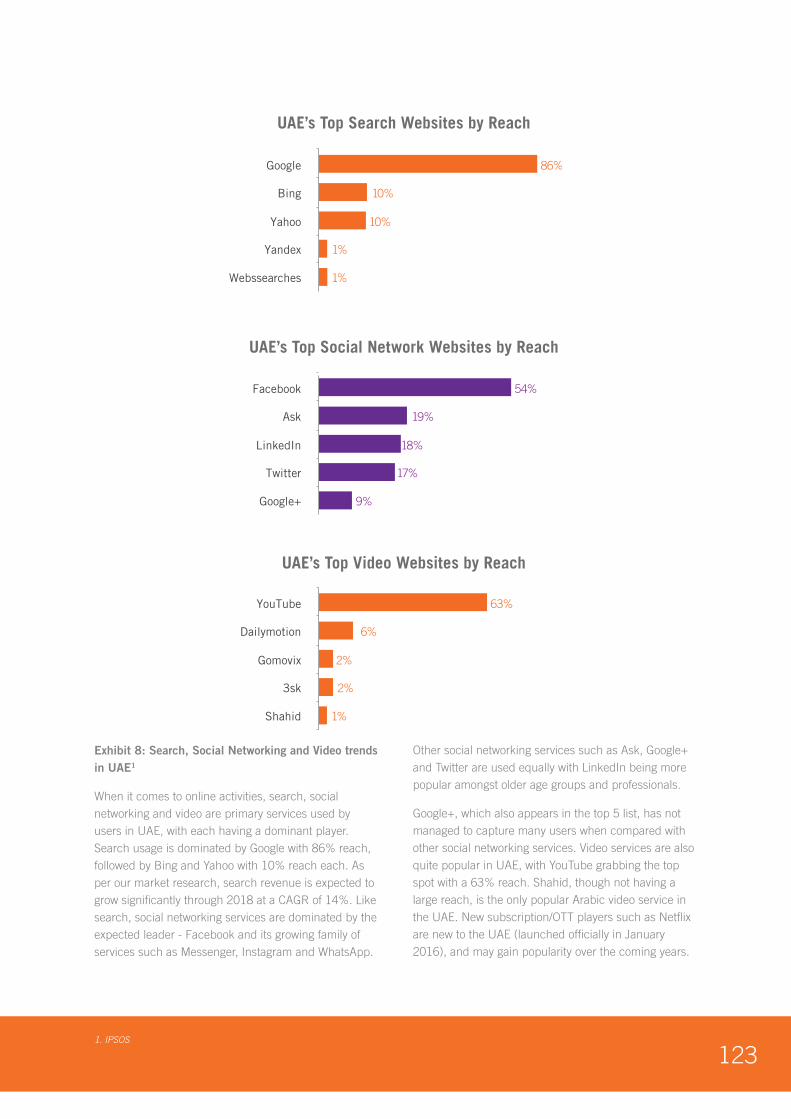
1231. IPSOS
Exhibit 8: Search, Social Networking and Video trends in UAE1
When it comes to online activities, search, social networking and video are primary services used by users in UAE, with each having a dominant player. Search usage is dominated by Google with 86% reach, followed by Bing and Yahoo with 10% reach each. As per our market research, search revenue is expected to grow significantly through 2018 at a CAGR of 14%. Like search, social networking services are dominated by the expected leader - Facebook and its growing family of services such as Messenger, Instagram and WhatsApp.
Other social networking services such as Ask, Google+ and Twitter are used equally with LinkedIn being more popular amongst older age groups and professionals.
Google+, which also appears in the top 5 list, has not managed to capture many users when compared with other social networking services. Video services are also quite popular in UAE, with YouTube grabbing the top spot with a 63% reach. Shahid, though not having a large reach, is the only popular Arabic video service in the UAE. New subscription/OTT players such as Netflix are new to the UAE (launched officially in January 2016), and may gain popularity over the coming years.
UAE’s Top Search Websites by Reach
86%
10%
10%
1%
1%
Bing
Yahoo
Yandex
Webssearches
UAE’s Top Video Websites by Reach
63%
6%
2%
2%
1%
YouTube
Dailymotion
Gomovix
3sk
Shahid
UAE’s Top Social Network Websites by Reach
54%
19%
18%
17%
9%
Ask
Google+
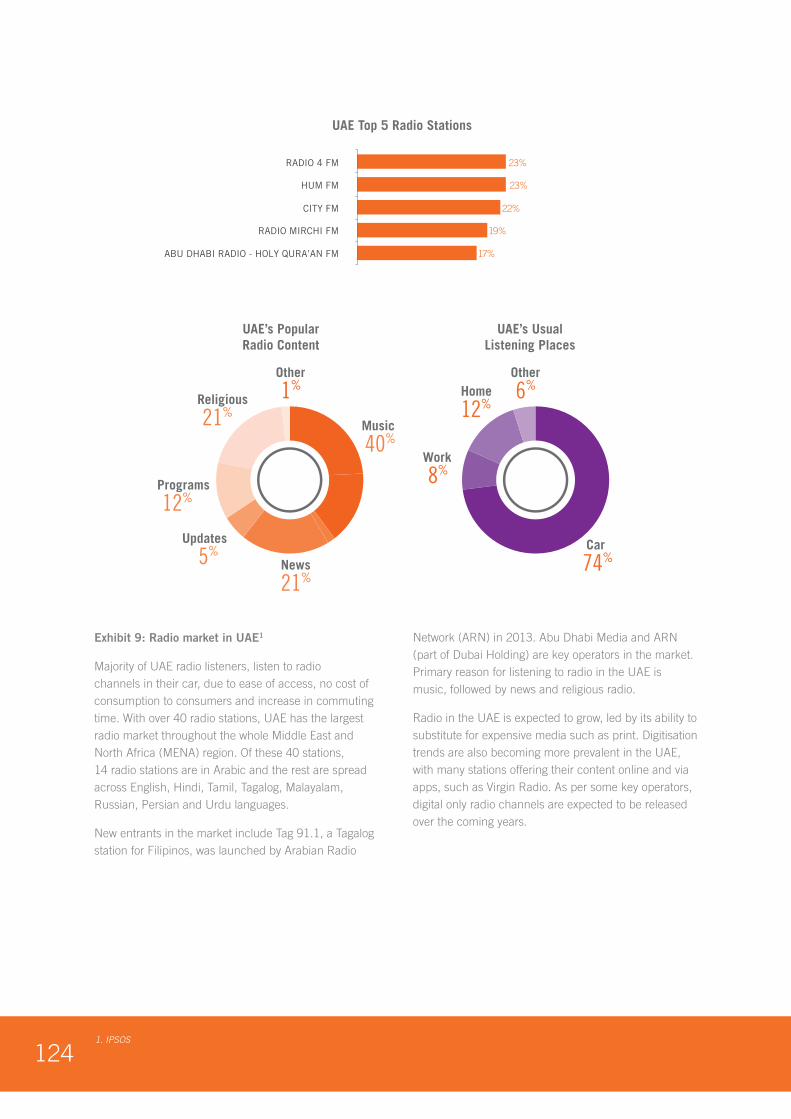
1241. IPSOS
Exhibit 9: Radio market in UAE1
Majority of UAE radio listeners, listen to radio channels in their car, due to ease of access, no cost of consumption to consumers and increase in commuting time. With over 40 radio stations, UAE has the largest radio market throughout the whole Middle East and North Africa (MENA) region. Of these 40 stations, 14 radio stations are in Arabic and the rest are spread across English, Hindi, Tamil, Tagalog, Malayalam, Russian, Persian and Urdu languages.
New entrants in the market include Tag 91.1, a Tagalog station for Filipinos, was launched by Arabian Radio
Network (ARN) in 2013. Abu Dhabi Media and ARN (part of Dubai Holding) are key operators in the market. Primary reason for listening to radio in the UAE is music, followed by news and religious radio.
Radio in the UAE is expected to grow, led by its ability to substitute for expensive media such as print. Digitisation trends are also becoming more prevalent in the UAE, with many stations offering their content online and via apps, such as Virgin Radio. As per some key operators, digital only radio channels are expected to be released over the coming years.
UAE’s PopularRadio Content
UAE’s UsualListening Places
Programs
12%
Religious
21%
Other
1%Other
6%
Music
40%
Home
12%
Work
8%
Car
74%News
21%
Updates
5%
UAE Top 5 Radio Stations
23%
23%
22%
19%
17%
RADIO 4 FM
HUM FM
CITY FM
RADIO MIRCHI FM
ABU DHABI RADIO - HOLY QURA’AN FM

125

126Strategy& analysis
Exhibit 1: KSA Snapshot
Key Indicators: 2015
Population Size (Millions)1 30.5
GDP per Capita ($) 21,039
Area (Square Km) 2.15 million
Size of the media market ($ million) 3,318 - 2015
Mobile broadband penetration as % of population
133%
Fixed broadband penetration on population 61%
KINGDOM OF SAUDI ARABIA (KSA)
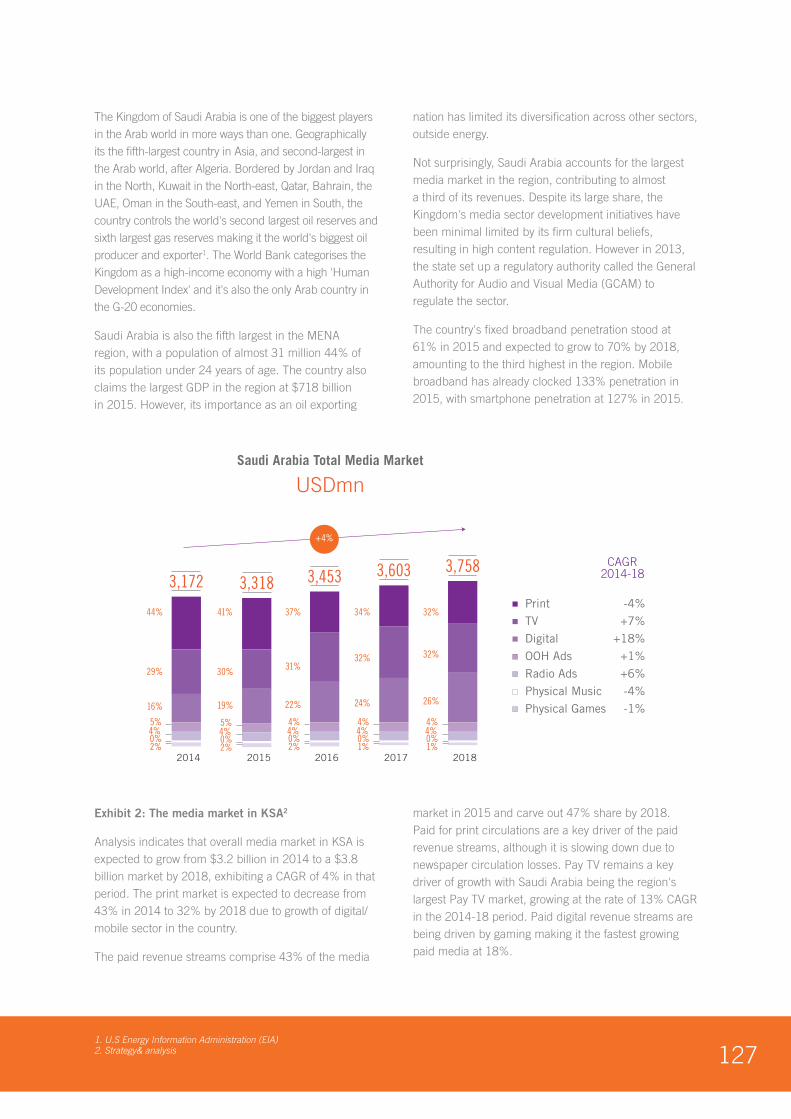
1271. U.S Energy Information Administration (EIA)2. Strategy& analysis
The Kingdom of Saudi Arabia is one of the biggest players in the Arab world in more ways than one. Geographically its the fifth-largest country in Asia, and second-largest in the Arab world, after Algeria. Bordered by Jordan and Iraq in the North, Kuwait in the North-east, Qatar, Bahrain, the UAE, Oman in the South-east, and Yemen in South, the country controls the world's second largest oil reserves and sixth largest gas reserves making it the world's biggest oil producer and exporter1. The World Bank categorises the Kingdom as a high-income economy with a high 'Human Development Index' and it's also the only Arab country in the G-20 economies.
Saudi Arabia is also the fifth largest in the MENA region, with a population of almost 31 million 44% of its population under 24 years of age. The country also claims the largest GDP in the region at $718 billion in 2015. However, its importance as an oil exporting
nation has limited its diversification across other sectors, outside energy.
Not surprisingly, Saudi Arabia accounts for the largest media market in the region, contributing to almost a third of its revenues. Despite its large share, the Kingdom's media sector development initiatives have been minimal limited by its firm cultural beliefs, resulting in high content regulation. However in 2013, the state set up a regulatory authority called the General Authority for Audio and Visual Media (GCAM) to regulate the sector.
The country's fixed broadband penetration stood at 61% in 2015 and expected to grow to 70% by 2018, amounting to the third highest in the region. Mobile broadband has already clocked 133% penetration in 2015, with smartphone penetration at 127% in 2015.
Exhibit 2: The media market in KSA2
Analysis indicates that overall media market in KSA is expected to grow from $3.2 billion in 2014 to a $3.8 billion market by 2018, exhibiting a CAGR of 4% in that period. The print market is expected to decrease from 43% in 2014 to 32% by 2018 due to growth of digital/mobile sector in the country.
The paid revenue streams comprise 43% of the media
market in 2015 and carve out 47% share by 2018. Paid for print circulations are a key driver of the paid revenue streams, although it is slowing down due to newspaper circulation losses. Pay TV remains a key driver of growth with Saudi Arabia being the region's largest Pay TV market, growing at the rate of 13% CAGR in the 2014-18 period. Paid digital revenue streams are being driven by gaming making it the fastest growing paid media at 18%.
2018
32%
32%
26%
Print -4%
TV +7%
Digital +18%
OOH Ads +1%
+6%Radio Ads
Physical Music -4%
Physical Games -1%
Saudi Arabia Total Media Market
USDmn
3,758
2017
34%
32%
24%
3,603
2016
37%
31%
22%
3,453
2014
44%
29%
16%
5%
0%2%
4%
3,172
2015
41%
30%
19%
3,318CAGR
2014-18
+4%
5%
0%2%
4%4%
0%2%
4%4%
0%1%
4%4%
0%1%
4%
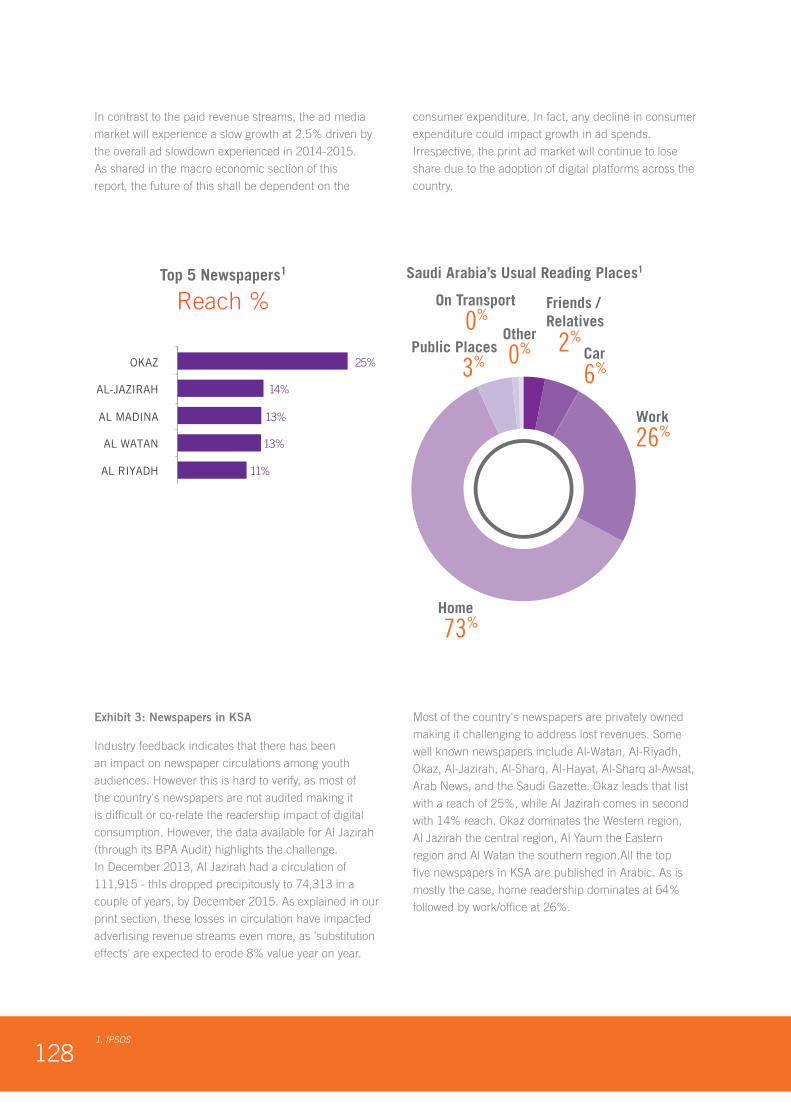
1281. IPSOS
In contrast to the paid revenue streams, the ad media market will experience a slow growth at 2.5% driven by the overall ad slowdown experienced in 2014-2015. As shared in the macro economic section of this report, the future of this shall be dependent on the
consumer expenditure. In fact, any decline in consumer expenditure could impact growth in ad spends. Irrespective, the print ad market will continue to lose share due to the adoption of digital platforms across the country.
Exhibit 3: Newspapers in KSA
Industry feedback indicates that there has been an impact on newspaper circulations among youth audiences. However this is hard to verify, as most of the country's newspapers are not audited making it is difficult or co-relate the readership impact of digital consumption. However, the data available for Al Jazirah (through its BPA Audit) highlights the challenge. In December 2013, Al Jazirah had a circulation of 111,915 - thIs dropped precipitously to 74,313 in a couple of years, by December 2015. As explained in our print section, these losses in circulation have impacted advertising revenue streams even more, as 'substitution effects' are expected to erode 8% value year on year.
Most of the country's newspapers are privately owned making it challenging to address lost revenues. Some well known newspapers include Al-Watan, Al-Riyadh, Okaz, Al-Jazirah, Al-Sharq, Al-Hayat, Al-Sharq al-Awsat, Arab News, and the Saudi Gazette. Okaz leads that list with a reach of 25%, while Al Jazirah comes in second with 14% reach. Okaz dominates the Western region, Al Jazirah the central region, Al Yaum the Eastern region and Al Watan the southern region.All the top five newspapers in KSA are published in Arabic. As is mostly the case, home readership dominates at 64% followed by work/office at 26%.
25%
14%
13%
13%
11%
OKAZ
AL-JAZIRAH
AL MADINA
AL WATAN
AL RIYADH
Top 5 Newspapers1
Reach %
Saudi Arabia’s Usual Reading Places1
Home
73%
Public Places
3%
On Transport
Other0%
0%
Work
26%
Friends /Relatives
2%Car
6%25%
14%
13%
13%
11%
OKAZ
AL-JAZIRAH
AL MADINA
AL WATAN
AL RIYADH
Top 5 Newspapers1
Reach %
Saudi Arabia’s Usual Reading Places1
Home
73%
Public Places
3%
On Transport
Other0%
0%
Work
26%
Friends /Relatives
2%Car
6%

1291. IPSOS2. Strategy&
Exhibit 4: Magazines in KSA1
Saudi Arabia has a strong magazine market compared to other GCC markets, continuing to deliver impressive reach numbers. The reach of top three magazines in Saudi are all above 10% point unlike other markets where magazines lag significantly behind newspapers. The top magazine in KSA is Sayidaty with 15.2% reach, followed by Zahrat Al Khaleej with 14.5% and Laha with 14.2% reach.
Even though these magazines cater to the GCC region and categorized as regional (or Pan-Arab) titles, they focus on Saudi audiences, keeping in mind the country's importance to advertisers in the region. As expected, magazines have a wider reading location mix with readers spread across many places like public places and friends vs. only reading at home or work.
Exhibit 5: Television in KSA
KSA TV Market1
USD mn
47.7%
18.9%
18.7%
15.2%
14.6%
MBC 1
AL ARABIYA
MBC 4
MBC 2
DUBAI AL OULA
KSA’s Top 5 FTA TV Channels1
Reach %
15.2%
14.5%
14.2%
9.5%
7.8%
SAYIDATY
ZAHRAT AL KHALEEJ
LAHA
HAYA
AL MUBAWABA DAMMAM
Saudi Arabia’s Top 51
MagazinesSaudi Arabia’s Usual
Reading Places
Home
45%
Public Places
17%
Other
9% Car
2%
Work
15%
Friends / Relatives
12%
996
930
62%
38%
2014
59%
41%
2015
1,064
56%
44%
2016
1,136
54%
46%
2017
1,126
51%
49%
2018
+7%
Paid +14%
+2%Ad
CAGR
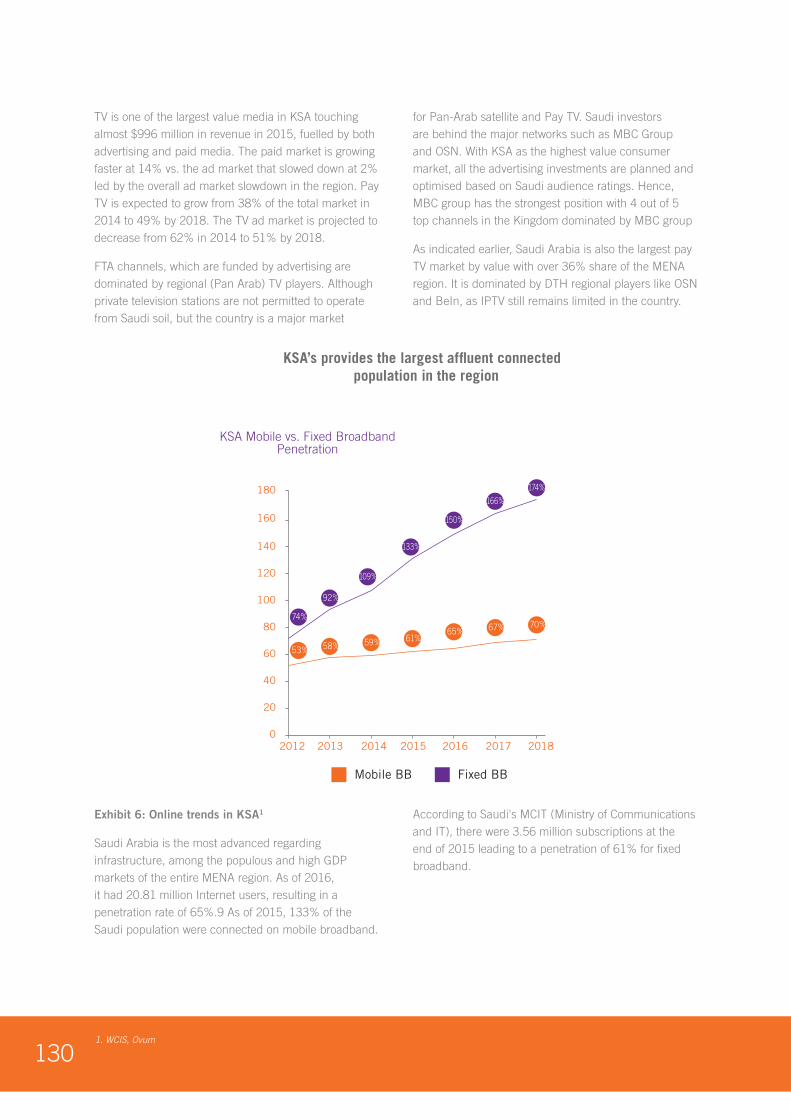
1301. WCIS, Ovum
TV is one of the largest value media in KSA touching almost $996 million in revenue in 2015, fuelled by both advertising and paid media. The paid market is growing faster at 14% vs. the ad market that slowed down at 2% led by the overall ad market slowdown in the region. Pay TV is expected to grow from 38% of the total market in 2014 to 49% by 2018. The TV ad market is projected to decrease from 62% in 2014 to 51% by 2018.
FTA channels, which are funded by advertising are dominated by regional (Pan Arab) TV players. Although private television stations are not permitted to operate from Saudi soil, but the country is a major market
for Pan-Arab satellite and Pay TV. Saudi investors are behind the major networks such as MBC Group and OSN. With KSA as the highest value consumer market, all the advertising investments are planned and optimised based on Saudi audience ratings. Hence, MBC group has the strongest position with 4 out of 5 top channels in the Kingdom dominated by MBC group
As indicated earlier, Saudi Arabia is also the largest pay TV market by value with over 36% share of the MENA region. It is dominated by DTH regional players like OSN and BeIn, as IPTV still remains limited in the country.
Exhibit 6: Online trends in KSA1
Saudi Arabia is the most advanced regarding infrastructure, among the populous and high GDP markets of the entire MENA region. As of 2016, it had 20.81 million Internet users, resulting in a penetration rate of 65%.9 As of 2015, 133% of the Saudi population were connected on mobile broadband.
According to Saudi's MCIT (Ministry of Communications and IT), there were 3.56 million subscriptions at the end of 2015 leading to a penetration of 61% for fixed broadband.
KSA’s provides the largest affluent connected population in the region
2018
KSA Mobile vs. Fixed BroadbandPenetration
120
100
140
160
180
80
60
40
20
02012 2013 2014 2015 2016 2017
74%
92%
109%
133%
150%
166%
174%
53% 58% 59% 61%65% 67% 70%
Mobile BB Fixed BB
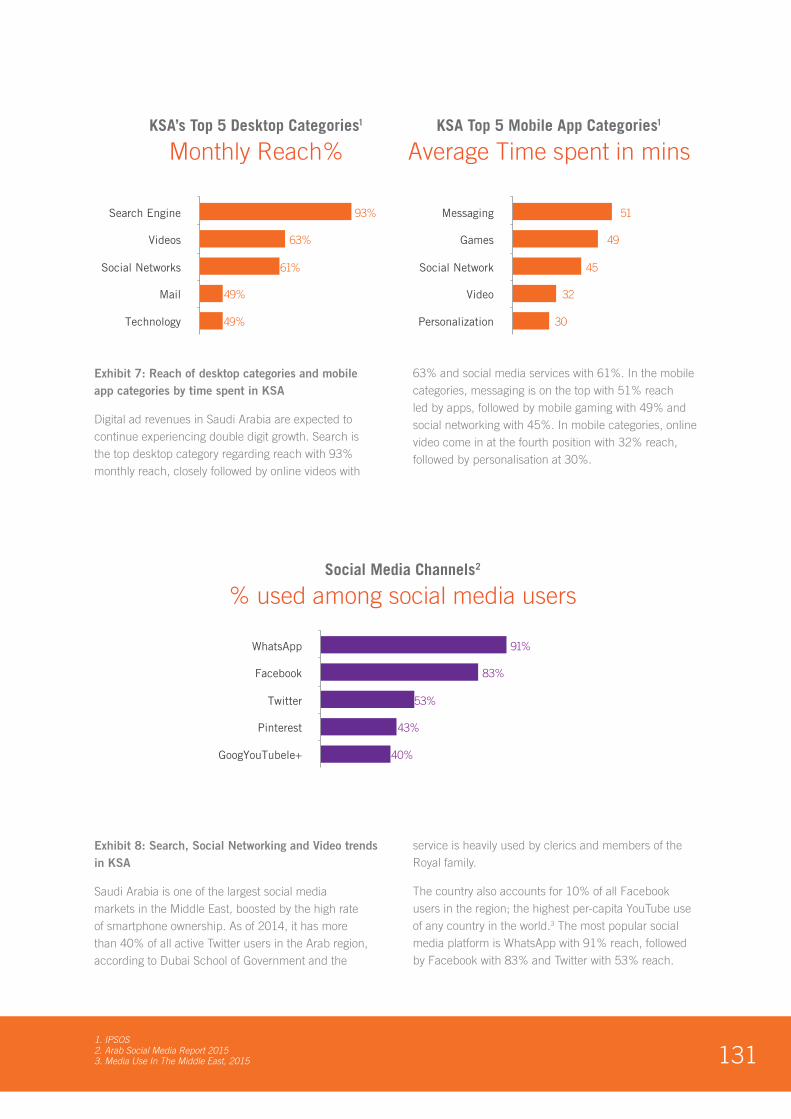
131
93%
63%
61%
49%
49%
Search Engine
Videos
Social Networks
Technology
Social Media Channels2
% used among social media users
KSA’s Top 5 Desktop Categories1
Monthly Reach%
51
49
45
32
30
Messaging
Games
Social Network
Video
Personalization
KSA Top 5 Mobile App Categories1
Average Time spent in mins
91%
83%
53%
43%
40%
GoogYouTubele+
1. IPSOS2. Arab Social Media Report 20153. Media Use In The Middle East, 2015
Exhibit 7: Reach of desktop categories and mobile app categories by time spent in KSA
Digital ad revenues in Saudi Arabia are expected to continue experiencing double digit growth. Search is the top desktop category regarding reach with 93% monthly reach, closely followed by online videos with
63% and social media services with 61%. In the mobile categories, messaging is on the top with 51% reach led by apps, followed by mobile gaming with 49% and social networking with 45%. In mobile categories, online video come in at the fourth position with 32% reach, followed by personalisation at 30%.
Exhibit 8: Search, Social Networking and Video trends in KSA
Saudi Arabia is one of the largest social media markets in the Middle East, boosted by the high rate of smartphone ownership. As of 2014, it has more than 40% of all active Twitter users in the Arab region, according to Dubai School of Government and the
service is heavily used by clerics and members of the Royal family.
The country also accounts for 10% of all Facebook users in the region; the highest per-capita YouTube use of any country in the world.3 The most popular social media platform is WhatsApp with 91% reach, followed by Facebook with 83% and Twitter with 53% reach.
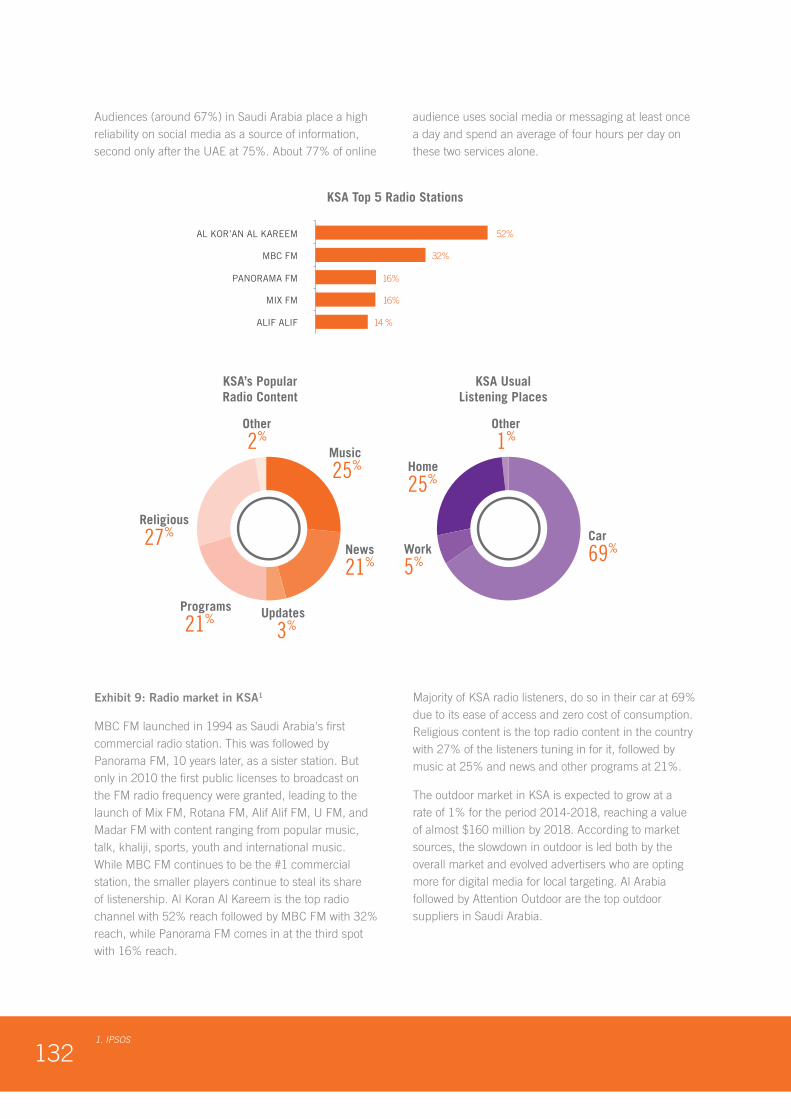
1321. IPSOS
Audiences (around 67%) in Saudi Arabia place a high reliability on social media as a source of information, second only after the UAE at 75%. About 77% of online
audience uses social media or messaging at least once a day and spend an average of four hours per day on these two services alone.
Exhibit 9: Radio market in KSA1
MBC FM launched in 1994 as Saudi Arabia's first commercial radio station. This was followed by Panorama FM, 10 years later, as a sister station. But only in 2010 the first public licenses to broadcast on the FM radio frequency were granted, leading to the launch of Mix FM, Rotana FM, Alif Alif FM, U FM, and Madar FM with content ranging from popular music, talk, khaliji, sports, youth and international music. While MBC FM continues to be the #1 commercial station, the smaller players continue to steal its share of listenership. Al Koran Al Kareem is the top radio channel with 52% reach followed by MBC FM with 32% reach, while Panorama FM comes in at the third spot with 16% reach.
Majority of KSA radio listeners, do so in their car at 69% due to its ease of access and zero cost of consumption. Religious content is the top radio content in the country with 27% of the listeners tuning in for it, followed by music at 25% and news and other programs at 21%.
The outdoor market in KSA is expected to grow at a rate of 1% for the period 2014-2018, reaching a value of almost $160 million by 2018. According to market sources, the slowdown in outdoor is led both by the overall market and evolved advertisers who are opting more for digital media for local targeting. Al Arabia followed by Attention Outdoor are the top outdoor suppliers in Saudi Arabia.
KSA Top 5 Radio Stations
52%
32%
16%
16%
14 %
AL KOR’AN AL KAREEM
MBC FM
PANORAMA FM
MIX FM
ALIF ALIF
KSA’s PopularRadio Content
KSA UsualListening Places
Programs
21%
Religious
27%
Other
2%Other
1%Music
25%
Car
69%Work
5%News
21%
Home
25%
Updates
3%

133
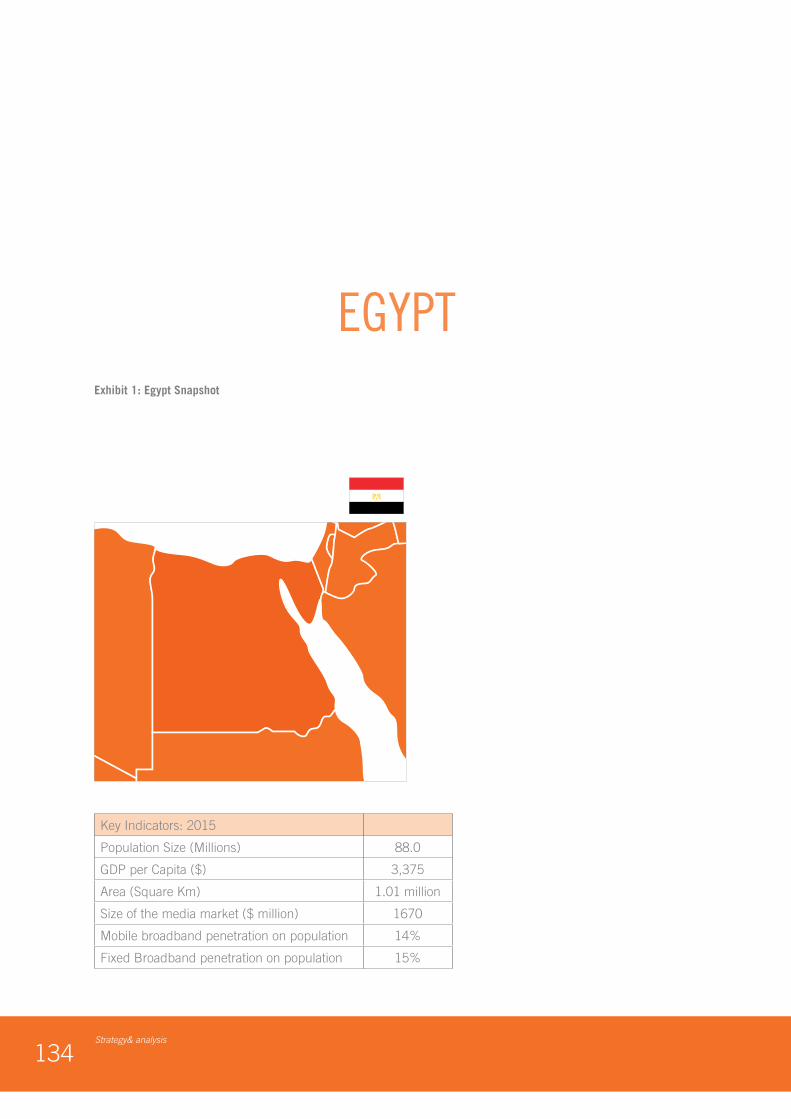
134Strategy& analysis
Exhibit 1: Egypt Snapshot
Key Indicators: 2015
Population Size (Millions) 88.0
GDP per Capita ($) 3,375
Area (Square Km) 1.01 million
Size of the media market ($ million) 1670
Mobile broadband penetration on population 14%
Fixed Broadband penetration on population 15%
EGYPT
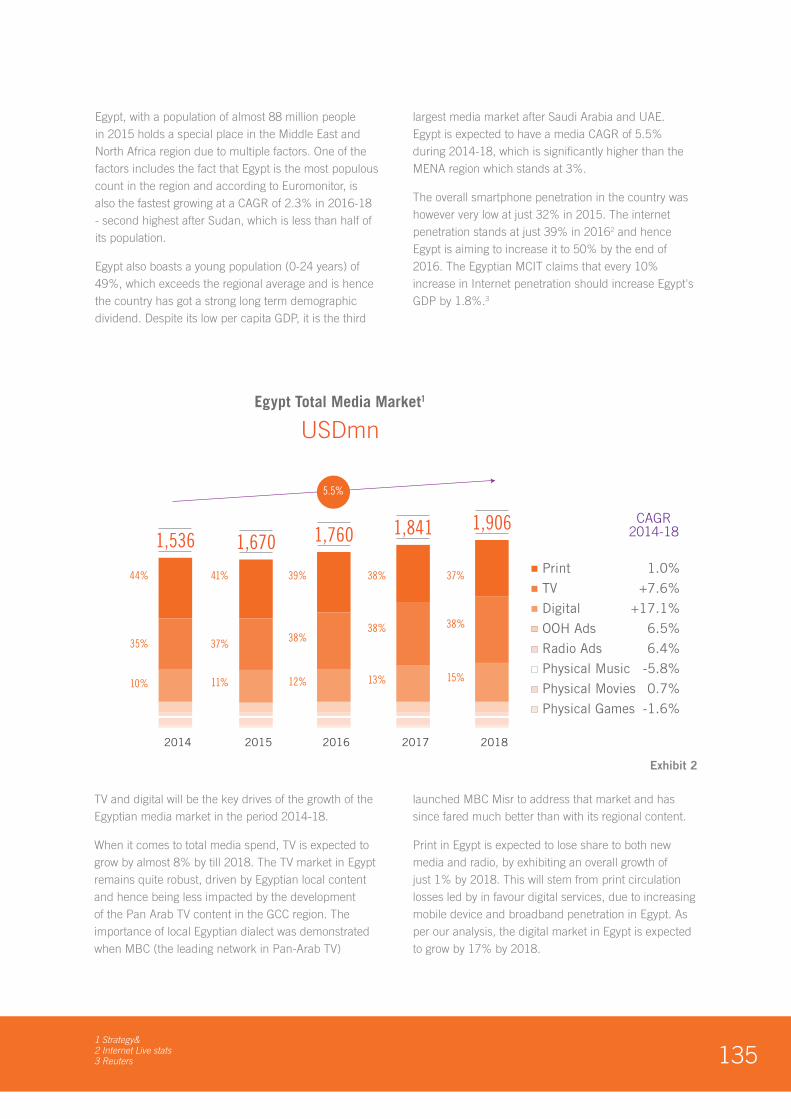
1351 Strategy& 2 Internet Live stats 3 Reuters
Egypt, with a population of almost 88 million people in 2015 holds a special place in the Middle East and North Africa region due to multiple factors. One of the factors includes the fact that Egypt is the most populous count in the region and according to Euromonitor, is also the fastest growing at a CAGR of 2.3% in 2016-18 - second highest after Sudan, which is less than half of its population.
Egypt also boasts a young population (0-24 years) of 49%, which exceeds the regional average and is hence the country has got a strong long term demographic dividend. Despite its low per capita GDP, it is the third
largest media market after Saudi Arabia and UAE. Egypt is expected to have a media CAGR of 5.5% during 2014-18, which is significantly higher than the MENA region which stands at 3%.
The overall smartphone penetration in the country was however very low at just 32% in 2015. The internet penetration stands at just 39% in 20162 and hence Egypt is aiming to increase it to 50% by the end of 2016. The Egyptian MCIT claims that every 10% increase in Internet penetration should increase Egypt's GDP by 1.8%.3
TV and digital will be the key drives of the growth of the Egyptian media market in the period 2014-18.
When it comes to total media spend, TV is expected to grow by almost 8% by till 2018. The TV market in Egypt remains quite robust, driven by Egyptian local content and hence being less impacted by the development of the Pan Arab TV content in the GCC region. The importance of local Egyptian dialect was demonstrated when MBC (the leading network in Pan-Arab TV)
launched MBC Misr to address that market and has since fared much better than with its regional content.
Print in Egypt is expected to lose share to both new media and radio, by exhibiting an overall growth of just 1% by 2018. This will stem from print circulation losses led by in favour digital services, due to increasing mobile device and broadband penetration in Egypt. As per our analysis, the digital market in Egypt is expected to grow by 17% by 2018.
2018
37%
38%
15%
Print 1.0%
TV +7.6%
Digital +17.1%
OOH Ads 6.5%
6.4%Radio Ads
Physical Music -5.8%
Physical Movies 0.7%
Physical Games -1.6%
Egypt Total Media Market1
USDmn
1,906
2017
38%
38%
13%
1,841
2016
39%
38%
12%
1,760
2014
44%
35%
10%
1,536
2015
41%
37%
11%
1,670CAGR
2014-18
5.5%
Exhibit 2
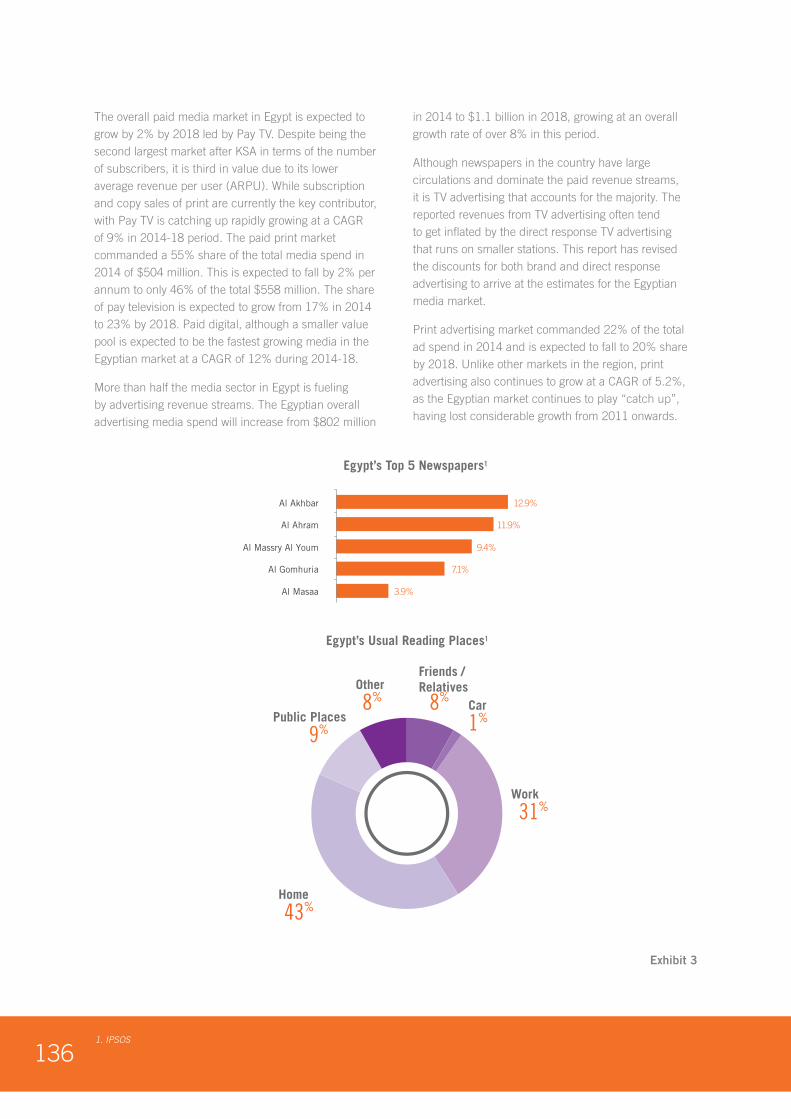
1361. IPSOS
The overall paid media market in Egypt is expected to grow by 2% by 2018 led by Pay TV. Despite being the second largest market after KSA in terms of the number of subscribers, it is third in value due to its lower average revenue per user (ARPU). While subscription and copy sales of print are currently the key contributor, with Pay TV is catching up rapidly growing at a CAGR of 9% in 2014-18 period. The paid print market commanded a 55% share of the total media spend in 2014 of $504 million. This is expected to fall by 2% per annum to only 46% of the total $558 million. The share of pay television is expected to grow from 17% in 2014 to 23% by 2018. Paid digital, although a smaller value pool is expected to be the fastest growing media in the Egyptian market at a CAGR of 12% during 2014-18.
More than half the media sector in Egypt is fueling by advertising revenue streams. The Egyptian overall advertising media spend will increase from $802 million
in 2014 to $1.1 billion in 2018, growing at an overall growth rate of over 8% in this period.
Although newspapers in the country have large circulations and dominate the paid revenue streams, it is TV advertising that accounts for the majority. The reported revenues from TV advertising often tend to get inflated by the direct response TV advertising that runs on smaller stations. This report has revised the discounts for both brand and direct response advertising to arrive at the estimates for the Egyptian media market.
Print advertising market commanded 22% of the total ad spend in 2014 and is expected to fall to 20% share by 2018. Unlike other markets in the region, print advertising also continues to grow at a CAGR of 5.2%, as the Egyptian market continues to play “catch up”, having lost considerable growth from 2011 onwards.
Exhibit 3
Egypt’s Top 5 Newspapers1
12.9%
11.9%
9.4%
7.1%
3.9%
Al Akhbar
Al Ahram
Al Massry Al Youm
Al Gomhuria
Al Masaa
Egypt’s Usual Reading Places1
Other
8%
Public Places
9%
Car
1%
Friends /Relatives
8%
Home
43%
Work
31%
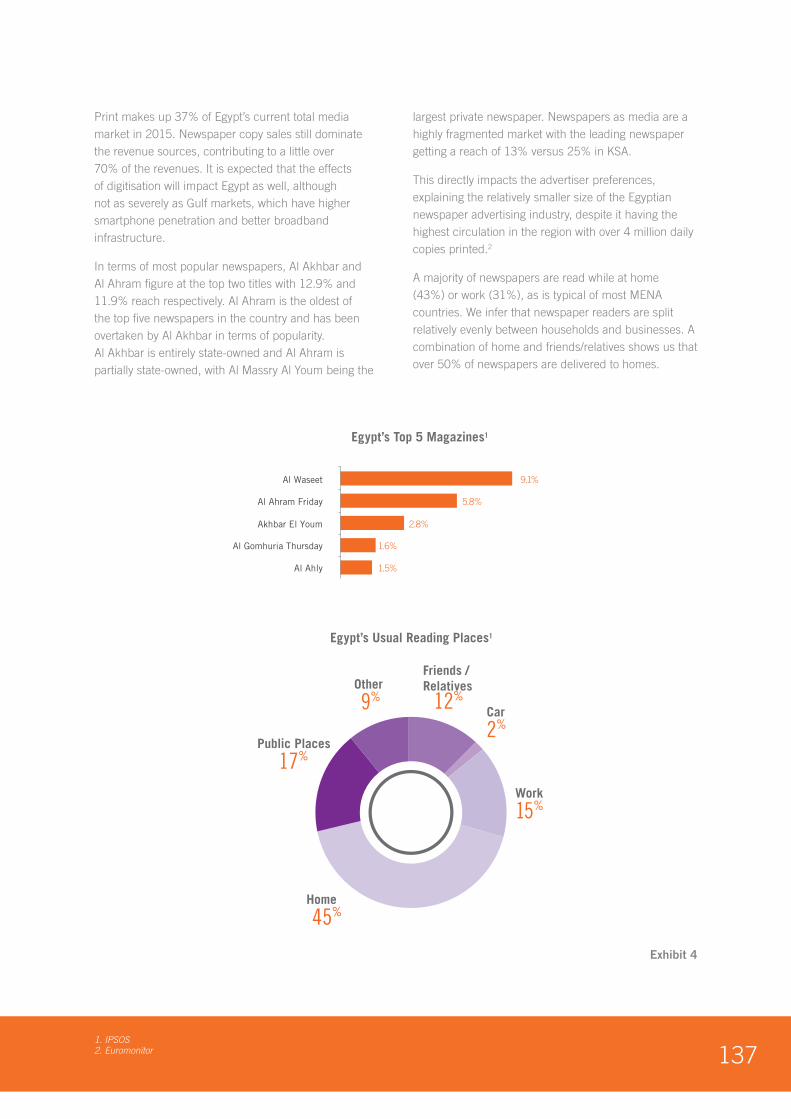
1371. IPSOS2. Euromonitor
Print makes up 37% of Egypt’s current total media market in 2015. Newspaper copy sales still dominate the revenue sources, contributing to a little over 70% of the revenues. It is expected that the effects of digitisation will impact Egypt as well, although not as severely as Gulf markets, which have higher smartphone penetration and better broadband infrastructure.
In terms of most popular newspapers, Al Akhbar and Al Ahram figure at the top two titles with 12.9% and 11.9% reach respectively. Al Ahram is the oldest of the top five newspapers in the country and has been overtaken by Al Akhbar in terms of popularity. Al Akhbar is entirely state-owned and Al Ahram is partially state-owned, with Al Massry Al Youm being the
largest private newspaper. Newspapers as media are a highly fragmented market with the leading newspaper getting a reach of 13% versus 25% in KSA.
This directly impacts the advertiser preferences, explaining the relatively smaller size of the Egyptian newspaper advertising industry, despite it having the highest circulation in the region with over 4 million daily copies printed.2
A majority of newspapers are read while at home (43%) or work (31%), as is typical of most MENA countries. We infer that newspaper readers are split relatively evenly between households and businesses. A combination of home and friends/relatives shows us that over 50% of newspapers are delivered to homes.
Exhibit 4
Egypt’s Top 5 Magazines1
9.1%
5.8%
2.8%
1.6%
1.5%
Al Waseet
Al Ahram Friday
Akhbar El Youm
Al Gomhuria Thursday
Al Ahly
Egypt’s Usual Reading Places1
Other
9%
Public Places
17%
Car
2%
Friends /Relatives
12%
Home
45%
Work
15%
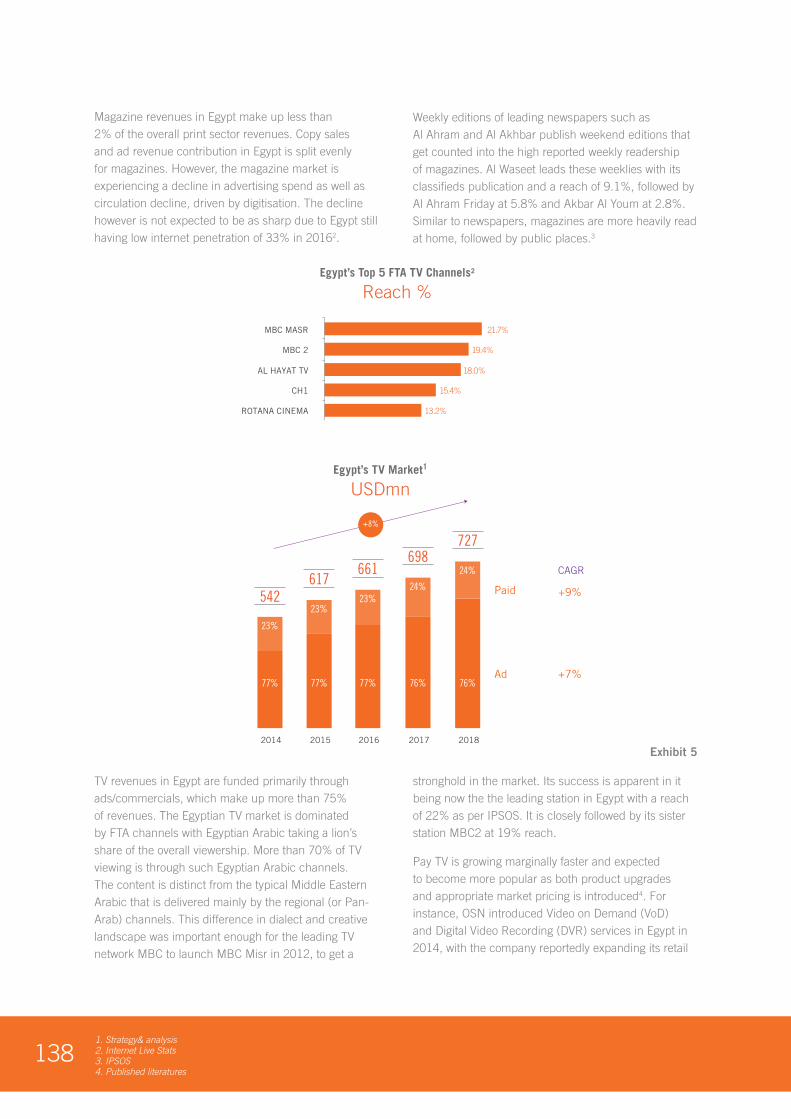
1381. Strategy& analysis 2. Internet Live Stats3. IPSOS4. Published literatures
Magazine revenues in Egypt make up less than 2% of the overall print sector revenues. Copy sales and ad revenue contribution in Egypt is split evenly for magazines. However, the magazine market is experiencing a decline in advertising spend as well as circulation decline, driven by digitisation. The decline however is not expected to be as sharp due to Egypt still having low internet penetration of 33% in 20162.
Weekly editions of leading newspapers such as Al Ahram and Al Akhbar publish weekend editions that get counted into the high reported weekly readership of magazines. Al Waseet leads these weeklies with its classifieds publication and a reach of 9.1%, followed by Al Ahram Friday at 5.8% and Akbar Al Youm at 2.8%. Similar to newspapers, magazines are more heavily read at home, followed by public places.3
TV revenues in Egypt are funded primarily through ads/commercials, which make up more than 75% of revenues. The Egyptian TV market is dominated by FTA channels with Egyptian Arabic taking a lion’s share of the overall viewership. More than 70% of TV viewing is through such Egyptian Arabic channels. The content is distinct from the typical Middle Eastern Arabic that is delivered mainly by the regional (or Pan-Arab) channels. This difference in dialect and creative landscape was important enough for the leading TV network MBC to launch MBC Misr in 2012, to get a
stronghold in the market. Its success is apparent in it being now the the leading station in Egypt with a reach of 22% as per IPSOS. It is closely followed by its sister station MBC2 at 19% reach.
Pay TV is growing marginally faster and expected to become more popular as both product upgrades and appropriate market pricing is introduced4. For instance, OSN introduced Video on Demand (VoD) and Digital Video Recording (DVR) services in Egypt in 2014, with the company reportedly expanding its retail
Egypt’s Top 5 FTA TV Channels2
Reach %
21.7%
19.4%
18.0%
15.4%
13.2%
MBC MASR
MBC 2
AL HAYAT TV
CH1
ROTANA CINEMA
Egypt’s TV Market1
USDmn
617
542
77%
23%
2014
77%
23%
2015
661
77%
23%
2016
698
76%
24%
2017
727
76%
24%
2018
+8%
Paid +9%
+7%Ad
CAGR
Exhibit 5
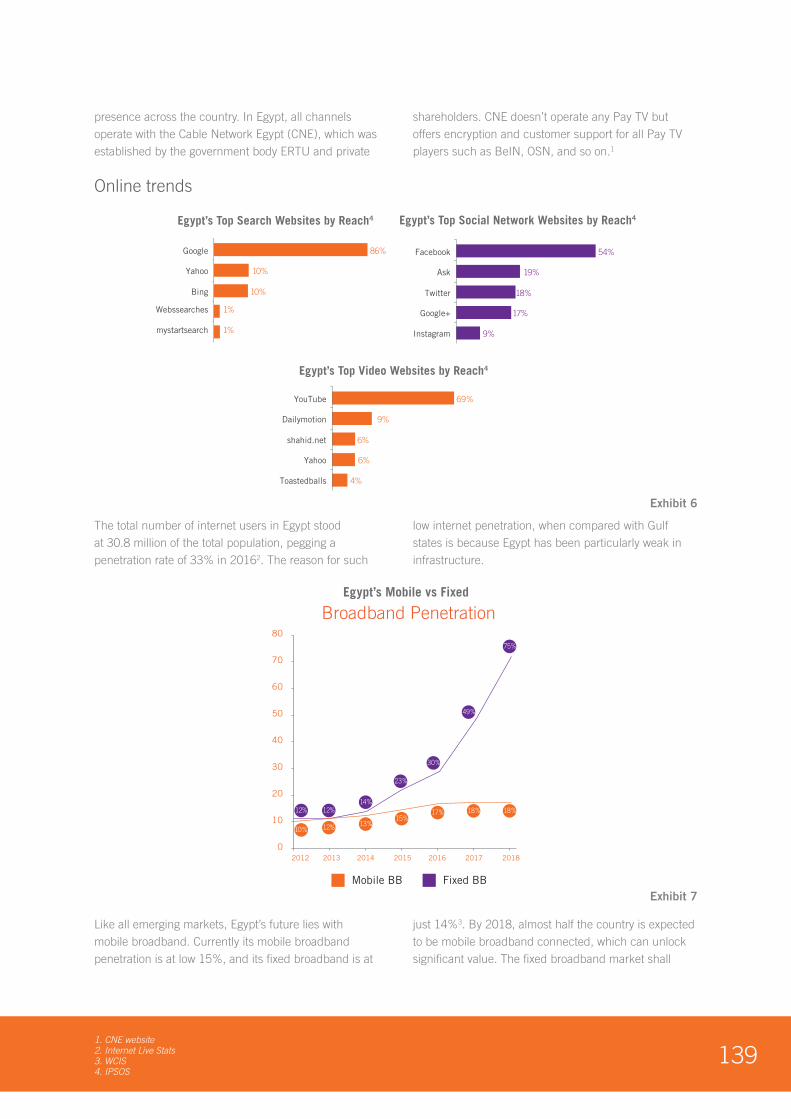
1391. CNE website2. Internet Live Stats3. WCIS 4. IPSOS
presence across the country. In Egypt, all channels operate with the Cable Network Egypt (CNE), which was established by the government body ERTU and private
shareholders. CNE doesn’t operate any Pay TV but offers encryption and customer support for all Pay TV players such as BeIN, OSN, and so on.1
The total number of internet users in Egypt stood at 30.8 million of the total population, pegging a penetration rate of 33% in 20162. The reason for such
low internet penetration, when compared with Gulf states is because Egypt has been particularly weak in infrastructure.
Egypt’s Top Search Websites by Reach4
86%
10%
10%
1%
1%
Yahoo
Bing
Webssearches
mystartsearch
Egypt’s Top Video Websites by Reach4
69%
9%
6%
6%
4%
YouTube
Dailymotion
shahid.net
Yahoo
Toastedballs
Egypt’s Top Social Network Websites by Reach4
54%
19%
18%
17%
9%
Ask
Google+
Mobile BB Fixed BB
2018
60
50
70
80
40
30
20
10
02012 2013 2014 2015 2016 2017
12% 12%14%
23%
30%
49%
75%
10% 12% 13%15%
17% 18% 18%
Egypt’s Mobile vs Fixed
Broadband Penetration
Exhibit 6
Exhibit 7
Online trends
Like all emerging markets, Egypt’s future lies with mobile broadband. Currently its mobile broadband penetration is at low 15%, and its fixed broadband is at
just 14%3. By 2018, almost half the country is expected to be mobile broadband connected, which can unlock significant value. The fixed broadband market shall
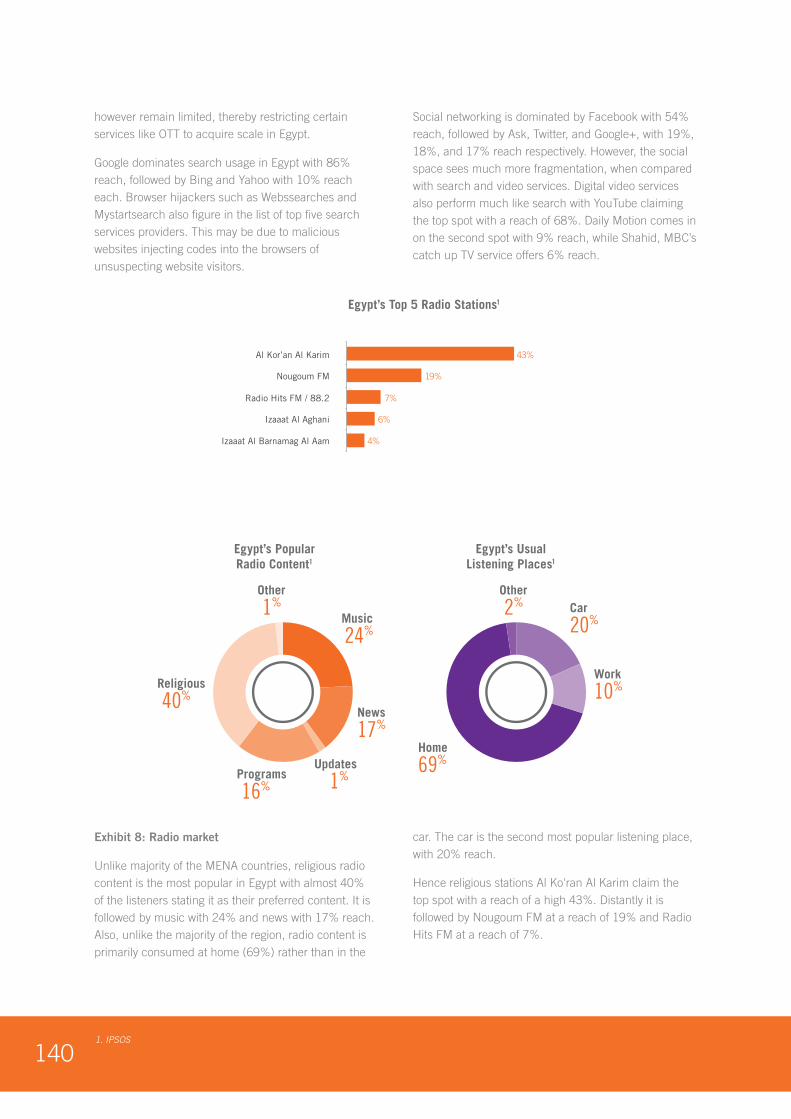
1401. IPSOS
however remain limited, thereby restricting certain services like OTT to acquire scale in Egypt.
Google dominates search usage in Egypt with 86% reach, followed by Bing and Yahoo with 10% reach each. Browser hijackers such as Webssearches and Mystartsearch also figure in the list of top five search services providers. This may be due to malicious websites injecting codes into the browsers of unsuspecting website visitors.
Social networking is dominated by Facebook with 54% reach, followed by Ask, Twitter, and Google+, with 19%, 18%, and 17% reach respectively. However, the social space sees much more fragmentation, when compared with search and video services. Digital video services also perform much like search with YouTube claiming the top spot with a reach of 68%. Daily Motion comes in on the second spot with 9% reach, while Shahid, MBC’s catch up TV service offers 6% reach.
Exhibit 8: Radio market
Unlike majority of the MENA countries, religious radio content is the most popular in Egypt with almost 40% of the listeners stating it as their preferred content. It is followed by music with 24% and news with 17% reach. Also, unlike the majority of the region, radio content is primarily consumed at home (69%) rather than in the
car. The car is the second most popular listening place, with 20% reach.
Hence religious stations Al Ko'ran Al Karim claim the top spot with a reach of a high 43%. Distantly it is followed by Nougoum FM at a reach of 19% and Radio Hits FM at a reach of 7%.
Egypt’s PopularRadio Content1
Egypt’s UsualListening Places1
Programs
16%
Religious
40%
Other
1%Other
2%Music
24%
Car
20%
Work
10%
News
17%
Home
69%Updates
1%
Egypt’s Top 5 Radio Stations1
43%
19%
7%
6%
4%
Al Kor’an Al Karim
Nougoum FM
Radio Hits FM / 88.2
Izaaat Al Aghani
Izaaat Al Barnamag Al Aam
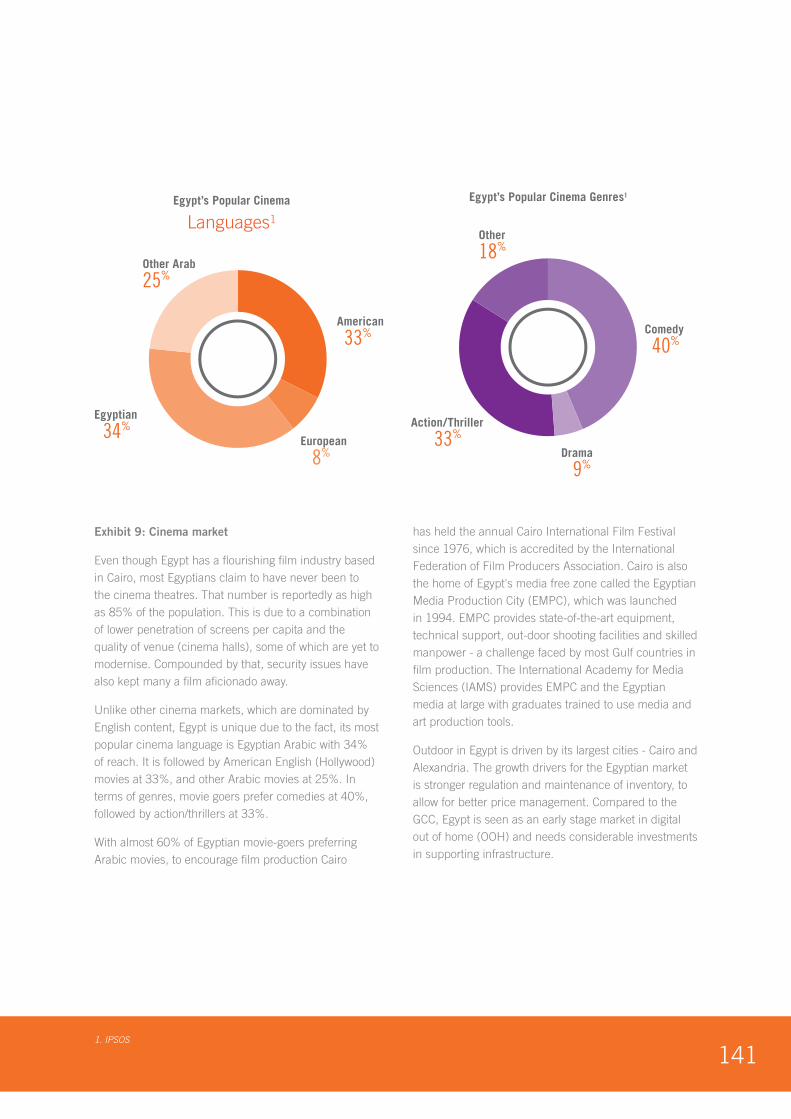
1411. IPSOS
Exhibit 9: Cinema market
Even though Egypt has a flourishing film industry based in Cairo, most Egyptians claim to have never been to the cinema theatres. That number is reportedly as high as 85% of the population. This is due to a combination of lower penetration of screens per capita and the quality of venue (cinema halls), some of which are yet to modernise. Compounded by that, security issues have also kept many a film aficionado away.
Unlike other cinema markets, which are dominated by English content, Egypt is unique due to the fact, its most popular cinema language is Egyptian Arabic with 34% of reach. It is followed by American English (Hollywood) movies at 33%, and other Arabic movies at 25%. In terms of genres, movie goers prefer comedies at 40%, followed by action/thrillers at 33%.
With almost 60% of Egyptian movie-goers preferring Arabic movies, to encourage film production Cairo
has held the annual Cairo International Film Festival since 1976, which is accredited by the International Federation of Film Producers Association. Cairo is also the home of Egypt's media free zone called the Egyptian Media Production City (EMPC), which was launched in 1994. EMPC provides state-of-the-art equipment, technical support, out-door shooting facilities and skilled manpower - a challenge faced by most Gulf countries in film production. The International Academy for Media Sciences (IAMS) provides EMPC and the Egyptian media at large with graduates trained to use media and art production tools.
Outdoor in Egypt is driven by its largest cities - Cairo and Alexandria. The growth drivers for the Egyptian market is stronger regulation and maintenance of inventory, to allow for better price management. Compared to the GCC, Egypt is seen as an early stage market in digital out of home (OOH) and needs considerable investments in supporting infrastructure.
Egypt’s Popular Cinema
Languages1
Egypt’s Popular Cinema Genres1
Other
18%
Action/Thriller
33%
Drama
9%
Comedy
40%
Other Arab
25%
Egyptian
34%European
8%
American
33%
Egypt’s Popular Cinema
Languages1
Egypt’s Popular Cinema Genres1
Other
18%
Action/Thriller
33%
Drama
9%
Comedy
40%
Other Arab
25%
Egyptian
34%European
8%
American
33%

142
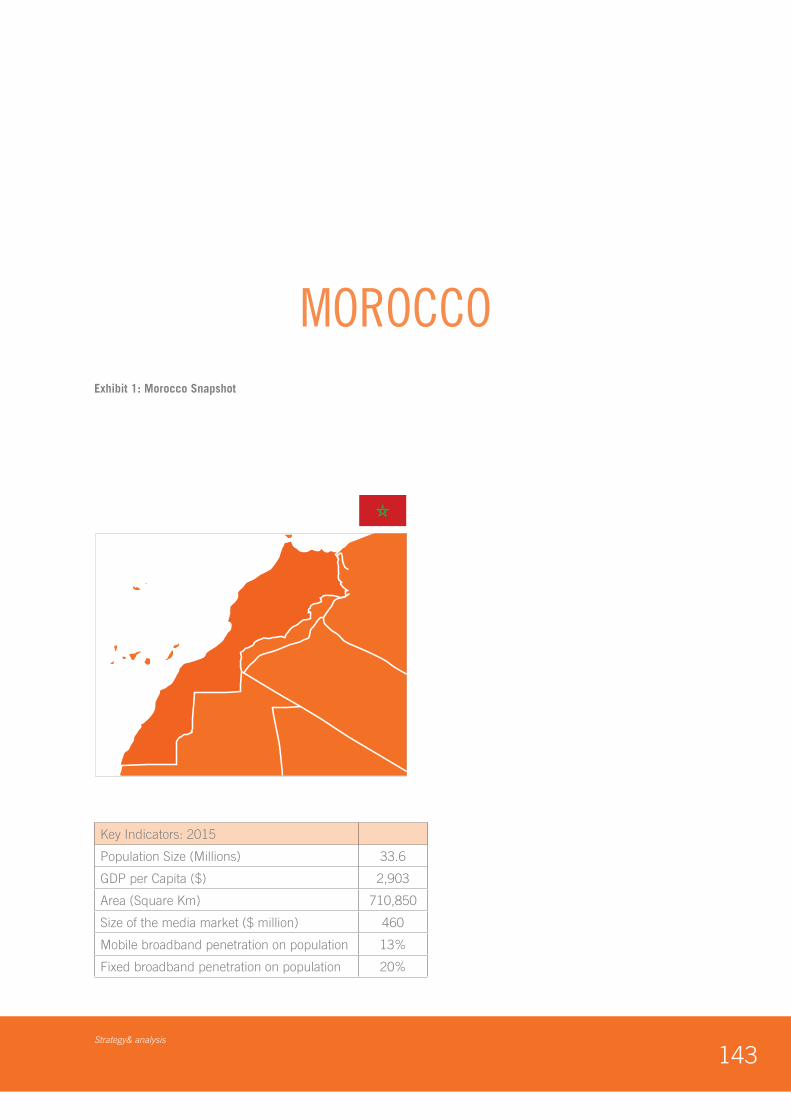
143Strategy& analysis
Exhibit 1: Morocco Snapshot
Key Indicators: 2015
Population Size (Millions) 33.6
GDP per Capita ($) 2,903
Area (Square Km) 710,850
Size of the media market ($ million) 460
Mobile broadband penetration on population 13%
Fixed broadband penetration on population 20%
MOROCCO
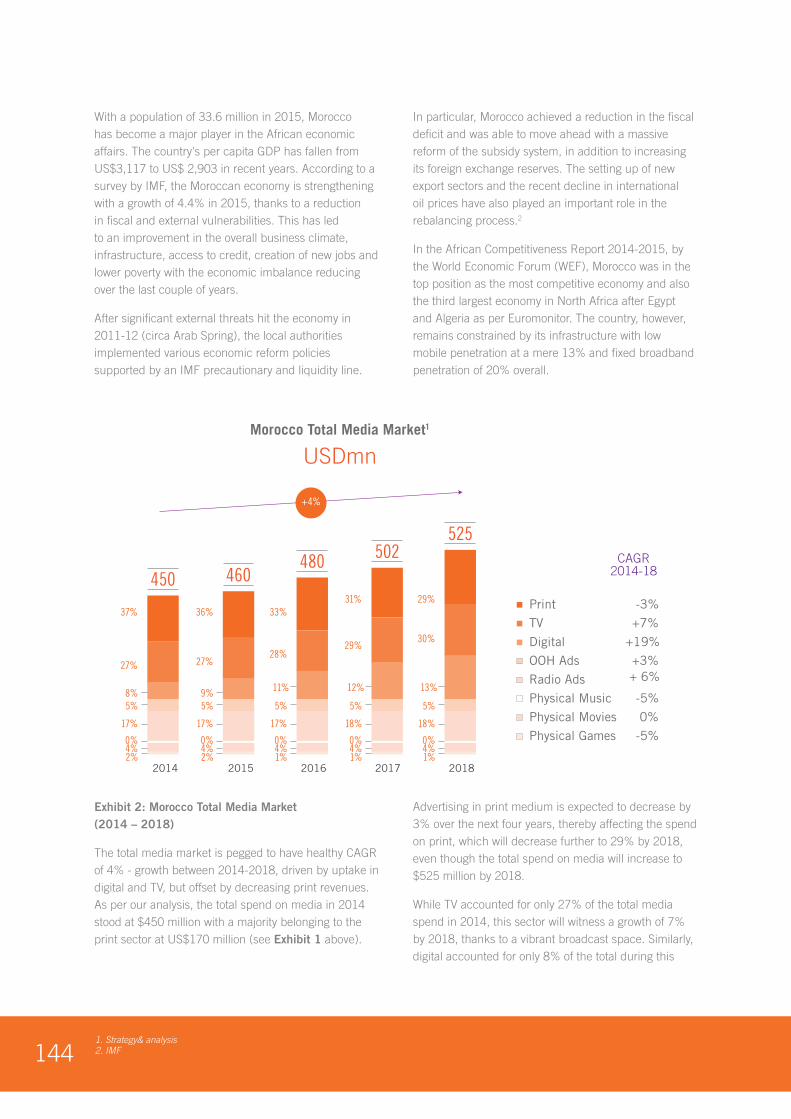
1441. Strategy& analysis2. IMF
With a population of 33.6 million in 2015, Morocco has become a major player in the African economic affairs. The country's per capita GDP has fallen from US$3,117 to US$ 2,903 in recent years. According to a survey by IMF, the Moroccan economy is strengthening with a growth of 4.4% in 2015, thanks to a reduction in fiscal and external vulnerabilities. This has led to an improvement in the overall business climate, infrastructure, access to credit, creation of new jobs and lower poverty with the economic imbalance reducing over the last couple of years.
After significant external threats hit the economy in 2011-12 (circa Arab Spring), the local authorities implemented various economic reform policies supported by an IMF precautionary and liquidity line.
In particular, Morocco achieved a reduction in the fiscal deficit and was able to move ahead with a massive reform of the subsidy system, in addition to increasing its foreign exchange reserves. The setting up of new export sectors and the recent decline in international oil prices have also played an important role in the rebalancing process.2
In the African Competitiveness Report 2014-2015, by the World Economic Forum (WEF), Morocco was in the top position as the most competitive economy and also the third largest economy in North Africa after Egypt and Algeria as per Euromonitor. The country, however, remains constrained by its infrastructure with low mobile penetration at a mere 13% and fixed broadband penetration of 20% overall.
Exhibit 2: Morocco Total Media Market (2014 – 2018)
The total media market is pegged to have healthy CAGR of 4% - growth between 2014-2018, driven by uptake in digital and TV, but offset by decreasing print revenues. As per our analysis, the total spend on media in 2014 stood at $450 million with a majority belonging to the print sector at US$170 million (see Exhibit 1 above).
Advertising in print medium is expected to decrease by 3% over the next four years, thereby affecting the spend on print, which will decrease further to 29% by 2018, even though the total spend on media will increase to $525 million by 2018.
While TV accounted for only 27% of the total media spend in 2014, this sector will witness a growth of 7% by 2018, thanks to a vibrant broadcast space. Similarly, digital accounted for only 8% of the total during this
2018
Print -3%
TV +7%
Digital +19%
OOH Ads +3%+ 6%Radio Ads
Physical Music -5%
Physical Movies 0%
Physical Games -5%
Morocco Total Media Market1
USDmn
201720162014
37%
27%
8%5%
17%
0%4%2%
450
2015
CAGR2014-18
+4%
36%
27%
9%5%
17%
0%4%2%
460
33%
28%
11%
5%
17%
0%4%1%
480
31%
29%
12%
5%
18%
0%4%1%
502
29%
30%
13%
5%
18%
0%4%1%
525
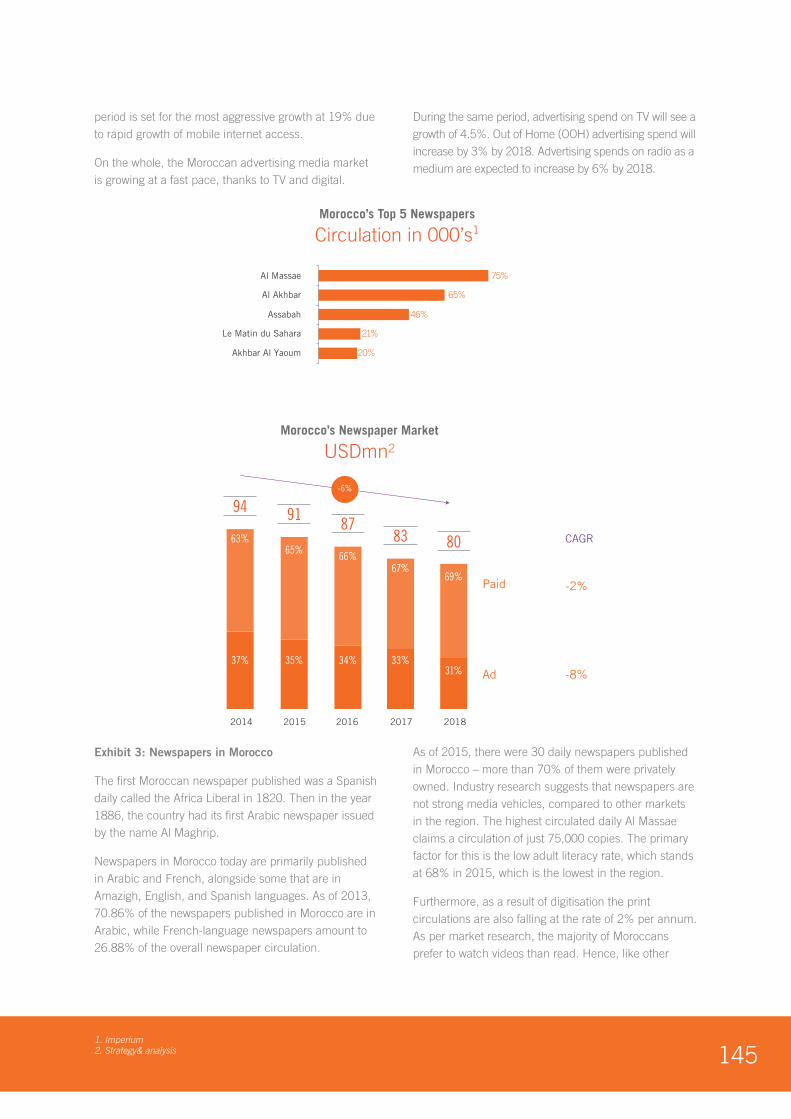
1451. Imperium2. Strategy& analysis
period is set for the most aggressive growth at 19% due to rapid growth of mobile internet access.
On the whole, the Moroccan advertising media market is growing at a fast pace, thanks to TV and digital.
During the same period, advertising spend on TV will see a growth of 4.5%. Out of Home (OOH) advertising spend will increase by 3% by 2018. Advertising spends on radio as a medium are expected to increase by 6% by 2018.
Exhibit 3: Newspapers in Morocco
The first Moroccan newspaper published was a Spanish daily called the Africa Liberal in 1820. Then in the year 1886, the country had its first Arabic newspaper issued by the name Al Maghrip.
Newspapers in Morocco today are primarily published in Arabic and French, alongside some that are in Amazigh, English, and Spanish languages. As of 2013, 70.86% of the newspapers published in Morocco are in Arabic, while French-language newspapers amount to 26.88% of the overall newspaper circulation.
As of 2015, there were 30 daily newspapers published in Morocco – more than 70% of them were privately owned. Industry research suggests that newspapers are not strong media vehicles, compared to other markets in the region. The highest circulated daily Al Massae claims a circulation of just 75,000 copies. The primary factor for this is the low adult literacy rate, which stands at 68% in 2015, which is the lowest in the region.
Furthermore, as a result of digitisation the print circulations are also falling at the rate of 2% per annum. As per market research, the majority of Moroccans prefer to watch videos than read. Hence, like other
Morocco’s Newspaper Market
USDmn2
Morocco’s Top 5 Newspapers
Circulation in 000’s1
83 80
31%
69%
2014
33%
67%
2015
87
34%
66%
2016
91
35%
65%
2017
94
37%
63%
2018
-6%
Paid -2%
-8%Ad
CAGR
75%
65%
46%
21%
20%
Al Massae
Al Akhbar
Assabah
Le Matin du Sahara
Akhbar Al Yaoum
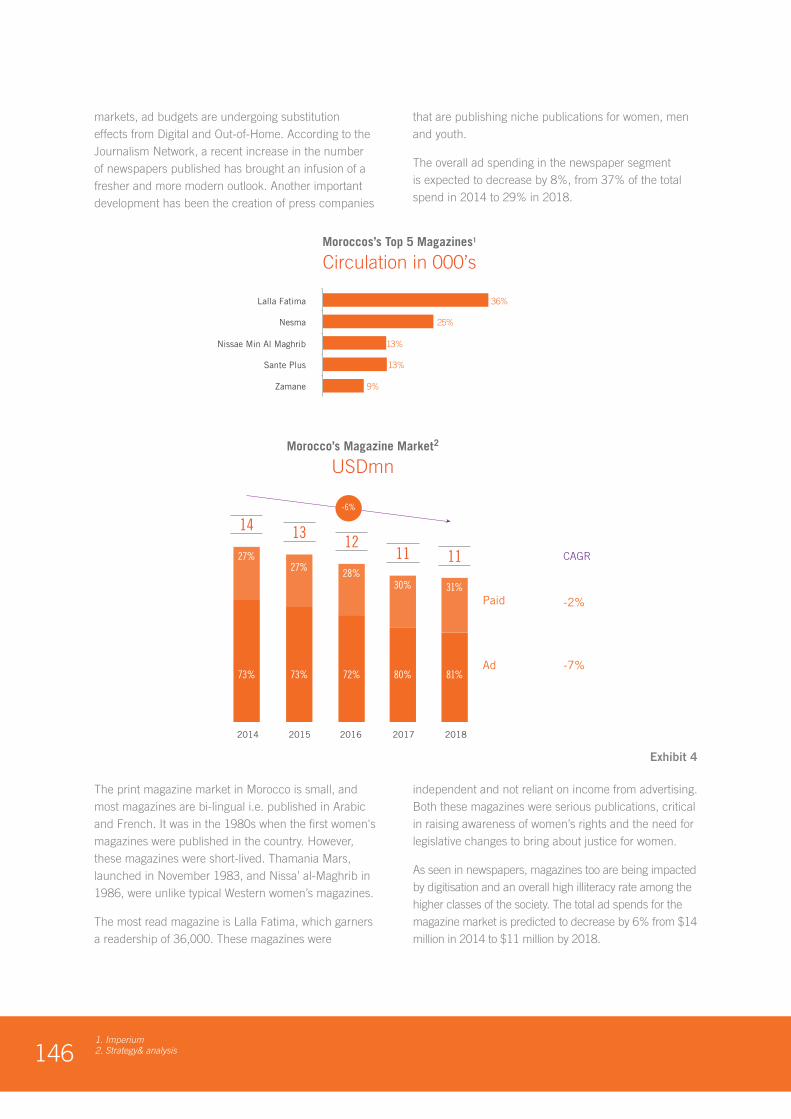
1461. Imperium2. Strategy& analysis
markets, ad budgets are undergoing substitution effects from Digital and Out-of-Home. According to the Journalism Network, a recent increase in the number of newspapers published has brought an infusion of a fresher and more modern outlook. Another important development has been the creation of press companies
that are publishing niche publications for women, men and youth.
The overall ad spending in the newspaper segment is expected to decrease by 8%, from 37% of the total spend in 2014 to 29% in 2018.
The print magazine market in Morocco is small, and most magazines are bi-lingual i.e. published in Arabic and French. It was in the 1980s when the first women's magazines were published in the country. However, these magazines were short-lived. Thamania Mars, launched in November 1983, and Nissa’ al-Maghrib in 1986, were unlike typical Western women’s magazines.
The most read magazine is Lalla Fatima, which garners a readership of 36,000. These magazines were
independent and not reliant on income from advertising. Both these magazines were serious publications, critical in raising awareness of women’s rights and the need for legislative changes to bring about justice for women.
As seen in newspapers, magazines too are being impacted by digitisation and an overall high illiteracy rate among the higher classes of the society. The total ad spends for the magazine market is predicted to decrease by 6% from $14 million in 2014 to $11 million by 2018.
Morocco’s Magazine Market2
USDmn
Moroccos’s Top 5 Magazines1
Circulation in 000’s
11 11
81%
31%
2014
80%
30%
2015
12
72%
28%
2016
13
73%
27%
2017
14
73%
27%
2018
-6%
Paid -2%
-7%Ad
CAGR
36%
25%
13%
13%
9%
Lalla Fatima
Nesma
Nissae Min Al Maghrib
Sante Plus
Zamane
Exhibit 4
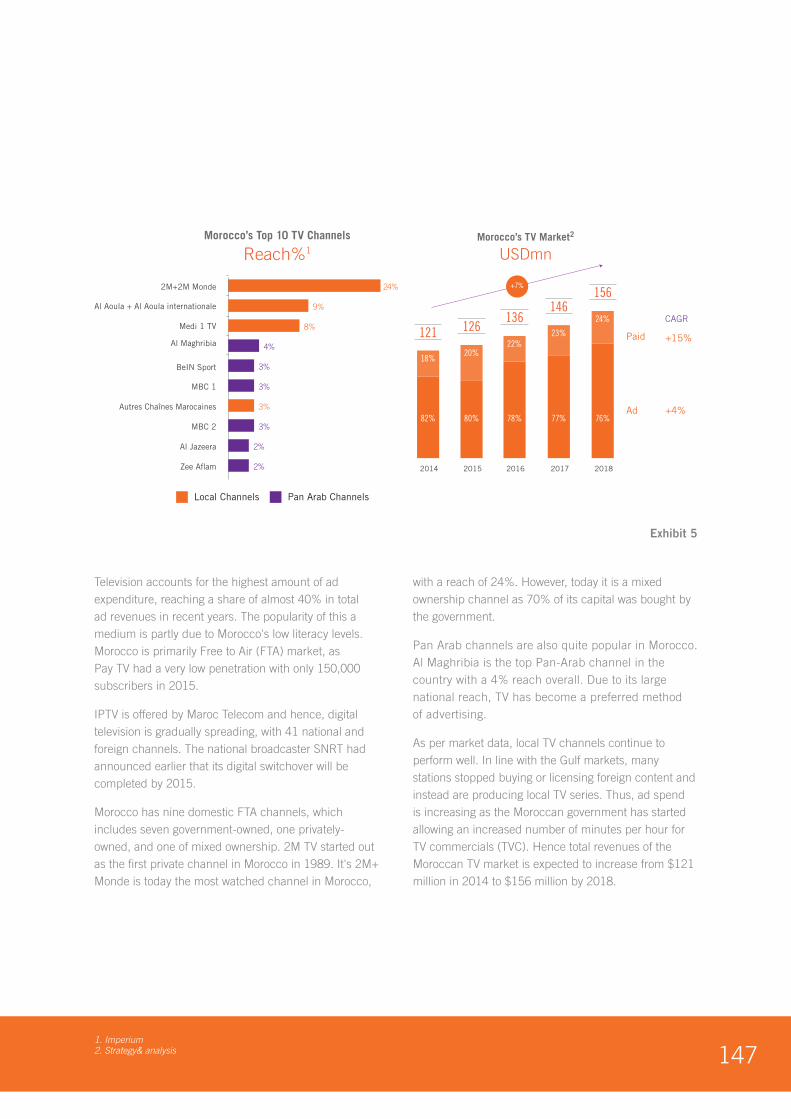
1471. Imperium2. Strategy& analysis
Television accounts for the highest amount of ad expenditure, reaching a share of almost 40% in total ad revenues in recent years. The popularity of this a medium is partly due to Morocco's low literacy levels. Morocco is primarily Free to Air (FTA) market, as Pay TV had a very low penetration with only 150,000 subscribers in 2015.
IPTV is offered by Maroc Telecom and hence, digital television is gradually spreading, with 41 national and foreign channels. The national broadcaster SNRT had announced earlier that its digital switchover will be completed by 2015.
Morocco has nine domestic FTA channels, which includes seven government-owned, one privately-owned, and one of mixed ownership. 2M TV started out as the first private channel in Morocco in 1989. It's 2M+ Monde is today the most watched channel in Morocco,
with a reach of 24%. However, today it is a mixed ownership channel as 70% of its capital was bought by the government.
Pan Arab channels are also quite popular in Morocco. Al Maghribia is the top Pan-Arab channel in the country with a 4% reach overall. Due to its large national reach, TV has become a preferred method of advertising.
As per market data, local TV channels continue to perform well. In line with the Gulf markets, many stations stopped buying or licensing foreign content and instead are producing local TV series. Thus, ad spend is increasing as the Moroccan government has started allowing an increased number of minutes per hour for TV commercials (TVC). Hence total revenues of the Moroccan TV market is expected to increase from $121 million in 2014 to $156 million by 2018.
Local Channels Pan Arab Channels
Morocco’s TV Market2
USDmn
Morocco’s Top 10 TV Channels
Reach%1
126121
82%
18%
2014
80%
20%
2015
136
78%
22%
2016
146
77%
23%
2017
156
76%
24%
2018
+7%
Paid +15%
+4%Ad
CAGR
24%
9%
8%
4%
3%
3%
3%
3%
2%
2%
2M+2M Monde
Al Aoula + Al Aoula internationale
Medi 1 TV
Al Maghribia
BeIN Sport
MBC 1
Autres Chaînes Marocaines
MBC 2
Al Jazeera
Zee Aflam
Exhibit 5
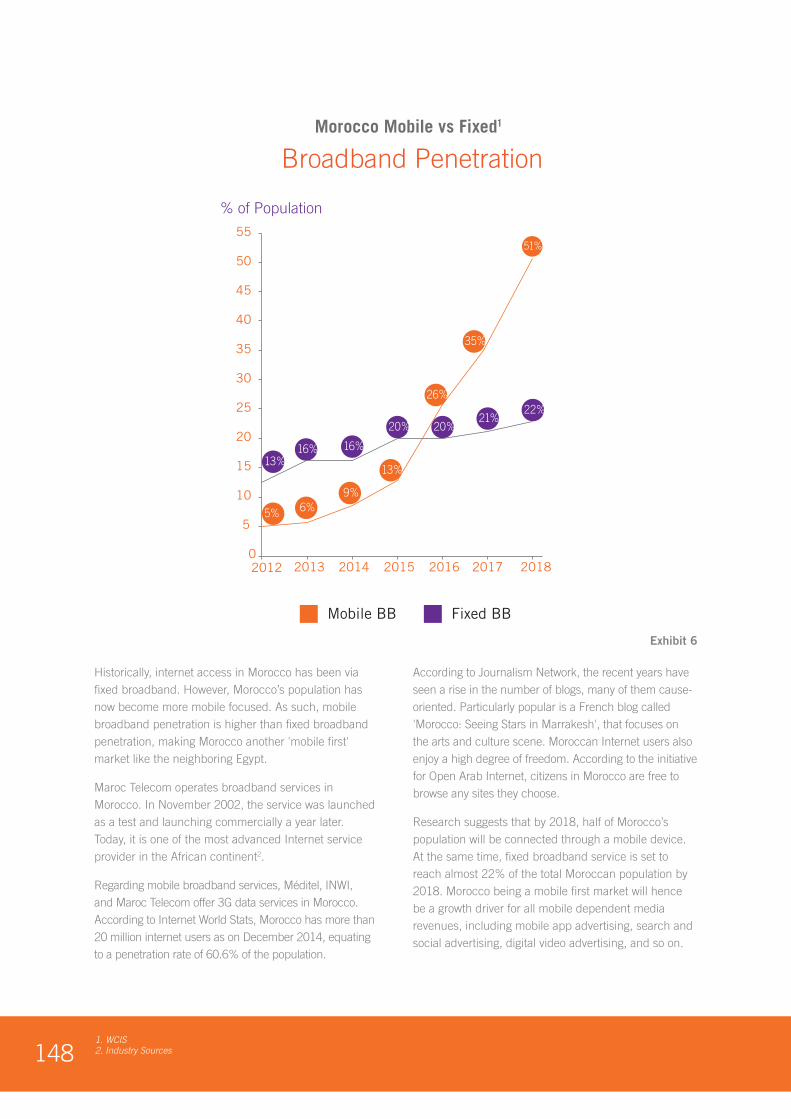
1481. WCIS2. Industry Sources
Historically, internet access in Morocco has been via fixed broadband. However, Morocco’s population has now become more mobile focused. As such, mobile broadband penetration is higher than fixed broadband penetration, making Morocco another 'mobile first' market like the neighboring Egypt.
Maroc Telecom operates broadband services in Morocco. In November 2002, the service was launched as a test and launching commercially a year later. Today, it is one of the most advanced Internet service provider in the African continent2.
Regarding mobile broadband services, Méditel, INWI, and Maroc Telecom offer 3G data services in Morocco. According to Internet World Stats, Morocco has more than 20 million internet users as on December 2014, equating to a penetration rate of 60.6% of the population.
According to Journalism Network, the recent years have seen a rise in the number of blogs, many of them cause-oriented. Particularly popular is a French blog called 'Morocco: Seeing Stars in Marrakesh', that focuses on the arts and culture scene. Moroccan Internet users also enjoy a high degree of freedom. According to the initiative for Open Arab Internet, citizens in Morocco are free to browse any sites they choose.
Research suggests that by 2018, half of Morocco’s population will be connected through a mobile device. At the same time, fixed broadband service is set to reach almost 22% of the total Moroccan population by 2018. Morocco being a mobile first market will hence be a growth driver for all mobile dependent media revenues, including mobile app advertising, search and social advertising, digital video advertising, and so on.
Morocco Mobile vs Fixed1
Broadband Penetration
2018
% of Population
30
25
35
40
45
50
55
20
15
10
5
02012 2013 2014 2015 2016 2017
13%
5% 6%9%
13%
26%
35%
51%
16% 16%
20% 20%21%
22%
Mobile BB Fixed BB
Exhibit 6
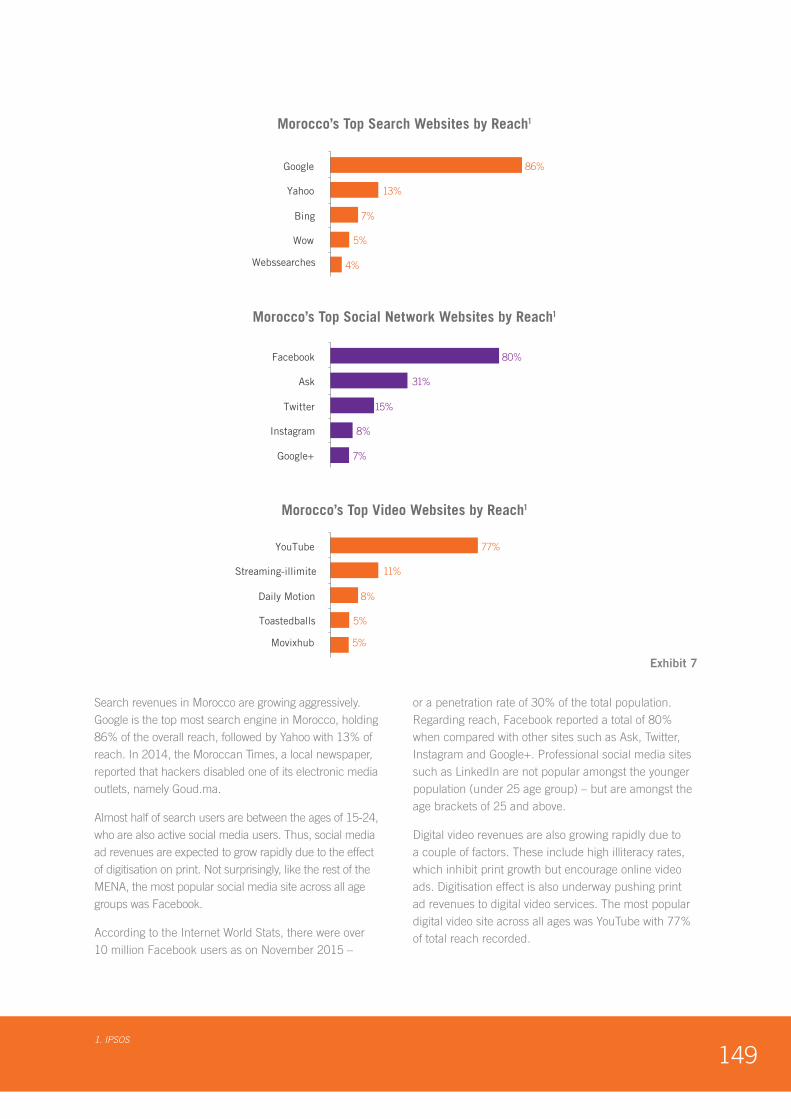
1491. IPSOS
Search revenues in Morocco are growing aggressively. Google is the top most search engine in Morocco, holding 86% of the overall reach, followed by Yahoo with 13% of reach. In 2014, the Moroccan Times, a local newspaper, reported that hackers disabled one of its electronic media outlets, namely Goud.ma.
Almost half of search users are between the ages of 15-24, who are also active social media users. Thus, social media ad revenues are expected to grow rapidly due to the effect of digitisation on print. Not surprisingly, like the rest of the MENA, the most popular social media site across all age groups was Facebook.
According to the Internet World Stats, there were over 10 million Facebook users as on November 2015 –
or a penetration rate of 30% of the total population. Regarding reach, Facebook reported a total of 80% when compared with other sites such as Ask, Twitter, Instagram and Google+. Professional social media sites such as LinkedIn are not popular amongst the younger population (under 25 age group) – but are amongst the age brackets of 25 and above.
Digital video revenues are also growing rapidly due to a couple of factors. These include high illiteracy rates, which inhibit print growth but encourage online video ads. Digitisation effect is also underway pushing print ad revenues to digital video services. The most popular digital video site across all ages was YouTube with 77% of total reach recorded.
Morocco’s Top Search Websites by Reach1
86%
13%
7%
5%
4%
Yahoo
Bing
Wow
Webssearches
Morocco’s Top Video Websites by Reach1
77%
11%
8%
5%
5%
YouTube
Streaming-illimite
Daily Motion
Toastedballs
Movixhub
Morocco’s Top Social Network Websites by Reach1
80%
31%
15%
8%
7%
Ask
Google+
Exhibit 7

1501. IPSOS
Morocco has a healthy radio market growing at a CAGR of 6%. The government owns many key media outlets, including radio, TV stations and the press agency, Maghreb Arab Press.
Moroccans have access to approximately 27 AM radio stations, 25 FM radio stations, and six short-wave stations. Growth in the advertising spend is primarily driven by the country’s high population and the large number of cars. Thus, the number of morning radio
listeners tuning in between 9 to 11 AM is at the peak in Morocco.
According to IPSOS research, Radio Mohamed VI is the top radio channel, offering an 18% overall reach, closely followed by MFM with 15% reach and MED 1 with 12% reach. FM Radio remains a surprisingly large market despite it being a large country as all the major multi-regional stations have extended their coverage, such as Hit Radio, Aswat, and so on.
Morocco’s Top 5 Radio Stations1
Reach %
18%
15%
12%
11%
10%
Radio Mohamed VI
MFM
MED 1
MED Radio
Al Ida Al Wataniya
Exhibit 8
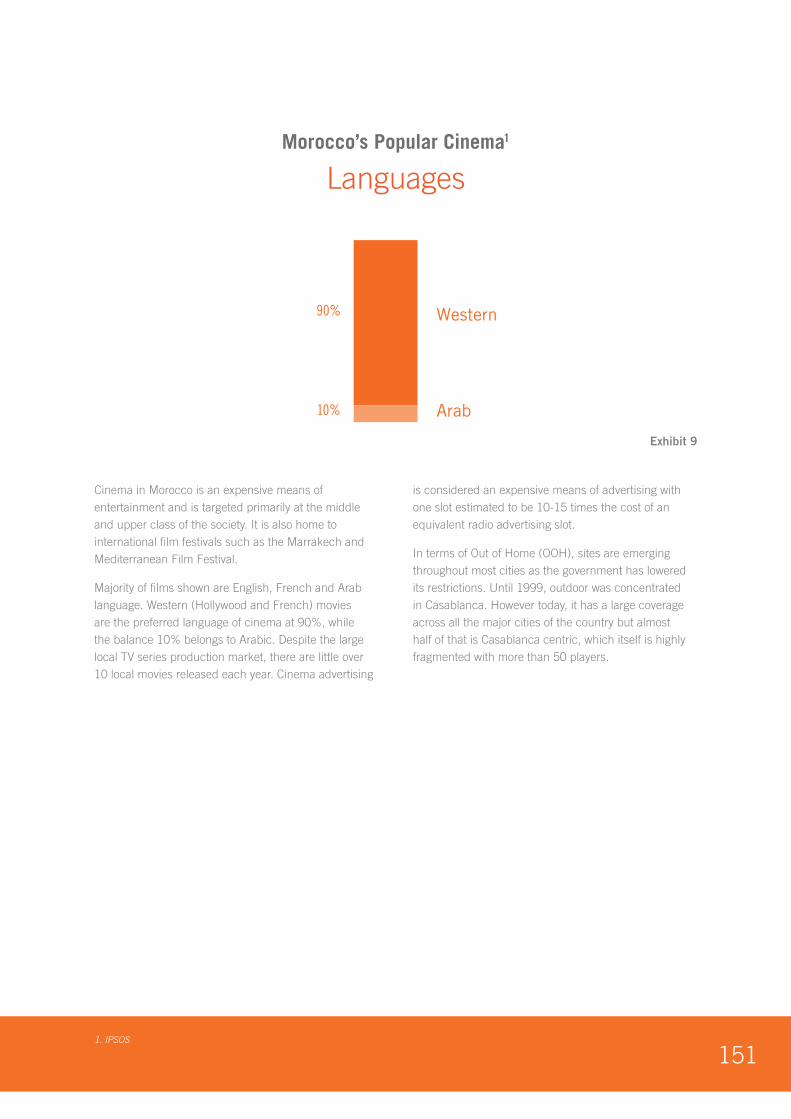
1511. IPSOS
Cinema in Morocco is an expensive means of entertainment and is targeted primarily at the middle and upper class of the society. It is also home to international film festivals such as the Marrakech and Mediterranean Film Festival.
Majority of films shown are English, French and Arab language. Western (Hollywood and French) movies are the preferred language of cinema at 90%, while the balance 10% belongs to Arabic. Despite the large local TV series production market, there are little over 10 local movies released each year. Cinema advertising
is considered an expensive means of advertising with one slot estimated to be 10-15 times the cost of an equivalent radio advertising slot.
In terms of Out of Home (OOH), sites are emerging throughout most cities as the government has lowered its restrictions. Until 1999, outdoor was concentrated in Casablanca. However today, it has a large coverage across all the major cities of the country but almost half of that is Casablanca centric, which itself is highly fragmented with more than 50 players.
Western
Arab
90%
10%
Morocco’s Popular Cinema1
Languages
Exhibit 9

152
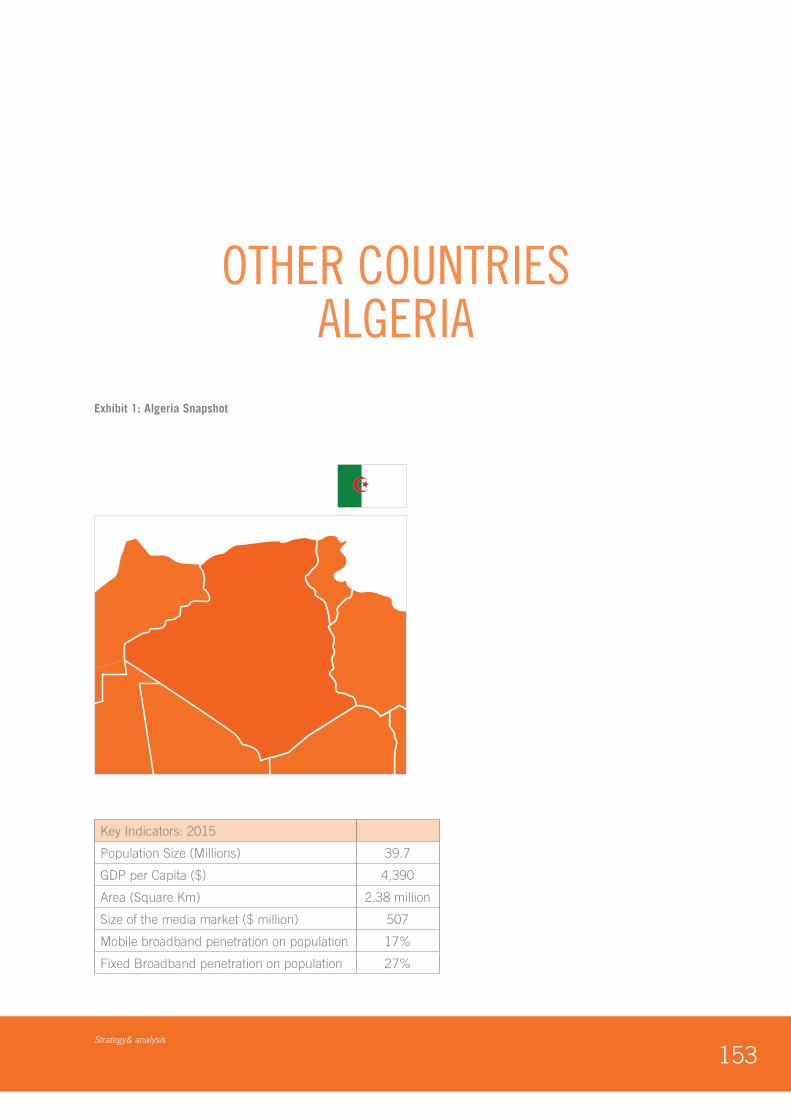
153Strategy& analysis
Exhibit 1: Algeria Snapshot
Key Indicators: 2015
Population Size (Millions) 39.7
GDP per Capita ($) 4,390
Area (Square Km) 2.38 million
Size of the media market ($ million) 507
Mobile broadband penetration on population 17%
Fixed Broadband penetration on population 27%
OTHER COUNTRIESALGERIA

1541. Strategy& analysis
Algeria is a North African country with a Mediterranean coastline. Its Sahara desert interior covers more than four-fifths of the land. The country supplies large amount of natural gas to Europe and energy exports, making it the backbone of the economy.
Low oil prices are expected to weaken Algeria’s outlook as oil revenue represents 60% of budget revenues and 30% of the GDP. At the end of 2015, the Algerian economy decelerated in annual terms in Q3 with GDP dropping from Q2’s 3.7% to 3.3%. According to the National Statistics Office of Algeria, the deceleration was driven by a contraction in the all-important hydro-carbon sector.
The country has the second largest population in the MENA region with a 45% young population, making it a sizable media market. Its media market comes in at the seventh place after Oman and before Morocco. Despite this, Algeria's media market is expected to remain stable with a slight yearly growth of 0.7% from 2014 to 2018. TV and radio station broadcasting are state-controlled. However, privately-owned networks transmit from abroad via satellite. In 2004 and 2005, the government increased the access of Amazigh language and culture to print and broadcast media.
The Algerian media market will experience very limited growth of 0.7% over the period 2014-18, from $507 million in 2015 to $525 million by 2018. This is because of a mix of macroeconomic factors and a lack of sector development.
Print remains a disproportionate part of the media sector, at over 60%. But it is expected to slow down and
lose share to TV and digital. TV market is projected to grow at a CAGR of 2% - in 2015, it represented 14% of the overall spend and is expected to reach 16% by 2018. Digital meanwhile is expected to see a massive growth at a yearly rate of 15.6% from 2014 to 2018 increasing its contribution from 7% to a 12% share of market growing at a high CAGR of 15.6%.
Algeria Total Media Market1
USDmn
2018
62%
16%
12%2%5%2%0%
0%
Print -1.6%TV 2.0%
Digital +15.6%
OOH Ads -1.2%
Radio Ads 6.4%
Physical Music -11.8%
Physical Movies -3.9%
Physical Games -11.6%
525
2017
65%
15%10%
2%5%2%0%
0%
518
2016
67%
15%9%2%4%2%0%
0%
511
2014
68%
16%7%2%4%3%1%
0%
511
2015
69%
14%8%2%4%2%0%
0%
507CAGR
2014-18
+0.7%
Exhibit 2
1551. Imperium 2. Arab Social Media Report 2016
The print market is expected to slow down at 2% CAGR between 2014 and 2018 due to digitisation. However, its advertising market is slowing down much faster at a CAGR of 8% between 2014 and 18. Paid print revenues dominate Algeria’s print market, as advertising is limited due to the low reach offered by publications. Most publications are in Arabic, French, and Amazigh languages. Arabic-language newspapers include Echorouq, El Khabar, and El Massa, French newspapers include El Watan and El Moudjahid. English dailies meanwhile include the North Africa Journal. The top newspaper is Echorouq with a reach of 6.5%, followed by Liberte, El Khabar, El Watan and El Heddaf that register very close respective reach of 3.9%, 3.7%, 3.5% and 3.2%.1
Television
The TV advertising market is expected to grow at 2% during the period 2014-2018 driven primarily by advertising. While Pay TV remains a smaller part of the market at 30% of the revenues it is growing at a faster pace than free-to-air with a 12% CAGR from 2014 to 2018. Ennahar TV, Dzair News, El Bilad TV , EPTV and CNA are but a few of the local Algerian channels. Algeria's most popular channels are Echorrouk, a satellite news channel, with 24% reach and TV A3, a state owned commercial channel, with 20% reach. While the top two channels in the top five ranking are local stations, the balance three are Pan-Arab stations that register a respective reach of 16%, 16% and 14%.1
Digital
With a yearly growth rate of 15% digital is becoming of the Algeria media landscape. In fact, in 2018 it is expected to contribute to 12% of the country's total media market. However, it is dominantly driven by paid digital media, as digital advertising is still nascent in the market. Regarding top social media platforms, Facebook comes in at the top with 81% reach, followed by WhatsApp with 80% and YouTube with 55% reach.2 Despite top websites in Algeria being global, the nascent industry still invests largely in small, local digital players.
Radio and OOH
Radio is the third largest contributor to Algeria’s advertising media market and expected to grow at a steady rate of 6% annually. The top radio stations are Chaîne 3 and JIL FM, with each garnering a reach of 7%. In the top five listing, El Bahdja and El Bahia are regional stations, while the rest are national. Out-of-Home does not represent a large contributor to it's media market, and a majority of OOH revenue comes from physical advertising, which is relatively disorganised. A dominant part of the outdoor is focused only on the northern Algerian market, due to urban agglomerations. As more malls are launched, the quality of the Algerian outdoor is expected to improve. However, OOH digitisation trends are not expected to catch up due to the lack of supporting infrastructure.

156
157Strategy& analysis
Exhibit 1: Bahrain Snapshot
Key Indicators: 2015
Population Size (Millions) 1.2
GDP per Capita ($) 25,396
Area (Square Km) 765.3
Size of the media market ($ million) 393
Mobile broadband penetration on population 123%
Fixed broadband penetration on population 157%
BAHRAIN
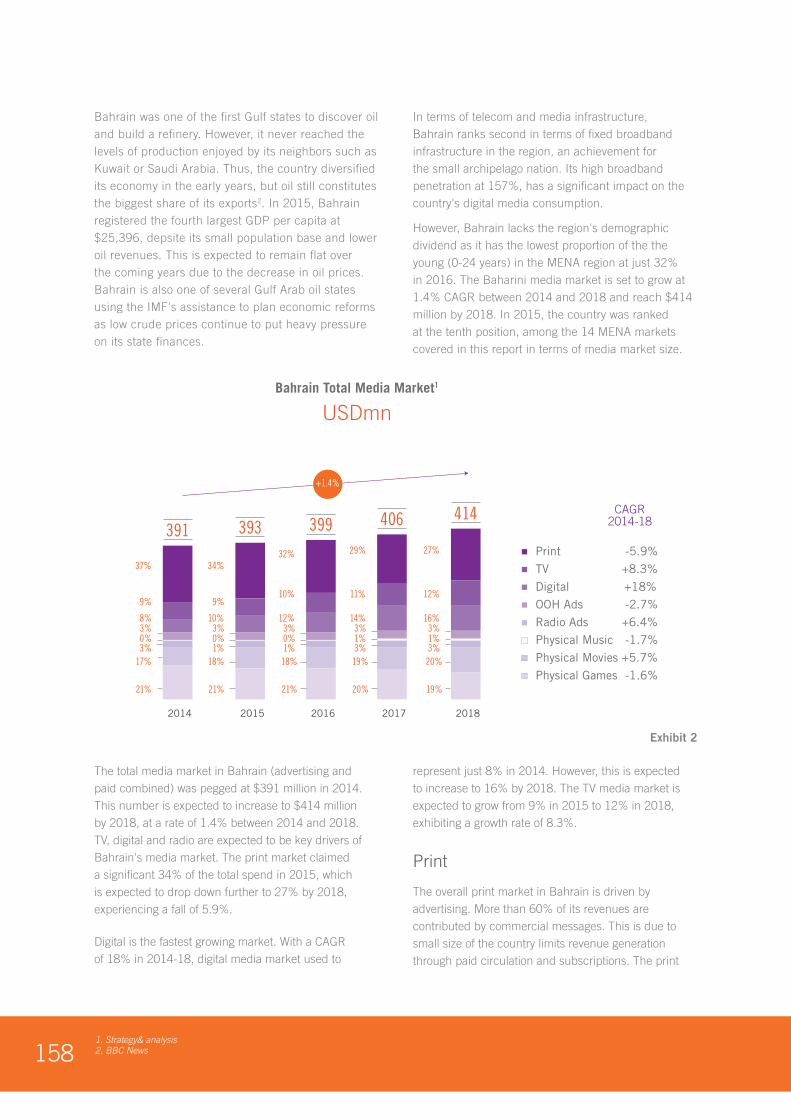
1581. Strategy& analysis 2. BBC News
Bahrain was one of the first Gulf states to discover oil and build a refinery. However, it never reached the levels of production enjoyed by its neighbors such as Kuwait or Saudi Arabia. Thus, the country diversified its economy in the early years, but oil still constitutes the biggest share of its exports2. In 2015, Bahrain registered the fourth largest GDP per capita at $25,396, depsite its small population base and lower oil revenues. This is expected to remain flat over the coming years due to the decrease in oil prices. Bahrain is also one of several Gulf Arab oil states using the IMF's assistance to plan economic reforms as low crude prices continue to put heavy pressure on its state finances.
In terms of telecom and media infrastructure, Bahrain ranks second in terms of fixed broadband infrastructure in the region, an achievement for the small archipelago nation. Its high broadband penetration at 157%, has a significant impact on the country's digital media consumption.
However, Bahrain lacks the region's demographic dividend as it has the lowest proportion of the the young (0-24 years) in the MENA region at just 32% in 2016. The Baharini media market is set to grow at 1.4% CAGR between 2014 and 2018 and reach $414 million by 2018. In 2015, the country was ranked at the tenth position, among the 14 MENA markets covered in this report in terms of media market size.
The total media market in Bahrain (advertising and paid combined) was pegged at $391 million in 2014. This number is expected to increase to $414 million by 2018, at a rate of 1.4% between 2014 and 2018. TV, digital and radio are expected to be key drivers of Bahrain's media market. The print market claimed a significant 34% of the total spend in 2015, which is expected to drop down further to 27% by 2018, experiencing a fall of 5.9%.
Digital is the fastest growing market. With a CAGR of 18% in 2014-18, digital media market used to
represent just 8% in 2014. However, this is expected to increase to 16% by 2018. The TV media market is expected to grow from 9% in 2015 to 12% in 2018, exhibiting a growth rate of 8.3%.
The overall print market in Bahrain is driven by advertising. More than 60% of its revenues are contributed by commercial messages. This is due to small size of the country limits revenue generation through paid circulation and subscriptions. The print
Bahrain Total Media Market1
USDmn
2018
27%
12%
16%3%1%
20%
19%
3%
Print -5.9%
TV +8.3%
Digital +18%
OOH Ads -2.7%
Radio Ads +6.4%
Physical Music -1.7%
Physical Movies +5.7%
Physical Games -1.6%
414
2017
29%
11%
14%3%1%
19%
20%
3%
406
2016
32%
10%
12%3%0%
18%
21%
1%
399
2015
34%
9%
10%3%0%
18%
21%
1%
393
2014
37%
9%
8%3%0%
17%
21%
3%
391CAGR
2014-18
+1.4%
Exhibit 2
1591. IPSOS2. Internet Live stats3. Arab Social Media Report 2015
market is expected to decline at a 6% CAGR between 2014 and 2018 - this slowdown is being led by the advertising market falling sharply by what we described in the print section of this report as “substitution effects” due to media such as digital and radio.
Bahrain's print market is fully privatised. Some of the newspapers include private dailies such as Akhbar al-Khaleej, Al-Ayam, Al-Wasat, Al-Bilad, and Al-Watan, and English dailies such as Gulf Daily News. Al Ayam is the leading newspaper in with an 18.8% reach, followed by Al Wasat with 13.9% and Akhbar Al Khaleej with 13.2%. Regarding magazines, the classified weekly Al Waseet is the most popular 'magazine' with a 38.3% reach. However among mainstream magazines, Layalina leads with a 6.8% reach among Bahraini readers.1
Television
Bahrain's Television market is relatively small, comprising of only 9% of the overall media market in 2015. More than three quarters of the market's revenues come from pay TV and DTH platforms are the main model of delivery of Pay TV. Hence the key players in Pay TV in Bahrain are regional players like OSN and BeIn.
FTA television remains a key source of information for Bahrainis but is yet a small portion of the TV revenues. Due to its small size, the domestic broadcaster scene is dominated by state-run media with a few private channels. The Bahrain Radio and Television Corporation (BRTC) is a state-run company that operates five terrestrial TV networks. Bahrain has a high proportion of expatriates - as a result its leading FTA channels include South Asian stations like Asianet and Asianet news being the 3rd and 5th most watched channels with a reach of 18% and 11% respectively. The top channel is the Saudi broadcaster's flagship TV channel MBC with a reach of 21%, followed by the national broadcaster Bahrain TV with a reach of 19%.1
Digital
Bahrain has an advanced telecom infrastructure and the population is widely connected to the Internet. According to industry data sources, there are 1.3 million Internet users with a penetration rate of 91.5% as of 2016.2 The Bahraini digital market is growing at a fast pace and projected to reach $64 million by 2018, exhibiting a growth of 18% between 2014 and 2018. As is the case across the region, social media remains one of the key activities for users. Whats App owned by Facebook remains the dominant social media/messaging platform with a claimed usage of 85% among all social media users. Parent brand Facebook follows closely at 81%. Photo sharing platform Pinterest comes at a surprising third position in Bahrain at a 51% usage, beating players like Twitter and popular video platform YouTube3
Radio and Out-of-Home
Radios in Bahrain date back to 1940, when the country's first radio broadcasting station was launched. The year 1955 saw the country launch its first Arabic radio broadcasting service, followed more than two decades with an English radio station with the increase in expatriates.
Most radio stations in Bahrain are state-owned. However, privately owned stations such as the South Asian Hindi station 'Your FM', also operate in the country. The top radio channel is Bahrain 93.3 FM with a reach of 13%, followed by Your FM with 11% and Al Quran Al Kareem with 9% reach1. The OOH market in Bahrain is relatively small with multiple players, and expected to fall by 3% by 2018.

160
161Strategy& analysis
Exhibit 1: Jordan Snapshot
Key Indicators: 2015
Population Size (Millions) 6.8
GDP per Capita ($) 5,470
Area (Square Km) 89,342
Size of the media market ($ million) 306
Mobile Broadband penetration on population 38%
Fixed Broadband penetration on population 28%
JORDAN
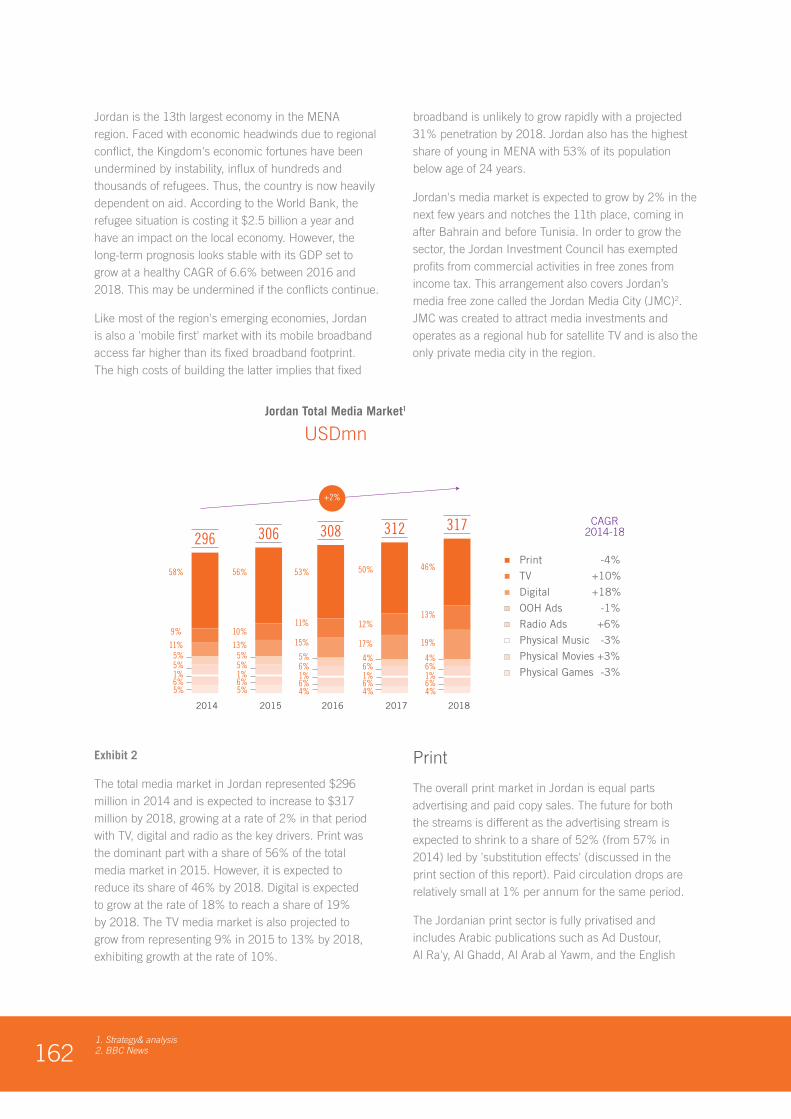
1621. Strategy& analysis2. BBC News
Jordan is the 13th largest economy in the MENA region. Faced with economic headwinds due to regional conflict, the Kingdom's economic fortunes have been undermined by instability, influx of hundreds and thousands of refugees. Thus, the country is now heavily dependent on aid. According to the World Bank, the refugee situation is costing it $2.5 billion a year and have an impact on the local economy. However, the long-term prognosis looks stable with its GDP set to grow at a healthy CAGR of 6.6% between 2016 and 2018. This may be undermined if the conflicts continue.
Like most of the region's emerging economies, Jordan is also a 'mobile first' market with its mobile broadband access far higher than its fixed broadband footprint. The high costs of building the latter implies that fixed
broadband is unlikely to grow rapidly with a projected 31% penetration by 2018. Jordan also has the highest share of young in MENA with 53% of its population below age of 24 years.
Jordan's media market is expected to grow by 2% in the next few years and notches the 11th place, coming in after Bahrain and before Tunisia. In order to grow the sector, the Jordan Investment Council has exempted profits from commercial activities in free zones from income tax. This arrangement also covers Jordan’s media free zone called the Jordan Media City (JMC)2. JMC was created to attract media investments and operates as a regional hub for satellite TV and is also the only private media city in the region.
Exhibit 2
The total media market in Jordan represented $296 million in 2014 and is expected to increase to $317 million by 2018, growing at a rate of 2% in that period with TV, digital and radio as the key drivers. Print was the dominant part with a share of 56% of the total media market in 2015. However, it is expected to reduce its share of 46% by 2018. Digital is expected to grow at the rate of 18% to reach a share of 19% by 2018. The TV media market is also projected to grow from representing 9% in 2015 to 13% by 2018, exhibiting growth at the rate of 10%.
The overall print market in Jordan is equal parts advertising and paid copy sales. The future for both the streams is different as the advertising stream is expected to shrink to a share of 52% (from 57% in 2014) led by 'substitution effects' (discussed in the print section of this report). Paid circulation drops are relatively small at 1% per annum for the same period.
The Jordanian print sector is fully privatised and includes Arabic publications such as Ad Dustour, Al Ra'y, Al Ghadd, Al Arab al Yawm, and the English
Jordan Total Media Market1
USDmn
2018
46%
13%
19%
4%6%
6%4%
1%
Print -4%
TV +10%
Digital +18%
OOH Ads -1%
Radio Ads +6%
Physical Music -3%
Physical Movies +3%
Physical Games -3%
317
2017
50%
12%
17%
4%6%
6%4%
1%
312
2016
53%
11%
15%
5%6%
6%4%
1%
308
2015
56%
10%
13%5%5%
6%5%
1%
306
2014
58%
9%
11%5%5%
6%5%
1%
296CAGR
2014-18
+2%
1631. IPSOS2. Internet Live Stats 3. Jordan Times newspaper report4. Arab Social Media Report 2015
newspaper Jordan Times. However, the readership of dailies is one of the lowest in the region with Al-Rai, the leading newspaper reaching only 4.3% of the population. This is followed by Al Ghad with 3.2% and Ad-Dustour with 2.8% reach. The classifieds leader Al Waseet is the top weekly magazine with 10.2% reach, followed by Al Mumtaz with 7.3% and Al Waseet – Az Zarqa with 3.2% reach. Among mainstream magazines Layalina leads with a reach of only 1.3%.1
Television
Television is a relatively small in Jordan at 10% of the overall media market in 2015. As is the case with smaller markets, it's driven mainly by the paid revenue streams with advertising being about 40% of its revenues in 2015. Also while both the revenues streams are growing, Pay TV is the key driver of the market value during the period 2014-18.
Jordan is relatively small Pay TV with less than 5% penetration and expected to grow to 6.1% by 2018. As per industry estimates, the influx of wealthy Syrians and other nationalities may drive the growth of Pay TV. This segment is almost entirely dominated by regional DTH leaders like OSN and BeIN.
In the FTA market, the state-run entity Jordan Radio and Television operates a bouquet of channels. The viewership is increasingly dominated by private channels like Roya TV and regional (or Pan-Arab) stations. The channel with the highest reach is MBC1 at 29%, followed closely by Roya TV at 27% and government run station JTV at 26% reach.1
Digital
Over 3.5 million Jordanians have internet access as of 2016, exhibiting a penetration rate of 45.7%.2 The government has now introduced a new tax
incentive program order to boost the country's ICT sector. Services related to apps, software development, outsourcing, portals, gaming, digital content, IT training and e-learning will be exempt from sales tax and customs duties, according to the new initiatives. The Central Bank of Jordan has also introduced a new electronic payment system, which allows users to receive and pay bills electronically from their computers, ATMs, kiosks and point-of-sale terminals. This is expected to provide growth opportunities for e-commerce startups.3
As per our analysis, the digital media market is expected to grow at the rate of 18% between 2014 and 2018. With social media being as one of the key activities across the region, Facebook prevails with a reach of 89% among users of social media, followed by WhatsApp with 71% and YouTube with 66% reach.4
Radio and Out-of-Home
Radio and Out of home combined, comprise about 10% of the Jordanian media market in 2015. The radio advertising market is expected to grow at 6% between 2014 and 2018, while outdoor is expected to reduce by 1% in the same period. Despite many government-run radio channels, radio listenership is dominated by private players. Some of the radio channels in Jordan include Beat FM, Mazaj FM, and Mood FM. The top radio station is Jordan Quran with 18% reach, followed by Hala with 12% and Rotana Radio with 11% reach.1 Over 90% of OOH advertising comes from physical advertising as digital OOH has not evolved due to Jordan’s lack of supporting infrastructure.

164
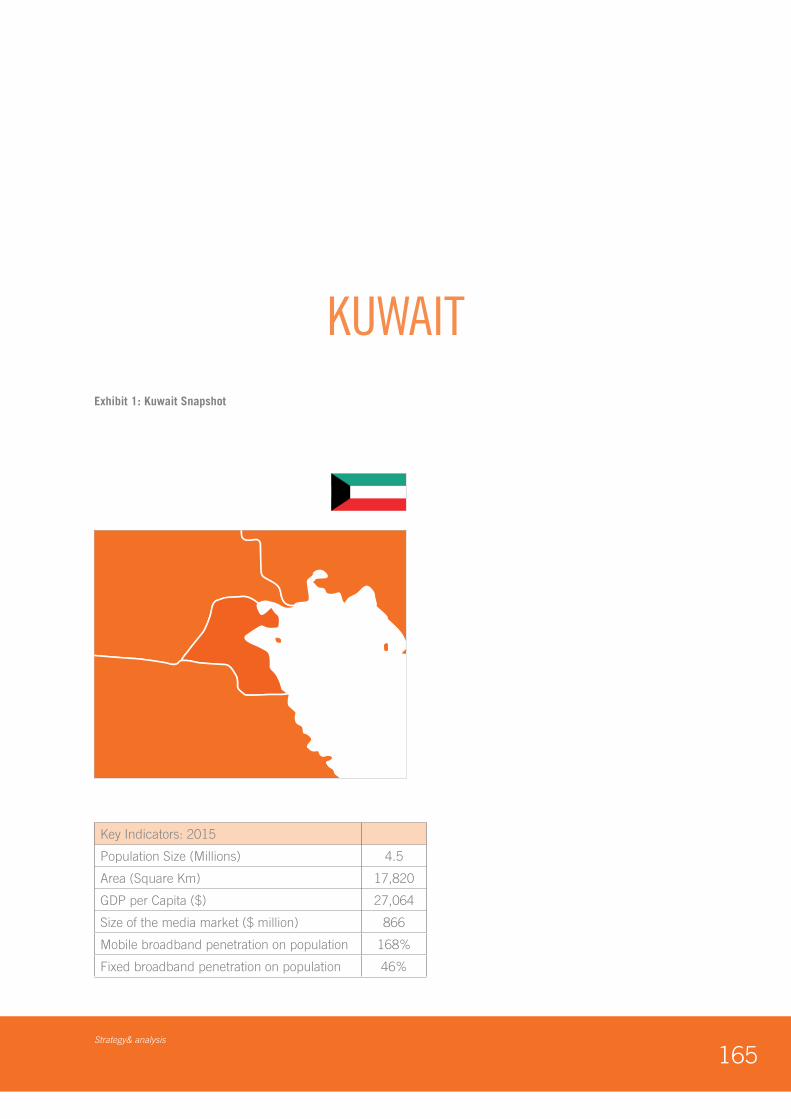
165Strategy& analysis
Exhibit 1: Kuwait Snapshot
Key Indicators: 2015
Population Size (Millions) 4.5
Area (Square Km) 17,820
GDP per Capita ($) 27,064
Size of the media market ($ million) 866
Mobile broadband penetration on population 168%
Fixed broadband penetration on population 46%
KUWAIT
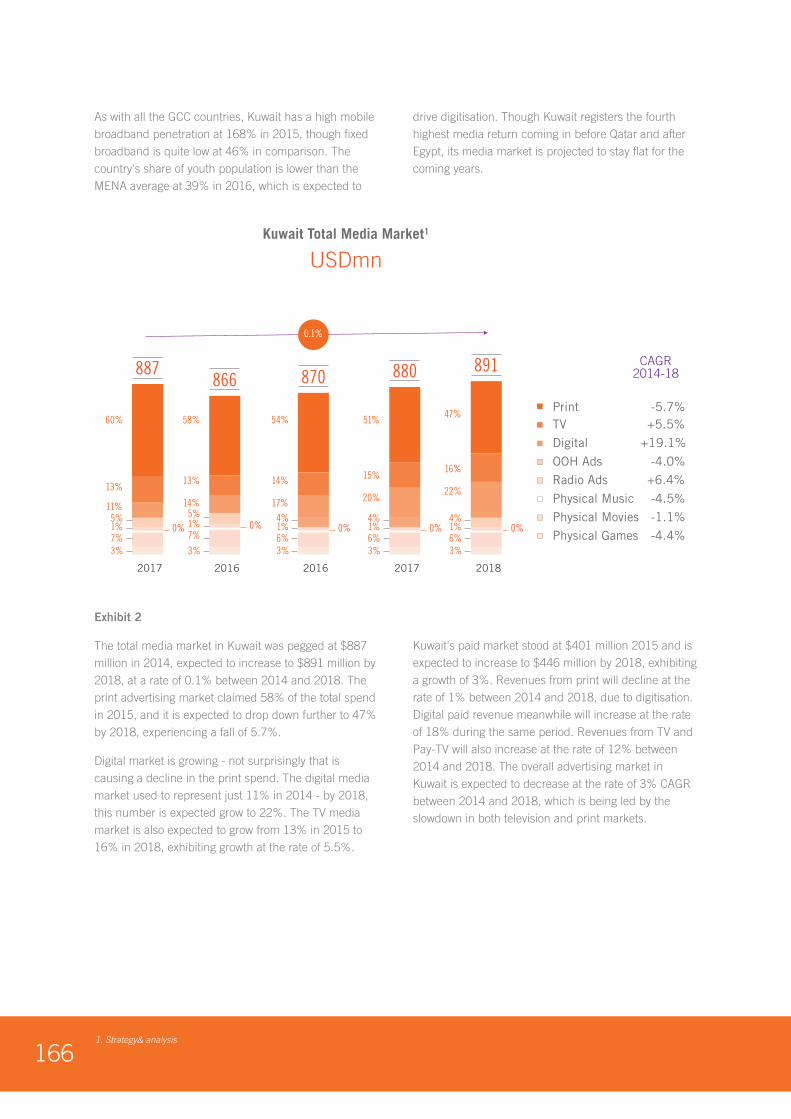
1661. Strategy& analysis
As with all the GCC countries, Kuwait has a high mobile broadband penetration at 168% in 2015, though fixed broadband is quite low at 46% in comparison. The country's share of youth population is lower than the MENA average at 39% in 2016, which is expected to
drive digitisation. Though Kuwait registers the fourth highest media return coming in before Qatar and after Egypt, its media market is projected to stay flat for the coming years.
Exhibit 2
The total media market in Kuwait was pegged at $887 million in 2014, expected to increase to $891 million by 2018, at a rate of 0.1% between 2014 and 2018. The print advertising market claimed 58% of the total spend in 2015, and it is expected to drop down further to 47% by 2018, experiencing a fall of 5.7%.
Digital market is growing - not surprisingly that is causing a decline in the print spend. The digital media market used to represent just 11% in 2014 - by 2018, this number is expected grow to 22%. The TV media market is also expected to grow from 13% in 2015 to 16% in 2018, exhibiting growth at the rate of 5.5%.
Kuwait's paid market stood at $401 million 2015 and is expected to increase to $446 million by 2018, exhibiting a growth of 3%. Revenues from print will decline at the rate of 1% between 2014 and 2018, due to digitisation. Digital paid revenue meanwhile will increase at the rate of 18% during the same period. Revenues from TV and Pay-TV will also increase at the rate of 12% between 2014 and 2018. The overall advertising market in Kuwait is expected to decrease at the rate of 3% CAGR between 2014 and 2018, which is being led by the slowdown in both television and print markets.
Kuwait Total Media Market1
USDmn
2018
47%
16%
22%
4%1%6%3%
0%
Print -5.7%TV +5.5%
Digital +19.1%
OOH Ads -4.0%
Radio Ads +6.4%
Physical Music -4.5%
Physical Movies -1.1%
Physical Games -4.4%
891
2017
51%
15%
20%
4%1%6%3%
0%
880
2017
60%
13%
11%5%1%7%3%
0%
887
2016
54%
14%
17%
4%1%6%3%
0%
870
2016
58%
13%
14%5%1%7%
3%
0%
866CAGR
2014-18
0.1%
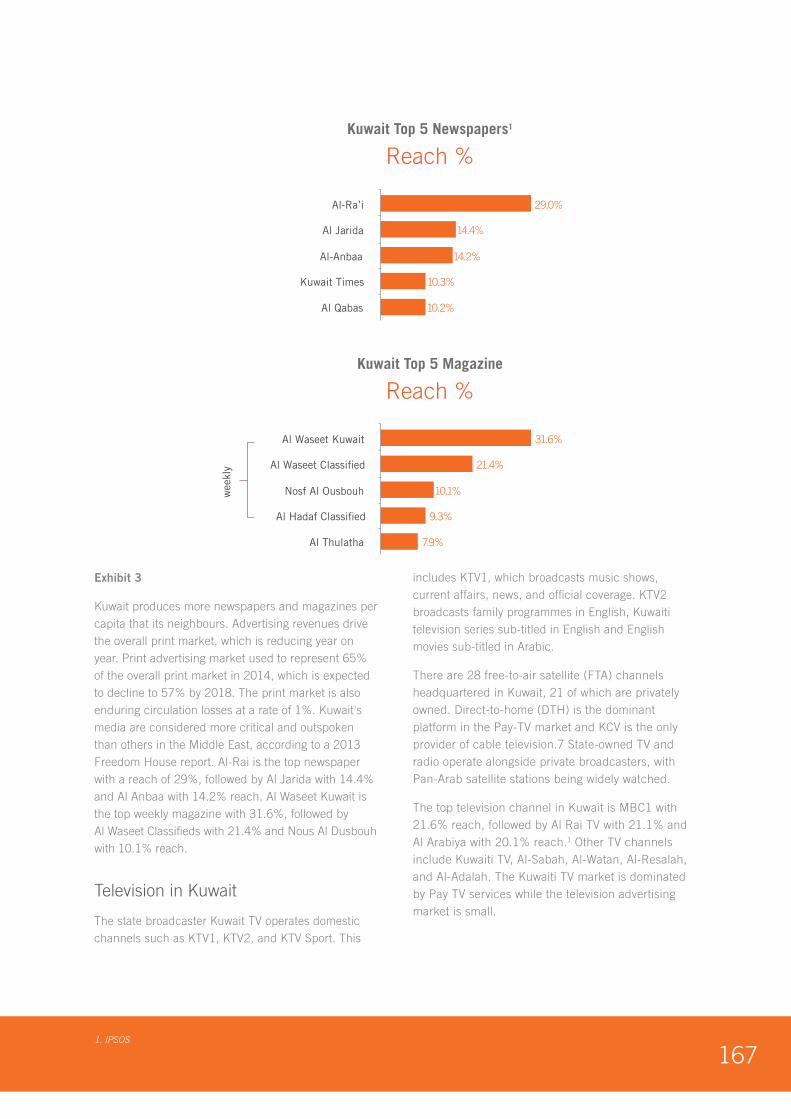
1671. IPSOS
Exhibit 3
Kuwait produces more newspapers and magazines per capita that its neighbours. Advertising revenues drive the overall print market, which is reducing year on year. Print advertising market used to represent 65% of the overall print market in 2014, which is expected to decline to 57% by 2018. The print market is also enduring circulation losses at a rate of 1%. Kuwait's media are considered more critical and outspoken than others in the Middle East, according to a 2013 Freedom House report. Al-Rai is the top newspaper with a reach of 29%, followed by Al Jarida with 14.4% and Al Anbaa with 14.2% reach. Al Waseet Kuwait is the top weekly magazine with 31.6%, followed by Al Waseet Classifieds with 21.4% and Nous Al Dusbouh with 10.1% reach.
Television in Kuwait
The state broadcaster Kuwait TV operates domestic channels such as KTV1, KTV2, and KTV Sport. This
includes KTV1, which broadcasts music shows, current affairs, news, and official coverage. KTV2 broadcasts family programmes in English, Kuwaiti television series sub-titled in English and English movies sub-titled in Arabic.
There are 28 free-to-air satellite (FTA) channels headquartered in Kuwait, 21 of which are privately owned. Direct-to-home (DTH) is the dominant platform in the Pay-TV market and KCV is the only provider of cable television.7 State-owned TV and radio operate alongside private broadcasters, with Pan-Arab satellite stations being widely watched.
The top television channel in Kuwait is MBC1 with 21.6% reach, followed by Al Rai TV with 21.1% and Al Arabiya with 20.1% reach.1 Other TV channels include Kuwaiti TV, Al-Sabah, Al-Watan, Al-Resalah, and Al-Adalah. The Kuwaiti TV market is dominated by Pay TV services while the television advertising market is small.
Kuwait Top 5 Newspapers1
Reach %
29.0%
14.4%
14.2%
10.3%
10.2%
Al-Ra’i
Al Jarida
Al-Anbaa
Kuwait Times
Al Qabas
Kuwait Top 5 Magazine
Reach %
31.6%
21.4%
10.1%
9.3%
7.9%
Al Waseet Kuwait
Al Waseet Classified
Nosf Al Ousbouh
Al Hadaf Classified
Al Thulatha
wee
kly
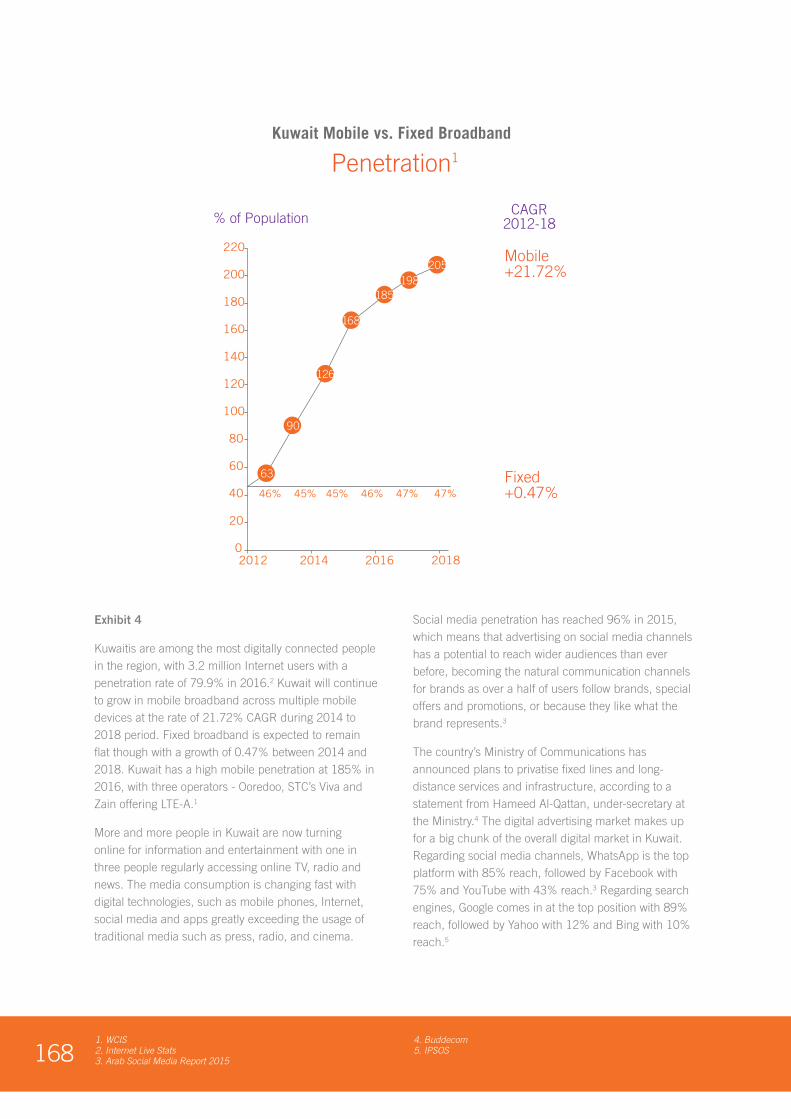
1681. WCIS 2. Internet Live Stats 3. Arab Social Media Report 2015
4. Buddecom5. IPSOS
Exhibit 4
Kuwaitis are among the most digitally connected people in the region, with 3.2 million Internet users with a penetration rate of 79.9% in 2016.2 Kuwait will continue to grow in mobile broadband across multiple mobile devices at the rate of 21.72% CAGR during 2014 to 2018 period. Fixed broadband is expected to remain flat though with a growth of 0.47% between 2014 and 2018. Kuwait has a high mobile penetration at 185% in 2016, with three operators - Ooredoo, STC’s Viva and Zain offering LTE-A.1
More and more people in Kuwait are now turning online for information and entertainment with one in three people regularly accessing online TV, radio and news. The media consumption is changing fast with digital technologies, such as mobile phones, Internet, social media and apps greatly exceeding the usage of traditional media such as press, radio, and cinema.
Social media penetration has reached 96% in 2015, which means that advertising on social media channels has a potential to reach wider audiences than ever before, becoming the natural communication channels for brands as over a half of users follow brands, special offers and promotions, or because they like what the brand represents.3
The country’s Ministry of Communications has announced plans to privatise fixed lines and long-distance services and infrastructure, according to a statement from Hameed Al-Qattan, under-secretary at the Ministry.4 The digital advertising market makes up for a big chunk of the overall digital market in Kuwait. Regarding social media channels, WhatsApp is the top platform with 85% reach, followed by Facebook with 75% and YouTube with 43% reach.3 Regarding search engines, Google comes in at the top position with 89% reach, followed by Yahoo with 12% and Bing with 10% reach.5
Kuwait Mobile vs. Fixed Broadband
Penetration1
% of Population
Mobile+21.72%
Fixed+0.47%
CAGR2012-18
2018
120
100
140
160
180
200
220
80
60
40 46% 45% 45% 46% 47% 47%
20
02012 2014 2016
63
90
126
168
185198
205
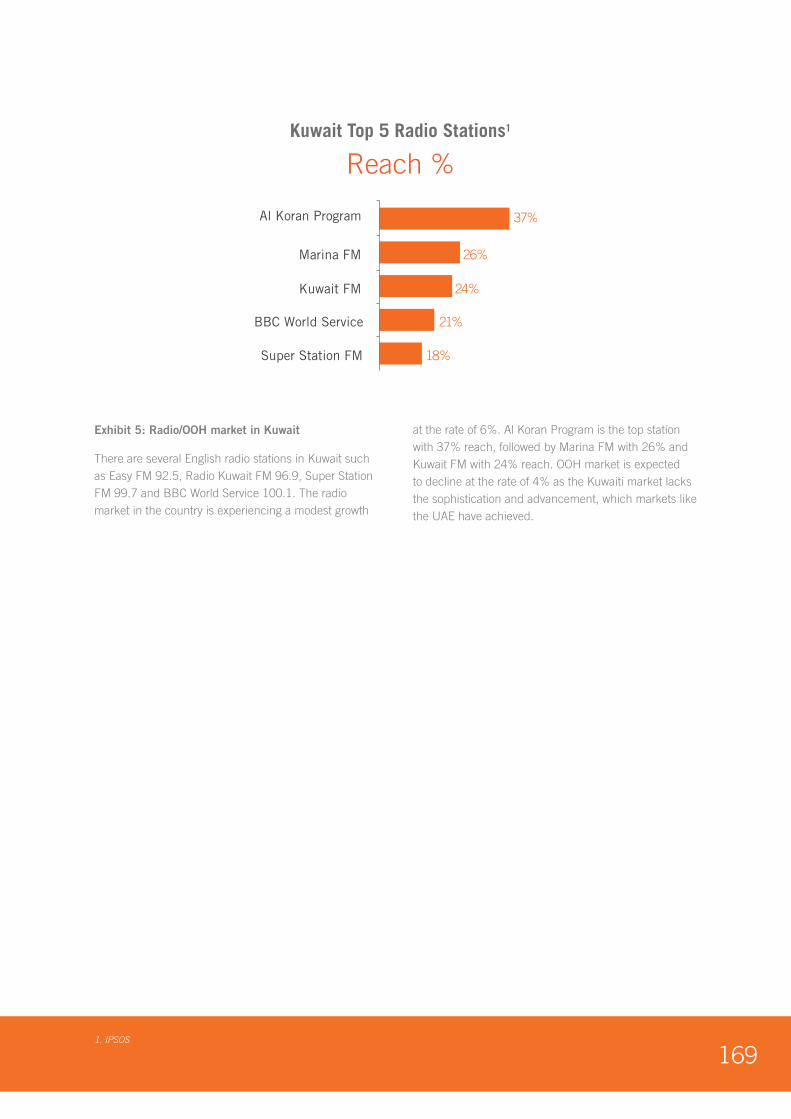
1691. IPSOS
Exhibit 5: Radio/OOH market in Kuwait
There are several English radio stations in Kuwait such as Easy FM 92.5, Radio Kuwait FM 96.9, Super Station FM 99.7 and BBC World Service 100.1. The radio market in the country is experiencing a modest growth
at the rate of 6%. Al Koran Program is the top station with 37% reach, followed by Marina FM with 26% and Kuwait FM with 24% reach. OOH market is expected to decline at the rate of 4% as the Kuwaiti market lacks the sophistication and advancement, which markets like the UAE have achieved.
Kuwait Top 5 Radio Stations1
Reach %
37%
26%
24%
21%
18%
Al Koran Program
Marina FM
Kuwait FM
BBC World Service
Super Station FM

170
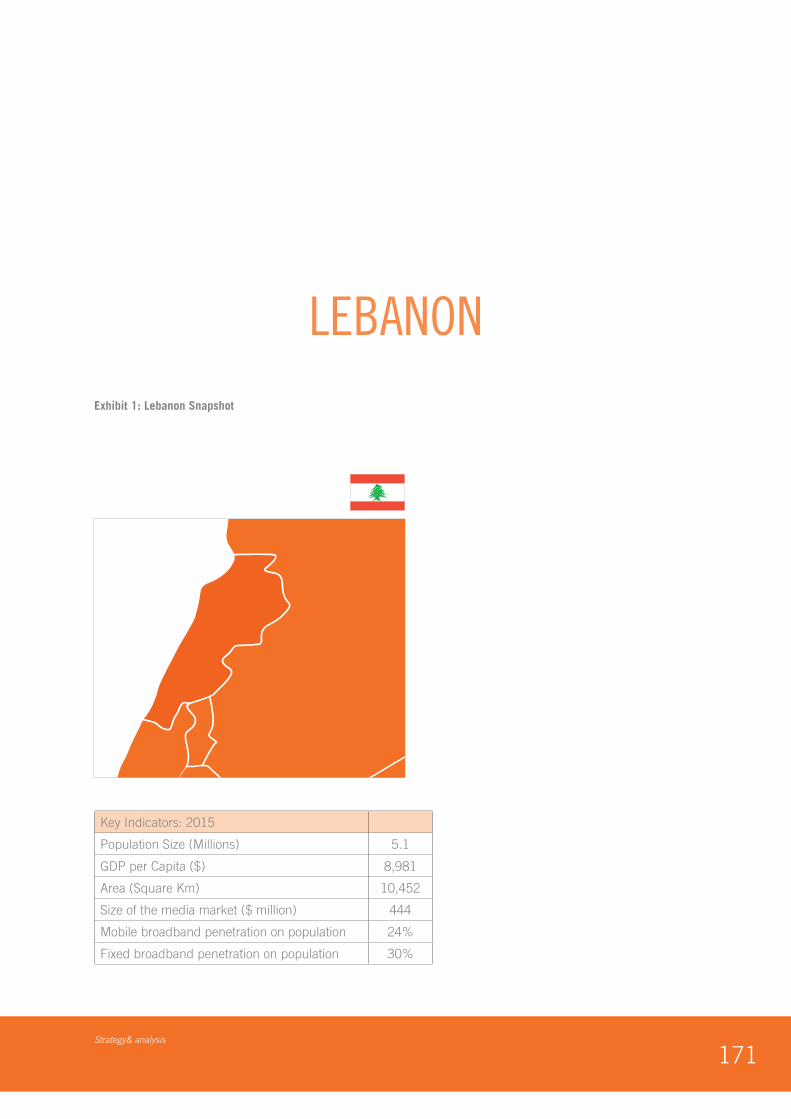
171Strategy& analysis
Exhibit 1: Lebanon Snapshot
Key Indicators: 2015
Population Size (Millions) 5.1
GDP per Capita ($) 8,981
Area (Square Km) 10,452
Size of the media market ($ million) 444
Mobile broadband penetration on population 24%
Fixed broadband penetration on population 30%
LEBANON
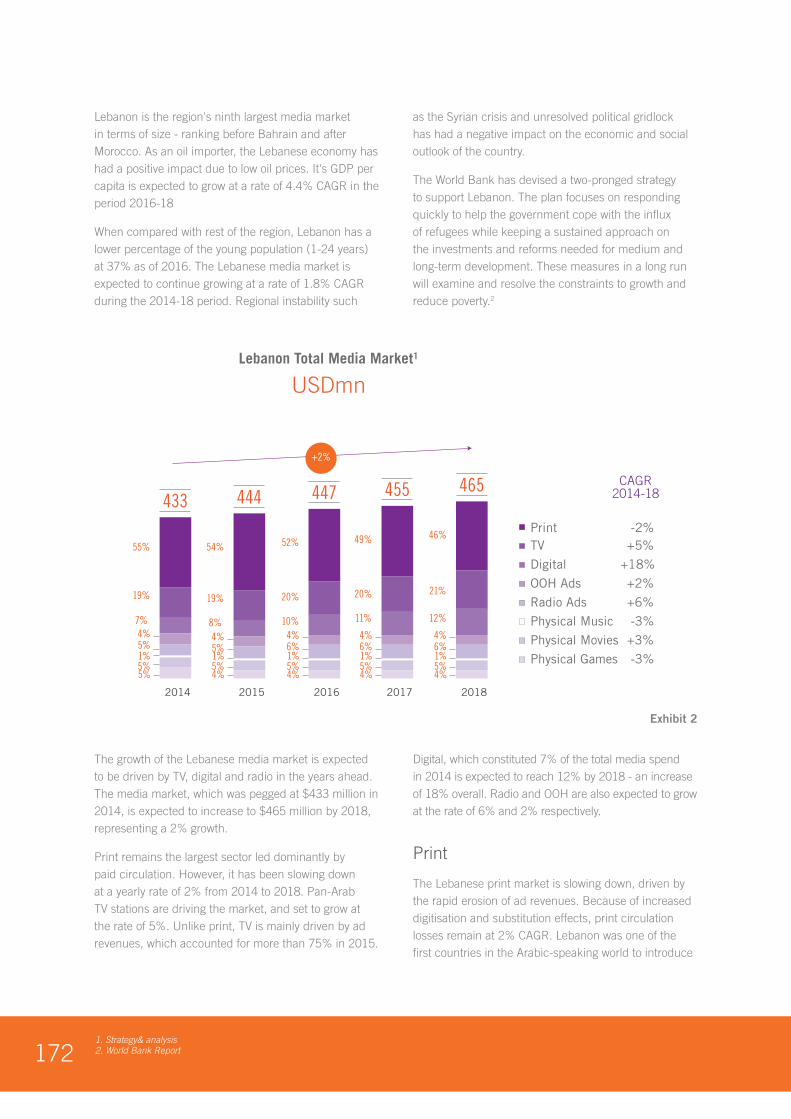
1721. Strategy& analysis2. World Bank Report
Lebanon is the region's ninth largest media market in terms of size - ranking before Bahrain and after Morocco. As an oil importer, the Lebanese economy has had a positive impact due to low oil prices. It's GDP per capita is expected to grow at a rate of 4.4% CAGR in the period 2016-18
When compared with rest of the region, Lebanon has a lower percentage of the young population (1-24 years) at 37% as of 2016. The Lebanese media market is expected to continue growing at a rate of 1.8% CAGR during the 2014-18 period. Regional instability such
as the Syrian crisis and unresolved political gridlock has had a negative impact on the economic and social outlook of the country.
The World Bank has devised a two-pronged strategy to support Lebanon. The plan focuses on responding quickly to help the government cope with the influx of refugees while keeping a sustained approach on the investments and reforms needed for medium and long-term development. These measures in a long run will examine and resolve the constraints to growth and reduce poverty.2
The growth of the Lebanese media market is expected to be driven by TV, digital and radio in the years ahead. The media market, which was pegged at $433 million in 2014, is expected to increase to $465 million by 2018, representing a 2% growth.
Print remains the largest sector led dominantly by paid circulation. However, it has been slowing down at a yearly rate of 2% from 2014 to 2018. Pan-Arab TV stations are driving the market, and set to grow at the rate of 5%. Unlike print, TV is mainly driven by ad revenues, which accounted for more than 75% in 2015.
Digital, which constituted 7% of the total media spend in 2014 is expected to reach 12% by 2018 - an increase of 18% overall. Radio and OOH are also expected to grow at the rate of 6% and 2% respectively.
The Lebanese print market is slowing down, driven by the rapid erosion of ad revenues. Because of increased digitisation and substitution effects, print circulation losses remain at 2% CAGR. Lebanon was one of the first countries in the Arabic-speaking world to introduce
2018
46%
21%
12%
4%6%
5%4%
1%
Print -2%TV +5%
Digital +18%
OOH Ads +2%
Radio Ads +6%
Physical Music -3%
Physical Movies +3%
Physical Games -3%
Lebanon Total Media Market1
USDmn
465
2017
49%
20%
11%
4%6%
5%4%
1%
455
2016
52%
20%
10%4%6%
5%4%
1%
447
2015
54%
19%
8%4%5%
5%4%
1%
444
2014
55%
19%
7%4%5%
5%5%
1%
433CAGR
2014-18
+2%
Exhibit 2
1731. IPSOS2. Arab Social Media Report 2015
internet services, and the country's newspapers were the first in the region to provide readers with online versions. An Nahar is the top newspaper in Lebanon with 12.3% reach, followed by Al Safir with 9.9% and Al Joum Houria with 9.5% reach. The top weekly magazine is Al Waseet Beirut with 23.1% reach; Al Waseet North occupies the second spot with 10.8% reach; at the third spot comes in Al Jaish, a monthly magazine, with 10.8% reach.1
Television
Lebanon's broadcasting scene is developed, lively and diverse at the same time. It was the first Arab country to permit private radio and TV.However, increasingly Pan-Arab performance is becoming dominant in the country's television scene with top four of the five TV stations (except Al Mayadeen) being Pan-Arab. The top channel is MBC4 with a total reach of 10.8% while MBC2 comes in at the second spot with 10.7% reach and Al Mayadeen comes in at the third spot with 6.7% reach.1 TV revenues mainly come from ad spend however the Pay TV market in Lebanon is the key driver of growth with a 14% CAGR from 2014 to 2018, and an expected market share of 28% by 2018.
Digital
The digital sector is driven by advertising revenues, as paid digital services such as gaming and music offer limited revenue streams. However, the digital market is a key growth driver at 18% CAGR. YouTube dominates online video with a 54% reach. Regarding social media services, Facebook dominates with a 66% reach, followed by Twitter with 17% reach. Google not surprisingly dominates the search landscape with 83% reach.2
Radio
Like the UAE, Lebanon is a vibrant radio market with many private and state-owned radio stations as Nostalie, Cedars Radio Sawt el Mada etc. Moreover, partner stations broadcast BBC Arabic and Radio France Internationale. As seen in the TV sector, there are certain radio stations that exist to promote specific political parties. The top four Lebanese radio stations, respectively Sawt El Ghad, Jaras Scope, Sawt Loubnan and Aghnai Aghani register very close reach of ranging from 13% to 11%.1

174
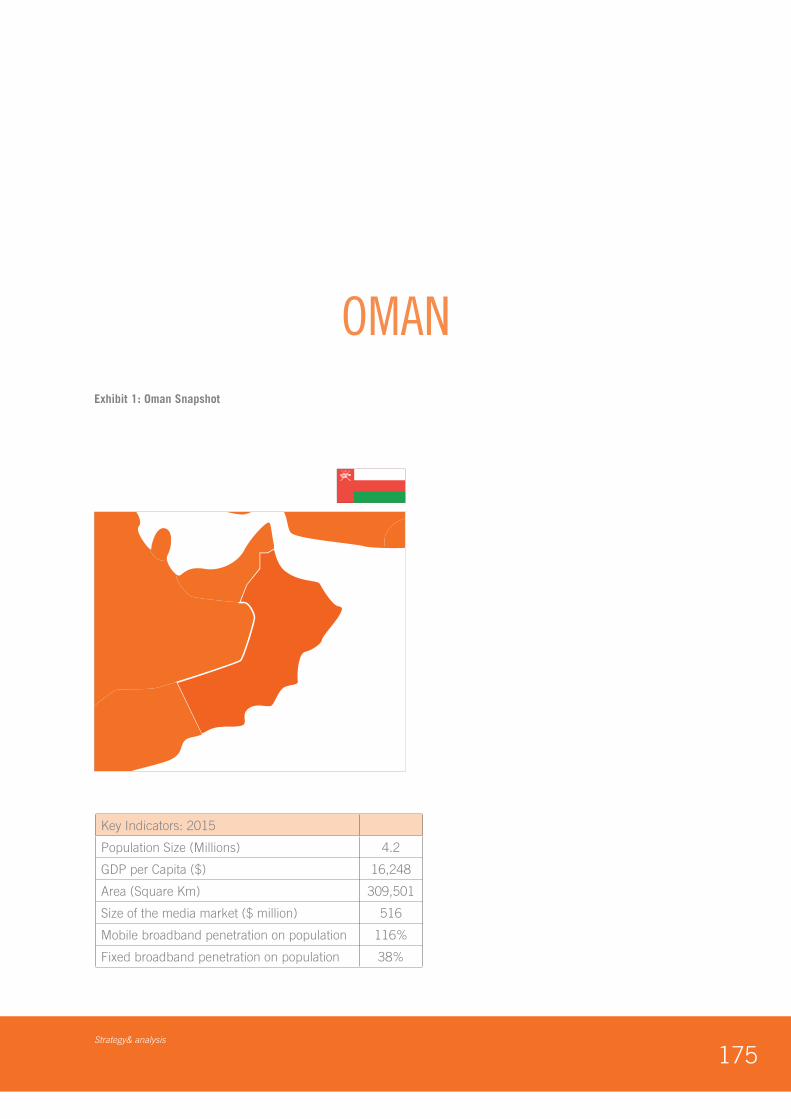
175Strategy& analysis
Exhibit 1: Oman Snapshot
Key Indicators: 2015
Population Size (Millions) 4.2
GDP per Capita ($) 16,248
Area (Square Km) 309,501
Size of the media market ($ million) 516
Mobile broadband penetration on population 116%
Fixed broadband penetration on population 38%
OMAN
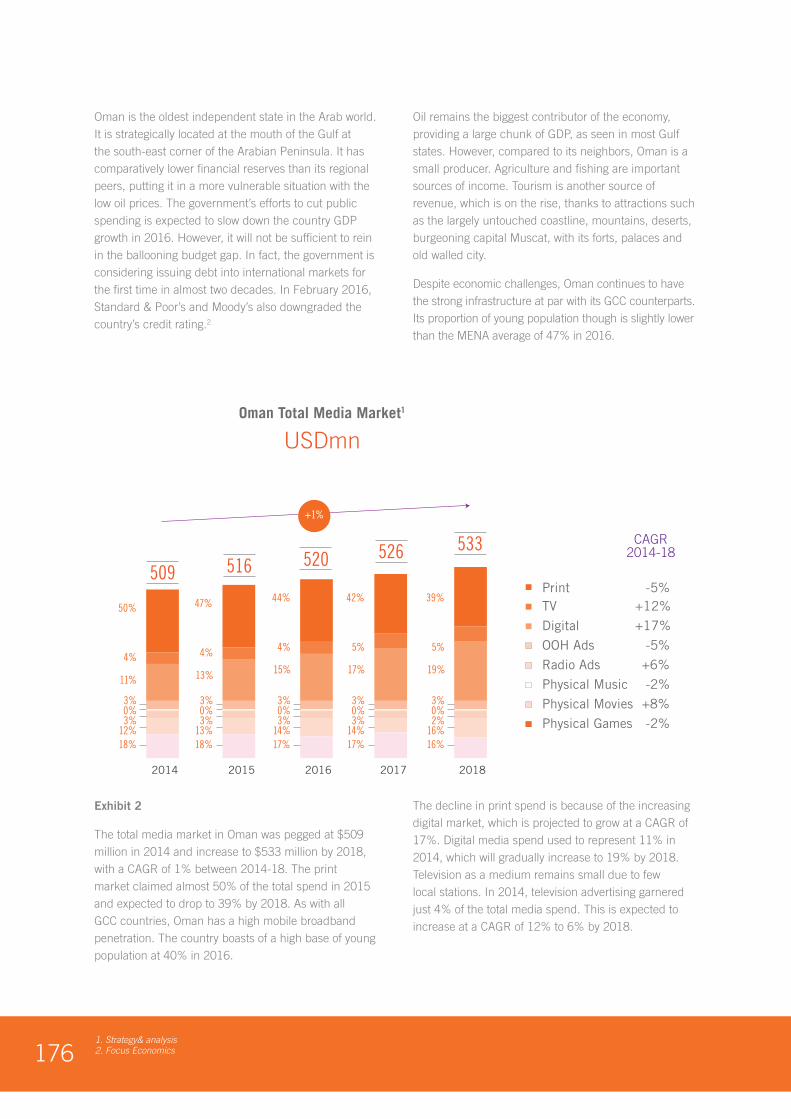
1761. Strategy& analysis2. Focus Economics
Oman is the oldest independent state in the Arab world. It is strategically located at the mouth of the Gulf at the south-east corner of the Arabian Peninsula. It has comparatively lower financial reserves than its regional peers, putting it in a more vulnerable situation with the low oil prices. The government’s efforts to cut public spending is expected to slow down the country GDP growth in 2016. However, it will not be sufficient to rein in the ballooning budget gap. In fact, the government is considering issuing debt into international markets for the first time in almost two decades. In February 2016, Standard & Poor’s and Moody’s also downgraded the country’s credit rating.2
Oil remains the biggest contributor of the economy, providing a large chunk of GDP, as seen in most Gulf states. However, compared to its neighbors, Oman is a small producer. Agriculture and fishing are important sources of income. Tourism is another source of revenue, which is on the rise, thanks to attractions such as the largely untouched coastline, mountains, deserts, burgeoning capital Muscat, with its forts, palaces and old walled city.
Despite economic challenges, Oman continues to have the strong infrastructure at par with its GCC counterparts. Its proportion of young population though is slightly lower than the MENA average of 47% in 2016.
Exhibit 2
The total media market in Oman was pegged at $509 million in 2014 and increase to $533 million by 2018, with a CAGR of 1% between 2014-18. The print market claimed almost 50% of the total spend in 2015 and expected to drop to 39% by 2018. As with all GCC countries, Oman has a high mobile broadband penetration. The country boasts of a high base of young population at 40% in 2016.
The decline in print spend is because of the increasing digital market, which is projected to grow at a CAGR of 17%. Digital media spend used to represent 11% in 2014, which will gradually increase to 19% by 2018. Television as a medium remains small due to few local stations. In 2014, television advertising garnered just 4% of the total media spend. This is expected to increase at a CAGR of 12% to 6% by 2018.
2018
Print -5%TV +12%
Digital +17%
OOH Ads -5%
Radio Ads +6%
Physical Music -2%
Physical Movies +8%
Physical Games -2%
Oman Total Media Market1
USDmn
533
2017
526
2016
520
2015
516
2014
50%
4%
11%
3%
3%12%18%
0%
50947%
4%
13%
3%
3%13%18%
0%
44%
4%
15%
3%
3%14%17%
0%
42%
5%
17%
3%
3%14%17%
0%
39%
5%
19%
3%
2%16%16%
0%
CAGR2014-18
+1%
1771. Strategy& analysis 2. IPSOS 3. Arab Social Media Report 2015
The overall print market is set to experience a sharp decline led mainly by ad spend, which is slowing down. This is due to the substitution effects as copy sales are expected to remain flat with no growth at all. As per IPSOS, the top newspaper is Al Watan with 18% reach, followed by Times of Oman with 12% and Al Shabiba with 11.8% reach. Regarding magazines, the leader is Basim with 8.9%, followed by H! with 8.8% and Laha with 8.6% reach.1
Television
The TV market in Oman is expected to have strong growths driven mainly by the increasing Pay TV penetration in the market. The ad market growth remains relatively slow at 2% led by the overall in-market economic situation.2 The paid TV market meanwhile is expected to see an overall growth of 17% by 2018. Oman has two state-owned TV stations, and one privately-owned channel. However, as per IPSOS, its viewership is dominated by Pan-Arab TV channels except Oman TV1, which is the leading local channel with 36% reach; Al Jazeera comes in at second with 34% reach, followed by MBC1 with 27% reach.1
Digital
Oman has a sophisticated telecom infrastructure. Fueled by this, the country's digital market is growing rapidly at a rate of 17% led by both the paid and ad side of the business. Regarding top social media channels, Facebook comes in at the top position with 86% reach, followed by WhatsApp with 80% and YouTube and Pinterest with 40% reach.3
Radio and Out-of-Home
Radio advertising in Oman is minimal. The first private radio station in the country was launched in 2007, with BBC broadcasting on FM in Salalah, in the south. Oman Radio Shabab and Al Quran El Kareem are the top stations with each boasting a reach of 22%. Oman Radio (Arabic) comes in at the second spot with 16% and Al Wisal at the third spot with 14% reach.1 Outdoor in Oman has remained relatively stagnant except for areas in and around its capital and two key airports - Muscat and Salalah.

178
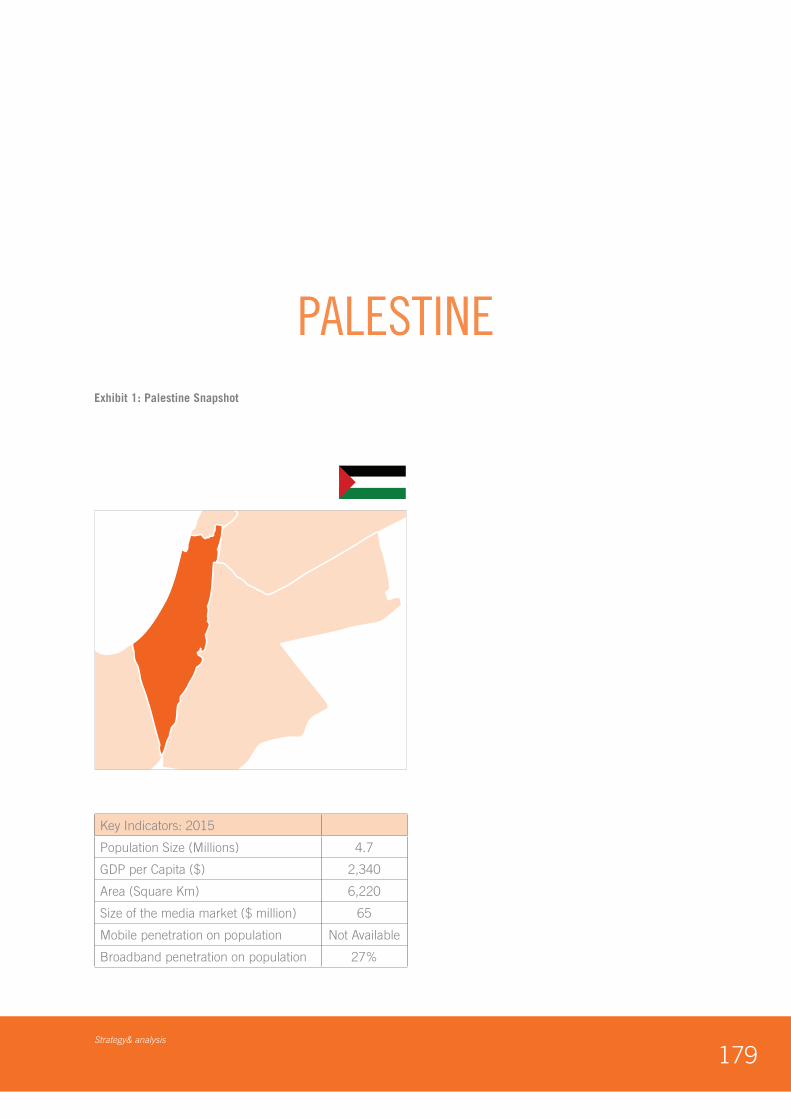
179Strategy& analysis
Exhibit 1: Palestine Snapshot
Key Indicators: 2015
Population Size (Millions) 4.7
GDP per Capita ($) 2,340
Area (Square Km) 6,220
Size of the media market ($ million) 65
Mobile penetration on population Not Available
Broadband penetration on population 27%
PALESTINE
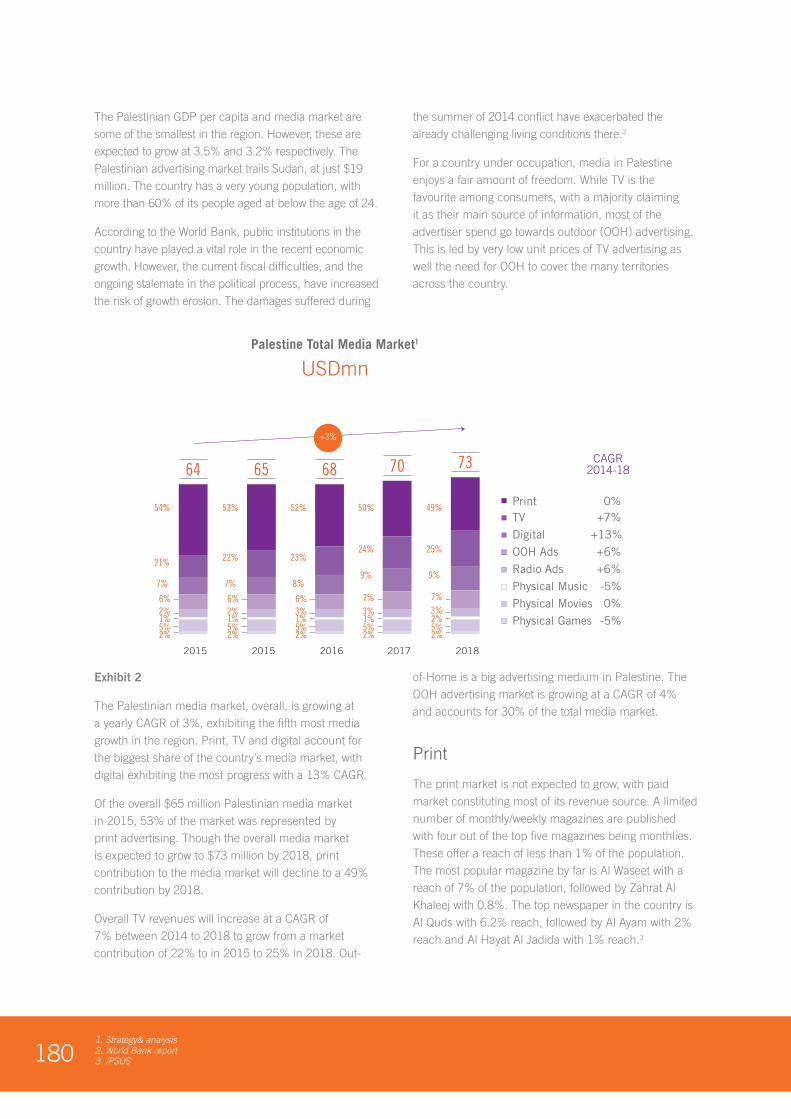
1801. Strategy& analysis2. World Bank report3. IPSOS
The Palestinian GDP per capita and media market are some of the smallest in the region. However, these are expected to grow at 3.5% and 3.2% respectively. The Palestinian advertising market trails Sudan, at just $19 million. The country has a very young population, with more than 60% of its people aged at below the age of 24.
According to the World Bank, public institutions in the country have played a vital role in the recent economic growth. However, the current fiscal difficulties, and the ongoing stalemate in the political process, have increased the risk of growth erosion. The damages suffered during
the summer of 2014 conflict have exacerbated the already challenging living conditions there.2
For a country under occupation, media in Palestine enjoys a fair amount of freedom. While TV is the favourite among consumers, with a majority claiming it as their main source of information, most of the advertiser spend go towards outdoor (OOH) advertising. This is led by very low unit prices of TV advertising as well the need for OOH to cover the many territories across the country.
Exhibit 2
The Palestinian media market, overall, is growing at a yearly CAGR of 3%, exhibiting the fifth most media growth in the region. Print, TV and digital account for the biggest share of the country's media market, with digital exhibiting the most progress with a 13% CAGR.
Of the overall $65 million Palestinian media market in 2015, 53% of the market was represented by print advertising. Though the overall media market is expected to grow to $73 million by 2018, print contribution to the media market will decline to a 49% contribution by 2018.
Overall TV revenues will increase at a CAGR of 7% between 2014 to 2018 to grow from a market contribution of 22% to in 2015 to 25% in 2018. Out-
of-Home is a big advertising medium in Palestine. The OOH advertising market is growing at a CAGR of 4% and accounts for 30% of the total media market.
The print market is not expected to grow, with paid market constituting most of its revenue source. A limited number of monthly/weekly magazines are published with four out of the top five magazines being monthlies. These offer a reach of less than 1% of the population. The most popular magazine by far is Al Waseet with a reach of 7% of the population, followed by Zahrat Al Khaleej with 0.8%. The top newspaper in the country is Al Quds with 6.2% reach, followed by Al Ayam with 2% reach and Al Hayat Al Jadida with 1% reach.3
Palestine Total Media Market1
USDmn
2018
49%
25%
9%
7%3%
5%2%
2%
Print 0%TV +7%
Digital +13%
OOH Ads +6%
Radio Ads +6%
Physical Music -5%
Physical Movies 0%
Physical Games -5%
73
2017
50%
24%
9%
7%3%
5%2%
1%
70
2016
52%
23%
8%
6%3%
5%2%
1%
68
2015
53%
22%
7%
6%2%
5%2%
1%
65
2015
54%
21%
7%
6%2%
5%2%
1%
64CAGR
2014-18
+3%
1811. IPSOS2. Arab Social Media Report 2015
Television
The TV market in Palestine consists of national stations, in addition to multiple TV stations broadcasting locally in each city. Revenues from television mainly come from advertising, with paid television registering a high yearly growth of 15%.
Local TV stations for the most part have limited viewership and are broadcast to a small audience and geographical area. In this light, Palestine TV (satellite) has gained viewership and is a strong candidate for advertisers. Low cost of TV spots for local channels makes it attractive to advertisers, but limits industry revenue. The most viewed channels are satellite stations such as MBC1 and Al Jazeera. In fact, Palestine TV is the only local station in top five channels in the country.1
The small screen remains a strong medium of advertising, and expected to register a 7% yearly growth from 2014 to 2018.
Digital
The last few years witnessed a boom in Internet and social media advertising, with more Palestinians getting online and going mobile. In fact, digital is the
fastest growing revenue source of the media market with a CAGR of 13%. Some of the popular websites are Watantv.com, Maannews.net, and AlIktisadi.ps. Palestine also has online networks such as “Oyoun Network”, which is a collation of more than 30 websites in the country. Networks are becoming one of the best advertising tools, because it garners good amount of audience reaching all localities. Each city has its popular website compared to regional ones, which allows for cheaper advertising in such websites. Regarding the use of social media, Facebook is the top social media platform with 84% reach, followed by WhatsApp with 47% and Google+ with 18% reach.2
Radio and OOH
Palestine currently has two national radio stations (AM and FM) and a large number of commercial local radio stations. Most offer general programming consisting of music, news, interactive shows, and information services with Ajyal being the most popular station with a reach of 7%.1. All stations transmit in Arabic-language, with the most popular listening time being between 7 to 9AM. Due to competitive pricing, radio is expected to grow at a yearly CAGR of 6%.

182
183Strategy& analysis
Exhibit 1: Qatar Snapshot
Key Indicators: 2015
Population Size (Millions) 2.3
GDP per Capita ($) 79,445
Area (Square Km) 11,571
Size of the media market 595
Mobile broadband penetration on population 140%
Fixed broadband penetration on population 181%
QATAR
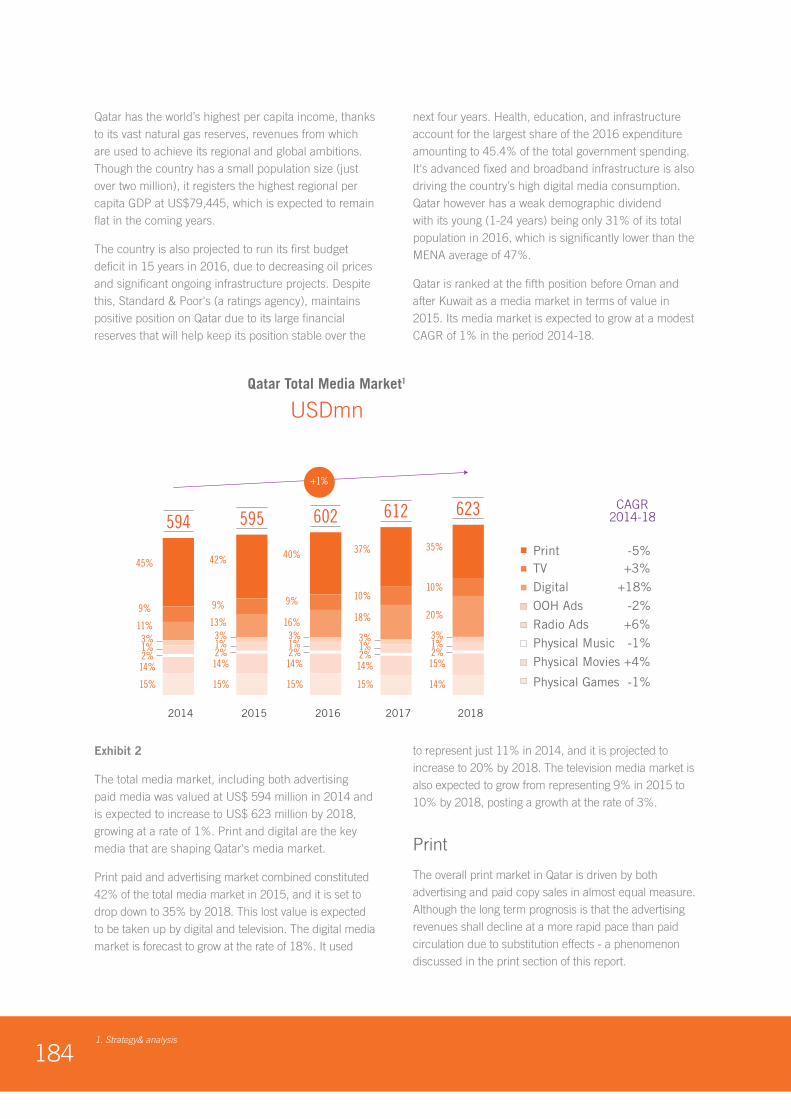
1841. Strategy& analysis
Qatar has the world’s highest per capita income, thanks to its vast natural gas reserves, revenues from which are used to achieve its regional and global ambitions. Though the country has a small population size (just over two million), it registers the highest regional per capita GDP at US$79,445, which is expected to remain flat in the coming years.
The country is also projected to run its first budget deficit in 15 years in 2016, due to decreasing oil prices and significant ongoing infrastructure projects. Despite this, Standard & Poor's (a ratings agency), maintains positive position on Qatar due to its large financial reserves that will help keep its position stable over the
next four years. Health, education, and infrastructure account for the largest share of the 2016 expenditure amounting to 45.4% of the total government spending. It's advanced fixed and broadband infrastructure is also driving the country’s high digital media consumption. Qatar however has a weak demographic dividend with its young (1-24 years) being only 31% of its total population in 2016, which is significantly lower than the MENA average of 47%.
Qatar is ranked at the fifth position before Oman and after Kuwait as a media market in terms of value in 2015. Its media market is expected to grow at a modest CAGR of 1% in the period 2014-18.
Exhibit 2
The total media market, including both advertising paid media was valued at US$ 594 million in 2014 and is expected to increase to US$ 623 million by 2018, growing at a rate of 1%. Print and digital are the key media that are shaping Qatar's media market.
Print paid and advertising market combined constituted 42% of the total media market in 2015, and it is set to drop down to 35% by 2018. This lost value is expected to be taken up by digital and television. The digital media market is forecast to grow at the rate of 18%. It used
to represent just 11% in 2014, and it is projected to increase to 20% by 2018. The television media market is also expected to grow from representing 9% in 2015 to 10% by 2018, posting a growth at the rate of 3%.
The overall print market in Qatar is driven by both advertising and paid copy sales in almost equal measure. Although the long term prognosis is that the advertising revenues shall decline at a more rapid pace than paid circulation due to substitution effects - a phenomenon discussed in the print section of this report.
2018
35%
10%
20%
3%1%
15%
14%
2%
Print -5%TV +3%
Digital +18%
OOH Ads -2%
Radio Ads +6%
Physical Music -1%
Physical Movies +4%
Physical Games -1%
Qatar Total Media Market1
USDmn
623
2017
37%
10%
18%
3%1%
14%
15%
2%
612
2016
40%
9%
16%3%1%
14%
15%
2%
602
2015
42%
9%
13%3%1%
14%
15%
2%
595
2014
45%
9%
11%3%1%
14%
15%
2%
594CAGR
2014-18
+1%
1851. IPSOS 4. Internet Live Stats2. Arab Social Media Report 2015
Qatar has daily newspapers in English and Arabic languages, with the leading daily newspapers having links to the ruling family. Like the UAE, Qatar has a high proportion of expatriates and hence publications in Qatar exist in both Arabic and English languages. According to IPSOS, the top newspaper is Gulf Times with 23.9% reach, followed by Al Sharq with 14.4% and Arrayah with 14.3% reach. Regarding magazines, the classifieds leader Al Waseet is the widely read weekly “magazine” with 15.7% reach, followed by pure-play magazines like Zahrat Al Khaleej with 6.7% and the Rotana Magazine with 4.6% reach.1
Television
The television market in Qatar is driven mainly by the paid revenue streams with advertising being less than a quarter of its revenues. Also unlike the advertising market, which is expected to have no growth, the pay TV market continues to show robust growth at a CAGR of 5% during the period 2014-18.
Qatar is the region's fifth largest Pay TV market after Kuwait with the strongest IPTV delivery in the region. Almost half of the Pay TV connections are IPTV, the other half being driven by DTH - the dominant platform of delivery in the region. Expectedly, the leading telecom player Ooredoo (called QTel earlier) is the country's largest Pay TV service provider.
In free-to-air TV, Qatar is best known both globally and in the region as the home of Al Jazeera - the influential Pan-Arab and international channel owned by the government. In February 2016, the network closed its Al Jazeera America operations quoting an unsustainable business model. Within Qatar however, Al Jazeera remains the most viewed channel
generating a reach of 26.5%, closely followed the MBC Group with MBC1 at 22.9% and MBC2 with 18.1% reach.1 Also, like the rest of Gulf countries, its high proportion of expatriates reflects on its top channels with the South Asian station Zee TV being in the top five ranking at the fourth spot.
Digital
Qatar has advanced internet infrastructure, which serves the country's 2.1 million Internet users as of 2016, resulting in a penetration of 92%.2 Digital is the fastest growing market, growing at a CAGR of 18% in 2014-18 driven equally by both the paid and advertising revenue streams. Social media remains one of the top activities in Qatar as well. Facebook dominates the top two social media places with its social network and WhatsApp at 81% and 80% of the usage respectively. YouTube, Pinterest and Twitter follow it at 55%, 42% and 35% respectively.3
Radio and Out-of-Home
Radio and Out of home combined comprise less than 5% of the media market of Qatar. The radio advertising market in Qatar will experience a growth of 6% between 2014 and 2018, while outdoor is expected to reduce by 2%.
The top radio stations in Qatar are state run. Quran Al Kareem FM leads with 20% reach, followed by Qatar Radio Arabic FM with 14% and Qatar Radio English FM with 7% reach.1 The majority of OOH advertising comes from physical advertising as Digital OOH is yet to evolve in Qatar. It is expected to grow depending on the improvement of supporting infrastructure and superior regulation.

186
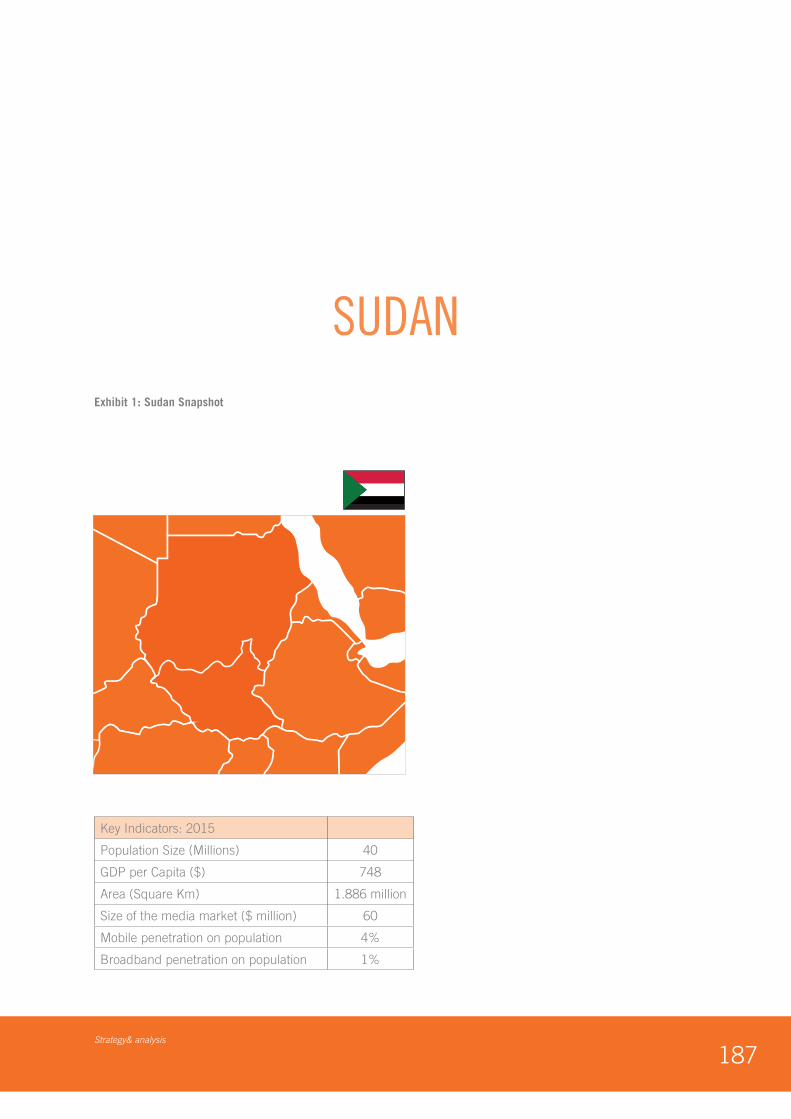
187Strategy& analysis
Exhibit 1: Sudan Snapshot
Key Indicators: 2015
Population Size (Millions) 40
GDP per Capita ($) 748
Area (Square Km) 1.886 million
Size of the media market ($ million) 60
Mobile penetration on population 4%
Broadband penetration on population 1%
SUDAN
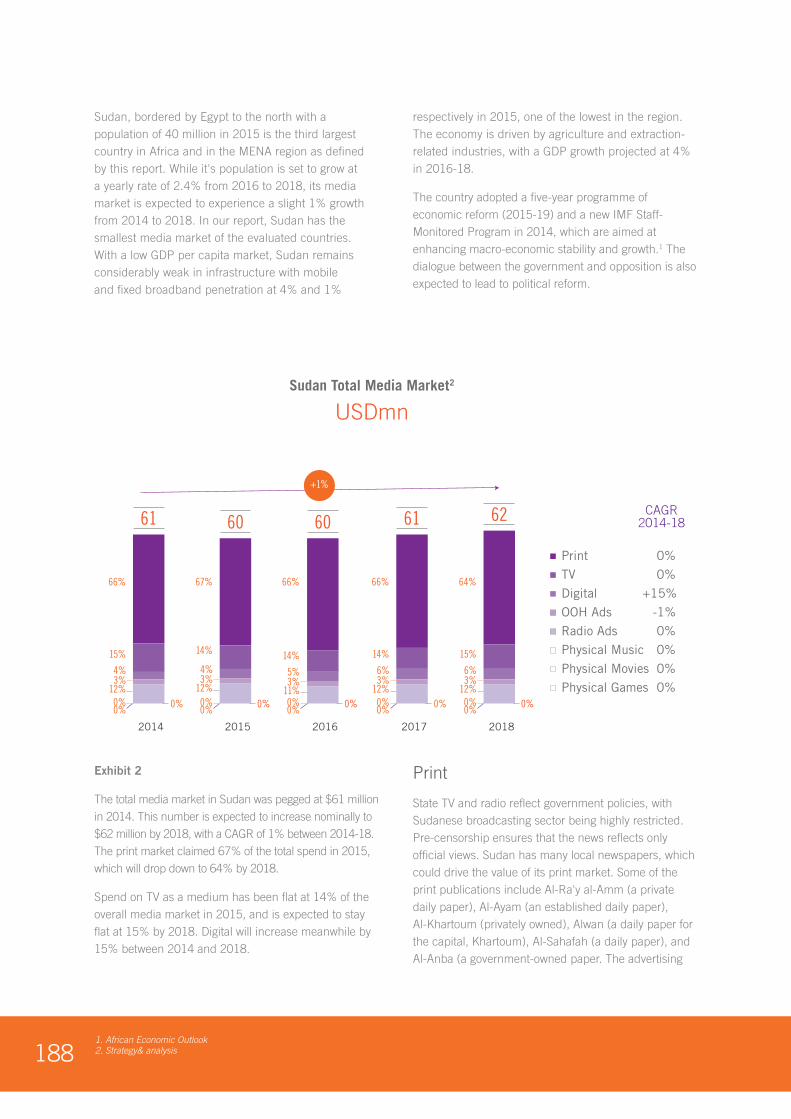
1881. African Economic Outlook2. Strategy& analysis
Sudan, bordered by Egypt to the north with a population of 40 million in 2015 is the third largest country in Africa and in the MENA region as defined by this report. While it's population is set to grow at a yearly rate of 2.4% from 2016 to 2018, its media market is expected to experience a slight 1% growth from 2014 to 2018. In our report, Sudan has the smallest media market of the evaluated countries. With a low GDP per capita market, Sudan remains considerably weak in infrastructure with mobile and fixed broadband penetration at 4% and 1%
respectively in 2015, one of the lowest in the region. The economy is driven by agriculture and extraction-related industries, with a GDP growth projected at 4% in 2016-18.
The country adopted a five-year programme of economic reform (2015-19) and a new IMF Staff-Monitored Program in 2014, which are aimed at enhancing macro-economic stability and growth.1 The dialogue between the government and opposition is also expected to lead to political reform.
Exhibit 2
The total media market in Sudan was pegged at $61 million in 2014. This number is expected to increase nominally to $62 million by 2018, with a CAGR of 1% between 2014-18. The print market claimed 67% of the total spend in 2015, which will drop down to 64% by 2018.
Spend on TV as a medium has been flat at 14% of the overall media market in 2015, and is expected to stay flat at 15% by 2018. Digital will increase meanwhile by 15% between 2014 and 2018.
State TV and radio reflect government policies, with Sudanese broadcasting sector being highly restricted. Pre-censorship ensures that the news reflects only official views. Sudan has many local newspapers, which could drive the value of its print market. Some of the print publications include Al-Ra'y al-Amm (a private daily paper), Al-Ayam (an established daily paper), Al-Khartoum (privately owned), Alwan (a daily paper for the capital, Khartoum), Al-Sahafah (a daily paper), and Al-Anba (a government-owned paper. The advertising
Sudan Total Media Market2
USDmn
2018
64%
15%
6%3%
12%0%0%
0%
Print 0%
TV 0%
Digital +15%
OOH Ads -1%
Radio Ads 0%
Physical Music 0%
Physical Movies 0%
Physical Games 0%
62
2017
66%
14%
6%3%
12%0%0%
0%
61
2014
66%
15%
4%3%
12%0%0%
0%
61
2016
66%
14%
5%3%
11%0%0%
0%
60
2015
67%
14%
4%3%
12%0%0%
0%
60CAGR
2014-18
+1%
1891. Internet World Stats2. Arab Social Media Report 2015
market is very small at 5% of the overall $40 million print market. According to local market estimates, less than the half of the country's population read a daily newspaper, driving its low print market size.
Television
Pan-Arab stations are popular in the country, with satellite dishes being a common sight in affluent areas. TV share of the media market is expected to remain flat for the years to come with a close to 14% share of market from 2014 to 2015. With limited Pay TV estimates available, the airwaves are dominated by local TV stations as Sudan TV, Ashrooq TV, Sudan Drama and Blue Nile a popular local channel. While Pan-Arab viewing dominates the country, it is very expensive for any local player to advertise especially that local TV stations offer lower prices for advertising.
Digital
Increased access to the internet and official curbs on traditional media have brought a rise in the use of social media. According to Internet World Stats, Sudan had a internet penetration of 30% in 2016, with approximately 11 million internet users - up from 30,000 in 2000.
According to market sources, most of the users access the internet through mobile phones rather than desktops. Social networks dominate online activities with more than 75% of internet users. Facebook is the most popular social media platform with 92% reach among internet users, followed by WhatsApp with 86% and Pinterest with 39%.2 Mobile penetration is estimated at 77% as per industry sources.
Radio and Out-of-Home
Unlike in most other Arab countries, radio is a major element in the news media environment. The main radio networks are run by the state. There are a handful of private FM radios in Khartoum, most of which focus on entertainment or religious content.3 Some radio stations include Mango 96 FM (Arabic), Sudan National Radio Corporation, SRTC FM 100 (Arabic), Khartoum FM, Radio Megamind, Miraya FM, SRTC Quran (Arabic) and SRTC Salam (Arabic). However, radio has a low audience compared to other markets, with less than 30% reach overall. Most of the listeners tune into the radio in the mornings. Outdoor remains disorganised across most of Sudan with limited regulation. That coupled with the large landmass has limited organised OOH to big cities such as Khartoum.

190
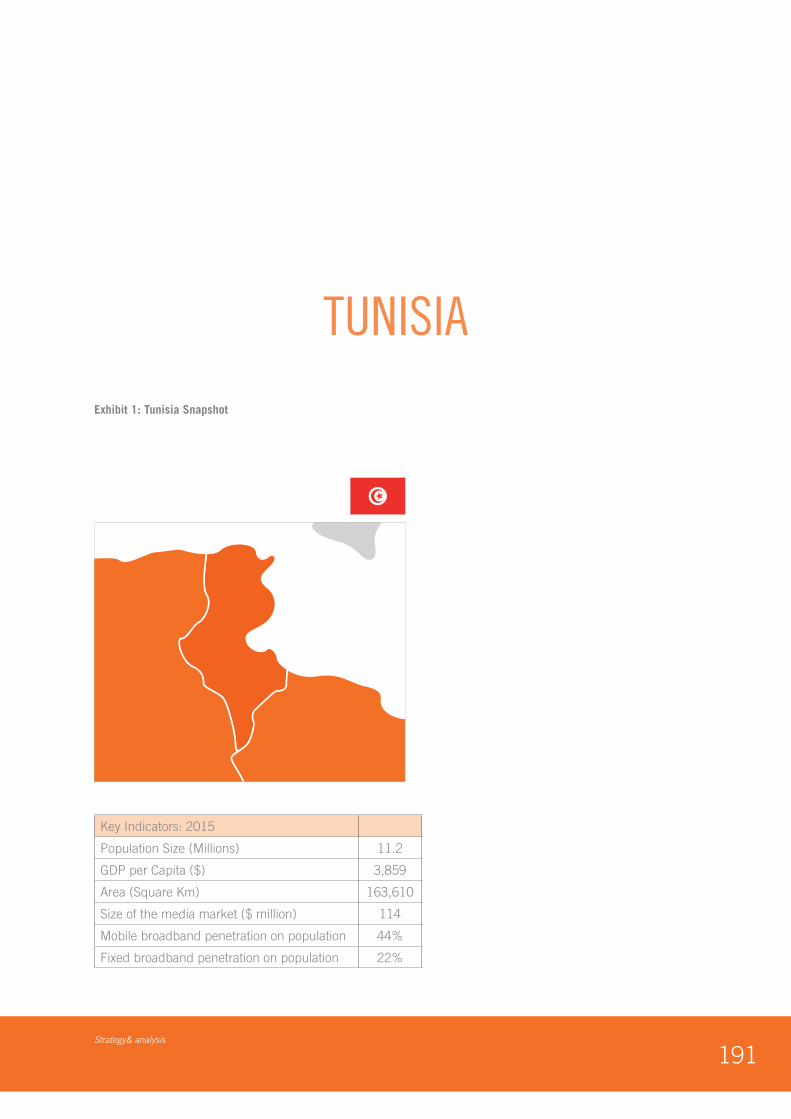
191Strategy& analysis
Exhibit 1: Tunisia Snapshot
Key Indicators: 2015
Population Size (Millions) 11.2
GDP per Capita ($) 3,859
Area (Square Km) 163,610
Size of the media market ($ million) 114
Mobile broadband penetration on population 44%
Fixed broadband penetration on population 22%
TUNISIA
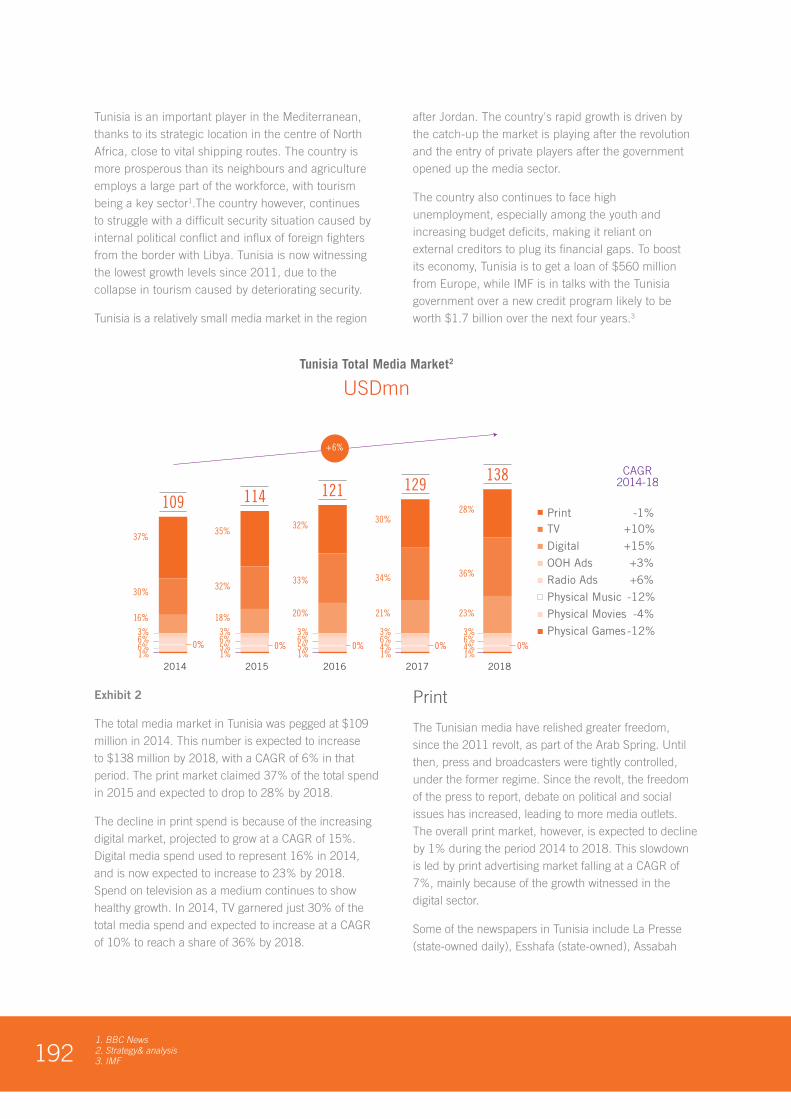
1921. BBC News2. Strategy& analysis 3. IMF
Tunisia is an important player in the Mediterranean, thanks to its strategic location in the centre of North Africa, close to vital shipping routes. The country is more prosperous than its neighbours and agriculture employs a large part of the workforce, with tourism being a key sector1.The country however, continues to struggle with a difficult security situation caused by internal political conflict and influx of foreign fighters from the border with Libya. Tunisia is now witnessing the lowest growth levels since 2011, due to the collapse in tourism caused by deteriorating security.
Tunisia is a relatively small media market in the region
after Jordan. The country's rapid growth is driven by the catch-up the market is playing after the revolution and the entry of private players after the government opened up the media sector.
The country also continues to face high unemployment, especially among the youth and increasing budget deficits, making it reliant on external creditors to plug its financial gaps. To boost its economy, Tunisia is to get a loan of $560 million from Europe, while IMF is in talks with the Tunisia government over a new credit program likely to be worth $1.7 billion over the next four years.3
Exhibit 2
The total media market in Tunisia was pegged at $109 million in 2014. This number is expected to increase to $138 million by 2018, with a CAGR of 6% in that period. The print market claimed 37% of the total spend in 2015 and expected to drop to 28% by 2018.
The decline in print spend is because of the increasing digital market, projected to grow at a CAGR of 15%. Digital media spend used to represent 16% in 2014, and is now expected to increase to 23% by 2018. Spend on television as a medium continues to show healthy growth. In 2014, TV garnered just 30% of the total media spend and expected to increase at a CAGR of 10% to reach a share of 36% by 2018.
The Tunisian media have relished greater freedom, since the 2011 revolt, as part of the Arab Spring. Until then, press and broadcasters were tightly controlled, under the former regime. Since the revolt, the freedom of the press to report, debate on political and social issues has increased, leading to more media outlets. The overall print market, however, is expected to decline by 1% during the period 2014 to 2018. This slowdown is led by print advertising market falling at a CAGR of 7%, mainly because of the growth witnessed in the digital sector.
Some of the newspapers in Tunisia include La Presse (state-owned daily), Esshafa (state-owned), Assabah
Tunisia Total Media Market2
USDmn
2018
28%
36%
23%
3%6%4%1%
0%
Print -1%
138
2017
30%
34%
21%
3%6%4%1%
0%
129
2016
32%
33%
20%
3%6%5%1%
0%
121
2015
35%
32%
18%
3%6%5%1%
0%
114
2014
37%
30%
16%
3%6%6%1%
0%
109
CAGR2014-18
+6%
TV +10%
Digital +15%
OOH Ads +3%
Radio Ads +6%
Physical Music -12%
Physical Movies -4%
Physical Games -12%
1931. Imperium2. Arab Social Media Report 2015
(privately-owned), Alchourouk (privately-owned), and Le Temps (privately-owned). Achourouk is the top newspaper with a reach of 34.6%, followed by Assarih with 13.7% and Assabah with 11.7%. Al Bayane is the most popular weekly with a 5% reach while Sayidati is the most popular monthly with a 4% reach.1
Television
The state broadcaster has two national TV channels (Wataniya 1 and Wataniya 2) and several radio networks. Egyptian, French and Pan-Arab satellite TV channels also have a large following. The total television market is growing at the rate of 10%, driven mainly by ad revenues, with paid revenues growing faster. As of January 2016, Tunisia has 13 private satellite channels, with more channels expected to launch in the years ahead. Increased competition in the TV ad market may have led to a downward pressure on prices, but is also expected to contribute to higher overall spending. El Hiwar Tounsi is the top channel with a 31% reach, followed by Al Wataniya 1 with 25.5%. Nessma TV comes in at the third spot with 24.8% reach.1
Digital
Tunisia’s digital media market is growing at a CAGR of 15%. Of the total digital media spend, 20% belongs
to the digital advertising market, while the digital paid market represents the balance 80%. Tunisia is also expected to award the country’s first 4G licenses in the first half of 2016. This improved access to high-speed Internet is projected to boost the country’s digital media industry on both the paid and advertising side. WhatsApp is the top social media channel in Tunisia with a reach of 93%, followed by Facebook with 92% and Google+ with 27%.2
Radio and Out-of-Home
Radio is a recession-proof medium and hence it is expected to grow at a rate of 6% every year. After the Tunisian revolution, the majority of regional radio channels have opened up their market, thus driving up the average radio penetration across most parts of Tunisia. Private radio stations outperform other stations and almost all are online. MFM is the highest performing channel in Tunisia while JFM is the most performing in Sousse. Overall, MFM has a reach of 24%, followed by Zitouna at 12% and Shems FM at 11%.1 Out-of-Home (OOH) is also growing at a rate of 3% year-on-year. OOH in Tunisia allows for city targeting and is dominated by telecom players and FMCG players like Danone.
194
EADY ARAB WORLD THE FUTURE-READY ARAB
ARAB MEDIA EXPOSURE AND TRANSITIONARAB MEDIA OUTLOOK 2016. 2020ARAB MEDIA EXPOSURE AND TRANSITIONARAB MEDIA OUTLOOK 2016. 2020
ARAB MEDIA OUTLOOK 2016. 2020ARAB MEDIA EXPOSURE AND TRANSITIONARAB MEDIA OUTLOOK 2016. 2020ARAB MEDIA EXPOSURE AND TRANSITIONARAB MEDIA OUTLOOK 2016. 2020ARAB MEDIA EXPOSURE AND TRANSITIONARAB MEDIA OUTLOOK 2016. 2020ARAB MEDIA EXPOSURE AND TRANSITIONARAB MEDIA OUTLOOK 2016. 2020ARAB MEDIA EXPOSURE AND TRANSITIONARAB MEDIA OUTLOOK 2016. 2020ARAB MEDIA EXPOSURE AND TRANSITIONARAB MEDIA OUTLOOK 2016. 2020ARAB MEDIA EXPOSURE AND TRANSITIONARAB MEDIA OUTLOOK 2016. 2020
1951. Search Engine People
EADY ARAB WORLD THE FUTURE-READY ARAB
ARAB MEDIA EXPOSURE AND TRANSITIONARAB MEDIA OUTLOOK 2016. 2020ARAB MEDIA EXPOSURE AND TRANSITIONARAB MEDIA OUTLOOK 2016. 2020
ARAB MEDIA OUTLOOK 2016. 2020ARAB MEDIA EXPOSURE AND TRANSITIONARAB MEDIA OUTLOOK 2016. 2020ARAB MEDIA EXPOSURE AND TRANSITIONARAB MEDIA OUTLOOK 2016. 2020ARAB MEDIA EXPOSURE AND TRANSITIONARAB MEDIA OUTLOOK 2016. 2020ARAB MEDIA EXPOSURE AND TRANSITIONARAB MEDIA OUTLOOK 2016. 2020ARAB MEDIA EXPOSURE AND TRANSITIONARAB MEDIA OUTLOOK 2016. 2020ARAB MEDIA EXPOSURE AND TRANSITIONARAB MEDIA OUTLOOK 2016. 2020ARAB MEDIA EXPOSURE AND TRANSITIONARAB MEDIA OUTLOOK 2016. 2020
Socially fuelled versus Established Stars - defining the SMI
Globally, with the wide spread use of social media a new kind of influencer has emerged. For this section it is important to define who these influencers are and their medium. Social media influence has two distinct models, separated by their original status and content structure.
The first model pertains to what this document defines as Social Media Influencers (SMIs) who gain fame specifically via social media. SMI's are also unique in their content and posting patterns i.e. they post their content regularly as they need to keep their followers engaged and they do so on a specific topic. By posting such frequent content they indirectly position themselves as experts in their content area and gain their follower's trust.
Hence, SMI exclude personalities are already well known and now leverage the power of social media to enhance their visibility. This report classifies the second type of social influencers as 'Celebrity Influencers’, which include already established and famous people across content genres including but not limited to politicians, athletes, movie/TV actors, state leaders, authors and musicians. Social networks have allowed celebrities to have greater control over their messages, engage more and directly with their fan base, letting them even more into their lives. Earlier celebrities would manage their fan-base through ‘fan mail’ or their agents that occasionally reached out to the public through PR or media. From
typical endorsement revenues, celebrity influencers are now diversifying to get paid for tweeting, posting paid product’s photos on Instagram and launching merchandise with minimal costs. Jessica Alba, a celebrity influencer, is using her movie and TV fame to promote her ‘Honest’ brand of cosmetics to millions of her fans (or prospective consumers now) every day via social media – essentially free marketing and PR with the company reportedly valued at $1 billion.
Unlike before, celebrity influencers can now connect directly with their fans unlike the earlier trial by media» syndrome that made and broke their careers. However, not all that glitters is gold. Social media by nature is a different beast1. It’s harder to censor and news (good and bad) flows rapidly in seconds. Unlike their highly curated public image managed by an entourage of publicists, managers, agents, celebrities now have less control. Social media is akin to a wild west; no holds barred; free speech model making it difficult to manage negative publicity, inappropriate tweets, offensive users, or protect their privacy due to the large uncontrolled distribution as a new medium.
With SMIs being able to reach significantly larger audiences than earlier, the value of the celebrity fame is now being evaluated with a different lens. Although celebrity influencers can obviously reach a larger audiences, SMIs drive greater engagement due to their relative expertise on a niche topic as celebrities aren’t necessarily viewed as trusted sources of content areas like beauty and are already leveraged by advertisers in
WORLD THE FUTURE-READY ARAB WORLD THE
Social Media Influencers (SMI)
1961. Media Kix 2. Ad Week3. Zefr4. Huffington Post5. Pew Research
commercial messages. As both glamour and credibility are important for most advertisers in their messaging, SMIs accessibility and authenticity has made them a key players on deriving the latter and in driving actions from their followers1.
In contrast, marketing campaigns with celebrities typically see less engagement. One example of reach vs. engagement is of Connor Franta (a popular YouTube star) and Jimmy Fallon, a late night TV show host. Fallon’s average reach across social platforms was 207% higher than Conor’s (38.4 million vs. 12.5 million for Conor), however Conor’s engagement was 66% greater (2 million for Conor vs. 1.2 million). It’s clear that brands using data for their influencer strategies are going to see stronger campaign results2. Another study found that not only do social media names often have follower counts to rival TV stars, but their endorsements may be more valuable for clients3. Brands now have different avenues to promote their products that have a strong possibility of creating better results at a lower price point4.
Fueling the growth of SMI
The rapid proliferation of SMIs is due to five factors - youth demographics of the region, technology adoption, social media, emergence of short content formats and convenience of consumption.
Possibly the single biggest driver of the SMI growth has been the strong youth skews that the region presents vs. more developed markets (see Macro Economic section for details). Youth are a big part of MENA with 47% of the population younger than 25 years of age. As is the case the world over youth are voracious content creators, consumers and the fastest adopters of new trends. Both in the region and globally, users as young as 13 years (the minimum age limit for services such as Facebook2) are part of this upsurge. Their always-connected, need to know, fear of missing out (FOMO) mindset keeps them glued to their mobile every waking moment.
This trend is now spreading to other age groups who are using social media as a ‘go to’ source for news, to stay in touch, and to unwind thereby creating different types of SMIs. In the US, Facebook was the most used site to learn about the 2016 American elections5. In the region, users spent an average of 80 minutes per day on social media alone basis the latest IPSOS data.
Unlike the predecessors of social media such as user groups, chat rooms, photo-sharing sites (like Flickr) and blogs that were desktop-bound, SMI growth has been driven by mobility. The increase in 4G connectivity and smartphones has contributed to the rapid development of youth in using mobile as their first screen. From 2011, in Jordan and Lebanon alone mobile broadband penetration grew at 42.2% yearly and is expected to reach 90% by 2018. While price can be a deterrent for adoption especially with young consumers with no direct income, the new generation of smartphones cost a few hundred dollars, and even free when purchased with a telecom contract. Data costs in the region have also been falling and WiFi hotspots are ubiquitous - hence making social media as a top activity.
In a generation growing up on short form, bite-sized chunks of content are also not demanding on their time. In 2013, 35% and 27% of time spent by UK consumers on mobile and laptop, respectively, was to view short form content5. Also this content has strong resonance, mostly created by the young for the young. In a region where most of the broadcast content has been dominated by dubbed content and globally adapted format shows, this is a compelling driver for youth to turn to social media to stay entertained and connected.
Finally, the biggest crowd-puller is the engagement itself. The youth are born in an age of interactivity and have limited appeal to the typical one-way communication that existed with celebrities on mass media. With likes, comments and tweets, the youth expect a degree of interactivity and access to authority figures, the rich and famous. And with this disintermediation of power, the users are connecting to those they can relate to, be it a leader, an influencer or a like-minded person like never before.
SMI Content
The content created by SMIs in the region is mainly visual and dominated by photos and videos that are self-explanatory and entertain easily across the region. SMI content hence covers a wide spectrum, from showing how to put on makeup, comedy sketches, cooking, antics and work-outs. Whatever be the content, fans follow them with fervor as its easy to relate to and cuts across genders, languages and nationalities.
The most famous case is Pewdiepie (pronounced
1971. Independent
Pewdy Pie), a professional gamer who gained even more fame when Forbes recognised him as the highest-earning YouTuber of 2015 with an annual income of $12 million - much of which came from advertising1 The 25-year-old plays video games from his home, and millions of fans ‘watch’ him play and dish out commentary. In six years, Pewdiepie has 42 million subscribers and clocked in over 11.4 billion views. In another example, we find the comedian "Jenna Marbles" channel valued at US $ 2.5 million, posting new videos for more than 16 million viewers each week.
Price of Fame
All of the above affirm that the trend for SMIs are likely to have greater reach and influence in the times to come. What is however unclear is their ability to monetise, sustain and grow that influence as opposed to being a flash in the pan. Most SMIs are young, accidentally famous and have limited understanding of the business dynamics that are required to become a sustainable force. SMIs at this stage are largely dependent on marcomms revenues to fuel their revenue streams. These sources hence derive directly via marketers wanting to work with them to leverage their influence for their products or with their from advertising agencies and the MCNs, the latter being their “agents” to represent and develop them as sustainable entities.
In that context SMIs lack of experience can be a challenge as their social popularity can be mistaken for their ability to create a sustainable revenue streams. In a region where quality content on SMIs remain a challenge, a few who are successful can price themselves out of the market - or fail to monetise their audiences in the correct manner. Hence while their subscriber base, video views or followers are a reasonable metric of influence, but developing those into value creating solutions is another matter altogether.
Copyrights are another challenge, which SMIs need to counter proactively. Most SMIs are amateurs, not IP lawyers and don’t necessarily tread carefully to protect their content and brand. In some cases they may even infringe on external content unwittingly. On another note, unlike traditional media which goes thorough clearances from the Ministry of Information and requires broadcasting licenses, SMIs need to maintain the
balance between content that pushes the boundaries and be socially compliant.
Like their global counterparts, majority of the region's SMIs start by creating content using basic equipment like camcorders and smartphones to record content from their homes. However as they evolve, they need to look and appear more professional, especially if they need to work with brands who are sensitive to quality. In this context, SMIs face the challenge of getting access to professional production capabilities like studios, HD recording equipment, and professional editing all of which are substantial costs. As a result of their limited expertise in content production, SMIs in the region are yet to evolve. According to industry sources, as high as 80% of today's content created cannot be monetised due to its quality.
Another challenge is more to do with the cultural aspects of the society, where career choices are still dominated by stable professions like government jobs, doctors or engineers. SMIs are yet to come into it's own as a career choice as there is a stigma on creative pursuits. Faced with these and a fear of failure many SMIs are forced to abandon their ‘social careers’ instead making it a passing hobby at best.
SMIs and MCNs - the ecosystem
As SMIs mature, they are integrating into the wider marketing ecosystem. Facilitating this are multi-channel networks or MCNs (please refer to the section on MCNs in this report) which are essentially the equivalent of SMIs record labels or talent agents. SMI's monetise directly through video views on platforms such as YouTube or through branded content deals. YouTube pays SMIs based on the number of times their video is seen - the transaction being done directly with SMIs or via MCNs. YouTube typically takes 45% of their revenues and their MCN takes 20-30%, leaving the SMIs with 25-35% on average of the overall video view revenue to cover for their time and effort. For every thousand times a video is viewed, between $1.36 to $3.40 is paid to the SMI - after slicing out YouTube's share.
What remains more lucrative for SMIs is the area of bespoke content creation for brands or integrating brands into their videos. While achieving scale is a challenge due to the time and effort required, it value to SMIs is driven by their higher share of revenue vs. YouTube.
1981. Fusion2. Wall Street Journal
The story on SMI monetisation is far from balanced. On one hand, there are success stories like Michelle Phan who has become a cosmetics expert and celebrity, courtesy her 8.4 million YouTube subscribers. So much so that L’Oréal co-branded a cosmetic line with her and she retains a PR agency.
On the other hand, the high degree of fragmentation in the SMI world makes scale important to derive value. For example, 'Just Between Us' a YouTube comedy channel run by Allison Raskin and Gaby Dunn highlights this. Despite their Instagram accounts trailing more than 300,000 followers each; YouTube channel with over 600,000 subscribers, clocking in 50 million video views, the reality is different. ‘Just between Us’ is estimated to have made $83,000 in its two years of existence, or just under $20,960 per head per year if the duo had to split it evenly. And that includes their production costs, taxes, time, effort and any other costs that they must bear1. This kind of economics works similarly in the region.
In short, for SMIs to monetise at scale they must fire on all cylinders. They need to make fresh high-quality and quantity content; ‘professionalise’ their revenue streams by working with MCNs closely; expand their platforms, build their brand consistently over a few years and diversify – so their influence can translate into income and become sustainable.
Future of SMI
As a phenomenon, although SMIs are relatively new, they can potentially be the purveyors of local culture. As shared earlier, the content of large private broadcasters in the region still has a preponderance of dubbed content and western movies which obviously are not reflective of the local culture. On the other hand, public sector broadcasters are centered on local culture, but are less appealing to youth due to their content (dominated by the national agenda) and the platforms they use.
Hence to derive value from the SMI's unique value proposition, key TV broadcasters are experimenting by integrating SMIs into their programming. One such cross-over talent is Noon Alniswa who was picked up by MBC to create her own TV show. Lebanese siblings Alice, Nadine and Farah Abdel Aziz who run the Instagram account 'Style in Beirut' were also cast by
Rotana to star in the Pan-Arab reality TV series, “The Sisters”2. While the jury is still out on their success, initial reports suggest that transferring SMI equity from to broadcast TV is more challenging than it appears. This is due to the inherent nature of SMI-created content, where the pace, format and duration are different to what broadcasters are used to.
In a region dominated by foreign media, governments could integrate SMIs to promote their culture and among youth audiences. E.g. ‘EyshElly’ is a YouTube channel on Saudi culture with 2.7 million subscribers features skits in Saudi locales with a different perspective - not covered by traditional mass media. Developing content in Arabic and filming it in the respective Arab country also makes it pertinent to the culture as noted in the film section of the report.
Most SMIs lack the infrastructure to make professional-grade content. Governments can alleviate this by subsidising MCNs on rents, facilities, access to their media zones or via monetary incentives. They can also improve the local talent pool by training students in content production, creating local talent contests, celebrating the achievements of SMIs and shedding light on the cultural acceptance on such new media professions.
The private sector can be the biggest driver of SMIs growth and also gain the most. Players like MCNs and talent managers can work with upcoming talent to make them aware of the opportunities . Working closely with the government and distribution platforms such as Facebook and YouTube, they can offer production support and improve the standards.
In countries where mobility or socio-cultural limitations apply e.g. Arab audience looking for specialised content not covered in the media or education - be it health or learning, SMIs can be an alternative source of knowledge.
Currently SMIs inform and provide access, but in the long run they can drive a more important agenda. SMIs have the potential to 'humanise the government' by facilitating the communication between them and the youth. In fact, by creating content from the people to the people, SMIs can help develop the local creative ecosystem. Moreover, as SMIs build a strong record of success stories, start appearing on media channels, they will help mitigate the Arab cultural fear of failure and foster local innovation.

199

200
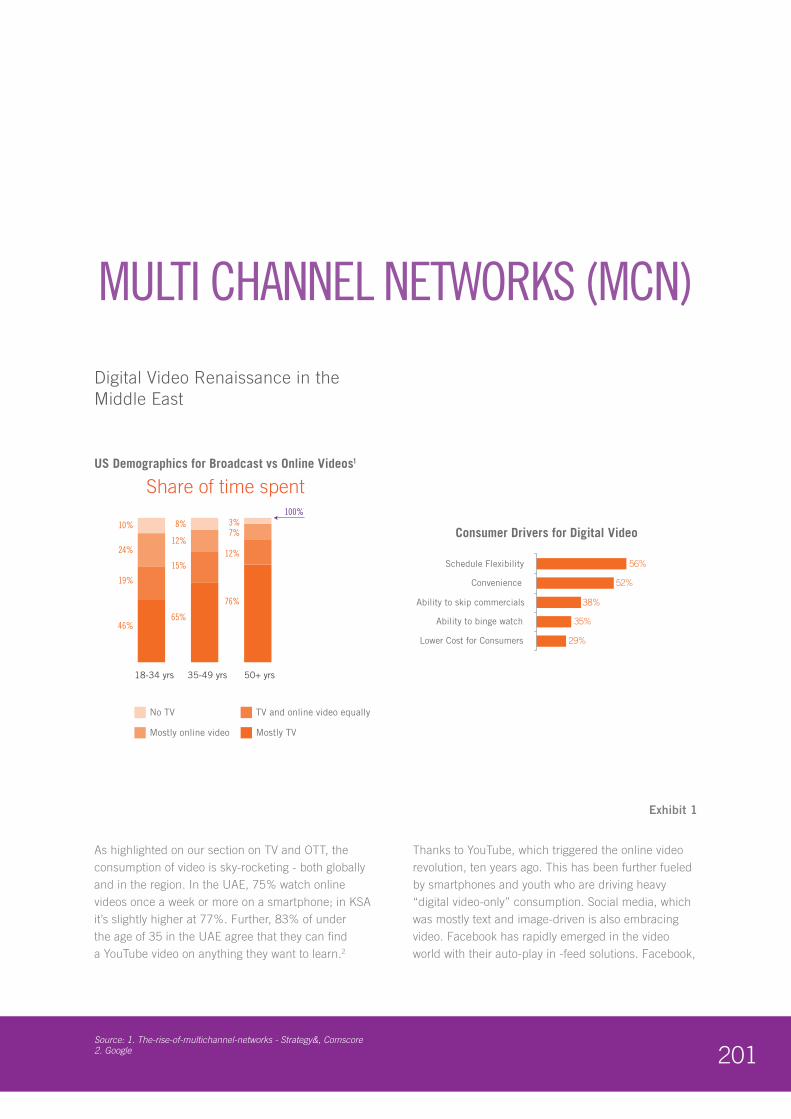
201Source: 1. The-rise-of-multichannel-networks - Strategy&, Comscore 2. Google
Digital Video Renaissance in the Middle East
Exhibit 1
As highlighted on our section on TV and OTT, the consumption of video is sky-rocketing - both globally and in the region. In the UAE, 75% watch online videos once a week or more on a smartphone; in KSA it’s slightly higher at 77%. Further, 83% of under the age of 35 in the UAE agree that they can find a YouTube video on anything they want to learn.2
Thanks to YouTube, which triggered the online video revolution, ten years ago. This has been further fueled by smartphones and youth who are driving heavy “digital video-only” consumption. Social media, which was mostly text and image-driven is also embracing video. Facebook has rapidly emerged in the video world with their auto-play in -feed solutions. Facebook,
MULTI CHANNEL NETWORKS (MCN)
US Demographics for Broadcast vs Online Videos1
Share of time spent
18-34 yrs
46%
19%
24%
10%
35-49 yrs
65%
15%
12%
8%
50+ yrs
76%
12%
7%3%
100%
No TV TV and online video equally
Mostly online video Mostly TV
Consumer Drivers for Digital Video
56%
52%
38%
35%
29%
Schedule Flexibility
Convenience
Ability to skip commercials
Ability to binge watch
Lower Cost for Consumers
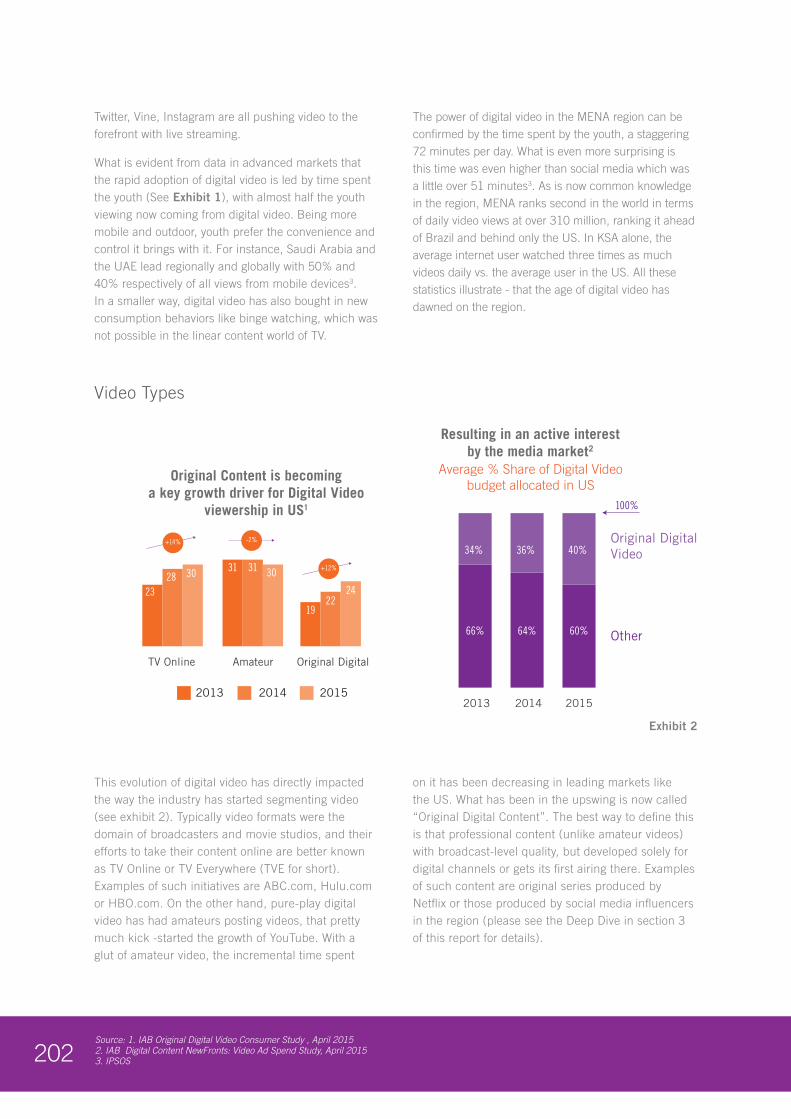
202Source: 1. IAB Original Digital Video Consumer Study , April 2015 2. IAB Digital Content NewFronts: Video Ad Spend Study, April 2015 3. IPSOS
Twitter, Vine, Instagram are all pushing video to the forefront with live streaming.
What is evident from data in advanced markets that the rapid adoption of digital video is led by time spent the youth (See Exhibit 1), with almost half the youth viewing now coming from digital video. Being more mobile and outdoor, youth prefer the convenience and control it brings with it. For instance, Saudi Arabia and the UAE lead regionally and globally with 50% and 40% respectively of all views from mobile devices3. In a smaller way, digital video has also bought in new consumption behaviors like binge watching, which was not possible in the linear content world of TV.
The power of digital video in the MENA region can be confirmed by the time spent by the youth, a staggering 72 minutes per day. What is even more surprising is this time was even higher than social media which was a little over 51 minutes3. As is now common knowledge in the region, MENA ranks second in the world in terms of daily video views at over 310 million, ranking it ahead of Brazil and behind only the US. In KSA alone, the average internet user watched three times as much videos daily vs. the average user in the US. All these statistics illustrate - that the age of digital video has dawned on the region.
This evolution of digital video has directly impacted the way the industry has started segmenting video (see exhibit 2). Typically video formats were the domain of broadcasters and movie studios, and their efforts to take their content online are better known as TV Online or TV Everywhere (TVE for short). Examples of such initiatives are ABC.com, Hulu.com or HBO.com. On the other hand, pure-play digital video has had amateurs posting videos, that pretty much kick -started the growth of YouTube. With a glut of amateur video, the incremental time spent
on it has been decreasing in leading markets like the US. What has been in the upswing is now called “Original Digital Content”. The best way to define this is that professional content (unlike amateur videos) with broadcast-level quality, but developed solely for digital channels or gets its first airing there. Examples of such content are original series produced by Netflix or those produced by social media influencers in the region (please see the Deep Dive in section 3 of this report for details).
Video Types
Average % Share of Digital Videobudget allocated in US
Original Content is becominga key growth driver for Digital Video
viewership in US1
Resulting in an active interestby the media market2
2014 20152013
+14%
+12%
-2% Original DigitalVideo
Other60%
40%
64%
36%
66%
34%
TV Online Amateur Original Digital
2328 30 3031 31
1922
24
20152014 2013
100%
Exhibit 2
2031. Variety and Comscore Report (February 2016) 2. Digiday
What is interesting is the value attributed by the marcomms industry to each of these three video categories. As is evident from Exhibit 2, advertisers see greater value in original video content are increasing their share of investments towards it. Original video is hence becoming a growth driver resulting in active interest by the media market at large, which is explained by the over-supply of amateur content thereby making original content even more valuable and premium for audience traction and monetisation.
Emergence of MCNs
To cater to this new video universe which serves original content and triggered by YouTube, an entire industry has sprung up over the past few years, which has now growing to the next level. Serving as an intermediary between those creating the videos and watching them are Multi-Channel Networks (MCNs, or “networks”). These new entities affiliate with multiple YouTube channels to offer content creators or ‘talents’ in their parlance, assisting them in programming, funding, cross-promotion, partnerships, copyright protection, sales, etc - for a percentage of ad revenue from the channel.
MCNs are no different from talent managers or studios but on a different scale with a long tail enabled by technology. Typically, MCNs do not specialise and have a variety of channels catering to diverse content types to achieve scale. But increasingly MCNs have seen a degree of specialisation, which was reserved for broadcasters. For example, Machinima is centered on gaming culture; DanceOn around the dance
community; Tastemade on food and travel. There’s also significant variation in size and exclusivity, too. Broadband TV or BBTV claims to be the biggest in the pack with 319 million worldwide unique viewers and 2.73 billion videos seen by its audience for December 2015 - 30% more than its nearest MCN competitor1. BBTV now produces about 500 original videos per month in-house; its network has about 74,000 creators who post 500,000 new videos per month and operates in 15 global markets1. Another MCN network, Fullscreen serves up 4 billion video views each month created by its 50,000 video makers; while Collective Digital Studio draws 1.5 billion monthly views with just 700 creators.2
It’s important to note that MCNs themselves are not affiliated with or endorsed by YouTube or Google, but their interest is mutual or symbiotic. MCN's create more valuable inventory for YouTube by doing the intensive work of coordinating with talents (more in Section 3 deep dive on social media influencers), helping YouTube improve its CPMs (Cost per 1000 impressions, a digital buying metric) with advertisers. YouTube continues to play the role of a technology platform, although in the last few years it has started to participate in the creator ecosystem by a slew of initiatives including a studio for its talents and MCNs to use.
Considering YouTube’s origins in the US, it’s no surprise that of the top 100 MCN’s globally - 62 are from US and growing outwards. The region is also fast evolving, and its first set of online original content creators are establishing themselves as MCNs.
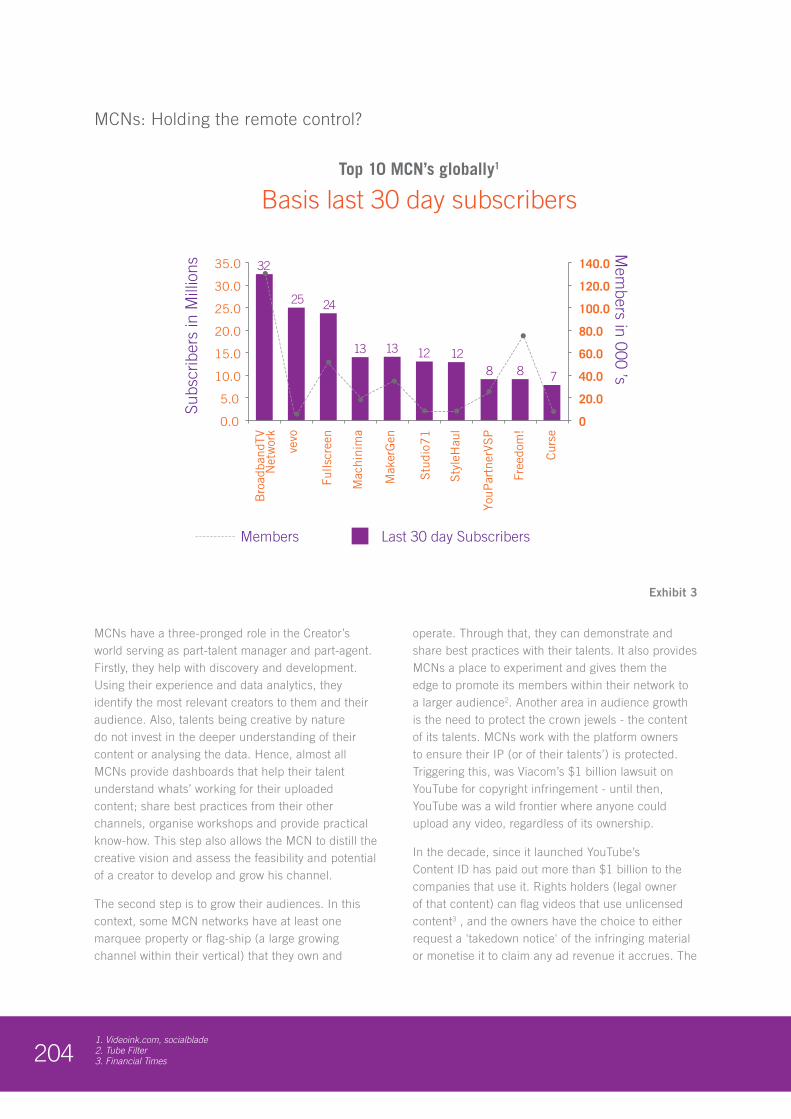
2041. Videoink.com, socialblade2. Tube Filter3. Financial Times
MCNs have a three-pronged role in the Creator’s world serving as part-talent manager and part-agent. Firstly, they help with discovery and development. Using their experience and data analytics, they identify the most relevant creators to them and their audience. Also, talents being creative by nature do not invest in the deeper understanding of their content or analysing the data. Hence, almost all MCNs provide dashboards that help their talent understand whats’ working for their uploaded content; share best practices from their other channels, organise workshops and provide practical know-how. This step also allows the MCN to distill the creative vision and assess the feasibility and potential of a creator to develop and grow his channel.
The second step is to grow their audiences. In this context, some MCN networks have at least one marquee property or flag-ship (a large growing channel within their vertical) that they own and
operate. Through that, they can demonstrate and share best practices with their talents. It also provides MCNs a place to experiment and gives them the edge to promote its members within their network to a larger audience2. Another area in audience growth is the need to protect the crown jewels - the content of its talents. MCNs work with the platform owners to ensure their IP (or of their talents’) is protected. Triggering this, was Viacom’s $1 billion lawsuit on YouTube for copyright infringement - until then, YouTube was a wild frontier where anyone could upload any video, regardless of its ownership.
In the decade, since it launched YouTube’s Content ID has paid out more than $1 billion to the companies that use it. Rights holders (legal owner of that content) can flag videos that use unlicensed content3 , and the owners have the choice to either request a 'takedown notice' of the infringing material or monetise it to claim any ad revenue it accrues. The
MCNs: Holding the remote control?
Top 10 MCN’s globally1
Basis last 30 day subscribers
Members Last 30 day Subscribers
13 13
35.0
30.0
25.0
20.0
15.0
10.0
5.0
0.0
Subs
crib
ers
in M
illio
nsM
embers in 000 ’s
140.0
120.0
100.0
80.0
60.0
40.0
20.0
0
Bro
adba
ndTV
Net
wor
k
vevo
Fulls
cree
n
Mac
hini
ma
Mak
erG
en
Stu
dio7
1
Sty
leH
aul
YouP
artn
erVS
P
Free
dom
!
Cur
se
32
25 24
12 128 8 7
Exhibit 3
2051. Google Legal
vast majority, instead choose to monetise and track it rather than block1 - turning fan-uploaded videos into alternative revenue streams. Since most talents start with a home studio, as they become bigger, MCN's also provide them access to professional equipment and recording facilities to improve the quality and value of their content. For those not trained, technical workshops are provided. For example, in the region, both Uturn and Kharabeesh have studios in their home markets of Jeddah and Amman, and building similar facilities in Dubai.
Typically channel owners have a limited understanding of workings of the marcomms industry. Since marcomms remains a key revenue source, MCN's educate their creators about the operating processes. For more content-led deals, they guide creators on pricing and benchmarks to stay competitive. Depending on the talent, MCN's also develop new revenue streams outside AdSense - YouTube's monetisation programme
The final area where MCN's support talents in the area of monetisation. Reserved for their most promising talent, MCN's promote a select group within their tent-pole networks. Other emerging talent, are promoted through social media outlets. MCN services are also graded with higher-performing talents (with more video views, subscribers) getting bespoke partnership support. In the case of UTurn (a Saudi-based MCN), to become a premium partner, one of the key criteria is for the talent to have a minimum of 5,000 subscribers. Since a lot of creators are startups, many MCNs are now giving minimum guarantees to creators freeing them from cash flow risks and give them some sustainability. One unique area of monetisation is the leverage to carry over MCN content and personalities to broadcast. A model made famous by Maker Studios (owned by Disney), many MCNs are now increasingly embedded with large parent companies (more on this below), and they offer creators access to traditional media projects and celebrities.
MCN: Monetisation models
In the broadest sense MCN’s revenue streams are broadly two-fold, driven by marcomms-based service and other which are not driven by leveraging their IP across new platforms. As MCN's evolve, its early
stages are highly dependent on the marcomms industry, as the other revenue streams require degree of success to start monetizing.
In the marcomms space YouTube adsense revenue is the essentially the start for most MCNs journeys. Of all the revenue earned in video ads, YouTube keeps up to 45%, leaving the rest (55%) for MCNs. This is not standard and there have been non-public instances of powerful networks negotiating a smaller share for YouTube. The cookie crumbles further as MCNs in turn provide the talent from 50-80% of the balance leaving the rest to the MCN. As the talent in an MCN is graded, so are their shares - e.g. Uturn gives 10% to its YouTube revenues to its lowest tier (called affiliate partner) while negotiating more lucrative one-on-one contracts with its senior talents.
While AdSense revenues were historically a large bucket for many MCNs, their importance is declining as creators are building direct relationships with YouTube. The CPM is in low single digits leaving little to share. MCNs have hence developed other revenue sources such as entertainment services, branded content and social media advisory. Of note is branded content revenues where MCNs and their talents work with marcomms players (ad agencies and advertisers) to do product placement, brand mentions, stand-alone videos and other offbeat ways, distributing it across the MCN network. Branded entertainment also helps MCNs monetise on platforms that currently do not accommodate standard pre-rolls, such as Instagram. As they mature, branded content is becoming a key revenue from the marcomms side. For example, Style Haul (an MCN) pulls in almost half its YouTube revenues from branded content; the rest from standard Google text and display ads.
Local MCN Uturn claims that a majority of its revenues now comes from product placement, brand integration, pre-rolls and branded content. Content revenues also not only important but are also more profitable with no share provided to YouTube. However, this revenue driver can be an inefficient way. To monetise branded content, deals can take weeks or months of back-and-forth approvals between content creators and brands, with MCNs acting as intermediaries. Also very recently, YouTube realised this 'revenue leakage', and insisting to get ad revenues for some categories of brand integration.
206
As mentioned earlier, the larger challenge for MCN's is always to migrate to non-marcomm revenues as that involves not only established branded channels, but also unique capabilities which are not typical of an MCN. Non-marcomms revenues typically come from partnerships with traditional media, licensing and merchandising of their brands and channels and in rare cases distribution revenue from other platforms including broadcast. In the case of merchandising, MCN and their talents embed their products or merchandise into the content. An example Kohl’s launched a new kids fashion line— the S.o. R.a.d. Collection (short for ‘So Radical’) via a web video series developed with MCN - Awesomeness TV. Another example is Endemol Beyond’s Michelle Phan - YouTube’s beauty SMI, who clocks as many as 50 million views for her popular videos. Phan working with L’Oréal launched her cosmetics line. The brand speaks to Phan’s core audience, and she credits her followers for inspiring her to develop the product line. Likewise, the makeup line’s online store has features targeted at young shoppers, such sharing selfies of their makeup looks. In the region, Kharabeesh has its own merchandise, which it markets with its talents wearing them in videos. It, however, is not a key revenue line in the region.
One of the biggest values of MCNs such as Channel Federator Network, Awesomeness and Maker Studios is the relationships they have with traditional media outlets. Few MCNs who have the backing of large
media groups (such as Maker Studios and Disney) leverage the talent across traditional media as well. This requires special skills as typically creators do not transition well across screens - this is more of an exception than a rule. Creators also benefit from ‘windowing’ i.e. getting a show on to TV, a book deal, or a movie made (Grumpy Cat one such channel was made into a movie) helping them scale and potentially make more money. Syndicating (licensing) creators’ content is also being done on other websites, creating more opportunities for them to expand their primary product. Beyond broadcast distribution solution that the likes of Maker can bring to the table, MCNs are also looking at telecom players as a distribution channel. The latter are looking for new revenue streams and greater connectivity with their youth subscribers, and are hence providing value added services through advertising or paid content. For instance, Kharabeesh has a deal with Zain Jordan to distribute its content as a VAS proposition and can be monetised through mobile advertising or content sales.
Finally, as their talent attains a certain stature, many MCN’s are also organising live events and private performances for ticket sales and sponsorships. Besides generating revenue and marketing value, this also allows the MCN to retain the talent vs. other streams managed by other talent managers. E.g. Kharabeesh runs events in its Jordan office where many of its talents do live performances.
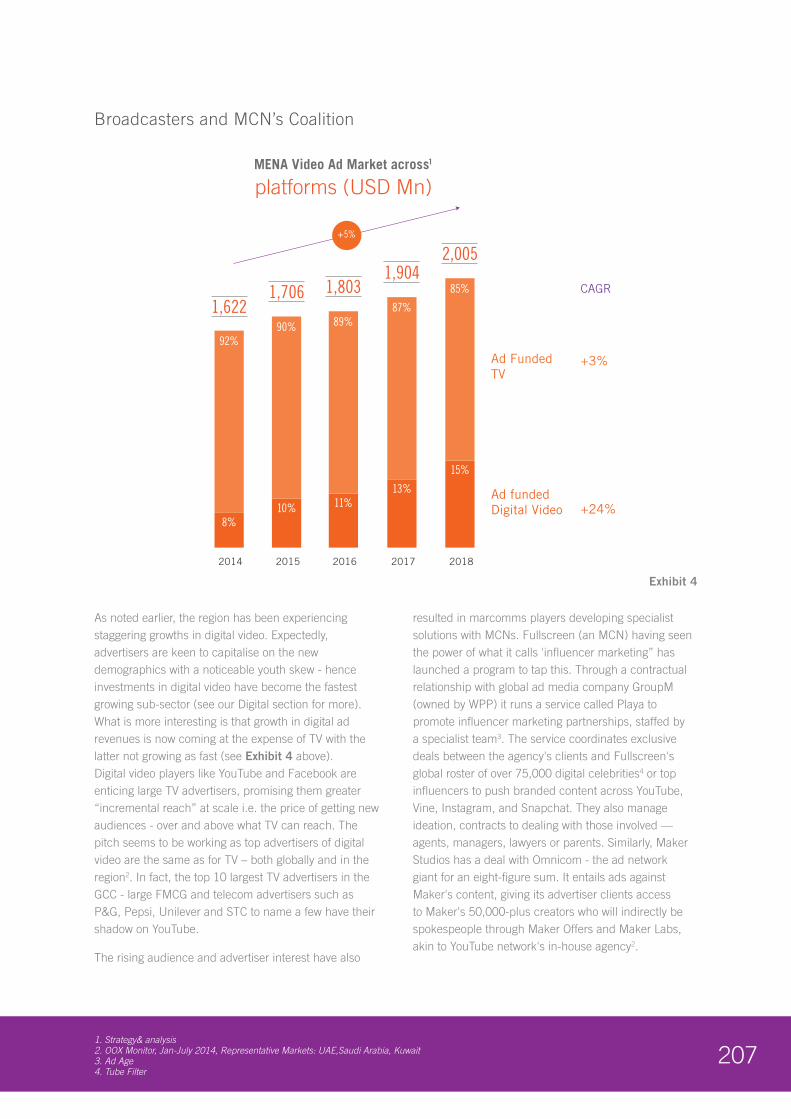
2071. Strategy& analysis2. OOX Monitor, Jan-July 2014, Representative Markets: UAE,Saudi Arabia, Kuwait3. Ad Age4. Tube Filter
Broadcasters and MCN’s Coalition
resulted in marcomms players developing specialist solutions with MCNs. Fullscreen (an MCN) having seen the power of what it calls 'influencer marketing” has launched a program to tap this. Through a contractual relationship with global ad media company GroupM (owned by WPP) it runs a service called Playa to promote influencer marketing partnerships, staffed by a specialist team3. The service coordinates exclusive deals between the agency's clients and Fullscreen's global roster of over 75,000 digital celebrities4 or top influencers to push branded content across YouTube, Vine, Instagram, and Snapchat. They also manage ideation, contracts to dealing with those involved — agents, managers, lawyers or parents. Similarly, Maker Studios has a deal with Omnicom - the ad network giant for an eight-figure sum. It entails ads against Maker's content, giving its advertiser clients access to Maker's 50,000-plus creators who will indirectly be spokespeople through Maker Offers and Maker Labs, akin to YouTube network's in-house agency2.
As noted earlier, the region has been experiencing staggering growths in digital video. Expectedly, advertisers are keen to capitalise on the new demographics with a noticeable youth skew - hence investments in digital video have become the fastest growing sub-sector (see our Digital section for more). What is more interesting is that growth in digital ad revenues is now coming at the expense of TV with the latter not growing as fast (see Exhibit 4 above). Digital video players like YouTube and Facebook are enticing large TV advertisers, promising them greater “incremental reach” at scale i.e. the price of getting new audiences - over and above what TV can reach. The pitch seems to be working as top advertisers of digital video are the same as for TV – both globally and in the region2. In fact, the top 10 largest TV advertisers in the GCC - large FMCG and telecom advertisers such as P&G, Pepsi, Unilever and STC to name a few have their shadow on YouTube.
The rising audience and advertiser interest have also
MENA Video Ad Market across1
platforms (USD Mn)
Exhibit 4
1,706
1,622
8%
92%
2014
10%
90%
2015
1,803
11%
89%
2016
1,904
13%
87%
2017
2,005
15%
85%
2018
+5%
Ad FundedTV
+3%
+24%Ad fundedDigital Video
CAGR
Exhibit 4
2081. Wamda2. MBC Ventures3. Rapid TV News4. Open Slate Data
MCNs: The Future of Broadcasters?
As a result of the above developments, MCN’s are being seen by broadcasters as enablers of 'future-readiness'. By bringing the data-driven culture with proprietary technology for audience segmentation and profiling, short form content production and management, and in-house technology teams, traditional companies can benefit from MCNs by piggy-backing on them.
The benefits are clear, Firstly, from an audience perspective, broadcasters get global audience scale much faster and more efficiently. As such, these international audiences are not immediately monetisable, hence they have significant promotional value for media companies’ other assets, such as filmed entertainment.Secondly, MCNs have expertise in original content in the short form video format vs. the traditional long form studio-led solution set which broadcasters typically possess. With youth audiences, this set can be a valuable one to leverage and create as broadcasters struggle to stay relevant to youth globally and in the region. MCN’s also possess real-time data of audiences that can help refine bigger bets in broadcasting content production - almost serving like a petri-dish. They can develop a content “test and learn” innovative, experimental culture and processes using such MCNs for R&D so to speak. From a marketing angle, new low-cost, data-intensive marketing practices followed by digital is helping advertisers (and broadcasters) to build richer profiles and better targeting solutions
Broadcasters have significant IP, which complements the MCN content and converted into digital revenues. They can also learn to build fan bases for digital-first originals and monetise them via ads, subscriptions and e-commerce. On the other hand, MCN’s channels provide a new way to sample broadcast content, driving greater viewership. Standalone MCNs can build reach among valuable youth audiences. Lastly, from an organisation perspective, the structure and set-up of incumbent media companies make it difficult to attract talent to win in digital – the benefit is mutual.
Not surprisingly, MCNs have become key M&A targets to broadcasters and traditional media companies alike. More than 75% of the top MCNs have been acquired in the last few years. As an example, Vevo has an ownership stake from the Abu Dhabi Media
Group, UMG and Sony Music. Maker Studio was acquired by the Walt Disney Company in early 2014 for $500 million (plus $450 million in performance-based incentives); Awesomeness TV was acquired by DreamWorks Animation for $33 million. While the promise of future revenue is yet to be realised, DreamWorks and Disney indicated that their MCN-related investments increased by 240% in just 18 months.1
In the region, the progress on this front has been limited. In November 2015, Uturn Entertainment got a $10 million investment from Beirut-based VC, Leap Ventures. Similarly, Jordan- based Kharabeesh raised capital from MBC Ventures with a second round of funding in 20162.
Future of MCNs in the region
With intense competition for talent, nurturing them while maintaining quality and scale is a challenge for MCNs - both outside and in the region. To quantify this, while there are more than 800,000 ad-supported channels on YouTube with over 100,000 views in the US, 0.0174% of those such as PewDiePie and 140 other channels to be precise, have five million subscribers or over that carry some weight. Almost 500,000 channels have less than 1,000 subscribers - as high as 80% of that content cannot be monetised, which makes it hard for MCNs to entice advertisers.4
In the region, the above long tail problem is compounded due to limited expertise is content production. As a result the lack of talent creates an unsuitable and over priced price tag for leading talents, leading to a damping effect on MCN revenues. To overcome this, large MCNs are investing B category talents, or the lower-tier, who don’t command the same premium and can be developed over time.
In the marcomms space as well there are some challenges. The resourcing behind content creation and conceptualisation is limited in media agencies with only a few having well-staffed units. Media planners are not trained on allocating budgets to video content creation. This is despite some global agencies having relations with MCNs illustrated earlier. This is changing with units like LiquidThread by SMG and MBA by Mediacom who are building capabilities to work with this ecosystem. On another footing, if the
2091. Digital Media Update2. Wamda.com3. V-Net
value of the MCN and its management of its talents is not established, agencies and advertisers tend to reach out directly to the talent – thereby cutting out MCNs from the action. In some cases, clients prefer working with talents directly to leverage their value. Hence MCN revenues typically take longer to build in content creation and require strong integration with the marcomms agencies and their specialist divisions that represent advertiser interest.
While digital video is growing at a rapid rate and taking share from TV – majority of this growth is driven by the distribution of commercials on platforms like YouTube. Like globally, broadcasters here as well are keen to establish their original content digital video. In most cases they are challenged by the very different content formats and consumption patterns which original digital video content creates.1 Hence, strategic engagement between broadcasters and MCNs is key in thje region to the development of the digital video ecosystem.
Faced with low CPMs and revenue shares on YouTube, MCNs are diversifying to new platforms. Few are even
rechristening themselves as Multi-platform networks (or MPNs) vs. being tagged as just multiple channels restricted to YouTube. Naturally, MPNs are looking at the biggest and widest reach for their video content on a variety of distribution platforms - which includes emerging fd established platforms like Snapchat and Facebook For instance, Uturn already publishes its content on Yahoo and Facebook. For the same reasons, another trend is for MCNs to start their platforms to capture more revenues.2 The decision by Endemol Beyond to create an owned-and-operated platform rather than rely on YouTube is a significant precedent. Owned by Endemol Shine Group (a joint venture of Endemol and Shine Group), it represents ‘traditional TV’ as the creator, producer and distributor of shows such as Master Chef USA, Broadchurch, Deal or No Deal. The company has positioned itself as a ‘premium content network’ than as an MCN. Apart from YouTube, it also uses Dailymotion, Roku and TiVo3. Similarly, in the region, all the leading MCNs are planning to launch their respective platforms to increase profitability, while maintaining YouTube as a key discovery channel.

210
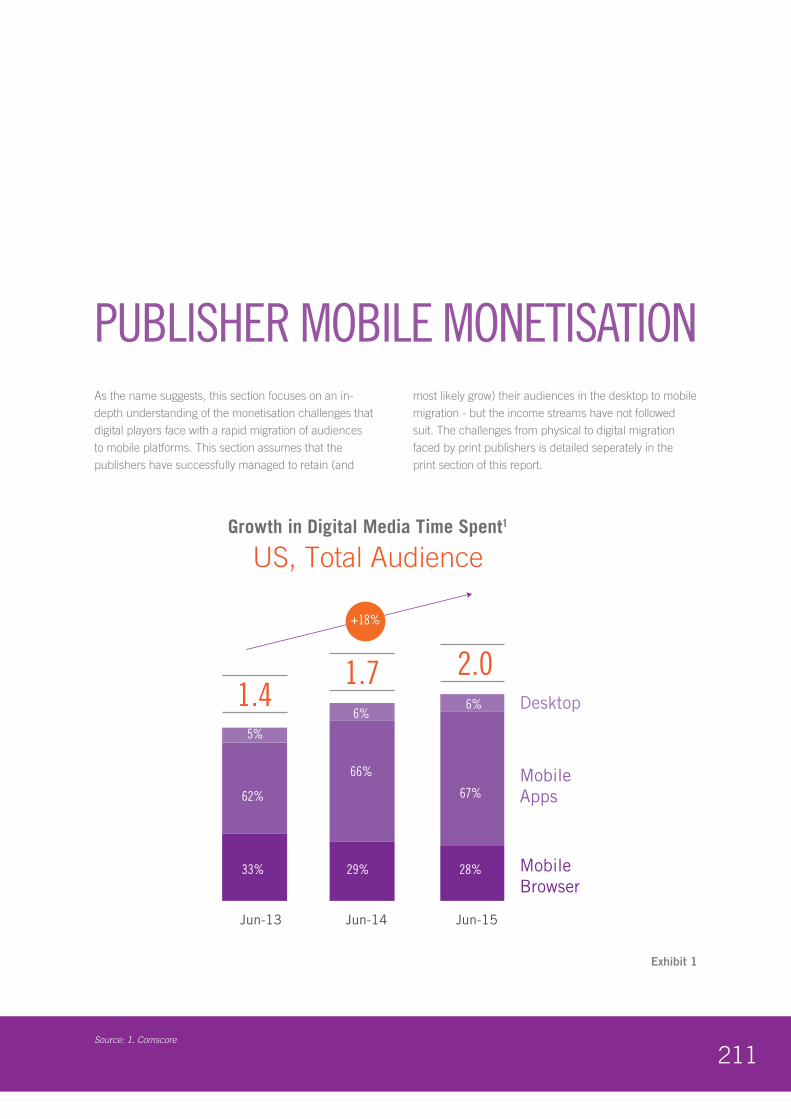
211Source: 1. Comscore
As the name suggests, this section focuses on an in-depth understanding of the monetisation challenges that digital players face with a rapid migration of audiences to mobile platforms. This section assumes that the publishers have successfully managed to retain (and
most likely grow) their audiences in the desktop to mobile migration - but the income streams have not followed suit. The challenges from physical to digital migration faced by print publishers is detailed seperately in the print section of this report.
Exhibit 1
PUBLISHER MOBILE MONETISATION
Growth in Digital Media Time Spent1
US, Total Audience
1.71.4
Jun-14
2.0
Jun-15Jun-13
+18%
Desktop
MobileApps
MobileBrowser
33%
62%
5%
29%
66%
6%6%
28%
67%
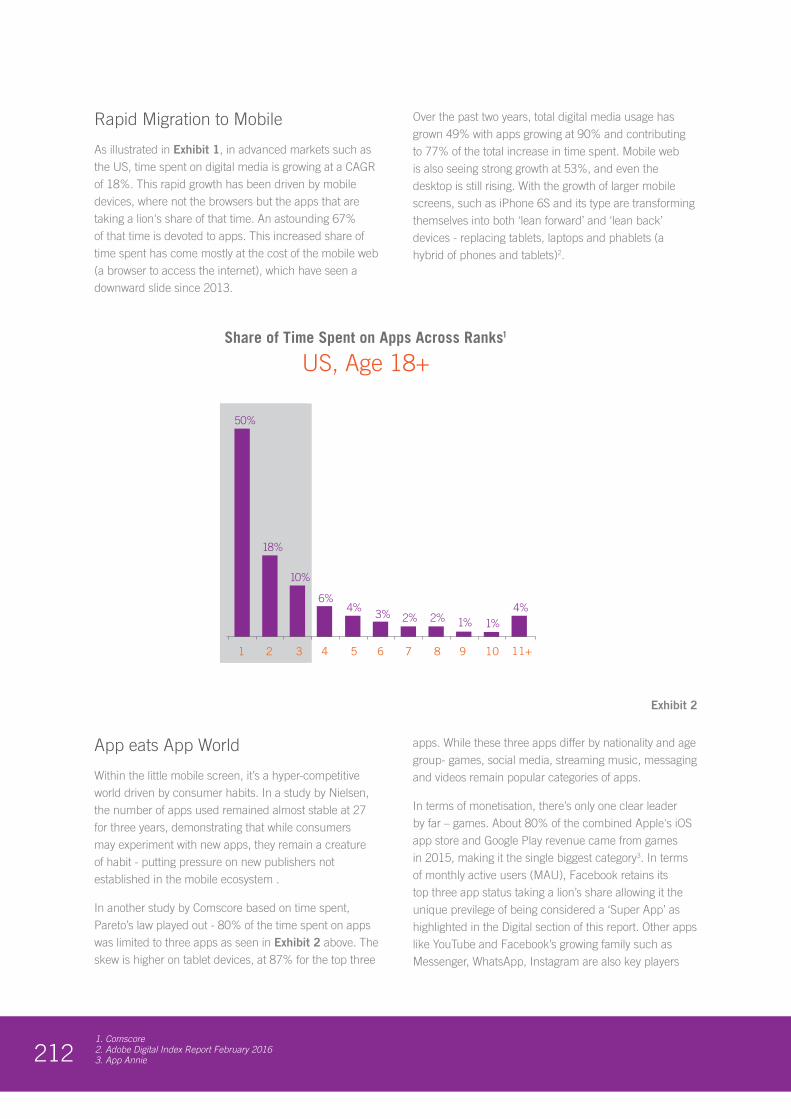
2121. Comscore 2. Adobe Digital Index Report February 20163. App Annie
Rapid Migration to Mobile
As illustrated in Exhibit 1, in advanced markets such as the US, time spent on digital media is growing at a CAGR of 18%. This rapid growth has been driven by mobile devices, where not the browsers but the apps that are taking a lion's share of that time. An astounding 67% of that time is devoted to apps. This increased share of time spent has come mostly at the cost of the mobile web (a browser to access the internet), which have seen a downward slide since 2013.
Over the past two years, total digital media usage has grown 49% with apps growing at 90% and contributing to 77% of the total increase in time spent. Mobile web is also seeing strong growth at 53%, and even the desktop is still rising. With the growth of larger mobile screens, such as iPhone 6S and its type are transforming themselves into both ‘lean forward’ and ‘lean back’ devices - replacing tablets, laptops and phablets (a hybrid of phones and tablets)2.
App eats App World
Within the little mobile screen, it’s a hyper-competitive world driven by consumer habits. In a study by Nielsen, the number of apps used remained almost stable at 27 for three years, demonstrating that while consumers may experiment with new apps, they remain a creature of habit - putting pressure on new publishers not established in the mobile ecosystem .
In another study by Comscore based on time spent, Pareto’s law played out - 80% of the time spent on apps was limited to three apps as seen in Exhibit 2 above. The skew is higher on tablet devices, at 87% for the top three
apps. While these three apps differ by nationality and age group- games, social media, streaming music, messaging and videos remain popular categories of apps.
In terms of monetisation, there’s only one clear leader by far – games. About 80% of the combined Apple's iOS app store and Google Play revenue came from games in 2015, making it the single biggest category3. In terms of monthly active users (MAU), Facebook retains its top three app status taking a lion’s share allowing it the unique previlege of being considered a ‘Super App’ as highlighted in the Digital section of this report. Other apps like YouTube and Facebook’s growing family such as Messenger, WhatsApp, Instagram are also key players
Share of Time Spent on Apps Across Ranks1
US, Age 18+
Exhibit 2 Individuals Top Ranked App by Usage
1 2 3 4 5 6 7 8 9 10 11+
50%
10%
4% 4%2% 2% 1%
18%
6%3%
1%
Exhibit 2
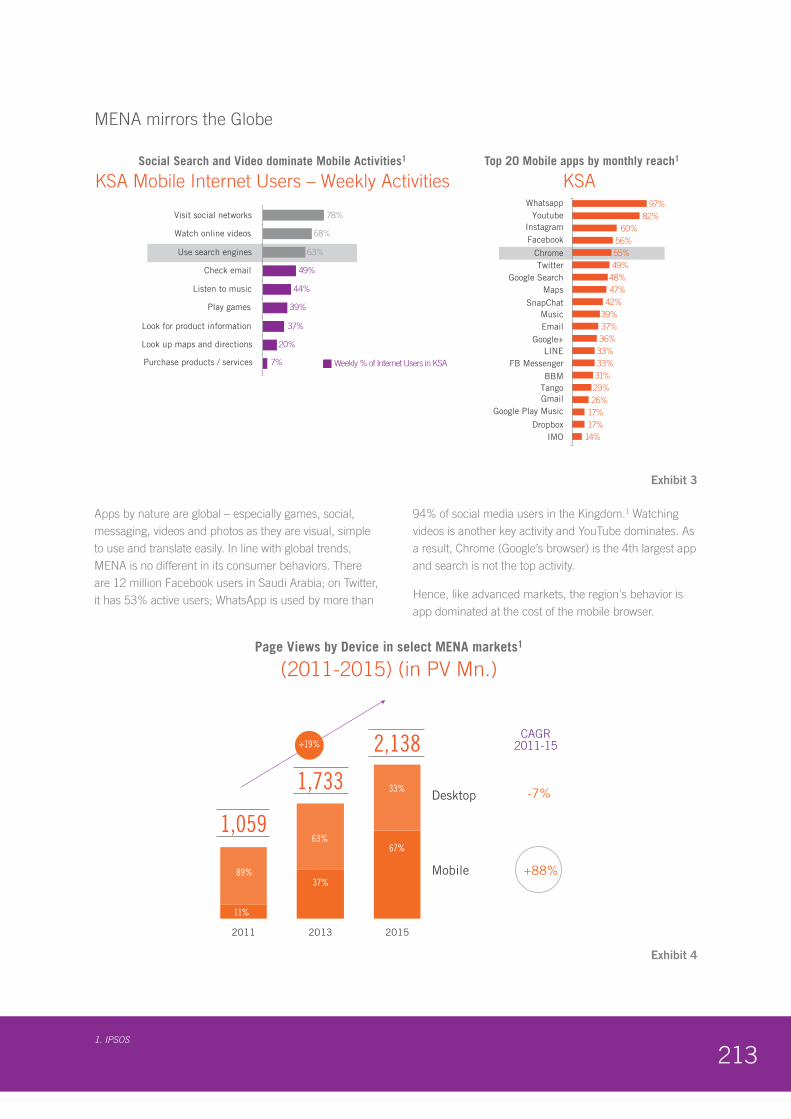
2131. IPSOS
MENA mirrors the Globe
Apps by nature are global – especially games, social, messaging, videos and photos as they are visual, simple to use and translate easily. In line with global trends, MENA is no different in its consumer behaviors. There are 12 million Facebook users in Saudi Arabia; on Twitter, it has 53% active users; WhatsApp is used by more than
94% of social media users in the Kingdom.1 Watching videos is another key activity and YouTube dominates. As a result, Chrome (Google’s browser) is the 4th largest app and search is not the top activity.
Hence, like advanced markets, the region's behavior is app dominated at the cost of the mobile browser.
Page Views by Device in select MENA markets1
(2011-2015) (in PV Mn.)
1,733
2013
Desktop
Mobile +88%
-7%
37%
63%
2,138
2015
1) the MENA market include; KSA, Bahrain, Kuwait,Lebanon, Jordan, and Morocco, Effective Measure, Strategy& Analysis
1,059
2011
+19%CAGR
2011-15
89%
11%
67%
33%
Exhibit 4
Social Search and Video dominate Mobile Activities1
KSA Mobile Internet Users – Weekly Activities
Weekly % of Internet Users in KSA
Top 20 Mobile apps by monthly reach1
KSA
78%
68%
63%
49%
44%
39%
37%
20%
7%
Visit social networks
Watch online videos
Use search engines
Check email
Listen to music
Play games
Look for product information
Look up maps and directions
Purchase products / services
97%Whatsapp
82%Youtube
60%56%55%49%
48%47%
42%39%37%36%
33%33%31%29%26%
17%17%
14%
InstagramFacebook
ChromeTwitter
Google SearchMaps
SnapChatMusicEmail
Google+LINE
FB MessengerBBM
TangoGmail
Google Play Music
DropboxIMO
Exhibit 3
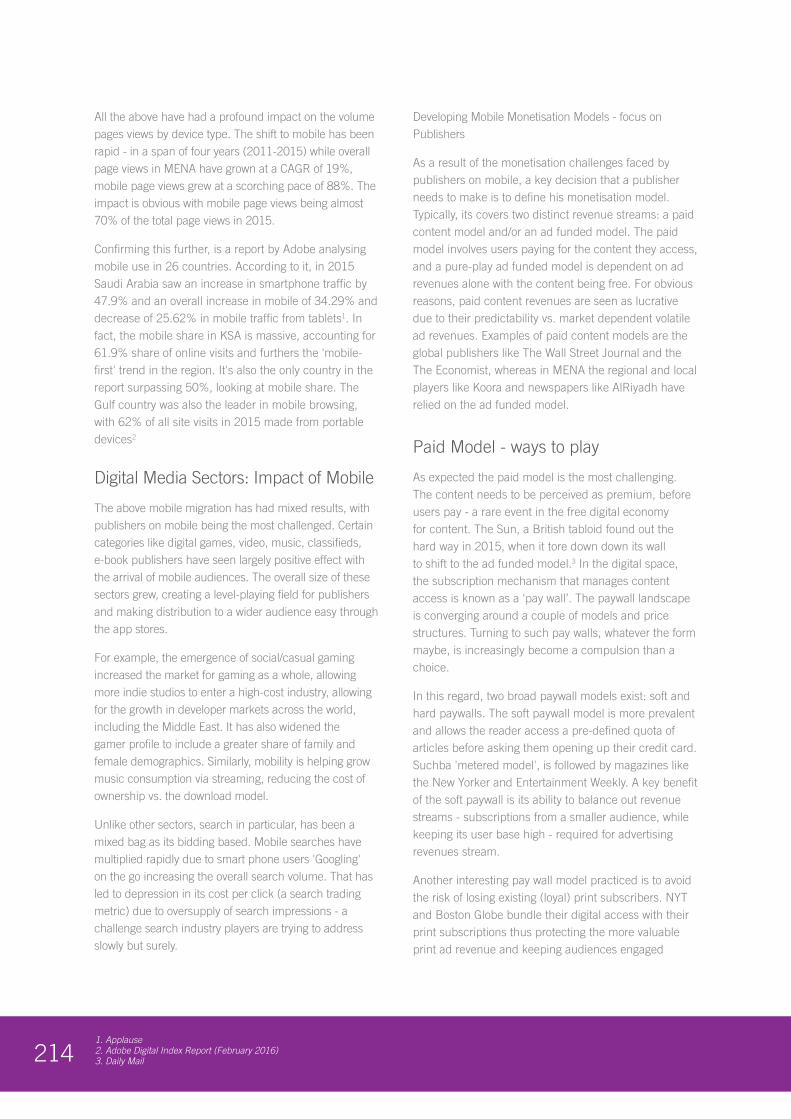
2141. Applause2. Adobe Digital Index Report (February 2016)3. Daily Mail
All the above have had a profound impact on the volume pages views by device type. The shift to mobile has been rapid - in a span of four years (2011-2015) while overall page views in MENA have grown at a CAGR of 19%, mobile page views grew at a scorching pace of 88%. The impact is obvious with mobile page views being almost 70% of the total page views in 2015.
Confirming this further, is a report by Adobe analysing mobile use in 26 countries. According to it, in 2015 Saudi Arabia saw an increase in smartphone traffic by 47.9% and an overall increase in mobile of 34.29% and decrease of 25.62% in mobile traffic from tablets1. In fact, the mobile share in KSA is massive, accounting for 61.9% share of online visits and furthers the 'mobile-first' trend in the region. It's also the only country in the report surpassing 50%, looking at mobile share. The Gulf country was also the leader in mobile browsing, with 62% of all site visits in 2015 made from portable devices2
Digital Media Sectors: Impact of Mobile
The above mobile migration has had mixed results, with publishers on mobile being the most challenged. Certain categories like digital games, video, music, classifieds, e-book publishers have seen largely positive effect with the arrival of mobile audiences. The overall size of these sectors grew, creating a level-playing field for publishers and making distribution to a wider audience easy through the app stores.
For example, the emergence of social/casual gaming increased the market for gaming as a whole, allowing more indie studios to enter a high-cost industry, allowing for the growth in developer markets across the world, including the Middle East. It has also widened the gamer profile to include a greater share of family and female demographics. Similarly, mobility is helping grow music consumption via streaming, reducing the cost of ownership vs. the download model.
Unlike other sectors, search in particular, has been a mixed bag as its bidding based. Mobile searches have multiplied rapidly due to smart phone users 'Googling' on the go increasing the overall search volume. That has led to depression in its cost per click (a search trading metric) due to oversupply of search impressions - a challenge search industry players are trying to address slowly but surely.
Developing Mobile Monetisation Models - focus on Publishers
As a result of the monetisation challenges faced by publishers on mobile, a key decision that a publisher needs to make is to define his monetisation model. Typically, its covers two distinct revenue streams: a paid content model and/or an ad funded model. The paid model involves users paying for the content they access, and a pure-play ad funded model is dependent on ad revenues alone with the content being free. For obvious reasons, paid content revenues are seen as lucrative due to their predictability vs. market dependent volatile ad revenues. Examples of paid content models are the global publishers like The Wall Street Journal and the The Economist, whereas in MENA the regional and local players like Koora and newspapers like AlRiyadh have relied on the ad funded model.
Paid Model - ways to play
As expected the paid model is the most challenging. The content needs to be perceived as premium, before users pay - a rare event in the free digital economy for content. The Sun, a British tabloid found out the hard way in 2015, when it tore down down its wall to shift to the ad funded model.3 In the digital space, the subscription mechanism that manages content access is known as a ‘pay wall’. The paywall landscape is converging around a couple of models and price structures. Turning to such pay walls, whatever the form maybe, is increasingly become a compulsion than a choice.
In this regard, two broad paywall models exist: soft and hard paywalls. The soft paywall model is more prevalent and allows the reader access a pre-defined quota of articles before asking them opening up their credit card. Suchba 'metered model', is followed by magazines like the New Yorker and Entertainment Weekly. A key benefit of the soft paywall is its ability to balance out revenue streams - subscriptions from a smaller audience, while keeping its user base high - required for advertising revenues stream.
Another interesting pay wall model practiced is to avoid the risk of losing existing (loyal) print subscribers. NYT and Boston Globe bundle their digital access with their print subscriptions thus protecting the more valuable print ad revenue and keeping audiences engaged
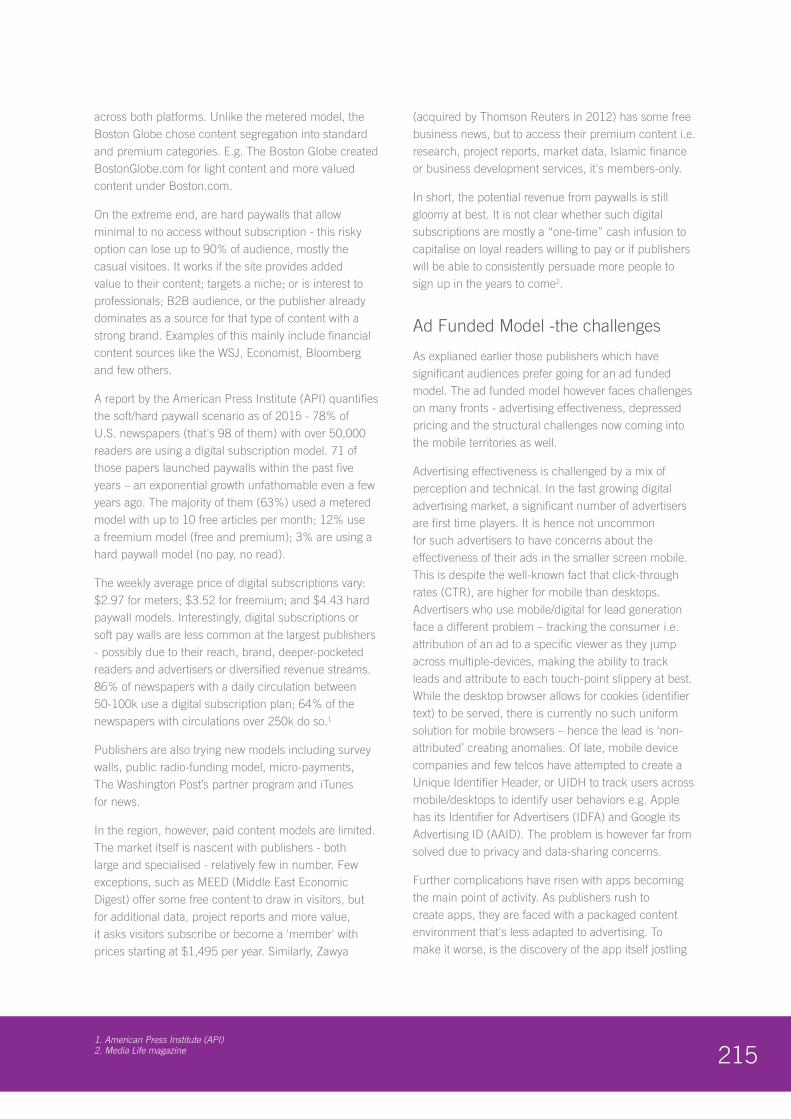
2151. American Press Institute (API) 2. Media Life magazine
across both platforms. Unlike the metered model, the Boston Globe chose content segregation into standard and premium categories. E.g. The Boston Globe created BostonGlobe.com for light content and more valued content under Boston.com.
On the extreme end, are hard paywalls that allow minimal to no access without subscription - this risky option can lose up to 90% of audience, mostly the casual visitoes. It works if the site provides added value to their content; targets a niche; or is interest to professionals; B2B audience, or the publisher already dominates as a source for that type of content with a strong brand. Examples of this mainly include financial content sources like the WSJ, Economist, Bloomberg and few others.
A report by the American Press Institute (API) quantifies the soft/hard paywall scenario as of 2015 - 78% of U.S. newspapers (that's 98 of them) with over 50,000 readers are using a digital subscription model. 71 of those papers launched paywalls within the past five years – an exponential growth unfathomable even a few years ago. The majority of them (63%) used a metered model with up to 10 free articles per month; 12% use a freemium model (free and premium); 3% are using a hard paywall model (no pay, no read).
The weekly average price of digital subscriptions vary: $2.97 for meters; $3.52 for freemium; and $4.43 hard paywall models. Interestingly, digital subscriptions or soft pay walls are less common at the largest publishers - possibly due to their reach, brand, deeper-pocketed readers and advertisers or diversified revenue streams. 86% of newspapers with a daily circulation between 50-100k use a digital subscription plan; 64% of the newspapers with circulations over 250k do so.1
Publishers are also trying new models including survey walls, public radio-funding model, micro-payments, The Washington Post’s partner program and iTunes for news.
In the region, however, paid content models are limited. The market itself is nascent with publishers - both large and specialised - relatively few in number. Few exceptions, such as MEED (Middle East Economic Digest) offer some free content to draw in visitors, but for additional data, project reports and more value, it asks visitors subscribe or become a 'member' with prices starting at $1,495 per year. Similarly, Zawya
(acquired by Thomson Reuters in 2012) has some free business news, but to access their premium content i.e. research, project reports, market data, Islamic finance or business development services, it's members-only.
In short, the potential revenue from paywalls is still gloomy at best. It is not clear whether such digital subscriptions are mostly a “one-time” cash infusion to capitalise on loyal readers willing to pay or if publishers will be able to consistently persuade more people to sign up in the years to come2.
Ad Funded Model -the challenges
As explianed earlier those publishers which have significant audiences prefer going for an ad funded model. The ad funded model however faces challenges on many fronts - advertising effectiveness, depressed pricing and the structural challenges now coming into the mobile territories as well.
Advertising effectiveness is challenged by a mix of perception and technical. In the fast growing digital advertising market, a significant number of advertisers are first time players. It is hence not uncommon for such advertisers to have concerns about the effectiveness of their ads in the smaller screen mobile. This is despite the well-known fact that click-through rates (CTR), are higher for mobile than desktops. Advertisers who use mobile/digital for lead generation face a different problem – tracking the consumer i.e. attribution of an ad to a specific viewer as they jump across multiple-devices, making the ability to track leads and attribute to each touch-point slippery at best. While the desktop browser allows for cookies (identifier text) to be served, there is currently no such uniform solution for mobile browsers – hence the lead is ‘non-attributed’ creating anomalies. Of late, mobile device companies and few telcos have attempted to create a Unique Identifier Header, or UIDH to track users across mobile/desktops to identify user behaviors e.g. Apple has its Identifier for Advertisers (IDFA) and Google its Advertising ID (AAID). The problem is however far from solved due to privacy and data-sharing concerns.
Further complications have risen with apps becoming the main point of activity. As publishers rush to create apps, they are faced with a packaged content environment that's less adapted to advertising. To make it worse, is the discovery of the app itself jostling
2161. Nuance 2. Adobe and PageFair 3. The Verge4. Maz Digital
5. Paper Litl6. Gummi Cube 7. Apple
amongst the millions of apps to be installed. Even those that do get installed - 95% are abandoned within 30 days or rarely used.1 For the apps that do survive, ensuring the ads are seen within them is crucial. Viewability is a metric that tracks viewers only who have seen the ad and charges advertisers accordingly. For example, if an ad loads at the bottom of a page and the user doesn’t scroll down far enough to see it should be deemed not viewable. Currently, a lot of inventory (56.1% according to Google) is not viewable but paid for. According to the Interactive Advertising Bureau (IAB), a private industry regulatory body - publishers should aim for above 50% viewability and target ideal locations on the viewer's screen to qualify as 'viewable'. This definition however, is not accepted by some major advertisers causing much disarray.
With more mobile visitors, the total mobile impressions has also multiplied creating more supply. Due to the challenges discussed earlier, publishers are unable to monetise their inventory leading to large remnant (unsold) inventory creating a supply glut. In the region, mobile ad networks like InMobi, AdFalcon and Plus 7 consign this inventory at high discounts depressing the prices. Further impacting the value (downwards) is programmatic or real-time bidding i.e. algorithm-based, automated trading of ads. Due to the remnant inventory being large (+70% page views are mobile in the region), such solutions’ machine-driven efficacy is driving down prices even further - especially if they are not adequately segmented.
To compound the problem are ad blockers coveted by users as they speed up loading time and reduce mobile data usage2. What was an emerging challenge on desktops, is now making its way to the mobile web. In late 2015, Apple’s iOS 9 version allowed developers to create extensions for its Safari mobile browser that blocks cookies, images, pop-ups, tracking, and most ads3. Samsung followed suit, by pre-installing such blockers on its Android phones. There are also a host of third-party browsers, such as Brave and apps created for this specific purpose. The ad blocking companies however have their shades of grey. Some take money to let few advertisers get past the gate (pay to play); while others offer a ‘white-listing’ service for the user to allow an ad, else it’s blocked by default. To be clear, at this stage, ad blockers are impacting the mobile web (outside the app) with no major impact on ads served within the app itself.
The Future of Mobile Monetisation
Clearly digital publishers are fighting on all fronts and levels – technical, financial, macro and on a perception level. Going forward, they can improve their mobile monetisation in multiple ways basis the revenue model or a combination thereof1.
One approach is to provide digital edition access with print subscription as a value added or minor costs. If subscriptions form the majority of circulation revenues for most magazines, up-selling digital access can increase margins while appealing to a mobile audience. It also gives prime real estate on their mobile device, to gather analytic data and engage the loyal customer. This is being deployed to some extent as noted in the paywall section of the report.
Other publishers have chosen to sell single issues and/or subscriptions as in-app purchases. This typically involves de-bundling the subscription period to a weekly or even day or hourly pass; selling per article on an a la carte’ or granular basis directly to digital consumers5. Renewable subscriptions with in-app purchase will allow publishers to get in front of new audiences and increase digital-only sales. In 2016, digital will account for up to 11% of global circulation for consumer magazines, with many titles far exceeding that projection. 30% of Rolling Stone and 8% of subscriptions at The New Yorker are in digital format.6 It is however important to note that while the costs of digital copies are low, app store owners like Apple’s App Store and Google Play take a 30% cut of any in-app purchases.
Advertising remains a key revenue streams along with the paid monetisation options via in-app advertising and purchasing. On an average only 5% of magazine downloads lead to sale. A cleverer sampling mechanic applied by publishers of apps like Spotify and Angry Birds is to provide a free experience and only after the user is engaged, prompt for an in-app purchase. This is apt, as typically users see no «value» for the content if asked to pay immediately after downloading the app. Such initial engagement leads to higher in-app sales and delivers 48% higher issue sales, 12% higher subscription sales and overall performance is 4x the industry average.7
Publishers can also promote their content by 'Deep Linking’ to a page to save valuable preview time with timed access. Global digital magazine ad revenue is
2171. Nieman Lab 2. Maz Digital3. Bloomberg
set to grow to $13.4 billion in 2016 - making up more than a quarter of publishers’ total advertising revenue1. Since a significant amount of traffic is required to make money with programmatic in-app advertising, many digital edition publishers can use direct ad sales as a gateway to monetisation. Ads can be placed directly in the digital edition via an ad server as a banner or interstitial ads, linking to advertiser websites. The display ads can be banner ads or short-form video ads, both of which are viable options for bringing in revenue. When an ad is integrated into the content, it becomes a native ad. In fact, native ads are viewed 53% more than banner ads.
As consumers move towards social and social becomes a key area of content discovery, all major social players have launched platforms suitable towards the publishing industry. This report calls them alternate publishing platforms as they discussed further in the deep dives (See Section 4). As Facebook may become a key source of traffic for publishers, publishers have realised the importance of these platforms and have started to proactively embrace them instead of fighting their existence. As this reports goes into publishing, market feedback already indicates that many publishers are in talk with these platform owners to define their new models of distribution. Facebook calls its platform Instant Articles, Snapchat called them Discover. Apple
is built as an app called Apple News. Very recently Twitter launched Moments, an aggregation of trending material to tell complete stories about the events1.
In Facebook’s offering, publishers get 100% share of their ads and 70% share of ads served by Facebook2. The articles are shown in the user’s Facebook’s feed. Although both Apple and Facebook are similar in approach as news aggregators, not surprisingly, Apple slants towards the in-app push while Facebook towards its network. By joining such curated platforms or ‘traffic referees’, publishers could improve their monetisation further.3
Finally for publishers, which have strong content relationships with an ecommerce leg, affiliates and referrals are a potentially powerful source of revenue. Affiliate marketing can generate up to 10%2 of the total revenue depending on the content and affiliate categories. The key is to avoid “affiliate bait”, i.e. have Editors write favorably, even if untrue, about the affiliate product to maintain trust. By setting up their own or joining an affiliate program, publishers get access to new revenues, while offering products or services relevant to their readers. For example, by affiliating with an e-commerce site, a lifestyle or fashion publisher can transform its app into a shopping touch point that drives sales.

218
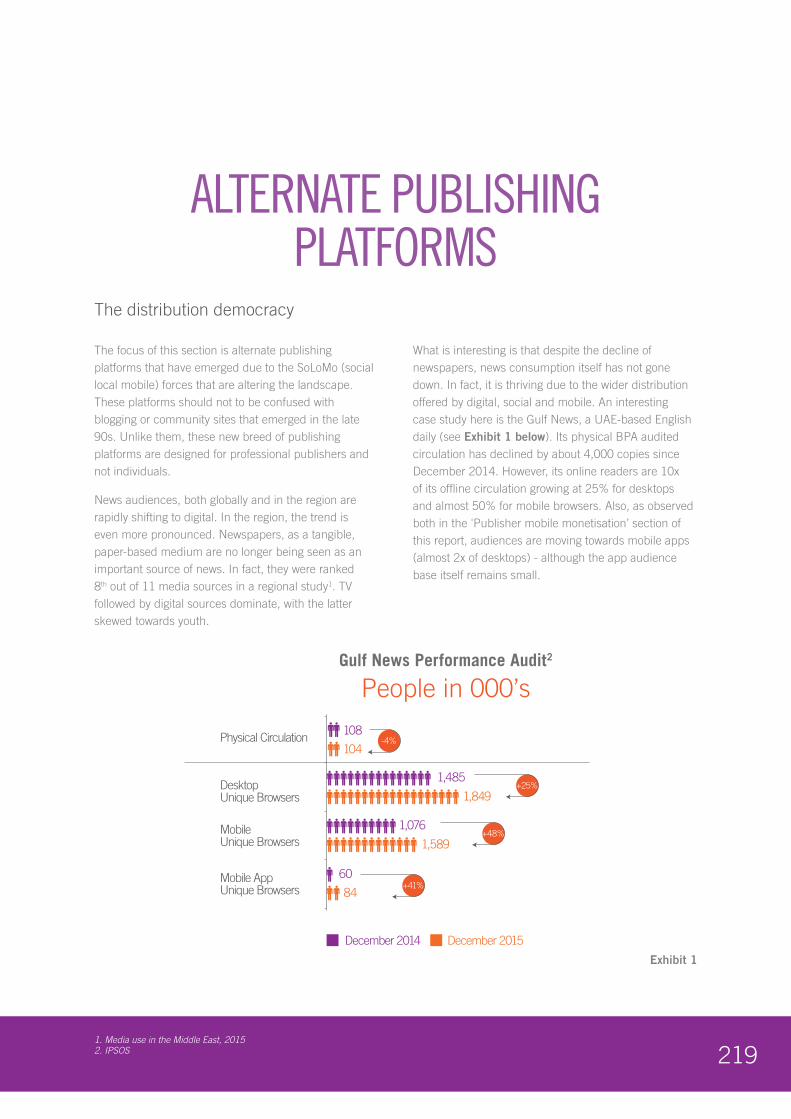
2191. Media use in the Middle East, 2015 2. IPSOS
The distribution democracy
The focus of this section is alternate publishing platforms that have emerged due to the SoLoMo (social local mobile) forces that are altering the landscape. These platforms should not to be confused with blogging or community sites that emerged in the late 90s. Unlike them, these new breed of publishing platforms are designed for professional publishers and not individuals.
News audiences, both globally and in the region are rapidly shifting to digital. In the region, the trend is even more pronounced. Newspapers, as a tangible, paper-based medium are no longer being seen as an important source of news. In fact, they were ranked 8th out of 11 media sources in a regional study1. TV followed by digital sources dominate, with the latter skewed towards youth.
What is interesting is that despite the decline of newspapers, news consumption itself has not gone down. In fact, it is thriving due to the wider distribution offered by digital, social and mobile. An interesting case study here is the Gulf News, a UAE-based English daily (see Exhibit 1 below). Its physical BPA audited circulation has declined by about 4,000 copies since December 2014. However, its online readers are 10x of its offline circulation growing at 25% for desktops and almost 50% for mobile browsers. Also, as observed both in the 'Publisher mobile monetisation’ section of this report, audiences are moving towards mobile apps (almost 2x of desktops) - although the app audience base itself remains small.
Exhibit 1
ALTERNATE PUBLISHING PLATFORMS
Gulf News Performance Audit2
People in 000’s
December 2015December 2014
108
104
1,849
1,589
60
84
1,485
1,076
-4%
+25%
+48%
+41%
Physical Circulation
DesktopUnique Browsers
MobileUnique Browsers
Mobile AppUnique Browsers
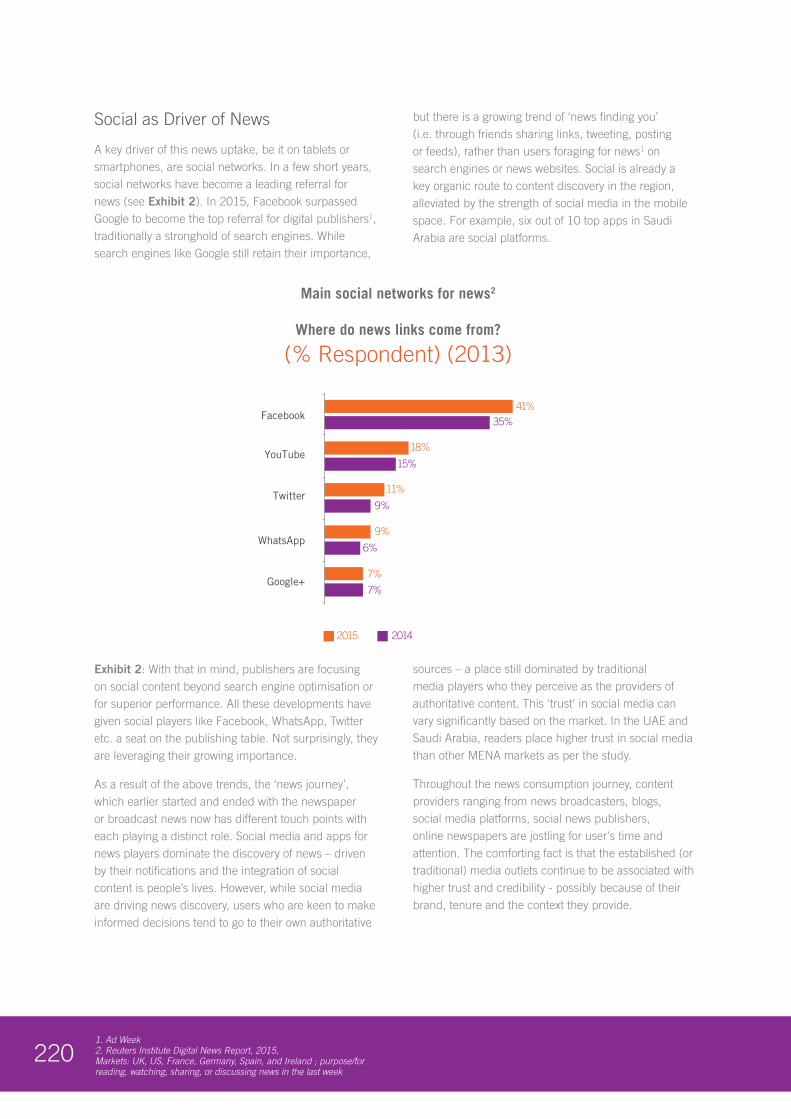
2201. Ad Week2. Reuters Institute Digital News Report, 2015, Markets: UK, US, France, Germany, Spain, and Ireland ; purpose/for reading, watching, sharing, or discussing news in the last week
Social as Driver of News
A key driver of this news uptake, be it on tablets or smartphones, are social networks. In a few short years, social networks have become a leading referral for news (see Exhibit 2). In 2015, Facebook surpassed Google to become the top referral for digital publishers1, traditionally a stronghold of search engines. While search engines like Google still retain their importance,
but there is a growing trend of ‘news finding you’ (i.e. through friends sharing links, tweeting, posting or feeds), rather than users foraging for news1 on search engines or news websites. Social is already a key organic route to content discovery in the region, alleviated by the strength of social media in the mobile space. For example, six out of 10 top apps in Saudi Arabia are social platforms.
Exhibit 2: With that in mind, publishers are focusing on social content beyond search engine optimisation or for superior performance. All these developments have given social players like Facebook, WhatsApp, Twitter etc. a seat on the publishing table. Not surprisingly, they are leveraging their growing importance.
As a result of the above trends, the ‘news journey’, which earlier started and ended with the newspaper or broadcast news now has different touch points with each playing a distinct role. Social media and apps for news players dominate the discovery of news – driven by their notifications and the integration of social content is people’s lives. However, while social media are driving news discovery, users who are keen to make informed decisions tend to go to their own authoritative
sources – a place still dominated by traditional media players who they perceive as the providers of authoritative content. This 'trust' in social media can vary significantly based on the market. In the UAE and Saudi Arabia, readers place higher trust in social media than other MENA markets as per the study.
Throughout the news consumption journey, content providers ranging from news broadcasters, blogs, social media platforms, social news publishers, online newspapers are jostling for user's time and attention. The comforting fact is that the established (or traditional) media outlets continue to be associated with higher trust and credibility - possibly because of their brand, tenure and the context they provide.
Main social networks for news2
Where do news links come from?
(% Respondent) (2013)
35%
15%
9%
9%
6%
7%
7%
2015 2014
18%
41%
11%
YouTube
Google+
2211. Facebook Instant Articles2. Digiday3. Journalism UK 4. Marketing Land
5. Tech Crunch 6. Digital Content Next7. Digiday
Alternate publishing solutions complement publisher owned websites
It’s natural to wonder in such a shifting landscape, who matters: publisher owned platforms such as their websites/apps or the emergent social publishing platforms. The answer would be both. Alternate publishing solutions fulfill an important and complementary objective of publishers. While the publisher owned platforms post content created by journalists, alternate publishing platforms amplify and curate it to a wider audience. In social media, news distribution is driven by the users, in publisher-owned properties it’s defined by editorial requirements.
Also, with publishers trying to ‘digitise’ or force-fit their broadsheets and glossy magazines into a small screen, the user experience doesn’t match. To the contrary, apps are built with social, digital and mobile in mind for a new generation of an audience from the ground up. While alternate publishing platforms are essentially content aggregators, they come in two varieties based on the fit - for publisher formats or audience i.e. end-users or readers.
Fit for publisher formats are custom-designed keeping for publisher brand and content requirements. The formats curate content in the way publishers do and hence provide unique audience opportunities to enhance both the publishers and platform revenue streams. As they are created with professional publishers in mind, these typically do not allow for self-published amateur content. Publishers are hence “verified” and only then allowed to be a part of these “fit-for-publisher” platforms. Examples of such platforms include Facebook’s Instant Articles, Apple News and Snapchat Discover.
Facebook’s Instant Articles, which is available to publishers of all sizes, globally allows users to read directly from within Facebook - rather than going outside via a link to a publisher's website1. Monetisation is through ads of all formats. It offers publishers 100% revenue share of their ads and 70% share of ads served by via the Facebook Audience Network - its advertising solution. Content discovery is via Facebook’s feed and according to its claims, Instant Articles are shared 3x more than regular links.1
The social giant also claims photos, videos and articles on its service load 10x faster than the standard mobile web1.
To expand its reach, Facebook now offers Instant Articles to brands, besides media companies. Although, it’s long-term success is yet to be proven, knowing the strength and scale of the platform, majority of the publishers have chosen to become a part of the platform. According to industry sources, Facebook is currently in beta with many regional publishers in the region.
Another ‘fit-for-publisher’ platform is Apple News that aggregates content from publishing partners. Launched in September 2015, it houses the content and does not enforce a paywall. Unlike Facebook, which has natural content discovery, Apple promotes it’s through in-app push messages and remains limited to those who purchase Apple phones and tablets. Like Facebook, publishers get 100% of revenues earned from ads they serve and 70% if the ads are served by iAD, Apple’s ad platform2.
Apple may claim a user base of over a billion ioS devices (iPhones and iPads), but that has not necessarily translated into their reader’s attention. As a result, Apple News active user base lags at 40 million1 despite the app being pre-installed. News reports suggest that publishers have voiced their concern on its effectiveness as a publishing platform.
Another platform is Twitter, now a decade old, known for its real-time news bursts. The company launched Twitter Moments in October 2015, that allows publishers to discover, curate relevant tweets around breaking news or major events.3 To complement that, it started Twitter Publish that offers better ‘packaged’ stories – a mix of tweets, images, videos mined from the raw tweets4. To go beyond, 140 characters, it also has Ampify – a video platform5 and Periscope for live steaming6. The monetisation is via ‘Promoted Moments’ that reportedly cost $1 million each7. In the future, it is expected Moments to become native advertising, where publishers get a revenue share.
Even players with no bearing to publishing are getting into the act. Snapchat, an image sharing app launched Discover in 2015. Targeted at millennials and teenagers, it already serves over 8 billion videos to more than 100 million viewers every month and growing. Discover is a tab in its app that offers daily ‘Editions’ or content channels from paying media partners. Its content cannot be cannot be repurposed from other formats as its vertical video and photos vs. other platforms. Publishers are warming up to platforms like Snapchat as they can reach out to millennials in higher
2221. Digiday2. Contently 3. Tech Crunch
4. GigaOM 5. Upday
proportions – an audience, which the publications are deficit of.
There are a host of other non-social, non-publishers positioning themselves as the ‘Netflix for magazines’. Zinio, Magzter, Amazon’s Kindle to name a few 10 are fighting on both fronts - offering publishers a new way to create, distribute their ware and define the pricing while promising users a better experience, more choice with unlimited access for a monthly fee or ability to purchase an issue a la carte. For example, Zinio, now into its 15th year, offers more than 5,000 digital magazines in 30 languages on the desktop, mobile and apps.
“Fit-for audience” formats
Fit-for-audience formats have always existed as the precursors of the fit-for-publisher formats. These are formats that also curate content but are more suited to audience consumption behaviors with the audiences doing the curation themselves. Examples include well known social platforms like Facebook, Twitter, YouTube etc.
Fit for audience formats don’t structure content like publishers and many formats like WhatsApp don’t have clear publisher monetisation models yet or authoritative publisher content. However, the value to publishers in such audience-friendly formats is being driven by their incremental audiences that provide referrals, share-ability, and faster distribution.
Interestingly, some are developing solutions amenable to both audience requirements. Examples include Pinterest’s Article pins to curate of written content2. Or Viber (a popular messaging app) introduced public chats for publishers to unlimited members, unlike WhatsApp, which limits group messages to 250 members. Even traditional broadcasters such as the BBC are using WhatsApp, Viber and Mixit in South Africa, allowing users to opt in into topic related lists1.
On the other side, are aggregators like Flipboard, LinkedIn's Pulse, Google News, which automatically curate tens and thousands of news sources into a single view. Take the case of Flipboard, it shares ad revenues with publishers, allows them to create and verify profiles of those who create ‘flip boards’ across 35,000 topics2. Outside text and images, video is also on the uptake. Streaming formats offered by Periscope (acquired by Twitter), Meerkat and Facebook Live Video allow live broadcasting, event-related, or breaking news. It has
attracted big names such as Sky Sports, Buzz Feed, BBC, TMZ, and the Washington Post.3
The alternate publishing platforms clearly have the users on their side and publishers warming up, albeit reluctantly. As a result, they need to be assessed based on the publishers’ priorities, which can be a combination of developing new audience, getting referral traffic, monetisation, enhancing audience experience or scaling up. Hence, publishers need to tread carefully, as no one platform does it all. For instance, if the publisher owned platform provides weak engagement, then they need to assess a platform like Facebook Instant Articles. Some platforms like Live Video introduce a new content stream, which may not be offered by certain publishers but may form an integral part of the audience’s news journey.
The verdict is not out yet. A lot of these formats be it publisher, audience fit are relatively new, with evolving business models and still being tested with no clear winner. However, for a user, the news journey has never been easier. But for digital publishers, it’s a whole new paper route.
Source Unknown
While getting new audiences and engaging them is vital, publishers may unwittingly be giving up on what defines them - the credibility of their name. As owners of content, publishers need to analyse the impact of such relinquishing. A recent study by Reuters showed that a substantial number of readers don’t know where the content they are reading comes from, because they get it from aggregators, search or social media sources4. Some publishers are instead choosing to look the other way by building publishing platforms - away from the social players and upstarts.
For instance, German publisher Axel Springer and others who are wary of being dependent on these platforms have built Upday (pronounced Up Day) in partnership with Samsung. A cross between a platform and an app, it aggregates content from fellow publishers, bloggers and curated by journalists5. Launched in September 2015, UpDay has 1,200 publishers on board including The Economist, The Daily Telegraph who are looking outside Facebook and Apple’s walled gardens. At this stage, it's restricted to Samsung S7 smartphone users (it comes pre-installed)
2231. Texture
and available only in English, Polish, French and German. It shares 5% of the ad revenue it makes with participating publishers.
Upday is not alone. Texture another such alternate publishing platform - a joint venture formed by six major publishers – Condé Nast, Hearst, Meredith, News Corp., Rogers Communications and Time Inc - offers unlimited access to their combined 140 titles, including archives starting at under $10 per month1. Unlike Upday's Samsung-Android only approach, Texture is cross-platform and can be used on any device.
Again, it’s still early days to gauge the success or potential of such publisher-driven efforts. While they have the content, credibility and greater control, what needs to be seen is whether users prefer their platforms or apps.
The Last Word
As noted above, in such a rapidly changing landscape, if publishers need to stay relevant, they must embrace three key principles. Firstly, the concept of alternate
publishing platforms itself - depending on one’s perspective, they can be perceived as frenemy (friend and enemy) and a relationship that cannot be avoided. On this basis, they must define the role, priority and the fit of these platforms in their distribution ecosystems.
Secondly, they must protect their most valuable asset - their content, by working with players that provide scale, ‘deep link’ back to the publisher’s owned properties and provide referral traffic. They must also assess the value of publisher owned platforms (such as Upday, Texture), work collaboratively with other publishers to create industry-wide initiatives and improve negotiability with such external players.
Lastly, publishers need to develop strong analytical capabilities and optimising based on performance. Only by honing these capabilities, can they understand the role these platforms and take control of their future. In the case of alternate publishing platforms, the future is already here.
224
LANDSCAPE MIDDLE EAST MEDIA EDUCATION LA
ARAB MEDIA EXPOSURE AND TRANSITIONARAB MEDIA OUTLOOK 2016. 2020ARAB MEDIA EXPOSURE AND TRANSITIONARAB MEDIA OUTLOOK 2016. 2020ARAB MEDIA EXPOSURE AND TRANSITIONARAB MEDIA OUTLOOK 2016. 2020
ARAB MEDIA EXPOSURE AND TRANSITIONARAB MEDIA OUTLOOK 2016. 2020ARAB MEDIA EXPOSURE AND TRANSITIONARAB MEDIA OUTLOOK 2016. 2020ARAB MEDIA EXPOSURE AND TRANSITIONARAB MEDIA OUTLOOK 2016. 2020ARAB MEDIA EXPOSURE AND TRANSITIONARAB MEDIA OUTLOOK 2016. 2020ARAB MEDIA EXPOSURE AND TRANSITIONARAB MEDIA OUTLOOK 2016. 2020ARAB MEDIA EXPOSURE AND TRANSITIONARAB MEDIA OUTLOOK 2016. 2020ARAB MEDIA EXPOSURE AND TRANSITION
225
LANDSCAPE MIDDLE EAST MEDIA EDUCATION LA
ARAB MEDIA EXPOSURE AND TRANSITIONARAB MEDIA OUTLOOK 2016. 2020ARAB MEDIA EXPOSURE AND TRANSITIONARAB MEDIA OUTLOOK 2016. 2020ARAB MEDIA EXPOSURE AND TRANSITIONARAB MEDIA OUTLOOK 2016. 2020
ARAB MEDIA EXPOSURE AND TRANSITIONARAB MEDIA OUTLOOK 2016. 2020ARAB MEDIA EXPOSURE AND TRANSITIONARAB MEDIA OUTLOOK 2016. 2020ARAB MEDIA EXPOSURE AND TRANSITIONARAB MEDIA OUTLOOK 2016. 2020ARAB MEDIA EXPOSURE AND TRANSITIONARAB MEDIA OUTLOOK 2016. 2020ARAB MEDIA EXPOSURE AND TRANSITIONARAB MEDIA OUTLOOK 2016. 2020ARAB MEDIA EXPOSURE AND TRANSITIONARAB MEDIA OUTLOOK 2016. 2020ARAB MEDIA EXPOSURE AND TRANSITION
NDSCAPE MIDDLE EAST MEDIA EDUCATION LANDSCAPE MIDDLE EAST MEDIA EDU

226
227
EDUCATION
Unlearning Learning
This section of the report focuses on formal structured education related to the media sector. Also called media sciences, communication arts or media studies - traditionally it has been summed up as ‘mass communication’ covering print journalism, broadcast (TV/radio), film, public relations, advertising and marketing. Be it a diploma, a special course module or a graduate degree, such training or learning drew on social sciences, humanities and the core discipline of communication studies.1
However, with digitisation, it has undergoing a drastic change, hence the reference to “unlearning”. The diversification is being driven by the rapid change in media consumption, demographics, new access tools (smartphones/tablets), new platforms (social media, blogs), formats (digital video, tweets, posts) extending its scope far and wide. For instance, in a report from LinkedIn on the “Hottest 25 Skills for 2015”, only six skills had no direct role for digital. The rest were heavily digital and/or analytics led.
The net result is two-fold. Firstly, job functions have evolved and include more responsibilities, scope and
adopting new technologies. For example, the classic writer or columnist has evolved into a blogger or digital writer, dishing out their perspective and opinions2. The Huffington Post one of the world’s most popular news sites, with 110 million unique monthly users and also the first online news outlet to win a Pulitzer Prize employs in-house writers, freelancers and bloggers and social media contributors. Another example of this evolution is the role of a Press Officer, which still exists but expanded to become 'Chief Listening Officer'. The job role includes tuning into social media, monitoring, sentiment analysis, engagement and tracking information as it happens. Researcher roles have now expanded to become Insight Analysts, thanks to technology revealing much more about audiences.
Secondly, it has involved the introduction of new job functions and job profiles, many of which didn’t exist even a decade ago3. For instance the role of Digital marketing specialist, which is adept in analytics, search engine optimisation (SEO)2, performance marketing and more while working with traditional marketing specialists. Similarly, job listings for Big Data analysts; Social Media Managers; User experience (UX) experts; Content Marketing Specialists are becoming common4. The rapid migration to mobiles has created a surge
1. Webster, Frank (1995): Theories of the information society2. Digital Marketing Institute3. HR Review (UK)4. Business Zone
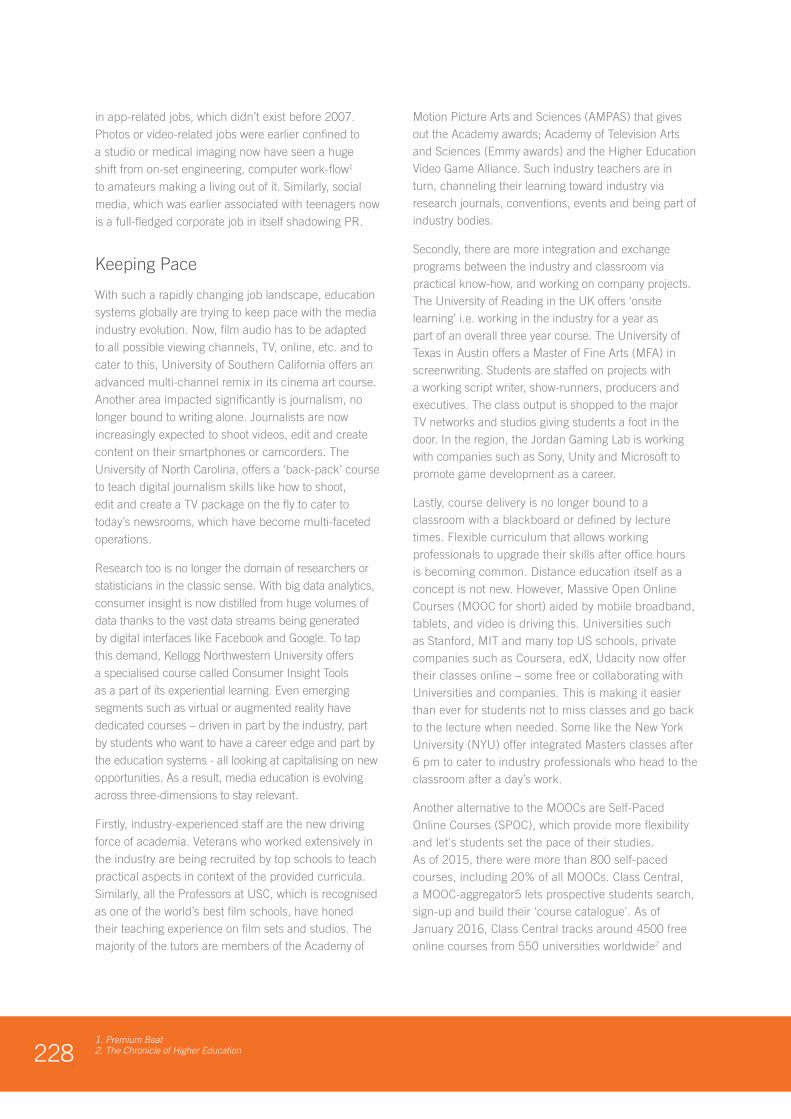
2281. Premium Beat 2. The Chronicle of Higher Education
in app-related jobs, which didn’t exist before 2007. Photos or video-related jobs were earlier confined to a studio or medical imaging now have seen a huge shift from on-set engineering, computer work-flow1 to amateurs making a living out of it. Similarly, social media, which was earlier associated with teenagers now is a full-fledged corporate job in itself shadowing PR.
Keeping Pace
With such a rapidly changing job landscape, education systems globally are trying to keep pace with the media industry evolution. Now, film audio has to be adapted to all possible viewing channels, TV, online, etc. and to cater to this, University of Southern California offers an advanced multi-channel remix in its cinema art course. Another area impacted significantly is journalism, no longer bound to writing alone. Journalists are now increasingly expected to shoot videos, edit and create content on their smartphones or camcorders. The University of North Carolina, offers a ‘back-pack’ course to teach digital journalism skills like how to shoot, edit and create a TV package on the fly to cater to today’s newsrooms, which have become multi-faceted operations.
Research too is no longer the domain of researchers or statisticians in the classic sense. With big data analytics, consumer insight is now distilled from huge volumes of data thanks to the vast data streams being generated by digital interfaces like Facebook and Google. To tap this demand, Kellogg Northwestern University offers a specialised course called Consumer Insight Tools as a part of its experiential learning. Even emerging segments such as virtual or augmented reality have dedicated courses – driven in part by the industry, part by students who want to have a career edge and part by the education systems - all looking at capitalising on new opportunities. As a result, media education is evolving across three-dimensions to stay relevant.
Firstly, industry-experienced staff are the new driving force of academia. Veterans who worked extensively in the industry are being recruited by top schools to teach practical aspects in context of the provided curricula. Similarly, all the Professors at USC, which is recognised as one of the world’s best film schools, have honed their teaching experience on film sets and studios. The majority of the tutors are members of the Academy of
Motion Picture Arts and Sciences (AMPAS) that gives out the Academy awards; Academy of Television Arts and Sciences (Emmy awards) and the Higher Education Video Game Alliance. Such industry teachers are in turn, channeling their learning toward industry via research journals, conventions, events and being part of industry bodies.
Secondly, there are more integration and exchange programs between the industry and classroom via practical know-how, and working on company projects. The University of Reading in the UK offers ‘onsite learning’ i.e. working in the industry for a year as part of an overall three year course. The University of Texas in Austin offers a Master of Fine Arts (MFA) in screenwriting. Students are staffed on projects with a working script writer, show-runners, producers and executives. The class output is shopped to the major TV networks and studios giving students a foot in the door. In the region, the Jordan Gaming Lab is working with companies such as Sony, Unity and Microsoft to promote game development as a career.
Lastly, course delivery is no longer bound to a classroom with a blackboard or defined by lecture times. Flexible curriculum that allows working professionals to upgrade their skills after office hours is becoming common. Distance education itself as a concept is not new. However, Massive Open Online Courses (MOOC for short) aided by mobile broadband, tablets, and video is driving this. Universities such as Stanford, MIT and many top US schools, private companies such as Coursera, edX, Udacity now offer their classes online – some free or collaborating with Universities and companies. This is making it easier than ever for students not to miss classes and go back to the lecture when needed. Some like the New York University (NYU) offer integrated Masters classes after 6 pm to cater to industry professionals who head to the classroom after a day’s work.
Another alternative to the MOOCs are Self-Paced Online Courses (SPOC), which provide more flexibility and let's students set the pace of their studies. As of 2015, there were more than 800 self-paced courses, including 20% of all MOOCs. Class Central, a MOOC-aggregator5 lets prospective students search, sign-up and build their 'course catalogue'. As of January 2016, Class Central tracks around 4500 free online courses from 550 universities worldwide2 and
2291. Class Central2. EHow: Pedagogy and Teachers
over 300 media related courses1. By providing access to industry experts, flexibility and creating closer ties with class rooms and board rooms, schools are increasingly preparing students for the future.
Course Correction
As a result of tighter integration with the industry, the courses themselves are changing. Historically, the curriculum, which took years to change, and then updated later by the authors/publishers is now accelerated. This superior curricula and pedagogy is differentiating traditional learning vs. ‘Best in Class’.
In the typical traditional learning approach educational institutions have had a curricula that has been mostly static and evolves slowly, staying behind the latest trends. In contrast, with Best in Class, relevant industry classes are added every few months and class content is updated based on trends as they happen. Similarly traditional learning implied technology being limited to engineering classes where as the advanced schools realise that media now is increasingly technology-led and also the medium of learning. Old-world class rooms teaching still revolved around concept-driven education with little real world application and limited evaluation techniques that are mostly written exams, while its new counterparts have real-world tests with knowledge performance indicators.
Pedagogy too is evolving. It no longer involves standing on a classroom podium and teaching. In fact, it is now engaging both teacher and student on many levels2. While the conventional classrooms still have lecture-led approach, the best in class school put the courseware online and include learning management systems such as Moodle, Blackboard, Desire2Learn. Courses are also becoming available as apps; classes are streamed live or available as on-demand videos, and include labs, real-life case studies, latest equipment – in many cases subsidised by the industry. The faculty too has industry experts inducted from the corporate world, or have close ties to it who have moved to the teaching world for a different pace. In contrast, traditional schools have few key-note speakers, or online resources while the new breed of schools have extensive access to industry resources, CEOs, guest speakers, online alumni and more.
Media education in MENA
In the region, media education is currently delivered across specialised and local universities. Local universities tend to take a general approach offering diverse courses to a larger number of students. On the other hand, the region’s specialised Universities are usually partnerships between global entities and government bodies. For e.g. The Northwestern University a specialised University in liberal arts and media was co-founded with the Qatar Foundation in 2008. Aqaba had the Red Sea Institute of Cinematic Arts - a joint effort of the Jordanian Royal Film Commission and USC, laying claim to be the first and only MFA program in the region. There has also been an uptake of global non-specialised universities. For e.g. the NYU in Abu Dhabi – while its media studies are not the core focus, it has a strong reputation for film studies.
In the local universities few deliver robust media-related curricula, unless they have a specialised school such as the Mohammed Bin Rashid School For Communication (AUD) in Dubai or the Northwestern University in Qatar. The most prominent local or the top regional universities do not have a media focus and yet have a large number of students. Due to this disconnect, the majority take generic media education making them deficient for hiring. To make up for the skills deficit, they take further courses outside the region.
Learning Curve
In order to develop a vibrant media education ecosystem, government, academia and the industry need to work collaboratively. Governments must step up efforts by identifying the 'in-demand' sectors and align academia with the country's priorities to meet industry demand. To expedite this, they need to partner with global communication schools to and bring their expertise. As highlighted above, countries like the UAE, Qatar, and Jordan are at the forefront of these initiatives.
To encourage media graduates to apply their skills and minimize risk in their initial years, some countries have created funds. Other efforts include partnering with international Universities; creating local jobs by investing in technology and launching new TV channels with more local content vs. global content. Several examples of these initiatives have been cited in the film, TV and gaming sections of this report.
2301. Skilled Up2. TechCity UK
Also, as most media education tends to be ‘Western-centric’ in English medium, some regional governments are Arabising it for authenticity and relevance. An example of this is Edraak, a not-for-profit platform. Created by H.E Queen Rania of Jordan, it is a free MOOC that offers Arab learners courses taught at Harvard, MIT, UC Berkeley, amongst others. Students can even earn certificates of mastery, including in film making.
Possibly, the biggest influencer are the academic institutions as students continue to hold their alma mater as a key source of learning. However, to become future ready challenges remain from the curriculum, pedagogy and the university structure itself. Educational institutions need to develop more exchange programs with global universities and update the curricula more frequently. Academia is evolving to provide more support to the local media students. For example, the American University of Beirut (AUB) added a new Masters in Journalism course with a focus on digital media and updates its course frequently to the fast changing media world. Universities can also put in mandatory internships to encourage students to look beyond the class-room and exams to graduate. There is also the emergence of specialised schools, offering advanced courses. For e.g., The New York Film Academy (NYFA) in Abu Dhabi offers 3D animation and visual FX classes.
Outside the University walls and long-term courses that require more commitment and money, a lot of private players are filling in some of the lacuna. Notable are entities like AstroLabs, Digital Vidya and SAE who offer specialised media training courses in topics such as social media, blogging, content management, SEO etc. for those who wish to upgrade their skills .They include industry professionals and students with limited time and/or money or cannot find such courses in traditional Universities. Even companies such as Adobe, Google are offering certification via authorised training centres and officially endorsing the learner. There are also a host of online course providers such as Lynda (owned by LinkedIn), Udemy, and others, which offer free and paid on-demand education videos. The prices for such
‘electronic self-education’ range from $20 per month to thousands of dollars for instructor-led certification programs1.
It is however important to have these courses graded by independent entities to separate the grain from the chaff. Such 'crash courses' may help the learner brush up their knowledge, but do not hold up in credence to a University’s offering or are recognised by the industry.
Hence participation by private companies needs to increase for creating more practical and ‘employment-ready’ courses. More needs to be done by the Universities by spinning off innovation labs; investing in media research and development. This way, the academia can create valuable IP and differentiate.
The media companies and marcomms agencies need to work more with the academia to build relevant curricula. While initiatives such as internships, providing students onsite training (at their offices) do their part, the active learning experience remains limited as industry players prefer to hire than develop talent. In this aspect, the industry needs to encourage volunteer staff to participate in media schools via teaching, guest lectures and mentoring. For example, Sky News Arabia with UAE-based Universities launched SNAP - a training program to encourage Emirati talent and develop their technical capabilities through workshops and internships.
In summary, the education sector needs to revolutionise itself to stay relevant. It is important that the efforts mentioned above are well orchestrated realising the value each entity brings to the ecosystem. An example of this is the Digital Business Academy launched by TechCity UK, a publicly funded, non-profit entity with a private sector mentality in its own words2. What is unique about the Academy is that the industry advise on courses, which are then developed and delivered by leading universities. Most importantly, students who succeed are given 'rewards' i.e. start-up loans (seed capital), free co-working space, paid internships, training - allowing for meritocracy and building practical skills at the same time. Such efforts remain at an early stage in the region, but could offer a template for growth.

231
232
LOGY METHODOLOGY METHODOLOGY METH
ARAB MEDIA EXPOSURE AND TRANSITIONARAB MEDIA OUTLOOK 2016. 2020ARAB MEDIA EXPOSURE AND TRANSITIONARAB MEDIA OUTLOOK 2016. 2020ARAB MEDIA EXPOSURE AND TRANSITIONARAB MEDIA OUTLOOK 2016. 2020
ARAB MEDIA EXPOSURE AND TRANSITIONARAB MEDIA OUTLOOK 2016. 2020ARAB MEDIA EXPOSURE AND TRANSITIONARAB MEDIA OUTLOOK 2016. 2020ARAB MEDIA EXPOSURE AND TRANSITIONARAB MEDIA OUTLOOK 2016. 2020ARAB MEDIA EXPOSURE AND TRANSITIONARAB MEDIA OUTLOOK 2016. 2020ARAB MEDIA EXPOSURE AND TRANSITIONARAB MEDIA OUTLOOK 2016. 2020ARAB MEDIA EXPOSURE AND TRANSITIONARAB MEDIA OUTLOOK 2016. 2020ARAB MEDIA EXPOSURE AND TRANSITION
233
LOGY METHODOLOGY METHODOLOGY METH
ARAB MEDIA EXPOSURE AND TRANSITIONARAB MEDIA OUTLOOK 2016. 2020ARAB MEDIA EXPOSURE AND TRANSITIONARAB MEDIA OUTLOOK 2016. 2020ARAB MEDIA EXPOSURE AND TRANSITIONARAB MEDIA OUTLOOK 2016. 2020
ARAB MEDIA EXPOSURE AND TRANSITIONARAB MEDIA OUTLOOK 2016. 2020ARAB MEDIA EXPOSURE AND TRANSITIONARAB MEDIA OUTLOOK 2016. 2020ARAB MEDIA EXPOSURE AND TRANSITIONARAB MEDIA OUTLOOK 2016. 2020ARAB MEDIA EXPOSURE AND TRANSITIONARAB MEDIA OUTLOOK 2016. 2020ARAB MEDIA EXPOSURE AND TRANSITIONARAB MEDIA OUTLOOK 2016. 2020ARAB MEDIA EXPOSURE AND TRANSITIONARAB MEDIA OUTLOOK 2016. 2020ARAB MEDIA EXPOSURE AND TRANSITION
The Arab Media Outlook 2016-18 presents, for the first time, a view of the overall media market in MENA covering both the paid as well as advertising funded revenue streams. The current edition also places greater emphasis on the future trends and how can they be capitalised in its deep dives as part of section 4 of this report.
A key area of analysis in this report was to determine the overall media market size across the 14 countries and the various segments of the media market, besides projecting its evolution. This effort was done utilising current industry data, as well as leveraging on the experience of senior industry leaders to both validate as well as guide the direction of their respective industries. In order to ensure greater insight, the profile of those interviewed was focused on the C Suite as well as the strategy leaders of leading media organisations in the region.
The advertising spend data was sourced from the leading monitoring agencies in their respective markets. Since advertising spends are reported basis rate cards for all monitored media, extensive market interviews were conducted to determine the discounts to determine the net value of the market. It is important for the reader to understand that these discounts are highly confidential data to both media agencies and sellers, and hence cannot be verified independently.
In order to project the trajectory of the media market, a macro-economic analysis was conducted to determine its key drivers of the growth in the region. An overview of this analysis is shared in the macro -economic section of this report. The analysis uses reputed sources like the IMF and the World Bank to determine the impact of the overall economy in the media market. It is however important for the reader to note, that the current economic climate in the region is heavily driven by market forces and hence its future path is uncertain. The reader is hence highly advised to refer to the latest data releases of these economic bodies while using the framework provided by this report to exercise their judgment.
With the larger media markets getting increasingly connected with broadband and smartphones, digitisation remains a key force which is shaping the media market structure and by sector importance. The future trends of the media industry overall and specifically the print paid circulations were adjusted to account for the potential impact of digitisation basis the digital maturity of each market.
In-line with the previous report, markets which have limited secondary data (like Sudan and Palestine) we relied deeply on market interviews to derive a consensus estimate on size and evolution of these markets.
ODOLOGY METHODOLOGY METHODOLOGY M
234
For the country sections where we focus on local market audience and industry trends, we have had a noticeable change in methodology. The previous report was based on a research which commissioned to determine the audience behaviors and media performance across four key markets of Egypt, Morocco, Saudi Arabia and UAE. Hence while providing valuable insights, as clearly stated, it had the limitation of not reflecting audience measurement studies, and, therefore, not being consistent with published data on audience consumption. Hence, in order to ensure the widest possible market acceptability, this report derives its audience learnings basis syndicated research conducted by industry-accepted research bodies.
The analysis can hence be used as common currency to understand the audience performance for each of the media in their respective countries. For instance, most of the traditional audience research in the GCC and Levant markets is conducted by IPSOS.
While all efforts have been made to ensure data consistency and to provide a comprehensive picture of the media market in the Arab countries, it is important to emphasize that these projections should not be used to inform any investment decisions. This is mainly driven by the lack of robust and consistent data across all 14 countries covered as part of this report.

235
236
ARAB MEDIA EXPOSURE AND TRANSITIONARAB MEDIA OUTLOOK 2016. 2020ARAB MEDIA EXPOSURE AND TRANSITIONARAB MEDIA OUTLOOK 2016. 2020ARAB MEDIA EXPOSURE AND TRANSITIONARAB MEDIA OUTLOOK 2016. 2020ARAB MEDIA EXPOSURE AND TRANSITIONARAB MEDIA OUTLOOK 2016. 2020ARAB MEDIA EXPOSURE AND TRANSITIONARAB MEDIA OUTLOOK 2016. 2020ARAB MEDIA EXPOSURE AND TRANSITIONARAB MEDIA OUTLOOK 2016. 2020ARAB MEDIA EXPOSURE AND TRANSITIONARAB MEDIA OUTLOOK 2016. 2020ARAB MEDIA EXPOSURE AND TRANSITIONARAB MEDIA OUTLOOK 2016. 2020ARAB MEDIA EXPOSURE AND TRANSITIONARAB MEDIA OUTLOOK 2016. 2020ARAB MEDIA EXPOSURE AND TRANSITIONARAB MEDIA OUTLOOK 2016. 2020