unraveling the innermost jet structure of oj 287 with the first
TRANSCRIPT

PDF hosted at the Radboud Repository of the Radboud University
Nijmegen
The following full text is a publisher's version.
For additional information about this publication click this link.
https://repository.ubn.ru.nl/handle/2066/251317
Please be advised that this information was generated on 2022-09-30 and may be subject to
change.
Unraveling the Innermost Jet Structure of OJ 287 with the First GMVA + ALMAObservations
Guang-Yao Zhao1 , José L. Gómez1 , Antonio Fuentes1 , Thomas P. Krichbaum2 , Efthalia Traianou1 , Rocco Lico1,3 ,Ilje Cho1 , Eduardo Ros2 , S. Komossa2 , Kazunori Akiyama4,5,6 , Keiichi Asada7 , Lindy Blackburn6,8 ,
Silke Britzen2 , Gabriele Bruni9 , Geoffrey B. Crew4 , Rohan Dahale1,10 , Lankeswar Dey11 , Roman Gold12 ,Achamveedu Gopakumar11, Sara Issaoun8,13,34 , Michael Janssen2 , Svetlana Jorstad14,15 , Jae-Young Kim16,17,2 ,
Jun Yi Koay7 , Yuri Y. Kovalev18,19,2 , Shoko Koyama20,7 , Andrei P. Lobanov2 , Laurent Loinard20,21 ,Ru-Sen Lu23,24,2 , Sera Markoff24,25 , Alan P. Marscher14 , Iván Martí-Vidal26,27 , Yosuke Mizuno28,29,30 ,
Jongho Park7,35 , Tuomas Savolainen32,33,2 , and Teresa Toscano11 Instituto de Astrofísica de Andalucía-CSIC, Glorieta de la Astronomía s/n, E-18008 Granada, Spain; [email protected]
2 Max-Planck-Institut für Radioastronomie, Auf dem Hügel 69, D-53121 Bonn, Germany3 INAF-Istituto di Radioastronomia, Via P. Gobetti 101, I-40129 Bologna, Italy
4 Massachusetts Institute of Technology Haystack Observatory, 99 Millstone Road, Westford, MA 01886, USA5 National Astronomical Observatory of Japan, 2-21-1 Osawa, Mitaka, Tokyo 181-8588, Japan6 Black Hole Initiative at Harvard University, 20 Garden Street, Cambridge, MA 02138, USA
7 Institute of Astronomy and Astrophysics, Academia Sinica, 11F of Astronomy-Mathematics Building, AS/NTU No. 1, Sec. 4, Roosevelt Road, Taipei 10617,Taiwan, R.O.C.
8 Center for Astrophysics | Harvard & Smithsonian, 60 Garden Street, Cambridge, MA 02138, USA9 INAF—Istituto di Astrofisica e Planetologia Spaziali, via Fosso del Cavaliere 100, I-00133 Roma, Italy
10 Indian Institute of Science Education and Research Kolkata, Mohanpur, Nadia, West Bengal 741246, India11 Department of Astronomy and Astrophysics, Tata Institute of Fundamental Research, Mumbai 400005, India
12 CP3-Origins, University of Southern Denmark, Campusvej 55, DK-5230 Odense M, Denmark13 Department of Astrophysics, Institute for Mathematics, Astrophysics and Particle Physics (IMAPP), Radboud University, P.O. Box 9010, 6500 GL Nijmegen, The
Netherlands14 Institute for Astrophysical Research, Boston University, 725 Commonwealth Ave., Boston, MA 02215, USA
15 Astronomical Institute, St. Petersburg University, Universitetskij pr., 28, Petrodvorets,198504 St.Petersburg, Russia16 Department of Astronomy and Atmospheric Sciences, Kyungpook National University, Daegu 702-701, Republic of Korea
17 Korea Astronomy and Space Science Institute, Daedeok-daero 776, Yuseong-gu, Daejeon 34055, Republic of Korea18 Lebedev Physical Institute of the Russian Academy of Sciences, Leninsky prospekt 53, 119991 Moscow, Russia19 Moscow Institute of Physics and Technology, Institutsky per. 9, Dolgoprudny, Moscow region, 141700, Russia
20 Niigata University, 8050 Ikarashi-nino-cho, Nishi-ku, Niigata 950-2181, Japan21 Instituto de Radioastronomía y Astrofísica, Universidad Nacional Autónoma de México, Morelia 58089, México
22 Instituto de Astronomía, Universidad Nacional Autónoma de México, CdMx 04510, México23 Shanghai Astronomical Observatory, Chinese Academy of Sciences, 80 Nandan Road, Shanghai 200030, Peopleʼs Republic of China
24 Key Laboratory of Radio Astronomy, Chinese Academy of Sciences, Nanjing 210008, Peopleʼs Republic of China25 Anton Pannekoek Institute for Astronomy, University of Amsterdam, Science Park 904, 1098 XH, Amsterdam, The Netherlands
26 Gravitation and Astroparticle Physics Amsterdam (GRAPPA) Institute, University of Amsterdam, Science Park 904, 1098 XH, Amsterdam, The Netherlands27 Departament d’Astronomia i Astrofísica, Universitat de València, C. Dr. Moliner 50, E-46100 Burjassot, València, Spain
28 Observatori Astronòmic, Universitat de València, C. Catedrático José Beltrán 2, E-46980 Paterna, València, Spain29 Tsung-Dao Lee Institute, Shanghai Jiao Tong University, Shengrong Road 520, Shanghai, 201210, Peopleʼs Republic of China
30 School of Physics and Astronomy, Shanghai Jiao Tong University, 800 Dongchuan Road, Shanghai, 200240, Peopleʼs Republic of China31 Institut für Theoretische Physik, Goethe-Universität Frankfurt, Max-von-Laue-Straße 1, D-60438 Frankfurt am Main, Germany
32 Aalto University Department of Electronics and Nanoengineering, PL 15500, FI-00076 Aalto, Finland33 Aalto University Metsähovi Radio Observatory, Metsähovintie 114, FI-02540 Kylmälä, FinlandReceived 2022 March 21; revised 2022 April 26; accepted 2022 April 27; published 2022 June 16
Abstract
We present the first very long baseline interferometric (VLBI) observations of the blazar OJ 287 carried out jointlywith the Global Millimeter VLBI Array (GMVA) and the phased Atacama Large Millimeter/submillimeter Array(ALMA) at 3.5 mm on 2017 April 2. The participation of phased ALMA has not only improved the GMVA north–south resolution by a factor of ∼3, but has also enabled fringe detections with signal-to-noise ratios up to 300 atbaselines longer than 2 Gλ. The high sensitivity has motivated us to image the data with newly developedregularized maximum likelihood imaging methods, revealing the innermost jet structure with unprecedentedly highangular resolution. Our images reveal a compact and twisted jet extending along the northwest direction, with twobends within the inner 200 μas, resembling a precessing jet in projection. The component at the southeastern endshows a compact morphology and high brightness temperature, and is identified as the VLBI core. An extended jetfeature that lies at ∼200 μas northwest of the core shows a conical shape, in both total and linearly polarized
The Astrophysical Journal, 932:72 (12pp), 2022 June 10 https://doi.org/10.3847/1538-4357/ac6b9c© 2022. The Author(s). Published by the American Astronomical Society.
34 NASA Hubble Fellowship Program, Einstein Fellow.35 EACOA Fellow.
Original content from this work may be used under the termsof the Creative Commons Attribution 4.0 licence. Any further
distribution of this work must maintain attribution to the author(s) and the titleof the work, journal citation and DOI.
1
intensity, and a bimodal distribution of the linear polarization electric vector position angle. We discuss the natureof this feature by comparing our observations with models and simulations of oblique and recollimation shockswith various magnetic field configurations. Our high-fidelity images also enabled us to search for possible jetfeatures from the secondary supermassive black hole (SMBH) and test the SMBH binary hypothesis proposed forthis source.
Unified Astronomy Thesaurus concepts: Very long baseline interferometry (1769); AGN host galaxies (2017);Radio jets (1347); Jets (870); Supermassive black holes (1663); Radio continuum emission (1340)
1. Introduction
The BL Lac–type object OJ 287 (z= 0.306; Stickel et al.1989) is a well-studied low synchrotron peaked BL Lac objectthat has attracted great interest, as it shows quasiperiodicoptical outbursts with a cycle of about 12 yr. These outburstsappear to come in pairs, with separations of one to two years,and they have been suggested to originate due to the presenceof a supermassive binary black hole (SMBBH) system at itscenter (e.g., Sillanpää et al. 1988; Lehto & Valtonen 1996).According to this model, the observed quasiperiodic double-peaked optical outbursts are triggered when the secondarysupermassive black hole (SMBH) impacts the accretion disk ofthe primary in its orbit. Further advances of this modelhave accounted for general relativistic effects, and theparameters have also been further constrained with follow-upobservations (e.g., Valtonen et al. 2008, 2011; Dey et al. 2018).The model requires a compact binary with a major axis of theorbit of 0.112 pc (corresponding to an angular scale of∼26 μas; e.g., Valtonen et al. 2008), featuring a very massiveprimary black hole (BH) of 1.8× 10¹⁰Me, and a secondary of1.5× 108Me (e.g., Valtonen et al. 2012; Dey et al. 2018). Thismodel is not only successful in reproducing the observed lightcurves of OJ 287, but also in predicting impact outbursts thathave later been confirmed by observations (e.g., Valtonen et al.2006, 2016; Laine et al. 2020; Komossa et al. 2020).Independent of the binary model of OJ 287, the dedicatedmultiwavelength observations and modeling of the OJ 287(MOMO) project has led to the discovery of several bright flareevents and long-lasting deep fades, while the monitoringspectroscopy over the last two decades has established OJ 287as one of the most spectrally variable blazars in the soft X-rayband (e.g., Komossa et al. 2017, 2021a, 2021b, 2021c).
Another observational signature of OJ 287 is that theposition angle (PA) of the parsec-scale jet was found to be“wobbling” by previous very long baseline interferometric(VLBI) observations (e.g., Tateyama & Kingham 2004; Agudoet al. 2012; Cohen 2017; Britzen et al. 2018). Such changes inthe inner jet PA could also be explained by the SMBBHmodel (e.g., Dey et al. 2021), but alternative models cannot befully ruled out. For instance, Agudo et al. (2012) suggestinstabilities coupled to the accretion disk as the likely origin ofthe nonperiodic changes in the inner jet orientation. Britzenet al. (2018) suggest that the flux variation could be explainedby viewing angle changes and the Doppler beaming effects of aprecessing jet. The precession could be driven by either thebinary motion (e.g., Dey et al. 2021) or the Lense–Thirringeffect due to the misalignment between the BH spin and theaccretion disk (e.g., Liska et al. 2018; Chatterjee et al. 2020).
The massive central BH, the relatively low redshift, and thebright relativistic jet close to the line of sight also make OJ 287one of the nearest high-luminosity active galactic nuclei inwhich the magnetic launching and acceleration of jets can bestudied through high-resolution VLBI observations. Two
competing scenarios have been proposed for the formation ofrelativistic jets. The main difference between them is whetherthe magnetic fields are twisted by the rotational energy of theBH (Blandford & Znajek 1977) or its accretion disk (Blandford& Payne 1982). It is also possible that both mechanisms are atwork (e.g., Chiaberge et al. 2000). In the innermost region ofthe jet, the plasma flow is accelerated and collimated in thepresence of a spiral magnetic field, while the jet expands inwidth and propagates downstream into the interstellar space.The disruption of the accretion flow and the interaction with theambient medium often result in the formation of moving andstanding shocks. The detailed process of jet formation,acceleration, and collimation remains unclear, as extremelyhigh angular resolution is required to probe into the innermostregion in the vicinity of the central BH.High-resolution VLBI observations are ideal for probing the
compact structure near the central engine. Previous VLBIobservations of OJ 287 have provided key information on theparsec-scale structure and the dynamics of the jet (e.g.,Cohen 2017; Hodgson et al. 2017; Britzen et al. 2018). Inparticular, Gómez et al. (2022) recently presented 22 GHzimages of OJ 287 with unprecedented angular resolution for thesource, obtained with RadioAstron space–ground VLBIobservations. The images revealed a progressive bending ofthe inner jet with increasing angular resolution, by comparisonwith multiband ground-based VLBI images. The inner jetcomponents show high brightness temperatures that exceed theinverse Compton limit, indicating strong Doppler boosting inthe jet. The polarized images show electric vector positionangles (EVPAs) aligned with the jet axis, which indicates thatthe jet has a predominantly toroidal magnetic field. Multi-frequency analysis shows hints of a rotation measure gradientacross the jet, which suggests that the VLBI core is threaded bya helical magnetic field.VLBI observations at wavelengths shorter than 7 mm have
the potential to probe areas closer to the central engine that areoptically thick at lower frequencies (see, e.g., Boccardi et al.2017). Previous VLBI observations at 3.5 mm with the GlobalMillimeter VLBI Array (GMVA) show the existence of quasi-stationary components and changes in the morphology and PAin the innermost jet region (e.g., Hodgson et al. 2017).However, most of the previous GMVA observations are limitedin sensitivity, due to typically shorter atmospheric coherencetimes, lower antenna efficiencies, and thus higher system-equivalent flux densities compared to longer wavelengths. Theparticipation of large sensitive stations in millimeter-VLBIobservations is desirable, together with further developments ofthe instruments and calibration methods (e.g., Rioja &Dodson 2011; Rioja et al. 2017; Zhao et al. 2018).In this paper, we present the first VLBI observations of
OJ 287 with the GMVA and phased Atacama Large Milli-meter/submillimeter Array (ALMA) on 2017 April 2. Theseobservations are accompanied by a multiwavelength campaign,
2
The Astrophysical Journal, 932:72 (12pp), 2022 June 10 Zhao et al.

including the first 1.3 mm observation of the source with theEvent Horizon Telescope (EHT; Event Horizon TelescopeCollaboration et al. 2019a), the results of which will bepresented in a forthcoming paper. The campaign was carriedout during a major outburst event of OJ 287 in 2016–17, withthe largest X-ray outburst recorded so far (Komossa et al.2017, 2021c) and the first very-high-energy (VHE) flaredetection (Mukherjee & VERITAS Collaboration 2017).
We summarize the details of the GMVA + ALMAobservations and the methods that we use to calibrate, image,and analyze the data in Section 2. We present our observationalresults, including total intensity and linear polarization imagesin Section 3. In Section 4, we discuss the nature of thecomponents in the jet and possible constraints on the theoreticalmodels, followed by a summary in Section 5.
2. Observations and Data Analysis
In this section, we describe the details of our 3.5 mmobservations of OJ 287 with GMVA + ALMA, the datacalibration procedure, and the methods used to obtainsubparsec-scale images of OJ 287.
2.1. Observations
We carried out high-resolution VLBI observations towardOJ 287 at 3.5 mm with GMVA on 2017 April 2. Theseobservations mark the first VLBI observations with the phasedALMA, which consists of 37 ALMA antennas and isequivalent to a 70 meter dish (Event Horizon TelescopeCollaboration et al. 2019a). The participating stations alsoinclude eight Very Long Baseline Array (VLBA) stations andfive European stations (Effelsberg, IRAM-30 m, Metsähovi,Onsala, Yebes-40m). The on-source time was around 375minutes between UT 17 and UT 7 the next day (April 3).
Most stations had good or typical weather conditions duringthe observation, except for the VLBA Maunakea and Pie Townstations, which resulted in few fringe detections with limitedsignal-to-noise ratio (S/N) on the baselines to these twostations. No fringes were found on the baselines to Metsähovi,due to a faulty backend setup. All data were recorded in fullpolarization mode, with most stations recording on a circularpolarization basis, while the ALMA data were converted froma mixed linear–circular basis to circular polarization modeusing PolConvert (Martí-Vidal et al. 2016). The Yebes-40 m telescope recorded only left-handed circular polarization(LCP). The bandwidths and frequency ranges recorded are notthe same for all stations.36 Only the common frequency rangesamong all participating stations are used in later processing.
2.2. Data Reduction
Data correlation was performed with the DiFX correlator(Deller et al. 2007) at the Max-Planck-Institut für Radio-astronomie in Bonn, Germany. The final correlated data have atotal bandwidth of 232MHz, which was further divided intofour 58MHz intermediate frequency (IF) bands.
The postcorrelation data set was then processed with theParselTongue (Kettenis et al. 2006) (Greisen 2003)interface for fringe fitting and a priori amplitude calibration.
We first performed parallactic angle correction with the task CLCOR37, and manual phase calibration using shortsegments of data to remove the instrumental phase offsetbetween the different IFs. We then performed a global fringefitting of the data using the task FRING, with a solution intervalof 10 s and subintervals down to 2 s, and by integrating overthe whole 232MHz bandwidth and averaging parallel-handpolarizations (RR and LL).The (u,v)-coverage toward OJ 287 for all baselines with
fringe detections is shown in Figure 1. We note that theparticipation of ALMA has provided an increase in the north–south resolution by a factor of ∼3 for observations of OJ 287.ALMA has also significantly improved fringe detection due toits high sensitivity (see Figure 2) with the maximum fringe S/Nreaching ∼350 at baselines longer than 1.5 Gλ.A priori amplitude calibration was performed in with
the task APCAL, by multiplying the system temperatures (Tsys)and gain curves of each antenna. Opacity corrections wereapplied to stations that measure system temperatures with thenoise diode method (VLBA and Effelsberg). For ALMA,IRAM-30 m, and Yebes-40 m, the Tsys measurements wereperformed using the hot/cold method, and therefore alreadyincluded opacity correction. The ALMA Tsys values have alsotaken into account the phasing efficiencies derived during thequality assurance and PolConvert processes (e.g., Goddiet al. 2019). The cross-hand phase and delay offsets of thereference station were calibrated using the procedureVLBACPOL.After the calibration, the data were averaged in time
(with an interval of 15 s) and frequency (with all channelswithin each IF averaged) for further processing.
Figure 1. (u,v)-coverage of the fringe-fitted interferometric visibilities ofOJ 287, observed with GMVA + ALMA on 2017 April 2 at 86 GHz. Thebaselines to ALMA are plotted in red and the other GMVA baselines areplotted in blue.
36 The recorded bandwidth for each station is as follows: ALMA32 × 62.5MHz, VLBA 2 × 128MHz, and most European stations1 × 512MHz.
37 We note that the mount types for IRAM-30 m (Nasmyth-Left) and Yebes-40 m (Nasmyth-Right) are different from the rest of the antennas in the array(altitude–azimuth). The Yebes-40 m data were not used for polarimetricanalysis, as they were only recorded in LCP.
3
The Astrophysical Journal, 932:72 (12pp), 2022 June 10 Zhao et al.

2.3. Imaging and Model Fitting
We performed the imaging and self-calibration of the dataindependently with three different imaging softwares: DIF-MAP, eht-imaging, and SMILI. DIFMAP is the softwarecommonly used for the conventional CLEAN method forinterferometric imaging (Shepherd et al. 1995). It interactivelyestablishes a collection of point-source models from the inverseFourier transform of the visibilities, i.e., the dirty map. CLEANwindows, which define the regions to search for CLEANcomponents, are used during our imaging process. Phase-onlyself-calibration is performed after each step of cleaning.Amplitude and phase self-calibration is performed once a goodfit to the visibilities has been established through multiple stepsof cleaning and phase self-calibration. We repeat the clean andself-calibration loops several times during our imaging processby gradually decreasing the solution interval of the amplitudeand phase self-calibration. On the other hand, the regularizedmaximum likelihood (RML) methods, employed by the eht-imaging (Chael et al. 2016, 2018) and SMILI (Akiyamaet al. 2017) libraries, reconstruct images by minimizing anobjective function, which is a weighted combination of χ2 ofthe data and various regularizer terms. The data terms mayinclude closure quantities (closure phases and amplitudes; e.g.,Thompson et al. 2017), visibility amplitudes, and complex
visibilities. Common regularizers include the maximumentropy (e.g., Chael et al. 2018), the ℓ1-norm (e.g., Honmaet al. 2014; Akiyama et al. 2017), the total variation (TV), andthe total squared variation (TSV) of the brightness (e.g.,Kuramochi et al. 2018). With RML methods, it is possible toachieve an angular resolution a few times finer than thenominal interferometric beam (e.g., Akiyama et al. 2017; EventHorizon Telescope Collaboration et al. 2019b). During ourimaging process with eht-imaging and SMILI, we startedwith a Gaussian prior image and reconstructed images withonly the closure quantities, or a combination of closurequantities and low-weighted visibility amplitudes. After a fewiterations of imaging and self-calibrating, we included fullcomplex visibilities in the optimization process, furtherconstraining the reconstructed images. To determine the bestset of regularizer combinations, we surveyed a range ofdifferent weights of each regularizer, in a total of ∼128combinations, and selected the one that resulted in the best fit tothe closure quantities.After the imaging of the total intensity, we estimated the
instrumental polarimetric leakage (known as D-terms) for eachstation, using the self-calibrated data of OJ 287. This processwas carried out independently with two pipelines: the task LPCAL and the eht-imaging library, each based on aparticular self-calibrated data set generated during the totalintensity imaging process, i.e., DIFMAP and eht-imaging,respectively. Both approaches provide consistent values ofD-terms. Details of the leakage calibration are described in theAppendix. The polarization imaging of the LPCAL processeddata was carried out with DIFMAP. With eht-imaging, theimaging was performed iteratively with the D-terms calcul-ation. The calibration of the absolute orientation of the EVPAswas performed through comparison with the ALMA array data(Goddi et al. 2021).We also carried out nonimaging analysis of the data to
measure the properties of the jet. We performed circularGaussian model fitting to the SMILI self-calibrated visibilitydata with DIFMAP. The results indicated that the jet structurecould be represented by four Gaussian components. We labeledthe components following the convention described in Gómezet al. (2022). The total flux, size, and position offset withrespect to the core (the component at the southeastern end ofthe jet; see Section 3 below) of all the components are listed inTable 1. The uncertainties of the fitted parameters are derivedfollowing the equations outlined in Nair et al. (2019).
3. Results
3.1. Jet Morphology
Figure 3 shows the total intensity maps of OJ 287 obtainedwith our GMVA + ALMA observations, achieving the highestangular resolution to date of the source at the wavelength of3.5 mm. The imaging results are consistent across differentimaging methods (CLEAN and RML). Under the nominalresolution, the jet appears to consist of three major features,extending along the southeast to northwest direction. Wedenote the three features as the components C0, C1, and C2, asshown in the bottom right panel of Figure 3.Component C0, which lies at the southern end of the jet, is
compact and shows the highest brightness temperature(Table 1). This feature is more likely to be the VLBI core at3.5 mm. The component C2 has the highest flux density among
Figure 2. Self-calibrated visibility amplitudes (top) and phases (middle) as afunction of (u,v)-distance of the GMVA + ALMA observations of OJ 287 on2017 April 2 at 86 GHz. The data were averaged every 15 s and all channels ineach IF are averaged. Overplotted in orange are the fits to the data of thereconstructed image obtained with SMILI. The bottom panel shows the fringeS/N as a function of (u,v)-distance, with the data on the ALMA baselinesplotted in red and the other baselines in blue.
4
The Astrophysical Journal, 932:72 (12pp), 2022 June 10 Zhao et al.
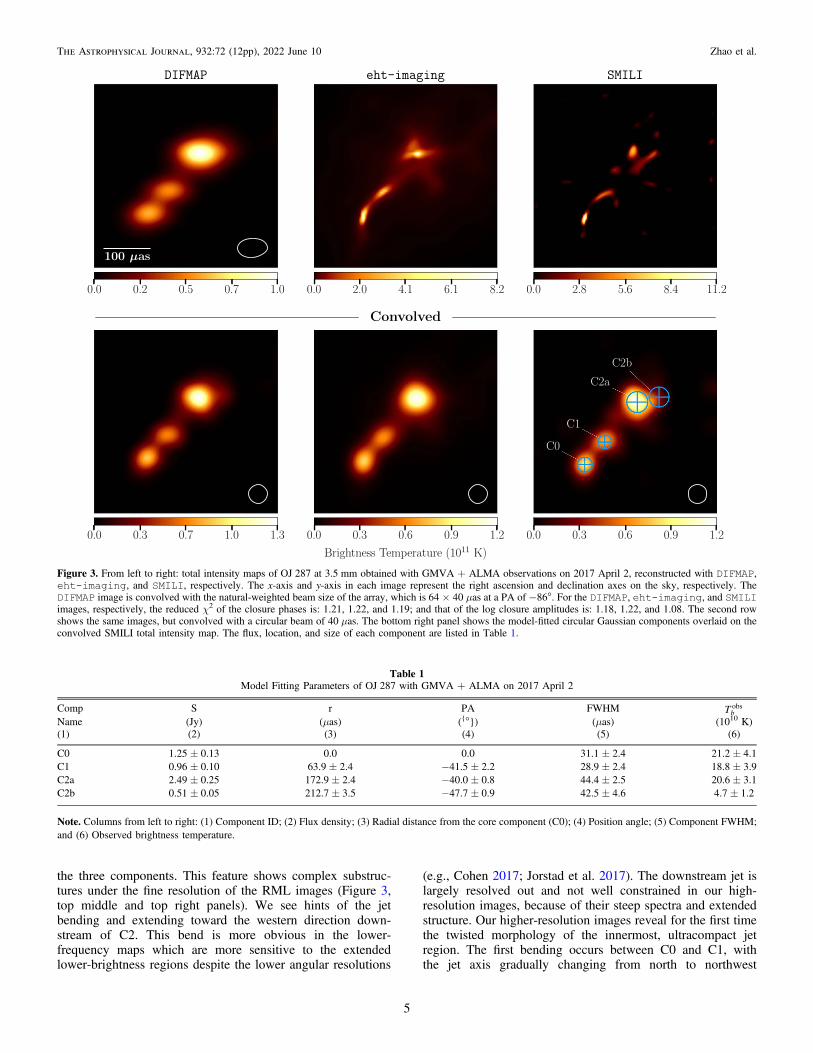
the three components. This feature shows complex substruc-tures under the fine resolution of the RML images (Figure 3,top middle and top right panels). We see hints of the jetbending and extending toward the western direction down-stream of C2. This bend is more obvious in the lower-frequency maps which are more sensitive to the extendedlower-brightness regions despite the lower angular resolutions
(e.g., Cohen 2017; Jorstad et al. 2017). The downstream jet islargely resolved out and not well constrained in our high-resolution images, because of their steep spectra and extendedstructure. Our higher-resolution images reveal for the first timethe twisted morphology of the innermost, ultracompact jetregion. The first bending occurs between C0 and C1, withthe jet axis gradually changing from north to northwest
Figure 3. From left to right: total intensity maps of OJ 287 at 3.5 mm obtained with GMVA + ALMA observations on 2017 April 2, reconstructed with DIFMAP,eht-imaging, and SMILI, respectively. The x-axis and y-axis in each image represent the right ascension and declination axes on the sky, respectively. TheDIFMAP image is convolved with the natural-weighted beam size of the array, which is 64 × 40 μas at a PA of −86°. For the DIFMAP, eht-imaging, and SMILIimages, respectively, the reduced χ2 of the closure phases is: 1.21, 1.22, and 1.19; and that of the log closure amplitudes is: 1.18, 1.22, and 1.08. The second rowshows the same images, but convolved with a circular beam of 40 μas. The bottom right panel shows the model-fitted circular Gaussian components overlaid on theconvolved SMILI total intensity map. The flux, location, and size of each component are listed in Table 1.
Table 1Model Fitting Parameters of OJ 287 with GMVA + ALMA on 2017 April 2
Comp S r PA FWHM Tbobs
Name (Jy) (μas) ({°}) (μas) (1010 K)(1) (2) (3) (4) (5) (6)
C0 1.25 ± 0.13 0.0 0.0 31.1 ± 2.4 21.2 ± 4.1C1 0.96 ± 0.10 63.9 ± 2.4 −41.5 ± 2.2 28.9 ± 2.4 18.8 ± 3.9C2a 2.49 ± 0.25 172.9 ± 2.4 −40.0 ± 0.8 44.4 ± 2.5 20.6 ± 3.1C2b 0.51 ± 0.05 212.7 ± 3.5 −47.7 ± 0.9 42.5 ± 4.6 4.7 ± 1.2
Note. Columns from left to right: (1) Component ID; (2) Flux density; (3) Radial distance from the core component (C0); (4) Position angle; (5) Component FWHM;and (6) Observed brightness temperature.
5
The Astrophysical Journal, 932:72 (12pp), 2022 June 10 Zhao et al.

(clockwise). We also see hints of a subsequent bendingoccurring downstream of C1, where the jet axis turns in thecounterclockwise direction.
The three-component structure is also consistent with therecent 22 GHz RadioAstron space–ground VLBI observationsof OJ 287 made at a similar resolution (Gómez et al. 2022).However, a PA difference of ∼50° in the inner jet can be foundwhen comparing with the RadioAstron image obtained in 2014.Such a difference could be attributed to the variation in the PAover ∼ 3 yr. A detailed analysis of the inner jet PA variation ona yearly scale, and a comparison with theoretical predictions,will be presented in a forthcoming paper (G-Y. Zhao et al., inpreparation).
In order to quantify the PA evolution along the jet, we fit thejet ridgeline on the eht-imaging map. First, we transformthe image to polar coordinates centered on the jet origin, thenslice it transversely. For each slice, we store the flux densitypeak position, then transform them back to Cartesiancoordinates. Thus, we obtain a collection of positions tracingthe jet axis between C0 and C2. The results are presented inFigure 4, where we also show a sketch tracing the conicalstructure of C2 in the figure. The jet axis near C0 extends alonga PA of ∼−15°, decreases to ∼−50° at C1, and then starts toincrease again near C2. A similar trend can also be found in theSMILI image.
3.2. Brightness Temperatures
We investigate the brightness temperature of the OJ 287 jetusing two independent approaches. (1) We calculate theobserved brightness temperature of each Gaussian componentfrom the model fitting results, using the following equation
(e.g., Tingay et al. 2002):
( )q n
= ´TS
1.22 10 , 1bobs 12
obs2 2
where S is the component flux density in Jy, θobs is the sizeof the emitting region in mas, and ν is the observing frequencyin GHz. (2) We calculate the minimum and maximumbrightness temperature directly from the visibilities, using themethod described in Lobanov (2015). The model fitting results,which are listed in Table 1, show the observed brightnesstemperature of the jet components at 86 GHz ranges from 1010
to 1011 K. This is in agreement with the values calculated fromthe visibility amplitudes, as shown in Figure 5. The brightnesstemperature values agree quantitatively with the typical valuesat the same frequency band (e.g., Lee et al. 2008; Nair et al.2019). The 86 GHz brightness temperatures are about one orderof magnitude lower compared to those at 22 GHz obtainedfrom the RadioAstron results (Gómez et al. 2022). This can beattributed to differences in the intrinsic brightness and opacitybetween the two frequencies.We estimate the intrinsic brightness temperature, Tb
int, by(e.g., Gómez et al. 2016):
( ) ( )d= + -T z T1 , 2bint 1
bobs
where δ stands for the Doppler factor. We adopt the value ofthe latest estimate based on the proper motion of movingcomponents from the VLBA-BU-BLAZAR monitoring pro-gram, δ= 8.6± 2.8 (Weaver et al. 2022). This gives theintrinsic brightness temperature values Tb,C0
int = ( ) ´3.2 1.7
( )= T10 K, 2.8 1.410b,C1int × ( )= T10 K, 3.1 1.410
b, C2aint ×
1010 K, and ( )= ´T 0.7 0.4 10 Kb, C2bint 10 , for each comp-
onent, respectively. These values fall below the equipartitionvalue of∼ 5× 10¹⁰ (Readhead 1994), indicating possiblemagnetic dominance in the innermost jet. However, this isquite uncertain, as the errors in the Doppler factor andbrightness temperature values are large.
3.3. Polarization
We perform polarimetric imaging of the instrumentalpolarization calibrated data with CLEAN and eht-imaging
Figure 4. The continuous blue line traces the ridgeline of the inner jet ofOJ 287, overplotted on the super-resolution image reconstructed with eht-imaging. The dashed blue lines represent the conical structure of the C2component.
Figure 5. Visibility-based brightness temperature estimates of OJ 287 at86 GHz, using the method described in Lobanov (2015). The red and blue dotsare the values of Tb,max and Tb,min, respectively. The orange and purple curvesare the rolling means of the Tb,max and Tb,min values.
6
The Astrophysical Journal, 932:72 (12pp), 2022 June 10 Zhao et al.
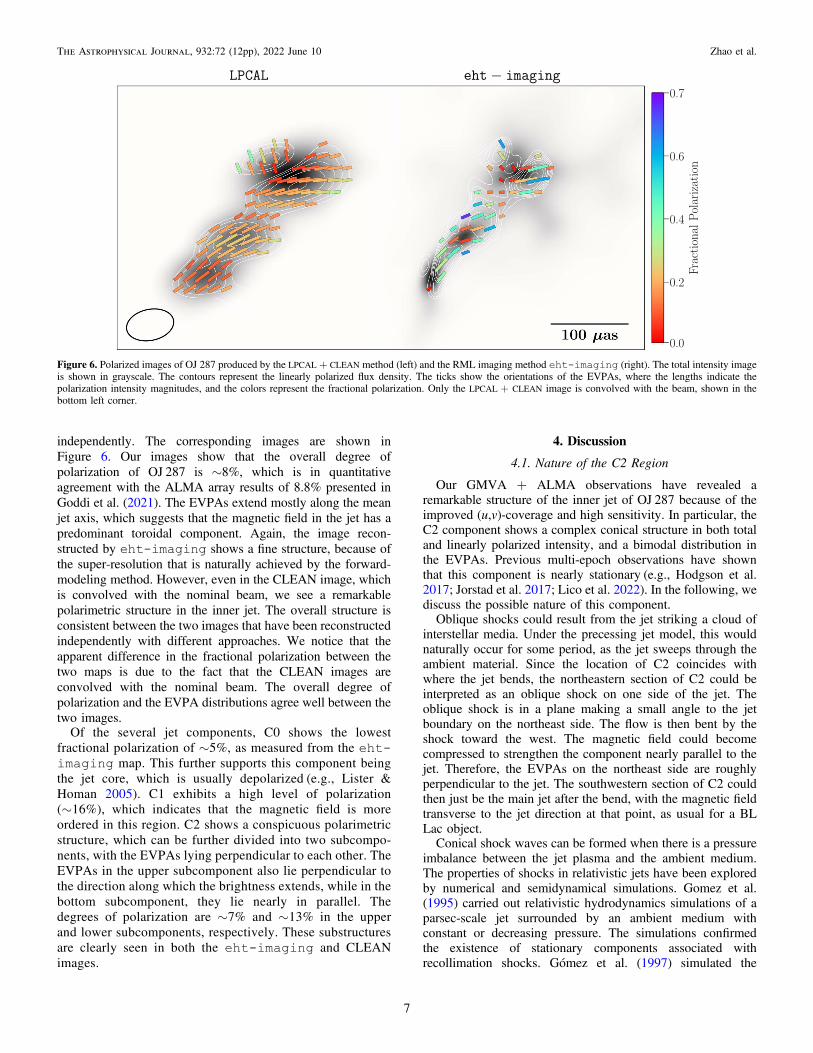
independently. The corresponding images are shown inFigure 6. Our images show that the overall degree ofpolarization of OJ 287 is ∼8%, which is in quantitativeagreement with the ALMA array results of 8.8% presented inGoddi et al. (2021). The EVPAs extend mostly along the meanjet axis, which suggests that the magnetic field in the jet has apredominant toroidal component. Again, the image recon-structed by eht-imaging shows a fine structure, because ofthe super-resolution that is naturally achieved by the forward-modeling method. However, even in the CLEAN image, whichis convolved with the nominal beam, we see a remarkablepolarimetric structure in the inner jet. The overall structure isconsistent between the two images that have been reconstructedindependently with different approaches. We notice that theapparent difference in the fractional polarization between thetwo maps is due to the fact that the CLEAN images areconvolved with the nominal beam. The overall degree ofpolarization and the EVPA distributions agree well between thetwo images.
Of the several jet components, C0 shows the lowestfractional polarization of ∼5%, as measured from the eht-imaging map. This further supports this component beingthe jet core, which is usually depolarized (e.g., Lister &Homan 2005). C1 exhibits a high level of polarization(∼16%), which indicates that the magnetic field is moreordered in this region. C2 shows a conspicuous polarimetricstructure, which can be further divided into two subcompo-nents, with the EVPAs lying perpendicular to each other. TheEVPAs in the upper subcomponent also lie perpendicular tothe direction along which the brightness extends, while in thebottom subcomponent, they lie nearly in parallel. Thedegrees of polarization are ∼7% and ∼13% in the upperand lower subcomponents, respectively. These substructuresare clearly seen in both the eht-imaging and CLEANimages.
4. Discussion
4.1. Nature of the C2 Region
Our GMVA + ALMA observations have revealed aremarkable structure of the inner jet of OJ 287 because of theimproved (u,v)-coverage and high sensitivity. In particular, theC2 component shows a complex conical structure in both totaland linearly polarized intensity, and a bimodal distribution inthe EVPAs. Previous multi-epoch observations have shownthat this component is nearly stationary (e.g., Hodgson et al.2017; Jorstad et al. 2017; Lico et al. 2022). In the following, wediscuss the possible nature of this component.Oblique shocks could result from the jet striking a cloud of
interstellar media. Under the precessing jet model, this wouldnaturally occur for some period, as the jet sweeps through theambient material. Since the location of C2 coincides withwhere the jet bends, the northeastern section of C2 could beinterpreted as an oblique shock on one side of the jet. Theoblique shock is in a plane making a small angle to the jetboundary on the northeast side. The flow is then bent by theshock toward the west. The magnetic field could becomecompressed to strengthen the component nearly parallel to thejet. Therefore, the EVPAs on the northeast side are roughlyperpendicular to the jet. The southwestern section of C2 couldthen just be the main jet after the bend, with the magnetic fieldtransverse to the jet direction at that point, as usual for a BLLac object.Conical shock waves can be formed when there is a pressure
imbalance between the jet plasma and the ambient medium.The properties of shocks in relativistic jets have been exploredby numerical and semidynamical simulations. Gomez et al.(1995) carried out relativistic hydrodynamics simulations of aparsec-scale jet surrounded by an ambient medium withconstant or decreasing pressure. The simulations confirmedthe existence of stationary components associated withrecollimation shocks. Gómez et al. (1997) simulated the
Figure 6. Polarized images of OJ 287 produced by the LPCAL + CLEAN method (left) and the RML imaging method eht-imaging (right). The total intensity imageis shown in grayscale. The contours represent the linearly polarized flux density. The ticks show the orientations of the EVPAs, where the lengths indicate thepolarization intensity magnitudes, and the colors represent the fractional polarization. Only the LPCAL + CLEAN image is convolved with the beam, shown in thebottom left corner.
7
The Astrophysical Journal, 932:72 (12pp), 2022 June 10 Zhao et al.

interactions of standing shocks and relativistically movingperturbations propagating down the stable jet, and found thatthe shock could enhance the emission of the moving featureand the stationary component could be temporarily “dragged”downstream. Further simulations of the interactions betweenrecollimation shocks and traveling shocks are presented inFromm et al. (2016), based on the observations presented inFromm et al. (2011, 2013a, 2013b, 2015), for the particularcase of CTA 102. Various configurations of the upstreammagnetic field components have also been included insubsequent numerical simulations (e.g., Broderick & McKin-ney 2010; Porth et al. 2011; Fuentes et al. 2018). In particular,Mizuno et al. (2015) studied kinematically dominated jets withdifferent magnetic field configurations, including axial, tor-oidal, and helical, based on a relativistic magnetohydrody-namics (RMHD) simulation code. Fuentes et al. (2018)characterized the properties of recollimation shocks in RMHDsimulations of jets at the parsec scale as a function of thedominant type of energy: internal, kinetic, or magnetic. Bysolving the radiative transfer equations for synchrothronradiation, using these simulations as inputs, they analyzed thetotal intensity and linear polarization signatures imprinted inthe stationary components associated with these shocks.Fuentes et al. (2021) extended the analysis to RMHD jetmodels threaded by helical magnetic fields with largermagnetic pitch angles, and also explored the effect of differentnonthermal particle populations on the polarimetric propertiesof stationary features and the overall observed synchrotronradiation.
On the other hand, Cawthorne & Cobb (1990) established asemidynamical model, assuming only that the shock front isemitting, and found that conical shock waves could result inpolarization angles that were either parallel or perpendicular tothe jet axis. This model also only considered random magneticfields in the upstream jet. In Cawthorne (2006), a poloidalmagnetic field component was added to the model, and theresults can well explain the observed polarization of the knotK1 in 3C 380. Furthermore, Cawthorne et al. (2013) extendedthis model to include a paired collimating and decollimatingshock, and the predicted EVPAs could successfully describethe observational results of the BL Lac object 1803+ 784.
Comparing our observational results of C2 with thenumerical and semidynamical studies, we find that the conicalshape of the emitting region is quite consistent between ourobservations and the simulations. Numerical simulationspredict a series of stationary shocks along the jet that can betriggered by a pressure imbalance between the jet and theexternal medium. The reason that we find only one conical-shaped component is most likely the adiabatic expansion of thejet. As also shown in Gomez et al. (1995), with decreasingpressure downstream of the jet, the intensity of the stationarycomponents gradually decreases and the separation between thecomponents increases, so the downstream shocks may be toofaint and become undetectable at our observing frequency.Regarding the polarized emission, the semidynamical simula-tions show different EVPA distributions across the cone.However, the EVPA pattern is more symmetric with respect tothe cone axis. The numerical simulations also show that theEVPA pattern will depend on the upstream magnetic fieldconfiguration and the viewing angle (e.g., Mizuno et al. 2015;Gómez et al. 2016; Fuentes et al. 2021). Fuentes et al. (2021)pointed out that jets with a large magnetic pitch angle, i.e.,
threaded by a helical magnetic field dominated by its toroidalcomponent, can exhibit a bimodal EVPA distribution aroundrecollimation shocks for small viewing angles. This EVPAconfiguration could imply a sign flip of the Stokes parameterthat leads to an EVPA flip, which then results in a dip in thelinearly polarized emission, as we observe in the C2 componentfrom the reconstructed polarimetric images.Alternative to the standing shock scenario, the observed
properties of the C2 component could be a result of geometriceffects due to the bending of the jet axis toward the line ofsight. With a decreasing viewing angle, the enhanced Dopplerboosting could amplify the emission in this region and makeC2 the brightest component in the inner jet. If the viewingangle becomes smaller than the jet opening angle, the bimodaldistribution of the EVPAs could be produced by the existenceof helical magnetic fields in the jet, as the directionof the projected magnetic field is different across thecomponent (Fuentes et al. 2021). This scenario is supportedby previous observations that revealed the existence of bendingaround C2 (e.g., Hodgson et al. 2017; Jorstad et al. 2017;Gómez et al. 2022). However, it is difficult to explain theconical shape of the emission region with this assumption.Moreover, by means of multi-epoch GMVA observations,
Lico et al. (2022) identified a new jet feature in the region ofC2, in a quasi-concurrent GMVA observing epoch. The authorsargued that the passage of this new jet component through thestationary feature at 0.1 mas core separation (i.e., C1) triggeredthe high-energy outburst during 2016–2017 (Komossa et al.2017, 2021a), including the faint VHE flare detected inFebruary 2017 (Mukherjee & VERITAS Collaboration 2017)38
and then moved down to the C2 jet region at the time of theseobservations. In this scenario, the C2 component in ourobservations could correspond to the blending of the newfeature and the standing shock. The observed bimodaldistribution of the EVPAs could be due to the differentpolarimetric properties of the two components. A similar casewas found in the core region of PKS 1510-089 during a γ-rayflare in 2015 (Park et al. 2019).
4.2. Testing the SMBBH Model
OJ 287 is one of the most promising candidates for harboringan SMBBH system at the center. In fact, OJ 287 is among thecandidates for hosting a nano-Hz gravitational wave–emittingSMBBH system (Valtonen et al. 2021). The binary model hasbeen successful in explaining the periodic light curves andpredicting upcoming impact flares, which have been confirmedby observations within a few hours (e.g., Laine et al. 2020).The direction of the jet axis was also found to vary with time,and this could also be related to the orbital motion of theBHs (Dey et al. 2021). Models that do not require a secondaryBH to explain the observed variability have also beenproposed. For instance, the flux variation could be explainedby viewing angle changes and the Doppler beaming effects of aprecessing jet. The precession could be driven by the Lense–Thirring effect, due to misalignment between the BH spin andthe accretion disk (e.g., Britzen et al. 2018; Liska et al. 2018;Chatterjee et al. 2020; Liska et al. 2021). It would also bepossible for MHD instabilities (current-driven or Kelvin–Helmholtz) to produce a helical distorted jet structure (e.g.,
38 In fact, the high X-ray flux of OJ 287 detected during the Swift MOMOprogram triggered the VHE observations, which led to the first VHE detection.
8
The Astrophysical Journal, 932:72 (12pp), 2022 June 10 Zhao et al.
Mizuno et al. 2012; Perucho et al. 2012; Vega-García et al.2019).
Dey et al. (2021) established a model to explain the parsec-scale jet direction variations at different frequencies, in whichthe jet precession is powered by the SMBBH with parametersconstrained by optical observations. This model predicts thatthe 86 GHz jet axis should be ∼−37° around 2017 April,assuming a disk model. The PAs of the inner jet components(e.g., C1 and C2a) measured in our GMVA + ALMAobservations agree well with this prediction (see Table 1).However, we note that this agreement is partially due to theobserving epoch being not far apart from the 86 GHz GMVAdata used to constrain the model. Furthermore, this agreementwill not rule out other possible scenarios. For example, thetilted accretion could also result in the precession of the innerjet. Britzen et al. (2018) argue that the PA change observed at15 GHz can be modeled by a jet precession combined with anutation of the axis. The precession could be a result of Lense–Thirring effects, and a secondary BH is not always required.Furthermore, our RML images also revealed a twisted patternof the innermost jet, which resembles a precessing jet inprojection.
Future kinematic studies with multi-epoch GMVA and EHTobservations will hopefully provide further insights todistinguish among different theoretical models regarding theunderlying nature of the source.
Dey et al. (2021) also explored the possibility of theexistence of a jet from the secondary SMBH based on theSMBBH model. With the high sensitivity and improved north–south resolution resulting from the participation of ALMA, wefound no evidence for a secondary jet, even in the eht-imaging and SMILI images with super-resolution. Therecould be several possible reasons for such a nondetection. First,the jet is likely to be short-lived, as commented upon in Deyet al. (2021). Since the projected separation of the two SMBHsin 2017 April is ∼10 μas (Dey et al. 2018), the current imageresolution is not sufficient to spatially resolve the binary systemif there is no extended jet emission from the secondary SMBH.The same would apply if the secondary jet extends in a similardirection as the primary jet. If the secondary jet is present andpoints in a different direction, the nondetection implies that thebrightness temperature of the jet must be lower than 4× 10⁹ K,which corresponds to three times the r.m.s. level of the eht-imaging map. We note that the dynamic range of our imagereconstruction is much higher than the mass ratio of thetwo BHs.
We further note that the GMVA + ALMA observationspresented in this work are part of a multiwavelength observingcampaign of OJ 287. Close-in-time observations with the EHTat 230 GHz (on 2017 April 4 and 9) and with the RadioAstronspace-VLBI mission at 22 GHz (on 2017 March 7) couldprovide even higher angular resolutions and probe slightlydifferent regions of the inner jet. Together with the observa-tions at X-ray and optical bands (e.g., Komossa et al.2017, 2020, 2021a, 2021b, 2021c), we will be able to test orobtain constraints on the physical parameters of the possible jetassociated with the secondary SMBH.
5. Summary
We carried out GMVA + ALMA observations of OJ 287 on2017 April 2, which are the first VLBI observations with thephased ALMA. The improved north–south resolution and array
sensitivity, together with the newly developed RML methods,have enabled us to obtain high-fidelity super-resolved imagesof the OJ 287 jet with unprecedentedly high angular resolution.The convolved RML images also agree with the CLEANreconstruction. The images have revealed a twisted structure inthe innermost region of the jet. Our result suggests that the C0component lying at the southeastern end of the jet is morelikely the VLBI core, as it is bright, compact, and relativelydepolarized. The C2 component located at ∼200 μas northwestof the core shows a conical morphology and complexsubstructures in polarization. We argue that this componentcould be an oblique or recollimation shock, or related to atraveling component passing through a stationary feature in thejet. We have also carried out the first attempt to search for a jetfrom the secondary BH, as proposed by Dey et al. (2021),based on the SMBBH model. The nondetection could be due tothe small projected separation, the short lifetime, or a differencein the physical conditions of the secondary jet. The EHT andRadioAstron observations carried out in 2017 and later couldprovide further tests of the SMBBH model.
The work at the IAA-CSIC is supported in part by theSpanish Ministerio de Economía y Competitividad (grantsAYA2016-80889-P and PID2019-108995GB-C21), the Con-sejería de Economía, Conocimiento, Empresas y Universidadof the Junta de Andalucía (grant P18-FR-1769), the ConsejoSuperior de Investigaciones Científicas (grant 2019AEP112),and the State Agency for Research of the Spanish MCIUthrough the “Center of Excellence Severo Ochoa” award to theInstituto de Astrofísica de Andalucía (SEV-2017-0709). Thispublication acknowledges the project M2FINDERS, which isfunded by the European Research Council (ERC) under theEuropean Unionʼs Horizon 2020 research and innovationprogram (grant agreement No. 101018682). L.L. acknowledgesthe support of the DGAPA/PAPIIT grants IN112417 andIN112820, the CONACyT-AEM grant 275201, and theCONACyT-CF grant 263356. T.S. was supported by theAcademy of Finland projects 274477, 284495, 312496, and315721. Y.K. was supported in the framework of the Stateproject “Science” by the Ministry of Science and HigherEducation of the Russian Federation, under the contract075-15-2020-778. J.Y.K acknowledges support from theNational Research Foundation of Korea (grant no.2022R1C1C1005255). R.-S. L is supported by the Max PlanckPartner Group of the MPG and the CAS, the Key Program ofthe National Natural Science Foundation of China (grant No.11933007), the Key Research Program of Frontier Sciences,CAS (grant No. ZDBS-LY-SLH011), and the Shanghai PilotProgram for Basic Research – Chinese Academy of Science,Shanghai Branch (JCYJ-SHFY-2022-013).This paper makes use of the following ALMA data: ADS/
JAO.ALMA#2016.1.01116.V. ALMA is a partnership of ESO(representing its member states), NSF (USA), and NINS(Japan), together with NRC (Canada), MOST and ASIAA(Taiwan), and KASI (Republic of Korea), in cooperation withthe Republic of Chile. The Joint ALMA Observatory isoperated by ESO, AUI/NRAO, and NAOJ. The ALMA datarequired nonstandard processing by the VLBI QA2 team(C. Goddi, I. Martí-Vidal, G. B. Crew, H. Rottmann, and H.Messias). This work is partially based on observations with the100-m telescope of the MPIfR (Max-Planck-Institut fürRadioastronomie) at Effelsberg. This research has made use
9
The Astrophysical Journal, 932:72 (12pp), 2022 June 10 Zhao et al.
of data obtained with the Global Millimeter VLBI Array(GMVA), which consists of telescopes operated by the MPIfR,IRAM, Onsala, Metsähovi, Yebes, the Korean VLBI Network,the Greenland Telescope, the Green Bank Observatory (GBT),and the Very Long Baseline Array (VLBA). The VLBA andthe GBT are facilities of the National Science Foundation,operated under a cooperative agreement by AssociatedUniversities, Inc. The data were correlated at the correlator ofthe MPIfR in Bonn, Germany.
Facilities: ALMA, GMVA, VLBA, GBT, EVN, Effelsberg,Metsähovi Radio Observatory, Onsala Space Observatory,IRAM-30 m RT, Yebes-40 m RT.
Software: (Greisen 2003), DiFX (Deller et al. 2007),DIFMAP (Shepherd et al. 1995), eht-imaging (Chael et al.2018), ParselTongue (Kettenis et al. 2006), SMILI(Akiyama et al. 2017), Altair (VanderPlas et al. 2018),Vega-Lite (Satyanarayan et al. 2017).
AppendixCalibration of the Instrumental Polarization
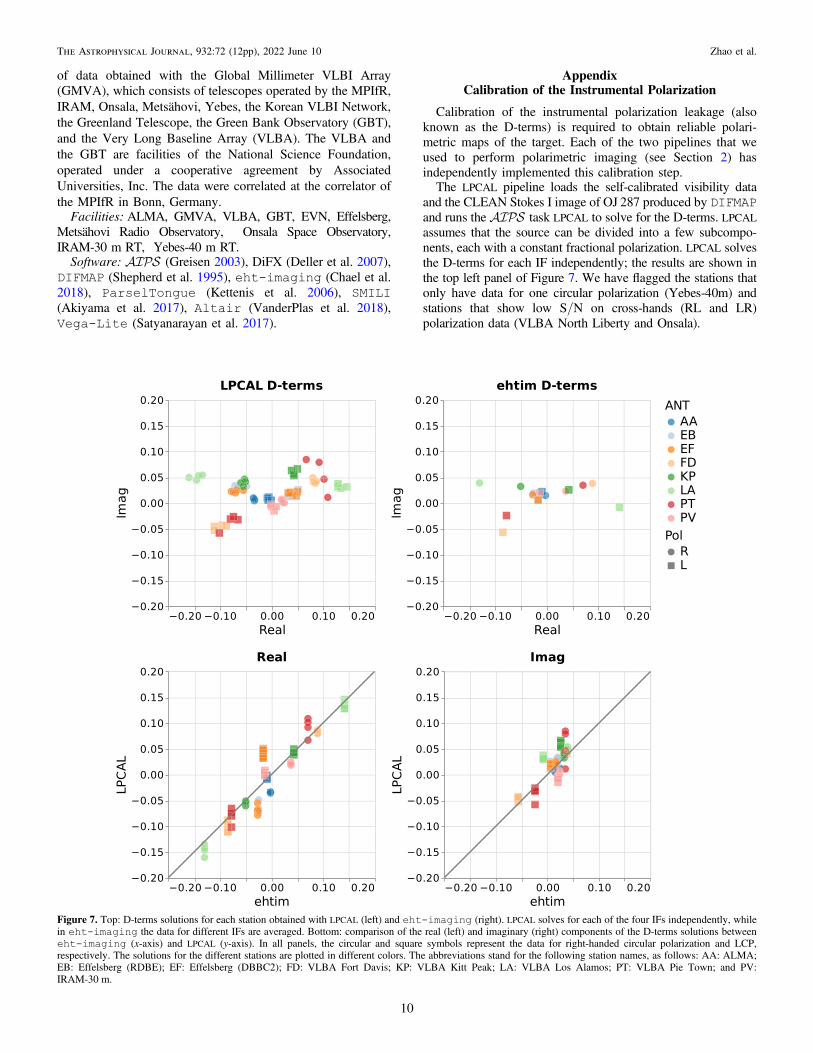
Calibration of the instrumental polarization leakage (alsoknown as the D-terms) is required to obtain reliable polari-metric maps of the target. Each of the two pipelines that weused to perform polarimetric imaging (see Section 2) hasindependently implemented this calibration step.The LPCAL pipeline loads the self-calibrated visibility data
and the CLEAN Stokes I image of OJ 287 produced by DIFMAPand runs the task LPCAL to solve for the D-terms. LPCALassumes that the source can be divided into a few subcompo-nents, each with a constant fractional polarization. LPCAL solvesthe D-terms for each IF independently; the results are shown inthe top left panel of Figure 7. We have flagged the stations thatonly have data for one circular polarization (Yebes-40m) andstations that show low S/N on cross-hands (RL and LR)polarization data (VLBA North Liberty and Onsala).
Figure 7. Top: D-terms solutions for each station obtained with LPCAL (left) and eht-imaging (right). LPCAL solves for each of the four IFs independently, whilein eht-imaging the data for different IFs are averaged. Bottom: comparison of the real (left) and imaginary (right) components of the D-terms solutions betweeneht-imaging (x-axis) and LPCAL (y-axis). In all panels, the circular and square symbols represent the data for right-handed circular polarization and LCP,respectively. The solutions for the different stations are plotted in different colors. The abbreviations stand for the following station names, as follows: AA: ALMA;EB: Effelsberg (RDBE); EF: Effelsberg (DBBC2); FD: VLBA Fort Davis; KP: VLBA Kitt Peak; LA: VLBA Los Alamos; PT: VLBA Pie Town; and PV:IRAM-30 m.
10
The Astrophysical Journal, 932:72 (12pp), 2022 June 10 Zhao et al.
On the other hand, the eht-imaging pipeline performsthe instrumental polarization calibration in parallel with theimaging of the polarimetric data products. The pipelinecomputes the leakage terms by minimizing the differencebetween the self-calibrated data and the sampled data from thecorrupted reconstructions. For details of the polarimetricimaging with eht-imaging, refer to Chael et al. (2016).The eht-imaging software by default averages the data atdifferent IFs, so we have flagged the stations that show largedifferences in D-terms across IFs (VLBA BR and OV) in ourpolarimetric analysis. The eht-imaging results are shown inthe top right panel of Figure 7.
Despite the different approaches to solving instrumentalleakages, the two pipelines provide very consistent results interms of the D-terms estimation, as shown in the bottom panels ofFigure 7, which validate our polarization calibration. The absolutecalibration of the EVPA was obtained by comparison with theALMA observations of OJ 287 at the same frequency performedduring the same observation campaign (Goddi et al. 2021).
ORCID iDs
Guang-Yao Zhao https://orcid.org/0000-0002-4417-1659José L. Gómez https://orcid.org/0000-0003-4190-7613Antonio Fuentes https://orcid.org/0000-0002-8773-4933Thomas P. Krichbaum https://orcid.org/0000-0002-4892-9586Efthalia Traianou https://orcid.org/0000-0002-1209-6500Rocco Lico https://orcid.org/0000-0001-7361-2460Ilje Cho https://orcid.org/0000-0001-6083-7521Eduardo Ros https://orcid.org/0000-0001-9503-4892S. Komossa https://orcid.org/0000-0002-9214-4428Kazunori Akiyama https://orcid.org/0000-0002-9475-4254Keiichi Asada https://orcid.org/0000-0001-6988-8763Lindy Blackburn https://orcid.org/0000-0002-9030-642XSilke Britzen https://orcid.org/0000-0001-9240-6734Gabriele Bruni https://orcid.org/0000-0002-5182-6289Geoffrey B. Crew https://orcid.org/0000-0002-2079-3189Rohan Dahale https://orcid.org/0000-0001-6982-9034Lankeswar Dey https://orcid.org/0000-0002-2554-0674Roman Gold https://orcid.org/0000-0003-2492-1966Sara Issaoun https://orcid.org/0000-0002-5297-921XMichael Janssen https://orcid.org/0000-0001-8685-6544Svetlana Jorstad https://orcid.org/0000-0001-6158-1708Jae-Young Kim https://orcid.org/0000-0001-8229-7183Jun Yi Koay https://orcid.org/0000-0002-7029-6658Yuri Y. Kovalev https://orcid.org/0000-0001-9303-3263Shoko Koyama https://orcid.org/0000-0002-3723-3372Andrei P. Lobanov https://orcid.org/0000-0003-1622-1484Laurent Loinard https://orcid.org/0000-0002-5635-3345Ru-Sen Lu https://orcid.org/0000-0002-7692-7967Sera Markoff https://orcid.org/0000-0001-9564-0876Alan P. Marscher https://orcid.org/0000-0001-7396-3332Iván Martí-Vidal https://orcid.org/0000-0003-3708-9611Yosuke Mizuno https://orcid.org/0000-0002-8131-6730Jongho Park https://orcid.org/0000-0001-6558-9053Tuomas Savolainen https://orcid.org/0000-0001-6214-1085Teresa Toscano https://orcid.org/0000-0003-3658-7862
References
Agudo, I., Marscher, A. P., Jorstad, S. G., et al. 2012, ApJ, 747, 63Akiyama, K., Ikeda, S., Pleau, M., et al. 2017, AJ, 153, 159Blandford, R. D., & Payne, D. G. 1982, MNRAS, 199, 883
Blandford, R. D., & Znajek, R. L. 1977, MNRAS, 179, 433Boccardi, B., Krichbaum, T. P., Ros, E., & Zensus, J. A. 2017, A&ARv, 25, 4Britzen, S., Fendt, C., Witzel, G., et al. 2018, MNRAS, 478, 3199Broderick, A. E., & McKinney, J. C. 2010, ApJ, 725, 750Cawthorne, T. V. 2006, MNRAS, 367, 851Cawthorne, T. V., & Cobb, W. K. 1990, ApJ, 350, 536Cawthorne, T. V., Jorstad, S. G., & Marscher, A. P. 2013, ApJ, 772, 14Chael, A. A., Johnson, M. D., Bouman, K. L., et al. 2018, ApJ, 857, 23Chael, A. A., Johnson, M. D., Narayan, R., et al. 2016, ApJ, 829, 11Chatterjee, K., Younsi, Z., Liska, M., et al. 2020, MNRAS, 499, 362Chiaberge, M., Celotti, A., Capetti, A., & Ghisellini, G. 2000, A&A, 358, 104Cohen, M. H. 2017, Galax, 5, 12Deller, A. T., Tingay, S. J., Bailes, M., & West, C. 2007, PASP, 119, 318Dey, L., Valtonen, M. J., Gopakumar, A., et al. 2021, MNRAS, 503, 4400Dey, L., Valtonen, M. J., Gopakumar, A., et al. 2018, ApJ, 866, 11Event Horizon Telescope Collaboration, Akiyama, K., Alberdi, A., et al.
2019a, ApJL, 875, L2Event Horizon Telescope Collaboration, Akiyama, K., Alberdi, A., et al.
2019b, ApJL, 875, L4Fromm, C. M., Perucho, M., Mimica, P., & Ros, E. 2016, A&A, 588, A101Fromm, C. M., Perucho, M., Ros, E., Savolainen, T., & Zensus, J. A. 2015,
A&A, 576, A43Fromm, C. M., Ros, E., Perucho, M., et al. 2013a, A&A, 557, A105Fromm, C. M., Perucho, M., Ros, E., et al. 2011, A&A, 531, A95Fromm, C. M., Ros, E., Perucho, M., et al. 2013b, A&A, 551, A32Fuentes, A., Gómez, J. L., Marti, J. M., & Perucho, M. 2018, ApJ, 860, 121Fuentes, A., Torregrosa, I., Martí, J. M., Gómez, J. L., & Perucho, M. 2021,
A&A, 650, A61Goddi, C., Martí-Vidal, I., Messias, H., et al. 2019, PASP, 131, 075003Goddi, C., Martí-Vidal, I., Messias, H., et al. 2021, ApJL, 910, L14Gómez, J. L., Marti, J. M., Marscher, A. P., & Ibanez, J. M. 1997, VA, 41, 79Gomez, J. L., Marti, J. M. A., Marscher, A. P., Ibanez, J. M. A., &
Marcaide, J. M. 1995, ApJL, 449, L19Gómez, J. L., Lobanov, A. P., Bruni, G., et al. 2016, ApJ, 817, 96Gómez, J. L., Traianou, E., Krichbaum, T. P., et al. 2022, ApJ, 924, 122Greisen, E. W. 2003, in Information Handling in Astronomy - Historical
Vistas, Vol. 285, ed. A. Heck (Dordrecht: Kluwer), 109Hodgson, J. A., Krichbaum, T. P., Marscher, A. P., et al. 2017, A&A, 597, A80Honma, M., Akiyama, K., Uemura, M., & Ikeda, S. 2014, PASJ, 66, 95Jorstad, S. G., Marscher, A. P., Morozova, D. A., et al. 2017, ApJ, 846, 98Kettenis, M., van Langevelde, H. J., Reynolds, C., & Cotton, B. 2006, in ASP
Conf. Ser. 351, Astronomical Data Analysis Software and Systems XV, ed.C. Gabriel et al. (San Francisco, CA: ASP), 497
Komossa, S., Grupe, D., Gallo, L. C., et al. 2021a, ApJ, 923, 51Komossa, S., Grupe, D., Parker, M. L., et al. 2020, MNRAS, 498, L35Komossa, S., Grupe, D., Schartel, N., et al. 2017, in IAU Symp. 324, New
Frontiers in Black Hole Astrophysics, ed. A. Gomboc (Cambridge:Cambridge Univ. Press), 168
Komossa, S., Grupe, D., Kraus, A., et al. 2021b, Univ, 7, 261Komossa, S., Grupe, D., Parker, M. L., et al. 2021c, MNRAS, 504, 5575Kuramochi, K., Akiyama, K., Ikeda, S., et al. 2018, ApJ, 858, 56Laine, S., Dey, L., Valtonen, M., et al. 2020, ApJL, 894, L1Lee, S.-S., Lobanov, A. P., Krichbaum, T. P., et al. 2008, AJ, 136, 159Lehto, H. J., & Valtonen, M. J. 1996, ApJ, 460, 207Lico, R., Casadio, C., Jorstad, S. G., et al. 2022, A&A, 658, L10Liska, M., Hesp, C., Tchekhovskoy, A., et al. 2018, MNRAS, 474, L81Liska, M., Hesp, C., Tchekhovskoy, A., et al. 2021, MNRAS, 507, 983Lister, M. L., & Homan, D. C. 2005, AJ, 130, 1389Lobanov, A. 2015, A&A, 574, A84Martí-Vidal, I., Roy, A., Conway, J., & Zensus, A. J. 2016, A&A, 587, A143Mizuno, Y., Gómez, J. L., Nishikawa, K.-I., et al. 2015, ApJ, 809, 38Mizuno, Y., Lyubarsky, Y., Nishikawa, K.-I., & Hardee, P. E. 2012, ApJ,
757, 16Mukherjee, R. & VERITAS Collaboration 2017, ATel, 10051, 1Nair, D. G., Lobanov, A. P., Krichbaum, T. P., et al. 2019, A&A, 622, A92Park, J., Lee, S.-S., Kim, J.-Y., et al. 2019, ApJ, 877, 106Perucho, M., Kovalev, Y. Y., Lobanov, A. P., Hardee, P. E., & Agudo, I. 2012,
ApJ, 749, 55Porth, O., Fendt, C., Meliani, Z., & Vaidya, B. 2011, ApJ, 737, 42Readhead, A. C. S. 1994, ApJ, 426, 51Rioja, M., & Dodson, R. 2011, AJ, 141, 114Rioja, M., Dodson, R., Gómez, J., et al. 2017, Galax, 5, 9Satyanarayan, A., Moritz, D., Wongsuphasawat, K., & Heer, J. 2017, IEEE
Trans. Vis. Comput. Graph., 23, 341Shepherd, M. C., Pearson, T. J., & Taylor, G. B. 1995, BAS, 27, 903Sillanpää, A., Haarala, S., Valtonen, M. J., Sundelius, B., & Byrd, G. G. 1988,
ApJ, 325, 628
11
The Astrophysical Journal, 932:72 (12pp), 2022 June 10 Zhao et al.

Stickel, M., Fried, J. W., & Kuehr, H. 1989, A&AS, 80, 103Tateyama, C. E., & Kingham, K. A. 2004, ApJ, 608, 149Thompson, A. R., Moran, J. M., & Swenson 2017, Interferometry and
Synthesis in Radio Astronomy (3rd edn.; Cham: Springer)Tingay, S. J., Reynolds, J. E., Tzioumis, A. K., et al. 2002, ApJS, 141, 311Valtonen, M. J., Ciprini, S., & Lehto, H. J. 2012, MNRAS, 427, 77Valtonen, M. J., Lehto, H. J., Takalo, L. O., & Sillanpää, A. 2011, ApJ,
729, 33
Valtonen, M. J., Nilsson, K., Sillanpää, A., et al. 2006, ApJL, 643, L9Valtonen, M. J., Lehto, H. J., Nilsson, K., et al. 2008, Natur, 452, 851Valtonen, M. J., Zola, S., Ciprini, S., et al. 2016, ApJL, 819, L37Valtonen, M. J., Dey, L., Gopakumar, A., et al. 2021, Galax, 10, 1VanderPlas, J., Granger, B., Heer, J., et al. 2018, JOSS, 3, 1057Vega-García, L., Perucho, M., & Lobanov, A. P. 2019, A&A, 627, A79Weaver, Z. R., Jorstad, S. G., Marscher, A. P., et al. 2022, ApJS, 260, 12Zhao, G.-Y., Algaba, J. C., Lee, S. S., et al. 2018, AJ, 155, 26
12
The Astrophysical Journal, 932:72 (12pp), 2022 June 10 Zhao et al.