understanding the immersive experience
TRANSCRIPT
UNDERSTANDING THE IMMERSIVE EXPERIENCE: EXAMINING THE INFLUENCE OF
VISUAL IMMERSIVENESS AND INTERACTIVITY ON SPATIAL EXPERIENCES AND
UNDERSTANDING
___________________________________________________
A Dissertation
Presented to
the academic committee members
University of Missouri-Columbia
___________________________________________________
In Partial Fulfillment
of the Requirements for the Degree
Doctor of Philosophy
___________________________________________________
by
DANIELLE OPREAN
Dr. Bimal Balakrishnan, Dissertation Supervisor
Dr. So-Yeon Yoon, Dissertation Supervisor
December 2014
The undersigned, appointed by the dean of the Graduate School, have examined the dissertation entitled
UNDERSTANDING THE IMMERSIVE EXPERIENCE: EXAMINING THE INFLUENCE OF VISUAL IMMERSIVENESS AND INTERACTIVITY ON SPATIAL
EXPERIENCES AND UNDERSTANDING
presented by Danielle Oprean,
a candidate for the degree of doctor of philosophy,
and hereby certify that, in their opinion, it is worthy of acceptance.
So-Yeon Yoon, Ph.D.
Bimal Balakrishnan, Ph.D.
Newton D’souza, Ph.D.
Sanda Erdelez, Ph.D.

Thanks to all my friends and family who have been there the past several years while I worked through my degree. Special thanks to my mom and dad, Celeste and Ted Oprean, who have been great in supporting me as I continued on with school to pursue this degree. I also am thankful for the friendship and support from Ji Young Cho. It was a wonderful experience getting to hangout and go through the program together. I can’t forget to mention my coworkers at the MU hospital. You were all amazing to work with through the years and I’ll miss stopping by to help out and enjoy food days during my breaks from academia. Lastly, I wanted to thank Michael Hardin and Laura Franklin for being there to support me at the end and during my dissertation writing. I really don’t think I could have made it through without all those lunches and fun weekends. It was good to have so many friends there as I was trying to work through the end of my degree program. Having the support of so many people has meant so much to me in taking on this endeavor. Thank you everyone!

ii
ACKNOWLEDGEMENTS
I would like to acknowledge all of the help and guidance received in my academic
career from my committee. Each has helped shape my education in a different way and I
am very thankful for all they have done for me.
I would like to start by thanking Dr. So-Yeon Yoon for all her guidance and help.
Dr. Yoon was there for me from the very beginning of my doctoral program and played a
large role in shaping my education. She continually challenged me and I believe it
improved my academic experience overall. I truly appreciate the time she took to help
mentor me.
Next, I would also like to extend special thanks to Dr. Bimal Balakrishnan for all
his help and guidance. Dr. Balakrishnan has been a driving force to complete my Ph.D.
and was extremely helpful in mentoring and preparing me for work beyond my degree.
He dedicated so much of his time to making sure I finished with a good foundation. I
have truly learned much from working with him and am very grateful.
I would like to also mention my thanks to Dr. Newton D’Souza for all his help
through the years. Dr. D’Souza was always very supportive of my degree and presented
new perspectives for me to consider. He always provided an open chair to discuss issues
and helped me to think of them in new ways. I greatly appreciate the open ideas and
alternatives he brought to my work.
Lastly, I would like to extend thanks to Dr. Sanda Erdelez. She was a wonderful
professor and committee member. She brought an interdisciplinary perspective to my
work and was wonderful in conveying information behavior theory to me. I appreciate
her willingness to be on my committee and work with me the last few years.
iii
TABLE OF CONTENTS
ACKNOWLEDGEMENTS ................................................................................. ii
LIST OF ILLUSTRATIONS ............................................................................ viii
LIST OF TABLES .................................................................................................x
LIST OF ABBREVIATIONS ............................................................................. xi
CHAPTER 1: INTRODUCTION .........................................................................1
1.1 Introduction ................................................................................................... 1
1.2 Rationale........................................................................................................ 7
CHAPTER 2: LITERATURE REVIEW ..........................................................13
2.1 Virtual reality systems and the immersive experience ................................ 13
2.2 Immersion.................................................................................................... 14
2.2.1 Perceptual Immersion ...................................................................... 17
2.2.2 Psychological Immersion ................................................................. 19
2.3 Interactivity ................................................................................................. 21
2.3.1 Navigation as a type of interaction .................................................. 22
2.3.2 Interactivity & immersion as defining characteristics of VR .......... 23
2.4 Spatial Experience ....................................................................................... 24
2.4.1 Spatial Presence ............................................................................... 25
iv
2.4.2 Vection ............................................................................................. 27
2.4.3 Reality Judgment ............................................................................. 28
2.4.4 Immersion and Presence .................................................................. 29
2.4.5 Visual Immersiveness and Spatial Presence .................................... 34
2.5 Spatial Understanding ................................................................................. 40
2.5.1 Spatial Task Performance ................................................................ 40
2.5.2 Spatial Recall ................................................................................... 48
2.6 Hypotheses .................................................................................................. 49
2.6.1 Research Question: .......................................................................... 62
2.6.2 Sub-Questions: ................................................................................. 62
CHAPTER 3: METHODS ..................................................................................64
3.1 Design of Experiment.................................................................................. 65
3.1.1 Experimental Setting ....................................................................... 66
3.1.2 Stimulus Details ............................................................................... 66
3.2 Independent Variable Operationalizations and Implementation ................. 68
3.2.1 Field of View ................................................................................... 68
3.2.2 Stereoscopy ...................................................................................... 70
3.2.3 Navigability ..................................................................................... 71
3.3 Dependent Variables and Control Measures ............................................... 72
v
3.3.1 Dependent Variables ........................................................................ 72
3.3.2 Control for Confounding Variables ................................................. 78
3.4 Sample ......................................................................................................... 80
3.5 Experimental Manipulations ....................................................................... 81
3.6 Pre-Testing .................................................................................................. 82
3.7 Procedure ..................................................................................................... 84
3.7.1 Joystick Training ............................................................................. 84
3.7.2 Study Task ....................................................................................... 86
3.7.3 Questionnaire ................................................................................... 87
3.7.4 Experimental Set-Up ....................................................................... 88
3.8 Data Analysis Plan ...................................................................................... 89
CHAPTER 4: ANALYSIS & RESULTS ...........................................................90
4.1 Sample Characteristics and Demographics ................................................. 90
4.2 Data Screening ............................................................................................ 91
4.3 Reliability Analysis for Dependent Variables and Covariates .................... 93
4.4 Relationship among Variables .................................................................... 93
4.5 Descriptives ................................................................................................. 94
4.6 Hypothesis Testing ...................................................................................... 95
4.6.1 Spatial Presence Measures ............................................................... 95
vi
4.6.2 Spatial Understanding Measures ................................................... 105
CHAPTER 5 – DISCUSSION...........................................................................116
5.1 Summary of Results .................................................................................. 116
5.2 Interpretation of Results ............................................................................ 118
5.2.1 Impact of Visual Immersiveness on Spatial Experience ............... 119
5.2.2 Impact of Visual Immersiveness and Interactivity on Spatial
Presence .................................................................................................. 122
5.2.3 Visual Immersiveness on Spatial Understanding .......................... 125
5.3 Theoretical Implications ............................................................................ 129
5.4 Methodological Implications..................................................................... 131
5.5 Practical Implications ................................................................................ 133
5.5.1 Implications for Architectural Visualization ................................. 133
5.5.2 Implications for Virtual Reality Technology Development .......... 136
5.5.3 Implications for Training Programs ............................................... 137
5.6 Potential Threats to Validity and Limitations of the Study ....................... 139
5.7 Conclusion & Future Directions ............................................................... 143
REFERENCES ...................................................................................................145
APPENDIX A – EXPERIMENTAL PROCEDURE PROTOCOLS ............159
APPENDIX B – NARRATIVE POWERPOINT SLIDES .............................165
vii
APPENDIX C – DEMOGRAPHICS QUESTIONNAIRE ............................169
APPENDIX D – POST-TEST QUESTIONNAIRE ........................................174
APPENDIX E – SCORING GUIDES FOR COGNITIVE MAPS ................185
VITA....................................................................................................................189
viii
LIST OF ILLUSTRATIONS
Figure Page
1. The dichotomy of immersion. ........................................................................... 15
2. Perceptual immersion as sensory factors. ......................................................... 18
3. Display attributes related to visual immersion.................................................. 19
4. User-based factors related to psychological immersion ................................... 21
5. The relationship between involvement and engagement. ................................. 33
6. Mapping self-location to visual immersion. ..................................................... 35
7. Visual immersiveness, interactivity and spatial presence. ................................ 37
8. Stereoscopy, interactivity and spatial presence. ............................................... 39
9. Field of view linked to spatial presence. ........................................................... 40
10. Conceptual break-down of spatial cognition. ................................................. 42
11. Conceptual break-down of spatial cognition. ................................................. 43
12. Conceptual break-down of spatial abilities. .................................................... 44
13. Conceptual break-down of spatial navigation................................................. 45
14. Explication of spatial task performance. ......................................................... 48
15. Explication of main independent variable concepts. ...................................... 50
16. Main hypotheses. ............................................................................................ 62
17. Mapped secondary hypotheses. ...................................................................... 63
18. Plan of the office environment. ....................................................................... 67
19. Perspectives of 7 office rooms. ....................................................................... 67
20. Horizontal FOV 200°, vertical FOV 135°. ..................................................... 68
ix
21. Joystick motion (low navigability on left) with added manipulation (high
navigability on right)....................................................................................... 72
22. Plan outline task given to participants. ........................................................... 74
23. Convex-mapped J-graph of actual floor plan.................................................. 77
24. Participant cognitive map with dimension and J-graph nodes. ....................... 77
25. Narrow field of view (Left), wide field of view (Right). ................................ 81
26. Training environment plan and perspective. ................................................... 85
27. Experiment set-up. .......................................................................................... 89
28. Significant main effect for FOV on spatial presence measures. ..................... 96
29. Significant interaction stereo*FOV on possibilities for action. ...................... 98
30. Significant interaction between FOV*navigability on self-location. ............. 99
31. Near significant interaction between FOV*navigability. ............................. 101
32. Significant interaction between FOV* navigability on reality judgment. .... 102
33. Significant main effect for field of view on area proportion error. .............. 107
34. Near significant main effect for FOV on area ratio. ..................................... 108
35. Near significant interaction between FOV*navigability on width ratio. ...... 109
36. Significant main effect for FOV on length ratio. .......................................... 110
37. Significant main effect for FOV on layout score. ......................................... 111
38. Significant main effect for FOV on object memory. .................................... 112
39. Significant main effect for FOV on cued route recall. .................................. 113
40. Hypotheses for spatial presence (P - partial significant, S - significant). ..... 117
41. Hypotheses for spatial understanding (S - significant, S*-significant but
opposite to predicted, P - partial significant, N - no significance). .............. 118
x
LIST OF TABLES
Table Page
1. Variables of study. ............................................................................................ 65
2. 8 Experimental conditions. ............................................................................... 65
3. Inter-rater reliability correlations across two coders for the 7 rooms. .............. 76
4. Number of cases per manipulation. .................................................................. 93
5. Reliability for dependent variables and covariates. .......................................... 93
6. Correlations between dependent variables and covariates. ............................... 94
7. Descriptives of covariates and dependent variables. ........................................ 95
8. Simple effects interaction contrast for possibilities for action.......................... 98
9. Simple effects interaction contrast for self-location. ...................................... 100
10. Simple effects interaction contrast for vection. ............................................ 101
11. Simple effects interaction contrast for reality judgment. .............................. 102
12. ANCOVAs for all spatial presence dimensions............................................ 103
13. Simple effects interaction contrast for width ratio. ....................................... 109
14. ANCOVAs for spatial understanding measures and covariates. .................. 113
xi
LIST OF ABBREVIATIONS
α Cronbach’s index of internal consistency
df Degrees of freedom: the number of values free to vary after certain restrictions
have been placed on the data
F F distributions: Fisher’s F ratio of two variances
M Sample Mean: the sum of a set of measurements divided by the number of
measurements in the set
p Probability of a success in a binary trial
r Estimate of the Pearson product-moment correlation coefficient
SE Standard error
< Less than
> Greater than
= Equal to
λ Wilk’s Lambda: test to see differences between the means of identified groups
of subjects on a combination of dependent variables
ηp2 Partial eta squared: The proportion of variance associated with or accounted for
by each of the main effects, interactions and error.
β Beta coefficient: estimates resulting from an analysis carried out on independent
variables that have been standardized so that their variances are 1
1
CHAPTER 1: INTRODUCTION
1.1 Introduction
Advances in computer graphics enable us to represent space and 3-dimensional
(3D) objects in a better and more realistic manner. Technology resulting from these
advances can accurately recreate a number of monocular depth cues and binocular depth
cues such as stereoscopy. Popularity of this 3D technology has been steadily increasing
as the entertainment field continues improvements for hardware and display devices to
enhance the ‘immersive experience’. This experience refers to ways in which users are
able to become part of the presented content. With the introduction of the 3D televisions,
3D gaming consoles, and a focus on 3D movies – both live action and animated – new
possibilities and techniques are becoming available to fields outside of the entertainment
industry. These new possibilities and techniques offer much to other fields which are
adopting 3D technology such as architecture, interior design, and training programs. All
of which seek to gain a better understanding of aspects of spatial information and
performance within a simulated environment. Despite the adoption of techniques and 3D
technology by fields outside of the entertainment industry, the impact of ‘immersive
experience’ on spatial understanding and the mechanism underlying it still remains
unclear.
As many have argued, 3D technology is only one contributor to the ‘immersive
experience’, several other factors pertaining to the user also play a role in creating a sense
of immersion (Ermi & Mäyrä, 2005; Tijs, 2006; Witmer & Singer, 1998). These factors
have ranged from the specific type of medium (virtual reality, gaming, movie, etc.) to the
2
presentation of information (visual, tactile, auditory, etc.) to the subjective perceptions of
the people using the technology. In addition to the multitude of factors that comprise the
immersive experience, there is theoretical ambiguity that occurs due to conceptual
overlap with related concepts like presence. Considering these two main issues, further
study of the immersive experience is necessary in order to improve both. This leads into
two concepts for study: immersion and presence.
Fields outside of entertainment have been slowly incorporating 3D technology in
an attempt to help in understanding space and performance. Disciplines like architecture
and interior design for instance seek to help designers and clients to better evaluate space
through various tools including renderings and physical models. These tools are used in
order to help both the designers and clients to make more informed design decisions
(Okeil, 2010). With the aid of drawings, plans, renderings, and physical models,
designers are able to ‘walk’ through their designs but, not necessarily experience them
(Okeil, 2010). Walk-throughs and other digital design representations have been
increasingly used in architecture providing a much richer experience of the designed
spaces at a more realistic scale. By capitalizing on the immersive experience from various
types of 3D technology, design disciplines can gain a better sense of architectural spaces
through simulated experiences.
Despite the benefit to the design disciplines, there are several barriers that impact
the adoption of these 3D technology including (Calado, Soares, Campos, & Correia,
2013): cost of technology, skills needed to use the technology, and identifying the actual
impact of the technology on users. Looking specifically at virtual reality systems,
3
possibly one of the most sophisticated forms of 3D technology with applications across
multiple disciplines, they are often sold as a comprehensive technological package for a
premium price. Gaining a better understanding of the immersive experience will help to
inform which aspects of 3D technology are more critical for evaluating the experiential
qualities of space. This in turn could help with the development of more cost-effective
and more customized systems which, focus more on the qualities of the system that
benefit the design fields more.
Design fields are not the only discipline outside of entertainment adopting 3D
technology. Training programs from all different areas (i.e. fire-fighting, military, airline
pilots, etc.) are also adopting various 3D technologies to help train individuals to respond
to specific environments or, to simulate how individuals would respond to specific
changes to an actual environment. The challenge of understanding simulated space in
design fields are therefore also applicable to training simulators.
Simulated training programs have continued to rely on the “immersive
experience” to aid trainees in understanding material which was either very costly or in
some cases too dangerous to simulate in the real world (Tate, Sibert, & King, 1997).
These simulated training programs tended to incorporate a “hands-on” learning
experience where focus was usually on the context of the training curriculum and how
that would transfer to the real-world (Bossard, Kermarrec, Buche, & Tisseau, 2008).
Little focus is usually given to the technology that facilitates the ‘immersive experience’
which, could be inhibiting the simulation from performing in the intended way. The
fields that utilize these training programs tend to have a highly specialized focus (e.g.

4
medical, fire-fighting, military, etc.) and provide a great need for a better understanding
of what the ‘immersive experience’ is and what it truly is doing to help trainees. This
consideration suggests a need to examine the spatial experiences of users.
When using 3D technology to create an ‘immersive experience’ in areas outside
of entertainment, it is important to distinguish how that technology is facilitating the
experience. Virtual reality, in particular, has allowed for users to experience a 3D world
through the use of an “experiential interface” which contains content with which users
could interact as if they were truly there (Gorini, Capideville, Leo, Mantovani, & Riva,
2011, p. 99). This indicates the importance of 3D technology in terms of experiential
components and what those components comprise of to create the ‘immersive
experience’. Using an experiential method alludes to the need to understand not only the
way in which a user perceives a virtual space using the technology but, also how the user
is actually interacting with the virtual space. Dalgarno and Lee (2010) suggested that
immersion itself was a product of fidelity and interactive capabilities of the simulated
environment. Adversely, Bowman and McMahan (2007) stated that while immersion and
interaction are important to consider together, that immersion was not increased by more
realistic methods of interaction with the environment. This is only a small indication of
the lack of clear understanding of the joint impact of immersion and interactivity. As a
whole these two concepts work together to allow users to actually participate in an
experiential interface generated through technology. This suggests looking at the
concepts of immersion and interactivity and how they work together.
5
To understand the benefits of the immersive experience, it is necessary to identify
what could be learned from an immersive environment. With any virtual environment,
space must be considered – for example, how one interacts with the space or how one
comprehends the content of the space. One could broadly classify virtual environments
into two categories: active and passive. To further contextualize the difference, active
virtual environments could be considered more “interactive” (i.e. video games, computer
games, etc.) whereas passive virtual environments are more static – less interactive (i.e.
IMAX movies, 3D movies, etc.). The spatial aspects of user participation could be
considered highly linked to the “immersive experience” depending on whether a medium
is presenting active or passive virtual environments. Meijer, Geudeke, and van den Broek
(2009) stated that spatial learning occurred from navigation based on their study of the
three types of spatial knowledge: landmark, route, and survey. They further stated that
learning in a virtual environment was similar to that of the real-world as similar spatial
knowledge was used when performing tasks in the real-world. This suggested that spatial
aspects of a virtual environment could be measured in a similar way to those of the real-
world. As a result of an indicated relationship between spatial learning and navigation, it
was also important to examine the construction of spatial understanding in virtual
environments.
Overall, this dissertation investigates the relative contributions of the immersive
experience through manipulations of immersion and interactivity on spatial experience
and understanding. To do this, immersive experience was explicated to help bring
conceptual clarity to each of the manipulations of immersion and interactivity. This
6
clarity helped in better identifying the relative impact of the manipulations on spatial
experience and understanding; aiding in addressing the overall research question, what is
the influence of the immersive experience on spatial experience and understanding.
Through the exploration of the theoretical ties between immersion and interactivity on
spatial understanding, this study looked at isolating individual components of the virtual
environment to better identify the relative contributions of each in aiding a user’s
experience within a simulated environment. The constructs of spatial experience and
spatial understanding were broken into common concepts. Spatial experience consisted of
concepts of spatial presence, vection and reality judgment. Spatial understanding
consisted of concepts of spatial task performance and spatial recall.
To evaluate the impact on the measures of spatial experience and understanding, a
simulation was developed and tested. Specifically, a simulation for a search task and
report of findings task from a building that was recently on fire was developed. A
narrative provided instruction for the combination of tasks in order to help provide
motivation for users to not only complete the tasks but, to actively explore the space,
gaining spatial knowledge through experience. This introductory chapter further explains
the rationale for the study and introduces the key concepts in the study. Chapter two starts
with a focused literature review to explicate key concepts in this study. Then research
questions and hypotheses regarding the impact of immersiveness and interactivity on
spatial experience and understanding are discussed. Chapter three describes the research
design and provides details of the controlled experiment carried out to address the
research question and hypotheses. Chapter four details the data analysis including the
7
data screening for assumptions. Chapter five concludes the study with a discussion on the
findings and how they related back to previous findings from the literature.
1.2 Rationale
The findings from this study should help to improve the overall understanding of
the immersive experience and how it relates to both spatial experience and understanding
in virtual environments. This project thus has important theoretical, methodological, and
practical implications. These implications form the overall rationale for conducting this
research on the immersive experience influencing spatial experience and understanding.
This study intended to clarify the concept of immersion and distinguish it from
related theoretical concepts such as presence, involvement and engagement. Currently, a
clear theoretical definition does not exist for the concept of immersion. Studies conducted
in human-computer interaction and entertainment have utilized varying research
approaches which have further muddled the definition. For the most part, human-
computer interaction research has focused on the definition provided by Slater (1999)
(i.e. immersion refers to the technology of the virtual system). The use of the technology-
focused definition of immersion has helped in distinguishing it from presence but,
seemingly ignores the concepts found in psychological immersion by simply labeling
them as presence. This again causes confusion in the conceptual clarity of presence and
how manipulations of immersion may or may not influence user perceptions of presence.
Nor did the definition provided by Slater (1999) rationalize links between immersion and
other user experience factors. Slater and Wilbur (1997) did attempt to create a framework
of immersion which, addressed some issues of linking immersion with other concepts.
8
However, like other established frameworks for immersion (Witmer & Singer, 1998)
subsequent research on immersion has turned to other operationalizations of immersion
in order to better fit the needs of the research. In particular, studies looking at human-
computer interaction of video games have added to the confusion by suggesting
immersion was different for video games than for virtual environments (Ermi & Mäyrä,
2005).Therefore, it was important to look at the theoretical ties between immersion and
other factors related to immersion.
More specifically, this study sought to gain an understanding of the concepts that
formed the construct of immersion. In order to do this, conceptual overlap with related
concepts were explored through a formal literature review and concept explication. One
of the key theoretical implications was the operationalization of immersion and the
systematic assessment of its impact on different user experience dependent variables (i.e.
spatial presence and spatial understanding). This study therefore sought to provide a
clearer understanding of the concept of immersion through the process of explication
elaborated by Chaffee (1991) and, by systematically assessing the relative impact on
concepts related to spatial understanding and experience.
Distinguishing immersion from spatial presence is important for virtual reality
research. This study builds on existing theoretical distinctions between immersion and
presence (Wirth, et al., 2007) in order to compare them at the level of measurable
dimensions. Providing a theoretical framing of the relationship between immersion and
presence could better test the role of immersion on presence measures. Similarly,
9
immersion was theoretically linked to spatial understanding in order to better establish
‘if’ and ‘how’ the influence of immersion occurred.
This study also intended to make a methodological contribution by adopting a
media effects approach to studying the impact of virtual reality system components.
Studies on technology and related concepts often treat technology as a monolithic entity,
limiting the ability to transfer methods and findings across different technologies. This
study used an approach which looked at technology in terms of its affordances in order to
determine how specific features and settings independently influenced measures of
spatial experience and understanding. This variable-centered approach proposed by Nass
and Mason (1990) was previously demonstrated within the context of virtual reality
technology by Balakrishnan and Sundar (2011).
The idea behind the variable-centered approach was not entirely new to the study
of virtual reality technology or the concept of immersion but, it can provide insight that
current methods do not yet cover. Laha, Bowman and Schiffbauer (2013) discussed a
similar approach, the mixed reality (MR) simulation approach, to studying immersion
and virtual reality technology. The MR simulation approach breaks immersion into a
taxonomy of sensory fidelity attributes to be varied using a single system. This study
combined the taxonomy of immersion of virtual reality technology from an affordance
perspective to explore the relative impacts of each specific affordance. The implications
of combining both approaches provided a more reliable way to test concepts like
immersion across the spectrum of virtual reality systems.
10
The study’s manipulations of the independent variables focused on specific
aspects of visual and interactive aspects independently. As McMahan, Gorton, Gresock,
McConnell, & Bowman (2006) pointed out, there needs to be a distinction between
immersion and interactivity influences within virtual environments to gain a better
understanding of the impact of each independently. This allows for better control over
correcting issues found with a simulation if individual components could be isolated and
addressed. To follow along these lines, the visual aspects would be investigated
separately from the interactive ones. The visual aspects dealt with how well the user saw
what was going on. While this could include multiple combinations of display features of
a virtual reality system, this study looked to start with just two features. This would
provide better information about the two display features than if they were grouped with
three or more. Ragan, Sowndararajan, Kopper and Bowman (2010) explained this
approach allowed for immersion to be identified in ‘levels’ as opposed to the immersive
or non-immersive approach (a common method for exploring immersion). Similarly, the
interactive aspect investigated the degree to which a user could interact in the simulation.
This was done by investigating a feature of the input device used by the participant. The
study sought to utilize two levels of a specific input device’s attributes. The features of
the input device would then be transferrable across different types of input devices and
not specific to just the one used in this study. The end benefit would be to have an
understanding for different levels of interaction capabilities and how that influences a
user’s understanding of the virtual environment.
11
Second, the key goal of this study was to establish the role of the technology
components in how users experience a virtual environment. Specifically, the study sought
to see how technology components influenced user experience, performance and
ultimately memory of experiences based on their understanding of the simulated space.
The findings of this study could then be used to inform disciplines interested in using
virtual environments to enhance understanding of space.
In most cases where users were asked to interact with a virtual space there would
be a degree of spatial presence experienced while in that space (Witmer & Singer, 1998).
Spatial presence has been generally defined as ‘feeling present in a space’. This definition
tied into the idea that if one felt present in a virtual space, they were more attentive to that
space and less attentive to the surrounding real-world (Wirth, et al., 2007). So when
simulations aimed at accomplishing a certain purpose was used, users should have felt as
if they were in the space experiencing the events in order to react in a more realistic
manner. Understanding the influences of different technology components on the sense of
presence would provide better insight into how to improve technology to better aid in
spatial understanding.
Performance within a simulated environment has been another concern for two
reasons. First, simulations are similar to virtual learning environments where users are
expected to learn by doing or experiencing content. Secondly, the information learned in
the simulated environment should transfer to real-world knowledge. In approaching these
two concerns of performance, Roussou (2004) discussed the importance of interaction
and other virtual environment aspects (i.e. presence, immersion, etc.) from a learning
12
perspective. How a learner interacted and received feedback from the simulated space
played a role in not only how the learner performed but, ultimately what would be
learned. In this case, different technologies could potentially influence how a user/learner
may make decisions due to the influence of a number of different factors (i.e. skill level,
novelty, etc.).
As simulations focused on transferring spatial knowledge to users are generally
situated within a context (i.e. a burning building for fire-fighters, a new renovation for
architectural designers, etc.), it is important to make sure the technology facilitates that
transfer of knowledge. Testing how the technology specifically influences performance
would provide better insight into how spatial understanding could be improved as a
function of different technology components.
Lastly, the study looked at the influences on memory of the experience with a
particular focus on the transfer of spatial information. The purpose of most simulations
for training has been to teach users about something with the understanding that
knowledge would transfer from their experiences in the simulation to the real-world. This
same idea pertains to information learned from the exploration of a designed space where
knowledge of layout and the relationships of designed elements should be remembered in
order to evaluate the spaces. Transfer occurs due to processes related to memory of
aspects of what was previously learned (Bossard, et al., 2008). Understanding again how
the technology facilitates a user’s ability to remember specifics about an experience after
performing tasks could provide information into which aspects really would benefit
disciplines focused on spatial comprehension more.
13
CHAPTER 2: LITERATURE REVIEW
This chapter discusses the key concepts related to the immersive experience in
virtual reality systems. The first section explicates the key concepts in this study –
immersion, interactivity, then spatial experience and understanding. The last section will
examine the theoretical model to pose the overall research question and generate specific
hypotheses for conducting the study.
2.1 Virtual reality systems and the immersive experience
Virtual reality systems are simply a technological medium which offer the
opportunity for users to experience and interact with 3-dimensional computer-generated
content. Gorini et al. (2011) noted that virtual reality systems comprise of several
components: hardware, software, a user interface, and human factors like perceptions,
cognition, and emotions (p. 99). Considering all the components involved in a virtual
reality system adds to the complexity in understanding how the immersive experience
occurs. But the complexity of the systems is not the only challenge in understanding
virtual reality system technology.
The landscape of virtual reality technology is broad, diverse and constantly
evolving. Different types of virtual reality systems exist. One can go from very costly
systems like a CAVE (i.e. a four to six screen projection system), to slightly less costly
systems like head-mounted displays (HMDs) (i.e. personal viewing systems), to more
cost effective systems like desktop-VR systems. Each type of system affords different
benefits particularly, in terms of generating an immersive experience. With the vast
diversity of these constantly evolving systems, one of the key challenges for research on
14
virtual reality systems is to be able to assess the impact of such systems on user
experiences (Steuer, 1992). In order to assess the impact of technology components used
in creating an immersive experience, it was important to explore commonalities and
distinctions.
Virtual reality systems capture user attention primarily through a display device
and involve users in the displayed content through an input device (Bowman &
McMahan, 2007). These common features of a virtual reality system relate directly to the
immersive experience found in all types of virtual reality systems. Distinctions of
features in a virtual reality system comes more in the form of the content and individual
user differences (Steuer, 1992). Based on this understanding of virtual reality systems and
the immersive experience, it was necessary to look in-depth at the concepts that comprise
the immersive experience in terms of the technology components in a virtual reality
system: immersion and interactivity.
2.2 Immersion
Immersive experience stems from a more complex concept, ‘immersion’. Immersion
itself is not a new concept and has been highly studied in the context of virtual reality
research. Its original meaning related to the actual submersion of an object in water which,
has later been translated to many fields pertaining to experience, particularly simulated
experiences (Murray, 1997). In terms of technology, a user is submerged in a simulated
experience generated by the technology.
Historically, immersion has been studied from a variety of disciplinary perspectives
including but not limited to that of education, media studies, communication, and
15
psychology. Research on immersion performed in the field of education focused more on
second language learning and later experiential learning (Curtain, 1986). Cognitive
psychologists researched immersion as a phenomena which occurred with the introduction of
new technology (Agarwal & Karahanna, 2000). The majority of recent research has centered
on video games and virtual environments (Brown & Cairns, 2004). Many fields now rely on
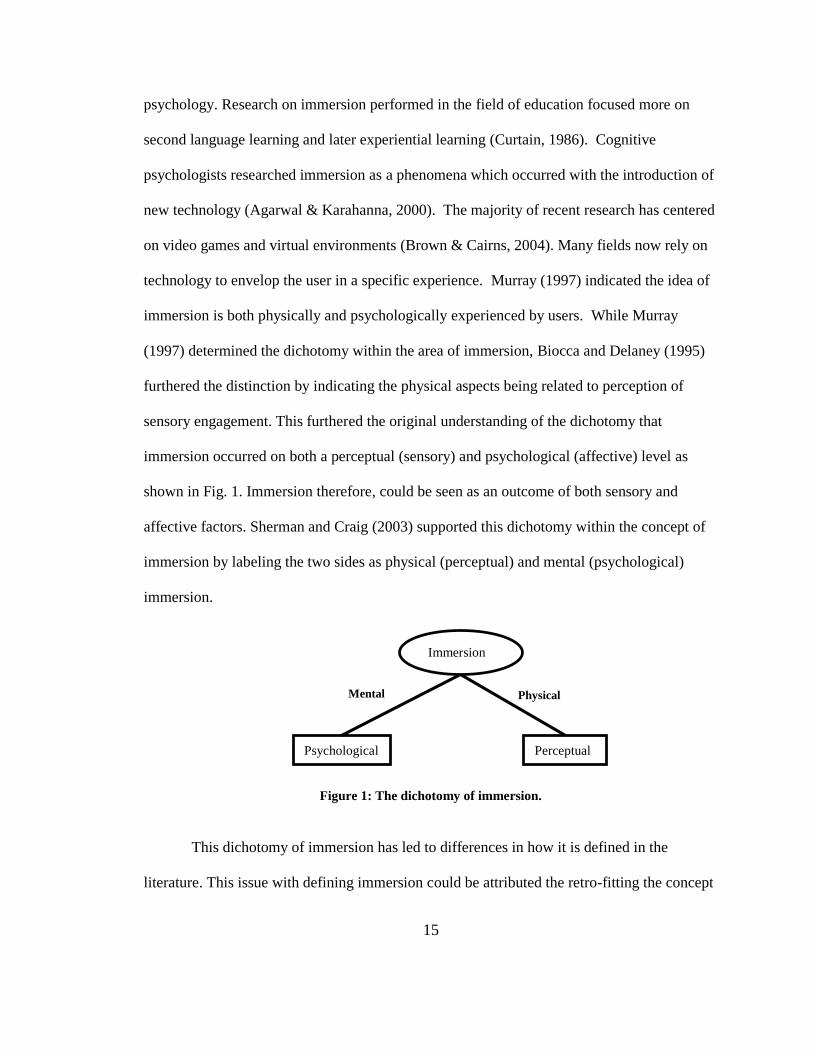
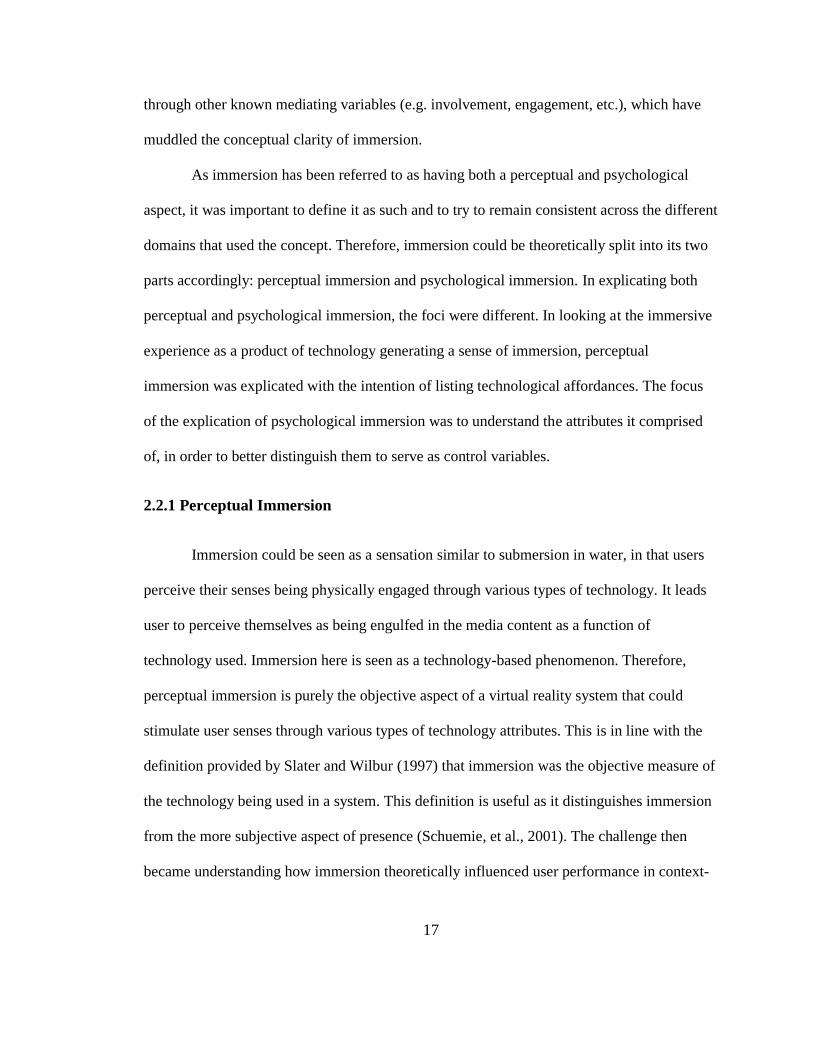
technology to envelop the user in a specific experience. Murray (1997) indicated the idea of
immersion is both physically and psychologically experienced by users. While Murray
(1997) determined the dichotomy within the area of immersion, Biocca and Delaney (1995)
furthered the distinction by indicating the physical aspects being related to perception of
sensory engagement. This furthered the original understanding of the dichotomy that
immersion occurred on both a perceptual (sensory) and psychological (affective) level as
shown in Fig. 1. Immersion therefore, could be seen as an outcome of both sensory and
affective factors. Sherman and Craig (2003) supported this dichotomy within the concept of
immersion by labeling the two sides as physical (perceptual) and mental (psychological)
immersion.
Figure 1: The dichotomy of immersion.
This dichotomy of immersion has led to differences in how it is defined in the
literature. This issue with defining immersion could be attributed the retro-fitting the concept
Immersion
Psychological Perceptual
Mental Physical
16
had undergone to be applied to technology (Murray, 1997). Several studies have attempted
defining and explicating the concept of immersion (Robertson, Czerwinski, & van Dantzich,
1997; Slater & Wilbur, 1997; Witmer & Singer, 1998). Despite these attempts, immersion
still remained an ill-defined term.
The concept of immersion continues to be relevant for newer technology. With the
improvements to user experiences, immersion as become more difficult to distinguish from
other related concepts like presence, engagement and involvement (Schuemie, Van Der
Straaten, Krijn, & Van Der Mast, 2001). To distinguish immersion from other known
concepts, studies have been conducted to measure both immersion as well as presence, a
concept that is often confounded with immersion. These studies led to debates on what
attributed to the distinction between the two concepts. Presence is a concept commonly found
in research dealing with virtual reality technology and, refers to the feeling of being in a
simulated or mediated space (Schubert, Friedmann, & Regenbrecht, 1999a). Witmer and
Singer (1998) developed a commonly used questionnaire in which presence could be
measured based on exposure to a virtual environment. In addition to measuring the concept
of presence, Witmer and Singer (1998) distinguished immersion from presence by
developing a second portion to their questionnaire which, focused on measuring a user’s
immersive tendency. It was from this second section that Witmer and Singer (1998)’s
definition of immersion became clear; that of a user-focused sensation based on responses to
the virtual environment, similar to that of presence. Slater (1999) countered this definition
suggesting that immersion was technology-focused causing the user to experience a sense of
presence. In this way, immersion and presence were more clearly distinguished; immersion
being objective and presence as a subjective measure. Other studies have furthered the debate
17
through other known mediating variables (e.g. involvement, engagement, etc.), which have
muddled the conceptual clarity of immersion.
As immersion has been referred to as having both a perceptual and psychological
aspect, it was important to define it as such and to try to remain consistent across the different
domains that used the concept. Therefore, immersion could be theoretically split into its two
parts accordingly: perceptual immersion and psychological immersion. In explicating both
perceptual and psychological immersion, the foci were different. In looking at the immersive
experience as a product of technology generating a sense of immersion, perceptual
immersion was explicated with the intention of listing technological affordances. The focus
of the explication of psychological immersion was to understand the attributes it comprised
of, in order to better distinguish them to serve as control variables.
2.2.1 Perceptual Immersion
Immersion could be seen as a sensation similar to submersion in water, in that users
perceive their senses being physically engaged through various types of technology. It leads
user to perceive themselves as being engulfed in the media content as a function of
technology used. Immersion here is seen as a technology-based phenomenon. Therefore,
perceptual immersion is purely the objective aspect of a virtual reality system that could
stimulate user senses through various types of technology attributes. This is in line with the
definition provided by Slater and Wilbur (1997) that immersion was the objective measure of
the technology being used in a system. This definition is useful as it distinguishes immersion
from the more subjective aspect of presence (Schuemie, et al., 2001). The challenge then
became understanding how immersion theoretically influenced user performance in context-
18
based tasks within a simulation and, how that is translated to the real world (Gorini, et al.,
2011).
According to Slater and Wilbur (1997), immersion was an objective aspect that
described technology and the degree a display was able to involve the user’s senses.
Bowman and McMahan (2007) refined the need to distinguish immersion based on the
senses. Bowman and McMahan (2007) suggested this refinement was due to a link
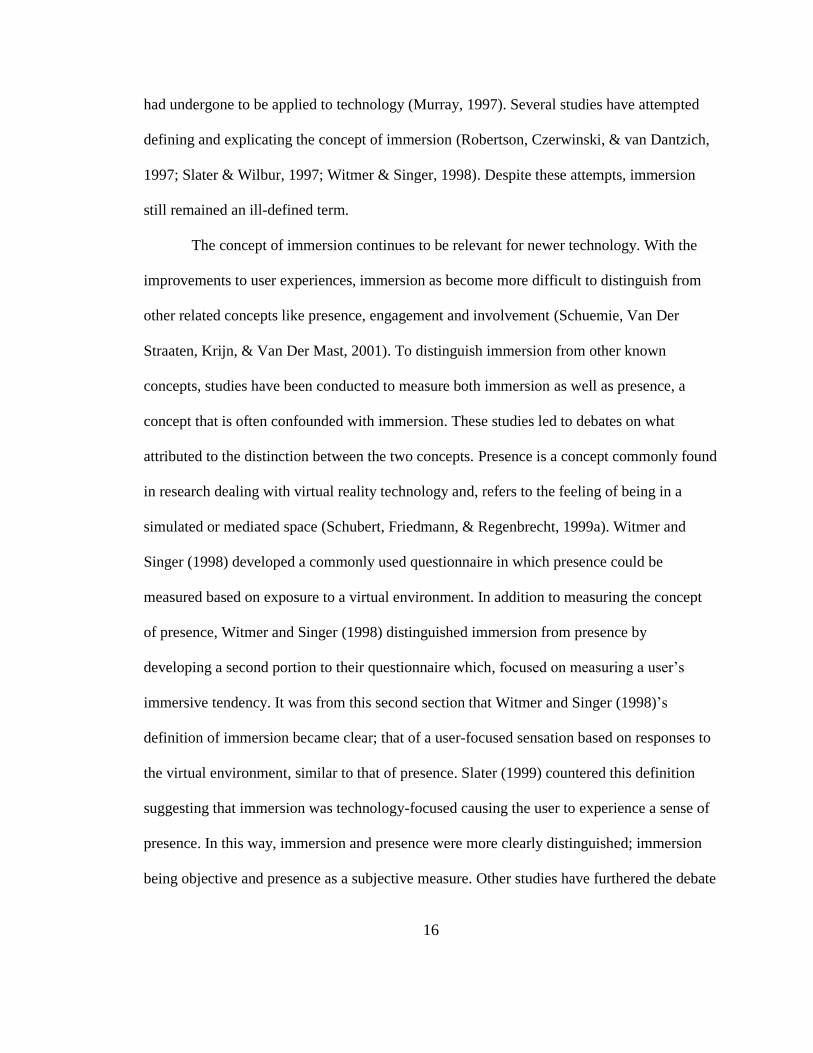
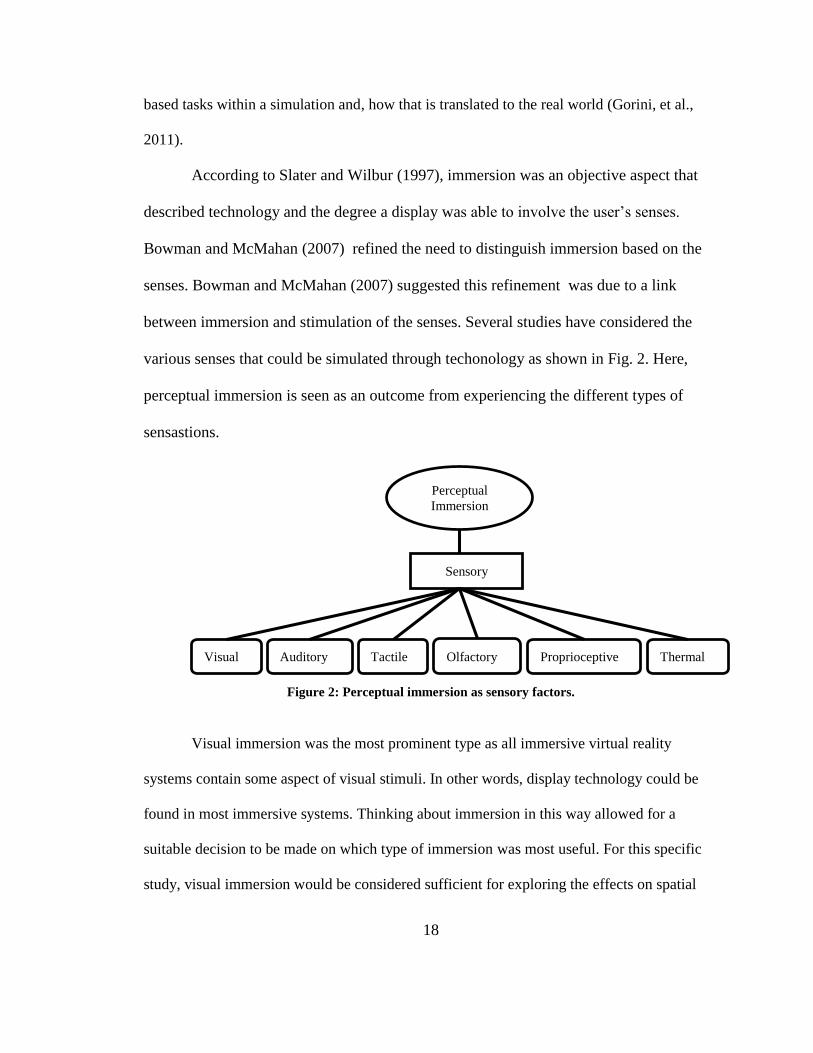
between immersion and stimulation of the senses. Several studies have considered the
various senses that could be simulated through techonology as shown in Fig. 2. Here,
perceptual immersion is seen as an outcome from experiencing the different types of
sensastions.
Figure 2: Perceptual immersion as sensory factors.
Visual immersion was the most prominent type as all immersive virtual reality
systems contain some aspect of visual stimuli. In other words, display technology could be
found in most immersive systems. Thinking about immersion in this way allowed for a
suitable decision to be made on which type of immersion was most useful. For this specific
study, visual immersion would be considered sufficient for exploring the effects on spatial
Perceptual
Immersion
Sensory
Visual Auditory Tactile Olfactory Proprioceptive Thermal
19
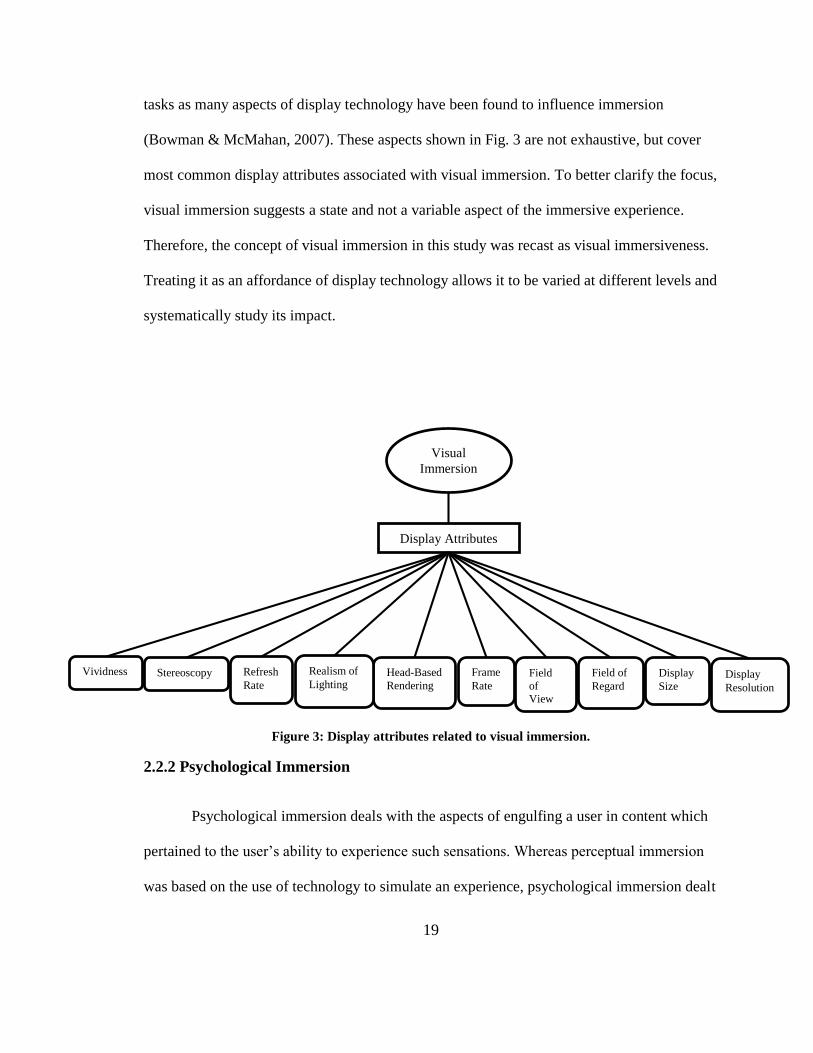
tasks as many aspects of display technology have been found to influence immersion
(Bowman & McMahan, 2007). These aspects shown in Fig. 3 are not exhaustive, but cover
most common display attributes associated with visual immersion. To better clarify the focus,
visual immersion suggests a state and not a variable aspect of the immersive experience.
Therefore, the concept of visual immersion in this study was recast as visual immersiveness.
Treating it as an affordance of display technology allows it to be varied at different levels and
systematically study its impact.
Figure 3: Display attributes related to visual immersion.
2.2.2 Psychological Immersion
Psychological immersion deals with the aspects of engulfing a user in content which
pertained to the user’s ability to experience such sensations. Whereas perceptual immersion
was based on the use of technology to simulate an experience, psychological immersion dealt
Visual
Immersion
Display Attributes
Field
of
View
Field of
Regard
Stereoscopy Head-Based
Rendering Display
Size Display
Resolution
Vividness Refresh
Rate
Frame
Rate
Realism of
Lighting
20
with playing off of a user’s mental ability to be immersed, i.e. a user’s emotional response. In
some regard, perceptual and psychological immersion work hand-in-hand. This was not
always the case though as other media studies have proven that immersion could occur
without the use of a perceptual medium, as in the case of reading books. When reading
books, individuals have claimed to be immersed in the storyline and yet no imagery, audio,
tactile, or olfactory mechanisms were used to create such an experience (Ryan, 1999). This
suggested that individuals were capable of experiencing immersion without the need of
sensory input from outside sources. The issue was that not all users were easily immersed in
different mediums. It has been argued that in many cases this was mislabeling of other
psychological concepts including imagination (Baños, et al., 2008) and narrative
transportation (Green, Brock, & Kaufman, 2004). Aside from the issues in distinguishing
psychological immersion from other psychological concepts, this was one of the larger
distinctions between perceptual and psychological immersion.
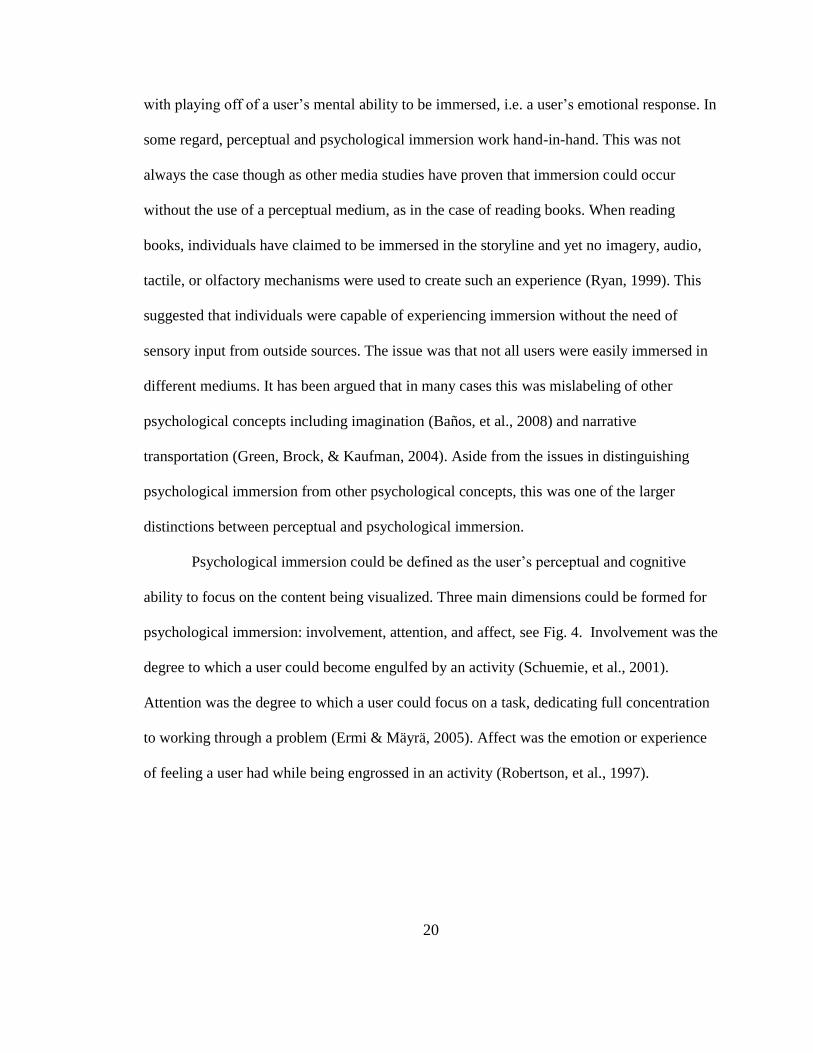
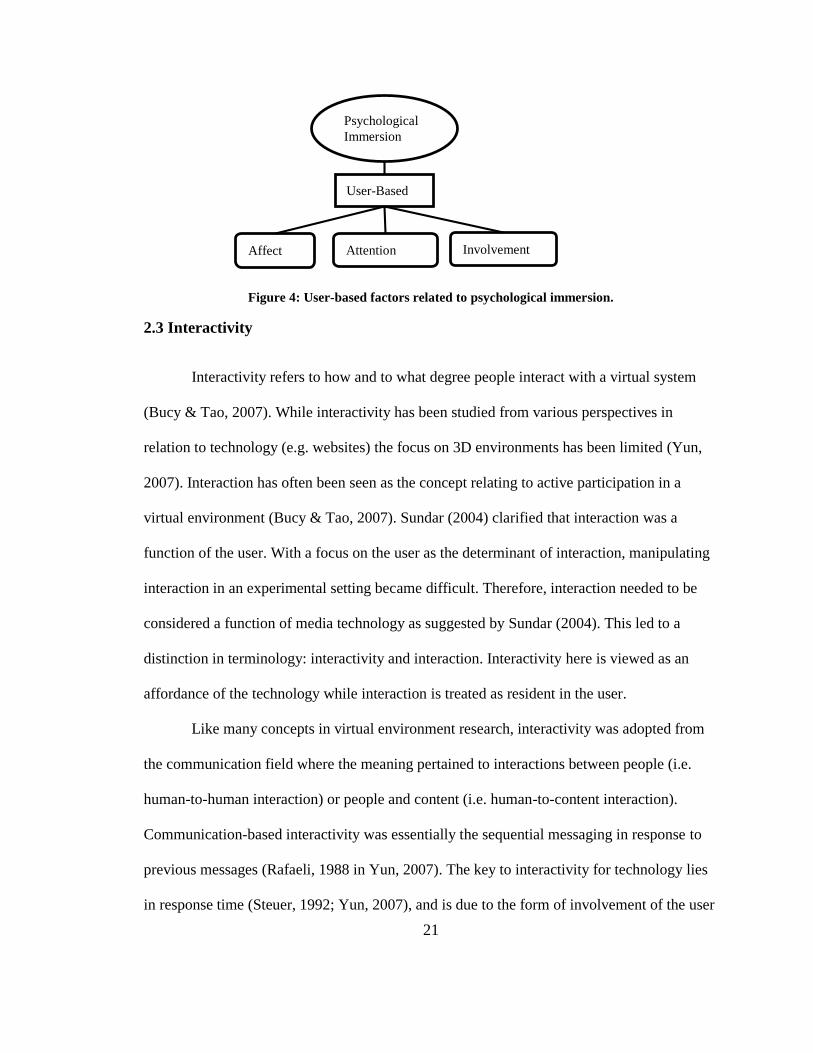
Psychological immersion could be defined as the user’s perceptual and cognitive
ability to focus on the content being visualized. Three main dimensions could be formed for
psychological immersion: involvement, attention, and affect, see Fig. 4. Involvement was the
degree to which a user could become engulfed by an activity (Schuemie, et al., 2001).
Attention was the degree to which a user could focus on a task, dedicating full concentration
to working through a problem (Ermi & Mäyrä, 2005). Affect was the emotion or experience
of feeling a user had while being engrossed in an activity (Robertson, et al., 1997).
21
Figure 4: User-based factors related to psychological immersion.
2.3 Interactivity
Interactivity refers to how and to what degree people interact with a virtual system
(Bucy & Tao, 2007). While interactivity has been studied from various perspectives in
relation to technology (e.g. websites) the focus on 3D environments has been limited (Yun,
2007). Interaction has often been seen as the concept relating to active participation in a
virtual environment (Bucy & Tao, 2007). Sundar (2004) clarified that interaction was a
function of the user. With a focus on the user as the determinant of interaction, manipulating
interaction in an experimental setting became difficult. Therefore, interaction needed to be
considered a function of media technology as suggested by Sundar (2004). This led to a
distinction in terminology: interactivity and interaction. Interactivity here is viewed as an
affordance of the technology while interaction is treated as resident in the user.
Like many concepts in virtual environment research, interactivity was adopted from
the communication field where the meaning pertained to interactions between people (i.e.
human-to-human interaction) or people and content (i.e. human-to-content interaction).
Communication-based interactivity was essentially the sequential messaging in response to
previous messages (Rafaeli, 1988 in Yun, 2007). The key to interactivity for technology lies
in response time (Steuer, 1992; Yun, 2007), and is due to the form of involvement of the user
Psychological
Immersion
Involvement Attention Affect
User-Based

22
– active or passive. Andersen (1997) in Yun (2007) indicated this had to do with the level of
control over the interaction that was necessary to become a part of the content.
2.3.1 Navigation as a type of interaction
Interactivity has been widely accepted as a form of communication with a synthetic
environment (Bucy & Tao, 2007). In virtual environment research, interactivity is heavily
focused on the technological aspects of the virtual environment system. Bowman and Hodges
(1999) classified interaction in terms of technology. Steuer (1992) generated a list of three
categories based on their research where interactivity consisted of: a focus on speed – the rate
input could be assimilated (i.e. Response time), a focus on range - the number of possible
actions at a given time, and a focus on mapping - the ability of a system to map its controls to
changes in a natural/predictable manner.
Bowman, Kruijff, LaViola Jr., and Poupyrev (2005) later defined interactivity in
terms of technology, specifically input devices for particular types of interaction. Bowman et
al. (2005) divided interaction into two main components: manipulation/selection and
navigation. The operationalization of manipulation/selection encompassed three basic
actions: selection, manipulation, and release. These three actions could be performed with
objects within a 3D virtual environment. Within navigation, Bowman et al. (2005) added that
travel and wayfinding were essential parts of navigation. This led to the issue of
differentiating interactivity from navigation. Sundar (2004) furthered this idea of interactivity
as different from navigation but, only so far that navigation was considered a type of
interactivity. In considering navigation as part of interactivity, the operationalizations of
travel and wayfinding also became a sub-component of interactivity.
23
Navigation presented similar complications in its definition as interactivity in that it
was commonly associated with the user rather than the technology (Balakrishnan & Sundar,
2011). Balakrishnan and Sundar (2011) re-conceptualized it as navigability, i.e. the
affordance for navigation thus recasting it from a user-centric to technology-centric
perspective. In their study, navigability was further broken down into two main technology-
based aspects: traversability and guidance, which enabled travel and wayfinding respectively.
Balakrishnan and Sundar (2011) explained that “traversability is defined as the affordance to
move large distances in a virtual environment as a function of (1) environmental constraints
and (2) steering control” (p. 164). It was found that steering control had significant influence
on spatial presence. Similarly, this study looked at the technology aspects of navigation to
represent interactivity with a specific focus on traversability.
2.3.2 Interactivity & immersion as defining characteristics of VR
Several studies have suggested that both immersion and interactivity were crucial to
spatial performance measures and user experience (Bowman & McMahan, 2007; Steuer,
1992; Zeltzer, 1992). Although no direct connection between immersion and interaction had
been identified, Zeltzer (1992) generated a taxonomy for exploring virtual reality systems
consisting of three characteristics: autonomy, interaction, and presence. As with many
studies, the term ‘presence’ was used by Zeltzer (1992) in an encompassing manner. As
Schuemie, Van Der Straaten, Krijn, & Van Der Mast (2001) stated, Zeltzer’s ‘presence’ was
more closely related to immersion as defined by Slater and Wilbur (1997). Therein, the
taxonomy for exploring virtual reality systems could be recharacterized as: autonomy,
interaction, and immersion. This showed the importance of considering immersion and
interactivity as viable virtual environment attributes which, could be implemented to
24
influence the relationship with spatial performance measures and user experience. Following
the same idea of exploring virtual reality systems, the same taxonomy could be considered as
immersiveness and interactivity. With this model for exploring virtual reality systems, the
impact on user experience measures, spatial presence in particular, could be examined.
Another more direct connection for looking at 3D virtual enviornment attributes from
the concepts of immersion and interaction came from the “human-VE interaction loop”
model developed by Bowman and McMahan (2007). In this loop, a model was sent to the
computer where rendering software delivered it to display devices for a user to view. The
user then utilized an input device sending a message back to the computer system to update
the rendering software. In considering this model, immersion and interaction were central to
user participation. Despite the inclusion of some form of interaction in their model, the
concept of interactivity was intentionally left out of the Bowman and McMahan (2007)
analysis. While their findings provided great insight into the relationship between virtual
environments attributes of immersion on spatial performance measures, it did not consider
interactivity as having any direct contribution to the overall outcome.
2.4 Spatial Experience
Spatial experience comprised of numerous concepts related to an individual’s
experiences in a space; regardless of whether it was simulated or real. In this section, key
aspects of spatial experiences in virtual reality environments are identified and discussed
in-depth. Spatial experience in virtual reality specifically pertains to an individual feeling
present within a space. This feeling of presence within a space comes from several
factors including the illusion of self-motion, vection, and the perception the simulated
25
space as ‘real’ known as reality judgment. For spatial experience, three main concepts are
discussed: spatial presence, vection and reality judgment.
2.4.1 Spatial Presence
Presence is a complex concept representing “the sense of being in a place” (Schubert,
Friedmann, & Regenbrecht, 1999a). Often considered a multidimensional variable
comprising of several subjective factors, there are numerous types of presence: telepresence,
spatial presence, social, mediated presence, and so on (IJsselsteijn, de Ridder, Freeman, &
Avons, 2000).
Spatial presence has been related to the larger concept of presence in a number of
ways. Schubert et al. (1999b) explained a basic model of presence which consisted of two
main components: spatial presence and involvement. The idea behind this basic model
stemmed from previous studies which aimed to identify presence based on key factors which
Schubert et al. (1999b) deemed necessary to distinguish: spatial presence and attentional
allocation.
Wirth et al. (2007) explained that “spatial presence is a binary experience, during
which perceived self-location and, in most cases, perceived action possibilities were
connected to a mediated spatial environment, and mental capacities are bound by the mediate
environment instead of reality” (p. 497). Prior work by Vorderer et al. (2004), a precursor to
the Wirth et al. (2007) work, defined spatial presence similarly in their development of the
MEC spatial presence questionnaire (MEC-SPQ). In their model for setting up the
questionnaire, Vorderer et al. (2004) defined spatial presence as a construct consisting of two
parts: self-location and possible action. These two parts were the result of both attention
allocation and the spatial situation model (SSM). In addition, two other factors were
26
included: cognitive involvement and suspension of disbelief. Combined, these factors could
generate spatial presence. Wirth et al. (2007) used this same idea in the development of their
model of spatial presence. In addition to including the major factors from Vorderer et al.
(2004)’s model, location of the primary ego reference frames (PERF) was introduced as the
explanatory mechanism for how the SSM facilitates the experience of spatial presence.
The spatial situation model was a mental model or representation which a person
forms of a space. This model was always in complete form though it was continually updated
(Wirth, et al., 2007). The model was highly dependent on user attention. Without attention,
the spatial situation model could not occur and spatial presence then becomes highly
unlikely. In addition to attention, the spatial situation model was also dependent on spatial
cues. These cues were used to not only grab a user’s attention but to also provide a basis for
the formation of a mental representation of the space. Once a user established a spatial
situation model, he/she then compared it to the mediated space to gain confirmation of the
PERF. This confirmation that a user’s PERF fit the spatial situation model was what
increased the perception of spatial presence. Wirth et al. (2007) presented a two level model
of spatial presence formation. The first step was based on attention and how it led to the
development of the spatial situation model. The second step was when confirmation of a
user’s PERF occurred, inducing a sense of spatial presence. Wirth et al. (2007) also noted
that several media factors and user differences may impede the process. Contrary to the
Wirth et al. (2007)’s model of spatial presence, Balakrishnan and Sundar (2011) found that
for virtual environments the formation of spatial presence can occur without the formation of
a spatial situation model. This occurred through the use of a bottom-up process as opposed to
27
Wirth et al. (2007)’s top-down process, suggesting that different mechanisms may impact
spatial presence.
Two related concepts, vection and reality judgment, can also aid in indirectly
assessing spatial presence. Vection, the perceptual illusion of self-motion, occurs when an
individual feels present and moving within a simulated space. This indicates how vection
indirectly measures presence. The other concept, reality judgment, is the acceptance of what
is being perceived as ‘real’. When an individual feels present within a simulated space, the
simulated space should become easier to accept as real. This illustrates how reality judgment
can also indirectly measure spatial presence.
2.4.2 Vection
Vection is the perception that motion occurs around a stationary observer,
otherwise referred to as illusory motion or self-motion. To gain a sense of self-motion,
typically vestibular cues were considered but, they have also proven to not be completely
necessary as both visual and auditory stimuli have reported instances of inducing vection
(Larsson, Västfjäll, & Kleiner, 2004). The instances of self-motion occurring from visual
stimuli suggested a link between vection and presence, particularly spatial presence
(Schulte-Pelkum, Riecke, von der Heyde, & Bülthoff, 2003). When an observer feels
present in a space, the potential for self-motion has been reported as higher, increasing
the sense of vection (Schulte-Pelkum, et al., 2003). The link between vection and spatial
presence has been explained in two ways. First, when an observer felt present in a space,
he/she was able to use that space as a ‘stable reference frame’ as would normally happen
in the real-world (Riecke, Schulte-Pelkum, Avraamides, von der Heyde, & Bülthoff,
28
2005). Essentially, an observer needed to overcome a conflict between sensory
information received from a simulated space while remaining physically stationary
(Riecke, 2011). To account for this conflict, the simulated space should be able to
increase the observer’s perception of being in the space to make the visual cues of motion
more ‘believable’.
Second, vection was impacted by similar display parameters such as field of view
and content of a visual stimulus with the exception of stereo (IJsselsteijn, de Ridder,
Freeman, Avons, & Bouwhuis, 2001). The added perception of depth related to
stereoscopic imagery had not been found to consistently impact vection (IJsselsteijn, et
al., 2001) but, had been considered to help facilitate self-motion through depth cues
(Riecke, 2011).
Studies on self-motion have focused on highly controlled experimental stimuli
which, allowed for precise settings on velocities and acceleration effects (Riecke, et al.,
2005). In these experimental settings, vection had typically been measured through either
self-report items (IJsselsteijn, et al., 2001) or direction indication exercises such as
pointing tasks (Riecke, et al., 2005).
2.4.3 Reality Judgment
In virtual environments, users are expected to accept what they perceive as real
(Baños, et al., 1999). Reality judgment was the outcome of a number of variables that
users collectively perceived as real. Baños et al. (2000) noted that reality judgment is not
about “sensorial or pictorial realism” (p. 328). Instead, reality judgment was more about
29
an individual’s “willingness to interpret virtual experiences as if they were veridical”
(Baños, et al., 2000, p. 328).
Presence has been considered a related but not always necessary factor in
establishing higher degrees of reality judgment by users (Baños, et al., 2000). The
relationship between reality and judgment could be linked through the concept of
absorption. When an individual became so absorbed in a virtual environment, he/she
became more present in the virtual space allowing the user to focus his/her perceptions on
the simulation as if it were real. The user’s focus on his/her perceptions from the
simulation then led to higher degrees of reality judgment. Reality judgment was
evaluated primarily through self-report items after being exposed to a stimulus (Baños, et
al., 1999).
2.4.4 Immersion and Presence
When considering the concept of immersion, it was also important to consider the
concept of presence. Presence and immersion have had a fairly long history of being
mislabeled (Schubert, Friedmann, & Regenbrecht, 1999a). Many followed the logical
distinction made by (Slater & Wilbur, 1997) where presence represented the subjective
psychological feeling of “being in a space” and immersion represented the objective
technology which allowed for presence to occur. Baños et al. (2004) agreed with the original
statement made by Schubert, Friedman, and Regenbrecht (2001) and pointed out it would be
“misleading to assume a one-to-one relationship between immersion and presence” (p. 735).
As Schubert et al. (2001) further explained this idea being due to “cognitive processes
leading from stimuli perception to presence” (p. 267). This idea by Schubert et al. (2001) sets
30
up how the relationship between immersion and presence should be considered, with
immersion influencing presence. To better gauge how this influence occurs, it was important
to consider the theoretical links between immersion and presence.
At the theoretical level, presence and immersion were related through two
different concepts: involvement and engagement. Schubert et al. (1999a) found that
involvement linked to presence through attention and awareness processes. Sherman and
Craig (2003) in Gorini et al. (2011) furthered the notion of the relationship “narratives are
responsible for mental immersion, through which users can be deeply engaged and
involved in the experience, increasing their sense of mediated presence” (p. 100). From
the narrative stemmed motivation which, became the causal factor between immersion
and engagement. From this perspective, the relationship between presence and immersion
could be seen as a product of other mediating variables, specifically those of involvement
and engagement. This study looked at the influence of immersion on presence and,
explored the theoretical relationship between immersion and presence through mediating
variables.
Thinking first about immersion and presence and the initial exploration, each
construct was defined in terms of less abstract concepts. Immersion was defined as a
dichotomy consisting of psychological and perceptual immersion (Sherman & Craig,
2003). Presence was defined as consisting of a spatial constructive and attentional
allocation (Schubert, Friedmann, & Regenbrecht, 1999a). From these definitions, the
distinction between the two constructs could be derived. Both perceptual and
psychological immersion were each split into different dimensions: sensory dimensions
and involvement, attention, and affect dimensions respectively. From this split of the two
31
types of immersion, the use of narrative was found to increase motivation which
establishes engagement. For presence, attentional allocation was found to be formed from
involvement which establishes a sense of presence (Lessiter, Freeman, Keogh, &
Davidoff, 2001). These two findings for each of the concepts called for a need to look at
the relationship between engagement and involvement.
Wirth et al. (2007) explained involvement as being a “motivation-related meta-
concept” containing numerous forms of interaction with a simulated environment.
Involvement itself was considered the “active and intensive processing of the mediated
world” (Wirth, et al., 2007, p. 513). The ‘intensive processing’ was what Wirth et al.
(2007) used to distinguish involvement from spatial presence. Intensive processing
referred to the level of information processing occurring: thinking, interpreting,
elaborating, appraising and assigning relevance to content within the media (Wirth,
2006). Schubert et al. (1999a) further added to the definition of involvement by
suggesting it was linked to both awareness and attention processes of users thus, adding
to the idea of active information processing. Witmer, Jerome, and Singer (2005)
supported this view by stating “involvement is a psychological state experience as a
consequence of focusing one’s mental energy and attention on a coherent set of stimuli or
meaningfully related activities or events” (p. 299). In all of the definitions, no direct
relationship existed between involvement and immersion, only indirect ones. As such, to
see the connection back to immersion, a similarly related concept, engagement, should be
defined differently.
32
Dede (2009) suggested that immersion influenced engagement in virtual
environments. This inferred a relationship between immersion and engagement. Sherman
and Craig (2003) further noted the relationship between immersion and engagement by
stating that immersion indicated a level of engagement while engagement indicated the
success of communicating the virtual environment to the user (p. 383). Frequently
referred to in education, “engagement predicts important outcomes (e.g. learning,
development) and because it reveals underlying motivation” (Reeve, Jang, Carrell, Jeon,
& Barch, 2004, p. 148). Also, having a link to motivation suggested a possible
relationship between engagement and involvement. Lessiter et al. (2001) suggested
engagement as a measure of both a user’s interest and involvement in the virtual
environment’s content along with the user’s general enjoyment of the experience (p.
293). This understanding of engagement inferred that involvement was necessary for
engagement to occur. Further presenting this line of thinking, Reeve et al. (2004)
explained “engagement refers to the behavioral intensity and emotional quality of a
person’s active involvement during a task” (p. 147). Considering the relationship between
engagement and involvement as one leading to the other, it was possible to think of
involvement being nested within engagement. As involvement was found to be nested in
engagement with user interest, the link between presence and immersion was seen.
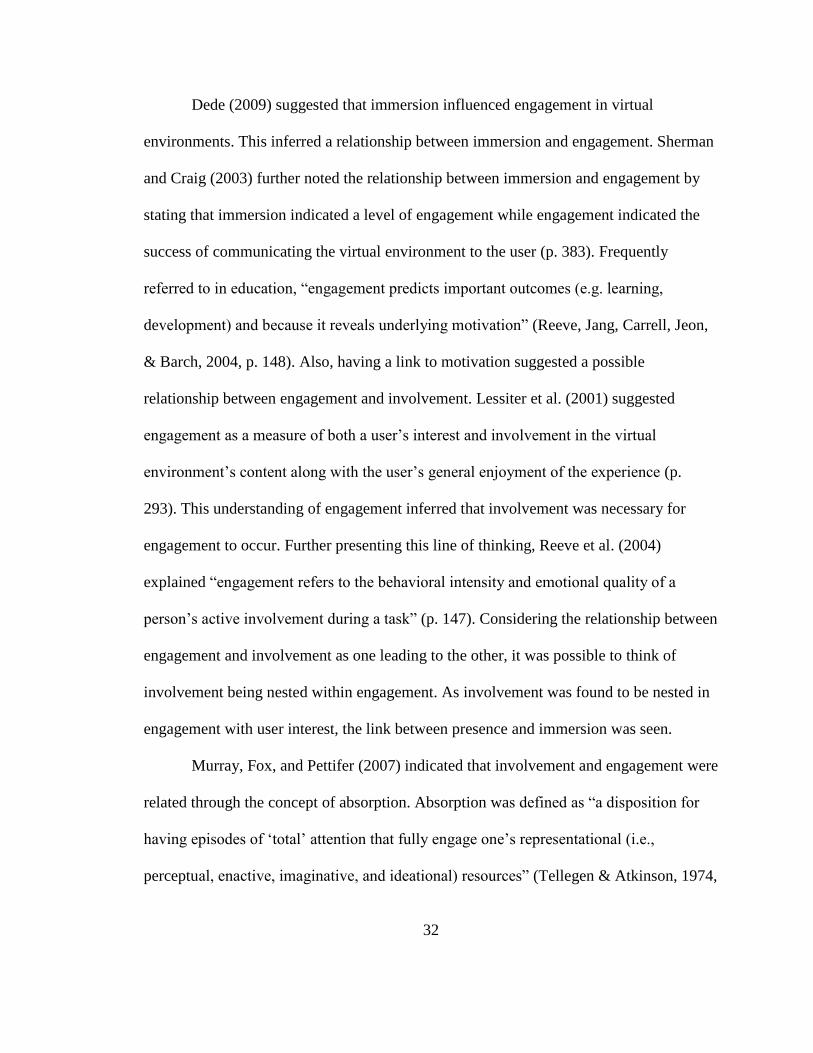
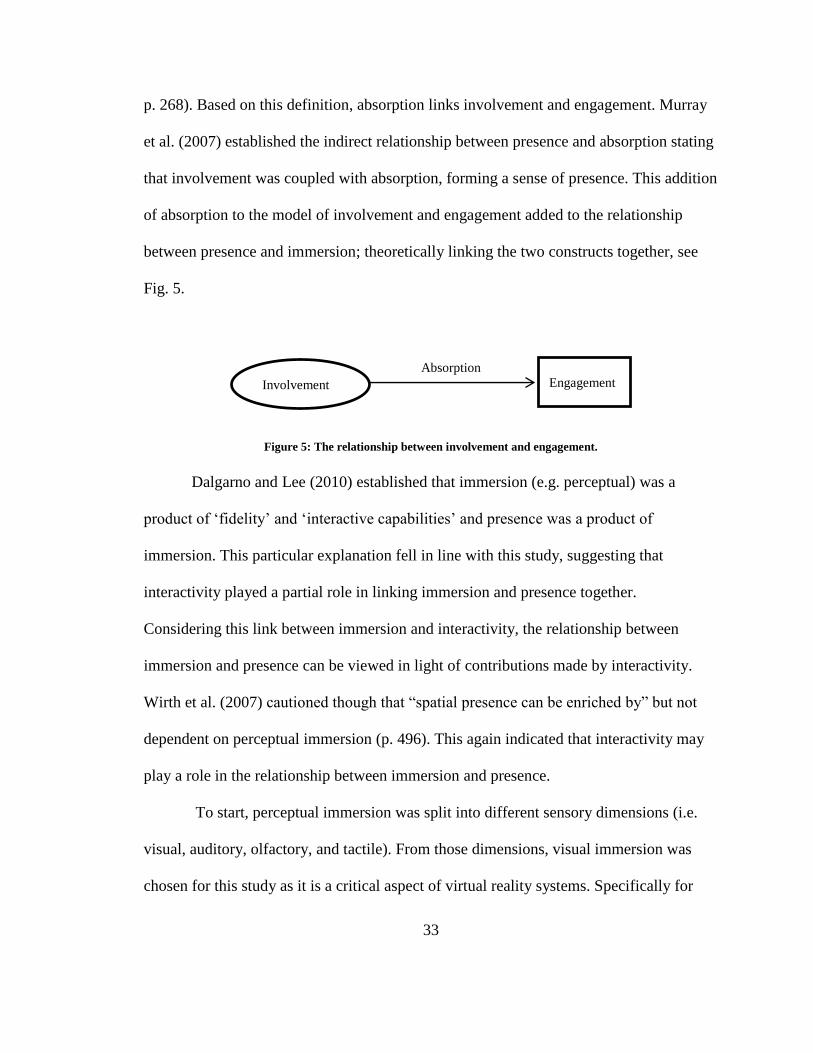
Murray, Fox, and Pettifer (2007) indicated that involvement and engagement were
related through the concept of absorption. Absorption was defined as “a disposition for
having episodes of ‘total’ attention that fully engage one’s representational (i.e.,
perceptual, enactive, imaginative, and ideational) resources” (Tellegen & Atkinson, 1974,
33
p. 268). Based on this definition, absorption links involvement and engagement. Murray
et al. (2007) established the indirect relationship between presence and absorption stating
that involvement was coupled with absorption, forming a sense of presence. This addition
of absorption to the model of involvement and engagement added to the relationship
between presence and immersion; theoretically linking the two constructs together, see
Fig. 5.
Figure 5: The relationship between involvement and engagement.
Dalgarno and Lee (2010) established that immersion (e.g. perceptual) was a
product of ‘fidelity’ and ‘interactive capabilities’ and presence was a product of
immersion. This particular explanation fell in line with this study, suggesting that
interactivity played a partial role in linking immersion and presence together.
Considering this link between immersion and interactivity, the relationship between
immersion and presence can be viewed in light of contributions made by interactivity.
Wirth et al. (2007) cautioned though that “spatial presence can be enriched by” but not
dependent on perceptual immersion (p. 496). This again indicated that interactivity may
play a role in the relationship between immersion and presence.
To start, perceptual immersion was split into different sensory dimensions (i.e.
visual, auditory, olfactory, and tactile). From those dimensions, visual immersion was
chosen for this study as it is a critical aspect of virtual reality systems. Specifically for
Involvement Engagement Absorption
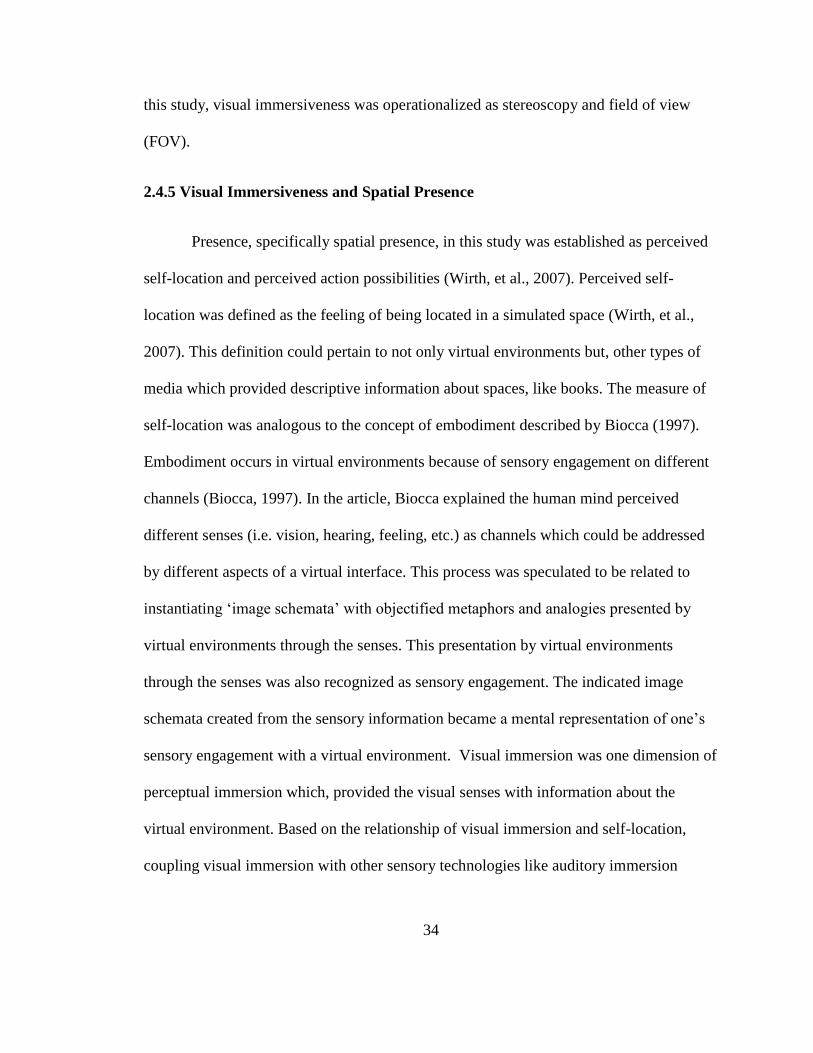
34
this study, visual immersiveness was operationalized as stereoscopy and field of view
(FOV).
2.4.5 Visual Immersiveness and Spatial Presence
Presence, specifically spatial presence, in this study was established as perceived
self-location and perceived action possibilities (Wirth, et al., 2007). Perceived self-
location was defined as the feeling of being located in a simulated space (Wirth, et al.,
2007). This definition could pertain to not only virtual environments but, other types of
media which provided descriptive information about spaces, like books. The measure of
self-location was analogous to the concept of embodiment described by Biocca (1997).
Embodiment occurs in virtual environments because of sensory engagement on different
channels (Biocca, 1997). In the article, Biocca explained the human mind perceived
different senses (i.e. vision, hearing, feeling, etc.) as channels which could be addressed
by different aspects of a virtual interface. This process was speculated to be related to
instantiating ‘image schemata’ with objectified metaphors and analogies presented by
virtual environments through the senses. This presentation by virtual environments
through the senses was also recognized as sensory engagement. The indicated image
schemata created from the sensory information became a mental representation of one’s
sensory engagement with a virtual environment. Visual immersion was one dimension of
perceptual immersion which, provided the visual senses with information about the
virtual environment. Based on the relationship of visual immersion and self-location,
coupling visual immersion with other sensory technologies like auditory immersion
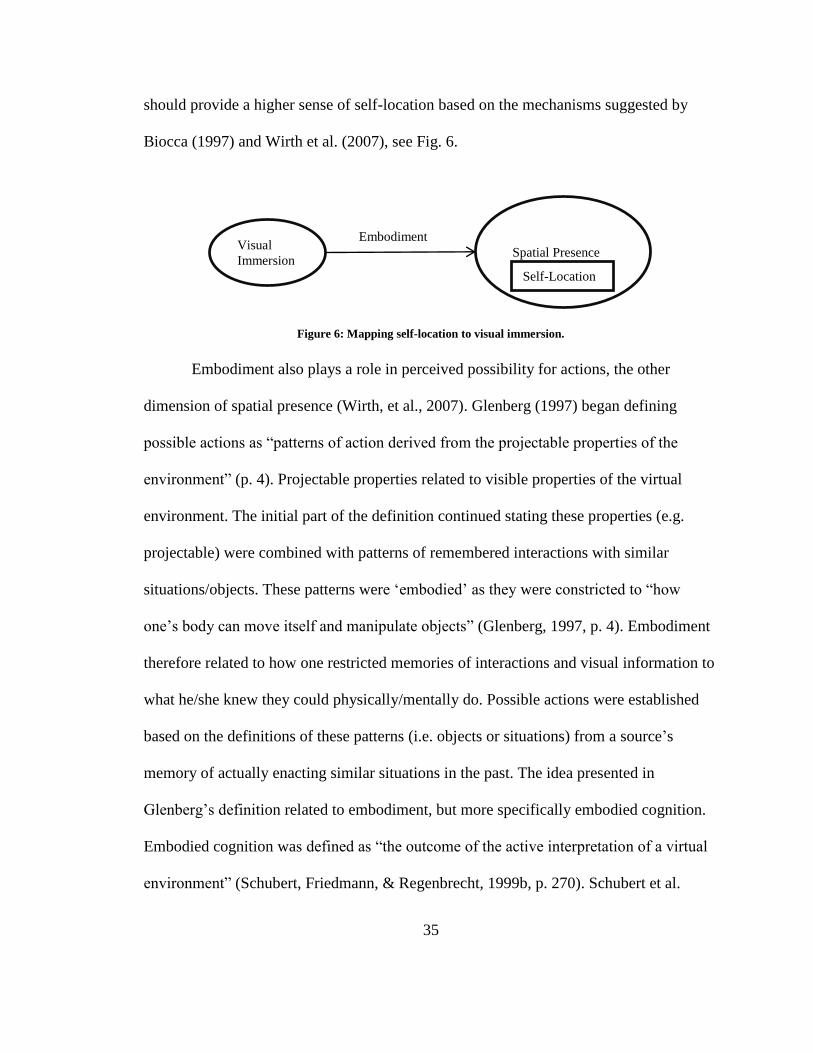
35
should provide a higher sense of self-location based on the mechanisms suggested by
Biocca (1997) and Wirth et al. (2007), see Fig. 6.
Figure 6: Mapping self-location to visual immersion.
Embodiment also plays a role in perceived possibility for actions, the other
dimension of spatial presence (Wirth, et al., 2007). Glenberg (1997) began defining
possible actions as “patterns of action derived from the projectable properties of the
environment” (p. 4). Projectable properties related to visible properties of the virtual
environment. The initial part of the definition continued stating these properties (e.g.
projectable) were combined with patterns of remembered interactions with similar
situations/objects. These patterns were ‘embodied’ as they were constricted to “how
one’s body can move itself and manipulate objects” (Glenberg, 1997, p. 4). Embodiment
therefore related to how one restricted memories of interactions and visual information to
what he/she knew they could physically/mentally do. Possible actions were established
based on the definitions of these patterns (i.e. objects or situations) from a source’s
memory of actually enacting similar situations in the past. The idea presented in
Glenberg’s definition related to embodiment, but more specifically embodied cognition.
Embodied cognition was defined as “the outcome of the active interpretation of a virtual
environment” (Schubert, Friedmann, & Regenbrecht, 1999b, p. 270). Schubert et al.
Spatial Presence Visual
Immersion
Self-Location
Embodiment
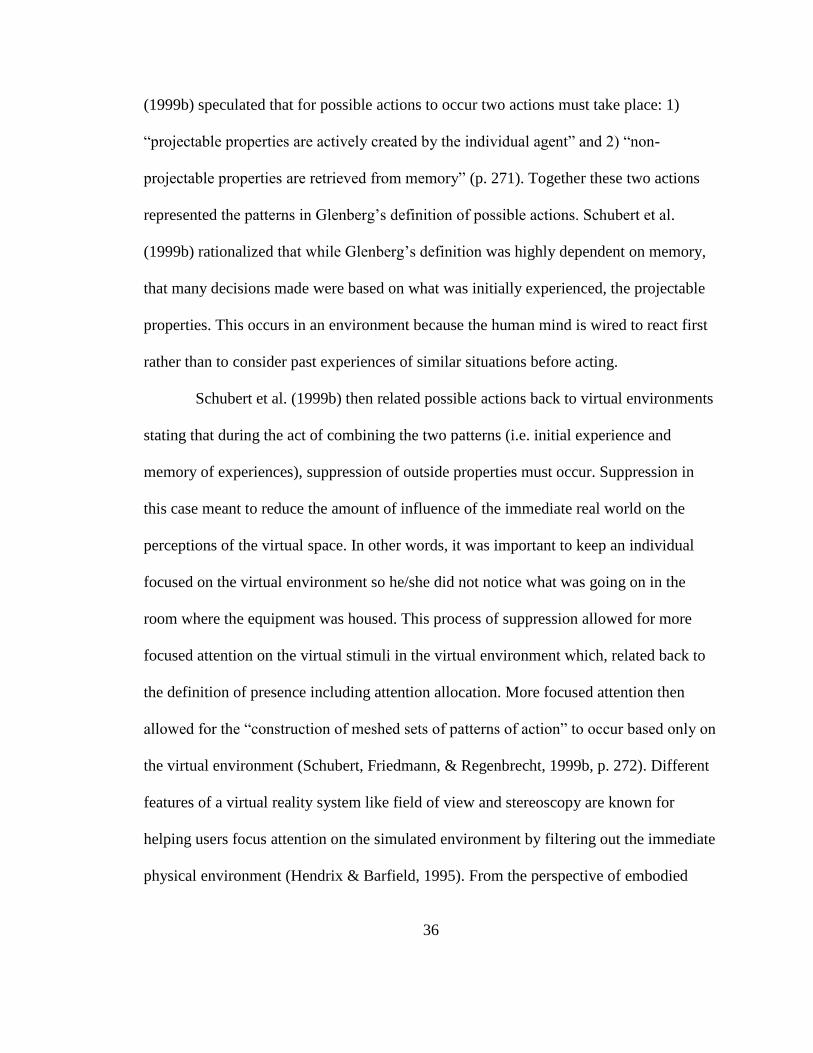
36
(1999b) speculated that for possible actions to occur two actions must take place: 1)
“projectable properties are actively created by the individual agent” and 2) “non-
projectable properties are retrieved from memory” (p. 271). Together these two actions
represented the patterns in Glenberg’s definition of possible actions. Schubert et al.
(1999b) rationalized that while Glenberg’s definition was highly dependent on memory,
that many decisions made were based on what was initially experienced, the projectable
properties. This occurs in an environment because the human mind is wired to react first
rather than to consider past experiences of similar situations before acting.
Schubert et al. (1999b) then related possible actions back to virtual environments
stating that during the act of combining the two patterns (i.e. initial experience and
memory of experiences), suppression of outside properties must occur. Suppression in
this case meant to reduce the amount of influence of the immediate real world on the
perceptions of the virtual space. In other words, it was important to keep an individual
focused on the virtual environment so he/she did not notice what was going on in the
room where the equipment was housed. This process of suppression allowed for more
focused attention on the virtual stimuli in the virtual environment which, related back to
the definition of presence including attention allocation. More focused attention then
allowed for the “construction of meshed sets of patterns of action” to occur based only on
the virtual environment (Schubert, Friedmann, & Regenbrecht, 1999b, p. 272). Different
features of a virtual reality system like field of view and stereoscopy are known for
helping users focus attention on the simulated environment by filtering out the immediate
physical environment (Hendrix & Barfield, 1995). From the perspective of embodied
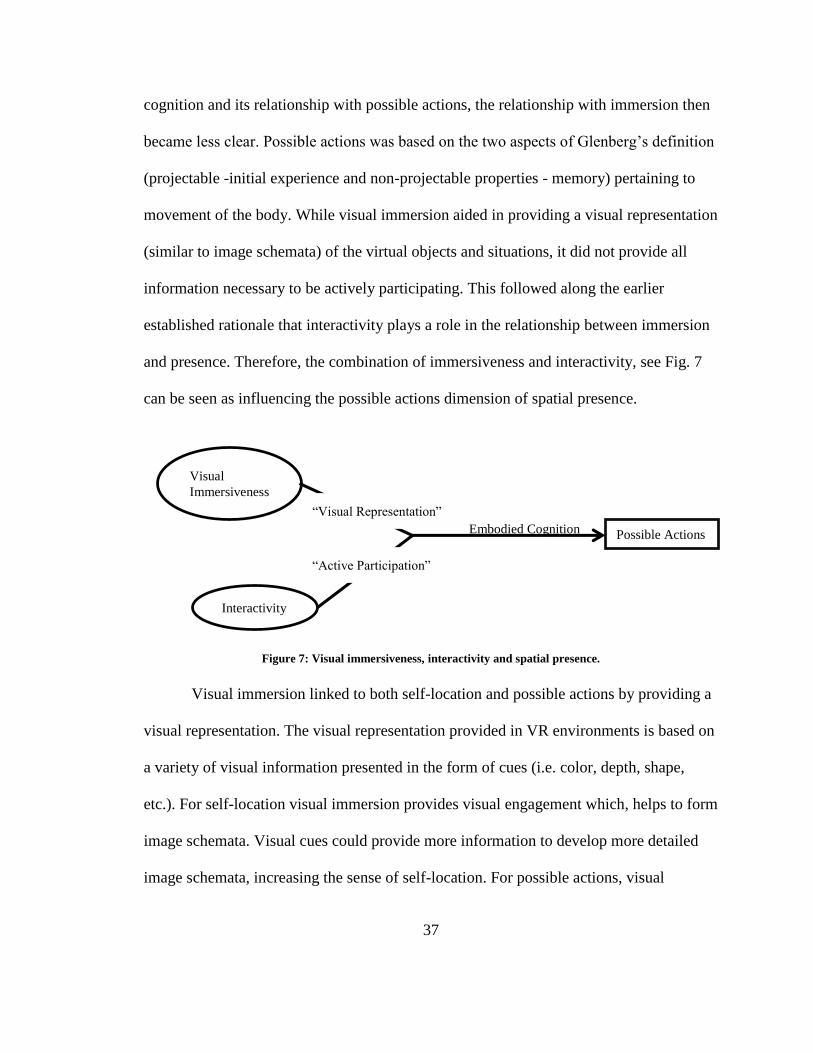
37
cognition and its relationship with possible actions, the relationship with immersion then
became less clear. Possible actions was based on the two aspects of Glenberg’s definition
(projectable -initial experience and non-projectable properties - memory) pertaining to
movement of the body. While visual immersion aided in providing a visual representation
(similar to image schemata) of the virtual objects and situations, it did not provide all
information necessary to be actively participating. This followed along the earlier
established rationale that interactivity plays a role in the relationship between immersion
and presence. Therefore, the combination of immersiveness and interactivity, see Fig. 7
can be seen as influencing the possible actions dimension of spatial presence.
Figure 7: Visual immersiveness, interactivity and spatial presence.
Visual immersion linked to both self-location and possible actions by providing a
visual representation. The visual representation provided in VR environments is based on
a variety of visual information presented in the form of cues (i.e. color, depth, shape,
etc.). For self-location visual immersion provides visual engagement which, helps to form
image schemata. Visual cues could provide more information to develop more detailed
image schemata, increasing the sense of self-location. For possible actions, visual
Possible Actions Embodied Cognition
Interactivity
Visual
Immersiveness
“Active Participation”
“Visual Representation”
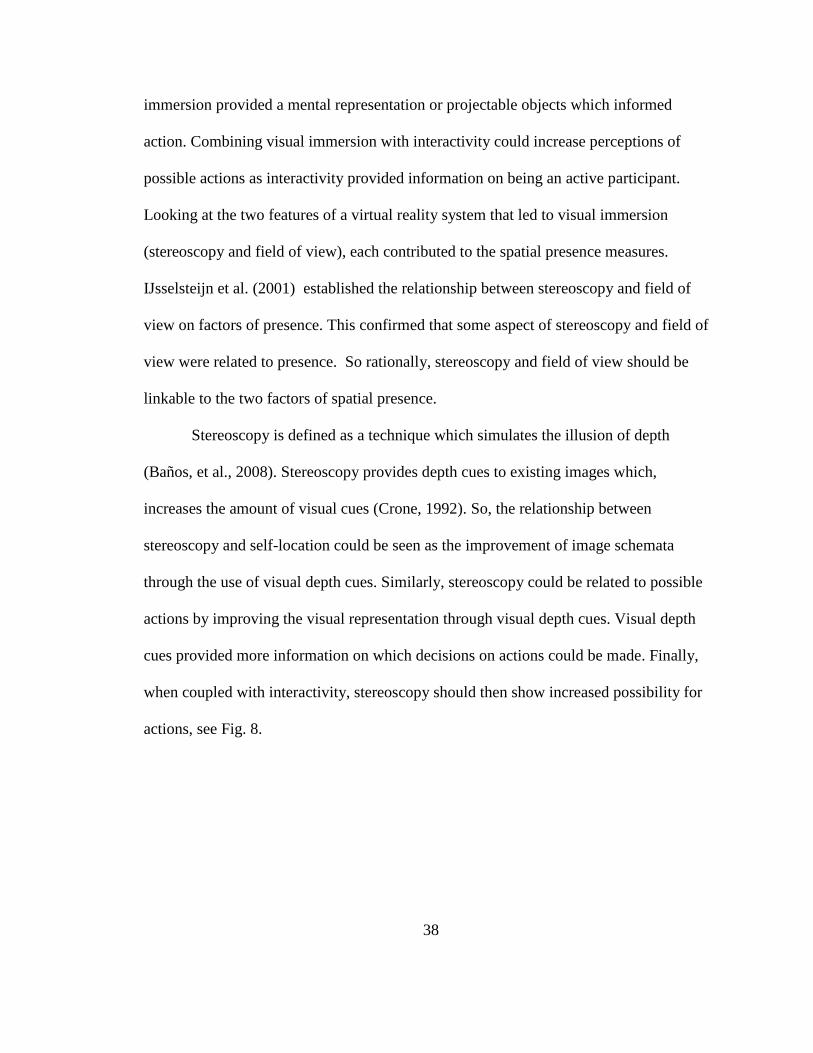
38
immersion provided a mental representation or projectable objects which informed
action. Combining visual immersion with interactivity could increase perceptions of
possible actions as interactivity provided information on being an active participant.
Looking at the two features of a virtual reality system that led to visual immersion
(stereoscopy and field of view), each contributed to the spatial presence measures.
IJsselsteijn et al. (2001) established the relationship between stereoscopy and field of
view on factors of presence. This confirmed that some aspect of stereoscopy and field of
view were related to presence. So rationally, stereoscopy and field of view should be
linkable to the two factors of spatial presence.
Stereoscopy is defined as a technique which simulates the illusion of depth
(Baños, et al., 2008). Stereoscopy provides depth cues to existing images which,
increases the amount of visual cues (Crone, 1992). So, the relationship between
stereoscopy and self-location could be seen as the improvement of image schemata
through the use of visual depth cues. Similarly, stereoscopy could be related to possible
actions by improving the visual representation through visual depth cues. Visual depth
cues provided more information on which decisions on actions could be made. Finally,
when coupled with interactivity, stereoscopy should then show increased possibility for
actions, see Fig. 8.
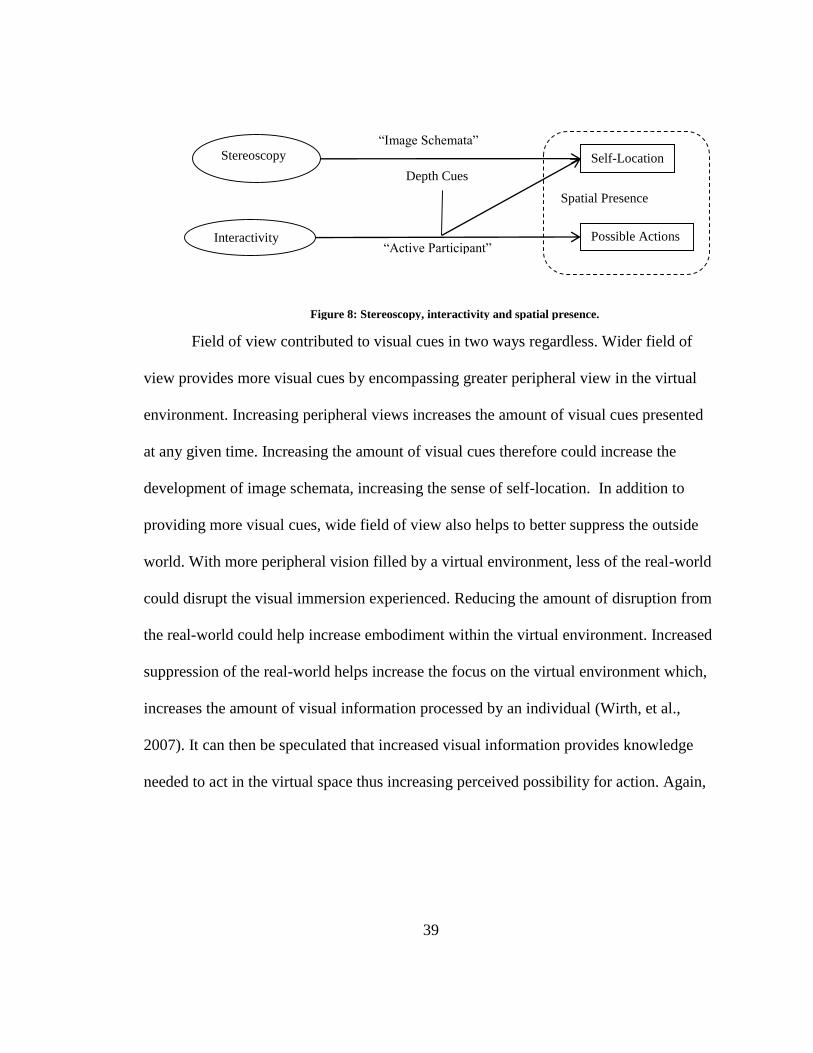
39
Field of view contributed to visual cues in two ways regardless. Wider field of
view provides more visual cues by encompassing greater peripheral view in the virtual
environment. Increasing peripheral views increases the amount of visual cues presented
at any given time. Increasing the amount of visual cues therefore could increase the
development of image schemata, increasing the sense of self-location. In addition to
providing more visual cues, wide field of view also helps to better suppress the outside
world. With more peripheral vision filled by a virtual environment, less of the real-world
could disrupt the visual immersion experienced. Reducing the amount of disruption from
the real-world could help increase embodiment within the virtual environment. Increased
suppression of the real-world helps increase the focus on the virtual environment which,
increases the amount of visual information processed by an individual (Wirth, et al.,
2007). It can then be speculated that increased visual information provides knowledge
needed to act in the virtual space thus increasing perceived possibility for action. Again,
Spatial Presence
Self-Location
Possible Actions
Stereoscopy
Depth Cues
Interactivity “Active Participant”
“Image Schemata”
Figure 8: Stereoscopy, interactivity and spatial presence.
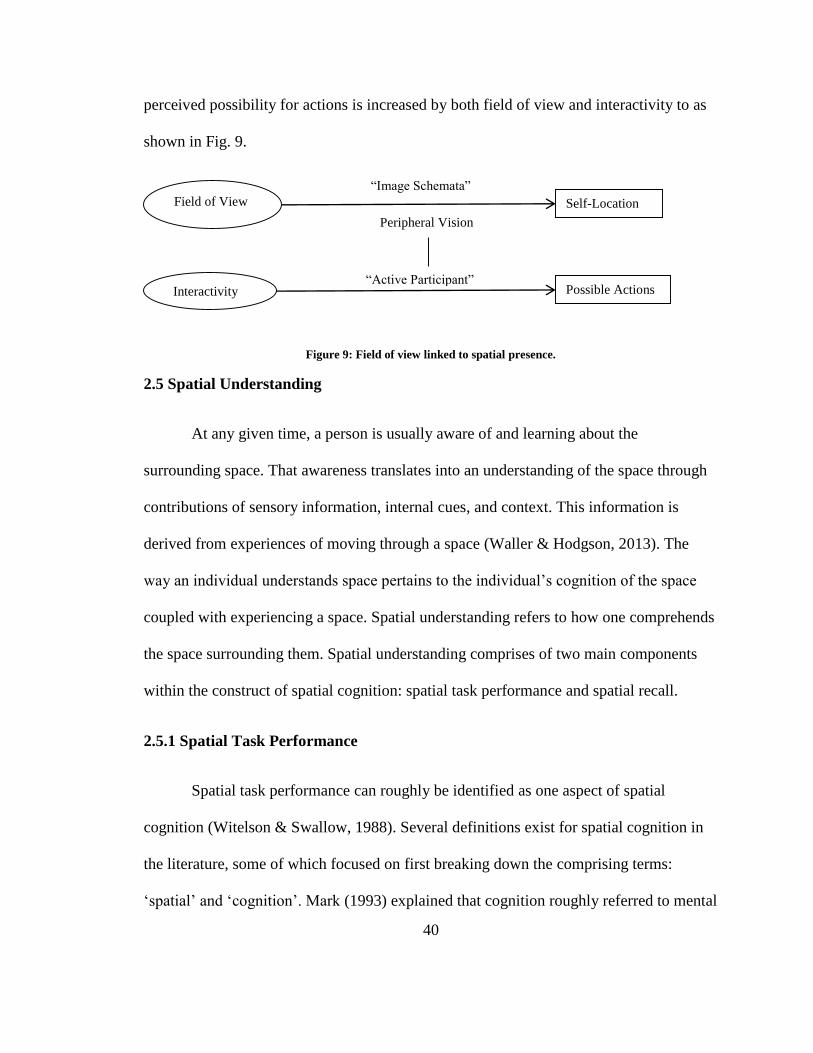
40
perceived possibility for actions is increased by both field of view and interactivity to as
shown in Fig. 9.
Figure 9: Field of view linked to spatial presence.
2.5 Spatial Understanding
At any given time, a person is usually aware of and learning about the
surrounding space. That awareness translates into an understanding of the space through
contributions of sensory information, internal cues, and context. This information is
derived from experiences of moving through a space (Waller & Hodgson, 2013). The
way an individual understands space pertains to the individual’s cognition of the space
coupled with experiencing a space. Spatial understanding refers to how one comprehends
the space surrounding them. Spatial understanding comprises of two main components
within the construct of spatial cognition: spatial task performance and spatial recall.
2.5.1 Spatial Task Performance
Spatial task performance can roughly be identified as one aspect of spatial
cognition (Witelson & Swallow, 1988). Several definitions exist for spatial cognition in
the literature, some of which focused on first breaking down the comprising terms:
‘spatial’ and ‘cognition’. Mark (1993) explained that cognition roughly referred to mental
Self-Location
Possible Actions
Field of View
Peripheral Vision
“Image Schemata”
Interactivity “Active Participant”
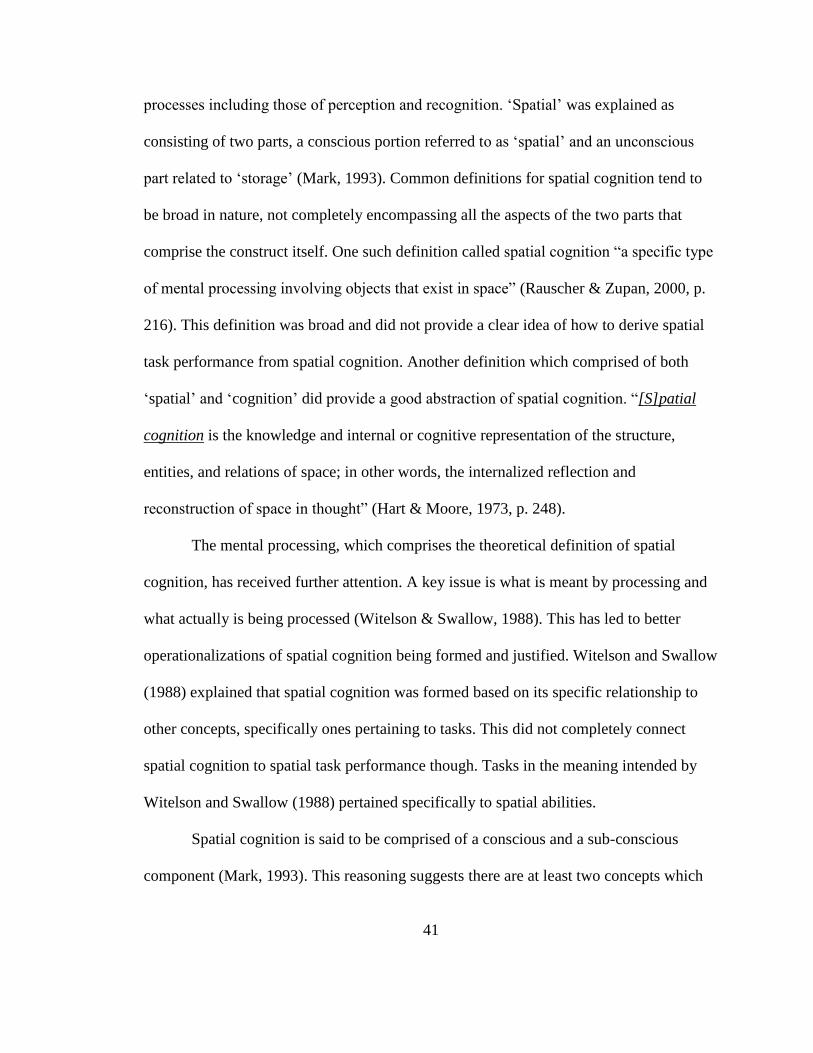
41
processes including those of perception and recognition. ‘Spatial’ was explained as
consisting of two parts, a conscious portion referred to as ‘spatial’ and an unconscious
part related to ‘storage’ (Mark, 1993). Common definitions for spatial cognition tend to
be broad in nature, not completely encompassing all the aspects of the two parts that
comprise the construct itself. One such definition called spatial cognition “a specific type
of mental processing involving objects that exist in space” (Rauscher & Zupan, 2000, p.
216). This definition was broad and did not provide a clear idea of how to derive spatial
task performance from spatial cognition. Another definition which comprised of both
‘spatial’ and ‘cognition’ did provide a good abstraction of spatial cognition. “[S]patial
cognition is the knowledge and internal or cognitive representation of the structure,
entities, and relations of space; in other words, the internalized reflection and
reconstruction of space in thought” (Hart & Moore, 1973, p. 248).
The mental processing, which comprises the theoretical definition of spatial
cognition, has received further attention. A key issue is what is meant by processing and
what actually is being processed (Witelson & Swallow, 1988). This has led to better
operationalizations of spatial cognition being formed and justified. Witelson and Swallow
(1988) explained that spatial cognition was formed based on its specific relationship to
other concepts, specifically ones pertaining to tasks. This did not completely connect
spatial cognition to spatial task performance though. Tasks in the meaning intended by
Witelson and Swallow (1988) pertained specifically to spatial abilities.
Spatial cognition is said to be comprised of a conscious and a sub-conscious
component (Mark, 1993). This reasoning suggests there are at least two concepts which
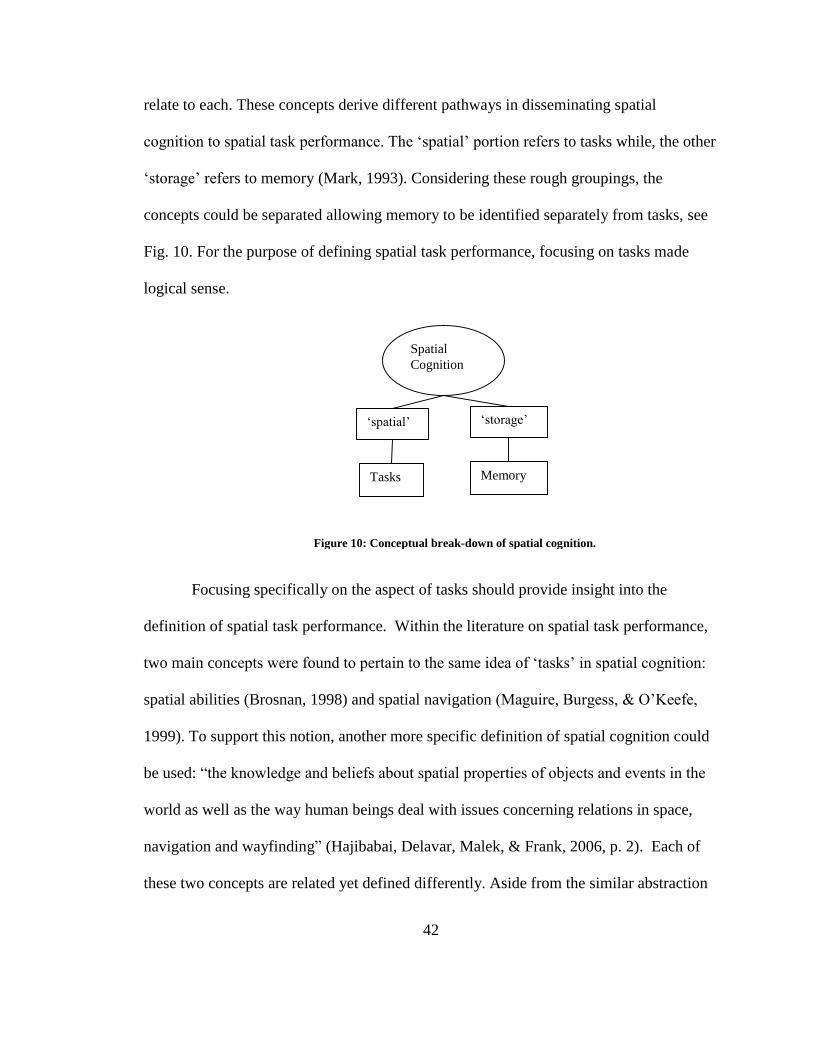
42
relate to each. These concepts derive different pathways in disseminating spatial
cognition to spatial task performance. The ‘spatial’ portion refers to tasks while, the other
‘storage’ refers to memory (Mark, 1993). Considering these rough groupings, the
concepts could be separated allowing memory to be identified separately from tasks, see
Fig. 10. For the purpose of defining spatial task performance, focusing on tasks made
logical sense.
Focusing specifically on the aspect of tasks should provide insight into the
definition of spatial task performance. Within the literature on spatial task performance,
two main concepts were found to pertain to the same idea of ‘tasks’ in spatial cognition:
spatial abilities (Brosnan, 1998) and spatial navigation (Maguire, Burgess, & O’Keefe,
1999). To support this notion, another more specific definition of spatial cognition could
be used: “the knowledge and beliefs about spatial properties of objects and events in the
world as well as the way human beings deal with issues concerning relations in space,
navigation and wayfinding” (Hajibabai, Delavar, Malek, & Frank, 2006, p. 2). Each of
these two concepts are related yet defined differently. Aside from the similar abstraction
Spatial
Cognition
‘storage’ ‘spatial’
Memory Tasks
Figure 10: Conceptual break-down of spatial cognition.
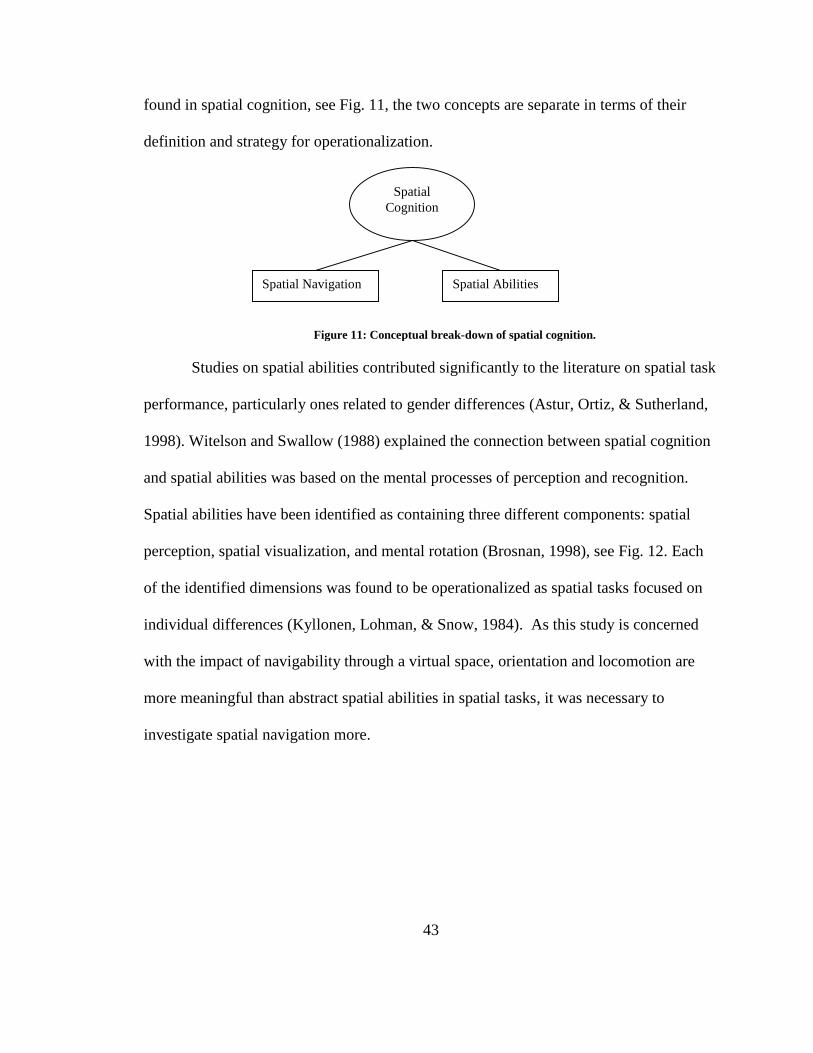
43
found in spatial cognition, see Fig. 11, the two concepts are separate in terms of their
definition and strategy for operationalization.
Studies on spatial abilities contributed significantly to the literature on spatial task
performance, particularly ones related to gender differences (Astur, Ortiz, & Sutherland,
1998). Witelson and Swallow (1988) explained the connection between spatial cognition
and spatial abilities was based on the mental processes of perception and recognition.
Spatial abilities have been identified as containing three different components: spatial
perception, spatial visualization, and mental rotation (Brosnan, 1998), see Fig. 12. Each
of the identified dimensions was found to be operationalized as spatial tasks focused on
individual differences (Kyllonen, Lohman, & Snow, 1984). As this study is concerned
with the impact of navigability through a virtual space, orientation and locomotion are
more meaningful than abstract spatial abilities in spatial tasks, it was necessary to
investigate spatial navigation more.
Spatial
Cognition
Spatial Navigation Spatial Abilities
Figure 11: Conceptual break-down of spatial cognition.
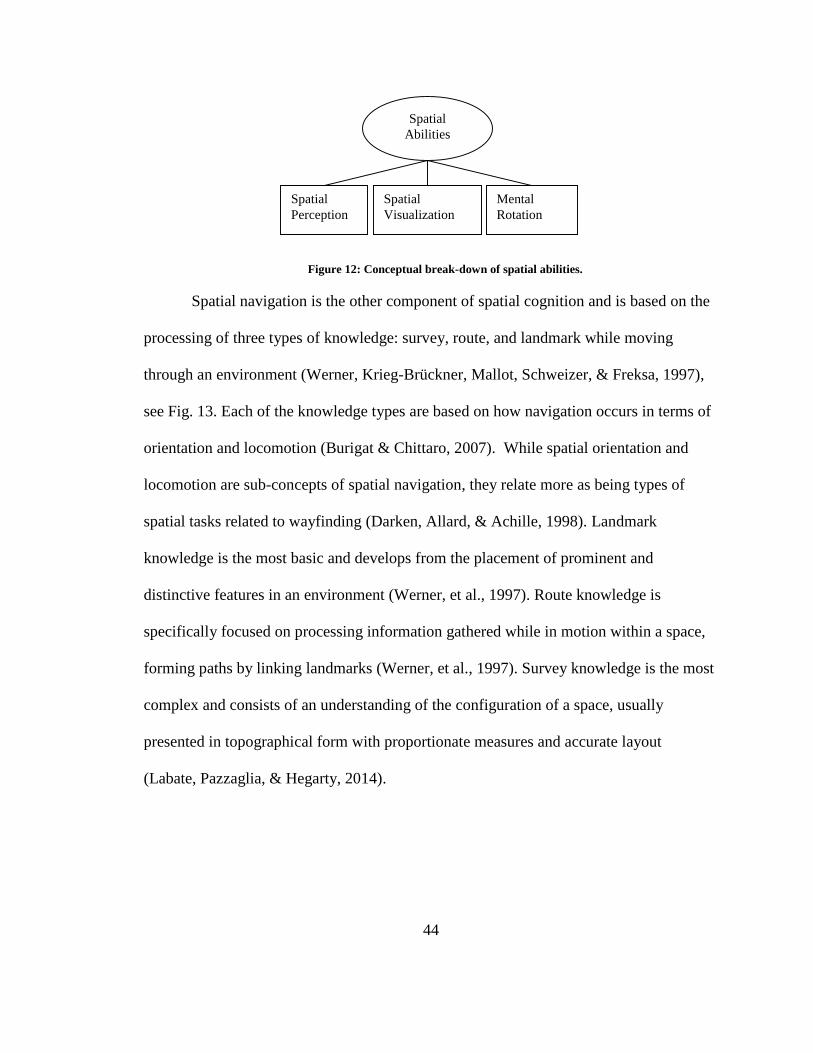
44
Spatial navigation is the other component of spatial cognition and is based on the
processing of three types of knowledge: survey, route, and landmark while moving
through an environment (Werner, Krieg-Brückner, Mallot, Schweizer, & Freksa, 1997),
see Fig. 13. Each of the knowledge types are based on how navigation occurs in terms of
orientation and locomotion (Burigat & Chittaro, 2007). While spatial orientation and
locomotion are sub-concepts of spatial navigation, they relate more as being types of
spatial tasks related to wayfinding (Darken, Allard, & Achille, 1998). Landmark
knowledge is the most basic and develops from the placement of prominent and
distinctive features in an environment (Werner, et al., 1997). Route knowledge is
specifically focused on processing information gathered while in motion within a space,
forming paths by linking landmarks (Werner, et al., 1997). Survey knowledge is the most
complex and consists of an understanding of the configuration of a space, usually
presented in topographical form with proportionate measures and accurate layout
(Labate, Pazzaglia, & Hegarty, 2014).
Figure 12: Conceptual break-down of spatial abilities.
Spatial
Abilities
Spatial
Perception
Spatial
Visualization
Mental
Rotation
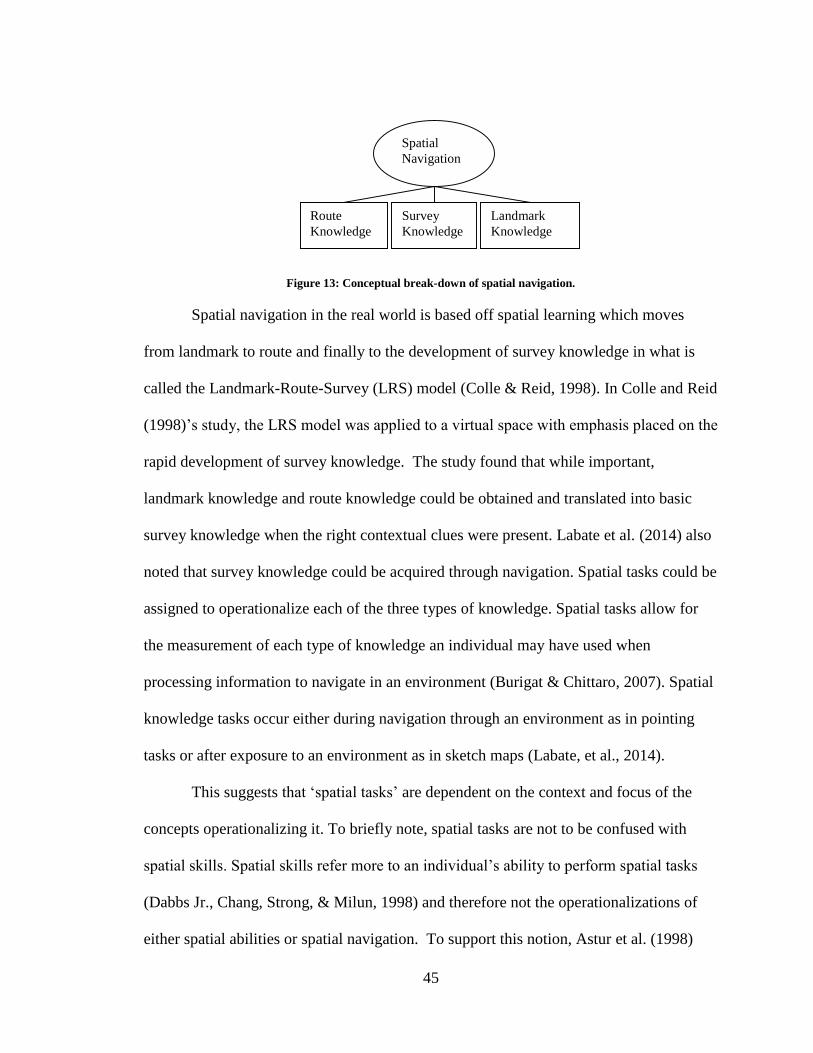
45
Figure 13: Conceptual break-down of spatial navigation.
Spatial navigation in the real world is based off spatial learning which moves
from landmark to route and finally to the development of survey knowledge in what is
called the Landmark-Route-Survey (LRS) model (Colle & Reid, 1998). In Colle and Reid
(1998)’s study, the LRS model was applied to a virtual space with emphasis placed on the
rapid development of survey knowledge. The study found that while important,
landmark knowledge and route knowledge could be obtained and translated into basic
survey knowledge when the right contextual clues were present. Labate et al. (2014) also
noted that survey knowledge could be acquired through navigation. Spatial tasks could be
assigned to operationalize each of the three types of knowledge. Spatial tasks allow for
the measurement of each type of knowledge an individual may have used when
processing information to navigate in an environment (Burigat & Chittaro, 2007). Spatial
knowledge tasks occur either during navigation through an environment as in pointing
tasks or after exposure to an environment as in sketch maps (Labate, et al., 2014).
This suggests that ‘spatial tasks’ are dependent on the context and focus of the
concepts operationalizing it. To briefly note, spatial tasks are not to be confused with
spatial skills. Spatial skills refer more to an individual’s ability to perform spatial tasks
(Dabbs Jr., Chang, Strong, & Milun, 1998) and therefore not the operationalizations of
either spatial abilities or spatial navigation. To support this notion, Astur et al. (1998)
Spatial
Navigation
Route
Knowledge
Landmark
Knowledge
Survey
Knowledge
46
identified several tests of abilities (perceiving spatial illusions, map learning, route
learning, pointing to places and judging water levels) which they indicated were often
“clumped together” as spatial tasks (p. 185). The phrase ‘spatial tasks’ alludes more to
what the definition of spatial task performance would encompass.
Looking closely at what was meant by ‘tasks’, the definition of spatial task
performance becomes even clearer. Wood (1986) developed a theoretical model of tasks
in terms of three main components which comprised all tasks: products, acts, and
information cues. From these components, tasks could be formed. Products are what the
tasks were set to produce whereas acts are the guidelines to create the products and
information cues represent the auxiliary information necessary to complete the guidelines
specified. The term ‘spatial’ relates back to the idea derived from spatial cognition and its
subsequent conceptual dimensions of spatial abilities and spatial navigation. Therefore,
the definition of spatial tasks became actions for goals based on specific mental
processing of information cues. This basic working definition did not identify whether
spatial abilities or spatial navigation was the main focus. Since the focus of this study is
on spatial navigation, it was logical to rework the theoretical definition to focus on spatial
navigation. Thus, the theoretical definition for spatial tasks became actions for
locomotion-focused goals based on specific mental processing of information cues.
From this stand point, spatial task performance could then be defined.
Performance is generally understood as an achievement or execution of an act. Based on
this addition, the theoretical definition of spatial task performance could now be given.
Spatial task performance is the achievement or execution of actions for locomotion-
focused tasks based on specific mental processing of information cues.
47
From this theoretical definition, an operational definition can be developed. The
theoretical definition of spatial task performance provides insight into how the concept
could be operationalized. The ‘achievement or execution of actions’ indicated a need to
measure completion whereas ‘specific mental processing of information cues’ indicated a
need to measure the use of information cues. Based on these two understandings, spatial
task performance comprised of two operationalizations: speed and accuracy. In addition
to being measurable dimensions of spatial task performance, the use of both speed and
accuracy were highly supported in the literature on spatial task performance (Henry &
Polys, 2010). One last set of dimensions to establish was how speed and accuracy are
operationalized. In many cases speed was straight forward, time to completion of a task.
Accuracy was less straight forward. Accuracy could mean one of two things, number of
correct steps taken to complete a task or the number of errors to complete a task.
Commonly, the number of errors made is used as the metric for accuracy (Ragan, et al.,
2010). Last, the entire explication of spatial task performance can illustrated graphically
as shown in Fig. 14.
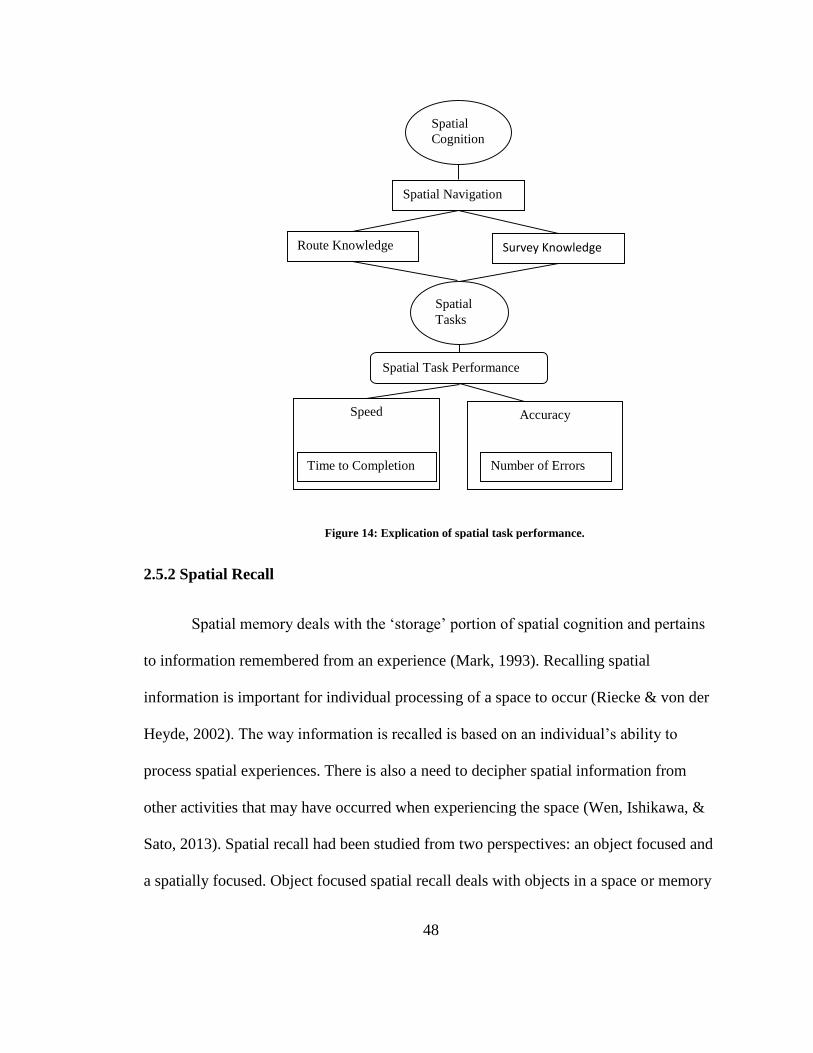
48
2.5.2 Spatial Recall
Spatial memory deals with the ‘storage’ portion of spatial cognition and pertains
to information remembered from an experience (Mark, 1993). Recalling spatial
information is important for individual processing of a space to occur (Riecke & von der
Heyde, 2002). The way information is recalled is based on an individual’s ability to
process spatial experiences. There is also a need to decipher spatial information from
other activities that may have occurred when experiencing the space (Wen, Ishikawa, &
Sato, 2013). Spatial recall had been studied from two perspectives: an object focused and
a spatially focused. Object focused spatial recall deals with objects in a space or memory
Spatial
Cognition
Spatial Navigation
Route Knowledge
Spatial
Tasks
Spatial Task Performance
Accuracy Speed
Number of Errors Time to Completion
Survey Knowledge
Figure 14: Explication of spatial task performance.
49
of prominent landmarks (Bennett, Coxon, & Mania, 2010; Coxon & Mania, 2014) .
Spatial recall pertains more to orientation and route memory (Stülpnagel & Steffens,
2013). Spatial recall was typically measured directly after an individual experiences an
environment regardless if the perspective was object or spatially focused. Recall was
commonly measured as accuracy and at times speed (Ragan, et al., 2010).
2.6 Hypotheses
Four main variables were proposed for this study: two independent variables,
immersion and interactivity, along with two dependent variables, spatial experience and
spatial understanding. To connect the proposed independent variables to the dependent
variables at the theoretical level, it was important to consider the potential causal
relationships between the independent variables and dependent variables. Several
connections existed between immersion and interactivity with the dependent variables (e.g.
spatial experience and spatial understanding). These connections were due to various
mediating variables identified in previous research.
To better understand the overall model and the relationships of the independent
variables on the dependent variables, it was necessary to examine each of the technology
manipulations directly with the dependent variable dimensions. Immersion was
explicated as visual immersiveness which consisted of two technology manipulations,
stereoscopy and field of view. Interactivity was explicated as the technology affordance
of navigability, degrees of freedom. This sets up the model to have three independent
variables, see Fig. 15.
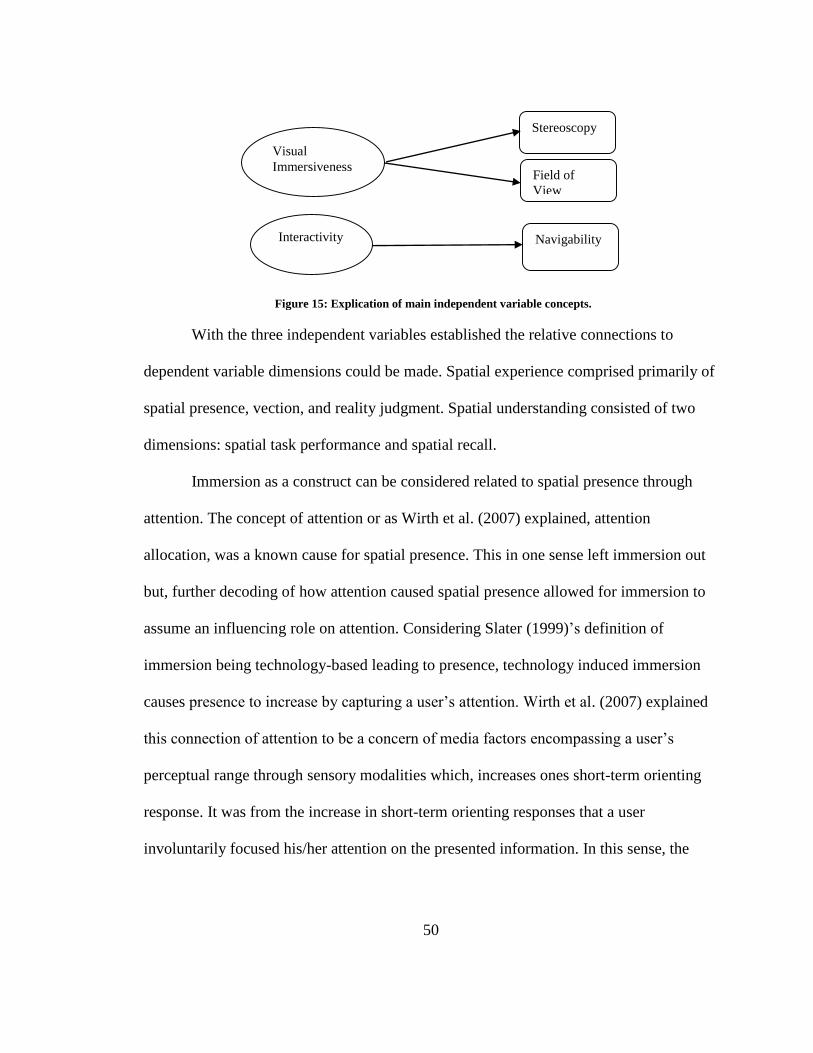
50
With the three independent variables established the relative connections to
dependent variable dimensions could be made. Spatial experience comprised primarily of
spatial presence, vection, and reality judgment. Spatial understanding consisted of two
dimensions: spatial task performance and spatial recall.
Immersion as a construct can be considered related to spatial presence through
attention. The concept of attention or as Wirth et al. (2007) explained, attention
allocation, was a known cause for spatial presence. This in one sense left immersion out
but, further decoding of how attention caused spatial presence allowed for immersion to
assume an influencing role on attention. Considering Slater (1999)’s definition of
immersion being technology-based leading to presence, technology induced immersion
causes presence to increase by capturing a user’s attention. Wirth et al. (2007) explained
this connection of attention to be a concern of media factors encompassing a user’s
perceptual range through sensory modalities which, increases ones short-term orienting
response. It was from the increase in short-term orienting responses that a user
involuntarily focused his/her attention on the presented information. In this sense, the
Figure 15: Explication of main independent variable concepts.
Visual
Immersiveness
Interactivity
Stereoscopy
Field of
View
Navigability
51
specific technology generating sensory immersion could increase a user’s involuntary
attention which therefore increased the sense of being in a space or spatial presence.
Considering attention as a main condition for immersion to influence spatial
presence, it was necessary to look at the specific role of visual immersiveness. Under
Biocca and Delaney (1995)’s definition of perceptual immersion in Rey, Alcañiz, Tembl,
and Parkhutik (2008) “the degree to which a virtual environment submerges the
perceptual system of the user” suggested the relationship between visual immersiveness
and spatial presence could be a positive one (p. 210). Adapting Wirth et al. (2007)’s
explanation, by submerging a user’s visual system, a user’s involuntary attention levels
should increase, inducing a greater focus on the virtual environment as opposed to the
real world. This helped force the user to attend to the content of the virtual environment
by shutting out the information received from the real world. This process could
eventually lead to an increased sense of spatial presence. Based on this basic process,
Wirth et al. (2007) also suggested that highly immersive technologies may cause human
users to “respond with feelings of spatial presence” (p. 496). Based on this understanding
of visual immersiveness inducing greater attention towards the virtual environment
causing a greater sense of spatial presence, it was predicted that:
H1: Greater levels of visual immersiveness will increase spatial presence.
Since visual immersiveness consisted of two technology manipulations, it was
necessary to look at individual contributions of stereoscopy to spatial presence to explore
H1. IJsselsteijn et al. (2001) conducted a study examining the effects of stereoscopy on
various dimensions of presence including both subjective and a more objective
52
approaches. Stereoscopy was found to have a significant positive effect on presence;
especially when the displayed information was in motion when compared to a
monoscopic (non-stereoscopic) condition. Similarly, Hendrix and Barfield (1995)
conducted a study and found stereoscopy to influence presence when compared to
monoscopic displays. In their study from 1995, Hendrix and Barfield established a
relationship between stereoscopy and presence, determining the added illusion of depth
increases participants sense of presence though not necessarily their sense of realism.
From the notion that motion and depth cues can both help explain why sterescopy may
relate to spatial presence, it was predicted that:
H1.A: Stereoscopic virtual environment will result in greater spatial presence
than non-stereoscopic virtual environment.
Again visual immersiveness consisted of two technology manipulations, so it was
necessary to also look at the individual contributions of field of view on spatial presence
to support H1. The Hendrix and Barfield (1995) study also looked at the influence of
geometric field of view (10°, 50°, and 90° specifically) on presence. Geometric field of
view is the view from the virtual camera. The study found that geometric field of view
did increase the sense of presence as the field of view increased. So the narrowest level of
field of view, 10°, showed the least increase in participant’s subjective presence ratings
than the widest level of field of view, 90°. It was interesting the authors mentioned both
the 50° and 90° manipulation together in comparison with the 10° manipulation. This
could have been due to the small variation in findings between the 50° and 90° results.
This provided some insight into using only a wide-narrow manipulation of field of view
53
as opposed to a series of varying manipulations. As the previous studies indicated a wider
field of view was able to capture user’s attention more increasing the sense of presence, it
was predicted that:
H1.B: Wider field of view will result in greater spatial presence than narrow
field of view.
Immersion was also linked with spatial task performance through attention.
Agarwal and Karahanna (2000) explained “focused immersion suggests that all of the
attentional resources of an individual are focused on the particular task, thereby reducing
the level of cognitive burden associated with task performance” (p. 675). The specific
connection though lies in how immersion captures a user’s attention. Through the display
technology itself, a user’s attention could be drawn to a virtual environment and
subsequently the task (Wirth, et al., 2007). Attention alone does not completely explain
the link between immersion and spatial task performance. In some cases, immersion was
found to be completely unrelated to task performance (McMahan, et al., 2006). One
possible explanation could be dependent on the type and complexity of the task (Raja,
Bowman, Lucas, & North, 2004). Raja et al. (2004) also suggested that immersion was
“shown to be beneficial to applications where spatial knowledge of an environment is
useful” (p. 1). Therefore, the task itself played a role in linking immersion to spatial task
performance.
The goal of visual immersiveness in the context of virtual environments is to
engulf a user’s visual system in order to block out the real world. This leads to a greater
influence in attention and focus on the content of the virtual environment. With an

54
increased focus on the content, a user is more likely to perform better at spatial tasks as
the perception of the virtual environment temporarily replaces that of the real world
reducing the cognitive burden of identifying two different environments at one time
(Agarwal & Karahanna, 2000). Considering both attention and task type and complexity
as factors for how visual immersiveness links to spatial task performance, this study
predicted that:
H2: Greater levels of visual immersiveness will improve spatial task
performance.
To better address H2, the individual technology manipulation of stereoscopy was
examined for contributions to spatial task performance. Stereoscopy was also found to
improve task performance measures but, only when grouped with other technology
components. Schuchardt and Bowman (2007) found in their study that stereoscopy as a
part of a grouped ‘high level’ immersion condition helped increase user accuracy and
speed in navigation tasks. In their study, the ‘high’ level combined several components
(stereoscopy (on), head-based rendering (on), and field of regard (270° horizontal)). For
the other condition, the ‘low’ level of immersion utilized the components in an opposite
manner (stereoscopy (off), head-based rendering (off), and field of regard (90°
horizontal)). This suggests that stereoscopy’s influence on spatial task performance may
be split with other technology components but, still could play a role. Based on the above
finding, this study predicted that:
H2.A: Stereoscopic virtual environment will result in improved spatial task
performance than non-stereoscopic virtual environment.
55
Again, to better address H2, the other technology manipulation of visual
immersiveness, field of view, was examined for influences on spatial task performance.
Wider field of view had been found to increase spatial task performance. Tan, Czerwinski
and Robertson (2006) investigated the use of field of view on spatial abilities and
navigation through navigation tasks with a focus on gender performance. The
manipulations of field of view were based on varying degrees of both display field of
view and geometric field of view. The performance of both male and female participants
was found to increase when display field of view increased, with a notably larger increase
in female performance for larger display field of view manipulations. Similarly, Ni,
Bowman and Chen (2006) conducted their study on navigation in a 3D space using
wayfinding tasks under different manipulations of display size (e.g. FOV) with
resolution. The study found that display size, specifically the large display improved task
performance in all manipulations, including those where resolution was low, when
compared to the small display. These findings suggest that gender and task type can
explain the link between field of view and spatial task performance. With this
understanding it was predicted that:
H2.B: Wider field of view will result in improved spatial task performance
than narrow field of view.
Immersive experiences provide necessary spatial cues and a high level of
engagement which increase the potential for users to recall material presented (Winn,
Windschitl, Fruland, & Lee, 2002; Ragan, et al., 2010). Spatial recall could be considered
dependent on a user’s ability to focus and associate information with spatial locations
56
(Ragan, et al., 2010). This focus comes from spatial cues which have often been
associated with immersion (Sowndararajan, Wang, & Bowman, 2008). Immersion in this
sense refers to the display characteristics of the system (i.e. stereoscopy, field of view,
etc.). The rationale behind spatial cues aiding memory is not a new idea (Yates, 1966;
Hess, Detweiler, & Ellis, 1999). In particular, the loci method, a known mnemonic, has
been cited for its link to the use of memorized locations in the memorization of new
ordered information (i.e. speeches, lists, etc.) (Yates, 1966; Hess, et al., 1999;
Sowndararajan, et al., 2008). Spatial cues link to memory as aids for generating mental
maps or representations of spaces (Sowndararajan, et al., 2008). The logic is the more
complete or accurate one’s mental map became the more likely the recall of that
representation would be accurate. So, when spatial cues were enhanced as in highly
immersive virtual environments, the likelihood of accurate spatial recall should be higher.
Spatial cues were not the only connection between immersion and spatial recall.
Highly immersive experiences allow for greater levels of engagement (Winn, et al.,
2002). Perceptual immersion in particular engages the senses of the user. This could
increase both attention and intrinsic motivation to perform in the virtual environment.
Learning is highly connected to performance but, for virtual environments, without the
incentive to participate, learning is less likely to be successful (Roussou, 2004).
Therefore, higher levels of engagement of the senses as found in highly immersive
systems should induce an incentive to perform in the virtual space which, presented a
greater ability to learn and thus recall information learned.
57
Considering immersion in terms of visual immersiveness, spatial cues become
more prominent to a user’s visual attention. This could allow for the user to better
establish a mental representation of the virtual environment. The stronger the mental
representation of the space, the more likely the user would be able to recall information
about the space, thus increasing spatial recall. This rationale of spatial cues and
motivation and attention supports the idea that a positive relationship exists between
visual immersiveness and spatial recall. Therefore, this study predicted that:
H3: Greater levels of visual immersiveness will improve spatial recall.
Stereoscopy was found to increase accuracy of memory. Bennett et al. (2010) in
their study aimed to see if stereoscopy had an impact on memory of objects in a space
when objects were displayed with contextual consistency or as primative shapes. Their
study did find a positive influence of stereoscopy on memory of objects in a space, but
they cautioned it was only when the objects were contextually consistent with the space.
The other findings of influences of stereoscopy in the study were found to be
insignificant. This finding suggests that again, stereoscopy is able to influence the
dependent variables significantly when grouped with other components. But the finding
should also take into consideration that few studies have actually investigated the
influence of stereoscopy on spatial memory but, failed to detect any significant influence.
Study by Baştanlar, Cantürk, & Karacan (2007) failed to detect any significant influence
of stereoscopy on memory. The findings of this study though should take into
considertation the size of the small sample size and form of analysis. Another study that
looked at stereoscopy when combined with head-tracking on object recall found the
58
condition with stereoscopy was not significant (Mania, Troscianko, Hawkes, &
Chalmers, 2003). Instead, studies on the influences of virtual reality technology on
memory have stated that stereoscopy would improve the results of memory due to the
enhanced spatial cues (Sowndararajan, et al., 2008). As stereoscopy was found to
positively influence the memory of objects in space when contextually consistent, it was
predicted that:
H3.A: Stereoscopic virtual environment will result in improved spatial recall
than non-stereoscopic virtual environment.
Field of view (FOV) was found to increase accuracy of memory. Ragan et al.
(2010) found that their operationalization of wide FOV did significantly improve recall
accuracy when dealing with procedural memorization. Procedural memorization pertains
to the memory of steps in a procedure. The rationale of the study dealt with mapping the
memorization of a multi-step procedure to spatial cues, suggesting that through spatial
memory, non-spatial memory tasks could be more easily remembered. The manipulation
of FOV was 60° for narrow and 180° for wide. In addition to the FOV, the study also
included software field of view (another aspect of FOV) in two manipulations, matched
(to the wide and narrow FOV) and unmatched. To clarify their definition of FOV, Ragan
et al. (2010) explained that a wider FOV allowed a “user to see more of the environment
at one time” (p. 530). All three components tested were found to have significant
influences on the accuracy of procedural memorization. The authors did note they were
surprised to find their hypothesis about wide FOV reducing recall time not being
significant. This finding suggests that wide FOV can increase accuracy but possibly not
59
speed of memory recall. As the manipulation of FOV was found to be significant for
procedural memorization it was predicted that:
H3.B: Wider of field of view will result in improved spatial recall than
narrower field of view.
Interactivity and navigability determines a user’s ability to participate in a virtual
space. Specifically, interactivity provides a user with a certain amount of control over
actions taken to participate. This activity involves users in the virtual space and its
plotline which, has been shown to increase a sense of spatial presence (Gorini, et al.,
2011). By exercising control over decisions and locomotion, a user should feel more
present in the virtual space. Thus, increasing the amount of control in the virtual space
could potentially increase spatial presence. Likewise, if a user is not skilled in how to
participate in the scene the lack of skill could interfere with feeling in the space. Poor
skill level combined with a high level of challenge presented by the activities of a virtual
environment could lead to lower levels of involvement which, is known to decrease the
sense of spatial presence (Sherman & Craig, 2003).
Sheridan (1992) indicated the relationship between navigability and presence is
based on the ability to manipulate viewpoints. Following Balakrishnan and Sundar
(2011), navigability was operationalized in this study earlier as comprising of travel or
locomotion and wayfinding. Travel in a virtual environment is defined by Bowman,
Koller, and Hodges (1997) as the “control of user viewpoint motion through a VE” (p.
45). Based on that description, one could look further to the relationship as Witmer and
Singer (1998) made the association that increasing one’s ability to manipulate a
60
viewpoint would positively influence the sense of spatial presence. By allowing for
increased control over viewport motion, users become more active participants in the
virtual environment. Increased participation could lead to greater involvement which,
could potentially lead to increased spatial presence. With this understanding, this study
predicted that:
H4: Greater navigability will increase spatial presence.
Similar to the relationship between navigability and spatial presence, spatial task
performance was also derives from a measure of control and skill level (Mestre & Fuchs,
2006; Sayers, 2004). If a user is adequately skilled and given enough control over their
participation, spatial task performance should increase as the user became more involved
in the task. The relationship between interactivity and task performance could be
understood to be based on a balance of amount of control and user skill level. With this
understanding that skill level and amount of control connect to spatial task performance
and navigability, it was predicted that:
H5: Greater navigability will improve spatial task performance.
The relationship between interactivity and spatial recall is not a clear one. Shelton
and McNamara (1997) pointed out that spatial memory was either view-dependent or
view-independent. As interactivity deals with the manipulation of viewpoints (Sheridan,
1992), the link between interactivity and spatial memory could be understood more
clearly. A system must interpret a user’s behavior in the 3D space and provide timely
feedback of actions, particularly viewpoint manipulations. The key causal relationship
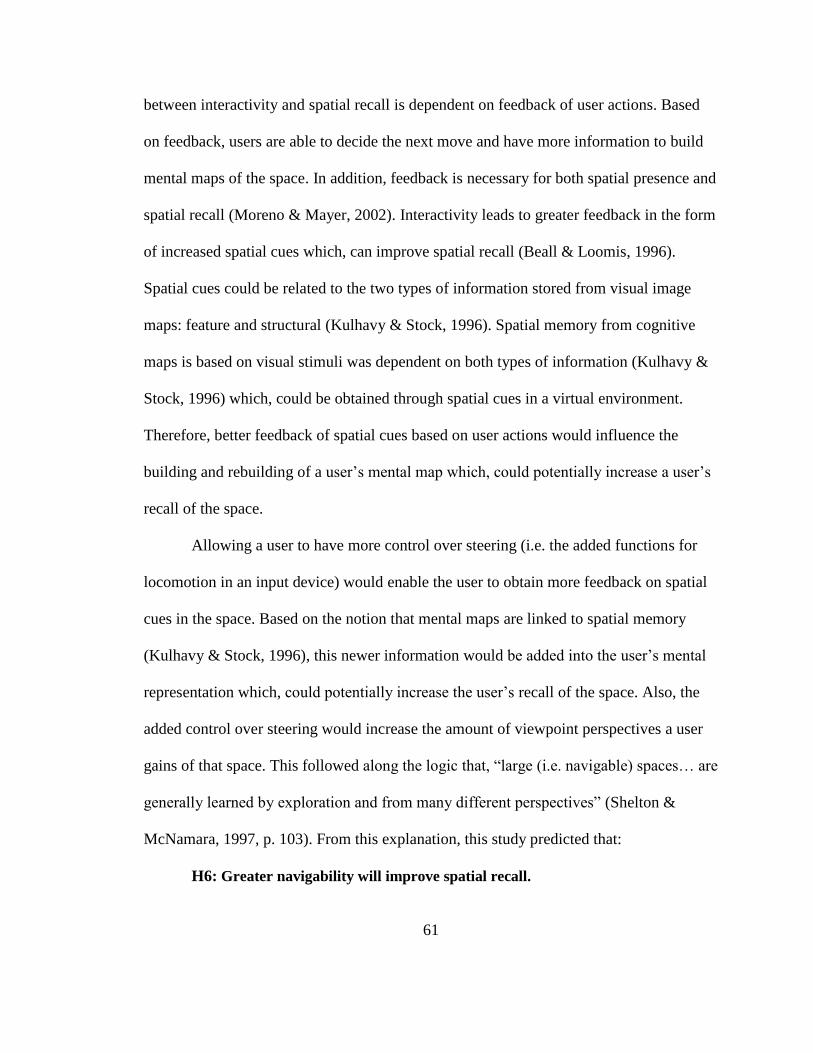
61
between interactivity and spatial recall is dependent on feedback of user actions. Based
on feedback, users are able to decide the next move and have more information to build
mental maps of the space. In addition, feedback is necessary for both spatial presence and
spatial recall (Moreno & Mayer, 2002). Interactivity leads to greater feedback in the form
of increased spatial cues which, can improve spatial recall (Beall & Loomis, 1996).
Spatial cues could be related to the two types of information stored from visual image
maps: feature and structural (Kulhavy & Stock, 1996). Spatial memory from cognitive
maps is based on visual stimuli was dependent on both types of information (Kulhavy &
Stock, 1996) which, could be obtained through spatial cues in a virtual environment.
Therefore, better feedback of spatial cues based on user actions would influence the
building and rebuilding of a user’s mental map which, could potentially increase a user’s
recall of the space.
Allowing a user to have more control over steering (i.e. the added functions for
locomotion in an input device) would enable the user to obtain more feedback on spatial
cues in the space. Based on the notion that mental maps are linked to spatial memory
(Kulhavy & Stock, 1996), this newer information would be added into the user’s mental
representation which, could potentially increase the user’s recall of the space. Also, the
added control over steering would increase the amount of viewpoint perspectives a user
gains of that space. This followed along the logic that, “large (i.e. navigable) spaces… are
generally learned by exploration and from many different perspectives” (Shelton &
McNamara, 1997, p. 103). From this explanation, this study predicted that:
H6: Greater navigability will improve spatial recall.
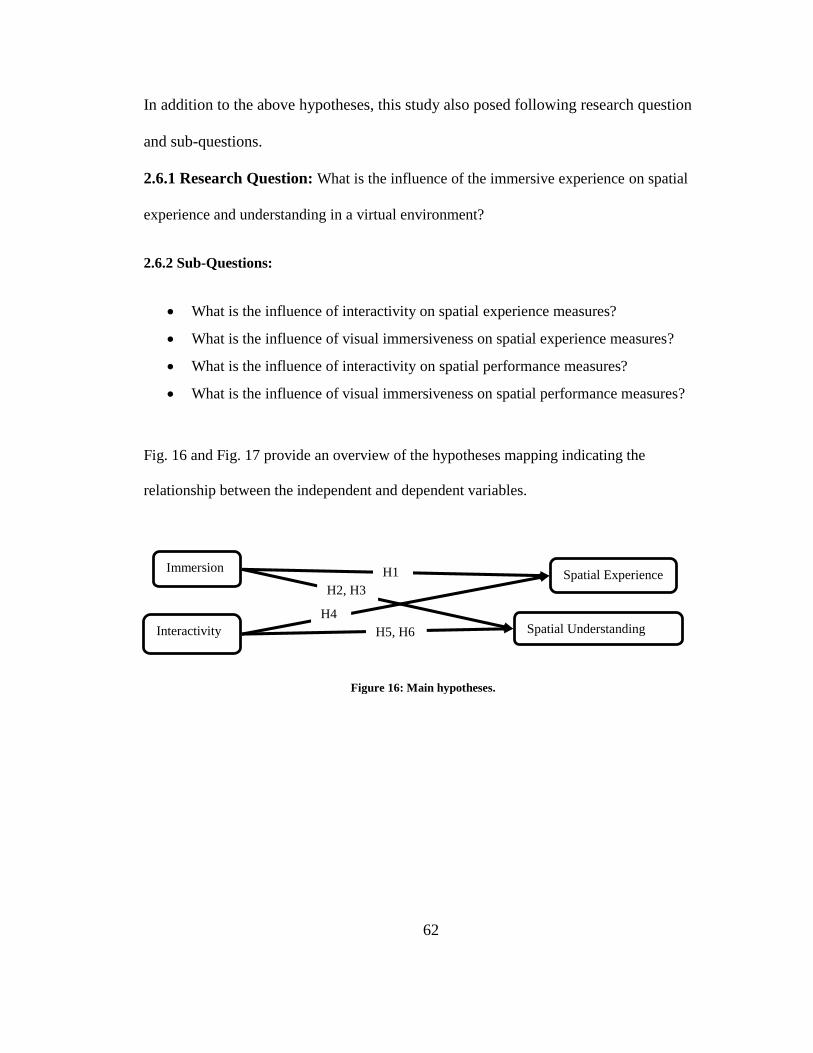
62
In addition to the above hypotheses, this study also posed following research question
and sub-questions.
2.6.1 Research Question: What is the influence of the immersive experience on spatial
experience and understanding in a virtual environment?
2.6.2 Sub-Questions:
What is the influence of interactivity on spatial experience measures?
What is the influence of visual immersiveness on spatial experience measures?
What is the influence of interactivity on spatial performance measures?
What is the influence of visual immersiveness on spatial performance measures?
Fig. 16 and Fig. 17 provide an overview of the hypotheses mapping indicating the
relationship between the independent and dependent variables.
Immersion
Interactivity
Spatial Experience
Spatial Understanding
H1 H2, H3
H4 H5, H6
Figure 16: Main hypotheses.
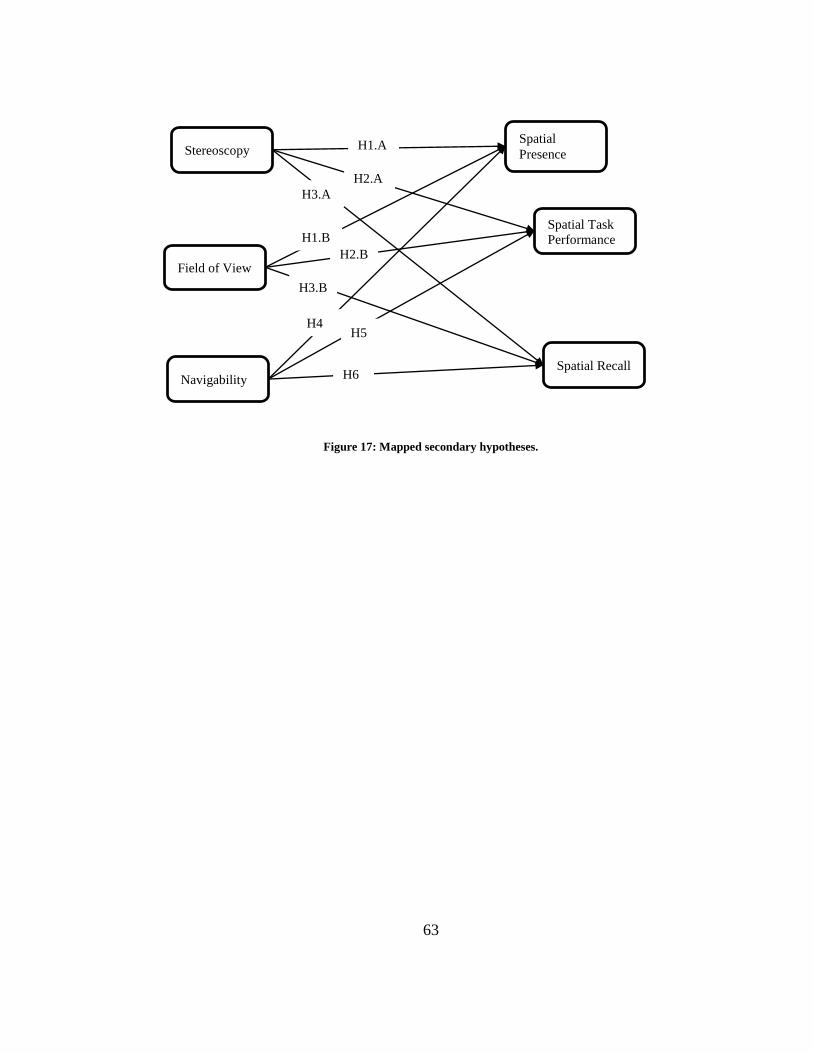
63
Figure 17: Mapped secondary hypotheses.
Stereoscopy
Field of View
Navigability
Spatial
Presence
Spatial Task
Performance
Spatial Recall
H1.A
H2.A
H4
H3.A
H5
H1.B H2.B
H3.B
H6
64
CHAPTER 3: METHODS
This chapter discusses the design of the controlled experiment to address the
overall research question. First, the design of the experiment, experimental setup and
stimulus details are discussed. The manipulations of visual immersiveness and
navigability are then discussed followed by a description of the variables for spatial
experience and understanding and their measures. Details of research participants and the
procedure used in the experiment are described next. Lastly, the plan for analyzing the
data is summarized.
In order to address the main research question and hypotheses, it was important to
consider the factors involved in the immersive experience first and, then those in spatial
experience and understanding. Previous research conducted on virtual reality system
technology has typically used experimental design in order to systematically look at
different technological contributions on a dependent variable (Bowman, Koller, &
Hodges, 1997). This study utilized a controlled experiment in order to capture the relative
contributions of visual immersiveness and navigability affordances on spatial experience
and understanding. Using a combination of the variable-centered approach (Nass &
Mason, 1990) with the mixed reality simulation approach (Laha, et al., 2013); visual
immersiveness and navigability were broken down into affordances of specific
technology. The independent variables here were treated as specific affordances of virtual
reality technology that could be systematically manipulated. These affordance
manipulations produce distinguishable, but often small effect sizes in terms of their
impact on user perceptions. A controlled experiment offers more precision than other
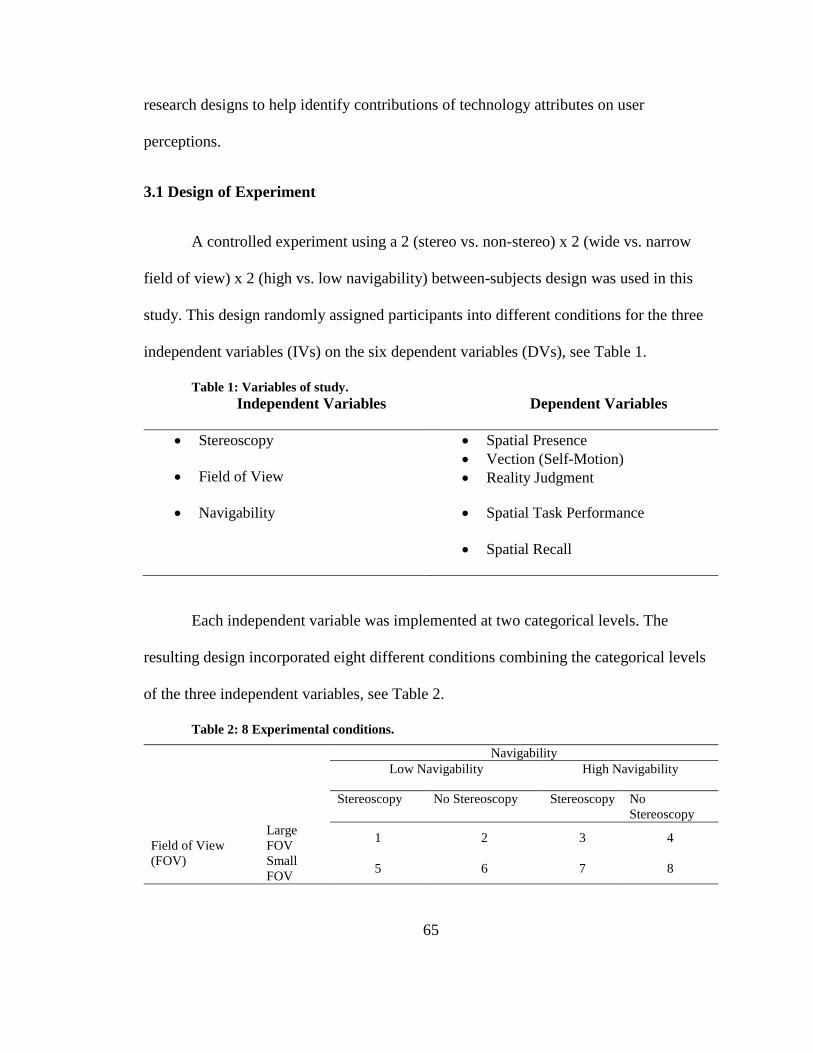
65
research designs to help identify contributions of technology attributes on user
perceptions.
3.1 Design of Experiment
A controlled experiment using a 2 (stereo vs. non-stereo) x 2 (wide vs. narrow
field of view) x 2 (high vs. low navigability) between-subjects design was used in this
study. This design randomly assigned participants into different conditions for the three
independent variables (IVs) on the six dependent variables (DVs), see Table 1.
Table 1: Variables of study.
Independent Variables Dependent Variables
Stereoscopy
Field of View
Spatial Presence
Vection (Self-Motion)
Reality Judgment
Navigability Spatial Task Performance
Spatial Recall
Each independent variable was implemented at two categorical levels. The
resulting design incorporated eight different conditions combining the categorical levels
of the three independent variables, see Table 2.
Table 2: 8 Experimental conditions.
Navigability
Low Navigability High Navigability
Stereoscopy No Stereoscopy Stereoscopy No
Stereoscopy
Field of View
(FOV)
Large
FOV 1 2 3 4
Small
FOV 5 6 7 8
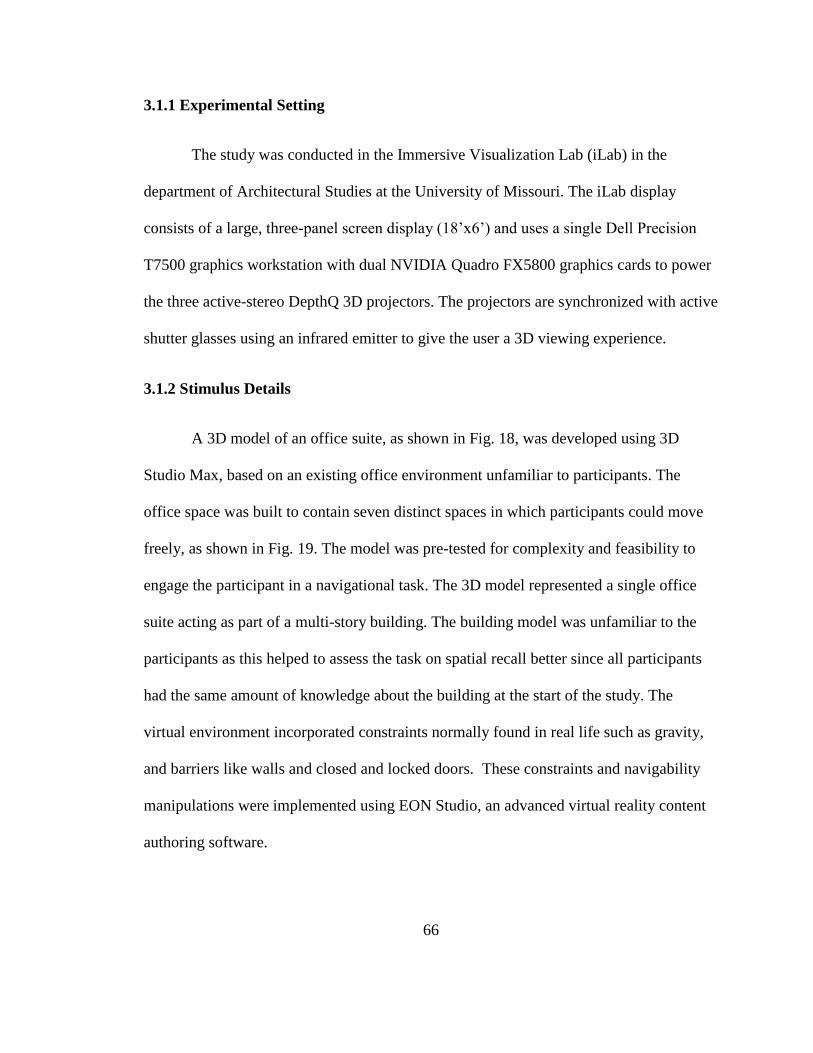
66
3.1.1 Experimental Setting
The study was conducted in the Immersive Visualization Lab (iLab) in the
department of Architectural Studies at the University of Missouri. The iLab display
consists of a large, three-panel screen display (18’x6’) and uses a single Dell Precision
T7500 graphics workstation with dual NVIDIA Quadro FX5800 graphics cards to power
the three active-stereo DepthQ 3D projectors. The projectors are synchronized with active
shutter glasses using an infrared emitter to give the user a 3D viewing experience.
3.1.2 Stimulus Details
A 3D model of an office suite, as shown in Fig. 18, was developed using 3D
Studio Max, based on an existing office environment unfamiliar to participants. The
office space was built to contain seven distinct spaces in which participants could move
freely, as shown in Fig. 19. The model was pre-tested for complexity and feasibility to
engage the participant in a navigational task. The 3D model represented a single office
suite acting as part of a multi-story building. The building model was unfamiliar to the
participants as this helped to assess the task on spatial recall better since all participants
had the same amount of knowledge about the building at the start of the study. The
virtual environment incorporated constraints normally found in real life such as gravity,
and barriers like walls and closed and locked doors. These constraints and navigability
manipulations were implemented using EON Studio, an advanced virtual reality content
authoring software.
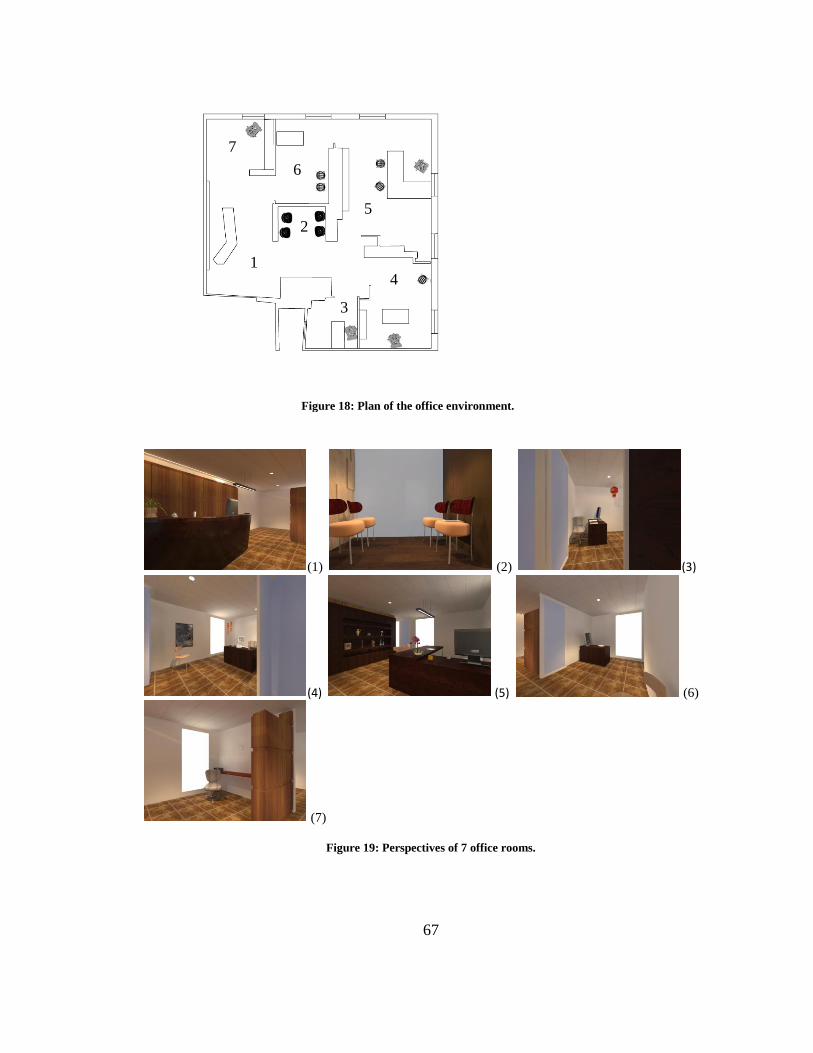
67
(1) (2) (3)
(4) (5) (6)
(7)
Figure 19: Perspectives of 7 office rooms.
Figure 18: Plan of the office environment.
1 1
2
3
4
5
6
7
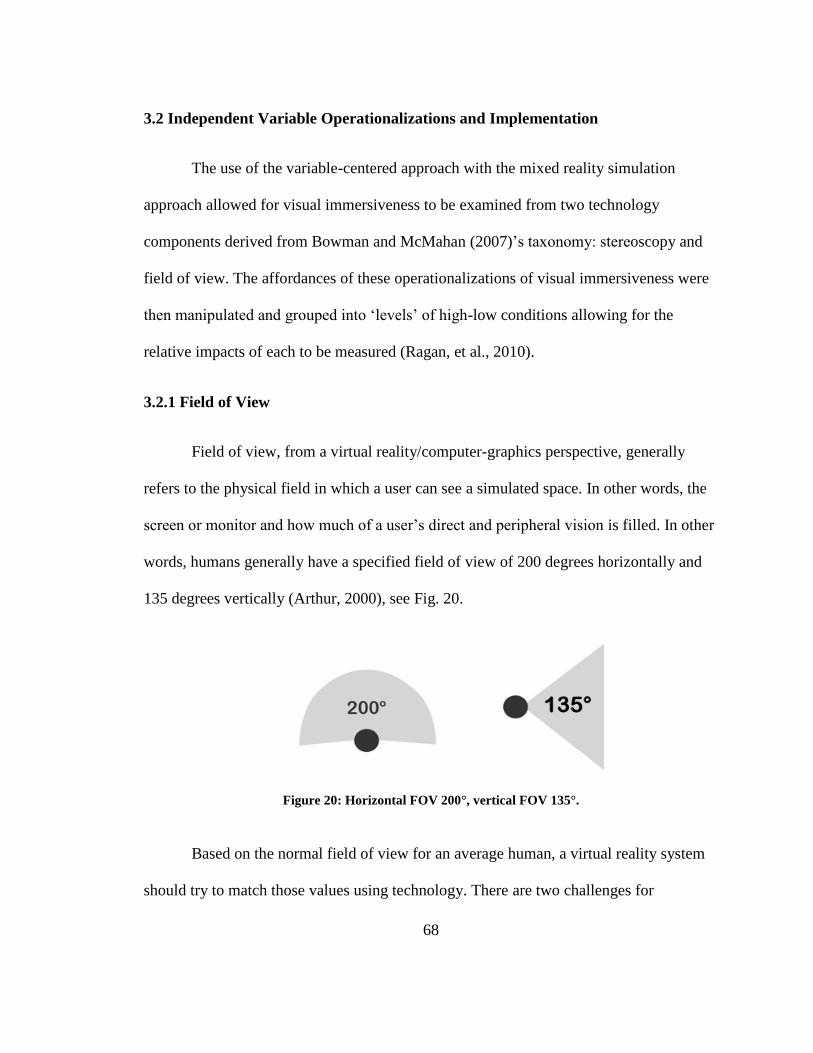
68
3.2 Independent Variable Operationalizations and Implementation
The use of the variable-centered approach with the mixed reality simulation
approach allowed for visual immersiveness to be examined from two technology
components derived from Bowman and McMahan (2007)’s taxonomy: stereoscopy and
field of view. The affordances of these operationalizations of visual immersiveness were
then manipulated and grouped into ‘levels’ of high-low conditions allowing for the
relative impacts of each to be measured (Ragan, et al., 2010).
3.2.1 Field of View
Field of view, from a virtual reality/computer-graphics perspective, generally
refers to the physical field in which a user can see a simulated space. In other words, the
screen or monitor and how much of a user’s direct and peripheral vision is filled. In other
words, humans generally have a specified field of view of 200 degrees horizontally and
135 degrees vertically (Arthur, 2000), see Fig. 20.
Figure 20: Horizontal FOV 200°, vertical FOV 135°.
Based on the normal field of view for an average human, a virtual reality system
should try to match those values using technology. There are two challenges for
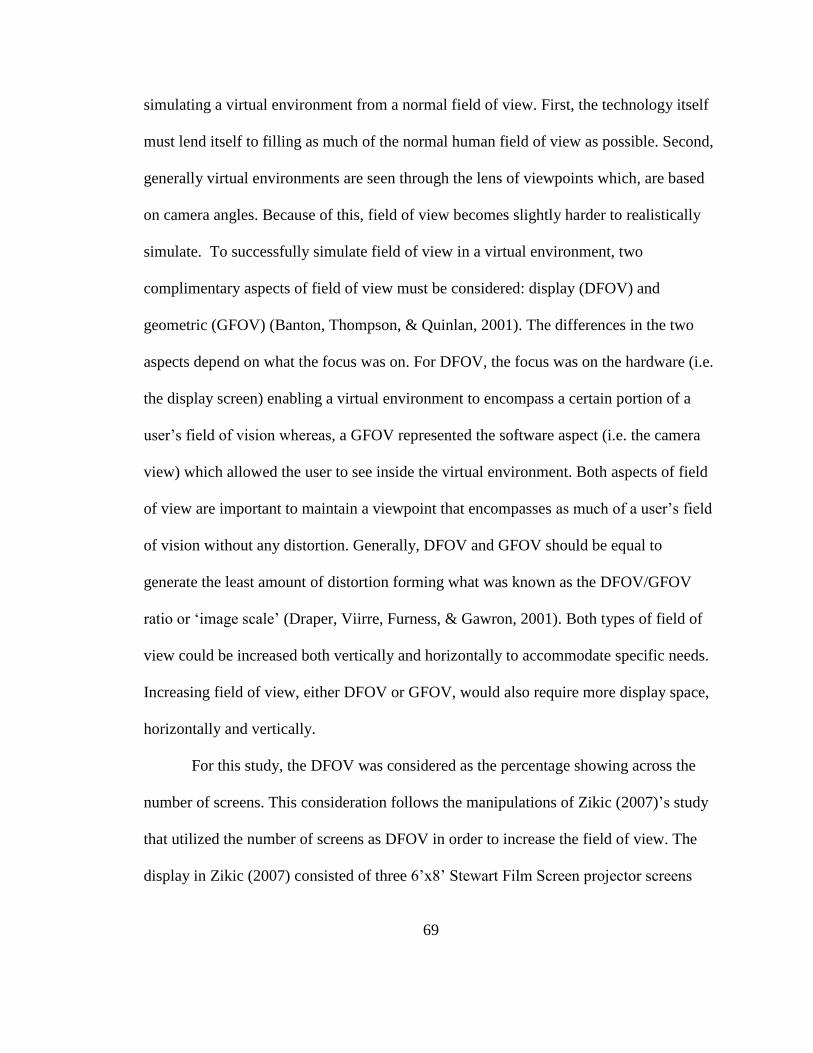
69
simulating a virtual environment from a normal field of view. First, the technology itself
must lend itself to filling as much of the normal human field of view as possible. Second,
generally virtual environments are seen through the lens of viewpoints which, are based
on camera angles. Because of this, field of view becomes slightly harder to realistically
simulate. To successfully simulate field of view in a virtual environment, two
complimentary aspects of field of view must be considered: display (DFOV) and
geometric (GFOV) (Banton, Thompson, & Quinlan, 2001). The differences in the two
aspects depend on what the focus was on. For DFOV, the focus was on the hardware (i.e.
the display screen) enabling a virtual environment to encompass a certain portion of a
user’s field of vision whereas, a GFOV represented the software aspect (i.e. the camera
view) which allowed the user to see inside the virtual environment. Both aspects of field
of view are important to maintain a viewpoint that encompasses as much of a user’s field
of vision without any distortion. Generally, DFOV and GFOV should be equal to
generate the least amount of distortion forming what was known as the DFOV/GFOV
ratio or ‘image scale’ (Draper, Viirre, Furness, & Gawron, 2001). Both types of field of
view could be increased both vertically and horizontally to accommodate specific needs.
Increasing field of view, either DFOV or GFOV, would also require more display space,
horizontally and vertically.
For this study, the DFOV was considered as the percentage showing across the
number of screens. This consideration follows the manipulations of Zikic (2007)’s study
that utilized the number of screens as DFOV in order to increase the field of view. The
display in Zikic (2007) consisted of three 6’x8’ Stewart Film Screen projector screens
70
side-by-side. For this study, a larger DFOV was based on three screens showing 100%
for the wide setting and a reduced projection of 25% decrease on all sides across the same
three screens for the narrow setting.
To do this, a software manipulation within EON Studio allowed for direct
manipulation of what the projectors showed. The wide field of view utilized the full
screen setting capabilities of the projectors. The narrow field of view setting shrank the
projected image by 25% on each side and centered it between the three projection
screens. These two settings became the operationalization of wide and narrow field of
view. The operationalization into these two specific size differences on the same three
screens was previously tested and found to be viable for testing field of view
(Balakrishnan, Oprean, Martin, & Smith, 2012). In addition to the DFOV, the GFOV
remained consistent with the size of the projection in order to reduce the distortion effect.
In other words, the camera field of view was set with a wide screen setting to
accommodate the size DFOV being used (i.e. either wide or narrow). The specific setting
for the camera field of view was determined through pre-testing of comfort level of users
for the distortion effect and to better maintain the image scale. The rationale behind
manipulating only DFOV was to help determine the influence of display technology size,
whether it is through a large display screen or a monitor.
3.2.2 Stereoscopy
Much of the newer 3D technology appearing in today’s market incorporate
stereoscopy. This was one reason to include stereoscopy as a variable. Stereoscopy is
defined as “a technique for creating the illusion of depth and 3D imaging while
71
presenting a different image to each eye” (Baños, et al., 2008). Stereoscopy is a binary
variable that is either on or off (Schuchardt & Bowman, 2007). This study also treats
stereoscopy as either on (or enabled) or off (or disabled). Stereoscopy is commonly
presented in two forms, active or passive. For this study, active stereoscopy was used by
combining three 3D DepthQ projectors with the active shutter glasses worn by the
subject. The projector images and the active shutter glasses were synchronized by an
infrared emitter.
3.2.3 Navigability
In this study, navigability was the key interactive affordance under consideration.
Navigability was operationalized in terms of degrees of freedom for steering control
similar to Balakrishnan & Sundar (2011)’s study. Degrees of freedom were implemented
by a manipulation of joystick functionality. Using a joystick, two different manipulations
of degrees of freedom were implemented while, keeping the input device the same. This
helped to control other confounding variables that might arise from using two different
input devices with different degrees of freedom. The low navigability condition was
implemented using just two degrees of freedom. The manipulation consisted of only
basic movements (forward/backward movement and rotation left/right around the z-axis).
The high navigability manipulation added one more degree of freedom. High navigability
used the same capabilities as the low navigability condition plus the added capability for
tilting the view point up and down, see Fig. 21.
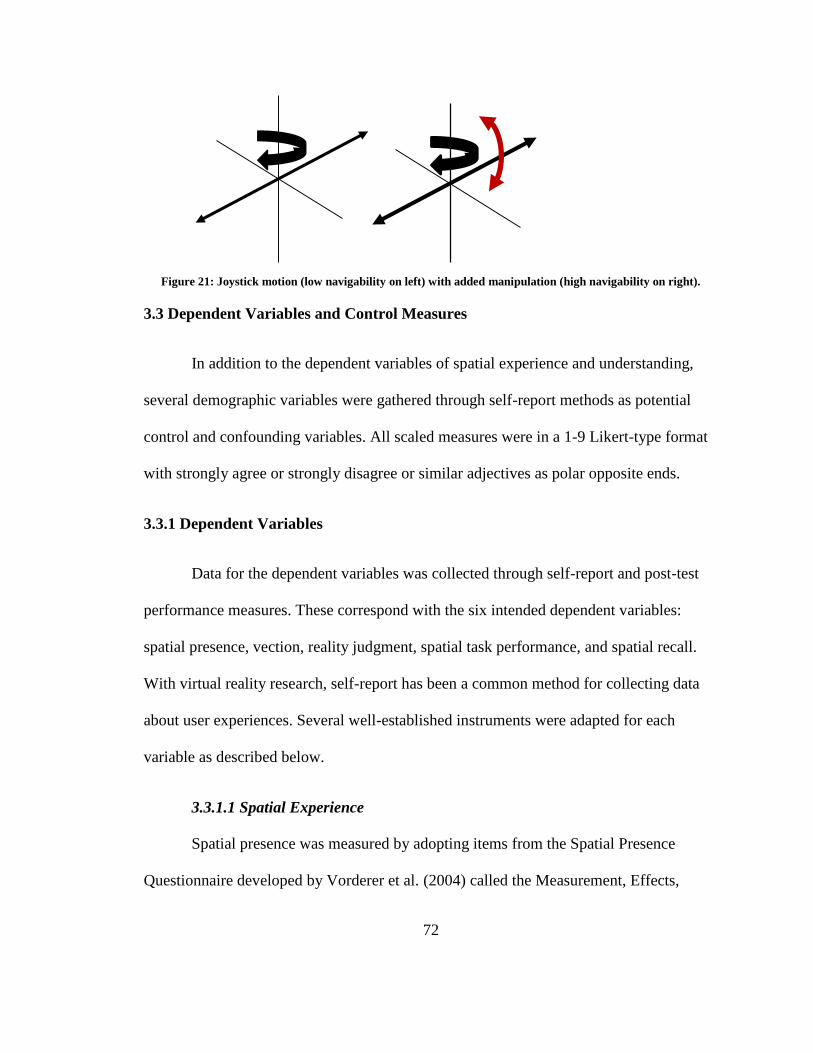
72
Figure 21: Joystick motion (low navigability on left) with added manipulation (high navigability on right).
3.3 Dependent Variables and Control Measures
In addition to the dependent variables of spatial experience and understanding,
several demographic variables were gathered through self-report methods as potential
control and confounding variables. All scaled measures were in a 1-9 Likert-type format
with strongly agree or strongly disagree or similar adjectives as polar opposite ends.
3.3.1 Dependent Variables
Data for the dependent variables was collected through self-report and post-test
performance measures. These correspond with the six intended dependent variables:
spatial presence, vection, reality judgment, spatial task performance, and spatial recall.
With virtual reality research, self-report has been a common method for collecting data
about user experiences. Several well-established instruments were adapted for each
variable as described below.
3.3.1.1 Spatial Experience
Spatial presence was measured by adopting items from the Spatial Presence
Questionnaire developed by Vorderer et al. (2004) called the Measurement, Effects,
73
Conditions – Spatial Presence Questionnaire (MEC-SPQ) for the sections of attention,
self-location and possibilities for action. For attention measures, four items on a 9-point
Likert-type scale were adapted which captured perceived attentional allocation in relation
to spatial presence (e.g. I concentrated on the office suite I just viewed). Four items on a
9-point Likert-type scale were adapted from the MEC-SPQ for spatial self-location (e.g.
It was though my true location had shifted into the environment in the office suite I just
viewed). Lastly, possibilities for action used seven items adopted from the MEC-SPQ on
a 9-point Likert-type scale (e.g. I felt I could have some influence on the environment of
the office suite).
In addition to the spatial presence measures, vection and reality judgment were
used and indirect measures for sense of presence. Vection, the illusion of self-motion,
used four items on a 9-point Likert-type scale adopted from Riecke and Schulte-Pelkum
(2006) (e.g. My sense of movement inside the office environment was very compelling).
For the last measures, reality judgment, eight items on a 9-point Likert-type scale were
adopted from Baños et al. (2000) (e.g. To what extent did you feel you “were” physically
in the virtual world?).
3.3.1.2 Spatial Understanding
In addition to the self-report questionnaires, there were two post-test tasks. The
first was for spatial task performance and the other for spatial recall. Spatial task
performance consisted of measures of accuracy on placement of objects with specific
spaces as well as knowledge of the office space’s configuration. Placement of the objects
consisted of matching the objects correctly to screenshots of each of the spaces. There
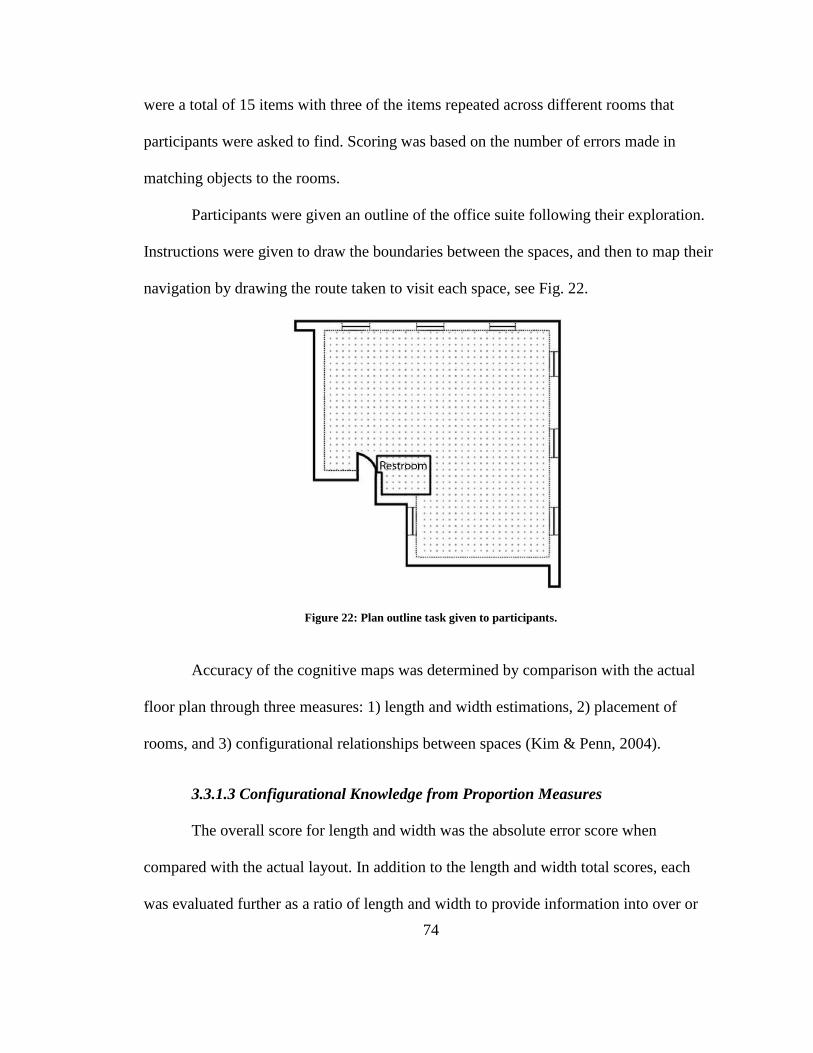
74
were a total of 15 items with three of the items repeated across different rooms that
participants were asked to find. Scoring was based on the number of errors made in
matching objects to the rooms.
Participants were given an outline of the office suite following their exploration.
Instructions were given to draw the boundaries between the spaces, and then to map their
navigation by drawing the route taken to visit each space, see Fig. 22.
Figure 22: Plan outline task given to participants.
Accuracy of the cognitive maps was determined by comparison with the actual
floor plan through three measures: 1) length and width estimations, 2) placement of
rooms, and 3) configurational relationships between spaces (Kim & Penn, 2004).
3.3.1.3 Configurational Knowledge from Proportion Measures
The overall score for length and width was the absolute error score when
compared with the actual layout. In addition to the length and width total scores, each
was evaluated further as a ratio of length and width to provide information into over or
75
under estimation of room sizes to test the accuracy of spatial perception (Interrante, Ries,
Lindquist, Kaeding, & Anderson, 2008). The room placement score was scaled 1-8 with
eight being the most accurate. Accurate placement was determined by splitting the
original space into four quadrants and using corner and window references to determine
if placement of rooms was accurate. The final eighth point was given if the cognitive map
had correct orientation. This placement scale allowed for indication of how good the
cognitive map was when compared with the actual floor plan (Zanbaka, Lok, Babu,
Ulinkski, & Hodges, 2005).
3.3.1.4 Configurational Knowledge from J-Graphs
The last measure for the cognitive maps was the development of a convex
mapping-justified graph using AGRAPH software. Justified graphs are commonly used
for determining spatial relationships and configurations of designed spaces (Bafna, 2003).
As the original cognitive maps were drawn without the specific requirement of doorways
to be placed, the common quantifying analysis method of axial mapping could not be
used (Stanney, et al., 2013). In this study, the justified graph was used to analyze and
quantify how well participants developed configurational knowledge of the office space.
To assess the cognitive maps for configurational knowledge, two coders were asked to
independently score the maps. Using the AGRAPH software, each coder linked the
convex boxes together, including corridors. Two scores were used to determine each
room’s score: 1) the mean depth and 2) the integration value. These scores would allow
for statistical comparisons to be made between the actual floor plan and the cognitive
maps (Kim & Penn, 2004). The final scores were then compared to the actual floor plan’s
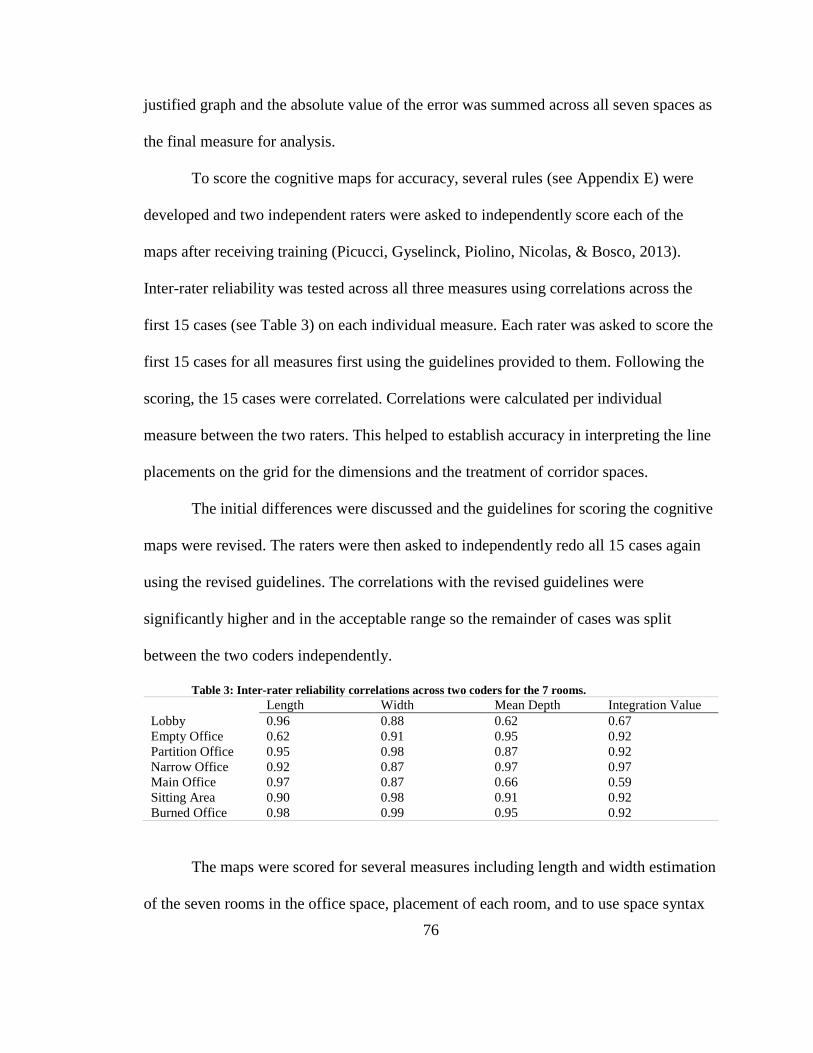
76
justified graph and the absolute value of the error was summed across all seven spaces as
the final measure for analysis.
To score the cognitive maps for accuracy, several rules (see Appendix E) were
developed and two independent raters were asked to independently score each of the
maps after receiving training (Picucci, Gyselinck, Piolino, Nicolas, & Bosco, 2013).
Inter-rater reliability was tested across all three measures using correlations across the
first 15 cases (see Table 3) on each individual measure. Each rater was asked to score the
first 15 cases for all measures first using the guidelines provided to them. Following the
scoring, the 15 cases were correlated. Correlations were calculated per individual
measure between the two raters. This helped to establish accuracy in interpreting the line
placements on the grid for the dimensions and the treatment of corridor spaces.
The initial differences were discussed and the guidelines for scoring the cognitive
maps were revised. The raters were then asked to independently redo all 15 cases again
using the revised guidelines. The correlations with the revised guidelines were
significantly higher and in the acceptable range so the remainder of cases was split
between the two coders independently.
Table 3: Inter-rater reliability correlations across two coders for the 7 rooms.
Length Width Mean Depth Integration Value
Lobby 0.96 0.88 0.62 0.67
Empty Office 0.62 0.91 0.95 0.92
Partition Office 0.95 0.98 0.87 0.92
Narrow Office 0.92 0.87 0.97 0.97
Main Office 0.97 0.87 0.66 0.59
Sitting Area 0.90 0.98 0.91 0.92
Burned Office 0.98 0.99 0.95 0.92
The maps were scored for several measures including length and width estimation
of the seven rooms in the office space, placement of each room, and to use space syntax
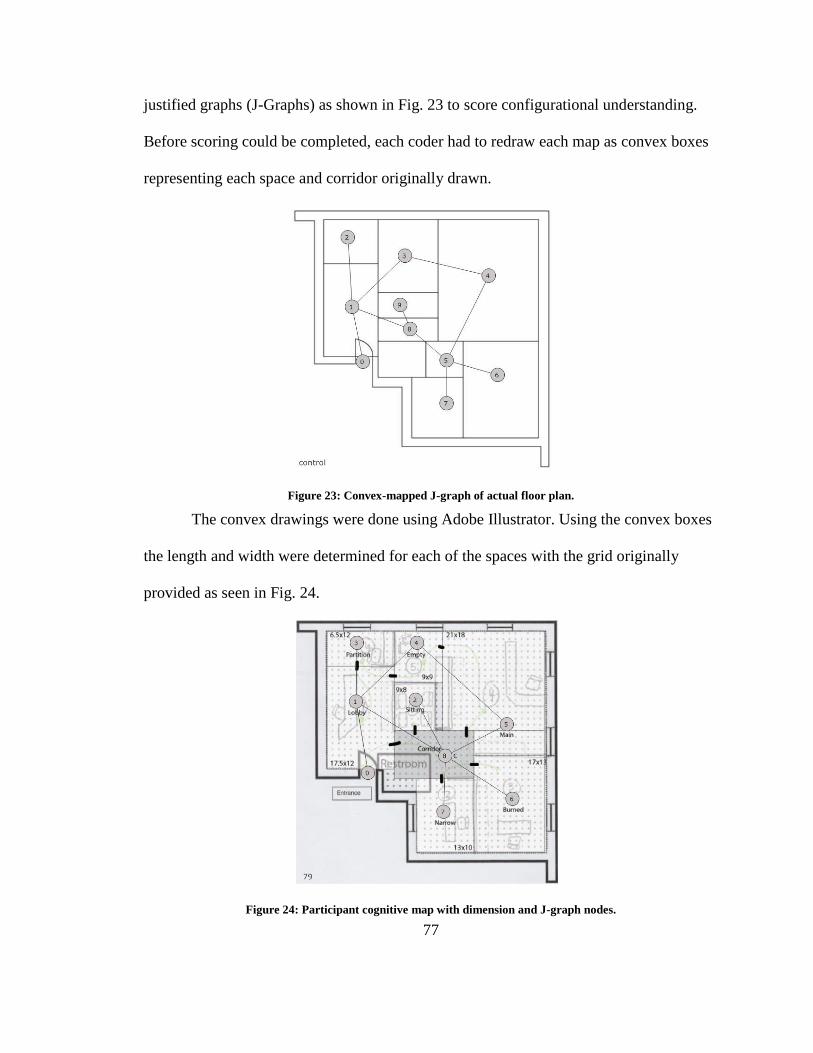
77
justified graphs (J-Graphs) as shown in Fig. 23 to score configurational understanding.
Before scoring could be completed, each coder had to redraw each map as convex boxes
representing each space and corridor originally drawn.
Figure 23: Convex-mapped J-graph of actual floor plan.
The convex drawings were done using Adobe Illustrator. Using the convex boxes
the length and width were determined for each of the spaces with the grid originally
provided as seen in Fig. 24.
Figure 24: Participant cognitive map with dimension and J-graph nodes.
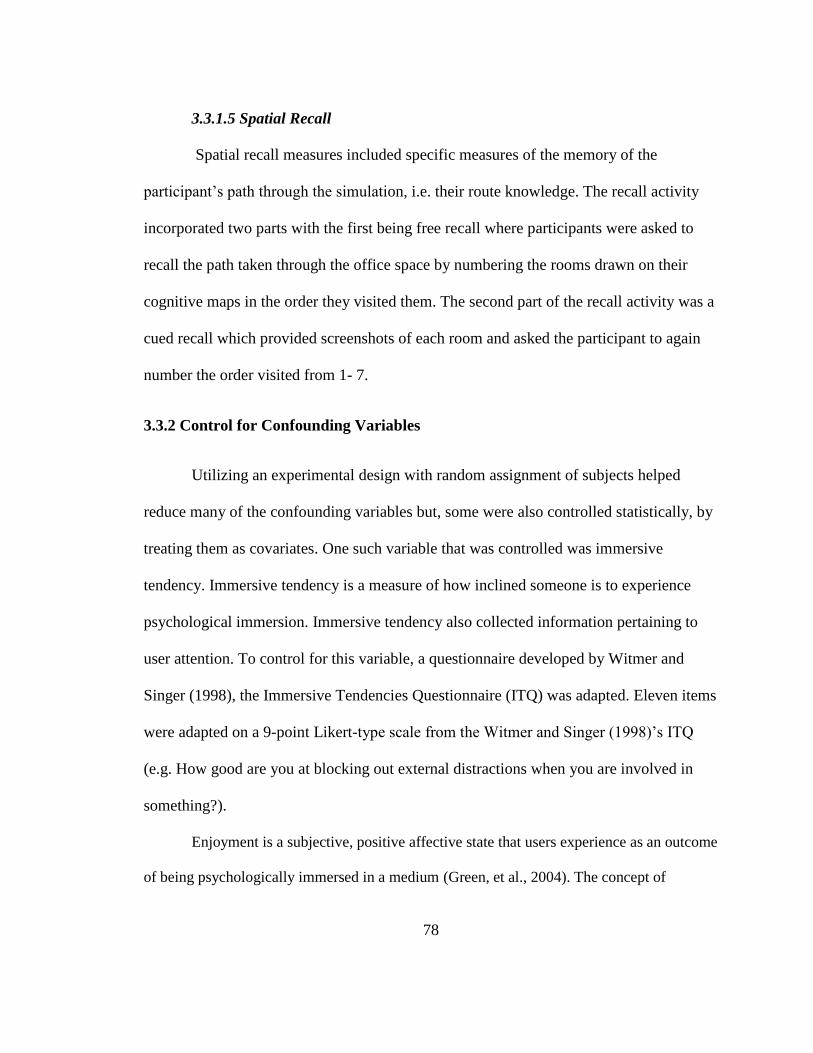
78
3.3.1.5 Spatial Recall
Spatial recall measures included specific measures of the memory of the
participant’s path through the simulation, i.e. their route knowledge. The recall activity
incorporated two parts with the first being free recall where participants were asked to
recall the path taken through the office space by numbering the rooms drawn on their
cognitive maps in the order they visited them. The second part of the recall activity was a
cued recall which provided screenshots of each room and asked the participant to again
number the order visited from 1- 7.
3.3.2 Control for Confounding Variables
Utilizing an experimental design with random assignment of subjects helped
reduce many of the confounding variables but, some were also controlled statistically, by
treating them as covariates. One such variable that was controlled was immersive
tendency. Immersive tendency is a measure of how inclined someone is to experience
psychological immersion. Immersive tendency also collected information pertaining to
user attention. To control for this variable, a questionnaire developed by Witmer and
Singer (1998), the Immersive Tendencies Questionnaire (ITQ) was adapted. Eleven items
were adapted on a 9-point Likert-type scale from the Witmer and Singer (1998)’s ITQ
(e.g. How good are you at blocking out external distractions when you are involved in
something?).
Enjoyment is a subjective, positive affective state that users experience as an outcome
of being psychologically immersed in a medium (Green, et al., 2004). The concept of
79
enjoyment has been positively linked to several other concepts: attention (Ji, Tanca, &
Janicke, 2013), presence and simulator sickness (Nichols, Haldane, & Wilson, 2000),
technology acceptance (Davis, Bagozzi, & Warshaw, 1992) and, pleasure (Lin, Duh, Parker,
Abi-Rached, & Furness, 2002). Operationally, enjoyment is typically considered as items
related to positive experiences measured using self-report (Ji, et al., 2013; Lin, et al., 2002).
Therefore, to control for enjoyment, three 9-point Likert-type scale items were adapted
from Davis et al. (1992) (e.g. Viewing the office suite was pleasant).
Gorini et al. (2011) suggested the use of narrative as the method of providing the
context would increase the level of attention and motivation thus increasing the level of a
user’s engagement. This went along the same lines as Witmer and Singer’s (1998) idea to
incorporate a plot to better engage users. Therefore, the same narrative plot line was used
for all conditions. Building on the narrative, basic audio was included for delivery of the
narrative in the same manner for all conditions. To address the issues of attention and
motivation, the study context needed to be carefully chosen. The user was actively
involved, meaning he/she was able to control decisions in the context which, was used to
address the issue of attention. By using specific tasks that go with the context, intrinsic
motivation at a basic level should also occur. The study context is described in detail later
on in this chapter.
Participant skill levels varied and were controlled best through a training session
prior to data collection. In addition, previous experience with VR systems, video games/
computer games, and technology in general were assessed using a self-report component
within the demographics portion of the questionnaire. Familiarity with 3D devices and
video games consisted for six items developed for this study on a 9-point Likert-type
80
format (e.g. How familiar are you with participating in 3D online virtual worlds?). In
addition to familiarity, eight items pertaining to participant confidence level with
different software packages on a scale of 1-9 was adapted from Balakrishnan et al.
(2012). Participants were also asked to give an estimate of the number of months or years
in experience they had with 3D modeling software packages.
Another measure was developed to control for individual spatial abilities, a three
item sense of direction scale on a 9-point Likert-type format (e.g. I am good at
remembering routes I use to travel).
One last measure was adapted from a previous study to capture participant’s
exposure to the iLab facility (Balakrishnan, et al., 2012). The question asked participants
about ever attending presentations or events in the iLab prior to participating in the study.
If the participant indicated yes, three items were provided for a rating of their experience.
3.4 Sample
Students in enrolled in architectural studies and textile apparel management
courses from a mid-western university were asked to volunteer to participate in the study
for one hour without compensation. Students were randomly assigned to a single
condition. The sample (N =121) consisted of 88 students were architectural studies
majors and minors while 33 were non-majors. The average amount of semesters spent in
the architectural studies program was (M=2.59, SE = .26, SD = 2.82). The class standing
of the students consisted of 27 freshmen, 22 sophomores, 24 juniors, 42 seniors and five
graduate students.
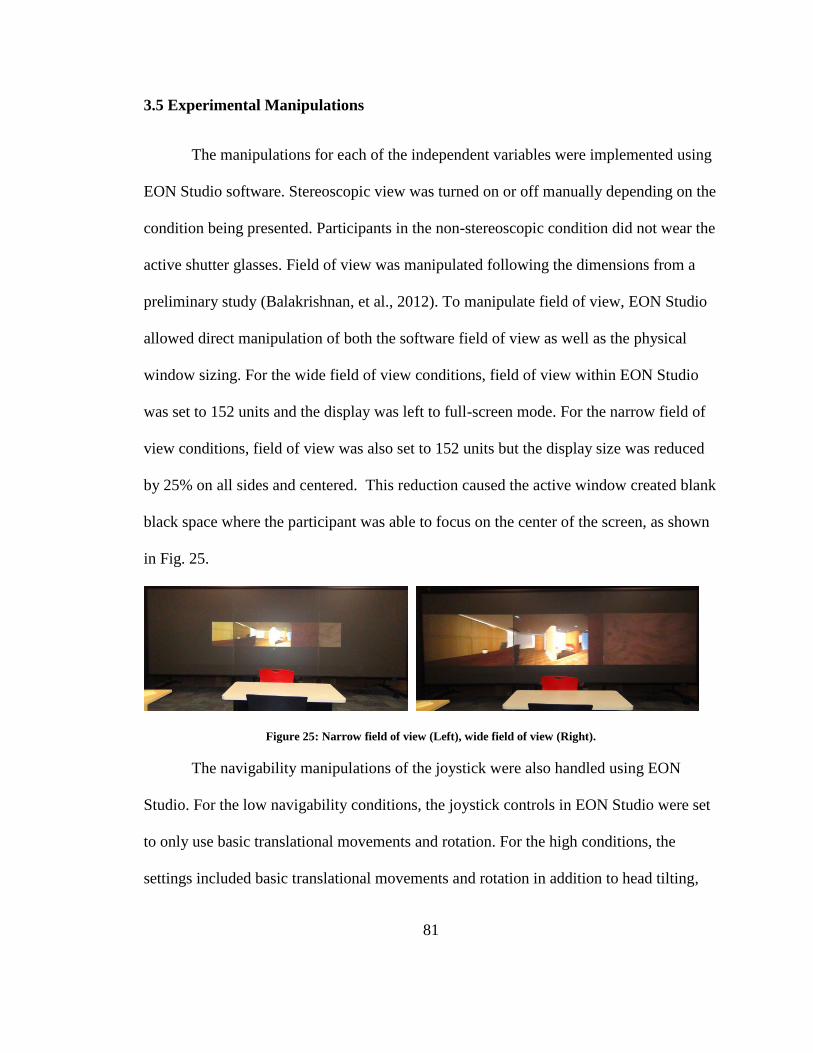
81
3.5 Experimental Manipulations
The manipulations for each of the independent variables were implemented using
EON Studio software. Stereoscopic view was turned on or off manually depending on the
condition being presented. Participants in the non-stereoscopic condition did not wear the
active shutter glasses. Field of view was manipulated following the dimensions from a
preliminary study (Balakrishnan, et al., 2012). To manipulate field of view, EON Studio
allowed direct manipulation of both the software field of view as well as the physical
window sizing. For the wide field of view conditions, field of view within EON Studio
was set to 152 units and the display was left to full-screen mode. For the narrow field of
view conditions, field of view was also set to 152 units but the display size was reduced
by 25% on all sides and centered. This reduction caused the active window created blank
black space where the participant was able to focus on the center of the screen, as shown
in Fig. 25.
Figure 25: Narrow field of view (Left), wide field of view (Right).
The navigability manipulations of the joystick were also handled using EON
Studio. For the low navigability conditions, the joystick controls in EON Studio were set
to only use basic translational movements and rotation. For the high conditions, the
settings included basic translational movements and rotation in addition to head tilting,
82
see Fig. 22. EON Studio allowed for specific buttons on the Logitech Freedom 2.4 GHz
Cordless Joystick. For all navigability manipulations, the main trigger button had to be
held down to move. In the high conditions, an extra button was programmed to allow for
the head-tilting motion.
3.6 Pre-Testing
A significant effort and amount of time was taken to pre-test manipulations as
well as measures in order to refine them multiple times before the final study was
conducted. As the study covered a number of different types of manipulations, it was
necessary to test if each manipulation was effective. Pre-testing also provided insights for
refining the questionnaire as well as spatial tasks, specifically for spatial understanding.
Prior research projects conducted in the iLab, notably Balakrishnan et al. (2012)’s study
also helped to improve the protocol and operationalizations for this study by acting as a
pilot study. The pilot study provided information into how far from the screen the
participant should sit. It also addressed how to operationalize field of view specifically as
a portrayal of actual image size projected on the screens as opposed to the virtual
camera’s field of view setting.
In addition to the pilot test, pre-testing was conducted with five architectural
studies graduate students and three undergraduate students from computer science. Using
these two diverse groups provided insight into how people from different disciplines
would react to each component of the study so that refinements could be made.
Subsequent revisions were made between every other pre-testing in order to gauge if the
change was necessary.
83
The results of the pre-test helped make improvements to the stimulus (e.g.
widening corridors and doorways for easier navigation), to help find a comfortable
geometric field of view based on the display size, a time frame for the task to be
completed (e.g. 10 minutes was the amount of time to complete the task on average), and
to improve the measures for spatial understanding (e.g. the orientation of the cognitive
map outline, image matching of objects to be found, and better worded instructions).
Lastly, pre-testing helped to improve the narrative for the task scenario.
Pre-testing showed that participants, particularly ones not familiar with how to
use a joystick had more difficulty with narrow corridors and doorways. When the
corridors and doorways were widened, easier navigation allowed for better interaction
with the virtual environment, subsequently compensation for the level of skill of the user
with a joystick. Depending on whether the display size was for wide or narrow field of
view, it was important to define a camera field of view or geometric field of view which
best suited the manipulation. Pre-testing included asking users about their comfort and
ease of navigating with two different camera field of view settings. To gauge the amount
of time to interact with the virtual environment, each pre-test subject was asked to
complete the task without a time limit. In timing each subject, the average time of 10
minutes was derived as enough time for accomplishing the search task.
Improving the measures for spatial understanding was one of the most involved
portions of the pre-test subjects. Understanding of the written instructions was one of the
first changes that occurred. In addition to the written instructions wording, the orientation
of the cognitive sketch map provided pre-test subjects with a better sense of recording
84
their own idea of the space. Lastly, pre-testing allowed for a change in free listing objects
found in the rooms to more of a visual matching. This determination came when several
of the pre-test subjects indicated that near the end of the questionnaire, fatigue was
setting in making it harder to complete. Utilizing visual images to match objects found to
the correct location negated some of the fatigue and enabled the pre-test subjects to
complete the questionnaire.
3.7 Procedure
A detailed research protocol was developed (see Appendix A), complete with
verbal scripts for instructions were developed to ensure consistency and avoid researcher
bias. Following the scripted protocol, participants were greeted and briefed about the
study. Once the participants indicated they understood what the study was about and what
was expected from their participation, formal verbal consent was obtained in compliance
with the Institutional Review Board specifications. The procedure included four main
parts: filling out a demographics questionnaire (see Appendix C), training on the joystick,
viewing the narrative for task instructions, performing the task, and filling out the post-
test questionnaire (see Appendix D). The initial questionnaire captured all demographic
data.
3.7.1 Joystick Training
Once the participant finished the first questionnaire, there was a short training
session on how to use the joystick as well as to screen the participant for issues with
simulator sickness. The training session lasted from five to ten minutes until the
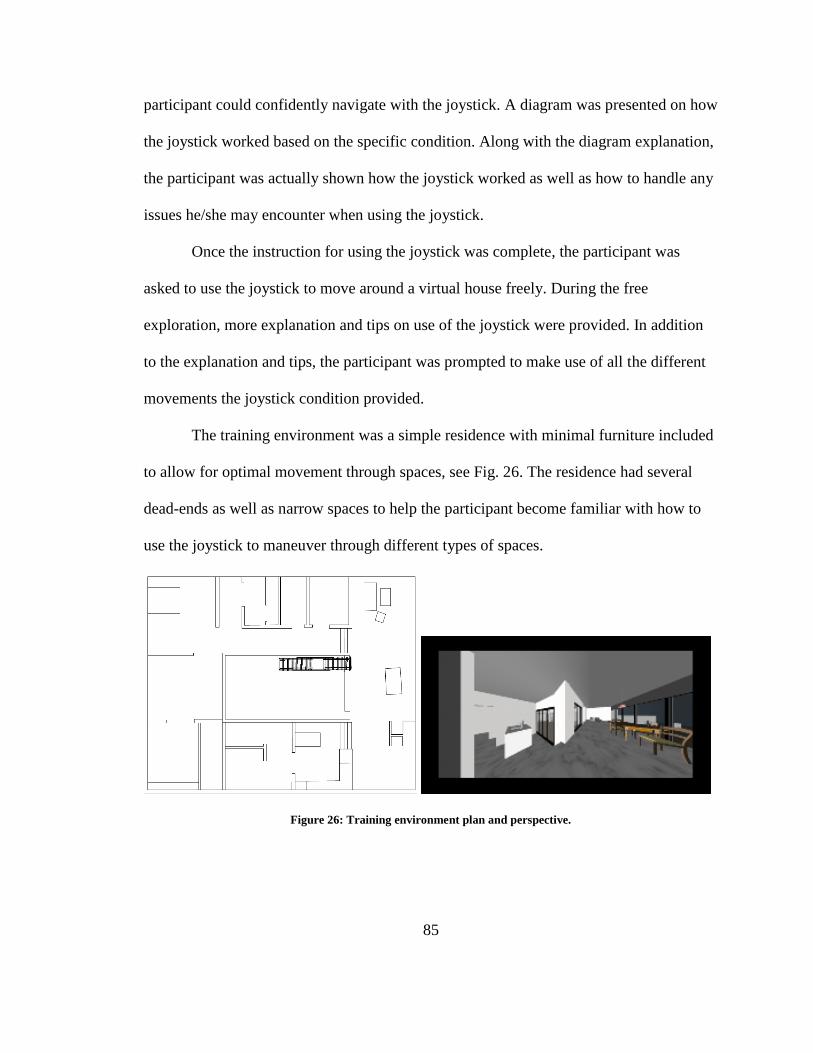
85
participant could confidently navigate with the joystick. A diagram was presented on how
the joystick worked based on the specific condition. Along with the diagram explanation,
the participant was actually shown how the joystick worked as well as how to handle any
issues he/she may encounter when using the joystick.
Once the instruction for using the joystick was complete, the participant was
asked to use the joystick to move around a virtual house freely. During the free
exploration, more explanation and tips on use of the joystick were provided. In addition
to the explanation and tips, the participant was prompted to make use of all the different
movements the joystick condition provided.
The training environment was a simple residence with minimal furniture included
to allow for optimal movement through spaces, see Fig. 26. The residence had several
dead-ends as well as narrow spaces to help the participant become familiar with how to
use the joystick to maneuver through different types of spaces.
Figure 26: Training environment plan and perspective.
86
3.7.2 Study Task
Following the training, participants were asked if there were any further questions
or concerns before moving on to the main task. Once the participant indicated there were
no more questions or issues, the task procedure was explained. To aid with psychological
immersion, it was important to help the participants maintain attention on the task. A
scripted narrative was presented using a Power Point Slide show with voice over (see
Appendix B) to provide details of the task to the participant. In addition to detailing the
task, the narrative requested the participant imagine being a fire-fighter trainee going into
a building to account for personal items left behind. This context was to narratively
transport’ the participant to the scenario and help keep participant motivation on the task
(Green, et al., 2004). The refined narrative from initial pre-testing provided participants
with the task details in both a verbal and written format. The narrative took the
participants through each room of the office space while, listing objects that should be
found.
To further help with maintaining attention, the verbal portion of the narrative was
given through BoseTM noise-cancelling headphones. This allowed for participants to
focus on the narrative instead of ambient noises which, might have occurred outside of
the lab space. The participant was also asked to keep the headphones on during the task
itself.
Following the narrative, the environment for the task was loaded and participants
were told they could start the task. The instructions indicated there was a 10 minute time
limit and that at the end of 10 minutes they would have two indicators that time was up:
87
1) the joystick would stop allowing any movement to occur, and 2) the fire chief would
say through the headphones that time was up. The 10 minute time limit was used to help
control for amount of time spent in the environment so it would remain consistent for all
participants.
During the 10 minute task, the researcher noted the route taken, order rooms were
visited, any use of the joystick manipulation, and any issues encountered. In addition to
the observational notes, a video camera was set up behind the participant to capture only
the screen while the task was being completed.
The task was made up of two parts where the first portion provided to participants
was simple search task. A list of 15 objects, some being repeated objects, were spread
across the seven room office suite. Participants were told of the room each object was
located and asked to find each of the items using the joystick. The second portion of the
task was to ‘report’ their findings by drawing a map of the space and indicating the
location of the objects.
The task started out in the entrance of the office suite which was located on the
upper level of a building. The fire chief narrated the task to the participants indicating
there were seven rooms in the office suite along with specific items to find in each room.
The fire chief also provided information about the task being two parts: 1) a ten minute
search task and 2) a final report indicating how the search went.
3.7.3 Questionnaire
Once the search part of the task was completed, participants were able to start
filling out the questionnaire and the second portion of the task. To keep responses
88
independent from one another, participants were asked to not change any initial
responses. Once the questionnaire and spatial understanding task were completed, the
participants were thanked and any additional questions were answered.
3.7.4 Experimental Set-Up
Based on the pre-testing, the protocol for the experiment procedure (see Appendix
A) was worked out. Only one participant was able to participate at any given time. The
total time to complete the study from beginning to end was approximately one hour. The
layout of the lab was set up to aid with making sure all participants experienced the study
in the same manner and reduced the need for standing, see Fig. 27. Participants were
seated in a rotatable chair that was positioned four feet from the center of the screen. A
table was placed behind the chair so participants could simply rotate around to fill out the
questionnaire after the task. On the other side of the table, the researcher sat to provide
details of the study to participants at the beginning of the study. A video camera was
positioned behind the researcher to capture the screen during the task. Off to the side of
the screen another table was used as an observation station so, it would not interfere with
the camera recording the screen. The researcher would move to the observation station
once the task was started and remain there until the participant finished.
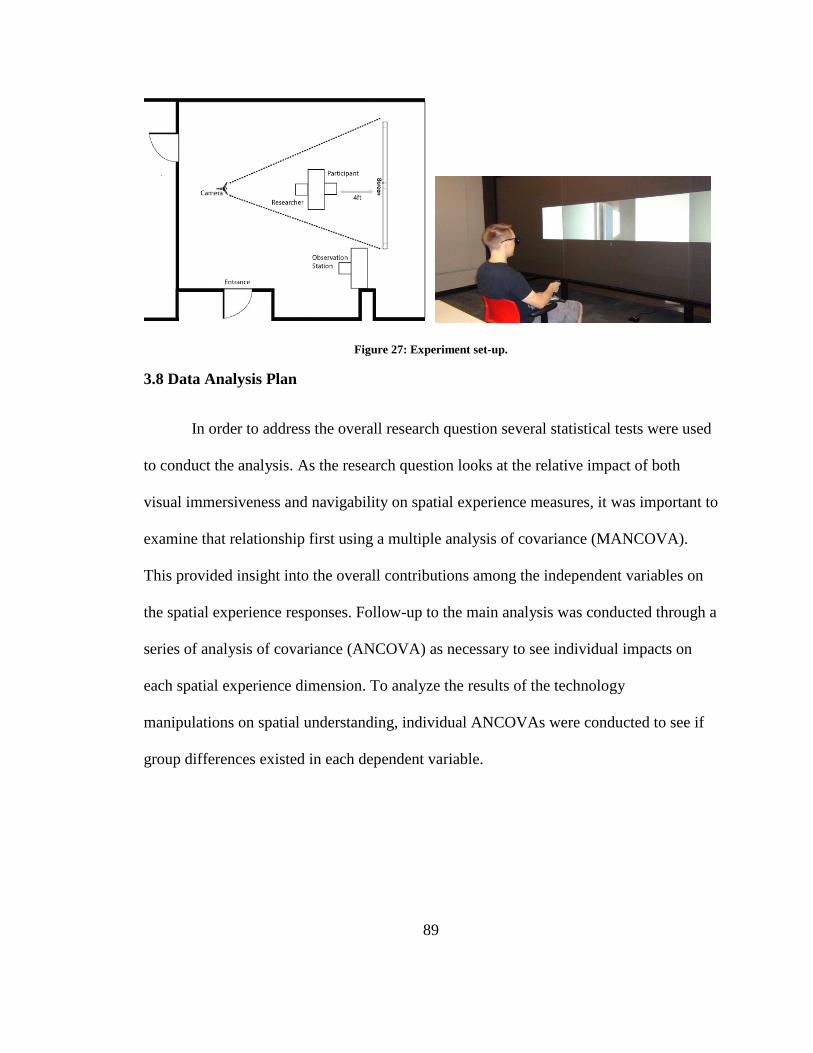
89
Figure 27: Experiment set-up.
3.8 Data Analysis Plan
In order to address the overall research question several statistical tests were used
to conduct the analysis. As the research question looks at the relative impact of both
visual immersiveness and navigability on spatial experience measures, it was important to
examine that relationship first using a multiple analysis of covariance (MANCOVA).
This provided insight into the overall contributions among the independent variables on
the spatial experience responses. Follow-up to the main analysis was conducted through a
series of analysis of covariance (ANCOVA) as necessary to see individual impacts on
each spatial experience dimension. To analyze the results of the technology
manipulations on spatial understanding, individual ANCOVAs were conducted to see if
group differences existed in each dependent variable.
90
CHAPTER 4: ANALYSIS & RESULTS
This chapter reports the results of data analysis from the experiment. The first
section will discuss data screening and assumptions. The next sections will detail out
results of statistical tests to address the research question and hypotheses. Specifically,
this study looked to investigate the influence of visual immersiveness and navigability on
spatial experience and understanding in a virtual environment. The analysis was
conducted using SPSS and JMP statistical analysis software. To address the overall
research question and hypotheses, several statistical tests were conducted on each of the
dependent measures. The initial analysis consisted of a multivariate analysis of
covariance (MANCOVA) to address how the technology affordance manipulations
impacted perceptions of spatial experience. Subsequent analysis to address each of the
dependent measures individually utilized analysis of covariance (ANCOVA).
4.1 Sample Characteristics and Demographics
Participants (N = 110) volunteered from a mid-western university from
architectural studies and textile apparel management courses. The average age was M =
20.95 with 42 males and 79 females. Academic standing consisted of 27 freshman, 22
sophomores, 24 juniors, 42 senior, and 5 graduate students. A total of 77 students were
architectural studies majors with 33 non-majors. There were 79 students in the
architectural studies program either as major or minor with 31 students not affiliated with
the program outside of the courses they were taking. Of the students in the architectural
studies program, the total number of semesters in the program ranges from 0 to 12, (M =
2.66, S.E. = 0.27).
91
Participants ranges from 0 to 66 months experience with 3D software (M = 14.28.
S.E. = 1.66). When asked about familiarity with 3D devices, video games, and virtual
environments, students reported an average of (M = 5.15, S.E. = 0.15). Similarly, when
asked about confidence with different types of software packages including 2D programs
(e.g. Photoshop, etc.) and 3D programs (e.g. 3D Studio Max, etc.), participants reported
on average (M = 3.87, S.E. = 0.19). Following along the lines of participants experience
with 3D technology, a total of 46 students had visited the iLab prior to the experiment
leaving 64 who had never been in the facility. Lastly, participants were asked to rate their
tendency to become immersed (M = 5.88, S.E. = 0.11) as well as their sense of direction
(M = 6.24, S.E. = 0.18).
4.2 Data Screening
Before testing hypotheses, the data was first screened for missing data and
outliers, both univariate and multivariate. A total of 23 missing data points were found
across the dependent variables and covariates. Missing data was handled in two ways: 1)
if a particular case had multiple missing data points it was treated as an outlier and
removed and, 2) missing values were double checked for data entry issues first. If the
missing values were not due to data entry issues, they were left as missing values.
Univariate outliers were detected in three ways: 1) Z-Scores were calculated and
values above ±3.29 were marked as outliers, 2) histograms with normal curves were
generated for visual confirmation of outliers, and 3) skewness and kurtosis were
evaluated for ±2.0. Most cases fell within the normal range and were not detected as
outliers. In some instances, the data showed outliers where the participant’s responses or
92
demographics were treated as special cases. Age showed three participants as outliers, it
was decided to leave these participants in the data set as extreme cases. Outliers were
found to differ across the two dependent variables and so outliers were excluded based on
each. Multivariate outliers were detected through testing the Mahalonobis Distance
through a chi-square distribution. Only one case was found to be a multivariate outlier. A
total of eight outliers and participants with missing values were excluded from the entire
analysis overall. Five of the cases were removed for analysis on the spatial experience
measures and six different cases were removed for the spatial understanding measures.
The data was tested for the assumptions of independence of observations,
normality and multivariate normality, homogeneity of variance-covariance matrices,
measurement error of covariates, linear relationships between covariate and dependent
variables, and homogeneity of regression. To test normality, outliers and missing data
were handled and histograms with normal curves were used. Skewness and kurtosis were
also examined. Reliability of the covariates and dependent variables was examined
through Cronbach’s α. Scatter plots were used to assess linearity of the covariates and
dependent variables. Homogeneity of variance-covariance matrices was evaluated using
Levene’s test and Box’s M test. Homogeneity of regression was checked to see if any
interaction existed between the independent variables and covariates. In almost all
instances the relationships between the independent variables and covariates were found
to have no significant interaction.
The design of the experiment accounted for having balanced cell sizes, after
dealing with the missing data and outliers the cells were still well balanced, see Table. 4.
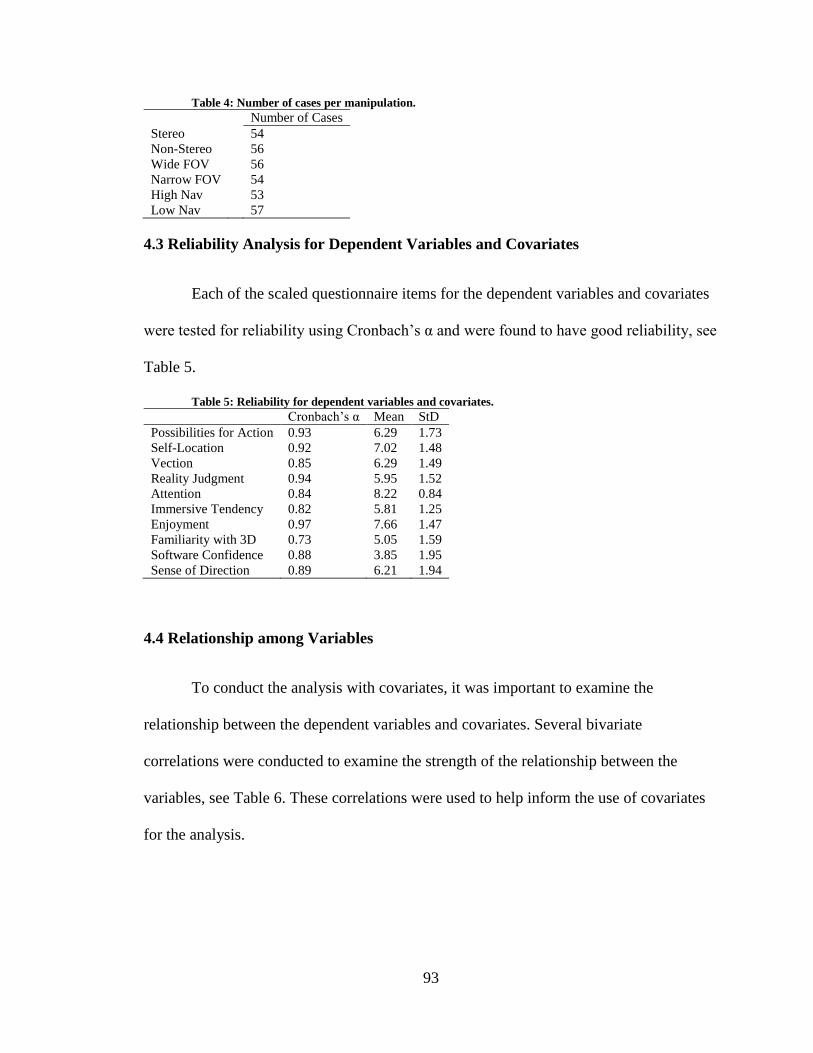
93
Table 4: Number of cases per manipulation.
Number of Cases
Stereo 54
Non-Stereo 56
Wide FOV 56
Narrow FOV 54
High Nav 53
Low Nav 57
4.3 Reliability Analysis for Dependent Variables and Covariates
Each of the scaled questionnaire items for the dependent variables and covariates
were tested for reliability using Cronbach’s α and were found to have good reliability, see
Table 5.
Table 5: Reliability for dependent variables and covariates.
Cronbach’s α Mean StD
Possibilities for Action 0.93 6.29 1.73
Self-Location 0.92 7.02 1.48
Vection 0.85 6.29 1.49
Reality Judgment 0.94 5.95 1.52
Attention 0.84 8.22 0.84
Immersive Tendency 0.82 5.81 1.25
Enjoyment 0.97 7.66 1.47
Familiarity with 3D 0.73 5.05 1.59
Software Confidence 0.88 3.85 1.95
Sense of Direction 0.89 6.21 1.94
4.4 Relationship among Variables
To conduct the analysis with covariates, it was important to examine the
relationship between the dependent variables and covariates. Several bivariate
correlations were conducted to examine the strength of the relationship between the
variables, see Table 6. These correlations were used to help inform the use of covariates
for the analysis.
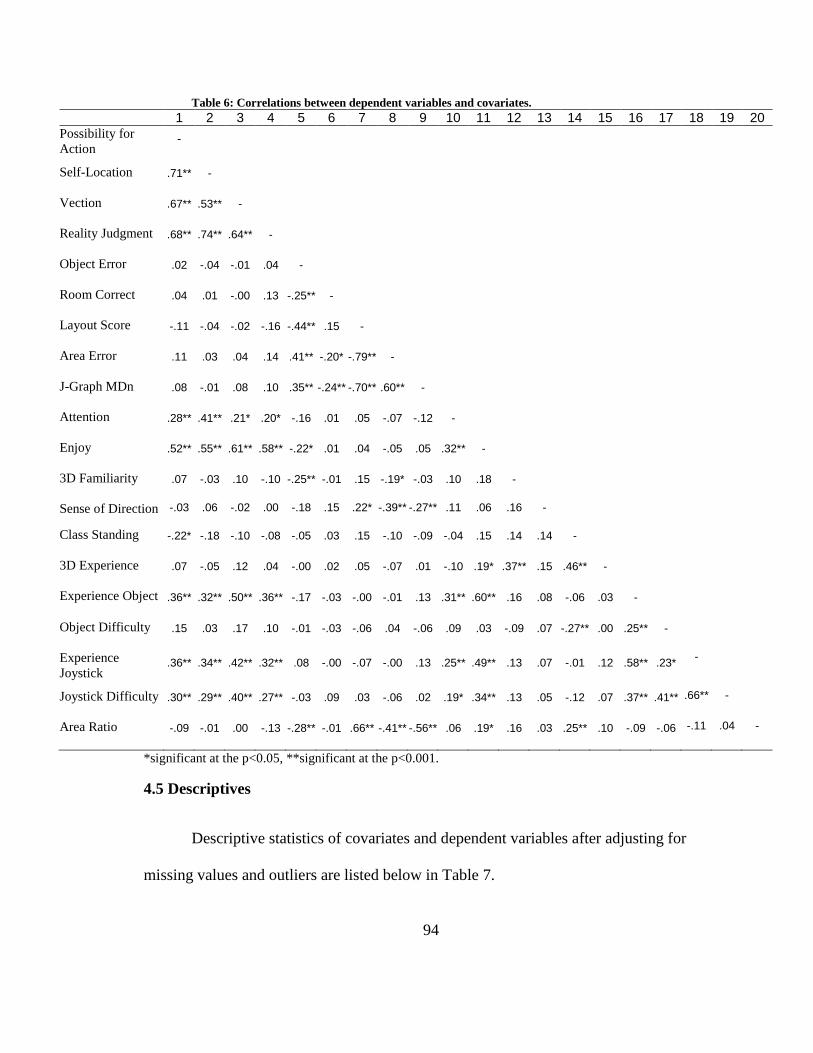
94
Table 6: Correlations between dependent variables and covariates.
1 2 3 4 5 6 7 8 9 10 11 12 13 14 15 16 17 18 19 20
Possibility for
Action -
Self-Location .71** -
Vection .67** .53** -
Reality Judgment .68** .74** .64** -
Object Error .02 -.04 -.01 .04 -
Room Correct .04 .01 -.00 .13 -.25** -
Layout Score -.11 -.04 -.02 -.16 -.44** .15 -
Area Error .11 .03 .04 .14 .41** -.20* -.79** -
J-Graph MDn .08 -.01 .08 .10 .35** -.24** -.70** .60** -
Attention .28** .41** .21* .20* -.16 .01 .05 -.07 -.12 -
Enjoy .52** .55** .61** .58** -.22* .01 .04 -.05 .05 .32** -
3D Familiarity .07 -.03 .10 -.10 -.25** -.01 .15 -.19* -.03 .10 .18 -
Sense of Direction -.03 .06 -.02 .00 -.18 .15 .22* -.39** -.27** .11 .06 .16 -
Class Standing -.22* -.18 -.10 -.08 -.05 .03 .15 -.10 -.09 -.04 .15 .14 .14 -
3D Experience .07 -.05 .12 .04 -.00 .02 .05 -.07 .01 -.10 .19* .37** .15 .46** -
Experience Object .36** .32** .50** .36** -.17 -.03 -.00 -.01 .13 .31** .60** .16 .08 -.06 .03 -
Object Difficulty .15 .03 .17 .10 -.01 -.03 -.06 .04 -.06 .09 .03 -.09 .07 -.27** .00 .25** -
Experience
Joystick .36** .34** .42** .32** .08 -.00 -.07 -.00 .13 .25** .49** .13 .07 -.01 .12 .58** .23*
-
Joystick Difficulty .30** .29** .40** .27** -.03 .09 .03 -.06 .02 .19* .34** .13 .05 -.12 .07 .37** .41** .66** -
Area Ratio -.09 -.01 .00 -.13 -.28** -.01 .66** -.41** -.56** .06 .19* .16 .03 .25** .10 -.09 -.06 -.11 .04 -
*significant at the p<0.05, **significant at the p<0.001.
4.5 Descriptives
Descriptive statistics of covariates and dependent variables after adjusting for
missing values and outliers are listed below in Table 7.
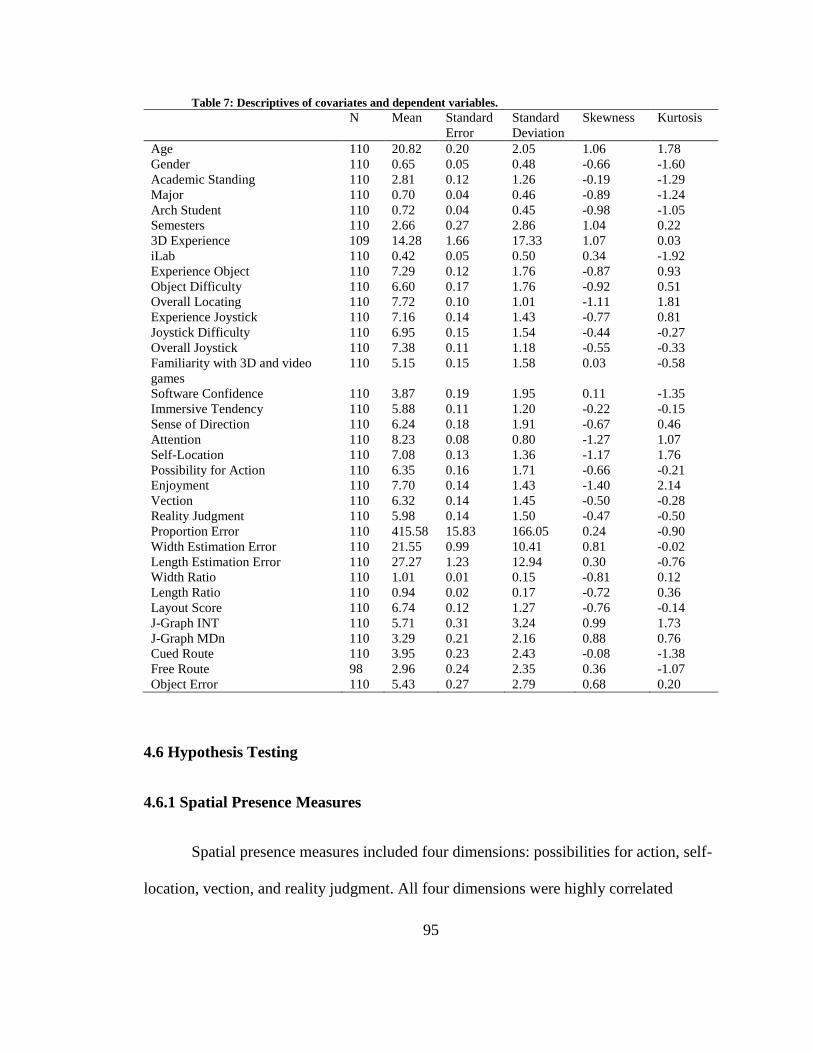
95
Table 7: Descriptives of covariates and dependent variables.
N Mean Standard
Error
Standard
Deviation
Skewness Kurtosis
Age 110 20.82 0.20 2.05 1.06 1.78
Gender 110 0.65 0.05 0.48 -0.66 -1.60
Academic Standing 110 2.81 0.12 1.26 -0.19 -1.29
Major 110 0.70 0.04 0.46 -0.89 -1.24
Arch Student 110 0.72 0.04 0.45 -0.98 -1.05
Semesters 110 2.66 0.27 2.86 1.04 0.22
3D Experience 109 14.28 1.66 17.33 1.07 0.03
iLab 110 0.42 0.05 0.50 0.34 -1.92
Experience Object 110 7.29 0.12 1.76 -0.87 0.93
Object Difficulty 110 6.60 0.17 1.76 -0.92 0.51
Overall Locating 110 7.72 0.10 1.01 -1.11 1.81
Experience Joystick 110 7.16 0.14 1.43 -0.77 0.81
Joystick Difficulty 110 6.95 0.15 1.54 -0.44 -0.27
Overall Joystick 110 7.38 0.11 1.18 -0.55 -0.33
Familiarity with 3D and video
games
110 5.15 0.15 1.58 0.03 -0.58
Software Confidence 110 3.87 0.19 1.95 0.11 -1.35
Immersive Tendency 110 5.88 0.11 1.20 -0.22 -0.15
Sense of Direction 110 6.24 0.18 1.91 -0.67 0.46
Attention 110 8.23 0.08 0.80 -1.27 1.07
Self-Location 110 7.08 0.13 1.36 -1.17 1.76
Possibility for Action 110 6.35 0.16 1.71 -0.66 -0.21
Enjoyment 110 7.70 0.14 1.43 -1.40 2.14
Vection 110 6.32 0.14 1.45 -0.50 -0.28
Reality Judgment 110 5.98 0.14 1.50 -0.47 -0.50
Proportion Error 110 415.58 15.83 166.05 0.24 -0.90
Width Estimation Error 110 21.55 0.99 10.41 0.81 -0.02
Length Estimation Error 110 27.27 1.23 12.94 0.30 -0.76
Width Ratio 110 1.01 0.01 0.15 -0.81 0.12
Length Ratio 110 0.94 0.02 0.17 -0.72 0.36
Layout Score 110 6.74 0.12 1.27 -0.76 -0.14
J-Graph INT 110 5.71 0.31 3.24 0.99 1.73
J-Graph MDn 110 3.29 0.21 2.16 0.88 0.76
Cued Route 110 3.95 0.23 2.43 -0.08 -1.38
Free Route 98 2.96 0.24 2.35 0.36 -1.07
Object Error 110 5.43 0.27 2.79 0.68 0.20
4.6 Hypothesis Testing
4.6.1 Spatial Presence Measures
Spatial presence measures included four dimensions: possibilities for action, self-
location, vection, and reality judgment. All four dimensions were highly correlated
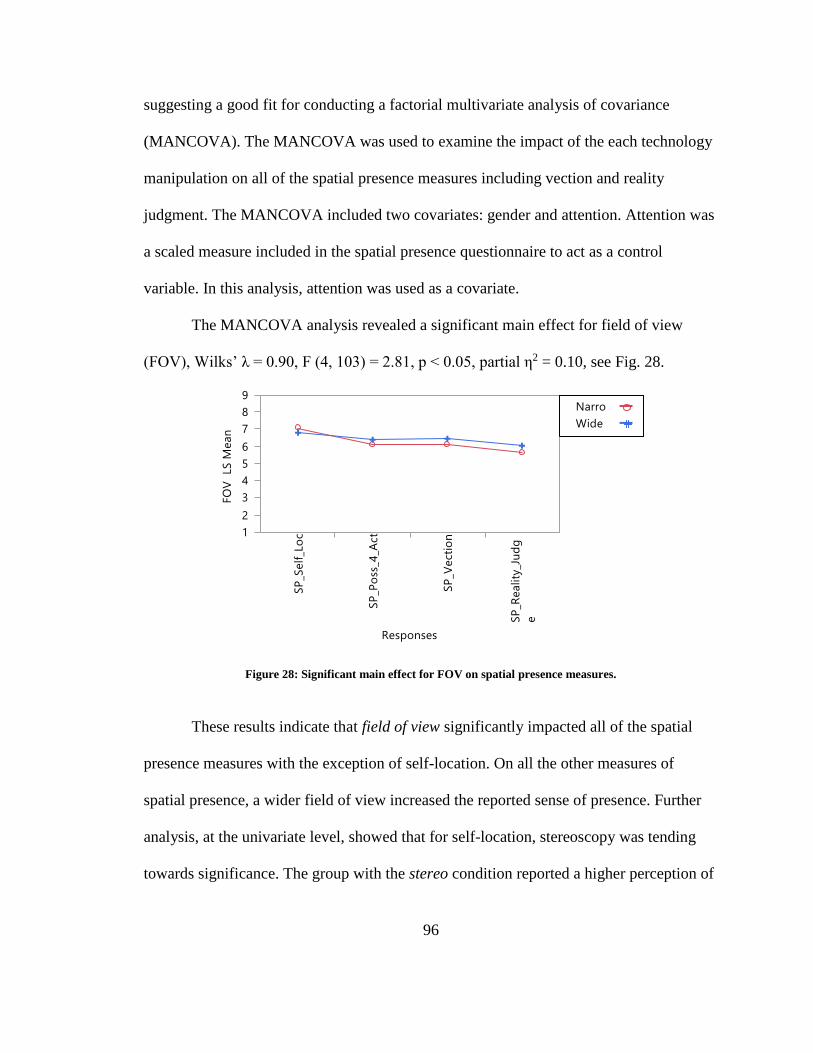
96
suggesting a good fit for conducting a factorial multivariate analysis of covariance
(MANCOVA). The MANCOVA was used to examine the impact of the each technology
manipulation on all of the spatial presence measures including vection and reality
judgment. The MANCOVA included two covariates: gender and attention. Attention was
a scaled measure included in the spatial presence questionnaire to act as a control
variable. In this analysis, attention was used as a covariate.
The MANCOVA analysis revealed a significant main effect for field of view
(FOV), Wilks’ λ = 0.90, F (4, 103) = 2.81, p < 0.05, partial η2 = 0.10, see Fig. 28.
Figure 28: Significant main effect for FOV on spatial presence measures.
These results indicate that field of view significantly impacted all of the spatial
presence measures with the exception of self-location. On all the other measures of
spatial presence, a wider field of view increased the reported sense of presence. Further
analysis, at the univariate level, showed that for self-location, stereoscopy was tending
towards significance. The group with the stereo condition reported a higher perception of
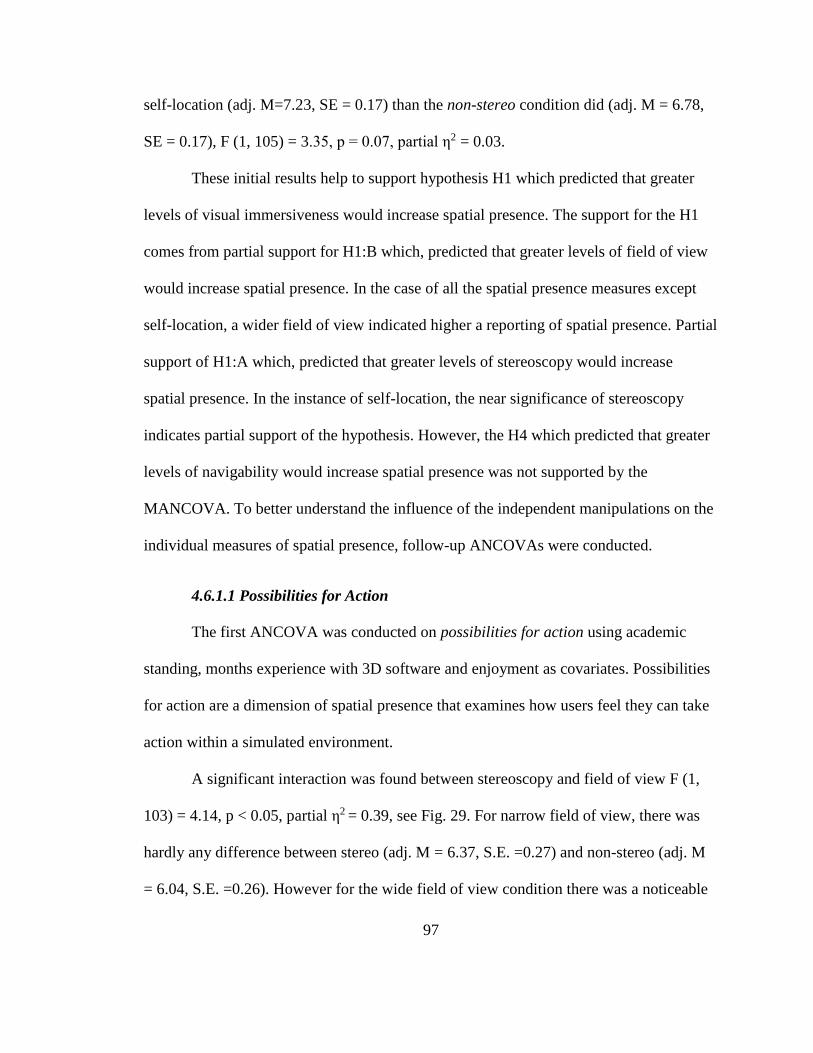
97
self-location (adj. M=7.23, SE = 0.17) than the non-stereo condition did (adj. M = 6.78,
SE = 0.17), F (1, 105) = 3.35, p = 0.07, partial η2 = 0.03.
These initial results help to support hypothesis H1 which predicted that greater
levels of visual immersiveness would increase spatial presence. The support for the H1
comes from partial support for H1:B which, predicted that greater levels of field of view
would increase spatial presence. In the case of all the spatial presence measures except
self-location, a wider field of view indicated higher a reporting of spatial presence. Partial
support of H1:A which, predicted that greater levels of stereoscopy would increase
spatial presence. In the instance of self-location, the near significance of stereoscopy
indicates partial support of the hypothesis. However, the H4 which predicted that greater
levels of navigability would increase spatial presence was not supported by the
MANCOVA. To better understand the influence of the independent manipulations on the
individual measures of spatial presence, follow-up ANCOVAs were conducted.
4.6.1.1 Possibilities for Action
The first ANCOVA was conducted on possibilities for action using academic
standing, months experience with 3D software and enjoyment as covariates. Possibilities
for action are a dimension of spatial presence that examines how users feel they can take
action within a simulated environment.
A significant interaction was found between stereoscopy and field of view F (1,
103) = 4.14, p < 0.05, partial η2 = 0.39, see Fig. 29. For narrow field of view, there was
hardly any difference between stereo (adj. M = 6.37, S.E. =0.27) and non-stereo (adj. M
= 6.04, S.E. =0.26). However for the wide field of view condition there was a noticeable
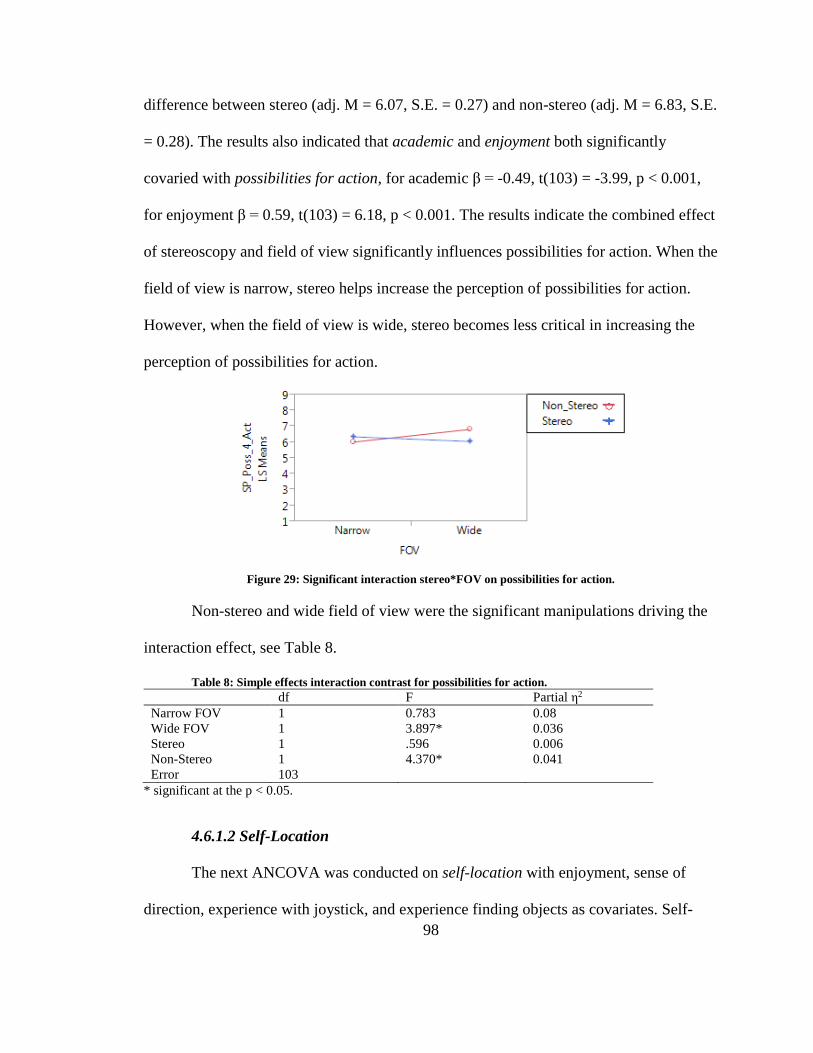
98
difference between stereo (adj. M = 6.07, S.E. = 0.27) and non-stereo (adj. M = 6.83, S.E.
= 0.28). The results also indicated that academic and enjoyment both significantly
covaried with possibilities for action, for academic β = -0.49, t(103) = -3.99, p < 0.001,
for enjoyment β = 0.59, t(103) = 6.18, p < 0.001. The results indicate the combined effect
of stereoscopy and field of view significantly influences possibilities for action. When the
field of view is narrow, stereo helps increase the perception of possibilities for action.
However, when the field of view is wide, stereo becomes less critical in increasing the
perception of possibilities for action.
Figure 29: Significant interaction stereo*FOV on possibilities for action.
Non-stereo and wide field of view were the significant manipulations driving the
interaction effect, see Table 8.
Table 8: Simple effects interaction contrast for possibilities for action.
df F Partial η2
Narrow FOV 1 0.783 0.08
Wide FOV 1 3.897* 0.036
Stereo 1 .596 0.006
Non-Stereo 1 4.370* 0.041
Error 103
* significant at the p < 0.05.
4.6.1.2 Self-Location
The next ANCOVA was conducted on self-location with enjoyment, sense of
direction, experience with joystick, and experience finding objects as covariates. Self-
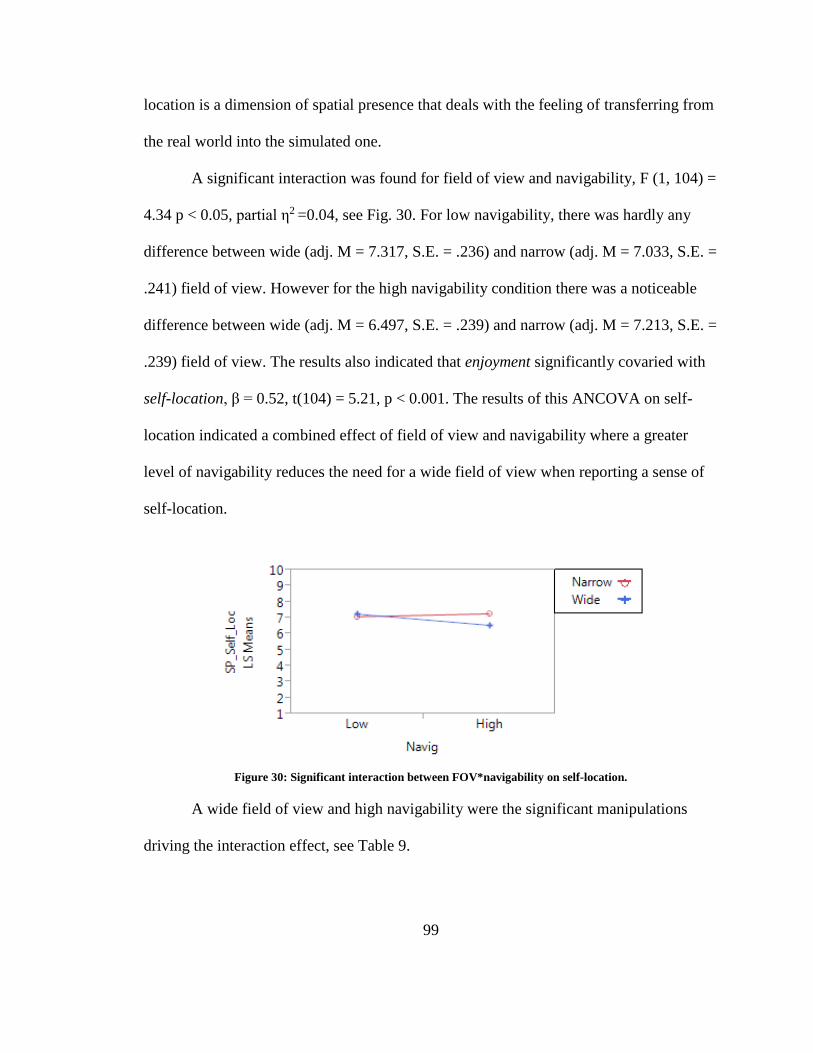
99
location is a dimension of spatial presence that deals with the feeling of transferring from
the real world into the simulated one.
A significant interaction was found for field of view and navigability, F (1, 104) =
4.34 p < 0.05, partial η2 =0.04, see Fig. 30. For low navigability, there was hardly any
difference between wide (adj. M = 7.317, S.E. = .236) and narrow (adj. M = 7.033, S.E. =
.241) field of view. However for the high navigability condition there was a noticeable
difference between wide (adj. M = 6.497, S.E. = .239) and narrow (adj. M = 7.213, S.E. =
.239) field of view. The results also indicated that enjoyment significantly covaried with
self-location, β = 0.52, t(104) = 5.21, p < 0.001. The results of this ANCOVA on self-
location indicated a combined effect of field of view and navigability where a greater
level of navigability reduces the need for a wide field of view when reporting a sense of
self-location.
Figure 30: Significant interaction between FOV*navigability on self-location.
A wide field of view and high navigability were the significant manipulations
driving the interaction effect, see Table 9.
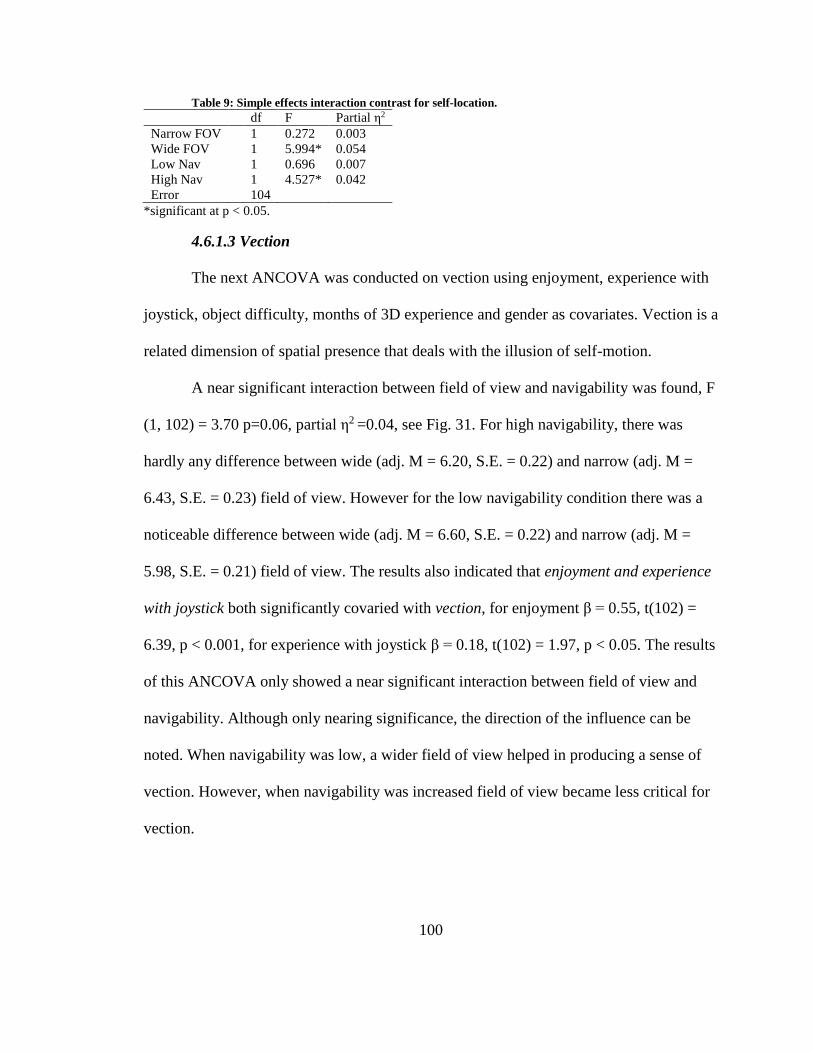
100
Table 9: Simple effects interaction contrast for self-location.
df F Partial η2
Narrow FOV 1 0.272 0.003
Wide FOV 1 5.994* 0.054
Low Nav 1 0.696 0.007
High Nav 1 4.527* 0.042
Error 104
*significant at p < 0.05.
4.6.1.3 Vection
The next ANCOVA was conducted on vection using enjoyment, experience with
joystick, object difficulty, months of 3D experience and gender as covariates. Vection is a
related dimension of spatial presence that deals with the illusion of self-motion.
A near significant interaction between field of view and navigability was found, F
(1, 102) = 3.70 p=0.06, partial η2 =0.04, see Fig. 31. For high navigability, there was
hardly any difference between wide (adj. M = 6.20, S.E. = 0.22) and narrow (adj. M =
6.43, S.E. = 0.23) field of view. However for the low navigability condition there was a
noticeable difference between wide (adj. M = 6.60, S.E. = 0.22) and narrow (adj. M =
5.98, S.E. = 0.21) field of view. The results also indicated that enjoyment and experience
with joystick both significantly covaried with vection, for enjoyment β = 0.55, t(102) =
6.39, p < 0.001, for experience with joystick β = 0.18, t(102) = 1.97, p < 0.05. The results
of this ANCOVA only showed a near significant interaction between field of view and
navigability. Although only nearing significance, the direction of the influence can be
noted. When navigability was low, a wider field of view helped in producing a sense of
vection. However, when navigability was increased field of view became less critical for
vection.
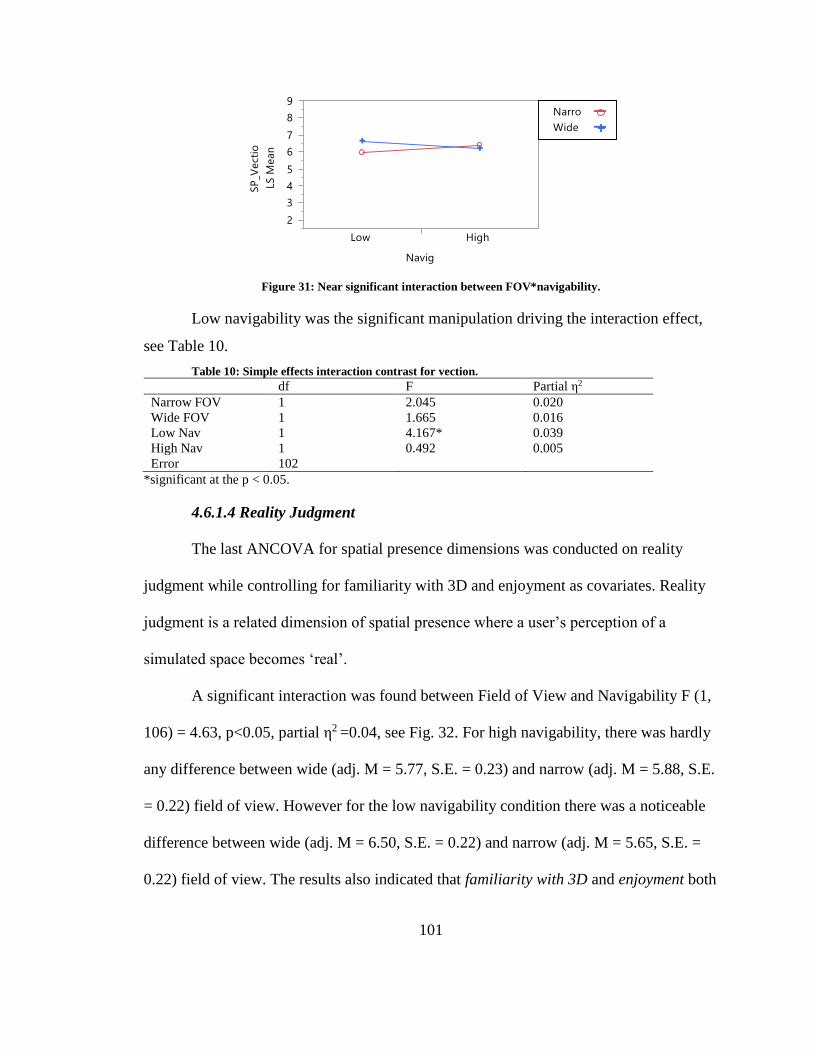
101
Figure 31: Near significant interaction between FOV*navigability.
Low navigability was the significant manipulation driving the interaction effect,
see Table 10.
Table 10: Simple effects interaction contrast for vection.
df F Partial η2
Narrow FOV 1 2.045 0.020
Wide FOV 1 1.665 0.016
Low Nav 1 4.167* 0.039
High Nav 1 0.492 0.005
Error 102
*significant at the p < 0.05.
4.6.1.4 Reality Judgment
The last ANCOVA for spatial presence dimensions was conducted on reality
judgment while controlling for familiarity with 3D and enjoyment as covariates. Reality
judgment is a related dimension of spatial presence where a user’s perception of a
simulated space becomes ‘real’.
A significant interaction was found between Field of View and Navigability F (1,
106) = 4.63, p<0.05, partial η2 =0.04, see Fig. 32. For high navigability, there was hardly
any difference between wide (adj. M = 5.77, S.E. = 0.23) and narrow (adj. M = 5.88, S.E.
= 0.22) field of view. However for the low navigability condition there was a noticeable
difference between wide (adj. M = 6.50, S.E. = 0.22) and narrow (adj. M = 5.65, S.E. =
0.22) field of view. The results also indicated that familiarity with 3D and enjoyment both
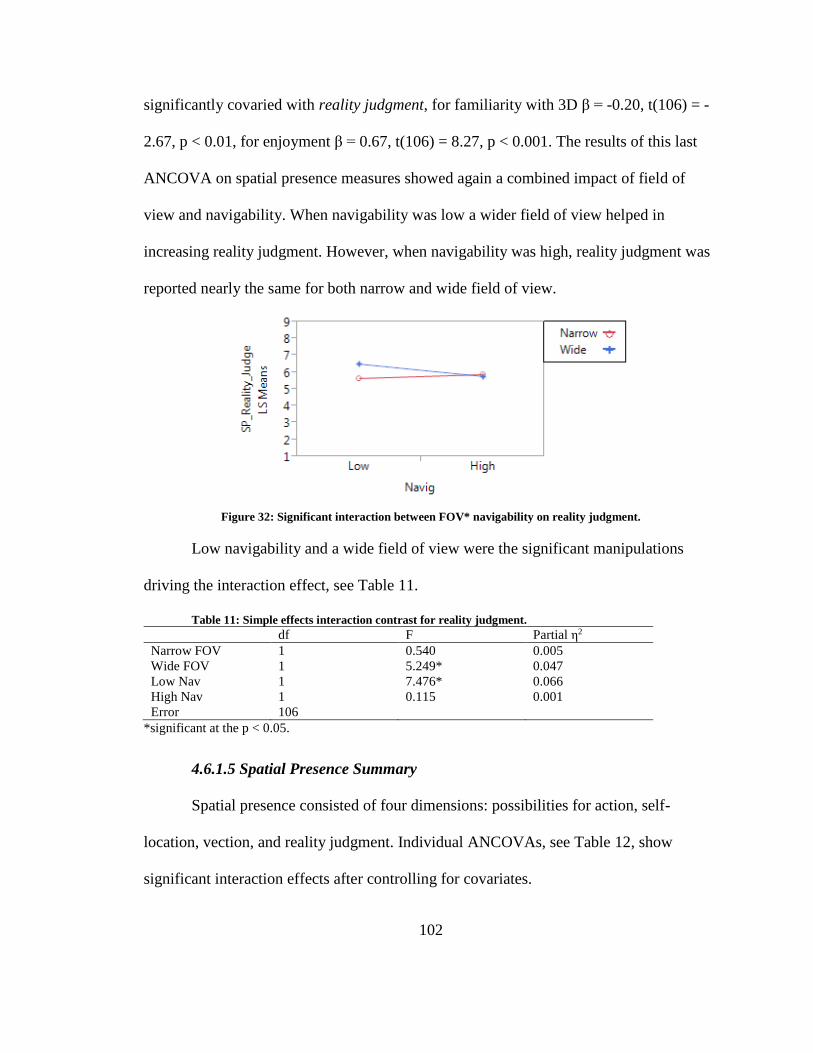
102
significantly covaried with reality judgment, for familiarity with 3D β = -0.20, t(106) = -
2.67, p < 0.01, for enjoyment β = 0.67, t(106) = 8.27, p < 0.001. The results of this last
ANCOVA on spatial presence measures showed again a combined impact of field of
view and navigability. When navigability was low a wider field of view helped in
increasing reality judgment. However, when navigability was high, reality judgment was
reported nearly the same for both narrow and wide field of view.
Figure 32: Significant interaction between FOV* navigability on reality judgment.
Low navigability and a wide field of view were the significant manipulations
driving the interaction effect, see Table 11.
Table 11: Simple effects interaction contrast for reality judgment.
df F Partial η2
Narrow FOV 1 0.540 0.005
Wide FOV 1 5.249* 0.047
Low Nav 1 7.476* 0.066
High Nav 1 0.115 0.001
Error 106
*significant at the p < 0.05.
4.6.1.5 Spatial Presence Summary
Spatial presence consisted of four dimensions: possibilities for action, self-
location, vection, and reality judgment. Individual ANCOVAs, see Table 12, show
significant interaction effects after controlling for covariates.
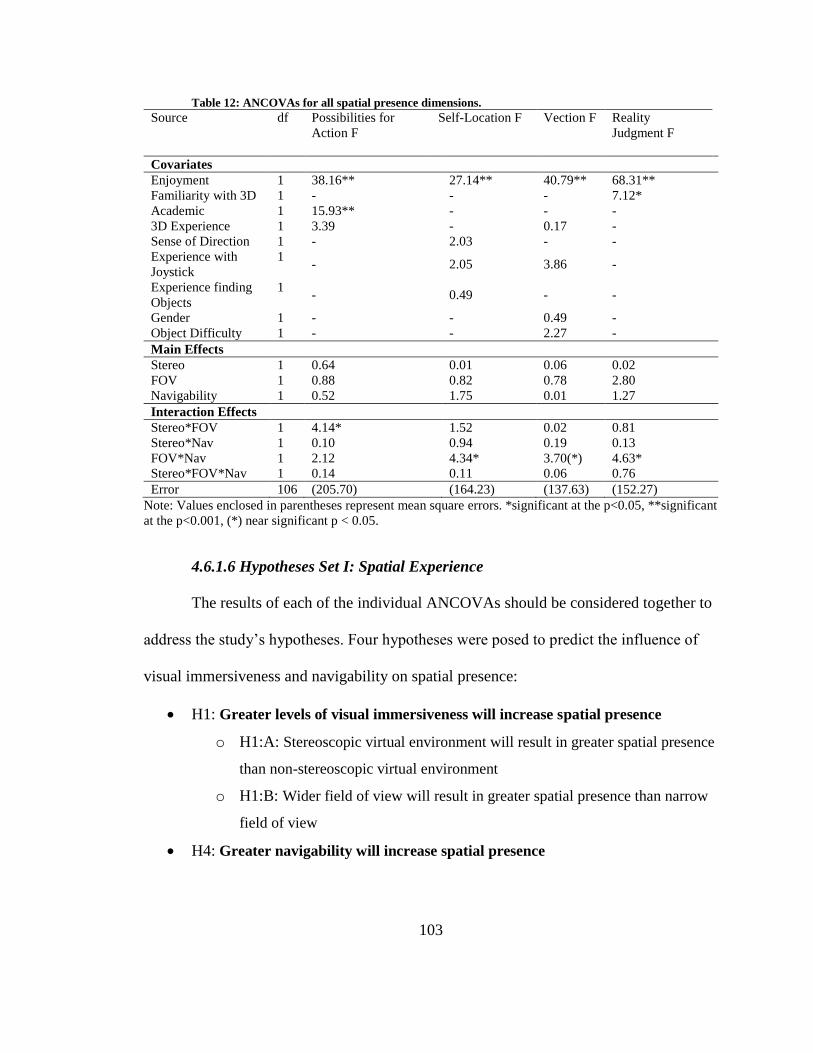
103
Table 12: ANCOVAs for all spatial presence dimensions.
Source df Possibilities for
Action F
Self-Location F Vection F Reality
Judgment F
Covariates
Enjoyment 1 38.16** 27.14** 40.79** 68.31**
Familiarity with 3D 1 - - - 7.12*
Academic 1 15.93** - - -
3D Experience 1 3.39 - 0.17 -
Sense of Direction 1 - 2.03 - -
Experience with
Joystick
1 - 2.05 3.86 -
Experience finding
Objects
1 - 0.49 - -
Gender 1 - - 0.49 -
Object Difficulty 1 - - 2.27 -
Main Effects
Stereo 1 0.64 0.01 0.06 0.02
FOV 1 0.88 0.82 0.78 2.80
Navigability 1 0.52 1.75 0.01 1.27
Interaction Effects
Stereo*FOV 1 4.14* 1.52 0.02 0.81
Stereo*Nav 1 0.10 0.94 0.19 0.13
FOV*Nav 1 2.12 4.34* 3.70(*) 4.63*
Stereo*FOV*Nav 1 0.14 0.11 0.06 0.76
Error 106 (205.70) (164.23) (137.63) (152.27)
Note: Values enclosed in parentheses represent mean square errors. *significant at the p<0.05, **significant
at the p<0.001, (*) near significant p < 0.05.
4.6.1.6 Hypotheses Set I: Spatial Experience
The results of each of the individual ANCOVAs should be considered together to
address the study’s hypotheses. Four hypotheses were posed to predict the influence of
visual immersiveness and navigability on spatial presence:
H1: Greater levels of visual immersiveness will increase spatial presence
o H1:A: Stereoscopic virtual environment will result in greater spatial presence
than non-stereoscopic virtual environment
o H1:B: Wider field of view will result in greater spatial presence than narrow
field of view
H4: Greater navigability will increase spatial presence
104
Overall, the results provide partial support for H1 (greater levels of visual
immersiveness will improve spatial presence). This finding is supported partially through
the significance of field of view on all four dimensions of spatial presence as well as from
the MANCOVA analysis. Looking closer at the individual hypotheses for H1, only H1:B
(wider field of view will improve spatial presence) is partially supported due to each of
the findings being interaction effects as opposed to main effects. Another distinction is
the directionality of the H1:B hypothesis was not found to be exactly true on each
individual dimension. For self-location, it was the narrow field of view that improved
instead of the predicted wide field of view. The other individual hypothesis of H1 was
found to not be supported, H1:A (stereoscopy will improve spatial presence) was only
found to be significant on one dimension of presence and only within an interaction
effect.
The results also indicated partial support for H4 (greater levels of navigability will
improve spatial presence). Partial support comes from the interaction effects of
navigability with field of view across nearly all the dimensions of spatial presence.
Similar to field of view, the directionality of the influence of navigability on certain
dimensions did not act as predicted. For reality judgment, high navigability was found
not improve ratings.
For the four hypotheses, only three were partially supported. The hypothesis on
stereoscopy, H1:A, was not supported by the results of the analysis.
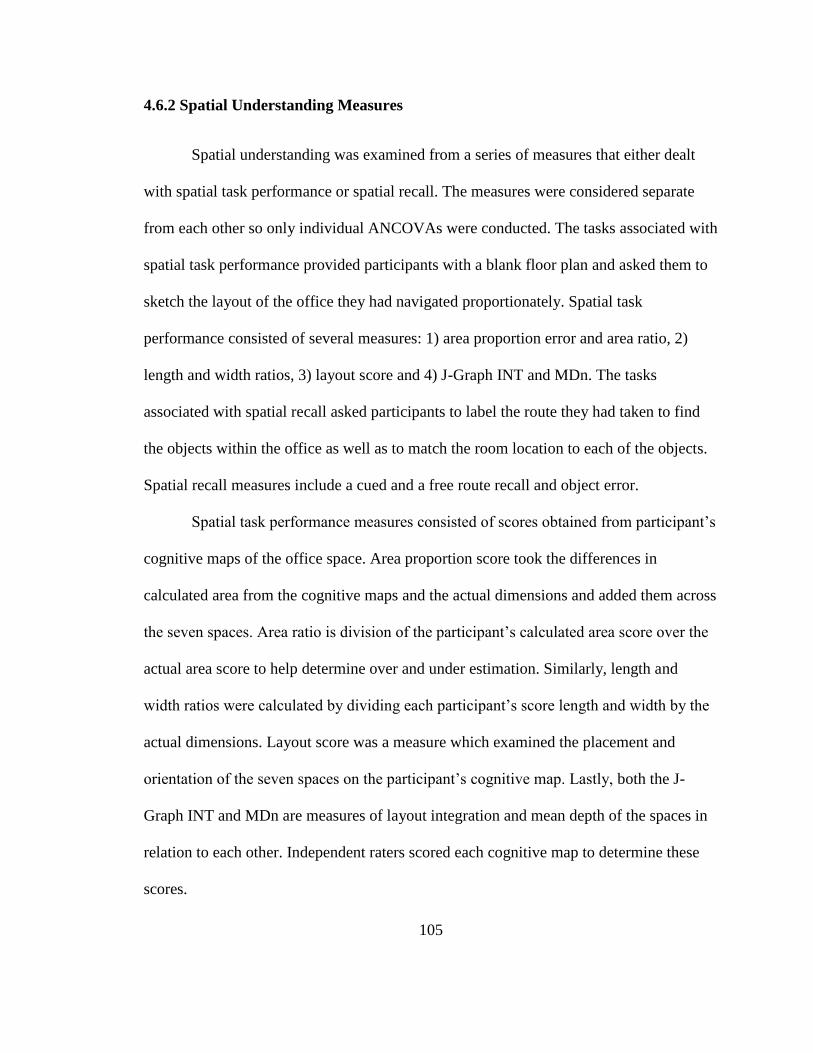
105
4.6.2 Spatial Understanding Measures
Spatial understanding was examined from a series of measures that either dealt
with spatial task performance or spatial recall. The measures were considered separate
from each other so only individual ANCOVAs were conducted. The tasks associated with
spatial task performance provided participants with a blank floor plan and asked them to
sketch the layout of the office they had navigated proportionately. Spatial task
performance consisted of several measures: 1) area proportion error and area ratio, 2)
length and width ratios, 3) layout score and 4) J-Graph INT and MDn. The tasks
associated with spatial recall asked participants to label the route they had taken to find
the objects within the office as well as to match the room location to each of the objects.
Spatial recall measures include a cued and a free route recall and object error.
Spatial task performance measures consisted of scores obtained from participant’s
cognitive maps of the office space. Area proportion score took the differences in
calculated area from the cognitive maps and the actual dimensions and added them across
the seven spaces. Area ratio is division of the participant’s calculated area score over the
actual area score to help determine over and under estimation. Similarly, length and
width ratios were calculated by dividing each participant’s score length and width by the
actual dimensions. Layout score was a measure which examined the placement and
orientation of the seven spaces on the participant’s cognitive map. Lastly, both the J-
Graph INT and MDn are measures of layout integration and mean depth of the spaces in
relation to each other. Independent raters scored each cognitive map to determine these
scores.
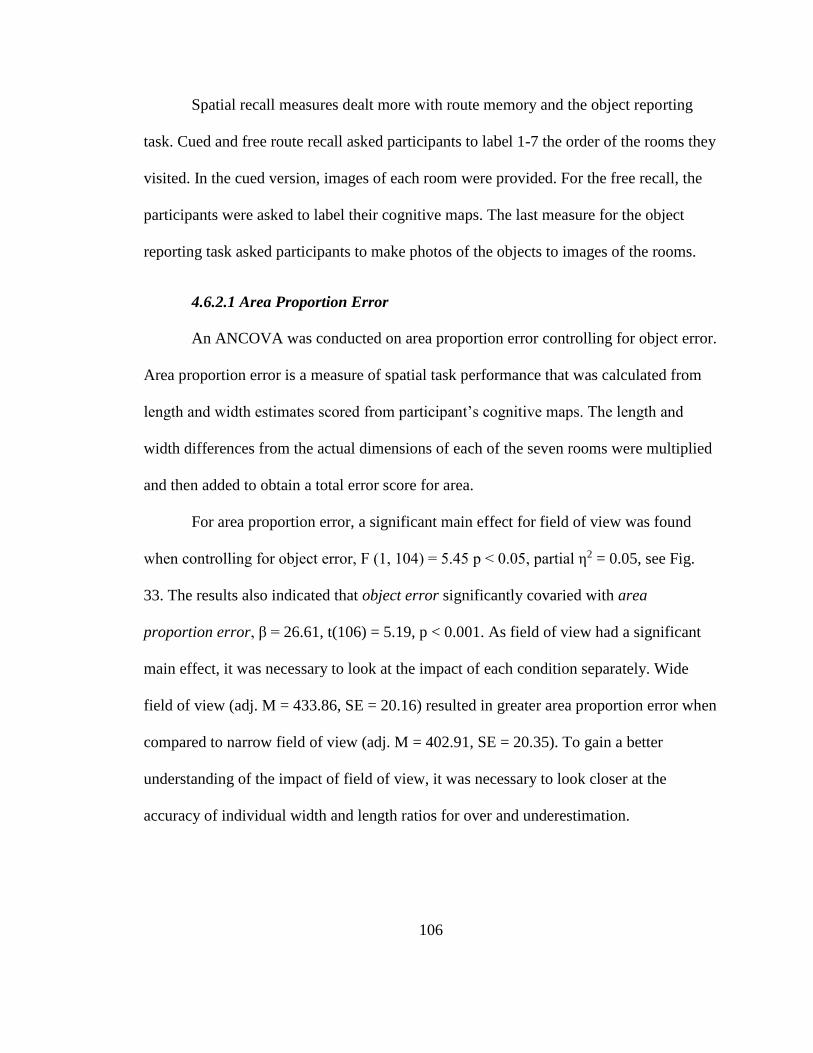
106
Spatial recall measures dealt more with route memory and the object reporting
task. Cued and free route recall asked participants to label 1-7 the order of the rooms they
visited. In the cued version, images of each room were provided. For the free recall, the
participants were asked to label their cognitive maps. The last measure for the object
reporting task asked participants to make photos of the objects to images of the rooms.
4.6.2.1 Area Proportion Error
An ANCOVA was conducted on area proportion error controlling for object error.
Area proportion error is a measure of spatial task performance that was calculated from
length and width estimates scored from participant’s cognitive maps. The length and
width differences from the actual dimensions of each of the seven rooms were multiplied
and then added to obtain a total error score for area.
For area proportion error, a significant main effect for field of view was found
when controlling for object error, F (1, 104) = 5.45 p < 0.05, partial η2 = 0.05, see Fig.
33. The results also indicated that object error significantly covaried with area
proportion error, β = 26.61, t(106) = 5.19, p < 0.001. As field of view had a significant
main effect, it was necessary to look at the impact of each condition separately. Wide
field of view (adj. M = 433.86, SE = 20.16) resulted in greater area proportion error when
compared to narrow field of view (adj. M = 402.91, SE = 20.35). To gain a better
understanding of the impact of field of view, it was necessary to look closer at the
accuracy of individual width and length ratios for over and underestimation.
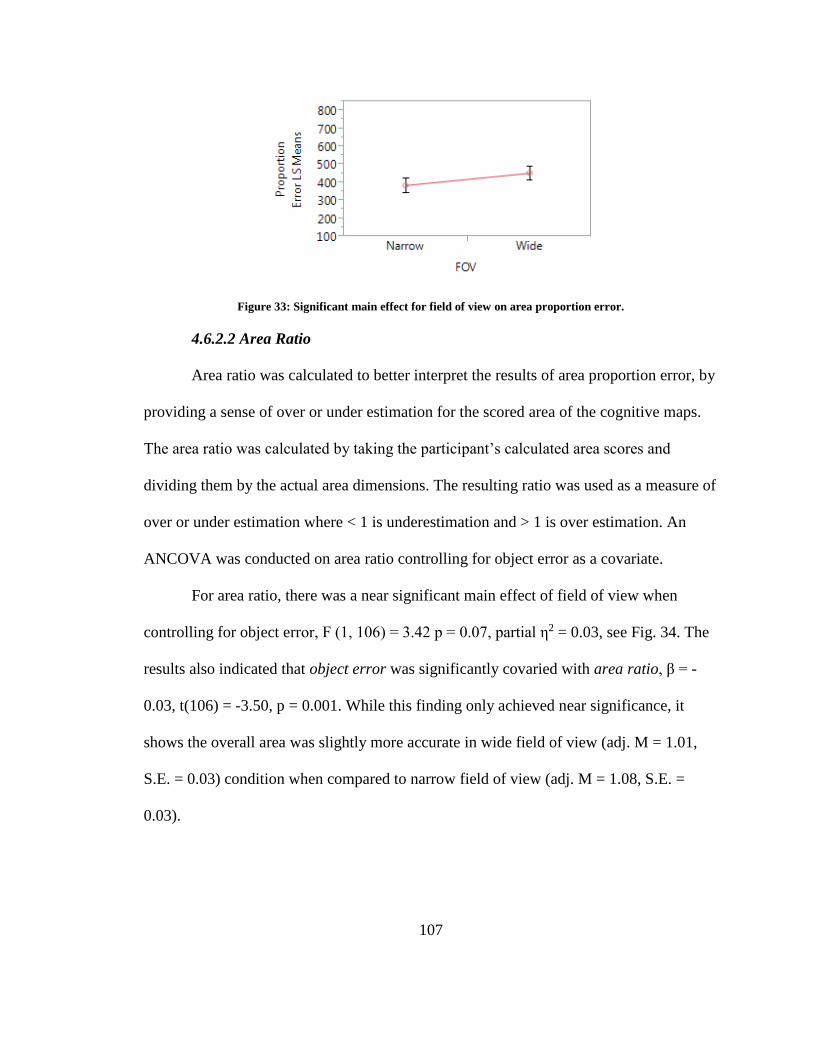
107
Figure 33: Significant main effect for field of view on area proportion error.
4.6.2.2 Area Ratio
Area ratio was calculated to better interpret the results of area proportion error, by
providing a sense of over or under estimation for the scored area of the cognitive maps.
The area ratio was calculated by taking the participant’s calculated area scores and
dividing them by the actual area dimensions. The resulting ratio was used as a measure of
over or under estimation where < 1 is underestimation and > 1 is over estimation. An
ANCOVA was conducted on area ratio controlling for object error as a covariate.
For area ratio, there was a near significant main effect of field of view when
controlling for object error, F (1, 106) = 3.42 p = 0.07, partial η2 = 0.03, see Fig. 34. The
results also indicated that object error was significantly covaried with area ratio, β = -
0.03, t(106) = -3.50, p = 0.001. While this finding only achieved near significance, it
shows the overall area was slightly more accurate in wide field of view (adj. M = 1.01,
S.E. = 0.03) condition when compared to narrow field of view (adj. M = 1.08, S.E. =
0.03).
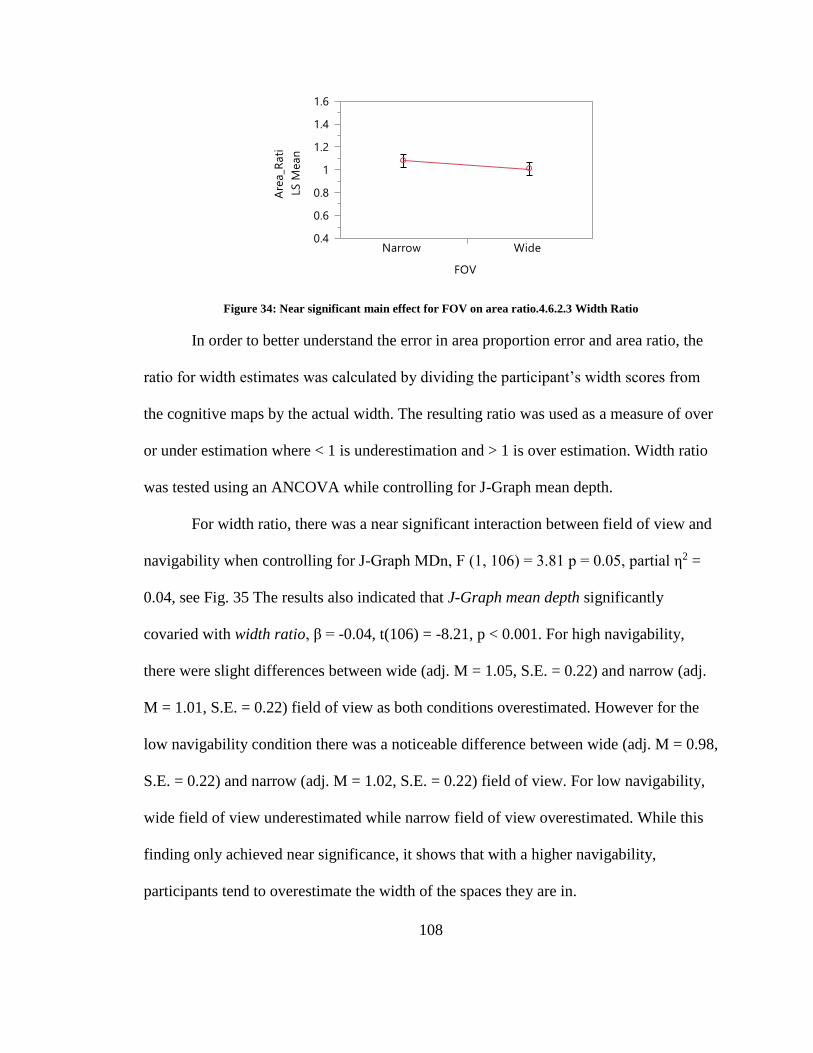
108
Figure 34: Near significant main effect for FOV on area ratio.4.6.2.3 Width Ratio
In order to better understand the error in area proportion error and area ratio, the
ratio for width estimates was calculated by dividing the participant’s width scores from
the cognitive maps by the actual width. The resulting ratio was used as a measure of over
or under estimation where < 1 is underestimation and > 1 is over estimation. Width ratio
was tested using an ANCOVA while controlling for J-Graph mean depth.
For width ratio, there was a near significant interaction between field of view and
navigability when controlling for J-Graph MDn, F (1, 106) = 3.81 p = 0.05, partial η2 =
0.04, see Fig. 35 The results also indicated that J-Graph mean depth significantly
covaried with width ratio, β = -0.04, t(106) = -8.21, p < 0.001. For high navigability,
there were slight differences between wide (adj. M = 1.05, S.E. = 0.22) and narrow (adj.
M = 1.01, S.E. = 0.22) field of view as both conditions overestimated. However for the
low navigability condition there was a noticeable difference between wide (adj. M = 0.98,
S.E. = 0.22) and narrow (adj. M = 1.02, S.E. = 0.22) field of view. For low navigability,
wide field of view underestimated while narrow field of view overestimated. While this
finding only achieved near significance, it shows that with a higher navigability,
participants tend to overestimate the width of the spaces they are in.
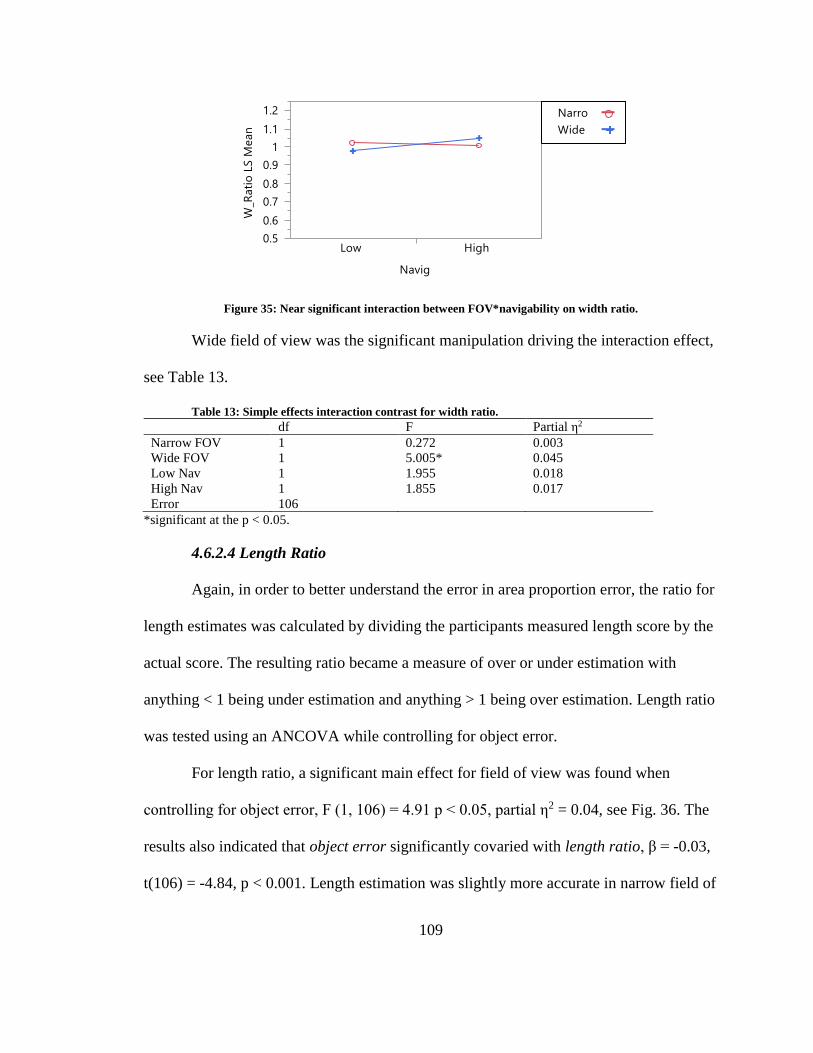
109
Figure 35: Near significant interaction between FOV*navigability on width ratio.
Wide field of view was the significant manipulation driving the interaction effect,
see Table 13.
Table 13: Simple effects interaction contrast for width ratio.
df F Partial η2
Narrow FOV 1 0.272 0.003
Wide FOV 1 5.005* 0.045
Low Nav 1 1.955 0.018
High Nav 1 1.855 0.017
Error 106
*significant at the p < 0.05.
4.6.2.4 Length Ratio
Again, in order to better understand the error in area proportion error, the ratio for
length estimates was calculated by dividing the participants measured length score by the
actual score. The resulting ratio became a measure of over or under estimation with
anything < 1 being under estimation and anything > 1 being over estimation. Length ratio
was tested using an ANCOVA while controlling for object error.
For length ratio, a significant main effect for field of view was found when
controlling for object error, F (1, 106) = 4.91 p < 0.05, partial η2 = 0.04, see Fig. 36. The
results also indicated that object error significantly covaried with length ratio, β = -0.03,
t(106) = -4.84, p < 0.001. Length estimation was slightly more accurate in narrow field of
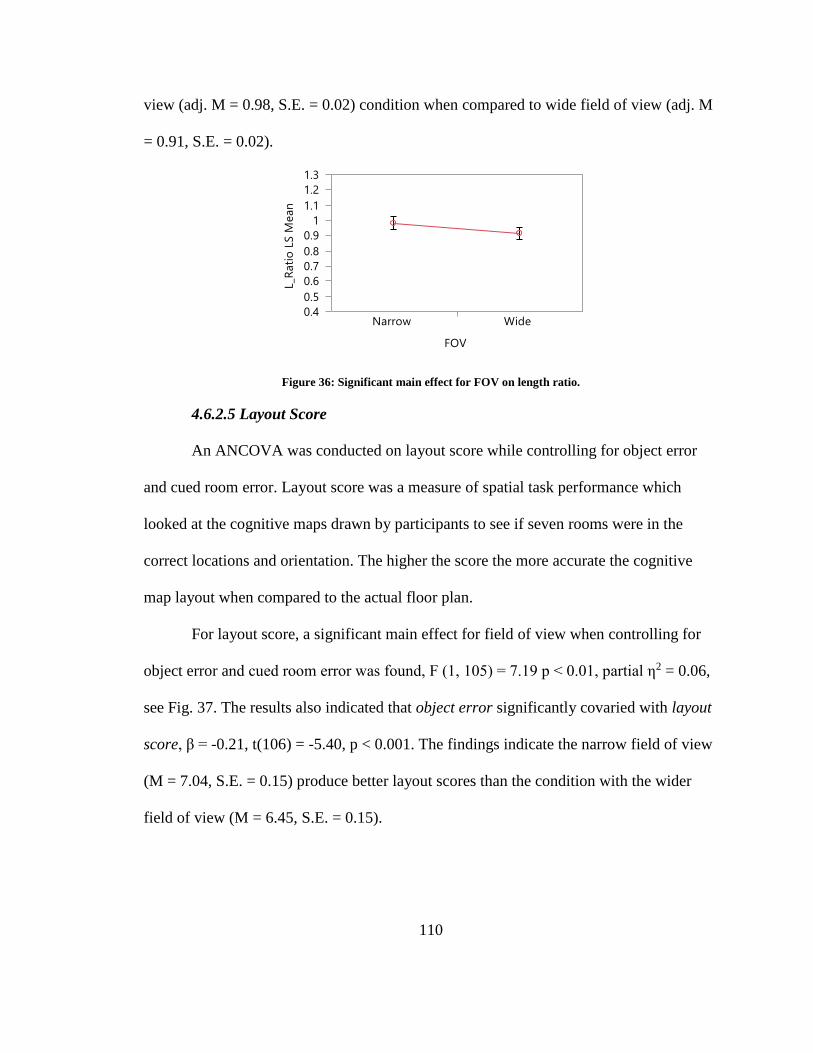
110
view (adj. M = 0.98, S.E. = 0.02) condition when compared to wide field of view (adj. M
= 0.91, S.E. = 0.02).
Figure 36: Significant main effect for FOV on length ratio.
4.6.2.5 Layout Score
An ANCOVA was conducted on layout score while controlling for object error
and cued room error. Layout score was a measure of spatial task performance which
looked at the cognitive maps drawn by participants to see if seven rooms were in the
correct locations and orientation. The higher the score the more accurate the cognitive
map layout when compared to the actual floor plan.
For layout score, a significant main effect for field of view when controlling for
object error and cued room error was found, F (1, 105) = 7.19 p < 0.01, partial η2 = 0.06,
see Fig. 37. The results also indicated that object error significantly covaried with layout
score, β = -0.21, t(106) = -5.40, p < 0.001. The findings indicate the narrow field of view
(M = 7.04, S.E. = 0.15) produce better layout scores than the condition with the wider
field of view (M = 6.45, S.E. = 0.15).
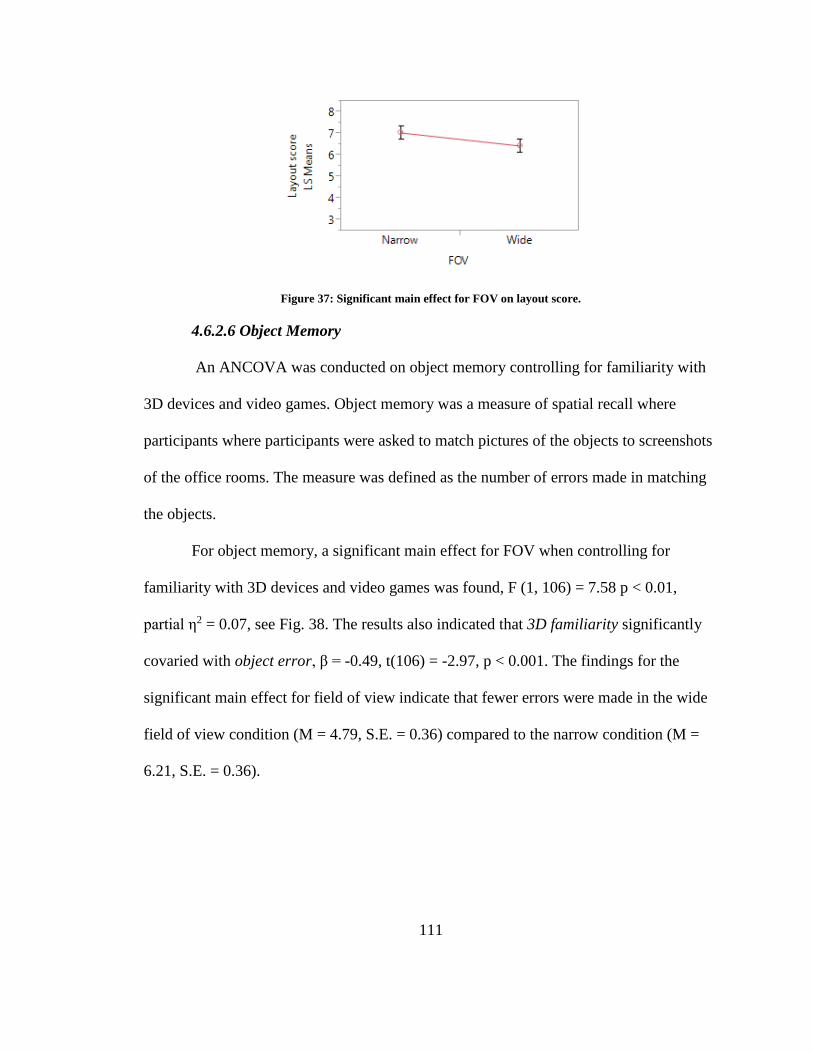
111
Figure 37: Significant main effect for FOV on layout score.
4.6.2.6 Object Memory
An ANCOVA was conducted on object memory controlling for familiarity with
3D devices and video games. Object memory was a measure of spatial recall where
participants where participants were asked to match pictures of the objects to screenshots
of the office rooms. The measure was defined as the number of errors made in matching
the objects.
For object memory, a significant main effect for FOV when controlling for
familiarity with 3D devices and video games was found, F (1, 106) = 7.58 p < 0.01,
partial η2 = 0.07, see Fig. 38. The results also indicated that 3D familiarity significantly
covaried with object error, β = -0.49, t(106) = -2.97, p < 0.001. The findings for the
significant main effect for field of view indicate that fewer errors were made in the wide
field of view condition (M = 4.79, S.E. = 0.36) compared to the narrow condition (M =
6.21, S.E. = 0.36).
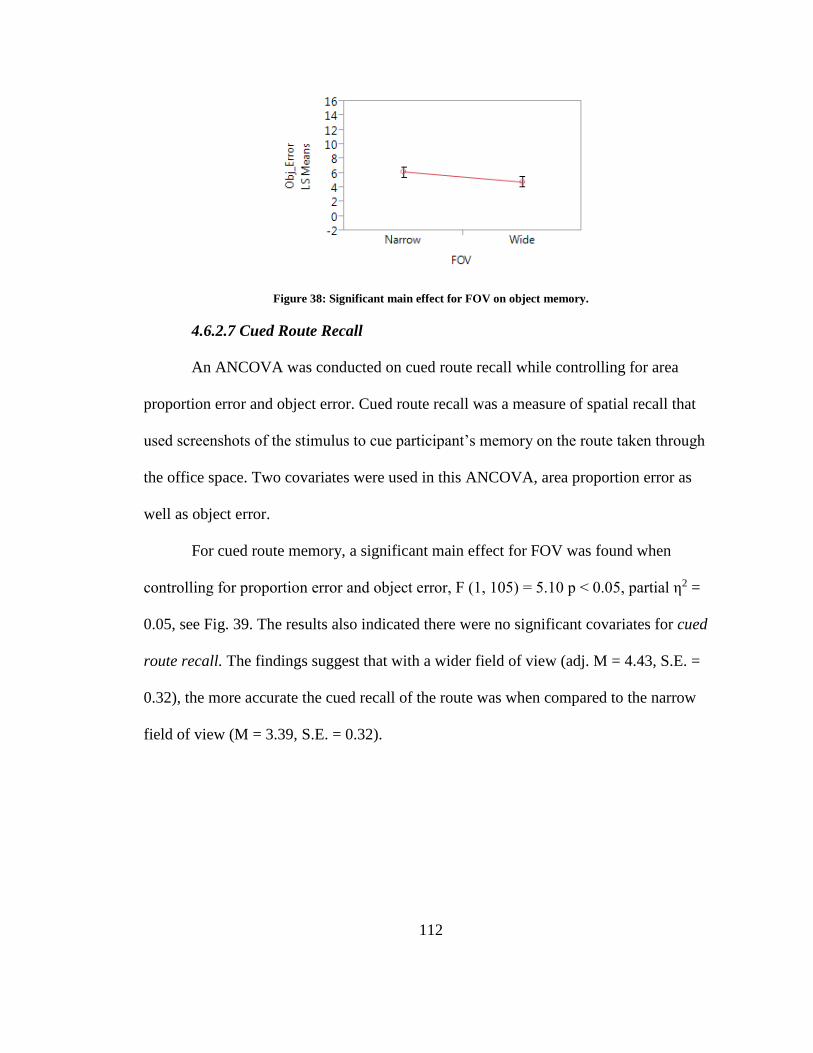
112
Figure 38: Significant main effect for FOV on object memory.
4.6.2.7 Cued Route Recall
An ANCOVA was conducted on cued route recall while controlling for area
proportion error and object error. Cued route recall was a measure of spatial recall that
used screenshots of the stimulus to cue participant’s memory on the route taken through
the office space. Two covariates were used in this ANCOVA, area proportion error as
well as object error.
For cued route memory, a significant main effect for FOV was found when
controlling for proportion error and object error, F (1, 105) = 5.10 p < 0.05, partial η2 =
0.05, see Fig. 39. The results also indicated there were no significant covariates for cued
route recall. The findings suggest that with a wider field of view (adj. M = 4.43, S.E. =
0.32), the more accurate the cued recall of the route was when compared to the narrow
field of view (M = 3.39, S.E. = 0.32).
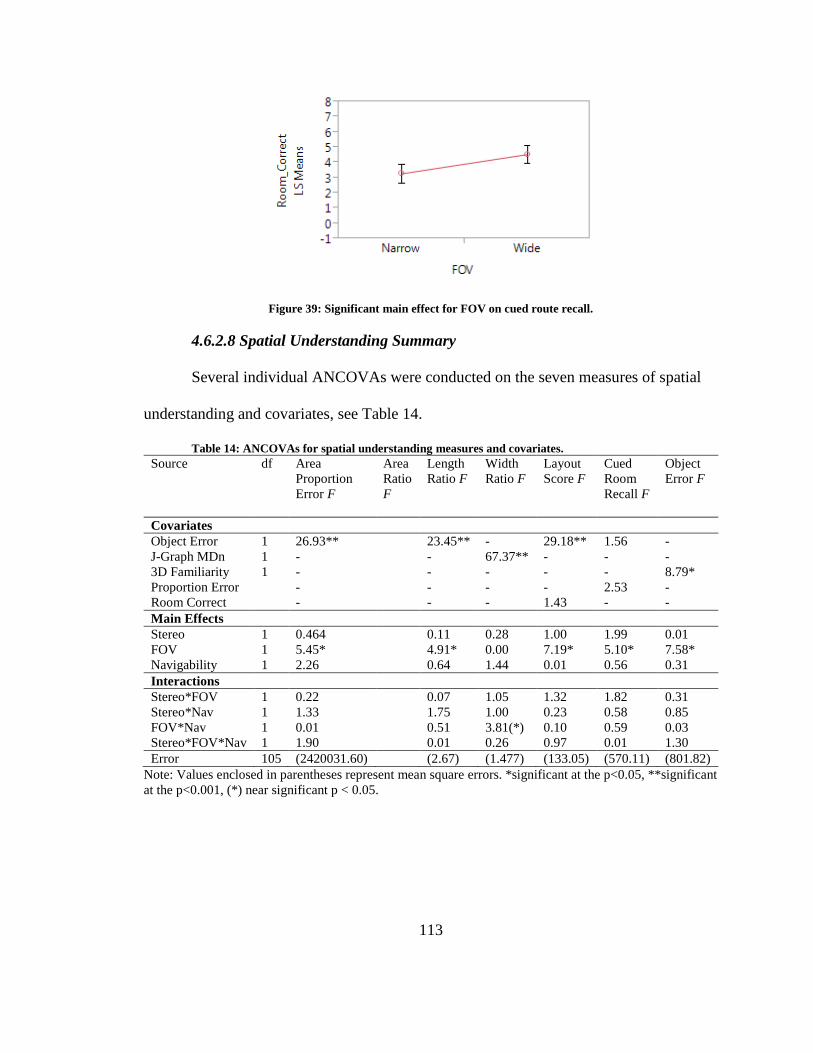
113
Figure 39: Significant main effect for FOV on cued route recall.
4.6.2.8 Spatial Understanding Summary
Several individual ANCOVAs were conducted on the seven measures of spatial
understanding and covariates, see Table 14.
Table 14: ANCOVAs for spatial understanding measures and covariates.
Source df Area
Proportion
Error F
Area
Ratio
F
Length
Ratio F
Width
Ratio F
Layout
Score F
Cued
Room
Recall F
Object
Error F
Covariates
Object Error 1 26.93** 23.45** - 29.18** 1.56 -
J-Graph MDn 1 - - 67.37** - - -
3D Familiarity 1 - - - - - 8.79*
Proportion Error - - - - 2.53 -
Room Correct - - - 1.43 - -
Main Effects
Stereo 1 0.464 0.11 0.28 1.00 1.99 0.01
FOV 1 5.45* 4.91* 0.00 7.19* 5.10* 7.58*
Navigability 1 2.26 0.64 1.44 0.01 0.56 0.31
Interactions
Stereo*FOV 1 0.22 0.07 1.05 1.32 1.82 0.31
Stereo*Nav 1 1.33 1.75 1.00 0.23 0.58 0.85
FOV*Nav 1 0.01 0.51 3.81(*) 0.10 0.59 0.03
Stereo*FOV*Nav 1 1.90 0.01 0.26 0.97 0.01 1.30
Error 105 (2420031.60) (2.67) (1.477) (133.05) (570.11) (801.82)
Note: Values enclosed in parentheses represent mean square errors. *significant at the p<0.05, **significant
at the p<0.001, (*) near significant p < 0.05.
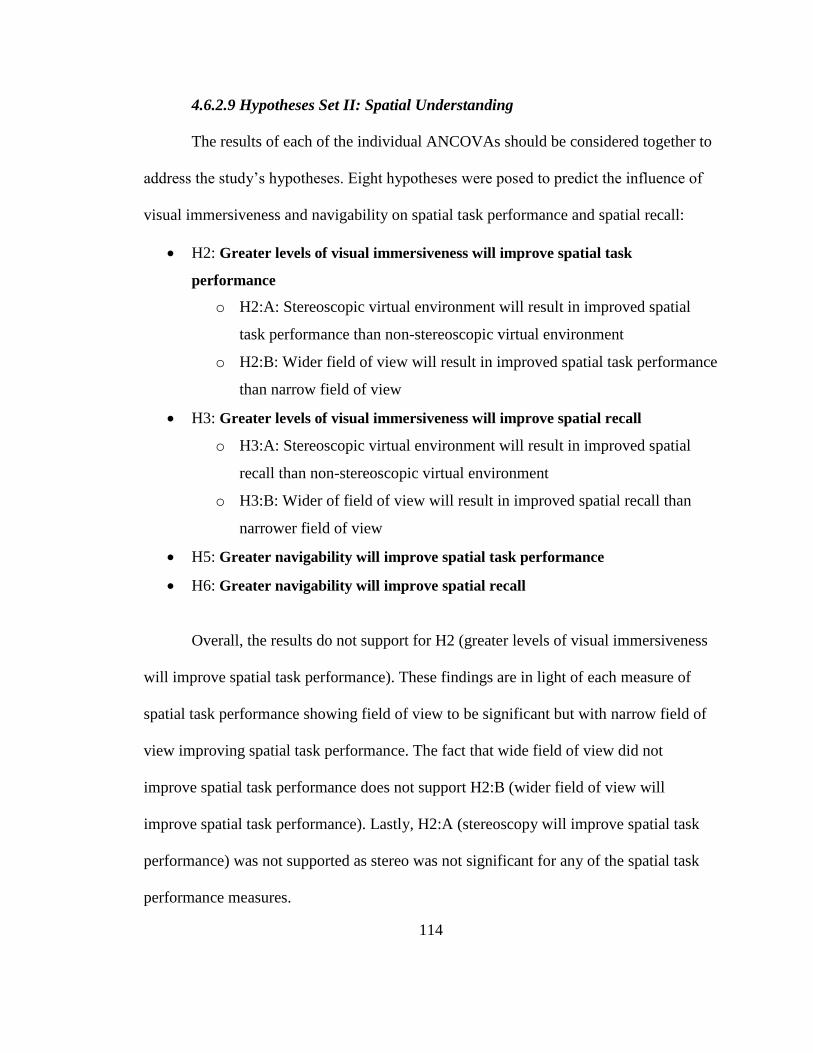
114
4.6.2.9 Hypotheses Set II: Spatial Understanding
The results of each of the individual ANCOVAs should be considered together to
address the study’s hypotheses. Eight hypotheses were posed to predict the influence of
visual immersiveness and navigability on spatial task performance and spatial recall:
H2: Greater levels of visual immersiveness will improve spatial task
performance
o H2:A: Stereoscopic virtual environment will result in improved spatial
task performance than non-stereoscopic virtual environment
o H2:B: Wider field of view will result in improved spatial task performance
than narrow field of view
H3: Greater levels of visual immersiveness will improve spatial recall
o H3:A: Stereoscopic virtual environment will result in improved spatial
recall than non-stereoscopic virtual environment
o H3:B: Wider of field of view will result in improved spatial recall than
narrower field of view
H5: Greater navigability will improve spatial task performance
H6: Greater navigability will improve spatial recall
Overall, the results do not support for H2 (greater levels of visual immersiveness
will improve spatial task performance). These findings are in light of each measure of
spatial task performance showing field of view to be significant but with narrow field of
view improving spatial task performance. The fact that wide field of view did not
improve spatial task performance does not support H2:B (wider field of view will
improve spatial task performance). Lastly, H2:A (stereoscopy will improve spatial task
performance) was not supported as stereo was not significant for any of the spatial task
performance measures.
115
There was however partial support for H3 (greater levels of visual immersiveness
will improve spatial recall). A wider field of view was found to improve spatial recall
measures. This finding also supports H3:B (wider field of view will improve spatial
recall). However, again stereo was not found to be significant on any of the spatial recall
measures which does not support H3:A (stereoscopy will improve spatial recall).
Similar to the findings with stereoscopy, navigability was found to have no
significance on either spatial task performance or spatial recall. There was no support for
H5 (greater levels of navigability will improve spatial task performance) though one
measure had a near significant interaction between navigability and field of view. This
interaction effect though showed that greater navigability did not improve spatial task
performance. Lastly, there was no support for H6 (greater levels of navigability will
improve spatial recall). There were no significant findings of navigability on either
spatial recall measure.
Overall, field of view influenced spatial understanding both dimensions. But the
findings should be considered in light of how field of view influenced each measure. For
spatial task performance, field of view did not always perform as predicted with narrow
field of view showing more accuracy. For spatial recall however, field of view performed
as predicted with a wider field of view improving both measures.
116
CHAPTER 5 – DISCUSSION
This chapter will first summarize the results of the analysis and then discuss
interpretation and implications of findings from the analysis. Then theoretical and
methodological contributions to virtual reality research and practical implications for
architectural visualization and related disciplines will be discussed. The chapter will
conclude with limitations of this study and future research directions.
5.1 Summary of Results
The analyses indicated that overall, the manipulation of field of view had a
significant impact on various dimensions of spatial presence and spatial understanding.
As predicted, a wider field of view did lead to a stronger sense of spatial presence. But
the findings of field of view on spatial presence should be considered in light of the
significant interactions that occurred between field of view and the other two
manipulations, see Fig. 40. Individual analysis of each spatial presence dimension
revealed that while field of view had a significant influence across the board, its impact
often depended on stereoscopy or navigability. In all cases with the exception of
possibilities for action dimension, a wider field of view accounted for higher feelings of
spatial presence in each dimension. But the combined effect with navigability showed
that a greater level of navigability actually reduced the need for a wide field of view. This
finding partially supports the prediction that a greater level of navigability will increase
spatial presence. For possibilities for action, the interaction of field of view and
stereoscopy showed that a greater level of field of view generated higher feelings of
presence. Stereoscopic display when compared to non-stereoscopic display increased
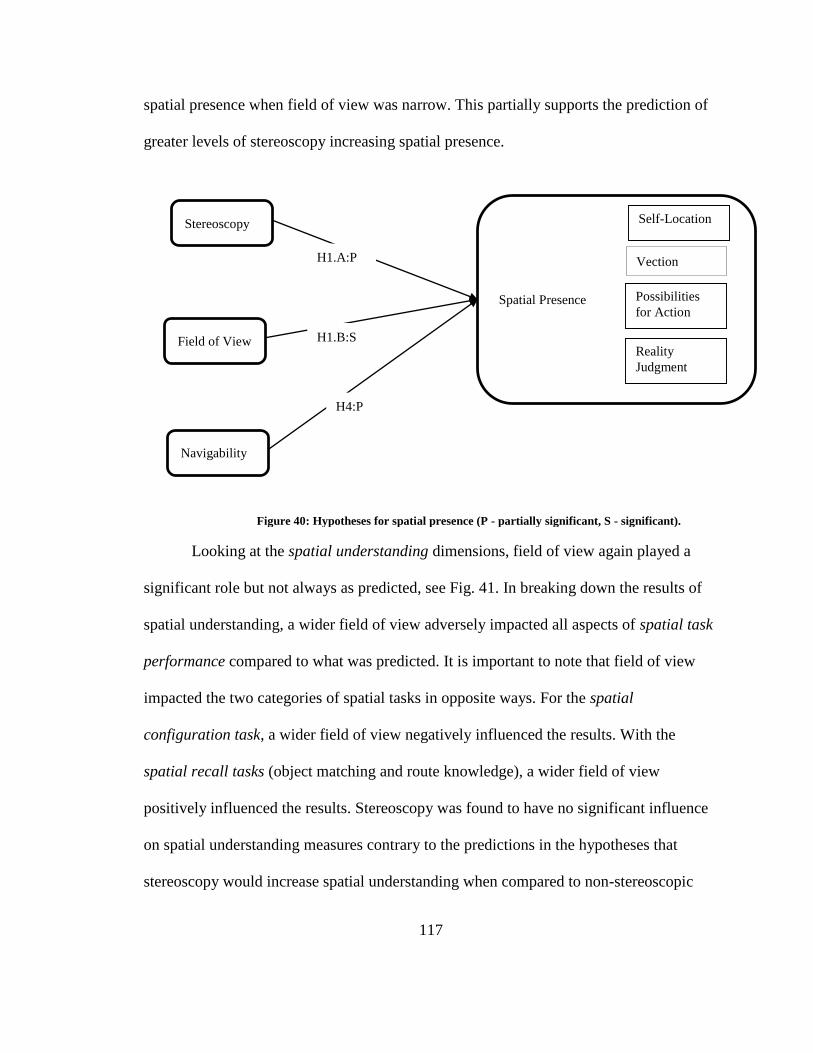
117
spatial presence when field of view was narrow. This partially supports the prediction of
greater levels of stereoscopy increasing spatial presence.
Looking at the spatial understanding dimensions, field of view again played a
significant role but not always as predicted, see Fig. 41. In breaking down the results of
spatial understanding, a wider field of view adversely impacted all aspects of spatial task
performance compared to what was predicted. It is important to note that field of view
impacted the two categories of spatial tasks in opposite ways. For the spatial
configuration task, a wider field of view negatively influenced the results. With the
spatial recall tasks (object matching and route knowledge), a wider field of view
positively influenced the results. Stereoscopy was found to have no significant influence
on spatial understanding measures contrary to the predictions in the hypotheses that
stereoscopy would increase spatial understanding when compared to non-stereoscopic
Spatial Presence
Stereoscopy
Field of View
Navigability
H1.A:P
H4:P
H1.B:S
Self-Location
Possibilities
for Action
Figure 40: Hypotheses for spatial presence (P - partially significant, S - significant).
Vection
Reality
Judgment
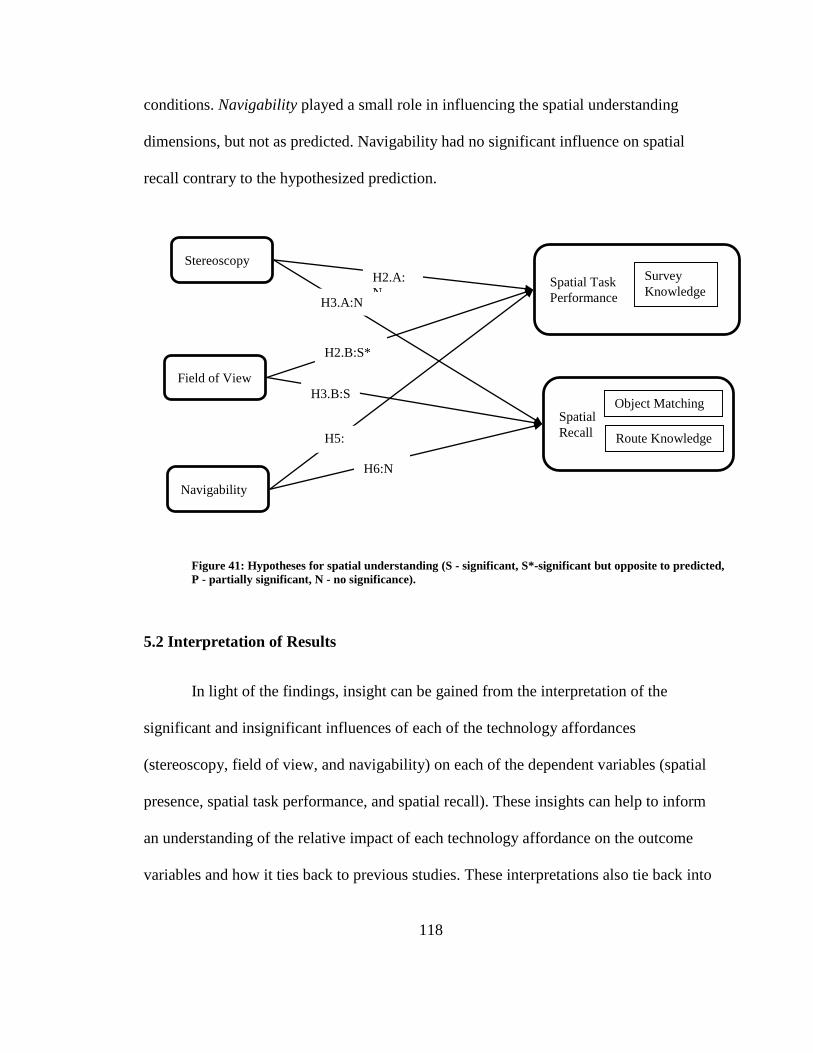
118
conditions. Navigability played a small role in influencing the spatial understanding
dimensions, but not as predicted. Navigability had no significant influence on spatial
recall contrary to the hypothesized prediction.
5.2 Interpretation of Results
In light of the findings, insight can be gained from the interpretation of the
significant and insignificant influences of each of the technology affordances
(stereoscopy, field of view, and navigability) on each of the dependent variables (spatial
presence, spatial task performance, and spatial recall). These insights can help to inform
an understanding of the relative impact of each technology affordance on the outcome
variables and how it ties back to previous studies. These interpretations also tie back into
Spatial Task
Performance
Stereoscopy
Field of View
Navigability
Spatial
Recall
H2.A:
N H3.A:N
H5:
N
H2.B:S*
H3.B:S
H6:N
Survey
Knowledge
Object Matching
Route Knowledge
Figure 41: Hypotheses for spatial understanding (S - significant, S*-significant but opposite to predicted,
P - partially significant, N - no significance).
119
the overall relationship that exists between the constructs of immersion and interactivity
with spatial experience and spatial understanding.
5.2.1 Impact of Visual Immersiveness on Spatial Experience
The findings from the analysis confirmed that visual immersiveness did
significantly impact perceptions of spatial experience with the exception of one
dimension, self-location. In the literature, it is speculated that manipulations of visual
immersion alone would enrich but, not establish a sense of presence (Wirth, et al., 2007).
This idea suggests that influences of interactivity should also exist as they relate to
Dalgarno and Lee (2010)’s ‘interactive capabilities’. The results from this study indicated
that visual immersiveness alone was sufficient in influencing spatial experience when
controlling for gender and attention. Looking closer at the manipulations of visual
immersiveness, when field of view was wide, feelings for each spatial presence
dimension increased except for self-location. Adversely, stereoscopy had little to no role
in impacting spatial presence. This suggests the immersive experience is not dependent
on a higher/lower level of each affordance.
Spatial presence is about establishing the experience that one feels present within
a simulated space (Schubert, Friedmann, & Regenbrecht, 1999). Wirth et al. (2007)
established this sensation occurs due to attention allocation and being able to block out
the real-world. A wider field of view is able to occupy more of an individual’s periphery
vision, thus blocking out the immediate physical environment to keep focus on the virtual
space. Stereoscopy only provides an added illusion of depth and therefore does not
provide the same ability in maintaining user focus on the virtual space.
120
Of the measures of spatial experience, self-location was found to not be
significantly influenced by either measure of visual immersiveness. Interestingly, there
was a near significant influence from stereoscopy though the mean differences between
the stereo and non-stereo groups were small. Stereoscopy provides visual depth cues to
existing images (Crone, 1992). Self-location is the feeling of being located within a
simulated space (Wirth, et al., 2007). It was speculated that from its shared characteristics
with embodiment that self-location was dependent on the perception of sensory cues to
develop an ‘image schemata’. It is also important to note that stereoscopy is only one of
many depth cues. In an interactive, highly navigable VR environment, an abundance of
other depth cues are present reducing the necessity for stereoscopy, hence only the near
significance of stereoscopy.
The connection between stereoscopy and self-location is dependent on the use of
visual depth cues to enhance image schemata which, leads to a higher sense of self-
location. Again with this finding it is also important to consider controlling for attention
which, would have allowed the visual depth cues provided by stereoscopy to be more
prominent. Overall, the findings of significance of field of view and near significance of
stereoscopy support earlier findings of the influence of visual immersion on spatial
presence (IJsselsteijn, et al., 2001). Each technology feature (field of view and
stereoscopy) impacts spatial experience in a different way and these differences should be
considered when attempting to achieve a certain type of spatial experience.
Possibilities for action, the dimension of spatial presence focused on users feeling
as ‘active participants’ in a virtual environment, was speculated to have an interactive
121
effect between manipulations of immersion and interactivity. This was due to the nature
of the ‘active participant’ being connected to movement of the body (Glenberg, 1997).
The findings of this study though found a significant interactive effect for field of view
and stereoscopy when the main effects for each affordance was not significant.
Subsequently, there were no significant influences from interactivity. This suggests that
other factors may have played a role in raising user perceptions of possibilities for action.
The significance occurred when controlling for class standing, experience with 3D
software, and enjoyment.
Possibilities for action are reported as higher when there is suppression of the
influence of the immediate real world on perceptions of the virtual environment and
focus is placed on visual cues from the simulated space (Wirth, et al., 2007). This
requires focused attention to the virtual environment but also mechanisms to aid in
filtering out the real world. It is known that both field of view and stereoscopy are
capable of helping user’s focus attention on the simulated environment by filtering out
the immediate physical environment (Hendrix & Barfield, 1995). In the case of the
findings from this study, a wider field of view increased possibilities for action, meaning
it was able to block out more of the real world supporting this notion. In doing so
though, stereoscopy became less necessary. This result again supports the idea that
technology affordances of visual immersiveness can work independently from one
another.
Field of view is able to help suppress the outside world in two ways: 1) by
providing more visual cues at any given time and 2) to fill more of the peripheral view
122
reducing the amount of external visual distraction. Through the interactive effect the
opposite effect occurred when field of view was narrow and stereoscopy compensated for
increased user experiences for possibilities for action. This could be due to the visual
depth cues described by Crone (1992). With a narrow field of view though visual depth
cues may not be enough to keep a user’s attention focused on being active in the virtual
environment.
5.2.2 Impact of Visual Immersiveness and Interactivity on Spatial Presence
Exploration of the other dimensions of spatial presence revealed significant
interactions between field of view and navigability. Specifically, the interaction effect
was significant for self-location, vection and reality judgment.
5.2.2.1 Self-location
Results for self-location revealed a difference from the overall model which,
indicated a near significant influence of stereoscopy. The results for self-location showed
a significant interaction effect for field of view and navigability. Again self-location is
the sensation of being located in a simulated space (Wirth, et al., 2007). Field of view
influences self-location through the ability to increase the amount of visual cues by
enlarging the scale of what can be seen in the virtual environment. Therefore, when
navigability was low, a wider field of view produced slightly higher feelings of self-
location. Navigability impacts spatial presence through the ability to control the
manipulation of viewpoints (Sheridan, 1992). So when field of view was narrow, a higher
123
navigability offered more control over the viewpoints which increased the feeling of self-
location.
5.2.2.2 Vection
A near significant interaction between field of view and navigability was found
for the ancillary dimension of vection. Vection is the illusion of self-motion (Schulte-
Pelkum, et al., 2003). The connection between both field of view and navigability with
vection can be speculated to be based on the perception of visual cues of motion. Where
the visual cues come from a wider field of view and motion comes from navigability. In
the case of this study, the findings indicated that a wide field of view elicited stronger
feelings of vection when navigability was low. This suggests that a wider field of view
results in an increased optic flow, creating the sensation of self-motion within the virtual
environment as described Riecke (2011). This suggests that visual cues from just the
basic motion of the low navigability condition provided a sense of self-motion. When
navigability was high though, experiences for wide and narrow field of view were
similar. This suggests that added control over motion in a virtual environment makes
little distinction over the number of visual cues from the display size. Lastly, the non-
significant finding for stereoscopy is consistent with earlier studies and can be speculated
to be due to large number of spatial cues in a large-screen interactive virtual environment
when compared to non-interactive, small-screen virtual environments (IJsselsteijn, et al.,
2001).
124
5.2.2.3 Reality Judgment
Reality judgment was the last spatial presence dimension explored in this study. A
significant interaction effect between field of view and navigability was found. Reality
judgment is the acceptance of what is perceived as being real (Baños, et al., 1999). In
order for simulated space to be perceived as ‘real’ certain cues need to be portrayed to a
user. These cues need to enhance the congruency of the virtual space to the physical
space it is attempting to portray. The virtual environment also needs to suppress any cues
that would suggest the non-real nature of the virtual space. In this study field of view
enabled the virtual environment to block out the real world as the field of view widened.
This reduced the cues that from the immediate physical environment which were highly
incongruent with the virtual environment.
Cues that enhanced congruency between the simulated and physical space were
found in the navigability condition. The ability to tilt head up and down like in the real
world and feelings of self-motion were able to increase the congruency of the virtual
office space experience with a real office space. As a result, low navigability and a wide
field of view resulted in improved reality judgment. As navigability increased though,
there was less distinction between wide and narrow field of view. To better understand
the connection between reality judgment and navigability, it is necessary to consider the
link between navigability and spatial presence. Similar to vection, reality judgment could
be influenced by the amount of control provided to the user by the navigability condition,
but could also be adversely affected by the skill level of the user. This suggests that
navigability and field of view could both increase reality judgment but through different
125
means. Field of view blocked out incongruencies of the immediate physical environment
while navigability included congruency between the virtual and physical space being
portrayed. This study specifically showed that to increase reality judgment a combination
of the two VR system variables was necessary.
5.2.3 Visual Immersiveness on Spatial Understanding
Visual immersiveness was found to significantly influence spatial understanding
while interactivity had no significant influence. First, the insignificance of interactivity
on spatial understanding could be attributed to how information is received and
comprehended in the real world, which is mostly through visual and auditory means.
While interaction itself may play a role in obtaining spatial information, visual and
auditory processes can function at comprehending information without the need for
movement as discovered in the study conducted by Balakrishnan et al. (2012).
Second, the significant impact of visual immersiveness was driven mainly by field
of view. The stereoscopy manipulation had no significant impact on spatial understanding
measures. Similar to the rationale for the role of visual immersiveness on spatial
experiences, attention and the ability to block out the real-world could help negate the
effects of stereoscopy on spatial understanding. Another reason why stereoscopy did not
attain significance could be due to type of task utilized, an object search task. Added
depth may not have aided locating objects in the space whereas a wider view could.
Considering visual immersiveness as the outcome of independent technology factors as
described in the spatial experience section, it is necessary to examine the relationship of
spatial understanding measures with visual immersiveness closer.
126
5.2.3.1 Spatial Task Performance
Although not significant, interactivity could have impacted how visual
immersiveness influenced spatial task performance. First, only field of view was found to
significantly influence spatial task performance but, not as the hypotheses originally
predicted. Spatial task performance included several measures focused on measuring
configurational knowledge based on participant exploration. The measures of
configurational knowledge found to be significantly influenced by field of view included
area proportion error, area ratio, length and width ratios, and layout accuracy. On all
measures of configurational knowledge, field of view adversely influenced accuracy
meaning that a wider field of view produced more errors. These findings could be
considered to show that survey knowledge was not completely developed during
navigation of the space as predicted.
Looking closer at each measure, the mean differences were not large between the
field of view conditions except for area proportion error. This could be due to the
multiplying effect of length and width scores forming the overall area proportion score.
Looking at the area ratio differences, a wider field of view actually showed better
accuracy than a narrow field of view. Individually, the findings of width and length ratios
(indicators of over or underestimation) better supported the idea that a wider field of view
is known to cause scaling issues found in the area proportion error. Stanney et al. (2013)
pointed out that optic flow motion cues can lead to overestimation of distances,
suggesting that proprioceptive motion cues were better suited for better interpretation of
spatial information.
127
The findings for space estimation also differ from previous research which,
looked at the accuracy of dimensions from a single room and found a wider field of view
to associate more with overestimation (Balakrishnan, et al., 2012). A possible explanation
could be due to the incorporation of interactivity as part of the search task. In the low
navigability condition, the participant was limited and the viewpoint perspective was
always level. Even though the implementation of high navigability condition mimicked
real-world head movements, an important point needs to be noted. In the real world our
heads are able to move and the representation of space is not perceived as distorted in our
brains. However, an interactive virtual environment attempting to mimic real world head
motions can create a slight distortion depending on the viewpoint. This was the case in
this study where participants found it challenging to re-align the viewpoint after using the
head-tilt manipulation, possibly causing a distorted view of the space. Alternately, for
length over and under estimation, a wider field of view was found to associate with
underestimations of the spaces. The differences in the findings from this study and
previous studies could be due to the nature in which individuals were able to gather
spatial information. In the Zikic (2007) study, the simulation was paused and participants
were asked to estimate the still space.
There are two key differences between these studies: 1) participants were asked to
fill in estimations in individual spaces directly after experiencing them, and 2) movement
was paused to allow for participants to estimate the spaces. This presents an important
methodological challenge when including visual immersiveness and interactivity in the
same study. When visually immersed, pulling a viewer away from the simulation to
128
momentarily fill out a question could reduce the overall accuracy by pulling the user out
of the experience of the space. The issue of interactivity however, may increase accuracy
but, will not be seen as a realistic behavior within the space. An individual may stop to
take in the details of a virtual space when conducting a task but, to be forced to stop may
become less natural.
5.2.3.2 Spatial Recall
The findings of the influence of field of view on spatial recall confirmed the
prediction that a wider field of view would improve recall accuracy. The findings should
be considered in light of the measures that comprised spatial recall: object memory and
route memory. Both measures were found to be positively influenced by a wider field of
view but, only when controlling for different factors. In the case of object memory,
familiarity with 3D and video games was a significant covariate. Removing the influence
of an individual’s familiarity with 3D and video games allowed for the findings of field
of view to be more prominent. Considering the role of field of view, with a wider field of
view, more of the space was visible to the viewer at one time allowing for better
associations of the object to each space to be made.
For cued route memory, object memory was controlled as a significant covariate.
As the participants were focused on the object locating task, attention and focus were
placed on locating the objects. By accounting for the influence of attention to the object
finding task, the individual influences of field of view on cued route memory became
clearer. Similar to the findings with object memory, with cued route recall, a wider field
of view allowed for more of the spaces to be seen at any given time providing more
129
spatial cues to be presented to the participant. The more spatial cues presented could
provide a base for participants to generate landmarks for remembering spaces. This
allowed for easier processing of remembering of the route taken to visit each of the
spaces.
In the literature, navigation tasks for gaining route knowledge were found to be
successful with concurrent tasks. Wen et al. (2013) found there was no significant trade-
off between concurrent task types based on whether it was visual, verbal, or spatial when
developing route knowledge. This suggests that while searching for the objects, the
participants were able to generate a mental map that better allowed for memory of the
route taken to find the objects. In this study, there was no significance for the free recall
of route. This could be attributed to the free recall of the route being dependent on the
participant to successfully construct the configurational knowledge of the space in their
cognitive maps.
5.3 Theoretical Implications
The immersive experience provided through technology components of a virtual
reality system have been confirmed to have an impact on spatial experiences and how
well people understand the virtual environment. The findings of the study provide a few
theoretical contributions.
Research in spatial presence has built on the model developed by Wirth et al.
(2007).The two-step process proposed by Wirth et al. (2007) suggests that spatial cues
from various sources influence the development of a spatial situation model (SSM)
which, then works to confirm the perceptual hypothesis, PERF hypothesis resulting in
130
spatial presence. Balakrishnan and Sundar (2011) though found that with a high fidelity
environment there is less need for SSM to generate a sense of spatial presence. Other
means such as steering control can provide low-level sensory cues which affect spatial
presence without the need for a SSM. This was speculated to be due to virtual
environments offering direct spatial cues and dynamic feedback so, the SSM was no
longer necessary. Though this study did not examine the development of the SSM, the
findings indicate the role of field of view on the different dimensions of spatial presence.
This follows along the lines that when user’s expectation is high, there is less need for
supporting information to confirm the PERF hypothesis and when the expectation is low
the opposite is true (Gregory, 1980). With a wider field of view, more of the real-world is
blocked out, keeping user attention focused on the simulated environment and providing
more visual cues, and increasing the expectation of the user. A narrow field of view
however, had lower expectations and was supplemented with navigability to help
improve the PERF hypothesis. These findings were consistent with previous research on
the development of spatial presence through a more bottom-up process.
This study sought to investigate the development of spatial understanding as a
function of technology affordances that create the immersive experience. The results
confirmed the development of route knowledge and object-focused task performance
were positively impacted by technology affordances. The development of configurational
knowledge, survey knowledge, though was not confirmed and indicated an opposite
effect. Research on the development of spatial knowledge in virtual environments have
stated that survey knowledge can form rapidly and accurately (Colle & Reid, 1998) and
131
from navigation (Labate, et al., 2014). A key difference between the studies is how
participants are primed. In many of the studies on the development of spatial knowledge
in virtual environments, participants were informed they needed to be aware of the space
as either route or survey knowledge tasks were primary. In this study however, survey
and route knowledge development were presented as secondary tasks to finding objects.
This suggests that attention to dual tasks is split across what is primary and what is
secondary. This notion supports the findings of Labate et al. (2014). Specifically, it
follows along the lines that spatial knowledge is dependent on attentional allocation and
working memory capacity. The findings from this study on primary versus secondary
tasks to obtain and retain information tie back into Lang (2000)’s limited capacity model
of mediated message processing. The limited capacity model states that people process
perceived stimuli but the mental resources for processing are limited. This findings of this
study support this idea that mental resources for encoding, storing and retrieving
information for a primary task will influence any secondary tasks.
5.4 Methodological Implications
This study combined two approaches to examining virtual reality system
technology, the variable-centered approach (Nass & Mason, 1990) and the mixed reality
simulation approach (Laha, et al., 2013). The mixed reality simulation approach
introduced a taxonomy of technology to be systematically manipulated. The variable-
centered approach was used to examine the technology by its affordances. The
combination of the two approaches allowed for clearer mapping of concepts to
132
technology features leading to more precise measurement of influences of individual
affordances.
Specifically, operationalizing the concepts that comprise the immersive
experience into manipulatable affordances of technology allowed for a much more
precise way to measure the relative impact of each technology feature. While the findings
of this study indicated the impact of each technology affordance was significant, the
overall influence was small in terms of the size of the effect. In any given VR system
there is a large number of parameters which, cause the effect of any one parameter to be
relatively small but still contributing to the overall experience. As a result, the findings
produced a much truer reflection of the influence of the technology features when taking
other related factors into consideration. Kalawsky (1998) sought to develop a model to
drive a tool for measure factors contributing to presence. This tool suggested several
factors existed pertaining to demand and supply of attentional resources, understanding of
situation, information and technological features. These listed groupings of factors can
include context, content, and individual differences which, all play a significant role in
making the immersive experience successful. Using the combination of the two
approaches allowed for those factors to be parsed out, helping with not only conceptual
clarity but, also a cleaner experimental design to test each technology feature.
While the purpose of this study was the look more at theoretical aspects of virtual
reality components, the combined taxonomy and variable-centered approach can prove
useful to other experimental designs such as fractional factorial designs (i.e. screening
designs). Specifically, this approach helps to simultaneously consider a large number of
133
factors related to virtual reality systems including technological and psychological factors
together. This aids in identifying relative contributions of a large number of factors and
establish which factors have more impact than others. The methodological approach
based on the variable-centered and mixed-reality approaches hold great potential for
virtual reality research as well as system design.
5.5 Practical Implications
Three main practical implications can be drawn from this study. It has
implications for architectural visualization and education, virtual reality system
development, and for training programs.
5.5.1 Implications for Architectural Visualization
This study has practical implications for architectural visualization and design
education. Specifically, the significant influence of field of view on not only spatial
presence but, also spatial understanding holds benefits in understanding how people
interpret their experiences in virtual environments and translate that to real-world
knowledge, particularly on the issue of scale. The true benefit of the findings comes from
how they can be adapted to improve how virtual reality systems are used as tools to
experience and evaluate architectural spaces under design.
Virtual reality in architectural design and visualization is not a new phenomenon
(Campbell & Wells, 1994). The rationale for incorporating virtual reality into
architectural design and visualization comes from the ability to experience simulated
spaces without having to build large scale physical prototypes that cost time and money
134
and are not easily modified. Many of the early explorations of virtual reality systems
being incorporated as computing tools for architectural design and visualization were
impeded by the technology itself (i.e. slow frame rates, narrow fields of view, etc.). In
many cases, the technology was found to inadequately handle the situation necessary for
design to occur (Campbell & Wells, 1994). Advances in technology have aided in
making virtual reality technology more robust and therefore, better able to handle
information specific to architectural design and visualization.
Despite the improvements made to technology for architectural visualization,
there is still little understanding of the influences on architectural design. Though not
specifically focused on architectural design and visualization, Wann and Mon-Williams
(1996) explored questions of how virtual reality technology influences sense of space and
spatial perception through specific linkages like depth cues. In terms of understanding
space, this study found the added depth cues from stereoscopy did not have any
significant impact. This suggests that stereoscopy may not be as beneficial to
understanding designed spaces when compared to other technology features like field of
view. But to also consider that stereoscopy may have more of an additive effect to
significant features of a virtual reality system like field of view (Schuchardt & Bowman,
2007). The findings from this study with the interaction effects on spatial presence
support this idea.
As both architectural design and visualization center on the communication of
designed space, a better understanding of the influence of immersion on user experience
and performance measures can provide insight on design computing tool development.
135
Campbell and Wells (1994) discussed that immersion worked well in terms of facilitating
an understanding of spatial qualities of spaces designed during different stages of the
design process. This indicated that immersion could play a role in the understanding of
virtual spaces. The findings from this study supported this notion that visual
immersiveness did improve the understanding of virtual spaces when users attended to
the task given.
The findings from the empirical testing of the two components of immersion (e.g.
stereoscopy and field of view) provided insight on the individual and combined
contributions to overall understanding of spatial qualities and more specifically spatial
experiences. As virtual reality technology tends to be grouped as sets of components (i.e.
varying screen sizes, stereoscopic projectors, different input devices, different image
resolutions, etc.), understanding the influence of components individually as well as
collectively can help in improving virtual reality systems for architectural design and
visualization. In the case of this study, field of view did not improve overall survey
knowledge but, it aided in route knowledge development. Looking at spatial experience
though, field of view combined with stereoscopy and navigability aided in generating
better spatial experiences, supporting the findings of Balakrishnan et al. (2012). This
insight into virtual reality technology allowed for assessment of not only individual
components but, also group effects of having multiple components in one system, which
is closer to how actual virtual reality systems tend to work.
136
5.5.2 Implications for Virtual Reality Technology Development
The findings of this study hold practical implications for the design and
development of virtual reality technology, specifically ones that rely on wide field of
view. Virtual reality systems are both complex and very diverse in the technology that
comprise them. Lately, newer and more affordable technology has tended to focus on key
aspects of virtual reality systems. One such technology would be the Oculus Rift, an
affordable head-mounted display (HMD) which is highly dependent on the aspects of
field of view and stereoscopy to immerse users in video game play. The Oculus Rift
utilizes the wide field of view offered by HMDs coupled with stereoscopy but, has low
fidelity graphics in terms of resolution. This trade-off presents an opportunity for the
findings of this study to help with the improvement of such systems. Systems like the
Oculus Rift can greatly benefit from a better understand of key features of a virtual
reality system. For instance, gaming devices may require different features to help
improve the overall experience of a gamer, while a training simulator may require
features which improve task performance and memory. Understanding the role of key
technology affordances could help to improve different needs.
Looking closer at the dependent measures from this study, the combination of the
three manipulations provided insight into the tradeoffs of using each for both spatial
experience and understanding. So, a virtual reality system such as the Oculus Rift could
benefit more with the understanding of how each individual feature works not only
independently but, also collectively on spatial experiences. For instance, field of view
combined with stereoscopy in this study was found to improve one dimension of spatial
137
presence. However, it was the combination of field of view and navigability in this study
that accounted for the rest of the dimensions of presence. Considering these findings, it
can be suggested that improvements to the Oculus Rift could use findings like the ones
from this study to improve the overall user experience.
5.5.3 Implications for Training Programs
This study also has practical implications for training programs involving both
spatial experiences and spatial activities. Training programs that use simulation systems
can roughly be grouped into two main categories: 1) ones that provide a spatial context
that is more realistic for trainees to develop specific skills and 2) ones that help to
develop spatial skills. Training programs that focus on the development of specific skills
provide very specific scenarios such as how to use machinery. In these cases, the spatial
context of the machinery and location of the user in the virtual space needs to be as
realistic as possible as the simulation is meant as a direct replication of the real-world.
Training programs that help users develop spatial skills on the other hand are not as
dependent on realism. In cases of developing spatial skills, there is not necessarily a
direct translation of say a specific layout of a building that may be on fire. Developing
skills for traversing spaces that are on fire is meant to relate to different situations. The
contributions of this study for training programs can then be considered from the
perspectives of spatial presence and spatial understanding.
For training programs that use spatial contexts to help trainees develop specific
skills, there is an aspect of ‘believability’ that becomes important. These training
programs are highly dependent on user experience in order to increase believability in the
138
simulated environment. These types of training programs include manufacturing
operations training (Dorozhkin, Vance, Rehn, & Lemessi, 2012), surgical training
(Beyer-Berjot & Aggarwal, 2013), and so on. The key aspect of these training programs
is the specific focus on learning a skill and the simulated environment aids in the
believability in accomplishing the task (Dorozhkin, et al., 2012). The findings from this
study suggest that key features of a virtual reality system such as field of view play a
large role increasing the sense of presence but, that it does not act alone. These findings
for improving spatial presence could be used to improve the current systems for training
without necessarily spending money on a top of the line system that may have features
that do not actually impact spatial presence.
The other category of training programs focus on the acquisition of spatial
knowledge to develop spatial skills. For training, the acquisition of spatial knowledge is
meant to transfer beyond the technology medium into the real-world (Stanney, et al.,
2013). This is a key difference where the contributions of this study come in. These
training programs can be thought of in two ways: 1) focused on recall of spaces and 2)
developing route and survey knowledge. The findings of this study suggest that field of
view plays a large role in the recall from search tasks and routes. This is particularly
useful for training programs such as fire fighter training where burn building simulations
require not only quick development of route knowledge but to also search for people
trapped inside. Building on the development of route knowledge, other training programs
such as flight and ship simulators can benefit from how field of view could adversely
influence precision of spatial knowledge development.
139
Overall, the findings of this study indicated that a wider field of view was
necessary in the acquisition of route knowledge but had adverse effects on survey
knowledge development. This key difference was speculated to have occurred due to the
task type and the focus of the users. The main contribution for training programs is that
visual immersiveness will increase spatial knowledge acquisition but within the context
and nature of the task given to obtain that knowledge.
5.6 Potential Threats to Validity and Limitations of the Study
Several steps were taken in this study to help mitigate potential threats to validity
and limitations. As with any research that takes place in a lab setting, there will be many
limitations that apply to the design of the experiment and method of analysis. Research in
human behavior simulation with virtual reality is no exception. Thinking about human
behavior simulation, there are limitations which relate to different aspects: development,
measurement, and equipment. Virtual reality, in general, tends to have some commonly
listed limitations in the literature. These limitations have, for the most part, existed since
virtual reality research first started (Psotka, 1995). Despite great progress made over the
years with improvements to technology and practices, some limitations cannot always be
easily overcome. The potential and critical limitations currently and in the foreseeable
future include fatigue, simulator sickness, novelty, believability, and inferring
generalizations from measurement.
Pretesting was performed on each of the different conditions for duration times in
order to gauge an average time for fatigue. This helped establish more optimal durations
for each step of the procedure (questionnaires, training session, etc.) including the
140
experimental tasks. Determining optimal times to complete all steps of the procedure
helped to potentially alleviate some frustration participants may have experienced.
Addressing simulator sickness is an aspect all studies utilizing virtual reality face
(Draper, et al., 2001). There is no real way to overcome this threat aside from limiting the
amount of exposure time and possibly identifying subjects who are susceptible to motion
sickness before beginning the experiment. To help with this issue, participants were
screened before and during the joystick training session for signs of simulator sickness.
To aid with the issue of novelty in being exposed to 3D technology, a short set of
items were added to the demographics questionnaire to control for previous experience
with the iLab technology in any capacity. Additionally, if users had been exposed to the
iLab technology there were an additional set of three items to rate their experience by the
frequency of their exposure to the technology.
One of the more critical limitations for human behavior simulation specifically is
that of believability. Research in the area of human behavior simulation is concerned with
replicating human reactions to specific events, activities or situations (Orr, Mallet, &
Margolis, 2009). Even with high fidelity virtual environments, creating a believable
experience is a challenge. As Psotka (1995) explained, users will always possess the
knowledge that the illusion of the simulation is virtual (p. 409). This knowledge can
therefore disrupt potential findings. Specifically, users may not behave as they normally
would in the same event in the real-world. For instance, the use of the office setting
without lots of smoke damage or a simulated ‘haze’ could have impacted the user’s belief
the simulation was about visiting a space that was recently in a fire. Another way to
141
perceive the office setting believability was by the brightness of the office space depicted
by the projectors. The bright light of the projectors could also have negated the belief the
office space had been in a fire. Another related aspect to this limitation is that
measurement equipment could further disrupt the illusion of the simulation.
One last potential limitation could relate to lack of sufficient tools to capture and
measure human behavior. This could lead to issues in inferring findings as generalizable
results. Human behavior is linked to so many processes that researchers have no way of
capturing to measure. For instance, presence is a measure that is highly studied in virtual
reality research. Despite its intensive measurement over the years, some believe it is not
entirely possible to measure (Slater, 2009). As a result, a lot of trust is put in the
participant to accurately fill out questionnaires about his/her experience once it has
happened. To overcome this limitation founded in self-report methods of measurement,
some researchers look to more objective measures like brain waves, heart rate, and
postural response (IJsselsteijn, et al., 2000). While more objective measures reduce the
need to rely on user’s to remember their experiences, there is another limitation.
Objective measures only capture the behavior, not the mental processes that led to the
behaviors. Again this leads to limitations in inferring that behaviors occur due to parts of
the simulation. Brain waves (EEG) research and other areas in neuroscience are currently
working towards developing objective measures which, could potentially reduce the
limitation of objective measures but, the measurement tools are still not reliable enough
at this point (Bohil, Alicea, & Biocca, 2011).
142
Looking at potential threats to the validity of this study, there was one threat to
external validity in the form of statistical conclusion validity. The choice of analysis
included an ANCOVA and MANCOVA. The statistical power of these tests may not
have been enough as the effect sizes could be small based on the data provided by the
sample size. This could have caused issues when trying to generalize findings (either
significant or non-significant). It could also have caused issues when making inferences
about the experimental condition’s influence on the participant’s overall experience. To
help mitigate this, the design of the experiment sought at least 120 participants and
generated experimental runs to randomly assign conditions. This helped with balancing
the cell sizes of each condition which, helped to improve the statistical power of the two
tests used for the analysis.
Lastly, there was a potential threat to construct validity is mono-method bias
towards spatial presence. Spatial presence was measured using only a self-report
questionnaire. As Slater (2009) indicated in his study, presence is typically not a directly
measurable variable. This indicates that multiple measures may be better suited to
identifying the experience of spatial presence. Using a pre-existing questionnaire that has
been highly cited was one way of mitigating the issue of mono-method bias. Although
multiple measures of spatial presence would produce more robust results, previous
studies have utilized single self-report measures for spatial presence and have proven to
valid (Balakrishnan & Sundar, 2011).
143
5.7 Conclusion & Future Directions
This study sought to investigate the influence of the immersiveness on spatial
experience and spatial understanding. Specifically, the study looked at the constructs that
made up the immersive experience: immersion and interactivity. From these two
constructs, concepts of visual immersiveness and navigability were examined in terms of
key technology affordances of a virtual reality system. The design of the study then
looked specifically at three key technology features of a virtual reality system: field of
view, stereoscopy and navigability. Based on the findings that within visual
immersiveness field of view played a significant role in all the measures but, with
adverse findings from what was predicted, further study should be conducted. To
investigate possible reasons for the adverse findings, one possibility would be to look
closer at the role of primary versus secondary tasks in development spatial knowledge.
Another direction for furthering this line of research is to take into consideration
the existing taxonomy of display technology attributes created by Bowman and
McMahan (2007). The existing taxonomy consists of several features yet to be fully
tested within a virtual reality system. In addition to the two measures of visual
immersiveness used in this study, there is strong evidence for other technology features
such as level of detail, realism, head-tracking, and field of regard. Level of detail and
realism have been examined and suggested to influence spatial knowledge in virtual
environments (Stanney, et al., 2013). Further support for realism comes from the study
conducted by Balakrishnan et al. (2012) where a photorealism versus hidden line
manipulation was found to impact width estimations of a virtual environment. Head-
144
tracking has been highly cited for its contributions to better self-location and influence on
accuracy of spatial knowledge (Stanney, et al., 2013). Lastly, field of regard has been
cited as an alternative manipulation to field of view as it encompasses more of the human
peripheral vision thereby blocking out more of the real world (Bowman & McMahan,
2007).
This study only looked at a few key factors of virtual reality system that create a
compelling spatial experience. Given the complex nature of virtual reality systems and
the large number of parameters, further research is necessary. Testing more of these
different attributes is necessary to gain a better sense of the overall impact of such
technology on spatial experiences and understanding.
145
REFERENCES
Agarwal, R., & Karahanna, E. (2000). Time flies when you're having fun: Cognitive
absorption and beliefs about information technology usage. MIS Quarterly, 24(4),
665-694.
Andersen, P. B. (1997). A Theory of Computer Semiotics. Cambridge, England:
Cambridge University Press.
Arthur, K. W. (2000). Effects of field of view on performance with head-mounted
displays. (Doctoral dissertation, University of North Carolina, Chapel Hill).
Retrieved from http://wwwx.cs.unc.edu/Research/eve/dissertations/2000-
Arthur.pdf
Astur, R. S., Ortiz, M. L., & Sutherland, R. J. (1998). A characterization of performance
by men and women in a virtual Morris water task: A large and reliable sex
difference. Behavioural Brain Research, 93, 185-190.
Bafna, S. (2003, January). Space syntax A brief introduction to its logic and analytical
techniques. Environment and Behavior, 35(1), 17-29.
Balakrishnan, B., & Sundar, S. (2011). Where am I? How can I get there? Impact of
navigability and narrative transportation on spatial presence. Human-Computer
Interaction, 26(3), 161-204.
Balakrishnan, B., Oprean, D., Martin, B., & Smith, M. (2012). Virtual reality: Factors
determining spatial presence, comprehension and memory. Proceedings of the
12th International Conference on Construction Applications of Virtual Reality
(CONVR), (pp. 451-459). Taipei, Taiwan.
Baños, R. M., Botella, C., Alcañiz, M., Liaño, V., Guerrero, B., & Rey, B. (2004).
Immersion and emotion: Their impact on the sense of presence. CyberPsychology
& Behavior, 7(6), 734-741.
Baños, R., Botella, C., García-Palacios, A., Villa, H., Perpiña, C., & Gallardo, M. (1999,
April). Psychological variables and reality judgment in virtual environments: The
roles of absorption and dissociation. CyberPsychology & Behavior, 2(2), 143-148.
146
Baños, R. M., Botella, C., Garcia-Palacios, A., Villa, H., Perpiña, C., & Alcañiz, M.
(2000, June). Presence and reality judgment in virtual environments: A unitary
construct? CyberPsychology & Behavior, 3(3), 327-335.
Baños, R. M., Botella, C., Rubió, I., Quero, S., García-Palacios, A., & Alcañiz, M.
(2008). Presence and emotions in virtual environments: The influence of
stereoscopy. CyberPsychology & Behavior, 11(1), 1-8.
Banton, P., Thompson, P., & Quinlan, P. T. (2001). Effect of geometric field of view on
stereoscopic spatial judgments. Human Factors: The Journal of the Human
Factors and Ergonomics Society, 43(1), 405-414.
doi:10.1518/001872001775898214
Baştanlar, Y., Cantürk, D., & Karacan, H. (2007). Effects of color-multiplex stereoscopic
view on memory and navigation. 3DTV Conference 2007 (pp. 1-4). Kos Island,
Greece: IEEE.
Beall, A. C., & Loomis, J. M. (1996). Visual control of steering without course
information. Perception, 25, 481-494.
Bennett, A., Coxon, M., & Mania, K. (2010). The effect of stereo and context on memory
and awareness states in immersive virtual environments. APGV '10 Proceedings
of the 7th Symposium on Applied Perception in Graphics and Visualization (pp.
135-140). New York, NY: ACM.
Beyer-Berjot, L., & Aggarwal, R. (2013). Toward technology-supported surgical
training: The potential of virutal simulators in larparoscopic surgery.
Scandinavian Journal of Surgery, 102(4), 221-226.
Biocca, F. (1997). The cyborg's dilemma: Embodiment in virtual environments.
Proceedings Second International Conference on Cognitive Technology
Humanizing the Information Age (pp. 12-26). Aizu-Wakamatsu City , Japan:
IEEE.
Biocca, F., & Delaney, B. (1995). Immersive Virtual Reality Technology. In F. Biocca, &
M. R. Levy (Eds.), Communication in the Age of Virtual Reality (pp. 57-126).
Hillsdale, NJ: L. Erlbaum Associates.
147
Bohil, C. J., Alicea, B., & Biocca, F. A. (2011, December). Virtual reality in
neuroscience research and therapy. Nature Reviews Neuroscience, 12, 752-762.
Bossard, C., Kermarrec, G., Buche, C., & Tisseau, J. (2008). Transfer of learning in
virtual environments: A new challenge? Virtual Reality, 12(3), 151–161.
Bowman, D. A., & Hodges, L. F. (1999). Formalizing the design, evaluation, and
application of interaction techniques for immersive virtual environments. Journal
of Visual Languages and Computing, 10, 37-53.
Bowman, D. A., & McMahan, R. P. (2007, July). Virtual reality: How much immersion
is enough? Computer, 40(7), pp. 36-43.
Bowman, D. A., Koller, D., & Hodges, L. F. (1997). Travel in immersive virtual
environments: An evaluation of viewpoint motion control techniques.
Proceedings of the 1997 Virtual Reality Annual International Symposium (VRAIS
'97) (pp. 45-52). Albuquerque, New Mexico: IEEE.
Bowman, D. A., Kruijff, E., LaViola Jr., J. J., & Poupyrev, I. (2005). 3D User Interfaces
Theory and Practice. Boston, MA: Addison-Wesley.
Brosnan, M. J. (1998). The implications for academic attainment of perceived gender-
appropriateness upon spatial task performance. British Journal of Educational
Psychology, 68, 203-215.
Brown, E., & Cairns, P. (2004). A grounded investigation of game immersion.
Proceedings from CHI '04: CHI '04 extended abstracts on Human Factors on
computing systems (pp. 1297-1300). New York, NY: ACM.
Bucy, E. P., & Tao, C.-C. (2007). The mediated moderation model of interactivity. Media
Psychology, 9, 647-672.
Burigat, S., & Chittaro, L. (2007, November). Navigation in 3D virtual environments:
Effects of user experience and location-pointing navigation aids. International
Journal of Human-Computer Studies, 65(11), 945-958.
148
Calado, A., Soares, M. M., Campos, F., & Correia, W. (2013). Virtual reality applied to
the study of the interaction between the user and built space: A literature review.
In A. Marcus (Ed.), Design, User Experience, and Usability. User Experience in
Novel Technological Environments (Vol. 8014, pp. 345-351). Berlin Heidelberg:
Springer.
Campbell, D. A., & Wells, M. (1994). A critique of virtual reality in the architectural
design process. Report No. 4-94-3: Human Interface Technology Laboratory
(HITL).
Colle, H., & Reid, G. (1998). The room effect: Metric spatial knowledge of local and
separated regions. Presence, 7(2), 116-128.
Coxon, M., & Mania, K. (2014). Measuring memories for objects and their locations in
immersive virtual environments: The subjective component of memorial
experience. In W. Huang (Ed.), Handbook of Human Centric Visualization (pp.
453-471). Springer New York.
Crone, R. A. (1992). The history of stereoscopy. Documenta Ophthalmologica, 81(1), 1-
16.
Curtain, H. A. (1986). The immersion approach: Principle and practice. In B. Snyder
(Ed.), Second language acquisition: Preparing for tomorrow (pp. 1-14).
Lincolnwood, IL: National Textbook Company.
Dabbs Jr., J. M., Chang, E.-L., Strong, R. A., & Milun, R. (1998, March). Spatial ability,
navigation strategy, and geographic knowledge among men and women.
Evolution and Human Behavior, 19(2), 89-98.
Dalgarno, B., & Lee, M. J. (2010). What are the learning affordances of 3-D virtual
environments? British Journal of Educational Technology, 41(1), 10–32.
Darken, R. P., Allard, T., & Achille, L. B. (1998). Spatial orientation and wayfinding in
large-scale virtual spaces: An introduction. Presence, 7(2), 101-107.
Davis, F., Bagozzi, R., & Warshaw, P. (1992). Extrinsic and intrinsic motivation to use
computers in the workplace. Journal of Applied Social Psychology, 22, 1111-
1132.
149
Dede, C. (2009). Immersive interfaces for engagement and learning. Science, 323(5910),
66-69.
Dorozhkin, D. V., Vance, J. M., Rehn, G. D., & Lemessi, M. (2012). Coupling of
interactive manufacturing operations simulation and immersive virtual reality.
Virtual Reality, 16(1), 15-23.
Draper, M. H., Viirre, E. S., Furness, T. A., & Gawron, V. J. (2001). Effects of image
scale and system time delay on simulator sickness within head-coupled virtual
environments. Human Factors: The Journal of the Human Factors and
Ergonomics Society, 43(1), 129–146.
Ermi, L., & Mäyrä, F. (2005). Fundamental components of the gameplay experience:
analysing immersion. Proceedings of DiGRA 2005 Conference: Changing Views
– Worlds in Play (pp. 1-14). Vancouver, Canada: Authors & Digital Games
Research Association DiGRA.
Glenberg, A. M. (1997). What memory is for. Behavioral and Brain Sciences, 20, 1-19.
Gorini, A., Capideville, C. S., Leo, G. D., Mantovani, F., & Riva, G. (2011). The role of
immersion and narrative in mediated presence: The virtual hospital experience.
Cyberpsychology, Behavior, and Social Networking, 14(3), 99-105. doi:DOI:
10.1089/cyber.2010.0100
Green, M., Brock, T., & Kaufman, G. (2004). Understanding media enjoyment: The role
of transportation into narrative worlds. Communication Theory, 14(4), 311-327.
Gregory, R. L. (1980). Perceptions as hypotheses. Philosophical Transactions of The
Royal Society B, 290(1038), 181-197.
Hajibabai, L., Delavar, M. R., Malek, M. R., & Frank, A. U. (2006). Spatial cognition
and wayfinding strategy during building fire. Proceedings of 3rd International
Conference on Spatial (ICSC2006) Dynamics in Spatial Interactions, (pp. 1-4).
Rome, Italy.
Hart, R. A., & Moore, G. T. (1973). The development of spatial cognition: A Review. In
R. M. Downs, & D. Stea (Eds.), Image and Environment: Cognitive Mapping and
Spatial Behavior (pp. 246-295). IL, Chicago: Aldine Publishing Company.
150
Hendrix, C., & Barfield, W. (1995). Presence in virtual environments as a function of
visual and auditory cues. Proceedings of the Virtual Reality Annual International
Symposium (VRAIS '95) (pp. 74-82). IEEE.
Henry, J. A., & Polys, N. F. (2010). The effects of immersion and navigation on the
acquisition of spatial knowledge of abstract data networks. Proceedings of the
International Conference on Computational Science (ICCS) '10. 1, pp. 1731-
1740. Amsterdam, The Netherlands: Proceedia Computer Science.
Hess, S. M., Detweiler, M. C., & Ellis, R. D. (1999). The utility of display space in
keeping track of rapidly changing information. Human Factors: The Journal of
the Human Factors and Ergonomics Society, 41(2), 257-281.
IJsselsteijn, W. A., de Ridder, H., Freeman, J., & Avons, S. E. (2000). Presence: Concept,
determinants and measurement. Proceedings of the SPIE, Human Vision and
Electronic Imaging V, (pp. 3959-3976). San Jose, CA.
IJsselsteijn, W., de Ridder, H., Freeman, J., Avons, S. E., & Bouwhuis, D. (2001). Effects
of stereoscopic presentation, image motion, and screen size on subjective and
objective corroborative measures of presence. Presence, 10(3), 298 –311.
Interrante, V., Ries, B., Lindquist, J., Kaeding, M., & Anderson, L. (2008, April).
Elucidating factors that can facilitate veridical spatial perception in immersive
virtual environments. Presence, 17(2), 176-198.
Ji, Q., Tanca, J., & Janicke, S. (2013, September). Does 3D increase the enjoyment
experience? A comparative experiment on the psychological effects of 3D. 3D
Research, 4(4), 1-8.
Kalawsky, R. (1998). VRSART: A tool for evaluation of contributory factors associated
with presence in spatially immersive environments. In Proceedings of the
Presence in Shared Virtual Environments Workshop, First International
Workshop on Presence, (pp. 1-5). Ipswich, Suffolk, UK.
Kim, Y.-O., & Penn, A. (2004, July). Linking the spatial syntax of cognitive maps to the
spatial syntax of the environment. Environment & Behavior, 36(4), 483-504.
151
Kulhavy, R. W., & Stock, W. A. (1996). How cognitive maps are learned and
remembered. Annals of the Association of American Geographers, 86(1), 123-
145.
Kyllonen, P. C., Lohman, D. F., & Snow, R. E. (1984). Effects of aptitudes, strategy
training, and task facets on spatial task performance. Journal of Educational
Psychology, 76(1), 130-145.
Labate, E., Pazzaglia, F., & Hegarty, M. (2014). What working memory subcomponents
are needed in the acquisition of survey knowledge? Evidence from direction
estimation and shortcut tasks. Journal of Environmental Psychology, 37, 73-79.
Laha, B., Bowman, D. A., & Schiffbauer, J. D. (2013, April). Validation of the MR
simulation approach for evaluating the effects of immersion on visual analysis of
volume data. IEEE Transactions on Visualization and Computer Graphics, 19(4),
529-538.
Lang, A. (2000). The limited capacity model of mediate message processing. Journal of
Communication, 50(1), 46-70.
Larsson, P., Västfjäll, D., & Kleiner, M. (2004). Peception of self-motion and presence in
auditory virtual environments. Proceedings of the 7th Annual workshop on
Presence (Presence 2004), (pp. 252-258). Valencia, Spain.
Lessiter, J., Freeman, J., Keogh, E., & Davidoff, J. (2001). A cross-media presence
questionnaire: The ITC-sense of presence inventory. Presence, 10(3), 282-297.
Lin, J.-W., Duh, H., Parker, D., Abi-Rached, H., & Furness, T. (2002). Effects of field of
view on presence, enjoyment, memory, and simulator sickness in a virtual
environment. Proceedings of the IEEE Virtual Reality 2002 (VR'02) (pp. 164-
171). Orlando, FL: IEEE.
Maguire, E. A., Burgess, N., & O’Keefe, J. (1999, April). Human spatial navigation:
cognitive maps, sexual dimorphism, and neural substrates. Current Opinion in
Neurobiology, 9(2), 171-177.
152
Mania, K., Troscianko, T., Hawkes, R., & Chalmers, A. (2003). Fidelity metrics for
virtual environment simulations based on spatial memory awareness states.
Presence, 12(3), 296-310.
Mark, D. M. (1993). Human Spatial Cognition. In D. Medyckyj-Scott, & H. M.
Hearnshaw (Eds.), Human Factors in Geographical Information Systems (pp. 51-
60). Belhaven Press.
McMahan, R. P., Gorton, D., Gresock, J., McConnell, W., & Bowman, D. A. (2006).
Separating the effects of level of immersion and 3D interaction techniques. VRST
'06 Proceedings of the ACM symposium on Virtual reality software and
technology (pp. 108-111). New York, NY: ACM.
Meijer, F., Geudeke, B. L., & van den Broek, E. L. (2009). Navigating through virtual
environments: Visual realism improves spatial cognition. Cyberpsychology &
Behavior, 12(5), 517-521.
Mestre, D. R., & Fuchs, P. (2006). Immersion et présence. In P. Fuchs (Ed.), Traité de la
Réalité Virtuelle, Troisième Edition (pp. 309-338). Paris, France: Presses de
l'Ecole des Mines.
Moreno, R., & Mayer, R. E. (2002). Learning science in virtual reality multimedia
environments: Role of methods and media. Journal of Educational Psychology,
94(3), 598-610.
Murray, C. D., Fox, J., & Pettifer, S. (2007). Absorption, dissociation, locus of control
and presence in virtual reality. Computers in Human Behavior, 23, 1347-1354.
Murray, J. (1997). Hamlet on the Holodeck: The Future of Narrative in Cyberspace.
Cambridge: MIT Press.
Nass, C., & Mason, L. (1990). On the Study of Technology and Task: A Variable-Based
Approach. In J. Fulk (Ed.), Organizations and Communication Technology (pp.
46-67). Newbury Park, CA: Charles Steinfield.
Ni, T., Bowman, D. A., & Chen, J. (2006). Increased display size and resolution improve
task performance in information-rich virtual environments. GI '06 Proceedings of
153
Graphics Interface 2006 (pp. 139-146). Toronto, Ont., Canada: Canadian
Information Processing Society.
Nichols, S., Haldane, C., & Wilson, J. (2000). Measurement of presence and its
consequences in virtual environments. International Journal of Human-Computer
Studies, 52, 417-491.
Okeil, A. (2010). Hybrid design environments: Immersive and non-immersive
architectural design. ITcon, 15, pp. 202-216. Retrieved from
http://www.itcon.org/2010/16
Orr, T. J., Mallet, L. G., & Margolis, K. A. (2009). Enhanced fire escape training for
mine workers using virtual reality simulation. Mining Engineering, 61, 12-16.
Picucci, L., Gyselinck, V., Piolino, P., Nicolas, S., & Bosco, A. (2013, May/June).
Spatial mental models: The interaction of presentation format, task requirements
and availability of working memory components. Applied Cognitive Psychology,
27(3), 314-327.
Psotka, J. (1995). Immersive training systems:Virtual reality and education and training.
Instructional Science, 23, 405-431.
Ragan, E. D., Sowndararajan, A., Kopper, R., & Bowman, D. A. (2010). The effects of
higher levels of immersion on procedure memorization performance and
implications for educational virtual environments. Presence: Teleoperators &
Virtual Environments, 19(6), 527-543.
Raja, D., Bowman, D. A., Lucas, J., & North, C. (2004). Exploring the benefits of
immersion in abstract information visualization. Proceedings of the 8th
International Immersive Projection Technology Workshop, (pp. 1-7).
Rauscher, F. H., & Zupan, M. A. (2000). Classroom keyboard instruction improves
kindergarten children’s spatial-temporal performance: A field experiment. Early
Childhood Research Quarterly, 15(2), 215–228.
Reeve, J., Jang, H., Carrell, D., Jeon, S., & Barch, J. (2004). Enhancing students’
engagement by increasing teachers’ autonomy support. Motivation and Emotion,
28(2), 147-169.
154
Rey, B., Alcañiz, M., Tembl, J., & Parkhutik, V. (2008). Brain activity and presence: A
preliminary study in different immersive conditions using transcranial doppler
monitoring. Proceedings of the 11th Annual International Workshop on Presence,
(pp. 209-218). Padova, Italy.
Riecke, B. E. (2011). Compelling Self-Motion Through Virtual Environments without
Actual Self-Motion - Using Self-Motion Illusions ("Vection") to Improve User
Experience in VR. In J.-J. Kim (Ed.), Virtual Reality (pp. 149-176). Rijeka,
Croatia: InTech. Retrieved from http://www.intechopen.com/books/virtual-
reality/compelling-self-motion-through-virtual-environments-without-actual-self-
motion-using-self-motion-ill
Riecke, B. E., & Schulte-Pelkum, J. (2006). Using the perceptually oriented approach to
optimize spatial presence & ego-motion simulation. (Technical Rep. No. 153).
Tübingen, Germany: Max Planck Institute for Biological Cybernetics.
Riecke, B. E., & von der Heyde, M. (2002). Qualitative modeling of spatial orientation
processes using logical propositions: Interconnecting spatial presence, spatial
updating, piloting, and spatial cognition. Technical Report No. 100, Max Planck
Institute for Biological Cybernetics, Department Bülthoff, Tübingen, Germany.
Riecke, B. E., Schulte-Pelkum, J., Avraamides, M., von der Heyde, M., & Bülthoff, H.
(2005). Scene consistency and spatial presence increase the sensation of self-
motion in virtual reality. Proceedings of the 2nd Symposium on Applied
Perception in Graphics and Visualization (APGV '05) (pp. 111-118). New York,
NY: ACM.
Robertson, G., Czerwinski, M., & van Dantzich, M. (1997). Immersion in desktop virtual
reality. UIST '97: Proceedings of the 10th annual ACM symposium on User
Interface Software and Technology (pp. 11-19). New York, NY: ACM.
Roussou, M. (2004, January). Learning by doing and learning through play: An
exploration of interactivity in virtual environments for children. Computers in
Entertainment (CIE) - Theoretical and Practical Computer Applications in
Entertainment, 2(1).
Ryan, M.-L. (1999). Immersion vs. interactivity: Virtual reality and literary theory.
SubStance, 28(89), 110-137.
155
Sayers, H. (2004). Desktop virtual environments: A study of navigation and age.
Interacting with Computers, 16, 939-956.
Schubert, T. W., Friedmann, F., & Regenbrecht, H. T. (1999a). Decomposing the sense
of presence: Factor analytic insights. 2nd International Workshop on Presence.
Essex, UK.
Schubert, T., Friedmann, F., & Regenbrecht, H. (1999b). Embodied presence in virtual
environments. In R. Paton, & I. Neilson (Eds.), Visual representations and
interpretations (pp. 269-278). Springer.
Schubert, T. W., Friedmann, F., & Regenbrecht, H. (2001). The experience of presence:
Factor analytic insights. Presence: Teleoperators & Virtual Environments, 10(3),
266-281. doi:10.1162/105474601300343603
Schuchardt, P., & Bowman, D. A. (2007). The benefits of immersion for spatial
understanding of complex underground cave systems. Proceedings from VRST
2007 (pp. 121-124). Newport Beach, CA: ACM.
Schuemie, M. J., Van Der Straaten, P., Krijn, M., & Van Der Mast, C. A. (2001).
Research on presence in virtual reality: A survey. CyberPsychology & Behavior,
4(2), 183-201.
Schulte-Pelkum, J., Riecke, B., von der Heyde, M., & Bülthoff, H. (2003). Circular
vection is facilitated by a consistent photorealistic scene. Proceedings of the 6th
Annual International Workshop on Presence (Presence 2003). Aalborg, Denmark.
Shelton, A. L., & McNamara, T. P. (1997). Multiple views of spatial memory.
Psychonomic Bulletin & Review, 4(1), 102-106.
Sheridan, T. B. (1992). Musing on telepresence and virtual presence. Presence:
Teleoperators and Virtual Environments, 1(1), 120-125.
Sherman, W., & Craig, A. B. (2003). Understanding virtual reality: Interface,
application, and design. San Fransico, CA: Morgan Kaufmann.
156
Slater, M. (1999). Questionnaire, measuring presence: A response to the witmer and
singer presence. Presence, 8(5), 560-565.
Slater, M. (2009). Place illusion and plausibility can lead to realistic behaviour in
immersive virtual environments. Philosophical Transactions of the Royal Society
B: Biological Sciences, 364, 3549-3557.
Slater, M., & Wilbur, S. (1997). A framework for immersive virtual environments (FIVE)
- Speculations on the role of presence in virtual environments. Presence:
Teleoperators & Virtual Environments, 6(6), 603-616.
Sowndararajan, A., Wang, R., & Bowman, D. A. (2008). Quantifying the benefits of
immersion for procedural training. Proceedings of the 2008 workshop on
Immersive projection technologies/Emerging display technologiges (IPT/EDT
'08) (pp. 2:1--2:4). New York, NY: ACM.
Stanney, K., Cohn, J., Milham, L., Hale, K., Darken, R., & Sullivan, J. (2013). Deriving
training strategies for spatial knowledge acquisition from behavioral, cognitive,
and neural foundation. Military Psychology, 25(3), 191-205.
Steuer, J. (1992). Defining virtual reality: Dimensions determining telepresence. Journal
of Communication, 42(4), 73-93.
Stülpnagel, R., & Steffens, M. (2013). Active route learning in virtual environments:
Disentangling movement control from intention, instruction specificity, and
navigation control. Psychological Research, 77(5), 555-574.
Sundar, S. S. (2004). Theorizing interacitivity's effects. The Information Society, 20, 385-
389.
Tan, D. S., Czerwinski, M. P., & Robertson, G. G. (2006). Large displays enhance optical
flow cues and narrow the gender gap in 3-D virtual navigation. Human Factors:
The Journal of the Human Factors and Ergonomics Society, 48(2), 318-333.
Tate, D., Sibert, L., & King, T. (1997). Using virtual environments to train firefighters.
Computer Graphics and Applications, IEEE, 17(6), 23-29.
157
Tellegen, A., & Atkinson, G. (1974). Openness to absorbing and self-altering experiences
("Absorption"), a trait related to hypnotic susceptibility. Journal of Abnormal
Psychology, 83(3), 268-277.
Tijs, T. J. (2006). Quantifying immersion in games by analyzing eye movements. Royal
Institute of Technology, Department of Computer and Systems Science,
Stockholm.
Vorderer, P., Wirth, W., Gouveia, F. R., Biocca, F., Saari, T., Jäncke, F., . . . Jäncke, P.
(2004). MEC spatial presence questionnaire (MEC-SPQ): Short documentation
and instructions for application. Report to the European Community, Project
Presence: MEC (IST-2001-37661). Retrieved from http://www.ijk.hmt-
hannover.de/presence
Waller, D., & Hodgson, E. (2013). Sensory contributions to spatial knowledge of real and
virtual environments. In F. Steinicke, Y. Visell, J. Campos, & A. Lecuyer (Eds.),
Human Walking in Virtual Environments Perception, Technology, and
Applications (pp. 3-26). New York, NY: Springer.
Wann, J., & Mon-Williams, M. (1996). What does virtual reality NEED? : Human factors
issues in the design of three-dimensional computer environments. Internation
Journal of Human-Computer Studies, 44, 829 – 847.
Wen, W., Ishikawa, T., & Sato, T. (2013). Individual differences in the encoding process
of egocentric and allocentric survey knowledge. Cognitive Science, 37, 176-192.
Werner, S., Krieg-Brückner, B., Mallot, H. A., Schweizer, K., & Freksa, C. (1997).
Spatial cognition: The role of landmark, route, and survey knowledge in human
and robot navigation. In M. Jarke, K. Pasedach, & K. Pohl (Ed.), Proceedings of
Informatik '97 (pp. 41-50). Berlin: Springer.
Winn, W., Windschitl, M., Fruland, R., & Lee, Y. (2002). When does immersion in a
virtual environment help students construct understand? In P. Bell, & R. Stevens
(Ed.), Proceedings of the International Conference of the Learning Societies ICLS
2002 (pp. 497-503). Mawah, NJ: Erlbaum.
Wirth, W. (2006). Involvement. In J. Bryant, & P. Vorderer (Eds.), Psychology of
Entertainment (pp. 199-213). Mahwah, NJ: Lawrence Erlbaum Associates.
158
Wirth, W., Hartmann, T., Böcking, S., Vorderer, P., Klimmt, C., Schramm, H., . . .
Jäncke, P. (2007). A process model of the formation of spatial presence
experiences. Media Psychology, 9, 493-525.
Witelson, S. F., & Swallow, J. A. (1988). Neuropsychological study of the development
of spatial cognition. In J. Stiles-Davis, M. Kritchevsky, & U. Bellugi (Eds.),
Spatial cognition: brain bases and development (pp. 373-409). Psychology Press.
Witmer, B. G., & Singer, M. J. (1998). Measuring presence in virtual environments: A
presence questionnaire. Presence: Teleoperators and Virtual Environments, 7,
225-240.
Witmer, B. G., Jerome, C. J., & Singer, M. J. (2005). The factor structure of the presence
questionnaire. Presence, 14(3), 298-312.
Wood, R. E. (1986, February). Task complexity: Definition of the construct.
Organizational Behavior and Human Decision Processes, 37(1), 60-82.
Yates, I. A. (1966). The art of memory. Chicago, IL: University of Chicago Press.
Yun, G. (2007). Interactivity concepts examined: Response time, hypertext, role taking,
and multimodality. Media Psychology, 9, 527-548.
Zanbaka, C., Lok, B., Babu, S., Ulinkski, A., & Hodges, L. (2005, Nov.-Dec.).
Comparison of path visualizations and cognitive measures relative to travel
technique in a virtual environment. Visualization and Computer Graphics, IEEE
Transactions on, 11(6), 694-705.
Zeltzer, D. (1992). Autonomy, interaction, and presence. Presence, 1(1), 127-132.
Zikic, N. (2007). Evaluating relative impact of VR components screen size, stereoscopy
and field of view on spatial comprehension and presence in architecture.
Technical Report #53, Penn State, Computer Integrated Construction Research
Program.

159
APPENDIX A – EXPERIMENTAL PROCEDURE PROTOCOLS
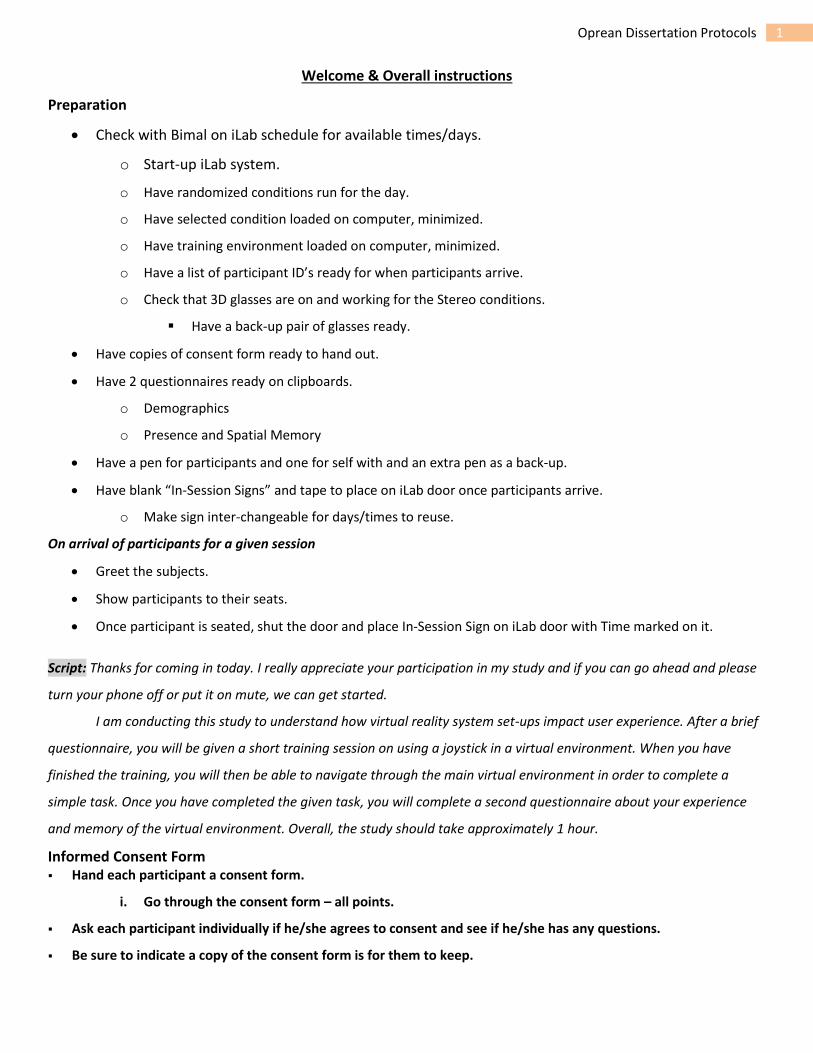
1 Oprean Dissertation Protocols
Welcome & Overall instructions
Preparation
Check with Bimal on iLab schedule for available times/days.
o Start-up iLab system.
o Have randomized conditions run for the day.
o Have selected condition loaded on computer, minimized.
o Have training environment loaded on computer, minimized.
o Have a list of participant ID’s ready for when participants arrive.
o Check that 3D glasses are on and working for the Stereo conditions.
Have a back-up pair of glasses ready.
Have copies of consent form ready to hand out.
Have 2 questionnaires ready on clipboards.
o Demographics
o Presence and Spatial Memory
Have a pen for participants and one for self with and an extra pen as a back-up.
Have blank “In-Session Signs” and tape to place on iLab door once participants arrive.
o Make sign inter-changeable for days/times to reuse.
On arrival of participants for a given session
Greet the subjects.
Show participants to their seats.
Once participant is seated, shut the door and place In-Session Sign on iLab door with Time marked on it.
Script: Thanks for coming in today. I really appreciate your participation in my study and if you can go ahead and please
turn your phone off or put it on mute, we can get started.
I am conducting this study to understand how virtual reality system set-ups impact user experience. After a brief
questionnaire, you will be given a short training session on using a joystick in a virtual environment. When you have
finished the training, you will then be able to navigate through the main virtual environment in order to complete a
simple task. Once you have completed the given task, you will complete a second questionnaire about your experience
and memory of the virtual environment. Overall, the study should take approximately 1 hour.
Informed Consent Form Hand each participant a consent form.
i. Go through the consent form – all points.
Ask each participant individually if he/she agrees to consent and see if he/she has any questions.
Be sure to indicate a copy of the consent form is for them to keep.
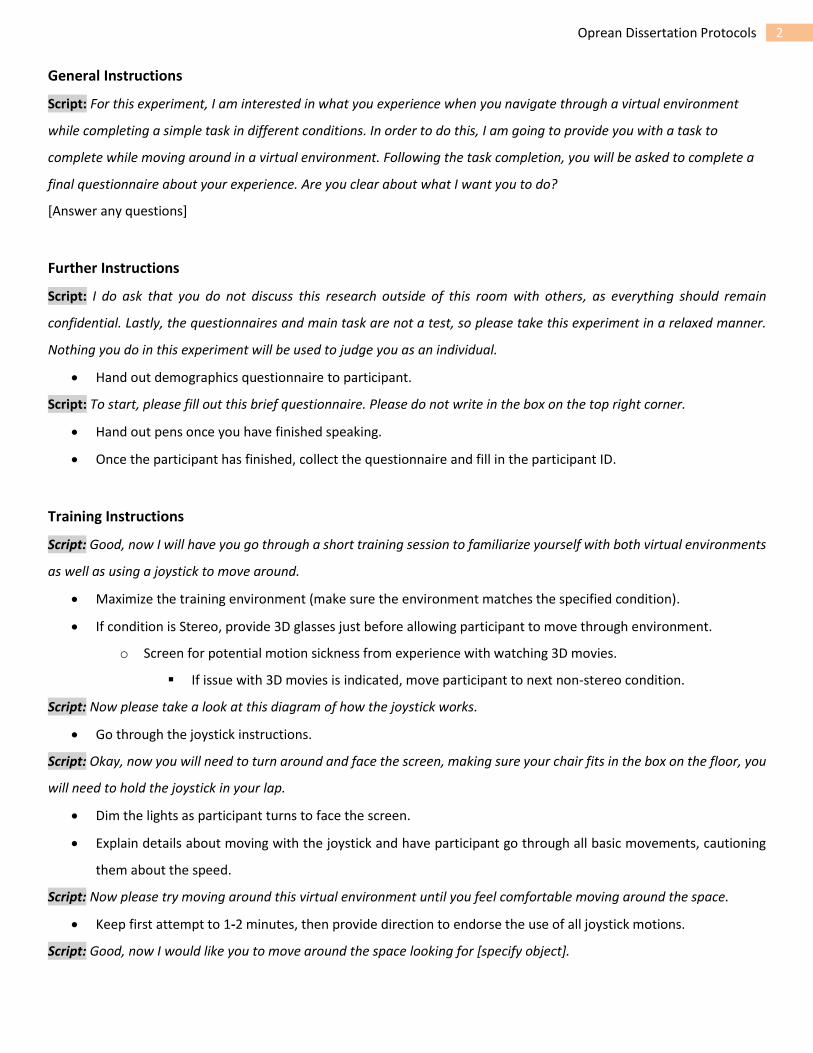
2 Oprean Dissertation Protocols
General Instructions
Script: For this experiment, I am interested in what you experience when you navigate through a virtual environment
while completing a simple task in different conditions. In order to do this, I am going to provide you with a task to
complete while moving around in a virtual environment. Following the task completion, you will be asked to complete a
final questionnaire about your experience. Are you clear about what I want you to do?
[Answer any questions]
Further Instructions
Script: I do ask that you do not discuss this research outside of this room with others, as everything should remain
confidential. Lastly, the questionnaires and main task are not a test, so please take this experiment in a relaxed manner.
Nothing you do in this experiment will be used to judge you as an individual.
Hand out demographics questionnaire to participant.
Script: To start, please fill out this brief questionnaire. Please do not write in the box on the top right corner.
Hand out pens once you have finished speaking.
Once the participant has finished, collect the questionnaire and fill in the participant ID.
Training Instructions
Script: Good, now I will have you go through a short training session to familiarize yourself with both virtual environments
as well as using a joystick to move around.
Maximize the training environment (make sure the environment matches the specified condition).
If condition is Stereo, provide 3D glasses just before allowing participant to move through environment.
o Screen for potential motion sickness from experience with watching 3D movies.
If issue with 3D movies is indicated, move participant to next non-stereo condition.
Script: Now please take a look at this diagram of how the joystick works.
Go through the joystick instructions.
Script: Okay, now you will need to turn around and face the screen, making sure your chair fits in the box on the floor, you
will need to hold the joystick in your lap.
Dim the lights as participant turns to face the screen.
Explain details about moving with the joystick and have participant go through all basic movements, cautioning
them about the speed.
Script: Now please try moving around this virtual environment until you feel comfortable moving around the space.
Keep first attempt to 1-2 minutes, then provide direction to endorse the use of all joystick motions.
Script: Good, now I would like you to move around the space looking for [specify object].

3 Oprean Dissertation Protocols
Continue training for 3-5 minutes as needed.
Script: Okay, do you feel comfortable using the joystick to move around a virtual environment?
If the response is yes, move on to next step.
If the response is No, provide extra guidance as needed. DO NOT GO BEYOND 10 minutes of training!
Close training environment.
Experiment Instructions
Script: Okay, now that you are comfortable with using the joystick, I am going to provide you with a simple task to perform
in a different virtual environment.
Hand participant noise-cancelling headphones.
Script: From this point on, you will need to follow the instructions provided in the following screens. I will be here to answer
any questions you may have as well as to keep track of the time. If you need to stop at any time please let me know right
away. You will have 10 minutes to complete the task, you will be notified when 10 minutes are up. After that turn around
and you can begin filling out the last questionnaire. Are you clear on the task and are you ready to begin?
Start the Narrative PowerPoint slideshow.
If Yes, then move to next step.
If No, then clarify any questions then move to next step.
Put final questionnaire and colored pencil on table behind participant.
On the second to last slide, start the video camera recording.
When slide show completes:
o Open the office environment in the correct condition.
Script: You may begin now.
Click the ESC key to start the timer.
Make observational notes about path taken, issues or interruptions, and number of times the joystick
manipulation is utilized.
After 10 minutes are up, stop video recording.
o If simulation does not end after 10 minutes automatically, let participant know time is up.
Close virtual environment and narrative slideshow while participant fills out the questionnaire.
o Load up the training environment for the next participant.
**Administer Questionnaire If subjects are running late, check on the next participant and make sure he/she has time to complete the
experiment.
If next participant does not have time, move the previous participant to the side and begin with the next
participant’s debriefing.

4 Oprean Dissertation Protocols
Debriefing & Thank You !! On completion of the last portion of the questionnaire, thank the subjects for their participation; clarify any further
questions regarding the experimental procedures, data analysis or use of data.
o Script: Thank you for your participation, and if you have any further questions, please feel free to contact
me. Also, please remember this study is confidential so do not discuss it with others.
Collect questionnaires from table once participant has finished.
o Mark the ID number for each participant in box on the questionnaire and file in the provided folder.
Exchange sign on door if necessary for next participant.

5 Oprean Dissertation Protocols
Post Experiment Session
• Double check ID number is on the questionnaire for each participant.
• File the questionnaires.
• Close out all open programs and shut down computer if no other participants are expected.
• Check that all Stereo glasses are shut off and put away.
• Remove sign from iLab door.
• Lock up the following in Bimal's office Cabinet
Completed Surveys
Extra consent forms
Extra In-Session Signs
• Check sufficiency of all form types (consent forms, questionnaires, and In-Session Signs), pens and clipboards for next
session / next day.
If insufficient, print required copies.

165
APPENDIX B – NARRATIVE POWERPOINT SLIDES
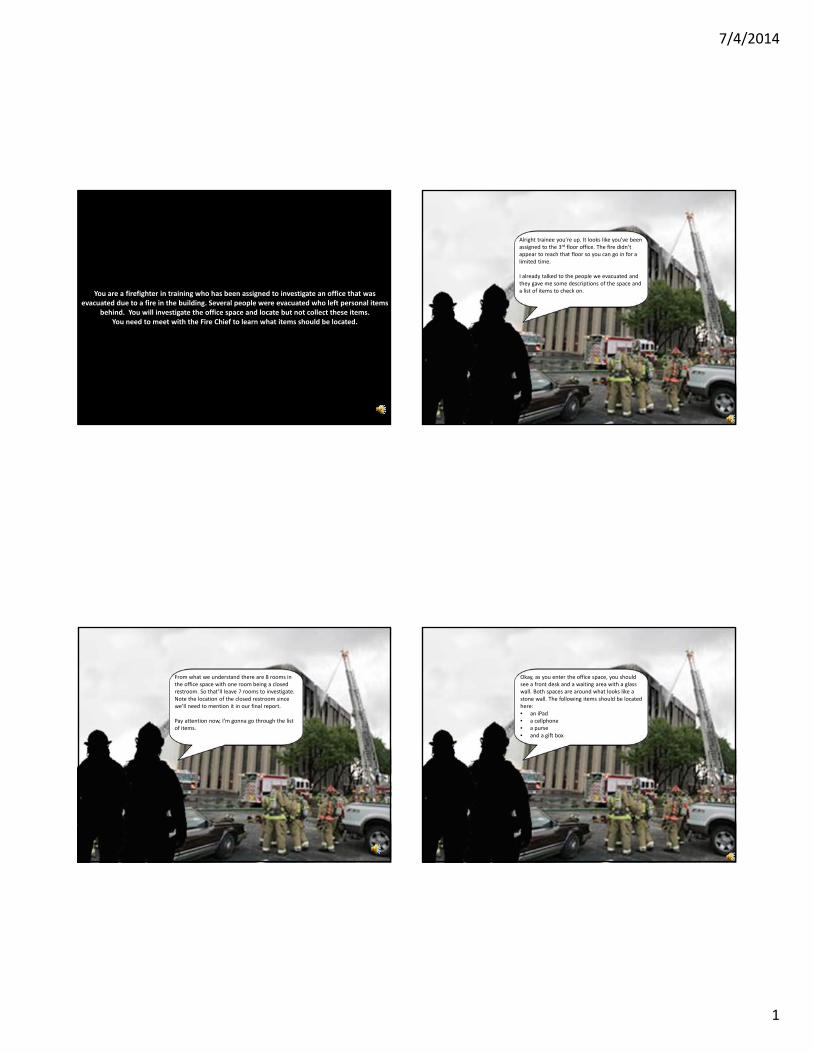
7/4/2014
1
You are a firefighter in training who has been assigned to investigate an office that was evacuated due to a fire in the building. Several people were evacuated who left personal items
behind. You will investigate the office space and locate but not collect these items. You need to meet with the Fire Chief to learn what items should be located.
Alright trainee you’re up. It looks like you’ve been assigned to the 3rd floor office. The fire didn’t appear to reach that floor so you can go in for a limited time.
I already talked to the people we evacuated and they gave me some descriptions of the space and a list of items to check on.
From what we understand there are 8 rooms in the office space with one room being a closed restroom. So that’ll leave 7 rooms to investigate. Note the location of the closed restroom since we’ll need to mention it in our final report.
Pay attention now, I’m gonna go through the list of items.
Okay, as you enter the office space, you should see a front desk and a waiting area with a glass wall. Both spaces are around what looks like a stone wall. The following items should be located here:• an iPad• a cellphone• a purse• and a gift box
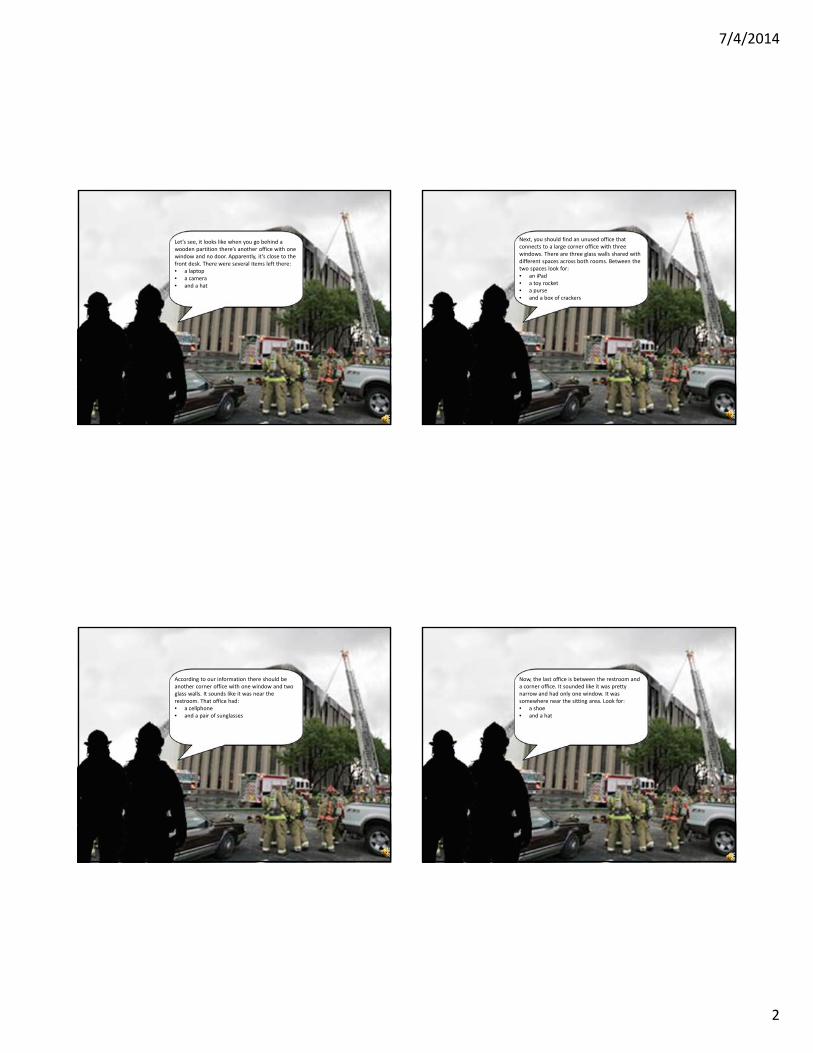
7/4/2014
2
Let’s see, it looks like when you go behind a wooden partition there’s another office with one window and no door. Apparently, it’s close to the front desk. There were several items left there:• a laptop• a camera• and a hat
Next, you should find an unused office that connects to a large corner office with three windows. There are three glass walls shared with different spaces across both rooms. Between the two spaces look for:• an iPad• a toy rocket• a purse• and a box of crackers
According to our information there should be another corner office with one window and two glass walls. It sounds like it was near the restroom. That office had:• a cellphone• and a pair of sunglasses
Now, the last office is between the restroom and a corner office. It sounded like it was pretty narrow and had only one window. It was somewhere near the sitting area. Look for:• a shoe• and a hat
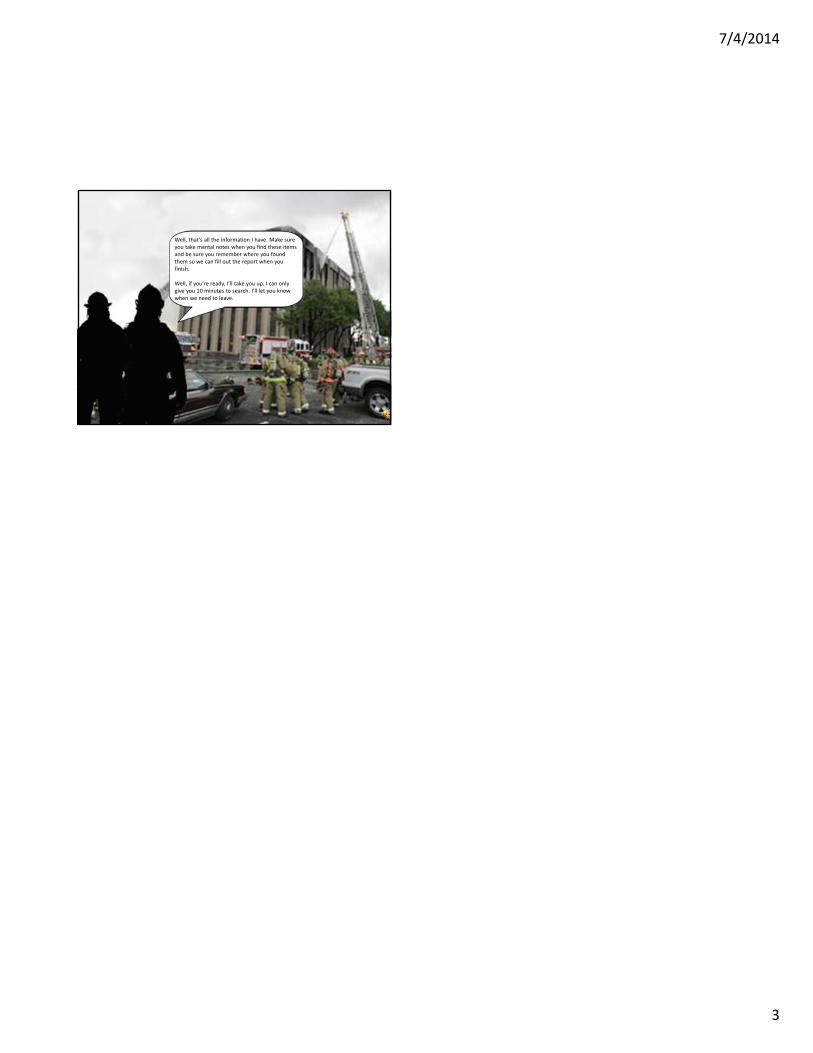
7/4/2014
3
Well, that’s all the information I have. Make sure you take mental notes when you find these items and be sure you remember where you found them so we can fill out the report when you finish.
Well, if you’re ready, I’ll take you up. I can only give you 10 minutes to search. I’ll let you know when we need to leave.

169
APPENDIX C – DEMOGRAPHICS QUESTIONNAIRE

Page 1 of 4
Please complete the following questions:
1. Age: _______ years
2. Gender: Male Female
3. Academic standing: Freshman Sophomore
Junior Senior Graduate
4. Academic major: _________________________________________________
5. Are you an Architectural Studies student: Yes No
a. If Yes, estimate how long you have been in the Architectural Studies program.
I have ________ semesters experience being in the Architectural Studies program.
6. Please estimate your experience with 3d-modelling with computer aided design softwares (Rhino, AutoCAD,
SketchUp, 3dStudio Max, etc) in general.
I have _______months OR ________ years experience in 3d modeling with computer aided design
software.
Please indicate how familiar you are with each of the following. Please circle a single number between 1 and 9 (where 1 = not at all familiar and 9 = very familiar).
1. How familiar are you with playing video games on Xbox, Playstation, or Nintendo consoles?
Not at all familiar 1 2 3 4 5 6 7 8 9 Very familiar
2. How familiar are you with playing personal computer (PC) games?
Not at all familiar 1 2 3 4 5 6 7 8 9 Very familiar
3. How familiar are you with playing games on your mobile phone?
Not at all familiar 1 2 3 4 5 6 7 8 9 Very familiar
4. How familiar are you with participating in 3D online virtual worlds? (For example: Second Life, Wonderland, etc.)
Not at all familiar 1 2 3 4 5 6 7 8 9 Very familiar
5. How familiar are you with watching 3D movies? (This can include theatres, IMAX, and 3D televisions)
Not at all familiar 1 2 3 4 5 6 7 8 9 Very familiar
6. How familiar are you with working with 3D software packages? (3D Studio Max, Maya, Lightwave, Blender, Rhino,
etc.)
Not at all familiar 1 2 3 4 5 6 7 8 9 Very familiar
Condition No.______________ Please do not write in this box
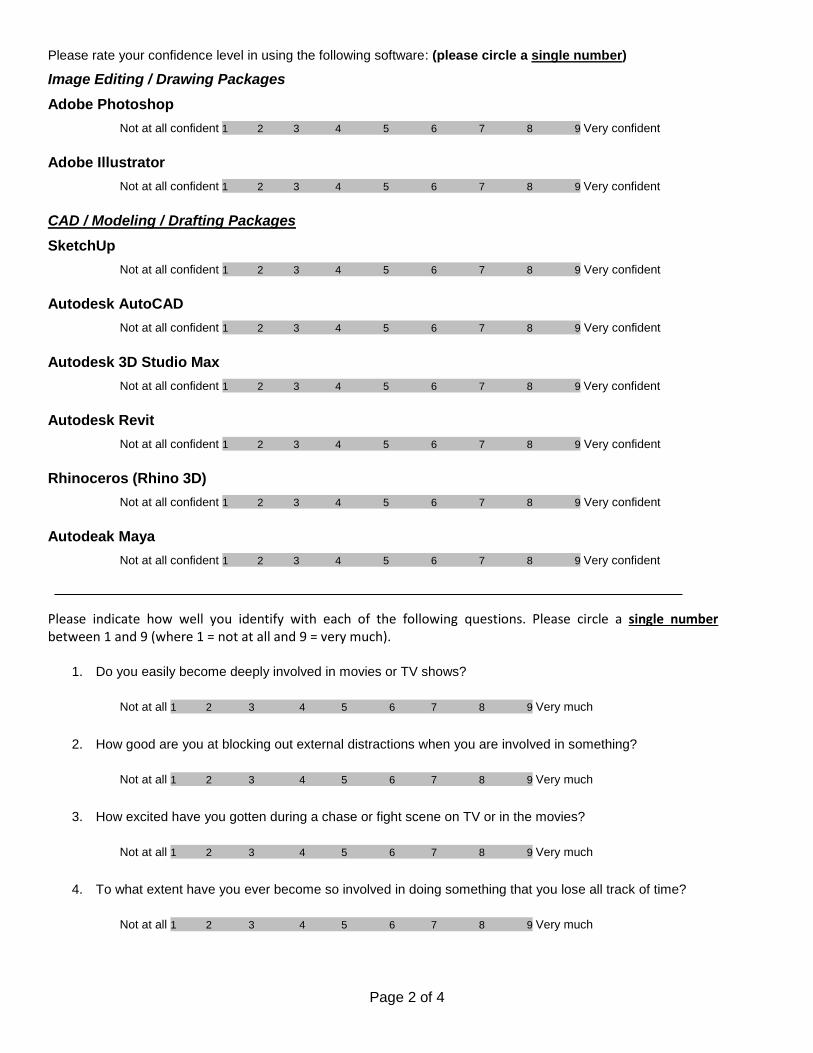
Page 2 of 4
Please rate your confidence level in using the following software: (please circle a single number)
Image Editing / Drawing Packages
Adobe Photoshop
Not at all confident 1 2 3 4 5 6 7 8 9 Very confident
Adobe Illustrator
Not at all confident 1 2 3 4 5 6 7 8 9 Very confident
CAD / Modeling / Drafting Packages
SketchUp
Not at all confident 1 2 3 4 5 6 7 8 9 Very confident
Autodesk AutoCAD
Not at all confident 1 2 3 4 5 6 7 8 9 Very confident
Autodesk 3D Studio Max
Not at all confident 1 2 3 4 5 6 7 8 9 Very confident
Autodesk Revit
Not at all confident 1 2 3 4 5 6 7 8 9 Very confident
Rhinoceros (Rhino 3D)
Not at all confident 1 2 3 4 5 6 7 8 9 Very confident
Autodeak Maya
Not at all confident 1 2 3 4 5 6 7 8 9 Very confident
Please indicate how well you identify with each of the following questions. Please circle a single number between 1 and 9 (where 1 = not at all and 9 = very much).
1. Do you easily become deeply involved in movies or TV shows?
Not at all 1 2 3 4 5 6 7 8 9 Very much
2. How good are you at blocking out external distractions when you are involved in something?
Not at all 1 2 3 4 5 6 7 8 9 Very much
3. How excited have you gotten during a chase or fight scene on TV or in the movies?
Not at all 1 2 3 4 5 6 7 8 9 Very much
4. To what extent have you ever become so involved in doing something that you lose all track of time?
Not at all 1 2 3 4 5 6 7 8 9 Very much
Page 3 of 4
5. To what extent have you ever remained apprehensive or fearful long after watching a scary movie?
Not at all 1 2 3 4 5 6 7 8 9 Very much
6. To what extent have you ever gotten scared by something happening on a TV show or in a movie?
Not at all 1 2 3 4 5 6 7 8 9 Very much
7. To what extent have you ever had dreams that are so real that you feel disoriented when you awake?
Not at all 1 2 3 4 5 6 7 8 9 Very much
8. To what extent have you ever become so involved in a daydream that you are not aware of things happening around you?
Not at all 1 2 3 4 5 6 7 8 9 Very much
9. Do you frequently find yourself closely identifying with the characters in a story line?
Not at all 1 2 3 4 5 6 7 8 9 Very much
10. To what extent have you ever become so involved in a movie that you are not aware of things happening around you?
Not at all 1 2 3 4 5 6 7 8 9 Very much
11. To what extent have you ever become so involved in a television program or book that people have problems getting your attention?
Not at all 1 2 3 4 5 6 7 8 9 Very much
Please indicate to what extent you agree or disagree with each of the following statements. Please circle a single number between 1 and 9 (where 1 = strongly disagree and 9 = strongly agree).
1. I am good at remembering routes I use to travel.
Strongly Disagree 1 2 3 4 5 6 7 8 9 Strongly Agree
2. I can easily orient myself using a map.
Strongly Disagree 1 2 3 4 5 6 7 8 9 Strongly Agree
3. I can give good directions.
Strongly Disagree 1 2 3 4 5 6 7 8 9 Strongly Agree
Page 4 of 4
Have you ever attended any presentations or have presented in the Immersive Visualization Lab (iLab) before?
If YES, please answer the following questions below. Please circle a single number between 1 and 9.
a. If Yes, how often have you been in the Immersive Visualization Lab (iLab) for presentations?
Very rarely 1 2 3 4 5 6 7 8 9 Very often
b. If Yes, how often was the technology in the iLab used for the presentations you gave or attended?
Very rarely 1 2 3 4 5 6 7 8 9 Very often
c. If Yes, how was your overall comfort level in presenting or attending a presentation in the iLab?
Not at all comfortable 1 2 3 4 5 6 7 8 9 Very comfortable
Thank you for completing this survey!

174
APPENDIX D – POST-TEST QUESTIONNAIRE

Page 1 of 10
Please indicate the extent to which you identify with the following statements that refer to your experience. Please circle a single number between 1 and 9 (where 1 = not at all and 9 = very much).
1. I devoted my whole attention to the office suite I just viewed.
Not at all 1 2 3 4 5 6 7 8 9 Very much
2. I concentrated on the office suite I just viewed.
Not at all 1 2 3 4 5 6 7 8 9 Very much
3. The office suite I just viewed captured my senses.
Not at all 1 2 3 4 5 6 7 8 9 Very much
4. I dedicated myself completely to the office suite I just viewed.
Not at all 1 2 3 4 5 6 7 8 9 Very much
5. I felt like I was actually there in the environment of the office suite I just viewed.
Not at all 1 2 3 4 5 6 7 8 9 Very much
6. It was as though my true location had shifted into the environment in the office suite I just viewed.
Not at all 1 2 3 4 5 6 7 8 9 Very much
7. I felt as though I was physically present in the environment of the office suite I just viewed.
Not at all 1 2 3 4 5 6 7 8 9 Very much
8. It seemed as though I actually took part in the action in the office suite I just viewed.
Not at all 1 2 3 4 5 6 7 8 9 Very much
9. I felt I could participate in the environment of the office suite I just viewed.
Not at all 1 2 3 4 5 6 7 8 9 Very much
10. I felt I could have some influence on the environment of the office suite.
Not at all 1 2 3 4 5 6 7 8 9 Very much
11. I felt like I could move around among the objects in the office suite I just viewed.
Not at all 1 2 3 4 5 6 7 8 9 Very much
12. The objects in the office suite I just viewed gave me the feeling that I could do things with them.
Not at all 1 2 3 4 5 6 7 8 9 Very much
Condition No.______________
1 2 3 4 5 6 7 8 Please do not write in this box
Page 2 of 10
13. I had the impression that I could reach for the objects in the office suite I just viewed.
Not at all 1 2 3 4 5 6 7 8 9 Very much
14. It seemed to me that I could have some influence on things in the office suite I just viewed, as I do in real life.
Not at all 1 2 3 4 5 6 7 8 9 Very much
15. It seemed to me that I could do whatever I wanted in the environment of the office suite I just viewed.
Not at all 1 2 3 4 5 6 7 8 9 Very much
Please indicate your level of agreement with each of the following statements. Please circle a single number between 1 and 9 (where 1 = disagree and 9 = agree).
1. I found viewing the office suite fun.
Disagree 1 2 3 4 5 6 7 8 9 Agree
2. I enjoyed viewing the office suite.
Disagree 1 2 3 4 5 6 7 8 9 Agree
3. Viewing the office suite was pleasant.
Disagree 1 2 3 4 5 6 7 8 9 Agree
Please answer the following questions about your experience searching the office suite. Please circle a single number between 1 and 9.
1. Indicate your experience locating the objects in the office suite:
Very frustrating 1 2 3 4 5 6 7 8 9 Very enjoyable
2. Indicate the difficulty in locating the objects in the office suite:
Very difficult 1 2 3 4 5 6 7 8 9 Very easy
3. Indicate your overall performance locating the objects in the office suite:
Very poor 1 2 3 4 5 6 7 8 9 Very good
4. Indicate your experience using the joystick to move around the office suite:
Very frustrating 1 2 3 4 5 6 7 8 9 Very enjoyable
5. Indicate the difficulty in using the joystick to move around the office suite:
Very difficult 1 2 3 4 5 6 7 8 9 Very easy
6. Indicate your overall performance using the joystick to move around the office space:
Very poor 1 2 3 4 5 6 7 8 9 Very good
Page 3 of 10
Please indicate to what extent you agree or disagree with each of the following statements. Please circle a single number between 1 and 9 (where 1 = strongly disagree and 9 = strongly agree).
1. My sense of movement inside the office environment was very compelling.
Strongly Disagree 1 2 3 4 5 6 7 8 9 Strongly Agree
2. I could examine the objects in the office environment from multiple viewpoints.
Strongly Disagree 1 2 3 4 5 6 7 8 9 Strongly Agree
3. My sense of movement inside the office seemed very natural.
Strongly Disagree 1 2 3 4 5 6 7 8 9 Strongly Agree
4. I felt a compelling sensation of self-motion within the office environment.
Strongly Disagree 1 2 3 4 5 6 7 8 9 Strongly Agree
Please indicate to what extent you agree or disagree with each of the following statements. Please circle a single number between 1 and 9 (where 1 = strongly disagree and 9 = strongly agree).
1. To what extent was what you saw in the virtual world similar to reality?
Strongly Disagree 1 2 3 4 5 6 7 8 9 Strongly Agree
2. To what extent did you feel you “were” physically in the virtual world?
Strongly Disagree 1 2 3 4 5 6 7 8 9 Strongly Agree
3. In your opinion, how was the quality of the images in the virtual world?
Strongly Disagree 1 2 3 4 5 6 7 8 9 Strongly Agree
4. To what extent did you feel you “went into” the virtual world?
Strongly Disagree 1 2 3 4 5 6 7 8 9 Strongly Agree
5. To what extent did the experience seem real to you?
Strongly Disagree 1 2 3 4 5 6 7 8 9 Strongly Agree
6. To what extent did your interactions with the virtual world seem natural to you, like in the real world?
Strongly Disagree 1 2 3 4 5 6 7 8 9 Strongly Agree
7. How real did the virtual objects seem to you?
Strongly Disagree 1 2 3 4 5 6 7 8 9 Strongly Agree
8. To what extent what you experienced in the virtual world was congruent to other experiences in the real world?
Strongly Disagree 1 2 3 4 5 6 7 8 9 Strongly Agree

Page 4 of 10
Please provide directions to best of your ability to answer each question.
How do you get from the entrance to the large corner office that has three windows?
How do you get from corner office with one window to the desk behind the partition?
How do you get from the unused office to the sitting area?
How do you get from the narrow office by the restroom to the welcome desk?

Page 5 of 10
Please do NOT flip back to previous pages as this questionnaire is focused on
obtaining your first impressions.
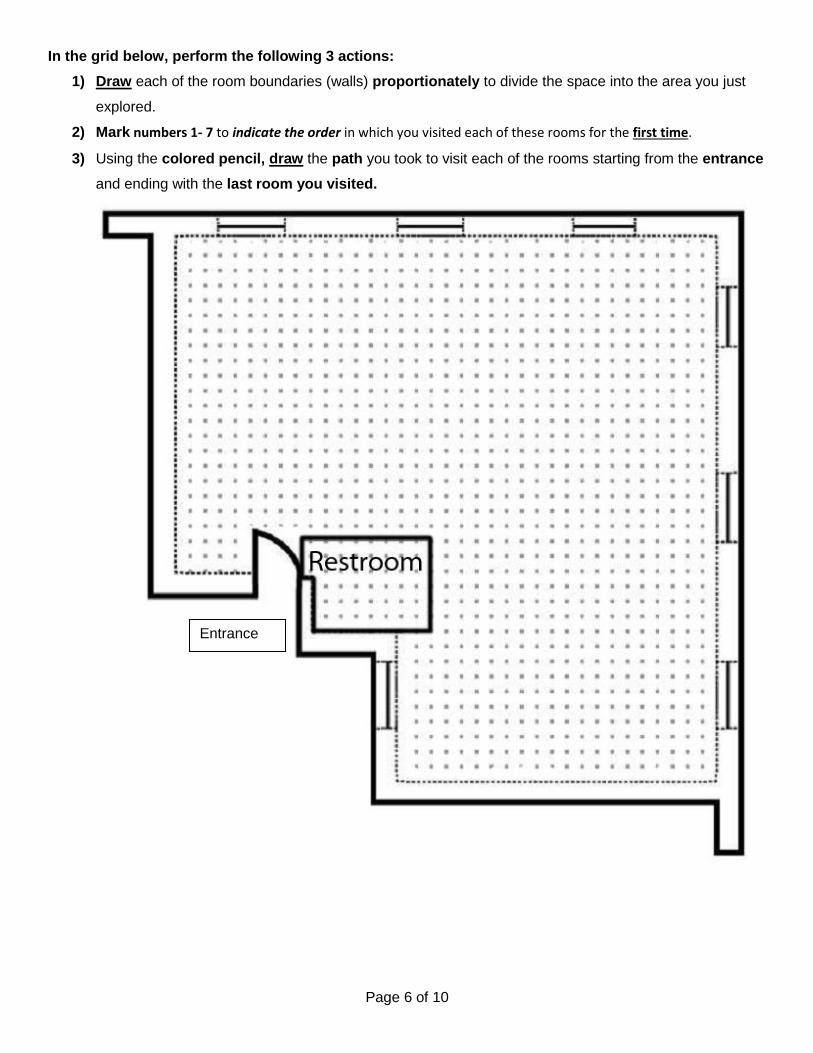
Page 6 of 10
In the grid below, perform the following 3 actions:
1) Draw each of the room boundaries (walls) proportionately to divide the space into the area you just
explored.
2) Mark numbers 1- 7 to indicate the order in which you visited each of these rooms for the first time.
3) Using the colored pencil, draw the path you took to visit each of the rooms starting from the entrance
and ending with the last room you visited.
Entrance

Page 7 of 10
Please do NOT flip back to previous pages as this questionnaire is focused on
obtaining your first impressions.
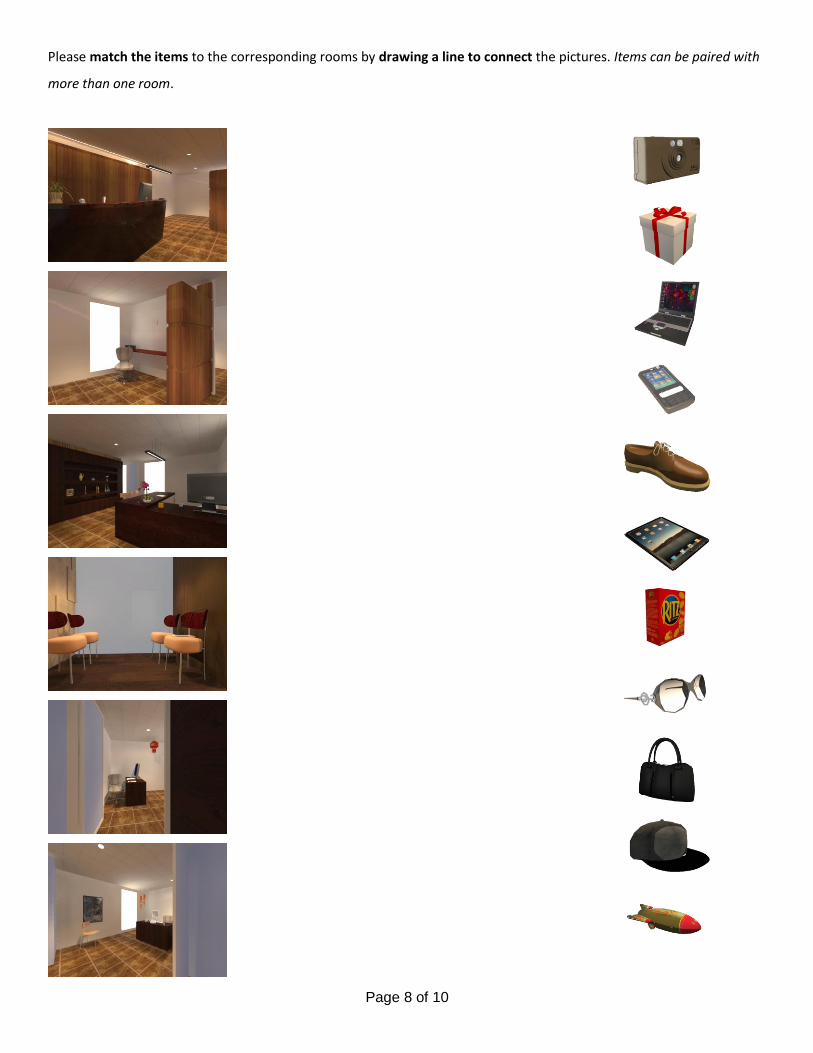
Page 8 of 10
Please match the items to the corresponding rooms by drawing a line to connect the pictures. Items can be paired with
more than one room.

Page 9 of 10
Please do NOT flip back to previous pages as this questionnaire is focused on
obtaining your first impressions.
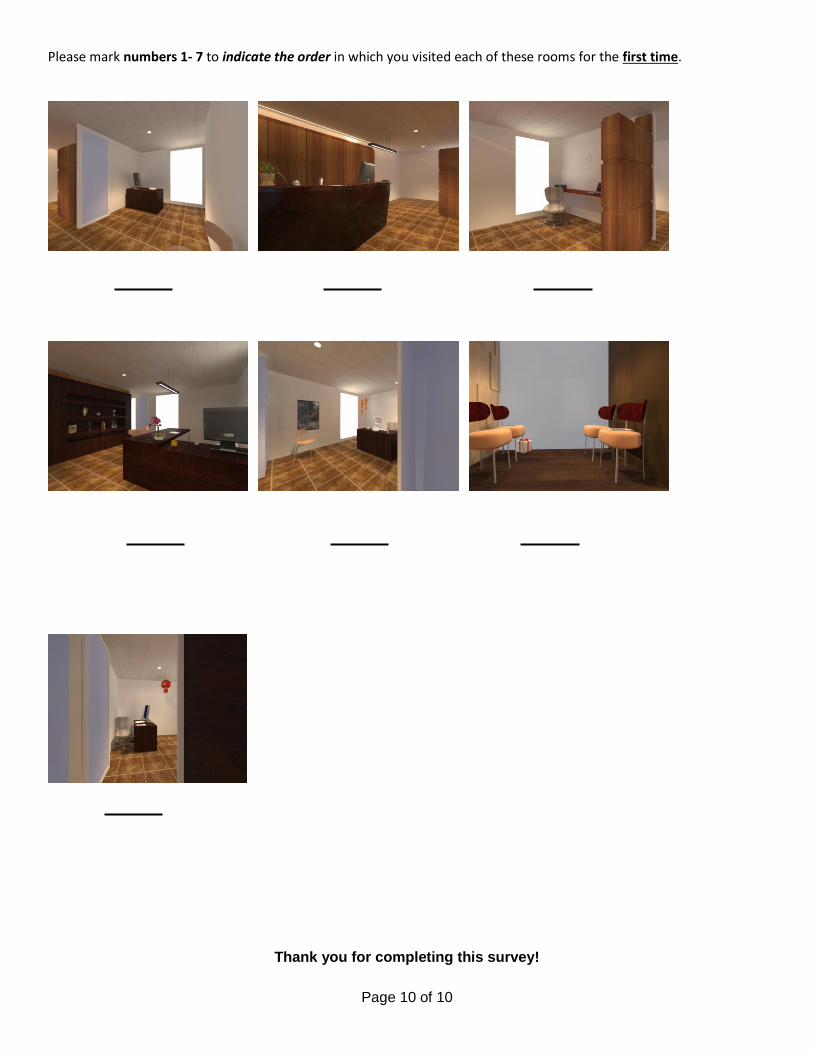
Page 10 of 10
Please mark numbers 1- 7 to indicate the order in which you visited each of these rooms for the first time.
Thank you for completing this survey!

185
APPENDIX E – SCORING GUIDES FOR COGNITIVE MAPS

Scoring Guidelines Drawing Convex Boxes (Length and Width from Provided
Grid)
Wall thickness: If 2 lines were drawn for walls take midpoint and count .5 for between grid spaces
Furniture and Labels: use furniture as a guide for where walls are located as well as delineation of
spaces (i.e. using end of a wall line as the boundary between 2 labeled spaces)
Crooked lines: take midpoint between the 2 furthest points, can also be .5 if between grid spaces
Numbered spaces without boundary: make the midpoint a boundary between numbered spaces, if
numbers listed closely together for large area, divide up space evenly between the number of labels
provided
Non-square room shapes: use furthest points to define ‘box’ shape except when overlapping with
adjacent spaces (i.e. L-shaped rooms) then count closest box shape and treat extra as corridor space
Overlapping spaces: box spaces cannot overlap, rooms must be distinct from other spaces, no space
between boxes
Doors: note doorways when drawing boxes for easier reference in J-Graphs
Corridors: mark out corridors as adjacent rectangles and squares, but don’t count the dimensions
(needed for j-graphs)
Uneven walls: take the mid-point between the two walls unless the distinction is obviously showing two
spaces sharing one wall (then take the shorter wall)
Dimension starting point: count from the first dot on the graph, do not start from the outer walls
Room dimensions: use the furthest points to determine room length and width of each room
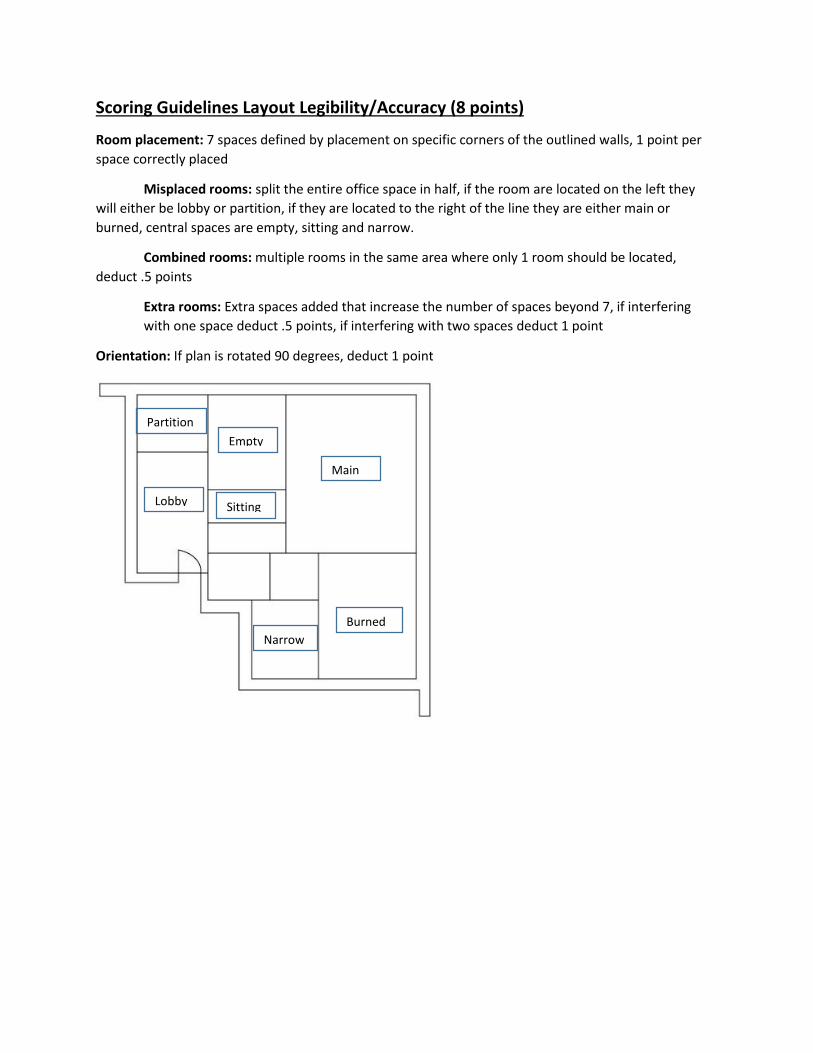
Scoring Guidelines Layout Legibility/Accuracy (8 points)
Room placement: 7 spaces defined by placement on specific corners of the outlined walls, 1 point per
space correctly placed
Misplaced rooms: split the entire office space in half, if the room are located on the left they
will either be lobby or partition, if they are located to the right of the line they are either main or
burned, central spaces are empty, sitting and narrow.
Combined rooms: multiple rooms in the same area where only 1 room should be located,
deduct .5 points
Extra rooms: Extra spaces added that increase the number of spaces beyond 7, if interfering
with one space deduct .5 points, if interfering with two spaces deduct 1 point
Orientation: If plan is rotated 90 degrees, deduct 1 point
Lobby Sitting
Main
Burned
Narrow
Partition
Empty
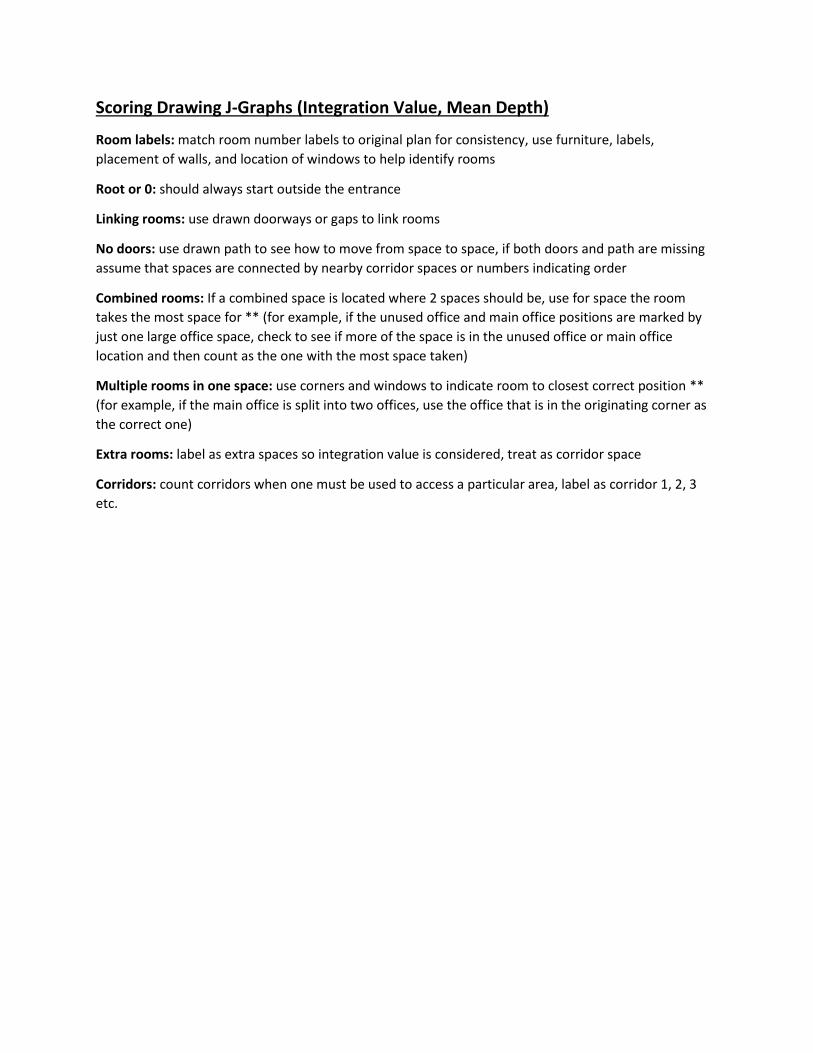
Scoring Drawing J-Graphs (Integration Value, Mean Depth)
Room labels: match room number labels to original plan for consistency, use furniture, labels,
placement of walls, and location of windows to help identify rooms
Root or 0: should always start outside the entrance
Linking rooms: use drawn doorways or gaps to link rooms
No doors: use drawn path to see how to move from space to space, if both doors and path are missing
assume that spaces are connected by nearby corridor spaces or numbers indicating order
Combined rooms: If a combined space is located where 2 spaces should be, use for space the room
takes the most space for ** (for example, if the unused office and main office positions are marked by
just one large office space, check to see if more of the space is in the unused office or main office
location and then count as the one with the most space taken)
Multiple rooms in one space: use corners and windows to indicate room to closest correct position **
(for example, if the main office is split into two offices, use the office that is in the originating corner as
the correct one)
Extra rooms: label as extra spaces so integration value is considered, treat as corridor space
Corridors: count corridors when one must be used to access a particular area, label as corridor 1, 2, 3
etc.
189
VITA
Danielle Oprean is originally from Etowah, North Carolina. She earned a
Bachelor’s of Science in Visualization in Digital Media from East Tennessee State
University. She went on to earn a Master’s of Science in Engineering Technology from
East Tennessee State University. Following her graduation, she joined the Ph.D. program
in Design with Digital Media in Architectural Studies at the University of Missouri.
During her academic program she completed both a Master of Arts in Design with Digital
Media in Architectural Studies and her Ph.D. in Human Environmental Sciences from the
University of Missouri. She holds research interests in human-computer interaction,
design tools and cognition, and visualization techniques. She is well versed in conducting
research, both quantitative and qualitative, and has experience in the design of
experiments. She enjoys experimenting with new technology and testing their usefulness
to various disciplines.