understanding the behavior of fdi and its role in capital formation in egypt
TRANSCRIPT
Understanding the Behavior of FDI and Its
Role in Capital Formation in Egypt
By
Ali Massoud, Ph.D.
Visiting scholar at Claremont Graduate University, USA
Associate professor of Economics, Sohag University, Egypt
1
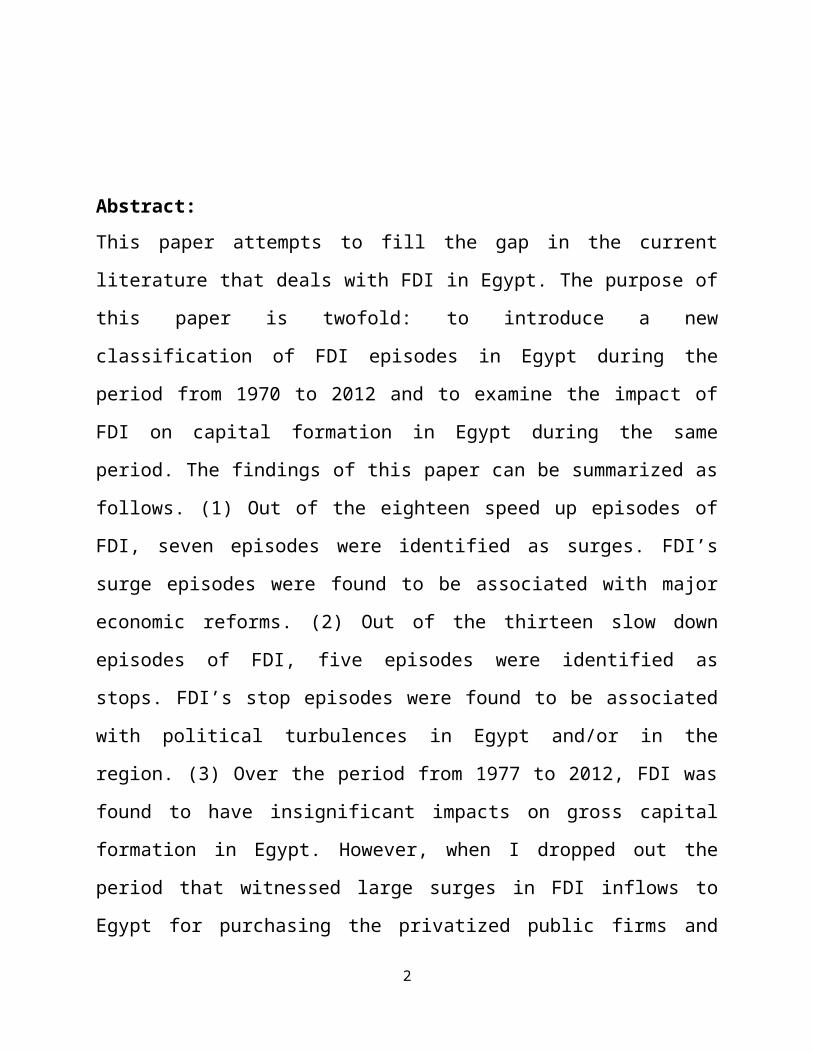
Abstract:This paper attempts to fill the gap in the current
literature that deals with FDI in Egypt. The purpose of
this paper is twofold: to introduce a new
classification of FDI episodes in Egypt during the
period from 1970 to 2012 and to examine the impact of
FDI on capital formation in Egypt during the same
period. The findings of this paper can be summarized as
follows. (1) Out of the eighteen speed up episodes of
FDI, seven episodes were identified as surges. FDI’s
surge episodes were found to be associated with major
economic reforms. (2) Out of the thirteen slow down
episodes of FDI, five episodes were identified as
stops. FDI’s stop episodes were found to be associated
with political turbulences in Egypt and/or in the
region. (3) Over the period from 1977 to 2012, FDI was
found to have insignificant impacts on gross capital
formation in Egypt. However, when I dropped out the
period that witnessed large surges in FDI inflows to
Egypt for purchasing the privatized public firms and
2
estimated the model over the period from 1977 to 2002,
FDI inflows were found to have a positive and
significant impact on gross capital formation.
Understanding the Behavior of FDI and ItsRole in Capital Formation in Egypt
ByAli Massoud, Ph.D
Visiting scholar at Claremont Graduate University, USA
Associate professor of Economics, Sohag University, Egypt
Introduction:
Since the Egyptian authorities implemented what is
known as “Open Door Policy” in October 1974, Egypt
changed its view on foreign direct investment (FDI).3
Thus, the government has given various types of
incentives for foreign investors to invest in Egypt. It
is not difficult to understand why does the Egyptian
government do that? FDI is not only a source of finance
for development in Egypt, but also a mean of
technological transfer as well. Egypt can use FDI in
extracting natural resources. Foreign multinationals
bring in capital, knowledge, and advanced technology.
However, contracts with multinationals have to be
managed in a way that enhances spillover-effects on
other sectors. Moreover, FDI should be encouraged
towards industry and manufacturing activities. Poelhekke
and Ploeg (2010) have argued that FDI that is directed to
the natural resources sector is proven to have less
spillover-effects than FDI that is directed to other
sectors. Tho Nguyen, et al (2011) and De Gregorio (2003) have
reviewed a wide range of literature dealing with the
impact of FDI and natural resources on economic growth.
FDI is found to be more attractive than other forms of
foreign investment because of the following reasons.
(1) FDI is less reversal than other forms of
investment. Capital flows reversals have been proven to
4
be a source of financial crises. Sula (2010) have found
that if capital flow is dominated by private loans and
portfolio flows rather than FDI, it has a high
probability to end with a sudden stop that may lead to
a financial crisis. (2) FDI, if it is associated with
sound policies, has proven to have a stronger impact on
economic growth comparing with other sources of foreign
investment. (3) FDI involves a risk-sharing
relationship with local investors. Such a criterion
does not exist in the formal contractual arrangements
for foreign loans as well as all types of portfolio
investments.
This paper tends to tackle two issues that the current
literatures on FDI inflows to Egypt lack. The first issue is
identifying the behavior of FDI in terms of speed up,
surge, slowdown, and stop episodes. The importance of
that is enhancing policymakers’ understanding of the
behavior of FDI inflows to Egypt and the reasons behind
this behavior. The second issue is investigating the impact
of FDI on capital formation in Egypt over a very long
period of time. The timeframe of the study is from 1970
to 2012. This timeframe covers the period right before
5
the “Open Door Policy” was introduced in Egypt up to
the most recent years. As far as I know, no empirical
studies so far cover this issue over this long
timeframe. The paper proceeds as follows. Section (1)
provides a brief summary of the most related literature
to the topic under investigation. Section (2) analyzes the
distribution of FDI inflows in the whole world and
emphasizes where do developing countries and Egypt
stand in terms of their share of FDI inflows? Section (3)
examines the behavior of FDI inflows to Egypt and
identifies its speed up, surge, slow down, and stop
episodes. Section (4) presents a simple model to estimate
the impact of FDI on gross capital formation in Egypt.
Section (5) emphasizes the conclusion remarks and the
policy implications that come out of this study.
(1) Literature Review:
This section presents an overview of the most related
literature to the two dimensions covered by this paper.
First, how can various episodes of FDI be identified?
Second, what is the impact of FDI on capital formation
in Egypt?
6
Regarding the identification of FDI’s episodes, Calvo, et al. (2004) have
defined a Sudden Stop as a phase that: (1) contains at
least one observation where capital flows fall under
two standard deviations below its sample mean. (2) The
Sudden Stop episode ends when the capital flows exceed
one standard deviation below its sample mean. By using
this technique, they identified the episodes of Sudden
Stops for 32 developed and developing countries. Reinhart
and Reinhart (2008) used two samples of advanced and
emerging countries to catalog capital inflow
“Bonanzas”. The first sample contains 181 countries and
covers the period from 1980 to 2007. The second sample
contains 66 countries and covers the period from 1960
to 2007. They defined a sudden stop as a deterioration
in the current account deficit / GDP ratio that lies
within the threshold of the 20th percentile of the
sample countries. Forbes and Warnock (2011) differentiated
between four episodes of capital flows: Surges, Stops,
Flight, and Retrenchment. They identified the four
episodes using three criteria: “(1) current year-over-year
changes in four-quarter gross capital inflows or outflows is more than two
standard deviations above or below the historic average during at least
one quarter of the episode; (2) the episode is defined as lasting for all7
consecutive quarters for which the year-over-year change in annual gross
capital flow is more than one standard deviation above or below the
historical average; (3) the length of the episode is greater than one
quarter.” (p.9). They used quarterly data on gross capital
flows for a sample of 58 countries over the period from
1980 to 2009 in order to identify the four types of
episodes they cited above. Burger and Ianchovichina (2014)
defined a surge episode of FDI as an increase in the
FDI/GDP ratio in a given year by more than one standard
deviation above its average. A stop episode was defined
in a symmetric way. They also imposed one more
restriction to FDI movements to be considered as a
surge or as a stop. According to this restriction, an
increase/ decrease in FDI/GDP ratio should fall with in
the top 25th percentile of the entire sample. They used
data for 95 developing countries covering the period
from 1990 to 2010 in order to identify FDI surges and
stops episodes using their definition of these episodes
as cited above. They also differentiated between two
types of FDI: Greenfield FDI and Mergers & Acquisitions
FDI.
8
Regarding the impact of FDI on capital formation, Acar, et al (2012)
used a panel data analysis to examine the relationship
between FDI and capital formation in 13 countries
through the MENA region covering the period from 1980
to 2008. They found a negative impact of FDI on capital
formation for the sample countries included in the
model. They concluded that for the 13 countries in the
MENA region, FDI is associated with a reduction in
domestic investment which means that FDI crowds out
domestic investment in this group of countries. Fry (1993)
used a sample of 16 developing countries. He found that
in 11 countries out of them, FDI has been associated
with a reduction in domestic investment. Timmer and Ark
(2002) examined the impact of FDI on capital stock in
Korea and Taiwan. They found a low share of FDI on
capital stock. Hejazi and Pauly (2002) used annual industry-
level data for the period from 1983 to 1995 in order to
examine the impact of FDI on domestic capital formation
in Canada. They found that FDI is a supplement to
domestic capital formation in Canada. Krkoska (2001)
examined the impact of FDI on gross fixed capital
formation in the transition economies in Central and
9
Eastern Europe. He found that FDI has a positive impact
on gross fixed capital formation.
(2) FDI inflows around the world: Where do developing
countries and Egypt stand?
From 1970 to 2012, FDI inflows around the world
accumulated to 21.3 trillion USD. Developed countries
have received 62% of global FDI flows and developing
countries received 34% while the transition economies
only received 4% of the world FDI flows. This means
that developed countries have received the largest
share of global FDI flows among the other groups of
countries while the transitions economies received just
a fraction of global FDI flows. But, how was the
historic trend of the distribution of FDI inflows among
these groups of countries like? To answer this
question, I graphed the distribution of FDI during four
periods of time. These periods are: 1970-19980, 1981-
1990, 1991-2000, and 2001-2012.
During the period from 1970 to 1980, developed
countries received more than 227 billion USD which was
around 77% of the total FDI inflows around the world.
During the same period, developing countries received10
more than 66 billion USD which was around 23% of the
total FDI inflows while transition economies received a
small share of FDI which was 23.6 million USD.
During the period from 1981 to 1990, there was no
substantial change in the distribution of global FDI
inflows among the different groups of countries. Over
this period, developed countries had kept their large
share of FDI and even their share increased by 1% to
get 78% of the global FDI inflows. Developing countries
lost 1% of its share to end up getting 22% of the
global FDI inflows. For the transition economies, they
received only 132 million USD from global FDI inflows
during this period.
To examine the trend of FDI inflows into the main
groups of countries during the period from 1991 to
2000, this section sheds light on the behavior of FDI
to these groups. During this decade, developed
countries had received the largest share of global FDI
inflows. This group received 72% of global FDI inflows.
However, its share declined from 78% during the
previous decade to 72% during the decade under
examination. For developing countries, their share from
11
global FDI inflows during this decade increased to 27%
compared with its share over the previous decade which
was 22%. Also, during this decade, transition economies
share of global FDI increased. This group of countries
received more than 51 billion USD which is much more
than what it had received during the previous period.
The period from 2001-2012 had witnessed a noticeable
change in the distribution of global FDI inflows among
the main groups of countries. During this period,
developed countries received around 8.5 trillion USD in
the form of FDI inflows. Even though the FDI received
by developed countries increased dramatically in
comparison with what this group received in the
previous period, its share declined from 72% to 58%
during the previous period. For developing countries,
FDI inflows increased dramatically during this period
as well. FDI inflows to this group of countries
increased from being around 1.4 trillion USD in the
previous period to be around 5.5 trillion USD in this
period. Moreover, its share of global FDI inflows
increased to be 37% compared with its share in the
previous period which was 27%. For transition
12
economies, they received during this period around
713.4 billion USD compared with what they received
during the previous period which was around 51.1
billion USD. Their share increased as well to reach 5%
from global FDI inflows compared with their share in
the last period which was 1%.
We conclude from the previous analysis that: (1)
developed countries have received the largest share of
global FDI. (2) The last decade has witnessed a sharp
increase in global FDI inflows into all groups of
countries. (3) During the last decade, both developing
countries and transition economies received higher
shares of global FDI inflows than they used to receive
during the previous decades. (5) Global FDI inflows are
moving in favor of developing countries.
To investigate to what extent Egypt has been a
destination for global FDI, I examined the share of
Egypt from global FDI and compared this share with what
developing countries had received from 1970 to 2012.
During the period from 1970 to 1980, Egypt received
around 2.3 billion USD of FDI inflows. In the same
period, developing countries received around 66.713
billion USD. Thus, Egypt’s share of global FDI inflows
overall this decade was 3% of the global FDI that
flowed into developing countries.
Over the period from 1981 to 1990, FDI inflows into
developing countries accumulated to 233.5 billion USA
which more what was received during the previous period
which was around 66.7 billion USD. This means that FDI
growth was 250% between this period and the previous
period. For Egypt, its share from FDI that flowed into
developing countries increased to 4% compared to its
share in the previous period which was 3%. Egypt
received around 8.8 billion USD as FDI inflows during
this period. If we compare this number with what Egypt
received from FDI inflows during the previous period,
we find that FDI inflows into Egypt increased by 283%
and this was more than the increase that happened in
the size of FDI that developing countries received
between the decade under investigation and the previous
decade.
During the period from 1991 to 2000, developing
countries received around 1.4 trillion USD in form of
FDI inflows. This period had witnessed a sharp increase
14
in global FDI inflows to developing countries. What
developing countries received during this period
increased dramatically by 507% of what these countries
received during the previous decade. From the data, we
conclude that this decade witnessed a large surge in
global FDI that flowed into developing countries. The
question now is where did Egypt stand among developing
countries regarding the size of FDI it received during
this period? As figure (8) shows, the answer for this
question is not in favor of Egypt. Egypt’s share from
FDI inflows to developing countries during this decade
declined to be only 1% from being 4% in the previous
decade. Not only did Egypt’s share of FDI inflows to
developing countries decline, but also the size of
these inflows declined during this decade as well. It
declined to be around 8.5 billion USD instead of being
8.8 billion USD during the previous decade. This means
that the size of FDI inflows to Egypt during this
decade declined by 3.4%. But why did Egypt’s position
in terms of what it received of FDI deteriorate during
the decade under investigation? I argue that the main
reason behind this deterioration is the first gulf war
at the beginning of this decade. This argument is15
supported by the noticeable decline in FDI inflows into
Egypt during 1991 and 1992.
The rest of this section is allocated to investigate
where did Egypt stand in terms of the size of FDI it
received during the period from 2000 to 2012? During
this period, FDI inflows to Egypt during the period
under investigation increased dramatically to be around
55.5 billion USD. By comparing this size with the size
of FDI that Egypt received during the previous decade
which was 8.5 billion USD, FDI inflows increased by 553
%. For Egypt, this is just a historical jump in FDI
inflows. But does this mean that Egypt’s position among
developing countries, in terms of FDI inflows that it
received during this period, had changed? During the
period under investigation, developing countries
received around 5.5 trillion USD in forms of FDI
inflow. By comparing this with the size of global FDI
that developing countries received during the previous
period which was around 1.4 trillion USD, I found that
FDI inflows to developing countries grew by a rate of
293%. We conclude from this figure that the sharp
increase in global FDI inflows was not a special case
16
for Egypt, but it was a common phenomenon for
developing countries.
This phenomenon can be attributed to the following
reasons. (1) The decline in the rate of return on
investments in developed countries. (2) The decline in
the global investment risk. (3) The global financial
crisis that started in developed countries between 2007
and 2008 and erupted all over the world afterward. (4)
The development that took place in the financial
markets in developing countries. (5) The accumulation
of human capital in developing countries. (6) The
tendency of developed countries to move some of their
heavy industries to developing countries. (7) During
this period many developing countries speeded up their
economic reform program which encouraged foreigners to
buy domestic assets.
(3) The behavior of FDI inflows into Egypt:
To examine the behavior of FDI inflows to Egypt from
1970 to 2012, I used the following steps. Firstly, I
graphed the data to see how it looks like and to
identify the behavior of FDI inflows to Egypt.
Secondly, I introduced a modification to the approach17
used by Calvo, et al. (2004); and Forbes and Warnock (2011) to
identify capital flows surges and stops. I applied
their technique after the modification to identify
various episodes of FDI inflows. This paper
differentiates among four episodes of FDI as follows:
speed up, slow down, surge, and stop. Using data for
FDI inflows to Egypt during the period under
investigation, I identified the four episodes mentioned
above.
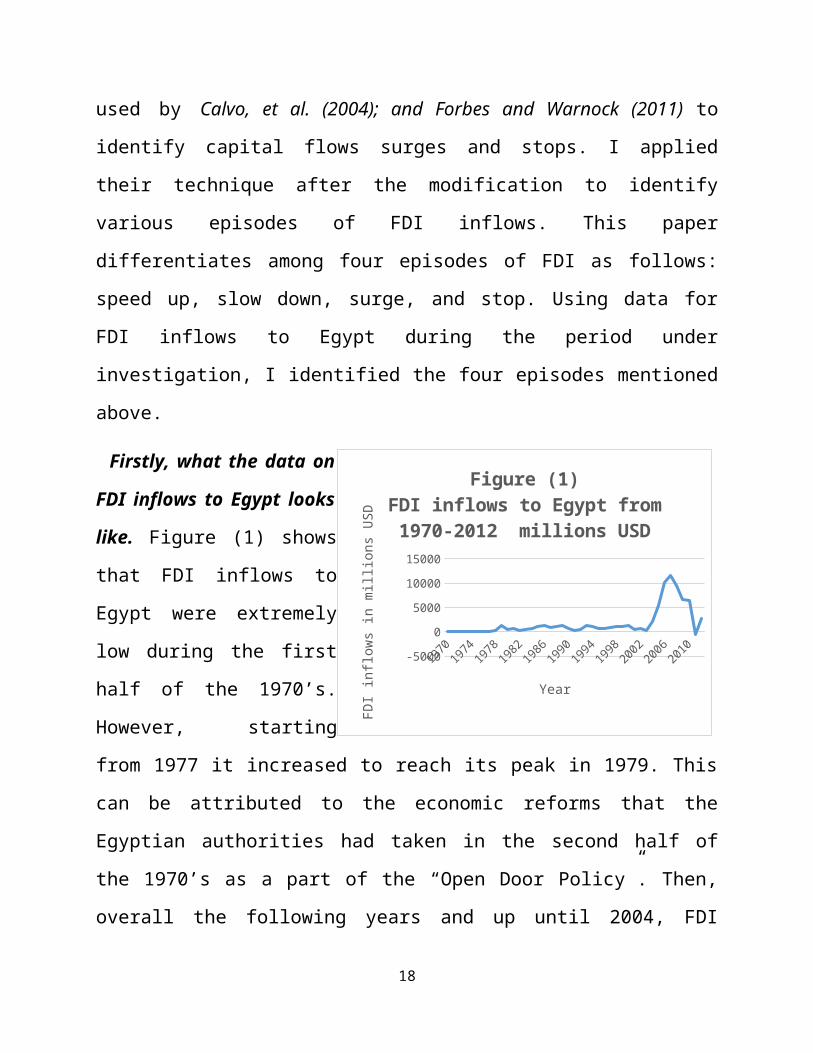
Firstly, what the data on
FDI inflows to Egypt looks
like. Figure (1) shows
that FDI inflows to
Egypt were extremely
low during the first
half of the 1970’s.
However, starting
from 1977 it increased to reach its peak in 1979. This
can be attributed to the economic reforms that the
Egyptian authorities had taken in the second half of
the 1970’s as a part of the “Open Door Policy”. Then,
overall the following years and up until 2004, FDI
18
1970
197419781982
19861990
1994
19982002
2006
2010-5000
0
5000
10000
15000
Figure (1)FDI inflows to Egypt from 1970-2012 millions USD
Year
FDI
infl
ows in
milli
ons
USD
inflows never reached 1.3 billion USD. In 2004, FDI
inflows were about 2.2 billion USD and this was the
first time in the history of FDI inflows to Egypt to
reach the 2 billion USD. Then, the size of FDI inflows
continued to increase to reach its peak in 2007 when it
was about 11.6 billion USD. This sharp increase in FDI
inflows can be attributed to the acceleration of
privatization program during this period. In 2008, FDI
inflows declined by 18% from its level in 2007 to be
around 9.5 billion USD. FDI inflows had continued to
decline over the following years until it crashed
dramatically in 2011 to be (-482.7) million USD. This
means that FDI in 2011 declined by 108% from its size
in 2010.
Secondly, identifying the speed up, slow down, surge, and stop
episodes for FDI inflows.
In this section, I identify the speed up, slow down,
surge, and stop episodes of FDI inflows to Egypt. To
calculate these episodes, I conducted the follow steps.
(1) I calculated the rolling mean for 5-year periods
for FDI inflows from 1970 to 2012. (2) I calculated
the standard deviation from the rolling mean for every19
5-year period. (3) I defined the above episodes as
follows:
“Speed Up”: an increase in FDI inflows in a given
year that is more than one standard deviation
above its 5-year rolling average.
“Slow Down”: a decline in FDI inflows in a given
year that is more than one standard deviation
below its 5-year rolling average.
“Surge”: an increase in FDI inflows in a given
year that is more than one standard deviation
above its 5-year rolling average and this increase
in FDI inflows should fall within the top 25th
percentile of the entire sample.
“Stop”: a decline in FDI inflows in a given year
that is more than one standard deviation below its
5-year rolling average and this decline in FDI
inflows should fall within the top 25th percentile
of the entire sample.
Based on the above methodology, I identified the
various episodes as defined before. Table (1)
summarizes the identified episodes. As table (1) shows,
over the period from 1970 to 2012, FDI inflows had been
20
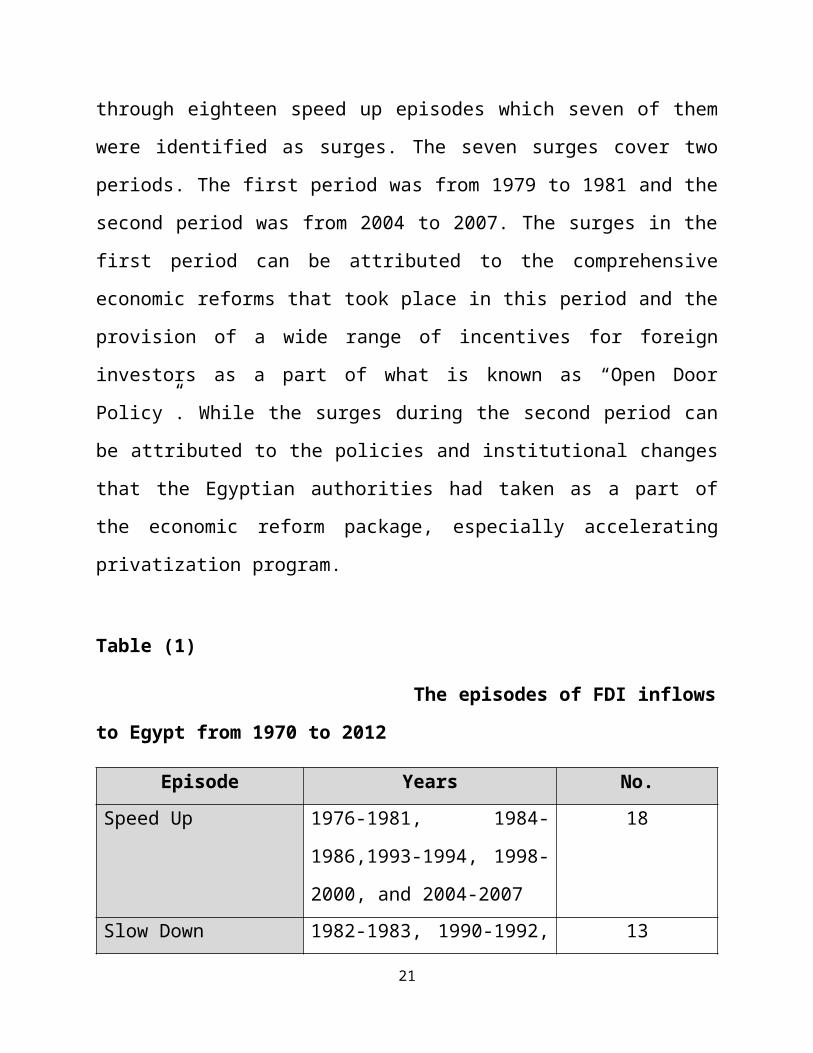
through eighteen speed up episodes which seven of them
were identified as surges. The seven surges cover two
periods. The first period was from 1979 to 1981 and the
second period was from 2004 to 2007. The surges in the
first period can be attributed to the comprehensive
economic reforms that took place in this period and the
provision of a wide range of incentives for foreign
investors as a part of what is known as “Open Door
Policy”. While the surges during the second period can
be attributed to the policies and institutional changes
that the Egyptian authorities had taken as a part of
the economic reform package, especially accelerating
privatization program.
Table (1)
The episodes of FDI inflows
to Egypt from 1970 to 2012
Episode Years No.Speed Up 1976-1981, 1984-
1986,1993-1994, 1998-
2000, and 2004-2007
18
Slow Down 1982-1983, 1990-1992, 13
21
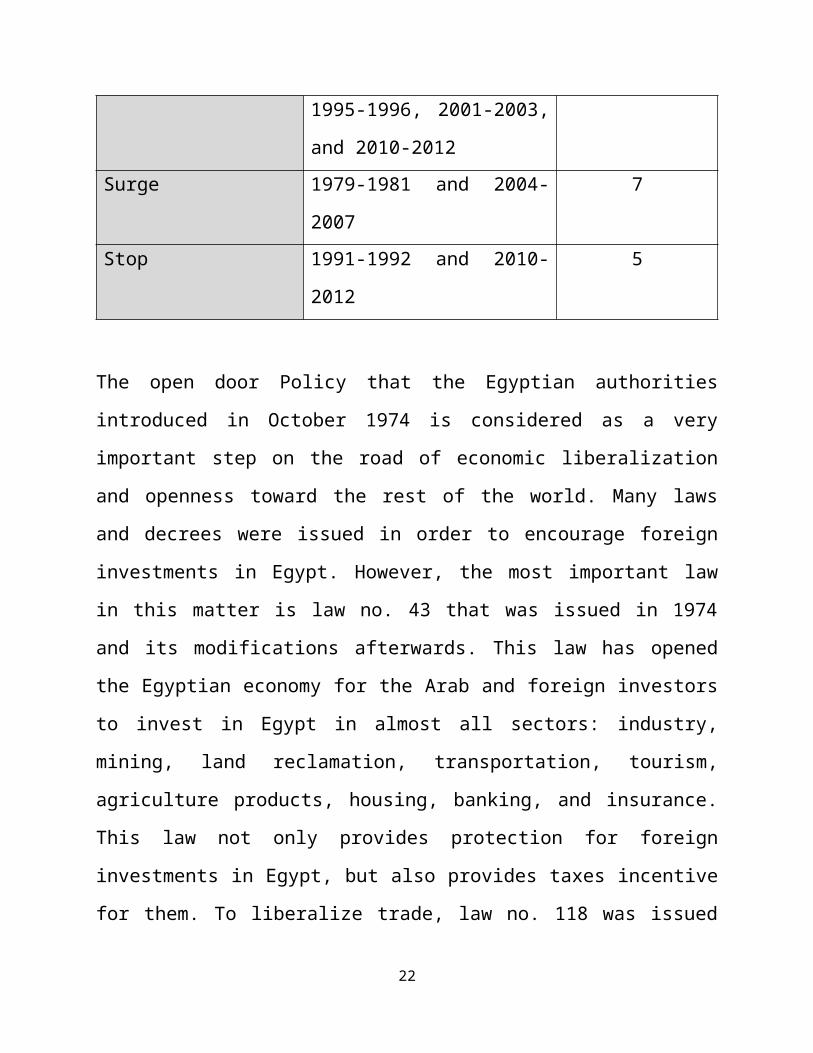
1995-1996, 2001-2003,
and 2010-2012Surge 1979-1981 and 2004-
2007
7
Stop 1991-1992 and 2010-
2012
5
The open door Policy that the Egyptian authorities
introduced in October 1974 is considered as a very
important step on the road of economic liberalization
and openness toward the rest of the world. Many laws
and decrees were issued in order to encourage foreign
investments in Egypt. However, the most important law
in this matter is law no. 43 that was issued in 1974
and its modifications afterwards. This law has opened
the Egyptian economy for the Arab and foreign investors
to invest in Egypt in almost all sectors: industry,
mining, land reclamation, transportation, tourism,
agriculture products, housing, banking, and insurance.
This law not only provides protection for foreign
investments in Egypt, but also provides taxes incentive
for them. To liberalize trade, law no. 118 was issued
22
in 1975 to give private sector the right to import and
export, which is very important to FDI inflows.
Moreover, many steps were taken in order to reform
foreign exchange market. For instance, law no. 97
issued in 1976 allowed private banks that have a
foreign share to deal with foreign exchange. All these
steps stimulated foreign investors and multinationals
to think about Egypt as a promising destination which
lead to the capital surge during the late of 1970’s.
One of the main institutional reforms in Egypt that has
been playing a very important role in attracting FDI
inflows to Egypt is the establishment of the General
Authority for Investment and Free Zones in 2004. This
specialized authority has been providing all data and
information that foreign investors need in order to
invest in Egypt. It also markets the investment
opportunities in Egypt. However, the main reason for
the FDI inflows’ surge in the second period was the
acceleration of the privatization program in Egypt
during this period. As figure (2) shows, the
investigated period had witnessed a sharp increase in
the value of assets that the Egyptian government
23
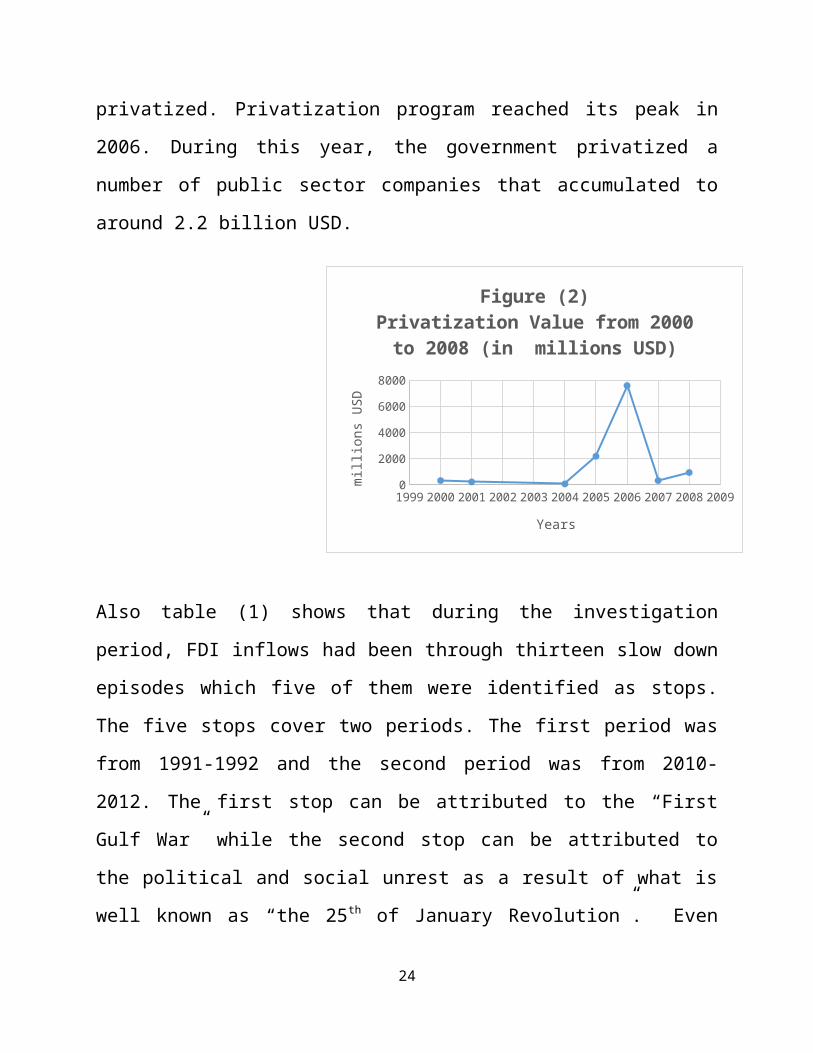
privatized. Privatization program reached its peak in
2006. During this year, the government privatized a
number of public sector companies that accumulated to
around 2.2 billion USD.
Also table (1) shows that during the investigation
period, FDI inflows had been through thirteen slow down
episodes which five of them were identified as stops.
The five stops cover two periods. The first period was
from 1991-1992 and the second period was from 2010-
2012. The first stop can be attributed to the “First
Gulf War” while the second stop can be attributed to
the political and social unrest as a result of what is
well known as “the 25th of January Revolution”. Even
24
1999 2000 2001 2002 2003 2004 2005 2006 2007 2008 20090
2000
4000
6000
8000
Figure (2)Privatization Value from 2000 to 2008 (in millions USD)
Years
mill
ions
USD
though the year of 2010 witnessed a stop episode in FDI
inflow, but this can be attributed to the global
financial crisis from 2007 to 2008. The negative impact
of this crisis on FDI inflows to Egypt had continued
from 2008 to 2010. However, the dramatic decline in FDI
inflows to Egypt happened in 2011.
(4) FDI and Capital Formation:
One of the main reasons for a developing country to
open up its economy for FDI is its willingness to
achieve a higher level of capital formation.
In this section, I used a simple model in order to
examine to what extent FDI has helped Egypt to achieve
a higher level of capital formation. The rest of this
section is allocated for model specification, data
sources, the estimation technique, model testing, and
the estimation results.
Model specification, in order to examine to what extent FDI
has helped Egypt to achieve a higher level of capital
formation, I used the following model.
CF = C + β1TR + β 2CR + β 3 FDI + µ
Where:
25
CF is gross capital formation as a percentage of GDP,
as defined in the World Bank Database (World
Development Indicators). According to the World
Development Indicators database “Gross capital formation
consists of outlays on additions to the fixed assets of the economy plus net
changes in the level of inventories. Fixed assets include land improvements
(fences, ditches, drains, and so on); plant, machinery, and equipment
purchases; and the construction of roads, railways, and the like, including
schools, offices, hospitals, private residential dwellings, and commercial
and industrial buildings. Inventories are stocks of goods held by firms to
meet temporary or unexpected fluctuations in production or sales, and
work in progress. According to the 1993 SNA, net acquisitions of valuables
are also considered capital formation.”
C is a constant term.
TR is trade as a percentage of GDP. Trade as defined
in the World Development Indicators database “is the sum of
exports and imports of goods and services.”
CR is domestic credit to private sector as a percentage
of GDP. As defined in the World Development Indicators
Database, “domestic credit to private sector refers to financial
resources provided to the private sector, such as through loans, purchases
of nonequity securities, and trade credits and other accounts receivable,
26
that establish a claim for repayment. For some countries these claims
include credit to public enterprises.”
FDI is foreign direct investment inflows.
µ is the residuals term.
Data sources, I used two sources of data for the
variables included in the model. For gross capital
formation, trade, and domestic credit to the private
sector, I used World Development Indicator Database
that published by the World Bank. For foreign direct
investment, I used the UNCTAD database. The data in the
model covers the period from 1977 (when FDI starts to
flow into Egypt in a considerable size as a result of
the” Open Door Policy” that had been implemented by the
Egyptian government in October 1974) to 2011, the years
in which the data for all variables was available.
The estimation technique, to conduct a time series analysis,
I used “Least Squares” technique and E-Views
statistical package version 8 in estimating the model’s
parameters and in conducting all the required tests. To
test for structure break, I conducted Chow Breakpoint Test.
The result suggests that there is no structure break in
27
the series of all variables. As stationary is a very
important condition in time series analysis, I tested
for the unit root using Augmented Dickey Fuller Test. The test
shows that all variables have a unit root. To make
variables stationary, I took the first difference for
all variables and then I applied the unit root test
again. The first difference for all variables was found
to be stationary. This means that all variables are
stationary on AR (1). Thus, the first difference was
used for all variables included in the model.
The estimation result, before presenting the result of the
model estimation, it is worth mentioning to report that
I conducted the following tests in order to be sure
that the model is reliable. First, to test for
Heteroskedasticity, I conducted Breusch-Pagan-Godfrey Test.
The result of the test suggests that there is no
Heteroskedasticity problem. Moreover, I conducted White
Test to test for the same problem. The result of White Test
suggests that there is no Hetroskedasticity as well.
Second, to test for the stability of the model, I used
Recursive Residuals Test. As figure (3) shows, the recursive
residuals are within the intervals of 2 S.E. This
28
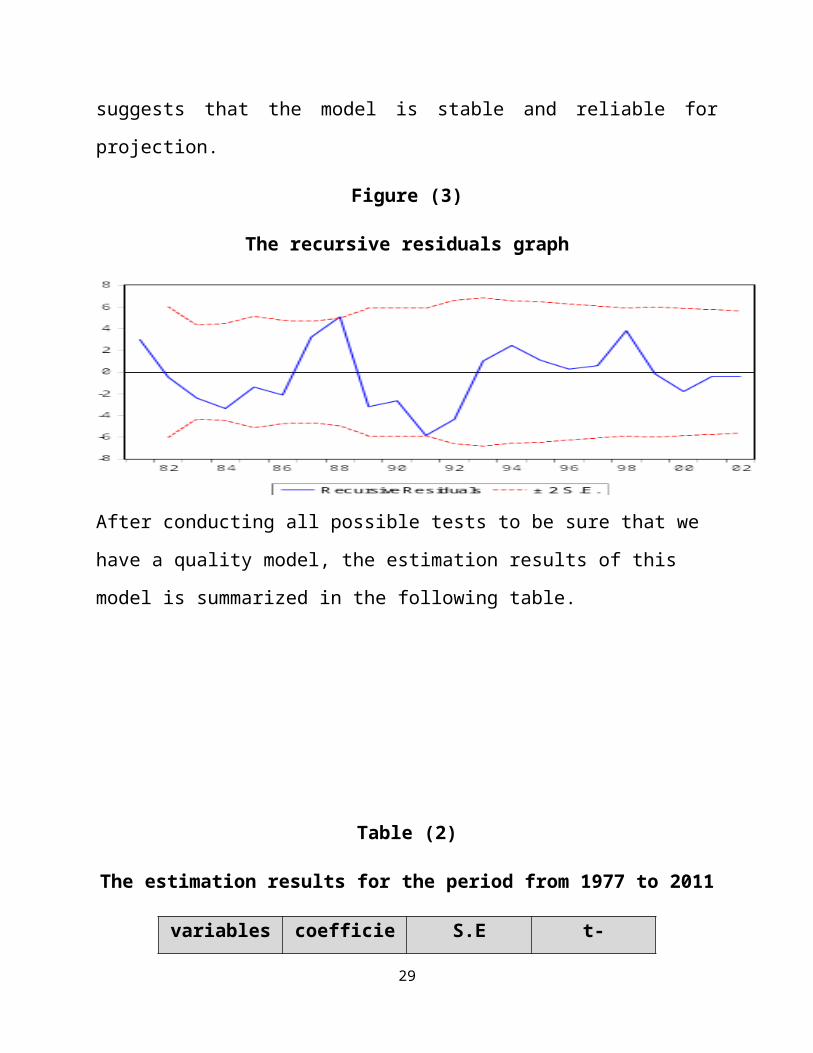
suggests that the model is stable and reliable for
projection.
Figure (3)
The recursive residuals graph
After conducting all possible tests to be sure that we
have a quality model, the estimation results of this
model is summarized in the following table.
Table (2)
The estimation results for the period from 1977 to 2011
variables coefficie S.E t-
29
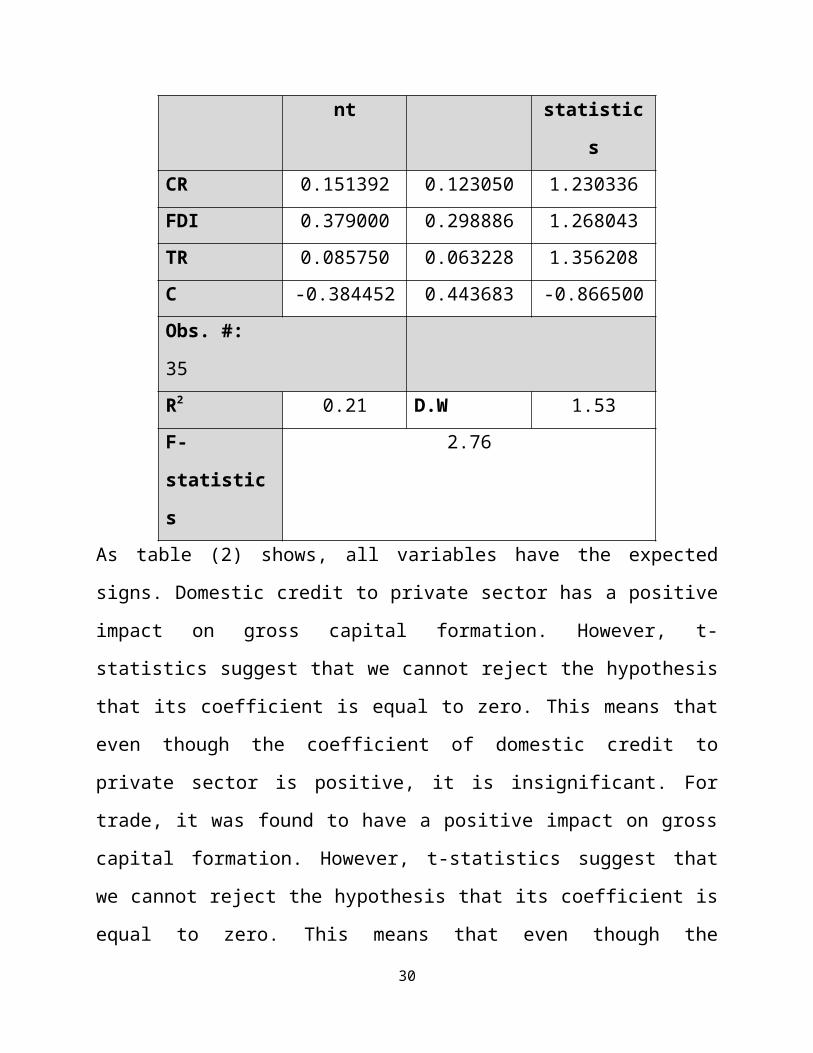
nt statistic
sCR 0.151392 0.123050 1.230336FDI 0.379000 0.298886 1.268043TR 0.085750 0.063228 1.356208C -0.384452 0.443683 -0.866500Obs. #:
35R2 0.21 D.W 1.53F-
statistic
s
2.76
As table (2) shows, all variables have the expected
signs. Domestic credit to private sector has a positive
impact on gross capital formation. However, t-
statistics suggest that we cannot reject the hypothesis
that its coefficient is equal to zero. This means that
even though the coefficient of domestic credit to
private sector is positive, it is insignificant. For
trade, it was found to have a positive impact on gross
capital formation. However, t-statistics suggest that
we cannot reject the hypothesis that its coefficient is
equal to zero. This means that even though the
30
coefficient of trade is positive, it is insignificant.
Regarding foreign direct investment, the estimation
results suggest that it has a positive impact on gross
capital formation. However, t-statistics suggest that
we cannot reject the hypothesis that its coefficient is
equal to zero. Thus, we conclude that the coefficient
of foreign direct investments is insignificant. This
means that there is no evidence, based on this model,
that foreign direct investment lead to a higher level
of gross capital formation in Egypt. This result is
consistent with what Timmer and Ark (2002) found. They
found fairly low shares of FDI in the capital stock in
both Korea and Taiwan. Moreover, Acar, et al (2012) found
that FDI has a negative impact on domestic investment
in the MENA region. Fry (193) also found that FDI has a
negative impact on domestic investments. Both the
latter two studies attribute their findings to the
relationship between FDI and local investors. They
argued that FDI has not created business for local
investors, but replaced them instead. Krkoska (2001) found
there is no statistically significant link between FDI
and capital formation in Central and Eastern Europe.
However, it is worth mentioning that Hejazi and Pauly (2002)31
found that FDI is a supplement to Canadian domestic
capital formation. We conclude that the findings from
the model I used go along with most of the other
studies findings. However, the interpretation for why
does the relationship between FDI and gross capital
formation in Egypt during the investigation period is
statistically insignificant? I argue that this result
can be attributed to the fact that a large share of FDI
inflows to Egypt went to the privatized public firms
according to the Egyptian privatization program. To
investigate to what extent this argument is valid, I
run the model by using data covering the period from
1977 to 2002. The new timeframe I used in the model
excluded the period when privatization program was in
its peak which the same period when FDI speeded up very
fast. The results of estimating the model using the new
timeframe is reported in the following table.
Table (3)
32
The estimation results for the period from 1977-2002
variables coefficie
nt
S.E t-
statistic
sCR 0.688370*
* 0.331052 2.079339FDI 1.058823* 0.546154 1.938688TR 0.104543 0.082914 1.260867C -0.276284 0.543989 -0.507885Obs. #:
26R2 0.31 D.W 1.82F-
statistic
s
3.25
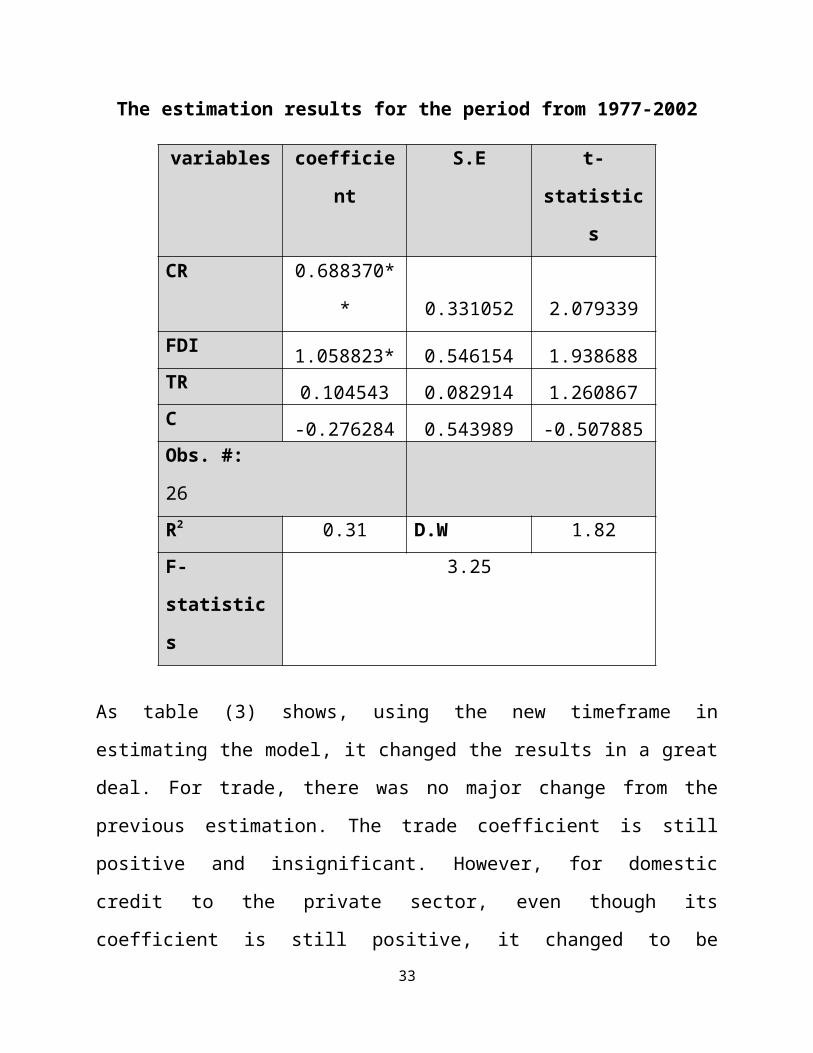
As table (3) shows, using the new timeframe in
estimating the model, it changed the results in a great
deal. For trade, there was no major change from the
previous estimation. The trade coefficient is still
positive and insignificant. However, for domestic
credit to the private sector, even though its
coefficient is still positive, it changed to be33
significant at level of 5%. This means that after
excluding the period of the speed up in foreign direct
investments and privatization in Egypt, domestic credit
to the private sector turns to have a statistically
significant impact on capital formation in Egypt.
Regarding foreign direct investment, its coefficient is
still positive. However, this coefficient changed to be
statistically significant at level of 10%. This means
that at a confidence level of 90%, foreign direct
investments have a positive impact on gross capital
formation in Egypt. From the new estimation results, we
conclude that there is an evidence that when a high
percentage of FDI takes the form of merges and
acquisitions, as what happened in the FDI that flowed
to Egypt for purchasing the public sector privatized
firms, FDI turns to have insignificant impact on
capital formation. Rather, it crowds out and replaces
domestic investment. However, when the Greenfield
investment has a high percentage of FDI, we found an
evidence of a positive significant impact of FDI
inflows on capital formation in Egypt.
(5) Conclusion and policy implications:
34
The purpose of this paper is twofold. The first is to
examine the behavior of FDI inflows to Egypt. In doing
so, I introduced a new classification of FDI episodes
as follows: speed up, surge, slow down, and stop. Using
the technique explained in section (3), I identified
eighteen episodes of speed up in FDI inflows. Seven out
of these speed up episodes were identified as surge
episodes. The FDI’s Surge episodes were found to be
associated with introduction of major economic reforms
in Egypt. Also, over the period of the study, I
identified thirteen FDI slow down episodes. Five out of
these slow down episodes identified as stop episodes.
The FDI’s stop episodes were found to be associated
with political turbulences in Egypt or in the Region.
The second purpose of this paper is to estimate the impact
of FDI on capital formation in Egypt. To do so, I used
a time series analysis with a simple model explained in
section (4). The findings of estimating the model over
the period from 1977 to 2011 prove that even though the
coefficient of FDI is positive, it is statistically
insignificant. This means that the model cannot prove
the existence of a positive impact of FDI on capital
35
formation during this period. However, when the model
was estimated using the period from 1977 to 2002, the
FDI coefficient was found to be positive and
statistically significant at level of 10%. This means
that at a confidence level of 90%, foreign direct
investment turns to have a positive impact on gross
capital formation in Egypt. From the new estimation
results, we conclude that there is evidence that when a
high percentage of FDI takes the form of merges and
acquisitions, as what happened in the FDI that flowed
to Egypt for purchase the public sector privatized
firms, FDI is found to have insignificant impact on
capital formation. Rather it crowds out and replaces
domestic investment. However, when the Greenfield
investment has a high percentage of FDI, we found out
evidence of a significant impact of FDI inflows on
capital formation in Egypt.
The main policy implications that emerge from this study can
be summarized as follows. (1) As the development
process in Egypt requires a large size of finance that
it is not available from the domestic sources,
encouraging FDI inflows should be a priority in policy
36
making process in Egypt. (2) As this study shows,
Greenfield FDI has much more impact on capital
formation than mergers & acquisitions FDI. Thus,
Egyptian authorities have to encourage a higher share
of FDI in form of Greenfield investments. As shown in
the literature that has been reviewed in this paper,
FDI that flows into natural resources sector has a weak
spillover effects on other sectors in the economy.
Based on these findings, I encourage the Egyptian
authorities to increase the share of FDI that flows
into industry and other sectors relative to the share
of FDI that flows to natural resources sector.
References:
[1] Acar, S., et al (2012). “The Effect of Foreign
Direct Investment on Domestic Investment: Evidence from
MENA Countries.” European Trade Study Group (ETSG) 14th Annual
Conference.
37
[2] Adhikary, B.K. (2011). “FDI, Trade Openness,
Capital Formation, and Economic Growth in Bangladesh: A
Linkage Analysis.” International Journal for Business and
Management, Vol.6, no.1, pp16-28.
[3] Burger, M. and E. I. Lanchovichina (2014). “Surges
and Stops in FDI Flows to Developing Countries: Does
the Mode of Entry make a Difference?” The World Bank, Policy
Research, Working Paper WPS6771.
[4] Calvo, G.A., et al (2004). “On the Empirics of
Sudden Stops: the Relevance of Balance-Sheet Effects.”
Inter-American Development Bank, Working Paper no.509.
[5] De Gregorio, J. (2003). “The Role of Foreign Direct
Investment and Natural Resources in Economic
Development.” Central Bank of Chile, Working Paper No.196.
[6] Forbes, K.J and F.E.Warnock (2012). “Capital Flow
Waves: Surges, Stops, Flight, and Retrenchment.” Journal
of International Economics, vol.88 (2), pp.235-251.
[7] Fry, M. J. (1993). “Foreign Direct Investment in a
Macroeconomic Framework: Finance, Efficiency,
Incentives, and Distortions.” The World Bank, Policy Research
Working Paper No. WPS1141.
38
[8] Hejazi, W. and P. Pauly (2002). “Foreign Direct
Investment and Domestic Capital Formation.” Industry
Canada Research Program, Working Paper No. 36.
[9] Krkoska, L. (2001). “Foreign Direct Investment
Financing of Capital Formation in Central and Eastern
Europe.” European Bank for Reconstruction and Development, Working
Paper No.67.
[10] Poelhekke, S. and F. v. d. Ploeg (2010). “Do
Natural Resources Attract FDI? Evidence from Non-
Stationary Sector Level Data.” De Nederlandsche Bank, DNB
Working Paper No.266.
[11] Reinhart, C.M. and V.R. Reinhart (2008). “Capital
Flow Bonanzas: an Encompassing View of the Past and
Present.” NBER Working Paper no.14321.
[12] Sula, O. (2010). “Surges and Sudden Stops of
Capital Flows to Emerging Markets.” Open Economies Review
21(4), pp.589-605.
[13] Tho Nguyen, Q., et al (2011). “The Nature and
Growth of Foreign Direct Investment and its Impact in
Vietnam: A National Innovation System Perspective.”
39
Aalborg University, Research Center on Development and International
Relations, Working Paper No.148.
[14] Timmer, M. and B.V. Ark (2002). “Capital Formationand Foreign Direct Investment in Korea and Taiwan:Coping with Diminishing Returns?” in J. Th. Lindblad,ed., Asian Growth and Foreign Capital: Case Studies from Eastern Asia,Aksant, Amsterdam, pp. 59-98.
40